A Beginner’s Guide to Water Management — Color Florida LAKEWATCH Department of Fisheries and Aquatic Sciences Institute of Food and Agricultural Sciences University of Florida Gainesville, Florida January 2004 1st Edition Information Circular 108 Joe Richard Reviewed January 2017

Welcome message from author
This document is posted to help you gain knowledge. Please leave a comment to let me know what you think about it! Share it to your friends and learn new things together.
Transcript

A Beginner’s Guide toWater Management — Color
Florida LAKEWATCHDepartment of Fisheries and Aquatic Sciences
Institute of Food and Agricultural SciencesUniversity of FloridaGainesville, Florida
January 20041st Edition
Information Circular 108
Joe
Ric
hard
Reviewed January 2017
This publication was produced by:
Florida LAKEWATCH © 2004UF/IFASDepartment of Fisheries and Aquatic Sciences7922 NW 71st StreetGainesville, FL 32653-3071Phone: (352) 392-4817Toll-Free Citizen Hotline: 1-800-LAKEWATch (1-800-525-3928)
E-mail: [email protected] Address: http://lakewatch.ifas.ufl.edu/
Copies of this document and other information circulars are available for download from the Florida LAKEWATCH website:
http://lakewatch.ifas.ufl.edu/LWcirc.html
As always, we welcome your questions and comments.
Florida LAKEWATCHUF/IFAS
Department of Fisheries and Aquatic Sciences Gainesville, Florida
January 20041st Edition
Reviewed January 2017
A Beginner’s Guide toWater Management — Color
Information Circular 108
This publication was produced by:
Florida LAKEWATCH © 2004University of Florida / Institute of Food and Agricultural SciencesDepartment of Fisheries and Aquatic Sciences7922 NW 71st StreetGainesville, FL 32653-3071Phone: (352) 392-4817Toll-Free Citizen Hotline: 1-800-LAKEWATch (1-800-525-3928)
E-mail: [email protected] Address: http://lakewatch.ifas.ufl.edu/
Copies of this document and other information circulars are available fordownload from the Florida LAKEWATCH website:
http://lakewatch.ifas.ufl.edu/LWcirc.html
As always, we welcome your questions and comments.
Note: For more information related to color in lakes,we recommend that you read Circulars 101, 102 and 103.
Beginner’s Guide to Water Management – The ABCs (Circular 101)This 44-page publication, in a user-friendly glossary format, provides a basic introduction to theterminology and concepts used in today’s water management arena.
A Beginner’s Guide to Water Management – Nutrients (Circular 102)A basic introduction to the presence of phosphorus and nitrogen in lakes — two nutrients commonlyassociated with algal growth and other forms of biological productivity in lakes. Limiting nutrients arediscussed, along with conceptual and mathematical tools that can be used to achieve a variety of watermanagement goals. The booklet is 36 pages in length.
A Beginner’s Guide to Water Management – Water Clarity (Circular 103)Anyone interested in the subject of water clarity can benefit from reading this 36-page circular. Topicsinclude the many factors that can affect water clarity in Florida lakes, techniques for measuring it, aswell as discussion of the methods used for managing this important lake characteristic.
A Beginner’s Guide to Water Management – Lake Morphometry (Circular 104)Knowledge of the size and shape of a lake basin (i.e., lake morphometry) can tell us a great deal abouthow a lake system functions. It can also help us appreciate lakes for what they are and manage themwith more realistic expectations. This 36-page booklet is recommended for anyone interested in learningmore about the terminology and techniques currently being used to study lake morphometry in Florida.
A Beginner’s Guide to Water Management – Symbols, Abbreviations and Conversion Factors (Circular 105)This 44-page booklet provides the symbols, abbreviations and conversion factors necessary to commu-nicate with water management professionals in the U.S. and internationally. Explanations for expressing,interpreting and/or translating chemical compounds and various units of measure are included.
A Beginner’s Guide to Water Management – Bacteria (Circular 106)This 38-page booklet provides a brief tutorial on the presence of bacteria in Florida lakes and theaquatic environment in general, followed by a discussion of the possible sources of bacterial contami-nation and how one might test for it. Also included: a comparison of wastewater treatment plantsversus septic tank systems; indicators used for detecting bacterial contamination; and laboratorymethods commonly used for detection of bacteria. Lastly, an easy 4-step process is provided for track-ing down bacterial contamination in a waterbody.
A Beginner’s Guide to Water Management – Fish Kills (Circular 107)In an effort to alleviate concerns voiced by the general public regarding fish kills, this 16-page bookletdiscusses five of the most common natural causes of fish kills: low dissolved oxygen; spawning fatalities;mortality due to cold temperatures; diseases and parasites; and toxic algae blooms. Human-inducedevents are also covered, along with a section on fish stress — a component of virtually every fish killsituation. The last section of the circular provides steps one can take to help biologists determine thecause of the event including a listing of fish health diagnostic laboratories and instructions on how tocollect fish and/or water samples for analysis.
Copies of these publications can be obtained by contacting the Florida LAKEWATCH office at1-800-LAKEWATch (1-800-525-3928). They can also be downloaded for free from the Florida LAKEWATCH web site at:
http://lakewatch.ifas.ufl.edu/LWcirc.html or from the UF/IFAS Electronic Document Information System (EDIS):http://edis.ifas.ufl.edu.
A Listing of Florida LAKEWATCH Information Circulars
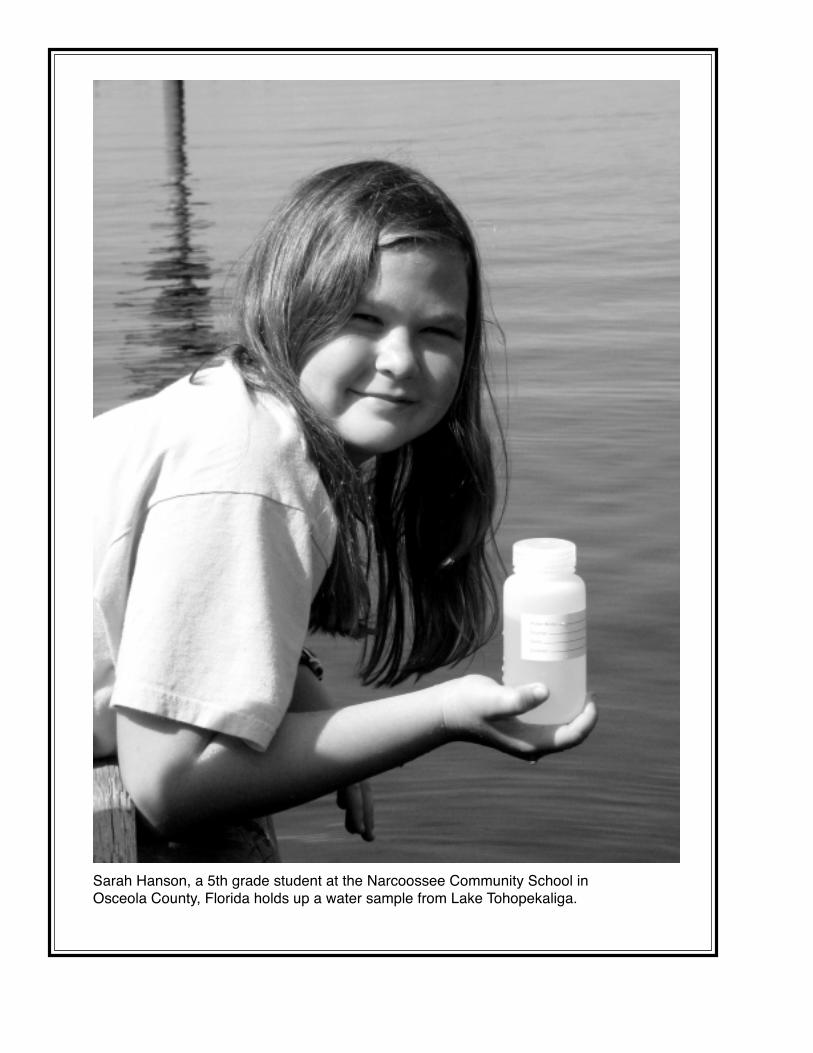
Sarah Hanson, a 5th grade student at the Narcoossee Community School inOsceola County, Florida holds up a water sample from Lake Tohopekaliga.
Aside from water clarity, the color of waterin a lake is one of the main attributes thatcaptures people’s attention — particularly
if the color begins to change. Such events oftentake us by surprise as many of us carry a mentalimage of a lake or waterbody as we first saw itand generally don’t expect changes to occur. Inreality, however, many lakes and waterways inFlorida can display a wide variety of hues overtime, ranging from a clear blue to vivid green, toorange or almost black.
Water color can be influenced by any numberof factors: some colors occur naturally; some maybe human-induced or result from a combinationof circumstances. For example, heavy rain eventsare known to wash organic substances into thewater where they dissolve and act as a dye;seasonal algae blooms can result in such highconcentrations of algae that the water becomestinted with the coloration of the algal cells; or windevents may stir up fine particles off the bottom,re-suspending them into the water column. Colormay also be the result of inorganic materials (e.g.,clay particles, etc.) from storm-water runoff orshoreline erosion.
It’s no wonder that many visitors and/orresidents are often bewildered when they see thespectrum of colored lakes and waterbodiesthroughout Florida. Sometimes, these differencesare misinterpreted as an indication of pollution.In rare instances, they may be correct, but most ofthe time lake color is a result of naturally occurringprocesses that have more to do with the geologyof the soils under the lake bed or runoff fromareas within the surrounding watershed.
Admittedly, accepting colored lakes as“normal” can be difficult, especially since color-
Introduction
less or “clear” water is traditionally considered theultimate water quality standard in many states.While this may be true when it comes to drinkingwater, it doesn’t always apply for many ofFlorida’s unique aquatic systems.
So, how do we know if colored water isnatural?
Collecting long-term color data is a goodway to start — especially if it’s combined withlong-term water chemistry measurements foralgae (total chlorophyll), nutrients (total nitrogenand total phosphorus) and water clarity. Withsuch information, we can discern much aboutwhat is happening in a lake or waterbody.Thanks to Florida LAKEWATCH (FLW) volunteersand a dedicated staff, we now have access to datafor hundreds of lakes throughout the state. In fact,much of the material provided in this circular wasmade possible by our volunteers and the samplesthey’ve collected. (In addition to the usual monthlysampling regimen, our water chemistry technicianshave been able to use the same water samples toconduct color analysis on FLW lakes two to fourtimes a year.)
These efforts have allowed us to compileand analyze data from thousands of samplesand, as a result, identify some rather strongpatterns between a lake’s water color and itsbiological productivity (i.e., the amount of algae,aquatic plants, fish and other wildlife). We’vealso learned just how important color can be tolake management even though it is often over-shadowed by concerns about nutrients, algae oraquatic plants. This is unfortunate as color maywell be influencing many of these same lakecharacteristics.
We hope you find this publication useful in
i

Included in this circular:
Introduction iList of Figures iii
Part 1 Two Ways to Define Color in a Waterbody 1Apparent Color 1Measuring Apparent Color 1Sidebar: Suspended and Dissolved Substances (definitions) 1Important Points to Remember About Apparent Color 2Sidebar: Illustrating the Difference Between Suspended and Dissolved Substances 2True Color 2Measuring True Color 2Important Points to Remember About True Color 2Sidebar: How Does Florida LAKEWATCH Measure True Color? 3Sidebar: An Anecdote About True Color 4
Part 2 More About Suspended and Dissolved Substances 7Suspended Substances 7Algal Matter 7Non-algal Matter 7Sidebar: A Mystery Color? 7Dissolved Substances 8Organic Matter 8Sidebar: Can Nutrients Such as Nitrogen and Phosphorus Add Color to a Lake? 8Inorganic Matter 9Sidebar: Long-term Color Changes 9
Part 3 Light and Color in Water 11Visible Light 11So Why Do We Need to Know About Light Absorption in Lakes? 12Measuring Light in a Lake 12Sidebar: What Is a Secchi Disk? 13Sidebar: Mathematical Formula Used to Calculate Light Attenuation 13
Part 4 Color and Its Influence on Algae and Aquatic Plants 15Algae, Color and Light 15Aquatic Plants, Color and Light 15Sidebar: What About Emergent or Floating-leaved Plants? 16Sidebar: Aquatic Plants and Color (Example: Tsala Apopka Chain-of-Lakes) 17
Part 5 Color, Water Clarity and Algae 19
Appendix 1: How to Use an Empirical Model 21Selected Scientific References 23Florida LAKEWATCH 24
your quest to learn more about the aquaticenvironment and, as always, we welcome yourquestions and comments. Because this material isintended for a varied audience including citizens,students and scientists, we’ve tried to organize the
information into agreeable portions for everyone.Think of this circular as an educational buffet; feelfree to take what you want and leave the rest forthose with larger appetites.
Bon appetite!
ii
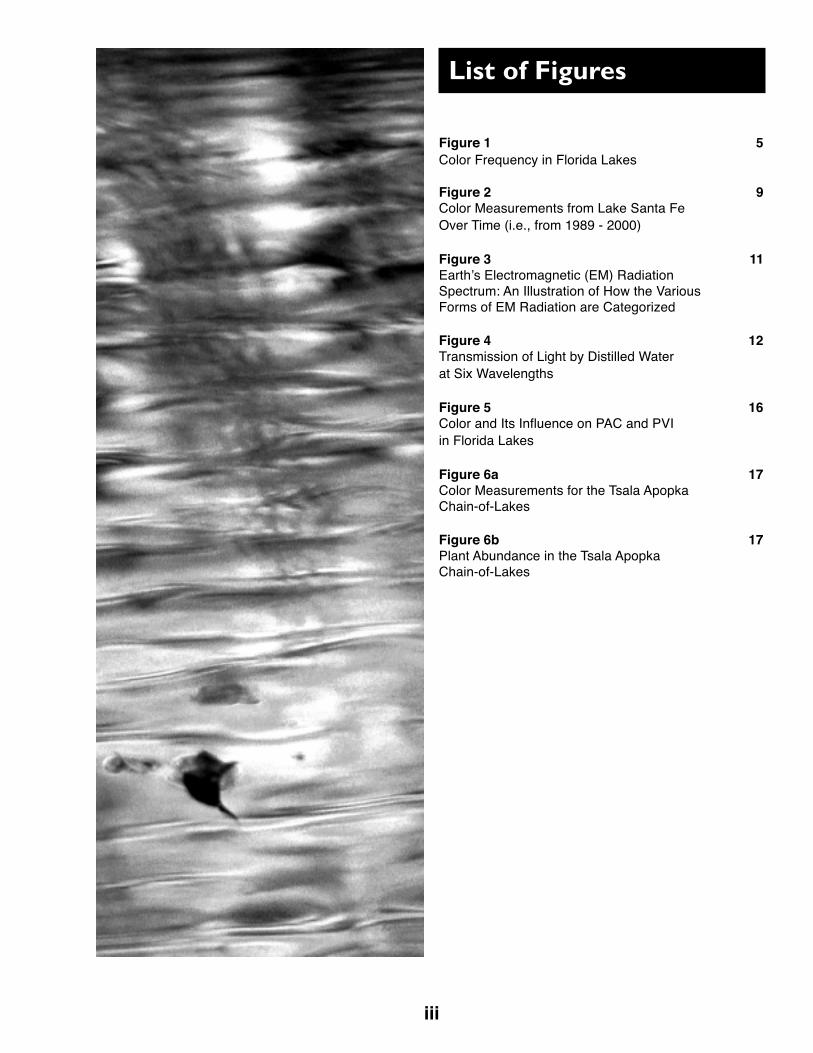
Figure 1 5Color Frequency in Florida Lakes
Figure 2 9Color Measurements from Lake Santa FeOver Time (i.e., from 1989 - 2000)
Figure 3 11Earth’s Electromagnetic (EM) RadiationSpectrum: An Illustration of How the VariousForms of EM Radiation are Categorized
Figure 4 12Transmission of Light by Distilled Waterat Six Wavelengths
Figure 5 16Color and Its Influence on PAC and PVIin Florida Lakes
Figure 6a 17Color Measurements for the Tsala ApopkaChain-of-Lakes
Figure 6b 17Plant Abundance in the Tsala ApopkaChain-of-Lakes
List of Figures
iii
Joe
Ric
hard
Joe
Ric
hard
Joe
Ric
hard
FC
CD
R/U
SF
There are two basic terms commonly usedwhen referring to the color of the water ina lake or waterbody. One is known as
apparent color and the other as true color. Whencommunicating with lake residents, lake manag-ers and others, it’s helpful to know the differencebetween the two. In Part 1, we’ll begin ourdiscussion by defining these two types of lakecolor and in Part 2, we will go into greater detailabout what influences both types. In Part 3, we’lldelve even deeper to see how color can influencethe biology of a lake (i.e., the amount of algae,aquatic plants and wildlife).
Apparent ColorApparent color is the color of the water as
seen by the human eye. For example, when aperson looks into a lake, the water may appear tobe colorless (i.e., clear), blue, green, yellow, red,brown, black or somewhere in between.
Most of the time, apparent colors are theresult of substances that are either suspended ordissolved in the water column. However, thereare other factors that can affect the apparent colorof a lake including the color of the lake bottom(i.e., is it light or dark?); the depth of the lake;reflections from the sky, trees or structures sur-rounding the waterbody; and the presence orabsence of aquatic plants. Some of these factorscan be difficult to measure, which is why lakemanagement professionals prefer to use true colormeasurements when assessing a lake.
See page 2 for information on true color.
Measuring Apparent ColorSome water management professionals
assess the apparent color of lake water using the
Forel-Ule color scale, a system developed byEuropean lake scientists. The scale classifies lakecolor into 22 categories ranging from blue, green-ish blue, bluish green, green, greenish yellow,yellow and brown. Using the scale, one candetermine the apparent color of a lake by visuallymatching (i.e.,, with the naked eye) the color ofthe water with the Forel-Ule color spectrum.
In Europe, this system has been used as away of defining the various levels of a lake’sproductivity: lakes with water that appears to beblue are considered to be less productive. Green,yellow and brown lakes are considered to be moreproductive. In the United States, the Forel-Ulesystem is seldom used for measuring the apparentcolor of water because it is cumbersome anddifficult to use.
Part 1Two Ways to Define Color in a Waterbody
Suspended substances can include algal matter(i.e., floating in the water column or stirred upbottom sediments due to wind mixing or boatingactivity) or non-algal matter such as finely groundcalcium carbonate particulates from limestone.Depending on the source, these substances mayimpart any number of colors to the water, includinga blue-green tint, various shades of brown, gray,green or even orange.
Dissolved substances often include metallicions of iron and manganese from natural sources(e.g., rocks and soils) as well as humic acids andtannins derived from organic matter (e.g., deadleaves and plants, etc.). These substancesusually impart a reddish or brown stain to thewater.
1
True ColorTrue color is defined as the color of water
resulting from dissolved substances only; allsuspended substances have been removed andare therefore not allowed to “conceal” or influencethe color of the water. In the United States,when lake management professionals talk about“color,” they are generally referring to truecolor.
Measuring True ColorTrue color is determined by first filtering a
water sample to remove all suspended substances.After the samples have been filtered, they arecompared to a specific color scale. This comparisonis generally done in a laboratory with a spectro-photometer.
In the United States, the most commonlyused color scale is the platinum-cobalt color scale.This system is comprised of 1,000 color units orplatinum-cobalt units (PCU or Pt-Co units). Ifone were to use the platinum-cobalt color scale tomeasure lake water that is especially clear (i.e.,colorless), the color readings would probably beless than 10 PCU, whereas lakes that have a littlecolor will have a true color measurement rangingfrom 20 to 50 PCU. On the far end of the spec-trum, lake water that is extremely dark in colorwill have a color reading of 500 PCU or higher.
In Florida lakes, true color generally rangesfrom 5 PCU to 600 PCU. Of course, there arealways exceptions: Lake Charles in MarionCounty has shown true color readings approach-ing 700 PCU! To the naked eye, such a lake appearsto be almost black in color.
Important Points to Remember About True Color
• True color measurements are especially helpfulto lake scientists because they provide a standard-ized way of assessing the color of a waterbody.
• True color is a component of apparent color.
• True color does not stay constant; it can increase
Important Points to Remember AboutApparent Color
• Most of the recognizable apparent color in alake is the direct result of suspended substancesin the water (i.e., both algal and non-algal matter).
• Apparent color can change significantly oncesuspended substances are filtered out of a watersample. That is why scientists rely less on apparentcolor when studying lakes and instead, usuallyinsist on taking true color measurements beforecoming to any conclusions about lake color.
• Nutrients can influence the apparent color ofwater indirectly by increasing algal populations.(e.g., Once algal populations increase, the algaethemselves are known to release organic substancesthat can tint the water various shades of green oreven brown.)
The following activities provide a handy visualaid for understanding the difference betweensuspended and dissolved substances:
Suspended substances
Fill a clear glass jar with water. Next, find severalpieces of chalk and break them up or grind them into a
coarse powder. Add this mixture to the water. If youwere to stir the mixture vigorously with a spoon, thechalk would become suspended into the water,
changing the overall color. Depending on how muchagitation is used, the chalk may stay in the watercolumn, sink to the bottom or float to the top.
Dissolved Substances
Now fill a clear jar with water and place three to fourtea bags into it and place it out in the sun for about 30
minutes. Tannins from the tea leaves will begin to stainor color the water. This is an example of dissolvedsubstances. The same process can be found in lakes
that are colored by tannins from decaying leaf material,plant stems or roots found within the waterbody and/orsurrounding watershed.
Illustrating the Difference BetweenSuspended and Dissolved Substances
2
• Criteria used to determine apparent color isconsidered to be somewhat subjective whereastrue color is based on actual water analysismeasurements.
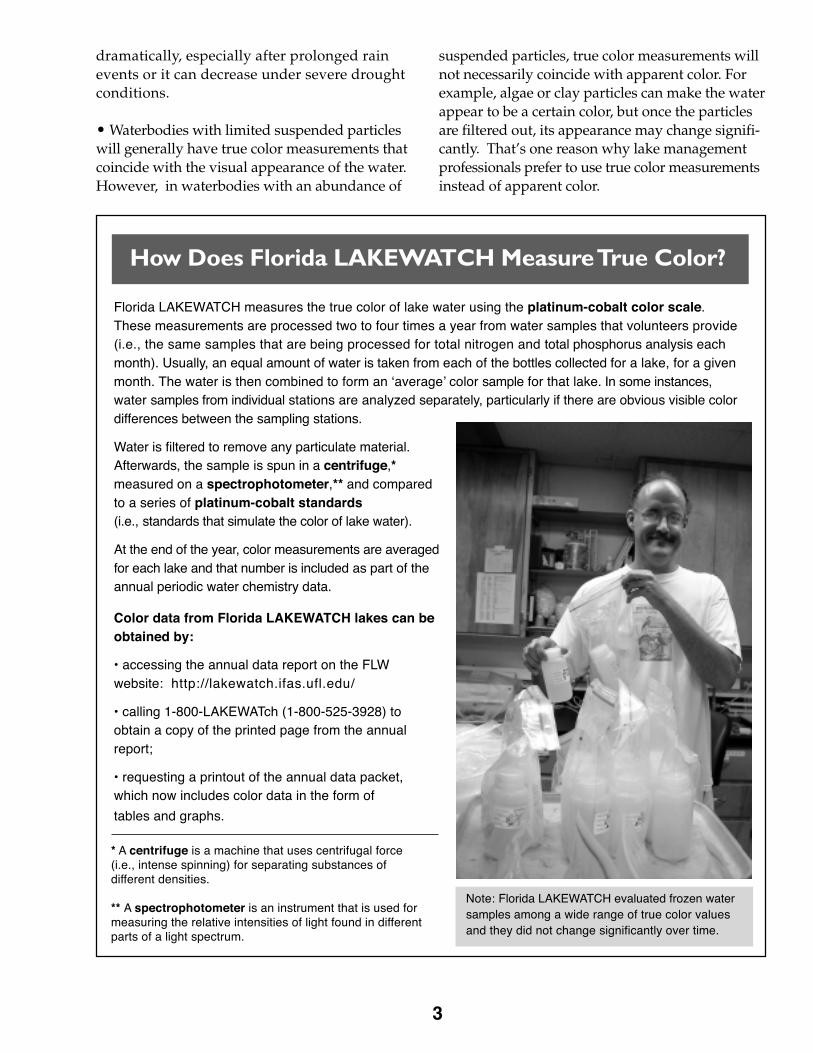
Florida LAKEWATCH measures the true color of lake water using the platinum-cobalt color scale.These measurements are processed two to four times a year from water samples that volunteers provide(i.e., the same samples that are being processed for total nitrogen and total phosphorus analysis eachmonth). Usually, an equal amount of water is taken from each of the bottles collected for a lake, for a givenmonth. The water is then combined to form an ‘average’ color sample for that lake. In some instances,water samples from individual stations are analyzed separately, particularly if there are obvious visible colordifferences between the sampling stations.
Water is filtered to remove any particulate material.Afterwards, the sample is spun in a centrifuge,*measured on a spectrophotometer,** and comparedto a series of platinum-cobalt standards(i.e., standards that simulate the color of lake water).
At the end of the year, color measurements are averagedfor each lake and that number is included as part of theannual periodic water chemistry data.
Color data from Florida LAKEWATCH lakes can beobtained by:
• accessing the annual data report on the FLWwebsite: http://lakewatch.ifas.ufl.edu/
• calling 1-800-LAKEWATch (1-800-525-3928) toobtain a copy of the printed page from the annualreport;
• requesting a printout of the annual data packet,which now includes color data in the form of
tables and graphs.
dramatically, especially after prolonged rainevents or it can decrease under severe droughtconditions.
• Waterbodies with limited suspended particleswill generally have true color measurements thatcoincide with the visual appearance of the water.However, in waterbodies with an abundance of
suspended particles, true color measurements willnot necessarily coincide with apparent color. Forexample, algae or clay particles can make the waterappear to be a certain color, but once the particlesare filtered out, its appearance may change signifi-cantly. That’s one reason why lake managementprofessionals prefer to use true color measurementsinstead of apparent color.
How Does Florida LAKEWATCH Measure True Color?
3
* A centrifuge is a machine that uses centrifugal force(i.e., intense spinning) for separating substances ofdifferent densities.
** A spectrophotometer is an instrument that is used formeasuring the relative intensities of light found in differentparts of a light spectrum.
Note: Florida LAKEWATCH evaluated frozen watersamples among a wide range of true color valuesand they did not change significantly over time.
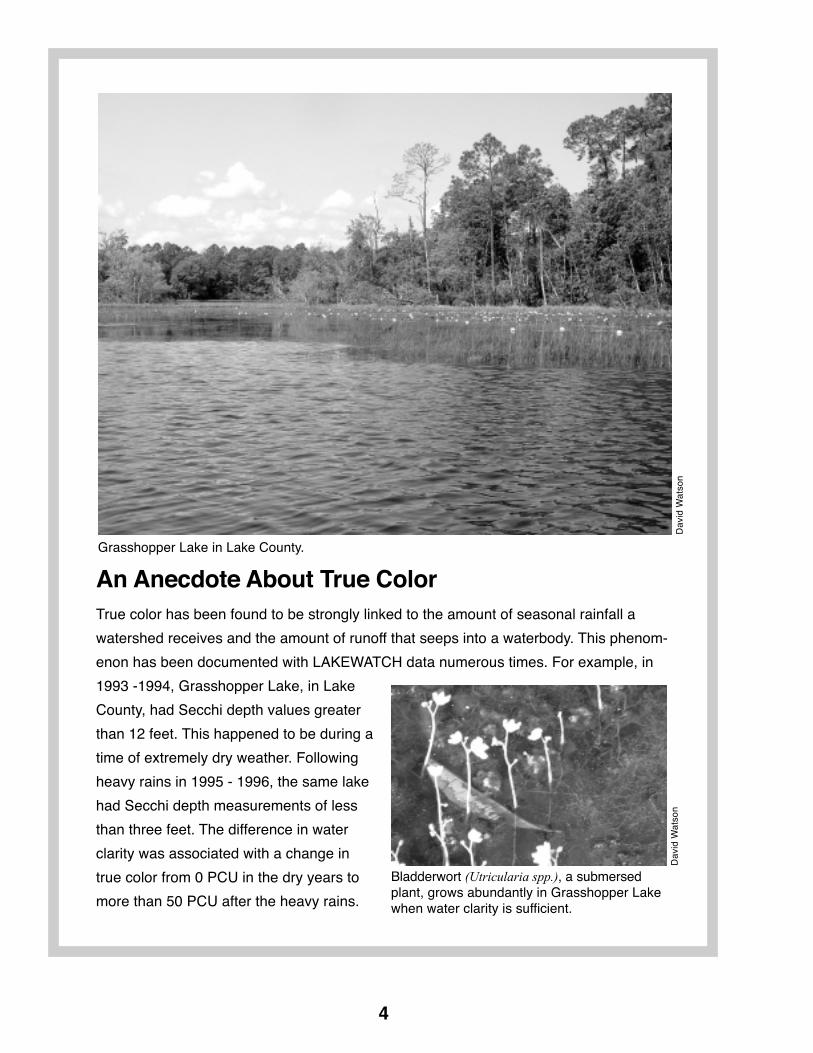
An Anecdote About True ColorTrue color has been found to be strongly linked to the amount of seasonal rainfall a
watershed receives and the amount of runoff that seeps into a waterbody. This phenom-
enon has been documented with LAKEWATCH data numerous times. For example, in
1993 -1994, Grasshopper Lake, in Lake
County, had Secchi depth values greater
than 12 feet. This happened to be during a
time of extremely dry weather. Following
heavy rains in 1995 - 1996, the same lake
had Secchi depth measurements of less
than three feet. The difference in water
clarity was associated with a change in
true color from 0 PCU in the dry years to
more than 50 PCU after the heavy rains.
Grasshopper Lake in Lake County.
Dav
id W
atso
nD
avid
Wat
son
4
Bladderwort (Utricularia spp.), a submersedplant, grows abundantly in Grasshopper Lakewhen water clarity is sufficient.
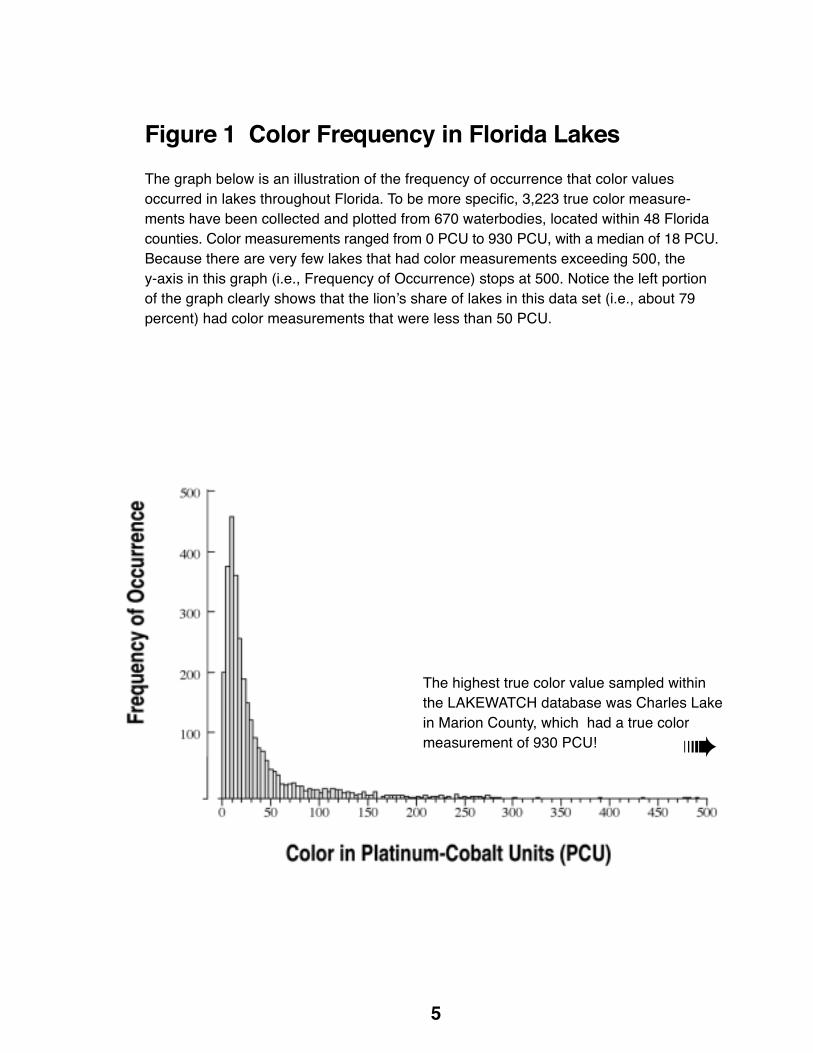
Figure 1 Color Frequency in Florida Lakes
The graph below is an illustration of the frequency of occurrence that color valuesoccurred in lakes throughout Florida. To be more specific, 3,223 true color measure-ments have been collected and plotted from 670 waterbodies, located within 48 Floridacounties. Color measurements ranged from 0 PCU to 930 PCU, with a median of 18 PCU.Because there are very few lakes that had color measurements exceeding 500, they-axis in this graph (i.e., Frequency of Occurrence) stops at 500. Notice the left portionof the graph clearly shows that the lion’s share of lakes in this data set (i.e., about 79percent) had color measurements that were less than 50 PCU.
5
➠The highest true color value sampled withinthe LAKEWATCH database was Charles Lakein Marion County, which had a true colormeasurement of 930 PCU!
6
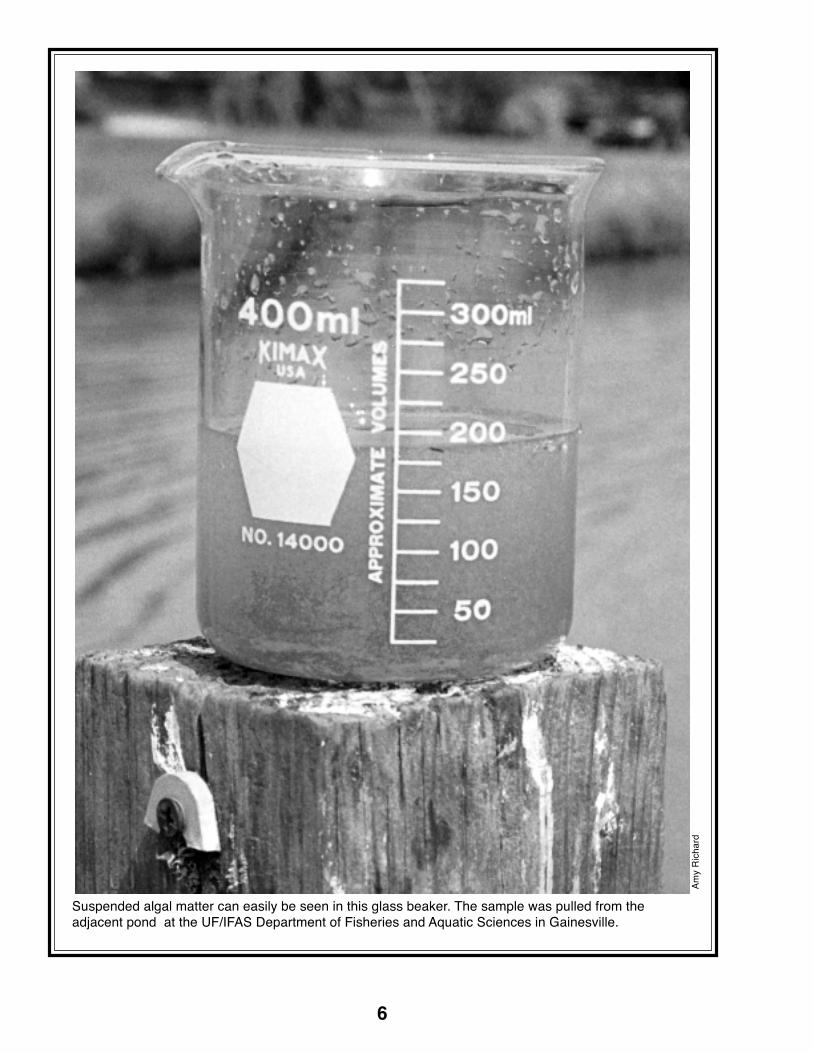
Suspended algal matter can easily be seen in this glass beaker. The sample was pulled from theadjacent pond at the UF/IFAS Department of Fisheries and Aquatic Sciences in Gainesville.
Am
y R
icha
rd
Now that we’ve learned about the twobasic ways that lake scientists definecolor, we will discuss suspended sub-
stances and dissolved substances in greater detail,as they are particularly important to understandingthe color of a waterbody.
Suspended SubstancesThere are any number of naturally occurring
suspended substances that can be found in Floridalakes or waterbodies. In lake management circles,they are also referred to as suspended matter orparticulates and they are usually classified intotwo basic groups: algal matter, which consist ofalgae cells suspended in the water column andnon-algal matter which includes fine soil particlesor non-living plant material. Both are described ingreater detail below.
Algal MatterIn many cases, apparent color in Florida
lakes is due to large concentrations of algaesuspended in the water. In other words, if thereare enough algae in the water column, lake waterwill appear to be the same color of the actual algalcells. Sometimes, this results in a short-term event— an algae bloom for example — or sometimeslakes maintain a particular color for many monthsor years, due to the presence of a dominant algalspecies. Depending on the species and theamount of algal cells in the water, such bloomscan impart a variety of colors to the water:
• Blue-green algae are dominant in the moreeutrophic lakes and impart a dull-green appearanceto the water. When large amounts of blue-greenalgae float to the surface, it may look like someonedumped a bucket of blue-green paint into the water.
Part 2More About Suspended and Dissolved Substances
• Yellowish-brown colors are frequently noticedin waterbodies where diatoms dominate the algalpopulation.
• Botryococcus (pronounced Ba - TREE - o - cockus)is a type of algae that gives many Florida lakes arusty or orange-brown color. It is often mostvisible during afternoon hours when it tends tofloat to the surface. At times, Botryococcus producesan oily sheen on the water, fooling people intothinking there’s been a gasoline or oil spill.
• Many turbid lakes display a green hue due togreen chlorophyll pigments within the algae.However, at times, some waterbodies have beenknown to develop a blood-red color. The cause ofthis red coloration is the alga Euglena, whichproduces a red pigment during intense periods ofsunlight to protect its green chlorophyll pigment.
Non-algal MatterSuspended particulate matter that is not of
algal origin can also influence the apparent colorof water. This includes both organic matter (e.g.,tiny particulates from dead aquatic and terrestrial
7
A Mystery Color?
During the months of March, April or May, manyFlorida lakes have been known to take on a brightyellow hue. As a result, FLW has heard from manypeople who are under the impression that an algalbloom is occurring in their lake when, in fact, whatthey are seeing is pine and oak pollen floating onthe surface or suspended in the water column.A clue for determining whether or not it’s algae:If a yellow powdery substance has collected oncars, windows and other outdoor objects in thearea, there’s a good chance it’s pollen.
plants) or inorganic particles (e.g., clay, sand, soils).These materials are usually introduced to a lakefrom storm-water runoff or erosion of the shoreline.In Florida, these lakes, which are often describedas “muddy,” are in the minority. However, they doexist. In the northern part of the state, some lakesreceive large amounts of red clay resulting in adistinctive reddish “Georgia clay” appearance.Lake Talquin and Lake Seminole are good examples.Other lakes receive inputs of grayish-white coloredclay, giving them a milky white appearance.
In flatter parts of the state, erosion or runoff-related color is rare. However, the central andsouthern portion of Florida does have its share oflakes that are influenced by non-algal suspendedsediments from within the lake itself. Lake Okee-chobee and Lake Apopka are prime examples. InOkeechobee, water depth at numerous mid-lakelocations is typically 2.7 meters (8.8 feet) and inLake Apopka, the average mid-lake depth is 1.7meters (5.6 feet). Because of the shallow depthand large amount of fetch in both lakes, wind isable to constantly re-suspend sediments from thebottom and mix them throughout the watercolumn causing changes in apparent color.1 This isknown as turbidity-related color. Needless to say,water clarity at these same mid-lake locations isquite low (i.e., as measured by a Secchi disk),typically less than 0.33 meters (one foot).
There are also instances in which colloidalsubstances (i.e., particles tiny enough to passthrough a filter) remain in a sample and affectwater color. This is particularly true in limerockpits where inorganic materials such as calcium andmagnesium carbonates will give water a green oremerald hue.
Dissolved SubstancesDissolved substances can affect both true and
apparent color. These substances enter lakes via avariety of pathways including surface water runofffrom the surrounding watershed, following rainevents, and the leaching of organic compounds fromdecomposing plant material within the lake itself.
OrganicThe dominant dissolved substances found in
water are typically organic compounds includinghumic acids and tannins that originate from many
8
Can nutrients, such as nitrogen andphosphorus, add color to water in a lake?
Phosphorus and nitrogen are nutrients found invirtually every lake or waterbody. They are alsonaturally occurring in plants and soils. In fact,Florida’s phosphorus-rich soils are what motivatedmany farmers to move to Florida in the early1900s. Phosphate mines are also prevalent invarious regions of the state, for the same reason. As far as color is concerned, when nitrogenand phosphorus are dissolved in water, theinorganic compounds are generally colorless sothey don’t really add to the apparent and/or truecolor of a waterbody directly. However nutrientscan affect color indirectly by influencing the growthof algae.
Example 1: In lakes where algae are abundant,the apparent color of the lake is affected becauseyou are seeing the color of algal cells in highdensities. Example 2: Should algae concentrations beginto increase in lakes that previously had low algalabundance, one of the first things people notice isa shift in from a bluish color to various shades ofgreen. This change is largely due to the release oforganic matter from within the algal cells, whichwill be evident in a true color measurement. For more on nutrients and algae, see A Beginner’s
Guide to Water Management — Nutrients (Circular 102).
1 Fetch is the distance that wind can travel over waterbefore intersecting a land mass.
types of terrestrial and aquatic plants. There areliterally hundreds of lakes in Florida that are col-ored due to the presence of these substances. (SeeFigure 1 on page 5.) As mentioned in Part 1, LakeCharles, in the Ocala National Forest, is a goodexample of this type of lake; the clear brown tea-colored water is the result of humic acids enteringthe waterbody from the surrounding watershed.Lakes with small amounts of these substanceswill generally appear green in color. (In thisinstance, the color is not related to algae.) As thewaterbody receives more dissolved organic matter,the color will begin to shift from green to yellow-green, to a yellow-brown and then a “clear” brown.
In addition to the compounds described above,algae can be another source of dissolved organicmatter in water. The substances are released
9
directly into the water from the algal cells. This typeof organic matter can change the true color of alake by affecting light absorption. (See Part 3 formore on this.) However, when algae are veryabundant, they can also affect apparent color asdescribed on page 7. (See section on Algal Matter.)
InorganicDissolved inorganic substances can also
influence color in lakes. For example, inwaterbodies that receive inputs that are high indissolved iron compounds, apparent colormight be described as rusty or orange-brown.
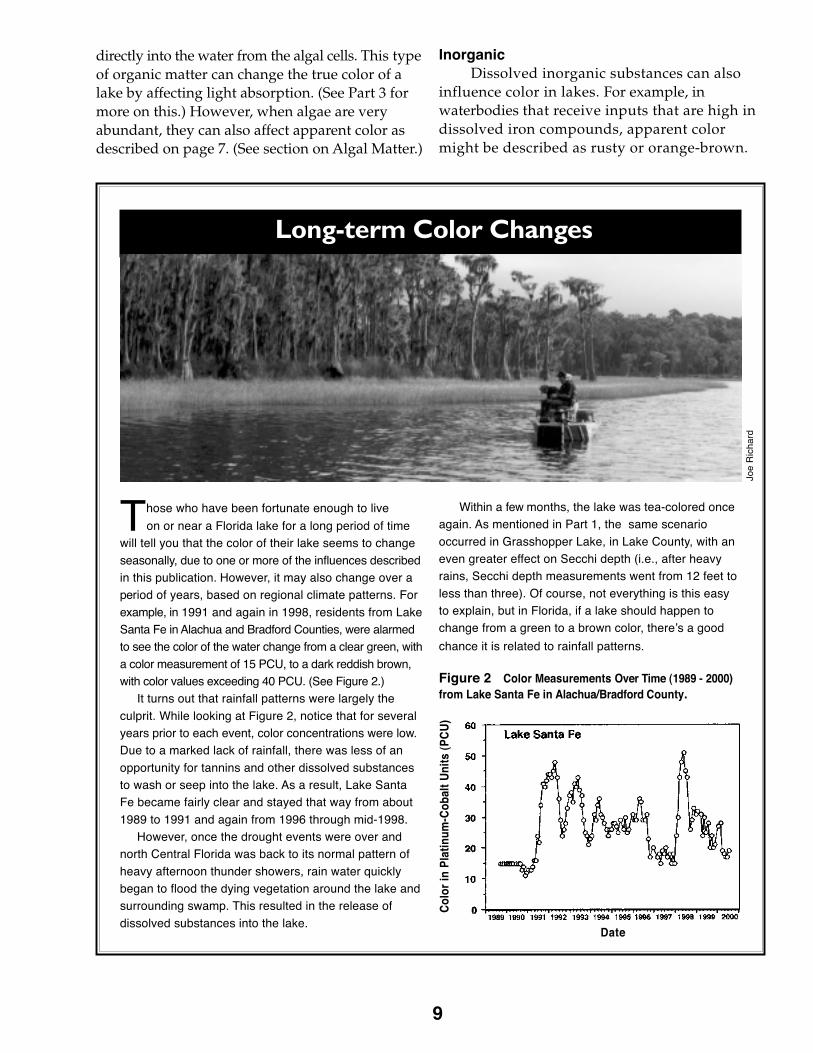
Long-term Color Changes
Those who have been fortunate enough to live
on or near a Florida lake for a long period of timewill tell you that the color of their lake seems to change
seasonally, due to one or more of the influences describedin this publication. However, it may also change over aperiod of years, based on regional climate patterns. For
example, in 1991 and again in 1998, residents from LakeSanta Fe in Alachua and Bradford Counties, were alarmedto see the color of the water change from a clear green, with
a color measurement of 15 PCU, to a dark reddish brown,with color values exceeding 40 PCU. (See Figure 2.) It turns out that rainfall patterns were largely the
culprit. While looking at Figure 2, notice that for severalyears prior to each event, color concentrations were low.Due to a marked lack of rainfall, there was less of an
opportunity for tannins and other dissolved substancesto wash or seep into the lake. As a result, Lake SantaFe became fairly clear and stayed that way from about
1989 to 1991 and again from 1996 through mid-1998. However, once the drought events were over andnorth Central Florida was back to its normal pattern of
heavy afternoon thunder showers, rain water quicklybegan to flood the dying vegetation around the lake andsurrounding swamp. This resulted in the release of
dissolved substances into the lake.
Within a few months, the lake was tea-colored onceagain. As mentioned in Part 1, the same scenario
occurred in Grasshopper Lake, in Lake County, with aneven greater effect on Secchi depth (i.e., after heavyrains, Secchi depth measurements went from 12 feet to
less than three). Of course, not everything is this easyto explain, but in Florida, if a lake should happen tochange from a green to a brown color, there’s a good
chance it is related to rainfall patterns.
Joe
Ric
hard
Figure 2 Color Measurements Over Time (1989 - 2000)from Lake Santa Fe in Alachua/Bradford County.
Col
or in
Pla
tinum
-Cob
alt U
nits
(PC
U)
Date
10
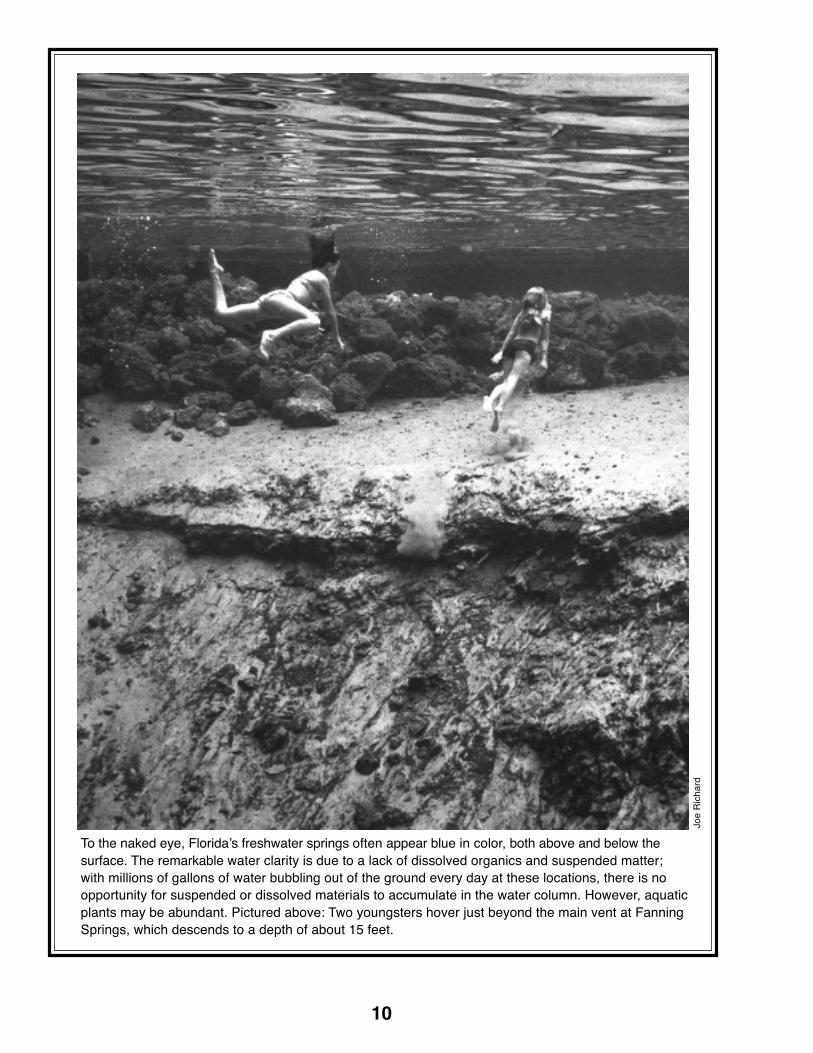
To the naked eye, Florida’s freshwater springs often appear blue in color, both above and below thesurface. The remarkable water clarity is due to a lack of dissolved organics and suspended matter;with millions of gallons of water bubbling out of the ground every day at these locations, there is noopportunity for suspended or dissolved materials to accumulate in the water column. However, aquaticplants may be abundant. Pictured above: Two youngsters hover just beyond the main vent at FanningSprings, which descends to a depth of about 15 feet.
Joe
Ric
hard

Now that we know a little more about thevarious substances that can cause lakewater to change and/or retain color, we
will begin to explore the effects that it may haveon a lake’s biological productivity (i.e., the amountof plant and animal life supported by the lake).But before we do, we need to take a short detourinto the physical sciences to learn about visiblelight. Granted, it may seem a bit odd to go off onthis tangent, but rest assured, it is quite relevant;without visible light, we would not be able to seeany of the colors discussed in this circular — ormuch else, for that matter. Ultimately, our littledetour will lead us back to one of the maininterests that lake scientists have regarding lakes:the growth of algae and aquatic plants.
Visible LightWhether emanating from a firefly, a lightbulb
or the sun, visible light is a form of electromag-netic (EM) radiation. Like other types of EMradiation (e.g., radiowaves, microwaves, infraredlight, X-rays, etc.), visible light is a form of energythat travels outward from its source and widensas it goes. See Figure 3 for an illustration of howthe various forms of EM radiation are categorizedwithin the earth’s electromagnetic spectrum.Notice that the low energy forms of radiation,such as radio waves have the longest wave-lengths (i.e., around 3,000 nm) and high energyradiation, such as x-rays and gamma rays haveshortest wavelengths (100 nm).
As its name suggests, visible light is the onlytype of EM radiation that is visible to the humaneye. That’s because, when we see light, we areseeing a combination of electromagnetic wavesthat are just the right size and intensity for our
Part 3Light and Color in Water
eyes to detect (i.e., between400 and 700 nanometers onthe EM spectrum).2 Most ofthe time, this light appearsto be white in color. How-ever, if one were to pass abeam of light through aprism, the primary colors ofthe rainbow would emerge:red orange, yellow, green,blue, indigo and violet. Thisoccurs because the prismseparates the wavelengths,allowing us to seethem individually.
When light shinesdown into a lake, itbehaves in much the sameway. While passing throughwater, light becomes re-fracted and is absorbed atdifferent rates and depths.Colors such as red orangeand yellow are the first to beabsorbed as they have alower radiant energy thanblue wavelengths.3 Oncered and yellow wavelengths are absorbed bywater, the higher energy blue wavelengths (indigo,blue and violet) are the only ones still visible tothe eye. This explains why deep lakes, with clearwater, often appear to be blue in color.
11
2 Within the EM system, radiation wavelengths range from 100 to3,000 metric units known as nanometers (nm).
3 Red has the lowest radiant energy of the visible light spectrumwith an electron voltage of 1.8 and violet has the highest radiantenergy with an electron voltage of 3.1
Figure 3
http
:/ /im
agin
e.gs
fc.n
asa.
gov/
docs
/ sci
ence
/ kno
w_l
1/em
spec
trum
.htm
l
So, Why Do We Need To KnowAbout Light Absorption In Lakes?
Humans aren’t the only ones who make useof light and its radiant energy. It is also critical tothe survival of nearly all animals and plants, bothterrestrial and aquatic. When radiant energy fallson a lake it is reflected off the surface; utilized byplants; or converted to heat, contributing to thethermal stratification of the water. This in turnaffects the rates of various biological and chemicalprocesses within the lake — even the behavior ofaquatic organisms.4
Photosynthesis is one of the most importantof these processes as it enables plants and algae toutilize sunlight for creating food, and then releasesoxygen into the water as a by-product. In fact,during this process, plants use the same portionof the visible light spectrum that we do (i.e., wave-lengths between 400 and 700 nm). In the lakescience arena, this portion of the spectrum is knownas Photosynthetic Active Radiation or PAR.Scientists who study light in waterbodies are
particularly interested in PAR, as it is a measure ofthe amount of light that is available at variousdepths and therefore can help us predict the abun-dance and type of plants (including algae) thatmight be expected to grow under those conditions.
Measuring Light in a LakeGenerally, a light meter is used to measure
the intensity of light just below the surface andat different depths. Information from the metercan then be used to calculate light attenuation (i.e.,the depth at which light is no longer able to pen-etrate into the water column). For more on howthis is done, see the mathematical formula providedon page 13. For the average citizen, the onlydrawback to this process is that light meters areexpensive and require special training to operate.
Fortunately, there is another way to assessthe depth of light penetration in water: A simpleand inexpensive device known as a Secchi diskcan be used. This device generally consists of a20-cm (8-inch) disk that is white in color or hasblack and white quadrants painted on it. A stringor rope is attached through the center. The rope is
12
4 Further discussion of chemical processes and/or the behavior ofaquatic animals, as it relates to light, is outside the scope of thispublication. For more on the subject, see G.E. Hutchinson (1957)and R.G. Wetzel (1975).
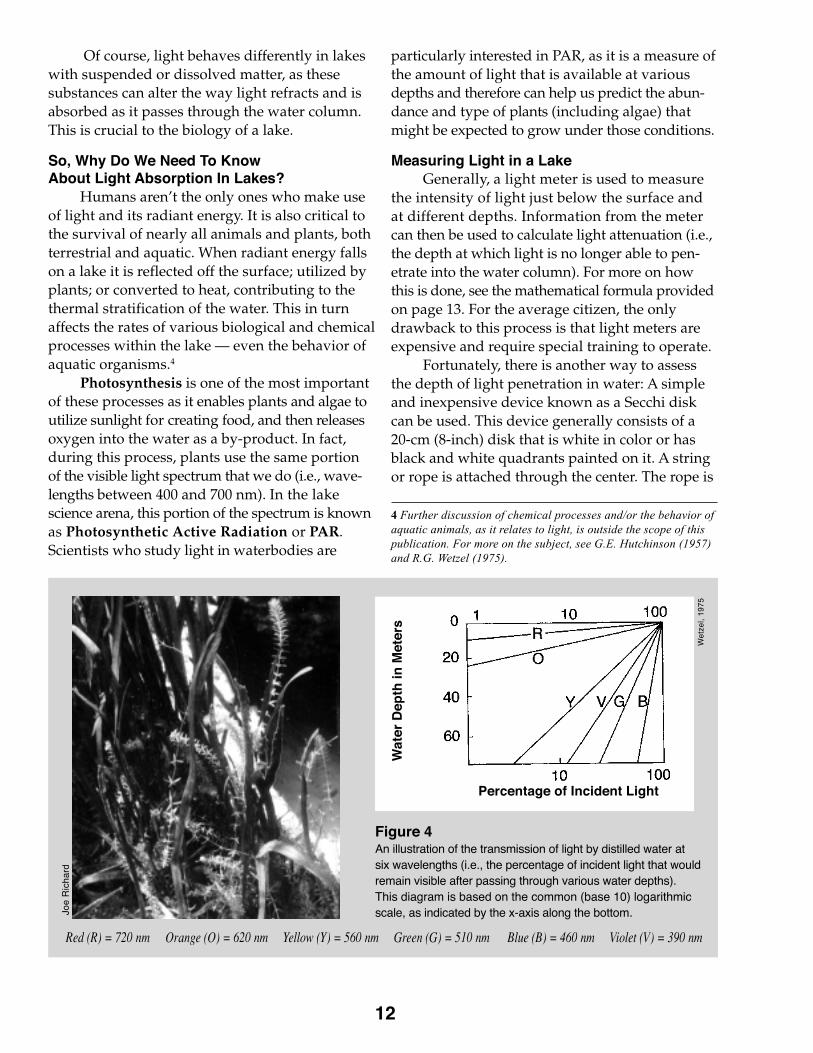
Figure 4An illustration of the transmission of light by distilled water atsix wavelengths (i.e., the percentage of incident light that wouldremain visible after passing through various water depths).This diagram is based on the common (base 10) logarithmicscale, as indicated by the x-axis along the bottom.
Red (R) = 720 nm Orange (O) = 620 nm Yellow (Y) = 560 nm Green (G) = 510 nm Blue (B) = 460 nm Violet (V) = 390 nm
Of course, light behaves differently in lakeswith suspended or dissolved matter, as thesesubstances can alter the way light refracts and isabsorbed as it passes through the water column.This is crucial to the biology of a lake.
Joe
Ric
hard
Wat
er D
epth
in M
eter
s
Percentage of Incident Light
Wet
zel,
1975
marked off in increments of meters or feet and asmall weight is attached underneath the disk itselfso that it will sink quickly when lowered into thewater. As the disk is being lowered, the personholding the device can use the markings on therope to determine the depth at which the diskdisappears. This measurement is commonlyreferred to as a Secchi depth or water claritymeasurement. Once it is obtained, the measure-ment can be used to estimate light attenuation.A general rule of thumb is to multiply the Secchidepth by two. For example, if the average depthof a lake is eight feet and the Secchi reading is fivefeet, then we can multiply the Secchi depth bytwo to get our estimate:
2 x 5-foot Secchi depth = 10 feet of light penetration.
In this particular example, our calculationtells us that light is reaching the bottom of thelake. However, in the same lake, if the Secchireading is only three feet, then it would tell usthat light does not penetrate to the bottom:
2 x 3-foot Secchi depth = 6 feet of light penetration.
If this were the case, submersed aquaticplants would not be able to grow on the bottom,due to the lack of sufficient sunlight.
Mathematical Formula Usedto Calculate Light Attenuation
The intensity of light diminishes with waterdepth in an exponential way. Professionalsmeasure the intensity of light just below thesurface and at different depths using lightmeters. They mathematically describe thedecrease in light, with depth, by the follow-ing equation:
Iz = I0 e - kz
Where:
Iz is the intensity of light at depth Z.
I0 is the intensity of light immediately below the
surface of the water.
e is the natural logarithm
k is the vertical attenuation (reduction) coefficient for
the downward penetration of light (also known as
“irradiance”).
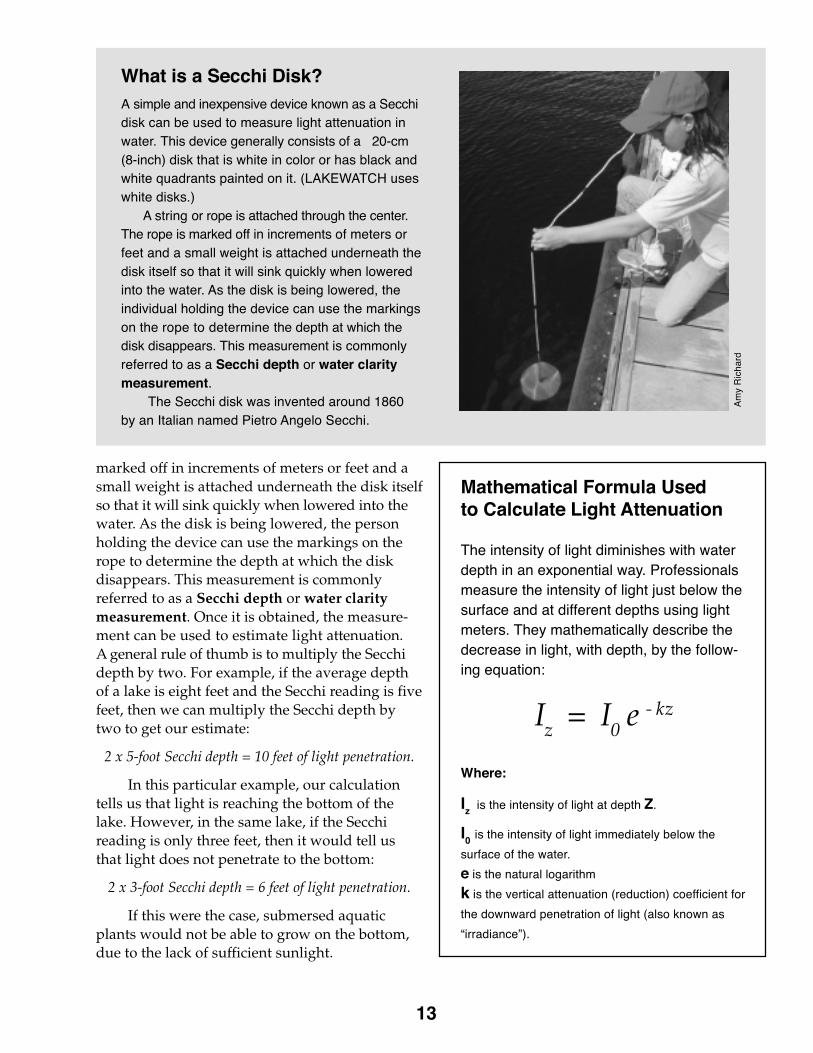
What is a Secchi Disk?A simple and inexpensive device known as a Secchidisk can be used to measure light attenuation inwater. This device generally consists of a 20-cm(8-inch) disk that is white in color or has black andwhite quadrants painted on it. (LAKEWATCH useswhite disks.) A string or rope is attached through the center.The rope is marked off in increments of meters orfeet and a small weight is attached underneath thedisk itself so that it will sink quickly when loweredinto the water. As the disk is being lowered, theindividual holding the device can use the markingson the rope to determine the depth at which thedisk disappears. This measurement is commonlyreferred to as a Secchi depth or water claritymeasurement.
The Secchi disk was invented around 1860by an Italian named Pietro Angelo Secchi.
13
Am
y R
icha
rd
14
Joe
Ric
hard
Because light is so critical to the growth ofaquatic plants and algae, lake scientistshave spent a great deal of time observing
and documenting just how much light is requiredfor optimal growth. From their research, theyhave developed special terminology that helpsdescribe their observations. For example, theterms euphotic zone and euphotic depth arefrequently used to describe just how far light isable to penetrate into the water column:
•Euphotic zone is the portion of the water columnwhere light is still present (i.e., greater than onepercent of the surface light level).
•Euphotic depth is considered to be the depth atwhich light levels fall below one percent of PAR.
Both the euphotic zone and euphotic depthof a lake are directly influenced by the amount ofcolor in the water (i.e., the amount of suspendedand/or dissolved substances). As the amount ofcolor increases in a lake, light penetration decreasesand results in a limited amount of algal and/orsubmersed aquatic plant growth. To be morespecific, algae have a difficult time growing whenlight levels fall below one percent surface PAR(1 PAR) and aquatic plants are affected when lightfalls below 10 percent of the surface PAR (10 PAR).Of course, there is some variation to this rule asdifferent species of algae and aquatic plantsrequire differing amounts of light.
Algae, Color and LightThanks to Florida LAKEWATCH data and
an analysis made by Brown et. al. (2000), we knowthat a high true color value (i.e., 50-100 PCU) canhave a negative effect on a lake’s algal biomass.5
Part 4Color and Its Influence on Algae and Aquatic Plants
In other words, it can limit the amount of algaegrowing in the water column. However, it mustalso be said that, most of the time, phosphorusand nitrogen have a much greater effect on algalabundance.
For more on the relationship between algae, color,nutrients and water clarity, see Part 5.
Aquatic Plants, Color and LightAs mentioned earlier, when light levels fall
below 10 PAR, there is insufficient light for mostsubmersed aquatic plants to grow or remainestablished in a lake.
How do we know this?LAKEWATCH data and analysis by
Bachmann et al. (2002) shows that Florida lakeswith low true color measurements (i.e., values lessthan 50 PCU) can have as much as 100 percent ofthe lake bottom covered in plants.6 (In scientificcircles, this is expressed as 100 Percent AreaCovered or 100 PAC.) However, once the truecolor exceeds 50 PCU, the percentage of thebottom that is covered seldom exceeds 40 PAC.
In addition, researchers have used the samedata to calculate how light affects submersedaquatic plants that grow up through the watercolumn. This measurement is known as thepercent volume inhabited or PVI. The results are
15
5 Claude D. Brown, Mark V. Hoyer, Roger W. Bachmann andDaniel E. Canfield, Jr. 2000. Nutrient-chlorophyll relationships:an evaluation of empirical nutrient-chlorophyll models usingFlorida and north-temperate lake data. Canadian Journal ofFisheries and Aquatic Sciences. 57(8): 1574-1583.
6 Roger W. Bachmann, Christine A. Horsburgh, Mark V. Hoyer,Laura K. Mataraza and Daniel E. Canfield, Jr. 2002. Relationsbetween trophic state indicators and plant biomass in Floridalakes. Hydrobiologia. 470: 219-234.
PAC
PV
I
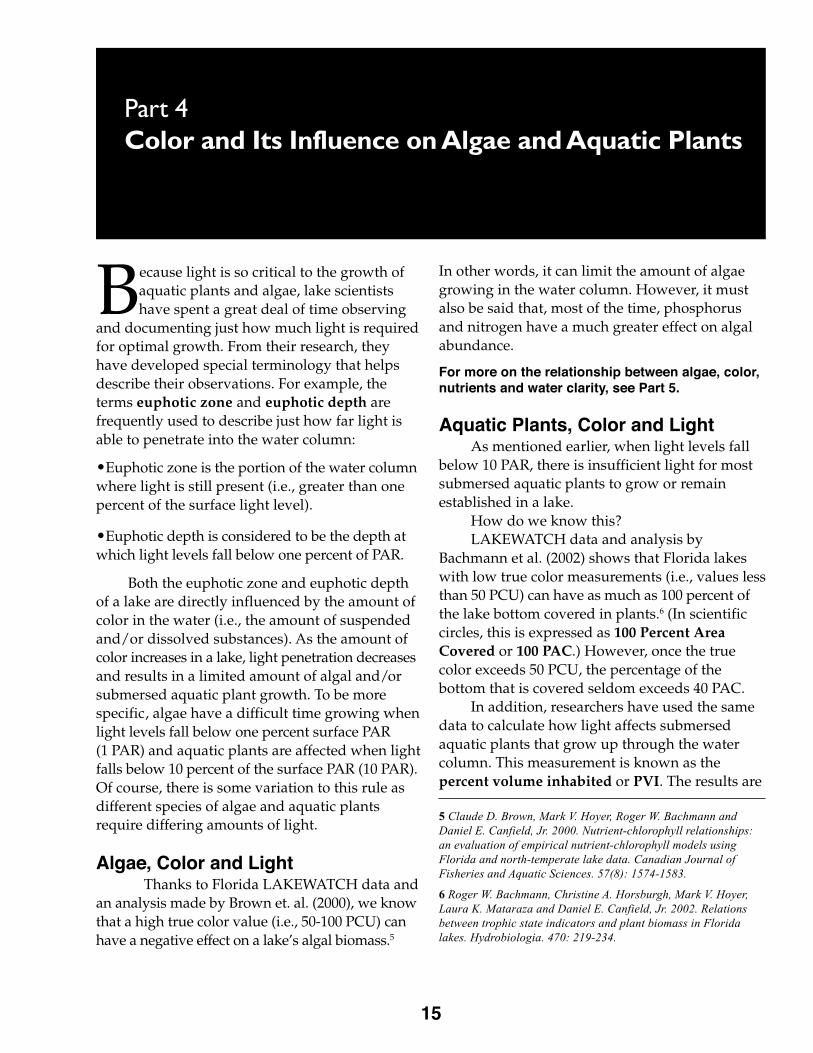
The two graphs pictured here reflect someinteresting patterns regarding aquatic plantabundance and color in Florida lakes:
The top graph illustrates the relationship betweencolor and the area of a lake that is covered by plants(i.e., Percent Area Covered or PAC).
The bottom graph illustrates the relationship betweencolor and the volume of a lake that is inhabited byplants (i.e., Percent Volume Inhabited or PVI).
Notice that when lake waters are highly colored, wedo not find high percentages of the lake area inhabitedby plants, nor do we find high percentages of the lakevolume inhabited by plants. In fact, the highestpercentages of plant abundance are found only inlakes with low color values (i.e., below 100 PCU).For lakes with color measurements below about 75PCU, there is a good spread of PAC values (0 to100%). However, notice that in the PVI graph, themajority of these lakes have PVI values below 10%.Only a few of them have higher values (i.e., rangingup to about 77%).
Figure 5 Color and Its Influence on PAC and PVI in Florida Lakes
16
While color can have a negative influence on submersedplants, things are a bit different when it comes toemergent or floating-leaved plants. In some instances,highly colored lakes (i.e., lakes with values higher than50 PCU) have been known to support an abundanceof emergent plants such as maidencane or variousfloating-leaved plants such as water hyacinth, waterlettuce or spatterdock (a.k.a. cow lilies). While some ofthese plants may be submersed under water, growth isstill possible as long as some of the leaves are abovewater or able to receive light.
similar.7 Lakes with color measurementsthat fall below 50 PCU have supportedplant growth that takes up as much as80 percent of the lake’s volume (80 PVI).However, once true color values exceed50 PCU, things change dramatically asthese lakes generally have plant growthtotaling 10 PVI or less. (See Figure 5 below.)
So what does this mean to the averagelake user or lakefront resident?
It means that if a lake has significantcolor in the water, there is the potential forthe lake to maintain less plant growth.This may be good news for individualswho aren’t fond of aquatic plants in theirlake (e.g., swimmers, waterskiers, etc.).However, others who like to bird watch orfish near aquatic plants might be lesshappy.
7 PVI is also used as an acronym for “PercentVolume Infested.”
What About Emergent or Floating-leaved Plants?
Joe
Ric
hard
Per
cen
t V
olu
me
Inh
abit
ed
17
Aquatic Plants and Color
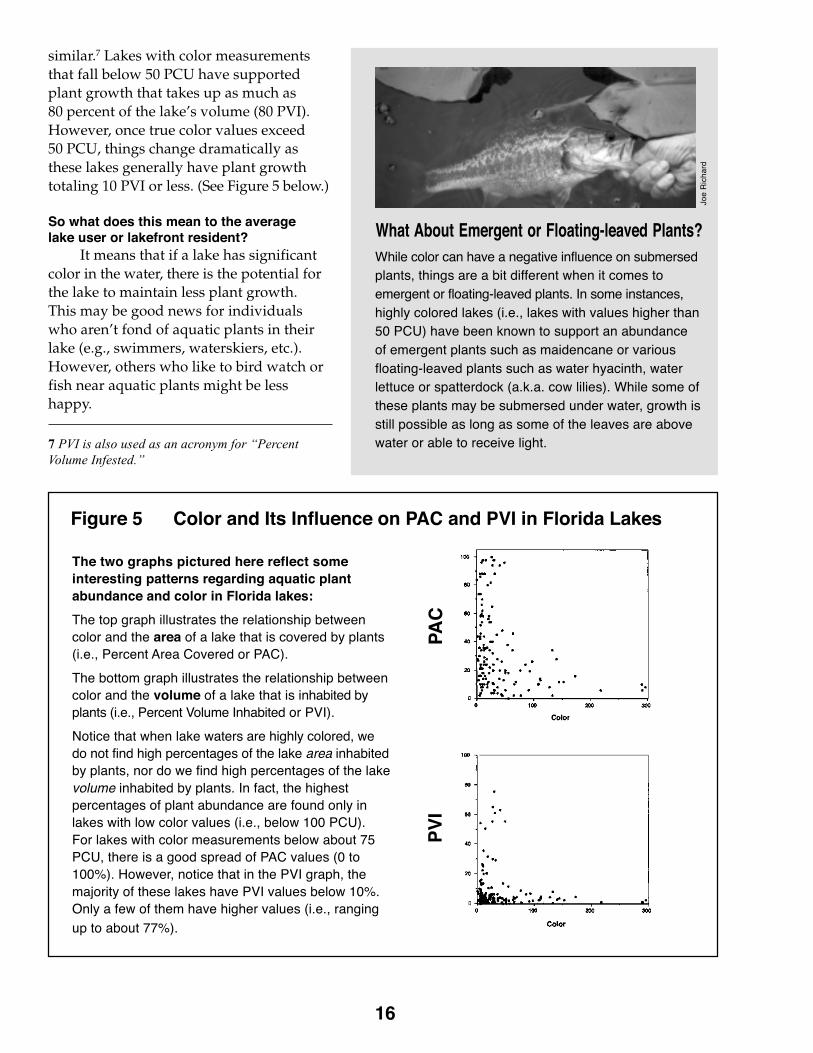
The Tsala-Apopka Chain-of-Lakes, locatedin Citrus County, in the west central portion ofFlorida, provides an excellent example of theinfluence that lake color can have on aquaticplant growth.
Dozens of lakes belong to this aquaticsystem — a fascinating network of islands,marshes, canals and lakes that seem to beloosely grouped into three pools: the FloralCity, Inverness and Hernando Pools. Thelakes within each pool are linked to eachother by natural and artificial means, butmany of the interconnecting waterways areintermittent, depending on rainfall and result-ing water levels.
Figure 6a, shown below, depicts theamount of color measured in the Chain-of-Lakes in the late 1990s. Figure 6b provides an indicationof the abundance of aquatic plants found in the Chain-of-Lakes within the same time frame. CompareFigure 6a with 6b. Notice that as color decreases (Figure 6a), the amount of submersed plantsincreases considerably (6b).
Note: The horizontal lines below each bar graph indicate which lakes are located in the three pools.Also, the lakes are listed in geographical order — as they exist within the prevailing water flow, whichruns from south (S) to north (N) in this system.
The lake shown in the distance is part of the Floral City Pool,within the greater Tsala-Apopka Chain-of-Lakes. The low waterlevel is the result of severe drought conditions that affected thisparticular lake system for several years (2000 - 2003).
Co
lor
(PC
U)
Figure 6bPlant Abundance in the Tsala Apopka Chain-of-Lakes
Figure 6aColor Measurements for the Tsala Apopka Chain-of-Lakes
18
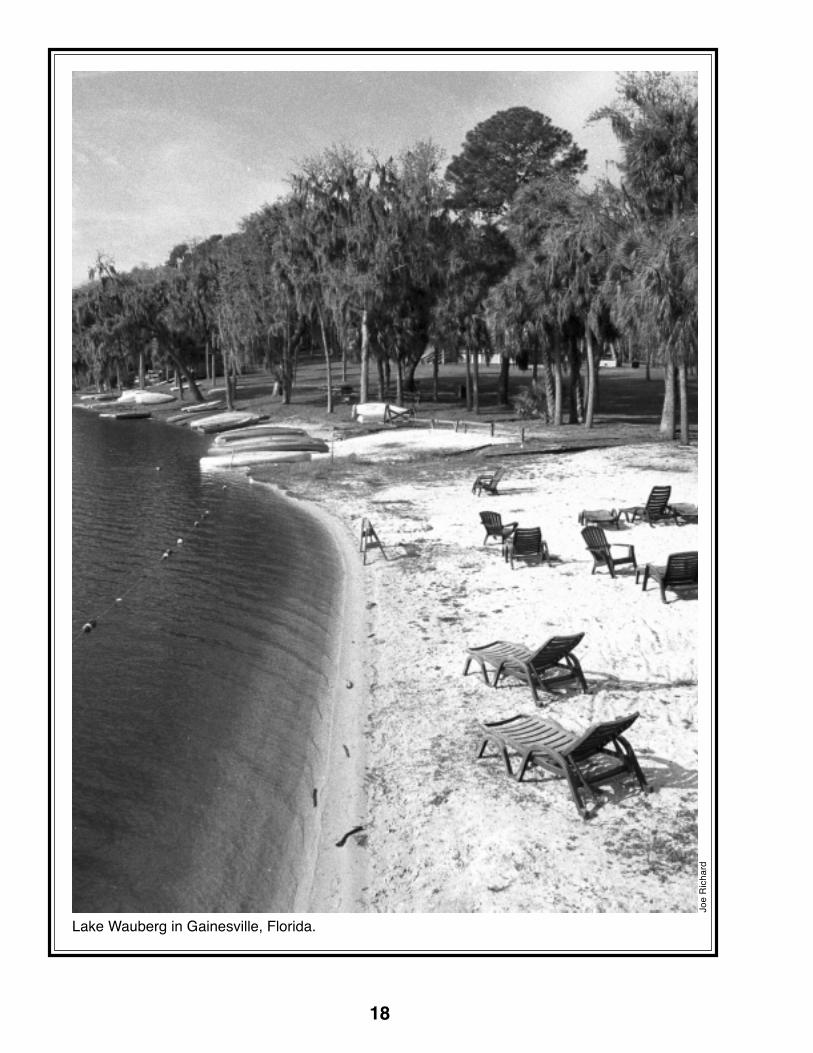
Lake Wauberg in Gainesville, Florida.
Joe
Ric
hard
Without a doubt, water clarity is a majorconcern for most citizens who live onor use lakes. In Florida, water clarity is
affected by three main factors:
• the amount of algae in the water;• the amount of true color in the water;• the amount of non-algal solids in the water(e.g., inorganic sediments such as sand and clay;and organic solids such as dead plant material).
For the most part, algae and true color arethe major players.8 We know this thanks to manyscientific studies and long-term water chemistrydata that have been collected by FLW volunteersaround the state since 1986. However, it’s notalways easy to tell which of the two is having thegreatest influence on water clarity. That’s whyscientists rely on mathematical equations, alsoknown as empirical models, to try and predictsuch things and as a way of checking each factoragainst the other. The models are derived fromstatistical analysis of a specific set of data. In thiscase, they are derived from many years’ worth ofmonthly water chemistry data, courtesy of FloridaLAKEWATCH.
Using these equations, one can plug in knowninformation from a data set (e.g., chlorophyll con-centrations, Secchi depth or color measurements)and then do the necessary calculations. If thenumbers don’t match up, it may be an indicationthat some other factor is limiting water clarity,such as non-algal suspended solids.
For lakes that are considered to be “algaedominated,” an empirical Secchi-chlorophyll
Part 5Color, Water Clarity and Algae
19
8 For more about water clarity and empirical models, seeA Beginner’s Guide to Water Management — WaterClarity (Circular 103).
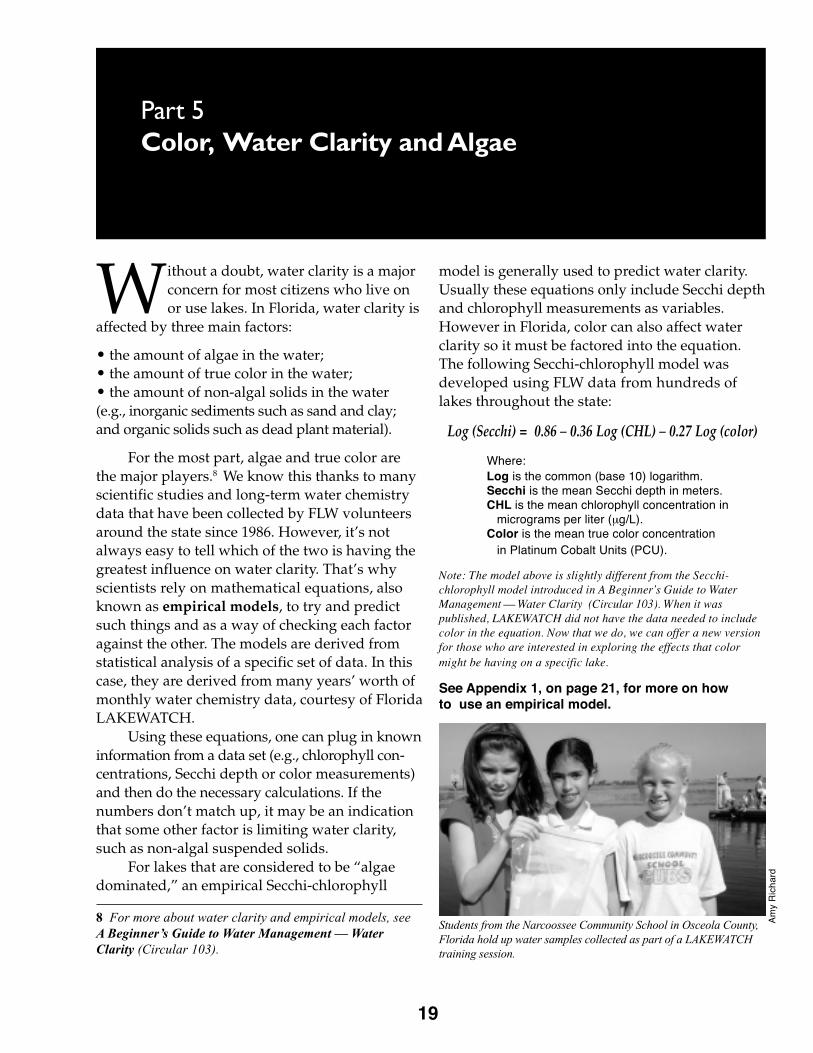
Students from the Narcoossee Community School in Osceola County,Florida hold up water samples collected as part of a LAKEWATCHtraining session.
Am
y R
icha
rd
See Appendix 1, on page 21, for more on howto use an empirical model.
model is generally used to predict water clarity.Usually these equations only include Secchi depthand chlorophyll measurements as variables.However in Florida, color can also affect waterclarity so it must be factored into the equation.The following Secchi-chlorophyll model wasdeveloped using FLW data from hundreds oflakes throughout the state:
Log (Secchi) = 0.86 – 0.36 Log (CHL) – 0.27 Log (color)
Where:Log is the common (base 10) logarithm.Secchi is the mean Secchi depth in meters.CHL is the mean chlorophyll concentration in
micrograms per liter (μg/L).Color is the mean true color concentration in Platinum Cobalt Units (PCU).
Note: The model above is slightly different from the Secchi-chlorophyll model introduced in A Beginner’s Guide to WaterManagement — Water Clarity (Circular 103). When it waspublished, LAKEWATCH did not have the data needed to includecolor in the equation. Now that we do, we can offer a new versionfor those who are interested in exploring the effects that colormight be having on a specific lake.
If a lake should have high true colormeasurements, an equation known as a multiplenutrient-color regression model can be used todetermine whether nutrients or color are having agreater influence on chlorophyll concentrations(i.e., algae) in a lake. The equation looks like this:
Log (CHL) = –1.92 + 0.70 Log (TP) + 0.75 Log(TN) – 0.15 Log(Color)
Where:Log is the common (base 10) logarithm.
CHL is the average chlorophyll concentration in
micrograms per liter (μg/L).
TP is the average total phosphorus concentration in μg/L.
TN is the average total nitrogen concentration in μg/L.
Color is the mean true color concentration in Platinum
Cobalt Units (PCU).
20
This equation was developed in much thesame way as the Secchi-chlorophyll modeldescribed on page 19. Both are the result of hoursof mathematical analysis, using data from hundredsof Florida lakes.
Using this model, FLW researchers havebeen able to demonstrate that true color does havean influence on algal abundance, but phosphorus
and nitrogen have the strongest influence.But that’s not all.The model also helps us predict what chloro-
phyll concentrations should be for a specific lake.For example, if we were to work through theequation by plugging in actual TP, TN and colormeasurements from a lake, we could compare ouranswer with chlorophyll measurements (aka CHL)from the same lake. If the chlorophyll value issimilar to our calculated answer (i.e., from theequation), we can conclude that nutrients andcolor are most likely having the greatest influenceon algal abundance in the lake.
However, if the actual chlorophyll valuefrom the lake is less than the value we’ve calculated,we can conclude that some other factor is influenc-ing algal abundance — and generally it’s thepresence of suspended solids.
This exercise is important because it gives usa way of determining whether a lake’s algalabundance is being affected by nutrients, truecolor or some other factor. It also tells us thatfurther examination will be necessary to pinpointexactly which factor is having the most influence.
See Appendix 1 on page 21, for a step-by-stepexample of how to use an empirical model.
21
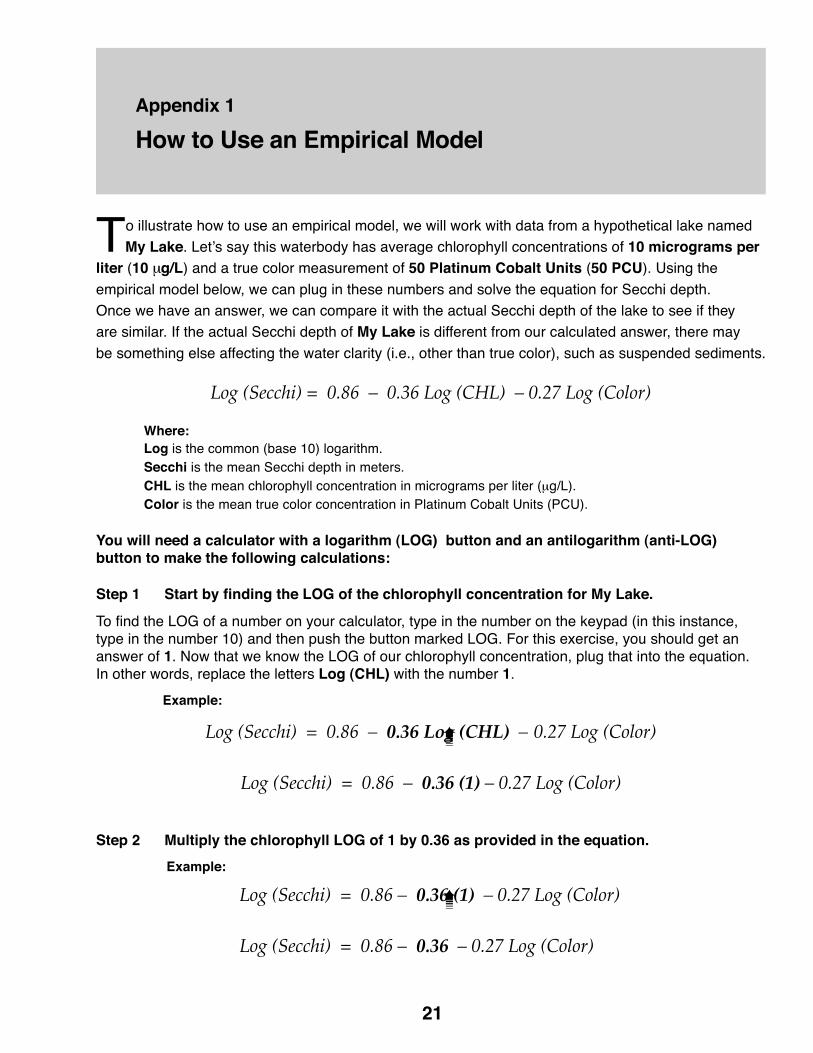
To illustrate how to use an empirical model, we will work with data from a hypothetical lake named
My Lake. Let’s say this waterbody has average chlorophyll concentrations of 10 micrograms perliter (10 μg/L) and a true color measurement of 50 Platinum Cobalt Units (50 PCU). Using the
empirical model below, we can plug in these numbers and solve the equation for Secchi depth.
Once we have an answer, we can compare it with the actual Secchi depth of the lake to see if they
are similar. If the actual Secchi depth of My Lake is different from our calculated answer, there may
be something else affecting the water clarity (i.e., other than true color), such as suspended sediments.
Log (Secchi) = 0.86 – 0.36 Log (CHL) – 0.27 Log (Color)
Where:Log is the common (base 10) logarithm.Secchi is the mean Secchi depth in meters.CHL is the mean chlorophyll concentration in micrograms per liter (μg/L).Color is the mean true color concentration in Platinum Cobalt Units (PCU).
You will need a calculator with a logarithm (LOG) button and an antilogarithm (anti-LOG)button to make the following calculations:
Step 1 Start by finding the LOG of the chlorophyll concentration for My Lake.
To find the LOG of a number on your calculator, type in the number on the keypad (in this instance,type in the number 10) and then push the button marked LOG. For this exercise, you should get ananswer of 1. Now that we know the LOG of our chlorophyll concentration, plug that into the equation.In other words, replace the letters Log (CHL) with the number 1.
Example:
Log (Secchi) = 0.86 – 0.36 Log (CHL) – 0.27 Log (Color)
Log (Secchi) = 0.86 – 0.36 (1) – 0.27 Log (Color)
Step 2 Multiply the chlorophyll LOG of 1 by 0.36 as provided in the equation.
Example:
Log (Secchi) = 0.86 – 0.36 (1) – 0.27 Log (Color)
Log (Secchi) = 0.86 – 0.36 – 0.27 Log (Color)
➠
➠
Appendix 1
How to Use an Empirical Model
22
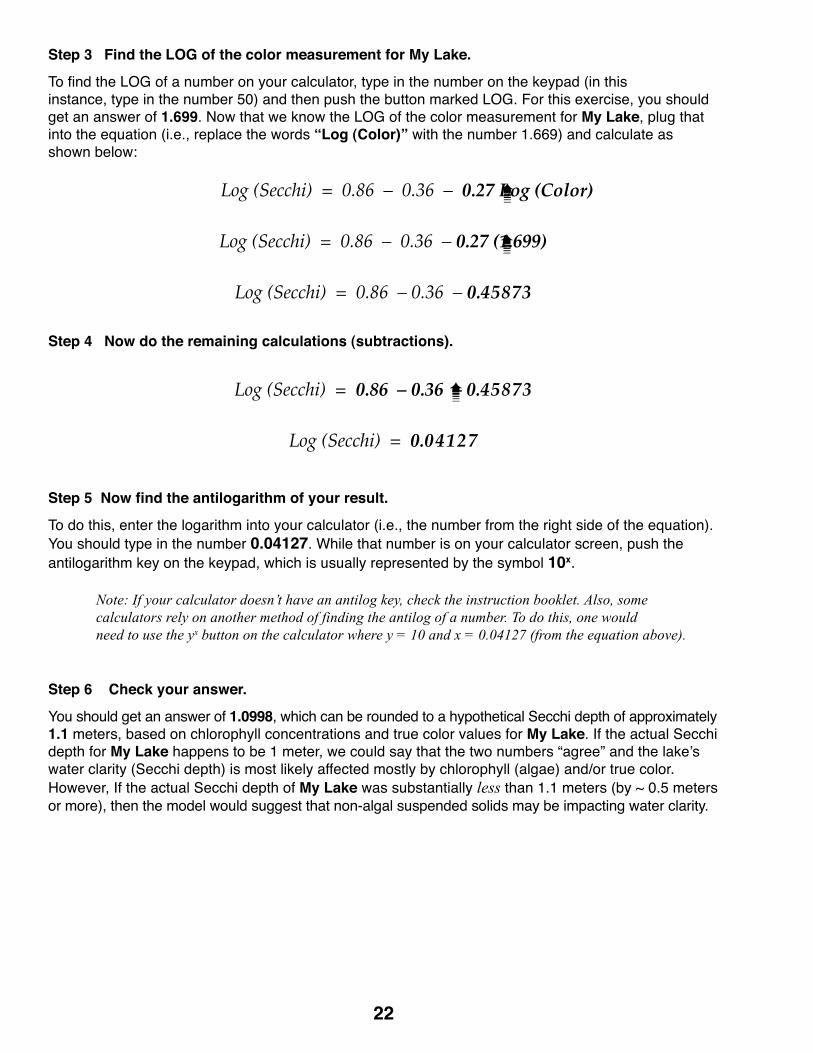
Step 3 Find the LOG of the color measurement for My Lake.
To find the LOG of a number on your calculator, type in the number on the keypad (in thisinstance, type in the number 50) and then push the button marked LOG. For this exercise, you shouldget an answer of 1.699. Now that we know the LOG of the color measurement for My Lake, plug thatinto the equation (i.e., replace the words “Log (Color)” with the number 1.669) and calculate asshown below:
Log (Secchi) = 0.86 – 0.36 – 0.27 Log (Color)
Log (Secchi) = 0.86 – 0.36 – 0.27 (1.699)
Log (Secchi) = 0.86 – 0.36 – 0.45873
Step 4 Now do the remaining calculations (subtractions).
Log (Secchi) = 0.86 – 0.36 – 0.45873
Log (Secchi) = 0.04127
Step 5 Now find the antilogarithm of your result.
To do this, enter the logarithm into your calculator (i.e., the number from the right side of the equation).You should type in the number 0.04127. While that number is on your calculator screen, push theantilogarithm key on the keypad, which is usually represented by the symbol 10x.
Note: If your calculator doesn’t have an antilog key, check the instruction booklet. Also, somecalculators rely on another method of finding the antilog of a number. To do this, one wouldneed to use the yx button on the calculator where y = 10 and x = 0.04127 (from the equation above).
Step 6 Check your answer.
You should get an answer of 1.0998, which can be rounded to a hypothetical Secchi depth of approximately1.1 meters, based on chlorophyll concentrations and true color values for My Lake. If the actual Secchidepth for My Lake happens to be 1 meter, we could say that the two numbers “agree” and the lake’swater clarity (Secchi depth) is most likely affected mostly by chlorophyll (algae) and/or true color.However, If the actual Secchi depth of My Lake was substantially less than 1.1 meters (by ~ 0.5 metersor more), then the model would suggest that non-algal suspended solids may be impacting water clarity.
➠
➠
➠
Books and Circulars
Hutchinson, G. E. 1957. A Treatise on Limnology. Volume I. Geography, Physics and Chemistry.John Wiley & Sons, Inc., New York, New York.
Florida LAKEWATCH. 1999. A Beginner’s Guide to Water Management – The ABCs / Descriptions of CommonlyUsed Terms. Information Circular #101. Florida LAKEWATCH, Department of Fisheries and Aquatic Sciences,University of Florida/Institute of Food and Agricultural Sciences (UF/IFAS), Gainesville, Florida.
Florida LAKEWATCH. 2000. A Beginner’s Guide to Water Management – Nutrients. Information Circular #102.Florida LAKEWATCH, Department of Fisheries and Aquatic Sciences, University of Florida/Institute of Foodand Agricultural Sciences (UF/IFAS), Gainesville, Florida.
Florida LAKEWATCH. 2000. A Beginner’s Guide to Water Management – Water Clarity. Information Circular#103. Florida LAKEWATCH, Department of Fisheries and Aquatic Sciences, University of Florida/Institute ofFood and Agricultural Sciences (UF/IFAS), Gainesville, Florida.
Wetzel, R. G. 1975. Limnology. W. B. Saunders Company. Philadelphia, Pennsylvania.
Publications
Roger W. Bachmann, Christine A. Horsburgh, Mark V. Hoyer, Laura K. Mataraza, and Daniel E. Canfield, Jr.2002. Relations between trophic state indicators and plant biomass in Florida lakes. Hydrobiologia 470: 219-234.
Brezonik, P.I. 1978. Effect of organic color and turbidity on Secchi disc transparency. Journal of the FisheriesResearch Board of Canada 35:1410-1416.
Brown, Claude D., Mark V. Hoyer, Roger W. Bachmann, and Daniel E. Canfield, Jr. 2000. Nutrient-chlorophyllrelationships: an evaluation of empirical nutrient-chlorophyll models using Florida and north-temperate lakedata. Canadian Journal of Fisheries and Aquatic Sciences. 57(8): 1574-1583.
Canfield, D. E., Jr. and L. M. Hodgson. 1983. Prediction of Secchi disc depths in Florida lakes: impact of algalbiomass and organic color. Hydrobiologia 99: 51-60.
Canfield, D. E., Jr., S. B. Linda and L. M. Hodgson. 1984. Relations between color and some limnological charac-teristics of Florida lakes. Water Resources Bulletin 20: 323-329.
Web Resources
For information about the earth’s electromagnetic spectrum: http://imagine.gsfc.nasa.gov/docs/science/know_l1/emspectrum.html
For information about plant management in Florida waters: http://plants.ifas.ufl.edu/guide/
Selected Scientific References
23
Florida LAKEWATCHFlorida LAKEWATCH (FLW) is one of thelargest citizen-based volunteer monitoringendeavors in the country with over 1,500individuals monitoring more than 700 lakesand waterbodies, in nearly 50 counties. Stafffrom the University of Florida’s Departmentof Fisheries and Aquatic Sciences trainvolunteers throughout the state to conductmonthly long-term monitoring of both freshand saline waterbodies. LAKEWATCH usesthe long-term data to provide citizens, agenciesand researchers with scientifically-sound watermanagement information and educationaloutreach.
To become part of the FLW team, volun-teers are required to have access to a boat andcomplete a two-hour training session. Duringthe session, they will learn to collect watersamples, take water clarity measurements,and prepare algae samples for laboratoryanalysis. Once a volunteer is certified by aregional coordinator and sampling sites areestablished, he or she will sample the desig-nated stations once a month. Samples arefrozen immediately upon being collected andare later delivered to a collection center, wherethey are stored until they can be picked up byone of our staff and delivered to the UF/IFASwater chemistry laboratory at the Departmentof Fisheries and Aquatic Sciences.
In return for participation, volunteers receive:
• Personalized training in water monitoringtechniques;• Use of lake sampling materials and waterchemistry analysis;• Periodic data reports, including an annualdata packet regarding their waterbody;• Invitations to meetings where FLW staffprovide an interpretation of the findings aswell as general information about aquatichabitats and water management;• Access to freshwater and coastal marineexperts;• Free newsletter subscription and educa-tional materials regarding lake ecology andwater management.
For more information, contact:
Florida LAKEWATCHUF/IFASDepartment of Fisheries and Aquatic Sciences7922 NW 71st StreetPO Box 110600Gainesville, FL 32653-3071Phone: (352) 392-4817Toll-free: 1-800-LAKEWATch (1-800-525-3928)E-mail: [email protected]: http://lakewatch.ifas.ufl.edu/
24
Related Documents