Innovation 2009 Making Hard Decisions in the Downturn R A BCG S M S

Welcome message from author
This document is posted to help you gain knowledge. Please leave a comment to let me know what you think about it! Share it to your friends and learn new things together.
Transcript

Innovation 2009Making Hard Decisions in the Downturn
R
A BCG S M S

The Boston Consulting Group (BCG) is a global manage-ment consulting fi rm and the world’s leading advisor on business strategy. We partner with clients in all sectors and regions to identify their highest-value opportunities, address their most critical challenges, and transform their businesses. Our customized approach combines deep in-sight into the dynamics of companies and markets with close collaboration at all levels of the client organization. This ensures that our clients achieve sustainable compet-itive advantage, build more capable organizations, and secure lasting results. Founded in 1963, BCG is a private company with 66 offi ces in 38 countries. For more infor-mation, please visit www.bcg.com.

Innovation 2009Making Hard Decisions in the Downturn
A BCG S M S
bcg.com
James P. Andrew
Knut Haanæs
David C. Michael
Harold L. Sirkin
Andrew Taylor
April 2009

© The Boston Consulting Group, Inc. 2009. All rights reserved.
For information or permission to reprint, please contact BCG at:E-mail: [email protected]: +1 617 850 3901, attention BCG/PermissionsMail: BCG/Permissions The Boston Consulting Group, Inc. One Beacon Street Boston, MA 02108 USA
I
Contents
Note to the Reader 4
Executive Summary 6
Innovation in 2009: Uncertainty—and Growing Caution 7The Primacy of Innovation… 7…But at What Cost? 8Key Metrics: Customer Satisfaction and Revenue Growth 9Obstacles to Boosting Investment Returns: Risk Aversion and Lengthy Development Times 10
Objectives and Tactics 12 A Growing Emphasis on Cost Reduction… 12…And a Larger Role for Rapidly Developing Economies 13M&A Activity? 15
Execution: Successes and Challenges 17Successes: Executive Sponsorship and Customer Knowledge 17Challenges: Speed and Discipline 19
The Most Innovative Companies 20
Leading out of the Downturn: Seven Aggressive Innovation Strategies 23
Survey Methodology 25
Appendix: Key Survey Findings by Industry 26
For Further Reading 32

T B C G
Note to the Reader
The Boston Consulting Group, working in partnership with BusinessWeek, recently completed its sixth annual global survey of senior executives on their innovation practices. This report summarizes that survey’s results. It covers the full suite of interrelated activities involved in turning ideas into fi nancial returns, going well beyond ideation and new-product develop-ment to include such issues as portfolio and life-cycle management, organizational alignment, and demands on leaders. It discusses what works and what doesn’t and the actions companies are taking to make innovation happen. Finally, the report off ers pragmatic advice for individuals who want to make a diff erence in their organizations.
About the AuthorsJames P. Andrew is a senior partner and managing director in the Chicago offi ce of The Boston Con-sulting Group. Knut Haanæs is a partner and managing director in the fi rm’s Oslo offi ce. David C. Michael is a senior partner and managing director in BCG’s Beijing offi ce. Harold L. Sirkin is a senior partner and managing director in the fi rm’s Chicago offi ce. Andrew Taylor is a partner and managing director in BCG’s Chicago offi ce.
AcknowledgmentsMore than 2,700 executives from around the world, representing all major markets and industries,
responded to BCG’s 2009 Senior Executive Innovation Survey. We thank them sincerely for their partici-pation. We would also like to thank the entire BCG team that drove and supported the survey, in particular Dustin Burke, Michael Greenway, and Haley Hill. Finally, we would like to acknowledge the editorial and production assistance of Gary Callahan, Angela DiBattista, Gina Goldstein, and Gerry Hill.
For Further ContactFor additional information on BCG’s thinking on innovation, visit the Web site of the BCG Innovation Institute (http://innovation.bcg.com), send an e-mail to [email protected], or contact one of the following leaders of the fi rm’s innovation activities:
The AmericasAtlantaMark Kistulinec+1 404 877 [email protected]
BostonSarah Cairns-Smith+1 617 973 [email protected]
Massimo Russo+1 617 973 [email protected]
ChicagoJames P. Andrew+1 312 993 [email protected]
Harold L. Sirkin+1 312 993 [email protected]
Andrew Taylor+1 312 993 [email protected]
DallasChristine Barton+1 214 849 1500 [email protected]
DetroitXavier Mosquet+1 248 688 [email protected]
Los AngelesMark Lubkeman+1 213 621 [email protected]
New YorkSumit Sahni+1 212 446 2800 [email protected]
Achim Schwetlick+1 212 446 [email protected]
Kim Wagner+1 212 446 [email protected]
San FranciscoColin Boyle+1 415 732 [email protected]
I
Steven Mallouk+1 415 732 [email protected]
TorontoKilian Berz+1 416 955 [email protected]
Joe Manget+1 416 955 [email protected]
EuropeAmsterdamStépan Breedveld+31 20 548 [email protected]
DüsseldorfSebastian Ehrensberger+49 2 11 30 11 [email protected]
Andreas Maurer+49 2 11 30 11 [email protected]
LondonAndy Maguire+44 207 753 [email protected]
MadridAnthony Pralle+34 91 520 61 [email protected]
MilanMassimo Busetti+39 0 2 65 59 [email protected]
MoscowVladislav Boutenko+7 495 258 34 [email protected]
MunichGeorg Beyer+49 89 23 17 [email protected]
OsloKnut Haanæs+47 23 10 20 [email protected]
ParisMark Freedman+33 1 40 17 10 [email protected]
StockholmPer Hallius+46 8 402 44 00 [email protected]
WarsawKevin Waddell+48 22 820 36 00 [email protected]
Asia-Pacifi cBeijingDavid C. Michael+86 10 8527 [email protected]
New DelhiArindam Bhattacharya+91 124 459 [email protected]
ShanghaiCollins Qian +86 21 6375 [email protected]
SydneyPatrick Forth+61 2 9323 [email protected]
TokyoOsamu Karita+81 3 5211 [email protected]
T B C G
Executive Summary
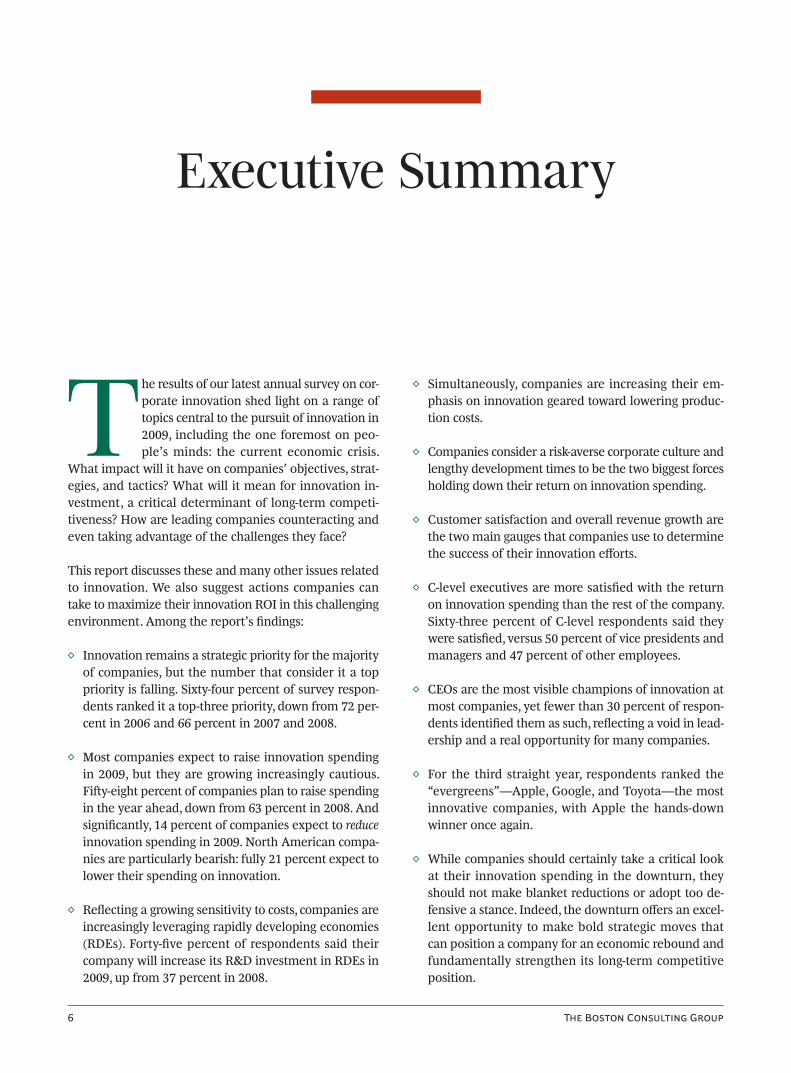
T he results of our latest annual survey on cor-porate innovation shed light on a range of topics central to the pursuit of innovation in 2009, including the one foremost on peo-ple’s minds: the current economic crisis.
What impact will it have on companies’ objectives, strat-egies, and tactics? What will it mean for innovation in-vestment, a critical determinant of long-term competi-tiveness? How are leading companies counteracting and even taking advantage of the challenges they face?
This report discusses these and many other issues related to innovation. We also suggest actions companies can take to maximize their innovation ROI in this challenging environment. Among the report’s fi ndings:
Innovation remains a strategic priority for the majority ◊ of companies, but the number that consider it a top priority is falling. Sixty-four percent of survey respon-dents ranked it a top-three priority, down from 72 per-cent in 2006 and 66 percent in 2007 and 2008.
Most companies expect to raise innovation spending ◊ in 2009, but they are growing increasingly cautious. Fi y-eight percent of companies plan to raise spending in the year ahead, down from 63 percent in 2008. And signifi cantly, 14 percent of companies expect to reduce innovation spending in 2009. North American compa-nies are particularly bearish: fully 21 percent expect to lower their spending on innovation.
Refl ecting a growing sensitivity to costs, companies are ◊ increasingly leveraging rapidly developing economies (RDEs). Forty-fi ve percent of respondents said their company will increase its R&D investment in RDEs in 2009, up from 37 percent in 2008.
Simultaneously, companies are increasing their em-◊ phasis on innovation geared toward lowering produc-tion costs.
Companies consider a risk-averse corporate culture and ◊ lengthy development times to be the two biggest forces holding down their return on innovation spending.
Customer satisfaction and overall revenue growth are ◊ the two main gauges that companies use to determine the success of their innovation eff orts.
C-level executives are more satisfi ed with the return ◊ on innovation spending than the rest of the company. Sixty-three percent of C-level respondents said they were satisfi ed, versus 50 percent of vice presidents and managers and 47 percent of other employees.
CEOs are the most visible champions of innovation at ◊ most companies, yet fewer than 30 percent of respon-dents identifi ed them as such, refl ecting a void in lead-ership and a real opportunity for many companies.
For the third straight year, respondents ranked the ◊ “evergreens”—Apple, Google, and Toyota—the most innovative companies, with Apple the hands-down winner once again.
While companies should certainly take a critical look ◊ at their innovation spending in the downturn, they should not make blanket reductions or adopt too de-fensive a stance. Indeed, the downturn off ers an excel-lent opportunity to make bold strategic moves that can position a company for an economic rebound and fundamentally strengthen its long-term competitive position.
I
Innovation in 2009Uncertainty—and Growing Caution
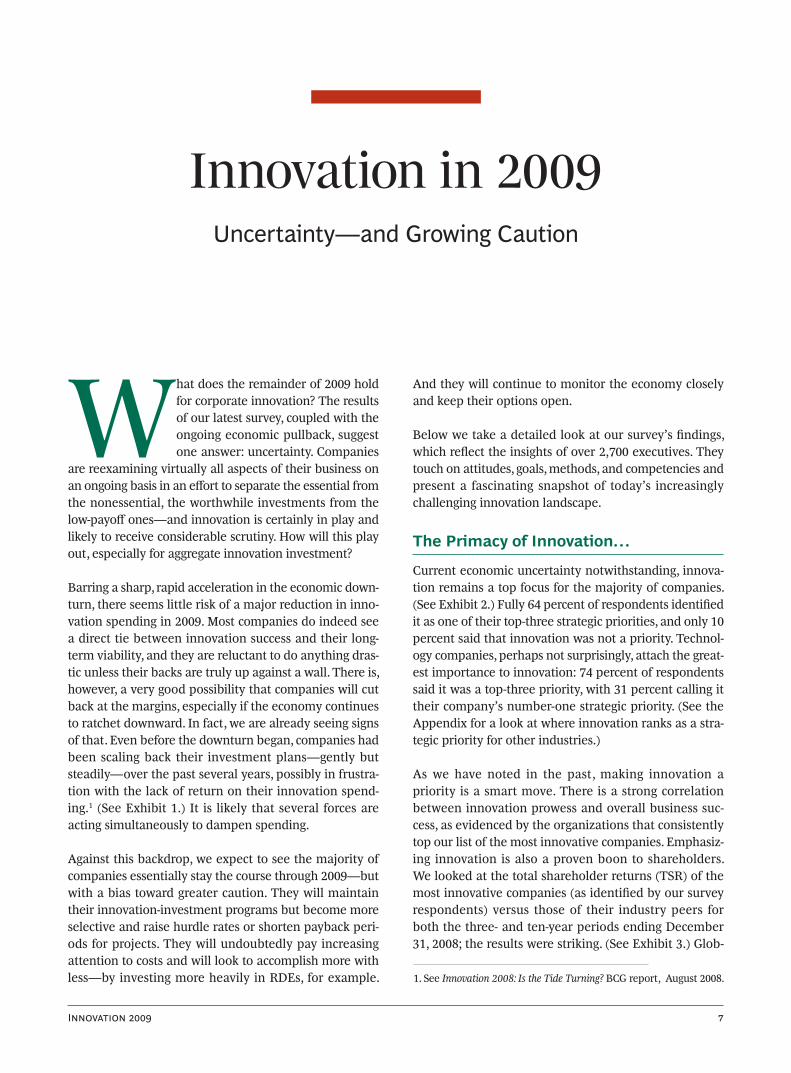
What does the remainder of 2009 hold for corporate innovation? The results of our latest survey, coupled with the ongoing economic pullback, suggest one answer: uncertainty. Companies
are reexamining virtually all aspects of their business on an ongoing basis in an eff ort to separate the essential from the nonessential, the worthwhile investments from the low-payoff ones—and innovation is certainly in play and likely to receive considerable scrutiny. How will this play out, especially for aggregate innovation investment?
Barring a sharp, rapid acceleration in the economic down-turn, there seems little risk of a major reduction in inno-vation spending in 2009. Most companies do indeed see a direct tie between innovation success and their long-term viability, and they are reluctant to do anything dras-tic unless their backs are truly up against a wall. There is, however, a very good possibility that companies will cut back at the margins, especially if the economy continues to ratchet downward. In fact, we are already seeing signs of that. Even before the downturn began, companies had been scaling back their investment plans—gently but steadily—over the past several years, possibly in frustra-tion with the lack of return on their innovation spend-ing.1 (See Exhibit 1.) It is likely that several forces are acting simultaneously to dampen spending.
Against this backdrop, we expect to see the majority of companies essentially stay the course through 2009—but with a bias toward greater caution. They will maintain their innovation-investment programs but become more selective and raise hurdle rates or shorten payback peri-ods for projects. They will undoubtedly pay increasing attention to costs and will look to accomplish more with less—by investing more heavily in RDEs, for example.
And they will continue to monitor the economy closely and keep their options open.
Below we take a detailed look at our survey’s fi ndings, which refl ect the insights of over 2,700 executives. They touch on attitudes, goals, methods, and competencies and present a fascinating snapshot of today’s increasingly challenging innovation landscape.
The Primacy of Innovation…
Current economic uncertainty notwithstanding, innova-tion remains a top focus for the majority of companies. (See Exhibit 2.) Fully 64 percent of respondents identifi ed it as one of their top-three strategic priorities, and only 10 percent said that innovation was not a priority. Technol-ogy companies, perhaps not surprisingly, attach the great-est importance to innovation: 74 percent of respondents said it was a top-three priority, with 31 percent calling it their company’s number-one strategic priority. (See the Appendix for a look at where innovation ranks as a stra-tegic priority for other industries.)
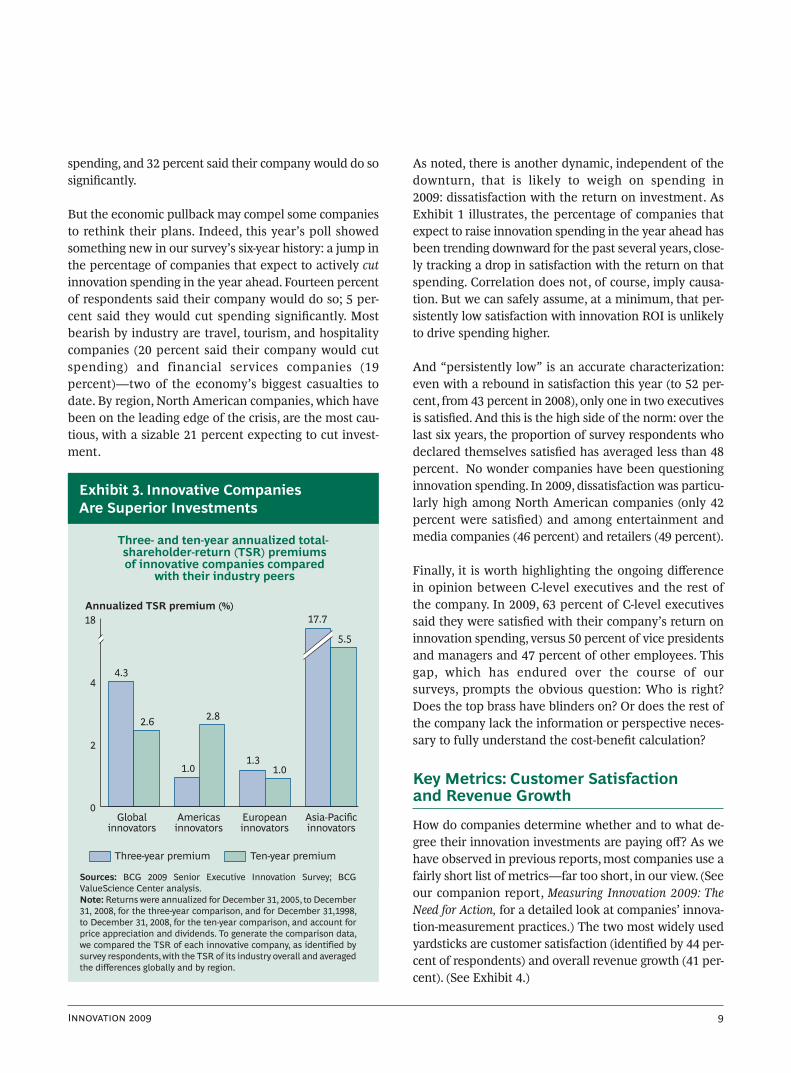
As we have noted in the past, making innovation a priority is a smart move. There is a strong correlation between innovation prowess and overall business suc-cess, as evidenced by the organizations that consistently top our list of the most innovative companies. Emphasiz-ing innovation is also a proven boon to shareholders. We looked at the total shareholder returns (TSR) of the most innovative companies (as identifi ed by our survey respondents) versus those of their industry peers for both the three- and ten-year periods ending December 31, 2008; the results were striking. (See Exhibit 3.) Glob-
1. See Innovation 2008: Is the Tide Turning? BCG report, August 2008.

T B C G
0
60
40
20
0
80
60
40
20
0
40
20
5246
43
52
7267
6358
41
30 2926
2006 2007 2008 2009 2006 2007 2008 2009 2006 2007 2008 2009
80 80
60
Percentage of respondents who say they are satisfied with their company’s return
on innovation spending
Percentage of respondents who say their company will increase innovation spending in the
coming year
Percentage of respondents who say their company will increase
innovation spending significantly (by more than 10 percent) in the
coming year
Exhibit 1. Persistently Low Satisfaction with Innovation ROI May Be Weighing on Spending Plans
Sources: BCG 2009 Senior Executive Innovation Survey; BCG 2008 Senior Executive Innovation Survey; BCG 2007 Senior Executive Innovation Survey; BCG 2006 Senior Executive Innovation Survey.
ally, on an annualized basis, innovators outperformed their peers by 430 basis points over the last three years and by 260 basis points over the last ten years—a sizable premium. The pattern of substantial outperfor-mance held when we looked at regional performance—for example, how innovators based in Europe did compared with their European industry peers. Clearly, if you are an investor, you’d do well to seek out innovative companies.
…But at What Cost?
Companies continue to invest in order to drive innova-tion: the majority (58 percent) of survey respondents said their company would boost innovation spending in 2009. By region, Asia-Pacifi c companies have the most aggres-sive plans, with 73 percent planning to raise spending and 35 percent planning to raise it signifi cantly (that is, by more than 10 percent). By industry, technology and telecommunications companies are the most bullish: 68 percent of respondents said their company would raise
Where does innovation rank amongyour company’s strategic priorities?
0
40
30
20
10
25
39
26
10
Toppriority
Top-threepriority
Top-tenpriority
Not apriority
Percentage of respondents
Exhibit 2. Innovation Remains a Top Strategic Focus for the Majority of Companies
Source: BCG 2009 Senior Executive Innovation Survey.
I
spending, and 32 percent said their company would do so signifi cantly.
But the economic pullback may compel some companies to rethink their plans. Indeed, this year’s poll showed something new in our survey’s six-year history: a jump in the percentage of companies that expect to actively cut innovation spending in the year ahead. Fourteen percent of respondents said their company would do so; 5 per-cent said they would cut spending signifi cantly. Most bearish by industry are travel, tourism, and hospitality companies (20 percent said their company would cut spending) and financial services companies (19 percent)—two of the economy’s biggest casualties to date. By region, North American companies, which have been on the leading edge of the crisis, are the most cau-tious, with a sizable 21 percent expecting to cut invest-ment.
As noted, there is another dynamic, independent of the downturn, that is likely to weigh on spending in 2009: dissatisfaction with the return on investment. As Exhibit 1 illustrates, the percentage of companies that expect to raise innovation spending in the year ahead has been trending downward for the past several years, close-ly tracking a drop in satisfaction with the return on that spending. Correlation does not, of course, imply causa-tion. But we can safely assume, at a minimum, that per-sistently low satisfaction with innovation ROI is unlikely to drive spending higher.
And “persistently low” is an accurate characterization: even with a rebound in satisfaction this year (to 52 per-cent, from 43 percent in 2008), only one in two executives is satisfi ed. And this is the high side of the norm: over the last six years, the proportion of survey respondents who declared themselves satisfi ed has averaged less than 48 percent. No wonder companies have been questioning innovation spending. In 2009, dissatisfaction was particu-larly high among North American companies (only 42 percent were satisfi ed) and among entertainment and media companies (46 percent) and retailers (49 percent).
Finally, it is worth highlighting the ongoing diff erence in opinion between C-level executives and the rest of the company. In 2009, 63 percent of C-level executives said they were satisfi ed with their company’s return on innovation spending, versus 50 percent of vice presidents and managers and 47 percent of other employees. This gap, which has endured over the course of our surveys, prompts the obvious question: Who is right? Does the top brass have blinders on? Or does the rest of the company lack the information or perspective neces-sary to fully understand the cost-benefi t calculation?
Key Metrics: Customer Satisfaction and Revenue Growth
How do companies determine whether and to what de-gree their innovation investments are paying off ? As we have observed in previous reports, most companies use a fairly short list of metrics—far too short, in our view. (See our companion report, Measuring Innovation 2009: The Need for Action, for a detailed look at companies’ innova-tion-measurement practices.) The two most widely used yardsticks are customer satisfaction (identifi ed by 44 per-cent of respondents) and overall revenue growth (41 per-cent). (See Exhibit 4.)
Three- and ten-year annualized total-shareholder-return (TSR) premiums of innovative companies compared
with their industry peers
Globalinnovators
Americasinnovators
Europeaninnovators
Asia-Pacificinnovators
4.3
2.6
1.0
2.8
1.31.0
17.7
5.5
Annualized TSR premium (%)18
4
2
Three-year premium Ten-year premium
0
Exhibit 3. Innovative Companies Are Superior Investments
Sources: BCG 2009 Senior Executive Innovation Survey; BCG ValueScience Center analysis.Note: Returns were annualized for December 31, 2005, to December 31, 2008, for the three-year comparison, and for December 31,1998, to December 31, 2008, for the ten-year comparison, and account for price appreciation and dividends. To generate the comparison data, we compared the TSR of each innovative company, as identified by survey respondents, with the TSR of its industry overall and averaged the differences globally and by region.

T B C G
Curiously, one of the least popular metrics remains time to market (19 percent), a chronically underutilized metric according to our surveys and experience. The irony here is that respondents consistently identify a lack of speed as one of their biggest weaknesses when it comes to ex-ecution, as well as one of the biggest hurdles to raising the return on their innovation investments.
That remains the case in 2009. It would not be too great a reach to say that until companies start to measure this factor aggressively and regularly, they have little hope of moving it off the top of the list of their biggest obstacles.
Diff erent industries have their own pet metrics, of course. The following are a few noteworthy examples:
Pharmaceutical, biotechnology, and health care com-◊ panies focus more than most companies on the num-ber of new off erings
Retailers look especially closely at the percentage of ◊ sales from new off erings, customer satisfaction, and projected versus actual performance
Automotive companies place particular emphasis on ◊ margin growth and time to market
There are also some interesting preferences by region:
North American companies place signifi cant emphasis ◊ on overall revenue growth and relatively little weight on time to market, the number of new off erings, and new-product success ratios
Asia-Pacifi c companies place heavy emphasis on new-◊ product success ratios and innovation ROI
Obstacles to Boosting Investment Returns: Risk Aversion and Lengthy Development Times
When asked to identify the factors that are preventing their companies from generating better returns on their innovation investments, respondents scattered their picks fairly widely. (See Exhibit 5.) The most popular answers were a risk-averse corporate culture (29 percent of respon-dents) and lengthy development times (27 percent), which
Customer satisfaction
Overall revenue growth
Projected versus actual performance
Increased margins
New-product success ratios
Number of new products or services
Return on innovation spending
Time to market
0 5030 40
44
41
29
25
23
22
21
21
19
2010Percentage of respondents
How does your company measure its success at innovation?
Percentage of sales from new offerings
Exhibit 4. Customer Satisfaction and Overall Revenue Growth Are the Most Commonly Used Measures of Innovation Success
Source: BCG 2009 Senior Executive Innovation Survey.

I
have been the top two responses for the past several years. On the surface, this suggests that companies are doing lit-tle to address their biggest problems. A closer look, how-ever, reveals that the percentage of respondents who iden-tifi ed these factors as obstacles has been moving downward and fell fairly signifi cantly this year, indicating that at least some companies are making headway. (In 2008, both fac-tors were identifi ed by 36 percent of respondents.)
There was again some interesting variation by industry:
Automotive companies wrestle with diffi culties in mar-◊ keting and publicizing their innovations
Retailers ◊ and automotive companies believe their re-turns are negatively aff ected by a lack of executive support
Entertainment and media companies struggle espe-◊ cially with a lack of customer insight
It is worth noting that, as in past surveys, a fairly small number of respondents—17 percent this year—identifi ed
a shortage of great ideas as a hurdle to higher returns. We have discussed the distinction between ideas and innova-tion in previous reports, but the point is worth making again. New ideas are rarely in short supply. In fact, as we see every day in our innovation practice and our work with companies, most organizations have an abundance of good and o en great ideas. But generating ideas and being able to turn those ideas into cash are two entirely diff erent things. The world’s top innovators have mas-tered both and do not get distracted by the mantra o en heard in the press and from pundits that the problem is a need for “breakthrough ideas.” That simply is not true, as this year’s survey again proves.
Risk-averse culture
Lengthy development times
Lack of coordination within the company
Difficulty selecting the right ideas to commercializeCompensation not tied
to innovation resultsInability to adequately measure performance
Ineffective marketing and communications
Insufficient support from leadership and management
Not enough customer insight
Not enough great ideas
0 3015 20 25
29
27
23
22
22
21
20
20
17
17
105Percentage of respondents
What are the biggest obstacles you face when it comesto generating a return on your investments in innovation?
Exhibit 5. A Risk-Averse Culture and Lengthy Development Times Are the Biggest Hurdles to Improving the Return on Innovation Spending
Source: BCG 2009 Senior Executive Innovation Survey.

T B C G
Objectives and Tactics
W hat are companies specifi cally target-ing with their innovation efforts? And what levers are they using? The answers to these questions may be starting to change in response to the
economy.
A Growing Emphasis on Cost Reduction…
Companies can direct their innovation eff orts at a range of objectives, from small upgrades to existing products to new off erings that spawn entire industries. For the past three years, we have asked respondents to prioritize among fi ve of them:
“New to the world” products or services that create ◊ entirely new markets
New off erings that allow expansion into new consum-◊ er groups
New off erings for existing customers◊
Incremental changes to existing off erings◊
Lower production costs for existing off erings ◊
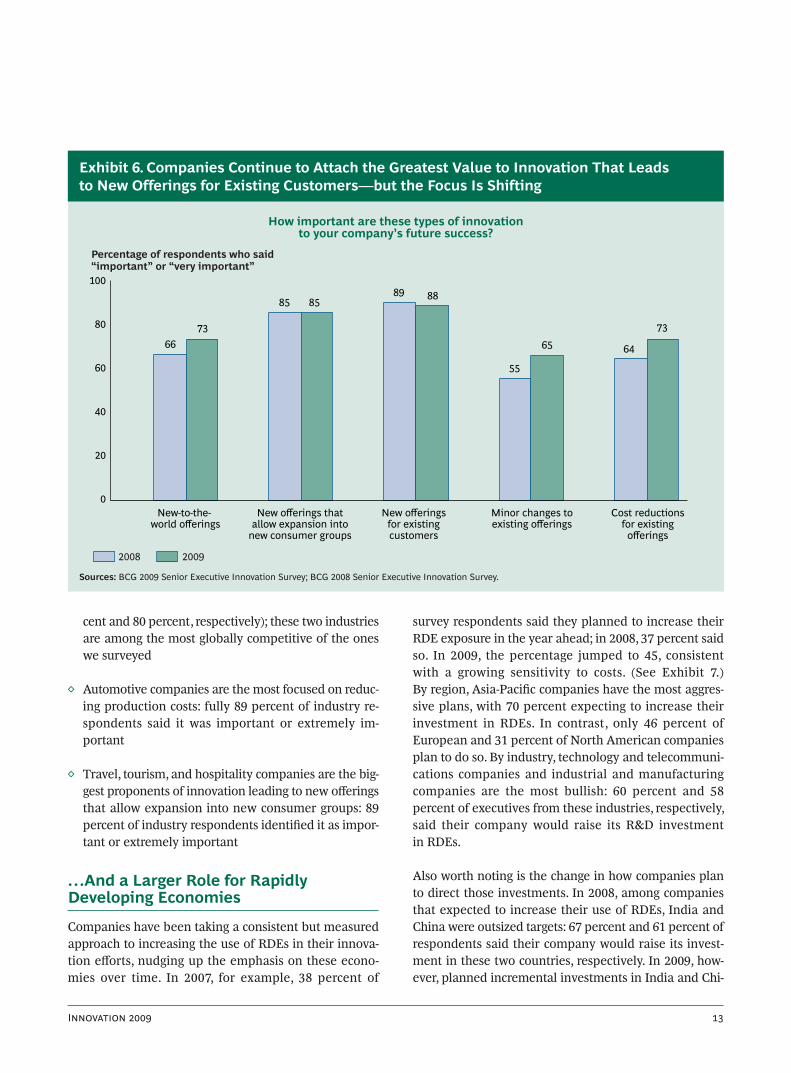
New off erings for existing customers has been the top choice in each of the past several years, followed by new off erings that allow expansion into new consumer groups. In 2009, those two objectives were identifi ed, respectively, by 88 percent and 85 percent of respondents as impor-tant or extremely important to their company’s success. (See Exhibit 6.) These percentages are nearly identical to what we saw in 2008.
There was, however, an eye-catching change in the impor-tance attached to innovation leading to lower production costs. In 2008, 64 percent of respondents said that type of innovation was important or extremely important to their business; in 2009, the percentage was 73. Presum-ably, many companies anticipate limited pricing power or revenue growth in the months ahead and are seeking to maintain profi tability through lower input costs. (In a similar vein, there was an increase in the number of com-panies emphasizing innovation that leads to incremental changes to existing products; 65 percent of respondents said that it was important or extremely important to their business, versus 55 percent in 2008. This is likely another sign of lowered expectations—and pragmatism.) This emphasis on lower production costs can be expected to grow if the economy continues to contract.
In parallel, there was a rise in the value assigned to in-novation that generates new-to-the-world off erings that create entirely new markets. Seventy-three percent of re-spondents identifi ed it as important or extremely impor-tant this year, versus 66 percent in 2008. This could be a case of companies attacking the same problem from the opposite angle: with top-line growth in their traditional markets likely to remain stagnant or contract in the months ahead, why not seek entirely new revenue streams—and why not aim high?
Responses to the question of which type of innovation is most important were fairly uniform by industry, but there were some outliers, most of which were driven by the particular industry dynamics these players face.
Technology and telecommunications companies at-◊ tach critical importance to new-to-the-world off erings, as do industrial and manufacturing companies (81 per-
I
cent and 80 percent, respectively); these two industries are among the most globally competitive of the ones we surveyed
Automotive companies are the most focused on reduc-◊ ing production costs: fully 89 percent of industry re-spondents said it was important or extremely im-portant
Travel, tourism, and hospitality companies are the big-◊ gest proponents of innovation leading to new off erings that allow expansion into new consumer groups: 89 percent of industry respondents identifi ed it as impor-tant or extremely important
…And a Larger Role for Rapidly Developing Economies
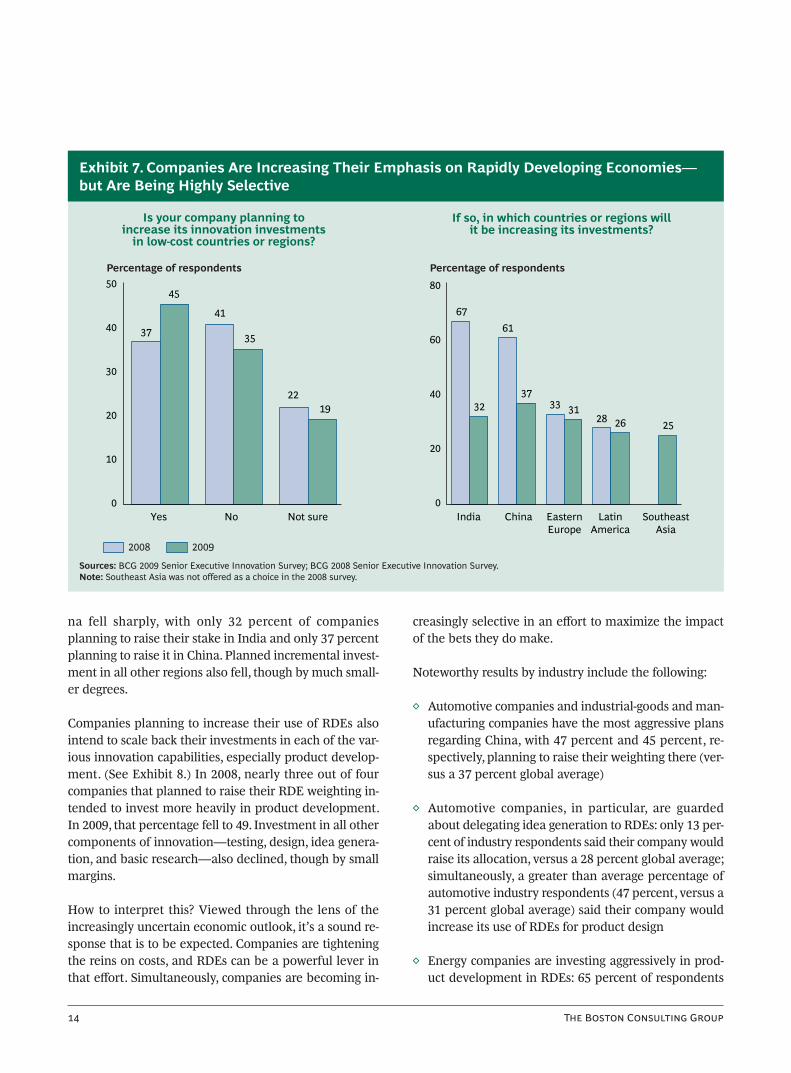
Companies have been taking a consistent but measured approach to increasing the use of RDEs in their innova-tion eff orts, nudging up the emphasis on these econo-mies over time. In 2007, for example, 38 percent of
survey respondents said they planned to increase their RDE exposure in the year ahead; in 2008, 37 percent said so. In 2009, the percentage jumped to 45, consistent with a growing sensitivity to costs. (See Exhibit 7.) By region, Asia-Pacifi c companies have the most aggres-sive plans, with 70 percent expecting to increase their investment in RDEs. In contrast, only 46 percent of European and 31 percent of North American companies plan to do so. By industry, technology and telecommuni-cations companies and industrial and manufacturing companies are the most bullish: 60 percent and 58 percent of executives from these industries, respectively, said their company would raise its R&D investment in RDEs.
Also worth noting is the change in how companies plan to direct those investments. In 2008, among companies that expected to increase their use of RDEs, India and China were outsized targets: 67 percent and 61 percent of respondents said their company would raise its invest-ment in these two countries, respectively. In 2009, how-ever, planned incremental investments in India and Chi-
How important are these types of innovation to your company’s future success?
Percentage of respondents who said“important” or “very important”
2008 2009
6673
85 8589 88
55
65 64
73
0
60
80
100
40
20
New-to-the-world offerings
New offerings that allow expansion into
new consumer groups
New offerings for existing customers
Minor changes to existing offerings
Cost reductions for existing
offerings
Exhibit 6. Companies Continue to Attach the Greatest Value to Innovation That Leads to New Offerings for Existing Customers—but the Focus Is Shifting
Sources: BCG 2009 Senior Executive Innovation Survey; BCG 2008 Senior Executive Innovation Survey.
T B C G
Is your company planning to increase its innovation investments
in low-cost countries or regions?
If so, in which countries or regions will it be increasing its investments?
Percentage of respondents Percentage of respondents
2008 2009
37
45
41
35
2219
67
32
61
3733 31
28 26 25
0
40
50
30
20
10
0
60
80
40
20
Yes No Not sure India China EasternEurope
LatinAmerica
SoutheastAsia
Exhibit 7. Companies Are Increasing Their Emphasis on Rapidly Developing Economies—but Are Being Highly Selective
Sources: BCG 2009 Senior Executive Innovation Survey; BCG 2008 Senior Executive Innovation Survey.Note: Southeast Asia was not offered as a choice in the 2008 survey.
na fell sharply, with only 32 percent of companies planning to raise their stake in India and only 37 percent planning to raise it in China. Planned incremental invest-ment in all other regions also fell, though by much small-er degrees.
Companies planning to increase their use of RDEs also intend to scale back their investments in each of the var-ious innovation capabilities, especially product develop-ment. (See Exhibit 8.) In 2008, nearly three out of four companies that planned to raise their RDE weighting in-tended to invest more heavily in product development. In 2009, that percentage fell to 49. Investment in all other components of innovation—testing, design, idea genera-tion, and basic research—also declined, though by small margins.
How to interpret this? Viewed through the lens of the increasingly uncertain economic outlook, it’s a sound re-sponse that is to be expected. Companies are tightening the reins on costs, and RDEs can be a powerful lever in that eff ort. Simultaneously, companies are becoming in-
creasingly selective in an eff ort to maximize the impact of the bets they do make.
Noteworthy results by industry include the following:
Automotive companies and industrial-goods and man-◊ ufacturing companies have the most aggressive plans regarding China, with 47 percent and 45 percent, re-spectively, planning to raise their weighting there (ver-sus a 37 percent global average)
Automotive companies, in particular, are guarded ◊ about delegating idea generation to RDEs: only 13 per-cent of industry respondents said their company would raise its allocation, versus a 28 percent global average; simultaneously, a greater than average percentage of automotive industry respondents (47 percent, versus a 31 percent global average) said their company would increase its use of RDEs for product design
Energy companies are investing aggressively in prod-◊ uct development in RDEs: 65 percent of respondents

I
said their company would increase its allocation, ver-sus a 49 percent global average
There were also some interesting results by region:
A strong bias toward local markets prevails: European ◊ companies have the most aggressive plans regarding in-vestments in Eastern European RDEs, Asia-Pacifi c com-panies have the most aggressive plans regarding China, and Latin American companies have the most aggres-sive plans regarding Latin American RDEs; again, this is consistent with a rising premium on risk mitigation
Asia-Pacifi c companies plan to make relatively heavy ◊ investments in RDEs for basic research, idea genera-tion, and design
M&A Activity?
Much corporate innovation activity is organic, in-house, and internally generated or orchestrated. But not all. In this year’s survey we posed a new question: What role
do mergers and acquisitions (M&A) play in your com-pany’s innovation strategy? The salient fi nding: M&A does indeed play a key role for many companies. (See Exhibit 9.) Companies are using M&A to achieve a range of ends: to gain access to new markets (29 percent of respondents said their company engages in or has en-gaged in M&A for this purpose), acquire innovation-sup-porting technology (27 percent), and secure innovative leaders and personnel (19 percent). Companies are also using innovation experts to vet potential acquisitions (19 percent).
M&A’s specifi c role varies by industry—and by region:
As might be expected, M&A plays an outsized role ◊ among pharmaceutical, biotechnology, and health care companies (only 19 percent of respondents from that industry said that M&A does not play a signifi cant role in their innovation strategy)
Consumer products companies make relatively heavy ◊ use of innovation experts to vet acquisition targets (25
2008 2009
Percentage of respondents
If you plan to increase your allocation to RDEs, which of the following types of innovation investment will you be making?
Product development Testing Design Idea generation Basic research
60
80
40
20
0
73
46
37 33 32
49
30 3128 28
–32%
Exhibit 8. Companies Are Scaling Back Their Investment in Product Development in Rapidly Developing Economies
Sources: BCG 2009 Senior Executive Innovation Survey; BCG 2008 Senior Executive Innovation Survey.

T B C G
percent of industry respondents, versus a 19 percent global average); they also aggressively employ M&A to acquire innovation talent and leadership (26 percent, versus a 19 percent global average)
Automotive companies make active use of M&A to ac-◊ quire innovative technologies that can be deployed in their existing businesses (38 percent, versus a 27 per-cent global average)
By region, European companies employ M&A most ag-◊ gressively; only 24 percent of respondents said it was not a major part of their innovation strategy
Asia-Pacifi c companies employ M&A actively on all ◊ fronts, particularly to acquire technology and expertise and gain access to new markets
North American companies, in contrast, make rela-◊ tively limited use of M&A; 36 percent of respondents said it does not play a signifi cant role in their innova-tion strategy
M&A does not play a significant role in our company’s innovation strategy
We look to acquire businesses that will give us access to new markets in which we
can deploy our innovative products
We look to acquire businesses with innovative technologies or processes that
we can deploy in our current markets
We look to acquire businesses whose leaders and employees have demonstrated
an ability to innovate over time
We include innovation experts in our target screening and due-diligence
process to help us identify acquisition targets, determine willingness to pay, or
plan for a smooth integration0 3015 20 25
29
29
27
19
19
105Percentage of respondents
What role does M&A play in your company’s innovation strategy?
Exhibit 9. Mergers and Acquisitions Play a Role in Many Companies’ Innovation Strategies
Source: BCG 2009 Senior Executive Innovation Survey.

I
ExecutionSuccesses and Challenges
A successful innovation process requires a range of capabilities, from idea generation and R&D through portfolio management and product launch. We asked respon-dents to gauge their organization’s perfor-
mance, from excellent to poor, in these specifi c areas:
Developing a deep understanding of customers◊
Partnering with suppliers and others for new ideas◊
Ensuring executive-level support for projects◊
Enforcing timelines and milestones◊
Earmarking suffi cient funds for projects◊
Moving quickly from idea generation to initial sales◊
Balancing risks, time frames, and returns across an en-◊ tire portfolio of projects
Fostering a company culture that promotes innovation ◊
There were few surprises in the responses; indeed, this self-assessment yields strikingly similar results from year to year. This continuity suggests that companies are main-taining or building on their strengths. But it also suggests that companies are not addressing their weaknesses ef-fectively—if they are addressing them at all.
Successes: Executive Sponsorship and Customer Knowledge
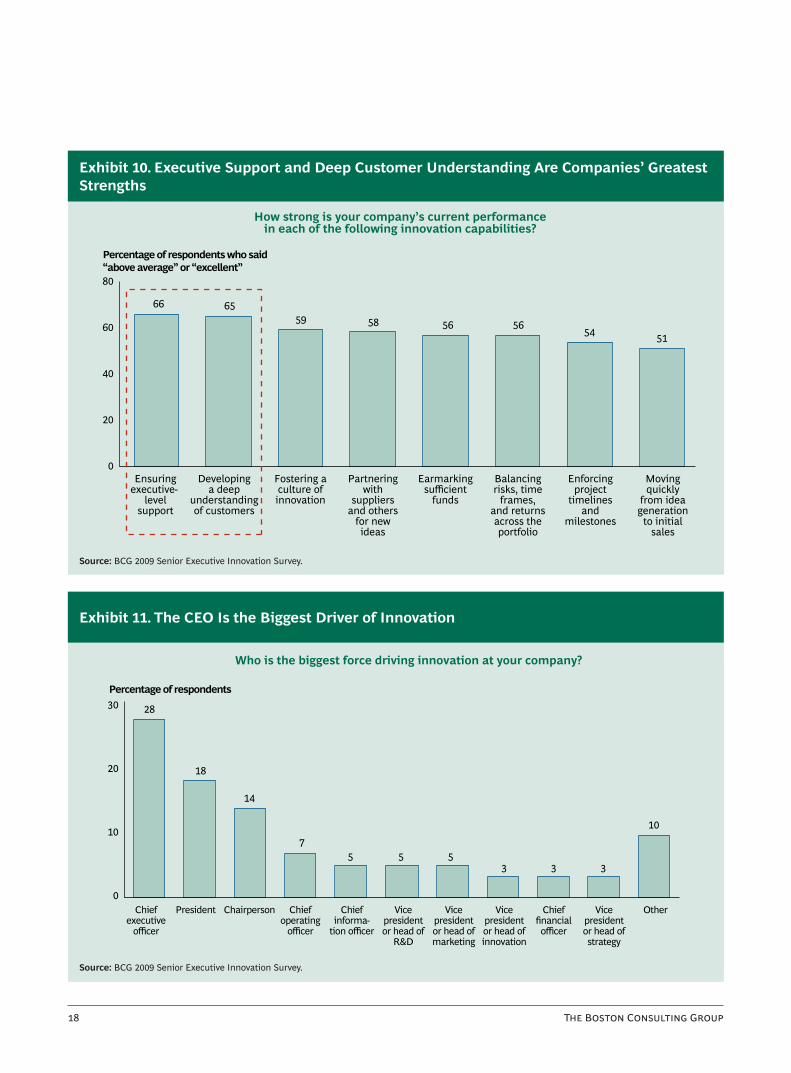
For the last four years, companies have consistently given themselves the highest marks in two areas—ensuring
executive-level sponsorship of projects and developing a deep understanding of customers. In 2009, 66 percent and 65 percent of respondents rated their company excel-lent or above average at those two capabilities, respec-tively. (See Exhibit 10.) Energy companies consider ex-ecutive sponsorship to be a particular strength (73 percent). The ability to develop a deep understanding of customers is considered a strong suit by fi nancial services companies (71 percent), pharmaceutical, biotechnology, and health care companies (70 percent), and Asia-Pacifi c companies generally (76 percent).
As in prior years, many respondents (59 percent) also rated their company excellent or above average at foster-ing a company culture that promotes innovation. This is noteworthy, given that a risk-averse culture has been con-sistently identifi ed in our surveys as one of the largest obstacles to maximizing the return on innovation invest-ment. (As noted above, it was the biggest obstacle in 2009.) Technology and telecommunications companies (68 percent) judge culture to be a particular strength.
A linchpin of both executive sponsorship and a support-ive culture is, of course, strong leadership. As in years past, respondents in 2009 identifi ed the CEO as the big-gest driver of innovation at their company. (See Exhibit 11.) Yet only 28 percent of respondents said so, suggest-ing that in many companies there is a real leadership vacuum. That vacuum can come at a substantial cost, since our experience confi rms that a CEO who is visibly committed to innovation can play a determining role in the ultimate success or failure of a company’s innovation eff orts. Leaders should do some soul-searching and deter-mine whether they are giving innovation all the support it truly needs. And they should make it a candid self-as-sessment: while 79 percent of CEOs, presidents, and
T B C G
Percentage of respondents who said“above average” or “excellent”
How strong is your company’s current performancein each of the following innovation capabilities?
0
60
80
66 6559 58 56 56
54 51
40
20
Ensuring executive-
level support
Developing a deep
understanding of customers
Fostering a culture of innovation
Partnering with
suppliers and others
for new ideas
Earmarking sufficient
funds
Balancing risks, time
frames, and returns across the portfolio
Enforcing project
timelines and
milestones
Moving quickly
from idea generation
to initial sales
Exhibit 10. Executive Support and Deep Customer Understanding Are Companies’ Greatest Strengths
Source: BCG 2009 Senior Executive Innovation Survey.
Percentage of respondents
Who is the biggest force driving innovation at your company?
0
30 28
18
14
75 5 5
3 3 3
10
20
10
Chief executive
officer
President Chairperson Chief operating
officer
Chief informa-
tion officer
Vice president or head of
R&D
Vice president or head of marketing
Vice president or head of innovation
Chief financial officer
Vice president or head of strategy
Other
Exhibit 11. The CEO Is the Biggest Driver of Innovation
Source: BCG 2009 Senior Executive Innovation Survey.

I
chairmen and chairwomen said they do an excellent or above-average job at ensuring executive-level support for innovation projects, only 64 percent of other respondents thought so.
There were some interesting results by industry:
Travel, tourism, and hospitality companies consider ◊ themselves particularly strong at enforcing project timelines and milestones (66 percent of respondents consider their company excellent or above average at it, versus a 54 percent global average)
Industrial goods and manufacturing companies consider ◊ themselves strong at securing suffi cient funds for proj-ects (66 percent, versus a 56 percent global average)
Challenges: Speed and Discipline
Respondents also acknowledged shortcomings in their innovation capabilities—and again, there were strong echoes from previous surveys. The most commonly iden-tifi ed challenge (45 percent of respondents) was speed—the time it takes to move from idea generation to initial sales. (See Exhibit 12.) Speed was deemed a particular
problem by automotive companies (56 percent of respon-dents rated their company below average or poor) and energy companies (54 percent). The second most com-monly identifi ed challenge (41 percent) was discipline—the ability to strictly enforce timelines and milestones. North American companies generally struggle with this capability (48 percent).
These two capabilities, it should be noted, were identifi ed as the top two challenges in our 2007 and 2008 surveys and ranked high in earlier surveys as well. Clearly, com-panies need to give far greater attention to these areas.
Every industry wrestles with its own particular challeng-es, of course. Among the more noteworthy fi ndings:
Entertainment and media companies and energy com-◊ panies struggle to develop a deep understanding of customers (41 percent and 39 percent, respectively, rate themselves below average or poor, versus a 32 percent global average)
Automotive companies struggle with fostering a cul-◊ ture that supports innovation (55 percent, versus a 38 percent global average)
Percentage of respondents whosaid “below average” or “poor”
How strong is your company’s current performancein each of the following innovation capabilities?
0
30
40
50
20
10
Moving quickly from idea generation
to initial sales
Enforcing project
timelines and milestones
Earmarking sufficient
funds
Balancing risks, time frames, and
returns across the portfolio
Fostering a culture of innovation
Partnering with suppliers
and others for new ideas
Developing a deep
understanding of customers
Ensuring executive-
level support
4541 40 39 38 38
32 31
Exhibit 12. Speed and Discipline Are Companies’ Greatest Challenges
Source: BCG 2009 Senior Executive Innovation Survey.
T B C G
The Most Innovative Companies
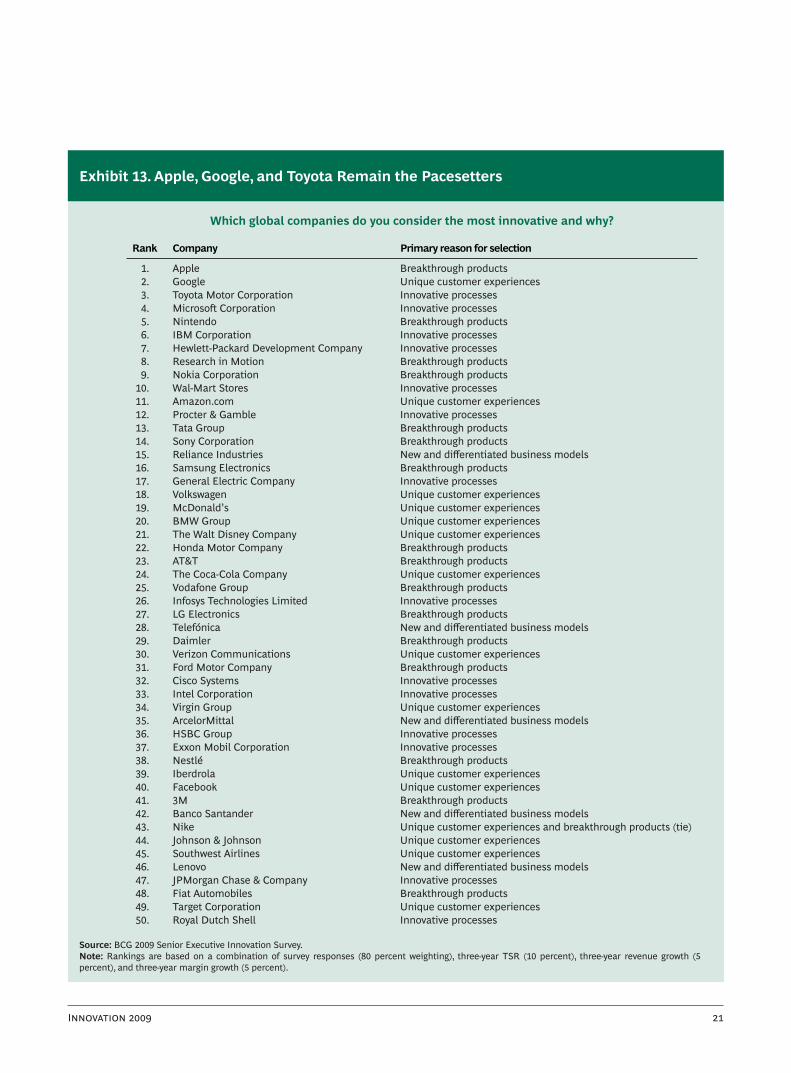
Before 2008, our rankings of the most innova-tive companies were based on a single crite-rion—respondents’ picks. In 2008, in an ef-fort to make the results more robust and truly refl ective of the actual top innovators,
we supplemented those choices with three fi nancial meas-ures: three-year shareholder returns, three-year revenue growth, and three-year margin growth. We used that same methodology this year. Respondents’ votes counted for 80 percent of the ranking, shareholder returns for 10 percent, and revenue and margin growth for 5 percent each.
We also asked respondents to specify, from the following fi ve general criteria, their primary reason for picking each company (they could also choose “other”):
The company employs innovative operational ◊ process-es that give it an advantage
The company’s ◊ business models for revenue streams are new and diff erentiated
The company has created unique ◊ customer experiences that create loyalty
The company has developed breakthrough ◊ products
The company has developed breakthrough ◊ services
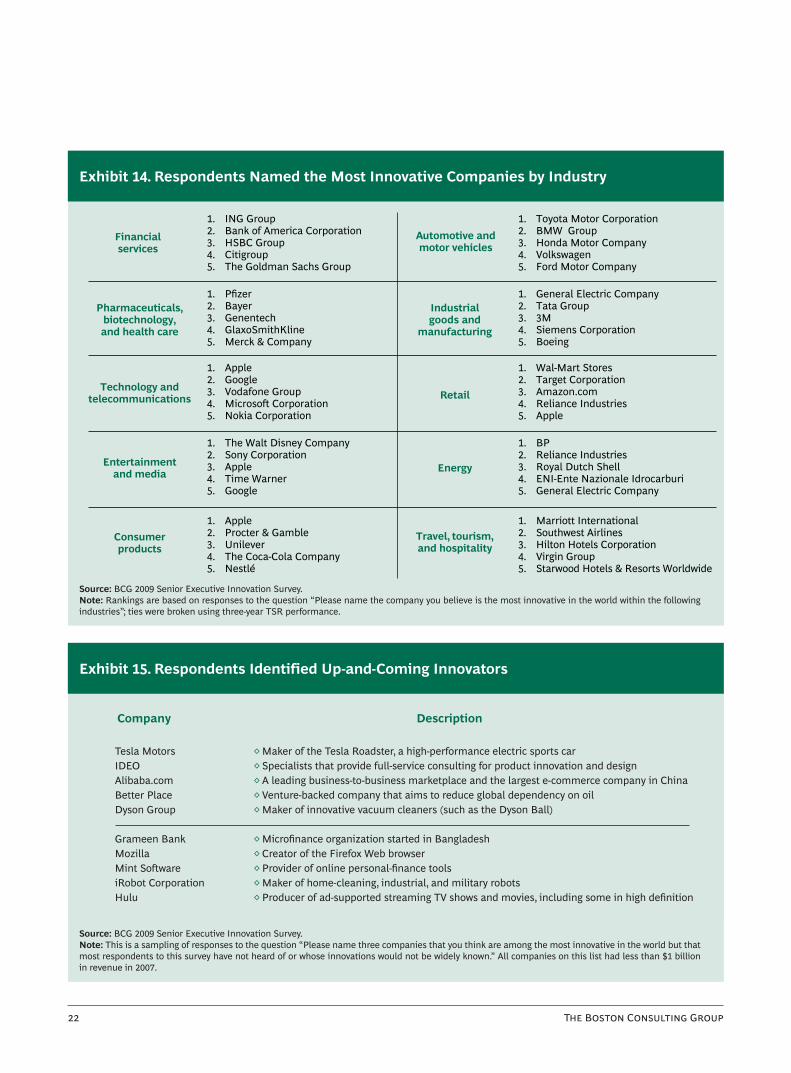
The results are presented in Exhibit 13. Apple, Google, and Toyota once again took the top three spots, as in 2007 and 2008. (There were some signifi cant changes else-where in the rankings, however.) Exhibit 14 shows the rankings of the top fi ve innovators within each industry. These results are based solely on respondents’ votes (that is, no fi nancial criteria were employed).
We also asked respondents to name the companies they considered to be particularly innovative that are not yet broadly recognized as such. Exhibit 15 highlights a num-ber of those companies.
I
Rank Company Primary reason for selection
1. Apple Breakthrough products 2. Google Unique customer experiences 3. Toyota Motor Corporation Innovative processes 4. Microso Corporation Innovative processes 5. Nintendo Breakthrough products 6. IBM Corporation Innovative processes 7. Hewlett-Packard Development Company Innovative processes 8. Research in Motion Breakthrough products 9. Nokia Corporation Breakthrough products 10. Wal-Mart Stores Innovative processes 11. Amazon.com Unique customer experiences 12. Procter & Gamble Innovative processes 13. Tata Group Breakthrough products 14. Sony Corporation Breakthrough products 15. Reliance Industries New and differentiated business models 16. Samsung Electronics Breakthrough products 17. General Electric Company Innovative processes 18. Volkswagen Unique customer experiences 19. McDonald’s Unique customer experiences 20. BMW Group Unique customer experiences 21. The Walt Disney Company Unique customer experiences 22. Honda Motor Company Breakthrough products 23. AT&T Breakthrough products 24. The Coca-Cola Company Unique customer experiences 25. Vodafone Group Breakthrough products 26. Infosys Technologies Limited Innovative processes 27. LG Electronics Breakthrough products 28. Telefónica New and differentiated business models 29. Daimler Breakthrough products 30. Verizon Communications Unique customer experiences 31. Ford Motor Company Breakthrough products 32. Cisco Systems Innovative processes 33. Intel Corporation Innovative processes 34. Virgin Group Unique customer experiences 35. ArcelorMittal New and differentiated business models 36. HSBC Group Innovative processes 37. Exxon Mobil Corporation Innovative processes 38. Nestlé Breakthrough products 39. Iberdrola Unique customer experiences 40. Facebook Unique customer experiences 41. 3M Breakthrough products 42. Banco Santander New and differentiated business models 43. Nike Unique customer experiences and breakthrough products (tie) 44. Johnson & Johnson Unique customer experiences 45. Southwest Airlines Unique customer experiences 46. Lenovo New and differentiated business models 47. JPMorgan Chase & Company Innovative processes 48. Fiat Automobiles Breakthrough products 49. Target Corporation Unique customer experiences 50. Royal Dutch Shell Innovative processes
Which global companies do you consider the most innovative and why?
Exhibit 13. Apple, Google, and Toyota Remain the Pacesetters
Source: BCG 2009 Senior Executive Innovation Survey. Note: Rankings are based on a combination of survey responses (80 percent weighting), three-year TSR (10 percent), three-year revenue growth (5 percent), and three-year margin growth (5 percent).
T B C G
Financialservices
Energy
1. ING Group2. Bank of America Corporation3. HSBC Group4. Citigroup5. The Goldman Sachs Group
1. Toyota Motor Corporation2. BMW Group3. Honda Motor Company4. Volkswagen5. Ford Motor Company
1. Pfizer2. Bayer3. Genentech4. GlaxoSmithKline5. Merck & Company
1. General Electric Company2. Tata Group3. 3M4. Siemens Corporation5. Boeing
1. Apple2. Google3. Vodafone Group4. Microso Corporation5. Nokia Corporation
1. Wal-Mart Stores2. Target Corporation3. Amazon.com4. Reliance Industries5. Apple
1. The Walt Disney Company2. Sony Corporation3. Apple4. Time Warner5. Google
1. BP 2. Reliance Industries3. Royal Dutch Shell4. ENI-Ente Nazionale Idrocarburi 5. General Electric Company
1. Apple2. Procter & Gamble3. Unilever4. The Coca-Cola Company5. Nestlé
1. Marriott International2. Southwest Airlines3. Hilton Hotels Corporation4. Virgin Group5. Starwood Hotels & Resorts Worldwide
Pharmaceuticals,biotechnology,and health care
Technology andtelecommunications
Entertainmentand media
Consumerproducts
Travel, tourism, and hospitality
Industrial goods and
manufacturing
Automotive and motor vehicles
Retail
Exhibit 14. Respondents Named the Most Innovative Companies by Industry
Source: BCG 2009 Senior Executive Innovation Survey.Note: Rankings are based on responses to the question “Please name the company you believe is the most innovative in the world within the following industries”; ties were broken using three-year TSR performance.
Tesla MotorsIDEOAlibaba.com Better Place Dyson Group
Grameen BankMozillaMint SowareiRobot CorporationHulu
◊ Maker of the Tesla Roadster, a high-performance electric sports car◊ Specialists that provide full-service consulting for product innovation and design◊ A leading business-to-business marketplace and the largest e-commerce company in China◊ Venture-backed company that aims to reduce global dependency on oil◊ Maker of innovative vacuum cleaners (such as the Dyson Ball)
◊ Microfinance organization started in Bangladesh ◊ Creator of the Firefox Web browser◊ Provider of online personal-finance tools◊ Maker of home-cleaning, industrial, and military robots◊ Producer of ad-supported streaming TV shows and movies, including some in high definition
Company Description
Exhibit 15. Respondents Identified Up-and-Coming Innovators
Source: BCG 2009 Senior Executive Innovation Survey.Note: This is a sampling of responses to the question “Please name three companies that you think are among the most innovative in the world but that most respondents to this survey have not heard of or whose innovations would not be widely known.” All companies on this list had less than $1 billion in revenue in 2007.
I
Leading out of the DownturnSeven Aggressive Innovation Strategies
T he current economic woes call to mind the old joke about two campers who see a bear approaching their campsite. As one camper starts to lace up his sneakers, the other one says, “What are you doing? Sneakers won’t
help you outrun a bear!” To which the fi rst camper re-torts, “I don’t have to outrun the bear—I just have to outrun you!”
No company can hope to outrun this bear market and emerge unharmed in the short term. But companies can take steps that will vastly improve their standing versus competitors, and they can position themselves optimally for an eventual economic rebound. Innovation can and should play a key part in that eff ort.
Below are seven innovation strategies that companies should consider implementing now, even though things continue to look bleak or at least very uncertain. Ideally, companies seeking to employ these strategies will start from a relatively strong fi nancial position. But even those that do not can still leverage some of these strategies by freeing up cash through cost-cutting moves and repriori-tization.
Stay aggressively invested in innovation. For compa-nies not fi ghting for immediate survival, now is the time, fi rst and foremost, to sustain or even increase their com-mitment to innovation—especially since their competi-tors may be unable or unwilling to do so. This obviously requires a superior cash position, strength in other areas of the business, and courage and leadership.
Acquire intellectual property on the cheap. As small companies’ traditional funding sources dry up, large, liq-uid companies have a unique opportunity to acquire in-
tellectual property at fi re-sale prices. One cash-rich man-ufacturer, for example, recently had its eye on a small start-up that possessed new technology that could create a valuable market adjacent to the manufacturer’s busi-ness. Desperate for cash, the smaller company accepted terms that would have been unthinkable in a stronger economy, selling the manufacturer a one-third ownership stake and a valuable fi rst right of refusal for any future sale of the company or its intellectual property.
Alter your business model in strategic, game-chang-ing ways. The perfect time to create a new business model is during a fi nancial downturn, when it’s harder for competitors to see, understand, copy, or adequately respond to changes. Innovative approaches to rethinking not only which activities a company should engage in, but also how it should do so and who should take these initiatives on, are particularly likely to pay off during downturns, when creative moves are diffi cult to follow by the less courageous (or fl exible). Which industries will be transformed during this recession by bold companies?
Go bargain hunting. The plunging stock market may off er a great opportunity to buy innovative companies—and their people, patents, products, and competitive po-sition—at steep discounts. Pharmaceutical companies are already aggressively seizing the moment: according to BusinessWeek, drug companies had announced $142 bil-lion in deals by November 2008, up 18 percent from all of 2007, and still have over $110 billion in cash on their balance sheets. And the buying spree has continued in the early months of 2009, with several deals already an-nounced, some of them driven by the desire to acquire innovative products and promising innovation pipelines. M&A activity will likely continue to increase as the down-turn drags on, with assets continuing to be available at

T B C G
signifi cant discounts. The optimal candidate for leverag-ing this situation would be a company in an industry where values are depressed but development pipelines are rich. (Good examples are pharmaceutical companies, technology companies, and higher-end technology-inten-sive industrial companies.)
Raid your competitors’ talent pools. Exceptional peo-ple are always a scarce resource. According to a leading executive-search company, while it still takes a compel-ling off er to lure top talent, the bar is much lower now than it was a year ago. As R&D budgets are cut and as funding tightens and job insecurity rises, a stable com-pany with deep fi nancial resources will fi nd its drawing power disproportionately enhanced—and it should lever-age that advantage aggressively.
Stage a network invasion. The downturn presents an opportunity to capture key partnerships, collaborators, and customer networks from weakened competitors. This strategy is viable in industries characterized either by ex-clusive relationships or by strong innate network eff ects that create barriers to entry. Companies should look for vulnerable players and identify a point of leverage to force out the incumbent and stake a claim on the net-work. This strategy has been successfully executed in the past by telecommunications suppliers, among others.
Use innovation to attack competitors’ profi t strong-holds. A company we’ll call Wolf was a large, diversifi ed organization with strong positions in all sectors in which it competed. Another company, which we’ll call Sheep, was smaller, and its business was driven by a dominant position in a single sector. When a tough economy put Sheep under fi nancial pressure, Wolf decided to attack Sheep’s stronghold. Wolf used its strong innovation skills and excess production capacity to create a product line that competed directly with Sheep’s 20 most profi table SKUs. Wolf’s product line off ered much lower prices and, in some cases, better performance. Unable to profi tably compete, Sheep was put up for sale—and bought by Wolf at a bargain price.
In our experience, while the vast majority of compa-nies batten down the hatches in times of crisis, lead-ing companies take a more sophisticated and proac-
tive approach. Yes, they pull defensive levers that improve short-term performance, but they also aggressively lever-age the strategies described above to fundamentally change their long-term competitive position. It’s ultimate-ly a question of vision. Companies that win with innova-tion see the downturn as a chance to re-create their in-dustry—on their own terms.

I
Survey Methodology
In November 2008, BCG sent this year’s survey electroni-cally to recipients of previous BCG innovation surveys whose e-mail addresses were known. We also sent it to BCG alumni who work in an innovation-related role in their current company and to senior management mem-bers of the BusinessWeek Market Advisory Board, an on-line reader panel. Participation was voluntary and anon-ymous. The survey closed in January 2009.
In total, 2,701 executives responded, representing all ma-jor markets and industries. The responses broke down as follows:
RegionNorth America 1,015Europe 905Asia-Pacifi c 604Latin America 164Other 10No response 3Total 2,701
IndustryTechnology and telecommunications 527Industrial goods and manufacturing 365Financial services 352Pharmaceuticals, biotechnology, and health care 208Consumer products 204Entertainment and media 136Retail 91Energy 82Travel, tourism, and hospitality 67Automotive and motor vehicles 63Other 548No response 58Total 2,701
PositionC levelChief executive offi cer or president 225Chief information offi cer or chief technology offi cer 123Chief operating offi cer or managing director 99Chief fi nancial offi cer, controller, or treasurer 53Chairperson 39Board member 24Other C-level executive 46 Subtotal 609
Other levelsDepartment manager or supervisor 426Director or group or division director 311Professional 298Vice president 160General manager 132Administrative or clerical staff 130Technical staff 120 Owner or partner 109Consultant 105Sales representative 47Government or public offi cial 45Senior or executive vice president 14Other positions 149Subtotal 2,046No response 46 Total 2,701

T B C G
0
20
40
60
80
100
0
20
40
60
80
100
0
20
40
60
80
100
Percentage ofrespondents
Percentage ofrespondents
Percentage ofrespondents
95
25
39
26
10
25
33
29
13
26
32
28
32
21
33
105
52
24
24
52
30
18
Yes
No
Not sure
Top priority
Top-three priority
Top-ten priority
Not a priority
>10 percent
0 to 10 percent
No change
0 to −10 percent >−10 percent
Allother
industries
Automotiveand motor
vehicles
Allother
industries
Automotiveand motor
vehicles
Allother
industries
Automotiveand motor
vehicles
Innovation as a strategic priority Planned change in innovation spending Satisfaction with innovation ROI
Main innovation metrics used Biggest obstacles to raising innovation ROI Planned expansion into RDEs◊ Overall revenue growth◊ Increased margins◊ Percentage of sales from
new offerings
◊ Ineffective marketing and communications
◊ Risk-averse culture◊ Insufficient support from
leadership and management
◊ 51 percent (all other industries = 46 percent)
◊ China and Eastern Europe
AppendixKey Survey Findings by Industry
As a new feature in this year’s report, we present key survey fi ndings by industry. For each industry, we show the following:
How innovation ranks as a strategic priority◊
The planned change in innovation spending in 2009◊
Satisfaction with the return on innovation spending◊
The three most commonly used innovation metrics ◊
The three biggest hurdles to raising the return on in-◊ novation spending
The percentage of companies that plan to increase ◊ their investment in RDEs and the countries or regions where they will concentrate those investments
Responses to the questions regarding strategic priority, spending, satisfaction with innovation ROI, and RDE investments are compared with those for other indus-tries.
Automotive and Motor Vehicles
Source: BCG 2009 Senior Executive Innovation Survey.Note: Because of rounding, percentages may not add up to 100.

I
Percentage ofrespondents
Percentage ofrespondents
Percentage ofrespondents
Allother
industries
Consumerproducts
Allother
industries
Consumerproducts
Allother
industries
Consumerproducts
Innovation as a strategic priority Planned change in innovation spending Satisfaction with innovation ROI
Main innovation metrics used Biggest obstacles to raising innovation ROI Planned expansion into RDEs◊ Customer satisfaction◊ Overall revenue growth◊ Percentage of sales from new
offerings
◊ Lengthy development times◊ Risk-averse culture◊ Lack of coordination within
the company
◊ 46 percent (all other industries = 46 percent)
◊ China and Latin America
0
20
40
60
80
100
0
20
40
60
80
100
0
20
40
60
80
100
105
25
39
26
10
25
40
26
9
26
31
28
26
35
27
75
52
24
24
57
22
21
Yes
No
Not sure
Top priority
Top-three priority
Top-ten priority
Not a priority
>10 percent
0 to 10 percent
No change
0 to −10 percent >−10 percent
Consumer Products
Source: BCG 2009 Senior Executive Innovation Survey.Note: Because of rounding, percentages may not add up to 100.
Percentage ofrespondents
Percentage ofrespondents
Percentage ofrespondents
Allother
industries
Energy Allother
industries
Energy Allother
industries
Energy
Innovation as a strategic priority Planned change in innovation spending Satisfaction with innovation ROI
Main innovation metrics used Biggest obstacles to raising innovation ROI Planned expansion into RDEs◊ Customer satisfaction◊ Overall revenue growth◊ Projected versus actual
performance
◊ Lengthy development times◊ Risk-averse culture◊ Ineffective marketing and
communications
◊ 38 percent (all other industries = 46 percent)
◊ China and Eastern Europe
0
20
40
60
80
100
0
20
40
60
80
100
0
20
40
60
80
100
Yes
No
Not sure
Top priority
Top-three priority
Top-ten priority
Not a priority
>10 percent
0 to 10 percent
No change
0 to −10 percent >−10 percent
95
25
39
26
10
22
35
26
17
26
32
28
28
28
32
56
52
24
23
55
12
33
Energy
Source: BCG 2009 Senior Executive Innovation Survey.Note: Because of rounding, percentages may not add up to 100.
T B C G
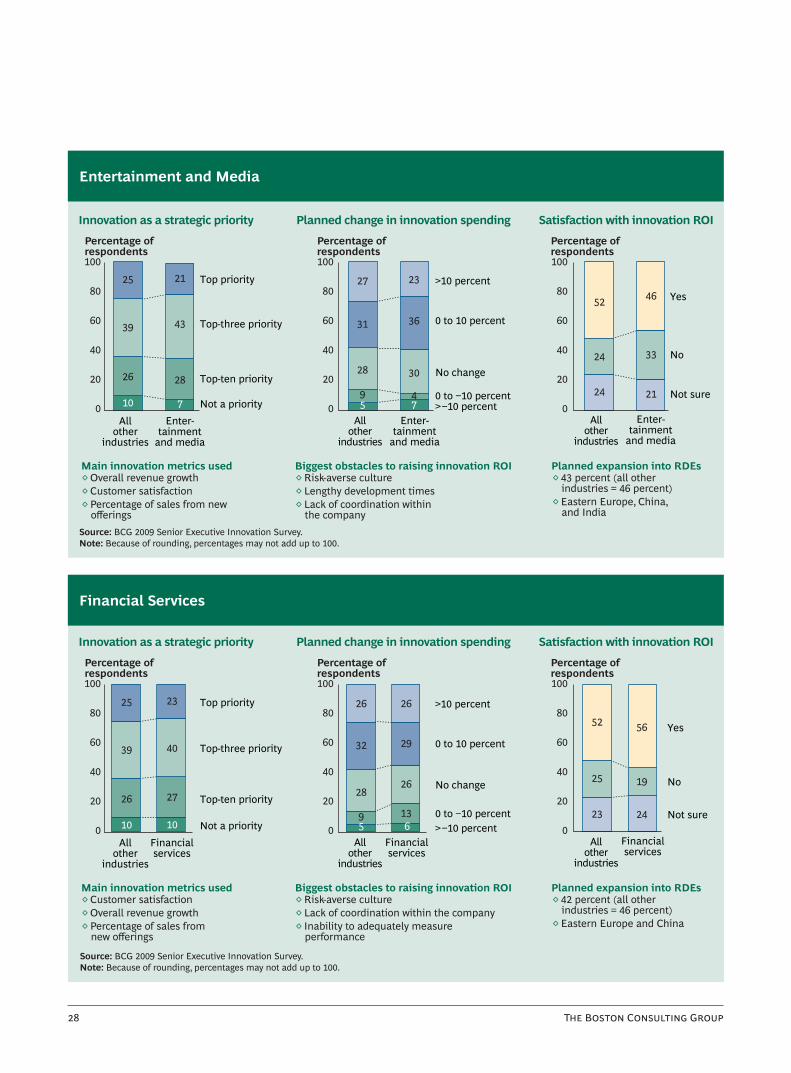
Percentage ofrespondents
Percentage ofrespondents
Percentage ofrespondents
Allother
industries
Enter-tainment
and media
Allother
industries
Enter-tainment
and media
Allother
industries
Enter-tainment
and media
Innovation as a strategic priority Planned change in innovation spending Satisfaction with innovation ROI
Main innovation metrics used Biggest obstacles to raising innovation ROI Planned expansion into RDEs◊ Overall revenue growth◊ Customer satisfaction◊ Percentage of sales from new
offerings
◊ Risk-averse culture◊ Lengthy development times ◊ Lack of coordination within
the company
◊ 43 percent (all other industries = 46 percent)
◊ Eastern Europe, China, and India
95
25
39
26
10
21
43
28
7
27
31
28
23
36
30
47
52
24
24
46
33
210
20
40
60
80
100
0
20
40
60
80
100
0
20
40
60
80
100
Yes
No
Not sure
Top priority
Top-three priority
Top-ten priority
Not a priority
>10 percent
0 to 10 percent
No change
0 to −10 percent >−10 percent
Entertainment and Media
Source: BCG 2009 Senior Executive Innovation Survey.Note: Because of rounding, percentages may not add up to 100.
Percentage ofrespondents
Percentage ofrespondents
Percentage ofrespondents
Allother
industries
Financialservices
Allother
industries
Financialservices
Allother
industries
Financialservices
Innovation as a strategic priority Planned change in innovation spending Satisfaction with innovation ROI
Main innovation metrics used Biggest obstacles to raising innovation ROI Planned expansion into RDEs◊ Customer satisfaction◊ Overall revenue growth◊ Percentage of sales from
new offerings
◊ Risk-averse culture◊ Lack of coordination within the company◊ Inability to adequately measure
performance
◊ 42 percent (all other industries = 46 percent)
◊ Eastern Europe and China
95
25
39
26
10
23
40
27
10
26
32
28
26
29
26
136
52
25
23
56
19
240
20
40
60
80
100
0
20
40
60
80
100
0
20
40
60
80
100
Yes
No
Not sure
Top priority
Top-three priority
Top-ten priority
Not a priority
>10 percent
0 to 10 percent
No change
0 to −10 percent >−10 percent
Financial Services
Source: BCG 2009 Senior Executive Innovation Survey.Note: Because of rounding, percentages may not add up to 100.
I
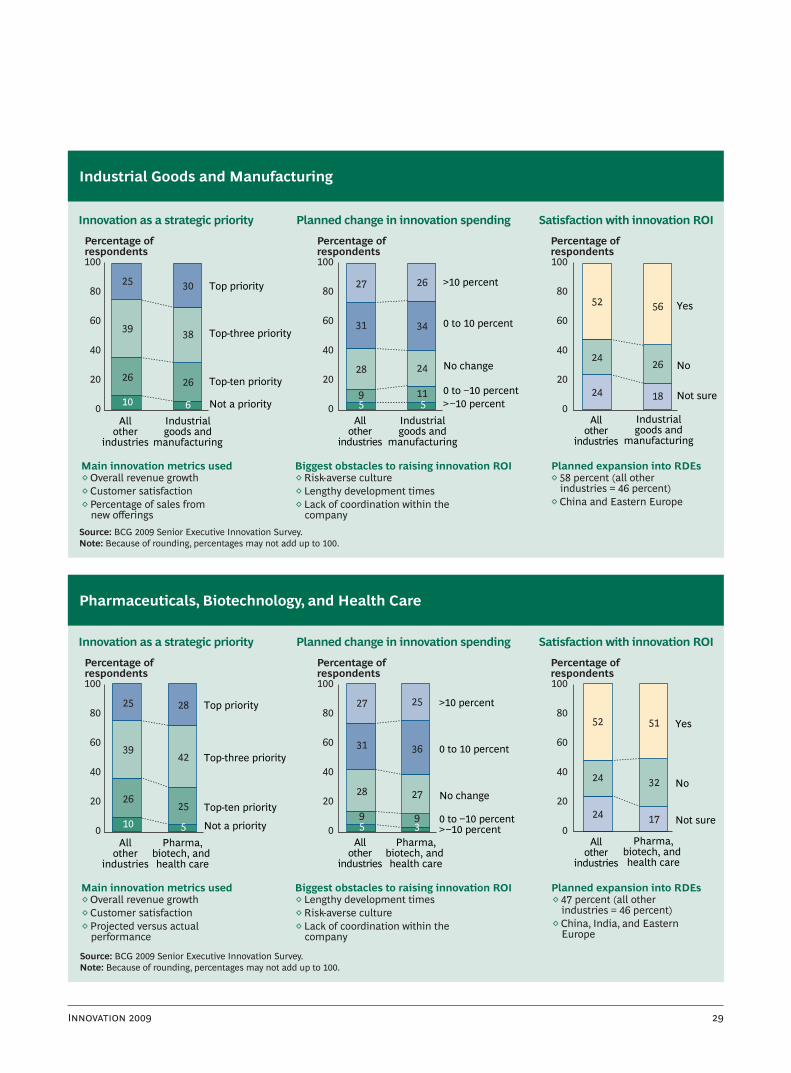
Percentage ofrespondents
Percentage ofrespondents
Percentage ofrespondents
Allother
industries
Industrialgoods and
manufacturing
Allother
industries
Industrialgoods and
manufacturing
Allother
industries
Industrialgoods and
manufacturing
Innovation as a strategic priority Planned change in innovation spending Satisfaction with innovation ROI
Main innovation metrics used Biggest obstacles to raising innovation ROI Planned expansion into RDEs◊ Overall revenue growth◊ Customer satisfaction◊ Percentage of sales from
new offerings
◊ Risk-averse culture◊ Lengthy development times◊ Lack of coordination within the
company
◊ 58 percent (all other industries = 46 percent)
◊ China and Eastern Europe
95
25
39
26
10
30
38
26
6
27
31
28
26
34
24
115
52
24
24
56
26
180
20
40
60
80
100
0
20
40
60
80
100
0
20
40
60
80
100
Yes
No
Not sure
Top priority
Top-three priority
Top-ten priority
Not a priority
>10 percent
0 to 10 percent
No change
0 to −10 percent >−10 percent
Industrial Goods and Manufacturing
Source: BCG 2009 Senior Executive Innovation Survey.Note: Because of rounding, percentages may not add up to 100.
Percentage ofrespondents
Percentage ofrespondents
Percentage ofrespondents
Allother
industries
Pharma,biotech, and health care
Allother
industries
Pharma,biotech, and health care
Allother
industries
Pharma,biotech, and health care
Innovation as a strategic priority Planned change in innovation spending Satisfaction with innovation ROI
Main innovation metrics used Biggest obstacles to raising innovation ROI Planned expansion into RDEs◊ Overall revenue growth◊ Customer satisfaction◊ Projected versus actual
performance
◊ Lengthy development times◊ Risk-averse culture◊ Lack of coordination within the
company
◊ 47 percent (all other industries = 46 percent)
◊ China, India, and Eastern Europe
95
25
39
26
10
28
42
25
5
27
31
28
25
36
27
93
52
24
24
51
32
170
20
40
60
80
100
0
20
40
60
80
100
0
20
40
60
80
100
Yes
No
Not sure
Top priority
Top-three priority
Top-ten priority
Not a priority
>10 percent
0 to 10 percent
No change
0 to −10 percent >−10 percent
Pharmaceuticals, Biotechnology, and Health Care
Source: BCG 2009 Senior Executive Innovation Survey.Note: Because of rounding, percentages may not add up to 100.

T B C G
Percentage ofrespondents
Percentage ofrespondents
Percentage ofrespondents
Allother
industries
Retail Allother
industries
Retail Allother
industries
Retail
Innovation as a strategic priority Planned change in innovation spending Satisfaction with innovation ROI
Main innovation metrics used Biggest obstacles to raising innovation ROI Planned expansion into RDEs◊ Customer satisfaction◊ Overall revenue growth◊ Percentage of sales from
new offerings
◊ Inability to adequately measure performance
◊ Risk-averse culture◊ Insufficient support from
leadership and management
◊ 40 percent (all other industries = 46 percent)
◊ Eastern Europe and China
95
25
39
26
10
27
40
18
15
27
32
28
23
30
32
114
52
24
23
50
26
240
20
40
60
80
100
0
20
40
60
80
100
0
20
40
60
80
100
Yes
No
Not sure
Top priority
Top-three priority
Top-ten priority
Not a priority
>10 percent
0 to 10 percent
No change
0 to −10 percent >−10 percent
Retail
Source: BCG 2009 Senior Executive Innovation Survey.Note: Because of rounding, percentages may not add up to 100.
Percentage ofrespondents
Percentage ofrespondents
Percentage ofrespondents
Allother
industries
Technologyand
telecom
Allother
industries
Technologyand
telecom
Allother
industries
Technologyand
telecom
Innovation as a strategic priority Planned change in innovation spending Satisfaction with innovation ROI
Main innovation metrics used Biggest obstacles to raising innovation ROI Planned expansion into RDEs◊ Overall revenue growth◊ Customer satisfaction◊ Percentage of sales from
new offerings
◊ Lengthy development times◊ Risk-averse culture◊ Difficulty selecting the right
ideas to commercialize
◊ 60 percent (all other industries = 46 percent)
◊ India and China
105
24
38
27
11
31
43
20
6
25
30
30
32
36
2074
51
24
25
59
24
160
20
40
60
80
100
0
20
40
60
80
100
0
20
40
60
80
100
Yes
No
Not sure
Top priority
Top-three priority
Top-ten priority
Not a priority
>10 percent
0 to 10 percent
No change0 to −10 percent >−10 percent
Technology and Telecommunications
Source: BCG 2009 Senior Executive Innovation Survey.Note: Because of rounding, percentages may not add up to 100.

I
Percentage ofrespondents
Percentage ofrespondents
Percentage ofrespondents
Allother
industries
Travel,tourism, andhospitality
Allother
industries
Travel,tourism, andhospitality
Allother
industries
Travel,tourism, andhospitality
Innovation as a strategic priority Planned change in innovation spending Satisfaction with innovation ROI
Main innovation metrics used Biggest obstacles to raising innovation ROI Planned expansion into RDEs◊ Customer satisfaction◊ Overall revenue growth◊ Percentage of sales from
new offerings
◊ Lengthy development times◊ Lack of coordination within the
company◊ Insufficient support from
leadership and management
◊ 43 percent (all other industries = 46 percent)
◊ China and India
95
25
39
26
10
15
46
33
6
26
32
28
26
28
26
128
52
24
23
49
22
29
0
20
40
60
80
100
0
20
40
60
80
100
0
20
40
60
80
100
Yes
No
Not sure
Top priority
Top-three priority
Top-ten priority
Not a priority
>10 percent
0 to 10 percent
No change
0 to −10 percent >−10 percent
Travel, Tourism, and Hospitality
Source: BCG 2009 Senior Executive Innovation Survey.Note: Because of rounding, percentages may not add up to 100.
T B C G
For Further Reading
This survey is a part of BCG’s extensive work and research on innovation and the innovation-to-cash process. A sample of related publications includes the following:
Measuring Innovation 2009: The Need for ActionA BCG Senior Management Survey, April 2009
Innovation 2008: Is the Tide Turning?A BCG Senior Management Survey, August 2008
Measuring Innovation 2008: Squandered OpportunitiesA BCG Senior Management Survey, August 2008
Tripling the Innovation Success Rate—with Less Eff ort Opportunities for Action in Industrial Goods, February 2008
Payback: Reaping the Rewards of InnovationJames P. Andrew and Harold L. Sirkin(Boston: Harvard Business School Press, 2007)

For a complete list of BCG publications and information about how to obtain copies, please visit our Web site at www.bcg.com/publications.
To receive future publications in electronic form about this topic or others, please visit our subscription Web site at www.bcg.com/subscribe.
4/09
Abu DhabiAmsterdamAthensAtlantaAucklandBangkokBarcelonaBeijingBerlinBostonBrusselsBudapestBuenos AiresChicago
CologneCopenhagenDallasDetroitDubaiDüsseldorfFrankfurtHamburgHelsinkiHong KongHoustonJakartaKievKuala Lumpur
LisbonLondonLos AngelesMadridMelbourneMexico CityMiamiMilanMinneapolisMonterreyMoscowMumbaiMunichNagoya
New DelhiNew JerseyNew YorkOsloParisPhiladelphiaPragueRomeSan FranciscoSantiagoSão PauloSeoulShanghaiSingapore
StockholmStuttgartSydneyTaipeiTokyoTorontoViennaWarsawWashingtonZurich
bcg.com
Related Documents