Defence R&D Canada Centre for Operational Research & Analysis A Bayesian Approach to Hypothesis Testing for the Kandahar Province Opinion Polls Dr. Philip T. Eles CEFCOM Operational Research Team Dr. Etienne Vincent CEFCOM Operational Research Team Ms. Eugenia Kalantzis CEFCOM Operational Research Team DRDC CORA TM 2009-066 December 2009

Welcome message from author
This document is posted to help you gain knowledge. Please leave a comment to let me know what you think about it! Share it to your friends and learn new things together.
Transcript

Defence R&D Canada
Centre for Operational Research & Analysis
A Bayesian Approach to Hypothesis Testing for the Kandahar Province Opinion Polls Dr. Philip T. Eles CEFCOM Operational Research Team Dr. Etienne Vincent CEFCOM Operational Research Team Ms. Eugenia Kalantzis CEFCOM Operational Research Team
DRDC CORA TM 2009-066December 2009

A Bayesian Approach to Hypothesis Testing for the Kandahar Province Opinion Polls
Dr. Philip T. Eles CEFCOM Operational Research Team Dr. Etienne Vincent CEFCOM Operational Research Team Ms. Eugenia Kalantzis CEFCOM Operational Research Team The information contained herein is proprietary to Her Majesty and is provided to the recipient on the understanding that it will be used for information and evaluation purposes only. Any commercial use including use for manufacture is prohibited. Terms of Release: This document is approved for UNLIMITED release.
Defence R&D Canada – CORA Technical Memorandum DRDC CORA TM 2009-066 December 2009

Principal Author
Original signed by Dr. Philip T Eles
Dr. Philip T Eles
CEFCOM OR Team
Approved by
Original signed by Dr. Dean S. Haslip
Dr. Dean S. Haslip
SH Land & Operational Commands
Approved for release by
Original signed by Dale Reding
Dale Reding
Chief Scientist
Defence R&D Canada – Centre for Operational Research and Analysis (CORA)
© Her Majesty the Queen in Right of Canada, as represented by the Minister of National Defence, 2009
© Sa Majesté la Reine (en droit du Canada), telle que représentée par le ministre de la Défense nationale, 2009
Abstract ……..
This technical memorandum reports on a Bayesian statistical hypothesis test that was developed to aid in the analysis of the Kandahar Province Opinion Polls conducted in support of Canada’s mission in Afghanistan. The test described herein was used by analysts to determine whether changes in public opinion between successive waves of polling or differences between geographic regions were statistically significant. For a number of practical reasons, multi-stage stratified clustered sampling was employed in the Kandahar polls rather than simple random sampling. The test was developed to incorporate corrections for the effects of non-simple random sampling as well as to handle small sample sizes. This paper demonstrates the validity of the test through simulation and by comparison with a conventional test in the regime where the two are expected to converge.
Résumé ….....
Cette note de service technique fait rapport sur un test d’hypothèse statistique bayesienne qui a été développé pour aider l’analyse des sondages d’opinion dans la province de Kandahar conduits à l’appui de la mission du Canada en Afghanistan. Le test décrit ici a été employé par des analystes pour déterminer si les changements de l’opinion publique entre les vagues successives de sondage ou les différences entre les régions géographiques avaient une importance statistique. Pour un certain nombre de raisons pratiques, un échantillonnage par grappe stratifié à plusieurs étages a été employé dans les sondages de Kandahar plutôt qu’un simple échantillonnage au hasard. Le test a été développé pour incorporer des corrections pour les effets de l’échantillonnage non simplement au hasard ainsi que pour traiter de petites quantités d’échantillons. Ce document démontre la validité du test par le biais de simulation et en comparant avec un test conventionnel dans le régime où les deux doivent converger.
DRDC CORA TM 2009-066 i

This page intentionally left blank.
ii DRDC CORA TM 2009-066
Executive summary
A Bayesian Approach to Hypothesis Testing for the Kandahar Province Opinion Polls:
P.T. Eles; E. Vincent; E. Kalantzis; DRDC CORA TM 2009- 066; Defence R&D Canada – CORA; December 2009.
Background:
In modern counter-insurgencies, where success is measured in terms of gaining legitimacy in the eyes of the people rather than achieving military superiority, a significant tool for campaign effects assessment has become opinion polling of the local population. Opinion polling has been employed in support of Canada’s mission in Afghanistan since March 2007. Since that time, opinion polls in Kandahar province have been administered quarterly and to date, nine province-wide surveys and two targeted polls have been conducted.
The CEFCOM Operational Research and Analysis Team (ORAT) is the scientific authority and project lead on the Canadian polling initiative in Afghanistan. In addition to questionnaire development, contract management, data analysis, and the production and communication of finished products, CEFCOM ORAT develops and implements tools and techniques for use in analyzing the polling data. The work presented in this technical memorandum documents work done in support of the polling analysis; namely a statistical test to determine whether observed changes in public opinion are statistically significant.
Results:
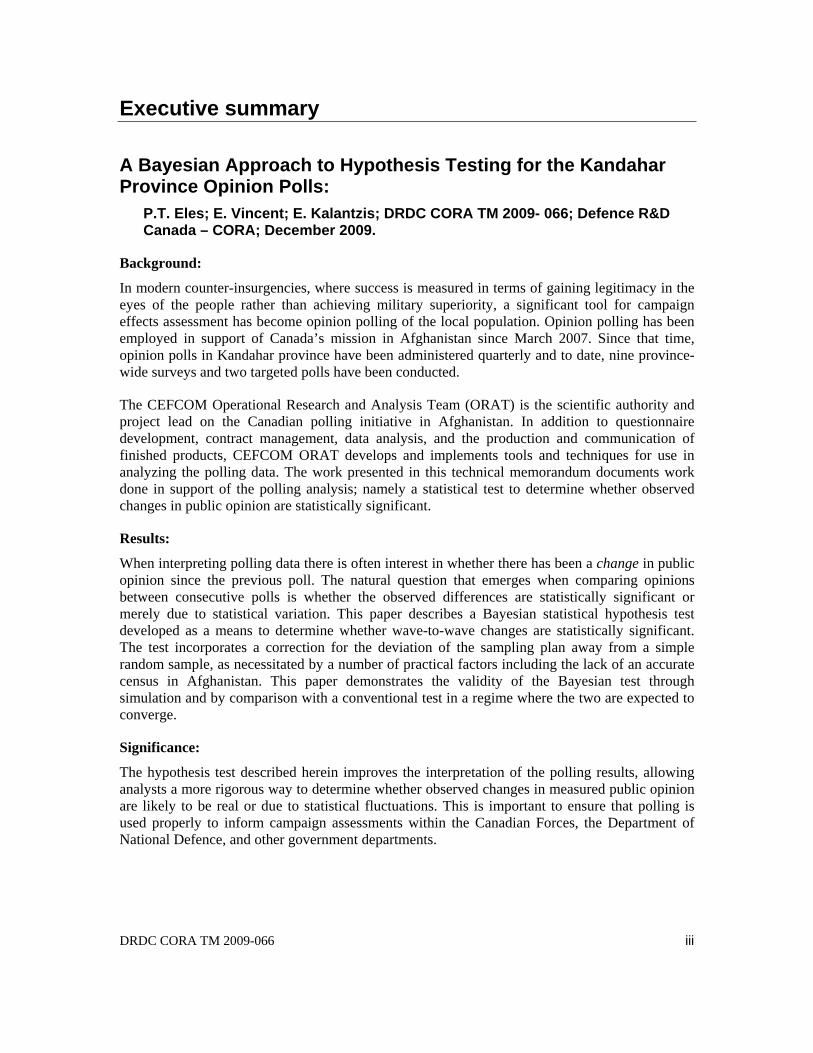
When interpreting polling data there is often interest in whether there has been a change in public opinion since the previous poll. The natural question that emerges when comparing opinions between consecutive polls is whether the observed differences are statistically significant or merely due to statistical variation. This paper describes a Bayesian statistical hypothesis test developed as a means to determine whether wave-to-wave changes are statistically significant. The test incorporates a correction for the deviation of the sampling plan away from a simple random sample, as necessitated by a number of practical factors including the lack of an accurate census in Afghanistan. This paper demonstrates the validity of the Bayesian test through simulation and by comparison with a conventional test in a regime where the two are expected to converge.
Significance:
The hypothesis test described herein improves the interpretation of the polling results, allowing analysts a more rigorous way to determine whether observed changes in measured public opinion are likely to be real or due to statistical fluctuations. This is important to ensure that polling is used properly to inform campaign assessments within the Canadian Forces, the Department of National Defence, and other government departments.
DRDC CORA TM 2009-066 iii

Sommaire .....
A Bayesian Approach to Hypothesis Testing for the Kandahar Province Opinion Polls:
P.T. Eles; E. Vincent; E. Kalantzis; DRDC CORA TM 2009-066; R & D pour la défense Canada – CORA; Décembre 2009.
Contexte :
Dans les opérations anti-insurrectionnelles modernes où le succès se mesure en termes d’obtention de la légitimité aux yeux de la population plutôt que d’obtention de la supériorité militaire, un important outil pour l’évaluation des effets de la campagne a été le sondage d’opinion de la population locale. Le sondage d’opinion a été employé à l’appui de la mission du Canada en Afghanistan depuis mars 2007. Depuis ce temps, des sondages d’opinion dans la province de Kandahar ont été administrés trimestriellement et, jusqu’à maintenant, neuf sondage dans toute la province et deux sondages visés ont été conduits.
L’Équipe de recherche et d’analyse opérationnelle (ERAO) du COMFEC est l’autorité scientifique et la responsable du projet pour l’initiative de sondage canadienne en Afghanistan. En plus du développement de questionnaires, de la gestion des contrats, de l’analyse des données et de la production et de la communication des produits finis, l’ERAO du COMFEC développe et met en œuvre des outils et techniques pour emploi dans l’analyse des données de sondage. Le travail présenté dans cette note de service technique documente le travail effectué à l’appui de l’analyse des sondages, qui est en fait un test statistique effectué pour déterminer si les changements observés dans l’opinion publique ont une importance statistique.
Résultats :
En interprétant les données de sondage, il est souvent intéressant de savoir s’il y a eu un changement dans l’opinion publique depuis le sondage précédent. La question naturelle qui survient lorsqu’on compare des opinions entre des sondages consécutifs est si les différences observées sont importantes statistiquement ou simplement dues à une variation statistique. Ce document décrit un test d’hypothèse statistique bayesienne développé comme moyen de déterminer si des changements d’une vague à une autre ont une importance statistique. Le test incorpore une correction pour la déviation du plan d’échantillonnage depuis un simple échantillon au hasard tel que nécessité par un certain nombre de facteurs pratiques incluant le manque d’un recensement précis en Afghanistan. Ce document démontre la validité du test bayesien par le biais de la simulation et en comparaison avec un test conventionnel dans un régime ou les deux doivent converger.
Signification :
Le test d’hypothèse décrit ici améliore l’interprétation des résultats de sondage, permettant aux analystes d’avoir une façon plus rigoureuse de déterminer si les changements observés dans l’opinion publique mesurée sont susceptibles d’être réels ou dues à des fluctuations statistiques. Ceci est important pour s’assurer que les sondages sont employés correctement pour informer les évaluations de campagne dans les Forces canadiennes, au ministère de la Défense nationale et dans les autres ministères du gouvernement.
iv DRDC CORA TM 2009-066
Table of contents
Abstract …….. ................................................................................................................................. i Résumé …..... ................................................................................................................................... i Executive summary ........................................................................................................................ iii Sommaire ....................................................................................................................................... iv Table of contents ............................................................................................................................. v List of figures ................................................................................................................................. vi List of tables .................................................................................................................................. vii 1....Introduction............................................................................................................................... 1
1.1 The Kandahar Province Opinion Polls .......................................................................... 1 1.2 Deviations from Simple Random Sampling in the Kandahar Province Opinion
Polls ............................................................................................................................... 2 1.3 Correcting for Non-Simple Random Sampling: the Design Effect .............................. 3 1.4 Outline ........................................................................................................................... 4
2....Theory....................................................................................................................................... 5 2.1 A Bayesian Statistical Hypothesis Test ......................................................................... 5 2.2 Correction for the Design Effect ................................................................................... 7
3....Validating the Bayesian Hypothesis Test ................................................................................. 9 3.1 Comparison to the Two-Proportion z-Test .................................................................... 9 3.2 Validation of the Design Effect Correction by Simulation ......................................... 10
4....Worked Examples................................................................................................................... 12 4.1 Example 1: Hypothesis Testing Without a Design Effect ........................................... 12 4.2 Example 2: Hypothesis Testing With a Design Effect ................................................ 14
5....Conclusion and Future Work.................................................................................................. 16 References ..... ............................................................................................................................... 17 Annex A .. Nomenclature .............................................................................................................. 18 List of symbols/abbreviations/acronyms/initialisms ..................................................................... 20 Distribution list.............................................................................................................................. 21
DRDC CORA TM 2009-066 v

List of figures
Figure 1: An example of a visual depiction of polling results......................................................... 2 Figure 2: The “resolution” of the two statistical hypothesis tests. ................................................ 10 Figure 3: Probability of type I error, Neff , and deff as a function of cluster size for fixed
sample size. ................................................................................................................. 11 Figure 4: The Bayesian posterior probability distribution for α. .................................................. 12 Figure 5: Sampling distribution for m'. ......................................................................................... 13 Figure 6: Posterior probability distribution. ................................................................................. 15 Figure 7: Sampling distribution for meff' ........................................................................................ 15
vi DRDC CORA TM 2009-066

List of tables
Table 1: Cluster corrected m and N for Example 2. ...................................................................... 14 Table 2: Summary of nomenclature adopted in this document. .................................................... 18
DRDC CORA TM 2009-066 vii

viii DRDC CORA TM 2009-066
This page intentionally left blank.

1 Introduction
1.1 The Kandahar Province Opinion Polls
In modern counter-insurgencies, where success is measured in terms of gaining legitimacy in the eyes of the people rather than achieving military superiority, public opinion research in the host nation has become a significant tool for measuring campaign effects [1].
Opinion polling has been employed in support of Canada’s mission in Afghanistan since March 2007. Since that time, opinion polls in Kandahar province have been administered quarterly and, at the time of writing, nine province-wide polls had been conducted as well as two targeted polls that focused on certain geographic areas [2].
Defence R&D Canada - Centre for Operational Research and Analysis has become the scientific authority and lead on the Canadian polling initiative in Afghanistan. The CEFCOM Operational Research and Analysis Team (ORAT) manages the contract with the Afghanistan-based polling company, and works with the primary military sponsors, Joint Task Force Afghanistan (JTF-Afg) and CEFCOM, and other Government of Canada departments to ensure that the survey addresses the needs of the various stakeholders. CEFCOM ORAT is responsible for questionnaire development, data analysis, and production and communication of finished products. Additionally, the team develops and implements analytical tools and techniques for use in the analysis of the polling data. For example, an information theory based tool [3] was developed to measure correlations between sets of survey questions, and advanced statistical techniques such as principal component analysis, multiple correspondence analysis, and cluster analysis have been applied to the polling data. The work presented in this technical memorandum represents another tool that has been used to assist in the analysis of polling data; namely a statistical test to determine whether observed changes in public opinion are statistically significant.
With nine waves of province-wide opinion polling completed to date, it appears that the real value of the initiative has been in observing and interpreting changes in public opinion. The natural question that emerges when comparing opinions between consecutive polls (or between districts in the same poll) is whether the observed differences are statistically significant, or whether they are due to sampling error (i.e. statistical fluctuation). The military sponsors are interested in knowing whether there have been statistically significant changes in public perceptions between successive waves of polling or between different geographic regions. Visual aids such as Figure 1 are used in presenting the polling data, and arrows aid in identifying regions where there has been a statistically significant change since the last wave. A rigorous approach was required to aid in determining which changes were relevant and should be reported, and which were likely due to sampling error.
The application of traditional statistical hypothesis tests is complicated by two factors. First, at the district level, there are often few individuals surveyed. In a few select cases, particularly in the early waves, as few as 20 men and 20 women were interviewed in some districts, though most often at least 30 men and 30 women were interviewed. Second, for a number of practical reasons, a simple random sample (SRS) was not achievable. An SRS was precluded by the lack of a national census in Afghanistan, from which a truly random sample could be drawn. Also, due to
DRDC CORA TM 2009-066 1

the concentration of the population within Kandahar City, oversampling in rural districts and undersampling within major urban centres was required in order to adequately capture the opinions in rural districts while maintaining a reasonable sample size. Therefore, due to the small sample size, and non-SRS sampling, a robust statistical test was required. Because the team had prior experience with related techniques, a Bayesian approach was adopted, and is described herein.
Figure 1: An example of a visual depiction of polling results. The map is of Kandahar Province with district colours corresponding to percentage of respondents with a certain opinion for a particular question in the opinion poll. The arrows represent percentages that are statistically significantly higher or lower than in the previous wave of polling.
These arrows are a result of the analysis presented in this document.
1.2 Deviations from Simple Random Sampling in the Kandahar Province Opinion Polls
Data for the Kandahar Opinion Polls was collected through a stratified multi-stage clustered sampling plan. Stratification was done by gender and by district. Within each stratum, multi-stage clustered sampling was employed in the following manner: 1) a population centre (i.e. city/town/village) was randomly selected from a list of known population centres within the district; 2) a household was selected within that population centre by a pseudo-random walk starting at some predetermined landmark (such as a mosque or well), and finally 3) an individual
2 DRDC CORA TM 2009-066

in the house was randomly selected using a modified Kish grid [4]. Typically, 10 interviews were collected in each population centre (i.e. in each cluster). The sampling plan used in the Kandahar Opinion Polls is described in greater detail in reference [5].
One may reasonably expect that non-random sampling would have an impact on the reliability of the results. For example, for clustered sampling where several subsets of the population (i.e. clusters) are randomly selected and several individuals within each cluster are sampled, it is often the case that individual clusters are more homogeneous than the whole population. For example, the range of opinions within a particular village may not be representative of the range of opinions within an entire province or country (due to any number of local factors such as economic, demographic, environmental and psychosocial factors).
1.3 Correcting for Non-Simple Random Sampling: the Design Effect
The effect of non-simple random sampling on the reliability of the results is typically referred to as the design effect, or deff [6]. It is defined as the fractional increase in the sample variance1 due to the sampling plan (varSP) compared to the variance that would have been obtained with a SRS (varSRS):
SRS
SPdeffvarvar
= . (1)
In practice the design effect is estimated for a particular sampling plan, and equation (1) is used to determine the sample variance, varSP, which in turn can be used for statistical hypothesis testing. Alternately, since the variance is a function of the sample size, an effective sample size may be calculated and used as an input for statistical hypothesis tests. In the work presented here, this latter approach is employed.
The design effect can be estimated by a variety of techniques including by simulation, empirically from the data (using for example jackknife or bootstrap methods [6]), or for some sampling plans by direct calculation.2
)
1 “Sample variance” refers to the variance in the estimate of the mean. This is emphasized here to clarify that subsequent discussions of Bayesian sample variance refer to the same concept. 2 As an example of the latter, for single stage clustered sampling, with n samples per cluster, the design effect is ( 11 −+= ndeff δ , where the intracluster correlation coefficient, δ , represents the likelihood that two elements in the same cluster have the same value, relative to two elements chosen completely at random in the population. For example, a value of 0.05 is interpreted to mean that the elements in the cluster are about 5% more likely to have the same value than if the two elements were chosen at random [7]. For the case where all clusters are the same size, the intracluster correlation coefficient is given by [6]:
( )( )∑ ∑
∑ ∑= =
= =
−
−
−−= )/(
1 1
2
)/(
1 1
2
11 nN
i
n
j ij
nN
i
n
j iij
XX
XX
nnδ
where Xij is the value (i.e. response) of the jth element (i.e. interview) of the ith cluster, N is the sample size, n is the size of the clusters, iX is the mean of the ith cluster, and X is the sample mean.
DRDC CORA TM 2009-066 3

At the time this work was conducted, the contractor for the Afghanistan polling indicated that based on their experience with this sampling plan in other polls in Afghanistan, they estimated a design effect of 1.27. Recent work by the CEFCOM ORAT, using jackknife methods to estimate the design effect from past polling data, suggests that the deff might be significantly higher, potentially as high as 3.82 for province-wide results, 3.05 and 3.16 for urban and rural areas respectively, with a rather wide variability depending on the particular question [8].
1.4 Outline
The methods in this technical memorandum have been implemented in the analysis of the Kandahar Province Opinion Polls. However, this memorandum is restricted to describing the methodology, staying clear of presenting data, due to the operational sensitivity of that information. The discussion herein is also restricted to the analysis of a single polling question, and in particular to a single response (or set of responses) to the question such that the random variable of interest is treated as binary.
The report is organized as follows: Section 2.1 describes the Bayesian statistical hypothesis test; Section 2.2 introduces a correction for non-simple random sampling; Section 3 validates the Bayesian test through comparison with another statistical test (Section 3.1) and by the use of simulation (Section 3.2); and Section 4 presents two examples to illustrate the implementation of the test.
4 DRDC CORA TM 2009-066

2 Theory
2.1 A Bayesian Statistical Hypothesis Test
This section describes a statistical test of difference between two measurements of public opinion. The null hypothesis is that the two measurements were made on a population with the same true population proportion (i.e. that public opinion has not changed). If α is the proportion measured in the first poll and α' the proportion measured in the second poll, then the null hypothesis is ( )α α ′=:H 0 .3 The approach taken in this section is to derive, by Bayesian means, a sampling distribution based on the results of the first poll, and to use the results of the second poll as a test statistic on that distribution. P-values are calculated and used to determine whether the null hypothesis can be rejected.
This section assumes a simple random sample. The effects of non-SRS sampling are incorporated in the subsequent section, where the design effect is used to increase the variance of the sampling distribution by a factor of deff as per Equation (1).
For a SRS of a population having a true proportion of α, the measured population proportion, m/N, is drawn from a binomial distribution with probability:
( ) mNm
mN
mNP −−⎟⎟⎠
⎞⎜⎜⎝
⎛= ααα 1)|,( , (2)
where N is the sample size. However, the value of the true population proportion α is not known; only the measured population proportion m/N is known. The Bayesian approach is to calculate a posterior probability distribution for α by applying Bayes’ Theorem:4
( )ααα PmNP
mNPmNP),(
)|,(),|( =
(3)
In the above, P(α) is the prior probability distribution for α, before the survey was taken. For simplicity, a uniform prior is assumed such that P(α) is constant over the range [0,1] and, as is conventional in Bayesian analysis, P(N, m) is set as a normalization constant that ensures that the integral over α of the posterior distribution P(α|N,m) is unity. Combining Equations (2) and (3), the following result is obtained:
3 A summary of the nomenclature used in this report is presented in Annex A. 4 Bayes’ Theorem, in its most basic form, states that the probability that outcome A occurs given that
outcome B has occurred is: ( ) ( ) ( )( )BP
APABPBAP = . Here P(B|A) is the probability of B occurring given A has
occurred, P(A) is the probability of A occurring irrespective of B, and P(B) is the probability of B occurring irrespective of A. Generally, P(A) is referred to as the prior, and represents the prior knowledge regarding A before outcome B is known. Often, as was the case in this report, P(A) is assumed to be uniform (i.e. there are no prior assumptions about A). In Bayesian analysis P(B) is a normalization constant to ensure that the total probability is unity.
DRDC CORA TM 2009-066 5

( )
( )∫ −
−
−⎟⎟⎠
⎞⎜⎜⎝
⎛
−⎟⎟⎠
⎞⎜⎜⎝
⎛
= 1
0
1
1),|(
ααα
ααα
dmNmN
mNPmNm
mNm
(4)
( ) ( ) mNm
mN
N −−⎟⎟⎠
⎞⎜⎜⎝
⎛+= αα 11 . (5)
Equation (5) represents the posterior probability distribution for the true population proportion given that the measured population proportion was m/N. It may be recognized that the result is just the binomial probability distribution scaled by the factor (N+1). The maximum of the distribution (i.e. the most likely value) occurs at αmax = m/N.
It is important to pause here to consider the significance of Equation (5). It describes a probability distribution for the true population mean. Thus, the sample variance is just the variance of this probability distribution. The sample variance is given by 22var αα −= , where
( ) 2, +== ∫ NdmNP αααα 1+m is the expectation value of α, and
( ) ( )( ))( )( 32,| ++== ∫ NNdmNP αααα 2122 ++ mm is the second moment of the distribution. Combining these
yields the Bayesian SRS sample variance5:
)3()2()1)(1(var 2 ++
++−=NN
mmNSRS . (6)
This result will be important in the subsequent section when taking the design effect into account.
It can also be pointed out that the centred 95% confidence intervals for the true population mean can be obtained directly from Equation (5) by finding where the area under the tails equals 2.5% on either side of the curve.6 This is more clearly illustrated in the examples in Section 4.
Returning now to the derivation of the statistical hypothesis test, the next step is to calculate the probability that in the second poll, the measured population proportion will be m'/N' given that the true population proportion is described by the probably distribution in Equation (5). As for the first poll, the measured population proportion for the second poll, m'/N', is described by a binomial distribution (as in Equation (2)). Therefore, based on the null hypothesis that the true population proportion has not changed between polls, the distribution for the measured proportion in the second poll, given the population proportion measured in the first poll, is given by:
( ) ( ) ( ααα dmNPmNPmNmNP ,||,,|,1
0∫ ′′=′′ )
(7)
5 Note that for large sample sizes (N>>1, m>>1), this result agrees with that obtained from a non-Bayesian approach, namely:
Npp
SRS)ˆ1(ˆ
var −= with Nmp =ˆ .
6 Note that this is the centred 95% confidence interval, it is not the only confidence interval that can be constructed for this distribution.
6 DRDC CORA TM 2009-066

⎟⎟⎠
⎞⎜⎜⎝
⎛′+′+
⎟⎟⎠
⎞⎜⎜⎝
⎛′′
⎟⎟⎠
⎞⎜⎜⎝
⎛
+′++=
mmNNmN
mN
NNN
11
. (8)
Equation (8) represents the sampling distribution against which the test statistic, m', can be compared. Note that this result is very similar in form to the result from Fisher’s Exact Test [9], an exact solution to a similar problem though under different constraints.
Based on the distribution in Equation (8), and the test statistic, m', a p-value can now be calculated. The p-value is defined as the probability of obtaining a result at least as extreme as the one that was actually measured, assuming that the null hypothesis is true. For the present purposes, a one-tailed p-value is used. The p-value is:
( )
( )⎪⎪
⎩
⎪⎪
⎨
⎧
′>′′
′<′′
=
∑
∑
′
′=
′
=
N
mi
m
i
NmNmformNiNP
NmNmformNiNP
p
/,|,
/,|,0
. (9)
Whether the null hypothesis is rejected or not depends on whether or not the p-value falls below some agreed-upon threshold (typically 5%). If the p-value falls below 0.05, then the null hypothesis is rejected at the 5% level of significance, whereas if the p-value is above 0.05, then the null hypothesis cannot be rejected at the 5% level of significance. A threshold of 5% implies that 5% of the time the null hypothesis will be rejected when it is in fact true (i.e. there is a 5% chance of Type I error). Section 4.1 works through a simple example to illustrate the concepts presented in this section.
2.2 Correction for the Design Effect
In order to take into account the design effect while keeping with the Bayesian methodology presented in the previous section, an effective sample size, Neff, is calculated such that the sample variance is larger than the SRS sample variance by a factor of deff, as per Equation (1). To achieve this without changing the measured population proportion, an effective m must also be defined such that
Nm
Nm
eff
eff =
(10)
The effective sample size thereby accounts for the effects of non-random sampling and its use in the Bayesian hypothesis from the previous section test takes into account the design effect.
As derived above, the Bayesian SRS sample variance is given by Equation (6). Recall that what is desired is an effective sample size for which the sample variance is a factor of deff larger than the SRS sample variance as per Equation (1). Combining Equations (1) and (6), what is desired is a meff and Neff that satisfy the condition:
DRDC CORA TM 2009-066 7

)3()2()1)(1(
)3()2()1)(1(
22 ++++−=
++++−
NNmmNd
NNmmN
effeffeff
effeffeff
(11)
Equation (11) combined with Equation (10) yield a polynomial equation that is cubic in Neff and can be solved exactly, though the solution is inelegant7, and which has only one positive real root.
In general, clusters tend to be more homogeneous than the entire population, so that deff>1, in which case Neff<N. This means that effectively fewer people were interviewed since there was more homogeneity of opinion within clusters than within the general population. In the limit that every individual in a cluster has exactly the same opinion, the effective number of interviews would equal the number of clusters ( nN /= ). N
( ))
eff
In order to incorporate the design effect into the Bayesian statistical hypothesis test presented earlier, meff and Neff are substituted for m and N in the calculation of the p-value in Equation (9). A few minor modifications are required to accommodate this substitution.
As meff and Neff will not necessarily be integers, terms of the form in Equation ⎟⎟⎠
⎞⎜⎜⎝
⎛mN (8) were
replaced by their generalizations in the real numbers,( ) ( 1+1
1−Γ+Γ
+Γknk
n , where ( )nΓ is the
Gamma function. Additionally, working with the natural logarithm of the Gamma function (the lngamma function; conveniently a predefined function in most mathematical software packages) prevents any computational overflows when working with large numbers in any software realization of the test.
The generalization to real numbers also necessitates the conversion of the summation in Equation (9) to integral form:
( )
( )⎪⎪⎪
⎩
⎪⎪⎪
⎨
⎧
′>′′′∂′′′′
′<′′′∂′′′
=
∫
∫
′
′
′
eff
effeffeff
N
meffeffeffeffeff
eff
effeffeff
m
effeffeffeffeff
NmN
mmmNmNP
NmN
mmmNmNP
peff
eff
eff
for,|,
for,|,0
(12)
In practice, this integral is numerically approximated using Riemann sums. An illustrative example of cluster correction is presented in Section 4.2.
7 The full cubic equation is: , where 023 =+++ dcNbNaN effeffeff
( ))3()2(
)1(12 ++
++−−=NN
mmNdeffa , ( )( )ab Nm
Nm 71 +−= ,
and . The exact solution is: ac 161 += ad 121+=a
beffN = ts 3−+ , and
NN
effeffmm = , where 3 rqs += ,
3 rqt −= , 3
32
542279
abdaabc −−q = and ( ) 23
93
2
2 qra
bac += − .
8 DRDC CORA TM 2009-066

3 Validating the Bayesian Hypothesis Test
3.1 Comparison to the Two-Proportion z-Test
It is typically not necessary to compare the results of Bayesian statistical analyses to other more traditional statistical approaches because Bayesian methods represent an equally valid approach to statistics (i.e. in contrast to frequentist statistics). However, on occasion, it serves a purpose to explicitly compare the two approaches in order to show that in those regimes where the two tests are expected to converge, they indeed do.
In the present case, it is expected that the Bayesian hypothesis test (without correction for design effect) should converge with a two-proportion z-test in the limit of large sample size and when both measured proportions are sufficiently far from 0 and 1.
The test statistic for the two-proportion z-test is
⎟⎠⎞
⎜⎝⎛
′+−
′′−=
NNpp
NmNmz11)1(
// , (13)
where . This test statistic is drawn from a standard normal distribution. )/()( NNmmp ′+′+=
A comparison can be made between the two tests by calculating for each test the smallest difference between measured proportions for which the null hypothesis can still be rejected (i.e.
such that the p-value = 0.05). In a sense, this measure represents the “resolution” of the two tests, as it describes how close the two proportions can get to each other without being considered statistically equivalent.
NmNm ′′− //
1// =′′+ NmNmTo facilitate the comparison, the simplifying assumption is made that , and that the two measured proportions are centred on 0.5 (i.e. ).
NN ′=Figure 2 depicts the resolution
of both the two-proportion z-test and the Bayesian test. As is evident from the figure, the two tests converge as the sample size increases, verifying that the Bayesian approach does not deviate from more traditional frequentist approach, at least in the appropriate limits for the SRS case. The following section deals non-SRS validation of the Bayesian approach, using simulation.
DRDC CORA TM 2009-066 9

0
0.1
0.2
0.3
0.4
0.5
0.6
0.7
1 10 100 1000 10000Sample size, N=N'
Res
olut
ion
of th
e te
st a
t 5%
leve
l of
sign
ifica
nce
(m/N
- m
'/N' |
p=0
.05) Two-proportion z-test
Bayesian test
Figure 2: The “resolution” of the two statistical hypothesis tests, defined as the difference in the two proportions for which the null hypothesis can still be rejected at the 5% level of significance. For simplicity the two proportions are assumed centred on 0.5, and N = N’.
3.2 Validation of the Design Effect Correction by Simulation
Another way to validate the Bayesian approach is by simulation, and this approach is employed here for the non-SRS case. The idea is to define a population with well defined properties which can be sampled in a non-SRS fashion in which the design effect is tuneable. For two consecutive samples of the same population, it is expected that the design-effect-corrected Bayesian test should incorrectly reject the null hypothesis at the 5% level of significance 5% of the time (i.e. the type I errors rate is 5%.) Thus the simulation described below measures the type I error rate as a function of design effect, aspiring to show that the rate is independent of the design effect, implying that the design effect correction applied to the Bayesian test is valid.
Assume a population that has a true population proportion of 0.5. One can define clusters within that population within which the local proportion deviates from the global proportion. This corresponds to a population in which the intra-cluster correlation is non-zero. The local proportion of the ith cluster can be written as
iip ε+= 5.0 , (14)
where iε is drawn from a distribution that is symmetric about the origin, such that the global proportion remains 0.5.
10 DRDC CORA TM 2009-066

A simple Monte Carlo simulation was developed to simulate single stage clustered sampling of this population, where n samples were drawn per cluster with a sample size of N samples and N/n clusters. For this simulation, iε was drawn from a normal distribution with a standard deviation of 0.2. The simulation was run for 5000 iterations. From the variance of the mean of the data, the design effect and the effective sample size were calculated. The Bayesian hypothesis test was applied to pairs of samples of the same population and the frequency of type I error was tallied. This process was repeated as a function of cluster size. The total sample size in each simulation was kept at N = 36, while the size of the clusters was varied in such a way that an integer number of clusters was maintained (i.e. ). )18,12,9,6,4,3,2,1(=n
The results are presented in Figure 3. As can be seen from Figure 3, for the case where there are no clusters, as expected, deff = 1 and the effective sample size is just Neff = N = 36. In
1=n
Figure 3, as the size of the clusters increases, the design effect increases and the effective sample size decreases, reaching a low of Neff = 15.5 effective samples when only two clusters were sampled. Figure 3 shows that the type I error rate remains approximately 5% regardless of the design effect. Note that it does appear that as the sampling plan calls for very few large clusters, the type I error rate begins to deviate from 5%. This suggests that the correction for non-SRS sampling made by substituting Neff and meff into the Bayesian hypothesis test may begin to break down in this limit. Nonetheless, it appears that indeed the design effect correction to the Bayesian hypothesis does produce the expected results, providing added confidence in the test.
0
5
10
15
20
25
30
35
40
1 2 3 4 6 9 12 18cluster size, n
P(Ty
pe I
erro
r) (%
); N
eff
0
0.5
1
1.5
2
2.5
3
3.5
4
deff
NeffP(Type I error)deff
5%
Figure 3: Probability of type I error (expressed as a percentage), Neff , and deff as a function of cluster size for fixed sample size, N=36 (depicted respectively by red circles, red
triangles and blue diamonds). As the size of the clusters increases and the number of clusters decreases, the deff increases, and Neff decreases. The type I error rate remains
approximately constant near the expected value of 5% (black dashed line).
DRDC CORA TM 2009-066 11

4 Worked Examples
4.1 Example 1: Hypothesis Testing Without a Design Effect
As an example, consider a hypothetical survey of 15 individuals that asked “Do you have access to electricity in your home?” Suppose that when this survey was administered, 10 individuals replied YES. Based on this result, the best estimate for the true population proportion is 10/15 = 67%. However, because the sample size was small, a large degree of uncertainty is associated with this estimate. The probability distribution for the true population proportion can calculated directly from Equation (5) with the result shown in Figure 4.
0 0.1 0.2 0.3 0.4 0.5 0.6 0.7 0.8 0.9 1
α
P( α
)
95% confidence interval
Figure 4: The Bayesian posterior probability distribution for α, in an example where the measured population proportion was 10/15 = 66.7%. The coloured area under each tail represents 2.5% of the area under the curve, giving a 95% confidence interval of [41%, 85%]. The width of the distribution (and therefore the size of the confidence interval) is
determined by the sample size: the larger the sample, the smaller the interval.
Now consider a second survey conducted at some future date in which 20 people were interviewed and asked the same question. If access to electricity had not changed (as per the null hypothesis), then approximately 13 people would be expected to say that they had access to electricity (0.67 × 20 = 13.3). But as is clear from Figure 4, α = 0.67 was the best estimate for α from the first poll, whereas the distribution in Figure 4 describes a broad range of possible values for α. For each value of α, the probability distribution for the number of respondents who have electricity is the binomial distribution which, combined with the probability distribution for α from Figure 4, yields (as per Equation (8)) the discrete probability distribution in Figure 5 for the number of people who would say that they had electricity if 20 people were surveyed. It represents the probability that m' out of 20 respondents would say that they had electricity given
12 DRDC CORA TM 2009-066

that 10 out of 15 people said that they had electricity in a previous survey assuming that the proportion of the population who have access to electricity did not change between surveys.
From Figure 5 it is clear that if, for example, 20 out of 20 people said that they had access to electricity, or if fewer than 5 out of 20 people said that they have access to electricity, then it is very unlikely that the sample was taken from a population with the same α as the first survey, whereas if m' = 13 out of 20, then it is highly likely that the populations had the same α.
As an example, suppose that in the second survey 18 out of 20 people said that they had electricity. The p-value, as defined in Equation (9), is the area under the curve of Figure 5 for m' = 18, 19, 20, representing the total probability that 18 or more people would say that they have electricity, under the null hypothesis that the population proportion has not changed. In this case, the area under the curve (i.e. the one-sided p-value) is 0.052. Therefore, one cannot reject the null hypothesis at a 5% level of significance.
0%
5%
10%
15%
0 1 2 3 4 5 6 7 8 9 10 11 12 13 14 15 16 17 18 19 20m'
P(m
'|m=1
0,N
=15,
N'=
20)
Figure 5: Sampling distribution for m', the number of people who will say that they have electricity, if 20 people were interviewed in the second survey, given that 10 out of 15 had
access to electricity in the first survey, under the null hypothesis that the proportion of supporters within the population has not changed.
DRDC CORA TM 2009-066 13

4.2 Example 2: Hypothesis Testing With a Design Effect
Consider a second example in which two surveys of a single population were conducted on separate occasions and respondents were asked whether they were satisfied with the quality of roads. Assume that in the first survey, 80 out of 100 respondents said that they were satisfied with roads (m = 80, N = 100), whereas in the second survey, 90 out of 100 were satisfied (m' = 90, N' = 100). Assume that each survey was designed in such a way that the design effect was deff = 1.45.
The effective m and N are given in Table 1. Using the effective values from the first survey in Equation (8) yields the probability distribution for α as shown in Figure 6. Note that the design effect broadened the probability distribution, in fact increasing the variance of the distribution by deff = 1.45. Figure 7 shows the probability distribution for meff'. From Table 1, the second survey found a meff' of 62.9. As per Equation (12), the integral of Figure 7 from meff' up to Neff' gives a value of p = 0.056, again suggesting that the null hypothesis cannot be rejected at the 5% level of significance. Note that had the design effect been ignored, then the p-value would have been 0.027 and the null hypothesis would have been rejected at the 5% level of significance.
Table 1: Cluster corrected m and N for Example 2.
0.55=effm 80=m Survey 1 100=N 7.68=effN9.62=′effm 90=′m Survey 2 100=′N 9.69=′effN
14 DRDC CORA TM 2009-066

0 0.1 0.2 0.3 0.4 0.5 0.6 0.7 0.8 0.9 1α
P(α
)
No cluster correction
Cluster correction (deff=1.45)
Figure 6: Posterior probability distribution for the proportion of the population that is satisfied with road quality, given 80 out of 100 respondents said that they were satisfied.
The pink and blue lines represent the distribution with and without correction for the design effect with deff = 1.45.
0%
2%
4%
6%
8%
10%
35 40 45 50 55 60 65 70
meff'
P(ef
f',Nef
f'|mef
fm
,Nef
f)
5.6%
mef
f) P
(Nef
f', m
eff'
| Nef
f,
Figure 7: Sampling distribution for meff' given that 80 out of 100 respondents were satisfied with road quality in the first survey, and 90 out of 100 were satisfied in the second survey, where the design effect was 1.45 for both surveys. The shaded area represents the p-value,
which suggests that the null hypothesis cannot be rejected at the 5% significance level.
DRDC CORA TM 2009-066 15

5 Conclusion and Future Work
A Bayesian approach to a statistical hypothesis testing was described. It was developed to aid in determining whether public opinion has changed significantly between successive polls in the Kandahar Province Opinion Polls. The test is valid for small samples and incorporates a correction for the effects of non-simple random sampling.
Future work includes proper estimations of the design effect for the Kandahar Province Opinion Polls based on polling data collected to date. A proper understanding of the value of the design effect is critical in interpreting the margins of error in the polling results and the deff is a critical input into the test described here. Equally important is the requirement to incorporate the design effect into the statistical analysis of the polling data. The latter requirement has been met by the work presented in this paper.
16 DRDC CORA TM 2009-066

References .....
[1] Vincent E.; Eles P.; Vasiliev B. “Opinion Polling in Support of Counter-Insurgency” The Cornwallis Group XIV: Analysis of Societal Conflict and Counter Insurgency Vol 14, April 2009.
[2] Vincent E. et al. Kandahar Province Opinion Polling Waves 1-9. Unpublished Results. Mar 2007- Sep 2009.
[3] Eles P.T.; Vincent E. “Information Theory Based Measures of Association Applied to Opinion Polls” DRDC CORA TM 2008-022, Defence R&D Canada – Centre for Operational Research and Analysis, July 2008.
[4] Kish L. “A Procedure for Objective Respondent Selection within the Household” Journal of the American Statistical Association, Vol 44, Bo. 247. Sep. 1949, pp.280-387.
[5] Warshaw M.; Kakar R.; Habibzei T.; Mohsini Z. “Starting from Scratch: Building Social Research Capacity in Afghanistan” ESOMAR Congress 2006 Proceedings, London, September 2006.
[6] Lohr S.L. “Sampling: Design and Analysis” Brooks/Cole Publishing Company, CA, 2999
[7] “Guidelines and Principles for Development of Disability Statistics” Statistics on Special Population Groups Series Y No. 10; United Nations Department of Economic and Social Affairs Statistics Division, United Nations, New York, 2001.
[8] Private communication. Results as yet unpublished.
[9] Fisher RA “On the Interpretation of Χ 2 for contingency tables, and the Calculation of P” Journal of the Royal Statistical Society, 85(1) pp 87-94, 1922.
DRDC CORA TM 2009-066 17

Annex A Nomenclature
In this work, two datasets obtained from two opinion polls are considered. A convention is chosen where all associated parameters for one data set are denoted as un-primed and, for the other data set as primed. Statistics for which design effect has been incorporated are denoted by the subscript eff. Table 2 describes the nomenclature used in this document.
Table 2: Summary of nomenclature adopted in this document.
Symbol Description N, N' Sample size for each survey (i.e. number of respondents).
Estimates of the population proportions (i.e. measured proportions). m/N, m'/N' The true population proportions. α, α' Effective m and N calculated to take into account the design effect. meff, Neff
n Cluster size. P(…) A probability distribution function. P(A|B) The probability of obtaining outcome A given that event B has occurred.
The probability that the true proportion of the population has characteristic X given that when N respondents were surveyed, m were found to have characteristic X.
P(α| N,m)
The probability that a second survey of the population would find m' out of N' individuals with characteristic X, given that a previous survey of the same population found m out of N individuals with characteristic X.
P(N',m' | N,m)
18 DRDC CORA TM 2009-066

This page intentionally left blank.
DRDC CORA TM 2009-066 19

List of symbols/abbreviations/acronyms/initialisms
DND Department of National Defence
DRDC Defence Research & Development Canada
CEFCOM Canadian Expeditionary Forces Command
OR Operational Research
ORAT Operational Research and Analysis Team
JTF-Afg Joint Task Force Afghanistan
SRS Simple Random Sample
deff Design effect
20 DRDC CORA TM 2009-066

Distribution list
Document No.: DRDC CORA TM 2009-066
LIST PART 1: Internal Distribution DRDC-CORA
1 CD copy DG DRDC CORA 1 CD copy DDG DRDC CORA 1 CD copy CSci CORA 1 CD copy Section Head, Land and Operational Command OR
1 email All CORA Team Leaders 3 Hard copies + 3
CD copies Authors
2 (CD & hard copy) DRDC CORA Library
DRDC-Toronto 1 CD copy Section Head Adversarial Intent, DRDC Toronto
Keith Stewart 1133 Sheppard Ave W, PO Box 2000 Toronto ON, M3M 3B9 Canada
1 CD copy Thinking, Risk and Intelligence Group Leader, DRDC Toronto Dave Mandel 1133 Sheppard Ave. West, P.O. Box 2000 Toronto ON, M3M 3B9 Canada
10x CD Copies 4x Hard Copies
+ emails
TOTAL LIST PART 1
DRDC CORA TM 2009-066 21

LIST PART 2: External Distribution
1 CD copy ADM(S&T) (for distribution) 1 CD copy Director S&T IC (Paul Comeau) 1 CD copy CISTI 1 CD copy Library and Archives Canada 1 CD copy DRDKIM 1 CD copy Document Exchange Manager
DSTO Research Library Defence Science & Technology Organisation PO Box 44 Pyrmont NSW 2009 AUSTRALIA
1 CD copy Dr. Neville J Curtis Research Leader Land Operations Research 75 Labs Land Operations Division PO Box 1500 Edinburgh SA 5111 AUSTRALIA
1 CD copy Michael Gillman (for dist’n and library) Chief Technologist Land Battlespace Systems Dstl Integrated Systems Room 31, Bldg A3, Fort Halstead Sevenoaks, Kent, UK, TN14 7BP
1 CD copy Dr. Jason Field Land Battlespace Systems Dstl Integrated Systems Fort Halstead Sevenoaks, Kent, UK, TN147BP
1 CD copy Director, US AMSAA ATTN: AMSRD-AMS-S 392 Hopkins Road APG, MD 21005-5071 USA
1 CD copy Mr. Patrick O’Neill Chief, Combat Support Analysis Division USAMSAA (ATTN: AMSRD-AMS-S) 392 Hopkins Road APG, MD 21005-5071 USA
22 DRDC CORA TM 2009-066

DRDC CORA TM 2009-066 23
1 CD copy Dr. James T. Treharne OCA Division Center for Army Analysis 6001 Goethals Road Fort Belvoir, VA 22060-5230
1 CD copy Mr. Robert Barrett Chief, International Activities Center for Army Analysis 6001 Goethals Road Fort Belvoir, VA 22060-5230
1 CD copy Mr. John Hughes HQ, TRADOC Analysis Center (TRAC) Programs & Resources Directorate (PRD) 255 Sedgwick Avenue Fort Leavenworth, Kansas 66027-2345
1 CD copy Mr. Bob Barbier TNO Defence, Security and Safety Information and Operations P.O. Box 96864, 2509 JG The Hague, The Netherlands
15 CD copies TOTAL LIST PART 2
25x CD Copies 4x Hard Copies
+ emails TOTAL COPIES REQUIRED

DOCUMENT CONTROL DATA (Security classification of title, body of abstract and indexing annotation must be entered when the overall document is classified)
1. ORIGINATOR (The name and address of the organization preparing the document. Organizations for whom the document was prepared, e.g. Centre sponsoring a contractor's report, or tasking agency, are entered in section 8.) Defence R&D Canada - Centre for Operational Research and Analysis 101 Colonel By Drive Ottawa, Ontario K1A 0K2
2. SECURITY CLASSIFICATION (Overall security classification of the document including special warning terms if applicable.)
UNCLASSIFIED
3. TITLE (The complete document title as indicated on the title page. Its classification should be indicated by the appropriate abbreviation (S, C or U) in parentheses after the title.) A Bayesian Approach to Hypothesis Testing for the Kandahar Province Opinion Polls:
4. AUTHORS (last name, followed by initials – ranks, titles, etc. not to be used) Eles, P.T.
5. DATE OF PUBLICATION (Month and year of publication of document.) December 2009
6a. NO. OF PAGES (Total containing information, including Annexes, Appendices, etc.)
35
6b. NO. OF REFS (Total cited in document.)
9 7. DESCRIPTIVE NOTES (The category of the document, e.g. technical report, technical note or memorandum. If appropriate, enter the type of report,
e.g. interim, progress, summary, annual or final. Give the inclusive dates when a specific reporting period is covered.) Technical Memorandum
8. SPONSORING ACTIVITY (The name of the department project office or laboratory sponsoring the research and development – include address.)
9a. PROJECT OR GRANT NO. (If appropriate, the applicable research and development project or grant number under which the document was written. Please specify whether project or grant.)
9b. CONTRACT NO. (If appropriate, the applicable number under which the document was written.)
10a. ORIGINATOR'S DOCUMENT NUMBER (The official document number by which the document is identified by the originating activity. This number must be unique to this document.) DRDC CORA TM 2009-066
10b. OTHER DOCUMENT NO(s). (Any other numbers which may be assigned this document either by the originator or by the sponsor.)
11. DOCUMENT AVAILABILITY (Any limitations on further dissemination of the document, other than those imposed by security classification.)
Unlimited
12. DOCUMENT ANNOUNCEMENT (Any limitation to the bibliographic announcement of this document. This will normally correspond to the Document Availability (11). However, where further distribution (beyond the audience specified in (11) is possible, a wider announcement audience may be selected.)) Unlimited

13. ABSTRACT (A brief and factual summary of the document. It may also appear elsewhere in the body of the document itself. It is highly desirable that the abstract of classified documents be unclassified. Each paragraph of the abstract shall begin with an indication of the security classification of the information in the paragraph (unless the document itself is unclassified) represented as (S), (C), (R), or (U). It is not necessary to include here abstracts in both official languages unless the text is bilingual.)
This technical memorandum reports on a Bayesian statistical hypothesis test that was developed to aid in the analysis of the Kandahar Province Opinion Polls conducted in support of Canada’s mission in Afghanistan. The test described herein was used by analysts to determine whether changes in public opinion between successive waves of polling or differences between geographic regions were statistically significant. For a number of practical reasons, multi-stage stratified clustered sampling was employed in the Kandahar polls rather than simple random sampling. The test was developed to incorporate corrections for the effects of non-simple random sampling as well as to handle small sample sizes. This paper demonstrates the validity of the test through simulation and by comparison with a conventional test in the regime where the two are expected to converge.
X
14. KEYWORDS, DESCRIPTORS or IDENTIFIERS (Technically meaningful terms or short phrases that characterize a document and could be helpful in cataloguing the document. They should be selected so that no security classification is required. Identifiers, such as equipment model designation, trade name, military project code name, geographic location may also be included. If possible keywords should be selected from a published thesaurus, e.g. Thesaurus of Engineering and Scientific Terms (TEST) and that thesaurus identified. If it is not possible to select indexing terms which are Unclassified, the classification of each should be indicated as with the title.) Statistical Hypothesis Test; Sample Size; Design Effect; Opinion Polling; Public Opinion Research; Bayesian Statistics; Clustering; Non-Simple Random Sampling; Stratified Multi-Stage Clustered Sampling

DRDC CORA
www.drdc-rddc.gc.ca
Related Documents