PROCEEDINGS, 42nd Workshop on Geothermal Reservoir Engineering Stanford University, Stanford, California, February 13-15, 2017 SGP-TR-212 1 Geothermal Drilling: A Baseline Study of Nonproductive Time Related to Lost Circulation Patrick Cole, 1 Katherine Young, 2 Clayton Doke, 3 Neel Duncan, 3 Bill Eustes 1 1 Colorado School of Mines, 1500 Illinois Street, Golden CO 80401 2 National Renewable Energy Laboratory, 15013 Denver West Parkway, Golden, CO 80401 3 Integrated Petroleum Technologies, Inc., 1707 Cole Blvd. #200, Golden, CO 80228 [email protected], [email protected] Keywords: Geothermal drilling, lost circulation, fluid loss, cement plug, lost-circulation material, nonproductive time, wellbore strengthening ABSTRACT A single production geothermal well costs up to $7 million and a typical geothermal field contains 10 to 20 wells for a development cost of potentially $140 million according to a Geothermal Resources Group study. Capital cost coupled with exploration and resource uncertainty lead to high upfront project risk. This study analyzed the time and cost of detailed geothermal drilling operations. We found that the largest cause of nonproductive time in geothermal wells is advancing through lost-circulation zones, where drilling fluid is lost from the well. Mitigation measures implemented during lost-circulation events can increase drilling time by a significant fraction of the drilling days. The opportunity exists to reduce the drilling costs by addressing logistical inefficiencies and ineffective mitigation measures to minimize nonproductive time. This study reviewed daily drilling data for 38 geothermal wells drilled since 2009 in the United States. Our analysis summarizes the lost-circulation events identified in the available drilling data by assessing time per event, costs incurred, materials used, success of mitigation strategies, and resolution time. This study found that wells averaged over 100 hours of unprogrammed nonproductive time due to lost circulation, adding rig costs of an estimated $185,000 or more to each well. We present a plan for future research aimed at reducing lost-circulation nonproductive time and cost. 1. INTRODUCTION Exploration, permitting, and drilling costs comprise about one-third of the capital for an average 50-megawatt (MW) geothermal plant, as shown in Figure 1. Drilling each well can cost up to $7 million, and fields typically contain 10–20 wells (Sanyal, 2011). These high upfront capital costs coupled with exploration and resource uncertainty lead to high upfront project risk. Reducing drilling costs can mitigate this risk. One way to reduce drilling costs is to reduce the significant unprogrammed nonproductive time (UNPT) that often occurs in geothermal well drilling, which can increase drilling costs by 20% or more. Figure 1: Breakdown of capital cost for an average 50-MW geothermal plant (IFC, 2013). The oil and gas industry has made increases in rate of penetration; however, geothermal drilling penetration rates remain slower. Figure 1 compares depth versus days for best-in-class geothermal and oil wells in a Colorado School of Mines study (Tilley et al., 2015). This baseline study collects geothermal drilling data to analyze one of the primary obstacles to improved geothermal rate of penetration (ROP)—namely, mitigating lost circulation (LC). The high-temperature and high-pressure conditions of geothermal environments provide additional challenges to solving LC and wellbore integrity issues. Reducing ROP can have significant financial impact, and it is a topic that is broader than the scope of this study. Our study focused on identifying inefficiencies, nonproductive time (NPT), and ways to mitigate these events. As the analysis progressed, we focused more specifically on LC events, because this was identified as the largest cause of inefficiencies and UNPT. Drilling (other) 27% Lost Circulation during drilling 7% Power Plant 55% Other 11%

Welcome message from author
This document is posted to help you gain knowledge. Please leave a comment to let me know what you think about it! Share it to your friends and learn new things together.
Transcript

PROCEEDINGS, 42nd Workshop on Geothermal Reservoir Engineering
Stanford University, Stanford, California, February 13-15, 2017
SGP-TR-212
1
Geothermal Drilling: A Baseline Study of Nonproductive Time Related to Lost Circulation
Patrick Cole,1 Katherine Young,2 Clayton Doke,3 Neel Duncan,3 Bill Eustes1
1 Colorado School of Mines, 1500 Illinois Street, Golden CO 80401 2 National Renewable Energy Laboratory, 15013 Denver West Parkway, Golden, CO 80401
3 Integrated Petroleum Technologies, Inc., 1707 Cole Blvd. #200, Golden, CO 80228
[email protected], [email protected]
Keywords: Geothermal drilling, lost circulation, fluid loss, cement plug, lost-circulation material, nonproductive time,
wellbore strengthening
ABSTRACT
A single production geothermal well costs up to $7 million and a typical geothermal field contains 10 to 20 wells for a development cost
of potentially $140 million according to a Geothermal Resources Group study. Capital cost coupled with exploration and resource
uncertainty lead to high upfront project risk. This study analyzed the time and cost of detailed geothermal drilling operations. We found
that the largest cause of nonproductive time in geothermal wells is advancing through lost-circulation zones, where drilling fluid is lost
from the well. Mitigation measures implemented during lost-circulation events can increase drilling time by a significant fraction of the
drilling days. The opportunity exists to reduce the drilling costs by addressing logistical inefficiencies and ineffective mitigation
measures to minimize nonproductive time. This study reviewed daily drilling data for 38 geothermal wells drilled since 2009 in the
United States. Our analysis summarizes the lost-circulation events identified in the available drilling data by assessing time per event,
costs incurred, materials used, success of mitigation strategies, and resolution time. This study found that wells averaged over 100 hours
of unprogrammed nonproductive time due to lost circulation, adding rig costs of an estimated $185,000 or more to each well. We
present a plan for future research aimed at reducing lost-circulation nonproductive time and cost.
1. INTRODUCTION
Exploration, permitting, and drilling costs comprise about one-third of the capital for an average 50-megawatt (MW) geothermal plant,
as shown in Figure 1. Drilling each well can cost up to $7 million, and fields typically contain 10–20 wells (Sanyal, 2011). These high
upfront capital costs coupled with exploration and resource uncertainty lead to high upfront project risk. Reducing drilling costs can
mitigate this risk. One way to reduce drilling costs is to reduce the significant unprogrammed nonproductive time (UNPT) that often
occurs in geothermal well drilling, which can increase drilling costs by 20% or more.
Figure 1: Breakdown of capital cost for an average 50-MW geothermal plant (IFC, 2013).
The oil and gas industry has made increases in rate of penetration; however, geothermal drilling penetration rates remain slower. Figure
1 compares depth versus days for best-in-class geothermal and oil wells in a Colorado School of Mines study (Tilley et al., 2015). This
baseline study collects geothermal drilling data to analyze one of the primary obstacles to improved geothermal rate of penetration
(ROP)—namely, mitigating lost circulation (LC). The high-temperature and high-pressure conditions of geothermal environments
provide additional challenges to solving LC and wellbore integrity issues. Reducing ROP can have significant financial impact, and it is
a topic that is broader than the scope of this study. Our study focused on identifying inefficiencies, nonproductive time (NPT), and ways
to mitigate these events. As the analysis progressed, we focused more specifically on LC events, because this was identified as the
largest cause of inefficiencies and UNPT.
Drilling (other)
27%
Lost Circulation
during drilling
7%
Power Plant 55%
Other 11%

Cole et al.
2
Figure 2: Days versus depth chart for best-in-class geothermal (green) and oil (yellow) wells in a small study
conducted by Colorado School of Mines (Tilley et al., 2015)
2. BACKGROUND
2.1 Lost Circulation
Modern drilling methods rely on drilling fluid, or mud,1 to lubricate the cutting surface, cool the bit, return cuttings to the surface, and
maintain proper hydrostatic pressure against the formation. In geothermal wells, drilling mud is typically used above reservoir
formations, which are then cased. Once steam begins to enter the wellbore, drillers typically drill pneumatically (i.e., with air) rather
than with fluid, which reduces bit life and slows drilling (Rickard, 2016).
In areas above the reservoir where drilling fluids are used, this fluid may be lost in fractured, cavernous, or high-permeability
formations; this is known as “lost circulation” or “lost returns.” When a portion of the mud pumped down hole is returned to the surface,
losses are said to be partial. The industry defines losses of less than 25 barrels per hour (BPH) as “seepage,” losses of 25 to 100 BPH as
“partial,” and losses of more than 100 BPH as “severe.” When no mud returns to the surface through the annulus, losses are said to be
“total.” Typically, drilling cannot continue through total losses unless near the next casing point. If only 50 feet of depth must be
attained before the next casing string is to be run, drilling will often continue while continuing to pump drilling fluids, even though the
fluid will not return. The challenge is that there is no hydrostatic pressure control and cuttings are transported to an unknown downhole
location. This acceptable length varies by driller and well. Circulation may also be lost through significantly overbalanced drilling
(OBD). This is when the pressure of the drilling fluid in the wellbore (annular pressure) significantly exceeds the formation fluid
pressure, causing fluid to be pushed into the formation (Savari, 2014). For this reason, mud characteristics (e.g., density, viscosity) must
be closely monitored and adjusted as formation pressure changes (Clapper, 2011).
When circulation losses are encountered, drillers have used several responsive actions. Primarily, the driller focuses on maintaining
downhole pressure by continuing to pump fluid down the hole. If this is unsuccessful and the annular pressure drops below the
formation pressure, a “kick” could occur, where formation fluid enters the wellbore uncontrollably. If left uncorrected, a kick may lead
to a dangerous blowout.2 Other actions include attempting to seal the LC zone or altering mud parameters to drill underbalanced.
Underbalanced drilling is using a mud weight lower than formation pressure to minimize the risk of fracture propagation and circulation
loss. Although this may tend to decreases ROP, this technique saves time if used in appropriate situations.
2.2 Importance of Lost-Circulation Mitigation Success in Geothermal Drilling
Two important distinctions between geothermal drilling and oil and gas drilling relevant to the LC discussion are the difference in
formations begin drilled and the completion of the wells. First, oil and gas wells are typically drilled in sedimentary rocks where lost
circulation can be mitigated more easily than in the cavernous hard rocks typical of geothermal systems. Second, oil and gas wells are
typically only cemented in the top and bottom portions of the well, and produce through tubing rather than the well casing. Therefore,
the zones of lost circulation encountered while drilling do not need to be cemented during well construction. Drilling through LC zones
can be done without later ramifications.
Geothermal wells, however, are cemented the entire length of the well because the hot geothermal fluids will heat the casing during
production. If only the top and bottom portions of a geothermal well were cemented, the hot production fluids could cause the middle
section of the casing to expand and buckle. Alternatively, if mud is trapped in the annulus, it too could heat and expand, causing the
1 Drilling mud is a slurry of solids and liquids in a base liquid (typically fresh water). 2 A blowout is the uncontrolled flow of fluids from the formation up the annulus to the surface. A blowout occurs when formation
pressure exceeds the pressure applied to it by the column of drilling fluids in the wellbore.
Cole et al.
3
internal casing to collapse. Thus, to prevent casing failure during production, geothermal wells are typically cased for the entire length
of the well.
Therefore, addressing LC events during geothermal drilling becomes much more important than in oil and gas drilling. Trying to cement
a well with LC zones becomes difficult because cement will be lost in these zones. Rather than completing cement jobs through the
bottom shoe, drillers may have to resort to “top jobs”—placing cement from the top down—and/or perforating the well and squeezing
cement into the annulus through the wellbore to fill open zones. Both of these methods add cost and are less successful at completing a
solid cement job than the traditional bottom-hole cementing method. Addressing LC during geothermal drilling becomes critical to
reducing the cost of well construction and cementing and to increasing the integrity of the well.
2.3 Lost-Circulation Mitigation
To solve partial losses, LC material (LCM) may be mixed into the circulating drilling fluid. The purpose of LCM is to block pores and
fractures in the formation, sealing the wellbore and preventing fluids from flowing into the formation. For this purpose, LC materials
often contain platelets, fibers, or polymers (Brandl, 2011). LCMs are relatively inexpensive and can be circulated and applied quickly
(in under an hour). Wells analyzed for this study used paper, cottonseed hulls, nutshells, and calcium carbonate among other materials
as LCM. These materials were used in 87% of the wells studied in this analysis.
LCM may also be mixed into the mud as a preventative measure if a fractured or highly permeable formation is predicted. This
technique, known as wellbore strengthening, can prevent or reduce losses while drilling and allows a wider range of mud weights.
Wellbore strengthening techniques were used in 8 of 15 wells in this study (53%). While drilling, mud weight must remain in a
particular “window”—above the pore pressure and below the fracture pressure. If the mud weight dips below the pore pressure, the
driller risks a kick, where formation fluid flows into the wellbore. Conversely, if the mud weight is above the fracture pressure, known
as overbalanced drilling, the hydrostatic pressure of the formation is not high enough to prevent fluid infiltration and circulation losses
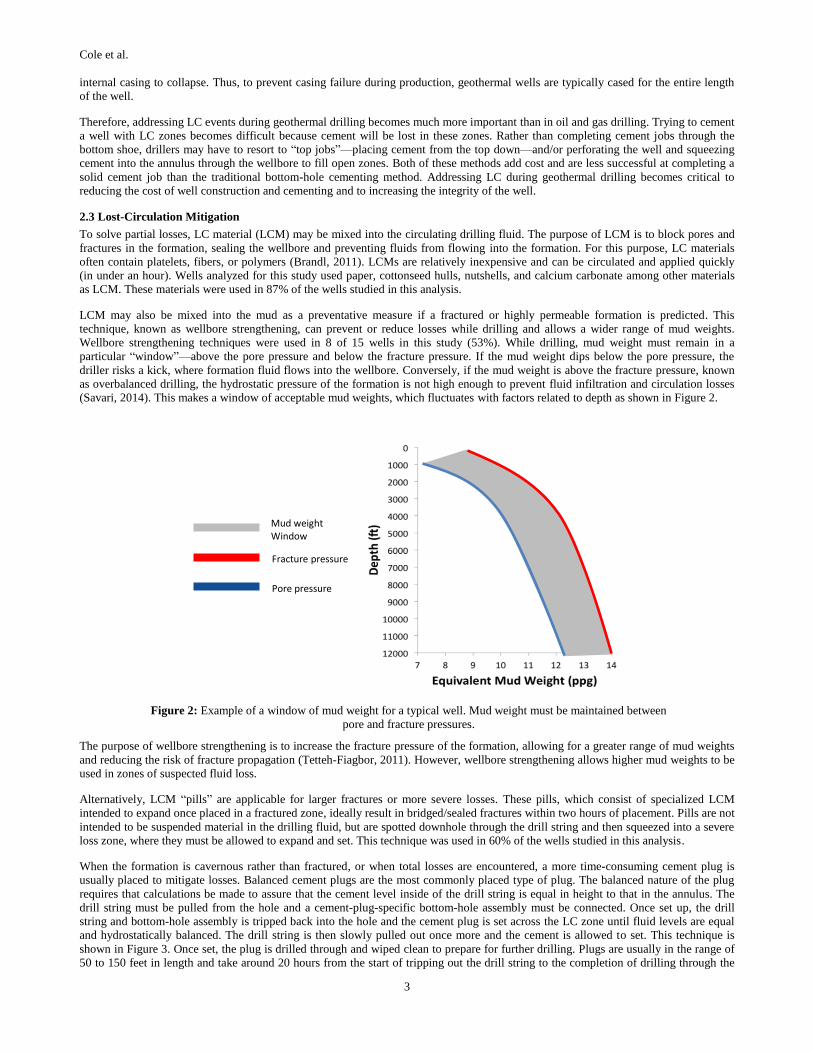
(Savari, 2014). This makes a window of acceptable mud weights, which fluctuates with factors related to depth as shown in Figure 2.
Figure 2: Example of a window of mud weight for a typical well. Mud weight must be maintained between
pore and fracture pressures.
The purpose of wellbore strengthening is to increase the fracture pressure of the formation, allowing for a greater range of mud weights
and reducing the risk of fracture propagation (Tetteh-Fiagbor, 2011). However, wellbore strengthening allows higher mud weights to be
used in zones of suspected fluid loss.
Alternatively, LCM “pills” are applicable for larger fractures or more severe losses. These pills, which consist of specialized LCM
intended to expand once placed in a fractured zone, ideally result in bridged/sealed fractures within two hours of placement. Pills are not
intended to be suspended material in the drilling fluid, but are spotted downhole through the drill string and then squeezed into a severe
loss zone, where they must be allowed to expand and set. This technique was used in 60% of the wells studied in this analysis.
When the formation is cavernous rather than fractured, or when total losses are encountered, a more time-consuming cement plug is
usually placed to mitigate losses. Balanced cement plugs are the most commonly placed type of plug. The balanced nature of the plug
requires that calculations be made to assure that the cement level inside of the drill string is equal in height to that in the annulus. The
drill string must be pulled from the hole and a cement-plug-specific bottom-hole assembly must be connected. Once set up, the drill
string and bottom-hole assembly is tripped back into the hole and the cement plug is set across the LC zone until fluid levels are equal
and hydrostatically balanced. The drill string is then slowly pulled out once more and the cement is allowed to set. This technique is
shown in Figure 3. Once set, the plug is drilled through and wiped clean to prepare for further drilling. Plugs are usually in the range of
50 to 150 feet in length and take around 20 hours from the start of tripping out the drill string to the completion of drilling through the
Fracture pressure
Pore pressure
Mud weight Window

Cole et al.
4
plug. If the formation causing losses is continuous beyond this length, cement plugs may be set consecutively (Guo, 2014), and this
technique was used in 87% of the wells studied in this analysis.
Figure 3: A balanced cement plug, where the height of the cement column outside the drill string (here called
the cement string), is equal with the height of the cement column inside of the string (“Balanced Cement
Plug,” 2011).
The goal of LCM, pills, and cement plugs is to either reduce or mitigate LC while drilling. These strategies are typically employed for
partial, severe, and total losses and are considered “successful” if losses are reduced to less than 25 BPH (i.e., if losses are reduced to
seepage losses). If losses are initially only seepage, then success is considered mitigating all losses. If losses are initially minimal,
drillers may try to “drill through” or mitigate using less-expensive LCMs. Drilling through the zone is possible because cuttings help to
seal loss zones caused by pores or small fractures. If unsuccessful, or for severe or total losses, drillers will then typically use cement
plugs. Generally, these mitigation methods are only seen in the surface and intermediate drill sections because circulation loss in the
production zone is required. LCM, pills, and cement are rarely used below a depth of 8,000 feet.
2.4 Lost-Circulation Mitigation Success Rates
Success rates for the traditional methods of LCMs and cement plugs are low, with overall success around 25% in geothermal wells. In a
study of 4,500 LC zones (Hyodo, 2000), LCM was used in 35% of cases and cement was used in 47%. Beyond a depth of 1,000 meters
(3,281 ft), success rates drop to 7% due to the higher temperature and pressure conditions, causing traditional LCMs and cements to fail.
When fluid losses were experienced, these losses were “total” about 65% of the time, indicating the complexity of fracture systems
encountered in high-temperature, high-pressure geothermal drilling (Hyodo, 2000).
Failed LC methods can add significant wasted costs to the drilling process. As previously mentioned, mixing LCM in the drilling fluid
typically takes 30 minutes to one hour, and cement plugs typically take about 20 hours. At an average onshore daily rig rate of $45,000,
halting operations to execute a cement plug is clearly a serious commitment (Ahrenst, 2016). In this study, we look at overall NPT in a
sample of wells—and, more specifically, LC frequency and success of LC cures. Ultimately, we find inefficiencies in the drilling
process and formulate process improvements. Specifically, we analyze LC mitigation techniques, as well as discuss an idea for potential
time and cost savings.
3. METHODOLOGY
3.1 Data Collection
We collected and analyzed data from 38 geothermal wells drilled since 2009 for our analysis. Fifteen of those wells are located in The
Geysers geothermal area in California. Data were collected online through California’s Division of Oil, Gas, and Geothermal Resources
(DOGGR). These 15 recent wells were chosen due to their thorough logs. DOGGR data included daily drilling logs, fluid-loss
information, cement details, directional surveys, permitting forms, bit information, drilling parameters, and mud logs for all wells (Table
1). Additionally, the U.S. Navy Geothermal Program shared data for seven of their recently drilled wells. These wells are located in two
different fields, located at the Fallon Naval Air Station and in Imperial County, California. The U.S. Navy Geothermal Program data
included daily drilling logs, cement details, directional surveys, bit information, and drilling parameters. The remaining 16 wells were
shared by the Colorado School of Mines (CSM) Petroleum Engineering Department and included daily drilling logs and cumulative LC
statistics. Additional geothermal well drilling data were examined, e.g., from the Nevada Division of Minerals (NDOM) and from the
U.S. Bureau of Land Management (BLM), but these data sets were not detailed enough to be used in this analysis. The data types
provided from each source are shown in Table 1. Table 2 in Appendix A lists each well with critical statistics such as total drilling days,
total measured depth, year drilled, NPT percentage, and number of LC zones.

Cole et al.
5
Table 1: Data Inventory for drilling data used in this study. We investigated four sources of data, but found
that sufficient data for analysis were only available from the California DOGGR. Future studies would
benefit from additional well data sets.
Data Source
# of Wells Date Range Location
Available Data
Daily Drilling
Mud Log
Mud Details
Drill Bit
Lost Circulation
DOGGR 15 2010–2015 CA x x x x x
Navy 7 2010–2014 CA, NV x
x x
CSM 16 2009–2014 – x
x
NDOM 0 2009–2011 NV
x
TOTAL 38 2009–2015 – – – – – –
It is standard for oil and gas drillers to capture, in real time, nearly all of the available data during drilling operations to identify all
opportunities for improving efficiency. We did not find geothermal data of this sort for our study. Many of the data sets collected were
disappointing in their lack of granularity, which was a significant impediment to our study. Although we are aware that at least some
geothermal drillers collect this sort of data, it is not clear how commonplace this is in geothermal drilling, nor if these data were
collected, but just not publically available, for the wells listed in Table 1.
3.2. Data Analysis
The first step in analyzing the well data was to categorize drilling time. The daily drilling reports contain activity codes or descriptions
in varying time increments of 0.25 to 24 hours. Twenty-four distinct operation codes were used in total across all 38 wells, with codes
categorized by their productivity. For the purpose of this study, NPT was defined as any activity that did not show progress in well
depth—any code other than drilling. Conversely, productive time was a sum of the time periods for which actual drilling occurred.
UNPT was defined as any responsive action or event that was not, or could not be, planned for ahead of time. This grouping of activities
included events responding to unexpected LC, stuck drill pipe, wireline loss, cutting and slipping the drill line, rig repairs, waiting, or
fishing for tools. Examples of these activity classifications on a depth versus days chart can be seen in Figure 4.
Figure 4: Sample of unprogrammed and programmed NPT and slower-than-planned ROP on a depth vs.
days chart. The blue line shows planned drilling, and gray represents actual drilling.
Data provided were generally formatted as copied tables or PDFs, and thus, were first digitized and formatted. Data from all sources
included depth, time of day, deviation, fluid loss, formation temperature, trip time, NPT, drill bit performance, LC cure success rate,
cement cure time and waiting time, cumulative trip time, and rate of penetration. Once collected, digitized, and formatted, we developed
figures to represent critical statistics for each well. Examples of the figures can be seen in Appendix A. Cumulative figures were made
to compare data across wells and gather trending information. This study focused on reducing cost and time in the drilling process, and
thus, it was directed toward NPT, especially that caused by LC events.
Dep
th (
ft)
Days
Unprogrammed NPT
Slower than planned ROP Programmed NPT
Planned drilling
Actual drilling

Cole et al.
6
3.3. Down-Selection and Lost Circulation
After the initial analyses suggested that LC was one of the major issues, subsequent analyses focused on a better understanding of these
events and subsequent mitigation. Circulation loss data were analyzed for the 15 DOGGR wells that provided appropriate LC
information to see at what depths and in what formation environments LC events occurred. Figures were compared across wells to see
what types of events related to longer drilling times and more NPT. These figures include representations for depth vs. drilling time, LC
histograms, programmed versus trouble NPT, LC mitigation method success distribution and time consumption, NPT distribution, and
waiting time per well.
Data were analyzed to find:
1. The probability and severity of LC events
2. The time required to mitigate LC events of each kind
3. Success rate and inefficiencies in mitigation methods
3.4. Geothermal Driller Interviews
Another aspect of this research involved contacting experienced drillers to get their opinion on the most important and pressing issues in
geothermal drilling. Although several drillers were contacted with questions regarding drilling in general, NPT, LC, and LC mitigation
techniques, we only interviewed two drillers. Future work may involve participation by additional drilling experts.
4. RESULTS
4.1 NPT Distribution
Areas of greatest potential improvement for all DOGGR and Navy wells are displayed in Figure 5, which is a Pareto chart of NPT. Note
that in this chart, trip time includes all tripping in and out of the hole, not just specifically for LC mitigation or bit changes. However,
this shows that there is opportunity to reduce trip time, and if each column is reduced, more efficiency may be attained per well.
Activities classified as “other” vary widely by the drilling logger, but generally include activities such as setting up for other activities,
picking up or laying down drill pipe, moving people or tools, waiting on daylight or weather, finding fluid level, or logging.
Figure 5: Pareto chart of NPT in all wells. Note that trip time includes all tripping in and out (e.g., bit
changes, LC, casing) and may be reduced but not eliminated. “Other” includes activities such as movement
of tools, taking measurements, or logging, although this varies among loggers and operations. Waiting time
consists largely of waiting for cement plugs or casing cement to set.
Waiting time designated in Figure 5 includes waiting time during cement-plug operations, which is typically waiting for cement to set.
This is a large factor in NPT because many of the attempted cement plugs failed to mitigate LC while drilling. Waiting for cement to set
is perhaps the most easily reduced factor in NPT shown in this Pareto chart. Because it constitutes a large percentage of NPT, LC
mitigation techniques are the focus for the remaining results.
4.2. Cumulative Trends
Across the 15 DOGGR wells that included LC remediation details, a total of 2,434 hours (101 days, 10 hours) were spent attempting to
resolve LC in 211 LC events, with 1,734.5 of those hours spent on failed methods (71.3%). Cement-plug application time, from start to
finish, averaged 20.15 hours. These data are summarized in Figure 6.
0
10
20
30
40
50
60
70
80
90
100
0
1000
2000
3000
4000
5000
6000
7000
Cu
mu
lati
ve %
of
UN
PT
Ho
urs

Cole et al.
7
Figure 6: Success of LC remediation techniques by initial loss level. Numbers of failed applications are
labeled on each column.
In Figure 6, attempts to mitigate LC are separated by initial loss level and the LC mitigation technique used. In the figure on the left, all
methods are summed into cumulative success and failures. Success in mitigating losses for partial, severe, or total losses is defined as
reducing losses to less than 25 BPH upon application. In general, failure rates were 77.8% for seepage, 64.7% for partial, 68.5% for
severe, and 83.6% for total. For losses that begin as seepage, success is here defined as complete elimination of fluid losses. LC
materials mixed into drilling fluid was the most common mitigation method for seepage losses (less than 25 BPH), and saw 3 successes
and 13 failures (19% success), whereas LCM pills led to one failure and cement plugs tallied one success. For partial losses (25–100
BPH), mud-mixed LCM was still the most common technique and experienced a higher success-to-failure ratio of 8:10 (44% success).
Two failed LCM pills were applied to partial losses, along with 10 failed and 4 successful cement plugs (29% success). For severe
losses (greater than 100 BPH, but some returns), cement plugs were the most commonly used mitigation technique, with 34 failed and
16 successful applications (32% success). Mud-mixed LCM was successful in 8 of 28 attempts when applied in severe losses (29%
success). LCM pills were successfully applied in 5 of 14 attempts (36% success). Cement plugs were the only mitigation method that
saw success in total losses. LCM experienced 15 failures, and LCM pills had one failure. Cement plugs succeeded in mitigating losses
in 11 of 51 attempts (22% success).
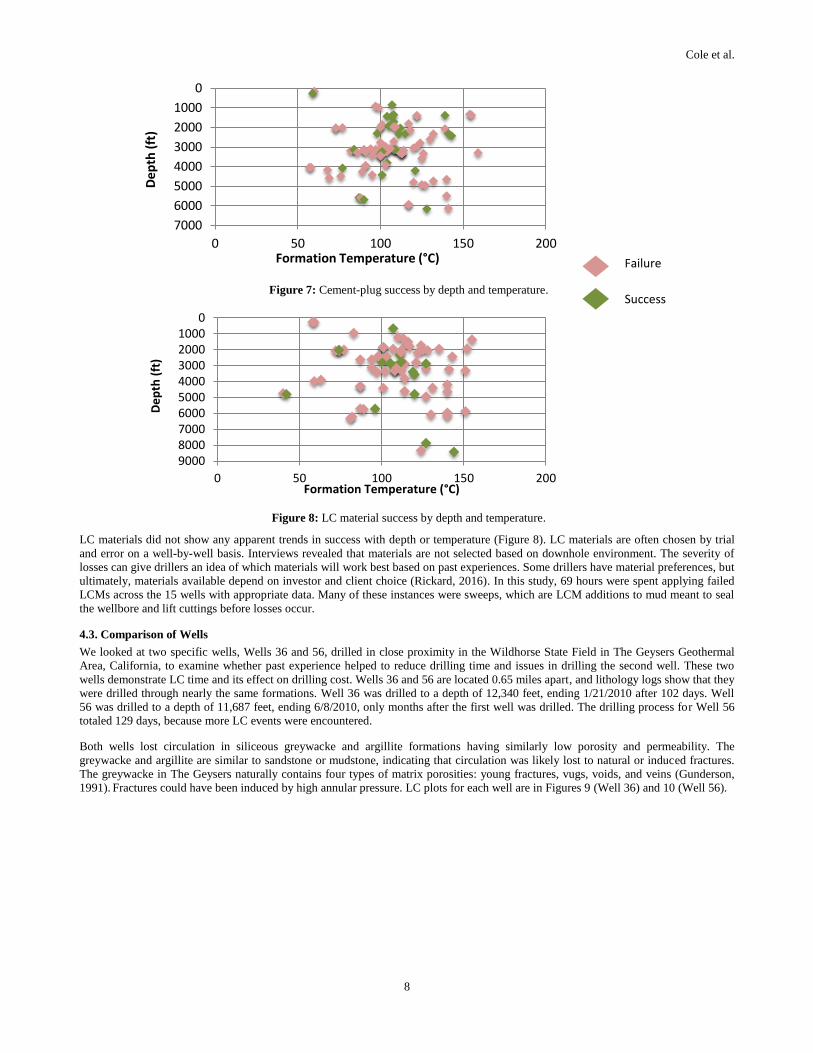
LCM and cement-plug success by depth and temperature for the 15 wells analyzed can be seen in Figures 7 and 8, respectively. Often
these techniques were applied together. In many situations, if LC materials failed to regain circulation, then using a cement plug was the
next step. Cement plugs were more commonly used for total or severe losses, whereas LCM was often applied preventatively or for
minor losses.
Many factors affect the success of a cement plug including: temperature, pressure, plug base, density, length, cause of circulation loss,
hydrostatic balancing, and contamination. Cement additives can include fibers, polymers, anti-settling agents, retarders, or foaming
agents (Hudson, 2015). Variations in additives were not well recorded in the drilling logs in this data set, but may be a contributing
factor in success rates. Figure 7 shows that cement-plug success was more common at depths of less than 3,000 feet. Of the 116 cement
plugs attempted, 32 (27.6%) cured circulation losses to acceptable (seepage) levels. This indicates a cement-plug success rate that is
slightly higher than LC materials, but the cement-plug process is more time-consuming and costly. Some 1,571.5 hours were spent
setting failed cement plugs—an average of more than 100 hours per well. This is UNPT, because no progress was made in drilling
depth. At an average rig rate3 of USD $45,000 per day (Ahrenst, 2016), these 15 wells likely lost more than $2.8 million related to
setting cement plugs that did not mitigate LC. This expense only accounts for the daily rig rate, not the cost of cement, tools, water, or
other resources.
3 Rig rates were estimated because actual costs for these wells are unknown.
4 12
29
11 14
22
63
56
0
10
20
30
40
50
60
70
80
90
100
SEEPAGE PARTIAL SEVERE TOTAL
# o
f in
stan
ces
in 1
5 w
ells
Failure
Success
3 1
8 4
8 5
16 11
13
1
10
2
10
20
9
34
15
1
40
0
10
20
30
40
50
60
LCM
LCM
pill
Cem
en
t
LCM
LCM
pill
Cem
en
t
LCM
LCM
pill
Cem
en
t
LCM
LCM
pill
Cem
en
t
SEEPAGE PARTIAL SEVERE TOTAL
Failure
Success
Cole et al.
8
Figure 7: Cement-plug success by depth and temperature.
Figure 8: LC material success by depth and temperature.
LC materials did not show any apparent trends in success with depth or temperature (Figure 8). LC materials are often chosen by trial
and error on a well-by-well basis. Interviews revealed that materials are not selected based on downhole environment. The severity of
losses can give drillers an idea of which materials will work best based on past experiences. Some drillers have material preferences, but
ultimately, materials available depend on investor and client choice (Rickard, 2016). In this study, 69 hours were spent applying failed
LCMs across the 15 wells with appropriate data. Many of these instances were sweeps, which are LCM additions to mud meant to seal
the wellbore and lift cuttings before losses occur.
4.3. Comparison of Wells
We looked at two specific wells, Wells 36 and 56, drilled in close proximity in the Wildhorse State Field in The Geysers Geothermal
Area, California, to examine whether past experience helped to reduce drilling time and issues in drilling the second well. These two
wells demonstrate LC time and its effect on drilling cost. Wells 36 and 56 are located 0.65 miles apart, and lithology logs show that they
were drilled through nearly the same formations. Well 36 was drilled to a depth of 12,340 feet, ending 1/21/2010 after 102 days. Well
56 was drilled to a depth of 11,687 feet, ending 6/8/2010, only months after the first well was drilled. The drilling process for Well 56
totaled 129 days, because more LC events were encountered.
Both wells lost circulation in siliceous greywacke and argillite formations having similarly low porosity and permeability. The
greywacke and argillite are similar to sandstone or mudstone, indicating that circulation was likely lost to natural or induced fractures.
The greywacke in The Geysers naturally contains four types of matrix porosities: young fractures, vugs, voids, and veins (Gunderson,
1991). Fractures could have been induced by high annular pressure. LC plots for each well are in Figures 9 (Well 36) and 10 (Well 56).
0
1000
2000
3000
4000
5000
6000
7000
0 50 100 150 200
De
pth
(ft
)
Formation Temperature (°C)
0100020003000400050006000700080009000
0 50 100 150 200
De
pth
(ft
)
Formation Temperature (°C)
Failure
Success

Cole et al.
9
Figure 9: LC for Well 36, drilled in 102 days.
Figure 10: LC for Well 56, drilled in 129 days.
Because of severe losses and inability to mitigate losses while drilling, Well 56 took an additional 27 days. At an average rig rate of
USD $45,000 per day (Ahrenst, 2016), the estimated additional cost of Well 56 was $1.22 million.
5. FUTURE RESEARCH
Experts interviewed stated that LC was the single-most unpredictable issue in geothermal drilling in 1977—and it still is today. Despite
the low success rates of LC materials and cement plugs, they both continue to be common techniques in geothermal drilling. The
petroleum industry has adopted many advanced techniques and materials to stop LC (Tilley et al., 2015). However, the high-pressure,
high-temperature, fractured environments in geothermal drilling call for more robust materials and methods. With newly developed
materials, it is often hard to field-test due to the low number of geothermal wells drilled annually, as well as risks associated with
potential downhole damage or production loss.
5.1 Discussions with Industry
Experts shared that LC is a commonly encountered problem, but certain materials and methods allow efficient mitigation. Real-time
data analysis is not often used, but data are analyzed after collection, especially for wells in the same field. Some experts cited that with
the use of more-advanced materials—such as micronized cellulose, fibrous material—they experience upwards of 90% LC mitigation
success; but those materials come at a cost of up to five times that of many other LCMs. Thus, it is sometimes difficult to convince
investors and clients to use it. If clients were willing to spend the money on more-advanced materials, and if significantly higher success
rates could be seen in mitigating LC, then savings would come in the form of drilling time and cost (Rickard, 2016). Future research
could identify successful materials in select temperature, pressure, and geological environments.
5.2 Lost-Circulation Laboratory
To test LC materials and methods, researchers are looking to develop a lost-circulation laboratory to increase research and testing prior
to use down hole. A laboratory for LCMs would need to include variable fluid chemistry, temperature, pressure, formation type,
porosity, and permeability. Furthermore, LC environments would need to be simulated, such as caverns, vugs, and natural and induced
fractures—all with variable sizes. With this approach, a matrix or spreadsheet could be created with recommended additives and
materials to use in each environment. Similar studies have been conducted (Savari, 2014), showing which additives and combinations of
LCM will work in select environments; but these studies have not included variations in pressure, temperature, and LC environment. By
continuing this work, a database may be created for selecting LCM and cement composition by down-hole environment. Measurements
0
200
400
600
800
1000
1200
0
10
00
20
00
30
00
40
00
50
00
60
00
70
00
80
00
Flu
id L
oss
(b
ph
)
Depth (ft)
0
200
400
600
800
1000
1200
0
10
00
20
00
30
00
40
00
50
00
60
00
70
00
80
00
Flu
id L
oss
(b
ph
)
Depth (ft)

Cole et al.
10
of pressure, temperature, and cuttings should provide enough detail to drillers for selecting appropriate materials. This could increase
LCM success rates and reduce NPT. The Colorado School of Mines has started to build such a laboratory for oil and gas operators.
5.3 Other Drilling Improvements
Wellbore integrity is a broad term that pertains to proper management of drilling parameters to allow for a safe and stable hole. During
the drilling process, annular pressure, weight on bit, revolutions per minute, rotary torque, and mud characteristics must all be observed
and managed. If drilling is executed properly, the wellbore will not only be more stable, but is likely to produce better. The oil and gas
industry has adopted methods to manage these parameters in real time. This beneficial technology is sometimes seen in geothermal
drilling, but it is not common (Tilley et al., 2015). Several other solutions for LC and NPT have been studied and published, most
notably: underbalanced drilling, the use of polycrystalline diamond compact (PDC) bits, and casing while drilling. Some experts
regularly implement underbalanced drilling to reduce risk of LC (Rickard, 2016). These techniques have been included in Figure 11,
which provides an overview of drilling improvements and difficulty of implementation.
Figure 11: A visual representation of solutions by estimated difficulty of implementation (10 = most
difficult) and estimated level of improvement (10 = most improvement).
6. CONCLUSION
Current hurdles to effective geothermal drilling operations are high costs combined with low success rates. Both factors are affected by
NPT, especially that caused by LC. Lost circulation is complicated in geothermal environments due to the high-temperature, high-
pressure, naturally fractured environments—even above the geothermal reservoir. The success rates of LC mitigation techniques in
these data—24.7% for mud-mixed LC materials, 27.8% for LCM pills, and 27.6 % for cement plugs—give insight into the complexity
of circulation loss. This suggests failure to mitigate LC occurs in three out of four tries. Even wells of the same depth and formations
can experience wildly varying amounts of LC, resulting in unpredictable well cost. To advance the geothermal industry, strides must be
made in mitigating LC in drilling. Advanced drill bits, underbalanced drilling, wellbore strengthening, and casing while drilling are all
commercialized technologies with potential to reduce NPT caused by LC. Future research could be done to investigate the most
successful materials for LCM and cement in all ranges of geothermal drilling environments. By testing these materials, a guide for
selecting highly successful materials will help the geothermal industry mitigate LC quickly and efficiently. This outcome could lead to
an increase in geothermal drilling success, shorter drilling time, and lower drilling cost, thereby helping to overcome current geothermal
drilling hurdles.
ACKNOWLEDGMENTS
This work was supported by the U.S. Department of Energy Office of Science, Office of Workforce Development for Teachers and
Scientists (WDTS) under the Science Undergraduate Laboratory Internship (SULI) program. The authors would like to thank the
mentors and supervisors of the SULI program at NREL, including Madison Martinez, Marcus Giron, and Linda Lung. We would also
like to thank Andy Sabin and Andy Tiedeman from the U.S. Navy Geothermal Program Office, Lowell Price at the Nevada Division of
Minerals, and California DOGGR for providing access to data and guidance with interpretation. Finally, we would like the thank Louis
Capuano, Jr., and Louis Capuano, III (Capuano Engineering Company), and Bill Rickard (Geothermal Resource Group) for sharing his
wisdom and expertise, and the NREL review team, including Bud Johnston, Don Gwinner, Emily Newes, and David Mooney.
Wellbore strengthening
Casing while drilling
PDC bit use
Underbalanced drilling
Lab test LCM
Lab test cement plugs
0
5
10
0 5 10
Esti
mat
ed
Le
vel o
f Im
pro
vem
en
t
Difficulty of Implementation
Cole et al.
11
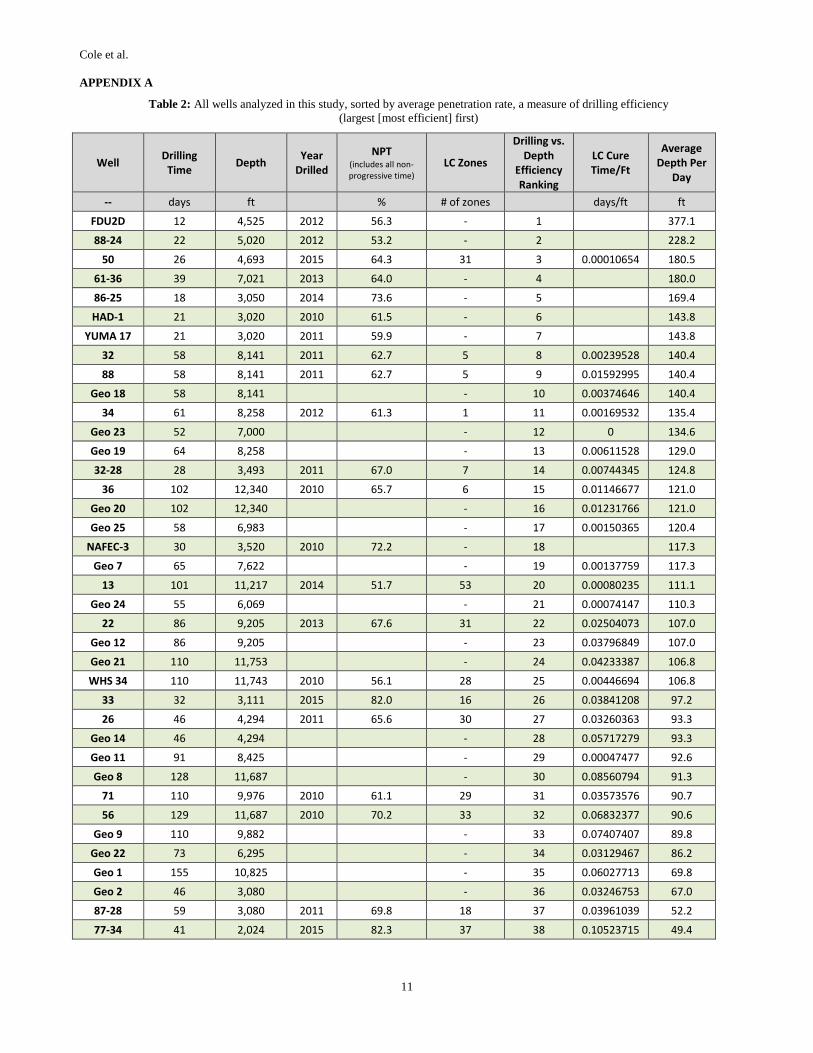
APPENDIX A
Table 2: All wells analyzed in this study, sorted by average penetration rate, a measure of drilling efficiency
(largest [most efficient] first)
Well Drilling
Time Depth
Year Drilled
NPT (includes all non-progressive time)
LC Zones
Drilling vs. Depth
Efficiency Ranking
LC Cure Time/Ft
Average Depth Per
Day
-- days ft % # of zones days/ft ft
FDU2D 12 4,525 2012 56.3 - 1 377.1
88-24 22 5,020 2012 53.2 - 2 228.2
50 26 4,693 2015 64.3 31 3 0.00010654 180.5
61-36 39 7,021 2013 64.0 - 4 180.0
86-25 18 3,050 2014 73.6 - 5 169.4
HAD-1 21 3,020 2010 61.5 - 6 143.8
YUMA 17 21 3,020 2011 59.9 - 7 143.8
32 58 8,141 2011 62.7 5 8 0.00239528 140.4
88 58 8,141 2011 62.7 5 9 0.01592995 140.4
Geo 18 58 8,141 - 10 0.00374646 140.4
34 61 8,258 2012 61.3 1 11 0.00169532 135.4
Geo 23 52 7,000 - 12 0 134.6
Geo 19 64 8,258 - 13 0.00611528 129.0
32-28 28 3,493 2011 67.0 7 14 0.00744345 124.8
36 102 12,340 2010 65.7 6 15 0.01146677 121.0
Geo 20 102 12,340 - 16 0.01231766 121.0
Geo 25 58 6,983 - 17 0.00150365 120.4
NAFEC-3 30 3,520 2010 72.2 - 18 117.3
Geo 7 65 7,622 - 19 0.00137759 117.3
13 101 11,217 2014 51.7 53 20 0.00080235 111.1
Geo 24 55 6,069 - 21 0.00074147 110.3
22 86 9,205 2013 67.6 31 22 0.02504073 107.0
Geo 12 86 9,205 - 23 0.03796849 107.0
Geo 21 110 11,753 - 24 0.04233387 106.8
WHS 34 110 11,743 2010 56.1 28 25 0.00446694 106.8
33 32 3,111 2015 82.0 16 26 0.03841208 97.2
26 46 4,294 2011 65.6 30 27 0.03260363 93.3
Geo 14 46 4,294 - 28 0.05717279 93.3
Geo 11 91 8,425 - 29 0.00047477 92.6
Geo 8 128 11,687 - 30 0.08560794 91.3
71 110 9,976 2010 61.1 29 31 0.03573576 90.7
56 129 11,687 2010 70.2 33 32 0.06832377 90.6
Geo 9 110 9,882 - 33 0.07407407 89.8
Geo 22 73 6,295 - 34 0.03129467 86.2
Geo 1 155 10,825 - 35 0.06027713 69.8
Geo 2 46 3,080 - 36 0.03246753 67.0
87-28 59 3,080 2011 69.8 18 37 0.03961039 52.2
77-34 41 2,024 2015 82.3 37 38 0.10523715 49.4

Cole et al.
12
Figure 12: Depth versus days chart for 22 wells (CSM wells excluded). The most efficient wells are those
that are the most vertical—drilling the most depth in the fewest days
REFERENCES
Ahrenst, A., Grosshans, C., Martinez Melo, A., Suarez Jerez, S.C. 2016. Improved cement plug placement method resulting in reduced
rig time. IADC/SPE 178853-MS.
"Balanced Cement Plug Calculation." DrillingForumlas.Com. N.p., 6 June 2011. Web. 29 Nov. 2016.
Bhaisora, D., Waheed, A., Abdel Gawad, M., Hollman, L., Idris, M., Fayed, B., Mehdiyev, A., Geldof, W. 2014. A novel way to spot
and squeeze a lost circulation cement plug using managed pressure drilling techniques in HPT/HT conditions: case history
from the Mediterranean Sea. SPE 170650-MS.
Brandl, A., Bray, W.S., Molaei, F. 2011. Curing lost circulation issues and strengthening weak formations with a sealing fluid for
improved zonal isolation of wellbores.
Clapper, D. K., Szabo, J. J., Spence, S., Otto, M., Creelman, B., Lewis, T.G., McGuffey, G. 2011. One sack rapid mix and pump
solution to severe lost circulation. SPE 139817.
0500
100015002000250030003500400045005000550060006500700075008000850090009500
10000105001100011500120001250013000
Dri
llin
g D
ep
th (
FT)
Drilling Days
Cole et al.
13
Durmaz, S., Karbasforoushan, H., Ozbayoglu, E.M., Miska, S.Z., Yu, M., Takach, N., Aranha, P.E. 2016. Mixing of cement slurries
during cement plug setting. SPE 180338-MS.
Ghalambor, A., Salehi, S., Shahri, M.P., Karimi, M. 2014. Integrated workflow for lost circulation prediction. SPE 168123.
Gunderson, R.P. 1991. Porosity of reservoir greywacke at the geysers. GRC Report No. 17
Guo, Y., Zhang, X., Taoutaou, S., Li, T., Li, Y., Lian, Y, Huang, S., Peng, Y. 2014. Successful placement of cement plugs in HP/HT
wells using an innovative computer-aided simulator. SPE 171395-MS
Halliburton Fluid Additives. 2016. HYDRO-PLUG lost circulation material
Hyodo, M., Kitao, K., Furukawa, T. 2000. Development of database system for lost circulation and analysis of the data.
Hudson, M., Sones, E.A., Eulberg, J.T. 2015. Minimizing NPT: the elimination of cement plug failures in the western US. SPE 173997-
MS.
International Finance Corporation (IFC). June 2013. Success of geothermal wells: a global study.
Olutimehin, A.A., Odunuga, M. 2012. A model to minimize risk of cement plug failure in HPHT conditions. SPE 149562.
Rickard, B. (2016, November 30). Phone interview.
Sanyal, S.K., Morrow, J.W. 2011. An investigation of drilling success in geothermal exploration, development, and operation. GRC
Transactions, Vol. 35.
Savari, S., Whitfil, D., Jamison, D.E., Kumar, A. 2014. A method to evaluate lost circulation materials—Investigation of effective
wellbore strengthening applications. SPE 167977.
Savari, S., Whitful, D., Walker, J. 2016. Lost circulation management in naturally fractured reservoirs. SPE/IADC 178165-MS.
Shadravan, A., Ghasemi, M., Alfia, M. 2015. Zonal isolation in geothermal wells.
Tetteh-Fiagbor, H. 2011. Practical approaches for solving lost circulation problems while drilling.
Tilley, M., Eustes, A., Visser, C., Baker, W., Bolton, D., Bell, J., Nagandran, U., Quick, R. 2015. Optimizing geothermal drilling: Oil
and gas technology transfer.
Xu, C. Kang, Y., You, L., Li, S., Chen, F. 2013. High-strength, high-stability pill system to prevent lost circulation. IPTC 17127
Related Documents