1 A Balanced Scorecard Service For Distributors Give Every Employee a Motivating, Game Plan for Better Economics for Them and All (4) Stakeholder Groups Key Objectives/Questions answered: 1. What is involved in Balanced Scorecard (BSC) reporting? What is the upside? 2. Global 2000 firms are paying $3MM+ to consulting firms to design customer BSC reporting systems. But, distributors can now get more than normal upside potential starting in 3 weeks for a negligible monthly subscription cost ? (How to evaluate this service?) 3. We can’t get high performance by managing our business just with financial numbers which are final derivative symptoms of the following forces which all can be measured, managed and improved: 1. High performance personnel practices => 2. People engagement metrics => 3. Service-value metrics improvement to excellence => 4. Customer: satisfaction, retention, penetration, premiums => 5. Long-term, sustainable, faster growth and better profitability than the industry.

Welcome message from author
This document is posted to help you gain knowledge. Please leave a comment to let me know what you think about it! Share it to your friends and learn new things together.
Transcript

1
A Balanced Scorecard Service For Distributors
Give Every Employee a Motivating, Game Plan for Better Economics for Them and All (4) Stakeholder Groups
Key Objectives/Questions answered:
1. What is involved in Balanced Scorecard (BSC) reporting? What is the upside?2. Global 2000 firms are paying $3MM+ to consulting firms to design customer
BSC reporting systems. But, distributors can now get more than normal upside potential starting in 3 weeks for a negligible monthly subscription cost ? (How to evaluate this service?)
3. We can’t get high performance by managing our business just with financial numbers which are final derivative symptoms of the following forces which all can be measured, managed and improved:
1. High performance personnel practices => 2. People engagement metrics => 3. Service-value metrics improvement to excellence => 4. Customer: satisfaction, retention, penetration, premiums => 5. Long-term, sustainable, faster growth and better profitability than the
industry.
2
2
Problem: How to Renew “Hope”?
After rounds of lay-offs & compensation cuts of every type with no big sales rebound on the horizon:
How to get all employees motivated?About specifically what?How to connect their renewed efforts
with more “progress” in – skills, value-creation, security, pride, money – for them?
“All” includes Management and shareholders.

3
3
Newsflash #1: “Power of Progress”
Multi-year study just published (1-4-10) by: Amabile & Kramer: http://hbr.org/search/Steven+J.+Kramer
• “Good days”: making progress & getting support to do so
• “Bad days”: spinning wheels; roadblocks to doing the right, best thing
Q: How do we publicly measure –individual, team and company –progress every day?

4
4
Newsflash #2 (1/6/10): “45% Happy”
Conference Board Poll Release
Lowest total in 22 yearsNot just the current bustContinues a 20 year general decline
Q: How big a competitive advantage in a service business if 90% were measurably engaged?
Imagine if our people are doing extra-effort, proactive service moves for our few, best target accounts per branch + our fill-rate for our core items for our core niches of customers are highly tuned V. the competitor with too much debt that lets fill-rates and morale slide across the board. Let’s steal only the weakened competitors most-profitable, best-fit for us customers and perhaps one or two of their very best people who are looking for a non-sinking ship.
5
5
Solution: A “Strategy Map”
Which every employee can:
1. Explain2. Point out where they are on it, and3. What they will do to help:
Improve service value efficientlyKeep/Win customers and Beat competitors
4. Expect to deliver better economics for all

6
6
How To Do: “Strategic Mapping”?
Google it, but too complex for SMEs*.
But, huge – simplification of, connection to and value for – distributors is possible!
Strategic mapping is step # 5 of 8 in a more comprehensive process called:
“Balanced Scorecard (BSC) Reporting”
*SME=Small, Medium Enterprises. In US, firms under 500 employees.

7
7
This Presentation Will Cover:A Balanced Scorecard (BSC) overview
How the 8-step BSC process can be simplified to be cost/benefit appealing to any sized distributor
How to evaluate “Quantum Profit Management Service” (QPMS) from Waypoint as the partnership answer to:
Core identification, renewal, extensionCreating a BSC capability in parallel

8
8
BSC OverviewMeasurement System that assumes:– Financial results are lagging indicators
driven by underlying, “balanced”measure-ables
– If daily value-creating activities are measured and improved, then only can final #s improve
Connects individuals’ daily activities with: – The company’s strategic metrics and – The company’s financial metrics– Better compensation and job
satisfaction for them
This slide starts to define what BSC is for those who aren’t sure. I have run across only one distribution chain that was using a formal balanced scorecard process and consultant. And, they did not have a specific, measurable definition of their core niche(s) of customers or a strategy map. They had confused the BSC exercise which is step 6 in an 8-step comprehensive process with the entire process.

9
9
Learn More About BSC (1)
www.balancedscorecard.org
Kaplan and Norton’s 5 Books on BSC– Latest: “The Executive Premium” (2008)– Has 4 measurable perspectives/views

10
10
Learn More About BSC (2)
Cost/benefit case study results:– 2004: Bain found 57% of global firms using it– 2007: Bain – 66% of 8,504 responding firms
using BSC– Multiple surveys find that firms with a formal
“strategy execution program” out-perform those who don’t by an average of 40% in over 70% of the cases.

11
11
Balances 4 Measurable Views
This is an example of trying to link the “four perspectives” together. But, the model is confusing, because it is trying to be all things for all types of companies instead of just an independent, physical-goods, distribution profit center. What if you only had to design a picture for a distributor? Think of the chronological, cause-and-effect chain of:
1. (Metrics for) High performance personnel practices to attract, keep, cross-train and motivate best employees for where you are growing to, which feeds….
2. Personal engagement metrics (averages, trend graphs v. all other branches) that suggests you have the focused, motivated talent to….
3. Measure, achieve, sell and get paid for basic service excellence metrics, which then allows the firm to gain….
4. Customer retention, penetration and profit maximization (from selling more core items with best practice replenishment inter-biz systems…
5. To yield faster sales growth, higher gross margin per employee, better profitability margin and higher pre-tax return on total assets – ALL AS A HAPPY BY-PRODUCT OF THE CUMULATING BENEFITS FROM the metric sub-sets above.
Trying to manage a business by “growing” sales, margin dollars and improving margin percentages would miss all of the underlying causes for the desired financial numbers.

12
12
BSC #5? A Bit Overwhelming!
1. This is one depiction of all of the ingredients that go into and around a BSC strategy-process program. (Note that BSC is band 6.) Most distributors have never articulated exactly what they are doing for every one of these steps, although all businesses are naturally fulfilling the hidden needs of the marketplace on a semi-conscious level; otherwise, they would cease to exist.
2. But, the first 5 are actually quite common to and generic for all distributors which allows these 5 bands to be standardized and simplified for distributors who want to grow wealth and have a sustainable business to pass on or sell for a high value.
3. I will explain the generic answers for the top five bands for all distribution firms in slides 18-41, and bands 6-8 in slides 31-48.

13
13
Who Really Uses BSC?(Global 2000; not SME*)
www.palladiumgroup.com– Consulting firm affiliated with
Kaplan/Norton– Global 2000 clients pay $3MM+ in
fees for designing a custom BSC system
Or, DIY by reading the 5 books, etc. ?
Is it all too complicated for small firms?*SME = small/medium (sized) enterprises
(< 500 employees in US)
The Palladium Group is a global consulting firm with which the two primary authors of the BSC movement, Kaplan and Norton, have affiliated. The firm will typically charge clients in excess of $3 million in fees to create a custom, organization-wide, top-to-bottom-to-top BSC system.Small businesses can’t pay such big fees or have 3 full-time MBA’s in their “office of strategy process management” to run such ambitious programs.The SME acronym is used more globally, in the US, SMB (for small/medium businesses) is used more frequently. Germany limits the use of the acronym to fewer than 250 employees, while the US governments have an upper limit of 500.

14
14
A Simplify-It-For-(S)ME Story? Recent classroom experience with Bob Kaplan*:
1. 10-2-09 “class day” of HBS Reunions
2. I’m back for 35th in Bob’s Class3. Huge handout, amazing slides, meticulous
process logic and Big Company Cases
4. When Bob recommends:“three full-timers in ‘office of strategy’ to
run the entire BSC process”…..*Bob is an acquaintance; has been an HBS (Harvard B-school)
professor since ’84; and is one of the two, driving forces behind the BSC trend.
I graduated with an MBA from Harvard Business School in 1974 and attended my 35th reunion in October ’09. Being active with Waypoint Analytics, a distribution-firm analytics web-service, I attended Bob Kaplan’s class that he conducted for returning alums. Most of his material was fine-tuning of material that is in his latest book: “The Execution Premium” (2008). This is his 5th book overall on the general subject of why and how to do Balanced Scorecard strategy-process management.In about the 60th minute of the 75 minute class, he got to the final step of a circular process which he called “the office of strategy’. When he mentioned that his average (Global 2000) client had about 3 full-time, professional managers running this office, a small business owner in the audience raised his hand and asked how a firm of 40 people could possibly do this entire process.
15
15
A Small Biz. Owner Alum asks..
“I’m CEO/Owner of a 40 person fabrication, distribution business, I can’t afford this scale of implementation:
How else can I do all of this?”(the Quickbooks v. SAP solution?)

16
16
Bob’s Honest Answer
“Don’t know what to tell you, except that the BSC process is immutable, every business must do each (logical) step”
MY TAKE:1. He’s only been helping Global 20002. But, SMEs have gotten big biz
solutions in the past that use 1-3 design concepts:
Bob couldn’t answer how his BSC process might be boiled down to a scale and a cost for SMEs. My solution to this question is in the rest of this slide show.

17
17
SME Re-Design Elements (1):
Standardized, turnkey solutions aimed at specific SME verticals (e.g. distribution channel (ERP systems emerged in the ‘80s; Quickbooks for smallest firms in the late ’80s)
Built-in, business models and systems withintegrated, franchise solutions – Fast food formats; consumer service
franchises

18
18
SME Re-Design Elements (2):
Outsourced VPs for functional leadership: – Long-time, expert problem-solving pros
for non, full-time functions (tax, law, IT, caterer)
– (Now) SaaS IT solutions v. in-house owned/run• Webex; Google Apps; Corp. accts at
various web sites

19
19
Why Do These Solutions Work?Small biz verticals have:
– Lower barriers to entry; local site key– Smaller scale critical mass skills/assets– Not as much differentiation amongst
them– Lots of them nationally with same needs
Outsourced, shared-cost, common-denominator solution => 80%(+) value for 20%(-) cost

20
20
5 Elements Before BSC in Pyramid Are “Standard” For Ambitious Distributors! (?)
(1) Mission: low-cost hub economics x 2(2) Values: earn high-performance,
economics for all 4 stakeholder groups(3) Vision: “people => service => profits”(4) Strategy: dominate 1 customer niche
profit pool at a time => barriers & profits(5) Strategy Map: “vision” (above) tuned
specifically to each target customer niche
This is an overview slide. Slides 22 to 43, which are sequenced by the 5 numbers/topics above will detail each pyramid band.
21
21
Assumptions About “Ambitious”Work on improving the business model to
create a sustainable, high-profit, salable entity
Not: “self-employed”; working full-time inthe business doing reactive fine-tuning of the past
Fine-tuning the past = death due to:– Not keeping up with the rate or type of
change in the environment; or,– The 4% innovating competitors that
kill them
The flip side of – “ambitious, perpetual innovators, gazelles, high-performers” – is the “entrepreneurial-myth or e-myth”. (Google it). It turns out that 85%+ of small businesses (think owner/operator, one-location) fail or grow no-where, because the founder/owner/inheritor is a technical, do-er within the business. Often they choose to have a life-style, self-employed existence in which they are the irreplaceable hub-of-the-wheel. They are not consciously trying to innovate with their business model to create something bigger, better, more sustainable and ultimately transferable or salable.

22
22
us
Suppliers Customers(3)Shock absorp.
(1) Lowest“TPC”
(2) Lowest“TSSC”
Math +/- you?100 500
TPC - total procurement cost; TxE = turn + earn TSSC - total sales/service cost; BE - breakeven
BEHi.TxE
0(6) old x old x sys.
(5)
(Neg.)
PBIT(4)
+ + +
(1) Mission: Hub Economics x 2
All physical goods distributors exist for 3 basic reasons and can grow win-win supply systems with best, right, smart customers. Here’s what the numbers on the slide refer to: 1) Distributors exist for their customers to lower ten of the 11 elements of “total procurement
cost”(TPC) more than they raise the 11th element, price. This slide is assuming that most customers could buy goods direct from 100 potential suppliers instead of the 1 distributor, but in greater quantities on a less timely basis each with its attendant set of buying and selling transaction costs.
2) Distributors exist for their suppliers to service end-users at a lower total sales and service cost (TSSC) than if the suppliers elected to sell the 500 customers direct.
3) The distributor’s inventory and people serve as shock absorbers for atypical problems that suppliers and customers may have. The distributor acts as an economy-of-solution, pain-removal, outsourced service provider. While the problem may be unusual for a given supplier or customer, the distributor sees the same type of problem often from a portfolio of similar suppliers or customers.
4) If we sort the 500 customers from highest PBIT contributor to biggest PBIT loser, and we study what items the best customers buy, we find that best customers have helped us unwittingly put in our best turn x earn (#5) items into a local distribution center.
5) Our best turn-earn products are bought by our best customers that share a common need for a specific one-stop-shop array of items.
6) High PBIT customers are then a by-product of bigger customers buying a lot of our best turn x earn items on a repeat, systematic (more or less) basis that generates above average order sizes. This reduces the fixed transactional and delivery costs as a percent of a bigger amount of gross margin dollars per order.
Some big questions are: Out of our top 10 PBIT customers what sub-niches of customers that buy the same 1-stop-
array of items can we identify? How do we protect these accounts and sell more old items to them on a greater win-win basis
that lowers both their TPC and our TSSC? What 5 best, target accounts within this same niche can we sell on a total team basis? How do we generally retain and penetrate all of the accounts within this niche with basic
service brilliance? (slide 5)

23
23
P.S. Corp. Culture TestEducate all employees to know/explain:
– Hub Economics– 4-way win stakeholder economics (WIIM)– The service profit chain (tuned to niches)– Life-cycle realities, strategies and tactics– Segment & re-serve customers differently:
• they are not all good; • same service for all +/- under-serves
v. best & over-serves the small, growing no-wheres
* WIIM = What’s In It (for) Me
All of these concepts are in my DVD training program entitled: “High Performance Distribution Ideas for All”. More on this product later.

24
24
(2) Values: 4-Way Win Economics“First Choice” due to best $’s for All
PAT
Customers(2)
Suppliers(3)
Shareholders(4)
Growth Capital(5)
Employees(1)
PAT - profit after tax
S
1) All 4 stakeholder groups want best-for-them total and long-term economics. The smart service management distributor: 1) pays more total-comp to get best caliber employees and keep them long enough to skill them up to deliver, as a team, the best service value equation metrics for a target niche of customers. Costco, for example, pays 41% more per employee than WMT/Sam’s, but gets 150% gross margin per both square foot and employee as Sam’s. So, Costco is growing faster at a better profit margin and return on assets than Sam’s even though they are one-eighth the size.2) The customers get the lowest total procurement cost (TPC: Ex. 3 and articles 4.1 and 4.2 at
merrifield.com) from the distributor that has best one-stop-shop-in-stock fill rates delivered on-time with zero errors, etc.. 3) Happy customers buy stay, buy more and tell their friends, so the distributor grows faster and more profitably than its competitors allowing it to buy more from suppliers and pay on time. 4) The shareholders make a higher ROI on a faster growing business (as in the Costco example above; UPS and FedEx are other exemplars that achieve the same economic philosophy). And, all of the best prospective – employees, customers, suppliers and investors – want to be affiliated with the best performing service economics firm. So, the firm is every, best prospective stakeholder’s “first choice” with whom to partner and invest extra discretionary resourcesFor very small businesses, another viable solution is to: hire them cheap, work them hard, supervise them tightly, be prepared to be the back up worker to fill in for high turnover. But, then the owner is working in the business which never grows and can’t leave the business unless a clone is willing to replace them. They aren’t working on the business model to create 4-way-win wealth for all and have a business that sustainably can run without them or be passed/sold on.

25
25
ALL STAKEHOLDERS WIN
This is an AD for my DVD training program which management should run through first to get a new consensus on what the unspoken (how dated?) success assumptions of the group (think) really is. Here are the facts: 6 DVDs; 53 10-minute modules (11 hours and 40 minutes of total programming); 274 page guide; list $995; Waypoint webinar attendees -$300; Waypoint subscribers - Free.

26
26
1. Happy Employees
2. Employee Retention
3. Improving Service
4. Happier Customers
5. Customer RetentionSystems, Praises
6. Growth and Profits
Pay
Hire
HPE
(F)
(D)
(C)
(B)
(E)
(A) Mastery
DIRTFT*
Job growth
Sales forcemotivation
Last look(+)
*DIRTFT = do it right the first time
(3) Vision Map = “Service Profit Chain”
A modification of Heskett, Sasser, et. al. “service profit chain”. The arrows are hopefully self-explanatory, but the virtuous feedback loops A-F are meant to suggest that:
A) The longer employees stay the more trained, skilled and expert they become which allows them to do their jobs ever better (a source of pride, esteem, advancement and compensation). The goal is to get all employees to understand and get to a level of self-motivation-fueling “mastery”.
B) As service improves, the absence of service mistake pain and stress coupled with the presence of prideful, improving, service excellence metrics boosts employee morale while reducing stress.
C) If the customers vocalized their satisfaction, then reps are motivated and emboldened to focus on (ask for) deeper penetration and fine-tuning customer replenishment systems. All of the best reps in the industry start to gravitate towards trying to work for the best service horse to ride.
D) Happy customers maximize their purchases with distinctively best suppliers. Both reps and customers are willing to take the long-term, partner view and invest in better replenishment systems to reduce inter-company friction costs. And, customers are more willing to give best service value providers last look plus a premium. This is all more motivating than putting out poor-service fires and trying to hold on to some business for lower prices due to the average, poor service value.
If customers stay, buy more and grant service value benefits, than the company grows faster and more profitably. F) If the company has profits which it must reinvest to finance faster growth, than all employees have job security
and job-growth-from-within potential. CONCLUSIONS: How many arrows and feedback loops are measured, managed, improved and rewarded within
your firm? If any service firm can orchestrate this process, especially tuned to one niche of customers at a time, then they will have outstanding, long-term, sustainable financial results. Imagine what happens if we “hire them cheap, work them hard”, and we have high turnover and poor service? All of the feedback loops turn from virtuous, upward, improving cycles to vicious downward spirals.

27
27
How Perfect Service Pays
CompanyProfitIndex
Acquisition
Referrals
Op. Cost savings
Quality Premium
Increased Sales
Initial Sales
From left to right, it will cost us some marketing expense to get a customer to buy from us (red= initial sales).If we are service excellent, the customer will buy more over time (increased sales)Because we are so good, we get last-look plus something extra (quality premium)Because we have zero errors, which is the low-cost, high-value, high-morale way to operate, plus high fill-rates with low shortage-scramble costs and larger order size and margin dollars per fixed cost of transactions, we put a higher percent of sales to the profit line.Because we are so great, customers talk and/or hire one another’s people who sell our story for us.Where do any of these economic realities show up in the financial numbers except for the firm with focused service excellence to dominate one customer niche at a time grows faster with higher profitability?How should we start to measure these important invisible,im-measurables? Read on!

28
28
(4) Strategy Assumptions-1
Tune Service-profit-chain for each niche:
– With specific, “service value equation #s”;
– & service model for each strata-size of customers in the targeted segment
– Equation and model must change with the life-cycle changes for both products and customer niche needs
The “service profit chain” generally seems logical, but it will not tell a distributor:a) What it’s historic, most-profitable niche of customers is or the 8 or so specific metrics
that have to be tuned, measured and improved for that niche’s optimum “service value equation”
b) Nor, will the service profit chain tell a distributor where in the product life-cycle a given supplier line or item is; or, how mature and consolidating its customers and their respective niches might be. Most distribution managers, like generals, are guilty of fighting the last war. That is, running the business on assumptions that worked in the industry when they were coming up through the ranks, but less to not at all now. When you look at slides 30 & 31, most distributors are guilty of still being too “product-centric” and too product-promotional. Slide 31 suggests that we should be working with best customers (that are the consolidators within their space) to sell all of the commodities that they need to and through them with a co-created replenishment system that delivers the lowest-total procurement cost for them and at the lowest total selling/service cost for us. The primary goal is a win-win, most-efficient supply chain re-engineering service solution for the 90% spend on commodities. Then, product-selling solutions as needed secondarily.
c) When we can calculate actual, net profitability of customers within a niche, we realize that not all are profitable and some can never be transformed into being profitable. If we can get 50% or more of the profits in the total pool of niche customers, then we will have the best “critical mass” inventory investment/fill-rate service and economics. More on this in 35-36.

29
29
Life-Cycle: Early v. LateEarly Stage: Key exclusive franchises are the
growth kernels – Cold-call selling for volume to keep
exclusive-line profitability– Be obedient, commissioned agent first;
Best-value seller 2nd
Late Stage: 90% sales on commodities from all – Be lowest total cost, “system-solution”
seller 1st ; – Profits from dominating a customer
niche – Goal: 50-80% of the niche’s “profit pool”
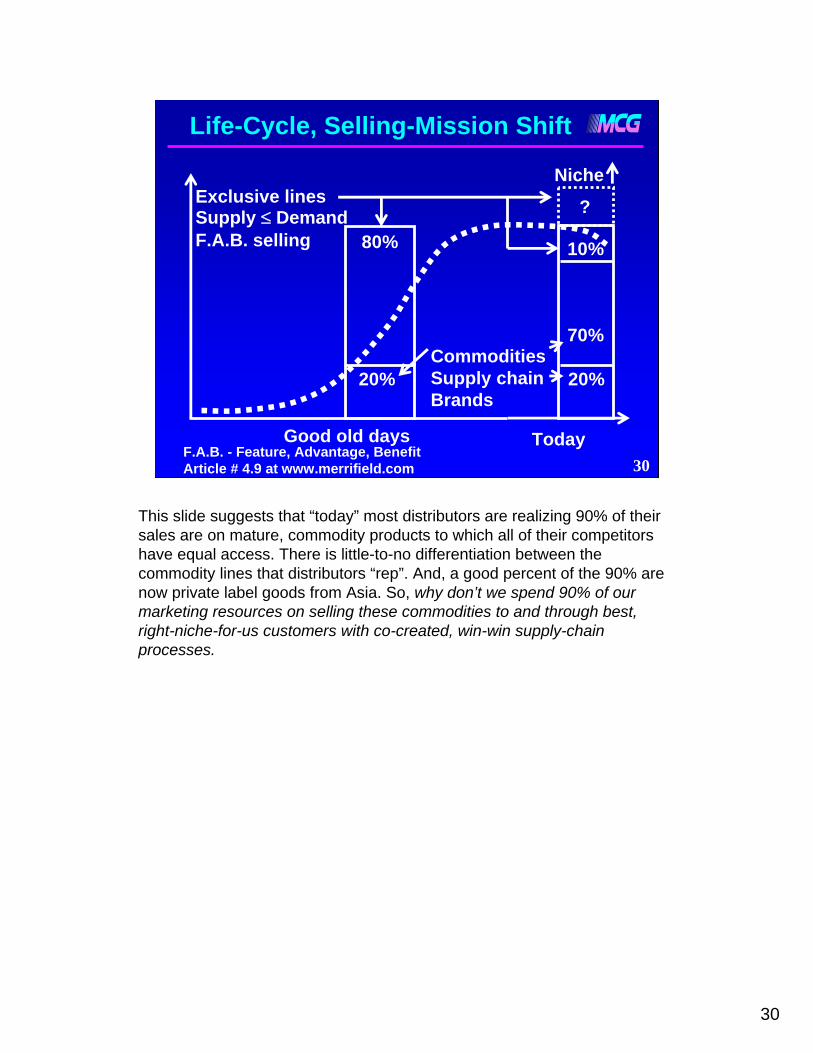
Think of these guidelines while looking at the following diagram of a typical life-cycle curve.
30
30
80%
20%
Niche
?
20%
Life-Cycle, Selling-Mission Shift
70%
Exclusive linesSupply DemandF.A.B. selling
CommoditiesSupply chainBrands
Good old days Today
10%
F.A.B. - Feature, Advantage, BenefitArticle # 4.9 at www.merrifield.com
This slide suggests that “today” most distributors are realizing 90% of their sales are on mature, commodity products to which all of their competitors have equal access. There is little-to-no differentiation between the commodity lines that distributors “rep”. And, a good percent of the 90% are now private label goods from Asia. So, why don’t we spend 90% of our marketing resources on selling these commodities to and through best, right-niche-for-us customers with co-created, win-win supply-chain processes.
31
31Copyright © Geoffrey A. Moore, 2005, from the book “DEALING WITH DARWIN”
Four Innovation Zones
DisruptiveInnovation
ApplicationInnovation
ProductInnovation
PlatformInnovation
EnhancementInnovation
IntegrationInnovation
ExperientialInnovation
ProcessInnovation
MarketingInnovation
Business ModelInnovation
Line ExtensionInnovation
Value EngineeringInnovation
Harvest& Exit
Renewal Innovation
ProductLeadership
Zone
OperationalExcellence
Zone
CustomerIntimacy
ZoneCategoryRenewal
Zone
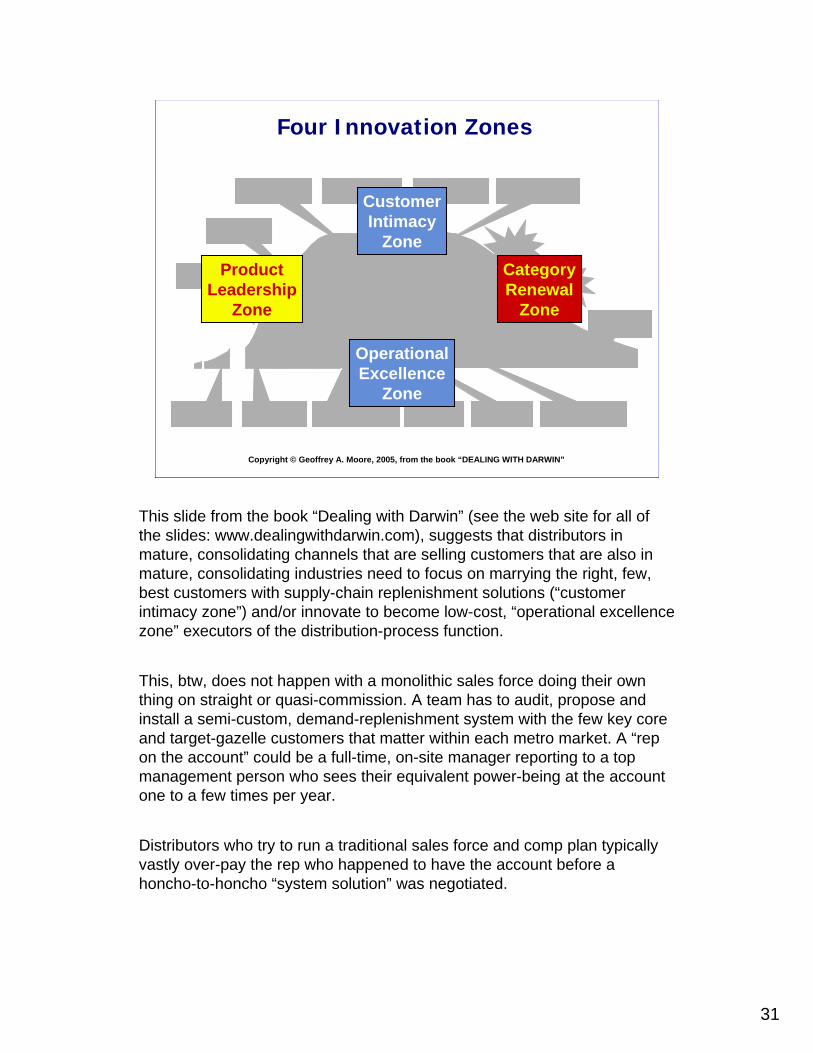
This slide from the book “Dealing with Darwin” (see the web site for all of the slides: www.dealingwithdarwin.com), suggests that distributors in mature, consolidating channels that are selling customers that are also in mature, consolidating industries need to focus on marrying the right, few, best customers with supply-chain replenishment solutions (“customer intimacy zone”) and/or innovate to become low-cost, “operational excellence zone” executors of the distribution-process function.
This, btw, does not happen with a monolithic sales force doing their own thing on straight or quasi-commission. A team has to audit, propose and install a semi-custom, demand-replenishment system with the few key core and target-gazelle customers that matter within each metro market. A “rep on the account” could be a full-time, on-site manager reporting to a top management person who sees their equivalent power-being at the account one to a few times per year.
Distributors who try to run a traditional sales force and comp plan typically vastly over-pay the rep who happened to have the account before a honcho-to-honcho “system solution” was negotiated.

32
32
(4) Strategy: Assumptions-2Parameters for defining “a customer niche”
(1) Industry segment (x) size strata (2) Dift. service bundle for each strata (x) (3) Buying philosophy/values of customers: – a) pal (or total, high-end “experience”); – b) total, best, service value (system) buyer; – c) pure price buyer (only about 5%) (4) Vitality/Growth Rate to estimate “NPV”
Net-Present-Value (NPV) of future “net profit” stream
Distributors should not define their “share of market” by the total product volume share that they have, which is early, life-cycle, exclusive-franchise thinking imposed by manufacturers. They should, instead, target a percentage share of the potential net profit that can be derived from a homogeneous pool of customers within a given niche. To define customers by niches they need to be broken down (1) first by industry segment categories which most distributors already use. Then each segment of customers needs to be (2) sub-divided further by sales volume strata as a casino does with gamblers or a bank does with depositors. Each size band or strata of customers than needs (3) a tailored service bundle. I typically use four strata: A-rep coverage, B-proactive inside contact, C-Wholetail, cash-n-carry, D-Web retail.If sales reps are going to be assigned to regularly cover and serve a customer today, that customer must have the current volume production or quick upside potential of doing at least $400/month in margin dollars minimum (article 4.11 at merrifield.com). Call those “A” accounts. Most distributors that go to market primarily with outside reps and who have not yet done this boundary math will find that up to 70% of the accounts assigned to reps are and will stay chronically below the $400 GM/month boundary. They have too many reps. The best reps should be assigned all of the A accounts and be put on a net-profit improvement change incentive for their new A territories. All of the B and C accounts formerly assigned to reps need a new service bundle which will allow the company to stop losing money on these accounts and potentially make some. (All in 4.11)Most distributors can do one, perhaps two out of four service model bands well. Otherwise, what it takes to dominate one band is mutually exclusive and either not economical or service-value-appealing to the other bands.Within a target strata of customers, customers can be sub-divided yet again into buying-value groups. Three main sub-groupings are ones who will:
buy from old pals in spite of higher prices and/or weaker service-metrics value; buy the best total service value, as best they define it (the great majority); and pure price buyers which is smaller than most distributors and sales reps think.
Assuming we target best total service value buyers which is about 80% + of all buyers, we can sub-divide them by their current and future net-profit potential. A large, efficient buying customer that is growing 2 to 5 times faster than the industry (“gazelle”) , because they are strategically focused and perpetually innovating will have the highest “net present value” for the sum of present and next 5 to 10 year profit potential stream. If your #1 best, historic niche is “A”, value-buyers within one industry segment, renew your service value equation for the niche and hyper-focus on the few most profitable and the one or two potential gazelle targets. The key to strategic effectiveness is SUPER FOCUS BY THE ENTIRE SERVICE TEAM ON THE RIGHT BEST CUSTOMERS IN THE RIGHT BEST NICHE FOR THE METRO MARKET CONSIDERING WHERE OTHER COMPETITORS ARE WEAK AND STRONG. GO FOR 50-80% OF THE PROFIT POOL.

33
33
Service Models x Strata
(2a)Present?
ABCD
(3a)Future
O.S.
(1a)
House
(2b)(3b)
(1b)
This graphic illustrates how we can slice an industry segment of customers into four theoretical size bands to serve each differently. On the left, treating all customers the same, we over-service the bottom two bands: the cost-to-serve exceeds the margin dollars per transaction for structural losses. Banks, for example, can’t afford to give small depositors free checking and interest on their balances. And, we under-service the top 1-2% customers, or are vulnerable to a competitor figuring out that they can offer the whales more custom services (at an extra bundled cost) and still make good profits instead of the obscene ones we might be accidentally and un-knowingly currently enjoying. On the right, the “A” band gets traditional full-service which includes being assigned an outside sales rep, contract prices, etc. Minimum floor is $400/month in gross margin, no ceiling. Note in the right hand figure that A’s at the very top should get service-value packages that are quite extensive and customized to match their net profit potential. A profit center will statistically only have a few of these.“B” are telemarketing or some form of proactive, low-cost marketing.“C” are wholetail, cash and carry customers who drive to a Fastenal-type, store-location to help themselves and pay with cash or credit card.“D” are retail or web-store customers who pay retail list price and all extra services are unbundled and charged for. Grainger, for example, makes a handsome profit on the mark up on their un-bundled, freight/handling charge.

34
34
(4) Strategy: Assumptions-3Within a niche, which customers are:– Currently most profitable & unprofitable
(analysis?*)– Target: “best-value buyers” for increasing buy-
sell, win-win equity? (Hi’r Net Present Value or NPV)?
– Target: innovators (“gazelles”) with Hi’est potential NPV, if we can marry them?
– The “living-dead” to harvest without write-offs? – The profitless “exploiters” (no partnering track
record with any of their stakeholders)?•All profitability analysis by customer and customer niches provided by Waypoint QPMS.
This slide adds some sub-species concept-names for different types of customers that might exist within the niche dimensions in slide 32.
35
35
Why, How To Dominate A Niche?
Each niche will have unique array of one-stop-shop items they will want in local stockHighest, local, competitive fill rates =>
Best service value to the nicheBest transaction economics for both
Breadth-depth of 1-stop investment = an investment barrier*Getting enough sales, market-share from a niche to turn the inventory = a second barrier
* Waypoint QPMS will identify & calculate core items & critical mass investment levels
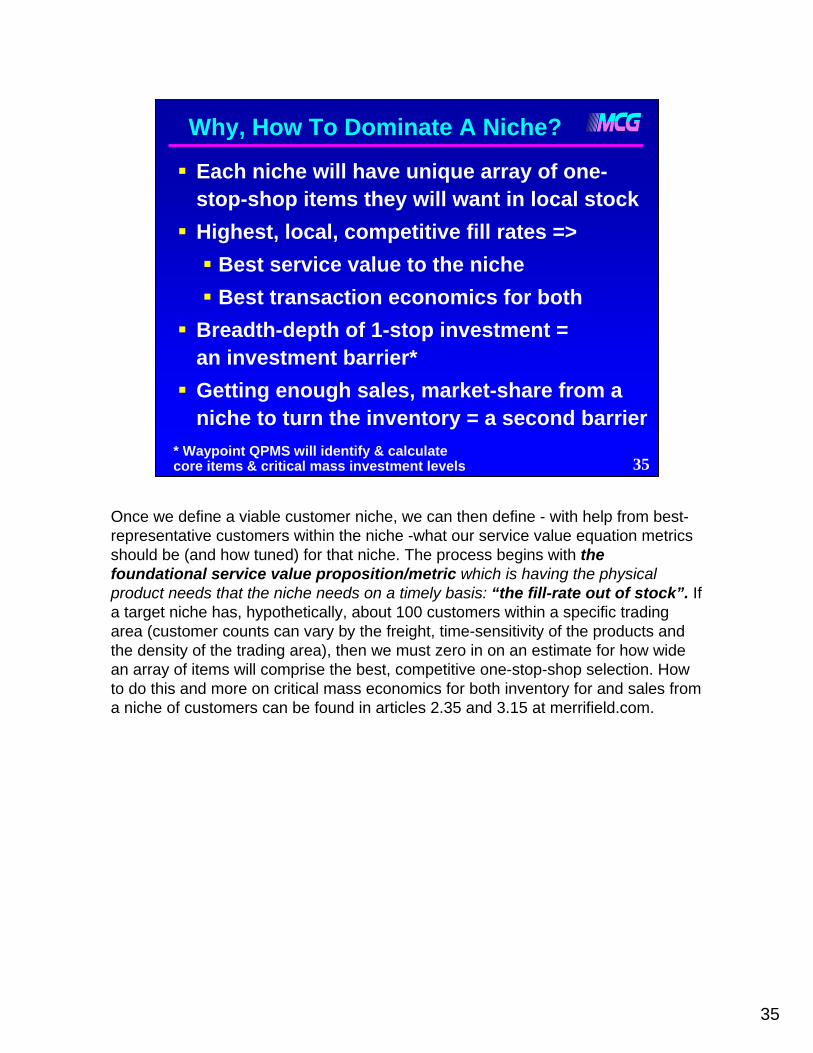
Once we define a viable customer niche, we can then define - with help from best-representative customers within the niche -what our service value equation metrics should be (and how tuned) for that niche. The process begins with the foundational service value proposition/metric which is having the physical product needs that the niche needs on a timely basis: “the fill-rate out of stock”. If a target niche has, hypothetically, about 100 customers within a specific trading area (customer counts can vary by the freight, time-sensitivity of the products and the density of the trading area), then we must zero in on an estimate for how wide an array of items will comprise the best, competitive one-stop-shop selection. How to do this and more on critical mass economics for both inventory for and sales from a niche of customers can be found in articles 2.35 and 3.15 at merrifield.com.

36
36
Key Critical Mass Questions:Given:
– size of trading area and niche spend– Size of critical mass inventory investment– Size of critical mass sales to get ROI turns
How many distributors can achieve these numbers in one trading area?
How tough for #2 to achieve, if a focused #1 already has 50-80% of pool?
Case example: to sell a commercial scale contractor niche, a distributor estimates that they must have a breadth of 6000 items, and for best, metro fill-rates a depth of investment of $800,000. Given an average margin rate of 25% for the marketplace, the distributor needs 4 full turns to get to an OK, not great, return on the 800k investment. This means the distributor will have to get 3.2MM in warehouse sales at cost or about 4.3MM in sales before adding on any indirect or direct sales that might naturally happen on top of warehouse sales. The questions are:
1. How many distributors in a given metro market get critical mass sales of 4.3mm or more out of the warehouse?
2. If one distributor can get 50 to 80 of the warehouse sales in a market, how can another afford to have 800K in clean, right inventory, but with poor returns? The poor turns are not from poor stock investment choices, but from lack of sales, because some other distributor has already achieved critical mass inventory and sales economics for the target niche.

37
37
Service Metrics Beyond Fill-rates:8+ metrics for service value equation!
Each customer niche is apt to have peculiar needs as well as tunings for:– Order fulfillment response time– Special-stock, fill-rate-level guarantees– (Custom) Processing, pre-assembly, etc.– Perfect Service guarantees for some
metrics– Special personal services to perfect
replenishment or JIT service needs
Defining and measuring all of the “basic, expected services” that wrap around the tangible commodity in the “augmented product” diagram in the next slide (38) is vital to achieving all of the benefits that come with true “service excellence”. It’s tough, but inspirational and rewarding work. If we don’t go for excellence, and provide instead an “average service experience”, than customers turn into what seem to be “price buyers”.If our service and our rep are both “good” like most of the other competitors, then what is left to differentiate suppliers in a customer’s eyes other than “price” and all competitors’ profit levels will migrate to zero over time. If on the other hand, we have “zero errors and on-time delivery guaranteed”, etc. (for at least the most important customers in the target niche) which allows us to help the customer measure the benefits they can get from better “up-time and done completely right the first time” in their business, then we have something unique and valued.

38
38
A DISTRIBUTOR’S TOTAL PRODUCT VALUE
1 2) 3 4 5 ?
The tangible commodities are “augmented”from the inside out
1. Lowest cost (China) clone tangibles2. Max. butterfly economics for a customer niche3. Basic service excellence metrics (“big 8”)4. Segment niches by strata
• extra services for best lifetime profit customers• less services, higher prices for smaller
5. New co-created extra services: bundled or fee?
Total, unique, best, value proposition
This is a jazzed up version of an old business model called the “augmented product”. Embellishments in this slide include:Circle 1: Not good enough to have just all of the traditional commodities, but world-class-quality and lowest-cost-produced clones from Asia. Circle 2: the butterfly economics we saw back in slide 22 must be tuned to one customer niche at a time if we are in a mature, repeat-buying stage of an industry/product group life-cycle.Circle 3: Then we worry about fill-rates, zero errors, on-time delivery and other “basic, expected, service” metrics (see ex. 3 at my site)Circle 4: Raises the issues of adding or subtracting services either bundled or unbundled-for-separate-fees depending upon the strata-size of the customer in the niche. (Slot players at casinos don’t get comp’d anything; drug lords dropping $5MM in a binge get comp’d all sorts of stuff.)Circle 5: For the few, huge, net-present-value, net-profit customers within a niche, there will always be customized, one-off services a distributor might co-create with the customer to get the products to and through the customers’ business at the lowest total procurement cost.

39
39
Or: Commodity “Margin Gravity”
This trend slide illustrates how a majority of all businesses have over-shot capacity for a mature, saturated, post-consumer society in the US. They are all forecasting to grow sales more than their markets are growing, which adds up to a blood-sport. To win business, competitors start to compete away profitability by lowering prices and/or giving away services. Only about 4% of all mature businesses are actually able to perpetually innovate at either or both: a) creating higher service value; or, b) creating a lower, total-operating-cost business model. Innovation will keep the margins higher until imitators knock off the advantage and lower prices. A firm can not innovate in the most strategic, target areas, if it does not have good business analytics and a good balanced scorecard strategy-process.These capabilities are necessary, but not sufficient for identifying winners and losers and innovating appropriately with both groups. Management must still pick the customer niches, define the service value equations and execute.

40
40
Summary Pts. For: #4 StrategyWhat is a branch’s #1 customer niche(s)?It will generate over 150%+ of true, net profits
to pay for all losing (customer) activities.Mature channel issues?
– Update our unspoken, dated, assumptions– Get better at “customer niching”:
• definition • service value equation & biz model reinv’n• #1 share of “profit pool” domination.
Need customer & item/supplier profitability analytics!

41
41
(5) Strategy Map Links:
1. High-Performance-Environment practices that will: attract, keep, train best people, so =>
2. People Engagement Metrics emerge to =>3. Achieve Service Excellence Metrics =>4. Delta Profit Per Customer Increases=>5. Expanding Profit Pie to reward all
stakeholders =>6. Best stakeholders make you “first choice”
for partnering and investing extra resources
This is a verbal re-summarization of the chronological steps that we covered in the “strategic profit chain” slide. But, once we know (#4) our own specific target customer niches and track our profits and profit improvement change (delta), then we can work backwards to define; (#3) service value metrics, then (#2) people engagement metrics so that we can achieve the service levels, etc.High-performance service organizations always start foundationally with “high performance environment practices” which notably includes how we pick our employees. We can pay thoroughbred wages to get a lot of candidates to show up, but if we can’t pick the right, best caliber people for where we are growing to, then no amount of good coaching, etc. is going to turn a donkey into a Derby winner. So, what are our “high performance personnel practices”? Next slide (42)

42
42
Hi-Performance (HR) Practices*
HiringSys.(2)
Orien-tation
System(3)
Pay-for-knowledgesystem(s)
(4)
Monthly Goals (5)
C.I. Scorecards (6)
Achieverpaystrategies (1)
Weeding System (7)
(Lessons)
7 Personnel “Practices”
C.I. - continuous improvement. See article 5.7 @ www.merrifield.comAlso see info on 6-hour, audio-tape: “Hiring,Training, Motivating & Keeping the Best Employees.”
(M 4.7)
(M 5.3)
(M 5.6)
This slide is the organizing agenda for a 6-hours of audiotapes (product available from MCG) of an all-day, live seminar that I did.

43
43
People Engagement Metrics
Percent A and B players (no C’s)% achieved 100% on culture test (WIIM)% of L-n-E* certifications v. total pot. baseAverage morale score/trend of employeesAverage score of mgt. by employeesQuarterly quiz score on company #s; estimated gainsharing bonus/personPublished “praising statements”/week (article 6.3)
*L-n-E = learn and earn (for cross-training learning programs or “pay for knowledge” programs, step 4, in the preceding slide
The goal of these metrics is to make sure that the minds, hearts and wallets of all employees is aligned with the “strategy map” of the profit center. An alignment tool is my “kinetic chain” which is exhibit 16 and article 2.1 at my site or module 5.10 in the DVD.
More specifics on the suggested metrics above (you may think of others):When managers put people in three piles: Ace, OK, problem/C: there are no C’s. They have been coached back into formation or outplaced.For boot-camp orientation training for all new employees, they have to take a summary “corporate culture test” as many time as they have to get 100% including explaining why the culture and the company’s BSC process is good for them.
I like to ask all employees twice a year how pumped up they are on the job on a scale from 1-10 on an anonymous, but everyone must participate survey.

44
44
Service Feature → TPC Benefits
1-stop-shop, highestfill-rates
Zero errors100% on time deliveryHeroic actions/recoveries
11 Elements of TPC1. Price2. Shop time3. Paperwork4. Expediting5. Mistakes6. Internal handling7. Storage costs8. Inventory financing9. Inventory control costs10. Inventory shrinkage11. Inventory Misc.
(taxes, insurance)
(From Module 4.1)
Buying costs
(From Module 4.11→)
↑
This same info is covered in more detail (all “8 elements of service excellence from one distribution company) in exhibit 3 at www.merrifield.com. The idea is to translate our service excellence metrics “features” – high fill-rates, with late cut-off, for next am delivery – into customer “benefits” which are the lowering of one or more of the 11 elements of TPC: such as, stock less, be out of stock for shorter times; more next day uptime, productivity.

45
45
Review Of First 5 Steps
Change “groupthink” about assumptions for high-performance distribution: mission, values, vision, strategy & strategy map
Analytics + Service Value insights are vital to creating niche-focused “Strategy Map” (both from QPMS)
Steps 6-8 are heavy info chores: collect, process, share, cont. improve
Overcoming traditional ways of thinking about and running a distribution business to embrace the high-performance ideas in this presentation is the first and biggest challenge. I suspect that some small, but fiercely-defending-of-the-past, percent of the hard-wired brains within the human gene pool are in capable of change. They may have to go in order for real change to occur. In my DVD training program, modules 4.1 to 4.13 cover the specific, how-to’s of -defining, measuring, achieving, selling, getting paid for and leveraging basic service metrics.
46
46
Specifics for #s 6-8 ?
MissionValuesVisionStrategy Strategy MapBalanced ScorecardCascading MeasuresStrategic Management System
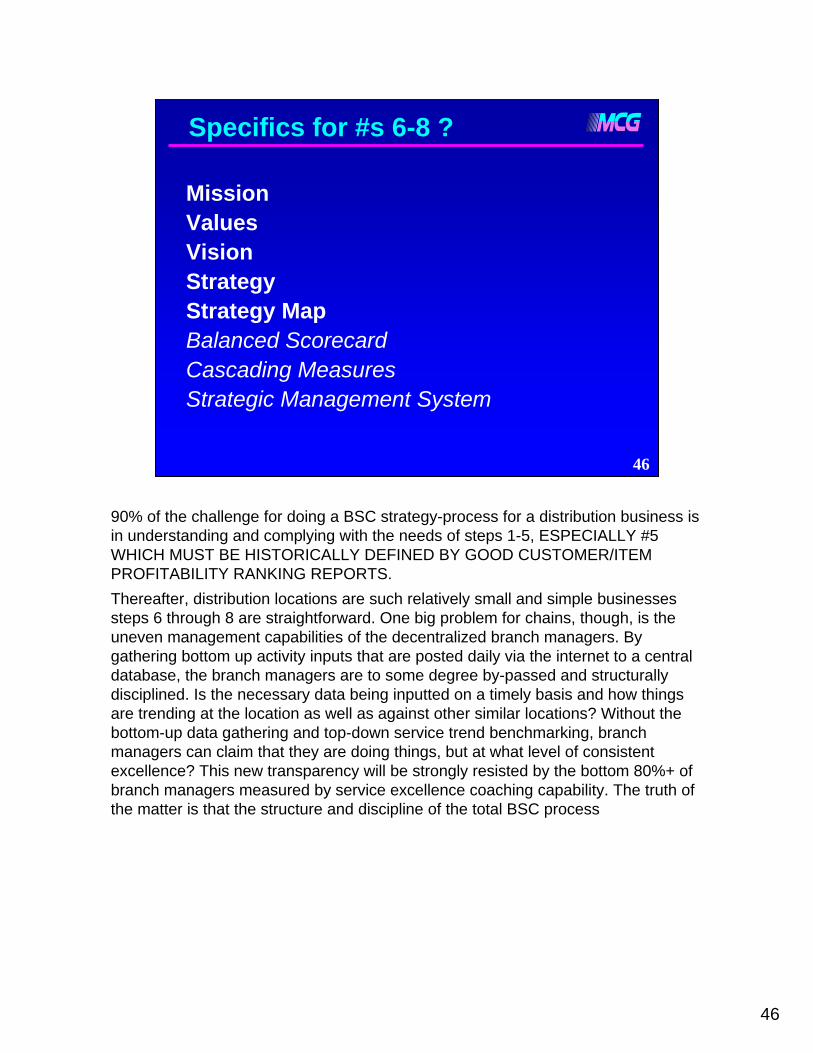
90% of the challenge for doing a BSC strategy-process for a distribution business is in understanding and complying with the needs of steps 1-5, ESPECIALLY #5 WHICH MUST BE HISTORICALLY DEFINED BY GOOD CUSTOMER/ITEM PROFITABILITY RANKING REPORTS. Thereafter, distribution locations are such relatively small and simple businesses steps 6 through 8 are straightforward. One big problem for chains, though, is the uneven management capabilities of the decentralized branch managers. By gathering bottom up activity inputs that are posted daily via the internet to a central database, the branch managers are to some degree by-passed and structurally disciplined. Is the necessary data being inputted on a timely basis and how things are trending at the location as well as against other similar locations? Without the bottom-up data gathering and top-down service trend benchmarking, branch managers can claim that they are doing things, but at what level of consistent excellence? This new transparency will be strongly resisted by the bottom 80%+ of branch managers measured by service excellence coaching capability. The truth of the matter is that the structure and discipline of the total BSC process

47
47
(6) BSC Implementation Points
24/7/365 Internet access for all (remote) employees to input and track their #s*
HR & Service Manager(s) enter daily data for environment, engagement, service #s
QPMS provides all entering, trend-tracking reports & graphs
Upstream, delta profit by customer/niche analysis, trends, comp. also from QPMS
* QPMS = provides security access for each employee to see only their #s
In-house ERP systems were not set up originally with the internet in mind. So, its hard for an existing ERP system to gather daily, decentralized process activity from branches and track/analyze them as needed. The question is: will a distributor think that they have to totally knock-off, duplicate all that QPMS does at many times the total cost and take months (years) to develop and maintain or just subscribe to the service one branch at a time?

48
48
(7) Cascading Measures:
Distribution is a simple, chronological, channel-flow, service-process business:– Easy to tie employee’s #s to a
“strategy map”– Easy to tie employees into “delta-profit,
improvement gain-sharing bonus plan– Transparency => positive, peer pressure for:
• All to contribute fairly to “service excellence”
• Or, shape up or out quickly
All branch employees should know by heart:1. The number one (or few) niche(s) that the branch is targeting.2. Which are the 5 most profitable customers and the 5 most potentially profitable
target accounts within each niche(s)3. What comprises a pro-active, heroic, extra-effort, service effort on their part on
behalf of one of the 5-most-profitable core or 5-highest, NPV, target gazelle accounts.
4. What the service metrics are for the value equation for the target niche(s); where they are posted; why and how they matter; what they can do directly or indirectly to make those numbers improve to and stay excellent.
5. Beyond the service equation metrics, which-working backward in the value-chain, any department might choose to measure the 4 to 8 most important efficiency and strategic effectiveness numbers around what they do to in order to support and add ultimate value to, first, the customers and then all stakeholders by growing faster, more profitability at a high pre-tax return on total assets.
6. What’s in it for them (station WIIM, “what’s in it for me”)7. They will then indirectly realize that if one person on the team is dogging it, then
everyone’s gainsharing bonus is in jeopardy. And/or, if the company has a soft-spoken policy of sharing a fired worker’s compensation with others who pick up the slack without replacing the person, there will be no place for any unengaged slackers to hide.
49
49
Motivation&
Responsibility
Education
Service
$ #'s
WIIM
Mastery
(+)
Rankings
100%Adults
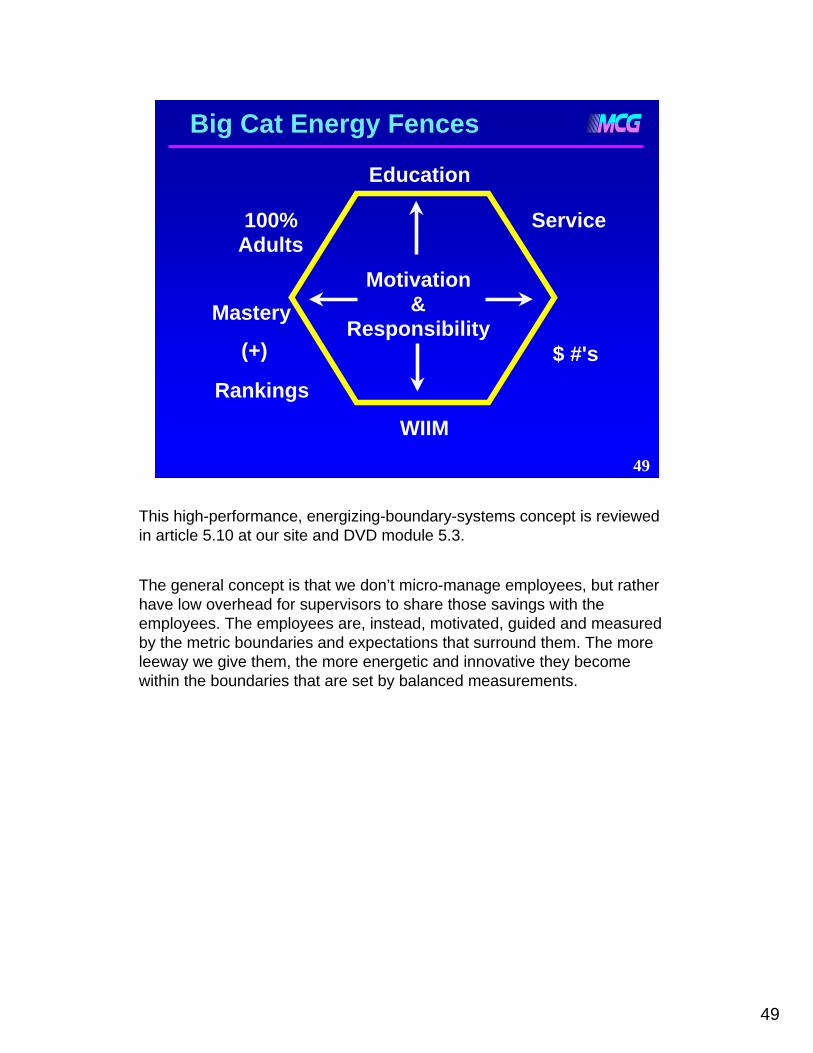
Big Cat Energy Fences
This high-performance, energizing-boundary-systems concept is reviewed in article 5.10 at our site and DVD module 5.3.
The general concept is that we don’t micro-manage employees, but rather have low overhead for supervisors to share those savings with the employees. The employees are, instead, motivated, guided and measured by the metric boundaries and expectations that surround them. The more leeway we give them, the more energetic and innovative they become within the boundaries that are set by balanced measurements.
50
50
High
Output
Low 5% problems
90% + coasters
5% Achievers
Turbo Steadies
Coasters Achievers (?)
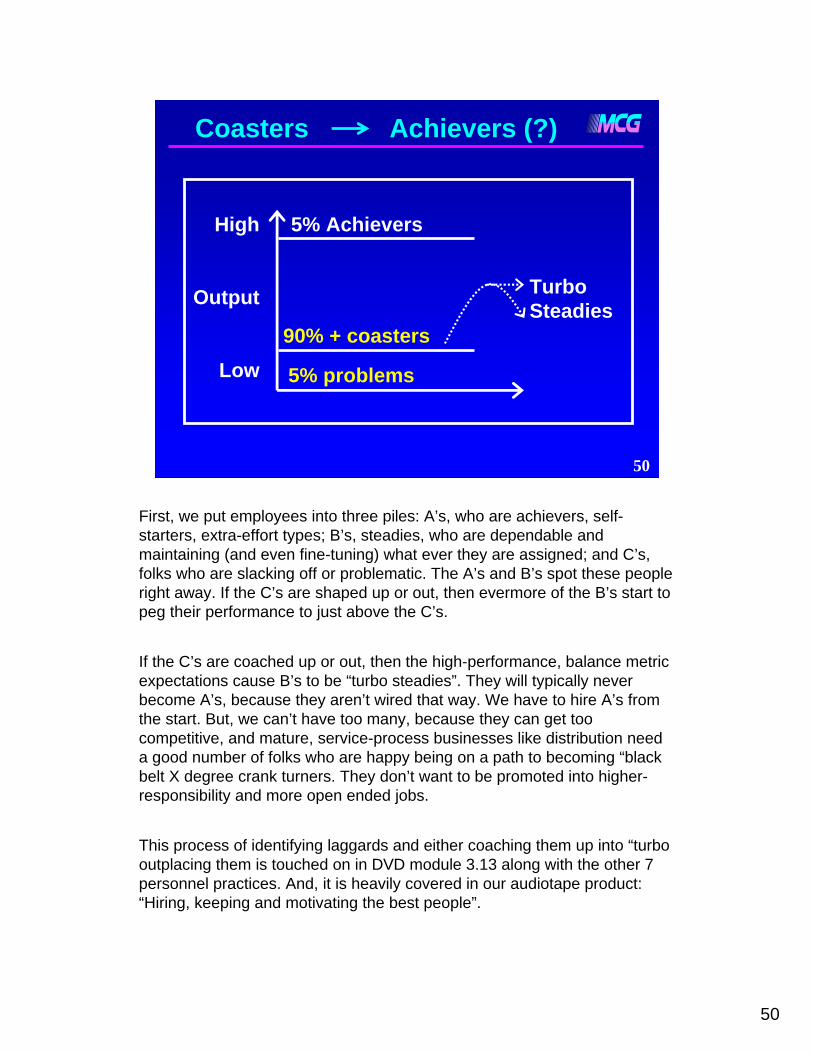
First, we put employees into three piles: A’s, who are achievers, self-starters, extra-effort types; B’s, steadies, who are dependable and maintaining (and even fine-tuning) what ever they are assigned; and C’s, folks who are slacking off or problematic. The A’s and B’s spot these people right away. If the C’s are shaped up or out, then evermore of the B’s start to peg their performance to just above the C’s.
If the C’s are coached up or out, then the high-performance, balance metric expectations cause B’s to be “turbo steadies”. They will typically never become A’s, because they aren’t wired that way. We have to hire A’s from the start. But, we can’t have too many, because they can get too competitive, and mature, service-process businesses like distribution need a good number of folks who are happy being on a path to becoming “black belt X degree crank turners. They don’t want to be promoted into higher-responsibility and more open ended jobs.
This process of identifying laggards and either coaching them up into “turbo outplacing them is touched on in DVD module 3.13 along with the other 7 personnel practices. And, it is heavily covered in our audiotape product: “Hiring, keeping and motivating the best people”.

51
51
More On Mastery
Time
Exce
llenc
e
*Best reference: Mastery by George Leonard. Plume, 1992
This concept/skill for learning how to learn is covered in DVD module 5.4. All modules in section 5 are key to continuous learning, cheap-experimenting, failing forward, etc. All of these innovation and continuous improvement modules will help to increase both individual employee’s and the company’s capacity for those objectives.

52
52
(8) Strategic Mgt. System
QPMS = the de facto SMS Glue– 5 x 5 sales reports allows all levels – rep,
branch, chain HQs - to track strategic accounts for “delta PBIT” progress
– Customer sub-set plays & tracking reports– HQ can – track, graph, compare- daily
input #s of all branch (dept.) metrics– Compensation reports on “delta PBIT”
AND cost-to-serve management are key
The tracking and compensation reports as well as the “database scorecard”templates for: service excellence metrics; people engagement metrics; etc. allow any part-time manager or virtual, part-time team to effectively manage and monitor the on-going strategic management process of a distribution location or chain.

53
53
How Do We Fund BSC?
To optimize/maximize our core, we:– Need extra resources to invest– Which are being wasted on structurally
losing customers and suppliers– We must transform or weed losing
elements to free resources to reinvest into the core
QPMS reports and plays will enable this
1st transform the losers
Lean organizations have no slack resources. Every employee is working as hard as they can (on an average, long-term sustainable basis). If people can’t find the time to do proactive, profit improvement plays, then they should start with the ones that free up slack such as:
1. Turn super-losers into winners or dictate profitable terms and expect to lose some volume for which the activity costs vastly exceed the margin dollar contributions
2. Solve the chronic small-customer, small-order problem in which MANY customers are receiving a service bundle for which the cost per transaction exceeds the margin contribution.
3. Solve the high incident of small, special, back-orders that may be caused by a supplier’s line splitting into commodities and specialty items; or too many small or unprofitable customers receiving this very expensive “extra service” free without special charges and conditions.
4. As small orders consolidate or disappear, the company can decide whether to lay-off the excess service people slack to reduce costs more than margin dollar loss and/or to reinvest some of the slack into doing other plays.

54
54
Section Summary Thoughts:
“Mission, Values, Vision” are generic for any ambitious, innovating distributor
But, “strategy” (niches) will vary for each distribution branch within chains; for each, local-market competitor too!
Can’t do BSC without first defining “historic strategy”: core: customers x items (suppliers)
QPMS analytic reports will identify these

55
55
Defining The “Diamond” Core,Allows Us To:
Focus on key accounts in best niche(s): Tune “Big 8+ of service excellence Educate all employees about:
“high-performance-service” economics service management practices x core (esp. 5/5) & WIIM benefits
Measure 4-step “perspectives” chain:practices => engagement => service
= profits

56
56
II. How To Assess QPMS
5-part, service solution + cont. support
What new capabilities (benefits)?
Compared to your next best alternative?
Should we try to build our own in-house capability?

57
57
QPMS: 5-Step, Total-Solution Process
1. QPA permits profitability ranking analysis
2. Virtual coaching helps to see and use …
3. Pre-packaged “profit improvement plays” to “manage the extreme winners and losers”
4. Next level tracking/analysis reports support execution and creation of a:
“high-performance, BSC capability”
5. Change-Mgt., educational support materials help on-going progress
QPMS is a 5-step bridge from “business as usual” to “high performance, service management” shaped and driven by both “business analytics” and “balanced scorecard capability” metrics.
Quantum Profit Analysis (QPA) is the cost-modeling that allows the basic profitability ranking reports to be done for: items, orders, customers, suppliers and sales territories.
“Virtual Coaching”: Randy Maclean, the founder of and chief software architect forWaypoint and I have identified and analytically supported tactical, profit improvement plays that allow distributors to quickly make sense of and manage the extremes (super-winners and super-losers) of the ranking reports. We meet with management as needed via go-to-meeting sessions in which we all use the company’s own numbers on the screen from QPMS.
Randy and I, along with my detailed recipe articles and DVD modules, continue to support clients’ change needs on an on-going basis, as needed.

58
58
What New Key Capabilities?
Comprehensive Analytics
BSC IT Strategic alignment for all:employees, processes, skills, incentives
Chronic profit bleeders are solved
More effective buy-sell systems x more-to-core plays for all highest NPV customers

59
59
Resource Flow Feeds Innovation
Logic (and research) Dictates:
1. Identify, measure, renew “Core”
2. Extend the “Core” to its maximum
3. Then, consider vector-moves using core competencies and free resource flow
Chris Zook of Bain Consulting wrote three impressive books on “core management”. The only problem is that most distributors do not know precisely, measurably what their core intersection(s) are of most profitable customers buying what most profitable items. QPMS will allow a distributor to: 1. Define exactly what the core is.2. Very surgically apply resource investments to strategically focused plays to quickly increase free cash-flow profits from the core.3. On a base of high-performance service excellence with free cash-flow to have many new strategic options to consider v. trying to survive as is with weak to no profitability or future for any of the stakeholders.

60
60
Build In-house? Remote Data Storage Costs?
The costs for: internet transmission; and, remote data storage on open-system, clones makes central utility consumption cheaper than having your own in-house data power plant. The “in-house plant” then requires scaling up all of the items in the next slide. Better that existing IT people keep working on their typically large and never-ending maintenance backlog lists and become key trainers with QPMS as well as the interface managers between the company and Waypoint. Far more impact, faster for far less total incremental investment by the company.
The choice of either subscribing to QPMS or trying to knock off at least its most compelling benefits is a false choice. Big chains may want to make it an and/both. Subscribe now, one-ready-or-desperate-turnaround branch at a time, and later decide which functions to take in-house, if not using the subscription fees as a substantial credit towards buying an in-house license for QPMS.

61
61
In-house Development + ?
In-house software people usually have a permanent back-log. Their first-time efforts at copying what Waypoint has done many times for many distributors will be lengthy and expensive, then all of the attendant overhead costs with in-house capabilities will not be shared cost as they are with Waypoint. The virtual coaching and networking with other high-performance clients is icing on the cake.

62
62
Steps From “Here” To “There”?
Webinar and/or Demo with QPMS
Read: quantumprofitmanagement.com & merrifield.com/quantum
Watch, debate “Bruce’s DVD”; QPMS Challenge Day
Subscribe to QPMS and execute “profit improvement plays” while building BSC
The DVD program is entitled: “High Performance Distribution Ideas for All”. Lots of info on it at merrifield.com. It is $300 for webinar attendees and free to subscribers of QPMS. A “challenge day” is when I spend a day with a large chain’s management team (typically for no fee, just expenses) on reviewing all of the details of why and how to become a “High Business Intelligence” distributor to let the team decide if they want to slowly and expensively try to knock-off QPMS or subscribe to it quickly, affordably and situationally: branch by branch. The sequence and speed of implementing “profit improvement plays” will be situationally different for each client.
63
63
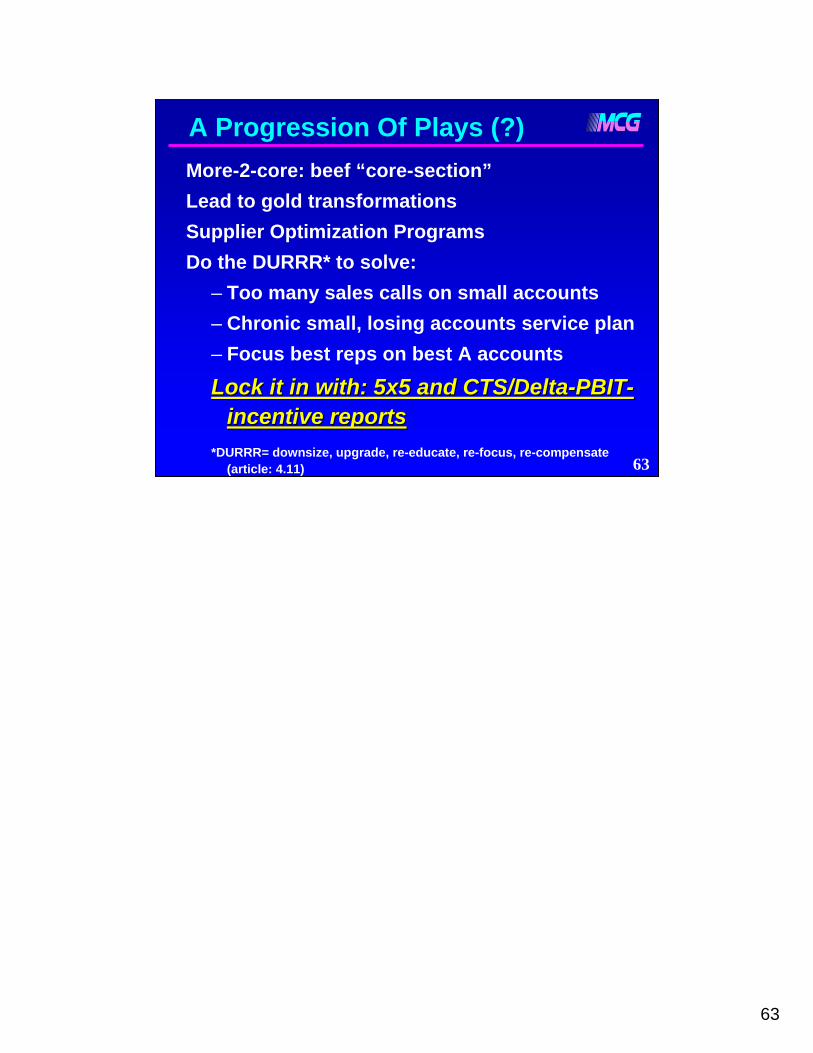
A Progression Of Plays (?)More-2-core: beef “core-section”Lead to gold transformationsSupplier Optimization ProgramsDo the DURRR* to solve:
– Too many sales calls on small accounts– Chronic small, losing accounts service plan– Focus best reps on best A accounts
Lock it in with: 5x5 and CTS/DeltaLock it in with: 5x5 and CTS/Delta--PBITPBIT--incentive reportsincentive reports
*DURRR= downsize, upgrade, re-educate, re-focus, re-compensate (article: 4.11)
64
64
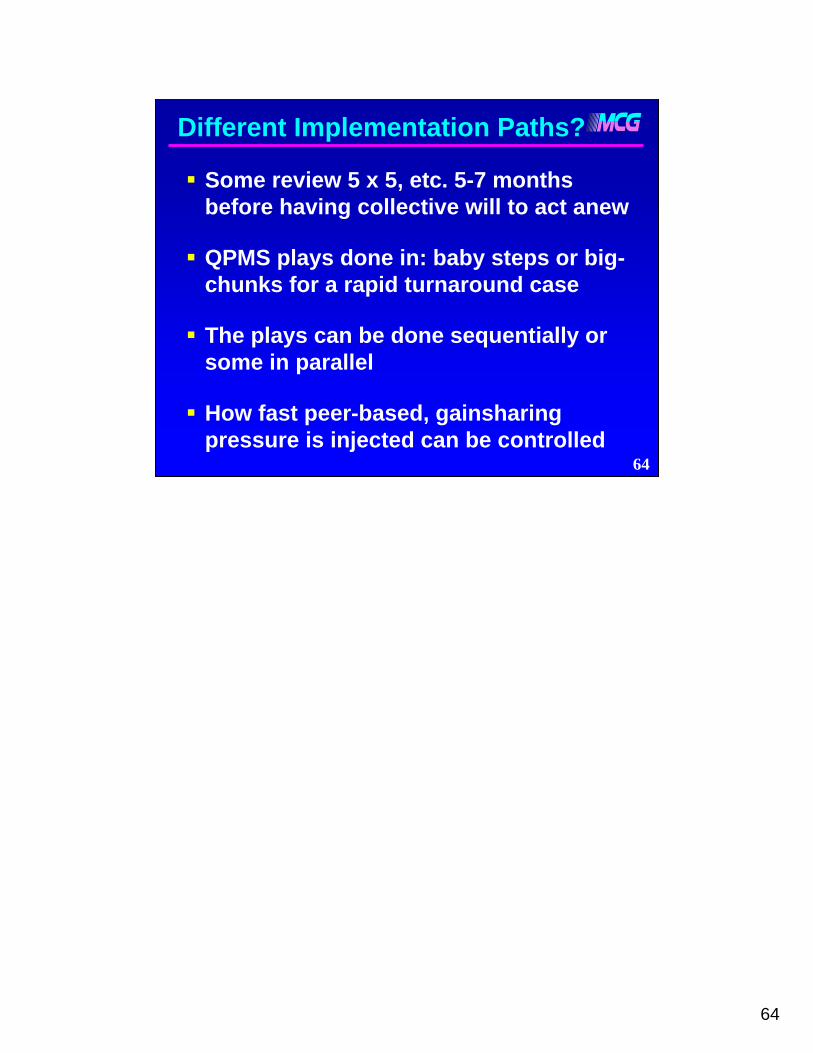
Different Implementation Paths?
Some review 5 x 5, etc. 5-7 months before having collective will to act anew
QPMS plays done in: baby steps or big-chunks for a rapid turnaround case
The plays can be done sequentially or some in parallel
How fast peer-based, gainsharing pressure is injected can be controlled

65
65
How Do All Stakeholders Win?
Re-visit the benefits thrown off for all 4 groups from the “service profit chain”
GM$/employee doubles, because of:-- Small order solutions-- More-to-core, less-work, hi-flow-thru
GM$s -- Zero errors, DIRTFT slack options-- Motivated, high-perf. service alignment

66
66
Hub-ite Pay EconomicsFedEx; UPS, L.L. Bean; drivers and hub-ites get paid 150% for:
1. Raw output2. No inspections3. Low supervision4. Cross training flexibility5. (-) Turnover costs; DIRTFT savings;
(+) morale; (+) customer economics?
120%+ 10+ 15+ 15 (160)
200%*Goal: 2x margin $x per employee
How companies like UPS and LL Bean pay their warehouse and driver personnel effectively 150% of the going, area compensation package for those respective job niches while getting 200% effective output or gross margin dollars per employee is explained in this slide and module 2.3 of the DVD training program.

67
67
BELL SHAPED JOB-WAGE DISTRIBUTION
50
10085 115 120 150
?
Average
95%-ile1/3 1/3
“AchieverPay Range”
(108)
This slide is included and discussed in our DVD (modules 2.2 and 2.3). If and when you use our video module #2.2 entitled, “Who invented the marketplace and its’ wages?”, you may be surprised at how naïve many employees are about this subject. You may also be quite surprised at how excited they get about the idea of being part of the solution for earning a “premium wage for their job niche” by helping to grow GM$/employee high enough to support those target wages.
Video Modules 2.6 – 2.11 deal with how much profit the company really makes, why it isn’t enough (for 95%+ of all distributors), what it is used for, and why everyone has to get serious about improving profits which are really both the cost of capital and everyone’s future.

68
68
What’s A Projected ROI?
Cost is $5k to get up, tuned and going
Subscription $1k/month/branch (declining)
Permanent, sustainable Delta PBIT per branch will be 3 to 10x subscription rate within 1 to 12 months depending upon execution ambition
Next problem? What to do with free cash-flow?
69
69
Final Points1. How do “good” companies know:
how “great” great can be?
2. How to comfort-zone big mental assumption shifts?
Watch and debate with managers: “High Performance Distribution
Ideas for All”Attend Waypoint webinar(s) and demo’sScore firm on Ex. 58 at merrifield.com
WAYPOINT IS READY WHEN YOU ARE
Related Documents