Objective: To examine the reversibility of adipose tissue alterations in HIV-infected patients after a 6-month interruption of antiretroviral therapy (ART). Methods: Forty HIV-infected patients on stable effective ART were enrolled, 33 of them completed the study. Patients underwent a physical examination, laboratory tests and needle biopsy of subcutaneous abdominal adipose tissue both at inclusion and at month 6. Changes in fat morphology, mitochondrial DNA (mtDNA) content and gene expression were examined in 29, 23 and 20 patients, respectively. Results: Body fat distribution was not clearly modified at month 6. Adipose tissue inflammation improved markedly, with fewer infiltrating macrophages and fewer tumour necrosis factor α (TNFα)- and interleukin 6 (IL6)-expressing cells. Expression of peroxisome proliferator-activated receptor γ (PPAR-γ) and of markers of mitochondrial function and biogenesis (cytochrome oxidase 2 and PPAR-γ coreceptor 1α) improved after protease inhibitor (PI) withdrawal. In patients who stopped taking stavudine or zidovudine, the number of TNFα- and IL6-expressing cells was lower at month 6 than at month 0, and so was CD68 expression, a macrophage marker. Adipocyte mitochon- drial status also improved, with lower mitochondrial density and cytochrome oxidase 4 mRNA levels, and higher mtDNA content. Sterol regulatory element binding protein 1 mRNA levels increased, reflecting better adipocyte differentiation. Conclusions: A 6-month ART interruption markedly improved adipose tissue functions, although fat distribu- tion did not visibly change. Stavudine and zidovudine were associated with marked inflammation, which improved when these drugs were withdrawn; they also had a negative effect on differentiation and mitochon- drial status. PIs were also associated with altered adipocyte differentiation and mitochondrial status. These data clearly show the detrimental effect of antiretroviral drugs, in particular thymidine analogues, on adipose tissue and argue for switch strategies sparing these drugs. A 6-month interruption of antiretroviral therapy improves adipose tissue function in HIV-infected patients: the ANRS EP29 Lipostop Study Min Ji Kim 1 , Pascale Leclercq 2† , Emilie Lanoy 3† , Pascale Cervera 1† , Barbara Antuna-Puente 1,4 , Mustapha Maachi 1,4 , Elena Dorofeev 3 , Laurence Slama 5 , Marc Antoine Valantin 6 , Dominique Costagliola 3 , Anne Lombes 7 , Jean-Philippe Bastard 1,4 and Jacqueline Capeau 1,4 * 1 Inserm, U680, Paris, F-75012, France; Université Pierre et Marie Curie-Paris 6, UMR S680 Faculté de Médecine, Paris, F-75012, France 2 Department of Infectious Diseases, CHU, Grenoble, France 3 Inserm U720, Paris, F75013, France; Université Pierre et Marie Curie-Paris 6, UMR S720, Paris, F-75013, France 4 AP-HP, Tenon Hospital, Department of Biochemistry, Paris, F-75020, France 5 AP-HP, Tenon Hospital, Department of Infectious Diseases, Paris, F-75020, France 6 AP-HP, Pitié Salpêtrière Hospital, Department of Infectious Diseases, Paris, F-75013, France 7 Inserm U582, Paris, F-75013, France; Université Pierre et Marie Curie-Paris 6, UMR S582, Paris, France † These authors made an equal contribution to this work *Corresponding author: Tel: +33 1 4001 1332; Fax: +33 1 4001 1352; E-mail: [email protected] Antiviral Therapy 12:1273–1283 The pathophysiology of HIV-related lipodystrophy is poorly understood, but antiretroviral drugs are now known to be the main causes [1–4]. Protease inhibitors (PI) and nucleoside reverse transcriptase inhibitors (NRTI) have markedly different potencies in this respect, and so do individual drugs within each class. A number of studies have now clearly linked the severity of peripheral lipoatrophy to the duration of the treatment with thymidine analogues, mainly stavu- dine but also zidovudine [2,5,6]. Among the PIs, the effect on metabolic parameters and adipose tissue differs according to the individual molecules. While indinavir, lopinavir and ritonavir can induce insulin resistance and dyslipidemia [7,8], atazanavir has less Introduction © 2007 International Medical Press 1359-6535 1273

Welcome message from author
This document is posted to help you gain knowledge. Please leave a comment to let me know what you think about it! Share it to your friends and learn new things together.
Transcript

Objective: To examine the reversibility of adipose tissuealterations in HIV-infected patients after a 6-monthinterruption of antiretroviral therapy (ART).Methods: Forty HIV-infected patients on stable effectiveART were enrolled, 33 of them completed the study.Patients underwent a physical examination, laboratorytests and needle biopsy of subcutaneous abdominaladipose tissue both at inclusion and at month 6. Changesin fat morphology, mitochondrial DNA (mtDNA) contentand gene expression were examined in 29, 23 and 20patients, respectively.Results: Body fat distribution was not clearly modifiedat month 6. Adipose tissue inflammation improvedmarkedly, with fewer infiltrating macrophages andfewer tumour necrosis factor α (TNFα)- and interleukin6 (IL6)-expressing cells. Expression of peroxisomeproliferator-activated receptor γ (PPAR-γ) and ofmarkers of mitochondrial function and biogenesis(cytochrome oxidase 2 and PPAR-γ coreceptor 1α)improved after protease inhibitor (PI) withdrawal. In
patients who stopped taking stavudine or zidovudine,the number of TNFα- and IL6-expressing cells waslower at month 6 than at month 0, and so was CD68expression, a macrophage marker. Adipocyte mitochon-drial status also improved, with lower mitochondrialdensity and cytochrome oxidase 4 mRNA levels, andhigher mtDNA content. Sterol regulatory elementbinding protein 1 mRNA levels increased, reflectingbetter adipocyte differentiation.Conclusions: A 6-month ART interruption markedlyimproved adipose tissue functions, although fat distribu-tion did not visibly change. Stavudine and zidovudinewere associated with marked inflammation, whichimproved when these drugs were withdrawn; they alsohad a negative effect on differentiation and mitochon-drial status. PIs were also associated with alteredadipocyte differentiation and mitochondrial status. Thesedata clearly show the detrimental effect of antiretroviraldrugs, in particular thymidine analogues, on adiposetissue and argue for switch strategies sparing these drugs.
A 6-month interruption of antiretroviral therapyimproves adipose tissue function in HIV-infectedpatients: the ANRS EP29 Lipostop Study
Min Ji Kim1, Pascale Leclercq2†, Emilie Lanoy 3†, Pascale Cervera1†, Barbara Antuna-Puente1,4,Mustapha Maachi 1,4, Elena Dorofeev 3, Laurence Slama5, Marc Antoine Valantin6,Dominique Costagliola 3, Anne Lombes7, Jean-Philippe Bastard 1,4 and Jacqueline Capeau1,4*
1Inserm, U680, Paris, F-75012, France; Université Pierre et Marie Curie-Paris 6, UMR S680 Faculté de Médecine, Paris, F-75012, France2Department of Infectious Diseases, CHU, Grenoble, France3Inserm U720, Paris, F75013, France; Université Pierre et Marie Curie-Paris 6, UMR S720, Paris, F-75013, France4AP-HP, Tenon Hospital, Department of Biochemistry, Paris, F-75020, France5AP-HP, Tenon Hospital, Department of Infectious Diseases, Paris, F-75020, France6AP-HP, Pitié Salpêtrière Hospital, Department of Infectious Diseases, Paris, F-75013, France7Inserm U582, Paris, F-75013, France; Université Pierre et Marie Curie-Paris 6, UMR S582, Paris, France
†These authors made an equal contribution to this work
*Corresponding author: Tel: +33 1 4001 1332; Fax: +33 1 4001 1352; E-mail: [email protected]
Antiviral Therapy 12:1273–1283
The pathophysiology of HIV-related lipodystrophy ispoorly understood, but antiretroviral drugs are nowknown to be the main causes [1–4]. Proteaseinhibitors (PI) and nucleoside reverse transcriptaseinhibitors (NRTI) have markedly different potenciesin this respect, and so do individual drugs within eachclass. A number of studies have now clearly linked the
severity of peripheral lipoatrophy to the duration ofthe treatment with thymidine analogues, mainly stavu-dine but also zidovudine [2,5,6]. Among the PIs, theeffect on metabolic parameters and adipose tissuediffers according to the individual molecules. Whileindinavir, lopinavir and ritonavir can induce insulinresistance and dyslipidemia [7,8], atazanavir has less
Introduction
© 2007 International Medical Press 1359-6535 1273
Capeau 21/11/07 16:20 Page 1273

effects on metabolic parameters [9]. However, riton-avir, even used at boosting concentrations, is able toadversely modify the metabolic profile of atazanavir[8]. Although a role in lipoatrophy has been recentlysuggested for the non-nucleoside reverse transcriptaseinhibitor (NNRTI) efavirenz in the ACTG 5142 study[10], previous large studies failed to show such aneffect [11,12]. In vitro studies of murine and humanadipocytes have consistently shown that some PIs canalter adipocyte differentiation, insulin sensitivity,adipokine production and mitochondrial function,and increase mitochondrial reactive oxygen species(ROS) production [13–16]. Again, the effect differsaccording to the individual molecules, atazanavirbeing almost devoid of effect when used alone [8,16]but being deleterious when used with boosting concen-trations of ritonavir [8,17]. In vitro, the thymidineanalogues zidovudine and stavudine, contrary to otherNRTIs, induce marked mitochondrial dysfunction,increase mitochondrial ROS production, and alter theexpression of certain adipogenic markers andadipokines [16–18]. Efavirenz was also shown to alteradipocyte differentiation [19].
Studies comparing adipose tissue samples fromhealthy controls and HIV-infected patients with andwithout lipodystrophy show major alterations, such asmacrophage infiltration, decreased mitochondrial DNA(mtDNA) content, and decreased expression of peroxi-some proliferator-activated receptor γ (PPAR-γ) andsterol regulatory element binding protein 1 (SREBP-1),the main adipogenic transcription factors [20–25]. Theslow reversibility of peripheral lipoatrophy has beenshown in several studies switching thymidine analoguesfor other NRTIs. When stavudine was replaced byzidovudine or abacavir (TARHEEL study [24]), orthymidine analogues were replaced by abacavir or teno-fovir (MITOX [26] and RAVE [Randomized AbacavirViread Evaluation] [27] studies), peripheral fatincreased by an average of 400–500 g after 1 year.Adipose tissue parameters were studied in a subgroup ofthe TARHEEL study [24]. Eleven patients switchingfrom stavudine either to zidovudine (2/11) or abacavir(9/11) had serial fat biopsies: after 48 weeks a partialrecovery of mtDNA was observed and apoptosis wasreduced; cytokine expression was not modified. Inthree patients switched from stavudine to zidovudinefor 5–24 months, Nolan et al. [6] reported anincreased level of mtDNA in all cases and a detectableimprovement on tissue toxicity in one case.
To decrease the occurrence of adverse effectsrelated to antiretroviral therapy (ART), CD4+ T-cellcount-guided interruption of ART has beenproposed. Recent results from the SMART studygroup revealed that this strategy could not be advo-cated even in patients with ART side effects, as it
significantly increased the risk of opportunisticdisease or death from any cause as a consequence oflowering the CD4+ T-cell count and increasing theviral load [28].
The present study (ANRS EP29 Lipostop) wasdesigned to further investigate the pathophysiology ofperipheral lipodystrophy and the role of the differentantiretroviral drugs. We examined adipose tissueparameters in HIV-infected patients before and after a6-month discontinuation of ART. At inclusion, all thepatients were on an effective regimen consisting oftwo NRTIs, with or without PI or NNRTI.
Materials and methods
PatientsThe patients infected by HIV-1 were ≥18 years of ageand had been on an ART regimen including at leasttwo NRTIs for ≥6 months. They were all eligible for atreatment interruption (nadir CD4+ T-cell count >200cells/mm3 before ART). HIV infection was wellcontrolled (CD4+ T-cell count >300 cells/mm3) and thedecision to stop ART was taken jointly by the patientand the clinician, for reasons not related to the study.The study focused on changes in subcutaneous adiposetissue after 6 months without ART.
At baseline, lipodystrophy was evaluated by aphysical examination. Fasting plasma levels of lipids,lactate, interleukin (IL)-6, tumour necrosis factor α(TNF-α), soluble tumour necrosis factor receptor 1and 2 (sTNFR1 and 2), adiponectin, leptin, resistinand high-sensitivity C-reactive protein (hs-CRP) weremeasured, along with the CD4+ T-cell count and HIVviral load. An oral glucose tolerance test (OGTT) wasperformed, with glucose and insulin assay at 0 and 2 h.During the study the patients were seen every 2 monthsfor viral load and CD4+ T-cell count assays, and treat-ment was resumed if the CD4+ T-cell count fell below250 cells/mm3. The same evaluation was performedafter 6 months of treatment interruption.
Subcutaneous abdominal fat was sampled at inclusionand at month 6 by needle aspiration after an overnightfast, with 1% lidocaine intradermal anaesthesia. Thesample was rinsed in 90/00 NaCl and immediately storedin liquid nitrogen. Part of the sample was fixed in 10%formol for morphological analysis.
All the patients gave their written informed consent,and the study protocol was approved by the InstitutionalReview Board of Grenoble University Hospital.
Blood samplesFasting blood samples were drawn at inclusion andmonth 6. Serum levels of IL-6, sTNFR1 and 2,adiponectin, leptin and resistin were measured withELISA methods (Quantikine™, R&D Systems,
MJ Kim et al.
© 2007 International Medical Press1274
Capeau 21/11/07 16:20 Page 1274

Oxford, UK). The hs-CRP levels were assessed byimmunonephelometry on an IMMAGE analyser(Beckman-Coulter, Villepinte, France).
Adipose tissue morphological studiesImmunostaining was performed on formalin-fixed,paraffin-embedded sections with the avidinbiotin–peroxidase complex method. Sections weredeparaffinized and rehydrated. Endogenous peroxidaseactivity was blocked with 3% hydrogen peroxide.
Sections were incubated with the following anti-bodies for 1 h: anti-IL6 (MAB206 1/50; R&D systems,Oxford, UK), anti-hTNF-α (MAB 610 1/50; R&Dsystems), anti-mitochondria (MU213UC 1/50;Biogenex, CA, USA) and anti-CD68 (1/300; Dako, CA,USA). Immunoperoxidase staining was performed withTrekkie Mouse Link Kit and Trek Avidin HRP(Biocare, Antony, France) and revealed with AEC (SK4200, Abcys, Paris). Positive and negative controltissues were processed in parallel.
Fat samples were inspected under the microscopeand the presence of adipose tissue was assessed.Adipocyte numbers and size, and adipose fibrosis, wereevaluated on Sirius Red-stained sections. The adiposetissue cross-sectional surface area, the cell-surface area,the cell density, and fibrosis were determined with asemi-automatic image analysis system (Explora Nova,Mercator, La Rochelle, France) on the entire adiposetissue surface of the biopsy.
Evaluation of mtDNATotal adipose tissue DNA was prepared by using theMasterPureTM DNA purification kit (EpicentreBiotechnologies, Madison, WI, USA) according to themanufacturer’s instructions. The mtDNA copy numberwas determined by real-time PCR on a LightCyclerdevice (Roche Diagnostics, Meylan, France) withFastStart DNA Master SYBR green I (RocheDiagnostics), by amplifying a fragment of the mtDNA12S gene in comparison with serial plasmid dilutionscontaining the mtDNA 12S gene as an insert. Theamount of nuclear DNA in the same sample was eval-uated by amplifying a fragment of the nuclear 28SRNA gene in comparison with serial dilutions of totalDNA from control human fibroblasts. The results wereexpressed as the copy number of mtDNA per 10 pg oftotal DNA, which roughly represents the DNA contentof one cell.
The primer sequences were as follows: 12S rRNA gene(forward, 5′ TAGCCCTAAACCTCAACAGT 3′;backward, 5′ TGCGCTTACTTTGTAGCCTTCAT3′); total mtDNA 28S rRNA gene (forward, 5′ATCCTTCGATGTCGGC 3′; backward, 5′ AGCA-CATACACCAAATGTCT 3′).
Evaluation of adipose tissue gene expressionThe mRNA concentrations were measured by real-timePCR on the LightCycler system (Roche Diagnostics).Total RNA was extracted from adipose tissue by usingthe RNeasy lipid tissue Minikit from Qiagen(Courtaboeuf, France). First-strand cDNAs weresynthesized from 500 ng of total RNA with SuperscriptII (Invitrogen, Eragny, France) using both random hexa-mers and oligo(dT). Real-time PCR was performed withthe FastStart DNA Master SYBR Green kit (RocheDiagnostics). A standard curve was generated withserial dilutions of pGEM plasmid (Promega, Madison,WI, USA) containing the target cDNA sequence. Eachassay was performed in duplicate and validated by themelting curve of the products and by the slope and errorof the standard curve. The analyses were performedwith LightCycler software (Roche Diagnostics). All thegene expression results are shown as a ratio to theTATA-binding protein (TBP) mRNA level.
The following primer sets were used: TBP (forward,5′-GCTCACCCACCAACAATTTAG-3′; backward, 5′-GAGCCATTACGTCGTCTTCC-3′); PPAR-γ2 (forward,5′-CTTCACTGATACACTGTCTGC-3′; backward, 5′-GCATTATGAGACATCCCCAC-3′); adiponectin(forward, 5′-AGGCCGTGATGGCAGAGATG-3′; back-ward, 5′-CTTCTCCAGGTTCTCCTTTCCTGC-3′);CCAAT/enhancer binding protein α (EBPα: forward, 5′-GCAAGGCCAAGAAGTCGGTGGAC-3′; backward,5′-TGCCCATGGCCTTGACCAAGGAG-3′); leptin(forward, 5′-TGCCAGTGTCTGGTCCATCTTG-3′;backward, 5′-CACCAGGATCAATGACATTTC-3′);SREBP1c (forward, 5′-GCAGATCGCGGAGCCATG-GATTGC-3′; backward, 5′-GAGGTGGAGACAAGCT-GCCTGG-3′); fatty acid synthase (FAS: forward,5′-GTGGCCTTTGAAATGTGCTC-3′; backward, 5′-CCTCCAGCACCCTGTTGT-3′); cytochrome oxidase 2(COX2: forward, 5′-TACGGCGGACTAATCTTCAA-3′; backward, 5′-CCGGGAATTGCATCTGTTTT-3′);COX4 (forward, 5′-TGGATGAGAAAGTCGAGTTG-3′; backward, 5′-CTTCTGCCACATGATAACGA-3′);PPAR-γ coreceptor 1α (PGC-1α: forward, 5′ GAGAG-TATGAGAAGCGAGAGT-3′; backward, 5′-GCAT-CACAGGTATAACGGTAG-3′); CD68 (forward,5′-TCAGCTTTGGATTCATGCAG-3′; backward, 5′-AGGTGGACAGCTGGTGAAAG-3′).
Statistical analysisContinuous variables were expressed as the mean andstandard deviation, at baseline and month 6. Values atbaseline and month 6 were compared by using thenon-parametric Wilcoxon test for paired groups.Changes between baseline and month 6 in the differentbaseline treatment groups were compared by using thenon-parametric Mann–Whitney test or theKruskall–Wallis test as appropriate. The χ2 test and
Antiviral Therapy 12:8 1275
Stopping ART improves adipose tissue function
Capeau 21/11/07 16:20 Page 1275
Fisher’s exact test were used as appropriate tocompare the frequency of events between groups. Weused two-way anova to test for a potential interactionbetween PI and thymidine analogues NRTI. Allreported P-values are two-tailed, with significance setat 0.05. The analyses were performed with the SPSSsoftware package version 13·0 for Windows (SPSSInc., Chicago, IL, USA) and Stata 10 for MacIntosh(StataCorp LP, College Station, TX, USA).
Results
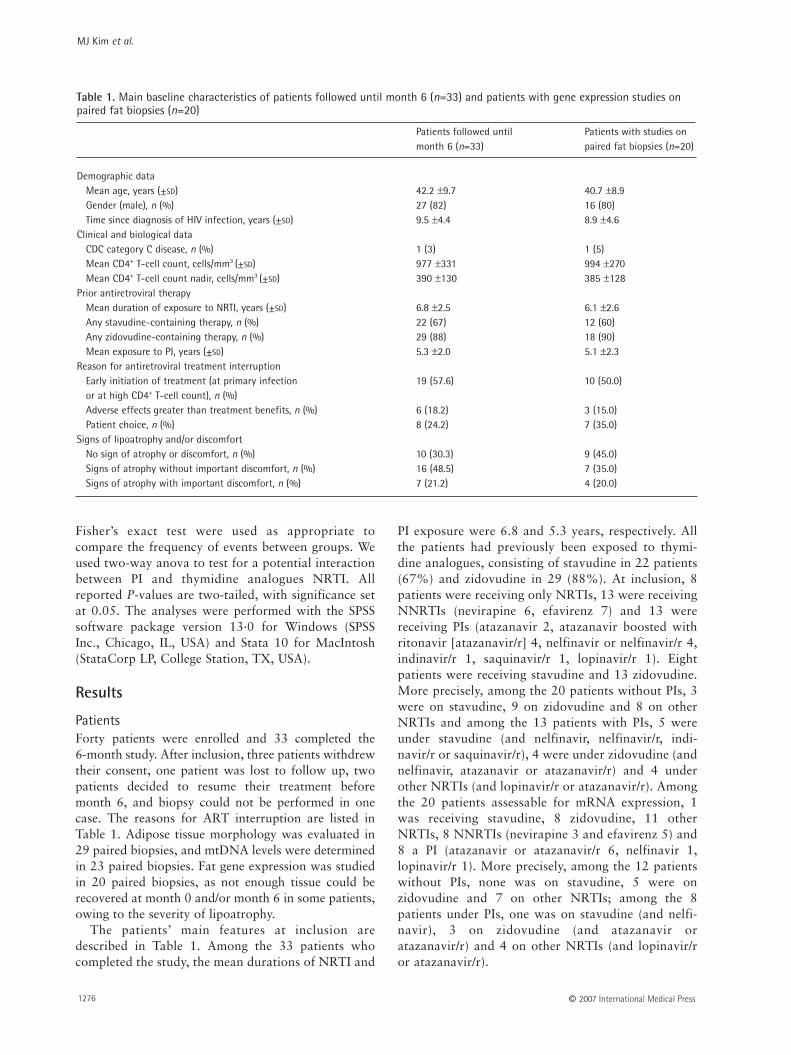
PatientsForty patients were enrolled and 33 completed the6-month study. After inclusion, three patients withdrewtheir consent, one patient was lost to follow up, twopatients decided to resume their treatment beforemonth 6, and biopsy could not be performed in onecase. The reasons for ART interruption are listed inTable 1. Adipose tissue morphology was evaluated in29 paired biopsies, and mtDNA levels were determinedin 23 paired biopsies. Fat gene expression was studiedin 20 paired biopsies, as not enough tissue could berecovered at month 0 and/or month 6 in some patients,owing to the severity of lipoatrophy.
The patients’ main features at inclusion aredescribed in Table 1. Among the 33 patients whocompleted the study, the mean durations of NRTI and
PI exposure were 6.8 and 5.3 years, respectively. Allthe patients had previously been exposed to thymi-dine analogues, consisting of stavudine in 22 patients(67%) and zidovudine in 29 (88%). At inclusion, 8patients were receiving only NRTIs, 13 were receivingNNRTIs (nevirapine 6, efavirenz 7) and 13 werereceiving PIs (atazanavir 2, atazanavir boosted withritonavir [atazanavir/r] 4, nelfinavir or nelfinavir/r 4,indinavir/r 1, saquinavir/r 1, lopinavir/r 1). Eightpatients were receiving stavudine and 13 zidovudine.More precisely, among the 20 patients without PIs, 3were on stavudine, 9 on zidovudine and 8 on otherNRTIs and among the 13 patients with PIs, 5 wereunder stavudine (and nelfinavir, nelfinavir/r, indi-navir/r or saquinavir/r), 4 were under zidovudine (andnelfinavir, atazanavir or atazanavir/r) and 4 underother NRTIs (and lopinavir/r or atazanavir/r). Amongthe 20 patients assessable for mRNA expression, 1was receiving stavudine, 8 zidovudine, 11 otherNRTIs, 8 NNRTIs (nevirapine 3 and efavirenz 5) and8 a PI (atazanavir or atazanavir/r 6, nelfinavir 1,lopinavir/r 1). More precisely, among the 12 patientswithout PIs, none was on stavudine, 5 were onzidovudine and 7 on other NRTIs; among the 8patients under PIs, one was on stavudine (and nelfi-navir), 3 on zidovudine (and atazanavir oratazanavir/r) and 4 on other NRTIs (and lopinavir/ror atazanavir/r).
MJ Kim et al.
© 2007 International Medical Press1276
Patients followed until Patients with studies onmonth 6 (n=33) paired fat biopsies (n=20)
Demographic dataMean age, years (±SD) 42.2 ±9.7 40.7 ±8.9Gender (male), n (%) 27 (82) 16 (80)Time since diagnosis of HIV infection, years (±SD) 9.5 ±4.4 8.9 ±4.6
Clinical and biological dataCDC category C disease, n (%) 1 (3) 1 (5)Mean CD4+ T-cell count, cells/mm3 (±SD) 977 ±331 994 ±270Mean CD4+ T-cell count nadir, cells/mm3 (±SD) 390 ±130 385 ±128
Prior antiretroviral therapyMean duration of exposure to NRTI, years (±SD) 6.8 ±2.5 6.1 ±2.6Any stavudine-containing therapy, n (%) 22 (67) 12 (60)Any zidovudine-containing therapy, n (%) 29 (88) 18 (90)Mean exposure to PI, years (±SD) 5.3 ±2.0 5.1 ±2.3
Reason for antiretroviral treatment interruptionEarly initiation of treatment (at primary infection 19 (57.6) 10 (50.0)or at high CD4+ T-cell count), n (%)Adverse effects greater than treatment benefits, n (%) 6 (18.2) 3 (15.0)Patient choice, n (%) 8 (24.2) 7 (35.0)
Signs of lipoatrophy and/or discomfortNo sign of atrophy or discomfort, n (%) 10 (30.3) 9 (45.0)Signs of atrophy without important discomfort, n (%) 16 (48.5) 7 (35.0)Signs of atrophy with important discomfort, n (%) 7 (21.2) 4 (20.0)
Table 1. Main baseline characteristics of patients followed until month 6 (n=33) and patients with gene expression studies onpaired fat biopsies (n=20)
Capeau 21/11/07 16:20 Page 1276

Clinical and biological changesNo significant change in body fat distribution wasnoted by the patients (data not shown).
As expected, ART withdrawal resulted in agradual and significant decline in the CD4+ T-cellcount (mean ±SD 933 ±385 cells/mm3 at inclusion and615 ±219 cells/mm3 at month 6) and an increase inviral load (undetectable levels at inclusion, geometricmean 26,304 copies/ml at month 6). Levels ofsystemic inflammatory markers also increased(sTNFR2 from 2.2 to 3.0 μg/ml, P<0.0001; resistinfrom 4.5 to 5.2 ng/ml, P=0.02). These increases wereobserved regardless of the nature of the discontinueddrug regimen. The IL-6 level increased marginally(P=0.10) (Table 2).
Triglyceride levels tended to fall (from 2.5 to2.0 mmol/l; P=0.08), while significant falls werenoted in total cholesterol (from 5.5 to 4.8 mmol/l;P=0.005) and high-density lipoprotein cholesterol(from 1.3 to 1.1 mmol/l; P<0.0001). Glucose andinsulin values in the OGTT were not significantlymodified, either in the fasting state or at 2 h. Lactatelevels fell from 1.7 to 1.4 mmol/l (P=0.05).Transaminase and hs-CRP values did not changesignificantly, and neither did circulating levels ofadiponectin, leptin or sTNFR1 (Table 2).
Changes in adipose tissue morphologyAdipocyte cross-sectional areas ranged from 250 to22,000 μm2, with no significant change between month0 and month 6. Adipose tissue inflammation, reflectedby CD68+ macrophage infiltration (CD68 is expressedby macrophages with a proinflammatory profile), wasmarkedly reduced at month 6 compared with month 0(1.8 versus 6.38 macrophages/mm2; P=0.002).
Some macrophages were organized into crown-likestructures or lipogranulomas surrounding deadadipocytes. The number of lipogranulomas was alsomarkedly lower at month 6 than at month 0 (P=0.003;Figure 1A). These decreases were observed regardlessof the nature of the discontinued drug regimen exceptfor the decreased number of lipogranulomas, whichwere seen in patients without efavirenz at inclusion(P=0.04). In particular, the number of CD68+
macrophages/mm2 was also significantly reduced inpatients stopping regimens with neither thymidineanalogues nor PIs (P<0.012).
The numbers of TNF-α-stained adipocytes(P=0.009) and inflammatory cells (P=0.005; Figure 1B)fell significantly between month 0 and month 6, as didthe number of IL-6-stained adipocytes (P=0.016) andinflammatory cells (P=0.001; Figure 1C). At inclusion,the numbers of TNF-α-positive adipocytes and
Antiviral Therapy 12:8 1277
Stopping ART improves adipose tissue function
Patients followed until month 6 (n=33) Patients with studies on paired fat biopsies (n=20)Month 0 Month 6 P-value* Month 0 Month 6 P-value*
LipidsTotal cholesterol, mmol/l 5.5 (1.3) 4.8 (1.0) 0.005 5.4 (0.9) 4.7 (0.9) 0.012LDL cholesterol, mmol/l 3.3 (1.1) 3.1 (0.9) 0.186 3.3 (0.9) 3.0 (0.9) 0.260HDL cholesterol, mmol/l 1.3 (0.6) 1.1 (0.4) 0.000 1.3 (0.5) 1.1 (0.3) 0.000Triglycerides, mmol/l 2.5 (2.7) 2.0 (2.3) 0.080 1.9 (1.3) 1.6 (1.5) 0.161
GlycaemiaFasting glycaemia, mmol/l 5.2 (0.4) 5.1 (0.5) 0.374 5.2 (0.4) 5.1 (0.4) 0.1422 h OGTT glycaemia, mmol/l 6.0 (1.8) 5.5 (1.8) 0.510 5.7 (1.4) 5.3 (1.8) 0.733Fasting insulin, mU/l 6.3 (4.8) 9.9 (11.9) 0.067 7.5 (5.2) 10.4 (5.5) 0.1612 h OGTT insulin, mU/l 43.7 (51.2) 24.4 (18.0) 0.374 47.3 (39.3) 29.6 (17.2) 0.655
Lactate, mmol/l 1.7 (0.6) 1.4 (0.4) 0.053 1.6 (0.5) 1.4 (0.5) 0.064Aspartate aminotransferase, U/l 32 (14) 35 (15) 0.272 35 (15) 38 (17) 0.400Alanine aminotransferase, U/l 35 (18) 34 (13) 0.631 34 (14) 36 (12) 0.370hs-CRP, mg/l 2.5 (2.5) 3.0 (3.0) 0.184 2.1 (2.4) 2.0 (1.7) 0.184
Adiponectin, µg/ml 6.9 (6.9) 5.9 (5.1) 0.695 6.7 (4.2) 6.5 (3.9) 0.911Leptin, ng/ml 6.3 (10.3) 7.7 (11.8) 0.688 8.6 (12.6) 10.2 (14.1) 0.940sTNFR1, ng/ml 0.9 (0.3) 1.0 (0.3) 0.120 0.8 (0.2) 0.9 (0.2) 0.173sTNFR2, ng/ml 2.2 (0.8) 3.0 (0.9) 0.000 1.9 (0.5) 2.6 (0.6) 0.000Interleukin 6, ng/ml 2.1 (2.3) 2.5 (2.3) 0.096 1.3 (0.9) 1.9 (1.1) 0.036Resistin, ng/ml 4.5 (2.4) 5.2 (2.4) 0.020 3.9(1.6) 4.7 (2.4) 0.017
Values are mean (±SD). *Comparison by using Wilcoxon test for two paired groups. HDL, high-density lipoprotein; hs-CRP, high-sensitivity C-reactive protein; LDL,low-density lipoprotein; OGTT, oral glucose tolerance test; sTNFR1/2, soluble tumour necrosis factor receptor 1 and 2.
Table 2. Main biological parameters at month 0 and month 6 in patients followed until month 6 (n=33) and in patients withgene expression studies in paired fat biopsies (n=20)
Capeau 21/11/07 16:20 Page 1277

inflammatory cells were higher in patients receivingstavudine (2.22 and 2.28/mm2) or zidovudine (0.74and 0.74/mm2) than in other patients (0.03 and0.04/mm2; P=0.13 and 0.005, respectively). Thesevalues fell significantly at month 6 in patients whostopped taking thymidine analogues (P=0.031 and0.026). Similarly, the numbers of IL-6-positiveadipocytes and inflammatory cells were higher at inclu-sion in patients on stavudine (2.01 and 2.43/mm2) orzidovudine (0.80 and 0.52/mm2) than in other patients(0.00 and 0.09/mm2; P=0.012 and 0.01, respectively)and were markedly decreased at month 6 in patientswho stopped taking the thymidine analogues (P=0.028and 0.006). The variation in these markers was notrelated to PI or efavirenz withdrawal and there was nointeraction for these effects between withdrawal of PIand withdrawal of thymidine analogues.
Increased mitochondrial number in some adipocyteswas evaluated by counting the number of adipocytesthat stained positive with the anti-mitochondrial anti-body, which labels only cells with an increased numberof mitochondria [14]. The number of positive
adipocytes was 3.81/mm2 at baseline and decreased to1.16/mm2 at month 6 (P=0.02). This decrease wasobserved in patients who stopped taking thymidineanalogues (P=0.05), but was not related to PI orefavirenz withdrawal and there was no interaction forthese effects between withdrawal of PI and withdrawalof thymidine analogues. No change in the percentageof fibrosis was observed at month 6.
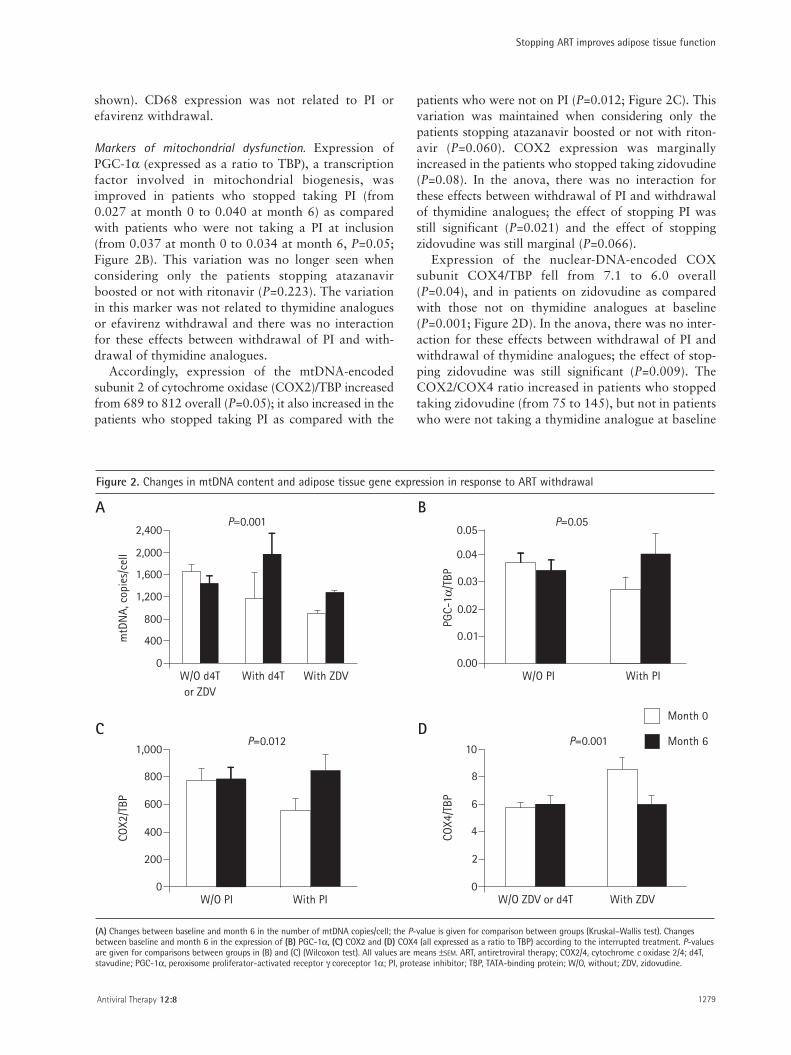
Changes in mtDNA contentThe level of mtDNA, evaluated in 23 paired biopsies,increased significantly at month 6 after withdrawal ofthymidine analogues compared with other drug classes(P=0.001; Figure 2A).
Changes in adipose tissue gene expressionMarkers of inflammation. CD68 expression (expressed asa ratio to that of TBP) was reduced in patients whostopped taking zidovudine (from 5.4 to 3.3) ascompared with patients who were not on a thymidineanalogue prior to inclusion (from 2.0 to 3.1; P=0.026),in keeping with the morphological results (data not
MJ Kim et al.
© 2007 International Medical Press1278
CD68
+ ce
lls, n
umbe
r/m
m2
P=0.003
P=0.002 Month 0
Month 6
Macrophages Lipogranuloma
10
8
6
4
2
0
P=0.009 P=0.005
TNF-
α+ ce
lls, n
umbe
r/m
m2
1.0
Adipocytes Inflammatory cells
0.8
0.6
0.4
0.2
0.0
1.0 P=0.001P=0.016
Adipocytes Inflammatory cells
IL-6
+ ce
lls, n
umbe
r/m
m2
0.8
0.6
0.4
0.2
0.0
Month 0 Month 6
Figure 1. Changes in adipose tissue morphology
Changes between baseline and month 6 in the number of (A) macrophages and lipogranulomas and (B) tumour necrosis factor α (TNF-α)- and (C) interleukin-6 (IL-6)-positive adipocytes and inflammatory cells. The values are expressed per mm2. P-values are given for comparisons between groups in (A), (B) and (C) (Wilcoxon test). All thevalues are means ±SEM. (D) Micrographs of typical CD68-labelled macrophages in adipose tissue before and after 6 months of antiretroviral withdrawal in the same patient.
A B
C D
Capeau 21/11/07 16:20 Page 1278
shown). CD68 expression was not related to PI orefavirenz withdrawal.
Markers of mitochondrial dysfunction. Expression ofPGC-1α (expressed as a ratio to TBP), a transcriptionfactor involved in mitochondrial biogenesis, wasimproved in patients who stopped taking PI (from0.027 at month 0 to 0.040 at month 6) as comparedwith patients who were not taking a PI at inclusion(from 0.037 at month 0 to 0.034 at month 6, P=0.05;Figure 2B). This variation was no longer seen whenconsidering only the patients stopping atazanavirboosted or not with ritonavir (P=0.223). The variationin this marker was not related to thymidine analoguesor efavirenz withdrawal and there was no interactionfor these effects between withdrawal of PI and with-drawal of thymidine analogues.
Accordingly, expression of the mtDNA-encodedsubunit 2 of cytochrome oxidase (COX2)/TBP increasedfrom 689 to 812 overall (P=0.05); it also increased in thepatients who stopped taking PI as compared with the
patients who were not on PI (P=0.012; Figure 2C). Thisvariation was maintained when considering only thepatients stopping atazanavir boosted or not with riton-avir (P=0.060). COX2 expression was marginallyincreased in the patients who stopped taking zidovudine(P=0.08). In the anova, there was no interaction forthese effects between withdrawal of PI and withdrawalof thymidine analogues; the effect of stopping PI wasstill significant (P=0.021) and the effect of stoppingzidovudine was still marginal (P=0.066).
Expression of the nuclear-DNA-encoded COXsubunit COX4/TBP fell from 7.1 to 6.0 overall(P=0.04), and in patients on zidovudine as comparedwith those not on thymidine analogues at baseline(P=0.001; Figure 2D). In the anova, there was no inter-action for these effects between withdrawal of PI andwithdrawal of thymidine analogues; the effect of stop-ping zidovudine was still significant (P=0.009). TheCOX2/COX4 ratio increased in patients who stoppedtaking zidovudine (from 75 to 145), but not in patientswho were not taking a thymidine analogue at baseline
Antiviral Therapy 12:8 1279
Stopping ART improves adipose tissue function
2,400
2,000
1,600
1,200
800
400
0
mtD
NA,
cop
ies/
cell
P=0.001
W/O d4Tor ZDV
With d4T With ZDV
0.05
0.04
0.03
0.02
0.01
0.00
P=0.05
PGC-
1α/T
BP
W/O PI With PI
1,000
800
600
400
200
0
COX2
/TBP
W/O PI With PI
P=0.01210
8
6
4
2
0
Month 0
Month 6
COX4
/TBP
P=0.001
W/O ZDV or d4T With ZDV
Figure 2. Changes in mtDNA content and adipose tissue gene expression in response to ART withdrawal
(A) Changes between baseline and month 6 in the number of mtDNA copies/cell; the P-value is given for comparison between groups (Kruskal–Wallis test). Changesbetween baseline and month 6 in the expression of (B) PGC-1α, (C) COX2 and (D) COX4 (all expressed as a ratio to TBP) according to the interrupted treatment. P-valuesare given for comparisons between groups in (B) and (C) (Wilcoxon test). All values are means ±SEM. ART, antiretroviral therapy; COX2/4, cytochrome c oxidase 2/4; d4T,stavudine; PGC-1α, peroxisome proliferator-activated receptor γ coreceptor 1α; PI, protease inhibitor; TBP, TATA-binding protein; W/O, without; ZDV, zidovudine.
A B
C D
Capeau 21/11/07 16:20 Page 1279

(from 146 to 136; P=0.002). COX2 and COX4expression was not related to efavirenz withdrawal.
Markers of adipocyte differentiationSREBP-1/TBP expression increased significantly, from7.7 to 10.5 overall (P=0.023); it also increased inpatients who stopped taking zidovudine as comparedwith those who were not taking a thymidine analogueat inclusion (P=0.016) (Figure 3A). Expression levelswere not related to PI or efavirenz withdrawal, andthere was no interaction for these effects between with-drawal of PI and withdrawal of thymidine analogues.Conversely, PPAR-γ2/TBP expression increasedmarkedly (from 1.9 to 3.1) in patients who stoppedtaking PI compared with patients who were not takinga PI at baseline (from 3.1 to 2.4) (P=0.007), regardlessof the NRTI or efavirenz therapy (Figure 3B). This vari-ation was maintained when considering only thepatients stopping atazanavir boosted or not with riton-avir (P=0.025). There was no interaction for theseeffects between withdrawal of PI and withdrawal ofthymidine analogues.
The expression of C/EBP-α/TBP, located down-stream of PPAR-γ in the differentiation pathway, wasmarginally improved in patients who stopped takingPIs as compared with patients who were not takingPIs (changes of 2.1 and 0.0 points, respectively;P=0.09) and in patients who stopped taking zidovu-dine as compared with those who were not takingthymidine analogues (changes of 1.9 and 0.1 points,respectively; P=0.10). There was no interaction forthese effects between withdrawal of PI and withdrawalof thymidine analogues.
The change in expression of PPAR-γ was related tothat of its target gene adiponectin (R=0.702; P=0.02).The change in the expression of SREBP-1 was relatedto that of its target gene FAS (fatty acid synthase)(R=0.507; P<0.03). These data indicate that PI orthymidine analogue withdrawal improves adipocytedifferentiation and that the two classes of drugs havedifferent cellular targets. Stopping efavirenz had noeffect on these markers.
Adipokine expressionAdiponectin expression tended to increase more inpatients who stopped taking PIs (from 34 to 59) thanin patients who were not on PIs (from 28 to 32;P=0.08), while leptin expression tended to increasemore in patients who stopped taking zidovudine (from34 to 65) than in patients who were not on thymidineanalogues (from 38 to 37; P=0.08).
Taken as a whole, stopping PI, and in particularstopping atazanavir boosted or not with ritonavir,resulted in increased levels of markers of mitochon-drial function (COX2) and differentiation (PPAR-γ2
and C/EBP-α). Thymidine analogue withdrawalresulted, as expected, in improved mitochondrialmarkers (decreased COX4 and increasedCOX2/COX4 ratio), but also in decreased inflamma-tion (CD68) and improved differentiation (increasedSREBP-1c and C/EBP-α).
Discussion
We show here, for the first time, that ART interruptionfor 6 months modifies adipose tissue status in HIV-infected patients with lipodystrophy. Patients whostopped taking thymidine analogues had a markedimprovement in adipose tissue inflammation, adipocytedifferentiation, and markers of mitochondrial insult.Different markers of adipocyte differentiation and
MJ Kim et al.
© 2007 International Medical Press1280
18P=0.016
SREB
P-1/
TBP
W/O ZDV or d4T ZDV
15
12
9
6
3
0
4
Month 0
Month 6
P=0.007
W/O IP With IP
PPAR
-γ2/
TBP
3
2
1
0
Figure 3. Changes in the expression of markers ofadipocyte differentiation
Changes between baseline and month 6 (A) in sterol regulatory element bindingprotein 1 (SREBP-1) mRNA expression and (B) peroxisome proliferator-activatedreceptor γ (PPAR-γ) mRNA expression both expressed as a ratio to TATA-bindingprotein (TBP) according to the interrupted treatment. P-values are for compar-isons between groups in (A) and (B) (Wilcoxon test). All the values are means±SEM. d4T, stavudine; PI, protease inhibitor; W/O, without; ZDV, zidovudine.
A
B
Capeau 21/11/07 16:20 Page 1280

mitochondrial insult were improved in patients whostopped taking PI, regardless of thymidine analogueexposure. This observation points to the involvementof PI, in addition to the established role of thymidineanalogues, in HIV-related adipose tissue dysfunction.By contrast, stopping efavirenz was almost devoid ofeffect on these parameters.
No change in fat distribution was perceived by thepatients at month 6, and no attempt was made tomeasure objective clinical parameters. Indeed, thisprospective study was designed to examine the possi-bility of adipose tissue improvement after stoppingART. The absence of objective assessment of fat amountand repartition is obviously a limitation of this study,even though a 6 month period would have been prob-ably too short to evidence such modifications. Markersof HIV infection deteriorated as expected, but remainedbelow the predetermined threshold for treatmentresumption, except in one patient. Serum markers ofinflammation (sTNFR2 and resistin) also deteriorated.
Major changes have been described in adipose tissueof lipodystrophic patients, usually on first-generationPI or thymidine analogues; macrophage infiltrationwas increased [20–24] as was tissue TNF-α and IL-6mRNA expression [20,23,29], indicating a low-gradeinflammatory state. As previously reported in patientswith HIV-related lipodystrophy, we found a wide rangeof adipocyte sizes, contrasting with the fairly homo-geneous size distribution in controls [20]. We alsodetected adipocytes and inflammatory cells expressingTNF-α and IL-6. Overall, ART interruption resulted ina marked improvement in local adipose inflammatorystatus, contrasting with the systemic deterioration(sTNFR2 and resistin) associated with untreated HIVinfection. Thus, adipose inflammation in this setting istissue-specific and unrelated to systemic inflammation.This has also been shown in animal models of obesityand lipodystrophy, in which macrophage infiltration isfound in adipose tissue but not in liver or muscle [30].
We were able to analyse the respective contributionsof thymidine analogues, other NRTIs, PIs andefavirenz. In vitro, all drug classes have been shown toalter adipocyte functions [14]. It is interesting to notethat the patients whose lipoatrophy was too severe atinclusion to sample sufficient fat for gene expressionstudies were mostly on stavudine (7/8 patients),zidovudine (5/13 patients), indinavir (1/1 patient) ornelfinavir (2/5 patients).
The biggest improvements in inflammatory markers(CD68, and adipocytes and macrophages expressingTNF-α and IL-6) were observed after stavudine andzidovudine interruption. This suggests that thymidineanalogues are toxic antiretrovirals in terms of localadipose inflammation. The recovery of peripheral fatobserved in longer-term clinical studies in which
thymidine analogues were replaced by other NRTIs[26,27] could have resulted from a reduction in localinflammation and in mitochondrial insult.
ART interruption led to increased expression of themain adipogenic transcription factors and of theirtarget genes, indicating improved adipocyte differenti-ation. We have previously reported that SREBP-1,PPAR-γ and C/EBP-α expression is markedly decreasedin lipodystrophic patients on PIs (mainly indinavir) andNRTIs (mainly stavudine) as compared with healthycontrols [20]. These data were confirmed in a studycomparing lipodystrophic and non-lipodystrophicHIV-infected patients [25].
As only one of the eight patients on stavudine in thisstudy was assessable for adipose gene expression, wecould not evaluate the specific role of this drug in geneexpression studies. It is thus possible that the mostsevere alterations could not be observed.
Thymidine analogues strongly reduced SREBP-1expression in our study, in keeping with recent data[31]. Most of the PI-treated patients from whompaired fat biopsy specimens could be obtained wereon atazanavir, a PI with less adverse effects on fatthan first-generation PIs. This could explain why PIinterruption had no apparent effect on SREBP-1expression. PPAR-γ expression improved in patientswho stopped taking PI and was unrelated to treat-ment with thymidine analogues. A low PPAR-γexpression was previously reported in patients’ fat inrelation to treatment with stavudine but not PIs [6,32]and in healthy volunteers treated for 2 weeks withstavudine/lamivudine or zidovudine/lamivudine [33].These studies suggest that both PIs and NRTIs nega-tively effect adipogenic transcription factor expres-sion and, thus, adipocyte differentiation, possiblyresulting in lipoatrophy.
Even though atazanavir is considered as a PI with abenign metabolic profile, we show here a role for thisPI in this setting. The fact that it was boosted withritonavir in most patients could possibly explain theseresults. Indeed, previous in vivo studies have evaluatedthe effect of atazanavir on metabolic parameters inhealthy volunteers. When used alone, this drug wasdevoid of any effect on insulin sensitivity after 5 days[34] but when boosted with ritonavir, atazanavirreduced insulin sensitivity, albeit to a lesser extent thatlopinavir/r [8]. Atazanavir treatment for 48 weeks inHIV-infected antiretroviral-naive patients neitherresulted in abnormal fat distribution nor induced meta-bolic alterations associated with other PIs [9]. In vitrostudies performed in human adipocytes revealed almostno deleterious effects of atazanavir on adipocyte func-tions when used alone [8,16], but did show the occur-rence of adverse effects when associated with ritonavirat boosting concentrations [8,17].
Antiviral Therapy 12:8 1281
Stopping ART improves adipose tissue function
Capeau 21/11/07 16:20 Page 1281
Our data do not reveal a synergic role of PI andthymidine analogues on the different effects that werestudied. By contrast, a synergic role for PI and zidovu-dine or abacavir has been previously found in patients’fat, resulting in an increased expression of the brownfat marker UCP1 [22].
Thymidine analogues have previously been linked toadipose mitochondrial dysfunction, with increasednumbers of mitochondria, decreased mtDNA content,and a decreased COX2/COX4 expression ratio[2–4,24,31,35]. Accordingly, we found that thymidineanalogue withdrawal resulted in an increase in mtDNAcontent. Mitochondrial density in adipocytes, andCOX4 expression, were decreased, in keeping with areversal of compensatory mitochondrial proliferation[6,35]. PI withdrawal also improved COX2 and PGC-1α expression, suggesting that PI too can induce mito-chondrial dysfunction. This is in keeping with in vitrostudies, in which some PIs induced mitochondrialdysfunction and increased mitochondrial oxidative stressin human fibroblasts [36] and adipocytes, indicatingincreased mitochondrial oxidative stress and ROSproduction [13,16]. This deleterious effect of PIs onmitochondria has not previously been considered, butmight have an important role in the pathophysiology ofART-linked lipodystrophy.
Discrepant data has been previously publishedregarding a role for efavirenz in lipoatrophy [10–12].In the present study, stopping efavirenz was not associ-ated with an improvement in adipose tissue functions.
No improvement in body fat distribution wasnoticed by the patients in our study, as in studies inwhich thymidine analogues were replaced by otherNRTIs for 1 year, even though limb fat increased by400–500 g [24,26,27].
In conclusion, we show that thymidine analoguewithdrawal leads to an improvement in markers ofadipose tissue differentiation, inflammation and mito-chondrial function at the tissue and molecular levels. PIwithdrawal also had a positive, albeit less marked effect.
It should be noted that even in patients withoutthymidine analogues or PIs at inclusion, an improve-ment in adipose tissue was observed as regards thenumber of CD68+ pro-inflammatory macrophagessuggesting a role for other antiretrovirals in that setting.
These results suggest that the lipodystrophy associatedwith antiretroviral drugs could be reversible whenswitching some antiretrovirals. Recent data obtained bythe SMART study group clearly outline the increased riskof adverse events associated with CD4+ T-cell count-guided interruption of antiretroviral treatment strategy[28]. Therefore, stopping effective ART is not recom-mended but, when possible, drugs with the most detri-mental effect on adipose tissue should be avoided, inparticular thymidine analogues.
Acknowledgements
The ANRS EP29 Lipostop study was supported bygrants from Agence Nationale de recherche sur le SIDA(ANRS), Institut National de la Santé et de laRecherche Médicale (INSERM), SIDACTION andAssistance Publique - Hôpitaux de Paris at the ClinicalInvestigation Center of Saint-Antoine UniversityHospital. Pierre Marie Girard (Hôpital Saint-Antoine,APHP, Paris), Eric Billaud, (CHU Nantes) and MichèleBentata, (Hôpital Jean Verdier, APHP, Bobigny) wereinvolved in patient recruitment. Min Ji Kim received afellowship from SIDACTION.
References1. Grinspoon S, Carr A. Cardiovascular risk and body-fat
abnormalities in HIV-infected adults. N Engl J Med 2005;352:48–62.
2. Nolan D, Mallal S. Complications associated with NRTItherapy: update on clinical features and possible pathogenicmechanisms. Antivir Ther 2004; 9:849–863.
3. Gougeon ML, Penicaud L, Fromenty B, Leclercq P,Viard JP, Capeau J. Adipocytes targets and actors in thepathogenesis of HIV-associated lipodystrophy andmetabolic alterations. Antivir Ther 2004; 9:161–177.
4. Villaroya F, Domingo P, Giralt M. Lipodystrophyassociated with highly active antiretroviral therapy for HIVinfection: the adipocyte as a target of antiretroviral-inducedmitochondrial toxicity. Trends Pharmacol Sci 2005;26:88–93.
5. Saves M, Chene G, Ducimetiere P, et al. Risk Factors forcoronary heart disease in patients treated for humanimmunodeficiency virus infection compared with thegeneral population. CID 2003; 37:292–297.
6. Nolan D, Hammond E, James I, et al. Contribution ofnucleoside-analogue reverse trancriptase inhibitor therapyto lipoatrophy from the population to the cellular level.Antivir Ther 2003; 8:617–626.
7. Noor MA, Lo JC, Mulligan K, et al. Metabolic effects ofindinavir in healthy HIV-seronegative men. AIDS 2001; 15:F11–18.
8. Noor MA, Flint O, Maa JF, et al. Effects ofatazanavir/ritonavir and lopinavir/ritonavir on glucoseuptake and insulin sensitivity: demonstrable differencesin vitro and clinically. AIDS 2006; 20:1813–1821.
9. Jemsek J, Arathoon E, Arlotti M et al. Body fat and othermetabolic effects of atazanavir and efavirenz, eachadministered in combination with zidovudine pluslamivudine, in antiretroviral-naive HIV-infected patients.CID 2005; 42:273–280.
10. Haubrich R, Riddler S, DiRienzo G, et al. Metabolicoutcomes of ACTG 5142: a prospective, randomized,phase III trial of NRTI-, PI-, and NNRTI-sparing regimensfor initial treatment of HIV-1 infection. 14th Conference onRetroviruses & Opportunistic Infections. 26–28 February2007, Los Angeles, CA, USA. Oral Abstract 38.
11. Gallant JE, Staszewski S, Pozniak A, et al. Efficacy andsafety of tenofivir DF vs stavudine in combination therapyin antiretroviral-naive patients. JAMA 2004; 292:191–201.
12. Podzamczer D, Ferrer E, Sanchez P, et al. Less lipoathorphyand better lipid profile with abacavir as compared tostavudine. J Acquir Immune Defic Syndr 2007;44:139–147.
13. Ben-Romano R, Rudich A, Etzion S, et al. Nelfinavirinduces adipocyte insulin resistance through the inductionof oxidative stress: differential protective effect ofantioxidant agents. Antivir Ther 2006; 11:1051–1060.
MJ Kim et al.
© 2007 International Medical Press1282
Capeau 21/11/07 16:20 Page 1282

14. Lagathu C, Kim M, Maachi M, et al. HIV antiretroviraltreatment alters adipokine expression and insulin sensitivity ofadipose tissue in vitro and in vivo. Biochimie 2005; 87:65–71.
15. Lagathu C, Bastard JP, Auclair M, et al. Antiretroviral drugswith adverse effects on adipocyte lipid metabolism and survivalalter the expression and secretion of proinflammatory cytokinesand adiponectin in vitro. Antivir Ther 2004; 9:911–920.
16. Lagathu C, Eustace B, Frantz D, et al. Some HIV-antiretroviralsincrease oxidative stress and alter chemokine, cytokine oradiponectin production in human adipocytes and macrophages.Antivir Ther 2007; 12:489–500.
17. Boccara F, Caron M, Auclair, et al. Irbesartan, an angiotensin IIreceptor I blocker, prevents the adverse efects of HIVantiretrovirals on adipocyte functions. Antivir Ther 2006;11:L7.
18. Caron M, Auclair M, Lagathu C, et al. The HIV-1 nucleosidereverse transcriptase inhibitors stavudine and zidovudine alteradipocyte functions in vitro. AIDS 2004; 18:2127–2136.
19. El Hadri K, Glorian M, Monsempes C, et al. In vitrosuppression of the lipogenic pathway by the nonnucleosidereverse transcriptase inhibitor efavirenz in 3t3 and humanpreadipocytes or adipocytes. J Biol Chem 2004;279:15130–15141.
20. Bastard JP, Caron M, Vidal H, et al. Association betweenaltered expression of adipogenic factor SREBP1 in lipoatrophicadipose tissue from HIV-1-infected patients and abnormaladipocyte differentiation and insulin resistance. Lancet 2002;359:1026–1031.
21. Lloreta J, Domingo P, Pujol RM, et al. Ultrastructural featuresof highly active antiretroviral therapy-associated partiallipodystrophy. Virchows Arch 2002; 441:599–604.
22. Pace CS, Martin AM, Hammond EL, Mamotte CD, Nolan DA,Mallal SA. Mitochondrial proliferation, DNA depletion andadipocyte differentiation in subcutaneous adipose tissue of HIV-positive HAART recipients. Antivir Ther 2003; 8:323–331.
23. Jan V, Cervera P, Maachi M, et al. Altered fat differentiationand adipocytokine expression are inter-related and linked tomorphological changes and insulin resistance in HIV-1-infectedlipodystrophic patients. Antivir Ther 2004; 9:555–564.
24. McComsey GA, Paulsen DM, Lonergan JT, et al. Improvementsin lipoatrophy, mitochondrial DNA levels and fat apoptosisafter replacing stavudine with abacavir or zidovudine. AIDS2005; 19:15–23.
25. Kannisto K, Sutinen J, Korsheninnikova E, et al. Expression ofadipogenic transcription factors, peroxisome proliferator-activated receptor gamma co-activator 1, IL-6 and CD45 insubcutaneous adipose tissue in lipodystrophy associated withhighly active antiretroviral therapy. AIDS 2003; 17:1753–1762.
26. Martin A, Smith DE, Carr A, et al. Mitochondrial ToxicityStudy Group. Reversibility of lipoatrophy in HIV-infectedpatients 2 years after switching from a thymidine analogueto abacavir: the MITOX Extension Study. AIDS 2004;18:1029–1036.
27. Moyle GJ, Sabin CA, Cartledge J, et al. RAVE(Randomized Abacavir versus Viread Evaluation) GroupUK. A randomized comparative trial of tenofovir DF orabacavir as replacement for a thymidine analogue inpersons with lipoatrophy. AIDS 2006; 20:2043–2050.
28. Strategies for the management of antiretroviral therapy(SMART) study group, El-Sadr WM, Lundgren JD,Neaton JD, et al. CD4+ count-guided interruption ofantiretroviral treatment: SMART study. N Engl J Med2006; 355:2283–2296.
29. Lihn AS, Richelsen B, Pedersen SB, et al. Increasedexpression of TNF-α, IL-6, and IL-8 in HALS:implications for reduced adiponectin expression andplasma levels. Am J Physiol Endocrinol Metab 2003;285:E1072–1080.
30. Weisberg SP, McCann D, Desai M, Rosenbaum M, LeibelRL. Obesity is associated with macrophage accumulationin adipose tissue. J Clin Invest 2003; 112:1796–1808.
31. Jones SP, Qazi N, Morelese J, et al. Assessment ofadipokine expression and mitochondrial toxicity in HIVpatients with lipoatrophy on stavudine- and zidovudine-containing regimens. J Acquir Immune Defic Syndr 2005;40:565–572.
32. Chaparro J, Reeds DN, Wen W, et al. Alterations in thighsubcutaneous adipose tissue gene expression in proteaseinhibitor-based highly active antiretroviral therapy.Metabolism 2005; 54:561–567.
33. Mallon PW, Unemori P, Sedwell R, et al. In vivo,nucleoside reverse-transcriptase inhibitors alter expressionof both mitochondrial and lipid metabolism genes in theabsence of depletion of mitochondrial DNA. J Infect Dis2005; 191:1686–1696.
34. Noor MA, Parker RA, O’Mara E, et al. The effects of HIVprotease inhibitors atazanavir and lopinavir/ritonavir oninsulin sensitivity in HIV-seronegative healthy adults.AIDS 2004; 18:2137–2144.
35. Kim MJ, Jardel C, Barthélémy C, et al. Preservedcytochrome c oxidase activity despite mtDNA depletion inadipose tissue of HIV-infected patients with lipodystrophyAntivir Ther 2005; 10 Suppl 3:L8.
36. Caron M, Auclair M, Donadille B, et al. Lipodystrophieslinked to HIV protease inhibitor therapy and mutations inA type lamins are both associated with prelamin Aaccumulation and premature senescence. Antivir Ther2006; 11:L30.
Antiviral Therapy 12:8 1283
Stopping ART improves adipose tissue function
Accepted for publication 26 August 2007
Capeau 21/11/07 16:20 Page 1283

Capeau 21/11/07 16:20 Page 1284
Related Documents