A 4103 marker integrated physical and comparative map of the horse genome Terje Raudsepp a,*,$ , Ashley Gustafson-Seabury a,$ , Keith Durkin a , Michelle L. Wagner b , Glenda Goh a , Christopher M. Seabury a , Candice Brinkmeyer-Langford a , Eun-Joon Lee a , Richa Agarwala c , Edward Stallknecht Rice c , Alejandro A. Schäffer c , Loren C. Skow a , Teruaki Tozaki d , Hiroshi Yasue e , M. Cecilia T. Penedo f , Leslie A. Lyons g , Kamal A. Khazanehdari h , Matthew M. Binns i , James N. MacLeod j , Ottmar Distl k , Gérard Guérin l , Tosso Leeb m , James R. Mickelson b , and Bhanu P. Chowdhary a,* a Department of Veterinary Integrative Biosciences, Texas A&M Univ., College Station TX 77843 b Department of Veterinary Biosciences, Univ. of Minnesota, St. Paul, MN 55108 USA c NCBI, NIH, DHHS, Bethesda MD 20894 USA d Laboratory of Racing Chemistry, 1731-2 Tsurutamachi Utsunomiya Tochigi 320-0851, Japan e National Institute of Agrobiological Sciences, Ikenodai 2, Tsukuba, Ibaraki 305-0901, Japan f Veterinary Genetics Laboratory, Univ. of California, Davis, CA 95616, USA g Department of Population Health & Reproduction, Univ. of California, Davis CA 95691-8743, USA h Central Veterinary Research Laboratory, PO Box 597, Dubai, UAE i Royal Veterinary College, London, NW10TU, U.K j Gluck Equine Research Center, Department of Veterinary Science, Univ. of Kentucky, Lexington, KY 40546-0099, USA k Institute for Animal Breeding and Genetics, Univ. of Veterinary Medicine Hannover, Buenteweg 17 p, 30559 Hannover, Germany l INRA, Centre de Recherche de Jouy, Jouy-en-Josas, France m Institute of Genetics, Univ. of Berne, CH-3001 Berne, Switzerland Abstract A comprehensive second-generation whole genome radiation hybrid (RH II), cytogenetic and comparative map of the horse genome (2n=64) has been developed using the 5000rad horse × hamster radiation hybrid panel and fluorescence in situ hybridization (FISH). The map contains 4,103 markers (3,816 RH, 1,144 FISH) assigned to all 31 pairs of autosomes and the X chromosome. The RH maps of individual chromosomes are anchored and oriented using 857 cytogenetic markers. The overall resolution of the map is one marker per 775 kilobase-pairs (kb), which represents a more than five- fold improvement over the first-generation map. The RH II incorporates 920 markers shared jointly with the two recently reported meiotic maps. Consequently the two maps were aligned with the RH II maps of individual autosomes and the X chromosome. Additionally, a comparative map of the horse genome was generated by connecting 1,904 loci on the horse map with genome sequences available for eight diverse vertebrates to highlight regions of evolutionarily conserved syntenies, linkages and chromosomal breakpoints. The integrated map thus obtained presents the most comprehensive information on the physical and comparative organization of the equine genome and will assist future assemblies of whole genome BAC fingerprint maps and the genome sequence. It will also serve as a tool to identify genes governing health, disease and performance traits in horses and assist us in understanding the evolution of the equine genome in relation to other species. *Correspondence: [email protected] and [email protected]. $ These authors have contributed equally to this work. NIH Public Access Author Manuscript Cytogenet Genome Res. Author manuscript; available in PMC 2009 January 1. Published in final edited form as: Cytogenet Genome Res. 2008 ; 122(1): 28–36. doi:10.1159/000151313. NIH-PA Author Manuscript NIH-PA Author Manuscript NIH-PA Author Manuscript

Welcome message from author
This document is posted to help you gain knowledge. Please leave a comment to let me know what you think about it! Share it to your friends and learn new things together.
Transcript
A 4103 marker integrated physical and comparative map of thehorse genome
Terje Raudseppa,*,$, Ashley Gustafson-Seaburya,$, Keith Durkina, Michelle L. Wagnerb,Glenda Goha, Christopher M. Seaburya, Candice Brinkmeyer-Langforda, Eun-Joon Leea,Richa Agarwalac, Edward Stallknecht Ricec, Alejandro A. Schäfferc, Loren C. Skowa, TeruakiTozakid, Hiroshi Yasuee, M. Cecilia T. Penedof, Leslie A. Lyonsg, Kamal A. Khazanehdarih,Matthew M. Binnsi, James N. MacLeodj, Ottmar Distlk, Gérard Guérinl, Tosso Leebm, JamesR. Mickelsonb, and Bhanu P. Chowdharya,*
a Department of Veterinary Integrative Biosciences, Texas A&M Univ., College Station TX 77843 bDepartment of Veterinary Biosciences, Univ. of Minnesota, St. Paul, MN 55108 USA c NCBI, NIH, DHHS,Bethesda MD 20894 USA d Laboratory of Racing Chemistry, 1731-2 Tsurutamachi Utsunomiya Tochigi320-0851, Japan e National Institute of Agrobiological Sciences, Ikenodai 2, Tsukuba, Ibaraki 305-0901,Japan f Veterinary Genetics Laboratory, Univ. of California, Davis, CA 95616, USA g Department ofPopulation Health & Reproduction, Univ. of California, Davis CA 95691-8743, USA h Central VeterinaryResearch Laboratory, PO Box 597, Dubai, UAE i Royal Veterinary College, London, NW10TU, U.K j GluckEquine Research Center, Department of Veterinary Science, Univ. of Kentucky, Lexington, KY 40546-0099,USA k Institute for Animal Breeding and Genetics, Univ. of Veterinary Medicine Hannover, Buenteweg 17 p,30559 Hannover, Germany l INRA, Centre de Recherche de Jouy, Jouy-en-Josas, France m Institute ofGenetics, Univ. of Berne, CH-3001 Berne, Switzerland
AbstractA comprehensive second-generation whole genome radiation hybrid (RH II), cytogenetic andcomparative map of the horse genome (2n=64) has been developed using the 5000rad horse × hamsterradiation hybrid panel and fluorescence in situ hybridization (FISH). The map contains 4,103 markers(3,816 RH, 1,144 FISH) assigned to all 31 pairs of autosomes and the X chromosome. The RH mapsof individual chromosomes are anchored and oriented using 857 cytogenetic markers. The overallresolution of the map is one marker per 775 kilobase-pairs (kb), which represents a more than five-fold improvement over the first-generation map. The RH II incorporates 920 markers shared jointlywith the two recently reported meiotic maps. Consequently the two maps were aligned with the RHII maps of individual autosomes and the X chromosome. Additionally, a comparative map of thehorse genome was generated by connecting 1,904 loci on the horse map with genome sequencesavailable for eight diverse vertebrates to highlight regions of evolutionarily conserved syntenies,linkages and chromosomal breakpoints. The integrated map thus obtained presents the mostcomprehensive information on the physical and comparative organization of the equine genome andwill assist future assemblies of whole genome BAC fingerprint maps and the genome sequence. Itwill also serve as a tool to identify genes governing health, disease and performance traits in horsesand assist us in understanding the evolution of the equine genome in relation to other species.
*Correspondence: [email protected] and [email protected].$These authors have contributed equally to this work.
NIH Public AccessAuthor ManuscriptCytogenet Genome Res. Author manuscript; available in PMC 2009 January 1.
Published in final edited form as:Cytogenet Genome Res. 2008 ; 122(1): 28–36. doi:10.1159/000151313.
NIH
-PA Author Manuscript
NIH
-PA Author Manuscript
NIH
-PA Author Manuscript
Keywordsradiation hybrid map; horse; comparative; whole genome
IntroductionHigh-resolution gene maps are essential for understanding the structure and organization of agenome, determining the location and relative order of genes and markers on chromosomes,obtaining detailed comparative information in relation to other genomes and isolating gene(s)governing traits of interest. In horses, traits of interest range from those governed by a singlegene (e.g., coat color and a number of inherited disorders) to complex traits controlled by theinteraction of several genes (e.g., allergies, disease resistance, athletic performance,reproduction, fertility). Horse (Equus caballus, ECA; 2n=64) whole-genome (WG) mapsreported to date are low to medium density and contain ~700–800 markers distributed onvarious autosomes and the X chromosome. These maps include the first-generation WGradiation hybrid (RH) and comparative map (Chowdhary et al. 2003, denoted below as RH I),the latest iterations of the two linkage maps (IRFHP – Penedo et al. 2005; AHT – Swinburneet al. 2006) and cytogenetic maps (Milenkovic et al. 2002; Perrocheau et al. 2006). Though allthese maps have been successfully used in the recent past to isolate genes governing somemonogenic traits and to detect the mutation/variation responsible for the phenotype (seeChowdhary and Raudsepp 2008), their resolution is not sufficient to study the genetics ofcomplex traits.
In recent years, medium to high density WG or single chromosome RH maps with a resolutionof about 1 marker per megabase (Mb) have been generated for a range of livestock and petspecies including cattle (Everts-van der Wind et al. 2004; Everts-van der Wind et al. 2005;Itoh et al. 2005; Jann et al. 2006; McKay et al. 2007), pig (Hamasima et al. 2003; Meyers etal. 2005), dog (Breen et al. 2004), etc. These maps are facilitating identification of genes forvarious traits in different species and are being used to compare genomes of distantly relatedmammals and study chromosome evolution (Murphy et al. 2005). The maps have also beeninstrumental in integrating synteny, cytogenetic and genetic linkage information into a singlelinearly ordered map, and have been useful in assembling the emerging WG sequenceinformation (Rowe et al. 2003; Kwitek et al. 2004; Meyers et al. 2005; Jann et al. 2006; Snellinget al. 2007). Medium- to high-resolution gene maps have been reported for some of the 31 pairsof equine autosomes and the X chromosome (Lee et al. 2004; Raudsepp et al. 2004;Brinkmeyer-Langford et al. 2005; Gustafson-Seabury et al. 2005; Dierks et al. 2006; Wagneret al. 2006; Goh et al. 2007). Since then we have added markers to all chromosomes andproduced a high-resolution second-generation map of the entire equine genome (denoted belowas RH II), excluding the Y chromosome. This map should serve as a valuable tool for manytypes of equine genome analysis.
Material and MethodsMarker development and genotyping
Markers for RH mapping were developed using equine genome resources available from UCSC(http://genome.ucsc.edu/), NCBI (http://www.ncbi.nlm.nih.gov/), HorseMap(http://locus.jouy.inra.fr/cgibin/lgbc/mapping/horsemap/intro2.pl/), horse BES sequencedatabases (http://www.tiho-hannover.de/einricht/zucht/hgp/index.htm), and from publishedliterature. Additionally, a number of gene specific markers were generated from conservedregions of orthologous mammalian genes using alignment (Chenna et al. 2003) of sequencesfrom multiple species. The orthologous genes were chosen from the human genome sequencemap at approximately every 1 Mb intervals as described earlier (Lee et al. 2004; Raudsepp et
Raudsepp et al. Page 2
Cytogenet Genome Res. Author manuscript; available in PMC 2009 January 1.
NIH
-PA Author Manuscript
NIH
-PA Author Manuscript
NIH
-PA Author Manuscript
al. 2004; Goh et al. 2007). Primers were designed with Primer3(http://www-genome.wi.mit.edu/cgibin/primer/primer3_www.cgi) or were obtained frompublications. All PCR products amplified using heterologous primers were validated bysequencing. Details about all markers included in this study are available in SupplementaryTable 2. All markers were genotyped in duplicate on the WG 5000rad horse × hamster RHpanel (Chowdhary et al. 2002), resolved on 2% agarose gels and scored manually as describedpreviously (Chowdhary et al. 2003; Brinkmeyer-Langford et al. 2005; Gustafson-Seabury etal. 2005; Wagner et al. 2006; Goh et al. 2007). Genotyping information available frompreviously published RH maps (Chowdhary et al. 2003; Raudsepp et al. 2004; Brinkmeyer-Langford et al. 2005; Gustafson-Seabury et al. 2005; Wagner et al. 2006; Goh et al. 2007) wasincluded as part of the input for the map computation.
Map computationComputations to analyze the genome-wide genotyping data and to construct RH maps forindividual chromosomes were performed using the rh_tsp_map (Agarwala et al. 2000; Schäfferet al. 2007); ftp://ftp.ncbi.nih.gov/pub/agarwala/rhmapping/rh_tsp_map.tar), CONCORDE(Applegate et al. 2006); http://www.isye.gatech.edu/~wcook/rh/) and Qsopt(http://www.isye.gatech.edu/~wcook/qsopt) software packages using the same procedures asdescribed in a recently published WG RH map for the cat (Murphy et al. 2007) and in therh_tsp_map tutorial, but with increased automation (Schäffer et al. 2007). We used a consensusof three formulations of the maximum-likelihood (MLE) criterion (Agarwala et al. 2000).Markers were assigned to linkage groups by two-point analysis with a LOD score threshold of7.6. Thresholds with one digit after the decimal between 7 and 8 were considered and LOD7.6 gave the best balance between the competing objectives of: i) discarding fewer markerswith inter-chromosomal scores above the threshold, and ii) unifying more linkage groups.Markers that did not have a score ≥ 7.6 with any other marker were removed from furtheranalysis. The MLE-consensus maps passed a flips test at LOD threshold 0.5. Markers droppedfrom the MLE-consensus map were placed in an interval between consecutive markers if thebest placement was at least 0.1 LOD units better than second best; multiple markers placed inthe same interval passed a flips test. The MLE-consensus markers and placed markers wereassigned cR positions by solving instances of a restricted traveling salesman problem.Remaining markers were binned if their best placements spanned at most three adjacent MLE-consensus intervals. The order and orientation of linkage groups on a chromosome wereprimarily determined by FISH and further verified using available genetic linkage maps(Penedo et al. 2005; Swinburne et al. 2006). Detailed information regarding the RH map foreach chromosome (linkage group size, map distances, MLE-consensus, placements, binnedmarkers) is available in Supplementary Table 3.
BAC library screening and cytogenetic mappingThe CHORI-241 BAC library was used to isolate clones containing markers pertinent foranchoring, ordering and orienting RH groups. Library screening by PCR and BAC DNAisolation followed procedures described earlier (Chowdhary et al. 2003). The BACs wereindividually labeled with biotin and/or digoxigenin and hybridized in pairs or triplets to horsemetaphase or interphase chromosomes. DNA labeling, in situ hybridization, signal detection,microscopy, and image analysis were performed as previously described (Chowdhary et al.2003).
Comparative analysisComparative information for equine orthologs of human, chimpanzee, dog, cattle, mouse, rat,opossum and chicken genes was retrieved from the UCSC Genome Browser(http://genome.ucsc.edu/). Homology between regions flanking equine microsatellites and the
Raudsepp et al. Page 3
Cytogenet Genome Res. Author manuscript; available in PMC 2009 January 1.
NIH
-PA Author Manuscript
NIH
-PA Author Manuscript
NIH
-PA Author Manuscript
human genome sequence was obtained from published papers (Tozaki et al. 2007) and byBLAST. Homologies between human genome and equine BES were retrieved from (Leeb etal. 2006) and http://www.tiho-hannover.de/einricht/zucht/hgp/index.htm. Blocks of conservedsynteny and conserved linkage were defined as described earlier (Nadeau and Sankoff 1998;Chowdhary et al. 2003, see Legends for Supplementary Figs. 1.1-1.X.). Comparative positionsof centromeres and telomeres were retrieved from available sequence and cytogenetic mapsas described below.
Construction of comparative mapsComparative information was retrieved from the UCSC Genome Bioinformatics website(http://genome.ucsc.edu) using the following builds for each species: human- NCBI Build36.1, browser March 2006; chimp - panTro2 Build 2 v1, browser March 2006; dog - canFam2v2.0, browser May 2005; cattle - Baylor release Btau_4.0, browser September 2007; mouse -mm9 NCBI Build 37, browser July 2007; rat - rn4 version 3.4, browser November 2004;opossum - monDom4, browser January 2006 and chicken - galGal3 v2.1 draft assembly,browser May 2006. Sequence maps of individual species were used to identify Mb positionsof the equine orthologs. Conserved syntenies and conserved linkages were manuallydemarcated following the convention laid out by (Nadeau and Sankoff 1998) and furtherexplained by us (Chowdhary et al. 2003). A minimum of three markers sharing the same orderin two species was considered as linked order shared between two species (i.e., conservedlinkage). Within blocks of conserved linkages, flips up to 5 Mb were not considered as breakagein conservation because such variations could be attributed to e.g., statistical constraints,assembly errors and even marginal genotyping errors. Centromere positions of bi-armedchromosomes were retrieved from combined cytogenetic and sequence maps and wereavailable only for human and chimp. Centromere positions for acrocentric chromosomes incattle, dog, mouse and rat were determined as the lowest Mb position on their sequence map.Centromere positions were not available for opossum and chicken and for chimp chromosomesthat have rearrangements compared to their human counterpart (Supplementary Table 5).Locations of telomeres were derived from comparative marker(s) located at or closest to 0 Mband the highest Mb positions position on the sequence map for individual chromosomes ineach species.
Results and DiscussionRadiation hybrid analysis and mapping
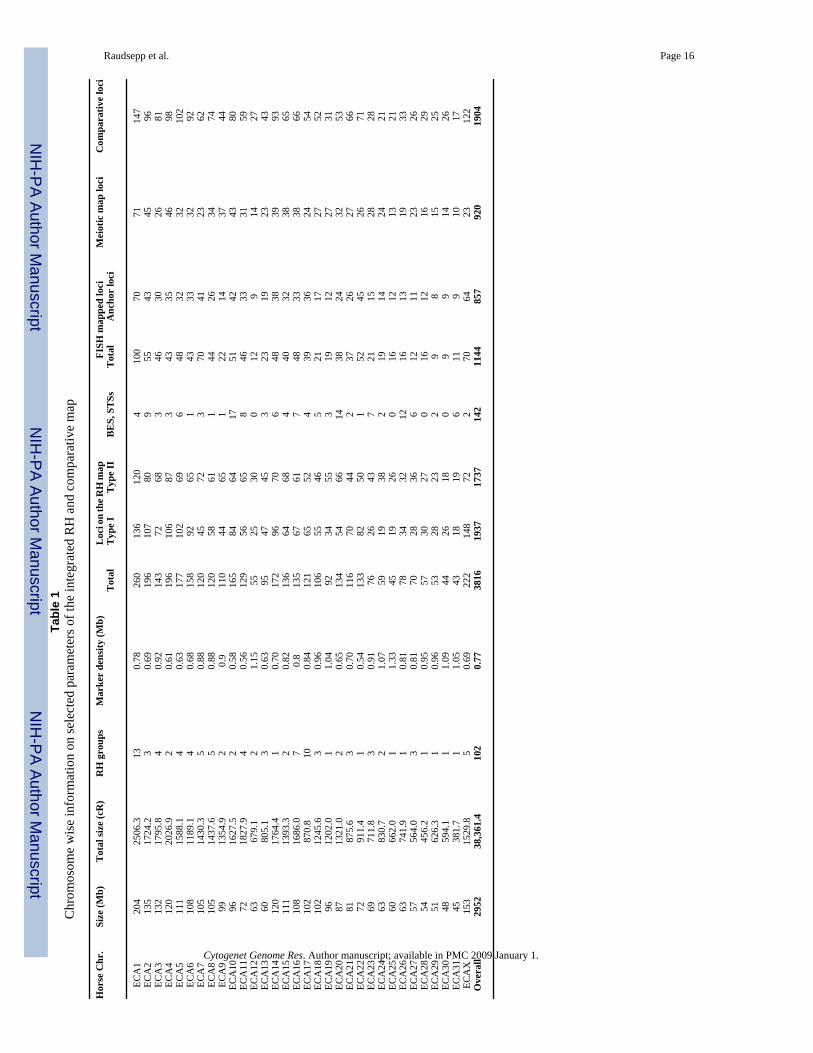
Markers and retention frequencies (RF)—A total of 4,493 markers were genotyped onthe 5,000rad Equine WG RH-panel. During and following two-marker LOD scorecomputations, 677 markers (15%) were discarded for one of the following reasons: i) markerretention frequency was below the designated threshold of 5%; ii) genotyping results wereinconsistent between duplicate typing with the same marker; iii) the same marker wasgenotyped by different research groups under alias names; iv) markers had high LOD scoreswith other markers on at least two distinct chromosomes suggesting that primers do notrecognize unique sequences; v) markers had no LOD score ≥ 7.6 with any other marker; and,vi) markers could not be reliably assigned to a multi-marker bin relative to the frameworkmaps. The final RH map contains 3,816 markers (Table 1 and Supporting Information (SI)Tables 1 and 2.1-2.X for details) of which 1,917 are on maximum likelihood (MLE)-consensus(a.k.a. framework) maps, 1,311 are placed in relation to the MLE-consensus markers, and 588are binned in intervals spanning at most four MLE-consensus markers (SI Tables 1 and 3).
The average retention frequency (RF) of markers in the panel is 19% (Supplementary Table4). This ranges from 10.4% for ECA1 to 39.4% for ECA11, which contains the selectableTK1 marker preferentially retained in all cell hybrids. Markers with low RF are mainly found
Raudsepp et al. Page 4
Cytogenet Genome Res. Author manuscript; available in PMC 2009 January 1.
NIH
-PA Author Manuscript
NIH
-PA Author Manuscript
NIH
-PA Author Manuscript
on the larger chromosomes, viz. ECA1, ECA17 and ECAX, while markers with RF above thegenome average are present mainly on small chromosomes such as ECA29 and ECA30. Thissuggests that irradiation-induced breakages were fewer in the smaller chromosomes than therest of the genome. Along the length of the chromosomes, the retention of markers is alsoslightly higher in the pericentromeric and telomeric region of many chromosomes, a trend thatwas also seen in RH I.
LOD score computations for all pairs of markers and subsequent single-linkage clusteringpartitioned the markers into 102 RH groups distributed over all horse autosomes and the Xchromosome (Table 1, SI Figures 1.1-1.X). On average, there are three RH groups perchromosome. While ECA14, 19, 22, 25, 26, 28, 29, 30, and 31 contain only one RH groupeach, ECA1 and ECA17 have 13 and 10 RH groups, respectively which coincides with theirlowest overall retention frequency (RF; Table 4). A break in the RH groups is typicallyobserved at the centromeres of bi-armed chromosomes, except for ECA11 and ECAX (SIFigures 1.11 and 1.X). The large number of RH groups is influenced by regions of low RF aswell as our decision to include ~25 small RH groups to avoid gaps in coverage. The overallsize of the map calculated as the sum of the 102 RH group lengths is 38,361 cR. Consideringthe physical size of the horse genome to be somewhere between 2,462 Mb (UCSC EquCab1,http://genome.ucsc.edu/) and 2,952 Mb (Chowdhary et al. 2003; Supplementary Table 1), 1cR in the 5000rad equine map correlates on average to ~64–76 kb.
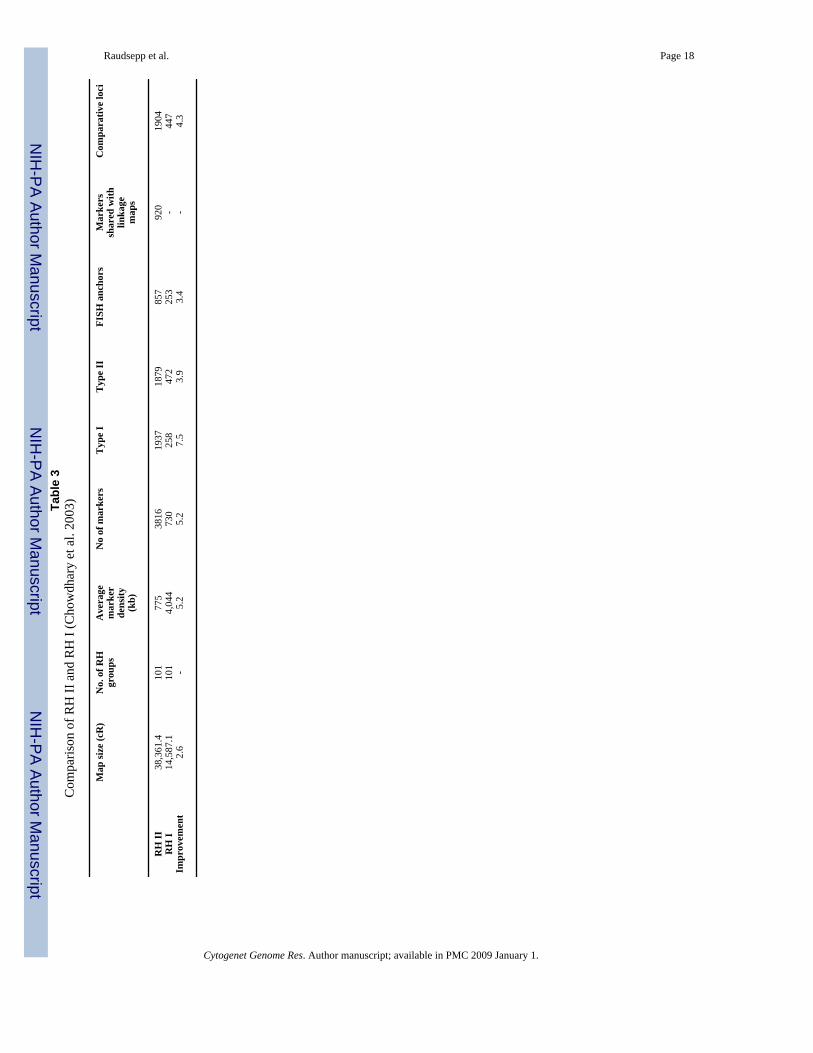
Distribution and density of markers—RH II has an average density of 1 marker/775 kb– including all 3,816 markers and an average density of 1/915kb for the 3,228 markers assigneda cR position (using the genome length estimate of 2,952 Mb from Chowdhary et al. 2003 forease of comparison). The marker density is highest on ECA22 with 1 marker/540 kb and loweston ECA25 with 1 marker/1,330 kb (Table 1). The current map provides a greater than five-fold improvement compared to RH I, where the average density was 1 marker/4,044 kb, makingit comparable to the recently reported 3000rad–7000rad WG RH maps in other species(Hamasima et al. 2003; Breen et al. 2004; Everts-van der Wind et al. 2005; Jann et al. 2006;McKay et al. 2007). In cattle, map resolution ranges from 1 marker/440 kb (Jann et al. 2006)to 1 marker/880 kb (Everts-van der Wind et al. 2005); in pig, the density is 1 marker/490kb(Hamasima et al. 2003); and in dog, the density is 1 marker/900kb (Breen et al. 2004).
The number and distribution of Type I (1,937) and Type II (1,737 microsatellite and 142 otherSTS) markers is fairly balanced on almost all chromosomes, with a slight bias towards geneson ECA5, 14 and X and towards microsatellites on ECA7, 19 and 24 (Table 1). The largenumber of polymorphic microsatellites makes RH II useful for genetic studies of horse traits.However, FISH-mapped markers and Type I markers were preferentially selected over othersin computing the MLE-consensus map to enable better comparisons with high-resolution RHmaps for domestic species that, are strongly biased towards genes (Breen et al. 2004;Everts-van der Wind et al. 2004).
Comparison of RH II with previously reported RH maps—RH II has improved almostall important map parameters compared to RH I (Table 3) both overall and on eachchromosome. In recent years, medium- to high-resolution RH maps were generated for tenhorse chromosomes or chromosomal regions (Lee et al. 2004;Raudsepp et al.2004;Brinkmeyer-Langford et al. 2005;Gustafson-Seabury et al. 2005;Wagner et al. 2006;Gohet al. 2007), however, maps for all of these chromosomes/regions have been further improvedby mapping and analyzing an additional set of markers. For example, the most recentlypublished map for ECA14 (Goh et al. 2007) with 1 marker per 940 Mb has been furtherimproved herein to a 1 marker per 700 kb.
Raudsepp et al. Page 5
Cytogenet Genome Res. Author manuscript; available in PMC 2009 January 1.
NIH
-PA Author Manuscript
NIH
-PA Author Manuscript
NIH
-PA Author Manuscript
FISH mapCytogenetic anchoring of the RH map—The cytogenetic map contains 1,144 markers(Table 1, SI Figures 1.1-1.X). The majority of the 401 newly FISH-mapped markers wereselected systematically from the ends of all RH groups and at regular intervals along the lengthof larger RH groups. Refined multicolor FISH in interphase nuclei using combinations of 3markers was applied to resolve the position and orientation of all small RH groups. AltogetherRH II contains 857 anchor loci (RH mapped or binned markers also present on the FISH map)that associate RH groups to chromosomes and confirm the computed marker order; 287markers present only on the cytogenetic map contribute primarily to the comparative map.
The utility of FISH is particularly noted in the assignment of 19 small RH groups containingonly 3–5 markers (on ECA1, 3, 6, 7, 13, 16, 17, 18, 23 and 27) and in correcting the locationof some of the RH groups or individual markers compared to previously published data. Forexample, FISH mapping of LPL, SFTPC and CTSB showed these markers to be present onECA2q and not on ECA9 as reported earlier (Milenkovic et al. 2002; Chowdhary et al.2003). Similarly, new cytogenetic mapping of microsatellite AHT30 moved a small RH group(2 loci) from the previously reported location on ECA22q13 (Swinburne et al. 2000;Chowdhary et al. 2003) to ECA13q13; also, FISH localization of KNG, UMPS and ZNF148showed that these loci are present on ECA19 and not on ECA16 (Godard et al. 2000;Milenkovic et al. 2002).
FISH also resolved discrepancies between the RH map and the most recent iteration of the twomeiotic maps. For example, FISH corrects reverse orientation of the meiotic map for ECA26by Penedo et al. (Penedo et al. 2005) (Supplementary Fig. 2.26) and both recent meiotic mapsfor ECA25 (Penedo et al. 2005; Swinburne et al. 2006) (Supplementary Fig. 2.25). With overone thousand FISH mapped markers and 857 anchor loci, the horse integrated RH/FISH mapis one of the most comprehensive among domestic species, and is comparable only to the dogWG map that contains a total of 1,000 FISH markers and 851 anchor loci (Breen et al. 2004).The second-generation WG RH maps for other domestic species are not physically aligned tothe chromosomes by FISH.
Comparison of the FISH and RH maps—The observed discrepancies in marker orderbetween the RH and FISH maps are minor and concern single or a few loci scattered over thegenome. These are partly attributed to imprecise band designations reported in earlier FISHmapping studies. Further, most of the earlier FISH studies used single-color FISH which cannotprecisely order closely locate loci. Some anomalies are also due to misidentification of theprobes. In such cases, the BAC library was re-screened using published PCR primers, theamplicons were re-sequenced to verify gene identity, and the new BAC clones were againmapped by FISH. Examples of such corrections include the re-assignment of NFIA fromECA5q12-q13 (Milenkovic et al. 2002) to ECA7q12, BRCA2 from ECA17q22 (Milenkovicet al. 2002) to ECA17q14, and AR from ECAXq15-q16 (Milenkovic et al. 2002) to ECAXq12.Several of these discrepancies could also be attributed to isolation and FISH mapping of clonescontaining another member of the same gene family. For example, primers thought to be forNFIA actually correspond to NFIX.
Integration of the RH and linkage mapsThe 766 markers in the IHRFP male linkage map (Penedo et al. 2005) and the 742 markers inthe AHT sex-averaged meiotic map (Swinburne et al. 2006) were, to the extent possible, alignedwith the 1,737 microsatellite markers present in RH II on all autosomes and the X chromosome.As a result, there are 920 markers shared between RH II and jointly the two meiotic maps.Alignments between the three maps demonstrate a general agreement in the order andorientation of markers and/or linkage groups (SI Figs. 2.1-2.X). The exceptions include i) minor
Raudsepp et al. Page 6
Cytogenet Genome Res. Author manuscript; available in PMC 2009 January 1.
NIH
-PA Author Manuscript
NIH
-PA Author Manuscript
NIH
-PA Author Manuscript
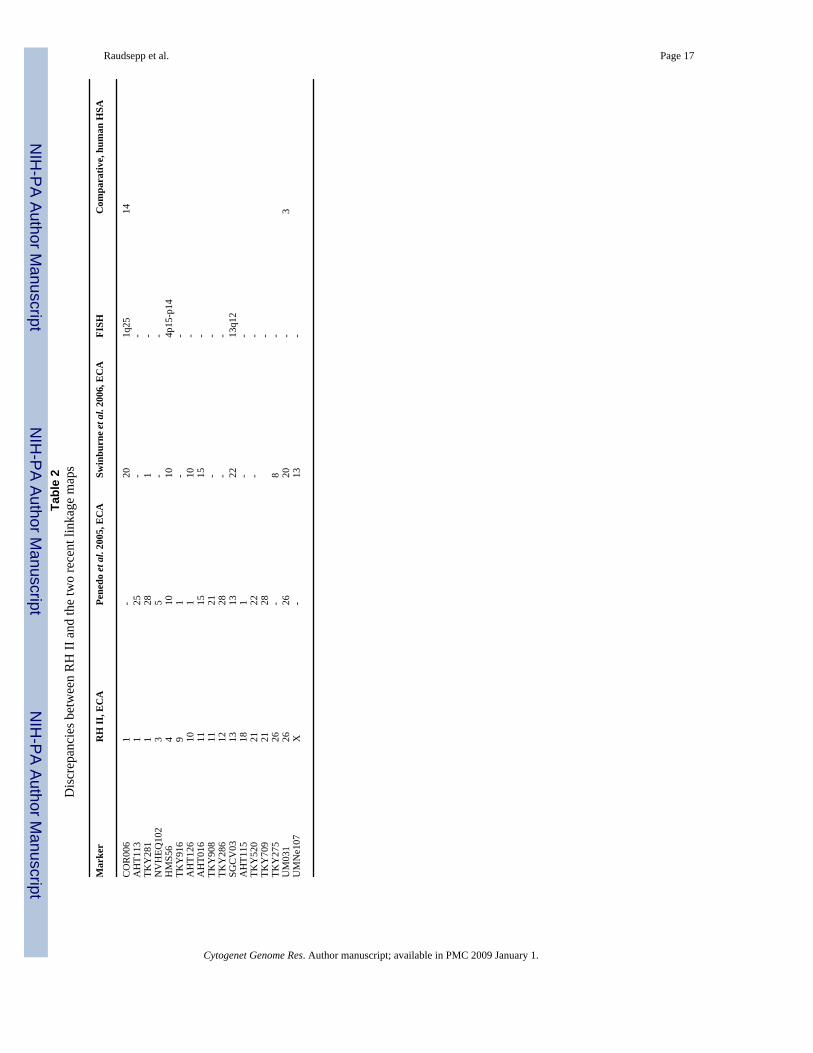
flips on ECA5, 6, 10, 14, 16, 17, 20, and 21; ii) an evident difference in the relative order ofHTG001 and ASB029 in the IHRFP map of ECA4 compared to their order in the other twomaps (Supplementary Fig. 2.4); iii) reversals involving entire linkage groups (e.g., for ECA25and ECA26, as described above); and, iv) 17 disparities involving assignment of markers to adifferent chromosome in one or both meiotic maps compared to RH II (Table 2). Moredifferences were observed between the RH II and IHRFP maps than between the RH II andAHT maps.
Comparison of the spacing of framework markers between the linkage and RH maps revealsregions that have high or low recombination rates per cR. Typically recombination is reducednear centromeres and elevated at distal parts of the chromosomes (Rowe et al. 2003). Forexample, on ECA12 two pairs of markers - AHT027-TKY404 and COR058-UCDEQ497 areseparated by similar distances on the RH map - >127.5 cR and 181.6 cR, respectively. However,their meiotic distances differ by more than 10 fold – 2.2 cM for the two pericentromeric markersAHT027-TKY404 and 23.4 cM for the two distal loci COR058-UCDEQ497 (SupplementaryFig. 2.12, Supplementary Table 3). The approximate genome-wide ratio of physical and geneticdistances between the RH II and the IHRFP and the AHT linkage maps is 10.1 cR5000/cM and13.7 cR5000/cM, respectively. This ratio varies between individual chromosomes but is clearlyhigher than those reported for cattle - from 4 cR5000/cM (Everts-van der Wind et al. 2004) to7.5 cR7000/cM (Itoh et al. 2005) indicating reduced coverage of the genome between physicaland genetic maps in the horse. The latter may be caused by the gaps between RH groups, aswell as a lower number of shared markers between RH and linkage maps compared to cattle.On the whole, alignment of RH and linkage maps indirectly connects meiotic data with thecytogenetic and comparative information and facilitates integration of all available mappinginformation for the equine genome.
Comparative mapThe 1,904 genes and BAC end sequences (BES) present in RH II enable a comparativeoverview of the organization of the horse genome in relation to eight sequenced vertebrategenomes representing eutherian mammals (human, chimp, dog, cattle, mouse, rat), marsupials(opossum) and birds (chicken). On average, comparative markers are distributed at 1.4 Mbintervals in RH II. Further, BLAST alignment of the flanking sequences of 766 equinemicrosatellite loci with the human genome sequence (Tozaki et al. 2007), provides additionalcomparative markers for these two genomes. The new map shows a four- to five-foldimprovement in the number of comparative markers over RH I and extends the comparison ofthe horse genome from human and mouse to six additional species. Because the focus of thisstudy is the high-resolution WG map for the horse, our remarks on map comparisons will berestricted to salient comparative features of the equine genome in relation to the eight sequencedgenomes, without expanding on the putative common ancestor.
The comparative map presented in RH II map figures for 31 autosomes and the X chromosome(Supplementary Fig. 1.1-1.X) confirms and refines the boundaries of conserved syntenicsegments known between the horse and human genomes (Raudsepp et al. 1996; Yang et al.2004). For example, mapping 39 horse-human comparative loci on ECA27, 60 on ECA26 and54 on ECA13 reaffirms synteny conservation and improves the previously known boundariesof correspondence with the human chromosomes HSA4/HSA8, HSA3/HSA21 and HSA7/HSA16, respectively. Mapping 14 HSA1 markers to the proximal region of ECA1q shows thatthe equine segment corresponds to the 225–229 Mb region on HSA1q and confirms recentZoo-FISH findings (Yang et al. 2004). The map also reveals a previously undetected segmentof homology between ECA2q and HSA8p. Furthermore, the new map refines the status ofseveral previously reported horse-human conserved syntenies and corrects a number of single-
Raudsepp et al. Page 7
Cytogenet Genome Res. Author manuscript; available in PMC 2009 January 1.
NIH
-PA Author Manuscript
NIH
-PA Author Manuscript
NIH
-PA Author Manuscript
locus-based homologies previously described between ECA1-HSA22, ECA2-HSA1, ECA3-HSA3, ECA5-HSA22 and ECA7-HSA19 (Milenkovic et al. 2002; Chowdhary et al. 2003).
An overview of conserved synteny or linkage between the horse and the eight comparedgenomes shows other interesting features. ECA11, ECA17, ECA22 and ECAX are the onlychromosomes that share one-to-one homology with human and chimp chromosomes, but theconserved synteny does not translate into conserved gene order along the three autosomes.ECAX seems to be the only chromosome that shares conserved linkage with human, chimpand also dog counterparts, including the position of the centromere. Broadly, the conservationholds good also for pig (Raudsepp et al. 2004), but not for cattle, mouse and rat where thereare several rearrangements (Supplementary Fig. 1.X).
The centromeres of many equine metacentric chromosomes represent sites of synteny breaksin the genomes of most of the compared species. Examples of such breaks are seen on ECA3,6, 8 and 10 where the short and the long arms correspond to separate chromosomes in all speciesincluding opossum and chicken, suggesting that putative ancestral segments have fused at thesepoints in the horse. Further, the position of equine centromeres and/or telomeres coincides at~58% of the locations with human and chimp, at 37% of the locations with dog but at less than20% of the locations of telomeres/centromeres in the remaining species (Supplementary Table5). These observations, together with the overall size of syntenic segments in various speciesshared with the horse, indicate that the organization of the horse chromosomes resembleshuman/chimp more closely than other compared species.
Some other interesting aspects about comparative organization of the horse genome in relationto the eight sequenced genomes include:
- clustering of synteny breaks or rearrangements at a number of places in the eightgenomes. Two such clusters can be seen on ECA1q14 and q15 where a distinct break insynteny is observed in almost all genomes. In cattle, where the break does not occur, arearrangement is evident at the same spot. Another interesting example of such a reshuffleis seen at ECA9cen where an inversion is evident in all species sharing conserved synteny.Aggregation of these rearrangements or synteny breaks at specific spots in other genomeshighlights some of the sites where fusion/reshuffle occurred during the formation of thehorse chromosomes. Similar congregation of synteny breaks or rearrangements can beseen on ECA2cen, ECA3cen, ECA7, ECA21 and a number of other locations in relationto the horse genome as indicated by a red vertical line across the eight genomes(Supplementary Fig. 1.1-1.X).
- Overall, the human and chimp genomes exhibit an almost identical pattern of similaritywith the horse genome. However, over the distal parts of ECA3q, 6q, 14q, and ECA21,the chimp genome shows inversions that are not seen in the human genome. Theseinversions were reported in previous human-chimp genome comparisons (Schmutz et al.2004; Kehrer-Sawatzki et al. 2005a; Kehrer-Sawatzki et al. 2005b) and likely representindependent events that occurred during the evolution of the chimp chromosomes.However, chimp inversion breakpoints seen on ECA3 and ECA14 comparative mapsmight have broader evolutionary importance, as they coincide with synteny breaks in dogand rodents, respectively.
- The mouse/rat genomes have undergone rapid karyotype evolution and therefore the totalnumber of syntenic segments shared between them and other eutherian genomes isconsiderably higher than that seen for comparisons between non-rodent mammaliangenomes. Although a similar trend is seen for horse-mouse/rat chromosome comparisons,some remarkably uninterrupted conserved syntenies and linkages spanning entire equinechromosomes are worth mentioning. For example, the conserved linkage shared betweenECA11 and parts of MMU11 and RNO10 is not seen for corresponding chromosomal
Raudsepp et al. Page 8
Cytogenet Genome Res. Author manuscript; available in PMC 2009 January 1.
NIH
-PA Author Manuscript
NIH
-PA Author Manuscript
NIH
-PA Author Manuscript
segments in the other six species. A similar trend is seen in conserved linkage sharedbetween ECA24 and parts of MMU12/RNO6, and between ECA26 and parts of MMU16/RNO11. Additionally, ECA22, 27, 28, 29 and 30 share synteny conservation along theirentire length with parts of (or complete) rat chromosomes, while ECA22, 27 and 30 shareit with mouse chromosomes.
- While a number of segments from the chicken genome (particularly themacrochromosomes) individually correspond to parts of single equine chromosomes, theconserved linkage between ECA17 and part of GGA1, and the conserved synteny betweenECA9, ECA18, ECA24, ECA28 and ECA31 with parts of GGA2, GGA7, GGA5, GGA1and GGA3, respectively, are noteworthy because some of these segments most likelyrepresent ancestral vertebrate regions.
- Among large equine autosomes, only ECA9 shares synteny and linkage conservationwith the corresponding opossum chromosome (MDO3). Large blocks of syntenyconservation are present also between other equine and marsupial chromosomes, but thegene order is usually rearranged resulting in shorter segments of conserved linkages. It isnot yet clear whether lower degree of linkage conservation between eutherian andmarsupial genomes is due to evolutionary divergence or an incomplete opossum genomeassembly. Likewise, many synteny and linkage rearrangements observed between horseand cattle genomes can probably be attributed to the sequence assembly difficulties ratherthan to real differences.
- Finally, comparative maps of some horse chromosomes, e.g., ECA5q, 13qcen and 22qshow discrepant synteny or linkage positions of some markers in all other species and mostlikely reflect inaccuracies in the horse RH map. Such discrepant markers tend to be locatedat the ends of RH groups and are shown in red font on RH maps (Supplementary Fig.1.1-1.X).
RH map as a framework for WG BAC fingerprint and sequence assembliesA WG physical map of BAC contigs based on fingerprinting 150,000 BAC clones fromCHORI-241 library is currently under construction (O. Distl, unpublished). Since RH IIcontains over 500 markers that are derived from CHORI-241 BAC clones, they can be used toverify the BAC fingerprint assembly and anchor it to specific chromosomes. The majority ofthe 4,103 markers on the integrated map should also serve as an excellent framework withwhich the WG draft sequence assembly (currently at build 2) of the female horse Twilight (C.Wade, unpublished) could be validated. We used e-PCR (Schuler 1997) to locate the RH IImarkers on horse build 2 to quantify how much improvement is possible. Only 2,869 markershad a chromosomal location, and only 2,757 markers had a unique location. Thus, it may bepossible to use the locations and primers of the other 1,000+ markers given herein to producebetter horse genome assemblies. We anticipate that as for human (Lander et al. 2001; Olivieret al. 2001; Venter et al. 2001), mouse (Rowe et al. 2003), rat (Kwitek et al. 2004) and otherspecies, the integrated WG RH II and comparative horse map presented in this study will serveas the main framework to support future efforts in both genome sequence and BAC contigassembly.
Supplementary MaterialRefer to Web version on PubMed Central for supplementary material.
Raudsepp et al. Page 9
Cytogenet Genome Res. Author manuscript; available in PMC 2009 January 1.
NIH
-PA Author Manuscript
NIH
-PA Author Manuscript
NIH
-PA Author Manuscript
AcknowledgementsThis work was supported by USDA/NRI grant 2003-03687 and 2006-04801, the Link Endowment, the Morris AnimalFoundation, the Dorothy Russell Havemeyer Foundation, the Grayson Jockey Club and in part by the IntramuralResearch Program of the NIH, NLM.
ReferencesAgarwala R, Applegate DL, Maglott D, Schuler GD, Schäffer AA. A fast and scalable radiation hybrid
map construction and integration strategy. Genome Res 2000;10:350–364. [PubMed: 10720576]Applegate, DL.; Bixby, R.; Chvátal, VWC. The Traveling Salesman Problem: A Computational Study.
Princeton University Press; New Jersey: 2006.Breen M, Hitte C, Lorentzen TD, Thomas R, Cadieu E, Sabacan L, Scott A, Evanno G, Parker HG,
Kirkness EF, Hudson R, Guyon R, Mahairas GG, Gelfenbeyn B, Fraser CM, Andre C, Galibert F,Ostrander EA. An integrated 4249 marker FISH/RH map of the canine genome. BMC Genomics2004;5:65. [PubMed: 15363096]
Brinkmeyer-Langford C, Raudsepp T, Lee E-J, Goh G, Schäffer AA, Agarwala R, Wagner ML, TozakiT, Skow LC, Womack JE, Mickelson JR, Chowdhary BP. A high-resolution physical map of equinehomologs of HSA19 shows divergent evolution compared with other mammals. Mamm Genome2005;16:631–649. [PubMed: 16180145]
Chenna R, Sugawara H, Koike T, Lopez R, Gibson TJ, Higgins DG, Thompson JD. Multiple sequencealignment with the Clustal series of programs. Nucl Acids Res 2003;31:3497–3500. [PubMed:12824352]
Chowdhary BP, Raudsepp T, Honeycutt D, Owens EK, Piumi F, Guérin G, Matise TC, Kata SR, WomackJE, Skow LC. Construction of a 5000rad whole-genome radiation hybrid panel in the horse andgeneration of a comprehensive and comparative map for ECA11. Mamm Genome 2002;13:89–94.[PubMed: 11889556]
Chowdhary BP, Raudsepp T, Kata SR, Goh G, Millon LV, Allan V, Piumi F, Guérin G, Swinburne J,Binns M, Lear TL, Mickelson J, Murray J, Antczak DF, Womack JE, Skow LC. The first-generationwhole-genome radiation hybrid map in the horse identifies conserved segments in human and mousegenomes. Genome Res 2003;13:742–751. [PubMed: 12671008]
Chowdhary BP, Raudsepp T. The Horse Genome Derby: racing from map to whole genome sequence.Chromosome Res 2008;16:109–127. [PubMed: 18274866]
Dierks C, Mömke S, Drögemuller C, Leeb T, Chowdhary BP, Distl O. A high-resolution comparativeradiation hybrid map of equine chromosome 4q12-q22. Anim Genet 2006;37:513–517. [PubMed:16978184]
Everts-van der Wind A, Kata SR, Band MR, Rebeiz M, Larkin DM, Everts RE, Green CA, Liu L,Natarajan S, Goldammer T, Lee JH, McKay S, Womack JE, Lewin HA. A 1463 gene cattle-humancomparative map with anchor points defined by human genome sequence coordinates. Genome Res2004;14:1424–1437. [PubMed: 15231756]
Everts-van der Wind A, Larkin DM, Green CA, Elliott JS, Olmstead CA, Chiu R, Schein JE, Marra MA,Womack JE, Lewin HA. A high-resolution whole-genome cattle-human comparative map revealsdetails of mammalian chromosome evolution. Proc Natl Acad Sci U S A 2005;102:18526–18531.[PubMed: 16339895]
Godard S, Vaiman A, Schibler L, Mariat D, Vaiman D, Cribiu E-P, Guérin G. Cytogenetic localizationof 44 new coding sequences in the horse. Mamm Genome 2000;11:1093–1097. [PubMed: 11130977]
Goh G, Raudsepp T, Durkin K, Wagner ML, Schäffer AA, Agarwala R, Tozaki T, Mickelson JR,Chowdhary BP. High-resolution gene maps of horse chromosomes 14 and 21: additional insightsinto evolution and rearrangements of HSA5 homologs in mammals. Genomics 2007;89:89–112.[PubMed: 16916595]
Gustafson-Seabury A, Raudsepp T, Goh G, Kata SR, Wagner ML, Tozaki T, Mickelson JR, WomackJE, Skow LC, Chowdhary BP. High-resolution RH map of horse chromosome 22 reveals a putativeancestral vertebrate chromosome. Genomics 2005;85:188–200. [PubMed: 15676277]
Raudsepp et al. Page 10
Cytogenet Genome Res. Author manuscript; available in PMC 2009 January 1.
NIH
-PA Author Manuscript
NIH
-PA Author Manuscript
NIH
-PA Author Manuscript
Hamasima N, Suzuki H, Mikawa A, Morozumi T, Plastow G, Mitsuhashi T. Construction of a new porcinewhole-genome framework map using a radiation hybrid panel. Anim Genet 2003;34:216–220.[PubMed: 12755823]
Itoh T, Watanabe T, Ihara N, Mariani P, Beattie CW, Sugimoto Y, Takasuga A. A comprehensiveradiation hybrid map of the bovine genome comprising 5593 loci. Genomics 2005;85:413–424.[PubMed: 15780744]
Jann OC, Aerts J, Jones M, Hastings N, Law A, McKay S, Marques E, Prasad A, Yu J, Moore SS, FloriotS, Mahe MF, Eggen A, Silveri L, Negrini R, Milanesi E, Ajmone-Marsan P, Valentini A, MarchitelliC, Savarese MC, Janitz M, Herwig R, Hennig S, Gorni C, Connor EE, Sonstegard TS, Smith T,Drogemuller C, Williams JL. A second generation radiation hybrid map to aid the assembly of thebovine genome sequence. BMC Genomics 2006;7:283. [PubMed: 17087818]
Kehrer-Sawatzki H, Sandig C, Chuzhanova N, Goidts V, Szamalek JM, Tanzer S, Muller S, Platzer M,Cooper DN, Hameister H. Breakpoint analysis of the pericentric inversion distinguishing humanchromosome 4 from the homologous chromosome in the chimpanzee (Pan troglodytes). Hum Mutat2005a;25:45–55. [PubMed: 15580561]
Kehrer-Sawatzki H, Sandig CA, Goidts V, Hameister H. Breakpoint analysis of the pericentric inversionbetween chimpanzee chromosome 10 and the homologous chromosome 12 in humans. CytogenetGenome Res 2005b;108:91–97. [PubMed: 15545720]
Kwitek AE, Gullings-Handley J, Yu J, Carlos DC, Orlebeke K, Nie J, Eckert J, Lemke A, Andrae JW,Bromberg S, Pasko D, Chen D, Scheetz TE, Casavant TL, Soares MB, Sheffield VC, Tonellato PJ,Jacob HJ. High-density rat radiation hybrid maps containing over 24,000 SSLPs, genes, and ESTsprovide a direct link to the rat genome sequence. Genome Res 2004;14:750–757. [PubMed:15060019]
Lander ES, Linton LM, Birren B, Nusbaum C, Zody MC, Baldwin J, Devon K, Dewar K, Doyle M,FitzHugh W, Funke R, Gage D, Harris K, Heaford A, Howland J, Kann L, Lehoczky J, LeVine R,McEwan P, McKernan K, Meldrim J, Mesirov JP, Miranda C, Morris W, Naylor J, Raymond C,Rosetti M, Santos R, Sheridan A, Sougnez C, Stange-Thomann N, Stojanovic N, Subramanian A,Wyman D, Rogers J, Sulston J, Ainscough R, Beck S, Bentley D, Burton J, Clee C, Carter N, CoulsonA, Deadman R, Deloukas P, Dunham A, Dunham I, Durbin R, French L, Grafham D, Gregory S,Hubbard T, Humphray S, Hunt A, Jones M, Lloyd C, McMurray A, Matthews L, Mercer S, MilneS, Mullikin JC, Mungall A, Plumb R, Ross M, Shownkeen R, Sims S, Waterston RH, Wilson RK,Hillier LW, McPherson JD, Marra MA, Mardis ER, Fulton LA, Chinwalla AT, Pepin KH, Gish WR,Chissoe SL, Wendl MC, Delehaunty KD, Miner TL, Delehaunty A, Kramer JB, Cook LL, FultonRS, Johnson DL, Minx PJ, Clifton SW, Hawkins T, Branscomb E, Predki P, Richardson P, WenningS, Slezak T, Doggett N, Cheng JF, Olsen A, Lucas S, Elkin C, Uberbacher E, Frazier M, Gibbs RA,Muzny DM, Scherer SE, Bouck JB, Sodergren EJ, Worley KC, Rives CM, Gorrell JH, Metzker ML,Naylor SL, Kucherlapati RS, Nelson DL, Weinstock GM, Sakaki Y, Fujiyama A, Hattori M, YadaT, Toyoda A, Itoh T, Kawagoe C, Watanabe H, Totoki Y, Taylor T, Weissenbach J, Heilig R, SaurinW, Artiguenave F, Brottier P, Bruls T, Pelletier E, Robert C, Wincker P, Smith DR, Doucette-StammL, Rubenfield M, Weinstock K, Lee HM, Dubois J, Rosenthal A, Platzer M, Nyakatura G, TaudienS, Rump A, Yang H, Yu J, Wang J, Huang G, Gu J, Hood L, Rowen L, Madan A, Qin S, Davis RW,Federspiel NA, Abola AP, Proctor MJ, Myers RM, Schmutz J, Dickson M, Grimwood J, Cox DR,Olson MV, Kaul R, Shimizu N, Kawasaki K, Minoshima S, Evans GA, Athanasiou M, Schultz R,Roe BA, Chen F, Pan H, Ramser J, Lehrach H, Reinhardt R, McCombie WR, de la Bastide M, DedhiaN, Blocker H, Hornischer K, Nordsiek G, Agarwala R, Aravind L, Bailey JA, Bateman A, BatzoglouS, Birney E, Bork P, Brown DG, Burge CB, Cerutti L, Chen HC, Church D, Clamp M, Copley RR,Doerks T, Eddy SR, Eichler EE, Furey TS, Galagan J, Gilbert JG, Harmon C, Hayashizaki Y, HausslerD, Hermjakob H, Hokamp K, Jang W, Johnson LS, Jones TA, Kasif S, Kaspryzk A, Kennedy S,Kent WJ, Kitts P, Koonin EV, Korf I, Kulp D, Lancet D, Lowe TM, McLysaght A, Mikkelsen T,Moran JV, Mulder N, Pollara VJ, Ponting CP, Schuler G, Schultz J, Slater G, Smit AF, Stupka E,Szustakowski J, Thierry-Mieg D, Thierry-Mieg J, Wagner L, Wallis J, Wheeler R, Williams A, WolfYI, Wolfe KH, Yang SP, Yeh RF, Collins F, Guyer MS, Peterson J, Felsenfeld A, Wetterstrand KA,Patrinos A, Morgan MJ, de Jong P, Catanese JJ, Osoegawa K, Shizuya H, Choi S, Chen YJ. Initialsequencing and analysis of the human genome. Nature 2001;409:860–921. [PubMed: 11237011]
Raudsepp et al. Page 11
Cytogenet Genome Res. Author manuscript; available in PMC 2009 January 1.
NIH
-PA Author Manuscript
NIH
-PA Author Manuscript
NIH
-PA Author Manuscript
Lee E-J, Raudsepp T, Kata SR, Adelson D, Womack JE, Skow LC, Chowdhary BP. A 1.4-Mb intervalRH map of horse chromosome 17 provides detailed comparison with human and mouse homologues.Genomics 2004;83:203–215. [PubMed: 14706449]
Leeb T, Vogl C, Zhu B, de Jong PJ, Binns MM, Chowdhary BP, Scharfe M, Jarek M, Nordsiek G, SchraderF, Blocker H. A human-horse comparative map based on equine BAC end sequences. Genomics2006;87:772–776. [PubMed: 16603334]
McKay SD, Schnabel RD, Murdoch BM, Aerts J, Gill CA, Gao C, Li C, Matukumalli LK, Stothard P,Wang Z, Van Tassell CP, Williams JL, Taylor JF, Moore SS. Construction of bovine whole-genomeradiation hybrid and linkage maps using high-throughput genotyping. Anim Genet 2007;38:120–125. [PubMed: 17302794]
Meyers SN, Rogatcheva MB, Larkin DM, Yerle M, Milan D, Hawken RJ, Schook LB, Beever JE. Piggy-BACing the human genome II. A high-resolution, physically anchored, comparative map of theporcine autosomes. Genomics 2005;86:739–752. [PubMed: 16246521]
Milenkovic D, Oustry-Vaiman A, Lear TL, Billault A, Mariat D, Piumi F, Schibler L, Cribiu E, GuérinG. Cytogenetic localization of 136 genes in the horse: comparative mapping with the human genome.Mamm Genome 2002;13:524–534. [PubMed: 12370783]
Murphy WJ, Larkin DM, Everts-van der Wind A, Bourque G, Tesler G, Auvil L, Beever JE, ChowdharyBP, Galibert F, Gatzke L, Hitte C, Meyers SN, Milan D, Ostrander EA, Pape G, Parker HG, RaudseppT, Rogatcheva MB, Schook LB, Skow LC, Welge M, Womack JE, O’Brien SJ, Pevzner PA, LewinHA. Dynamics of mammalian chromosome evolution inferred from multispecies comparative maps.Science 2005;309:613–617. [PubMed: 16040707]
Murphy WJ, Davis B, David VA, Agarwala R, Schäffer AA, Pearks Wilkerson AJ, Neelam B, O’BrienSJ, Menotti-Raymond M. A 1.5-Mb-resolution radiation hybrid map of the cat genome andcomparative analysis with the canine and human genomes. Genomics 2007;89:189–196. [PubMed:16997530]
Nadeau JH, Sankoff D. Counting on comparative maps. Trends Genet 1998;14:495–501. [PubMed:9865155]
Olivier M, Aggarwal A, Allen J, Almendras AA, Bajorek ES, Beasley EM, Brady SD, Bushard JM,Bustos VI, Chu A, Chung TR, De Witte A, Denys ME, Dominguez R, Fang NY, Foster BD,Freudenberg RW, Hadley D, Hamilton LR, Jeffrey TJ, Kelly L, Lazzeroni L, Levy MR, Lewis SC,Liu X, Lopez FJ, Louie B, Marquis JP, Martinez RA, Matsuura MK, Misherghi NS, Norton JA,Olshen A, Perkins SM, Perou AJ, Piercy C, Piercy M, Qin F, Reif T, Sheppard K, Shokoohi V, SmickGA, Sun WL, Stewart EA, Fernando J, Tejeda Tran NM, Trejo T, Vo NT, Yan SC, Zierten DL, ZhaoS, Sachidanandam R, Trask BJ, Myers RM, Cox DR. A high-resolution radiation hybrid map of thehuman genome draft sequence. Science 2001;291:1298–1302. [PubMed: 11181994]
Penedo MCT, Millon LV, Bernoco D, Bailey E, Binns M, Cholewinski G, Ellis N, Flynn J, Gralak B,Guthrie A, Hasegawa T, Lindgren G, Lyons LA, Roed KH, Swinburne JE, Tozaki T. Internationalequine gene mapping workshop report: a comprehensive linkage map constructed with data fromnew markers and by merging four mapping resources. Cytogenet Genome Res 2005;111:5–15.[PubMed: 16093715]
Perrocheau M, Boutreux V, Chadi S, Mata X, Decaunes P, Raudsepp T, Durkin K, Incarnato D, IannuzziL, Lear TL, Hirota K, Hasegawa T, Zhu B, de Jong P, Cribiu EP, Chowdhary BP, Guérin G.Construction of a medium-density horse gene map. Anim Genet 2006;37:145–155. [PubMed:16573529]
Raudsepp T, Frönicke L, Scherthan H, Gustavsson I, Chowdhary BP. Zoo-FISH delineates conservedchromosomal segments in horse and man. Chromosome Res 1996;4:218–225. [PubMed: 8793207]
Raudsepp T, Lee E-J, Kata SR, Brinkmeyer C, Mickelson JR, Skow LC, Womack JE, Chowdhary BP.Exceptional conservation of horse-human gene order on X chromosome revealed by high-resolutionradiation hybrid mapping. Proc Natl Acad Sci U S A 2004;101:2386–2391. [PubMed: 14983019]
Rowe LB, Barter ME, Kelmenson JA, Eppig JT. The comprehensive mouse radiation hybrid map denselycross-referenced to the recombination map: a tool to support the sequence assemblies. Genome Res2003;13:122–133. [PubMed: 12529315]
Schäffer AA, Rice ES, Cook W, Agarwala R. rh_tsp_map 3.0: End-to-end radiation hybrid mapping withimproved speed and quality control. Bioinformatics 2007;23:1156–1158. [PubMed: 17332018]
Raudsepp et al. Page 12
Cytogenet Genome Res. Author manuscript; available in PMC 2009 January 1.
NIH
-PA Author Manuscript
NIH
-PA Author Manuscript
NIH
-PA Author Manuscript
Schmutz J, Martin J, Terry A, Couronne O, Grimwood J, Lowry S, Gordon LA, Scott D, Xie G, HuangW, Hellsten U, Tran-Gyamfi M, She X, Prabhakar S, Aerts A, Altherr M, Bajorek E, Black S,Branscomb E, Caoile C, Challacombe JF, Chan YM, Denys M, Detter JC, Escobar J, Flowers D,Fotopulos D, Glavina T, Gomez M, Gonzales E, Goodstein D, Grigoriev I, Groza M, Hammon N,Hawkins T, Haydu L, Israni S, Jett J, Kadner K, Kimball H, Kobayashi A, Lopez F, Lou Y, MartinezD, Medina C, Morgan J, Nandkeshwar R, Noonan JP, Pitluck S, Pollard M, Predki P, Priest J, RamirezL, Retterer J, Rodriguez A, Rogers S, Salamov A, Salazar A, Thayer N, Tice H, Tsai M, UstaszewskaA, Vo N, Wheeler J, Wu K, Yang J, Dickson M, Cheng JF, Eichler EE, Olsen A, Pennacchio LA,Rokhsar DS, Richardson P, Lucas SM, Myers RM, Rubin EM. The DNA sequence and comparativeanalysis of human chromosome 5. Nature 2004;431:268–274. [PubMed: 15372022]
Schuler GD. Sequence mapping by electronic PCR. Genome Res 1997;7:541–550. [PubMed: 9149949]Snelling WM, Chiu R, Schein JE, Hobbs M, Abbey CA, Adelson DL, Aerts J, Bennett GL, Bosdet IE,
Boussaha M, Brauning R, Caetano AR, Costa MM, Crawford AM, Dalrymple BP, Eggen A, Everts-van der Wind A, Floriot S, Gautier M, Gill CA, Green RD, Holt R, Jann O, Jones SJ, Kappes SM,Keele JW, de Jong PJ, Larkin DM, Lewin HA, McEwan JC, McKay S, Marra MA, Mathewson CA,Matukumalli LK, Moore SS, Murdoch B, Nicholas FW, Osoegawa K, Roy A, Salih H, Schibler L,Schnabel RD, Silveri L, Skow LC, Smith TP, Sonstegard TS, Taylor JF, Tellam R, Van Tassell CP,Williams JL, Womack JE, Wye NH, Yang G, Zhao S. A physical map of the bovine genome. GenomeBiol 2007;8:R165. [PubMed: 17697342]
Swinburne J, Gerstenberg C, Breen M, Aldridge V, Lockhart L, Marti E, Antczak D, Eggleston-Stott M,Bailey E, Mickelson J, Roed K, Lindgren G, von Haeringen W, Guerin G, Bjarnason J, Allen T,Binns M. First comprehensive low-density horse linkage map based on two 3-generation, full-sibling,cross-bred horse reference families. Genomics 2000;66:123–134. [PubMed: 10860657]
Swinburne JE, Boursnell M, Hill G, Pettitt L, Allen T, Chowdhary B, Hasegawa T, Kurosawa M, LeebT, Mashima S, Mickelson JR, Raudsepp T, Tozaki T, Binns M. Single linkage group per chromosomegenetic linkage map for the horse, based on two three-generation, full-sibling, crossbred horsereference families. Genomics 2006;87:1–29. [PubMed: 16314071]
Tozaki T, Swinburne J, Hirota K, Hasegawa T, Ishida N, Tobe T. Improved resolution of the comparativehorse-human map: investigating markers with in silico and linkage mapping approaches. Gene2007;392:181–186. [PubMed: 17306472]
Venter JC, Adams MD, Myers EW, Li PW, Mural RJ, Sutton GG, Smith HO, Yandell M, Evans CA,Holt RA, Gocayne JD, Amanatides P, Ballew RM, Huson DH, Wortman JR, Zhang Q, Kodira CD,Zheng XH, Chen L, Skupski M, Subramanian G, Thomas PD, Zhang J, Gabor Miklos GL, NelsonC, Broder S, Clark AG, Nadeau J, McKusick VA, Zinder N, Levine AJ, Roberts RJ, Simon M,Slayman C, Hunkapiller M, Bolanos R, Delcher A, Dew I, Fasulo D, Flanigan M, Florea L, HalpernA, Hannenhalli S, Kravitz S, Levy S, Mobarry C, Reinert K, Remington K, Abu-Threideh J, BeasleyE, Biddick K, Bonazzi V, Brandon R, Cargill M, Chandramouliswaran I, Charlab R, Chaturvedi K,Deng Z, Di Francesco V, Dunn P, Eilbeck K, Evangelista C, Gabrielian AE, Gan W, Ge W, GongF, Gu Z, Guan P, Heiman TJ, Higgins ME, Ji RR, Ke Z, Ketchum KA, Lai Z, Lei Y, Li Z, Li J, LiangY, Lin X, Lu F, Merkulov GV, Milshina N, Moore HM, Naik AK, Narayan VA, Neelam B, NusskernD, Rusch DB, Salzberg S, Shao W, Shue B, Sun J, Wang Z, Wang A, Wang X, Wang J, Wei M,Wides R, Xiao C, Yan C, Yao A, Ye J, Zhan M, Zhang W, Zhang H, Zhao Q, Zheng L, Zhong F,Zhong W, Zhu S, Zhao S, Gilbert D, Baumhueter S, Spier G, Carter C, Cravchik A, Woodage T, AliF, An H, Awe A, Baldwin D, Baden H, Barnstead M, Barrow I, Beeson K, Busam D, Carver A,Center A, Cheng ML, Curry L, Danaher S, Davenport L, Desilets R, Dietz S, Dodson K, Doup L,Ferriera S, Garg N, Gluecksmann A, Hart B, Haynes J, Haynes C, Heiner C, Hladun S, Hostin D,Houck J, Howland T, Ibegwam C, Johnson J, Kalush F, Kline L, Koduru S, Love A, Mann F, MayD, McCawley S, McIntosh T, McMullen I, Moy M, Moy L, Murphy B, Nelson K, Pfannkoch C,Pratts E, Puri V, Qureshi H, Reardon M, Rodriguez R, Rogers YH, Romblad D, Ruhfel B, Scott R,Sitter C, Smallwood M, Stewart E, Strong R, Suh E, Thomas R, Tint NN, Tse S, Vech C, Wang G,Wetter J, Williams S, Williams M, Windsor S, Winn-Deen E, Wolfe K, Zaveri J, Zaveri K, Abril JF,Guigo R, Campbell MJ, Sjolander KV, Karlak B, Kejariwal A, Mi H, Lazareva B, Hatton T,Narechania A, Diemer K, Muruganujan A, Guo N, Sato S, Bafna V, Istrail S, Lippert R, SchwartzR, Walenz B, Yooseph S, Allen D, Basu A, Baxendale J, Blick L, Caminha M, Carnes-Stine J, CaulkP, Chiang YH, Coyne M, Dahlke C, Mays A, Dombroski M, Donnelly M, Ely D, Esparham S, FoslerC, Gire H, Glanowski S, Glasser K, Glodek A, Gorokhov M, Graham K, Gropman B, Harris M, Heil
Raudsepp et al. Page 13
Cytogenet Genome Res. Author manuscript; available in PMC 2009 January 1.
NIH
-PA Author Manuscript
NIH
-PA Author Manuscript
NIH
-PA Author Manuscript
J, Henderson S, Hoover J, Jennings D, Jordan C, Jordan J, Kasha J, Kagan L, Kraft C, Levitsky A,Lewis M, Liu X, Lopez J, Ma D, Majoros W, McDaniel J, Murphy S, Newman M, Nguyen T, NguyenN, Nodell M, Pan S, Peck J, Peterson M, Rowe W, Sanders R, Scott J, Simpson M, Smith T, SpragueA, Stockwell T, Turner R, Venter E, Wang M, Wen M, Wu D, Wu M, Xia A, Zandieh A, Zhu X.The sequence of the human genome. Science 2001;291:1304–1351. [PubMed: 11181995]
Wagner ML, Raudsepp T, Goh G, Agarwala R, Schäffer AA, Dranchak PK, Brinkmeyer-Langford C,Skow LC, Chowdhary BP, Mickelson JR. A 1.3-Mb interval map of equine homologs of HSA2.Cytogenet Genome Res 2006;112:227–234. [PubMed: 16484777]
Yang F, Fu B, O’Brien PCM, Nie W, Ryder OA, Ferguson-Smith MA. Refined genome-wide comparativemap of the domestic horse, donkey and human based on cross-species chromosome painting: insightinto the occasional fertility of mules. Chromosome Res 2004;12:65–76. [PubMed: 14984103]
Raudsepp et al. Page 14
Cytogenet Genome Res. Author manuscript; available in PMC 2009 January 1.
NIH
-PA Author Manuscript
NIH
-PA Author Manuscript
NIH
-PA Author Manuscript
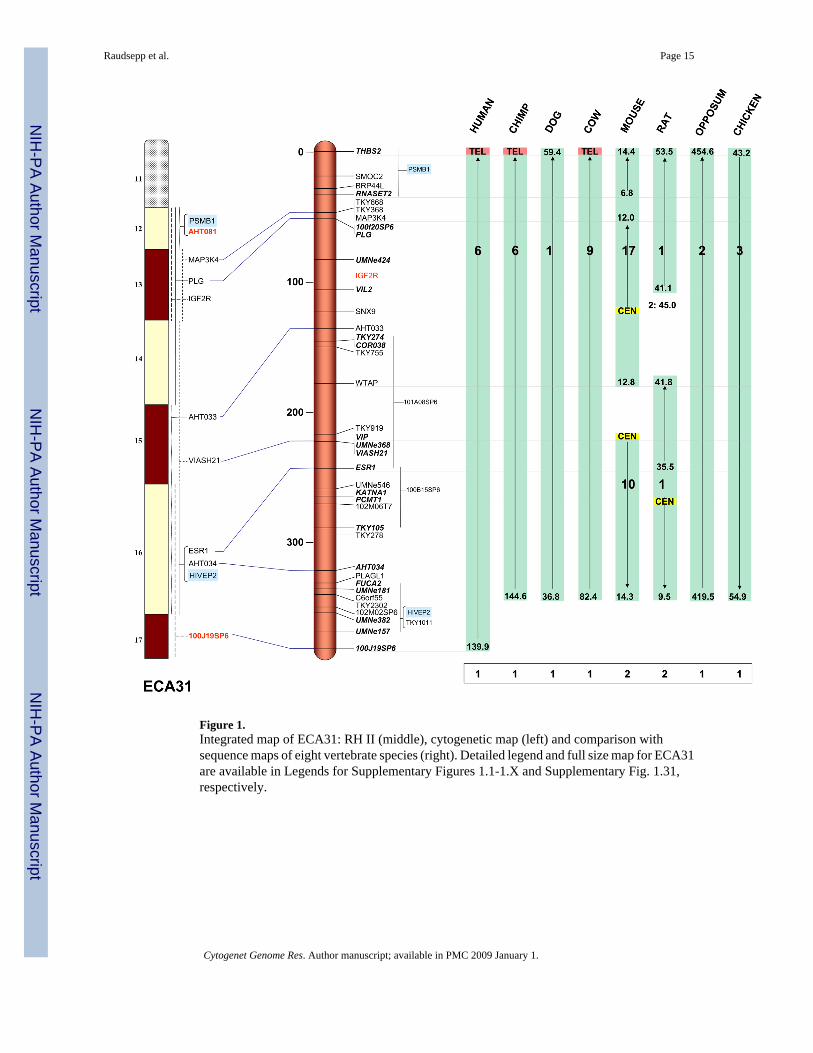
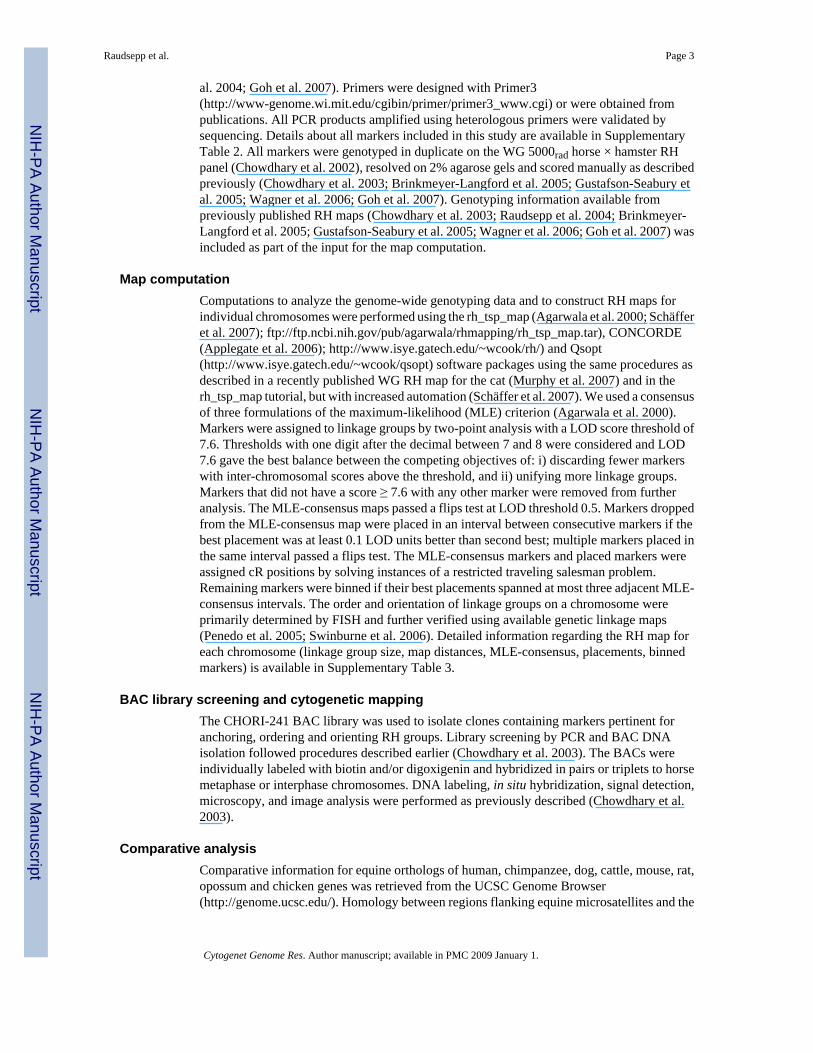
Figure 1.Integrated map of ECA31: RH II (middle), cytogenetic map (left) and comparison withsequence maps of eight vertebrate species (right). Detailed legend and full size map for ECA31are available in Legends for Supplementary Figures 1.1-1.X and Supplementary Fig. 1.31,respectively.
Raudsepp et al. Page 15
Cytogenet Genome Res. Author manuscript; available in PMC 2009 January 1.
NIH
-PA Author Manuscript
NIH
-PA Author Manuscript
NIH
-PA Author Manuscript
NIH
-PA Author Manuscript
NIH
-PA Author Manuscript
NIH
-PA Author Manuscript
Raudsepp et al. Page 16Ta
ble
1C
hrom
osom
e w
ise
info
rmat
ion
on se
lect
ed p
aram
eter
s of t
he in
tegr
ated
RH
and
com
para
tive
map
Hor
se C
hr.
Size
(Mb)
Tot
al si
ze (c
R)
RH
gro
ups
Mar
ker
dens
ity (M
b)L
oci o
n th
e RH
map
FISH
map
ped
loci
Mei
otic
map
loci
Com
para
tive
loci
Tot
alT
ype
IT
ype
IIB
ES,
ST
SsT
otal
Anc
hor
loci
ECA
120
425
06.3
130.
7826
013
612
04
100
7071
147
ECA
213
517
24.2
30.
6919
610
780
955
4345
96EC
A3
132
1795
.84
0.92
143
7268
346
3026
81EC
A4
120
2026
.92
0.61
196
106
873
4335
4698
ECA
511
115
88.1
40.
6317
710
269
648
3232
102
ECA
610
811
89.1
40.
6815
892
651
4333
3292
ECA
710
514
30.3
50.
8812
045
723
7041
2362
ECA
810
514
37.6
50.
8812
058
611
4426
3474
ECA
999
1354
.92
0.9
110
4465
122
1437
44EC
A10
9616
27.5
20.
5816
584
6417
5142
4380
ECA
1172
1827
.94
0.56
129
5665
846
3331
59EC
A12
6367
9.1
21.
1555
2530
012
914
27EC
A13
6080
5.1
30.
6395
4745
323
1923
43EC
A14
120
1764
.41
0.70
172
9670
648
3839
93EC
A15
111
1393
.32
0.82
136
6468
440
3238
65EC
A16
108
1686
.07
0.8
135
6761
748
3338
66EC
A17
102
870.
810
0.84
121
6552
439
3624
54EC
A18
102
1245
.63
0.96
106
5546
521
1727
52EC
A19
9612
02.0
11.
0492
3455
319
1227
31EC
A20
8713
21.0
20.
6513
454
6614
3824
3253
ECA
2181
875.
63
0.70
116
7044
237
2627
66EC
A22
7291
1.4
10.
5413
382
501
5245
2671
ECA
2369
711.
83
0.91
7626
437
2115
2828
ECA
2463
830.
72
1.07
5919
382
1914
2421
ECA
2560
662.
01
1.33
4519
260
1612
1321
ECA
2663
741.
91
0.81
7834
3212
1613
1933
ECA
2757
564.
03
0.81
7028
366
1211
2326
ECA
2854
456.
21
0.95
5730
270
1612
1629
ECA
2951
626.
31
0.96
5328
232
98
1525
ECA
3048
594.
11
1.09
4426
180
99
1426
ECA
3145
381.
71
1.05
4318
196
119
1017
ECA
X15
315
29.8
50.
6922
214
872
270
6423
122
Ove
rall
2952
38,3
61.4
102
0.77
3816
1937
1737
142
1144
857
920
1904
Cytogenet Genome Res. Author manuscript; available in PMC 2009 January 1.
NIH
-PA Author Manuscript
NIH
-PA Author Manuscript
NIH
-PA Author Manuscript
Raudsepp et al. Page 17Ta
ble
2D
iscr
epan
cies
bet
wee
n R
H II
and
the
two
rece
nt li
nkag
e m
aps
Mar
ker
RH
II, E
CA
Pene
do e
t al.
2005
, EC
ASw
inbu
rne e
t al.
2006
, EC
AFI
SHC
ompa
rativ
e, h
uman
HSA
CO
R00
61
-20
1q25
14A
HT1
131
25-
-TK
Y28
11
281
-N
VH
EQ10
23
5-
-H
MS5
64
1010
4p15
-p14
TKY
916
91
--
AH
T126
101
10-
AH
T016
1115
15-
TKY
908
1121
--
TKY
286
1228
--
SGC
V03
1313
2213
q12
AH
T115
181
--
TKY
520
2122
--
TKY
709
2128
-TK
Y27
526
-8
-U
M03
126
2620
-3
UM
Ne1
07X
-13
-
Cytogenet Genome Res. Author manuscript; available in PMC 2009 January 1.
NIH
-PA Author Manuscript
NIH
-PA Author Manuscript
NIH
-PA Author Manuscript
Raudsepp et al. Page 18Ta
ble
3C
ompa
rison
of R
H II
and
RH
I (C
how
dhar
y et
al.
2003
)
Map
size
(cR
)N
o. o
f RH
grou
psA
vera
gem
arke
rde
nsity
(kb)
No
of m
arke
rsT
ype
IT
ype
IIFI
SH a
ncho
rsM
arke
rssh
ared
with
linka
gem
aps
Com
para
tive
loci
RH
II38
,361
.410
177
538
1619
3718
7985
792
019
04R
H I
14,5
87.1
101
4,04
473
025
847
225
3-
447
Impr
ovem
ent
2.6
-5.
25.
27.
53.
93.
4-
4.3
Cytogenet Genome Res. Author manuscript; available in PMC 2009 January 1.
Related Documents