A 3D finite-difference model for the effective thermal conductivity of thermal barrier coatings produced by plasma spraying Jiang-Hao Qiao, Rodolphe Bolot * , Hanlin Liao, Pierre Bertrand, Christian Coddet IRTES-LERMPS, University of Technology of Belfort-Montbéliard, Site de Sévenans, 90010 Belfort Cedex, France article info Article history: Received 9 September 2011 Received in revised form 26 September 2012 Accepted 29 September 2012 Available online 2 November 2012 Keywords: 3D Finite difference methods Image-based modeling Thermal conductivity Thermal barrier coatings abstract Effective properties of thermal barrier coatings produced by plasma spraying can be quantified via different measurement techniques. Numerical modeling applied on 2D cross-sectional images of the coating represents an alternative method often applied in the literature. In the present study, a three- dimensional finite-difference-based model was developed for analyzing the heat transfer mechanisms through a porous structure and also for investigating the differences between 2D and 3D results. An artificial pore network was first specially generated from the microstructural information measured for a real coating cross-sectional image captured by scanning electron microscopy. The computed effective thermal conductivity based on 2D calculations performed on cross-sectional images of the 3D artificial structure was found to be nearly the same compared with the thermal conductivity evaluated from cross-sectional images of the real coating. In a second time, the 3D computed value of the effective thermal conductivity was found to be in better agreement with the measured value, in comparison with that computed on the basis of 2D cross-sectional images. In addition, the effective thermal conductivity was also evaluated with two different packages based on the finite element method (namely OOF2 and ANSYS): the computed thermal conductivity derived with these tools was found to be somewhat larger than the one obtained with the present FD model. Finally, the thermal conductivity computed for different artificial pore networks were compared with those obtained from 2D computations performed on their cross-sections, revealing the differences between 2D and 3D image-based modeling: a correla- tion was then derived between the results computed with 3D and 2D models. Ó 2012 Elsevier Masson SAS. All rights reserved. 1. Introduction Thermal barrier coating (TBC) systems, constituted of a ceramic coating (i.e., Yttria Partially Stabilized Zirconia e YPSZ), a thermal grown oxide and a metallic bonding layer (i.e., MCrAlY where M represents a combination of Ni and Co), are commonly used as protective thermal barriers of creep resistant stationary parts in land-based gas turbines [1]. According to their low thermal conductivity, ceramic coatings play a key role in the decrease of thermal fluxes under high temperature environments. The effective thermal conductivity of ceramic coatings varies in a large range, typically from 1.8 to 2.0 W m 1 K 1 for EBPVD coatings and from 0.9 to 1.4 W m 1 K 1 for standard plasma sprayed (APS) coatings [2]. The architecture of the coatings depend on the elaboration process: EBPVD coatings present a columnar structure whereas plasma sprayed coatings present a porous microstructure characterized by the presence of thin interlamellar and intra-splat microcracks (with sub-micron thicknesses), coarse globular pores (with micrometer- order diameter) and splat boundaries [3]. Their porosity ranges between 10% and 20%. The effective thermal conductivity of a coating mainly depends on both the intrinsic thermal conductivity of the bulk ceramic and on the porous architecture of the coating. For the former, numerous types of ceramics, such as Al 2 O 3 , TiO 2 , mullite, CaO/MgO þ ZrO 2 , YSZ, CeO 2 þ YSZ, zircon and La 2 Zr 2 O 7 , etc. have been evaluated as TBC materials [4]. For many years YPSZ (especially 7e8 wt% YPSZ), has been the prime choice thanks to its best high-temperature performances. The thermal conductivity of dense YPSZ varies from 0.6 to 3 W m 1 K 1 [5], according to the temperature and grain size. On the other hand, many studies have been carried out to show the influence of the coating pore structure on its effective thermal conductivity [6e9]. In particular, image-based numerical analysis was intensively applied using either real images or artifi- cial coating models during the last 10 years. Since S. Deshpande [10] applied image analysis to characterize the porosity in thermal sprayed coatings, several studies [11e 13] have taken advantage of * Corresponding author. Tel.: þ33 3 84 58 31 79. E-mail address: [email protected] (R. Bolot). Contents lists available at SciVerse ScienceDirect International Journal of Thermal Sciences journal homepage: www.elsevier.com/locate/ijts 1290-0729/$ e see front matter Ó 2012 Elsevier Masson SAS. All rights reserved. http://dx.doi.org/10.1016/j.ijthermalsci.2012.09.008 International Journal of Thermal Sciences 65 (2013) 120e126

Welcome message from author
This document is posted to help you gain knowledge. Please leave a comment to let me know what you think about it! Share it to your friends and learn new things together.
Transcript
at SciVerse ScienceDirect
International Journal of Thermal Sciences 65 (2013) 120e126
Contents lists available
International Journal of Thermal Sciences
journal homepage: www.elsevier .com/locate/ i j ts
A 3D finite-difference model for the effective thermal conductivity of thermalbarrier coatings produced by plasma spraying
Jiang-Hao Qiao, Rodolphe Bolot*, Hanlin Liao, Pierre Bertrand, Christian CoddetIRTES-LERMPS, University of Technology of Belfort-Montbéliard, Site de Sévenans, 90010 Belfort Cedex, France
a r t i c l e i n f o
Article history:Received 9 September 2011Received in revised form26 September 2012Accepted 29 September 2012Available online 2 November 2012
Keywords:3DFinite difference methodsImage-based modelingThermal conductivityThermal barrier coatings
* Corresponding author. Tel.: þ33 3 84 58 31 79.E-mail address: [email protected] (R. Bolot)
1290-0729/$ e see front matter � 2012 Elsevier Mashttp://dx.doi.org/10.1016/j.ijthermalsci.2012.09.008
a b s t r a c t
Effective properties of thermal barrier coatings produced by plasma spraying can be quantified viadifferent measurement techniques. Numerical modeling applied on 2D cross-sectional images of thecoating represents an alternative method often applied in the literature. In the present study, a three-dimensional finite-difference-based model was developed for analyzing the heat transfer mechanismsthrough a porous structure and also for investigating the differences between 2D and 3D results. Anartificial pore network was first specially generated from the microstructural information measured fora real coating cross-sectional image captured by scanning electron microscopy. The computed effectivethermal conductivity based on 2D calculations performed on cross-sectional images of the 3D artificialstructure was found to be nearly the same compared with the thermal conductivity evaluated fromcross-sectional images of the real coating. In a second time, the 3D computed value of the effectivethermal conductivity was found to be in better agreement with the measured value, in comparison withthat computed on the basis of 2D cross-sectional images. In addition, the effective thermal conductivitywas also evaluated with two different packages based on the finite element method (namely OOF2 andANSYS): the computed thermal conductivity derived with these tools was found to be somewhat largerthan the one obtained with the present FD model. Finally, the thermal conductivity computed fordifferent artificial pore networks were compared with those obtained from 2D computations performedon their cross-sections, revealing the differences between 2D and 3D image-based modeling: a correla-tion was then derived between the results computed with 3D and 2D models.
� 2012 Elsevier Masson SAS. All rights reserved.
1. Introduction
Thermal barrier coating (TBC) systems, constituted of a ceramiccoating (i.e., Yttria Partially Stabilized Zirconia e YPSZ), a thermalgrown oxide and a metallic bonding layer (i.e., MCrAlY where Mrepresents a combination of Ni and Co), are commonly used asprotective thermal barriers of creep resistant stationary parts inland-based gas turbines [1]. According to their low thermalconductivity, ceramic coatings play a key role in the decrease ofthermal fluxes under high temperature environments. The effectivethermal conductivity of ceramic coatings varies in a large range,typically from 1.8 to 2.0Wm�1 K�1 for EBPVD coatings and from 0.9to 1.4 W m�1 K�1 for standard plasma sprayed (APS) coatings [2].The architecture of the coatings depend on the elaboration process:EBPVD coatings present a columnar structure whereas plasmasprayed coatings present a porous microstructure characterized by
.
son SAS. All rights reserved.
the presence of thin interlamellar and intra-splat microcracks (withsub-micron thicknesses), coarse globular pores (with micrometer-order diameter) and splat boundaries [3]. Their porosity rangesbetween 10% and 20%.
The effective thermal conductivity of a coating mainly dependson both the intrinsic thermal conductivity of the bulk ceramic andon the porous architecture of the coating. For the former, numeroustypes of ceramics, such as Al2O3, TiO2, mullite, CaO/MgO þ ZrO2,YSZ, CeO2 þ YSZ, zircon and La2Zr2O7, etc. have been evaluated asTBC materials [4]. For many years YPSZ (especially 7e8 wt% YPSZ),has been the prime choice thanks to its best high-temperatureperformances. The thermal conductivity of dense YPSZ variesfrom 0.6 to 3 W m�1 K�1 [5], according to the temperature andgrain size. On the other hand, many studies have been carried out toshow the influence of the coating pore structure on its effectivethermal conductivity [6e9]. In particular, image-based numericalanalysis was intensively applied using either real images or artifi-cial coatingmodels during the last 10 years. Since S. Deshpande [10]applied image analysis to characterize the porosity in thermalsprayed coatings, several studies [11e13] have taken advantage of
Fig. 1. Schematic view of a cell, including its four neighbors [24].
J.-H. Qiao et al. / International Journal of Thermal Sciences 65 (2013) 120e126 121
this technique in conjunction with the use of finite element basedsoftware programs such as OOF [14e16] to estimate the effectivethermal conductivity of coatings from cross-sectional images.Besides, Wang [11] and A. Kulkarni [17,18] built an artificial struc-tural model of coatings from the collective microstructural infor-mation obtained by multiple small-angle neutron scattering(MSANS) [17e21], and then calculated the thermal conductivity.
In our group, G. Antou [22,23] and R. Bolot [24e28] used animage-based finite differencemethod (FDM) to predict the effectivethermal conductivity with an in-house code named TS2C. In thiscode, the 2D heat conduction problem under stationary condition isdiscretized according to a five point integration formula. The FDMmesh is generated by thresholding SEM cross-sectional images ofYPSZ polished coatings. Each pixel of the image represents anintegration volume of the 2D heat conduction equation, withproperties determined from its color (i.e. white for ceramic andblack for pores). In most cases, a fairly good agreement was foundwith experiments.
All previous image-based modeling studies allowed to predictthe effective thermal conductivity of TBCs from 2D cross-sectionalimages. Subsequently, the heat flow perpendicular to the plane isneglected. In principle, this assumption is only applicable if themicrostructure in the third dimension is totally repetitive orsymmetrical, such as for homogeneous materials and unidirec-tional long fiber reinforced composites. Unfortunately, for disor-dered materials such as TBCs produced by plasma spraying, thisassumption is not valid. For this reason, the use of 2D modeling forthe estimation of the thermal conductivity of thermal barriercoatings needs to be discussed. Consequently, 3D image-basedmodeling seems more suitable to better approach the thermalconductivity of thermal spray coatings. However, the capture of 3Dimageswith a suitable resolution is difficult, especially for ceramics.
Fortunately, in the recent years the development of somesophisticated 3D imaging approaches, such as X-ray micro-tomography (XMT, also known as Micro CT) and Serialsectioning, allowed generating images of thermal spray coatings.A. Kulkarni [18,21,29] applied XMT for the visualization of themicrostructure of ceramic coatings deposited by high-velocityoxygen-fuel spraying, plasma spraying and EB-PVD processes.Serial sectioning was intensively applied for the characterizationof alloys [30e32] but rarely for ceramics [33]. Furthermore, thematerial properties including the thermal conductivity werecomputed by finite element methods [33,34]. Generally, a 3Dproblem brings a very large computational system of equations.For solving this system, FE software packages require a hugememory capacity and very long CPU time. In order to reduce thecomputational load, images with a small size or a low resolutionwere chosen in these studies, even though a higher resolution andlarger images should be better to represent the material. On theother hand, it was previously found that finite difference modelsconsume much less computational resources. For this reason, theapplication of FD methods seems more appropriate for this type3D problems.
This study aimed at developing a 3D image-based finite differ-ence model to analyze the heat transfer mechanisms througha porous structure, such as thermal barrier coatings. As a simplermethod than XMT or serial sectioning, the microstructure wasrepresented by a 3D artificial coating image reconstructed consid-ering two homogeneous phases, namely the pores and the matrix.Three types of pores, including inter-lamellar pores, intra-splatcracks and globular pores, were generated into the YSZ matrix interms of their volume fractions, morphologies and orientationdistributions. This 3D image was used to estimate the thermalconductivity of TBCs. The numerical results were validated bycomparison with experiments. Finally, comparisons of the effective
thermal conductivities obtained from the 3D image and from itscross-sections revealed some differences between 2D and 3Dmodeling.
2. Finite-difference numerical model
2.1. 2D numerical model
The implementation of a finite-differencemethod for estimatingthe effective thermal conductivity of thermal spray coatings wasfirst proposed by Dorvaux et al. [35]. This method is based on theintegration of the heat conduction equation over the entire domaindescribed by the porosity field image. This equation can beexpressed as follows:
�V/
$�lV/
T� ¼ 0
in which l is the thermal conductivity and T is the temperature.With regards to a 5-point integration formula, a schematic view[24] of a cell of the domain (i.e., a pixel of the binary image) and itsfour neighbors is presented in Fig. 1.
For the particular case of square pixels, the above equation maybe discretized as follows [24]:
� ðTðiþ 1; jÞ � Tði; jÞÞ=Rlðiþ 1=2; jÞþ ðTði; jÞ � Tði� 1; jÞÞ=Rlði� 1=2; jÞ� ðTði; jþ 1Þ � Tði; jÞÞ=Rlði; jþ 1=2Þþ ðTði; jÞ � Tði; j� 1ÞÞ=Rlði; j� 1=2Þ ¼ 0
in which Rl(i þ 1/2,j) represents the thermal resistivity betweencells centers (i,j) and (i þ 1,j), and can be expressed as:
Rlðiþ 1=2; jÞ ¼
1lði;jÞ
þ 1lðiþ1;jÞ
!,2
The thermal conductivity l(i,j) is assigned to each pixeldepending on its corresponding color: Y-PSZ for the white pixelsand pores for the black ones. For the considered images, theboundary conditions are settled by applying a constant tempera-ture on the top side edge (e.g., 50 �C) as well as on the bottom side

J.-H. Qiao et al. / International Journal of Thermal Sciences 65 (2013) 120e126122
edge (e.g., 20 �C), whereas a zero flux BC is applied for the twolateral edges (i.e., left and right).
2.2. 3D numerical model
Regarding the three dimensional model, a cell of the domain inpresented in Fig. 2. For the particular case of cubic voxels, the aboveequation was discretized as follows:
� ðTðiþ 1; j; kÞ � Tði; j; kÞÞ=Rlðiþ 1=2; j; kÞþ ðTði; j; kÞ � Tði� 1; j; kÞÞ=Rlði� 1=2; j; kÞ� ðTði; jþ 1; kÞ � Tði; j; kÞÞ=Rlði; jþ 1=2; kÞþ ðTði; j; kÞ � Tði; j� 1; kÞÞ=Rlði; j� 1=2; kÞ� ðTði; j; kþ 1Þ � Tði; j; kÞÞ=Rlði; j; kþ 1=2Þþ ðTði; j; kÞ � Tði; j; k� 1ÞÞ=Rlði; j; k� 1=2Þ ¼ 0
in which Rl(i þ 1/2,j,k) also represents the thermal resistivitybetween cells centers (i,j,k) and (i þ 1,j,k), and can be expressed by:
Rlðiþ 1=2; j; kÞ ¼
1lði;j;kÞ
þ 1lðiþ1;j;kÞ
!,2
The thermal conductivity l(i,j,k) is assigned to the voxels in thesame way as for the 2D model. In addition, a zero flux boundarycondition was applied for the four lateral faces.
2.3. Successive overrelaxation (SOR) method
Considering the case of large systems of equations, the use ofiterative algorithms is required in order to accelerate convergenceand thus to reduce the required computational time. The Jacobi andGausseSeidel methods are well known, but their convergence isrelatively slow for large systems of equations. In this study, thesuccessive overrelaxation (SOR) procedure [36,37] was imple-mented and gives rise to amuch faster convergence rate, as follows:
Tmþ1p ¼ Tmp þ u
�Tmþ1;GSp � Tmp
�
in which Tmþ1;GSp is the most recent value of Tmþ1
p calculated fromthe Gauss-Seidel procedure (detailed in Ref. [24]) and u (1 < u < 2)is the relaxation parameter controlling the convergence rate.
Fig. 2. Schematic view of a cell in 3D model, including its six neighbors.
The optimum u providing the fastest convergence can bedetermined as:
uopt ¼ 2=ð1þ sinðphÞÞ
in which h ¼ 1/(N þ 1) for a 2D model consisting of a N � N mesh.A recent study has suggested that this optimum value of uopt is
also suitable for the case of three or even higher space dimensions[38]. In view of the 300 � 300 mesh used for 2D calculations per-formed on artificial images and 300 � 300 � 300 mesh for 3Dcalculations, the value of uopt was equal to 1.979 for both cases.
3. Thermal conductivity of YPSZ and pores
Because of directional cooling and rapid solidification during thedeposition, most of the grains in coatings exhibit a typical columnarstructure. T. Chraska [39] reported the structure of a typical plasma-sprayed 7 wt% Y-PSZ splat on a stainless steel substrate preheatedto 450 �C. The columnar grains present an average width of 65 nmand a height of 1.5e1.8 mm. In fact, the grain size influencessignificantly the lattice thermal conductivity of YPSZ due to pointdefects and grain boundary scattering [5]. Therefore, at roomtemperature, the average thermal conductivity of the columnargrains is about 1.8 W m�1 K�1 in the direction parallel to the splatplane and 2.9Wm�1 K�1 in the direction perpendicular to the splatplane. However, an isotropic model of the pixels was considered inour model so that the thermal conductivity of YPSZ was thus esti-mated. Considering that the splats are mostly perpendicular to theimposed temperature gradient (normal to the substrate), theeffective thermal conductivity of coatings should be more sensitiveto the splat’s conductivity along the normal direction. If an equiv-alent value has to be chosen for the assumption of isotropic splats,it is thus certainly closer to 2.9 W m�1 K�1. Therefore, a value2.5 W m�1 K�1 was presently used.
Regarding the pores, it can be assumed as first approximationthat they contain trapped air for which the thermal conductivitymay be estimated to 0.025 W m�1 K�1 at room temperature. Thethermal conductivity of air tends to increase with temperature butthe Knudsen effect tends to lower it on the other hand, so that theinfluence of the crack gap dimension on the thermal conductivity ofair was not considered in the present study.
4. Porosity characterization and 3D coating image
4.1. Porosity characterization by 2D image analysis (IA)
Assuming that the resolution limits are considered, the porositywithin the microstructure can be easily detected by image analysisdue to the high degree of contrast between the dark pores and thehighly reflective coating material. Scanning electron microscopy(SEM) was implemented to observe the coating microstructure inpolished cross-sections. Backscattering electron mode was chosenbecause of a very sharp contrast between the YPSZ matrix andpores. Images were captured in different regions in the format1024� 768 pixels with a corresponding resolution of 0.13 mm/pixel.Images were analyzed using Beta Release 4 of Scion image software(Scion Corporation, Frederick, MD).
With a valid threshold [28,40], the grayscale image may beconverted to a binary image (Fig. 3), in which the white pixels areassigned to the YPSZ matrix and the black pixels to the pores.Concerning thermal spray ceramic coatings, the porous networkcan be characterized by three types of pores, including inter-lamellar pores, intra-splat cracks and globular pores. The totalporosity could be obtained by simply quantifying the percentage ofblack pixels among the total ones. Large pores, containing mostly

Fig. 3. Determination of porosity and distinction between large pores and microcracks from a coating cross-sectional image. (a) Original image, (b) binary image, (c) image withlarge pores, (d) image with microcracks.
J.-H. Qiao et al. / International Journal of Thermal Sciences 65 (2013) 120e126 123
globular pores and a small part of the thick cracks, were isolated byimplementing a series of erosionedilation operations. Microcracks,constituted of small inter-lamellar pores and thin intrasplat cracks,persisted after extracting the large pores from the images (Fig. 3).The microcracks network was also characterized by its total lengthaccording to the orientation from 0 (parallel to the substrate) to 90�
by steps of 5� (Fig. 4). Cracks presenting an orientation above 45�
were classified as intrasplat cracks whereas the others representinterlamellar pores (Fig. 4). Assuming that intrasplat cracks andinterlamellar pores present an equivalent thickness, the length ofcracks was considered to be related to their corresponding porositylevel. Consequently, interlamellar pores and microcracks wereproportionally distributed by their total lengths.
Six images were analyzed and the results were then averaged. Inthis way, the computed total porosity is 19.0% � 1.1%, in whichinterlamellar pores, microcracks and globular pores contents are11.1% � 0.5%, 4.2% � 0.9% and 3.7% � 0.6% respectively (shown inFig. 5).
Fig. 4. Measurements of the total length of the microcracks according to their orien-tation from 0 (parallel to the substrate) to 90� by steps of 5� . Intrasplat cracks andinterlamellar pores were classified by an orientation of 45� .
4.2. 3D artificial coating image generation
Similar to Z. Wang [11] and A. Kulkarni’s [17,18] method,a coating was represented by an artificial image consisting in twohomogeneous phases, namely the pores and the YSZ matrix.According to previous measurements, three types of pores,including large pores, interlamellar pores and intra-splat cracks,were given birth into an YPSZ matrix in terms of their volumefractions, morphologies and orientation distributions. Large poreswere idealized by spheres with stochastic diameters ranging from 3
to 30 voxels (i.e., 0.39e3.9 mm). As reported by P. Ctibor [41],interlamellar pores were horizontally formed as flat cuboids pre-senting a length and awidth comprised between 10 and 100 voxels(i.e., 1.3e13 mm), and a thickness of 1e3 voxels (i.e., 0.13e0.39 mm).Intrasplat cracks, originating from interlamellar pores andpropagating perpendicularly, are crisscrossing with a height of25e35 voxels (i.e., 3.25e4.55 mm) and a thickness of 1e2 voxels(i.e., 0.13e0.26 mm). Each size parameter described above
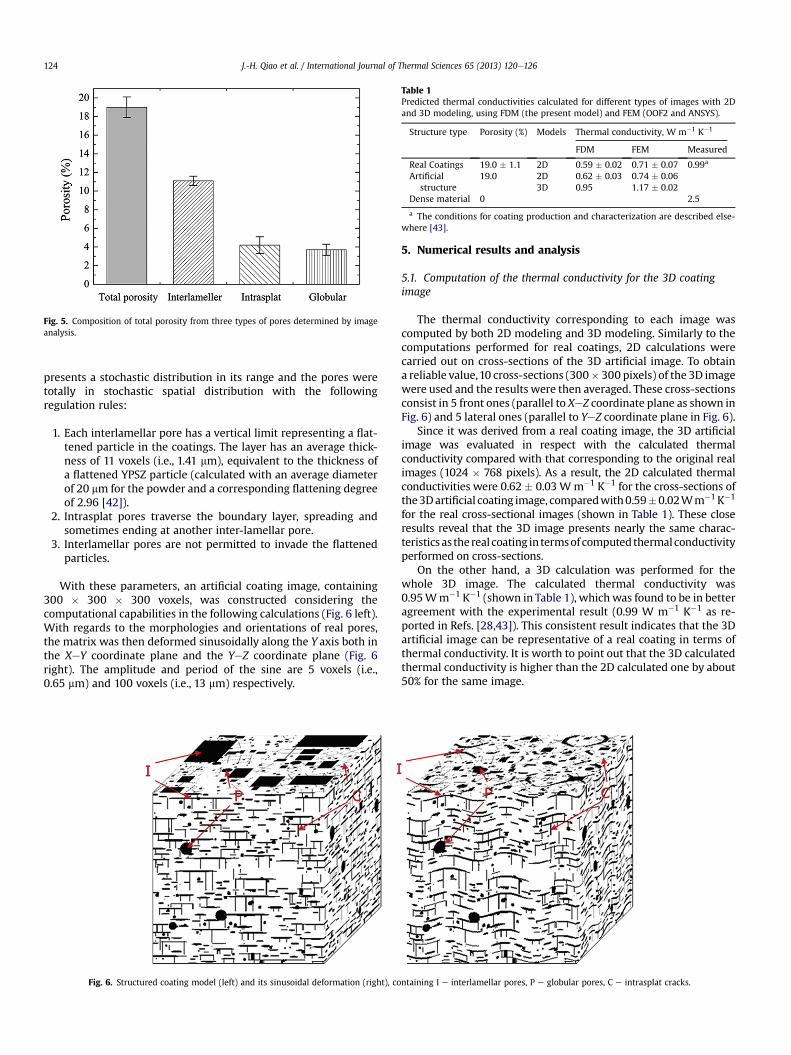
Fig. 5. Composition of total porosity from three types of pores determined by imageanalysis.
Table 1Predicted thermal conductivities calculated for different types of images with 2Dand 3D modeling, using FDM (the present model) and FEM (OOF2 and ANSYS).
Structure type Porosity (%) Models Thermal conductivity, W m�1 K�1
FDM FEM Measured
Real Coatings 19.0 � 1.1 2D 0.59 � 0.02 0.71 � 0.07 0.99a
Artificialstructure
19.0 2D 0.62 � 0.03 0.74 � 0.063D 0.95 1.17 � 0.02
Dense material 0 2.5
a The conditions for coating production and characterization are described else-where [43].
J.-H. Qiao et al. / International Journal of Thermal Sciences 65 (2013) 120e126124
presents a stochastic distribution in its range and the pores weretotally in stochastic spatial distribution with the followingregulation rules:
1. Each interlamellar pore has a vertical limit representing a flat-tened particle in the coatings. The layer has an average thick-ness of 11 voxels (i.e., 1.41 mm), equivalent to the thickness ofa flattened YPSZ particle (calculated with an average diameterof 20 mm for the powder and a corresponding flattening degreeof 2.96 [42]).
2. Intrasplat pores traverse the boundary layer, spreading andsometimes ending at another inter-lamellar pore.
3. Interlamellar pores are not permitted to invade the flattenedparticles.
With these parameters, an artificial coating image, containing300 � 300 � 300 voxels, was constructed considering thecomputational capabilities in the following calculations (Fig. 6 left).With regards to the morphologies and orientations of real pores,the matrix was then deformed sinusoidally along the Y axis both inthe XeY coordinate plane and the YeZ coordinate plane (Fig. 6right). The amplitude and period of the sine are 5 voxels (i.e.,0.65 mm) and 100 voxels (i.e., 13 mm) respectively.
Fig. 6. Structured coating model (left) and its sinusoidal deformation (right), co
5. Numerical results and analysis
5.1. Computation of the thermal conductivity for the 3D coatingimage
The thermal conductivity corresponding to each image wascomputed by both 2D modeling and 3D modeling. Similarly to thecomputations performed for real coatings, 2D calculations werecarried out on cross-sections of the 3D artificial image. To obtaina reliable value,10 cross-sections (300� 300 pixels) of the 3D imagewere used and the results were then averaged. These cross-sectionsconsist in 5 front ones (parallel to XeZ coordinate plane as shown inFig. 6) and 5 lateral ones (parallel to YeZ coordinate plane in Fig. 6).
Since it was derived from a real coating image, the 3D artificialimage was evaluated in respect with the calculated thermalconductivity compared with that corresponding to the original realimages (1024 � 768 pixels). As a result, the 2D calculated thermalconductivities were 0.62 � 0.03Wm�1 K�1 for the cross-sections ofthe3Dartificial coating image, comparedwith0.59�0.02Wm�1K�1
for the real cross-sectional images (shown in Table 1). These closeresults reveal that the 3D image presents nearly the same charac-teristics as thereal coating in termsofcomputedthermalconductivityperformed on cross-sections.
On the other hand, a 3D calculation was performed for thewhole 3D image. The calculated thermal conductivity was0.95Wm�1 K�1 (shown in Table 1), which was found to be in betteragreement with the experimental result (0.99 W m�1 K�1 as re-ported in Refs. [28,43]). This consistent result indicates that the 3Dartificial image can be representative of a real coating in terms ofthermal conductivity. It is worth to point out that the 3D calculatedthermal conductivity is higher than the 2D calculated one by about50% for the same image.
ntaining I e interlamellar pores, P e globular pores, C e intrasplat cracks.

Fig. 7. Relationship between 2D and 3D computed thermal conductivities for differentartificial pore networks.
J.-H. Qiao et al. / International Journal of Thermal Sciences 65 (2013) 120e126 125
5.2. Comparison with FE modeling
The representativeness of the 3D image is thus validated by theFDM method. Some complementary investigations must howeverbe implemented using some other numerical methods in order tovalidate the artificial coating image. In view of the differencespreviously reported between FDM and FEM [44], the thermalconductivity was computed by FEM modeling. In particular, the 2FEM codes OOF2 [16] and ANSYS were used for performing 2D and3D calculations respectively. Computations were implemented forthe above-mentioned images. Because of the high consumption ofRAM for ANSYS, the 3D image had to be segmented with a dimen-sion of 150 � 150 � 150 voxels for each part. The results were thenaveraged and are shown in Table 1.
Similarly to the case of the FDM method, the thermal conduc-tivities computed with OOF2 for the cross-sections of the 3Dcoating image (0.74 � 0.06 W m�1 K�1) are very close to the valuescalculated for the real coating images (0.71 � 0.07Wm�1 K�1). Thedifference is only about 5%. It allows checking the representative-ness of the artificial coating image from a thermal conduction pointof view. However, the 3D results obtained with ANSYS indicatea thermal conductivity of 1.17 � 0.02 W m�1 K�1, which is higherthan the measured value (0.99 W m�1 K�1) by about 18%. On theother hand, a closer value 0.95 Wm�1 K�1 was previously obtainedwith our code based on FDM, meaning that this 3D FD model maybe better to approach the real thermal conductivity of coatings.
It may also be noticed that FEM results are higher than thoseobtained with our models, by about 20% for 2Dmodeling and about23% for 3D calculations. One of the major reasons, demonstrated inour recent works [27], is the different discretization methods forthe two codes: a cell-centered formulation is used in our model, incomparison with the nodal formulation applied in FEM basedmodels. The different formulations lead to different expressions ofthe thermal resistances between cells or nodes: in-series for theformer and in-parallel for the latter. The second reason concernsthe different interpolation functions applied for the two methods.However, it has been also proved that subdividing the mesh, bymeans of splitting the pixels, can reduce the differences betweenvalues obtained by the two methods [27]. Therefore, it can bededuced that the real value, excluding the error of the numericalmethod, should be in the interval between the computed values forthe two methods (0.95e1.17 W m�1 K�1). The measured value of0.99 W m�1 K�1 is comprised within this range, which tends toconfirm the validity of the 3D model.
5.3. Comparison between 2D modeling and 3D modeling
It is worth mentioning the differences between 2D modelingand 3D modeling. Either using our code or FEM, the 2D calculatedthermal conductivities are lower than the 3D ones, as shown inTable 1. This conclusion was thus checked for different 3D struc-tures for which the porosity varied at 5.0%, 7.5%, 10.0%, 12.1%, 14.3%,16.7%, 19.0% and 21.0%. On the other hand, 3D artificial networkswith a unique type of pores (interlamellar pores or globular pores)were generated for two levels of porosity (12.1% and 19.0%) andthree levels of dimension of the pores (diameters of 1, 10, 20 and30 pixels for globular pores; side lengths of 20, 40 and 60 pixels forinterlamellar pores). Computations were eventually implementedfor all above images and the results are shown in Fig. 7.
Fig. 7 allows checking that the 3D computed thermal conduc-tivity is definitely higher than the 2D one. In the 2D model, eachpixel exchanges heat with its neighbors in the plane so that the heatflow perpendicular to the section is not taken into account. Inprinciple, this assumption is uniquely applicable if the micro-structure in the third dimension is totally repetitive or symmetrical.
In other words, this assumption is not representative of the case ofreal TBCs as it is assumed in 2D models. On the other hand the 3Dmodel is in better agreement with the real situation of disorderedmaterials such as TBCs. In the third direction, a new path is suppliedfor the heat transfer around the pores. Therefore, the obstructiveaction of pores is weakened, compared with the 2D case. For thisreason, the 3D computed thermal conductivity is higher than the2D values. Thus, the use of 3D modeling is strongly recommendedfor TBCs and the results are expected to be closer to the experi-mental values.
It was also found that a power law function could rather accu-rately define the relationship between 2D and 3D results (the blackcurve shown in Fig. 7). Using k to represent the effective thermalconductivity, this relationship could be expressed as:
k3D ¼ akb2D
in which a is equal to 1.3197 and b is equal to 0.6919.Either the pore type or the porosity does not appear to affect this
function. This empirical equation, as a matter of fact, improves the2D image-based modeling. The 3D computed result, which is muchmore reliable but difficult to get, can be predicted from the 2D valuewith this equation. However, the verification for real coatingimages is expected to be carried out in our following works. If thisfunction is confirmed, 2D image-based analyses could remain analternative reliable method for approaching the effective thermalconductivity, instead of 3D image-based analyses.
6. Conclusions
The present work was devoted to implement a 3D image-basedfinite difference model for analyzing the heat transfer mechanismsthrough a porous structure, such as YPSZ coatings produced byplasma spraying. A 3D artificial matrix-pore network was generatedbased on the collective microstructural information obtained byimage analysis of real coating cross-sectional images. This 3D imagewas then evaluated by computing its corresponding effective thermalconductivity. The predicted effective thermal conductivity obtainedby 2D computations performed on cross-sections of the 3D structurehighly agreed with the values derived for cross-sections of the realcoating (0.59Wm−1 K−1 for the real cross-sections against 0.62Wm−1
K−1 for the cross-sections of the artificial 3D image). However, the 3Dcalculated value of the thermal conductivity was 0.95 W m�1 K�1
J.-H. Qiao et al. / International Journal of Thermal Sciences 65 (2013) 120e126126
which is higher and in better agreement with the experimental valueof 0.99Wm�1 K�1 .
Compared with the values obtained with finite element models(OOF2 for 2D calculations and ANSYS for the 3D ones), the resultscalculated with the present FDmethod are smaller by about 20% for2D modeling and about 23% for 3D calculations. Despite the factthat a smaller domain had to be considered with ANSYS (due tohuge memory requirements), the differences are mainly explainedby the discretization methods applied in these models: namelydifferent formulations (i.e. nodal against centered) and interpola-tion equations. It is worth mentioning that the 2D calculatedthermal conductivities are lower than the 3D one either using theFD code or FEM. This result was confirmed for images corre-sponding to various structures. Eventually, a power law functionwas found to fit the relationship between 2D and 3D calculateddata. This function was confirmed for different types of artificialimages and is expected to be also valid for real pore networks, thatcould allow using a 2D image-based model, easier to implement.
References
[1] N.A. Fleck, A.C.F. Cocks, A multi-scale constitutive model for the sintering of anair-plasma-sprayed thermal barrier coating, and its response, under hotisostatic pressing, J. Mech. Phys. Solids 57 (2009) 689e705.
[2] U. Schulz, C. Leyens, K. Fritscher, et al., Some recent trends in research andtechnology of advanced thermal barrier coatings, Aerosp. Sci. Technol. 7(2003) 73e80.
[3] H. Herman, Plasma-sprayed coatings, Sci. Am. 259 (1988) 112e118.[4] X.Q. Cao, R. Vassen, D. Stoever, Ceramic materials for thermal barrier coatings,
J. Eur. Ceram Soc. 24 (2004) 1e10.[5] P.G. Klemens, M. Gell, Thermal conductivity of thermal barrier coatings, Mater.
Sci. Eng. A Struct. 245 (1998) 143e149.[6] G. Antou, G. Montavon, F. Hlawka, et al., Modification of thermal barrier
coating architecture by in situ laser remelting, J. Eur. Ceram Soc. 26 (2006)3583e3597.
[7] C. Petorak, J. Ilavsky, H. Wang, et al., Microstructural evolution of 7 wt.% Y2O3-ZrO2 thermal barrier coatings due to stress relaxation at elevated tempera-tures and the concomitant changes in thermal conductivity, Surf. Coat.Technol. 205 (2010) 57e65.
[8] A.F. Renteria, B. Saruhan, U. Schulz, et al., Effect of morphology on thermalconductivity of EB-PVD PYSZ TBCs, Surf. Coat. Technol. 201 (2006) 2611e2620.
[9] H.J. Ratzer-Scheibe, U. Schulz, T. Krell, The effect of coating thickness on thethermal conductivity of EB-PVD PYSZ thermal barrier coatings, Surf. Coat.Technol. 200 (2006) 5636e5644.
[10] S. Deshpande, A. Kulkarni, S. Sampath, et al., Application of image analysis forcharacterization of porosity in thermal spray coatings and correlation withsmall angle neutron scattering, Surf. Coat. Technol. 187 (2004) 6e16.
[11] Z. Wang, A. Kulkarni, S. Deshpande, et al., Effects of pores and interfaces oneffective properties of plasma sprayed zirconia coatings, Acta Mater. 51 (2003)5319e5334.
[12] A.D. Jadhav, N.P. Padture, E.H. Jordan, et al., Low-thermal-conductivityplasma-sprayed thermal barrier coatings with engineered microstructures,Acta Mater. 54 (2006) 3343e3349.
[13] Y. Tan, J.P. Longtin, S. Sampath, Modeling thermal conductivity of thermalsprayed coatings: comparing predictions to experiments, in: Proceedings ofthe ITSC 2006, Seattle, USA, 2006.
[14] S.A. Langer, E. Fuller, W.C. Carter, OOF: an image-based finite-element analysisof material microstructures, Comput. Sci. Eng. 3 (2001) 15e23.
[15] A.C.E. Reid, S.A. Langer, R.C. Lua, et al., Image-based finite element meshconstruction for material microstructures, Comp. Mater. Sci. 43 (2008) 989e999.
[16] A.R.S. Langer, V.R. Coffman, G. Do�gan. Available on: <http://www.nist.gov/mml/ctcms/oof/>.
[17] A. Kulkarni, Z. Wang, T. Nakamura, et al., Comprehensive microstructuralcharacterization and predictive property modeling of plasma-sprayed zirconiacoatings, Acta Mater. 51 (2003) 2457e2475.
[18] A. Kulkarni, J. Gutleber, S. Sampath, et al., Studies of the microstructure andproperties of dense ceramic coatings produced by high-velocity oxygen-fuelcombustion spraying, Mater. Sci. Eng. A Struct. 369 (2004) 124e137.
[19] A.J. Allen, J. Ilavsky, G.G. Long, et al., Microstructural characterization of yttria-stabilized zirconia plasma-sprayed deposits using multiple small-angleneutron scattering, Acta Mater. 49 (2001) 1661e1675.
[20] A.J. Allen, G.G. Long, H. Boukari, et al., Microstructural characterization studiesto relate the properties of thermal-spray coatings to feedstock and sprayconditions, Surf. Coat. Technol. 146 (2001) 544e552.
[21] A. Kulkarni, A. Goland, H. Herman, et al., Advanced neutron and X-ray tech-niques for insights into the microstructure of EB-PVD thermal barrier coat-ings, Mater. Sci. Eng. A Struct. 426 (2006) 43e52.
[22] G. Antou, R. Bolot, G. Montavon, et al., Prediction of thermal spray coatingthermal conductivity by 2D heat transfer modeling, in: Proceedings of theITSC 2004, Osaka, JAP, 2004.
[23] G. Antou, F. Hlawka, R. Bolot, et al., Pore network architecture and thermalconductivity of Y-PSZ TBCs in situ remelted during their deposition, in:Proceedings of the ITSC 2005, Basel, Swiss, 2005.
[24] R. Bolot, G. Antou, G. Montavon, et al., A two-dimensional heat transfer modelfor thermal barrier coating average thermal conductivity computation,Numer. Heat Transf. A Appl. 47 (2005) 875e898.
[25] R. Bolot, G. Antou, G. Montavon, et al., Calcul Numérique de la ConductivitéThermique de Dépôts de Zircone Yttriée Élaborés par Projection Thermique,ref of MATERIAUX 2006 (2006) (Dijon, France).
[26] J.H. Qiao, R. Bolot, H.L. Liao, et al., A 3D finite-difference model for the effectivethermal conductivity of thermal barrier coatings, in: Proceedings of the ITSC2011, Hamburg, Germany, 2011.
[27] R. Bolot, J.L. Seichepine, J.H. Qiao, et al., Predicting the thermal conductivity ofAlSi/polyester abradable coatings: effects of the numerical method, J. Therm.Spray Technol. 20 (2011) 39e47.
[28] R. Bolot, J.H. Qiao, G. Bertrand, et al., Effect of thermal treatment on theeffective thermal conductivity of YPSZ coatings, Surf. Coat. Technol. 205(2010) 1034e1038.
[29] A. Kulkarni, S. Sampath, A. Goland, et al., Computed microtomography studiesto characterize microstructure-property correlations in thermal sprayedalumina deposits, Scripta Mater. 43 (2000) 471e476.
[30] H. Singh, A.M. Gokhale, Visualization of three-dimensional microstructures,Mater. Charact. 54 (2005) 21e29.
[31] J.E. Spowart, Automated serial sectioning for 3-D analysis of microstructures,Scripta Mater. 55 (2006) 5e10.
[32] S.G. Lee, A.M. Gokhale, A. Sreeranganathan, Reconstruction and visualizationof complex 3D pore morphologies in a high-pressure die-cast magnesiumalloy, Mater. Sci. Eng. A Struct. 427 (2006) 92e98.
[33] N. Takano, M. Zako, F. Kubo, et al., Microstructure-based stress analysis andevaluation for porous ceramics by homogenization method with digitalimage-based modeling, Int. J. Solids Struct. 40 (2003) 1225e1242.
[34] N. Tsafnat, G. Tsafnat, A.S. Jones, Micro-finite element modelling of cokeblends using X-ray microtomography, Fuel 87 (2008) 2983e2987.
[35] J.M. Dorvaux, O. Lavigne, R. Mévrel, et al., Modelling the Thermal Conductivityof Thermal Barrier Coatings, in: Proc. 85th AGARD SMP Meeting on ThermalBarrier Coatings, Aalborg, Denmark, 1997.
[36] J.C. Tannehill, D.A. Anderson, R.H. Pletcher, Computational Fluid Mechanicsand Heat Transfer, Hemisphere, NewYork, 1984, pp. 132e135.
[37] P.J. Roache, Computational Fluid Dynamic, revised ed. Hermosa, Albuquerque,NM, 1982, pp. 117e123.
[38] S.M. Yang, M.K. Gobbert, The optimal relaxation parameter for the SORmethod applied to the Poisson equation in any space dimensions, Appl. Math.Lett. 22 (2009) 325e331.
[39] T. Chraska, A.H. King, Transmission electron microscopy study of rapidsolidification of plasma sprayed zirconia e part I. First splat solidification, ThinSolid Films 397 (2001) 30e39.
[40] G. Antou, G. Montavon, F. Hlawka, et al., Characterizations of the pore-cracknetwork architecture of thermal-sprayed coatings, Mater. Charact. 53 (2004)361e372.
[41] P. Ctibor, R. Lechneroca, V. Benes, Quantitative analysis of pores of two typesin a plasma-sprayed coating, Mater. Charact. 56 (2006) 297e304.
[42] C.J. Li, H.L. Liao, P. Gougeon, et al., Experimental determination of the rela-tionship between flattening degree and Reynolds number for spray moltendroplets, Surf. Coat. Technol. 191 (2005) 375e383.
[43] G. Bertrand, P. Bertrand, P. Roy, et al., Low conductivity plasma sprayedthermal barrier coating using hollow psz spheres: correlation between ther-mophysical properties and microstructure, Surf. Coat. Technol. 202 (2008)1994e2001.
[44] C. Vachiratienchai, S. Boonchaisuk,W.Siripunvaraporn,Ahybridfinitedifference-finite element method to incorporate topography for 2D direct current (DC)resistivity modeling, Phys. Earth Planet. Inter. 183 (2010) 426e434.
Nomenclature
l: thermal conductivity, W m�1 K�1
k: effective thermal conductivity, W m�1 K�1
k2D: 2D computed effective thermal conductivity, W m�1 K�1
k3D: 3D computed effective thermal conductivity, W m�1 K�1
Rl: thermal resistivity, K m W�1
T: temperature, �CTp: temperature of a pixel, �Ci,j,k: grid point indicesx,y,z: Cartesian coordinatesu: over-relaxation factoruopt: optimum over-relaxation factorN: number of pixels along the axisa, b: equation coefficients
Superscriptm: iterative step indicesGS: GausseSeidel method
Related Documents