A 2008 Update of Cost Savings and a Marketplace Analysis of the Health Care Group Purchasing Industry July 2009 David E. Goldenberg, Ph.D. Roland “Guy” King, F.S.A., M.A.A.A. Locus Systems, Inc. 601 Seventh Street. Suite 304 Laurel, MD 20707 (301) 725-3337

Welcome message from author
This document is posted to help you gain knowledge. Please leave a comment to let me know what you think about it! Share it to your friends and learn new things together.
Transcript

A 2008 Update of CostSavings and a MarketplaceAnalysis of the Health CareGroup Purchasing Industry
July 2009
David E. Goldenberg, Ph.D.Roland “Guy” King, F.S.A., M.A.A.A.
Locus Systems, Inc.601 Seventh Street. Suite 304
Laurel, MD 20707(301) 725-3337
Locus Systems, Inc.
i
A 2008 Update of Cost Savings and aMarketplace Analysis of the Health Care Group Purchasing Industry
EXECUTIVE SUMMARY
In light of current economic circumstances, there is considerable interest and discussion throughout thecountry on how to keep health care costs low while preserving service quality. To this end, the health caregroup purchasing industry makes a significant contribution by continually working to bring down healthcare costs. Group Purchasing Organizations (GPOs), large national health care purchasing organizationsand smaller regional purchasing entities, help health care providers realize cost savings by aggregatingpurchasing volume and using that leverage to negotiate discounts with manufacturers, distributors, andother vendors. GPOs negotiate on behalf of hospitals and affiliated health care providers to contract forthe best value in their purchase of supplies and services. GPOs’ bulk buying power helps hospitals andother health care organizations save money by purchasing products and services at lower cost than theindividual facilities could purchase themselves.
That GPOs have a significant impact on the marketing and movement of health care commodities in theU.S. and produce substantial savings by removing costs from across sales and supply chains is not an issue.Through the power of aggregated purchasing volume and negotiated contracts with manufacturers,distributors, and vendors, GPOs assure that providers and patients receive needed products and serviceswhile realizing significant cost savings. However, while GPO practices result in savings, it is the extent ofthese savings that has remained a question.
To answer this question, the Health Industry Group Purchasing Association (HIGPA) commissioned a studyto examine the size of the GPO marketplace and GPO market penetration and finds that GPOs realizesignificant costs savings in U.S. national health expenditures. Using the most recent data available, thestudy estimates that in Calendar Year 2008, GPOs saved the nation up to $64 billion – with savings topublic health care programs ranging from $16 billion to $36 billion. The study also estimates thatMedicare realized savings of between $8 billion and $17 billion in CY 2008 with savings to Medicaidranging from $5.7 billion to more than $12 billion.
ObjectiveThis study was undertaken to estimate the size, market penetration, and cost savings associated withGPOs in the U.S. health care system – savings generated through their practices in both the private andpublic sectors, including Medicare and Medicaid.
General Conclusions Group purchasing plays an important role and has a significant impact on the U.S. health care system,
by providing efficiencies to medical sales supply chains thereby resulting in major cost savings tohospitals and patients.
Locus Systems, Inc.
ii
GPOs have a significant impact on the marketing and movement of health care commodities in the U.S.which translates into a reduction in health care costs.
GPOs produce substantial savings by removing costs from across sales and supply chains, not by simplycontracting for the cheapest products. GPO members and customers receive financial benefits throughup-front pricing discounts and reduced administrative costs.
GPOs make a major contribution to the U.S. health care industry as a whole by improving not onlyincremental costs but also much larger systems and processes; these benefits lead to better use ofstaff and lower total costs.
Specific Findings
U.S. Health care sector. In CY 2007, U.S. national health expenditures totaled over $2.3 trillion orabout 17 percent of U.S. GDP. This included over $2.2 trillion in spending on health services andsupplies. Personal health care expenditures (e.g., hospital care, professional services, nursing homecare, home health care, etc.) were almost $2.0 trillion. Public sector health care programs accountedfor $974 billion in personal health care expenditures, with the federal government responsible for 73percent of this amount.
Size of GPO marketplace. Based on the most recent data in the Centers for Medicare and Medicaidservices’ National Health Expenditure Accounts (NHEs), the total potential GPO marketplace for CY2008 was $367 billion. This sum reflects total hospital non-labor and total nursing home non-laborexpenditures.
GPO Marketplace penetration. Previous examinations suggest that the upper threshold of GPO marketpenetration (i.e., expenditures channeled through GPOs) is 80 cents of each dollar of non-personnelexpenditures. Providers report that approximately 72 percent of their purchases are made throughGPOs. The GPO share of the health care marketplace is estimated at between 72 and 80 percent ofhospital and nursing home non-labor expenditures. For CY 2008, the total GPO marketplacepenetration (hospitals and freestanding nursing homes) ranged between $263 billion and $293billion (roughly 11-12 percent of the total national health care expenditures).
GPO Savings. Hospitals and nursing homes report that they save between 10 and 18 percent bychanneling their purchases through GPOs. For CY 2008, GPOs generated overall savings for the U.S.health care system of between $29 billion and $64 billion. Over 5 years (CY 2007 – CY 2011) thehealth care system would realize savings of between $164 billion and $361 billion. In CY 2008, GPOssaved public health care programs a significant amount of money—between $16 billion and $36billion. In CY 2008, GPO-related savings to the federal government would have totaled between $12billion and $28 billion. State and local government savings would have totaled between $3 billion and$7 billion. Medicare realized savings up to $17 billion in CY 2008 and Medicaid saved up to $12 billion.
Locus Systems, Inc.
1
A 2008 Update of Cost Savings and aMarketplace Analysis of the Health Care Group Purchasing Industry
INTRODUCTION
This report is the most recent in a series of studies for the Health Industry Group PurchasingAssociation (HIGPA) on the importance of GPOs in the U.S. health care system and the savingsthat are generated through GPO business processes. It includes estimates of the size of theGPO marketplace, GPO market penetration, and the savings that GPOs generated through theirbusiness practices in 2008 (CY 2008) in both the private and public sectors including Medicareand Medicaid. It does not account for the cost of resources (FTEs) to conduct contractingcurrently performed by GPOs.
In 1996, Muse & Associates conducted a study for the Health Industry Group PurchasingAssociation (HIGPA) on the impact of expanding access to the federal supply schedule for healthcare products to all public entities.1 This was followed by an analysis of trends in non-laborhealth care costs in 1998.2 A new study on the role of group purchasing organizations (GPOs) inthe U.S. health care system was conducted in 2000.3 The 2000 study was partially updated andexpanded in 2002 to examine the impact on public health expenditures if additional restrictionswere imposed on GPO contracting processes.4 The 2002 study was updated in 2005 and againin 2008.5,6 However, in the 2008 report, the focus was shifted to emphasize the savings thatGPOs generate rather than the impact of an erosion in savings due to new legislative orregulatory mandates. With the recent release of new data by the Centers for Medicare andMedicaid Services (CMS), HIGPA requested that the 2008 study be updated again to incorporatethis newly available information.
The report is organized into eight sections. Following this brief introduction, the role andcontributions of GPOs in the U.S. health care system are discussed. The next section describesthe objective of the study. After that, the primary dataset and the important parameters usedin the study are described. This is followed by an overview of the methodology that was
1Muse & Associates, The Federal Acquisition Streamlining Act of 1994: The Effect of Federal Supply Schedule
Expansion on Expenditures for Health Care Products, October 1996.2
Muse & Associates, Trends in Non-Labor Costs and Implications for the Health Care Marketplace, October 1998.3
Muse & Associates, The Role of Group Purchasing Organizations in the U.S. Health Care System, March 2000.4
Muse & Associates, The Role of Group Purchasing in the Health Care system and the Impact on Public HealthExpenditures if Additional Restrictions are Imposed on GPO Processes, September 2002.5
Muse & Associates, A Cost Savings and Marketplace Analysis of the Health Care Group Purchasing Industry, June2005.6
Locus Systems, Inc., A 2007 Update of Cost Savings and a Marketplace Analysis of the Health Care GroupPurchasing Industry, January 2009.
Locus Systems, Inc.
2
employed in the analysis. The final section of the study provides estimates and projections ofthe overall savings attributable to GPOs for the total health care sector and for individual publicsector health care programs. The report concludes with a short summary of the majorfindings.
THE ROLE AND CONTRIBUTIONS OF GPOS
The health care sector is a major component of the U.S. economy. In 2007, the most recentcalendar year for which CMS estimates are currently available, health care comprised 16.2percent of total gross domestic product.7 The health care sector consists of a complex set ofrelationships among manufacturers, distributors, providers, benefit administrators, regulators,payers, and of course patients, the ultimate end users. Organized group purchasing has existedin the U.S. health care system in some form since at least the early 1900s.
Group purchasing plays an important role and has a significant impact on the U.S. health caresystem, bringing efficiency to sales supply chains which result in overall cost savings toproviders and patients. By organizing providers into purchasing groups that commandsignificant market share, it is possible to negotiate contracts, with associated volume discounts,with manufacturers and suppliers that afford providers the best possible and most appropriateproducts at the most competitive prices. The volume discounts that group purchasingmembers receive are attractive to purchasing agents and administrative personnel and helpreduce costs for providers and the health care system.
The health care group purchasing industry in the U.S. is composed of both large, nationalpurchasing organizations and smaller regional purchasing entities. Collectively, theseorganizations are referred to as GPOs. GPOs negotiate on behalf of hospitals and affiliatedhealth care providers to contract for the best value in their purchase of supplies and servicesand help providers realize savings by aggregating purchasing volume and using that leverage tonegotiate discounts with manufacturers, distributors, and other vendors.8,9 GPO members andcustomers receive financial benefits through up-front pricing discounts, patronage dividendsand distributions, and reduced administrative costs.
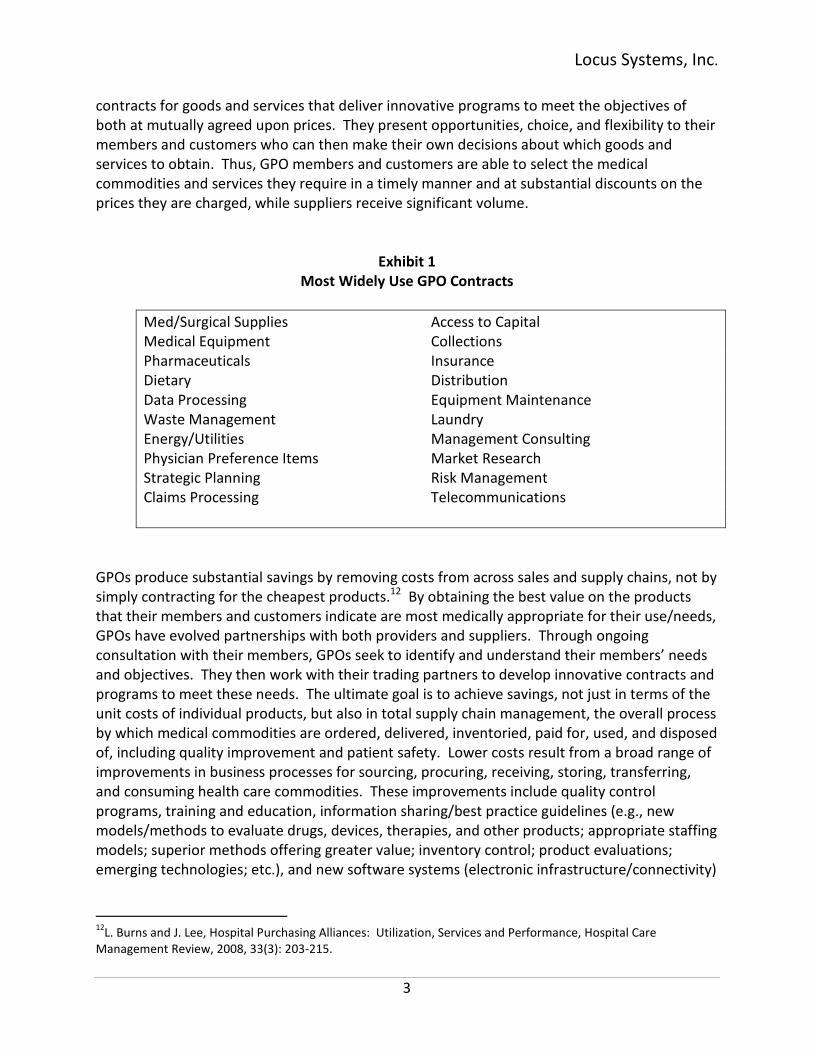
GPO contracts cover virtually everything hospitals, nursing home, and other health careproviders buy, offering discounted prices on supplies and equipment related to almost everyaspect of a health care facility (Exhibit 1).10,11 In their role as agents, brokers, and facilitators,GPO work closely with their members, customers, and vendors to develop fair and progressive
7Centers for Medicare and Medicaid Services, 2007 National Health Expenditures Projections 2007-2017, January
2008.8
The Lewin Group, Assessing the Value of Group Purchasing Organizations, May 2003, P. 3 and p. 16.9
Schneller, Eugene, The Value of Group Purchasing – 2009: Meeting the Needs for Strategic Savings, Health CareSector Advances, Inc., April 2009.10
Schlag-Mendenhall, M., In Search of a Cost-Control Cure-All, Sanitary Maintenance, March 1988.11
Lewin, op. cit., p 4.
Locus Systems, Inc.
3
contracts for goods and services that deliver innovative programs to meet the objectives ofboth at mutually agreed upon prices. They present opportunities, choice, and flexibility to theirmembers and customers who can then make their own decisions about which goods andservices to obtain. Thus, GPO members and customers are able to select the medicalcommodities and services they require in a timely manner and at substantial discounts on theprices they are charged, while suppliers receive significant volume.
Exhibit 1Most Widely Use GPO Contracts
Med/Surgical Supplies Access to CapitalMedical Equipment CollectionsPharmaceuticals InsuranceDietary DistributionData Processing Equipment MaintenanceWaste Management LaundryEnergy/Utilities Management ConsultingPhysician Preference Items Market ResearchStrategic Planning Risk ManagementClaims Processing Telecommunications
GPOs produce substantial savings by removing costs from across sales and supply chains, not bysimply contracting for the cheapest products.12 By obtaining the best value on the productsthat their members and customers indicate are most medically appropriate for their use/needs,GPOs have evolved partnerships with both providers and suppliers. Through ongoingconsultation with their members, GPOs seek to identify and understand their members’ needsand objectives. They then work with their trading partners to develop innovative contracts andprograms to meet these needs. The ultimate goal is to achieve savings, not just in terms of theunit costs of individual products, but also in total supply chain management, the overall processby which medical commodities are ordered, delivered, inventoried, paid for, used, and disposedof, including quality improvement and patient safety. Lower costs result from a broad range ofimprovements in business processes for sourcing, procuring, receiving, storing, transferring,and consuming health care commodities. These improvements include quality controlprograms, training and education, information sharing/best practice guidelines (e.g., newmodels/methods to evaluate drugs, devices, therapies, and other products; appropriate staffingmodels; superior methods offering greater value; inventory control; product evaluations;emerging technologies; etc.), and new software systems (electronic infrastructure/connectivity)
12L. Burns and J. Lee, Hospital Purchasing Alliances: Utilization, Services and Performance, Hospital Care
Management Review, 2008, 33(3): 203-215.
Locus Systems, Inc.
4
to streamline business processes and the movement of products. GPOs often act as a bridgebetween health care providers in an otherwise chaotic health care “system.”
Through such improvements in supply chain management, the efficiency and cost-effectivenessof clinical care processes are also enhanced, resulting in better clinical outcomes acrossepisodes of care and provider settings and in savings to both the health care system and theultimate consumer, the patient. For some providers, the efficiencies and savings realizedthrough group purchasing are significant to their economic viability and their ability to provideservices, especially as third-party payers, including governments, seek ways to lower their owncosts.
The role of GPOs and their contributions to the U.S. health care industry, therefore, go beyondunit costs of individual products and encompass a much broader focus on systems andprocesses. Collectively, these improvements lead to increased efficiencies, better use of staff,and lower total costs. Thus, the role and contributions of GPOs result in savings to providers,patients, and the entire health care system.
OBJECTIVE
There is no question that GPOs have a significant impact on the marketing and movement ofhealth care commodities in the United States which can be translated into a reduction in healthcare costs. However, the size of the impact remains a question. In response to HIGPA’srequest, the current study seeks to develop updated estimates of the size of the contributionthat GPOs make. The primary objective of the updated study is to:
Estimate the size of the GPO marketplace, GPO market penetration, and the savings thatGPOs generated through their purchasing and other business practices in CY 2008,especially in the public sector of the health care market.
HIGPA believes that it is important that its members examine these issues in order to betterunderstand the size and characteristics of the health care system, their role in bringingefficiencies and cost savings, and how new legislative and/or regulatory requirements mightaffect the group purchasing industry and GPO-related savings.
DATA
The primary data used in this study were compiled from the CY 2007 version of the NationalHealth Expenditure Accounts (NHEs) and (CY 2008-CY 2018) projections released by the CMSOffice of the Actuary in January 2009. These were the most recent NHE data available whenthe study began. For present purposes, CY 2007 will serve as the baseline year. CY 2008 will bethe actual focus of the study.

Locus Systems, Inc.
5
Published since 1964, The NHEs are an annual series of statistics presenting total nationalaggregate health expenditures estimates and projections for specific calendar years.13 Withinthe NHEs, “Total National Health Expenditures” equals the sum of health services and suppliesplus investment. “Health Services and Supplies” represents spending for all medical careprovided during the year. It is the sum of personal health care expenditures, governmentpublic health activity, and program administration and the net cost of private health insurance.“Personal Health Care Expenditures” measures the total amount spent to treat individuals withspecific medical conditions.
Hospitals are a major component of the health care sector as well as a primary segment of theGPO marketplace. The nursing home industry is also a significant market for GPOs. However,health care delivery has undergone many changes in recent years and will continue to evolve.In addition to hospitals and nursing homes, GPO members and customers may now include abroad range of health care providers and settings (i.e., hospices, ambulatory surgery centers(ASCs), clinics, outpatient rehabilitation centers, continuous care/assisted living facilities, etc.)Unfortunately, little hard data are available to examine the potential marketplace or GPOpenetration for these other types of providers. For example, there are no line items in theNHEs for ASCs. Neither is there any national level or industry data on total expenditures, labor-non-labor expenditure splits, or GPO penetration rates for these other provider types. Due tothe lack of data, ASCs and these other types of providers have been deleted from the analysis.Thus, our estimates of the size of the GPO marketplace and the savings that GPOs generate erron the conservative side.
PARAMETERS FOR THE 2008 UPDATE
To maintain continuity with the 2005 and 2008 studies and to minimize the amount of time andcosts to complete the project, HIGPA opted to reuse most of the parameters and the samebasic methodology that were used in these earlier studies regarding the non-labor componentof health care expenditures, GPO market penetration rates, and estimates of GPO savings. Aswill be seen below, these parameters are employed at specific points in the analysis.
Non-Labor Component
The hospital non-labor component of total hospital expenditures is estimated to be 44.6percent. This figure was compiled from a review of several years of the American HospitalAssociation’s Hospital Statistics and confirmed by a survey of providers. The correspondingnon-labor component for nursing homes is 25 percent. It was determined both by discussionwith nursing home industry representatives and a review of nursing home cost report data.
13Additional information about the NHEs may be found on the CMS website at www.cms.hhs.gov/nhe/default.asp.

Locus Systems, Inc.
6
GPO Marketplace Penetration Rates
In earlier versions of this study, industry estimates suggested that 80 cents of each dollar ofnon-personnel (i.e., non-labor) expenditures is channeled through GPOs. Providers reportedthat approximately 72 percent (71.71%) of their non-labor expenditures are made throughGPOs. More recently, Schneller has reported that hospitals, on average, purchase 72 percent oftheir goods through GPOs.14 Thus, the industry estimate (80%) can serve as an upper boundaryand the provider estimate (71.71%) the lower threshold to approximate GPO marketpenetration.
GPO Savings
Providers surveyed15 reported that they save between 10 percent and 15 percent by channelingtheir purchases through GPOs. They base such claims on detailed analyses and costcomparisons that they have conducted. The Lewin Group also surveyed hospital purchasingprofessionals and found that, on average, they save 10.4 percent of the costs of goods bypurchasing through GPOs, confirming the lower savings estimate.16 Schneller, on the otherhand, reports overall savings resulting from GPO purchases of 18 percent. Since it is difficult todecide on a precise value, we use all three of the savings rates (10%, 15%, and 18%) toapproximate the range of savings that GPOs produce. The consumer price index for medicalcare (CPI-M) for 2008 (3.7%) and population growth factor of 2.0 percent are used to inflate theestimates forward for five-year and ten-year periods.17 The total inflation factor used in thecurrent study is, therefore, 5.7 percent.
METHODOLOGY
Data on the health care sector of the U.S. economy are published annually by CMS in the NHEs.For purposes of this study, we use the CY 2007 data release (see Table 1), the most recent NHEdata that are currently available. CY 2007 was selected to serve as the baseline year and CMSprojections for 2008-2018, which are based on the 2007 NHEs, are used in determining theestimates for the 2008 update.
For CY 2007, CMS has estimated that national health expenditures totaled over $2.2 trillion,16.2 percent of U.S. gross domestic product. Health services and supplies ($2.098 trillion) areestimated to have accounted for over 93 percent of total national health expenditures.Personal health care expenditures, which include spending on hospital care, professionalservices, nursing homes, home health care, retail outlet sales of medical products, and public
14Schneller, op. cit., p. 11.
15Muse & Associates, September 2002, op. cit.
16Lewin, op. cit., p. 16
17For present purposes, utilization is held constant.

Locus Systems, Inc.
7
health activities, totaled $1.878 trillion. Public sector health care programs18 accounted forover $974.2 billion (46%) of expenditures for health services and supplies with the federalgovernment responsible for $712.9 billion (73%) of this amount (see Table 4). Public sectorexpenditures for personal health care totaled $850.6 billion. National health expenditures forhospitals and freestanding nursing facility care,19 the two sectors of the health care market ofgreatest interest to GPOs, are estimated to have been $696.5 billion and $131.3 billion,respectively, in CY 2007. Together, hospital care and freestanding nursing facility servicesaccounted for approximately 44 percent of all personal health care expenditures.
For CY 2008, CMS has projected total national health care expenditures of $2.379 trillion, about17 percent of gross domestic product (Table 1). Health services and supplies are thought tohave totaled $2.227 trillion, the same proportion of total national health care expenditures(93.6%) as they were in CY 2007. Personal health care expenditures were about $1.993 trillion,6.1 percent higher than in 2007, with public sector expenditures of $910.8 billion (see Table 5).Total health expenditures for hospital care were $746.5 billion in 2008. Freestanding nursingfacility care totaled $137.4 billion. Together hospital and freestanding nursing homeexpenditures accounted for 44 percent of total personal health care expenditures.
Estimation of CY 2008 savings attributable to GPOs begins with the CMS projections based onthe CY 2007 NHEs. A “top down” methodology is used to calculate the savings that GPOsgenerate. This approach begins with total national health expenditures. The data are thendisaggregated into various components of health expenditures. From the disaggregated data,the size of the potential GPO marketplace is estimated and the GPO market share determined.Estimates of the dollar savings that result from GPO practices are then determined.
18Public sector health care programs include Medicare, Medicaid, other state and local public assistance programs,
Workers’ Compensation, state and local hospitals, health care programs of the Department of Veterans Affairsand the Department of Defense, and other public health care programs for personal care.19
Data for hospital-based nursing facilities are included in the hospital data.

Locus Systems, Inc.
8
Table 1
National Health Expenditures by Type of Expenditure: Calendar Years 2003-20181
2003 2004 2005 2006 2007 2008 2009 2010 2011 2012 2013 2014 2015 2016 2017 2018
National Health Expenditures: Total $1,734.9 $1,854.8 $1,980.6 $2,112.7 $2,241.2 $2,378.6 $2,509.5 $2,624.4 $2,770.3 $2,930.7 $3,110.9 $3,313.0 $3,541.3 $3,790.2 $4,061.7 $4,353.2
Health Services and Supplies $1,623.1 $1,733.1 $1,850.4 $1,976.1 $2,098.1 $2,226.6 $2,350.1 $2,457.8 $2,595.5 $2,746.1 $2,915.8 $3,107.4 $3,322.5 $3,556.1 $3,811.4 $4,086.2
Personal Health Care $1,447.5 $1,550.2 $1,655.1 $1,765.5 $1,878.3 $1,992.6 $2,099.0 $2,191.3 $2,312.0 $2,446.3 $2,598.3 $2,769.3 $2,961.0 $3,169.0 $3,395.6 $3,639.2
Hospital Care $527.4 $566.8 $607.5 $649.3 $696.5 $746.5 $789.4 $829.7 $877.4 $931.7 $992.6 $1,056.0 $1,125.3 $1,201.0 $1,284.6 $1,374.1
Professional Services $543.0 $581.2 $621.5 $661.4 $702.1 $744.7 $785.8 $812.9 $855.2 $901.0 $953.7 $1,017.5 $1,090.1 $1,167.6 $1,250.1 $1,338.1Physicians and Climical Services $366.7 $393.6 $422.2 $449.7 $478.8 $508.5 $539.1 $551.6 $577.0 $604.5 $636.1 $674.7 $719.0 $765.9 $814.6 $865.2Other Professional Services $49.0 $52.9 $56.0 $58.7 $62.0 $65.8 $68.7 $71.5 $75.4 $79.5 $84.1 $89.8 $96.2 $102.7 $109.5 $116.8Dental Services $76.9 $81.5 $86.4 $90.5 $95.2 $99.9 $101.9 $106.3 $110.9 $115.8 $121.4 $128.5 $136.3 $144.2 $152.5 $161.4Other Personal Health Care Services $50.4 $53.3 $56.9 $62.5 $66.2 $70.5 $76.1 $83.5 $91.9 $101.2 $112.0 $124.4 $138.6 $154.8 $173.4 $194.7
Nursing Home and Home Health $148.5 $157.9 $168.7 $178.4 $190.4 $201.8 $213.6 $225.8 $238.8 $253.5 $269.8 $287.6 $307.0 $328.1 $351.0 $375.8Home Health Care $38.0 $42.7 $48.1 $53.0 $59.0 $64.4 $69.7 $74.6 $79.7 $85.7 $92.4 $99.5 $107.3 $115.8 $124.9 $134.9Nursing Home Care $110.5 $115.2 $120.6 $125.4 $131.3 $137.4 $143.9 $151.2 $159.2 $167.8 $177.4 $188.0 $199.7 $212.3 $226.0 $240.9
Retail Outlet Sales of Medical Products $228.6 $244.3 $257.5 $276.4 $289.3 $299.6 $310.2 $322.9 $340.5 $360.1 $382.1 $408.2 $438.6 $472.3 $509.9 $551.3Prescription Drugs $174.2 $188.8 $199.7 $216.8 $227.5 $235.4 $244.8 $255.9 $271.6 $288.8 $307.8 $329.8 $355.8 $384.9 $417.6 453.7Other Medical Equipment $54.5 $55.5 $57.8 $59.6 $61.8 $64.2 $65.4 $67.1 $69.0 $71.3 $74.4 $78.4 $82.8 $87.4 $92.3 $97.6
Durable Medical Equipment $22.4 $22.8 $23.8 $24.2 $24.5 $25.2 $25.2 $25.9 $26.6 $27.6 $29.0 $30.6 $32.4 $34.1 $36.0 $38.1Other Non-Durable Medical Products $32.1 $32.7 $34.0 $35.3 $37.4 $39.0 $40.2 $41.2 $42.4 $43.6 $45.4 $47.8 $50.5 $53.3 $56.3 $59.5
Program Admin. and Net Cost of Private Health Insurance $121.9 $128.8 $138.7 $150.4 $155.7 $165.6 $178.8 $190.1 $202.4 $213.4 $225.2 $239.2 $255.3 $273.1 $293.1 $315.0
Government Public Health Activities $53.7 $54.0 $56.6 $60.2 $64.1 $68.3 $72.3 $76.4 $81.2 $86.4 $92.3 $98.9 $106.2 $114.1 $122.7 $132.0
Investment $111.8 $121.7 $130.2 $136.6 $143.1 $152.0 $159.4 $166.5 $174.8 $184.6 $195.2 $205.5 $218.8 $234.1 $250.3 $267.0
Research2$35.5 $38.8 $40.2 $41.3 $42.4 $43.6 $44.5 $45.6 $47.2 $49.2 $52.2 $55.5 $59.0 $62.6 $66.3 $70.2
Structures and Equipment $76.3 $83.0 $90.0 $95.2 $100.7 $108.4 $114.9 $120.9 $127.6 $135.3 $142.9 $150.0 $159.8 $171.5 $183.9 $196.8
Gross Domestic Product $10,960.8 $11,658.9 $12,421.9 $13,178.4 $13,807.5 $14,290.8 $14,262.2 $14,818.4 $15,514.9 $16,275.1 $17,072.6 $17,892.1 $18,733.0 $19,613.4 $20,535.3 $21,479.9
1The health spending projections are based on the 2007 version of the National Health Expenditures (NHEs).
2Research and development expenditures of drug companies and other manufacturers and providers of medical equipment and supplies are excluded from research expenditures. These research expenditures are implicitly included in the expenditure class in which the product falls,
in that they are covered by the payment received for that product.
Note: Numbers may not add to totals because of rounding.
Source: CMS, Office of the Actuary, January 2009.
Estimates ProjectionsAmount in Billions
Locus Systems, Inc.
9
SAVINGS ATTRIBUTABLE TO GPOS
POTENTIAL GPO MARKETPLACE
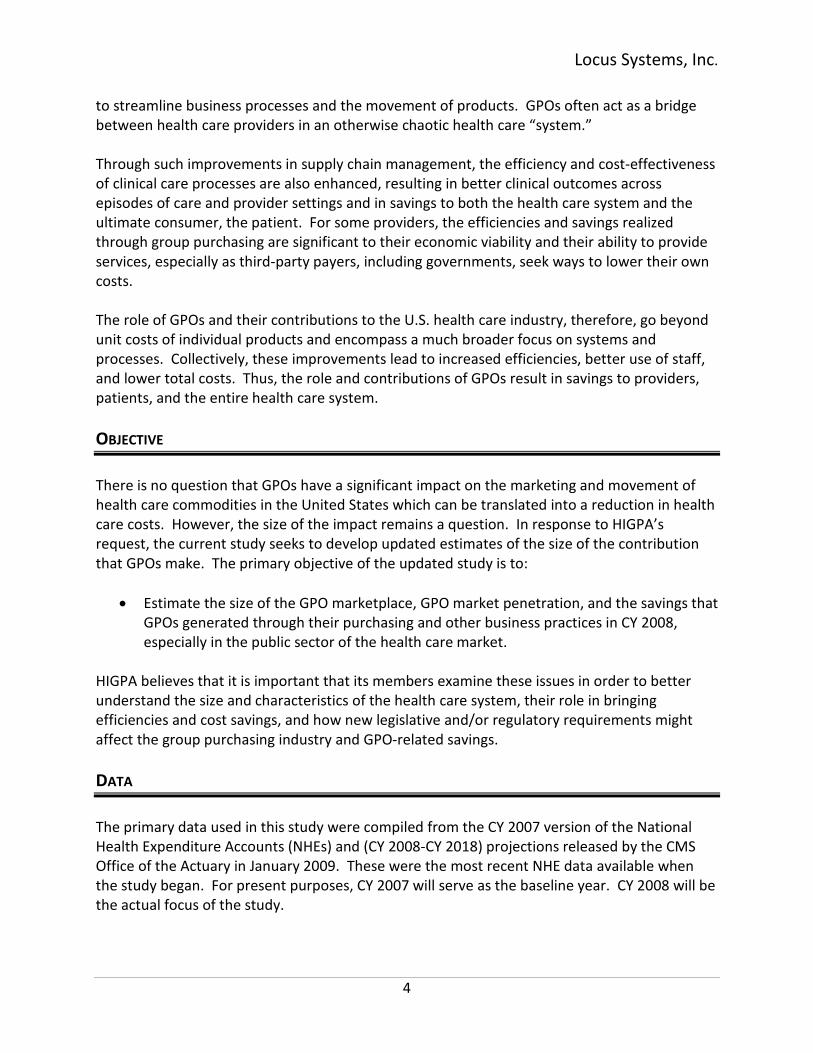
The first step in determining the savings attributable to GPOs is to estimate the size of the GPOmarketplace in CY 2008. Beginning with the NHE projections for CY 2008, total national health careexpenditures are disaggregated into the major CMS expenditure categories of health services and suppliesand personal health care (Table 2). For the reasons stated above, the analysis then focuses on hospital andnursing home expenditures, the two primary components of the GPO marketplace.
Table 2Potential GPO Marketplace
(Amount in $ Billions)
2003 2004 2205 2006 2007 2008
National Health Expenditures: Total $1,734.9 $1,854.8 $1,980.6 $2,112.7 $2,241.2 $2,378.6
Health Services and Supplies $1,623.1 $1,733.1 $1,850.4 $1,976.1 $2,098.1 $2,226.6
Personal Health Care $1,447.5 $1,550.2 $1,655.1 $1,765.5 $1,878.3 $1,992.6
Hospital Care Total $527.4 $566.8 $607.5 $649.3 $696.5 $746.5% Change 8.0% 7.5% 7.2% 6.9% 7.3% 7.2%Non-Labor (44.6%) $235.2 $252.8 $270.9 $289.6 $310.6 $332.9
Nursing Home Total $110.5 $115.2 $120.6 $125.4 $131.3 $137.4% Change 4.5% 4.3% 4.7% 4.0% 4.7% 4.6%Non-Labor (25.0%) $27.6 $28.8 $30.2 $31.4 $32.8 $34.4
Total Hospital + Nursing Home Marketplace $637.9 $682.0 $728.1 $774.7 $827.8 $883.9
Total Potential GPO Marketplace = Total hospital non-labor and total nursing home non-laborHospital $235.2 $252.8 $270.9 $289.6 $310.6 $332.9Nursing Home $27.6 $28.8 $30.2 $31.4 $32.8 $34.4
Total $262.8 $281.6 $301.1 $320.9 $343.5 $367.3
Note: Numbers may not add to totals because of rounding.
Source: Locus Systems analysis of CMS National Health Expenditures Accounts for CY 2007 and Projections for CY 2008-CY 2018.
According to CMS, hospital care and nursing home expenditures totaled $746.5 billion and $137.4 billion,respectively, in CY 2008 (Table 1). These expenditures can be disaggregated into labor and non-laborcomponents. Hospitals report that approximately 45% of their expenditures are non-labor-related (i.e.,medical equipments, supplies, pharmaceuticals, food, etc.)20 This is similar to the 44.6 percent non-laborexpenditure figure published by the American Hospital Association (AHA).21 Applying the AHA percentageto total hospital expenditures yields a CY 2008 estimate of hospital non-labor spending of $332.9 billion(Table 2).
20Muse & Associates, March 2000, op. cit.
21Health Forum LLC, 2004 Hospital Statistics.
Locus Systems, Inc.
10
Nursing homes are more labor intensive than hospitals. Hence, a higher proportion of their expendituresgo towards personnel costs. Analysis of the Medicare nursing home master cost reports file indicates thatapproximately 75 percent of nursing home expenditures are labor-related and 25 percent of expendituresare for non-labor purposes.22 When applied to the CMS’ CY 2008 projections for nursing homeexpenditures, this results in an estimate of non-labor expenditures in freestanding nursing homes of $34.4billion.
The potential GPO marketplace is the sum of total hospital non-labor and total nursing home non-laborexpenditures. Were all non-labor hospital and nursing home spending during CY 2008 channeled throughGPOs, the potential GPO marketplace in CY 2007 would have been $367.3 billion.
GPO Marketplace Penetration
The potential GPO marketplace represents the theoretical upper limit on GPO business opportunity. Thus,if every dollar of non-labor expenditures were channeled through GPOs, the GPO marketplace would havetotaled over $367 billion in CY 2008 (Table 2). The actual size of the GPO marketplace is probably less thanthe theoretical upper limit. For whatever reasons, providers do not purchase all of the goods and servicesthey require through GPOs. However, lack of hard data leaves determination of GPO market penetrationopen to debate.
The conventional industry wisdom suggests that approximately 80 cents of each dollar of hospital non-personnel expenditures is channeled through GPOs. Providers report that, on average, approximately 72percent of their purchases are made through GPOs.23 The provider-reported figure was confirmed in arecent study by Schneller who found that the average GPO market penetration rate is approximately 73percent for all hospitals (with a spread ranging from 30 percent to 90 percent).24 Using the industry valueas an upper boundary and provider responses as a lower threshold, it is possible to estimate a dollar rangefor GPO marketplace penetration (Table 3).
Applying the upper boundary and lower threshold values defined above, GPO hospital market penetrationis estimated at between $238.8 billion and $266.4 billion in CY 2008. Similarly, for freestanding nursinghomes, GPO market penetration is estimated to have been between $24.6 billion and $27.5 billion.Together, the total GPO marketplace for CY 2008 was between $263.4 billion and $293.8 billion (about11%-12% of total national health expenditures).
The next task was to calculate similar estimates of CY 2008 GPO market penetration by public sectorhealth care program (i.e., federal, state and local governments, Medicare, Medicaid, Department ofVeterans Affairs, Department of Defense, etc.). This involved several steps.
22Muse & Associates analysis of the 2002 Medicare nursing home Master Cost Reports File, December 2004.
23Ibid.
24Schneller, op.cit, p. 11.

Locus Systems, Inc.
11
Table 3GPO Marketplace Penetration
(Amount in $ Billions)
2003 2004 2005 2006 2007 2008
HospitalsHospital Care Total $527.4 $566.8 $607.5 $649.3 $696.5 $746.5Non-Labor (44.6%) $235.2 $252.8 $270.9 $289.6 $310.6 $332.9GPO Share @ .7171 $168.7 $181.3 $194.3 $207.7 $222.8 $238.8GPO Share @ .8 $188.2 $202.2 $216.8 $231.7 $248.5 $266.4
Nursing HomesNursing Home Total $110.5 $115.2 $120.6 $125.4 $131.3 $137.4Non-Labor (25.0%) $27.6 $28.8 $30.2 $31.4 $32.8 $34.4GPO Share @ .7171 $19.8 $20.7 $21.6 $22.5 $23.5 $24.6
GPO Share @ .8 $22.1 $23.0 $24.1 $25.1 $26.3 $27.5
HCPE Market Penetration@ .7171 penetration (Survey)
Hospital $168.7 $181.3 $194.3 $207.7 $222.8 $238.8Nursing Home $19.8 $20.7 $21.6 $22.5 $23.5 $24.6
Total $188.5 $201.9 $215.9 $230.1 $246.3 $263.4
HCPE Market Penetration@ .8 penetration (HIGPA)
Hospital $188.2 $202.2 $216.8 $231.7 $248.5 $266.4Nursing Home $22.1 $23.0 $24.1 $25.1 $26.3 $27.5
Total $210.3 $225.3 $240.9 $256.8 $274.8 $293.8
Source: Locus Systems analysis of CMS National Health Expenditures Accounts for CY 2007 and Projections for CY 2008-CY 2018.
The initial step in creating a dataset of expenditures which would enable calculation of market penetrationand, ultimately, savings for each public health care program began with the CY 2007 NHEs. Among theinformation presented in the 2007 NHEs are aggregate data on expenditures for health services andsupplies for each public sector health care programs. The data are further disaggregated by type ofexpenditure including Personal Health Care (i.e., hospital care, nursing home care, prescription drugs,DME, etc.), Administration and Public Health Activities (Table 4).
Unfortunately, a complete set of similar data is not available in the CMS health care expendituresprojections for CY 2008-CY 2018. However, for these years, CMS does project 2007 data forward for allnational health expenditures, public health program expenditures, federal health care spending, state andlocal health care spending, and Medicare and Medicaid program spending for each expenditure category.

Locus Systems, Inc.
12
Table 4Expenditures for Health Services and Supplies Under Public Programs, by Type of Expenditure and
Program: Calendar Year 2007(Amount in $ Billions)
All Health
Services and
Supplies
Expenditures
Personal
Health Care
Total Hospital Care
Physician
and Clinical
Services
Dental
Services
Other
Professional
Services
Home Health
Care
Prescription
Drugs
Other Non
Durable
Medical
Products
Durable
Medical
Equipment
Nursing
Home Care
Other
Personal
Health Care
Administratio
n
Public Health
Activities
Health Services and Supplies: Total Public and Private Spending $2,098.1 $1,878.3 $696.5 $478.8 $95.2 $62.0 $59.0 $227.5 $37.4 $24.5 $131.3 $66.2 $155.7 $64.1
All Public Programs $974.2 $850.6 $384.3 $161.3 $6.1 $20.3 $46.4 $80.8 $2.3 $7.5 $81.6 $59.8 $59.5 $64.1Federal Funds $712.9 $663.0 $307.8 $133.5 $3.6 $16.1 $35.4 $66.5 $2.3 $7.1 $57.0 $33.7 $40.2 $9.7State and Local Funds $261.3 $187.6 $76.6 $27.8 $2.5 $4.3 $11.0 $14.3 $0.0 $0.4 $24.6 $26.1 $19.3 $54.4
Medicare $431.2 $409.6 $196.2 $96.1 $0.2 $13.7 $23.8 $47.0 $2.3 $7.0 $23.2 - $21.6 -
Medicaid1
$329.4 $303.9 $120.0 $33.2 $5.0 $3.5 $20.5 $18.8 - - $54.8 $48.2 $25.4 -Federal $186.1 $171.7 $68.2 $19.4 $2.8 $2.0 $11.1 $10.8 - - $30.6 $26.9 $14.4 -State and Local $143.3 $132.2 $51.8 $13.8 $2.2 $1.5 $9.4 $7.9 - - $24.2 $21.3 $11.1 -
Other State and Local Public AssistancePrograms $6.3 $6.3 $1.8 $0.7 $0.1 $0.1 $0.1 $2.8 $0.0 $0.0 $0.4 $0.2 - -
Department of Veterans Affairs $33.8 $33.6 $22.5 $3.6 $0.1 - $0.5 $2.6 - - $3.3 $1.2 $0.2 -
Department of Defense2
$31.7 $28.6 $16.0 $6.2 - - - $4.8 - - - $1.6 $3.1 -
Workers' Compensation $32.4 $24.7 $6.2 $12.7 - $2.4 - $3.1 - $0.3 - - $7.7 -Federal $0.8 $0.8 $0.2 $0.4 - $0.1 - $0.1 - $0.0 - - $0.0 -State and Local $31.6 $23.9 $6.0 $12.3 - $2.3 - $3.0 - $0.3 - - $7.7 -
State and Local Hospitals3
$20.6 $20.6 $15.8 - - - $1.5 - - - - $3.3 $0.0 -
Other Public Programs for Personal
Health Care4
$24.7 $23.2 $5.8 $8.8 $0.7 $0.6 $0.0 $1.7 - $0.2 $0.0 $5.3 $1.5 -Federal $19.6 $18.7 $4.7 $7.9 $0.6 $0.2 $0.0 $1.1 - $0.1 $0.0 $4.0 $1.0 -State and Local $5.1 $4.6 $1.1 $1.0 $0.2 $0.4 $0.0 $0.6 - $0.1 $0.0 $1.3 $0.5 -
Government Public Health Activities $64.1 - - - - - - - - - - - - $64.1Federal $9.7 - - - - - - - - - - - - $9.7State and Local $54.4 - - - - - - - - - - - - $54.4
CMS ProgramsMedicare, Medicaid, and SCHIP $769.6 $721.4 $319.1 $131.5 $5.7 $17.4 $44.3 $67.3 $2.3 $7.1 $78.0 $48.7 $48.2 -
1Excludes funds paid into the Medicare trust funds by States under buy-in agreements to cover premiums for Medicaid recipients.
2Includes care for retirees and military dependents.
3Category comprises state and local subsidies to hospitals and home health agencies, as well as school health programs.
4Includes program spending for Medicaid SCHIP Expansion and SCHIP; maternal and child health; vocational rehabilitation medical payments; temporary disability insurance medical payments; Public Health Service and other Federal hospitals; Indian health services; alcoholism,
drug abuse, and mental health.
Note: The figure 0.0 denotes amounts less than $50 million. Numbers may not add to total because of rounding. Dashes (-) indicate not applicable. Dollar amounts shown are in current dollars.
Program Area
Personal Health Care
By assuming that the proportionate distributions of expenditures by type of expenditure for the otherpublic health care programs not projected by CMS are similar in CY 2007 and CY 2008, it is possible, usingthe available CMS projections for CY 2008, to impute the “missing” values and create a CY 2008 datasetshowing expenditures by public sector health care programs and type of expenditure. This dataset ispresented in Table 5.
Through a multi-step process, the dataset was further refined. Initially, personal health care expenditureswere divided into GPO-related and non-GPO-related categories (Table 6). GPO-related categories includehospital care, nursing home care, prescription drugs, DME, and non-prescription drugs and other non-durable medical products. The non-GPO-related category is composed of professional services and homehealth care.
Locus Systems, Inc.
13
Table 5CY 2008 Estimates of Personal Health Care Expenditures by Type of Expenditure and Program1
(Amount in $ Billions)
Program Area
Personal
Health Care
Total Hospital Care
Physician
and Clinical
Services
Dental
Services
Other
Professional
Services
Home Health
Care
Prescription
Drugs
Other Non
Durable
Medical
Products
Durable
Medical
Equipment
Nursing
Home Care
Other
Personal
Health Care
Total Public and Private Spending $1,992.6 $746.5 $508.5 $99.9 $65.8 $64.4 $235.4 $39.0 $25.2 $137.4 $70.5
All Public Programs $910.8 $411.6 $171.7 $6.8 $21.8 $51.5 $88.2 $2.4 $8.0 $85.2 $63.8
Federal Funds $711.8 $330.8 $142.3 $4.0 $17.4 $38.8 $72.7 $2.4 $7.6 $59.8 $36.0
State and Local Funds2
$199.0 $80.8 $29.4 $2.7 $4.4 $12.6 $15.5 $0.0 $0.4 $25.4 $27.8
Medicare3
$440.9 $211.7 $102.2 $0.2 $14.9 $25.7 $51.6 $2.4 $7.4 $24.8 $0.0
Medciad4
$324.9 $127.8 $35.4 $5.6 $3.8 $23.5 $20.7 - - $56.5 $51.5Federal $183.6 $72.6 $20.7 $3.1 $2.2 $12.7 $12.0 - - $31.5 $28.7
State and Local $141.3 $55.2 $14.7 $2.5 $1.6 $10.8 $8.7 - - $25.0 $22.8
Other State and Local Public Assistance
Programs $6.7 $1.9 $0.7 $0.1 $0.1 $0.1 $3.0 $0.0 $0.0 $0.4 $0.2
Department of Veterans Affairs $35.6 $23.8 $3.8 $0.1 - $0.6 $2.8 - - $3.5 $1.3
Department of Defense5
$30.3 $16.9 $6.6 - - - $5.1 - - - $1.7
Workers' Compensation $26.1 $6.6 $13.5 - $2.4 - $3.3 - $0.4 - -
Federal $0.8 $0.2 $0.4 - $0.1 - $0.1 - $0.0 - -
State and Local $25.3 $6.4 $13.1 - $2.3 - $3.2 - $0.4 - -
State and Local Hospitals6
$21.8 $16.7 - - -$1.6 - - - - $3.5
Other Public Programs for Personal
Health Care7
$24.6 $6.1 $9.4 $0.8 $0.6 $0.0 $1.8 - $0.2 $0.0 $5.6Federal $19.8 $5.0 $8.3 $0.6 $0.2 $0.0 $1.2 - $0.1 $0.0 $4.2State and Local $4.8 $1.2 $1.1 $0.2 $0.4 $0.0 $0.6 - $0.1 $0.0 $1.4
1The health spending projections were based on the 2007 version of the National Health Expenditures (NHEs) released in January 2009.
2Includes Medicaid SCHIP Expansion and SCHIP
3Subset of Federal Funds.
4Subset of Federal and state and local funds. Includes Medicaid SCHIP Expansion.
5Includes care for retirees and military dependents.
6Category includes state and local subsidies to hospitals and home health agencies, as well as school health programs.
7Includes program spending for maternal and child health; vocational rehabilitation medical payments; temporary disability insurance medical payments; Public Health Service and other Federal hospitals; Indian health services; alcoholism,
drug abuse, and mental health.
Note: The figure 0.0 denotes amounts less than $50 million. Numbers may not add to total because of rounding.
Source: Locus Systems analysis of CMS National Health Expenditures Accounts for CY 2007 and Projections for CY 2008-CY 2018.
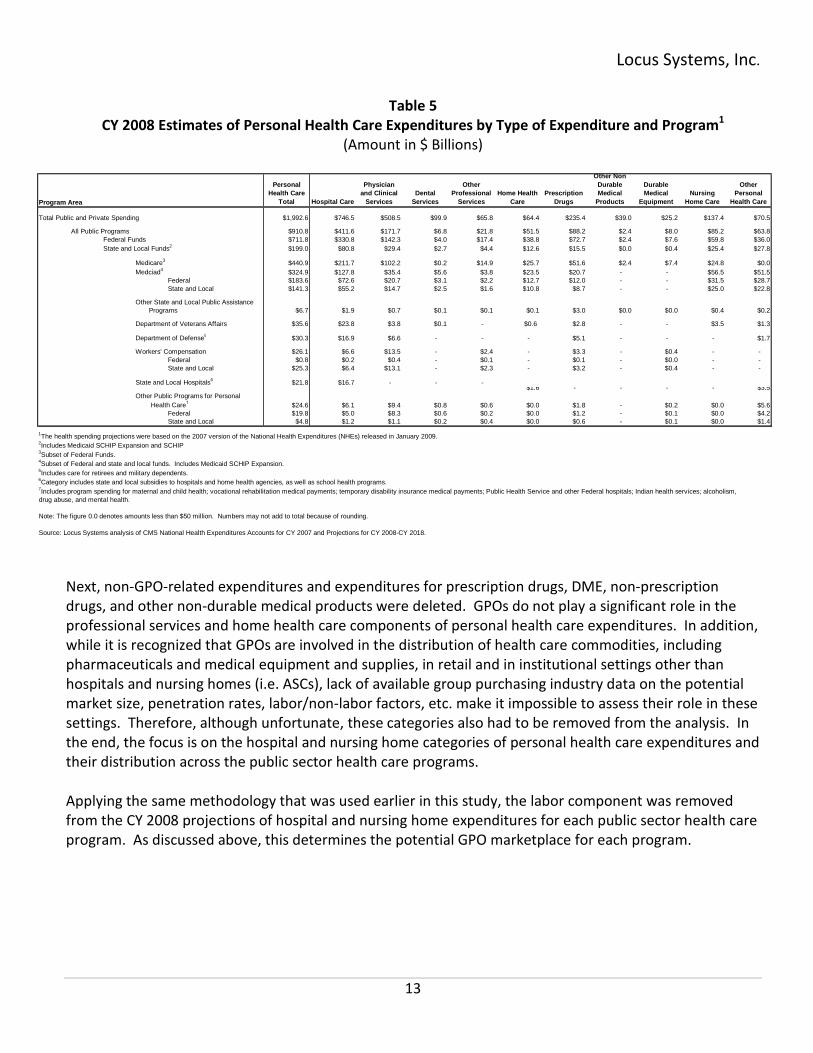
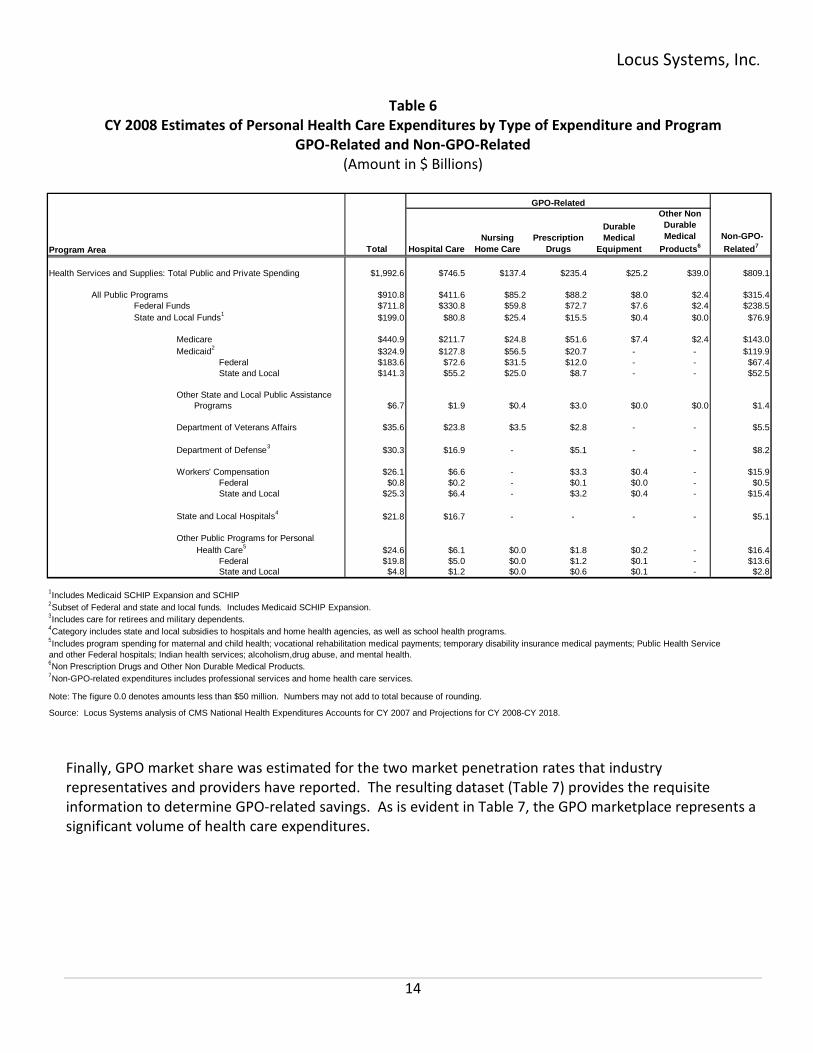
Next, non-GPO-related expenditures and expenditures for prescription drugs, DME, non-prescriptiondrugs, and other non-durable medical products were deleted. GPOs do not play a significant role in theprofessional services and home health care components of personal health care expenditures. In addition,while it is recognized that GPOs are involved in the distribution of health care commodities, includingpharmaceuticals and medical equipment and supplies, in retail and in institutional settings other thanhospitals and nursing homes (i.e. ASCs), lack of available group purchasing industry data on the potentialmarket size, penetration rates, labor/non-labor factors, etc. make it impossible to assess their role in thesesettings. Therefore, although unfortunate, these categories also had to be removed from the analysis. Inthe end, the focus is on the hospital and nursing home categories of personal health care expenditures andtheir distribution across the public sector health care programs.
Applying the same methodology that was used earlier in this study, the labor component was removedfrom the CY 2008 projections of hospital and nursing home expenditures for each public sector health careprogram. As discussed above, this determines the potential GPO marketplace for each program.
Locus Systems, Inc.
14
Table 6CY 2008 Estimates of Personal Health Care Expenditures by Type of Expenditure and Program
GPO-Related and Non-GPO-Related(Amount in $ Billions)
Program Area Total Hospital Care
Nursing
Home Care
Prescription
Drugs
Durable
Medical
Equipment
Other Non
Durable
Medical
Products6
Non-GPO-
Related7
Health Services and Supplies: Total Public and Private Spending $1,992.6 $746.5 $137.4 $235.4 $25.2 $39.0 $809.1
All Public Programs $910.8 $411.6 $85.2 $88.2 $8.0 $2.4 $315.4Federal Funds $711.8 $330.8 $59.8 $72.7 $7.6 $2.4 $238.5
State and Local Funds1
$199.0 $80.8 $25.4 $15.5 $0.4 $0.0 $76.9
Medicare $440.9 $211.7 $24.8 $51.6 $7.4 $2.4 $143.0
Medicaid2
$324.9 $127.8 $56.5 $20.7 - - $119.9Federal $183.6 $72.6 $31.5 $12.0 - - $67.4State and Local $141.3 $55.2 $25.0 $8.7 - - $52.5
Other State and Local Public AssistancePrograms $6.7 $1.9 $0.4 $3.0 $0.0 $0.0 $1.4
Department of Veterans Affairs $35.6 $23.8 $3.5 $2.8 - - $5.5
Department of Defense3
$30.3 $16.9 - $5.1 - - $8.2
Workers' Compensation $26.1 $6.6 - $3.3 $0.4 - $15.9Federal $0.8 $0.2 - $0.1 $0.0 - $0.5State and Local $25.3 $6.4 - $3.2 $0.4 - $15.4
State and Local Hospitals4
$21.8 $16.7 - - - - $5.1
Other Public Programs for Personal
Health Care5
$24.6 $6.1 $0.0 $1.8 $0.2 - $16.4Federal $19.8 $5.0 $0.0 $1.2 $0.1 - $13.6State and Local $4.8 $1.2 $0.0 $0.6 $0.1 - $2.8
1Includes Medicaid SCHIP Expansion and SCHIP
2Subset of Federal and state and local funds. Includes Medicaid SCHIP Expansion.
3Includes care for retirees and military dependents.
4Category includes state and local subsidies to hospitals and home health agencies, as well as school health programs.
5Includes program spending for maternal and child health; vocational rehabilitation medical payments; temporary disability insurance medical payments; Public Health Service
and other Federal hospitals; Indian health services; alcoholism,drug abuse, and mental health.6Non Prescription Drugs and Other Non Durable Medical Products.
7Non-GPO-related expenditures includes professional services and home health care services.
Note: The figure 0.0 denotes amounts less than $50 million. Numbers may not add to total because of rounding.
Source: Locus Systems analysis of CMS National Health Expenditures Accounts for CY 2007 and Projections for CY 2008-CY 2018.
GPO-Related
Finally, GPO market share was estimated for the two market penetration rates that industryrepresentatives and providers have reported. The resulting dataset (Table 7) provides the requisiteinformation to determine GPO-related savings. As is evident in Table 7, the GPO marketplace represents asignificant volume of health care expenditures.

Locus Systems, Inc.
15
Table 7CY 2008 Estimates of GPO Market Penetration by Program
(Amount in $ Billions)
Program Area
Potential GPO
Marketplace
@ 71.71% Penetration @ 80% Penetration
Health Services and Supplies: Total Public and Private Spending $367.3 $263.4 $293.8
All Public Programs $204.9 $146.9 $163.9Federal Funds $162.5 $116.5 $130.0
State and Local Funds1
$42.4 $30.4 $33.9
Medicare $100.6 $72.2 $80.5
Medicaid2
$71.1 $51.0 $56.9Federal $40.3 $28.9 $32.2State and Local $30.9 $22.1 $24.7
Other State and Local Public AssistancePrograms $0.9 $0.7 $0.8
Department of Veterans Affairs $11.5 $8.2 $9.2
Department of Defense3
$7.5 $5.4 $6.0
Workers' Compensation $2.9 $2.1 $2.4Federal $0.1 $0.1 $0.1State and Local $2.9 $2.0 $2.3
State and Local Hospitals4
$7.4 $5.3 $6.0
Other Public Programs for Personal
Health Care5
$2.7 $2.0 $2.2Federal $2.2 $1.6 $1.8State and Local $0.5 $0.4 $0.4
1Includes Medicaid SCHIP Expansion and SCHIP
2Subset of Federal and state and local funds. Includes Medicaid SCHIP Expansion.
3Includes care for retirees and military dependents.
4Category includes state and local subsidies to hospitals and home health agencies, as well as school health programs
5Includes program spending for maternal and child health; vocational rehabilitation medical payments; temporary disability insurance
Note: Numbers may not add to total because of rounding.
Source: Locus Systems analysis of CMS National Health Expenditures Accounts for CY 2007 and Projections for CY 2008-CY 2018.
GPO Market Share
GPO Savings – CY 2008
Providers report that they save between 10 percent and 15 percent by channeling their purchases throughGPOs.25 They base their claims on detailed internal analyses and cost comparisons that they haveconducted. More recent work by Schneller suggests a GPO-related savings rate of 18 percent.26 If GPOsdid not provide such savings to their members, providers would incur additional costs to procure neededproducts, equipment, and supplies. GPO-related savings for CY 2008 can be calculated for each of the twomarket penetration rates and three savings rates discussed above. Findings are presented in Table 8.
25Muse & Associates, September 2002, op. cit.
26Schneller, op. cit., p. 12.
Locus Systems, Inc.
16
Table 8GPO Savings – CY 2008(Amount in $ Billions)
GPOs generate savings of 10%, 15%, and 18%
@ 71.71% penetration, GPO market = $263.4 billion ($238.8 billion + $24.6 billion)
Savings = 10%0.9X = 263.4 Hospital = $265.3 billion $26.5 billion9X = 2634 NH = $27.3 billion $2.7 billionX = 2634/9 $292.7 billion $29.2 billionX = $292.7 billion
Savings* =$292.7 billion - $263.4 billion = $29.3 billion
Savings = 15% 0.85X = 263.4 Hospital = $280.9 billion $42.1 billion85X = 26340 NH = $28.9 billion $4.3 billionX = 26340/85 $309.9 billion $46.4 billionX = $309.9 billion
Savings* =$309.9 billion - $263.4 billion = $46.5 billion
Savings = 18% 0.82X = 263.4 Hospital = $291.2 billion $52.4 billion82X = 26340 NH = $30.0 billion $5.4 billionX = 26340/82 $321.2 billion $57.8 billionX = $321.2 billion
Savings* =$321.2 billion - $263.4 billion = $57.8 billion
@ 80.0% penetration, GPO market = $293.8 billion ($266.4 billion + $27.5 billion)
Savings = 10% 0.9X = 293.8 Hospital = $296.0 billion $29.6 billion9X = 2938 NH = $30.4 billion $2.9 billionX = 2938/9 $326.4 billion $32.5 billionX = $326.4 billion
Savings* =$326.4 billion - $293.8 billion = $32.6 billion
Savings = 15% 0.85X = 293.8 Hospital = $313.4 billion $47.0 billion85X = 29380 NH = $32.3 billion $4.8 billionX = 29380/85 $345.7 billion $51.8 billionX = $345.6 billion
Savings* =$345.6 billion - $293.8 billion = $51.8 billion
Savings = 18% 0.82X = 293.8 Hospital = $324.9 billion $58.5 billion82X = 29380 NH = $33.5 billion $6.0 billionX = 29380/82 $358.4 billion $64.5 billionX = $358.3 billion
Savings* =$358.3 billion - $293.8 billion = $64.5 billion
*Total savings values may differ due to rounding.
Source: Locus Systems analysis of CMS National Health Expenditures Accounts for CY 2007 and Projectionsfor CY 2008-CY 2018.
Savings*
Savings*
Savings*
Savings*
Savings*
Savings*

Locus Systems, Inc.
17
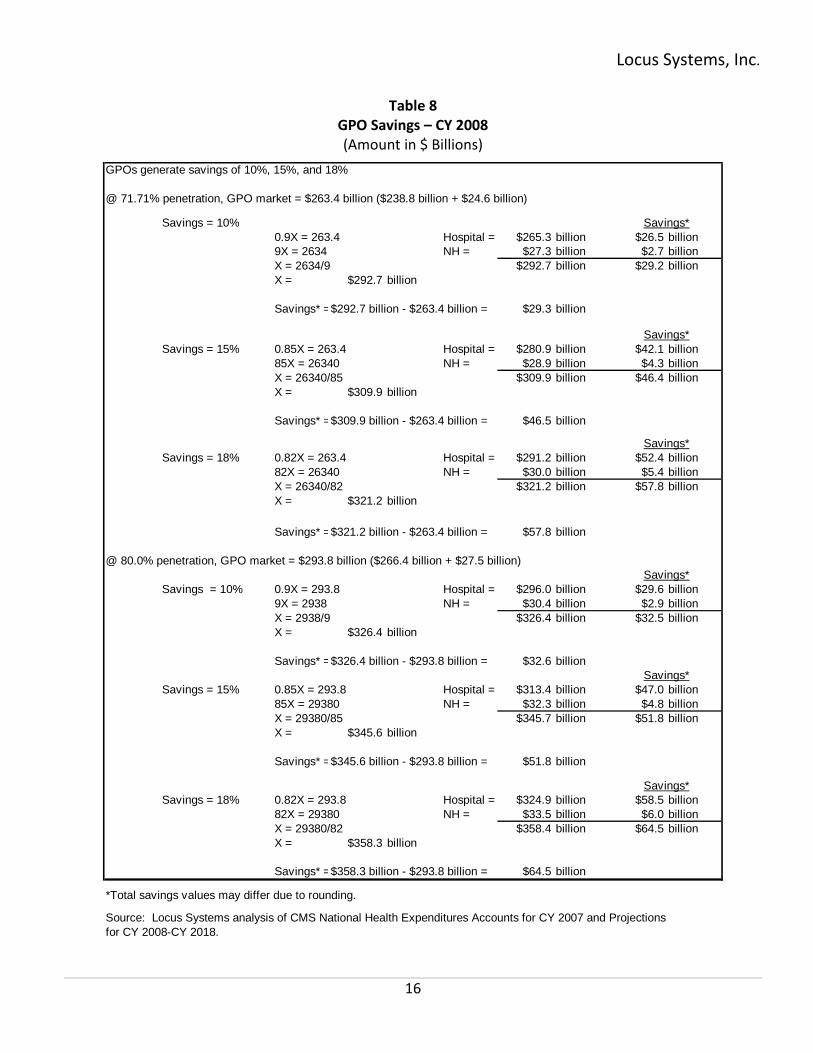
At a non-labor market penetration rate of approximately 72 percent, the size of the GPO marketplace wasestimated at $263.4 billion in CY 2008. If estimated GPO savings of 10 percent were to disappear, insteadof spending $263.4 billion in CY 2008 on the pharmaceuticals, equipments, supplies, etc. that they needed,hospitals and nursing homes would have had to spend $292.7 billion to obtain the same products. If GPOsavings are 15 percent of expenditures and were eliminated, hospital and nursing home spending onmaterials and supplies would have risen from $263.4 billion to $309.9 billion in CY 2008. For a savings rateof 18 percent, hospital and nursing facilities would have spent $321.2 billion to obtain the products theyneeded to serve their patients.
The analysis was replicated for a GPO market penetration rate of 80 percent of non-labor expenditures. Atan 80 percent market penetration rate, CY 2008 provider expenditures channeled through GPOs areestimated to have been $293.8 billion. Had GPO savings of 10 percent disappeared, spending would haveincreased to $326.4 billion. If savings of 15 percent were eliminated, hospital and nursing homes wouldhave spent $345.6 billion in CY 2008 to obtain the needed equipment, materials, and supplies. If GPOsavings of 18 percent were eliminated, spending would have increased from $293.8 billion to $358.3 billionin CY 2008
GPO-Related Savings
In 2008, GPOs generated overall savings for the U.S. health care system of between $29.3 billionand $64.5 billion. Over five years (CY 2008-CY 2012) the health care system would realize savingsof between $164.2 billion and $361.4 billion. Over ten years (CY 2008-CY 2017), GPO-relatedsavings are estimated at between $380.8 billion and $838.3 billion.
All public health care programs would between $16.3 billion and $36.0 billion in CY 2008. GPO-related savings to the federal government would total between $12.9 billion and $28.5 billion inCY 2008. State and local governments would save between $3.4 billion and $7.4 billion. Eachpublic sector health care program also realized GPO-related savings in CY 2008.
Over a five-year period, projected savings for all public sector health care programs would bebetween $90.3 billion and $201.7 billion. For the federal government, GPO-related savingswould total between $72.3 billion and $160.0 billion. Savings to state and local governmentswould be between $19.1 billion and $41.5 billion. Each public sector health care program wouldalso experience significant savings over the period.
Ten-year savings for the entire health care system are projected at between $380.8 billion and$838.3 billion. Public sector health care programs would save between $211.9 billion and $467.9billion. Savings to the federal government would range between $167.7 billion and $370.4billion. State and local governments would realize savings of between $44.2 billion and 96.2billion. Other public health care programs would also save considerable money over the period.
Locus Systems, Inc.
18
The overall savings attributable to GPOs can be calculated as the difference between current estimates ofthe GPO marketplace and estimates of hospital and nursing home purchases if GPO savings/discountswere eliminated. Therefore, for the two rates of GPO market penetration, the analysis indicates thatGPOs generated overall savings for the U.S. health care system of between $29.3/$32.6 billion and$57.8/$64.5 billion in CY 2008.
The analysis presented in Table 8 was repeated for each public sector health care program areaindividually. The results are presented in Table 9.
As shown in Table 9, GPOs saved individual public sector health care programs significant amounts ofmoney in CY 2008. For example, all public sector health care programs saved between $16.3/$18.2 billionand $32.2/$36.0 billion. The federal government saved between $12.9/$14.4 billion and $25.6/$28.5billion. Savings to state and local governments are estimated to have been totaled between $3.4/$3.8billion and $6.7/$7.4 billion. Medicare realized savings of between $8.0/$8.9 and $15.8/$17.7 billion in CY2008. Medicaid saved between $5.7/$6.3 billion and $11.2/$12.5 billion. Other public sector health careprograms also realized significant savings.
Finally, the CY 2008 GPO-related savings data presented in Table 9 were projected forward over five-year(CY 2008-CY 2012) and ten-year (CY 2008-CY 2017) scoring windows using an annual inflation factor of 5.7percent. The inflation factor consists of two components: the CY 2008 consumer price index for medicalcare (3.7%) and a population growth factor (2.0 %). The results are presented in Tables 10 and 11.
Five-year projections indicate that GPOs will save the health care system and individual public sectorhealth care programs considerable amounts of money. For the entire health care system, the five-yearsavings projections range between $164.2 billion and $361.4 billion. The public sector of the health caresystem would save between $91.3 billion and $201.7 billion. Savings to the federal government wouldbe between $72.3 billion and $160.0 billion.
State and local governments would save between $19.1 billion and $41.5 billion in health careexpenditures. Significant five-year savings would also accrue to the Medicare program ($44.8 billion to$99.2 billion) and to Medicaid ($31.9 billion to $70.0 billion). Other public sector health care programsincluding the Department of Veterans Affairs and the Department of Defense would also experienceimportant savings over the five-year period.
Likewise, when projected over a ten-year period (CY 2008-CY 2017), GPO-related savings would besignificant. Savings to the total health care system would total between $380.8 billion and $838.3billion. All public health care programs would save between $211.8 and $467.9 billion. The federalgovernment would realize savings of $167.7 billion and $370.4 billion. Savings to state and localgovernments would total $44.2 billion to $96.2 billion.
The Medicare program would realize savings of between $104.0 and $230.0 billion. Medicaid wouldsave between $74.1 billion and $162.5 billion. Savings would also be realized by the Department ofVeterans Affairs, the Department of Defense, and other public sector health care programs.

Locus Systems, Inc.
19
Table 9GPO Savings by Program: CY 2008
(Amount in $ Billions)
Savings @ 10% Savings @ 15 % Savings @ 18 % Savings @ 10% Savings @ 15 % Savings @ 18 %
Health Services and Supplies: Total Public and Private Spending $29.3 $46.5 $57.8 $32.6 $51.8 $64.5
All Public Programs $16.3 $25.9 $32.2 $18.2 $28.9 $36.0
Federal Funds $12.9 $20.6 $25.6 $14.4 $22.9 $28.5
State and Local Funds1
$3.4 $5.4 $6.7 $3.8 $6.0 $7.4
Medicare $8.0 $12.7 $15.8 $8.9 $14.2 $17.7
Medicaid2
$5.7 $9.0 $11.2 $6.3 $10.0 $12.5Federal $3.2 $5.1 $6.3 $3.6 $5.7 $7.1
State and Local $2.5 $3.9 $4.9 $2.7 $4.4 $5.4
Other State and Local Public AssistancePrograms $0.1 $0.1 $0.2 $0.1 $0.1 $0.2
Department of Veterans Affairs $0.9 $1.4 $1.8 $1.0 $1.6 $2.0
Department of Defense3
$0.6 $1.0 $1.2 $0.7 $1.1 $1.3
Workers' Compensation $0.2 $0.4 $0.5 $0.3 $0.4 $0.5Federal $0.0 $0.0 $0.0 $0.0 $0.0 $0.0State and Local $0.2 $0.4 $0.4 $0.3 $0.4 $0.5
State and Local Hospitals4
$0.6 $0.9 $1.2 $0.7 $1.1 $1.3
Other Public Programs for Personal
Health Care5
$0.2 $0.4 $0.4 $0.2 $0.4 $0.5
Federal $0.2 $0.3 $0.3 $0.2 $0.3 $0.4State and Local $0.0 $0.1 $0.1 $0.0 $0.1 $0.1
1Includes Medicaid SCHIP Expansion and SCHIP
2Subset of Federal and state and local funds. Includes Medicaid SCHIP Expansion.
3Includes care for retirees and military dependents.
4Category includes state and local subsidies to hospitals and home health agencies, as well as school health programs.
5Includes program spending for maternal and child health; vocational rehabilitation medical payments; temporary disability insurance medical payments;
Public Health Service and other Federal hospitals; Indian health services; alcoholism, drug abuse, and mental health.
Note: Numbers may not add to total because of rounding.
Source: Locus Systems analysis of CMS National Health Expenditures Accounts for CY 2006 and Projections for CY 2008-CY 2018.
Program Area GPO Penetration @ 71.71% GPO Penetration @ 80%
Table 105-Year GPO Savings by Program: CY 2008-CY 2012
(Amount in $ Billions)
Savings @ 10% Savings @ 15 % Savings @ 18 % Savings @ 10% Savings @ 15 % Savings @ 18 %
Health Services and Supplies: Total Public and Private Spending $164.2 $260.6 $323.9 $182.7 $290.3 $361.4
All Public Programs $91.3 $145.1 $180.4 $102.0 $161.9 $201.7
Federal Funds $72.3 $115.4 $143.4 $80.7 $128.3 $160.0
State and Local Funds1$19.1 $30.3 $37.5 $21.3 $33.6 $41.5
Medicare $44.8 $71.2 $88.5 $49.9 $79.6 $99.2
Medicaid2$31.9 $50.4 $62.8 $35.3 $56.0 $70.0
Federal $17.9 $28.6 $35.3 $20.2 $31.9 $39.8State and Local $14.0 $21.9 $27.5 $15.1 $24.5 $30.3
Other State and Local Public AssistancePrograms $0.6 $0.6 $1.1 $0.6 $0.6 $1.1
Department of Veterans Affairs $5.0 $7.8 $10.1 $5.6 $9.0 $11.2
Department of Defense3$3.4 $5.6 $6.7 $3.9 $6.2 $7.3
Workers' Compensation $1.1 $2.2 $2.8 $1.7 $2.2 $2.8Federal $0.0 $0.0 $0.0 $0.0 $0.0 $0.0State and Local $1.1 $2.2 $2.8 $1.7 $2.2 $2.8
State and Local Hospitals4$3.4 $5.0 $6.7 $3.9 $6.2 $7.3
Other Public Programs for Personal
Health Care5
$1.1 $2.2 $2.2 $1.1 $1.8 $2.3Federal $1.1 $1.7 $2.2 $1.1 $1.7 $2.2State and Local $0.0 $0.3 $0.1 $0.0 $0.1 $0.1
1Includes Medicaid SCHIP Expansion and SCHIP2Subset of Federal and state and local funds. Includes Medicaid SCHIP Expansion.
3Includes care for retirees and military dependents.4Category includes state and local subsidies to hospitals and home health agencies, as well as school health programs.5Includes program spending for maternal and child health; vocational rehabilitation medical payments; temporary disability insurance medical payments;
Public Health Service and other Federal hospitals; Indian health services; alcoholism, drug abuse, and mental health.
Note: Numbers may not add to total because of rounding.
Program Area GPO Penetration @ 71.71% GPO Penetration @ 80%
Locus Systems, Inc.
20
Table 1110-Year GPO Savings by Program: CY 2008-CY 2017
(Amount in $ Billions)
Savings @ 10% Savings @ 15 % Savings @ 18 % Savings @ 10% Savings @ 15 % Savings @ 18 %
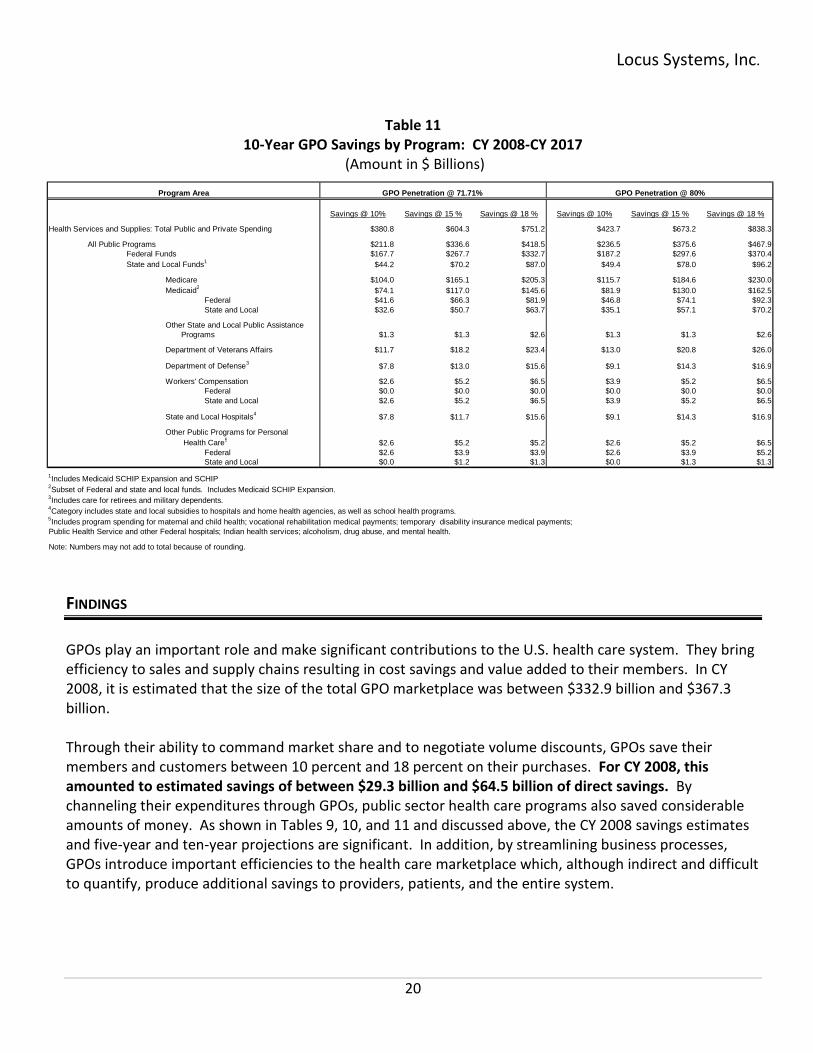
Health Services and Supplies: Total Public and Private Spending $380.8 $604.3 $751.2 $423.7 $673.2 $838.3
All Public Programs $211.8 $336.6 $418.5 $236.5 $375.6 $467.9Federal Funds $167.7 $267.7 $332.7 $187.2 $297.6 $370.4
State and Local Funds1$44.2 $70.2 $87.0 $49.4 $78.0 $96.2
Medicare $104.0 $165.1 $205.3 $115.7 $184.6 $230.0
Medicaid2
$74.1 $117.0 $145.6 $81.9 $130.0 $162.5Federal $41.6 $66.3 $81.9 $46.8 $74.1 $92.3
State and Local $32.6 $50.7 $63.7 $35.1 $57.1 $70.2
Other State and Local Public AssistancePrograms $1.3 $1.3 $2.6 $1.3 $1.3 $2.6
Department of Veterans Affairs $11.7 $18.2 $23.4 $13.0 $20.8 $26.0
Department of Defense3$7.8 $13.0 $15.6 $9.1 $14.3 $16.9
Workers' Compensation $2.6 $5.2 $6.5 $3.9 $5.2 $6.5Federal $0.0 $0.0 $0.0 $0.0 $0.0 $0.0
State and Local $2.6 $5.2 $6.5 $3.9 $5.2 $6.5
State and Local Hospitals4
$7.8 $11.7 $15.6 $9.1 $14.3 $16.9
Other Public Programs for Personal
Health Care5$2.6 $5.2 $5.2 $2.6 $5.2 $6.5
Federal $2.6 $3.9 $3.9 $2.6 $3.9 $5.2State and Local $0.0 $1.2 $1.3 $0.0 $1.3 $1.3
1Includes Medicaid SCHIP Expansion and SCHIP2Subset of Federal and state and local funds. Includes Medicaid SCHIP Expansion.
3Includes care for retirees and military dependents.4Category includes state and local subsidies to hospitals and home health agencies, as well as school health programs.
5Includes program spending for maternal and child health; vocational rehabilitation medical payments; temporary disability insurance medical payments;
Public Health Service and other Federal hospitals; Indian health services; alcoholism, drug abuse, and mental health.
Note: Numbers may not add to total because of rounding.
Program Area GPO Penetration @ 71.71% GPO Penetration @ 80%
FINDINGS
GPOs play an important role and make significant contributions to the U.S. health care system. They bringefficiency to sales and supply chains resulting in cost savings and value added to their members. In CY2008, it is estimated that the size of the total GPO marketplace was between $332.9 billion and $367.3billion.
Through their ability to command market share and to negotiate volume discounts, GPOs save theirmembers and customers between 10 percent and 18 percent on their purchases. For CY 2008, thisamounted to estimated savings of between $29.3 billion and $64.5 billion of direct savings. Bychanneling their expenditures through GPOs, public sector health care programs also saved considerableamounts of money. As shown in Tables 9, 10, and 11 and discussed above, the CY 2008 savings estimatesand five-year and ten-year projections are significant. In addition, by streamlining business processes,GPOs introduce important efficiencies to the health care marketplace which, although indirect and difficultto quantify, produce additional savings to providers, patients, and the entire system.
Related Documents