A 10-year Outlook for the Canadian Labour Market (COPS 2009 Reference Projection) Part 1: Labour Demand: the Jobs of the Future January 5, 2010 Policy Research Directorate, Strategic Policy and Research Branch

A 10-year Outlook for the Canadian Labour Market (COPS 2009 Reference Projection) Part 1: Labour Demand: the Jobs of the Future January 5, 2010 Policy.
Dec 19, 2015
Welcome message from author
This document is posted to help you gain knowledge. Please leave a comment to let me know what you think about it! Share it to your friends and learn new things together.
Transcript

A 10-year Outlook for the Canadian Labour Market (COPS 2009 Reference Projection) Part 1: Labour Demand: the Jobs of the Future
January 5, 2010
Policy Research Directorate, Strategic Policy and Research Branch

2
Macro-Economic Reference Scenario 2009 – Key Messages
Years prior to the recession: −Solid performance of the Canadian economy, with resource boom
bringing substantial gains in terms of trade and national income, leading to strong job creation in most sectors and a fall in the unemployment rate to 30-year lows
−But challenges for the manufacturing sector: globalization, higher materials/energy costs, and substantial appreciation of the Canadian dollar
Changes from Reference 2008: −In the short term, much weaker growth in GDP and employment, and
slightly stronger growth thereafter−On average, growth relatively unchanged for the full 10 years
Current versus previous two recessions: −Canada's current recession is typical: slightly faster fall, slightly shorter
duration−Full recovery in GDP and employment to pre-recession levels by 2011 −Smaller increase and faster recovery to pre-recession low in the
unemployment rate due to slower labour force growth
Next decade versus previous decade:−Slower growth in GDP and employment, mostly due to demographics

3
The global financial crisis has led to the deepest world recession since the Great Depression, ...
-4
-2
0
2
4
6
8
1970 1974 1978 1982 1986 1990 1994 1998 2002 2006 2010 2014
World Real GDP Growthpercentage change
Oil supply shocks in 1973 and 1979
US savings and loan crisis + Gulf War oil shock
Asian financial and economic crisis
World high-tech boom and bust
China joined WTO
1970-2014 Average
Global financial crisis and deepest world recession since the Great Depression
Global responses from fiscal and monetary authorities
Source: International Monetary Fund (IMF), World Economic Outlook Database.

4
... but the decline in Canadian real GDP in this recession has not been worse than in the previous two downturns
-4
-2
0
2
4
6
8
1970 1976 1982 1988 1994 2000 2006 2012 2018
Canadian Real GDP Growthpercentage change
1981-82 recession
1991 recession
1970-2018 Average
2009 recession
Sources: 1970-2008: Statistics Canada, Economic Accounts. 2009-2018: HRSDC, Policy Research Directorate, 2009 Reference Scenario.
5
500
700
900
1,100
1,300
1,500
1,700
1976 1982 1988 1994 2000 2006 2012 2018
Actual2008 P rojection2009 P rojection
Real Canadian GDP$ Billions 2006
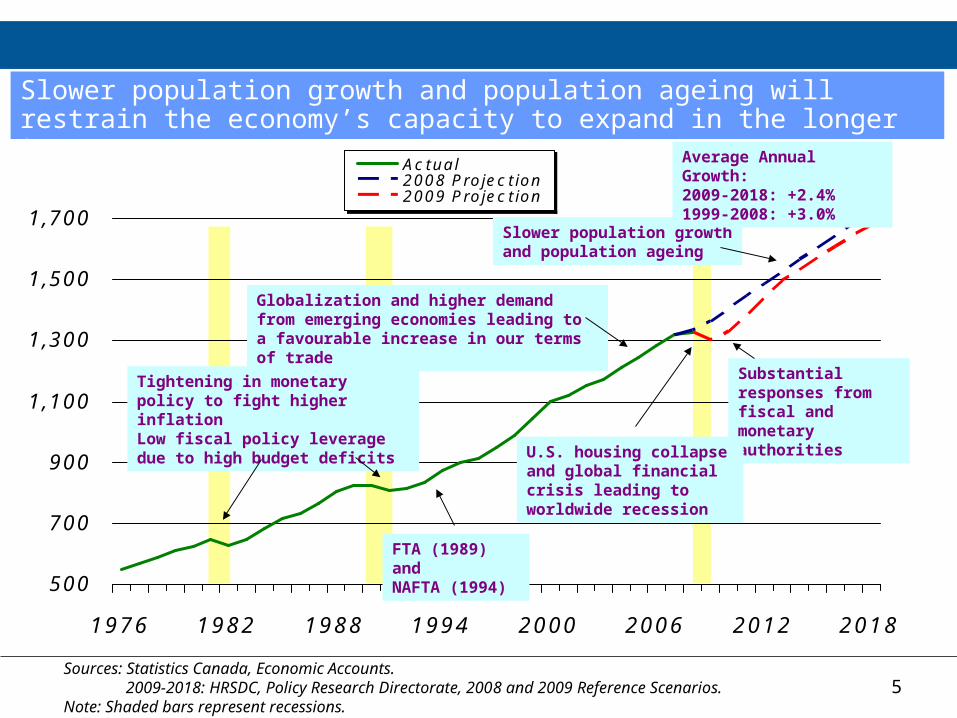
Tightening in monetary policy to fight higher inflationLow fiscal policy leverage due to high budget deficits
Globalization and higher demand from emerging economies leading to a favourable increase in our terms of trade
Substantial responses from fiscal and monetary authorities U.S. housing collapse
and global financial crisis leading to worldwide recession
FTA (1989) and NAFTA (1994)
Slower population growth and population ageing
Average Annual Growth: 2009-2018: +2.4%1999-2008: +3.0%
Slower population growth and population ageing will restrain the economy’s capacity to expand in the longer term
Sources: Statistics Canada, Economic Accounts. 2009-2018: HRSDC, Policy Research Directorate, 2008 and 2009 Reference Scenarios.Note: Shaded bars represent recessions.

6
Potential output growth of the Canadian economy will be limited by labour availability
Decomposition of Potential Output Growth(Average annual contribution to potential output growth, by input; in per cent)
2003-07 2008-13 2014-18
Recession Recovery
(2008-09) (2010-13)
Labour 0.7 0.6 0.6 0.4
Capital 1.0 1.3 1.2 1.3
Total Factor Productivity 0.7 0.3 0.4 0.7
Potential Output 2.4 2.1 2.2 2.3
Actual Output 2.7 -0.7 3.6 2.3
Sources: Conference Board of Canada and HRSDC, Policy Research Directorate, 2009 Reference Scenario.

7
9
10
11
12
13
14
15
16
17
18
19
20
1976 1982 1988 1994 2000 2006 2012 2018
Actual2008 P rojection2009 P rojection
Total Employmentmillions
Decline of 3.1% in 1982; It took about 2 years before returning to pre-recession level
Cumulative decline of 2.7% in 1991 and 1992; It took about 2 years before returning to pre-recession level
Expected decline of 2.0% in 2009 (actual decline of 1.6% in first ten months).Full recovery by 2011
Strong job creation and significant increases in PR and ER
Average Annual Growth: 2009-2018: +0.8%1999-2008: +2.0%
Slower growthin labour force
Employment will return to its baseline trajectory by 2013 but longer-term growth will be constrained by labour force
Sources: 1976-2008: Statistics Canada, Labour Force Survey. 2009-2018: HRSDC, Policy Research Directorate, 2008 and 2009 Reference Scenarios.

8
The unemployment rate is expected to recover at a faster pace than in the previous two recessions due to slower labour force growth
Sources: 1976-2008: Statistics Canada, Labour Force Survey. 2009-2018: HRSDC, Policy Research Directorate, 2009 Reference Scenario.
0
3
6
9
12
15
1976 1982 1988 1994 2000 2006 2012 2018
Actual2008 P rojection2009 P rojection
Unemployment Ratepercent
It took from 8 to 10 years before returning to pre-recession level
Smaller increase and faster recovery than previous recessions due to slower growth in labour force

9
‘The Jobs of the Future’ by Industry – Key Messages
Years prior to recession: Strong employment gains in primary and domestic-oriented* sectors,
driven by resource-boom and gains in terms of trade and national income Declining trend in manufacturing employment brought by adjustments to
higher dollar, higher energy costs and increased competition from low-cost countries
Current versus previous two recessions: Hardest hit industries the ‘usual suspects’: manufacturing (particularly
auto and wood), construction, forestry, and mining and fuels Services industries much less cyclically-sensitive
Changes from Reference 2008: Slower employment growth in primary, manufacturing and domestic-
oriented sectors in the short term Employment in most industries returning to Ref 2008 by mid next decade,
except in manufacturing where projections were revised to a permanent lower trajectory
For the whole 10-year period, much weaker employment growth in manufacturing and relatively no change in remaining two sectors
Next decade versus previous decade: Slower employment growth in the domestic-oriented sector Modest improvement in the primary and manufacturing sectors
* Note: The domestic-oriented sector is composed of construction, utilities, commercial and public services industries.

10
60
80
100
120
140
160
1976 1982 1988 1994 2000 2006 2012 2018
PrimaryManufacturing Domestic -oriented
Employment by Aggregated Sectorindex 1989 = 100
Adjustment to higher dollar and commodity prices and increased competition from low-cost countries
Most of the decline in agriculture and fishing
Most of the rebound in mining and fuels
Manufacturing and primary sectors are highly cyclical and more sensitive to global economic conditions
Solid growth in domestic demand leading to job creation in construction, commercial services and health/education
As in previous decades, job creation will be driven by the less cyclically-sensitive domestic-oriented sector
Sources: 1976-2008: Statistics Canada, Labour Force Survey (based on NAICS, data prior to 1987 based on SIC). 2009-2018: HRSDC, Policy Research Directorate, 2009 Reference Scenario.

11
0
100
200
300
400
500
600
1976 1982 1988 1994 2000 2006 2012 2018
Actual2008 P rojection2009 P rojection
Employment in Primary Industries
thousands
Agriculture and Fishing
Mining and Fuels
Forestry
Lower world prices, severe droughts, fishing quotas
Booming global demand for energy and base metals
US housing crisis and lower residential investment in Canada
Shift from conventional oil production to oil sands extraction
Despite slower growth in the next decade, mining and fuels will continue to support job creation in the primary sector
Sources: 1976-2008: Statistics Canada, Labour Force Survey (based on NAICS, data prior to 1987 based on SIC). 2009-2018: HRSDC, Policy Research Directorate, 2009 Reference Scenario.
12
0.7
0.9
1.1
1.3
1976 1982 1988 1994 2000 2006 2012 2018
Actual2008 P rojection2009 P rojection
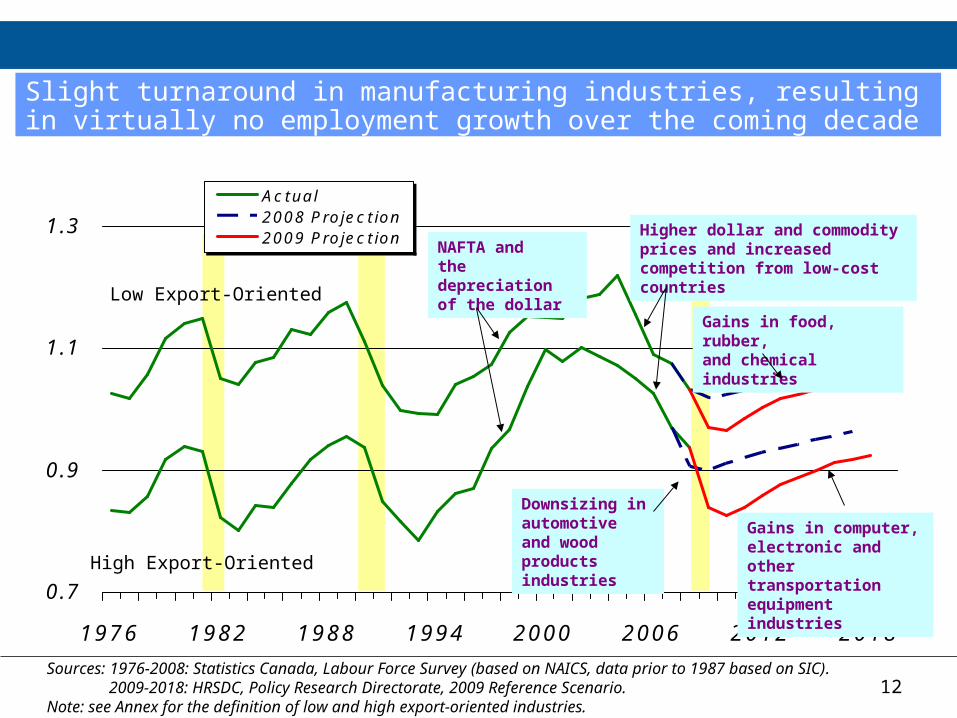
Manufacturing Employment by Export Intensity
millions
Low Export-Oriented
High Export-Oriented
Downsizing in automotive and wood products industries
NAFTA and the depreciationof the dollar
Higher dollar and commodity prices and increased competition from low-cost countries
Gains in food, rubber, and chemical industries
Gains in computer, electronic and other transportation equipment industries
Slight turnaround in manufacturing industries, resulting in virtually no employment growth over the coming decade
Sources: 1976-2008: Statistics Canada, Labour Force Survey (based on NAICS, data prior to 1987 based on SIC). 2009-2018: HRSDC, Policy Research Directorate, 2009 Reference Scenario.Note: see Annex for the definition of low and high export-oriented industries.
13
0.5
0.7
0.9
1.1
1.3
1.5
1976 1982 1988 1994 2000 2006 2012 2018
Actual2008 P rojection2009 P rojection
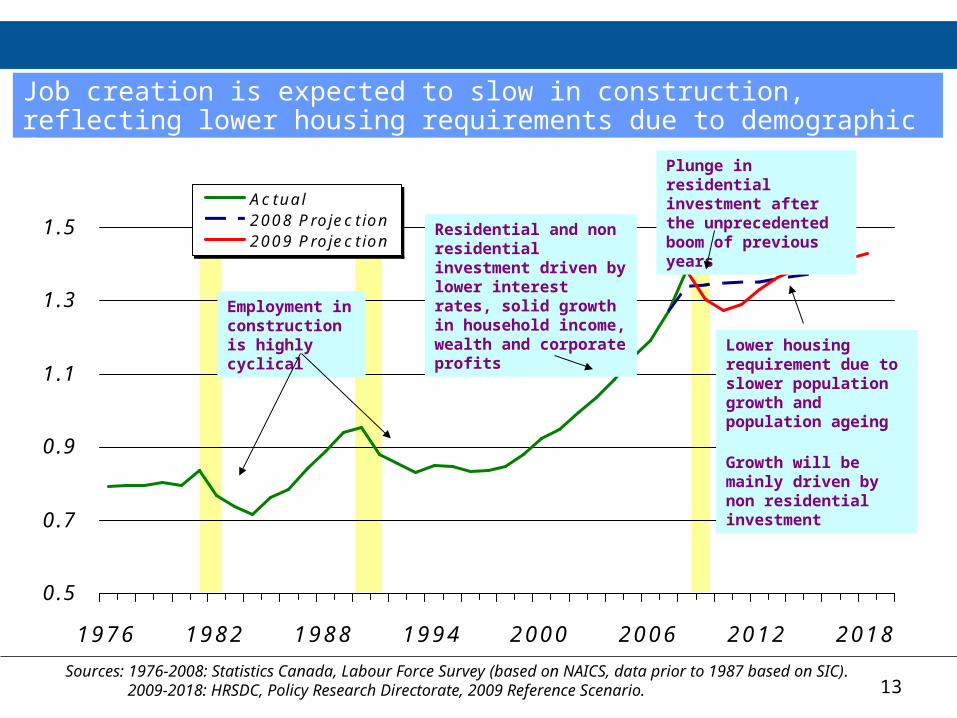
Employment in Construction (and Utilities)
millions
Residential and non residential investment driven by lower interest rates, solid growth in household income, wealth and corporate profits
Plunge in residential investment after the unprecedented boom of previous years
Lower housing requirement due to slower population growth and population ageing
Growth will be mainly driven by non residential investment
Employment in construction is highly cyclical
Job creation is expected to slow in construction, reflecting lower housing requirements due to demographic factors
Sources: 1976-2008: Statistics Canada, Labour Force Survey (based on NAICS, data prior to 1987 based on SIC). 2009-2018: HRSDC, Policy Research Directorate, 2009 Reference Scenario.

14
1
2
3
4
5
1976 1982 1988 1994 2000 2006 2012 2018
Actual2008 P rojection2009 P rojection
Employment in Commercial Servicesmillions
Business investment largely driven by healthy growth in corporate profits
Reflecting slower GDP growth in services, party attributable to demographic factors
Household consumption largely driven by solid growth in disposable income and wealth gains Consumer-oriented
services more cyclically sensitive as they tend to be more affected by changes in household income and job insecurity (retail trade and tourism)
Commercial services will remain the largest contributors to overall job creation in the longer term
Consumer-Oriented
Business-Oriented
Sources: 1976-2008: Statistics Canada, Labour Force Survey (based on NAICS, data prior to 1987 based on SIC). 2009-2018: HRSDC, Policy Research Directorate, 2009 Reference Scenario.Note: see Annex for the definition of consumer- and business-oriented services industries.

15
0.25
0.50
0.75
1.00
1.25
1.50
1.75
2.00
2.25
2.50
1976 1982 1988 1994 2000 2006 2012 2018
Actual2008 P rojection2009 P rojection
Employment in Public Servicesmillions
Education
Public Administration
Health
Closely linked to the fiscal positions and programs of governments
Employment in public services is much less sensitive to the business cycle
Increased government spending in health care and educational services(population ageing and knowledge-based economy)
In public services, job creation will continue to be largely driven by the health care and social assistance industry
Sources: 1976-2008: Statistics Canada, Labour Force Survey (based on NAICS, data prior to 1987 based on SIC). 2009-2018: HRSDC, Policy Research Directorate, 2009 Reference Scenario.

16
10-Year Employment Growth Outlook for 33 COPS Industries
-3 -2 -1 0 1 2 3
Computer System Design ServicesProfessional Business Services
Health Care and Social AssistanceOil and Gas Extraction
Other Professional Services (scientific, technical)Other Transportation Equipment
Mining (except oil and gas extraction)Accommodation and Food Services
Information, Culture and Recreation ServicesManagement, Administrative and Support
Computer, Electronic and Electrical ProductsWholesale Trade
Retail TradeOther Commercial Services (household serv.)
Educational ServicesUtilities
Support Activities for Mining Oil and GasPublic Administration
Rubber, Plastics and ChemicalsFood and Beverage Products
Finance, Insurance, Real Estate and LeasingConstruction
AgricultureFishing, Hunting and Trapping
Transportation and WarehousingManufactured Mineral Products
Metal Fabrication and Machinery Printing and Related Activities
Forestry and LoggingOther Manufacturing (textile, clothing furniture)
Wood Products Paper Manufacturing
Motor Vehicles, Trailers and Parts Average = 0.8%
(AAGR 2009-2018, per cent)
Mainly domestic-oriented industries (most commercial services + public services) and some high-tech manufacturing industries
High-tech industries, mining and fuels, health care and professional services
Most manufacturing and primary industries (excluding mining and fuels) + FIRE and construction
Source: HRSDC, Policy Research Directorate, 2009 Reference Scenario.
17
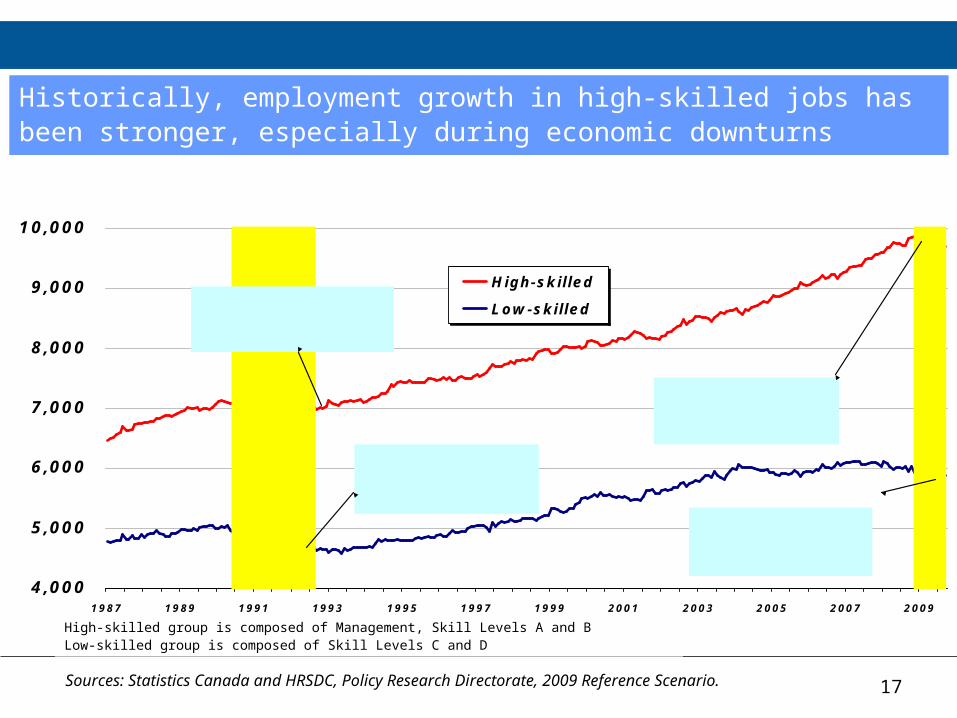
Historically, employment growth in high-skilled jobs has been stronger, especially during economic downturns
4,000
5,000
6,000
7,000
8,000
9,000
10,000
1987 1989 1991 1993 1995 1997 1999 2001 2003 2005 2007 2009
High-skilled
Low-skilled
1990's Recession
Low-skilled:395,600 (-7.2%) jobs lostin 29 months
High-skilled:67,500 (-0.9%) jobs lostin 29 months
High-skilled:193,300 (-1.8%) jobs lostin 11 months
Low-skilled:163,400 (-2.5%) jobs lostin 11 months
High- and Low-Skilled Employment, Monthly, 1987-2009M9Thousands
Sources: Statistics Canada and HRSDC, Policy Research Directorate, 2009 Reference Scenario.
High-skilled group is composed of Management, Skill Levels A and BLow-skilled group is composed of Skill Levels C and D

18
Index of Employment by Skill Level during the 1990s and Current Recessions
In the current recession, high-skilled occupations have been more impacted than in previous downturns
Low-Skilled J obs
0.90
0.92
0.94
0.96
0.98
1.00
1.02
-4 -2base 2 4 6 8 10 12 14 16 18 20 22 24 26 28
Months
Base: October, 2008
Base: April, 1990
395,600 (-7.2% ) jobs lost in 29 months (Sept. 1992)
163,400 (-2.5% ) jobs lostin 11 months (Sept 2009)
Sources: Statistics Canada and HRSDC, Policy Research Directorate, 2009 Reference Scenario.
High-skilled group is composed of Management and Skill Levels A and BLow-skilled group is composed of Skill Levels C and D
High-Skilled J obs
0.90
0.92
0.94
0.96
0.98
1.00
1.02
-4 -2base2 4 6 8 10 12 14 16 18 20 22 24 26 28
Months
Base: October, 2008
Base: April, 1990
67,500 (-0.9% ) jobs lost in 29 months (Sept. 1992)
193,300 (-1.8% ) jobs lost in11 months (Sept. 2009)

19
High- and Low-Skilled Employment, 2005-2018
The impact of the recession on low-skilled jobs will be felt longer
High-Skilled
8,000
8,500
9,000
9,500
10,000
10,500
11,000
2005 2007 2009 2011 2013 2015 2017
Actual
2008 Projection
2009 Projection
Thousands
3 yrs
Sources: Statistics Canada and HRSDC, Policy Research Directorate, 2009 Reference Scenario.
High-skilled group is composed of Management, Skill Levels A and BLow-skilled group is composed of Skill Levels C and D
Low-Skilled
5,000
5,500
6,000
6,500
7,000
7,500
8,000
2005 2007 2009 2011 2013 2015 2017
Actual
2008 Projection
2009 Projection
Thousands
5 yrs
3 yrs

20
High- and Low-Skilled Employment (Non-student), 2005-2018
Over the next ten years, 3 in 4 new jobs are expected to be in management or in occupations usually requiring postsecondary education
Sources: Statistics Canada and HRSDC, Policy Research Directorate, 2009 Reference Scenario.
High-skilled group is composed of Management, Skill Levels A and BLow-skilled group is composed of Skill Levels C and D
-600
-400
-200
0
200
400
600
800
1,000
2005 2006 2007 2008 2009 2010 2011 2012 2013 2014 2015 2016 2017 2018
10,000
11,000
12,000
13,000
14,000
15,000
16,000
17,000
18,000
Annual Change, Low-SkilledAnnual Change, High-SkilledEmployment (Right-Hand Scale)
Annual Change, Thousands Thousands
Annual change,
left-hand side scale
Employment
right-hand side scale

21
2008
28.4%
9.8%
18.0%
9.7%
34.2%
Management university educationcollege or apprenticeship secondary schoolon-the-job training
Sources: Statistics Canada and HRSDC, Policy Research Directorate, 2009 Reference Scenario.
High-skilled occupations represented 61.9% of total employment in 2008
Employment Composition by Skill Level (Non-student), 2008
High-Skilled Jobs 61.9%
Low-Skilled Jobs 38.1%

22
2018
27.7%
9.5%
19.1%
9.8%
33.9%
Management university educationcollege or apprenticeship secondary schoolon-the-job training
Sources: Statistics Canada and HRSDC, Policy Research Directorate, 2009 Reference Scenario.
The proportion of high-skilled occupations is expected to change minimally over the next 10 years
Employment Composition by Skill Level (Non-student), 2018
High-Skilled Jobs 62.8%
Low-Skilled Jobs 37.2%
73.6% of expansion demand will be in high-skilled occupations (2009-2018)

23
11 22 33 44 55 66 77 88 99
BUS, FINBUS, FIN
& ADMIN& ADMIN
NATUR & NATUR & APPLIEDAPPLIED
SCIENCESCIENCEHEALTHHEALTH
SOCIAL, EDU,SOCIAL, EDU,
GOV’T SERV GOV’T SERV & RELIGION& RELIGION
ART,ART,
CULTU, CULTU, RECR & RECR & SPORTSPORT
SALES & SALES & SERVSERV
TRADES, TRADES, TRANSP TRANSP
AND EQUIAND EQUI
PRIMARY PRIMARY INDUINDU
PROCESS PROCESS MANUMANU
& UTIL& UTIL
MANAG.MANAG. Management N010
LEVEL ALEVEL Auniversityuniversity
11 - Prof in Business & Finance
21 - Prof in Natural / Applied Sciences
31 - Prof in Health
41 - Prof in Social Sci / Edu / Gov't Serv/Religion
51 - Prof in Art & Culture
LEVEL BLEVEL Bcollege orcollege or
apprenticapprentic
12 - Skilled Admin & Business
22 - Techl Occ's Related to Natural / Applied Sciences
32 - Tech / Skilled Occs in Health
42 - Paraprof Occ's in Law / Social Services / Education / Religion
52 - Tech / Skilled Occ's in Art / Culture / Recr/Spo
62 - Skilled Sales & Service Occs
72-73 -72-73 -Trades & Trades & Skilled Skilled Transp & Transp & Equip Equip OperatorsOperators
82 - Skilled Occ's in Primary Industry
92 - Process 92 - Process / Manu / / Manu / Utilities Utilities Supervisors Supervisors & Skilled & Skilled OperatorsOperators
LEVEL CLEVEL Csecond second occ-occ-specific specific trainingtraining
14 - Clerical Occs
34 - Assisting Occ's in Support of Health Services
64 - Intermediate Sales & Service Occ’s
74– Interm. Occ's in Transp / Equip Operation / Install / Maint.
84 - 84 - Intermed Intermed Occ's in Occ's in Primary Primary IndustryIndustry
94-95 - 94-95 - Process & Process & Manu Manu Machine Machine Operators & Operators & AssembleAssemble
LEVEL DLEVEL DOn-the-On-the-job job trainingtraining
66 - Elemental Sales & Service Occ’s
76 - Trade 76 - Trade Helpers, Helpers, Construc. Construc. Labourers Labourers & Related& Related
86 - Primary Industry Labour
96 - 96 - Labourer in Labourer in Process, Process, Manu & Manu & UtilitiesUtilities
green: Above average = AAGR > 1.25% green: Above average = AAGR > 1.25% yellow: Average = 1.25% > AAGR > 0.3% yellow: Average = 1.25% > AAGR > 0.3% red: below average = AAGR < 0.3%red: below average = AAGR < 0.3%
NOC Matrix, Coloured by Projected Growth Rate, 2009-18

24
Replacement demand is primarily composed of retirements
0
100,000
200,000
300,000
400,000
500,000
1992 1994 1996 1998 2000 2002 2004 2006 2008 2010 2012 2014 2016 2018
Deaths Emigration RetirementsProjection
Sources: Statistics Canada and HRSDC, Policy Research Directorate, 2009 Reference Scenario.
Sources of Replacement Demand
25Sources: Statistics Canada and HRSDC, Policy Research Directorate, 2009 Reference Scenario.
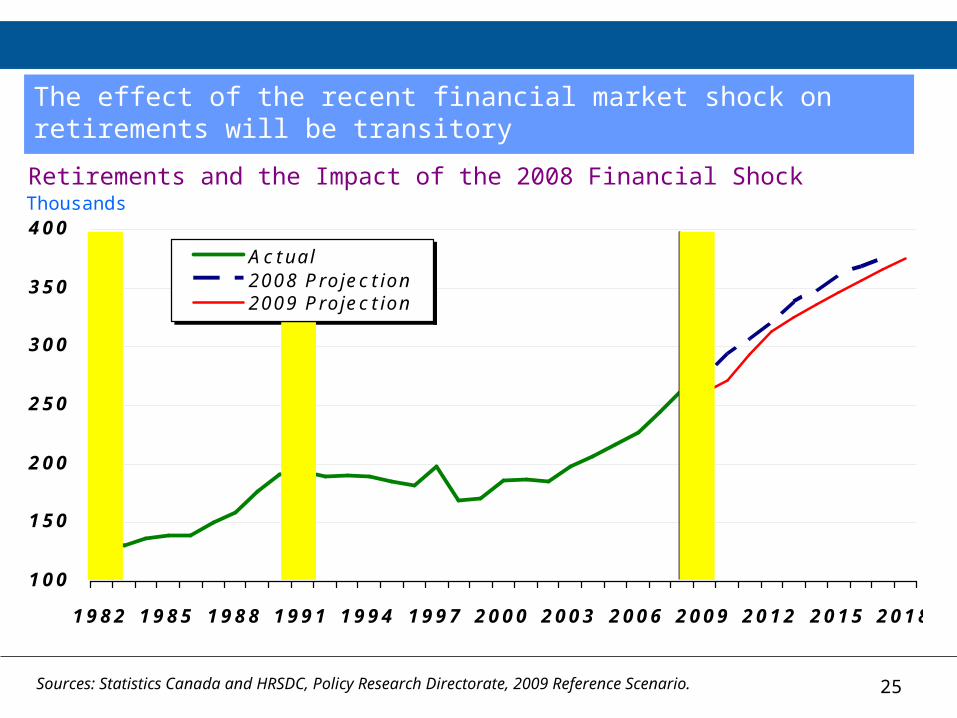
The effect of the recent financial market shock on retirements will be transitory
100
150
200
250
300
350
400
1982 1985 1988 1991 1994 1997 2000 2003 2006 2009 2012 2015 2018
Actual2008 Projection2009 Projection
Projection
Retirements and the Impact of the 2008 Financial ShockThousands

26Sources: Statistics Canada and HRSDC, Policy Research Directorate, 2009 Reference Scenario.
The increased importance of retirements will persist in the long run
0
100
200
300
400
500
1987 1991 1995 1999 2003 2007 2011 2015 2019 2023 2027 2031 2035 2039 2043 2047 2051
30
35
40
45
50
55
Retirements
Share of Population 50+
Medium-term
scenario
Long-term
scenario
ThousandsRetirements and the Share of the Population Aged 50 and Over
Per cent

27
2.3% 2.0% 1.9% 1.9% 1.6%
0.0%
0.5%
1.0%
1.5%
2.0%
2.5%
Management University Community
College
High School On-the-job
Training
Retirement Rate, Mean Employment Age and Median Retirement Age by Skill Level, 2009-2018
Retirement rates are less dispersed across skill groups than expansion demand…
Sources: Statistics Canada and HRSDC, Policy Research Directorate, 2009 Reference Scenario.
Mean Emp. Age 45 42 39 41 35
Med. Ret. Age 62 61 61 61 63
Age Gap 17 19 22 20 28

28
0
200,000
400,000
600,000
800,000
1,000,000
1,200,000
Management Skill Level A Skill Level B Skill Level C Skill Level D
Retirements by Skill Level , 2009-2018
…leading to job openings arising from retirements even in low-skilled occupations
Sources: Statistics Canada and HRSDC, Policy Research Directorate, 2009 Reference Scenario.
Ret. Rate 2.3% 2.0% 1.9% 1.9% 1.6%
Retirements 371,200 623,500 1,073,600 887,200 259,500

29
-400,000
-300,000
-200,000
-100,000
0
100,000
200,000
300,000
400,000
500,000
600,000
700,000
800,000
1996 1998 2000 2002 2004 2006 2008 2010 2012 2014 2016 2018
Expansion Demand
Replacement DemandProjec tion
Net impact of -17,000 jobs
Following the current recession, both expansion and replacement demand are expected to continue rising
Sources: Statistics Canada and HRSDC, Policy Research Directorate, 2009 Reference Scenario.
Job Openings from Expansion Demand and Replacement Demand

30
-1,000
0
1,000
2,000
3,000
4,000
5,000
6,000
In Out In Out
School Leavers
Immigrants
Other
School Leavers
Other
Retirements
Deaths
Emigrants
Immigrants
Retirements
Deaths
Labour force available to grow the economy
Labour force available to grow the economy
The increase of retirements will limit the labour force available to "grow the economy"
2009-2018
Sources: Statistics Canada and HRSDC, Policy Research Directorate, 2009 Reference Scenario.
Labour Force Inflows and Outflows, 1999-2008 and 2009-2018
1999-2008
Labour Force Average Annual Growth:1.7% (259,000 people a year)
Labour Force Average Annual Growth:0.8% (141,000 people a year)
thousands

31
0
200
400
600
800
1,000
1,200
1,400
1,600
1,800
2,000
Management University College High School On-the-job
Training
Expansion Demand
Replacement (Retirements)
Replacement (Deaths and Emigration)
11.2%
22.7%
32.9%
25.6%
7.7%
Source: HRSDC, Policy Research Directorate, 2009 Reference Scenario.
Two-thirds of all job openings will be in occupations usually requiring PSE or in management occupations
Job Openings from Expansion Demand and Replacement Demand by Skill Level, 2009-2018
Thousands

32
15 Occupations with Higher Proportion of Job Openings
Non-student Employment 2008
(000s)
Job Openings2009-2018 (000s)
Job Openings as % of 2008
Employment (AR*)
All Occupations 15,765.7 5,269.3 3.3%
Legislators & Senior Management (N001) 75.8 51.1 6.7%
Health / Education / Social & Community Services Mgr's (N031) 95.4 59.2 6.2%
Nurse Supervisors & Registered Nurses (N315) 268.9 161.7 6.0%
Physicians / Dentists / Veterinarians (N311) 111.8 62.7 5.6%
Human Resources & Business Service Professionals (N112) 161.0 89.3 5.5%
Managers in Public Administration (N041) 28.9 15.9 5.5%
Psychologists / Social Workers / Clergy (N415) 134.2 67.6 5.0%
Other Tech. Occupations in Health (Except Dental) (N323) 118.3 59.0 5.0%
University Professors & Assistants (N412) 92.8 45.7 4.9%
Assisting Occupations in Health Services (N341) 283.3 138.1 4.9%
Pharmacists, Dietitians & Nutritionists (N313) 29.8 13.4 4.5%
Therapy & Assessment Professionals (N314) 47.5 21.1 4.4%
Engineering / Science / Information Systems Mgr's (N021) 80.4 34.4 4.3%
College & Other Vocational Instructors (N413) 91.4 39.0 4.3%
Life Science Professionals (N212) 24.2 10.2 4.2%
*AR: The annual job openings rate corresponds to the ratio of the average level of job openings over the projection period to the employment level in the base year (2008)Sources: Labour Force Survey, Statistics Canada; HRSDC, Policy Research Directorate, 2009 Reference Scenario.
Almost all occupations with highest labour demand will be in management or health sector

33
15 Occupations with Lowest Proportion of Job Openings
Non-student Employment 2008
(000s)
Job Openings2009-2018 (000s)
Job Openings as % of 2008
Employment (AR*)
All Occupations 15,765.7 5,269.3 3.3%
Trades Helpers & Labourers (N761) 115.5 12.0 1.0
Machine Operators: Fabric / Fur / Leather (N945) 34.3 3.7 1.1
Other Transport Equipment Operators (N743) 17.9 2.0 1.1
Machine Operators: Pulp & Paper Prod (N943) 44.7 5.1 1.1
Agriculture & Horticulture Workers (N843) 72.6 9.0 1.2
Logging & Forestry Workers (N842) 11.0 1.8 1.6
Carpenters & Cabinetmakers (N727) 166.4 29.6 1.8
Masonry & Plastering Trades (N728) 72.6 13.6 1.9
Machining / Metalworking / Woodworking Operators (N951) 99.3 18.6 1.9
Machinists & Related Occupations (N723) 61.8 11.8 1.9
Metal Forming / Shaping / Erecting Occupations (N726) 146.0 28.7 2.0
Other Construction Trades (N729) 94.6 18.7 2.0
Mine Service Workers & Operators in Oil (N841) 17.5 3.5 2.0
Logging Machinery Operators (N824) 10.1 2.1 2.0
Office Equipment Operators (N142) 62.0 12.6 2.0
*AR: The annual job openings rate corresponds to the ratio of the average level of job openings over the projection period to the employment level in the base year (2008)Sources: Labour Force Survey, Statistics Canada; HRSDC, Policy Research Directorate, 2009 Reference Scenario.
Occupations with lowest labour demand will be concentrated in manufacturing and construction

34
Replacement demand is expected to become the primary source of new job openings.
The need to replace existing workers will eat up 3/4 of new labour supply, constraining growth.
Recession impacts more low- than high-skilled jobs. However, this time high-skilled occupations were more affected than in the past, while low-skilled occupations were less impacted.
The recent recession will have short-term impacts, but over the medium-term labour constraints to growth are expected to return.
Two-thirds of job openings are expected to occur in high-skilled occupations, i.e. in occupations usually requiring PSE or in management occupations.
The occupations with the highest proportion of job openings are found in management and in the health sector.
Occupational Labour Demand – Key Messages

35
ANNEX – Definition of Industry Groupings
Manufacturing:
Low-exported oriented: Food and beverage products; Printing and related activities; Rubber, plastic and chemicals; Manufactured mineral products; Other manufacturing (textile, clothing, furniture)
High-exported oriented: Wood products; Paper; Metal fabrication and machinery; Computer, electronic and electrical products; Motor vehicles, trailers and parts; Other transportation equipment (aerospace, railroad, boats)
Commercial services:
Consumer-oriented: Retail trade; Wholesale trade; Transportation and warehousing; Accommodation and food services
Business-oriented: Finance, insurance, real estate and leasing; Professional business services; Computer system design; Other professional services (scientific and technical); Management, administrative and other support services; Information, culture and recreation; Other commercial services (repair, maintenance, personal and household services)
Related Documents


