Telecom Italia Group 9M 2014 Results TELECOM ITALIA GROUP 9M 2014 Results Rome, November 7th, 2014 Piergiorgio Peluso Marco Patuano

Welcome message from author
This document is posted to help you gain knowledge. Please leave a comment to let me know what you think about it! Share it to your friends and learn new things together.
Transcript

Telecom Italia Group9M 2014 Results
TELECOM ITALIA GROUP9M 2014 ResultsRome, November 7th, 2014
Piergiorgio PelusoMarco Patuano

9M 2014 Results 2
Safe HarbourThis presentation contains statements that constitute forward looking statements within the meaning of the Private Securities Litigation Reform Act of 1995. Thesestatements appear in a number of places in this presentation and include statements regarding the intent, belief or current expectations of developments and changesin the customer base, estimates regarding future growth in the different business lines and the global business, market share, financial results and other aspects ofthe activities and situation relating to the Telecom Italia Group. Such forward looking statements are not guarantees of future performance and involve risks anduncertainties, and actual results may differ materially from those projected or implied in the forward looking statements as a result of various factors. Consequently,Telecom Italia makes no representation, whether expressed or implied, as to the conformity of the actual results with those projected in the forward lookingstatements. Forward-looking information is based on certain key assumptions which we believe to be reasonable as of the date hereof, but forward lookinginformation by its nature involves risks and uncertainties, which are outside our control, and could significantly affect expected results. Analysts and investors arecautioned not to place undue reliance on those forward looking statements, which speak only as of the date of this presentation. Telecom Italia undertakes noobligation to release publicly the results of any revisions to these forward looking statements which may be made to reflect events and circumstances after the date ofthis presentation, including, without limitation, changes in Telecom Italia business or acquisition strategy or planned capital expenditures or to reflect the occurrenceof unanticipated events. Analysts and investors should consult the Company's Annual Report on Form 20-F as well as periodic filings made on Form 6-K, which areon file with the United States Securities and Exchange Commission which may identify factors that affect the forward looking statements included herein.
The accounting policies and consolidation principles adopted in the preparation of the Condensed Consolidated Financial Statements as of and for the nine monthsended 30 September 2014 have been applied on a basis consistent with those adopted in the Annual Consolidated Financial Statements at 31 December 2013, towhich reference should be made, except for the new standards and interpretations adopted by the Telecom Italia Group starting from 1 January 2014 which had noeffects on the Condensed Consolidated Financial Statements as of and for the nine months ended 30 September 2014. The Telecom Italia Group CondensedConsolidated Financial Statements at 30 September 2014 have not undergone an external audit/review.
Following the classification, starting from the fourth quarter 2013, of the Sofora - Telecom Argentina group as a disposal group (Discontinued operations/Non-currentassets held for sale) the consolidated financial statements data of prior periods (including the nine months ended 30 September 2013) have been restatedaccordingly and therefore the Sofora - Telecom Argentina group is no longer separately presented as a business unit.
Furthermore:
• starting from 2014, Organic changes in Revenues, EBITDA and EBIT are determined excluding, where applicable, only the effects of the changes in the scope ofconsolidation and exchange differences and therefore don’t take into account, as in the past, non-organic income and expenses, including those non-recurring;
• starting from 2014, the Domestic business unit includes the Olivetti group, in addition to Core Domestic and International Wholesale. This different presentationreflects the commercial and business placement of the Olivetti group and the process of integrating its products and services with those offered by Telecom Italia inthe domestic market. Therefore, the Olivetti group is no longer separately presented as a business unit;
as a result, the data for prior periods under comparison have been restated, accordingly.
In this presentation reference is also made to a normalization called “Domestic Underlying Ebitda trend”, which is based on the Adjusted (for one-offs anddiscontinuities) Reported Domestic Ebitda. This representation is provided as additional information to our Reported Ebitda that represents Operating profit beforedepreciation and amortization, capital gains (losses) and impairment reversals (losses) on non-current assets.
Marco Patuano - Piergiorgio Peluso

9M 2014 Results 3
• TI 3Q’14 Results
• Financial Update
• Take-Aways
• Appendix
Agenda
Marco Patuano

9M 2014 Results 4Marco Patuano
3Q’14 Group Highlights
Service Revenues4,943 mln €
(2Q’14: 4,871 mln €)
• Improving organic performance at -5.7% YoY vs -7.1% in 2Q’14 due to a different mix:• Better domestic trend both in Fixed and Mobile underpinned by healthier competitive environment and good acquisition results in UBB KPIs
• TIM Brasil: Positive “Business Generated” results supported by an excellent MBB take-up
Ebitda2,243 mln €
(2Q’14: 2,145 mln €)
• Group Ebitda at 2.2 bln € in 3Q’14 (Reported -8.0% YoY, Organic -8.5% YoY)• Performance at domestic level (Reported Ebitda -11.6% YoY) impacted by non-recurring items; Underlying Domestic Ebitda (net of new handset subsidy approach and one-offs) -7% YoY in 3Q’14
• Sound performance in Brazil (+6.5% YoY in 3Q’14) driven by a strong results in data revenues, efficiency on network and reduction in interconnection costs
Net debt reduction to
26.57 bln €• Lower by 0.2 bln € vs FY’13 and by 0.8 bln € vs 2Q’14. Usual 2H NFP improvement kicks in
InnovativeCapex
~620 mln € YTD(Italy & Brazil)
• Focus on innovation confirmed:• Italy: current 27% NGN coverage is above the mid-point of 2014-16 of the Original Plan target; actual 74% LTE coverage shows strong upbeat vs FY’14 target at 60% and FY’15 target at 70%
• Brazil: 700Mhz spectrum acquired at fair price, ensuring a better coverage (Indoor and Rural) with a much larger penetration than the 2,500 MHz band currently used for 4G services. 81 cities have been covered so far by our MBB Project (36% Urban coverage); 100 cities will be covered by end of 2014
Argentina
• On October 24, Sale Agreement with Fintech was Amended and Restated:• Total Sale Proceeds confirmed at US$ 960mln, which now translate into a 6x Ebitdamultiple after recent Peso devaluation
• 2nd Tranche for US$ 215.7mln cashed in• Cash collateral and Break-up Fee to support completion of transaction
9M 2014 Results 5
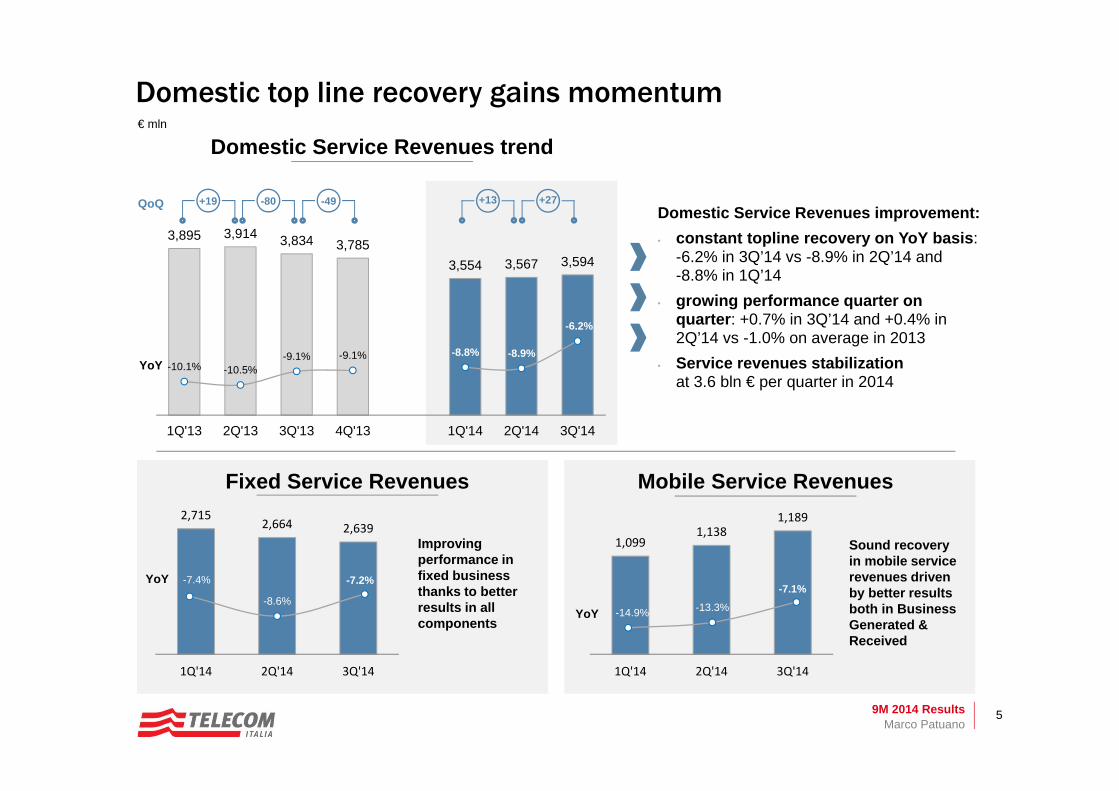
3,895 3,914 3,834 3,785 3,554 3,567 3,594
1Q'13 2Q'13 3Q'13 4Q'13 1Q'14 2Q'14 3Q'14
-10.1% -10.5%-9.1% -9.1% -8.8% -8.9%
-6.2%
Marco Patuano
Domestic Service Revenues trend
YoY
Domestic Service Revenues improvement: • constant topline recovery on YoY basis:
-6.2% in 3Q’14 vs -8.9% in 2Q’14 and -8.8% in 1Q’14
• growing performance quarter on quarter: +0.7% in 3Q’14 and +0.4% in 2Q’14 vs -1.0% on average in 2013
• Service revenues stabilizationat 3.6 bln € per quarter in 2014
QoQ
2,715 2,664 2,639
1Q'14 2Q'14 3Q'14
1,099 1,138
1,189
1Q'14 2Q'14 3Q'14
-7.4%
-8.6%
-7.2%
-14.9% -13.3%
-7.1%YoY
YoY
€ mln
Improving performance in fixed business thanks to better results in all components
Sound recovery in mobile service revenues driven by better results both in Business Generated & Received
+19 -80 -49 +13 +27
Domestic top line recovery gains momentum
Fixed Service Revenues Mobile Service Revenues

9M 2014 Results 6
2,031
1,795
3Q'13 3Q'14
Marco Patuano
40
-9.8%
-11.6%
net of newhandset subsidy
approach
Domestic Ebitda Ebitda trend%YoY,€ mln
Domestic Ebitda: progressing towards an improving FY trend
• Effects on Year-on Year performance for this quarter are:
• ~ 30 mln euro for• incentive plans for employees &
management and • salary discontinuous increases enabling
insourcing• ~ 30 mln euro for regulatory termination disputes
and other provisions • 40 mln euro for new handset subsidy approach
Ebitda Discontinuities
Normalized for discontinuous increases in labour costs, provisions & handset subsidy
net of newhandset subsidy
approach
reported
-9%
-7%
1H'14 3Q'14 4Q'14
+
Underlying Ebitda trend
-7.9%
-11.6%
-5.4%
-9.8%
1H'14 3Q'14

9M 2014 Results 7
138
1,089 1,122
443 380
249
195
106 -63 - 54
-11 -138
95
9M'13 network IT commercial&othersIT
others subsidy 9M'14
32% 32%35%
24%25%
28%
1Q 2Q 3Q
31%32%
33%
28% 28%
30%
1Q 2Q 3Q
(2) net of wholesale
2014
2013
Translating Domestic Innovative Capex into Revenues
Marco Patuano
2,0251,792
handset subsidy
network
IT
commercial&others IT
others
+102-69
innovative traditional
network
Efficiency(1): -197 mln €
(1) total domestic capex efficiency= a b c d+ + +
a b c d
33%35%
37%
1Q'14 2Q'14 3Q'14
Innovative portion on network capex9M’1435%
+8pp YoY
Innovative Mobile Service Revenues(3) Innovative Fixed Service Revenues(4)
(3) Broadband & VAS Content(4) Broadband, VAS Content & ICT
commercial&others IT
Growing penetration of Innovative Revenues on total(2)

9M 2014 Results 8
15 45
103 151
3477
123
163
0.2 0.5 >1.0 ~1.0
4Q'13 1Q'14 2Q'14 3Q'14
TI Retail NGN OLO Subloop/NGN Avg daily acquisition
Market Fiber Lines Mobile BB CB
today @27%
51%
2014 2015 2016
today @74%
2014 2015 2016
Marco Patuano
6,853 7,166 8,023 8,444 8,677 9,151 9,596
0% 1% 2%4% 5%
7%9%
1Q'13 2Q'13 3Q'13 4Q'13 1Q'14 2Q'14 3Q'14
MBB % LTE
>50%>80%
‘000
+10pp vs FY’13 FY’14 target already exceeded
NGN & LTE current Coverage
Additional Giga take-up
>50k clients per week
49
122
226
313
October~1.5k/day
Target furtherupgradable
First moveradvantage to be preserved
NGN Coverage LTE Coverage
«Open Fiber» launched

9M 2014 Results 9Marco Patuano
530 531 536
52 56 57 132 139 134
264 281 301 64 61 90
58 70 72
76 126 95
1Q'14 2Q'14 3Q'14
713 726 727
328 342 390
1,175 1,264 1,284
1,099 1,138 1,189
Outgoing voice
Incomingvoice
SMS
Traditional
BroadbandVAS content
Innovativewholesale
Service
handsets
Total
+13
+14
+39
+12
+89
+1
+48
+51
+2
+20+50 -31
€ mln, QoQ
-14.9%-13.3%
-7.1%
1Q'14 2Q'14 3Q'14 4Q'14
+
-24.1% -21.9% -16.7%
+9.9% +8.4%+16.6%
+8.7% +5.6% -0.5%
Traditional
Innovative
wholesale
Domestic Mobile
• Mobile Service Revenues improvements due to: • Constant recovery in outgoing voice and positive support from
incoming thanks to zero MTR drag
• Sound performance in Innovative revenues driven by progressive growth in browsing and additional revenue stream from new digital entertainment services
• We confirm Mobile Service Revenues is trending towards parity in 4Q’14
Quarterly Mobile Revenues Breakdown Service Revenues Trend YoY

9M 2014 Results 10
367 352 334
666 647 632
238 232 229
395 402 410
37 38 38133 134 135
878 859 861
56 73 79
1Q'14 2Q'14 3Q'14
1,271 1,231 1,195Traditional
565 574 583Innovative
2,715 2,664 2,639Service
2,771 2,737 2,718Total
Traditional
Innovative
-10.4% -13.1% -10.1%
+0.1%+1.8%
+3.0%
Wholesale & others
-7.2% -7.9%-9.3%
-7.4%
-8.6%
-7.2%
1Q'14 2Q'14 3Q'14 4Q'14
+
Outgoing voice
Access
Others
National, Int’ wholesale + Subs&others
VASICT
Broadband
handsets
-40
+9
-51
-34
-36
+9
-25
-19
Marco Patuano
Domestic Fixed
-7.4%-8.9%
-6.2%
1Q'14 2Q'14 3Q'14
Fixed Service Retail YoY• Monthly Retail Fee
upward revision effective November 1st to provide further uplift in 4Q’14
• Significant support from increasing fiber take-up
€ mln, QoQ
Quarterly Fixed Revenues Breakdown Service Revenues Trend YoY
9M 2014 Results 11
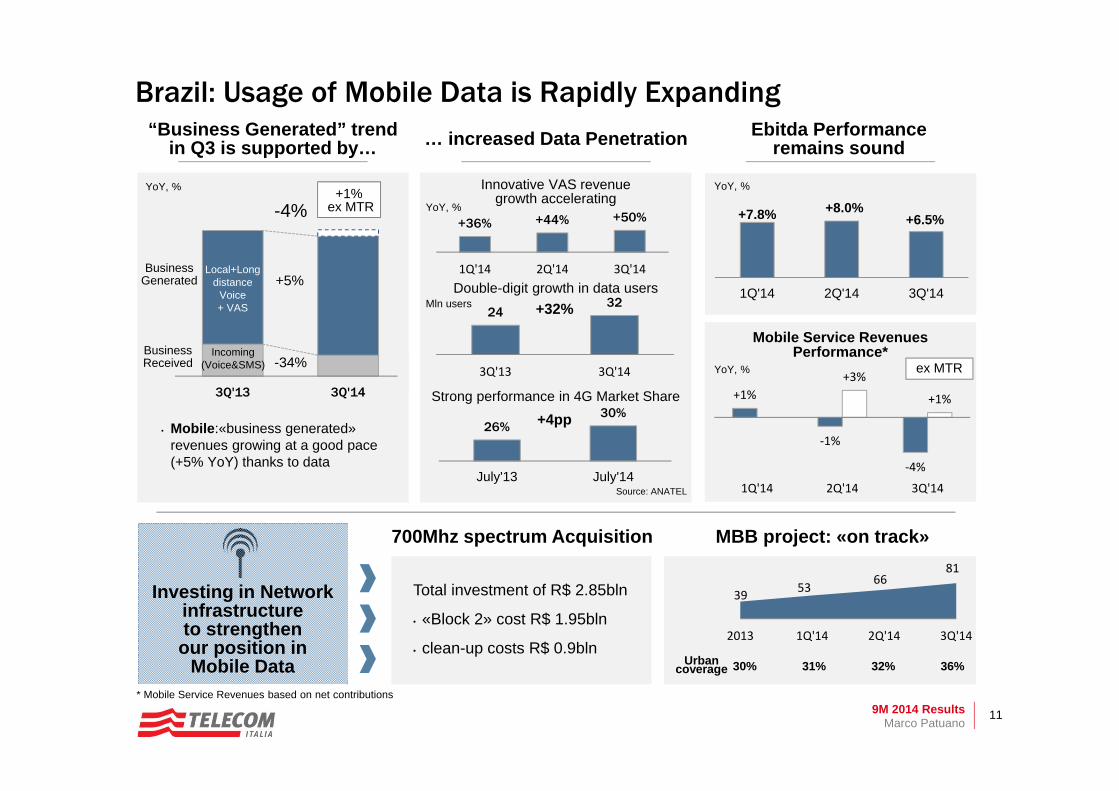
“Business Generated” trend in Q3 is supported by…
Marco Patuano
Ebitda Performance remains sound
YoY, %
+1%
‐1%
‐4%
+3%
+1%
1Q'14 2Q'14 3Q'14
ex MTR
… increased Data Penetration
• Mobile:«business generated» revenues growing at a good pace (+5% YoY) thanks to data
26%30%
July'13 July'14
Strong performance in 4G Market Share
+4pp
24 32
3Q'13 3Q'14
+32%Double-digit growth in data users
Mln users
YoY, % Innovative VAS revenuegrowth accelerating
+36% +44% +50%
1Q'14 2Q'14 3Q'14
700Mhz spectrum Acquisition
39 53 6681
2013 1Q'14 2Q'14 3Q'14
MBB project: «on track»
30% 36%31% 32%Urban coverage
Investing in Network infrastructure to strengthen our position in
Mobile Data
Total investment of R$ 2.85bln
• «Block 2» cost R$ 1.95bln
• clean-up costs R$ 0.9bln
Brazil: Usage of Mobile Data is Rapidly Expanding
3Q'13 3Q'14
Business Generated
BusinessReceived
-4%+1%
ex MTR
+5%
-34%
Local+Long distance
Voice + VAS
Incoming (Voice&SMS)
* Mobile Service Revenues based on net contributions
Source: ANATEL
+7.8% +8.0%+6.5%
1Q'14 2Q'14 3Q'14
YoY, %
Mobile Service Revenues Performance*
YoY, %

9M 2014 Results 12Piergiorgio Peluso
• TI 3Q’14 Results
• Financial Update
• Take-Aways
• Appendix
Agenda

9M 2014 Results 13
3Q’14 Reported€ mln, %YoY
Organic(1)
(1) Starting from 2014, Organic performance includes only exchange rate variations and impacts from perimeter changes(2) Including TI Media, Other & Elimination. Olivetti is included in the Domestic perimeter
Piergiorgio Peluso
Telecom Italia 3Q’14 Group Results
net of new handsetsubsidy
approach
Weight(2)€mln YoY YoY
CapexDomesticBrazil
933615317
-13.2%-9.3%
-19.7%
-12.5%-9.3%
-18.4%
-9.1%-3.6%66%
34%
RevenuesDomesticBrazil
5,4213,8051,608
-4.5%-5.0%-3.1%
-4.9%-5.0%-4.5%
70%29%
n.a.
Ebitda-CapexDomesticBrazil
1,3101,180
124
-4.0%-12.8%
-
-5.4%-12.8%
-90%9%
n.a.
EbitdaDomesticBrazil
2,2431,795
441
-8.0%-11.6%+8.4%
-8.5%-11.6%+6.5%
-7.0%-9.8%80%
20%-7%
Normalized for cost of labour, provisions &
handset subsidy

9M 2014 Results 14
2,045 2,034
1,327 1,080
864 762
2,148 2,164
9M'13 9M'14
‐53
+17 +24
1Q'14vs'13 2Q'14vs'13 3Q'14vs13
(1) Interconnection, Cost of Equipment, Other COGs(2) Acquisition costs, ADV, Customer Care, Other commercial costs
Volume/Revenue-Driven (1)
Market/Customer-Driven (2)
Process/Asset-Driven (3)
LabourCost
Solid Cost Reduction:• Commissioning: volume acquisition reduction• Advertising: cost optimization supported by single
format and brand• Operating Costs for Network & IT: savings in
procurement and positive impacts of process reengineering
• G&A: zero-budget approach and policy review
6,0406,383
-102
-246
Piergiorgio Peluso
9M’14 Domestic Opex Efficiency Plan to Overperform FY Target € mln
-11
SolidarityAgreement
ExtraordinaryCompensationPlans
Labour Cost YoY
YoY impact
neutral
negative
negative
neutral
negativeSalaryIncrease(4)
€ mln
positive
negative
-72
-31
-66
-180
-348
comm./adv./ccarebad debt/other
commercialindustrial
costs/G&A other opex total efficiency
Market-driven-102 mln euro
Process-driven-246 mln euro Including:
• 71 mln euro Sparkle provisionreversal
• 84 mln euro Antitrust fine in 2013
Operating Expenditures
External Opex net of COGs-348 mln € YoY
(3) Industrial costs, G&A, Real Estate, Other(4) Starting from February 1, 2014

9M 2014 Results 15
Reported, € mln
Piergiorgio Peluso
9M’14 Operating FCF Generation Remains Solid
1,281107
-843
-331
Ebitda Capex D operating WC&others OpFCF
Gro
up
Dom
estic
Bra
zil
vs. 2013
-184-29+397-552
OpFCF on Revenues
13%20%
25%
1Q'14 2Q'14 3Q'14
-491306
292
1Q'14 2Q'14 3Q'14
OpFCF quarterly breakdown
TI recurring stronger Second Half Operating Free Cash Flow is confirmed
9M’14 figures
-14
1,058
1,228
1Q'14 2Q'14 3Q'14 4Q'14
6,588
2,272
2,640
1,676
Ebitda Capex operatingWC&others
OpFCF
2014 Free Cash Flow Generation
5,2962,166
1,7921,338
Ebitda Capex D operatingWC&others
OpFCF
19% onRevenues

9M 2014 Results 16
-2,272 +1,213 +396 -47 +234 +241
FY'13 OpFCF Cash FinancialExpenses/Financial
Accruals
Taxes & otherimpacts
M&A Telecom Argentina(discontinued)
Dividends/ Change inequity
9M'14
9M’14 Net Financial Position Improvement
26,807 26,572
-235
+184 -88
vs. 2013
-304 +394-89 -287
Piergiorgio Peluso
FX impact
FX negative impact
-190
-1,657 mln €vs 9M’13
Including 1.3 bln euro Mandatory Convertible Bond25,507 25,272
MandatoryConvertible Bond
MandatoryConvertible Bond
€ mln

9M 2014 Results 17
Italy Brazil Argentina
• Digital terrestrial network businesses merger completion with Gruppo Editoriale L’Espresso
• Sale process on track, while new regulatory framework stilldeveloping
Towers 700Mhz Auction
TI Media
Sale Agreement renegotiated to allow for transaction completion• Same amount granted • TI Management • Discontinued operation• New US$175mln break-up fee in place
New Agreement Supports Disposal
Towers, Frequencies and Disposals Update
Towers
US$113.7mln already cashed in in Dec’13
US$215.7mln cashed in on Oct 29th, 2014
US$600.6mln TI note issued entirely purchased by the Buyer, providing Cash collateralUS$30mln service fee
Structure of the deal
a
b
c
d
US$ 960 mlnTotal Consideration
Piergiorgio Peluso
TIM Tower sale finalization soon
• Process in its Final Stage; final agreement expected to be signed by year end
• Transaction scope involving about 6.4k TIM Towers
• Proceeds expected to finance TIM network deployment, including 700 MHZ license costs
A Positive Outcome for TIM • Overall Cost in Line with
expectations• Awarded “Lot n.2” Fits our Existing
Spectrum Profile at best • Increased 4G Frequencies to
maintain momentum in TIM’s mobile data strategy
Value Extraction from Separation remains a Priority
• Tower Division created• Service Management Agreement
finalized• Advisors appointed for further steps
3G/4G Spectrum Auction
• “Lot 8” awarded to TEO consisting in30MHz for 15-year licenses on AWS(band 1700-2100Mhz) and 20Mhzon 700MHz
9M 2014 Results 18
• TI 3Q’14 Results
• Financial Update
• Take-Aways
• Appendix
Agenda
Marco Patuano

9M 2014 Results 19
Domestic
• Upbeat 3Q’14 paves the way for further improvements in 4Q and beyond:• Transition from price-based to quality-driven competition opens to further value generation
from Data, while polarization between High-Quality Network Operators and Other Operators increases
• Recovery in Mobile is well ahead and has started in Fixed, whose upside is shown by both our Retail and Wholesale take-up of Fiber offers
• Further push on convergence, offer simplification and superior quality experience for both our Consumer and Business segments ongoing
• Domestic Opex Efficiency Plan to overperform the €200mln FY’14 target, while favorably facing 2015 step-up to €400mln. In Brazil, TIM presented a strong Opex saving in 3Q with -8.1% YoY, mainly due to efficiency on network and lower interconnection costs
EfficiencyPlan
InnovativeCapex
• We are investing to strengthen our role of Digital Champion in Italy, where innovative services and content create more and more demand for bandwidth and speed – not a game for all. Network and IT transformation and delayering are a key part of the process
• Also in Brazil innovative investments are being increased in order to accelerate the implementation of new technologies for mobile data and further stimulate the commercial take-up of 4G. TIM currently covers around 36% of the urban population with 4G, serving 45 municipalities
M&A • Opportunities will be considered only if compliant with our Group’s Financial Discipline and if clearly generating value for our Companies and our shareholders / bondholders
Marco Patuano
• Supported by all the above actions, FCF generation is key to preserve our leadership in our Key Markets and to ensure our deleveraging goals
FCFgeneration
3Q’14 Group Take-Aways
Brazil • TIM Brasil is set to generate relevant value from its important, country-wide MBB expansion

9M 2014 Results 20Marco Patuano - Piergiorgio Peluso
• TI 3Q’14 Results
• Financial Update
• Take-Aways
• Appendix
Agenda
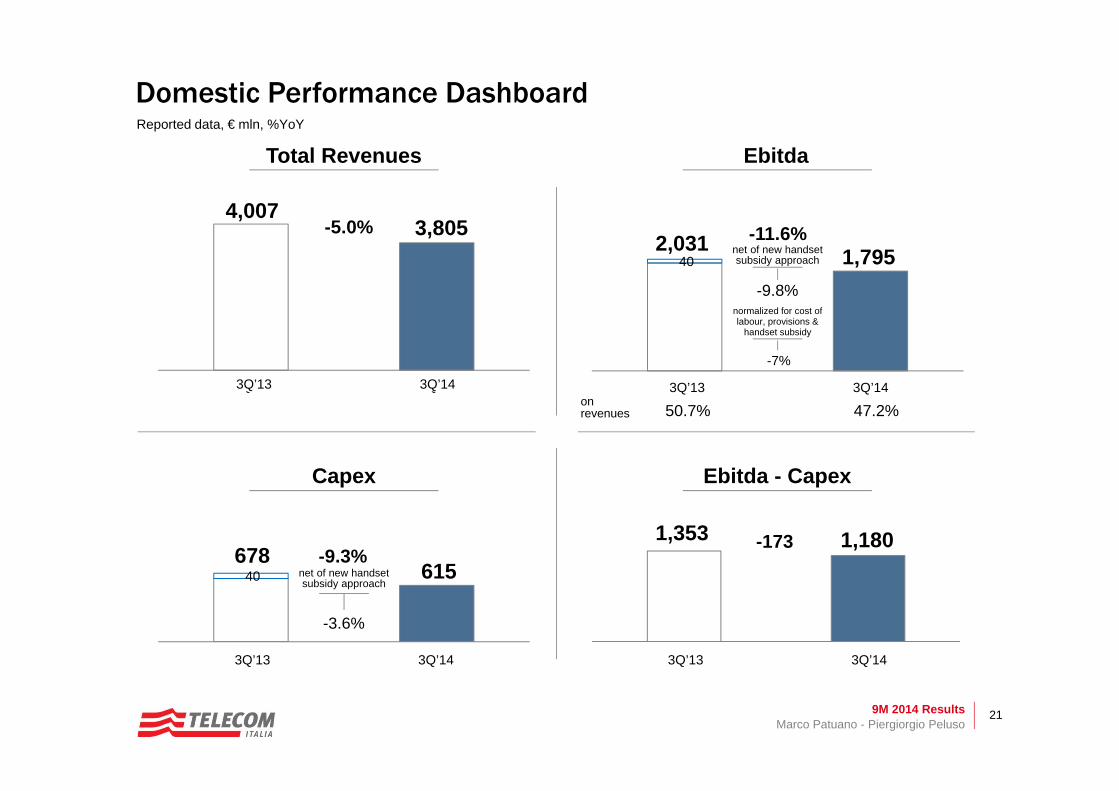
9M 2014 Results 21
Reported data, € mln, %YoY
2Q'13 2Q'14
40
2Q'13 2Q'14
2Q'13 2Q'14
40
2Q'13 2Q'14
Total Revenues
Ebitda - Capex
Ebitda
Capex
on revenues 50.7% 47.2%
-9.8%
net of new handsetsubsidy approach
2,031 1,795-11.6%
4,0073,805
678615
-5.0%
-9.3%-1731,353 1,180
-3.6%
net of new handsetsubsidy approach
Domestic Performance Dashboard
3Q’13 3Q’14 3Q’13 3Q’14
3Q’13 3Q’143Q’13 3Q’14
normalized for cost of labour, provisions &
handset subsidy
Marco Patuano - Piergiorgio Peluso
-7%

9M 2014 Results 22
29124
3Q'13 3Q'14
386 317
3Q'13 3Q'14
415 441
3Q'13 3Q'14
1,394 1,341
290 267
3Q'13 3Q'14
Organic data*, € mln, %YoY
24.6% 27.4%
+6.5%
-4.5%
-18.4%
+95
* Excluding exchange rate
Brazil Performance Dashboard 3Q’14
Service
Handsets1,6081,684
-4%
Mobile ServiceRevenues**+1% ex-MTR
9M’14 -5.5% YoY
** Mobile Service Revenues based on net contributions
Marco Patuano - Piergiorgio Peluso
on revenues
Total Revenues
Ebitda - Capex
Ebitda
Capex

9M 2014 Results 23
1Q'13 2Q'13 3Q'13 4Q'13 1Q'14 2Q'14 3Q'14
Marco Patuano - Piergiorgio Peluso
Domestic Mobile KPIs‘000
31,858 31,706 31,554 31,221 30,996 30,660 30,374
83%85%
1Q'13 2Q'13 3Q'13 4Q'13 1Q'14 2Q'14 3Q'14
+2pp YoY
-28-20 -8 -17
-41 -34
-80
-2-1
-111 -107
-178 -197
-124-92
+75
+16
-18
Jan Feb Mar Apr May June July Aug Sep
MNP Balance
2014
2013 Cum.+504 YoY
Highlights
Clear signs of market stabilization translated into:
• better MNP balance +504k YTD• lower gross adds -36% YoY in Q3• better churn rate 25.2%; -3.6pp YoY
Mobile CB Active CB

9M 2014 Results 24
761 736 711 684 655 625 597
965 1,014 1,045 1,084 1,122 1,155 1,164
1 1 4 15 45 103 151
1Q'13 2Q'13 3Q'13 4Q'13 1Q'14 2Q'14 3Q'14
18.919.1
19.2 19.2 19.2
19.6
20.0
+3.5% +3.5% +3.6%+1.6% +1.8% +2.3%
+3.9%
1Q'13 2Q'13 3Q'13 4Q'13 1Q'14 2Q'14 3Q'14
ARPU BB YoY
€/month
Domestic Fixed KPIs
13,777 13,555 13,372 13,210 13,027 12,828 12,656
7,238 7,233 7,164 7,169 7,211 7,258 7,167
1Q'13 2Q'13 3Q'13 4Q'13 1Q'14 2Q'14 3Q'14
Fixed Access
OLO
TI retail
21,016 20,788 20,536 20,378 20,238 20,085
‘000
19,823
965 1,015 1,050 1,100 1,167 1,259 1,3156,984 6,933 6,892 6,915 6,933 6,939 6,932
Total
(201) (222)(183) (163) (182) (200) (171)
1Q'13 2Q'13 3Q'13 4Q'13 1Q'14 2Q'14 3Q'14
Line Losses
+18+22
+12YoY
BB ARPU
Marco Patuano - Piergiorgio Peluso
6,019 5,918 5,842 5,814 5,766 5,679 5,617
Flat ADSL
Total BB FastTotal
Free ADSL
Total ADSL
SI+20MbFiber
BB Access

9M 2014 Results 25
+1.9%
-10.7%
-12.6%
-22.2%
+0.7%
-8.9%
+16.9%
-18.7%-64.7%
+0.5%
-6.0%
-7.6%
-18.5%
+4.6%
+18.9%
+18.4%
-15.4%-61.8%
81
1,203
1,109
536
523
50
94
51917
wholesale(1)
Consumer+Business
services
outgoing voice
VAS
business received
handsets
(1) Including Visitors (2) Total Retail Service Revenues net of Incoming
voicefees&other
-10.0%-5.6%1,284Total 1,360
80
1,280
1,200
-12.7%-8.5%1,059business generated(2) 1,158
658
500
42
80
61344
3Q’13 3Q’14 YoY 9M YoY
Domestic Mobile Revenues BreakdownReported, € mln, %YoY
Marco Patuano - Piergiorgio Peluso

9M 2014 Results 26
Reported, € mln, %YoY
Sparkle group
Wholesale Domestic
Retail Service
Service Wireline 2,844 2,639 -7.2% -7.7%
339 304 -10.3% -3.2%
650 595 -8.5% -10.3%
1,899 1,781 -6.2% -7.5%
voice & access 1,178 1,056 -10.4% -11.2%
internet 401 415 +3.5% +1.5%
business data 279 264 -5.3% -2.9%
other 41 46 n.m. n.m.elim. & other (43) (41) n.m. n.m.
Total Wireline 2,898 2,718 -6.2% -7.1%
products 54 79 +47.8% +22.1%
Domestic Fixed Revenues Breakdown
3Q’13 3Q’14 YoY 9M YoY
Marco Patuano - Piergiorgio Peluso

9M 2014 Results 27
Liquidity Margin
€ 30,657 mln is the nominal amount of outstanding medium-long term debt. Adding the Mandatory Convertible Bond (€ 1,300 mln), the discontinued operations (€ 28 mln), IAS adjustments (€ 1,223 mln) and current financial liabilities (€ 487 mln), the gross debt figure of € 33,695 mln is reached.N.B. Debt maturities are net of € 1,262 mln (face value) of repurchased (of which € 504 in the 2013 and € 543 in the 2014) own bonds (of which € 1,047 mln related to bonds due within 2016).
Loans (of which long-term rent, financial and operating lease payable € 1,200)
Drawn bank facilityBonds
Debt Maturities
Undrawn Portion of Facility/CommittedC&CE (escluded discontinued)
Marco Patuano - Piergiorgio Peluso
Robust Liquidity Margin and Well-Distributed Debt Maturities
Fully Covered until 2018
€ mln € mln
4491,359
918
896
1,030
1,354
1,264
7,2707,0001,949
1,880
2,965
2,295
3,138
11,160
23,387
5,305
12,305
449
3,308
2,798
3,861
3,325
4,492
12,424 30,657
Liquiditymargin
Within 2014 FY 2015 FY 2016 FY 2017 FY 2018 FY 2019 Beyond 2019 Total M/LTerm Debt
9M 2014 Results 28
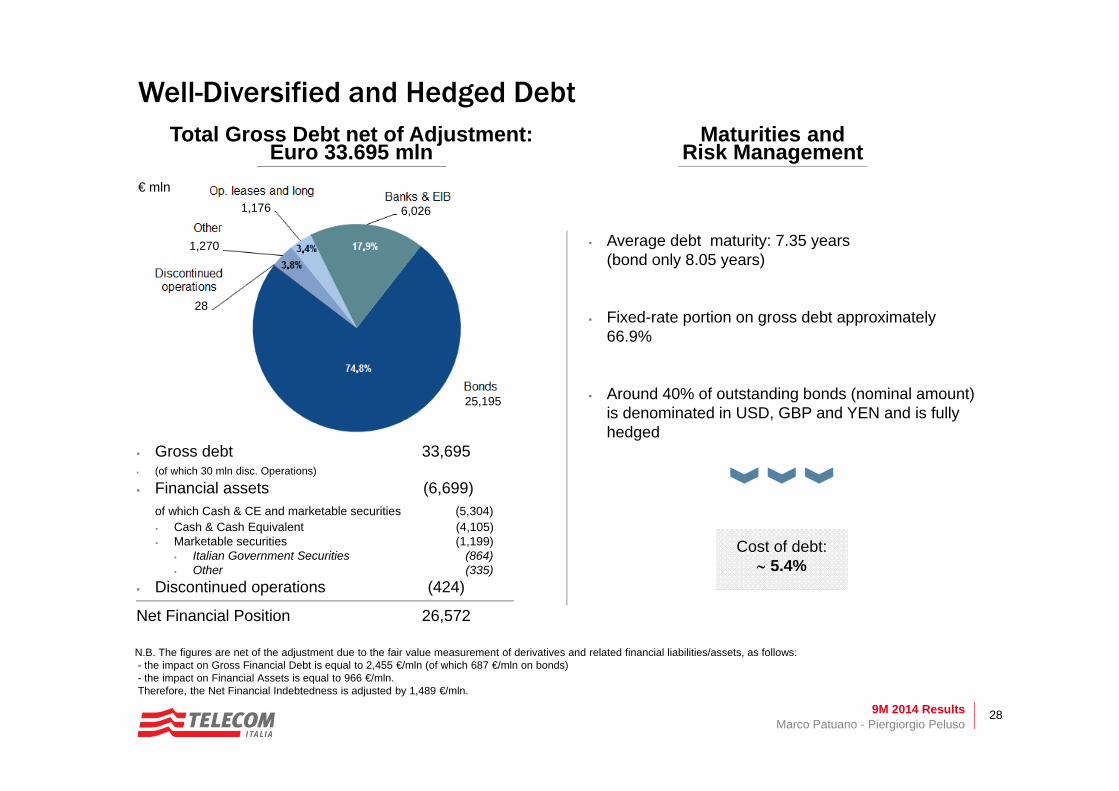
N.B. The figures are net of the adjustment due to the fair value measurement of derivatives and related financial liabilities/assets, as follows: - the impact on Gross Financial Debt is equal to 2,455 €/mln (of which 687 €/mln on bonds)- the impact on Financial Assets is equal to 966 €/mln.Therefore, the Net Financial Indebtedness is adjusted by 1,489 €/mln.
Total Gross Debt net of Adjustment: Euro 33.695 mln
Gross debt 33,695 (of which 30 mln disc. Operations)
Financial assets (6,699) of which Cash & CE and marketable securities (5,304) Cash & Cash Equivalent (4,105) Marketable securities (1,199)
Italian Government Securities (864) Other (335)
Discontinued operations (424)
Net Financial Position 26,572
Maturities and Risk Management
Cost of debt: 5.4%
Average debt maturity: 7.35 years (bond only 8.05 years)
Fixed-rate portion on gross debt approximately 66.9%
Around 40% of outstanding bonds (nominal amount) is denominated in USD, GBP and YEN and is fully hedged
Marco Patuano - Piergiorgio Peluso
Well-Diversified and Hedged Debt
1,270
1,176 6,026
25,195
.
.
..
28
€ mln
Related Documents