PROCEEDINGS OF THE I.R.E. Interpretation of High-Frequency CW Field-Intensity Records with the Aid of Simultaneous Pulse Data* R. SILBERSTEINt, SENIOR MEMBER, IRE Summary-Several causes of changes in field intensity of cw signals are outlined and their identification by the use of pulses discussed. Results of comparisons of cw and pulse records are given for a winter-type record and a summer-type record and charac- teristics due to several of the listed causes are identified. INTRODUCTION A N ionospherically propagated skywave from a dis- tant point usually consists of a group of several waves, each with its own changing phase and amplitude characteristics, coming down at different angles to the horizontal. These waves and their ground- reflected components combine at the antenna to give a resultant voltage which is amplified and detected. In a record of the field intensity of a continuous-wave signal in which more than one mode is present at any one time, it is not easy to tell what combinations are present. Identification of arriving modes by determina- tion of their angles of arrival is difficult when several modes are present simultaneoLisly; the resultant arriv- ing wave does not have a plane phase front, does not provide uniform illumination of the antenna aperture, and undergoes violent time fluctuations of all its char- acteristics.' With pulsed signals the delay differences between the various observed modes can be measured and corre- spondence obtained between them and the delay differ- ences calculated for combinations of possible modes. Some ambiguities can still occur, but may often be re- solved if enough is known about ionospheric conditions over the path. It is possible to enumerate several different causes of field-intensity changes appearing on radio-field-inten- sity records, among which are (a) focusing effects as conditions approach or recede from skip, (b) failure and recovery due to ionospheric irregulari- ties, (c) interference between modes, (d) interference within a mode, (e) changes in absorption in or shielding by a lower layer,2 (f) antenna-pattern effects. * Decimal classification: R271.4. Original manuscript received by the Institute, July 11, 19il; revised manuscript received, Anril 9, 1952. The material is adopted from the National Bureau of Stand- ards Report No. 1085 of the same title, dated July 27, 1951. t National Bureau of Standards, Washington, D. C. F. W. Schott, "On the response of a directive antenna to inco- herent radiation," PROC. I.R.E., vol. 39, p. 677; June, 1951. 8 E. V. Appleton, W. J. G. Beynon, and W. R. Piggott, "Anoma- lous effects in ionospheric absorption," Nature, vol. 161, p. 968; June 19, 1948. A study of simultaneously observed pulses transmit- ted over the same path and on about the same frequency should make it possible to identify effects such as those of (a) and (b) with a fair degree of certainty. It should also be possible to obtain an idea of what modes of prop- agation are present and thus identify a given depth and rate of fading with the modes responsible for it (c). The effect of (d) will probably always be present because of ionospheric roughness, but will show as a fast fading rate usually superimposed upon slow-fading cycles due to other causes. The effects of (e), not considered in this work, should be identifiable by a very slow change in the intensity of one mode of a group on A-scope pulse records. One effect under (f) is that of changing polarization or angle of arrival resulting in a change of pickup as deter- mined by receiving-antenna characteristics. Angle-of- departure changes also result in changes in received field intensity because of the directional patterns of the an- tennas. The effects of (f) are not always identifiable without auxiliary polarization- and angle-of-arrival measuring equipment, but should be easy to demonstrate in certain cases, such as near the limit of one-hop trans- mission, where angles of departure for the lowest order mode are very small. In the case to be considered the path was fairly short so that the lowest order mode was not severely attenuated. INSTRUMENTATION The path of which a study was made was that from Beltsville, Md. to the White Sands Proving Ground, N. M., a distance of about 2,700 km. Continuous re- cordings were made at White Sands of the field strength of WWV 15 mc, the over-all time constant of the receiv- ing and recording system being 18 seconds. Occasion- ally, simultaneous high-power pulse transmissions were made on a frequency between 15.00 and 15.09 mc from Sterling, Va. and received at XVhite Sands on a loran- type indicator, pulse groups being photographed every minute during the failure and recovery period. The cw power at WWV was 9 kw into a half-wave vertical an- tenna and the peak power at Sterling was 700 kw into a rhombic antenna, a 40-microsecond pulse being used. RESULTS An examination was made of a number of field- strength records for the summer and late fall in con- junction with accompanying pulse records. With regard to the field-strength records, in general, there were large differences between individual days and between sea- sons. However, certain common characteristics were 9'i-4 August Authorized licensed use limited to: NIST Research Library. Downloaded on August 11, 2009 at 12:23 from IEEE Xplore. Restrictions apply.

Welcome message from author
This document is posted to help you gain knowledge. Please leave a comment to let me know what you think about it! Share it to your friends and learn new things together.
Transcript
PROCEEDINGS OF THE I.R.E.
Interpretation of High-Frequency CW Field-IntensityRecords with the Aid of Simultaneous Pulse Data*
R. SILBERSTEINt, SENIOR MEMBER, IRE
Summary-Several causes of changes in field intensity of cwsignals are outlined and their identification by the use of pulsesdiscussed. Results of comparisons of cw and pulse records aregiven for a winter-type record and a summer-type record and charac-teristics due to several of the listed causes are identified.
INTRODUCTIONA N ionospherically propagated skywave from a dis-
tant point usually consists of a group of severalwaves, each with its own changing phase and
amplitude characteristics, coming down at differentangles to the horizontal. These waves and their ground-reflected components combine at the antenna to give aresultant voltage which is amplified and detected.
In a record of the field intensity of a continuous-wavesignal in which more than one mode is present at anyone time, it is not easy to tell what combinations arepresent. Identification of arriving modes by determina-tion of their angles of arrival is difficult when severalmodes are present simultaneoLisly; the resultant arriv-ing wave does not have a plane phase front, does notprovide uniform illumination of the antenna aperture,and undergoes violent time fluctuations of all its char-acteristics.'With pulsed signals the delay differences between the
various observed modes can be measured and corre-spondence obtained between them and the delay differ-ences calculated for combinations of possible modes.Some ambiguities can still occur, but may often be re-solved if enough is known about ionospheric conditionsover the path.
It is possible to enumerate several different causes offield-intensity changes appearing on radio-field-inten-sity records, among which are
(a) focusing effects as conditions approach or recedefrom skip,
(b) failure and recovery due to ionospheric irregulari-ties,
(c) interference between modes,(d) interference within a mode,(e) changes in absorption in or shielding by a lower
layer,2(f) antenna-pattern effects.
* Decimal classification: R271.4. Original manuscript received bythe Institute, July 11, 19il; revised manuscript received, Anril 9,1952. The material is adopted from the National Bureau of Stand-ards Report No. 1085 of the same title, dated July 27, 1951.
t National Bureau of Standards, Washington, D. C.F. W. Schott, "On the response of a directive antenna to inco-
herent radiation," PROC. I.R.E., vol. 39, p. 677; June, 1951.8 E. V. Appleton, W. J. G. Beynon, and W. R. Piggott, "Anoma-
lous effects in ionospheric absorption," Nature, vol. 161, p. 968; June19, 1948.
A study of simultaneously observed pulses transmit-ted over the same path and on about the same frequencyshould make it possible to identify effects such as thoseof (a) and (b) with a fair degree of certainty. It shouldalso be possible to obtain an idea of what modes of prop-agation are present and thus identify a given depth andrate of fading with the modes responsible for it (c). Theeffect of (d) will probably always be present because ofionospheric roughness, but will show as a fast fading rateusually superimposed upon slow-fading cycles due toother causes.The effects of (e), not considered in this work, should
be identifiable by a very slow change in the intensity ofone mode of a group on A-scope pulse records.One effect under (f) is that of changing polarization or
angle of arrival resulting in a change of pickup as deter-mined by receiving-antenna characteristics. Angle-of-departure changes also result in changes in received fieldintensity because of the directional patterns of the an-tennas. The effects of (f) are not always identifiablewithout auxiliary polarization- and angle-of-arrivalmeasuring equipment, but should be easy to demonstratein certain cases, such as near the limit of one-hop trans-mission, where angles of departure for the lowest ordermode are very small. In the case to be considered thepath was fairly short so that the lowest order mode wasnot severely attenuated.
INSTRUMENTATIONThe path of which a study was made was that from
Beltsville, Md. to the White Sands Proving Ground,N. M., a distance of about 2,700 km. Continuous re-cordings were made at White Sands of the field strengthof WWV 15 mc, the over-all time constant of the receiv-ing and recording system being 18 seconds. Occasion-ally, simultaneous high-power pulse transmissions weremade on a frequency between 15.00 and 15.09 mc fromSterling, Va. and received at XVhite Sands on a loran-type indicator, pulse groups being photographed everyminute during the failure and recovery period. The cwpower at WWV was 9 kw into a half-wave vertical an-tenna and the peak power at Sterling was 700 kw into arhombic antenna, a 40-microsecond pulse being used.
RESULTSAn examination was made of a number of field-
strength records for the summer and late fall in con-junction with accompanying pulse records. With regardto the field-strength records, in general, there were largedifferences between individual days and between sea-sons. However, certain common characteristics were
9'i-4 August
Authorized licensed use limited to: NIST Research Library. Downloaded on August 11, 2009 at 12:23 from IEEE Xplore. Restrictions apply.

Silberstein: Interpretations of HF Field-Intensity Records
noted and made more readily identifiable by the use ofpulses. The simpler records were those for late fall be-cause of an absence of the Fl-layer and because the rateof change of ionization at the beginning and end of skipwas very fast.
Y
50
10 <
so E
I
Fig. 1-Field Intensity of WVWV, 15 mc, received at White SandsProving Ground, N. M., with concurrent pulse delay times for anadjacent frequency arriving over almost the same path, December1-2, 1950.
Fig. 1 shows a field-strength recording made on De-cember 1, 1950 which illustrates a typical late fall or
winter record. The time is Greenwich Civil Time and
,
umminI=m~n~rw
Path recovery 1247 to 1405 Path failureGCT, December 1 2248 GCT, December 1 to
0136 GCT, December 2
Fig. 2-Typical pulse patterns received at White Sands, December1-2, 1950.
reads from right to left. Below the periods of rise andfall are superposed scalings of relative delay times of thevarious modes as shown by the pulse positions on theloran indicator. Zero delay is taken as the time of ar-
rival of the first pulse, presumably propagated by theone-hop F2-mode; occasional solid lines indicate groupsof many peaks, or strong peaks with indefinite separa-tion. Fig. 2 is a group of A-scope photographs of the
pulse groups, the time here being GCT on a 12-hourbasis.
In Fig. 1 the field intensity of WWV is seen risingabove the noise level at 1246. At 1247 a single dot onthe record indicates a pulse seen in the noise. At 1250two pulses are seen separated by about 0.1 millisecond.In the succeeding minutes there are usually two pulsesseparating in range as time increases. The first pulse isthe one-hop f2 low ray and the second pulse the one-hopf2 high, or Pedersen, ray. The phenomenon of the lowand high rays may be explained by the theory ad-vanced by Appleton and Beynon3 or by application ofSmith's transmission curves to vertical-incidenceionospheric data.4 A continuous photographic plot ofechoes showing both low and high rays appears in amemorandum by Pierce.'As the high ray increases in delay and dies out in in-
tensity the cw signal increases in intensity, rising toabout 20 db above the noiEe in the first 4 minutes andreaching a peak of about 35 db above the noise by 1310.This peak represents a focusing effect pointed out byEckersley5 and others.
After 1310 the field intensity drops about 20 db, withthe high ray presumably delayed even more, and fallsbelow the noise level. A minimum intensity of the cwfield is reached at 1340 after a fall of about 15 db. Up tothis time the cw signal is seen to fade at a rapid rate.It seems reasonable to say that these fades are partlycaused by interference between waves propagated bydifferent modes, such as the low and the high modes seenon the pulse record, (c), and partly because of the effectof interference within a single mode (d).7At 1348 a pulse group is first seen at 0.65 millisecond
spreading upward and downward as time progresses.This pulse group is most probably the start of two-hoppropagation, the spread being due to the formation oflow and high rays. Coincidentally, with its appearancethe field-intensity curve rises to a maximum which itreaches within two or three minutes. The group ofechoes starting and persisting at about 0.35 millisecondis possibly an M-type reflection.The presence of waves coming via a two-hop mode
along with those coming via one hop is identifiable di-rectly on the field-intensity records by coarse fadingcycles of duration of the order of 30 minutes.These fading cycles are most probably caused by
beats between the one- and two-hop modes due to
'E. V. Appleton and W. J. G. Beynon, "The application ofionospheric data to radio communication problems," Proc. Phys. Soc.(London), vol. 52, pt. I, p. 518; July, 1940; vol. 59, pt. II, p. 58;January, 1947.
4 N. Smith, "The relation of radio sky-wave transmission to iono-spheric measurements," PROC. I.R.E., vol. 27, pp. 332-347; May,1939.
5 J. A. Pierce, "The frequency dependence of ionospheric maxi-mum speeds," Cruft Laboratory, Harvard University, TechnicalMemorandum No. 4, Contract N50RI-76 Task Order No. 28, Officeof Naval Research, May 5, 1949.
6 T. L. Eckersley, "Studies in radio transmission," Jour. IEE,vol. 71, pp. 405-459; September, 1932.
7 J. A. Ratcliffe, "Diffraction from the ionosphere and the fadingof radio waves," Nature, vol. 162, p. 9; July, 1948.
1952 975
Authorized licensed use limited to: NIST Research Library. Downloaded on August 11, 2009 at 12:23 from IEEE Xplore. Restrictions apply.
PROCEEDINGS OF THE I.R.E.
changes in the relative path lengths for the two modes.The existence of swells in the F2 region of the ionosphereof 5 to 30 minutes in length has been fairly well demon-strated by Ross8 in lateral-deviation experiments withprecision direction finders and by other experimentersin other ways.9 Such swells, having greater effect inchanging total path length for the relatively high-angletwo-hop mode at its two reflecting regions than for therelatively low-angle one-hop mode at its one reflectingregion, could well produce beats of the order of magni-tude of 30 minutes. A characteristic beat-wave form hassharp spikes at the bottom and is rounded on top. Thepeaks appearing at the tops of the two-hop fading-pat-tern maxima in Fig. 1 are probably due to momentarymaxima of the individual modes.The middle of the day is characterized on the cw rec-
ord by a slight drop of the average curve to a minimumat about noon over the path or around 1800 or 1900GCT. No pulse patterns were available for the period.At 2248 pulse delay times are recorded again with
multiple 2-hop echo groups at delay times starting at
0.5 millisecond. By 2310 the last 2-hop pulse echo isseen at 0.75-millisecond delay. Sometimes a 2-hop focuseffect is seen just before 2-hop failure, but does not ap-pear on this record; ionospheric irregularities probablymasked the effect. A build-up to one-hop focus now be-gins. A high ray is first seen at 2315 on the pulse plot.As the rays merge the focus field intensity rises, aidedby the decrease in ionospheric absorption at the end ofthe day, the peak of focus being reached at about 0005.At 0031 the pulses observed were weakest, well merged,and had a scattered appearance. The field-intensityrecord at this point is at the end of a 15-db drop. A field-intensity rise beyond this point is followed by an appar-ent spreading of the pulse groups, indicating a partialrecovery of propagation, such as would be caused by theappearance of another high-ionization area affordingpartial regular-layer propagation, perhaps because ofmotion of irregularities or because of pressure waves inthe F2-region. This field-intensity rise might also becaused by a drop of virtual height, resulting in a de-crease of skip distance. Since the pulses appearing afterthis first failure were fairly clean but with an occasionalappearance of a large number of modes, it is definitethat the partial recovery is not a scatter mode. Thepeak of the partial recovery of WWV appears to be at0045 although the signal was partially contaminated bythe presence of fields from WWVH in Hawaii. Begin-ning at 0120 the signal makes a final rapid drop of 18 dbto the noise level. The last pulse was seen at 0138 andWWV was last heard at 0144.
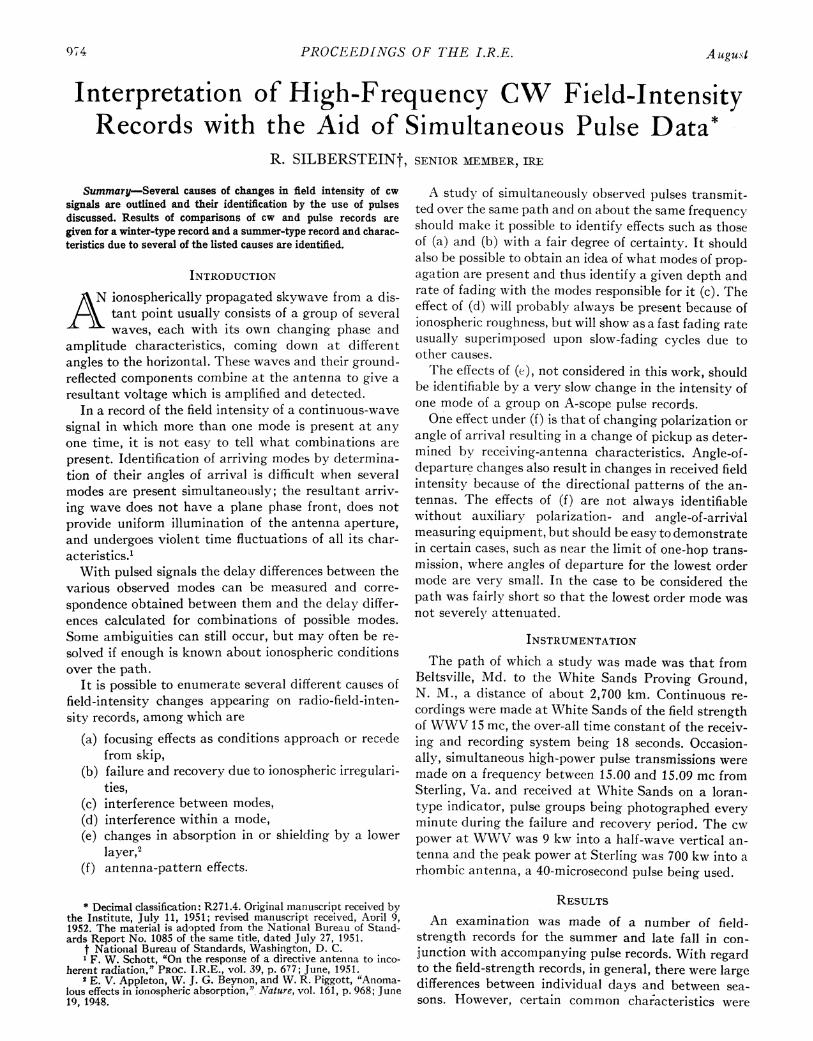
Fig. 3 is similar to Fig. 1 for a summer day, June 13-
8W. Ross, "Lateral Deviation of Radio Waves Reflected at the
Ionosph2re," Department of Scientific and Industrial Research,Radio Research Special Report No. 19, London; 1949.
Winds and turbulence in the upper atmosphere," Nature, vl.
167, pp. 626-628; April 21, 1951.
14, 1950. Pulse data were available for the failure periodonly.
v vi- -_ -TIME, GcT w -o - -u
Fig. 3-Field intensity of WWV, 15 mc, received at White SandsProving Ground, N.M., with concurrent pulse delay times for anadjacent frequency arriving over almost the same path, June 13-14, 1950.
The June 13-14 record is harder to interpret thanthat for December 1 because of the slower rates ofchange of ionization at path failure, general propagationcharacteristics approaching those for summertime iono-spheric conditions. However, the pulse pattern showsthe same general agreement with the cw pattern as wasthe case for the December record. The group of dots ata delay time of 0.9 to 1.1 milliseconds disappearing at0200 appears to be the nose of the 3-hop curve. A sharpdip of 0812 agrees with a merging of the pulsed modesand probably represents a temporary path failure. Animmediate recovery follows, corresponding to a spread-ing of the modes and a subsequent second failure cor-responding to another decrease of delay time betweenpulse groups. The final disappearance of the pulses intothe noise was at 0936, but the exact time of signal dis-appearance could not be determined because of con-tamination of the record by weak signals from WWVHin Hawaii, identifiable by interruptions on the hour andhalf hour.
Identification of the modes on the pulse patterns wasaccomplished in part by geometric calculations for thepath length and reasonable ionospheric heights, and inpart by considerations of the changes of the pulse pat-terns with time. In general, measured delay differenceswere smaller than expected, indicating lower effectiveionospheric heights.
ACKNOWLEDGMENTThe author wishes to express his thanks to Mr. E. J.
Wiewara whose careful operation of the recording gearand meticulous annotation of the log sheets were an in-valuable aid to this study.
976 A ugust
Authorized licensed use limited to: NIST Research Library. Downloaded on August 11, 2009 at 12:23 from IEEE Xplore. Restrictions apply.
Related Documents