Operations Strategy Nigel Slack Michael Lewis Third Edition

9d60986d6bde8d2f02947fd3fb19ea5f
Aug 17, 2015
Welcome message from author
This document is posted to help you gain knowledge. Please leave a comment to let me know what you think about it! Share it to your friends and learn new things together.
Transcript

Front cover image: © Getty Images
Operations StrategyNigel SlackMichael Lewis
Third Edition
Operations Strategy
Third Edition
SlackLewis
Ideal for Advanced Undergraduate and Postgraduate students, this book builds on concepts from Strategic Management, Operations Management, Marketing and HRM to give students a comprehensive understanding of Operations Strategy.
Features
• Comprehensive and accessible with authoritative authorship and an excellent blend of theory and practice
• A European context
• Engaging case studies
• Teaching resources including an Instructor’s Manual with extensive case notes and PowerPoint slides at www.pearsoned.co.uk/slack.
New to this edition
• This new edition has once more focused on the most significant topics in the subject. The 10 chapters have been slightly rearranged to give a clearer tour through the subject. New material has been added and coverage of some of the older topics has been refreshed.
• New topics include: the relevance of the operations strategy approach to any functional strategy, the importance of operations leadership, and the concept of ‘operating models’.
• Many of the popular case studies have been retained with new cases added.
• Similarly, new examples have been included, although the most popular of the existing ones have been retained.
• The final two chapters on operations strategy implementation have been restructured around a clearer stage model.
www.pearson-books.com
Operations StrategyNigel SlackMichael Lewis
Third Edition
CVR_SLAC0445_03_SE_CVR.indd 1 24/11/2010 14:19

operations strategy

We work with leading authors to develop the strongesteducational materials in operations management,bringing cutting-edge thinking and best learningpractice to a global market.
Under a range of well-known imprints, includingFinancial Times Prentice Hall, we craft high-qualityprint and electronic publications which helpreaders to understand and apply their content,whether studying or at work.
To find out more about the complete range of ourpublishing please visit us on the World Wide Web at:www.pearsoned.co.uk

third edition
nigel slack
Michael Lewis
operations strategy

Pearson Education LimitedEdinburgh GateHarlowEssex CM20 2JEEngland
and Associated Companies throughout the world
Visit us on the World Wide Web at:www.pearsoned.co.uk
First published 2002Second edition 2008Third edition 2011
© Nigel Slack and Michael Lewis 2002, 2008, 2011
The rights of Nigel Slack and Michael Lewis to be identified as authors of this work have been asserted by them in accordance with the Copyright, Designs and Patents Act 1988.
All rights reserved. No part of this publication may be reproduced, stored in a retrieval system, or transmitted in any form or by any means, electronic, mechanical, photo-copying, recording or otherwise, without either the prior written permission of the publisher or a licence permitting restricted copying in the United Kingdom issued by the Copyright Licensing Agency Ltd, Saffron House, 6–10 Kirby Street, London EC1N 8TS.
All trademarks used herein are the property of their respective owners. The use of any trademark in this text does not vest in the author or publisher any trademark ownership rights in such trademarks, nor does the use of such trademarks imply any affiliation with or endorsement of this book by such owners.
Pearson Education is not responsible for the content of third party internet sites.
ISBN: 978-0-273-74044-5
British Library Cataloguing-in-Publication DataA catalogue record for this book is available from the British Library
Library of Congress Cataloging-in-Publication DataSlack, Nigel. Operations strategy / Nigel Slack, Michael Lewis. -- 3rd ed. p. cm. Includes index. ISBN 978-0-273-74044-5 (pbk.) 1. Production management. I. Lewis, Michael, 1969- II. Title. TS155.S563 2011 658.5--dc22 2010039430
10 9 8 7 6 5 4 3 2 114 13 12 11 10
Typeset in 9.5/12 by 3Printed and bound by Ashford Colour Press Ltd. in Gosport

Brief Contents
List of figures and tables, and exhibits from case studies xipreface xixacknowledgements xxiiipublisher’s acknowledgements xxiv
1 operations strategy – developing resources for strategic impact 1
2 operations performance 41
3 substitutes for strategy 82
4 Capacity strategy 113
5 purchasing and supply strategy 144
6 process technology strategy 181
7 improvement strategy 215
8 product and service development and organisation 246
9 the process of operations strategy – formulation and implementation 280
10 the process of operations strategy – monitoring and control 312
Case studies 341index 423


Contents
List of figures and tables, and exhibits from case studies xipreface xixacknowledgements xxiiipublisher’s acknowledgements xxiv
Chapter 1 operations strategy – developing resources for strategic impact 1Introduction 1Key questions 1Why is operations excellence fundamental to strategic success? 2What is strategy? 5What is operations strategy? 6What is the content of operations strategy? 22The operations strategy matrix 29What is the process of operations strategy? 32Summary answers to key questions 35Further reading 37Appendix: the resource-based view of the firm 38Notes on the chapter 39
Chapter 2 operations performance 41Introduction 41Key questions 42Operations performance can make or break any organisation 42The five generic performance objectives 47The relative importance of performance objectives changes over time 59Trade-offs – are they inevitable? 65Targeting and operations focus 71Summary answers to key questions 79Further reading 80Notes on the chapter 80
Chapter 3 substitutes for strategy 82Introduction 82‘New’ approaches to operations 82Key questions 83Total quality management 84Lean operations 89Business process reengineering 96Six stigma 99Some common threads 104

viii Contents
Summary answers to key questions 110Further reading 111Notes on the chapter 111
Chapter 4 Capacity strategy 113Introduction 113What is capacity strategy? 113Key questions 114The overall level of operations strategy 115The number and size of sites 124Capacity change 126Location of capacity 133Summary answers to key questions 141Further reading 142Notes on the chapter 143
Chapter 5 purchasing and supply strategy 144Introduction 144Key questions 144What is purchasing and supply strategy? 144Do or buy? The vertical integration decision 152Contracting and relationships 157Which type of arrangement? 166Supply network dynamics 167Managing suppliers over time 172Purchasing and supply chain risk 175Summary answers to key questions 178Further reading 179Notes on the chapter 180
Chapter 6 process technology strategy 181Introduction 181Key questions 182What is process technology strategy? 182Scale/scalability – the capacity of each unit of technology 185Degree of automation/’analytical content’ – what can each unit of technology do? 187Degree of coupling/connectivity – how much is joined together? 188The product–process matrix 190The challenges of information technology 196Evaluating process technology 201Summary answers to key questions 212Further reading 214Notes on the chapter 214

ix Contents
Chapter 7 improvement strategy 215Introduction 215Key questions 215Development and improvement 215Setting the direction 220Importance–performance mapping 227Developing operations capabilities 231Deploying capabilities in the market 239Summary answers to key questions 243Further reading 244Notes on the chapter 245
Chapter 8 product and service development and organisation 246Introduction 246The strategic importance of product and service development 246Key questions 247Product and service development as a process 255A market requirements perspective on product and service development 263An operations resources perspective on product and service development 268Summary answers to key questions 277Further reading 278Notes on the chapter 278
Chapter 9 the process of operations strategy – formulation and implementation 280Introduction 280Key questions 280Formulating operations strategy 281What is the role of alignment? 281Analysis for formulation 290The challenges to operations strategy formulation 293How do we know when the formulation process is complete? 295Implementing operations strategy 298Summary answers to key questions 308Further reading 310Notes on the chapter 311
Chapter 10 the process of operations strategy – monitoring and control 312Introduction 312Key questions 312Strategic monitoring and control 313

x Contents
Monitoring implementation – tracking performance 316The dynamics of monitoring and control 322Implementation risk 322Learning, appropriation and path dependency 329Summary answers to key questions 336Further reading 338Notes on the chapter 339
Case studies 341McDonald’s Corporation 343Delta Synthetic Fibres (DSF) 355The Greenville Operation 362Turnround at the Preston plant 371Disneyland Resort Paris 378Contact Utilities 389IDEO: Service Design 396Ocado versus Tesco.com 416
index 423
Supporting resourcesVisit www.pearsoned.co.uk/slack to find valuable online resources
For instructors• Complete downloadable Instructor’s Manual• PowerPoint slides that can be downloaded and used for presentations
For more information please contact your local Pearson Education sales repre-sentative or visit www.pearsoned.co.uk/slack

List of figures, tables and exhibits from case studies
FiguresFigure 1.1 Operations strategy must reflect four perspectives: top down,
bottom up, market requirements and operations resources 2Figure 1.2 Operations and process management requires analysis at three
levels: the supply network, the operation and the process 4
Figure 1.3 The relationship between the concepts of ‘the business model’ and the ‘operating model’ 9
Figure 1.4 ‘C-suite’ expertise should include strength in his or her specialist technical area, leadership responsibility, and the ability to make sure that their processes deliver the internal and external services that fulfil their organizational role 10
Figure 1.5 Four perspectives on operations strategy: top down, bottom up, market requirements and operations resources 11
Figure 1.6 Top down and bottom up perspectives of strategy for the metrology company 13
Figure 1.7 The ‘market requirement’ and ‘operations resource’ analysis of the lighting company 15
Figure 1.8 Operations strategy is the strategic reconciliation of market requirements with operations resources 23
Figure 1.9 Decomposing the ratio profit/total assets to derive the four strategic decision areas of operations strategy 27
Figure 1.10 The operations strategy matrix 30
Figure 1.11 Operations strategy matrix for Seven-Eleven Japan 32
Figure 1.12 The stages of the process of operations strategy 33
Figure 1.13 Competing Values Framework 34
Figure 2.1 This chapter looks at how the relative importance of the market requirements and operations resource perspectives change over time, how performance objectives trade off against each other, and how operations focus can lead to exceptional performance 41
Figure 2.2 Broad strategic objectives for a parcel delivery operation applied to stakeholder groups 43
Figure 2.3 Significant times for the delivery of two products/services 49
Figure 2.4 Different product groups require different performance objectives 55

xii L ist oF Figures, taBLes and exhiBits FroM Case studies
Figure 2.5 Polar diagrams for newspaper collection and general recycling services, and a proposed police performance method 55
Figure 2.6 Qualifiers, order-winners and delights expressed in terms of their competitive benefit with achieved performance 57
Figure 2.7 What is the operation doing today to develop the capabilities that will provide the ‘delights’ of the future? 58
Figure 2.8 The effects of the product/service life cycle on the operations performance objectives 60
Figure 2.9 Market requirements, operations resources and strategic reconciliation at VW over 70 years 64
Figure 2.10 The efficient frontier 68
Figure 2.11 To what extent to ethical and financial performance trade off? 72
Figure 2.12 Burning bridges behind you increases commitment but reduces flexibility 77
Figure 3.1 This chapter concerns how some organisations use ‘approaches’ to operations improvements as substitutes for strategy 82
Figure 3.2 EFQM excellence model 87
Figure 3.3 TQM elements in the four operations strategy decision categories 89
Figure 3.4 Traditional and lean synchronised flow between stages 90
Figure 3.5 The four elements of lean 91
Figure 3.6 Lean elements in the four operations strategy decision categories 95
Figure 3.7 BPR advocates reorganising (reengineering) processes to reflect the natural ‘end-to-end’ processes that fulfil customer needs 97
Figure 3.8 BPR elements in the four operations strategy decision categories 100
Figure 3.9 The DMAIC cycle of Define, Measure, Analyse, Improve and Control 102
Figure 3.10 Six Sigma elements in the four operations strategy decision categories 104
Figure 3.11 Each of the ‘new approaches’ positioned in terms of its emphasis on what changes to make or how to make changes, and whether it emphasises rapid or gradual change 107
Figure 4.1 This chapter looks at capacity strategy 113
Figure 4.2 Some factors influencing the overall level of capacity 116
Figure 4.3 Cost, volume, profit illustration 120
Figure 4.4 Unit cost curves 120

xiiiFigures
Figure 4.5 Expanding physical capacity in advance of effective capacity can bring greater returns in the longer term 124
Figure 4.6 Some factors influencing the number and size of sites 124
Figure 4.7 Some factors influencing the timing of capacity change 127
Figure 4.8 (a) Capacity-leading and capacity-lagging strategies; (b) smoothing with inventories means using the excess capacity of one period to produce inventory that can be used to supply the under-capacity period 128
Figure 4.9 (a) Capacity plans for meeting demand using either 800- or 400-unit capacity plants; (b) smaller-scale capacity increments allow the capacity plan to be adjusted to accommodate changes in demand 130
Figure 4.10 Rarely does each stage of a supply chain have perfectly balanced capacity, because of different optimum capacity increments 133
Figure 4.11 Some factors influencing the location of sites 136
Figure 4.12 A major influence on where businesses locate is the cost of operating at different locations, but total operation cost depends on more that wage costs or even total labour costs (which depend on allowances for different productivity rates). This chart illustrates what makes up the cost of a shirt sold in France. Remember, the retailer will often sell the item for more that double the cost 140
Figure 5.1 This chapter looks at purchasing and supply strategy 145
Figure 5.2 Supply networks are the interconnections of relationships between operations 146
Figure 5.3 The value net 148
Figure 5.4 Types of supply arrangement 153
Figure 5.5 Vertical integration decisions 153
Figure 5.6 The decision logic of outsourcing 156
Figure 5.7 Generic sourcing strategies 157
Figure 5.8 Supply arrangements are a balance between contracting and relationships 158
Figure 5.9 Elements of partnership relationships 161
Figure 5.10 Fluctuations of production levels along supply chain in response to small change in end-customer demand 168
Figure 5.11 Potential perception mismatches in supply chains 170
Figure 5.12 Typical supply chain dynamics 172

xiv List oF Figures, taBLes and exhiBits FroM Case studies
Figure 5.13 Matching the operations resources in the supply chain with market requirements 175
Figure 5.14 Robustness, reduction and rapidity in supply risk 177
Figure 6.1 This chapter looks at process technology strategy 181
Figure 6.2 Process technologies can be classified by the transformed resource that they process (material, information or customer processing), but many technologies integrate more than one transformed source 183
Figure 6.3 The three dimensions of process technology are often closely linked 190
Figure 6.4 The product–process matrix and the technology dimensions 191
Figure 6.5 Moving down the diagonal of the product–process matrix in retail banking 193
Figure 6.6 Market pressures are requiring operations to be both flexible and low cost 195
Figure 6.7 New developments in process technology can change the cost–flexibility trade-off 196
Figure 6.8 ERP integrates planning and control information from all parts of the organisation 199
Figure 6.9 Broad categories of evaluation criteria for assessing concepts 202
Figure 6.10 Cash inflows, outflows and requirements up to the end of the project 204
Figure 6.11 Assessing the ‘acceptability’ of a process technology 205
Figure 6.12 Performance of laboratory analysis and data-based systems 211
Figure 7.1 This chapter looks at development and organisation (operations development and improvement) 216
Figure 7.2 The ‘direct, ‘develop’, ‘deploy’ strategic improvement cycle 220
Figure 7.3 Directing improvement is a cycle of comparing targets with performance 221
Figure 7.4 Performance targets can involve different levels of aggregation 223
Figure 7.5 Different standards of comparison give different messages 226
Figure 7.6 The importance–performance matrix 228
Figure 7.7 The importance–performance matrix for TAG’s ‘overnight temperature-controlled’ service 230
Figure 7.8 The sandcone model of improvement; cost reduction relies on a cumulative foundation of improvement in the other performance objectives 232
Figure 7.9 Log-log experience curve for a voucher processing centre 233

xvFigures
Figure 7.10 Process control may be one of the most operational tasks, but it can bring strategic benefits 238
Figure 7.11 Deploying operations capabilities to create market potential means ensuring that the operations function is expected to contribute to market positioning 239
Figure 7.12 The four-stage model of operations’ contribution 241
Figure 8.1 This chapter looks at development and organisation strategy (product and service development and organisation) 246
Figure 8.2 The increasing strategic importance of product and service development 247
Figure 8.3 The link between product/service and process development can be closer in service industries 253
Figure 8.4 Operations strategy analysis for product and service development 257
Figure 8.5 A typical ‘stage model’ of the product and service development process 258
Figure 8.6 (a) The idealised development funnel; (b) the development funnel for one company 261
Figure 8.7 (a) Sequential arrangement of the stages in the development activity; (b) simultaneous arrangement of the stages in the development activity 263
Figure 8.8 Slow and/or delayed development times, which can be the result of quality or flexibility failures, will increase costs and can reduce revenue 267
Figure 8.9 The ‘vicious cycle’ of under-resourcing development capacity 269
Figure 8.10 Organisation structures for design processes 275
Figure 9.1 This chapter concerns the formulation and implementation stages of the process of operations strategy 280
Figure 9.2 In operations strategy, ‘fit’ is the alignment between market and operations capability 282
Figure 9.3 Align operations resources with market requirements, or align market positioning with operations resources capabilities 283
Figure 9.4 Alignment over time at CAG Recycling Services 287
Figure 9.5 ‘Fit’ is concerned with ensuring comprehensiveness, correspondence, coherence and criticality 296
Figure 9.6 Implementing an operations strategy that involves moving from A to B means understanding current and intended market requirements and operations resource capabilities so that the extent and nature of the change can be assessed 299
Figure 9.7 The typology of the ‘central operations’ function 301
xvi List oF Figures, taBLes and exhiBits FroM Case studies
Figure 9.8 Information relationships for the four types of central operations functions 305
Figure 10.1 This chapter concerns the monitoring and control stages of the process of operations strategy 312
Figure 10.2 Monitoring and control is less clear at a strategic level 313
Figure 10.3 Monitoring and control types 315
Figure 10.4 Process objectives for centralisation of risk assessment departments implementation 318
Figure 10.5 The measures used in the balanced scorecard 320
Figure 10.6 Excessively tight ‘fit’ can increase the risks of misalignment between market requirements and operations resource capability 323
Figure 10.7 Implementing a strategy that moves an operation from A to B may mean deviating from the ‘line of fit’ and therefore exposing the operation to risk 324
Figure 10.8 Pure risk has only negative consequences (A to C); speculative risk can be both positive (A to B) and negative (A to D or A to E) consequences 325
Figure 10.9 The reduction in performance during and after the implementation of a new technology reflects ‘adjustment costs’ 328
Figure 10.10 Single-loop learning in operations and its potential limitations 330
Figure 10.11 Double-loop learning questions the appropriateness of operations performance 331
Figure 10.12 ‘Disruptive’ technological change 324
Figure 10.13 Learning potential depends on both resource and process ‘distance’ 335
Figure 10.14 The stakeholder power–interest grid 336
tablesTable 1.1 Competitive factors for two operations grouped under
their generic performance objectives 24
Table 1.2 Some decisions in each decision area for a hotel chain and an automobile manufacturer 28
Table 1.3 The generic leadership characteristics of the Competing Values Framework 35
Table 2.1 Typical stakeholders’ performance objectives 44

xviitaBLes
Table 2.2 Examples of ‘hard’ and ‘soft’ dimensions of specification quality 48
Table 2.3 The range and response dimensions of the four types of total operations flexibility 51
Table 2.4 Internal and external benefits of excelling at each performance objective 53
Table 2.5 Multiple dimensions of sustainability 71
Table 2.6 Firms can use various criteria to ‘focus’ their operations 75
Table 4.1 Three levels of capacity decision 115
Table 4.2 Analysis of existing operation and two options 126
Table 4.3 The advantages and disadvantages of pure leading, pure lagging and smoothing-with-inventories strategies of capacity timing 129
Table 5.1 How in-house and outsourced supply may affect an operation’s performance objectives 154
Table 5.2 A summary of some problems that can arise from asymmetric information 159
Table 5.3 Understanding the qualitative dynamics of supply chains 171
Table 5.4 Coordinating mechanisms for reducing supply chain dynamic instability 173
Table 5.5 Indicative purchasing and supply-related risks 176
Table 6.1 Some process technologies classified by their primary inputs 184
Table 6.2 Evaluating the acceptability of process technology investment on market criteria 207
Table 6.3 The four dimensions of ‘strategic’ operations resources 209
Table 7.1 Some features of breakthrough and continuous improvement (based on Imai) 218
Table 7.2 The degree of process change can be characterised by changes in the arrangement and nature of process activities 219
Table 7.3 Some typical partial measures of performance 225
Table 7.4 Characteristics of Bohn’s eight stages of process knowledge 235
Table 8.1 The degree of product/service change can affect both its external appearance and its internal methodology/technology 249
Table 9.1 Internal and external ‘defensive’ static mechanisms of sustainability 289
Table 9.2 Some possible operations-related factors in a SWOT analysis 291
Table 10.1 Type I and type II errors for the control of an operations strategy implementation 329

xviii L ist oF Figures, taBLes and exhiBits FroM Case studies
exhibits from case studies
Mcdonald’s Corporation 353
Exhibit 1 McDonald’s original menu 353
Exhibit 2 McDonald’s menu, 1992 354
delta synthetic Fibres (dsF) 355
Exhibit 1 Current market volumes by product and region, 2004 (millions of kg) 360
Exhibit 2 Forecasts Britlene and Brition ranges 360
Exhibit 3 Estimated Brition capital costs 361
turnaround at the preston plant 371
Exhibit 1 Typical process control charts (May 1998) 376
Exhibit 2 Typical process control charts (January 1999) 377
ideo: service design 396
Exhibit 1 IDEO practice areas as of January 2005 410
Exhibit 2 IDEO’s product development process 411
Exhibit 3 IDEO method cards 413
ocado versus tesco.com 416
Exhibit 1 Key data overview Ocado vs. Tesco.com 420

preface
Operations strategy is important to any type of enterprise and, just as important, to any type of manager. It can have a huge impact on the success of any type of enterprise, and the contribution of any function within the enterprise – not just in the short term, but on an enduring basis. Just look at those companies that have transformed their prospects through the way they manage their operations resources strategically. Amazon, Apple, Google, IKEA, Tesco, Singapore Airlines, SAB Miller, Seven-Eleven Japan, Toyota, Zara and many more – all have developed their strategic operations capabilities to the point where they represent a formidable asset. (And all are amongst the many examples to be found in this book.) These firms have found that it is the way they manage their operations, and their resources in general, which sets them apart from, and above, their competitors. The dilemma is that when we talk about ‘operations’, we must include the major-ity of the firm’s resources, because contributing to creating the firm’s services and products is such an all-consuming task. And when something is all around us, as operations resources are, it can be difficult to see them in their entirety. This is the paradox of operations strategy. It lies at the heart of how organisations manage their strategic intent in practice, and is vitally important for long-term success. Yet it is also so all-embracing that it becomes easy to underestimate the significance of the subject. If you doubt the importance of the subject, the following are just some of the decisions with which operations strategy is concerned.
●● How should the organisation satisfy the requirements of its customers?●● How should each function within the organisation satisfy the requirements of its
internal customers?●● What intrinsic capabilities should the organisation try to develop as the founda-
tion for its long-term success?●● How specialised should the organisation’s activities become?●● Should the organisation sacrifice some of its objectives in order to excel at others?●● How big should the organisation be?●● Where should the organisation locate its resources?●● When should it expand or contract, and by how much?●● What should it do itself and what should it contract out to other businesses?●● How should it develop relationships with other organisations?●● What type of technology should it invest in?●● How should it organise the way it develops new products and services?●● How should it bind together its resources into an organisational structure?●● How should the organisation’s resources and processes be improved and devel-
oped over time?●● What guiding principles should shape the way any organisation formulates its
operations strategies?
All these questions are not merely important, they are fundamental. No organi-sations whether large or small, for-profit or not-for-profit, in the services or

xx preFaCe
manufacturing sector, international or local, can ignore such questions. Operations strategy is central, ubiquitous, and vital to any organisation’s sustained success.
new to this edition
The success of the previous two editions was helped by the many suggestions we received from fellow teachers of operations strategy. They have been kind enough to provide further feedback, which has informed the changes we have made for the third edition. These changes include the following.
●● An approach that highlights the relevance of operations strategy ideas to all func-tions within any type of business or non-profit organisation.
●● Some new and updated examples, which cover the topical issues in operations strategy.
●● An approach to the ‘process’ of operations strategy that clearly distinguishes between the stages of ‘making operations strategy happen’.
●● Moving the chapter on ‘substitutes for strategy’, introduced in the second edi-tion, to a position earlier in the book so as to distinguish between ‘improvement approaches’ and strategy before the individual components of operations strategy are covered. We believe that this results in a more logical flow of ideas.
●● Introducing some new longer cases, but retaining those which proved popular from the previous edition. These cases can still be used to form the basis of a whole course in operations strategy.
the aim of this book
The aim of this book is to provide a treatment of operations strategy which is clear, well structured, and interesting. It seeks to apply some of the ideas of operations strategy to a variety of businesses and organisations. The text provides a logical path through the key activities and decisions of operations strategy as well as covering the broad principles which underpin the subject and the way in which operations strategies are put together in practice. More specifically, the text aims to be:
●● Balanced in its treatment of the subject. In addition to taking the orthodox ‘mar-ket-led’ approach to operations strategy, the book also provides an alternative but complementary ‘resource-based’ perspective.
●● Conceptual in the way it treats the decisions, activities and processes which together form an organisation’s operations strategy. Although some examples are quantified, the overall treatment in the book is managerial and practical.
●● Comprehensive in its coverage of the more important ideas and issues which are relevant to most types of business. In any book covering such a broad area as operations strategy, one cannot cover everything. However, we believe that the more important issues are all addressed.
●● Grounded in the various bodies of knowledge which underpin operations strat-egy. Theory boxes are included in most chapters which introduce concepts and principles, often from other academic disciplines, which illuminate the particular operations strategy issue being discussed.

xxidistinCtive Features
●● International in the examples it uses to describe practical operations strategy issues.
Who should use this book?
This book is intended to provide a broad introduction to operations strategy for all students who wish to understand the strategic importance and scope of the opera-tions function. For example:
●● MBA students, who should find that it both links and integrates their experience and study of operations management with their core studies in business strategy.
●● Higher-level undergraduates studying business or technical subjects, although we assume a prior knowledge of the basics of operations management.
●● Postgraduate students on other specialised Masters degrees, who should find that it provides them with a well-grounded approach to the subject.
●● Executives, who will also be able to relate the practical and pragmatic structure of the book to the more conceptual and theoretical issues discussed within the structure.
distinctive features
Clear structure
The book employs coherent models of the subject that run through each part of the text and explain how the chapters fit into the overall subject. Key questions set the scene at the beginning of each chapter and also provide a structure for the summary at the end of each chapter.
illustration-based
The study of operations, even at a strategic level, is essentially a practical subject and cannot be taught in a purely theoretical manner. Because of this we have used both abstracted examples and ‘boxed’ examples which explain some issues faced by real operations.
theory
Operations strategy is a practical subject, which is driven by theoretical ideas. Most chapters contain one or more theories which explain the underpinning ideas which have contributed to our understanding of the issues being discussed.
Case studies
The book includes a number of case studies suitable for class discussion. The cases are long enough to provide depth, and serve as illustrations which can be used to supplement class sessions.
selected further reading
Every chapter ends with a list of further reading which takes the topic covered in the chapter further, or treats some important related issues.

xxii preFaCe
Website
A website is available which helps students to develop a firm understanding of each issue covered in the book and provides lecturers with pedagogical assistance. There is also a teacher’s manual available.
Chapters
Chapter 1 defines operations strategy in terms of the reconciliation between market requirements and operations resources.
Chapter 2 looks at three interrelated issues which affect reconciliation – how opera-tions change over time, how operations deal with trade-offs, and how trade-offs can be used to understand ‘targeted’, or focused, operations.
Chapter 3 examines some of the popular approaches to improving operations per-formance. These are total quality management (TQM), lean operations, business process reengineering (BPR), and Six-Sigma. Although they are not strategies as such, implementing any of them is a strategic decision.
Chapter 4 examines those decisions which shape the overall capacity of the opera-tions resources, particularly the level of capacity and where the capacity should be located, and deals with the dynamics of the capacity decision by examining how capacity is changed over time.
Chapter 5 looks at supply networks, particularly the nature of the relationships which develop between the various operations in a network, the advantages of taking a total network perspective, and how networks behave in a dynamic sense.
Chapter 6 characterises the various types of process technology which are at the heart of many operations; in particular, it looks at the effects of some newer types of technology on operations capabilities, and proposes some ideas which help opera-tions to choose between different technologies and implement them once chosen.
Chapter 7 examines the way operations resources can be developed and improved within the organisation, and especially how capabilities can be directed, developed and deployed in a cycle of improvement.
Chapter 8 applies some of the issues covered in the previous chapters to the activi-ties associated with product and service development and organisation.
Chapter 9 is concerned with ‘how’ to reconcile market requirements with operations resources over the long term. In particular it looks at the first two of the four stages of the process of operations strategy, namely formulation and implementation.
Chapter 10 looks at the second two stages of the four stages of the process of opera-tions strategy, namely monitoring and control.

acknowledgements
Again we have been fortunate enough to receive advice from a number of leading aca-demics and industrialists: in particular, Pär Åhlström of Chalmers University, David Barnes of the Open University, Alan Betts of ht2, Ruth Boaden of Manchester Business school, Mike Bourne of Cranfield University, Paul Coghlan of Trinity College Dublin, Henrique Correa of Rollins College, Roland van Dierdonck of the University of Ghent, Kasra Ferdows of Georgetown University, Keith Goffin of Cranfield University, Mike Gregory of Cambridge University, Christer Karlsson of Copenhagen Business School, Bart McCarthy of Nottingham University, Samuel B. Larsen of IHK (Copenhagen University College of Engineering), Arunkumar Madapusi of Drexel University, John Mills of Cambridge University, Chris Morgan of Cranfield University, Andy Neely of Cranfield University, Ken Platts of Cambridge University, Ed Burns of the University of Toronto, Martin Spring of Lancaster University, Ann Vereecke of the University of Ghent, and Dr Gera Welker of The University of Groningen. Our academic colleagues at Warwick and Bath Universities also helped us, both by contributing ideas and by creating a lively and stimulating work environment. At Warwick our thanks go to Dr Dan Chicksand, Dr Mihalis Giannakis, Professor Bob Johnston, Dr Zoe Radnor, Dr Mike Shulver, Dr Rhian Silvestro, Dr Helen Walker, Dr Nick Wake, Paul Wally and, in particular, Dawei Lu of Warwick Manufacturing Group, who provided both ideas and materials for examples. At Bath our thanks go to Dr Alistair Brandon-Jones, Professor Andrew Brown, Professor Chris McMahon, Professor Steve Culley, Dr Mickey Howard, Dr Thomas Johnsen; and also research students Catherine Phillips, Richard Johns, Lisa Brodie, Richard Battams and Jens Roehrich. We are also grateful to many friends, colleagues, and company contacts. In partic-ular, thanks go to Peter Norris of the Royal Bank of Scotland, David Garman of TDG plc, Hans Mayer of Nestlé, Gillian McGrattan of NS&I, Philip Godfrey and Cormack Campbell of OEE, Graeme Green of QBE, John Tyley of Lloyds TSB, Professor Kasra Ferdows of Georgetown University, Professor Glenn Schmidt, also of Georgetown University, Professor Jose Machuca, Dr Andrew Court of QinetiQ, Tony Solomons, Chris Spencer and Maurice Dunster of Waitrose, John Palmer of the Welsh Assembly, Nathan Travis of Gloucestershire Fire and Rescue, John Richardson of Elizabeth Shaw, Dr Hanno Kirner of Rolls Royce Motors and Dr Karin Breu of Linde. Mary Walton is the coordinator of the Warwick Business School Operations Management Group. She will claim that she did not contribute to this book. In fact her cheerful disposition and (largely forlorn) efforts to keep us organised have con-tributed more than she could imagine. The team from Pearson Education provided their usual high professional support. Particular thanks go to Matthew Walker, Sophie Playle, Mary Lince, Astrid DeRidder and Oli Adams. Finally, and most importantly, we would like to thank our wives, Angela and Helen, for their forbearance and their unwavering support.
Nigel SlackMichael Lewis
publisher’s acknowledgements
We are grateful to the following for permission to reproduce copyright material:
Figures
text
Figure 1.13 reprinted by permission, Quinn, R. E. and Rohrbaugh, J. A spatial model of effective criteria: Towards a competing values approach to organizational analysis, Management Science, 29 (3) 363-377 (©1983), the Institute for Operations Research and the Management Sciences (INFORMS) 7240 Parkway Drive, Suite 300, Hanover, MD 21076 USA; Figure 5.7 from European Management Journal, Vol 26, McIvor, R., What Is The Right Outsourcing Strategy For Your Process?, 24-34, Copyright 2008, with permission from Elsevier; Figure 5.13 from What is the right supply chain for your product?, Harvard Business Review, March-April, 105-116 (Fischer, M.C. 1997); Figure 10.3 from Accounting, Organizations and Society, Vol. 6, No. 3, Hofstede, G., Management Control of Public and Not-For-Profit Activities, 193-211, Copyright 1981, with permission from Elsevier; Figure 10.12 from The Innovator’s Dilemma, Harvard Business School Press (Christenson, C.M. 1997) p. xvi; Figure 5.10 from Operations Management, Financial Times Prentice Hall (Slack et al. 2007), © The Financial Times Ltd.
Case Study 1: Copyright © 1992 by the President and Fellows of Harvard College. Harvard Business School Case 693-028. This case was prepared by Professor David Upton and Joshua Margolis as the basis for class discussion rather than to illustrate either effective or ineffective handling of an administrative situation. Reprinted by permission of Harvard Business School; Case Study 6 from Contact Utilities, pub-lished by Michael Shulver and Nigel Slack; Case Study 7 from IDEO: Service Design (A), 606-012-1 (2008), This case was written by Ritesh Bhavnani, Research Associate and INSEAD MBA (July 2004), and Manuel Sosa, Assistant Professor of Technology and Operations Management at INSEAD, as basis for class discussion rather than to illustrate either effective or ineffective handling of an administrative situation. The information in this case has been obtained from both public sources and company interviews. Copyright © 2006 INSEAD; Case Study 8 from Ocado Versus Tesco, IMD, 3-0323 (Keller-Birrer, V. and Tsikriktsis, N.), Copyright ©2010 by IMD International Institute for Management Development, Lausanne, Switzerland. Not to be used or reproduced without prior written permission directly from IMD
In some instances we have been unable to trace the owners of copyright material, and we would appreciate any information that would enable us to do so.

chapter
Operations strategy – developing resources for strategic impact
1
For many in business the very idea of an ‘operations strategy’ is a contradiction in terms After all, to be involved in the strategy process is the complete opposite of those day-to-day tasks and activities associated with being an operations manager. Yet at the same time we know that operations can have a real strategic impact. For many enduringly remarkable enterprises, from Amazon to IKEA, and from Apple to Zara – operations resources are central to long-term strategic success. Moreover, these firms have found that it is the way they manage their operations that sets them apart from, and above, their competitors. Just as revealing, when companies stumble, it is often because they have either taken their eye off the operations ball, or failed to appreciate its importance in the first place. More generally, all enterprises, and all parts of the enterprise, need to prevent strategic decisions being frustrated by poor operational implementation. And this idea leads us to the second purpose of this book: to show how, by using the principles of operations strategy, all parts of any business, and all functions of a business can contribute effectively to the overall suc-cess of the business. So the idea of ‘operations strategy’ has two different but related meanings. The first is concerned with the operations function itself, and how it can contribute to strategic success. The second is concerned with how any function can develop its processes and resources and establish its strategic role. This is the first chapter of the book, and we look at both these meanings of opera-tions strategy and how all parts of the business can use four perspectives on opera-tions strategy to establish a connection between strategy and operational process and resources.
Introduction
●● Why is operations excellence fundamental to strategic success?
●● What is strategy?
●● What is operations strategy?
●● how should operations strategy reflect overall strategy?
●● how can operations strategy learn from operational experience?
●● how do the requirements of the market influence operations strategy?
●● how can the intrinsic capabilities of an operation’s resources influence operations strategy?
●● What is the ‘content’ of operations strategy?
●● What is the ‘process’ of operations strategy?
key questIOns
2 chapter 1 • OperatIOns strategy – develOpIng resOurces fOr strategIc Impact
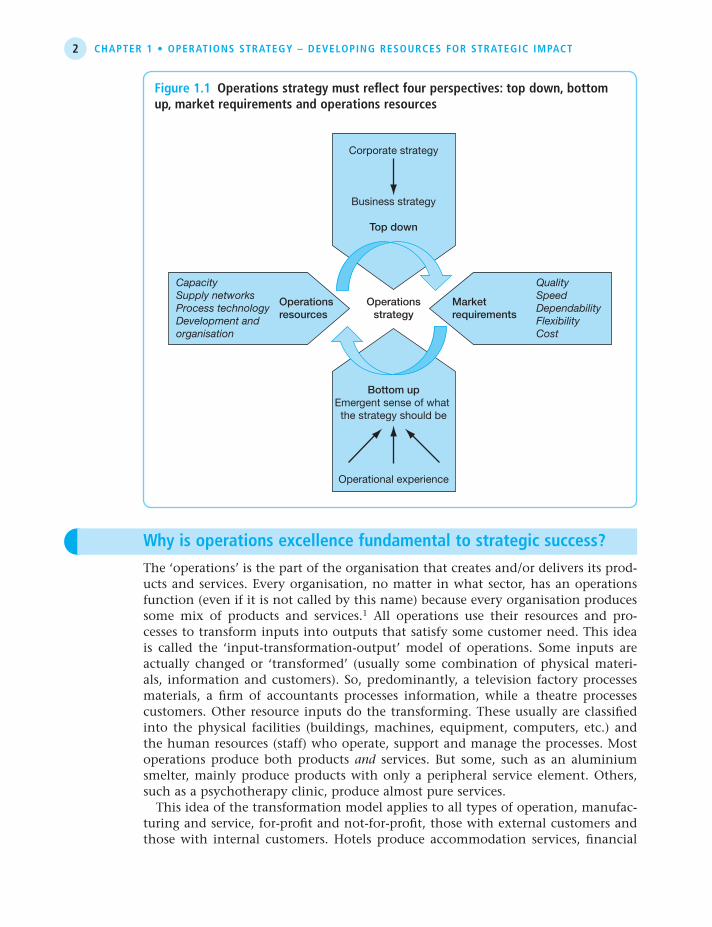
The ‘operations’ is the part of the organisation that creates and/or delivers its prod-ucts and services. Every organisation, no matter in what sector, has an operations function (even if it is not called by this name) because every organisation produces some mix of products and services.1 All operations use their resources and pro-cesses to transform inputs into outputs that satisfy some customer need. This idea is called the ‘input-transformation-output’ model of operations. Some inputs are actually changed or ‘transformed’ (usually some combination of physical materi-als, information and customers). So, predominantly, a television factory processes materials, a firm of accountants processes information, while a theatre processes customers. Other resource inputs do the transforming. These usually are classified into the physical facilities (buildings, machines, equipment, computers, etc.) and the human resources (staff) who operate, support and manage the processes. Most operations produce both products and services. But some, such as an aluminium smelter, mainly produce products with only a peripheral service element. Others, such as a psychotherapy clinic, produce almost pure services. This idea of the transformation model applies to all types of operation, manufac-turing and service, for-profit and not-for-profit, those with external customers and those with internal customers. Hotels produce accommodation services, financial
Operationsstrategy
Operationsresources
Marketrequirements
CapacitySupply networksProcess technologyDevelopment andorganisation
QualitySpeedDependabilityFlexibilityCost
Corporate strategy
Business strategy
Top down
Bottom upEmergent sense of what the strategy should be
Operational experience
figure 1.1 Operations strategy must reflect four perspectives: top down, bottom up, market requirements and operations resources
Why is operations excellence fundamental to strategic success?

3Why Is OperatIOns excellence fundamental tO strategIc success?
services invest, store, move, or sell us money and investment opportunities, and manufacturing businesses physically change the shape and the nature of materials to produce products. Although these businesses are from different sectors (banking, hospitality, manufacturing, etc.), they share a very similar set of issues and prob-lems. In fact there are often bigger differences within economic sectors than between them. The transformation model also describes functions other than the operations function. Marketing, finance, information systems and HRM – they all transform inputs into outputs (usually services) to satisfy customer needs. Sometimes these customers are external, sometimes internal. But the principle holds true: all parts of the business and all functions of the business are, in a sense, ‘operations’.
three levels of analysis
Operations management uses the input-transformation-output model to analyse businesses at three levels. The most obvious level is that of the business itself or, more specifically, the operations function of the business. But any operation can also be viewed as part of a greater network of operations. It will have operations that supply it with the products and services it needs to make its own products and services. And, unless it deals directly with the end consumer, it will supply customers who themselves may go on to supply their own customers. Moreover, any operation could have several suppliers and several customers and may be in competition with other operations producing similar services to those it produces itself. This collection of operations is called the supply network. Also, inside the operation, there will be a network of processes. Some of these processes will be ‘operations’ processes in that they are within the operations function. But many processes in this internal net-work will be in the other functions of the business. Sales, marketing, HRM, finance and all the other functions’ processes will form part of (and hopefully be integrated with) the internal process network. What’s more, within each process there will be a ‘network’ of individual resources (technology and people). At each level of analysis, functional managers must understand the capabilities of each element, and the rela-tionship between them. This idea is called the hierarchy of operations.2
What we should expect from ‘operations’
Through the management of its resources and its networks at all levels operations management can contribute to the success of any organisation by providing what the business needs to survive and prosper (higher margins, innovative new products, unique competencies, etc.) and by satisfying its customers. It does this by achieving five broad objectives.
●● It can reduce the costs of producing products and services by being efficient in the way it transforms inputs into outputs.
●● It can increase revenue by promoting outstanding customer satisfaction through its ability to provide exceptional quality, responsiveness, reliability and flexibility.
●● It can reduce operations-related risk and promote resilience (the ability to recover after operations failure).
●● It can reduce the amount of investment (capital employed) that is necessary to pro-duce the required type and quantity of products and services. It can do this by

4 chapter 1 • OperatIOns strategy – develOpIng resOurces fOr strategIc Impact
increasing the effective capacity of the operation and by being innovative in how it uses its physical resources.
●● It can provide the basis for future innovation by building a solid base of operations-based capabilities, skills and knowledge within the business.
These five ways in which operations can contribute to any enterprise’s success are undeniably strategic. Achieving them may come through a detailed and sustained focus on operations resources and processes, but their combined effect has real value at a strategic level.
Analysis at the level of the process – a process is an arrangement of resources
Need to know – the capabilities of each unit of resource in the process and the relationship between them
Analysis at the level of the operation – an operation is an arrangement of processes
Need to know – the capabilities of each process in the operation and the relationship between them
Analysis at the level of the supply network – a supply network is an arrangement of operations
Need to know – the capabilities of each operation in the network and the relationship between them
Operational analysis
Strategic analysisFlow between operations
Flow between processes
Flow between resources (people and facilities)
figure 1.2 Operations and process management requires analysis at three levels: the supply network, the operation and the process
AESSEAL® is a UK-based engineering company, and it is a leader in its field; designing and manufacturing mechanical seals (mechanical devices that fit on rotating machines such as pumps and stop liquids leaking out), engineered seal support systems, bearing protectors and gland packing designed to maximise rotating equipment up-time. It sounds technical, and it is. It is a company that thrives on its high-tech capabilities. Yet it sees its competitive advantage as coming also from what it calls ‘exceptional customer service as standard’. Its attitude reflects an important emerging idea; that there’s really no such thing as manufactur-ing strategy – it’s all service strategy.
example aesseal3

5What Is strategy?
We have used the word ‘strategy’ several times. So what exactly is strategy? Surprisingly, it is not easy to answer what seems like a straightforward question. Linguistically the word derives from the Greek word strategos meaning ‘leading an army’. And, although there is no direct historical link between Greek military practice and modern ideas of strategy, the military metaphor is powerful. Both military and business strategy can be described in similar ways, and include some of the following.
●● setting broad objectives that direct an enterprise towards its overall goal;
●● planning the path (in general rather than specific terms) that will achieve these goals;
●● stressing long-term rather than short-term objectives;
●● dealing with the total picture rather than stressing individual activities;
●● being detached from, and above, the confusion and distractions of day-to-day activities;
Later views of strategy have introduced some of the practical realities of business based on observations of how organisations really do go about making (or not making) strategic decisions. These include the following considerations.
Because its business also involves specifying the seals for its customers, it has become as much an engineering consultant as it is a manufacturer. Chris Rea, the Chairman and owner of AESSEAL®, says, ‘Service is a vital part of the company’s strategy. Of the company’s 920 employees, just under half are in service-related jobs – most concerned with specifying the nature of the seal that AESSEAL® will make for individual customers from 20 million possible types. Our product is not a commodity. We believe our customers need an element of consultancy to make sure they get the best value from what we can provide.’ But consultancy is only one of many services available to ‘manufacturers’. Design services, installation services, spare parts supply, maintenance, online remote diagnostics, training, regular updating of control systems, the list is virtually endless. Even companies who cannot exploit some of these revenue streams can still gain from thinking of themselves as service providers. Even when a product can be made cheaper in Asia or Eastern Europe, advice, delivery, and extended service can still go some way to overcoming cost disadvantages. AESSEAL® is not alone. In all but the most commodity-like of products, the physical pres-ence of the product is not what brings in the revenue, rather it is the knowledge and service embedded in or around the product. This is a simple message but one that is only reluctantly being accepted by some manufacturing companies. Yet many successful ‘manufacturers’ derive more than half their revenues from services. Rolls Royce, who manufacture aero and other engines, GE, who manufacture many high-tech products, and many other companies are all forecasting a continued rise in service revenues. Of course, much of these revenues would not be there if they didn’t make the product in the first place. Earning money from maintaining aircraft engines, for example, is at least partly dependent on having the depth of knowledge of the engine and its technology that comes from actually having manufac-tured it. The idea of manufacturers moving towards service (which is known by the rather ugly word ‘servitisation’) is not a plea to manufacture less, but rather to think of manufactur-ing as just one component in delivering service value to customers.
What is strategy?

6 chapter 1 • OperatIOns strategy – develOpIng resOurces fOr strategIc Impact
●● Business objectives may not ever become ‘clear’. In fact, most organisations will have multiple objectives that may themselves conflict. For example, an outsourc-ing decision may improve profitability but could involve a firm in long-term reputational risk.
●● Markets are intrinsically unstable in the long term so there must be some limit to the usefulness of regarding strategy as simply planning what to do in the future. It may be more important to keep close to what is actually happening in the market and adapt to whatever circumstances develop.
●● Many decisions are far less formal than the simple planning model assumes. In fact many strategic decisions ‘emerge’ over time rather than derive from any single formal senior management decision.
●● Organisations do not always do in practice what they say they do, or even what they want to do. The only way to deduce the effect strategy of an organisation is to observe the pattern of decisions that it makes over time.
In this book we recognise the problematic nature of strategy. Nevertheless, we do offer some models and approaches that implicitly assume that managers can have some influence over the strategic direction of their organisation – even if this influ-ence may, at times, be limited. So, notwithstanding the uncertainties and complexi-ties of real strategy making, it is our belief that some kind of structure, model, or plan can help most managers to understand what they believe they should be doing. Also note that, although strategy is described here as being an ‘enterprise-level’ issue, almost everything that is contained in the previous discussion also applies to an individual function or subset of an enterprise. This is a question we shall develop later.
There is a famous story that illustrates the importance of having some kind of plan, even if hindsight proves it to be the wrong plan.4 During manoeuvres in the Alps, a detachment of Hungarian soldiers got lost. The weather was severe and the snow was deep. In these freezing conditions, after two days of wandering, the soldiers gave up hope and became reconciled to a frozen death on the mountains. Then, to their delight, one of the soldiers discovered a map in his pocket. Much cheered by this discovery, the soldiers were able to escape from the mountains. When they were safe back at their headquarters, they discovered that the map was not of the Alps at all, but of the Pyrenees. The moral of the story? A plan (or a map) may not be perfect but it gives a sense of purpose and a sense of direction. If the soldiers had waited for the right map they would have frozen to death. Yet their renewed confidence motivated them to get up and create opportunities.
example sometimes any plan is better than no plan
What is operations strategy?
One of the biggest mistakes a business can make is to confuse ‘operations’ with ‘operational’. The meaning of ‘operational’ is the opposite of strategic; it means detailed, localised, short-term and day-to-day. And operations management is very much like this. Yet ‘managing the resources and processes that produce and deliver goods and services’ should also be seen as a long-term and strategic issue. More

7What Is OperatIOns strategy?
importantly, it should be seen as one that can have a significant strategic impact. Operations strategy is concerned less with individual processes and more with the total transformation process that is the whole business. It is concerned with how the competitive environment is changing and what the operation has to do in order to meet current and future challenges. It is also concerned with the long-term develop-ment of its operations resources and processes so that they can provide the basis for a sustainable advantage. If a business does not fully appreciate the strategic impact that effective operations and process management can have it is missing an oppor-tunity. Perhaps more significantly, many of the businesses that seem to be especially competitively successful, and who appear to be sustaining their success into the longer term, have a clear (and often innovative) operations strategy. Just look at some of the high-profile companies quoted in this book, or that feature in the busi-ness press. From Tesco to IKEA, from Ryanair to Singapore Airlines, it is not just that their operations strategy provides these companies with adequate support; it is their operations strategy that is the pivotal reason for their competitive superiority. Yet some businesses, like Coca-Cola or Heinz, are more marketing and brand driven. But even these types of business need a strong operations strategy. Their brand position may be shaped in the consumer’s mind by their promotional activi-ties, but it would soon erode if they could not deliver products on time, or if their quality was sub-standard, or if they could not introduce new products in response to market trends. So, for example, a ‘fast moving consumer goods’ (FMCG) company that has operations that are capable of mastering new process technologies, or flex-ing their capacity, or running agile yet efficient supply chains, or continually cut-ting cost out of the business through its improvement programme, will have a huge advantage over less capable rivals.
from ‘business model’ to ‘operating model’
Two concepts that have emerged over the last few years are relevant to operations strategy (or at least the terms are new; one could argue that the ideas are far older). These are the concepts of the ‘business model’ and the ‘operating model’. Put simply, a ‘business model’ is the plan that is implemented by a company to generate revenue and make a profit. It includes the various parts and organisational functions of the business, as well as the revenues it generates and the expenses it incurs. In other words, what a company does and how they make money from doing it. More formally, it is ‘A conceptual tool that contains a big set of elements and their relationships and allows [the expression of] the business logic of a specific firm. It is a description of the value a company offers to one or several segments of customers and of the architecture of the firm and its network of partners for creating, market-ing, and delivering this value and relationship capital, to generate profitable and sustainable revenue streams.’5
One synthesis of literature shows that business models have a number of common elements.6
1 The value proposition of what is offered to the market.
2 The target customer segments addressed by the value proposition.
3 The communication and distribution channels to reach customers and offer the value proposition.
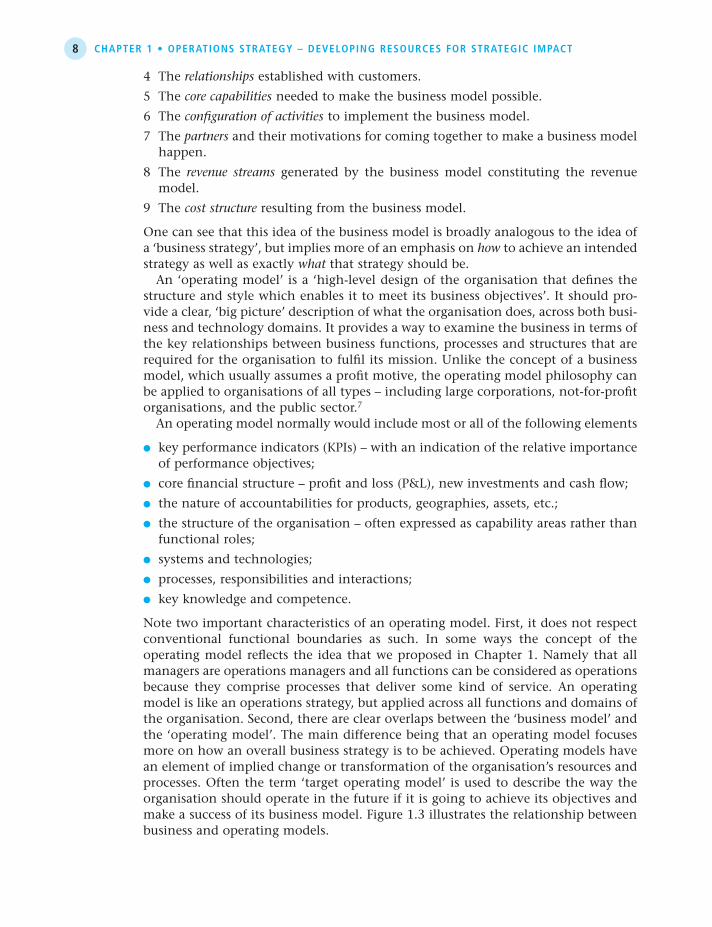
8 chapter 1 • OperatIOns strategy – develOpIng resOurces fOr strategIc Impact
4 The relationships established with customers.
5 The core capabilities needed to make the business model possible.
6 The configuration of activities to implement the business model.
7 The partners and their motivations for coming together to make a business model happen.
8 The revenue streams generated by the business model constituting the revenue model.
9 The cost structure resulting from the business model.
One can see that this idea of the business model is broadly analogous to the idea of a ‘business strategy’, but implies more of an emphasis on how to achieve an intended strategy as well as exactly what that strategy should be. An ‘operating model’ is a ‘high-level design of the organisation that defines the structure and style which enables it to meet its business objectives’. It should pro-vide a clear, ‘big picture’ description of what the organisation does, across both busi-ness and technology domains. It provides a way to examine the business in terms of the key relationships between business functions, processes and structures that are required for the organisation to fulfil its mission. Unlike the concept of a business model, which usually assumes a profit motive, the operating model philosophy can be applied to organisations of all types – including large corporations, not-for-profit organisations, and the public sector.7
An operating model normally would include most or all of the following elements
●● key performance indicators (KPIs) – with an indication of the relative importance of performance objectives;
●● core financial structure – profit and loss (P&L), new investments and cash flow;
●● the nature of accountabilities for products, geographies, assets, etc.;
●● the structure of the organisation – often expressed as capability areas rather than functional roles;
●● systems and technologies;
●● processes, responsibilities and interactions;
●● key knowledge and competence.
Note two important characteristics of an operating model. First, it does not respect conventional functional boundaries as such. In some ways the concept of the operating model reflects the idea that we proposed in Chapter 1. Namely that all managers are operations managers and all functions can be considered as operations because they comprise processes that deliver some kind of service. An operating model is like an operations strategy, but applied across all functions and domains of the organisation. Second, there are clear overlaps between the ‘business model’ and the ‘operating model’. The main difference being that an operating model focuses more on how an overall business strategy is to be achieved. Operating models have an element of implied change or transformation of the organisation’s resources and processes. Often the term ‘target operating model’ is used to describe the way the organisation should operate in the future if it is going to achieve its objectives and make a success of its business model. Figure 1.3 illustrates the relationship between business and operating models.

9What Is OperatIOns strategy?
Operations and functional strategy – the ‘c suite’ perspective
Earlier we established that the transformation model, on which operations activities are based, not only applies to all types of business, but also describes functions other than the operations function, such as marketing, finance, information systems and HRM. So it follows that, if it is helpful to take a strategic view of the ‘operations’ transformation process, it should also be worthwhile doing the same for any other organisational function. In other words, operations strategy, its frameworks, con-cepts, models and tools can form the basis of any functional strategy. Or, put another way, all functions deliver service externally or internally using their resources and processes, and just like the operations function, every function has a responsibility to make sure that the way they develop their resources and processes contributes to overall strategy. Therefore the application of operations strategy should be central to senior managers in any function. This is where we need to distinguish between the different components of expertise necessary to lead a function. There is a strong case for an appreciation of operations strategy being accepted as an essential part of ‘chief officers’’ expertise. By ‘chief officers’ we mean the managers who often carry titles such as chief finance officer (CFO), chief information officer (CIO), chief operations officer (COO), and so on. These people are often called ‘C-suite’ managers. Everyone assumes that to have reached the top of their function such people will have acquired a reasonable competence in their area of ‘technical’ expertise (finance, information, marketing, human resources, and so on). And that is a necessary, but nowhere near sufficient, condition for being an effective functional chief. So what expertise should the C-suite possess? Clearly they must be strong in their specialist technical area. Without this no one can fulfil their functional role, or become a trusted advisor to the business, or represent their function’s unique
The business model
The operating model
sets the overallpurpose andobjectives for
defines how thebusiness modelwill be achieved
Business strategy
Functional strategies
Operationaloperations
Operationalfinance
Marketingstrategy
Operationsstrategy
Financestrategy
Technologystrategy
Operationalmarketing
Operationaltechnology
figure 1.3 the relationship between the concepts of the ‘business model’ and the ‘operating model’

10 chapter 1 • OperatIOns strategy – develOpIng resOurces fOr strategIc Impact
perspective. Their expertise also should reflect their undoubted leadership respon-sibility. Chief officers are the essential link between the overall strategic direction of the business and the contribution of their function. This means contributing to the leadership team and aligning business and functional visions. But you can be technically expert and a visionary leader, yet without the resources and processes to convert expertise into action, the most insightful strategic decisions can be rendered impotent. This is the third area of expertise that is vital to any chief officer – the ability to make sure that his or her resources and processes deliver the internal and external services that fulfil its essential organisational role. Of course we are used to thinking of process in the context of operations. Unless our operations processes produce services efficiently, quickly and in an error-free way, no business can thrive. And it’s exactly the same for any other function. Poor internal or external service can hold the whole operation back; conversely, great service from great processes can help any part of the enterprise to fulfil its potential. This idea of these three areas of expertise for chief officers is shown in Figure 1.4. We can now combine two ideas. The first is that all functions have processes and resources that are (or should be) integrated with the total internal network of pro-cesses within the enterprise. The second is that all functions need to develop their processes strategically over the longer term. This has an important implication for how we think about operations strategy. Its basic principles, concepts and tools can be used to help develop the strategy of any function of any type of organi-sation. Keep this in mind when you work through each chapter. The ideas may need adapting slightly and a different terminology may be more conventional, but essentially the operations strategy approach holds true irrespective of functional responsibilities.
Delivering your expertisethrough your serviceprocesses
Technicalexpertise
Leadershipexpertise
Processexpertise
Being the trustedadvisor to the business
and representing yourfunction’s perspective
Contributing tothe leadership teamand aligning businessand functional visions
Functional‘operations
strategy’
figure 1.4 ‘c-suite’ expertise should include strength in his or her specialist technical area, leadership responsibility, and the ability to make sure that their processes deliver the internal and external services that fulfil their organisational role.
11What Is OperatIOns strategy?
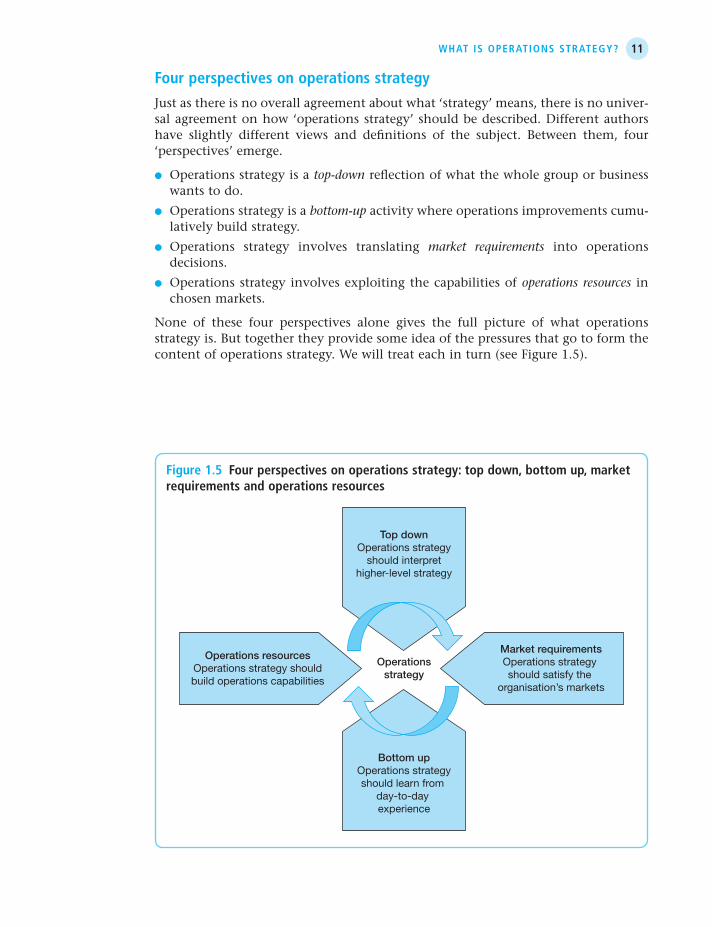
four perspectives on operations strategy
Just as there is no overall agreement about what ‘strategy’ means, there is no univer-sal agreement on how ‘operations strategy’ should be described. Different authors have slightly different views and definitions of the subject. Between them, four ‘perspectives’ emerge.
●● Operations strategy is a top-down reflection of what the whole group or business wants to do.
●● Operations strategy is a bottom-up activity where operations improvements cumu-latively build strategy.
●● Operations strategy involves translating market requirements into operations decisions.
●● Operations strategy involves exploiting the capabilities of operations resources in chosen markets.
None of these four perspectives alone gives the full picture of what operations strategy is. But together they provide some idea of the pressures that go to form the content of operations strategy. We will treat each in turn (see Figure 1.5).
Bottom upOperations strategyshould learn from
day-to-day experience
Operations resourcesOperations strategy shouldbuild operations capabilities
Market requirementsOperations strategy should satisfy the
organisation’s markets
Operationsstrategy
Top downOperations strategy
should interprethigher-level strategy
figure 1.5 four perspectives on operations strategy: top down, bottom up, market requirements and operations resources

12 chapter 1 • OperatIOns strategy – develOpIng resOurces fOr strategIc Impact
how should operations strategy reflect higher-level strategy? the top-down perspective
An operations strategy (or functional strategy) must reflect the decisions taken at the top of the organisation and which set the overall strategic direction of the organisa-tion. This is called a ‘top-down’ approach to operations strategy. So, if the organisa-tion is a large, diversified corporation, its corporate strategy will consist of decisions about what types of business the group wants to be in, in what parts of the world it wants to operate, what businesses to acquire and what to divest, how to allocate its cash between its various businesses, and so on. Within the corporate group, each business unit will also need to put together its own business strategy, which sets out its individual mission and objectives, as well as defining how it intends to compete in its markets. Similarly, within the business each function will need to consider what part it should play in contributing to the strategic and/or competitive objectives of the business by developing a functional strategy which guides its actions within the business. So, in the ‘top-down’ view, these three levels of strategy – corporate, busi-ness and functional – form a hierarchy, with business strategy forming the context of functional strategies and corporate strategy forming the context of business strategies. For example, a manufacturer of metrology instruments is part of a group that contains several high-tech companies. It has decided to compete by being the first in the market with every available new product innovation. Its operations function, therefore, needs to be capable of coping with the changes that constant innovation will bring. It must develop processes that are flexible enough to manufacture novel parts and products. It must organise and train its staff to understand the way prod-ucts are developing so that they can put in place the necessary changes to the opera-tion. It must develop relationships with its suppliers that will help them to respond quickly when supplying new parts. Everything about the operation, its technology, staff, and its systems and procedures, must, in the short term, do nothing to inhibit the company’s competitive strategy.
how can operations strategy learn from day-to-day experience? the bottom-up perspective
In reality the relationship between the levels in the strategy hierarchy is more complex than the top-down perspective implies and certainly does not represent the way strategies are always formulated. Businesses, when reviewing their strate-gies, will (hopefully) consult the individual functions within the business. In doing so they may also incorporate the ideas that come from each function’s day-to-day experience. Therefore an alternative view to the top-down perspective is that many strategic ideas emerge over time from actual experiences. Sometimes companies move in a particular strategic direction because the ongoing experience of providing products and services to customers at an operational level convinces them that it is the right thing to do. There may be no high-level decisions examining alternative strategic options and choosing the one that provides the best way forward. Instead, a general consensus emerges, often from the operational level of the organisation. The ‘high level’ strategic decision making, if it occurs at all, may confirm the con-sensus and provide the resources to make it happen effectively. This idea of strategy being shaped by experience over time is sometimes called the concept of emergent strategies.8 Strategy gradually becomes clearer over time and is based on real-life

13What Is OperatIOns strategy?
experience rather than theoretical positioning. Indeed, strategies are often formed in a relatively unstructured and fragmented manner to reflect the fact that the future is at least partially unknown and unpredictable. This may seem not to be a particularly useful guide for specific decision making. Yet while emergent strategies are less easy to categorise, the principle governing a bottom-up perspective is clear: ‘shape the operation’s objectives and action, at least partly by the knowledge it gains from its day-to-day activities’. The key virtues required for doing this are an ability to learn from experience and a philosophy of continual and incremental improvement that is built into the strategy-making process. For example, the manufacturer of metrology instruments, described earlier, dis-covers that continual product innovation both increases its costs and confuses its customers. The company’s designers therefore work out a way of ‘modularising’ their product designs so that one part of the product can be updated without inter-fering with the design of the main body of the product. This approach becomes standard design practice within the company. Note that this strategy has emerged from the company’s experience. No top-level board decision was probably ever taken to confirm this practice, but nevertheless it emerges as the way in which the company organises its designs. Figure 1.6 illustrates both the top-down and bottom-up perspectives for this example.
how do the requirements of the market influence operations strategy? the market requirements perspective
Operations exist to serve markets. So, whatever the operations strategy of an organi-sation, it must in some way reflect the requirements of the organisation’s markets. Indeed, a sensible starting point for any operations strategy is to look to its markets
Business strategy
Day-to-day experience of providing products and services to the market reveals problems and
potential solutions that become formalised into
operations strategy
Group building corporate capability in high technology products and services
Metrology division competes on ‘fast-to-market’ innovations
Experiment with ‘modular’ design of key products and components
Customers confused by continual product innovation and costs are
increasing
Emergent sense of what thestrategy should be
Operational experience
Top down
Bottom up
Corporate strategy
Top down
Bottom up
Operations strategy
Operations must have fast and flexible technology, supply
relationships, process and staffModular strategy provides flexibility and innovation at relatively low cost
Corporate objectives impact on business objectives which, in turn, influence
operations strategy
figure 1.6 top down and bottom up perspectives of strategy for the metrology company

14 chapter 1 • OperatIOns strategy – develOpIng resOurces fOr strategIc Impact
and ask the simple but important question, ‘How can operations help the organi-sation to compete in its market place?’ Remember though that the organisation itself usually has some influence over what its markets demand, if for no other reason than that it has chosen to be in some markets rather than others. Therefore, by choosing to inhabit a particular market position, the organisation is, to some extent, influencing how easy it is for the operations function to support the market position. This opens up the possibility that, in some circumstances, it may be sen-sible to shift the markets in which the organisation is trying to compete in order to reflect what its operation is good (or bad) at. We shall discuss this in more detail later; for now we return to the important point that operations strategy must reflect the organisation’s market position. And the starting point for this is to develop an understanding of what is required from the operation in order to support the market position. One problem with this is that the concepts, language and, to some extent, philosophy used by the marketing function to help them understand markets are not always useful in guiding operations activities. So, descriptions of market needs developed by marketing professionals usually need ‘translating’ before they can be used in an operations strategy analysis. Market positioning is influenced by (amongst other things) customers and com-petitors. Both, in turn, influence operations strategy. Market segmentation is a common approach to understanding markets by viewing heterogeneous markets as a collection of smaller, more homogeneous, markets. Usually this is done by assess-ing the needs of different groups of potential users in terms of the needs that will be satisfied by the product or service. Segmentation variables help to classify these needs. The marketing purpose of segmentation is to ensure that the product or service specification, its price, the way it is promoted and how it is channelled to customers are all appropriate to customer needs. However, market segmentation is also important in shaping operations strategy. The same needs that define markets will shape the objectives for an operation’s attempt to satisfy those needs. Similarly, how an organisation chooses to position itself in its market will depend on how it feels it can achieve some kind of advantage over its competitors. This, of course, will depend on how its competitors have positioned themselves. Although one particular segment of a market may look attractive, the number of other companies competing in it could deter any new entrants. However, if a company sees itself as having the operations capability of servicing that market better, even in the face of the competi-tion from other firms, it may be worth entering the market. So, both customer and competitor analysis are prerequisites to developing an effective operations strategy. For example, the original business of a medium-sized theatre lighting company was devoted to designing the lighting arrangements and hiring the necessary equip-ment for theatrical and entertainment events, exhibitions and conferences. The company could supply any specialist lighting equipment, partly because it held a wide range, and partly because it had developed close relationships with other equipment hire firms. It also focused on the ‘top end’ of the lighting market, target-ing customers who were less price-conscious. This was becoming a problem in the theatre lighting and exhibition markets because competition was forcing margins lower as competitors undercut prices. Soon they realised that the greatest potential for profitable growth lay in the conference market, where competition was not yet as fierce, and where its high (but expensive) service levels, ability to give presenta-tion advice and innovation were valued. Figure 1.7 illustrates how this analysis of

15What Is OperatIOns strategy?
the company’s customers and competitors sets the performance objectives for its operations strategy. In this case the ‘translation’ logic goes something like the following:
(a) There are several segments in the lighting design and supply market, but the fastest growing segment is the conference market.
(b) Competition is getting tougher in the theatre market because the large inter-national lighting groups are able to provide lower-cost lighting solutions. Also exhibition venues are increasingly developing in-house operations and encour-aging exhibitors to use the in-house service. Margins are being squeezed in both markets.
Resources• Equipment• Staff• Reputation• Relationships (internal and external)• Experience
Capabilities• Application of leading-edge lighting and sound technology
• Articulation of client requirements
Processes
• Integration of equipment supply and client requirements
• Design process
• Supplier liaison process
Operations strategy decisions• Location• Virtual reality technology• Supplier development• Equipment tracking system• Organisational structure• Staff meetings
Performanceobjectives
• Aesthetically innovative designs• Presentation advice• High customisation of lighting solutions• Fast and dependable supply
Market position• Traditionally differentiated on high service level in theatre and exhibition markets, innovation and service in conference market
Customers• Professional theatres (static, low margins)
• Exhibitions (slow growth, low margins)
• Conferences, etc. (fast growth, higher margins)
Competitors
• Big groups dominating professional theatres
• In-house operations growing in exhibitions market
• Conferences market still fragmented
Operations resources Market requirements
Operations strategy should satisfythe organisation’s markets
Operations strategy should buildoperations capabilities
figure 1.7 the ‘market requirement’ and ‘operations resource’ analysis of the lighting company

16 chapter 1 • OperatIOns strategy – develOpIng resOurces fOr strategIc Impact
(c) Therefore the company has chosen to target the broad conference market where margins and growth are higher.
(d) They believe they can differentiate themselves from competitors by their aes-thetically innovative designs, ability to give good presentation advice, high customisation of lighting solutions, and fast and reliable supply.
(e) Operations, therefore, needs to prioritise high-quality technical and aesthetic consultancy advice, customisation, fast response and dependability.
Although these are somewhat simplified statements, they demonstrate a path of increasing specificity, with increasing meaning to the operations function of the business. Not all businesses work through this logic in such a systematic way, nor is it intended to be a prescription as such, but it is an example, however, of how the market-operations translation process can work.
performance objectivesThe last stage of analysis in Figure 1.7 needs more explanation. This is the stage that identifies the performance objectives for the operation. That is, the aspects of opera-tions performance that satisfy market requirements and therefore that the operation is expected to pursue. Many authors on operations strategy have their own set of performance objectives, and no overall agreement exists on terminology. They are referred to variously as ‘performance criteria’, operations ‘strategic dimensions’, ‘performance dimensions’, ‘competitive priorities’ and ‘strategic priorities’. Here, we will be using the term performance objectives. While there are differences between authors as to exactly what these performance dimensions are, there are some com-monly used categories. Here, we will use a set of five performance objectives which have meaning for any type of operation (though obviously their relative priorities will differ). Within these five we will subsume the other dimensions. They are:
●● quality
●● speed
●● dependability
●● flexibility
●● cost.
Each will be examined in more detail later in this chapter.
Internal customers and the ‘market requirements’ perspective
For functional strategy, some ‘customers’ will be internal customers. By internal customers we mean the individuals or parts of the business to which the function provides internal service, as opposed to external customers, that actually buy the businesses’ products or services. Yet there is clearly a difference between internal and external customers. At a fundamental level the only real customer is the one that actually pays for products and services and provides revenues. Internal customers and the internal service providers that serve them are not ‘stand-alone’ businesses, nor would many want them to be. The obvious difference between internal and external customers is that there are no effective ‘competitors’, at least in the short term. The idea of markets and market positioning is simply inappropriate when considering functional strategy for internal service providers. More dangerously, treating internal
17What Is OperatIOns strategy?
relationships as pseudo-commercial can promote competition between supplier and customer and a general lack of internal alignment. However, the customer perspec-tive is still important for shaping functional strategy. Internal customers have needs, and functional strategy must reflect these needs. Accepting that it is important to understand internal customer requirements is a starting point. Understanding that internal customers (like external customers) may not always have fully articulated requirements is also imperative, as is to recognise that internal customer require-ments and the top-down requirements of the business may not always align.
how can the intrinsic capabilities of an operation’s resources influence operations strategy? the operations resource perspective
The resources and processes within an operation are not simply passive elements; they have an existence and a role that should be part of any operations strategy. No surprise then, that long-term resource management is often regarded as the underlying rationale for operations strategy. The problem is again one of translation, because the approach and terminology which are useful for understanding a firm’s resources are not necessarily appropriate to clarify the nature of the decisions that shape those resources. A useful starting point is to understand ‘what we have’ – that is, the totality of the resources owned by, or available to, the operation (or func-tion). Next, one needs to link the broad understanding of resources and processes with the specific operations strategy decisions (‘what actions we are going to take’). To achieve this linkage we need a concept to bridge the gap between the sometimes fuzzy understanding of ‘what is there’ and the necessarily more specific ‘what should we do?’ stages. In the operations resource perspective we use the concept of opera-tions capabilities.
Operations resources, processes, routines and capabilitiesListing its resources provides a first step in understanding an operation, but this is rather like describing an automobile by listing its component parts. To understand how an operation works we need to examine the interaction between its resources. For example, how different resources, such as processing centres, are positioned rela-tive to each other, how staff are organised into units and so on. These arrangements of resources constitute the processes of the operation that describe the way things happen in the operation. To return to the automobile analogy, processes are the mech-anisms that power, steer and control its performance. Yet even this technical explana-tion of an automobile’s mechanisms does not convey either the full extent of how it performs on the road or its style, feel and ‘personality’. Similarly, any view of an opera-tion that limits itself to a description of its obvious tangible resources and processes fails to move our knowledge of the operation beyond the most basic level. Any audit of a company’s resources and processes needs to include the organisation’s intangible resources. These are the factors that may not be directly observable but are nonetheless significant in enabling any company to function. They include such things as:
●● supplier relationships, contracts and mutual understanding of how suppliers are managed;
●● knowledge of, and experience in, dealing with technology sources and labour markets;

18 chapter 1 • OperatIOns strategy – develOpIng resOurces fOr strategIc Impact
●● process knowledge relating to the day-to-day production of products and services;
●● new product and service development skills and procedures;
●● contacts and relationships in the market which enable an understanding of market trends and more specific customer needs.
Notice how many of the issues concerning intangible assets involve not so much what an operation has but what it does. All operations have documented procedures to formalise their regular activities, such as ‘generating orders’, ‘fulfilling orders’, ‘developing new products and services’, and so on. But they also have ways of get-ting things done which are less formally documented. The effectiveness of these informal practices depends on the relationships between individual staff, their shared values and understandings of overall objectives, the tacit (non-articulated) knowledge accumulated by individuals, an understanding of ‘who knows what’ and ‘who can get things done’, and so on. It is these informal arrangements of a com-pany’s resources that go a long way to explaining the effectiveness of its operations. Not that the formal processes are unimportant. It is the combination of formal and informal processes, explicit and tacit knowledge, the intrinsic attributes of the com-pany’s resources and the way in which these resources are deployed that describes an operation’s abilities. The collective term for both formal and informal processes is the ‘routines’ of the firm. Accountants have considerable trouble when dealing with intangible resources (or invisible assets as they are sometimes called). Yet, intangible assets are often the reason for a firm’s success. Bill Gates, of Microsoft, points out that ‘. . . our primary assets, which are our software and software development skills, do not show up in the balance sheet at all’.9
It started to become clear back in October 2006. The founder and boss of Amazon, Jeff Bezos, was out speaking about the company’s plans at a number of public events. Although Amazon was seen generally as an internet book retailer and then a more general internet retailer, Bezos was actually pushing three of Amazon’s ‘utility computing’ services. These were a com-pany that provides cheap access to online computer storage, a company that allows program developers to rent computing capacity on Amazon systems, and a service that connects firms with other firms who perform specialist tasks that are difficult to automate. The problem with online retailing, said Bezos, is its seasonality. At peak times, such as Christmas, Amazon has far more computing capacity than it needs for the rest of the year. At low points it may be using as little as 10 per cent of its total capacity. Hiring out that spare capacity is an obvious way to bring in extra revenue. In addition, Amazon soon had developed a search engine, a video download business, a service (Fulfilment By Amazon) that allowed other companies to use Amazon’s logistics capability including the handling of returned items, and a service that provided access to Amazon’s ‘back-end’ technology. A couple of years later Amazon announced its EC2 (Elastic Compute Cloud) service that provides resizable computing capacity ‘in the cloud’.11 It is designed, says Amazon, to make web-scale computing easier for developers. ‘Amazon EC2’s simple web service interface allows you to obtain and configure capacity with minimal friction. It provides you with complete control of your computing resources and lets you run on Amazon’s proven computing environment. Amazon EC2 reduces the time required to obtain and boot new server instances to minutes, allowing you to quickly scale capacity, both up and down, as your computing requirements change. Amazon EC2 changes the economics of computing by allowing you to pay only for capacity that you actually
example amazon, so what exactly is your core competence?10

19What Is OperatIOns strategy?
The concepts of intangible (or invisible) resources and of routines are central to what is sometimes called the ‘resource-based view’ (or RBV) of strategic manage-ment. The resource-based view is centred on the notion that most companies con-sider themselves to be particularly good at some specific activities, but try to avoid head-to-head competition in others. The terms ‘distinctive capabilities’ or ‘distinc-tive competence’ are used to describe those unique aspects of operations through which the firm competes. While the concept of capability or competence remains somewhat ambiguous (and the words themselves are often used interchangeably), the central idea is very close to the resource-based view of the firm, namely that externally unobservable (within-firm) factors are at least as important as observ-able industry market (between-firm) factors in determining competitive advantage. However, resource-based capabilities are not a substitute for sensible market posi-tioning (even though they may be a better predictor of sustainable competitive advantage). Rather the idea is that a company’s operations capabilities can allow it to take up an attractive market position and can protect it from competitive threat. Furthermore, the sustainability of any market advantage will depend upon the advantage not being ‘competed away’ too quickly. For example, a computer chip company, such as Intel, might, at any point in time, possess a significant capability-based performance advantage over its competitors. Yet in such a hyper-competitive market its advantage may be ‘competed away’ relatively quickly, possibly in months rather than years. But even here a resource-based advantage is still exceptionally valuable, even if the advantage is relatively short-lived compared with other indus-tries. RBV is explained further in the appendix to this chapter. As an example, return to the lighting business described earlier. Its market require-ments analysis had indicated a shift towards targeting commercial companies who needed lighting designs (and often specialised equipment) for sales promotion events, conferences, displays and exhibitions. An analysis of the firm’s resources, processes and capabilities revealed that the company’s history and experience of advising theatrical producers was a valuable asset, particularly in the conference market. It allowed them to excel at understanding how to translate someone else’s vision into theatrical reality. Furthermore, their lighting and sound technicians were experienced at re-programming equipment and configuring equipment to fit almost any concept their clients wanted. These skills, combined with an intimate
use. Amazon EC2 provides developers the tools to build failure resilient applications and isolate themselves from common failure scenarios.’ Don’t worry if you can’t follow the technicalities of Amazon’s statement; it is aimed at IT professionals. The important point is that it is a business-to-business service based on the company’s core competence of leveraging its pro-cesses and technology that can make retail operations ultra-efficient. Amazon’s apparent redefinition of its strategy was immediately criticised by some observ-ers. ‘Why not,’ they said, ‘stick to what you know, focus on your core competence of internet retail-ing?’ Bezos’s response was clear. ‘We are sticking to our core competence; this is what we’ve been doing for the last 11 years. The only thing that’s changed is that we are exposing it for (the benefit of) others.’ At least for Jeff Bezos, Amazon is not so much an internet retailer as a provider of internet-based technology and logistics services. Some observers see this competency-based strategy as the future for Amazon. Larry Dignan at ZDNet observed: ‘Amazon’s real business down the line will be its cloud services. Amazon will be like a book store that sells cocaine out the back door. Books will be just a front to sell storage and cloud computing.’

20 chapter 1 • OperatIOns strategy – develOpIng resOurces fOr strategIc Impact
network of contracts with equipment and software suppliers, enabled the company to outperform competitors and eventually dominate this (for them) new market. In order to maintain its competitive advantage it opened new sites in a number of locations where existing and potential customers were located, all of which had a resident lighting and sound design expert. The company also developed a virtual reality simulation which helped demonstrate to potential customers how a set might look. This simulation was developed in consultation with key equipment suppliers, to utilise their expertise. In order to make all equipment readily available at all sites the company installed a computer-based equipment tracking and scheduling system which was integrated across all sites. It also organised periodic ‘state of play’ confer-ences where all staff discussed their experiences of serving clients. Some suppliers and customers were invited to these meetings. Consider this example and how its resources have helped it to compete so effec-tively. Figure 1.7 on page 15 illustrates how the firm has ‘translated’ an understand-ing of its resources to a set of operations strategy decisions. The translation logic goes something like this.
(a) We have a set of equipment that is sophisticated and useful in the theatre lighting business. We also have some staff that have sound and lighting design expertise.
(b) As a company we have developed a reputation for being able to take a theatre director’s ‘vision’ for a production, and use our knowledge to make it reality, even improving the original vision.
(c) What allows us to do this so well is the way we have ‘grown up together’ and are able to understand all the stages of satisfying customers, from an understanding of what equipment is available right through to managing the design, installa-tion, operating and dismantling of the production.
(d) These capabilities are particularly attractive in the commercial conference market. This is now the firm’s target market.
(e) In order to consolidate and sustain this competitive position, the company makes a number of resource decisions as to how its capabilities can be preserved, developed and deployed, for example concerning location, virtual reality tech-nology, supplier development, tracking systems, organisational structure, etc.
Keeping the market requirements and operations resource perspectives together can work in favour of those companies that have operations capabilities whose value increases because of shifts in market conditions. When many of Europe’s economies began to suffer during the 2008/09 recession, supermarkets that offered discounted products, such as the German companies Lidl and Aldi, started taking market share away from more mainstream competi-tors. Even in markets such as the UK, where Aldi and Lidl had not made a huge impact, they became amongst the fastest-growing supermarkets. This is not surprising, given that they can charge significantly less for groceries than some competitor supermarkets. So how do they do it? It may help that they are privately owned, which may encourage them to take a long-term approach to expansion. According to Jürgen Elfers, a retail ana-lyst at Commerzbank, the discounters’ stores tend to be less fancy than competitors and therefore cost less to open, and they generate rapid sales, which means that discounters can
example aldi, lidl and the ‘hard discount’ model of retailing12

21What Is OperatIOns strategy?
so what is operations strategy?
The four perspectives on operations strategy that we have outlined need not neces-sarily conflict. Nor are they ‘alternative’ views of how operations strategy should be formulated. Operations managers can hold all four views simultaneously. They simply represent alternative starting points for understanding the nature, scope and rationale of operations strategy. Bringing all four views together can even expose the dilemmas inherent within an operations strategy. In fact, operations strategy can be seen as the attempt to reconcile all four perspectives: the top-down with the bottom-up view and the market requirements with the operations resource view. In particular, the tension between the market requirements perspective and the operations resource perspective is central to all operations strategy decision making. Operations managers obviously must satisfy the requirements of the market if their enterprise is to survive in the long term. Yet simply following a market is unlikely to provide long-term competitive advantage. After all, competitors themselves will be attempting to do the same thing. To escape from being permanently ‘jerked around’ by the dynamics of the market, operations should also be attempting to develop the long-term capabilities that competitors will find difficult to imitate. This is why our definition of operations strategy, and the main theme throughout this book, encom-passes the reconciliation of market requirements with operations resources. This is actually a very complex interaction. Partly the complexity lies in the diffi-culty most organisations have in clarifying either the nature of market requirements or the characteristics of their operations resources. Sometimes this is simply because not enough effort is put into clarifying their intended markets. Some operations strategies are formulated without the context of a well-understood market and/or business strategy. But, even in better-managed companies, market requirements may be unclear. For example, a company may compete in many different markets which exhibit sometimes subtle, but nevertheless important, differences in their require-ments. Furthermore, markets are dynamic. Neither customers nor competitors are totally predictable. Customer behaviour may change for reasons that become clear only after the event. Competitor reaction, likewise, can be unpredictable and
expand during hard times more rapidly than other retailers. But this is not the only way in which they can keep costs down. Both Aldi and Lidl are ‘limited assortment’ supermarkets specialising in ‘private label’, mainly food products. Aldi has carefully focused its service concept and delivery system to attract customers in a highly competitive market. The com-pany believes that their unique approach to operations strategy makes it ‘. . . virtually impos-sible for competitors to match our combination of price and quality’. Their operations challenge the norms of retailing. They are deliberately simple, using basic facilities to keep down over-heads. Most stores stock only a limited range of goods (typically around 700 compared with 25,000 to 30,000 stocked by conventional supermarket chains). The private-label approach means that the products have been produced according to Aldi quality specifications and are sold only in Aldi stores. Without the high costs of brand marketing and advertising, and with Aldi’s formidable purchasing power, prices can be 30 per cent below their branded equivalents. Other cost-saving practices include open carton displays which eliminate the need for special shelving, no grocery bags to encourage recycling as well as saving costs, and using a ‘trolley rental’ system which requires customers to return the trolley to the store to get their coin deposit back.

22 chapter 1 • OperatIOns strategy – develOpIng resOurces fOr strategIc Impact
sometimes irrational. Above all, it is important to understand that the links between customers, competitors and market positioning are not always obvious. Market posi-tioning is not an exact science and the strategic reconciliation process of operations strategy may have to take place under conditions of both uncertainty and ambigu-ity. The operations resources side of the equation may be equally unclear. Businesses do not always know the value, abilities, or performance of their own resources and processes. Notwithstanding the popularity of the ‘core competence’ concept, organisations frequently find difficulty in identifying what are, could be, or should be, their core competences. More significantly, the resources and processes within the operation are not deterministically connected, like some machine where adjust-ments to levers of control lead inexorably to a predictable and precise change in the behaviour of the operation. The cause–effect mechanisms for most operations are, at best, only partially understood. A company may find that its intended market position is matched exactly by the capabilities of its operations resources, the strategic decisions made by its operations managers having, over time, generated precisely the right balance of performance objectives to achieve a sustainable competitive advantage in its markets. Then again, it may not. In fact, even where they are understood, the capabilities of its opera-tions resources are unlikely to be in perfect alignment with the requirements of its markets. The objective of operations strategy is to attempt this alignment over time without undue risk to the organisation. Operations managers must attempt to do this through the process of reconciliation, a process that is ongoing and iterative. We can include this concept of ‘reconciliation’ in our definition of operations strategy.
Operations strategy is the total pattern of decisions that shape the long-term capabilities of any type of operation and their contribution to overall strategy, through the reconciliation of market requirements with operations resources.
‘content’ and ‘process’
A conventional and (sometimes) useful distinction that is often used when discuss-ing strategy is that between ‘content’ and ‘process’. ‘Content’ means the collection of decisions that are made (deliberately or by default) within the operations strategy domain. Content is concerned with the strategic decisions that shape and develop the long-term direction of the operation and form the ‘building blocks’ of an opera-tions strategy. ‘Process’ means the way in which operations strategies are (or can be) formulated. It is a reflection both of what operations managers should do and of what they actually do in practice. This division is a simplification, but it allows us to examine the set of issues associated with each in a logical manner. Chapters 2 to 8 of this book are concerned with issues of the content of operations strategy, while Chapters 9 and 10 are concerned with the operations strategy process.
What is the content of operations strategy?
Operations strategy is concerned with the reconciliation of market requirements and operations resources. It attempts to influence the way it satisfies market require-ments by setting appropriate performance objectives. It attempts to influence the capabilities of its operations resources through the decisions it takes in how those resources are deployed. So, the content of operations strategy is the interaction

23What Is the cOntent Of OperatIOns strategy?
between the operation’s performance objectives and the decisions that it takes concerning resource deployment. Figure 1.8 illustrates this idea. It particularly high-lights the importance of:
●● understanding the relative importance of the operation’s performance objectives; and
●● understanding the influence on them of the decision areas that determine resource deployment.
Operations strategy performance objectives
In Figure 1.8 the market requirements perspective on operations strategy is summa-rised in terms of five generic performance objectives: quality, speed, dependability, flexibility and cost. Their purpose is to articulate market requirements in a way that will be useful to operations. However, before we can pursue the idea of performance objectives further we must take a step back in order to consider market positioning and how competitive factors are used to describe positioning. A company may try to articulate its position in the market in a number of ways. It might compare itself with a competitor: for example, ‘We wish to offer a wider range of products than Gap, but not be as expensive as Donna Karan’. Alternatively it might associate itself with the needs of a particular customer group. For example, ‘We wish to provide a level of service and attention which discerning business people expect when they stay at our hotels’. Either way, it finishes up defining market position in terms of a number of dimensions, for example, range, price, quality of service, etc. These dimensions on which a company wishes to compete are
Operationscapabilities
Tangible andintangibleresources
Operationsprocesses
Marketpositioning
Customerneeds
Competitors’actions
Required performance• Quality• Speed• Dependability• Flexibility• Cost
Operationsstrategy
decision areas
Understanding resources and
processes
Performanceobjectives
Understandingmarkets
Strategic decisions• Capacity• Supply networks• Process technology• Development and organisation
figure 1.8 Operations strategy is the strategic reconciliation of market requirements with operations resources

24 chapter 1 • OperatIOns strategy – develOpIng resOurces fOr strategIc Impact
called competitive factors. Different words will be used for different types of opera-tion, and their relative importance will change depending on how the company wishes to compete. Nevertheless, their common characteristic is that they describe the things that a customer can see or experience. Table 1.1 illustrates this idea for two contrasting operations. This clusters the competitive factors for each operation into the five generic performance objectives which they represent. Note that the two operations we have used as examples in Table 1.1 have a differ-ent view of each of the performance objectives. So, for example, the mortgage serv-ice sees quality as being at least as much about the manner in which their customers relate to their service as it does about the absence of technical errors. The steel plant, on the other hand, while not ignoring quality of service, primarily emphasises product-related technical issues. Different operations will see quality (or any other performance objective) in different ways, and emphasise different aspects. Broadly speaking though, they are selecting from the same pool of factors which together
table 1.1 competitive factors for two operations grouped under their generic performance objectives
Performance objective Mortgage services Steel plant Finance function Associated competitive Associated competitive Associated competitive factors include . . . factors include . . . factors include . . .
Quality Professionalismofstaff Percentageofproducts Accuracyofwork Friendlinessofstaff conformingtotheir Insightfulnessoffinancial Accuracyofinformation specification advice Abilitytochangedetails Absolutespecificationof Trustandrelationship infuture products withotherfunctions Usefulnessoftechnical advice
Speed Timeforcallcentreto Lead-timefromenquiryto Responsivenesstoother respond quotation function’squeries Promptadviceresponse Lead-timefromorderto Timebetweenneedfor Fastloandecisions delivery financialinformation Fastavailabilityoffunds Lead-timefortechnical andissuingit advice
Dependability Reliabilityoforiginal Percentageofdeliveries Financialinformation promisedate ‘ontime,infull’ reliablyavailablewhen Customerskeptinformed Customerskeptinformed needed,forexample,in ofdeliverydates timeformeetings
Flexibility Customisationofterms, Rangeofsizes,gauges, Customisationoffinancial suchasduration/lifeof coatings,etc.possible reports offer Rateofnewproduct Abilitytoadjustvolume Copewithchangesin introduction ofworktomeet circumstances,suchas Abilitytochangequantity, deadlines levelofdemand compositionandtiming ofanorder
Cost Interestratecharged Priceofproducts Costpertransaction Arrangementcharges Priceoftechnicaladvice completed Insurancecharges Discountsavailable Headcount(numberand Paymentterms costoffinancestaff) Facilities(officespace, informationtechnology, etc.used)

25What Is the cOntent Of OperatIOns strategy?
constitute the generic performance objective, in this case ‘quality’. So, each of the performance objectives represents a cluster of competitive factors grouped together for convenience. Sometimes operations may choose to re-bundle, using slightly dif-ferent headings. For example, it is not uncommon in some service operations to refer to ‘quality of service’ as representing all the competitive factors we have listed under quality and speed and dependability. In practice, the issue is not so much one of universal definition but rather of consistency within one, or a group of operations. At the very least it is important that individual companies have it clear in their own minds what list of generic performance objectives is appropriate to their business, what competitive factors each represents, and how each competitive factor is to be defined. However, note that cost is different from the other performance objectives. While most competitive factors are clear manifestations of their performance objec-tives, the competitive factors of ‘price’ are related to the cost performance objective. So, an improvement in cost performance does not necessarily mean a reduction in the price charged to customers. Firms that achieve lower costs may choose to take some, or all, of the improvement in higher margins rather than reduce prices.
decision areas
Also in Figure 1.8 is a set of ‘decision areas’. These are the sets of decisions needed to manage the resources of the operation. Again, different writers on operations strategy use slightly different groupings and refer to them collectively in slightly different ways, such as operations policy areas, sub-strategies or operations tasks. We shall refer to them throughout this book as operations strategy decisions or decision areas, and the groupings of decision areas that we shall use are as follows.
Capacity strategyThis concerns how capacity and facilities in general should be configured. It includes questions such as ‘What should be the overall level of capacity?’; ‘How many sites should the capacity be distributed across, and what size should they be?’; ‘Should each site be engaged in a broad mixture of activities, or should they specialise in one or two?’; ‘Exactly where should each site be located?’; ‘When should changes be made to overall capacity levels?’; ‘How big should each change in capacity be?’; ‘How fast should capacity expansion or reduction be pursued?’; and so on. Chapter 4 will deal with the decisions concerning capacity strategy.
Supply network strategy including purchasing and logisticsThis concerns how operations relate to its interconnected network of other opera-tions, including customers, customers’ customers, suppliers, suppliers’ suppliers, and so on. All operations need to consider their position in this network, both to under-stand how the dynamic forces within the network will affect them, and to decide what role they wish to play in the network. Decisions here include such things as: ‘How much of the network do we wish to own?’; ‘How can we gain an understand-ing of our competitive position by placing it in a network context?’; ‘How do we predict and cope with dynamic disturbances and fluctuations within the network?’; ‘Should we attempt to manage the network in different ways depending on the types of market we are serving?’; ‘How many suppliers should we have?’; ‘What should be the nature of our relationship with our suppliers, purely market-based or long-term partnerships?’; ‘What are the appropriate ways of managing different types of sup-plier relationships?’; and so on. Chapter 5 deals with supply network strategy.

26 chapter 1 • OperatIOns strategy – develOpIng resOurces fOr strategIc Impact
Process technology strategyThis concerns the choice and development of the systems, machines and processes that act directly or indirectly on transformed resources to convert them into finished products and services. Decisions here include such things as: ‘How should we char-acterise alternative process technology?’; ‘How should we assess the consequences of choosing a particular process technology?’; and so on. Chapter 6 will deal with process technology decisions.
Development and organisationThis concerns the set of broad- and long-term decisions governing how the opera-tion is run on a continuing basis. Decisions here include such things as: ‘How do we enhance and improve the processes within the operation over time?’; ‘How should resources be clustered together within the business?’; ‘How should reporting relationships be organised between these resources?’; How should new product and service development be organised?’. We devote two chapters to these areas. Chapter 7 will deal with the strategic improvement, and Chapter 8 with product and service development.
Why these decision areas?
All these decision areas will be familiar to managers in a wide variety of operations. However, it is possible to support this intuitive list of decision areas with a slightly more rigorous approach. To do this let us indulge in some simple ratio analysis. Essentially, ratio analysis is an attempt to decompose a fundamental ratio of some element of performance into other ratios by inserting the same measure on the top and bottom of the resulting ratios. The idea is to split the fundamental ratio into other measures so that we can understand how it is built up. The best-known exam-ples of this occur in financial accounting. Here we will do it in a slightly different way by inserting measures that have some meaning in an operations context. We are not proposing this ratio analysis as a practical analysis tool. Rather it is intended to provide some underpinning for each decision area. Figure 1.9 shows how we can do this for the fundamental ratio of profit divided by total assets, or return on assets (ROA).13
The simple ROA ratio, profit over total assets, is broken down into ‘profit/output’ and ‘output/total assets’. This first ratio (in effect, average profit) can be further broken down into average revenue minus average cost. Operations affects the former through its ability to deliver superior levels of competitive performance (better qual-ity, speed, dependability and flexibility). It affects the latter through the more pro-ductive use of its resources (lower costs). These are the two measures that have been seen as the great operations balancing act, keeping revenue high through standards of service and competitive pricing while keeping costs low. Both are a function of an organisation’s success in achieving an effective and efficient operation through its development and organisation decisions. These decisions attempt to ensure that improvement and learning continually reduce costs, while the performance of prod-ucts and services and its level of service to customers are continually increased. The other part of the decomposed ROA ratio – output/total assets – represents the output being produced for the investment being put into the operation. It is shown in Figure 1.9 broken down into three ratios, ‘output/capacity’, ‘fixed assets/total assets’ and ‘capacity/fixed assets’. ‘Output/capacity’, or the utilisation of the

27What Is the cOntent Of OperatIOns strategy?
operation, is determined by the balance of demand on the operation and its long-term ability to meet that demand. To improve ROA, utilisation needs to be as close to 1 as possible. To do this, either demand must be generated to match capacity, or the operation must develop an ability to adjust its capacity to match demand. This ratio is largely a function of an organisation’s capacity decisions. Has it managed to balance the provision of capacity with demand (output) and can it change its capac-ity to meet changing levels of demand? ‘Fixed assets/total assets’ is a ratio partially governed by the working capital requirements of the business. The smaller the work-ing capital required by the operation, the closer fixed assets is to total assets. For the operations function, working capital minimisation is often a matter of reducing the inventories in its supply network, a function of an organisation’s supply network decisions. Can the supply network maintain appropriate delivery of its products and services without carrying excessive levels of inventory? ‘Capacity/fixed assets’ is sometimes called the productivity of fixed assets. It is a measure of how much the operation has had to spend in order to acquire, or develop, its capacity. To some extent this is determined by the skill of the opera-tion’s designers and technologists. An operation that achieves the required capacity levels without needing large amounts of capital expenditure will have a better ratio than the operation that has ‘thrown money at the problem’. This ratio is largely a function of an organisation’s process technology decisions. Has it invested wisely in appropriate process technologies, which can create a sufficient volume of appropri-ate products and/or services, without excessive capital expenditure? Obviously this is not a totally clean categorisation. In some way all the decision areas will have some impact on all the ratios. For example, a company’s development
ProfitTotal assets
OutputTotal assets
= ×
=
ProfitOutput
ProfitOutput
RevenueOutput
Averagerevenue
–Cost
Output
Averagecost
=Output
Total assetsOutput
Capacity
Utilisation
×Fixed assetsTotal assets
Working capital
×Capacity
Fixed assets
Productivityof fixed assets
CapacitySupplynetwork
Processtechnology
Operations strategydecision areas
Development andorganisation
figure 1.9 decomposing the ratio profit/total assets to derive the four strategic decision areas of operations strategy
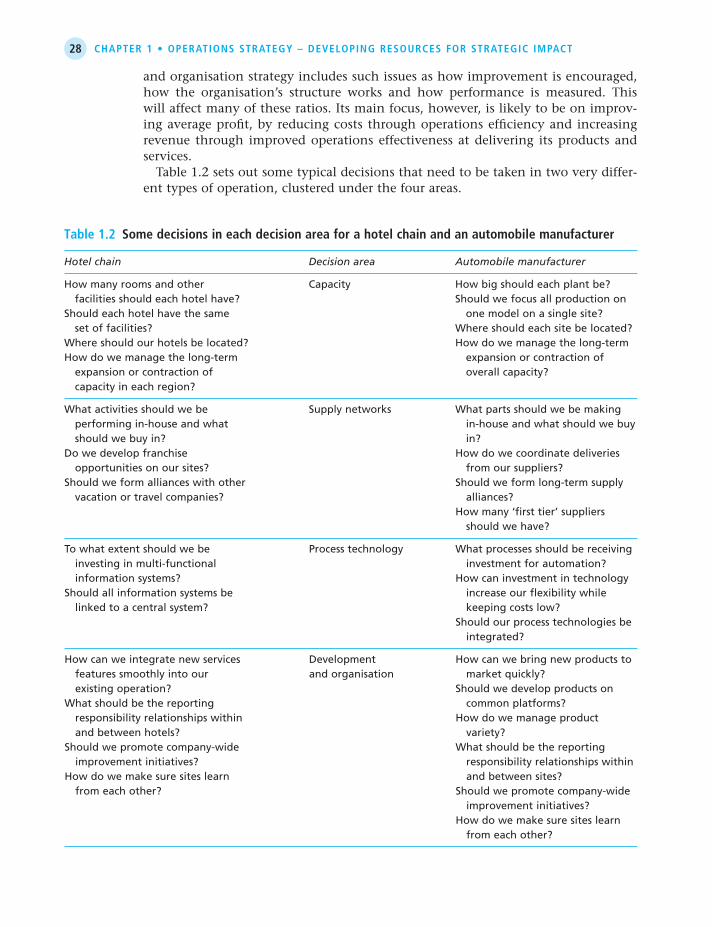
28 chapter 1 • OperatIOns strategy – develOpIng resOurces fOr strategIc Impact
and organisation strategy includes such issues as how improvement is encouraged, how the organisation’s structure works and how performance is measured. This will affect many of these ratios. Its main focus, however, is likely to be on improv-ing average profit, by reducing costs through operations efficiency and increasing revenue through improved operations effectiveness at delivering its products and services. Table 1.2 sets out some typical decisions that need to be taken in two very differ-ent types of operation, clustered under the four areas.
table 1.2 some decisions in each decision area for a hotel chain and an automobile manufacturer
Hotel chain Decision area Automobile manufacturer
Howmanyroomsandother Capacity Howbigshouldeachplantbe? facilitiesshouldeachhotelhave? ShouldwefocusallproductiononShouldeachhotelhavethesame onemodelonasinglesite? setoffacilities? Whereshouldeachsitebelocated?Whereshouldourhotelsbelocated? Howdowemanagethelong-termHowdowemanagethelong-term expansionorcontractionof expansionorcontractionof overallcapacity? capacityineachregion?
Whatactivitiesshouldwebe Supplynetworks Whatpartsshouldwebemaking performingin-houseandwhat in-houseandwhatshouldwebuy shouldwebuyin? in?Dowedevelopfranchise Howdowecoordinatedeliveries opportunitiesonoursites? fromoursuppliers?Shouldweformallianceswithother Shouldweformlong-termsupply vacationortravelcompanies? alliances? Howmany‘firsttier’suppliers shouldwehave?
Towhatextentshouldwebe Processtechnology Whatprocessesshouldbereceiving investinginmulti-functional investmentforautomation? informationsystems? HowcaninvestmentintechnologyShouldallinformationsystemsbe increaseourflexibilitywhile linkedtoacentralsystem? keepingcostslow? Shouldourprocesstechnologiesbe integrated?
Howcanweintegratenewservices Development Howcanwebringnewproductsto featuressmoothlyintoour andorganisation marketquickly? existingoperation? ShouldwedevelopproductsonWhatshouldbethereporting commonplatforms? responsibilityrelationshipswithin Howdowemanageproduct andbetweenhotels? variety?Shouldwepromotecompany-wide Whatshouldbethereporting improvementinitiatives? responsibilityrelationshipswithinHowdowemakesuresiteslearn andbetweensites? fromeachother? Shouldwepromotecompany-wide improvementinitiatives? Howdowemakesuresiteslearn fromeachother?

29the OperatIOns strategy matrIx
structural and infrastructural decisions
A distinction is often drawn in operations strategy between the strategic decisions that determine an operation’s structure, and those that determine its infrastructure. Structural issues primarily influence the physical arrangement and configuration of the operation’s resources. Infrastructural strategy areas influence the activities that take place within the operation’s structure. This distinction in operations strategy has been compared to that between ‘hardware’ and ‘software’ in a computer system. The hardware of a computer sets limits to what it can do. Some computers, because of their technology and their architecture, are capable of higher performance than others, although those computers with high performance are often more expensive. In a similar way, investing in advanced process technology and building more or better facilities can raise the potential of any type of operation. But the most power-ful computer can only work to its full potential if its software is capable of exploiting the potential embedded in its hardware. The same principle applies with operations. The best and most costly facilities and technology will be effective only if the opera-tion also has an appropriate infrastructure that governs the way it will work on a day-to-day basis. However, it is a mistake to categorise decision areas as being either entirely struc-tural or entirely infrastructural. In reality all the decision areas have both structural and infrastructural implications. Capacity strategy, since it is concerned with the physical size and location of operations, is mainly a structural issue, but can also affect the organisation’s reporting relationships systems and procedures. Similarly, supply network decisions have much to do with whether the organisation chooses to perform in-house and what it chooses to buy in, but this needs infrastructural support for communications and the development of relationships. Process technol-ogy, likewise, has its structural aspects that partly will determine the physical form of the operation, but much of an operation’s process technology will be devoted to driving the systems, procedures and monitoring systems that form its infrastructure. Even decisions within the development and organisation category, while primarily being concerned with infrastructure, can have structural elements. A set of report-ing relationships embedded within an organisational structure may reflect different locations and different process technologies.
the operations strategy matrix
We can now bring together the two perspectives of market requirements and opera-tions resources to form the dimensions of a matrix. This ‘operations strategy matrix’ is shown in Figure 1.10. It describes operations strategy as the intersection of a com-pany’s performance objectives with its decision areas. It emphasises the intersections between what is required from the operations function (the relative priority given to each performance objective), and how the operation tries to achieve this through the set of choices made (and the capabilities that have been developed) in each deci-sion. Although sometimes complex, the matrix can, at the very least, be considered a checklist of the issues that are required to be addressed. Any operation that claims to have an operations strategy presumably will be able to have some kind of story to tell for each of the intersections. It should be able to explain exactly how capacity strategy is going to affect quality, speed, dependability, flexibility or cost. It should be able to explain exactly how flexibility is influenced by capacity, supply network,
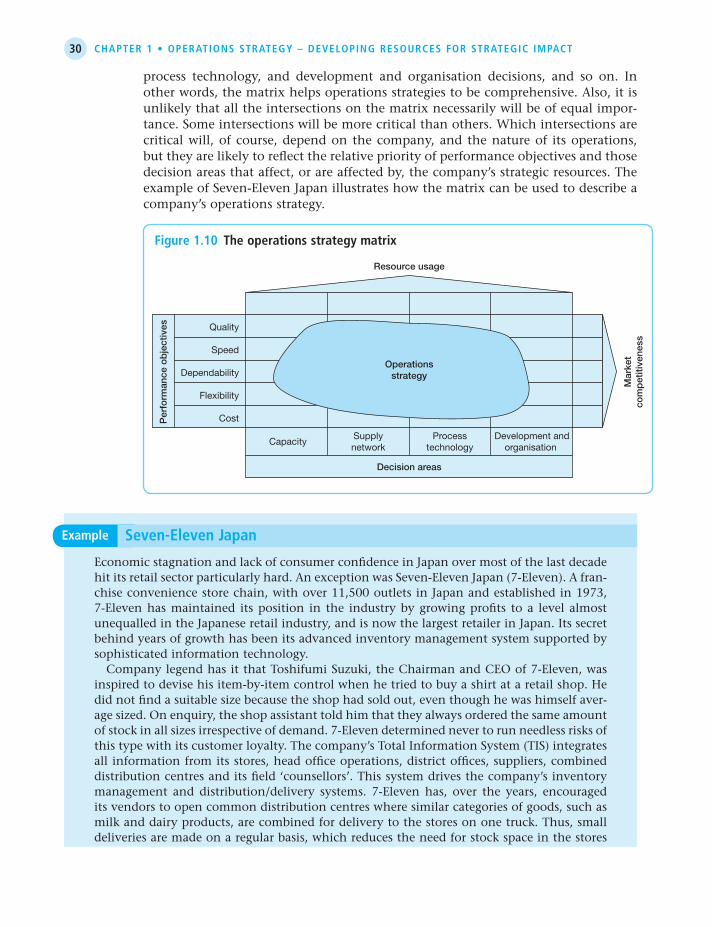
30 chapter 1 • OperatIOns strategy – develOpIng resOurces fOr strategIc Impact
process technology, and development and organisation decisions, and so on. In other words, the matrix helps operations strategies to be comprehensive. Also, it is unlikely that all the intersections on the matrix necessarily will be of equal impor-tance. Some intersections will be more critical than others. Which intersections are critical will, of course, depend on the company, and the nature of its operations, but they are likely to reflect the relative priority of performance objectives and those decision areas that affect, or are affected by, the company’s strategic resources. The example of Seven-Eleven Japan illustrates how the matrix can be used to describe a company’s operations strategy.
Quality
Speed
Dependability
Flexibility
CostPer
form
ance
ob
ject
ives
Mar
ket
com
pet
itive
ness
CapacitySupplynetwork
Decision areas
Resource usage
Processtechnology
Development andorganisation
Operationsstrategy
figure 1.10 the operations strategy matrix
Economic stagnation and lack of consumer confidence in Japan over most of the last decade hit its retail sector particularly hard. An exception was Seven-Eleven Japan (7-Eleven). A fran-chise convenience store chain, with over 11,500 outlets in Japan and established in 1973, 7-Eleven has maintained its position in the industry by growing profits to a level almost unequalled in the Japanese retail industry, and is now the largest retailer in Japan. Its secret behind years of growth has been its advanced inventory management system supported by sophisticated information technology. Company legend has it that Toshifumi Suzuki, the Chairman and CEO of 7-Eleven, was inspired to devise his item-by-item control when he tried to buy a shirt at a retail shop. He did not find a suitable size because the shop had sold out, even though he was himself aver-age sized. On enquiry, the shop assistant told him that they always ordered the same amount of stock in all sizes irrespective of demand. 7-Eleven determined never to run needless risks of this type with its customer loyalty. The company’s Total Information System (TIS) integrates all information from its stores, head office operations, district offices, suppliers, combined distribution centres and its field ‘counsellors’. This system drives the company’s inventory management and distribution/delivery systems. 7-Eleven has, over the years, encouraged its vendors to open common distribution centres where similar categories of goods, such as milk and dairy products, are combined for delivery to the stores on one truck. Thus, small deliveries are made on a regular basis, which reduces the need for stock space in the stores
example seven-eleven Japan

31the OperatIOns strategy matrIx
the operations strategy matrix analysis for seven-eleven Japan
For a company like Seven-Eleven Japan, it is possible to find some kind of relation-ship between each performance objective and every decision area. However, in Figure 1.11 we have confined ourselves to some of the critical issues described in the example. This operations strategy matrix has been adapted slightly to combine speed and dependability under the single performance objective ‘availability’. The relative degree of ‘criticality’ has also been indicated. Arguably, the pivotal intersection in this company’s operations strategy matrix is that between its process technology, in the form of its Total Information System, and the flexibility that this gives it to under-stand and respond to both sales and suppliers’ trends. Many of the other cells in the matrix derive from this particularly critical cell. Here process technology is enabling strategic action both in the development of the company’s supply networks and in its general development and organisation strategy. Similarly, the enhanced flexibility which the TIS gives helps to reduce cost, increase availability and maintain quality. As in most analyses of this type, it is the interrelationship between the intersec-tions (cells) of the matrix that are as important to understand as the intersections themselves. It is also worth noting that one column of issues (those concerned with supply networks) has all its cells filled in. Again, this is not unusual. In this case the reason lies in the purpose of this company. It is essentially a supply organisation. Its only reason for existence is to supply its franchise holders. Not surprising then that it should be particularly concerned with supply network issues.
but also guards against stock-outs. These common distribution centres also reduce the total number of deliveries a day to individual stores. In 1980 a typical store would receive over 30 deliveries per day; by 1999 this had shrunk to under 10. The company further refined this common distribution centre process by grouping items for each centre, not by type but rather by storage temperature, for example frozen foods, chilled foods, room temperature process foods, hot foods, etc. This grouping helps to maintain product quality. The Total Information System also allows the company to respond to changes in trends and customer demand. With an average floor space of just over 1,000 square feet, 7-Eleven stores must make sure that every product sold is earning its shelf space. Networked cash registers and hand-held terminals allow sales staff to input details of the type of customer making each purchase. This is tracked, along with the time of day when the products are purchased, and analysed daily by product, customer type, and store. The aggregated results, as well as the data from individual stores, are used by 7-Eleven’s field counsellors whose job it is to develop franchisees and ‘help the stores to make more money’. By combining advanced information and distribution systems, 7-Eleven has been able to minimise the time between the receipt of orders from stores and the delivery of goods. 7-Eleven’s expansion was carefully planned to ensure that it has a minimum presence of 50 stores in any area, thus reducing advertising and distribution costs. Franchisees were chosen partly by location and partly for their willingness to fit in with 7-Eleven procedures. To maintain the welfare of franchisees the company tries to ensure that skills and learning are shared between stores to continually enhance operations best practice. It seems to be paying off. Average daily sales per 7-Eleven store are more than 30 per cent higher than those of its main rival. Presumably this is why 7-Eleven’s franchisees are prepared to pay relatively high royalty fees compared with its rivals.

32 chapter 1 • OperatIOns strategy – develOpIng resOurces fOr strategIc Impact
The ‘process’ of operations strategy is the procedures that are, or can be, used to formu-late operations strategy. ‘Process’ determines how an operation pursues the reconciliation between its market requirements and operations resources in practice. However, there are significant overlaps between content and process. For example, part of the ‘content’ of operations strategy is concerned with the organisational structure and responsibility relationships within the operations function. Yet these issues have a direct impact on the process of how the organisation formulates its own operations strategies. Nevertheless, despite the overlap, it is conventional to treat content and process separately. To a large extent we shall leave the discussion of ‘process’ until Chapters 9 and 10. But it is worth making two points at this stage. The first is that the practical real-ity of putting operations strategies together and making them happen in practice is extremely complex (and a subject in its own right). As MacLennon says: ‘The chal-lenge of implementing strategy successfully is one that faces managers across the globe and in organisations of every kind. However, few organisations have discovered how to make strategy work reliably – the failure rate of planned strategies remains remarkably high. We
QUALITY ofproductsand services
Speed anddependabilitycombined toindicateAVAILABILITY
FLEXIBILITY ofresponse tosales andcustomers’ trends
COST in terms ofminimising:• operating cost• capital cost• working capital
******
Very critical
Critical
Secondary
Area dominancereduces distributionand advertising costs
• Location of stores• Size of stores
Distribution centregrouping bytemperature
Distribution centresand inventorymanagement systemsgive fast stockreplenishment
TIS allows trends tobe forecast andsupply adjustmentsmade
Common distributioncentres give small,frequent deliveriesfrom fewer sources
• Number and type of distribution centres
• Order and stockreplenishment
TIS givessophisticated analysisof sales and supplypatterns daily
• The Total Information System (TIS)
Information sharingand parenting systemspread service ideas
Field counsellorswith sales data helpstores to minimisewaste and increasesales
• Franchisee relationships
• New product/servicedevelopment
• Approach tooperationsimprovement
**
**
***
**
**
*
***
Mar
ket
com
pet
itive
ness
CAPACITYSUPPLY
NETWORKS
Resource development
PROCESSTECHNOLOGY
DEVELOPMENTAND
ORGANISATION
figure 1.11 Operations strategy matrix for seven-eleven Japan
What is the process of operations strategy?

33What Is the prOcess Of OperatIOns strategy?
use a simplified stage model to identify some of the key issues.’14 The model that we use later in the book is shown in Figure 1.12 and distinguishes four stages; formulation, implementation, monitoring and control. The second point is that the success of effective operations strategy ‘process’ is closely linked to the style and skills of the leaders who do it. The next section examines this issue.
Operations strategy and leadership
Guiding both the content and process of operations strategy requires operations leaders who are capable, knowledgeable and energetic. This is especially true of exe-cuting operations strategies (process). We know that at the operational level effective operations management requires a focus on processes, but recent research reveals that making operational excellence have an impact strategically is also determined by individual managerial characteristics. Highly effective operations managers must have not only the ‘technical’ skills to build processes but, even more importantly, must have a set of political skills15 underpinned by key personal traits (for example, self-motivation, sense of humility, affability) and sustainable interpersonal behav-iours16 (for example, leading by example, developing trust).
Operations strategycontrol
Operations strategyformulation
Operations strategyimplementation
Operations strategymonitoring
figure 1.12 the stages of the process of operations strategy
Southwest Airlines is today one of the largest airlines in the world. Its low-cost operating model has been copied endlessly (see the example in Chapter 2 on Ryanair, which uses similar tactics, such as flying only one aircraft type, rapid turnarounds, less costly airports, and so on). And almost as famous as the airline’s brand itself is its legendary founder, Herb Kelleher. In addition to a range of potentially unique habits – such as a propensity for dressing up as Elvis – Kelleher’s instinctive approach to strategy was to combine a relent-less emphasis on the future with a bias towards action. Interviewed in 2001 he explained ‘[T]he way I’ve approached things is to be prepared for all possible scenarios . . . I do this all the time. I do it in the shower. I do it when I’m out drinking . . . You have to do that sort of thing so you’re prepared to go one way or the other way depending on what [your rivals do]. You have to think that way all of the time.’17
example southwest airlines’ herb kelleher
It is interesting to reflect on the example of Herb Kelleher of Southwest Airlines and his approach to strategy. This is relevant to our exploration of the nature of operations strategy because, during the creation and evolution of this extraordinary firm, there was inevitably little distinction between the organisation’s overall strategy and the design, development and implementation of its specific operating model (in other words, its operations strategy). If we look at Kelleher’s key ‘leadership’ principles, they can offer some insight into the distinct attributes that mark out the human side

34 chapter 1 • OperatIOns strategy – develOpIng resOurces fOr strategIc Impact
of an effective operations strategy. The strategic skills he promotes stress the constant identification and articulation of options for the future. These seem to be very differ-ent from the skills that are associated with routine ‘day-to-day’ delivery. But what are those skills? In order to build a more comprehensive picture of operations strategy-related skills, it is helpful to turn to the Competing Values Framework.18 This model identifies a range of generic leadership characteristics that underpin organisational effectiveness set against the specific challenges of any particular set of circumstances. The framework is defined by the intersection of two dimensions:
●● The first dimension distinguishes between an emphasis on internal and external focus. Some organisations are effective in their set of circumstances because they have established robust internal business processes and developed cohesive work-ing relationships. Others are effective if they emphasise competition and differ-entiation from external rivals.
●● The second dimension distinguishes between different approaches to control and flexibility. Some organisations are effective in their set of circumstances because they can be highly adaptable and transformational. Others are effective because they provide stability and dependability.
Taken together these dimensions form four quadrants (see Figure 1.13). Each quad-rant incorporates a set of generic leadership characteristics (see Table 1.3). Interestingly, as the name and the figure suggest, these characteristics actively compete against each other, pulling in different directions (for example, it is chal-lenging to emphasise process stability and control, while at the same time trying
Coordinator
Emphasis on stability
Emphasison external
players
Emphasis oninternal
processes
Innovator
Broker
Producer
Director
Mentor
Facilitator
Monitor
Emphasis on flexibility
figure 1.13 competing values framework

35summary ansWers tO key questIOns
to be open to new ideas). This provides an important link back to our notion of operations strategy as a process of reconciliation. In other words, although specific strategic leadership behaviours may tend to dominate at certain points in time and in certain contexts, all are potentially applicable to operations strategy formulation and implementation. It is interesting to note, for example, that alongside Kelleher with his entrepreneurial, informal approach to strategy was Colleen Barrett, a largely unsung personality who ‘built the infrastructure on which Southwest’s culture is based’. Her leadership characteristics couldn’t have been more different from Kelleher, as she has explained: ‘Herb would have a dream in the middle of the night and say, “Okay, this is what I want to do.” But he wouldn’t have a clue, God love him, what steps have to be taken to get there . . . I’m not the most brilliant person in the whole world but I can see systematically from A to Z, and I know what has to be done.’19 The critical question becomes looking for balance – something that may not be achievable in a single person. Note that Southwest is no longer a radical up-start challenger to the established airlines. It is now the largest, most profitable incumbent in a vastly changed air travel market, and the precise leadership mix necessary to drive forward its operations strategy is likely to shift.
table 1.3 the generic leadership characteristics of the competing values framework
Role Characteristics
1 Innovator Encouragingcreativethinking.Leadingchange.Challengingstatusquo.
2 Broker Negotiatingagreementandcommitment.Presentingarangeofideas.Maintainingapowerbase.
3 Producer Emphasisonefficiencyandproductiveworkenvironment.Timemanagement.
4 Director Planningandgoalsetting.Designingandorganising.Effectivedelegation.
5 Coordinator Designingandmanagingprojects.Managingworkacrossfunctions.
6 Monitor Monitoringandmanagingindividualandcollectiveperformance.
7 Facilitator Buildingteamsandusingparticipativedecisionmaking.Seekingtomitigateandmanageconflict.
8 Mentor Strongemphasisonunderstandingselfandothers.Communicatingeffectivelyandactivelydevelopingsubordinates.
summary ansWers tO key questIOns
Why is operations excellence fundamental to strategic success?‘Operations’ is the activity of managing the resources and processes that produce and deliver goods and services. All operations transform resource inputs into out-puts of products and services and can be analysed at three levels: that of the busi-ness itself, as part of a greater network of operations, and at the level of individual processes within the operation. Operations management contributes to the success of any organisation by reducing costs, by increasing revenue by reducing capital employed, and by providing the basis for future innovation.

36 chapter 1 • OperatIOns strategy – develOpIng resOurces fOr strategIc Impact
What is strategy?Strategic decisions are those that set broad objectives that direct an enterprise towards its overall goal, plan the path that will achieve these goals, stress long-term rather than short-term objectives, deal with the total picture rather than with indi-vidual activities, and are often seen as above or detached from routine day-to-day activities. However, it is not easy to totally characterise strategy or strategic deci-sions. Some organisations make no explicit strategic decisions as such. Rather they develop over time, often with strategies that ‘emerge’ from their ongoing experience of doing business. Furthermore, the strategy as espoused by an organisation may not always be reflected in what it actually does. This is why strategy is often taken to be the ‘pattern of decisions’ that indicate the company’s overall path.
What is operations strategy?Operations strategy is the total pattern of decisions that shape the long-term capa-bilities of any kind of operation and their contribution to overall strategy, through the ongoing reconciliation of market requirements and operation resources. All busi-nesses have markets, all businesses own or deploy resources; therefore all businesses are concerned with the reconciliation of markets and resources.
how should operations strategy reflect overall strategy?An operations strategy will be one of several functional strategies that are governed by the decisions that set the overall strategic direction of the organisation. This is called the ‘top-down’ approach. So, corporate strategy should be reflected in the strategies of each business unit, which should, in turn, inform the strategy of each business function.
how can operations strategy learn from operational experience?An alternative view to the top-down perspective (one that is based on observing how strategy happens in practice) is the bottom-up perspective, which stresses how strategic ideas emerge over time from actual experiences. Companies adopt strate-gies partly because of their ongoing experience, sometimes with no high-level deci-sion making involved. The idea of strategy being shaped by experience over time is also called the concept of emergent strategies. Shaping strategy from the bottom up requires an ability to learn from experience and a philosophy of continual and incremental improvement.
how do the requirements of the market influence operations strategy?Two important elements within markets are customers and competitors. The con-cept of market segmentation is used to identify target markets that have a clear set of requirements and where a company can differentiate itself from current, or potential, competitors. On the basis of this, the company takes up a market posi-tion. This market position can be characterised in terms of how the company wishes to compete for customers’ business. By grouping competitive factors into clusters under the heading of generic performance objectives (quality, speed, dependability, flexibility and cost), market requirements are translated into a form useful for the development of the operation.

37further readIng
how can the intrinsic capabilities of an operation’s resources influence operations strategy?Over time, an operation may acquire distinctive capabilities, or competences, on the basis of the accumulation of its experiences. These capabilities may be embed-ded within a company’s intangible resources and its operating ‘routines’. So, they concern both what the operation has and what it does. Operations shapes these capabilities (consciously or unconsciously) through the way it makes a whole series of decisions over time. These decisions can be grouped under the headings of capac-ity, supply network, process technology, and development and organisation
What is the ‘content’ of operations strategy?The ‘content’ of operations strategy is the building blocks from which any opera-tions strategy will be formed. This includes the definition attached to individual per-formance objectives, together with a prioritisation of those performance objectives. It also includes an understanding of the structure and options available in the four decision areas of capacity, supply networks, process technology, and development and organisation. Performance objectives and decision areas interact in a way that can be described by the operations strategy matrix. When devising an operations strategy it is important to ensure that, in terms of the matrix, the strategy is compre-hensive (all obvious aspects are at least considered) and has the critical intersections identified.
What is the ‘process’ of operations strategy?The ‘process’ of operations strategy is the procedures that are, or can be, used to formulate operations strategy. It determines how an operation pursues the recon-ciliation between its market requirements and operations resources in practice. The practical reality of putting operations strategies together and making them happen in practice is complex, but, at a simple level, has four stages; formulation, imple-mentation, monitoring and control. The success of effective operations strategy process is also closely linked to the style and skills of the leaders who do it.
further reading
Bettley A., Mayle, D. and Tantoush, T. (eds) (2005) Operations Management: A Strategic Approach. London: Sage Publications.
Fitzsimmons, J.A. and Fitzsimmons, M.J. (2010) Service Management: Operations, Strategy, Information Technology. McGraw-Hill Higher Education.
Hayes, R.H., Pisano, G.P., Upton, D.M. and Wheelwright, S.C. (2004) Operations, Strategy, and Technology: Pursuing the Competitive Edge. New York: John Wiley & Sons.
Hayes, R.H., Pisano, G.P. and Upton, D.M. (1996) Strategic Operations: Competing Through Capabilities: Text and Cases. New York: The Free Press.
Hill, T. (2000) Manufacturing Strategy, 2nd edn. Macmillan Press.Hill, A. and Hill, T. (2009) Manufacturing Operations Strategy: Texts and Cases. Palgrave
Macmillan.Kaplan, R.S. and Norton, D.P. (2004) Strategy Maps: Converting Intangible Assets into
Tangible Outcomes. Harvard Business School Publishing.MacLennon, A. (2010) Strategy Execution: Translating Strategy into Action in Complex
Organisations. Routledge.

38 chapter 1 • OperatIOns strategy – develOpIng resOurces fOr strategIc Impact
Mintzberg, H., Ahlstrand, B. and Lampel, J.B. (2008) Strategy Safari: The Complete Guide Through the Wilds of Strategic Management, Financial Times/Prentice Hall.
Skinner, W. (1978) Manufacturing in the Corporate Strategy. Wiley.Slack, N., Chambers, S., Johnston, R., and Betts, A. (2009) Operations and Process
Management: Principles and Practice for Strategic Impact, 2nd edn, Harlow, UK: Financial Times Prentice Hall.
Wernerfelt, B. (1984) ‘A resource-based theory of the firm’, Strategic Management Journal, No. 5, pp. 272–280.
The resource-based view (RBV) of the firm has its origins in early economic theory. Some of the initial works in strategic management also included consideration of the firm’s internal resources.20 The ‘SWOT’ (strengths, weaknesses, opportunities, threats) approach saw competitive advantage as exploiting the opportunities raised in the competitive environment using the firm’s strengths, while neutralising exter-nal threats and avoiding being trapped by internal weaknesses. While one school of thought, the ‘environmental’ school, focused on a firm’s opportunities and threats, the other, the ‘resource-based’, focused on a firm’s strengths.21 Each school is grounded on different economic theories. The environmental approach adopted neo-classical economics, and more specifically industrial organisations (IO) theory,22 whereas the resource-based theory has many similarities to the ‘Austrian school’, which stresses the importance of entrepreneurship, and behavioural economics. The two schools of thought differ in the way they explain why some companies outperform others over time – what strategists call a ‘sustainable competitive advan-tage’ (SCA). Through the 1970s and 1980s, the dominant school, the environmental school, saw a firm’s performance as being closely related to the industrial structure of its markets. In this view, key strategic tasks centred on competitive positioning within industrial sectors. This firm itself is seen as an allocator of resources between different product-market opportunities. The implication of this is that a firm should analyse the forces present within the environment in order to assess the profit potential of the industry, and then design a strategy that aligns the firm to the envi-ronment. The ‘resource-based’ explanation of why some companies manage to gain sustainable competitive advantage, by contrast, focuses on the role of the resources which are (largely) internal to the company’s operations. Put simply, ‘above average’ performance is more likely to be the result of the core capabilities (or competences) inherent in a firm’s resources than of its competitive positioning in its industry. The RBV also differs in its approach to how firms protect any competitive advan-tage they may have. The environmental view sees companies as seeking to protect their competitive advantage through their control of the market, for example by creating barriers to entry through product differentiation, or making it difficult for customers to switch to competitors, or controlling the access to distribution chan-nels (a major barrier to entry in gasoline retailing, for example, where oil companies own their own retail stations), and so on. By contrast, the RBV sees firms being able to protect their competitive advantage by building up ‘difficult-to-imitate’ resources. Thus the resources that a firm possesses are closely linked to its ability to outperform competitors. Certain of these resources are particularly important, and can be classi-fied as ‘strategic’ if they exhibit the following properties.23
appendix: the resource-based view of the firm

39nOtes On the chapter
●● They are scarce – unequal access to (or information about) resources can lead to their uneven distribution amongst competing firms. In this way scarce resources such as specialised production facilities, experienced engineers, proprietary soft-ware, etc. can underpin competitive advantage.
●● They are imperfectly mobile – some resources are difficult to move out of a firm. For example, resources that were developed in-house, or are based on the experi-ence of the company’s staff, cannot be traded easily. As a result, the advantages that they create are more likely to be retained over time.
●● They are imperfectly imitable and imperfectly substitutable – these critical dimen-sions help define the overall sustainability of a resource-based advantage. It is not enough only to have resources that are unique and immobile. If a competitor can copy these resources or, less predictably, replace them with alternative resources, then their value will quickly deteriorate. Again, the more the resources are con-nected with tacit knowledge and routines embedded within the firm, the more difficult they are for competitors to understand and to copy.
extended resource-Based theory (erBt)24
Although ‘classic’ RBT has obvious appeal, research has emerged on resource-based advantage within a broader network context: the so-called ‘extended’ Resourced Based Theory (RBT). ERBT assumes that strategic resources lying beyond the boundaries of the firm can be used to generate ‘relational’ or ‘collaboration specific quasi-rents’, emphasizing their reliance on inter-firm relationships. ERBT shares explicit links with the broader supply literature and, in particular, work focused on determining appropriate levels of synergy between firms, with specific reference to issues such as the development and evolution of buyer-seller relationships, strategic returns from collaboration (e.g. supplier development), economic value of market power, etc. ERBT is founded on the assumption that strategic resources lying beyond the boundaries of the firm can be accessed, especially given the existence of certain types of inter-firm relationships. It represents an extension of RBT, because the struc-ture and function of these relationships relate to the specificity of the resources to be transferred. Research focused on inter-firm knowledge transfer has explored the per-formance implications of strong and weak ties between network nodes. It is argued that weak ties (i.e. those lacking history, reciprocity, emotional intensity, etc.) are best suited to transfer of codified technical-type information, but are less suited to richer knowledge transfer. For example, strong ties were central to the development of Toyota’s hugely effective supply network.
notes on the chapter
1 Operations managers are called by many names: the ‘fleet manager’ in a distribution company, or the ‘administrative manager’ in a hospital, or the ‘store manager’ in a supermarket.
2 Slack, N., Chambers, S. and Johnston, R. (2010) Operations Management, 6th edn, Harlow: Financial Times Prentice Hall.
3 Sources include: company websites (2007); Marsh P. (2006) ‘The masters of good service’, Financial Times, 30 June.

40 chapter 1 • OperatIOns strategy – develOpIng resOurces fOr strategIc Impact
4 Weick, K.E. (1990) ‘Cartographic myths in organisations’, in Huff, A. (ed.) Managing Strategic Thought’. London: Wiley.
5 Osterwalder, A., Pigneur, Y. and Tucci, C. (2005) Clarifying Business Models: Origins, Present and Future of the Concept. CAIS, Vol. 15, 2005, pp. 751–775.
6 Osterwalder, A. (2005) What is a business model? http://business-model-design.blogspot.com/2005/11/what-is-business-model.html.
7 Based on the definitions developed by Cap Gemini. 8 Mintzberg, H. and Quinn, J. (1990) The Strategy Process: Concepts, Context, and Cases. Upper
Saddle River, NJ: Prentice Hall. 9 Source: Microsoft website (2007).10 Source: ‘Lifting the bonnet’, The Economist, 7 October 2006.11 Cloud computing is a general term for the provision of internet-based access to computing
capacity so that shared resources, such as software, can be provided on demand.12 Sources include: ‘The Germans are coming’, The Economist, 14 August 2008.13 An idea put forward by Eilan, S. and Gold, B. (1978) Productivity Measurement, Oxford:
Pergamon Press.14 MacLennan, A. (2010) Strategy Execution: Translating Strategy into Action in Complex
Organisations. Abingdon: Routledge.15 Ferris, G.R., Perrewe, P.L., Anthony, W.P., Gilmore, D.C. (2000) ‘Political skill at work’,
Organizational Dynamics, 28 (4), pp. 25–37.16 Smith, A.D., Plowman, D.A., Duchon, D. and Quinn, A.M. (2009). ‘A qualitative study
of high-reputation plant managers: Political skill and successful outcomes’, Journal of Operations Management, Vol. 17, pp. 237–246.
17 Fortune, 28 May 2001.18 Quinn, R.E. and Rohrbaugh, J. (1983) ‘A spatial model of effectiveness criteria: towards a
competing values approach to organizational analysis’, Management Science, 29, 363–377.19 Fortune, 28 May 2001.20 Learned, E.C., Christensen, C., Andrews, K. and Guth, W. (1969) Business Policy: Text and
Cases. Homewood IL: Irwin.21 Penrose, E. (1959) The Theory of the Growth of the Firm. Oxford: Blackwell.22 Bain, J.S. (1968) Industrial Organization. New York: John Wiley & Sons.23 Barney, J. (1991) ‘The resource-based model of the firm: origins, implications and pros-
pects; and firm resources and competitive advantage’, Journal of Management, 17(1).24 For example, see: Dyer, J.H. and Nobeoka, K. (2000) ‘Creating and managing a high per-
formance knowledge-sharing network: the Toyota case’, Strategic Management Journal, Vol. 21, pp. 345–367; Granovetter, M.S. (1973) ‘The strength of weak ties’, American Journal of Sociology, 78, pp. 1360–1380; Ireland, R.D., Hitt, M.A. and Vaidyanath, D. (2002), ‘Alliance management as a source of competitive advantage’, Journal of Management, Vol. 8, No. 3, pp. 413–466; Madhok, A. and Taliman, S.B. (1998) ‘Resources, transactions and rents: man-aging value through interfirm collaborative relationships’, Organization Science, 9, pp. 326–339; Matthews, J.A. (2003) ‘Competititve dynamics and economic learning: an extended resource-based view’, Industrial and Corporate Change, 12(1), pp. 115–145; Matthews, J.A. (2003) ‘Strategizing by firms in the presence of markets for resources’, Industrial and Corporate Change, 12(6), pp. 1157–1193; Szulanski, G. (2000) ‘The process of knowledge transfer: a diachronic analysis of stickiness’, Organisational Behaviour and Human Decision Processes, Vol. 82, pp. 9–27.

chapter
Operations performance2
In this chapter we look at how we judge the performance of operations, primarily in terms of the five performance objectives: quality, speed, dependability, flexibility and cost. We then look at three related aspects of performance that are fundamental to understanding operations strategy. First, we examine how the relative importance of different aspects of performance changes over time. This is because the relative importance of the market requirements and operations resource perspectives does not stay constant over time. Sometimes market requirements dominate and opera-tions resources must be made to fit whatever the market dictates. At other times the capabilities and constraints of operations resources will place restrictions on the organisation’s choice of its market positioning. Second, we look at how performance objectives trade off against each other. Operations are often called on to enhance some specific aspects of their performance. The key issue is, do improvements in some aspects of performance necessarily mean a reduction in the performance of others? Third, we examine how exceptional performance levels can be reached by focusing on a limited set of objectives and exploiting the trade-offs between objectives.
Introduction
Relativeimportance of
the marketrequirementsperspectiveTRADE-OFFS
Performance objective A
Per
form
ance
ob
ject
ive
B
?
Relativeimportance ofthe operations
resource perspective
Figure 2.1 this chapter looks at how the relative importance of the market requirements and operations resource perspectives change over time, how performance objectives trade off against each other, and how operations focus can lead to exceptional performance

42 chapter 2 • OperatIOns perFOrmance
Operations strategy, and the resulting performance that it brings can either ‘make’ or ‘break’ any business. Not just because the operations function is large and, in most businesses, represents the bulk of its assets and the majority of its people, but because the operations function gives the ability to compete by providing the ability to respond to customers and by developing the capabilities that will keep it ahead of its competitors in the future. For example, the performance of their operations func-tions proved hugely important in the Heathrow T5 and Dubai T3 launches (see the example later in this chapter). It was a basic failure to understand the importance of operations that (temporarily) damaged British Airways’ reputation. It was Dubai’s thorough operational preparation that avoided similar problems. However, assessing the performance of anything at any time is hardly ever straightforward. Perceived performance is a function of, amongst other things, who you are (customer, employee, stockholder, etc.), your objectives (often disputed), timescale (what is judged as good now may not be appropriate next year), measurability (how do you measure trust, relationship, security, etc?), and how comprehensive you want to be (do you really want to measure everything every customer may find important?). Nevertheless, for operations strategy to be effective, performance must be assessed in some way, and an obvious starting point is to consider the operation’s range of stakeholders.
the ‘stakeholder’ perspective on operations performance
All operations have stakeholders. Stakeholders are the people and groups who have a legitimate interest in the operation’s strategy. Some are internal, for example the operation’s employees; others are external, for example customers, society or commu-nity groups, and a company’s shareholders. External stakeholders may have a direct commercial relationship with the organisation, for example suppliers and customers; others may not, for example, industry regulators. In not-for-profit operations, these stakeholder groups can overlap. So, voluntary workers in a charity may be employ-ees, shareholders and customers all at once. However, in any kind of organisation, it is a responsibility of the operations function to understand the (sometimes conflict-ing) objectives of its stakeholders and set its objectives accordingly. Figure 2.2 illustrates some main stakeholder groups for a parcel delivery company together with some of the aspects of operations performance in which they may
●● how can operations performance ‘make or break’ the organisation?
●● What are operations performance objectives?
●● Do the role and key performance objectives of operations stay constant or vary over time?
●● are trade-offs between operations performance objectives inevitable, or can they be overcome?
●● What are the advantages and disadvantages of focused operations?
key questIOns
Operations performance can make or break any organisation

43OperatIOns perFOrmance can make Or break any OrganIsatIOn
be interested. The company is clearly concerned to satisfy its customers’ require-ments for fast and dependable services at reasonable prices, as well as helping and improving its own suppliers (a whole range of organisations, from those who print packets to those who clean the offices). Similarly, it is concerned to ensure the long-term economic value delivered to its stockholders. But the company also has a responsibility to ensure that its own employees are well treated and that society at large is not negatively affected by the operation’s activities – the company must minimise vehicle pollution, minimise wastage of materials or energy, ensure that its operations do not disrupt the life and well-being of those who live nearby, and so on. But, although each of these groups, to different extents, will be interested in operations performance, they are likely to have very different views of which aspect of performance is important. Table 2.1 identifies typical stakeholder requirements. But stakeholder relationships are not just one-way. It is also useful to consider what an individual organisation or business wants of the stakeholder groups themselves. Some of these requirements are also illustrated in Table 2.1. The dilemma with using this wide range of stakeholders to judge performance is that organisations, particularly commercial companies, have to cope with the conflicting pressures of maximising profitability on the one hand, with the expec-tation on the other hand that they will manage in the interests of (all or part of) society in general with accountability and transparency. Even if a business wants to reflect aspects of performance beyond its own immediate interests, how is it to do it? According to Michael Jensen of Harvard Business School, ‘At the economy-wide or social level, the issue is this: if we could dictate the criterion or objective function to be max-imised by firms (and thus the performance criterion by which corporate executives choose among alternative policy options), what would it be? Or, to put the issue even more simply: How do we want the firms in our economy to measure their own performance? How do we want them to determine what is better versus worse?’ He also holds that using stake-holder perspectives gives undue weight to narrow special interests who want to use
SocietyIncrease employmentEnhance community well-beingProduce sustainable productsEnsure clean environment
CustomersAppropriate product or
service specificationConsistent qualityFast deliveryDependable deliveryAcceptable price
SuppliersContinue businessDevelop supplier
capabilityProvide transparent
information
ShareholdersEconomic value
from investmentEthical value from
investment
EmployeesContinuous employmentFair payGood working conditionsPersonal development
Parcel delivery
Figure 2.2 broad strategic objectives for a parcel delivery operation applied to stakeholder groups

44 chapter 2 • OperatIOns perFOrmance
the organisation’s resources for their own ends. The stakeholder perspective gives them a spurious legitimacy that ‘undermines the foundations of value-seeking behav-iour’. The stakeholder perspective is also covered in Chapter 10 when we discuss the monitoring and control of operations strategy implementation.
table 2.1 typical stakeholders’ performance objectives
Stakeholder Whatstakeholderswantfrom Whattheoperationwants theoperation fromstakeholders
Shareholders Returnoninvestment Investmentcapital Stabilityofearnings Long-termcommitment Liquidityofinvestment
Directors/topmanagement Low/acceptableoperatingcosts Coherent,consistent,clear,and Securerevenue achievablestrategies Well-targetedinvestment Appropriateinvestment Lowriskoffailure Futureinnovation
Staff Fairwages Attendance Goodworkingconditions Diligence/bestefforts Safeworkenvironment Honesty Personalandcareerdevelopment Engagement
Staffrepresentativebodies Conformancewithnational Understanding (e.g.tradeunions) agreements Fairness Consultation Assistanceinproblemsolving
Suppliers(ofmaterials,services, Earlynoticeofrequirements Integrityofdelivery,qualityand equipment,etc.) Long-termorders volume Fairprice Innovation On-timepayment Responsiveness Progressivepricereductions
Regulators(e.g.financialregulators) Conformancetoregulations Consistencyofregulation Feedbackoneffectivenessof Consistencyofapplicationof regulations regulations Responsivenesstoindustryconcerns
Government(local,national, Conformancetolegalrequirements Low/simpletaxation regional) Contributionto(local/national/ Representationoflocalconcerns regional)economy Appropriateinfrastructure
Lobbygroups(e.g.environmental Alignmentoftheorganisation’s Nounfairtargeting lobbygroups) activitieswithwhateverthe Practicalhelpinachievingaims(if groupispromoting theorganisationwantstoachieve them)
Society Minimisenegativeeffectsfromthe Supportfortheorganisation’splans operation(noise,traffic,etc.),and maximisepositiveeffects(jobs, localsponsorship,etc.)

45OperatIOns perFOrmance can make Or break any OrganIsatIOn
On 15 April 2008 British Airways (BA) announced that two of its most senior executives, its director of operations and its director of customer services, would leave the company. They were paying the price for the disastrous opening of British Airways’ new Terminal 5 at London’s Heathrow airport. ‘The opening of the £4.3 billion terminal,’ said BA’s boss Willie Walsh with magnificent understatement, ‘was not the company’s finest hour.’ The chaos at the terminal on its opening days made news around the world and was seen by many as one of the most public failures of basic operations management in the modern history of avia-tion. ‘It’s a terrible, terrible PR nightmare to have hanging over you,’ said David Learmount, an aviation expert. ‘Somebody who may have been a faithful customer and still not have their luggage after three weeks, is not good for their [BA’s] image. The one thing that’s worse than having a stack of 15,000 bags is adding 5,000 a day to that heap.’ According to a BA spokeswoman it needed an extra 400 volunteer staff and courier companies to wade through the backlog of late baggage. So the new terminal that had opened on 27 March could not even cope with BA’s full short-haul service until 8 April (two hundred flights in and out of T5 were cancelled in its first three days). This delayed moving its long-haul operations to the new building from Terminal 4 as scheduled on 30 April, which, in turn, disrupted the operations of other airlines, many of whom were scheduled to move into Terminal 4 once BA had moved its long-haul flights from there. Sharing the blame with BA was the British Airports Authority (BAA), which was already suffering criticism, from passenger groups, airlines, and businesses, for allegedly poor performance. BAA’s non-executive chairman, Sir Nigel Rudd, said he was ‘bitterly disappointed’ about the opening of the terminal: ‘It was clearly a huge embarrassment to the company, me personally, and the board. Nothing can take away that failure. We had all believed genuinely that it would be a great opening, which clearly it wasn’t.’ Yet it all should have been so different. T5 took more than 6 years and around 60,000 workers to build. And it’s an impressive building. It is Europe’s largest free-standing struc-ture. It was also keenly anticipated by travellers and BA alike. Willie Walsh has said that the terminal ‘will completely change his passengers’ experience.’ He was right, but not in the way he imagined! So what went wrong? As is often the case with major operations failures, it was not one thing, but several interrelated problems (all of which could have been avoided). Press reports initially blamed glitches with the state-of-the-art baggage handling system that consisted of 18 km of conveyor belts and was (theoretically) capable of transporting 12,000 bags per hour. And indeed the baggage handling system did experience problems that had not been exposed in testing. But BAA, the airport operator, doubted that the main problem was the baggage system itself. The system had worked until it became clogged with bags that were overwhelming BA’s handlers loading them onto the aircraft. This may have been partly because staff were not sufficiently familiar with the new system and its operating processes, but handling staff had also suffered delays getting to their new (and unfamiliar) work areas, negotiating (new) security checks and finding (again, new) car parking spaces. Also, once staff were airside they had problems logging in. The cumulative effect of these problems meant that the airline was unable to get ground handling staff to the correct locations for loading and unloading bags from the aircraft, so baggage could not be loaded onto aircraft fast enough, so baggage backed up, clogging the baggage handling system, which in turn meant closing baggage check-in and baggage drops, leading eventually to baggage check-in being halted. However, not every airline underestimates the operational complexity of airport processes. During the same year that Terminal 5 at Heathrow was suffering queues, lost bags and bad publicity, Dubai International Airport’s Terminal 3 opened quietly with little publicity and
example a tale of two terminals1

46 chapter 2 • OperatIOns perFOrmance
corporate social responsibility (csr)
Strongly related to the stakeholder perspective of operations performance is that of corporate social responsibility (generally known as CSR). According to the UK Government’s definition, ‘CSR is essentially about how business takes account of its economic, social and environmental impacts in the way it operates – maximising the bene-fits and minimising the downsides . . . Specifically, we see CSR as the voluntary actions that business can take, over and above compliance with minimum legal requirements, to address both its own competitive interests and the interests of wider society.’ A more direct link with the stakeholder concept is to be found in the definition used by Marks & Spencer, the UK-based retailer. ‘Corporate Social Responsibility . . . is listening and responding to the needs of a company’s stakeholders. This includes the requirements of sustainable development. We believe that building good relationships with employees, suppliers and wider society is the best guarantee of long-term success. This is the backbone of our approach to CSR.’ The issue of how broader social performance objectives can be included in operations management’s activities is of increasing importance, both from an ethical and a commercial point of view. It is treated again at various points throughout this book.
fewer problems. Like T5, it is also huge and designed to impress. Its new shimmering facili-ties are solely dedicated to Emirates Airline. Largely built underground (20 metres beneath the taxiway area), the multi-level environment reduces passenger walking by using 157 elevators, 97 escalators and 82 moving walkways. Its underground baggage handling system is the deepest and the largest of its kind in the world with 90 km of baggage belts handling around 15,000 items per hour, with 800 RFID (see Chapter 8) read/write stations for 100 per cent accurate tracking. Also like T5 it handles about 30 million passengers a year. But one difference between the two terminals was that Dubai’s T3 could observe and learn lessons from the botched opening of Heathrow’s Terminal 5. Paul Griffiths, the former head of London’s Gatwick Airport, who is now Dubai Airport’s chief executive, insisted that his own new terminal should not be publicly shamed in the same way. ‘There was a lot of arrogance and hubris around the opening of T5, with all the . . . publicity that BA generated,’ Griffiths says. ‘The first rule of customer service is under-promise and over-deliver because that way you get their loyalty. BA was telling people that they were getting a glimpse of the future with T5, which created expectation and increased the chances of disappointment. Having watched the development of T5, it was clear that we had to make sure that everyone was on-message. We just had to bang heads together so that people realised what was at stake. We knew the world would be watching and waiting after T5 to see whether T3 was the next big terminal fiasco. We worked very hard to make sure that didn’t happen.’ Griffiths was also convinced that Terminal 3 should undergo a phased programme with flights added progressively, rather than a ‘big bang’ approach where the terminal opened for business on one day: ‘We exhaustively tested the terminal systems throughout the summer . . . We continue to make sure we’re putting large loads on it, week by week, improving reliability. We put a few flights in bit by bit, in waves rather than a big bang.’ Prior to the opening he also said that Dubai Airports would never reveal a single opening date for its new Terminal 3 until all pre-opening test programmes had been completed. ‘T3 opened so quietly,’ said one journalist, ‘that passengers would have known that the terminal was new only if they had touched the still-drying paint.’

47the FIve generIc perFOrmance ObjectIves
Understanding broad stakeholder objectives is important, mainly because different or conflicting priorities between stakeholder groups often provide the backdrop to operations strategy decision-making. But, in practical terms, an operation requires a more tightly defined set of objectives. These are the five generic ‘performance objectives’ that were briefly introduced in the previous chapter and that apply to all types of operation. It is worth examining each of them in a little more detail. Not to present any precise definitions, but rather to illustrate how the terms qual-ity, speed, dependability, flexibility and cost may be used to mean slightly different things depending on how they are interpreted in different operations. This is not to imply that broad stakeholder objectives are irrelevant to operations strategy – far from it. But the five generic performance objectives have meaning for all types of operation and relate specifically to operations’ basic task of satisfying customer requirements.
Holcim is a global company, based in Switzerland, and employing around 80,000 people, with production sites in around 70 countries. It is one of the world’s leading manufacturers and distributors of cement and aggregates (for example, crushed stone, gravel and sand). It also supplies ready-mix concrete and asphalt as well as offering consulting, research, trading, engineering and other services. But, along with other companies in this sector, Holcim faces some considerable challenges in pursuing its CSR objectives. After all, cement manufacture is an activity that has a significant impact on almost every aspect of sustainability and social responsibility. Concrete is the second most used resource in the world after water. As the chief ingredient in concrete, cement is therefore a key requirement of modern society, but its manufacture is a resource- and energy-intensive process. This possibly explains why Holcim put so much effort into its sustainable development strategies. It aspires, it says, ‘to be the world’s most respected and attractive company in our industry, creating value for all our stakehold-ers, by placing sustainable development at the core of our business strategy aims to enhance this value, safeguards our reputation and contributes to continued success.’ Holcim’s strategy and its approach to value creation attempt to integrate economic, environmental and social impacts. These are the three elements of what has become known as the ‘triple bottom line’. Triple bottom line accounting for company performance first came to prominence in John Elkington’s 1998 book Cannibals with Forks: The Triple Bottom Line of 21st Century Business.3 It advocated expanding the conventional financial reporting conventions to include ecological (sustainability) and social performance in addition to financial performance. To achieve its triple bottom line business goals Holcim has established a set of group-wide performance targets. But, before targets are met, the company aims to understand its current perform-ance. It does this by establishing consistent measurement and reporting techniques, as well as implementing management systems to monitor progress toward its goals. Yet CSR-related performance measurement systems should not, says Holcim, be separate from the more conventional business systems. To work effectively, CSR performance systems are integrated into overall business processes and supported by appropriate training.
example holcim works with the ‘triple bottom line’2
the five generic performance objectives

48 chapter 2 • OperatIOns perFOrmance
quality
Many definitions of quality refer to the ‘specification’ of a product or service, usually meaning high specification; as in ‘the Mercedes-Benz S Class is at the quality end of the market.’ Quality can also mean appropriate specification, meaning that the products and services are ‘fit for purpose’; they do what they are supposed to do. ‘Fit for purpose’ quality includes two concepts that are far more usefully treated sepa-rately. One is the level of the product or services specification; the other is whether the operation achieves conformance to that specification. Specification quality is also a multidimensional issue. We needed to use several aspects of specification in the automobile example above, even to reach a crude indication of what type of car is being produced. So any product or service needs to use several dimensions of specification to define its nature. These dimensions can be separated into ‘hard’ and ‘soft’ aspects of specification quality. Hard dimensions are those concerned with the evident and largely objective aspects of the product or service. Soft dimensions are associated with aspects of personal interaction between customers and the product (or more usually) service. Table 2.2 identifies some hard and soft dimensions of specification quality, though each list will change depending on the type of product or service being considered.4
Conformance quality is more a concern of the operation itself. It refers to the operation’s ability to produce goods and services to their defined specification reliably and consistently. This is not always a simple matter of yes it can, or no it cannot. Rather the issue is often a matter of how closely the operation can achieve the product or service specification consistently. Here there is a difference between hard and soft dimensions of specification. Generally the conformance to soft dimen-sions of quality is more difficult to measure and more difficult to achieve. This is largely because soft dimensions, being related to interpersonal interaction, depend on the response of individual customers relating with individual staff.
speed
At its most basic, speed indicates the time between the beginning of an operations process and its end. It is an elapsed time. This may relate to externally obvious events: for example, from the time when the customer requests a product or service, to the time when the customer receives it. Or it may be used internally in the opera-tion: for example, the time between when material enters an operation and when it leaves fully processed. As far as operations strategy is concerned we are usually
table 2.2 examples of ‘hard’ and ‘soft’ dimensions of specification quality
‘Hard’dimensionsofspecificationquality ‘Soft’dimensionsofspecificationquality
Features HelpfulnessPerformance AttentivenessReliability CommunicationAesthetics FriendlinessSecurity/safety CourtesyIntegrity

49the FIve generIc perFOrmance ObjectIves
interested in the former. Part of this elapsed time may be the actual time to ‘produce the product or service’ (the ‘core’ processing time). It may also include the time to clarify a customer’s exact needs (for example, designing a product or service), the ‘queuing’ times before operations resources become available, and after the core processing, the time to deliver, transport and/or install the product or service. Figure 2.3 illustrates some of the significant ‘process’ times which signify the steps in cus-tomer response for two operations – a hospital and a software producer. One issue for these organisations’ operations is how to define the speed of delivery. Clearly, limiting it to the elapsed time taken by the core process (though this is the part they can most directly control) is inadequate. From the customers’ view the total proc-ess starts when they become aware that they may need the product or service and ends when they are completely satisfied with its ‘installation’. Some may even argue that, given the need continually to engage the customer in other revenue-generating activities such as maintenance or improvement, the process never ends.
Awareness ofneed
Milestone
Customer decides newsoftware is needed
Software producer
Presentation ofsymptoms
Hospital
Asks for specificationand estimates
Visit to doctor foradvice and tests
Receives proposalTest information
confirms diagnosis
Places orderDecide on
surgery
Start of designand coding
Enter hospitalfor surgery
Software‘completed’
Proceduresuccessfully
completed
Software fullydebugged andworking
Patient fullyrecovered
Request forinformation
Receipt ofinformation
Request forproduct/service
Start of coreprocessing
‘Installed’product/servicefully operational
End of coreprocessing
Diagnostic lead-time
Waiting time for surgery
Recovery time
Consultation decision time
Customer decision time
Core processing time
Enquiry lead-time
Service waiting time
Installation time
Enquiry decision time
Customer decision time
Core processing time
Figure 2.3 significant times for the delivery of two products/services

50 chapter 2 • OperatIOns perFOrmance
Dependability
The term ‘dependability’ here is used to mean keeping delivery promises – honour-ing the delivery time given to the customer. It is the other half of total delivery performance along with delivery speed. The two performance objectives are often linked in some way. For example, theoretically, one could achieve high depend-ability merely by quoting long delivery times: in which case the difference between the expected delivery time and the time quoted to the customer is being used as an insurance against lack of dependability within the operation. However, companies that try to absorb poor dependability inside long lead-times can finish up being poor at both. There are two reasons for this. First, delivery times tend to expand to fill the time available. Attempting to discipline an operation to achieve delivery in two weeks when three are available is unambitious and allows the operation to relax its efforts to use all the available time. Second, long delivery times are often a result of slow internal response, high work-in-progress, and large amounts of non-value-added time. All of these can cause confusion, complexity and lack of control, which are the root causes of poor dependability. Good dependability can often be helped by fast throughput, rather than hindered by it. In principle, dependability is a straightforward concept:
Dependability 5 due delivery time 2 actual delivery time.
When delivery is on time, the equation should equal zero. Positive means it is early and negative means it is late. What, though, is the meaning of ‘due time’? It could be the time originally requested by the customer or the time quoted by the operation. Also, there can be a difference between the delivery time scheduled by operations and that promised to the customer. Delivery times can also be changed, sometimes by customers, but more often by the operation. If the customer wants a new delivery time, should that be used to calculate delivery performance? Or if the operation has to reschedule delivery, should the changed delivery time be used? It is not uncommon in some circumstances to find four or five arguable due times for each order. Nor is the actual delivery time without its complications. When, for example, should the product or service be considered to have been delivered? Here we are facing a similar issue to that posed when considering speed. Delivery could be when the product or service is produced, when the customer receives it, when it is working, or when they are fully comfortable with it. Then there is the problem of what is late. Should delivery to the promised minute, hour, day, week or even month be counted as on time?
Flexibility
The word ‘flexibility’ means two different things. One dictionary definition has flexibility meaning the ‘ability to be bent’. It is a useful concept that translates into operational terms as the ability to adopt different states – take up different positions or do different things. So one operation is more flexible than another if it can do more things – exhibit a wide range of abilities. For example, it might be able to pro-duce a greater variety of products or services, or operate at different output levels. Yet the range of things an operation can do does not totally describe its flexibility. The same word is also used to mean the ease with which it can move between its possible states. An operation that moves quickly, smoothly and cheaply from doing

51the FIve generIc perFOrmance ObjectIves
one thing to doing another should be considered more flexible than one that can achieve the same change only at greater cost and/or organisational disruption. Both the cost and time of making a change are the ‘friction’ elements of flexibility. They define the response of the system – the condition of making the change. In fact, for most types of flexibility, time is a good indicator of cost and disruption, so response flexibility can usually be measured in terms of time. So the first distinction to make is between range flexibility – how much the operation can be changed; and response flexibility – how fast the operation can be changed. The next distinction is between the way we describe the flexibility of a whole operation and the flexibility of the individual resources which, together, make up the system. Total operations flexibility is best visualised by treating the operation as a ‘black box’ and considering the types of flexibility that would contribute to its competitiveness. For example:
●● product or service flexibility – the ability to introduce and produce novel products or services or to modify existing ones;
●● mix flexibility – the ability to change the variety of products or services being pro-duced by the operation within a given time period;
●● volume flexibility – the ability to change the level of the operation’s aggregated output;
●● delivery flexibility – the ability to change planned or assumed delivery dates.
Each of these types of total operations flexibility has its range and response compo-nents, described in Table 2.3.
cost
Cost is here treated last, not because it is the least important performance objec-tive, but because it is the most important. To companies that compete directly on
table 2.3 the range and response dimensions of the four types of total operations flexibility
Totaloperationsflexibility Rangeflexibility Responseflexibility
Product/serviceflexibility Therangeofproductsandservices Thetimenecessarytodevelopor thatthecompanyhasthedesign, modifytheproductsorservicesand purchasingandoperations processesthatproducethemtothe capabilitytoproduce pointwhereregularproductioncan start
Mixflexibility Therangeofproductsandservices Thetimenecessarytoadjustthe thatthecompanyproduceswithin mixofproductsandservicesbeing agiventimeperiod produced
Volumeflexibility Theabsolutelevelofaggregated Thetimetakentochangethe outputthatthecompanycan aggregatedlevelofoutput achieveforagivenproductor servicemix
Deliveryflexibility Theextenttowhichdeliverydates Thetimetakentoreorganisethe canbebroughtforward operationsoastoreplanforthe newdeliverydate

52 chapter 2 • OperatIOns perFOrmance
price, cost clearly will be their major performance objective. The lower the cost of producing their products and services, the lower the price to their customers can be. Yet even companies that compete on things other than price will be interested in keeping their costs low. Other things being equal, every euro, dollar or yen removed from an operation’s cost base is a further euro, dollar or yen added to its profits. Not surprisingly, low cost is a universally attractive objective. Here we are taking a broad definition of ‘cost’ as it applies in operations strategy. In this broad definition, cost is any financial input to the operation that enables it to produce its products and services. Conventionally, these financial inputs can be divided into three categories: Operating expenditure – the financial inputs to the operation needed to fund the ongoing production of products and services. It includes expenditure on labour, materials, rent, energy, etc. Usually the sum of all these expenditures is divided by the output from the operation (number of units produced, customers served, pack-ages carried, etc.) to give the operation’s ‘unit cost’. Capital expenditure – the financial inputs to the operation that fund the acquisi-tion of the ‘facilities’ that produce its products and services. It includes the money invested in land, buildings, machinery, vehicles, etc. Usually the funding for facili-ties is in the form of a lump sum ‘outflow’ investment followed by a series of smaller inflows of finance, in the form of either additional revenue or cost savings. Most methods of investment analysis are based on some form of comparison between the size, timing and risks associated with the outflow and its consequent inflows of cash. Working capital – the financial inputs needed to fund the time difference between regular outflows and inflows of cash. In most operations, payments must be made on the various types of operating expenditure that are necessary to produce goods and services before payment can be obtained from customers. Thus funds are needed to bridge the time difference between payment out and payment received. The length of this time difference, and therefore the extent of the money required to fund it, is influenced largely by two processes – the process that handles the day-to-day finan-cial transactions of the business, and the operations process itself which produces the goods and services. The faster the financial process can get payment from cus-tomers and the more it can negotiate credit delays to its suppliers, the shorter the gap between money going out and money coming in, and the less working capital is required. Similarly, the faster the operations process can move materials through the operation, the shorter the gap between obtaining the materials and having products and services ready for sale. This argument may also apply to information process-ing or even customer processing operations if operating expenditure is associated with the information or customers entering and progressing through the operation process.
the internal and external effects of the performance objectives
The whole idea of generic performance objectives is that they can be clearly related to some aspects of external market positioning, and can be clearly connected to the internal decisions that are made concerning the operations resources. Because of this, it is worthwhile examining each of the performance objectives in terms of how they affect market position outside the operation and operations resources inside the operation. Table 2.4 identifies some of these effects. What is interesting is that, whereas the consequences of excellent performance outside the operation are

53the FIve generIc perFOrmance ObjectIves
specific and direct, the consequences inside the operation are more interdependent. So, for example, a high performance in terms of speed of delivery outside the opera-tion gives clear benefits to customers who value short delivery times for products or queuing times for services. If an operation competes on speed of delivery, then it will need to develop the speed objective inside its operations. Internally, fast throughput time presumably will help it to achieve short delivery times to its external custom-ers. However, there are other benefits that may come through fast throughput times inside the operation. Materials, information or customers moving rapidly through an operation can mean less queuing, lower inventory levels, or a lower need for materials, information or customers to be organised and tracked through the proc-ess. All this adds up to lower processing costs in general. This gives operations strategy one of its more intriguing paradoxes. Even if a performance objective has little value externally in terms of helping the company to achieve its desired market position, the operation may still value high performance in that objective because of the internal benefits it brings.
the relative priority of performance objectives differs between businesses
Not every operation will apply the same priorities to its performance objectives. Businesses that compete in different ways should want different things from their operations functions. So, a business that competes primarily on low prices and ‘value for money’ should be placing emphasis on operations objectives such as cost, productivity and efficiency, one that competes on a high degree of customisation of its services or products should be placing an emphasis on flexibility, and so on. Many successful companies understand the importance of making this connection
table 2.4 Internal and external benefits of excelling at each performance objective
Operationsresources Performanceobjective MarketrequirementsPotentialinternalbenefitsinclude... Potentialexternalbenefitsinclude...
Error-freeprocesses Quality HighspecificationproductsandservicesLessdisruptionandcomplexity Error-freeproductsandservicesMoreinternalreliability ReliableproductsandservicesLowerprocessingcosts
Fasterthroughputtimes Speed Shortdelivery/queuingtimesLessqueuingand/orinventory FastresponsetorequestsLoweroverheadsLowerprocessingcosts
Higherconfidenceintheoperation Dependability On-timedelivery/arrivalofproductsandservicesFewercontingenciesneeded KnowledgeofdeliverytimesMoreinternalstabilityLowerprocessingcosts
Betterresponsetounpredictedevents Flexibility FrequentnewproductsandservicesBetterresponsetovarietyofactivities WiderangeofproductsandservicesLowerprocessingcosts Volumeadjustments Deliveryadjustments
Productiveprocesses Cost LowpricesHighermargins

54 chapter 2 • OperatIOns perFOrmance
between their message to customers and the operations performance objectives that they emphasise. For example,5
Our management principle is the commitment to quality and reliability . . . to deliver safe and innovative products and service . . . and to improve the quality and reliability of our businesses.’ (Komatsu) ‘The management team will . . . develop high quality, strongly differentiated consumer brands and service standards . . . use the benefits of the global nature and scale economies of the business to operate a highly efficient support infrastructure (with) . . . high quality and service standards which deliver an excellent guest experience . . .’ (InterContinental Hotels Group) ‘A level of quality durability and value that’s truly superior in the market place . . . the principle that what is best for the customer is also best for the company . . . (our) . . . cus-tomers have learnt to expect a high level of service at all times – from initiating the order, to receiving help and advice, to speedy shipping and further follow-up where necessary . . . (our) . . . employees “go that extra mile”.’ (Lands’ End)
the relative priority of performance objectives differs between different products and services within the same businesses
If, as is likely, an operation produces goods or services for more than one customer group, it will need to determine a separate set of competitive factors and, therefore, different priorities for the performance objectives for each group. For example, one of the most obvious differences to be found within an airline’s activities is that between the operations supporting business and first-class travellers on the one hand, and those supporting economy-class travellers on the other. This is shown in Figure 2.4.
the polar representation of performance objectives
A useful way of representing the relative importance of performance objectives is shown in Figure 2.5(a). This is called the polar representation because the scales that represent the importance of each performance objective have the same origin. A line describes the relative importance of each performance objective. The closer the line is to the common origin, the less important is the performance objective to the operation. Two services are shown: a newspaper collection recycling service and general recycling service. Each essentially provides a similar type of service, but for different markets, and therefore different objectives. Of course, the polar diagram can be adapted to accommodate any number of different performance objectives. For example, Figure 2.5(b) shows a proposal for using a polar diagram to assess the relative performance of different police forces in the UK. Note that this proposal uses three measures of quality (reassurance, crime reduction and crime detection), one measure of cost (economic efficiency), and one measure of how the police force develops its relationship with ‘internal’ customers (the criminal justice agencies). Note also that actual performance as well as required performance is also marked on the diagram.

55the FIve generIc perFOrmance ObjectIves
Services
Customers
Service range
Rate of serviceinnovation
Volume of activity
Profit margins
First/Business Class cabin,airport lounges, pick-up service
Wealthy people, businesspeople, VIPs
Wide range, may need tobe customised
Relatively high
Relatively low volume
Medium to high
Economy cabin
Travellers (friends and family),holiday makers, cost-sensitivebusiness travellers
Standardised
Relatively low
Relatively high volume
Low to medium
First/Business Class Economy Class
Main competitivefactors
Customisation, extra service,comfort features, convenience
Price, acceptable service
Performanceobjectives
Quality (specification andconformance), flexibility, speed
Cost, quality (conformance)
Figure 2.4 Different product groups require different performance objectives
Dependability
(a) (b)
Reassurance
Crimereduction
CrimedetectionWorking with
criminal justiceagencies
Efficiency
Requiredperformance Actual
performanceCost
Quality Flexibility
General recyclingservice
Newspapercollection
service
Speed
Figure 2.5 polar diagrams for newspaper collection and general recycling services, and a proposed police performance method

56 chapter 2 • OperatIOns perFOrmance
Order-winning and qualifying competitive factors
One way of determining the relative importance, or at least the different nature, of competitive factors is to distinguish between what are sometimes called ‘order-win-ning’ and ‘qualifying’ factors.6 Although not a new idea, it is a particularly useful one. Different authors use different terms, so order-winners can also be called competitive edge factors, critical or primary factors, motivating factors, enhancing factors, and so on. Qualifiers sometimes go under the names hygiene factors or failure preventors. Order-winning factors are things that directly and significantly contribute to winning business. They are regarded by customers as key reasons for purchasing the product or service. They are, therefore, the most important aspects of the way a company defines its competitive stance. Raising performance in an order-winning factor will either result in more business or improve the chances of gaining more business. Of course some order-winning factors are more important than others. In Figure 2.6 the slope of the line indicates how sensitive competitive benefit is to an operation’s achieved performance in the factor. Qualifying factors may not be the major competitive determinants of success, but are important in another way. They are those aspects of competitiveness where the operation’s performance has to be above a particular level just to be considered by the customer. Below this ‘qualifying’ level of performance the company probably will not even be considered by many customers. Above the ‘qualifying’ level, it will be considered, but mainly in terms of its performance in the order-winning factors. Any further improvement in qualifying factors above the qualifying level is unlikely to gain much competitive benefit.
Delights
In addition to order-winners and qualifiers, some authorities add a third category, generally known as ‘delights’. Notwithstanding its rather off-putting name, delights are aspects of performance that customers have not yet been made aware of, or that are so novel that no one else is aware of them. If an organisation presents a customer with a ‘delight’ the implication is that, because the customer is unaware of it, no competitor has offered it to them. For example, healthcare companies that supply products and services to clinics and hospitals have always been aware that they need to supply their customers in a fast and efficient manner. Factors such as the range of products supplied and the dependability of supply would be regarded as qualifiers, with speed of supply and cost regarded as order winners. Thus, the basis of competition was relatively clear. Then one or two companies started to offer a much more comprehensive service, which included, in effect, taking over the whole supply responsibility for individual customers. A hospital could not just buy prod-ucts from a company, it could hand over total responsibility for forecasting demand, purchasing, delivery, and storage of its supplies. This was a ‘delight’ to the hospitals that were able to effectively outsource the supply of these items enabling them to concentrate on their core task of curing and caring for the sick.
the benefits from order-winners and qualifiers
The distinction between qualifiers, order-winners and delights does illustrate the important point that competitive factors differ, not only in their relative

57the FIve generIc perFOrmance ObjectIves
importance, but also in their nature. This is best thought of as how the competitive benefit which is derived from a competitive factor varies with how well an operation performs in delivering that competitive benefit. In other words, it is an indication of the benefits an operation gains by being good at different aspects of performance. Figure 2.6 shows the benefits from qualifiers, order-winners and delights as perform-ance levels vary. No matter how well an organisation performs at its qualifiers, it is not going to achieve high levels of competitive benefits. The best that it can usually hope for is neutrality. After all, customers expect these things, and are not going to applaud too loudly when they receive them. They are the givens. However, if the organisation does not achieve satisfactory performance with its qualifiers, it is likely to result in considerable dissatisfaction amongst customers – what in Figure 2.6 is termed as negative competitive benefit. In effect, there is a discontinuity in the benefit function. This is different from an order-winner which can achieve nega-tive or positive competitive benefit, depending on performance, and whose benefit function is far more linear. The advantage of order-winners (and why they are called order-winners) is that high levels of performance can provide positive competitive benefit, and hence more orders. The benefits to be derived from ‘delights’ are also shown in Figure 2.6. The absence of delights (that is, very low achieved performance) will not upset custom-ers because they did not expect them anyway. However, as the operation starts to perform successfully in terms of its ‘delights’, the potential for customer satisfaction, and therefore positive competitive benefit, could be very significant. Note that for something to be classed as a delight it is both novel (and therefore unexpected) and genuinely adds value for customers. The idea is that the combination of added value together with its unexpected nature will make delights, when delivered effectively, particularly attractive. But because they are unexpected, the competitive benefit will not become negative for the very reason that customers are not aware of the delights.
Qualifiers
Low HighNegative
Positive
Neutral
Achieved performance
Com
pet
itive
ben
efit
Delights
Order winners
Time
Figure 2.6 qualifiers, order-winners and delights expressed in terms of their competitive benefit with achieved performance

58 chapter 2 • OperatIOns perFOrmance
Two points should be made about ‘delight’. The first is that the curves in Figure 2.6 are conceptual. They are there to illustrate an idea rather than to be drawn with any degree of precision. (Nevertheless, the theory of delights is closely associated with what some people know as the Kano model, which product designers can use in a more quantitative manner.7) The other point to make is that delights apply only at one point in time. By definition, because delights rely on their novelty, when offered in the market they will no longer be novel. This means that competitors can attempt to imitate them. So, in the example of the healthcare companies discussed previously, when they introduced their enhanced service it provided considerable competitive advantage for the few companies that could satisfactorily deliver the service. Since that time many more companies have introduced similar services. Therefore, what was once a delight became an order-winner, with customers choosing supplies on the basis of the effectiveness of their supply chain management service. In time, it may even become a qualifier, where all companies who wish to compete in the market for healthcare sup-plies are expected to offer this service. So, what were once delights will erode over time as competitors achieve high levels of performance in the same competitive factors. This prompts an interesting debate for any organisation. How sustainable are the order-winners and delights on which your business depends? Figure 2.7 illustrates a matrix that will allow for this kind of analysis. For any particular product or service it is important first to understand what competitive factors are order-winners, what are qualifiers, and what (if any) are delights. But because delights and order-winners can both erode over time, in the future what will happen is that some (if not all) delights will become order-winners and some (if not all) order-winners will become qualifiers. There is a general drift downwards (as shown by the arrows in the figure) as competitors catch up or exceed one’s level of performance. Usually the cell in the matrix that is the most problematic is that marked as ‘tomorrow’s delights’. This prompts the intriguing question of ‘What is the organisation doing today in order to develop the things that will delight its customers tomorrow?’
criticisms of the order-winning and qualifying concepts
Not everyone agrees with the idea of categorising competitive factors as order-winners or qualifiers. There are two major criticisms.8 The first is that order-winners
Tomorrow
Delights
Order-winners
Qualifiers
Today
???
Figure 2.7 What is the operation doing today to develop the capabilities that will provide the ‘delights’ of the future?

59the relatIve ImpOrtance OF perFOrmance ObjectIves changes Over tIme
and qualifiers are based on how potential purchasers of services and products behave when considering a single transaction. Increasingly though, purchasers of both consumer and ‘industrial’ services and goods do not consider a single transaction but rather think in terms of longer-term relationships. Some purchasers may be willing to accept occasional lapses in performance in either order-winners or quali-fiers because they wish to preserve the long-term relationship with their supplier. So the relationship itself both transcends the idea of order-winners and qualifiers and becomes the major order-winning competitive factor itself. Second, the original interpretation of the order-winner/qualifier concept is based on considering past sales data, including the reaction of individual customers for individual orders. A more traditional, market-based approach would treat far larger groups of customers in its segmentation procedures.
the relative importance of performance objectives changes over time
In addition to the ‘erosion’ effect mentioned previously, there are more generic changes caused by the way markets change over time and operations resource capa-bilities develop over time. Not surprising then that the nature of the reconciliation process, and therefore the role of operations strategy, changes over time, though the stimulus for change may vary. At some times markets change fast. Competitors may be particularly aggressive, or novel products or services may redefine customer expectations. If so, the competitive agenda for the business will be influenced largely by how the organisation positions itself in its markets.
changes in the firm’s markets – the product/service life cycle influence on performance
One way of generalising the market requirements that operations need to fulfil is to link it to the life cycle of the products or services that the operation is producing. The exact form of product/service life cycles will vary, but generally they are shown as the sales volume passing through four stages – introduction, growth, maturity and decline. The important implication of this for operations management is that products and services will require operations strategies in each stage of their life cycle (see Figure 2.8).
Introduction stageWhen a product or service is first introduced, it is likely to be offering something new in terms of its design or performance. Few competitors will be offering the same product or service, and because the needs of customers are not perfectly understood, the design of the product or service could frequently change. Given the market uncertainty, the operations management of the company needs to develop the flexibility to cope with these changes and the quality to maintain product/service performance.
Growth stageAs the volume of products or services grows, competitors start to develop their own products and services. In the growing market, standardised designs emerge. Standardisation is helpful in that it allows the operation to supply the rapidly growing market. Keeping up with demand could prove to be the main operations

60 chapter 2 • OperatIOns perFOrmance
preoccupation. Rapid and dependable response to demand will help to keep demand buoyant while ensuring that the company keeps its share of the market as competi-tion starts to increase. Also, increasing competition means that quality levels must be maintained.
Maturity stageEventually demand starts to level off. Some early competitors will have left the market and the industry will probably be dominated by a few larger companies. The designs of the products or services will be standardised and competition will prob-ably emphasise price or value for money, although individual companies might try to prevent this by attempting to differentiate themselves in some way. So operations will be expected to get the costs down in order to maintain profits or to allow price cutting, or both. Because of this, cost and productivity issues, together with depend-able supply, are likely to be the operation’s main concerns.
Decline stageAfter time, sales will decline and competitors will start dropping out of the market. To the companies left there might be a residual market, but if capacity in the indus-try lags demand, the market will continue to be dominated by price competition. Operations objectives will therefore still be dominated by cost.
changes in the firm’s resource base
At other times the focus for change may be within the resources and processes of the operation itself. New technologies may require a fundamental rethink of how operations resources can be used to provide competitive advantage. Internet-based
Bulk of market
Stable numbers
Low priceDependable supply
RangeQuality
CostDependability
Early adopters
Increasingnumbers
Availability
PriceRange
SpeedDependabilityQuality
Laggards
Decliningnumber
Low price
Dependablesupply
Cost
Innovators
Few/none
Product/servicespecification
QualityRange
FlexibilityQuality
Customers
Competitors
Likely order-winners
Likely qualifiers
Dominantoperationsperformanceobjectives
Decline asmarket
becomessaturated
Maturity ofmarket, sales
level off
Growth in marketacceptance
Introductioninto market
Sal
es v
olum
e
Figure 2.8 the effects of the product/service life cycle on the operations performance objectives

61the relatIve ImpOrtance OF perFOrmance ObjectIves changes Over tIme
technologies, for example, provided opportunities for many retail operations to shift, or enhance, market positioning. Other operations-based changes may be necessary, not to change, but merely to maintain a market position. They may even reflect opportunities revealed by the operations-based capabilities of competi-tors. For example, for the last two decades much of the focus of change in US and European automotive companies was within their operations processes, mainly because of the lower operations costs realised by their Japanese competitors. Again, this balance may change as niche markets become more distinctive. But this is the point. Although different industries may have a predisposition towards market or operations concerns, the relative balance is likely to experience some kind of change over time.
mapping operations strategies
To understand how an organisation’s operations strategy changes over time is to understand how it views its markets, how it sees the role of its operations resources and, most of all, how it has attempted to achieve reconciliation between the two. It also illustrates how an organisation understands its markets and how its resources evolve, often reacting to external pressures and internal possibilities. Of course, the minutiae of the thousands of decisions that constitute the mechanics of the recon-ciliation process over time are the key to understanding how the balance between markets and resources moves. Ideally we need to map the pattern and flow of each of these decisions, but this would be an immense task if our historical perspective is to be longer than a few years. Often, though, it is the nature of an organisation’s products or services that one looks to see how the internal reconciliation process resolved itself. Products and services are after all the outward manifestation of the reconciliation process. Within their design they embody the characteristics that the company hopes will satisfy the market and at the same time exploit its resource capabilities. The following example illustrates this.
For years Ferdinand Porsche had dreamt of designing a ‘people’s car’. Presenting his ideas to the Reich Government in 1934, he found enthusiastic support for the idea. By 1939 the fac-tory was completed, although the Second World War meant that it was almost immediately turned over to the production of war vehicles. By the end of the war two-thirds of the factory had been destroyed, the local infrastructure was in ruins, and both material and labour were in desperately short supply. Although attempts were made to sell the plant, no one seemed to want a ruined plant. In 1948, the occupying authorities put in Heinrich Nordhoff to run the business. Nordhoff had faith in the basic concept of Porsche’s design but added an emphasis on quality and engineering excellence. Throughout the 1950s the company overcame the difficulties of manufacturing in a recovering economy, and expanded both its manufacturing and its sales operations. The car itself, however, hardly changed at all. In fact, Nordhoff actively suppressed any change to the design. Nothing would be allowed to interfere with the core values of a simple, cheap, robust and standardised people’s car. Yet the world was chang-ing. Local economies were recovering fast and customers were demanding more choice and touches of luxury in their motor vehicles. Eventually Volkswagen was forced to introduce a new model (the 1500). In all essentials, however, the company strategy was unchanged.
example vW: the first seventy years9
62 chapter 2 • OperatIOns perFOrmance
understanding vW’s operations strategy over time10
Like any company, VW’s strategy has changed over time and, in turn, so has its operations strategy. The requirements of the market have changed, as world mar-kets have grown, matured and become increasingly sophisticated over time, but VW’s change is also in response to how its competitors have behaved. Thus VW’s markets, which were small, local and disrupted at the beginning of the period, over time became increasingly large, international and differentiated. Also competitive
During the early part of the 1960s, the 1500 model helped to take some of the pressure off the company. But consumer tastes were still moving faster than the company’s response. Although sales held up, increased costs, together with stiff price competition, were having a severe effect on the company’s profitability. By the end of the 1960s profits were declining and, in an attempt to find a new way forward, Volkswagen introduced several new products and acquired some smaller companies, most notably Auto Union GmbH from Daimler Benz, which later would form the nucleus of Audi. Out of this somewhat rudderless period (Nordhoff had died in 1968), the company eventually started to find a coherent strategy, with new models formed around the designs emerging from Audi. More in tune with modern tastes, they were front wheel drive, water cooled and more stylish than the old Beetle. Also the company started to rationalise its operations to ensure commonality between models and bring enhanced organisation to its global manufacturing operations, and the company resumed profitable growth in 1975. During the remainder of the 1970s and through the 1980s, Volkswagen continued to pro-duce its successful Polo, Golf and Passat models. Production facilities continued to expand around the world, but never again, Volkswagen vowed, would they be left behind by con-sumer tastes. Design and product performance moved to the front of VW’s strategy and all models were updated at regular intervals. The next big challenge for the company came, not from the inadequacy of its models, but from its manufacturing facilities. In the early 1990s Volkswagen’s models were still highly regarded and commercially suc-cessful, but costs were significantly above both its local European rivals and its Japanese competitors. And, although by now it was by far the largest auto-maker in Europe, the prospects for VW looked bleak. Management structures were bureaucratic; labour costs in Germany were significantly higher than other European and US levels. And one estimate had Volkswagen needing to operate at 95 per cent of capacity just to cover its costs. The break-even points of its rivals were significantly lower, at around 70 per cent. A fundamental cost-cutting exercise was seen by many commentators as the only thing that would save the company. By the late 1990s, once more things were looking brighter. The company had negotiated pay and flexibility deals with its employees, successfully cut the costs of buying parts from its supply base (at one point hiring the cost-cutting José Ignacio López from General Motors) and was continuing to introduce its new models. The most eye-catching of these was the New Beetle, a design based on the old Beetle but with thoroughly modern parts under its skin. Just as significantly, the company worked on the commonality of its designs. Within the VW group several models, although looking different on the surface, were based on the same basic platform. Yet the company found that there were limits to how far one could sell essentially the same car as different brands at different prices, and it eventually devised a less obvious modular design strategy. Throughout the 2000s there was continued cost pres-sure from (mainly Japanese) competitors and a severe recession at the end of the decade. In response VW’s production shifted increasingly to lower-cost locations such as East Europe and China. At the same time it started to seriously adopt lean principles in all its operations.

63the relatIve ImpOrtance OF perFOrmance ObjectIves changes Over tIme
pressure counted for little at the beginning of the period, but by the 2000s automo-bile markets had become fiercely competitive. Likewise the nature of VW’s opera-tions resources has changed, starting with a desperate effort merely to satisfy even the most primitive of markets. Then, at various times, VW’s operations resources became more systematised, considerably larger, and far more complex, involving an interconnected network of internationally located operations. Figure 2.9 shows the relative significance of market requirements and operations resources at VW over time. This gives an indication of the relative degree of strate-gic activity within the firm’s operations over time. It also gives us a clue as to the role of operations strategy over time. At some stages the role of operations strategy is relatively minor, often confined merely to implementing the company’s market strategy. So, during the period 1959 to 1964 the firm’s strategy was driven largely by a desire to change its market position slightly through the introduction of the 1500 model. The firm’s operations strategy was limited to ensuring that the new model could be manufactured satisfactorily. Similarly, in the period 1976 to 1989, the firm’s focus was mainly on how its markets could be segmented in order to achieve successful differentiation of its various products. At other times the strategy of the company not only relies on its operations capabilities but could be described as being driven by them. So, in the period 1946 to 1951 the company’s strategy was dictated largely by the ability of its operations resources to produce the cars in suf-ficient quantity to satisfy its emerging market. Similarly, in the period 1990 to 1996, and again from 2001 to 2007, the firm’s profitability, and even survival, depended on the ability of its operations resources to reduce its cost base significantly. In both these periods the company’s market activity was, to some extent, driven by its opera-tions capabilities (or lack of them). At other times the relative roles of market and operations strategy are more balanced. (Even if they are balanced only in terms of their mutual confusion, as they were in the 1965 to 1970 period.) The key point here is not so much that the firm’s operations strategy is at times better or worse than at other times. Rather it is that, over the long term, any firm can expect the role of its operations strategy to change as its circumstances change. However, one should not infer that the role of operations is exclusively driven by environmental forces. Interwoven with environmental pressures are a whole set of significant choices VW has made. The company chose to suppress new designs in the 1950s, it chose to try out many designs in the late 1960s and it chose to develop its common products platform strategy in the late 1990s. The development of operations strategy over time is a combination of uncontrollable environmental forces and factors that can be more readily influenced. Above all, it is determined by choices about how operations resources are developed and the role we expect of the operations function within the firm. Notice how the two major crises for VW, in its loss of strategic direc-tion in the late 1960s and its loss of cost control in the early 1990s, were preceded by a period where operations strategy had a relatively minor role within the company. Note also how VW’s operations objectives changed as market circumstances changed. In its early history, the very basic objective of making products available (a combination of speed and dependability) was pre-eminent in an environment where basic resources were difficult to obtain. Latterly, the company, by now far larger and more complex, was struggling with the task of reducing its costs while maintaining its performance in other areas. The issue here is, because of changing market requirements, not all per-formance objectives are equally important. But also, from a resource perspective, operations cannot be exceptionally good at every single aspect of performance at the same time.

64 chapter 2 • OperatIOns perFOrmance
Marketrequirements
Operationsresources
Strategicreconciliation
Simpledesign
Emerging,any working
vehicle
1946–51Implementing
strategy
Building upcapacity andcapability
Standardiseddesign
Maturing,simple robust
vehicle
1952–58Continuity of
strategy
Systemisationof resourcesand processes
New 1500model
Moresophisticatedperformance,
quality
1959–64Minor changeand continuity
Minorreconfigurationfor newmodel
Multiplenew
designs
Uncertainrejection of
VW traditionalproducts
1965–70Searching forviable strategy
Fragmentedacquisition ofnew resources
Definedrange
Clarifyingaround style,
quality andvariety
1971–75Emergentstrategy
Adapt bestpractices fromenlarged group
Productdevelopment
paths
Segmentationaround performance,
style and variety
1976–89Continuingwith minorchanges
Accommodatenew modelsand acquisitions
Design forlow-cost
manufacture
Increasinglycompetitive
around price
1990–96Major change
(internal)
Drasticreconfigurationto increaseefficiency,reduce costs
Commonproduct
platforms
Continuousprocessimprovementand costreduction
Branding withprice, quality
and style
1997–2000Implementing
strategy
Modulardesign
Increasinglycompetitive
around priceand innovation
2001–07Implementing
refinedstrategy
Lean process improvement and more low-cost locations
Figure 2.9 market requirements, operations resources and strategic reconciliation at vW over 70 years

65traDe-OFFs – are they InevItable?
Volkswagen emphasised different aspects of performance at different points in time. And, in order to excel in some particular aspects of performance, they would, to some extent, sacrifice performance in others. This idea is usually referred to as the trade-off concept. It is fundamental to our understanding of operations strategy. Perhaps most important, the idea of trade-offs is also at the heart of how operations seek to improve their performance over time. One of the many questions central to improvement efforts is, ‘What do we want to be particularly good at?’ Is there one particular aspect of performance that we wish to stress above everything else (‘with us it is quality first, second and third’), or are we trying to achieve a balance between objectives (‘we wish to offer the customer a wide range of services but not to the extent that costs get out of control’)? In order to answer these questions we need to understand the way performance objectives relate to each other. This is where trade-offs come in.
What is a trade-off?
All of us are familiar with the simple idea that (much as we would like) we cannot have everything. Most of us want some combination of health, wealth and hap-piness. But we also know that sometimes we must sacrifice one to get the others. Driving ourselves too hard at work may give us wealth but can have negative effects on both health and happiness. Of course we cannot let the wealth objective decrease too far or our poverty will undermine happiness and even health. We all instinc-tively understand that: (a) the three objectives are related; (b) because some resource is finite (time, ability, etc.) we must, to some extent, trade off each objective against the others; (c) the trade-off relationship is not simple and linear (we do not decrease, or increase, our health by a fixed amount for every €1,000 earned); (d) the nature of the relationship will differ for each individual (some of us can derive great happiness and well-being from the process of making money); and, perhaps most importantly, (e) none of us is always totally certain just how our own trade-offs operate (although some of us are better at knowing ourselves than others). That these ideas also apply to operations was first articulated by Professor Wickham Skinner at Harvard University. As ever in those days he was speaking of manufacturing operations, but broadly the same principles apply. He said:
‘. . . Few executives realise the existence of trade-offs. Yet most managers will readily admit that there are compromises or trade-offs to be made in designing an airplane or a truck. In the case of an airplane, trade-offs would involve matters such as cruising speed, take-off and landing distances, initial costs, maintenance, fuel consumption, passenger comfort, and cargo or passenger capacity. A given stage of technology defines limits of what can be accomplished in these respects. For instance, no one today can design a 500-passenger plane that can land on a carrier and also break the sonic barrier. Much the same thing is true of manufacturing. The variables of cost, time, quality, technological constraints, and customer satisfaction place limits on what management can do, force compromises, and demand an explicit recognition of a multitude of trade-offs and choices.’11
trade-offs – are they inevitable?

66 chapter 2 • OperatIOns perFOrmance
Why are trade-offs important?
We judge the effectiveness of any operation by how well it performs. The call centre that can respond to our call and solve our problems within seconds, any time of the day or night, is superior to one that takes several minutes to answer our call and does not operate through the night. The plant that can deliver products in 24 hours is judged superior to one that takes 3 days, plants turning over their stock 25 times a year are superior to one which, operating under similar conditions, only manages to turn over stock 7 times a year, and so on. Yet in making our judgement we rec-ognise two important characteristics of operations performance. The first is that all measures of performance will not have equal importance for an individual opera-tion. Certain aspects of performance will outweigh others, their relative importance being determined by both the competitive characteristics of the market in which the operation is competing and, more importantly, the way in which the company chooses to position itself within that market. The second characteristic of perform-ance, which will shape our view of the operation, is that we recognise that aspects of performance will, to some extent, trade off against each other. So for example, we are less impressed with the call centre that answers our calls quickly at all times of the day or night if its costs of running the operation make it necessary to charge us higher fees, or if the plant that delivers within 24 hours is achieving this only by investing in high levels of finished goods inventory. Though maybe we will be more indulgent towards the operation if we discover it has deliberately positioned itself in the market to compete primarily on instant response or fast delivery. Then the cost implications of high finished goods inventory may not matter so much. The operations have chosen to ‘trade off’ higher costs or high inventory to achieve fast response and fast delivery. However, we would be even more impressed with the call centre if it had ‘overcome’ the trade-off and was achieving both fast and 24-hour response and low cost levels. Similarly with the manufacturing plant, if it was achieving both fast delivery and low inventories. In both these examples we are using a broad understanding of the relationship between different performance objectives to judge the effectiveness of their operations management. But we are also implying that, in order to improve, these operations must overcome the trade-offs by changing the nature of the relationship between performance objectives.
are trade-offs real or imagined?
Skinner’s original idea of trade-offs was both straightforward and intuitively attractive. Essentially it formalised the notion that there is no such thing as a free lunch. Any operation, like any machine, is ‘technologically constrained’.12 It therefore cannot provide all things to all people. The trade-off relationships between competitive objec-tives (cost, quality, delivery, variety, inventory, capital investment, etc.) mean that excellence in one objective usually means poor performance in some or all of the others. Operations that attempt to be good at everything finish up by being mediocre at everything. Therefore the key issue of operations strategy is to position the competi-tive objectives of the operation to reflect the company’s overall competitive strategy. Although Skinner has subsequently modified his original ideas, he maintains their essential validity: ‘trade-offs . . . are as real as ever but they are alive and dynamic.’13
The counter-view came from a new breed of more evangelical academics and con-sultants inspired by the perceived success of some (mainly Japanese) companies in

67traDe-OFFs – are they InevItable?
overcoming, at least some, trade-offs, most notably that between cost and quality. They embraced the ‘bottom up’ improvement techniques of ‘world class’ operations. Both trade-offs and positioning, they claimed, are illusions. Trade-offs are not real, therefore positioning is not necessary. Citing the success of many companies that achieved improvements in several aspects of performance simultaneously, they dis-miss trade-offs as distractions to what should be the real imperative of operations, namely improvement. Making choices between alternative aspects of performance leads to ‘merely good’, as opposed to ‘outstanding’ achievements. This is what some called ‘the tyranny of either/or’. Rather than accepting the either/or approach, they recommend the more positive ‘and/also’ approach, which works towards ‘having it all’. New forms of operations organisation and practice could overcome the ‘techni-cal constraints’ of any operation, this being especially true if they are applied with a radical creativity hitherto unexpected in operations managers. In spite of the appealing positive approach of this school, it could not fully explain away the intuitive appeal of the trade-off concept, and several attempts at an inclusive compromise which brings the two schools together were proposed. For example, it was suggested that some trade-offs did still, and would always, exist, while others had, for all practical purposes, been overcome by the new technologies and methodologies of manufacturing. Others suggested that while all trade-offs were real in the very short term, they could all be overcome in the long term. Most recent authors hold that ‘trading off’ and ‘overcoming trade-offs’ are in fact distinct strate-gies, either of which may be adopted at different times by organisations. Neither are they mutually exclusive; operations may choose to trade off by repositioning the balance of their performance, both as a response to changes in competitive strat-egy and to provide a better starting point for improvement. And key to overcom-ing trade-off constraints is the building of appropriate operating capabilities. Thus operations performance improvement is achieved by overcoming trade-offs, which, in turn, is achieved through enhanced operations capabilities. The position taken in this book is close to the last school of thought. That is, that while there is a clear requirement for operations managers to position their opera-tion such that they achieve the balance between performance objectives which is most appropriate for competitive advantage, there is also a longer-term imperative which involves finding ways of overcoming the intrinsic trade-offs caused by the constraints imposed by the operation’s resources.
trade-offs and the efficient frontier
Figure 2.10(a) shows the relative performance of several companies in the same industry in terms of their cost efficiency and the variety of products or services that they offer to their customers. Presumably all the operations ideally would like to be able to offer very high variety while still having very high levels of cost efficiency. However, the increased complexity that a high variety of product or service offerings brings generally will reduce the operation’s ability to operate efficiently. Conversely, one way of improving cost efficiency is to severely limit the variety on offer to cus-tomers. The spread of results in Figure 2.10(a) is typical of an exercise such as this. Operations A, B, C, D all have chosen a different balance between variety and cost efficiency. But none is dominated by any other operation in the sense that another operation necessarily has ‘superior’ performance. Operation X, however, has an inferior performance because operation A is able to offer higher variety at the same

68 chapter 2 • OperatIOns perFOrmance
level of cost efficiency, and operation C offers the same variety but with better cost efficiency. The convex line on which operations A, B, C and D lie is known as the ‘efficient frontier’. They may choose to position themselves differently (presumably because of different market strategies) but they cannot be criticised for being inef-fective. Of course any of these operations that lie on the efficient frontier may come to believe that the balance they have chosen between variety and cost efficiency is inappropriate. In these circumstances they may choose to reposition themselves at some other point along the efficient frontier. By contrast, operation X has also chosen to balance variety and cost efficiency in a particular way but is not doing so effectively. Operation B has the same ratio between the two performance objectives but is achieving them more effectively. Operation X will generally have a strategy that emphasises increasing its effectiveness before considering any repositioning. However, a strategy that emphasises increasing effectiveness is not confined to those operations that are dominated, such as operation X. Those with a position on the efficient frontier generally will also want to improve their operations effective-ness by overcoming the trade-off that is implicit in the efficient frontier curve. For example, suppose operation B in Figure 2.10(b) is the metrology systems company described earlier in this chapter. By adopting a modular product design strategy it improved both its variety and its cost efficiency simultaneously (and moved to posi-tion B1). What has happened is that operation B has adopted a particular operations practice (modular design) that has pushed out the efficient frontier. This distinction between positioning on the efficient frontier and increasing operations effectiveness to reach the frontier is an important one. Any operations strategy must make clear the extent to which it is expecting the operation to reposition itself in terms of its performance objectives and the extent to which it is expecting the operation to improve its effectiveness.
Cost efficiency
The ‘efficient frontier’
Varie
ty
AB
C
(a) (b)
D
X
The new ‘efficient frontier’
CX
Cost efficiency
B1Varie
ty
AB
D
Figure 2.10 the efficient frontier
69traDe-OFFs – are they InevItable?
Improving operations effectiveness by using trade-offs
Improving the effectiveness of an operation by pushing out the efficient frontier requires different approaches depending on the original position of the operation on the frontier.14 For example, an operation may have an original position that offers a high level of variety at the expense of low cost efficiency. It has probably reached this position by adopting a series of operations practices that enable it to offer the variety even if these practices are intrinsically expensive. For example, it may have invested in general purpose technology and recruited employees with a wide range of skills. Improving variety even further may mean adopting even more extreme operations practices that emphasise variety. For example, it may reorganise its processes so that each of its larger customers has a dedicated set of resources that understands the specific requirements of that customer and can organise itself to totally customise every product and service it produces. This will probably mean a further sacrifice of cost efficiency, but it allows an ever greater variety of products or services to be produced. Another operation may increase the effectiveness of its cost efficiency, by becoming even less able to offer any kind of variety. For both opera-tions, effectiveness is being improved through increasing the focus of the operation on one (or a very narrow set of) performance objectives and accepting an even fur-ther reduction in other aspects of performance. For example, if an audit firm designed an operation to carry out only simple standard audits on small to medium-sized engineering manufacturing companies, it could develop processes and procedures specifically to meet the needs of such clients. It could devise expert systems to automate much of its decision making and it could train its staff with only the knowledge to carry out such audits. Focused and efficient, the operation could achieve exceptional productivity provided the demand could keep it fully employed. However, such an operation is something of a one-trick pony. Ask it to do anything else and it would have considerable diffi-culty. Increasing the variety placed on the operation outside its design specification would have an immediate and significant impact on its costs. In effect, designing the operation this way has made the relationship curve between variety and cost concave rather than convex. Asking the operation to move away from the perform-ance objectives for which it was specifically designed brings an immediate penalty. Asking it to move even further away from its design specification also brings a cost, but not one to match that initial penalty.
At one time most airlines operated a ‘twin class’ system – First Class and Economy Class. Then came Business Class, with service standards placed between First and Economy. Ideally designed for the burgeoning business travel market, it attracted customers from both the First and Economy Classes. British Airways’ strategy was typical. On most non-European sectors, BA offered all three levels of cabin service to their customers, with First and Business Classes particularly popular on long-haul flights, the transatlantic route being the single big-gest market. By the mid-1990s the First Class market seemed to be in terminal decline, with many airlines pulling out of the First Class product entirely and, instead, concentrating on offering superior service in Business Class. British Airways took a different view. They believed that the whole concept of First Class travel needed to be redefined and in early 1994 they decided to refurbish their First Class
example Flat beds trade off utilisation for comfort

70 chapter 2 • OperatIOns perFOrmance
trade-off, operations strategy and csr
The idea of trade-offs and the ‘efficient frontier’ can also help with an understand-ing of how corporate social responsibility (CSR) fits into operations strategy. Many advocates of ‘green’ operations talk about how being environmentally sustainable is also economically efficient. If Marks & Spencer (the UK-based retailer) makes its trucks more aerodynamic then it saves fuel and saves costs; if a firm reduces its travel budgets and increases use of teleconferencing, it saves money and reduces its carbon footprint, etc. Yet within these dimensions of sustainability, it seems clear that there can also be trade-offs. For example, in choosing between local suppliers, and those in developing countries whose activities promote economic self-sufficiency, there may well be a higher total carbon footprint associated with the transaction. Others are less obvious but equally challenging. For example, doing things voluntarily is often presented as an important principle of CSR and yet subsequent regulatory changes – such as a universally accepted price for carbon – may require an organisa-tion to make further adaptations. In fact there are several ‘dimensions’ of CSR, some of which are briefly described in Table 2.5. And even at this simple level one can see that CSR is a very broad term encompassing a range of potentially complementary, but also potentially contradictory, objectives. Figure 2.11 illustrates the idea of trade-offs between the financial and the ethical performance of any operations. The first point to make is that there are relatively extreme positions on both financial and ethical performance. On the side of those who believe that CSR is essentially a distraction for business, the most famous quote comes from Milton Friedman, the famous economist who said:
cabins. Existing First Class cabins had 18 passenger seats, each with a 62 inch seat pitch, serviced by four cabin crew. BA’s research using passenger focus groups showed that the most important factors associated with First Class travel were, in fact, space related. The main challenge was to create maximum passenger space within the existing area and simultane-ously boost revenues from this segment. Their answer was a new design for their First Class cabins, the ‘Bed in the Sky’ – a private first class seat encased in a shell that could transform itself into a completely horizontal bed. With the help of in-cabin technology, all control facilities were accessible within an arm’s length of the passenger seat – audio/video, light switches, call buttons, etc. However, the more spacious seats meant that cabin size, in terms of seating, was reduced to 14 passenger seats. BA was also able to complement the new cabin designs with improved standards of cabin service and cuisine. Refitting all their long-haul aircraft in this way succeeded in repositioning BA’s First Class product so it had a unique First Class offering with no comparable competition. But it also had spent money to have fewer seats. Service quality was improved, but its costs per pas-senger were higher. This meant that BA had to increase its seat utilisation (the proportion of seats actually filled with paying passengers) in order to generate higher revenues from its improved service. In fact BA was able to arrest the decline in First Class travel, and increase its market share and revenues in the segment (revenues exceeded the business plan propos-als by over 10 per cent). BA had traded off cost efficiency (it went down) for service quality (it went up). This paid off because of the extra revenue it brought. So successful was this exercise that BA repeated the strategy in its Business Class products. But now many other airlines have implemented a similar strategy, so the concept of ‘erosion of delights’ applies. Flat beds have become an ‘order-winner’, even in Business Class.

71targetIng anD OperatIOns FOcus
‘The business of business is business. A society that puts equality before freedom will get neither. A society that puts freedom before equality will get a high degree of both.’
In the opposite corner, representing those who believe that business should exist only in the context of a broader set of social responsibilities, is the founder of Body Shop – Anita Roddick. She said:
‘In terms of power and influence . . . there is no more powerful institution in society than business . . . The business of business should not be about money, it should be about responsibility. It should be about public good, not private greed.’
In between these two positions, most businesses try and reach some degree of com-promise. In this sense they are ‘repositioning’ themselves on an efficient frontier as in Figure 2.11(a). As pointed out earlier, repositioning an operation on the efficient frontier is sometimes necessary as the demands of the market (or environment) change. In this case, it is increasingly difficult to focus exclusively on either financial or ethical performance. Societal pressure and issues of reputational risk are defining minimum ethical standards while tough market conditions and stockholder expec-tations are defining minimum financial standards. Thus exercising improvement creativity to try and become better at financial and ethical performance simultane-ously could be argued to be the only realistic option for most businesses (see Figure 2.11(b).
table 2.5 multiple dimensions of sustainability
Type Definition
Environmental Theimpactofoperationsonthenaturalenvironment(e.g.pollution)andoncarbonfootprintinparticular
Social Therelationshipbetweenbusinessandsocietyingeneral;consideringallstakeholdersorstake-holdergroups
Economic Thecontributionmadetoeconomicdevelopment–inparticularinareas/countrieswithrelativeeconomicdisadvantage
Voluntariness Undertakingactionsnotprescribedbylaw;doingmorethanyouhaveto
targeting and operations focus
The idea of repositioning the trade-off balance between conflicting performance objectives underpins one of the most effective ‘types’ of operations strategy – focused operations. This concept of focus is both powerful and proven because at its heart lies a very simple notion, that many operations are carrying out too many (often conflicting) tasks. The obvious result is that they are unable to perform them all with any real degree of success, whereas concentrating on one or two specific objectives, even at the expense of adopting a vulnerable ‘concave’ trade-off curve as discussed previously, can lead to substantially superior performance in those few objectives. It means redeploying operations resources to the needs of only a very specific part of the market.

72 chapter 2 • OperatIOns perFOrmance
the concept of focus
Most of the early work on what was then called the ‘focused factory’ concept was carried out by Wickham Skinner of Harvard Business School. Based on his ideas of how trade-offs dominated operations decision making, he argued that one way of achieving an effective operations strategy is through the concept of factory focus. This meant that first a business should establish a consistent set of policies for the various elements of its operations, which will support, not only each other, but also market-ing requirements. Second, because of the inherent trade-offs, one operation cannot provide peak performance in all performance objectives at the same time. In his article ‘The Focused Factory’, Skinner based these arguments on his observations of a variety of US industries in the early 1970s.15 He found that most factories were trying to tackle too many tasks and therefore trying to achieve too many objectives. Because of this they were failing to perform well in any single objective. He concluded that a factory that was focused on a narrow range of products, and aimed at satisfying a particular section of the market, would outperform a plant that was attempting to satisfy a broader set of objectives. The equipment, systems and procedures that are necessary to achieve a more limited range of tasks for a smaller set of customers could also result in lower (especially overhead) costs. Focus, according to Skinner, can be expressed as dedicating each operation to a limited, concise, manageable set of products, technolo-gies, volumes and markets, then structuring policies and support services so they focus on one explicit task, rather than on a variety of inconsistent, conflicting, implicit tasks.
Focus as operations segmentationIn Chapter 1 we briefly described how marketing managers attempt to understand their markets through the process of segmentation. Market segmentation breaks heterogeneous markets down into smaller, more homogeneous, markets. Within
(b) Simultaneously improving both ethical andfinancial performance, partly because extremepositions on either are becoming less acceptable
Ethical performance Ethical performance
Fina
ncia
l per
form
ance
Fina
ncia
l per
form
ance
Societal pressure +reputational risk definingminimum ethical standards
Repositioning between ethicaland financial performance
The efficient frontierbetween ethical andfinancial performance
(a) Changing the balance (trade-off) betweenethical and financial performance
Stockholderexpectationsdefining minimumfinancial standards
Figure 2.11 to what extent do ethical and financial performance trade off?
73targetIng anD OperatIOns FOcus
operations resources, what we have called ‘focus’ is very similar to the process of segmentation. In fact it can be regarded as operations segmentation. Operations, like markets, are complex. A whole range of different skills, process technologies, flow sequences, knowledge applications, individual decisions, and so on, come together to create a range of different products and/or services. Operations managers spend much of their time attempting to split up the tasks of managing these resources in order to simplify them and thereby manage them more effectively. In effect, they are segmenting their operations resources. And, just as in marketing there are con-tinual debates around the best way to segment markets, so in operations there are similar debates as to the most sensible way to segment resources. Ideally, operations segmentation and market segmentation should correspond. That is, separate clusters of resources clearly and distinctively serve individual market segments. The major problem with the whole idea of focus, however, is that what is a sensible basis for segmenting markets does not always map onto the ideal basis for segmenting opera-tions resources. For example, an advertising agency may segment its market by the size of the promotional accounts of its clients. Ideally, it may wish to have different service offerings for large, medium and small accounts. Each of these offerings would have different mixes of services specialising in different types of communication, such as TV, posters, radio, press, etc. In this way they can position themselves as ‘one-stop shops’ that will produce entire marketing campaigns seamlessly for each market segment. However, from an operations viewpoint, the company’s creative staff (its main resource) may retain their creativity more effectively if they work in teams focused on specific media, with, for example, one team specialising in TV advertis-ing, another in press campaigns, and so on. So, what is ideal for the market (one-stop shops by size of promotional spend) does not match the ideal way of organising resources to maintain or improve their effectiveness (in this case, creativity).
the ‘operation-within-an-operation’ conceptAny decision to focus an operation might appear to carry with it the need to set up completely new operations if further products/services are added to the range, and it is true that in some cases a failure to do this has undermined successful opera-tions. However, it is not always feasible, necessary or desirable to do this, and the ‘operation-within-an-operation’ (or ‘plant-within-a-plant’, or ‘shop-within-a-shop’) concept is a practical response that allows an organisation to accrue the benefits of focus without the considerable expense of setting up independent operations. A portion of the operation is partitioned off and dedicated to the manufacture of a par-ticular product/delivery of a particular service. The physical separation of products/services will allow the introduction of independent workforces, control systems, quality standards, etc. In addition, this approach allows for easier supervision, moti-vation and accounting.
It all started when Southwest Airlines in the USA organised its airline operations ruthlessly around providing a low-cost ‘no frills’ service; it could both grow its customer base and do so profitably. Around the world, and especially in Europe, Southwest’s example inspired a number of imitators, who likewise focused on focus. In Europe the European Airlines Deregulation Act prompted the emergence of several low-cost airlines (LCAs). The larger
example ryanair’s focus on low costs16

74 chapter 2 • OperatIOns perFOrmance
types of focus
Just as there are many ways of segmenting markets, so there are several approaches to focusing operations. The organisation of process technologies staff and processes can be based on several criteria. Table 2.6 illustrates some of the more common approaches to focus. These can be placed on a spectrum from those that take market-related factors as being an appropriate way to segment operations resources, through to those that allow the resource characteristics themselves to dictate how operations are split up.
airlines had been drawn towards longer-haul routes where their interconnecting network of services and their extended levels of service were a major attraction. So, even in Europe, which has a viable and popular rail network, several companies saw the opportunity to offer low-cost, short-haul services. Companies such as Ryanair adopted similar strategies for keeping costs down. To some extent these strategies included trading off levels of service for reduced costs. So complimentary in-flight service was kept to a minimum, secondary and sometimes less convenient airports were used, and one standard class of travel was offered. In other ways these companies attempted to overcome trade-offs by focusing their operations. For example, they focused on a standardised fleet of aircraft, thus keeping main-tenance costs down. They focused on their key processes such as passenger handling while outsourcing more peripheral processes. They focused on direct sales to their customers, often pioneering low-cost channels such as the internet. They also focused on those elements of the process that hinder the effective utilisation of their expensive resources, such as reducing aircraft turn-round time at the airports. To keep focused, however, requires a clarity of vision. Ryanair’s boss Michael O’Leary’s policy on customer service is also clear.
‘Our customer service is about the most well defined in the world. We guarantee to give you the lowest air fare. You get a safe flight. You get a normally on-time flight. That’s the package. We don’t, and won’t, give you anything more. Are we going to say sorry for our lack of customer serv-ice? Absolutely not. If a plane is cancelled, will we put you up in a hotel overnight? Absolutely not. If a plane is delayed, will we give you a voucher for a restaurant? Absolutely not.’
One attempt by Ryanair to cut costs prompted a backlash when it was accused of being ‘puerile and childish’ by the UK’s Office of Fair Trading (OFT). John Fingleton, the OFT’s boss, criticised the company for adding extra fees when customers use any but a MasterCard prepaid card to pay for flights, using, he said, a legal loophole to justify charging the extra fee. The law states that if an airline offers at least one free payment method, it is allowed to advertise cheap fares that do not include extra credit card charges. Fingleton was reported as saying that:
‘Ryanair has this funny game where they have found some very low frequency payment mecha-nism and say: “Well because you can pay with that”. It’s almost like taunting consumers and pointing out: “Oh well, we know this is completely outside the spirit of the law, but we think it’s within the narrow letter of the law”.’
Stephen McNamara, Ryanair’s Head of Communications, retorted that:
‘Ryanair is not for the overpaid John Fingletons in this world but for the everyday Joe Bloggs who opt for Ryanair’s guaranteed lowest fares. What the OFT must realise is that passengers prefer Ryanair’s model as it allows them to avoid costs, such as baggage charges, which are still included in the high fares of high cost, fuel surcharging . . . airlines.’

75targetIng anD OperatIOns FOcus
●● Performance objective focus. The operation is set up solely to satisfy the perform-ance requirements of a particular market or market segment. So all products or services produced in an operation have very similar characteristics in terms of generic performance objectives.
●● Product/service specification focus. The operation is set up for a clearly defined product or service, or range of products or services, the implication being that each defined range of products or services is targeted at a clearly defined market segment.
●● Geographic focus. Sometimes operations can be segmented in terms of the geo-graphic market they serve. This may be because the characteristics of a com-pany’s different market segments are largely defined by their geographic location. Alternatively, it may mean that the nature of the service offered by an operation
table 2.6 Firms can use various criteria to ‘focus’ their operations
Focuscriteria Idealoperationsresource Idealmarket conditions requirementsconditions
Operationssegmentation Performance objectives Productsandserviceswith Marketsegmentationisbasedonmarketcriteria Clusterproducts/services similarmarket basedclearlyoncustomer bymarketrequirements requirementshavesimilar requirements processingrequirements
Product/service Similarproductsand Productsandservicesare specification servicesrequiresimilar targetedonspecific Limitsnumberof technologies,skillsand marketsegments products/servicesineach processes partoftheoperation
Geography Thegeographicarea Marketsegmentationcan Clusterproducts/services whereproductsand bebasedongeographic bythegeographicmarket servicesarecreatedhasa regions theyserve significantimpacton operationsperformance
Variety Thenatureoftechnology, Marketsegmentationcan Separatelyclustershigh- skillsandprocessesis bebasedonthedegree varietyproducts/services determinedprimarilyby ofproduct/servicechoice andlow-varietyproducts/ thevarietywithwhich requiredbycustomers servicestogether products/servicesare created
Volume Thenatureoftechnology, Marketsegmentationcan Separatelyclustershigh- skillsandprocessesis besummarisedas‘mass volumeproducts/services determinedprimarilyby markets’versusmore andlow-volumeproducts/ thevolumeatwhich ‘specialisedmarkets’ servicestogether products/servicesare created
Operationssegmentation Process requirements Theprocessrequirements Productsandserviceswithbasedonresourcecriteria Clusterproducts/services (typesoftechnology, similarprocessing withsimilarprocess skills,knowledge,etc.)of requirementsaretargeted requirementstogether products/servicescanbe onspecificmarket clearlydistinguished segments

76 chapter 2 • OperatIOns perFOrmance
The nature of focus is that it is not ambiguous. Opting for excellence in a narrow set of objectives at the expense of the ability to be excellent at the others calls for a significant level of commitment to the objectives that have been chosen. The idea of commitment to a strategy has long been debated in business strategy and, before that, in military strategy. A classic military illustration of commitment is shown in Figure 2.12. Two armies want to occupy an island, though neither is particularly keen to fight the other for it. Suppose Army 1 occupies the island pre-emptively and burns the bridge behind it. Army 2 then is likely to cede the island because it realises that Army 1 has no option other than to fight if Army 2 attacks. By restricting its own flexibility (to retreat) and ensuring its commitment, Army 1 has won the island without having to fight.
example burning your bridges (or boats)17
is geographically limited. Most high-contact operations, such as fast-food restau-rants, would fall into this category.
●● Variety focus. A company may wish to segment its operations in terms of the number of different activities (usually dictated by the number of different prod-ucts or services) it is engaged in. So, for example, one site may concentrate on relatively low variety or standardised products and services while another concen-trates on high variety or customised products and services.
●● Volume focus. High-volume operations, with their emphasis on standardisation and repetition, are likely to need different process technologies, labour skills and plan-ning and control systems from those with lower volume. Volume focus extends this thinking to the creation of separate operations for different volume requirements.
●● Process requirements focus. Here, a particular technology is the point of focus for the operation. This allows the organisation to concentrate on extending its knowledge and expertise about the process. Over the life cycle of a production/service system, the likely advantage to be gained from a process focus will change. As an operation starts up and moves into the growth phase, building process capa-bility will be critical; however, as volumes stabilise the process itself will become more stable. A process focus can also become very significant as volumes decline and the organisation seeks to redirect its operations. However, many firms choose to close an operation rather than redirect it.
benefits and risks in focus
Different kinds of focus criteria carry different kinds of benefits and risk. However, usually the benefits and risks of focus can be summarised as follows. Benefits include:
●● Clarity of performance objectives. Clearly targeted markets imply at least some degree of discrimination between market segments. This in turn makes easier the task of prioritising those few performance objectives that are important for that market. This allows operations managers to be set relatively unambiguous and non-conflicting objectives to pursue in their day-to-day management of resources.
●● Developing appropriate resources. A narrow set of focused resources allows those resources to be developed specifically to meet the relatively narrow set of per-formance objectives required by the market. Process technologies, skills and

77targetIng anD OperatIOns FOcus
infrastructural resources can all be organised so as to trade off unimportant aspects of performance for those valued by the target market.
●● Enhanced learning and improvement. A combination of clear objectives, together with resources organised to meet those objectives, can enhance an operation’s ability to manage its learning and improvement of its processes. Certainly the opposite holds true. Broad and/or confused objectives, together with complex resource structures, make it difficult to build process knowledge, learn how to extend the capabilities of processes or thereby improve their performance.
The risks involved in focus include:
●● Significant shifts in the marketplace. Although less common than ‘scare stories’ often suggest, it is clear that a dramatic shift in the overall competitive envi-ronment can undermine the effectiveness of a focus strategy. For example, in turn-of-the-twentieth-century New England, one firm dominated the market for domestic and commercial ice throughout North America. They had established an immensely successful and highly focused production and distribution system but they were powerless when a technical innovation – the domestic refrigerator – effectively removed their market.
●● Few economies of scale. Within an operation, focusing often involves separating out resources that once were bundled together. This allows these resources to be
An example of this is the action taken by the Spanish Conquistador Hernán Cortés. In 1518 he landed his 12 ships on the coast of Mexico and soon determined to strike inland to the Aztec capital to defeat the Emperor Montezuma. However, Montezuma’s troops had such a fearsome reputation that Cortés’ men were somewhat reluctant to face the far larger Aztec army, especially since they knew that capture would mean a horrible death. Discontent reached such a pitch that one group of men planned to steal a ship and sail back to their homes. Cortés’ solution to this was to execute the chief conspirators and beach 9 of his 12 ships. In the face of such focused commitment, his men had little option but to follow him.
Island Army 2
Army 1
Figure 2.12 burning bridges behind you increases commitment but reduces flexibility

78 chapter 2 • OperatIOns perFOrmance
developed appropriately for the market they serve but, because they no longer form part of a larger whole, they may not be able to achieve the same economies of scale as before. For example, a corporate purchasing department, buying goods and services for a whole corporation, may achieve economies of scale in the use of its resources and in its purchasing power. Splitting up such a department between businesses may allow them to enhance their capabilities in the type of purchasing necessary for each individual business but this may be gained at the expense of buying power and efficiency.
●● Structural vulnerability. Combine the two risks above and any focused set of resources may be structurally vulnerable. Relatively minor changes in market requirements may destroy the benefits of being close to a market while, at the same time, there are few economies of scale to protect their viability.
Drifting out of focus
Even when operations are set up to focus on one clearly specified set of objectives, they can, over time, drift out of focus. In fact some authorities would argue that unfocused operations are often a result of a gradual, but insidious, drift away from a clear strategy.17 There can be several reasons for this.
●● New products and services. Many companies, after developing new products or services, look to their existing operations to produce/deliver them. There is clearly a temptation to do this without examining the specific requirements of that particular product/service and evaluating the merits (and costs) of developing a new operation. Problematically, it is the firm’s most successful operations that are perceived as being most able to cope with new products/services – even if their success is built upon focus.
●● Strategy drift. In the absence of a clear competitive direction, managers often attempt to perform equally well against all of the many operations performance measures that exist. This (as discussed earlier) can lead to the dilution of the over-all strategic impact of the firm.
●● Control by specialist. Specialists in areas such as process technology, computer systems, inventory control, etc. will tend, in the absence of a more explicit opera-tions strategy, to develop their own ‘systems’, which protect their own organi-sational position, or optimise their local objectives, at the expense of greater strategic objectives.
●● Company-wide solutions. Looking for panaceas in the belief that one solution can cure all the problems of every operation, without sufficient regard for the need to tailor solutions to suit particular circumstances.
●● Business growth. When operations have to stretch or be reconfigured to deal with larger volumes, this often leads to a loss of focus.

79
summary ansWers tO key questIOns
how can operations performance ‘make or break’ the organisation?The way that an organisation’s operations strategy is fashioned and implemented determines how its resources are used and, because the operations function is large and, in most businesses represents the bulk of its assets and the majority of its people, this has a profound impact on the organisation’s performance. But it is not only the size of the operations function that determines operations strategy’s cen-trality to competitiveness, it is also its ability to develop the capabilities that will keep it ahead of competitors in the future. And for operations strategy to be effec-tive, its performance must be assessed in terms of all its stakeholders. All operations have stakeholders; they are the people and groups who have a legitimate interest in the operation’s strategy. Strongly related to the stakeholder perspective of operations performance is that of corporate social responsibility (generally known as CSR).
What are operations performance objectives?Operations strategy must include a relatively wide range of objectives that take into account the needs and aspirations of its stakeholders. However, because operations strategy is always concerned with addressing customers’ needs, in this book we focus primarily on the five generic performance objectives of quality, speed, depend-ability, flexibility, and cost. Each of these performance objectives has both internal and external effects. Externally their relative importance will differ depending on the nature of the markets served by the operation and/or its products and services. Internally these objectives can be mutually dependent. One way of distinguishing between the relative importance of each performance objective is by classifying them as order-winners and qualifiers and, more recently, as ‘delights’.
Do the role and key performance objectives of operations stay constant or vary over time?Both. Markets change, and the capabilities of operations resources develop over time. Therefore, not only does operations strategy change, the relative importance of its performance objectives will change. In fact, over the long term, the operations strategies of most enterprises can be seen to vary, either in response to deliberate attempts to change overall strategic direction, or in a more emergent sense where a consensus of the most appropriate strategic direction forms through accumulated operational experience.
are trade-offs between operations performance objectives inevitable, or can they be overcome?Both. Yes, trade-offs are always, to some extent, inevitable in that pushing an opera-tion to extremes in one aspect of performance will inevitably mean some sacrifice in other aspects of performance. Yet trade-offs can, at the margin, be overcome. In fact the whole concept of operations performance improvement is, in effect, an attempt to overcome trade-offs. It is therefore the responsibility of all operations managers to seek ways of overcoming trade-offs. This also holds true when broader trade-offs are being considered, such as those between corporate social responsibility (CSR) performance and more obviously commercial aspects of performance.
summary ansWers tO key questIOns

80 chapter 2 • OperatIOns perFOrmance
What are the advantages and disadvantages of focused operations?The benefits of focus include achieving a clarity of performance objectives which aids day-to-day decision making, developing resources in a manner appropriate to achieve a narrow set of objectives, and the enhanced learning and improvement that derives from concentrating on a narrow set of tasks. On the other hand, the problems with focus include the dangers inherent if there are significant shifts in the marketplace which may leave the operation ‘stranded’ with an inappropriate per-formance mix, the reduction in opportunities for economies of scale as operations are segmented internally, and some structural vulnerability because of the first two issues.
Further reading
notes on the chapter
1 Sources: BBC website (2008) ‘BA managers leave after T5 fiasco, 15 April; Browning, A. (2008) ‘How do you clear a bags backlog?’ BBC website, 19 April; Yeoman, F. and Hines, N. (2008) ‘Heathrow T5 disruption to continue over weekend’, Times Online, 28 March; Done, K. (2008) ‘BA to cancel hundreds more flights from T5’, Financial Times, 30 March; Done, K. (2008) ‘Long haul to restore BA’s reputation’, Financial Times, 28 March; Robertson, D. (2008) ‘Why Heathrow’s T5 disaster provides a lesson for Dubai’s T3’, The Times, 29 November.
2 Sources: Holcim press releases. 3 Elkington, J. (1998) Cannibals with Forks: The Triple Bottom Line of 21st Century Business.
New Society Publishers. 4 Driver, C. and Johnston, R. (2000) ‘Understanding service customers: the value of hard and
soft attributes’, Warwick University Working Paper. 5 All quotes taken from company websites. 6 Hill, T. (1993) Manufacturing Strategy. London: Macmillan. 7 Kano, S.T., Seraku, N. and Takahashi, F. (1984) ‘Attractive quality and must-be quality’,
Journal of the Society of Quality Control, 14(2). 8 Spring, M. and Bowden, R. (1997) ‘One more time: how do you win orders: a critical
appraisal of the Hill manufacturing strategy framework’, International Journal of Operations and Production Management, 17(8).
9 Based partly on information provided by Volkswagen Kommunikation (2007) and The Economist (2005). ‘Dark days for Volkswagen’, 16 July.
Boyer, K.K. and Lewis, M.W. (2002) ‘Competitive priorities: investigating the need for trade-offs in operations strategy’, Production and Operations Management, 11(1) pp. 241–250.
Hayes, R. and Pisano, G.P. (1996) ‘Manufacturing strategy: at the intersection of two paradigm shifts’, Production and Operations Management, 5(1).
Hayes, R., Pisano, G.P., Upton, D. and Wheelwright, S. (2005) Pursuing the Competitive Edge. New York: John Wiley & Sons.
Menda, R. and Dilts, D. (1997) ‘The manufacturing strategy formulation process: linking multifunctional viewpoints’, Journal of Operations Management, 15(4), pp. 223–241.
Neely, A. (2005) Measuring Business Performance. London: Economist Books.Parmenter, D. (2007) Key Performance Indicators (KPI): Developing, Implementing and Using
Winning KPIs. New York: John Wiley & Sons.Savitz, A.W. and Weber, K. (2006) The Triple Bottom Line: How Today’s Best-run Companies Are
Achieving Economic, Social and Environmental Success – And How You Can Too. Jossey Bass.

81nOtes On the chapter
10 Mintzberg, in his classic paper, Mintzberg, H. (1978) ‘Patterns of strategy formulation’, Management Science, 24(9), carried out an analysis of VW on which the first part of this analysis is based.
11 Skinner, W. (1969) ‘Manufacturing – missing link in corporate strategy’, Harvard Business Review, May–June, p. 136.
12 Ibid.13 Skinner, W. (1992) ‘Missing the links in manufacturing strategy’, in Voss, C.A., Manufacturing
Strategy – Process and Content. London: Chapman & Hall.14 Skinner, W. (1974) ‘The focused factory’, Harvard Business Review, May–June, p. 113.15 Sources: BBC News site (2010) ‘OFT watchdog says Ryanair payment policy is “puerile”’, 3
January.16 For further discussion see Ghemawat, P. and del Sol, P. (1998) ‘Commitment versus flex-
ibility?’, California Management Review, 40(4).17 Hill, T. (1993) op. cit.

chapter
Substitutes for strategy3
Ask any organisation what its operations strategy is and you can expect a wide range of answers. Some will not even know what is meant by ‘operations strategy’; some will have a clearly worked out and thought through articulation of how they reconcile market requirements with operations resource capabilities. But many are likely to mention one of the ‘new approaches’ to operations that they have picked up, or have been sold by consultants, or have judged to be particularly appropriate in improving their operations performance. Such responses might include: ‘We are trying to make our operations as lean as possible’; ‘We are reengineering our opera-tions to avoid organisational silos’; and so on. But are these approaches to opera-tions strategy as such, or are they merely substitutes for strategy? In this chapter we will examine some of these approaches and the extent to which they can be seen as ‘strategic’, as well as discuss how they fit into operations strategy implementation.
Introduction
Decision areas
Per
form
ance
obje
ctiv
es
TQMLean
SixSigma BPR
Relativeimportance ofthe operations
resourceperspective
Relativeimportance of
the marketrequirementsperspective
Figure 3.1 this chapter concerns how some organisations use ‘approaches’ to operations improvement as substitutes for strategy
‘New’ approaches to operations
One of the defining characteristics of business though over the last two or three decades has been the number of ‘new approaches’ to the management of operations. Many of these new approaches have captured popular management imagination, at least for a short while. This is why many managers will say that their operations
83‘New’ approacheS to operatIoNS
strategy is to implement lean operations principles, or total quality management, or business process reengineering, or enterprise resource planning, or Six Sigma. What such responses indicate is that the company has opted to use a pre-packaged approach to improve its operations performance. And it is an increasingly common response. This is because:
(a) these approaches are an easily understood and a relatively simply way to tackle the complexities of modern operations; or
(b) they seem to have worked in other organisations; or
(c) they sound as if they are new and by implication therefore must be better than what went before; or
(d) they have been sold the idea by a consultant (or read about it in a book), and it’s worth trying something new because many other things have failed to bring improvements.
So, are these approaches really strategic? Or are they simply a way of avoiding the difficult process of reconciling market requirements and operations resource capabilities? The answer is probably that they are a bit of both. Why one adopts a particular approach, and how it is implemented, is at least as important as which approach is adopted. Certainly some organisations have gained significant operations-based advantages from adopting these approaches. None of the ideas is entirely without merit, and there have been many well-reported triumphs. Particularly in the popu-lar business press, these new approaches were hailed as almost a prerequisite to any kind of competitive success. However, it is also evident that many organisations have failed to derive much, if any, benefit from their adoption, and as a result there has come a backlash. This is a natural phenomenon. No sooner is something set up as being the answer to sorting out operations’ many problems, than someone wishes to knock it down again. There is always mileage for journalists and academics in ‘smashing the myth’, ‘exposing the truth’, etc. Yet amidst these predictable reactions there were several studies that called into serious question the universal applicability and universal success of the new approaches. Although these studies do vary, many indicate that (at the most) only around one third of all initiatives involving these new approaches are deemed successful. Before anyone can judge whether any of these new approaches is right for them, they must understand what they are, their underlying philosophy, and how they differ from each other. In this chapter we look at four of the most commonly adopted of these solutions. They are as follows:
●● how does total quality management fit into operations strategy?
●● how do lean operations fit into operations strategy?
●● how does business process reengineering fit into operations strategy?
●● how does Six Sigma fit into operations strategy?
●● what place do these new approaches have in operations strategy?
key queStIoNS

84 chapter 3 • SubStItuteS For Strategy
●● total quality management;
●● lean operations;
●● business process reengineering;
●● Six Sigma.
total quality management
Total quality management (TQM) was one of the earliest management ‘fashions’. Its peak of popularity was in the late 1980s and early 1990s. As such it has suffered from something of a backlash in recent years. Yet the general precepts and principles that constitute TQM are still huge. Few, if any, managers have not heard of TQM and its impact on improvement. Indeed, TQM has come to be seen as an approach to the way operations and processes should be managed and improved, generally.
what is tqM?
A.V. Feigenbaum, generally held to be the originator of the term, defines TQM as ‘an effective system for integrating the quality development, quality maintenance and quality improvement efforts of the various groups in an organisation so as to enable production and service at the most economical levels which allow for full customer satisfaction’.1 However, it was the Japanese who first made the concept work on a wide scale and subse-quently popularised the approach and the term TQM. It was then developed further by several, so-called, ‘quality gurus’. Each ‘guru’ stressed a different set of issues, from which emerged the TQM approach to operations improvement (although they rarely used the term TQM). For example, W.E. Deming, considered in Japan to be the father of quality control, asserted that quality starts with top management and is a strategic activity.2 Deming’s basic philosophy is that quality and productivity increase as ‘process variability’ (the unpredictability of the process) decreases. He emphasises the need for statistical control methods, participation, education, open-ness and purposeful improvement.
the elements of tqM
TQM is best thought of as a philosophy of how to approach the organisation of qual-ity improvement. This philosophy, above everything, stresses the ‘total’ of TQM. It is an approach that puts quality (and indeed improvement generally) at the heart of everything that is done by an operation. This totality can be summarised by the way TQM lays particular stress on the following elements.
Meeting the needs and expectations of customersTQM was one of the first of the ‘customer-centric’ approaches. In the TQM approach, meeting the expectations of customers means more than simply meeting customer requirements. It involves the whole organisation in understanding the central importance of customers to its success and even to its survival. Customers are seen not as being external to the organisation but as the most important part of it.

85total qualIty MaNageMeNt
covering all parts of the organisationOne of the most significant elements of TQM is the concept of the internal customer and internal supplier. This means that everyone is a customer within the organisa-tion and consumes goods or services provided by other internal suppliers, and every-one is also an internal supplier of goods and services for other internal customers. The assumption is that errors in the service provided within an organisation will eventually affect the external customer. TQM utilises this concept by stressing that each process in an operation has a responsibility to manage these internal customer–supplier relationships.
Including every person in the organisationTQM uses the phrase ‘quality at source’, stressing the impact that each individual has on quality. The contribution of all individuals in the organisation is expected to go beyond ‘not make mistakes’. Individuals are expected to bring something posi-tive to improving the way they perform their jobs. The principles of ‘empowerment’ are frequently cited as supporting this aspect of TQM, an idea that seemed radical when it first began to migrate from Japan in the late 1970s. Some Japanese industri-alists even thought (mistakenly) that companies in Western economies would never manage to change. Take, for example, a statement by Konosuke Matsushito which, at the time, attracted considerable publicity:
‘We are going to win and the industrial West is going to lose out – there is nothing much you can do about it, because the reasons for your failure are within yourselves. For you, the essence of management is getting the ideas out of the heads of bosses into the hands of labour. For us, the core of management is precisely the art of mobilising and pulling together the intellectual resources of all employees in the service of the firm. Only by drawing on the combined brainpower of all its employees can a firm face up to the turbu-lence and constraints of today’s environment. That is why our large companies give their employees three to four times more training than yours. This is why they foster within the firm such intensive exchange and communication. This is why they seek constantly everybody’s suggestions and why they demand from the educational system increasing numbers of graduates as well as bright and well-educated generalists, because these people are the lifeblood of industry.’3
examining all costs which are related to quality, especially failure costsThe costs of quality are usually categorised as prevention costs (identifying and pre-venting potential problems, improving the design of products and services and pro-cesses to reduce quality problems, training and development, process control, etc.), appraisal costs (the costs of controlling quality to check to see if problems or errors have occurred during and after production), internal failure costs (costs associated with errors which are dealt with inside the operation, scrap, rework, lost production time, failure-related disruption, etc.) and external failure costs (the loss of customer goodwill, litigation, guarantee and warranty costs, etc.). TQM holds that increasing the costs associated with prevention will bring even greater reductions in the other cost categories.

86 chapter 3 • SubStItuteS For Strategy
getting things ‘right first time’, i.e. designing-in quality rather than inspecting it inTQM shifts the emphasis from reactive (waiting for something to happen) to proac-tive (doing something before anything happens). This change in the view of qual-ity costs has come about with a movement from an inspect-in (appraisal-driven) approach to a design-in (getting it right first time) approach.
Developing the systems and procedures that support improvementTypical of these is the ISO 9000 series, a set of worldwide standards that establishes requirements for companies’ quality management systems. It is different from, but closely associated with, TQM. ISO 9000 registration requires a third-party assessment of a company’s quality standards and procedures, and regular audits are made to ensure that the systems do not deteriorate.
criticisms of tqM
Many of the criticisms of TQM tend to fall into two slightly conflicting categories. The first is that historically many TQM initiatives fail, or at least are not entirely successful. The second is that, even if TQM is not the label given to improvement initiatives, many of the elements of TQM, such as continuous improvement, have now become routine. As far as the first criticism is concerned, not all TQM initiatives that are launched, often with high expectations, will go on to have a major impact on performance. Companies who were in the vanguard of the TQM movement, such as Hewlett-Packard, admit that at one time they pushed quality for its own sake, and have shifted too much responsibility down to the shop floor. Similarly The Economist magazine, reporting on some companies’ disillusionment with their experiences, quoted from several surveys.4 For example:
●● ‘Of 500 US manufacturing and service companies, only a third felt their Total Quality programmes had significant impact on their competitiveness.
●● ‘Only a fifth of the 100 British firms surveyed believed their quality programmes had achieved tangible results.
●● ‘Of those quality programmes that have been in place for more than two years, two thirds simply grind to a halt because of their failure to produce hoped-for results.’
Also the excessive ‘quality bureaucracy’ associated with TQM, in particular the continued use of standards and procedures, encourages ‘management by manual’ and over-systematised decision making, and is expensive and time-consuming. Furthermore, it is too formulaic, encouraging operations to substitute a ‘recipe’ for a more customised and creative approach to managing operations improvement. As far as the second criticism (‘We have incorporated much of TQM anyway’) is concerned, it is undoubtedly true that some of the fundamentals of TQM have entered the vernacular of operations improvement. The idea of continuous improve-ment is perhaps the most obvious example. However, other elements such as the internal customer concept including service level agreements (SLAs), the idea of internal and external failure-related costs, and many aspects of individual staff

87total qualIty MaNageMeNt
empowerment, have all become widespread. Yet this is not really a criticism of TQM as such. Rather it is a criticism of the practice of ‘packaging’ individual improvement elements under a single improvement ‘brand’. It is an issue that we shall return to later in this chapter.
lessons from tqM
The core concept of a ‘total, or holistic, view’ of any issue is both powerful and attractive. At its simplest, it provides an outline ‘checklist’ of how to go about opera-tions improvement. It is also capable of being developed into a more prescriptive form. The best example of this is the EFQM Excellence Model, developed by the European Foundation for Quality Management (EFQM). Originally the European Quality Award (EQA), awarded to the most successful exponent of total quality man-agement in Europe each year, the model on which the award was based was modi-fied and renamed The EFQM Excellence Model or Business Excellence Model. The EFQM Excellence Model is shown in Figure 3.2. The five ‘enablers’ are concerned with how results are being achieved, while the four ‘results’ are concerned with what the company has achieved and is achieving. The main advantage of using such models for self-assessment seems to be that companies find it easier to understand some of the more philosophical concepts of TQM when they are translated into spe-cific areas, questions and percentages. Self-assessment also allows organisations to measure their progress in changing their organisation and in achieving the benefits of TQM. An important aspect of self-assessment is an organisation’s ability to judge the relative importance of the assessment categories to its own circumstances.
Partnerships and resources – how the organisation plans and manages its external partnerships and internal resources to support its policy and strategy and the effective operation of its processes
Policy and strategy – how the organisation implements its mission and vision through a clear stakeholder-focused strategy, supported by relevant policies, plans, objectives, targets and processes
Customer results – this includes customers’ loyalty and their perceptions of the organisation’s image, product and services, sales and after-sales support
Leadership – how leaders develop and facilitate the achievement of the mission and vision, develop values required for long-term success and implement these through appropriate actions and behaviour, and are personally involved in ensuring that the organisation’s management system is developed and implemented
Processes – how the organisation designs, manages and improves its processes in order to support its policy and strategy and fully satisfy, and generate increasing value for, its customers and other stakeholders
Key performance results – this shows the financial and non-financial outcomes of the organisation’s planned performance, including such things as cash flow, profit, meeting budgets, success rates and the value of intellectual property
People – how the organisation manages, develops and releases the knowledge and full potential of its people
People results – this covers employees’ motivation, satisfaction, performance and the services the organisation provides for its people
Society results – this relates to the organisation’s performance as a responsible citizen, its involvement in the community in which it operates, and any recognition it may have received
ResultsEnablers
Figure 3.2 eFqM excellence model

88 chapter 3 • SubStItuteS For Strategy
how does tqM fit into operations strategy?
Various authors have put forward prescriptions on how to integrate TQM into a business strategy. Many of these prescriptions stress that operations quality pro-grammes should be both strategic and comprehensive. In other words, if one applied the operations strategy matrix to such an initiative, we would expect to see a spread of activities (albeit of differing priority) at the intersections with each of the deci-sion areas. To test this assertion out, look at Deming’s (one of the quality ‘gurus’) 14 points.5 These are in many ways a summary of his and other authorities’ ideas on quality. In order to translate these different elements onto the operations strategy matrix, we have listed each of Deming’s 14 points followed by the operations strat-egy decision areas to which they relate.
●● Plan for a long-term commitment to quality (development and organisation).
●● Quality must be built into the processes at every stage (process technology, supply network, development and organisation).
●● Cease mass inspection (process technology, supply network, development and organisation).
●● Do not make purchase decisions on price alone (supply network, development and organisation).
●● Identify problems and work continuously to improve the system (supply network, development and organisation).
●● Implement statistical process control and quality training (process technology, development and organisation).
●● Institute leadership and a human-centred approach to supervision (development and organisation).
●● Eliminate fear (supply network, development and organisation).
●● Break down barriers between departments (supply network, development and organisation).
●● Stop demanding higher productivity without the methods to achieve it (capacity strategy, process technology, supply network, development and organisation).
●● Eliminate performance standards based solely on output (capacity strategy, pro-cess technology, supply network, development and organisation).
●● Remove barriers to pride in workmanship (development and organisation).
●● Institute education and self-improvement programmes (development and organisation).
●● Create a top management structure that emphasises the above 13 points every day (development and organisation).
The matrix in Figure 3.3 summarises Deming’s points in each decision area and illus-trates that the Deming points are comprehensive, though heavily emphasising the infrastructural aspects of operational change. However, changing behaviours and beliefs is not easy and requires constant emphasis over an extended period of time.

89leaN operatIoNS
The idea of lean operations (also known as just-in-time, lean synchronisation, con-tinuous flow operations, and so on) spread beyond its Japanese roots and became fashionable in the West at about the same time as TQM. And although its popularity has not declined to the same extent as TQM, over 25 years of experience (at least in manufacturing) have diminished the excitement once associated with the approach. But, unlike TQM, it was seen initially as an approach to be used exclusively in manufacturing. Now, lean has become newly fashionable as an approach that can be applied in service operations.
what is ‘lean’?
The lean approach aims to meet demand instantaneously, with perfect quality and no waste. Put another way, it means that the flow of products and services always delivers exactly what customers want (perfect quality), in exact quantities (neither too much nor too little), exactly when needed (not too early or too late), exactly where required (not to the wrong location), and at the lowest possible cost. It results in items flowing rapidly and smoothly through processes, operations and supply networks. It is best illustrated with an example. Figure 3.4(a) shows a simple three-stage process. The traditional approach assumes that each stage in a process or supply network will be ‘buffered’ from the next stage downstream. These buffers ‘insulate’ each stage from its neighbours, making each stage relatively independent, so that if one stage stops operating for some reason, the next stage can continue, at least for a time. The larger the buffer inventory, the greater the degree of insulation between the stages, but throughput times will be slow because items will spend time waiting
Quality
Speed
Dependability
Flexibility
Cost
Per
form
ance
ob
ject
ives
Mar
ket
com
pet
itive
ness
Capacitystrategy
Supplynetwork
Decision areas
Resource usage
Processtechnology
Developmentand
organisation
• Provide resources to support quality
• Use quality as performance criterion
• Continuous quality emphasis with suppliers
• Purchase using quality criterion
• Work on functional barriers
• Built-in quality in processes
• Statistical process control
• Enhance quality capability
• Quality as a performance criterion
• Long-term plans• Quality culture• Continuous
improvement• Quality performance
measurement and control
• Training and education emphasis
• Operational supervision is important
• Communication• Appropriate org.
structure
Figure 3.3 tqM elements in the four operations strategy decision categories
lean operations

90 chapter 3 • SubStItuteS For Strategy
in the inventories. The main argument against this traditional approach is that when a problem occurs at one stage it will not immediately be apparent elsewhere in the system, so the responsibility for solving the problem will be centred largely on the people within that stage. By contrast, with a pure lean process, as shown in Figure 3.4(b), items will flow from one to another only when the subsequent stage requests them. This means that problems at any stage are quickly exposed. The responsibility for solving the problem is now shared and is more likely to be solved. By preventing items accumulating between stages, the operation has increased the chances of the intrinsic efficiency of the process being improved. The lean approach exposes the process (although not suddenly) to problems, both to make them more evident and to change the motivation towards solving the problems.
the elements of lean
Return to our simple example illustrated in Figure 3.4. Note how the trigger for any activity is the direct request of the internal customer. This reflects the emphasis that lean places on meeting the needs of customers exactly. Second, note how, in the absence of inventories, items flow in a smooth and synchronous manner. In fact the term ‘lean synchronisation’ is perhaps a more accurate name for what we are here calling the lean approach. Third, note how the synchronisation leads to fewer inventories in the process, which in turn leads to a change in people’s behaviour, involvement in, and motivation for, improvement. Finally, note how this motiva-tion to improve reinforces the quest for seeking out and eliminating waste within processes. It is these four elements of customer-based demand triggers, synchronised flow, enhanced improvement behaviour, and waste elimination that mesh together to form the lean approach (see Figure 3.5). We will examine each briefly in turn.
Scheduling and movement information fromoperation’s planning and control system
(b) Lean approach – deliveries are made on request
(a) Traditional approach – buffers separate stage
Information(Orders)
Information(Orders)
Deliveries Deliveries
Stage A Stage B Stage C
Deliveries
Information
Deliveries
Information
Deliveries
Information
Deliveries
Information
Stage A Stage B Stage C
Bufferinventory
Bufferinventory
Figure 3.4 traditional and lean synchronised flow between stages

91leaN operatIoNS
customer-based demand triggersIn the lean approach, demand is to be met exactly when it is needed, no more no less, not early not late, and always to exact levels of quality. This is obviously easier when demand is predictable and, preferably, relatively steady. The implication of this is that the ability to implement lean principles is much enhanced when an organisation understands (and to some extent controls) the nature and level of the demands on its resources. The most common approach to achieving customer-based triggering is by utilising ‘pull’ control as opposed to push control. Push control was illustrated in Figure 3.4(a) when any items that are processed by a stage are imme-diately pushed forward to the next stage irrespective of whether that customer stage actually requires them at that time. Pull control is implicit in Figure 3.4(b) where items are ‘pulled’ forward only in response to a specific customer request.
Synchronised flowSynchronised flow means that items in a process, operation or supply network flow smoothly and with even velocity from start to finish. This is a function of how inventory accumulates within the operation. Whether inventory is accumulated in order to smooth differences between demand and supply, or as a contingency against unexpected delays, or simply to batch for purposes of processing or move-ment, it all means that flow becomes asynchronous. It waits as inventory rather than progressing smoothly on. Of course, once this state of perfect synchronisation of flow has been achieved, it becomes easier to expose any irregularities of flow which may be the symptoms of more deep rooted underlying problems.
Involvement behaviourLike TQM, the lean approach has always stressed the importance of staff involve-ment. However, often the way in which this was expressed, using terms such as ‘respect for humans’ and ‘enlightened vision’, did not always resonate with Western perspectives on organisational behaviour. Indeed, the lean approach often seemed
BehaviourW
aste elimination
Synchronisation
Customer focus
Figure 3.5 the four elements of lean

92 chapter 3 • SubStItuteS For Strategy
naïve, patronising, or worse to liberal Western eyes. Yet return to the fundamental idea as illustrated in our simple example and we have something that is not funda-mentally countercultural, namely that smooth flow and the absence of inventory motivate individuals to help their colleagues improve the whole process rather than focusing exclusively on their own area of direct responsibility. So behaviour is partly a function of synchronous flow, which is itself a function of customer-based trigger-ing of demand. Furthermore, it is these changes in motivation and behaviour that in turn lead on to the fourth element – waste elimination.
waste eliminationThis is arguably the most significant part of the lean philosophy: the elimination of all forms of waste, where waste is any activity that does not add value. Identifying waste is the first step towards eliminating it. Toyota has described seven types. Here we consolidate these into four broad categories of waste that apply in many different types of operation.
●● Waste from irregular flow. Perfect synchronisation means smooth and even flow through processes, operations and supply networks.
●● Waste from inexact supply. Perfect synchronisation means supplying exactly what is wanted, exactly when it is needed. Any under or over supply and any early or late delivery will result in waste.
●● Waste from inflexible response. Customer needs can vary, in terms of what they want, how much they want, and when they want it. But unless an operation is flexible, it can make change only infrequently. This mismatch is the cause of much inventory, for example because machines make a large batch of similar products together.
●● Waste from variability. Synchronisation implies exact levels of quality. If there is variability in quality levels then customers will not consider themselves as being adequately supplied. Variability therefore is an important barrier to achieving synchronised supply.
Some organisations, especially now that lean is being applied more widely in service operations, view waste elimination as the most important of all the elements of the lean approach. In fact, they sometimes see the lean approach as consisting almost exclusively of waste elimination. What they fail to realise is that effective waste elim-ination is best achieved through changes in behaviour. It is the behavioural change brought about through synchronised flow and customer triggering that provides the window onto exposing and eliminating waste.
capacity utilisation may be sacrificed in the short termA paradox in the lean concept is that it may mean some sacrifice of capacity utilisa-tion. In organisations that place a high value on the utilisation of capacity this can prove particularly difficult to accept. It occurs because, when stoppages occur in the traditional system, the buffers allow each stage to continue working and thus achieve high capacity utilisation. The high utilisation does not necessarily make the system as a whole produce more, because the extra production goes into the large buffer inventories. In a lean process, stoppages will affect the rest of the operation. This will lead to lower capacity utilisation, at least in the short term. However, there

93leaN operatIoNS
is no point in producing output just for it to increase inventory. In fact, producing just to keep utilisation high is not only pointless, it is counter-productive, because the extra inventory produced merely serves to make improvements less likely.
criticisms of lean
The lean approach to people management can be viewed as, at best, patronising. It may be less autocratic than some earlier Japanese management practice, but it is not always in line with ‘Western’ job design philosophies. Even in Japan the just-in-time (JIT) approach is not without its critics. Kamata wrote an autobiographical descrip-tion of life as an employee at a Toyota plant called Japan in the Passing Lane.6 His account speaks of ‘the inhumanity and the unquestioning adherence’ of working under such a system. Similar criticisms have been supported in some studies that point out some of the negative effects of the flexibility principles within the lean approach.7
Lean principles can also be taken to an extreme. When lean ideas first started to have an impact on operations practice in the West, some authorities advocated the reduction of between-process inventories to zero. While in the long term this pro-vides the ultimate in motivation for operations managers to ensure the efficiency and reliability of each process stage, it does not admit the possibility of some pro-cesses always being intrinsically less than totally reliable. An alternative view is to allow inventories around process stages with higher than average uncertainty. This at least allows some protection for the rest of the system. The same ideas apply to just-in-time delivery between factories. The Toyota Motor Corporation, often seen as the epitome of lean, has suffered from its low inter-plant inventory policies. Both the Kobe earthquake and fires in supplier plants have caused production at Toyota’s main factories to close down for several days because of a shortage of key parts. Even in the best-regulated manufacturing networks, one cannot always account for such events. Arguably, the major weakness of lean principles is that they can break down when fluctuations in supply or demand become extreme, especially when they are also unpredictable. The pull control of hamburgers in a fast-food restaurant works per-fectly well when demand stays within predictable limits. However, when subjected to an unexpected large influx of customers, it leaves most of those customers waiting for their meal. Similarly, in very complex and interrelated processes, lean principles are sometimes difficult to apply.
lessons from lean
Looking back to when the lean approach was first introduced into Western manu-facturing, it is easy to forget just how radical and, more importantly, counterin-tuitive it seemed. Although ideas of continuous improvement were starting to be accepted, the idea that inventories were generally a bad thing, and that throughput time was more important than capacity utilisation, seemed to the more tradition-ally minded to border on the insane. So, as lean ideas have been gradually accepted, we have likewise come to be far more tolerant of ideas that are radical and/or counterintuitive. This is an important legacy because it opened up the debate on operations practice and broadened the scope of what are regarded as acceptable approaches.

94 chapter 3 • SubStItuteS For Strategy
Similarly, the idea that protecting parts of the operation (by buffering them with inventory) is not sensible in the long term has also had profound effects. Opening up an operation’s resources to its external customers is now seen as promoting the same behavioural change as reducing inventory between the stages of a process. It exposes the operation to the realities of the market and forces it to adapt to what the market really wants, often by increasing the flexibility of its resources. A further legacy that the absorption of lean ideas has brought operations in gen-eral concerns the interdependence of a number of important ideas. Before the lean approach there was relatively little understanding of how inventory, throughput time, value-added and waste elimination, utilisation and flexibility all related to each other. Although the way in which lean philosophy integrated these ideas was novel, it was at least coherent. In fact, it legitimised the whole idea of a philosophy of operations. Prior to lean, operations was a relatively loose collection of ideas from the scientific management era of the early twentieth century, some elegant but rela-tively naïve mathematical modelling, and simple practical ideas based on pragmatic operations practice. It is also worth remembering that when Taiichi Ohno wrote his seminal book on lean (after retiring from Toyota in 1978) he was able to portray Toyota’s manufactur-ing plants as embodying a coherent production approach. However, this encouraged observers to focus in on the specific techniques of lean production and de-empha-sised the importance of 30 years of ‘trial and error’. The success of Toyota has much to do with the process of fit (see ‘alignments’ in Chapter 9). Staff at Toyota worked over decades to ensure alignment between their intended market position and their operations resources. Maybe the real achievement of Toyota was not so much what they did but how long they stuck at it.
For almost 30 years, Volvo had acquired a reputation for experimenting with new models of work practice in its auto plants. In the 1970s Kalmar marked the first of Volvo’s moves away from the traditional plant, breaking up the ‘big factory’ long assembly line into small ‘mini factory’ workshops. Most spectacularly, the assembly line itself was scrapped and cars were moved about the factory on independently moving trolleys. Volvo moved to this design of process for one overriding reason – to attract workers into the factories. At the time, car assembly work was so unattractive that there were no indigenous Swedish workers in some parts of its more traditional Gothenberg plant. Low unemployment combined with a social reluctance to work on repetitive tasks made recruitment difficult. Later the Uddevalla plant was designed with teams of operators (called ‘car builders’, not ‘assembly workers’) working in parallel to build the whole car. The fully integrated teams were completely responsible, not only for building the car, but for many other indirect tasks such as quality, planning and, most radically of all, liaising with the customer sales end of the business. At the time, busi-ness was booming but the company was having some quality problems. It wanted highly skilled workers with personal dedication who would ensure the manufacture of high-quality products. However, in parallel with the Kalmar and Uddevalla experiments, Volvo’s plant at Ghent in Belgium had been slowly adopting the principles of lean production which would eventually kill off the two more radical plants. It was the first plant outside Japan to be awarded the Total Productive Maintenance (TPM) award. It had also developed a form of teamwork, while still retaining the traditional line process design. By the late 1980s the cost and quality performance levels of Japanese-owned factories were making for intense
example Volvo falls to the power of lean8

95leaN operatIoNS
how do lean operations fit into operations strategy?
Figure 3.6 summarises some of the elements of the lean approach, again using the four decision categories in the operations strategy matrix. This shows that the core principles of the lean approach are contained largely within the supply network and development and organisation decision areas. This is not surprising given the emphasis on flow (which is what supply network strategy is partly about) and improvement through waste elimination (an important part of development and organisation strategy). The role of process technology strategy is largely to ensure that technology choices support the core elements of lean through flexibility, reli-ability and reduced variability. Although there is only one entry under the category of capacity strategy, it is nonetheless important. If lean principles are to be adopted through the supply chain, then to maintain synchronous flow it will be necessary to tolerate reduced capacity utilisation. Or putting it the other way round, one cannot allow capacity bottlenecks to disturb smooth and synchronous flow through the chain. The implication is that under a lean approach more capacity may have to be provided than under a more traditional approach to managing supply chain throughput.
competition in the automobile market. And while Volvo’s more experimental plants were struggling to compete, the Ghent plant with its lean working principles was achieving levels of quality, cost and throughput time significantly superior to the company’s other plants.
Quality
Speed
Dependability
Flexibility
Cost
Per
form
ance
ob
ject
ives
Mar
ket
com
pet
itive
ness
Capacitystrategy
Supplynetwork
Decision areas
Resource usage
Processtechnology
Developmentand
organisation
Sacrifice high utilisation for fast and dependable throughput
Supplier development to ensure quality and delivery conformance
Integrated supply network coordination to ensure synchronous flow
Expectation of continuous improvement (and price reductions) from suppliers
Small flexible technology
Emphasis on equipment reliability
Reduce process variability
Continuous improvement through waste elimination
Smooth synchronised flow exposes waste
People motivation and involvement through reduced buffering
Figure 3.6 lean elements in the four operations strategy decision categories
96 chapter 3 • SubStItuteS For Strategy
Business process reengineering (BPR) originated in the early 1990s when Michael Hammer proposed that, rather than using technology to automate work, it would be better applied to doing away with the need for the work in the first place (‘don’t automate, obliterate’). In doing this he was warning against establishing non-value-added work within an information technology system where it would be even more difficult to identify and eliminate. All work, he said, should be examined for whether it adds value for the customer, and, if not, processes should be redesigned to eliminate it. In doing this, BPR was echoing similar objectives in both scientific management and more recently lean approaches. But BPR, unlike those two earlier approaches, advocated radical changes rather than incremental changes to pro-cesses. Shortly after Hammer’s article, other authors developed the ideas, again the majority of them stressing the importance of a radical approach. This radicalism was summarised by Davenport who, when discussing the difference between BPR and continuous improvement, held that, ‘Today’s firms must seek not fractional, but multiplicative levels of improvement – ten times rather than ten per cent.’ 9
what is bpr?
BPR has been defined as:
‘. . . the fundamental rethinking and radical redesign of business processes to achieve dramatic improvements in critical, contemporary measures of performance, such as cost, quality, service and speed’.10
But there is far more to it than that. In fact, BPR was a blend of a number of ideas that had been current in operations management for some time. Lean concepts, process flow charting, critical examination in method study, operations network management and customer-focused operations all contribute to the BPR concept. It was the potential of information technologies to enable the fundamental redesign of processes, however, that acted as the catalyst in bringing these ideas together. It was the information technology that allowed radical process redesign even if many of the methods used to achieve the redesign had been explored before. For example, ‘Business Process Reengineering, although a close relative, seeks radical rather than merely continuous improvement. It escalates the effort of . . . (lean) . . . and TQM to make process orientation a strategic tool and a core competence of the organisation. BPR concentrates on core business processes, and uses the specific techniques within the . . . (lean) . . . and TQM tool boxes as enablers, while broadening the process vision.’11
the elements of bpr
The main elements of BPR can be summarised in the following points.
rethink business processesRethink these processes in a cross-functional manner which organises work around the natural flow of information (or materials or customers). This means organising around outcomes of a process rather than the tasks that go into it. Underlying the BPR approach is the belief that operations should be organised around the total
business process reengineering

97buSINeSS proceSS reeNgINeerINg
process that adds value for customers, rather than the functions or activities that perform the various stages of the value-adding activity. The core of BPR is a redefi-nition of the processes within an operation, to reflect the business processes that satisfy customer needs. Figure 3.7 illustrates this idea.
Strive for dramatic improvementsStrive for dramatic improvements in performance by radically rethinking and rede-signing the process. It was this radical approach that generated much of the public-ity surrounding BPR when it was first proposed. But many would argue that it is inevitable that a BPR ‘solution’ will be radical when it seeks to redesign processes on an end-to-end basis as described above. Traditional organisational and functional boundaries will have to be reconfigured and individuals’ jobs and responsibilities redefined. Furthermore the use of new information technologies is likely to promote previously unexplored process designs. In fact Hammer and Champy discussed the role of what they termed ‘disruptive technologies’ that would directly challenge the orthodoxy of process design.12
have those who use the output from a process, perform the processCheck to see if all internal customers can be their own supplier rather than depend-ing on another function in the business to supply them (which takes longer and separates out the stages in the process). In process design this idea is sometimes referred to as a ‘short fat’ process, as opposed to the more conventional multi-stage ‘long thin’ process.
put decision points where the work is performedDo not separate those who do the work from those who control and manage the work. Control and action are just one more type of supplier–customer relationship that can be merged.
Functionally based processes
Function 1 Function 2 Function 3 Function 4
End-to-end process 1
End-to-end process 3
End-to-end process 2
Cus
tom
er n
eed
s
Cus
tom
er n
eed
s fu
lfille
d
Bus
ines
s p
roce
sses
Figure 3.7 bpr advocates reorganising (reengineering) processes to reflect the natural ‘end-to-end’ processes that fulfil customer needs

98 chapter 3 • SubStItuteS For Strategy
criticisms of bpr
BPR has aroused considerable controversy, mainly because it sometimes looks only at work activities rather than at the people who perform the work. Because of this, people become ‘cogs in a machine’. Many of these critics equate BPR with the much earlier principles of scientific management, pejoratively known as ‘Taylorism’. Generally these critics mean that, like some forms of early scientific management, BPR is overly harsh in the way it views human resources. Certainly there is evidence that BPR is often accompanied by a significant reduction in staff. Studies at the time when BPR was at its peak often revealed that the majority of BPR projects could reduce staff levels by over 20 per cent.13 Often BPR was viewed as merely an excuse for getting rid of staff. Companies that wished to ‘downsize’ were using BPR as the pretext, putting the short-term interests of the shareholders of the company above either their longer-term interests or the interests of the company’s employees. The real danger is that a combination of radical redesign together with down-sizing could mean that the essential core of experience is lost from the operation. This leaves it vulnerable to any market turbulence since it no longer possesses the knowledge and experience of how to cope with unexpected changes. This is a similar criticism to what we describe in Chapter 8 as an overly ‘tight fit’ between resources and market requirements. When the operation’s resources are designed to focus exclusively on one narrowly defined set of market requirements, it is vulnerable to any changes either in market requirements or in its own resource capabilities. In this sense the outcome of a BPR project, even when implemented effectively, could be seen as carrying the same combination of advantages and disadvantages as the focus strategy described in Chapter 2: namely, exceptional performance under a defined set of circumstances but excess risk when these circumstances no longer apply.
lessons from bpr
Although one of the later of the new approaches to operations, BPR is already suffer-ing from a backlash. Perhaps this is not surprising given its radical nature. The greater the deviation from orthodoxy, the greater the level of criticism. Nevertheless, even with a relatively short experience of using BPR principles, certain lessons emerge.
●● Do not dismiss radical approaches to reconfiguring operations resources. A radical reconfiguration may carry a higher risk but it is a legitimate alternative to incre-mental development. Although, like many of these new approaches, there are examples where expectations have not been met, there are also examples where radical redesign has brought significant benefits. General Motors, South West Airlines, Hewlett Packard, and many other high-profile companies all claim to have experienced some significant success with BPR.
●● New process technology, especially information technology, needs to be fully incorporated into process redesign. These new technologies often have much more potential than simply speeding up, or doing better, what was done before. They both have capabilities (often associated with flexibility) that could be exploited in new ways, and they may need new infrastructural support to develop their potential.
●● Beware of the publicity that comes when a new approach is branded in a particu-lar way. Very soon after its introduction BPR had polarised expectations. Labour
99SIx SIgMa
representatives assumed that it would always be used as a heartless exercise for ‘employment bloodshed’. Business leaders, looking forward to often over-inflated estimates of the saving that could be achieved, became disenchanted when these expectations were not met immediately.
●● Many of the ideas generated by BPR and the debate it provoked were already com-monplace in manufacturing processes. BPR succeeded in moving the arena of this debate from manufacturing to direct service processes and even to non-operations processes. In that sense BPR helped to establish the idea that processes are ubiq-uitous in business, and the same ideas and principles that shape process design within the operations function can also be used outside it.
●● Beware of any approach that dismisses the contribution played by people in operations or processes. Even the originators of BPR later admitted that they had paid insufficient attention to human resources within processes. Because of this the initial impression (that BPR inevitably meant trampling over human aspira-tions and potential) became difficult to reverse.
where does bpr fit into operations strategy?
Figure 3.8 places some of the elements of BPR into our strategic decision areas. Again note how most of the elements lie within the infrastructural area of develop-ment and organisation. Organisationally BPR’s recommendations regarding where decisions should be made and how processes should be conceptualised do much to shape the underlying philosophy of an operation’s organisational design. Similarly, the idea that dramatic reductions in cost can be gained from eliminating unneces-sary process steps is as much a state of mind as it is any change in the business’s structural resources. Where structural resources are affected it is to emphasise the potential of process technology in facilitating cost reduction, recommend merging stages in the internal supply chain in order to simplify processes, and imply that capacity should be balanced along end-to-end process lines rather than between functions as such.
Six Sigma
The Six Sigma approach was first popularised by Motorola, the electronics and communications systems company. When it set its quality objective as ‘total cus-tomer satisfaction’ in the 1980s, it started to explore what the slogan would mean to its operations processes. They decided that true customer satisfaction would be achieved only when its products were delivered when promised, with no defects, with no early-life failures and when the product did not fail excessively in service. To achieve this, Motorola initially focused on removing manufacturing defects. However, it soon came to realise that many problems were caused by latent defects, hidden within the design of its products. These may not show initially but eventu-ally could cause failure in the field. The only way to eliminate these defects was to make sure that design specifications were tight (i.e. narrow tolerances) and its pro-cesses very capable (exhibited little variability relative to design tolerances).

100 chapter 3 • SubStItuteS For Strategy
what is Six Sigma?
Motorola’s Six Sigma quality concept was so named because it required that the natural variation of processes (63 standard deviations) should be half their specifica-tion range. In other words, the specification range of any part of a product or service should be 66 the standard deviation of the process. The Greek letter sigma (s) is often used to indicate the standard deviation of a process: hence the Six Sigma label. How has the definition of Six Sigma widened to well beyond this rather narrow statistical perspective? General Electric (GE), which is probably the best known of the early adopters of Six Sigma, defined it as ‘a disciplined methodology of defining, measuring, analysing, improving, and controlling the quality in every one of the company’s products, processes, and transactions – with the ultimate goal of virtually eliminating all defects’. So, now Six Sigma should be seen as a broad improvement concept rather than a simple examination of process variation, even though this is still an impor-tant part of process control, learning and improvement.
the elements of Six Sigma
Although the scope of Six Sigma is disputed, among the elements frequently associ-ated with Six Sigma are the following.
customer-driven objectivesSix Sigma is sometimes defined as ‘the process of comparing process outputs against customer requirements’. In taking on this definition, Six Sigma is conforming to what almost all of the new approaches to operations do, namely starting by empha-sising the importance of understanding customers and customer requirements. The
Quality
Speed
Dependability
Flexibility
Cost
Per
form
ance
ob
ject
ives
Mar
ket
com
pet
itive
ness
Capacitystrategy
Supplynetwork
Decision areas
Resource usage
Processtechnology
Developmentand
organisation
Balance capacity across end-to-end processes
Internally, customers become their own supplier rather than depending on another function
Information technology is an enabler of cost reduction
Locate decision making at the lowest practical level
Rethink business processes in a cross-functional manner
Dramatic cost reductions can come from the elimination of unnecessary process steps
Figure 3.8 bpr elements in the four operations strategy decision categories
101SIx SIgMa
idea of comparing what processes can do against what customers want can be seen as an operational-level articulation of the definition of operations strategy used in this book – reconciling market requirements against operations resource capabili-ties. Although the Six Sigma approach is inevitably narrower, it uses a number of measures to assess the performance of operations processes. In particular it expresses performance in terms of defects per million opportunities (DPMO). This is exactly what it says: the number of defects that the process will produce if there were one million opportunities to do so. This is then related to the ‘Sigma measurement’ of a process and is the number of standard deviations of the process variability that will fit within the customer specification limits.
use of evidenceAlthough Six Sigma is not the first of the new approaches to operations to use stat-istical methods (some of the TQM gurus promoted statistical process control, for example) it has done a lot to emphasise the use of quantitative evidence. In fact much of the considerable training required by Six Sigma consultants is devoted to mastering quantitative analytical techniques. However, the statistical methods used in Six Sigma do not always reflect conventional academic statistical knowledge as such. Six Sigma emphasises observational methods of collecting data and the use of experimentation to examine hypotheses. Techniques include graphical methods, analysis of variance, and two-level factorial experiment design. Underlying the use of these techniques is an emphasis on the scientific method, responding only to hard evidence, and using statistical software to facilitate analysis.
Structured improvement cycleThe structured improvement cycle used in Six Sigma is called the DMAIC (pro-nounced De-Make) cycle (see Figure 3.9). The DMAIC cycle starts with defining the problem or problems, partly to understand the scope of what needs to be done and partly to define exactly the requirements of the process improvement. Often at this stage a formal goal or target for the improvement is set. After definition comes the measurement stage. This is an important point in the cycle, and in the Six Sigma approach generally, which emphasises the importance of working with hard evidence rather than opinion. This stage involves validating the problem to make sure that it really is a problem worth solving, using data to refine the problem and measuring exactly what is happening. Once these measurements have been established, they can be analysed. The analysis stage is sometimes seen as an opportunity to develop hypotheses as to what the root causes of the problem really are. Such hypotheses are validated (or not) by the analysis, and the main root causes of the problem are identified. Once the causes of the problem are identified, work can begin on improv-ing the process. Ideas are developed to remove the root causes of problems, solutions are tested and those solutions that seem to work are implemented, formalised and results measured. The improved process then needs to be continually monitored and controlled to check that the improved level of performance is sustaining. After this point the cycle starts again and defines the problems that are preventing further improvement. Remember though, it is the last point about both cycles that is the most important – the cycle starts again. It is only by accepting that in a continuous improvement philosophy these cycles quite literally never stop that improvement becomes part of every person’s job.
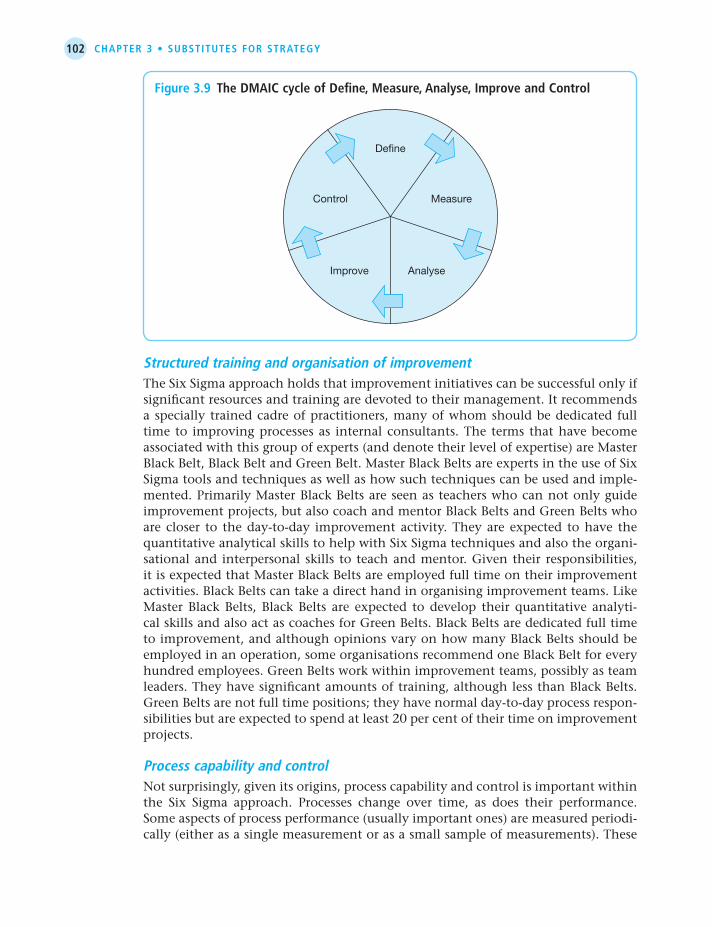
102 chapter 3 • SubStItuteS For Strategy
Structured training and organisation of improvementThe Six Sigma approach holds that improvement initiatives can be successful only if significant resources and training are devoted to their management. It recommends a specially trained cadre of practitioners, many of whom should be dedicated full time to improving processes as internal consultants. The terms that have become associated with this group of experts (and denote their level of expertise) are Master Black Belt, Black Belt and Green Belt. Master Black Belts are experts in the use of Six Sigma tools and techniques as well as how such techniques can be used and imple-mented. Primarily Master Black Belts are seen as teachers who can not only guide improvement projects, but also coach and mentor Black Belts and Green Belts who are closer to the day-to-day improvement activity. They are expected to have the quantitative analytical skills to help with Six Sigma techniques and also the organi-sational and interpersonal skills to teach and mentor. Given their responsibilities, it is expected that Master Black Belts are employed full time on their improvement activities. Black Belts can take a direct hand in organising improvement teams. Like Master Black Belts, Black Belts are expected to develop their quantitative analyti-cal skills and also act as coaches for Green Belts. Black Belts are dedicated full time to improvement, and although opinions vary on how many Black Belts should be employed in an operation, some organisations recommend one Black Belt for every hundred employees. Green Belts work within improvement teams, possibly as team leaders. They have significant amounts of training, although less than Black Belts. Green Belts are not full time positions; they have normal day-to-day process respon-sibilities but are expected to spend at least 20 per cent of their time on improvement projects.
process capability and controlNot surprisingly, given its origins, process capability and control is important within the Six Sigma approach. Processes change over time, as does their performance. Some aspects of process performance (usually important ones) are measured periodi-cally (either as a single measurement or as a small sample of measurements). These
Control
Define
Measure
AnalyseImprove
Figure 3.9 the DMaIc cycle of Define, Measure, analyse, Improve and control

103SIx SIgMa
are then plotted on a simple time-scale. This has a number of advantages. The first is to check that the performance of the process is, in itself, acceptable (capable). They can also be used to check if process performance is changing over time, and to check on the extent of the variation in process performance.
process designLatterly Six Sigma proponents also include process design into the collection of elements that define the Six Sigma approach. This is somewhat surprising because process design (or rather, redesign) is implicit in the DMAIC cycle. Presumably, by formally including this element, practitioners are emphasising the need to improve whole processes rather than individual elements of a process.
process improvementSome of the ideas of continuous improvement are also now formally included in Six Sigma, but it does not confine itself to continuous improvement only. In fact Six Sigma projects often may be relatively wide in scope and aim to achieve relatively large improvements.
criticisms of Six Sigma
One common criticism of Six Sigma is that it does not offer anything that was not available before the term was used. Its emphasis on improvement cycles comes from TQM, its emphasis on reducing variability comes from statistical process control, its use of experimentation and data analysis is simply good quantitative analysis. The only contribution that Six Sigma has made, argue its critics, is using the rather gimmicky martial arts analogy of Black Belt, etc. to indicate a level of expertise in Six Sigma methods. All Six Sigma has done is package pre-existing elements together in order for consultants to be able to sell it to gullible chief executives. In fact it is difficult to deny some of these points. Maybe the real issue is whether it is really a criticism. If bringing these elements together really does form an effective problem-solving approach, why is this a problem? Six Sigma is also accused of being too hierarchical in the way it structures its various levels of involvement in the improvement activity (as well as the dubious use of martial-arts-derived names such as Black Belt). It is also expensive. Devoting such a large amount of training and time to improvement is a significant investment, especially for small companies. Nevertheless, Six Sigma proponents argue that the improvement activity generally is neglected in most operations, and if it is to be taken seriously, it deserves the sig-nificant investment implied by the Six Sigma approach. Furthermore, they argue, if operated well, Six Sigma improvement projects run by experienced practitioners can save far more than their cost. There are also technical criticisms of Six Sigma – most notably that in purely sta-tistical terms the normal distribution that is used extensively in Six Sigma analysis does not actually represent most process behaviour. Other technical criticisms (that are not really the subject of this book) imply that aiming for the very low levels of defects per million opportunities, as recommended by Six Sigma proponents, is far too onerous.

104 chapter 3 • SubStItuteS For Strategy
lessons from Six Sigma
If one were cynical one would argue that the real lesson from Six Sigma is that with a scientific sounding title and a set of commonsense analytical tools, consultants can sell anything. But whether one accepts that or not, one cannot deny the success of how Six Sigma has been sold. So maybe a more charitable view is that there is a gen-uine hunger for, and appreciation of, evidence-based improvement tools. Certainly, one can argue that before Six Sigma there was too little emphasis on evidence-based and statistical analysis. Softer and more cultural and behaviour-based approaches are useful, but they must be balanced with more rigorous quantitative perspectives.
how does Six Sigma fit into operations strategy?
Figure 3.10 again categorises some of the elements of Six Sigma in the four opera-tions strategy decision areas. In fact it shows that Six Sigma is very much biased towards infrastructural decision making. One could argue that Six Sigma’s emphasis on process control is a function of how process technology is managed, but it is very much towards the infrastructural end of process technology strategy. All the other elements of Six Sigma are firmly in the development and organisation category. In other words, Six Sigma is more about how the systems, procedures, organisational structure, and routines of the business are shaped rather than how its physical pres-ence is configured.
Quality
Speed
Dependability
Flexibility
Cost
Per
form
ance
ob
ject
ives
Mar
ket
com
pet
itive
ness
Capacitystrategy
Supplynetwork
Decision areas
Resource usage
Processtechnology
Developmentand
organisation
Emphasis on process control
Improvement through a structured decision-making cycle
Strong evidence-based methodology
Very substantial training required
Emphasis on process knowledge
Figure 3.10 Six Sigma elements in the four operations strategy decision categories
Some common threads
Before adopting any of the ‘approaches to operations’ that we have covered in this chapter it is worth considering the extent to which one should be influenced by

105SoMe coMMoN threaDS
‘I think Six Sigma is powerful because of its definition; it is the process of comparing process out-puts against customer requirements. Processes operating at less than 3.4 defects per million oppor-tunities means that you must strive to get closer to perfection and it is the customer that defines the goal. Measuring defects per opportunity means that you can actually compare the process of, say, a human resources process with a billing and collection process.’
Paul Ruggier, Head of Process at Xchanging, is a powerful advocate of Six Sigma, and credits the success of the company, at least partly, to the approach. Xchanging, created in 1998, is one of a new breed of companies, operating as an outsourc-ing business for ‘back office’ functions for a range of companies, such as Lloyd’s of London, the insurance centre. Xchanging’s business proposition is for the client company to transfer the running of the whole, or part of, their back office to Xchanging, either for a fixed price or one determined by cost savings achieved. The challenge Xchanging faces is to run that back office in a more effective and efficient manner than the client company had managed in the past. So, the more effective Xchanging is at running the processes, the greater its profit. To achieve these efficiencies Xchanging offers larger scale, a higher level of process expertise, focus and investment in technology. But above all, it offers a Six Sigma approach. Paul Ruggier says:
‘Everything we do can be broken down into a process. It may be more straightforward in a manu-facturing business; frankly, they’ve been using a lot of Six Sigma tools and techniques for decades. But the concept of process improvement is relatively new in many service companies. Yet the concept is powerful. Through the implementation of this approach we have achieved 30 per cent productivity improvements in 6 months.’
The company also adopts the Six Sigma terminology for its improvement practitioners – Master Black Belts, Black Belts and Green Belts. Attaining the status of Black Belt is very much sought after as well as being fulfilling, says Rebecca Whittaker, who is a Master Black Belt at Xchanging:
‘At the end of a project it is about having a process which is redesigned to such an extent that it is simplified and consolidated and people come back and say, “It’s so much better than it used to be.” It makes their lives better and it makes the business results better, and those are the things that make being a Black Belt worthwhile.’
Whittaker was recruited by Xchanging along with a number of other Master Black Belts as part of a strategic decision to kick-start Six Sigma in the company. It is seen as a particularly responsible position by the company, and Master Black Belts are expected to be well versed in the Six Sigma techniques and to be able to provide the training and know-how to develop other staff within the company. In Whittaker’s case she has been working as a Six Sigma facilitator for five years, initially as a Green Belt and then as a Black Belt. Typically a person identified as having the right analytical and interpersonal skills will be taken off their job for at least a year for training, immersed in the concepts of improvement and then sent to work with line staff as project manager/facilitator. Their role as Black Belt will be to guide the line staff to make improvements in the way they do the job. One of the new Black Belts at Xchanging, Sarah Frost, is keen to stress the responsibility she owes to the people who will have to work in the improvement process:
‘Being a Black Belt is about being a project manager. It is about working with the staff and com-bining our skills in facilitation and our knowledge of the Six Sigma process with their knowledge of the business. You always have to remember that you will go on to another project, but they (process staff) will have to live with the new process. It is about building solutions that they can believe in.’
example Six Sigma at xchanging14

106 chapter 3 • SubStItuteS For Strategy
the experiences of other organisations, especially when packaged as ‘best practice’. It may be that operations that rely on others to define what is ‘best practice’ are always limiting themselves to currently accepted methods of operating or currently accepted limits to performance. ‘Best practice’ is not ‘best’ in the sense that it cannot be bettered, it is ‘best’ only in the sense that it is the best one can currently find. Accepting this may prevent operations from ever making the radical breakthrough or improvement that takes the concept of ‘best’ to a new and fundamentally improved level. Furthermore, because one operation has a set of successful practices in the way it manages its operations does not mean that adopting those same practices in another context will prove equally successful. It is possible that subtle differences in the resources within a process (such as staff skills or technical capabilities) or the strategic context of an operation (for example, the relative priorities of performance objectives) will be sufficiently different to make the adoption of seemingly successful practices inappropriate. But, even if one accepts ‘best practice’ as distilled into the new approaches that we have reviewed, there are some important points to consider.
Senior managers sometimes use these new approaches without fully understanding them
In this chapter we have chosen very briefly to explain six of the approaches some-times referred to as ‘operations strategies’. One could easily have extended this list of four to include several others such as total preventive maintenance (TPM), lean Sigma (a combination of lean and Six Sigma), and so on. But these four in our view constitute a representative sample of the most commonly used approaches. Nor do we have the space to describe them fully. Each of the approaches is the subject of several books that describe them in great detail. There is no shortage of advice from consultants and academics as to how they should be used. Yet it is not difficult to find examples of where senior management have embarked on a programme of using one or more of these approaches without fully understanding them. And if senior management do not understand these approaches, how can the rest of the organisation take them seriously? The details of Six Sigma or lean, for example, are not simply technical matters. They are fundamental to how appropriate the approach could be in different contexts. Not every approach fits every set of circum-stances. So understanding in detail what each approach means must be the first step in deciding whether it is appropriate.
all these approaches are different
There are clearly some common elements between some of these approaches, the most obvious element being the idea of a ‘customer centric’ perspective. Furthermore, as these approaches develop over time, they may acquire elements from elsewhere. Look how Six Sigma has developed beyond its process control roots to encompass many other elements. Yet there are also differences between them, and these differences also need to be understood. For example, one important differ-ence relates to whether the approaches emphasise a gradual, continuous approach to change, or whether they recommend a more radical ‘breakthrough’ change. Another difference concerns the aim of the approach. What is the balance between whether the approach emphasises what changes should be made or how changes should be

107SoMe coMMoN threaDS
made? Some approaches have a firm view of what is the best way to organise the operation’s processes and resources. Other approaches hold no particular view on what an operation should do, but rather concentrate on how the management of an operation should decide what to do. Put in operations strategy terms this distinction is similar to that between the content and process of operations strategy. Figure 3.11 places each of the four approaches on these two dimensions. Just as different authors have differing views as to the exact nature of some of these approaches, one could position them on the two dimensions shown in Figure 3.11 in a slightly different way. Nevertheless, there are some important differences between the approaches that should be recognised. First, they differ in the extent to which they prescribe appropriate operations practice. BPR, for example, is relatively clear in what it is recommending. It has a definite list of things that operations resources should or should not be – processes should be end-to-end, non-value-added work should be eliminated, inventory should be reduced, technology should be flexible, and so on. Contrast this with both Six Sigma and TQM, which focus to a
Emphasis onwhat to do
Emphasis onhow to do it
Emphasis ongradual change
Emphasis onrapid change
Six Sigma
BPR
TQM
Lean
Figure 3.11 each of the ‘new approaches’ positioned in terms of its emphasis on what changes to make or how to make the changes, and whether it emphasises rapid or gradual change
108 chapter 3 • SubStItuteS For Strategy
far greater extent on how operations should be improved. Six Sigma in particular has relatively little to say about what is good or bad in the way operations resources are organised (with the possible exception of its emphasising the negative effects of pro-cess variation). Its concern is largely the way improvements should be made: using evidence, using quantitative analysis, using the DMAIC cycle, and so on. They also differ in terms of whether they emphasise gradual or rapid change. BPR is explicit in its radical nature; it implicitly assumes a fairly dramatic change. By contrast TQM and lean both incorporate ideas of continuous improvement. Six Sigma is relatively neutral on this issue and can be used for small or very large changes.
these approaches are not strategies, but they are strategic decisions
So, are any of these approaches that we have described in this chapter operations strategies? Remember that our definition of operations strategy is the reconcilia-tion of market requirements and operations resource capabilities. Implicit in this definition, and indeed in everything we have discussed in this book, is the idea that an individual enterprise’s market requirements and their operations resource capabilities are to some extent unique to that enterprise. Even companies compet-ing in ostensibly the same market for the same customers generally will have to position themselves slightly differently. Certainly, given that there is an infinite number of ways that they can organise their resources, they are likely to have differ-ent operations resource capabilities. The essence of an operations strategy is that it is individual and specific to one organisation at one point in time. By contrast, the approaches we have described in this chapter are generic in nature. That is after all why they are attractive: they offer generic advice that is broadly applicable across a range of businesses. That is also why they are not strategies. And that is why senior managers who adopt them as operations strategies are deluding themselves. Nevertheless, none of them is incompatible with a sensible operations strategy. They can all be considered as part of a strategy, in terms either of its content or of its process. In fact the choice of which, if any, approach to adopt is an important strategic decision. Before adopting any of the approaches at least some of the follow-ing issues should be considered.
●● Does the approach have the potential to add value in terms of the requirements of our customers?
●● Do we have the resources (expertise, capacity, budget) to adopt the approach?
●● Have similar organisations to ours adopted this approach, and what is their expe-rience of using it?
●● Is this approach compatible with other strategic decisions that we have made?
●● Are we capable of communicating the ideas behind the approach and carrying out the necessary training and development to ensure that all staff understand how it fits into the company’s strategy?

109SoMe coMMoN threaDS
avoid becoming a victim of improvement ‘fashion’
Finally, remember that operations improvement has, to some extent, become a fashion industry, with new ideas and concepts continually being introduced as offering a novel way to improve business performance. There is nothing intrinsically wrong with this. Fashion stimulates and refreshes through introducing novel ideas. Without it, things would stagnate. The problem lies not with new improvement ideas, but rather with some managers becoming a victim of the process, where some new idea will entirely displace whatever went before. Most new ideas have some-thing to say, but jumping from one fad to another will not only generate a backlash against any new idea, but also destroy the ability to accumulate the experience that comes from experimenting with each one. Avoiding becoming an improvement fashion victim is not easy. It requires that those directing the strategy process take responsibility for a number of issues.
(a) They must take responsibility for improvement as an ongoing activity, rather than becoming champions for only one specific improvement initiative.
The Erdington Group is a major private group in the Scotch whisky industry with a number of specialist operations covering every facet of Scotch whisky distilling, blending and bot-tling. With a history that goes back to the 1850s, the Group is owned by the Robertson Trust, which gives more than £7 million of dividend income to charitable causes in Scotland each year, and its employees, more than 90 per cent of whom are shareholders. Erdington’s brands are well known: The Famous Grouse; Cutty Sark; and a malt, The Macallan, which is matured in selected ex-sherry oak casks. Another, Highland Park, was recently named ‘best spirit in the world’ by The Spirit Journal, USA. The Group’s Glasgow site has been commended in a ‘Best Factory’ award scheme for its use of improvement approaches in achieving excel-lence in quality, productivity and flexibility. This is a real achievement given the constraints of whisky production, bottling and distribution. Some whisky can take 30 years to mature, and with malts, there is a limited number of available ex-sherry casks. Production planning must look forward to what may be needed in 10, 18 or even 30 years’ time, and having the right malts in stock is crucial. After the whisky has been blended in vats, it is decanted into casks again for the ‘marrying’ process. The whisky stays in these casks for three months. After this, it is ready for bottling. The main bottling line runs at 600 bottles per minute, which is fast, so dealing with problems in the plant is important. Production must be effi-cient and reliable, with changeovers as fast as possible. This is where the company’s improvement efforts have paid dividends. It has used several improvement approaches to help it maintain its operations performance. Stan Marshall, Director of Operational Excellence explains:
‘We did TQM, then CIP and Six Sigma (there are 10 Black Belts on site and 30 Green Belts) and now lean, which is an evolution for us.’
Roseann McAlindon, a line operator on line 8 – the lean pilot line – who has worked in the site for 17 years says:
‘Lean has helped the line and has helped us. On changeovers, parts were reviewed for ease of fit-ment, made lighter and easier to handle, and procedures written down.’
example erdington embraces the spirit of improvement15

110 chapter 3 • SubStItuteS For Strategy
(b) They must take responsibility for understanding the ideas underlying each new concept. Improvement is not ‘following a recipe’ or ‘painting by numbers’. Unless one understands why improvement ideas are supposed to work, it is dif-ficult to understand how they can be made to work properly.
(c) They must take responsibility for understanding the antecedents to a ‘new’ improvement idea, because it helps to understand it better and to judge how appropriate it may be for their own operation.
(d) They must be prepared to adapt new ideas so that they make sense within the context of their own operation. ‘One size’ rarely fits all.
(e) They must take responsibility for the (often significant) education and learning effort that will be needed if new ideas are to be intelligently exploited.
(f) Above all they must avoid the over-exaggeration and hype that many new ideas attract. Although it is sometimes tempting to exploit the motivational ‘pull’ of new ideas through slogans, posters and exhortations, carefully thought out plans will always be superior in the long run, and will help avoid the inevitable backlash that follows ‘over-selling’ a single approach.
SuMMary aNSwerS to key queStIoNS
how does total quality management fit into operations strategy?TQM is a philosophy of how to approach the organisation of quality improvement that stresses the ‘total’ of TQM. It puts quality and improvement generally at the heart of everything that is done by an operation. It provides a checklist of how to organise operations improvement. It has also been developed into a more prescrip-tive form as in the EFQM Excellence Model, developed by the European Foundation for Quality Management (EFQM).
how do lean operations fit into operations strategy?The lean approach aims to meet demand instantaneously, with perfect quality and no waste. It can be seen as having four elements; customer-based demand triggers, syn-chronised flow, enhanced improvement behaviour, and waste elimination. However, the lean concept implies some sacrifice of capacity utilisation. It occurs because, when stoppages occur in the traditional system, buffers allow each stage to continue working and thus achieve high capacity utilisation. There is far less buffering in lean processes.
how does business process reengineering fit into operations strategy?BPR is the fundamental rethinking and radical redesign of business processes to achieve dramatic improvements in critical, contemporary measures of performance, such as cost, quality, service and speed. The approach strives for dramatic improve-ments in performance by radically rethinking and redesigning the process using end-to-end processes and by exploiting the power of IT to integrate processes.
how does Six Sigma fit into operations strategy?Sigma is a disciplined methodology of defining, measuring, analysing, improving and controlling the quality in every one of the company’s products, processes,
111NoteS oN the chapter
and transactions – with the ultimate goal of virtually eliminating all defects. Although it started as a statistical process control-based concept, it is now a broad improvement concept rather than a simple examination of process variation. It stresses the use of (preferably quantitative) evidence in decision making, systematic problem solving and the use of improvement specialists called Black Belts, Green Belts, etc.
what place do these new approaches have in operations strategy?These approaches are not strategies in themselves (operations strategy specific to one organisation at one point in time), they are generic in nature, but they are strategic decisions. But none of them is incompatible with operations strategy; they can all be considered as part of a strategy. It is also important to understand any approach fully before it is adopted, because all the approaches are different. Some emphasise gradual change, others more radical change. Some hold a view of the best way to organise resources, others concentrate on how to decide what to do. So the focus of BPR is what should happen rather than how it should happen, and lean is similar. But both Six Sigma and TQM focus more on how operations should be improved. BPR is explicit in its advocacy of radical and dramatic change. TQM and lean, on the other hand, both incorporate ideas of continuous improvement, whereas Six Sigma can be used for small or very large changes.
Further reading
Bicheno, J. and Holweg, M. (2009) The Lean Toolbox: The Essential Guide to Lean Transformation. Buckingham: PICSIE Books.
Dale, B.D., van der Wiele, T. and van Iwaarden, J. (2007) Managing Quality. 5th edn. Wiley-Blackwell.
George, M.L., Rowlands, D. and Kastle, B. (2003) What Is Lean Six Sigma? McGraw-Hill.George, M.L., Maxey, J., Rowlands, D.T. and Upton, M. (2005) The Lean Six Sigma
Pocket Toolbook: A Quick Reference Guide to 70 Tools for Improving Quality and Speed. McGraw-Hill.
Jeston, J. and Nelis, J. (2008) Business Process Management: Practical Guidelines to Successful Implementations. 2nd edn. Butterworth-Heinemann.
Liker, J. (2003) The Toyota Way: 14 Management Principles from the World’s Greatest Manufacturer. McGraw-Hill Education.
Pande, P.S., Neuman, R.P. and Cavanagh, R. (2002) Six Sigma Way Team Field Book: An Implementation Guide for Project Improvement Teams. McGraw-Hill.
Womack, J.P. and Jones, D.T. (2003) Lean Thinking: Banish Waste and Create Wealth in Your Corporation. New York: Simon and Schuster.
Notes on the chapter
1 Feigenbaum, A.V. (1986) Total Quality Control, New York: McGraw-Hill. 2 Deming, W.E. (1986) Out of Crisis, Cambridge, MA: MIT Centre for Advanced Engineering
Study. 3 Matsushito, K. (1985) ‘Why the West will lose’, Industrial Participation, Spring. 4 Source: The Economist (2000) ‘Was It All Worth It?’, 24 April. 5 Deming, W.E. (1986) op. cit.
112 chapter 3 • SubStItuteS For Strategy
6 Kamata, S. (1983) Japan in the Passing Lane: An Insider’s Account of Life in a Japanese Auto Factory, London: Allen & Unwin.
7 Schultz, K., McCain, J. and Thomas, L.J. (2003) ‘Overcoming the dark side of worker flex-ibility’, Journal of Operations Management, Vol. 21, pp. 81–92.
8 Based on Karlsson, C. (1996) ‘Radically new production systems’, International Journal of Operations and Production Management, 16(11).
9 Davenport, T. (1995) ‘Reengineering: the fad that forgot people’, Fast Company, November.10 Hammer, M. and Champy, J. (1993) Reengineering the Corporation: A Manifesto for Business
Revolution, New York: Harper Business.11 Johansson, H.J. (1993) Business Process Reengineering: Break Point Strategies for Market
Dominance, New York: John Wiley & Sons.12 Hammer, M. and Champy, J. op. cit.13 For example, Davenport, T. (1995) op. cit.14 Source: Discussion with staff at Xchanging.15 Sources include: company website, The Best Factory Awards (2006).

chapter
capacity strategy4
Capacity is the first of the operations strategy decision areas to be treated and, for operations managers, it is a fundamental decision. After all, the purpose of operations strategy is to provide and manage the capacity to supply demand. Also, capacity strat-egy decisions affect a large part of the business (indeed capacity decisions can create a large part of the business), and the consequences of getting them wrong are almost always serious and sometimes fatal to a firm’s competitive abilities. Too much capacity under-utilises resources and drives costs up. Too little capacity limits the operation’s ability to serve customers and therefore earn revenues. The risks inherent in getting capacity wrong lie both in having an inappropriately configured set of resources and in mismanaging the process of changing capacity over time. This chapter will look at the principles behind how operations configure, and reconfigure, their capacity.
Introduction
Quality
Speed
Dependability
Flexibility
CostPer
form
ance
ob
ject
ives
Mar
ket
com
pet
itive
ness
Capacity strategySupply
networks
Decision areas
Resource usage
Processtechnology
Developmentand
organisation
Issues include:
• Capacity levels
• Number of sites
• Size of sites
• When to change capacity
• How much to change capacity
• Location
Figure 4.1 this chapter looks at capacity strategy
What is capacity strategy?
An operation’s capacity dictates its potential level of productive activity. It is ‘the maximum level of value-added activity over a period of time that the operation can

114 chapter 4 • capacIty strategy
achieve under normal conditions.’ Operations strategy is the set of decisions con-cerned with how operations configure and change their overall capacity in order to achieve a particular level of output potential. Note that capacity is not the same as output. Demand may not be sufficient to warrant an operation producing at full capacity, and in many high customer contact operations, such as theatres, ‘output’ (i.e. the number of customers entertained) cannot normally exceed demand. The capacity strategy of an operation defines its overall scale, the number and size of different sites between which its capacity is distributed, the specific activities allocated to each site and the location of each site. All these decisions are related. For example, an air conditioning servicing operation will have sites with relatively small individual capacity if it chooses to have many sites located no more than 30 minutes’ travelling time from any customer. If it relaxed this ‘response time’ to 60 minutes, it could have fewer, larger sites. Together these decisions determine the configuration of an operation’s capacity, its overall shape, size and deployment. An appropriate configuration of capacity for one set of products or services, and pattern of demand, will not necessarily be appropriate for another. So when the nature of competition shifts in some way, companies often need to reconfigure their capacity. This process of changing (or reconfiguring) capacity is also part of capacity strategy. It usually involves deciding when capacity levels should be changed (up or down), how big each change step should be and overall how fast capacity levels should change.
capacity at three levels
The provision of capacity is not just a strategic issue. It takes place in all operations minute by minute, day by day and month on month. Every time an operations manager moves a staff member from one part of the operation to another, he or she is adjusting capacity within the operation. Similarly, when setting shift patterns to determine working hours, effective capacity is being set. Neither of these decisions is strategic – they do not necessarily impact directly on the long-term physical scale of the operation. But shift patterns will be set within the constraints of the physi-cal limits of the operation, and the minute-by-minute deployment of staff will take place within the constraints of the number and skills of the people present within the operation at any time. Thus, although capacity decisions are taken for different time-scales and spanning different areas of the operation, each level of capacity deci-sion is made with the constraints of a higher level. Table 4.1 illustrates this idea. Note, though, that the three levels of capacity decision used here are, to some extent, arbitrary and there is, in practice, overlap
●● What is capacity strategy?
●● how much capacity should an operation have?
●● how many separate sites should an operation have?
●● What issues are important when changing capacity levels?
●● Where should capacity be located?
key questIons
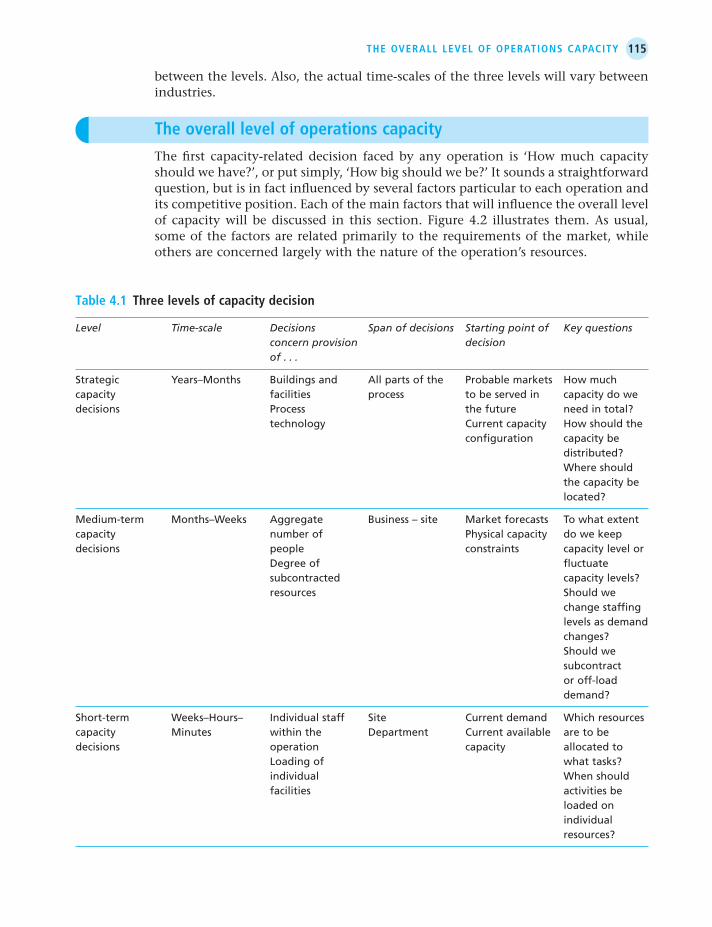
115the overall level oF operatIons capacIty
between the levels. Also, the actual time-scales of the three levels will vary between industries.
table 4.1 three levels of capacity decision
Level Time-scale Decisions Spanofdecisions Startingpointof Keyquestions concernprovision decision of...
Strategic Years–Months Buildingsand Allpartsofthe Probablemarkets Howmuchcapacity facilities process tobeservedin capacitydowedecisions Process thefuture needintotal? technology Currentcapacity Howshouldthe configuration capacitybe
distributed?Whereshouldthecapacitybelocated?
Medium-term Months–Weeks Aggregate Business–site Marketforecasts Towhatextentcapacity numberof Physicalcapacity dowekeepdecisions people constraints capacitylevelor Degreeof fluctuate subcontracted capacitylevels? resources Shouldwe
changestaffinglevelsasdemandchanges?Shouldwesubcontractoroff-loaddemand?
Short-term Weeks–Hours– Individualstaff Site Currentdemand Whichresourcescapacity Minutes withinthe Department Currentavailable aretobedecisions operation capacity allocatedto Loadingof whattasks? individual Whenshould facilities activitiesbe
loadedonindividualresources?
the overall level of operations capacity
The first capacity-related decision faced by any operation is ‘How much capacity should we have?’, or put simply, ‘How big should we be?’ It sounds a straightforward question, but is in fact influenced by several factors particular to each operation and its competitive position. Each of the main factors that will influence the overall level of capacity will be discussed in this section. Figure 4.2 illustrates them. As usual, some of the factors are related primarily to the requirements of the market, while others are concerned largely with the nature of the operation’s resources.

116 chapter 4 • capacIty strategy
Forecast demand
Only rarely will a business decide to invest in a level of capacity that is exactly equal to its expectation of future demand. However, it is a starting point in trying to under-stand why operations finish up the size they are. So, for example, if a leisure business believes there is likely to be a demand for 500 rooms per night at a newly developed resort location, then it may build a 500-roomed hotel. If an insurance company’s call centre is forecast to handle 500,000 calls per week and one operator can handle a call every 3 minutes, then it may build a 625-station call centre (operators have 40 3 60 minutes a week, so can receive 2400/3 5 800 calls a week, so 500,000/800 5 625 oper-ators are needed). But capacity decisions are not always as simple as this. Although a ‘single point’ forecast of future demand for an operation’s products and services will have a major influence on how big its operations will be, other considerations will affect the decision. It is these other factors, acting to modify a simple demand fore-cast, that reveal much about the strategic context of operations decisions.
MARKETREQUIREMENTS
OPERATIONSRESOURCES
Overall levelof capacity
Economiesof scale Flexibility
of capacityprovisions
Availabilityof capitalCost structure
of capacityincrement
Forecastlevel ofdemand
Consequencesof over/under-
supply
Changes infuture
demand
Uncertaintyof futuredemand
Figure 4.2 some factors influencing the overall level of capacity
Sometimes capacity decisions can be made with the objective of influencing demand itself. The most obvious example of this is the ‘category killer’ in retailing. These are highly efficient operations that sell a specific category of goods at keen prices, often from large ‘edge-of-town’ superstores. One of the best-known category killers in retailing is IKEA, the furniture and homeware chain that started life in Sweden but has now spread all over the world. With over 210 giant stores operating in more than 30 countries, IKEA sells ‘a wide range of well designed, functional home furnishing products at prices so low that as many people as possible will be able to afford them’. This IKEA concept ‘guides the way IKEA products are designed, manufactured, transported, sold and assembled.’ The name IKEA comes from the initials of its founder, Ingvar Kamprad, I and K, plus the first letters of Elmtaryd and Agunnaryd, which are the names of the farm and village where
example Ikea exploits the scale factor

117the overall level oF operatIons capacIty
uncertainty of future demand
Even when the demand for an operation’s products or services can be reasonably well forecast, the uncertainty inherent in all estimates of future demand may inhibit the operation from investing to meet the most likely level of demand. The econom-ics of the operation may mean that, should the lower level of demand occur, the financial consequences would be unacceptable to the company. There are also other consequences of over- and under-supply. For example, the availability of excess capacity may give an operation the flexibility to respond to short-term surges in demand. This could be especially valuable when either demand needs to be satis-fied in the short term, or when satisfying short-term demand can have long-term implications, so immediately after the introduction of a new a product or service, especially when there are several competitors, is a bad time not to be able to sat-isfy demand. Market share lost at this point may never be regained. Paradoxically though, in some circumstances, under-supplying a market may increase the value (and therefore price) of an operation’s goods or services. Such a scarcity-based strat-egy, however, does rely on an appropriate market positioning and a confidence in the lack of competitor activity.
changes in demand – long-term or short-term demand?
In addition to any uncertainty surrounding future demand, there is also the ques-tion of the time-scale over which demand is being forecast. For example, short-term expected demand may be higher than expected long-term sustainable demand. In which case, does an organisation plan to provide capacity to meet the short-term peak or, alternatively, plan to satisfy only longer-term sustainable levels of demand? Conversely, short-term demand may be relatively low compared to longer-term demand. Again, there is the same dilemma. Should the operation build capacity for the short or long term? Like many capacity strategy decisions, this is related to the economies of scale of individual operations and the ease with which they can add or subtract increments of capacity. The dynamics of changing capacity levels will be discussed later in the chapter. Here we are concerned with the decision of where initially to pitch capacity levels.
he grew up. In the 1950s Kamprad, who was successfully selling furniture through a cata-logue operation, built a showroom in Stockholm: not in the centre of the city where land was expensive, but on the outskirts of town. Instead of buying expensive display stands, he simply set the furniture out as it would be in a domestic setting. Instead of moving the furniture from the warehouse to the showroom area, customers pick the furniture up from the warehouse themselves. The furniture is usually designed to be stored and sold as a ‘flat pack’ which the customer assembles at home. The stores are all designed around the same self-service concept – that finding the store, parking, moving through the store itself, and ordering and picking up goods should be simple, smooth and problem-free. But it is the company’s huge capacity at each site that allows it to offer customers the range of choice which attracts them in large numbers. The large numbers mean high throughput which, in turn, means not only that the company can build large capacity, low ‘transaction cost’ sites, but also that it can win substantial discounts from suppliers, reducing costs even further (and attracting even more customers).

118 chapter 4 • capacIty strategy
long-term demand lower than short-term demandSuppose a confectionery company is launching a new product aimed at the children’s market. From previous experience it realises that it must make an initial impact in the market with many sales based on the novelty of the product, in order to reach a lower but sustainable level of demand. It estimates that initial demand for the prod-uct will be around 500 tons per month. However, longer-term demand is more likely to settle down to a reasonably steady level of 300 tons per month. A key issue here is whether the higher level of demand will sustain for long enough to recoup the extra capital cost of providing capacity to meet that high level. Furthermore, even if this is the case, can an operation with a nominal capacity of 500 tons per month operate sufficiently profitably when it is only producing 300 tons per month? If the answer to either of these questions is ‘No’, then a capacity-based analysis would tend to discourage investment at the higher level of capacity. The main problem with this approach is that it may prove to be self-fulfilling. Under-supplying the market may depress demand, which would otherwise have grown to justify the 500 tons per month capacity level. More likely, competitors will take advantage of the company’s inability to supply to increase their own share of the market. Of course, the company may wish to counteract any under-supply by adopting pricing and promotion strategies that minimise the effects of, or even exploit, product shortage. The lesson here is that setting the initial capacity level cannot be done in isolation from the company’s market positioning strategy.
short-term demand lower than long-term demandAgain, the issues here are partly concerned with economies of scale versus the costs of operating at levels below the operation’s capacity. If the economies of scale of providing capacity at the higher level of demand mean that the profits generated in the long term are worth the costs associated with under-utilisation of capacity in the short term, then building capacity at the higher level may be justified. Once more though, the relationship between capacity provision, costs and market positioning needs to be explored. Initial over-capacity may be exploited by producing at higher volume, and therefore lower costs, and pricing in order to take market share or even stimulate the total market. Indeed, over-capacity may be deliberately provided in order to allow such aggressive market strategies.
the availability of capital
One obvious constraint on whether operations choose to meet demand fully is their ability to afford the capacity with which to do it. So, for example, a company may have developed a new product or service that it is convinced will be highly attrac-tive in the marketplace. Sales forecasts are extremely bullish, with potential revenues being two or three times higher than the company’s present revenue. Competitors will take some time to catch up with the company’s technological lead and so it has the market to itself for at least the next two years. All of this sounds very posi-tive for the company; its products and services are innovative, the market appears to want them, forecasts are as firm as forecasts can be, and the company is in a position to make very healthy profits for at least the next two years. But consider what the company will have to do to its resource base. Irrespective of how novel or technologically difficult the new processing requirements are, there certainly will be

119the overall level oF operatIons capacIty
a lot more of them. The company will need to increase its operations resources by two or three hundred per cent. The question must arise of whether it can afford to do this, or more accurately, whether it is prepared to face the consequences of doing this. Borrowing enough cash to double or triple the worth of the company may not be possible from conventional sources of lending. The owners may not wish to float the company at this stage. Other sources of finance, such as venture capitalists, may demand an equity stake. Under these circumstances the company may forgo the opportunity to meet forecast demand fully. Even though in pure accounting terms the return on any investment in operating capacity may be perfectly acceptable, the consequence in terms of ownership or vulnerability of the company to being taken over may not be worth risking. An alternative for the company may be to increase capacity only as fast as its currently feasible borrowing capability will allow. The risk then is that competitor companies will have the time to enter the market and reduce the longer-term potential for the company.
the cost structure of capacity increments – break-even points
One of the most basic, and yet most important, issues in capacity strategy is con-cerned with the relationship between the capacity of an operation, the volume of output which it is actually processing, and its profitability. Simple break-even analysis can illustrate the basics of this. Each additional unit of capacity results in a fixed-cost break. The fixed costs of a unit of capacity are those expenditures that have to be incurred irrespective of how much the capacity is actually being used. The variable costs of operating the capacity are those expenditures that rise propor-tionally to output. As volume increases for one operation, the additional capacity required can move an operation through its ‘break-even’ point from profitability to loss. Further additions to the capacity of the operation will be needed to cope with increased demand. Each addition brings a new set of fixed costs. Fixed-cost breaks may mean that there are levels of output within which a company might not wish to operate. This issue is particularly important when the fixed costs of operation are high compared with the variable costs. Figure 4.3 shows how this might be in one operation. Each unit of capacity can process 4,000 units of output per month. The fixed costs of operating this capacity are $2,000 per month and the variable costs $0.25 per unit. The revenue from each unit processed to the operation is $0.9 per unit. Demand is forecast to be steady at around 9,000 units per month. To meet this demand fully, three units of capacity would be needed, though the third unit would be much under-utilised. As Figure 4.3 shows, meeting demand fully, the company’s total costs are higher than its total revenue. It would therefore be operating at a loss. Under these circumstances, the company might very well choose to process only 8,000 units per month, not meet-ing demand but operating more profitably than if it was meeting demand.
economies of scale
If the total cost of the output from an operation is its fixed costs plus its output mul-tiplied by its variable costs per unit, then we can calculate the average cost per unit of output simply by dividing total costs by the output level. So, for example, Figure 4.4(a) shows the unit cost for an increment of capacity of the operation described

120 chapter 4 • capacIty strategy
earlier. In reality though, the real average cost curve may be different from that shown in Figure 4.4(a) for a number of reasons. The real maximum capacity may be larger than the theoretical maximum capac-ity. For example, the theoretical capacity in Figure 4.4(a) was based on an assump-tion that the operation would be working 112 hours a week (14 shifts a week out of a possible 21 shifts a week) whereas the operation is theoretically available 168 hours a week. Utilising some of this unused time for production will help to spread further the fixed costs of the operation but could also incur extra costs. For example, overtime payments and shift premiums together with incrementally higher energy bills may be incurred after a certain level of output. There may also be less obvious costs of operating above nominal capacity levels. Long periods of overtime may reduce productivity levels, reduced or delayed
Volume in thousands of units0 12
0
12
Cos
ts/R
even
ue ($
)
10
8
6
4
2
108642
Fore
cast
dem
and
= 9
,000
uni
ts
Revenue
Cost
Figure 4.3 cost, volume, profit illustration
Volume in thousands of units
(a)
00
Uni
t co
st (t
otal
cos
t/vo
lum
e) 8
6
4
2
642 531
Nominalcapacity
limit
Volume in thousands of units
(b)
00
Uni
t co
st (t
otal
cos
t/vo
lum
e) 8
6
4
2
642 531
Diseconomies ofscale kick in
Figure 4.4 unit cost curves

121the overall level oF operatIons capacIty
maintenance time may increase the chances of breakdown, operating facilities and equipment at a higher rate or for longer periods may also expose problems which hitherto lay dormant. These ‘diseconomies’ of over-using capacity can have the effect of increasing unit costs above a certain level of output. However, all the fixed costs are not usually incurred at one time at the start of opera-tions. Rather they occur at many points as volume increases. Furthermore, operations managers often have some discretion as to where these fixed-cost breaks will occur. So, for example, the manager of a delivery operation may know that at the level of demand forecast for next month a new delivery vehicle should be purchased. This extra vehicle (together with the extra fixed cost it brings) could be purchased now in order to improve service delivery next month, when it is technically needed, or delayed beyond next month. This last option may involve taking the risk that any vehicle breakdown would leave the operation dangerously short of capacity but may yet be preferred if the operations manager has little faith in next month’s level of demand being sustained. All these points taken together mean that, as is illustrated in Figure 4.4(b), in prac-tice, unit cost curves:
●● are capable of being extended beyond nominal capacity;
●● often show increases in cost beyond a certain level of volume;
●● are best represented by a band within which the true cost will lie, rather than a smooth, clean line.
Cemex is a growing global producer and distributor of ready-mix concrete, aggregates, and building materials in more than 50 countries. It has grown from a local player to one of the top global companies in its industry, with an annual production capacity of approximately 98 million metric tons of cement. So what advantages does Cemex see itself as gaining from its capacity growth? It is well aware of the obvious advantages that come from conventional economies of scale. But in addition the company makes sure that it exploits its process knowledge across its capacity:
‘We always look for ways to improve our productivity and operating efficiency. As a part of this process, we have implemented several standardised worldwide platforms designed to reduce our costs, streamline our processes, and extract synergies from our global operations. Through these platforms, we have developed and deployed centralised management-information systems throughout our operations – including administrative, accounting, purchasing, customer-manage-ment, budget-preparation, and control systems – to help us lower our costs.’
Or as the boss of Cemex, Lorenzo Zambrano, says:
‘Scale gives us substantial economies, sure. It also lets us implement the Cemex way. Central control and the transfer of knowledge and best practice, that’s what makes us efficient.’
As the company expands there is also an ‘economy of growth’ effect.
‘With each international acquisition, we have refined the technological and managerial pro-cesses required to integrate acquisitions more rapidly and smoothly into our corporate structure. Consequently, we have been able to consolidate our acquisitions more quickly and efficiently.’
Or, put another way, the more the company expands its overall capacity, the better it becomes at doing it.
example so why should cemex want to be bigger?1
122 chapter 4 • capacIty strategy
The factors that go together to reduce costs as volume increases are often called economies of scale. Those that work to increase unit costs for increased output beyond a certain volume are called diseconomies of scale. What we have described above are the economies and diseconomies of scale for a single increment of capac-ity within an operation. Yet the same logic can be applied for the whole operation. As more units of capacity are added, the total fixed costs per unit of potential output tend to decrease. So, for example, the number of people staffing support services such as maintenance, supervision, warehousing, etc. is unlikely to double when the capacity of the whole operation doubles. As the size of the operation increases it becomes possible eventually to replace the capacity that has been built up incrementally over time with new, larger and more integrated units. This may allow two further economies of scale. The first comes through the increases in operations efficiency which can be gained by integrating, or combining, the processes established separately over time. So, for example, each increase of capacity may have included a particular kind of machine that could be replaced by a larger, more efficient machine once total capacity exceeds a certain level. Second, the capital costs of building operations do not increase proportionally to their capacity. The reason for this is that whereas the capacities of many types of facilities and equipment that go into an operation are related to their volume (a cubic function), the capital cost of the facilities and equipment are related to its surface area (a square function). Generally the cost (Cy) of providing capacity in one increment of size y is given as follows:
Cy 5 Ky k
where K is a constant scale factor and k is a factor that indicates the degree of econo-mies of scale for the technology involved (usually between 0.5 and 1.0).2
There may be, however, significant diseconomies of scale as the size of one site increases. The most significant of these are related to the complexity inherent in a large operation. As organisations grow larger they may become more unwieldy and need a greater degree of planning and coordination. More activities are needed just to keep the organisation operating, and more staff are needed to manage the extra support processes. All this not only adds cost, it can make the whole operation incapable of responding to changes in customer demands. Very large operations find it difficult to be flexible because even if they can sense changes in the markets, they may not be able to respond to them. As operations grow communication also becomes more complex, which in turn provides more opportunities for miscommu-nication and errors.
Founded in 1980 as one small store in Austin, Texas, Whole Foods Market® is now the world’s leading retailer of natural and organic foods. Whole Foods Market is keen to point out that, as a company, it is:
‘highly selective about what we sell [and] . . . dedicated to stringent quality standards, and com-mitted to sustainable agriculture . . . believing . . . in a virtuous circle entwining the food chain, human beings and Mother Earth: each is reliant upon the others through a beautiful and delicate symbiosis.’
example can you get too big?

123the overall level oF operatIons capacIty
Flexibility of capacity provision
Committing to an investment in a particular level of capacity may be managed in such a way as to facilitate later expansion. Effective capacity requires all the required resources and processes to be in place in order to produce goods and services. This may not necessarily imply that all resources and processes are put in place at the same time. It may be possible, for example, to construct the physical outer shell of an operation without investing in the direct and indirect process technologies that will convert it into productive capacity. There may be capital expenditure efficien-cies to be gained by constructing a larger building than is strictly necessary in the medium term, which can be fitted out with equipment when demand justifies it in the future. Clearly there is some risk involved in committing even part of the capital expenditure necessary before demand is certain. However, such a strategy is frequently employed in growing markets. Figure 4.5 shows alternative capacity strategies, and the resultant cash flow profiles, for an operation that is planning to expand its capacity to meet the forecast demand. One option involves building the whole physical facility (with a larger net cash outflow) but equipping it to only half its potential physical capacity. Only when demand justifies it would expenditure be made to fully exploit this capacity. The alternative is to build a fully equipped facility of half the capacity. A further identical capacity increment would then be added as required. Although this latter strategy requires a lower initial cash outflow, it shows a lower cumulative cash flow in the longer term.
The group tries to obtain its products locally where possible, often from small suppliers. Yet, although the company has been highly successful and has undoubtedly brought the benefits of organic food to millions of customers, in recent years it has started to receive criticism from the ‘progressive’ and ‘liberal’ groups who would normally be seen as its natural allies. And much of the criticism is associated with the company’s scale. Here are quotes from some websites critical of the company.
‘Many people love the community at Whole Foods – this is what brought us to work here in the first place. But many of us have also seen that as the company has grown, the focus has shifted to profits and expansion at the expense of worker respect and fair compensation.’
‘Like many “green lifestyle”-branded corporations, Whole Foods understands that marketing to educated, middle-class shoppers with disposable income is more effective when it is framed less as a sales pitch than as consumer education for a worthy cause (e.g., support for organic farm-ers; GE-free foods; your health). But the trouble is even the most informative marketing remains ultimately still, well . . . a sales pitch. In other words, driven by profit. And sometimes, duplicity.’
‘Whole Foods Market® refuses to support better working conditions for strawberry workers.’
What is demonstrated here are two negative consequences of scale for a company like Whole Foods Market®. First, if special interest groups are attacking Whole Foods Market®, they are doing so partly because it is so successful and therefore big. There is less publicity to be gained by attacking the little guy. Second, the very nature of what Whole Foods Market® is selling conflicts in some people’s minds with large-scale operation. Organic food is associ-ated with small, local (and probably amateurish) operations. No matter how much it tries to promote its values, perhaps some of its customers will never be able to reconcile them with high-capacity, large-scale operations.

124 chapter 4 • capacIty strategy
The decision of how many separate operational sites to have is concerned with where a business wants to be on the spectrum between many small sites on the one hand and few large sites on the other. Once again, we can think of this decision as the reconciliation of market factors and resource factors. This is illustrated in Figure 4.6. Separating capacity into several small units may be necessary if demand for a business’s products or services is widely distributed. This will be especially true if customers demand high absolute levels, or immediate service. Of course, dividing capacity into small units may also increase costs because of the difficulty of exploit-ing the economies of scale possible in larger units. A small number of larger units may also be less costly to supply with their input resources. There again, in material transformation operations, a single large unit will bear extra transportation costs in supplying its distributed market.
Time
TimeVolu
me
Cum
ulat
ive
cash
flow
Demand
Physicalcapacity of
facilities
Cash flow with twoidentical capacity
increments
Cash flow withextended physical
capacity
Effective capacity
Figure 4.5 expanding physical capacity in advance of effective capacity can bring greater returns in the longer term
the number and size of sites
MARKETREQUIREMENTS
OPERATIONSRESOURCES
Size andnumberof sites
Supplycosts
Economiesof scale
Requiredservice level
Geographicaldistributionof demand
Figure 4.6 some factors influencing the number and size of sites

125the number and sIze oF sItes
distribution operation
Suppose a company that stores and distributes books to book shops is considering its capacity strategy. Currently in its European market it has three distribution centres, one in the UK, one in France and one in Germany. The UK depot looks after the UK and Ireland, the French depot looks after France, Spain, Portugal and Belgium, and the German depot looks after the rest of Europe. The company is facing conflicting pressures. On the one hand it wants to minimise the total operations cost of its dis-tribution services; on the other hand it wishes to improve its level of service to its customers. In order to explore alternatives to its existing depots it engages a firm of consultants to evaluate two alternative proposals which had been discussed within the company. Option 1 would require the company to concentrate its operations in one central depot which would serve the whole of Europe. It is likely that this would be in the Netherlands, probably in Rotterdam. Option 2 would require the company to move in the opposite direction, in the sense that it envisages a depot to be located in each of its six sales regions in Western Europe. These regions are the Iberian Peninsula, the UK, France and the Benelux countries, Italy, Germany and Scandinavia. The consultants decide to simulate the alternative operations in order to estimate (a) the cost of running the depots (this includes fixed costs such as rent and local taxes, heating, wages, security and working capital charges for the inventory, etc.), (b) transportation costs of delivering the books to customers, and (c) the average delivery time in working days between customers requesting books and them being delivered. Table 4.2 shows the results of this simulation. From Table 4.2 one can see that concentrating on one large site gives substantial economies of scale in terms of the costs of running the depot but increases transpor-tation costs, and (because there is further, on average, to travel) increases the aver-age delivery time. Conversely, moving to several smaller sites increases depot costs but reduces transportation costs as well as improving the average delivery time. The company is here in a dilemma. By moving to one large site it can save €9.1 million per year (the savings on depot costs easily outweighing the increase in transporta-tion costs). Yet delivery times will increase on average by 1.4 days. Alternatively, moving to six smaller sites would increase costs by €9.3 million per year, yet gives what looks like a significant improvement in delivery time of 2.5 days. In theory the financial consequences of the different delivery times could be calculated, combined with the capital costs of each option, and a financial return derived for each option. In practice, however, the decision is probably more sensibly approached by present-ing a number of questions to the company’s managers.
●● Is an increase in average delivery time from 6.3 to 7.7 days likely to result in losses of business greater than the €9.1 million savings in moving to a large site?
●● Is the increase in business which may be gained from a reduction in delivery time from 6.3 days to 3.8 days likely to compensate for the €9.3 million extra cost of moving to six smaller sites?
●● Are either of these alternative positions likely to be superior to its existing profitability?
One final point. In evaluating the sizes and number of sites in any operation it is not just the increase in profitability that may result from a change in configuration that needs to be considered, it is whether that increase in profitability is worth the

126 chapter 4 • capacIty strategy
costs of making the change. Presumably either option will involve this company in not only capital expenditure, but a great deal of management effort and disruption to its existing business. It may be that these costs and risks outweigh any increase in profitability.
table 4.2 analysis of existing operation and two options
Capacityconfiguration Depotcosts Transportcosts Averagedeliverytime (€millions) (€millions) (workingdays)
Currentthreesites 55.3 15.6 6.3● Toulouse● Birmingham● Hamburg
Onelargesite 41.1 20.7 7.7● Rotterdam
Sixsmallersites 68.8 11.4 3.8● Madrid● Paris● Stockholm● Milan● Berlin● Birmingham
capacity change
Planning changes in capacity levels would be easy if it were not for two characteris-tics of capacity – lead-time and economies of scale. If capacity could be introduced (or deleted) with zero delay between the decision to expand (or contract) and the capacity coming on (or off) stream, an operation could wait until demand clearly warranted the change. The fact that changing capacity takes time means that deci-sions need to be made before demand levels are known for sure. So deciding to change capacity inevitably involves some degree of risk, but so does delaying the decision, because delay may still mean that capacity is not appropriate to demand. And all this is made even more problematic because of economies of scale (the ten-dency for both capital and operating costs to reduce as the increment of capacity increases). This means that, when changing capacity levels, there is pressure to make the change big enough to exploit scale economies. Again though, this carries risks that demand will not be sufficient for the capacity to be utilised sufficiently for the scale economies to be realised. Conversely, changing capacity by too little may mean opportunity risks of tying the operation in to small, non-economic units of capacity. Put both long lead-times and significant economies of scale together and capacity change decisions become particularly risky.
timing of capacity change
The first decision in changing capacity levels is when to make the change. As with so many capacity decisions, the forecast level of future demand will be a major influence on the timing of capacity change. Capacity will be increased, or decreased,
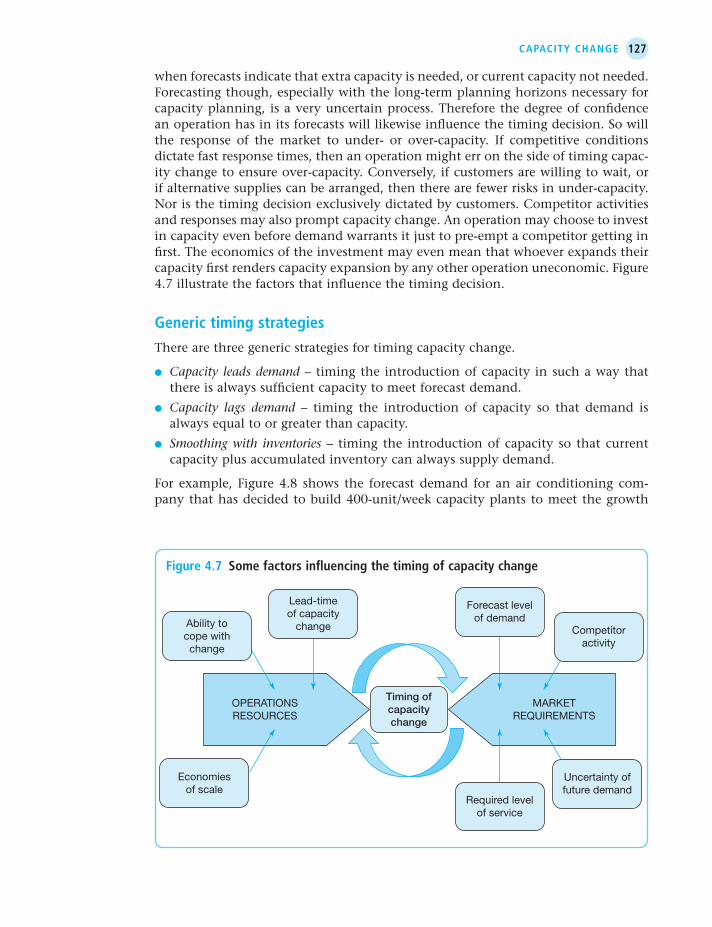
127capacIty change
when forecasts indicate that extra capacity is needed, or current capacity not needed. Forecasting though, especially with the long-term planning horizons necessary for capacity planning, is a very uncertain process. Therefore the degree of confidence an operation has in its forecasts will likewise influence the timing decision. So will the response of the market to under- or over-capacity. If competitive conditions dictate fast response times, then an operation might err on the side of timing capac-ity change to ensure over-capacity. Conversely, if customers are willing to wait, or if alternative supplies can be arranged, then there are fewer risks in under-capacity. Nor is the timing decision exclusively dictated by customers. Competitor activities and responses may also prompt capacity change. An operation may choose to invest in capacity even before demand warrants it just to pre-empt a competitor getting in first. The economics of the investment may even mean that whoever expands their capacity first renders capacity expansion by any other operation uneconomic. Figure 4.7 illustrate the factors that influence the timing decision.
generic timing strategies
There are three generic strategies for timing capacity change.
●● Capacity leads demand – timing the introduction of capacity in such a way that there is always sufficient capacity to meet forecast demand.
●● Capacity lags demand – timing the introduction of capacity so that demand is always equal to or greater than capacity.
●● Smoothing with inventories – timing the introduction of capacity so that current capacity plus accumulated inventory can always supply demand.
For example, Figure 4.8 shows the forecast demand for an air conditioning com-pany that has decided to build 400-unit/week capacity plants to meet the growth
MARKETREQUIREMENTS
OPERATIONSRESOURCES
Timing ofcapacitychange
Forecast levelof demand
Competitoractivity
Uncertainty offuture demand
Required levelof service
Lead-timeof capacity
changeAbility tocope withchange
Economiesof scale
Figure 4.7 some factors influencing the timing of capacity change

128 chapter 4 • capacIty strategy
in demand. Figure 4.8(a) illustrates capacity leading and lagging strategies, while Figure 4.8(b) illustrates the ‘smoothing with inventories’ strategy. Each strategy has its own advantages and disadvantages. These are shown in Table 4.3. The actual approach taken by any company will depend on how it views these advantages and disadvantages. For example, if the company’s access to funds for capital expenditure is limited, it is likely to find the delayed capital expenditure requirement of the capacity-lagging strategy relatively attractive. Pure leading and pure lagging strategies can be implemented so that no inven-tories are accumulated. All demand in one period is satisfied (or not) by the activity of the operation in the same period. For a customer-processing operation there is no alternative to this. An hotel cannot satisfy demand in one year by using rooms that were vacant the previous year. For some materials- and information-processing
0
2,400
(b)
(a)
Volu
me
(uni
ts/w
eek)
2,000
1,600
1,200
800
400
Time
Capacity lags demand
Demand
Capacity leads demand
0
2,400
Volu
me
(uni
ts/w
eek)
2,000
1,600
1,200
800
400
Time
Demand
Figure 4.8 (a) capacity-leading and capacity-lagging strategies; (b) smoothing with inventories means using the excess capacity of one period to produce inventory that can be used to supply the under-capacity period

129capacIty change
operations, however, the output from the operation that is not required in one period can be stored for use in the next period. Inventories can be used to obtain the advantages of both capacity-leading and capacity-lagging. In Figure 4.8(b) plants have been introduced such that over-capacity in one period is used to make air con-ditioning units for the following or subsequent periods. This may seem like an ideal state. Demand is always met and so revenue is maximised. Capacity is usually fully utilised and so costs are minimised. The profitability of the operation is therefore likely to be high. There is a price to pay, however, and that is the cost of carrying the inventories. Not only will these have to be funded, but the risks of obsolescence and deterioration of stock are introduced.
leading, lagging or smoothingWhich of these strategies is used and at what time is partly a matter of the com-pany’s competitive objectives at any point in time. Just as significant, though, is the effect these strategies have on the financial performance of the organisation. Both the capacity-leading strategy and the smoothing-with-stocks strategy will tend to increase the cash requirements of the company through earlier capital expenditure and higher working capital respectively. Sometimes companies may wish to time capacity introduction in order to have a particular effect on the balance of cash requirement and profitability. It may be that some strategies of capacity change
table 4.3 the advantages and disadvantages of pure leading, pure lagging and smoothing-with-inventories strategies of capacity timing
Advantages Disadvantages
Capacity-leadingstrategy Alwayssufficientcapacitytomeet Utilisationoftheplantsisalways demand,thereforerevenueis relativelyhigh. maximisedandcustomerssatisfied. Risksofevengreater(oreven Mostofthetimethereisa‘capacity permanent)over-capacityif cushion’whichcanabsorbextra demanddoesnotreachforecast demandifforecastsarepessimistic. levels. Anycriticalstart-upproblemswith Capitalspendingonplantearly. newplantsarelesslikelytoaffect supplytocustomers.
Capacity-laggingstrategy Alwayssufficientdemandtokeep Insufficientcapacitytomeet theplantsworkingatfullcapacity, demandfully,thereforereduced thereforeunitcostsareminimised. revenueanddissatisfiedcustomers. Over-capacityproblemsare Noabilitytoexploitshort-term minimisedifforecastsareoptimistic. increasesindemand. Capitalspendingontheplantsis Under-supplypositionevenworseif delayed. therearestart-upproblemswith
thenewplants.
Smoothing-with-inventories Alldemandissatisfied,therefore Thecostofinventoriesintermsofstrategy customersaresatisfiedandrevenue workingcapitalrequirementcanbe maximised. high.Thisisespeciallyseriousata Utilisationofcapacityishighand timewhenthecompanyrequires thereforecostsarelow. fundsforitscapitalexpansion. Veryshort-termsurgesindemand Risksofproductdeteriorationand canbemetfrominventories. obsolescence.

130 chapter 4 • capacIty strategy
improve profitability at the expense of long-term cash requirements, while others minimise longer-term cash requirements but do not yield as high a level of short-term profitability. Thus, capacity strategy may be influenced by the required finan-cial performance of the organisation, which in turn may be a function of where the company is raising its finance, on the equity markets or from long-term loans.
the magnitude of capacity change
Earlier we examined some of the advantages of large capacity increments (econo-mies of scale, category killer effects, etc.). Large units of capacity also have some disadvantages when the capacity of the operation is being changed to match chang-ing demand. If an operation where forecast demand is increasing seeks to satisfy all demand by increasing capacity using large capacity increments, it will have substan-tial amounts of over-capacity for much of the period when demand is increasing, which results in higher unit costs. However, if the company uses smaller increments, although there will still be some over-capacity it will be less than that using large capacity increments. This results in higher capacity utilisation and therefore lower costs. Remember, though, that the larger increments of capacity can be intrinsi-cally more efficient (because of economies of scale) when they are well utilised. For example, suppose that the air conditioning unit manufacturer forecasts that demand increase over the next three years, as shown in Figure 4.9(a), will level off at around 2,400 units a week. If the company seeks to satisfy all demand by building three plants, each of 800 units capacity, the company will have substantial amounts of over-capacity for much of the period when demand is increasing. Over-capacity means low capacity utilisation, which in turn means higher unit costs. If the com-pany builds smaller plants, say 400-unit plants, there will still be over-capacity but to a lesser extent, which means higher capacity utilisation and possible lower costs.
Forecast demand
Actual demand
Volu
me
(uni
ts/w
eek)
Time
Demand
Capacity plan using800-unit plants
Capacityplan using400-unitplants
2,400
2,000
1,600
1,200
800
400
Volu
me
(uni
ts/w
eek)
Time
Capacity plan using800-unit plants
Capacityplan using400-unitplants
2,400
2,000
1,600
1,200
800
400
(a) (b)
Figure 4.9 (a) capacity plans for meeting demand using either 800- or 400-unit capacity plants; (b) smaller-scale capacity increments allow the capacity plan to be adjusted to accommodate changes in demand

131capacIty change
risks of over-capacity with large capacity incrementsThe inherent risks of changing capacity using large increments can also be high. For example, if the rate of change demand unexpectedly slows, the capacity will be only partly utilised. However, if smaller units of capacity are used the likelihood is that the forecast error would have been detected in time to delay or cancel the capacity adjustment, leaving demand and capacity in balance. For example, if demand does not reach 2,400 units a week but levels off at 2,000 units a week, the final 800-unit plant will only be 50 per cent utilised. However, if 400-unit plants are used the like-lihood is that the over-optimistic forecast would have been detected in time. Figure 4.9(b) shows the consequences of adopting each of the two strategies in this case.
There are few industries where the total demand for products and services matches the cumulative capacity of all the firms in the industry. In many industries capacity far exceeds demand. The automotive, computer chips, steel, chemicals, oil and hotel industries all have significant over-capacity because of over-investment and/or a collapse in demand. Take the automobile industry, for example. One estimate claimed that the industry worldwide was wasting $70 billion a year because of over-capacity. By 2000 around 30 per cent of all car-making capacity was unused. The lost profit amounted to around $2,000 per car, which is more than the combined industry profits worldwide. This is partly bad news for those firms with the higher level of over-capacity because most car plants can make significant profits only when operating at over 80 per cent of capacity. However, over-capacity may not be viewed with too much alarm. Many of the well-known Western hotel chains in Asia, such as Westin and Sheraton, do not own the property itself, but confine themselves to managing it. The owner may be a local property developer or business person who invested for prestige or tax purposes. Many of the management contracts of this type, put together in the boom times, included fees based on a percentage of total revenue as well as a percentage of gross operating profits. So, even with no profit, the management company could make healthy returns. By contrast, other hotel chains, such as Shangri-La Asia, Mandarin-Oriental and Peninsular Hotels, both owned and managed their hotels. Because of this they were far more exposed to the consequences of over-capacity because it hit profits directly. So why do companies invest, even when there is a high risk of industry over-capacity and thus under-utilised operations? One reason, of course, is optimistic forecasting. The risks of mis-forecasting are high, especially when there is a long gap between deciding to build extra capacity and the capacity coming on stream. A second reason is that all capacity is not the same. Newer operations generally are more efficient and may have other operations advantages compared to older operations using less state-of-the-art technologies. Thus, there is always the chance that a new operation coming on stream will attract business at the expense of older capacity. A third reason is that investment decisions usually are made by individual firms, whereas industry over-capacity is a result of all their decisions taken together. So a firm might be able to reduce its costs by investing in new capacity but the prices it receives for its products and services are determined partly by the cumulative deci-sions of its competitors. This also explains why it is not always easy to reduce over-capacity in an industry. Often it is in nobody’s interest to be the first mover to shut down capacity. The costs of closing down capacity are paid by its owner. The benefits, however, in terms of higher prices and margins, are spread across the industry as a whole. So every firm wants capacity to be reduced as long as it is not its own capacity.
example Why industries have more capacity than they need3

132 chapter 4 • capacIty strategy
balancing capacity changeDuring 2006 the price of oil (and therefore gasoline) shot up to unprecedented levels (in dollar terms). Why was this? Well, there was uncertainty in the supply of crude oil and demand from developing economies was growing, but the reason why these elements of supply and market uncertainty had such a dramatic effect was that there was a shortage of refining capacity. The oil companies had failed to plan for sufficient refinery capacity, and the bottleneck in the supply chain had increased the fear of shortages. So planning for capacity change must take into account that the capacity of a whole chain of operations will be limited by the lowest capacity or ‘bottleneck’ part of the chain. For example, if the 800-unit capacity air conditioning plant, introduced earlier, not only assembles products but also manufactures the parts from which they are made, then any change in the assembly plant must be matched by changes in the ability to supply it with parts. Similarly, further down the chain, operations such as warehousing and distribution may also have to change their capacity. For the chain to operate efficiently, all its stages must have more or less the same capacity. This is not too much of an issue if the economic increment of capacity is roughly the same for each stage in the chain. However, if the most cost-effective increment in each stage is very different, changing the capacity of one stage may have a significant effect on the economics of operation of the others. For example, Figure 4.10 illustrates the air conditioning plant example. Currently the capacity of each stage is not balanced. This could be the result of many different factors involving historical demand and capacity changes. The bottleneck stage is the warehouse, which has a weekly capacity of 900 units. If the company wants to increase output from its total operations to 1,800 units a week, all four stages will require extra capacity. The economy of scale graphs for each stage are illustrated. They indicate that for the parts manufacturing plant and the distribution opera-tion, operating cost is relatively invariant to the size of capacity increment chosen. Presumably this is because individual trucks and/or machines can be added within the existing infrastructure. However, for both the assembly plant and the warehouse, operating costs will be dependent on the size of capacity increment chosen. In the case of the assembly plant the decision is relatively straightforward. A single addi-tion to the operation of 800 units will both minimise its individual operating costs and achieve the required new capacity. The warehouse has more of a problem. It requires an additional capacity of 900 units. This would involve either building units of sub-optimum capacity or building two units of optimal capacity and under-utilising them, with its own cost penalties. The same issues apply on a wider scale when independent operations are affected by imbalance in the whole chain. Air travel is a classic example of this. Three of the most important elements in the chain of operations that provides air travel are the terminals that provide passenger facilities at airports, the runways from which aircraft take off and land, and the aircraft themselves operating on all the various sectors, which include the airport. Each of these stages, in planning their capacity, is subject to different pressures. Building new terminals is not only expensive in terms of the capital required, but also subject to environmental considerations and other issues of public concern. The individual aircraft that use these facilities are both far smaller units of capacity in themselves and form an element in the capacity chain which is subject to normal business commercial pressures. Different sizes of aircraft will be used for different routes depending on the ‘density’ (volume of demand) of

133locatIon oF capacIty
the route. Because they represent relatively small units of capacity, the number of aircraft using an airport can change relatively smoothly over time. Runways and terminals, however, represent large increments of capacity and therefore change less frequently. Also, within each part of the chain the effective capacity may improve because of technical changes. Terminals are becoming more efficient in the way they can handle large amounts of baggage or even tag customers with micro-chipped tick-ets so that they can be traced and organised more effectively. All of this can, to some extent, increase the capacity of a terminal without making it any larger. Likewise, runways can accommodate more aircraft landing by providing more ‘turn-offs’ which allow aircraft to clear the main runway very soon after landing in order to let the next aircraft land. On high-density routes the aircraft themselves are getting larger. When the number of slots available to an airline is limited, and if route den-sity warrants it, very large aircraft can increase the number of passengers carried per landing or take-off slot. However, these changes in effective capacity at each stage in the chain may affect the other stages. For example, very large aircraft have to be designed so as to keep the air turbulence they cause to a minimum so that it does not affect the time between landing slots. Also, very large aircraft may need different terminal equipment such as the air bridges which load and unload passengers.
Partsmanufacture
Capacity increment
Op
erat
ing
cost
Current capacity= 1,010 units
Required newcapacity
= 1,800 units
Assemblyplant
Capacity increment
800 units
Op
erat
ing
cost
Current capacity= 1,000 units
Required newcapacity
= 1,800 units
Warehouse
Capacity increment
600 units
Op
erat
ing
cost
Current capacity= 900 units
Required newcapacity
= 1,800 units
Distribution
Capacity increment
Op
erat
ing
cost
Current capacity= 1,100 units
Required newcapacity
= 1,800 units
Figure 4.10 rarely does each stage of a supply chain have perfectly balanced capacity, because of different optimum capacity increments
location of capacity
Often the reason why operations are where they are is not always obvious. Sometimes historical reasons dictated the location. Such operations are ‘there because they’re there’. Even more recent location decisions are not always logical. Entrepreneurial whim or lifestyle preference may overcome seemingly locational disadvantages. In other cases the location decision is reached only after extensive thought and analysis.

134 chapter 4 • capacIty strategy
the importance of location
The location decision is rarely unimportant but sometimes can be very important to the long-term health of an organisation. This is because the location decision can have a significant impact on both the investment in the operation’s resources and the market impact of the operation’s resources. For example, locating a fire service station in the wrong place can either slow down the average time for the fire crew to respond to the call or increase the required investment to build the station, or both. Similarly, locating a manufacturing plant where it is difficult to attract labour with appropriate skills may affect the quality of its products (and hence revenues), or the wages it has to pay to attract appropriate labour (and hence costs).
Finding a suitable site for any operation can be a political as well as an economic problem. It certainly was when Tata, the Indian company, unveiled its plans for the Nano in 2007. Named the ‘1 lakh’ car (in India 1 lakh means 100,000), it would be the cheapest car in the world, with the basic model priced at 100,000 rupees, or $2,500, excluding taxes. The price was about half of existing low-cost cars. And the site chosen by Tata was equally bold. It was to be made at Singur, in the Indian state of West Bengal, a populous state with Calcutta (now called Kolkata) as its capital. Although the Communist Party had the state for four decades, the West Bengal government was keen to encourage the Nano plant. It would bring much-needed jobs and send a message that the state welcomed inward investment. In fact, it had won the plant against stiff competition from rival states. Controversially, the state government had expropriated land for the factory using an old law dating from 1894, which requires private owners to sell land for a ‘public purpose’. The government justified this action by pointing out that over 13,000 people had some kind of claim to parts of the land required for the new plant. Tata could not be expected to negotiate, one by one, with all of them. Also financial compensation was offered at signifi-cantly above market rates. Unfortunately about 2,250 people refused to accept the offered compensation. The political opposition organised mass protests in support of the farmers who did not want to move. They blocked roads, threatened staff and even assaulted an employee of a Tata supplier. In response, Ratan Tata, Chairman of the Tata Group, threat-ened to move the Nano plant from the state if the company really was not wanted, even though the company had already invested 15 billion rupees in the project. Eventually, exasperated with being caught in the ‘political crossfire’, Tata said it would abandon its factory in the state. Instead, the company selected a location in Gujarat, one of India’s most industrialised states, which quickly approved even more land than the West Bengal site.
example the tata nano finds a new home
The costs of physically moving the operation’s resources may be high but the risks involved may be even more important. Complex arrangements involving changes to many parts of the operation’s resources invariably increase the risk of something going wrong with the move. Delays can mean inconvenience to customers, inter-ruption of supply and increased costs. All this adds inertia to the location decision. Once made, a location decision is difficult to change, which is why few operations want to move frequently. But organisations do move their location, and it is usually for one of two reasons. Either:

135locatIon oF capacIty
●● there are changes in the demand for its goods and services; or
●● there are changes in the supply of its input resources to the operation.
Where the stimulus for relocation is a change in demand it may be because of a change in the aggregated volume of demand. For example, if the demand for a cloth-ing manufacturer’s products is increasing beyond its capacity, the company could either expand at its existing site or, alternatively, if the site is not large enough, it could move to a larger site in another location. A third option would be to keep its existing site and find a second location for an additional plant. Two of these options involve a location decision. Similarly, a reduction in the aggregate volume of demand may mean the company under-utilising its site, selling or leasing part of the site, or moving to a smaller new site. Some high customer contact operations do not have the choice of expanding on the same site to meet rising demand. For example, a fast-food restaurant chain competes, at least partially, by having locations close to its customers. As demand increases, it may well respond by investing in more locations. There will come a time, however, when locating a new restaurant in between the areas covered by two existing ones will, to some extent, cannibalise demand. The other reason for relocation is some kind of change in the cost or availability of its supply of inputs. An oil company, for example, will need to relocate as the oil it is extracting becomes depleted. A manufacturing company might choose to relocate its operations to a part of the world where labour costs are low. In other words, the labour costs differ-ential, in the context of its competitive position, has changed. Similarly, the value of the land it has occupied compared with an alternative location may become too great to forgo the opportunity of releasing the value of the land.
spatially variable factorsA prerequisite to effective location decisions is to understand the spatial character-istics of costs, revenues and investment. ‘Spatially variable characteristics’ are those whose value changes with geographical location. In not-for-profit organisations, where revenue may not be a relevant objective, customer service may be used as a substitute. So, for example, the fire service may use average (or maximum) response time as its ‘market phasing’ objective. Figure 4.11 identifies some of the spatially variable factors that organisations may use in location decisions.
the suitability of the site itselfThe intrinsic characteristic of a location may affect an operation’s ability to serve its customers and generate revenue. For example, locating a luxury business hotel in a high-prestige site close to the business district may be appropriate for the hotel’s cus-tomers. Move it one or two kilometres away where it is surrounded by warehouses and it rapidly loses its attraction.
the image of the locationSome locations are firmly associated in customers’ minds with a particular image. Suits made and sold in Savile Row, which is the centre of the up-market bespoke tailoring district in London, may be little better than high-quality suits made else-where. However, a location there will establish a tailor’s reputation and possibly its revenue. The availability of appropriate local skills can also have an impact on how

136 chapter 4 • capacIty strategy
customers see the nature of an operation’s products or services. For example, science parks are located close to universities because they hope to attract companies inter-ested in using the skills available there. An entertainment production company may locate in Hollywood, partly, at least, because of the pool of talent on which it can draw to produce high-quality (or at least high-revenue-earning) projects.
service levelFor many operations this is by far the most important demand-side factor. Locating a general hospital, for example, in the middle of the countryside may have many advantages for its staff and maybe even for its costs, but clearly would be very incon-venient for its customers. Not only would those visiting the hospital need to travel long distances, but those being attended to in an emergency would have to wait longer than necessary to be brought in for admission. Because of this, hospitals are located close to centres of demand. Similarly, with other public services, location has a significant effect on the ability of an operation to serve its customers effectively. Likewise, other high customer contact operations such as restaurants, stores, banks, etc. have revenues that are directly affected by how easily customers can access the service. Also, speed and dependability issues are becoming more important in many parts of the manufacturing industry. Locating close to customers can be a competi-tive advantage or even a prerequisite for some customers. It is increasingly common for large manufacturers to demand that their suppliers build local plants, so as to ensure regular, fast and dependable supply. These may even be physically adjoin-ing so that a supplier is able to deliver products through ‘a hole in the wall’ to its customers.
land and facilities investmentIf the operation is considering purchasing the land for its site this may be an important factor. If the operation is leasing the land then it is usually regarded as a
MARKETREQUIREMENTS
OPERATIONSRESOURCES
Locationof sites
Resourceavailability
Communityfactors
ResourcecostsLand and
facilitiesinvestment
Requiredservice
level Suitabilityof site
Image oflocation
Figure 4.11 some factors influencing the location of sites
137locatIon oF capacIty
supply-side cost factor. Certainly both land and rental costs vary between countries and cities. Companies sometimes locate where they already have available land, or even unused buildings, in order to avoid the investment costs. In some location decisions, investment in the infrastructure needed to support the main operations facility can be as significant as if not more than, the investment in the operation itself. At a simple level, infrastructural investment may include such things as build-ing access roads, improving waste disposal, or building power generation support. At a more extensive level, a company locating in an under-developed part of the world may need to invest in road, or even rail, links. It may even be necessary to invest significantly in the local supply industry, either providing sites for suppliers or encouraging such things as producer cooperatives. Indeed, part of the deal that may be struck with the local government of the site may include a commitment to develop infrastructures.
Similar companies with similar needs often cluster together in the same location. For example, knitted garment manufacturers dominate parts of Northern Italy. Perhaps the most famous location cluster is in the area south of San Francisco known as Silicon Valley, acknowledged as the most important intellectual and commercial hub of high-tech business. And Silicon Valley has inspired other computer clusters around the world. Back in the 1980s Bangalore in India attracted software code writing business from Western multinationals attracted by the ready availability of well-educated, low-cost, English-speaking software technicians. Now the area has attracted even more, and even more sophisticated, business. Companies such as Intel, Sun Microsystems, Texas Instruments and Cisco have a presence in the area and are using their Bangalore development centres to tackle cutting-edge projects. The biggest draw is still India’s pool of high-quality, low-cost software engineers. Each year Bangalore alone graduates 25,000 computer science engineers, almost the number that graduates in the entire USA. More significantly, the average wage of a top-class graduate soft-ware engineer is around one fifth of that in the USA. Nor is there any lack of multinational experience. The same factors are at work in Shanghai in China. Their high-tech research and development activities do not have the pedigree of those in India, but increasingly are seen as significant in the global technology industry. According to Michael J. Moritz, a Californian venture-capital firm specialising in high-tech businesses:
‘Over the next 10 years, China will become a ferociously formidable competitor for companies that run the entire length of the technology food chain’.
And although most industry commentators admit that China has far to go, the combination of the availability of a highly skilled and well-educated workforce, often at even lower cost than India, together with the Chinese government encouragement of joint ventures with multinationals is seen as a big impetus to high-tech growth. Multinationals such as Alcatel, the French telecom giant, and Matsushita, Japan’s largest consumer electronics company, as well as chip manufacturer Intel are all investing in research and development facilities. Some other clusters are more surprising. The UK’s recent history in successful indigenous automobile manufacture has not been uniformly inspiring. Yet it dominates the world of motorsport. Six out of the ten Formula 1 teams are based in Britain, while many of the rest use the services of around 4,500 UK specialist firms. These firms supply services such as building and repairing motorsport cars, making engines and components, and providing technical and management services. In total the estimated annual turnover is around £6
example clustering, computers, cars and typewriters4

138 chapter 4 • capacIty strategy
resource costs – labourAlthough wages and the other costs of employing people can vary between different areas in any country, they are more likely to be a significant factor when interna-tional comparisons are made. Here wage costs mean those costs to the organisation of paying wages directly to individual employees. Non-wage costs are the employ-ment taxes, social security costs, holiday payments, and other welfare provisions that the organisation has to make in order to employ people. However, such labour costs should be treated with some caution. Two factors can influence them. The first is the productivity of labour. On an international level this is often inversely related to labour costs. This means that generally the average amount produced by each individual employed in a given unit of time is greater in countries with higher labour costs. This is at least partly because in countries with high labour costs there is more incentive to invest in productivity-enhancing technology. This effect goes some way towards offsetting the large international variations in labour costs. The second factor is the rate of exchange of countries’ currencies, which may swing considerably over time. This in turn changes relative labour costs. Yet in spite of these adjustments to the real value of relative labour costs, they may exert a major influence on the location decision, especially in industries such as clothing, where labour costs are a high proportion of total costs.
billion – and most of it is located in the area between Oxfordshire and Northamptonshire in the middle part of the UK. How did this happen? Well there was always some, rather ama-teur, motorsport industry in the UK to serve their gentlemanly clients racing their Bentleys around the Brooklands circuit. But the global industry was dominated by more professional Italian companies such as Ferrari, Alfa Romeo and Maserati. The British firms did not have such ‘vertically integrated’ relationships with the ‘end-user’ racing teams, so to compete they were forced to cooperate with each other. And it was this cooperative network of expertise that fostered the innovation that became its competitive advantage. For example, Cooper, originally a family-run garage, innovated by placing the engines of its racing cars, not forward of the driver as was conventional, but right behind the driver, which significantly improved their handling. Within a few years all Formula 1 cars were built this way. Sometimes history combines with local culture. In some ways Austin in Texas is an island of counter-culture surrounded by one of America’s most conservative states. It is also home to a cluster of advanced technology industries. So why did Austin prove so attractive for companies like Samsung, Dell, and IBM? Partly it goes back to a decision by IBM in 1967 to build a plant to make its (then revolutionary) Selectric typewriters. After that it expanded the plant to manu-facture mainframe circuit boards and terminals, eventually also making its personal computers there. Because of IBM’s dominance in the market place, other companies including suppliers such as Texas Instruments also built plants there. A further boost came when Michael Dell, a drop-out student from the University of Texas at Austin, created his firm in the mid-1980s. Since then literally thousands of other technology firms have followed. This is, in part, a further vindication of the idea that similar companies like to cluster together. Between them they soon create a critical mass of appropriate labour (computer geeks) and support industries. But it is also a testament to other, softer, factors. The ‘quality of life’ factor is important, particularly for computer types who value the atmosphere, amenities (house prices are far less than in Silicon Valley) and general atmosphere (Austin is the live music capital of America). It is an area that revels in its quirkiness; its local slogan is ‘Keep Austin Weird’. Along with this Austin has one of the best universities in America and (quite important this) no local income tax.

139locatIon oF capacIty
resource costs – energyThose operations that use large amounts of energy, for example aluminium smelt-ing, may be influenced in their location decisions by the availability of relatively inexpensive energy. Low-cost energy sources may be direct, as in the availability of hydro-electric generation in an area, or indirect, for example a low-cost coal area which can be used to generate inexpensive electricity.
resource costs – transportationTransportation costs clearly are spatially variable because the operation’s resources need to be transported (or transport themselves) from their point of origin to the operation itself. In many operations also, goods and services (or the people who perform the services) need to be transported from the operation to customers. Of course, not all goods and services are transported to customers. In operations such as hotels, retailers and hospitals, customers visit the operation to receive their services. In these cases we treat the ease with which customers can access such services as a demand-side or revenue-influencing factor (or customer service factor in not-for-profit operations). Proximity to sources of supply dominates location decisions where the cost of transporting input materials is high. So, for example, food processing or other agriculturally based activities are often located close to growing areas. Similarly, for-estry and mining operations could only be located close to their sources of supply. Proximity to customers dominates location decisions where the transportation of products and services to customers is expensive or impossible. So, for example, many civil engineering projects are constructed where they are needed; similarly, accountancy audits take place at customers’ own facilities because that is where the information resides.
community factorsThe general category of community factors are those influences on an operation’s costs that derive from the social, political and economic environment of its location. These include:
●● government financial or planning assistance;
●● local tax rates;
●● capital movement restrictions;
●● political stability;
●● language;
●● local amenities (schools, theatres, shops, etc.);
●● history of labour relations, absenteeism, productivity, etc.;
●● environmental restrictions and waste disposal.
Community factors can be particularly influential on the location decision. Some issues obviously affect the profitability of the operation. For example, local tax rates clearly can affect the viability of a new location. Others are less obvious. For exam-ple, the European country that has had the most inward investment from Japanese companies is the UK. Some investments, especially the early ones, were influenced by the UK government’s generous financial support and tax concessions. Other

140 chapter 4 • capacIty strategy
factors included a relatively cheap but well-educated workforce. Yet a less obvious, but equally important, factor was language. Many Japanese companies were accus-tomed to trading and producing in the USA. The English language is the first foreign language for most Japanese business people. Drawings of products and processes, for example, together with instruction sheets, computer programs, etc., were often immediately available for use without further translation for the UK. This means a lower risk of misunderstandings and mistranslation, smoothing communications between the new location and its Japanese head office.
the nature of location decisionsAlthough all location decisions will involve some, or all, of the market requirement and operations resource factors outlined above, the nature of the decision itself can vary sig-nificantly. Locating new fast-food restaurant franchises is a very different type of decision from locating a new electronics factory, for example. The differences between these two location decisions (or indeed any other location decisions) can be characterised on two dimensions. These are the objectives of the location decision and the number of location options available. In many high-contact operations, such as fast-food restaurants, retail shops and hotels, both costs and revenue are spatially variable. In other words, both the market and resource sides of the reconciliation process are significant. So, for example, locating a fast-food restaurant in an out-of-the-way location may allow it to operate with very low costs but its ability to attract customers (and therefore revenue) will be, likewise, very low. A more attractive location undoubtedly will be more expensive but would also attract higher custom. Most low-contact operations have revenues that are relatively invariant to location. Costs, however, will vary with location. Thus, location is largely one of cost minimisation, this being an approximation for profit maximisation.
France
Portugal
Turkey
Thailand
Morocco
Romania
China
Myanmar
Cost in euros0 2 4 6 8 10 12 14 16
15.5
14.33
11.43
11.43
11.13
10.82
10.37
9.60
Labour
Transport
Fabric
Supplies
Custom duties
Figure 4.12 a major influence on where businesses locate is the cost of operating at different locations, but total operation cost depends on more than wage costs or even total labour costs (which depend on allowances for different productivity rates). this chart illustrates what makes up the cost of a shirt sold in France. remember, the retailer will often sell the item for more than double the cost
Source:Slack,N.,Chambers,S.andJohnston,R.(2007)OperationsManagement,5thedn.Harlow:FinancialTimesPrenticeHall.ReproducedwithpermissionfromPearsonEducationLtd.

141summary ansWers to key questIons
The other major dimension of the location decision is concerned with the number of options between which a choice will be made. The electronics manufacturer may first of all decide on a relatively large geographic region, such as ‘Hungary’. Once that broad decision is made, the number of possible sites is very large indeed, in fact, for all practical purposes, infinite. The decision process involves narrowing the number of options down to a smaller representative number which can be system-atically evaluated against a common set of criteria. Many high-contact operations, however, are not located in this way. More likely, a company will first of all decide on a relatively limited area. For example, ‘We wish to locate one of our franchises in Budapest.’ Once this decision is made the search begins for a suitable site. The choice then is between any site that may be immediately available or, alternatively, waiting until a more attractive site becomes available. Each decision is, in effect, a yes/no decision of accepting a site or, alternatively, deferring a decision in the hope that a better one will become available.
summary ansWers to key questIons
What is capacity strategy?Capacity-related decisions conventionally are divided into three time horizons – long-term strategic, medium-term and short-term. Strategic decisions are those con-cerned with the provision of buildings, facilities and process technology, in all parts of the business, for at least months and probably years into the future. Capacity strategy includes a number of interrelated decisions, which include defining the overall scale of the operation, the number and size of the sites between which capac-ity is distributed, the specific activities allocated to each site, when capacity levels should be changed, how big each step change should be, and the location of each site.
how much capacity should an operation have?The starting point in determining overall capacity level will be the demand fore-cast. However, actual capacity may not be the same as forecast demand. It may be modified to account for the relative certainty, or uncertainty, of demand, long-term changes in expected demand level, the availability of capital needed, the ratio of fixed to variable costs, and general economies of scale. Also, a company may choose to provide more of one kind of resource (for example, the size of the physical build-ing) before demand warrants it in order to save capital costs in the long run.
how many separate sites should an operation have?The decision here concerns the choice between many small sites on the one hand, or fewer larger sites on the other. The geographical distribution of demand, together with customers’ required service level, will influence this decision, as will the econo-mies of scale of the operation and the costs associated with supply. If demand is widely distributed between customers demanding high levels of service, and if there are no significant economies of scale or costs of supply, then the business is more likely to operate with many small sites.

142 chapter 4 • capacIty strategy
What issues are important when changing capacity levels?Capacity can be introduced to either lead or lag demand. Lead demand strategies involve early capital expenditure and under-utilisation of capacity but ensure that the operation is likely to be able to meet demand. Lagging-capacity strategies involve later capital expenditure and full utilisation of the capacity but fail to fulfil forecast demand. If inventories are carried over so as to smooth the effects of introducing capacity increments, it may be possible to achieve both high sales and high utilisation of resources, and therefore low costs. However, working capital requirements will be higher because the inventory needs to be funded. Changing capacity in large incre-ments can minimise the costs of changing capacity (closure costs if demand is decreas-ing and capital expenditure if demand is increasing) but can also mean a significant mismatch between capacity and demand at many points in time. Conversely, chang-ing by using small increments of capacity will match demand and capacity more exactly but require more frequent changes. Especially when increasing capacity, these changes can be expensive in capital cost and disruption terms. Often it is the risks of making too large a change in capacity that weigh heavily with operations, especially when forecasts of future demand are uncertain. Generally, the more uncertain future demand is, the more likely operations are to choose relatively small increments of capacity change. Notwithstanding this, there is a general pressure in many industries towards building new capacity even when over-capacity exists in the industry.
Where should capacity be located?Required service levels from customers will influence this decision. Fast and regular supply implies location close to customer locations. Other market-related factors include the suitability of the site and the general image of its location. As far as opera-tions resources are concerned, significant factors include the resource costs associated with the site, such as land and energy costs, the investment needed in land and facili-ties, the availability of any specialist resources required, and general community factors.
Further reading
DeToni, A., Filippini, R. and Forza, C. (1992) ‘Manufacturing strategy in global market: an operations management model’, International Journal of Operations and Production Management, 12(4).
DuBois, F.L., Toyne, B. and Oliff, M.D. (1993) ‘International manufacturing strategies of US multinationals: a conceptual framework based on a four industry study’, Journal of International Business Studies, 24(2).
Evans, P. and Wurster, T.S. (2000) Blown to Bits: How the New Economics of Information Transforms Strategy. Boston, MA: Harvard Business School Press.
Gunther, N.J. (2006) Guerrilla Capacity Planning: A Tactical Approach to Planning for Highly Scalable Applications and Services. Berlin and Heidelberg: Springer-Verlag.
Kapper, A. (2005) Location-Based Services: Fundamentals and Operation: Fundamentals and Application. Chichester: John Wiley & Sons.
Porter, M.E. (1989) ‘Changing patterns of international competition’, California Management Review, 28(2).
Tombak, M.M. (1995) ‘Multinational plant location as a game of timing’, European Journal of Operational Research, 86(4).
Wolfe, D. and Lucas, M. (eds) (2005) Global Networks and Local Linkages: The Paradox of Cluster Development in an Open Economy. School of Policy Studies, Queen’s University.

143
notes on the chapter
1 Source: company website (2009).2 Hayes, R.H. and Wheelwright, S.C. (1984) Restoring Our Competitive Edge. New York: John
Wiley & Sons.3 Sources include: Liu, H.C.K. (2005) ‘Scarcity economics and overcapacity’, Asia Times
Online, 28 July; The Economist (1999) ‘Double parked’, 9 January.4 Sources: The Economist (2009) ‘Britain and Formula 1, Cluster champs’, 22 October (2006);
‘Blame it on the typewriter’, 23 September.
notes on the chapter

chapter
purchasing and supply strategy5
No operation works in isolation – it is always, directly or indirectly, part of a larger value network. As a result, no operations strategy can work in isolation – it must always consider the role of supply networks. Some would argue that, in today’s globalised and technology-enabled economy, purchasing and supply decisions are often the most critical set of operations strategy decisions. Think about Apple’s phenomenally successful iPhone. The firm has world-class operations – it designed the phone, created the operating software, runs the Apps (applications) store, and so on. But it is Apple’s suppliers that undertake almost everything else. Firms, large and small, from around the world provide a range of, often extremely sophisticated, inputs into the product. So, Apple’s phenomenal recent success has been built as much on the back of its purchasing and supply strategy as on its research and devel-opment. In fact when the consultancy, AMR, generates its annual list of the world’s best supply chain players it is no surprise to discover that Apple has been rated as either number one or two since 2007 (this in spite of having not been in the top 25 in 2005). In other words, underlying performance is increasingly determined through those decisions relating not only to what an organisation does itself, but also what it purchases, where it buys from, and how it manages these crucial exter-nal connections. Figure 5.1 illustrates the coverage of this chapter.
Introduction
●● What is purchasing and supply strategy?
●● What should we ‘do’ and what should we ‘buy’?
●● how do we buy; what is the role of contracts and/or relationships?
●● how do we manage supply dynamics?
●● how do we manage suppliers over time?
●● how do we manage supply chain risks?
key questIons
What is purchasing and supply strategy?
At the heart of purchasing and supply strategy is the deceptively simple concept of buyer–supplier interaction. Buying and selling are not new of course but, in recent years, shifts in the business environment have led to an increased strategic empha-sis on more complex value-creating supply networks. Here we define value-creating supply networks as ‘a set of interconnected organisations whose different processes and

145What Is purchasIng and supply strategy?
activities together produce value’. Figure 5.2 illustrates a supply network with three main companies (A, B and C) at the centre of the network. Company A is called the ‘focal’ company of the network and, together with Companies B and C, forms the ‘focal level’ of the network. In other words, the network is drawn from Company A’s perspective. Company A’s suppliers, together with its suppliers’ suppliers and so on, form the upstream or supply side of the network, while its customers and cus-tomers’ customers, etc. form the downstream or demand side of the network. The various processes within Company A form the internal supply network. Outside its boundaries, Company A will have direct contact with a number of suppliers and a number of customers; this forms the immediate supply network. The linkages of suppliers to Company A’s suppliers, and customers to Company A’s customers, form its total supply network. Companies that are predominantly part of the focal level’s immediate supply network are called first-tier suppliers or first-tier customers. Those who are one level beyond this are called second-tier suppliers and customers, and so on. The relationships between companies within the network are not always exclu-sive. Company A may purchase exactly the same products or services from a number of different suppliers, who in turn may ‘multi-source’ from several second-tier sup-pliers. Also, the focal company’s networks all involve several parallel relationships, each having several first-tier suppliers and several first-tier customers, which them-selves may have more than one second-tier supplier or customer. But within these parallel relationships there are several supply chains. These are the sequential link-ages of operations which intersect at the focal company. So, for example, the opera-tions marked with an X form one of the supply chains passing through Company C. The interaction between buyer and supplier has never been simple, but increas-ingly buyers are seeking more ‘strategic’ contributions from their supply chains. The
Quality
Speed
Dependability
Flexibility
Cost
Per
form
ance
ob
ject
ives
Mar
ket
com
pet
itive
ness
Capacitystrategy
Decision areas
Resource usage
Developmentand
organisation
Issues include:• What is purchasing and supply strategy?• What should we do and what should we buy?• How do we buy; what is the role of contracts and/or relationships?• How do we manage supply dynamics?• How do we manage suppliers over time?• How do we manage supply chain risks?
Process technologySupply networks
Figure 5.1 this chapter looks at purchasing and supply strategy

146 chapter 5 • purchasIng and supply strategy
chemical company DuPont, for instance, after years of outsourcing non-core serv-ices, awarded a long-term contract to Convergys (a firm that provides ‘customer rela-tionship services’, such as outsourced human resources management, professional services, billing services, and so on). In the computing and telecommunications sectors, the volume of outsourced research and development has grown at a phe-nomenal rate. Similarly firms like Infosys (one of the largest information technology services companies in India, based in Bangalore, India) is developing and maintain-ing a range of ‘mission-critical’ IT applications for numerous international financial institutions. The same trend of outsourcing even important activities is evident in public sector procurement. For example the private company Serco (‘We improve services by managing people, processes, technology and assets more effectively’1) has managed the UK’s national standards laboratory since 1995.
X
Company A
Focallevel
DownstreamUpstream
First-tiercustomers
Second-tiercustomers
First-tiersuppliers
Demand side ofthe network
Flow of products/servicesFlow of information
Internal supply network
Immediate supply network
Total supply network
Supply side ofthe network
Second-tiersuppliers
For Company A
Company B
Company C
XX
X
X
X
Figure 5.2 supply networks are the interconnections of relationships between operations

147What Is purchasIng and supply strategy?
Why adopt a network perspective?
A key insight derived from adopting a network perspective is the recognition that different organisations in a network relate to each other in a range of different ways. These include ‘classic’ interactions such as upstream and downstream market linkages (i.e. buying and selling from each other) and competition (i.e. ultimately, a whole range of performance attributes – such as price – will be driven, even if indirectly, by competitor offerings). But a broader network perspective also reveals that organisations, many of them direct competitors, frequently collaborate: it is increasingly common for instance, for groups of organisations to come together into consortia when buying goods and services; or work together on ‘pre-competitive’ research and development. Moreover, many organisations’ value propositions are also dependent on complementors – other businesses providing complementary service and products.
a network perspective enhances understanding of competitive and cooperative forcesWhen a business sees itself in the context of the whole network it may help it to understand why its customers and suppliers act as they do. Any operation has only two options if it wants to understand its ultimate customers at the end of the net-work. It can rely on all the intermediate customers and customers’ customers, etc., which form the links in the network between the company and its end customers, to transmit the end customer needs efficiently back up the network, or it can take the responsibility on itself for understanding how customer–supplier relationships transmit competitive requirements through the network. Increasingly, organisa-tions are taking the latter course. Relying exclusively on one’s immediate network is seen as putting too much faith in someone else’s judgement of things which are central to an organisation’s own competitive health. There is also a further category
On average, car companies source around three quarters of their parts externally. This means that, although an automobile company may be thought of as German or Italian or British, many (if not most) of its components may have been sourced abroad, and it may also have been assembled abroad. This can give some problems to cars whose brand is associated with a particular nationality, or whose core markets are particularly ‘patriotic’. Italians may prefer to buy Fiat cars because Fiat is an Italian company, even though in reality many Fiats are now produced in Turkey and Poland. More than half of German buyers choose cars pro-duced by German owned companies. Yet there is a good chance that the car has been made in Poland or Slovakia. Even the most nationally conservative French buyers will buy ‘French’ cars even though Citroën and Peugeot have plants in Slovakia. Buy an Audi TT in the UK and it was probably made in Hungary. Mercedes’ ML-Class is built in the United States as is BMW’s X5. Porsche builds the Boxter sports car in Finland. Even the Aston Martin, beloved by James Bond fans for its Britishness, has its front seats, automatic transmission, steering components, crank shafts, stability control, and even its engine, made in Germany. Even stranger, buy a Nissan Micra in Europe and you will find that it was designed in London, engineered in Bedfordshire, and manufactured in Sunderland. It’s more British than the Aston Martin.
example What’s the nationality of your car?2

148 chapter 5 • purchasIng and supply strategy
of companies in the supply network – ‘complementors’. Most businesses would find their lives more difficult if it were not for ‘complementors’ – other businesses pro-viding complementary services and products (for example, internet retailers depend on ‘order fulfilment’ delivery companies). Figure 5.3 illustrates the ‘value net’ for a company. It sees any company as being surrounded by four types of players: suppli-ers, customers, competitors and complementors.3
Complementors enable customers to value your product or service more when they have their product and service as opposed to when they have yours alone. Competitors are the opposite; they make customers value your product or service less when they can have their product or service, rather than yours alone. Also, competitors can be complementors and vice versa. For example, adjacent restaurants may see themselves as competitors for customers’ business. A customer standing outside and wanting a meal will choose between the two of them. Yet in another way they are complementors. Would that customer have come to this part of town unless there was more than one restaurant for him or her to choose between? Restaurants, theatres, art galleries, and tourist attractions generally, all cluster together in a form of cooperation to increase the total size of their joint market. It is important to distinguish between the way companies cooperate in increasing the total size of a market and the way in which they then compete for a share of that market. Historically, insufficient emphasis has been put on the role of the supplier. Harnessing the value of suppliers is just as important as listening to the needs of customers. Destroying value in a supplier in order to create it in a customer does not increase the value of the network as a whole. For example, pressurising suppli-ers because customers are pressurising you will not add long-term value. In the long term it creates value for the total network to find ways of increasing value for suppli-ers as well as customers. All the players in the network, whether they be customers,
Focal company
Competitors
Complementors
CustomersSuppliersMARKET
REQUIREMENTSOPERATIONSRESOURCES
Figure 5.3 the value net

149What Is purchasIng and supply strategy?
suppliers, competitors or complementors, can be both friends and enemies at differ-ent times. This is not ‘unusual’ or ‘aberrant’ behaviour. It is the way things are. The term used to capture this idea is ‘co-opetition’.
a network perspective confronts the operation with its strategic resource optionsA supply network perspective illustrates to any operation exactly where it is posi-tioned in its network. It also, therefore, highlights where it is not. That is, it clearly delineates between the activities that are being performed by itself and those that are being performed by other operations in the network. This prompts the question of why the operations boundaries are exactly where they are. Should the operation extend its direct control over a greater part of the network through vertical integra-tion? Alternatively, should it outsource some of its activities to specialist suppliers? Furthermore, should it encourage particular patterns of relationships in other parts of the network? Again, it is the network perspective that raises the questions, and sometimes helps to answer them.
a network perspective highlights the ‘operation to operation’ nature of business relationshipsThis may be the most far-reaching implication of a supply network perspective. It concerns the nature of the relationships between the various businesses in the network. Traditionally these relationships have been seen as ‘customer–supplier’ relationships. What is new in the way supply networks are now treated is that rather than conceptualising the relationship as ‘doing business’ with customers and suppli-ers, we are concerned with the ‘flow of goods and services’ between operations. Look at any supply network and the vast majority of businesses represented in it have other businesses as their customers rather than end customers. Not that the end customer is unimportant. But behind each business serving the end customer is a whole network of other businesses. To the end customer, it is the chain of operations lying behind the one they can see that is important. For that chain of operations the important questions are not ‘How can I sell to my customer?’ and ‘How can I get supplies from my supplier?’ Rather the questions should be ‘How can my operation help my customer’s operation to be more effective?’ and ‘How can my supplier’s operation help my operation to be more effective?’
globalisation and sourcing
Globalisation is the more or less simultaneous marketing and sale of identical goods and services around the world. So widespread, says The Economist, has the phenom-enon become over the past two decades that no one is surprised any more to find Coca-Cola in rural Vietnam, Accenture in Tashkent and Nike shoes in Nigeria.4 It has made supply network strategy into a global issue. Global sourcing means identi-fying, evaluating, negotiating and configuring supply across multiple geographies. Traditionally, even companies who exported their goods and services still sourced the majority of their supplies locally. Companies are now increasingly willing to look further afield for their supplies, and for very good reasons. Most companies report a 10 to 35 per cent cost saving by sourcing from low-cost-country suppliers.5 Also, there are other factors promoting global sourcing. The formation of trading blocs in different parts of the world (eg. European Union, EU, the North American

150 chapter 5 • purchasIng and supply strategy
Free Trade Agreement, NAFTA, and the South American Trade Group, MERCOSUR) has lowered tariff barriers within those blocs. Transportation infrastructures are con-siderably more sophisticated and cheaper than they once were. Super-efficient port operations in Rotterdam and Singapore, for example, integrated road–rail systems, jointly developed auto route systems, and cheaper air freight have all reduced some of the cost barriers to international trade. But, most significantly, far tougher world competition has forced companies to look to reducing their total costs. There are of course problems with global sourcing. The risks of increased complex-ity and increased distance need managing. The risks of delays and hold-ups can be far greater than when sourcing locally. Also, negotiating with suppliers whose native language is different from one’s own makes communication more difficult and can lead to misunderstandings over contract terms. Therefore global sourcing decisions require businesses to balance cost, performance, service and risk factors, not all of which are obvious. These factors are important in global sourcing because of non-price or ‘hidden’ cost factors such as cross-border freight and handling fees, complex inventory stocking and handling requirements, even more complex administrative, documentation and regulatory requirements, and issues of social responsibility.
global sourcing and corporate social responsibility (csr)This last point, that global sourcing requires extra attention to be placed on social responsibility, has significant risk implications. Although the responsibility of opera-tions to ensure that they deal only with ethical suppliers has always been important, the expansion of global sourcing has brought the issue into sharper focus. Local suppliers can (to some extent) be monitored relatively easily. However, when sup-pliers are located around the world, often in countries with different traditions and ethical standards, monitoring becomes more difficult. Not only that, but there may be genuinely different views of what is regarded as ethical practice. Social, cultural and religious differences can easily make for mutual incomprehension regarding each other’s ethical perspective. This is why many companies are putting significant effort into articulating and clarifying their supplier selection policies.
The following example is an extract from Levi Strauss’ policy on ethical sourcing. It is typical of many organisations’ approach to global sourcing. Remember though, it does not guaran-tee that all suppliers will conform. The example on Gap that follows illustrates this.
‘Our Global Sourcing and Operating Guidelines help us to select business partners who follow workplace standards and business practices that are consistent with our company’s values. These requirements are applied to every contractor who manufactures or finishes products for Levi Strauss & Co. Trained inspectors closely audit and monitor compliance among approximately 600 cutting, sewing, and finishing contractors in more than 60 countries. [. . .] The numerous countries where Levi Strauss & Co. has existing or future business interests present a variety of cultural, politi-cal, social and economic circumstances. [. . .] The Country Assessment Guidelines help us assess any issue that might present concern in light of the ethical principles we have set for ourselves. Specifically, we assess [. . .] the [. . .] Health and Safety Conditions Human Rights Environment, the Legal System and the Political, Economic and Social Environment would protect the company’s commercial interests and brand/corporate image’.
example extracts from levi strauss’ global sourcing policy6

151What Is purchasIng and supply strategy?
The company’s employment standards state that they will only do business with partners who adhere to the following guidelines:
Child Labor: Use of child labor is not permissible. Workers can be no less than 15 years of age and not younger than the compulsory age to be in school. We will not utilize partners who use child labor in any of their facilities.Prison Labor/Forced Labor: We will not utilize prison or forced labor in contracting relation-ships in the manufacture and finishing of our products. We will not utilize or purchase materials from a business partner utilizing prison or forced labor.Disciplinary Practices: We will not utilize business partners who use corporal punishment or other forms of mental or physical coercion.Working Hours: While permitting flexibility in scheduling, we will identify local legal limits on work hours and seek business partners who do not exceed them except for appropriately compensated overtime. Employees should be allowed at least one day off in seven.Wages and Benefits: We will only do business with partners who provide wages and benefits that comply with any applicable law and match the prevailing local manufacturing or finish-ing industry practices.Freedom of Association: We respect workers’ rights to form and join organisations of their choice and to bargain collectively. We expect our suppliers to respect the right to free asso-ciation and the right to organize and bargain collectively without unlawful interference.Discrimination: While we recognize and respect cultural differences, we believe that workers should be employed on the basis of their ability to do the job, rather than on the basis of personal characteristics or beliefs. We will favor business partners who share this value.Health & Safety: We will only utilize business partners who provide workers with a safe and healthy work environment. Business partners who provide residential facilities for their workers must provide safe and healthy facilities.
It is expensive to manufacture garments in developed coutries where wages, transport and infrastructure costs are high. It is also a competitive market. As customers, most of us look to secure a good deal when we shop.This is why most garments sold in devel-oped countries are actually made in less developed countries. Large retail chains such as Gap select suppiers who can deliver acceptable quality at a cost that allows both them and the chain to make a profit. But what if the supplier achieves this by adopting prac-tices that, while not unusual in the supplier’s country, are unnacceptable to consumers? Then, in addition to any harm to the victims of the practice, the danger to the retail chain is one of ‘reputational risk’. This is what happened to the garment retailer Gap when a British newspaper ran a story under the headline ‘Gap Child Labour Shame’. The story went on:
‘An “Observer” investigation into children making clothes has shocked the retail giant and may cause it to withdraw apparel ordered for Christmas. Amitosh concentrates as he pulls the loops of thread through tiny plastic beads and sequins on the toddler’s blouse he is making. Dripping with sweat, his hair is thinly coated in dust. In Hindi his name means “happiness”. The hand-embroidered garment on which his tiny needle is working bears the distinctive logo of interna-tional fashion chain Gap. Amitosh is 10.’
Within two days Gap responded as follows:
example the gap between perception, reality and intention in supply7

152 chapter 5 • purchasIng and supply strategy
Inter-operations arrangements in supply networks
Writers on supply network management have offered several ways of categorising the arrangements between players in supply networks, and again we distinguish between the market and resource perspectives of relationship.8. In terms of the resources with suppliers, what is the degree and importance of the activities that are performed in-house – from doing everything in-house, through doing the most important things in-house, to totally outsourcing all activities? In terms of the market relationship, what are the number of separate supply arrangements and how close are they – from using many suppliers with little closeness in the arrangements, through to a few close (or even one very close) supplier? Figure 5.4 illustrates this. Different types of supply-network arrangement can be positioned in terms of their implied resource scope and market relationships. At an extreme on both dimensions is the vertically integrated operation. This type of operation performs everything (or almost everything) within the organisation’s boundaries. Unless the organisation has chosen to perform the same activity in many different parts of its operations there will be few (probably only one) inter-nal suppliers. This allows the potential for very close arrangements. At the other extreme an operation may choose to do nothing in-house and buy in all its require-ments – the so-called virtual company that retains relatively few physical resources. Its network is one of information and contacts with other players in the network who can supply all it requires to satisfy its own customers. When the nature of these supply arrangements is temporary and market-based, it is called ‘virtual spot trading’. Spot trading means that at any point in time an organisation looks at the spot price, or spot terms of supply, and makes a choice independently of what its previous or future choices might be. But not all virtual operations need be based on transactional market arrangements. When almost all its activities are outsourced an organisation may seek to compensate for its lack of control by attempting to build long-term and close arrangements with relatively few suppliers. This is the long-term virtual operation.
‘Earlier this week [. . .] an allegation of child labor at a facility in India. An investigation was immediately launched [. . .] a very small portion of one order [. . .] was apparently subcontracted to an unauthorized subcontractor without the company’s knowledge [. . .] in direct violation of [our] agreement under [our] Code of Vendor Conduct. “We strictly prohibit the use of child labor. This is non-negotiable for us – and we are deeply concerned and upset by this allegation. As we’ve dem-onstrated in the past, Gap has a history of addressing challenges like this head-on. In 2006, Gap Inc. ceased business with 23 factories due to code violations. We have 90 people located around the world whose job is to ensure compliance with our Code of Vendor Conduct.”’
do or buy? the vertical integration decision
The decision whether to do (i.e. create, deliver, design, etc.) something within the organisation (‘in-house’) or buy it from external suppliers (outsource it) is the most fundamental purchasing and supply strategy issue. Too often the decision is made on narrow, short-term, cost savings, with firms that are struggling to be price com-petitive, and searching for ways to shift their cost base – often by using global sup-pliers. Whilst efficiency maximisation should be a central feature of any ‘do/buy’

153do or buy? the vertIcal IntegratIon decIsIon
analysis, it is a profoundly strategic decision and its results will affect the operations performance objectives in a number of complicated ways (see Table 5.1). The outsourcing debate is just part of a far larger issue that will shape the funda-mental nature of any business. Namely, what should the scope of the business be? In other words, what should it do itself and what should it buy in? This is often referred to as the ‘do or buy decision’ when individual components or activities are being considered, or ‘vertical integration’ when it is the ownership of whole operations that are being decided. Vertical integration is the extent to which an organisation owns the network of which it is a part. It usually involves an organisation assessing the wisdom of acquiring suppliers or customers. Vertical integration can be defined in terms of three factors (see Figure 5.5).9
Resource scope
Typ
e of
inte
r-fir
m c
onta
ct
Tran
sact
iona
l–
man
ysu
pp
liers
Verticalintegration
Long-termvirtual
operation
‘Partnership’supply
relationships
TraditionalmarketsupplyVirtual
spottrading
Clo
se–
few
sup
plie
rs
The character of internal operations activity
Donothing
Doeverything
Mar
ket
rela
tions
hip
Figure 5.4 types of supply arrangement
Exclusive balancebetween stages
Non-exclusive balancebetween stages
Backward integration
Extent of integration
Forward integration
Focaloperation
Figure 5.5 vertical integration decisions

154 chapter 5 • purchasIng and supply strategy
table 5.1 how in-house and outsourced supply may affect an operation’s performance objectives
Performance objective ‘Do it yourself’ in-house supply ‘Buy it in’ outsourced supply
Quality Theoriginsofanyqualityproblemsare Suppliermayhavespecialisedknowledge usuallyeasiertotracein-houseand andmoreexperience,alsomaybe improvementcanbemoreimmediatebut motivatedthroughmarketpressures,but canbesomeriskofcomplacency communicationofqualityproblemsmore
difficult
Speed Canmeanclosersynchronisationof Speedofresponsecanbebuiltintothe schedules,whichspeedsupthethroughput supplycontractwherecommercial ofmaterialsandinformation,butifthe pressureswillencouragegood operationalsohasexternalcustomers, performance,buttheremaybesignificant internalcustomersmayreceivelowpriority transport/deliverydelays
Dependability Easiercommunicationsinternallycanhelp Latedeliverypenaltiesinthesupply dependabledelivery,whichalsomayhelp contractcanencouragegooddelivery wheninternalcustomersneedtobe performance,butdistanceand informedofpotentialdelays,butaswith organisationalbarriersmayinhibit speed,iftheoperationalsohasexternal communication customers,internalcustomersmayreceive lowpriority
Flexibility Closenesstotherealneedsofabusiness Outsourcesuppliersarelikelytobelarger canalertthein-houseoperationthatsome andhavewidercapabilitiesthanin-house kindofchangeisrequiredinits suppliers:thisgivesthemmoreability operations,buttheabilitytorespondmay torespondtochanges,buttheycan belimitedbythescaleandscopeof respondonlywhenaskedtodosobythe internaloperations customer,andtheymayhavetobalance
theconflictingneedsofdifferentcustomers
Cost In-houseoperationsgivethepotentialfor Probablythemainreasonwhyoutsourcing sharingsomecosts,suchasresearchand issopopular;outsourcedcompanies development,orlogistics;more canachieveeconomiesofscaleandthey significantly,in-houseoperationsdonot aremotivatedtoreducetheirowncosts havetomakethemarginrequiredby becausethisimpactsdirectlyontheir outsidesuppliers,sothebusinesscan profits,butextracostsofcommunication capturetheprofitswhichotherwisewould andcoordinationwithanexternal begiventothesupplier,butrelativelylow supplierneedtobetakenintoaccount volumesmaymeanthatitisdifficultto gaineconomiesofscaleorthebenefitsof processinnovation
The direction of vertical integration – should an operation expand by buying one of its suppliers or by buying one of its customers? The strategy of expanding on the supply side of the network is sometimes called backward or upstream vertical integration, and expanding on the demand side is sometimes called forward or downstream vertical integration.
The extent of vertical integration – how far should an operation take the extent of its vertical integration? Some organisations deliberately choose not to integrate far, if at all, from their original part of the network. Alternatively, some organisations choose to become very vertically integrated.

155do or buy? the vertIcal IntegratIon decIsIon
The balance among stages – is not strictly about the ownership of the network, but rather the exclusivity of the relationship between operations. A totally balanced network arrangement is one where one operation produces only for the next stage in the network and totally satisfies its requirements. Less than full balance allows each operation to sell its output to other companies or to buy in some of its supplies from other companies. Fully balanced networks have the virtue of simplicity and also allow each operation to focus on the requirements of the next stage along in the network. Having to supply other organisations, perhaps with slightly different requirements, might serve to distract from what is needed by their (owned) primary customer. However, a totally self-sufficient network is sometimes not feasible, nor is it necessarily desirable.
The downturn of 2009 affected even professional service firms like lawyers and consultants. Staff numbers were cut, professionals laid off, and recruitment slashed or postponed. It also led to a certain grim humour: ‘What do you say to a recent law-school graduate?’ Answer: ‘A skinny double-shot latte to go, please.’ But businesses, including professional services, recover as economies recover. Possibly more significant is that such firms are taking far more advantage of outsourcing to protect themselves against fluctuations in demand (as well as cutting costs generally). Legal-process outsourcing, especially, began to grow fast, with law firms outsourcing some of their more routine basic work to reduce costs and give them the agility to cope with demand that they saw as increasingly unpredictable. One company that has benefitted from this is Pangea3, the established leader in legal outsourcing services to international corpo-rations and law firms. Its offices in Delhi and Mumbai, India, take on work from clients worldwide. Pangea3 was founded in 2004 and, now with hundreds of employees, has since grown to become the largest legal process outsourcing company globally. It provides legal outsourcing services to more than one hundred major corporations and law firms. Its suc-cess, it says, is founded on helping law firms ‘improve their efficiency, minimise business and legal risks, stay ahead of the competition and reduce their legal costs by delivering world-class qual-ity legal process outsourcing services using attorneys, engineers and technologists in India’. It has, ‘a carefully structured business model that ensures that its clients receive the highest quality work, total peace of mind and dramatic cost savings’.
example outsourcing spreads to professional services10
the process of do/buy analysis
In addition to the effect on the operation’s performance objectives, there are other issues when deciding if outsourcing is a sensible option. If an activity has long-term strategic importance to a company, it is unlikely to outsource it. For example, a retailer might choose to keep the design and development of its website in-house even though specialists could perform the activity at less cost because it plans to move into web-based retailing at some point in the future. Nor would a company usually outsource an activity where it had specialised skills or knowledge. For exam-ple, a company making laser printers may have built up specialised knowledge in the production of sophisticated laser drives. This capability may allow it to introduce product or process innovations in the future. It would be foolish to ‘give away’ such capability. After these two strategic factors have been considered, the company’s operations performance can be taken into account. Obviously if its operation’s

156 chapter 5 • purchasIng and supply strategy
performance is already too superior to any potential supplier, it would be unlikely to outsource the activity. But also, even if its performance was currently below that of potential suppliers, it might not outsource the activity if it felt that it could signifi-cantly improve its performance. Figure 5.6 illustrates this decision logic. A strategic approach to do/buy decisions requires the firm to reflect on its own relative capabilities and its contribution to competitive advantage. Insights from the resource-based view of the firm (see discussion in Chapter 1) are potentially valuable here. Having identified those operations in which the firm has neither any meaning-ful competitive advantage nor a critical strategic need, the analysis also has to look for the most effective sourcing arrangement. In determining what is effective, the firm must pay full attention to the possibility of opportunistic supplier behaviour. Insights from transaction cost economics (see below) are extremely valuable here.
transaction cost economics (tce)
This hugely influential theory, most closely associated with the work of economists Oliver Williamson and, before him, Ronald Coase, attempts to explain the particular structure of firms or, more specifically, why managers choose to undertake certain transactions within the firm as opposed to letting them take place in supply markets. Addressing as it does the fundamental ‘do and/or buy’ question, it has become a core theory for understanding purchasing and supply behaviour. TCE assumes that most people cannot remember everything and often cannot figure out what to do with the information they do have (i.e. they exhibit bounded rationality), and exchange partners are not always completely honest about their intentions (i.e. they may act opportunistically; as a result, transaction costs emerge). For example, in any real buying activity, lack of information about alternative suppliers often leads firms to pay too high a price for something they purchase. The most pragmatic contribution of the theory comes from the dimensions that are used to characterise the nature of different transactions:
●● Frequency. Why would a firm choose to bring ‘in-house’ the provision of a good or service that is very rarely used? For example, most firms do not have their own legal department because this is a highly specialised and infrequently used resource.
●● Asset specificity. In general terms, when transactions involve highly specific assets, such as dedicated production facilities, transaction costs are likely to be higher in a market exchange.
No
Yes
NoNo
Yes
No
Yes Yes
Exploreoutsourcing
of thisactivity
Is activity ofstrategic
importance?
Doescompany
havespecialisedknowledge?
Is company’soperations
performancesuperior?
Is significantoperations
performanceimprovement
likely?
Explore keeping this activity in-house
Figure 5.6 the decision logic of outsourcing

157contractIng and relatIonshIps
●● Uncertainty. The greater the duration of a transaction (e.g. contract period) the more difficult it is to envisage all potential eventualities that might occur during the course of the transaction. For example, if entering into a long-term arrange-ment with a supplier, how do you know if it will still be in business?
Finally, although TCE is very useful it does have limitations. For example, it is often very difficult to measure transaction costs in practice. Equally, although TCE assumes bounded rationality, it does not consider other factors such as power, reputation and trust, which affect supply-related decision making. The interaction of these two dimensions suggests a range of generic outsourcing options (see Figure 5.7).
INVEST TO PERFORMINTERNALLY
(if high potential for opportunism)
CO
NT
RIB
UT
ION
TO
CO
MP
ET
ITIV
E A
DVA
NTA
GE
RELATIVE CAPABILITY POSITION strongerweaker
not
criti
cal
PERFORM INTERNALLY TO DEVELOP
(if high potential for opportunism)
OUTSOURCE(if possible to mitigate risk
of opportunism)
OUTSOURCE(if possible to mitigate risk
of opportunism)
KEEP INTERNAL(if lack of capable suppliersand spin-off not feasible)
OUTSOURCE(if possible to mitigate risk
of opportunism)
OUTSOURCE(if possible to mitigate risk
of opportunism)
criti
cal
Figure 5.7 generic sourcing strategies
contracting and relationships
There are two basic ingredients of any supply arrangement; they are ‘contracts’ and ‘relationships’. Whatever arrangement with its suppliers a firm chooses to take; it could be described by the balance between contracts and relationships (see Figure 5.8). They are strongly complementary, and in the same way that separating marketing and operations decisions can cause major supply dysfunction, a lack of alignment between contracting activity (negotiating, legal procedures, etc.) and relationship strategy can cause significant damage. Moreover, what is clear from the do/buy typology is that effective supply management – effective in the sense that
Source:adaptedfromMcIvor,R.(2008)‘Whatistherightoutsourcingstrategyforyourprocess?’,European Management Journal,26,pp.24–34.

158 chapter 5 • purchasIng and supply strategy
it maximises the benefits to the buyer whilst protecting against opportunism – will require a range of different approaches in different capability and market contexts. If a very strong trusting relationship can be built with a supplier, then the risk of outsourcing even very critical capabilities might be acceptable. In the absence of this trust, even the most sophisticated contractual form may be felt to afford insufficient protection, for example, against intellectual property rights (IPR) infringements.
contracts and contracting
Contracts are those explicit (usually written, often detailed) and formal documents that specify the legally binding obligations and roles of both parties in a relationship. Using the logic of transaction cost economics (TCE), contracts are intended to both reduce uncertainty (e.g. by providing a clear specification of what is and what is not allowed within a relationship) and minimise the risk of opportunism (e.g. by enforc-ing legal rules, standards and other remedies implied in law). There are lots of different contract types, usually categorised according to the type of payment. For example:
●● Fixed price or lump sum contracts. This type of contract provides a degree of cer-tainty because it defines the expectations of all parties with an agreed price for the performance of work or supply or goods at a designated time.
●● Unit rate contracts. Monetary exchange takes place when work is performed, and is directly proportional to the volume and range of work. An example of a unit rate contract would be the supply of raw material inputs where the volume of units supplied would define the total price. The terms of this type of contract often accommodate flexibility for price adjustment. The agreed value may be subject to amendment if demand volume is reduced or exceeds the original negotiated terms and price.
●● Reimbursable (cost plus) contracts. Typically used when the scope of the work is difficult to define. An example of this type of contract is the procurement of spe-cialised professional services to solve a problem that may take an indefinite period of time. The upfront payment covers the initial commitments to the project.
Emphasis predominantlyon contracting
Emphasis predominantlyon relationships
‘Transactional’ or ‘market-based’supply arrangements
‘Partnership’ supplyarrangements
Figure 5.8 supply arrangements are a balance between contracting and relationships

159contractIng and relatIonshIps
Renegotiation for increased tenure or reimbursement may take place if the con-tract comes to an abrupt end.
●● Financing contracts. Widely used in the mining, building, oil and gas, transporta-tion and infrastructure sectors, they include the raising of debt and equity by the contracted party.
●● Project management contracts. The supplier agrees to manage the contract, as defined by the scope of the agreement, for a specified duration of time for mon-etary consideration. This type of contract can be short term or long term.
●● Relational contracts. Recognising the limits of traditional contractual control, this type specifies the kind of social mechanisms that promote flexibility, information exchange and joint problem solving.
Control through contracts depends on three underlining conditions:
●● Codification. Formal contracts are reliant on tasks working broadly to plan and the ‘up front’ measurability of outcomes.
●● Monitoring. Formal contracts require monitoring to determine supplier behaviour with regards to the rules set out in the contract.
●● Safeguards. For effective control, there need to be structures in place to enforce the contract – it has to be worth the paper it’s written on!
Although the ‘best’ contract generally is assumed to be the most ‘complete’ contract (i.e. one that covers the greatest number of contingencies), all organisations enter-ing into a contractual exchange face information asymmetry – that is, imperfect and incomplete information about their suppliers preferences and characteristics. Table 5.2 summarises the problems that can arise as a result of asymmetric information. So whatever the specific cause, in most exchanges one party has an unavoidable informational advantage over another. And in purely contractual terms it potentially could be exploited to the benefit of that party at the expense of the partner. This reinforces the tendency to incur additional contract-related costs such as up-front supplier search and selection costs (adverse selection risk) and ongoing monitoring and enforcement costs (moral hazard and hold-up risks).
table 5.2 a summary of some problems that can arise from asymmetric information
Risk Adverse selection Moral hazard Hold up
Timing Ex ante (beforesigning Ex post (aftersigninga Ex post(aftersigninga contract) contract) contract)
Illustration Cannotaccuratelyjudge Cannot completelycontrol Regardlessofperformance, supplier‘quality’asdetermined supplieractivities(evenifthe buyerfurtheremploysa bysoftskills,education,etc. buyercanfullymonitor particularsupplierbecauseof Cannotjudgethefutureplans actions)butobservesthat irreversibleinvestments(‘sunk ofthesupplier suppliermaximisingownprofit costs’) insteadofrealisingthebuyers’ objectives

160 chapter 5 • purchasIng and supply strategy
partnership supply relationships
Partnership supply relationships, sometimes called just ‘relationships’, are those inter-organisational mechanisms that are not part of formal contractual positions but emerge from ongoing interactions (for example, regular calls to enquire ‘How is it going?’). Partnership supply relationships can be based, at least partly, on social processes such as personal bonding. Because of this they tend to be ‘emergent’ arrangements, developing over time, that are not readily accessible through writ-ten documents and often cannot be directly observed. Their development between customers and suppliers in supply networks is sometimes seen as a compromise between the ‘extremes’ of vertical integration and contractual market trading. They attempt to achieve some of the closeness and coordination efficiencies of vertical integration without the necessity to own the assets, and they attempt to achieve the sharpness of service and the incentive to continually improve, which is often seen as the benefit of traditional market trading. Yet partnership is more than a mixture of vertical integration and market trading. It is an approach to how relationships in supply networks can be formed with a degree of trust that effectively substitutes for the ownership of assets. Partnership relationships can be viewed as strategic alli-ances, which have been defined as: ‘relatively enduring inter-firm cooperative arrange-ments, involving flows and linkages that use resources and/or governance structures from autonomous organisations, for the joint accomplishment of individual goals linked to the corporate mission of each sponsoring firm’.12 In such an alliance partners are expected to cooperate, even to the extent of sharing skills and resources, to achieve joint benefits beyond those they could achieve by acting alone. Figure 5.9 identifies some of the major elements that contribute to closeness necessary for partnership, and
The idea of outsourcing activities previously done internally is not confined to whole depart-ments or processes; it can also apply to individuals. Especially when full-time salaried jobs are difficult to find, the availability of a large pool of skilled ‘freelancers’ is an attractive alter-native for firms that are reluctant to take on permanent staff. One market-research firm, IDC, says that there were around 12 million full-time, home-based freelancers and independent contractors in the USA in 2009, and forecast an increase to 14 million by 2015. European numbers are not known, but it is likely that the number of freelancers could keep rising for a number of reasons. First, it is possibly the most attractive option (or the only option) for people without permanent employment yet who want to preserve (and possibly improve) their skills. Second, there is a mounting aspiration on the part of some for the flexibility to pursue other requirements, such as child care. Technology is facilitating this movement towards more freelancing. The increase in so called ‘e-lancing’ sites that act as brokers between employers looking for skills and workers seeking work brings buyers and sellers of skills together. And the range of work transacted on this basis is growing. One site posted requests for people who were interested in composing a rap song to help teach English to Chinese students and for people interested in designing a luxury hotel in Barbados. But the development of this trend is not without its critics. Some claim that it is little more than a ‘digital sweatshop’ that drives down wages and humiliates workers. Independent contractors generally have fewer employment rights than permanent employees.
example Individual outsourcing; the rise of freelancing11

161contractIng and relatIonshIps
divides them into those that are primarily related to the attitude with which the customer and supplier approach the relationship, and those that relate to the actions undertaken by both parties.
closenessCloseness is the degree of intimacy, understanding and mutual support that exists between partners, and reflects the degree of interdependence of the partners. An analogy is often drawn between the concept of closeness in business relations and how the word is used in personal relations. Interpersonal intimacy relies on the attitude with which individuals approach the relationship with their partner/friend, and is also affected by an accumulation of individual actions. Both are important. Intimacy relies on each partner’s belief in the other’s attitude and motivation in maintaining the relationship. It is that belief that helps dispel any doubt that we can rely on supportive actions from our partner. But it is also those actions which, over time, deepen and enhance the positive beliefs and attitudes concerning the relation-ship itself. In this way, closeness can be seen as both the result of, and the objective of, the interplay between attitudes towards the relationship and the ongoing activi-ties that are the day-to-day manifestations of the relationship.
trustIn this context trust means: ‘the willingness of one party to relate with another in the belief that the other’s actions will be beneficial rather than detrimental to the first party, even though this cannot be guaranteed’.13 The greater the degree of trust, the greater is the willingness to make oneself vulnerable to the actions of the other, even though this vulnerability is not as keenly felt because of the existence of trust. If there
Fewrelationships
Joint problemsolving
Informationtransparency
Closeness ofrelationship
Dedicatedassets
Trust
Jointcoordinationof activities
Attitudes
Actions
Multiplepoints ofcontact
Jointlearning
Long-termexpectations
Sharingsuccess
Figure 5.9 elements of partnership relationships
162 chapter 5 • purchasIng and supply strategy
were no risk involved in a relationship there would be no need for trust, and with-out some degree of trust there is little justification for taking risks with a partner. Although most organisations are aware of different degrees of trust in their relation-ships with suppliers or customers, they do not always see trust as an issue to be managed explicitly. Sometimes this is the result of a broad philosophical view of the issue (‘in the end suppliers will always look after their interests; it’s foolish to believe otherwise’). At other times it may be that managers do not believe such a nebulous concept can be either analysed or indeed managed (‘trust is one of those things that is either there or it isn’t; you can’t account for it like profit and loss’). However, almost all research in the area of supplier–customer relationships highlights the role of trust in determining the scope and limits to the relationship. Furthermore, it is at the heart of any understanding of partnership relationships. It is useful to think of trust in three stages.14 Progression through these states of trust is often associated with time and the accumulation of positive, relationship-building experiences.
●● Calculative trust is the most basic level of trust that arises because one of the parties calculates that trusting the partner is likely to lead to a better outcome than not trusting them. Underlying this is often the belief that the benefits from maintaining trust are greater than those from breaking it.
●● Cognitive trust is based on a sharing of each partner’s cognitions or understand-ings of aspects concerned with the relationship. By knowing how each other sees the world, each partner is able to predict how the other will react. In other words, the other partner’s behaviour can be anticipated; it therefore comes as no surprise and, therefore, will not threaten the relationship.
●● Bonding trust is deeper. It is based on partners holding common values, moral codes and a sense of what obligations are due to each other. The partners identify with each other at an emotional level beyond the mere mechanics of the day-to-day transactions that occur. Trust is based on the belief that each party feels as well as thinks the same.
sharing successAn attitude of shared success means that both partners recognise that they have more to gain through the success of the other partner than they have individually, or by exploiting the other partner. Both customers and suppliers are less interested in manoeuvring in order to get a bigger slice of the pie and are more interested in increasing the size of the pie. It is this belief that helps to prevent individual partners from acting against the interests of the other in order to gain immediate advantage – what economists call opportunistic behaviour. However, it must be clear that the size of the pie will indeed be larger if both partners are to cooperate. It also is impor-tant to have an agreement as to how the larger pie will be divided up.
long-term expectationsPartnership relationships imply relatively long-term relationships between suppli-ers and customers. The deeper levels of trust require time to develop. Furthermore, there is no need to incur the transaction costs of frequent changes of partner, always assuming that the partner behaves in the best interests of the other. All of this points to long-term relationships – but not necessarily permanent ones. At the heart of the partnership concept is the fact that either party could end the partnership. That is
163contractIng and relatIonshIps
(partly) what keeps each motivated to do the best for the other. Maintaining the relationship is an affirmation that each partner has more to gain from the relation-ship than from ending it.
Multiple points of contactMultiple points of contact mean that communication between partners involves many links between many individuals in both organisations. Although this sounds like an action rather than an attitude, it is best thought of as an attitude that allows, and indeed encourages, multiple person-to-person relationships. It implies that both partners are sufficiently relaxed in their mutual dealings not to feel they have to control every discussion and development. Over time, this may lead to a complex web of agreements and understandings being formed, perhaps not in the legal contractual sense of a single ‘all embracing’ agreement, but as a multi-stranded, intertwined ‘Velcro-connected’ binding of the two partners.
Joint learningAgain, this sounds like an action but in reality, though, is more of an attitude that encourages approaching the relationship in a sense of mutual learning. Presumably, a partner has been selected on the basis that the partner has something to contribute beyond what the customer can do for themselves. While the customer would not necessarily wish to gain technical knowledge of these core processes (they have, after all, decided not to do these things themselves), it may be able to learn much about the application of whatever is supplied.
Few relationshipsPartnership relationships do not necessarily imply single sourcing by customers, nor do they imply exclusivity by suppliers. However, even if the relationships are not monogamous, they are not promiscuous. Partnerships inevitably involve a limit on the number of other partnerships, if for no other reason than that a single organi-sation cannot maintain intimacy in a large number of relationships. Furthermore, it also implies that the other partner has some say in the other’s relationships. Generally, partners agree the extent to which they might form other relationships that may involve some longer-term threat to their partner.
Joint coordination of activitiesPartly because there are fewer individual partners with whom to coordinate, the quan-tity, type and timing of product and service deliveries are usually subject to a greater degree of mutual agreement in a partnership relationship. However, notwithstanding the mutuality of interest, it is usually the customer side of a partnership that has a far greater say in the coordination of activities than the supplier. Customers, after all, are closer to the demand-driven end of a supply chain and thus subject to a greater degree of demand pull. A customer’s increased involvement in a supplier’s day-to-day plan-ning and control (combined with a degree of trust) allows inventory to be reduced.
Information transparencyOpen and efficient information exchange is a key element in partnership as well as the natural consequence of the various attitudinal factors discussed earlier. It

164 chapter 5 • purchasIng and supply strategy
means that each partner is open, honest and timely in the way they communicate with each other. As a way of encouraging appropriate decisions to be made by each party, and as a way of preventing misunderstanding between the parties, efficient information exchange and dissemination are vital. But the nature of the informa-tion exchanged by the partners may become increasingly sensitive, meaning that it would be embarrassing to one party if the other leaked it. And if the information is commercially valuable, leakage could mean one partner being placed at a commer-cial and/or strategic disadvantage.
Joint problem solvingPartnerships do not always run smoothly. In fact, the degree of closeness between partners would be severely limited if they did. When problems arise, either minor problems concerned with the day-to-day flow of products and services, or more fundamental issues concerned with the nature of the relationship itself, they will need to be addressed, by one or both partners. The way in which such problems are addressed is widely seen as being central to how the partnership itself develops. In fact it can be argued that it is only when problems arise that the opportunity exists to explore fully many of the issues we have been discussing regarding trust, shared success, long-term expectations, and so on.
dedicated assetsOne of the more evident ways of demonstrating a commitment to partnership, and one of the most risky, is by one partner (usually the supplier) investing in resources that will be dedicated to a single customer. A company will do this only if it is con-vinced that the partnership will be long-term, that advantages can be gained by both parties, and that the customer will not exploit the investment in order to bargain the price down below what was originally agreed.
limitations of partnership relationships
It is important to point out that trust ‘not only binds, but also blinds’ buyers and suppliers.15 Long-standing relationships can result in sub-optimal information searches. That is, organisations become ‘locked into’ those relationships and thereby neglect to obtain other relevant information from the market. Such information may, for instance, prove vital for spotting shifting market trends or emerging inno-vative technology. In summary, like contracting, relationships (with trust as their key component) are equally unreliable as a stand-alone supply management mecha-nism, and therefore some form of formal control is still needed to reduce the hazards of opportunism. In other words, we need to proactively develop both contracting and relationship building capabilities.
the internet and e-procurement
By making it easier to search for alternative suppliers, the internet has changed the economics of the search process, and offers the potential for wider searches. It has also changed the economics of scale in purchasing. Purchasers requiring relatively low volumes find it easier to group together in order to create orders of sufficient size to warrant lower prices. E-procurement is the generic term used to describe the use

165contractIng and relatIonshIps
of electronic methods in every stage of the purchasing process from identification of requirement through to payment, and potentially to contract management. Many of the large automotive, engineering and petrochemical companies, for example, have adopted such an approach. Typical of these companies’ motives are those put forward by Shell Services International, part of the petrochemical giant:
‘Procurement is an obvious first step in e-commerce. First, buying through the web is so slick and cheap compared to doing it almost any other way. Second, it allows you to aggregate, spend and ask: Why am I spending this money, or shouldn’t I be getting a bigger discount? Third, it encourages new services like credit, insurance and accreditation to be built around it.’
Generally the benefits of e-procurement are taken to include the following:
●● It promotes efficiency improvements (the way people work) in purchasing processes.
●● It improves commercial arrangements with suppliers.
●● It reduces the transaction costs of doing business for suppliers.
●● It opens up the marketplace to increased competition and therefore keeps prices competitive.
●● It improves a business’s ability to manage its supply chain more efficiently.
The cost savings from purchased goods may be the most visible advantages of e-pro-curement, but some managers say that it is just the tip of the iceberg. It can also be far more efficient because purchasing staff are no longer chasing purchase orders and performing routine administrative tasks. Many of the advantages and time savings come from more effective transactions. Purchasing staff can negotiate with vendors faster and more effectively. Online auctions can compress negotiations from months to one or two hours, or even minutes.
electronic marketplacesE-procurement has grown largely because of the development over the last 10 years of electronic marketplaces offering services to both buyers and sellers. They are information systems that allow buyers and sellers to exchange information about prices and product and service offerings, and the firm operating the electronic market place acts as in intermediary. They can be categorised as consortium, private, or third party.
●● A private e-marketplace is one where buyers or sellers conduct business in the market only with their partners and suppliers by previous arrangement.
●● The consortium e-marketplace is one where several large businesses combine to create an e-marketplace controlled by the consortium.
●● A third party e-marketplace is one where an independent party creates an unbi-ased, market-driven e-marketplace for buyers and sellers in an industry.
The internet is also an important source of purchasing information, even if the purchase is actually made by using more traditional methods. Also, even through many businesses have gained advantages by using e-procurement, it does not mean that everything should be bought electronically. When businesses purchase very large amounts of strategically important products or services, they will negotiate

166 chapter 5 • purchasIng and supply strategy
multimillion-euro deals, which involve months of discussion, arranging for deliv-eries up to a year ahead. In such environments, e-procurement adds little value. Deciding whether to invest in e-procurement applications (which can be expensive), say some authorities, depends on what is being bought. For example, simple office supplies such as pens, paper clips and copier paper may be appropriate for e-procure-ment, but complex, made-to-order engineered components are not. Four questions seem to influence whether e-procurement will be appropriate.
Is the value of the spend high or low? High spending on purchased products and serv-ices gives more potential for savings from e-procurement.
Is the product or commodity highly substitutable or not? When products and services are ‘substitutable’ (there are alternatives), e-procurement can identify and find lower-cost alternatives.
Is there a lot of competition or a little? When several suppliers are competing, e-pro-curement can manage the process of choosing a preferred supplier more effectively and with more transparency.
How efficient are your internal processes? When purchasing processes are relatively inefficient, e-procurement’s potential to reduce processing costs can be realised.
Which type of arrangement?
There is no simple formula for choosing what form of arrangement to develop, but one can identify some of the more important factors that can sway the decision. Before doing so, however, it is worthwhile reminding ourselves that firms do not make an overall policy decision to adopt one of the arrangements. Most have a portfolio of widely differing arrangements where a whole set of factors have been influential. From a market perspective, the most obvious issue will be how the firm intends to differentiate itself through its market positioning. If a firm is competing primarily on price then the arrangement could be dictated by minimising transaction costs. If it is competing primarily on product or service innovation, then it may well wish to form a collaborative alliance with a partner with whom it can work closely. Unless, that is, the market from which innovations derive is turbulent and fast growing (as with many software and internet-based industries), in which case it might wish to retain the freedom to change partners quickly through the market mechanism. However, in such turbulent markets, a firm might wish to develop arrangements that reduce its risks. One way to do this is to form relationships with many dif-ferent potential long-term customers and suppliers, until the nature of the market stabilises. Opportunities to develop arrangements, however, may be limited by the structure of the market itself. If the number of potential suppliers, or customers, is small, then it may be sensible to attempt to develop a close relationship with at least one customer or supplier. Opportunities to play off customers and suppliers against each other may be limited. Firms will also be influenced by likely competitor behaviour. For example, close partnership, or even vertical integration, may be seen as a defensive move against a competitor acquiring a major supplier or customer. From an operations resource perspective, economies of scale are important if the total requirement for a given product or service falls below the optimum level of

167supply netWork dynaMIcs
efficiency. Low volume is one of the main factors that prevent firms doing things in-house. The level of transaction costs also is important. Low transaction costs favour market-based arrangements, while the possibility of jointly reducing trans-action costs makes partnership an attractive option. Partnership is also attractive when there is the potential for learning from a partner. An absence of any potential learning suggests a more market-based relationship. Finally, although obvious, it is worthwhile pointing out that any sort of outsourcing, whether partnership or mar-ket-based, may be as a response to some sort of resource deficiency. That is, a firm will go outside for products and services if it does not have the resources to create them itself.
supply network dynamics
Supply chains have their own dynamic behaviour patterns which tend to distort the smooth flow of information up the chain and product moving down the chain. Flow in supply chains can be turbulent, with the activity levels in each part of the chain differing significantly, even when demand at the end of the chain is relatively stable. Small changes in one part of the chain can cause seemingly erratic behaviour in other parts. This phenomenon is known as ‘supply chain amplification’, ‘supply chain distortion’, ‘the Forrester effect’16 (after the person who first modelled it), or most descriptively ‘the bull whip effect’.17
For convenience we shall examine the underlying causes of supply chain behav-iour in terms of their:
●● quantitative dynamics; and
●● qualitative dynamics.
quantitative supply chain dynamics
Inventory in supply chains has an ‘uncoupling’ effect on the operations they con-nect, which has advantages for each operation’s efficiency, but also introduces ‘elasticity’ into the chain, which limits its effectiveness. This is because of the errors and distortions that are introduced to decision making in the chain. Not that the managers of each individual operation are acting irrationally. On the contrary, it is a rational desire by the operations in the supply chain to manage their production rates and inventory levels sensibly. To demonstrate this, examine the production rate and stock levels for the supply chain shown in Figure 5.10. This is a four-stage supply chain where an original equipment manufacturer (OEM) is served by three tiers of suppliers. The demand from the OEM’s market has been running at a rate of 100 items per period, but in period 2 demand reduces to 95 items per period. All stages in the supply chain work on the principle that they will keep in stock one period’s demand. This is a simplification but not a gross one. Many operations gear their inventory levels to their demand rate. The column headed ‘stock’ for each level of supply shows the starting stock at the beginning of the period and the finished stock at the end of the period. At the beginning of period 2 the OEM has 100 units in stock (that being the rate of demand up to period 2). Demand in period 2 is 95 and so the OEM knows that it would need to produce sufficient items to finish up at the end of the period with 95 in stock (this being the new demand rate). To do this it need manufacture only 90 items; this, together with 5 items taken out of the

168 chapter 5 • purchasIng and supply strategy
starting stock, will supply demand and leave a finished stock of 95 items. The begin-ning of period 3 finds the OEM with 95 items in stock. Demand is also 95 items and therefore its production rate to maintain a stock level of 95 will be 95 items per period. The OEM now operates at a steady rate of producing 95 items per period. Note, however, that a change in demand of only 5 items has produced a fluctuation of 10 items in the OEM’s production rate. Now carry the same logic through to the first-tier supplier. At the beginning of period 2 the second-tier supplier has 100 items in stock. The demand that it has to supply in period 2 is derived from the production rate of the OEM. This has dropped down to 90 in period 2. The first-tier supplier, therefore, has to produce sufficient to supply the demand of 90 items (or the equivalent) and leave one month’s demand (now 90 items) as its finished stock. A production rate of 80 items per month will achieve this. It will therefore start period 3 with an opening stock of 90 items but the demand from the OEM has now risen to 95 items. It therefore has to produce sufficient to fulfil this demand of 95 items and leave 95 items in stock. To do this it must produce 100 items in period 3, and so on. Note again, however, that the fluctuation has been even higher than that in the OEM’s production rate, decreasing to 80 items per period, increasing to 100 items per period, and then achieving a steady rate of 95 items per period.
1
2
3
4
5
6
(Note – all operations keep one period’s inventory)
100
95
95
95
95
95
100
20
180
60
100
95
Prodn.
Third-tiersupplier
3
Second-tiersupplier
2
First-tiersupplier
1
Originalequipment mfg.
OEM
Orders
Items
Market
Perio
d
Deman
d
100100
10060
60120
12090
9095
9595
Stock
100
60
120
90
95
95
Prodn.
100100
10080
80100
10095
9595
9595
Stock
100
80
100
95
95
95
Prodn.
100100
10090
9095
9595
9595
9595
Stock
100
90
95
95
95
95
Prodn.
100100
10095
9595
9595
9595
9595
Stock
Orders
Items
Orders
Items
Orders
Items
Figure 5.10 Fluctuations of production levels along supply chain in response to small change in end-customer demand
Source:Slack,N.,Chambers,S.andJohnston,R.(2007).Operations Management,5thedn,Harlow:FinancialTimesPrenticeHall.ReproducedwithpermissionofPearsonEducationLtd.

169supply netWork dynaMIcs
This logic can be extended right back to the third-tier supplier. If you do this you will notice that the further back up the supply chain an operation is placed the more drastic are the fluctuations caused by the relatively small change in demand from the final customer. In this simple case the decision of how much to produce each month was governed by the following relationship:
Total available for sale in any period 5 Total required in the same period
Starting stock 1 production rate 5 Demand + closing stock
Starting stock 1 production rate 5 2 3 demand (because closing stock
must be equal to demand)
Production rate 5 2 3 demand 2 starting stock
qualitative supply chain dynamics
Supply fluctuation is also caused because, at each link in the chain, there is the potential for misunderstandings and misinterpretation both of what each operation wants and how each is seen to be performing. It may not be able to make the logi-cal association between how it should be serving its customers and, therefore, what demands it should be placing on its own suppliers. There are three logical links that have to be correctly executed:
●● understanding customers’ needs correctly
●● understanding the association between what an operation’s customers need and therefore what its suppliers should be providing
●● ensuring that suppliers really do understand what is required.
These three links represent the information specifying market requirements flowing back up the supply chain. For the chain to be working effectively it is also necessary to ensure that the performance of each part of the chain is monitored. Again, any operation in the chain can identify three logical links which must be in place for effective supply chain performance monitoring.
●● Suppliers understand how they are performing.
●● The operation itself understands the association between its suppliers’ perform-ance and its ability to serve its own customers.
●● The operation is correctly interpreting its customers’ view of its own performance.
A model that identifies four types of mismatch that occur between and within each stage in a supply chain is shown in Figure 5.11 and Table 5.3. It pursues the analysis from the viewpoint of operation B – the focal operation. It highlights some obvious questions with which an operation can assess its own supply chain performance. Here it is enough to point out that, even in the simple three-stage supply chain shown in Figure 5.11, there are ample opportunities for gaps to exist between market requirements and operations performance within the chain.

170 chapter 5 • purchasIng and supply strategy
Operation B Operation COperation A
What Athinks
B wants
How Athinks it isperforming
Marketperception
gap
Marketperception
gap
Operationsimprovement gap
Supplychoice
Supplydevelopment
Market requirements
Operations performance
Supplierimprovement gap
What Bwants
What Bthinks
A wants
What Awants
How Bthinks A isperforming
How Bthinks it isperforming
How Cthinks B isperforming
Operationsperformance
gap
Operationsperformance
gap
Supplierimprovement gap
Operationsimprovement gap
Figure 5.11 potential perception mismatches in supply chains
supply chain instability
Put together both qualitative and quantitative dynamics and it is easy to understand why supply chains are rarely stable. Figure 5.12 shows the fluctuations in orders over time in a typical consumer goods chain. One can see that fluctuations in order levels (the demand at the preceding operation) increase in scale and unpredictability the further back an operation is in the chain, with relatively small changes in consumer demand causing wild and disruptive activity swings at the first tier, and subsequent suppliers. Four major causes of this type of supply chain behaviour can be identified.18
●● Demand forecast updating – this was the cause of the dynamics that were illustrated in Figure 5.10. The order sent to the previous operation in the chain is a function of the demand it receives from its own customers, plus the amount needed to replenish its inventory levels. In effect, the view an operation holds about future demand is being changed every decision period.
●● Order batching – every time a supermarket sells a box of breakfast cereal it does not order a replacement from its suppliers. Rather it waits until it needs to order a sufficient quantity to make the order administration, transport, etc. economic. This batching effect may be exaggerated further when many customers batch their orders simultaneously.
●● Price fluctuation – businesses often use the price mechanism in the short term to increase sales. The result of price promotions is that customers place orders for quantities of goods that do not correspond to their immediate needs, inducing distortions into the supply chain. Promotions have been called the ‘dumbest mar-keting ploy ever’ in a now famous Fortune magazine article.19
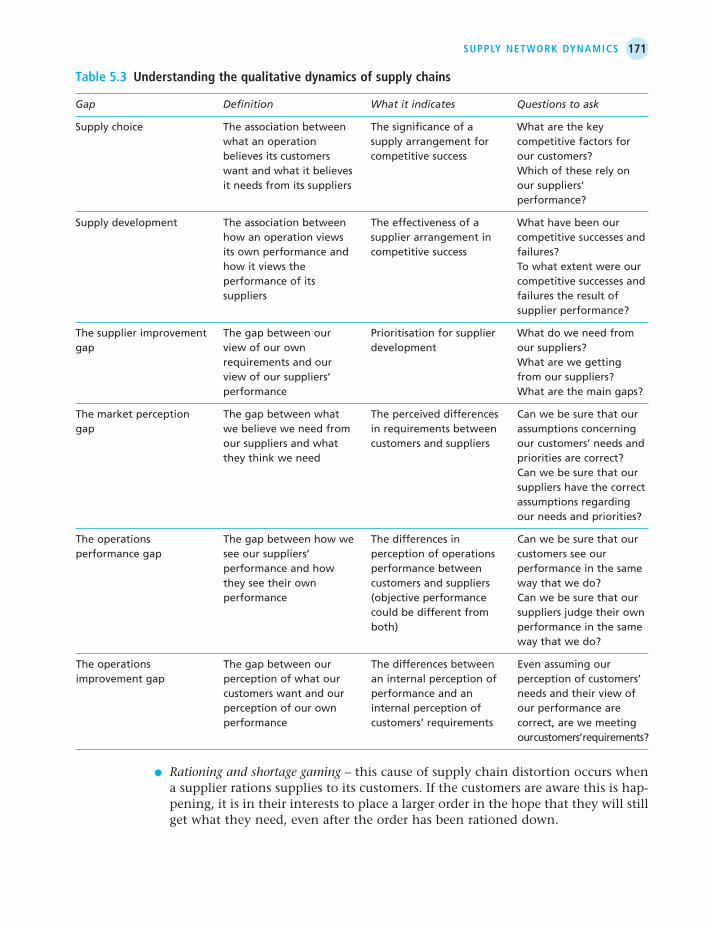
171supply netWork dynaMIcs
●● Rationing and shortage gaming – this cause of supply chain distortion occurs when a supplier rations supplies to its customers. If the customers are aware this is hap-pening, it is in their interests to place a larger order in the hope that they will still get what they need, even after the order has been rationed down.
table 5.3 understanding the qualitative dynamics of supply chains
Gap Definition What it indicates Questions to ask
Supplychoice Theassociationbetween Thesignificanceofa Whatarethekey whatanoperation supplyarrangementfor competitivefactorsfor believesitscustomers competitivesuccess ourcustomers? wantandwhatitbelieves Whichoftheserelyon itneedsfromitssuppliers oursuppliers’
performance?
Supplydevelopment Theassociationbetween Theeffectivenessofa Whathavebeenour howanoperationviews supplierarrangementin competitivesuccessesand itsownperformanceand competitivesuccess failures? howitviewsthe Towhatextentwereour performanceofits competitivesuccessesand suppliers failurestheresultof
supplierperformance?
Thesupplierimprovement Thegapbetweenour Prioritisationforsupplier Whatdoweneedfromgap viewofourown development oursuppliers? requirementsandour Whatarewegetting viewofoursuppliers’ fromoursuppliers? performance Whatarethemaingaps?
Themarketperception Thegapbetweenwhat Theperceiveddifferences Canwebesurethatourgap webelieveweneedfrom inrequirementsbetween assumptionsconcerning oursuppliersandwhat customersandsuppliers ourcustomers’needsand theythinkweneed prioritiesarecorrect? Canwebesurethatour
suppliershavethecorrectassumptionsregardingourneedsandpriorities?
Theoperations Thegapbetweenhowwe Thedifferencesin Canwebesurethatourperformancegap seeoursuppliers’ perceptionofoperations customersseeour performanceandhow performancebetween performanceinthesame theyseetheirown customersandsuppliers waythatwedo? performance (objectiveperformance Canwebesurethatour couldbedifferentfrom suppliersjudgetheirown both) performanceinthesame
waythatwedo?
Theoperations Thegapbetweenour Thedifferencesbetween Evenassumingourimprovementgap perceptionofwhatour aninternalperceptionof perceptionofcustomers’ customerswantandour performanceandan needsandtheirviewof perceptionofourown internalperceptionof ourperformanceare performance customers’requirements correct,arewemeeting
ourcustomers’requirements?

172 chapter 5 • purchasIng and supply strategy
Operations spend most of their supply chain effort in trying to overcome the worst effects of supply chain dynamics. While the first step in doing this is clearly to understand the nature of these dynamics, there are several, more proactive, actions that operations take. These include coordination activities, differentiation activities, and reconfiguration activities.
coordination
Efforts to coordinate supply chain activity have been described as falling into three categories as illustrated in Table 5.4.20
●● Information sharing – demand information, not just from immediate customers, is transmitted up the chain so that all the operations can monitor true demand, free of the normal distortions. Information regarding supply problems, or shortages, may also be transmitted down the line so that downstream customers can modify their schedules and sales plans accordingly.
●● Channel alignment – this is the adjustment of scheduling, material movements, pricing and other sales strategies, and stock levels to bring them into line with each other.
Wholesaler’s ordersto manufacturer
Manufacturer’sorders to its suppliers
Time0
10
Ord
ers
Time0
10
Ord
ers
Sales from store
Time0
10
Ord
ers
Store’s ordersto wholesaler
Time0
10
Ord
ers
Manufacturer
Wholesaler Retail store
Consumers
Figure 5.12 typical supply chain dynamics
Managing suppliers over time

173ManagIng supplIers over tIMe
●● Operational efficiency – each operation in the chain can reduce the complexity of its operations, reduce costs and increase throughput rate. The cumulative effect of these individual activities is to simplify throughput in the whole chain.
differentiation – matching supply network strategy to market requirements
Supply networks should differentiate between different market requirements. Supply chains, just like operations, need to ask, ‘How do we compete?’ If the answer turns out to be ‘We compete in different ways in different parts of the market’, then the supply chains serving those markets need to be organised in different ways. If a supply chain is organised in a standardised manner, notwithstanding the different market needs it is serving, it results in the supply distortions described previously. Here we will take an approach articulated by Marshall Fisher of Wharton Business School, who makes a connection between different types of market requirements and different objectives for operations resources.21
different market requirementsOperations producing one set of products and services may still be serving markets with different needs. For example, Volvo Heavy Truck Corporation, selling spare parts, found itself with a combination of poor service levels at the same time as its inventory levels were growing at an unacceptable rate. Market analysis revealed that spare parts were being used in two very different situations. Scheduled maintenance
table 5.4 coordinating mechanisms for reducing supply chain dynamic instability
Causes of supply chain Supply chain coordination activities instability Information sharing Channel alignment Operational efficiency
Demandforecastupdate Understandingsystem Vendor-managed Lead-timereduction dynamics inventory(VMI) Echelon-basedinventory Useofpoint-of-sale(POS) Discountforinformation control data sharing Electronicdata Consumerdirect interchange(EDI) Internet Computer-assisted ordering(CAO)
Orderbatching EDI Discountfortruck-load Reductioninfixedcostof Internetordering assortment orderingbyEDIor Deliveryappointments electroniccommerce Consolidation CAO Logisticsoutsourcing
Pricefluctuations Continuousreplenishment Everydaylowprice(EDLP) programme(CPR) Activity-basedcosting Everydaylowcost(EDLC) (ABC)
Shortagegaming Sharingsales,capacity Allocationbasedonpast andinventorydata sales
Source:AdaptedfromLee,H.L.et al.(1997)‘Thebullwhipeffectinsupplychains’,MITSloan Management Review,Spring,pp.93–102.Copyright©1997byMassachusettsInstituteofTechnology,allrightsreserved.Reproducedbypermission.

174 chapter 5 • purchasIng and supply strategy
was predictable, with spare parts ordered well ahead of time. Emergency repairs, however, needed instant availability and were far more difficult to predict. The fact that the parts are identical is irrelevant; they are serving two different markets with different characteristics. It is a simple idea and it applies in many industries. Chocolate manufacturers have their stable lines but also produce ‘media related’ spe-cials which may last only a matter of months. Garment manufacturers produce clas-sics, which change little over the years, as well as fashions that last only one season.
different resource objectivesThe design and management of supply chains involve attempting to satisfy two broad objectives – speed and cost. Speed means being responsive to customer demand within the chain. Its virtue lies in the ability it gives the chain to keep cus-tomer service high even under conditions of fluctuating or unpredictable demand. Speed can also keep costs down. Fast throughput in the supply chain means that products do not hang around in stock, and therefore the chain consumes little work-ing capital. Other contributors to keeping costs down include keeping the processes, especially manufacturing processes, well utilised.
achieving fit between market requirements and supply chain resource policiesProfessor Marshall Fisher’s advice to companies reviewing their own supply chain policies is, first, to determine whether their products are functional or innovative, second, to decide whether their supply chain is efficient or responsive, and third, to plot the position of the nature of their demand and their supply chain priorities on a matrix similar to that shown in Figure 5.13.
reconfiguration
The most fundamental approach to managing network behaviour is to reconfigure the network so as to change the scope of the activities performed in each operation and the nature of the relationships between them. This could mean changing the trading relationships between operations in the network, or merging the activities currently performed in two or more separate operations into a single operation, or bypassing a stage in a current supply network. When one or more operations are bypassed in a supply chain the rather clumsy term ‘disintermediation’ is used. This need not mean that those bypassed operations become totally redundant; it just means that for some final customers they are not used. So, for example, when internet retailers started selling goods to consumers through their websites, it ‘disin-termediated’ retail stores. Yet retail stores still exist; indeed the internet has become an alternative channel for providing service to customers. Disintermediation is becoming a particularly significant issue because of the potential of technology to bypass traditional elements in supply chains. For exam-ple, originally corporate banks serving large business clients borrowed money on the capital markets at one rate of interest and lent it to their corporate clients at a higher rate of interest. This ‘spread’ between the two interest rates was how they earned their revenue. Other services that might have been provided to clients were used to justify, or even increase, this spread. Now large corporations have direct access to those same capital markets, partly because information technology makes it easy for them to do so. Corporate banking now makes its revenue by guiding and facilitating

175purchasIng and supply chaIn rIsk
this process, advising clients on the best way to exploit capital markets. Corporate banks charge fees for these services. Disintermediation has caused the whole busi-ness model of corporate banking to change.
Operations resources
Mar
ket
req
uire
men
ts
EFFICIENTPROCESSES
Low costHigh utilisationMin. inventory
Low-cost suppliers
Mismatch Match
Match Mismatch
Fast responseLow T/P timeDeployed inventoryFlexible suppliers
RESPONSIVEPROCESSES
FUN
CTI
ON
AL
INN
OVA
TIV
E
Pre
dic
tab
leFe
w c
hang
esLo
w v
arie
tyP
rice
stab
leLo
ng le
ad-t
ime
Low
mar
gin
Unp
red
icta
ble
Man
y ch
ange
sH
igh
varie
tyP
rice
mar
k-d
owns
Sho
rt le
ad-t
ime
Hig
h m
argi
n
Figure 5.13 Matching the operations resources in the supply chain with market requirements
purchasing and supply chain risk
The increased significance of purchasing and supply strategies reflects the grow-ing importance of outsourcing and reliance on global supply networks. We have already discussed the numerous significant benefits associated with these trends (i.e. efficiency, improved business focus, reduced capital investment, etc.) but inevita-bly increased dependence on suppliers increases exposure to suppliers risk profiles. Consider the attractions of building a strong relationship with a single source of supply. This might offer the buyer significant benefits – extra leverage in terms of volume discounts, easy sharing of market and operational data, etc. – but for all the additional capability that such an arrangement provides it also, as per our previ-ous discussion of transaction cost economics, creates extra rigidity and risk. More obviously, since the publication of the first edition of this book, numerous events have had a major impact on global supply networks. But regardless of whether we are discussing the September 11 terrorist attacks, the Severe Acute Respiratory
Source:AdaptedfromFisher,M.C.(1997)‘Whatistherightsupplychainforyourproduct?’Harvard Business Review,March–April,pp.105–116.

176 chapter 5 • purchasIng and supply strategy
Syndrome (SARS) pandemic in 2002–2003, the banking crisis and subsequent eco-nomic recession, or the Icelandic Eyjafjallajökull volcano that grounded flights across Europe for a week in 2010 – all of these events caused significant disruptions to supply chains and produced major losses for many companies involved. Even less severe events can trigger significant supply chain problems and have a correspond-ing impact on financial performance: stock market reactions to announcements of supply disruptions have resulted in market capitalisation declines of as much as 10 per cent.22
categories of purchasing and supply risks
So what are the key purchasing supply chain-related risks? Some are in the category discussed above, major disruptions that become headlines across the world, and others are less public but still potentially devastating in terms of their consequences. Table 5.5 offers a helpful starting point for considering these different risk categories and then, more importantly, deciding what needs to be done to avoid and/or miti-gate their impact. All the risks identified in Table 5.5 can be managed – not necessarily avoided, but certainly managed. A firm can always avoid single-source supply arrangements; always purchase more capacity than necessary; pay to hedge exchange rate and
table 5.5 Indicative purchasing and supply-related risks
Category of risk Typical drivers of risk
Supplydisruptions Naturaldisaster(e.g.volcano) Industrialdispute(e.g.postalstrike) Supplierbankruptcy Warandterrorism
Supplydelays Highcapacityutilisationatsupplysource Inflexibilityofsupplysource Poorqualityoryieldatsupplysource Internationaltravel(includingcustoms,etc.)
Systemsbreakdown Upgradinginformationinfrastructure Web‘attack’one-commerce
Forecastinaccuracy Longlead-times,seasonality,productvariety,shortlifecycles,smallcustomerbase ‘Bullwhipeffect’causedbysalespromotions,incentives,lackofvisibilityand
demandexaggeration
Lossofintellectualproperty Globaloutsourcing/overlappingsupplybase WeakerIPenforcementregimes
Procurementproblems Exchangeraterisk Rawmaterialpriceincreases Industry-widecapacityutilisation Weakcontractingcapability
Inventorycosts Rateofproductobsolescence Inventoryholdingcost Demandandsupplyuncertainty
Source:adaptedfromChopra,S.andSodhi,M.S.(2004)‘Managingrisktoavoidsupply-chainbreakdown’,MIT Sloan Management Review,Fall,46(1).
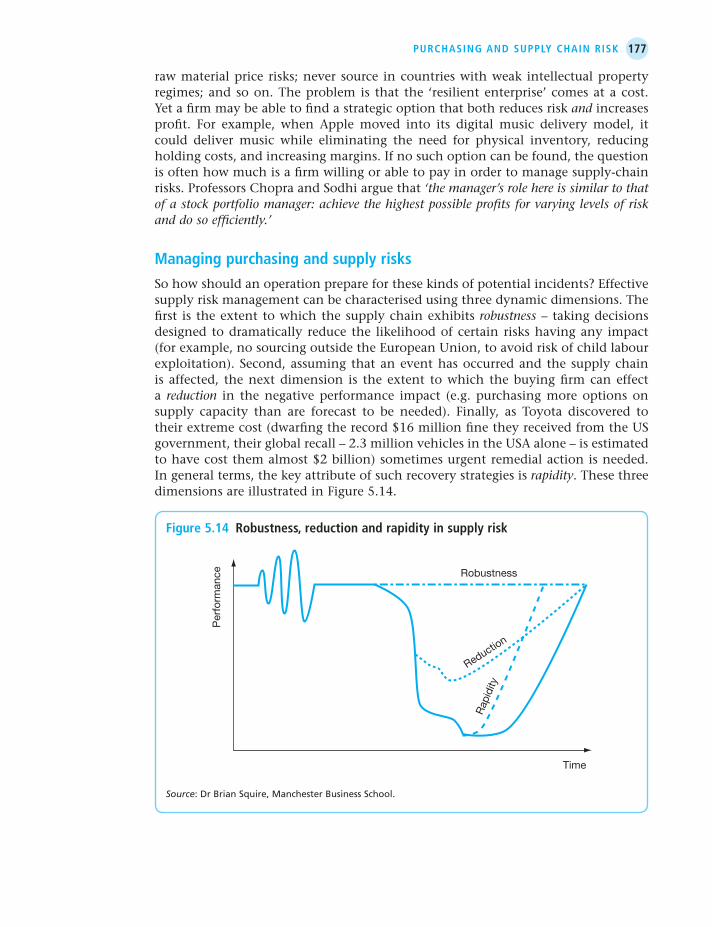
177purchasIng and supply chaIn rIsk
raw material price risks; never source in countries with weak intellectual property regimes; and so on. The problem is that the ‘resilient enterprise’ comes at a cost. Yet a firm may be able to find a strategic option that both reduces risk and increases profit. For example, when Apple moved into its digital music delivery model, it could deliver music while eliminating the need for physical inventory, reducing holding costs, and increasing margins. If no such option can be found, the question is often how much is a firm willing or able to pay in order to manage supply-chain risks. Professors Chopra and Sodhi argue that ‘the manager’s role here is similar to that of a stock portfolio manager: achieve the highest possible profits for varying levels of risk and do so efficiently.’
Managing purchasing and supply risks
So how should an operation prepare for these kinds of potential incidents? Effective supply risk management can be characterised using three dynamic dimensions. The first is the extent to which the supply chain exhibits robustness – taking decisions designed to dramatically reduce the likelihood of certain risks having any impact (for example, no sourcing outside the European Union, to avoid risk of child labour exploitation). Second, assuming that an event has occurred and the supply chain is affected, the next dimension is the extent to which the buying firm can effect a reduction in the negative performance impact (e.g. purchasing more options on supply capacity than are forecast to be needed). Finally, as Toyota discovered to their extreme cost (dwarfing the record $16 million fine they received from the US government, their global recall – 2.3 million vehicles in the USA alone – is estimated to have cost them almost $2 billion) sometimes urgent remedial action is needed. In general terms, the key attribute of such recovery strategies is rapidity. These three dimensions are illustrated in Figure 5.14.
Per
form
ance
Time
Robustness
Reduction
Rap
idity
Figure 5.14 robustness, reduction and rapidity in supply risk
Source:DrBrianSquire,ManchesterBusinessSchool.

178 chapter 5 • purchasIng and supply strategy
suMMary ansWers to key questIons
What is purchasing and supply strategy?A supply network is an interconnection of organisations that relate to each other through upstream and downstream linkages between the different processes and activities that produce value in the form of products and services to the ultimate consumer. Purchasing and supply strategy is the strategic direction of an organi-sation’s relationships with suppliers, customers, suppliers’ suppliers, customers’ customers, etc. It includes understanding the supply network context, determin-ing supply network relationships, and understanding the dynamics of the supply network.
What should we ‘do’ and what should we ‘buy’?Deciding on the extent of outsourcing (or lack of vertical integration) involves an operation in drawing the boundaries of its organisation in terms of the direction of integration, the extent, or span, of integration, and the balance between its verti-cally integrated stages. In doing so, an organisation is primarily trying to leverage the advantages of coordination, and cost reduction, as well as trying to secure prod-uct and process learning. However, the disadvantages of vertical integration can be significant. The internal monopoly effect is often held to inhibit improvement. In addition, vertical integration is said to limit economies of scale, reduce flexibility, insulate a firm from innovation, and be distracting from what should be the core activities of the firm. In determining what is effective, the firm must pay full atten-tion to the possibility of opportunistic supplier behaviour. Insights from transaction cost economics can be used to help make these types of decision.
how do we buy; what is the role of contracts and/or relationships?Contracts are those explicit (usually written, often detailed) and formal documents that specify the legally binding obligations and roles of both parties in a relation-ship. Contracts and relationships are the basic ingredients of any supply arrange-ment. Market-based supply depends on contracts while ‘partnerships’ are built on relationships. The issue of trust is important in partnerships; strong trusting relationships can facilitate outsourcing of even critical activities. Long-term partner-ships with a relatively small number of strategic partners have been put forward as a way of maintaining the coordination and low transaction cost effects of vertical integration, while at the same time avoiding the internal monopoly effect on opera-tions improvement. The major problem with partnerships, however, is the difficulty of maintaining the attitudes and activities that bolster the high degree of trust which is necessary for them to work effectively.
how do we manage supply dynamics?Because supply networks are interrelationships of independent operations, the way in which each operation relates to the others in the network provides an opportu-nity for supply network distortions. These distortions can be considered in both a quantitative and a qualitative sense. Quantitative distortions are caused by the necessity to manage the inventories between operations in the supply network. This can lead to short-term imbalance between supply and demand, the overall effect of

179Further readIng
which is to amplify the level of activity fluctuations back up the supply chain. So, relatively small changes in ultimate demand can cause very large changes in the output levels of operations upstream in the supply chain. Qualitative distortions can occur through misperceptions in the way market requirements are transmitted up a supply chain and the way in which operations performance is viewed down the supply chain. They can also be caused by mismatches between what is perceived as required by customers and suppliers and the performance that is perceived as being given to customers.
how do we manage suppliers over time?Operations attempt to overcome the worst effects of distortions in the supply chain, usually by one of three methods: coordination, differentiation and recon-figuration. Coordination attempts to line up the activities of operations in a supply chain through information sharing, channel alignment and changes in operational efficiency. Differentiation involves adopting different supply chain management strategies for different types of market. Reconfiguration involves changing the scope and shape of a supply chain. This may mean attempting to merge or reorder the activities in a supply chain, so as to reduce complexity or response times in the net-work. Increasingly, technology is having the effect of disintermediating operations in supply chains.
how do we manage supply chain risks?Increased dependence on suppliers increases exposure to risk. Social, political, geo-graphic and many other factors all produce significant disruptions for supply chains and can produce major losses for companies. There are several categories of purchas-ing and supply risks, such as supply disruptions, supply delays, systems breakdown, forecast inaccuracy, procurement problems and so on. Supply risk management uses three dynamic dimensions: robustness (reducing the likelihood of risks having an impact), reduction and rapidity (reducing the recovery time).
Further reading
Barney, J.B. (1999) ‘How a firm’s capabilities affect its boundary decisions’, Sloan Management Review, Spring.
Brandenburger, A.M. and Nalebuff, B.J. (1996) Co-opetition, New York: Doubleday.Caplan, S. and Sawhney, M. (2000) ‘E-hubs: the new B2B market places’, Harvard Business
Review, May–June.Chopra, S. and Meindl, P. (2009) Supply Chain Management. 4th edn. Harlow, UK: Pearson
Education.Christopher, M. (2004) Logistics and Supply Chain Management: Creating Value – Adding
Networks. 3rd edn. Harlow, UK: Financial Times Prentice Hall.Cohen, S. and Roussel, J. (2004) Strategic Supply Chain: The Five Disciplines for Top
Performance. McGraw-Hill.Farrington, B. and Lysons, K. (2005) Purchasing and Supply Chain Management. 7th edn.
Harlow, UK: Financial Times Prentice Hall.Friedman, T. (2005) The World is Flat: A Brief History of the Globalised World in the Twenty-
first Century, Allen Lane. (2006) Penguin.

180 chapter 5 • purchasIng and supply strategy
Handley, S.M. and Benton, W.C. Jr. (2009) ‘Unlocking the business outsourcing process model’, Journal of Operations Management, 27, pp. 344–361.
Harvard Business School (2006) Harvard Business Review on Supply Chain Management. Boston, MA: Harvard Business School Press.
Lysons, K. and Farrington, B. (2005) Purchasing and Supply Chain Management. 7th edn. Harlow, UK: Financial Times Prentice Hall.
Van Weele, A. (2009) Purchasing and Supply Chain Management: Analysis, Strategy, Planning and Practice. 5th edn. Cengage Learning.
notes on the chapter
1 Source: Serco website 2010. 2 Source: Sunday Times (2006) ‘How British is that car?’, 21 May. 3 Brandenburger, A.M. and Nalebuff, B.J. (1996) Co-opetition. New York: Doubleday. 4 The Economist (2009) ‘Globalisation’. Economist.com, 20 July. 5 Minahan, T. (2003) ‘Global sourcing: what you need to know to make it work’, CIO.com,
11 August. 6 Source: company website, www.levistrauss.com/responsibility/conduct/guide-lines 7 McDougall, D. (2007) ‘Gap child labour shame’, The Observer, 28 October. 8 For example, see Ford, D.L. (1998) Managing Business Relationships. New York: John Wiley
& Sons. 9 Hayes, R. and Wheelwright, S.C. (1984) Restoring our Competitive Edge: Competing through
Manufacturing. New York: John Wiley & Sons.10 Sources include: The Economist (2010) ‘Laid-off lawyers, cast-off consultants’, Economist print
edition, 21 January; Pangea3 website, 2010.11 Source: (2010) ‘Work in the digital age – A clouded future’, The Economist. 13 May.12 Parkhe, A. (1993) ‘Strategic alliance structuring: a game theoretic and transaction cost
examination of interfirm co-operation’, Academy of Management Journal, Vol. 36, pp. 794–829.
13 Child, J. and Faulkner, D. (1998) Strategies of Co-operation: Managing Alliances, Networks and Joint Ventures. Oxford: Oxford University Press.
14 Lane, C. and Backmann, R. (eds) (1998) Trust Within and Between Organisations. Oxford: Oxford University Press.
15 Poppo, L., Zheng Zhou, K. and Ryu, S. (2008) ‘Alternative origins to interorganizational trust: an interdependence perspective on the shadow of the past and the shadow of the future’, Organization Science, 19(1), pp. 39–55.
16 Forrester, J.W. (1961) Industrial Dynamics. Boston, MA: MIT Press.17 Lee, H.L., Padmanebhan, V. and Wang, S. (1997) ‘The bullwhip effect in supply chains’,
Sloan Management Review, Spring, pp. 93–102.18 Ibid.19 Sellers, P. (1992) ‘The dumbest marketing ploy’, Fortune, 126(5), pp. 88–93.20 Lee, H.L. et al. (1997) op. cit.21 Fisher, M.L. (1997) ‘What is the right supply chain for your product?’, Harvard Business
Review, March–April, pp. 105–116.22 Hendricks, K. and Singhal, V.R. (2005). ‘The effect of supply chain disruptions on long-
term shareholder value, profitability, and share price volatility’, Production and Operations Management, 14(1), pp. 35–52.

chapter
process technology strategy6
Technology has a profound impact on all operations. Yet, despite a widespread acceptance of its significance, strategic analysis too often treats it as a ‘black box’ fit only for technical experts. However, all operations need to understand the analyti-cal dimensions for identifying the technical, managerial and ‘operations strategy’ characteristics of technology (see Figure 6.1). This is an essential prerequisite for deciding ‘what’ technological options to explore. Operations need to clarify exactly ‘why’ the investments in process technology investments can give strategic advan-tage, and explore ‘how’ managers can make such investments work in practice: that is, how can they ensure that their investments are implemented so as not to waste the potential of the process technology? The risks associated with implementation are particularly important, given the number of high-profile failures and claims of waste that seem to go hand-in-hand with such investments.
Introduction
Quality
Speed
Dependability
Flexibility
Cost
Per
form
ance
ob
ject
ives
Mar
ket
com
pet
itive
ness
Capacity Supplynetwork
Decision areas
Resource usage
Developmentand
organisation
Issues include:• Characterising process
technologies• Understanding the general
characteristics of process technologies over time
• The effect of new forms of technology on performance
• Evaluating process technology• The impact of process
technology on performance objectives
Process technologystrategy
Figure 6.1 this chapter looks at process technology strategy
182 chapter 6 • process technology strategy
Although the word ‘technology’ is frequently used in managerial conversation, what does this term actually mean? We employ a generic definition for technology similar to that used as a corporate slogan by white goods manufacturer Zanussi. In their advertisements they talk about their products being the result of the appliance of science. In this chapter we shall be examining how process technologies add value in the creation of products and services. Therefore, combining the Zanussi slogan with our transformation process view of operations, we can say that process tech-nology is the ‘appliance of science to any operations process’. Note the ‘process’ in this definition. In this chapter we shall focus upon process technology as distinct from product or service technology. In manufacturing operations, it is a relatively simple matter to separate the two. For example, the product technology of a computer is embodied in its hardware and software. But the process technology that manufac-tured the computer is the technology that assembled all the different components. In service operations it can be far more difficult to distinguish process from product/service technology. For example, theme parks like Disney World use flight simulator technologies in some of their rides. These are large rooms mounted on a movable hydraulic platform that, when combined with wide-screen projection, gives a realis-tic experience of, say, space flight. But is it product/service or process technology? It clearly processes Disney’s customers, yet the technology is also part of the product – the customers’ experience. Product/service and process technologies are, in effect, the same thing.
Direct or indirect process technology
A common misapprehension is that the term ‘process technology’ describes only technology that acts directly on resource inputs to their operations. Yet both manu-facturing and service operations are increasingly reliant upon less ‘direct’ forms of technology. Infrastructural and information technologies that help control and coordinate direct processes are having a major impact on operations. In mass serv-ices like retailing, stock control systems link specific customer requirements into complex supply chains. Intelligent yield planning and pricing systems provide air-lines with the cornerstone of their competitive strategies. Many professional service firms (consultants, accountants, engineers, etc.) utilise information databases in order to retain knowledge and experience. But the distinction between direct and indirect process technology is not always clear. For example, the ‘direct’ functional capabilities of an insurance company’s IT system will define the types of product
●● What is ‘process’ technology strategy?
●● What are suitable dimensions for characterising process technology?
●● how do market volume and variety influence process technology?
●● What are some of the challenges of information technology?
●● how can process technology be evaluated strategically?
key questIons
What is process technology strategy?
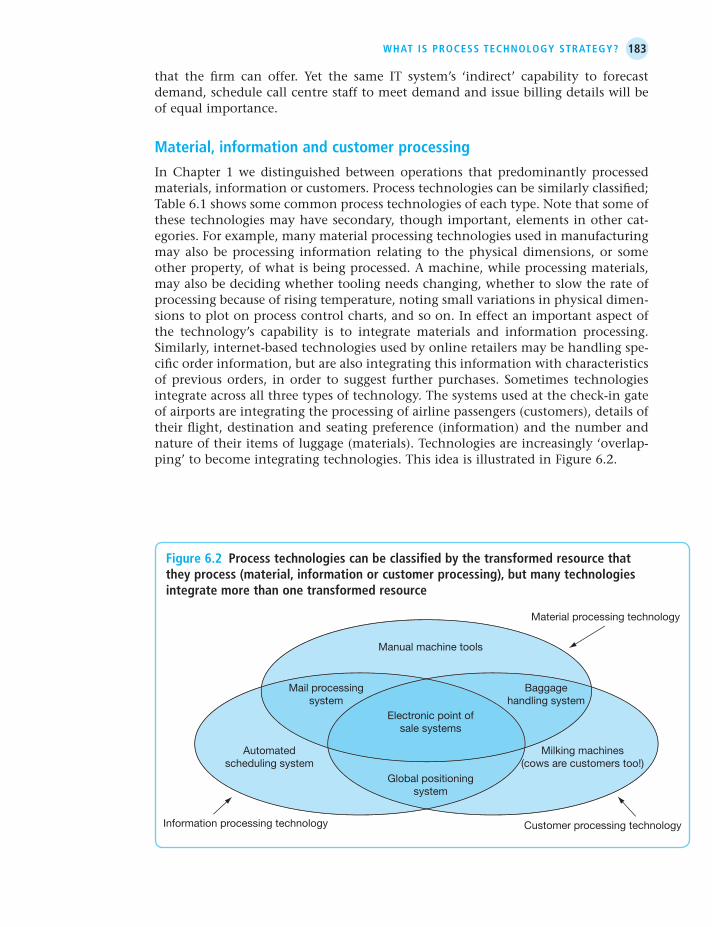
183What Is process technology strategy?
that the firm can offer. Yet the same IT system’s ‘indirect’ capability to forecast demand, schedule call centre staff to meet demand and issue billing details will be of equal importance.
Material, information and customer processing
In Chapter 1 we distinguished between operations that predominantly processed materials, information or customers. Process technologies can be similarly classified; Table 6.1 shows some common process technologies of each type. Note that some of these technologies may have secondary, though important, elements in other cat-egories. For example, many material processing technologies used in manufacturing may also be processing information relating to the physical dimensions, or some other property, of what is being processed. A machine, while processing materials, may also be deciding whether tooling needs changing, whether to slow the rate of processing because of rising temperature, noting small variations in physical dimen-sions to plot on process control charts, and so on. In effect an important aspect of the technology’s capability is to integrate materials and information processing. Similarly, internet-based technologies used by online retailers may be handling spe-cific order information, but are also integrating this information with characteristics of previous orders, in order to suggest further purchases. Sometimes technologies integrate across all three types of technology. The systems used at the check-in gate of airports are integrating the processing of airline passengers (customers), details of their flight, destination and seating preference (information) and the number and nature of their items of luggage (materials). Technologies are increasingly ‘overlap-ping’ to become integrating technologies. This idea is illustrated in Figure 6.2.
Information processing technology
Mail processingsystem
Manual machine tools
Baggagehandling system
Global positioningsystem
Milking machines(cows are customers too!)
Electronic point ofsale systems
Automatedscheduling system
Material processing technology
Customer processing technology
Figure 6.2 process technologies can be classified by the transformed resource that they process (material, information or customer processing), but many technologies integrate more than one transformed resource

184 chapter 6 • process technology strategy
process technology strategy
We define process technology strategy as ‘the set of decisions that defines the strategic role that direct and indirect process technology can play in the overall operations strategy of the organisation and sets out the general characteristics that help to evaluate alternative technologies’. Operations managers cannot avoid involvement with process technol-ogies. They work with them on a day-by-day basis and should also be able to articu-late how technology can improve operational effectiveness. Other functional areas will, of course, also be involved; engineering/technical, accountancy and human resources. Yet it is operations that must act as ‘impresario’ for other functional areas’ contributions, and which are likely to take responsibility for implementation. And to carry out their ‘impresario role’, operations should have a grasp of the techni-cal nature of process technologies. This does not necessarily mean that operations managers need to be experts in engineering, computing, biology, electronics, or whatever the core science behind the technology is, but they need to know enough about the technology to be comfortable in evaluating technical information, and be able to ask relevant questions of the technical experts. These questions include the following:
●● What does the technology do that is different from other similar technologies?
●● How does it do it?
●● What constraint does using the technology place on the operation?
●● What skills will be required from the operations staff in order to install, operate and maintain the technology?
●● What capacity does each unit of technology have?
●● What is the expected useful lifetime of the technology?
process technology should reflect volume and variety
Although process technologies vary between different types of operation, there are some underlying characteristics that can be used to distinguish between them. These characteristics are strongly related to volume and variety, with different pro-cess technologies appropriate for different parts of the volume–variety continuum. High variety–low volume processes generally require process technology that is
table 6.1 some process technologies classified by their primary inputs
Material processing technologies Information processing technologies Customer processing technologies
Flexible manufacturing systems Optical character recognition Surgical equipment (FMS) machines Milking machines Weaving machines Management information systems Medical diagnostic equipment Baking ovens Global positioning systems Body scanners Automatic vending machines Search engines on the internet Aircraft Container handling equipment Online financial information Mass rapid transport (MRT) systems Trucks systems Renal dialysis systems Automated guided vehicles (AGVs) Telecommunication technologies Cinema digital projection Automatic warehouse facilities Archive storage systems Computer games Low temperature warehouses Theme park rides

185scale/scalabIlIty – the capacIty oF each unIt oF technology
general purpose, because it can perform the wide range of processing activities that high variety demands. High volume–low variety processes can use technology that is more dedicated to its narrower range of processing requirements. Within the spec-trum from general purpose to dedicated process technologies three characteristics in particular tend to vary with volume and variety. The first is the extent to which the process technology carries out activities or makes decisions for itself, that is, its degree of ‘automation’. The second is the capacity of the technology to process work, that is, its ‘scale’ or ‘scalability’. The third is the extent to which it is integrated with other technologies, that is, its degree of ‘coupling’ or ‘connectivity’. We shall look at each of these characteristics.
scale/scalability – the capacity of each unit of technology
Scale is an important issue in almost all process technologies and is closely related to the discussion in Chapter 4 dealing with capacity strategy. Here we delve inside ‘capacity’ to explore how individual units of process technology go to make up the overall capacity of an operation. For example, consider a small regional airline serv-ing just one main route between two cities. It has an overall capacity of 2,000 seats per day in either direction on its route. This capacity is ‘defined’ by its two 200-seater aircraft making five return journeys each day between the two cities. An alternative plan would be to replace its two identical 200-seat aircraft with one 250-seater and one 150-seater. This gives the company more flexibility in how it can meet varying demand levels throughout the day. It also may give more options in how its aircraft are deployed, should it take on another route and buy additional aircraft. Of course, costs will be affected by the company’s mix of aircraft. Generally, at full utilisa-tion larger aircraft offer superior cost performance per passenger mile than smaller aircraft. The important point here is that, by adopting units of process technology (aircraft) with different scale characteristics, the airline could significantly affect its operation’s performance. Factors influencing the desirability of large-scale technol-ogy include the following considerations.
●● What is the capital cost of the technology? Broadly speaking, the larger the unit of technology, the more is its capital cost but the less its capital cost per unit of capacity. Similarly, the costs of installing and supporting the technology are likely to be lower per unit of output. Likewise, operating (as opposed to capital) costs per unit are often lower on larger machines, the fixed costs of operating the plant being spread over a higher volume.
●● Can the process technology match demand over time? As discussed in Chapter 4, there is a traditional trade-off between large increments of capacity exploiting economies of scale but potentially resulting in a mismatch between capacity and demand, and smaller increments of capacity with a closer match between capac-ity and demand but fewer economies of scale. The same argument clearly applies to the units of process technology that make up that capacity. Also, larger incre-ments of capacity (and therefore large units of process technology) are difficult to stream on and off if demand is uncertain or dynamic. Small units of process technology with the same or similar processing costs as larger pieces of equipment would reduce the potential risks of investing in the process technology. This is why efficient but smaller-scale technologies are being developed in many indus-tries. Even in industries where received wisdom has always been that large scale is

186 chapter 6 • process technology strategy
economic (e.g. steel and electricity generation), smaller, more flexible operations are increasingly amongst the most profitable.
●● How vulnerable is the operation? Building an operation around a single large machine introduces greater exposure to the risk of failure. Suppose that the choice is between setting up a mail sorting operation with ten smaller or one very large machine. If there is a single machine failure, then the operation with ten machines is more robust, as 90 per cent of the mail can still be sorted. In the large-scale machine operation, no mail can be sorted.
●● What scope exists for exploiting new technological developments? Many forms of pro-cess technology are advancing at a rapid rate. This poses a threat to the useful life of large units of technology. If an operation commits substantial investment to a few large pieces of equipment, it changes them only infrequently and the opportunities for trying out new ideas are somewhat limited. Having a broader range of different technological options (albeit each of a smaller scale) makes it easier to take advantage of new developments – provided the operation can cope with potential inconsistencies.
From ‘scale’ to ‘scalability’
Information processing technologies are an important exception to some of the issues discussed above. Information is transmitted far more easily between units of technology than either materials or customers. Information technology also has the capability of overcoming traditional links between volume and variety. Both of these factors mean that information technology processes can be linked relatively easily to combine their total processing capacity. Because of this, in many new tech-nologies, the dynamic capacity challenges relate less to absolute scale and more to scalability. By scalability we mean the ability to shift to a different level of useful capacity quickly, cost-effectively and flexibly. Yet one of the key challenges for information processing technology is still to judge how much computing capacity is required. This is especially true if the process technology is customer facing and in a dynamic marketplace (such as e-commerce) where demand uncertainty and vari-ability are common. As many business-to-consumer internet-based businesses have discovered, too little capacity means that the technology (web-site server, etc.) can quickly become swamped and lead to extreme customer dissatisfaction. (It is worth reflecting at this point on your own experience of trying to connect to and use a very busy website.) Conversely, too much technology means excess invested capital to service too few customers. Scalability, however, does depend on the ability of IT systems to work together. Upgrading the functionality (what it can do) of an IT system is usually a matter of evolution rather than revolution. Sometimes totally separate and only partially connected systems are installed alongside existing ones. So, some IT systems finish up with patched and inconsistent system architectures. This does not mean that they are in themselves inefficient. However, it does make them difficult to scale up because they do not fit conveniently with other units of technology. Thus the underlying consistency and stability of an IT platform’s architecture are important determinants of its scalability. Also, a more stable platform often will have support staff who have developed a greater depth of expertise. Similarly, if IT is stable and standardised, one of the possible reasons for changing a process is removed. It is

187Degree oF autoMatIon/‘analytIcal content’– What can each unIt oF technology Do?
partly because of these issues that many organisations have adopted ‘off-the-shelf’ internal business process management systems such as enterprise resource planning (ERP). Indeed, many adopters of ERP systems have chosen to change their business processes to match the IT rather than the other way around. This is explained fur-ther later in this chapter.
Degree of automation/‘analytical content’– what can each unit of technology do?
No technology (as yet) operates continually, totally and completely in isolation, without ever needing some degree of human intervention. The degree of human intervention varies from almost continual (the driver’s control over a bus) to the very occasional (an engineer’s control in an automated pharmaceutical plant). This relative balance between human and technological effort is usually referred to as its capital intensity or degree of automation of the technology. Early applications of automation to material transformation processes revolved around relatively simple and regularly repeated tasks, because technology is ‘dumber’ than humans; it cannot match people in many delicate tasks or those requiring complex (and especially intuitive) thought processes. But low automation often means higher direct costs, a requirement for control skills and human creativity, whereas automated technology can repeat tasks endlessly, and is capable of repeating these tasks with precision, speed and power. However, in many cases there have not been overall savings associ-ated with automation, especially if a complex system requires regular and expensive maintenance. It is common for a shift towards greater capital intensity to necessitate the employment (either directly or contractually) of more engineers, programmers, etc. who normally come with a much higher price tag than the direct labour that was replaced. Other potential downsides of automated technology include possible decreases in flexibility (labour-intensive technologies can usually be changed more readily than capital-intensive technologies) and dependability (highly automated technology can be less robust than a more basic ‘tried and tested’ technology).
From ‘automation’ to ‘analytical content’
Again, information processing technologies are, to some extent, an exception. Even when considering automation of the most sophisticated forms of material and customer processing technology, there is usually an underlying strategic choice to be made about the balance between people and technology. The choice is often between emphasising the power, speed and general physical abilities of automation against the flexible, intuitive and analytical abilities of human beings. However, an increasing number of purely information transformation processes are entirely automated (including most processing technology in the financial services sector, for instance). We need a different metric to differentiate between different informa-tion processing technologies that are 100 per cent ‘automated’, or very close to it. Consider the range of new information-based technologies. Sophisticated data management and decision-making systems are being used to enhance existing pro-cesses. These might include adding automatic measurement and process control to manufacturing technology, or the use of expert systems to help authorise financial transactions. Two drivers influence the analytical content of the technology. The

188 chapter 6 • process technology strategy
first is the amount of parallel processing required. One of the real operational attrac-tions of IT is that it can transform sequential tasks into ones that can be carried out in parallel. This parallel processing could be in a complex multinational design process, such as that used by Ford for its global product development platform, or more simply in IT ‘work-flow’ applications for compiling an insurance policy. In order to do this, and regardless of the precise tasks, the IT requires internal schedul-ing and data management protocols that are inherently more analytical than those employed in a straightforward sequential process. The second is the level of cus-tomer interaction. The greater the degree of customer interaction that is required, the greater is the information ‘richness’ that must be input, processed and output. This can be directly related to the underlying task complexity with which the tech-nology has to cope. Although using the keypad on your cell phone to order cinema seats with a credit card is a valuable automated and interactive service, such a system is really only a virtual vending machine. The system has a finite (and relatively small) number of options (just like the limited range of snack foods in a vending machine). The analytical content of the system, such as checking seat availability and verifying the credit card, is relatively low (using the vending machine analogy again, it is like checking if a particular candy bar has run out and then verifying that coins are correct).
Degree of coupling/connectivity – how much is joined together?
Process technologies are increasingly coupled together. Many newer advanced manu - facturing technologies derive their competitive cost and quality advantages from the ‘coupling’ or integration of activities that were previously separated. Coupling could consist of physical links between pieces of equipment, for example a robot removing a piece of plastic from an injection moulding machine and locating it in a machine tool for finishing, or it could mean merging the formerly managerial tasks of scheduling and controlling these machines with their physical activities to form a synchronised whole. Many of the direct benefits associated with increased coupling echo those described with respect to automation and scale. For example, the integration of separate processes often involves high capital costs; increasing coupling removes much of the fragmentation caused by physical or organisational separation (what is called ‘straight-through processing’ in financial services); closer coupling can lead to a greater degree of synchronisation, thereby reducing work-in-process and costs; and closer integration can increase exposure (with positive and negative effects) if there is a failure at any stage.
From ‘coupling’ to ‘connectivity’
Coupling in information processing technology once meant physically ‘hard wiring’ together disparate process elements and, as a result, was economically viable only at higher volumes and lacked the flexibility to cope with very high variety. However, more recently information processing has moved towards platform independence, allowing communication between computing devices regardless of their specifica-tion and, increasingly, organisational boundaries. For example, supermarkets have dramatically altered the way they manage their buying process. Connected IT systems allow many suppliers access to a common data portal that gives real-time information about how products are selling in all stores. Such systems enable the

189Degree oF couplIng/connectIvIty – hoW Much Is joIneD together?
supply companies to modify their production schedules in order to meet demand more precisely and ensure fewer stock-outs. Here the defining technological charac-teristic associated with platform independence is not coupling in the classic sense of integration, but rather a greater degree of connectivity. The issues connected with connectivity are similar to those concerned with scalability and analytical content. Low connectivity is often associated with idio-syncratically designed, bespoke and ‘legacy’ IT systems. Often such systems come with restricted opportunities for the access that is a prerequisite to connectivity. High-connectivity technologies, on the other hand, are usually based on the plat-form independence discussed above and have the bandwidth capacity to enable rich communications. Sometimes, however, their very openness and easy access can give security concerns. Much new technology, although offering wonderful levels of con-nectivity, creates new opportunities for fraud, ‘denial of service’ attacks, and so on. Two key drivers have allowed ‘connectivity’ to develop at such a phenomenal rate.
●● Hardware development. Client/server systems (initially promoted as a less costly replacement for mainframe technology) have permitted the separation of user interfaces, processing applications and data sources. This has encouraged the development of interconnection technology, including software protocols and connection technology (such as bandwidth enhancement).
●● Software development. Arguably, the distinguishing feature of the development of the World Wide Web has been the adoption of a universal browser interface, which has considerably expanded the potential for connectivity.
When the IBM computer ‘Deep Blue’ beat the world chess champion, Gary Kasparov, it rein-forced an image that had been around in popular culture for years – that computers eventu-ally will take over from human beings, either benignly in order to make our lives easier or, more worryingly, in some Terminator-type struggle for dominance. Even within the more mundane world of business, there is an underlying assumption that the limits to advances in process technology are governed by the limits to computing power, and the limits to computing power will take only a combination of time, money and effort to overcome. And a combination of sheer computing power and clever algorithms has now mastered most games enough to beat mere humans. But computers cannot, and probably will never be able to, perform certain tasks. Some problems are inherently non-computable. It can be mathematically proven that some tasks cannot be solved by computer, such as figuring out whether it is possible to cover an infinitely large plane with a given set of different tiles. This is not because computers are not powerful enough as such, it is just that a computer’s logic cannot tackle such problems. Another class of problems that are puzzling to computers are those known as ‘intractable’ problems. For example, working out whether there is a guar-anteed winning strategy for an arbitrary chess position cannot be solved, even with parallel processing, in less than many trillions of years. Another category of tasks that puzzles com-puters are known as ‘NP-complete’ problems. Working out the shortest route around several cities or putting together a typical school timetable are examples of this kind of problem. Perhaps the most problematic types of task are those that require creativity and/or intuition. Although computers can bring much-needed discipline to such problems, they still need the human touch. Just as significant, computers cannot hold a decent conversation, and as customers we still feel more secure dealing with human beings, at least some of the time.
example Will computers eventually do everything?1

190 chapter 6 • process technology strategy
Generally the characteristics of process technology affect cost and flexibility as shown in Figure 6.3. All of the three technology dimensions described above are strongly related. For example, the larger the unit of capacity, the more likely it is to be capital rather than labour intensive; this gives more opportunity for high coupling between its various parts. Conversely, small-scale technologies, combined with highly skilled staff, tend to be more flexible than large-scale, capital-intensive, closely coupled systems. As a result, these systems can cope with a high degree of product variety or service customisation (‘boutique’ strategy consulting firms are an example of this). Conversely, where flexibility is of little importance (with standardised, low-cost products such as industrial fastenings, or a mass transaction service such as letter sorting) but achieving dependable high volumes and low unit costs is critical, these inflexible systems come into their own. In IT-rich technologies, scalability generally depends upon connectivity (hence the emphasis upon standardisation in systems architecture and underlying operating processes). The analytical functionality that is so central to complex task automation normally requires different applications and data sources, so the greater the connectivity, the greater the analytical power, and so on. Remember though, although the three dimensions of process technology do often go together in this way, they do not always match perfectly. Several authors have also made a further link to the volume and variety require-ments of the market. The logic goes something like this. Companies serving high-vol-ume, and therefore usually low-variety, markets usually have a competitive position that values low prices; therefore low-cost operations are important; therefore process technologies need to be large, automated and integrated. Conversely, low-volume, high-variety operations need the flexibility that comes with small-scale, loosely coupled technologies with significant human intervention. This idea is incorporated in the product–process matrix, which was first described by Professors Robert Hayes
COUPLING
HIGH LOW
AUTOMATION
SCALE
Flexibilityperformance
Costperformance
Few, largeunits of
technology
Many,small units
of technology
Process(technology
plus humans)has high acuityand judgement
Process(technology
plus humans)has low acuityand judgement
Technology isintegrated
Technology isseparated
Figure 6.3 the three dimensions of process technology are often closely linked
the product–process matrix
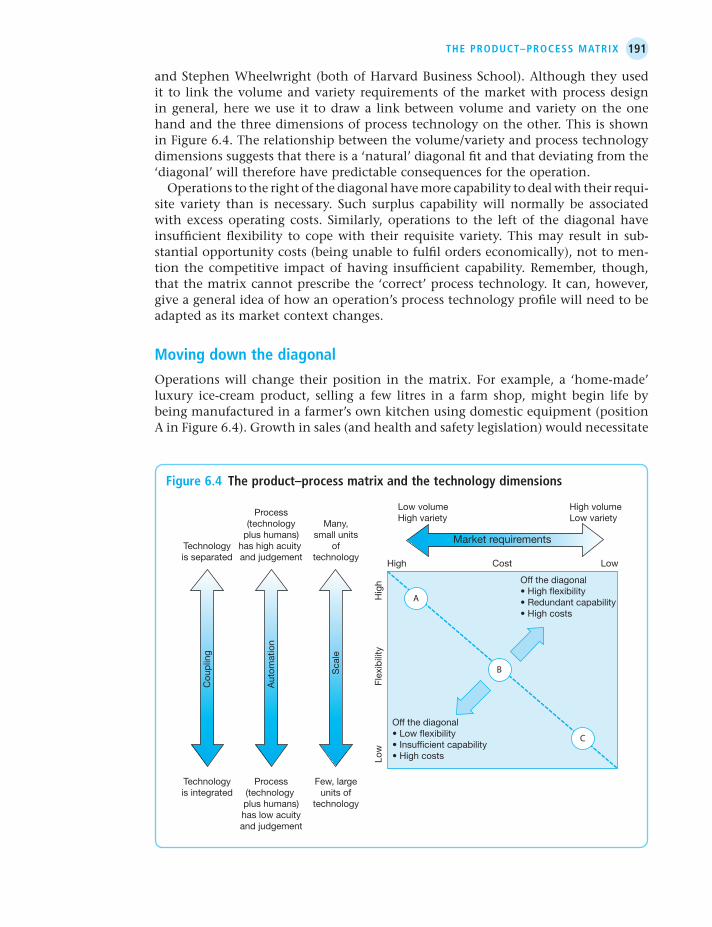
191the proDuct–process MatrIx
and Stephen Wheelwright (both of Harvard Business School). Although they used it to link the volume and variety requirements of the market with process design in general, here we use it to draw a link between volume and variety on the one hand and the three dimensions of process technology on the other. This is shown in Figure 6.4. The relationship between the volume/variety and process technology dimensions suggests that there is a ‘natural’ diagonal fit and that deviating from the ‘diagonal’ will therefore have predictable consequences for the operation. Operations to the right of the diagonal have more capability to deal with their requi - site variety than is necessary. Such surplus capability will normally be associated with excess operating costs. Similarly, operations to the left of the diagonal have insufficient flexibility to cope with their requisite variety. This may result in sub-stantial opportunity costs (being unable to fulfil orders economically), not to men-tion the competitive impact of having insufficient capability. Remember, though, that the matrix cannot prescribe the ‘correct’ process technology. It can, however, give a general idea of how an operation’s process technology profile will need to be adapted as its market context changes.
Moving down the diagonal
Operations will change their position in the matrix. For example, a ‘home-made’ luxury ice-cream product, selling a few litres in a farm shop, might begin life by being manufactured in a farmer’s own kitchen using domestic equipment (position A in Figure 6.4). Growth in sales (and health and safety legislation) would necessitate
Market requirements
Low volumeHigh variety
High volumeLow variety
Off the diagonal• High flexibility• Redundant capability• High costs
Off the diagonal• Low flexibility• Insufficient capability• High costs
Technologyis integrated
Few, largeunits of
technology
Technologyis separated
Many,small units
oftechnology
Process(technology plus humans)has low acuityand judgement
Process(technology
plus humans)has high acuity and judgement
Flex
ibili
tyH
igh
Low
Cost LowHigh
A
C
Sca
le
Cou
plin
g
Aut
omat
ion
B
Market requirements
Figure 6.4 the product–process matrix and the technology dimensions

192 chapter 6 • process technology strategy
investment in a small production facility, although, because of the different varie-ties, the production unit will still need some flexibility (position B in Figure 6.4). Ultimately, if projected demand for some flavours and sizes reaches mass-market levels, major continuous-flow process investment will be necessary (position C in Figure 6.4). Equally, at this stage the product might become attractive to a large established manufacturer because the volume and variety of demand would match its existing integrated production facilities. The natural trajectory of movement ‘down’ the product/process matrix can be observed in many different operational contexts. Many financial service firms, for instance, have been able to make major reductions in their back-office operations by reducing clerical and administrative staffing and cost levels through investment in large-scale, integrated, automated process technology. The example ‘Voucher processing in retail banking’ illustrates this.
Although, throughout the financial services sector, volumes of paper-based transactions employing vouchers, such as cheques, are declining in absolute terms, the total volumes remain substantial. As a result, there remain substantial costs associated with the ‘clearing’ process (receiving paper transactions, checking data, updating accounts, transporting paper to other financial institutions). During most of the last 30 or 40 years banks in most devel-oped countries have been merging and therefore getting larger. Simultaneously, they have attempted to standardise products and procedures within their own operations. Generally this has led to a lower variety of distinct activities being carried out in higher volume across a bank’s network of operations. This is illustrated by the move from position 1 to 2 in Figure 6.5. At one time every branch had its own ‘desktop’ voucher processing technology, and customer service staff would have to spend a proportion of every day operating this system. Performing identical activities in a fragmented manner across hundreds or thousands of separate operations resulted in each individual back-office operation at each branch operat-ing well below economic capacity levels. In the past 10 years, most banking businesses have reconfigured their technology to use a small number of large, automated voucher processing centres with high-volume, integrated processing lines, where optical character recognition technology reads thousands of cheques per minute and processes all the requisite data. This is shown as the move from 2 to 3 in Figure 6.5.
example voucher processing in retail banking
Moving on the diagonal has its challenges
We can use the previous example on how retail banking process technology has developed in retail banking to illustrate some general points about how operations change their position on the product/process matrix:
●● A traditional branch dealt with nearly all the variety (services, products, etc.) that the bank offered, but equally dealt with relatively small volumes. While the branch network operated as a series of autonomous units, therefore, the small-scale, labour-intensive and stand-alone process technology appeared to be completely appropriate.
●● When one begins to consider the entirety of the branch network, the absolute level of variety does not change; however, the total volume is far greater. This sug-gests that there was perhaps too much flexibility in the network as a whole and that there was substantial scope for simplification and redesign that might exploit

193the proDuct–process MatrIx
larger-scale (lower unit cost) technology. Interestingly, one of the most significant challenges associated with the transition to stage 3 in Figure 6.5 was developing the (now critical) integrating systems that allowed relatively small volumes of vouchers to be moved from branch to centre and back again.
●● After establishing their voucher processing centre (VPC) networks (often overcom-ing a number of innovative technology implementation difficulties), many banks have substantially reduced the transaction unit costs associated with voucher processing. There is recognition that such systems are less flexible than before, and more vulnerable to failure (as discussed earlier in this chapter). However, the risk was felt to be more than justified by the cost savings.
●● Moving to a position on the diagonal towards the bottom of the matrix often requires a greater degree of standardisation and control in associated operations. In banking, for example, while voucher processing was performed at branches, small variations in procedure could be tolerated and even small errors rectified relatively easily. When vouchers were shipped to regional VPCs, branch proce-dures had to be totally standardised, and any errors made by the branch could cause major disruption in the high-volume environment of the VPCs.
●● An operation’s whole approach to managing its technology, together with its organisational culture, will usually have to change as an operation’s position on the diagonal changes. Many banks encountered unexpected problems when they moved over to large VPCs. Some of these were the result of having to cope with unfamiliar new technology. Most banks had anticipated that. What they had not anticipated was the change in managerial approach that was required. The people staffing the new VPCs were often long-standing bank employees. They had never before worked in high-volume operations. They had to learn how to be ‘factory managers’ rather than ‘bank managers’. Some retail banks called their operations function ‘manufacturing’ to emphasise this point.
Moving from one point to another on the diagonal cannot always be done without moving off the diagonal at some point. Some banks made the move to very large
High volumeLow variety
Low volumeHigh variety
High volumeLow variety
Low volumeHigh variety
Incr
easi
ng s
cale
Incr
easi
ng a
utom
atio
n
Incr
easi
ng c
oup
ling Individual
branches
1 2
Voucherprocessing
centres
3
2
Figure 6.5 Moving down the diagonal of the product–process matrix in retail banking
194 chapter 6 • process technology strategy
VPCs in two steps. First, they assigned area voucher processing responsibility to a number of the larger branches. Each day they would take in vouchers from the surrounding 10 or 15 smaller branches and act as a mini VPC. Because they were still relatively small they could cope with some variation in their satellite branches’ operating procedures. Unfortunately, when the move to full regional VPCs was made, this tolerance of variety in branch operating procedures proved problematic for the (now inflexible) technology until all branches could be brought into using standardised procedures.
Market pressures on the flexibility/cost trade-off?
The traditional flexibility/cost trade-off inherent in the scale, automation and inte-gration dimensions of process technology (and the product/process matrix for that matter) is coming under increasing pressure from more challenging and demanding markets. In many sectors, increased market fragmentation and the demand for more customisation are reducing absolute volumes of any one type of product or serv-ice. Simultaneously, shortening product/service life cycles can mean periodic step changes in the requirements placed on an operation and its process technology. This can severely reduce the potential for applying large-scale and relatively inflexible, though traditionally low-cost, technologies. Yet at the same time there is increasing pressure to compete on cost, which is driving ongoing reductions in direct labour and placing increased emphasis on automation. In fact, for many traditionally labour-intensive sectors such as the banking industry referred to earlier, absence of sufficient technological investment (and the corresponding presence of ‘too many staff’) has a significant impact on analyst and shareholder confidence and therefore share price. Both these pressures are placing conventional process technology solu-tions under strain (see Figure 6.6). Of course, this competitive challenge has proved to be simply too much for many operations but, interestingly, many of those that have survived and prospered have not abandoned technology in their operations strategies. Rather, many operations have more fully embraced process technology, albeit in new IT-rich forms. Indeed it is increasingly difficult to overstate the impact that information technology is having upon organisational life. There is almost no sphere of operations where computing technology in one form or another has not had a substantial impact.
process technology trends
So, markets seem to be demanding both greater flexibility and lower costs simultan-eously from process technology. To the traditional mindset, which we illustrated in Figure 6.4, this seems to be difficult, bordering on impossible. Yet remember our discussions on trade-offs between performance objectives back in Chapter 2. There we saw the development and improvement of operations (including pro-cess technology) as being a process of overcoming trade-offs. Now we must include developments in information technology, especially their effect of shifting tradi-tional balances and trade-offs. In effect we have argued that emerging scalability, analytical content and connectivity characteristics have enabled process technolo-gies to enhance their flexibility while still retaining reasonable efficiency, and vice versa. In other words, these trends in process technology are having the net effect of overcoming some of the traditional trade-offs inherent within the dimensions of

195the proDuct–process MatrIx
process technology. This has, for some industries, changed the nature of the prod-uct–process matrix, which we discussed earlier. Figure 6.7 shows how three separate but connected ideas have come together.
●● The three dimensions of process technology – scale, automation and coupling – are related to the volume/variety characteristics of the market. In traditional process technologies, especially those with relatively little IT element, large, auto-mated and tightly coupled technologies were capable of processing at low cost but had relatively little flexibility. This made them suitable for high-volume, low-variety processes. If process requirements were for high variety but low volume, process technology was likely to consist of smaller separated units with relatively little automation.
●● Trends in the development of each dimension of process technology, especially those related to their increasing richness in information processing, are over-coming some of the traditional trade-offs within each dimension. In particular, technology with high levels of scalability can give the advantages of flexible, small-scale technology and yet be quickly expanded if demand warranted it. Similarly, even high-volume information processing technology can still display the relatively high analytical content at one time reserved for more manual pro-cesses. Finally, technology with high connectivity can integrate processes without the rigidity once associated with high coupling.
●● Market trends are themselves calling simultaneously for high performance in both cost and flexibility. No longer is it acceptable to suffer high costs if flexibil-ity is demanded by the market, nor operations rigidity if costs need to be kept
Traditional trade-off ‘diagonal’between cost and flexibility
Low
Fle
xib
ility
Hig
h
Cost
Marketfragmentation
makingflexibility
morevaluable
Competitivepressure toreduce costs
The need toovercome thetraditional cost-flexibility trade-offand achieve highlevels of performancein both
LowHigh
Figure 6.6 Market pressures are requiring operations to be both flexible and low cost

196 chapter 6 • process technology strategy
low. As far as market requirements are concerned, the ideal area in the traditional product–process matrix is one that delivers both low cost and high flexibility.
This is why information processing technology has had such an impact in so many industries. In effect it has partially overcome some of the traditional trade-offs in choosing process technology. But note the words ‘partially’ and ‘some’. There are still trade-offs within technology choice, even if they are not as obvious as they were once. Moreover, information processing and computing power have undoubt-edly had a major impact on almost all technologies but there are still limits to what computers can do.
Market requirements
Low volumeHigh variety
High volumeLow variety
Technologyis integrated
Few, largeunits of
technology
Technologyis separated
Many,small units
oftechnology
Process(technology plus humans)has low acuityand judgement
Process(technology
plus humans)has high acuity and judgement
Flex
ibili
tyH
igh
Low
Cost LowHigh
Sca
le
Cou
plin
g
Aut
omat
ion
Market requirements
Con
nect
ivity
Ana
lytic
al c
onte
nt
Sca
lab
ility
Figure 6.7 new developments in process technology can change the cost–flexibility trade-off
the challenges of information technology
As we saw in the previous discussion of the three ‘dimensions’ of process tech-nology, the dominance of information technology (IT) has caused a profound rethink of the issues connected with technology in an operations strategy context. Surprisingly, given the ubiquity of IT, the cost effectiveness of investment in IT is not altogether straightforward. Generally research recognises a plain and positive connection between investment in IT and operations productivity growth, even if the returns can vary widely. As one authority put it, ‘there’s no bank where companies can deposit IT investment and withdraw an “average” return [. . . A] strategy of blindly investing in IT and expecting productivity to automatically rise is sure to fail.’2 Moreover, there is a high failure rate for IT projects (often cited as between 35 per cent and 75

197the challenges oF InForMatIon technology
per cent, although the definition of failure is debated). Yet there is extensive agree-ment that the most common reasons for failure are connected in some way with managerial, implementation, or organisational factors. And of these managerial, implementation, or organisational factors, one of the main issues was the degree of alignment and integration between IT strategy and the general strategy of the firm. This is a particularly important point for operations strategy. It reinforces the idea that IT strategy must be regarded as an integral part of overall operations strategy. Of course, different kinds of IT pose different kinds of challenge. The impact of some IT is limited to a defined and (relatively) limited part of the operation. This type of IT is sometimes called ‘function IT’ because it facilitates a single function or task.3 Examples include computer aided design (CAD), spreadsheets and simple decision support systems. The organisational challenges for this type of technology usually can be treated separately from the technology itself. Put another way, IT function can be adopted with or without any changes to other organisational structures. Yet this does not mean that no organisational, cultural or development challenges will be faced. Often the effectiveness of the technology can be enhanced by appropriate changes to other aspects of the operation. By contrast, ‘enterprise IT’ extends across much of, or even the entire organisation. Because of this, enterprise IT potentially will need extensive changes to the organisation. The most common (and problem-atic) enterprise IT is an enterprise resource planning (ERP) system. Because of the importance of ERP to operations strategy we will describe it in some detail in the next section. The third IT category is network IT. Network IT facilitates exchanges between people and groups inside and/or outside the organisation. However, it does not necessarily pre-define how these exchanges should work. For example, e-mail is a network IT. It has brought significant changes to how operations and supply networks function, but the changes are not imposed by the technology itself; rather they emerge over time as people gain experience of using the technology. The chal-lenge with this type of technology is to learn how to exploit its emergent potential.
enterprise resource planning (erp)
As information technology established itself within most businesses, the various functions within the business developed appropriate systems and databases to meet their own needs. Within operations the most significant of these systems was based around materials requirements planning (MRP). Enterprise resource planning (ERP) systems attempt to integrate all these various systems. This allows changes made in one part of the business to be reflected immediately in information held for the benefit of other parts of the business, thereby improving both the communication and the effectiveness of the systems as a whole. However, this obvious and seem-ingly straightforward idea is, in practice, hugely complex and expensive to put into practice. And that is what ERP has become known for: its high cost and difficult implementation. Some large corporations are reported to have spent hundreds of millions of euros on their ERP systems. Even medium-sized companies can easily spend hundreds of thousands of euros. And, although some authorities claim that even successfully implemented ERP systems will never offer any significant return on their investment, others argue that ERP was simply one of those things that any large company had to invest in simply to keep pace with its customers, suppliers, and competitors.4 Certainly ERP has spawned a huge industry devoted to developing the computer systems needed to drive it.

198 chapter 6 • process technology strategy
What is erp?One of the most important issues in resource planning and control is managing the sometimes vast amounts of information generated from all functions of the busi-ness. So, unless all relevant information is brought together and integrated, it is difficult to make informed planning and control decisions. This is what enterprise resource planning (ERP) is about. It is often described as a complete enterprise-wide business solution that integrates the planning, resource allocation and control activities of all parts of the business. The intent is that all transaction information is entered into the system at its source, and this is done only once. Consider, for instance, a manufacturing firm receiving an order for a product. The transaction is entered into the system and the data is then sent to the master database, which accesses and updates the other business processes. For example, the finance process is instructed to raise an invoice, the sales and marketing processes are advised of sales and customer information, the production process triggers the manufactur-ing, etc. If the system does not have its own scheduling software, it can (to varying degrees) be integrated with pre-existing packages. From an operations perspective, ERP is part of a development that started with materials requirements planning (MRP), an approach that became popular during the 1970s, although the planning and control logic that underlies it had been known for some time. It is a method (simple in principle but complex in execution) of translating a statement of required output into a plan for all the activities that must take place to achieve the required output. What popularised MRP was the availability of computer power to drive the basic planning and control mathematics in a fast, efficient and, most importantly, flexible manner. Manufacturing resource planning (MRP II) expanded out of MRP during the 1980s. This extended concept has been described as a game plan for planning and monitoring all the resources of a manufac-turing company: manufacturing, marketing, finance and engineering. The strength of MRP and MRP II lay always in the fact that they could explore the consequences of any changes to what an operation was required to do. So, if demand changed, the MRP system would calculate all the ‘knock-on’ effects and issue instructions accord-ingly. The same principle applies to ERP, but on a much wider basis. ERP systems allow decisions and databases from all parts of the organisation to be integrated so that the consequences of decisions in one part of the organisation are reflected in the planning and control systems of the rest of the organisation (see Figure 6.8).
the elements of erpThe ERP system consists of software support modules such as: marketing and sales, field service, product design and development, production and inventory control, procurement, distribution, industrial facilities management, process design and development, manufacturing, quality, human resources, finance and accounting, and information services. Integration between the modules is stressed without the duplication of information. In addition to the integration of systems, ERP usually includes other features which make it a powerful planning and control tool:
●● It is based on a client/server architecture; that is, access to the information sys-tems is open to anyone whose computer is linked to central computers.
●● It can include decision support facilities that enable operations decision makers to include the latest company information.

199the challenges oF InForMatIon technology
●● It is often linked to external extranet systems, such as the electronic data inter-change (EDI) systems, which are linked to the company’s supply chain partners.
●● It can be interfaced with standard applications programs which are in common use by most managers, such as spreadsheets, etc.
●● Often, ERP systems are able to operate on most common platforms such as Windows, UNIX, or Linux.
Arguably the most significant issue in many companies’ decisions to buy an off-the-shelf ERP system is that of its compatibility with the company’s current business processes and practices. Experience of ERP installation suggests that it is extremely important to make sure that the current way of doing business will fit (or can be changed to fit) with a standard ERP package. If a business’s current processes do not fit, they can either change their processes to fit the ERP package, or modify the software within the ERP package to fit their processes. Both of these options involve costs and risks. Changing business practices that are working well will involve reorganisation costs as well introducing the potential for errors to creep into the processes. Adapting the software will both slow down the project and introduce potentially dangerous software ‘bugs’ into the system. It would also make it difficult to upgrade the software later on.
supply network erpThe step beyond integrating internal ERP systems with immediate customers and suppliers is to integrate it with the systems of other businesses throughout the supply network. This is often exceptionally complicated. Not only do different ERP systems have to communicate together, they have to integrate with other types of system. For example, sales and marketing functions often use systems such as cus-tomer relationship management (CRM) systems that manage the complexities of customer requirements, promises and transactions. Getting ERP and CRM systems to
CustomersDelivery anddistributionapplications
Sales andmarketing
applications
Serviceapplications
Financialapplications
Operationsapplications
Purchasingand supplyapplications
Humanresources
applications
Integrateddatabase
Employees
Senior management and stakeholders
Strategicreporting
applications
Suppliers
Bac
k-of
fice
staf
f
Fron
t-of
fice
staf
f
Figure 6.8 erp integrates planning and control information from all parts of the organisation

200 chapter 6 • process technology strategy
work together is itself often difficult. Nevertheless, such web-integrated ERP applica-tions are emerging. Although a formidable task, the benefits are potentially great. Transaction costs between supply network partners could be dramatically reduced, and the potential for avoiding errors is significant. Yet such transparency also brings risks. If the ERP system of one operation within a supply chain fails for some reason, it may block the effective operation of the whole integrated information system throughout the network.
criticisms of erpAttempting to get new systems and databases to talk to old legacy systems can be very problematic. Not surprisingly, many companies choose to replace most, if not all, their existing systems simultaneously. New common systems and relational databases help to ensure the smooth transfer of data between different parts of the organisation. Therefore ERP installation can be particularly expensive. In addition, there are also considerable ‘adjustment costs’ associated with many of the imple-mentations. ERP implementations have developed a reputation for exceeding their budgets, with 200/300 per cent cost and time overruns being commonly cited for reasonably sized installations. Yet, given that such systems are predicated on both substantial IT development and process redesign work, it should not be surprising that costs and timeframes proved to be larger and longer than predicted. In addition to the obvious investment of time and effort there is also the cost of providing training in new ways of working. Given that old systems, procedures, and routines are being replaced in an ERP implementation, this retraining cost can be very significant. During the retraining period there may also be an increased chance of staff error which, combined with the novelty of the system, could cause further failures. By definition ERP systems are ‘enterprise wide’. This means that all parts of the enterprise must agree on a shared way of working (which coincides with the ERP sys-tem’s underlying structure) and uniformly implement the system in the same way. There are two important implications of this. First, getting all parts of the enterprise to agree on a common business model is rarely straightforward, even supposing that the ERP system’s business model is appropriate for the way the enterprise prefers to operate. Second, because all parts of the enterprise are linked together, the whole business could be held back by the ‘weakest link’. That is, inefficiency or incompe-tence in one part of the enterprise may hold back the whole business. Note that these disadvantages of ERP are not so much concerned with the fun-damental logic of integrating enterprise-wide information systems. Rather they are concerned with the sheer difficulty of making it happen. This leads some authori-ties to argue that the disadvantages of ERP systems are not really disadvantages. The question is really whether any individual firm has the money, time and talent to exploit the advantages of ERP.
lessons from erpWhen ERP is implemented successfully it has the potential to significantly improve performance. This is partly because of the very much enhanced visibility that infor-mation integration gives, but it is also a function of the discipline that ERP demands. Yet this discipline is itself a ‘double-edged’ sword. On the one hand, it ‘sharpens up’ the management of every process within an organisation, allowing best practice (or
201evaluatIng process technology
at least common practice) to be implemented uniformly through the business. No longer will individual idiosyncratic behaviour by one part of a company’s operations cause disruption to all other processes. On the other hand, it is the rigidity of this discipline that is both difficult to achieve and (arguably) inappropriate for all parts of the business. Nevertheless, the generally accepted benefits of ERP are as follows:
●● greater visibility of what is happening in all parts of the business;
●● forcing the business process-based changes that potentially make all parts of the business more efficient;
●● improved control of operations, which encourages continuous improvement (albeit within the confines of the common process structures);
●● more sophisticated communication with customers, suppliers, and other business partners, often giving more accurate and timely information;
●● integrating whole supply chains including suppliers’ suppliers and customers’ customers.
An important justification for embarking on ERP is the potential it gives to link up with the outside world. For example, it is much easier for an operation to move into internet-based trading if it can integrate its external internet systems into its internal ERP systems. However, as has been pointed out by some critics of the ERP software companies, ERP vendors were not prepared for the impact of e-commerce and had not made sufficient allowance in their products for the need to interface with inter-net-based communication channels. The result of this has been that, whereas the internal complexity of ERP systems was designed only to be intelligible to systems experts, the internet has meant that customers and suppliers (who are non-experts) are demanding access to the same information.
evaluating process technology
Evaluating process technology quite literally means determining its value or worth. It involves exploring, understanding and describing the strategic consequences of adopting alternatives. Although there can be no ‘all-purpose’ list of attributes to be evaluated, indeed the precise nature of the attributes to be included in any evalu-ation should depend on the nature of the technology itself, it is useful to consider three generic classes of evaluation criteria:
●● the feasibility of the process technology; that is the degree of difficulty in adopt-ing it, and the investment of time, effort and money that will be needed;
●● the acceptability of the process technology; that is how much it takes a firm towards its strategic objectives, or the return the firm gets for choosing it;
●● the vulnerability associated with the process technology; that is the extent to which the firm is exposed if things go wrong, the risk that is run by choosing the technology (see Figure 6.9).
evaluating feasibility
All process technology decisions have resource implications – even the decision to do nothing liberates resources that would otherwise be used. In this context we are not just talking about financial resources which, although critical, are no help if, say,

202 chapter 6 • process technology strategy
the technical skills necessary to design and implement a technology are not avail-able. Therefore, if the resources required to implement technology are greater than those that are either available or can be obtained, the technology is not feasible. So evaluating the feasibility of an option means finding out how the various types of resource that the option might need match up to what is available. Four broad questions are applicable. What technical or human skills are required to implement the technology? Every process technology will need a set of skills to be present within the organisation, so that it can be successfully implemented. If new technology is very similar to that existing in the organisation, it is likely that the necessary skills will already be present. If, however, the technology is completely novel, it is necessary to identify the required skills and to match these against those existing in the organisation. What ‘quantity’ or ‘amount’ of resources is required to implement the technology? Determining the quantity of resources (people, facilities, space, time, etc.) required for the implementation of a technology is an important stage in assessing feasibility, because it is time dependent. Rarely will a lack of sufficient, say, process engineers, rule out a particular process technology, but it could restrict when it is adopted. So, a firm may deliberately choose to delay some of its process technology decisions because it knows that its current commitments will not allow it. In order to assess this type of feasibility a company may compare the aggregate workload associated with its implementation over time with its existing capacity. What are the funding or cash requirements? The previous two questions can be dif-ficult to answer in a meaningful way, but this does not diminish their significance. However, in any real investment evaluation one ‘feasibility’ factor will inevitably come to dominate all other considerations – do we have enough money? Because of this significance we will spend a little more time reviewing some of the many approaches that have been developed to aid managers in their analysis of cash flow and funding requirements over the lifetime of an investment project. Can the operation cope with the degree of change in resource requirements? Even if all these resource requirements can quite feasibly be obtained individually by the organisation, the degree of change in the total resource position of the company might itself be regarded as infeasible. Consider, for instance, a bespoke manufac-turer of road-racing bicycles being encouraged to leverage its reputation for high quality into the ‘top end’ of the mass cycle market (i.e. much higher volumes). This would require the firm to make substantial investment in automated tube
Acceptability – Howworthwhile is it?
The criteriafor
screeningconcepts
What RETURN(in terms of benefits to
the operation) will it give?
Overallevaluation
of theconcept
What RISKSdo we run if things go
wrong?
Vulnerability – Whatcould go wrong?
Feasibility – Howdifficult is it?
What INVESTMENT (bothmanagerial and financial)
will be needed?
Figure 6.9 broad categories of evaluation criteria for assessing concepts

203evaluatIng process technology
welding equipment. The firm is confident that it will be able to obtain all the differ-ent categories of resource required for the project. It believes that it can recruit the appropriate expertise in sufficient quantity from the labour market. Furthermore, it believes that it could fund the project until it broke even. Yet in the final analysis, the company regards the investment as unfeasible. It decides that absorbing such a radical new process technology in a relatively short time frame would put too great a strain on its own capacity for self-organisation. Thus sometimes it is not the absolute level but rather the rate of change in resource requirements that renders a project unfeasible.
assessing financial requirements
In most process technology decisions the most important feasibility question is, ‘How much financial investment will the technology require, and can we afford it?’ At its simplest, this could mean simply examining the one-off cost of the purchase price of the technology. Usually, though, an examination of the effect of the cash requirements on the whole organisation is necessary. If so, it is often necessary to simulate the organisation’s cash flow over a period of time. Computing the total inflow of cash over time as it occurs, and subtracting from it the total outflow of cash as it occurs, leaves the net funding requirement for the option. For example, Figure 6.10 shows the net cash inflows likely to be earned if a proposed technology is adopted and the cash outflows associated with its purchase and implementation. The resulting cash requirements show that a maximum funding requirement of €1,050,000 occurs within the first eight months of the project, and diminishes only slowly for two years. After that, the project enjoys a large net inflow of cash. Of course, this analysis does not include the effects of interest payments on cash bor-rowed. When it is decided how the cash is to be raised (i.e. borrowed from a bank or private investor, raised from the equity markets) this can be included.
evaluating acceptability
Evaluating acceptability can be done from many technical and managerial perspec-tives. Here we limit our discussion to cover the financial perspective on evaluation and the ‘market requirements’ and ‘operations resource’ perspectives. Figure 6.11 summarises the different elements of our analysis.
acceptability in financial termsFinancial evaluation involves predicting and analysing the financial costs to which an option would commit the organisation, and the financial benefits that might accrue from acquiring the process technology. However, ‘cost’ is not always a straightforward concept. An accountant has a different view of ‘cost’ to that of an economist. The accountant’s view is that the cost of something is whatever you had to pay to acquire it originally. The economist, on the other hand, is more likely to define costs in terms of the benefits forgone by not investing elsewhere: that is, the opportunity cost of the technology. Thus, to the economist, the cost of investing in a process technology is whatever could be gained by investing an equivalent sum in the best feasible alternative investment. While opportunity costing has obvious intuitive attractions, and is particularly useful in process technology investments

204 chapter 6 • process technology strategy
where alternative technologies may bring very different benefits, it does depend on what we define as the best feasible alternative use of our resources. The accountant’s model of acquisition cost is at least stable – if we paid €1,000 for something, then its value is €1,000, irrespective of whatever alternative use we might dream up for the money.
the life-cycle costThe concept of life-cycle costing is useful in process technology evaluation. It involves accounting for all costs over the life of the investment that are influenced directly by the decision. For example, suppose a company is evaluating alternative integrated warehousing systems. One system is significantly less expensive and seems at first sight to be the least costly. But what other costs should the company consider apart from the acquisition cost? Each system would require some initial development to remedy outstanding technical problems before installation. The systems would also have to be ‘debugged’ before operation, but, more importantly, during its years of life the plant will incur operation and maintenance costs that will in part be determined by the original choice of system. Finally, if the company wants to look so far ahead, the disposal value of the plant could also be significant.
Time (months)48
End
3,000
Cas
h re
qui
rem
ents
(€00
0s)
2,000
1,000
-1,000
362412Start
Cash inflows
Cash outflows
Net cash flow
Beginning cash without financing
Ending cash without financing
0
1,050
(1,050)
0
(1,050)
1,000
800
200
(1,050)
(850)
1,000
970
30
(850)
(820)
1,000
950
50
(820)
(770)
1,000
700
300
(770)
(470)
2,000
200
1,800
(470)
1,330
0
200
(200)
1,330
1,130
0
200
(200)
1,130
930
3,000
300
1,700
930
2,630
0 1 2 3 4 5 6 7 8Six-month periods
All figures in €000s
Figure 6.10 cash inflows, outflows and requirements up to the end of the project
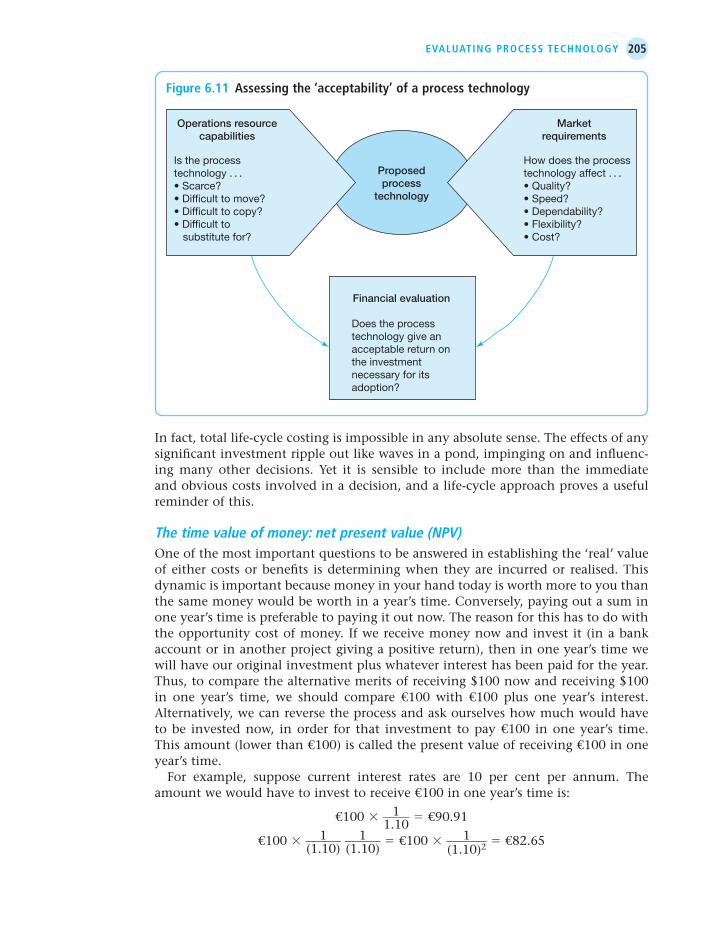
205evaluatIng process technology
In fact, total life-cycle costing is impossible in any absolute sense. The effects of any significant investment ripple out like waves in a pond, impinging on and influenc-ing many other decisions. Yet it is sensible to include more than the immediate and obvious costs involved in a decision, and a life-cycle approach proves a useful reminder of this.
the time value of money: net present value (npv)One of the most important questions to be answered in establishing the ‘real’ value of either costs or benefits is determining when they are incurred or realised. This dynamic is important because money in your hand today is worth more to you than the same money would be worth in a year’s time. Conversely, paying out a sum in one year’s time is preferable to paying it out now. The reason for this has to do with the opportunity cost of money. If we receive money now and invest it (in a bank account or in another project giving a positive return), then in one year’s time we will have our original investment plus whatever interest has been paid for the year. Thus, to compare the alternative merits of receiving $100 now and receiving $100 in one year’s time, we should compare €100 with €100 plus one year’s interest. Alternatively, we can reverse the process and ask ourselves how much would have to be invested now, in order for that investment to pay €100 in one year’s time. This amount (lower than €100) is called the present value of receiving €100 in one year’s time. For example, suppose current interest rates are 10 per cent per annum. The amount we would have to invest to receive €100 in one year’s time is:
€100 3 1 _____ 1.10
5 €90.91
€100 3 1 ______ (1.10)
1 ______ (1.10)
5 €100 3 1 _______ (1.10)2 5 €82.65
Proposedprocess
technology
Operations resourcecapabilities
Is the processtechnology . . .• Scarce?• Difficult to move?• Difficult to copy?• Difficult to substitute for?
Marketrequirements
How does the processtechnology affect . . .• Quality?• Speed?• Dependability?• Flexibility?• Cost?
Financial evaluation
Does the processtechnology give anacceptable return onthe investmentnecessary for itsadoption?
Figure 6.11 assessing the ‘acceptability’ of a process technology

206 chapter 6 • process technology strategy
The rate of interest assumed (10 per cent in our case) is known as the discount rate. More generally, the present value of €x in n years’ time, at a discount rate of r per cent is:
x ____________ (1 1 r/100)n
limitations of conventional financial evaluationConventional financial evaluation has come under criticism for its inability to include enough relevant factors to give a true picture of complex investments. Nowhere is this more evident than in the case of justifying investment in process technologies cotaining a significant IT element. Here costs and benefits are uncer-tain, intangible, and often dispersed throughout an organisation. Indeed, with all the talk about there being a ‘new economy’, the myriad discussions about computers removing cost (labour) from operational processes, or the impact of the creation of knowledge and information-based markets, you could be forgiven for thinking that the computer age was an unambiguously positive thing for business. Until recently, however, there has been little actual evidence that for all the IT investment that firms have made, there has been any real impact upon overall productivity.
acceptability in terms of impact on market requirementsExtending the idea of considering all competitive benefits from an investment, we have argued elsewhere in this chapter that process technology can impact on all of the generic operational performance objectives: quality, speed, dependability, flexibility and cost. The questions listed in Table 6.2 can help provide a framework for assessing the impact of any proposed investment on each of them. In order to illustrate this we have applied them to a generic analysis of the effect of process technology on the airline industry. Although the examples in Table 6.2 were set in the airline industry, we could have done the same for any industry. The most important point to emerge from any similar analysis in any sector is that the market opportunities associated with proc-ess technology are far greater than the traditional narrow focus on cost reduction. Any sensible evaluation of process technology must include all the effects impact-ing on quality, speed, dependability, flexibility and cost. As we stressed in Chapter 2, the generic performance objectives are very rarely equally important for all types of operation. Their relative importance will reflect the actual and intended market position of the organisation. The implication of this for evaluating process technol-ogy is straightforward. Any evaluation must reflect the impact of process technology on each performance objective relative to their importance to achieving a particular market position. Often there will be trade-offs involved in adopting a new process technology. Reverting to our airline examples earlier, one advantage of having a fleet of mixed aircraft is the flexibility it provides to match aircraft to routes as the demand on different routes changes. Yet different types of aircraft require differ-ent spare parts, different maintenance procedures, different interfaces with ground technology, and so on. This may add more cost and complexity to the total airline operations than is gained through the benefits of flexibility. For example, Airbus, the European airline consortium and great rival to the US aerospace giant Boeing, claims that its strategy of common cockpit and flight control systems across its range of planes saves considerable cost. Commonality in such systems allows pilots and ground crews to deal with similar systems with 120-seater to 400-seater aircraft.

207evaluatIng process technology
table 6.2 evaluating the acceptability of process technology investment on market criteria
Generic questions Example
Quality Does the process technology improve the An airline investing in in-flight entertainment specification of the product or service? technology to enhance the specification of its That is, does it provide something better or flight services. different that customers value? An airline investing in maintenance equipment Does the process technology reduce unwanted that keeps the performance of its aircraft and variability within the operation? ancillary systems within very tight Even if absolute specification quality is tolerances. This reduces the risk of failure in unaffected by process technology, it may equipment as well as increasing the internal contribute to conformance quality by reducing predictability of the airline’s processes. variability.
Speed Does the process technology enable a faster The check-in technology used by airlines at response to customers? Does it shorten the airport gates and lounges in effect allows time between a customer making a request customers’ requests for seating or dietary and having it confirmed (or a product requirements to be explored quickly and, if delivered, etc.)? possible, confirmed. Does the process technology speed the The technology that allows the fast loading throughput of internal processes? Even if of customers’ bags and in-flight catering customers do not benefit directly from faster supplies, allows fuel to be loaded and engines process throughput within an operation, to be checked, etc., all reducing the time the technology increasing ‘clock speed’ can benefit aircraft spends on the ground. This allows the the operation by, for instance, reducing costs. aircraft to be used more intensively.
Dependability Does the process technology enable products Specialist navigation equipment installed in and/or services to be delivered more aircraft can allow them to land in conditions dependably? Although many of the causes of of poor visibility, thus reducing the possibility poor dependability may appear to be outside of delays due to bad weather. the control of an operation, technology may Customers benefit directly from such an help to bring some of the factors within its increase in dependability. control. Airlines invest in advanced aircraft Does the process technology enhance the communications technology. dependability of processes within the Efficient communication between aircraft and operation? Again, even when customers see no control centres reduces the possibility of direct result of more dependable technology, miscommunication, which, even when it can provide benefits for the operation itself. presenting no danger, can waste time and
cause confusion. Indeed, an oft-cited concern of many airlines is that airports around the world do not always match their investment in communications technology – preventing maximum productivity gains from their equipment.
Flexibility Does the process technology allow the When an airline considers the mix of aircraft operation to change in response to changes in types to include in its fleet, it does so partly to customer demand? Such changes may be in retain sufficient flexibility to respond to such either the level or nature of demand. things as timetable change or unexpected Does the process technology allow for demand. adjustments to the internal workings of the Some aircraft (notably the Boeing 777) permit operations processes? the precise configuration of cabins and seating
to be changed. While this may not happen very frequently, it offers airlines the flexibility to provide a different mix of services without having different types of aircraft.

208 chapter 6 • process technology strategy
acceptability in terms of impact on operational resourcesUsing the generic performance objectives can help us to characterise the potential contribution that process technology can make to market requirements. At the same time, however, it is important to build up a picture of the contribution that process technology can make to the longer-term capability ‘endowment’ of the operation. We can use the dimensions described in Chapter 1 as being ‘strategic’ according to the resource-based view of the firm. As a reminder, these four dimensions are:
●● the scarcity of resources;
●● how difficult the resources are to move;
●● how difficult the resources are to copy;
●● how difficult the resources are to substitute for.
These four dimensions provide us with a ‘first cut’ mechanism for assessing the impact that a specific technological resource will have upon sustainable competitive advantage. Table 6.3 develops these four dimensions with examples.
tangible and intangible resourcesIt is important to recall that in our discussion in Chapter 1 on the importance of operations resources and process we were careful to distinguish between tangible and intangible resources. Tangible resources are the actual physical assets that the company possesses. In process technology terms these will be the machines, computers, materials handling equipment, and so on, used within the operation. Intangible resources are not necessarily directly observable but nevertheless have value for the company. Things such as relationship and brand strength, supplier relationships, process knowledge, and so on are all real but not always directly tan-gible. This concept of intangible resources is important when considering process technology. A unit of technology may not be any different physically from the tech-nology used by competitors. However, its use may add to the company’s reputation, skills, knowledge and experience. Thus, depending on how the process technology is used, the value of the intangible aspect of a process technology may be greater than its physical worth. If the usefulness of process technology also depends on the software it employs, then this also must be evaluated. Again, although software may be bought off the shelf and is therefore available to competitors, if it is deployed in imaginative and creative ways its real value can be enhanced.
Cost Does the process technology process materials, A major driver for airlines to invest in new information or customers more efficiently? As aircraft is the greater efficiency (€/passenger we mentioned previously, this is by far the mile flown) of each new generation of aircraft most common basis for justifying new process that derives from the overall design of the technology, even if it is not always the most aircraft and, most especially, the engines important. It is never unimportant, however. powering them. Does the process technology enable a greater The ‘yield management’ decision support effectiveness of the operations processes? Even systems used by airlines enable them to if straightforward efficiency is unaffected, maximise the revenue from flights by process technology can aid the deployment of adjusting capacity and pricing strategies to the operations capabilities to increase match demand patterns. profitability or general effectiveness.

209evaluatIng process technology
evaluating market and resource acceptability
Consider, for instance, a Windows-based data management system for a police force to help manage their crime laboratory. The lab is where samples from a range of crime scenes are tested in a large variety of different processes (DNA testing, fingerprint analysis, etc.) that vary widely in their sophistication and complexity. Although speed is often of the essence in the lab, accuracy and dependability are equally critical, as is the legal requirement to store and access information over
table 6.3 the four dimensions of ‘strategic’ operations resources
Generic questions Example
Scarcity Does the technology represent any Such resources might include bespoke kind of first-mover advantage? In production facilities in industries like other words, how much of the petrochemicals and pharmaceuticals, developed technology (or perhaps its where first-mover advantage often underlying R&D) is not possessed by generates superior returns. competitors? Capturing customer data over time Does the technology help create or and then exploiting this information exploit proprietary product/service has long been a core element of knowledge, perhaps in the tangible airline competitive strategies – such form of a database? information is extremely scarce.
Difficult to move How much of the process technology The value of resource immobility helps was developed in-house? If a process to explain the increased emphasis technology is unique and, moreover, it being placed upon infrastructure was developed ‘in-house’, then such development in the management resources cannot easily be accessed consulting sector – to facilitate the without purchasing the firm. retention of skills, knowledge and How many of the critical technological experience. resources ‘don’t walk on legs’? In other Mobility concerns in, say, the IT sector words, highlight those resources that explain the emergence of more are more than contractually tied into complicated contracts (constraining the operation. subsequent employment, etc.) and
wage inflation for certain key staff.
Difficult to copy How far down the ‘learning curve’ is Experiences such as those documented the process technology? in high-volume processes, like Intel How strong is your legal protection? and semiconductors, can create Patents offer some protection, even competitive performance barriers. though the process is long, often In the competitive confectionery expensive and may attract greater market, for instance, there is almost competitive risk than simply having pathological secrecy associated with better site security. proprietary production processes but
very little recourse to the filing of patents.
Difficult to create a substitute What, if any, market mechanisms exist Traditional EDI-type connections to prevent process technology simply integrate supply chains but can also becoming irrelevant through the help to establish de-facto standards introduction of a substitute? and introduce switching costs. They
can therefore prevent rivals offering substitute services.

210 chapter 6 • process technology strategy
extended periods of time (for legal appeals, long-term investigations, etc.). While this operation does not have a market position as such, it still has a set of social and legal priorities which are its direct equivalent. Figure 6.12 illustrates this by adding a further line to the profile which indicates what the laboratory’s performance targets are. Although the new process technology does not improve operations performance in all aspects of the crime lab’s ‘market’ requirements, it does improve some specific areas of performance and does not appear to have any negative effects. However, it is when we turn our attention to the resource profile of the technology that the relevance for ‘not for profit’ operations of dimensions derived from a competitive marketplace needs to be more closely examined. Although we might see the useful-ness of a unique and difficult-to-copy crime database in the ‘war against crime’, the positive advantage of having resources that rank highly on the RBV dimensions is not clear for an accountable public sector operation. In other words, if a resource (like knowledge or experience) is difficult to move or copy this can contribute to sustainable advantage in a competitive marketplace. However, such characteristics can act against critical public sector objectives such as effective information transfer or even accountability over performance. In this type of application, therefore, it is necessary to see the resource characteristics as useful in a different way. So, for instance, imagine that the staff experience associated with analysing particular types of DNA evidence is crucial for the crime lab but very dif-ficult to copy and therefore shared both within and between labs. The operations strategy response might therefore be to diminish (rather than embrace) this ‘imita-bility’ characteristic by developing systems and procedures that seek to codify (i.e. papers, technical diaries, open databases) and encourage regular sharing of experi-ence (i.e. seminars, staff exchanges, apprenticeships).
evaluating vulnerability
There have been some spectacular and very public failures associated with the intro-duction of new process technology. Yet presumably all of these process technology ‘failures’ were at one time determined to be both feasible and acceptable to the operation. Their subsequent failure highlights one further important issue to explore – vulnerability. That is, what exposure is the firm accepting if something goes wrong with the technology once the decision to invest is made?
Every week in the UK, over 20 million people will visit a Tesco store. When paying, either to the checkout assistant, or using the automated self-scanning technology, most will show their Tesco Clubcard, which tracks their purchases and adds to their accumulated clubcard points. Later, these can be converted into money-off vouchers and other discounts. In 2011 Tesco had been using this technology for 16 years, and in that time it has built up an astonishing insight into its customers’ lives, preferences and buying patterns. Not only does Tesco profit from this information, it can sell it to companies such as Coca-Cola, Nestlé and Unilever. Tesco’s clubcard technology (then codenamed Project Omega) was developed by a team of eight working from a small office, known as the bunker, at Tesco’s headquarters. The scheme was unveiled to staff only four days before it went live and, initially, slightly more than 8 million cards were produced for the launch. But the response from customers far exceeded
example tesco; retail is detail5

211evaluatIng process technology
Data allows statisticaltracking of cases over time.Tool for internal processimprovement and enhancedcrime solving
QualityConfidence in analysisNumber of tests possibleImprovement potential
The elimination of paperwork is intended to increase productivity by freeing staff from non-coreactivities
Reduced time to analyse case material and produce reports
The new (more scalable)system allows increased case volume (5% growth predicted) to be accommodated
Increased % on-time deliveryof crime reports. Often a critical-path element in a criminal investigation
SpeedAnalysis timeReport lead-time
DependabilityProportion on-time reports
FlexibilityVolume fluctuationRange of tests
CostProductivity of direct workProductivity of indirect work
Excellent Poor
PoorExcellent
Targetperformance
New labsystem
performancewith new
technology Currentperformance
Notes
Figure 6.12 performance of laboratory analysis and data-based systems
expectations. Three months later Tesco overtook J Sainsbury to become Britain’s No. 1 super-market. But the innovation had more than a one-off impact. It is becoming increasingly important, as the task of running Clubcard and deciphering the data has become increas-ingly complex with Tesco’s sales growth. Every statement that details all items in each and every customer’s shopping basket is logged in a data centre and decoded by Dunnhumby, a marketing firm (now owned by Tesco) that is in charge of the scheme. It has to process a hundred baskets a second: that is, six million transactions a day. It gets even more complex. Each product has 45 pieces of data, and is categorised as to its price, brand, type of recipe, exotic, and so on. Customers are categorised not only by where they live or their educational status; they are also grouped into sophisticated sub-categories that describe whether they have a baby or a pet, and whether they like to cook a lot or cannot cook at all, amongst other traits. This information is consolidated into a huge search engine, which is used for research by Tesco and more than 200 of its suppliers. It assists in deciding which products should go onto what shelves, at what times. It may seem trivial but it has a very significant effect on sales. One former Tesco Chairman famously told Dunnhumby after an early Clubcard trial: ‘What scares me about this is that you know more about my customers after three months than I know after 30 years.’ But not everyone likes such close surveillance. One online commentator fumed, ‘This is pre-cisely the reason why I don’t shop at Tesco’s – their desire to own your life completely. I make a point of always shopping with cash for anonymity. If a few more people boycotted Tesco’s and Sainsbury’s then we might get a choice of shops again, and even local small shops might flourish.’

212 chapter 6 • process technology strategy
vulnerability because of changed resource dependenciesAll process technologies depend for their effective operation on support services. Specific skills are needed if the technology is to be installed, maintained, upgraded and controlled effectively. In other words, the technology has a set of ‘resource dependencies’. Changing to a different process technology often means chang-ing this set of resource dependencies. This may have a positive aspect. The skills, knowledge and experience necessary to implement and operate the technology can be scarce and difficult to copy and hence provide a platform for sustainable advan-tage. But there can also be a downside to a changed set of resource dependencies. For example, the specific skills needed to implement or operate a new process tech-nology, because they are scarce, could become particularly valuable in the labour market. The company is vulnerable to the risk of the staff who have these skills leaving in order to leverage their value. Issues of trust and power also influence the vulnerability created by dependence upon external organisations such as suppliers and customers. If there is a high degree of trust between a firm and its technology supplier, it can be entirely appropriate to become dependent for the installation, maintenance and upgrading of process technology upon a particular external provider. Dependence can also work the other way. Customers may ask for a particular piece of technology to be dedicated to their business. Again, this can be entirely legitimate if the operation trusts its customer to continue generating work for them over a suitable period. However, such exclusive relationships inevitably introduce vulnerabilities. For example, suppose an opera-tion is choosing between alternative suppliers of software. One supplier seems to be particularly price competitive, very service-oriented and has developed a particularly effective leading-edge application. Unfortunately, this supplier is also smaller than the alternative suppliers. Although its products and service may be superior, it is itself more vulnerable to business pressures. If it went out of business the company would be left with unsupported infrastructure. Under these circumstances the com-pany may decide that choosing this supplier would expose it to unacceptable levels of vulnerability.
suMMary ansWers to key questIons
What is ‘process’ technology strategy?Getting beyond a view of technology as a ‘black box’ is critical for any operations strategy. To help structure our review of technology we defined it in generic terms as the practical ‘appliance of science’. Process technology is technology as applied to operational processes and is traditionally treated as separate from product/service technology. This distinction is inevitably less clear in many service operations where the product is the process. We can further classify two types of process technology. The first is that contributing ‘directly’ to the production of goods and services. The second type is the ‘indirect’ or ‘infrastructure’ technology that acts to support core transformation processes. Process technology strategy is the set of decisions that define the strategic role that direct and indirect process technology can play in the overall operations strategy of the organisation and sets out the general characteris-tics that help to evaluate alternative technologies.

213suMMary ansWers to key questIons
What are suitable dimensions for characterising process technology?Although generic dimensions will always fail to capture completely the rich detail of any individual piece of process technology, it is normally useful to describe scale (capacity of each technology unit), automation (what the machine can do) and coup - ling (how much is or can be joined together) characteristics. Although these three dimensions are unlikely to be equally relevant for all types of technology, they do offer a useful categorisation for comparing a range of process technology options. We can modify our original dimensions (scale, automation and integration) to more accurately reflect the characteristics of IT-rich process technology. More suit-able characteristics are therefore scalability, analytical content and connectivity. We argued that these new characteristics were overcoming the traditional flexibility/cost trade-off and that new process technologies were able to enhance operational flexibility while still retaining reasonable underlying efficiency and vice versa.
how do market volume and variety influence process technology?There is often a ‘natural’ diagonal fit relationship between the volume/variety and process technology dimensions. For example, the larger the unit of capacity, the more likely that it is capital rather than labour intensive, which gives more oppor-tunity for high coupling between its various parts. Where flexibility is unimportant but achieving dependable high volumes and low unit costs is critical, such inflex-ible systems come into their own. Conversely, small-scale technologies, combined with skilled staff, tend to be more flexible than large-scale, capital-intensive, closely coupled systems. As a result, these systems can cope with a high degree of variety.
What are some of the challenges of information technology?The dominance of information technology (IT) has caused a rethink of how technol-ogy fits into operations strategy. Although there is a positive connection between adopting IT and productivity growth, it is not guaranteed. But where failure occurs it is usually caused by managerial, implementation, or organisational factors. Moreover, different kinds of IT pose different kinds of challenge. Limited ‘function IT’ such as CAD facilitates a single function or task. Enterprise IT extends across the entire organisation. Because of this it will need potentially extensive changes to the organisation. Network IT facilitates exchanges between people and groups inside and/or outside the organisation. However, it does not necessarily pre-define how these exchanges should work. Enterprise resource planning (ERP) is an example of enterprise IT. It integrates the planning, resource allocation and control activities of all parts of the business, the better to make informed planning and control deci-sions. However, the practical implementation of this idea has proved to be very com-plex and expensive. If a business’s current processes do not fit with the structure of whatever ERP package is purchased, they can either change their processes to fit the ERP package, or modify the software within the ERP package to fit their processes. Both of these options involve costs and risks.
how can process technology be evaluated strategically?Evaluating process technology quite literally means determining its value or worth. It involves exploring, understanding and describing the strategic consequences of adopting alternatives. We outlined three possible dimensions:

214 chapter 6 • process technology strategy
1 The ‘feasibility’ of technology indicates the degree of difficulty in adopting it, and should assess the investment of time, effort and money that will be needed.
2 The ‘acceptability’ of technology is how much it takes a firm towards its strategic objectives. This includes contribution in terms of cost, quality, speed, etc. as well as the development of strategic resources. In general terms it is about establish-ing the return (defined in a very broad manner) the operation gets for choosing a process technology.
3 The ‘vulnerability’ of technology indicates the extent to which the firm is exposed if things go wrong. It is the risk that is run by choosing that specific technology.
Further reading
Arthur, W.B. (2009) The Nature of Technology: What it is and How it Evolves. Allen Lane.Boardman, A., Greenberg, D., Vining, A. and Weimer, D. (2006) Cost Benefit Analysis:
Concepts and Practice 3rd edn. Prentice Hall.Bocij, P., Greasley, A. and Hickie, S. (2008) Business Information Systems: Technology,
Development and Management for the E-Business. Financial Times Prentice Hall.Carlopio, J. (2003) Changing Gears: The Strategic Implementation of Technology. Palgrave
Macmillan.Edgerton, D. (2006) The Shock of the Old: Technology in Global History Since 1900. London:
Profile Books.Hayes, R.H., Pisano, G.P., Upton, D.M. and Wheelwright, S.C. (2004) Operations, Strategy,
and Technology: Pursuing the Competitive Edge. John Wiley & Sons.McKeen, J.D. (2003) Making IT Happen: Critical Issues in Managing Information Technology.
John Wiley & Sons Series in Information Systems.
notes on the chapter
1 Sources: The Economist (2007) ‘Winning ways’, 27 January; Harel, D. (2000) Computers Ltd: What They Really Can’t Do. Oxford University Press.
2 Brynjolfsson, E. (1994) ‘Technology’s true payoff’, Information Week, October.3 This categorisation is described in McAffee, A. (2007) Managing in the Information Age.
Harvard Business School, teaching note 5–608–011.4 Teach, E. (2004) ‘Watch how you think’, CFO Magazine, January.5 Sources: Davey, J., (2009) ‘Every little bit of data helps Tesco rule retail’, The Sunday Times,
4 October.

chapter
Improvement strategy7
A large body of work has grown around how operations can be developed, enhanced and generally improved. Some of this focuses on specific techniques and prescrip-tions while some looks at the underlying philosophy of improvement. Of course, all of operations strategy is concerned with improving operations. Our treatment of the other ‘content’ decision areas in operations strategy, such as capacity, supply networks and technology, is all based on the implicit assumption that we take deci-sions in these areas in order to improve the operation. However, most organisations review their overall operations strategy relatively infrequently, and the final two chapters will look at the operations strategy formulation process, which presumably is done to improve overall performance. Between these times they do not expect the operation to ‘freeze itself’ between each major strategic review. Rather, organisa-tions aspire to develop and improve their operations on a more routine basis. This chapter deals with the more ongoing improvement activity. We are concerned, not with strategy formulation on a grand scale, but with the more general issues of how companies can shape the routines that encourage the ongoing development of their operations (see Figure 7.1).
Introduction
●● What are the differences between managing large ‘breakthrough’ improvement and managing continuous improvement?
●● how do the needs of the market direct the ongoing development of operations processes?
●● how can the ongoing management and control of operations be harnessed to develop their capabilities?
●● What can operations do to deploy their capabilities into the market?
key questIons
Development and improvement
In this chapter we examine the development of operations resources and processes, that is, the way in which operations build their capabilities and by doing so improve their performance. Many authorities stress the importance of how organisations manage their development and improvement efforts. For example, ‘The companies that are able to turn their . . . organisations into sources of competitive advantage are those that can harness various improvement programs . . . in the service of a broader [operations] strategy that emphasises the selection and growth of unique operating [capabilities].’1 But

216 chapter 7 • Improvement strategy
as with the previous chapter, we must accept some ambiguity as to the role of the development and improvement activity within operations strategy. On the one hand it is a content decision area in the sense that there are decisions to be taken about how the operation thinks about and organises its own development. On the other hand, because we are dealing with the way in which improvement decisions are made, the topics covered in this chapter could also be considered part of the process of operations strategy formulation.
process improvement
Most operations improvements are relatively minor ongoing changes to the opera-tions processes. Every time a machine is adapted to facilitate faster changeover, and any time a software failsafe routine is installed to prevent the mis-keying of customer information, the operation is being improved. Sometimes, though, improvements are grander, involving major changes in capacity, supply networks, process technol-ogy and organisation. It is important therefore to apply some calibration to the degree of process improvement so that we can distinguish between different ways of treating different types of improvement. We will start by revisiting two particular strategies that were described in Chapter 3, and represent different, and to some extent opposing, philosophies. These two strategies are breakthrough improvement and continuous improvement.
Quality
Speed
Dependability
Flexibility
Cost
Per
form
ance
ob
ject
ives
Mar
ket
com
pet
itive
ness
Issues include:
• Big radical improvement projects,or small, continuous improvements
• Performance measurement usedfor setting the direction ofimprovement
• Benchmarking againstother operators
• Prioritising improvements
• Learning and enhancing processknowledge through control
• Expectations of, and contributionsfrom, the operations function
CapacitySupplynetwork
Decision areas
Resource usage
Processtechnology
Development andorganisation
(operations developmentand improvement)
Figure 7.1 this chapter looks at development and organisation (operations development and improvement)

217Development anD Improvement
Breakthrough improvementBreakthrough, or ‘innovation’-based, improvement assumes that the main vehicle of improvement is major and dramatic change in the way the operation works – the total redesign of a computer-based hotel reservation system, for example. The impact of these improvements is relatively sudden, abrupt, and represents a step change in practice (and hopefully performance). Such improvements are rarely inexpensive, usually calling for high investment, often disrupting the ongoing workings of the operation, and frequently involving changes in the product/service or process tech-nology. Moreover, a frequent criticism of the breakthrough approach to improve-ment is that such major improvements are, in practice, difficult to realise quickly.
continuous improvementContinuous improvement, as the name implies, adopts an approach to improving performance that assumes more and smaller incremental improvement steps, for example simplifying the question sequence when taking a hotel reservation. This is also known as kaizen. While there is no guarantee that such a small step towards better performance will be followed by other steps, the whole philosophy of continu-ous improvement attempts to ensure that they will be. Continuous improvement is not concerned with promoting small improvements per se, but it does see small improvements as having one significant advantage over large ones – they can be fol-lowed relatively painlessly by other small improvements. Thus continuous improve-ment becomes embedded as the ‘natural’ way of working within the operation. So, in continuous improvement it is not the rate of improvement that is important; it is the momentum of improvement. It does not matter if successive improvements are small; what does matter is that every month (or week, or quarter, or whatever period is appropriate) some kind of improvement has actually taken place.
the differences between breakthrough and continuous improvementOne analogy that helps to understand the difference between breakthrough and continuous improvement is that of the sprint and the marathon. Breakthrough improvement is a series of explosive and impressive sprints. Continuous improve-ment, like marathon running, does not require the expertise and prowess required for sprinting; but it does require that the runner (or operations manager) keeps on going. Table 7.1 lists some of the differences between the two approaches. But, not-withstanding the fundamental differences between the two approaches, it is possible to combine the two, albeit at different times. Large and dramatic improvements can be implemented as and when they seem to promise significant improvement steps, but between such occasions the operation can continue making its quiet and less spectacular kaizen improvements.
the degree of process changeWhile continuous improvement implies relatively small changes to operations processes (but carried out frequently, in fact continually), breakthrough improve-ment implies substantially greater changes to processes. However, this dichotomy is a simplification used to highlight differences in improvement philosophy. The scale of improvement is a continuum. The scale shown in Table 7.2 characterises process change as being, in order of increasing degree of change, concerned with

218 chapter 7 • Improvement strategy
‘modification’, ‘extension’, ‘development’ and ‘pioneer’ levels of change. Table 7.2 also illustrates what these degrees of process change could mean in two types of process. Modifications to existing processes are relatively small changes where the nature of the activities within a process remain largely the same even if there are some minor rearrangements in the details of the sequence or arrangement of the activities within the process. At the other extreme, ‘pioneer’ change implies adopt-ing radically different, or at least novel to the operation, types of change both to what is done in the process and to how it is done. What we have termed extension and development lie in between these extremes. Continuous improvement usually is taken to mean degrees of process change limited to ‘modification’ or ‘extension’ changes to the process. Breakthrough improvement is usually assumed to mean what we have termed ‘development’ or ‘pioneer’ process change. For example, illus-trations of business process re-engineering described in the press tend to be at this end of the scale, although some examples of BPR are relatively minor – what we have called ‘extension’ change. The most important issues here are, first, that the greater the degree of process change, the more difficult that change is to manage success-fully; and second, that many small changes need managing in a different way from few, relatively large changes.
Improvement cycles
A recurring theme in operations process development is the idea that continuous improvement is cyclical in nature – a literally never-ending cycle of repeatedly ques-tioning and adjusting the detailed workings of processes. There are many improve-ment cycles which attempt to provide a prescription for continuous improvement, some of them proposed by academics, others devised by consultancy firms. And
table 7.1 some features of breakthrough and continuous improvement (based on Imai)2
Breakthroughimprovement Continuousimprovement
Effect Short-termbutdramatic Long-termandlong-lastingbutundramatic
Pace Bigsteps Smallsteps
Time-frame Intermittentandnon-incremental Continuousandincremental
Change Abruptandvolatile Gradualandconstant
Involvement Selectafew‘champions’ Everybody
Approach Individualism,individualideasandefforts Collectivism,groupefforts,systemsapproach
Stimulus Technologicalbreakthroughs,new Conventionalknow-howandstateofthe inventions,newtheories art
Risks Concentrated–‘alleggsinonebasket’ Spread–manyprojectssimultaneously
Practicalrequirements Requireslargeinvestmentbutlittleeffort Requireslittleinvestmentbutgreateffort tomaintainit tomaintainit
Effortorientation Technology People
Evaluationcriteria Resultsforprofit Processandeffortsforbetterresults

219Development anD Improvement
although most of these cycles are not ‘strategic’, the concept of improvement as a cycle can be translated to mean an ongoing readjustment of strategic understand-ings, objectives and performance. In fact the model of operations strategy and reconciliation between market requirements and operations resources itself implies ongoing cyclical readjustment. Market potential responds to the capabilities which the operations function is capable of deploying. Conversely, the operation adjusts its resources and processes in response to the direction set by the company’s intended market position. Also, within the operations function, operations capabilities are continually developed or evolved by learning how to use operations resources and processes more effectively. Similarly, within the marketing function, the company’s intended market position may be refined and adjusted at least partly by the poten-tial market positioning made possible because of operations capabilities.
Direct, develop and deploy
Figure 7.2 illustrates the strategic improvement cycle we shall use to structure this chapter. It employs the three ‘operations strategy’ elements of direct, develop and deploy described above, plus a market strategy element.
Direct. A company’s intended market position is a major influence on how the opera-tions function builds up its resources and processes. Some authorities argue that the
table 7.2 the degree of process change can be characterised by changes in the arrangement and nature of process activities
Degreeofprocesschange
Modification Extension Development Pioneer
Arrangementof Minor Redesignof Redefinitionof Novel/radicalactivities(whatis rearrangementof sequenceorrouting purposeorrole changedone) activities betweenactivities activities
Natureofactivities Noorlittlechange Minorchangein Somechangein Novel/radical(howitisdone) tonatureof natureofactivities coremethodology/ change activities technologyprocess
Example:thinfilm Newreel-change Clean-roomfiltering High-energydrying High-capacityprecisioncoating unit,allowsfaster technology allowingshorter machinewith‘fluidprocess changeovers introducedwhich dryingpathand electron’vacuum reduces energysavings coatinggives contamination exceptionalquality
andlowcosts
Example:health Patientcompletes Nurseperforms Internet-basedpre- Totalremotemonitoring/ pre-check-up initialchecksat visitroutineallows testing/monitoringdiagnosticsprocess questionnaireand clinic,includingnew testprogrammeto serviceusing‘body bringsittoregular combinedheartand becustomisedfor shirts’which check-up respirationtesting eachpatientplus downloadvia after-visit internet monitoringof patienthealth routine

220 chapter 7 • Improvement strategy
most important feature of any improvement path is that of selecting a direction. In other words, even micro-level, employee-driven improvement efforts must reflect the intended strategic direction of the firm.
Develop. Within the operations function those resources and processes are increas-ingly understood and developed over time so as to establish the capabilities of the operation. Essentially this is a process of learning.
Deploy. Operations capabilities need to be leveraged into the company’s markets. These capabilities, in effect, define the range of potential market positions which the company may wish to adopt. But this will depend on how effectively operations capabilities are articulated and promoted within the organisation.
Market strategy. The potential market positions that are made possible by an opera-tion’s capabilities are not always adopted. An important element in any company’s market strategy is to decide which of many alternative market positions it wishes to adopt. Strictly, this lies outside the concerns of operations strategy. In this chapter we shall restrict ourselves to examining the direct, develop and deploy elements.
In reality, the improvement process is never so straightforward, sequential or simple. This cyclical model is not prescriptive. Rather, it merely identifies the types of activity which together contribute to operations improvement at a strategic level. Moreover, no organisation would execute each link in the cycle in a rigorous sequential manner. The activities of directing the overall shape of the operations resources and processes, developing their capabilities through learning, deploying the operations contribution and deciding on market strategy, all should occur con-tinually and simultaneously.
The strategicoperations
improvementcycle
Operations resources Market requirements
DEVELOP operation’scapabilitiesthrough learning
DIRECT performanceand prioritisation
DEPLOY operation’scontribution
Operation’sresources and
processes
Operation’scapabilities
Marketpotential
Marketstrategy
Intendedmarketposition
Figure 7.2 the ‘direct’, ‘develop’, ‘deploy’ strategic improvement cycle
setting the direction
An important element in the improvement process is the influence a company’s intended market position has on the way it manages its resources and processes. In the view of many, it is the only important element. According to this view, opera-tions improvement is a constant search for better ways of supporting the company’s markets. And although the model of operations development used here (and our

221settIng the DIrectIon
view of operations strategy generally) also takes into account the influence of opera-tions capabilities on market position, the ‘direction’ to improvement provided by market requirements is clearly an important element. At its simplest, it involves translating the intended market position of the organisation into performance goals or targets for the operation. In fact, just as the whole improvement task can be seen as a cycle, so can each stage. In this case the cycle involves the ongoing refinement of these targets. For example, a company may decide that its customers place reason-able importance on its products being delivered on time. It therefore sets a target on-time delivery performance of 99.5 per cent. However, it finds that some customer requirements are so complex that manufacturing time is difficult to forecast, and therefore delivery dates cannot be met. Because of this, its overall delivery perform-ance is only 97 per cent. However, it emerges during discussions with those custom-ers that they understand the inherent difficulty in forecasting delivery times. What is important to them is not that the original delivery date is met, but that they are given at least two weeks’ notice of what the delivery date will actually be. Thus the failure of the operation’s performance to match its target prompts the targets to be changed to reflect customers’ real requirements more exactly. It is the cycle of setting targets and attempting to meet them that can lead to a more accurate interpretation of the real requirements of the market. In this section of the chapter we will examine briefly three approaches to managing this cycle: performance measurement systems, benchmarking, and ‘importance-performance’ comparisons (see Figure 7.3).
performance measurement
At a day-to-day level the direction of improvement will be determined partly by whether the current performance of an operation is judged to be good, bad or indif-ferent, so some kind of performance measurement is a prerequisite for directing improvement. Traditionally, performance measurement has been seen as a means of quantifying the efficiency and effectiveness of action.3
Performance measurement, as we are treating it in this chapter, concerns four generic issues:
●● What factors should be included as performance targets?
●● Which are the most important?
●● How should they be measured?
●● On what basis should actual against target performance be compared?
Operation’sresources and
processes
Intendedmarketposition
Performance
DIRECT
Targets
Figure 7.3 Directing improvement is a cycle of comparing targets with performance

222 chapter 7 • Improvement strategy
What factors should be included as performance targets?In operations performance measurement there has been a steady broadening in the scope of what is measured. First, it was a matter of persuading the business that because the operations function was responsible for more than cost and productiv-ity, it should therefore measure more than cost and productivity. For example,
‘A . . . major cause of companies getting into trouble with manufacturing is the tendency for many managements to accept simplistic notions in evaluating performance of their manufacturing facilities . . . the general tendency in many companies is to evaluate manu-facturing primarily on the basis of cost and efficiency. There are many more criteria to judge performance.’4
After this, it was a matter of broadening out the scope of measurement to include external as well as internal, long-term as well as short-term, and ‘soft’ as well as ‘hard’ measures. The best-known manifestation of this trend is the ‘Balanced Scorecard’ approach taken by Kaplan and Norton (see Chapter 10).
the degree of aggregation of performance targetsFrom an operations perspective, an obvious starting point for deciding which per-formance targets to adopt is to use the five generic performance objectives: qual-ity, speed, dependability, flexibility and cost. Of course, these can be broken down further into more detailed performance targets, since each performance objective, as we have mentioned before, is in reality a cluster of separate aspects of perform-ance. Conversely, they can be aggregated with composite performance targets. Broad aspects of performance such as ‘customer satisfaction’, ‘operations agility’ or ‘pro-ductivity’ can give a higher-level picture of both what is required by the market and what performance the operation is achieving. These broad targets may be further aggregated into even broader aims such as ‘achieve market objectives’ or ‘achieve financial objectives’, or even ‘achieve overall strategic objectives’. This idea is illus-trated in Figure 7.4. The more aggregated performance targets have greater strategic relevance in so much as they help to draw a picture of the overall performance of the business, although by doing so they necessarily include many influences outside those that operations strategy would normally address. The more detailed perform-ance targets are usually monitored more closely and more often and, although they provide only a very limited view of an operation’s performance, they provide in many ways a more descriptive and complete picture of what should be and what is happening within the operation. In practice, most organisations will choose to use performance targets from throughout the range.
Which are the most important performance targets?One of the problems of devising a useful performance measurement system is trying to achieve some balance between having a few key measures on the one hand (straightforward and simple, but may not reflect the full range of organisational objectives) and, on the other, having many detailed measures (complex and difficult to manage, but capable of conveying many nuances of performance). Broadly, a compromise is reached by making sure that there is a clear link between competitive strategy, the key performance indicators (KPIs) which reflect the main performance objectives, and the bundle of detailed measures which are used to ‘flesh out’ each key performance indicator. Obviously, unless competitive strategy is well defined

223settIng the DIrectIon
(not only in terms of what the organisation intends to do but also in terms of what the organisation will not attempt to do), it is difficult to focus on a narrow range of key performance indicators. So, for example, an international company that responds to oil exploration companies’ problems during drilling by offering techni-cal expertise and advice might interpret the five operations performance objectives as follows:
●● Quality. Operations quality is usually measured in terms of the environmental impact during the period when advice is being given (oil spillage, etc.) and the long-term stability of any solution implemented.
●● Speed. The speed of response is measured from the time the oil exploration com-pany decides that it needs help to the time when the drilling starts safely again.
●● Dependability. Largely a matter of keeping promises on delivering after-the-event checks and reports.
●● Flexibility. A matter of being able to resource (sometimes several) jobs around the world simultaneously, i.e. volume flexibility.
●● Cost. The total cost of keeping and using the resources (specialist labour and spe-cialist equipment) to perform the emergency consultations.
The company’s competitive strategy is clear. It intends to be the most responsive company at getting installations safely back to normal working, while also provid-ing long-term effectiveness of technical solutions offered with minimum environ-mental impact. It is not competing on cost. The company therefore decides that speed and quality are the two performance objectives key to competitive success. This it translates into three key performance indicators (KPIs):
●● the time from drilling stopping to it starting safely again;
●● the long-term stability of the technical solution offered;
●● the environmental impact of the technical solution offered.
Customersatisfaction
Resilience
Quality Dependability Speed Flexibility Cost
Agility
Marketstrategic
objectives
Financialstrategic
objectives
Overallstrategic
objectives
Detailedperformancemeasures, e.g.
Operationsstrategic
objectives
High strategicrelevance andaggregation
Highdiagnosticpower and
frequency ofmeasurement
Broadstrategicmeasures
Functionalstrategic measures
Compositeperformancemeasures
Generic operationsperformancemeasures
• Defects per unit
• Level of customer complaints
• Scrap level
• Mean time between failures
• Lateness complaints
• Customer query time
• Order lead- time
• Throughput time
• Time to market
• Product range
• Transaction costs
• Labour productivity
• Machine efficiency
Figure 7.4 performance targets can involve different levels of aggregation
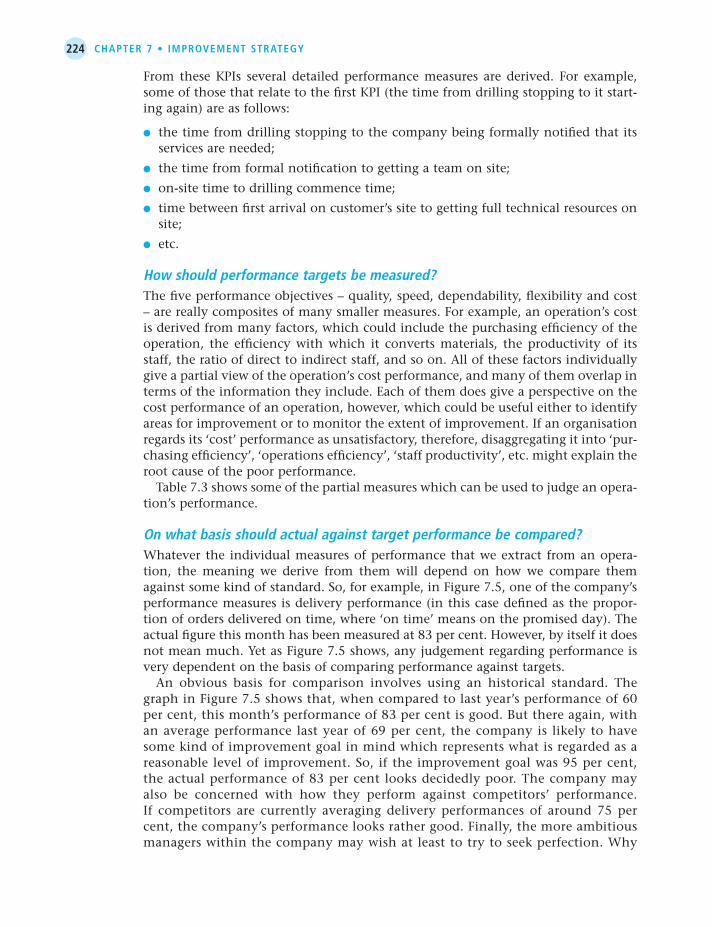
224 chapter 7 • Improvement strategy
From these KPIs several detailed performance measures are derived. For example, some of those that relate to the first KPI (the time from drilling stopping to it start-ing again) are as follows:
●● the time from drilling stopping to the company being formally notified that its services are needed;
●● the time from formal notification to getting a team on site;
●● on-site time to drilling commence time;
●● time between first arrival on customer’s site to getting full technical resources on site;
●● etc.
how should performance targets be measured?The five performance objectives – quality, speed, dependability, flexibility and cost – are really composites of many smaller measures. For example, an operation’s cost is derived from many factors, which could include the purchasing efficiency of the operation, the efficiency with which it converts materials, the productivity of its staff, the ratio of direct to indirect staff, and so on. All of these factors individually give a partial view of the operation’s cost performance, and many of them overlap in terms of the information they include. Each of them does give a perspective on the cost performance of an operation, however, which could be useful either to identify areas for improvement or to monitor the extent of improvement. If an organisation regards its ‘cost’ performance as unsatisfactory, therefore, disaggregating it into ‘pur-chasing efficiency’, ‘operations efficiency’, ‘staff productivity’, etc. might explain the root cause of the poor performance. Table 7.3 shows some of the partial measures which can be used to judge an opera-tion’s performance.
on what basis should actual against target performance be compared?Whatever the individual measures of performance that we extract from an opera-tion, the meaning we derive from them will depend on how we compare them against some kind of standard. So, for example, in Figure 7.5, one of the company’s performance measures is delivery performance (in this case defined as the propor-tion of orders delivered on time, where ‘on time’ means on the promised day). The actual figure this month has been measured at 83 per cent. However, by itself it does not mean much. Yet as Figure 7.5 shows, any judgement regarding performance is very dependent on the basis of comparing performance against targets. An obvious basis for comparison involves using an historical standard. The graph in Figure 7.5 shows that, when compared to last year’s performance of 60 per cent, this month’s performance of 83 per cent is good. But there again, with an average performance last year of 69 per cent, the company is likely to have some kind of improvement goal in mind which represents what is regarded as a reasonable level of improvement. So, if the improvement goal was 95 per cent, the actual performance of 83 per cent looks decidedly poor. The company may also be concerned with how they perform against competitors’ performance. If competitors are currently averaging delivery performances of around 75 per cent, the company’s performance looks rather good. Finally, the more ambitious managers within the company may wish at least to try to seek perfection. Why

225settIng the DIrectIon
not, they argue, use an absolute performance standard of 100 per cent delivery on time? Against this standard the company’s actual 83 per cent again looks disappointing.
BenchmarkingAnother very popular, although less ‘day-to-day’, method for senior managers to drive organisational improvement is to establish operational benchmarks. By high-lighting how key operational elements ‘shape up’ against ‘best in class’ competitors, key areas for focused improvement can be identified. Originally, the term ‘bench-mark’ derived from land surveying, where a mark, cut in the rock, would act as a reference point. In 1979 the Xerox Corporation, the document and copying com-pany, used the term ‘competitive benchmarking’ to describe a process ‘used by the manufacturing function to revitalise itself by comparing the features, assemblies and components of its products with those of competitors’.5
table 7.3 some typical partial measures of performance
Performanceobjective Sometypicalmeasures
Quality Numberofdefectsperunit Levelofcustomercomplaints Scraplevel Warrantyclaims Meantimebetweenfailures Customersatisfactionscore
Speed Customerquerytime Orderleadtime Frequencyofdelivery Actualversustheoreticalthroughputtime Cycletime
Dependability Percentageofordersdeliveredlate Averagelatenessoforders Proportionofproductsinstock Meandeviationfrompromisedarrival Scheduleadherence
Flexibility Timeneededtodevelopnewproducts/services Rangeofproducts/services Machinechange-overtime Averagebatchsize Timetoincreaseactivityrate Averagecapacity/maximumcapacity Timetochangeschedules
Cost Minimumdeliverytime/averagedeliverytime Varianceagainstbudget Utilisationofresources Labourproductivity Addedvalue Efficiency Costperoperationhour

226 chapter 7 • Improvement strategy
Since that time, the term benchmarking has widened its meaning in a number of ways.6
●● It is no longer confined only to manufacturing organisations but is commonly used in services such as hospitals and banks.
●● It is no longer practised only by experts and consultants but can involve all staff in the organisation.
●● The term ‘competitive’ has been widened to mean more than just the direct comparison with competitors. It is now taken to mean benchmarking to gain competitive advantage (perhaps by comparison with, and learning from, non-competitive organisations).
types of benchmarkingThere are many different types of benchmarking (which are not necessarily mutually exclusive), some of which are listed below.
●● Non-competitive benchmarking is benchmarking against external organisations that do not compete directly in the same markets.
●● Competitive benchmarking is a comparison directly between competitors in the same, or similar, markets.
●● Performance benchmarking is a comparison between the levels of achieved perform-ance in different operations. For example, an operation might compare its own performance in terms of some or all of its performance objectives – quality, speed, dependability, flexibility and cost – against other organisations’ performance in the same dimensions.
●● Practice benchmarking is a comparison between an organisation’s operations prac-tices, or way of doing things, and those adopted by another operation.
Time
Last year’s average performance = 60%
Competitor performance = 75%
Actual performance = 83%
Strategic goal = 95%Absolute performance = 100%
Performance by historical standards is GOODPerformance against improvement goal is POORPerformance against competitors is GOODAbsolute performance is POOR
100
90
80
70
60
50
40
Figure 7.5 Different standards of comparison give different messages

227Importance–perFormance mappIng
the objectives of benchmarkingBenchmarking is concerned partly with being able to judge how well an operation is doing. It can be seen, therefore, as one approach to setting realistic performance standards. It is also concerned with searching out new ideas and practices which might be able to be copied or adapted. For example, a bank might learn some things from a supermarket about how it could cope with demand fluctuations during the day. The success of benchmarking, however, is due largely to more than its abil-ity to set performance standards and enable organisations to copy one another. Benchmarking is essentially about stimulating creativity and providing a stimulus that enables operations better to understand how they should be serving their cus-tomers. Many organisations find that it is the process itself of looking at different parts of their own company, or looking at external companies, that allows them to understand the connection between the external market needs that an operation is trying to satisfy and the internal operations practices it is using to try to satisfy them. In other words, benchmarking can help to reinforce the idea of the direct contribution that an operation has to the competitiveness of its organisation.
Importance–performance mapping7
Importance–performance mapping is a particularly useful approach to directing operations improvement because it explicitly includes both of the major influences on the generic performance objectives that define market requirements:
●● the needs and importance preferences of customers; and
●● the performance and activities of competitors.
Both importance and performance have to be brought together before any judge-ment can be made as to the relative priorities for improvement. Because something is particularly important to its customers does not mean that an operation should give it immediate priority for improvement. The operation may already be consider-ably better than its competitors in this respect. Similarly, because an operation is not very good at something when compared with its competitors’ performance does not necessarily mean that it should be immediately improved. Customers may not par-ticularly value this aspect of performance. Both importance and performance need to be viewed together to judge improvement priority. Yet, although we have associated importance with the view of customers and per-formance with the activities of competitors, the approach may be adapted to deviate from this. For example, a company may choose to give importance to some aspect of operations activity even when customers do not find it important. If a company is working towards providing customised products or services in the near future, it may regard flexibility as being more important than do its customers who are, as yet, unaware of the change in the company’s market stance. Nor is performance always judged against competitors. Although it may be an obvious benchmark, it does presuppose the existence of competitors. Many not-for-profit organisations may not see themselves as having competitors as such. They could, however, assess their performance against other similar organisations. Alternatively, they could measure performance against customer perceptions or customer expectations.

228 chapter 7 • Improvement strategy
the importance–performance matrix
The priority for improvement that each competitive factor should be given can be assessed from a comparison of their importance and performance. This can be shown on an importance–performance matrix which, as its name implies, positions each competitive factor according to its score or ratings on these criteria. Figure 7.6 shows an importance–performance matrix where both importance and performance are judged using (in this case) a simple 9-point scale, and where the matrix is divided into zones of improvement priority. The first zone boundary is the ‘lower boundary of acceptability’ shown as line AB in Figure 7.6. This is the boundary between acceptable and unacceptable per-formance. When a competitive factor is rated as relatively unimportant (8 or 9 on the importance scale) this boundary will, in practice, be low. Most operations are prepared to tolerate performance levels that are ‘in the same ballpark’ as their competitors (even at the bottom end of the rating) for unimportant competitive factors. They become concerned only when performance levels are clearly below those of their competitors. Conversely, when judging competitive factors that are rated highly (1 or 2 on the importance scale) they will be markedly less sanguine at poor or mediocre levels of performance. Minimum levels of acceptability for these competitive factors usually will be at the lower end of the ‘better than competitors’ class. Below this minimum bound of acceptability (AB) there is clearly a need for improvement; above this line there is no immediate urgency for any improvement. However, not all competitive factors falling below the minimum line will be seen as having the same degree of improvement priority. A boundary approximately rep-resented by line CD represents a distinction between an urgent priority zone and a less urgent improvement zone. Similarly, above the line AB, not all competitive
Importance for customersHIGHLOW
GO
OD
BA
D
C
F
A
9
9 8 7 6 5 4 3 2 1
8
7
6
5
4
3
2
1
Per
form
ance
aga
inst
com
pet
itors
E
B
D
APPROPRIATE
IMPROVE
URGENTACTION
EXCESS?
Figure 7.6 the importance–performance matrix

229Importance–perFormance mappIng
factors are regarded as having the same priority. The line EF can be seen as the approximate boundary between performance levels that are regarded as ‘good’ or ‘appropriate’ on the one hand and those regarded as ‘too good’ or ‘excess’ on the other. Segregating the matrix in this way results in four zones which imply very dif-ferent priorities.
●● The ‘appropriate’ zone. This zone is bounded on its lower edge by the ‘lower bound of acceptability’, that is, the level of performance below which the company, in the medium term, would not wish the operation to fall. Moving performance up to, or above, this boundary is likely to be the first-stage objective for any improve-ment programme. Competitive factors that fall in this area should be considered satisfactory, at least in the short to medium term. In the long term, however, most organisations will wish to edge performance towards the upper boundary of the zone.
●● The ‘improve’ zone. Any competitive factor that lies below the lower bound of the ‘appropriate’ zone will be a candidate for improvement. Those lying either just below the bound or in the bottom left-hand corner of the matrix (where per-formance is poor but it matters less) are likely to be viewed as non-urgent cases. Certainly they need improving, but probably not as a first priority.
●● The ‘urgent action’ zone. More critical will be any competitive factor that lies in the ‘urgent action’ zone. These are aspects of operations performance where achieve-ment is so far below what it ought to be, given its importance to the customer, that business is probably being lost directly as a result. Short-term objectives must be, therefore, to raise the performance of any competitive factors lying in this zone at least up to the ‘improve’ zone. In the medium term they would need to be improved beyond the lower bound of the ‘appropriate’ zone.
●● The ‘excess?’ zone. The question mark is important. If any competitive factors lie in this area their achieved performance is far better than would seem to be war-ranted. This does not necessarily mean that too many resources are being used to achieve such a level, but it may do. It is only sensible therefore to check if any resources that have been used to achieve such a performance could be diverted to a more needy factor – anything that falls in the ‘urgent action’ area, for example.
TAG Transport is a successful logistics company that is reviewing one of its fastest-growing services – an overnight, temperature-controlled, delivery service for chilled food. It is par-ticularly keen to improve the level of service that it gives to its customers. As a first stage in the improvement process it has devised a list of the various aspects of its operations performance:
●● Price/cost – the price (including discounts, etc.) that it can realise from its customers and the real internal cost of providing the service.
●● Distribution quality – the ability to deliver goods in an undamaged state and its custom-ers’ perceptions of the appearance of its vehicles and drivers.
●● Order/dispatch quality – the courtesy and effectiveness of its customer-facing call centre staff.
example tag transport

230 chapter 7 • Improvement strategy
●● Enquiry lead-time – the elapsed time between an enquiry from a new customer and pro-viding a fully specified proposal.
●● Drop time – the earliest time each morning when delivery can be made.
●● ‘Window’ quote – the guaranteed time window around the drop time within which deliv-ery should be made.
●● Delivery performance – the proportion of actual deliveries made within the quoted ‘window’.
●● Delivery flexibility – the ability to change delivery destination.
●● Volume flexibility – the ability to provide extra capacity at short notice.
●● Documentation service – the reliability of documents such as temperature control charts supplied with each delivery.
Based on its discussions with customers, the company manages to assign a score to each of these factors on the 1 to 9 scale. A score of 1 for ‘importance’ means that the factor is extremely important to customers and 9 means that it has no importance. For performance a score of 1 means that TAG is considerably and consistently better than any of its com-petitors; a score of 9 means that it is very much worse than any competitor. TAG plotted the importance and performance rating they had given to each aspect of performance on an importance–performance matrix. This is shown in Figure 7.7. It shows that the most important issue, delivery performance, is also where the company performs well against its competitors. Several issues need improving, however, three urgently. Enquiry lead-time, order/dispatch quality and delivery flexibility are all relatively important yet the company scores poorly against its competitors.
Importance for customersHIGHLOW
GO
OD
BA
D
9
9 8 7 6 5 4 3 2 1
8
7
6
5
4
3
2
1
Per
form
ance
aga
inst
com
pet
itors
Volumeflexibility
Dropquote
Order/dispatchquality
Price/cost
Windowquote
Distributionquality
Deliveryflexibility
Enquirylead-time
Documentation service
Delivery
Figure 7.7 the importance–performance matrix for tag’s ‘overnight temperature-controlled’ service

231DevelopIng operatIons capaBIlItIes
the sandcone theory
Techniques such as the importance–performance matrix assume that the improve-ment priority given to various aspects of operations performance is contingent upon the specific circumstances of an organisation’s market position. But some authorities believe that there is also a generic ‘best’ sequence in which operations perform-ance should be improved. The best-known theory of this type is sometimes called the sandcone theory. Although there are slightly different versions of this, the best known is that originally proposed by Kasra Ferdows and Arnoud de Meyer.8 In fact, the sandcone model incorporates two ideas. The first is that there is a best sequence in which to improve operations performance; the second is that effort expended in improving each aspect of performance must be cumulative. In other words, moving on to the second priority for improvement does not mean dropping the first, and so on. According to the sandcone theory, the first priority should be quality, since this is a precondition to all lasting improvement. Only when the operation has reached a minimally acceptable level in quality should it then tackle the next issue, that of internal dependability. Importantly though, moving on to include dependability in the improvement process should not stop the operation making further improve-ments in quality. Indeed, improvement in dependability will actually require further improvement in quality. Once a critical level of dependability is reached, enough to provide some stability to the operation, the next stage is to turn attention to the speed of internal throughput, but again only while continuing to improve quality and dependability further. Soon it will become evident that the most effective way to improve speed is through improvements in response flexibility, that is, changing things more quickly within the operation: for example, reacting to new customer requirements quickly, changing production volumes rapidly and introducing new products faster. Again, including flexibility in the improvement process should not divert attention from continuing to work further on quality, dependability and speed. Only now, according to the sandcone theory, should cost be tackled head on. The ‘sandcone model’ is so called because the sand is analogous to management effort and resources. To build a stable sandcone a stable foundation of quality improvement must be created. Upon such a foundation one can build layers of dependability, speed, flexibility and cost – but only by widening up the lower parts of the sandcone as it is built up (see Figure 7.8). Building up improvement is thus a cumulative process, not a sequential one.
Developing operations capabilities
Underlying the whole concept of continuous improvement is a simple yet far-reach-ing idea – small changes, continuously applied, bring big benefits. Small changes are relatively minor adjustments to resources and processes and the way they are used. In other words, it is the interaction between resources, processes and the staff who manage and operate them wherein lies the potential inherent in continuous improvement. It is the way in which humans learn to use and work with their opera-tions resources and processes that is the basis of capability development. Learning, therefore, is a fundamental part of operations improvement. Here we examine two views of how operations learn. The first is the concept of the learning curve, a largely descriptive device that attempts to quantify the rate of operational improvement

232 chapter 7 • Improvement strategy
over time. Then we look at how operations’ learning is driven by the cyclical rela-tionship between process control and process knowledge.
the learning/experience curve
The relationship between the time taken to perform a task and the accumulated learning or experience was first formulated in the aircraft production industry in the 1930s. The learning curve argues that the reduction in unit labour hours will be proportional to the cumulative number of units produced, and that every time the cumulative output doubles, the hours reduce by a fixed percentage. For example, in much labour-intensive manufacturing (e.g. clothing manufacture) a reduction in hours per unit of 20 per cent is found every time cumulative production has dou-bled. This is called an 80 per cent learning curve. When plotted on log-log paper, such a curve will appear as a straight line – making extrapolations (and strategic planning) more straightforward. Such ‘learning’ curves are still used in the aero-space, electronics and defence industries. The patterns that exist in labour hours have also been found when costs are examined. They have been found not only in individual product costs but also in operation and industry-wide costs. When used to describe cost behaviour, the term ‘experience curve’ rather than learning curve is used. Where costs are not available, price has often been found to be a suitable proxy. An example of an experience curve is shown in Figure 7.9. It charts the progress of a voucher processing operation in a bank. Voucher processing operations sort, read (using optical character recogni-tion) and process the information from the paper documents generated by the branch operations of the bank. This figure shows how the average cost of process-ing a voucher reduced over time. To begin with, the operation had not used the
Cost
Flexibility
Speed
Dependability
Quality
Quality •••••••••••
Quality + dependability ••••
Quality + dependability + speed •••
Quality + dependability + speed + flexibility
Quality + dependability + speed + flexibility + cost
Figure 7.8 the sandcone model of improvement; cost reduction relies on a cumulative foundation of improvement in the other performance objectives

233DevelopIng operatIons capaBIlItIes
type of large machines used in these processes, nor had it organised itself to receive the hundreds of thousands of vouchers from the branches it serviced. Over time it learned how to organise itself and to use the machines effectively. Although the data in Figure 7.9 stops at a point in time, future learning can be extrapolated from the operation’s ‘learning history’. This enables the bank to establish its capacity require-ments for the future, work out the cost savings from using such large processing operations and provide improvement targets for this and other similar operations.
limits to experience-curve-based strategies
There are clearly risks associated with any strategy that is based exclusively on one form of analysis. In this instance, basing the long-term competitive viability of a firm solely on the potential for ongoing cost reduction is open to a number of seri-ous criticisms:
●● Attributing specific costs is notoriously difficult, and overhead costs are often arbitrarily allocated. In addition, units may perform poorly because they have the oldest capital equipment and their volume–variety mix may be inappropriate, factors which the experience may not capture.
●● The product or service may be superseded. Innovation from within or (even less predictably) from outside an industry can shift the competitive ‘rules of the game’.
●● Relentless pursuit of cost reduction (to the detriment of all the other key perform-ance measures) can lead to operational inflexibility. Although traditional trade-off models are questioned in the ‘world-class operations’ paradigm, there remains an inevitable link between cost and flexibility.
●● The control of cost is not the only way that an operation can contribute to the competitive position of the firm. Competing on quality, service, speed, etc. are all equally viable strategic options.
Cumulative volume of vouchers processed10,000 100,000,00010,000,0001,000,000100,0001
100
10
Uni
t co
st (c
ents
)
Figure 7.9 log-log experience curve for a voucher processing centre

234 chapter 7 • Improvement strategy
process knowledge
Central to developing operations capabilities is the concept of process knowledge. The more we understand the relationship between how we design and run pro-cesses and how they perform, the easier it is to improve them. No process will ever reach the point of absolutely perfect knowledge – but most processes can benefit from attempting to move towards it. Moreover, few if any processes operate under conditions of total ignorance. Most operations have at least some idea as to why the processes behave in a particular way. Between these two extremes lies the path of process improvement along which operations managers attempt to journey. It is useful to identify some of the points along this path. One approach to this has been put forward by Roger Bohn.9 He described an eight-stage scale ranging from ‘total ignorance’ to ‘complete knowledge’ of the process (see Table 7.4).
●● Stage 1, Complete ignorance. There is no knowledge of what is significant in pro-cesses. Outputs appear to be totally random and unconnected with any phenom-ena that can be recognised.
●● Stage 2, Awareness. There is an awareness that certain phenomena exist and that they are probably relevant to the process, but there is no formal measurement or understanding of how they affect the process. Managing the process is far more of an art than a science, and control relies on tacit knowledge (that is, unarticulated knowledge within the individuals managing the system).
●● Stage 3, Measurement. There is an awareness of significant variables that seem to affect the process with some measurement, but the variables cannot be controlled as such. The best that managers could do would be to alter the process in response to changes in the variables.
●● Stage 4, Control of the mean. There is some idea of how to control the significant variables that affect the process, even if the control is not precise. Managers can control the average level of variables in the process, even if they cannot con-trol the variation around the average. Once processes have reached this level of knowledge, managers can start to carry out experiments and quantify the impact of the variables on the process.
●● Stage 5, Process capability. The knowledge exists to control both the average and the variation in significant process variables. This enables the way in which pro-cesses can be managed and controlled to be written down in some detail. This in turn means that managers do not have to ‘reinvent the wheel’ when repeating activities.
●● Stage 6, Know how. By now the degree of control has enabled managers to know how the variables affect the output of the process. They can begin to fine-tune and optimise the process.
●● Stage 7, Know why. The level of knowledge about the processes is now at the ‘scientific’ level with a full model of the process predicting behaviour over a wide range of conditions. At this stage of knowledge, control can be performed automatically, probably by microprocessors. The model of the process allows the automatic control mechanisms to optimise processing across all previously expe-rienced products and conditions.
●● Stage 8, Complete knowledge. In practice, this stage is never reached, because it means that the effects of every conceivable variable and condition are known

235DevelopIng operatIons capaBIlItIes
and understood, even when those variables and conditions have not even been considered before. Stage 8 therefore might be best considered as moving towards this hypothetically complete knowledge.
table 7.4 characteristics of Bohn’s eight stages of process knowledge
Stageterm Indication Operations Process Process Tomaintain Tomoveup activity learning knowledge
1Complete Purechance Expertise- Artistic Inpeople’s Tinkeringignorance based heads
2Awareness Art Professionalism Developstandardsandsystematicmeasures
3 Measurement Measure Preserve Eliminate goodoutput standards causesof
largedisturbancetoprocess
4Controlof Meanmade Observeand Eliminatemean stable correct causesof
deviations important fromlimits variance,
identifynewsourcesofvariability
5Process Process Natural Writtenand Eliminate Stabilisecapability variation experiments oral newcauses process
keptsmaller ofvariability transitions than and tolerance differencesin band process
conditionsfordifferentparts
6Process Transitions Monitor Scientificcharacter- between process experimen-isation productsand parameters tationand
processesare and theory known transitions buildingon andeliminate important causesof variablesfor new newproduct variability introduction

236 chapter 7 • Improvement strategy
7Knowwhy Science Procedure- Controlled Databases Science Scientific aboutallkey based experiments andsoftware enquiryand experimen- variables and debate tationand simulations theory
buildingonallvariables
8Complete Knowallknowledge variableand
relationships forproducts nowandin thefuture
Source:fromBohn,R.E.(1994)‘Measuringandmanagingtechnicalknowledge’,MITSloanManagementReview,Fall1994,articleno.3615.Copyright©1994MassachusettsInstituteofTechnology,allrightsreserved.Reproducedwithpermission.
Improvement methodologies are often associated with repetitive operations. Performing the same task repeatedly means that there are plenty of opportunities to ‘get it right’. The whole idea behind continuous improvement (see Chapter 3) derives from this simple idea. By contrast, operations that have to perform more difficult activities, especially those that call for expert judgement and diagnostic ability, must call for equally complex improve-ment approaches, no? Well no, according to Atul Gawande, an oncologist at the prestigious Johns Hopkins Hospital. Gawande thinks that the very opposite is true, although medicine is advancing at an astounding rate, and medical journals produce learned papers adding the results of advanced research to an ever-expanding pool of knowledge. Surgeons carry out over 200 major operations a year, unfortunately not all of them successful, but the medical profession overall does not always have a reliable method for learning from its mistakes. Gawande’s idea is that his, and similar ‘knowledge-based’ professions are in danger of sink-ing under the weight of facts. Scientists are accumulating more and more information, and professions are fragmenting into ever narrower specialisms. Gawande tells the story of Peter Pronovost, a specialist in critical care at Johns Hopkins Hospital who in 2001 tried to reduce the number of patients who were becoming infected on account of the use of intravenous central lines. There are five steps that medical teams can take to reduce the chances of contracting such infections. Initially Pronovost simply asked nurses to observe whether doctors took the five steps. What they found was that, at least a third of the time, they missed one or more of the steps. So nurses were authorised to stop doctors who had missed out any of the steps and, as a matter of course, ask whether existing intravenous central lines should be reviewed. As a result of applying these simple checklist style rules, the 10-day line-infection rates went down from 11 per cent to 0 per cent. In one hospital it was calculated that, over a year, this simple method had prevented 43 infections and 8 deaths, and saved about $2 million. Using the same checklist approach the hospital identified and applied the method to other activities. For example, a check in which nurses asked patients about their pain levels led to untreated pain reducing from 41 per cent to 3 per cent. Similarly, the simple checklists method helped the average length of patient stay in intensive care to fall by half. When Pronovost’s approach was adopted by other hospitals, within 18 months 1,500 lives and $175 million had been saved. Gawande describes checklists used in this way as a ‘cognitive net’ – a mechanism that can help prevent experienced people from making errors due to flawed memory and attention, and ensure that teams work together. Simple checklists are common in other professions.
example the checklist manifesto10

237DevelopIng operatIons capaBIlItIes
the strategic importance of operational knowledgeOne of the most important sources of process knowledge is the routines of process control. Process control, and especially statistically based process control, is one of the foundations of the Six Sigma improvement approach, and is explained in Chapter 3. And while process control and process knowledge may seem surprisingly operational for a book about the more strategic aspects of managing operations, it is vital to establishing an operations-based strategic advantage. In reality, the strategic management of any operation cannot be separated from how resources and proc-esses are managed at a detailed and day-to-day level. The process knowledge, process control cycle of capability development is one of the best illustrations of this. As an operation increases its process knowledge it has a better understanding of what its processes can do at the limits of their capability, even though those limits are con-tinually expanding. This allows them to develop better products and services, not only because of the enhanced process capability but also because of the operation’s confidence in that capability. Similarly, as process knowledge increases, some of the more obvious operations trade-offs can be overcome. Often processes become more flexible in terms of widening their range of capabilities, without excessive additional cost. This in turn allows the operation to produce a wider range of products and services. At the same time, fewer process errors mean better conformance quality and (usually) happier customers. Most staff too will prefer to work in a process that is under control. Certainly, process uncertainty can undermine staff morale. Retaining good staff within chaotic processes is not easy in the long term. Well-controlled processes will also have fewer errors and waste, therefore high efficiency and therefore low cost. It can even affect relationships with suppliers. High levels of process knowledge imply an understanding of how input will affect the process. Armed with this knowledge, relationships with suppliers can develop on a more pro-fessional basis. The important point here is that whereas grappling with the details of process control may seem operational, its benefits are not. The increased revenue opportunities of better products and services, a wide product range and customer loyalty, together with better supply relationships, good staff and lower costs, are unquestionably strategic (see Figure 7.10).
Civil engineers use them to make certain that complicated structures are assembled on schedule. Chefs use them to make sure that food is prepared exactly to the customers’ taste. Airlines use them to make sure that pilots take off safely, and also to learn from, now rela-tively rare, crashes. Indeed, Gawande is happy to acknowledge that checklists are not a new idea. He tells the story of the prototype of the Boeing B17 Flying Fortress that crashed after take-off on its trial flight in 1935. Most experts said that the bomber was ‘too complex to fly’. Facing bankruptcy, Boeing investigated and discovered that, confronted with four engines rather than two, the pilot forgot to release a vital locking mechanism. But Boeing created a pilot’s checklist, in which the fundamental actions for the stages of flying were made a mandated part of the pilot’s job. In the following years, B17s flew almost two million miles without a single accident. Even for pilots, many of whom are rugged individualists, says Gawande, it is usually the application of routine procedures that saves planes when things go wrong, rather than ‘hero-pilotry’ so fêted by the media. It is discipline rather than bril-liance that preserves life. In fact it is discipline that leaves room for brilliance to flourish.

238 chapter 7 • Improvement strategy
Operation’sresources and
processes
Operation’scapabilities
Kno
wle
dge
DE
VE
LOP
Con
trol
Enhanced supplierrelationships
Understanding ofprocess inputs
Better products andservices
Understandingprocess limits
Higher processefficiency
Less costlyflexibility
Lowercosts
Wide product/service range
Staff jobsatisfaction
Retain beststaff
Customerloyalty
Enhancedquality
Figure 7.10 process control may be one of the most operational of tasks, but it can bring strategic benefits
Michael Dell, a student at the University of Texas in Austin, had a side-line in buying up unused stock of PCs from local dealers, adding components, and re-selling the now higher-specification machines to local businesses. When the side line grew to over $50,000 per month he quit university and founded a computer company which was to revolutionise the industry’s supply network management. But he faced some real difficulties. First, Dell was just too small to develop and make its own components. Better, he figured, learn how best to manage a network of committed specialist component manufacturers and take the best of what was available in the market. Dell says that his commitment to outsourcing was always done for the most positive of reasons. ‘Outsourcing, at least in the IT world, is almost always a way to get rid of a problem a company hasn’t been able to solve itself . . . that’s not what we’re doing at all. We focus on how we can coordinate our activities to create the most value for customers.’ This meant devising new methods of working, a point emphasised by Michael Dell: ‘When we launch a new product, their engineers are stationed right in our plants. If a customer calls up with a problem, we’ll stop shipping product while they fix design flaws in real time.’ Dell has also enhanced the economic incentive to collaborate with suppliers. ‘We can share design and performance databases with suppliers, enabling them to shorten product development times.’ But Dell still faced a cost disadvantage against its far bigger competitors. Seeking ways to undercut its rivals, it decided to sell its computers direct to its customers, bypassing retail-ers. This allowed the company to cut out the retailer’s (often considerable) margin, which in turn allowed Dell to offer lower prices, but the move was controversial. Computers are complex purchases, it was argued, customers need to have their hands held while they are
example Dell (part 1) – learning how to turn difficulties into advantages11

239DeployIng capaBIlItIes In the market
Operations capabilities are of little benefit if not used. Indeed, it could be argued that operations capabilities do not really exist unless they are used. They remain nothing more than unrealised potential. A vital element in strategic operations improvement, therefore, is the ability to leverage developed operations capabilities into the market. Not that operations capability will necessarily exclusively define a company’s market position. We are not suggesting that because a company’s operations have a particular capability it should always attempt to exploit it in the market. But the deployment of capability does create potential in the market. How this potential is realised (or not) and how organisations target market segments is beyond the scope of this book. However, what is very much important to operations strategy is how the operation can deploy its capabilities to provide the potential for the organisation to inhabit profitable market segments. Again, we use the idea of a cycle within the overall strategic improvement cycle. This is illustrated in Figure 7.11. Operations capabilities must provide a contribution to what the organisation regards as being its range of potential market positions, but how the operation can contribute to this potential is influenced strongly by the expectations that the rest of the organisation has for its operations.
making up their minds, they won’t buy a product they can’t see and touch. Yet Dell realised that cutting out the link in the supply network between them and the customer also pro-vided them with significant learning opportunities. First, it offered an opportunity for them to get to know their customers’ needs far more intimately. At the simplest level, this allows them to forecast based on the thousands of customer contact calls they receive every hour. In a longer-term sense, it allows them to talk with customers about what they really want from their machines. In this way design decisions are made in an environment of realistic customer awareness. Second, it allowed Dell to learn how to run its supply chain in a differ-ent way. The time taken for products to move from suppliers through the supply chain to the end customer could be cut, reducing Dell’s level of inventory to under 10 days’ worth, as opposed to over 80 days for some competitors. This gave Dell a significant cost advantage – so much so that it went on to become the largest personal computer company in the world. But no business model lasts forever. See the example ‘Dell (part 2) Things change, OK?’, in Chapter 9.
Deploying capabilities in the market
Operationscapabilities
Marketpotential
Contribution
DEPLOY
Expectations
Figure 7.11 Deploying operations capabilities to create market potential means ensuring that the operations function is expected to contribute to market positioning

240 chapter 7 • Improvement strategy
the four-stage model
The ability of any operation to contribute to opening up market potential for the organisation and the organisational aims, expectations and aspirations of the opera-tions function has been captured in a model developed by Professors Hayes and
Siemens, the leading European electrical engineering firm’s story began in 1850 in a small workshop in Berlin. Now the company employs 430,000 people in 190 countries. Long before globalisation became fashionable, Siemens looked beyond national boundaries. It built lines from Finland to the Crimea for the Russian Empire, from London to Calcutta for the British Crown, as well as the transatlantic cable linking Europe to the Americas, and it was doing business with China as early as 100 years ago. But now its commitment to China is much deeper. It has responded to the rise of low-cost manufacturing and the opening of the Chinese market by moving mass production to Asia. Siemens’ global network of operations exploits different capabilities in different parts of the world. In China and many of its other Asian plants it has developed a low-cost base capability that helps it to export its more price-sensitive products to developing countries. It uses low-cost countries for making components for products that are assembled in Europe or America. But it also owns whole businesses, factories, service centres and distribution networks around the world, as well as doing much of its product development abroad. ‘We have to examine each stage of the value chain in each business area, from development to produc-tion, service and, of course, sales, and decide where to put it, based on customer proximity, skills and costs,’ says Dr Ulrich Stock, head of the company’s Global Competitiveness programme. For example, a lower-cost version of one of its medical body scanners, aimed at the Chinese market, initially was developed jointly between its Munich headquarters and in China, where it is also being manufactured. Now its Chinese operations have grown their capabili-ties to the point where the product is developed entirely in China and sold in developing countries worldwide. The challenges in Siemens’ European operations is different. Germany in particular is a high-wage economy where attempting to produce low-cost products and services would be impossible. But it does have an extremely technically capable and increasingly flexible workforce. This means exploiting a different set of capabilities, so in its German home it now concentrates on the design and manufacture of high-added-value products. ‘Of course Germany can’t avoid this (low-cost) competition,’ says outgoing CEO Heinrich v. Pierer. ‘But we shouldn’t just look at the negative consequences of companies creating jobs abroad. These jobs also create jobs in Germany. Studies have shown that for every four jobs created abroad, one is created in Germany.’ Nevertheless, in high-wage countries like Germany, the relocation of operations to low-cost regions often creates anxiety. Klaus-Peter Gittler, head of the Global Manufacturing Concept initiative, says there has to be a change in attitudes: ‘Highly industrialised countries like Germany need to have more courage and confidence in their own strengths. They have to be highly innovative and assume the role of trendsetter to justify their higher costs.’ In fact Siemens’ electronics plant in Erlangen, which manufactures drives and controls for machine tools and production equipment and has 1,100 employees, was awarded the title of ‘Best Factory in Europe’ in 2007. Manufacturing lead-times at the plant were cut to just two to three days in order to implement state-of-the-art, just-in-time production. The concept is also driven by new, flexible working time models that allow the plant to absorb fluctuations in order volumes.
example siemens leverages its global capabilities12

241DeployIng capaBIlItIes In the market
Wheelwright of Harvard University.13 With later contributions from Professor Chase of the University of Southern California,14 they developed what they call the ‘Four-Stage Model’, which is ideal for evaluating the effectiveness of the contribution/expectation cycle. The model traces the progression of the operations function from what is the largely negative role of Stage 1 operations to it becoming the central ele-ment of competitive strategy in excellent Stage 4 operations (see Figure 7.12).
stage 1 – internal neutralityThis is the very poorest level of contribution by the operations function. In a Stage 1 organisation, the operation is considered a ‘necessary evil’. The other functions in the organisation regard it as holding them back from competing effectively. The operations function, they would say, is inward-looking and at best reactive. It certainly has very little positive to contribute towards competitive success. The best that can be expected from the operations function is to cure the most obvious problems. Certainly the rest of the organisation would not look to operations as the source of any originality, flair or competitive drive. The expectations on it are to be ‘internally neutral’, a position it attempts to achieve not by anything positive but by avoiding the bigger mistakes.
stage 2 – external neutralityThe first step of breaking out of Stage 1 is for the operations function to begin comparing itself with similar companies or organisations in the outside market. A Stage 2 operation has achieved a sufficient level of capability to cease holding the company back, even if it may not yet be particularly creative in its contribution to
Incr
easi
ng s
trat
egic
imp
act
Internallyneutral
STAGE 1Correct the
worstproblems
Holding theorganisation
back
Externallyneutral
As good ascompetitors
Internallysupportive
Clearly the bestin the industry
Externallysupportive
Redefiningindustry
expectations
STAGE 2Adoptbest
practice
STAGE 3 Link
strategy withoperations
STAGE 4Give an
operationsadvantage
Implementin
g
strategy
Supporting
strategy
Driving
strategy
Increasing operations capabilities
Increasing contribution of o
perations
Figure 7.12 the four-stage model of operations’ contribution

242 chapter 7 • Improvement strategy
competitiveness. It is expected, at least, to adopt ‘best practice’ and the best ideas and norms of performance from the rest of its industry. It is expected to be ‘exter-nally neutral’, with operations capabilities similar to its competitors. This may not give the organisation any competitive advantage, but nor is operations the source of competitive disadvantage.
stage 3 – internally supportiveStage 3 operations may not be better than their competitors on every aspect of operations performance, but they are broadly up with the best. Nevertheless, good as they may be, Stage 3 operations aspire to be clearly and unambiguously the very best in the market. They try to achieve this level of contribution by a clear understand-ing of the company’s competitive or strategic goals. Then they organise and develop their operations resources to excel in the things in which the company needs to compete effectively. The expectation on the operations function is to be ‘internally supportive’ by providing credible support to operations strategy.
stage 4 – externally supportiveAt one time, Stage 3 was taken as the limit of the operations function’s contribution. Yet Hayes and Wheelwright capture the emerging sense of the growing importance of operations management by suggesting a further stage – Stage 4. The difference between Stage 3 and Stage 4 is admitted by Hayes and Wheelwright to be subtle, but nevertheless important. A Stage 4 company is one that sees the operations function as providing the foundation for its future competitive success, because it is able to deploy unique competencies which provide the company with the performance to compete in future market conditions. In effect, the contribution of the operations function becomes central to strategy making. Stage 4 operations are creative and proactive. They are likely to organise their resources in ways that are innovative and capable of adaptation as markets change. Essentially they are expected to be ‘one step ahead’ of competitors – what Hayes and Wheelwright call being ‘externally supportive’. Figure 7.12 brings together the two concepts of role and the contribution of the operations function. Moving from Stage 1 to Stage 2 requires operations to overcome its problems of implementing existing strategies. The move from Stage 2 to Stage 3 requires operations actively to develop its resources so that they are appropriate for long-term strategy. Moving up to Stage 4 requires operations to be driving strategy through its contribution to competitive superiority. Notice also how moving up from Stage 1 to Stage 4 requires operations progressively to adapt the roles of the operations function discussed in the previous chapter, implementer, supporter and driver, as shown in Figure 7.12. Two points are important in understanding the power of the four-stage 1 to 4 model. First, it is linked to the company’s aspirations (at least their operations manage-ment aspirations). In other words, there is an active desire (some might say even an evangelical desire) to improve the operation. Second, it is the endpoint of progression which emphasises the increasing importance and centrality of operations strategy to overall competitive advantage. The idea of a proactive and inventive ‘Stage 4’ opera-tions function, described by Hayes and Wheelwright, foreshadows the somewhat later concept of ‘world-class operations’. That is, the idea that companies should aspire not only to have performance levels equal to, or better than, any other similar business in the world, but should achieve this superiority because of their operations ability.

243
summary ansWers to key questIons
What are the differences between managing large ‘breakthrough’ improvement and managing continuous improvement?Although it is common to distinguish between major ‘leaps forward’ in terms of operations improvement on the one hand, and more continuous incremental improvement on the other, these are really two points on a spectrum describing the degree of operations change. Major improvement initiatives (such as most business process re-engineering) are dramatic and radical changes in the way opera-tions resources and processes are organised. They therefore need to be managed as projects, with ‘champions’ and project managers being given responsibility to coordinate the individual ideas and efforts of the staff involved in the change. Continuous improvement, on the other hand, is less dramatic and longer term, involving small incremental steps. Change is gradual and constant, and involves most or all staff. Here it is the collective motivation and culture that are impor-tant in maintaining the momentum of the improvement. Coordination becomes important because there will probably be many different small projects happening simultaneously. Continuous improvement is often described as a ‘never-ending cycle’. In fact the concept of the cycle can also be used to put in place the routines and procedures that help to embed continuous improvement at a more strategic level. One such cycle uses the stages ‘direct’, ‘develop’, and ‘deploy’ to link market position to market potential.
how do the needs of the market direct the ongoing development of operations processes?Usually market needs make their impact on how operations improve themselves through formal mechanisms such as performance measurement systems and benchmarking efforts, although these formal mechanisms are themselves cycles, in so much as they involve continually seeking gaps between the formal targets for the operation set by what the market requires and the actual performance of the operation. Designing performance measurement systems includes four generic issues. First, what factors should be included as performance targets? It is likely that performance measures at different levels of aggregation will be needed. The second question is, what are the most important performance targets? These are the aspects of performance that reflect the particular market strategy adopted by an organisa-tion. Often these are contained in a small number of key performance indicators (KPIs). The third question is, how should the performance targets be measured? Usually a number of measures are needed to describe broader or more aggregated performance measures adequately. The final question concerns the basis on which to compare actual against target performance. Different bases of performance can affect how we judge performance. Typically, bases for comparison are against his-torical standards, against improvement goals, against competitors or against some idea of absolute perfection. Benchmarking is also used to direct improvement within operations. One particular type of benchmarking is importance–performance map-ping. This involves formally assessing the relative importance and performance of different aspects of the operation and plotting them on a matrix.
summary ansWers to key questIons
244 chapter 7 • Improvement strategy
how can the ongoing management and control of operations be harnessed to develop their capabilities?As operations gain experience they improve. In some ways this improvement is pre-dictable and can be plotted over time using learning or experience curves. Of more immediate concern in operations strategy, however, is how operations can improve by building their capabilities over time. An important mechanism of capability building is the way in which operations increase their knowledge of their processes through attempting to control them. Process control (especially using approaches such as statistical process control) attempts to reduce the variation within a pro-cess. This will usually involve examining deviations from expected performance and ‘problem solving’ out the root causes of such variation. This in itself improves the process and makes it more predictable. Because it is more predictable it becomes easier to control, and so on. And although such control may be very operational in nature, the results of the improvement it brings can result in important strategic benefits.
What can operations do to deploy their capabilities into the market?The extent to which an operation deploys its capabilities to create the potential for the organisation to operate in profitable parts of the market is shaped partly by the expectations placed on the operations function. The greater the expectations on the operations function, the more it will attempt to make a significant strategic contribution. The greater the contribution it makes, the higher the expectations of the rest of the organisation will be, and so on. One, relatively well-known, model for assessing contribution is the Hayes and Wheelwright four-stage model. This model traces the progression of the operations function from the largely negative role of Stage 1, to becoming the central element in competitive strategy in so-called Stage 4 operations.
Further reading
Dale, B.D., van der Wiele, T. and van Iwaarden, J. (2007) Managing Quality, 5th edn, Wiley-Blackwell.
Dirgo, R. (2006) Look Forward Beyond Lean and Six Sigma: A Self-perpetuating Enterprise Improvement Method. Conyers, GA: J. Ross Publishing. (hardcover).
Goldratt, E.M., Cox, J. and Whitford, J.C.D. (2004) The Goal: A Process of Ongoing Improvement, 3rd edn. Great Barrington, MA: North River Press.
Jeston, J. and Nelis, J. (2008) Business Process Management: Practical Guidelines to Successful Implementations, 2nd edn. Butterworth-Heinemann.
Kaplan, R.S. and Norton, D.P. (2004) Strategy Maps: Converting Intangible Assets into Tangible Outcomes. Boston, MA: Harvard Business School Publishing.
Kaplan, R.S. and Norton, D.P. (2008) Execution Premium: Linking Strategy to Operations for Competitive Advantage. Boston, MA: Harvard Business School Press.
Leonard-Bart, D. (1995) Wellsprings of Knowledge: Building and Sustaining the Sources of Innovation. Boston, MA: Harvard Business School Press.
MacLennon, A. (2010) Strategy Execution: Translating Strategy into Action in Complex Organisations. Routledge.
Neely, A. (Editor) (2007) Business Performance Measurement: Unifying Theory and Integrating Practice, 2nd edn. Cambridge University Press.

245notes on the chapter
Upton, D. (1996) ‘Mechanisms for building and sustaining operations improvement’, European Management Journal, 14(3).
notes on the chapter
1 Hayes, R.H. and Pisano, G.P. (1996) ‘Manufacturing strategy: at the intersection of two paradigm shifts’, Production and Operations Management, 5(1).
2 Imai, M. (1986) Kaizen – The Key to Japan’s Competitive Success. McGraw-Hill. 3 Neely, A.D. (1998) Measuring Business Performance. London: Economist Books. 4 Skinner, W. (1974) ‘The focused factory’, Harvard Business Review, May–June. 5 Camp, C. (1989) ‘Benchmarking: the search for best practices which lead to superior per-
formance’, Quality Progress, January–May. 6 Pickering, I.M. and Chambers, S. (1991) ‘Competitive benchmarking: progress and future
development’, Computer Integrated Manufacturing Systems, 4(2). 7 This section is based on Slack, N. et al. (2010) Operations Management, 6th edn. Financial
Times, Harlow, UK: Prentice Hall. 8 Ferdows, K. and de Meyer, A. (1990) ‘Lasting improvement in manufacturing’, Journal of
Operations Management, 9(2). 9 Bohn, R.E. (1994) ‘Measuring and managing technical knowledge’, Sloan Management
Review, Fall.10 Sources: Gawande, A. (2010) ‘The Checklist Manifesto: how to get things right’, Metropolitan;
Aaronovitch, D. (2010) ‘The Checklist Manifesto: review, The Times (of London), 23 January.
11 Sources: Dell corporate website (2007); Dell, M. (1998) Direct from Dell: Strategies That Revolutionsed an Industry, New York Harper Business The Economist (1996): ‘Selling PCs like bananas’, October; Magretta, J. (1998) ‘The power of virtual integration: an interview with Dell Computer’s Michael Dell’, Harvard Business Review, March–April.
12 Sources: Siemens Journal (2007) ‘The road to success’, 15 February; Siemens Journal (2007) ‘Global added value’, 15 February; The Economist (2007) ‘Home and abroad’, 10 February.
13 Hayes, R.J. and Wheelwright, S.C. (1984) Restoring Our Competitive Edge. New York: John Wiley & Sons.
14 Chase, R.B. and Hayes, R.J. (1991) ‘Beefing up operations in service firms’, Sloan Management Review, Fall, pp. 15–16.
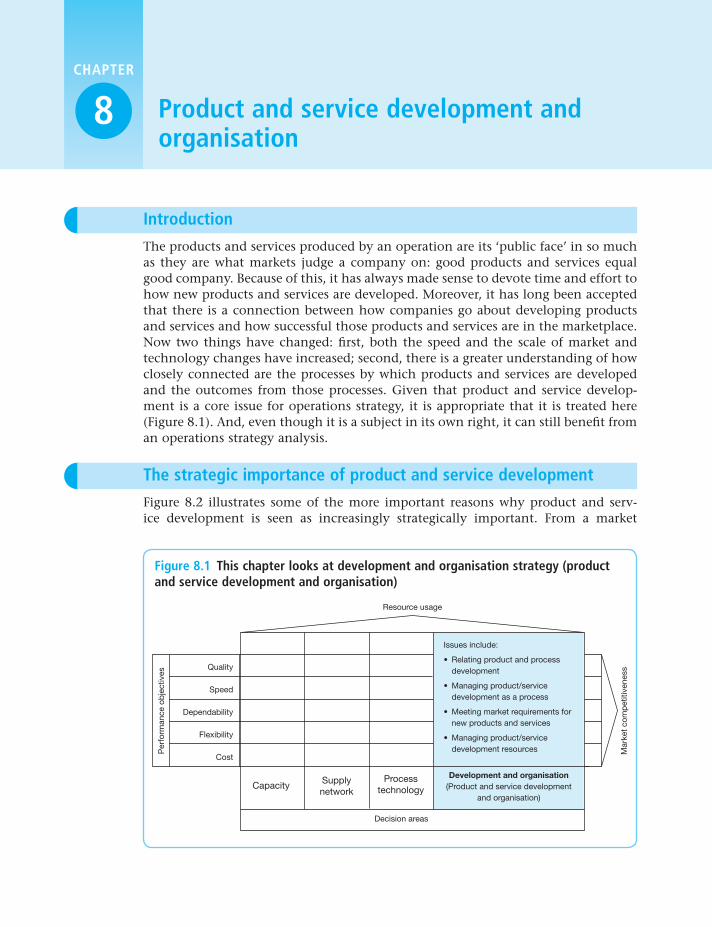
chapter
product and service development and organisation
8
The products and services produced by an operation are its ‘public face’ in so much as they are what markets judge a company on: good products and services equal good company. Because of this, it has always made sense to devote time and effort to how new products and services are developed. Moreover, it has long been accepted that there is a connection between how companies go about developing products and services and how successful those products and services are in the marketplace. Now two things have changed: first, both the speed and the scale of market and technology changes have increased; second, there is a greater understanding of how closely connected are the processes by which products and services are developed and the outcomes from those processes. Given that product and service develop-ment is a core issue for operations strategy, it is appropriate that it is treated here (Figure 8.1). And, even though it is a subject in its own right, it can still benefit from an operations strategy analysis.
Introduction
Quality
Speed
Dependability
Flexibility
Cost
Per
form
ance
ob
ject
ives
Mar
ket
com
pet
itive
ness
Issues include:
• Relating product and processdevelopment
• Managing product/servicedevelopment as a process
• Meeting market requirements fornew products and services
• Managing product/servicedevelopment resources
Capacity Supplynetwork
Decision areas
Resource usage
Processtechnology
Development and organisation(Product and service development
and organisation)
Figure 8.1 this chapter looks at development and organisation strategy (product and service development and organisation)
the strategic importance of product and service development
Figure 8.2 illustrates some of the more important reasons why product and serv-ice development is seen as increasingly strategically important. From a market

247the strategIc Importance oF product and servIce development
perspective, international competition has become increasingly intense. In many markets there are a number of competitors bunched together in terms of their prod-uct and service performance. Even small advantages in product and service specifi-cations can have a significant impact on competitiveness. This has made customers both more sophisticated in exercising their choice and often more demanding in terms of wanting products and services that fit their specific needs. Also, markets are becoming more fragmented. Unless companies choose to follow relatively narrow niche markets, they are faced with developing products and services capable of being adapted in different ways to different markets. If this were not enough, product and service life cycles have become shorter. An obvious way to try to gain advantage over competitors is to introduce updated products and services. Competitors respond by doing the same and the situation escalates. While not every industry has such short life cycles as, say, the entertainment or fashion garment industry, the trend, even in industrial markets, is towards more frequent new product and service introductions. A different, but equally important, set of pressures affect the operations resources that have to develop and deliver new products and services. Perhaps most impor-tantly, rapid technology changes have affected most industries. For example,
●● Why is the way in which companies develop their products and services so important?
●● What process do companies use to develop products and services?
●● how should the effectiveness of the product and service development process be judged in terms of fulfilling market requirements?
●● What operations resource-based decisions define a company’s product and service development strategy?
key questIons
MARKETREQUIREMENTS
OPERATIONSRESOURCES
Product andservice
development
Involves allparts of the
business
Rapidtechnology
changeMeans ofbuilding
capabilities
Increasedcompetitiveness
Shortenedlife cycles
Fragmentedmarkets
Figure 8.2 the increasing strategic importance of product and service development

248 chapter 8 • product and servIce development and organIsatIon
internet-based technologies have introduced startlingly new possibilities (and uncer-tainties) for almost all products and services in all industries. Partly because of the scale and pace of such technological developments, it has become increasingly obvi-ous that effective product and service development places responsibilities on every part of the business. Marketing, purchasing, accounting, operations, are all, like it or not, an integral part of any organisation’s ability to develop products and services effectively and efficiently. Every part of the business is now faced with the question, ‘How can we deploy our competencies and skills towards developing better or differ-ent products and services?’ New product and service development is now seen as the mechanism by which all parts of the business, but especially operations, leverages their capabilities into the marketplace.
developing products and services and developing processes
For convenience and for ease of explanation we often treat the design of products and services on the one hand, and the design of the processes that produce them on the other, as though they were totally separate activities. In many organisations the two developments are organised separately. But this does not imply that they necessarily should be treated or organised separately, and they are clearly interrelated. It would be foolish to develop any product or service without taking into consideration the constraints and capabilities of the processes that will produce it. Similarly, develop-ing processes to take advantage of new technologies or process methods will have implications for the development of products and services in the future. Successful developments often have a history of both product/service and process development.
the degree of product change is importantJust as it was important in the previous chapter to understand the degree of process change expected of the development process, so here it is important to understand the degree of product or service change. Again, we can construct a conceptual scale which helps to give some degree of discrimination between different levels of change. Also again, we can calibrate this scale from relatively minor modifications to a product or service at one extreme, through to the novel and/or radical changes exhibited by a ‘pioneer’ product or service. In the previous chapter we distinguished between what is done in a process and how it is done. The equivalent here is the distinction between what is seen externally to have changed in the product or service and how the product or service performs its function through its internal mechanisms. Table 8.1 describes four levels of change, ‘modification’, ‘extension’, ‘development’ and ‘pioneer’, in terms of the products or services’ external and inter-nal characteristics. It also shows two illustrative examples, one based on a company that manufactures exercise machines, the other a financial service company that runs a bank card service. Remember, though, that the level of change implied by these categories of development to products and services is approximate. What is important is to recognise that the nature of the product and service development process is likely to be different depending on the degree of product/service change. Relatively small ‘modification’ changes, such as those described in the two exam-ples in Table 8.1, are likely to be relatively frequent and probably will be made using routine procedures. Most companies have standard procedures such as ‘engi-neering change orders’ (ECOs), where small changes are proposed in one part of

249the strategIc Importance oF product and servIce development
the organisation and approved by other relevant departments. But although these small modifications may be incorporated into standard procedures, they may still require organisation-wide exposure, especially if the part of the product or service being modified has high ‘connectivity’. Connectivity is the degree to which changes in one part of a product or service impact on other parts. It is a concept that also can apply at an organisational level and is important in understanding why, as the degree of product or service change moves through ‘extension’ and ‘develop-ment’ to ‘pioneer’, the changes become more difficult and more risky. Fundamental changes to products and service almost always involve the whole organisation. So, in addition to the obvious difficulties of market acceptability and resource capability inherent in high degrees of product and service change, the coordination between functional strategies must be well managed.
table 8.1 the degree of product/service change can affect both its external appearance and its internal methodology/technology
Degreeofproduct/servicechange
Modification Extension Development Pioneer
External customer Little/none More functionality ‘Next generation’ Novel/radical awareness (what is progression change seen)
Internal Minor/isolated Some changes to Extensive redesign Novel/radical methodology/ original of original method/ change technology (how it methodology/ technology is done) technology
Example: exercise Minor engineering Extra options on Aesthetic redesign ‘Total health machines change to control/display of and changes to monitoring’ component parts computer internal resistance concept with mechanism intelligent
machines’ response to body monitoring and full automatic analysis
Example: bank card Minor changes to Improvement of Incorporation of Ultimately flexible services back-office monthly statement smart-card ‘one card’ concept procedures with analysis of technology with advanced expenditure smart-card
capability and links with other financial services
If anyone doubted the importance of product/service development to strategic success (or failure), just look at the history of the Airbus A380. Its long and incident-packed journey from drawing board to reality illustrates the dangers when the design activity goes wrong. This is the story in brief.
example the troubled history of the airbus a3801

250 chapter 8 • product and servIce development and organIsatIon
1991 – Airbus consults with International Airlines about its requirements for a super-large passenger aircraft.
January 1993 – Airbus’s rival Boeing says it has begun studies into ‘very large’ commercial aircraft.
June 1993 – Boeing decides not to go for a super-large passenger aircraft, but instead to focus on designing smaller ‘jumbos’. Airbus and its partners set up the A3XX team to start the ‘super-jumbo’ project.
1996 – Airbus forms its ‘Large Aircraft’ Division. Because of the size of the aircraft, it is decided to develop specially designed engines rather than adapt existing models.
2000 – The commercial launch of the A3XX (later to be named the A380).
2002 – Work starts on manufacturing the aircraft’s key components.
February 2004 – Rolls-Royce delivers the first Airbus engines to the assembly plant in Toulouse.
April 2004 – The first Airbus wings are completed in the north Wales factory. London’s Heathrow airport starts to redevelop its facilities so that it can accommodate the new aircraft.
May 2004 – Assembly begins in the Toulouse plant.
December 2004 – EADS reveals the project is €1.45 billion over budget, and will now cost more than €12 billion.
January 2005 – Airbus unveils the A380 to the world’s press and European leaders.
27 April 2005 -The aircraft makes its maiden flight, taking off in Toulouse and circling the Bay of Biscay for four hours before returning to Toulouse. A year of flight-testing and certi-fication work begins.
June 2005 – Airbus announces that the plane’s delivery schedule will slip by six months.
March 2006 – The plane passes important safety tests involving 850 passengers and 20 crew safely leaving the aircraft in less than 80 seconds with half the exits blocked.
July 2006 – The A380 suffers another production delay. Airbus now predicts a delay of a further six to seven months. This caused turmoil in the boardrooms of both Airbus and its parent company EADS. The company’s directors were accused of supressing the news for months before revealing it to shareholders. It leads to the resignations of Gustav Humbert, Airbus’s Chief Executive, Noel Forgeard, EADS Co-Chief Executive, and Charles Campion, the A380 Programme Manager.
October 2006 – Airbus infuriates customers by announcing yet a further delay for the A380, this time a whole year. The first plane is now forecast to enter commercial service around 20 months later than had been originally planned. The delays will cost Airbus another esti-mated €4.8 billion over the next four years. The company announces a drastic cost-cutting plan to try to recoup some of the losses. The Power8 programme is intended to ‘reduce costs, save cash and develop new products faster’. Airbus wants to increase productivity by 20 per cent and reduce overheads by 30 per cent.
October 2007 – The super-jumbo eventually takes off in full service as a commercial airliner for Singapore Airlines. It wins rave reviews from both airlines and passengers – even if it is two years late!

251the strategIc Importance oF product and servIce development
product and process change should be considered together
We can put together the degree of process change scale from the previous chapter with the scale indicating the degree of product/service change described in Table 8.1. This is done in Figure 8.3. Advanced or ‘blue sky’ research and development lies beyond both of these scales, but it is from this direction that most radical innova-tion emerges. The dotted lines indicate the degree of difficulty encountered in the development process. Put simply, product/service change is easier when the underly-ing processes that produce them are not being changed at the same time, and vice versa. Figure 8.3 also shows three service/process developments at a bank. Making changes to the services offered in a bank branch involves relatively minor ‘product’
So what caused the delays? First, the A380 was the most complex passenger jet ever to be built. Second, the company was notorious for its internal rivalries, its constant need to balance work between its French and German plants so that no country had too obvi-ous an advantage, constant political infighting, particularly by the French and German governments, and frequent changes of management. According to one insider, ‘the underly-ing reason for the mess we were in was the hopeless lack of integration [between the French and German sides] within the company.’ Even before the problems became evident to outsiders, critics of Airbus claimed that its fragmented structure was highly inefficient and prevented it from competing effectively. Eventually it was this lack of integration between design and manufacturing processes that was the main reason for the delays to the aircraft’s launch. During the early design stages the firm’s French and German factories had used incompatible software to design the 500 km of wiring that each plane needs. Eventually, to resolve the cabling problems, the company had to transfer 2,000 German staff from Hamburg to Toulouse. Processes that should have been streamlined had to be replaced by temporary and less efficient ones, described by one French union official as a ‘do-it-yourself system’. Feelings ran high on the shop floor, with tension and arguments between French and German staff. ‘The German staff will first have to succeed at doing the work they should have done in Germany,’ said the same official. Electricians had to resolve the complex wiring prob-lems, with the engineers having to adjust the computer blueprints as they modified them so they could be used on future aircraft. ‘Normal installation time is two to three weeks,’ said Sabine Klauke, a team leader. ‘This way it is taking us four months.’ Mario Heinen, who ran the cabin and fuselage cross-border division, admitted the pressure to keep up with intense production schedules and the overcrowded conditions made things difficult: ‘We have been working on these initial aircraft in a handmade way. It is not a perfectly organised industrial pro-cess.’ But, he claimed, there was no choice: ‘We have delivered five high-quality aircraft this way. If we had left the work in Hamburg, to wait for a new wiring design, we would not have delivered one by now.’ But the toll taken by these delays was high. The improvised wiring processes were far more expensive than the planned ‘streamlined’ processes, and the delay in launching the aircraft meant two years without the revenue that the company had expected. But Airbus was not alone. Its great rival, Boeing, was also having problems. Engineer strikes, supply-chain problems and mistakes by its own design engineers had further delayed its ‘787 Dreamliner’ aircraft. Specifically, fasteners used to attach the titanium floor grid to the composite ‘barrel’ of the fuselage had been wrongly located, resulting in 8,000 fasten-ers having to be replaced. By 2009 it looked as if the Boeing aircraft was also going to be two years late. At the same time, Airbus finally moved to what it called ‘wave 2’ production where the wiring harnesses that caused the problem were fitted automatically, instead of manually.

252 chapter 8 • product and servIce development and organIsatIon
and process changes compared with the redesign of both product and process involved in a major new call centre. This, in turn, is less than the development of a totally new internet banking service.
managing the overlap between product and process developmentBecause it is often difficult to untangle a service ‘product’ from the process that produces it, operations developing new services know they have to develop new processes concurrently. But manufacturing operations are different. It is often both possible to develop products independently of the processes that make them and also common practice for many companies. Yet, because product development and process development are not the same thing, it does not mean that they should not overlap. In fact one of the more important trends in product design has been the considerable effort that recently has been put into managing the overlap. There are probably two reasons for this. First, there is a growing recognition that the design of products has a major effect on the cost of making them. Many decisions taken during the development of products, such as the choice of material, or the way components are fastened together, will all define much of the cost of making the product. It clearly makes sense, therefore, to build into the development process the need to evaluate product design choices in terms of their effect on manufacturing processes as well as the functionality of the product itself. Second, the way overlap is managed between product and process development has a significant effect on the effectiveness and efficiency of the development process itself. This is particularly true for the time between the initial product or service concept and its eventual delivery into the market, and the overall cost of the total development effort. We shall deal with this issue later in the chapter.
modular design and mass customisationTwo separate, but related ideas – modularity in product and service design and mass customisation – have made an impact on product and service development. We will consider them separately and then bring the two ideas together. Modularity – is a strategy for organising complex products (and services) and processes efficiently. A modular system is composed of units (or modules) that are designed independently but still function as an integrated whole.2 So, rather than designing a product and service as a totally integrated and indivisible whole, the design is divided into modules that can be put together in various ways. Putting different modules together will result in products or services with different function-ality. Yet because the modules themselves are standardised, they can be produced in a standardised, low-cost manner. The most obvious examples of modular design are in the computer industry, where relatively complex products can be built up using smaller subsystems. Customers who have different requirements can simply choose which modules they require within the overall product. Provided the over-all architecture of the design (the way modules fit together and the functions they perform) and the interfaces between the modules allow for easy connection and communication, then modularity can offer considerable advantages. For example, innovative ideas can be tried out in one module without it necessarily interfering with the design of the product or service as a whole. So, suppose a medical centre offers a range of different health check-up services. If it designs its processes and systems to separate its different clinical procedures, it could introduce new tests in

253the strategIc Importance oF product and servIce development
one area while leaving the others undisturbed. Of course, it would have to ensure that the interfaces between the improved test area and the other parts of its services processes (records, diagnostics, follow-up appointments, and so on) could handle any new information generated. Mass customisation – is the ability to provide customers with high levels of variety and customisation through flexible and responsive processes and flexible product and service designs.3 The vision of mass customisation is to reduce radically the effect of the assumed trade-off between variety and cost. Some authorities see it as an inevitable successor to mass production, while others argue that there is little essentially new in the idea; rather, it pushes existing ideas such as flexibility and agility to their logical conclusion.4 The mass customisation concept includes the ideas that, as far as market requirements are concerned, markets are becoming increasingly fragmented, while as far as operations resources are concerned, new forms of organisation and technology are allowing greater degrees of flexibility and responsiveness. Thus, it is possible to ‘mass produce’ a basic family of products or services that can still be customised to the needs of individual customers. The major management task, therefore, is to understand the implications of market and operations developments and harness them by embracing an attitude that stresses sensitivity to customers’ individual needs and a willingness to supply them with cus-tomised offerings. This means changes in the way the operation produces its prod-ucts and services and the way it markets them. But, of particular relevance here, it also implies a different approach to designing products and services. Predominantly this involves the standardisation and modularisation of components (see above) to increase variety while reducing production costs.
Degree of product/service change
Modificationto product/service
Extension toproduct/service
Development ofproduct/service
‘Pioneer’product/service
‘Pioneer’process
Research andadvanced
development
Internetbankingservice
Call centrebankingservice
Branchbankingservice
Increasing diffi
culty
Developmentsto process
Extensionto processes
Modificationsto process
Deg
ree
of p
roce
ss c
hang
e
Increasing difficulty
Figure 8.3 the link between product/service and process development can be closer in service industries

254 chapter 8 • product and servIce development and organIsatIon
One much-quoted example of how modular design contributed to mass cus-tomisation is the way Black & Decker, the hand tool manufacturer, produced a wide range of well over one hundred basic hand tools, each with their own variants, from a relatively small set of modular and standardised components. The first con-sequence of this modular approach was more effective and efficient design.
‘Much of the work in design and tooling was eliminated because of the standardisation of motors, bearings, switches, . . . etc. New designs could be developed using components already standardised for manufacturing ability. The product did not have to start with a blank sheet of paper and be designed from scratch’.5
The second was drastically reduced production costs because standardised parts ena-bled standardised production processes.
The once mighty Kodak dominated the photographic and film markets for decades. No longer; back in 1988, it employed 145,300 people and made substantial profits, but by 2010 it had shrunk to around 19,000, with regular quarterly losses. This dramatic fall from grace is usually put down to the company’s failure to see the approach of digital photography, or fully appreciate how it would totally undermine Kodak’s traditional products. Yet, ironically, Kodak was more than ahead of its competitors than most people outside the company real-ised. It actually invented the digital camera. Sadly though, it lacked the foresight to make the most of it. For years the company had, as one insider put it, ‘too much technology in its labs rather than on the market’. It was back in 1975 when a newly hired scientist at Kodak, Steve Sasson, was given the task of researching how to build a camera using a comparatively new type of electronic sensor – the charge-coupled device (CCD). He found little previous research so he used the lens from a Kodak motion-picture camera, an analogue-to-digital convertor, some CCD chips and some digital circuitry that he made himself. By December 1975 he had an opera-tional prototype. Yet the advance was largely, although not completely, ignored inside the company. ‘Some people talked about reasons it would never happen, while others looked at it and realised it was important,’ he says. He also decided not to use the word ‘digital’ to describe his trial product. ‘I proposed it as filmless photography, an electronic stills camera. Calling it “digital” would not have been an advantage. Back then “digital” was not a good term. It meant new, esoteric technology.’ Some resistance came from genuine, if mistaken, technical reservations. But others feared the magnitude of the changes that digital photography could bring. Objections ‘. . . were coming from the gut: a realisation that [digital] would change everything . . . and threaten the company’s entire film-based business model.’ Some see Kodak’s reluctance to abandon its traditional product range as understandable. It was making vast profits from film and, as late as 1999, its annual film sales rose by 6.5 per cent to over three billion dollars. Todd Gustavson, Curator of Technology at the George Eastman House Museum says that, ‘Kodak was almost recession-proof until the rise of digital. A film-coating machine was like a device that printed money.’ Kodak’s first digital camera, the Quicktake, was licensed to and sold by Apple in 1994.
example ‘too much technology in its labs rather than on the market’ – kodak and its first digital camera6

255product and servIce development as a process
There are two views of how to characterise product and service development. One sees it as essentially a creative process where a technical understanding of the mechanisms involved in the service or product is brought together with ingenuity and flair. The emphasis should be on creativity, novelty and innovation. For all this to happen the people involved must be given the space and time to be creative. Of course, the activity has to be managed but not to the point where it interferes with originality. Typically this view of product and service development sees the activity as a collection of, sometimes interdependent, projects. And, although some aspects of project management may be relevant in guiding the activity, it cannot be regarded as a ‘process’. Processes are what create products and services on a routine basis, whereas product and service development is the creation of original one-offs. Furthermore, the raw material of this knowledge is a substance that is difficult to define and even more difficult to identify. Product and service development, there-fore, must focus on its outcome and not worry too much about how that outcome is achieved. The counter-argument contends that, as with everything, output depends on process. Great ideas for products and services emerge from a process that makes them great. Therefore, of course, one should examine the process of product and service development. While no two development projects are exactly alike, there is sufficient commonality in all such projects to be able to model the process and work on improving its overall performance. The normal generic performance objec-tives that apply to any operations process – quality, speed, dependability, flexibility and cost – all have relevance to product and service development. Most companies would willingly adopt an approach that gave them higher-quality designs for new products and services, delivered faster and more dependably while maintaining suf-ficient flexibility to incorporate new ideas that were produced at lower cost. It makes sense, therefore, to apply similar approaches to improving product and service development processes as one would to any other process. Define the steps in the process, examine the characteristics of how prospective product and service designs flow through the resources that act upon them, look for bottlenecks and attempt to smooth them out, identify critical points in the flow and guard against quality failures at these points, and so on. This is the approach we shall take. Product and service development is a process, and needs to be managed strategically.
product and service development as a process
In 1907 a janitor called Murray Spangler put together a pillowcase, a fan, an old biscuit tin, and a broom handle. It was the world’s first vacuum cleaner. One year later he sold his patented idea to William Hoover, whose company went on to dominate the vacuum cleaner market for decades, especially in its United States homeland. Yet between 2002 and 2005 Hoover’s market share dropped from 36 per cent to 13.5 per cent. Why? Because a futur-istic looking and comparatively expensive rival product, the Dyson vacuum cleaner, had jumped from nothing to over 20 per cent of the market. In fact, the Dyson product dates back to 1978 when James Dyson noticed how the air filter in the spray-finishing room of a company where he had been working was constantly clogging with powder particles (just like a vacuum cleaner bag clogs with dust). So he designed and built an industrial cyclone
example spangler, hoover and dyson7

256 chapter 8 • product and servIce development and organIsatIon
product/service development – an operations strategy analysis
Product and service development can be treated as a coherent operation in its own right. We include it here as a part of the development and organisation decision area because developing products and services is clearly vital to any organisation’s strategic development. However, the topic could be treated as an entirely separate function (which it is in many organisations). Indeed for professional design con-sultancies, for example, it is their whole reason for existing. We include the topic within operations strategy not because we believe product and service development should be always an integral part of the operations function organisationally. Rather, it is because of the difficulty in untangling the process of producing and delivering products and services and that of developing those products and services in the first place. Also, because we treat the topic as an integral part of operations strategy does not mean that no benefit can be derived from analysing product and service devel-opment as a distinct operations strategy in its own right. For example, Figure 8.4 illustrates how an operations strategy matrix (discussed in Chapter 1) can be constructed for product and service development operations. The generic performance objectives of quality, speed, dependability, flexibility and cost can be used to describe the impact of new or modified products and services in the marketplace. In order to achieve competitive ‘production’ of product and service designs, the resources and processes that are used to develop them will themselves need organising along the lines of any other operation. The company’s design capac-ity will have to be matched to the demand placed on it over time, relationships with an external supply network for design and development knowledge will have to be established, process technologies such as computer aided design (CAD) systems, expert systems, simulations, and so on may be needed, and the resources technol-ogy and processes used to develop products and services will need organising and themselves developing over time. All decision areas are of some relevance to most companies’ development efforts. The remainder of this chapter will first examine the nature of the product and service development process and then use the operations strategy approach to illus-trate the requirements of the market and the capabilities of development resources.
tower, which removed the powder particles by exerting centrifugal forces. The question intriguing him was, ‘Could the same principle work in a domestic vacuum cleaner?’ Five years and five thousand prototypes later he had a working design, since praised for its ‘uniqueness and functionality’. However, existing vacuum cleaner manufacturers were not as impressed – two rejected the design outright. So Dyson started making his new design himself. Within a few years Dyson cleaners were, in the UK, outselling the rivals who had once rejected them. The aesthetics and functionality of the design help to keep sales growing in spite of a higher retail price. To Dyson, good ‘is about looking at everyday things with new eyes and working out how they can be made better. It’s about challenging existing technology.’ Dyson scientists were determined to challenge even their own technology and create vacuum cleaners with even higher suction. So they set to work developing an entirely new type of cyclone system. They discovered that a smaller diameter cyclone gives greater centri-fugal force. So they developed a way of getting 45 per cent more suction than a dual cyclone and removing more dust, by dividing the air into eight smaller cyclones. This advanced technology was then incorporated into Dyson’s new products.

257product and servIce development as a process
stages of development
Describing the way in which organisations develop products and services is prob-lematic because different organisations will adopt different processes. Furthermore, what companies specify as a formal product or service development procedure, and what happens in reality, can be very different things. Yet three ideas do seem to have found wide acceptance:
●● The development process moves through a series of stages, some of which may be missed out, and sometimes the process recycles back through stages. Somewhere towards the beginning of the process there are stages concerned with collecting ideas and generating product and service concepts, and towards the end of the proc-ess there are stages concerned with specifying the detail of the product or service.
●● As the development process moves through these stages, the number of alterna-tive design options reduces until one final design remains. The process often includes decision points that screen out options deemed to be unsatisfactory.
●● As these possible design options are reduced there is a move from a state of uncertainty regarding the final design to a state of increasing certainty. One
Quality –error-free designsthat fulfil marketrequirements
Speed –fast developmentfrom conceptto launch
Dependability –designs deliveredto schedule
Flexibility –designs whichinclude latest ideas
Cost –designs producedwithout consumingexcessive cost
Per
form
ance
ob
ject
ives
Mar
ket
com
pet
itive
ness
Capacity –amount ofdevelopmentresource matchedto demandover time
Supply network –relationshipswith outsidesources ofdevelopmentknowledge
Decision areas
Resource usage
Processtechnology –provision ofdesign technology(CAD), expertsystems, etc.
Development andorganisation –organisation ofdevelopmentresources andimprovementstrategy
Operations strategyfor the product and
service development
Figure 8.4 operations strategy analysis for product and service development

258 chapter 8 • product and servIce development and organIsatIon
consequence of this is that the ability to change the design gets increasingly lim-ited. Making changes at the end of the process can be considerably more expen-sive than making them at the beginning.
Different authors present different stage models which attempt to describe product and service development. These vary in the number and type of stages they include but are broadly similar. Figure 8.5 illustrates a typical stage model. Remember, though, that even if we assume that these stages are not sequential, it is a some-what simplistic approach to describing what really happens in product and service development. The reality of bringing products and services from concept to market introduction is in reality both complex and messy.
concept generationIdeas for new product or service concepts may be generated from sources outside the organisation, such as expressed customers’ needs or competitor activity, or from sources within the organisation, such as sales staff and front-of-house operations staff or, more formally, from the R&D department. There are many market research tools for gathering data in a formal and structured way from customers, including questionnaires and interviews. These techniques, however, usually tend to be struc-tured in such a way as only to test out ideas or check products or services against predetermined criteria.
concept screeningNot all concepts, or variants within a concept, have the potential to be developed through to market launch. The purpose of the concept-screening stage is to take the flow of concepts emerging from the development process and evaluate them. Concepts may have to pass through many different screens, and several functions might be involved, each using different criteria to screen the proposals. Screening may be divided into three sets of criteria related to market positioning, operations/technical implications and financial evaluation:
Concept generation
Concept screening
Preliminary design
Design evaluation and improvement
Prototyping and final design
Developing the operations process
Figure 8.5 a typical ‘stage model’ of the product and service development process

259product and servIce development as a process
●● Does the proposed product or service occupy a market position that is both attrac-tive in its own right and consistent with the organisation’s overall marketing strategy?
●● Does the proposed product or service exploit existing operations resource capa-bilities or help the operation to develop attractive new capabilities?
●● Is the investment in the proposed product or service feasible, and is the return from this investment acceptable?
preliminary designThis stage represents the beginning of detailed work on the product or service design. It includes defining what will go into the product or service. This will require the collection of information about such things as: the constituent component parts that make up the product or service package; the product/service structure, that is, the order in which the component parts of the package have to be put together; and the bill of materials (BOM), that is, the quantities of each component part required to make up the total package. This stage also may include specifying how the various components are put together to create the final product or service.
design evaluation and improvementThis stage takes the preliminary design and attempts to improve it before the proto - type product or services are tested in the market. There are a number of techniques that can be employed at this stage to evaluate and improve the preliminary design. Some of these techniques are concerned with costing the proposed product or service and identifying areas for cost improvement. Some are concerned with fully exploring the technical characteristics of the product or service in an effort to improve its overall value. Most are based on an approach that emphasises system-atic questioning of exactly what each part of the product or service is intended to contribute to its overall value, why it is being done in a particular way, and how it might be done differently. It is not the purpose of this book to explore any of these techniques in detail.
Predicting consumer reaction is an important part of all product and service design. Air travel is no different. Also, it is getting a bad press. It is crowded, it is the target of terror-ists, it swamps the areas around airports with noise pollution and, above all, it is destroying the planet with its carbon emissions. But there may be a technical solution – a design that could have a significant impact on at least the last two problems, noise pollution and fuel efficiency. A joint research project from the University of Cambridge and the Massachusetts Institute of Technology, in collaboration with aerospace companies such as Boeing and Rolls-Royce, has come up with a design that smooth the airflow around an aircraft, making it quieter and more fuel efficient. The researchers are proposing a mid-range aircraft that is slightly slower than current models. But the slower speed brings a dramatic reduction in noise levels. Furthermore, the aircraft could also glide into land at a low approach speed, and when it takes off it could climb steeply enough to make it almost inaudible outside the airport. There are several pieces of clever technology embedded in this design including smaller, quieter engines that have variable nozzles, constructing the aircraft from composites, and
example Will airline passengers learn to love stealth technology?8

260 chapter 8 • product and servIce development and organIsatIon
prototyping and final designOften ‘close to final’ designs are ‘prototyped’. The next stage in the design activity is to turn the improved design into a prototype so that it can be tested. This may be to learn more about the nature of the proposed product or service, but often it is also to reduce the risk inherent in going straight to market. Product prototypes may include clay models of car designs and computer simulations, for example. Computer simulations can be used as service prototypes but also can include the actual implementation of the service on a pilot basis. Many retailing organisations pilot new products and services in a small number of stores in order to test custom-ers’ reaction to them.
developing the operations processMost models of product and service development assume that the final stage will involve developing the operations processes that eventually will produce the designed product or service. Although we dealt with process development in the previous chapter, it is important to stress again that, in practice, produce/service development on the one hand and process development on the other are inexora-bly linked. Placing this stage at the end of the development process, however, does reinforce the idea that, generally speaking, if the development process is intended to design products and services that will fulfil a market need, then process decisions can take place only after some product or service characteristics have been decided.
product and service development as a funnel
Although stage models such as we illustrated in Figure 8.5 are useful in identifying the activities that must at some time take place within the overall development activity, they do not form a strict set of stages to which the development process must conform. In reality, stages may merge, the sequence of stages may vary and, almost always, the development process recycles back and forth between the stages. But the underlying ideas behind such stage models are widespread. For example, a common method of describing the product or service development process is to liken it to a funnel. The mouth of the funnel, being wide, can accommodate many alternative designs for the product or service. Indeed, theoretically, there will always be an infinite number of ways in which the benefits required from a product or service design can be delivered, even if some are only minor variants on each other. As the development process progresses, some design operations are discarded.
eliminating the flaps on its wings. But there is also another element to the design, which is its biggest snag. It would resemble current stealth bombers, which are in effect a flying wing with the body of the aircraft blended in to the wing design. Passengers would have to sit in a wide cabin with little or no sight of the exterior conditions, and surrounded by fuel and cargo carried in the wings. Even with views of the outside projected around the cabin, tests have indicated that passenger reaction is extremely negative. So which will win? Fuel efficiency (yes votes from the green lobby and the airlines) and reduced noise pollution (again, yes votes from the green lobby together with anyone who lives near an airport), or will it be the reluctance of us all to purchase a service that reinforces the lack of control we have over our own destinies whilst flying?

261product and servIce development as a process
There may be formal ‘filters’ at various points in the funnel whose sole purpose is to exclude some of the options. These filters often represent ‘screens’ which evalu-ate alternative designs against criteria of market acceptability, technical capability, financial return, and so on. Eventually, only one design option remains, which is then developed into its final form. The whole process moves from a broad concept capable of infinite interpretation at one end of the funnel to a fully formed and specified design at the other. Just as the stage model in Figure 8.5 was a simplification, so is the concept of the development funnel. Do not expect that all product and service development will conform to the obvious and regular funnel shape as shown in Figure 8.6(a). Most developments do not look like this and, more to the point, nor necessarily should they. Rather than see the funnel as a prescription for how development should be, it is better to see it as a metaphor for the design process that can be reshaped to reflect how the development process itself can be designed. The implication of this is that, even if an organisation does not want to progressively reduce its new product and service ideas using a perfectly smooth funnel, it certainly needs to understand what shape of funnel it really does want. Consider the following quote from the vice president in charge of product devel-opment in a company that makes advanced and customised electronic devices:
‘Our customers put business our way mainly because we are experts in taking their prob-lems and solving them. They usually give us an initial specification, to which we design, then at some time in the future they approve the design and we start to manufacture for
Many concepts enter thedevelopment process
(a)
(b)
One ‘best’design emerges
One recycle(sometimes) Discussions
with customer
Expansion of original idea
Narrowing ofoptions forcustomer
Mutuallyagreed
developmentspecification
Developmentof agreed
design
Customer’soriginal
specification
Figure 8.6 (a) the idealised development funnel; (b) the development funnel for one company
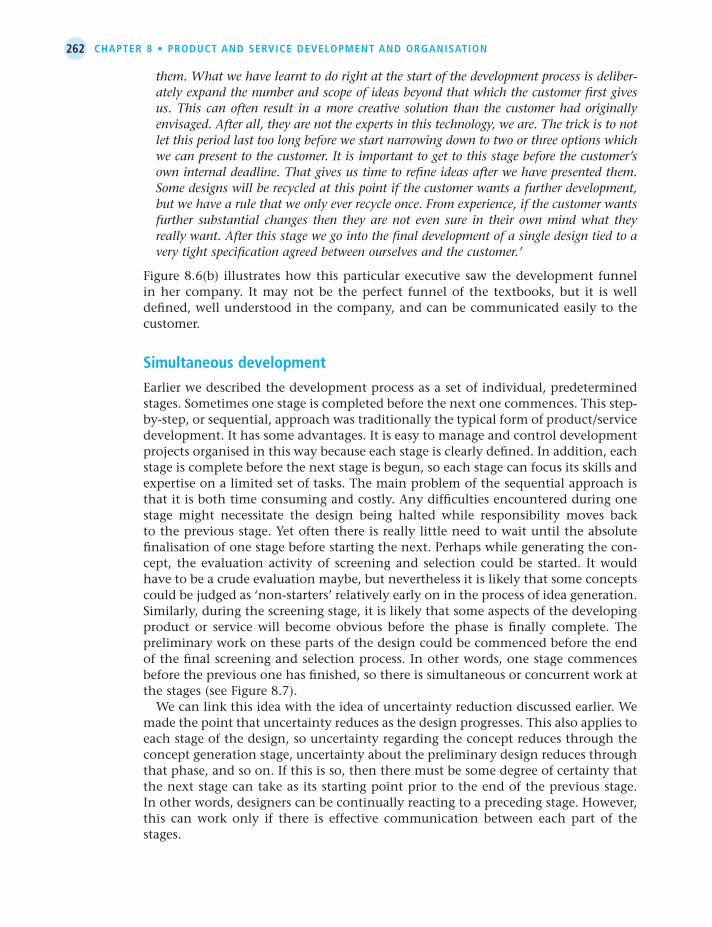
262 chapter 8 • product and servIce development and organIsatIon
them. What we have learnt to do right at the start of the development process is deliber-ately expand the number and scope of ideas beyond that which the customer first gives us. This can often result in a more creative solution than the customer had originally envisaged. After all, they are not the experts in this technology, we are. The trick is to not let this period last too long before we start narrowing down to two or three options which we can present to the customer. It is important to get to this stage before the customer’s own internal deadline. That gives us time to refine ideas after we have presented them. Some designs will be recycled at this point if the customer wants a further development, but we have a rule that we only ever recycle once. From experience, if the customer wants further substantial changes then they are not even sure in their own mind what they really want. After this stage we go into the final development of a single design tied to a very tight specification agreed between ourselves and the customer.’
Figure 8.6(b) illustrates how this particular executive saw the development funnel in her company. It may not be the perfect funnel of the textbooks, but it is well defined, well understood in the company, and can be communicated easily to the customer.
simultaneous development
Earlier we described the development process as a set of individual, predetermined stages. Sometimes one stage is completed before the next one commences. This step-by-step, or sequential, approach was traditionally the typical form of product/service development. It has some advantages. It is easy to manage and control development projects organised in this way because each stage is clearly defined. In addition, each stage is complete before the next stage is begun, so each stage can focus its skills and expertise on a limited set of tasks. The main problem of the sequential approach is that it is both time consuming and costly. Any difficulties encountered during one stage might necessitate the design being halted while responsibility moves back to the previous stage. Yet often there is really little need to wait until the absolute finalisation of one stage before starting the next. Perhaps while generating the con-cept, the evaluation activity of screening and selection could be started. It would have to be a crude evaluation maybe, but nevertheless it is likely that some concepts could be judged as ‘non-starters’ relatively early on in the process of idea generation. Similarly, during the screening stage, it is likely that some aspects of the developing product or service will become obvious before the phase is finally complete. The preliminary work on these parts of the design could be commenced before the end of the final screening and selection process. In other words, one stage commences before the previous one has finished, so there is simultaneous or concurrent work at the stages (see Figure 8.7). We can link this idea with the idea of uncertainty reduction discussed earlier. We made the point that uncertainty reduces as the design progresses. This also applies to each stage of the design, so uncertainty regarding the concept reduces through the concept generation stage, uncertainty about the preliminary design reduces through that phase, and so on. If this is so, then there must be some degree of certainty that the next stage can take as its starting point prior to the end of the previous stage. In other words, designers can be continually reacting to a preceding stage. However, this can work only if there is effective communication between each part of the stages.

263a market requIrements perspectIve on product and servIce development
Products and services are developed to satisfy market needs. It follows then that an important way of judging the effectiveness of the product and service development process is to judge how it performs in terms of quality, speed, dependability, flex-ibility and cost. These performance objectives have just as much relevance for the production of new product and service ideas or designs as they do for their ongoing production once they are introduced to the market. There is, however, a difference in judging how development processes satisfy market needs. When customers are both familiar and relatively satisfied with existing products and services they find it difficult to articulate their needs for novel products or services.9 Customers often develop an enhanced understanding of their own needs only when they come into direct contact with the product or service and start to use it. Many software compa-nies talk about the ‘I don’t know what I want but I’ll know when I see it’ syndrome, meaning that only when customers use the software are they in a position to articu-late what they do or do not require.
First stage in thedesign activity
(a)
Second stage in thedesign activity
Fourth stage in thedesign activity
Development timecompression
Communicationbetween stages
First stage in thedesign activity
(b)
Second stage in thedesign activity
Third stage in thedesign activity
Fourth stage in thedesign activity
Third stage in thedesign activity
Figure 8.7 (a) sequential arrangement of the stages in the development activity; (b) simultaneous arrangement of the stages in the development activity
a market requirements perspective on product and service development

264 chapter 8 • product and servIce development and organIsatIon
quality of product and service development
In Chapter 1, when we were discussing generic performance objectives, quality was not easy to define precisely. It is no easier when we are looking at the quality of product and service development. However, it is possible to distinguish high-quality product and service development from low-quality product and service development (although this is easier to do in hindsight). A useful approach if we wish to judge ongoing product and service development is to use the distinction between market requirements quality and operations resource quality. By market requirements quality we mean the ability of the output from the product or service development process (its final design) to meet the requirements of the company’s intended market position. Operations resource quality indicates the extent to which the final design of the product or service allows the exploitation of the capabilities of the company’s processes.
speed of product and service development
Fast product and service development has become the norm in many industries. Sometimes this is because the pressures of market competition have forced com-panies to capture the market’s imagination with the frequent introduction of new offerings. Consumer electronics, for example, significantly increased the rate of new product introduction during the 1980s and 1990s. Sometimes it is the result of fast-changing consumer fashion. Getting to market quickly in order to capture a trend is important in many sectors of the garment and toy industries, for example. Sometimes fast development is the result of a rapidly changing technology base. Personal computers need to be updated frequently because their underlying tech-nology is constantly improving. Sometimes all of these pressures are evident, as in many internet-based services, for example. But no matter what pressures have moti-vated organisations to speed up their development processes, many have discovered that fast development brings a number of specific advantages.
●● Early market launch. The most obvious advantage of an ability to develop products and services speedily is that they can be introduced to the market earlier and thus earn revenue for longer. Not only that, but if the product or service is the first of its type into the market, initially it has a 100 per cent market share, and customers subsequently may be reluctant to move to a competitor. Moreover, new offerings often can command price premiums.
●● Starting development late. An alternative way of deploying a fast development advantage is by starting the development process late rather than introducing a product or service early. In some markets this has advantages, especially those where either the nature of customer demand or the availability of technology is uncertain and dynamic. In both cases fast development allows design decisions to be made closer to the point at which they are introduced to the market.
●● Frequent market stimulation. Short development times allow the introduction of new or updated products or services more frequently. With a given set of devel-opment resourcing, if it takes 12 months to develop a new product and service, a company can introduce a new or updated offering only every 12 months. A six-month development process doubles the company’s potential for making an impact in the market.

265a market requIrements perspectIve on product and servIce development
●● More opportunities for innovation. In markets where the underlying ‘technology’ base is moving fast, it may be important to have frequent opportunities to introduce these new technologies as often as possible. Short development time with frequent updates produces more windows of opportunity for this type of innovation.
dependability of product service development
Fast product and service development processes that cannot be relied on to deliver innovations dependably are, in reality, not fast at all. Development schedule slip-page can extend development times, but worse, a lack of dependability adds to the uncertainty surrounding the development process. Conversely, processes that are dependable give stability and minimise development uncertainty. Yet this poses a problem for most development processes. Unexpected technical difficulties, inno-vations that do not work or have to be modified, suppliers who themselves do not deliver solutions on time, customers or markets that change during the development process itself, and so on, all contribute to an uncertain and sometimes ambiguous environment. Certainly professional project management of the development pro-cess can help to reduce uncertainty. At least it should minimise the risk of internal disturbance to the development process if effective project management can prevent (or give early warning of) missed deadlines, detect bottlenecks and spot resource shortages. External disturbances to the process, however, will remain. Again, these may be minimised through close liaison with suppliers and effective market or environmental monitoring. Nevertheless, unexpected disruptions will always occur, and the more innovative the development, the more likely they are to occur. This is why flexibility within the development process is one of the most important ways in which dependable delivery of new products and services can be ensured.
Flexibility of product and service development
Flexibility in new product and service development usually is taken to mean the ability of the development process to cope with external or internal change. The most common reason for external change is because the market in general, or spe-cific customers, change their requirements. This may be prompted by their own cus-tomers and markets changing, or because developments in competitors’ products or services dictate a matching or leapfrogging move in specification. Internal changes could include the emergence of superior materials or technical solutions. One sug-gestion for measuring development flexibility is to compare the cost of modifying a product or service design in response to such changes against the consequences to profitability if no changes are made. The higher the cost of modifying a product or service in response to a given change, the lower is the development flexibility.10
Two trends in many markets make development flexibility particularly important. The first is the pace and magnitude of environmental change. Although flexibility may not be needed in relatively predictable environments, it is clearly valuable in more fast-moving and volatile environments. The second factor, however, which amplifies environmental volatility is increasing complexity and interconnectedness of products and services. A bank, for example, may bundle together a number of separate services for one particular segment of its market. Privileged account hold-ers may obtain special deposit rates, premium credit cards, insurance offers, travel

266 chapter 8 • product and servIce development and organIsatIon
facilities and so on together in the same ‘product’. Changing one aspect of this bundle may require changes to be made in other elements. So extending the credit card benefits to include extra travel insurance may also mean the redesign of the separate insurance element of the package. One of the biggest benefits of development flexibility is that it can reduce devel-opment risk. Much development risk derives from the changes that occur during the development period. At the beginning of the development time, managers will presumably form a view concerning customer requirements, available technologies, and specification of competitor products and services. During the development period any, or all, of these might change. Customers may change their mind, either because their needs have changed or because they did not understand their own needs in the first place. The boundary of what was technologically possible may change as new technologies come onto the market, and competitors introduce rival products and services with superior or different performance. Development flexibil-ity can help to minimise the impact of such occurrences.
the newspaper metaphorNot all aspects of a development programme need to be flexible. Some aspects of a product or service may be judged unlikely to change over the development period, whereas others may be particularly difficult to forecast. It would seem sensible, therefore, to delay decisions regarding the uncertain elements until as late as pos-sible in the process and build in sufficient flexibility in these elements rather than ‘waste’ it on the more stable elements. This is exactly how a daily newspaper designs its content. Special feature sections may be planned several weeks in advance and may even be printed well before their publication. Similarly, regular sections such as television times and advertisements are prepared several days before the newspa-per is due to come out. On the day of publication, several stories may be vying for the front page. This is where flexibility is needed. The more flexible the news desk is in taking in new news and deciding the layout and priority of stories, the later the decision can be made and the more current the newspaper will be. Thus, in the development of any product or service, the more stable elements can be designed (in terms of making decisions around their form) well in advance, with their speci-fication fixed early in the process. Other elements of the design can remain fluid so as to incorporate the latest thinking and then be fixed only at the last moment.11
Incremental commitmentOne method of retaining some flexibility in development processes is to avoid yes/no decisions. Alternative and parallel options can be progressed in stages. So, for example, an idea might be given approval to move to the next stage with no implied commitment to develop that idea through to the end of the project. One often-quoted example concerns the development of the Boeing 777. Unusually for this type of product, the drawing that defined some parts had six or seven ‘release levels’. This means that, rather than confirming the final design of a part, it would be done in stages. So the design may be given approval for purposes of purchasing test materials but not for purposes of confirming tool design. This provides a more flexible way of delaying decisions until the last minute without holding up the whole development process.

267a market requIrements perspectIve on product and servIce development
cost of product and service development
The cost of developing products and services is conventionally analysed in a similar way to the ongoing cost of producing the goods and services. In other words, cost factors are split up into three categories: the cost of buying the inputs to the pro-cess, the cost of providing the labour in the process, and the other general overhead costs of running the process. In most in-house development processes the latter two costs outweigh the former. As with day-to-day production of products and services, however, it is perhaps more revealing to consider how the other performance objec-tives drive cost:
●● Quality – ‘error-free’ processes reduce reworking concepts and designs.
●● Speed – fast development can use resources for shorter periods.
●● Dependability – on-time development provides process stability, allows efficient resource planning and prevents expensive launch date slippage.
●● Flexibility – the ability to delay design decisions can ensure the most appropri-ate options being chosen, preventing the costs of changing direction in the development.
One way of thinking about the effect of the other development performance objectives on cost is shown in Figure 8.8. Whether through quality errors, intrinsi-cally slow development processes, a lack of project dependability, or delays caused through inflexible development processes, the end result is that the development is
Sales revenue
+ve
�ve
Cumulativecash flow
Sales revenue(delayed launch)
Cumulative cash flow(delayed launch)
Time
Delay inlaunch
Delay in break-even isgreater than the launch delay
Figure 8.8 slow and/or delayed development times, which can be the result of quality or flexibility failures, will increase costs and can reduce revenue

268 chapter 8 • product and servIce development and organIsatIon
late. Delayed completion of the development results in both more expenditure on the development and delayed (and probably reduced) revenue. The combination of both these effects usually means that the financial breakeven point for a new prod-uct or service is delayed far more than the original delay in the product or service launch.
an operations resources perspective on product and service developmentAn operation’s resource perspective on product and service development involves examining the decision areas that we would normally use but applying them spe-cifically to the development process. This is not difficult since all the categories can be applied directly. The capacity of the organisation’s development processes needs managing over the long term, choices need to be made about whether some activi-ties are performed in-house or subcontracted, investments in process technology are becoming an increasingly important element in managing new product and service development, and the organisation of the development process has become an important factor in managing the development process. Furthermore, behind each of these decisions lies the general objective of nurturing and exploiting the organisation’s capabilities.
product and service development capacity
As in any other process, the management of capacity involves deciding on the over-all level of activity that an operation can support and also deciding how that level of support can be changed in order to respond to likely changes in demand. Essentially all the issues discussed in Chapters 4 and 5, in the context of the whole operation, also apply to the product and service development process. However, remember that the development process is a service in that it creates and works with knowledge for the benefit of its (usually internal) customers. This means that such options as build-ing up an ‘inventory’ of designs are not usually feasible as such. Storing knowledge in a relatively developed form, however, may be possible. Indeed, in many ways, the whole development process can be characterised as building up and then deploy-ing ‘inventories’ of design-based knowledge. Similarly, a ‘capacity lagging’ strategy (see Chapter 3) is not usually practical. The whole ethos of product and service development is one of broadly anticipating market requirements and attempting to bring ideas to market as early as possible. Deliberately planning to have a level of design capacity lower than the likely demand for such development rather implies extended time-to-market performance.
uneven demand for developmentThe central issue for managing product and service development in many organisa-tions is that the internal ‘demand’ for such development is uneven. Even in very large companies the rate of new service or product introduction is not constant. The need for product/service innovation is likely to be dictated by several complex and interrelated market factors. This may lead to several new offerings being introduced to the market close together, while at other times little development is needed, thus posing a resourcing problem. The capacity of a firm’s development capability is

269an operatIons resources perspectIve on product and servIce development
often difficult to flex. The expertise necessary for development is embedded within designers, technologists, market analysts, and so on. Some expertise may be able to be hired in as and when it is needed, but much development resource is, in effect, fixed. Such a combination of varying demand and relatively fixed development capacity leads some organisations to be reluctant to invest in development capacity because they see it as an under-utilised resource. This may lead to a vicious cycle in which, although there is a short-term need for development resources, companies fail to invest in those resources because many of them (such as skilled development staff) cannot be hired in the short term, which leads to development projects being under-resourced, with an increased chance of project overrun or failure to deliver appropriate technical solutions. This in turn may lead to the company losing busi-ness or otherwise suffering in the marketplace, which makes the company even less willing to invest in development resources (see Figure 8.9).
product and service development networks
Most interest in supply networks has focused on the flow of parts and products (and occasionally services). Recently interest has also started to focus around the exchange of product and service development knowledge, and the integrating of suppliers into the innovation process. This network of knowledge exchange is some-times called the ‘design (or development) network’ or ‘design chain’, and in many ways the operations strategy decisions concerning conventional supply networks are also reflected in development networks. Two decisions in particular do much to determine the effectiveness of development networks. The first is the extent of vertical integration – the decisions on how much development to do in-house and how much to subcontract. The second is how to manage the relationship between the ‘players’ (most notably, customers and suppliers) in the network.
So, problems in the developmentproject result in lost business
opportunities
Development need isconfirmed only for the
short term
So, there is reluctance to invest inlong-term development resources
So, in the short termthe project runs into
problems because it isunder-resourced
Figure 8.9 the ‘vicious cycle’ of under-resourcing development capacity

270 chapter 8 • product and servIce development and organIsatIon
In-house and subcontracted developmentCompanies position themselves on a continuum of varying degrees of design engagement with suppliers. At one extreme, a firm may retain all the necessary design capabilities in-house, while at the other end, it outsources all its develop-ment work, acting only as a focal point for the coordination of the design process. Between these extremes there exist options with varying degrees of internal and external design capability. In general, though, few companies are at the extremes of this continuum, since process development necessitates some kind of interaction. Design resources will be easy to control if they are kept in-house, because they are closely aligned with the company’s normal organisational structures, but control should be relatively loose because of the extra trust present in working with famil-iar colleagues. Outsourced design requires greater control and, because it has to be applied at a distance, contracts, often with penalty clauses for delay, may be needed. However, penalty clauses and contracts do not help to build long-term partnership relationships. In-house design has an advantage here because of its strong familiarity with the rest of the company’s product or service range, operations processes, materi-als and market requirements. In contrast, outsourcing design can mean a weaker understanding in the short term, although if long-term relationships do develop,
In the early years of the twenty-first century the idea of outsourcing manufacturing capabil-ity to China became well established. But perhaps of more long-term significance was the way in which global corporations started to outsource much of their research and develop-ment into the area. Yet the first large company to establish a Chinese research and develop-ment presence was IBM, back in 1995. Now, there are hundreds of multinational research and development labs, but in 1995 it was seen as very much of a gamble. In fact, IBM has built research labs around the world, largely because the company is keen to attract the best talent. This was why IBM established its China Research Lab (CRL). And not only did China have technical talent in abundance, it was also clear that it would be the most important emerging market in the world. Having a research presence in the local market that under-stood its culture and language helped IBM establish close ties with customers who could become very important to its future growth. ‘In the early days,’ says Dr Katherine Shen, who was the first employee of CRL, ‘the problem was how to establish CRL in terms of capability and reputation. People had no way to foretell the future of the lab, and students on the hunt for jobs had never had the opportunity to work for this kind of organisation before. People didn’t know how many years the lab could survive.’ Now, with CRL firmly established with a reputation for development its own products, it has one particularly important tip for any other multinational establishing a remote devel-opment location: ‘Make sure that you work closely with headquarters and business units in location other than China.’ This close collaboration with other labs allowed CRL to develop quickly. IBM sent its executives to visit CRL frequently, bringing new ideas, and new under-standings of markets around the world were moving. Similarly, ERL established a programme of sending its own scientists around the world, not only to other IBM locations but also to universities and independent research organisation. ‘It’s our experience,’ says CRL, ‘that face-to-face communication plus conference calls works better than only knowing voices over the phone. Face-to-face communication is necessary for building trust and relationships between team members who are located across oceans.’
example IBm develops its research base in china12

271an operatIons resources perspectIve on product and servIce development
product and service familiarity will become stronger. The underlying capabilities built up through the development activity are generally assumed to be highly acces-sible when the development is done in-house. It is more difficult to provide access to tacit knowledge when it is housed outside the organisation. One motive behind companies investing heavily in common computer-aided design systems with their design suppliers is to ensure better accessibility. The overall cost of in-house versus outsourced development will vary, depending on the firm and the development project. An important difference, however, is that external developments tend to be regarded as a variable cost. The more external resources are used, the more the cost will be. In-house development is more of a fixed cost. Indeed a shift to outsourcing may occur because fixed development costs are viewed as too great. Paradoxically though, as external sourcing of development becomes an integral part of a com-pany’s strategy and relationships become stable, costs tend to be more or less fixed. Finally, a major driver of this decision can be the risk of knowledge leakage. Firms become concerned that experience gained through collaboration with a supplier of development expertise may be transferred to competitors. Again there is a paradox here. Companies usually outsource development primarily because of the supplier’s capabilities, which are themselves an accumulation of specialist knowledge from working with a variety of customers. Without such knowledge ‘leakage’ the benefits of the supplier’s accumulated development capabilities would not even exist.13
Involving suppliers in developmentThe nature of the relationship with suppliers of product or service design services is not the same as when a supplier (even the same supplier) is providing product or services on an ongoing basis. For example, a component manufacturer, asked by a customer to design a new part, is providing a service rather than making a physical product. Even a supplier of services, in designing a new service for a customer, is engaged in a one-off (or at least relatively infrequent) exchange with its customer, in which its own knowledge is embedded in the design. In fact, a development rela-tionship between customer and supplier is very similar to that between professional service firms, such as lawyers or consultants, and their clients. When choosing sup-pliers of design and development knowledge, companies often use criteria such as experience, trust, technical knowledge and ‘relationship’: a very similar list to that used to select their accountancy firm and their legal representatives.14
Characterising development relationships as professional services has practical implications, especially for suppliers. First, it emphasises the importance of customer perception of the ‘process’ of development as well as the final design that emerges from the process. Frequently, demonstrating expertise during the development process allows suppliers to build their ‘technical’ reputation. Second, just as profes-sional services, such as accountants, keep ‘client files’ which detail all contacts with individual clients, so design suppliers can use similar client knowledge management to manage the development of the relationship with customers. Third, it broadens the nature of contact with customers to include a more general responsibility for the development of relationships among other sources of expertise in the network. This has implications for the way suppliers might organise their design activity, for example in the way they attempt to respond to change in client needs during the creation of the design service, or in the use of implicit ‘service guarantees’.

272 chapter 8 • product and servIce development and organIsatIon
Involving customers in developmentFew people know the merits and limitations of products and services better than the customers who use them. An obvious source, then, of feedback on product or service performance will be those who regularly use (or have ceased using) them. Different types of customer have the potential to provide different types of information. New users can pinpoint more attractive product and service features; those who have switched to a competitor offering can reveal its problems. A particularly interesting group of customers are the so-called ‘lead users’.15 Lead users have requirements of a product or service that will become more general in a market, but they are aware of these needs well ahead of the rest of the market. They also are users who will benefit significantly by finding a solution to their requirements. This may prompt them to develop or modify products or services themselves rather than wait for them to become commercially available. One reported example of lead-user research concerns a new product development manager at Bose, the high-quality hi-fi and speaker company.16 On visiting his local music store, his professional ear noted the high quality of the background music being played. Investigating, he found that the store manager was using Bose speakers designed for home use but had attached metal strips around the speaker boxes so that they could be suspended close to the ceiling of the store. Inspired by this, Bose built prototypes of speakers that would satisfy the need for quality in-store speakers. These were taken back to the music store for further testing and eventually led to the company successfully entering the market for high-fidelity background music speakers.
product and service development technology
One of the more significant changes in product and service development has been the growing importance of ‘process’ technology within the development process. Until relatively recently, although product/service technology knowledge was an important input into the development activity, the technology used to process this knowledge was relatively unusual. It was limited to testing and evaluation technolo-gies such as the mechanical devices that would simulate the stresses of everyday use on products such as automobiles or sports shoes, often testing them to destruction. Now process technologies are much more common, especially those based on com-puting power. For example, simulation software is now common in the design of everything from transportation services through to chemical factories. These allow developers to make design decisions in advance of the actual product or service being created. They allow designers to work through the experience of using the service or product and learn more about how it might operate in practice. They can explore possibilities, gain insights and, most important, they can explore the conse-quences of their decisions. In this sense, simulation is often a predictive rather than an optimising technology.
knowledge management technologiesIn many professional service firms, such as management consultancies, service development involves the evaluation of concepts and frameworks that can be used in client organisations to diagnose problems, analyse performance and construct possible solutions. They may include ideas of industry best practice, benchmarks of performance within an industry, and ideas that can be transported across industry

273an operatIons resources perspectIve on product and servIce development
boundaries. However, the characteristics of management consulting firms are that they are geographically dispersed and rarely are staff at their offices. The consultants spend most of their time in client organisations acquiring knowledge day by day. Yet at the same time it is vital for such companies to avoid continually ‘reinventing the wheel’. Any means of collectivising the cumulative knowledge and experience within the organisation must greatly assist the development of new concepts and frameworks. Most consultancy companies attempt to tackle this problem using knowledge management routines based on their intranet capabilities. This allows consultants to put their experience into a common pool, contact other staff within the company who have skills relevant to a current assignment, and identify previous similar assignments. In this way information is integrated into the ongoing knowl-edge development process within the company and can be tapped by those charged with developing new products.17
The significance of most of these development technologies is that they help to reduce the impact both of uncertainty and of complexity. Simulation technologies allow developers to reduce their own uncertainty of how products and services will work in practice. Similarly, knowledge management systems consolidate and juxta-pose information on what is happening within the organisation, thus presenting a more comprehensive vision and reducing uncertainty. CAD systems also help to deal with complexity by storing data on component details as they develop through various interactions. The absolute size and interrelatedness of some large products require sophisticated CAD systems if they are to be developed effectively. One of the most reported examples was the development of Boeing’s 777 aircraft. The powerful CAD system used on this project was credited with Boeing’s success in being able to involve its customers in the design process, allow more product configuration flexi-bility (such as the proportion of seats in each class, etc.), and still bring the huge project successfully to completion.
the organisation of product and service development
Amongst the criteria that are used to assess the effectiveness of different organisa-tional forms, two in particular are important to product and service development – specialisation and integration. Specialisation is important because it encourages the depth of knowledge and technical understanding that is required in a concentrated form during the development process. Because of the (normally) finite time allowed for product and service development, technical knowledge needs to be deployed in a concentrated manner during limited windows of opportunity. Clustering resources around technical specialisms encourages the development of such concentrated knowledge. Integration is important because both product and services are com-posed of smaller components or subsystems. Coordinating the efforts of developers in different parts of a project and integrating their technical solutions in such a way as to reflect the market priorities within the development project are clearly impor-tant aspects of any organisational structure. Both these criteria need to be incorpor-ated in the organisational structure that is built to support a development project.
project-based organisation structuresThe total process of developing concepts through to market almost certainly will involve personnel from several different areas of the organisation. Most functions

274 chapter 8 • product and servIce development and organIsatIon
will have some part to play in making the decisions that will shape a final design. Yet any development project will also have an existence of its own. It will have a project name, an individual manager or group of staff who are championing the project, a budget and, hopefully, a clear strategic purpose in the organisation. The organisational question is which of these two ideas – the various organisational functions that contribute to development, or the development project itself – should dominate the way in which the development activity is managed. The matrix form of organisation is a compromise between two (or more) approaches to clustering resources. It is an ideal model to examine the debates over an appropriate organisa-tional form for development projects. Here the two conflicting approaches are the functional (specialist) dominated structure, and the project (or programme) domi-nated structure. In a pure functional organisation all staff associated with the design project are based unambiguously in their functional groups. There is no project-based group at all. They may be working full-time on the project, but all communication and liaison are carried out through their functional manager. The project exists only because of agreement between these functional managers. At the other extreme, all the individual members of staff from each function who are involved in the project could be moved out of their functions and perhaps even physically relocated to a ‘task force’ dedicated solely to the project. The task force could be led by a project manager who probably holds all the budget allocated to the design project. Not all members of the task force necessarily have to stay in the team throughout the development period, but a substantial core might see the project through from start to finish. Some members of a design team may even be from other companies. In between these two extremes there are various types of ‘matrix’ organisation with varying emphasis on these two aspects of the organisation (see Figure 8.10). And, although there are, in practice, an infinite number of structures, five stereotypical positions on the continuum are often discussed:
●● Functional organisation – the project is divided into segments and assigned to relevant functional areas and/or groups within functional areas. The project is coordinated by functional and senior management.
●● Functional matrix (or lightweight project manager) – a person is formally desig-nated to oversee the project across different functional areas. This person has lim-ited authority over the functional people involved, and serves primarily to plan and coordinate the project. The functional managers retain primary responsibility for their specific segments of the project.
●● Balanced matrix – a person is assigned to oversee the project, and interacts on an equal basis with functional managers. This person and the functional man-agers jointly direct work flow segments and approve technical and operational decisions.
●● Project matrix (or heavyweight project manager) – a manager is assigned to over-see the project and is responsible for the completion of the project. Functional managers’ involvement is limited to assigning personnel as needed and providing advisory expertise.
●● Project team (or tiger team) – a manager is given responsibility for a project team composed of a core group of personnel from several functional areas and/or groups, assigned in a full-time basis. The functional managers have no formal involvement.
275an operatIons resources perspectIve on product and servIce development
Heavyweight project managers
Pure functionalorganisation
Pure projectorganisation
Increasing projectorientation
Balancedmatrix
organisation
FM = Functional managerPM = Project manager
Lightweight project managers
FM
PM
FM
PM
FM
PMFM FMFM
FM
PM
FM
PM
FM
PM
FM
PM
FM
PM
FM
PM
FM
PM
FM
PM
FM
PM
FM
PM
FM
PM
FM
PM
PM
PM
PM
Figure 8.10 organisation structures for design processes
When the hugely popular RAZR (pronounced ‘razor’) phone was launched in late 2004, it was hailed as an iconic design. Yet many industry commentators declared the product was a one-off from a once great company that would never gain its former status as a technol-ogy leader. It had already lost the position of market leader to Nokia some time earlier. But then followed the SLVR (‘sliver’), a slim ‘candy bar’ design that offered an alternative to the RAZR’s clamshell design, and the KRZR (‘crazer’), a narrower version of the RAZR. Much of the credit for the firm’s return to successful new product development is cred-ited to the way in which Motorola reorganised its development activities. ‘One of the biggest changes at Motorola,’ says Jim Wicks, who heads the firm’s ‘consumer experience design’ group, ‘has been in the way that different teams, from design and engineering to marketing and finance, have got together to sort out the enormous complexities involved in developing new hand-sets. Cooperation improved because each group became willing to try something difficult that might help the others – without worrying too much about who would get blamed if they failed.’ Now all the company’s developers know that the rules of product development have changed. Even the company’s hiring policy has changed, with more emphasis given to people and communication skills, as well as technical ability. ‘After all,’ said one review of the company’s success, ‘when innovation involves complex interactions between many internal teams and outside partners – as it does at Motorola – the ability to communicate is prized.’
example changing development rules at motorola18
276 chapter 8 • product and servIce development and organIsatIon
effectiveness of the alternative structuresAlthough there is no clear ‘winner’ amongst the alternative organisational struc-tures, there is wide support for structures towards the project rather than the func-tional end of the continuum. In one widely respected study, Professors Clark and Fujimoto argued that heavyweight project manager structures and dedicated project teams are the most efficient forms of organisation for product competitiveness, shorter lead-times and technical efficiency.19 Other studies, although sometimes more equivocal, have shown that, in terms of the best total outcome from the devel-opment process, structures from balanced matrix through to project teams can all give high success rates. Perhaps of more interest is the suitability of the alternative structures for different types of product or service development project. Matrix struc-tures generally are deemed to be appropriate for both simple and highly complex projects. Dedicated project teams, on the other hand, are seen as coming into their own especially in highly complex projects. Yet again, there are advantages in functionally based development structures. In Chapter 10 we discuss how clustering resources around a functional specialism helped the development of technical knowledge. Some organisations do manage to capture the deep technological and skills development advantages of functional structures, while at the same time coordinating between the functions so as to ensure satisfactory delivery of new product and service ideas. Perhaps the best known of these organisations is Toyota, the Japanese car giant. They have a strong function-ally based organisation to develop their products. They adopt highly formalised development procedures to communicate between functions and places strict limits on the use of cross-functional teams. But what is really different is their approach to devising an organisational structure for product development that is appropriate for them. The argument that most companies have adopted to justify cross-functional project teams goes something like this:
Problems with communication between traditional functions have been the main reasons for, in the past, failing to deliver new product and service ideas to specification, on time and to budget. Therefore let us break down the walls between the functions and organise resources around the individual development projects. This will ensure good communica-tion and a market-oriented culture.
Toyota and similar companies, on the other hand, have taken a different approach. Their argument goes something like this:
The problem with cross-functional teams is that they can dissipate the carefully nurtured knowledge that exists within specialist functions. The real problem is how to retain this knowledge on which our future product development depends, while overcoming some of the traditional functional barriers that have inhibited communication between the func-tions. The solution is not to destroy the function but to devise the organisational mecha-nisms to ensure close control and integrative leadership which will make the functional organisation work.20

277
summary ansWers to key questIons
Why is the way in which companies develop their products and services so important?Competitive markets and demanding customers require updated and ‘refreshed’ products and services. Even small changes to products and services can have an impact on competitiveness. Markets are also becoming more fragmented, requiring product and service variants developed specifically for their needs. At the same time, technologies are offering increased opportunities for their exploitation within new products and services. Nor can one always separate the development of products and services on the one hand from the development of the processes that produce them on the other. Thus product and service development influences and is influenced by almost all other decisions and activities within the operations function.
What process do companies use to develop products and services?There is no single product and service development process as such. However, there are many stage models that attempt to define and describe the various stages that a process should include. Typical of these stages are such activities as concept genera-tion, concept screening, preliminary design, design evaluation and improvement, prototyping and final design, and developing the operations process. It is important to remember, though, that although these stages are often included (either formally or informally) within an organisation’s product or service development process, they do not always follow each other sequentially. In reality the process may recycle through stages and even miss some out altogether. A common metaphor to illustrate the process is that of the ‘funnel of development’. Again, though, the idea of many ideas passing through a funnel, being periodically screened and a single product or service design emerging from the end, is itself a simplification.
how should the effectiveness of the product and service development process be judged in terms of fulfilling market requirements?The market effectiveness of any product or service development process can be judged in the same way as the day-to-day operations processes that produce the prod-ucts and services themselves. That is, the development process can be judged in terms of its quality, speed, availability, flexibility and cost. Development projects must be error free, be fast to market, deliver on time, retain sufficient flexibility to change as late as possible in the process, and not consume excessive development resources.
What operations resource-based decisions define a company’s product and service development strategy?Again we can classify the decisions around the product or service development pro-cess in the same way as we can classify the decisions that specify the resources for day-to-day operations process. The overall development capacity of an organisation needs to be managed to reflect fluctuating demand for development activities, deci-sions must be made regarding the outsourcing of some, or all, of the development activity as well as the nature of the relationships with development ‘suppliers’, tech-nologies such as computer aided design and simulation may be required to aid the development process, and the resources used for development need to be clustered into some form of organisational structure.
summary ansWers to key questIons

278 chapter 8 • product and servIce development and organIsatIon
Further reading
Cross, R. and Baird, L. (2000) ‘Technology is not enough: improving performance by building organisational memory’, Sloan Management Review, Spring.
Goffin, K. and Mitchell, R. (2010) Innovation Management, Strategy and Implementation Using the Pentathlon Framework, 2nd edn. Palgrave Macmillan.
Tidd, J. and Bessant, J. (2009) Managing Innovation: Integrating Technological, Market and Organizational Change, 4th edn. John Wiley & Sons.
Trott, P. (2008) Innovation Management and New Product Development, 4th edn. Harlow, UK: Financial Times Prentice Hall.
Ulrich, K. and Eppinger, S. (2007) Product Design and Development, 4th edn. McGraw-Hill.Voudouris, C, Owusu, G., Dorne, R. and Lesaint, D. (2007) Service Chain Management:
Technology Innovation for the Service Business. Springer.Walker, S. (2006) Sustainable by Design: Explorations in Theory and Practice. London:
Earthscan Publications.
notes on the chapter
1 Sources: The Times (2006) ‘Timeline – Airbus A380 superjumbo’, 26 October; BBC news website (2006) ‘Q&A: A380 delays’, Monday 30 October; BBC news website (2007) ‘Q&A: Airbus job cuts’, 28 February; Hollinger, P. and Wiesmann, G. (2008) ‘Airbus is hampered by cultural differences’, The Financial Times; The Economist (2008) ‘Airbus Marathon Man’, 17 July; The Economist (2008) ‘Boeing and Airbus – Swings and roundabouts’, 27 November.
2 Baldwin, C.Y. and Clark, K.B. (1997) ‘Managing in an age of modularity’, Harvard Business Review, September–October.
3 Mass customisation was first fully articulated in Pine, B.J. (1993) Mass Customisation: The New Frontier in Business Competition. Boston MA: Harvard Business School Press. See also Hart, C.W.L. (1995) ‘Mass customisation: conceptual underpinnings, opportunities and threats’, International Journal of Service Industry Management, 6(2).
4 Ahlström, P. and Westbrook, R. (1999) ‘Implications of mass customisation for operations management’, International Journal of Operations and Production Management, 19(3).
5 Lehnerd, A.P. quoted in Pine, B.J. (1993) op.cit. 6 Source: Wright, M. (2010) ‘Kodak develops: a film giant’s self-reinvention’, Wired Magazine,
15 February. 7 Source: Doran, J. (2006) ‘Hoover heading for sell off as Dyson sweeps up in America’, The
Times, 4 February. 8 Source: The Economist, (2006) ‘Silent skies’, 11 November. 9 von Hippel, E. (1988) The Sources of Innovation. New York: Oxford University Press.10 Thomke, S. and Reinertsen, D. (1998) ‘Agile product development’, California Management
Review, 41(1).11 Ibid.12 Source: Zhao, C. (2006) ‘IBM research in China’, Interactions, March–April.13 The above discussion is based on Twigg, D. (1997) ‘A typology of supplier involvement in
automotive product development’, Warwick Business School Research Paper No. 271.14 Haywood-Farmer, J. and Nollet, J. (1991) Service Plus: Effective Service Management.
Boucherville, Quebec: Marin.15 Von Hippel, E., Churchill, J. and Sonnack, M. (1998) Breakthrough Products and Services with
Lead User Research. New York: Oxford University Press.16 Ibid.17 Iansiti, M. and MacCormack, A. (1997) ‘Developing products on internet time’, Harvard
Business Review, September–October.

279notes on the chapter
18 Sources: Motorola website (2007); The Economist (2006) ‘Motorola’s boss is combining slim mobile phones with big bets’, 5 October.
19 Clark, K.B. and Fujimoto, T. (1991) Product Development Performance. Boston, MA: Harvard Business School Press.
20 Sobek, D.K. II, Licker, J.K. and Ward, A.C. (1998) ‘Another look at how Toyota integrates product development’, Harvard Business Review, July–August.

chapter
the process of operations strategy – formulation and implementation
9
The process of operations strategy formulation is concerned with ‘how’ to reconcile market requirements with operations resources over the long-term. The reason for these final two chapters is simple. In practice achieving this alignment is much more difficult than it sounds. And, although any simple step-by-step model of how to ‘do’ operations strategy will inevitably be a simplification of a messy reality, we shall use a four-stage model to illustrate some of the elements of ‘process’. This stage model is shown in Figure 9.1. It divides the process of operations strategy into formulation, implementation, monitoring and control. In this chapter we examine the first two of these stages: formulation and implementation. The following chapter looks at the final two stages: monitoring and control.
Introduction
Operations strategycontrol
Operations strategyformulation
Operations strategyimplementation
Operations strategymonitoring
This chapter
Figure 9.1 this chapter concerns the formulation and implementation stages of the process of operations strategy
●● What is the ‘formulation’ of operations strategy?
●● What is the role of ‘alignment’ in formulation?
●● What is meant by strategic sustainability?
●● What analysis is needed for formulation?
●● how do we know that formulation is complete?
●● What is operations strategy implementation?
●● Who is responsible for implementation?
●● how can participation affect implementation?
key questIons

281What Is the role oF alIgnment?
Formulation of operations strategy is the practical process of articulating the various objectives and decisions that make up the strategy. Unlike day-to-day operations management, formulating an operations strategy is likely to be only an occasional activity. Some firms will have a regular (e.g. annual) planning cycle, and operations strategy consideration may form part of this, but the extent of any changes made in each annual cycle is likely to be limited. In other words, the ‘complete’ process of formulating an entirely new operations strategy will be a relatively infrequent event. This often results in firms looking to consultancies for guidance with the process, and as a result many detailed ‘how to formulate’ procedures – typically multi-stage models involving some type of performance ‘gap’ analysis – have been developed. Some of these models often share a number of common elements. For example:
●● a process that formally aligns the total organisation’s strategic objectives (usually a business strategy) to resource-level objectives;
●● using operations performance objectives as a translation device for alignment between market positioning objectives and operations strategy;
●● judging alignment via assessment of the relative importance of operations per-formance objectives (in terms of customer preference) and achieved performance (usually compared against competitor performance levels).
In other words, formulating an operations strategy is essentially about different ways of aligning plans, activities and objectives.
Formulating operations strategy
What is the role of alignment?
In the opening chapters of the book we discussed the process of reconciling opera-tional resources with market requirements so that there is an approximate degree of ‘fit’ or alignment between them. When alignment is achieved, the firm’s customers do not need, or expect, levels of operations performance that it is unable to supply. Nor does the firm have operations strengths that are either inappropriate for market needs or remain unexploited in the market. Figure 9.2 provides a diagrammatic illustration. Note that this diagram is not intended as a practical tool, but it does illustrate the nature of what is meant by alignment. The position on the vertical dimension of Figure 9.2 (e.g. position Y) represents the nature and level of market requirements: reflecting both intrinsic customer needs and/or expectations that have been shaped by the firm’s marketing activity. Movement up this axis is meant to indicate a broadly enhanced level of market performance or market capabilities, reflecting factors such as strength of brand/reputation, degree of differentiation, extent of plausible market promises, etc. The horizontal scale represents the level and nature of the firm’s capabilities. The position on this axis (e.g. position X) will be determined by factors such as resource efficiency, process control, innovation, and so on. Here again, movement along the axis indicates a broadly enhanced level of operations capabilities and performance.

282 chapter 9 • the process oF operatIons strategy – FormulatIon and ImplementatIon
the direction of alignment
The process of formulating an operations strategy to achieve alignment can be com-pleted in two different ‘directions’. Most commonly, firms start with their market requirements and then align resources to match them. That is, on Figure 9.2, they start by analysing point Y and then determine what point X should be. Such an approach has a number of intrinsic advantages, not least of which is the sheer availability of practical tools and techniques for classifying and identifying market requirements. This direction of alignment also corresponds with the traditional top-down hierarchy of strategies (discussed in Chapter 1) whereby operations’ role is to support predetermined market decisions. The alternative approach is for the operation to analyse its resources and then seek market opportunities that align well with it. That is, again referring to Figure 9.2, they start by analysing point X and then determine what point Y could be. However, in practice this is difficult to do. All businesses have markets. They may not always be well understood, and the business may not be good at identifying which part of a market it is trying to serve. Nevertheless, all businesses have some idea of the requirements of their market. But not every business understands its operations capabilities, and many may not have any ‘distinctive’ capabilities. And while we have continually stressed the importance of leveraging operations capabilities into the market - place, this does presuppose that a business has some operations capabilities worth leveraging. The logic of these alternative formulation processes is shown in Figure 9.3.
maintaining alignment over time
Most organisations are as mortal as the people who create and run them. So why are those firms that last for many years the exception rather than the rule? Most new
Mar
ket
req
uire
men
ts
Level of operations resource capability
Line
of fit
Alignment betweenmarket and operationscapability
Y
X
Figure 9.2 In operations strategy, ‘fit’ is the alignment between market and operations capability

283What Is the role oF alIgnment?
business ventures fail to make it past their first year. The obvious explanation is that firms fail to reconcile market requirements and operations resources, because it is all too easy either to misinterpret customer requirements or to fail to develop the requi-site operational capabilities. At the same time, history is littered with companies that had their moment of competitive glory but then faded or disappeared for ever. They may have effectively reconciled operational resources and market requirements to
Understandresources andprocesses, and
identify corecapabilities
Operationscapabilities
Operationsstrategy
decision areas
Operationsperformance
objectives
Make appropriatestrategic operations
decisions thatenhance thecapabilities
Understandmarkets and define
competitiveposition
State marketrequirements in
terms of operationsperformance
objectives
Make strategicoperationsdecisions
… to enhancecore capabilities
required bymarket
Operationscapabilities
Operationsstrategy
decision areas
Operationsperformance
Potentialmarket
positioning
Tangible andintangibleresources
Operationsprocesses
…that indicatepotentially competitive
market positions
Identifyperformance
benefitsfrom
capabilities
Marketpositioning
Marketsegmentation
Competitoractivity
Figure 9.3 align operations resources with market requirements, or align market positioning with operations resources capabilities

284 chapter 9 • the process oF operatIons strategy – FormulatIon and ImplementatIon
achieve alignment at one point in time. Yet subsequently they failed to sustain this position. And while many other factors, such as macroeconomic shifts and exchange rate fluctuations, have a huge influence on the success of organisations, the ongoing battle to reconcile resources and requirements to achieve sustainable alignment is clearly of great importance. This emphasises the idea that operations strategy formulation should not be a one-off event. Strategies will be formed repeat-edly over time in order to take into account changes in both operations resources and market requirements. At each of these ‘formulation episodes’ (which may be both frequent and informal), a key objective is likely to be the retention of ‘align-ment’. Sometimes this will mean maintaining alignment during an increase in both operations resource capabilities and market requirements. More realistically, even the most successful long-run firms will experience differing degrees of alignment between market requirements and their operational resources.
time and timing
Firms like Intel and Dell in the computer industry might, at any point in time, pos-sess a significant design and manufacturing performance advantage over their com-petitors. Unfortunately, in their hyper-competitive markets the danger is that their advantage will be quickly ‘competed away’, with sustainability sometimes measured in months rather than years. Jeffrey Williams published a study of sustainability patterns in a range of industries.1 He proposed a model classifying capability-based advantages according to how fast they can be duplicated. Nothing lasts for ever, and competitive success inevitably attracts imitators who offer superior product features or lower prices. Yet it is also clear that some organisations are able to sustain the advantages of their products and services for much longer than others. For instance, throughout the 1990s in the PC industry, why was it that certain products like Microsoft’s Office suite of programs were highly stable, with functionality and prices essentially unchanged during more than 10 years, whereas physical products sold by Hewlett-Packard, Toshiba, Apple, etc. could last less than 1 year? In attempting to explain these and other differing patterns of sustainability, the following typology of resource life cycles offers some interesting insights:2
Slow cycle. Products and services in this class (Microsoft Word, British Airways flights through Heathrow) reflect resource positions that are strongly shielded from competitive pressures by mechanisms that are durable and enduring. In economic terms, such resources exploit scarcity characteristics that are derived from factors that are impossible (or at least extremely difficult) to imitate, such as unique geo-graphical locations, long-standing brand reputations, personal client relationships, etc. Although being the first mover into a resource/market position is not a guaran-tee of advantage, in certain markets it can lead to incredibly sustainable positions. Standard cycle. Products and services in this class (Toyota’s cars, McDonald’s fast food, Visa credit card services) exploit less specialised resources and therefore face higher levels of resource imitation pressure. Firms in this position often face direct competition over extended periods of time, and this encourages a kind of trench warfare between established rivals (automobiles, banking, branded food, soft drinks, etc.). As a result, successful companies tend to emphasise discipline (control and coordination) in operations, and products tend to be standardised for production at high volumes (product/service line rationalisations are common in this type of firm) and are strongly market share oriented. The huge financial and organisational

285What Is the role oF alIgnment?
commitments that derive from such strategies mean that firms tend to tread very carefully over their competitive territory. Indeed, efforts to streamline these opera-tions and make them more lean can, if duplicated by rivals (and this is what nor-mally happens!), bring on even more intense resource-imitation pressures – creating fast-cycle markets that they are poorly equipped to deal with. Fast cycle. Products and services in this class (iPods, Intel microprocessors, Nokia mobile phones, and corporate financial instruments) face the highest levels of resource imitation pressure. Such products/services are often idea driven, and their economic half-life (the rate of product profit margin reduction minus reinvestment expenditure) is typically less than two years. Once established, these products do not require complex operations to support them, and are increasingly outsourced to low-cost, focused producers. To maintain sustainable alignment, these firms must master competitive routines associated with innovation and time to market. In his article, Williams asks ‘How is a 1 Mbyte DRAM chip like a Cabbage Patch doll?’ Both products derive their value from the idea, and information content is (unless protected by patents) inherently unsustainable. The implications for management could seem counter-intuitive for operations managers used to emphasising speed and efficiency as key strategic goals. They include:
●● Determining the correct speed for innovation – too much innovation can become distracting for both the operation and its customers. The correct speed of innova-tion should depend upon the sustainability of the firm’s resources. Williams cites the example of the Campbell Soup Company, which during the 1980s launched 300 products in a 5-year period. Only a few were successful, and the firm had to, according to CEO David Johnson, ‘fight the motherhood of innovation’.
●● Resource cycles should influence diversification – business history is littered with examples of firms such as many defence contractors, who attempt to shift from their own ‘slow cycle’ markets into seemingly attractive ‘medium cycle’ or even ‘fast cycle’ markets. Their lack of understanding and capabilities in dealing with faster resource/requirement dynamics leaves them with over-engineered prod-ucts, missed development lead-times, exorbitant production costs, etc. The key lesson becomes ‘beware of hidden barriers to entry’.
●● Look out for cycle time shifts – not all changes necessarily drive markets towards higher rates of imitation. For instance, the advent of hub and spoke control in airports gave less dominant regional airlines an invaluable source of competitive advantage over the major carriers. However, regardless of the direction of change, such shifts can be difficult to adjust to and therefore need to be actively sought out and analysed. At the same time, as in the airline example, they also represent major opportunities.
With the widespread adoption of copying and printing technologies, paper usage for most firms exploded, leaving them with vast quantities of paper to dispose of. Recognising this requirement as a potential opportunity for a new business, Clean and Green began operating in late 1990 as a venture in and around the town of Maastricht – initially targeting medium-sized businesses with a confidential paper removal and recycling service. The idea was to
example clean and green (cag) recycling services

286 chapter 9 • the process oF operatIons strategy – FormulatIon and ImplementatIon
allow businesses to dispose of their paper without worrying about negative environmental impact (in effect CAG was also offering intangible enhancement to its clients’ reputation for citizenship) while also preventing confidential information leaks. As a support to its relatively focused operations, its marketing effort emphasised the quality and dependability of the service. Initially, the operation consisted of dedicated collection receptacles and a number of vehicles (capacity and process technology decisions). Additionally, the firm made special contractual arrangements with paper producers (a supply network decision). The firm entered the next phase of its development when ‘green’ politics were increasingly influential at the national and local level, and many publicly provided recycling services were developed. Having built up a reputation with local businesses, the firm was invited by a consortium of local authorities to tender for a domestic paper collection contract. This was not just an increase in requirements but also a very different kind of market. It required the company to collect and recycle a wider range of paper from more sites, and without any value being placed upon the confidentiality of their service. It needed to add capacity and enhance its process technology in order to both increase flexibility and reduce costs. After negotiating with the consortium (which was keen to assist in the development of a range of potential contractors), it was awarded a contract with an understanding that it would take almost 12 months to acquire and develop the requisite operational capability. After the award of this first very large contract, CAG won more public and private work, and over time both added extra capacity and introduced other types of recycling process (different materials, etc.). This was essentially an incremental process over a period of about four years, leveraging and developing existing capability while introducing new relation-ships with other physical recycling plants. The firm’s next significant strategic decision was to gamble on future recycling legislation in the Netherlands and the rest of Europe. Over an 18-month period it invested heavily in a ‘complete recycling’ capability which allowed it to collect a large percentage of all recyc lable household waste. This meant extra collection capacity (vehicles and staff), different collec-tion and sorting systems, and new external relationships (including political lobbying). In particular, growth of the firm and the nature of the work meant that significantly more tem-porary staff were employed. This necessitated the introduction of new control and training systems. Future legislation was likely to ‘require’ much higher levels of domestic waste to be recy-cled, which would introduce a step change in market requirements. Unlike CAG’s previous experience, in trying to achieve a sustainable advantage for this new market it deliberately developed capability before the market required it.
cag over timeThe operations strategy matrix to describe CAG’s changing issues over time allows us to see how different resource and requirement issues become more or less important as the com-pany develops, and allows us to discuss the complexity, coherence and comprehensiveness of the overall strategy. However, it does not fully capture the balancing act of reconciliation over time. Figure 9.4 represents this dynamic process. CAG was the first in its area to offer a confidential and environmentally friendly paper disposal service, and therefore the initial level of market requirement (shown as level y1 in Figure 9.4) exactly matched the operation’s capability to deliver (x1). This ‘start-up’ phase is represented in Figure 9.4 by the transition to position C. Having built up a reputation with local businesses over a three-year period, the firm was invited by a consortium of local authorities to tender for a much larger single contract (market requirement y2). It was

287What Is the role oF alIgnment?
strategic sustainability
The CAG example reinforces the point that even the most successful and appar-ently problem-free development paths include times of mismatch between resources and requirements. More specifically, it illustrates the two basic models for ensuring sustainability:
●● the use of ‘static’ mechanisms which defend a given position;
●● the use of ‘dynamic’ mechanisms which encourage innovation and change.
awarded a contract with an understanding that it would take it a number of months to acquire and develop the requisite operational capability (x2). This transition from points C to D on the diagram is shown as a shift to the left of the ‘line of alignment’ – indicating that initially it had insufficient capability for the market requirements. After the award of this first large contract, the firm won more and more similar public and private work, and over time (requirements shifting from y2 to y3) added gradually to its underlying capabilities. This incremental growth phase is represented by the transition from point D to E. The stra-tegic decision to invest heavily in a ‘complete recycling’ capability (x3) allowed it to present a more extensive market offering (y3). It was then CAG’s strategic strategy to anticipate the introduction of new legislation introducing a step change in market requirements (y5). On the diagram, position F is to the right of the ‘line of alignment’ (this indicates that CAG only currently needs to meet y4 requirements) but it anticipates leveraging these capabilities rapidly (i.e. moving to position G) once the new market requirements are introduced.
G
Level of operations resource capabilityx4x2 x3x1
y5
Leve
l of m
arke
t re
qui
rem
ents
y2
y3
y4
y1C
D
E
F
Figure 9.4 alignment over time at cag recycling services

288 chapter 9 • the process oF operatIons strategy – FormulatIon and ImplementatIon
‘static’ or defensive approaches to sustainability‘Static’ mechanisms for achieving sustainability are concerned with preventing com-petitors from attacking existing market and resource positions, rather than trying to move to an entirely new position. So, to some extent, it is a defensive rather than offensive approach. An operation can seek to identify the market-isolating (barriers to entry) and resource-isolating (barriers to imitation) mechanisms that minimise change and act to keep a lock on a specific resource/requirement position. It can do this using internal or external approaches. Internal approaches exploit the idea that we have used before – that operations resources can be considered particularly valuable if they are scarce, difficult to move, difficult to copy or difficult to find substitutes for. Because they are difficult to repli-cate, such resources act to sustain competitive advantage by preventing competitors replicating their advantage. External mechanisms are based on the idea that the overall performance of a firm will depend on how well its strategy and its actions take into account the specific structure of the industry in which it is competing. In particular, the work of Michael Porter has been hugely influential in understanding this view. The forces Porter refers to can be summarised as:
(a) the bargaining power of suppliers and buyers;
(b) the threat of potential market entrants;
(c) the threat of substitute products/services; and
(d) the challenge from existing competitive rivals.
Table 9.1 offers some illustrations of how operations strategy can exploit both inter-nal and external strategic attributes of sustainability.
‘dynamic’ or offensive approaches to sustainabilityUltimately, even in the most isolated of market niches, customer requirements evolve and, as a result, operational capabilities also need to evolve. So, in addition to exploiting existing barriers to entry and imitation, operations can raise their game through innovation and change in order to achieve sustainability. Doing this involves the operation actively moving up the line of alignment and achieving a balance between market requirements and operations resources at a higher level. For instance, prior to the launch of the Federal Express ‘next day’ delivery service (‘for when it absolutely, positively has to be there overnight’) market analyses sug-gested that few organisations needed such a fast and dependable service.3 Once it was launched, however, early adopters of the service, such as global industrial firms and professional and financial services, obtained competitive advantage from the speed and dependability benefits of overnight mail. As a result, increasing num-bers of firms began to use the service. Although rivals eventually began to imitate the services, for a number of years this radical operating innovation proved to be hugely profitable for Federal Express, which, in effect, had gone to market with an entirely new set of capabilities delivering significantly improved speed and depend-ability performance.

289What Is the role oF alIgnment?
table 9.1 Internal and external ‘defensive’ static mechanisms of sustainability
‘Defensive’ static mechanisms of sustainabilityInternal Notes External Notes
Scarcity Scarceoperationalresourcesmight Bargaining Ifanoperationcancontrolaccess includecustomisedproduction powerofbuyers tothemarketthenotherfirmsare facilities,orexperienced andsuppliers effectivelycompelledtosupply. operationalstaffembodyingtacit Suppliersareabletoexploitsimilar knowledgedevelopedovertime. strategiesiftheirproducts/services areseenasvital.The‘IntelInside’
marketingcampaignwasanexampleofsuchastrategy.
Difficultto Anyoperationalresource(i.e. Thethreatof Thethreatposedbynewmove processtechnology)developedin- potential entrantscanbedramatically housecannotbeaccessedwithout marketentrants reducediffirmshavean purchasingtheentirecompany. effective‘barriertoentry’(e.g. Becauseofgreaterlabourmobility, economiesofscaleinsteel criticalskillsandexperiencescan production,installednetworksin movetorivalsquiteeasily.The telecommunications). resourcesthatarethemostdifficult tomovearethereforethosethat ‘don’twalkonlegs’andaretied somehowintotheoperation.
Difficulttocopy Althoughsimilartotheideaof Thethreatof Reducingthethreatfromsubstitute mobility,therelativeimitabilityofa substitute products/servicesisanextension resourceisanimportantdefensive productsand/or ofthemechanismsassociatedwith characteristic.Any‘learningcurve’ services barrierstoentry(seeabove),but effectsthatmightexistin specificallyrelatedtoproductsand operationscanmakecapabilities services,however.Iftheoperation difficulttocopy. hasestablishedadominanttechno-
logicalstandard(e.g.Microsoftoperatingsystems),thiscanbeamajorbarriertoentry.
Difficultto Nooperationwantsitsoperational Thechallenge Thechallengefromexistingrivalsiscreatea resourcestobecomeirrelevant fromexisting stronglyinfluencedbyallofthesubstitute throughtheintroductionofa competitive categoriesdiscussedabove. substitute(oralternative).Yetitcan rivals Additionally,becauseoperations happen;theopenprotocolsofthe guardtheirprocesssecrets,most internetmakeswitching,and firms‘reverseengineer’rival hencesubstitution,fareasier. products/servicestotrytoestablish
thenatureoftheprocess.
What is right at one time may become a liability later on. For 20 years Dell had exhibited remarkable ‘growth in the PC market. (See the example, ‘Dell (Part 1) – Learning how to turn difficulties into advantages’ in Chapter 7). Yet by the mid-2000s, although Dell was still the largest seller of PCs in the world, growth had started to slow down and the com-pany’s stock market value had been downgraded. The irony of this is that what had been the
example dell (part 2) – things change, ok?4

290 chapter 9 • the process oF operatIons strategy – FormulatIon and ImplementatIon
However formulation is approached, it is likely to require some significant analy-sis. As one would expect in a process that reconciles market requirements with operations resource capabilities, the two chief areas of analysis concern markets and resources. The practical reason for emphasising the problems with this analy-sis is to help reinforce the balanced nature of the reconciliation between resources and requirements. Although analysis of the marketplace is generally characterised by better tools and techniques, in reality both are characterised by ambiguity and uncertainty.
analysing market requirements
It is beyond the scope of an operations strategy book to explore the many practical models that exist to help practitioners assess the requirements of the marketplace. There is a rich and sophisticated literature on marketing stretching back over the history of modern business. However, simply because there are many highly struc-tured, rational models for analysing the external environment, this does not imply that these analyses are foolproof. No matter how complex and detailed the model, regardless of how much time and effort is invested in the data collection, it is still an ambiguous and unreliable process.
company’s main advantages – its direct sales model using the internet and its market power to squeeze price reductions from suppliers – were starting to be seen as disadvantages. Some commentators claimed that, although the market had changed, Dell’s operating model had not. Over the 20 years Dell had developed a radically different and very successful set of operations based on an extremely efficient supply chain, low inventories, modular product designs that allowed it to customise to its individual customer requirements, and a direct link to customers. All of this allowed it to sell robust computers at low prices. Some of the questions raised by commentators focused on Dell’s size. Perhaps it had grown so big that its lean supply model was no longer appropriate? How could a $56 billion company remain lean, sharp, and alert? Other commentators pointed out that Dell’s rivals had also now learnt to run efficient supply chains (‘Getting a 20-year competitive advantage from your knowledge of how to run supply chains isn’t too bad.’) However, one of the main factors was seen as the shift in the nature of the market itself. Sales of PCs to business users had become largely a commodity business with wafer-thin margins, and this part of the market was growing slowly compared to the sale of computers to individuals. Selling computers to individuals provided slightly better margins than the corporate market, but increasingly they wanted up-to-date computers with a high design value and, most significantly, they wanted to see, touch, and feel the products before buying them. This was clearly a problem for a company like Dell, which had spent 20 years investing in its telephone and, later, internet-based sales channels. Also, Dell’s early attempts to move into products other than PCs, such as televisions, were also hindered by its lack of physical stores. What all com-mentators agreed on was that in the fast-moving and cut-throat computer business, where market requirements could change overnight, operations resources must constantly develop appropriate new capabilities.
analysis for formulation

291analysIs For FormulatIon
analysing operational resource capabilities
It can be difficult to analyse the external environment despite the widespread avail-ability of practical tools and techniques designed to help in this process. But it can be even more difficult to analyse the ‘inside’ of the organisation. This aspect of strat-egy formulation is not supported by many practical frameworks. Birger Wernerfelt, one of the first academics to advocate a resource-based view of the firm, argued that conceptually we tend to treat organisational resources as an ‘amorphous heap’.5 In fact, that widely applied strategy management tool, SWOT analysis, is a good starting point for the analysis of operations resources. This mechanism explicitly links inter-nal (strengths and weaknesses) and external (opportunities and threats) factors. And although SWOT analysis is extremely difficult to incorporate into an effective plan-ning process, the ‘strengths and weaknesses’ part of SWOT is particularly useful. Table 9.2 lists some possible operations factors which might be included in such an analysis. Although this is only a selection of general strengths and weaknesses, many weak-nesses (in Table 9.2) are simply a lack of a particular strength: for example, having ‘in-house operations expertise’ is a strength, while not having it is a weakness. But other strengths may conflict with each other. So achieving good ‘economies of scale’ can leave the operation open to ‘under-utilisation of capacity’ if demand drops. Similarly, ‘resource capability’ is only a strength if there are greater benefits of capturing extra demand than there are costs of providing the excess capacity. What are strengths in one set of circumstances could be weaknesses in another. It is important, therefore, to clarify the assumptions under which such lists are derived. Although every SWOT analysis will be unique to the operation for which it is being devised, some general hints have been suggested that will enhance the quality of the analysis.6
table 9.2 some possible operations-related factors in a sWot analysis
Strengths Weaknesses
Economiesofscale Uneconomicvolume
Abilitytoadjustcapacity Under-utilisationofcapacity
Reservecapacity Insufficientcapacity
Appropriatelocations Inappropriatelocations
Long-termsupplierrelationships Lackofpowerinsupplymarket
Supplymarketknowledge Nolong-termsupplyrelationships
Supplychaincontrol Oldprocesstechnologywithpoorperformance
Advancedprocesstechnologyknowledge Nocapabilitytoimprove‘offtheshelf’processtechnology
In-houseprocesstechnologydevelopmentcapability Rigidorganisationordecision-makingstructure
Flexibleorganisationalstructure Noin-houseoperationsexpertise
In-houseoperationsexpertise Staticlevelsofoperationsperformance
Continuousimprovementculture Poorproductandservicedevelopmentskills
Effectiveproductandservicedevelopmentprocesses
292 chapter 9 • the process oF operatIons strategy – FormulatIon and ImplementatIon
●● Keep it brief: pages of analysis are usually not required.
●● Relate strengths and weaknesses, wherever possible, to key factors for success.
●● Strengths and weaknesses should also be stated in competitive terms, if possible. It is reassuring to be ‘good’ at something, but it is more relevant to be ‘better than the competition’.
●● Statements should be specific and avoid blandness; there is little point in stating ideas that everyone believes in.
●● Analysis should distinguish between where the company wishes to be and where it is now. The gap should be realistic.
●● It is important to be realistic about the strengths and weaknesses of one’s own and competitive organisations.
capabilities
Analysing strengths and weaknesses is the starting point for understanding resources. The next challenge is to understand the capabilities that they (may) represent. The idea of core capabilities is central to understanding how operations strategy can be sustained over time. But the idea of operations capabilities is not a straightforward one. Capabilities derive from strategically important assets – those that are scarce, difficult to move, difficult to copy and difficult to substitute for. But these types of assets are, by definition, more difficult to manage than those assets that are well understood, widely available and easy to copy. Practical analysis and implementa-tion that is based upon a concept that is so ambiguous is therefore not always easy. However, it is possible to highlight a number of critical issues.
●● Definitions (such as, what is capability?) can be important. As one confused engineer once exclaimed to one of the authors, ‘This is very difficult you know; you don’t walk around the factory and bang your head on the core capabilities of the firm!’ Yet they do exist, and identifying them is an obvious first step in nurturing them. While complex definitions of different types of capability can be used, the more abstract the definition, the less likely it is that managers will find it useful. This drastically reduces the legitimacy of any decisions based upon the analysis, and makes it harder for the dynamics of capability development to be incorporated on an ongoing basis. Therefore, if possible, keep definitions of capability as simple as is practical.
●● The level of aggregation in how capabilities are defined is also critical. For instance, while one might reasonably assert that Sony’s core capability is ‘minia-turisation’, this may be too generic for Sony’s managers to act upon. Collis and Montgomery illustrate this challenge with the example of a manufacturer of medical diagnostics test equipment that had defined its core capability as ‘instru-mentation’.7 Such an intuitively obvious definition was too broad for managers to act upon. Analysing to greater levels of disaggregation, however, revealed that their strength was mainly the result of competitive advantage in designing the human/machine interface. In order to exploit and deepen this competence, the firm hired ergonomists and set out to design a product for the fast-growing gen-eral practitioner market where the equipment would not be operated by skilled technicians.

293the challenges to operatIons strategy FormulatIon
●● Articulating capabilities in very abstract terms may capture their essence but can make them difficult to use. Some degree of operationalisation is usually neces-sary. Collis and Montgomery argue that ‘evaluating whether Kraft General Foods or Unilever has better consumer marketing skills may be impossible, but analysing which is more successful at launching product-line extensions is feasible.’8 In many ways such analyses are essentially forms of internal benchmarking and, as with that process, the greater the level of detail, the greater the cost and time necessary to perform the analysis.
●● Much of the competence and capability literature regularly uses the words ‘core’ or ‘distinctive’ to add extra emphasis to those capabilities that are most important to the business. Indeed the most celebrated of these authors, Prahalad and Hamel, use only the phrase ‘core competence’.9 Their implicit warning is to focus on the very few capabilities that really are ‘core’ to the sustainability of the operation.
●● The practical consequences of identifying the ‘core’ capabilities within an opera-tion are usually that additional resources will be acquired and deployed. This is clearly a political issue within the organisation. It can alter power balances, bolstering one set of managers, perhaps at the expense of others. It is impor-tant therefore to understand that asking managers to judge core capabilities is inevitably a political process. In one workshop, for example, a senior information technology (IT) manager was asked to rate the importance of ‘managerial IT skills, knowledge and experience’. The answer was an unsurprising ‘absolutely critical!’
the challenges to operations strategy formulation
There are limits to the ability of any organisation to align itself to changing envi-ronmental requirements. This is because in any complex system there are certain resources and processes that tend to prevent adaptation/innovation rather than enable it, or, in other words, organisations are subject to a wide range of inertial forces. The dictionaries tend to define inertia as ‘the tendency to continue in the same state [or] to resist change’, and, as we discuss the practical challenges of achiev-ing operational alignment, it is important to explore the sources of inertia. One of the most infamous examples of an operation that was unable to overcome inertia and adapt itself to a new set of market requirements is IBM between 1980 and the mid-1990s when it struggled to adapt to the world of the PC. (See the following example, ‘IBM falls victim to a reluctance to change’.)
In 1980 the US corporation International Business Machines (IBM) posted profit figures of $3.6 billion. Time magazine described IBM as the ‘colossus that works’, echoing a widely held belief that this massive company was probably the best-managed organisation in the world. At that time it had over 300,000 staff, assets of $27 billion, and sales of $26 billion. At this time IBM was often cited as an example of the benefits to be gained from ‘alignment’. Although IBM was not really known for any specific radical innovations, it was widely viewed as simply being good at everything it did. Its operations strategy provided a strong degree of alignment with the dominant market requirements of cost and quality. Combining IBM’s extensive sales, marketing and support network with an operations strategy that
example IBm falls victim to a reluctance to change

294 chapter 9 • the process oF operatIons strategy – FormulatIon and ImplementatIon
It is easy to forget that in 1980 Microsoft was a start-up with fewer than 50 staff (IBM had 300,000 employees) and that, despite phenomenal growth, by 1982 the combined market capitalisation of both Intel and Microsoft was only about one-tenth of IBM’s. But many successful organisations contain the seeds of their own downfall – a phenom-enon that has been explored by a number of authors, including Dorothy Leonard.10 When discussing the relationship between what she calls core capabilities and core rigidities. Leonard offers the following quote from John F. McDonnell of the McDonnell Douglas Corporation to illustrate the phenomenon of success-enabled inertia:
‘While it is difficult to change a company that is struggling, it is next to impossible to change a company that is showing all the outward signs of success. Without the spur of a crisis or a period of great stress, most organisations – like most people – are incapable of changing the habits and attitudes of a lifetime.’
But why should this be so? Surely success generates revenue and profits that in turn can be invested in the future of the firm? Inertial forces need to be understood if
ensured well-designed products widely available at competitive prices offered IBM a ‘tight alignment’ with its core market. The firm entered the 1990s, a decade widely predicted to see a global explosion in com-puter applications, as the largest computer firm in the world, and in 1990 it made $6 billion profits. Incredibly, just two years later in 1992, the firm posted the largest loss in American corporate history – a staggering $4.97 billion! The share price collapsed from over $100 dol-lars to less than $50, and that same year the firm was forced to make nearly 50,000 people redundant. But, of course, such a dramatic reversal of fortune does not truly happen over-night, and in IBM’s case its fall from a position of business ‘super-stardom’ reflected a series of poor corporate decisions over the previous decade. As discussed earlier, IBM’s operational ‘alignment’ was primarily with the mainframe market, and although this was still a valuable and profitable business, the global computer industry was rapidly shifting towards smaller, personal computers. IBM launched its first PC in 1981, and it proved to be a great success, yet as it attempted to further exploit this market opportunity it made two fundamental errors of judgement relating to software (the Microsoft DOS and Windows operating sys-tems) and hardware (the Intel 80386 microprocessor). At the beginning of the 1980s, IBM passed up its option to acquire the operating system that evolved into DOS (Disk Operating System), leaving Bill Gates to buy it for only $75,000. This has now entered folklore as one of the greatest business mistakes but, in a similar vein, IBM signed a joint development agreement with Microsoft in 1985 that did not include its new project, Windows. Intel’s 80386 chip promised to be the fastest, most powerful processor on the market, but IBM prevaricated over the decision to purchase this chip, which would eventually dominate PC hardware standards, diminishing its influence over the company. In addition to these specific managerial blunders, changes in IBM’s approach to its ‘core’ mainframe market also impeded the development of its PC business. IBM had traditionally leased many of its mainframes but, in the early 1980s, the decision was taken to encourage customers to buy their machines outright. Although initially this gave a great boost to the firm’s revenues, its longer-term impact was largely negative. Its renowned sales force no longer achieved com-mission through keeping established customers happy; rather they emphasised finding new buyers. At the same time, the sales commission on a mainframe was so much greater than that on a PC that there was little incentive to exploit existing relationships to promote PC sales.

295hoW do We knoW When the FormulatIon process Is complete?
their negative impact is to be overcome. If we explore the impact of high levels of success we can discern a number of specific structural issues that can increase the potential level of inertia. For instance:
●● Operations’ resource profile. Once an investment has been made in either tangible or intangible assets, this inevitably influences subsequent decision making. It is fairly obvious how certain assets are dedicated to specific tasks and not readily transferable, but more broadly the whole profile of an organisation’s operations strategy can create inertial forces. For instance, IBM’s vertically integrated produc-tion system made it the largest chip manufacturer in the world. This technological independence had an inevitable influence upon its delayed decision to purchase Intel’s market-leading 80386 chip. Similarly, the agreement with Microsoft that overlooked Windows was internally justifiable because at that time the software was just a prototype and IBM had its own system in development.
●● Investment bias. Operations will tend to invest further in those resource/require-ment intersections that have proved successful. Regardless of whether this takes the form of extra capacity, additional R&D expenditure or staff recruitment, etc., investment here appears to offer a more reliable return. Given a finite resource base to draw upon, other aspects of the operation can easily suffer comparative neglect.
●● History. Organisations become constrained by their own history. Once systems and procedure and ‘ways of working’ are established, it becomes difficult and expensive to change them. So, for example, even though IBM invented both floppy disk and hard drive technology, the firm saw itself as ‘a supplier of inte-grated systems’ and therefore it did not sell these components – effectively leav-ing other firms to make a fortune from IBM’s invention.
●● Organisational structures/political forces. Often overlooked in rational discussions of operations management, political forces have an enormous influence. In all operations there are individual managers and influential groups who compete for resources with their different priorities, opinions and values. In an organisation the size of IBM (in the mid-1980s) the combination of a cumbersome organisa-tional structure (a single hierarchy for the whole business) and political machina-tions effectively killed off its entry into the PC market. Its first model, in 1981, had been very successful but the supposedly mass-market PC Jr model (intended for launch in July 1983) was delayed by senior management interference. It intro-duced an inferior keyboard, scrapped plans to sell it in department stores, missed the crucial Christmas sales period and gave it too high a price. A year later, it dropped the price, sold through different outlets and realised it was too late – its competitors had developed new, more appealing models.
how do we know when the formulation process is complete?
Back in Chapter 1 we introduced the idea of the operations strategy matrix. We sug-gested that, because it emphasised the intersections between what is required from operations (in terms of the relative priority that should be given to each performance objective) and how the operation tries to achieve this through the choices made in each decision area, it was a useful device to describe any organisation’s operations strategy. At least it could act as a checklist to ensure that the organisation had been

296 chapter 9 • the process oF operatIons strategy – FormulatIon and ImplementatIon
reasonably comprehensive in considering different aspects of its operations strategy. In fact we can use the matrix to go further than merely describe an operations strat-egy. We can use it to question, develop and even formulate strategies. Indeed, using the matrix to check for comprehensiveness could be considered the first step in a formulation process. Here we will use the matrix to explore some of the most basic aspects of operations strategy formulation (see Figure 9.5):
●● exploring what it means for an operations strategy to be comprehensive;
●● ensuring there is internal coherence between the different decision areas;
●● ensuring that decisions taken as part of the operations strategy process correspond to the appropriate priority for each performance objective;
●● highlighting which resource/requirement intersections are the most critical with respect to the broader financial and competitive priorities of the organisation.
comprehensiveness
The notion of ‘comprehensiveness’ is a critical first step in seeking to achieve operations alignment. Business history is littered with world-class companies that simply failed to notice the potential impact of, for instance, new process technology, or emerging changes in their supply network. Also, many attempts to achieve alignment have failed because operations have paid undue attention to only one of the key decision areas.
coherence
As a comprehensive strategy evolves over time, different tensions will emerge that threaten to pull the overall strategy in different directions. This can result in a loss
Quality
Speed
Dependability
Flexibility
CostPer
form
ance
ob
ject
ives
Mar
ket
com
pet
itive
ness
CapacitySupplynetwork
Decision areas
Resource usage
Comprehensive?
Processtechnology
Developmentand
organisation
Coherence
Critical
Cor
resp
ond
ence
Critical
Critical
Critical
Critical
Figure 9.5 ‘Fit’ is concerned with ensuring comprehensiveness, correspondence, coherence and criticality

297hoW do We knoW When the FormulatIon process Is complete?
of coherence. Coherence is when the choices made in each decision area do not pull the operation in different directions. For example, if new, flexible technology is introduced, which allows products or services to be customised to individual clients’ needs, it would be ‘incoherent’ to devise an organisation structure that did not enable the relevant staff to exploit the technology, because it would limit the effective flexibility of the operation. For the investment in flexible technology to be effective, it must be accompanied by an organisational structure that deploys the organisation’s skills appropriately, a performance measurement system that acknowledges that flexibility must be promoted, a new product/service development policy that stresses appropriate types of customisation, a supply network strategy that develops suppliers and customers to understand the needs of high-variety customisation, a capacity strategy that deploys capacity where the customisation is needed, and so on. In other words, all the decision areas complement and reinforce each other in the promotion of that particular performance objective. The main problem with achieving coherence is that so many decisions are made that have a strategic impact; it is relatively easy to make decisions that inadvertently cause a loss of coherence.
correspondence
Equally, an operation has to achieve a correspondence between the choices made against each of the decision areas and the relative priority attached to each of the performance objectives. In other words, the strategies pursued in each decision area should reflect the true priority of each performance objective. So, for example, if cost reduction is the main organisational objective for an operation then its process technology investment decisions might err towards the purchase of ‘off-the-shelf’ equipment from a third-party supplier. This would reduce the capital cost of the technology, and might also imply lower maintenance and running costs. Remember, however, that making such a decision will also have an impact on other performance objectives. An off-the-shelf piece of equipment may not, for example, have the flexi-bility that more ‘made-to-order’ equipment has. Also, the other decision areas must correspond with the same prioritisation of objectives. If low cost is really important then one would expect to see capacity strategies that exploit natural economies of scale, supply network strategies that reduce purchasing costs, performance meas-urement systems that stress efficiency and productivity, continuous improvement strategies that emphasise continual cost reduction, and so on.
criticality
In addition to the difficulties of ensuring coherence between decision areas, there is also a need to include financial and competitive priorities. Although all decisions are important, and a comprehensive perspective should be maintained, in practical terms some resource/requirement intersections will be more critical than others. The judgement over exactly which intersections are particularly critical is very much a pragmatic one that must be based on the particular circumstances of an individual firm’s operations strategy. It is therefore difficult to generalise as to the likelihood of any particular intersections being critical. However, in practice, one can ask reveal-ing questions such as, ‘If flexibility is important, of all the decisions we make in terms of our capacity, supply networks, process technology, or development and
298 chapter 9 • the process oF operatIons strategy – FormulatIon and ImplementatIon
organisation, which will have the most impact on flexibility?’ This can be done for all performance objectives, with more emphasis being placed on those having the highest priority. Generally, when presented with a framework such as the operations strategy matrix, executives can identify those intersections that are particularly sig-nificant in achieving alignment.
Implementing operations strategy
Operations strategy implementation is the way that strategies are operationalised or executed. It involves the processes that attempt to ensure that strategies are achieved. It is important because, no matter how sophisticated the intellectual and analytical underpinnings of a strategy, it remains only a document until it has been implemented. So implementation is an important part of operations strategy, even if it does come at the end of the operations strategy process. Yet it is not always straightforward to make general points about the implementation process, because it is very context dependent. That is, the way one implements any strategy will very much depend on the specific nature of the changes implied by that strategy and the organisational and environmental conditions that apply during its implementation.
What is implementation?
One way of thinking about the underlying purpose of an operations strategy imple-mentation is to use the ‘line of fit’, or alignment, concept introduced earlier. To recap, the idea is that operations strategy can be diagrammatically illustrated by its position relative to its operations resource capabilities, the requirements of its markets, and the degree of ‘fit’ or alignment between them. We focused on the idea of achieving sustainable alignment between operations resource capabilities and market requirements. We also stressed the difficulty of achieving alignment because of uncertain markets and operations resource capabilities. In Figure 9.6 moving along the market requirements dimension indicates a change in intended market performance. Moving along the operations resource capabilities dimension indicates changes in operations capabilities. Using this model gives us a starting point for understanding the purpose of the operations degree of change involved in the strategy implementation. It is impor-tant to be clear regarding how much change is intended. So, if, in Figure 9.6, point A is the current operations strategy and point B is the intended operations strategy, it is necessary to develop an understanding of current and intended market require-ments and operations resource capabilities. Certainly, without such an understand-ing it is exceedingly difficult to expect the whole organisation to comprehend why, how, and how much, things are going to change when the new strategy is implemented. Yet providing guidance to those who will be carrying out the imple-mentation is not a straightforward task. We are again confronted with the tensions between seeing strategy as a plan that provides a ‘grand design’ for the operation on the one hand, and seeing strategy as an emergent process that takes full account of the experiences that are derived from the day-to-day running of the operation and the day-to-day implementation of the new strategy on the other. This means that any statement that articulates an intended change must be specific enough to provide useful guidance and yet broad enough to allow for adaptation of the imple-mentation plan within an overall strategic direction.

299ImplementIng operatIons strategy
But there is a problem. During the implementation from A to B in Figure 9.6 the balance between market requirements and operations resource capabilities may not always be maintained. Sometimes the market may expect something that the opera-tion cannot (temporarily) deliver. Sometimes operations may have capabilities that cannot be exploited in the market. At a strategic level, there are risks deriving from a failure to achieve fit between operations resources and market requirements. And how to understand, and cope with, these risks during implementation should be part of any implementation plan.
Who is responsible for implementation?
A particularly important organisational relationship that can have a profound impact on strategy implementation is that between those in the operations func-tion that have responsibility for formulating strategy and those that run the day-to-day operations tasks. Of course these two sets of people may be one and the same. Particularly in small organisations there is simply not enough ‘organisational slack’ to resource a separate ‘operations strategy formulation’ function. However, in larger organisations it is now common to have a function or department devoted to the broader aspects of formulating the way in which operations should be managed
Ext
ent
and
nat
ure
of m
arke
tre
qui
rem
ents
cha
nge Lin
e of f
itLe
vel/n
atur
e of
mar
ket
req
uire
men
ts
Level/nature of operations resource capability
Current resourcecapability
Intended resourcecapability
Cur
rent
mar
ket
req
uire
men
tsIn
tend
ed m
arke
tre
qui
rem
ents
Extent and nature of operationsresource capability change
B
A
Figure 9.6 Implementing an operations strategy that involves moving from a to B means understanding current and intended market requirements and operations resource capabilities so that the extent and nature of the change can be assessed

300 chapter 9 • the process oF operatIons strategy – FormulatIon and ImplementatIon
and resources allocated. We shall call this group of people ‘central operations’. This distinction between central operations and day-to-day operations managers is often termed ‘staff’ and ‘line’ roles.
‘staff’ and ‘line’ in operationsPeople occupying classic ‘staff’ positions have a monitoring, planning and shaping role. They are the ones who are charged with building up the company’s operations capabil-ity. They may look forward to the way markets are likely to be moving, judge the best way to develop each part of the operation, and keep an eye on competitor behaviour. All of these are tasks that need close liaison with marketing planners, product and service development and finance. They are also tasks that need some organisational ‘space’ to be performed effectively. They are certainly not tasks that coexist readily with the hectic and immediate concerns of running an operation. These people constitute what could be termed ‘central operations’. People occupying ‘line’ roles are those who run the day-to-day operations. Theirs is partly a reactive role, one that involves find-ing ways round unexpected problems: reallocating labour, adjusting processes, solving quality problems, and so on. They need to look ahead only enough to make sure that resources are available to meet targets. Theirs is the necessary routine. Knowing where the operation is heading, keeping it on budget and pulling it back on course when the unexpected occurs – no less valuable a task than the developer’s, but very different. While these descriptions are clearly stereotypes, they do represent two types of operations task. The issue, for organisational design, is whether it is wise to sepa-rate them organisationally. It may cause more problems than it solves. Although it allows each to concentrate on their different jobs, it also can keep apart the two sets of people who have most to gain by working together. Here is the paradox: the development function does need freedom from the immediate pressures of day-to-day management, but it is crucial that it understands the exact nature of these pres-sures. What makes the operation distinctive? Where do the problems occur? What improvements would make most difference to the performance of the operation? These are questions answered only by living with the operation, not cloistered away from it. Similarly, the day-to-day operations manager has to interpret the workings of the operation, collect data, explain constraints, and educate developers. Without the trust and cooperation of each, neither set of managers can be effective.
Four types of central operations functionHere we are particularly concerned with how headquarters operations staff can act to create value for their company and its individual operations. Central opera-tions could be involved in any of the four headquarters parenting responsibilities. Particularly, though, they tend to become involved in the provision of central func-tional services, in its broadest sense. This includes the provision of central resources which could provide technical advice, information systems capabilities, laboratory testing services, improvement teams, quality procedures, environmental services, and so on. It also could be taken to mean the general coordination of all operations activity in the different parts of the company. This may include the compilation of performance statistics, the encouragement of inter-operations learning, and the development of broad operations strategies. Within this, how central operations exercises its responsibilities very much depends on the view it has of operations strategy and development. For example, we

301ImplementIng operatIons strategy
can use the dimensions that define the perspectives on operations strategy described in Chapter 1.
●● Top-down or bottom-up? If central operations has a predominantly top-down view of the world, it is likely to take a programmatic approach to its activities, empha-sising the implementation of overall company strategy. Conversely, if it takes a bottom-up view, it is more likely to favour an emergent model of operations development where individual business operations together contribute to the overall building of operations expertise.
●● Market requirements or operations resource focus? If central operations takes a market requirements view of operations development, it is likely to focus on the explicit performance achieved by each business operation and how far that performance serves to satisfy the operation’s customers. An operations resource focus, on the other hand, emphasises the way in which each business operation develops its competences and successfully deploys them in its marketplaces.
We can use these two dimensions to define a typology of the central operations function as shown in Figure 9.7. It classifies central operations into four pure types called governors, curators, trainers and facilitators, a typology based on Merali and McGee’s work.11 Although, in practice, the central operations function of most busi-nesses is a combination of these pure types, usually one type predominates.
central operations as governorHere we use the term ‘governor’ to describe the role of central operations first in its imperial sense. The ancient Roman Empire ruled its provinces by appointing
Per
form
ance
focu
s
Marketrequirements
Operationsresources
Bottomup
TrainerInstructing operations in the development and deployment of their capabilities through standardised improvement methods
Roles:Central operations – teacher/consultant Business operations – pupil/client
GovernorControlling the performance of the operations by setting clear priorities and measuring performance against targets
Roles:Central operations – messenger/judge Business operation – recipient/defendant
FacilitatorEnabling operations in the development and deployment of their capabilities through shared advice, support and learning
Roles:Central operation – mentor Business operations – member of a community
CuratorNurturing the performance of the operations by collecting performance data and distributing comparative performance information
Roles:Central operations – recorder/analyst Business operations – source of information
Topdown
Programmatic
Emergent
Cap
abili
ties
focu
s
Figure 9.7 a typology of the ‘central operations’ function

302 chapter 9 • the process oF operatIons strategy – FormulatIon and ImplementatIon
governors whose job it was to impose the will of the Emperor and Senate on its possessions. They acted as the agent of a central authority, interpreting the Imperial will and arbitrating over any disputes within the framework of central rule. The word ‘governor’, however, is also used in mechanics to denote the mechanism that prevents an engine running out of control and damaging itself. Central operations of this type interpret strategy in terms of market performance, set clear goals for each business operation, judge their performance and, if performance is not to target, want to know the reason why. They are likely to have a set of predetermined responses to ‘fix’ operations that do not perform up to requirements, and tend to expect results to improve in the short term.
central operations as curatorCentral operations can be concerned primarily with performance against market requirements without being top-down. They may take a more emergent view by acting as the repository of performance data and ideas regarding operations practice for the company as a whole. We use the term ‘curator’ to capture this idea. Curators collect information and examples so that all can be educated by examining them. Central operations therefore will be concerned with collecting performance infor-mation, examples of best practice, and so on. They will also be concerned with dis-seminating this information so that operations managers in different parts of the business can benchmark themselves against their colleagues and, where appropriate, adopt best practice from elsewhere. The term ‘curator’ can also be taken to mean more than a collector. It can also imply someone who nurtures and cares for the exhibits. So central operations acting as curators may also analyse and explain the performance data and examples of operations practice they collect. In this way they educate business operations and encourage debate around operations practice.
central operations as trainerMoving from the market requirements to the operations resources emphasis shifts the focus more to the development of internal capabilities. If the mindset of central operations is top-down their role becomes one of a ‘trainer’. Trainers go to some effort to develop clear objectives, usually derived from overall company strategy, and devise effective methods of instructing their ‘pupils’. Because the specific needs of individual operations may differ, ‘trainer’ central operations may devise improve-ment methodologies which can, to some extent, be customised to each business operation’s specific needs. However, their approach is likely to be common, with a relatively coherent and centralised view of operations development. Even if indi-vidual business operations do initiate contact with central operations, they do so in the role of clients seeking advice on central policy from ‘consultants’ who bring a standardised approach. These internal consultants can, however, accumulate consid-erable experience and knowledge.
central operations as facilitatorIn some ways this final type of central operations is the most difficult to operate effectively. Central operations are again concerned with the development of opera-tions capabilities but do so by acting as facilitators of change rather than instructors. Their role is to advise, support and generally aid the development and deployment of capabilities through a process of mentoring business operations. They share

303ImplementIng operatIons strategy
responsibility with the business operations in forming a community of operations practice. The development of the relationships between central operations and business operations is crucial in encouraging shared learning. The value placed on these relationships themselves becomes the prime, although somewhat diffused, mechanism for control of the improvement process. Implicit in this type of cen-tral operations is the acceptance of a relatively long-term approach to operations development.
central operations and information networksThe different types of central operations will play different roles within the infor-mation network which connects business operations to central operations and to each other. Figure 9.8 illustrates the likely nature of these information networks. In both the governor and trainer types, central operations is the dominant power player. Their vision of what the individual business operations should be doing dominates the rest of the network. When the emphasis is on individual business operations performance, as in the governor type, there is relatively little, if any, communication between the businesses. Because operations resource competences are more diffuse than hard performance measures, the trainer type will have to accommodate the needs and views of business operations to some extent and also rely on individual business operations having some, albeit weak, sharing of opera-tions practice. Central operations that adopt a more emergent approach implicitly accept a two-way relationship between themselves and the business operations; only in this way can central operations be aware of emergent practice. The curator type, by publishing comparative performance data, is, to some extent, encouraging some communication between the individual business operations. The facilitator type of central operations, however, is entirely dependent on regular, strong and two-way communication between themselves and the community of business operations that they guide.
One of Louis Schweitrer’s ambitions before he retired as Chairman of the French carmaker Renault was to produce the ‘$5,000 car’. His goal was to produce a low-cost vehicle targeted at developing countries (80 per cent of consumers who have never owned a car live in developing countries). However, there also seems to be surprisingly buoyant demand in the West for utilitarian cars. Schweitrer succeeded when Renault started producing the Logan in Romania in its Dacia operation. But when Renault bought the Dacia plant in Pitesti, about 100 miles southwest of Bucharest, in 1999 it was described by one industry commentator as, ‘one of the scruffiest car assembly operations I had seen in years. Dark, dismal and more like hell’s kitchen than a manufacturing operation, it was hardly conducive to producing quality products.’ Now, having implemented a €500 million turnaround strategy, it is turning out a car that is thoroughly modern in terms of fit and finish, but without the frills. But in achieving its strategy, Renault/Dacia have needed to implement it in a manner that fits the particular conditions of the product and where it is being made. In a region where the public perception of privatisation is tainted by images of cowboy capitalists enriching themselves, Francois Fourmont, Dacia General Manager, points out that ‘you have to make it clear that you are very serious about running a business that benefits both shareholders and Romania. When Renault comes to a country, it does not come for only a few years.’ Yet Renault had to make some harsh decisions. It cut Dacia’s workforce from more than 27,000 to 12,500.
example Implementing renault’s romanian strategy12

304 chapter 9 • the process oF operatIons strategy – FormulatIon and ImplementatIon
participation in operations strategy implementation
It is 60 years since Coch and French argued that a key mechanism for overcoming resistance to change was to include the people to whom the change would happen
‘We had no choice,’ said Fourmont. ‘Our first responsibility is to make money, because that is the only way we can survive as a business,’ he explains. ‘Once we have that basis, we can start to think about other factors. And many of the fired workers were retrained and subsequently found jobs with the suppliers that had moved their production to the area.’ In Romania, given the turbulence of the move from a centrally planned economy towards a market economy, it was also particularly important to work closely with state and local governments, especially over social issues. The company has had to address environmental concerns and develop a network of local suppliers that can produce to an international standard of quality. Many of the firms, including multinationals like Valeo, are now based on-site. Renault also put continuous training at the heart of Dacia’s business, although at first it was a challenge. But, argues Fourmont, ‘the more efficient and better trained the workforce is, the more likely they are to withstand competition from abroad, allowing the company to reward staff better for their good performance and quality product.’ One worker, who had been with Dacia for more than a decade, remembed what life was like before Renault took over:
‘It was hard work, with a lot of effort and very little satisfaction. People were suspicious [of the changes] at first, especially when the job cuts came. But then they saw the company was serious and they began to trust Renault.’
The design of the car was critical to its low cost. Renault designed a car that was modern but without costly design elements and superfluous technology. Production costs for the Logan were estimated at $1,089 per car, less than half the $2,468 estimate for an equivalent Western auto. ‘The Logan is the McDonald’s of cars,’ says Kenneth Melville, who headed the Logan design team. ‘The concept was simple: reliable engineering without a lot of electronics, cheap to build and easy to maintain and repair.’ To keep costs low, Renault adapted the platform used for its other small cars and then slashed the number of components by more than 50 per cent. The dashboard is one continuous injection-moulded part, compared with up to 30 pieces for a top-of-the-line Renault. The rear-view mirrors are symmetrical, so they can be used on both the left and right side of the car. Renault also opted for a flat windshield: curves result in more defects and higher costs. Sourcing from local suppliers was another critical factor, as was encouraging Renault’s existing suppliers to set up shop on a new supplier park within the Dacia factory complex. This was not easy, because many suppliers were sceptical about the whole project. But they were won over; now 65 per cent of parts bought in from suppliers are produced locally, with 26 of Renault’s existing suppliers having agreed to set up nearby, seven of them inside the supplier park. Partly as a result of the Logan’s low-cost objectives and simple design, assembly at the Romanian plant was implemented almost entirely without robots. This overcame some of the problems from using state-of-the-art technologies in a region where support services are relatively underdeveloped, and it lets Renault capitalise on the country’s low labour costs. Now, Renault is ramping up production of the Logan from Russia to Morocco. ‘The invest-ment in manufacturing is relatively low, so you can have factories that don’t have to produce huge volumes to finance themselves,’ says Christoph Stürmer, senior analyst at research Company Global Insight in Frankfurt. Renault has already expanded its output in Romania, and is cre-ating the world’s largest logistical project that will ship Logan cars in bits so that they can be assembled in Russia, Morocco, India, Iran and Columbia.

305ImplementIng operatIons strategy
in the process, and allow them to influence what changes would take place.13 After all, by including people in the decision process, they are more likely to ‘buy in’ to the change. Also, involving users in the design of the processes affected by imple-mentation allows designers to access their detailed knowledge and experience. This is especially important because some elements of strategy may be developed, at least partially, by external contractors and consultants. Although they may understand the details of the strategy, they often lack sufficient practical understanding of the organisational context of its implementation. Professor Dorothy Leonard of Harvard Business School argues that the often used term ‘user involvement’ is insufficiently precise, because it covers a multitude of dif-ferent approaches to interaction, each with its own advantages and disadvantages. She proposes a model of four different modes of user involvement, each of which offers a progressively greater degree of descriptive and prescriptive value. (She was referring to implementation involving new process technology, but her ideas have wider applicability.)
1 Delivery mode. When users (and managers for that matter) have very little knowl-edge of any new resources needed for the strategy, it is relatively easy for external vendors or internal developers to treat the implementation project like a prod-uct to be finished and then delivered to the client. This ‘over the wall’ mode of
Trainer Governor
Faciliator Curator
Strong
Weak
Per
form
ance
focu
s
Marketrequirements
Operationsresources
TRAINER
FACILITATOR CURATOR
GOVERNOR
Bottomup
Topdown
Programmatic
Emergent
Cap
abili
ties
focu
s
CommunicationPowerDominant
Subservient
Predominantly one-way
Predominantly two-way
Relationship
Figure 9.8 Information relationships for the four types of central operations functions

306 chapter 9 • the process oF operatIons strategy – FormulatIon and ImplementatIon
development requires almost no interaction with users and, where interaction exists, the feedback may have little impact beyond possibly improving the next generation of technology. The critical strategic question is whether such a one-way flow of information is sufficient to help develop underlying operational resources and capabilities.
2 Consultancy mode. The next mode, requiring slightly more user interaction, is closer to a classic consultancy implementation project. Designers/vendors recog-nise that there are established patterns of work (routines, etc.) in the processes that they are helping to change, and invest time asking questions of experienced users. Again, although this accesses more of the firm’s operational resources, it does not necessarily contribute to their development because the flow of informa-tion remains largely one way.
3 Co-development mode. This mode is much closer to a form of partnership. This approach can be very effective when levels of uncertainty are high (either the developers’ uncertainty about the existing system or users’ uncertainty about any new resources). This is because there is relatively little pre-existing knowledge to be captured and exploited.
4 Apprenticeship mode. Users wanting a greater degree of independence from developers often seek a mode of implementation whereby lead users are almost ‘apprenticed’ to the developer. This radically changes the nature of the implemen-tation process, moving it much closer to what we described in an earlier section as ‘learning’. Such an approach is normally more time and money intensive, but from a capability-building perspective it is very attractive.
Dorothy Leonard suggests three useful dimensions for thinking about different types of users:
●● Form of expertise. Certain users might be the best operatives in the organisation, but this does not guarantee that they are capable of articulating what it is they do. Equally, they may well lack the critical skills to question a system develop-ment process.
●● Representativeness. Earlier we discussed the value of adopting a pilot approach to implementation. Doing so poses a problem common in all scientific experiments, namely, ‘Is it representative of a broader sample or did something atypical occur during the experiment?’ This is an issue that needs to be considered when select-ing user participants for any implementation project. Are their skills and experi-ence representative of the rest of the organisation?
●● Willingness. A basic question perhaps, but some studies have shown that levels of user satisfaction amongst implementation participants are related to the level of involvement they originally wanted in the process, compared with the involvement they actually had.14 Anyone who is forced to spend more time than they believe reasonable on an implementation project may resent it, regardless of the outcome.
Increasing the level of user involvement is, of course, not unambiguously positive. Truly radical solutions do not always emerge from discussions limited to current experience. Such a limited range of experience can also lead to the development of processes that address today’s rather than tomorrow’s difficulties. Despite such con-cerns, the benefits of increased user involvement in overcoming process ‘distance’ are usually regarded as significant.

307ImplementIng operatIons strategy
pre-requisites for effective involvementAlthough there is no simple formula that will ensure everyone’s commitment to making strategic implementation a success, there are some key elements of basic human resource practice that can facilitate successful involvement. Here we group these elements in a structure known as the ‘CEO Principle’. This means simply that, for people to be involved effectively in an implementation, they must:
●● have the confidence that involvement will be a positive experience;
●● have the education that will allow them to contribute intelligently; and
●● be allowed the opportunity to participate in the implementation process.
confidence that involvement will be a positive experienceOne of the most important elements affecting people’s confidence in their ability to contribute is an organisational culture that makes it clear that its people are an important strategic resource that can directly affect its success. If, through its actions and its communications, an organisation makes it clear that everyone’s individual efforts can have an impact on what happens in the organisation, most people will feel that their contributions are worthwhile. Just as importantly, the opposite is also true. If people feel that they cannot influence what happens, why should they bother participating? The same argument applies to how people regard their security within the organisation. By security we mean both the obvious issues such as job security or salary security and more subtle types of security, such as security that their reputation will not suffer by making suggestions that are not supported by others in the organisation. Unless one has a future in the organisation, why become fully involved? A factor that can negatively affect confidence is confusion over what a strategy is trying to achieve. An unambiguous and shared vision of the overall purpose of the implementation is clearly a help in moving everyone towards the same goal. Charismatic leadership can sometimes achieve this but, even where this exists, effective communication is equally important. Remember though that for people to have the confidence to participate, communication should be a two-way street. That is, individuals should feel that they can, without any threat to their own security, communicate their views honestly upwards in the organisation. Certainly, the abil-ity to communicate upwards can be enhanced by support from colleagues and team members as well as through more formal statements of individual empowerment.
education in the necessary skillsExperience at a job is not always sufficient to ensure effective participation. Experience must be structured and contextualised through education, training and development. Education allows individuals to generalise their experience so that it can be used in different contexts. It also provides a shared language and body of knowledge that helps in the generation of innovative ideas, as we discussed earlier. But education in the basics of (in this case) operations management and operations strategy must also be complemented by education about what the strategy imple-mentation is trying to achieve. The general term for this is ‘policy deployment’. This is the way in which high-level strategic objectives are translated into more specific objectives and measurements appropriate for each individual group within the organisation. Of course, this presupposes two things: first, that a clearly articulated

308 chapter 9 • the process oF operatIons strategy – FormulatIon and ImplementatIon
and coherent implementation plan exists and, second, that there is an appropriate process in place to ‘cascade’ and communicate the purpose of the strategy and its implementation down the organisation. For education to thrive there must be learning. For learning to be an important element in an organisation’s culture, both individuals and the organisation in general must learn how to learn. Amongst other things this means never wasting an opportunity to learn. And many of the best opportunities to learn come from the mistakes that one makes. It may be something of a cliché, but mistakes really are one of the most valuable sources of learning. They provide an opportunity to discuss and debate exactly why things went wrong and what can be done about it in the future. Of course, this will not happen if an organisation routinely punishes its employees for every mistake they make. And many organisations do claim that they punish mistakes only when there has been a clear dereliction of duty, or when individuals refuse to learn from their mistakes. Yet relatively few organisations have managed to build a culture that genuinely exploits the full potential of being able to learn from mistakes. Those that have come close to it (including the much quoted example of Toyota, see Chapter 3) have, over the years, developed a culture of con-tinuous improvement based on a problem-solving methodology that emphasises the importance of learning.
opportunity to participate in the implementation processIndividuals may be supremely confident and soundly educated, yet unless they are provided with the opportunity to participate, their contribution will remain untapped. Those organisations that see implementation simply as a set of tasks, devised by senior management and communicated ‘down the line’ which people simple have to carry out, are not providing the opportunity for individuals to partici - pate. The most obvious way to provide opportunities for participation is to expect employees to participate in planning the implementation itself. But organisational space must be provided to allow this. It cannot simply be expected that employees will participate in implementation planning in addition to an already excessive load. Some organisations programme formal workshops or team meetings to provide opportunities for participation. Some also include implementation planning as part of their appraisal process. Whatever mechanisms are used, the overall intention is to foster a feeling of ownership of the implementation process. This may be facilitated by devolving decision making downwards in the organisation, perhaps using self-managed teams. However, especially in large organisations, this may work against other attempts to coordinate activities across the organisation as well as conflicting with any attempt to promote a single and unambiguous vision for the organisation. Such devolved decision making, however, may be appropriate where the implemen-tation climate has a high level of uncertainty, individual staff members’ technical expertise is important, and the organisation is relatively small.
summary ansWers to key questIons
What is ‘formulation’ of operations strategy?Formulation of operations strategy is the practical process of articulating the various objectives and decisions that make up the strategy. It is is essentially about different

309summary ansWers to key questIons
ways of aligning plans, activities and objectives. It will be a relatively occasional activity, although operations strategy consideration may form part of the annual planning cycle. Many detailed formulation models have been developed.
What is the role of ‘alignment’ in formulation?Alignment is the state where an operation’s capabilities match the requirements of its market. Most organisations try to make their operations resources fit the require-ments of their market, but at higher levels of alignment they may look at their unique capabilities and then attempt to leverage these into appropriate market positioning.
What is meant by strategic sustainability?Sustainability is the achievement of alignment over time. Maintaining an exist-ing market requirements and operations capability balance is a ‘static’ approach to sustainability. Attempting to raise both operations capabilities and market require-ments through a process of innovation is called a ‘dynamic’ approach to sustain-ability. There is really no alternative to considering sustainability if an organisation wishes to survive. Even if an operation’s ambitions are not to raise its level of align-ment to higher levels of market requirements and operations capabilities, it needs to ensure that its position is not eroded.
What analysis is needed for formulation?Although most frameworks start with the requirement to understand markets, this is not always straightforward. Markets are, by their nature, dynamic, and companies frequently mistake market reaction. Similarly, understanding operations resources is not straightforward. In particular, understanding the nature and value of intangible assets can be problematic. Also, the sheer inertia of organisations makes implement-ing strategic decisions difficult. In large companies especially, radical new changes in markets or internal technologies can often be underestimated.
how do we know that formulation is complete?In terms of the operations strategy matrix, the formulation process is trying to make sure that the operations strategy:
●● is comprehensive, covering all the important aspects of strategy;
●● has internal coherence between the different decision areas;
●● ensures that decisions correspond to the appropriate priority for each perform-ance objective;
●● highlights which resource/requirement intersections are the most critical with respect to the broader financial and competitive priorities of the organisation.
What is operations strategy implementation?Operations strategy implementation is the way that strategies are operationalised or executed. It involves the processes that attempt to ensure that strategies are achieved. It is important because no matter how sophisticated the intellectual and analytical underpinnings of a strategy, it remains only a document until it has been implemented.

310 chapter 9 • the process oF operatIons strategy – FormulatIon and ImplementatIon
Who is responsible for implementation?Although operational line managers are important in operations strategy implemen-tation, it is those managers occupying ‘staff’ positions who usually have a strategic monitoring, planning and shaping role. The role needs close liaison with market-ing planners, product and service development and finance. They also need some organisational ‘space’. There are four types of ‘staff’ central operations roles called governors, curators, trainers and facilitators.
how can participation affect implementation?A key aspect of overcoming resistance to the changes implied by any implementa-tion is to include the people to whom the change would happen in the process, and allow them to influence what changes would take place. Doing so improves the likelihood of their ‘buying in’ to the change. Also, involving users in the design allows those managing the implementation to access their detailed knowledge and experience. This is especially important because some elements of strategy may be developed, at least partially, by external contractors and consultants. Although there is no simple formula to ensure commitment to an implementation, there are some basic human resource practices than can facilitate successful involvement. For people to be involved effectively in an implementation they must have the confi-dence that involvement will be a positive experience, have the education that will allow them to contribute intelligently, and be allowed the opportunity to participate in the implementation process.
Further reading
Alkhafaji, A.F. (2003) Strategic Management: Formulation, Implementation, and Control in a Dynamic Environment. Haworth Press Inc.
Bettley A., Mayle, D. Tantoush, T. (eds) (2005) Operations Management: A Strategic Approach. Sage Publications.
Carlopio, J. (2003) Changing Gears: The Strategic Implementation of Technology. Palgrave Macmillan.
Fitzsimmons, J.A. and Fitzsimmons, M.J. (2010) Service Management: Operations, Strategy, Information Technology. McGraw-Hill Higher Education.
Hill, A. and Hill, T. (2009) Manufacturing Operations Strategy: Texts and Cases. Palgrave Macmillan.
Jessen, M., Holm, Jenster, P. Junghagen, S. (2007) Strategy Execution: Passion & Profit. Copenhagen Business School Press.
Kaplan, R.S. and Norton, D.P. (2008) Execution Premium. Linking Strategy to Operations for Competitive Advantage. Boston, MA: Harvard Business School Press.
Kaplan, R.S. and Norton, D.P. (2004) Strategy Maps: Converting Intangible Assets into Tangible Outcomes. Boston, MA: Harvard Business School Publishing.
MacLennon, A. (2010) Strategy Execution: Translating Strategy into Action in Complex Organisations. Routledge.
Menda, R., Dilts, D. (1997) ‘The manufacturing strategy formulation process: linking multifunctional viewpoints’, Journal of Operations Management, 15(4) pp. 223–241.
Mintzberg, H, Ahlstrand, B. and Lampel, J.B. (2008) Strategy Safari: The Complete Guide Through the Wilds of Strategic Management. Harlow, UK: Financial Times Prentice Hall.
Pearce, J.A. (2006) Formulation, Implementation and Control of Competitive Strategy. McGraw-Hill.

311
notes on the chapter
1 Williams, J. (1992) ‘How sustainable is your competitive advantage?’, California Management Review, 34(3).
2 Ibid. 3 See James Gleick’s fascinating book, Faster (Little Brown, 1999) for an exploration of the
societal issues raised by the speed revolution. 4 Source: The Economist (2006) ‘For whom the Dell tolls’, 13 May. 5 Wernerfelt, B. (1984) ‘A resource-based theory of the firm’, Strategic Management Journal,
Vol. 13, pp. 111–125. 6 Lynch, R. (1997) Corporate Strategy, Harlow, UK: Financial Times Prentice Hall. 7 Collis, D.J. and Montgomery, C.A. (1998) Corporate Strategy: Resources and Scope of the Firm.
Boston, MA: Irwin. 8 Ibid. 9 Prahalad, C.K. and Hamel, G. (1990) ‘The core competencies of the corporation’, Harvard
Business Review, May–June.10 Leonard-Barton, D. (1992) ‘Core capabilities and core rigidities: a paradox in managing
new product development’, Strategic Management Journal, Vol. 13, pp. 111–125.11 Merali, Y. and McGee, J. (1998) ‘Information competences and knowledge creation at the
corporate centre’, in Hamel, G., Prahalad, C.K., Thomas, H. and O’Neal, D. (1998) Strategic Flexibility, New York: John Wiley & Sons. Here we use somewhat different terminology.
12 Sources: Lewis, A. (2005) ‘Renault’s Romanian route: Renault’s Dacia plant gears up to build a quality, $5,000 car for Eastern Europe’, Automotive Industries, February; Richardson, B. (2006) ‘Renault tunes up Romania’s top carmaker’, BBC News website.
13 Coch, L. and French, J.P.R., Jr. (1948) ‘Overcoming resistance to change’, Human Relations, No. 1, pp. 512–532.
14 Doll, W.J. and Torkzaden, G. (1989) ‘A discrepancy model of end-user computing involve-ment’, Management Science, 35(10), pp. 1151–1171.
notes on the chapter

chapter
the process of operations strategy – monitoring and control
10
In the previous chapter we explained how, although it is a simplification, the process of operations strategy can be divided into four stages: formulation, implementation, monitoring and control. The previous chapter examined the first two of these stages, formulation and implementation. This chapter looks at the final two stages, moni-toring and control. Figure 10.1 illustrates how these two stages fit into the simple stage model, although more accurately the four stages could be seen as a cycle in the same way as the DMAIC cycle (see Chapter 3) implies a continuous set of activities that create strategic intent, attempt to execute it, judge the progress towards implied or explicit objectives and re-plan if necessary.
Introduction
Operations strategycontrol
Operations strategyformulation
Operations strategyimplementation
Operations strategymonitoring
This chapter
Figure 10.1 this chapter concerns the monitoring and control stages of the process of operations strategy
●● What are the differences between operational and strategic monitoring and control?
●● how is progress towards strategic objectives tracked?
●● What are the dynamics of monitoring and control?
●● how can the monitoring and control process attempt to control risks?
●● how does learning contribute to strategic control?
●● how does stakeholder management contribute to strategic control?
key questIons

313strategIc monItorIng and control
Strategic monitoring and control involves the monitoring and evaluation of activities, plans and performance with the intention of corrective future action if required. The procedure should be capable of providing early indications (or a ‘warn-ing bell’ as some call it) by diagnosing data and triggering appropriate changes in how the operations strategy is being implemented. In some ways this strategic view of monitoring and control is similar to how it works operationally. But at a strategic level there are differences. At an operational level, monitoring and controlling an operation’s activities seems a straightforward issue. Having created a plan for the operation, each part of it has to be monitored to ensure that planned activities are indeed happening. Any deviation from what should be happening (that is, its plans) can then be rectified through some kind of intervention in the operation. Hopefully this will bring the operation back on course, which itself will probably involve some re-planning. Eventually, however, some further deviation from planned activity will be detected and the cycle is repeated. Figure 10.2(a) illustrates this simple view of control. At a more strategic level, control is less clear cut. Figure 10.2(b) shows just some of the many objections to its use in an operations strategy context. For example, are strategic objectives clear and unambiguous? Ask any experienced managers; they will acknowledge that it is not always possible (or necessarily desirable) to articulate every aspect of a strategic decision in detail. Many strategies are just too complex for that. Nor does every senior manager always agree on what the strategy should be trying to achieve. Often the lack of a clear objective is because individual managers have different and conflicting interests. For example, if two parts of an organisa-tion are to be reorganised so that their activities are combined, the managers of each part are likely to have different views of how the merger is to be accomplished (presumably wanting less disruption to the resources for which they are responsi-ble); even if they are agreed on the need for, and broad outline of, the new merged unit, at the margin they may favour different ways of bringing it about. In some
strategic monitoring and control
(a) Simple operational control model
Input Output
InterventionPlans
Monitor
Operation orprocess
Compare/re-plan
(b) Simple strategic control model
How evidentis progress?
Can we predictoutcomes?Are objectives
clear?
Frequency?
ObjectivesImplementation
plans
Change assumptionsor strategy
Plans
Trackprogress
Operations strategyformulation
Compare/re-plan
Figure 10.2 monitoring and control is less clear at a strategic level

314 chapter 10 • the process oF operatIons strategy – monItorIng and control
public sector organisations there may be explicit and well-accepted differences of interests. In social care organisations, for example, some managers are charged with protecting vulnerable members of society, others with ensuring that public money is not wasted, and yet others may be required to protect the independence of pro-fessional staff. At other times objectives are ambiguous because the strategy has to cope with unpredictable changes in the environment, making the original objectives redundant. A further assumption in the simplified control model is that there is some reason-able knowledge of how to bring about the desired outcome. That is, when a deci-sion is made, one can predict its effects with a reasonable degree of confidence. In other words, operational control assumes that any interventions that are intended to bring a process back under control will indeed have the intended effect. Yet, this implies that the relationships between the intervention and the resulting conse-quence within the process are predictable, which in turn assumes that the degree of process knowledge is high (see Chapter 7). However, at the strategic level, this is rarely totally true. For example, if an organisation decides to relocate in order to be more convenient for its customers, it may or may not prove to be correct. Customers may react in a manner that was not predicted. Even if customers initially seem to respond well to the new location there may be a lag before negative reactions become evident. In fact many strategic decisions are taken about activities about which the cause–effect relationship is only partly understood. There is a degree of uncertainty in most strategic decisions, which cannot be entirely eliminated. A further difference between operational and strategic control is the frequency with which control interventions are made. Operational control interventions are often repetitive and occur frequently (for example checking on progress, hourly, daily, or even weekly). This means that the organisation has the opportunity to learn how its interventions affect the implementation process, which considerably facilitates control. By contrast, strategic control can be non-repetitive, with each implementation task involving unique projects or investments. So because the intervention, or the deviation from plan that caused it, may not be repeated exactly, there is little learning. So, how do these differences between operational and strategic control impact on the process of operations strategy? Professor Geert Hofstede, an academic better known for his work on the international characteristics of strategic decision making, has incorporated these, and other, differences into a typology of control, a modified version of which is shown in Figure 10.3.1 Hofstede’s typology indentifies a number of types of control that are a function of the differences between operational and strategic control discussed above. Operational control, he concludes, is relatively straightforward: objectives are unambiguous, the effects of interventions are known, and activities are repetitive. This type of control can be codified using predetermined conventions and rules. There are, however, still some challenges to successful routine control. It needs operational discipline to make sure that control procedures are systematically imple-mented. The main point though is that any divergence from the conditions neces-sary for routine control implies a different type of control. Expert control – if objectives are unambiguous, and the effects of interventions are relatively well understood, but the activity is not repetitive (for example, installing a ‘new to the company’ piece of technology such as an ERP system), control can be delegated to an ‘expert’, someone for whom such activities are repetitive because

315strategIc monItorIng and control
they have built their knowledge on previous experience elsewhere. Making a success of expert control requires that such experts exist and can be ‘acquired’ by the firm. It also requires that the expert takes advantage of the control knowledge already present in the firm and integrates his or her ‘expert’ knowledge with the support that potentially exists internally. Both of these place a stress on the need to ‘net-work’, in terms both of acquiring expertise and then integrating that expertise into the organisation. Trial and error control – if strategic objectives are relatively unambiguous, but effects of interventions not known, while, however, the activity is repetitive, the organisation can gain knowledge of how to control successfully through its own failures. In other words, although simple prescriptions may not be available in the early stages of making control interventions, the organisation can learn how to do it through experience. It is the cause–effect ‘knowledge gap’ that defines this type of control that must become the target of the firm’s knowledge-building activities. For example, if a firm is introducing a new product or service into a new market, it may
YesNo
No
NoNo
Yes
Yes
Yes
Needs networkingskills
Needs decisionskills
Needs knowledge-building skills
Needssystematisation skills
Are objectivesunambiguous?
Needs ‘political’skills
Negotiatedcontrol
Is processknowledgecomplete ?
Expertcontrol
Intuitivecontrol
Trial anderror control
Routinecontrol
Is activityrepetitive ?
Is activityrepetitive ?
Figure 10.3 monitoring and control types

316 chapter 10 • the process oF operatIons strategy – monItorIng and control
not be sure how best to arrange the launch. But if the launch is the first of several, the strategic objective must be not only to make as good a success of the launch as possible, but equally (or more) important, it must learn from the experience. The organisation must put in mechanisms to gain knowledge and embed the learning into its decision making. It is these knowledge-building skills that ultimately will determine the effectiveness of trial and error control. Intuitive control – if strategic objectives are relatively unambiguous, but effects of interventions not known, nor is strategic decision making repetitive, learning by trial and error is not possible. Therefore, says Hofstede, the organisation has to view strategic control as more of an art than a science. And in these circumstances control must be based on the management team using its innate intuition to make strategic control decisions. Many competition-based strategic decisions fall into this category. Objectives are clear (survive in the long term, make an acceptable return, and so on), but not only are control interventions not repetitive and their effects not fully understood, there are competitors whose interests are in conflict with yours. Yet, simply stating that ‘intuition’ is needed in these circumstances is not particularly helpful. Instinct and feelings are, of course, valuable attributes in any management team, but they are the result, at least partly, of understanding how best to organise their shared understanding, knowledge and decision-making skills. It requires thor-ough decision analysis, not to ‘mechanistically’ make the decision, but to frame it so that connections can be made, consequences understood and insights gained. Put another way, instinct may thrive best when used in the context of refined decision-making skills. Negotiated control – the most difficult circumstance for strategic control is when objectives are ambiguous. This type of control involves reducing ambiguity in some way by making objectives less uncertain. Or as Hofstede (who calls it ‘political’ con-trol) puts it, ‘resolving ambiguities so that external uncertainties become internal certainties’. Sometimes this is done simply by senior managers ‘pronouncing’ or arbitrarily deciding what objectives should be, irrespective of opposing views. More consensually, a negotiated settlement may be sought which can then become an unambiguous objective. Alternatively outside experts (for example consultants) could be used, either to help with the negotiations, or to remove control decisions from those with conflicting views. The success of this method will depend partly on whether the ‘expert’ has credibility within the organisation as someone who can resolve ambiguity. Yet, even within the framework of negotiation, there is almost always a political element when ambiguities in objectives exist. Negotiation pro-cesses will be, to some extent, dependent on power structures.
monitoring implementation – tracking performance
Especially in times when their environment is changing rapidly, organisations feel the need to detect change by tracking performance, scanning the environ-ment, interpreting the information that they detect, and responding appropriately. Monitoring, in our terms, involves the first three of these activities. If the informa-tion resulting from this monitoring activity is to be useful for control purposes it should collect useful data and interpret its meaning through comparison with pre-existing standards or objectives, and then respond in some way. At a strategic level, this interpretation process should involve more than simple data analysis. It

317monItorIng ImplementatIon – trackIng perFormance
should be an exercise that tries to make sense of what is really happening with the implementation. To do this successfully any operations strategy process should:
●● be tracking the appropriate elements so that it can assess progress;
●● compare progress against some aspiration or target;
●● have some idea as to what risks the implementation faces.
tracking the appropriate elements
‘Performance measurement is a hugely important but difficult area for organisations of all kinds. Accurately calibrating performance of activities and their outcomes has many advan-tages – as well as some risks. Performance measurement is therefore central to successful strategy execution.’2
What aspects of implementation performance are appropriate to track will obvi-ously depend on the implementation itself. Implementations with different strategic objectives will focus on different operations objectives. Because of this, it is difficult to generalise. However, it is important to draw a distinction between two types of implementation objective.
●● ‘Project’ objectives – those that indicate the progress of the implementation towards its end point. In other words, is the strategy being implemented as planned?
●● ‘Process’ objectives – those that indicate the consequences that the implementation has for the operations processes that it is intended to affect. In other words, are the results produced by the strategy as they were intended?
project objectivesProject objectives help to provide a definition of the end point which can be used to monitor progress and identify when success has been achieved. This can be judged in terms of what are usually termed the ‘three objectives of project management’ – cost, time and ‘quality’. Any implementation will normally be allocated a budget to ‘make things happen’. This should include the resources that will execute the implementation as well as any disruption to the ongoing operation during the implementation. Similarly, no implementation would be planned without some idea of how long it will take. Sometimes the deadline for the implementation is set by external events (for exam-ple, competitors entering your market); sometimes the deadline is governed by internal views on what is appropriate. ‘Quality’ (the quotation marks are deliberate) is how well the ‘project’ meets its objectives – does the implementation do what it is supposed to do? In an operations strategy context one could argue that the best way to assess the ‘quality’ of the implementation project is by judging the consequences it has for the operations processes that it is intended to affect; in other words ‘qual-ity’ here means the process objectives of the implementation. The relative importance of each project objective will differ for different types of implementation. Some implementations in the aerospace sector, such as the devel-opment of a new aircraft manufacturing technology, which impacts on passenger safety, will place a very high emphasis on ‘quality’ objectives. With other imple-mentations, for example where cash availability is limited, cost might predominate. Other implementations emphasise time: for example, bringing new capacity on line in time to honour a supply contract. In each of these implementation projects,

318 chapter 10 • the process oF operatIons strategy – monItorIng and control
although one objective might be particularly important, the other objectives can never be totally forgotten.
process objectivesThese objectives are so called because, when monitored, they measure the impact that the implementation has on the process within the operation (and therefore the operation as a whole). In Chapters 2 and 7 we introduced the core ‘performance objectives’ of operations strategy – quality, speed, dependability, flexibility and cost. So, at a minimum, the effect an implementation has on these five basic objectives should be assessed. But in addition, broader measures such as return on assets, or more specific measures, such as capacity utilisation, could also be used. For example, a global oil exploration company is reorganising its technical support function and, over time, is centralising its risk assessment resources (they were previously organ-ised on a regional basis). In this case the ‘process’ objectives are shown in Figure 10.4. Each objective has its performance under the original organisational structure marked, together with the performance of each objective that the new centralised structure should achieve. Over the three-month implementation period the per-formance of each objective is measured and marked to indicate the progress of the implementation.
10090807060504030
10090807060504030
10090807060504030
10090807060504030
2030405060708090
10090807060504030
140130120110100908070
Fully meeting businessrequirements (%)
Response timeacceptable (%)
Report finished aspromised (%)
Customised asrequested (%)
Cost per project($’0000)
Follow-up serviceacceptable (%)
Engineer utilisation (onnominal FTE basis)
Process performance at thestart of the implementation
Target processperformance when neworganisation implemented
Process performance at month 1
Process performance at month 2Process performance at month 3
Figure 10.4 process objectives for centralisation of risk assessment departments implementation

319monItorIng ImplementatIon – trackIng perFormance
the red queen effectFor longer-term implementations, target levels of process objectives will not neces-sarily remain constant. They could shift during the implementation itself, espe-cially in highly competitive or dynamic environments. For example, if competitors increase their performance during implementation, one’s own performance will need to increase proportionately simply to stay (relatively) still. This is sometimes called the ‘Red Queen’ effect. In 1973, Leigh Van Valen was searching for a way to describe the discovery that he had made while studying marine fossils. He had established that, no matter how long a family of animals had already existed, the probability that the family will become extinct is unaffected. In other words, the struggle for survival never gets easier. However well a species fits with its environment, it can never relax. The anal-ogy that Van Valen drew has a strong resonance with business realities. He recalled that in Lewis Carroll’s Through The Looking Glass (1872), Alice had encountered living chess pieces and, in particular, the Red Queen. ‘“Well, in our country,” said Alice, still panting a little, “you’d generally get to somewhere else – if you ran very fast for a long time, as we’ve been doing”. “A slow sort of country!” said the Queen. “Now, here, you see, it takes all the running you can do, to keep in the same place. If you want to get somewhere else, you must run at least twice as fast as that!”’ In many respects this is like business. The strategy that proves the most effective is the one that people will try to block or imitate. Innovations are soon countered in response by others that are stronger. The quality revolution in manufacturing industry, for example, is widely accepted, but most firms that have survived the past 15 years (in the automotive sector, for example) now achieve much higher levels of quality performance, reflecting greater depth of operational capability. Yet their rela-tive position has in many cases not changed. Their competitors who have survived have only done so by achieving similar levels of quality themselves.
the balanced scorecard approach
Generally operations performance measures have been broadening in their scope. It is now generally accepted that the scope of measurement should, at some level, include external as well as internal, long-term as well as short-term, and ‘soft’ as well as ‘hard’ measures. The best-known manifestation of this trend is the ‘balanced scorecard’ approach taken by Kaplan and Norton.
‘The balanced scorecard retains traditional financial measures. But financial measures tell the story of past events, an adequate story for industrial age companies for which investments in long-term capabilities and customer relationships were not critical for success. These financial measures are inadequate, however, for guiding and evaluating the journey that information age companies must make to create future value through investment in customers, suppliers, employees, processes, technology, and innovation.’3
As well as including financial measures of performance, in the same way as tradi-tional performance measurement systems, the balanced scorecard approach also attempts to provide the important information that is required to allow the over-all strategy of an organisation to be reflected adequately in specific performance measures. In addition to financial measures of performance, it also includes more operational measures of customer satisfaction, internal processes, innovation and

320 chapter 10 • the process oF operatIons strategy – monItorIng and control
other improvement activities. In doing so it measures the factors behind financial performance which are seen as the key drivers of future financial success. In particu-lar, it is argued that a balanced range of measures enables managers to address the following questions (see Figure 10.5).
●● How do we look to our shareholders (financial perspective)?
●● What must we excel at (internal process perspective)?
●● How do our customers see us (the customer perspective)?
●● How can we continue to improve and build capabilities (the learning and growth perspective)?
The balanced scorecard attempts to bring together the elements that reflect a busi-ness’s strategic position, including product or service quality measures, product and service development times, customer complaints, labour productivity, and so on. At the same time it attempts to avoid performance reporting becoming unwieldy by restricting the number of measures and focusing especially on those seen to be essential. The advantages of the approach are that it presents an overall picture of the organisation’s performance in a single report, and by being comprehensive in the measures of performance it uses, encourages companies to take decisions in the interests of the whole organisation rather than suboptimising around narrow measures. Developing a balanced scorecard is a complex process and is now the subject of considerable debate. One of the key questions that have to be considered is: how should specific measures of performance be designed? Inadequately designed performance measures can result in dysfunctional behaviour, so teams of managers are often used to develop a scorecard that reflects their organisation’s specific needs.
Customer performancemeasuresTo achieve strategicimpact, how should webe viewed by customers?
Internal processperformance measuresTo achieve strategic impact, what aspects of perfor-mance should business processes excel at?
Overallstrategic
objectives
Financial performancemeasuresTo achieve strategicimpact, how should webe viewed by shareholders?
Learning and growthperformance measuresTo achieve strategic impact, how will we build capabilities over time?
Figure 10.5 the measures used in the balanced scorecard
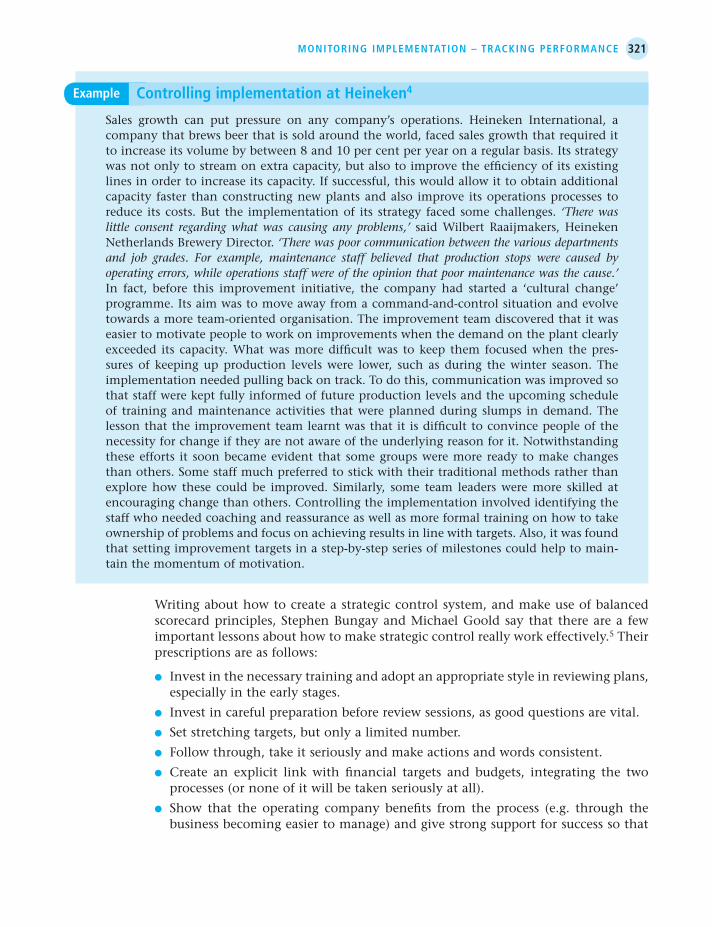
321monItorIng ImplementatIon – trackIng perFormance
Writing about how to create a strategic control system, and make use of balanced scorecard principles, Stephen Bungay and Michael Goold say that there are a few important lessons about how to make strategic control really work effectively.5 Their prescriptions are as follows:
●● Invest in the necessary training and adopt an appropriate style in reviewing plans, especially in the early stages.
●● Invest in careful preparation before review sessions, as good questions are vital.
●● Set stretching targets, but only a limited number.
●● Follow through, take it seriously and make actions and words consistent.
●● Create an explicit link with financial targets and budgets, integrating the two processes (or none of it will be taken seriously at all).
●● Show that the operating company benefits from the process (e.g. through the business becoming easier to manage) and give strong support for success so that
Sales growth can put pressure on any company’s operations. Heineken International, a company that brews beer that is sold around the world, faced sales growth that required it to increase its volume by between 8 and 10 per cent per year on a regular basis. Its strategy was not only to stream on extra capacity, but also to improve the efficiency of its existing lines in order to increase its capacity. If successful, this would allow it to obtain additional capacity faster than constructing new plants and also improve its operations processes to reduce its costs. But the implementation of its strategy faced some challenges. ‘There was little consent regarding what was causing any problems,’ said Wilbert Raaijmakers, Heineken Netherlands Brewery Director. ‘There was poor communication between the various departments and job grades. For example, maintenance staff believed that production stops were caused by operating errors, while operations staff were of the opinion that poor maintenance was the cause.’ In fact, before this improvement initiative, the company had started a ‘cultural change’ programme. Its aim was to move away from a command-and-control situation and evolve towards a more team-oriented organisation. The improvement team discovered that it was easier to motivate people to work on improvements when the demand on the plant clearly exceeded its capacity. What was more difficult was to keep them focused when the pres-sures of keeping up production levels were lower, such as during the winter season. The implementation needed pulling back on track. To do this, communication was improved so that staff were kept fully informed of future production levels and the upcoming schedule of training and maintenance activities that were planned during slumps in demand. The lesson that the improvement team learnt was that it is difficult to convince people of the necessity for change if they are not aware of the underlying reason for it. Notwithstanding these efforts it soon became evident that some groups were more ready to make changes than others. Some staff much preferred to stick with their traditional methods rather than explore how these could be improved. Similarly, some team leaders were more skilled at encouraging change than others. Controlling the implementation involved identifying the staff who needed coaching and reassurance as well as more formal training on how to take ownership of problems and focus on achieving results in line with targets. Also, it was found that setting improvement targets in a step-by-step series of milestones could help to main-tain the momentum of motivation.
example controlling implementation at heineken4

322 chapter 10 • the process oF operatIons strategy – monItorIng and control
another real benefit becomes the approval of senior management or a better rela-tionship with the centre).
the dynamics of monitoring and control
As implementation proceeds and monitoring indicates its progress, the trajectory of the implementation may have to be changed. Competitive activity or more gen-eral environmental change could affect the level of performance required, as in the Red Queen effect previously described, or the change may need to be more funda-mental, with changes in the direction of strategy as well as its extent. How easy an operation finds a change of direction will depend on its agility, which, in turn, will depend partly on how tightly its operations resources are aligned with its market requirements.
tight alignment and loose alignment
In the diagrammatic representation of alignment, explained earlier in Figures 9.2 and 9.6, we represented alignment as being a single point of alignment between market requirements and operations resource capability. The implication of this is that there is a single ‘tight’ and well-defined statement of market requirements together with a relatively narrow set of operations capabilities that correspond exactly with market requirements. Remember though that both market requirements and opera-tions resource capabilities can change over time. Markets are dynamic and exhibit, sometimes unexpected, changes. Operations resource capabilities may change at a slower pace but are still subject to, sometimes unexpected, movements. Therefore, on our diagrammatic representation, the origin of the requirements and resources diagram can shift over time. If the alignment between operations capabilities and market requirements is too ‘tight’ or ‘narrow’, this could mean that, what was previ-ously alignment between the two, can (relatively) move off the line of it. A looser or broader set of capabilities and market relationships, however, can provide some insurance against these unexpected shifts. This difference between tight and loose alignment is illustrated in Figure 10.6.
Implementation risk
A key task for any manager responsible for implementing an operations strategy is to think through the potential risks that might throw the implementation off track. The basic motivation for including consideration of risk in the monitoring and control phase of the operations strategy process is simply to ‘be prepared’ for the events that could cause implementation to deviate from its intended course. Of course risk is an ongoing issue for all firms. This is why they have internal audit experts and departments. Internal auditing is supposed to be an independent, objective assurance activity that is designed to add value and improve an organisation’s operations by bringing a systematic and dis-ciplined approach to evaluating and improving the effectiveness of risk management.6 Risk management is a huge topic in its own right, and one that is largely outside the scope of this book. But it is important to think in terms of how the practical issues of strategy implementation can incorporate some consideration of risk. Here we will look at five aspects of risk that are particularly relevant to operations strategy:

323ImplementatIon rIsk
●● the risk of market and operations performance becoming out of balance;
●● the distinction between pure and speculative risk;
●● controlling risk through prevention, mitigation and recovery;
●● adjustment cost risk;
●● intervention risk.
market and operations performance becoming out of balance
Particularly during implementation, when changes in both market positioning and operations resources are likely, the possibility of deviating from the ‘line of fit’ (see Figure 9.2 in Chapter 9) is very real. This may be because some part of the implementation is not going to plan: for example, delays in the implementation of a new website mean that customers do not receive the level of service they were promised. Or, it may be an inevitable and expected part of the implementation plan. For example, a firm may plan to install and de-bug a new IT system before it starts to use its potential to make promises to its market. Either way the deviation from alignment between market requirements and operations resources is exposing the firm to risk, and while there is no widely accepted definition for operations-related risk, our working definition of operations-related risk is: operations risk is the potential for unwanted negative consequences from an operations-related event. Many risks can be related to the uncertainty associated with both the develop-ment of an operational resource-base and shifting market requirements. Any opera-tions strategy implementation, therefore, must accommodate these risks. Figure 10.7 illustrates this idea. Moving above the diagonal implies that market performance (that is, the requirements and/or the expectations of the market) is in advance of the operation’s capability to satisfy it. This is called external operations-related risk. The area below the diagonal implies that a firm has levels of competence or potential
New market requirements andoperations resource capability
Movement in marketrequirements andoperations resourcesproduces misalignment
Looser fit betweenmarket requirementsand operationsresources preservesalignment
Loose fit
Original market requirementsand operations resource capability
Mar
ket
req
uire
men
ts
Level of operationsresource capability
Line
of fit
Tight fit
Mar
ket
req
uire
men
ts
Level of operationsresource capability
Line
of fit
Figure 10.6 excessively tight ‘fit’ can increase the risks of misalignment between market requirements and operations resource capability

324 chapter 10 • the process oF operatIons strategy – monItorIng and control
performance that are not being exploited in the marketplace. This is called internal operations-related risk.
pure and speculative risk
A useful distinction is that between pure risks, involving events that will produce the possibility only of loss (or negative outcomes), and speculative risks that emerge from competitive scenarios and hold the potential for loss or gain (positive out-comes). A pure risk might be the risk that, while implementing a new blood-testing strategy for HIV, a technician at a medical laboratory is involved in an accident that leads to possible infection. A speculative risk might be the risk associated with developing a new computer-based diagnostics and information infrastructure to enable the laboratory to offer a range of profitable new services. The risk here is that the technology may not work (or not work on time or in budget), or that the market will not want to pay for the new services. This is illustrated in Figure 10.8. The pure risk type of ‘accident’ involves a reduction in effective operations resource capability of the type represented by the movement between A and C. Speculative risk of the type represented by the new information infrastructure is represented by the possible outcomes B, D and E. Movement from A to B is positive in the sense that it represents a fulfilment of the intended outcome. Negative consequences are represented by point D, where market requirements have increased as intended but operations capabilities have failed to match them, and E, where operations capabili-ties have been increased but have not been fully exploited in the market.
Line o
f fit
Internal operations-related risk (excess capability for current market needs means risk of unexploited capabilities)
Leve
l/nat
ure
ofm
arke
t re
qui
rem
ents
Level/nature of operations resource capability
External operations-related risk (market needs exceeding current levels of capability means risk of failing to satisfy the market)A
B
Figure 10.7 Implementing a strategy that moves an operation from a to B may mean deviating from the ‘line of fit’ and therefore exposing the operation to risk

325ImplementatIon rIsk
controlling risk
Operations strategy practitioners understandably are interested in how an operation can avoid failure in the first place or, if it does happen, how they can survive any adverse conditions that might follow. In other words, how they can control risk. A simple structure for describing generic mechanisms for controlling risk uses three approaches.
●● Prevention strategies – are where an operation seeks to completely prevent (or reduce the frequency of) an event occurring.
●● Mitigating strategies – are where an operation seeks to isolate an event from any possible negative consequences.
●● Recovery strategies – are where an operation analyses and accepts the consequences of an event but undertakes to minimise or alleviate or compensate for them.
prevention strategiesIt is almost always better to avoid negative consequences than have to recover from them. The classic approach is to audit plans to try and identify causes of risk. For instance, by emphasising its use of ‘fair trading’ principles, the high street retailer The Body Shop was able to develop its ‘ethical’ brand identity as a powerful advantage, but it also became a potential source of vulnerability. When a journalist accused one of the firm’s suppliers of using animal product testing, the rest of the media eagerly took up the story. To prevent this kind of accusation from resurfacing, the firm introduced a detailed auditing method to prevent any suspicion of unethi-cal behaviour in its entire supply chain.
Pure risk has only negativeconsequences
Speculative risk canhave both positiveand negativeconsequences
Line o
f fit
Leve
l/nat
ure
ofm
arke
t re
qui
rem
ents
Level/nature of operations resource capability
A
B
D
C
E
Figure 10.8 pure risk has only negative consequences (a to c); speculative risk can have both positive (a to B) and negative (a to d or a to e) consequences

326 chapter 10 • the process oF operatIons strategy – monItorIng and control
mitigation strategiesNot all events can be avoided, but an operation can try to separate an event from its negative consequences. This is called mitigation. For example, look at the way that an operation deals with exposure to currency fluctuations. After the collapse of com-munism in the early 1990s, a multinational consumer goods firm began to invest in the former Soviet Union. Their Russian subsidiary sourced nearly all the products from its parent’s factories in Germany. Conscious of the potential volatility of the rouble, the firm needed to minimise its exposure to a devaluation of the currency. Any such devaluation would leave the firm’s cost structure at a serious disadvantage and without any real option but to increase its prices. Financial tools were avail-able to mitigate currency exposure. Most of these allowed the operation to reduce the risk of currency fluctuations but involved an ‘up front’ cost. Alternatively, the company could restructure its operations strategy in order to mitigate its currency risk, developing its own production facilities within Russia. This might reduce, or even eliminate, the currency risk, although it would probably introduce other risks. A further option was to form supply partnerships with other Russian companies. Again, this would not eliminate risks but could shift them to ones that the company felt more able to control.
recovery strategiesRecovery strategies can involve a wide range of activities. They include the (micro) recovery steps necessary to minimise an individual customer’s dissatisfaction. This might include apologising, refunding monies, reworking a product or service, or providing compensation. At the same time, operations have to be prepared for the (macro) major crises that might necessitate a complete product recall or abandon-ment of service. The question that an operations strategy needs to consider is, ‘At what point do we reach the limit of avoidance and mitigation strategies before we start to rely on recovery strategies?’
It was a product recall that attracted more than usual negative media coverage. Cadbury’s, the confectionary manufacturer, recalled seven product lines accounting for more than a million chocolate bars. This was the result of potential salmonella contamination caused by a leaking pipe in a production factory. Initially a decision was taken not to recall any products, but this was reversed later. According to Chris Woodcock, Managing Director of Razor, a risk assessment firm,
‘. . . this is a classic case of a business needing to consider all the reputational and brand-protection aspects of a possible food safety, technical problem before deciding whether or not to recall. The logical, technical facts are often not enough on their own to influence a decision on recall or no-recall. It is also vital to assess emotional and brand associations.’
Particularly where a brand is trusted to the extent of Cadbury’s, recovery planning is vital. In this case the scientific justification for a recall was considered when it was first discovered that the pipe leaking had caused the low levels of salmonella.
‘There was possibly still a good case for reconsidering the longer-term brand damage should the no-recall decision subsequently escape into the public domain. It was the apparent lack of trans-parency that attracted most criticism in media and expert commentary.’
example planning for recovery7

327ImplementatIon rIsk
adjustment cost risk
It is worth emphasising that any implementation methodology will need to account for the costs of implementation. These costs include both the direct and/or invest-ment costs of providing whatever additional resources the strategy requires, and also what could be termed the adjustment cost of making any changes. By adjustment costs we mean the losses that could be incurred before the new strategy is function-ing as intended. Calculating the true costs of implementing any strategy is notoriously difficult. This is particularly true because, more often than not, ‘Murphy’s Law’ seems to prevail. This law is usually stated as ‘if anything can go wrong, it will’. This means that most implementations will incur ‘adjustment costs’ before the strategy works as expected. This effect has been identified empirically in a range of operations, especially when new types of process technology are involved. Specifically discuss-ing technology-related implementation (although the ideas apply to almost any implementation), Bruce Chew of Massachusetts Institute of Technology argues that adjustment costs stem from unforeseen mismatches between the new technology’s capabilities and needs and the existing operation. New technology rarely behaves as planned, and as changes are made their impact ripples throughout the organisation. Figure 10.9 is an example of what Chew calls a Murphy Curve.8 It shows a typical pattern of performance reduction (in this case, quality) as a new process technology is introduced. It is recognised that implementation may take some time: therefore allowances are made for the length and cost of a ‘ramp-up’ period. However, as the operation prepares for the implementation, the distraction causes performance actu-ally to deteriorate. Even after the start of the implementation this downward trend continues, and it is only weeks, indeed maybe months, later that the old perform-ance level is reached. The area of the dip indicates the magnitude of the adjustment costs, and therefore the level of vulnerability faced by the operation.
Intervention risk – getting performance back on track
Monitoring involves tracking how an implementation is progressing and interpret-ing the tracking data. Control requires decision and intervention. Decisions are needed as to whether to intervene or not as well as how to intervene. Intervention means not only doing something to bring the implementation closer towards its
But the Cadbury’s incident is far from being an isolated case. The number of product recalls is increasing as firms try to protect their reputations from the harm caused by faulty goods, according to Reynolds Porter Chamberlain, a London law firm.
‘Corporate reputations have become more fragile as consumers increasingly use the internet and other media to share and publicise information about faulty products. The Sony laptop battery debacle, which saw nearly 10 million battery packs recalled, is a perfect example. The growth of sites such as YouTube meant millions of consumers saw videos of a computer spontaneously catching fire due to the fault. The legal costs and compensation paid out can be colossal, so the need to recall quickly is vital, and so is insurance cover. With consumers becoming ever more liti-gious, companies are playing it safe and recalling even where the risk of a liability is slight. They know the courts and the press will punish them if they are seen as dragging their feet.’

328 chapter 10 • the process oF operatIons strategy – monItorIng and control
objectives but also learning from the intervention, so that future interventions will be better targeted.
type I and type II errors in controlThe concept of type I and type II errors is commonly used in operational control, and it is also useful in understanding strategic control. It concerns the possibility of getting the decision of whether to intervene wrong, although one can apply the idea to any decision. Take the example of a pedestrian waiting to cross a street. He or she has two options: whether to continue waiting or to cross. If there is a satisfactory break in the traffic and the pedestrian crosses then a correct decision has been made. Similarly, if that person continues to wait because the traffic is too dense then he or she has again made a correct decision. There are two types of incorrect decision or errors, however. One incorrect decision would be if he or she decides to cross when there is not an adequate break in the traffic, resulting in an accident – this is referred to as a type I error, taking action when one should not. Another incorrect decision would occur if he or she decides not to cross even though there is an adequate gap in the traffic – this is called a type II error, not taking action when one should. So type I errors are those that occur when a decision is made to do something when the situation does not warrant it. Type II errors are those that occur when nothing is done, yet a decision to do something should have been taken as the situation did indeed warrant it. Applied to strategic control, a type I error is when there is a failure to intervene in an implementation even though an intervention is necessary. A type II error is when an intervention is made to the implementation when it was not necessary. This is summarised in Table 10.1. Managers identifying and interpreting monitoring data face the risk of both type I and type II errors. Effective operations strategy control prompts the appropriate
Time
Op
erat
ions
per
form
ance
(qua
lity
leve
ls)
Plannedperformance
Start of newtechnology
implementation
New technologyplanned to be
on-stream
Forecast performance
Plannedimplementation
period
Actualperformance
Figure 10.9 the reduction in performance during and after the implementation of a new technology reflects ‘adjustment costs’

329learnIng, approprIatIon and path dependency
response at the appropriate time, avoiding both types of error. Type I errors can occur when managers are ‘over active’; with a bias towards being more interven-tionist that is necessary. Type II errors may occur when the managers are too inert, failing to recognise the need for intervention where it actually exists. It has been argued that in uncertain and dynamic business environments type II errors are more likely to occur.
table 10.1 type I and type II errors for the control of an operations strategy implementation
Wastheinterventionnecessary?
Decision No Yes
Intervene to ‘correct’ the implementation Type I error Correct decision
Do not intervene to ‘correct’ the implementation Correct decision Type II error
learning, appropriation and path dependency
Both type I and type II errors will be reduced as an organisation and its managers increase their situational knowledge through learning. Over time, the smooth imple-mentation of operations strategy changes needs to address four important issues:
●● How can an operations strategy encourage the learning necessary to make sure that operations knowledge is carried forward over time?
●● How can an operations strategy ensure that the organisation appropriates (cap-tures the value of) the competitive benefits that are derived from the buildup of operations knowledge?
●● How can an operations strategy take into account the fact that the innovations that derive from the buildup of operations knowledge have a momentum of their own and are strongly path dependent (they are influenced by what has happened before)?
●● How can an operation take into account the interaction between the extent of resource and process change?
organisational learning
In uncertain environments any organisation’s ability to pre-plan or make decisions in advance is limited. So, rather than adhering dogmatically to a predetermined plan, it may be better to adapt as circumstances change. And, the more uncertain the environment, the more an operation needs to emphasise this form of strategic flexibility and develop its ability to learn from events. Generally this strategic flexi-bility depends on a learning process which concerns the development of insights and knowledge, and establishes the connections between past actions, the results of those actions, and future intentions. The crucial issue here is an essentially prag-matic and practical one: how does an operations strategy encourage, facilitate and exploit learning, in order to develop strategic sustainability? Initially this requires us to recognise that there is a distinction between single- and double-loop learning.9

330 chapter 10 • the process oF operatIons strategy – monItorIng and control
single and double-loop learning
Single-loop learning is a phenomenon that is widely understood in operations man-agement. It occurs when there is repetitive association between input and output factors. Statistical process control, for instance, measures output characteristics from a process, such as product weight, telephone response time, etc. These can then be used to alter input conditions, such as supplier quality, manufacturing consistency or staff training, with the intention of ‘improving’ the output. In Chapter 7 we indi-cated how such forms of control provide the learning which can form the basis for strategic improvement. Every time an operational error or problem is detected, it is corrected or solved, and more is learned about the process, but without questioning or altering the underlying values and objectives of the process. Single-loop learning is of great importance to the ongoing management of opera-tions. The underlying operational resources can become proficient at examining their processes and monitoring general performance against generic performance objectives (cost, quality, speed, etc.), thereby providing essential process knowledge and stability. Unfortunately, the kind of ‘deep’ system-specific process knowledge that is so crucial to effective single-loop learning can, over time, help to create the kind of inertia that proves so difficult to overcome when an operation has to adapt to a changing environment. All effective operations are better at doing what they have done before, and this is a crucial source of advantage. But while an operation develops its distinctive capability only on the basis of single-loop learning, it is exposing itself to risks associated with the things that it does not do well (see Figure 10.10). Sustainable operations strategies therefore also need to emphasise learning mecha-nisms that prevent the operation becoming too conservative and thereby effectively introducing delays and inappropriate responses to major change decisions. Double-loop learning, by contrast, questions fundamental objectives, service or market positions, or even the underlying culture of the operation. This kind of learning implies an ability to challenge existing operating assumptions in a fundamental way, seeking to re-frame competitive questions and remain open to any changes in the competitive environment. But being receptive to new opportunities sometimes requires the abandonment of existing operating routines at certain points in time – sometimes without any specific replacement in mind. This is difficult to achieve in
Examine the performanceof operations processes
Operationsinnovation
Develop new insightsand capabilities
Compare this performanceagainst objectives
Reduced performance ofoperations processes
Operations innovationless easy
Insights and capabilitiesless useful
Performance objectivesless appropriate
Shifts in technology,
processes or markets,
leading to improved
competitor performance
Figure 10.10 single-loop learning in operations and its potential limitations
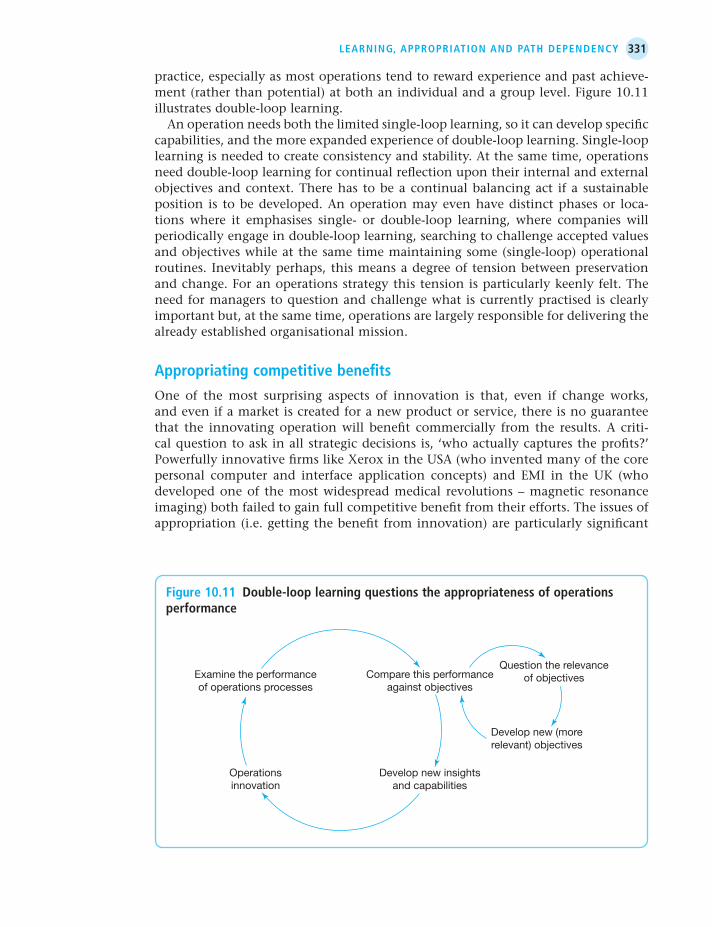
331learnIng, approprIatIon and path dependency
practice, especially as most operations tend to reward experience and past achieve-ment (rather than potential) at both an individual and a group level. Figure 10.11 illustrates double-loop learning. An operation needs both the limited single-loop learning, so it can develop specific capabilities, and the more expanded experience of double-loop learning. Single-loop learning is needed to create consistency and stability. At the same time, operations need double-loop learning for continual reflection upon their internal and external objectives and context. There has to be a continual balancing act if a sustainable position is to be developed. An operation may even have distinct phases or loca-tions where it emphasises single- or double-loop learning, where companies will periodically engage in double-loop learning, searching to challenge accepted values and objectives while at the same time maintaining some (single-loop) operational routines. Inevitably perhaps, this means a degree of tension between preservation and change. For an operations strategy this tension is particularly keenly felt. The need for managers to question and challenge what is currently practised is clearly important but, at the same time, operations are largely responsible for delivering the already established organisational mission.
appropriating competitive benefits
One of the most surprising aspects of innovation is that, even if change works, and even if a market is created for a new product or service, there is no guarantee that the innovating operation will benefit commercially from the results. A criti-cal question to ask in all strategic decisions is, ‘who actually captures the profits?’ Powerfully innovative firms like Xerox in the USA (who invented many of the core personal computer and interface application concepts) and EMI in the UK (who developed one of the most widespread medical revolutions – magnetic resonance imaging) both failed to gain full competitive benefit from their efforts. The issues of appropriation (i.e. getting the benefit from innovation) are particularly significant
Compare this performanceagainst objectives
Question the relevanceof objectives
Develop new (morerelevant) objectives
Examine the performanceof operations processes
Develop new insightsand capabilities
Operationsinnovation
Figure 10.11 double-loop learning questions the appropriateness of operations performance

332 chapter 10 • the process oF operatIons strategy – monItorIng and control
for operations strategy because, as we discussed in Chapter 5, ‘partnership’ rela-tionships have become more important. Products and services are often developed jointly with customers, and companies are increasingly actively sharing knowledge with suppliers.10 For example, firms such as Bose have adopted particularly close relationships with suppliers, often involving exchanges of key staff. It is argued that the benefit for the customer is instant access to ‘rich’ supplier expertise on a range of current and future product issues. The main benefit for the supplier is the ‘opportu-nity’ to learn of ‘potential’ new contracts.11 Issues of long-term intellectual property rights can become very difficult to manage in such circumstances.
path dependencies and development trajectories
History matters when it comes to operations strategy. Very few operations have a completely blank sheet (or ‘green field’ scenario) when it comes to options and choices. Current resource and requirement positions act to constrain the future development paths, or trajectories, of the operation. In other words, operations capabilities are path dependent. For example, when chemical giant Monsanto first embarked upon its strategy to develop a biotechnology business, it had great diffi-culties in hiring new staff because it had no pre-existing capabilities for new staff to join, and hence no visible career path, no guarantee of appropriate facilities, rewards and recognition and so on. The influence of path dependency on sustainability is best summed up by the idea of capability and market trajectories. An operation may have been pursuing a particular strategy in each of its decision areas over a period of time. The pattern of these decisions will have become well established within the decision-making culture of the operation to the extent that the pattern of decisions may have estab-lished its own momentum. The organisation may have developed particular skills at making decisions to support its strategies and may be building upon the learning that it acquired from previous similar decisions. The decision area has developed its own trajectory. This may have both positive and negative effects. For example, a clothing retailer may have an operations strategy that includes aggressive capac-ity expansion. The result is that the company succeeds in capturing significant and profitable market share. For one or two years its skills at identifying, acquiring and commissioning new stores are a major factor in its ongoing success. However, its competitors soon start to adopt a similar expansion strategy and the company finds it increasingly difficult to maintain its market share. Yet the policy of capacity expansion is so entrenched within the company’s decision making that it continues to increase its floor space beyond the time when it should have been consolidating, or even reducing, its overall capacity. The trajectory of its capacity strategy, which was once a significant advantage, is now in danger of undermining the whole company’s financial viability. What was once a core capability of the company has become a core rigidity.12
The same idea applies to the performance objectives which reflect market require-ments. If an operation is used to thinking about quality, or speed, etc. in a particular way it will find it difficult to reconsider how it thinks about them internally and how it communicates them to its customers. Again, there is a momentum based on the trajectory of previous decisions. And again, this can have both positive and negative effects. Strong market-based trajectories can both lead to market success and expose companies to market vulnerability when challenged by radically new
333learnIng, approprIatIon and path dependency
products and services. For example, Digital Equipment Corporation once domi-nated the minicomputer market. It was renowned for understanding its customers’ requirements, translating these into products that matched its customers’ require-ments, and developing operations to support its product/market strategy. But eventually it was its very expertise at following its existing customers’ requirements that caused it to ignore the threat from smaller and cheaper personal computers. Clayton Christensen, of Harvard Business School, has studied companies that found themselves in this position precisely because these firms listened to their customers, invested aggressively in new technologies that would provide their customers with more and better products of the sort they wanted, but because they carefully studied market trends they lost their positions of leadership; there are times at which it is right not to listen to customers . . .13
the innovator’s dilemma14
Both market and capability trajectories are brought together in what Christensen calls the innovator’s dilemma, the dilemma being that, especially when faced by rad-ical shifts in the technological or operating model of a product or service, meeting long-established customer needs can become an obstacle, rather than an enabler, of change. Christensen divides technologies into sustaining and disruptive technolo-gies. Sustaining technologies are those that improve the performance of established products and services along the same trajectory of performance which the majority of customers have historically valued. Disruptive technologies are those that, in the short term, cannot match the performance that customers expect from products and services. They are typically simpler, cheaper, smaller and sometimes more con-venient, but they do not often provide conventionally enhanced product or service characteristics. However, all technologies, sustaining or disruptive, will improve over time. Christensen’s main point is that, because technology can progress faster than the requirements of the market, disruptive technologies will eventually enter the zone of performance that is acceptable to the markets (see Figure 10.12). One example Christensen uses is that of the electric car. At the moment, no elec-tric car can come close to the performance characteristics of internal combustion engines. In that sense, this technology is not an immediate threat to existing car or engine manufacturers. However, the electric car is a disruptive technology in so much as its performance eventually will improve to the extent that it enters the lower end of the acceptable zone of performance. Perhaps initially, only custom-ers with relatively undemanding requirements will adopt motor vehicles using this technology. Eventually, however, it could prove to be the dominant technology for all types of vehicle. The dilemma facing all organisations is how to simultaneously improve product or service performance based on sustaining technologies, while deciding whether and how to incorporate disruptive technologies.
resource and process ‘distance’
The degree of learning, and the degree of difficulty in the implementation process, will depend on the degree of novelty of any new resources and the changes required in the operation’s processes. The less that the new resources are under-stood (influenced perhaps by the degree of innovation), the greater their ‘distance’ from the current resource base of the operation. Similarly, the extent to which an

334 chapter 10 • the process oF operatIons strategy – monItorIng and control
implementation requires an operation to modify its existing processes, the greater the ‘process distance’. The greater the resource and process distance, the more dif-ficult any implementation is likely to be. This is because such distance makes it diffi-cult to adopt a systematic approach to analysing change and learning from mistakes. Those implementations that involve relatively little process or resource ‘distance’ provide an ideal opportunity for organisational learning. As in any classic scientific experiment, the more variables that are held constant, the more confidence you have in determining cause and effect. Conversely, in an implementation where the resource and process ‘distance’ means that nearly everything is ‘up for grabs’, it becomes difficult to know what has worked and what has not. More importantly, it becomes difficult to know why something has or has not worked (see Figure 10.13).
stakeholders
All implementation projects have stakeholders who must be included in their plan-ning and execution. By stakeholders we mean the individuals and groups that have an interest in the project process or outcome. Individual stakeholders are likely to have different views on a project’s objectives, which may conflict with other stake-holders. At the very least, different stakeholders are likely to stress different aspects of a project. So, as well any ethical imperative to include as many stakeholders as possible in an implementation, it also can prevent problems later in the implemen-tation. There may also be more direct benefits from a stakeholder-based approach.
Time
‘Disruptive’technological
change
Performance requiredby ‘bottom end’ of
the market
Zone ofmarket-acceptable
performance
Performance basedon ‘new’ technology
Performance basedon ‘old’ technology
Performance requiredby ‘top end’ of
the market
B
Per
form
ance
of g
ood
s an
d s
ervi
ces
bas
ed o
n th
e te
chno
logy
A
Figure 10.12 ‘disruptive’ technological change

335learnIng, approprIatIon and path dependency
Powerful stakeholders may shape the implementation at an early stage, making it more likely that they will support the project.
the power–interest grid
Managing stakeholders can be a subtle and delicate task, requiring significant social and, sometimes, political skills. It is based on three activities: identifying, prioritis-ing, and understanding the stakeholder group. One approach to discriminating between different stakeholders and, more important, how they should be managed is to distinguish between their power to influence the project and their interest in doing so. Stakeholders who have the power to exercise a major influence over the project should never be ignored. At the very least, the nature of their interest, and their motivation, should be well understood. But not all stakeholders who have the power to exercise influence over a project will be interested in doing so, and not everyone who is interested in the project has the power to influence it. The power–interest grid, shown in Figure 10.14, classifies stakeholders simply in terms of these two dimensions. Although there will be graduations between them, the two dimen-sions are useful in providing an indication of how stakeholders can be managed in terms of four categories. Stakeholders’ positions on the grid give an indication of how stakeholders might be managed. High power, interested groups must be fully engaged, with the great-est efforts made to satisfy them. High power, less interested groups require enough effort to keep them satisfied, but not so much that they become bored or irri-tated with the message. Low power, interested groups need to be kept adequately informed, with checks to ensure that no major issues are arising. These groups may
Pioneeringnew resources
Resource distance
Processmodification
Processpioneer
Modification toexisting
resources
Pro
cess
dis
tanc
e
Potential forlearning isrelatively
high
Potential forlearning is
limited – toomany things
change
Figure 10.13 learning potential depends on both resource and process ‘distance’

336 chapter 10 • the process oF operatIons strategy – monItorIng and control
be very helpful with the detail of the project. Low power, but less interested groups need monitoring, but without excessive communication. Some key questions that can help to understand high priority stakeholders are the following.
●● What financial or emotional interest do they have in the outcome of the imple-mentation? Is it positive or negative?
●● What motivates them most of all?
●● What information do they need?
●● What is the best way of communicating with them?
●● What is their current opinion of the implementation project?
●● Who influences their opinions? Do some of these influencers therefore become important stakeholders in their own right?
●● If they are not likely to be positive, what will win them around to support the implementation?
●● If you do not think you will be able to win them around, how will you manage their opposition?
Stakeholderpower
Stakeholder interest
Keep satisfied Manage closely
Monitor Keep informed
Low
High
Low High
Figure 10.14 the stakeholder power–interest grid
summary ansWers to key questIons
What are the differences between operational and strategic monitoring and control?Strategic monitoring and control involves the monitoring and evaluation of activities, plans and performance with the intention of corrective future action, if required. The strategic view of monitoring and control is similar to the operational view, but there are differences. At a strategic level objectives are often less clear. There may also be less knowledge of how to bring about the desired outcome. Similarly, the frequency with which control interventions are made is different. Strategic control can be non-repetitive, with each implementation task involving

337summary ansWers to key questIons
unique projects or investments. One model of control uses the following questions to distinguish between:
●● expert control;
●● trial and-error control;
●● intuitive control;
●● negotiated control; and
●● routine (operational) control.
how is progress towards strategic objectives tracked?Monitoring and control involves tracking performance, scanning the environ-ment, interpreting the information that it detects, and responding appropriately. Monitoring includes the first three of these activities. To do this successfully any operations strategy process should:
●● be tracking progress against two types of implementation objective – ‘project’ objectives that indicate the progress of the implementation towards its end point, and ‘process’ objectives that indicate the consequences that the implementation has on the operations processes that it is intended to affect; and
●● compare progress against some aspiration or target, preferably involving a broad range of measures, as is the intention of the balanced scorecard, which retains tra-ditional financial measures, but also includes measures of customer satisfaction, internal processes, innovation and other improvement activities.
What are the dynamics of monitoring and control?Monitoring often indicates that the trajectory of the implementation may have to be changed. How easy this is depends partly on how tightly its operations resources are aligned with its market requirements. ‘Tight’ alignment means that very specific market requirements are aligned exactly with a relatively narrow set of operations capabilities. ‘Loose’ alignment indicates a broader set of capabilities matching an equivalently wide set of market requirements. This can provide some insurance against unexpected shifts in the environment.
how can the monitoring and control process attempt to control risks?A key task in the operations strategy process is the consideration of potential risks, because understanding risks can help to cope with them should they occur. There are five aspects of risk that are particularly relevant to operations strategy:
●● The risk of market and operations performance becoming out of balance, which can lead to ‘external’ and ‘internal’ operations-related risk.
●● The distinction between pure risks, involving events, which will produce the possi-bility only of loss (or negative outcomes) and speculative risks, which emerge from competitive scenarios and hold the potential for loss or gain (positive outcomes).
●● Controlling risk through prevention strategies (where an operation seeks to prevent an event occurring), mitigating strategies (where an operation seeks to isolate an event from possible negative consequences) and recovery strategies (where an operation analyses and accepts the consequences from an event but undertakes to minimise, alleviate or compensate for them).

338 chapter 10 • the process oF operatIons strategy – monItorIng and control
●● Adjustment cost risk: these are the losses that could be incurred before the new strategy is functioning as intended.
●● Intervention risk, which is incurring ‘type I’ and ‘type II’ errors. Type I errors occur when managers intervene unnecessarily. Type II errors occur when the managers fail to recognise the need for intervention where it actually exists.
how does learning contribute to strategic control?Implementation risk is reduced as an organisation learns over time. Four issues are important in understanding how learning affects implementation.
●● How can an operations strategy encourage the learning necessary to make sure that operations knowledge is carried forward over time? Here the distinction between single-loop and double-loop learning is important.
●● How can an operations strategy ensure that the organisation appropriates (cap-tures the value of) the competitive benefits that are derived from the buildup of operations knowledge?
●● How can an operations strategy take into account the fact that the innovations that derive from the buildup of operations knowledge have a momentum of their own and are strongly path dependent (they are influenced by what has happened before)?
●● How can an operation take into account the interaction between the extent of resource and process change?
how does stakeholder management contribute to strategic control?All implementation projects have stakeholders, who are the individuals and groups that have an interest in the project process or outcome, and should be included in its planning and execution. One approach to discriminating between different stake - holders, and how they should be managed, is to distinguish between their power to influence the project and their interest in doing so. This results in the power– interest grid. Stakeholders’ position on the grid gives an indication of how they might be managed.
Further reading
Alkhafaji, A.F. (2003) Strategic Management: Formulation, Implementation, and Control in a Dynamic Environment. Haworth Press Inc.
Carlopio, J. (2003) Changing Gears: The Strategic Implementation of Technology. Palgrave Macmillan.
Jessen, M., Holm, P.J. and Junghagen, S. (2007) Strategy Execution: Passion & Profit. Copenhagen Business School Press.
Kaplan, R.S. and Norton, D.P. (2008) Execution Premium. Linking Strategy to Operations for Competitive Advantage. Boston, MA: Harvard Business School Press.
Kaplan, R.S. and Norton, D.P. (2004) Strategy Maps: Converting Intangible Assets into Tangible Outcomes. Boston, MA: Harvard Business School Publishing.
Ketokivi, M. and Castaner, X. (2004) ‘Strategic planning as an integrative device’, Administrative Science Quarterly, 49(2) pp. 337–365.

339notes on the chapter
MacLennon, A. (2010) Strategy Execution: Translating Strategy into Action in Complex Organisations. Routledge.
Menda, R., Dilts, D. (1997) ‘The manufacturing strategy formulation process: linking multifunctional viewpoints’, Journal of Operations Management, 15(4) pp. 223–241.
notes on the chapter
1 Geert Hofstede (198l) ‘Management control of public and not-for-profit activities Accounting’, Organizations and Society, 6(3) pp. 193–211.
2 MacLennon, A. (2010) Strategy Execution: Translating Strategy into Action in Complex Organisations. Routledge.
3 Kaplan, R.S. and Norton, D.P. (1996) The Balanced Scorecard. Boston, MA: Harvard Business School Press.
4 Deaves, M. (2002) ‘Bottoms-up’, Manufacturing Engineer, December. 5 Bungay, S. and Goold, M. (1991) ‘Creating a strategic control system’, Long Range Planning,
24(3) pp. 32–39. 6 Based on the definition issued by the Institute of Internal Auditors. 7 Sources: Moynihan, T. (2007) ‘Product recalls up 20% as firms act quickly to shore up repu-
tations’, The Guardian, 19 February; Woodcock, C. (2007) Comment on Cadbury’s recall, on http://www.continuitycentral.com.
8 Chew, W.B., Leonard-Barton, D. and Bohnm, R.E. (1991) ‘Beating Murphy’s Law’, Sloan Management Review, Spring.
9 Argyris, C. and Schon, D. (1978) Organisational Learning. Reading, MA: Addison-Wesley.10 Lewis, M. (2000) ‘Lean production and sustainable competitive advantage’, International
Journal of Operations and Production Management, 20(8).11 Dixon, L. and Porter, A.M. (1994) JITII: A revolution in buying and selling. Newton, MA:
Cahners Publishing.12 This idea is pursued in the context of product development by Dorothy Leonard in
Leonard-Barton, D. (1992) ‘Core capabilities and core rigidities: a paradox in managing new product development’, Strategic Management Journal, Vol. 13, pp. 111–125.
13 Christensen, C.M. (1997) The Innovator’s Dilemma: When New Technologies Cause Great Firms to Fail. Boston, MA: Harvard Business School Press.
14 This discussion is based on Slack, N., Chambers, S. and Johnston, R. (2007) Operations Management, 5th edn. Harlow, UK: Financial Times, Prentice Hall.


1.McDonald’sCorporation 343
2.DeltaSyntheticFibres(DSF) 355
3.TheGreenvilleOperation 362
4.TurnroundatthePrestonplant 371
5.DisneylandResortParis 378
6.ContactUtilities 389
7.IDEO:ServiceDesign 396
8.OcadoversusTesco.com 416
Case studies


Whether in Moscow or Massachusetts, the same experience would greet a customer in any of the 12,611 McDonald’s quick-service restaurants worldwide. McDonald’s had distinguished itself in the quick-service industry through its remarkable consist-ency across all units. To competitors and customers alike, the Golden Arches – the corporate emblem that adorned every restaurant – symbolised pleasant, fast service and tasty, inexpensive food. In the United States alone, McDonald’s served over 20 million customers every day.1 Although such a number testified to the restaurant chain’s success, it also suggested a troubling question for management. With McDonald’s already serving so many customers, how could it possibly attract more business? External pres-sures reinforced the dilemma. Demographic trends were reshaping American eating habits while competitors were attacking the quick-service giant from all sides. From chains specialising in speed and service, to those offering wider variety and those that featured deeply discounted menus, McDonald’s faced competitors poised to challenge the industry leader on all fronts. McDonald’s had built its success on a leg-endary operating system that amazed competitors and the financial community by generating an average annual return on equity of 25.2 per cent from 1965 through 1991, and an average annual earnings growth of 24.1 per cent. However, sales per unit had slowed between 1990 and 1991, causing management to wonder whether the company’s operating system, so vital in guaranteeing uniform quality and serv-ice at every McDonald’s outlet, was suited to the new circumstances the company faced. Top managers faced a vexing challenge: To what extent should McDonald’s change its operations strategy to accommodate the growing need for flexibility and variety in products. Was it merely tweaking, or a dramatic change, that would sup-port the company’s volume growth objectives?
the speedee service systemDick and Mac McDonald opened their first drive-in restaurant in 1941, relying on carhops – waiters who went from car to car – to take orders from patrons parked in the restaurant’s large lot. In 1948, the brothers abandoned their popular format and introduced self-service windows, 15-cent hamburgers, french fries and milk shakes. They standardised their preparation methods (in what they termed the ‘Speedee
Case study
1 MCdonald’s Corporationdavid upton
Source: Copyright © 1992 by the President and Fellows of Harvard College. Harvard Business School Case 693-028. This case was prepared by Professor David Upton and Joshua Margolis as the basis for class discussion rather than to illustrate either effective or ineffective handling of an administrative situation. Reprinted by permission of Harvard Business School.

344 Case study 1 • MCdonald’s Corporation
Service System’) with exact product specifications and customised equipment. Every hamburger, for example, was prepared with ketchup, mustard, onions and two pickles; the ketchup was applied through a pump dispenser that required just one squirt for the required amount. Ray Kroc, who held the national marketing rights to the multimixers used in the restaurants to make milk shakes, met the McDonald brothers in 1954. He was so impressed by their restaurant and its potential that he became a national franchise agent for the brothers, and founded the McDonald’s chain. Like the McDonald brothers’ first restaurant in San Bernardino, California, the McDonald’s chain featured a limited menu, low prices and fast service. From the moment in 1955 when he opened his first McDonald’s, in Des Plaines, Illinois, Kroc made the operating system his passion and his company’s anchor. Whereas many competitors could prepare products that were similar to McDonald’s, most focused on recruiting franchisees, which they promptly ignored, and on identifying the lowest-cost suppliers. Kroc, on the other hand, sought (1) to make sure McDonald’s products were of consistently high quality, (2) to establish a unique operating system, and (3) to build a special set of relationships between the McDonald’s cor-poration, its suppliers, and its franchisees (see Exhibit 1).
Getting it right – again and againMcDonald’s designed its operating system to ensure consistency and uniformity across all outlets. Operating procedures guaranteed customers the same quality of food and service visit after visit, store after store. Every hamburger, for example, was dressed in exactly the same way: mustard first, then ketchup, onions, and two pickles. One competitor marvelled at McDonald’s record of consistency: ‘I’ve been to McDonald’s in Tokyo, Vienna, and Australia, and I get a great sense of having the same product from each one of their locations. Most people haven’t been able to bring the discipline needed in fast food to get that type of consistency.’ McDonald’s operating system concentrated on four areas: improving the product; developing outstanding supplier relationships; improving equipment; and training and monitoring franchisees. In its quest for improvement, McDonald’s revolution-ised the entire supply chain, introducing innovations in the way farmers grew pota-toes and ranchers raised beef, altering processing methods for both potatoes and meat, and inventing efficient cooking equipment tailored to the restaurant’s needs. Most revolutionary, perhaps, was McDonald’s attention to detail. Never before had a restaurant cared about its suppliers’ product beyond the price, let alone the sup-pliers’ methods of operation. McDonald’s was able to spend as much time and effort as it did in perfecting its operating system because it restricted its menu to 10 items. Most restaurants in the 1960s and 1970s offered a variety of menu items, which made specialisation and uniform standards rare and nearly impossible. Fred Turner, one of Kroc’s original managers and later senior chairman of McDonald’s, stressed the critical importance of menu size in attributing success of the company’s operating system: ‘It wasn’t because we were smarter. The fact that we were selling just 10 items, had a facility that was small, and used a limited number of suppliers created an ideal environment for really digging in on everything.’ Turner developed the first operations manual in 1957 which, by 1991, reached 750 detailed pages. It described how operators should make milk shakes, grill

345Case study 1 • MCdonald’s Corporation
hamburgers and fry potatoes. It delineated exact cooking times, proper temperature settings, and precise portions for all food items – even prescribing the quarter ounce of onions to be placed on every hamburger and the 32 slices to be obtained from every pound of cheese. French fries were to be 9⁄32 of an inch, and to ensure quality and taste, no products were to be held more than 10 minutes in the transfer bin. McDonald’s patrolled suppliers and franchisees scrupulously. The meat in McDonald’s hamburgers, for example, had particular specifications: 83 per cent lean chuck (shoulder) from grass-fed cattle and 17 per cent choice plates (lower rib cage) from grain-fed cattle. Fillers were unacceptable. Whereas other restaurants merely accepted what suppliers provided and complained only when meat was visually inferior, McDonald’s routinely analysed its meat in laboratories. In 1991, McDonald’s spent $26.9 million on its field service operation to evaluate and assist each of its restaurants. Each of the company’s 332 field service consult-ants visited over 20 restaurants in the United States several times every year, review-ing the restaurants’ performance on more than 500 items ranging from rest-room cleanliness to food quality and customer service. Turner was the first corporate employee to visit and evaluate each restaurant and, as early as 1957, he summarised his evaluations by assigning a letter grade to a restaurant’s performance in three categories: quality, service and cleanliness (QSC). For more than 30 years, therefore, McDonald’s had prided itself on QSC and a fourth letter – V for value.2
McDonald’s meticulous attention to detail and careful analysis of quality and procedures did not come from an unbending need for regimentation. Instead, McDonald’s sought to study every component of its operation to learn what worked and what failed, to determine how best to offer consistently good service and food. Whereas other chains ignored both franchisees and suppliers, McDonald’s sought to elicit commitment from them – commitment that required not only adherence but experimentation. Turner explained: ‘We were continuously looking for a better way to do things, and then a revised better way to do things, and then a revised, revised better way.’
suppliersA simple handshake secured every arrangement between McDonald’s and a supplier, and it symbolised the way McDonald’s revolutionised the entire relationship. Jim Williams, head of Golden State Foods, which supplied McDonald’s with meat, con-trasted the traditional supplier/restaurant relationship with the changes McDonald’s introduced:
‘Deals and kickbacks were a way of life. How long you let a guy stretch out his payments was more the determining factor of whether you got the business than the quality of the product you were selling. Kroc brought a supplier loyalty that the restaurant business had never seen. If you adhered to McDonald’s specifications, and were basically competitive on price, you could depend on their order.’
When McDonald’s first approached the established food processing giants, such as Kraft, Heinz and Swift, the restaurant chain received a cold response. The established suppliers refused to accept McDonald’s concepts and specifications and continued to concentrate solely on the retail market. Only small, fledgling suppliers were will-ing to gamble on McDonald’s, and in turn, McDonald’s created a whole new set of major institutional vendors. Each McDonald’s restaurant ordered 1,800 pounds of

346 Case study 1 • MCdonald’s Corporation
hamburger meat per week and 3,000 pounds of potatoes. By meeting McDonald’s strict standards and price requests, suppliers were guaranteed future volumes from a burgeoning restaurant chain. A supplier described the novel relationship that developed:
‘Other chains would walk away from you for half a cent. McDonald’s was more con-cerned with getting quality. They didn’t chisel on price and were always concerned with suppliers making a fair profit. A lot of people look on a supplier as someone to walk on. But McDonald’s always treated me with respect even when they became much bigger and didn’t have to. That’s the big difference, because if McDonald’s said “Jump”, an awful lot of people would be asking “How high?”’
Suppliers grew alongside McDonald’s and were thus carefully attuned to the com-pany’s needs. As one supplier commented, ‘You’ve got to be deaf, dumb, and ignorant to lose McDonald’s business once you have it’.
FranchiseesMcDonald’s referred to its 3,500 US franchisees as its partners for good reason. By 1992, McDonald’s generated 39 per cent of its revenues from franchise restaurants. When Ray Kroc first sold franchises, he made sure that his ‘partners’ would make money before the company did, and he insisted that corporate revenue come not from initial franchise fees but from success of the restaurants themselves. That philosophy continued to be at the centre of McDonald’s franchise and operating practices. Franchise owners did indeed see themselves as partners, developing such products as the Filet-O-fish sandwich and the Egg McMuffin in the 1960s and the McDLT in the 1980s. Franchisees also formed powerful regional cooperatives for both advertis-ing and purchasing. Their regional advertising budgets enabled them to ‘customise’ local promotions while also supporting national programmes, and the buying co - operatives gave franchisees a channel for challenging suppliers to be innovative, even when those suppliers were meeting corporate requirements. Together with corporate management and suppliers, franchisees infused McDonald’s with an entrepreneurial spirit. All three partners balanced one another, just as the entrepreneurial inventiveness within each balanced their collective emphasis on disciplined standards of quality.
Cooking up productsNothing exemplified the success of McDonald’s operating system like the develop-ment of its food. From french fries to Chicken McNuggets, McDonald’s had distin-guished its menu offerings by drawing both on the rigorous operating system, with its focus on uniformity, and on the orchestra formed by corporate management, suppliers and franchisees.
in pursuit of the perfect fries
When McDonald’s first began operating, french fried potatoes accounted for approx-imately 5 per cent of the entire US potato crop. By 1985, french fries accounted for

347Case study 1 • MCdonald’s Corporation
more than 25 per cent of the US market. McDonald’s had made french fries standard fare for an American meal, but more important for McDonald’s, french fries became the restaurant chain’s most distinctive item. Ray Kroc was well aware of the import-ance of the chain’s fries:
‘A competitor could buy the same kind of hamburger we did, and we wouldn’t have any-thing extra to show. But the french fries gave us an identity and exclusiveness because you couldn’t buy french fries anywhere to compete with ours. You could tell the results of tender loving care.’
McDonald’s did indeed apply tender loving care in preparing its french fries. At first the company simply monitored the way french fries were cooked in its res-taurants, trying to determine the exact temperature and settings that yielded the best french fries. They discovered, however, that temperature settings on the fryers had little connection to the temperature of the oil in the vat once cold potatoes were dropped in. By putting temperature sensors in the vat and on potato slices, McDonald’s charted temperature readings during the cooking process. When a batch of cold, wet potatoes were thrown into a vat of melted shortening, the shortening’s temperature dropped radically. Each batch of fries fell to a different temperature, but, McDonald’s researchers discovered, the fries were always perfectly cooked when the oil temperature rose three degrees above the low temperature point. This discovery enabled the company to design a fryer that produced perfect french fried potatoes every order. The initial research team eventually learned that potatoes also need to be cured for three weeks to produce perfect french fries: in that period of time the sugars within potatoes convert into starches. To prevent excessive browning and permit uniform crispness through the fry, McDonald’s only accepted potatoes with a 21 per cent starch content. Members of the company’s field operations staff visited produce sup-pliers with hydrometers, a floating instrument that measured the starch content of potatoes when immersed in a bucket of water. As the number of McDonald’s outlets grew to over four hundred in the early 1960s, the company’s potato consumption surpassed six million pounds a year. That gave McDonald’s and its suppliers sufficient purchasing power to influence growers of Idaho Russet potatoes to adhere to planting practices that yielded potatoes with high starch content. McDonald’s also began looking for potato processors willing to invest in storage facilities with sophisticated temperature controls. In the early 1960s, Jack Simplot, a major potato grower who supplied 20 per cent of McDonald’s potatoes, approached McDonald’s with an idea for improving the chain’s french fries. He agreed to spend $400,000 to put Idaho Russets in cold stor-age during the summer, when they typically were not available. During the summer months, McDonald’s relied on California white potatoes, less suited to production of crisp french fries. Although his gamble failed, and all of the stored potatoes rotted, Simplot returned with another, bolder suggestion in 1965. He recommended that McDonald’s consider converting from fresh to frozen potatoes. Reluctant though the company was to tamper with its renowned french fries, Ray Kroc recognised the distribution problems involved in supplying fresh potatoes to his growing chain. Simplot pitched his idea to Kroc on the basis not of price but of qualiy, as he later explained:
‘They were having a hell of a time maintaining potato quality in their stores. The sugar content of the potatoes was constantly going up and down, and they would get fries with

348 Case study 1 • MCdonald’s Corporation
every colour of the rainbow. I told him that frozen fries would allow him to better control the quality and consistency of McDonald’s potato supply.’
McDonald’s studied the freezing process carefully learning that the traditional process robbed structure and flavour from french fries. Ice crystals would form in the potato during freezing, rupturing the starch granules. McDonald’s developed a process to dry french fries with air, run them through a quick frying cycle, then freeze them. This reduced the moisture in the frozen fry while preserving its crisp-ness. Simplot volunteered to build the initial production line that implemented this process, and by 1992, his company supplied McDonald’s with 1.8 billion pounds of french fries – close to 50 per cent of the chain’s domestic potato business. Only a small, local supplier when he first approached McDonald’s, Simplot’s organisation grew to a $650 million frozen potato processing giant. McDonald’s even improved the way restaurant crews filled orders for french fries. Operators had complained that employee productivity suffered because the metal tongs traditionally used to fill french-fry bags proved clumsy. In response, a McDonald’s engineer, Ralph Weimer, designed a V-shaped aluminum scoop with a funnel at the end that enabled operators to fill a french-fry bag in one motion and, in addition, align the fries in the same vertical direction within the bag.
Fast break from competitors: breakfast and the McMuffin
In June 1976, McDonald’s franchisees introduced the chain’s most significant new product: not just a new menu item but a new meal – breakfast. Most operators were sufficiently busy keeping their restaurants open between 11:00 a.m. and midnight, but a Pittsburgh franchisee looked at these hours as a limitation that offered an opportunity: ‘We were paying rent, utilities, and insurance 24 hours a day, but we were only open for business for half that time. We had all those morning hours before 11:00 a.m. to do some business.’ This franchisee began opening his restaurant at 7:00 a.m., serving coffee, dough-nuts, sweet rolls, pancakes, and sausage. Without detracting from McDonald’s exist-ing menu, he generated entirely new business. Other franchisees would agree to extend morning hours only if they happened upon a breakfast item that promised enormous sales growth. Herb Peterson, a franchise operator in Santa Barbara, California believed that to launch a new meal, McDonald’s required a unique product that could be eaten like all other McDonald’s foods – with the fingers. He turned to a classic egg dish – Eggs Benedict – for inspiration. In 1971, he developed a sandwich and a special utensil that could, in classic McDonald’s style, guarantee foolproof production of the sandwich. A cluster of six Teflon-coated rings could be used on a grill to give eggs the rounded shape of an English muffin while giving them the look and taste of poached eggs. When a slice of cheese and bacon were added, McDonald’s had developed the cornerstone prod-uct of its breakfast menu: the Egg McMuffin. McDonald’s rolled out a complete breakfast menu in 1976, featuring the Egg McMuffin, hotcakes, scrambled eggs, sausage, and Canadian-style bacon. McDonald’s had again distinguished itself from competitors, none of whom responded until the mid-1980s, by which time McDonald’s held a virtual monopoly on breakfast, which accounted for 15 per cent of average restaurant sales.
349Case study 1 • MCdonald’s Corporation
McDonald’s once again turned to suppliers for support in developing the Egg McMuffin; some were responsive while others lost a revolutionary opportunity. Pork processors, for example, worked with McDonald’s to build equipment that could cut round slices of bacon instead of strips.
Chicken comes to the golden arches
In the late 1970s, McDonald’s official chef, Rene Arend, tried to develop an onion product – deep-fried chunks of onion – but the variation in onion supplies made it difficult to control quality. Instead, CEO Fred Turner suggested that Arend substitute bite-sized chunks of deep-fried chicken. McDonald’s immediately turned to two suppliers to help develop the product in record time. Gorton, the original supplier of fish for McDonald’s Filet-O-Fish sandwich, was selected to solve the breading and battering challenge as it had done previously with fish. McDonald’s handed the most difficult challenge to Keystone, one of McDonald’s meat suppliers: find an efficient way to cut chicken into bite-sized, boneless chunks. Arend, meanwhile, developed four sauces to accompany the nuggets. The collaborative effort between McDonald’s and its suppliers produced breakthroughs that made the new product, Chicken McNuggets, not only possible but unique: a modified hamburger-patty machine that cut boneless chicken into nuggets, for example, and a special batter that gave the nuggets the taste and appear-ance of being freshly battered. By March 1980, just five months after beginning work on McNuggets, McDonald’s was testing them in a Knoxville restaurant. Within three years of introducing Chicken McNuggets throughout its chain, McDonald’s was deriving 7.5 per cent of domestic sales from its newest product. The giant of the hamburger business had suddenly become the second-largest chicken retailer in the food-service indus-try, positioned behind Kentucky Fried Chicken. Keystone’s efforts on behalf of McDonald’s again provided proof of the success bred by loyalty: by 1992, Keystone had 65 per cent of McDonald’s chicken business, transforming the meat supplier into a major chicken producer as well.
Competitors and growth
McDonald’s had built the most successful quick-service franchise in the world, maintaining phenomenal growth for over 35 years. Distinguishing itself from other chains by adhering tenaciously to an operating system focused on uniformity, it worked with its franchisees and suppliers as partners to improve the operating system and introduce new products. But as management reviewed McDonald’s per-formance in recent years, many wondered if the company’s traditional strategy still suited the dramatic changes it now seemed to face. McDonald’s share of the US quick-service market had dropped from 18.7 per cent in 1985 to 16.6 per cent in 1991, even though the company gained sales from a bigger quick-service ‘pie’. Despite this, between 1988 and 1990, sales per US outlet dropped an average of 3.7 per cent in real dollars. After years of double-digit income growth, McDonald’s 1991 net US income grew just 7.2 per cent to $860 million. It was estimated that by 1995, profit from overseas outlets would surpass profit from US outlets. Overseas business, in fact, showed the greatest growth in recent years, with operating income rising from $290 million in 1987 to $678 million in 1991.
350 Case study 1 • MCdonald’s Corporation
Although international expansion clearly offered McDonald’s its most fertile fron-tier, McDonald’s had to concentrate on US operations. There were 2,500 franchisees in the United States, over 8,814 restaurants (1,416 company-operated), and 25 per cent of company revenues came from franchise fees based on a percentage of sales. US business accounted for 60 per cent of profits, and it simply had to be bolstered. Moreover, McDonald’s had to consider demographic trends. Hamburger con-sumption had dropped from 19 per cent of all restaurant orders in 1982 to 17 per cent of all orders in 1990 (hamburger consumption at McDonald’s had nevertheless increased over the same time period). Increasingly, though, consumers were becom-ing more conscious of nutrition and dietary options without compromising taste. The change in dietary preference was, however, certainly not universal, and there was a strong constituency of customers who continued to enjoy McDonald’s tradi-tional fare. The quick-service industry had grown at an average annual rate of 8.7 per cent in the 1980s but was projected only to keep pace with inflation during the 1990s. Perhaps most confusing in its implications, the number of meals eaten off the premises of quick-service restaurants had increased from 23 per cent per cent in 1982 to 62 per cent in 1990. McDonald’s responded with double drive-through windows to keep pace with changing consumer preference, as well as new venues for its restaurants, such as schools, sporting arenas, museums, airports, and hospitals. It also developed new smaller restaurants, less expensive than its traditional designs, which could service customers profitably in ‘seam’ areas between existing McDonald’s restaurants.
new competition
The once simple quick-service market had been complicated by the entry of special-ist competitors who had emulated McDonald’s strategy to capture their own seg-ment of the market. Michael Quinlan, chairman of McDonald’s, acknowledged just how fierce the competition had become. ‘Our competition is much tougher, no question about it. And not just in numbers but in quality.’ McDonald’s most menacing competi-tion no longer came from Burger King, Wendy’s, or Kentucky Fried Chicken – the traditional rivals. Chili’s and Olive Garden catered to customers searching for full-service and greater variety. Both were family-style restaurants where patrons sat down to be served. Menus offered a wide variety of foods, yet prices remained competitive with those at McDonald’s (see Exhibit 2 for McDonald’s menu). Casual dining restaurants were likely to grow in the 1990s as their most frequent patrons – people between the ages of 40 and 60 – increased in number by about 20 million. Two hamburger chains, Sonic and Rally’s, offered drive-through service only and specialised in delivering burgers fast. For four years Sonic sales per restaurant grew an average of 11.3 per cent per annum, and in 1991 alone, sales per unit increased 13 per cent. There were 1,150 Sonic units and 327 Rally’s.3 Taco Bell featured Mexican food and a menu with 26 items under one dollar. Along with Kentucky Fried Chicken and Pizza Hut, Taco Bell was owned by PepsiCo and had seen the great-est increase in sales of any quick-service chain in the late 1980s. By learning from McDonald’s, Taco Bell shifted food preparation to outside suppliers, reduced kitchen space in its outlets, and used a cost-based strategy to compete – prices were always kept low. Between 1988 and 1991, Taco Bell served 60 per cent more customers and sales rocketed 63 per cent.
351Case study 1 • MCdonald’s Corporation
early responses from Mcdonald’s
McDonald’s drew on its traditional strengths to respond to competitors’ challenges and customers’ new habits. Careful product development, closely gauged to cus-tomer tastes, again formed the focus of attention as McDonald’s turned to suppliers and franchisees for assistance. To address concerns about nutrition, McDonald’s had introduced salads, chicken and muffins. In conjunction with Keystone and Auburn University, it developed the first ever 91 per cent fat-free burger, McLean Deluxe. Keystone also convinced McDonald’s to experiment with chicken fajitas, which proved an instant success in initial tests. The chicken arrived precooked and sea-soned, so it only required heating and did not slow operations. The fajitas sold well in market tests and were soon scheduled for national introduction. Just as McDonald’s had spent five years perfecting its breakfast menu for national rollout, the company spent seven years developing a pizza suitable for its restau-rants. Meticulous product development included design of advanced technology, as it had when McDonald’s engineers introduced a special french-fry scoop and a grill that prepared hamburgers in half the time by cooking them on both sides simul-taneously. Now McDonald’s engineers had invented a pizza oven that could cook McDonald’s pizza in under five minutes. In addition, McDonald’s was developing new staging equipment – high-tech temperature and moisture controlled cabinets – that would allow parts of a product to be prepared ahead of time without detracting from food quality. Toasted buns, for example, could be stored in these containers without becoming dried out. In early 1991, McDonald’s returned to a value menu, cutting prices an average 20 per cent. Cheeseburgers sold for only 69 cents, and McDonald’s Happy Meals™ – complete children’s meals (sandwich, fries, drink and toy in a colourful box) – for just $1.99. As a result, sales of hamburgers increased by 30 per cent and customer counts rose. Revenues and profits, however, increased less dramatically. These initial moves suggested a fundamental tension between McDonald’s expanded efforts to provide greater value, on the one hand, and enhanced variety, on the other. As Fred Turner noted, ‘We’re a penny-profit business’, and with a value menu, volume was critical. That made the chain’s hallmark of speed more vital than ever, yet a wider variety of menu offerings posed the risk of slowing each unit’s service. Variety and value had to be carefully balanced. Management’s challenge was to sustain McDonald’s painstaking attention to products and service in achieving that balance.
Flexibility and growthMcDonald’s had achieved success by focusing on a simple formula: limited menu, low prices, and fast service. The golden arches symbolised a uniform product – primarily burgers, fries and shakes – delivered in a consistent manner. Whereas uniformity and consistency had formed McDonald’s focal point for 35 years, the company’s new advertising slogan seemed to suggest a subtle yet significant shift: ‘What You Want Is What You Get at McDonald’s Today’. Catering to customers had always been the company’s focal point, but to meet changing and divergent customer needs, McDonald’s was exploring many different options, and manage - ment thought a basic question had to be answered. Would the chain’s new con - cern with flexibility in meeting customers’ changing needs require a fundamental
352 Case study 1 • MCdonald’s Corporation
change in McDonald’s bedrock strategy? Or was this just a new, albeit incred-ibly complicated, situation once again adaptable to the company’s traditional approach? Early responses to new customer desires and intensifying competition represented just a piece of the company’s maelstrom of creative activity. Further efforts were in progress as well. For example, McDonald’s had developed a number of new building prototypes, from drive-through-only models to compete with Rally’s and Sonic, to small cafes suitable for small towns. Menu diversification offered the greatest area of experimentation. A wide range of items was being tested, including lasagne, carrot sticks, corn on the cob, fruit cups, and oven-baked chicken. McDonald’s was also looking for new ways to address nutritional concerns revolving around calcium deficiency and sodium and fat reduction. McDonald’s changes to date had not threatened its traditional operating system, but increased variation throughout the chain – whether in menu offerings, build-ing plans, or eating experience – would pose formidable challenges to McDonald’s in maintaining its remarkable quality control and speed of service. The operat-ing system had been constructed to ensure uniformity, quality, and speed at all McDonald’s restaurants. If the chain intended to offer a wider variety of foods, such as spaghetti and meatballs or baked chicken, it could disrupt an operating system built around a limited menu. McDonald’s traditional rival, Burger King, afforded an example of the dangers con - tained in variety. Burger King flame-broil – if the flame-broiled Burger King burgers were cooked correctly. But flame-broiled hamburgers were inconsistent in quality and Burger King was not able to implement an operating system that could sustain consistency across all units. Increasing variety posed another potential dilemma for McDonald’s. As the chain responded to pricing challenges from competitors like Taco Bell, higher volume became imperative. To generate higher volume at each restaurant, speed became even more important, and speed could not be risked on a cornucopia of new products. Although the new menu items McDonald’s had thus far tested, such as chicken fajitas, had not clogged operations and were well-received by franchisees, McDonald’s had to guarantee similar smoothness with some of the more exotic products under consideration, whether chicken, spaghetti or corn on the cob. The sheer number of additional products could also detract from the speed of service. McDonald’s perfected its operating procedures and equipment in part to accommodate its workforce, whose annual turnover rate was greater than 100 per cent (nevertheless, the lowest in the industry). While McDonald’s commitment to training continued to set the industry standard, no McDonald’s outlet could afford to engage in complicated preparation processes for new products that might work at cross-purposes with speed of service. If those challenges did not prove sufficiently daunting to the quick-service giant, it also had to consider restaurant image if it hoped to expand its business through enhanced variety. McDonald’s had built its image as the place for hamburgers and quick service – not for other food and not for casual dining. If people sought Mexican food, they would go to Taco Bell. If people wanted pizza, they would go to Pizza Hut. If they wanted to sit down to a leisurely, reasonably priced meal, Olive Garden, Chili’s, Perkin’s, TGI Friday’s, and Friendly’s all came to mind before McDonald’s. Not only did McDonald’s have to extend its own image, it also had to confront the established reputations of competitors.

353Case study 1 • MCdonald’s Corporation
These challenges appeared especially troubling because dinner presented perhaps the final frontier of potential growth. Only 20 per cent of McDonald’s sales came from dinner, and to entice customers to visit the golden arches for dinner required a new menu – as it had for breakfast – and even a different ambiance. To defend against competitors, McDonald’s could not introduce dinner items one by one. Competitors could tout their specialties and thus respond easily. McDonald’s, there-fore, had to present an entire dinner menu at once, and the earliest possible date for such a rollout appeared to be the spring of 1993. Dinner differed in other ways too. Lunch and breakfast customers were most con-cerned with speed and convenience, but dinner was more of an event, and custom-ers expected full meals and more complete service. Tablecloths and table service, for example, did not seem out of the question. With 62 per cent of 1990 quick-service sales coming from off-premises eating, compared to just 23 per cent in 1982, the trends for lunch and breakfast seemed to be headed in the opposite direction. While these competitive pressures mounted, a new challenge had been growing: protecting the environment. While many companies had seen the outbreak of environ-mentalism in the late 1980s as a threat – McDonald’s saw an opportunity: the chance of knitting a responsible environmental policy into its evolving operations strategy. Management considered all of these challenges and knew McDonald’s would like to maintain the same core menu, operating systems, and decor. The chain nonethe-less would have to allow greater latitude across units and provide a broader variety of products and experiences for the customer. But would there still be such a thing as a standard McDonald’s?
notes on the case
1 With 250 million people living in the United States, McDonald’s was serving roughly 8 per cent of the US population daily.
2 Franchisees could not be graded on value because it violated antitrust regulations, which prohibited rigid pricing and required independent business owners be given the latitude to set prices on their own.
3 Therrien (1991) ‘The Upstarts Teaching McDonald’s A Thing or Two’ Business Week, 21 October, p. 122.
exhibit 1 Mcdonald’s original menu
HAMBURGER 15c ROOT BEER 10cCHEESEBURGER 19c OREANGEADE 10cFRENCH FRIES 10c COCA COLA 10cMILK 10c COFFEE 10cMILK SHAKE Chocolate Strawberry Vanilla 20c
McDonalds

354 Case study 1 • MCdonald’s Corporation
exhibit 2 Mcdonald’s menu, 1992
APPROVED NATIONAL MENU ITEMS – Listed on Menu Boards – (Effective 6/1/92)
Regular Menu Items
1.Hamburger 19.MediumFries 2.Cheeseburger 20.LargeFries 3.QuarterPounderwithCheese 21.LowfatMilkShakes 4.BigMac 22.1%Milk 5.McLeanDeluxe(andcheeseoption)(8,12,16oz.) 23.Drink–ChildSize(12oz.) 6.McChickenSandwich 24.Drink–Small(16oz.) 7.McNuggets–6Piece 25.Drink–Medium(21.9oz.) 8.McNuggets–9Piece 26.Drink–Large(32oz.) 9.McNuggets–20Piece 27.OrangeJuice10.HappyMeal–Hamburger 28.Coffee(8,12,16oz.)11.HappyMeal–Cheeseburger 29.DecaffeinatedCoffeeFreshBewed12.HappyMeal–4pc.McNuggets 30.HotTea13.Filet 31.IcedTea(12,16,21.9,32oz.)14.ChunkyChickenSalad 32.ApplePie15.ChefSalad 33.ChocolateChipCookie16.GardenSalad 34.McDonaldlandCookies17.SideSalad 35.Sundaes18.SmallFries 36.Cones
Breakfast Menu Items
1. EggMcMuffin 2. SausageMcMuffinw/Egg 3. BigBreakfast 4. HotcakesandSausage 5. SausageBiscuit 6. Sausage/EggBiscuit 7. Bacon/Egg/CheeseBiscuit 8. BreakfastBurrito 9. HashBrowns10. AppleBranMuffin(fatfree)11. Cereal(Wheaties&Cheerios)
APPROVED NATIONAL ‘VALUE MENU COMBOS’ – Listed on Menu Board – (Effective 6/1/92)
Regular Menu Breakfast
1. BigMac,Lg.Fry,Med.Drink 1. EggMcMuffin,anysizedrink2. 2Cheeseburgers,Lg.Fry,Med.Drink 2. BaconEgg&CheeseBiscuit,anysizedrink3. QuarterPounderw/Cheese,Lg.Fry,Med.Drink 3. SausageMcMuffinw/Egg,anysizedrinka4. McChicken,Lg.Fry,MediumDrink a4. SausageBiscuitw/Egg,anysizedrink
aThe#4positioncanbeusedasaflexibleoptionwithprovidedoptionsbeingMcLeanDeluxe,2ChickenFajitas,Filet-O-Fish,orHotcakesduringBreakfast.Source:companydocument.

‘When you are a small player in this business you really do need to develop your own approach to doing business. We are not in the same game as BASF or DuPont. Our key objectives have always been based on three things – niche markets, focused production and innovative products.’
(Paul Mayer – CEO, Delta Synthetic Fibres)
By the standards of the synthetic fibre industry, DSF was a very small, but interna-tional and technically successful company. For over eight years the company had been heavily dependent on one range of products based on the polymer ‘Britlene’, which it had developed itself in the late 1990s. By 2004, Britlene products accounted for 97 per cent of total revenue (the other 3 per cent came from the sale of licences). In fact, since it was founded in the 1970s, the company had always limited itself to a single product range at one time. The original product range ‘Teklon’ had been replaced by ‘Deklon’, which had in turn been replaced by ‘Britlene’. None of these product changes had required substantial changes to the company’s processes.
‘I guess that, until now, we have been lucky in only having one product range to con-centrate on. This means that the early parts of our manufacturing process have to cope with relatively little variety. There are different grades and variants of the basic Britlene polymer but only five or six main varieties, with around 10 or 12 “specials”, which we make for specific customers. The real variety comes later on in the process, in the extru-sion stage and especially in the finishing and packing stages. We have 35 extrusion “pat-terns” which, together with 17 “finishes” and 10 to 12 pack types, means that we have potentially around seven thousand ways of producing each polymer grade. Of course, as usual, 20 per cent of possible end product codes account for 80 per cent of our output. However, I feel it is important that we should try and control this variety. Not only does it add complexity to the process, it will become an even greater problem if we do not tackle it before we start producing Britlon as well as Britlene.’
(Paul Mayer, CEO)
The Britlene range was used mainly as a ‘blend fibre’ in heavy-duty clothing, although smaller quantities were used to produce industrial goods such as tyre cord, flexible industrial drives and insulating sleeves. Its main properties were very high wear resistance, together with high thermal and electrical insulation. Sales of Britlene products, especially in the United States had started to fall off in 2004 as competitor products eroded DSF’s traditional markets. These products rarely matched the technical specification of the Britlene products but were significantly less expensive.
case study
2 delta synthetic Fibres (dsF)nigel slack
From britlene to britlonIn 2004 the company had developed a new product range built around a new poly-mer to be known as Britlon. Britlon polymers had all the properties of Britlene but were superior in their strength, heat resistant qualities and electrical insulation. It was hoped that these additional properties would open up new clothing uses (for example, as a substitute for mineral wool) as well as allowing entry into the far larger markets associated with thermal and electrical insulation. By late 2004, after some delays, the major technical and engineering problems associated with bulk produc-tion of the Britlon range seemed to have been solved.
‘Britlon has come later than we hoped. Partly this is because it is a genuine advance in product formulation and we had some difficult technical problems to overcome. I have to admit though that partly the delay was due to not starting Britlon development early enough. Our Marketing colleagues have been telling us for some time that an enhanced product range could have a significant impact on the market around this time. Yet now, because of construction lead-times, we are in the position of not being able to introduce the Britlon range into the market until early 2006.’
(Paul Mayer, CEO)
The basic production method for both the Britlene and Britlon ranges was similar to that of most synthetic fibres. An oil-based organic chemical is polymerised (a process of joining several molecules into a long chain) in conditions of intense pressure and heat, often by the addition of a suitable catalyst. This polymerisation takes place in large autoclaves (like an industrial pressure cooker). The polymer is then extruded (forced through a nozzle like the rose of a garden watering can), rapidly cooled and then finished in a variety of ways, for example, spun on to cones or collected in bales. After this, a variety of different conversion processes were used to add value before the product was shipped to the customer. The later stages of the production processes were relatively flexible. With some ‘change-over’ losses in productivity, the equipment could be used to process most types of fibre with little modification. However, the early stages in the process, par-ticularly the polymerisation stage, were usually designed for one range of polymer and might need substantial modification before a different polymer range could be made. For this reason a new Britlon line or a Britlene line converted to produce the Britlon range, could only produce Britlon products, just as a Britlene line could only produce Britlene products.
current facilitiesCurrently the Britlene range was produced at the company’s three factories: Teesside in the UK, Hamburg in Germany and Chicago in the USA. The largest site was Teesside with three lines. There was one line at each of the other two sites. All five production lines had a nominal design capacity of 5.5 million kg per year of Britlene. However, after allowing for change-over losses, maintenance and holidays, expected output was around 5 million kg per year. Each plant operated on a 24 hours per day, seven days per week basis. The cost of raw materials was more or less the same at each location, but labour costs, general employment costs, local taxation and energy costs did vary. The
356 case study 2 • delta synthetic Fibres (dsF)

Hamburg plant had the highest production costs followed by the Chicago plant, with the Teesside plant having the lowest cost per kg produced (at full utilisation). However, the cost differences between the plants were less than the differences in the input costs. Partly this was because of higher productivity at both the Hamburg and Chicago plants, and partly because all three Teesside lines were relatively old and prone to breakdown.
dsF’s marketsThe largest single market for the Britlene range was still the UK, although the per-centage of sales to UK customers had declined from over 60 per cent in 1998 to around 41 per cent in 2004. The potential for volume growth was greatest in the Far East markets, especially South East Asia, and least in the UK. Earnings growth potential however was likely to be greatest in continental Europe and the USA. In terms of market sector sales, both industrial and domestic clothing were growing only slowly for DSF, while the company’s sales into general industrial markets had grown from practically nothing in 1990 to around 13 per cent of sales in 2004 and were likely to grow further in the next five years especially in the USA. Thermal and electrical insulation markets, after fast growth in the early 2000s, had grown only slowly over the last two years.
‘We are trading in two quite different types of market. Clothing, both industrial and domestic, is relatively predictable, and we are established suppliers with a relatively large share of a very small market. The industrial and insulation markets however are far larger in themselves and we have only a tiny share. In the clothing markets we are competing, usually on price, against very similar products. In the other markets we are competing against a whole range of different materials, usually on product performance and supply flexibility.’
(Tim Williams, Vice-President Marketing)
Exhibit 1 shows market volumes for 2004. Tim Williams also saw the new Britlon product range changing the sales profile of the company.
‘Britlon products will be based on a technically superior material which is also likely to be marginally less expensive to produce. We should be able to, at least, maintain our share of the clothing market and possibly stop the margin erosion we have suffered in this sector over the last few years. But the real benefits are going to show in the Insulation and, to only a slightly less extent, in the Industrial markets. The improved strength and insulation properties of the Britlon range should let us capture a greater share of a larger and more profitable market. Also, because we will have two product ranges, we can dif-ferentiate between different market needs in different parts of the world. The future will be one where we will have far more choice as to how we position ourselves in our markets. But it will also be one where we will face increased level of market uncertainty.’
Exhibit 2 shows the aggregated volume and price forecasts for both products for 2005 through to 2010.
357case study 2 • delta synthetic Fibres (dsF)

creating a britlon capabilityThe production process needed to manufacture the Britlon range was very similar to that used for the Britlene range, however a totally new type of polymerisation unit would be needed prior to the extrusion stage. Also the technologies for polymerisa-tion were mutually exclusive. Britlon and Britlene products could not be produced on the same line. Early in the development of Britlon, DSF had approached Alpen GmbH, an international chemical plant construction company, for help on a large-scale plant design of the new unit. Together they produced and tested an accept-able design for the new line and had explored different construction methods. Essentially there were two ways of acquiring Britlon capacity. DSF could convert the old Britlene-based lines, or it could construct entirely new lines. For a conversion a new polymer unit would need to be constructed alongside the old line (without interfering with production). When complete it would be connected to the extrusion unit which would itself require only minor conversion. Alpen were quoting a lead-time of two years for both the construction of a new Britlon line or to convert an old Britlene plant to Britlon production.
‘The long lead-times which are being quoted for constructing this type of process are partly a result of a high level of demand for Alpen’s services because of their reputation for providing sound technical solutions in process design. Also, I guess they are a bit cau-tious because of the technical novelty of the Britlon process.’
(Liam Flaherty, Vice-President Operations)
Although the lead-time for building a new line was the same as for a conversion, the capital cost of the latter was lower. Exhibit 3 shows the capital estimates for both conversion and new lines. Economies of scale were such that, whether converted or built new, the capacity of Britlon plants would be around 5 million kg per year.
Focus or flexibility?Liam Flaherty, the Vice-President of Operations, based at Teesside, was keen to take advantage of the opportunities provided by the introduction of the Britlon range. In particular, he wanted to avoid concentrating exclusively on the problems posed in the short-term by the introduction of new Britlon capacity.
‘I know that getting the capacity expansion strategy right must be a priority. It is a major investment programme for the company and we must keep tight control of how the new capacity is installed. However, we are also laying down the structure of the company’s operations for the long-term. In effect we are moving, for the first time, into being a “two product range” company. This presents us with a whole range of issues which either we have not faced before or we have avoided confronting.’
(Liam Flaherty, Vice-President Operations)
Liam had already identified what he regarded as some of the key questions in a report to Paul Mayer. These were as follows.
●● Should every site produce both product ranges, or should we try and develop ‘Centres of Expertise’ for the two product ranges?
●● Even if all three sites do produce both product ranges, should each site specialise in one part of each product range?
358 case study 2 • delta synthetic Fibres (dsF)

●● How can we make sure that all sites understand their contribution to the com-pany’s overall operations capability? In other words, should strategic operations decisions still be made at the centre or should we allow each site some degree of autonomy in developing their own strategies for their markets or their product ranges?
●● In the longer term should we give different sites different roles in developing our overall operations capability? For example, Chicago has shown particular enthu-siasm (and enjoyed some success) in improving both productivity and flexibility on its line. It has done this mainly through a series of incremental technology improvements to the process. Because of this, should it be given responsibility for process improvement, even though traditionally this responsibility has been seen as belonging to the central technical resource at Teesside?
●● Following from this last point, what should be the role of our central technology resource? In the past it has been good at understanding the practicalities of imple-menting modifications to our existing technology in a ‘top-down’ way. However, it has been less good at motivating and training factory level operations people in the three sites to take responsibility on themselves for improvement.
●● How can we link our technology/operations capabilities with sales and market-ing? So far we have prospered through pushing our new technologies out into the market, but this is unlikely to be successful in the future. Although Britlon’s enhanced performance will give a major boost to sales, increasingly it will be small product modifications which will win us extra business. I’m sure there will be some big technology breakthroughs in the future. But we can’t wait for these to come through every few years. The future is more likely to be one of fast devel-opment and response to specific customer needs in a wider variety of markets.
the capacity working groupIn the autumn of 2004 Paul Mayer set up the capacity working group to consider the introduction of the new product range and all its implications. However, he did place some limits on what the company would do.
‘Liam is right, we have to consider the underlying issues and assumptions behind the reconfiguration of our operations, but for the time being we need to confine ourselves to existing sites. In the short-term the creation of an entirely new site would increase the complexities of multi-site operation to an unacceptable level. Conversely, the complete closure of one of the three existing sites is, I consider, a waste of the manpower and physical resources that we have invested in that location. I believe expansion could take place at one, two or all of the existing sites. In the future however all things are possible. For example, it may make sense to develop a new site in Asia both to service the growing Eastern markets and to take advantage of lower costs.’
(Paul Mayer, CEO)
359case study 2 • delta synthetic Fibres (dsF)

360 case study 2 • delta synthetic Fibres (dsF)
exhibit 1 current market volumes by product and region, 2004 (millions of kg)
Market sectors UK Continental Europe USA Far East
Clothing – industrial 8.04 3.74 1.69 1.84
Clothing – domestic 1.22 0.09 N.A. N.A.
Clothing – general 0.52 1.02 1.10 0.73
Thermal insulation 0.41 0.39 1.01 N.A.
Electrical insulation 0.18 0.64 1.10 0.98
Total 10.37 5.88 4.90 3.55
exhibit 2 Forecasts britlene and britlon ranges
Potential sales
Britlene (all products) millions of kg p.a. Britlon (all products) millions of kg p.a.
2004 (actual) 24.7
2005 22
2006 20
2007 17 3 (assuming availability)
2008 13 16
2009 11 27
2010 10 29
Average price forecast (p. per kg)
Britlene (across all products) Britlon (across all products)
2005 98 –
2006 98 –
2007 95 125
2008 90 120
2009 85 120
2010 85 120

361case study 2 • delta synthetic Fibres (dsF)
exhibit 3 estimated britlon capital costs
The table below gives estimated costs and stage payments required by Alpen for Britlon polymer line and extrusion unit construction.
Type of order Cost (£ million) Timing
Whole new ‘Britlon’ line including 4.8 Begin 6 months from orderpolymer and extrusion units Onstream 2 years from order
Conversion of ‘Britlene’ line to 3.0 Begin 6 months from order ‘Britlon’ line Onstream 2 years from order
The cost of a new plant is payable in three six-monthly instalments – £1,000,000 being due one year after ordering; £1,000,000 due six months later and the balance on completion. The cost of a conversion is payable in three six-monthly instalments of £1,000,000; one year and 18 months from the order and on completion.
In Greenville, South Carolina, is the largest piece of technology within the Carlsen group, described by the company as ‘the most advanced machine of its type in the world, which will enable us to achieve new standards of manufacturing excellence for products requiring absolute cleanliness and precision in production’ and ‘a quantum leap in harness-ing economies of scale, new technology and new forms of organisation to provide the plant of the 21st century’. The Greenville plant was joining Carlsen’s, two existing US plants in North Carolina, 100 km from the new plant. Both the old plants offered precision custom coating and laminating services to a wide range of customers, amongst the most important being, Phanchem for whom it made dry photoresist imaging films, a critical step in the printed wiring board manufacturing process. Yet, although the Greenville plant was seen as being right for the 21st century, its origins lay back in 1998.
‘The Big One’Nineteen ninety-eight was a traumatic year for Carlsen’s photoresist imaging busi-ness. Prior to that, it had been the clear market leader based on high quality, com-petitive costs and excellent working relationships with its customers. So when Grade Graphics, the company’s major competitor, introduced a new coating technology, enabling it to produce product at levels of cleanliness significantly better than Carlsen, the shock was severe.
We paid millions in customer rejections and the coating machine was down for eight months. Imagine it; we just didn’t make any of this product line for eight months! it was a very painful experience. Up to then we had acted as though we would always be the best. It was this competitive failure which woke us up.
(Will Small, Vice-President and General Manager, Carlsen Custom)
By modifying its own coating technology, the company overcame the worst of its problems and by mid-1999 had recovered most of its market share. Yet, the experi-ence had convinced Carlsen that it should be considering more radical manufactur-ing methods. A team, led by Will Small, was formed to create a concept for a coating machine that would push the boundaries of process technology further than anything considered previously, with a large capacity, faster speed, state-of-the-art automation and ultra clean conditions. This could result in lower costs and very high quality levels.
case sTudy
3 The Greenville OperaTiOnnigel slack
Source: Revised October 2006. Some data have been changed for reasons of commercial confidentiality. This case is for the purposes of class discussion, and is not intended to illustrate either good or bad management practice.

‘We called this machine “The Big One”. It was a kind of design exercise I guess, but with a very serious intent. it was a “mind-expanding” experience yet with a clear business goal’.
(Greg Russell, Engineering Manager, Greenville)
However, shortly after the creation of the ‘The Big One’ concept, market forecasts were revised downwards and the project was abandoned. However, all who had participated in the ‘The Big One’ team were convinced of the value of the process.
‘During the time of incubation which followed the exercise many of the ideas that we had put into “The Big One” were changed and modified as new technology became available and as our ideas developed. But “The Big One” had planted the seed so the effort that we put in, although aborted at the time, did lead us to be able to be more effective when we got to the point of doing it in reality.’
(Greg Russell)
‘The Big One’ resurrectedBy 2000, forecasts of demand once again indicated a need for extra coating capacity and work started on examining how this extra capacity might be provided. It was thought that a new low-cost operation could secure a very large part of Phanchem’s future business – perhaps even an exclusive agreement to supply 100 per cent of their needs. After consideration three options were presented to Carlsen’s board.
A. Expand an existing site by building a new machine within existing site bound-aries. This would provide around 120 to 130 million square feet (MSF) per year of additional capacity and require somewhat less than $15 million in capital expenditure.
B. Build a new facility alongside the existing plant. This new facility could accom-modate additional capacity of around 150 MSF per year but, unlike option A, would also allow for future expansion. Initially this would require around $18 million capital.
C. Set up a totally new site with a much larger increment of capacity (probably around 250 MSF per year). This option could also incorporate much of the ‘The Big One’, ultra clean technology which had been explored previously. This option would be much more expensive, almost certainly in excess of $28 million.
Will Small and his team initially favoured option B but in discussion with Carlsen Group senior management, opinion shifted towards the more radical option C.
‘It may have been the highest risk option but it held considerable potential and it fitted with the Carlsen Group philosophy of getting into high-tech specialised areas of business. So we went for it.’
(Will Small)
The option of a very large, ultra clean, state-of-the-art facility also had a further advantage – it could change the economics of the photoresist imaging industry. Worldwide demand and capacity did not immediately justify investing in such a large increase in capacity. In fact, there was probably some overcapacity in the industry. But a ‘The Big One’ type operation would provide a level of quality at such low costs that, if there was overcapacity in the industry, it would not be Carlsen’s capacity which would by lying idle.
363case sTudy 3 • The Greenville OperaTiOn
designing the new plantDetailed decisions were needed in four interrelated areas.
●● Capacity – what type of factory should be built, how big should it be, and where should it be built?
●● Technology – what type of coating technology should be installed?
●● Organisation – what type of work organisation would be appropriate for the new plant?
●● Supply relationships – what should be the relationship with Phanchem?
capacity
The team considered two options for the coating machine capacity. The first was to install two coating lines, each with around 150 MSF per year. This was a reason-ably ambitious option given that the largest machine existing at that time had a capacity of around 100 MSF per year. However, this paled beside the second option which was to install a single prototype machine with a capacity of over 250 MSF per year. Although risky and requiring more technological development, it would be more effective in its use of capital and, potentially, would allow very efficient use of labour. The risk was that effective capacity might be reduced because of lower yields from such a big and untried machine, especially if there were changeover losses. The location of the new plant would also have to be decided. It should be within two to three hours’ drive of the division’s headquarters, and also had to be a non-attainment area for ozone under US Environmental Protection Agency (EPA) rules. It would need good communications, be near an interstate highway and preferably close to an interstate intersection. Furthermore, it should be reasonably close to an airport and be in an area that would attract professionals because of the ‘quality of life’ available.
‘We contacted the government representatives of both North Carolina and South Carolina. Interestingly those in South Carolina were much more receptive. The North Carolina guys did not seem to be as excited at the prospect of the new plant.’
(Greg Russell)
The site at Greenville was selected partly because of the cooperation from the South Carolina authorities and partly because of the intrinsic attractiveness of the area. In retrospect, it was felt that perhaps not all the effort expended on choosing a site was justified.
‘One of the things we learnt from the whole process of finding a site was that we ought to not necessarily go for the best site possible. Rather look until you’ve found something which meets your needs and then stop.’
(Will Small)
Technology
Two decisions regarding the design of the process technology faced the team. First, what type of drying technology to incorporate within the line? And second, what kind of feed system should be installed to deliver the coating material to the coating heads? The decision over the drying technology was a choice between traditional
364 case sTudy 3 • The Greenville OperaTiOn

and radical options. A traditional approach involved drying using relatively low energy levels applied to the material over a long web path. The more radical solution was to subject the material to higher energy levels over a shorter web path. A major advantage of high energy drying was that, if it worked, it would give significantly lower capital costs, and potentially slightly lower processing costs. However, there were risks in choosing high energy systems because quality levels were sometimes difficult to control. A similar decision faced the team over the technical design of the feed system which transported the coating material to the coating heads after mixing. Sophisticated, computer controlled feed systems involving complex piping arrangements between the mixing and coating areas were available on the market. Although expensive, these seemed to offer convenient linking with process control technology, less phys-ical handling of the material, and greater flexibility. On the other hand, a simple piped system was both considerably less expensive and more robust.
Focus or flexibility?It became clear that there was one issue which was underlying all the team’s dis-cussions – how flexible should the process be? Should the team assume that they were designing a plant which would be dedicated exclusively to the manufacture of photoresist imaging film for the foreseeable future, and ruthlessly cut out any tech-nological options that would enable them to manufacture other products, or should they design a more general purpose plant which was suitable for photoresist imag-ing film, but could be adapted to coat other products? It proved a difficult decision.
●● The advantages of the more flexible option were obvious. ‘At least it would mean that there was no chance of me being stuck with a plant and no market for it to serve in a couple of years’ time.’ (Harry Barton, Plant Manager)
●● But the advantages of a totally dedicated plant were less obvious, although there was a general agreement that both costs and quality could be superior in a focused plant.
The team decided on a mixture of the adventurous and the conservative, deciding to go for a single large machine, but using robust, conventional drying and feed line technologies. They also decided to focus on a relatively non-flexible single dedicated large machine.
‘You can’t imagine the agonies we went through when we decided not to make this a flexible machine. Many of us were not comfortable with saying, “This is going to be a photoresist machine exclusively, and if the market goes away we’re in real trouble”. We had a lot of debate about that. Eventually we more or less reached a consensus for focus but it was certainly one of the toughest decisions we ever made.’
(Harry Barton)
The capital cost savings of a focused facility and operating costs savings of up to 25 per cent were powerful arguments, as was the philosophy of total process dedication.
‘The key word for us was focus. We wanted to be quite clear about what was needed to sat-isfy our customer in making this single type of product. As well as providing significant cost savings to us it made it a lot easier to identify the root causes of any problems because we would not have to worry about how it might affect other products. It’s all very clear. When the
365case sTudy 3 • The Greenville OperaTiOn

line was down we would not be generating revenue! It would also force us to understand our own performance. At our other plants, if a line goes down, the people can be shifted to other responsibilities. We don’t have other responsibilities here – we’re either making it or we’re not.’
(Greg Russell)
Work organisationIn the same way that many of the technical ideas which found their way into the Greenville plant had their origins some years earlier, so the pattern of work organisa-tion and the concept of self-managed team work had been discussed for some time. The Greenville project provided the opportunity to use them. However, before com-mitting themselves, the team members drew up a list of 15 reasons why they should adopt the self-managed work team approach and 15 reasons why they should not do so. These are set out in the table below.
366 case sTudy 3 • The Greenville OperaTiOn
Reasons why we should do it Reasons why we should not do it
It will allow us to change rapidly We are currently successful
Enriches jobs for all employees We are inexperienced in using/implementing such a concept
Increases employee ‘ownership’ Starting a new operation. We have plenty going on as it is
Greater technical requirements demand it Culture of people we recruit or transfer might not adapt to it
More fulfilling for all employees involved We do not have the support of Middle Management
If it leads to high quality, it will lead to lower cost It is a big piece of our business to risk
Therefore, we think this method will increase Increased training costs/employee costs. We might our profitability have to pay more to get more
Involves all employees in a joint venture to achieve Risks, personnel policies, legalities, etc. customer satisfaction
If our objective is to stay number one, we must change Immediate impact on other Carlsen plants our people/management philosophy to stay abreast, etc.
May be the last opportunity to do this for 10 years We may not have enough time to do it right
Competition may try it before us Unmet expectations by more high calibre employees
It will attract a higher-calibre employee Uncertain consequences of failure. (flexible, thinking) Would we be better off for having tried and failed or
better off not to try?
People are the way you think they are Are we willing to reward for success
Our value statement – ‘Let’s walk like we talk Takes away some (or all) management controlregarding the worth and dignity of people, quality, customers, etc.’
The people we recruit will want change Human beings resist change

recruiting the work teamsThe team members were in favour of going ahead with the team approach and early in 2003 they started the recruitment process. Over 1,500 applicants for the posi-tions of production technician were interviewed. Two hundred passed this initial screening, from which 100 were selected for team interviews that involved four people from marketing, technical and manufacturing. The team interviews whittled the 100 down to 28, with whom the company started pre-employment classes. This consisted of four, four-hour sessions per week over nine weeks. Both morning and evening sessions were conducted in order to accommodate people who were work-ing a second- or third-shift job. The pre-employment classes were also intended to test the candidates’ willingness to stretch themselves and their desire to join the company. Out of the 24 who completed the training programme, 19 who excelled in team exercises and interactive skills were selected to join the firm. All 19 accepted.
starting upThe plant started producing in June 2003, with a capacity at start-up of 325 MSF per year, working on a seven-day basis. Notwithstanding some initial teething troubles it was, from the start, a technical and commercial success. In October 2000 a contract was signed with Phanchem to supply 100 per cent of Phanchem’s needs for the next 10 years. Phanchem’s decision was based on the combination of manufacturing and business focus which the Greenville team has achieved, a point stressed by Harry Barton:
‘Co-locating all necessary departments on-site was seen as particularly important. All the technical functions and the marketing and business functions are now on site. Our other plants are 60 km from their marketing and support functions. Yet those 60 km are really significant. In terms of the mind-set, it might as well be 600 km.’
Will Small was also convinced that Greenville’s team-based approach was the foun-dation of the plant’s success:
‘Our associates are now well used to the idea that nothing ever stays the same, that we have to adapt, change, and improve no matter how successful we are. They understand business objectives and customer needs as well as any manager. It was certainly the only time in my career when I saw a work team take over a machine which still had some problems to iron out and yet immediately took responsibility for it themselves.’
developing the supply relationshipAt the time of the start-up, product produced in Greenville was shipped to Phanchem’s facility in Massachusetts, over 1,000 km away. This distance caused a number of problems including some damage in transit and delays in delivery. However, the relationship between Carlsen and Phanchem remained sound; helped by the two companies’ co-operation during the Greenville start-up.
‘We had worked closely with them during the design and construction of the new Greenville facility. More to the point, they saw that they would certainly achieve cost savings from the plant, with the promise of more savings to come as the plant moved down the learning curve.’
(Harry Barton)
367case sTudy 3 • The Greenville OperaTiOn

With the 100 per cent supply agreement, Carlsen and Phanchem increasingly adopted a partnership philosophy towards the business. In particular the idea of a physically closer relationship between Carlsen and Phanchem was explored.
‘During the negotiations with Phanchem for our 100 per cent contract there had been some talk about co-location but I don’t think anyone took it particularly seriously. Nevertheless there was general agreement that it would be a good thing to do. After all, our success as Phanchem’s sole supplier of coated photoresist was tied in to their success as a player in the global market, what was good for Phanchem was good for Carlsen.’
(Will Small).
Several options were discussed within and between the two companies. Phanchem had, in effect, to choose between four options:
●● Stay where they were in Massachusetts.
●● Locate in the same part of the country but not too close to Carlsen.
●● Locate on the adjacent site across the road from the Greenville plant.
●● Co-locate within an extension built to the Carlsen plant at Greenville.
The state of the carlsen–phanchem relationshipThe closeness of the relationship between the two companies was a result of their staff working together in solving the issues involved in starting the Greenville plant. Partly also it was born from adversity. Carlsen’s engineers had hit problems with the line’s winding mechanism. They found that the problems derived from ‘bowed’ paper cores. Moving to more rigid steel cores eliminated the problem. But, until rigid plastic cores could be sourced, Phanchem staff had to cope with the heavier loads. Carlsen engineers were impressed by their customer’s willingness to help out by doing this while they worked on finding suitable lighter cores. A second prob-lem concerned the auto-splicer. Carlsen’s engineers were not convinced that the auto-splicer would work consistently on a long-term basis. Yet, Phanchem could not afford any interruption to supplies from Greenville if the auto-splicer failed. To prevent this happening, Carlsen’s engineers rushed through a capital approval for $400,000 to install an accumulator that would ensure the continuity of supply to Phanchem.
‘The splicing problem was potentially very serious. But we made a conscious effort to keep the customer fully informed. In fact, they were very helpful in doing anything they could to help us sort the problem. Partly because we worked together on that problem the rela-tionship has grown stronger and stronger. They have become a real part of the partnership rather than someone waiting on the side lines expecting product to come to them. They agonised when we failed and they shared the sense of achievement when we succeeded.’
(Harry Barton)
evaluating the co-location optionsRelatively early in the discussions between the two companies, the option of ‘doing nothing’ by staying in Massachusetts was discounted. The advantages of some kind of move, both in cost savings and in ease of communications, were significant. The
368 case sTudy 3 • The Greenville OperaTiOn

option of Phanchem moving to a site 45 km from Greenville was considered but rejected because it had no advantages over locating even closer to the Greenville plant. Phanchem also strongly considered building and operating a facility across the road from the Greenville plant. But eventually the option of locating in a build-ing attached to Carlsen’s coating plant was the preferred option.
‘There was a lot of resistance to having a customer on the same site as ourselves. At one stage we said we would never do it. No one in Carlsen had ever done it before and we couldn’t imagine working so closely with a customer. The step from imagining our cus-tomer across the road to imagining them on the same site took some thinking about. It was a matter of getting used to the idea, taking one step at a time.’
(Will Small)
Yet, the more the options were discussed, the more it became obvious to both companies that the best plan was to have Carlsen build an extension to the Greenville plant and lease it to Phanchem. Co-location would have a signifi- cant impact on Phanchem’s competitiveness by reducing their operating costs. This would enable them to gain market share by offering quality film at attrac- tive prices, thus increasing volume for Carlsen. The managers at the Greenville plant also looked forward to an even closer operational relationship with the customer
The proposalBy August of 2002 the Greenville managers presented their proposal for extending the plant, but to their surprise the proposal was not well received by Carlsen’s main board when it was presented at a capital budget meeting.
‘We were beaten up severely at that meeting. Providing factory space seemed a long way from our core business. Although we understood that this company is not in the real estate business, we felt we had a good package and could put together a leasing deal which was profitable in its own right and enhance our ability to make profit in our main business of coating.’
(Will Small)
However, after several months of persuasion, the proposal was eventually approved by the end of 2005. Nevertheless, there was still concern over actually sharing a facil-ity, and as a condition the board insisted that the door between the two companies areas should be capable of being locked from both sides.
The customer becomes a paying guestThe construction of the new extension proceeded smoothly with no significant deviations from the design or timeframe. Phanchem took occupancy in October 2006 and was slitting sellable product within one week of moving in. The construc-tion and commissioning of the new facility was also a model of cooperation.
‘We involved the customer from the very beginning. The few problems which our cus-tomer had in moving down here were really problems of shifting their operations rather than any interface problems with us. In fact we could help in the installation of their
369case sTudy 3 • The Greenville OperaTiOn

equipment. Our maintenance people looked after some of their equipment for a while until they got settled in.’
(Harry Barton)
Now, all visitors to the plant are shown the door that had to be ‘capable of being locked from both sides’ and asked how many times they think it has been locked. The answer, of course, is ‘never’.
370 case sTudy 3 • The Greenville OperaTiOn

‘Before the crisis the quality department was just for looks, we certainly weren’t used much for problem solving, the most we did was inspection. Data from the quality depart-ment was brought to the production meeting and they would all look at it, but no one was looking behind it.’
(Quality Manager, Preston Plant)
The Preston plant of Rendall Graphics was located in Preston, Vancouver, across the continent from their headquarters in Massachusetts. The plant had been bought from the Georgetown Corporation by Rendall in March 2000. Precision coated papers for ink-jet printers accounted for the majority of the plant’s output, especially paper for specialist uses. The plant used coating machines that allowed precise coat-ings to be applied. After coating, the conversion department cut the coated rolls to the final size and packed the sheets in small cartons.
The curl problemIn late 1998 Hewlett-Packard (HP), the plant’s main customer for ink-jet paper, informed the plant of some problems it had encountered with paper curling under conditions of low humidity. There had been no customer complaints to HP, but their own personnel had noticed the problem, and they wanted it fixed. Over the next seven or eight months a team at the plant tried to solve the problem. Finally, in October of 1999 the team made recommendations for a revised and considerably improved coating formulation. By January 2000 the process was producing accept-ably. However, 1999 had not been a good year for the plant. Although sales were reasonably buoyant the plant was making a loss of around $2 million for the year. In October 99, Tom Branton, previously accountant for the business, was appointed as Managing Director.
Slipping out of controlIn the spring of 2000, productivity, scrap and re-work levels continued to be poor. In response to this, the operations management team increased the speed of the line and made a number of changes to operating practice in order to raise productivity.
‘Looking back, changes were made without any proper discipline, and there was no real concept of control. We were always meeting specification, yet we didn’t fully under-stand how close we really were to not being able to make it. The culture here said, “If it’s within specification then it’s OK” and we were very diligent in making sure that the product which was shipped was in specification. However, Hewlett-Packard gets
caSe STudy
4 Turnround aT The PreSTon PlanTnigel Slack

“process charts” that enables them to see more or less exactly what is happening right inside your operation. We were also getting all the reports but none of them were being internalised, we were using them just to satisfy the customer. By contrast, HP have a statistically-based analytical mentality that says to itself, “You might be capable of making this product but we are thinking two or three product generations forward and asking ourselves, will you have the capability then, and do we want to invest in this relationship for the future?”’
(Tom Branton)
The spring of 2000 also saw two significant events. First, Hewlett-Packard asked the plant to bid for the contract to supply a new ink-jet platform, known as the Vector project, a contract that would secure healthy orders for several years. The second event was that the plant was acquired by Rendall.
‘What did Rendall see when they bought us? They saw a small plant on the Pacific coast losing lots of money.’
(Finance Manager, Preston Plant)
Rendall was not impressed by what it found at the Preston plant, which was making a loss and had only just escaped from incurring a major customer’s disapproval over the curl issue. If the plant did not get the Vector contract, its future looked bleak. Meanwhile, the chief concern continued to be productivity, but also, once again, there were occasional complaints about quality levels. However, HP’s attitude caused some bewilderment to the operations management team.
‘When HP asked questions about our process the operations guys would say, “Look we’re making roll after roll of paper, it’s within specification. What’s the problem?”’
(Quality Manager, Preston Plant)
But it was not until summer that the full extent of HP’s disquiet was made:
‘I will never forget June of 2000. I was at a meeting with HP in Chicago. It was not even about quality. But during the meeting one of their engineers handed me a control chart, one that we supplied with every batch of product. He said “Here’s your latest control chart. We think you’re out of control and you don’t know that you’re out of control and we think that we are looking at this data more than you are.” He was absolutely right, and I fully understood how serious the position was. We had our most important cus-tomer telling us we couldn’t run our processes just at the time we were trying to persuade them to give us the Vector contract.’
(Tom Branton)
The crisisTom immediately set about the task of bringing the plant back under control. They first of all decided to go back to the conditions which prevailed in the January, when the curl team’s recommendations had been implemented. This was the state before productivity pressures had caused the process to be adjusted. At the same time the team worked on ways of implementing unambiguous ‘shut-down rules’ that would allow operators to decide under what conditions a line should be halted if they were in doubt about the quality of the product they were making.
372 caSe STudy 4 • Turnround aT The PreSTon PlanT

‘At one point in May of 2000 we had to throw away 64 jumbo rolls of out-of-specification product. That’s over $100,000 of product scrapped in one run. Basically that was because they had been afraid to shut the line down. Either that or they had tried to tweak the line while it was running to get rid of the defect. The shut-down guidelines in effect say, “We are not going to operate when we are not in a state of control”. Until then our operators just couldn’t win. If they failed to keep the machines running we would say, “You’ve got to keep productivity up”. If they kept the machines running but had quality problems as a result, we criticised them for making garbage. Now you get into far more trouble for violating process procedures than you do for not meeting productivity targets.’
(Engineer, Preston Plant)
This new approach needed to be matched by changes in the way the communica-tions were managed in the plant.
‘We did two things that we had never done before. First, each production team started holding daily reviews of control chart data. Second, one day a month we took people away from production and debated the control chart data. Several people got nervous because we were not producing anything. But it was necessary. For the first time you got operators from the three shifts meeting together and talking about the control chart data and other quality issues. Just as significantly we invited HP up to attend these meetings. Remember these weren’t staged meetings, it was the first time these guys had met together and there was plenty of heated discussion, all of which the Hewlett-Packard representa-tives witnessed.’
(Engineer, Preston Plant)
At last something positive was happening in the plant and morale on the shop floor was buoyant. By September 2000 the results of the plant’s teams’ efforts were starting to show results. Process were coming under control, quality levels were improving and, most importantly, personnel both on the shop floor and in the management team were beginning to get into the ‘quality mode’ of thinking. Paradoxically, in spite of stopping the line periodically, the efficiency of the plant was also improving. Yet, the Preston team did not have time to enjoy its emerging success. In September of 2000 the plant learned that it would not get the Vector project because of the recent quality problems. Then Rendall decided to close the plant:
‘We were losing millions, we had lost the Vector project, and it was really no surprise. I told the senior management team and said that we would announce it probably in April of 2001. The real irony was that we knew that we had actually already turned the corner.’
(Tom Branton)
convincing the rest of the worldNotwithstanding the closure decision, and convinced that their overall performance could be substantially improved, the management team in Preston set about the task of convincing both HP and Rendall, that the plant could be viable. The team figured it would take three things. First, it was vital to continue to improve quality. Second, costs had to be brought down so as to lower the break-even volume of the plant substantially. Third, the plant had to create a portfolio of new product ideas which could establish a greater confidence in future sales.
373caSe STudy 4 • Turnround aT The PreSTon PlanT

First – quality
Progressing with their quality initiative involved establishing full statistical process control (SPC) and increasingly capable processes. (Exhibits 1 and 2 show how pro-cess variation reduced through this period and how process capability improved.) It also meant establishing quality consciousness and problem solving tools throughout the plant.
‘We had people out there, professional engineers and operators, who saw themselves as concerned with the project rather than the processes that made it. But taking time out for quality meetings and discussing process performance and improvement, we got used to discussing the basic capabilities that we needed to improve.’
(Quality Manager, Preston Plant)
Second – get costs down
Working on cost reduction was inevitably going to be painful. The first task was to get an understanding of what should be an appropriate level of operating costs.
‘We went through a zero-based assessment to decide what an ideal plant would look like, and the minimum number of people needed to run it. By the way, in hindsight, cutting numbers had a greater impact on cost than the payroll saving figures seems to suggest. If you really understand your process, when you cut people it cuts complexity and makes things clearer to understand.’
(Tom Branton)
Although most staff had not been informed of Rendall’s closure decision, they were left in no doubt that the plant had its back to the wall.
‘We were careful to be very transparent. We made sure that everyone knew whether they would be affected or not. I did lots of walking around explaining the company’s position. There were tensions and some negative reactions from the people who had to leave. Yet most accepted the business logic of what we were doing.’
(Tom Branton)
By December of 2000 there were 40 per cent fewer people in the plant than two months earlier. All departments were affected. Surprisingly the quality department shrank more than most, moving from 22 people down to nine.
‘When the plant was considering down-sizing they asked me, “How can we run a lab with six technicians?” Remember that at this time we had 22 technicians. I said, “Easy. We get production to make good paper in the first place, and then we don’t have to control all the garbage. That alone would save an immense amount of time. Also, having some-one working with the suppliers so that we can guarantee to give production good material and take that problem out of the equation saves people as well.”’
(Quality Manager, Preston Plant)
Third – work on new products
Several new ideas were investigated; including some that were only possible because of the plant’s enhanced capability. The most important of these became known as ‘Greenwrap’, a product, aimed particularly at the Japanese market. Short of landfill
374 caSe STudy 4 • Turnround aT The PreSTon PlanT
space, newsprint companies wanted their suppliers to ship newsprint in a wrap that could be repulped. Producing a protective wrap that was recyclable, an effective bar-rier against moisture, and could keep the newsprint free of welts and buckles was technically difficult. However, the plant’s newly acquired capabilities allowed it to develop appropriate coatings at a cost that made the product attractive.
out of the crisisIn spite of their trauma in the autumn, the plant’s management team faced Christmas of 2000 with increasing satisfaction, if not optimism for the plant’s future. In December it made an operational profit for the first time for over two years. By spring of 2001 even HP, at a corporate level, were starting to look more favourably on the Preston plant. It was becoming obvious to HP that the plant really had made a major change. More significantly, HP had asked the plant to start work on trials for a new product – ‘heavyweight’ paper. April 2001 was a good month for the plant. It had chalked up three months of profitability (which was to be the start of routine double-digit return on sales). HP formally gave the heavyweight ink-jet paper contract to Preston, and were generally more up-beat about the future. At the end of April, Rendall reversed its decision to close the plant.
The futureBoth 2001 and 2002 were profitable years for the Preston plant. By the end of 2002 the plant had also captured the majority of Hewlett-Packard’s Canadian business and was being asked to work on several other large projects.
‘Hewlett-Packard now seems particularly keen to work with us. I’m sure that one reason is that we have been obliged to understand their way of doing business. It has helped us with our own suppliers also. We have already given considerable assistance to our main paper supplier with improving their own internal process control procedures. Recently we were in a meeting with people from all different parts of HP. There was all kinds of con-fidential information going around. But you could never tell that there was an outsider (us) in the room. They were having arguments amongst themselves about certain issues and no one could have been there without feeling that basically we were a part of that company. In the past they’ve always been very close with some information. Basically the change is all down to their new found trust in our capabilities.’
(Tom Branton)
375caSe STudy 4 • Turnround aT The PreSTon PlanT
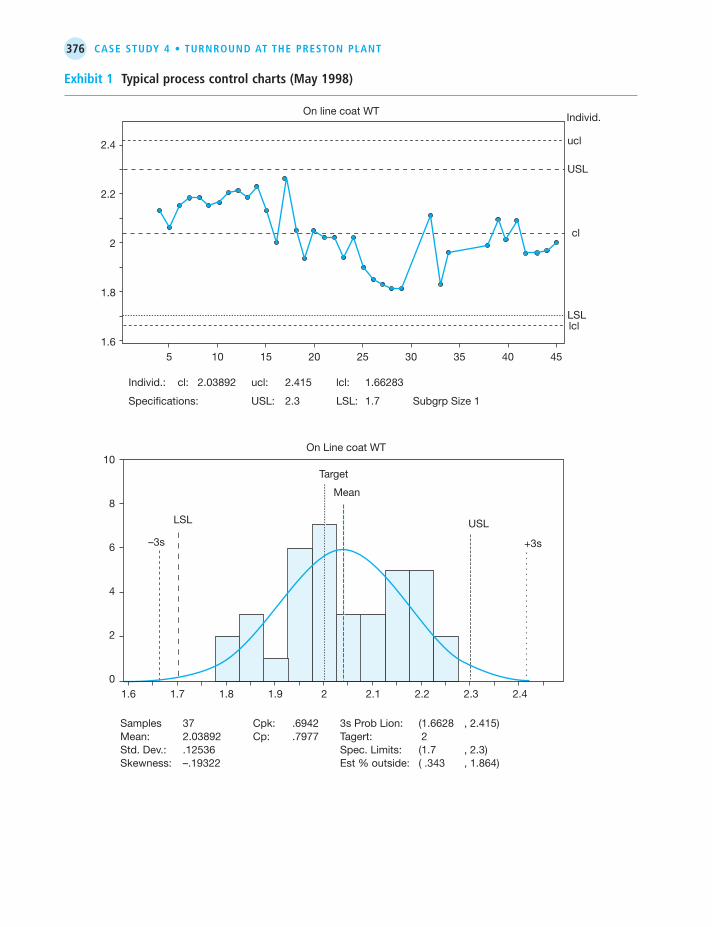
376 caSe STudy 4 • Turnround aT The PreSTon PlanT
exhibit 1 Typical process control charts (May 1998)
2.4
2.2
2
1.8
1.65
Individ.: cl: 2.03892 ucl: 2.415 lcl: 1.66283
Specifications: USL: 2.3 LSL: 1.7 Subgrp Size 1
10 15 20 25 30 35 40 45
ucl
USL
cl
LSLlcl
On line coat WTIndivid.
10
8
6
4
2
01.6
Samples 37 Cpk: .6942 3s Prob Lion: (1.6628 , 2.415)Mean: 2.03892 Cp: .7977 Tagert: (2Std. Dev.: .12536 Spec. Limits: (1.7 , 2.3)Skewness: –.19322 Est % outside: ( .343 , 1.864)
1.7 1.8 1.9 2 2.1 2.2 2.3 2.4
LSL
Target
Mean
USL
–3s +3s
On Line coat WT

377caSe STudy 4 • Turnround aT The PreSTon PlanT
exhibit 2 Typical process control charts (January 1999)
2.2
2
1.8
5 10 15 20 25
ucl
USL
cl
LSL
lcl
On line coat WTIndivid.
Individ.: cl: 2.01786 ucl: 2.10631 lcl: 1.9294
Specifications: USL: 2.3 LSL: 1.7 Subgrp Size 1
8
6
4
2
01.7 1.8 1.9 2 2.1 2.2 2.3
LSL
Target
Mean
USL
–3s +3s
On Line coat WT
Samples 28 Cpk: 3.19 3s Prob Lion: ( 1.9294 , 2.1063)Mean: 2.01786 Cp: 3.392 Taget: (2Std. Dev.: .029484 Spec. Limits: (1.7 , 2.3)Skewness: –.75762 Est % outside: ( .0000 , .0000)

In August 2006, the company behind Disneyland Resort Paris reported a 13 per cent rise in revenues, saying that it was making encouraging progress with new rides aimed at getting more visitors. ‘I am pleased with year-to-date revenues and especially with third quarter’s, as well as with the success of the opening of Buzz Lightyear Laser Blast, the first step of our multi-year investment programme. These results reflect the group’s strategy of increasing growth through innovative marketing and sales efforts as well as a multi-year investment programme. This performance is encouraging as we enter into the important summer months’, said Chairman and Chief Executive Karl L. Holz. Revenue for the quarter ending 30 June rose to €286.6 million ($362 million) from €254 mil-lion a year earlier. The results helped to boost overall profits at Disney Company, and the company’s stock price soared. Yet, it hadn’t always been like that. The fourteen-year history of Disneyland Paris had more ups and downs than any of its rollercoasters. The company had hauled itself back from what some commentators had claimed was the brink of bankruptcy in 2005. In fact, from 12 April 1992 when Euro Disney opened through to this more optimistic report, the resort had been subject simultane-ously to both wildly optimistic forecasts and widespread criticism and ridicule. An essay on one critical internet site (called ‘An Ugly American in Paris’) summarised the whole venture in this way:
‘When Disney decided to expand its hugely successful theme park operations to Europe, it brought American management styles, American cultural tastes, American labor prac-tices, and American marketing pizzazz to Europe. Then, when the French stayed away in droves, it accused them of cultural snobbery.’
The ‘magic’ of DisneySince its founding in 1923, the Walt Disney Company had striven to remain faith-ful in its commitment to ‘producing unparalleled entertainment experiences based on its rich legacy of quality creative content and exceptional storytelling’. It did this through four major business divisions: Studio Entertainment, Parks and Resorts, Consumer Products, and Media Networks. Each segment consists of integrated businesses that worked together to ‘maximise exposure and growth worldwide’.
case sTuDy
5 DisneylanD ResoRT PaRisnigel slack
Source: This case was prepared by Nigel Slack of Warwick Business School, Warwick University, United Kingdom, using published sources of information. It does not reflect the views of the Walt Disney Company, who should not be held responsible for the accuracy or interpretation of the information or views contained in this case. It is not intended to illustrate either good or bad management practice. Copyright © 2006 Nigel Slack.
In the Parks and Resorts division, according to the company’s description, cus-tomers could experience the ‘magic of Disney’s beloved characters’. It was founded in 1952, when Walt Disney formed what is now known as ‘Walt Disney Imagineering’ to build Disneyland in Anaheim, California. By 2006, Walt Disney Parks and Resorts operated or licensed 11 theme parks at five Disney destinations around the world. They were, Disneyland Resort, California, Walt Disney World Resort, Florida, Tokyo Disney Resort, Disneyland Resort Paris, and their latest park, Hong Kong Disneyland. In addition, the division operated 35 resort hotels, two luxury cruise ships and a wide variety of other entertainment offerings. But in the history of the Walt Disney Company, perhaps none of its ventures had proved to be as challenging as its Paris Resort.
service delivery at Disney resorts and parks
The core values of the Disney Company and, arguably, the reason for its success, originated in the views and personality of Walt Disney, the company’s founder. He had what some called an obsessive focus on creating images, products and experi-ences for customers that epitomised fun, imagination and service. Through the ‘magic’ of legendary fairytale and story characters, customers could escape the cares of the real world. Different areas of each Disney Park are themed, often around vari-ous ‘lands’ such as Frontierland, Fantasyland, Tomorrowland and Adventureland. Each land contains attractions and rides, most of which are designed to be accept-able to a wide range of ages. Very few rides are ‘scary’ when compared to many other entertainment parks. The architectural styles, decor, food, souvenirs, and cast costumes were all designed to reflect the theme of the ‘land’, as were the films and shows. Although there were some regional differences, all the theme parks followed the same basic setup. Over the years, Disney had built up a reputation for imaginative rides. Its ‘imagineers’ had years of experience in using ‘auto animatronics’ to help recreate and reinforce the essence of the theme. The terminology used by the com-pany reinforced its philosophy of consistent entertainment. Employees, even those working ‘back stage’, were called cast members. They did not wear uniforms but ‘costumes’, and rather than being given a job they were ‘cast in a role’. All park visi-tors were called ‘guests’. Disney employees were generally relatively young, often of school or college age. Most were paid hourly on tasks that could be repetitive even though they usually involved constant contact with customers. Yet, employees were still expected to maintain a high level of courtesy and work performance. All cast members were expected to conform to strict dress and grooming standards. Applicants to become cast members were screened for qualities such as how well they responded to ques-tions, how well they listened to their peers, how they smiled and used body lan-guage, and whether they had an ‘appropriate attitude’. All Disney parks had gained a reputation for their focus (some would say obses-sion) with delivering a high level of service and experience through attention to operations detail. To ensure that their strict service standards were met they had developed a number of specific operations policies.
●● All parks employed effective queue management techniques such as providing information and entertainment for visitors.
379case sTuDy 5 • DisneylanD ResoRT PaRis

●● Visitors (guests) were seen as having a role within the park. They were not merely spectators or passengers on the rides, they were considered to be participants in a play. Their needs and desires were analysed and met through frequent interac-tions with staff (cast members). In this way they could be drawn into the illusion that they were actually part of the fantasy.
●● Disney’s stated goal was to exceed their customers’ expectations every day.
●● Service delivery was mapped and continuously refined in the light of customer feedback.
●● The staff induction programme emphasised the company’s quality assurance pro-cedures and service standards. These were based on the four principles of safety, courtesy, show and efficiency.
●● Parks were kept fanatically clean.
●● The same Disney character never appears twice within sight – how could there be two Mickeys?
●● Staff were taught that customer perceptions are both the key to customer delight, but also are extremely fragile. Negative perceptions can be established after only one negative experience.
●● Disney University was the company’s in-house development and learning facility with departments in each of the company’s sites. The university trained Disney’s employees in its strict service standards as well as providing the skills to operate new rides as they were developed.
●● Staff recognition programmes attempted to identify outstanding service delivery performance as well as ‘energy, enthusiasm, commitment, and pride’.
●● All parks contained phones connected to a central question hot-line for em - ployees to find the answer to any question posed by customers.
Tokyo Disneyland
Tokyo Disneyland was owned and operated by the Oriental Land Company. Disney had designed the park and advised on how it should be run. In return, they received 10 per cent of all admissions revenues, and 5 per cent of food and souvenir revenues. The Tokyo project was considered a great success. Japanese customers revealed a significant appetite for American themes, American brands, and already had a good knowledge of Disney characters. Feedback from visitors at the Tokyo park was extremely positive. Visitors commented on the cleanliness of the park, the efficiency of staff members, and the courtesy with which they were treated. Visitors also appre-ciated the Disney souvenirs (a wider range than in the American parks) because giving gifts is deeply embedded in the Japanese culture. Although the Tokyo park was almost identical to Disney’s Californian park, there had been no complaints about the dilution of Japanese culture by so strong an American themed entertain-ment. The Japanese operators had added many new attractions since its opening. Many signs were written in English as were cast members’ name badges. Similarly, many of the live shows and attractions were conducted in English and although almost all visitors to the park were Japanese, only one out of its thirty restaurants sold Japanese food. The success of the Tokyo park was explained by one American living in Japan:
380 case sTuDy 5 • DisneylanD ResoRT PaRis

‘Young Japanese are very clean-cut. They respond well to Disney’s clean-cut image, and I am sure they had no trouble filling positions. Also, young Japanese are generally comfort-able wearing uniforms, obeying their bosses, and being part of a team. These are part of the Disney formula. Also, Tokyo is very crowded and Japanese here are used to crowds and waiting in line. They are very patient. And above all, Japanese are always very polite to strangers.’
Disneyland Tokyo had opened in 1982. Because Disney was wary of losing money on the Japanese venture it decided not to own the Tokyo site – a decision it came to regret. Disney also regretted allowing hotels owned by other companies to be built at its earlier US Disneyland parks, to the extent that Disney only owned about 25 per cent of hotels in the vicinity. It decided that it would take full control of Euro Disney and all its hotels.
Disneyland ParisBy 2006 Disneyland Paris consisted of three parks: the Disney village, Disneyland Paris itself and the Disney Studio Park. The village was comprised of stores and restaurants; Disneyland Paris was the main theme park; and Disney Studio Park has a more general moviemaking theme. Yet, the idea of a European park was not new. Because many of Walt Disney’s most successful animations were taken from European literature, he had always wanted to build a park in Europe. In the event, his wish wasn’t completed until 25 years after his death. But when the Walt Disney Company planned its European venture, its reputation was riding high and it was confident of success. At the time of the European park’s opening, more than two million Europeans visited the US Disney parks, accounting for 5 per cent of the total visitors. The company’s brand was strong and it had over half a century of translat-ing the Disney brand into reality. The name ‘Disney’ had become synonymous with wholesome family entertainment that combined childhood innocence with high-tech ‘imagineering’.
alternative locations
Formal plans to build a European Disney Park were first considered as early as 1975. Initially, as well as France, Germany, Britain, Italy and Spain were all considered as possible locations, though Germany, Britain and Italy were soon discarded from the list of potential sites. The decision soon came to a straight contest between the Alicante area of Spain, which had a similar climate to Florida for a large part of the year and the Marne-la-Vallée area just outside Paris. Certainly, winning the contest to host the new park was important for all the potential host countries. The new park promised to generate more than 30,000 jobs. It was the French location that eventually won out, partly because of the close proximity to the large population of the Paris conurbation and the city’s attraction as a tourist centre. Also its central positioning within Western Europe was though to be crucial to if it was to attract sufficient visitors. Early concerns that the park would not have the same sunny, happy feel in a cooler climate than Florida were allayed by the spectacular success of Disneyland Tokyo in a location with a similar climate to Paris. The first letter of agreement was signed with the French government in December 1985, and started to draw up the financial contracts during the following
381case sTuDy 5 • DisneylanD ResoRT PaRis

spring. Robert Fitzpatrick, a key organiser of the 1984 Los Angeles Olympics, was appointed as the Euro Disney President, and construction started on the 2,000 hec-tare site in August 1988. But from the announcement that the park would be built in France, it was subject to a wave of criticism. One critic called the project a ‘cultural Chernobyl’ because of how it might affect French cultural values. Another described it as ‘a horror made of cardboard, plastic, and appalling colours; a construction of hard-ened chewing-gum and idiot folk lore taken straight out of comic books written for obese Americans’. However, as some commentators noted, the cultural arguments and anti-Americanism of the French intellectual elite did not seem to reflect the behaviour of most French people, who ‘eat at McDonalds, wear Gap clothing, and flock to American movies’. The major advantage of locating in Spain was the weather. However, the eventual decision to locate near Paris was thought to have been driven by a number of factors that weighed more heavily with Disney executives. These included the following:
●● There was a site available just outside Paris which was both large enough and flat enough to accommodate the park.
●● The proposed location put the park within a two-hour drive for 17 million people, a four-hour drive for 68 million people, a six-hour drive for 110 million people and a two-hour flight for a further 310 million or so.
●● The site also had potentially good transport links. The Euro Tunnel that was to connect England with France was due to open in 1994. In addition, the French autoroutes network and the high-speed TGV network could both be extended to connect the site with the rest of Europe.
●● Paris was already a highly attractive vacation destination and France generally attracted around 50,000,000 tourists each year.
●● Europeans generally take significantly more holidays each year than Americans (five weeks of vacation as opposed to two or three weeks).
●● Market research indicated that 85 per cent of people in France would welcome a Disney park in their country.
●● Both national and local government in France were prepared to give significant financial incentives (as were the Spanish authorities) including an offer to invest in local infrastructure, reduce the rate of value added tax on goods sold in the park, provide subsidised loans, and value the land artificially low to help reduce taxes. Moreover, the French government were prepared to expropriate land from local farmers to smooth the planning and construction process.
The resort was to be 49 per cent owned by the Walt Disney Company and 51 per cent owned by a company called Euro Disney SCA which was quoted on the French stock exchange. Initially all shares were offered to European investors. The Walt Disney Company was to receive management fees and royalty fees based on the park’s revenues as well as an incentive-based management fee calculated on the park’s cash flow.
Designing Disney land Resort Paris
Phase 1 of the Euro Disney Park was designed to have 29 rides and attractions as well as six hotels with over 5,000 rooms in total. In addition, the park had a
382 case sTuDy 5 • DisneylanD ResoRT PaRis

championship golf course together with many restaurants, shops, live shows, and parades. Although the park was designed to fit in with Disney’s traditional appear-ance and values, a number of changes were made to accommodate what was thought to be the preferences of European visitors. For example, market research indicated that Europeans would respond to a ‘wild west’ image of America. Therefore, both rides and hotel designs were made to emphasise this theme. Disney was also keen to diffuse criticism, especially from French left-wing intellectuals and politicians, that the design of the park would be too ‘Americanised’ and would become a vehicle for American ‘cultural imperialism’. To counter charges of American imperialism, Disney gave the park a flavour that stressed the European heritage of many of the Disney characters, and increased the sense of beauty and fantasy. They were, after all, competing against Paris’s exuberant architecture and sights. For example, Discoveryland featured storylines from Jules Verne, the French author. Snow White (and her dwarfs) was located in a Bavarian village. Cinderella was located in a French inn. Even Peter Pan was made to appear more ‘English Edwardian’ than in the ori-ginal US designs. Disney conceded to the pressure for French to be the language of the park with English taking second place. The American actor, Vincent Price’s voice-over for the Phantom Manor, that was used initially, was replaced by a French actor. Only Price’s maniacal laugh remained. In keeping with their desire to make this park more ‘European’, even the story behind the Disneyland Paris Phantom Manor (named The Haunted Mansion in the US versions), although open to interpretation, was changed to include bits of The Phantom of the Opera and Great Expectations. Main Street USA, built in the idealised style of America at the beginning of the twentieth century, contained ornate shopping arcades one of which (diplomatically!) contains an exhibition telling the history behind the presentation of the Statue of Liberty by France to the USA in a spirit of friendship. Because of concerns about the popularity of American ‘fast-food’, Euro Disney introduced more variety into its restaurants and snack bars, featuring foods from around the world. In a bold publicity move, Disney invited a number of top Paris chefs to visit and taste the food. Some anxiety was also expressed concerning the different ‘eating behaviour’ between Americans and Europeans. Whereas Americans preferred to ‘graze’, eating snacks and fast meals throughout the day, Europeans generally preferred to sit down and eat at traditional meal times. This would have a very significant impact on peak demand levels on dining facilities. A further concern was that in Europe (especially French) visitors would be intolerant of long queues. To overcome this, extra diversions such as films and entertainments were planned for visitors as they waited in line for a ride. Discoveryland was new for a Disney park, it was based on the concept of the future based on past European Visionaries. Fantasyland was also new in that it had its own new ‘European’ attractions, along with a newly created castle especially for Euro Disney. Adventureland gained some extra new areas, again with a more authentic ‘European’ look than in previous parks. Before the opening of the park, Euro Disney had to recruit and train between 12,000 and 14,000 permanent and around 5,000 temporary employees. All these new employees were required to undergo extensive training in order to prepare them to achieve Disney’s high standard of customer service as well as understand operational routines and safety procedures. Originally, the company’s objective was to hire 45 per cent of its employees from France, 30 per cent from other European
383case sTuDy 5 • DisneylanD ResoRT PaRis

countries, and 15 per cent from outside of Europe. However, this proved difficult and when the park opened around 70 per cent of employees were French. Most ‘cast members’ were paid around 15 per cent above the French minimum wage. Espace Euro Disney (an information centre) was opened in December 1990 to show the public what Disney was constructing. The ‘casting centre’ was opened on 1 September 1991 to recruit the cast members needed to staff the park’s attractions. But the hiring process did not go smoothly. In particular, Disney’s grooming require-ments that insisted on a ‘neat’ dress code, a ban on facial hair, set standards for hair and fingernails, and an insistence on ‘appropriate undergarments’ proved contro-versial. Both the French press and trade unions strongly objected to the grooming requirements, claiming they were excessive and much stricter than was generally held to be reasonable in France. Nevertheless, the company refused to modify its grooming standards. Accommodating staff also proved to be a problem, when the large influx of employees swamped the available housing in the area. Disney had to build its own apartments as well as rent rooms in local homes just to accommodate its employees. Notwithstanding all the difficulties, Disney did succeed in recruiting and training all its cast members before the opening.
The park opens
The park opened to employees, for testing during late March 1992, during which time the main sponsors and their families were invited to visit the new park. The formal press preview day was held on 11 April 1992, and the park finally opened to visitors on 12 April 1992. When opening the new resort, Roy Disney, nephew of Walt Disney, spoke of his ‘emotional homecoming for the Disney family, which traced its roots to the French town of Isigny-sur-Mer’. The opening was not helped by strikes on the commuter trains leading to the park, staff unrest, threatened security problems (a terrorist bomb had exploded the night before the opening) and protests in sur-rounding villages who demonstrated against the noise and disruption from the park. The opening day crowds, expected to be 500,000, failed to materialise, however, and at close of the first day only 50,000 people had passed through the gates. Disney had expected the French to make up a larger proportion of visiting guests than they did in the early days. This may have been partly due to protests from French locals who feared that their culture would be damaged by Euro Disney. Also all Disney parks had traditionally been alcohol-free. To begin with Euro Disney was no different. However, this was extremely unpopular, particularly with French visi-tors who like to have a glass of wine or beer with their food. But whatever the cause, the low initial attendance was very disappointing for the Disney Company. It was reported that, in the first nine weeks of operation, approximately 1,000 employees left Euro Disney, about one half of whom ‘left voluntarily’. The reasons cited for leaving Disney’s employment varied. Some blamed the hectic pace of work and the long hours that Disney expected. Others mentioned the ‘chaotic’ condi-tions in the first few weeks. Even Disney conceded that conditions had been tough immediately after the park opened. Some leavers blamed Disney’s apparent difficulty in understanding ‘how Europeans work’. ‘We can’t just be told what to do, we ask ques-tions and don’t all think the same.’ Some visitors who had experience of the American parks commented that the standards of service were noticeably below what would be acceptable in America. There were reports that some cast members were failing to meet Disney’s normal service standard:
384 case sTuDy 5 • DisneylanD ResoRT PaRis

‘. . . even on opening weekend some clearly couldn’t care less . . . My overwhelming impression . . . was that they were out of their depth. There is much more to being a cast member than endlessly saying “Bonjour”. Apart from having a detailed knowledge of the site, Euro Disney staff have the anxiety of not knowing in what language they are going to be addressed [in] . . . Many were struggling.’
It was also noticeable that different nationalities exhibited different types of behav-iour when visiting the park. Some nationalities always used the waste bins while others were more likely to drop litter. Most noticeable were differences in queueing behaviour. Northern Europeans tend to be disciplined and content to wait for rides in an orderly manner. By contrast, some southern European visitors ‘seem to have made an Olympic event out of getting to the ticket taker first’. The press in a number of countries debated whether Euro Disney really knew what it was trying to be. Is it an American theme park in Europe? Is it a theme park that exploits the European heritage of Disney characters? Had the park any connec-tion at all with France, its host country? Is there a fundamental difference between Europeans and Americans in the type of entertainment that they appreciate? Is it even possible to devise a theme park that can please so many different nationalities and cultures? Others claimed that the nature of the European work force was such that they could never achieve the US standards of Disney service:
‘The Disney style of service is one with which Americans have grown up. There are several styles of service (or lack of it) in Europe; unbridled enthusiasm is not a marked feature of them.’
Nevertheless, not all reactions were negative. European newspapers also quoted plenty of positive reaction from visitors, especially children. Euro Disney was so different from the existing European theme parks, with immediately recognisable characters and a wide variety of attractions. Families who could not afford to travel to the United States could now interact with Disney characters and ‘sample the experi-ence at far less cost’. The first phase of development (the theme park, hotel complex and golf course) had gone massively over budget. And attendance figures failed to improve much (by May the park was only attracting around 25,000 visitors a day instead of the predicted 60,000). Moreover it appeared that only three in every 10 visitors were native French. Seven weeks after the opening of the park, visitor attendance was reported at 1.5 million, a disappointment for the park which had expected 11 mil-lion visitors in its first year, and when Euro Disney announced its first quarter rev-enues of $489,000,000, it also said that it would make a loss in its first financial year. Again, the loss was blamed on disappointing attendance figures. Nevertheless, the company pointed out that Disney’s other theme parks had made comparable losses in their first year of operation, and anyway, it was foolish to try to predict future attendance so early in the park’s history. However, the Euro Disney company stock price started a slow downward spiral, rapidly losing almost a third of its value.
The next 15 yearsBy August 1992 estimates of annual attendance figures were being drastically cut from 11 million to just over 9 million. Euro Disney’s misfortunes were further com-pounded in late 1992 when a European recession caused property prices to drop
385case sTuDy 5 • DisneylanD ResoRT PaRis

sharply, and interest payments on the large start-up loans taken out by Euro Disney forced the company to admit serious financial difficulties. Also the cheap dollar resulted in more people taking their holidays in Florida at Walt Disney World. At the first anniversary of the park’s opening, in April 1993, Sleeping Beauty’s Castle was decorated as a giant birthday cake to celebrate the occasion, however, further problems were approaching. Criticised for having too few rides, the roller coaster Indiana Jones and the Temple of Peril was opened in July. This was the first Disney roller coaster that included a 360-degree loop, but just a few weeks after opening emergency brakes locked during a ride, causing injuries to some guests. The ride was temporarily shut down for investigations. Also in 1993 the proposed Euro Disney phase 2 was shelved due to financial problems. Which meant Disney MGM Studios Europe and 13,000 hotel rooms would not be built to the original 1995 deadline originally agreed upon by The Walt Disney Company. However, Discovery Mountain, one of the planned phase 2 attractions, did get approval. By the start of 1994, rumours were circulating that the park was on the verge of bankruptcy. Emergency crisis talks were held between the banks and backers with things coming to a head during March when Disney offered the banks an ultima-tum. It would provide sufficient capital for the park to continue to operate until the end of the month, but unless the banks agreed to restructure the park’s $1 billion debt, the Walt Disney company would close the park, and walk away from the whole European venture, leaving the banks with a bankrupt theme park and a massive expanse of virtually worthless real estate. Disney then forced the bank’s hand by calling the annual stockholder meeting for 15 March. Shortly before the stockholder meeting, Michael Eisner, Disney’s CEO, announced that Disney was planning to pull the plug on the venture at the end of March 1994 unless the banks were prepared to restructure the loans. Faced with no alternative other than to announce that the park was about to close, just before the annual meeting the banks agreed to Disney’s demands. This effectively wrote off virtually all of the next two years’ worth of inter-est payments, and granted a three-year postponement of further loan repayments. In return, the Walt Disney Company wrote off $210 million in unpaid bills for services, and paid $540 million for a 49 per cent stake in the estimated value of the park, as well as restructuring its own loan arrangements for the $210 million worth of rides at the new park. In May 1994, the connection between London and Marne-la-Vallée was com-pleted, along with a TGV link, providing a connection between several major European cities. By August the park was starting to find its feet at last, and all of the park’s hotels were fully booked during the peak holiday season. Also, in October, the park’s name was officially changed from Euro Disney to ‘Disneyland Paris’, in order to, ‘show that the resort now was named much more like it’s counterparts in California and Tokyo’ and to link the park more closely with the romantic city of Paris. Some commentators noted that the name change would disassociate the resort in people’s minds with controversy, debts and politics. The end of year figures for 1994 showed encouraging signs despite a 10 per cent fall in attendance caused by the bad public-ity over the earlier financial problems. And by the end of March 1995 Disney execu-tives were predicting that Disneyland Paris might break even by the end of 1995. 1995 saw the opening of the new roller coaster, not after all to be called ‘Discovery Mountain’ but ‘Space Mountain de la Terre à la lune’, because it was decided that the new name was more exciting. Unlike its counterparts in Tokyo, Florida and California, it was not housed in a big white dome, but in a very ornate Victorian
386 case sTuDy 5 • DisneylanD ResoRT PaRis

futuristic style dome. Intensive marketing of Space Mountain on television channels all over Europe and the release of the popular movie Pocahontas contributed to an improvement in the resort’s financial results. In fact, the Euro Disney resort complex did announce its first annual operating profit in November 1995, helped by the opening of Space Mountain in June. In 1997 the five-year celebrations included, a new parade with Quasimodo and all the characters from the latest Disney blockbusting classic, The Hunchback of Notre Dame, the ‘Year To Be Here’ marketing campaign, the resort’s first Hallowe’en celebra-tion and a new Christmas parade. A new attraction was added in 1999, ‘Honey I Shrunk The Audience’, making the audience the size of a bug while being invited to Inventor of the Year Award Ceremony. This was the more modern replacement to the ageing 3D movie Captain EO. However, the planned Christmas and New Year celebrations were disrupted when a freak storm caused havoc, destroying the Mickey Mouse glass statue that had just been installed for the Lighting Ceremony and many other attractions. Also damaged were trees next to the castle, the top of which developed a pronounced lean, as did many street signs and lamp posts. Disney’s ‘Fastpass’ system was introduced in 2000. This was a new service that allowed guests to use their entry passes to gain a ticket at certain attractions and return at the time stated and gain direct entry to the attraction without queueing. Two new attractions are opened, ‘Indians Jones et le temple du péril’ and ‘Tarzan le recontre’ starring a cast of acrobats along with Tarzan, Jane and all their Jungle friends with music from the movie in different European languages. In 2001 the ‘ImagiNations Parade’ was replaced by the ‘Wonderful World of Disney Parade’ which received some criticism for being ‘less than spectacular’ with only eight parade floats. Also Disney’s ‘California Adventure’ was opened in California. The resort’s tenth Anniversary saw the opening of the new Walt Disney Studios Park attraction. The Disney-MGM Studios at the Walt Disney World Resort, Florida, had already proved to be a major success and the original concept for the Paris studios had first been studied in 1992, shortly before the park opened. The concept, which was based on the world of cinema, seemed perfectly adaptable to the expecta-tions of a European audience so development for the new park was started in 1997 when a small team of Disney Imagineers were asked to design it. In parallel to this, opinion leaders from the worlds of French and European cinema, culture and media were consulted about the project. R. Julienne, the famous French stunt designer, was among the first Europeans to work with Disney on the new Theme Park’s concept. Also, in this year, Disneyland Paris was renamed Disneyland Resort Paris, the ori-ginal park was also renamed Disneyland Park to accommodate the new Walt Disney Studios. André Lacroix from Burger King was appointed as CEO of Disneyland Resort Paris in 2003, to ‘take on the challenge of a failing Disney park in Europe and turn it around’. Increasing investment, he refurbished whole sections of the park, increased the numbers of dancers to the ageing ‘Wonderful World of Disney Parade’ and intro-duced the Jungle Book Carnival in February to increase attendance during the slow months. By 2004, attendance had increased but the company announced that it was still losing money. It again renegotiated its €2.4 billion debt to the Walt Disney Company and French financial institutions. Losses were attributed partly to the
387case sTuDy 5 • DisneylanD ResoRT PaRis

costs of opening Walt Disney Studios two years earlier, just as the world theme park business slumped in the wake of the American terrorist attacks. New hotels were opened (not owned by Disney) close to the park which meant increased competition for the park’s own hotels. The positive news of 2006 was well received. As one commentator put it:
‘[W]ould Disney, the stockholders, the banks, or even the French government make the same decision to go ahead if they could wind the clock back to 1987? Is this a story of a fundamentally flawed concept, or was it just mishandled?’
Questions
1. What markets are the Disney resorts and parks aiming for?
2. Was Disney’s choice of the Paris site a mistake?
3. What aspects of its parks’ design did Disney change when it constructed Euro Disney?
4. What did Disney not change when it constructed Euro Disney?
5. What were Disney’s main mistakes from the conception of the Paris resort through to 2006?
388 case sTuDy 5 • DisneylanD ResoRT PaRis
some events in overview of the history of Disneyland Resort Paris
1955 Disneyland,Californiaopens1971 WaltDisneyWorldopensinOrlando,Florida1982 EpcotCenteropensinOrlando,Florida1984 TokyoDisneyopens1987 TheannouncementthattheresortonMarne-la-Valléehadbeenchosenastheplacetobuildthenewest
MagicKingdom(calledEuroDisneythen).Constructionstartswithaplantocompleteinfiveyears1989 Disney-MGMStudiosThemeParkopensinOrlando1992 ThegrandopeningofEuroDisneyresortwithacastofthousandstheretomeetthedemandthatdidnot
materialise1993 ThesecondyearofEuroDisney’soperations.Onthe12AprilthecastlewasrenamedfromLechâteaude
labelleauBoisdormanttotheLechâteauduGâteau1994 Stand-offwithFrenchbanksovertakingawaysomeofEuroDisney’sdebtthathadaccumulatedbecause
oflowerthanexpectedrevenuesandtheprojectduetogoingoverbudget.On14MarchagreementisreachedwiththeFrenchbanksandEuroDisneystaysopen.ThecompanywouldpayfewerroyaltiestotheWaltDisneyCompanyandmoremoneyfromtheWaltDisneyCompanywouldbeinvestedintotheresort
1995 Openingofthenewrollercoasterprovesagreatsuccess1996 PlanetHollywoodwasopenedwithintheresort1997 TheParkopenforfiveyears1998 Disney’sAnimalKingdomopenedinOrlando1999 StormdisruptsthePark’soperations.2000 Disney’s‘Fastpass’introduced2001 Disney’sCaliforniaAdventureopenedinCalifornia2002 ThetenthAnniversaryandWaltDisneyStudioopenedinParis2003 AndréLacroixfromBurgerKingisappointedasCEOofDisneylandResortParis2004 Thecompanyannouncesthatitisstilllosingmoneyandagainrenegotiatesits€2.4billiondebttothe
WaltDisneyCompanyandFrenchfinancialinstitutions2006 Riseinrevenuesreported
case study
6 contact utilitiesMike shulver and nigel slack
‘I can’t believe how much we have changed in a relatively short time. From being a focused but inward looking reseller of telecoms services to retail consumers, we have expanded to become an innovative, higher margin and customer-centric designer and packager of utilities services; an integrated solutions provider to the business market. These days most of our new business comes from the business partnerships that we have formed. In effect, we design utility packages jointly with both suppliers and consumers of energy, and offer them a complete service from price and service-level negotiation, to integrated billing. In many ways we are now much more of a B2B [business-to-business] company rather than a B2C [business-to-consumer] company.’
(Kevin Lindsay, CEO of Contact Utilities)
BackgroundContact Utilities (CU) was one of Europe’s most profitable utilities re-sellers and service providers. Based in the south of the UK, it was originally founded as Target Telecoms in 1996. Since then the company had moved from supplying low-cost telephone call routing to providing a ‘one stop’ utilities shop both for businesses and home customers. The company offered customers an integrated package of gas, electricity, landline, broadband and mobile phone services. But the company’s growth had not been smooth. CU had not always been successful in its dealings in the energy markets, taking on ‘short’ positions on gas in 2004, after which rapidly increasing prices in late 2005 threatened the company’s viability. With a severe short-term cash deficit, the company was part-rescued by apf energy, a large energy supplier, in early 2006. In return for a 28 per cent equity holding for apf CU’s sur-vival was assured, as was a guaranteed stream of revenue in providing integrated customer service and billing solutions for its now major stockholder. The move from selling simple low-cost telecoms call routing into higher margin utilities packages had been masterminded by Jeanette Netza, CU’s Marketing Director, who had previously worked for one of the UK’s ‘Big Six’ Energy Suppliers.
‘Experience in the energy supply industry had taught me the importance of simplicity and transparency in service pricing and billing. Frankly, the Big Six were (and are) terrible at this, with complaints increasing year on year, largely concerning erroneous and overly complex billing. I realised that there was great potential to provide simple and open bill-ing, and decent customer service which would be attractive to customers of all types. I felt that the bar was very low, and that any reseller who paid the slightest attention to customers could do well. Furthermore, even after years of de-regulation in many European
Source: written by Mike Shulver and Nigel Slack. This is a fictionalised version of a real organisation’s circumstances; it is intended to be used for discussion only and does not represent either good or bad management practice.

390 case study 6 • contact utilities
markets it is still extremely difficult for customers to make an optimum, or sensible choice amongst the gas and electricity packages that are on offer from the major energy suppliers. Instinctively I knew that if we coupled expert negotiating skills with simple integrated billing we could really make an impact in the retail utility sector. However, we were comfortable in telecoms and the move into energy made some members of the board quite nervous. Yet it proved to be the best thing that we could have done. And we continue to respond to customer trends. For example, latterly, customers have demanded that we make green energy-sourcing options available to them, and our systems have been enhanced to allow us to do this. For the last four years we have won the Customer Choice Association’s “What Best Energy Reseller?” customer service award and I think this is the most important indicator of success for us. The market was crying out for a service like ours, and I guess there will be others who will copy us, but for now it’s just us, and customers love us. Within a year of launching our first new range of utilities offerings under the “Contact” brand name, we had over 200,000 customers signed up throughout Europe. Press coverage generated enormous interest, reinforced by exposure on TV Consumer programmes. Within two years “Contact” services were providing over 75 per cent of our revenue and 90 per cent of our profits. The margin for Contact services is many times higher than for Target Telecoms.’
(Jeanette Netza, Marketing Director, CU)
In 2008 CU launched its integrated utilities packages for the small and medium business sector under the brand name of ‘UtilityPartners®’. This involved designing packages in conjunction with their customers’ internal purchasing and operations staff, offering them a level of customization and negotiating expertise they could not get elsewhere. ‘UtilityPartners®’ was in immediate success and forecasts indi-cated solid growth, especially in continental Europe. As Utility Retailer put it, ‘“UtilityPartners®” has been another success for Jeanette’, said Kevin Lindsay, CEO of CU. ‘It’s interesting, if you go into a manufacturing company you will usually find a design department or new product development department. There will be a board member with responsibility for design with a team of expert designers. Yet an equivalent arrangement is far less common in services, but that’s effectively what Jeanette has set up. She has a small team dedicated to utility package design, and I think it’s one of the key ingredients of our success with both retail and corporate clients.’
OperationsCU’s Head Office and Operations were now housed in a facility, purpose-built for CU in 2006 and located near Croydon in the south of the UK. In addition approximately 600 sales agents worked around the UK, mainly in metropolitan areas. Sales agents worked in ‘cells’ with cell leaders driving the company’s distinctive green and white chequered Fiat Cinquecento cars. Like most large centralised service operations, the rationale for setting up the operations centre was to achieve scale economies. In the days of Target Telecoms, the centre simply had to process customer orders for routing boxes, and run bill-ing processes; the customer service element was negligible as the routing box ‘just worked.’ As their telecoms services were expanded to offer broadband services and mobile phones, dedicated internal ‘cells’ were created to support these aspects of the offer-package. Additionally, for broadband services technical support cells were set up. An expansion of sales operations capacity came in the mid 2000s with extra

391case study 6 • contact utilities
cells dedicated to gas and electricity sales being added. It was admitted within CU that this had led to some increase in complexity and occasionally lack of coordina-tion. Centralised operations had become more complex, with the management and customer service (integration) overhead increasing considerably during this period. Previously, in the ‘Target’ days of simple telecoms products, sales, billing, customer relationships and even some technical support were managed by multi-skilled staff. In fact, the expansion and to an extent the fragmentation of service-offerings even-tually necessitated the establishment of dedicated customer relationship teams who were responsible for providing an integrated ‘face’ to customers. Alongside the sales and customer relationship teams were dedicated purchasing teams for each of the utility areas.
Enhancing the retail serviceAlthough both ‘Contact’ services primarily for domestic retail customers and ‘UtilityPartners®’ for business customers were not ‘value’ offerings Jeanette saw considerable potential in enhancing the customer relationship manager’s role to offer premium utility packages. These were sold as ‘Contact plus’ and ‘UtilityPartners Plus®’. For both packages each customer had a dedicated client manager, a named person with whom the client could query a bill, raise a customer service issue and so on. The customer service manager acted as a gatekeeper to provide priority access to technical support and service. Another aspect of these premium packages was that the client manager aggressively actively managed the customer service portfolio so as to minimise the overall bill.
The Croydon Operations CentreAnyone visiting CU’s Operations would see a large processing centre with dedicated areas for the various activities. Sales Operations were in practice the co-ordinating body. For most of the retail sales, Sally Warrens’ team would initiate the creation of a standard package ‘envelope’ based upon options already selected by the customer. These were passed around the various specialist teams (broadband, gas, electricity etc.) for processing. Any non-standard retail packages (such as ‘Contact Plus’) and all new ‘UtilityPartners®’ packages had first to be specified by the Design Team before they returned to Sales Operations who managed their progression to the specialised cells. On completion packages were passed to the Customer Relationship Teams (CRT), where they were inspected before the agreement commenced. The newer more complex products often had to move from Sales Operations, then to Design, then to the specialist cell, and then back again for further inspection and decision-making/customisation. All packages followed the same broad process route but with some packages (green packages in particular) needing several iterative negotiation and pricing stages. Andrew Wilkner (CU’s Operations Manager) was considering devoting a separate, multi-skilled cell to set up the newer and more complex pack-ages until they had ‘bedded in’. However, it would need investment in extra IT capacity and office space, as well as the training of expensive multi-skilled staff who would rarely be fully utilised.
‘When we moved into the higher margin “contact” packages, we disbanded the older, small multi-purpose teams, and merged these into larger units. This increased

392 case study 6 • contact utilities
productivity; though now we might need to bring them back! Staff turnover in this busi-ness is relatively high, by having the larger teams we could ensure that we retained a good base of experience so as to keep quality levels high. We also had a lot more flexibility, at the level of the team, in terms of staff holidays, and with flexible working we could extend the operations of our response centre at minimal cost. This was an ideal situation from a planning perspective, as we have always been in a situation where we would be asked to assemble small numbers or single high-value Contact and “UtilityPartners®” packages at short notice.’
(Andrew Wilkner, CU Operations Manager)
In 2009 increasing volume and a desire to reduce cost prompted CU to outsource its old Target telecoms call routing business to Wifrom, an Indian specialist in call handling and processing. CU did not want to risk outsourcing any part of its high-margin premium services, but thought that the relatively simple telecoms products could safely be performed effectively by less expensive outsource suppliers.
‘We would never do it with any complex packages like “UtilityPartners®”, but out-sourcing the lower margin work seemed to make sense. It would allow us to reduce the cost of making basic packages while releasing capacity for higher margin ones. We also knew that you could not simply “lift and shift” our processes out to Wifrom. In fact we very carefully redesigned all the processes and routines as well as setting documented serv-ice standards before we transferred the work. More than that, we sent some of our own staff over to train the Wifrom people. Yet when we went live it was a disaster. We found that the Wifrom staff we had trained had been redeployed to another of Wifrom’s clients and untrained people were trying to cope with our work. We sorted it out quickly but it was scary for a couple of weeks. There were also other “teething problems”. Coordinating the multiple process schedules is currently a problem, as is agreeing quality standards. To some extent it’s our own fault. We didn’t realise that making outsourcing work was a skill in its own right. And although we have got over most of the problems, we still do not have a satisfactory relationship with our outsourcing supplier.’
(Andrew Wilkner)
Distributed SalesThe Sales department of the company was regarded as being at the heart of the company’s customer service drive. Its purpose was to integrate the efforts of Design, Operations and Sales itself by planning the flow of packages from initial sales agree-ment, through setup to the customer. Sally Warrens, the Sales Operations Manager, reported to Jeanette Netza and was responsible for the Sales Teams in the Croydon Centre, and across all regions.
‘In field sales and in the CRTs we try to provide stability (at the level of customer type) for each team. Teams tended to get into a “groove” in which they spoke the “language” of green energy, price, ethics . . ., or whatever. If a team or individual has to constantly move between say a small retailer, and a medium size European transport business then it’s actually quite disruptive. We have also noticed quality problems when team members have to jump between customer types. This is especially true for the telephony teams. When a customer calls, their identity, package (“Contact” or “UtilityPartners®”, stan-dard or “plus”) and whether they are retail or corporate is all flagged up on the screen. However, it’s easy to make a mistake when you have lots of changeovers – you can end

393case study 6 • contact utilities
up treating “plus” customers as if they were standard customers and they really don’t like that.
‘Our own marketing team causes us grief too. Marketing will get together with Design and put together a novel “bundle” of say, heavily discounted broadband but coupled with an actively managed energy deal. This is great for revenue generation, but sometimes we in Sales Operations don’t always get the relevant package specification on time. It’s embar-rassing sometimes. Another problem is the training lead time. If we are asked to introduce a new package it may be required to go on stream in a month, whereas I know that I could not recruit and train staff in the new package for two months or so, sometimes much longer if it’s the wrong time of year. The answer to most of these problems is good scheduling, but it’s not always possible if we are to remain customer targeted; we just have to be responsive, especially in preparation of proposals.’
‘Also, queries from domestic retail clients tend to come in at lunchtime, and early evening. Wherever possible we try to free up capacity at these times, and to schedule “UtilityPartners®” work so that it’s outside these times. Another problem for us can be spikes in demand. In some ways it’s a nice problem to have, but for example, if one of the green bundles were to feature on a consumer affairs show, or in a magazine article we could be inundated. Similarly with the various Consumer awards, these tend to send our demand through the roof. This is why I continue to resist the pressure to split up the Operations Teams into dedicated cells. It would mean frequent periods of low utilisa-tion. I come out of the retail banking environment, and there we really suffered because our large central processing operations were fragmented to address market pressure for variety. It really upsets us in operations if we do this. No, let’s keep things simple. Our raison d’être is scale economy – that’s what these central processing establishments are all about.’
(Sally Warrens, CU Sales Operations Manager)
While the company paid great attention to operational efficiency, sometimes they were not as flexible as their markets demanded.
‘Often we just can’t “do a trade”. With retail customers we simply take a competitive position around about the industry average. However, with a large industrial client we would want to negotiate a specific forward price, and we might not be able to do so safely if markets are volatile as was the case for gas in 05/06.’
(John Phelps, CU Gas Purchasing Team Leader)
Challenges for CUAlthough the company was financially successful and very well regarded in the utility industry, there were a number of issues and challenges that it knew it would have to address. The partial bailout by apf Energy in 2006 resulted in CU handling their billing, customer service, metering, debt collection and administration. The move was beneficial to both parties. The supplier’s previous horrendous customer service record had now improved to the point where it was an exemplar to the European supply industry. In return, besides a regular stream of customer accounts to service, CU received considerable discounts on energy purchased from the new partner. However, the downside was that operational complexity was increased still further.

394 case study 6 • contact utilities
Sally Warrens thought that it was about time that a dedicated cell was set up to address apf Energy’s accounts and billing department. The idea of CU taking over other energy supply companies’ back office customer service activities was already being discussed within CU. If this actually happened a dedicated cell or section would certainly make sense. Another issue was that not everyone was so sanguine about the rise of Jeanette’s Design Department.
‘It is undeniable that relationships between marketing and other parts of the company have been under strain recently. I suppose it is, to some extent, inevitable. After all, they really do need the freedom to pitch new and attractive offerings as they wish. I can under-stand it when they get frustrated at some of the constraints which we have to work under in the operations end of the business. They also should be able to expect a professional level of service from us. Yet the truth is that marketing, and the package design team make most of the problems themselves. They sometimes don’t seem to understand the consequences or implications of their new package development decisions or the promises they make to potential partners. More seriously they don’t really understand that we could actually help them do their job better if they cooperated a bit more, especially when it comes to scheduling.’
(Andrew Wilkner)
The third major issue concerned sales forecasting, and again there were two different views. Andrew Wilkner was convinced that forecasts should be improved.
‘Every Friday morning we devise a schedule of package-building and distribution for the following week. Yet, usually before Tuesday morning, it has had to be significantly changed because of unexpected orders coming in from our sales teams’ weekend sales. This causes tremendous disruption. If sales could be forecast more accurately we would achieve far high utilisation, better customer service, and I believe, significant cost savings.’
(Andrew Wilkner)
However, Jeanette Netza saw things differently.
‘Look, I do understand Andrew’s frustration, but after all, this has to be a reactive busi-ness. By definition it is impossible to forecast accurately. In terms of month-by-month sales volumes we are in fact pretty accurate, but trying to make a forecast for every week end every package is almost impossible to do accurately. Sorry, that’s just the nature of the business we’re in. In fact, although Andrew complains about our lack of forecast accuracy, he always does a great job in responding to unexpected customer demand.’
(Jeanette Netza)
Kevin Lindsay, the Managing Director, summed up his view of the current situation.
‘Particularly significant has been our alliance with apf Energy. In effect we are position-ing ourselves as a complete service partner to the Big Six in the UK, and eventually other supply companies in mainland Europe. We have a world-class design capability together with package design and construction, order processing, order-taking and distribution services. These abilities allow us to develop genuinely equal partnerships which integrate us into the whole industry’s activities.’
(Kevin Lindsay)

395case study 6 • contact utilities
The final issue under debate within the company was longer term, and particularly important:
‘The two big changes we have made in this company have both happened because we exploited a strength we already had within the company. Moving into utility sales through “Contact” Packages was only possible because we leveraged the customer serv-ice expertise that we had developed in the telecoms sector into the utilities sector. Then, when we moved into “UtilityPartners®” we did so because we had operations teams, and package design capability that could command respect from the enterprises with whom we formed partnerships. So what is the next move for us? Do we expand globally? We are getting stronger in Europe but nowhere else in the world. Do we extend our design scope into other markets, such as cable or Internet Protocol television (IPTV)? If so, that would take us into areas where we have no operations expertise. We are great at utilities marketing, sales and back-office support, but if we tried any other processes, we would be no better, and probably worse, than other firms with more experience. So what’s the future for us?’
(Kevin Lindsay, CEO CU)
Questions
1. Why are ‘operations’ important in CU?
2. What are the company’s main products, and how do they compete in their markets?
3. How well do CU’s operations capabilities and performance fit its market requirements?
4. What should they do in the future?

0CASE STUDY
7 IDEO: SErvICE DESIgn
‘I should have had the café latte,’ thought Peter Coughlan as he sipped his strong decaf double no-fat soya latte macchiato at Peet’s Coffeehouse, just around the corner from his office. Designers and engineers from his company, IDEO, one of the world’s largest and arguably most successful design firms, often gathered here and talked. He looked up to see Dennis Boyle, another IDEO employee, glaring at his own coffee nearby. Boyle had been the project leader on the Palm V and Handspring Visor handheld computer projects, and Coughlan briefly wondered if Boyle had ever had to wrestle with the same kind of problem that he was facing now. The coffee he’d created was just terrible. Coughlan had just come out of a four-hour meeting with David Becker, presi-dent and CEO of Portland General Health Center. Becker had chanced to see the famous Nightline documentary about IDEO’s design process and had been suitably impressed. Ted Koppel, the host of Nightline, had challenged IDEO to completely redesign the traditional shopping cart in five days, and Nightline had filmed the entire process. In the end, IDEO delivered a sleek and streamlined shopping cart, with modular detachable shopping baskets, a baby chair, a do-ityourself barcode scanner and a host of other innovations. More importantly, the report had given public exposure to the famed IDEO design process, a process that had elevated the firm to near-legendary status in the design world, enabling it to win more design awards than any other company year after year.1 Becker had come to IDEO looking for new ideas on how to improve healthcare service in his hospital. American healthcare had never been known for its design. When Tom Kelley, the general manager of IDEO and brother of David Kelley, one of the company founders, was interviewed on the radio programme Fresh Air, he had described a handful of things whose design ‘had been bad so long that you don’t even really think about them.’ He mentioned irons (‘The state-of-the-art method for deciding whether your steam iron is hot or not is to put your tender fingers onto the metal’), and airline tickets (‘There’s all sorts of codes and 17digits on there’).2 When he came to hospital waiting rooms, no anecdotal evidence was required; everyone could picture the painfully bright fluorescent lighting, out-of-date magazines, and stiff uncomfortable chairs. Hospitals had to deal with severe financial pressures, escalating costs and staff shortages, yet, perversely, were expected to continue to deliver state-of-the-art medi-cal care and keep up to date with rapidly evolving medical technology. ‘Design’ had never really been thought of as an important factor in delivering better patient treatment. The challenge that Becker put to IDEO wasn’t easy: how do you redesign a healthcare service and improve patient care in the face of limited budgets and constrained resources?
397CASE STUDY 7 • IDEO: SErvICE DESIgn
The History of IDEO
‘Good design is good business.’(Thomas Watson, CEO, IBM)
IDEO was a company born of two histories. The first part of the history began in 1969, when a British industrial designer, Bill Moggridge, set up Moggridge Associates in London. In 1979 he expanded his business by opening up an office in San Francisco called ID Two, which focused on industrial design. The second part of the history took place in the early boom days of Silicon Valley, when David Kelley, a doctorate student at Stanford University, realised that most technology companies lacked access to general product development skills. Accordingly, in 1978 he gave up writing his Ph.D. thesis and went on to form his own company, David Kelley Design, to address the engineering design requirements of firms in the Valley. The two individuals met in 1979 and started co-operating on joint projects. They realised early on that the field of design was evolving to such a point that an inter-disciplinary, multifunctional approach was required to provide effective service to companies. IDEO was formed in 1991 when David Kelly Design, Moggridge Associates, ID Two and Matrix Product Design (another design company) merged. The merger brought under one roof professionals with experience in the hitherto diverse fields of mechanical and electrical engineering, industrial design, ergonomics, informa-tion technology, cognitive psychology and prototyping – practice areas that rapidly came to be considered integral to product design. Another important advantage that IDEO had was the fact that it was a transcontinental firm from its very inception. Both founders are still closely associated with IDEO, although Kelley, formerly CEO, became chairman in March 2000, relinquishing the reins of the organisation to Tim Brown, who used to be in charge of IDEO London. By January 2005 IDEO spanned two continents with six locations (Palo Alto, San Francisco, Chicago, Boston, London and Munich) and had a staff of 350 people and annual revenues of about $70 million. IDEO encourages the continual flow of people across locations and projects to enable the cross-fertilization of new ideas and ensure knowledge sharing. The company also believes that multiple locations gives it access not just to local business and local space, but also local talent – an important necessity for a firm that prides itself on its ability to harness the differences in people to generate creative ideas.
IDEO in 2005The pace of technological change and ever-changing conditions in the broader busi-ness world have had the effect of radically transforming IDEO’s business as well. Given the ever-increasing complexity of the assignments it undertakes today, most of its projects involve collaborating extremely closely not just with clients but with external partners on behalf of its clients. These range from advertising and branding firms to contract manufacturers. Another important change at IDEO has been its transformation from an organi-sational structure based primarily around geographies, to one where there is more
398 CASE STUDY 7 • IDEO: SErvICE DESIgn
emphasis on practice areas. According to Alan South, Service Design and Innovation principal and also head of IDEO Europe, ‘IDEO used to be able to be considered a loose federation of independent studios, each with their own profit & loss’, united by a strong shared culture. Today, IDEO is organised around seven practice areas (see Exhibit 1 for details), with a stronger sense of ‘one firm’. The organisation of the firm around practice areas is similar to the organizational structure of more traditional consulting firms. ‘With practices you can talk to clients with one voice. It allows us to focus on their broader needs and serve them more effectively,’ says Tim Brown, CEO.3
The IDEO Innovation Process
As such, everything is now subject to innovation – not just physical objects, but also political systems, economic policy, ways in which medical research is conducted, and even complete ‘user experiences’.
(Laura Weiss, IDEO4)
IDEO’s core competence is primarily in the process of design and innovation, fol-lowed by an understanding of specific domain knowledge. According to Laura Weiss, a principal of the Service Design and Innovation practice at IDEO, clients ‘hire us to think about things in ways that [they] don’t think about every day. [They] hire us to bring in a sense of wonder’.5 On projects, IDEO views itself as a cross between a movie producer and a direc-tor – bringing together and co-ordinating the various ‘stars’ (some of whom may be external) and then determining what has to be done and how. Key to its creative process is ‘radical collaboration’, the intense, all-encompassing way that IDEO works with the client and external partners. Unlike mainstream consulting firms who tend to camp out at the client site, IDEO usually brings the client into its own work-ing environment. By working closely and continuously with clients and external partners, IDEO ensures that the client is intimately involved in the creative process and, more importantly, that there are no last minute surprises or costly mistakes on its part. IDEO goes as far as actually sharing its innovation process with clients, advising them on how they themselves can become more innovative (through its Transformation practice). Another critical factor in IDEO’s recipe for innovation is the use of interdisci-plinary teams. On any project, an IDEO team is usually composed of people from disciplines ranging from cognitive psychology to industrial design. IDEO em - ployees oftentimes find themselves working with employees from other offices or on projects staffed at different office locations. This fluidity ensures that ideas have a chance to propagate through the organisation, and that the creativity within the organisation is stimulated through the continual injection of new influences. Although the IDEO innovation process is constantly evolving (see Exhibit 2), there is an underlying ‘project journey’ or set of steps:
IDEO Project Journey Observe → Synthesize → Generate Ideas → Refine → Implement

399CASE STUDY 7 • IDEO: SErvICE DESIgn
Observe: IDEO functions not just through market surveys and aggregate user data, but spends a great deal of time observing and empathising with the user to truly understand their needs and requirements. This user-centric form of design is a big part of what has enabled IDEO to be so successful for so many years.
Synthesize: After generating a large number of observations and data points, IDEO steps back and synthesises all the data, distilling the information collected into cogent and succinct guiding principles for the solution to be designed.
Generate Ideas: Based on the synthesised understanding of its observations, IDEO will work to cast a wide net for possible opportunities. A commonly-used process is that of brainstorming. There are strict rules that govern the brainstorming process and they have been well codified.6
Refine: An oft-quoted maxim at IDEO, espoused by its chairman David Kelley, is: ‘Fail early and fail often.’ This ‘culture of failure’ is one of the foundation stones of the IDEO creative process: quick and dirty prototypes are created to refine ideas and ensure that they can be fleshed out early so that costly wrong decisions are avoided. Additionally, IDEO solutions are iterative loops, with each iteration being further refined and brought closer to the final solution.
Implement: Implementation is an important step of the design process. Often, design projects are carried out for commercial gain in the market, so if a design cannot be effectively implemented all the work has been wasted. Yet if IDEO’s process is fol-lowed, implementation is the natural outcome of an evolution of iterative, increas-ingly refined prototypes.
A typical IDEO client assignment or ‘project journey’ follows the five basic steps described above. While the project evolution itself may be standardised, the specific tools used for a particular project will vary depending on the project. IDEO’s approaches to gathering insights that lead to design opportunities are recorded on ‘IDEO method cards’, which list some of its most popular research methods and detail how and when they are to be used (see Exhibit 3 for some exam-ples). They are one of the mechanisms of sharing knowledge used by the company. Another mechanism for knowledge transfer is their ‘Tech Box’, a veritable treasure chest of gadgets, materials and mechanisms that are meant to spark creativity and aid in the communication of new concepts. Each office has a ‘Tech Box’ and there is a ‘curator’ who ensures that the collection is refreshed and continually growing. Unlike traditional large companies, IDEO’s knowledge sharing is more organic and less structured, with a greater reliance on informal, even social, mechanisms. ‘Some organisations rely on big databases to disseminate information,’ says CEO Brown. ‘We disseminate our knowledge through stories.’7 In Monday morning meetings held across the firm, regular leadership meetings, lunchtime show-and-tell sessions, and other meetings, the sharing and communication of ideas and best practices is done through stories. ‘People hold stories in their heads better than other forms of information,’ says Brown. ‘Knowledge management at IDEO is largely organic and, by definition, chaotic. It’s a Darwinian process,’ says Alan South. ‘Only the fittest – that is the strongest ideas – survive.’ However it is done, the sharing of knowledge across its people and offices is critical to a company like IDEO. The company prides itself on its ability to

400 CASE STUDY 7 • IDEO: SErvICE DESIgn
leverage its process across any industry; indeed, it sees as one of its core strengths its ability to be a ‘knowledge broker’, leveraging information gleaned in one industry and applying it effectively to another.
Service Design
‘…the design of intangible experiences that reach people through many different touch-points, and that happen over time.’
(live|work website8)
Service design is a relatively young field which has come into the spotlight due to the increasing and continuing importance of the service sector in most developed economies. Additionally, even traditional product companies are realising that by designing not just the product, but also the process and the service interface, they can add value and maximize profit through the entire value chain. This places a greater degree of emphasis on the service end of the entire cycle and, as a result, more emphasis is being placed on service design. According to G. Lynn Shostack, who has chaired the task force on service market-ing of the American Marketing Association. ‘Traditionally, service design had been characterised by the lack of systematic method for design and control.’ As a result, new services were usually developed by trial and error: in the absence of a detailed design there was no metric to gauge whether the service was complete, rational, and fulfilled the original need. Service suppliers must be prepared to cope with the unexpected. While it is poss-ible to blueprint the process through which the customer passes, the blueprints are rarely able to take account of the variability inherent in people-related processes. Richard Eisermann, formerly of IDEO and now director of Design & Innovation at the Design Council in the UK, agrees: ‘The trick in service design is its subjective nature: that’s difficult to codify and capture. The best you can do is give guidelines for people to follow. You can make millions of identical razors, and the four hun-dredth razor will be identical to the four hundred thousandth razor. It’s easy to make a deliberate controlled experience for users. But if you are a service company, how can you attempt to brand that experience, make it standardised, make it consistent?’ Today, in addition to in-house departments within large firms, several companies are focused on serving the increasing demands of clients for service design. Companies like live|work in London, Design Continuum near Boston and Ziba Design in Portland all compete with IDEO for service design work.
IDEO and Service Design Whilst IDEO had been thinking of entering the service design field for strategic reasons to broaden its practice offerings, its actual entry into service design was opportunistic. In 1997 Amtrak approached IDEO to do an assessment of the designs for the train cars that it was building for Acela, its new high-speed rail service that was to run from Washington D.C. to Boston. IDEO realized that in order for the service to be successful Amtrak needed to be thinking about the entire customer

401CASE STUDY 7 • IDEO: SErvICE DESIgn
experience, of which the train car was but one part. In other words, to design the train cars they first had to design the service. Recalls Eisermann, who was the IDEO project manager for the Amtrak project:
‘There was considerable nervousness amongst the engineers in Palo Alto when we under-took this project. I remember pulling David Kelley (CEO of IDEO) aside and asking him for advice. He said that all we have to do is focus on the users, get the story out of them and build a solution out of it – that if we stick to what we know best, it’ll be fine.’
The design of both services and products is based on the same fundamental prin-ciples outlined earlier in the IDEO process section. Projects follow the basic steps of observation, synthesis, idea generation, refinement and implementation. ‘Service design is not fundamentally different from product design. The fundamental meth-ods we use in service design don’t differ, they’re just tailored,’ says Laura Weiss. Service design projects also tend to have different staffing requirements due to the difference in the nature of the projects. Whilst service design is inherently user-centred, it also requires a systems-oriented approach and ‘big picture’ thinking due to the large number of implications that a service has across an organisation.
Amtrak (1998)When Amtrak was doing market research for the launch of its new Acela high-speed trains service serving the North-East corridor in the United States (Boston–New York–Washington D.C.), it discovered that people still loved trains but were sick of them being treated like a commodity. According to Barbara Richardon, Executive Vice President of Amtrak: ‘People love the notion of travelling a long distance, relax-ing, looking out of the window,’ but ‘what was discouraging to us was that none of that translated to Amtrak. We were viewed like a utility.’9 Looking to provide a better passenger experience, Amtrak turned to IDEO to work on what would be one of its first service design projects. IDEO’s initial mandate was to design only the armchairs for the trains, which in itself was no trivial project given that most people view journey comfort as the most important criteria when they travel on trains. IDEO quickly realised that the seat was but one component in the overall customer experience; if Amtrak’s new service were to be successful the entire consumer experience would have to be tackled. As part of its research, IDEO embarked on several different strategies during its empathic observation phase. First, IDEO human factors experts10 ‘shadowed’ a broad range of rail travellers: retired grandparents visiting their grandchildren, a businessman on a business trip, a young couple with kids going on vacation. For each group, IDEO tried to understand where the existing service was substandard, and which aspects of the service could be improved. They even shadowed a person in a wheelchair through the station and during the journey to get a feel for what he went through to get on the train and use it. But the observations didn’t just stop at the customers. IDEO also surveyed train employees – everyone from conductors and train drivers to senior managers and station operators – to get more information not just about customer usage patterns and complaints, but also about what the train staff required to do their job better. IDEO discovered that, in the customer’s mind, a train journey started long before they actually boarded the train, and extended for a period of time after they had

402 CASE STUDY 7 • IDEO: SErvICE DESIgn
disembarked. To better understand the different stages of travel, IDEO created a ‘cus-tomer journey’ map which articulated the 10 steps that people went through on an Amtrak train ride, as follows:
1 Learning (about routes, times etc.)
2 Planning
3 Starting
4 Entering
5 Ticketing
6 Waiting
7 Boarding
8 Riding
9 Arriving
10 Continuing (on their journey).
IDEO realized that in order to provide customers with the service they were seek-ing it would have to design all 10 steps in the customer’s journey, not just the train ride. ‘We wanted to create a seamless journey,’ says Richard Eiserman, IDEO’s project leader on Acela. ‘Riding on the train was actually the eighth step. The 10 points became the core of what we tried to do. We wanted to look at design implications across the board.’11
The customer journey framework has proved to be an enormously successful tool within the IDEO repertoire of service design methods. Essentially, a customer journey map is a blueprint for all the steps a user must go through in a service. The act of documenting the service is one that is highly useful, though not widespread. Observes Dr. Hollins: ‘Unlike manufacturing organisations, in the service design field specifications . . . tend not to be written.’12 The customer journey framework enables a service designer to think about every step the user will take through a service, and also to account for all the different service ‘touch-points’, i.e., the points within the service environment when the user interacts with particular service com-ponents. Concurs Fran Samalionis, another London-based principal of the Service Design Practice within IDEO: ‘A large component of service design is trying to make tangible the interactions that occur during the provision of a service.’ The customer journey framework is useful because it enables service designers to make the invisible visible. The information gleaned through the processes used above guided the development of IDEO’s three main deliverables:
●● Train layout and design
●● A set of station concepts (to deal with the other aspects of the customer journey)
●● A brand strategy and image platform (done in coordination with a branding strategy firm)
IDEO subsequently worked closely with Amtrak on the implementation of the train layout and design, overhauling everything from the bathroom experience to the system for luggage handling. To appropriately prototype the various components of the service, IDEO built half a train car within its studio in Boston. They used the train car to mock up the passenger section, the service car and even the bathroom. All the prototyping was ‘quick and dirty’ using foam core13 to represent virtually everything. As part of the prototyping, IDEO got actual service personnel from Amtrak and potential passengers to walk through the mocked-up cars and make comments and suggestions. Recalls Ilya Prokopoff, an IDEO designer involved on the project:
‘For Amtrak, this was not just business as usual. They really needed to understand what their customer needs were, and organise the disparate elements of their system in a way

403CASE STUDY 7 • IDEO: SErvICE DESIgn
that hadn’t been done before in order to meet those customer needs. We had to take a wider view and think about systems design and not just at the object level. We had to understand how everything connected together and focus on linkages, as the service straddled many intermediate steps captured in the customer journey framework.
‘We did a great job on building the hardware, because that’s what we know how to do well. We didn’t really focus on enabling the people who were delivering the service and training them to do so. That’s something that has changed in IDEO over the past few years.’
Juniper Financial (1999) When a group of former employees of Wingspan, one of the first online banks, left to start Juniper Financial, they called on IDEO to help them define and establish their strategy, determine the suite of product offerings with a consistent service proposition, and create the interface for the company’s website. IDEO realized that the founders of Juniper needed to decide who their customers would be, what those customers wanted, and how they currently managed their finances. According to Fran Samalionis, the IDEO project leader: ‘The founders of Juniper . . . wanted to solve everything that was wrong with banking.’ The IDEO team was composed of a mix of people specialising in human factors, business factors, environments design and more traditional product and industrial designers. Says Samalionis:
‘Even though most of the people were experts in one particular area, most of them had developed significant exposure and experience in another field. That’s true about service design in general: you need to turn up the volume on the T-shapedness of the people – people who have both a breadth of experience and a depth of expertise . . . For most service design projects it’s useful to bring “systems” thinking people into the team – physicists rather than engineers. They need to understand how systems are designed, how they interact, how one component will affect the others.’
The first step was to understand the customer and the customer experience. IDEO and Juniper could then translate the customer experience into the value proposition for the customer, and use that to determine the specific service offerings. To understand customers and their needs, IDEO conducted interviews in cities across the US. In contrast to traditional methods of market research such as focus groups and surveys, IDEO used techniques that were more in line with empathic research. Members of the IDEO project team acted like ‘flies on the wall’, watch-ing how people used online banking, closely noting how they navigated through the interface, which functions and offers were used and how frequently. IDEO also walked through their homes and got people to show them what items they associ-ated with money. Another method used in this project was an empathic exercise known as ‘Be a bill’. IDEO team members examined how bills would move through people’s homes to try and understand the rituals around finance based on these patterns. The ‘Be a . . .’ method enables IDEO designers to get a perspective on an entire system by choosing an inanimate object within the system and observing the path it takes and the inter-actions that occur through the system. According to Samalionis: ‘It was amazing
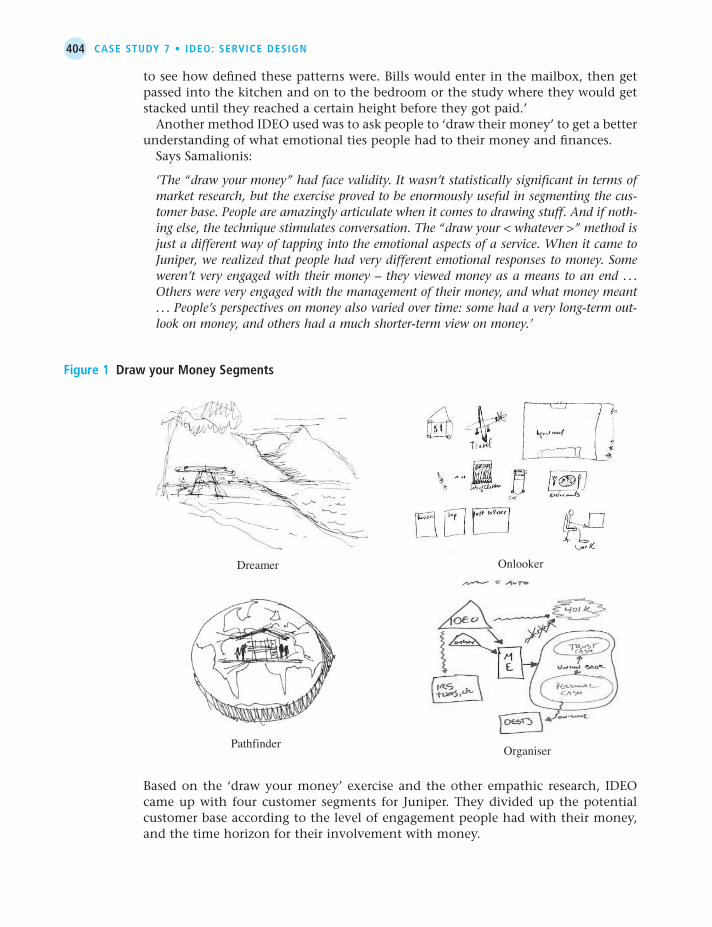
404 CASE STUDY 7 • IDEO: SErvICE DESIgn
to see how defined these patterns were. Bills would enter in the mailbox, then get passed into the kitchen and on to the bedroom or the study where they would get stacked until they reached a certain height before they got paid.’ Another method IDEO used was to ask people to ‘draw their money’ to get a better understanding of what emotional ties people had to their money and finances. Says Samalionis:
‘The “draw your money” had face validity. It wasn’t statistically significant in terms of market research, but the exercise proved to be enormously useful in segmenting the cus-tomer base. People are amazingly articulate when it comes to drawing stuff. And if noth-ing else, the technique stimulates conversation. The “draw your < whatever >” method is just a different way of tapping into the emotional aspects of a service. When it came to Juniper, we realized that people had very different emotional responses to money. Some weren’t very engaged with their money – they viewed money as a means to an end . . . Others were very engaged with the management of their money, and what money meant . . . People’s perspectives on money also varied over time: some had a very long-term out-look on money, and others had a much shorter-term view on money.’
Figure 1 Draw your Money Segments
Dreamer Onlooker
Pathfinder Organiser
Based on the ‘draw your money’ exercise and the other empathic research, IDEO came up with four customer segments for Juniper. They divided up the potential customer base according to the level of engagement people had with their money, and the time horizon for their involvement with money.
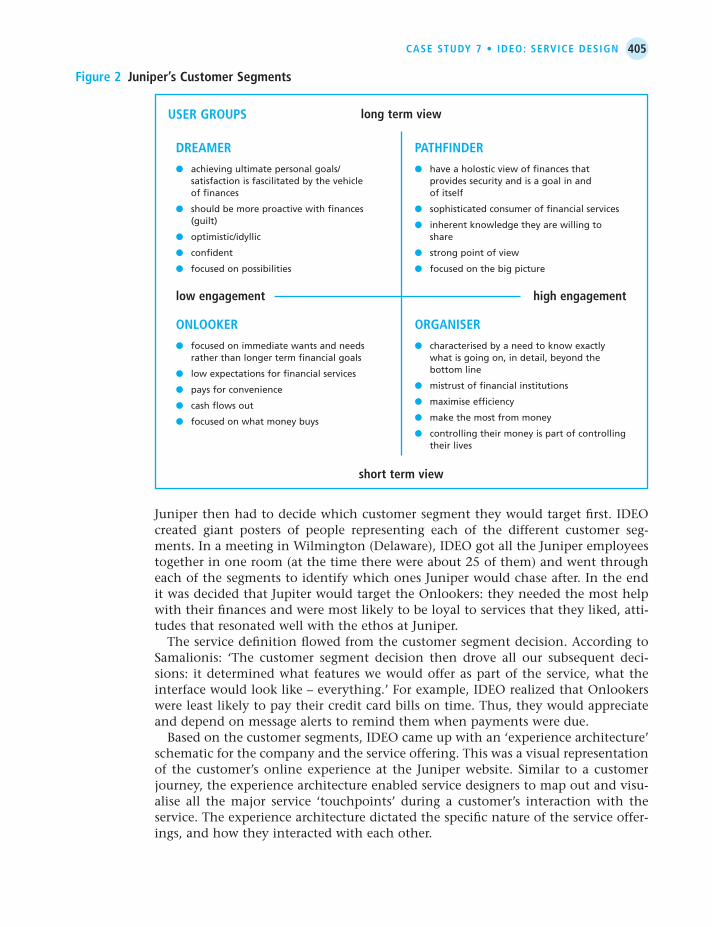
405CASE STUDY 7 • IDEO: SErvICE DESIgn
Juniper then had to decide which customer segment they would target first. IDEO created giant posters of people representing each of the different customer seg-ments. In a meeting in Wilmington (Delaware), IDEO got all the Juniper employees together in one room (at the time there were about 25 of them) and went through each of the segments to identify which ones Juniper would chase after. In the end it was decided that Jupiter would target the Onlookers: they needed the most help with their finances and were most likely to be loyal to services that they liked, atti-tudes that resonated well with the ethos at Juniper. The service definition flowed from the customer segment decision. According to Samalionis: ‘The customer segment decision then drove all our subsequent deci-sions: it determined what features we would offer as part of the service, what the interface would look like – everything.’ For example, IDEO realized that Onlookers were least likely to pay their credit card bills on time. Thus, they would appreciate and depend on message alerts to remind them when payments were due. Based on the customer segments, IDEO came up with an ‘experience architecture’ schematic for the company and the service offering. This was a visual representation of the customer’s online experience at the Juniper website. Similar to a customer journey, the experience architecture enabled service designers to map out and visu-alise all the major service ‘touchpoints’ during a customer’s interaction with the service. The experience architecture dictated the specific nature of the service offer-ings, and how they interacted with each other.
Figure 2 Juniper’s Customer Segments
USEr grOUPS
DrEAMEr
●● achieving ultimate personal goals/ satisfaction is fascilitated by the vehicle of finances
●● should be more proactive with finances (guilt)
●● optimistic/idyllic
●● confident
●● focused on possibilities
OnLOOKEr
●● focused on immediate wants and needs rather than longer term financial goals
●● low expectations for financial services
●● pays for convenience
●● cash flows out
●● focused on what money buys
PATHFInDEr
●● have a holostic view of finances that provides security and is a goal in and of itself
●● sophisticated consumer of financial services
●● inherent knowledge they are willing to share
●● strong point of view
●● focused on the big picture
OrgAnISEr
●● characterised by a need to know exactly what is going on, in detail, beyond the bottom line
●● mistrust of financial institutions
●● maximise efficiency
●● make the most from money
●● controlling their money is part of controlling their lives
high engagement
long term view
short term view
low engagement

406 CASE STUDY 7 • IDEO: SErvICE DESIgn
Another method that IDEO utilised for the Juniper project was the ‘path to participa-tion’. While an experience architecture prototyped one single interaction between the user and the service, the path to participation was meant to chart the evolution of the repeated interactions between the user and the service over time.
Figure 3 Experience Architecture
Figure 4 Path to Participation
Information push – alerts and prompts to act
ONLOOKER
Simple bottom line summary of accounts
action action action action action
Simple toolsand calculators
Information push –goals and life
event productsCustomer service
Online credit cardoffer rather than astandard credit card
refocus acquisition topromote the benefits of an online credit card
CONVERT TO. . .
Offer provocative contentto engage customers inJuniper’s offerings
decide how to offerrelevant content
ENGAGE TO. . .
Create opportunitiesfor customers to talk toJuniper about themselvesand their needs
give product managersincentives to developdifferential customer-focused offerings
LEARN TO. . .
Offer customerspersonalized advice
train and support relationship managersto act as advisors
ADVISE TO. . .
Equip customers to sharetheir Juniper experience
give your customerbranded accessories astangible conversation starters
CELEBRATE TO. . .
407CASE STUDY 7 • IDEO: SErvICE DESIgn
The subsequent design of the website, both in terms of functionality and form, was largely driven by the customer segmentation and experience architectures developed. Recalls Samalionis about the service design process:
‘Having had four more years of experience with service design, would we do things differ-ently? Probably. A couple of basic steps that we do these days are experience and informa-tion audits right at the beginning of a project. An experience audit is when we look at the various touch-points for a particular service and audit them, both from the perspective of the user and the organisation, to get a better idea of what’s working and what’s not. An information audit is used to figure out where the information in an organisation resides and how it moves through the organisation. After all, at the end of the day it is informa-tion that enables the provision of a service.’
AT&T mMode (2003) In January 2003, AT&T Wireless asked IDEO to assist it in designing a new, easier-to-use interface for its mMode service. mMode was the GPRS service14 launched in 2002 to enable users to surf the web, conduct transactions, send and receive messages, and carry out a host of other data-driven functions. Says Sam Hall, a vice-president at AT&T Wireless: ‘It was clear that we had reached beyond the classic 35-year-old early adopter. We saw our customers are now moms and teens and older folks.’15 The new design was supposed to help AT&T Wireless make the service appealing to the wider mainstream market. IDEO was tasked with providing a new user interface for the mMode service and a style guide that would be passed to content partners to guide them in the develop-ment of third party content for the service. IDEO usually hosts a project kick-off prior to the start of the actual project itself in order to get the client to buy in to ‘the IDEO way’ and get an understanding of its innovation process. For this project, IDEO took the AT&T Wireless managers on a scavenger hunt in San Francisco. Executives were shuttled around San Francisco in cars, and asked to conduct basic errands such as finding a book or buying an aspirin. Whilst everything they were asked to do were theoretically possible using mMode, they were allowed to use any means they wanted to accomplish the tasks. The executives quickly found out that it wasn’t as easy as they thought it would be. For starters, the mMode service went down midway through the game. Eventually, frustrated by their inability to use the mMode service effectively, they resorted to traditional methods like looking up a phone directory, or asking someone on the street. Says Laura Weiss, one of the leads on the AT&T project: ‘The aim of the scavenger hunt was to get the AT&T people to start thinking from the user’s perspective. The scavenger hunt was very effective in showing them just how difficult the service was: they got a first hand view of what worked and what didn’t.’ The problem was that whereas the mMode service, much like other mobile data services at the time, had been designed as a portable web browser, the cell-phone was a vastly different medium from the computer and needed to be designed for accordingly. In designing the user interface for the phone, IDEO needed to understand exactly what a mobile was meant to do – from the users’ perspective, naturally. Says Weiss:

408 CASE STUDY 7 • IDEO: SErvICE DESIgn
‘When we’re doing the research for a particular project we try and look for “extreme users” - i.e. people who fit a particular profile, use (or are likely to use) a particular service fairly often, and hence will be able give interesting results fairly quickly.’ In the case of mMode, IDEO talked to a range of extreme phone users from teenagers in school to business people on the go. In addition, IDEO had to consider a whole other set of stakeholders as well, says Weiss:
‘We had to talk to the third party content developers and ensure that the newly designed user interface would meet their requirements as well as those of end users. In service design projects you end up dealing with an ecosystem and not just the end users. And if you don’t deal with all the stakeholders, you don’t have a great service solution. The business element in a service design project is probably more important than in product design projects. Designing a service is as close to designing a business as you can get. Thus, it’s more critical to introduce the business factors into the design process as early on as possible.’
The third party content developers were critical to the success of mMode: if they were not happy with the new service design, or their requirements were not accom-modated, then they wouldn’t develop services for mMode, and users wouldn’t use their phones as much. The insight gained from the interviews and observations allowed IDEO to create a set of unified design principles that would act as a platform for the development of the new user interface and the accompanying style guide for the mMode service. The three guiding design principles were: Social: This was based on the notion that data services needed to provide connec-tivity between people, the way voice is able to, but also go beyond and create rich communities and social networks.
TimeSlice: Interacting with data on a mobile phone is fundamentally different from surfing the Web on a PC. On a mobile phone, people are more task-oriented and stay online for small slices of time instead of surfing for long, sustained periods. Thus, the interface needs to be able to support services that can be done in 20 or 30 seconds, with a greater focus on immediacy and access.
Figure 5 ‘Social’ Design Principle (note the phone display as well)
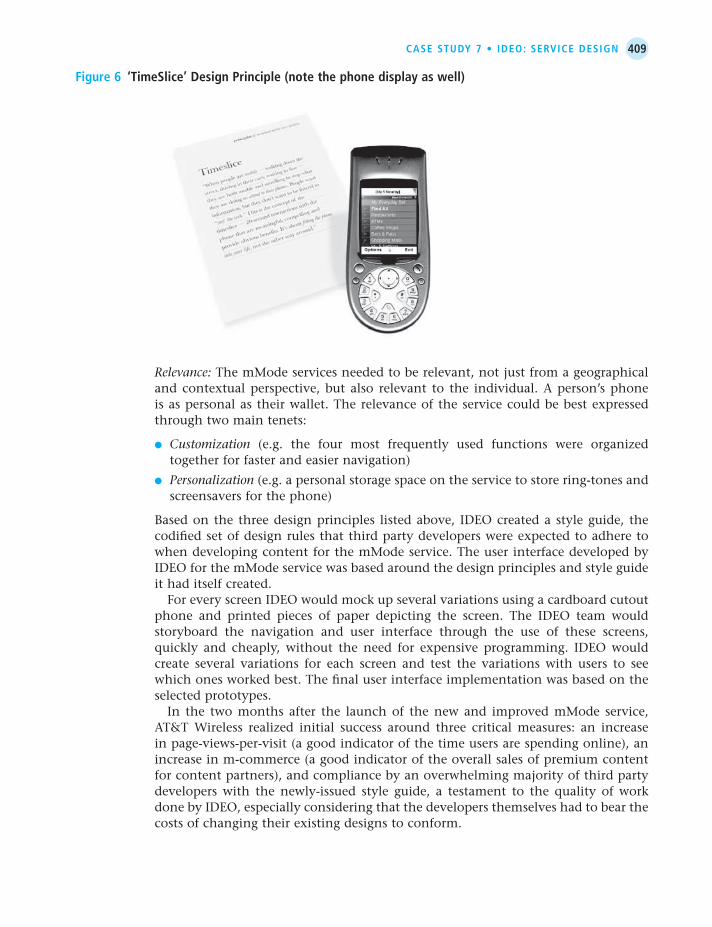
409CASE STUDY 7 • IDEO: SErvICE DESIgn
Figure 6 ‘TimeSlice’ Design Principle (note the phone display as well)
Relevance: The mMode services needed to be relevant, not just from a geographical and contextual perspective, but also relevant to the individual. A person’s phone is as personal as their wallet. The relevance of the service could be best expressed through two main tenets:
●● Customization (e.g. the four most frequently used functions were organized together for faster and easier navigation)
●● Personalization (e.g. a personal storage space on the service to store ring-tones and screensavers for the phone)
Based on the three design principles listed above, IDEO created a style guide, the codified set of design rules that third party developers were expected to adhere to when developing content for the mMode service. The user interface developed by IDEO for the mMode service was based around the design principles and style guide it had itself created. For every screen IDEO would mock up several variations using a cardboard cutout phone and printed pieces of paper depicting the screen. The IDEO team would storyboard the navigation and user interface through the use of these screens, quickly and cheaply, without the need for expensive programming. IDEO would create several variations for each screen and test the variations with users to see which ones worked best. The final user interface implementation was based on the selected prototypes. In the two months after the launch of the new and improved mMode service, AT&T Wireless realized initial success around three critical measures: an increase in page-views-per-visit (a good indicator of the time users are spending online), an increase in m-commerce (a good indicator of the overall sales of premium content for content partners), and compliance by an overwhelming majority of third party developers with the newly-issued style guide, a testament to the quality of work done by IDEO, especially considering that the developers themselves had to bear the costs of changing their existing designs to conform.

410 CASE STUDY 7 • IDEO: SErvICE DESIgn
The Portland general Health Center Project Coughlan ruminated about the Portland General Health Center project. The health-care industry was not completely unknown to IDEO though: a significant number of its projects and a large share of its revenues came from the design and engineering of medical devices – products such as Lilly’s insulin pens, the Heartstream ForeRunner defibrillator, and the Oral-B Gripper toothbrush. Even so, IDEO had no direct experi-ence in the design of healthcare services, and that made the project even more chal-lenging. Coughlan was confident that the IDEO process could be easily transposed to healthcare services, just as it had to the other service design projects in the past. Besides, IDEO was always eager to expand into new practice areas and expand its design process by exposure to new industries. Coughlan had been asked by Becker to focus on the patient experience at the hospital and suggest steps for improving the quality of the healthcare service. Additionally, the project’s budget constraints meant that IDEO would have to work within the existing hospital parameters: quick and cheap incremental innovation would be required. IDEO had come a long way in the five years it had been involved in service design. It had a fairly robust process and had developed a full suite of methods to be used in the design of a service. As Coughlan drained the dregs of his coffee, he wondered how best to approach this particular project. What process would he follow? Which of the established IDEO methods would he use, and at which stages? Wrestling with these thoughts as he finished up his strong decaf double no-fat soya latte macchiato, he went back upstairs to meet with Tim Brown.
Exhibit 1 IDEO practice areas as of January 2005
Practice Area Description
CxD Consumer Experience Design, focused on creating emotional connections between people and companies, applying IDEO’s ‘from think to build’ concept to experiences.
SX Experiences revolving around the design of software experiences based on PC, internet, mobile and emerging platforms.
Health Healthcare related projects.
Transformation A change consultancy practice, teaching clients how to foster innovation within their own companies.
Zero20 Focused on designing products and services for children.
Smart Space Focused on the emerging field of environment design.
Service Design Centred on service design and innovation.

411CASE STUDY 7 • IDEO: SErvICE DESIgn
This is the IDEO Way
Five steps in the process of designing a better consumer experience
1. OBSERVATION
IDEO’s cognitive psychologists, anthropologists, and sociologists team up with corporate clients to understand the consumer experience. Some of IDEO’s techniques:Shadowing Observing people using products, shopping, going to hospitals, taking the train, using their cell phone.Behavioral mapping Photographing people within a space, such as a hospital waiting room, over two or three days.Consumer journey Keeping track of all the interactions a consumer has with a product, service, or space.Camera journals Asking consumers to keep visual diaries of their activities and impressions relating to a product.Extreme user interviews Talking to people who really know – or know nothing – about a product or service, and evaluating their experience using it.Storytelling Prompting people to tell personal stories about their consumer experiences.Unfocus groups Interviewing a diverse group of people. To explore ideas about sandals, IDEO gathered an artist, a bodybuilder, a podiatrist, and a shoe fetishist.
2. BRAINSTORMING
An intense, idea-generating session analyzing data gathered by observing people. Each lasts no more than an hour. Rules of brainstorming are strict and are sten-cilled on the walls:Defer judgement Don’t dismiss any ideas.Build on the ideas of others No ‘buts’, only ‘ands’.Encourage wild ideas Embrace the most out-of-the-box notions because they can be the key to solutions.Go for quantity Aim for as many new ideas as possible. In a good session, up to 100 ideas are generated in 60 minutes.Be visual Use yellow, red, and blue markers to write on big 30 3 25-inch Post-its that are put on a wall.Stay focused on the topic Always keep the discussion on target.One conversation at a time No interrupting, no dismissing, no disrespect, no rudeness.
Exhibit 2 IDEO’s product development process

412 CASE STUDY 7 • IDEO: SErvICE DESIgn
3. RAPID PROTOTYPING
Mocking up working models helps everyone visualize possible solutions and speeds up decision-making and innovation. Some guidelines:Mock up everything It is possible to create models not only of products but also of services such as healthcare and spaces such as museum lobbies.Use videography Make short movies to depict the consumer experience.Go fast Build mock-ups quickly and cheaply. Never waste time on complicated concepts.No frills Make prototypes that demonstrate a design idea without sweating over the details.Create scenarios Show how a variety of people use a service in different ways and how various designs can meet their individual needs.Bodystorm Delineate different types of consumers and act out their roles.
4. REFINING
At this stage, IDEO narrows down the choices to a few possibilities. Here’s how it’s done:Brainstorm in rapid fashion to weed out ideas and focus on the remaining best options.Focus prototyping on a few key ideas to arrive at an optimal solution to a problem.Engage the client actively in the process of narrowing the choices.Be disciplined and ruthless in making selections.Focus on the outcome of the process – reaching the best possible solution.Get agreement from all stakeholders. The more top-level executives who sign off on the solution, the better the chances of success.
5. IMPLEMENTATION
Bring IDEO’s strong engineering, design, and social-science capabilities to bear when actually creating a product or service.Tap all resources Involve IDEO’s diverse workforce from 40 countries to carry out the plans.The workforce Employees have advanced degrees in different kinds of engineer-ing: mechanical, electrical, biomedical, software, aerospace, and manufacturing. Many are experts in materials science, computer-aided design, robotics, computer science, movie special effects, molding, industrial interaction, graphic and Web information, fashion and automotive design, business, communications, lin-guistics, sociology, ergonomics, cognitive psychology, biomechanics, art therapy, ethnology, management consulting, statistics, medicine, and zoology.
Source: Bruce Nussbaum, ‘The Power of Design’, BusinessWeek, 17 May 2004, p. 71.
Exhibit 2 Continued

413CASE STUDY 7 • IDEO: SErvICE DESIgn
Exhibit 3 IDEO method cards
IDEO Method Cards show some of the ways that IDEO puts people at the centre of the design process. These methods are typically used at the earliest stages of the design process to support observation-based research and learning consistent with the firm’s user-centred design process. The techniques are not proprietary and have been adapted from various established human and social research methods. Initially compiled to inspire and inform IDEO’s own design teams, the cards are now avail-able publicly to inspire creative teams in almost any context.
Shadowing How: Tag along with people to observe and understand their day-to-day routines, interactions and contexts.Why: This is a valuable way to reveal design opportunities and show how a product might affect or complement users’ behaviour.
Draw the Experience How: Ask the participants to visualize an experience through drawings and diagrams.Why: This can be a good way to debunk assumptions and reveal how people con-ceive of and order their experiences or activities.
role Playing How: Identify stakeholders involved in the design problem and assign those roles to members of the team.Why: By enacting the activities within a real or imagined context, the team can trigger empathy for actual users and raise other relevant issues.
Extreme User Interviews How: Identify individuals who are extremely familiar or completely unfamiliar with the product and ask them to evaluate their experience using it.Why: These individuals are often able to highlight key issues of the design prob-lem and provide insights for design improvements.
Fly on the Wall How: Observe and record behaviour within its context, without interfering with people’s activities.Why: It is useful to see what people actually do within real contexts and time frames, rather than accept what they say they did after the fact.

414 CASE STUDY 7 • IDEO: SErvICE DESIgn
Bodystorming How: Set up a scenario and act out roles, with or without props, focusing on the intuitive responses prompted by the physical enactment.Why: This method helps to quickly generate and test out many context and behaviour-based concepts.
Camera Journal How: Ask potential users to keep a written and visual diary of their impressions, circumstances, and activities related to the product.Why: This rich, self-conducted notation technique is useful for prompting users to reveal points of view and patterns of behaviour.
narration How: As they perform a process or execute a specific task, ask participants to describe aloud what they are thinking.Why: This is a useful way to reach users’ motivations, concerns, perceptions and reasoning.
Character Profiles How: Based on the observations of real people, develop character profiles to repre-sent archetypes and the details of their behaviour or lifestyles.Why: This is a useful way to bring a typical customer to life and to communicate the value of different concepts to various target groups.
Quick-and-Dirty Prototyping How: Using any materials available, quickly assemble possible forms or interac-tions for evaluation.Why: This is a good way to communicate a concept to the team and evaluate how to refine the design.
Source: IDEO Method Cards deck.
notes on the case1 In 2004, the company won 10 Industrial Design Excellence Awards (IDEA), double the
number of the next two firms, Smart Design and fuseproject, each of which won five. 2 Christopher Hawthorne, ‘The IDEO Cure’, Metropolis Magazine, October 2002, pp. 3–7.3 Bruce Nussbaum, ‘The Power of Design’, BusinessWeek, 17 May 2004, pp. 75.4 Laura Weiss, ‘Developing Tangible Strategies’, Design Management Journal, Winter 2002, pp.
34.5 Harold Greenberg, ‘Building a Better mMode’, mMode Magazine, Fall 2004, pp. 34.7 Catherine Fredman, “The IDEO Difference”, Hemispheres Magazine, August 2002, pp. 56
Exhibit 3 Continued

415CASE STUDY 7 • IDEO: SErvICE DESIgn
6 For details on IDEO’s brainstorming refer to Kelley, T. The Art of Innovation (chapter 4), 2002.
8 http://www.livework.co.uk/home/research0/glossary.html9 ‘Acela’, @ Amtrak Magazine, pp. 2510 Human factors specialists, according to IDEO’s website, employ a range of observational
and empathic techniques to understand the issues people face and are an integral part of interdisciplinary design teams
11 ‘Acela’, @ Amtrak Magazine, pp. 27.12 Dr. Bill Hollins, ‘About: Service Design’, www.designcouncil.org.uk, pp. 11.13 Foam core is also a sheet material, like cardboard and is used extensively in art and design
projects.14 GPRS stands for General Packet Radio Service, and is traditionally considered as 2.5G,
enabling data to be transferred wirelessly at speeds of up to approximately 500 Kbps.15 Harold Greenberg, ‘Building a Better mMode’, mMode Magazine, Fall 2003, p. 34.

CASE STUDY
8 OCADO VERSUS TESCO.COMValérie Keller-Birrer
By 2009 online retailing had become an important channel for many product categories. However, it still represented only a relatively small part of the grocery business. Brick-and-mortar grocery retailers found it challenging to run a successful online business: Despite category knowledge, they had to develop a completely new business model. Still, a few grocery retailers such as Albertson’s in the US, Auchan and Carrefour in France, and Tesco and Sainsbury’s in the UK managed to success-fully operate an online service in parallel with their physical stores. Tesco, in particu-lar, was often cited as an example of a retailer running a profitable online business and was the biggest online grocery retailer in the world.1 Several purely online start-up grocers were also launched around the world during the internet boom. However, few succeeded. Exceptions were LeShop in Switzerland and Ocado in the UK. Ocado was an internet grocery retailer headquartered in Hatfield, Hertfordshire. The company was founded by three former investment bankers in early 2000 and rolled out in early 2002. By 2009 Ocado had grown from its original three founders to over 3,000 employees and was just about to become profitable. The challenge online grocers faced was in developing a business model that would allow them to sell groceries over the internet in significant volumes, at reasonable prices and still make a profit. The brick-and-mortar supermarkets and the start-up grocers competed with one another, but each had a different business model for their online operations. The general opinion was that the brick-and-mortar grocers had a more sustainable model than start-ups; however, Ocado was challenging that assumption. Had Ocado found a new way of making pure online retailing a profitable business? Or was Tesco CEO Terry Leahy right in saying that Ocado’s business was not sustainable as food retailing had such low margins, and established supermarkets’ online businesses were a more profitable way of selling and delivering groceries?
The UK Online Grocery Market The UK online grocery market was estimated to be about £2.4 billion* in 2007, grow-ing by nearly one-third that year.2 Though it could still be characterized as a niche of the retail grocery market, accounting for at most 2 per cent to 3 per cent of total UK grocery sales, it was growing over six times as fast as the market as a whole. The market was forecast to more than double over the next couple of years to reach £6.9 billion in 2014.3
* £1 = US$1.94, €1.50 Source: Case Study CS.8 from Ocado Versus Tesco, IMD, 3-0323 (Keller-Birrer, V. and Tsikriktsis,
N.), Copyright ©2010 by IMD International Institute for Management Development, Lausanne, Switzerland. Not to be used or reproduced without prior written permission directly from IMD

417CASE STUDY 8 • OCADO VERSUS TESCO.COM
The online grocery market was dominated by four of the UK’s leading supermarket chains – Tesco, Sainsbury’s, Asda and Waitrose – and by a fifth supplier, Ocado. Tesco was the market leader, with an estimated share of 49 per cent of the online grocery market, followed by Ocado which captured about 14 per cent of the market, in line with Asda and Sainsbury’s.4 Demand for online groceries had been explosive, driven by increased service accessibility, thanks to increased broadband penetration and the steady expansion of online grocers’ geographical coverage. Nevertheless, few consumers purchased their groceries online. A consumer research study conducted in 2009 showed that less than 18 per cent of customers ordered groceries online at least once a year, while the proportion of regular users was about 6 per cent.5
Ocado
Background Ocado’s annual turnover in 2008 was £338.56 million. It was growing, but was still relatively small. While the company was EBITDA* positive – generating cash on top of its £35 million fixed costs – it still had a net loss of £33 million in 2007. Although Ocado was an independent business, the three founders retained a 22 per cent share of the firm and 24.1 per cent was held by the John Lewis Partnership pension fund, which also owned the upmarket Waitrose supermarket chain that operated mainly in the Greater London area. Interestingly, Waitrose had its own delivery operation in London, where it competed with Ocado.7
Operations Ocado used what was known in the industry as a centralized distribution model. The company was based in a purpose-built 11.5 hectare Customer Fulfillment Centre (CFC). The four-story warehouse, which cost £80 million, housed the world’s largest order storage and retrieval system. All of the orders were received via the website www.ocado.com and processed in the computerized warehouse. Ocado believed that it could pick customers’ orders at the rate of 300 items per hour (roughly three times the rate achieved by in-store pickers at Tesco or Safeway).8 At its maximum capacity, it was capable of handling the same order volume as 25 supermarkets. A network of five regional trans-ship-ment points and a fleet of 70 double-decker trucks supported the CFC. Ocado operated a fleet of over 500 specially designed Mercedes delivery vans, equipped with satellite navigation systems.
* EBITDA = earnings before interest, taxes, depreciation, and amortization
Figure 1 Key Facts about Ocado Operations
12,000 orders processed and delivered every day12 million items processed each day by the computer60 per cent of British households serviced

418 CASE STUDY 8 • OCADO VERSUS TESCO.COM
The whole picking process was computerized. Groceries were put in colour-coded boxes and routed to the delivery trucks over a maze of conveyor belts. The trucks then either went directly to home delivery or to one of the trans-shipment points, where the customer service team took over and delivered the goods in smaller trucks.
Value Ocado’s selling proposition was ‘to deliver world-class groceries and award-winning service straight into your kitchen’. Its product offer was focused on quality and included own brand groceries from the Waitrose supermarket chain, renowned for its high quality products, as well as a selection of name brand groceries and other items including flower, toys and magazines. Ocado promised a one-hour delivery slot, a substantial improvement over the two-hour slot offered by competitors. It saw home delivery as an opportunity to fur-ther differentiate itself from competitors by offering a state-of-the-art service. There was a delivery charge of £1.49 to £6.49 on small orders (minimum order was £40), but delivery was free for orders over £75 during time slots with lower demand. The prices of branded goods at Ocado were comparable with those of brick-and-mortar supermarkets. Waitrose own-label products were sold at an internet-only price, which was lower than the retail price in Waitrose shops. On 12 March 2008, Ocado announced a Tesco price match and guaranteed to match the prices of over 5,000 branded goods with Tesco’s cheapest pricing format.9
Marketing Marketing efforts were focused on the company’s target customer: A woman with one or more children under 15 in a household in which both spouses work. A key benefit for these customers was avoiding crowded stores at rush hour and the result-ant ‘trolley rage’.10 The grocer rolled out its service by focusing on its target group in fairly dense geo-graphic areas in order to facilitate delivery. Initially, in order to best reach its target group and build its user base, Ocado preferred direct marketing over mass media. Once Ocado was better established, it also focused on mass media, in particular TV and radio ads, to further build awareness and usage. Ocado’s communication strategy was to tell customers that ‘. . . they can have the best of everything – superior and convenient service, premium quality, accuracy that rivals shopping in a store and really competitive prices’. The company was active on the environmental front and had managed to lower its carbon emissions to the point where it could claim that shopping with Ocado was greener than walking to the supermarket. It used this as a selling point in its ad campaigns and the claim was endorsed by Greenstone, the carbon management consultancy.11
Tesco
Background Founded in 1919, Tesco was the UK’s biggest retailer and the third largest retailer in the world. In 2009 the group’s turnover rose to £59.4 billion, with £2.9 billion prof-

419CASE STUDY 8 • OCADO VERSUS TESCO.COM
its. Tesco had more than 470,000 employees and owned 4,331 stores in 14 different countries – 2,306 of them in the UK.12 Tesco started its online grocery delivery service in 1996 and Tesco.com was launched in 2000. It was the first retailer to go online in the UK and the first retail grocer in the world to offer a robust home shopping service. Tesco managed to develop a successful and profitable online business with a relatively small invest-ment of £30 million. With a turnover estimated at about £1.2 million, sales growth of 30 per cent, an operating margin of 5 per cent and a profit of £131 million, Tesco.com was well established as the UK’s leading online grocer by 2009.13
Operations Tesco chose to keep its home delivery operation simple by using existing stores as distribution centres rather than building a new warehouse dedicated to its online business. Customer orders were sent to the server computer of the store nearest the customer’s home and assigned to a van that would make the delivery. Then the orders were sent on to a ‘picking trolley’ manned by a Tesco employee or ‘picker.’ Each trolley was equipped with a touch-pad computer with shelf- identifier software that planned efficient routes through the store and scanned each item to verify that it was the one that had been ordered. Orders were then assembled in the back of the store and delivered by van. Tesco’s pickers prepared around 250,000 orders per week from 300 stores in the UK.
Value Proposition Tesco.com offered a wide range of food and non-food products, including books, CDs, DVDs, home appliances and clothing. Like Ocado, it used various web func-tions to make online shopping easier. The prices of goods ordered from the website were the same as those in the physi-cal stores, and in-store discounts, promotions and special offers were also available to online shoppers. Home delivery of groceries, seven days a week, was seen as a value-added service and Tesco charged between £3 and £6 for each delivery, depend-ing on the day of the week and the two-hour time slot selected by the customer. The company’s fleet of delivery trucks consisted only of electric vans. In order to cut down on pollution and waste, Tesco tried to reduce its use of plastic bags for home deliveries, and customers could choose a ‘no bag option’, in which groceries were delivered in stackable, reusable plastic trays.
Case Discussion Questions
1. As a customer, what do you want from an online grocery store? How do Ocado and Tesco.com perform on these dimensions?
2. Ocado delivers from a central, dedicated warehouse straight to the customer, while Tesco uses existing stores to deliver to nearby customers. What are the pros and cons of each model?
3. Does consumers’ behaviour differ when shopping for groceries online vs. offline? If yes, how?
4. Should Tesco worry about Ocado? If, yes, what should Tesco do?

420 CASE STUDY 8 • OCADO VERSUS TESCO.COM
Sources:Davidson, A. ‘The MT Interview: The Ocado Boys.’ Management Today, 8 June 2008.Tesco’s Financial Report 2009.Authors’ estimates: Tesco.com sales are estimated based on number deliveries per week times average amount spent.
Exhibit 1 Key data overview Ocado vs. Tesco.com
OCADO Tesco.com
Financial information
Turnover £338 million £1.2 billion
Sales growth 17% 30%
Market share 14% (50% in London) 49%
Profit (Loss) (2009) (£32.6 million) £131 million
Operating margin n.a. 5.7%
Operations data
No. of sites used for picking 1 300
No. of employees 3,000 Tesco.com n.a.Tesco UK: 286,394
No. of items picked per hour 300 120
Delivery price £1.49 to £6.49Free for orders > £75
£3 to £6
No. of deliveries per week 56,500 250,000
No. of delivery vans 500 1,800
Delivery coverage 60% of UK households 95% of UK households
Areas covered South England, Midlands, North West England, South Coast and most of Yorkshire
95% of UK
Customer data
Registered users 1 million n.a.
Active users 150,000 n.a.
Average amount spent per order £117 £90

421CASE STUDY 8 • OCADO VERSUS TESCO.COM
Notes on the case1 Enders, A. and T. Jelassi. ‘Leveraging Multi-channel Retailing: The Experience of Tesco.
com.’ MIS Quarterly Executive, 2009.2 www.ocado.com: media information
http://www.ocado.com/content/miscellany/pdfs/media_pack.pdf (accessed 11 January 2010).3 Palmer, D. ‘Online Grocery Still Treading Water.’ Australian Food News – Thought for Food.
30 September 2009. www.ausfoodnews.com. (accessed 16 October 2009).4 Research and Markets. ‘E-Commerce: The Internet Grocery Market Assessment 2009.’5 Research and Markets. ‘E-Commerce: The Internet Grocery Market Assessment 2009.’6 ‘Ocado Delivers “First Ever” Profit for Year.’ Just-food.com, 7 October 2009. 7 Davidson, A. ‘The MT Interview: The Ocado Boys.’ Management Today, 8 June 2008.8 Delaney-Klinger, K., K. K. Boyer and M. Frohlich. ‘The Return of Online Grocery Shopping:
A Comparative Analysis of Webvan and Tesco’s Operational Methods.’ The TQP Magazine, Vol. 15, No. 2, 2003.
9 www.ocado.com – media information http://www.ocado.com/content/miscellany/pdfs/media_pack.pdf (accessed 11 January 2010).
10 K. K. Boyer and M. Frohlich. ‘Ocado: An Alternative Way to Bridge the Last Mile in Grocery Home Delivery.’ Michigan State University, MI, 2002.
11 www.ocado.com. 12 Tesco 2009 Financial Report. Tesco’s fiscal year 2008/2009 ended on 28 February 2009.13 Tesco 2009 Financial Report.


Index
Accenture 149acceptability in process technology 208–9, 211activities, configuration of 8adjustment cost risks 327, 328adverse selection risks 159AESSEAL 4–5Airbus 380 249–51Albertson’s 416Aldi 20–1alignment in strategy formulation 281–90
direction of 282maintaining over time 282–4market requirements with operations
resources 283role of 281–2tight and loose 322–3timing 284–5
Alkatel 137Amazon.com 18–19AMR 144Amtrak 401–3analytical content in process technology
strategy 187–8apf Energy 393, 394Apple 254, 284
supply strategy 144apprenticeship mode of user participation 306Arend, Rene 349Asda 417Aston Martin 147AT&T mMode 407–9Auchan 416Audi 62, 147automation in process technology 187–8automobile industry, over-capacity in 131
Balanced Scorecard approach 222to implementation 319–20
balancing capacity change 132–3Barton, Harry 365, 367, 368, 369–70‘Be a bill’ exercise (IDEO) 403–4benchmarking 225–7
objectives 227types 226
Bezos, Jeff 18–19Black & Decker 254BMW 147Boeing
design changes 259–60flexibiliity of 266, 273product changes 251
Bohn, Roger 234–6bonding trust in partnerships 162Bose
customer involvement 272supplies relationships 332
bottom up perspective on operations strategy 11, 12–13
Brandenburger, A.M. 148Branton, Tom 372, 373, 374, 375break-even points in capacity strategy 119breakthrough improvement 217, 218British Airports Authority (BAA) 45British Airways 284
First Class, marketing 69–70Terminal 5 opening 45–6
Brown, Tim 397, 398Bungay, S. 321Burger King 350, 352business growth and loss of focus 78business model and operating model 7–9business process reengineering 96–9
criticisms of 98defined 96elements of 96–7
decision points 97improvement 97process and output 97processes, rethinking 96–7
lessons learned 98–9in operations strategy 99, 100
common threads 104, 106–10improvement fashion, avoiding 109–10positioning 107senior management in 105as strategic decisions 108
‘C-suite’ perspective 9–10Cadbury’s 326–7calculative trust in partnerships 162Cambridge University 259–60capabilities in operations resources perspective
17–21capacity lagging in product/service
development 268capacity strategy 113–41
changes in capacity 126–33balancing change 132–3leading, lagging or smoothing 129–30magnitude of change 130–1over-capacity 131timing of 126–7

424 Index
timing strategies 127–30as decision area 25defined 113–15distribution operation 125–6levels 114–15location 133–41
clustering 137–8community factors 139–40decision making 140–1image of site 135–6land and facilities 136–7resource costs 138–9service level 136site suitability 135spatially variable factors 135–7
overall level 115–24capital, availability of 118–19changes in demand 117–18economies of scale 119–21, 122flexibility 123–4forecast demand 116long-term 118short-term 118uncertain demand 117
in product/service development 268–9capacity utilisation in lean operations 92–3capital cost of technology 185capital expenditure 52capital for capacity change, availability of
118–19Carlsen Custom (case study) 362–70
‘Big One’ 362–3capacity 364co-location options 368–9customer relationships 369–70flexibility of 365–6and Phanchem 368–9supply relationships 367–8technology 364–5work organisation 366work teams, recruiting 367
Carrefour 416Carroll, Lewis 319Cemex 121central operations functions in strategy
implementation 300–3as curator 302as facilitator 302–3as governor 301–2and information networks 303as trainer 302
Chambers, S. 140, 168checklist manifesto 236–7chemical industry, over-capacity in 131Chicken McNuggets (McDonald’s) 346Chilli’s 352China Research Lab (CRL) 270Chopra, S. 176–7Christensen, Clayton 333
Cisco 137Citroen 147Clark, K.B. 276closeness in partnerships 161clustering 137–8co-development mode of user participation 306Coase, R. 156Coca-Cola 149Coch, L. 304codification in contracts 159cognitive trust in partnerships 162coherence in formulation process 296–7Collis, D.J. 292, 293communication in partnerships 163community factors in capacity location 139–40company-wide changes and loss of focus 78Competing Values Framework 34–5competitive benefits of innovation 331–2competitive factors
in performance objectives 56–9and resources 24
competitors of McDonald’s 349–51complementors 148comprehensiveness in formulation process 296computer chip industry, over-capacity in 131concept generation in product and service
development 258concept screening in product and service
development 258–9conformance quality 48connectivity in process technology strategy
188–9consortium e-marketplace 165consultancy mode of user participation 306Contact Utilities (case study) 389–95
background 389–90challenges 393–5Croydon Operations Centre 391–2distributed sales 392–3operations 390–1retail service 391
continuous improvement 217, 218control of strategy
dynamics of 322operational control 314risks, controlling 325–6strategic control 313–16type I and II errors in 328–9types of control 315
Convergys 145core capabilities 8core competencies 293corporate social responsibility (CSR)
and operations performance 46trade-offs in 70–1
in purchasing and supply strategy 150correspondence in formulation process 297cost plus contracts 158cost structure 8

425Index
costs 3control of at Rendall Graphics 374in improvement strategy 223, 225as performance objective 15, 51–2of product/service development 267–8
coupling in process technology strategy 188–9criticality in formulation process 297–8Croydon Operations Centre (Contact Utilities)
391–2curator in central operations functions 302customer processing technology 183–4customer requirements management (CRM)
199customer segments, targeting 7customers
and Carlsen Custom 369–70and lean operations 91in product/service development 272and Six Sigma 100–1in total quality management 84
Davenport, T. 96David Kelley Design 397de Meyer, A. 231decision making
on location 140–1in Six Sigma 108in TQM 108in vertical integration 152–7
balance of 155direction of 154do/buy analysis 155–6extent of 154outsourcing 155and performance objectives 154transaction cost economics in 156–7
decision points in BPR 97dedicated assets in partnerships 164delights 56–7delivery dependability 15, 50delivery flexibility 51delivery mode of user participation 305Dell, Michael 138, 238–9Dell Computers 289–90Delta Synthetic Fibres (DSF, case study) 355–61
Britlene and Britlon 356capital costs 361forecasts for 360
Britlon capability 358capacity working group 359current facilities 356–7flexibility 358–9market volumes 360markets 357
demand forecast updating 170Deming, W.E. 88dependability
in improvement strategy 223, 225as performance objective 15, 50
in process technology 207in product/service development 265
deploy improvement 219–20Design Continuum 400design evaluation in product and service
development 259design improvement in product and service
development 259develop improvement 219–20development and organisation as decision area
26development trajectories in operations strategy
332–3Digital Equipment Corporation 333Dignan, Larry 19direct improvement 219–20direct process technology strategy 182–3Disney, Roy 384Disney World 182Disneyland Paris (case study) 378–88
background and development 381–5design of 382–4locational decisions 382locations 381–2
commitment 378–9opening 384–5service delivery 379–80success of 385–8and Tokyo Disneyland 380–1
disruptive technologies 333, 334distributed sales (Contact Utilities) 392–3distribution channels 7diversification and resource cycles 285do/buy analysis 155–6double-loop learning 330–1‘Draw your money’ exercise (IDEO) 404–5Dubai International Airport, Terminal 3 45–6Dupont 145Dyson, James 255–6
e-procurement 164–6early market launch of products/services 264economies of scale
and capacity strategy 119–21, 122limited 77–8
The Economist 86, 149efficient frontier in operations performance
67–8Egg McMuffin (McDonald’s) 346, 348–9Eisermann, Richard 400, 402Eisner, Michael 386Elastic Compute Cloud (Amazon) 18–19electronic marketplaces 165–6Elfers, Jürgen 20Elkington, John 47emergent strategies, concept of 12–13EMI 331Emirates Airline 46energy costs of capacity location 139

426 Index
enterprise resource planning (ERP) 197–201criticisms of 200elements of 198–9lessons from 200–1supply networks in 199–200
Erdlington Group 109ethical performance 70–1, 72European Foundation for Quality Management
(EFQM) 87European Quality Awards (EQA) 87experience architecture (IDEO) 405–6expert control 314–15expertise mode of user participation 306external performance objectives 52–3
facilitator in central operations functions 302–3fast cycle of product/service development 285feasibility in process technology strategy 201–3Ferdows, K. 231Fiat 147Filet-o-Fish (McDonald’s) 346financial acceptability in process technology
203–4financial performance 70–1, 72financial requirements of process technology
203–4financing contracts 159Fingleton, John 74Fitzpatrick, Robert 382fixed price contracts 158Flaherty, Liam 358flexibility
in capacity strategy 123–4of Carlsen Custom 365–6of Delta Synthetic Fibres 358–9in improvement strategy 223, 225of McDonald’s 351–3as performance objective 15, 50–1in process technology 207
focus on operations performance 71–8as concept 72–3losing focus 78operation-within-an-operation concept 73as segmentation 72–3types 74–5
Foregeard, N. 250formulation of strategy 281–98
alignment 281–90direction of 282maintaining over time 282–4role of 281–2tight and loose 322–3timing 284–5
analysis for 290–8market requirements 290operational resources 291–2
challenges to 293–5completing 295–8sustainability 287–90
defensive approaches 288offensive approaches 288–9
SWOT analysis for 291–2Fourmont, Francois 303–4franchises of McDonald’s 346freelancing 160Freeman, Milton 70–1French, J.P.R. 304Friendly’s 352Frost, Sarah 105Fujimoto, T. 276functional strategy 9–10funnel, product/service development as 260–2
Gap 151–2Gates Bill
and IBM 294on resources 18
Gawande, A. 236–7General Electric (GE)
service revenues 5and Six Sigma 100
General Foods 293General Motors 98geographic focus 75, 76Gittler, K.-P. 240Global Insight 304globalisation and sourcing 149–50Goold, M. 321Gorton 349governor in central operations functions 301–2Griffiths, Paul 46Gustavson, Todd 254
Hall, Sam 407Hamel, G. 293Hammer, Michael 96Hayes, Robert 190, 240–2Heinen, M. 250Heinken 321–2Hewlett-Packard
product change 284and Rendall Graphics 371–3, 375TQM in 86
Hofstede, Geert 314, 316Holcim 47hold up risks 159Hollins, Dr. W. 400, 402Hoover, William 255hotel industry, over-capacity in 131Humbert, G. 250
IBM 293–4, 295in China 270innovation and alignment 293–4, 295process technology 189
ID Two 397IDEO (case study) 396–415
and Amtrak 401–3

427Index
and AT&T 407–9history of 397Innovation Process 398–400and Juniper Financial 403–7method cards 413–14and Portland General Health Center 410practice areas 410product development process 411–12service design 400–1in 2005 397–8
IKEA 116–17importance-performance mapping 227–31
sandcone theory 231improvement fashion, avoiding 109–10improvement strategy 215–42
breakthrough improvement 217, 218continuous improvement 217, 218cycles of 218–19deploying capabilities in market 239–42
model for 240–2development of 215–20direct, develop, deploy 219–20importance-performance mapping 227–31
sandcone theory 231importance-performance matrix 228–9operations capabilities, developing 231–9
checklist manifesto 236–7learning-experience curves 232–3process knowledge 234–6strategic importance of 237–8
performance targets 221–7and actual performance 224–5benchmarking 225–7factors included 222importance of 222–4measurement of 224target aggregation 222, 223
process improvement 216degree of 217–19
in-house product/service development 270–1indirect process technology strategy 182–3information networks in central operations
functions 303information processing technology 183–4information technology in process technology
strategy 196–201information transparency in partnerships
163–4Infosys 146infrastructural decisions 29innovation
and competitive benefits 331–2opportunities for in product/service
development 265and resource cycles 285
Innovation Process in IDEO 398–400innovator’s dilemma 333, 334intangible resources 19
in process technology strategy 208
Intelinnovation and alignment 294, 295product change 285in technical clusters 137
InterContiental Hotels Group 54internal performance objectives 52–3internet 164–6intervention risks 327–8intuitive control 315, 316investment 3investment bias and structural inertia 295
Jensen, Michael 43John Lewis Partnership 417Johnston, R. 140, 168joint coordination in partnerships 163joint learning in partnerships 163joint problem solving in partnerships 164Julienne, R. 387Juniper Financial 403–7just-in-time approach 93
Kamata, S. 93Kamprad, Ingvar 116–17Kaplan, R.S. 222, 319Kasparov, Gary 189Kelleher, Herb 33Keller-Birrer, Valérie 416–21Kelley, David 397, 399, 401Kentucky Fried Chicken 349, 350key performance indicators (KPIs)
in improvement strategy 222–4in operations strategy 8
Keystone Meats 349, 351Klauke, S. 250knowledhe management in product/service
development 272–3Komatsu 54Kraft Foods 293Kroc, Ray 344, 345, 346, 347
labour costs of capacity location 138Lacroix, André 387lagging capacity change 128–30Lands’ End 54late development of products/services 264lead users in product/service development 272leading capacity change 128–30Leahy, Terry 416lean operations 89–95
criticisms of 93defined 89–90elements of 90–3
capacity utilisation 92–3customers 91involvement 91–2synchronised flow 91waste elimination 92
lessons learned 93–4

428 Index
in operations strategy 95common threads 104, 106–10improvement fashion, avoiding 109–10positioning 107senior management in 105as strategic decisions 108
Learmont, David 45learning 329
enhanced 77single and double-loop 330–1
learning-experience curves 232–3limits to 233
Leonard, D. 294, 305–6LeShop 416Levi Strauss & Co. 150–1Lidl 20–1life-cycle cost of process technology 204–5Lindsay, Kevin 389, 390, 394–5live*work 400location in capacity strategy 133–41
clustering 137–8community factors 139–40decision making 140–1image of site 135–6land and facilities 136–7resource costs 138–9service level 136site suitability 135spatially variable factors 135–7
long-term capacity strategy 118long-term expectations in partnerships 162–3loose alignment 322–3López, JoséIgnacio 62lump sum contracts 158
McAlindon, Roseann 109McDonald, Dick and Mac 343McDonald’s 284
case study 343–57breakfasts 348–9chicken 349competitors 349–51consistency 344–5flexibility 351–3franchises 346fries 346–8Speedee Service System 343–4suppliers 345–6
McDonnell, J.F. 294McDonnell Douglas Corporation 294McIvor, R. 157McNamara, Stephen 74market changes and operations performance
59–60market positioning 14market requirements
operations risk in 323–4perspective on operations strategy 11, 13–17
internal customers in 16–17
performance objectives 15–16positioning 14
of process technology strategy 206–8in product and service development 263–8and strategy formulation 283, 290
market stimulation of products/services 264marketplace, shifts in 77Marks & Spencer 46Marshall, Stan 109mass customisation in product and service
development 253–4Massachusetts Institute of Technology 259–60material processing technology 183–4materials requirements planning in process
technology 197–8Matrix Product Design 397Matsushita 137Matsushito, Konosuke 85Mayer, Paul 355, 356, 358–9Melville, Kenneth 304Mercedes 147Microsoft
product change 284technical change 294, 295
mitigation strategies against risks 326mix flexibility 51modular design in product and service
development 252–3Moggridge, Bill 397Moggridge Associates 397monitoring of contracts 159monitoring operations strategy 312–22
dynamics of 322strategic monitoring 313–16tracking performance 316–22
balanced scorecard approach 319–20process objectives 318project objectives 317–18Red Queen effect 319
Montgomery, C.A. 292, 293moral hazard risks 159Moritz, Michael J. 137Motorola
product and service development 275Six Sigma in 99, 100
Nalebuff, B.J. 148negotiated control 315, 316net present value (NPV) in process technology
205–6Netza, Jeanette 389–90, 392, 394new products/services and loss of focus 78newspaper metaphor of product/service
development 266Nike 149Nissan 147Nokia 285Nordhoff, Heinrich 61–2Norton, D.P. 222, 319

429Index
Ocado (case study) 416–21data overview 420marketing 418operations 417–18value 418
Ohno, Taiichi 94oil industry, over-capacity in 131O’Leary, Michael 74Olive Garden 352Online Grocery market, UK 416–17operating expenditure 52operating model 8–9operation to operation business 149operations
expectations 3–5hierarchy of 3plans 6and process management 4
operations capabilities, developing 231–9checklist manifesto 236–7learning-experience curves 232–3process knowledge 234–6strategic importance of 237–8
operations excellence and strategic success 2–5analysis 3, 4
operations performance 41–78generic objectives 47–59
competitive factors 56–9cost 51–2dependability 50flexibility 50–1internal and external effects 52–3polar representation of 54–5quality 48relative priorities 53–4speed 48–9
impact of 42–7corporate social responsibility 46stakeholder perspective 42–6
relative importance of change 59–64, 66mapping strategies 61–4market changes 59–60in resource base 60–1
targeting and operations focus 71–8benefits and risks 75–8focus, as concept 72–3types of 74–5
targets in process improvement 221–7and actual performance 224–5benchmarking 225–7factors included 222importance of 222–4measurement of 224target aggregation 222, 223
trade-offs 65–71and corporate social responsibility 70–1defined 65effectiveness, improving 69and efficient frontier 67–8
importance of 66real or imagined 66–7
operations-related risk 3operations resources 1–39
business model and operating model 7–9competitive factors 24content vs process 22decision areas 25–9defined 21–2and formulation of strategy 283, 291–2and functional strategy 9–10performance objectives 23–5perspectives on 11–21, 17–21
bottom-up 11, 12–13interactions 21–2market requirements 11, 13–17operations resources 11, 17–21processes, routines and capabilities 17–21top-down 11, 12, 13
and process technology 208, 209in product and service development
268–76development capacity 268–9in-house or subcontracted development
270–1networks 269–72suppliers in 271–2uneven demand 268–9
and structural inertia 295operations strategy
in business process reengineering 99, 100common threads 104, 106–10improvement fashion, avoiding 109–10positioning 107senior management in 105as strategic decisions 108
common threads 104, 106–10control see control of strategydevelopment trajectories 332–3formulation see formulation of strategyimplementation see strategy implementationand leadership 33–5monitoring see monitoring operations
strategynew approaches to 82–111
business process reengineering 96–9lean operations see lean operationsSix Sigma 99–104, 106total quality management 84–9
operations risk 323–4path dependencies 332–3and performance see operations performanceprocess for 32–5resources for see operations resourcesstrategy mix 29–32
order batching 170order-winning factors 56–7
benefits from 56–8criticisms of concept 58–9
430 Index
organisation of product and service development 273–6
alternative structures, effectiveness of 276project-based structures 273–4
organisational learning 329organisational structures and structural inertia
295outsourcing 155, 160, 238over-capacity 131
part to participation (IDEO) 406partners 8partnerships in purchasing and supply 160–4
limitations of 164–6path dependencies in operations strategy
332–3PepsiCo 350performance measurement 317performance objective focus 75, 76
clarity of 75performance targets in process improvement
221–7and actual performance 224–5benchmarking 225–7factors included 222importance of 222–4measurement of 224target aggregation 222, 223
Perkin’s 352Peugeot 147Phanchem 352
and Carlsen Custom 368–9Phelps, John 393Pierer, Heinrich 240Pizza Hut 350, 352Porsche 147Porsche, Ferdinand 61Portland General Health Center Project 410positioning
in lean operations 107market, translation logic of 15market requirements 14
power-distance grid of stakeholders 335–6Prahalad, C.K. 293preliminary design in product and service
development 259prevention strategies against risks 325Price, Vincent 383price fluctuations 170private e-marketplace 165process design
in Six Sigma 103in total quality management 86
process distance 333–4, 335process improvement 216
in business process reengineering 97degree of 217–19in Six Sigma 103in total quality management 86
process knowledge 234–6process objectives, tracking 318process requirements focus 75, 76process technology strategy 181–212
automation and analytical content 187–8coupling and connectivity 188–9as decision area 26defined 184direct or indirect 182–3enterprise resource planning 197–201
criticisms of 200elements of 198–9lessons from 200–1supply networks in 199–200
evaluation of 201–12acceptability 208–9, 211feasibility 201–3financial requirements 203–4life-cycle cost 204–5and market requirements 206–8and operational resources 208, 209tangible and intangible resources 208time value of money 205–6vulnerability 210–12
and information technology 196–201material, information and customer
processing 183–4product-process matrix 190–6
on the diagonal 192–4down the diagonal 191–2flexibility/cost trade-offs 194trends 194–6
scale and scalability 185–7volume and variety 184–5
processes in operations resources perspective 17–21
product and service development 246–76cycles of 284–5importance of 246–54
modular design and mass customisation 252–4
overlap, managing 252and product change 248–9
market requirements perspective 263–8operations resource perspective 268–76
development capacity 268–9in-house or subcontracted development
270–1networks 269–72organisation of 273–6suppliers in 271–2uneven demand 268–9
as process 254–63analysis of 256–7as a funnel 260–2simultaneous development 262–3stages of 257–60
product change in development 248–9product flexibility 51

431Index
product life cycle influence on performance 59–60
product-process matrix in process technology 190–6
on the diagonal 192–4down the diagonal 191–2flexibility/cost trade-offs 194trends 194–6
product/service specification focus 75, 76project management contracts 159project objectives, tracking 317–18Prokopoff, Ilya 400, 402Pronovost, P. 236purchasing and supply strategy 144–77
contracting and relationships 157–66contracts and contracting 158–9partnerships 160–4
and corporate social responsibility 150defined 144–52globalisation and sourcing 149–50risks 175–7
categories 176–7managing 177
suppliers, management of 172–5coordination 172–3differentiation 173–4reconfiguration 174–5
supply networks 147–9competitive and cooperative forces 147–9dynamics of 167–72instability in 170–2inter-operations in 152operation to operation business 149qualitative dynamics 169–70quantitative dynamics 167–9strategic resources 149
types of arrangements 166–7vertical integration decision 152–7
balance of 155direction of 154do/buy analysis 155–6extent of 154outsourcing 155and performance objectives 154transaction cost economics in 156–7
pure risk 324–5
qualifying factors 56–7benefits from 56–8criticisms of concept 58–9
qualitative dynamics in supply networks 169–70
qualitycontrol of at Rendall Graphics 374designing-in in TQM 86in improvement strategy 223, 225as performance objective 15, 48in process technology 207in product/service development 264
quantitative dynamics in supply networks 167–9
Quinlan, Michael 350
Raaijmakers, Wilbert 321Rally’s 350, 352ratio analysis 26–7rationing 171Rea, Chris 4–5recovery strategies against risks 326Red Queen effect 319reimbursable (cost plus) contracts 158relational contracts 159relationships 8relationships in partnerships 163Renault 303–4Rendall Graphics (case study) 371–7
closure threatened 373costs, control of 374crisis at 372–3product development 374–5productivity 371–2quality control 374
representative mode of user participation 306resilience 3resource base changes and operations
performance 60–1resource costs of capacity location 138–9resource cycles in innovation 285resource distance 333–4, 335resources, appropriate, developing 75–6retail banking, voucher processing in 192, 193,
232–3retail service (Contact Utilities) 391revenue 3revenue streams 8Reynolds Porter Chamberlain 327Richardon, Barbara 401risks
in implementation 322–9adjustment cost 327, 328controlling 325–6intervention risk 327–8markets and performance out of balance
323–4mitigation strategies 326prevention strategies 325pure and speculative risk 324–5recovery strategies 326type I and II errors in 328–9
in purchasing and supply strategy 175–7categories 176–7contract relationships 159managing 177
The Robertson Trust 109Roddick, Anita 71Rolls Royce
service revenue 5technological development 259–60

432 Index
routine control 315routines in operations resources perspective
17–21Rudd, Sir Nigel 45Ruggier, Paul 105Russell, Greg 363.364, 366Ryanair 73–4
safeguards in contracts 159Sainsbury’s 416Samalionis, Fran 402, 403–4, 405, 407sandcone theory 231Sasson, Steve 254scalability in process technology strategy 185–7scale in process technology strategy 185–7Schweitrer, Louis 303scientific management 98senior management in lean operations 105Serco 146service design in IDEO 400–1service development see product and service
developmentservice flexibility 51service level and capacity location 136service life cycle influence on performance
59–60service strategy 4–5Seven-Eleven Japan 30–2Shell Services International 165short-term capacity strategy 118shortage gaming 171Shostack, G. Lynn 400Siemens 240Silican Valley 137Simplot, Jack 347simultaneous development in product/service
development 262–3single-loop learning 330–1sites in capacity strategy
availability of 124–6suitability and location 135
Six Sigma 99–104, 106criticisms of 103defined 100elements of 100–3
capability and control 102–3customers 100–1evidence, use of 101improvement, structured 101–2process design 103process improvement 103structured training 102
lessons learned 104in operations strategy 104
common threads 104, 106–10improvement fashion, avoiding 109–10positioning 107senior management in 105as strategic decisions 108
Skinner, Wickham 65, 66, 72Slack, N. 140, 168slow cycle of product/service development
284Small, Will 362, 363.364, 367, 368, 369smoothing capacity change 128–30Sodhi, M.S. 176–7Sonic 350, 352Sony Corporation 292sourcing strategies 158South, Alan 398, 399Southwest Airlines 73
and BPR 98process strategy in 33
Spangler, Murray 255spatially variable factors in capacity location
135–7specialist control and loss of focus 78specification quality 48speculative risk 324–5speed
in improvement strategy 223, 225as performance objective 15, 48–9in process technology 207in product/service development 264–5
Speedee Service System (McDonald’s) 343–4Squire, B. 177stakeholders
perspective on performance 42–6typical objectives 44
and strategy implementation 334–5power-distance grid 335–6
standard cycle of product/service development 284–5
steel industry, over-capacity in 131Stock, U. 240strategic success and operations excellence 2–5
analysis 3, 4strategy
control ofdynamics of 322operational control 314risks, controlling 325–6strategic control 313–16type I and II errors in 328–9types of control 315
definition 5–6plans 6
strategy drift 78strategy implementation 298–308
central operations functions 300–3as curator 302as facilitator 302–3as governor 301–2and information networks 303as trainer 302
participation in 304–8education for 307–8modes 305–6

433Index
opportunitiesfor 308pre-requisites for 307users 305–6
responsibility for 299–303market requirements or operations
resources 301‘staff’ and ‘line’ operations 300top down or bottom up 301
risks 322–9adjustment cost 327, 328controlling 325–6intervention risk 327–8markets and performance out of balance
323–4mitigation strategies 326prevention strategies 325pure and speculative risk 324–5recovery strategies 326type I and II errors in 328–9
stakeholders and 334–5structural decisions 29structural inertia 295structural vulnerability 78structured improvement in Six Sigma 101–2structured training in Six Sigma 102Stürmer, Christoph 304subcontracted product/service development
270–1success, sharing in partnerships 161Sun Microsystems 137supply network strategy as decision area 25supply networks 146, 147–9
of Carlsen Custom 367–8competitive and cooperative forces 147–9dynamics of 167–72in ERP 199–200instability in 170–2inter-operations in 152McDonald’s case study 345–6operation to operation business 149in product/service development 271qualitative dynamics 169–70quantitative dynamics 167–9strategic resources 149
sustainability of strategy formulation 287–90defensive approaches 288offensive approaches 288–9
sustaining technologies 333Suzuki, Toshifumi 30–2synchronised flow in lean operations 91
Taco Bell 350, 352TAG transport 229–30tangible resources in process technology 208targeting operations performance 71–8Tata, Ratan 134Tata Nano 134technology
in Carlsen Custom 364–5
and innovation 333of product/service development 272–3
Tesco 210–11case study
data overview 420and Ocado 416–21operations 419value proposition 419
Texas Instruments 137, 138TGI Friday 352tight alignment 322–3time value of money in process technology
205–6timing strategies in capacity change 127–30Tokyo Disneyland 380–1top down perspective on operations strategy
11, 12, 13Toshiba 284Total Information System (TIS) 30, 31Total Productive Maintenance (TPM) 94total quality management (TQM) 84–9
criticisms of 86–7defined 84elements of 84–6
costs 85customers 84designing-in quality 86employees 85organisation 85supporting improvement 86
lessons learned 87in operations strategy 88–9
common threads 104, 106–10improvement fashion, avoiding 109–10positioning 107senior management in 105as strategic decisions 108
Toyota Motor Corporationcoordinating strategies in 276lean production in 93product development in 284
tracking operations performance 316–22balanced scorecard approach 319–20process objectives 318project objectives 317–18Red Queen effect 319
trade-offs in operations performance 65–71and corporate social responsibility 70–1defined 65effectiveness, improving 69and efficient frontier 67–8importance of 66real or imagined 66–7
trainer central operations functions 302transaction costs in vertical integration 156–7translation logic of market positioning 15transport costs of capacity location 139trial and error control 315–16triple bottom line accounting 47

434 Index
trust in partnerships 161–2Turner, Fred 344, 349, 351
UK Online Grocery market 416–17uncertain demand and capacity strategy 117uneven demand for product/service
development 268–9Unilever 293unit rate contracts 158user participation in strategy implementation
305–6UtilityPartners® 390, 391, 392, 393, 395
value net 148value proposition 7Van Valen, Leigh 319variety focus 75, 76variety in process technology strategy 184–5vertical integration 152–7
balance of 155direction of 154do/buy analysis 155–6extent of 154outsourcing 155and performance objectives 154transaction cost economics in 156–7
vicious cycle of under resourcing development capacity 269
volume flexibility 51volume focus 75, 76volume in process technology strategy 184–5voucher processing in retail banking 192, 193,
232–3vulnerability of process technology 186, 210–12
VW 61–2operations strategy over time 62–4
Waitrose 417Walsh, Willie 45Warrens, Sally 391, 392–3waste elimination in lean operations 92Watson, Thomas 397Weimer, Ralph 348Weiss, Laura 398, 407–8Wendy’s 350Wheelwright, Stephen 191, 241–2Whittaker, Rebecca 105Whole Foods Market 122–3Wicks, Jim 275Wifrom 392Wilkner, Andrew 391–2, 394Williams, Jeffrey 284, 285Williams, Jim 345Williams, Tim 357Williamson, O. 156willingness mode of user participation
306Wingspan 403Woodcock, Chris 326working capital 52
Xchanging 105Xerox Corporation
benchmarking in 225organisational learning in 331
Zambrano, Lorenzo 121Zanussi 182Ziba Design 400

