996 IEEE COMMUNICATIONS SURVEYS & TUTORIALS, VOL. 15, NO. 3, THIRD QUARTER 2013 Stochastic Geometry for Modeling, Analysis, and Design of Multi-Tier and Cognitive Cellular Wireless Networks: A Survey Hesham ElSawy, Ekram Hossain, and Martin Haenggi Abstract—For more than three decades, stochastic geometry has been used to model large-scale ad hoc wireless networks, and it has succeeded to develop tractable models to characterize and better understand the performance of these networks. Recently, stochastic geometry models have been shown to provide tractable yet accurate performance bounds for multi-tier and cognitive cellular wireless networks. Given the need for interference characterization in multi-tier cellular networks, stochastic ge- ometry models provide high potential to simplify their modeling and provide insights into their design. Hence, a new research area dealing with the modeling and analysis of multi-tier and cognitive cellular wireless networks is increasingly attracting the attention of the research community. In this article, we present a comprehensive survey on the literature related to stochastic geometry models for single-tier as well as multi-tier and cognitive cellular wireless networks. A taxonomy based on the target network model, the point process used, and the performance evaluation technique is also presented. To conclude, we discuss the open research challenges and future research directions. Index Terms—Multi-tier cellular networks, heterogeneous net- works (HetNets), cognitive networks, interference modeling, stochastic geometry. I. I NTRODUCTION D UE to the rapid proliferation of smart phones, tablets, and PDAs with powerful processing capability, the pop- ulation of users using the wireless cellular infrastructure for Internet connectivity as well as the traffic demand per user are increasing dramatically. It is expected that by 2020 there will be more than 50 billion connected devices, and the cellular infrastructure should be developed accordingly [1]. The traditional homogeneous network expansion techniques via cell splitting cannot cope with the rapid growth of user population and their associated traffic. Moreover, macro base station (MBS) deployment necessitates a huge capital expen- diture (CAPEX) which would be very difficult to recover with the decreasing service cost [2], [3]. In response to the capacity challenges, the industry is driving the standardization bodies to develop new solutions to accommodate the increased capacity Manuscript received February 13, 2013; revised April 24, 2013. H. ElSawy and E. Hossain are with the Department of Electrical and Com- puter Engineering at University of Manitoba, Winnipeg, MB, Canada R3T 5V6 (e-mail: [email protected], [email protected]). M. Haenggi is with the Department of Electrical Engineering at the University of Notre Dame, Indiana, USA (e-mail: [email protected]). Digital Object Identifier 10.1109/SURV.2013.052213.00000 demand (i.e., network capacity and the link capacity) 1 . For instance, small cells including femto cells have been added to the 3G, LTE and WiMAX standards, and many cellular service providers have already commercially launched their small cell services [3]. “Small cell” is an umbrella term for low-power and low- cost radio access nodes that operate in both licensed and unlicensed spectra and have a range of several meters to several hundred meters. Note that a typical mobile macrocell may have a range of up to several kilometers. The term “small cell” covers femtocells, picocells, microcells, and metrocells. When compared to unlicensed small cells (e.g., Wi-Fi), small cells operating in the licensed band (i.e., licensed small cells) provide support for legacy handsets, operator-managed quality of service (QoS), seamless continuity with the macro networks through better support for mobility/handoff, and improved security. Some of the small cells (e.g., femto cells) are deployed and managed by the users, which means that some of the network CAPEX and operational expenditure (OPEX) are offloaded from the service providers to the users [3]. Small cells offer a fine grained and customer needs-oriented network expansion, which permits an optimized network operation. The small cells will offload a controllable percentage of the users and their associated traffic from the congested macro network tier, and hence, the number of users served by each network entity decreases, leading to a higher QoS per user. The network constituted by the MBSs overlaid by the small cell base stations (SBSs) is called a multi-tier cellular network (also referred to as a heterogeneous network [HetNet]). Multi-tier cellular network is a broad term that implies the coexistence of different networks (e.g., traditional macro cell as well as small cell networks) each of them constituting a network tier, and captures the single-tier (i.e., homogenous) cellular network as a special case. Multi-tier cellular networks are envisioned to provide a fast, flexible, cost-efficient and fine-tuned design and network expansion for the existing cellular architecture [2]. Due to the scarcity of the wireless spectrum along with the ever increasing capacity (both network and link capaci- ties) demand, universal frequency reuse is one of the main characteristics of multi-tier cellular networks [3]–[7]. That is, the available spectrum will be aggressively reused by all of 1 Hereafter, we will use the term network capacity to refer to the total number of active users per unit area that can be accommodated by the network, and the link capacity to indicate the achievable data rate for a user using Shannon’s formula. 1553-877X/13/$31.00 c 2013 IEEE

Welcome message from author
This document is posted to help you gain knowledge. Please leave a comment to let me know what you think about it! Share it to your friends and learn new things together.
Transcript

996 IEEE COMMUNICATIONS SURVEYS & TUTORIALS, VOL. 15, NO. 3, THIRD QUARTER 2013
Stochastic Geometry for Modeling, Analysis, andDesign of Multi-Tier and Cognitive Cellular
Wireless Networks: A SurveyHesham ElSawy, Ekram Hossain, and Martin Haenggi
Abstract—For more than three decades, stochastic geometryhas been used to model large-scale ad hoc wireless networks, andit has succeeded to develop tractable models to characterize andbetter understand the performance of these networks. Recently,stochastic geometry models have been shown to provide tractableyet accurate performance bounds for multi-tier and cognitivecellular wireless networks. Given the need for interferencecharacterization in multi-tier cellular networks, stochastic ge-ometry models provide high potential to simplify their modelingand provide insights into their design. Hence, a new researcharea dealing with the modeling and analysis of multi-tier andcognitive cellular wireless networks is increasingly attracting theattention of the research community. In this article, we presenta comprehensive survey on the literature related to stochasticgeometry models for single-tier as well as multi-tier and cognitivecellular wireless networks. A taxonomy based on the targetnetwork model, the point process used, and the performanceevaluation technique is also presented. To conclude, we discussthe open research challenges and future research directions.
Index Terms—Multi-tier cellular networks, heterogeneous net-works (HetNets), cognitive networks, interference modeling,stochastic geometry.
I. INTRODUCTION
DUE to the rapid proliferation of smart phones, tablets,and PDAs with powerful processing capability, the pop-
ulation of users using the wireless cellular infrastructure forInternet connectivity as well as the traffic demand per userare increasing dramatically. It is expected that by 2020 therewill be more than 50 billion connected devices, and thecellular infrastructure should be developed accordingly [1].The traditional homogeneous network expansion techniquesvia cell splitting cannot cope with the rapid growth of userpopulation and their associated traffic. Moreover, macro basestation (MBS) deployment necessitates a huge capital expen-diture (CAPEX) which would be very difficult to recover withthe decreasing service cost [2], [3]. In response to the capacitychallenges, the industry is driving the standardization bodies todevelop new solutions to accommodate the increased capacity
Manuscript received February 13, 2013; revised April 24, 2013.H. ElSawy and E. Hossain are with the Department of Electrical and Com-
puter Engineering at University of Manitoba, Winnipeg, MB, Canada R3T5V6 (e-mail: [email protected], [email protected]).
M. Haenggi is with the Department of Electrical Engineering at theUniversity of Notre Dame, Indiana, USA (e-mail: [email protected]).
Digital Object Identifier 10.1109/SURV.2013.052213.00000
demand (i.e., network capacity and the link capacity)1. Forinstance, small cells including femto cells have been added tothe 3G, LTE and WiMAX standards, and many cellular serviceproviders have already commercially launched their small cellservices [3].
“Small cell” is an umbrella term for low-power and low-cost radio access nodes that operate in both licensed andunlicensed spectra and have a range of several meters toseveral hundred meters. Note that a typical mobile macrocellmay have a range of up to several kilometers. The term “smallcell” covers femtocells, picocells, microcells, and metrocells.When compared to unlicensed small cells (e.g., Wi-Fi), smallcells operating in the licensed band (i.e., licensed small cells)provide support for legacy handsets, operator-managed qualityof service (QoS), seamless continuity with the macro networksthrough better support for mobility/handoff, and improvedsecurity.
Some of the small cells (e.g., femto cells) are deployed andmanaged by the users, which means that some of the networkCAPEX and operational expenditure (OPEX) are offloadedfrom the service providers to the users [3]. Small cells offer afine grained and customer needs-oriented network expansion,which permits an optimized network operation. The small cellswill offload a controllable percentage of the users and theirassociated traffic from the congested macro network tier, andhence, the number of users served by each network entitydecreases, leading to a higher QoS per user. The networkconstituted by the MBSs overlaid by the small cell basestations (SBSs) is called a multi-tier cellular network (alsoreferred to as a heterogeneous network [HetNet]). Multi-tiercellular network is a broad term that implies the coexistence ofdifferent networks (e.g., traditional macro cell as well as smallcell networks) each of them constituting a network tier, andcaptures the single-tier (i.e., homogenous) cellular network asa special case. Multi-tier cellular networks are envisioned toprovide a fast, flexible, cost-efficient and fine-tuned design andnetwork expansion for the existing cellular architecture [2].
Due to the scarcity of the wireless spectrum along withthe ever increasing capacity (both network and link capaci-ties) demand, universal frequency reuse is one of the maincharacteristics of multi-tier cellular networks [3]–[7]. That is,the available spectrum will be aggressively reused by all of
1Hereafter, we will use the term network capacity to refer to the totalnumber of active users per unit area that can be accommodated by the network,and the link capacity to indicate the achievable data rate for a user usingShannon’s formula.
1553-877X/13/$31.00 c© 2013 IEEE

ELSAWY et al.: STOCHASTIC GEOMETRY FOR MODELING, ANALYSIS, AND DESIGN OF MULTI-TIER AND COGNITIVE... 997
the coexisting network tiers. This will increase the spatialspectrum efficiency and network capacity at the expense ofincreased interference. In a multi-tier cellular network withuniversal frequency reuse and K coexisting tiers, there aretwo types of interferences, namely, the cross-tier (or inter-tier) interference and the co-tier (or intra-tier) interference.In the downlink, the cross-tier interference is the interferenceexperienced by a user served by a BS from tier i from BSsbelonging to tier j, ∀j �= i, j = 1, 2, 3, . . . ,K . On the otherhand, the co-tier interference is the interference experienced bya user served by a BS in tier i from the other BSs in the sametier i. In multi-tier cellular networks, interference is one of themain performance limiting parameters, and hence, interferencemodeling, coordination, and avoidance are of primary interestto both the academic and industry communities. Cognitive (orintelligent) radio technology, which enables the radio devicesto dynamically adjust the transmission parameters based on theambient radio environment, will be an enabling technology forinterference management and avoidance in multi-tier cellularnetworks [5].
For the analysis and design of interference avoidance andmanagement techniques in multi-tier cellular networks, rig-orous yet simple interference models are required. However,interference modeling has always been a challenging problemeven in simple traditional single-tier cellular networks. Forinterference characterization, assuming that the BSs of thecellular network follow a regular grid (e.g., the traditionalhexagonal grid model) leads to either intractable results whichrequire massive Monte Carlo simulation [8] or inaccurateresults due to unrealistic assumptions [9]. Moreover, due tothe variation of the capacity (both network and link capacities)demand across the service area (e.g., downtowns, residentialareas, parks, sub-urban and rural areas), the BSs will notexactly follow a grid-based model. That is, for snapshots of acellular network at different locations, the positions of the BSswith respect to (w.r.t.) each other will have random patterns.Hence, the grid-based modeling assumption is violated and isconsidered too idealized. If topological randomness is a char-acteristic of the single-tier cellular networks, multi-tier cellularnetworks with independent deployment of small cells (e.g.,femto cells) will have even more topological randomness.
Recently, a new modeling approached has been adoptedfor multi-tier cellular networks. It is based on stochasticgeometry and not only captures the topological randomnessin the network geometry but also leads to tractable analyticalresults. Stochastic geometry is a very powerful mathematicaland statistical tool for the modeling, analysis, and designof wireless networks with random topologies [10]–[16]. Ithas been applied to ad hoc networks for more than threedecades [17], in particular to model and analyze systems withrandom channel access (e.g., ALOHA [17]–[39] and carriersensing multiple access (CSMA) [40]–[51]), single- and multi-tier cellular networks [52]–[80], and networks with cognitiveelements [76]–[86].
In this article, we will not delve into the literature related tointerference modeling in large-scale ad hoc networks becausethere exist excellent resources dealing with them [11]–[16].Instead, we will focus on the related literature on stochasticgeometry modeling and analysis of single-tier, multi-tier, and
cognitive cellular networks, which was not considered in [11]–[16]2. Nevertheless, we will shed light on some stochasticgeometric models for interference in large-scale ad hoc wire-less networks which are necessary to give the mathematicalpreliminaries required to understand the discussion throughoutthis article. We will also provide a detailed taxonomy ofthe existing literature according to the point process used,the interference modeling approach, and the target networkmodel. The proposed taxonomy will reveal the popularityand applicability of the different point processes (PPs) andmodeling techniques. Finally, we will discuss the limitations ofstochastic geometry modeling, potential methods to overcomesome of these limitations, open research problems, and futureresearch directions.
The rest of the paper is organized as follows. The math-ematical preliminaries for stochastic geometry modeling arepresented in Section II. In Section III, we classify the stochas-tic geometry modeling techniques used in the literature andprovide a taxonomy of these techniques. In Section IV, thestochastic geometry modeling for multi-tier cellular networksis surveyed. Stochastic geometry modeling for cognitive net-works is discussed in Section V. Section VI provides fu-ture directions for stochastic geometry modeling of cellularnetworks. Finally, we discuss the merits and limitations ofstochastic geometry modeling in Section VII before conclud-ing the paper in Section VIII.
II. PRELIMINARIES ON THE STOCHASTIC GEOMETRYMODELING OF WIRELESS NETWORKS
In this section, we provide some mathematical preliminarieson the stochastic geometry modeling to help understand thediscussions presented later in this paper.
A. Signal-to-Interference-Plus-Noise Ratio (SINR) ModelIn wireless communications, the signal power decays with
the distance between the transmitter and the receiver accordingto the power law
Pr(y) = Pt(x)Ahxy ‖x− y‖−η (1)
where x ∈ Rd is the spatial location of a test transmitter, Pt(x)
is the transmit power indexed by the transmitter location,y ∈ R
d is the spatial location of the receiver, hxy is a randomvariable accounting for the random channel (power) gain3
between the two locations x and y, ‖.‖ is the Euclidean norm,A is a propagation constant, and η is the path-loss exponent.Note that (1) is called the unbounded path-loss model due toits singularity at the origin. Although the unbounded path-lossmodel is only valid for calculating the received power at thefar field, it has been extensively used in the literature due to itssimplicity. An alternative path-loss model, called the boundedpath-loss model, is more practical but complicates the analysis.The bounded path-loss model is given by
Pr(y) =Pt(x)Ahxy
ε+ ‖x− y‖η (2)
2The reason we focus on cognitive networks is that dynamic spectrumaccess via cognition is envisioned to be a key characteristic in a multi-tiernetwork with self-organizing small cells [5].
3Random channel gains are used to model the uncertainties in the receivedsignal power that arise due to multi-path fading and shadowing.

998 IEEE COMMUNICATIONS SURVEYS & TUTORIALS, VOL. 15, NO. 3, THIRD QUARTER 2013
where ε > 0 is added to avoid the singularity at the origin.While the choice of the model may significantly affect theinterference statistics, its impact on the SINR statistics issmaller. More discussions on the effects of bounded andunbounded path-loss models can be found in [30]. Throughoutthis paper, for simplicity, we will use the unbounded path-lossmodel given in (1). Although (1) holds for any number ofdimensions, the dimensions d = 1, 2, and 3 are of primaryinterest due to their physical interpretations.
Due to the distance-dependent signal power decay, alongwith the shared nature of the wireless medium, the networkgeometry has a significant impact on the performance ofwireless networks. That is, the position of a test receiver w.r.t.its serving network entity highly affects the desired signal.On the other hand, the position of the test receiver w.r.t.other network entities that are simultaneously using the samechannel highly affects the interference seen by the test receiver.Therefore, the network geometry has a significant impact onthe SINR experienced by the receivers.
The SINR at a test receiver in the network can be calculatedas
SINR(y) =Pt(x0)Ahx0y‖x0 − y‖−η
W +∑
x∈I Pt(x)Ahxy‖x− y‖−η(3)
where y is the location of the test receiver, x0 is the locationof the test transmitter (desired transmitter), I = {x1, x2, . . .}is the set of the locations of the interferers (active transmittersusing the same channel as the test transmitter), and W isthe noise power. The term
∑x∈I ... = Iagg is the aggregate
interference power at the test receiver.According to the network model, I can be either finite or
infinite, and the locations and the intensity of the interferers(i.e., the number of interferers per unit area) depend onthe network characteristics (e.g., network topology, numberof channels, association criterion, etc.) and medium accesscontrol (MAC) layer protocol (e.g., ALOHA, CSMA, TDMA,CDMA, etc.). The effect of user association and spectrumaccess method (i.e., MAC protocol) on the locations and/orintensities of the interferers are explained below.
• In a cellular network, a user may select the BS providingthe highest signal power to be her serving BS. Therefore,in a single-tier cellular network, when all the BSs havethe same transmit powers, the distance between a genericuser and her nearest interfering BS will be greater thanthe distance between that user and her serving BS. Ina multi tier cellular network, different network entitieshave different transmit powers. Therefore, as shown inFig. 1(a), given that the distance between a macro-celluser and her serving MBS is r and the transmit powerof the serving MBS is Pm, the nearest interfering MBStransmitting with the same power Pm will be located at adistance rm > r. On the other hand, assuming the samepath-loss exponent η for macro and small cell tiers, thenearest interfering SBS with transmit power Ps will be
located at a distance rs > r(
Ps
Pm
) 1η
. Similarly, Fig. 1(b)shows the relation between the desired link distance fora small cell user (i.e., the distance between the small celluser and her serving SBS) and the nearest interferencesources.
(a)
(b)
Fig. 1. The relation between the desired link distance and the nearestinterference sources: (a) macro-cell user, (b) small-cell user.
• A cognitive spectrum access method affects both thelocations of the interference sources as well as theirintensity. In a cognitive cellular network, each networkelement performs spectrum sensing and accesses a chan-nel if and only if the received power on that channel isless than a given threshold (γ). If deterministic channelgains are assumed, the spectrum sensing threshold (γ)
translates to a minimum exclusion distance re =(
PtAγ
) 1η
between the network elements using the same channel.Fig. 2(a) shows the locations of the cognitive networkelements and Fig. 2(b) shows the potential locations ofthe simultaneously transmitting network elements on thesame channel. From Fig. 2(b), we can see that there isa minimum distance between any two network elementsusing the same channel which controls both the minimumdistance between a receiver and her interference sourcesas well as the intensity of the interference sources.
At a generic time instant, the SINR experienced by eachreceiver depends on its location, the positions of the inter-

ELSAWY et al.: STOCHASTIC GEOMETRY FOR MODELING, ANALYSIS, AND DESIGN OF MULTI-TIER AND COGNITIVE... 999
(a)
(b)
Fig. 2. (a) The locations of the cognitive network elements, (b) the potentiallocations of the simultaneously transmitting network elements on the samechannel (the shaded network elements cannot simultaneously transmit on thesame channel due to the cognitive nature of the spectrum access).
ference sources as well as the instantaneous channel gains.Hence, given the effect of network geometry on interference,the SINR is a random variable that strongly depends on thenetwork geometry and significantly varies from one receiverto another and from one time instant to another.
Stochastic geometry is a mathematical tool that providesspatial averages, i.e., averages taken over large number ofnodes at different locations or4 over many network realiza-tions, for the quantities of interest (e.g., interference, SINR,outage probability, and achieved data rate) [11]. In otherwords, the stochastic geometry averages over all networktopologies seen from a generic node weighted by their proba-bility of occurrence [10], [83]. In this paper, after presentingthe necessary preliminaries, we will elaborate how stochasticgeometry captures the topological randomness while account-ing for the system characteristics in cellular networks.
4If the point process is ergodic, the spatial averages (across points) equalthe ensemble averages (across realizations) [10, Ch. 2].
B. Point Processes
In stochastic geometry analysis, the network is abstractedto a convenient point process (PP) which captures the networkproperties. That is, according to the network type, as well asthe MAC layer behavior, a matching PP is selected to modelthe positions of the network entities. At first, we define themost popular PPs used in wireless communications systems,then we show the analogy between the PPs and the networksthey model.
Definition 1 (Poisson point process (PPP)): A PP Π ={xi; i = 1, 2, 3, . . .} ⊂ R
d is a PPP if and only if thenumber of points inside any compact set B ⊂ R
d is a Poissonrandom variable, and the numbers of points in disjoint sets areindependent.
Definition 2 (Binomial point process (BPP)): The BPP mod-els the random patterns produced by a fixed number ofpoints (N ) in a set B ⊂ R
d with a finite Lebesgue measureL(B) < ∞, where L(.) denotes the Lebesgue measure5. LetΠ = {xi; i = 1, 2, 3, . . .} and Π ⊂ B, then Π is a BPP if thenumber of points inside a compact set b ⊆ B is a binomialrandom variable, and the numbers of points in disjoint sets arerelated via a multinomial distribution.
Definition 3 (Hard core point process (HCPP)): An HCPP isa repulsive point process where no two points of the processcoexist with a separating distance less than a predefined hardcore parameter rh. A PP Π = {xi; i = 1, 2, 3, . . .} ⊂ R
d isan HCPP if and only if ‖xi − xj‖ ≥ rh, ∀xi, xj ∈ Π, i �= j,where rh ≥ 0 is a predefined hard core parameter.
Definition 4 (Poisson cluster process (PCP)): The PCP mod-els the random patterns produced by random clusters. ThePoisson cluster process is constructed from a parent PPPΠ = {xi; i = 1, 2, 3, . . .} by replacing each point xi ∈ Πwith a cluster of points Mi, ∀xi ∈ Π, where the points inMi are independently and identically distributed in the spatialdomain.
More formal definitions of these PPs can be found in [10],[13], [14]. Fig. 3 shows a realization for a PPP and itscorresponding HCPP and PCP. Note that every realization ofa finite PPP is a BPP with the number of realized points [10,Thm. 2.9]. The PPP is used to model or abstract a networkcomposed of a possibly infinite number of nodes randomlyand independently coexisting in a finite or infinite service area[17], [18], [21], [25]–[28], [31] (e.g., nodes in a large-scalewireless network or users in a cellular network). If the totalnumber of nodes is known and the service area is finite (e.g.,a certain number of sensors dropped from a plane for battlefield surveillance), then the BPP will be used to abstract thenetwork [37], [38]. The PCP is used to model a network ifthe nodes are clustered according to certain social behavior orby the MAC protocol [39], [83] (e.g., users gathered aroundWi-Fi hot spots). If there is a minimum distance separatingthe nodes due to some physical constrains (e.g., geographicalconstrains), due to network planning, or due to the MAC layer
5This is the standard way of assigning a measure to subsets of an n-dimensional Euclidean space. For n = 1, 2, or 3, it coincides with the standardmeasure of length, area, or volume.

1000 IEEE COMMUNICATIONS SURVEYS & TUTORIALS, VOL. 15, NO. 3, THIRD QUARTER 2013
behavior, then a repulsive point process such as the MaternHCPP will be used for modeling their spatial locations [40]–[51], [87], [88] (e.g., contention domain in a CSMA protocol).
The Matern HCPP conditions on having a minimum dis-tance rh between any two points of the process, and is obtainedby applying dependent thinning to a PPP. That is, startingfrom a PPP, the HCPP is obtained by assigning a randommark uniformly distributed in [0, 1] to each point in the PPP,then deleting all points that coexist within a distance less thanthe hard core parameter rh from another point with a lowermark. Hence, only the points that have the lowest mark withintheir rh neighborhood distance are retained. As a result, notwo points with a separation less that rh will coexist in theconstructed HCPP.6
Among these point processes, due to its independenceproperty, the PPP is the most popular, most tractable, andmost important. Models based on the PPP have been usedfor large-scale ad hoc networks for more than three decades[17], [18], [28], and the performance of PPP-based networks iswell characterized and well understood. For instance, the exactprobability density function (pdf) of the aggregate interferenceas well as the exact outage probability were obtained in [28]for a planar PPP network with deterministic channel gainsand a path-loss exponent η = 4. Results for Rayleigh fadingchannels can be found in [19]. The exact distribution for theaggregate interference in a Rayleigh fading channel and a path-loss exponent η = 4 was derived in [29]. A model that capturesgeneral fading and propagation effects was developed in [31].The maximization of transmission capacity7 was performed in[21], [26]. The exact upper and lower bounds on the outageprobability can be found in [26]. The effect of fading channelsand power control via channel inversion on the transmissioncapacity was studied in [20]. The effect of interference can-cellation on the transmission capacity was studied in [22].The transmission capacity-optimal decentralized power controlpolicy for a PPP network was derived in [23], and the delay-optimal decentralized power control for PPP networks wasderived in [33], [34]. The interference correlation due tomobility was characterized in [35]. Most of these results havebeen summarized in the two monographs [13], [14].
The importance of the PPP lies in that, besides beingtractable and easy to handle, it does not only fit to modellarge-scale ad hoc networks with randomized multiple accesstechniques (e.g., ALOHA), it also provides tight bounds forthe performance parameters in planned infrastructure-basednetworks and coordinated spectrum access networks. More-over, as shown in the definitions above, the PPP providesthe base line model (i.e., parent PP) for the different pointprocesses used in the literature for wireless communicationssystems. For instance, in a coordinated access ad hoc network,the complete set of nodes attempting to access the spectrumcan be modeled using a PPP. On the other hand, the subset ofnodes selected by the MAC protocol to access the spectrum
6More precisely, this model is called a Matern hard-core process of typeII [10, Def. 3.8].
7The transmission capacity is a parameter that captures both the spatialfrequency reuse efficiency and the outage probability. It is defined as thenumber of successful transmissions per unit area under an outage probabilityconstraint [21].
0 2 4 6 8 10 12 14 16 18 200
2
4
6
8
10
12
14
16
18
20
(a)
0 2 4 6 8 10 12 14 16 18 200
2
4
6
8
10
12
14
16
18
20
(b)
0 2 4 6 8 10 12 14 16 18 200
2
4
6
8
10
12
14
16
18
20
(c)
Fig. 3. (a) PPP in a 20m × 20m region with intensity 0.1 points/m2 , (b)HCPP in a 20m × 20m region for the parent PPP in (a) and hard coreparameter rh = 2m, each point of the HCPP lies at the center of a non-overlapping circles with radius rh/2 represented by the dashed circles, (c)PCP in a 20m × 20m region for the parent PPP in (a) and clusters with aPoisson distributed number of points with mean 2 uniformly distributed in aunit circle neighborhood (i.e., Matern cluster process), the parent PPP pointsare plotted in crosses“+” while the added cluster points are plotted in dots.
will be modeled via the Matern HCPP derived from the parentPPP modeling the complete set of nodes. Similarly, for aninfrastructure-based network, a PPP can be used to modelthe set of candidate locations acquired by the site acquisitionteam for deployment of BSs, while a Matern HCPP can be

ELSAWY et al.: STOCHASTIC GEOMETRY FOR MODELING, ANALYSIS, AND DESIGN OF MULTI-TIER AND COGNITIVE... 1001
used to model the subset of the locations selected by thenetwork planning team for actual deployment of BSs. Afterabstracting the network by a convenient point process, severalperformance metrics can be characterized.
C. Performance Metrics
Interference is one of the main network parameters tocharacterize using the stochastic geometry analysis. For ageneric node in the network, the aggregate interference Iagg =∑x∈I
Pt(x)Ahxy ‖x− y‖−η is a stochastic process that depends
on the locations of the interferers captured by the point processI = {xi} and the random channel gains hxy. Note that Iis defined by the network properties and the MAC layer asshown in Fig. 1 and Fig. 2. The aggregate interference is astochastic process which varies according to the test locationand time. As mentioned before, stochastic geometry analysisgives the statistics of the interference (averaged w.r.t. the spa-tial domain) behavior experienced by the nodes existing in thenetwork. Hence, interference can be completely characterizedby its pdf (or equivalently, its cumulative distribution function(cdf)). Generally, there is no known expression for the pdfof the aggregate interference in large-scale networks. Hence,the aggregate interference is usually characterized by usingthe Laplace transform (LT) of the pdf (or equivalently itscharacteristic function [CF] or moment generation function[MGF])8. The Laplace transform of the aggregate interferenceis given by
LIagg (s) = E[e−sIagg ]. (4)
At a generic time instant, since the aggregate interferenceis a strictly positive random variable, its Laplace transformalways exists. Stochastic geometry provides a systematic wayto obtain the LT, CF, or MGF for the aggregate interferenceassociated with the PP of interest. In this article, we will notgo into the details of how to derive the LT, CF, or MGF forthe aggregate interference associated with the PP of interest asthey are well explained in the literature [11], [13], [14], [25],[27]. However, it is important to note that although the exactLT, CF, or MGF are available for the PPP, BPP, and the PCP,only approximate expressions of LT, CF, or MGF are availablefor the Matern HCPP. With the LT, CF, or MGF, we areable to generate the moments (if they exist) of the aggregateinterference as E[Inagg] = (−1)n L(n)
Iagg(s)
∣∣∣s=0
, where L(n)Iagg
(s)
is the nth derivative of LIagg (s). In the general case, it isnot possible to derive the exact performance metrics (e.g.,outage probability, transmission capacity, average achievablerate) from the LT, CF, or the MGF.
In the next section, we will show different techniques usedin the literature to utilize the LT, CF, or the MGF and gobeyond the moments of the aggregate interference to evaluatethe network performance.
III. TECHNIQUES TO ANALYZE NETWORK PERFORMANCE
In the literature, there are five main techniques to utilizethe LT, CF, or the MGF and go beyond the moments of
8Hereafter, we will say “the Laplace transform of the random variable” todenote the Laplace transform of its pdf.
interference and model the network performance metrics. Inthe following, we will discuss the techniques which were usedin the literature to overcome the obstacle imposed by the non-existence of any useful closed-form expression for the pdf ofthe interference.
A. Technique #1: Resort to the Rayleigh Fading Assumption
Because of its analytical tractability, the Rayleigh fadingassumption is the most popular assumption in the literature toovercome the obstacle imposed by the non-existence of anyclosed-form expression for the pdf of the aggregate interfer-ence [25], [27]. Although the interference statistics cannot beobtained, by assuming Rayleigh fading on the desired link (i.e.,the link between the test receiver and its serving transmitter),the exact distribution for the SINR can be obtained. That is, ifthe desired link is impaired by Rayleigh fading, the expressionfor the cdf of the SINR can be obtained from the Laplacetransform evaluated at some value.
Without loss of generality, let r = ‖x0 − y‖ be the constantdistance between the transmitter and the test receiver, h0 ∼exp(μ) be the channel power gain of the desired link, thenwe have
FSINR(θ) = P {SINR ≤ θ}= P
{PtAh0r
−η
W + Iagg≤ θ
}
= P
{h0 ≤ (W + Iagg)θr
η
PtA
}
=
∫u
Fh0
((W + u)θrη
PtA
)fIagg (u)du
(i)= 1− EIagg
[exp
(− (W + Iagg)μθr
η
PtA
)]
= 1− exp
(−Wμθrη
PtA
)EIagg
[exp
(−Iaggμθr
η
PtA
)]
= 1− exp
(−Wμθrη
PtA
)LIagg (s)
∣∣s= μθrη
PtA
= 1− exp (−Wcθ) LIagg (s)∣∣s=cθ
(5)
where Fh0(.) is the cdf of h0, fIagg (.) is the pdf of theaggregate interference, the expectation in (i) is w.r.t. both thepoint process and the channel gains between the interferencesources and the test receiver, and c = μrη
PtAis a constant.
Relaxing the constant distance r is straightforward [54]. Asmentioned before, the LT for the aggregate interference canbe found in a systematic manner [13]–[16]. For interference-limited networks (i.e., Iagg � W ), the effect of noise can beignored and the cdf reduces to FSINR(θ) = 1− LIagg (s)
∣∣s=cθ
,in which the Laplace transform of the aggregate interferenceis evaluated at some constant c multiplied by the parameter θof the cdf of SINR. With the exact cdf of the SINR, differentperformance metrics such as the outage probability, transmis-sion capacity, and the achievable data rate (i.e., obtained usingShannon’s formula) can be quantified. This technique is usedin [9], [25]–[27], [32]–[35], [37], [39], [54]–[60], [62]–[66],[68], [77], [78], [80], [81], [83], [85], [86], [89], [90].
The main drawback of this technique is that it is onlyvalid with the Rayleigh fading assumption for the desired link,

1002 IEEE COMMUNICATIONS SURVEYS & TUTORIALS, VOL. 15, NO. 3, THIRD QUARTER 2013
which may not always be the case. We can relax the Rayleighfading assumption at the expense of the tractability of themodel. As a result, we may be able to get only approximatesolutions or tight bound on the SINR distribution.
B. Technique #2: Resort to Dominant Interferers by RegionBounds or Nearest n Interferers
Technique #2 is also a very popular technique becauseof its simplicity and accuracy. This is based on the idea ofobtaining a lower bound on the outage probability by onlyconsidering the subset of dominant interferers. In the literature,it has been shown that, under a high path-loss exponent(e.g., η = 4), both the approaches (i.e., approaches based onthe vulnerability region and nearest n interferers) give tightlower bounds on the outage probability. However, when thepath-loss exponent decreases and approaches 2 (in the planarcase), the contribution of distant interferers to the outageevents increases and becomes overwhelming, and hence, bothapproaches lose their accuracy and therefore should not beused.
Assuming deterministic channel gains, the region bound isdetermined by the vulnerability circle around the test receiver.The vulnerability circle is the region where the signal power ofany active transmitter measured at the test receiver is greaterthan the desired signal power at the test receiver multiplied bya certain threshold θ [12]. In other words, for a given SINRthreshold θ, the vulnerability circle contains all transmitterswhere the transmission of any of them can alone corruptthe signal received at the test receiver. The notion of thevulnerability circle can be extended to random channel gainsas in [77].
In the vulnerability region analysis, it is not required toderive the Laplace transform of the aggregate interference.Instead, only the spatial statistics of the PP are studiedover the vulnerability region corresponding to the desiredsignal strength and the SINR threshold. That is, the outageprobability (i.e., the cdf of the SINR) can be lower boundedby the probability that the vulnerability region is non-empty.
The approach based on the nearest n interferers leads to thesame results (i.e., lower bounds), however, since the distribu-tion of the distances for the n nearest interference sourcesneeds to be determined, the analysis here is significantlymore involved than the vulnerability region analysis. Thedistribution of distances for the PPP and BPP was derivedin [36] and [38] respectively.
Since the moments of the aggregate interference can begenerated from the LT, CF, or the MGF, an upper boundfor the outage probability can be obtained using the Markovinequality, Chebyshev’s inequality, or the Chernoff bound. TheMarkov inequality is the easiest to compute, however, it is themost loose inequality. On the other hand, the Chernoff boundis quite tight for the tail probability, but its computation ismore involved and requires the knowledge of the MGF tobe optimized. Generally, the lower bounds provided by theregion bounds or the n nearest interferers are tighter thanthese upper bounds [26]. The lower bound obtained basedon the vulnerability region analysis was used in [17], [18],[21]–[26], [39], [43]–[45], [67], [69]. The bound based on the
nearest n interferers was used in [19], [20], [35], [38], [81].The Markov upper bound was used in [22], [25], [26], [39].The Chebyshev’s upper bound was used in [20]–[22], [26],[43], [69] and the Chernoff upper bound was used in [26].
C. Technique #3: Resort to the Approximation of the pdf ofthe Aggregate Interference
In technique #3, the pdf of the aggregate interference poweris approximated by one of the known pdfs. The parametersof the approximate pdf are obtained via the LT, CF, orMGF. For instance, if the pdf of the aggregate interferenceis approximated by a normal distribution, then the mean andthe standard deviation will be obtained from LT, CF, or theMGF of the aggregate interference. The main drawback of thismethod is that there is no known criterion to choose whichpdf to use and the approximation error can be only quantifiedby simulations.
In the literature, different papers used different pdfs ac-cording to the problem in hand and the results were verifiedvia simulations. For a PPP, it was discussed in [25], [27]that under the bounded path-loss or a guard zone around thereceiver, the moments of aggregate interference exist and thedistribution of it approaches the Gaussian distribution. In [37],[43], [46], the aggregate interference was approximated via aGaussian distribution. However, in [82] it was shown that thepdf of aggregate interference from a PPP with an exclusionregion around the test receiver is skewed and hence deviatesfrom normality. The authors in [82] showed that the shiftedlog-normal distribution gives a better approximation than theGaussian approximation for the pdf of the secondary users’aggregate interference in a cognitive network. In [84], thepdf of aggregate interference power was approximated by atruncated stable distribution, and in [76] by log-normal andshifted log-normal distributions. In [13, Sec. 5.5], the gamma,inverse Gaussian, and the inverse gamma distributions wereused to model interference powers under general PPs. In [71],the pdf of the amplitude of the aggregate interference wasapproximated with a circularly symmetric complex Gaussiandistribution.
D. Technique #4: Resort to the Plancherel-Parseval Theorem
The Plancherel-Parseval theorem [91] states that if f1(t)and f2(t) are square integrable complex functions, then∫
R
f1(t)f∗2 (t)dt =
∫R
F1(ω)F∗2 (ω)dω (6)
where F1(ω) is the Fourier transform (FT) of f1(t), F2(ω)is the FT of f2(t), and f∗(t) denotes the conjugate of f (t).The Fourier transform of a pdf is equivalent to the CF ofthat pdf, which is a special case of the Laplace transformand is obtained as F(ω) = L(s)|s=iω, where i =
√−1.The Plancherel-Parseval theorem precludes the need of in-verting the Laplace transform (i.e., obtaining the pdf of theinterference) obtained from the stochastic geometry analysisto obtain the performance metrics. Moreover, with the aidof the Plancherel-Parseval theorem, results for general fadingenvironment can be obtained by stochastic geometry analysis.However, the main drawback here is that the integrals are

ELSAWY et al.: STOCHASTIC GEOMETRY FOR MODELING, ANALYSIS, AND DESIGN OF MULTI-TIER AND COGNITIVE... 1003
quite involved due to the complex nature of the characteristicfunctions. Hence, the stochastic geometry analysis loses itsmain merit which is the analytical tractability that leads tosimple closed-form equations, and in turn, helps understandingthe behavior of the tested system in response to variationsin the design variables. Nevertheless, the Plancherel-Parsevaltheorem provides a mathematically elegant technique to extendall of the existing stochastic geometry results for generalfading environments. It was used in [15], [16], [32], [42].
E. Technique #5: Inversion
In this technique, the LT, CF, or MGF is inverted to obtainthe pdf of the interference [28]–[31], [40], [41], [70], [71]. Dueto the complex nature of the expressions for the LT, CF, orMGF, generally we cannot find the pdf in closed form. Thistechnique is only useful for very special cases of the PPPwhere the expressions for LT, CF, or MGF are invertible ormatch the LT, CF, or MGF of a known distribution [28], [29],[31], [70], [71]; otherwise, inversion is done numerically [30],[40], [41]. For instance, the Laplace transform of the aggregateinterference, measured at a receiver located at an arbitraryorigin in R
d, associated with an infinite PPP that starts fromthat arbitrary origin (i.e., there is no interference protectionregion around the receiver defined by the MAC layer) with un-bounded path-loss function (e.g., eq. (1)) matches the Laplacetransform of an alpha-stable distribution9 [11]–[14]. Althoughthis result looks promising, it is not very useful because theunbounded path-loss results in a significant deviation fromreality due to the singularity at the origin [30]. Hence, theinterference does not have finite moments. Moreover, dealingwith alpha-stable distributions is tricky since they do notprovide a closed-form expression for the pdf. The only twoexceptions where the pdf of interference has a closed-formexpression can be found in [28] for deterministic channels, andin [29] for Rayleigh fading channels. Both the closed-formpdfs were obtained under the assumptions of an unboundedpath-loss model, an infinite PPP, and path-loss exponent η = 4.
F. Summary and Taxonomy
Fig. 4 and Table I provide a taxonomy for the literatureaccording to the target network model, the point processused, and the technique to utilize the LT, CF, or the MGFfor performance evaluation. Note that if the same referenceappears in different categories of the taxonomy, this meansthat this reference uses all of these techniques. The taxonomyclearly shows the popularity of each point process and eachperformance modeling technique. From Fig. 4 and Table Iwe can see that the PPP is the most popular point processused in the literature because of its simplicity. Furthermore,the PPP provides accurate performance bounds and it is theparent point process for the HCPP and the PCP. The HCPP hasalso been extensively used to model wireless communicationsystems due to the hard core condition (i.e., the minimumdistance rh) which captures the contention-based spectrumaccess [40]–[51]. Furthermore, in [92], the authors showed
9Alpha-stable distributions generalize Gaussian distributions and have heav-ier tails [10, Sec. 5.1], [12].
that, compared to the PPP, the HCPP better captures the spatialdistribution of the base stations in a real network deployment.
To summarize, in stochastic geometry modeling we usepoint processes (PPs) to model the locations of the networkentities. Then, the LT, CF, or the MGF of the aggregateinterference is obtained. In this article, we have not shownhow to obtain the LT, CF, or the MGF of the aggregateinterference associated with the PP of interest because it isgenerally straightforward and is available in [11], [13]–[16].Finally, according to the accuracy, tractability, and practica-bility tradeoffs, one of the five techniques in the literature asdiscussed above is chosen to derive the performance metricsof interest from the LT, CF, or the MGF of the aggregateinterference. Some examples that show when to use each ofthe five performance evaluation techniques are provided below.
• For a network with general fading in the interferencelinks and Rayleigh fading in the desired link, technique#1 is the right technique to use. As shown in Fig. 4and Table I, technique #1 has been extensively used inthe literature because it is simple and gives the exactdistribution for the SINR.
• If general fading is observed on the desired link, thena lower bound via technique #2 can be obtained. It isworth mentioning that the lower bound in technique #2 isgenerally tighter than the upper bounds [26]. Note that theaccuracy of the lower bound increases for higher valuesof the path-loss exponent due to the faster signal decaywhich makes the effect of far interferers negligible.
• On the other hand, for lower values of the path-lossexponent, it is better to use technique #3 and have anapproximate analysis. It has been shown that for theapproximation of the pdf of interference, the shifted log-normal distribution is better than both the Gaussian andlog-normal distributions [76], [82]. However, there is noknown method to validate the approximation except bysimulations.
• With general fading in the direct (i.e., desired) link, ifan exact analysis is required, then technique #4 has tobe used, but the analysis will be highly involved. FromFig. 4 and Table I it can be observed that technique #4has not been frequently used in the literature due to itsanalytical complexity.
• Finally, technique #5 is only limited to some specialcases as far as only the analytical evaluation is concerned.
In the next section, we will not go into the mathematicaldetails used in the references which deal with stochasticgeometry modeling of wireless networks. However, for eachreference we will clearly show how to reduce the problem athand into one of the known PPs and which technique out ofthe popular five techniques is used for performance evaluation.
IV. STOCHASTIC GEOMETRY MODELING APPROACHESFOR MULTI-TIER CELLULAR NETWORKS
Multi-tier cellular networks consist of macro BSs (MBSs)overlaid by different tiers of small cells (i.e., microBSs (MiBSs), pico BSs (PiBSs), and femto access points

1004 IEEE COMMUNICATIONS SURVEYS & TUTORIALS, VOL. 15, NO. 3, THIRD QUARTER 2013
Large Scale Ad-hoc & IEEE 802.11 Networks
Single & Multi-tier Cellular
Cognitive Networks
[17] – [37], [71] PPP
[37], [38] BPP
[39] PCP
[40] – [51] HCPP
[9], [52]-[70], [72]-[80]
PPP
[77]-[79] HCPP
[76]-[84] PPP
[77], [78], [83], [85], [86]
HCPP
[9], [25]-[27], [32]-[35], [37], [39], [46] [54]-[60], [62]-[66]
[68], [77], [78], [80], [81], [83], [85], [86]
Technique #1
[37], [43], [71], [76], [82], [84]
Technique #3
[32], [42]
Technique #4
[28]-[31], [40], [41], [70], [71]
Technique #5
Type of Network Point Process Used Performance Characterization Technique
[17] -[26], [35], [38], [39], [43]-[45], [67], [69], [81]
Technique #2
[83] PCP
Fig. 4. Taxonomy of the related work on stochastic geometry-based modeling of wireless networks.
(FAPs))10. Small cells are deployed in the high traffic spotsof the cellular networks to satisfy the high traffic demand.Some of the small cells such as the femto cells are installedand operated by the users. Femto cells are small access pointsmainly installed indoors to enhance indoor coverage. Femtocells may be installed by the operator to enhance poorlycovered spots or by users to enhance their indoor coverage.With small cells, more randomness and more interference areintroduced to the cellular network. In the following, we firstshow the baseline models used to derive the outage probabilityand mean transmission rate of multi-tier cellular networks,then we will show how these simplified models are adaptedto capture, model, and analyze more sophisticated networkmodels.
A. PPP and HCPP Models
In the context of cellular networks, the hexagonal gridmodel is widely accepted and has been extensively used inthe literature to model, analyze, and design traditional single-tier cellular networks. In the hexagonal grid model, it isassumed that the locations of the BSs follow a deterministicgrid, each BS covers a hexagonal cell, and all cells have thesame coverage area. Due to the complexity and analyticalintractability of modeling inter-cell interference in the gridmodel, researchers have always used simplifications whichmake the accuracy of their models disputable [9], [54]. More-over, due to the variation in capacity (both network and linkcapacities) demand across the service area, the locations of the
10In this article, our main focus is on heterogeneous networks composedof a cellular network overlaid by small cells. This is different from that in[71] which models the coexistence between narrow band networks and ultrawide band networks.
BSs significantly deviate from the idealized grid-based model[54].
Looking at the cellular networks at different locations (i.e.,downtown, residential areas, parks, rural areas, etc.), we noticethat the positions of the BSs exhibit random patterns. Hence,stochastic geometry can be used to model the locations of theBSs. Ideally, the locations of the BSs should be modeled viaa repulsive PP to reflect the basic planning procedure used incellular network deployment. That is, although the distancesamong the BSs are random, in a real (i.e., deployed) cellularnetwork, we cannot find two BSs owned by same serviceprovider arbitrarily close to each other. Therefore, a repulsivePP such as the Matern HCPP with a hard core parameter thatreflects the minimum acceptable distance between two BSscan be used to model the cellular network topology [92]. Fig.5 shows the modeling of a cellular network via the hexagonalgrid, the PPP, and the HCPP.
As shown in Fig. 5, with the PPP modeling, there couldbe some BSs arbitrarily close to each other. On the otherhand, the grid-based model is too idealized. Instead, the HCPPprovides a more realistic modeling at the expense of analyticaltractability. Dealing with repulsive PPs is relatively morecomplicated and the Matern HCPP suffers from some flaws(i.e., the nonexistence of the probability generating functionaland the flaw of underestimating the intensity of the pointsthat can coexist for a given hard core parameter) that arestill being addressed by the research community [49], [51],[87], [88]. Therefore, the PPP is much more appealing dueto its simplicity and tractability [11], [13], [14]. However, itseems impractical to assume that the locations of the BSsare completely uncorrelated. In [54], the authors comparedthe performance of a PPP and a square grid model to theperformance of an actually deployed cellular network. Surpris-

ELSAWY et al.: STOCHASTIC GEOMETRY FOR MODELING, ANALYSIS, AND DESIGN OF MULTI-TIER AND COGNITIVE... 1005
TABLE ITAXONOMY OF THE LITERATURE BASED ON THE NETWORK TYPE, POINT PROCESS USED, AND THE TECHNIQUE USED TO OBTAIN THE PERFORMANCE
METRICS
Performance Evaluation TechniquesNetwork Used
Type PPTechnique #1 Technique #2 Technique #3 Technique #4 Technique #5
PPP [25]–[27], [32]–[35] [17]–[26], [35] [71] [32] [28]–[31], [71]
Ad hoc BPP [37] [38] [37] - -
& IEEE 802.11 HCPP [46] [43]–[45] [43] [42] [40], [41]
PCP [39] [39] - - -
PPP[9], [54]–[60], [62]–[66]
[67], [69] [76] - [70]Single-tier & [68], [77], [78]
Multi-tier Cellular BPP - - - - -
HCPP [77], [78] - - - -
PCP - - - - -
PPP [77], [78], [80], [81], [83] [81] [76], [82], [84] - -
Cognitive BPP - - - - -
HCPP [77], [78], [83], [85], [86] - - - -
PCP [83] - - - -
ingly, the PPP was observed to provide lower bounds on thecoverage probability and the mean transmission rate obtainedby measurements that are as tight as the upper bound providedby the idealized grid-based model. Further validations ofmodeling cellular networks via PPP can be found in [92],[93].
Although the idea of modeling the cellular network usingthe PPP goes back to the late 90’s [52], [53], the work in [54]brought much attention to this modeling approach due to theuseful formulas derived for the performance metrics (such asthe outage probability and the mean transmission rate), andcomparison with the grid-based model and the actual systemthat revealed the accuracy of the PPP model. The relativelytight bounds provided by the PPP opened a new researchdirection to model, analyze, and understand cellular networks.With the vast amount of results on the PPP available in theliterature along with its simplicity and tractability, it can beused to characterize and understand the behavior of cellularnetworks in terms of the various design parameters as will beshown later in the article.
B. Baseline Stochastic Geometry Models
The baseline models are simplified models that are used tounderstand and establish the analytical paradigm to be usedin more practical and complicated cases. In this section, wewill review the baseline stochastic geometry models for multi-tier cellular networks. In the baseline model, for the specialcase of a single tier cellular network, the locations of the BSsare modeled via a PPP. Assuming that all BSs transmit withthe same transmit power and each user associates with oneof the BSs based on the received signal strength (RSS), thecoverage regions of the BSs forms a Voronoi tessellation11
[94]. That is, a line bisecting the distance between each two
11The Voronoi tessellation captures the hexagonal grid as a special case.
neighboring BSs will separate their coverage regions. Theplanar graph constructed by perpendicular lines bisecting thedistances between the points of a PP is called a Voronoitessellation. Fig. 5 shows the Voronoi tessellations for differentpoint processes12.
In [54], both the BSs and the users were modeled viaindependent homogeneous PPPs, and it was assumed thatall BSs use the same frequency (channel). The users wereassumed to associate based on the long term average RSS(i.e., to the nearest BS). The authors used the Rayleigh fadingassumption (i.e., technique #1) to find the exact downlinkcoverage probability (i.e., P{SINR ≥ θ} where θ is thethreshold for correct signal reception) and the average trans-mission rate for a test user added at the origin. Note that,according to Slivnyak’s theorem, the statistics seen from aPPP is independent from the test location [10], [13], [14].Hence, no generality is lost in studying the statistics seen bythe user added at the origin.
In [54], the average transmission rate is derived in the samemanner as the coverage probability as follows:
E[ln (1 + SINR)](i)=
∫ ∞
0
P {ln (1 + SINR) > t} dt
=
∫ ∞
0
P{SINR >
(et − 1
)}dt
(ii)=
∫ ∞
0
e−Wc(et−1)LIagg
(c(et − 1
))dt
(7)
where (i) follows because ln (1 + SINR) is a strictly positiverandom variable, and (ii) follows from (5). Given that theLaplace transform of the aggregate interference associatedwith a PPP is available and easily computable, the meantransmission rate can be easily obtained by evaluating (7).
12Fig. 5 is plotted with Matlab via the command voronoi.

1006 IEEE COMMUNICATIONS SURVEYS & TUTORIALS, VOL. 15, NO. 3, THIRD QUARTER 2013
0 5 10 15 200
2
4
6
8
10
12
14
16
18
20
(a)
0 5 10 15 200
2
4
6
8
10
12
14
16
18
20
(b)
0 5 10 15 200
2
4
6
8
10
12
14
16
18
20
(c)
Fig. 5. (a) Cellular network modeled via the grid-based model, (b) Cellularnetwork modeled via the PPP, (c) Cellular network modeled via the HCPP.
The main findings of [54] are: (a) the PPP provides a relativelytight bound for the performance of actual networks, (b) simpleexpressions can be derived for the coverage probability andmean transmission rate, (c) in interference-limited networks(i.e., the noise is negligible w.r.t. the interference and hence
is ignored), the signal-to-interference-ratio (SIR) statistics areindependent of the intensity of BSs [54, eq. (25)].
It is quite insightful to see that in interference-limitednetworks (i.e., when noise is ignored), both the performancemetrics (i.e., coverage probability and average rate) are inde-pendent of the intensity of the BSs. That is, increasing theintensity (number) of the BSs neither degrades nor improvesthe coverage probability within the cell and the average rateachieved by the users. This behavior can be explained asfollows: as the intensity of the BSs increases, the average dis-tance between the users and their serving BSs decreases whichincreases the desired signal power. On the other hand, theaggregate interference (i.e., inter-cell interference) increaseswith the same rate as the desired signal. Hence, the SIRremains constant. Therefore, the coverage probability andaverage rate can only be increased through interference man-agement techniques such as frequency reuse, multiple-input-multiple-output (MIMO) antennas, or inter-cell cooperation.Although these results are only valid for the PPP networkmodel, they are insightful because they reflect the worst-casenetwork performance. More specifically, deploying more BSs,in the worst case, will never degrade the SIR statistics.
In [72], the lemma presented in [95] was used as analternative way to evaluate the downlink mean transmissionrate in cellular networks. In [95], an easy method that relieson the MGFs was proposed to evaluate averages in the form
of ln(1 +
∑Ni=1 ai∑M
j=1 bj+1
), where ai and bj are random variables
with arbitrary distributions. Note that ai corresponds to thedesired signal power (i.e., numerator of the SINR), while eachof the bjs corresponds to the power of an interference signal.[72] applied the MGF method developed in [95] to obtainthe exact average transmission rate for the cellular networkmodeled via the PPP for Nakagami-m fading in the desiredlink (i.e., the Rayleigh fading assumption used in technique#1 is relaxed). However, this method is only valid for thetransmission rate and is not applicable to evaluate the SINRdistribution (i.e., the outage probability). The work in [54] forcellular networks was extended to a single cellular networkconsisting of K-tiers in [55], and to M -cellular networks eachconsisting of K-tiers in [56].
In multi-tier cellular networks, the coverage of each networkentity depends on its type (i.e., an MBS, MiBS, PiBS ora FAP) and the network geometry (i.e., its location w.r.t.other network entities). That is, assuming that each userwill associate with (i.e., is covered by) the network entitythat provides the highest signal power, the coverage of eachnetwork entity will depend on its transmit power as well as therelative positions of the neighboring network entities and theirtransmission powers. For instance, if two MBSs have the sametransmission power, a line bisecting the distance between themwill separate their coverage areas. However, for an MBS with100 times higher transmit power than a FAP, a line dividingthe distance between them with a ratio of (100)
1η : 1 will
separate their coverage areas, and so on. If the BSs in allthe tiers are modeled via independent homogenous PPPs, dueto the high variation of the transmission power of the BSsbelonging to different tiers, the multi-tier cellular networkcoverage will constitute a weighted Voronoi tessellation. The

ELSAWY et al.: STOCHASTIC GEOMETRY FOR MODELING, ANALYSIS, AND DESIGN OF MULTI-TIER AND COGNITIVE... 1007
(a)
(b)
Fig. 6. (a) The HetNet model, (b) The network modeled as a weightedVoronoi tessellation (the square shapes represent the MBSs and the dotsrepresent the SBSs).
weighted Voronoi tessellation is the planar graph constructedby bisecting the distances between the points of a PPP ac-cording to the ratio between their weights, where the weightsare obtained based on the transmission powers of the BSs andthe propagation condition (e.g., path-loss exponent).
Fig. 6 shows an example for the coverage of a two-tiercellular network and the corresponding weighted Voronoitessellation. In [55], the authors modeled a multi-tier cellularnetwork where all network tiers were assumed to followindependent homogenous PPPs and all tiers used the samefrequency channel. The authors computed the tier associationprobability and the average tier load using the Rayleighfading assumption (technique #1) to evaluate the coverageprobability and the mean transmission rate assuming that theusers connect to the BSs offering the highest long term averageSINR. Note that, due to the assumption of independent PPPs,the aggregate interference received from each network tieris independent of the aggregate interferences received fromother network tiers. It is worth mentioning that the SINR-based association is more complicated than the RSS-basedassociation because it depends on both the desired RSS aswell as the interference signal strength. The authors overcamethis problem and proved that if the target SINR threshold is
greater than 1 (i.e., 0 dB), only one network entity can satisfythe SINR requirement [55, Lemma 1]. Hence, the probabilitythat a user is covered is just the sum of the probabilities thatthe SINR from each network tier is satisfied. In [55], it wasshown that the PPP assumption is accurate to within 1-2 dB ofthe measured coverage probability in an actual LTE networkoverlaid by heterogeneous tiers modeled as PPPs.
The assumption that only one BS can satisfy the targetSINR (i.e., SINR threshold is greater than 0 dB) as well as theassumption that each BS allocates its total power to the testuser, which were used in [55], were relaxed in [66]. In [66], theauthor assumed a more realistic case where the total transmitpower of the BS is shared among the served users and thatthe user connects to the network entity providing the highestinstantaneous SINR, although the instantaneous SINR can besatisfied by more than one tier. Under the modified networkmodel, the author in [66] derived the joint complementarycdf (ccdf) of the SINR measured at an arbitrary user fromthe set of candidate network entities (i.e., the nearest BS fromeach network tier) in a general K-tier HetNet. The author alsoused the Rayleigh fading assumption (i.e., technique #1) toobtain an exact closed-form expression for the joint ccdf (i.e.,association and coverage probability).
Different from the downlink analysis in [54], [55], [66],[72], the uplink analysis is significantly more involved due tothe per user power control. In [57], the authors assumed thatthe BSs and the users follow independent PPPs and used theRayleigh fading assumption (i.e., technique #1) to evaluatethe uplink coverage probability when the users are employingfractional channel inversion power control.
Although the basic network models are very simplified (i.e.,not very practical), they provide a simple yet accurate androbust baseline analytical paradigm for modeling and analysisof multi-tier cellular networks. As we will see later, manyresearch papers are building on these simple models to providemore practical and more rigorous models for multi-tier cellularnetworks.
C. Stochastic Geometry Models for Frequency Reuse in Cel-lular Networks
Incorporating frequency reuse in a stochastic geometrymodel is challenging because it introduces correlation amongthe BSs using the same frequencies. Hence, the tractability ofthe PPP will be partially lost (i.e., neighboring BSs should beusing different frequency sub-bands).
In [54], the authors overcame this problem and kept theproperties of PPP by modeling the worst-case frequency reusein cellular networks. That is, they assumed that each BSwould randomly and uniformly pick one of the availablefrequency sub-bands to use. Since independent thinning ofa PPP leads to another PPP [10], the network model afterfrequency reuse is also a PPP. Hence, applying frequencyreuse is equivalent to applying independent thinning to thecomplete set of interfering BSs. If the network has BSs withintensity λ and each BS randomly and uniformly picks one ofthe Δ available sub-bands, the BSs using the same sub-bandconstitute a PPP with intensity λ
Δ . Therefore, the intensity ofthe interfering BSs will be 1
Δλ.
1008 IEEE COMMUNICATIONS SURVEYS & TUTORIALS, VOL. 15, NO. 3, THIRD QUARTER 2013
Although, as discussed in the previous section, it was con-cluded in [54] that the intensity of the BSs affects neither thecoverage probability nor the average rate (since both the userassociation and interference change with the BS intensity),exploiting frequency reuse will affect both the performancemetrics. This is because frequency reuse will decrease theinterference without changing users’ association to the cor-responding serving BSs. That is, while a typical user will beserved from one of the complete set of BSs with intensityλ, she will experience interference only from BSs using thesame frequency sub-band with intensity 1
Δλ. Hence, there isno contradiction between the results obtained for the frequencyreuse and the result that both the coverage probability andthe average rate are independent of the intensity of the BSs.Frequency reuse will increase the coverage probability at theexpense of decreasing the average achievable rate because only1Δ of the spectrum is available per BS.
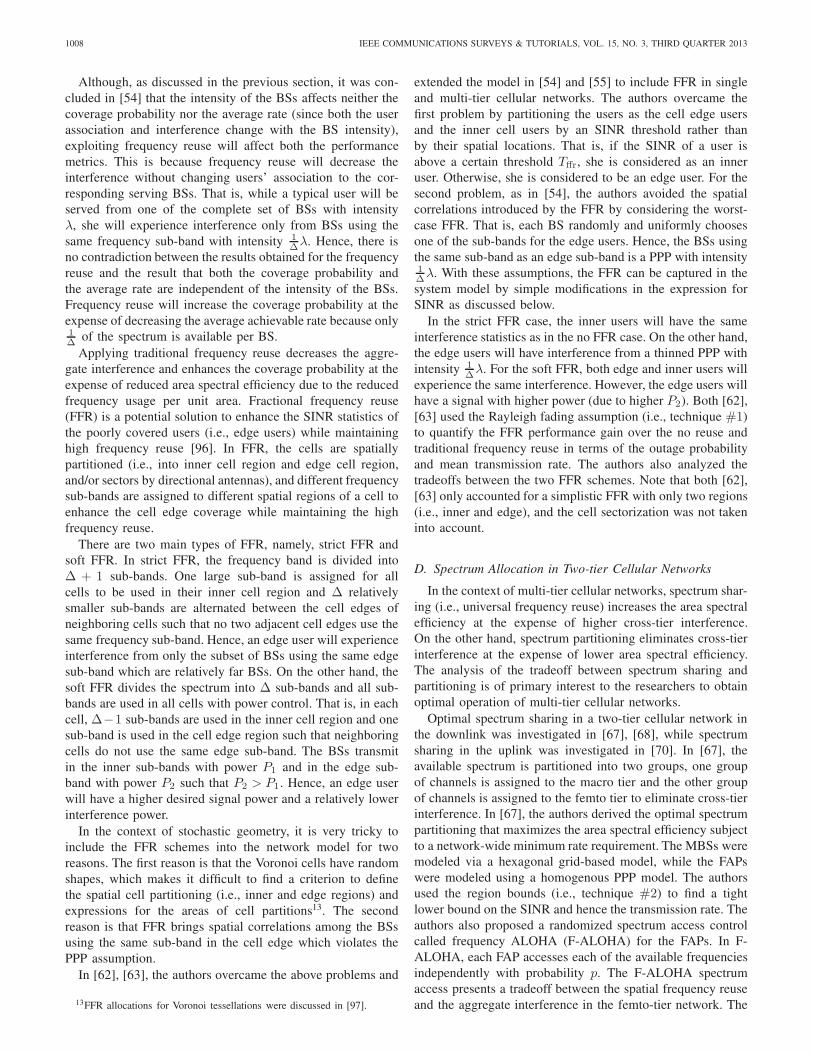
Applying traditional frequency reuse decreases the aggre-gate interference and enhances the coverage probability at theexpense of reduced area spectral efficiency due to the reducedfrequency usage per unit area. Fractional frequency reuse(FFR) is a potential solution to enhance the SINR statistics ofthe poorly covered users (i.e., edge users) while maintaininghigh frequency reuse [96]. In FFR, the cells are spatiallypartitioned (i.e., into inner cell region and edge cell region,and/or sectors by directional antennas), and different frequencysub-bands are assigned to different spatial regions of a cell toenhance the cell edge coverage while maintaining the highfrequency reuse.
There are two main types of FFR, namely, strict FFR andsoft FFR. In strict FFR, the frequency band is divided intoΔ + 1 sub-bands. One large sub-band is assigned for allcells to be used in their inner cell region and Δ relativelysmaller sub-bands are alternated between the cell edges ofneighboring cells such that no two adjacent cell edges use thesame frequency sub-band. Hence, an edge user will experienceinterference from only the subset of BSs using the same edgesub-band which are relatively far BSs. On the other hand, thesoft FFR divides the spectrum into Δ sub-bands and all sub-bands are used in all cells with power control. That is, in eachcell, Δ−1 sub-bands are used in the inner cell region and onesub-band is used in the cell edge region such that neighboringcells do not use the same edge sub-band. The BSs transmitin the inner sub-bands with power P1 and in the edge sub-band with power P2 such that P2 > P1. Hence, an edge userwill have a higher desired signal power and a relatively lowerinterference power.
In the context of stochastic geometry, it is very tricky toinclude the FFR schemes into the network model for tworeasons. The first reason is that the Voronoi cells have randomshapes, which makes it difficult to find a criterion to definethe spatial cell partitioning (i.e., inner and edge regions) andexpressions for the areas of cell partitions13. The secondreason is that FFR brings spatial correlations among the BSsusing the same sub-band in the cell edge which violates thePPP assumption.
In [62], [63], the authors overcame the above problems and
13FFR allocations for Voronoi tessellations were discussed in [97].
extended the model in [54] and [55] to include FFR in singleand multi-tier cellular networks. The authors overcame thefirst problem by partitioning the users as the cell edge usersand the inner cell users by an SINR threshold rather thanby their spatial locations. That is, if the SINR of a user isabove a certain threshold Tffr, she is considered as an inneruser. Otherwise, she is considered to be an edge user. For thesecond problem, as in [54], the authors avoided the spatialcorrelations introduced by the FFR by considering the worst-case FFR. That is, each BS randomly and uniformly choosesone of the sub-bands for the edge users. Hence, the BSs usingthe same sub-band as an edge sub-band is a PPP with intensity1Δλ. With these assumptions, the FFR can be captured in thesystem model by simple modifications in the expression forSINR as discussed below.
In the strict FFR case, the inner users will have the sameinterference statistics as in the no FFR case. On the other hand,the edge users will have interference from a thinned PPP withintensity 1
Δλ. For the soft FFR, both edge and inner users willexperience the same interference. However, the edge users willhave a signal with higher power (due to higher P2). Both [62],[63] used the Rayleigh fading assumption (i.e., technique #1)to quantify the FFR performance gain over the no reuse andtraditional frequency reuse in terms of the outage probabilityand mean transmission rate. The authors also analyzed thetradeoffs between the two FFR schemes. Note that both [62],[63] only accounted for a simplistic FFR with only two regions(i.e., inner and edge), and the cell sectorization was not takeninto account.
D. Spectrum Allocation in Two-tier Cellular Networks
In the context of multi-tier cellular networks, spectrum shar-ing (i.e., universal frequency reuse) increases the area spectralefficiency at the expense of higher cross-tier interference.On the other hand, spectrum partitioning eliminates cross-tierinterference at the expense of lower area spectral efficiency.The analysis of the tradeoff between spectrum sharing andpartitioning is of primary interest to the researchers to obtainoptimal operation of multi-tier cellular networks.
Optimal spectrum sharing in a two-tier cellular network inthe downlink was investigated in [67], [68], while spectrumsharing in the uplink was investigated in [70]. In [67], theavailable spectrum is partitioned into two groups, one groupof channels is assigned to the macro tier and the other groupof channels is assigned to the femto tier to eliminate cross-tierinterference. In [67], the authors derived the optimal spectrumpartitioning that maximizes the area spectral efficiency subjectto a network-wide minimum rate requirement. The MBSs weremodeled via a hexagonal grid-based model, while the FAPswere modeled using a homogenous PPP model. The authorsused the region bounds (i.e., technique #2) to find a tightlower bound on the SINR and hence the transmission rate. Theauthors also proposed a randomized spectrum access controlcalled frequency ALOHA (F-ALOHA) for the FAPs. In F-ALOHA, each FAP accesses each of the available frequenciesindependently with probability p. The F-ALOHA spectrumaccess presents a tradeoff between the spatial frequency reuseand the aggregate interference in the femto-tier network. The

ELSAWY et al.: STOCHASTIC GEOMETRY FOR MODELING, ANALYSIS, AND DESIGN OF MULTI-TIER AND COGNITIVE... 1009
authors in [67] showed that, due to the increased interference,the optimal p is a non-increasing function of the FAP intensity.
Since spectrum partitioning reduces the area spectral effi-ciency, it may not be the optimal spectrum allocation schemeeven if the share of the coexisting networks is optimized.In [68], the authors studied the spectrum sharing/partitioningtradeoffs and aimed at deriving the optimal spectrum al-location scheme that maximizes the transmission capacitysubject to an outage probability constraint in a two-tier cellularnetwork (i.e., MBSs overlaid by FAPs). Unlike [67], theauthors investigated both joint and disjoint spectrum sharingfor two-tier cellular networks. That is, assuming that thereare C available channels to be shared among both networktiers, the authors investigated whether it is optimal to haveboth network tiers jointly share the entire channels or todisjointly divide the available channels among the two tiers.The authors used PPP modeling for both the network tiers andthe Rayleigh fading assumption (i.e., technique #1) to derivethe outage probability and mean transmission rate to optimizethe spectrum allocation scheme. It was shown that jointallocation is optimal for sparse network deployments whiledisjoint allocation is optimal in dense network deployments.
For the uplink case, the authors of [70] derived the networkcapacity region of a two-tier cellular network consisting ofMBSs modeled via the hexagonal grid, FAPs modeled viaPPP, and users modeled via an independent PPP. The networkcapacity region is defined as all combinations of the intensitiesof users of the two networks that satisfy an outage constraint.The system model considered in [70] accounts for sectoredantennas, spread spectrum transmission, and power controlvia channel inversion. Due to the small transmission radiusof the FAPs, the interference seen from all users served bythe same FAP was approximated by an isotropic point sourceof interference with the worst-case sum transmission powersof the FAP users. The aggregate interference seen from allFAP users is approximated by the aggregate interference seenfrom a PPP modeling the location of the FAPs, hence theaggregate interference from the femto tier can be calculatedvia the inversion method (technique #5). The authors showedthat spectrum sharing with sectored antennas along withtime hopping spread spectrum boosts the network capacityof the system by a factor of seven relative to the spectrumpartitioning with omni-directional antennas. However, sincethe analysis in the paper is based on the worst-case scenario,only very pessimistic bounds on the performance metrics canbe obtained.
Spectrum sharing between a cellular network uplink and amobile ad hoc network was investigated in [69]. The authorscompared the tradeoff between overlay and underlay spectrumsharing for the uplink channels of the cellular network. It wasassumed that the transmitters in both networks use frequency-hopping spread spectrum to transmit their signals and that thecellular network controls the spectrum sharing method. TheBSs of the cellular network, the ad hoc transmitters, and thecellular network users follow independent PPPs. The authorsused the bounding technique (technique #2) to find upperand lower bounds on the outage probability as well as thetransmission capacity with and without successive interferencecancellation. The authors also determined the capacity regions
for the networks. In contrast to the two-tier cellular networkanalyzed in [70], in the case of spectrum sharing between acellular network uplink and a mobile ad hoc network, it wasshown that spectrum partitioning outperforms the spectrumsharing allocation. One explanation for this result is thatdifferent tiers in a multi-tier cellular network complement eachother. That is, each user associates with the best network entity(i.e., the best in terms of SINR or RSS) from the differentcoexisting tiers, hence, individual interference sources areusually weaker than the intended transmission source (see Fig.1). On the other hand, in the cellular network overlaid bya mobile ad hoc network, the two networks are completelydisjoint and there are no bounds on the locations of theinterference sources. Hence, spectrum partitioning is optimalin the latter case.
E. Biasing and Load Balancing in Multi-tier Cellular Net-works
In multi-tier cellular networks, choosing the appropriatenetwork tier to associate with is a non-trivial problem [98], anda simple RSS- or an SINR-based network selection schememay not be optimal. As shown earlier (see Fig. 6), the coverageof each network element highly depends on its type and thenetwork geometry. Therefore, there are significant differencesin the size of the coverage areas of the different networkelements, which may result in high diversity in the loadsserved by the different network elements. The high diversityof cell loads in a K-tier cellular network was analyzed in [58].The authors showed that due to the high diversity of the loadsserved by the coexisting network elements, some networkelements might be idle and hence would not contribute to theaggregate interference. Therefore, the authors in [58] upgradedthe SINR model in [55] (i.e., used PPPs with technique #1) toaccount for the activity factor of the coexisting heterogeneousBSs. It was shown that adding lightly-loaded femto and picocells to the network increases the overall coverage probability.However, due to the random deployment of the small cellsalong with the high transmission power gap with the MBSs,there might be some overloaded network elements (i.e., net-work elements with high transmit powers) and a large numberof un-utilized small cells. That is, since a user associates withone of the coexisting network tiers based on the RSS, theload per network tier is hard to control since it depends onseveral factors such as the relative transmission power and theintensity of the BSs belonging to each network tier. Hence,according to the network configuration, we may end up withsome congested tiers and under-utilized tiers.
In [59], [60], the authors investigated the above issue andintroduced a parameter called the biasing factor to controlthe network load of each network tier. The biasing factoris used to bias the users to associate with a given networktier even if it does not provide the strongest signal power (orequivalently the strongest SINR). The biasing can be viewedas a virtual increase in the relative transmit power of thegiven network tier. Biasing is also widely known as rangeexpansion in the 3GPP standards and proposals [99], [100].Note that biasing will affect the interference geometry bychanging the minimum separation distance between a user and
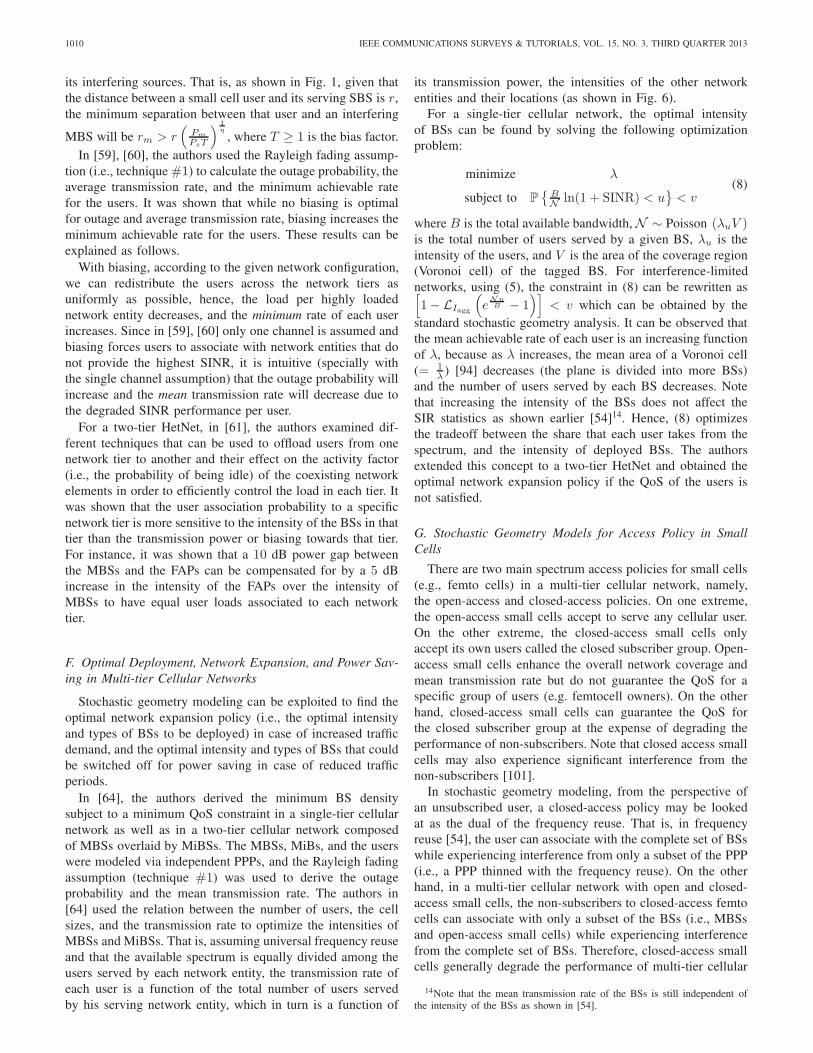
1010 IEEE COMMUNICATIONS SURVEYS & TUTORIALS, VOL. 15, NO. 3, THIRD QUARTER 2013
its interfering sources. That is, as shown in Fig. 1, given thatthe distance between a small cell user and its serving SBS is r,the minimum separation between that user and an interfering
MBS will be rm > r(
Pm
PsT
) 1η
, where T ≥ 1 is the bias factor.In [59], [60], the authors used the Rayleigh fading assump-
tion (i.e., technique #1) to calculate the outage probability, theaverage transmission rate, and the minimum achievable ratefor the users. It was shown that while no biasing is optimalfor outage and average transmission rate, biasing increases theminimum achievable rate for the users. These results can beexplained as follows.
With biasing, according to the given network configuration,we can redistribute the users across the network tiers asuniformly as possible, hence, the load per highly loadednetwork entity decreases, and the minimum rate of each userincreases. Since in [59], [60] only one channel is assumed andbiasing forces users to associate with network entities that donot provide the highest SINR, it is intuitive (specially withthe single channel assumption) that the outage probability willincrease and the mean transmission rate will decrease due tothe degraded SINR performance per user.
For a two-tier HetNet, in [61], the authors examined dif-ferent techniques that can be used to offload users from onenetwork tier to another and their effect on the activity factor(i.e., the probability of being idle) of the coexisting networkelements in order to efficiently control the load in each tier. Itwas shown that the user association probability to a specificnetwork tier is more sensitive to the intensity of the BSs in thattier than the transmission power or biasing towards that tier.For instance, it was shown that a 10 dB power gap betweenthe MBSs and the FAPs can be compensated for by a 5 dBincrease in the intensity of the FAPs over the intensity ofMBSs to have equal user loads associated to each networktier.
F. Optimal Deployment, Network Expansion, and Power Sav-ing in Multi-tier Cellular Networks
Stochastic geometry modeling can be exploited to find theoptimal network expansion policy (i.e., the optimal intensityand types of BSs to be deployed) in case of increased trafficdemand, and the optimal intensity and types of BSs that couldbe switched off for power saving in case of reduced trafficperiods.
In [64], the authors derived the minimum BS densitysubject to a minimum QoS constraint in a single-tier cellularnetwork as well as in a two-tier cellular network composedof MBSs overlaid by MiBSs. The MBSs, MiBs, and the userswere modeled via independent PPPs, and the Rayleigh fadingassumption (technique #1) was used to derive the outageprobability and the mean transmission rate. The authors in[64] used the relation between the number of users, the cellsizes, and the transmission rate to optimize the intensities ofMBSs and MiBSs. That is, assuming universal frequency reuseand that the available spectrum is equally divided among theusers served by each network entity, the transmission rate ofeach user is a function of the total number of users servedby his serving network entity, which in turn is a function of
its transmission power, the intensities of the other networkentities and their locations (as shown in Fig. 6).
For a single-tier cellular network, the optimal intensityof BSs can be found by solving the following optimizationproblem:
minimize λ
subject to P{
BN ln(1 + SINR) < u
}< v
(8)
where B is the total available bandwidth, N ∼ Poisson (λuV )is the total number of users served by a given BS, λu is theintensity of the users, and V is the area of the coverage region(Voronoi cell) of the tagged BS. For interference-limitednetworks, using (5), the constraint in (8) can be rewritten as[1− LIagg
(e
NuB − 1
)]< v which can be obtained by the
standard stochastic geometry analysis. It can be observed thatthe mean achievable rate of each user is an increasing functionof λ, because as λ increases, the mean area of a Voronoi cell(= 1
λ ) [94] decreases (the plane is divided into more BSs)and the number of users served by each BS decreases. Notethat increasing the intensity of the BSs does not affect theSIR statistics as shown earlier [54]14. Hence, (8) optimizesthe tradeoff between the share that each user takes from thespectrum, and the intensity of deployed BSs. The authorsextended this concept to a two-tier HetNet and obtained theoptimal network expansion policy if the QoS of the users isnot satisfied.
G. Stochastic Geometry Models for Access Policy in SmallCells
There are two main spectrum access policies for small cells(e.g., femto cells) in a multi-tier cellular network, namely,the open-access and closed-access policies. On one extreme,the open-access small cells accept to serve any cellular user.On the other extreme, the closed-access small cells onlyaccept its own users called the closed subscriber group. Open-access small cells enhance the overall network coverage andmean transmission rate but do not guarantee the QoS for aspecific group of users (e.g. femtocell owners). On the otherhand, closed-access small cells can guarantee the QoS forthe closed subscriber group at the expense of degrading theperformance of non-subscribers. Note that closed access smallcells may also experience significant interference from thenon-subscribers [101].
In stochastic geometry modeling, from the perspective ofan unsubscribed user, a closed-access policy may be lookedat as the dual of the frequency reuse. That is, in frequencyreuse [54], the user can associate with the complete set of BSswhile experiencing interference from only a subset of the PPP(i.e., a PPP thinned with the frequency reuse). On the otherhand, in a multi-tier cellular network with open and closed-access small cells, the non-subscribers to closed-access femtocells can associate with only a subset of the BSs (i.e., MBSsand open-access small cells) while experiencing interferencefrom the complete set of BSs. Therefore, closed-access smallcells generally degrade the performance of multi-tier cellular
14Note that the mean transmission rate of the BSs is still independent ofthe intensity of the BSs as shown in [54].

ELSAWY et al.: STOCHASTIC GEOMETRY FOR MODELING, ANALYSIS, AND DESIGN OF MULTI-TIER AND COGNITIVE... 1011
networks [55]. Hybrid channel access is considered as apotential solution to control the tradeoff between the overallnetwork performance and the QoS guarantee for the closedsubscriber group.
In hybrid-access small cells, the available spectrum ispartitioned into two groups. One group is assigned to theclosed subscriber group to guarantee their QoS, while theother group is assigned to the non-subscribers to enhancetheir coverage and reduce the interference experienced fromthem. In [65], the authors optimized the hybrid-access policyin a two-tier HetNet. That is, the authors found the optimalnumber of accessible channels for non-subscribers subject toa tolerable degradation for the small cells’ closed groups ofsubscribers. The authors used independent PPPs to modelthe MBSs, the FAPs, the macro users, the non-subscribedusers, and the closed group subscribers, and used the Rayleighfading assumption (i.e., technique #1) to find the coverageprobability and mean transmission rate. It was shown that ifthe optimal number of channels are left open for unsubscribedusers, significant improvements for non-subscribed users canbe achieved with a negligible performance degradation forthe closed group of subscribed users. However, the model in[65] does not capture the offloading effect (i.e., the amountof decreased interference) by accepting non-subscribers to beserved by the FAPs which might improve the performance ofthe closed subscribers.
H. Stochastic Geometry Models for Multiple Input MultipleOutput (MIMO) Systems
Multiple-input-multiple-output (MIMO) systems will be keyenablers for high-speed communications in LTE and LTE-Advanced networks. Incorporating MIMO into the modelwill increase the complexity of analysis. For instance, thesimplistic Rayleigh distribution assumption for the channelpower gains in a single-antenna system is not practical inthe MIMO case because the interference power as well asthe desired signal power distributions will depend on theMIMO configuration used. Moreover, different network tiersmay use different MIMO configurations which will increasethe complexity of the tier association problem. That is, theassociation probability is not just a function of the ratio oftransmission power for the different network tiers. Instead,the association will depend on both the MIMO configurationas well as the transmit power. Furthermore, the condition thatonly one network entity can satisfy the SINR threshold for agiven user (for SINR thresholds greater than 0 dB [55], [66])will not hold.
In [73], the authors used stochastic geometry techniquesdeveloped in [24] to characterize the interference, and hence,the downlink coverage and rate in a given cell for a MIMO-based single-tier as well as multi-tier cellular network. Thatis, instead of deriving the system-wide spatial averages for theperformance measures as in [54], [55], the authors derivedthe spatial averages for the coverage probability as well asthe link capacity over a given cell with a known radiusand interference protection region. The main idea in [73] forinterference characterization is based on the result in [24],where it was shown that, for some MIMO configurations, the
distribution of the channel (power) gain in the desired link canbe represented in the following form:
P {h0 > x} =∑n
∑k
an,ke−nxxk (9)
and hence, the SIR distribution can be obtained from theLaplace transform as in the equation at the top of the followingpage, where (i) follows from (9) and (ii) follows from theidentity tnf(t)
LT−→ (−1)kdkLf(t)(s)
dsk. Hence, the SIR statistics
can be obtained directly from the Laplace transform as in thecase of Rayleigh fading single antenna channel (i.e., technique#1).
An important distribution satisfying (9) is the Erlang dis-tribution. It was argued in [74] that, if a MIMO channelis impaired by Rayleigh fading, both the power from thedesired link and powers from the interference links followthe Erlang distribution. More specifically, the channel powergain in the desired link will follow the gamma distributionGamma(ρk, 1) and that in the interference links will followthe gamma distribution Gamma(δj , 1), where ρk and δj arepositive integers that depend on the applied MIMO techniqueapplied and the number of antennas. If the channel powergain has a gamma distribution h0 ∼ Gamma (α, β)15, whereα and β are the shape and rate parameters, respectively, thenfor integer values of α, the distribution of h0 matches theErlang distribution and can be represented in the form of (9)as follows:
P {h0 > x} =Γ(α, αβ)
Γ(α)= e−αβ
∑α−1
k=1
(αβ)k
k!(10)
where Γ(., .) is the upper incomplete gamma function. Theauthors in [74] used the union bound along with the techniqueused in [24], [73] to obtain an upper bound on network-wide(i.e, not for a given cell as in [73]) coverage probability in aK-tier cellular network16.
Since the interference characterization technique used in[24], [73], [74] is limited to channel power gains that can berepresented in the form of (9), in [75], the authors proposedthe gamma distribution (i.e., technique #3) to approximatethe interference in a MIMO multi-tier cellular network withsystem model similar to the one assumed in [73]. The authorsin [75] used the moments obtained via the Laplace transformof the aggregate interference to approximate its pdf using thegamma distribution. The accuracy of the gamma approxima-tion in [75] was validated by simulations.
V. STOCHASTIC GEOMETRY MODELS FOR COGNITIVENETWORKS
It is a well established fact that rigid spectrum allocationsignificantly degrades the spectrum utilization17. Therefore,cognitive radio techniques, where a licensed spectrum band isopportunistically utilized by cognitive users (called secondaryusers), has been a hot topic of research. In the context of
15A gamma distributed channel power gain corresponds to the Nakagami-mfading.
16The upper bound is due to the union bound.17Rigid spectrum allocation divides the entire available spectrum into sub-
bands which are permanently allocated to some network entities for theirexclusive usage.

1012 IEEE COMMUNICATIONS SURVEYS & TUTORIALS, VOL. 15, NO. 3, THIRD QUARTER 2013
P
{PtAh0r
−η
Iagg> θ
}= P
{h0 >
rηIaggPtA
θ
}
(i)= E
[∑n
∑k
an,k
(θrη
PtA
)k
Ikagge−nθrηIagg
PtA
]
(ii)=
∑n
∑k
an,k
(− θrη
PtA
)k dkLIagg (s)
dsk
∣∣∣∣∣s=nθrη
PtA
multi-tier cellular networks, the objective of cognitive radio isdifferent from the conventional cognitive radio networks (i.e.,cognitive networks with licensed and unlicensed users). Thatis, in conventional cognitive networks, the licensed band isopportunistically utilized by unlicensed networks subject to atolerable performance degradation for the primary network.In contrast, in multi-tier cellular networks, there is no notionof priority because both cognitive network tiers and non-cognitive network tiers are licensed to use the spectrum. Inmulti tier cellular networks, cognitive radio-based distributedspectrum access techniques can be developed to improvethe spectrum utilization, reduce interference, and enable thesmall cells to have self organizing network (SON) capabilities.Cognitive spectrum access in cellular networks will reducethe CAPEX and the OPEX for the network operators [3]–[5]. Therefore, all the design tradeoffs between the cognitiveand non-cognitive network tiers can be optimized so that theoverall performance of the cellular network can be optimized[77], [80].
Although the objective of cognition in conventional cogni-tive networks differs from that in cognitive cellular networks,stochastic geometry models that characterize interference inthe conventional cognitive networks can be adapted for the cel-lular networks. Therefore, in this section, we will first reviewsome stochastic models for conventional cognitive networkssince they contain the basic foundations to be extended formulti-tier cellular networks. Then, we will review the fewworks that exist in the literature for multi-tier cognitive cellularnetworks.
A. Stochastic Geometry Models for Conventional CognitiveNetworks
A simple primary network comprised of one primary linkand a secondary network modeled as a PPP was consid-ered in [81], [82], [84]. In [82], the aggregate interferencefrom the secondary network on the primary receiver with anexclusion region was characterized. The authors assumed aPPP distribution for the secondary users and characterizedthe interference by approximating its pdf and ccdf using theEdgeworth expansion, the log-normal distribution, and theshifted log-normal distribution (i.e., technique #3). It wasshown that the shifted log-normal approximation outperformsthe other approximation (i.e., Edgeworth expansion and thelog-normal distribution) schemes.
In [84], the aggregate interference from the secondary users(modeled as PPP) to a primary receiver was modeled. It wasassumed that the primary link operates in the full-duplex
mode, hence, by listening to the uplink, the location of theprimary receiver can be estimated. [84] obtained the character-istic function of the interference and generated the cumulantsto approximate the pdf of the aggregate interference caused bythe secondary network (technique #3) by a truncated alpha-stable distribution. The model in [84] accounts for shadowing,small-scale fading, and power control. However, in a half-duplex network, the primary receiver is idle, and its locationcannot be estimated.
Unlike [84], in [81], the secondary users control theirspectrum access w.r.t. the primary transmitter rather thanthe primary receiver. Therefore, the set of active secondaryusers constitutes a PPP outside the exclusion region (which israndom due to fading) of the primary transmitter. [81] aimedat deriving the maximum intensity of secondary users thatsatisfy the outage constraint for the primary link. The authorsused the Rayleigh fading assumption (technique #1) to findthe exact results for the outage probability of the primarylink as well as the mean transmission rate of the secondaryusers. To relax the Rayleigh fading assumption and account forshadowing effects, [81] also proposed an approximation basedon the lower bound obtained by considering only the strongestsecondary interferer (i.e., technique #2). [81] also analyzedthe effect of power control, imperfect sensing, and cooperativesensing on the secondary and primary links. However, onlyone primary user was assumed.
The effect of multiple primary users was analyzed in [83].In [83], a cognitive network composed of multiple primaryusers scattered as a PPP and multiple secondary users scatteredaccording to an independent PPP in the spatial domain wasmodeled. The main focus in [83] was to characterize the ag-gregate interference in the cognitive network where secondaryusers are only allowed to transmit outside the exclusion regionof the primary users. It was shown that the active secondaryusers form a Poisson hole process, which is a special caseof the doubly stochastic Poisson process or the Cox process[10, Sec. 3.3]. That is, the active secondary users form aPPP existing outside the exclusion regions of the primaryusers. Since the Poisson hole process is hard to character-ize, [83] obtained bounds on the aggregate interference byapproximating the Poisson hole process with a PPP existingoutside the exclusion region of the test primary user. [83] alsoproposed an approximation based on the PCP for the activecognitive devices and showed that it is quite accurate. Themain performance metric in [83] is the outage probability,and the Rayleigh fading assumption (technique #1) was usedto evaluate it. However, in [83], a secondary user does notconsider transmissions from other secondary users, which may
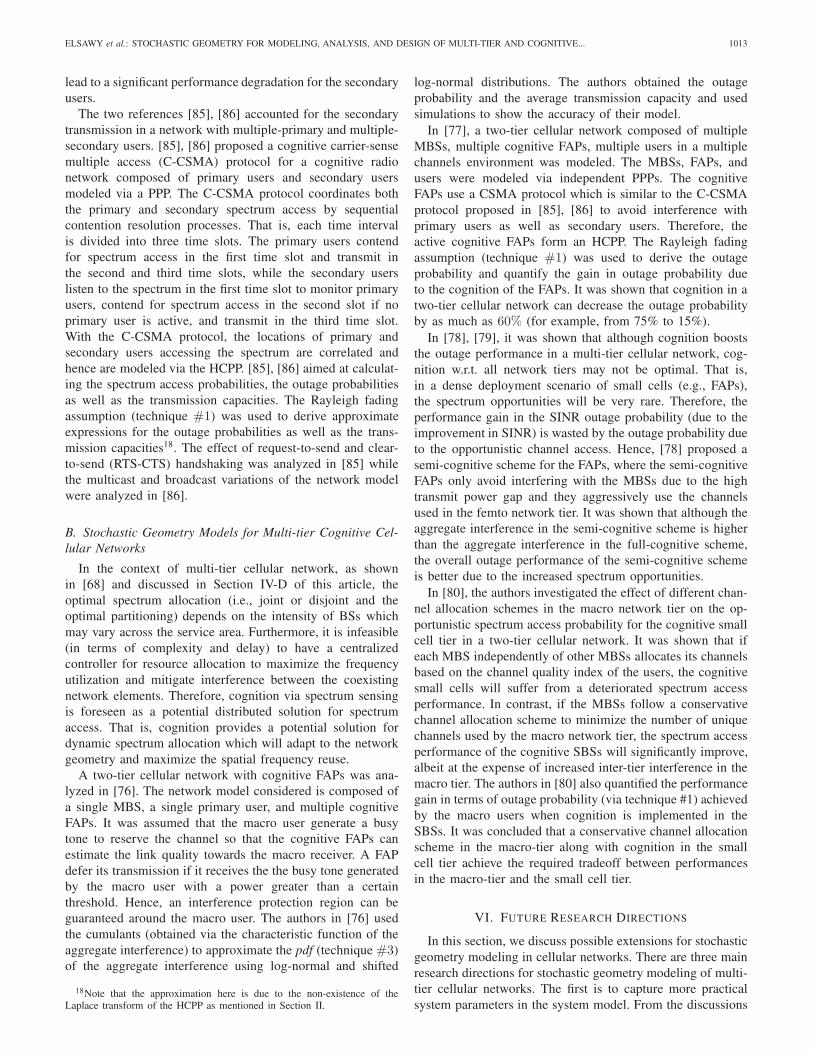
ELSAWY et al.: STOCHASTIC GEOMETRY FOR MODELING, ANALYSIS, AND DESIGN OF MULTI-TIER AND COGNITIVE... 1013
lead to a significant performance degradation for the secondaryusers.
The two references [85], [86] accounted for the secondarytransmission in a network with multiple-primary and multiple-secondary users. [85], [86] proposed a cognitive carrier-sensemultiple access (C-CSMA) protocol for a cognitive radionetwork composed of primary users and secondary usersmodeled via a PPP. The C-CSMA protocol coordinates boththe primary and secondary spectrum access by sequentialcontention resolution processes. That is, each time intervalis divided into three time slots. The primary users contendfor spectrum access in the first time slot and transmit inthe second and third time slots, while the secondary userslisten to the spectrum in the first time slot to monitor primaryusers, contend for spectrum access in the second slot if noprimary user is active, and transmit in the third time slot.With the C-CSMA protocol, the locations of primary andsecondary users accessing the spectrum are correlated andhence are modeled via the HCPP. [85], [86] aimed at calculat-ing the spectrum access probabilities, the outage probabilitiesas well as the transmission capacities. The Rayleigh fadingassumption (technique #1) was used to derive approximateexpressions for the outage probabilities as well as the trans-mission capacities18. The effect of request-to-send and clear-to-send (RTS-CTS) handshaking was analyzed in [85] whilethe multicast and broadcast variations of the network modelwere analyzed in [86].
B. Stochastic Geometry Models for Multi-tier Cognitive Cel-lular Networks
In the context of multi-tier cellular network, as shownin [68] and discussed in Section IV-D of this article, theoptimal spectrum allocation (i.e., joint or disjoint and theoptimal partitioning) depends on the intensity of BSs whichmay vary across the service area. Furthermore, it is infeasible(in terms of complexity and delay) to have a centralizedcontroller for resource allocation to maximize the frequencyutilization and mitigate interference between the coexistingnetwork elements. Therefore, cognition via spectrum sensingis foreseen as a potential distributed solution for spectrumaccess. That is, cognition provides a potential solution fordynamic spectrum allocation which will adapt to the networkgeometry and maximize the spatial frequency reuse.
A two-tier cellular network with cognitive FAPs was ana-lyzed in [76]. The network model considered is composed ofa single MBS, a single primary user, and multiple cognitiveFAPs. It was assumed that the macro user generate a busytone to reserve the channel so that the cognitive FAPs canestimate the link quality towards the macro receiver. A FAPdefer its transmission if it receives the the busy tone generatedby the macro user with a power greater than a certainthreshold. Hence, an interference protection region can beguaranteed around the macro user. The authors in [76] usedthe cumulants (obtained via the characteristic function of theaggregate interference) to approximate the pdf (technique #3)of the aggregate interference using log-normal and shifted
18Note that the approximation here is due to the non-existence of theLaplace transform of the HCPP as mentioned in Section II.
log-normal distributions. The authors obtained the outageprobability and the average transmission capacity and usedsimulations to show the accuracy of their model.
In [77], a two-tier cellular network composed of multipleMBSs, multiple cognitive FAPs, multiple users in a multiplechannels environment was modeled. The MBSs, FAPs, andusers were modeled via independent PPPs. The cognitiveFAPs use a CSMA protocol which is similar to the C-CSMAprotocol proposed in [85], [86] to avoid interference withprimary users as well as secondary users. Therefore, theactive cognitive FAPs form an HCPP. The Rayleigh fadingassumption (technique #1) was used to derive the outageprobability and quantify the gain in outage probability dueto the cognition of the FAPs. It was shown that cognition in atwo-tier cellular network can decrease the outage probabilityby as much as 60% (for example, from 75% to 15%).
In [78], [79], it was shown that although cognition booststhe outage performance in a multi-tier cellular network, cog-nition w.r.t. all network tiers may not be optimal. That is,in a dense deployment scenario of small cells (e.g., FAPs),the spectrum opportunities will be very rare. Therefore, theperformance gain in the SINR outage probability (due to theimprovement in SINR) is wasted by the outage probability dueto the opportunistic channel access. Hence, [78] proposed asemi-cognitive scheme for the FAPs, where the semi-cognitiveFAPs only avoid interfering with the MBSs due to the hightransmit power gap and they aggressively use the channelsused in the femto network tier. It was shown that although theaggregate interference in the semi-cognitive scheme is higherthan the aggregate interference in the full-cognitive scheme,the overall outage performance of the semi-cognitive schemeis better due to the increased spectrum opportunities.
In [80], the authors investigated the effect of different chan-nel allocation schemes in the macro network tier on the op-portunistic spectrum access probability for the cognitive smallcell tier in a two-tier cellular network. It was shown that ifeach MBS independently of other MBSs allocates its channelsbased on the channel quality index of the users, the cognitivesmall cells will suffer from a deteriorated spectrum accessperformance. In contrast, if the MBSs follow a conservativechannel allocation scheme to minimize the number of uniquechannels used by the macro network tier, the spectrum accessperformance of the cognitive SBSs will significantly improve,albeit at the expense of increased inter-tier interference in themacro tier. The authors in [80] also quantified the performancegain in terms of outage probability (via technique #1) achievedby the macro users when cognition is implemented in theSBSs. It was concluded that a conservative channel allocationscheme in the macro-tier along with cognition in the smallcell tier achieve the required tradeoff between performancesin the macro-tier and the small cell tier.
VI. FUTURE RESEARCH DIRECTIONS
In this section, we discuss possible extensions for stochasticgeometry modeling in cellular networks. There are three mainresearch directions for stochastic geometry modeling of multi-tier cellular networks. The first is to capture more practicalsystem parameters in the system model. From the discussions

1014 IEEE COMMUNICATIONS SURVEYS & TUTORIALS, VOL. 15, NO. 3, THIRD QUARTER 2013
provided in Section IV, we see that the system models used inthe literature are simplistic and do not account for actual sys-tem characteristics. For instance, most of the system modelsconsider PPP distributed BSs, one channel, single antenna, anddownlink transmission. Therefore, advanced system modelsthat account for MIMO, multiple channels, different channelallocation strategies, power control, coordinated multi-pointtransmission, mobility, cognition, and uplink transmission arerequired. The second direction is to go beyond the coverageprobability and the performance metrics based only on theShannon’s formula. For instance, if the queuing dynamics canbe incorporated in the analysis, useful performance metricssuch as the transmission delay can be obtained. The thirddirection is to adopt point processes that capture the char-acteristics of cellular networks with more accuracy and thusprovide better modeling approaches. A detailed discussion onthese potential research directions is provided below.
Although spatial randomness in the topology is an intrin-sic characteristic of both large-scale ad hoc networks andcellular networks, sophisticated distributed MAC protocolsin ad hoc networks as well as sophisticated planning andinterference management protocols in cellular networks bringsome structure to the network topology. That is, the in-dependence assumption for the positions of simultaneouslyactive transmitters is not realistic. Hence, the repulsive pointprocesses such as the Matern HCPP provide more realistic andaccurate modeling for wireless networks.
In [92] the authors examined four point processes to findwhich of them better models the spatial distribution of anactual cellular network, namely, the PPP, the HCPP, the Straussprocess (SP), and the perturbed triangular lattice. The Straussprocess belongs to the general class of Gibbs processes, whichfirst appeared in statistical physics [10, Sec. 3.6]. It capturesthe pairwise interactions between nearby BSs by making itless likely that two BSs are located close to each other,i.e., Strauss processes are soft-core processes. The authorsin [92] showed that, compared to the PPP, the three non-Poisson models can model the spatial locations of the deployedBSs more accurately. The Gibbs processes were also used in[102]. The authors compared the spatial characteristics of twoactual cellular deployments in a coastal city and sprawlinglandlocked city to the spatial characteristics of the PPP, thehexagonal grid as well as to the Gibbs models, and it wasshown that the Gibbs model, in particular the so-called Geyersaturation process, better captures (i.e., better than both thePPP and the hexagonal grid models) the spatial characteristicsof the actual cellular deployments. However, the main problemwith Gibbs processes is that they are not analytically tractable[10, Sec. 3.6].
The tractability issue of the Gibbs processes makes theHCPP of special interest. The HCPP is relatively moretractable than the Gibbs process and has been frequently usedfor modeling ad hoc networks and the existing results mayfacilitate its application in the context of cellular networks.However, there are some challenges that should be addressedfor efficient and accurate modeling via the HCPP. The firstchallenge is to obtain a simple closed-form expression thataccurately captures the intensity of the nodes that can co-exist for a given hard core parameter. The known closed-
form expression (for the MHCPP type II), which has beenextensively used in the literature, underestimates the intensity(i.e., number) of the points that can coexist for a given valueof the hard core parameter. Furthermore, the gap between thetrue intensity and the calculated intensity of the MHCPP typeII (i.e., the amount of underestimation) increases with the hardcore distance and the intensity of the parent PPP. The effectof the intensity underestimation flaw of the MHCPP type IIon the modeling of CSMA networks was discussed in [45],[51], where the intensity underestimation flaw was mitigatedfor relatively low intensities of the parent PPP. The secondchallenge is to obtain an expression for the distribution of thedistance between a generic location and the nearest point in theHCPP. The distribution of this distance is crucial if the HCPPis used to model a cellular network because this distance refersto the distance between a user and her serving network entity.An approximate expression for this distance was derived in[41]. Another challenge is to obtain an expression for theprobability generating functional in order to obtain the LTof the interference associated with a HCPP. This problem wasreported in [40], [49], and approximate expressions for the LTswere derived. One interesting future direction is to address thechallenges of the HCPP and extend the existing results in theliterature for more accurate modeling of cellular and cognitivewireless networks.
In [89], [90], an asymptotic approach for the outage charac-terization of wireless networks with general node distributionand general fading was presented. This includes the PPP,HCPP, clustered PPs, and grid models as special cases, andpermits arbitrary MAC schemes. However, the results arerestricted to the high-SIR case. In [103], the method offactorial moment expansion [104] was used to characterize andapproximate the interference in networks with general spatialdistribution of nodes. The proposed model has a high potentialfor more accurate modeling of wireless networks and presentsa clear tradeoff between the accuracy and complexity of theexpressions obtained. The initiatives proposed in [89], [90],[102], [103] open the road for discovering new stochastic ge-ometry tools for more accurate, flexible, and general modelingof wireless networks.
Another interesting future direction is to incorporate thequeueing dynamics into the stochastic geometry models. Mostof the work in the literature assume saturation conditionsfor the traffic. That is, the buffers of all network elementsare always full, which might not be true and will providea pessimistic view of the aggregate interference as wellas some other performance metrics (e.g., spectrum accessprobability in cognitive and CSMA networks). Moreover, noinsights regarding the packet delays can be obtained since thequeuing dynamics are ignored. The commonly used saturationconditions were relaxed in [44], [105], [106] for ad hocnetworks. However, to the best of our knowledge, there hasnot been any work that incorporate the queueing dynamicsinto the stochastic geometry models for cellular networks.[44] proposed a three-dimensional PPP to model the trafficflow for the coexisting network nodes in a CSMA network.The locations of the network nodes were modeled via a two-dimensional PPP while the traffic arrivals were modeled via aone-dimensional PPP. However, [44] only modeled the outage

ELSAWY et al.: STOCHASTIC GEOMETRY FOR MODELING, ANALYSIS, AND DESIGN OF MULTI-TIER AND COGNITIVE... 1015
probability and no insights on the packet delay performancewas given. In [105], the stability and delay performances wereanalyzed for nodes with infinite queues in a PPP ad hoc net-work with one and two classes of nodes. In [106], the authorscalculated bounds on the end-to-end delay, the optimum hoplengths, and the number of hops in a TDMA/ALOHA multi-hop network in the presence of a PPP field of interferers.
In the context of multi-tier cellular networks only few re-sults are available on cognitive small cells, MIMO, optimizedload balancing, mobility, and uplink network modeling. Asdiscussed earlier, cognition provides a potential solution fordynamic spectrum allocation in multi-tier cellular networks.In [74], it was assumed that the interference seen by eachantenna is independent, however, this assumption may nothold because, as shown in [35], [107], [108], the aggregateinterference is correlated in time and across small spatialintervals. We would like to emphasize that in [24], [73], [74]the authors did not use any of the popular five techniquespresented in Section III for the performance evaluation of thedownlink coverage with MIMO transmissions. This indicatesthat there are opportunities for innovating techniques whichfacilitate the stochastic geometry modeling and get aroundthe well-known obstacles. A mobility model that relies onstochastic geometry tools was proposed in [109] where theauthors used the random waypoint mobility model to derivethe cell crossing rate in cellular networks.
VII. DISCUSSIONS
Stochastic geometry is the only mathematical techniqueavailable that provides a rigorous analytical approach to themodeling, analysis, and design of HetNets and cognitive multi-tier cellular networks. While it is extremely powerful whenapplied to networks modeled as PPPs with Rayleigh fading,leading to short and general closed-form expressions, gener-alizing the network models diminishes its tractability. Thatsaid, we have seen that simple baseline stochastic geometrymodeling helps understanding the effects of the fundamentaldesign parameters on the system behavior. For instance, in[54], [55], for a network tier modeled via a PPP, it wasshown that the SIR statistics do not depend on the intensityof the BSs constituting that tier. References [54], [62], [63]quantified the minimum performance gain (in terms of outageprobability and average achievable rate) for different frequencyreuse schemes. In [59], the effect of biasing on the achievabledata rate as well as the outage probability was quantified.Spectrum sharing/partitioning was optimized in [67]–[69]. Anapproach towards the optimal BS deployment was proposed in[64]. The performance gain in terms of outage probability hasbeen quantified in [77]–[80] when cognition is implementedin small cells.
The above examples show the potential of the simple base-line models and how they can be easily modified and adaptedto more practical cases. Moreover, simple approximations(i.e., technique #2, technique #3) prove to be powerful yetaccurate for more flexible and general modeling of wirelessnetworks. Note that we do not have to run computationallyintensive simulations to check the accuracy of the approx-imation techniques. Instead, the accuracy for approximationtechniques can be numerically verified by comparing to the
results obtained using Plancherel-Parseval Theorem (technique#4).
Spatial averaging is argued to be another limitation forthe stochastic geometry modeling. Considering only spatialaverages may hide the effect of the design parameters onthe uncertainties due to the spatial randomness [41], [110].That is, the performance metrics are random variables thatmay vary from one location to another in the spatial domainbased on the position of the tagged node w.r.t. the interferencesources. Spatial averages may hide important details thatimpact the network performance and limit the insights thatcan be obtained from the spatial averaging.
For instance, with the spatial average of the outage prob-ability, we cannot design the network such that at least 95%of the users experience an outage probability less than 1%. In[41], the authors proposed a new method based on computingthe conditional performance metrics (i.e., conditioning on thenumber of nodes having high influence on the performancemetric of interest) to analyze the effect of the design param-eters on the distribution of the performance metrics.
It was shown in [41] that the sensing threshold in a CSMAnetwork might have a significant impact on the percentiles ofusers experiencing negligible data rates while showing a goodspatial average due to the users that have high data rates. In[110], the authors characterized the spatial distribution (insteadof the spatial average) of the link outage in a PPP ad hocnetwork. The distribution of link outage was characterizedby its moments and the Markov inequality was utilized toderive an upper bound on the spatial distribution of the linkoutage. The authors also used the Markov inequality to derivean upper bound on the transmission capacity, which wasdefined as the maximum allowable intensity of simultaneoustransmissions such that a certain percentile of nodes have asuccess probability (the complement of outage probability)more than a predefined threshold. From the results of [41],[110] we can conclude that insights beyond spatial averagesare crucial to the network performance and that stochasticgeometry techniques are powerful enough to provide theseinsights.
VIII. CONCLUSION
Stochastic geometry modeling for multi-tier cellular andcognitive networks provides tractable and accurate expressionsfor the performance metrics in terms of the design param-eters. A comprehensive review of the literature related tothe stochastic geometry modeling of multi-tier and cognitivecellular networks has been presented. A taxonomy that revealsthe popularity and applicability of different point processesand different performance evaluation techniques have alsobeen presented. It has been shown that the baseline modelsdeveloped for multi-tier cellular networks are simple, flexibleand can capture many practical network properties such asfrequency reuse, FFR, and cognition. The models for multi-tier cellular networks in the literature provide useful insightsto the network design and have been adapted to optimize thedeployment of BSs, frequency sharing/partitioning for multi-tier cellular networks, frequency reuse, transmission rate,outage probability and cognition. Looking into the literature,

1016 IEEE COMMUNICATIONS SURVEYS & TUTORIALS, VOL. 15, NO. 3, THIRD QUARTER 2013
we can see that technique #1 and technique #2 are themost popular performance evaluation techniques due to theirsimplicity and tractability. If a simple analysis is required fora network in which the channel power gain in the desiredlinks is not exponentially distributed and also the path-lossexponent is low, then technique #3 is preferred. However,only approximate results can be obtained. On the other hand,technique #4 provides the potential to obtain the exact resultsvia stochastic geometry modeling, however, at the expenseof reduced tractability. Finally, the usage of technique #5 islimited to very special cases.
ACKNOWLEDGMENT
This work was supported in part by an IPS from Natural Sci-ences and Engineering Research Council of Canada (NSERC),an NSERC Strategic Grant (STPGP 430285), in part by ascholarship from TRTech, Winnipeg, Manitoba, Canada, andin part by U.S. NSF grant CCF 1216407.
REFERENCES
[1] “More Than 50 Billion Connected Devices”, Ericsson White Paper,February 2011.
[2] K. Samdanis, T. Taleb, and S. Schmid, “Traffic Offload Enhancementsfor eUTRAN,” IEEE Commun. Surveys Tutorials, vol. 14, no. 3, ThirdQuarter 2012, pp. 884–896.
[3] P. Lin, J. Zhang, Y. Chen, and Q. Zhang, “Macro-Femto HeterogeneousNetwork Deployment and Management: From Business Models toTechnical Solutions,” IEEE Wireless Commun., vol. 18, no. 3, pp. 64–70, June 2011.
[4] J. Andrews, H. Claussen, M. Dohler, S. Rangan, and M. Reed,“Femtocells: Past, Present, and Future,” IEEE J. Sel. Areas Commun..,vol, 30 no. 3, pp. 497–508, April 2012.
[5] S. Cheng, S. Lien, F. Hu, and K. Chen, “On Exploiting Cognitive Radioto Mitigate Interference in Macro/Femto Heterogeneous Networks,”IEEE Wireless Commun., vol. 18, no. 3, pp. 40–47, June 2011.
[6] N. Saquib, E. Hossain, L. B. Le, and D. I. Kim, “Interference Manage-ment in OFDMA Femtocell Networks: Issues and Approaches,” IEEEWireless Commun., vol. 19, no. 3, pp. 86–95, June 2012.
[7] D. Perez, I. Guvenc, G. de la Roche, M. Kountouris, T. Quek, and J.Zhang, “Enhanced Inter-Cell Interference Coordination Challenges inHeterogeneous Networks,” IEEE Wireless Commun., vol. 18, no. 3, pp.22–30, June 2011.
[8] K. Gilhousen, I. Jacobs, R. Padovani, A. J. Viterbi, L. Weaver, andC. Wheatley, “On the Capacity of a Cellular CDMA System,” IEEETrans. Veh. Technol., vol. 40, no. 2, pp. 303–312, May 1991.
[9] J. Xu, J. Zhang, and J. G. Andrews, “On the Accuracy of the WynerModel in Cellular Networks,” IEEE Trans. Wireless Commun., vol. 10,no. 9, pp. 3098–3109, September 2011.
[10] M. Haenggi, Stochastic Geometry for Wireless Networks. CambridgeUniversity Press, 2012.
[11] M. Haenggi, J. G. Andrews, F. Baccelli, O. Dousse, and M.Franceschetti, “Stochastic Geometry and Random Graphs for the Anal-ysis and Design of Wireless Networks,” IEEE J. Sel. Areas Commun.,vol. 27, no. 7, pp. 1029–1046, September 2009.
[12] P. Cardieri, “Modeling Interference in Wireless Ad hoc Networks,”IEEE Commun. Surveys Tutorials, vol. 12, no. 4, pp. 551–572, FourthQuarter 2010.
[13] M. Haenggi and R. Ganti, Interference in Large Wireless Networks, inFoundations and Trends in Networking, NOW Publishers, 2008, vol.3, no. 2, pp. 127–248.
[14] S. Weber and J. G. Andrews, Transmission Capacity of WirelessNetworks in Foundations and Trends in Networking, NOW Publishers,February 2012.
[15] F. Baccelli and B. Blaszczyszyn, Stochastic Geometry and WirelessNetworks in Foundations and Trends in Networking, Volume 1, NowPublishers, 2009.
[16] F. Baccelli and B. Blaszczyszyn, Stochastic Geometry and WirelessNetworks in Foundations and Trends in Networking, Volume 2, NOWPublishers, 2009.
[17] L. Kleinrock and J. A. Silvester, “Optimum Transmission Radii forPacket Radio Networks or Why Six is a Magic Number,” in ConferenceRecord: National Telecommunication Conference, December 1978, pp.4.3.1-4.3.5.
[18] T. Hou and V. Li, “Transmission Range Control in Multihop PacketRadio Networks,” IEEE Trans. Commun., vol. 34, no. 1, pp. 38–44,January 1986.
[19] R. Mathar and J. Mattfeldt, “On the Distribution of Cumulated Inter-ference Power in Rayleigh Fading Channels,” Wireless Networks, vol.1, pp. 31–36, February 1995.
[20] S. Weber, J. G. Andrews and N. Jindal, “The Effect of Fading, ChannelInversion and Threshold Scheduling on Ad Hoc Networks,” IEEETrans. Inf. Theory, vol. 53, no. 11, pp. 4127–4149, November 2007.
[21] S. Weber, X. Yang, J. G. Andrews, and G. de Veciana, “TransmissionCapacity of Wireless Ad hoc Networks with Outage Constraints,” IEEETrans. Inf. Theory, vol. 51, no. 12, pp. 4091–4102, December 2005.
[22] S. Weber, J. Andrews, X. Yang, and G. de Veciana, “TransmissionCapacity of Wireless Ad Hoc Networks with Successive InterferenceCancellation,” IEEE Trans. Inf. Theory, vol. 53, no. 8, pp. 2799–2814,August 2007.
[23] N. Jindal, S. Weber and J. G. Andrews, “Fractional Power Control forDecentralized Wireless Networks,” IEEE Trans. Wireless Commun.,vol. 7, no. 12, pp. 5482–5492, December 2008.
[24] A. M. Hunter, J. G. Andrews and S. P. Weber, “Transmission Capacityof Ad Hoc Networks with Spatial Diversity,” IEEE Trans. WirelessCommun., vol. 7, no. 12, pp. 5058–71, December 2008.
[25] J. Venkataraman, M. Haenggi, and O. Collins, “Shot Noise Models forOutage and Throughput Analyses in Wireless Ad hoc Networks,” inProc. of IEEE Military Commun. Conf. (MILCOM’06), Washington,DC, USA, October 2006.
[26] S. Weber, J. G. Andrews, and N. Jindal, “An Overview of theTransmission Capacity of Wireless Networks,” IEEE Trans. Commun.,vol. 58, no. 12, December 2010.
[27] J. Venkataraman, M. Haenggi, and O. Collins, “Shot Noise Models forthe Dual Problems of Cooperative Coverage and Outage in RandomNetworks,” in Proc. 44th Annual Allerton Conf. Commun., Control,and Comput. (Allerton’06), Monticello, IL, USA, September 2006.
[28] E. S. Sousa, “Optimum Transmission Range in a Direct-sequenceSpread Spectrum Multihop Packet Radio Network,” IEEE J. Sel. AreasCommun., vol. 8, no. 5, pp. 762–771, 1990.
[29] M. Souryal, B. Vojcic and R. Pickholtz, “Ad hoc, Multihop CDMANetworks with Route Diversity in a Rayleigh Fading Channel,” in Proc.IEEE Military Commun. Conf. (MILCOM’01) pp. 1003–1007, October2001.
[30] H. Inaltekin, S. B. Wicker, M. Chiang, and H. V. Poor, “On UnboundedPath-loss Models: Effects of Singularity on Wireless Network Perfor-mance,” IEEE J. Sel. Areas Commun., pp. 1078–1092, 2009.
[31] M. Z. Win, P. C. Pinto, and L. A. Shepp, “A Mathematical Theoryof Network Interference and Its Applications,” in Proc. IEEE, vol. 97,no. 2, pp. 205–230, 2009.
[32] F. Baccelli, B. Blaszczyszyn, and P. Muhlethaler, “Stochastic Analysisof Spatial and Opportunistic ALOHA,” IEEE J. Sel. Areas Commun.,vol. 27, no. 7, pp. 1105–1119, September 2009.
[33] X. Zhang and M. Haenggi, “Random Power Control in PoissonNetworks,” IEEE Trans. Commun., vol. 60, pp. 2602–2611, Sept. 2012.
[34] X. Zhang and M. Haenggi, “Delay-optimal Power Control Policies,”IEEE Trans. Wireless Commun., vol. 11, pp. 3518–3527, Oct. 2012.
[35] Z. Gong and M. Haenggi, “Interference and Outage in Mobile RandomNetworks: Expectation, Distribution, and Correlation,” IEEE Trans.Mobile Computing, 2012. Accepted.
[36] M. Haenggi, “On Distances in Uniformly Random Networks,” IEEETrans. Inf. Theory, vol. 51, pp. 3584–3586, October 2005.
[37] S. Srinivasa and M. Haenggi, “Modeling Interference in Finite Uni-formly Random Networks,” in International Workshop on InformationTheory for Sensor Networks (WITS 2007), Santa Fe, NM, June 2007.
[38] S. Srinivasa and M. Haenggi, “Distance Distributions in Finite Uni-formly Random Networks: Theory and Applications,” IEEE Trans. Veh.Technol., vol. 59, pp. 940–949, February 2010.
[39] R. K. Ganti and M. Haenggi, “Interference and Outage in ClusteredWireless Ad Hoc Networks,” IEEE Trans. Inf. Theory, vol. 55, pp.4067–4086, September 2009.
[40] H. Nguyen, F. Baccelli, and D. Kofman, “A Stochastic GeometryAnalysis of Dense IEEE 802.11 Networks,” in Proc. 26th IEEE Inter-national Conference on Computer Communications (INFOCOM’07),May 2007, pp. 1199–1207.
[41] G. Alfano, M. Garetto, and E. Leonardi, “New Insights into theStochastic Geometry Analysis of Dense CSMA Networks,” in Proc.
ELSAWY et al.: STOCHASTIC GEOMETRY FOR MODELING, ANALYSIS, AND DESIGN OF MULTI-TIER AND COGNITIVE... 1017
30th Annual IEEE International Conference on Computer Communi-cations (INFOCOM’11), April 2011, pp. 2642–2650.
[42] Y. Kim, F. Baccelli, and G. de Veciana, “Spatial Reuse and Fairnessof Mobile Ad-hoc Networks with Channel-aware CSMA Protocols,”in Proc. 17th Workshop on Spatial Stochastic Models for WirelessNetworks, May 2011.
[43] A. Hasan and J. G. Andrews, “The Guard Zone in Wireless Ad hocNetworks,” IEEE Trans. Wireless Commun., vol. 4, no. 3, pp. 897–906,March 2007.
[44] M. Kaynia, N. Jindal, and G. Oien, “Improving the Performance ofWireless Ad hoc Networks through MAC Layer Design,” IEEE Trans.Wireless Commun., vol. 10, no. 1, pp. 240–252, January 2011.
[45] H. ElSawy and E. Hossain, “A Modified Hard Core Point Processfor Analysis of Random CSMA Wireless Networks in General FadingEnvironments,” IEEE Trans. Commun., accepted.
[46] H. ElSawy, E. Hossain, and S. Camorlinga, “Spectrum-efficient Multi-channel Design for Coexisting IEEE 802.15.4 Networks: A StochasticGeometry Approach,” submitted to the IEEE Trans. Mobile Computing.
[47] H. ElSawy, E. Hossain, and S. Camorlinga, “Multi-channel Design forRandom CSMA Wireless Networks: Stochastic Geometry Approach,”in Proc. IEEE Int. Conference on Communications (ICC’13), Budapest,Hungary, 9-13 June, 2013.
[48] P. Muhlethaler and A. Najid, “Throughput Optimization of a MultihopCSMA Mobile Ad hoc Network,” INRIA, Research Report 4928,September 2003.
[49] M. Haenggi, “Mean Interference in Hard-core Wireless Networks,”IEEE Communications Letters, vol. 15, pp. 792–794, August 2011.
[50] H. ElSawy and E. Hossain, “Modeling Random CSMA WirelessNetworks in General Fading Environments,” in Proc. IEEE Int. Conf.on Communications (ICC 2012), Ottawa, Canada, 10-15 June 2012.
[51] H. ElSawy, E. Hossain, and S. Camorlinga, “Characterizing RandomCSMA Wireless Networks: A Stochastic Geometry Approach,” in Proc.IEEE Int. Conf. on Communications (ICC 2012), Ottawa, Canada, 10-15 June 2012.
[52] F. Baccelli, M. Klein, M. Lebourges, and S. Zuyev, “StochasticGeometry and Architecture of Communication Networks,” J. Telecom-munication Systems, vol. 7, no. 1, pp. 209–227, 1997.
[53] T. X. Brown, “Cellular Performance Bounds via Shotgun CellularSystems,” IEEE J. Sel. Areas Commun., vol. 18, no. 11, Nov. 2000,pp. 2443–2455.
[54] J. Andrews, F. Baccelli, and R. Ganti, “A Tractable Approach toCoverage and Rate in Cellular Networks,” IEEE Trans. Commun., vol.59, no. 11, pp. 3122–3134 November 2011.
[55] H. Dhillon, R. Ganti, F. Baccelli, and J. Andrews, “Modeling andAnalysis of K-Tier Downlink Heterogeneous Cellular Networks,” IEEEJ. Sel. Areas Commun., vol. 30, no. 3, pp. 550–560, April 2012.
[56] S. Singh, H. S. Dhillon, and J. G. Andrews, “Offloading in Hetero-geneous Networks: Modeling, Analysis, and Design Insights,” IEEETrans. Wireless Commun., accepted.
[57] H. Dhillon, T. Novlan, J. Andrews, “Coverage Probability of UplinkCellular Networks,” in Proc. IEEE Global Communications Conference(Globecom 2012), 3-7 December, Anaheim, CA, USA, 2012.
[58] H. S. Dhillon, R. K. Ganti and J. G. Andrews, “Load-Aware Modelingand Analysis of Heterogeneous Cellular Networks”, IEEE Trans.Wireless Commun., Vol. 12, No. 4, April 2013.
[59] H. Jo, Y. Sang, P. Xia, and J. Andrews, “Outage Probability forHeterogeneous Cellular Networks with Biased Cell Association,” inProc. IEEE Global Communications Conference (Globecom 2011), 5-9 December, Houston, TX, USA, 2011.
[60] H. Jo, Y. Sang, P. Xia, and J. Andrews, “Heterogeneous CellularNetworks With Flexible Cell Association: A Comprehensive DownlinkSINR Analysis,” IEEE Trans. Wireless Commun., vol. 11, no. 9,pp. 3484–3495, October 2012.
[61] H. ElSawy, E. Hossain, and S. Camorlinga, “Offloading Techniquesin Two-tier Femtocell Networks,” in Proc. IEEE Int. Conference onCommunications (ICC’13), Budapest, Hungary, 9-13 June 2013.
[62] T. Novlan, R. Ganti, A. Ghosh, and J. Andrews, “Analytical Evaluationof Fractional Frequency Reuse for OFDMA Cellular Networks,” IEEETrans. Wireless Commun., vol. 10, no. 12, pp. 4294–4305, December2011.
[63] T. Novlan, R. Ganti, A. Ghosh, and J. Andrews, “Analytical Evaluationof Fractional Frequency Reuse for Heterogeneous Cellular Networks,”IEEE Trans. Commun., vol. 60, no. 7, pp. 2029–2039, July 2012.
[64] D. Cao, S. Zhou, and Z. Niu, “Optimal Base Station Density forEnergy-efficient Heterogeneous Cellular Networks,” in Proc. IEEE Int.Conf. on Communications (ICC 2012), Ottawa, Canada, 10-15 June2012.
[65] Y. Zhong and W. Zhang, “Downlink Analysis of Multi-channel HybridAccess Two-tier Networks,” in Proc. IEEE Int. Conf. on Communica-tions (ICC 2012), Ottawa, Canada, 10-15 June 2012.
[66] S. Mukherjee, “Distribution of Downlink SINR in HeterogeneousCellular Networks,” IEEE J. Sel. Areas Commun., vol. 30, no. 3, pp.575–585, April 2012.
[67] V. Chandrasekhar and J. Andrews, “Spectrum Allocation in TieredCellular Networks,” IEEE Trans. Commun., vol. 57, no. 10, pp. 3059–3068, October 2009.
[68] W. Cheung, T. Quek, and M. Kountouris, “Throughput Optimization,Spectrum Allocation, and Access Control in Two-tier Femtocell Net-works,” IEEE J. Sel. Areas Commun., vol. 30, no. 3, pp. 561–574,April 2012.
[69] K. Huang, V. Lau, and Y. Chen, “Spectrum Sharing between Cellularand Mobile Ad hoc Networks: Transmission-capacity Tradeoff,” IEEEJ. Sel. Areas Commun., vol. 27, no. 7, pp. 1256–1266, September 2009.
[70] V. Chandrasekhar and J. Andrews, “Uplink Capacity and InterferenceAvoidance for Two-tier Femtocell Networks,” IEEE Trans. WirelessCommun., vol. 8, no. 7, pp. 3498–3509, July 2009.
[71] P. Pinto, A. Giorgetti, M. Win, and M. Chiani, “A Stochastic GeometryApproach to Coexistence in Heterogeneous Wireless Networks,” IEEEJ. Sel. Areas Commun., vol. 27, no. 7, pp. 1268–1282, September 2009.
[72] A. Guidotti, M. Di Renzo, G. Corazza, and F. Santucci, “SimplifiedExpression of the Average Rate of Cellular Networks Using StochasticGeometry,” in Proc. IEEE Int. Conf. on Communications (ICC 2012),Ottawa, Canada, 10-15 June 2012.
[73] R. W. Heath, M. Kountouris, “Modeling heterogeneous network in-terference,” in Proc. Information Theory and Applications Workshop(ITA), pp.17–22, 5-10 Feb. 2012
[74] H. Dhillon, M. Kountouris, J. Andrews, “Downlink Coverage Probabil-ity in MIMO HetNets,” in Proc. 46th Annual Asilomar Conference onSignals, Systems, and Computers, 4-7 November, Pacific Grove, CA,USA, 2012.
[75] R. W. Heath, M. Kountouris, and T. Bai, “Modeling HeterogeneousNetwork Interference With Using Poisson Point Processes,” submit-ted to IEEE Trans. Signal Process., July 2012. Available Online:(http://arxiv.org/abs/1207.2041).
[76] C. Lima, M. Bennis, and M. Latva-aho, “Coordination Mechanisms forSelf-Organizing Femtocells in Two-Tier Coexistence Scenarios,” IEEETrans. Wireless Commun., vol. 11, no. 6, pp. 2212–2223, June 2012.
[77] H. ElSawy and E. Hossain, “Two-Tier HetNets with Cognitive Fem-tocells: Downlink Performance Modeling and Analysis in a Multi-Channel Environment,” IEEE Trans. Mobile Computing, accepted.
[78] H. ElSawy and E. Hossain, “On Cognitive Small Cells in Two-tier Heterogeneous Networks,” in Proc. 9th Workshop on SpatialStochastic Models for Wireless Networks (SpaSWiN 2013), TsukubaScience City, Japan, May 13-17, 2013.
[79] H. ElSawy, E. Hossain, and D. I. Kim, “HetNets with CognitiveSmall Cells: User Offloading and Distributed Channel AllocationTechniques,” IEEE Commun. Mag., Special Issue on “Heterogeneousand Small Cell Networks (HetSNets), May 2013.
[80] H. ElSawy and E. Hossain, “Channel Assignment and OpportunisticSpectrum Access in Two-tier Cellular Networks with Cognitive SmallCells,” submitted to IEEE Global Communications Conference (Globe-com 2013), Atlanta, GA, USA, 9-13 December 2013.
[81] M. Khoshkholgh, K. Navaie, and H. Yanikomeroglu, “Outage Perfor-mance of the Primary Service in Spectrum Sharing Networks,” IEEETrans. Mobile Computing, Accepted, 2012.
[82] A. Ghasemi and E. Sousa, “Interference Aggregation in SpectrumSensing Cognitive Wireless Networks,” IEEE J. Sel. Topics SignalProcess., vol. 2, no. 1, pp. 41–56, February 2008.
[83] C.-H. Lee and M. Haenggi, “Interference and Outage in PoissonCognitive Networks,” IEEE Trans. Wireless Commun., vol. 11, pp.1392–1401, April 2012.
[84] A. Rabbachin, T. Q. S. Quek, H. Shin, and M. Z. Win, “CognitiveNetwork Interference,” IEEE J. Sel. Areas Commun., vol. 29, no. 2,pp. 480–493, February 2011.
[85] T. Nguyen and F. Baccelli, “A Probabilistic Model of Carrier SensingBased Cognitive Radio,” in Proc. IEEE Symposium on New Frontiersin Dynamic Spectrum Access Networks, pp. 1–12, April 2010.
[86] T. Nguyen and F. Baccelli, “Stochastic Modeling of Carrier SensingBased Cognitive Radio Networks,” in Proc. 8th International Sympo-sium on Modeling and Optimization in Mobile, Ad Hoc and WirelessNetworks (WiOpt), pp. 472–480, June 2010.
[87] J. Møller, M. L. Huber, and R. L. Wolpert, “Perfect Simulationand Moment Properties for the Matern Type III Process,” StochasticProcesses and Their Applications, vol. 120, no. 11, November 2010,pp. 2142–2158.

1018 IEEE COMMUNICATIONS SURVEYS & TUTORIALS, VOL. 15, NO. 3, THIRD QUARTER 2013
[88] M. L. Huber and R. L. Wolpert, “Likelihood Based Inference forMatern Type III Repulsive Point Processes,” Advances in AppliedProbability, vol. 41, no. 4, 2009, pp. 958–977.
[89] R. K. Ganti, J. G. Andrews, and M. Haenggi, “High-SIR Transmis-sion Capacity of Wireless Networks with General Fading and NodeDistribution,” IEEE Trans. Inf. Theory, vol. 57, pp. 3100–3116, May2011.
[90] R. Giacomelli, R. K. Ganti, and M. Haenggi, “Outage Probability ofGeneral Ad hoc Networks in the High-reliability Regime,” IEEE/ACMTrans. Netw., vol. 19, pp. 1151–1163, August 2011.
[91] P. Bremaud, Mathematical Principles of Signal Processing: Fourierand Wavelet Analysis. Springer, 2002.
[92] A. Guo and M. Haenggi, “Spatial Stochastic Models and Metricsfor the Structure of Base Stations in Cellular Networks,” submit-ted to IEEE Trans. Wireless Commun., 2013. Available Online:http://www.nd.edu/∼mhaenggi/pubs/twc13b.pdf.
[93] B. Blaszczyszyn, M. K. Karray, and H.-P. Keeler, “Using PoissonProcesses to Model Lattice Cellular Networks,” in Proc. 32th AnnualIEEE International Conference on Computer Communications (INFO-COM’13), Turin, Italy, April 14-19 2013.
[94] A. Okabe, B. Boots, and K. Sugihara, Spatial Tessellations: Conceptsand Applications of Voronoi Diagrams. John Wiley, 1992.
[95] K. Hamdi, “A Useful Lemma for Capacity Analysis of Fading Inter-ference Channels,” IEEE Trans. Commun., vol. 58, no. 2, pp. 411–416,February 2010.
[96] N. Saquib, E. Hossain, and D. I. Kim, “Fractional Frequency Reuse forInterference Management in LTE-Advanced HetNets,” IEEE WirelessCommun., to appear.
[97] P. Mitran and C. Rosenberg, “On Fractional Frequency Reuse inImperfect Cellular Grids,” in Proc. IEEE Wireless Communications andNetworking Conference (WCNC 2012), Paris, France, pp. 2967–2972,April 2012.
[98] R. Trestian, O. Ormond, and G. Muntean, “Game Theory-BasedNetwork Selection: Solutions and Challenges,” IEEE Commun. SurveysTutorials, vol. 14, no. 4, pp. 1212–1231, Fourth Quarter 2012.
[99] 3GPP TR 36.942, Radio Frequency (RF) system scenarios (Release10), Dec. 2010.
[100] 3GPP TSG RAN WG1, R1-101506, Importance of serving cellselection in heterogeneous networks, Qualcomm Incorporated, SanFrancisco, Feb. 2010.
[101] G. de la Roche, A. Valcarce, D. Lopez-Perez, and J. Zhang, “AccessControl Mechanisms for Femtocells,” IEEE Communications Maga-zine, vol. 48, no. 1, pp. 33–39, January, 2010
[102] D. Taylor, H. Dhillon, T. Novlan, and J. Andrews, “Pairwise InteractionProcesses for Modeling Cellular Network Topology,” in Proc. IEEEGlobal Communications Conference (Globecom 2012), 3-7 December,Anaheim, CA, USA, 2012.
[103] R. Ganti, F. Baccelli, and J. Andrews, “Series Expansion for Interfer-ence in Wireless Networks,” IEEE Trans. Inf. Theory, vol. 58, no. 4,pp. 2194–2205, April 2012.
[104] B. Blaszczyszyn, “Factorial Moment Expansion for Stochastic Sys-tems,” Stochastic Processes and Their Applications. vol. 56, no. 2, pp.321–335, 1995.
[105] K. Stamatiou and M. Haenggi, “Random-Access Poisson Networks:Stability and Delay,” IEEE Commun. Lett., vol. 14, pp. 1035-1037,November 2010.
[106] K. Stamatiou and M. Haenggi, “Delay Characterization ofMultihop Transmission in a Poisson Field of Interference,”IEEE/ACM Trans. Netw., 2011. Submitted, available at(http://www.nd.edu/∼mhaenggi/pubs/ton11b.pdf).
[107] M. Haenggi, “Diversity Loss due to Interference Correlation,” IEEECommun. Lett., vol. 16, pp. 1600–1603, October 2012.
[108] R. K. Ganti and M. Haenggi, “Spatial and Temporal Correlation of theInterference in ALOHA Ad Hoc Networks,” IEEE Commun. Lett., vol.13, pp. 631–633, September 2009.
[109] X. Lin, R. Ganti, P. Fleming, and J. Andrews, “Fundamentals ofMobility in Cellular Networks: Modeling and Analysis,” in Proc.of IEEE Global Communications Conference (Globecom 2012), 3-7December, Anaheim, CA, USA, 2012.
[110] R. K. Ganti and J. G. Andrews, “Correlation of Link Outages in Low-mobility Spatial Wireless Networks,” in Proc. 2010 Forty Fourth Asilo-mar Conference on Signals, Systems and Computers (ASILOMAR),pp. 312–316, 7-10 November 2010.
Hesham ElSawy received his B.Sc and M.Sc bothin electrical engineering from Assiut University,Assiut, Egypt, and Arab Academy for Science andTechnology, Cairo, Egypt, in 2006 and 2009, re-spectively. Currently, he is a Ph.D. candidate in thedepartment of Electrical and Computer Engineer-ing, University of Manitoba, Canada. During theperiod of 2006 to 2010, he worked at the NationalTelecommunication Institute, Egypt, where he con-ducted professional training both at the national andinternational levels, as well as research on network
planning. Since 2010, he has been with TRTech, Winnipeg, Canada, as astudent researcher. For his academic excellence, Hesham has received severalacademic awards including the NSERC Industrial Postgraduate Scholarshipduring the period of 2010-2013, and the TRTech graduate students fellowshipin the period of 2010-2014. Hesham’s research interests include statisticalmodeling of wireless networks, stochastic geometry and queueing analysisfor wireless communication networks.
Ekram Hossain is a Professor in the Department ofElectrical and Computer Engineering at Universityof Manitoba, Winnipeg, Canada. He received hisPh.D. in Electrical Engineering from University ofVictoria, Canada, in 2001. Dr. Hossain’s currentresearch interests include design, analysis, and op-timization of wireless/mobile communications net-works, cognitive radio systems, and network eco-nomics. He has authored/edited several books inthese areas (http://www.ee.umanitoba.ca/∼ekram).Dr. Hossain serves as the Editor-in-Chief for the
IEEE Communications Surveys and Tutorials (for the term 2012-2013), anEditor for the IEEE J. Sel. Areas Commun. - Cognitive Radio Series andIEEE Wireless Communications. Also, he serves on the IEEE Press EditorialBoard (for the term 2013-2015). Previously, he served as the Area Editor forthe IEEE Trans. Wireless Commun. in the area of “Resource Managementand Multiple Access” from 2009-2011 and an Editor for the IEEE Trans.Mobile Computing from 2007-2012. Dr. Hossain has won several researchawards including the University of Manitoba Merit Award in 2010 (forResearch and Scholarly Activities), the 2011 IEEE Communications SocietyFred Ellersick Prize Paper Award, and the IEEE Wireless Communicationsand Networking Conference 2012 (WCNC’12) Best Paper Award. He is aDistinguished Lecturer of the IEEE Communications Society for the term2012-2013. Dr. Hossain is a registered Professional Engineer in the provinceof Manitoba, Canada.

ELSAWY et al.: STOCHASTIC GEOMETRY FOR MODELING, ANALYSIS, AND DESIGN OF MULTI-TIER AND COGNITIVE... 1019
Martin Haenggi is a Professor of Electrical En-gineering and a Concurrent Professor of Appliedand Computational Mathematics and Statistics atthe University of Notre Dame, Indiana, USA. Hereceived the Dipl.-Ing. (M.Sc.) and Dr.sc.techn.(Ph.D.) degrees in electrical engineering from theSwiss Federal Institute of Technology in Zurich(ETH) in 1995 and 1999, respectively. After apostdoctoral year at the University of California inBerkeley, he joined the University of Notre Dame in2001. In 2007-08, he spent a Sabbatical Year at the
University of California at San Diego (UCSD). For both his M.Sc. and hisPh.D. theses, he was awarded the ETH medal, and he received a CAREERaward from the U.S. National Science Foundation in 2005 and the 2010 IEEECommunications Society Best Tutorial Paper award. He served as a memberof the Editorial Board of the Elsevier Journal of Ad Hoc Networks from
2005-08, as a Guest Editor for the IEEE J. Sel. Areas Commun. in 2008-09,as an Associate Editor for the IEEE Trans. Mobile Computing from 2008-11and for the ACM Transactions on Sensor Networks from 2009-11, and as aDistinguished Lecturer for the IEEE Circuits and Systems Society in 2005-06.He also served as a TPC Co-chair of the Communication Theory Symposiumof the 2012 IEEE International Conference on Communications (ICC12),and as a General Co-chair of the 2009 International Workshop on SpatialStochastic Models for Wireless Networks and the 2012 DIMACS Workshopon Connectivity and Resilience of Large-Scale Networks. Presently he is aSteering Committee Member of the IEEE Trans. Mobile Computing. He is aco-author of the monograph “Interference in Large Wireless Networks” (NOWPublishers, 2009) and the author of the textbook Stochastic Geometry forWireless Networks (Cambridge University Press, 2012). His scientific interestsinclude networking and wireless communications, with an emphasis on adhoc, cognitive, cellular, sensor, and mesh networks.
Related Documents


