Copyright Undertaking This thesis is protected by copyright, with all rights reserved. By reading and using the thesis, the reader understands and agrees to the following terms: 1. The reader will abide by the rules and legal ordinances governing copyright regarding the use of the thesis. 2. The reader will use the thesis for the purpose of research or private study only and not for distribution or further reproduction or any other purpose. 3. The reader agrees to indemnify and hold the University harmless from and against any loss, damage, cost, liability or expenses arising from copyright infringement or unauthorized usage. IMPORTANT If you have reasons to believe that any materials in this thesis are deemed not suitable to be distributed in this form, or a copyright owner having difficulty with the material being included in our database, please contact [email protected] providing details. The Library will look into your claim and consider taking remedial action upon receipt of the written requests. Pao Yue-kong Library, The Hong Kong Polytechnic University, Hung Hom, Kowloon, Hong Kong http://www.lib.polyu.edu.hk

Welcome message from author
This document is posted to help you gain knowledge. Please leave a comment to let me know what you think about it! Share it to your friends and learn new things together.
Transcript
Copyright Undertaking
This thesis is protected by copyright, with all rights reserved.
By reading and using the thesis, the reader understands and agrees to the following terms:
1. The reader will abide by the rules and legal ordinances governing copyright regarding the use of the thesis.
2. The reader will use the thesis for the purpose of research or private study only and not for distribution or further reproduction or any other purpose.
3. The reader agrees to indemnify and hold the University harmless from and against any loss, damage, cost, liability or expenses arising from copyright infringement or unauthorized usage.
IMPORTANT
If you have reasons to believe that any materials in this thesis are deemed not suitable to be distributed in this form, or a copyright owner having difficulty with the material being included in our database, please contact [email protected] providing details. The Library will look into your claim and consider taking remedial action upon receipt of the written requests.
Pao Yue-kong Library, The Hong Kong Polytechnic University, Hung Hom, Kowloon, Hong Kong
http://www.lib.polyu.edu.hk
THE ROLE OF PERSONAL COOLING SYSTEM
(PCS) IN COMBATING BODY HEAT STRAIN: A
CASE STUDY IN HONG KONG
ZHAO YIJIE
PhD
The Hong Kong Polytechnic University
2018
The Hong Kong Polytechnic University
Department of Building and Real Estate
The Role of Personal Cooling System (PCS) in Combating
Body Heat Strain: A Case Study in Hong Kong
ZHAO Yijie
A thesis submitted in partial fulfillment of the requirements
for the degree of Doctor of Philosophy
Jan 2018
CERTIFICATE OF ORIGINALITY
I hereby declare that this thesis is my own work and that, to the best of my knowledge
and belief, it reproduces no material previously published or written, nor material that
has been accepted for the award of any other degree or diploma, except where due
acknowledgement has been made in the text.
(Signed)
ZHAO Yijie
(Name of Student)
STATEMENT OF THE CONTRIBUTION AND CERTIFICATE
OF ORIGINALITY
This study is originated from and funded by a Research Grants Council (RGC) project, titled
“Developing a personal cooling system (PCS) for combating heat stress in the construction
industry”, of which the author is a team member. The RGC research project focuses on
developing a PCS for the construction industry, which includes design, testing and application.
The author has extended the work as a part of her PhD study. As the key research personnel
of the research team, the author was involved in the whole process of the product
development (as shown in Chapter 4), the entire experimentation process of laboratory
experiment (as shown in Chapter 5 and 6), and the field survey (as shown in Chapter 7). The
author was also involved in data collection and data analysis under the guidance of the
principal supervisor and other team members. The author’s individual contribution is
embodied by the execution and generalization of laboratory experiment and the field study as
shown in Chapter 5, 6, and 7. Furthermore, reviewing literature and proposing a cooling
intervention for construction workers in Hong Kong is another key contribution of the PhD
study as shown in Chapters 2 and 3. Although the author was not involved in some research
activities personally, for example, testing of phase change materials (PCMs) and clothing
fabrics, the results are reported in Chapter 4 for the integrity of the thesis. The author also
declares that this thesis is her own work, and that, to the best of her knowledge and belief, it
reproduces no material previously published or written, nor material that has been accepted
for the award of any other degree or diploma, except where the acknowledgement has been
made in the text.
I│Page
ABSTRACT
The construction industry features high-level risks on the safety and health of the working
population. The safety and health of construction workers should be given with significant
attention by the research community and governments. The nature of climatic and urbanised
conditions in Hong Kong poses considerable threats to occupational safety and health. Heat
stress is a major occupational hazard in Hong Kong’s construction industry. During the hot
and humid summer season in Hong Kong, construction workers are susceptible to heat stress
due to physically strenuous and demanding work activities, high air temperature and relative
humidity, and prolonged exposure to sunlight. Various cooling countermeasures [e.g.
personal cooling system (PCS), fanning and hand and/or forearm immersion in cold water]
have been proposed to relieve heat stress and improve work performance.
PCS, in the form of cooling garment, enables microclimate cooling around the body, thereby
promoting heat dissipation. PCS is amongst the most effective cooling methods. Various
PCSs have been used in firefighting, hazmat operations, military and sports. However, their
application in the construction industry is still in its infancy, and their effects are yet to be
evaluated. To bridge this research gap and develop practical solutions, a study was undertaken
to engineer and design a tailor-made PCS for construction workers. This PCS is a two-layer
cooling vest, specifically designed to wear over the construction uniform. The PCS design
comprehensively considers cooling effect, cooling duration, weight, mobility, comfort,
aesthetics, visibility and safety of construction workers. This initiative requires further
II│Page
evaluation on the effectiveness and practicality of this newly designed PCS to protect
construction workers from heat-related injuries.
The current study aims to develop a cooling intervention with this newly designed PCS to
reduce body heat strain in the construction industry. The main objectives are to present a
research framework for cooling intervention development research, examine the effectiveness
and applicability of wearing the PCS on alleviating heat strain and formulate
recommendations on precautionary measures to safeguard workers’ health and safety whilst
working in a hot environment. Experimentation, which is a scientific approach that facilitates
the discovery and creation of knowledge, is adopted in this study. A series of laboratory tests
on thermal manikin and human subjects and field wear trial studies are conducted in sequence
to assess the cooling capability, effectiveness and applicability of the newly designed PCS.
Results of the thermal manikin test in the laboratory revealed that the newly designed PCS
displays higher cooling power and longer cooling duration than a commercially available
cooling vest. An optimal cooling intervention, in which the PCS is used during rest between
repeated bouts of work, is determined through human wear trials in the climatic chamber. The
findings of the wear trial test in the climatic chamber indicated that the newly designed PCS
can significantly attenuate physiological and perceptual strains and improve work
performance compared with the control condition (no cooling intervention). The field
experiments showed that the heat strain of the steel bar workers wearing the PCS during rest
is significantly reduced compared with that of the control condition. Furthermore, field
III│Page
surveys from 143 construction workers across two trades on construction sites revealed that
approximately 91% of the workers are satisfied with the newly designed PCS. Most of these
workers also provide good subjective evaluation on this PCS.
The current study develops an optimal cooling intervention and presents a fresh perspective to
further improve occupational safety and health in construction. This study helps address the
research gap caused by the lack of cooling intervention research in construction. The
experimentation used in this study is well structured, rigorous and reliable. Moreover, this
study is carried out within a multidisciplinary context (e.g. construction management,
industrial hygiene, occupational hygiene, textile science, biological science and exercise
science) to deal with scientific, theoretical, technical, statistical, sociopolitical and practical
issues, thereby promoting the collaboration between academia and industry practitioners.
IV│Page
LIST OF PUBLICATIONS
Journal papers (Published and accepted)
1. Zhao Y., Yi W.*, Chan A.P.C., Wong D.P. (2018) Impacts of cooling intervention on
the heat strain attenuation of construction workers. International Journal of
Biometeorology, 62, 1625-1634.
2. Yi W., Zhao Y.*, Chan A.P.C., Lam E.W.M. (2017) Optimal cooling intervention for
construction workers in a hot and humid environment, Building and Environment,
118, 91-100.
3. Yi W., Zhao Y.*, Chan A.P.C. (2017) Evaluation of the ventilation unit for personal
cooling system (PCS), International Journal of Industrial Ergonomics, 58, 62-68.
4. Yi W., Zhao Y.*, Chan A.P.C. (2017) Evaluating the effectiveness of cooling vest in
a hot and humid environment, Annals of Work Exposures and Health, 61(4):481-494.
5. Zhao Y., Yi W.*, Chan A.P.C., Wong F.K.W., Yam M.C.H. (2017) Evaluating the
physiological and perceptual responses of wearing a newly designed cooling vest for
construction workers, Annals of Work Exposures and Health, 61(7): 883-901.
6. Zhao Y., Yi W.*, Chan A.P.C., Chan D.W.M. (2017). Comparison of heat strain
recovery in different anti-heat stress clothing ensembles after work to exhaustion.
Journal of Thermal Biology, 69: 311-318.
Journal Papers (Under review)
1. Yi W., Zhao Y.*, Chan A.P.C. (2017). Continuous and intermittent cooling for
improving work tolerance in civilian and military sectors: A systematic review and
meta-analysis. Occupational and Environmental Medicine, Under review.
V│Page
Conference Papers (Published and accepted)
1. Chan A.P.C., Yi W., Zhao Y.*, Yang Y., Wong F.K.W., Yam M.C.H., Chan D.W.M.,
Lam E.W.M., Li Y., Guo Y. Developing a Personal Cooling System (PCS) for
Construction Workers – An Experimental Approach. 18th International Conference on
Construction in the 21st Century (CITC-VIII), May 27-30, 2015, Thessaloniki,
Greece.
2. Chan A.P.C., Yi W., Zhao Y.*. Mapping the Scientific Research of Occupational
Safety and Health (OSH) in Construction Industry. 2nd International Conference on
Sustainable Urbanization (ICSU 2015), Jan 7-9, 2015, Hong Kong.
VI│Page
ACKNOWLEDGEMENTS
I am indebted to many individuals who gave their time, energy and support in making this
research study possible. Grateful acknowledgement is first made to Professor Albert P.C.
Chan, my Chief Supervisor, for his continuous support, encouragement, valuable guidance
and advice in the process of conducting this study. I would also like to express my gratitude
to Dr Wen Yi, my co-supervisor, for her continuous encouragement and supervision on my
research work.
Special thanks are also given to Professor Francis K.W. Wong, Dr Michael C.H. Yam, Dr
Daniel W.M. Chan, Dr Edmond W.M. Lam, Dr Yueping Guo, Dr Jackie Y. Yang of The
Hong Kong Polytechnic University and Professor Del P. Wong of The Shandong Sport
University for his kindly suggestions and continuous support; and to Mr I.K. Chan and Mr
C.F. Wong of The Hong Kong Polytechnic University for their technical support. The
experience of working with such a strong supervisory team not only witnesses a friendly
supervisor-and-student relationship, but also, more importantly, becomes a precious fortune
of my life.
Last, but not least, I would like to extend my deepest gratitude to my parents, and other
family members for their everlasting love and support.
VII│Page
TABLE OF CONTENTS
ABSTRACT .............................................................................................................................. I
LIST OF PUBLICATIONS .................................................................................................. IV
ACKNOWLEDGEMENTS .................................................................................................. VI
TABLE OF CONTENTS .................................................................................................... VII
LIST OF FIGURES ............................................................................................................ XIV
LIST OF TABLES ............................................................................................................. XVII
CHAPTER 1 INTRODUCTION ....................................................................................... 1
1.1 INTRODUCTION ................................................................................................... 1
1.2 RESEARCH BACKGROUND ............................................................................... 1
1.2.1 Construction safety and health ....................................................................... 1
1.2.2 Occupational heat stress ................................................................................. 2
1.2.3 Heat stress in construction .............................................................................. 4
1.2.4 Precautionary measures for heat stress in construction .................................. 6
1.3 RESEARCH PROBLEM ...................................................................................... 12
1.4 RESEARCH AIM AND OBJECTIVES ............................................................... 14
1.5 SIGNIFICANCE AND VALUE ........................................................................... 17
1.6 RESEARCH APPROACH .................................................................................... 18
1.7 SUMMARY .......................................................................................................... 21
VIII│Page
CHAPTER 2 LITERATURE REVIEW ......................................................................... 23
2.1 INTRODUCTION ................................................................................................. 23
2.2 PERSONAL COOLING SYSTEM (PCS) ............................................................ 23
2.3 METHODOLOGY ................................................................................................ 30
2.3.1 Search strategy and study identification ....................................................... 30
2.3.2 Methodological quality assessment .............................................................. 32
2.3.3 Statistical analysis and data synthesis .......................................................... 33
2.4 OVERVIEW OF STUDIES .................................................................................. 35
2.5 COOLING EFFECTS ON PHYSIOLOGICAL RESPONSE ............................... 36
2.6 EFFECTIVENESS OF DIFFERENT PCS ........................................................... 39
2.7 INDUSTRIAL APPLICATION ............................................................................ 43
2.8 SUMMARY .......................................................................................................... 45
CHAPTER 3 RESEARCH METHODOLOGY ............................................................. 46
3.1 INTRODUCTION ................................................................................................. 46
3.2 RESEARCH DESIGN .......................................................................................... 46
3.2.1 Intervention research .................................................................................... 46
3.2.2 Tasks in intervention research ...................................................................... 47
3.3 RESEARCH PROCESS ........................................................................................ 52
3.4 OVERVIEW OF RESEARCH METHODS.......................................................... 53
3.4.1 Physical testing of PCS elements ................................................................. 54
3.4.2 Sweating thermal manikin measurements .................................................... 54
IX│Page
3.4.3 Wear trials in the laboratory ......................................................................... 57
3.4.4 Field wear trials ............................................................................................ 59
3.5 SUMMARY .......................................................................................................... 61
CHAPTER 4 DEVELOPMENT OF PCS ....................................................................... 62
4.1 INTRODUCTION ................................................................................................. 62
4.2 REQUEST MADE ................................................................................................ 62
4.3 DESIGN SITUATION EXPLORED .................................................................... 63
4.4 PROBLEM STRUCTURE PERCEIVED ............................................................. 63
4.5 FABRIC SELECTED ............................................................................................ 67
4.6 COOLING SOURCE ENGINEERED .................................................................. 72
4.6.1 Phase change material (PCM) packs ............................................................ 73
4.6.2 Ventilation unit ............................................................................................. 75
4.7 PROTOTYPE DEVELOPED ............................................................................... 82
4.8 SUMMARY .......................................................................................................... 85
CHAPTER 5 COOLING CAPACITY OF PCS ............................................................. 87
5.1 INTRODUCTION ................................................................................................. 87
5.2 MATERIALS AND METHOD ............................................................................ 87
5.2.1 Cooling vest .................................................................................................. 87
5.2.2 Test protocol ................................................................................................. 92
5.2.3 Calculation and analysis ............................................................................... 94
X│Page
5.3 RESULTS .............................................................................................................. 95
5.3.1 Thermal insulation and evaporative resistance ............................................. 95
5.3.2 Cooling capacity of different clothing combinations ................................... 97
5.4 DISCUSSION ....................................................................................................... 99
5.4.1 Efficiency of the hybrid cooling vest ........................................................... 99
5.4.2 Cooling efficiency of ventilation fan .......................................................... 100
5.4.3 Cooling efficiency of PCM ........................................................................ 101
5.4.4 Industrial applications ................................................................................ 102
5.5 SUMMARY ........................................................................................................ 104
CHAPTER 6 OPTIMAL COOLING INTERVENTION WITH PCS ....................... 105
6.1 INTRODUCTION ............................................................................................... 105
6.2 PARTICIPANTS AND PROTOCOL I ............................................................... 105
6.3 PARTICIPANTS AND PROTOCOL II ............................................................. 109
6.4 MEASUREMENTS AND CALCULATION ..................................................... 112
6.4.1 Physiological measurements ...................................................................... 112
6.4.2 Perceptual measurements ........................................................................... 114
6.4.3 Statistical analysis ...................................................................................... 116
6.5 RESULTS OF PROTOCOL I ............................................................................. 116
6.5.1 Work performance ...................................................................................... 116
6.5.2 Core temperature ........................................................................................ 117
6.5.3 Skin temperature ......................................................................................... 117
XI│Page
6.5.4 Heart rate .................................................................................................... 118
6.5.5 Change in body heat storage ....................................................................... 120
6.5.6 Microclimate temperature and humidity .................................................... 120
6.5.7 Perceptual responses ................................................................................... 123
6.5.8 Sweat rate ................................................................................................... 125
6.6 RESULTS OF PROTOCOL II ............................................................................ 125
6.6.1 Exercise duration ........................................................................................ 125
6.6.2 Body temperatures and heat storage ........................................................... 126
6.6.3 Heart rate and PSI ....................................................................................... 129
6.6.4 Local skin temperatures and microclimate humidity.................................. 131
6.6.5 Perceptual responses ................................................................................... 133
6.6.6 Sweat rate ................................................................................................... 136
6.7 DISCUSSION ..................................................................................................... 136
6.8 SUMMARY ........................................................................................................ 143
CHAPTER 7 APPLICABILITY OF PCS .................................................................... 145
7.1 INTRODUCTION ............................................................................................... 145
7.2 METHODS OF DATA COLLECTION ............................................................. 145
7.2.1 Participants ................................................................................................. 145
7.2.2 Procedure .................................................................................................... 146
7.2.3 Measurements and calculation.................................................................... 149
7.2.4 Statistical analysis ...................................................................................... 150
XII│Page
7.3 RESULTS ............................................................................................................ 151
7.3.1 Field experiment ......................................................................................... 151
7.3.2 On-site questionnaire .................................................................................. 156
7.4 DISCUSSION ..................................................................................................... 157
7.5 SUMMARY ........................................................................................................ 161
CHAPTER 8 CONCLUSIONS AND RECOMMENDATIONS ................................ 162
8.1 INTRODUCTION ............................................................................................... 162
8.2 SUMMARY OF MAJOR FINDINGS ................................................................ 162
8.2.1 Tailor-made PCS for the construction industry .......................................... 162
8.2.2 Cooling power of the PCS .......................................................................... 165
8.2.3 Optimal cooling intervention with the PCS ................................................ 165
8.2.4 Applicability of the cooling intervention with the PCS.............................. 167
8.3 SIGNIFICANCE AND CONTRIBUTIONS....................................................... 169
8.3.1 Alternative approach for conducting construction safety and health research
................................................................................................................... 169
8.3.2 Facilitating cooling intervention research in construction.......................... 170
8.4 LIMITATIONS OF THE STUDY ...................................................................... 170
8.5 FUTURE RESEARCH DIRECTIONS ............................................................... 172
8.6 SUMMARY ........................................................................................................ 173
XIII│Page
APPENDICES ..................................................................................................................... 174
APPENDIX 1: Supplemental tables in literature review ............................................... 174
APPENDIX 2: Data collection sheet used in the laboratory experiment ...................... 183
APPENDIX 3: Questionnaire used in the laboratory experiment ................................. 186
APPENDIX 4: Data collection sheet used in the field experiment ............................... 190
APPENDIX 5: Questionnaire used in the field survey .................................................. 193
APPENDIX 6: Consent form used in the study ............................................................ 213
APPENDIX 7: Equipment for collecting data ............................................................... 215
REFERENCES .................................................................................................................... 219
XIV│Page
LIST OF FIGURES
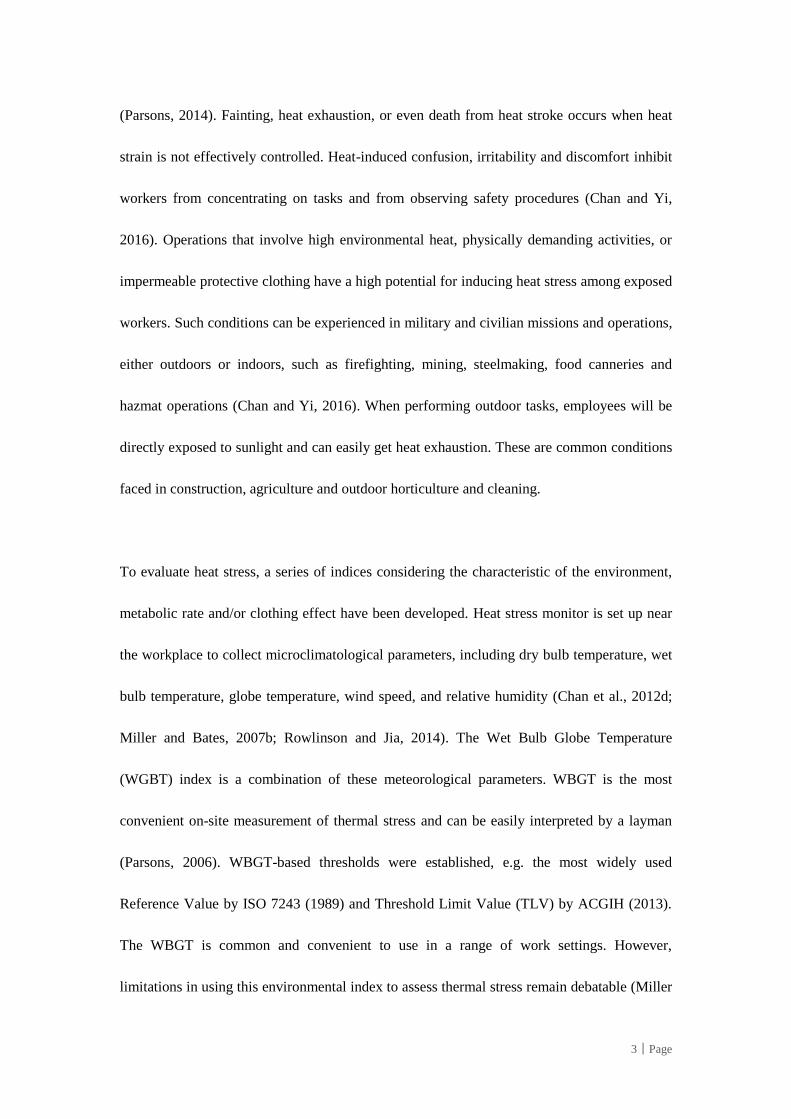
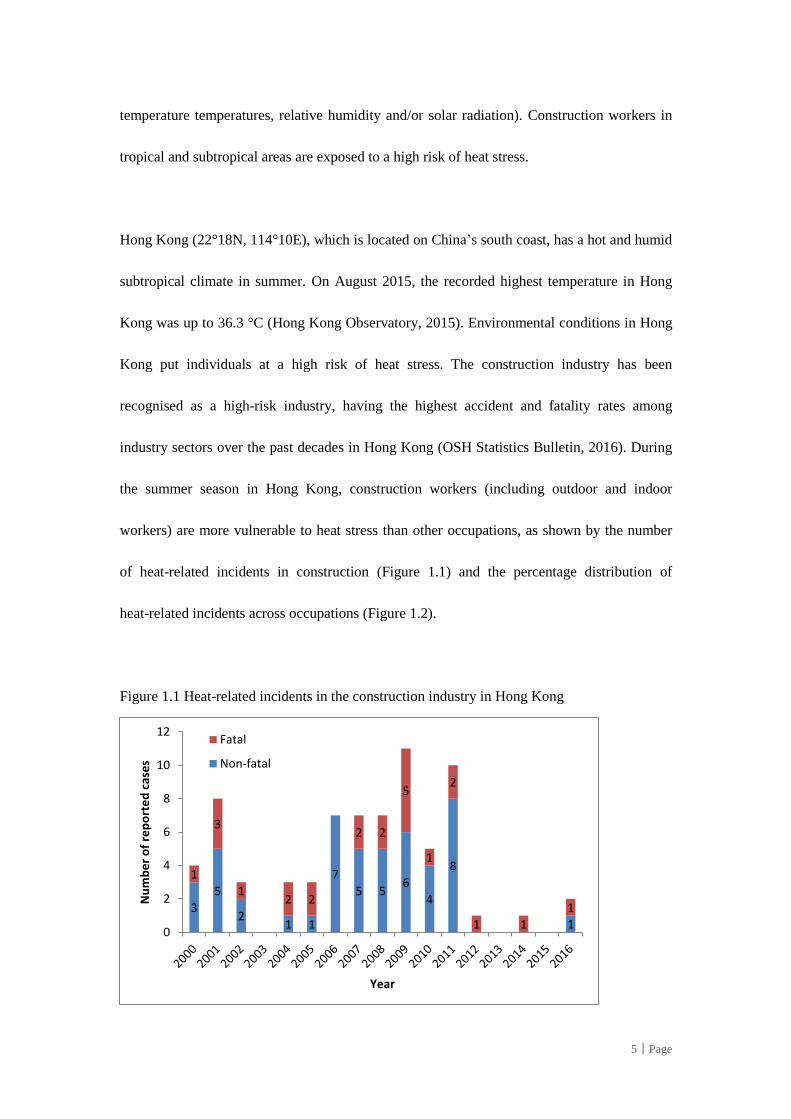
Figure 1.1 Heat-related incidents in the construction industry in Hong Kong .................................... 5
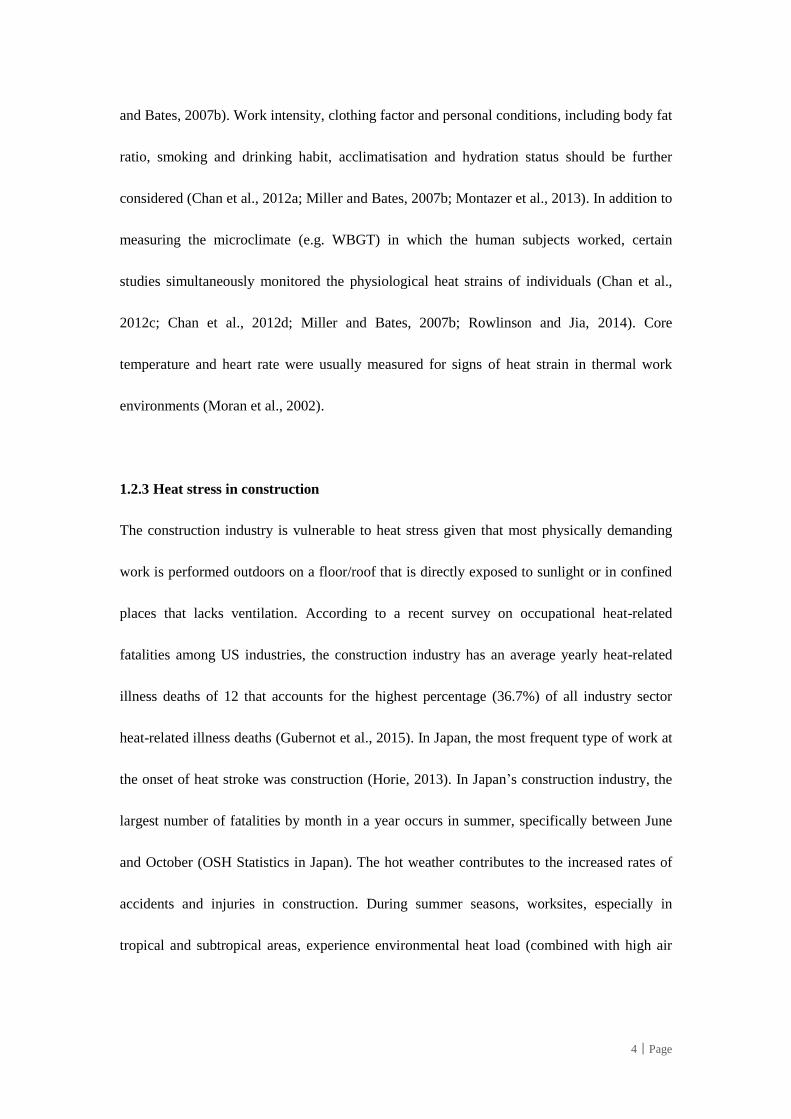
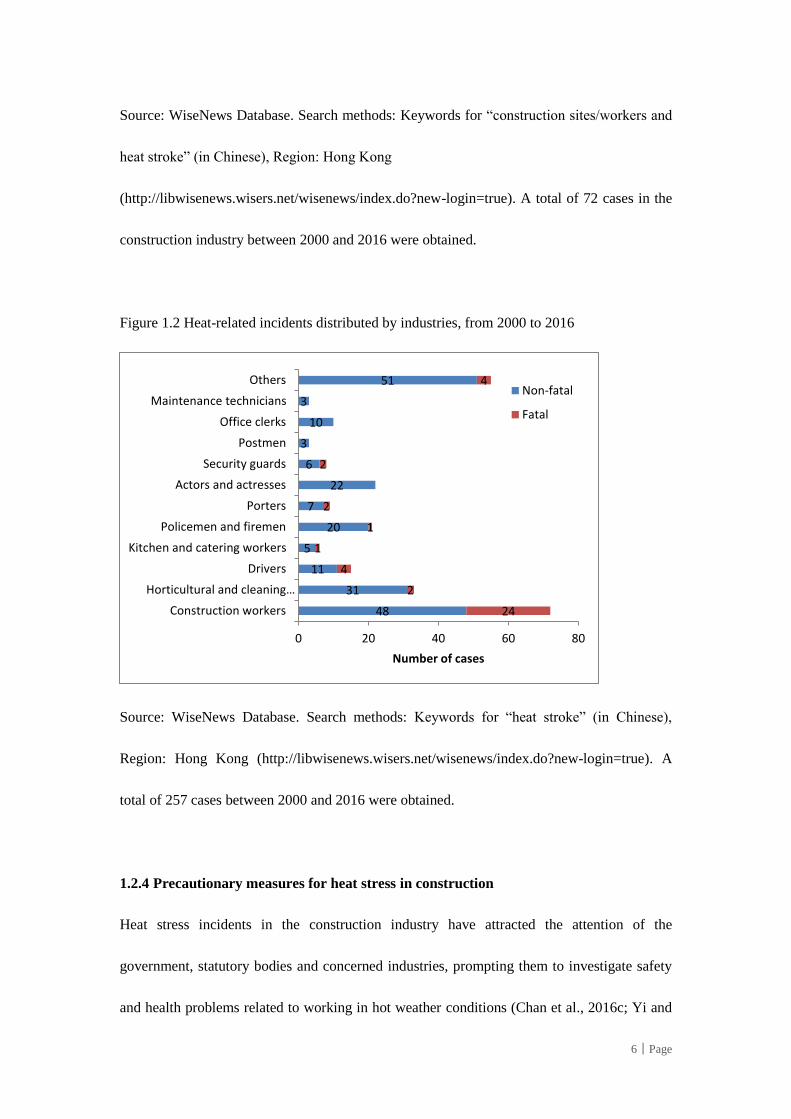
Figure 1.2 Heat-related incidents distributed by industries, from 2000 to 2016 .................................. 6
Figure 1.3 Relationships between objectives ..................................................................................... 16
Figure 1.4 A three-level evaluation system of PCS performance ...................................................... 17
Figure 1.5 Research flow of the research .......................................................................................... 19
Figure 2.1 Flow chart of literature identification and study selection ............................................... 32
Figure 2.2 Correlations between exercise performance enhancement (%) and differences in change
rates of (a) core temperature (°C /h), (b) mean skin temperature (°C /h), and (c) heart rate
(bpm/h) ............................................................................................................................. 37
Figure 2.3 Forest plot of PCSs effects on work performance ............................................................ 40
Figure 3.1 The 5-D model for conducting intervention research ....................................................... 48
Figure 3.2 The sweating thermal manikin in a climatic chamber ...................................................... 57
Figure 4.1 The newly designed PCS (two-layer cooling vest) worn over the construction uniform
(from left to right: front view, back view) ....................................................................... 68
Figure 4.2 Ventilation unit (a pair of fans and a battery pack) .......................................................... 76
Figure 4.3 Overall framework of evaluating the ventilation unit for PCS ......................................... 76
Figure 4.4 (a) Velocity profile in a straight length of outlet duct; (b) Airflow distribution on the
circular cross section ........................................................................................................ 80
Figure 4.5 Air flow rate and work duration of the Unit A and Unit B .............................................. 81
XV│Page
Figure 4.6 The newly designed PCS (two-layer cooling vest) incorporating PCM packs and
ventilation fans ................................................................................................................. 84
Figure 4.7 (a) Cooling vest with small ventilation fans and openings at the back (b) 2D model for
the air gap between the skin surface and vest .................................................................. 85
Figure 5.1 Appearance of the two types of cooling vest: (A) Vest CB, (B) Vest B .......................... 88
Figure 5.2 (a) Air flow in Vest CB; (b) Air flow in Vest B ............................................................... 89
Figure 5.3 The whole manikin clothing system ................................................................................. 92
Figure 5.4 Thermal insulations of It_Torso in different scenarios .................................................... 96
Figure 5.5 Evaporative resistances of Ret_Torso in different scenarios ............................................ 96
Figure 5.6 Heat loss_Torso in different test scenarios ....................................................................... 98
Figure 5.7 Cooling power_Torso in different test scenarios .............................................................. 98
Figure 6.1 Protocol I of the experiment ........................................................................................... 107
Figure 6.2 Protocol II of the experiment ......................................................................................... 111
Figure 6.3 Cooling vest worn during the passive recovery ............................................................. 112
Figure 6.4 Physiological responses during the experiment (a) core temperature, (b) mean skin
temperature, and (c) heart rate ....................................................................................... 119
Figure 6.5 Rate of heat storage during the experiment .................................................................... 120
Figure 6.6 (a) Microclimate temperature and (b) microclimate relative humidity in the upper body
region during the experiment ......................................................................................... 122
Figure 6.7 (a) RPE, (b) thermal sensation, and (c) wetness sensation during the experiment ......... 124
Figure 6.8 Exercise duration of individual participants in VEST and CON: (a) 1st stage exercise; (b)
2nd
stage exercise ............................................................................................................ 126
XVI│Page
Figure 6.9 Body temperatures in VEST and CON during the experiment (a) Tc; (b) Tsk; (c) Tb. .. 128
Figure 6.10 (a) Heart rate and (b) PSI in VEST and CON during the experiment ............................ 130
Figure 6.11 (a) Local skin temperatures and (b) microclimate temperature (c) microclimate relative
humidity (RH) in VEST and CON during the experiment ............................................. 132
Figure 6.12 (a) Perceived exertion, (b) thermal sensation, (c) wetness sensation, and (d) comfort
sensation in VEST and CON during the experiment ..................................................... 134
Figure 6.13 Perceptual sensations of the hybrid cooling vest after passive recovery ........................ 136
Figure 7.1 Participant construction worker with the heart rate belt ................................................. 148
Figure 7.2 A group of participants wearing the cooling vest during rest ......................................... 148
Figure 7.3 Frequency distributions of meteorological data during the field study .......................... 151
Figure 7.4 Frequency distributions of physiological and perceptual parameters ............................. 152
Figure 7.5 Change in (a) PhSI and (b) PeSI during the whole heat exposure .................................. 154
Figure 7.6 Relationship between PhSI and PeSI ............................................................................. 155
Figure 7.7 Ratings of subjective sensations in the questionnaire survey ......................................... 157
XVII│Page
LIST OF TABLES
Table 2.1 Characteristics of different PCSs ....................................................................................... 25
Table 3.1 Research objectives and corresponding methods .............................................................. 53
Table 4.1 Survey questionnaire on the commercially available cooling vests (Vest CA and CB) .... 65
Table 4.2 Survey questionnaire on Vest CB ...................................................................................... 65
Table 4.3 Fabric physical characteristics ........................................................................................... 70
Table 4.4 Total score of each fabric .................................................................................................. 71
Table 4.5 Thermo-physical properties of the phase change materials (PCMs) used in the cooling
vests ................................................................................................................................. 75
Table 4.6 Parameters of ventilation fans ......................................................................................... 77
Table 4.7 Parameters of battery ....................................................................................................... 78
Table 4.8 Test scenarios .................................................................................................................. 79
Table 5.1 Cloth properties of the cooling vests ............................................................................... 90
Table 5.2 Thermo-physical properties of the phase change materials (PCMs) used in the two
cooling vests..................................................................................................................... 91
Table 5.3 Properties of ventilation unit in the two cooling vests ..................................................... 91
Table 5.4 Test scenarios .................................................................................................................. 93
Table 6.1 Perceptual rating scales on perceived exertion (RPE), thermal sensation (TS), wetness
sensation (WS), and comfort sensation (CS) ................................................................. 115
Table 8.1 Characteristics of the new cooling vest (Vest B) and the commercial cooling vest (Vest
CB) ................................................................................................................................. 163
1│Page
CHAPTER 1 INTRODUCTION
1.1 INTRODUCTION
This chapter sets the background, states the research problem, clarifies the aim and
objectives, provides the significance and value of the present study, and outlines the research
approaches.
1.2 RESEARCH BACKGROUND
1.2.1 Construction safety and health
In most industrialised countries, construction is one of the most significant industries in terms
of its contribution to GDP (Lingard and Rowlinson, 2005). The construction industry is
labour intensive and recognised as a high hazard industry. This industry has approximately 7%
of the world’s work force but accounts for 30%–40% of casualties (Sunindijo and Zou, 2012).
Construction workers commonly suffer from a high frequency of construction site accidents
and injuries, such as falling from high heights or scaffolding; getting hit by a vehicle; getting
caught in-between objects or materials; getting electrocuted and having illnesses due to their
exposure to dusts, fibers, chemicals, vibration, radiation, noise and temperature extremes
(Reese and Eidson, 2006). Academics and practitioners should take initiatives to promote
occupational safety and health policies as well as practices in the construction industry. Since
the past decades, construction management research has witnessed a growing concern over
the issue of safety management system, safety culture and accident prevention (Zhou et al.,
2015). In comparison with safety and accident research, the health and well-being of
2│Page
construction workers received less attention from researchers and practitioners (Lingard and
Rowlinson, 2005). The management of occupational hygiene in construction is more
challenging than in other industries given that the construction industry has temporary
worksites, diffused control mechanisms and a complex mix of different activities and trades
(Lingard and Rowlinson, 2005). Given the high frequency of occupational health hazards and
illnesses in the construction industry, it remained a priority area for research and interventions
(Hoonakkera et al., 2005).
1.2.2 Occupational heat stress
Heat stress refers to the “net heat load to which a worker may be exposed from the combined
contributions of metabolic cost of work, environmental factors and clothing requirements”
(ACGIH, 2011). It is dependent on four meteorological parameters, namely, ambient
temperature, relative humidity, air velocity and solar radiation, combined with metabolic heat
and clothing effect (Chan et al., 2012c; Kjellstrom et al., 2009; Parsons, 2014). Environmental
heat load combined with physical work may induce heat stress above the compensable level,
which results in productivity loss and increased risk of heat-related incidents, as indicated by
the excessively elevated body temperature and cardiovascular strain (Cheung et al., 2000).
The risk of heat stress can be further increased by personal protective equipment (PPE), such
as a protective ensemble, work uniforms, goggles, helmets and gloves, given that the
impermeable nature of PPE can severely impede evaporative heat loss through sweating. Heat
strain denotes the physiological and/or psychological consequences of heat stress (Sawka et
al., 2003). Body heat strain includes an increase in core temperature, heart rate, and sweat rate
3│Page
(Parsons, 2014). Fainting, heat exhaustion, or even death from heat stroke occurs when heat
strain is not effectively controlled. Heat-induced confusion, irritability and discomfort inhibit
workers from concentrating on tasks and from observing safety procedures (Chan and Yi,
2016). Operations that involve high environmental heat, physically demanding activities, or
impermeable protective clothing have a high potential for inducing heat stress among exposed
workers. Such conditions can be experienced in military and civilian missions and operations,
either outdoors or indoors, such as firefighting, mining, steelmaking, food canneries and
hazmat operations (Chan and Yi, 2016). When performing outdoor tasks, employees will be
directly exposed to sunlight and can easily get heat exhaustion. These are common conditions
faced in construction, agriculture and outdoor horticulture and cleaning.
To evaluate heat stress, a series of indices considering the characteristic of the environment,
metabolic rate and/or clothing effect have been developed. Heat stress monitor is set up near
the workplace to collect microclimatological parameters, including dry bulb temperature, wet
bulb temperature, globe temperature, wind speed, and relative humidity (Chan et al., 2012d;
Miller and Bates, 2007b; Rowlinson and Jia, 2014). The Wet Bulb Globe Temperature
(WGBT) index is a combination of these meteorological parameters. WBGT is the most
convenient on-site measurement of thermal stress and can be easily interpreted by a layman
(Parsons, 2006). WBGT-based thresholds were established, e.g. the most widely used
Reference Value by ISO 7243 (1989) and Threshold Limit Value (TLV) by ACGIH (2013).
The WBGT is common and convenient to use in a range of work settings. However,
limitations in using this environmental index to assess thermal stress remain debatable (Miller
4│Page
and Bates, 2007b). Work intensity, clothing factor and personal conditions, including body fat
ratio, smoking and drinking habit, acclimatisation and hydration status should be further
considered (Chan et al., 2012a; Miller and Bates, 2007b; Montazer et al., 2013). In addition to
measuring the microclimate (e.g. WBGT) in which the human subjects worked, certain
studies simultaneously monitored the physiological heat strains of individuals (Chan et al.,
2012c; Chan et al., 2012d; Miller and Bates, 2007b; Rowlinson and Jia, 2014). Core
temperature and heart rate were usually measured for signs of heat strain in thermal work
environments (Moran et al., 2002).
1.2.3 Heat stress in construction
The construction industry is vulnerable to heat stress given that most physically demanding
work is performed outdoors on a floor/roof that is directly exposed to sunlight or in confined
places that lacks ventilation. According to a recent survey on occupational heat-related
fatalities among US industries, the construction industry has an average yearly heat-related
illness deaths of 12 that accounts for the highest percentage (36.7%) of all industry sector
heat-related illness deaths (Gubernot et al., 2015). In Japan, the most frequent type of work at
the onset of heat stroke was construction (Horie, 2013). In Japan’s construction industry, the
largest number of fatalities by month in a year occurs in summer, specifically between June
and October (OSH Statistics in Japan). The hot weather contributes to the increased rates of
accidents and injuries in construction. During summer seasons, worksites, especially in
tropical and subtropical areas, experience environmental heat load (combined with high air
5│Page
temperature temperatures, relative humidity and/or solar radiation). Construction workers in
tropical and subtropical areas are exposed to a high risk of heat stress.
Hong Kong (22°18N, 114°10E), which is located on China’s south coast, has a hot and humid
subtropical climate in summer. On August 2015, the recorded highest temperature in Hong
Kong was up to 36.3 °C (Hong Kong Observatory, 2015). Environmental conditions in Hong
Kong put individuals at a high risk of heat stress. The construction industry has been
recognised as a high-risk industry, having the highest accident and fatality rates among
industry sectors over the past decades in Hong Kong (OSH Statistics Bulletin, 2016). During
the summer season in Hong Kong, construction workers (including outdoor and indoor
workers) are more vulnerable to heat stress than other occupations, as shown by the number
of heat-related incidents in construction (Figure 1.1) and the percentage distribution of
heat-related incidents across occupations (Figure 1.2).
Figure 1.1 Heat-related incidents in the construction industry in Hong Kong
3
5
2 1 1
7
5 5 6
4
8
1
1
3
1 2 2
2 2
5
1
2
1 1
1
0
2
4
6
8
10
12
Nu
mb
er
of
rep
ort
ed
cas
es
Year
Fatal
Non-fatal
6│Page
Source: WiseNews Database. Search methods: Keywords for “construction sites/workers and
heat stroke” (in Chinese), Region: Hong Kong
(http://libwisenews.wisers.net/wisenews/index.do?new-login=true). A total of 72 cases in the
construction industry between 2000 and 2016 were obtained.
Figure 1.2 Heat-related incidents distributed by industries, from 2000 to 2016
Source: WiseNews Database. Search methods: Keywords for “heat stroke” (in Chinese),
Region: Hong Kong (http://libwisenews.wisers.net/wisenews/index.do?new-login=true). A
total of 257 cases between 2000 and 2016 were obtained.
1.2.4 Precautionary measures for heat stress in construction
Heat stress incidents in the construction industry have attracted the attention of the
government, statutory bodies and concerned industries, prompting them to investigate safety
and health problems related to working in hot weather conditions (Chan et al., 2016c; Yi and
48
31
11
5
20
7
22
6
3
10
3
51
24
2
4
1
1
2
2
4
0 20 40 60 80
Construction workers
Horticultural and cleaning…
Drivers
Kitchen and catering workers
Policemen and firemen
Porters
Actors and actresses
Security guards
Postmen
Office clerks
Maintenance technicians
Others
Number of cases
Non-fatal
Fatal
7│Page
Chan, 2014a). In most cases, heat stress can be avoided through improving the efficiency of
the body’s cooling mechanisms (e.g. sweating efficiency) or reducing the level of heat
exposure. A series of guidelines and practice notes, including engineering and administrative
for controlling occupational heat stress (e.g. appropriate work arrangements, shelters at work
or rest places to reduce radiant heat gain, ventilation in indoor working environments,
air-conditioned rest rooms, provision of drinking water or sports drinks and heat
acclimatisation programs), have been proposed (Department of Health, 2010; HSE, UK, 2011;
US Department of Labour, 2010).
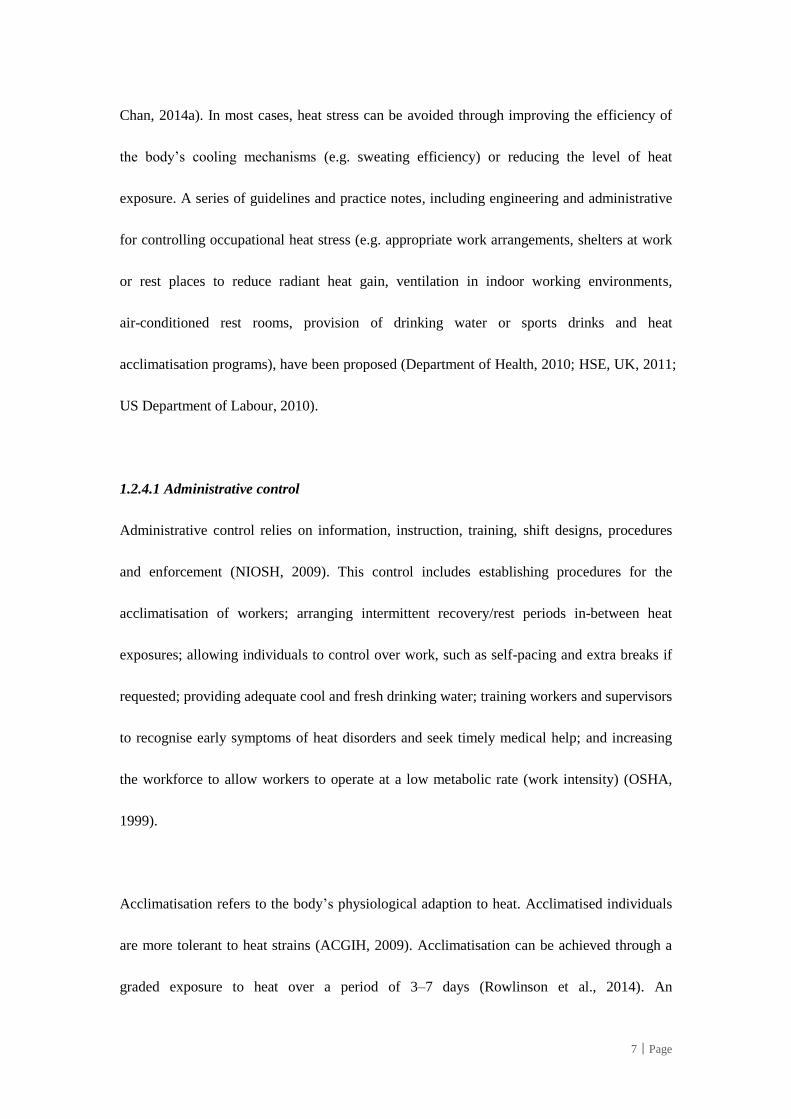
1.2.4.1 Administrative control
Administrative control relies on information, instruction, training, shift designs, procedures
and enforcement (NIOSH, 2009). This control includes establishing procedures for the
acclimatisation of workers; arranging intermittent recovery/rest periods in-between heat
exposures; allowing individuals to control over work, such as self-pacing and extra breaks if
requested; providing adequate cool and fresh drinking water; training workers and supervisors
to recognise early symptoms of heat disorders and seek timely medical help; and increasing
the workforce to allow workers to operate at a low metabolic rate (work intensity) (OSHA,
1999).
Acclimatisation refers to the body’s physiological adaption to heat. Acclimatised individuals
are more tolerant to heat strains (ACGIH, 2009). Acclimatisation can be achieved through a
graded exposure to heat over a period of 3–7 days (Rowlinson et al., 2014). An
8│Page
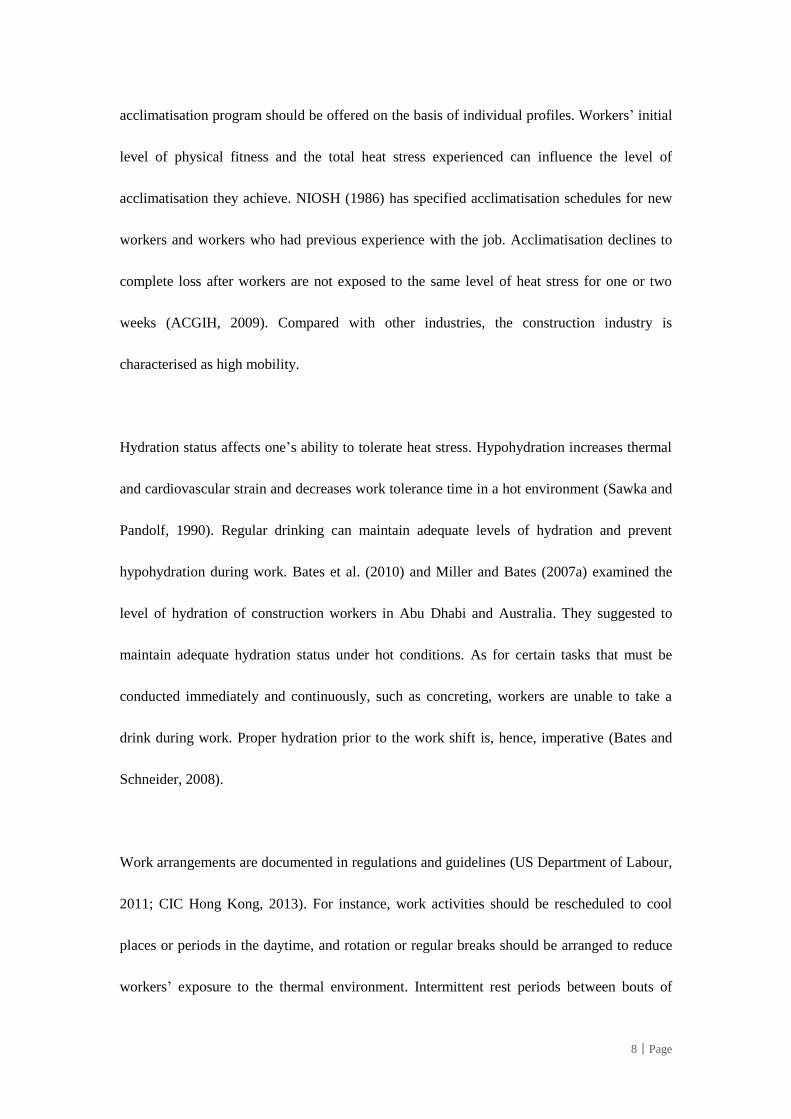
acclimatisation program should be offered on the basis of individual profiles. Workers’ initial
level of physical fitness and the total heat stress experienced can influence the level of
acclimatisation they achieve. NIOSH (1986) has specified acclimatisation schedules for new
workers and workers who had previous experience with the job. Acclimatisation declines to
complete loss after workers are not exposed to the same level of heat stress for one or two
weeks (ACGIH, 2009). Compared with other industries, the construction industry is
characterised as high mobility.
Hydration status affects one’s ability to tolerate heat stress. Hypohydration increases thermal
and cardiovascular strain and decreases work tolerance time in a hot environment (Sawka and
Pandolf, 1990). Regular drinking can maintain adequate levels of hydration and prevent
hypohydration during work. Bates et al. (2010) and Miller and Bates (2007a) examined the
level of hydration of construction workers in Abu Dhabi and Australia. They suggested to
maintain adequate hydration status under hot conditions. As for certain tasks that must be
conducted immediately and continuously, such as concreting, workers are unable to take a
drink during work. Proper hydration prior to the work shift is, hence, imperative (Bates and
Schneider, 2008).
Work arrangements are documented in regulations and guidelines (US Department of Labour,
2011; CIC Hong Kong, 2013). For instance, work activities should be rescheduled to cool
places or periods in the daytime, and rotation or regular breaks should be arranged to reduce
workers’ exposure to the thermal environment. Intermittent rest periods between bouts of
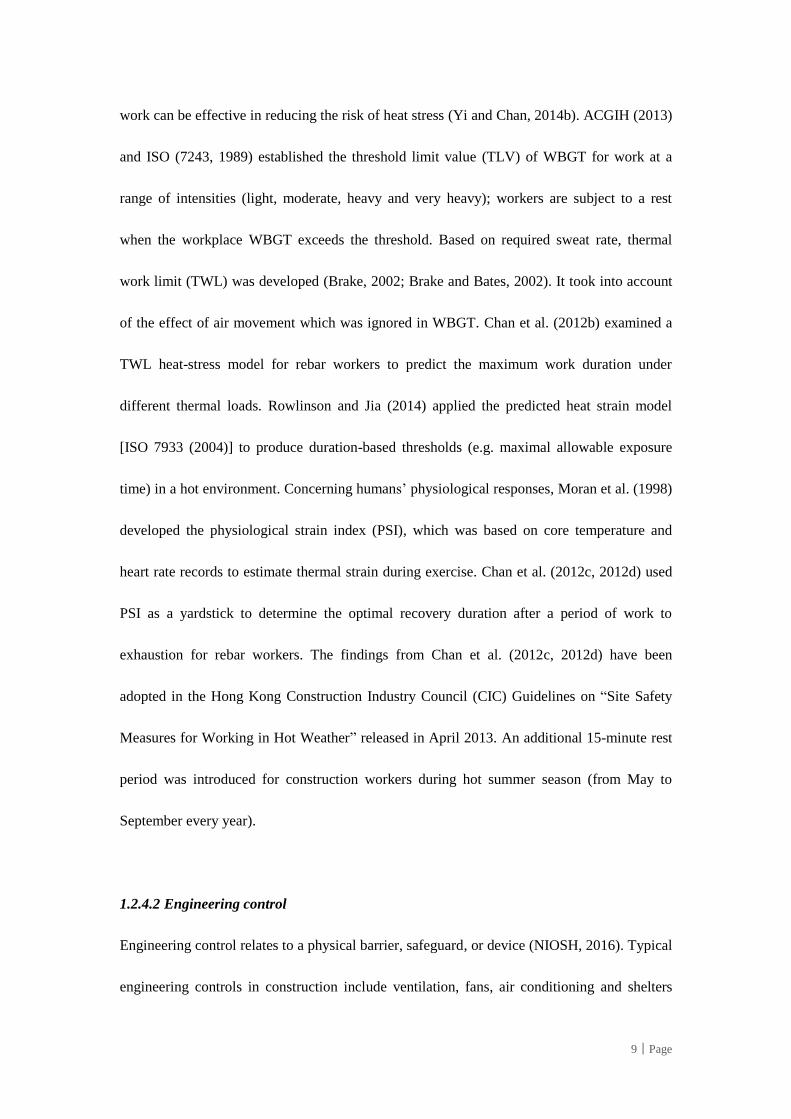
9│Page
work can be effective in reducing the risk of heat stress (Yi and Chan, 2014b). ACGIH (2013)
and ISO (7243, 1989) established the threshold limit value (TLV) of WBGT for work at a
range of intensities (light, moderate, heavy and very heavy); workers are subject to a rest
when the workplace WBGT exceeds the threshold. Based on required sweat rate, thermal
work limit (TWL) was developed (Brake, 2002; Brake and Bates, 2002). It took into account
of the effect of air movement which was ignored in WBGT. Chan et al. (2012b) examined a
TWL heat-stress model for rebar workers to predict the maximum work duration under
different thermal loads. Rowlinson and Jia (2014) applied the predicted heat strain model
[ISO 7933 (2004)] to produce duration-based thresholds (e.g. maximal allowable exposure
time) in a hot environment. Concerning humans’ physiological responses, Moran et al. (1998)
developed the physiological strain index (PSI), which was based on core temperature and
heart rate records to estimate thermal strain during exercise. Chan et al. (2012c, 2012d) used
PSI as a yardstick to determine the optimal recovery duration after a period of work to
exhaustion for rebar workers. The findings from Chan et al. (2012c, 2012d) have been
adopted in the Hong Kong Construction Industry Council (CIC) Guidelines on “Site Safety
Measures for Working in Hot Weather” released in April 2013. An additional 15-minute rest
period was introduced for construction workers during hot summer season (from May to
September every year).
1.2.4.2 Engineering control
Engineering control relates to a physical barrier, safeguard, or device (NIOSH, 2016). Typical
engineering controls in construction include ventilation, fans, air conditioning and shelters
10│Page
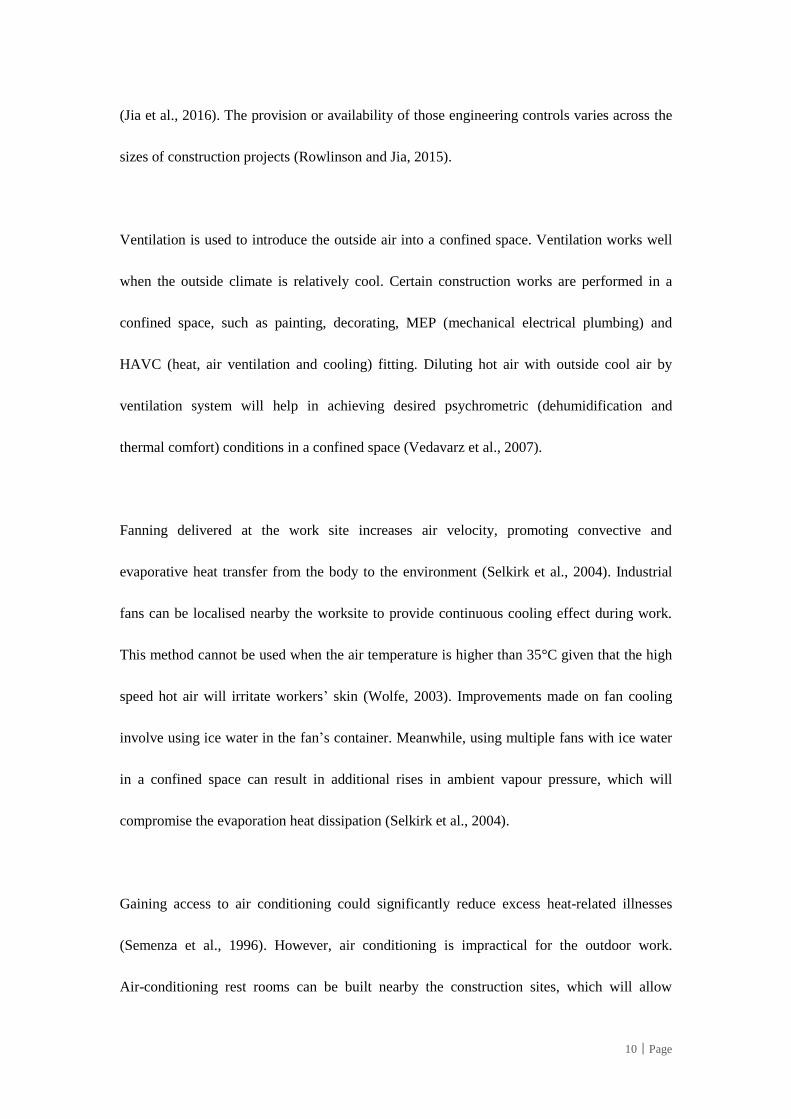
(Jia et al., 2016). The provision or availability of those engineering controls varies across the
sizes of construction projects (Rowlinson and Jia, 2015).
Ventilation is used to introduce the outside air into a confined space. Ventilation works well
when the outside climate is relatively cool. Certain construction works are performed in a
confined space, such as painting, decorating, MEP (mechanical electrical plumbing) and
HAVC (heat, air ventilation and cooling) fitting. Diluting hot air with outside cool air by
ventilation system will help in achieving desired psychrometric (dehumidification and
thermal comfort) conditions in a confined space (Vedavarz et al., 2007).
Fanning delivered at the work site increases air velocity, promoting convective and
evaporative heat transfer from the body to the environment (Selkirk et al., 2004). Industrial
fans can be localised nearby the worksite to provide continuous cooling effect during work.
This method cannot be used when the air temperature is higher than 35°C given that the high
speed hot air will irritate workers’ skin (Wolfe, 2003). Improvements made on fan cooling
involve using ice water in the fan’s container. Meanwhile, using multiple fans with ice water
in a confined space can result in additional rises in ambient vapour pressure, which will
compromise the evaporation heat dissipation (Selkirk et al., 2004).
Gaining access to air conditioning could significantly reduce excess heat-related illnesses
(Semenza et al., 1996). However, air conditioning is impractical for the outdoor work.
Air-conditioning rest rooms can be built nearby the construction sites, which will allow
11│Page
workers to take a rest and recovery from heat stress. This method is probably the most
effective one in cooling down body temperature but costs too much to install and operate.
Temporary shelters are widely used at work or rest places of construction sites. They shield
outdoor workers from radiant heat exposures. Although the heat-relief benefit of shelters is
inferior to that of air conditioning rooms, the build-up of shelters at all sites can be
considerably cheap and easy.
1.2.4.3 Personal protective clothes and equipment
When administrative and engineering controls are infeasible or ineffective, personal
protective clothes could be used. Anti-heat stress clothing ensembles are used to protect
workers from heat-related injuries and hazards. Chan et al. (2016a, 2016b) developed a work
uniform with superior air permeability and excellent moisture management capacity for
construction workers and reported its effectiveness in alleviating heat strains through
laboratory experiments and field wear trials. The summer work uniform is viewed as passive
cooling clothing, which relies on natural air movement between the body surface and the
clothing to facilitate evaporative heat dissipation (Selkirk et al., 2004). Whereas, cooling
garment utilises cooling sources (e.g. cooling packs and ventilation fans) to increase
conductive, convective and evaporative heat dissipation (Zhao et al., 2017a). OSHA
recommended the use of auxiliary body cooling garments, such as ice vest, and water- and
air- cooled garments to prevent from heat stress. The Hong Kong Occupational Safety and
Health Council (OSHC), in collaboration with the local government, launched the “Cooling
12│Page
Vest Promotion Pilot Scheme” in 2013 and tested the effectiveness of commercially available
cooling vests in several outdoor and indoor industries (including the construction industry).
Questionnaire surveys were conducted to compare the acceptability and practicality of several
commercially available cooling vests (Chan et al., 2013). The shortcomings of the
commercially available cooling vests were identified (Chan et al., 2016c). The development
of a tailor-made personal cooling system (PCS) for the construction industry is inconsiderably
explored.
1.3 RESEARCH PROBLEM
Construction workers are exposed to a high risk of heat stress. To help alleviate body heat
strain and ensure work performance, cooling intervention is proposed for the construction
industry in the present study. The design of a proper cooling intervention in construction
should consider the practical conditions of the workplaces. Fanning enhanced convective and
evaporative heat dissipation from the body through increasing the air flow of
microenvironments (Barwood et al., 2009a). Industries blowers should be connected to a
heavy motor and supplied by constant electricity to ensure sufficient air ventilation around the
body and maintain steady air velocity (Hostler et al., 2010). However, the installation of
blowers at construction sites is occasionally impossible because of elevated platform, limited
space, uneven ground and lack of electricity. A large reservoir with water at a low
temperature (10–20 °C) is required for cold water immersion, which generally immersed
extremities (e.g. forearm and/or hand immersion) to reduce body temperatures (McEntire et
al., 2013). However, the cold water immersion of the large groups of workers is usually
13│Page
problematic given that cold water delivery and storage may be impractical in construction
sites. Cold water ingestion is a convenient and cheap cooling method that is particularly
useful when electrical equipment is unavailable or in cases of difficult transportation (Jones et
al., 2012). However, limited evidence indicated the effectiveness of cold water drink in
reducing heat strains (warm water drink is generally used as the control condition to maintain
a similar hydration level) (Bongers et al., 2014; Jones et al., 2012). PCS, in the form of
cooling garment, was used to remove body heat from the wearer (Chan et al., 2017). PCS is
portable and wearable and does not require external power source or pre-installation.
Furthermore, meta-analysis studies corroborated that the PCS had a moderate-to-large cooling
effect, which was comparable with cold water immersion and fanning (Bongers et al., 2014;
Chan et al., 2015). Therefore, this garment type has a high potential to be well accepted and
applied in the construction industry.
PCSs have been applied in various occupations, particularly for athletes (Luomala et al.,
2012), firefighters (Bennett et al., 1995; Hostler et al., 2010; Kenny et al., 2011), soldiers
(DeGroot et al., 2013) and hazmat personnel (Carter et al., 2007; House et al., 2003).
PCSs provide microclimate cooling around the body and can be used continuously during the
entire work period. The three types of PCSs have been examined in previous studies,
including air cooling garments (ACGs), liquid cooling garments (LCGs) and phase change
garments (PCGs) (Mokhtari Yazdi and Sheikhzadeh, 2014). Air and liquid cooling garments
are connected to external cooling devices and circulate cooled air or liquid around human
14│Page
body (Chan et al., 2016c). PCGs use the precooled phase change materials (PCMs), e.g.
inorganic salt, ice and paraffin wax, to absorb heat and act as a heat sink (Mondal, 2008).
PCM, classified as latent heat storage material, can absorb and release heat at a roughly
constant temperature (i.e. melting temperature) as it goes through solid–liquid transitions
(Shim et al., 2001). When the ambient temperature is higher than the melting temperature,
PCM absorbs heat energy as it goes from a solid state to a liquid state, producing a temporary
cooling effect (Shim et al., 2001). After reviewing the characteristics of different PCSs,
potential PCS for the construction industry was selected as reference prototype for the
engineer and design of the cooling sources and fabrics in the new PCS.
Although existing studies and meta-analyses have designed and evaluated the effectiveness
and applicability of PCSs for athletes, firefighters, soldiers and hazmat personnel, little
attention has been paid to construction workers who are susceptible to heat stress (Chinevere
et al., 2008; Kenny et al., 2011; McLellan et al., 1999; Muir et al., 1999; Song and Wang,
2016).
1.4 RESEARCH AIM AND OBJECTIVES
This research aims to develop a cooling intervention with a tailor-made PCS to protect
construction workers from heat-related injuries while working in a thermal environment. A
tailor-made PCS is engineered and designed for the construction industry. Then, this research
attempts to examine the effectiveness and applicability of the newly designed PCS by a series
15│Page
of laboratory experiments and field wear trials. Hence, the objectives of this research are as
follows.
Objective 1: To review different PCSs for combating occupational heat stress and improving
work performance.
Objective 2: To engineer and design a tailor-made PCS for the construction industry.
Objective 3: To assess the cooling capability of the newly developed PCS on a sweating
thermal manikin.
Objective 4: To evaluate the effectiveness of the cooling intervention with the newly
developed PCS in reducing heat stress by human wear trials in the laboratory.
Objective 5: To examine the applicability of the cooling intervention with the newly
developed PCS by human wear trials in real work settings.
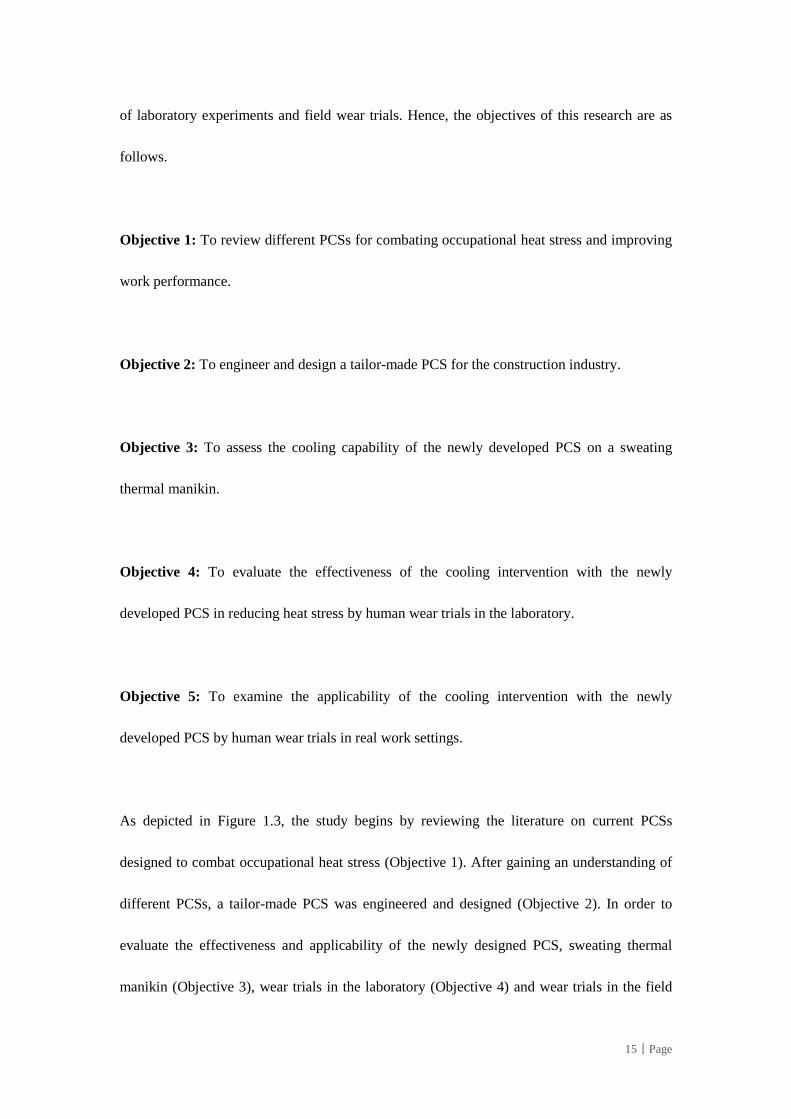
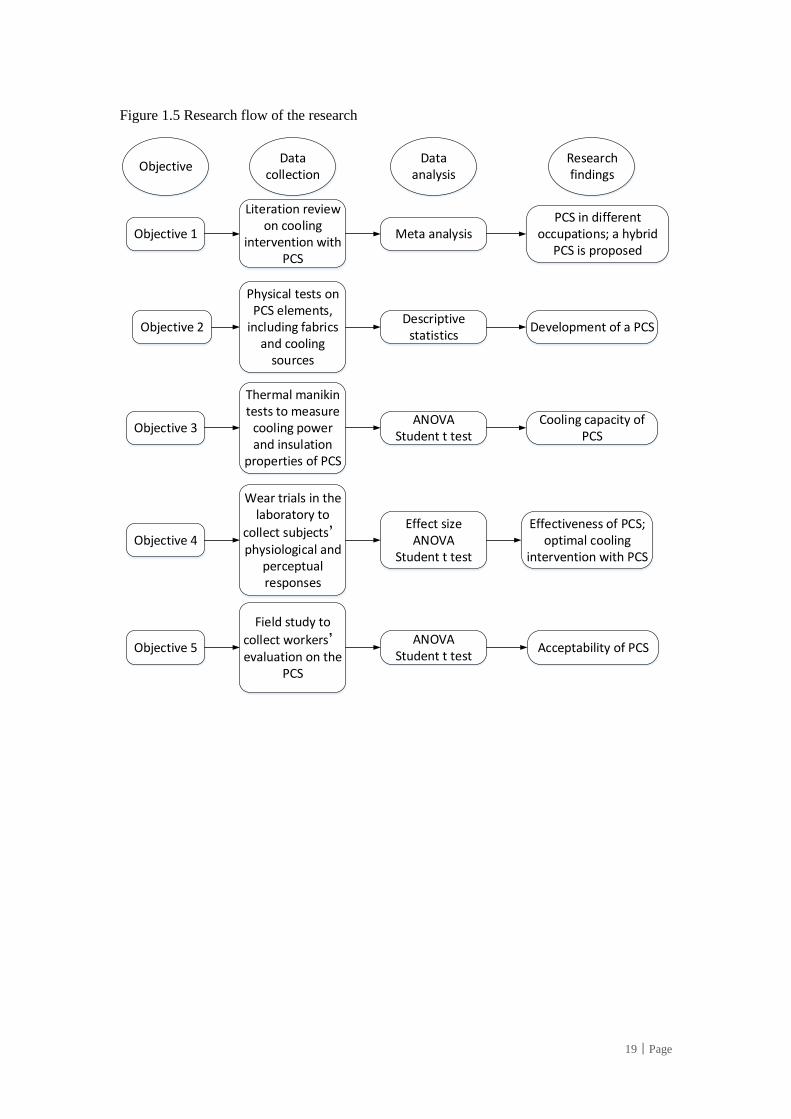
As depicted in Figure 1.3, the study begins by reviewing the literature on current PCSs
designed to combat occupational heat stress (Objective 1). After gaining an understanding of
different PCSs, a tailor-made PCS was engineered and designed (Objective 2). In order to
evaluate the effectiveness and applicability of the newly designed PCS, sweating thermal
manikin (Objective 3), wear trials in the laboratory (Objective 4) and wear trials in the field
16│Page
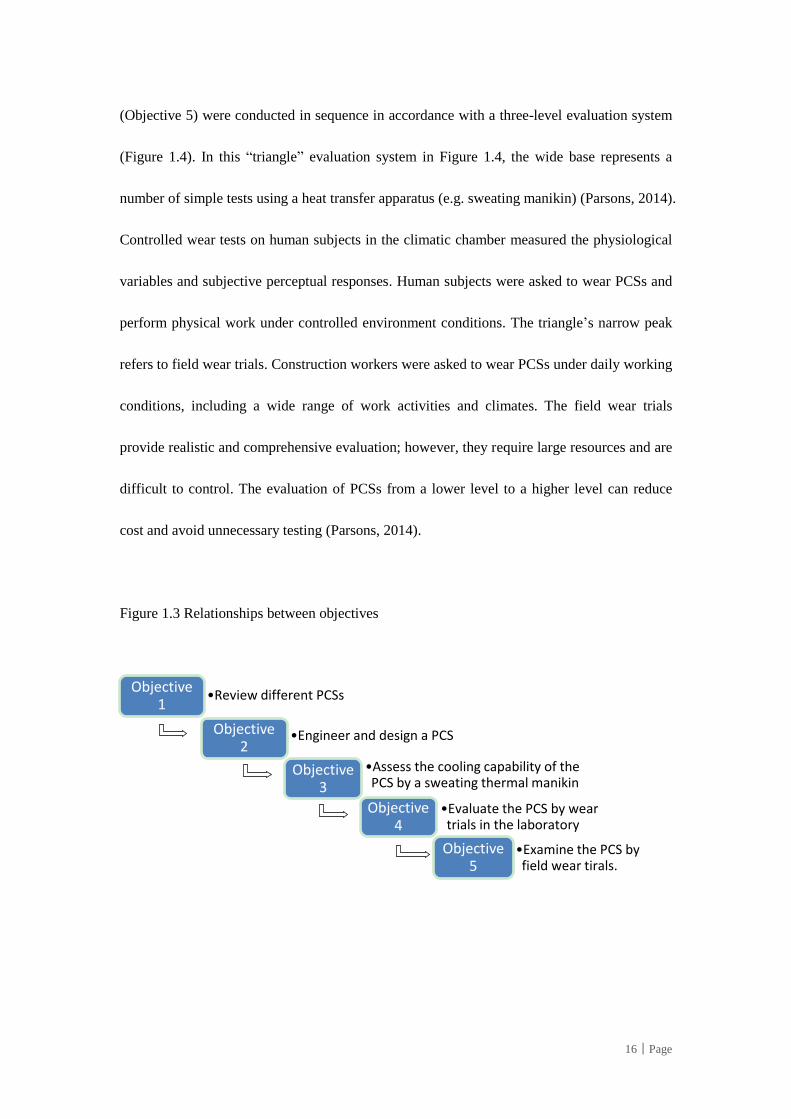
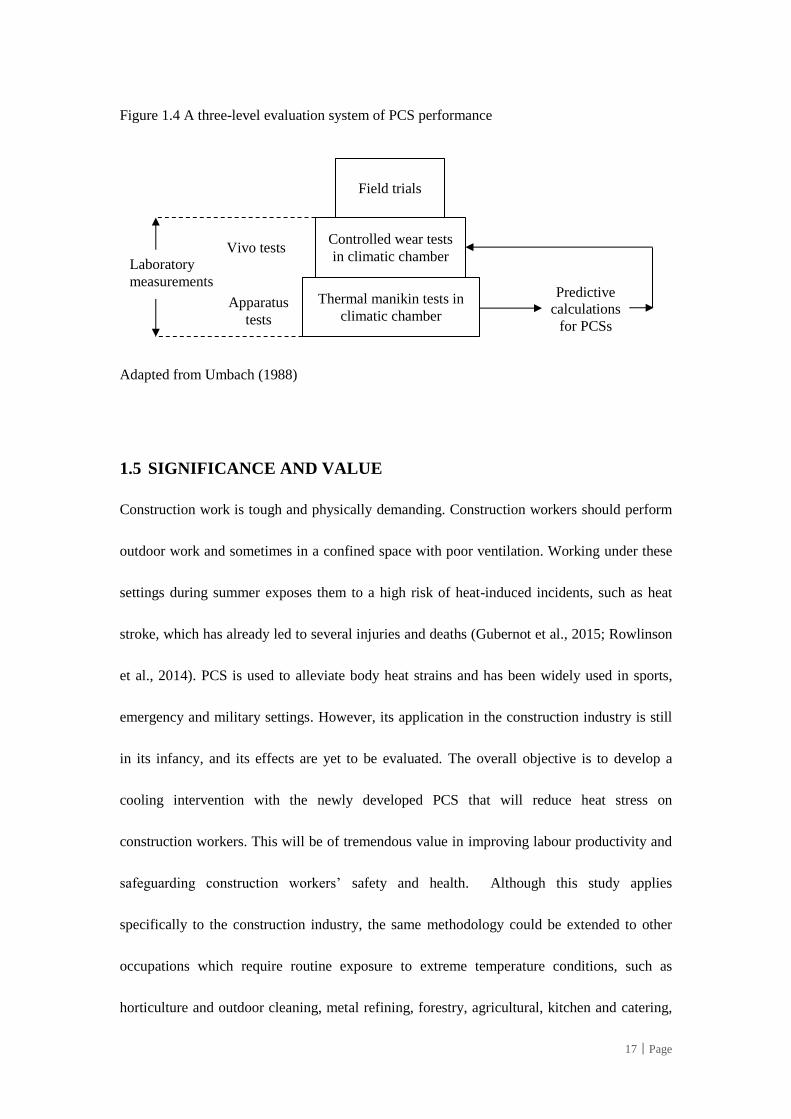
(Objective 5) were conducted in sequence in accordance with a three-level evaluation system
(Figure 1.4). In this “triangle” evaluation system in Figure 1.4, the wide base represents a
number of simple tests using a heat transfer apparatus (e.g. sweating manikin) (Parsons, 2014).
Controlled wear tests on human subjects in the climatic chamber measured the physiological
variables and subjective perceptual responses. Human subjects were asked to wear PCSs and
perform physical work under controlled environment conditions. The triangle’s narrow peak
refers to field wear trials. Construction workers were asked to wear PCSs under daily working
conditions, including a wide range of work activities and climates. The field wear trials
provide realistic and comprehensive evaluation; however, they require large resources and are
difficult to control. The evaluation of PCSs from a lower level to a higher level can reduce
cost and avoid unnecessary testing (Parsons, 2014).
Figure 1.3 Relationships between objectives
Objective 1
•Review different PCSs
Objective 2
•Engineer and design a PCS
Objective 3
•Assess the cooling capability of the PCS by a sweating thermal manikin
Objective 4
•Evaluate the PCS by wear trials in the laboratory
Objective 5
•Examine the PCS by field wear tirals.
17│Page
Figure 1.4 A three-level evaluation system of PCS performance
Adapted from Umbach (1988)
1.5 SIGNIFICANCE AND VALUE
Construction work is tough and physically demanding. Construction workers should perform
outdoor work and sometimes in a confined space with poor ventilation. Working under these
settings during summer exposes them to a high risk of heat-induced incidents, such as heat
stroke, which has already led to several injuries and deaths (Gubernot et al., 2015; Rowlinson
et al., 2014). PCS is used to alleviate body heat strains and has been widely used in sports,
emergency and military settings. However, its application in the construction industry is still
in its infancy, and its effects are yet to be evaluated. The overall objective is to develop a
cooling intervention with the newly developed PCS that will reduce heat stress on
construction workers. This will be of tremendous value in improving labour productivity and
safeguarding construction workers’ safety and health. Although this study applies
specifically to the construction industry, the same methodology could be extended to other
occupations which require routine exposure to extreme temperature conditions, such as
horticulture and outdoor cleaning, metal refining, forestry, agricultural, kitchen and catering,
Field trials
Controlled wear tests
in climatic chamber
Thermal manikin tests in
climatic chamber
Predictive
calculations
for PCSs
Laboratory
measurements Apparatus
tests
Vivo tests
18│Page
and airport apron and ramp handling, after considering their unique job features and
characteristics.
1.6 RESEARCH APPROACH
This study involves major research stages, namely, literature review, PCS engineering and
design, cooling power measurements and performance assessment by human wear trials under
laboratory and field settings.
The research project commenced in January 2014. Followed by comprehensive literature
review, fabric selection, cooling sources engineering and clothing design, a new pattern of the
PCS was devised in the middle of 2015. Ten sets of PCSs were manufactured by the end of
June 2015. From July to September 2015, sweating thermal manikin tests were conducted in a
climatic chamber to compare the cooling power of the PCSs. In early 2016, human wear trials
were conducted in a climatic chamber to examine the effectiveness of the PCS in reducing
body heat strains in a hot and humid environment. An optimal cooling intervention with the
newly designed PCS was, thus, determined through the wear tests in the laboratory. Design
improvements on the PCS were made according to the results of the manikin tests and the
human wear trials in the laboratory. Subsequently, 100 sets of PCSs were manufactured by
the end of June 2016. Field studies were conducted on construction sites to evaluate the
applicability of the PCS in the summer of 2016. Figure 1.5 illustrates the overall flow chart of
this study.
19│Page
Figure 1.5 Research flow of the research
ObjectiveData
collectionData
analysisResearch findings
Objective 1
Objective 2
Objective 3
Objective 4
Objective 5
Literation review on cooling
intervention with PCS
Meta analysisPCS in different
occupations; a hybrid PCS is proposed
Thermal manikin tests to measure
cooling power and insulation
properties of PCS
ANOVA Student t test
Cooling capacity of PCS
Wear trials in the laboratory to
collect subjects’ physiological and
perceptual responses
Field study to
collect workers’evaluation on the
PCS
Physical tests on PCS elements,
including fabrics and cooling
sources
Descriptive statistics
Development of a PCS
Effectiveness of PCS;optimal cooling
intervention with PCS
Acceptability of PCS
Effect sizeANOVA
Student t test
ANOVA Student t test
20│Page
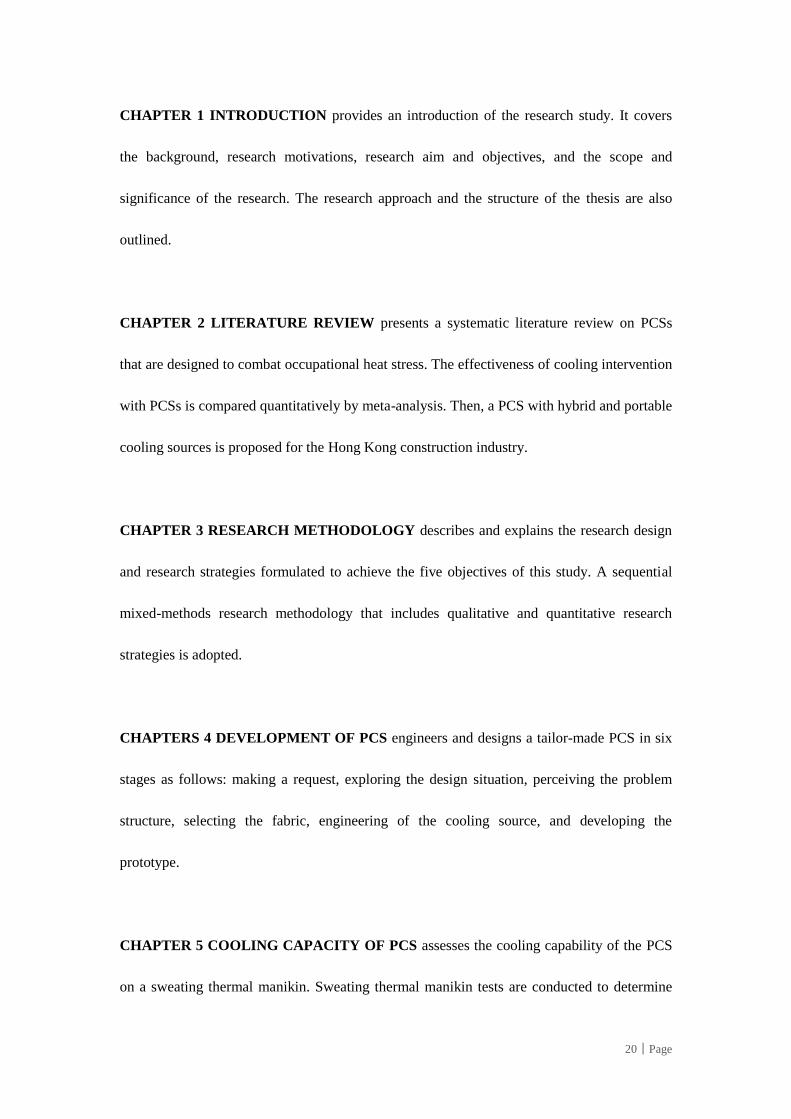
CHAPTER 1 INTRODUCTION provides an introduction of the research study. It covers
the background, research motivations, research aim and objectives, and the scope and
significance of the research. The research approach and the structure of the thesis are also
outlined.
CHAPTER 2 LITERATURE REVIEW presents a systematic literature review on PCSs
that are designed to combat occupational heat stress. The effectiveness of cooling intervention
with PCSs is compared quantitatively by meta-analysis. Then, a PCS with hybrid and portable
cooling sources is proposed for the Hong Kong construction industry.
CHAPTER 3 RESEARCH METHODOLOGY describes and explains the research design
and research strategies formulated to achieve the five objectives of this study. A sequential
mixed-methods research methodology that includes qualitative and quantitative research
strategies is adopted.
CHAPTERS 4 DEVELOPMENT OF PCS engineers and designs a tailor-made PCS in six
stages as follows: making a request, exploring the design situation, perceiving the problem
structure, selecting the fabric, engineering of the cooling source, and developing the
prototype.
CHAPTER 5 COOLING CAPACITY OF PCS assesses the cooling capability of the PCS
on a sweating thermal manikin. Sweating thermal manikin tests are conducted to determine
21│Page
and compare the cooling power of the newly developed PCS with the commercially available
one.
CHAPTER 6 OPTIMAL COOLING INTERVENTION WITH PCS examines the
effectiveness of the newly developed PCS by human wear trials in the laboratory. An optimal
cooling intervention is, thus, determined in the experiments. The experiments are conducted
in a climatic chamber, which simulates the hot and humid environment during summer in
Hong Kong.
CHAPTER 7 APPLICABILITY OF PCS examines the applicability of the cooling
intervention with the newly developed PCS by human wear trials in real work settings.
CHAPTER 8 CONCLUSIONS AND RECOMMENDATIONS provides an overview of
the research findings and highlights the contributions, significance and limitations of this
study.
1.7 SUMMARY
Heat stress impairs the health and well-being of construction workers as shown by the
alarming heat-induced casualties in the construction industry. Prolonged physically
demanding activities in a hot ambient environment, e.g. under direct sunlight or in a confined
place that lacks ventilation, expose workers to a high risk of heat stress. The local government
has set a series of guidelines and notes for preventing heat stress. Among these precautionary
22│Page
measures, PCS gained an increasing concern. PCS has been widely used in sports, firefighting,
military, and hazmat operations. However, its application in construction is still in its infancy,
and its effectiveness and applicability are yet to be evaluated. This study attempts to present
an overall research framework for conducting a cooling intervention with the PCS that will be
verified through a case study—the role of PCS—that is expected to provide a fresh insight
into cooling intervention studies in the construction industry.
The objectives of this study include reviewing current PCSs for combating occupational heat
stress, developing a tailor-made PCS for the construction industry, assessing the cooling
capability of the newly developed PCS, evaluating the effectiveness of the cooling
intervention with the newly developed PCS in reducing heat stress and examining the
applicability of the cooling intervention with the newly developed PCS in real work settings.
23│Page
CHAPTER 2 LITERATURE REVIEW1
2.1 INTRODUCTION
Literature review systematically identified the literature related to cooling intervention with
personal cooling system (PCS) for combating occupational heat stress. Meta-analysis was
conducted to quantitatively synthesise findings from peer-reviewed randomised controlled
trials (RCTs) that deal with the effects of PCSs on work performance.
2.2 PERSONAL COOLING SYSTEM (PCS)
PCS is a form-fitting garment used to remove body heat from the wearer (Chan et al., 2017).
PCS is portable and wearable and does not require external power source or pre-installation.
PCSs provide microclimate cooling around the body and can be used continuously during the
entire work period. PCSs have been applied in various occupations, particularly for athletes
(Luomala et al., 2012), firefighters (Bennett et al., 1995; Hostler et al., 2010; Kenny et al.,
2011), soldiers (DeGroot et al., 2013) and hazmat personnel (Carter et al., 2007; House et al.,
2003). The three basic types of PCSs are air cooling garments (ACGs), liquid cooling
garments (LCGs) and phase change garments (PCGs) (Mokhtari Yazdi and Sheikhzadeh,
2014). Hybrid cooling garments (HCGs) combine two or more of the aforementioned cooling
techniques (Chan et al., 2015). PCG combined with air ventilation and LCG combined with
1 Presented in a paper under review: Yi W., Zhao Y.*, Chan A.P.C. (2017). Continuous and intermittent cooling
for improving work tolerance in civilian and military sectors: A systematic review and meta-analysis.

24│Page
air ventilation are two common types of HCGs (Kim et al., 2011; Lu et al., 2015; Song et al.,
2016). The characteristics of different PCSs are shown in Table 2.1.
25│Page
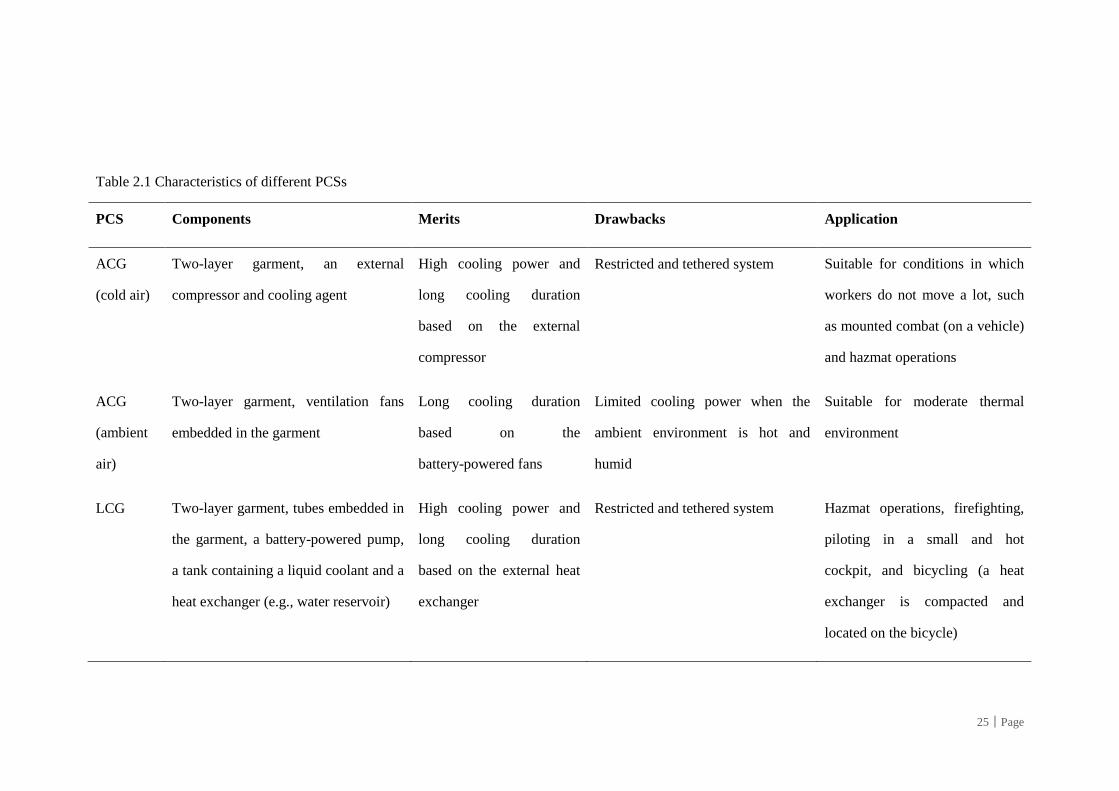
Table 2.1 Characteristics of different PCSs
PCS Components Merits Drawbacks Application
ACG
(cold air)
Two-layer garment, an external
compressor and cooling agent
High cooling power and
long cooling duration
based on the external
compressor
Restricted and tethered system Suitable for conditions in which
workers do not move a lot, such
as mounted combat (on a vehicle)
and hazmat operations
ACG
(ambient
air)
Two-layer garment, ventilation fans
embedded in the garment
Long cooling duration
based on the
battery-powered fans
Limited cooling power when the
ambient environment is hot and
humid
Suitable for moderate thermal
environment
LCG Two-layer garment, tubes embedded in
the garment, a battery-powered pump,
a tank containing a liquid coolant and a
heat exchanger (e.g., water reservoir)
High cooling power and
long cooling duration
based on the external heat
exchanger
Restricted and tethered system Hazmat operations, firefighting,
piloting in a small and hot
cockpit, and bicycling (a heat
exchanger is compacted and
located on the bicycle)
26│Page
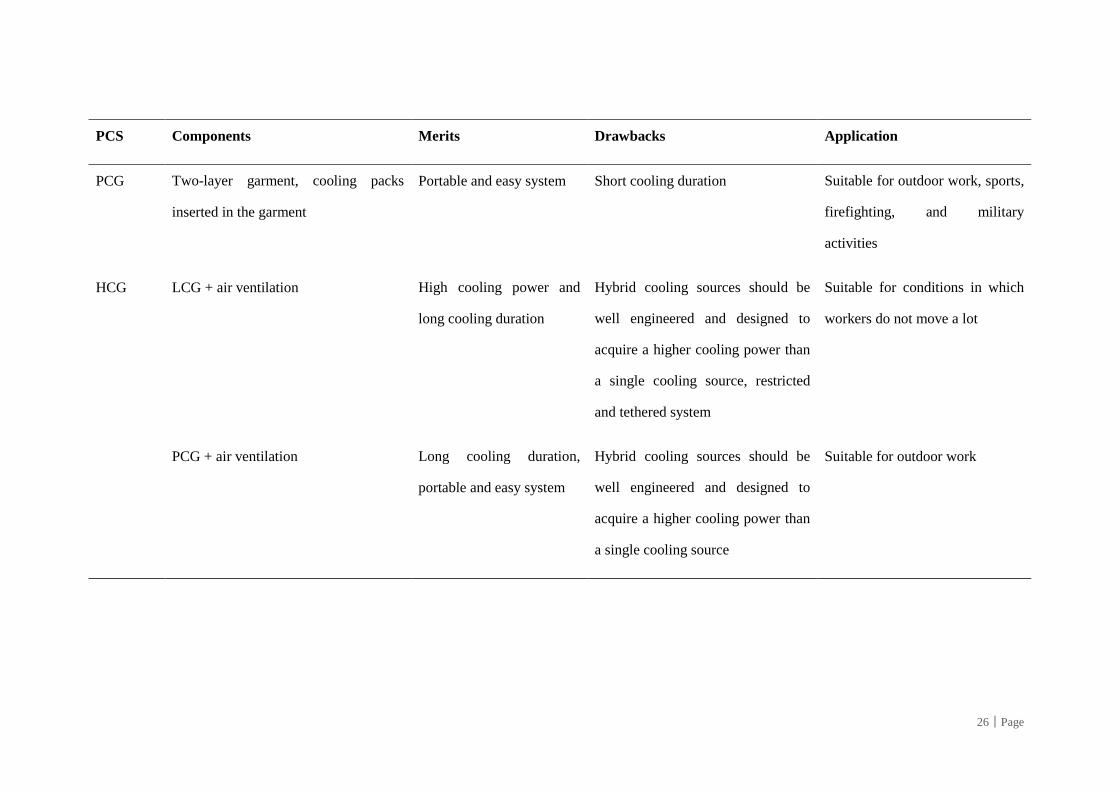
PCS Components Merits Drawbacks Application
PCG Two-layer garment, cooling packs
inserted in the garment
Portable and easy system Short cooling duration Suitable for outdoor work, sports,
firefighting, and military
activities
HCG LCG + air ventilation High cooling power and
long cooling duration
Hybrid cooling sources should be
well engineered and designed to
acquire a higher cooling power than
a single cooling source, restricted
and tethered system
Suitable for conditions in which
workers do not move a lot
PCG + air ventilation Long cooling duration,
portable and easy system
Hybrid cooling sources should be
well engineered and designed to
acquire a higher cooling power than
a single cooling source
Suitable for outdoor work
27│Page
ACG blows cold, dry air surrounding the body, thereby improving convective heat dissipation
and enhancing evaporation of sweat secreted on the skin surface. ACG usually has two layers,
an inner layer cloth characterised as air permeable and an outer layer cloth characterised as
impermeable. Thus, forced air circulates between two layers and onto the skin surface through
the inner layer, whilst the outer layer prevents air from escaping to the environment. The cold,
dry air is supplied by an external compressor and cooling agent (heat exchanger) connected to
the garment. The cooling power of ACG can be influenced by air flow rate and inlet
temperature (McLellan, 2007). The higher the air flow rate and the lower inlet temperature,
the higher the cooling power. When the external compressor is removed, ACG works by
directly ventilating ambient air around the body. A low air temperature and relative humidity
in the local environment can improve the effectiveness of ACG. ACG (supplied with cold air)
has tethered system and is suitable for conditions in which workers do not move a lot, such as
mounted combat (on a vehicle) and some hazmat operations (Bishop et al., 1991; McLellan et
al., 1999; Pimental et al., 1987; Vallerand et al., 1991). ACG (supplied with ambient air) is
suitable for moderate thermal environments. Chinevere et al. (2008) demonstrated the
effectiveness of ACG in reducing heat stress for marching soldiers under 30 °C air
temperature and 50% relative humidity.
LCG operates by circulating cooled water through tubes embedded in the garment. LCG
consists of a three-layer system with tubes sandwiched between two fabric layers (Cao et al.,
2006). The distribution, diameter, length and wall thickness of the tubing properties in LCG
are optimised to enhance system efficiency (Burton, 1966; Shvartz, 1972; Shvartz et al.,
28│Page
1974). A battery-powered pump, a tank containing a liquid coolant and a heat exchanger (e.g.,
water reservoir) are required for supplying continuous flow of temperature-controlled liquid
to LCG (Burton and Collier, 1964; Shvartz, 1970). The contact pressure and uniformity of
LCG on the body influence the efficiency of conductive heat transfer (London, 1969;
Nunneley, 1970). Liquid flow rate and inlet temperature are two other factors that affect the
heat extraction (Burton, 1969). LCG restricts body movements because of external
connections with a heat exchanger. LCG is usually used for hazmat operations, firefighting,
piloting in a small and hot cockpit, and bicycling (a heat exchanger is compacted and located
on the bicycle) (Bishop et al., 1991; Cadarette et al., 2003; Caldwell et al., 2012; Vallerand et
al., 1991).
PCG use phase change materials (PCMs) (e.g. inorganic salt, ice and paraffin wax) to absorb
heat from the body. PCM is classified as latent heat storage material, which can absorb and
release heat at a roughly constant temperature (i.e. melting temperature) as it goes through
solid–liquid transitions (Shim et al., 2001). When the ambient temperature is higher than the
melting temperature, PCM absorbs heat energy as it goes from a solid state to a liquid state,
producing a temporary cooling effect (Shim et al., 2001). The PCM packs (average dimension:
5–15 cm) were inserted in the garment to enhance the conductive cooling effect. Many factors,
including the temperature gradient between the PCM melting temperature and skin
temperature, the covering area of PCM, the amount of PCM, and the PCM latent heat
capacities, have an impact on the cooling efficiency of PCG (Gao et al., 2010, 2011;
Reinertsen et al., 2008). PCG is portable and can be widely used for outdoor work, sports,
29│Page
firefighting, and military activities (Bennett et al., 1995; Luomala et al., 2012; Muir et al.,
1999; Zhang et al., 2010). However, the cooling duration of PCG is always short based on the
cooling effect provided by PCMs as they undergo solid–liquid transitions.
In recent years, HCG is developed based on two or more of the aforementioned cooling
techniques (Chan et al., 2015). The design of HCG aims to combine the advantages of
different cooling techniques, thereby improving cooling efficiency and thermal comfort (Kim
et al., 2011; Lu et al., 2015; Song et al., 2016). A typical example is PCG combined with
ventilation air (Lu et al., 2015). PCG is portable and has wide ranging applications (Mokhtari
Yazdi and Sheikhzadeh, 2014). However, solid PCM packs in the clothing increase the
clothing insulation, thereby impeding sweat evaporation and making the skin sticky and wet
(Lu et al., 2015). When circulating air (by ventilation fans) is added to PCG, evaporative and
convective heat dissipation is enhanced, thereby largely improving body wetness sensation.
Research on the applications of HCG is limited (Chan et al., 2015). Selecting and combining
cooling techniques is essential to develop a tailor-made HCG for a specific industry, and such
a design should meet the requirements of ergonomics and high cooling efficiency.
Previous studies have designed and implemented cooling intervention with PCS for various
occupations, including sports, firefighting, hazmat operations and military activities (Bennett
et al., 1995; Carter et al., 2007; DeGroot et al., 2013; Hostler et al., 2010; House et al., 2003;
Kenny et al., 2011; Luomala et al., 2012). The design of a cooling intervention considers the
characteristics of occupations, the types of PCSs as well as intervened time and length.
30│Page
Through a series of wear trial tests, the effectiveness of the cooling intervention was
examined by comparing the results of the cooling group with those of the control group.
Measurements for evaluation typically include core body temperature, heart rate, skin
temperature, subjective ratings of perceived exertion and thermal sensation. Most studies used
total work time (tolerance time) to assess the effectiveness of the cooling intervention with
PCS on work performance. In this chapter, previous studies that examined cooling
intervention with PCS were systematically reviewed and quantitatively analysed by
meta-analysis.
2.3 METHODOLOGY
2.3.1 Search strategy and study identification
The following databases were searched: MEDLINE (Ovid Web, 1946 to 2016), EMBASE
(Ovid Web, 1980 to 2016), EMBASE Classic (Ovid Web, 1947 to 1979), CINAHL
(EBSCOhost, 1982 to 2016), Web of Science (1899 to 2016) and SPORTDiscus (EBSCOhost,
1830 to 2016). Keywords adopted in the search strategy and the search results are shown in
Appendix 1 Table 1. The search keywords were used in varying combination by Boolean
logic (AND) or (OR) and the results were further limited to English language. Review articles
and reference lists were also retrieved to ensure relevant studies had been involved.
The main bodies of the selected articles were reviewed. Studies included in the quantitative
analysis are those that met the following criteria: (i) studies that tested PCSs for different
occupations, including construction, iron and steel manufacturing, mining, oil and gas well

31│Page
operations, glass factories, horticulture, cleaning, catering, agricultural activity, firefighting,
hazmat operations, and military; (ii) PCSs was administered during whole heat exposure or
during recovery stages (i.e. continuous and intermittent cooling); (iii) randomised crossover
experimental design, that is, the existence of a control condition, and participants acting as
their own controls; and (iv) studies that reported work tolerance parameters (e.g. time to
exhaustion).
Reviews, case studies, textbooks, unpublished studies, non-full texts, non-peer reviewed
publications, and articles not written in English were excluded in the meta-analysis. In
addition, studies were excluded when they met one or more of the following criteria: (i)
studies that used non-human subjects, such as animal subjects, thermal manikin, and skin
model, and participants with pathological conditions that make them susceptibility to heat
stress, such as multiple sclerosis (White et al., 2000) and spinal cord injury (Price, 2006); (ii)
investigation of post-exercise cooling only for reducing heat strain, without following
exercise performance test; and (iii) no attritions of subjects and all subjects succeeded in
completing the trial.
Online article records were imported to EndNote X7 (Thomson Reuters, Philadelphia, PA,
USA). In total, 9992 literature were gathered. After deleting some duplicates due to the
cross-referenced literature, a total of 6005 literature were identified. Each title and abstract
was assessed by two reviewers using an inclusion/exclusion criteria checklist. When
information included in the title and abstract was insufficient to determine, the full text were
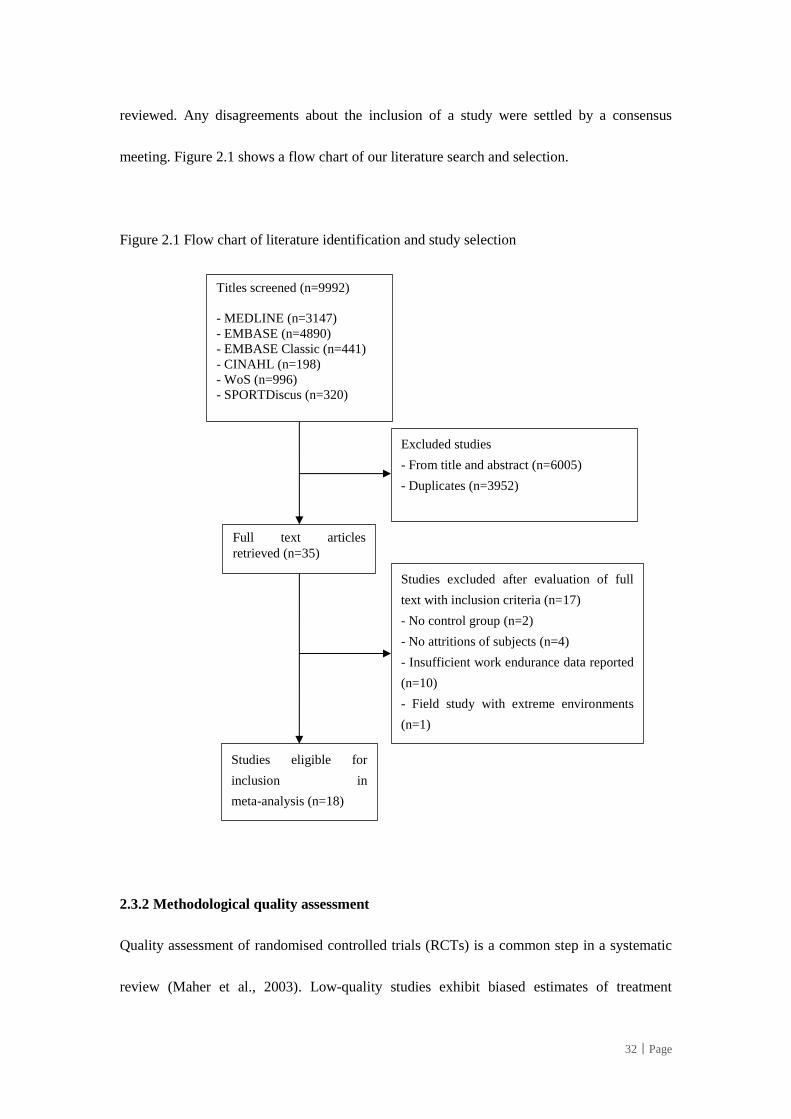
32│Page
reviewed. Any disagreements about the inclusion of a study were settled by a consensus
meeting. Figure 2.1 shows a flow chart of our literature search and selection.
Figure 2.1 Flow chart of literature identification and study selection
2.3.2 Methodological quality assessment
Quality assessment of randomised controlled trials (RCTs) is a common step in a systematic
review (Maher et al., 2003). Low-quality studies exhibit biased estimates of treatment
Full text articles
retrieved (n=35)
Studies eligible for
inclusion in
meta-analysis (n=18)
Studies excluded after evaluation of full
text with inclusion criteria (n=17)
- No control group (n=2)
- No attritions of subjects (n=4)
- Insufficient work endurance data reported
(n=10)
- Field study with extreme environments
(n=1)
Excluded studies
- From title and abstract (n=6005)
- Duplicates (n=3952)
Titles screened (n=9992)
- MEDLINE (n=3147)
- EMBASE (n=4890)
- EMBASE Classic (n=441)
- CINAHL (n=198)
- WoS (n=996)
- SPORTDiscus (n=320)
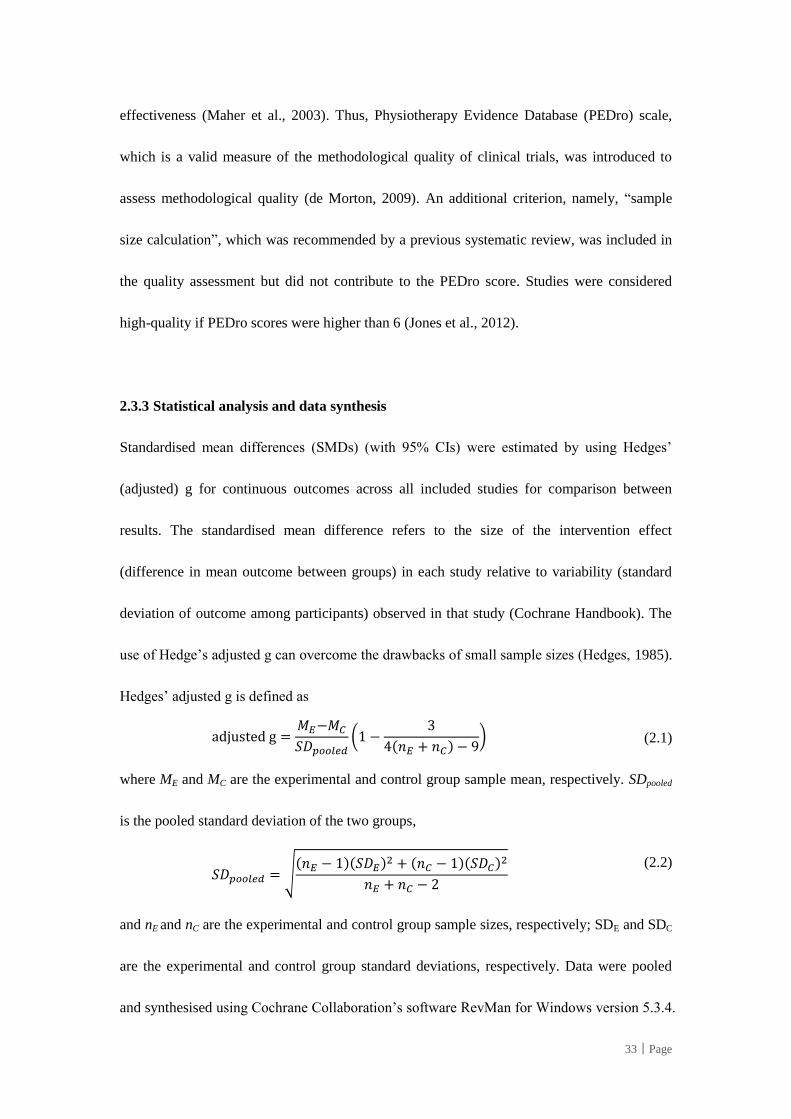
33│Page
effectiveness (Maher et al., 2003). Thus, Physiotherapy Evidence Database (PEDro) scale,
which is a valid measure of the methodological quality of clinical trials, was introduced to
assess methodological quality (de Morton, 2009). An additional criterion, namely, “sample
size calculation”, which was recommended by a previous systematic review, was included in
the quality assessment but did not contribute to the PEDro score. Studies were considered
high-quality if PEDro scores were higher than 6 (Jones et al., 2012).
2.3.3 Statistical analysis and data synthesis
Standardised mean differences (SMDs) (with 95% CIs) were estimated by using Hedges’
(adjusted) g for continuous outcomes across all included studies for comparison between
results. The standardised mean difference refers to the size of the intervention effect
(difference in mean outcome between groups) in each study relative to variability (standard
deviation of outcome among participants) observed in that study (Cochrane Handbook). The
use of Hedge’s adjusted g can overcome the drawbacks of small sample sizes (Hedges, 1985).
Hedges’ adjusted g is defined as
adjusted g =𝑀𝐸−𝑀𝐶
𝑆𝐷𝑝𝑜𝑜𝑙𝑒𝑑(1 −
3
4(𝑛𝐸 + 𝑛𝐶) − 9) (2.1)
where ME and MC are the experimental and control group sample mean, respectively. SDpooled
is the pooled standard deviation of the two groups,
𝑆𝐷𝑝𝑜𝑜𝑙𝑒𝑑 = √
(𝑛𝐸 − 1)(𝑆𝐷𝐸)2 + (𝑛𝐶 − 1)(𝑆𝐷𝐶)2
𝑛𝐸 + 𝑛𝐶 − 2
(2.2)
and nE and nC are the experimental and control group sample sizes, respectively; SDE and SDC
are the experimental and control group standard deviations, respectively. Data were pooled
and synthesised using Cochrane Collaboration’s software RevMan for Windows version 5.3.4.
34│Page
If the data provided by the original literature were inadequate (e.g. no standard deviations)
such that effect size calculations could not be completed, emails were sent to the
corresponding author of the study for the required data. The effect size was interpreted based
on Cohen’s scale: ≥ 0.8 = large effect, 0.50 to 0.79 = moderate effect, 0.20 to 0.49 = small
effect, 0 to 0.19 = negligible effect. Negative effects of cooling intervention were indicated by
a minus sign. Heterogeneity was examined by using Higgins’ I2 statistic with a significance
level set at p-value < 0.10 (Cochran’s Q test), which estimates the percentage of variation
among studies (Higgins and Thompson, 2002; Higgins et al., 2003). An I2 value below 40%,
between 40% and 75%, and above 75% suggests negligible heterogeneity, moderate
heterogeneity and considerable heterogeneity respectively. The publication bias was assessed
by Begg’s funnel plot asymmetry and Egger’s linear regression test, in which p < 0.05 was
considered significant. The Begg’s method plots the effect size against sample size of all
included studies. Egger’s test quantifies the bias by the funnel plot, which calculates the
values of the effect sizes and their deviation, instead of ranks (Borenstein, 2005). Begg’s and
Egger’s test were conducted in Stata version 12.
The physiological parameters, including core temperature (Tc), mean skin temperature (T𝑠𝑘 ),
and heart rate (HR), were extracted from the included studies. The change rates of ΔTc, ∆𝑇𝑠𝑘 ,
and ΔHR were estimated by subtracting the initial value from the end-point value divided by
the heat exposure duration for each included study. The change rates of Tc, T𝑠𝑘 and HR
between the cooling and control condition were examined by student’s paired t-test. The
differences in change rates of the physiological parameters between the control and cooling
35│Page
condition were calculated (ΔTc_control – ΔTc_cooling, ∆𝑇𝑠𝑘 _control – ∆𝑇𝑠𝑘
_cooling, ΔHR_control –
ΔHR_cooling). The exercise performance enhancement (EPE) was calculated by percentage
change in exercise duration between the cooling and the control condition, i.e.,
(Duration_cooling – Duration_control)/Duration_control × 100%. Correlations between the
differences in change rates of physiological parameters and the EPE were estimated, and the
level of significance was set at p < 0.05.
2.4 OVERVIEW OF STUDIES
A total of 18 articles that met the inclusion criteria were identified for the statistical analysis.
Several studies that examined various cooling interventions were involved more than once,
thus resulting in 27 pairs of comparison between cooling and control condition. A total of 305
subjects were included in these studies. The average sample size of participants was 9,
ranging from 4 to 14. Investigation protocol for each involved study is shown in Appendix 1
Table 2. 13 studies adopted work–rest pattern in their exercise protocol, while 5 studies
designed continuous treadmill exercise without rest period. The work ensembles worn during
heat exposure include general work uniform, nuclear, biological, chemical (NBC) protective
suit, firefighting garment, and the body armor. 7 studies designed cooling intervention for
civilian settings, including 2 studies for firefighters (Bennett et al., 1995; Kim et al., 2011), 3
studies for civilian hazmat personnel (Caldwell et al., 2012; Kenny et al., 2011; Muir et al.,
1999), and 2 studies for industrial workers (Chan et al., 2017; Zhang et al., 2010). 11 studies
for military settings, including 6 studies for army hazmat team (Bishop et al., 1991; Cadarette
et al., 2001; Cadarette et al., 2003; McLellan et al., 1999; Muza et al., 1988; Pimental et al.,
36│Page
1987), 1 study for aircrew defense personnel (Vallerand et al., 1991), and 4 studies for
marching soldiers (Amorim et al., 2010; Barwood et al., 2009b; Chinevere et al., 2008; Ciuha
et al., 2016).
The results of Egger’s test (p = 0.02) and Begg’s test (p = 0.01) indicated the presence of
significant publication bias. The reason might be that we only used peer-reviewed studies,
while dissertations, technical reports and others were not reviewed. High statistical
heterogeneity exists across studies, suggesting the subgroup analysis. Heterogeneity for
different continuous and intermittent cooling techniques was acceptable, ranging from 0% to
50% (p > 0.05).
Quality assessment of included studies show that 8 studies attained a PEDro score of 6/10,
and 10 studies attained a PEDro score of 5/10 (Appendix 1 Table 3). Sample size calculation
was found in one study (Chinevere et al., 2008).
2.5 COOLING EFFECTS ON PHYSIOLOGICAL RESPONSE
Tc, T𝑠𝑘 and HR during the control and cooling conditions in each study were extracted and
the change rate in these physiological parameters was calculated. The change rates of Tc (0.94
± 0.03°C/h), T𝑠𝑘 (1.03 ± 0.08°C/h) and HR (55 ± 9 bpm/h) were significantly lower in the
cooling condition than those of the control condition (1.52 ± 0.05°C/h, p < 0.01; 2.07 ±
0.06 °C/h, p < 0.05; 72 ± 10 bpm/h, p < 0.01). Correlations were found between the
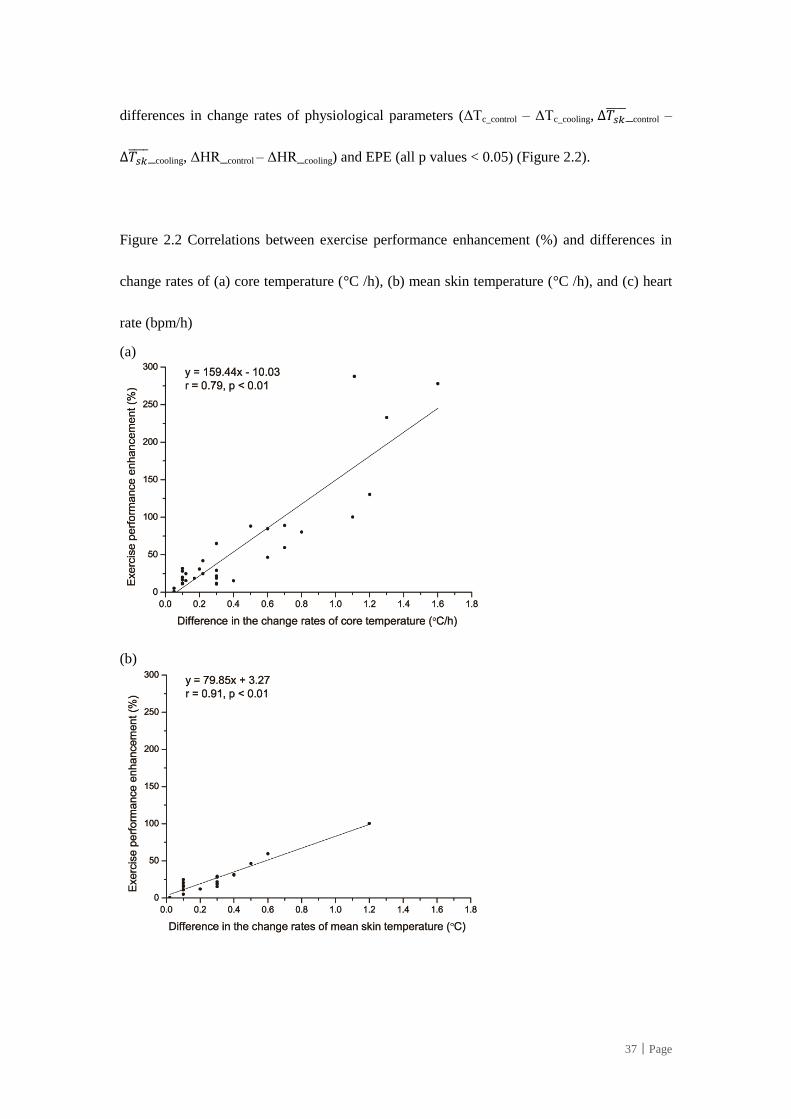
37│Page
differences in change rates of physiological parameters (ΔTc_control – ΔTc_cooling, ∆𝑇𝑠𝑘 _control –
∆𝑇𝑠𝑘 _cooling, ΔHR_control – ΔHR_cooling) and EPE (all p values < 0.05) (Figure 2.2).
Figure 2.2 Correlations between exercise performance enhancement (%) and differences in
change rates of (a) core temperature (°C /h), (b) mean skin temperature (°C /h), and (c) heart
rate (bpm/h)
(a)
(b)
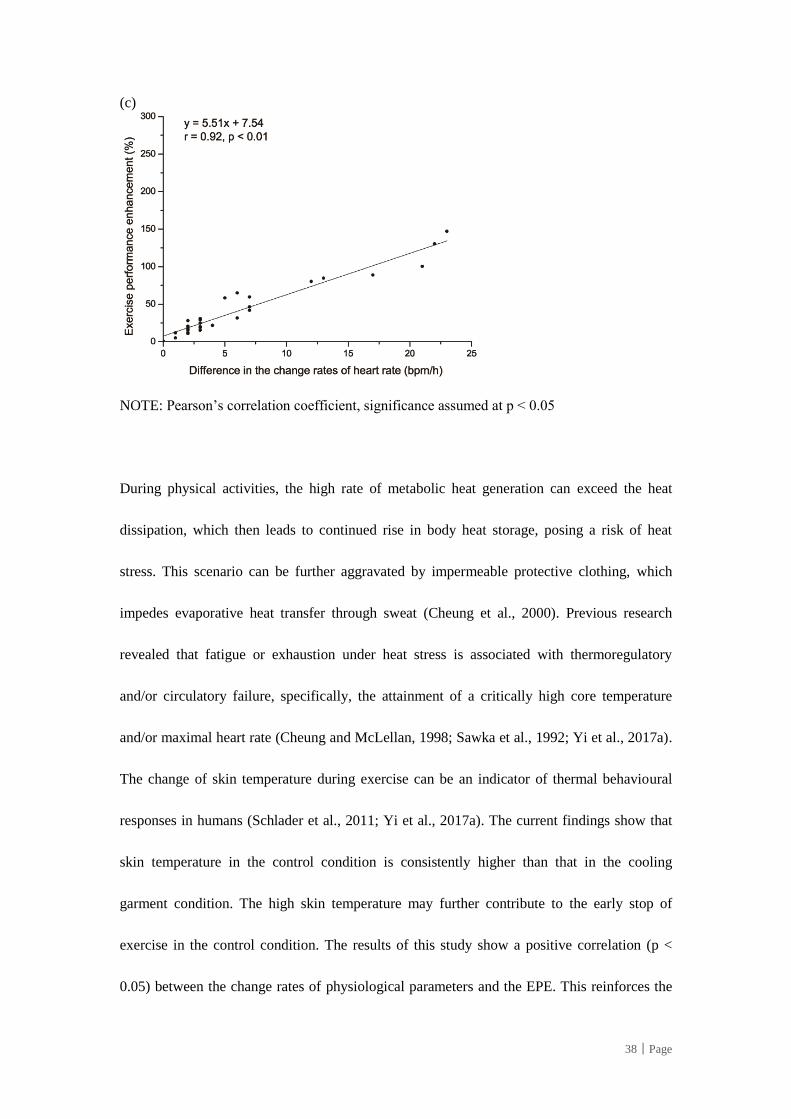
38│Page
(c)
NOTE: Pearson’s correlation coefficient, significance assumed at p < 0.05
During physical activities, the high rate of metabolic heat generation can exceed the heat
dissipation, which then leads to continued rise in body heat storage, posing a risk of heat
stress. This scenario can be further aggravated by impermeable protective clothing, which
impedes evaporative heat transfer through sweat (Cheung et al., 2000). Previous research
revealed that fatigue or exhaustion under heat stress is associated with thermoregulatory
and/or circulatory failure, specifically, the attainment of a critically high core temperature
and/or maximal heart rate (Cheung and McLellan, 1998; Sawka et al., 1992; Yi et al., 2017a).
The change of skin temperature during exercise can be an indicator of thermal behavioural
responses in humans (Schlader et al., 2011; Yi et al., 2017a). The current findings show that
skin temperature in the control condition is consistently higher than that in the cooling
garment condition. The high skin temperature may further contribute to the early stop of
exercise in the control condition. The results of this study show a positive correlation (p <
0.05) between the change rates of physiological parameters and the EPE. This reinforces the
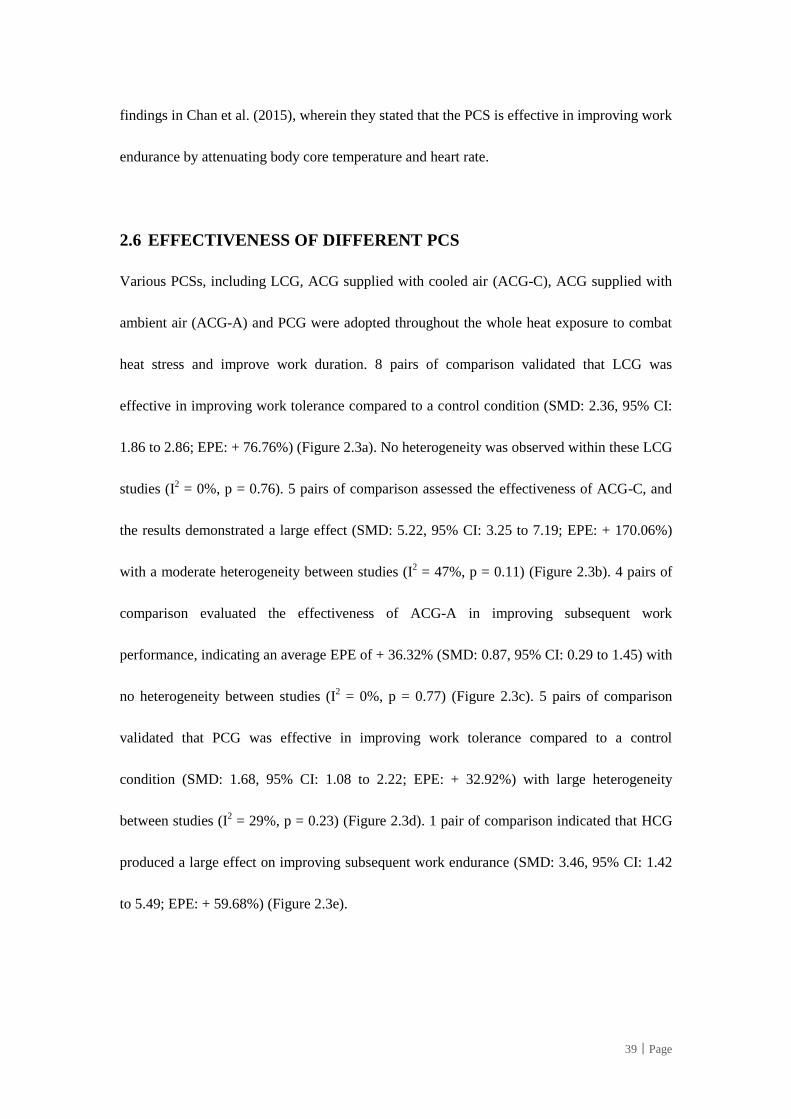
39│Page
findings in Chan et al. (2015), wherein they stated that the PCS is effective in improving work
endurance by attenuating body core temperature and heart rate.
2.6 EFFECTIVENESS OF DIFFERENT PCS
Various PCSs, including LCG, ACG supplied with cooled air (ACG-C), ACG supplied with
ambient air (ACG-A) and PCG were adopted throughout the whole heat exposure to combat
heat stress and improve work duration. 8 pairs of comparison validated that LCG was
effective in improving work tolerance compared to a control condition (SMD: 2.36, 95% CI:
1.86 to 2.86; EPE: + 76.76%) (Figure 2.3a). No heterogeneity was observed within these LCG
studies (I2 = 0%, p = 0.76). 5 pairs of comparison assessed the effectiveness of ACG-C, and
the results demonstrated a large effect (SMD: 5.22, 95% CI: 3.25 to 7.19; EPE: + 170.06%)
with a moderate heterogeneity between studies (I2 = 47%, p = 0.11) (Figure 2.3b). 4 pairs of
comparison evaluated the effectiveness of ACG-A in improving subsequent work
performance, indicating an average EPE of + 36.32% (SMD: 0.87, 95% CI: 0.29 to 1.45) with
no heterogeneity between studies (I2 = 0%, p = 0.77) (Figure 2.3c). 5 pairs of comparison
validated that PCG was effective in improving work tolerance compared to a control
condition (SMD: 1.68, 95% CI: 1.08 to 2.22; EPE: + 32.92%) with large heterogeneity
between studies (I2 = 29%, p = 0.23) (Figure 2.3d). 1 pair of comparison indicated that HCG
produced a large effect on improving subsequent work endurance (SMD: 3.46, 95% CI: 1.42
to 5.49; EPE: + 59.68%) (Figure 2.3e).
40│Page
LCG, ACG-C, ACG-A, and HCG were utilised as an intermittent cooling intervention during
rest period. There were 5 pairs of comparison of PCSs during recovery, exhibiting a large
effect in improving subsequent work endurance (SMD: 1.81, 95% CI: 1.23 to 2.38; EPE: +
45.03%) with a moderate heterogeneity between studies (I2 = 40%, p = 0.15) (Figure 2.3f).
Figure 2.3 Forest plot of PCSs effects on work performance
(a) Continuous cooling_Liquid cooling garment (LCG)
(b) Continuous cooling_Air cooling garment supplied with cooled air (ACG_C)
(c) Continuous cooling_Air cooling garment supplied with ambient air (ACG_A)
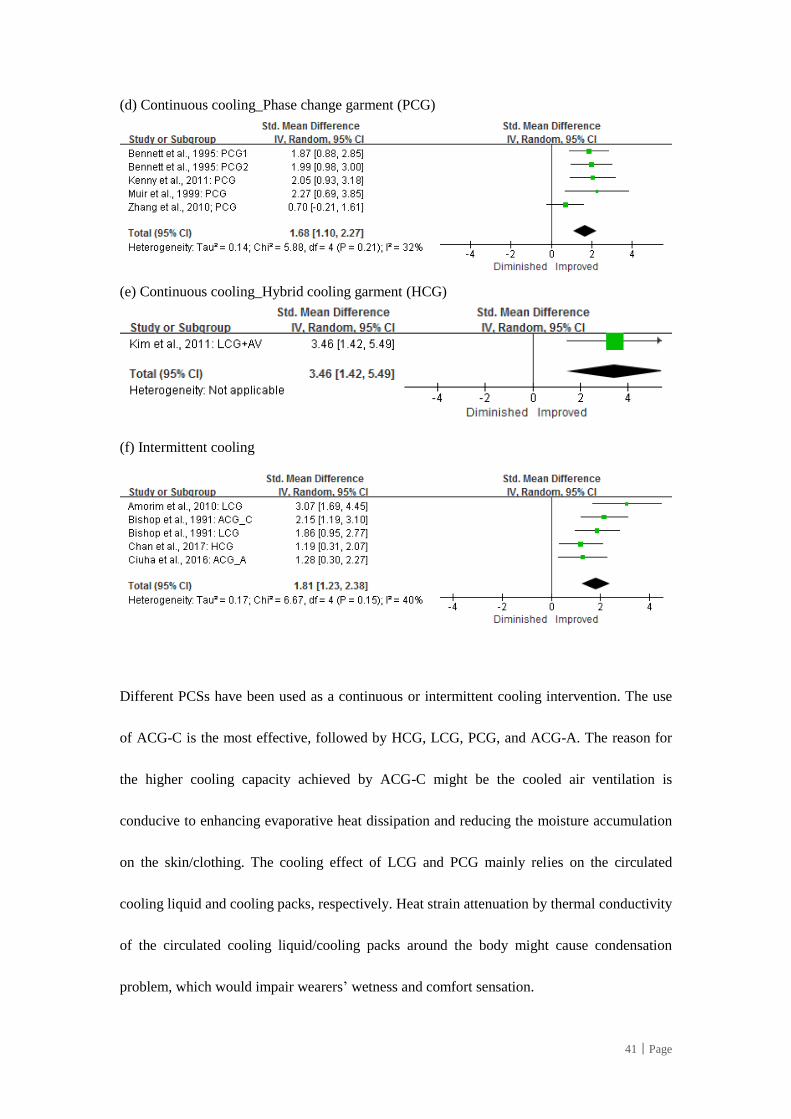
41│Page
(d) Continuous cooling_Phase change garment (PCG)
(e) Continuous cooling_Hybrid cooling garment (HCG)
(f) Intermittent cooling
Different PCSs have been used as a continuous or intermittent cooling intervention. The use
of ACG-C is the most effective, followed by HCG, LCG, PCG, and ACG-A. The reason for
the higher cooling capacity achieved by ACG-C might be the cooled air ventilation is
conducive to enhancing evaporative heat dissipation and reducing the moisture accumulation
on the skin/clothing. The cooling effect of LCG and PCG mainly relies on the circulated
cooling liquid and cooling packs, respectively. Heat strain attenuation by thermal conductivity
of the circulated cooling liquid/cooling packs around the body might cause condensation
problem, which would impair wearers’ wetness and comfort sensation.
42│Page
HCG combined two or more of the aforementioned cooling techniques (Chan et al., 2015;
Pandolf, 1995). Taking the advantages of air ventilation that increases evaporative heat
transfer and cooled liquid/PCMs that enhance conductive heat dissipation, a variety of HCGs
(e.g. LCG with air ventilation and PCG with air ventilation) were developed. Current
evidence showed that the EPE of HCG (LCG with air ventilation) and HCG (PCG with air
ventilation) was +59.68% and +100.45%, respectively, which was higher than that of ACG-A
(+ 36.32%) and PCG (+32.92%). Since only two studies on HCG were included in this
meta-analysis, further work with more randomised controlled trials on assessing HCGs is
envisaged to be examined.
ACG-A also exhibited significant effectiveness in enhancing work endurance, although
relatively low compared to other PCSs. It was noted that the effect size of ACG-A (suppled
air temperature at 35–40°C) is much lower than that of ACG-C (supplied air temperature at
12–27°C), which reinforced the theoretical model that inlet air temperature is an important
factor affecting the heat absorbing capacity of an ACG (Mokhtari Yazdi and Sheikhzadeh,
2014). In addition, air velocity was demonstrated to influence the cooling capacity of ACG. It
can be seen in Figure 2.3c that ACG with inlet air flow rate at 18 cubic feet per minute (cfm)
had a larger effect on improving work endurance compared with that of ACG at 10 cfm
(Muza et al., 1988).
43│Page
Different work–rest patterns were adopted in the experimental protocol, e.g. a 50 min
treadmill walking followed by a 40 min rest (Amorim et al., 2010) and a 15 min treadmill
running followed by a 10 min rest (Kim et al., 2011). Intermittent cooling with PCSs was
implemented during recovery between bouts of work. Large effect on work performance was
observed in intermittent cooling intervention with PCS.
2.7 INDUSTRIAL APPLICATION
The application of cooling intervention with PCSs in occupational settings considers the
cooling efficiency, thermal comfort, safety and ergonomic factors of weight, mobility and
convenience. Thermal comfort is associated with the heat balance of the body and the absence
of uncomfortable hot due to sweating or uncomfortable cold due to vasoconstriction and low
skin temperatures (Parsons, 2014). The PCS design considers the sufficient cooling power
and the acceptable thermal comfort. Research found that the wearer feels discomfort when the
coolant inlet temperature is below 10 °C (Speckman et al., 1988). An ice vest (melting
temperature at 0 °C) may also cause torso erythema when insufficient insulation is worn
between the skin and the cooling packs (House et al., 2013). Reflective strips are attached,
and flame-retardant fabric is used for safety in industrial settings (Chan et al., 2016b). The
burden induced by PCSs may lead to increased metabolic production, thereby aggregating
body thermal strain and impairing work performance (Lu et al., 2015; Wang et al., 2013).
Body movement and/or mobility restriction can cause physiological (e.g. musculoskeletal
pain) and psychological discomfort (Akbar-Khanzadeh et al., 1995; Chan et al., 2015).
44│Page
Different PCSs have been adopted in different occupations by considering the type of task,
exposure level of heat stress and the required protective clothing.
Amongst the cooling garments, LCGs and ACGs (with cooled air) exhibit high performance
in alleviating heat stress and extending exercise performance (measured by the effect size of
endurance time) in laboratory experiments. However, both LCGs and ACGs are heavy. They
also require external connections to the coolant supplier or compressor, which may restrict
user mobility and compromise the general cooling benefits. PCGs provide cooling through the
insertion of the precooled PCMs in the garment. This process requires no external
connections (high portability), and it is easy to operate. Certain PCMs provide cooling in a
limited duration compared with “infinite” cooling source (e.g. LCGs with external heat sink).
Large amount of PCMs can extend the effective cooling duration. Nevertheless, the added
weight increases the human metabolic rate/physical work load. The environment for
construction workers is difficult because of various practices associated to heat, such as
activities on the floor/roof, which expose workers to direct sunlight, and activities in a
confined place with poor ventilation. LCGs and ACGs consist of a complex and bulky system.
These garments are not always suitable for construction workplaces because of many factors,
including elevated platform, limited space and lack of electricity. The use of PCG is also
limited in the construction industry because of its limited cooling duration. On the basis of
literature review and comparison of different commercial PCS products, this research project
aims to design a hybrid PCS for construction workers. PCS is designed based on
characteristics of the construction industry, e.g. work activity (forceful pulling and heavy
45│Page
lifting), work shift (work-rest schedule), and complex working environment including
elevated platforms, uneven grounds and confined spaces. Therefore, cooling duration, cooling
power, thermal comfort, ergonomics and mobility of the PCS are considered. The hybrid PCS
will combine PCM cooling and air cooling by using PCM packs and ventilation fans. This
PCS should be portable (no external connection to coolant or compressor requirement) and
lightweight and able to provide consistent cooling for approximately 7 h. Given the limited
previous research on hybrid cooling garment, further work is required to examine the
effectiveness and applicability of this PCS.
2.8 SUMMARY
This chapter systematically reviews selected papers related to cooling intervention with PCSs.
The meta-analysis reveals the effectiveness of different PCSs on work endurance. The
evaluation of cooling intervention considers the characteristics of different occupations,
including the design of exercise protocol (exercise type, duration and intensity),
meteorological condition and clothing ensemble. The literature review identifies the research
gap and provides a basis for developing the research framework of the present study.
46│Page
CHAPTER 3 RESEARCH
METHODOLOGY
3.1 INTRODUCTION
This chapter presents the research design and strategies to achieve the five objectives of this
study. A comprehensive review on major research methods employed in this study is
reported.
3.2 RESEARCH DESIGN
3.2.1 Intervention research
Intervention research determines the cause–effect relationships between an intervention and
an outcome (Melnyk and Morrison-Beedy, 2012). Intervention research in the occupational
health area gained an increasing attention over the past 30 years (Kristensen, 2005).
Occupational intervention research examines the effects of planned activities in the workplace
to improve workers’ health and well-being, increase motivation, job satisfaction and
productivity, alleviate morbidity and mortality and reduce absence or turnover (Kristensen,
2005). The present study developed a cooling intervention with personal cooling system (PCS)
and examined its effectiveness in improving occupational health and safety (e.g. alleviating
workers’ body heat strain) in the construction industry. In addition to evaluating the utility of
the intervention to produce the desired effect or unintended outcomes, disseminating
convincing evidences to implement the intervention in the workplace is an important part of
the intervention research (Goldenhar et al., 2001). Intervention research enables close
cooperation between researchers and practitioners.
47│Page
Intervention research includes three phases, namely, development, implementation and
effectiveness (Goldenhar et al., 2001). First, an intervention that has scientific basis and
satisfies the needs of the practitioners is developed. Second, the procedures of implementing
an intervention are systematically outlined. Finally, the effectiveness of an intervention is
evaluated. The three phases are interdependent and require an interdisciplinary research team
to conduct the agenda (Goldenhar et al., 2001).
3.2.2 Tasks in intervention research
A well-structured research framework with scientific rigor and practical concerns has been
proposed to carry out an occupational intervention research (Figure 3.1) (Yang and Chan,
2017). The efficacy–effectiveness–diffusion transition cycle was introduced by Camp (2001).
The efficacy of an intervention refers to the degree to which it produces an effect under ideal
conditions, while the effectiveness of an intervention is the degree to which it produces an
effect under realistic workplace conditions (Shannon et al., 1999). Once proven effective, an
intervention should be diffused, which will make the intervention accessible to wide
population. In the efficacy–effectiveness–diffusion transition cycle, five research tasks are
fulfilled, namely, determine problems, develop partnerships, design methods, do assessments
and disseminate results (Goldenhar et al., 2001).
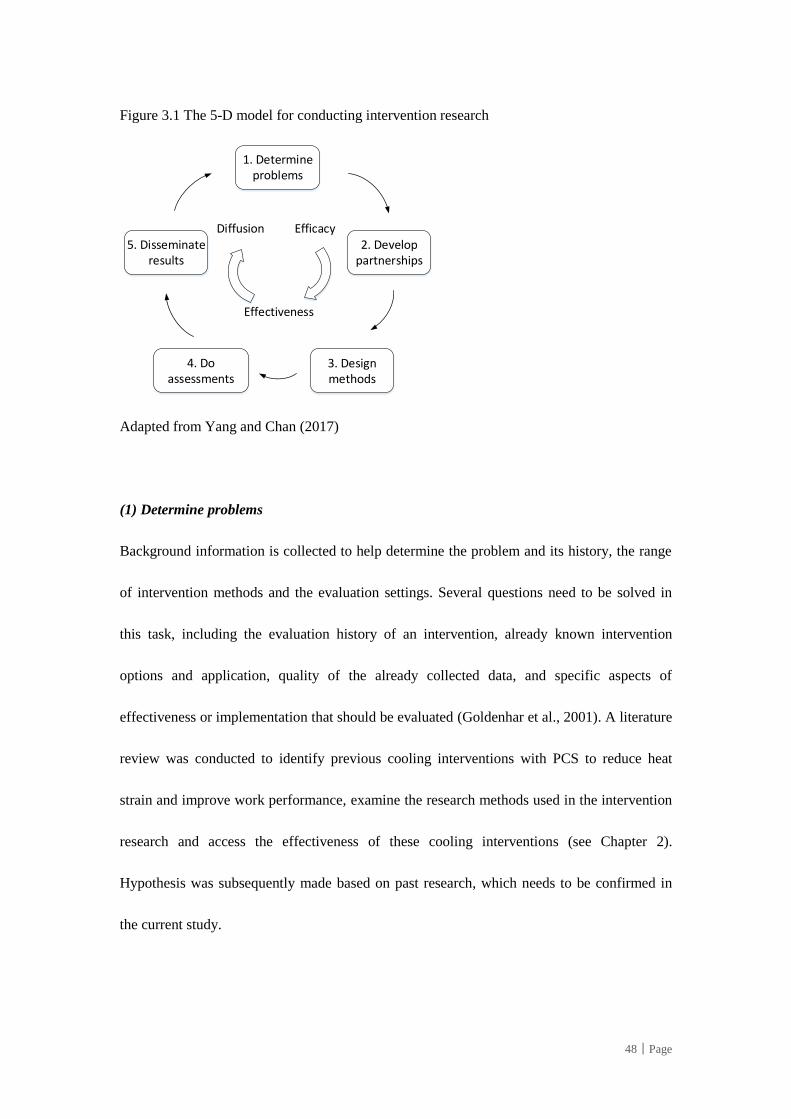
48│Page
Figure 3.1 The 5-D model for conducting intervention research
1. Determine problems
2. Develop partnerships
5. Disseminate results
4. Do assessments
3. Design methods
Diffusion Efficacy
Effectiveness
Adapted from Yang and Chan (2017)
(1) Determine problems
Background information is collected to help determine the problem and its history, the range
of intervention methods and the evaluation settings. Several questions need to be solved in
this task, including the evaluation history of an intervention, already known intervention
options and application, quality of the already collected data, and specific aspects of
effectiveness or implementation that should be evaluated (Goldenhar et al., 2001). A literature
review was conducted to identify previous cooling interventions with PCS to reduce heat
strain and improve work performance, examine the research methods used in the intervention
research and access the effectiveness of these cooling interventions (see Chapter 2).
Hypothesis was subsequently made based on past research, which needs to be confirmed in
the current study.
49│Page
(2) Develop partnerships
Collaboration between researchers and workplaces is required in occupational intervention
research (Kristensen, 2005). Stakeholders from the industry, government agencies and
academia are involved in the process. A multidisciplinary team is better equipped to deal with
various theoretical, technical, scientific, practical and socio-political factors during the
intervention research phases (Goldenhar et al., 2001). The research team in the present study
possesses expertise and experience in occupational safety and health, industrial hygiene,
materials science, textile science, biological and exercise science and other relevant
disciplines. Extensive professional and research experience from team members in these
fields is useful in enriching and enhancing research capability.
(3) Design methods
Previous studies have documented the methodologies used in intervention research (Shannon
et al., 1999). Intervention research designs can generally be categorised as experimental,
quasi-experimental and nonexperimental. In experimental design, subjects are assigned
randomly to either experimental or control conditions, thus comprising two (or more) groups.
The randomisation ensures that subjects are assigned to the conditions in an unbiased manner,
thereby improving the internal validity of the intervention research. Due to practical, ethical,
legal, financial and/or political constraints, the experimental design is sometimes not feasible
(Shannon et al., 1999). In such case, ‘lesser’ design options (i.e. quasi- or non-experimental)
would be used (Shannon et al., 1999). Quasi-experimental design refers to non-randomly
50│Page
assigned experimental and control groups (Goldenhar and Schulte, 1994). Non-experimental
design refers to the experimental group only (Goldenhar and Schulte, 1994).
Randomised controlled trials (RCTs) are the basic methodological paradigm in intervention
research (Kristensen, 2005). Randomisation is performed for avoiding confounding and
selection bias. The control group is adopted to distinguish “between change and effect (the
effect refers to the difference between what happened in the intervention group and what
would have happened without the intervention)” (Kristensen, 2005). Blinding and placebo
treatment are necessary in RCT for biomedical research to reduce information bias. RCT is
generally carried out in the laboratory under highly controlled conditions. However, RCTs
can be difficult to conduct in some occupational settings (e.g. occupational safety
interventions) because of practical, ethical technical and/or financial factors (Shannon et al.,
1999).
The evaluation of intervention implementation usually includes survey (e.g. field
questionnaire survey), case study, qualitative (e.g. collection of subjective ratings from
participants) and quantitative (e.g. measure of core body temperature during the experiment)
research methods. The effectiveness evaluation should consider both internal validity (i.e.
whether the intervention made a difference) and external validity (i.e. generalisation of
results).
51│Page
In the present study, participants are randomly assigned to either experimental (cooling) or
control conditions to examine the effectiveness of the cooling intervention. Both quantitative
(including body temperature and heart rate) and qualitative (including subjective ratings of
perceived exertion and thermal sensation) data are collected during the experiment. The
influence of extraneous variables (unwanted sources of variation) is controlled to ensure the
causal inference between the independent and the dependent variables and attain internal
validity.
(4) Do assessments
Comparisons are typically made between pre- and post-intervention conditions or between
experimental and control groups (Shannon et al., 1999). Descriptive statistics (e.g. percentage,
frequency, mean, standard deviation and effect size) and appropriate analytic techniques [e.g.
analysis of variance (ANOVA) and paired t-test] are conducted to examine whether the
proposed intervention makes a difference as expected. ANOVA is used to compare multiple
group differences, whereas paired t-test is used to compare two groups. When evaluating the
differential effect of an intervention across several groups, specific comparison (e.g. Tukey
test) is conducted after determining that the overall (multiple) group effect exists (multiple
group effect is assessed by ANOVA).
(5) Disseminate results
This task is the crucial closing of the intervention research loop (shown in Figure 3.1)
(Goldenhar et al., 2001). Research results are disseminated to intervention participants
52│Page
intuitively and in easy-to-understand manner. Moreover, dissemination of research findings to
relevant nonparticipants (e.g. safety and health professionals, stakeholders, producers of
intervention products and government agencies) is essential (Goldenhar et al., 2001). Key
features in disseminating research findings include engineering (whether the intervention
works as expected), infrastructure (whether there is an infrastructure that supports the
widespread of the new knowledge), price (whether the price allows the widespread of the new
knowledge) and standards (whether standards are adopted and/or required for the
dissemination of the knowledge) (Goldenhar et al., 2001).
3.3 RESEARCH PROCESS
The research methods and process employed to achieve each of the research objectives are
presented in Figure 1.3. Throughout the research process, data collected through literature
review, laboratory experiments and field studies were analysed and consolidated.
The purpose of this study is to develop a cooling intervention with the newly designed PCS
for combating heat stress in the construction industry. Table 3.1 shows the five specific
research objectives and the corresponding research methods.
53│Page
Table 3.1 Research objectives and corresponding methods
No. Research Objectives Research Methods
1 Review different PCSs for combating
occupational heat stress
Literature review
2 Engineer and design a tailor-made PCS Physical testing of fabrics and
cooling sources
3 Assess the cooling capability of the newly
developed PCS
Sweating thermal manikin
measurements
4 Evaluate the effectiveness of the newly
developed PCS in reducing heat stress
Human wear trials in the
laboratory
5 Examine the applicability of the newly
developed PCS in the construction industry
Field wear trials
3.4 OVERVIEW OF RESEARCH METHODS
This study aims to develop a cooling intervention with PCS for the construction industry.
Literature review was conducted in Objective 1 to lay the foundation of this study. Then, a
series of physical testing of the PCS elements were carried out in Objective 2 to engineer and
design a tailor-made PCS. Sweating thermal manikin was used in Objective 3 to measure and
compare the thermal properties (including cooling power, thermal insulation, and evaporative
resistance) of the PCS. Subsequently, a cooling intervention with the newly developed PCS
was implemented and examined in Objective 4 and 5 (i.e. human wear trials in climatic
chamber and construction field). RCTs were adopted to examine the effectiveness of the
54│Page
cooling intervention with the newly developed PCS. Questionnaire survey was further carried
out, which focused on assessing the applicability of the proposed cooling intervention.
3.4.1 Physical testing of PCS elements
A series of physical testing of the PCS elements (including fabrics and cooling sources) were
carried out. First, fabrics for the inner and outer layers of the PCS were tested and selected.
The fabrics were tested considering the weight, thickness, heat/moisture transporting
properties and UV protection. The air resistance, water vapour permeability and radiation
properties of the fabrics were tested by KES-F8-API (Kato Tech Co., Ltd., Kyoto, Japan), test
dish and electric balance (GF-2000, A&D, Japan) and CRAY 300 Conc UV-visible
spectrophotometer (Agilent Technologies, Inc., USA), respectively (photos of the instrument
are provided in Appendix 7). Then, the cooling sources involving a pair of ventilation unit
and phase change materials (PCMs) packs were identified by comparing and testing several
commercially available products. Ventilation units were tested considering weight, air
velocity and work duration. PCM packs were tested considering weight, melting temperature
and heat of fusion. An electronic balance (GF-2000, A&D, Japan) and a hot wire anemometer
(RS327-0640, Tecpel, Taiwan) were used to measure the weight and air flow rate of the
ventilation unit, respectively (see photos in Appendix 7). A Differential Scanning Calorimeter
(DSC) (DSC822e, Mettler Toledo, USA) was used to test the melting temperature and heat of
fusion of the PCMs (see photos in Appendix 7).
55│Page
3.4.2 Sweating thermal manikin measurements
The thermal manikin is developed to simulate the heat transfer between humans and the
thermal environment (Foda and Sirén, 2012). A human-shaped thermal manikin can measure
conductive, convective and radiative heat losses over its skin surface (Holmér, 2004). When
sweating is simulated on the thermal manikin, heat exchange by evaporation can be further
measured (Holmér, 2004). The thermal manikin has been widely used to evaluate clothing
insulation and the effect of thermal environments on the body. The current thermal manikin
generally consists of more than 30 independently regulated segments (e.g. face, head, right
hand, left hand, shoulders, upper chest, stomach and mid back) (Holmér, 2004). During
operation, the manikin’s segmental heat loss and surface temperature are measured and
recorded (Wang et al., 2014). The overall body heat loss can be estimated by summing up the
surface area-weighted segmental heat loss. The method of thermal manikin measurements is
quick and easily standardised and repeatable (Holmér, 2004).
Sweating thermal manikin measurements were conducted in an isothermal condition
Tmanikin=Ta=Tr (air temperature Ta equals the manikin temperature Tmanikin; both values are
equal to the radiant temperature Tr) in a climatic chamber. Under the isothermal condition, no
dry heat exchange (i.e. radiative, conductive and convective heat losses are all equal to zero)
occurred between the manikin surface and the environment (Wang et al., 2011).
A heated sweating thermal manikin, Newton (Measurement Technology Northwest, Seattle,
WA, USA) (Figure 3.2), was used in this study. The manikin consisted of 34 individually
56│Page
controlled zones. Its segmental surface temperature could be individually controlled and each
segmental heat loss could also be recorded by the ThermDAC® software (Lu et al., 2015).
This study used the constant temperature mode, and the surface temperature of all segments
was set to 34.0°C to assess the cooling effect of the PCS in the so-called isothermal condition
(Tmanikin = Ta = Tr) (Lu et al., 2015). The total surface area (i.e., all) of the manikin is 1.697 m2.
A torso fabric skin (100% nylon knitted) that tightly fitted the Newton was employed to
simulate torso sweating. It was pre-wetted by using tap water to simulate the sweat-saturated
skin (Wang et al., 2012; Wang et al., 2011; Zhao et al., 2013a). In the current study, the
sweating rate was set to 1,200 ml/hr m2 to simulate the human body during heavy sweating.
The water flow was heated up to 34.0°C.
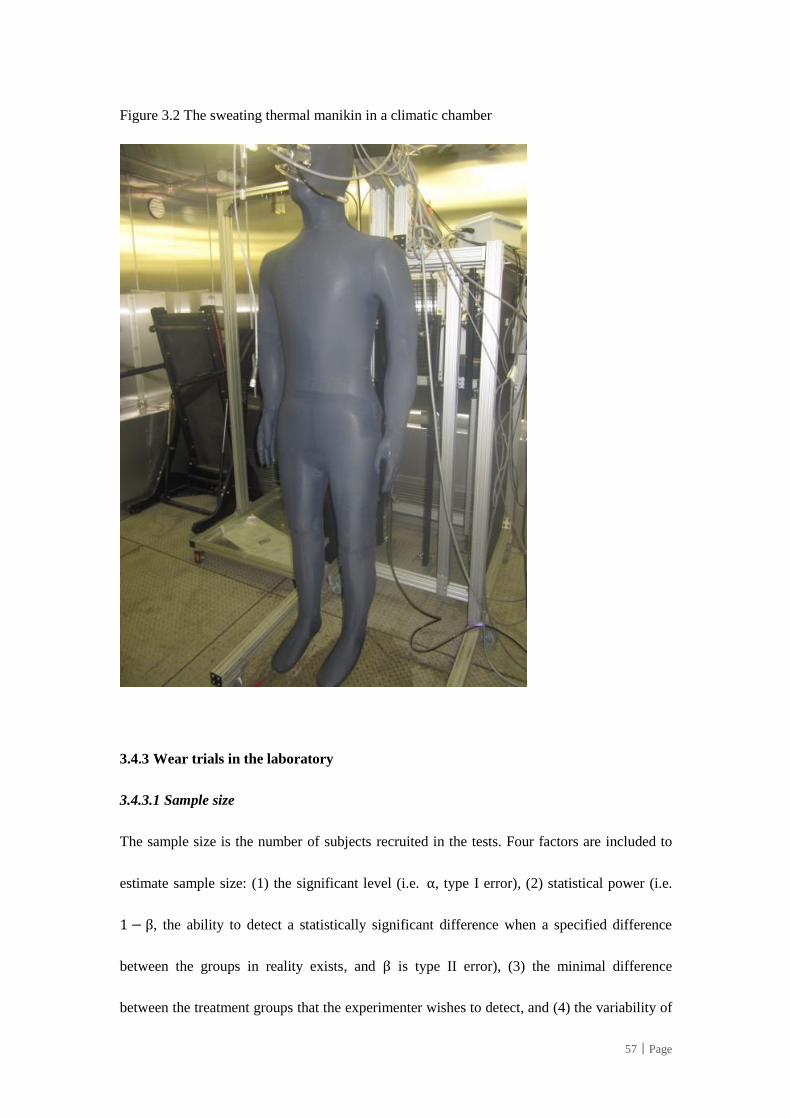
57│Page
Figure 3.2 The sweating thermal manikin in a climatic chamber
3.4.3 Wear trials in the laboratory
3.4.3.1 Sample size
The sample size is the number of subjects recruited in the tests. Four factors are included to
estimate sample size: (1) the significant level (i.e. α, type I error), (2) statistical power (i.e.
1 − β, the ability to detect a statistically significant difference when a specified difference
between the groups in reality exists, and β is type II error), (3) the minimal difference
between the treatment groups that the experimenter wishes to detect, and (4) the variability of
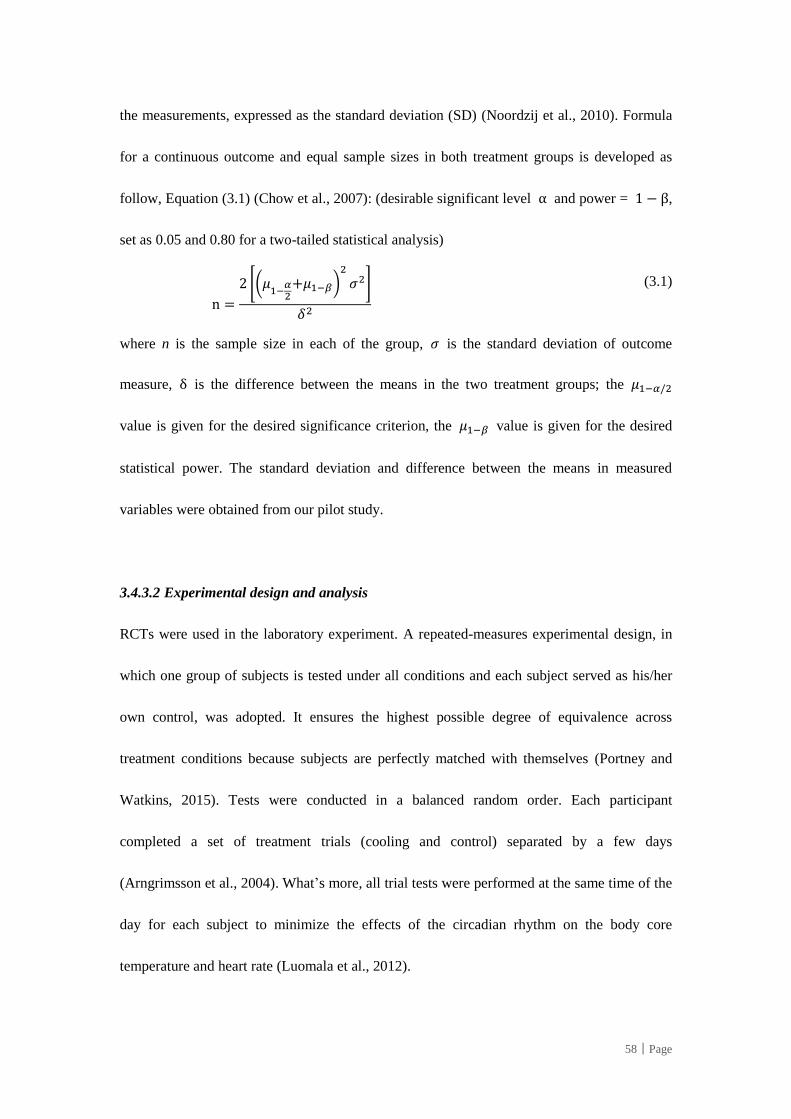
58│Page
the measurements, expressed as the standard deviation (SD) (Noordzij et al., 2010). Formula
for a continuous outcome and equal sample sizes in both treatment groups is developed as
follow, Equation (3.1) (Chow et al., 2007): (desirable significant level α and power = 1 − β,
set as 0.05 and 0.80 for a two-tailed statistical analysis)
n =
2 [(𝜇1−
𝛼2
+𝜇1−𝛽)2
𝜎2]
𝛿2
(3.1)
where n is the sample size in each of the group, 𝜎 is the standard deviation of outcome
measure, δ is the difference between the means in the two treatment groups; the 𝜇1−𝛼/2
value is given for the desired significance criterion, the 𝜇1−𝛽 value is given for the desired
statistical power. The standard deviation and difference between the means in measured
variables were obtained from our pilot study.
3.4.3.2 Experimental design and analysis
RCTs were used in the laboratory experiment. A repeated-measures experimental design, in
which one group of subjects is tested under all conditions and each subject served as his/her
own control, was adopted. It ensures the highest possible degree of equivalence across
treatment conditions because subjects are perfectly matched with themselves (Portney and
Watkins, 2015). Tests were conducted in a balanced random order. Each participant
completed a set of treatment trials (cooling and control) separated by a few days
(Arngrimsson et al., 2004). What’s more, all trial tests were performed at the same time of the
day for each subject to minimize the effects of the circadian rhythm on the body core
temperature and heart rate (Luomala et al., 2012).
59│Page
3.4.4 Field wear trials
To further evaluate the applicability of the PCS, construction workers will be invited to wear
the newly designed PCS during their regular working activities on a number of occasions and
in different workplaces. On August 2016, a total of 14 visits to construction sites were made.
Both on-site questionnaire survey and field experiment were conducted during the visits. The
questionnaire survey aims to examine the applicability of the PCS by collecting participants’
subjective ratings and their preference to the newly developed PCS. The purpose of the field
experiment is to further examine the effectiveness of the cooling intervention with the newly
designed PCS in reducing heat strain in real-world setting.
3.4.4.1 On-site questionnaire survey
Each survey consists of two wear trials in counterbalanced order, one with cooling
intervention and one without cooling intervention. To minimise systematic errors, workers
participating in the wear trials were randomly assigned to two groups, in which one group of
workers wore the PCS during rest (COOL) and the other group did not wear the PCS (CON)
in the first wear trial. In the second wear trial, the COOL and CON conditions were reversed
among workers. Before the wear trials, the participants were briefed of the survey procedures
and objectives. Participants were asked to fill in a questionnaire immediately after each wear
trial to collect their subjective ratings on the PCS. The questionnaire includes questions
regarding cooling capacity, comfort, suitability, acceptability and safety of the PCS.
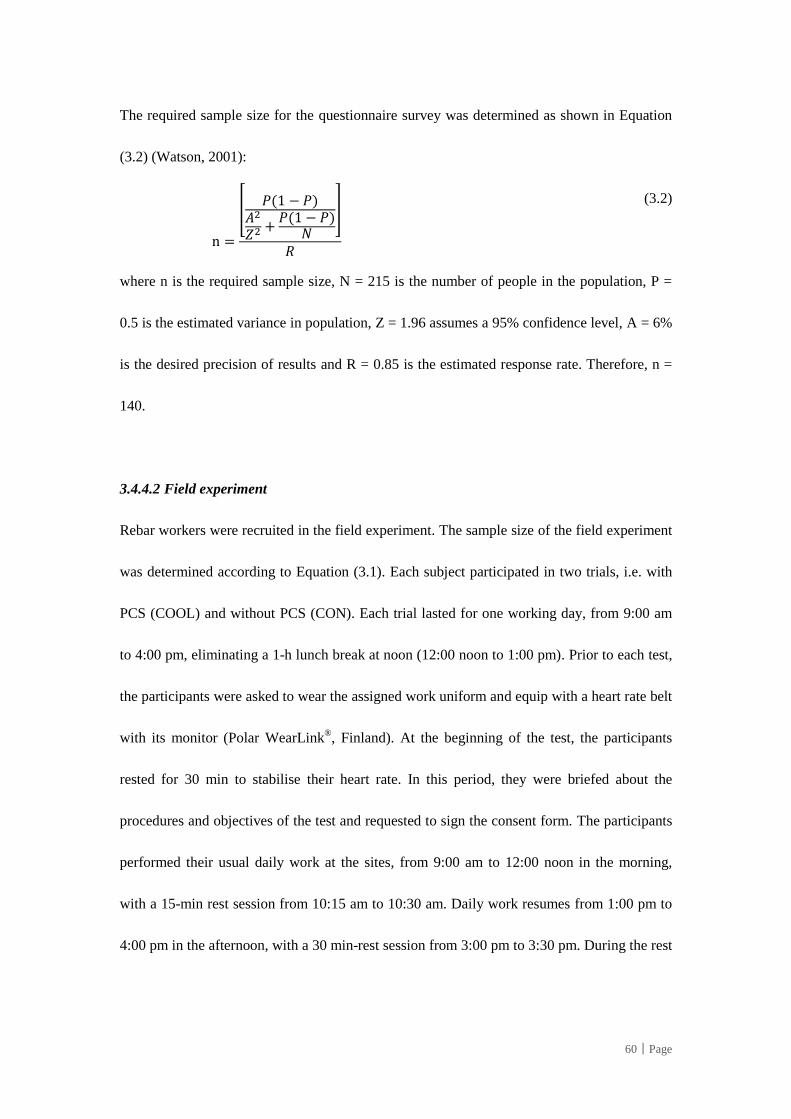
60│Page
The required sample size for the questionnaire survey was determined as shown in Equation
(3.2) (Watson, 2001):
n =
[𝑃(1 − 𝑃)
𝐴2
𝑍2 +𝑃(1 − 𝑃)
𝑁
]
𝑅
(3.2)
where n is the required sample size, N = 215 is the number of people in the population, P =
0.5 is the estimated variance in population, Z = 1.96 assumes a 95% confidence level, A = 6%
is the desired precision of results and R = 0.85 is the estimated response rate. Therefore, n =
140.
3.4.4.2 Field experiment
Rebar workers were recruited in the field experiment. The sample size of the field experiment
was determined according to Equation (3.1). Each subject participated in two trials, i.e. with
PCS (COOL) and without PCS (CON). Each trial lasted for one working day, from 9:00 am
to 4:00 pm, eliminating a 1-h lunch break at noon (12:00 noon to 1:00 pm). Prior to each test,
the participants were asked to wear the assigned work uniform and equip with a heart rate belt
with its monitor (Polar WearLink®, Finland). At the beginning of the test, the participants
rested for 30 min to stabilise their heart rate. In this period, they were briefed about the
procedures and objectives of the test and requested to sign the consent form. The participants
performed their usual daily work at the sites, from 9:00 am to 12:00 noon in the morning,
with a 15-min rest session from 10:15 am to 10:30 am. Daily work resumes from 1:00 pm to
4:00 pm in the afternoon, with a 30 min-rest session from 3:00 pm to 3:30 pm. During the rest
61│Page
session, workers in the COOL wore the PCS. Their ear temperature, heart rate, rating of
perceived exertion (RPE) and thermal sensation were recorded every 5 min.
3.5 SUMMARY
This chapter describes and explains the research methodology adopted in this study.
Qualitative and quantitative research methods are employed to achieve the five research
objectives. First, systematic literature review and meta-analysis are conducted to examine
different PCSs in combating occupational heat stress. Second, physical testing is conducted
for the development of a tailor-made PCS for construction workers. Third, a sweating thermal
manikin test is employed to assess and compare the cooling capability of the PCS. Fourth,
human wear trials in the laboratory are conducted to examine the effectiveness of the PCS in
terms of thermo-physiological and perceptual parameters. Fifth, field wear trials are
conducted to further examine the applicability of the PCS in the construction industry.
62│Page
CHAPTER 4 DEVELOPMENT OF PCS
4.1 INTRODUCTION
This chapter focuses on the development of personal cooling system (PCS) for the
construction industry. PCS development includes six stages as follows: making a request,
exploring the design situation, perceiving the problem structure, selecting the fabric,
engineering of the cooling source, and developing the prototype.
4.2 REQUEST MADE
In this stagey, request has been made to introduce PCS into construction worksites where
workers are exposed to heat stress. Heat stress is a cause of preventable deaths, and it is a
major hazard in construction in Hong Kong, particularly during hot and humid summer
season (Chan et al., 2016c). Cooling garments/suits work by providing a cooler microclimate
around the body. They are among the most effective methods for reducing heat strain,
increasing comfort and productivity and enhancing safe work conditions (Hasegawa et al.,
2005; Webster et al., 2005). Various PCSs have been engineered for athletes, soldiers,
firefighters and hazmat personnel. However, construction workers who are susceptible to heat
stress have not been the focus of research. During the summer of 2013, the Hong Kong
Occupational Safety and Health Council (OSHC) launched the “Cooling Vest Promotion Pilot
Scheme” and tested the effectiveness of commercially available cooling vests in construction,
kitchen and catering, outdoor cleaning and horticulture and airport apron service industries.
63│Page
Workers are unwilling to wear the commercially available cooling vest because of many
reasons, as follows: easily stained colours, heavy weight, short cooling time, inflexibility (e.g.
poses hazard around moving equipment) and lack of industry-specific design (e.g. lack of
reflective strips) (Chan et al., 2016c), thereby inducing the request to develop a tailor-made
PCS for the construction industry.
4.3 DESIGN SITUATION EXPLORED
Design situation has been examined by analysing the characteristics of construction work and
interviewing frontline workers and managers to identify user requirement.
Construction work is physically strenuous and demanding (Chan et al., 2012c; Chan et al.,
2012d; Yi and Chan, 2013). The construction work is complex and includes standing,
squatting and bending postures. Besides the cooling effect, the PCS design for the
construction industry should consider weight, mobility, overall comfort, aesthetics, visibility
and interference with work.
Most construction tasks are performed outdoors, thereby exposing workers to direct sunlight.
The PCS cloth should be UV resistant to protect workers against the UV rays of the sun.
4.4 PROBLEM STRUCTURE PERCEIVED
A questionnaire survey was conducted to identify the practicability of existing PCSs in the
construction industry (Chan et al., 2016c).
64│Page
To examine the effectiveness of various types of PCS, OSHC tested a number of
commercially available PCSs that are commonly used in Hong Kong (OSHC, Hong Kong,
2013). PCG (e.g. ice vest) is often the most usable cooling technique because of its simple
mechanism, untethered system and unpowered nature based on the literature review (Chan et
al., 2015). Considering the cost, quality, availability and popularity, two kinds of commercial
PCGs (Vest CA and CB) were identified for evaluation in the “Cooling Vest Promotion Pilot
Scheme” launched by the Hong Kong Labour Department in cooperation with the OSHC.
Vest CA incorporated 12 packs of frozen gel, whereas Vest CB incorporated three packs of
frozen gel and a pair of ventilation fans. The first round of field studies was carried out during
the summer of 2012 in four industries, namely construction, kitchen and catering, outdoor
cleaning and horticulture and airport apron service (Chan et al., 2013). The questionnaire
survey was administered immediately after each wear trial. The questionnaire included 11
subjective attributes (rated by scales 1–7) towards the tested cooling vests (Table 4.1). The
results showed that most workers preferred Vest CB in terms of thermal comfort, usability,
tactile comfort and fabric hand (feel). The second round of field studies was carried out
during the summer of 2013. In the “Cooling Vest Promotion Pilot Scheme”, about 1,500 sets
of Vest CB were distributed to the aforementioned four industries. A questionnaire was
developed to further evaluate Vest CB (Table 4.2) (Chan et al., 2016c). Top ten shortcomings
were identified: “(1) easily staining colour; (2) short cooling time; (3) heavy weight; (4)
inflexibility (i.e. it presents a hazard around moving equipment); (5) a lack of
industry-specific design (i.e. a lack of reflective strips); (6) easily fragile fabric; (7) thick
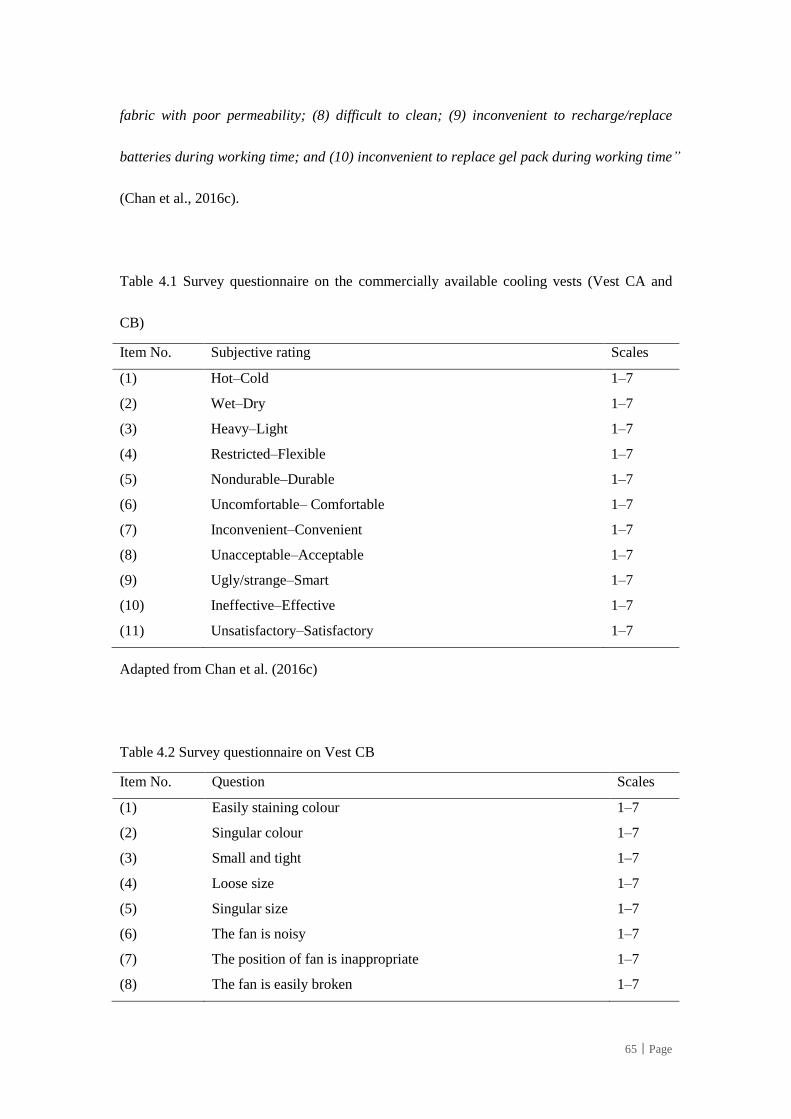
65│Page
fabric with poor permeability; (8) difficult to clean; (9) inconvenient to recharge/replace
batteries during working time; and (10) inconvenient to replace gel pack during working time”
(Chan et al., 2016c).
Table 4.1 Survey questionnaire on the commercially available cooling vests (Vest CA and
CB)
Item No. Subjective rating Scales
(1) Hot–Cold 1–7
(2) Wet–Dry 1–7
(3) Heavy–Light 1–7
(4) Restricted–Flexible 1–7
(5) Nondurable–Durable 1–7
(6) Uncomfortable– Comfortable 1–7
(7) Inconvenient–Convenient 1–7
(8) Unacceptable–Acceptable 1–7
(9) Ugly/strange–Smart 1–7
(10) Ineffective–Effective 1–7
(11) Unsatisfactory–Satisfactory 1–7
Adapted from Chan et al. (2016c)
Table 4.2 Survey questionnaire on Vest CB
Item No. Question Scales
(1) Easily staining colour 1–7
(2) Singular colour 1–7
(3) Small and tight 1–7
(4) Loose size 1–7
(5) Singular size 1–7
(6) The fan is noisy 1–7
(7) The position of fan is inappropriate 1–7
(8) The fan is easily broken 1–7
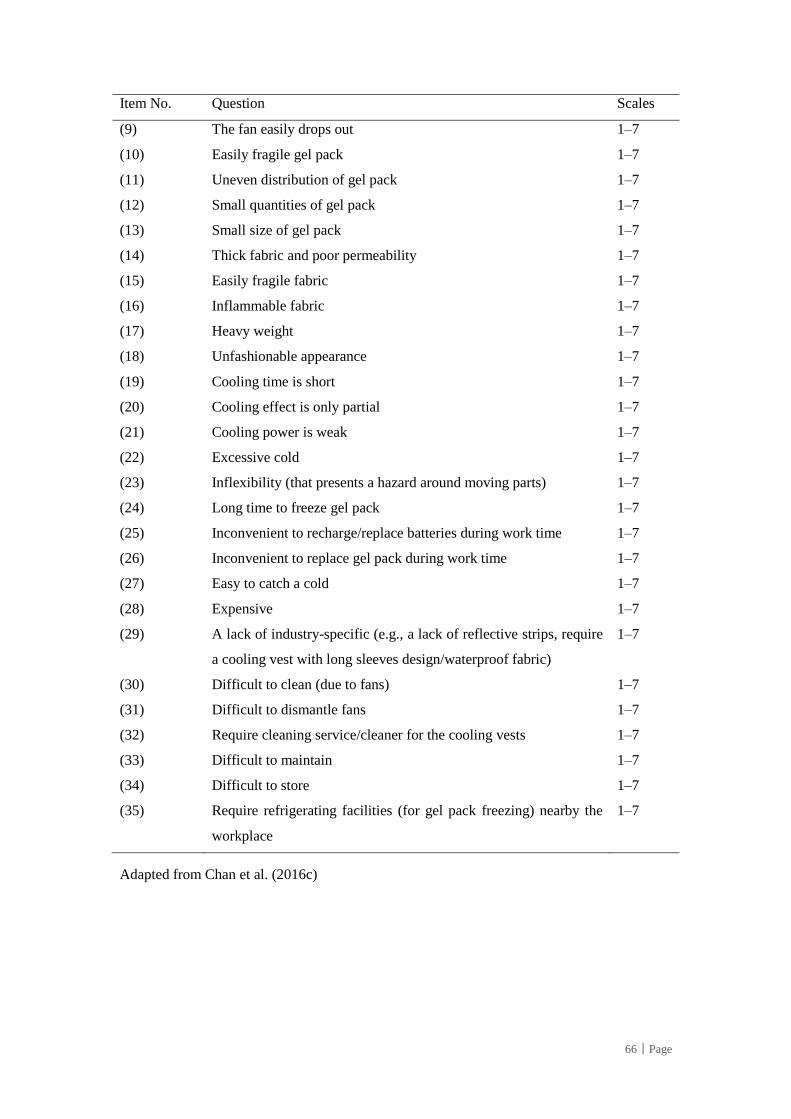
66│Page
Item No. Question Scales
(9) The fan easily drops out 1–7
(10) Easily fragile gel pack 1–7
(11) Uneven distribution of gel pack 1–7
(12) Small quantities of gel pack 1–7
(13) Small size of gel pack 1–7
(14) Thick fabric and poor permeability 1–7
(15) Easily fragile fabric 1–7
(16) Inflammable fabric 1–7
(17) Heavy weight 1–7
(18) Unfashionable appearance 1–7
(19) Cooling time is short 1–7
(20) Cooling effect is only partial 1–7
(21) Cooling power is weak 1–7
(22) Excessive cold 1–7
(23) Inflexibility (that presents a hazard around moving parts) 1–7
(24) Long time to freeze gel pack 1–7
(25) Inconvenient to recharge/replace batteries during work time 1–7
(26) Inconvenient to replace gel pack during work time 1–7
(27) Easy to catch a cold 1–7
(28) Expensive 1–7
(29) A lack of industry-specific (e.g., a lack of reflective strips, require
a cooling vest with long sleeves design/waterproof fabric)
1–7
(30) Difficult to clean (due to fans) 1–7
(31) Difficult to dismantle fans 1–7
(32) Require cleaning service/cleaner for the cooling vests 1–7
(33) Difficult to maintain 1–7
(34) Difficult to store 1–7
(35) Require refrigerating facilities (for gel pack freezing) nearby the
workplace
1–7
Adapted from Chan et al. (2016c)
67│Page
4.5 FABRIC SELECTED
The newly designed PCS is a two-layer cooling vest, specifically designed to wear over the
construction uniform that was previously designed by our research team (Figure 4.1). This
two-layer cooling vest design was determined based on the following process:
(1) In the “Cooling Vest Promotion Pilot Scheme”, several commercially cooling vests
were tested and the two-layer cooling vest was preferred by construction workers.
(2) Shortcomings of the commercially available two-layer cooling vest were further
identified in the scheme.
(3) The commercially available two-layer cooling vest was used as reference prototype
for the current design.
(4) The current design improved the commercially available two-layer cooling vest in
terms of fabrics, cooling sources, thermal comfort, safety, aesthetics and ergonomics.
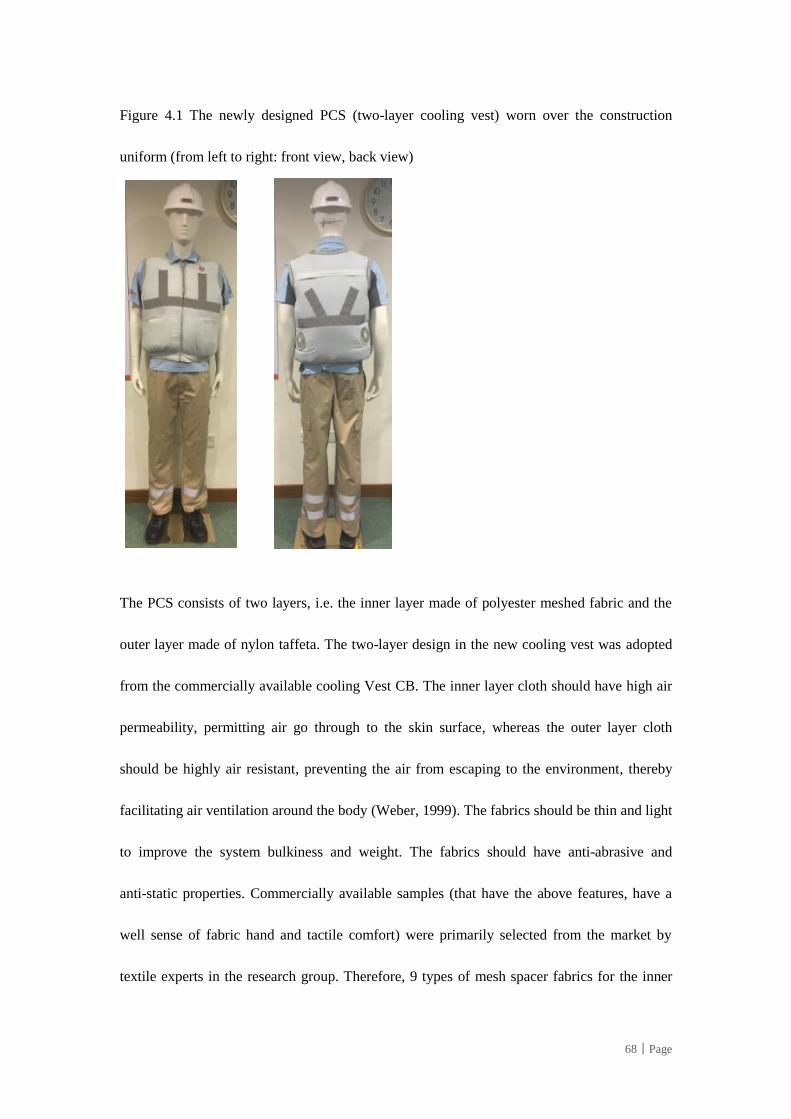
68│Page
Figure 4.1 The newly designed PCS (two-layer cooling vest) worn over the construction
uniform (from left to right: front view, back view)
The PCS consists of two layers, i.e. the inner layer made of polyester meshed fabric and the
outer layer made of nylon taffeta. The two-layer design in the new cooling vest was adopted
from the commercially available cooling Vest CB. The inner layer cloth should have high air
permeability, permitting air go through to the skin surface, whereas the outer layer cloth
should be highly air resistant, preventing the air from escaping to the environment, thereby
facilitating air ventilation around the body (Weber, 1999). The fabrics should be thin and light
to improve the system bulkiness and weight. The fabrics should have anti-abrasive and
anti-static properties. Commercially available samples (that have the above features, have a
well sense of fabric hand and tactile comfort) were primarily selected from the market by
textile experts in the research group. Therefore, 9 types of mesh spacer fabrics for the inner
69│Page
layer and 12 types of nylon taffeta fabrics for the outer layer were identified to test for the
thermal properties (air permeability and water vapour permeability) and mechanical
properties (UPF rating, anti-static and anti-abrasion) (Table 4.3). These fabric properties were
examined according to some well-recognised international standards (i.e., International
Standard Organization, American Society for Testing and Materials).
A total of 21 commercially available fabrics (9 polyester meshed fabrics for the inner layer
and 12 nylon taffeta fabrics for the outer layer) were identified and tested to select the optimal
fabrics for the new PCS. The properties of fabrics, including thickness, air permeability and
water vapour permeability (WVP), were used as critical indicators for assessing the thermal
comfort of a clothed body. Furthermore, UV protection, anti-abrasion and anti-static
properties were considered for the outer layer fabrics. Table 4.3 shows the properties of the
fabrics for the inner and outer layers. For inner layer, the lower the fabric weight, fabric
thickness and air resistance the better. The higher the WVP the better. The values in each
property of inner layer were equally divided into 3 groups and scored from 1 to 3 accordingly
(Table 4.4). For outer layer, the lower the fabric weight and fabric thickness the better. The
higher the air resistance and WVP the better. The values in each property of outer layer were
equally divided into 4 groups and scored from 1 to 4 accordingly (Table 4.4). The total score
of each fabric were calculated (Table 4.4). Consequently, fabrics I2 and O10 were chosen for
the inner and outer layers, respectively (based on Table 4.4, the higher the total score the
better). The thin and light fabric improves the system bulk and weight; it can be easily blown
up by the fan, thereby accelerating air convection between the skin and vest (McLellan, 2007).
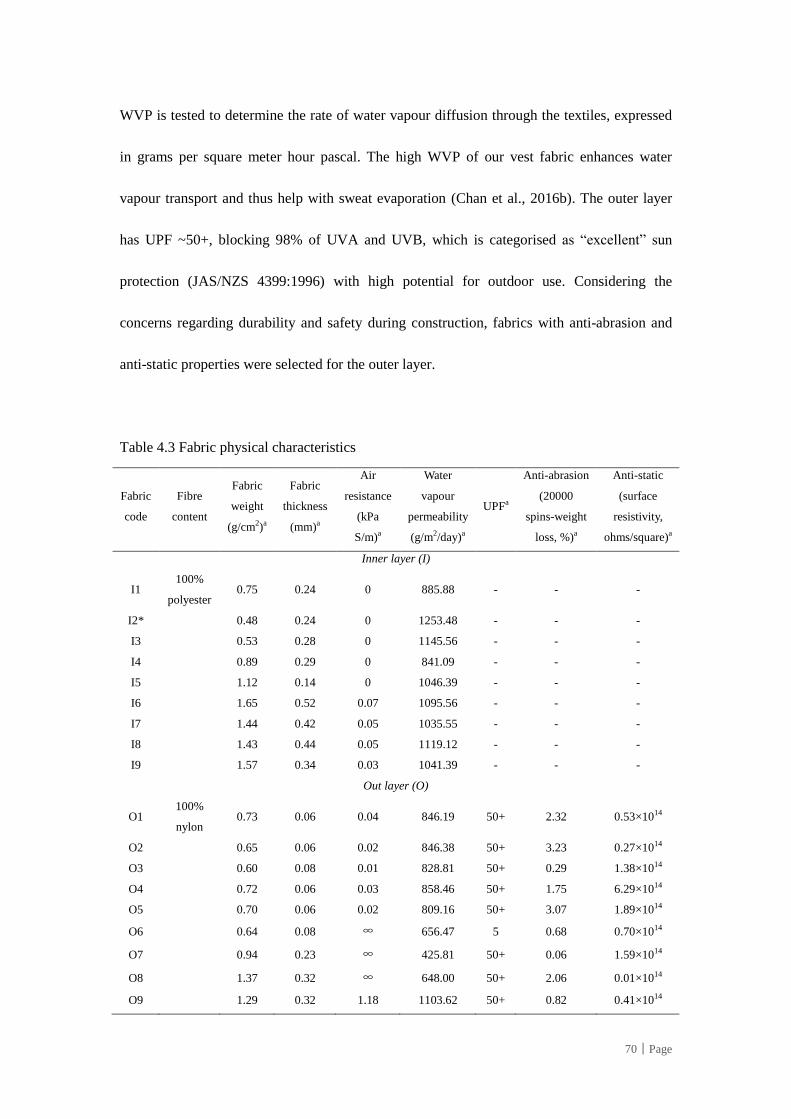
70│Page
WVP is tested to determine the rate of water vapour diffusion through the textiles, expressed
in grams per square meter hour pascal. The high WVP of our vest fabric enhances water
vapour transport and thus help with sweat evaporation (Chan et al., 2016b). The outer layer
has UPF ~50+, blocking 98% of UVA and UVB, which is categorised as “excellent” sun
protection (JAS/NZS 4399:1996) with high potential for outdoor use. Considering the
concerns regarding durability and safety during construction, fabrics with anti-abrasion and
anti-static properties were selected for the outer layer.
Table 4.3 Fabric physical characteristics
Fabric
code
Fibre
content
Fabric
weight
(g/cm2)a
Fabric
thickness
(mm)a
Air
resistance
(kPa
S/m)a
Water
vapour
permeability
(g/m2/day)a
UPFa
Anti-abrasion
(20000
spins-weight
loss, %)a
Anti-static
(surface
resistivity,
ohms/square)a
Inner layer (I)
I1 100%
polyester 0.75 0.24 0 885.88 - - -
I2* 0.48 0.24 0 1253.48 - - -
I3 0.53 0.28 0 1145.56 - - -
I4 0.89 0.29 0 841.09 - - -
I5 1.12 0.14 0 1046.39 - - -
I6 1.65 0.52 0.07 1095.56 - - -
I7 1.44 0.42 0.05 1035.55 - - -
I8 1.43 0.44 0.05 1119.12 - - -
I9 1.57 0.34 0.03 1041.39 - - -
Out layer (O)
O1 100%
nylon 0.73 0.06 0.04 846.19 50+ 2.32 0.53×10¹⁴
O2 0.65 0.06 0.02 846.38 50+ 3.23 0.27×10¹⁴
O3 0.60 0.08 0.01 828.81 50+ 0.29 1.38×10¹⁴
O4 0.72 0.06 0.03 858.46 50+ 1.75 6.29×10¹⁴
O5 0.70 0.06 0.02 809.16 50+ 3.07 1.89×10¹⁴
O6 0.64 0.08 ∞ 656.47 5 0.68 0.70×10¹⁴
O7 0.94 0.23 ∞ 425.81 50+ 0.06 1.59×10¹⁴
O8 1.37 0.32 ∞ 648.00 50+ 2.06 0.01×10¹⁴
O9 1.29 0.32 1.18 1103.62 50+ 0.82 0.41×10¹⁴
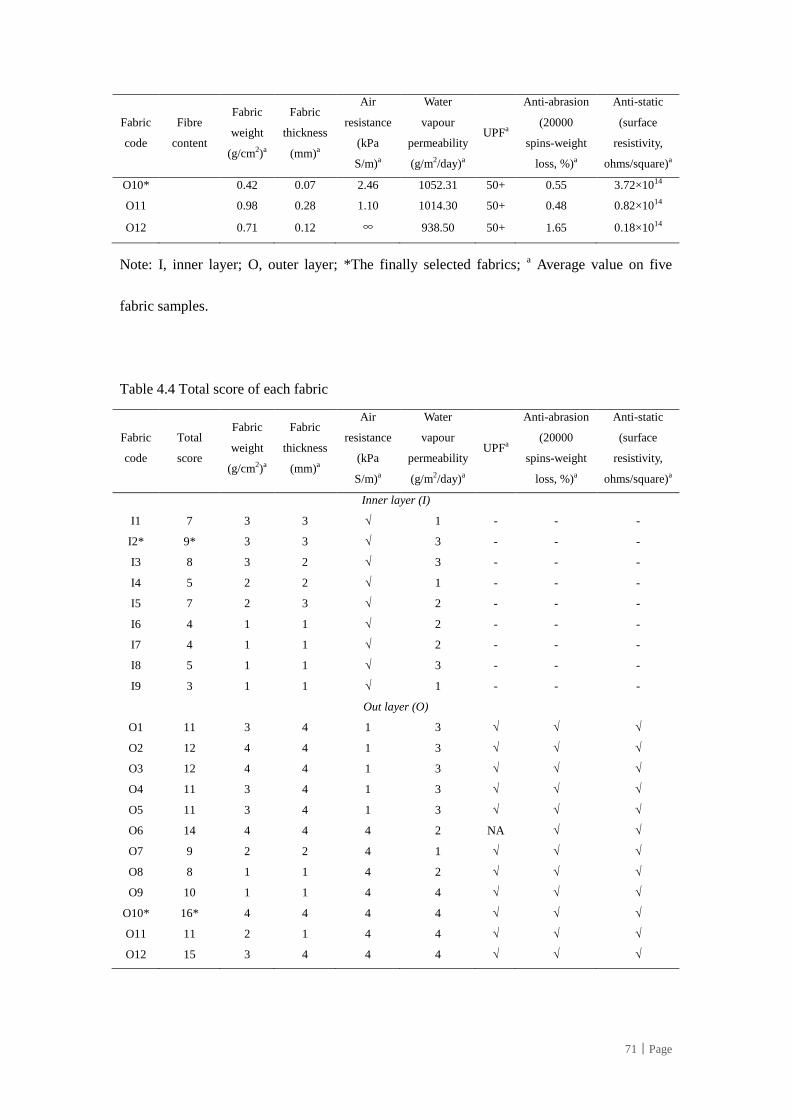
71│Page
Fabric
code
Fibre
content
Fabric
weight
(g/cm2)a
Fabric
thickness
(mm)a
Air
resistance
(kPa
S/m)a
Water
vapour
permeability
(g/m2/day)a
UPFa
Anti-abrasion
(20000
spins-weight
loss, %)a
Anti-static
(surface
resistivity,
ohms/square)a
O10* 0.42 0.07 2.46 1052.31 50+ 0.55 3.72×10¹⁴
O11 0.98 0.28 1.10 1014.30 50+ 0.48 0.82×10¹⁴
O12 0.71 0.12 ∞ 938.50 50+ 1.65 0.18×10¹⁴
Note: I, inner layer; O, outer layer; *The finally selected fabrics; a Average value on five
fabric samples.
Table 4.4 Total score of each fabric
Fabric
code
Total
score
Fabric
weight
(g/cm2)a
Fabric
thickness
(mm)a
Air
resistance
(kPa
S/m)a
Water
vapour
permeability
(g/m2/day)a
UPFa
Anti-abrasion
(20000
spins-weight
loss, %)a
Anti-static
(surface
resistivity,
ohms/square)a
Inner layer (I)
I1 7 3 3 √ 1 - - -
I2* 9* 3 3 √ 3 - - -
I3 8 3 2 √ 3 - - -
I4 5 2 2 √ 1 - - -
I5 7 2 3 √ 2 - - -
I6 4 1 1 √ 2 - - -
I7 4 1 1 √ 2 - - -
I8 5 1 1 √ 3 - - -
I9 3 1 1 √ 1 - - -
Out layer (O)
O1 11 3 4 1 3 √ √ √
O2 12 4 4 1 3 √ √ √
O3 12 4 4 1 3 √ √ √
O4 11 3 4 1 3 √ √ √
O5 11 3 4 1 3 √ √ √
O6 14 4 4 4 2 NA √ √
O7 9 2 2 4 1 √ √ √
O8 8 1 1 4 2 √ √ √
O9 10 1 1 4 4 √ √ √
O10* 16* 4 4 4 4 √ √ √
O11 11 2 1 4 4 √ √ √
O12 15 3 4 4 4 √ √ √
72│Page
Note: For inner layer, fabric weight 0.48~0.87 scored 3, 0.88~1.26 scored 2 and 1.27~1.65
scored 1; fabric thickness 0.24~0.26 scored 3, 0.27~0.39 scored 2, 0.40~0.52 scored 1; all
values in air resistance are qualified; water vapour permeability 841.09~978.55 scored 1,
978.56~1116.02 scored 2, 1116.03~1253.48 scored 3. For outer layer, fabric weight
0.42~0.65 scored 4, 0.66~0.89 scored 3, 0.90~1.13 scored 2, 1.14~1.37 scored 1; fabric
thickness 0.06~0.12 scored 4, 0.13~0.19 scored 3, 0.20~0.25 scored 2, 0.26~0.32 scored 1; air
resistance < 1 poor air resistance scored 1, 1~∞ good air resistance scored 4; water vapour
permeability 425.81~595.26 scored 1, 595.27~764.71 scored 2, 764.72~934.16 scored 3,
934.17~1103.62 scored 4; all UPF rating are qualified except O6; all anti-abrasion and
anti-static values are qualified.
4.6 COOLING SOURCE ENGINEERED
Hybrid cooling is used for the newly designed PCS, which includes ventilation fans and phase
change material (PCM) packs. The effectiveness of the newly designed hybrid PCS mainly
depends on the combined cooling source, i.e. PCMs and air cooling system (Song and Wang,
2016). Hybrid cooling sources with ventilation fans and PCMs were selected because of many
reasons, including the following. (1) The PCMs help with conductive cooling. Solid PCM
packs in the clothing increase the clothing insulation, thereby impeding sweat evaporation and
making the skin sticky and wet. (2) The circulating air by the ventilation fans around the body
enhances evaporative and convective heat dissipation; however, the ventilated air can be
inefficient or even harmful to the skin when the ambient air temperature is very high (over
35 °C). (3) Combining PCMs and ventilation fans in the PCS helps improve wetness
73│Page
sensation because of the circulated air around the body and ensure cooling efficiency since
the PCMs improve conductive heat transfer and cool down the ventilated air. Commercially
available products were tested for selecting the PCM with appropriate melting temperature
and large heat of fusion and customising ventilation fans with high air flow rate, light weight
and long work duration.
4.6.1 Phase change material (PCM) packs
PCM (e.g. ice, inorganic salt and paraffin wax), classified as latent heat storage material, can
absorb and release heat at a roughly constant temperature (i.e. melting temperature) as it goes
through solid–liquid transitions (Shim et al., 2001). When the ambient temperature is higher
than the melting temperature, PCM absorbs heat energy as it goes from a solid state to a
liquid state, producing a temporary cooling effect (Shim et al., 2001). The PCM packs were
chosen in the PCS to enhance conductive heat dissipation. Indicated by PCM’s transition
from solid to liquid, the conductive cooling effect can sustain 1–3 hours based on the amount
of the PCM packs, surface area of the PCM packs and temperature gradient between the
PCM’s melting temperature and ambient environment’s temperature. Commercially available
PCM packs with melting temperature of 10 °C–30 °C were compared. Heat of fusion of PCM
packs was measured by the differential scanning calorimetry (DSC822e, Mettler Toledo,
USA). Differential scanning calorimetry was used to measure heat flow during the phase
transitions of PCM, resulting in a curve of heat flux versus temperature.
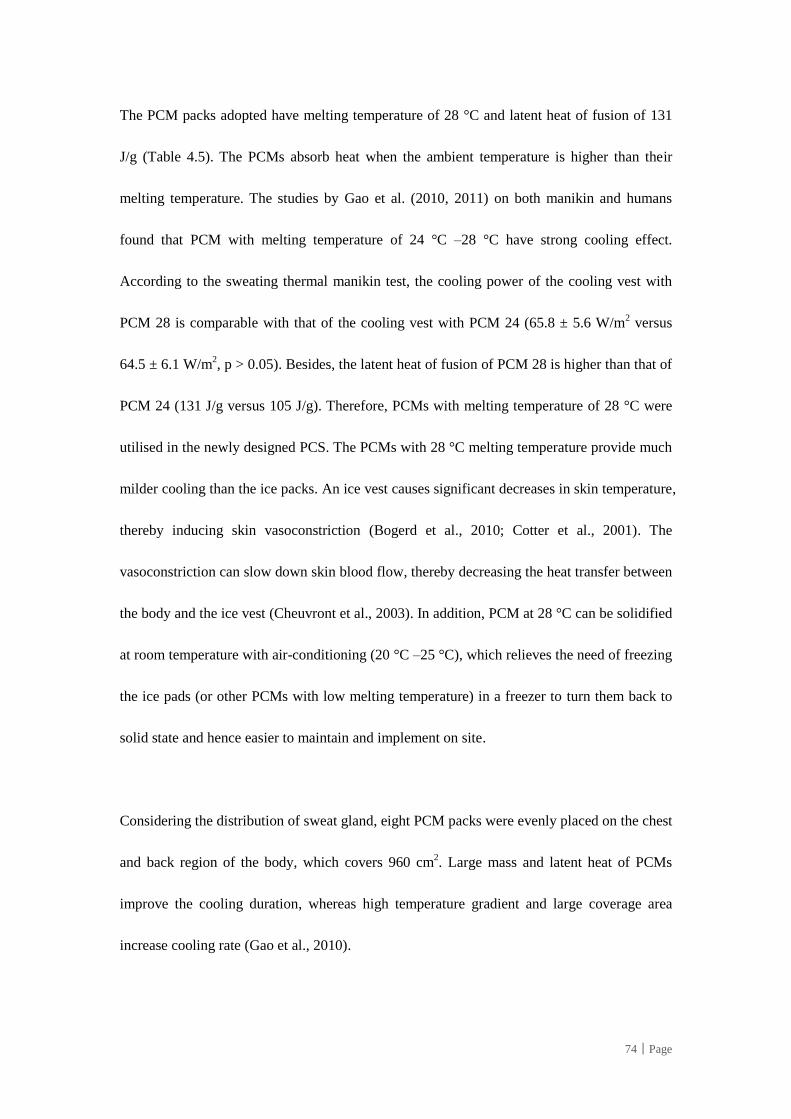
74│Page
The PCM packs adopted have melting temperature of 28 °C and latent heat of fusion of 131
J/g (Table 4.5). The PCMs absorb heat when the ambient temperature is higher than their
melting temperature. The studies by Gao et al. (2010, 2011) on both manikin and humans
found that PCM with melting temperature of 24 °C –28 °C have strong cooling effect.
According to the sweating thermal manikin test, the cooling power of the cooling vest with
PCM 28 is comparable with that of the cooling vest with PCM 24 (65.8 ± 5.6 W/m2 versus
64.5 ± 6.1 W/m2, p > 0.05). Besides, the latent heat of fusion of PCM 28 is higher than that of
PCM 24 (131 J/g versus 105 J/g). Therefore, PCMs with melting temperature of 28 °C were
utilised in the newly designed PCS. The PCMs with 28 °C melting temperature provide much
milder cooling than the ice packs. An ice vest causes significant decreases in skin temperature,
thereby inducing skin vasoconstriction (Bogerd et al., 2010; Cotter et al., 2001). The
vasoconstriction can slow down skin blood flow, thereby decreasing the heat transfer between
the body and the ice vest (Cheuvront et al., 2003). In addition, PCM at 28 °C can be solidified
at room temperature with air-conditioning (20 °C –25 °C), which relieves the need of freezing
the ice pads (or other PCMs with low melting temperature) in a freezer to turn them back to
solid state and hence easier to maintain and implement on site.
Considering the distribution of sweat gland, eight PCM packs were evenly placed on the chest
and back region of the body, which covers 960 cm2. Large mass and latent heat of PCMs
improve the cooling duration, whereas high temperature gradient and large coverage area
increase cooling rate (Gao et al., 2010).
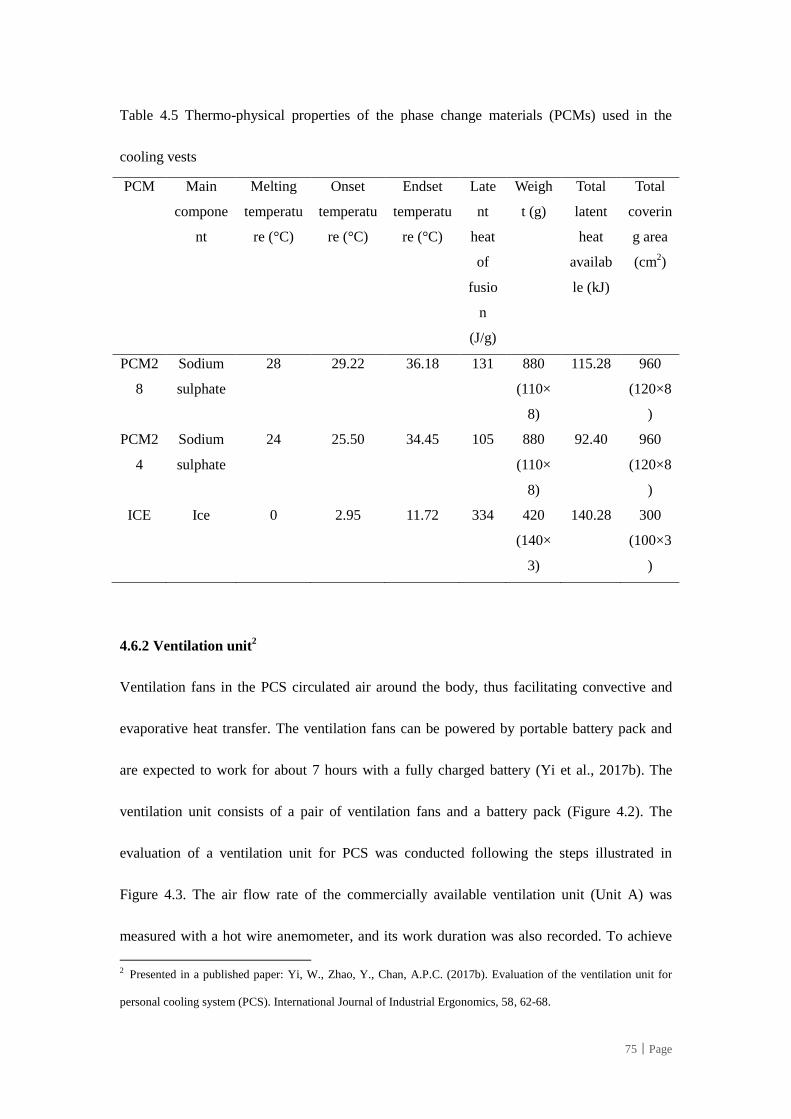
75│Page
Table 4.5 Thermo-physical properties of the phase change materials (PCMs) used in the
cooling vests
PCM Main
compone
nt
Melting
temperatu
re (°C)
Onset
temperatu
re (°C)
Endset
temperatu
re (°C)
Late
nt
heat
of
fusio
n
(J/g)
Weigh
t (g)
Total
latent
heat
availab
le (kJ)
Total
coverin
g area
(cm2)
PCM2
8
Sodium
sulphate
28 29.22 36.18 131 880
(110×
8)
115.28 960
(120×8
)
PCM2
4
Sodium
sulphate
24 25.50 34.45 105 880
(110×
8)
92.40 960
(120×8
)
ICE Ice 0 2.95 11.72 334 420
(140×
3)
140.28 300
(100×3
)
4.6.2 Ventilation unit2
Ventilation fans in the PCS circulated air around the body, thus facilitating convective and
evaporative heat transfer. The ventilation fans can be powered by portable battery pack and
are expected to work for about 7 hours with a fully charged battery (Yi et al., 2017b). The
ventilation unit consists of a pair of ventilation fans and a battery pack (Figure 4.2). The
evaluation of a ventilation unit for PCS was conducted following the steps illustrated in
Figure 4.3. The air flow rate of the commercially available ventilation unit (Unit A) was
measured with a hot wire anemometer, and its work duration was also recorded. To achieve
2 Presented in a published paper: Yi, W., Zhao, Y., Chan, A.P.C. (2017b). Evaluation of the ventilation unit for
personal cooling system (PCS). International Journal of Industrial Ergonomics, 58, 62-68.
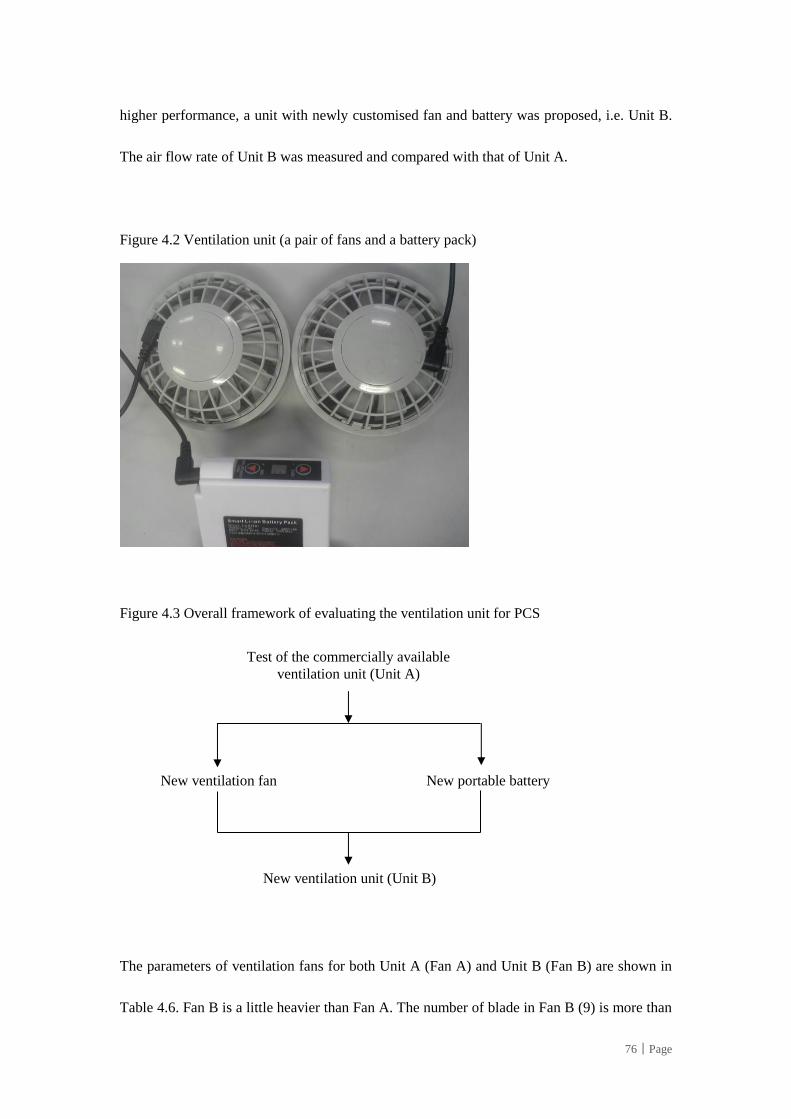
76│Page
higher performance, a unit with newly customised fan and battery was proposed, i.e. Unit B.
The air flow rate of Unit B was measured and compared with that of Unit A.
Figure 4.2 Ventilation unit (a pair of fans and a battery pack)
Figure 4.3 Overall framework of evaluating the ventilation unit for PCS
The parameters of ventilation fans for both Unit A (Fan A) and Unit B (Fan B) are shown in
Table 4.6. Fan B is a little heavier than Fan A. The number of blade in Fan B (9) is more than
Test of the commercially available
ventilation unit (Unit A)
New ventilation fan
New ventilation unit (Unit B)
New portable battery
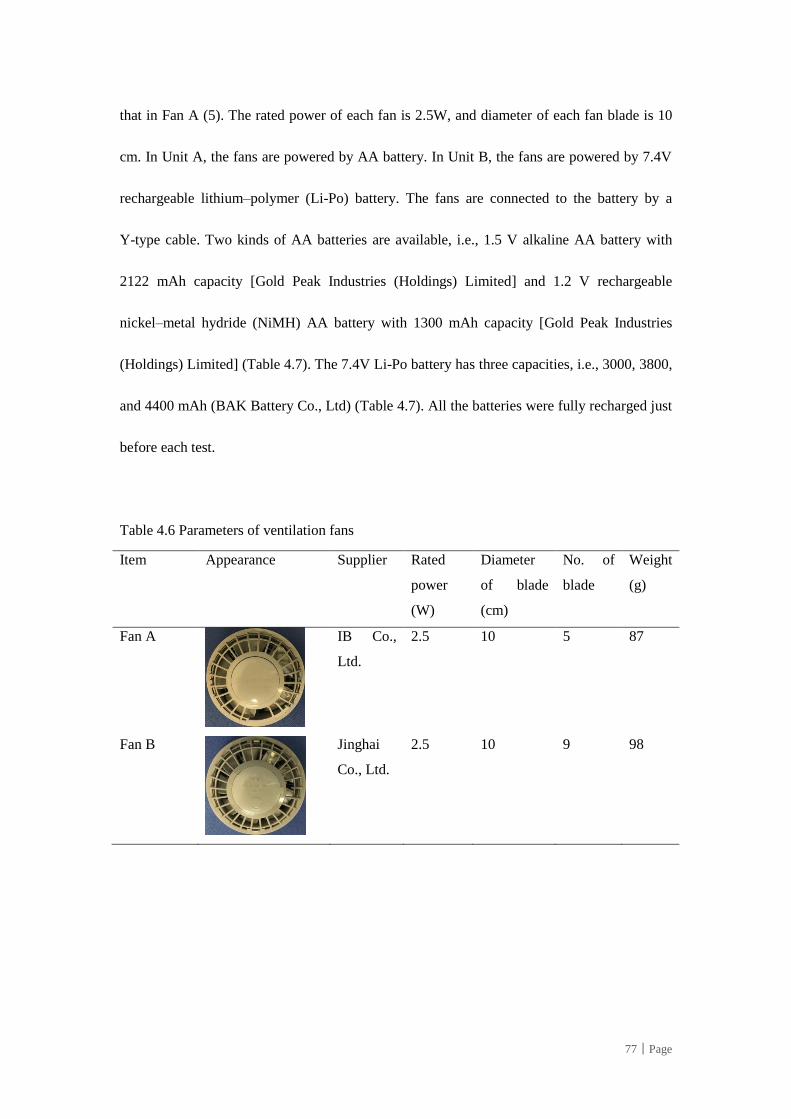
77│Page
that in Fan A (5). The rated power of each fan is 2.5W, and diameter of each fan blade is 10
cm. In Unit A, the fans are powered by AA battery. In Unit B, the fans are powered by 7.4V
rechargeable lithium–polymer (Li-Po) battery. The fans are connected to the battery by a
Y-type cable. Two kinds of AA batteries are available, i.e., 1.5 V alkaline AA battery with
2122 mAh capacity [Gold Peak Industries (Holdings) Limited] and 1.2 V rechargeable
nickel–metal hydride (NiMH) AA battery with 1300 mAh capacity [Gold Peak Industries
(Holdings) Limited] (Table 4.7). The 7.4V Li-Po battery has three capacities, i.e., 3000, 3800,
and 4400 mAh (BAK Battery Co., Ltd) (Table 4.7). All the batteries were fully recharged just
before each test.
Table 4.6 Parameters of ventilation fans
Item Appearance Supplier Rated
power
(W)
Diameter
of blade
(cm)
No. of
blade
Weight
(g)
Fan A
IB Co.,
Ltd.
2.5 10 5 87
Fan B
Jinghai
Co., Ltd.
2.5 10 9 98
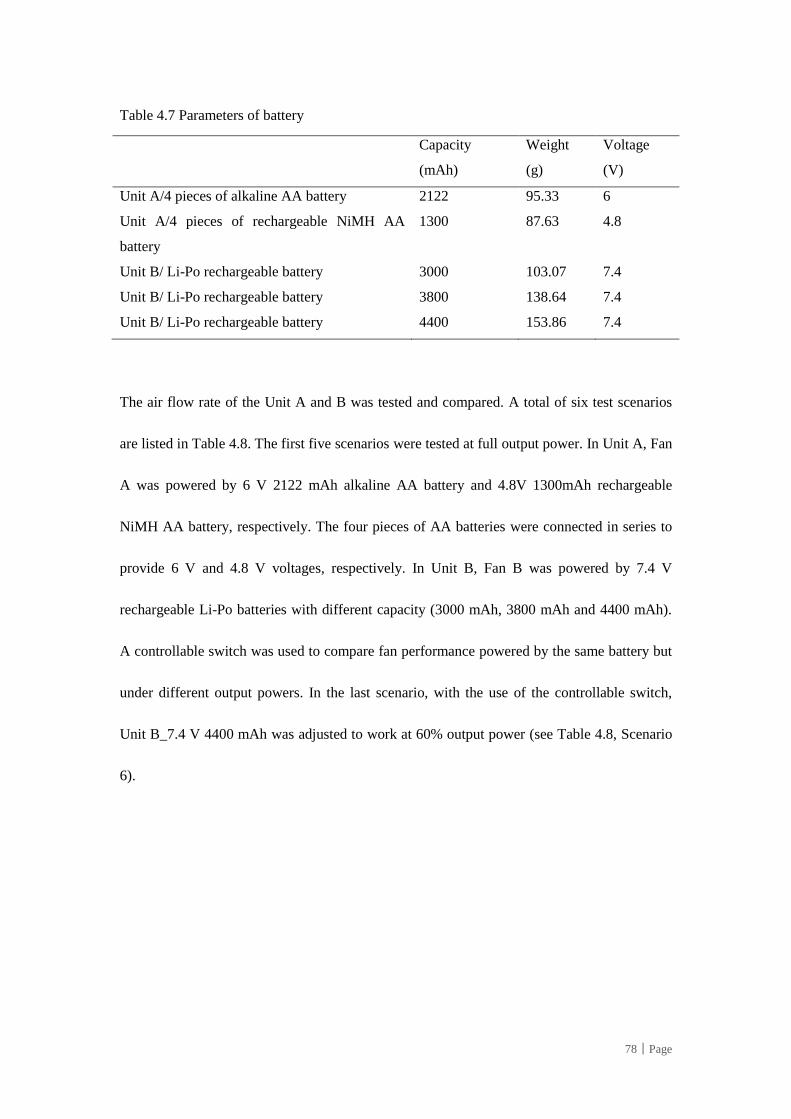
78│Page
Table 4.7 Parameters of battery
Capacity
(mAh)
Weight
(g)
Voltage
(V)
Unit A/4 pieces of alkaline AA battery 2122 95.33 6
Unit A/4 pieces of rechargeable NiMH AA
battery
1300 87.63 4.8
Unit B/ Li-Po rechargeable battery 3000 103.07 7.4
Unit B/ Li-Po rechargeable battery 3800 138.64 7.4
Unit B/ Li-Po rechargeable battery 4400 153.86 7.4
The air flow rate of the Unit A and B was tested and compared. A total of six test scenarios
are listed in Table 4.8. The first five scenarios were tested at full output power. In Unit A, Fan
A was powered by 6 V 2122 mAh alkaline AA battery and 4.8V 1300mAh rechargeable
NiMH AA battery, respectively. The four pieces of AA batteries were connected in series to
provide 6 V and 4.8 V voltages, respectively. In Unit B, Fan B was powered by 7.4 V
rechargeable Li-Po batteries with different capacity (3000 mAh, 3800 mAh and 4400 mAh).
A controllable switch was used to compare fan performance powered by the same battery but
under different output powers. In the last scenario, with the use of the controllable switch,
Unit B_7.4 V 4400 mAh was adjusted to work at 60% output power (see Table 4.8, Scenario
6).
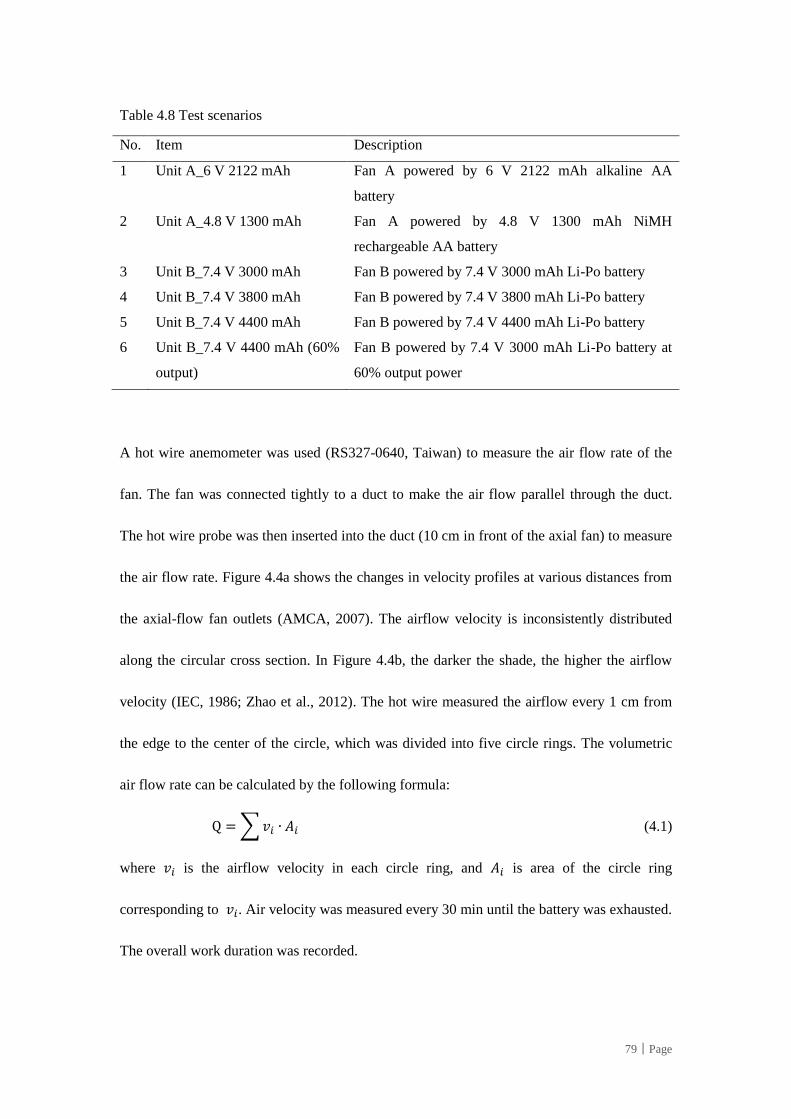
79│Page
Table 4.8 Test scenarios
No. Item Description
1 Unit A_6 V 2122 mAh Fan A powered by 6 V 2122 mAh alkaline AA
battery
2 Unit A_4.8 V 1300 mAh Fan A powered by 4.8 V 1300 mAh NiMH
rechargeable AA battery
3 Unit B_7.4 V 3000 mAh Fan B powered by 7.4 V 3000 mAh Li-Po battery
4 Unit B_7.4 V 3800 mAh Fan B powered by 7.4 V 3800 mAh Li-Po battery
5 Unit B_7.4 V 4400 mAh Fan B powered by 7.4 V 4400 mAh Li-Po battery
6 Unit B_7.4 V 4400 mAh (60%
output)
Fan B powered by 7.4 V 3000 mAh Li-Po battery at
60% output power
A hot wire anemometer was used (RS327-0640, Taiwan) to measure the air flow rate of the
fan. The fan was connected tightly to a duct to make the air flow parallel through the duct.
The hot wire probe was then inserted into the duct (10 cm in front of the axial fan) to measure
the air flow rate. Figure 4.4a shows the changes in velocity profiles at various distances from
the axial-flow fan outlets (AMCA, 2007). The airflow velocity is inconsistently distributed
along the circular cross section. In Figure 4.4b, the darker the shade, the higher the airflow
velocity (IEC, 1986; Zhao et al., 2012). The hot wire measured the airflow every 1 cm from
the edge to the center of the circle, which was divided into five circle rings. The volumetric
air flow rate can be calculated by the following formula:
Q = ∑ 𝑣𝑖 ∙ 𝐴𝑖 (4.1)
where 𝑣𝑖 is the airflow velocity in each circle ring, and 𝐴𝑖 is area of the circle ring
corresponding to 𝑣𝑖. Air velocity was measured every 30 min until the battery was exhausted.
The overall work duration was recorded.
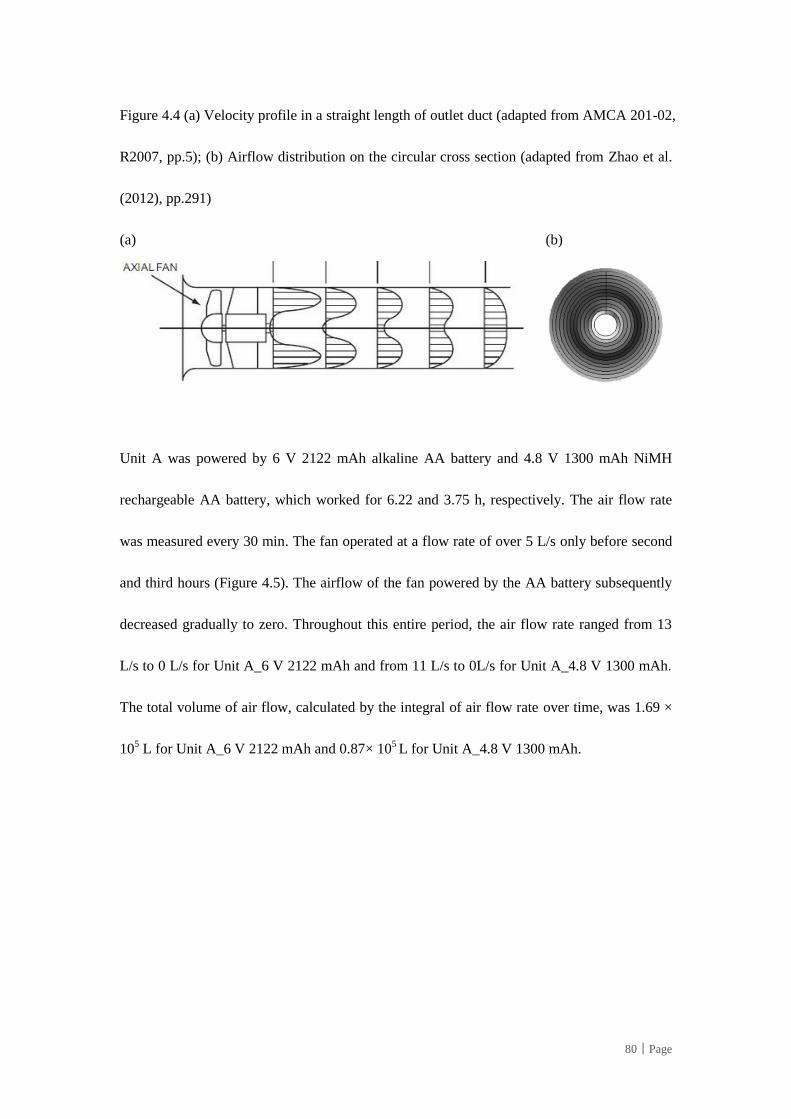
80│Page
Figure 4.4 (a) Velocity profile in a straight length of outlet duct (adapted from AMCA 201-02,
R2007, pp.5); (b) Airflow distribution on the circular cross section (adapted from Zhao et al.
(2012), pp.291)
(a) (b)
Unit A was powered by 6 V 2122 mAh alkaline AA battery and 4.8 V 1300 mAh NiMH
rechargeable AA battery, which worked for 6.22 and 3.75 h, respectively. The air flow rate
was measured every 30 min. The fan operated at a flow rate of over 5 L/s only before second
and third hours (Figure 4.5). The airflow of the fan powered by the AA battery subsequently
decreased gradually to zero. Throughout this entire period, the air flow rate ranged from 13
L/s to 0 L/s for Unit A_6 V 2122 mAh and from 11 L/s to 0L/s for Unit A_4.8 V 1300 mAh.
The total volume of air flow, calculated by the integral of air flow rate over time, was 1.69 ×
105 L for Unit A_6 V 2122 mAh and 0.87× 10
5 L for Unit A_4.8 V 1300 mAh.
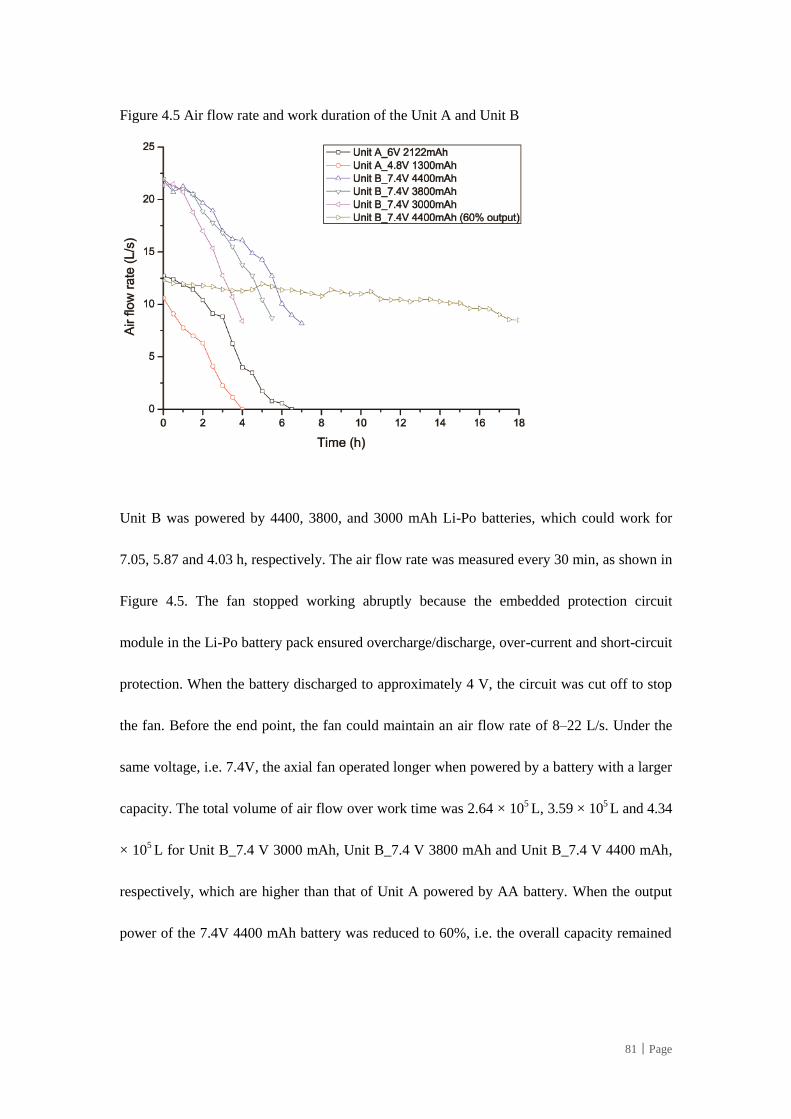
81│Page
Figure 4.5 Air flow rate and work duration of the Unit A and Unit B
Unit B was powered by 4400, 3800, and 3000 mAh Li-Po batteries, which could work for
7.05, 5.87 and 4.03 h, respectively. The air flow rate was measured every 30 min, as shown in
Figure 4.5. The fan stopped working abruptly because the embedded protection circuit
module in the Li-Po battery pack ensured overcharge/discharge, over-current and short-circuit
protection. When the battery discharged to approximately 4 V, the circuit was cut off to stop
the fan. Before the end point, the fan could maintain an air flow rate of 8–22 L/s. Under the
same voltage, i.e. 7.4V, the axial fan operated longer when powered by a battery with a larger
capacity. The total volume of air flow over work time was 2.64 × 10⁵ L, 3.59 × 10
5 L and 4.34
× 105 L for Unit B_7.4 V 3000 mAh, Unit B_7.4 V 3800 mAh and Unit B_7.4 V 4400 mAh,
respectively, which are higher than that of Unit A powered by AA battery. When the output
power of the 7.4V 4400 mAh battery was reduced to 60%, i.e. the overall capacity remained
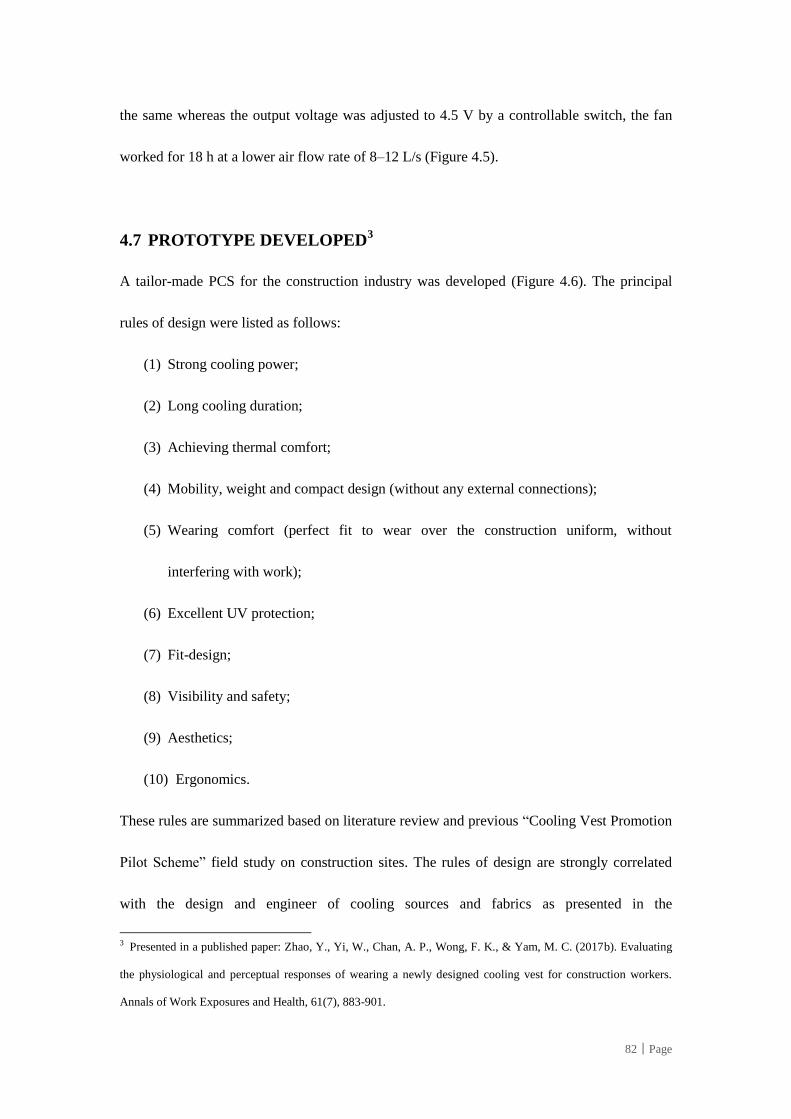
82│Page
the same whereas the output voltage was adjusted to 4.5 V by a controllable switch, the fan
worked for 18 h at a lower air flow rate of 8–12 L/s (Figure 4.5).
4.7 PROTOTYPE DEVELOPED3
A tailor-made PCS for the construction industry was developed (Figure 4.6). The principal
rules of design were listed as follows:
(1) Strong cooling power;
(2) Long cooling duration;
(3) Achieving thermal comfort;
(4) Mobility, weight and compact design (without any external connections);
(5) Wearing comfort (perfect fit to wear over the construction uniform, without
interfering with work);
(6) Excellent UV protection;
(7) Fit-design;
(8) Visibility and safety;
(9) Aesthetics;
(10) Ergonomics.
These rules are summarized based on literature review and previous “Cooling Vest Promotion
Pilot Scheme” field study on construction sites. The rules of design are strongly correlated
with the design and engineer of cooling sources and fabrics as presented in the
3 Presented in a published paper: Zhao, Y., Yi, W., Chan, A. P., Wong, F. K., & Yam, M. C. (2017b). Evaluating
the physiological and perceptual responses of wearing a newly designed cooling vest for construction workers.
Annals of Work Exposures and Health, 61(7), 883-901.
83│Page
aforementioned sections 4.5 and 4.6. Some rules are conflicting with each other whereas
others are supplementary. For example, (1) strong cooling power and (2) long cooling
duration are balanced with (3) thermal comfort and (4) weight. To achieve strong cooling
power and long cooling duration, heavy cooling sources are needed (e.g. large amount
cooling packs and high volume battery). However, the total weight was controlled below 1.5
kg by selecting proper amount and type of PCM packs and customizing lightweight battery
with required volume. The use of PCM packs with low melting temperature (e.g. ice packs)
can provide strong cooling power. However, the ice packs may irritate the skin and provide
negative thermal comfort sensation. After comparison and test, PCM with 28°C melting
temperature was selected. Rules (5), (6), (7), (8), (9) and (10) are supplementary factors that
can be combined with each other in the design of PCS.
This two-layer cooling vest incorporated a pair of ventilation fan and eight PCM packs. The
total mass of the cooling vest is 1.26 kg (including a pair of fans and eight PCM packs).The
eight PCM packs are evenly placed (four at the chest and four at the back region considering
the distribution of sweat gland) in the newly designed PCS. The PCM packs cover an area of
960 cm2. To enhance air circulation, the ventilation fans are fixed at the lower back with two
openings at the upper back of PCS (Figure 4.7a) (Zhao et al., 2017b). The air gap between the
skin surface and inner layer of the new vest is from 55 mm at the lower back region to 10 mm
at the upper back region (Figure 4.7b shows the 2D geometry) (Zhao et al., 2017b). The air
gap was determined through the following steps. First, the two measuring points were marked
on the middle of the lower back and upper back of the cooling vest (non-solid circle in Figure
84│Page
4.7a). The cooling vest was worn on a male manikin, and the ventilation fan was turned on
(with PCM packs). Then, a long needle was inserted into the marked point, and the distance
between the outer layer of the vest and the manikin surface in contact with the needle was
recorded. This step was repeated five times, and the average distance value was used. This
value minus 7 mm (the thickness of the vest with PCM packs) is the air gap between the skin
surface and the inner layer. A larger gap thickness between the skin and textile garment can
enhance convective and evaporative heat transfer along the skin surface. At the upper back,
the much smaller air gap ensures close contact between the PCM packs and the skin surface
to increase conductive cooling.
Figure 4.6 The newly designed PCS (two-layer cooling vest) incorporating PCM packs and
ventilation fans
Adapted from Chan et al. (2017)
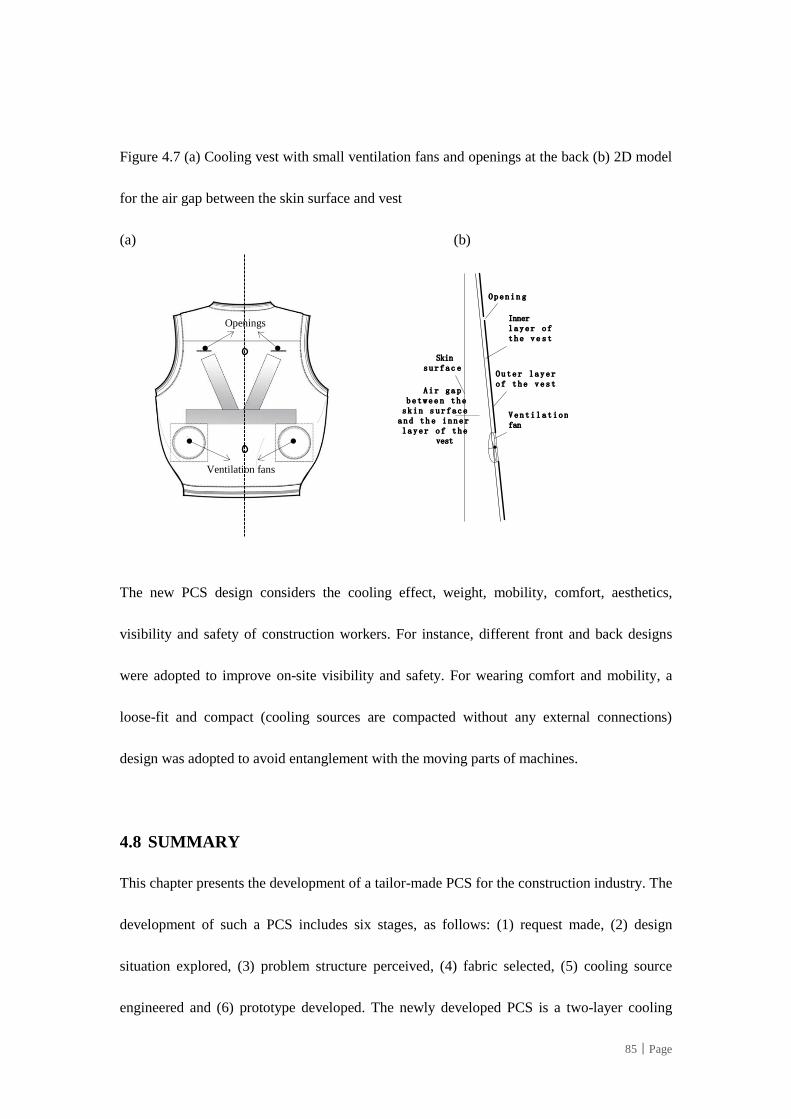
85│Page
Figure 4.7 (a) Cooling vest with small ventilation fans and openings at the back (b) 2D model
for the air gap between the skin surface and vest
(a) (b)
O u t e r l a y e r o f t h e v e s t
V e n t i l a t i o n fan
O p e n i n g
Skin s u r f a c e
Inner l a y e r o f t h e v e s t
A i r g a p b e t w e e n t h e
s k i n s u r f a c e a n d t h e i n n e r l a y e r o f t h e
vest
The new PCS design considers the cooling effect, weight, mobility, comfort, aesthetics,
visibility and safety of construction workers. For instance, different front and back designs
were adopted to improve on-site visibility and safety. For wearing comfort and mobility, a
loose-fit and compact (cooling sources are compacted without any external connections)
design was adopted to avoid entanglement with the moving parts of machines.
4.8 SUMMARY
This chapter presents the development of a tailor-made PCS for the construction industry. The
development of such a PCS includes six stages, as follows: (1) request made, (2) design
situation explored, (3) problem structure perceived, (4) fabric selected, (5) cooling source
engineered and (6) prototype developed. The newly developed PCS is a two-layer cooling
Ventilation fans
Openings
86│Page
vest specifically designed to be worn over the construction uniform that was previously
designed by our research team. The newly designed PCS has hybrid cooling feature, which
includes ventilation fans and PCM packs. The PCS design comprehensively considers the
cooling effect, cooling duration, weight, mobility, comfort, aesthetics, visibility and safety of
construction workers.
87│Page
CHAPTER 5 COOLING CAPACITY OF
PCS4
5.1 INTRODUCTION
In this chapter, the cooling power of the personal cooling system (PCS) was measured and
compared by a sweating thermal manikin in the climate chamber. The PCS incorporates
hybrid cooling sources, namely, ventilation fans and phase change materials (PCMs). Four
test scenarios were included: fan off with no PCMs (Fan-off), fan on with no PCMs (Fan-on),
fan off with completely solidified PCMs (PCM + Fan-off), and fan on with completely
solidified PCMs (PCM + Fan-on).
5.2 MATERIALS AND METHOD
5.2.1 Cooling vest
Two types of PCSs are compared in this chapter, namely, the commercially available
ICEBANK cooling vest (Vest CB) and the other is the newly developed cooling vest (Vest B)
(Yi et al., 2017c). The appearance of Vests CB and B is shown in Figure 5.1. The tested
cooling vests are in the same size and both cooling vests include hybrid cooling sources, i.e.,
a pair of ventilation fans and cooling packs.
4 Presented in a published paper: Yi, W., Zhao, Y., Chan, A.P.C. (2017c). Evaluating the effectiveness of cooling
vest in a hot and humid environment. Annals of Work Exposures and Health, 61(4), 481-494.
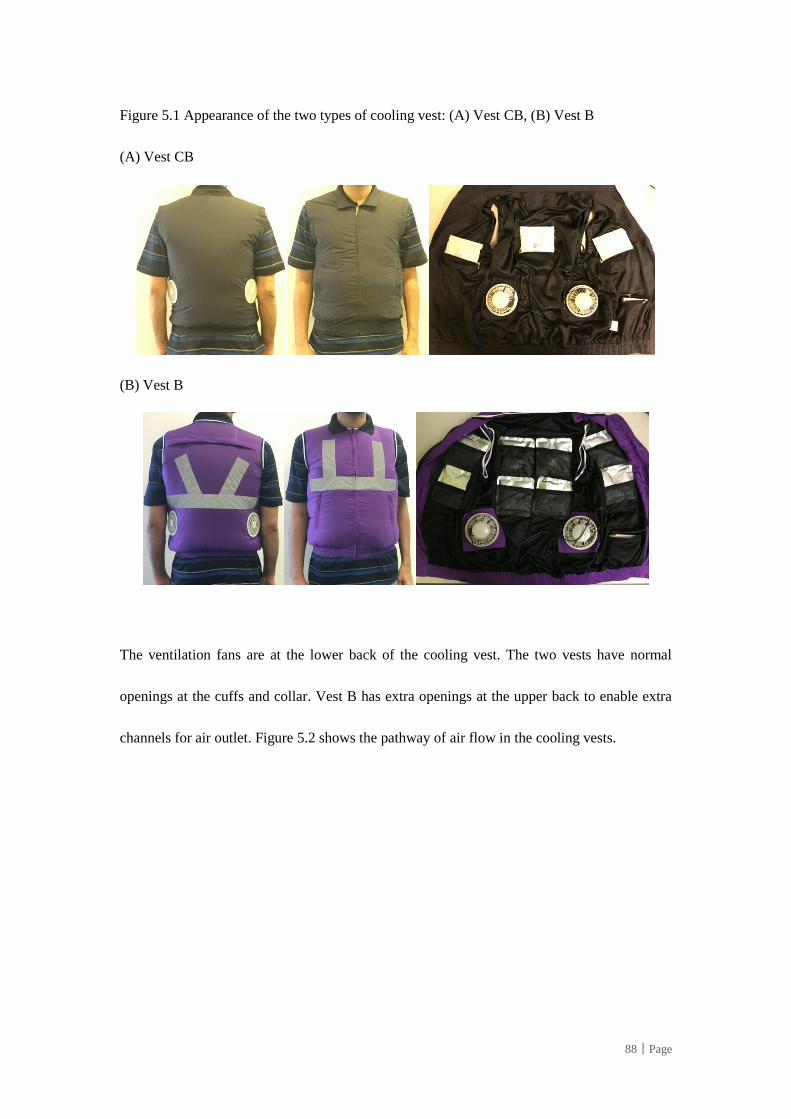
88│Page
Figure 5.1 Appearance of the two types of cooling vest: (A) Vest CB, (B) Vest B
(A) Vest CB
(B) Vest B
The ventilation fans are at the lower back of the cooling vest. The two vests have normal
openings at the cuffs and collar. Vest B has extra openings at the upper back to enable extra
channels for air outlet. Figure 5.2 shows the pathway of air flow in the cooling vests.
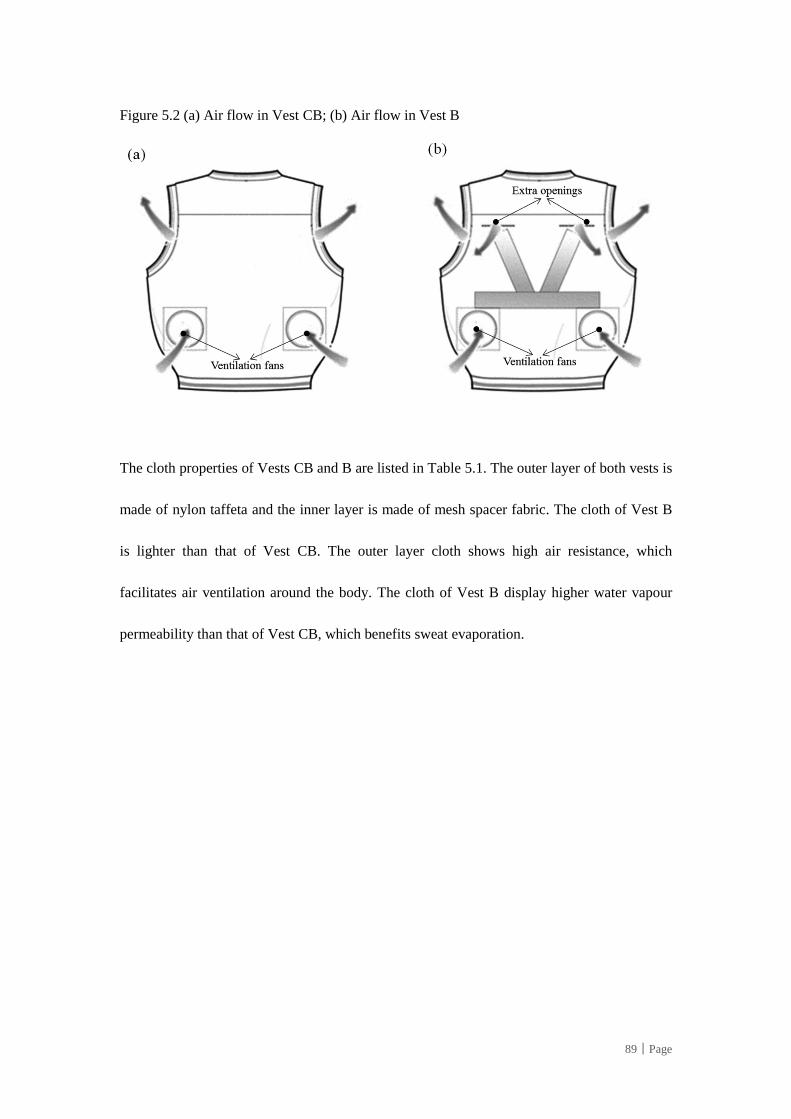
89│Page
Figure 5.2 (a) Air flow in Vest CB; (b) Air flow in Vest B
The cloth properties of Vests CB and B are listed in Table 5.1. The outer layer of both vests is
made of nylon taffeta and the inner layer is made of mesh spacer fabric. The cloth of Vest B
is lighter than that of Vest CB. The outer layer cloth shows high air resistance, which
facilitates air ventilation around the body. The cloth of Vest B display higher water vapour
permeability than that of Vest CB, which benefits sweat evaporation.
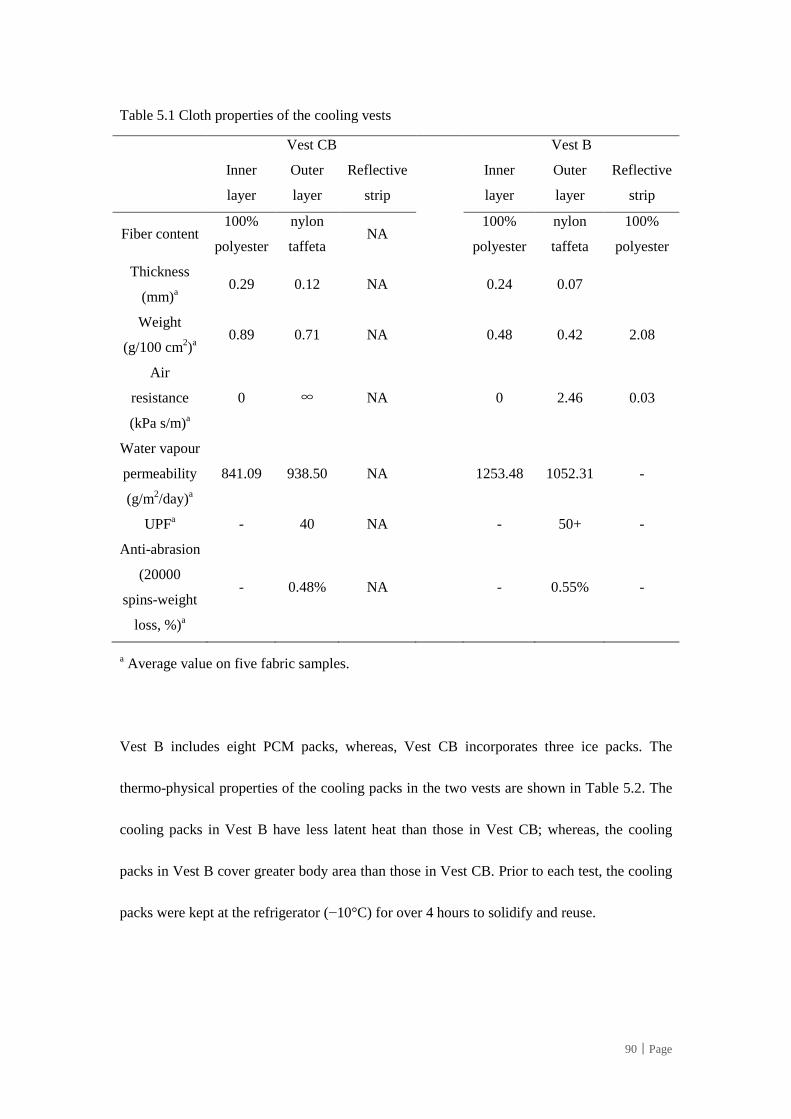
90│Page
Table 5.1 Cloth properties of the cooling vests
Vest CB Vest B
Inner
layer
Outer
layer
Reflective
strip
Inner
layer
Outer
layer
Reflective
strip
Fiber content 100%
polyester
nylon
taffeta NA
100%
polyester
nylon
taffeta
100%
polyester
Thickness
(mm)a
0.29 0.12 NA
0.24 0.07
Weight
(g/100 cm2)
a
0.89 0.71 NA
0.48 0.42 2.08
Air
resistance
(kPa s/m)a
0 ∞ NA
0 2.46 0.03
Water vapour
permeability
(g/m2/day)
a
841.09 938.50 NA
1253.48 1052.31 -
UPFa - 40 NA - 50+ -
Anti-abrasion
(20000
spins-weight
loss, %)a
- 0.48% NA
- 0.55% -
a Average value on five fabric samples.
Vest B includes eight PCM packs, whereas, Vest CB incorporates three ice packs. The
thermo-physical properties of the cooling packs in the two vests are shown in Table 5.2. The
cooling packs in Vest B have less latent heat than those in Vest CB; whereas, the cooling
packs in Vest B cover greater body area than those in Vest CB. Prior to each test, the cooling
packs were kept at the refrigerator (−10°C) for over 4 hours to solidify and reuse.
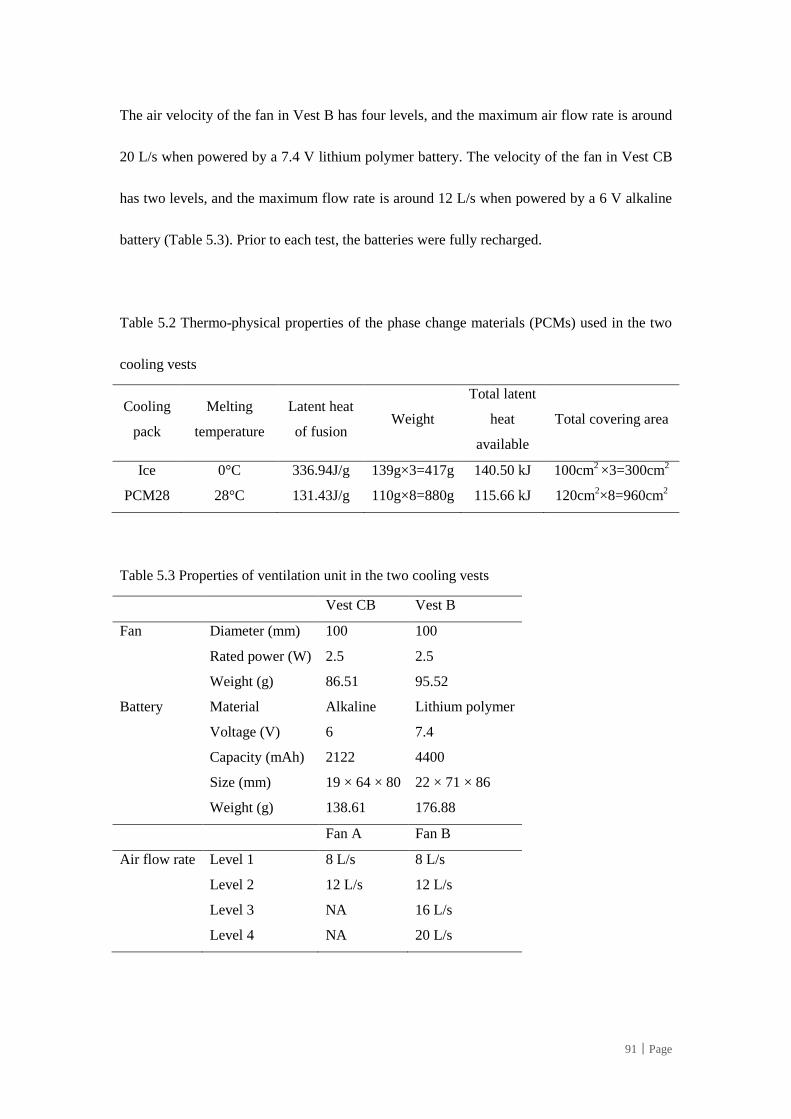
91│Page
The air velocity of the fan in Vest B has four levels, and the maximum air flow rate is around
20 L/s when powered by a 7.4 V lithium polymer battery. The velocity of the fan in Vest CB
has two levels, and the maximum flow rate is around 12 L/s when powered by a 6 V alkaline
battery (Table 5.3). Prior to each test, the batteries were fully recharged.
Table 5.2 Thermo-physical properties of the phase change materials (PCMs) used in the two
cooling vests
Cooling
pack
Melting
temperature
Latent heat
of fusion Weight
Total latent
heat
available
Total covering area
Ice 0°C 336.94J/g 139g×3=417g 140.50 kJ 100cm2 ×3=300cm
2
PCM28 28°C 131.43J/g 110g×8=880g 115.66 kJ 120cm2×8=960cm
2
Table 5.3 Properties of ventilation unit in the two cooling vests
Vest CB Vest B
Fan Diameter (mm) 100 100
Rated power (W) 2.5 2.5
Weight (g) 86.51 95.52
Battery Material Alkaline Lithium polymer
Voltage (V) 6 7.4
Capacity (mAh) 2122 4400
Size (mm) 19 × 64 × 80 22 × 71 × 86
Weight (g) 138.61 176.88
Fan A Fan B
Air flow rate Level 1 8 L/s 8 L/s
Level 2 12 L/s 12 L/s
Level 3 NA 16 L/s
Level 4 NA 20 L/s
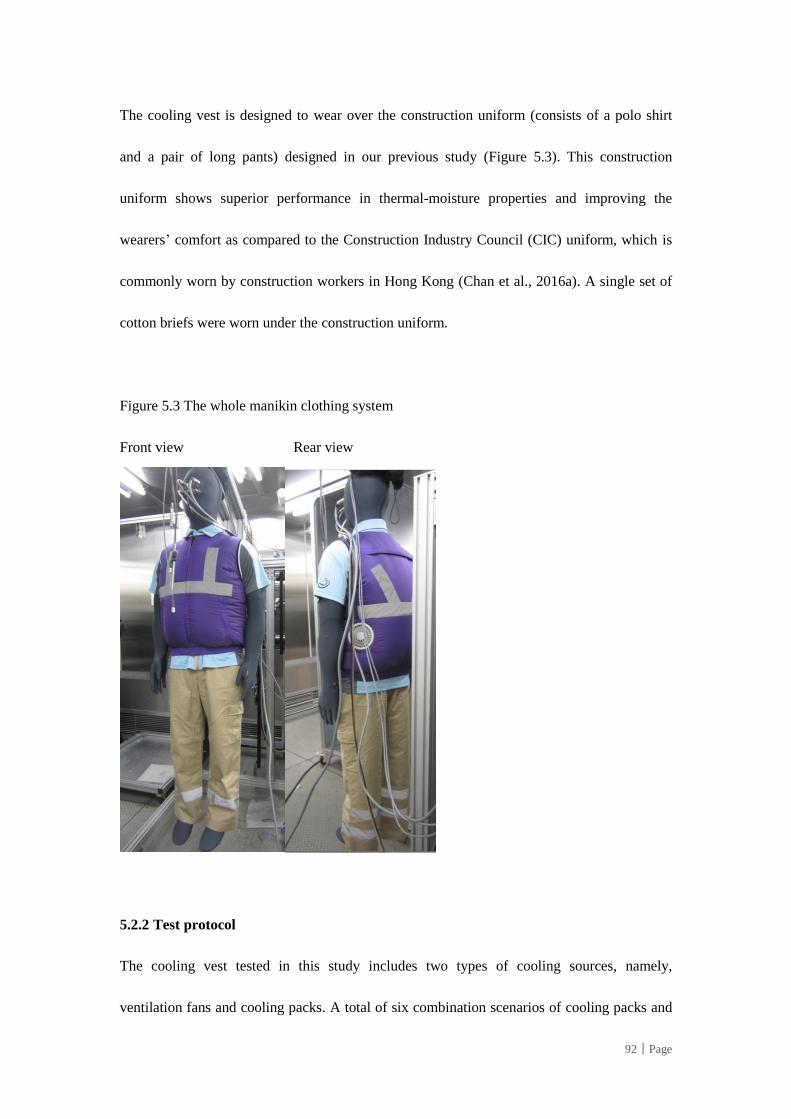
92│Page
The cooling vest is designed to wear over the construction uniform (consists of a polo shirt
and a pair of long pants) designed in our previous study (Figure 5.3). This construction
uniform shows superior performance in thermal-moisture properties and improving the
wearers’ comfort as compared to the Construction Industry Council (CIC) uniform, which is
commonly worn by construction workers in Hong Kong (Chan et al., 2016a). A single set of
cotton briefs were worn under the construction uniform.
Figure 5.3 The whole manikin clothing system
Front view Rear view
5.2.2 Test protocol
The cooling vest tested in this study includes two types of cooling sources, namely,
ventilation fans and cooling packs. A total of six combination scenarios of cooling packs and
93│Page
fans were tested according to standard ASTM F2370 and ASTM F2371 (Table 5.4). A heated
sweating thermal manikin, Newton (Measurement Technology Northwest, Seattle, WA, USA),
was used in this study. A torso fabric skin (100% nylon knitted) that tightly fitted the Newton
was used to simulate torso sweating. The sweating rate was set to 1,200 ml/hr m2 in the
current study to simulate the heavy sweating of human body. The air temperature in the
climate chamber was set at 34°C equal to the manikin surface temperature. This process
ensures that no dry heat loss will occur from the manikin to the ambient environment. Air
velocity was set to 0.4 ± 0.1 m/s. Relative humidity in the chamber was maintained at 60%,
which was the average value collected in the construction field in Hong Kong during the
summer from July 2011 to August 2011 (Wong et al., 2014). Segmental heat losses under
each scenario were recorded at 1-min interval. Each test scenario was repeated thrice on the
thermal manikin and average values were used for data analysis.
Moreover, the thermal insulation of different clothing scenarios was determined by using a
thermal manikin (dry, without sweating skin) under the environment of 19.5 °C, 50 ± 5% RH,
and 0.4 ± 0.1m/s. The manikin surface temperature was maintained at 34 °C. Tests were
carried out according to procedures in ASTM F1291-10 and ISO 15831-2004.
Table 5.4 Test scenarios
Item Description
CU Construction Uniform
Vest CB (Icepack + Fan-on) Construction Uniform + ICEBANK Vest (three ice packs
+ Fan-on)
Vest CB (Fan-on) Construction Uniform + ICEBANK Vest (Fan-on)
94│Page
Item Description
Vest CB (Icepack) Construction Uniform + ICEBANK Vest (three ice packs)
Vest B (PCM28 + Fan-on) Construction Uniform + NEW Vest (eight PCM28 packs
+ Fan-on)
Vest B (Fan-on) Construction Uniform + NEW Vest (Fan-on)
Vest B (PCM28) Construction Uniform + NEW Vest (eight PCM28 packs)
NOTE: The air flow rate of Fan-on in Vest CB is 12 L/s and that of Fan-on in Vest B is 20
L/s.
5.2.3 Calculation and analysis
The cooling power of the torso region was calculated to quantify the cooling capability of the
cooling vests. Torso heat loss Q in W/m2 referred to the area weighted by the six covered
zones, namely, upper chest, shoulders, stomach, mid-back, waist, and lower back. The
baseline test was performed without the cooling source (or the cooling source is turned off).
The cooling capability test was conducted with the cooling source (or the cooling source is
turned on). The cooling power in Fan-on and PCM + Fan-on scenarios was calculated by
deducting the mean steady-state heat loss in Fan-off and completely melted PCM (mPCM) +
Fan-off (i.e., the baseline condition) from the total recorded heat losses in Fan-on and PCM +
Fan-on, respectively. The thermal insulation It in °C·m2/W and evaporative resistance Ret in
kPa·m2/W of different clothing scenarios was further calculated by dry and evaporative heat
loss, respectively.
Then, one way analysis of variance (ANOVA) was performance to analyse the significant
difference in clothing scenarios according to torso cooling. Bonferroni’s post hoc test was
further used to assess the difference between clothing scenarios (Lu et al., 2015). SPSS
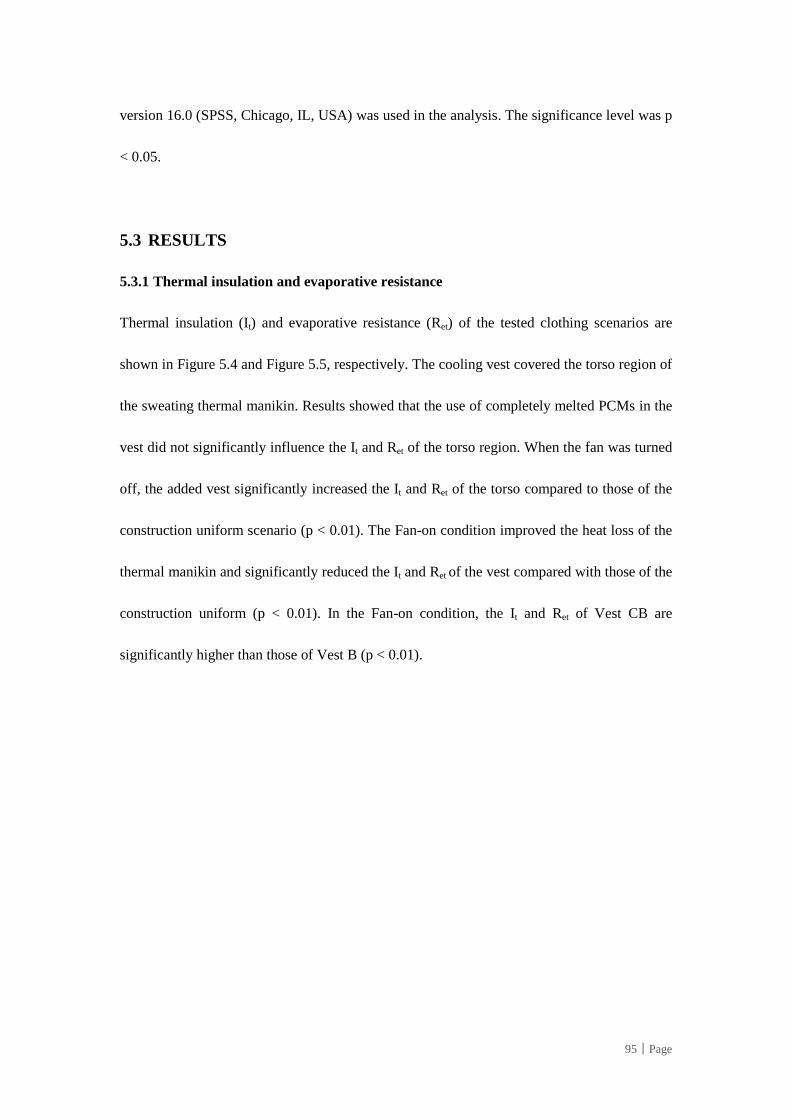
95│Page
version 16.0 (SPSS, Chicago, IL, USA) was used in the analysis. The significance level was p
< 0.05.
5.3 RESULTS
5.3.1 Thermal insulation and evaporative resistance
Thermal insulation (It) and evaporative resistance (Ret) of the tested clothing scenarios are
shown in Figure 5.4 and Figure 5.5, respectively. The cooling vest covered the torso region of
the sweating thermal manikin. Results showed that the use of completely melted PCMs in the
vest did not significantly influence the It and Ret of the torso region. When the fan was turned
off, the added vest significantly increased the It and Ret of the torso compared to those of the
construction uniform scenario (p < 0.01). The Fan-on condition improved the heat loss of the
thermal manikin and significantly reduced the It and Ret of the vest compared with those of the
construction uniform (p < 0.01). In the Fan-on condition, the It and Ret of Vest CB are
significantly higher than those of Vest B (p < 0.01).
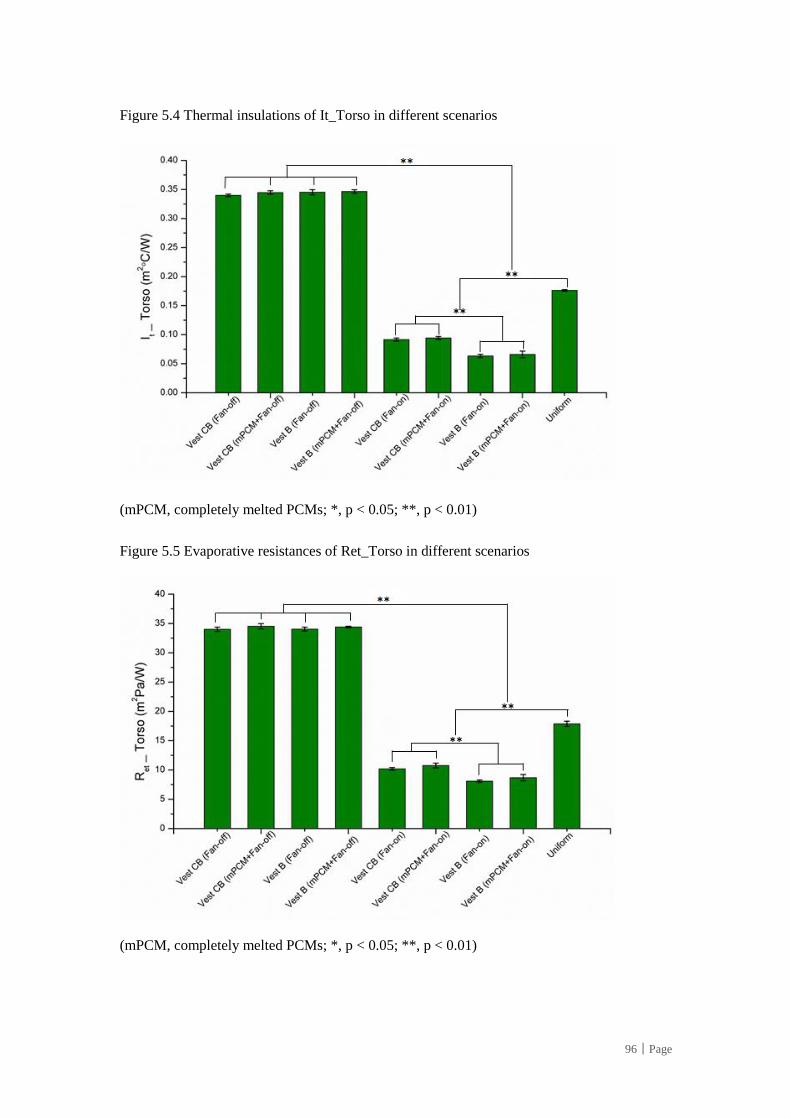
96│Page
Figure 5.4 Thermal insulations of It_Torso in different scenarios
(mPCM, completely melted PCMs; *, p < 0.05; **, p < 0.01)
Figure 5.5 Evaporative resistances of Ret_Torso in different scenarios
(mPCM, completely melted PCMs; *, p < 0.05; **, p < 0.01)
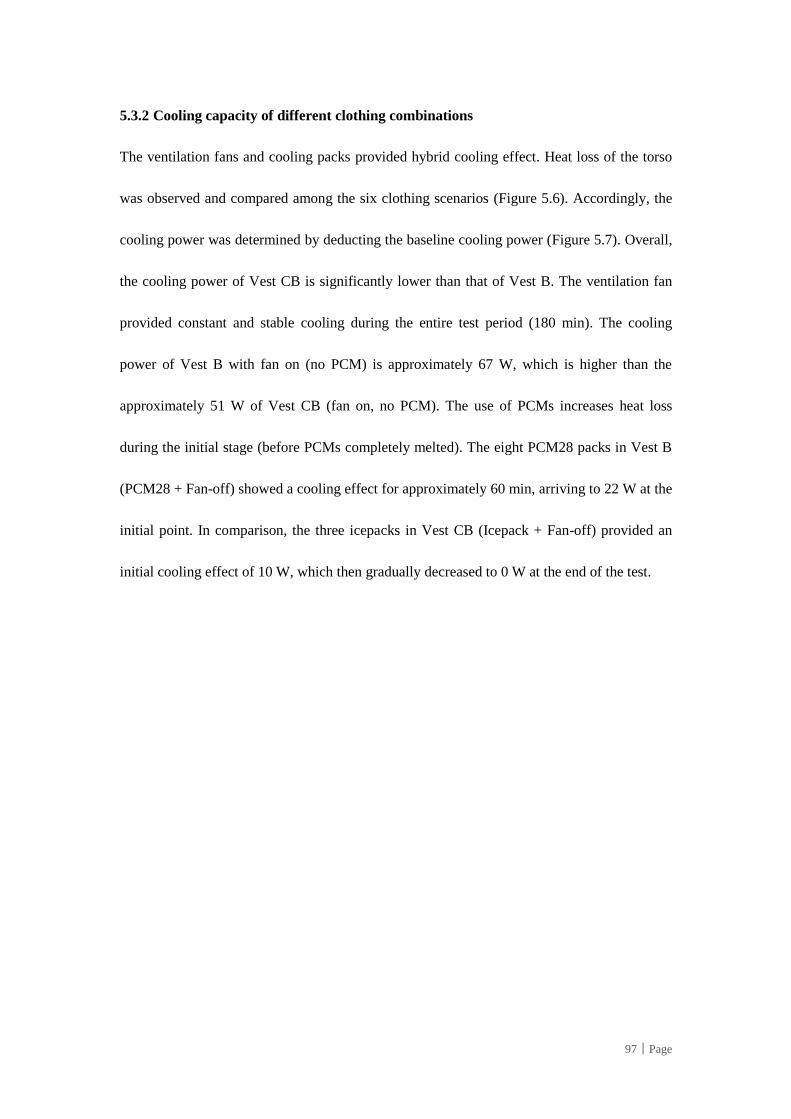
97│Page
5.3.2 Cooling capacity of different clothing combinations
The ventilation fans and cooling packs provided hybrid cooling effect. Heat loss of the torso
was observed and compared among the six clothing scenarios (Figure 5.6). Accordingly, the
cooling power was determined by deducting the baseline cooling power (Figure 5.7). Overall,
the cooling power of Vest CB is significantly lower than that of Vest B. The ventilation fan
provided constant and stable cooling during the entire test period (180 min). The cooling
power of Vest B with fan on (no PCM) is approximately 67 W, which is higher than the
approximately 51 W of Vest CB (fan on, no PCM). The use of PCMs increases heat loss
during the initial stage (before PCMs completely melted). The eight PCM28 packs in Vest B
(PCM28 + Fan-off) showed a cooling effect for approximately 60 min, arriving to 22 W at the
initial point. In comparison, the three icepacks in Vest CB (Icepack + Fan-off) provided an
initial cooling effect of 10 W, which then gradually decreased to 0 W at the end of the test.
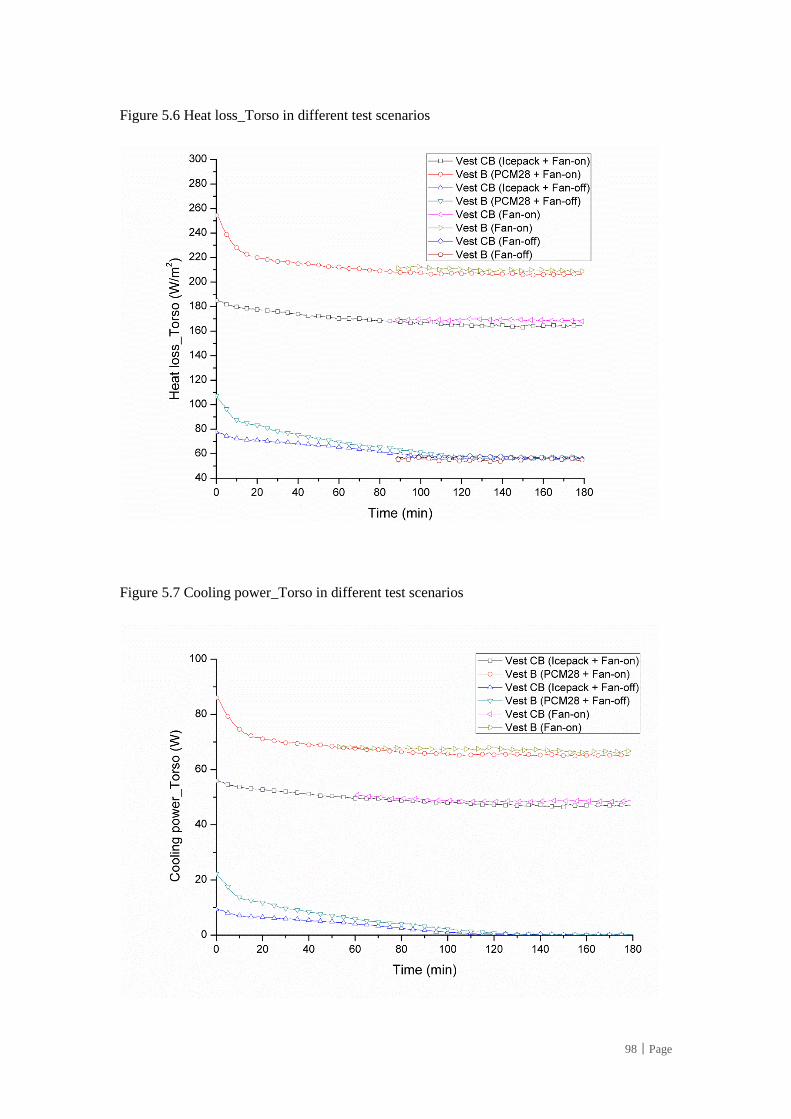
98│Page
Figure 5.6 Heat loss_Torso in different test scenarios
Figure 5.7 Cooling power_Torso in different test scenarios
99│Page
5.4 DISCUSSION
5.4.1 Efficiency of the hybrid cooling vest
The cooling power of different clothing scenarios were measured and compared inside the
environmental chamber under 34°C temperature, 60% RH, and 0.4 m/s air velocity, which
simulated a mean weather condition of construction sites in Hong Kong during summer
(recorded in July to September 2010–2011) (Wong et al., 2014). The cooling vests used in the
present study are effective in such a hot and humid environment. Results show that Vest B
(newly designed cooling vest) has significantly higher cooling power than Vest CB
(commercially available cooling vest). In the Fan-on + PCM condition, before the PCM is
completely melted, the vest provided two types of cooling sources, namely, PCM and
ventilation fan, thereby improving both conductive and evaporative heat transfer. Another
study by Kim et al. (2011) applied hybrid cooling in human trials where they combined liquid
cooling garments (LCGs) with ventilation air; they determined that the hybrid cooling
garment significantly reduced heat strain and improved exercise performance in a hot
environment (35°C, 50% RH). This hybrid cooling garment (LCG/PCM enhances conductive
heat transfer and ventilation fan enhances evaporative heat transfer) is quite similar to air
cooling garments (ACGs) with cooled inlet air, which is connected to an external cooling
device, thus promoting the circulation of the cooled air around the body. Previous studies on
human tests demonstrated that ACGs with cooled inlet air at certain considerably low flow
rates, such as 12°C at 9.17 L/s (McLellan et al., 1999), 13°C at 4.67 L/s (Vallerand et al.,
1991), and 20°C to 27°C at 7.075 L/s (Pimental et al., 1987), have significantly reduced heat
strain and substantially enhanced the subjects’ heat tolerance. ACGs with cooled air can still
100│Page
be effective in extremely hot environment, such as 49°C and 20% RH (Pimental et al., 1987),
40°C and 30% RH (McLellan et al., 1999), and 37°C and 50% RH (Vallerand et al., 1991).
5.4.2 Cooling efficiency of ventilation fan
The ventilation fans in the vest blew the ambient air on the skin and increased the torso heat
loss compared to those in the Fan-off condition. The ventilation fan increases the air velocity
around the torso, which alters the evaporative heat transfer coefficient (Candas et al., 1979;
Zhao et al., 2013b). Thus, evaporative cooling is enhanced because of the increased
evaporative heat transfer coefficient (Zhao et al., 2013b). Under 34°C, 60% RH, Vest B had a
275% increase in torso heat loss compared to that of the Fan-off condition; Vest CB had a 200%
increase in torso heat loss. These results are comparable to previous manikin test studies. The
air velocity of the ventilation fan is 20 L/s in Vest B and 12 L/s in Vest CB. Zhao et al.
(2013b) determined that the short-sleeved air jacket had an increase of 205% heat loss in the
torso region in comparison with that of the Fan-off condition in a 34°C, 60% RH environment.
Lu et al. (2015) used the ventilation unit on a long-sleeved jacket and determined a 160%
increase of heat loss in the upper body region in a hot and humid condition (34°C, 75% RH).
They also determined a considerable increase of 184% heat loss in a hot and dry condition
(34°C, 28% RH). The air velocity of the fans in the studies of Zhao et al. (2013b) and Lu et al.
(2015) was at 12 L/s. The high cooling efficiency of the ventilation fan in a hot and dry
environment is driven by the considerably large water vapour pressure gradient between the
wet fabric skin and the ambient (Lu et al., 2015; Zhao et al., 2013b). Based on Xu and
101│Page
Gonzalez’s (2011) model, the cooling capacity of an air ventilation garment on a sweating
thermal manikin decreases as the ambient air temperature or relative humidity increases.
The cooling power measured on the thermal manikin is regarded as a physical property, and
its actual effectiveness in reducing heat strain from the human body is further evaluated in
physiological studies (Xu and Gonzalez, 2011). Researchers have demonstrated the cooling
effectiveness of the ACG ventilating ambient air around the body with different air flow rates
under hot environments, such as, 6.2 L/s under 45°C, 10% RH (Barwood et al., 2009b);
approximately 6 L/s under 40 °C, 20% RH, 30°C, 50% RH, and 35°C, 75% RH (Chinevere et
al., 2008); and 5.7 L/s under 32°C, 40% RH. The ACGs airflow rate and ambient
environment can have an effect on the cooling capacity (Xu and Gonzalez, 2011).
5.4.3 Cooling efficiency of PCM
The PCM inserted in the vests enabled an additional cooling mechanism through conductive
heat transfer (Zhao et al., 2013a). The melting temperature of PCMs is lower than the skin
temperature, thus the temperature gradient between them enhanced the heat loss from the
body. Generally, a minimum of 6°C temperature gradient is required when the PCM vests are
used in a hot environment (Gao et al., 2010). The initial cooling power provided by the PCMs
of Vest B seems higher than that of Vest CB; the cooling duration is almost similar between
the two vests. The PCM28 in Vest B had a larger covering area and more mass amount but
less latent heat and higher melting temperature than those of the icepacks in Vest CB.
Reinertsen et al. (2008) demonstrated that the distribution and number of PCM packs can
102│Page
determine the heat strain alleviation of similar PCM vests. Hence, “the higher the
temperature gradient, the greater the cooling area and the higher cooling rate” (Gao et al.,
2010). The mass and latent heat of capacities of PCMs mainly influence the duration of the
cooling effect (Gao et al., 2010). The PCMs in Vest B are different from the icepack in Vest
CB in terms of comprehensive factors, including vest design and the number and distribution
of PCM packs.
Under a different environment, the PCM vest exhibits a different performance in reducing
heat stress. When applied in a dry or moderately dry environment, the cooling effect of the
PCM vests is not significant, because the evaporative heat loss in the baseline situation could
have played an effective role (Lu et al., 2015; Zhao et al., 2013b). The cooling efficiency of
PCMs is better in a hot and humid environment than in a hot and dry one (Lu et al., 2015).
This finding is the opposite of the cooling effect of the ventilation fan garment, which
exhibits better performance in a relatively dry environment (Lu et al., 2015; Xu and Gonzalez,
2011). Thus, the hybrid vest, which is a combination of PCMs and ventilation fans, is a better
alternative for use in a range of conditions.
5.4.4 Industrial applications
In this study, cooling power was calculated by comparing the manikin heat loss in the Fan-on
(with/without PCMs) and Fan-off (with/without completely melted PCMs) conditions.
However, this result cannot be thought of equivalent to that in human tests (Xu and Gonzalez,
2011). The extra weight added by the cooling garment increases metabolic heat production,
103│Page
which may compensate the cooling effect. Wang et al. (2013) reported that the 6.5 kg
additional weight of protective clothing (e.g., firefighting clothing) raised the human
metabolic rate by approximately 20 W/m2. The total weight of the cooling vest (including 8
PCM packs and 1 ventilation unit) developed in the present study is 1.26 kg, which resulted in
an estimated increase of 3.88 W/m2 metabolic rate (assuming the relationship between the
added clothing weight and human metabolic rate is linear, that is, 6.98 W for an average man
of 1.8 m2 surface area) (Lu et al., 2015). Meanwhile, the cooling power of Vest B in the
Fan-on and Fan-on + PCM conditions tested in this study was approximately 67 W and 86 to
67 W, respectively, thereby exhibiting high cooling performance during the entire 3 hours.
Given that construction workers are generally required to complete intensive construction
work in a hot outdoor environment, a cooling vest designed with the cooling power
considerably higher than the increased metabolic rate that its weight brings can be easier for
the user to accept (Lu et al., 2015).
Apart from the added weight, insulation parameter including the evaporative and thermal
resistance of the overall clothing is another factor that should be considered when the cooling
vest is applied in practical situations. The added clothing layer of the vest increased both
evaporative and thermal resistance compared to those of the construction uniform (t-shirt +
pair of pants) only. When the fan is turned on, this situation is significantly improved, that is,
the evaporative resistance from 34 m2Pa/W in the Fan-off condition to 12 m
2Pa/W in the
Fan-on condition is considerably lower than that of the construction uniform condition (16
m2Pa/W). The cooling vest in this study exhibited high performance in terms of cooling
104│Page
power and insulation on the sweating manikin. However, further comparison of human
responses with and without the cooling vest is necessary to determine its actual cooling
effectiveness.
5.5 SUMMARY
This chapter compares the cooling performance of the newly developed cooling vest with that
of a commercially available cooling vest on the sweating thermal manikin. The hybrid
cooling vest includes PCM packs and a pair of ventilation fans compacted in the vest without
any external connection. Without cooling sources (no PCM and the fan was turned off), the
newly designed vest has similar insulation performance in the torso region (i.e., thermal
insulation and evaporative resistance) with the commercially available vest (approximately
0.36 m2°C /W thermal insulation and 34 m
2Pa/W evaporative resistance). In the Fan-on
condition, the insulation parameter of the newly designed vest is significantly lower than that
of the commercial one (p < 0.01). In the PCM + Fan-on condition, the vest provides two
cooling sources, exhibiting 86 W to 67 W cooling power in the newly designed vest and 56 W
to 49 W cooling power in the commercial one.
Overall, the sweating manikin tests in this chapter show that the newly designed cooling vest
exhibits better cooling power than the commercial one. Human wear trials in the laboratory
and real work settings should be conducted (shown in the following chapters) to
comprehensively evaluate the newly designed cooling vest and promote its application in the
construction industry.
105│Page
CHAPTER 6 OPTIMAL COOLING
INTERVENTION WITH PCS5
6.1 INTRODUCTION
This chapter examines the effectiveness of the newly designed personal cooling system (PCS) (i.e.
a hybrid cooling vest) in alleviating physiological and perceptual strains in a climatic chamber
that is set to 37 °C air temperature and 60% relative humidity to simulate a typical summer
working environment of construction sites in Hong Kong. Human wear trials were performed
with a work–rest protocol inside the climate chamber. Physiological and perceptual responses of
human subjects were measured. The effectiveness of the cooling intervention with the newly
designed cooling vest during work and/or rest period (VEST) was compared with that of the
control condition without any cooling (CON).
6.2 PARTICIPANTS AND PROTOCOL I
Protocol I was first proposed with the hypotheses that (1) PCS could reduce heat strain during
exercise, (2) PCS could reduce heat strain during recovery, and (3) PCS could enhance work
performance (prolong exercise duration). A total of ten healthy male university students
participated in Protocol I (mean ± SD: age 23 ± 3.51 years; height 169 ± 4.63 cm; body mass 60 ±
7.55 kg; BMI 21.12 ± 2.17; resting heart rate 73 ± 5 beats/min). They have no history of
diagnosed major health problem including diabetes, hypertension, cardiovascular disease,
5 Presented in a published paper: Yi, W., Zhao, Y., Chan, A.P.C., Lam, E.W.M. (2017d). Optimal cooling intervention
for construction workers in a hot and humid environment. Building and Environment, 118, 91-100.
106│Page
neurological problem, and regular medication intake. All participants took exercises two or three
times per week and were thought of physically active. They were asked to refrain from any
medication/drug, smoking, caffeinated products or alcohol use, and doing intense exercises for at
least 4 hours prior to each test. Participants were briefed on the study protocol. They signed a
consent form approved by the University's Human Subjects Ethics Sub-committee. They were
informed to avoid any smoking, medication/drug, alcohol use or caffeinated products, and
intensive exercises for at least 24 h before each test.
Each participant undertook two experimental trials on separate days spaced at around one week (7
to 9 days), at the same time in the afternoon (to avoid circadian variation) (Price et al., 2009).
Trials were conducted in a counter-balanced order and consisted of a repeated measures design in
which subjects served as their own controls. Trials included VEST and CON, and were conducted
in an environmental chamber. The whole protocol included 30 min pre-exercise rest, exercise (a
period of 48 min intermittent jogging/walking), and post-exercise recovery (6 min active recovery
and 30 min passive recovery) (Figure 6.1). In VEST, the cooling vest was used throughout the
entire exercise and recovery periods. While in CON condition, no cooling vest was applied.
Intermittent running was designed since construction work is largely intermittent in nature
(Rappaport et al., 2003). Exercise intensities were designed based on the oxygen consumption of
rebar workers captured in construction sites during hot summer in our previous studies, which
ranged from 3.17 to 30.8 ml/min/kg and averaged 13.5 ± 4.9 ml/min/kg (Chan et al., 2012c). The
6 km/h with 8% slope corresponds to the estimated oxygen consumption of 30.7 ml/min/kg; 3
km/h with 2% slope corresponds to the estimated oxygen consumption of 10.3 ml/min/kg (ACSM,
2013). During exercise, participants stopped the exercise and progressed to recovery when any of
the following circumstances occurred: (i) Tc reached 38.5°C; (ii) HR reached 95% of the
age-predicted maximum HR (age-predicted maximum HR = 220 – age); (iii) participant
requested to stop (due to difficulty in breathing, feeling very hot, or exhaustion); or (iv) they
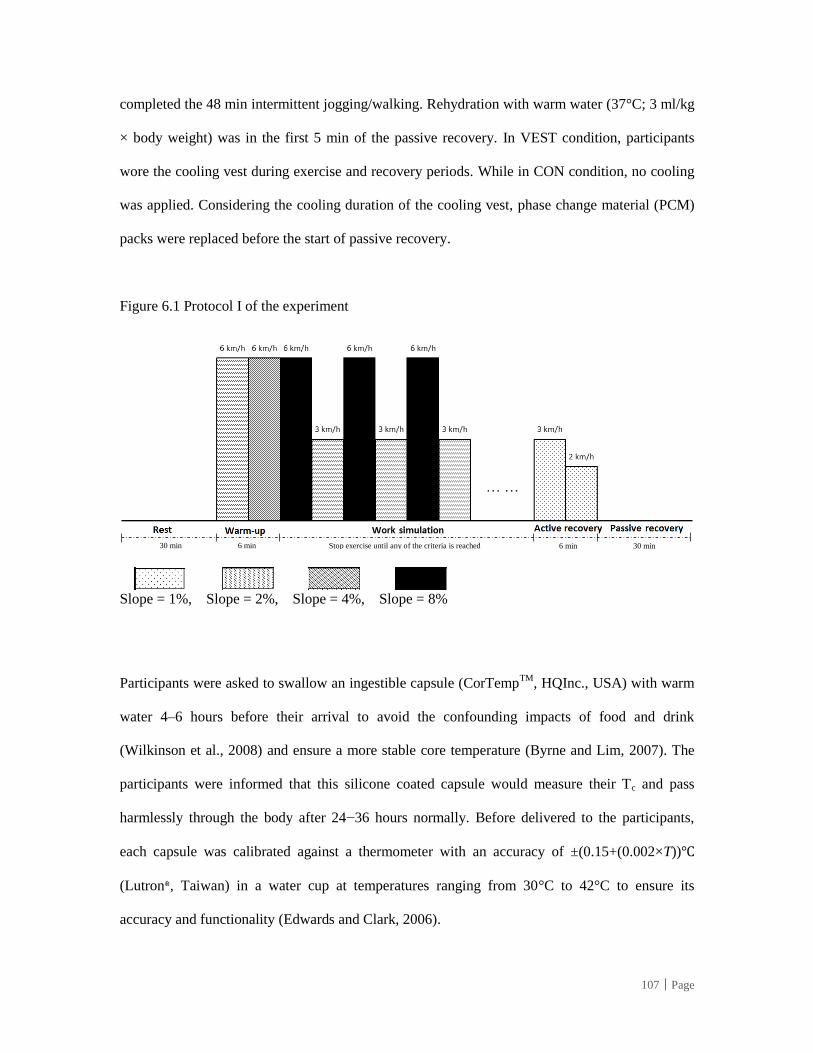
107│Page
completed the 48 min intermittent jogging/walking. Rehydration with warm water (37°C; 3 ml/kg
× body weight) was in the first 5 min of the passive recovery. In VEST condition, participants
wore the cooling vest during exercise and recovery periods. While in CON condition, no cooling
was applied. Considering the cooling duration of the cooling vest, phase change material (PCM)
packs were replaced before the start of passive recovery.
Figure 6.1 Protocol I of the experiment
Slope = 1%, Slope = 2%, Slope = 4%, Slope = 8%
Participants were asked to swallow an ingestible capsule (CorTempTM
, HQInc., USA) with warm
water 4–6 hours before their arrival to avoid the confounding impacts of food and drink
(Wilkinson et al., 2008) and ensure a more stable core temperature (Byrne and Lim, 2007). The
participants were informed that this silicone coated capsule would measure their Tc and pass
harmlessly through the body after 24−36 hours normally. Before delivered to the participants,
each capsule was calibrated against a thermometer with an accuracy of ±(0.15+(0.002×T))℃
(Lutron○R, Taiwan) in a water cup at temperatures ranging from 30°C to 42°C to ensure its
accuracy and functionality (Edwards and Clark, 2006).
Stop exercise until any of the criteria is reached 6 min 30 min 30 min 6 min
… …
108│Page
At the beginning of the experiment session, the participant was briefed on the protocol of the
experiment and signed a consent form approved by the University’s Human Subjects Ethics
Sub-committee. The participant then consumed 3 ml/kg body weight of warm water at 37.00 ±
0.18°C. Afterwards, the participant was asked to take off his own clothes, weigh body mass (with
only underwear), and put on the experimental uniform. In the test, this newly designed cooling
vest was worn over the construction uniform, consisting of a T-shirt and a pair of long pants. The
specification of the uniform has been used as an industry standard to help workers combat heat
stress (Chan et al., 2016a). The participant was also equipped with a HR belt (Polar T34
Transmitter, Finland), CorTemp data logger (CorTempTM
, HQInc., USA), thermistor sensors
(LT8A, Gram Co., Japan), and microclimate humidity sensors (Especmic, Japan) for recording
the heart rate, the core temperature, the skin temperatures, and the microclimate humidity,
respectively.
The participant then entered the environmental chamber, which was set to 37°C temperature, 60%
relative humidity, 0.3 m/s air velocity, and solar radiation of 450 W/m2 to simulate the typical
summer working environment of construction sites in Hong Kong (Yi et al., 2017a). The
environmental chamber (LabTester, KSON, Taiwan) has a dimension of 3 m × 2.5 m × 2.2 m
(length × width × height). The WBGT monitor was set in the chamber to ensure that the
environment had reached 36.1°C WBGT, which is a typically recorded value in the construction
sites (Chan et al., 2012a; Wong et al., 2014). The subject remained seated in the environmental
chamber for 30 minutes for the stabilization of muscle and core temperature. After the
stabilization period, the participant performed intermittent running on a motorized treadmill
(h/p/cosmos○R pulsar, Germany).
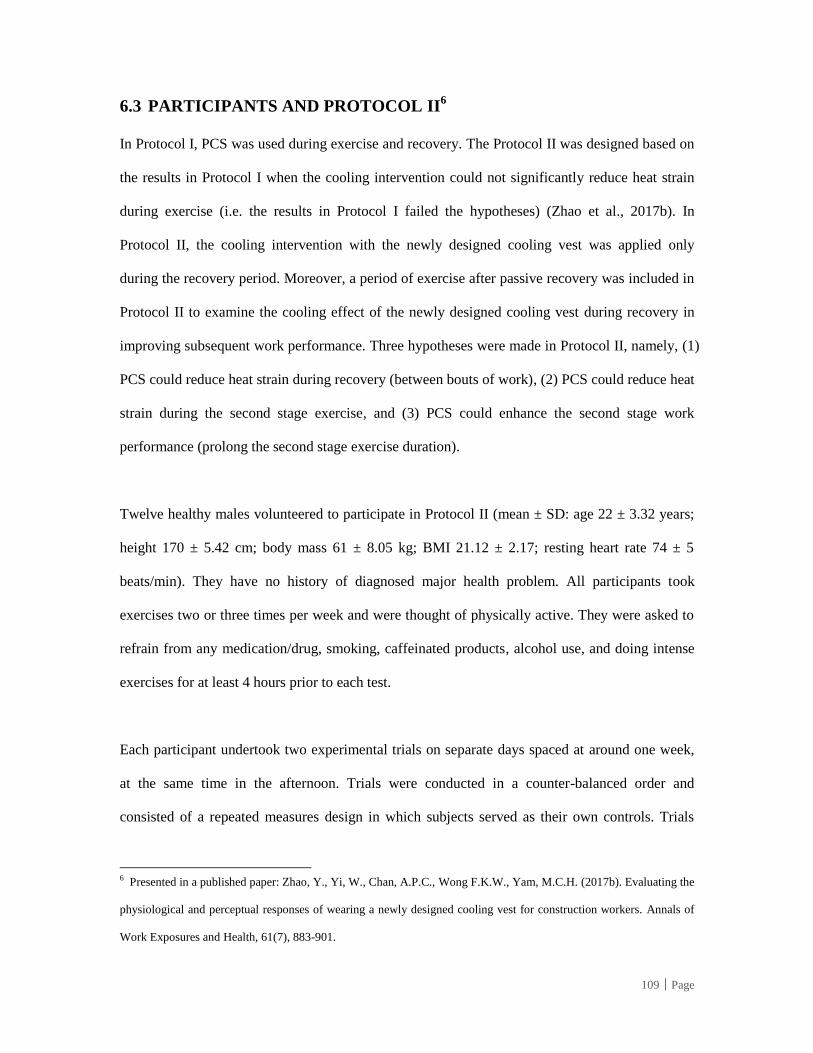
109│Page
6.3 PARTICIPANTS AND PROTOCOL II6
In Protocol I, PCS was used during exercise and recovery. The Protocol II was designed based on
the results in Protocol I when the cooling intervention could not significantly reduce heat strain
during exercise (i.e. the results in Protocol I failed the hypotheses) (Zhao et al., 2017b). In
Protocol II, the cooling intervention with the newly designed cooling vest was applied only
during the recovery period. Moreover, a period of exercise after passive recovery was included in
Protocol II to examine the cooling effect of the newly designed cooling vest during recovery in
improving subsequent work performance. Three hypotheses were made in Protocol II, namely, (1)
PCS could reduce heat strain during recovery (between bouts of work), (2) PCS could reduce heat
strain during the second stage exercise, and (3) PCS could enhance the second stage work
performance (prolong the second stage exercise duration).
Twelve healthy males volunteered to participate in Protocol II (mean ± SD: age 22 ± 3.32 years;
height 170 ± 5.42 cm; body mass 61 ± 8.05 kg; BMI 21.12 ± 2.17; resting heart rate 74 ± 5
beats/min). They have no history of diagnosed major health problem. All participants took
exercises two or three times per week and were thought of physically active. They were asked to
refrain from any medication/drug, smoking, caffeinated products, alcohol use, and doing intense
exercises for at least 4 hours prior to each test.
Each participant undertook two experimental trials on separate days spaced at around one week,
at the same time in the afternoon. Trials were conducted in a counter-balanced order and
consisted of a repeated measures design in which subjects served as their own controls. Trials
6 Presented in a published paper: Zhao, Y., Yi, W., Chan, A.P.C., Wong F.K.W., Yam, M.C.H. (2017b). Evaluating the
physiological and perceptual responses of wearing a newly designed cooling vest for construction workers. Annals of
Work Exposures and Health, 61(7), 883-901.
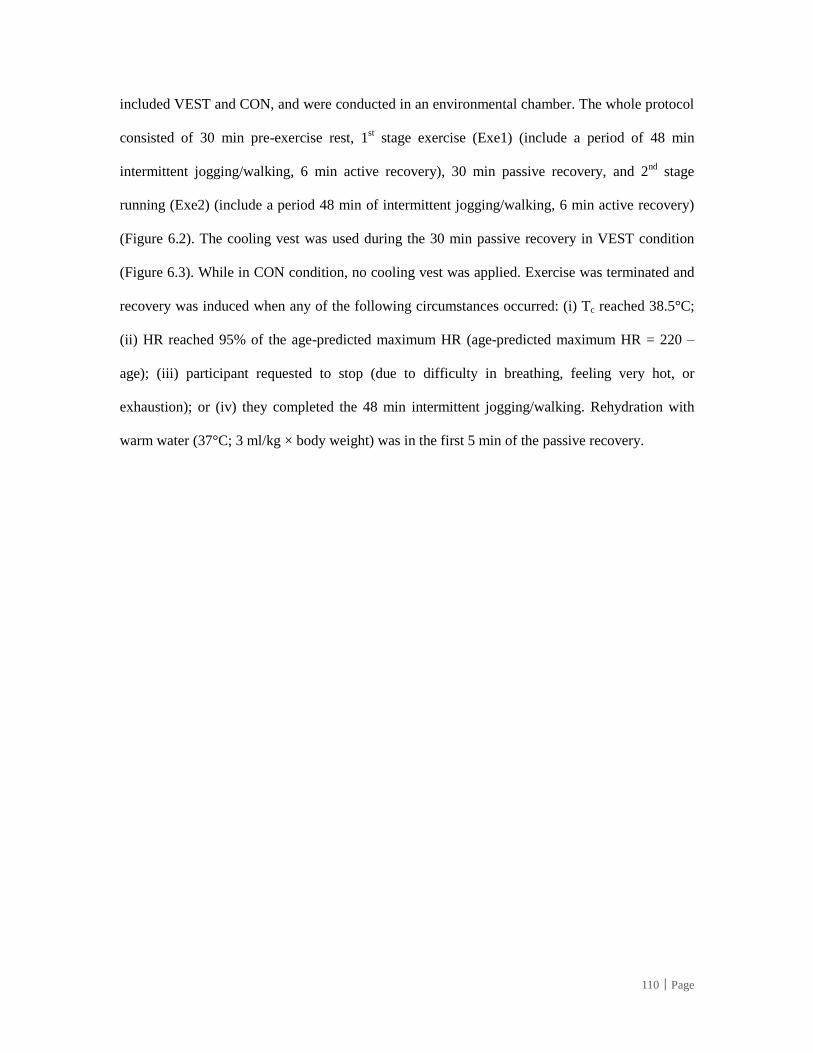
110│Page
included VEST and CON, and were conducted in an environmental chamber. The whole protocol
consisted of 30 min pre-exercise rest, 1st stage exercise (Exe1) (include a period of 48 min
intermittent jogging/walking, 6 min active recovery), 30 min passive recovery, and 2nd
stage
running (Exe2) (include a period 48 min of intermittent jogging/walking, 6 min active recovery)
(Figure 6.2). The cooling vest was used during the 30 min passive recovery in VEST condition
(Figure 6.3). While in CON condition, no cooling vest was applied. Exercise was terminated and
recovery was induced when any of the following circumstances occurred: (i) Tc reached 38.5°C;
(ii) HR reached 95% of the age-predicted maximum HR (age-predicted maximum HR = 220 –
age); (iii) participant requested to stop (due to difficulty in breathing, feeling very hot, or
exhaustion); or (iv) they completed the 48 min intermittent jogging/walking. Rehydration with
warm water (37°C; 3 ml/kg × body weight) was in the first 5 min of the passive recovery.
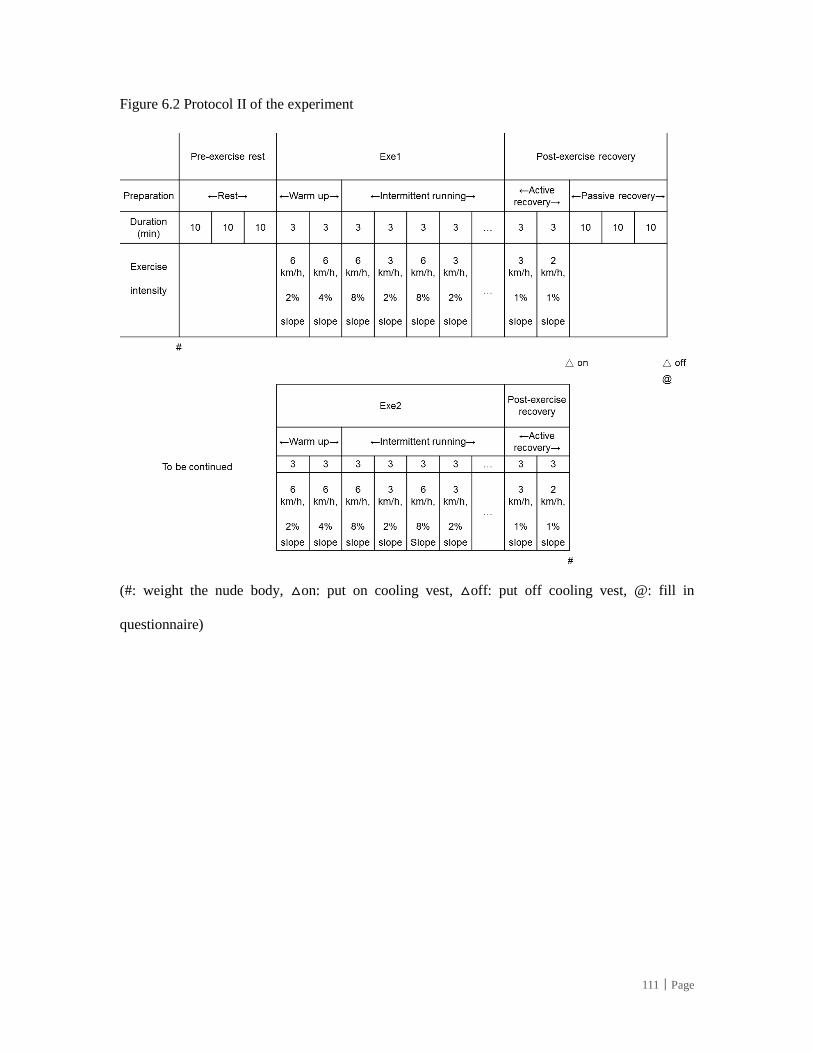
111│Page
Figure 6.2 Protocol II of the experiment
(#: weight the nude body, △on: put on cooling vest, △off: put off cooling vest, @: fill in
questionnaire)
112│Page
Figure 6.3 Cooling vest worn during the passive recovery
6.4 MEASUREMENTS AND CALCULATION
6.4.1 Physiological measurements
Physiological data, including heart rate, core temperature, skin temperature, and microclimatic
temperature and humidity were recorded at a sampling frequency of 30 s throughout the entire
experiment. Core temperature was measured by a CorTemp data logger (CorTempTM
, HQInc.,
USA) inside a bum bag, which was fastened around the participant’s waist. A small digital
camera was also connected to the data logger in order to monitor core temperature during the
experiment. Heart rate was measured by a Polar® heart rate watch and a chest strap (Polar T34
Transmitter, Finland). Microclimate temperature and humidity at two locations (i.e., chest and
back) were also continuously recorded using the microclimate sensor attached between the
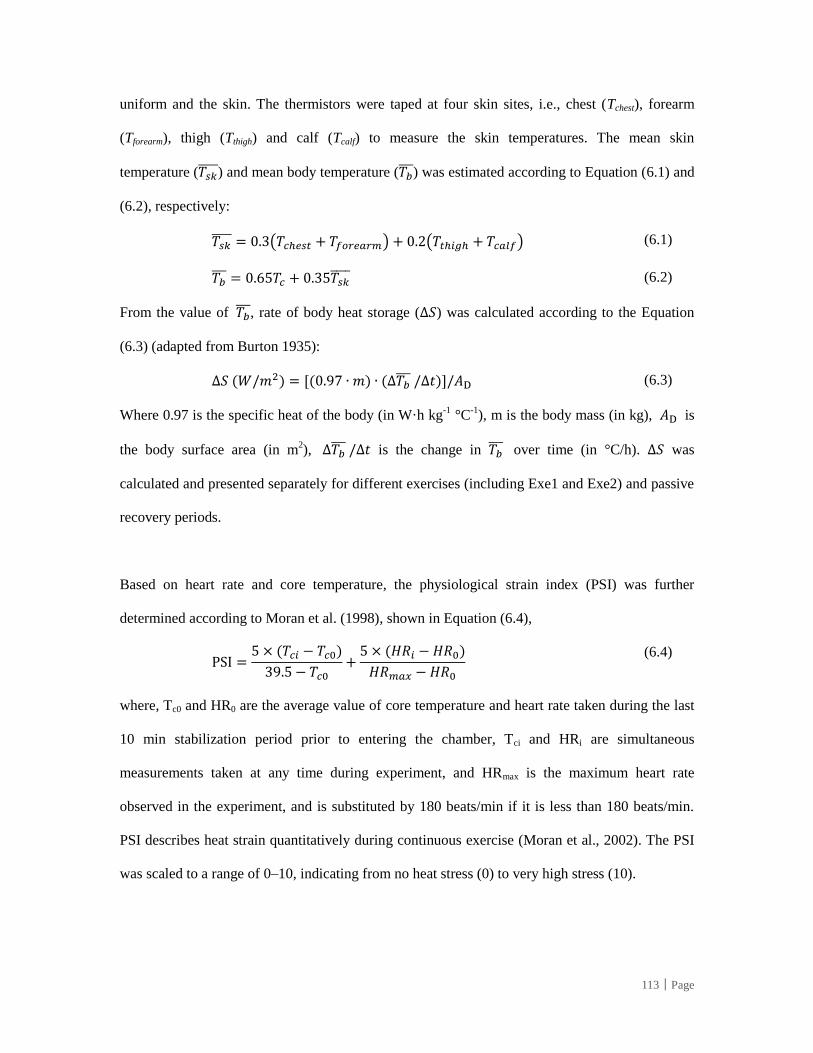
113│Page
uniform and the skin. The thermistors were taped at four skin sites, i.e., chest (Tchest), forearm
(Tforearm), thigh (Tthigh) and calf (Tcalf) to measure the skin temperatures. The mean skin
temperature (𝑇𝑠𝑘 ) and mean body temperature (𝑇𝑏
) was estimated according to Equation (6.1) and
(6.2), respectively:
𝑇𝑠𝑘 = 0.3(𝑇𝑐ℎ𝑒𝑠𝑡 + 𝑇𝑓𝑜𝑟𝑒𝑎𝑟𝑚) + 0.2(𝑇𝑡ℎ𝑖𝑔ℎ + 𝑇𝑐𝑎𝑙𝑓) (6.1)
𝑇𝑏 = 0.65𝑇𝑐 + 0.35𝑇𝑠𝑘
(6.2)
From the value of 𝑇𝑏 , rate of body heat storage (∆𝑆) was calculated according to the Equation
(6.3) (adapted from Burton 1935):
∆𝑆 (𝑊/𝑚2) = [(0.97 ∙ 𝑚) ∙ (∆𝑇𝑏 /∆𝑡)]/𝐴D (6.3)
Where 0.97 is the specific heat of the body (in W·h kg-1
°C-1
), m is the body mass (in kg), 𝐴D is
the body surface area (in m2), ∆𝑇𝑏
/∆𝑡 is the change in 𝑇𝑏 over time (in °C/h). ∆𝑆 was
calculated and presented separately for different exercises (including Exe1 and Exe2) and passive
recovery periods.
Based on heart rate and core temperature, the physiological strain index (PSI) was further
determined according to Moran et al. (1998), shown in Equation (6.4),
PSI =
5 × (𝑇𝑐𝑖 − 𝑇𝑐0)
39.5 − 𝑇𝑐0+
5 × (𝐻𝑅𝑖 − 𝐻𝑅0)
𝐻𝑅𝑚𝑎𝑥 − 𝐻𝑅0
(6.4)
where, Tc0 and HR0 are the average value of core temperature and heart rate taken during the last
10 min stabilization period prior to entering the chamber, Tci and HRi are simultaneous
measurements taken at any time during experiment, and HRmax is the maximum heart rate
observed in the experiment, and is substituted by 180 beats/min if it is less than 180 beats/min.
PSI describes heat strain quantitatively during continuous exercise (Moran et al., 2002). The PSI
was scaled to a range of 0–10, indicating from no heat stress (0) to very high stress (10).
114│Page
Nude body mass (with underwear) was recorded before and after each trial with an electronic
scale accurate to 0.01 kg (Sam Hing Scales Fty Ltd, Hong Kong). Sweat loss was determined
from the difference in nude body mass, adjusted by fluid intake. Sweat rate in liters per hour (L/h)
was estimated from body mass change divided by the experiment time.
6.4.2 Perceptual measurements
The participant was asked to report their subjective ratings, including rates of perceived exertion
(RPE), thermal sensation (TS), comfort sensation (CS), and skin wetness sensation (WS) every 3
min during whole heat exposure. RPE was assessed by the Borg CR-10 scale, ranging from 0
(rest) to 10 (maximal exertion) (Table 6.1). Thermal sensation (TS) (Gagge et al., 1967;
ASHRAE Standard, 2004), wetness sensation (WS) (Gagge et al., 1967), and overall comfort
sensation (CS) (Chan et al., 2016a; Song and Wang, 2016) were assessed by a seven-point scale
(Table 6.1). After the passive recovery period, the participant was further asked to complete a
self-administered questionnaire to describe the perceptual sensations on the cooling vest. In the
questionnaire, seven items of subjective attributes were rated by scales 1–7, namely, from
breathable to air-tight, from dry to damp, from light to heavy, from cold to hot, from comfortable
to uncomfortable, from allow movement to not allow movement, and from like to not like (OSHC,
2013).
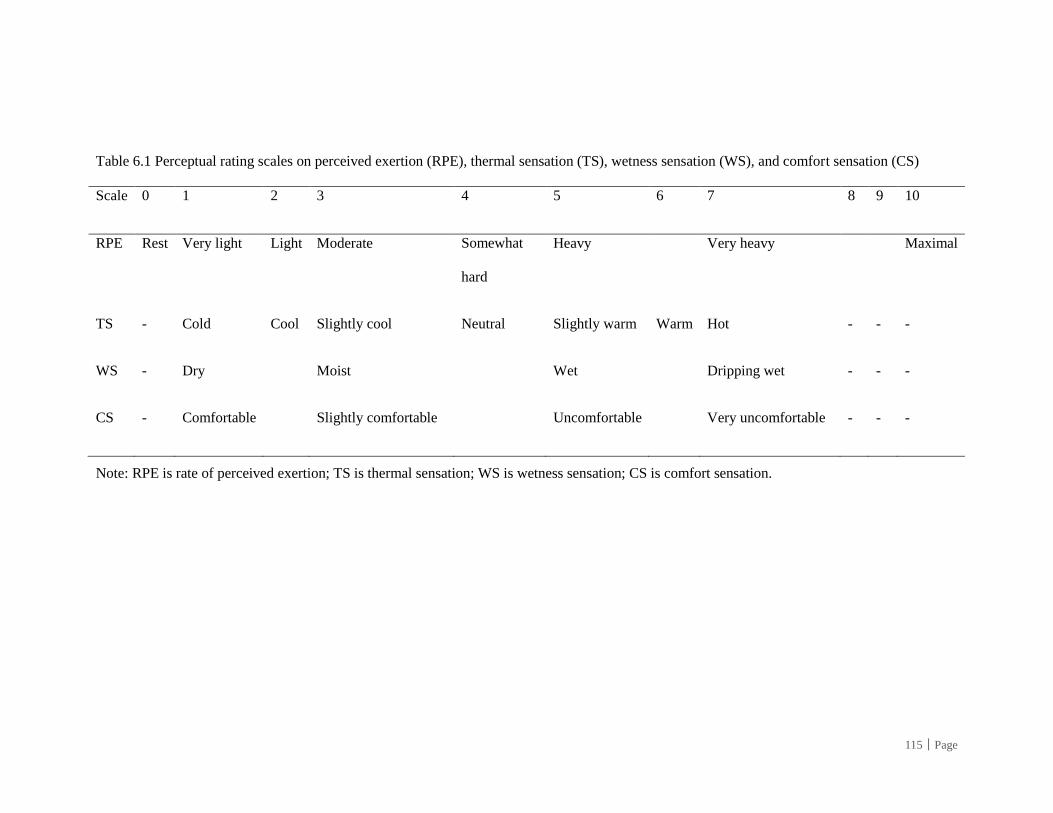
115│Page
Table 6.1 Perceptual rating scales on perceived exertion (RPE), thermal sensation (TS), wetness sensation (WS), and comfort sensation (CS)
Scale 0 1 2 3 4 5 6 7 8 9 10
RPE Rest Very light Light Moderate Somewhat
hard
Heavy Very heavy Maximal
TS - Cold Cool Slightly cool Neutral Slightly warm Warm Hot - - -
WS - Dry Moist Wet Dripping wet - - -
CS - Comfortable Slightly comfortable Uncomfortable Very uncomfortable - - -
Note: RPE is rate of perceived exertion; TS is thermal sensation; WS is wetness sensation; CS is comfort sensation.
116│Page
6.4.3 Statistical analysis
Descriptive statistics (mean ± SD) were reported for dependent variables. A two-way [Time
(every 3 minutes during the whole heat exposure) × Condition (CON versus VEST)] repeated
measures ANOVA was conducted to analyse any treatment differences for core temperature,
heart rate, PSI, 𝑇𝑠𝑘 , and 𝑇𝑏
. The Greenhouse-Geisser correction was designated as statistical
significance in case of the Mauchly’s test of Sphericity was significant, suggesting that the
violation of Mauchly’s test of Sphericity assumption. Student paired t-tests for each time
point were performed whenever there is significance from repeated measures analysis. Paired
t-tests were also used to compare the work duration, body heat storage, and sweat rate
between the two conditions. The levels of statistical significance in all tests were p < 0.05 (*)
and p < 0.01 (**). Further, the magnitudes of change between the two conditions were
estimated according to Cohen’s d effect size. The effect size was interpreted on Cohen’s scale:
0 to 0.19 are classified as ‘negligible’, 0.2–0.4 as ‘small’, 0.5–0.7 as ‘moderate’, and > 0.8 as
‘large’ effects. All data analyses were conducted by the statistical software program SPSS
v.20 (IBM Inc., Armonk, NY).
6.5 RESULTS OF PROTOCOL I
6.5.1 Work performance
The exercise duration in VEST and CON was 36.4 ± 7.79 min and 36.2 ± 5.62 min,
respectively (no significant difference, p = 0.95). The number of participants who stopped
exercise upon reaching the core temperature of 38.5 °C, maximal heart rate, and subjective
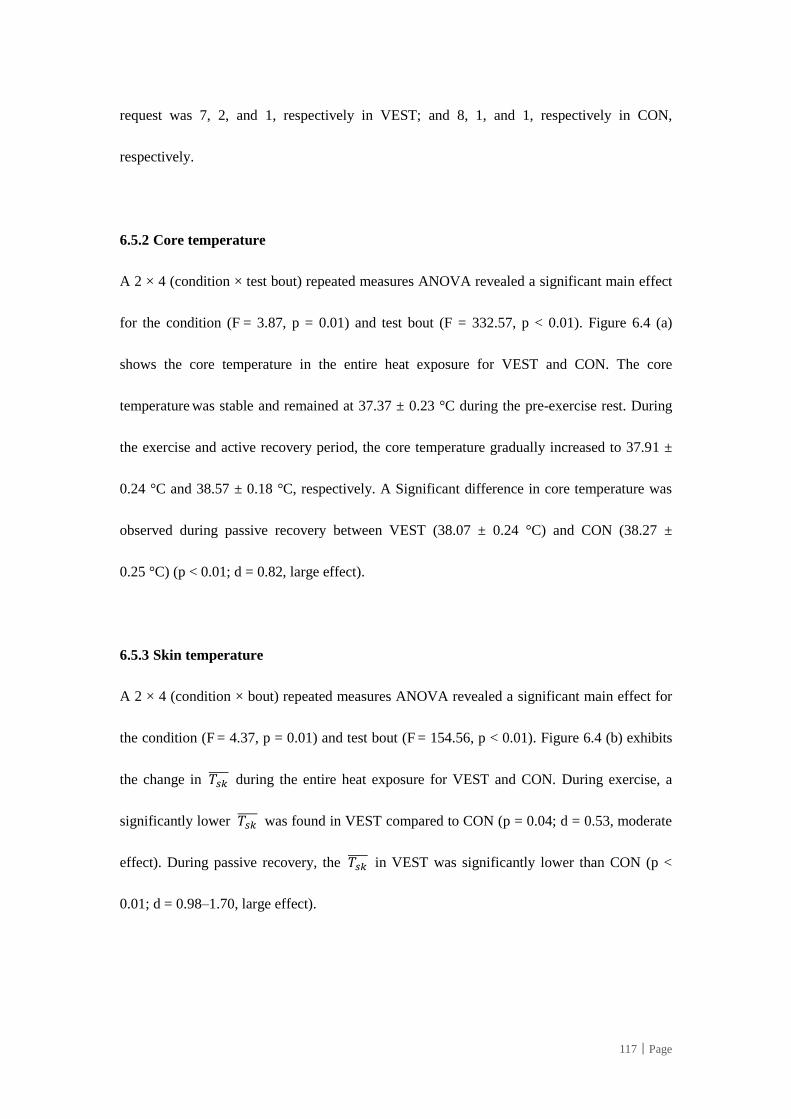
117│Page
request was 7, 2, and 1, respectively in VEST; and 8, 1, and 1, respectively in CON,
respectively.
6.5.2 Core temperature
A 2 × 4 (condition × test bout) repeated measures ANOVA revealed a significant main effect
for the condition (F = 3.87, p = 0.01) and test bout (F = 332.57, p < 0.01). Figure 6.4 (a)
shows the core temperature in the entire heat exposure for VEST and CON. The core
temperature was stable and remained at 37.37 ± 0.23 °C during the pre-exercise rest. During
the exercise and active recovery period, the core temperature gradually increased to 37.91 ±
0.24 °C and 38.57 ± 0.18 °C, respectively. A Significant difference in core temperature was
observed during passive recovery between VEST (38.07 ± 0.24 °C) and CON (38.27 ±
0.25 °C) (p < 0.01; d = 0.82, large effect).
6.5.3 Skin temperature
A 2 × 4 (condition × bout) repeated measures ANOVA revealed a significant main effect for
the condition (F = 4.37, p = 0.01) and test bout (F = 154.56, p < 0.01). Figure 6.4 (b) exhibits
the change in 𝑇𝑠𝑘 during the entire heat exposure for VEST and CON. During exercise, a
significantly lower 𝑇𝑠𝑘 was found in VEST compared to CON (p = 0.04; d = 0.53, moderate
effect). During passive recovery, the 𝑇𝑠𝑘 in VEST was significantly lower than CON (p <
0.01; d = 0.98–1.70, large effect).
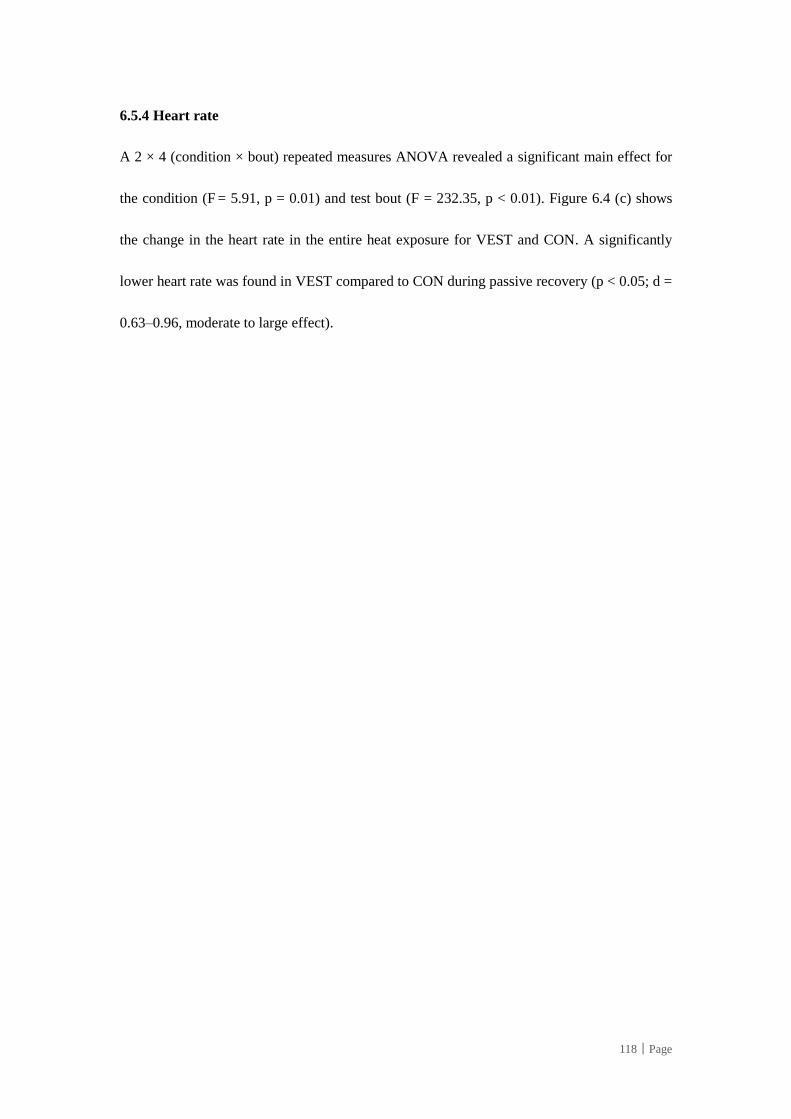
118│Page
6.5.4 Heart rate
A 2 × 4 (condition × bout) repeated measures ANOVA revealed a significant main effect for
the condition (F = 5.91, p = 0.01) and test bout (F = 232.35, p < 0.01). Figure 6.4 (c) shows
the change in the heart rate in the entire heat exposure for VEST and CON. A significantly
lower heart rate was found in VEST compared to CON during passive recovery (p < 0.05; d =
0.63–0.96, moderate to large effect).
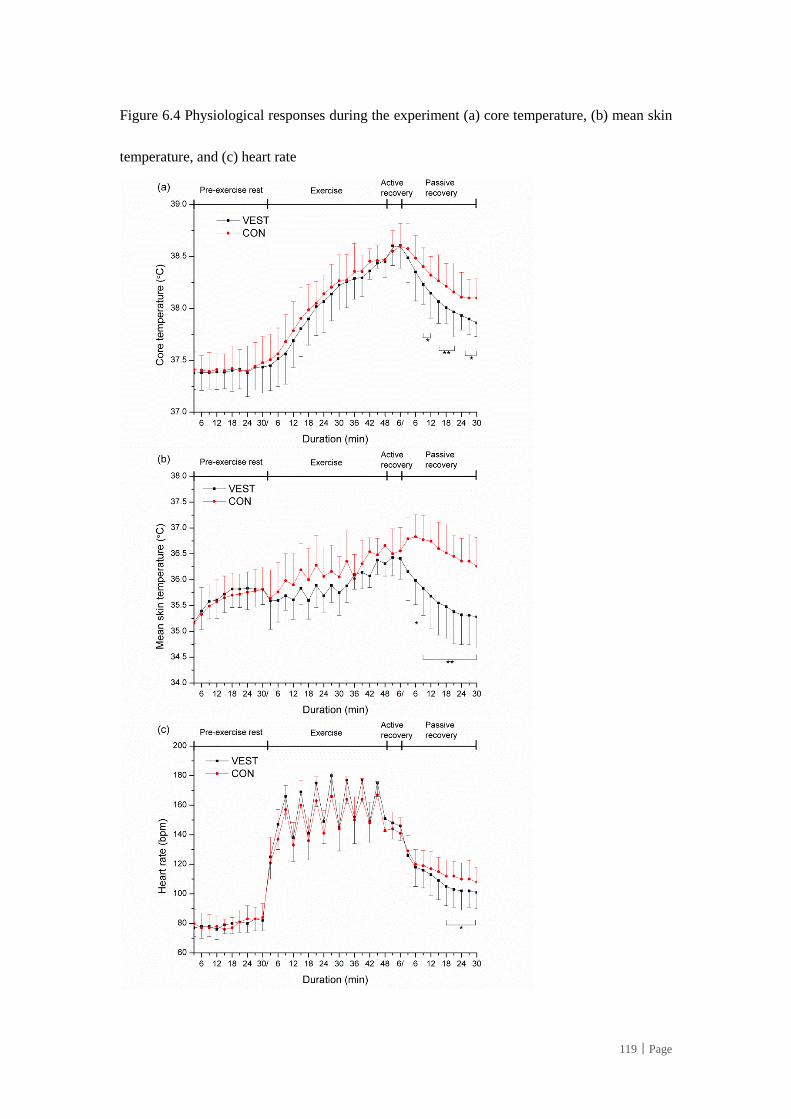
119│Page
Figure 6.4 Physiological responses during the experiment (a) core temperature, (b) mean skin
temperature, and (c) heart rate
120│Page
6.5.5 Change in body heat storage
A 2 × 4 (condition × bout) repeated measures ANOVA revealed a significant main effect for
the condition (F = 65.17, p < 0.01) and test bout (F = 424.55, p < 0.01). The increasing rate of
body heat storage during exercise was similar between VEST and CON (p = 0.79), with an
average value of 62.20 W/m2 (Figure 6.5). During passive recovery, a significantly decreasing
rate of body heat storage was observed in VEST (−57.65 W·m-2
) compared with that in CON
(−34.28 W·m-2
) (p < 0.01; d = 1.43, large effect).
Figure 6.5 Rate of heat storage during the experiment
6.5.6 Microclimate temperature and humidity
Microclimate temperature and humidity at the chest and back during the entire heat exposure
were compared (Figure 6.6). Repeated measures ANOVA demonstrated a significant
difference in microclimate temperatures at the chest and back between VEST and CON (p <
0.01) across the test bouts. Repeated measures ANOVA also revealed a significant difference
-90
-70
-50
-30
-10
10
30
50
70
90
110
130
150
Pre-exercise rest Exercise Active recovery Passive recovery
Rat
e o
f b
od
y h
eat
sto
rage
(W
/m2
)
VEST
CON
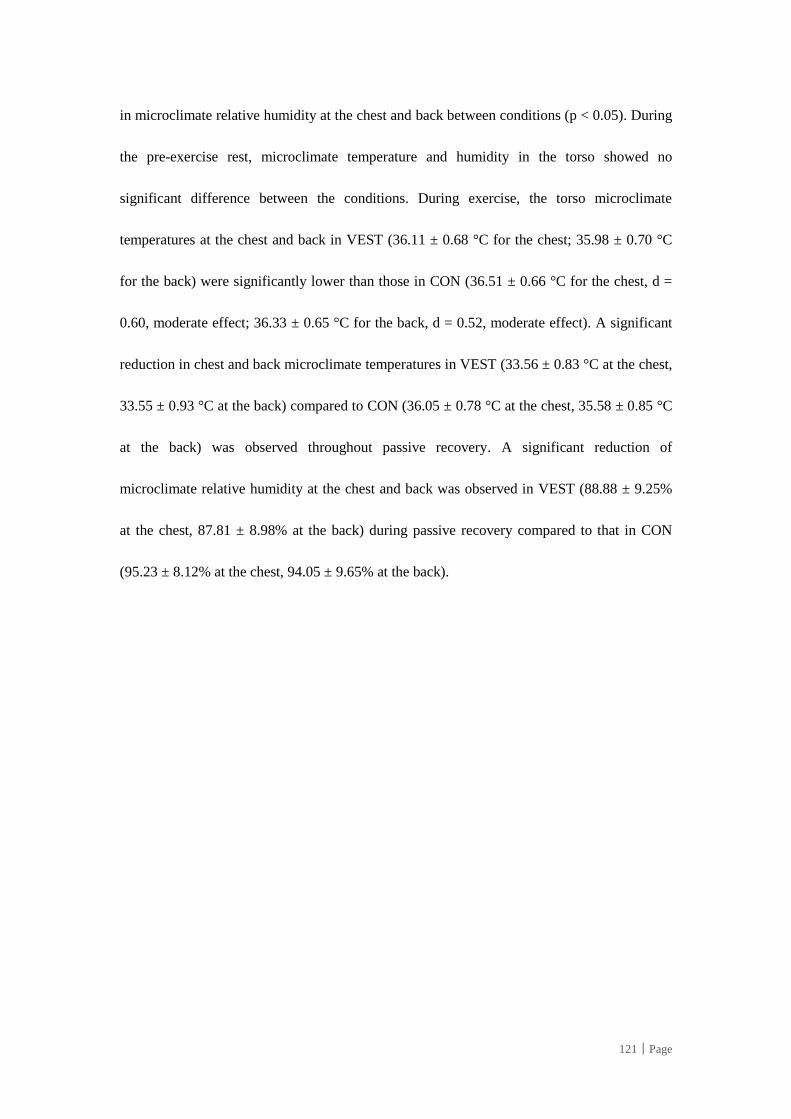
121│Page
in microclimate relative humidity at the chest and back between conditions (p < 0.05). During
the pre-exercise rest, microclimate temperature and humidity in the torso showed no
significant difference between the conditions. During exercise, the torso microclimate
temperatures at the chest and back in VEST (36.11 ± 0.68 °C for the chest; 35.98 ± 0.70 °C
for the back) were significantly lower than those in CON (36.51 ± 0.66 °C for the chest, d =
0.60, moderate effect; 36.33 ± 0.65 °C for the back, d = 0.52, moderate effect). A significant
reduction in chest and back microclimate temperatures in VEST (33.56 ± 0.83 °C at the chest,
33.55 ± 0.93 °C at the back) compared to CON (36.05 ± 0.78 °C at the chest, 35.58 ± 0.85 °C
at the back) was observed throughout passive recovery. A significant reduction of
microclimate relative humidity at the chest and back was observed in VEST (88.88 ± 9.25%
at the chest, 87.81 ± 8.98% at the back) during passive recovery compared to that in CON
(95.23 ± 8.12% at the chest, 94.05 ± 9.65% at the back).
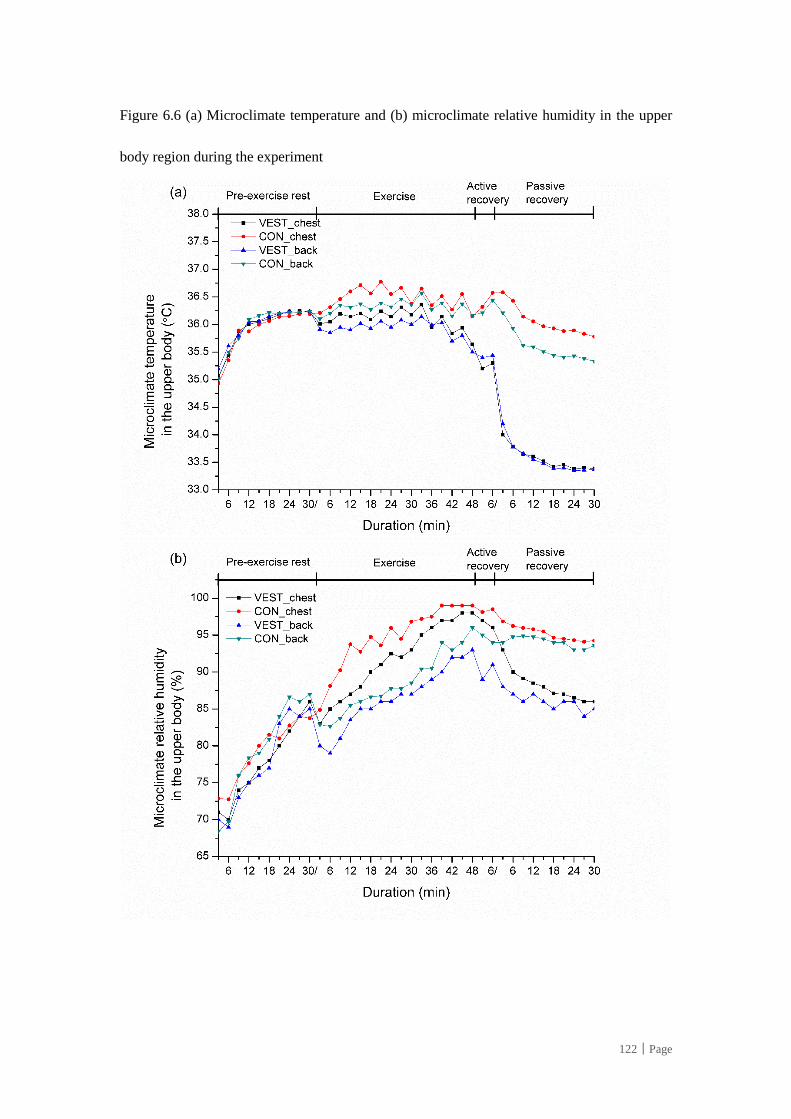
122│Page
Figure 6.6 (a) Microclimate temperature and (b) microclimate relative humidity in the upper
body region during the experiment
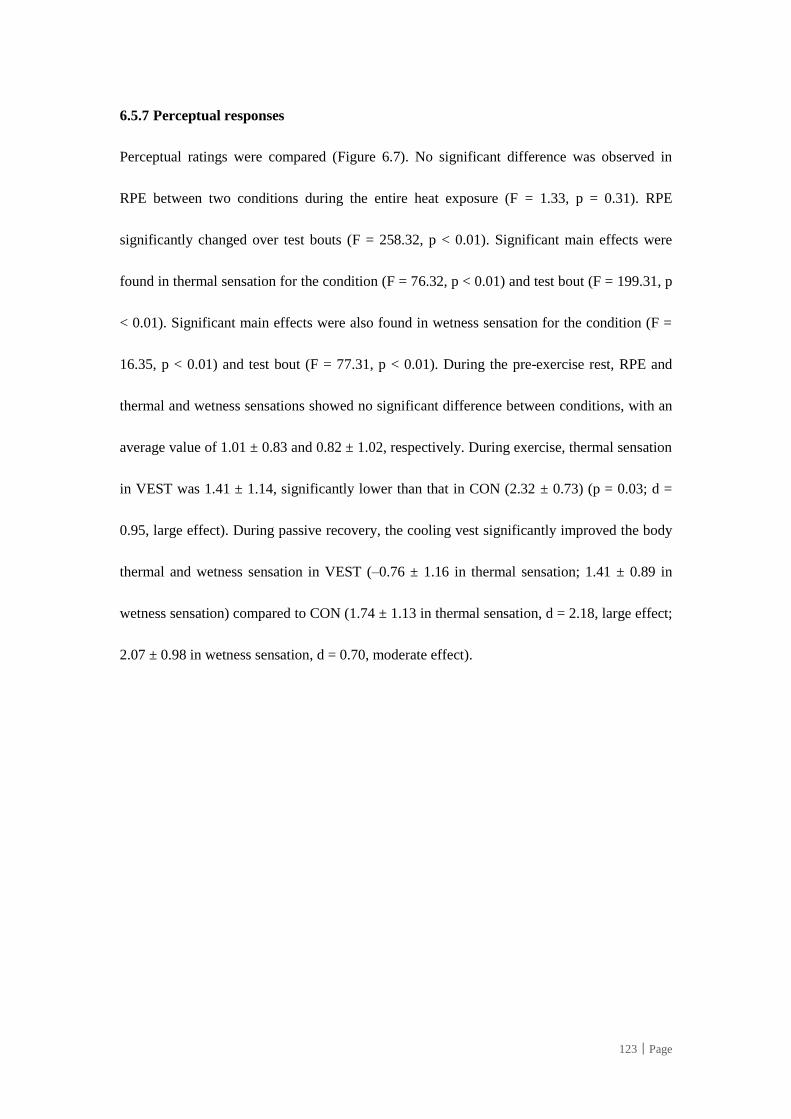
123│Page
6.5.7 Perceptual responses
Perceptual ratings were compared (Figure 6.7). No significant difference was observed in
RPE between two conditions during the entire heat exposure (F = 1.33, p = 0.31). RPE
significantly changed over test bouts (F = 258.32, p < 0.01). Significant main effects were
found in thermal sensation for the condition (F = 76.32, p < 0.01) and test bout (F = 199.31, p
< 0.01). Significant main effects were also found in wetness sensation for the condition (F =
16.35, p < 0.01) and test bout (F = 77.31, p < 0.01). During the pre-exercise rest, RPE and
thermal and wetness sensations showed no significant difference between conditions, with an
average value of 1.01 ± 0.83 and 0.82 ± 1.02, respectively. During exercise, thermal sensation
in VEST was 1.41 ± 1.14, significantly lower than that in CON (2.32 ± 0.73) (p = 0.03; d =
0.95, large effect). During passive recovery, the cooling vest significantly improved the body
thermal and wetness sensation in VEST (–0.76 ± 1.16 in thermal sensation; 1.41 ± 0.89 in
wetness sensation) compared to CON (1.74 ± 1.13 in thermal sensation, d = 2.18, large effect;
2.07 ± 0.98 in wetness sensation, d = 0.70, moderate effect).
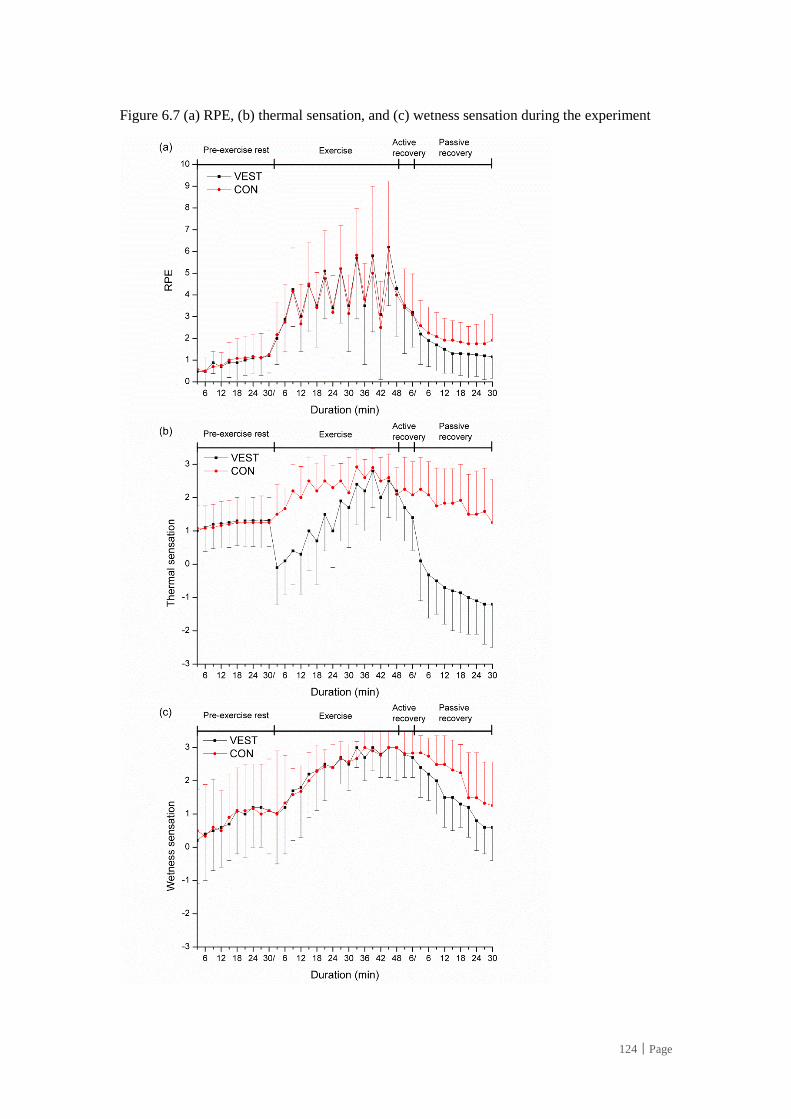
124│Page
Figure 6.7 (a) RPE, (b) thermal sensation, and (c) wetness sensation during the experiment
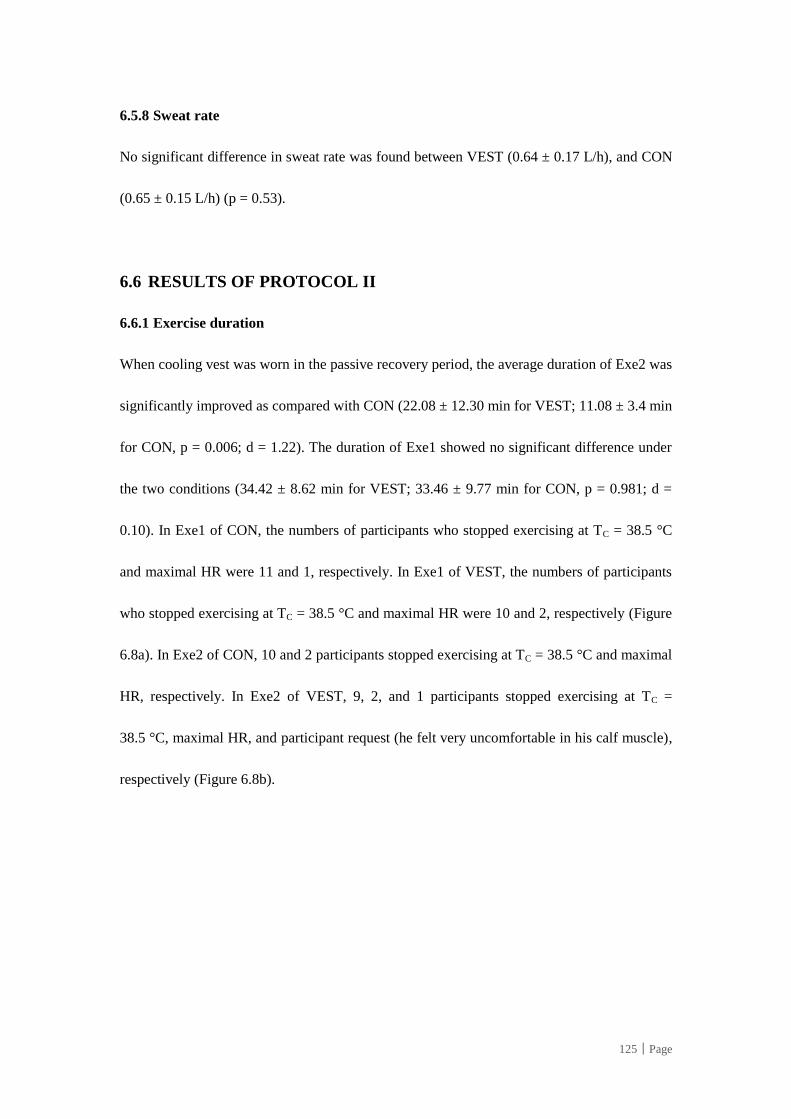
125│Page
6.5.8 Sweat rate
No significant difference in sweat rate was found between VEST (0.64 ± 0.17 L/h), and CON
(0.65 ± 0.15 L/h) (p = 0.53).
6.6 RESULTS OF PROTOCOL II
6.6.1 Exercise duration
When cooling vest was worn in the passive recovery period, the average duration of Exe2 was
significantly improved as compared with CON (22.08 ± 12.30 min for VEST; 11.08 ± 3.4 min
for CON, p = 0.006; d = 1.22). The duration of Exe1 showed no significant difference under
the two conditions (34.42 ± 8.62 min for VEST; 33.46 ± 9.77 min for CON, p = 0.981; d =
0.10). In Exe1 of CON, the numbers of participants who stopped exercising at TC = 38.5 °C
and maximal HR were 11 and 1, respectively. In Exe1 of VEST, the numbers of participants
who stopped exercising at TC = 38.5 °C and maximal HR were 10 and 2, respectively (Figure
6.8a). In Exe2 of CON, 10 and 2 participants stopped exercising at TC = 38.5 °C and maximal
HR, respectively. In Exe2 of VEST, 9, 2, and 1 participants stopped exercising at TC =
38.5 °C, maximal HR, and participant request (he felt very uncomfortable in his calf muscle),
respectively (Figure 6.8b).
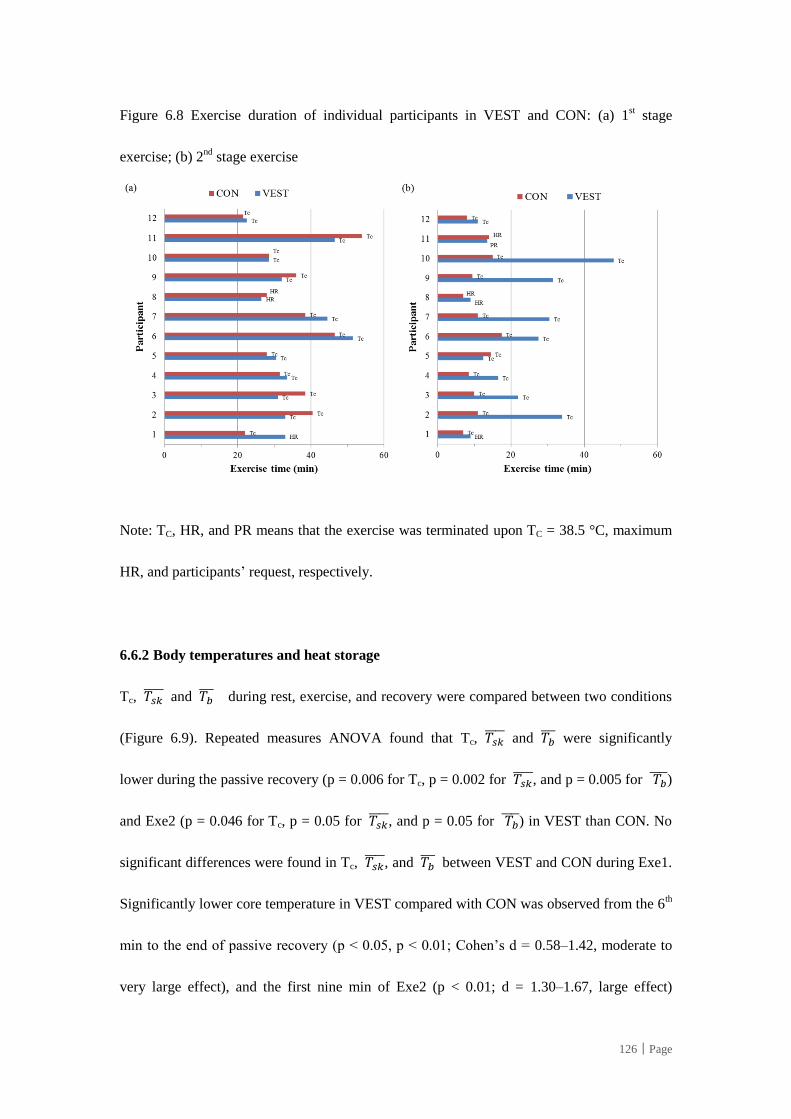
126│Page
Figure 6.8 Exercise duration of individual participants in VEST and CON: (a) 1st stage
exercise; (b) 2nd
stage exercise
Note: TC, HR, and PR means that the exercise was terminated upon TC = 38.5 °C, maximum
HR, and participants’ request, respectively.
6.6.2 Body temperatures and heat storage
Tc, 𝑇𝑠𝑘 and 𝑇𝑏
during rest, exercise, and recovery were compared between two conditions
(Figure 6.9). Repeated measures ANOVA found that Tc, 𝑇𝑠𝑘 and 𝑇𝑏
were significantly
lower during the passive recovery (p = 0.006 for Tc, p = 0.002 for 𝑇𝑠𝑘 , and p = 0.005 for 𝑇𝑏
)
and Exe2 (p = 0.046 for Tc, p = 0.05 for 𝑇𝑠𝑘 , and p = 0.05 for 𝑇𝑏
) in VEST than CON. No
significant differences were found in Tc, 𝑇𝑠𝑘 , and 𝑇𝑏
between VEST and CON during Exe1.
Significantly lower core temperature in VEST compared with CON was observed from the 6th
min to the end of passive recovery (p < 0.05, p < 0.01; Cohen’s d = 0.58–1.42, moderate to
very large effect), and the first nine min of Exe2 (p < 0.01; d = 1.30–1.67, large effect)
127│Page
(Figure 6.9a). At the end of 30 min passive recovery, a pronounced decrease was observed in
Tc in VEST compared with CON (37.89 ± 0.13°C vs. 38.13 ± 0.20°C), averaging 0.24 ±
0.23°C lower (d = 1.42). Significant lower 𝑇𝑠𝑘 was observed immediately after putting on
the cooling vest from the 3rd min to the end of passive recovery (p < 0.01; d = 1.18–1.76),
and the first three min of Exe2 (p < 0.05; d = 0.38) (Figure 6.9b). Combining Tc and 𝑇𝑠𝑘 , the
𝑇𝑏 in VEST was also significantly reduced during passive recovery and the first 6
th min of
Exe2 as compared with CON (Figure 6.9c).
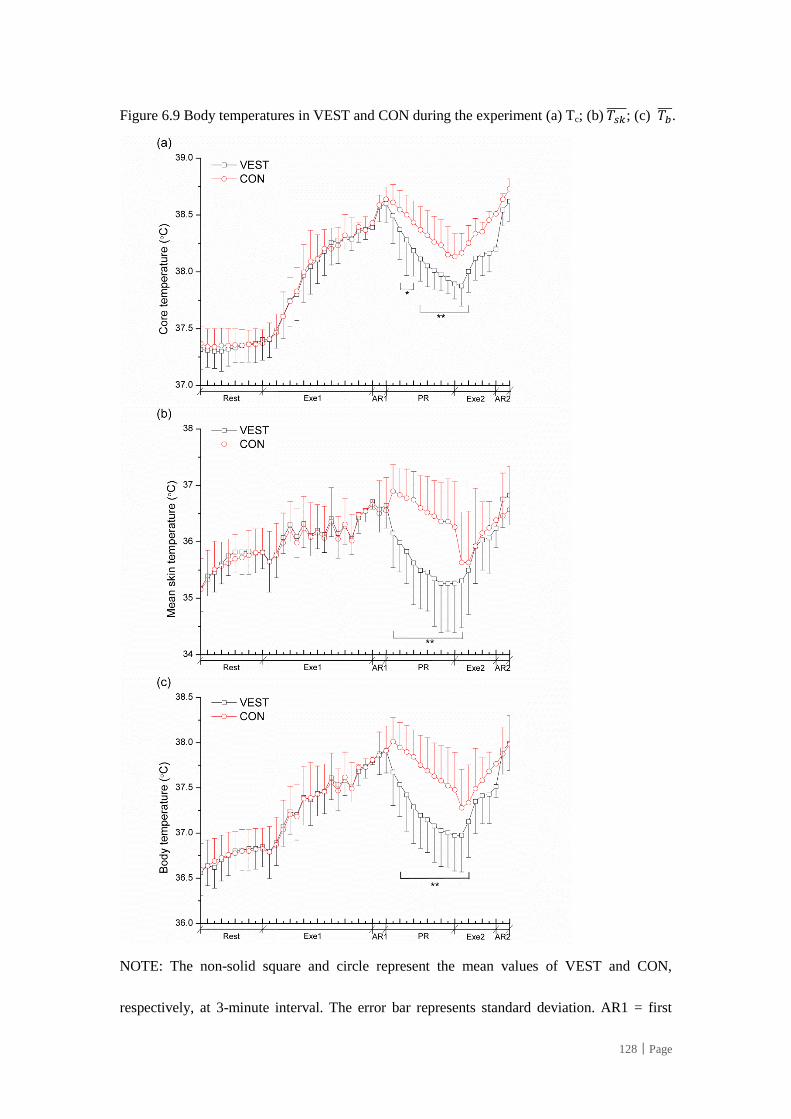
128│Page
Figure 6.9 Body temperatures in VEST and CON during the experiment (a) Tc; (b) 𝑇𝑠𝑘 ; (c) 𝑇𝑏
.
NOTE: The non-solid square and circle represent the mean values of VEST and CON,
respectively, at 3-minute interval. The error bar represents standard deviation. AR1 = first
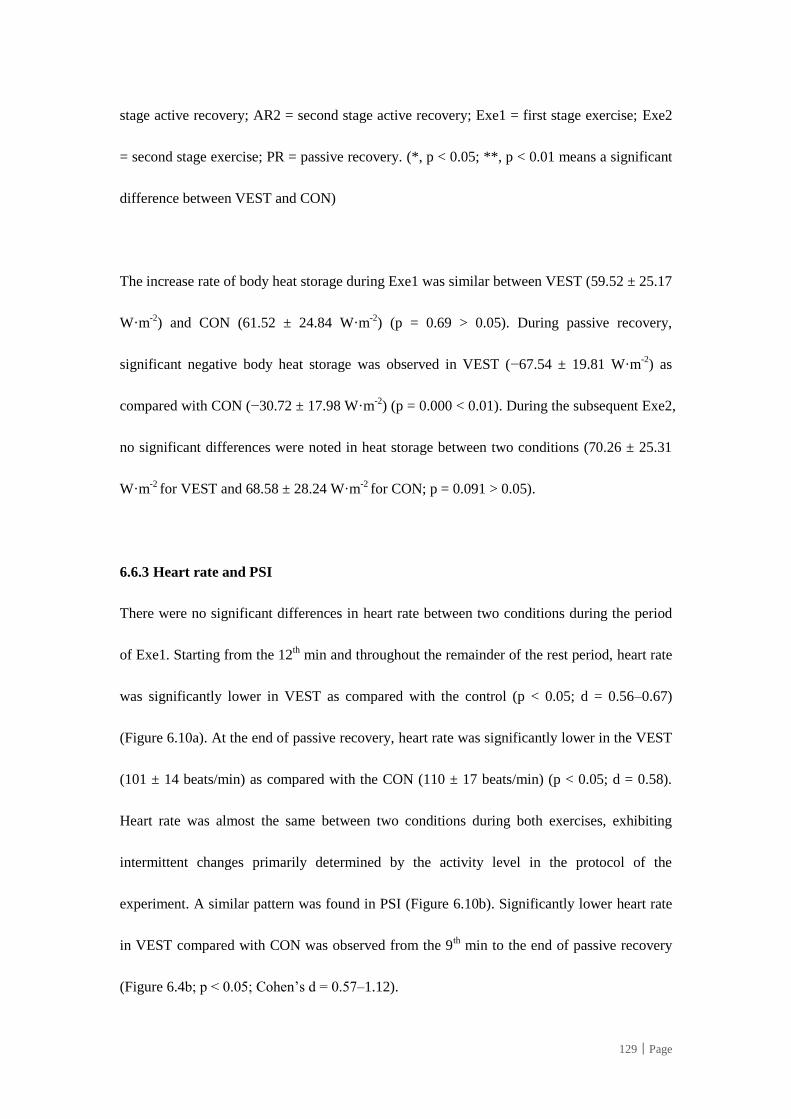
129│Page
stage active recovery; AR2 = second stage active recovery; Exe1 = first stage exercise; Exe2
= second stage exercise; PR = passive recovery. (*, p < 0.05; **, p < 0.01 means a significant
difference between VEST and CON)
The increase rate of body heat storage during Exe1 was similar between VEST (59.52 ± 25.17
W·m-2
) and CON (61.52 ± 24.84 W·m-2
) (p = 0.69 > 0.05). During passive recovery,
significant negative body heat storage was observed in VEST (−67.54 ± 19.81 W·m-2
) as
compared with CON (−30.72 ± 17.98 W·m-2
) (p = 0.000 < 0.01). During the subsequent Exe2,
no significant differences were noted in heat storage between two conditions (70.26 ± 25.31
W·m-2
for VEST and 68.58 ± 28.24 W·m-2
for CON; p = 0.091 > 0.05).
6.6.3 Heart rate and PSI
There were no significant differences in heart rate between two conditions during the period
of Exe1. Starting from the 12th min and throughout the remainder of the rest period, heart rate
was significantly lower in VEST as compared with the control (p < 0.05; d = 0.56–0.67)
(Figure 6.10a). At the end of passive recovery, heart rate was significantly lower in the VEST
(101 ± 14 beats/min) as compared with the CON (110 ± 17 beats/min) (p < 0.05; d = 0.58).
Heart rate was almost the same between two conditions during both exercises, exhibiting
intermittent changes primarily determined by the activity level in the protocol of the
experiment. A similar pattern was found in PSI (Figure 6.10b). Significantly lower heart rate
in VEST compared with CON was observed from the 9th min to the end of passive recovery
(Figure 6.4b; p < 0.05; Cohen’s d = 0.57–1.12).
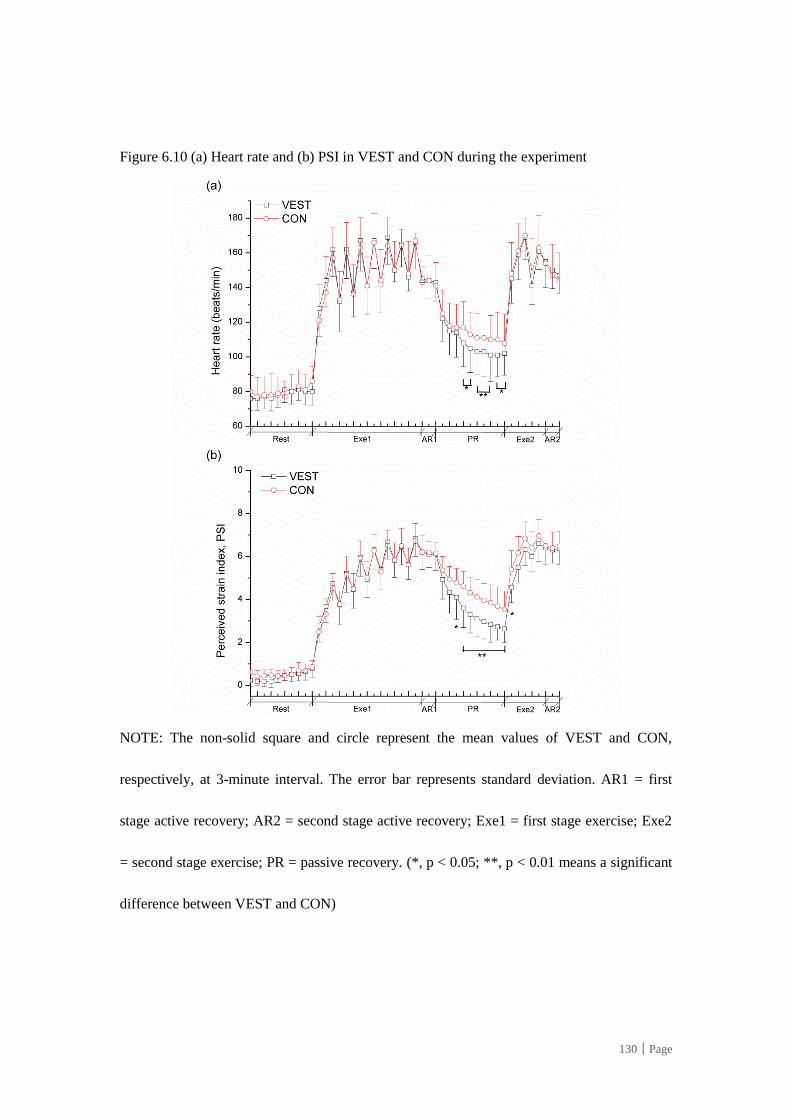
130│Page
Figure 6.10 (a) Heart rate and (b) PSI in VEST and CON during the experiment
NOTE: The non-solid square and circle represent the mean values of VEST and CON,
respectively, at 3-minute interval. The error bar represents standard deviation. AR1 = first
stage active recovery; AR2 = second stage active recovery; Exe1 = first stage exercise; Exe2
= second stage exercise; PR = passive recovery. (*, p < 0.05; **, p < 0.01 means a significant
difference between VEST and CON)
131│Page
6.6.4 Local skin temperatures and microclimate humidity
A similar response pattern was evident with local skin temperature and microclimate
temperature in the upper body (Figure 6.11a and Figure 6.11b). Chest, forearm, and back
temperatures were significantly lower throughout the passive recovery (for chest 33.66 ±
0.31°C in VEST vs 36.59 ± 0.17°C in CON; for forearm 34.69 ± 0.25°C in VEST vs 36.23 ±
0.24°C in CON; for back 33.65 ± 0.14°C in VEST vs 35.59 ± 0.16°C in CON) in VEST than
CON (p < 0.01). Significant reduction of the microclimate relative humidity in the upper body,
especially in the chest region, in VEST (averaging 78.98 ± 7.92% for chest; 92.72 ± 5.44%
for back) compared with CON (averaging 95.37 ± 7.87% for chest; 95.61 ± 3.89% for back)
was also observed throughout the passive recovery (p < 0.05) (Figure 6.11c).
132│Page
Figure 6.11 (a) Local skin temperatures and (b) microclimate temperature (c) microclimate
relative humidity (RH) in VEST and CON during the experiment
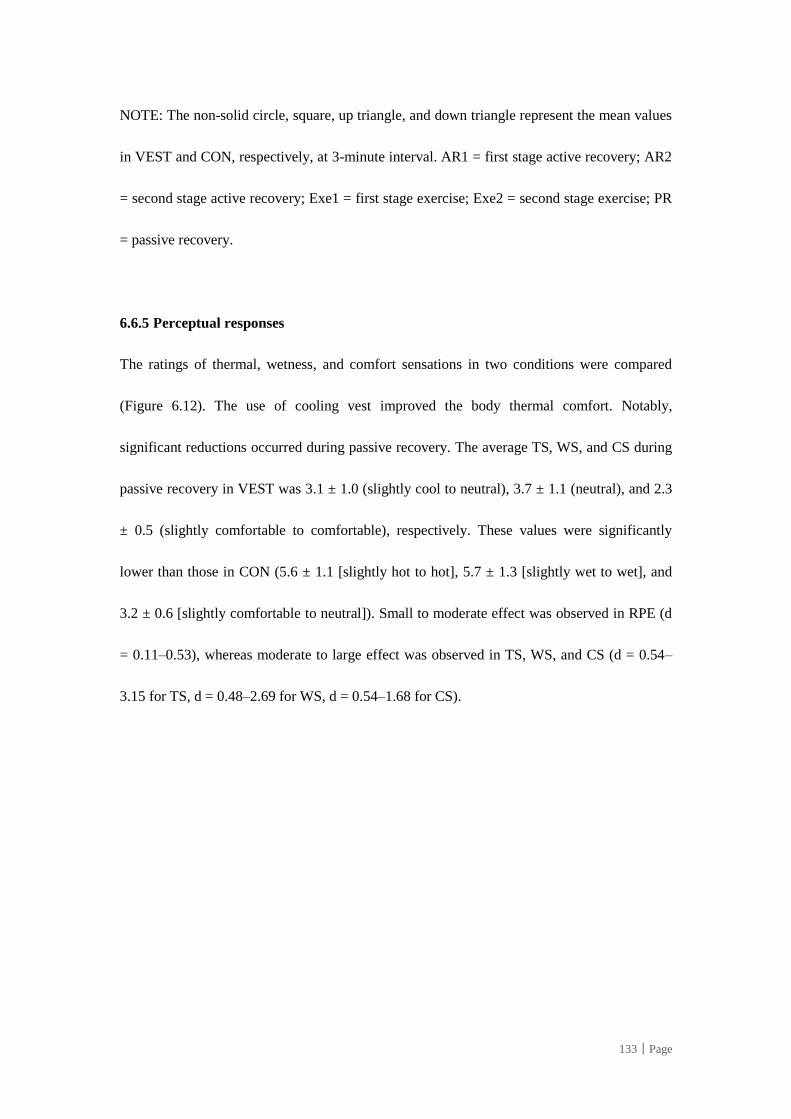
133│Page
NOTE: The non-solid circle, square, up triangle, and down triangle represent the mean values
in VEST and CON, respectively, at 3-minute interval. AR1 = first stage active recovery; AR2
= second stage active recovery; Exe1 = first stage exercise; Exe2 = second stage exercise; PR
= passive recovery.
6.6.5 Perceptual responses
The ratings of thermal, wetness, and comfort sensations in two conditions were compared
(Figure 6.12). The use of cooling vest improved the body thermal comfort. Notably,
significant reductions occurred during passive recovery. The average TS, WS, and CS during
passive recovery in VEST was 3.1 ± 1.0 (slightly cool to neutral), 3.7 ± 1.1 (neutral), and 2.3
± 0.5 (slightly comfortable to comfortable), respectively. These values were significantly
lower than those in CON (5.6 ± 1.1 [slightly hot to hot], 5.7 ± 1.3 [slightly wet to wet], and
3.2 ± 0.6 [slightly comfortable to neutral]). Small to moderate effect was observed in RPE (d
= 0.11–0.53), whereas moderate to large effect was observed in TS, WS, and CS (d = 0.54–
3.15 for TS, d = 0.48–2.69 for WS, d = 0.54–1.68 for CS).
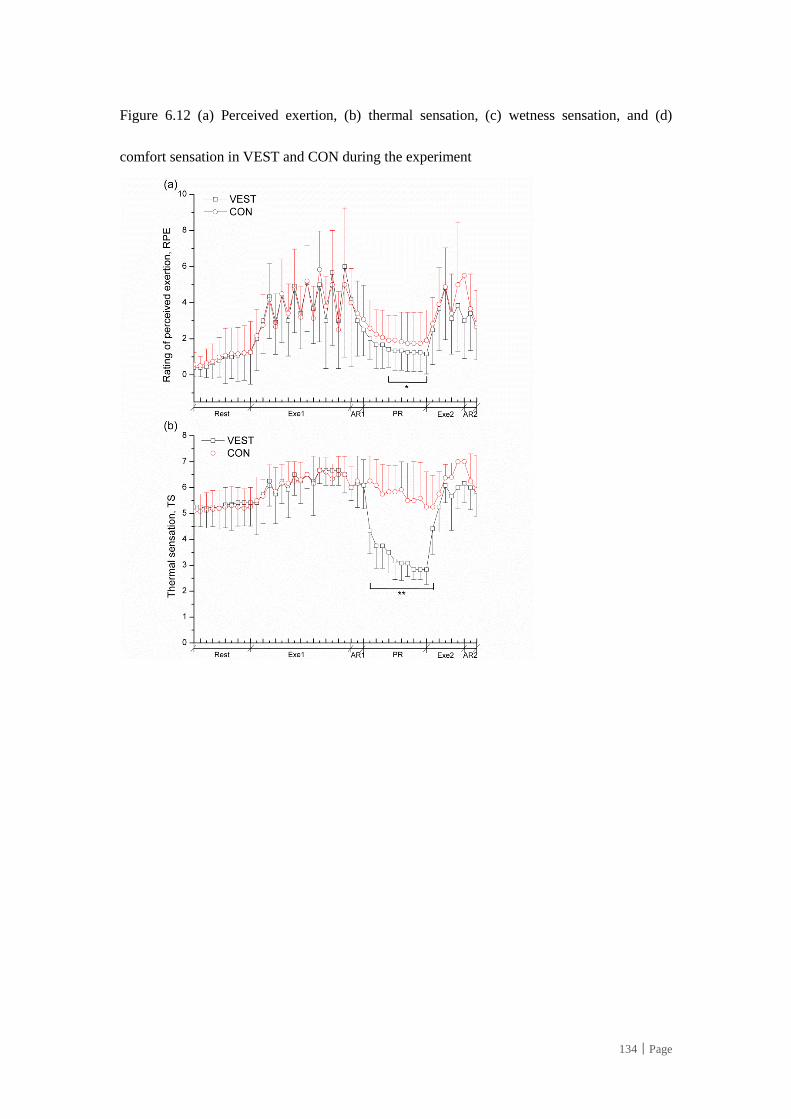
134│Page
Figure 6.12 (a) Perceived exertion, (b) thermal sensation, (c) wetness sensation, and (d)
comfort sensation in VEST and CON during the experiment
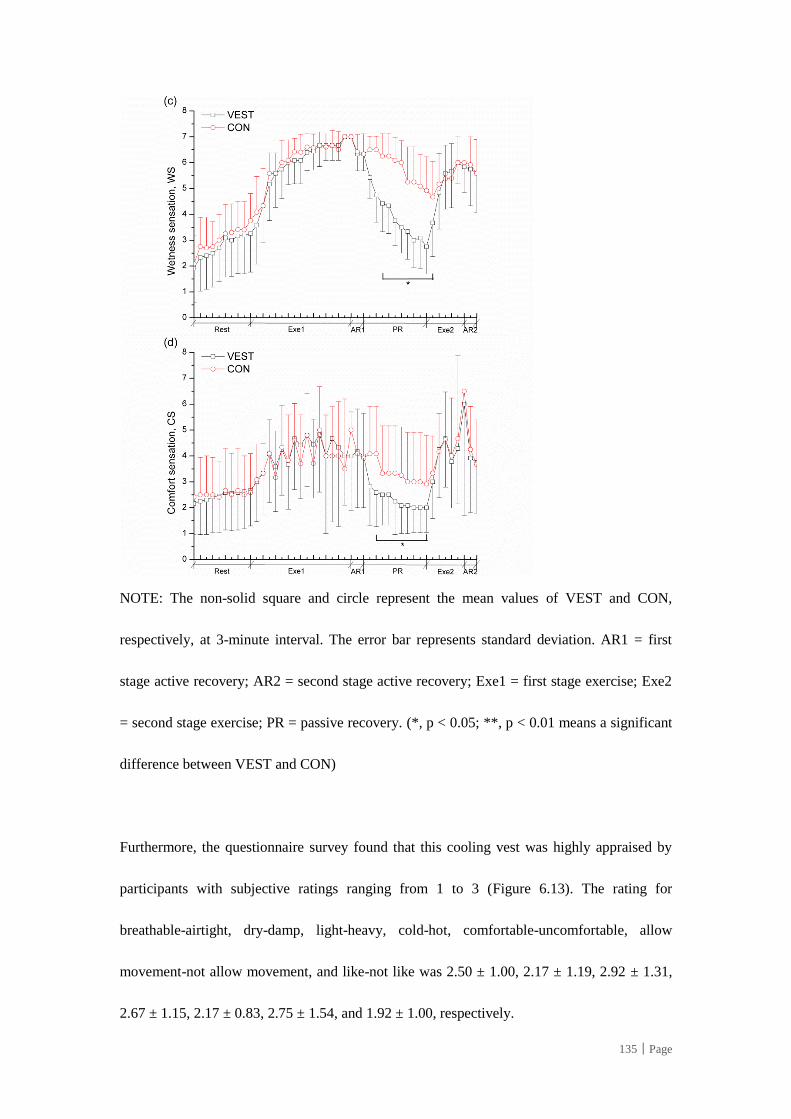
135│Page
NOTE: The non-solid square and circle represent the mean values of VEST and CON,
respectively, at 3-minute interval. The error bar represents standard deviation. AR1 = first
stage active recovery; AR2 = second stage active recovery; Exe1 = first stage exercise; Exe2
= second stage exercise; PR = passive recovery. (*, p < 0.05; **, p < 0.01 means a significant
difference between VEST and CON)
Furthermore, the questionnaire survey found that this cooling vest was highly appraised by
participants with subjective ratings ranging from 1 to 3 (Figure 6.13). The rating for
breathable-airtight, dry-damp, light-heavy, cold-hot, comfortable-uncomfortable, allow
movement-not allow movement, and like-not like was 2.50 ± 1.00, 2.17 ± 1.19, 2.92 ± 1.31,
2.67 ± 1.15, 2.17 ± 0.83, 2.75 ± 1.54, and 1.92 ± 1.00, respectively.
136│Page
Figure 6.13 Perceptual sensations of the hybrid cooling vest after passive recovery
NOTE: Values are presented as mean and standard error
6.6.6 Sweat rate
No significant difference in sweat rate was found between VEST (0.640 ± 0.17 L/h) and CON
(0.642 ± 0.16 L/h) (p = 0.98).
6.7 DISCUSSION
The aim of this chapter is twofold: (1) examine the effectiveness of a newly designed cooling
vest on attenuating heat strain during work and recovery periods and (2) ascertain whether
improvements in physiological and perceptual strains caused by the cooling vest during
recovery could prolong subsequent bouts of exercise/work. Human wear trials were carried
137│Page
out under the work–rest protocol in a climate chamber that simulated a typical hot and humid
environment in Hong Kong’s construction sites during summer season.
Under such a hot and humid condition (controlled at 37°C, 60% relative humidity), the
cooling vest provided a cooler microclimate around the body, as indicated by the significantly
lower microclimate temperature at the chest and back region in VEST compared to CON. The
temperature gradient between the skin surface and the ambient environment improved the
conductive heat dissipation. Meanwhile, the water vapour pressure gradient between the
sweating skin (100% relative humidity) and the ambient environment enhanced evaporative
heat loss. The moving air ventilated by the small fans further contributed the convective and
evaporative heat loss. A significant dropping in local skin temperatures (i.e., chest, back and
forearm) was observed in VEST compared to CON. It can be found that when the cooling
vest was used, local skin temperature was very close to the normal skin temperature (about
33°C), which would not cause skin irritation due to extreme coldness (Yazdanirad and
Dehghan, 2016). Driven by the remarkable dropping in skin temperatures, body core
temperature declined significantly a period after the cooling vest was worn. Skin temperature
was immediately reduced as soon as the vest was worn (throughout the passive recovery),
while core temperature was significantly decreased in VEST from the 10th min of the passive
recovery. The decrease in core temperature lagged behind the skin temperature. One
explanation is that it took time for conductive heat transfer from the skin surface, go through
subcutaneous fat and underlying muscle, to the body’s central core (Otte et al., 2002).
138│Page
The core temperature and heart rate are considered as the main indicators of heat strain during
both work and rest (Yi et al., 2017a). A critically high core temperature or hear rate is related
to heat exhaustion (Cheung and McLellan, 1998; Gonzàlez-Alonso et al., 1999; Sawka et al.,
1992). The present study set core temperature of 38.5°C and maximal heart rate (95% of the
age-predicted maximal heart rate) as the criteria to terminate exercise and proceed to recovery
stage. At the end of exercise, no significant difference was found in core temperature and
heart rate between VEST and CON, which provided a similar body thermal state for the
subsequent recovery. The change in RPE during exercise showed similar pattern with that in
heart rate, which was mainly influenced by the level of exercise intensity (Chan et al., 2012c;
Miyamoto et al., 2006; Yi et al., 2017a). This study used intermittent exercise intensity,
resulting in intermittent increase in RPE and hear rate during exercise. The rating of thermal
sensation was highly associated with the change in skin temperature in a warm to hot ambient
environment (Gagge et al., 1969; Song and Wang, 2016). Compared with CON, skin
temperature and thermal sensation were significantly alleviated in VEST during the exercise
and recovery periods. Participants’ wetness sensation was influenced by the moisture
accumulation on the skin in the clothing (Hatch et al., 1990). Wetness sensation was
significantly attenuated in VEST as compared to CON during only the recovery period. One
explanation was that body movement during exercise can promote air ventilation and enhance
evaporation (Gavin, 2003). Whereas, participants remained seated during recovery and the
evaporation of the sweat on the skin solely depended on the air ventilation of the cooling vest.
139│Page
In protocol I, the cooling vest was worn throughout the entire heat exposure (including
exercise and recovery) in VEST. Whereas, in protocol II, the cooling vest was worn only in
recovery in VEST. The protocol II was proposed based on the results in protocol I, which
found that the heat strain was significantly reduced during recovery but not significantly
attenuated during exercise. The results indicated that the cooling vest could not effectively
reduce heat strain during exercise. The results can be comparable to some previous studies,
which reported small to moderate cooling effect without significance during exercise period
(Ciuha et al., 2016; Kenny et al., 2011; Zhang et al., 2010). In comparison, a number of
studies observed a moderate to large cooling effect with significance during exercise (Bennett
et al., 1995; Caldwell et al., 2012; Kim et al., 2011). In Ciuha et al. (2016), Kenny et al.
(2011), Zhang et al. (2010), and the present study, participants were asked to wear basic
clothes (e.g., T-shirt, shorts, and pants) with no protective garment in the control group. In
Bennett et al. (1995); Caldwell et al. (2012); Kim et al. (2011), participants in the control
group were required to wear protective clothing (characterised as impermeable to sweat
evaporation), which might enlarge the difference from the cooling condition and further
aggravate risk of heat stress. Another reason was from the added weight of cooling clothes,
which could increase metabolic heat production during exercise. When the garment’s cooling
effect could not compensate for its added metabolic heat production, the cooling garment will
negatively affected exercise performance (Lu et al., 2015). The cooling power of the newly
designed cooling vest measured on a thermal manikin was approximately 70 W (Yi et al.,
2017c). According to Wang et al. (2013)’s equation, the added weight of the cooling vest
(1.26 kg) resulted in an estimated metabolic cost of 7.3 W. The measured cooling power of
140│Page
the vest was larger than its metabolic heat production. However, the high cooling power
measurement on the thermal manikin did not necessarily indicate a physiological performance
improvement since the human thermal regulation is a complex process with a series of
physiological regulatory behaviours, including sweating, vasoconstriction, and vasodilatation
(Kenny and Flouris, 2014). During exercise period, the insulation and added mass of the
cooling vest might offset the cooling power, as shown by an insignificant reduction in core
temperature and heart rate in VEST.
Heat storage accumulated during exercise in the heat, resulting in early termination of
exercise or reduced work performance (Drust et al., 2005; Gonzàlez-Alonso et al., 1999). A
period of recovery was induced after exercise to reduce heat strain and accelerate fatigue
recovery. In a hot environment, the accumulated heat in the exercise cannot be easily
alleviated to achieve a satisfactory recovery depending on the body’s own heat dissipation
system through sweating and skin vasodilation. According to Kenny and Flouris (2014),
much less than 50% of the heat storage can be offset after 1 h of recovery. In the current study,
less than 30% of heat gained during the exercise was lost in the control group. By contrast,
heat storage reduction was approximately 55% in the cooling group after the 30 min recovery.
The newly designed cooling vest could significantly reduce physiological (core temperature
and heart rate) and perceptual strains during passive recovery. After recovery, the core
temperature was reduced by approximately 1.0 °C (from 38.7 °C to 37.8 °C) in VEST, as
compared to 0.5 °C (from 38.7 °C to 38.2 °C) in CON. Therefore, a lower onset core
temperature for the following exercise can be achieved in VEST than in CON. This low core
141│Page
temperature resulted in an increased heat storage prior to arriving at the critical limiting core
temperature, which contributed to improving the exercise duration (Arngrimsson et al., 2004).
It was observed in protocol II that the duration of exercise was largely prolonged. The use of
the newly designed cooling vest during recovery showed an approximately 200% increase in
subsequent work duration. The current data were comparable to those found in previous
studies. Some studies employed cooling garment during the entre heat exposure including
both exercise and rest periods. Bennett et al. (1995) found a 0.4°C decrease in rectal
temperature after 30 min using an ice vest between bouts of exercise and a 130% increase in
exercise duration. Cadarette et al. (2003) used liquid cooling garment under a work–rest
schedule of 20 min treadmill walking and 10 min rest, resulting in a 0.5°C reduction in
maximal rectal temperature and around 185% increase in work time. Considering actual work
situations, several studies used the cooling garment during only the recovery period. The
study by Barr et al. (2009) used an ice vest together with hand and forearm immersion during
a 15 min recovery period, resulting in a 0.5 °C reduction in core body temperature and a 160%
increase in work time compared to the control. Amorim et al. (2010) examined 40 min
recovery between two bouts of exercise, indicating that the water-perfused vest during the
recovery reduced 0.2 °C in body core temperature and increased 165% duration in subsequent
bout of exercise. Results from the aforementioned studies suggest that the use of cooling suits
in the recovery period is comparably effective with that throughout the entire heat exposure.
142│Page
The optimal cooling intervention with the newly designed cooling vest during recovery period
was proposed based on the results in Protocol I and II. The current research considered work
environment, work activity, and schedule to determine an optimal cooling intervention for the
construction industry. The newly designed cooling vest is individualised and portable, and
can be applied in construction sites with elevated platforms, uneven grounds and confined
spaces. Installing blowers and cold water reservoirs are generally difficult and impractical
under such a congested environment. Although fanning by blowers was found to be the most
effective post-exercise cooling method in a mildly hot environment of 31 °C with 70% of
relative humidity among different cooling techniques (i.e., hand immersion and cooling
garments) in Barwood et al. (2009a), it is not recommended to use in areas with high air
temperature and humidity since because the increased air movement is associated with heat
stress when the air temperature is approximately 37.8 °C (with relative humidity higher than
35%) (CDC, 1995; Wolfe, 2003). The newly designed cooling vest provides combined
cooling through ventilation fans (convective and evaporative cooling which exhibits higher
performance in a relatively dry environment) and PCM packs (conductive cooling which
shows better capacity in a hot and humid environment than in a hot and dry one). Therefore, it
could be a superior alternative in a wide range of hot conditions and has high application
potential in the construction industry. In some situations (not applicable to situations requiring
continuously pour of concrete until completion), work and rest schedule is allowed and
optimised for the construction industry. It was observed in Protocol I that the cooling vest
worn during exercise neither significantly reduced heat strain nor improved the work duration.
The whole-body mode activity (treadmill walking), which is better than the upper (arm
143│Page
ergometer) or lower body (cycle ergometer) modes, was used in the current study to simulate
actual work intensity in construction sites (Chan et al., 2012a). However, construction work
was not fully considered. Complex tasks, such as forceful pulling and heavy lifting, have
more requirements on the ergonomic design of the added clothing (cooling garment); thus,
wearing the cooling garment throughout the work session continues to be a challenge in the
construction industry (Chan et al., 2016c). The newly designed cooling vest largely (with
significance) alleviated heat strain during recovery. Moreover, the subsequent work
performance was significantly improved after using this cooling vest during recovery
(Protocol II). Therefore, construction workers should be instructed/encouraged to wear the
newly designed cooling vest during their regular breaks between repeated bouts of work.
Limitations in the human wear trials in the climatic chamber should be acknowledged. First,
blinding participants in the treatment was difficult, similar to most cooling research, because
these participants were requested to wear chilled vests (Jones et al., 2012). Second, the
participants recruited in the current study consisted only of young healthy males, thereby
limiting the results to aged population, females, and people with poor physical fitness; these
types of population are seldom employed in the construction industry but may be vulnerable
to heat-related illnesses and injuries.
6.8 SUMMARY
In this chapter, human wear trials of the newly designed cooling vest were conducted in a
climatic chamber with a controlled hot and humid environment (37 °C temperature and 60%
144│Page
relative humidity) that simulated the summer days on Hong Kong’s construction sites.
Treadmill exercise was designed to simulate construction work intensity. Physiological (i.e.
core temperature, heart rate and skin temperature) and perceptual responses (i.e. RPE, thermal
sensation, wetness sensation and comfort sensation) were measured throughout the
experiment. In Protocol I, the cooling vest was worn during the exercise and recovery periods.
The results reveal that the newly designed cooling vest significantly reduces heat strain during
recovery but does not significantly alleviate heat strain during exercise. Consequently,
Protocol II, which used the cooling vest only during recovery, is proposed. In the cooling vest
group, heat storage during recovery is reduced by approximately 120%, and subsequent work
duration after recovery is improved by approximately 100%. Therefore, the ergonomic
requirements and logistic arrangements of construction sites should be considered, and
optimal cooling interventions should be provided for a wide range of construction work
conditions. The optimal cooling intervention that used the newly designed cooling vest during
recovery is proposed. This process can be a valid and practical countermeasure in alleviating
thermoregulatory and cardiovascular strain and improving work performance in a hot and
humid environment. It will improve the health and well-being of construction workers. Indeed,
workers in other occupations who need to labour under direct sunlight or those who are
subjected to heat stress may also benefit.
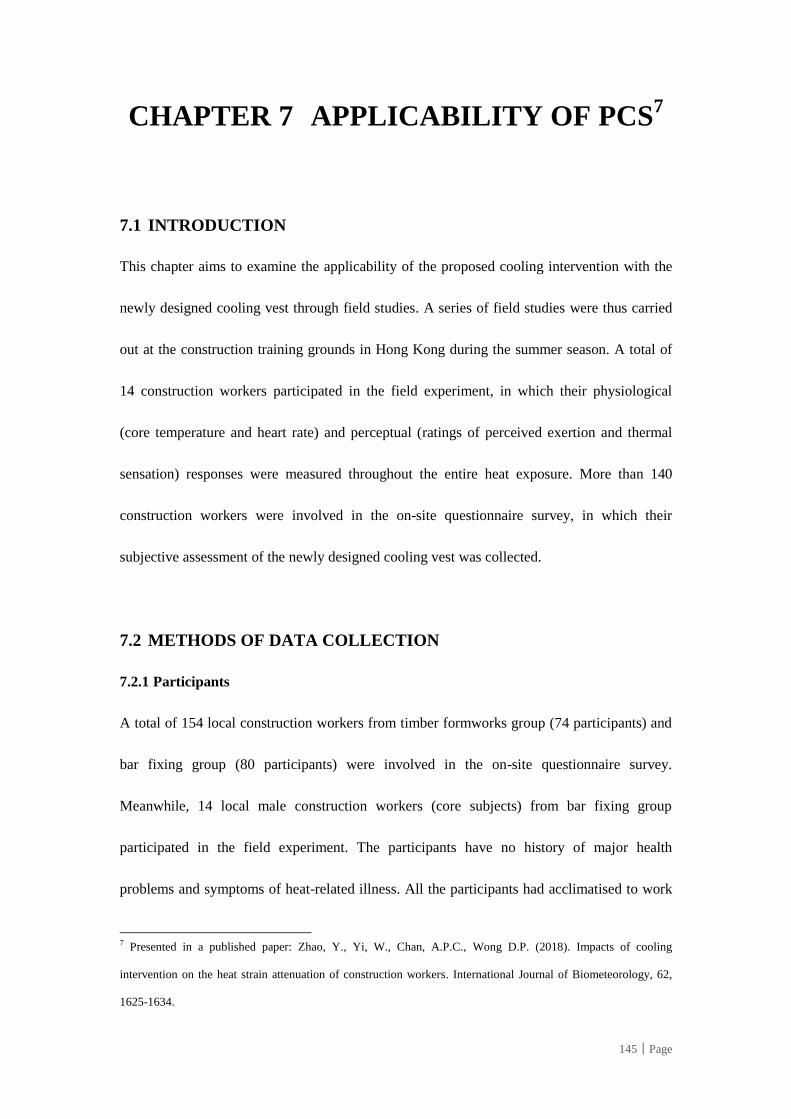
145│Page
CHAPTER 7 APPLICABILITY OF PCS7
7.1 INTRODUCTION
This chapter aims to examine the applicability of the proposed cooling intervention with the
newly designed cooling vest through field studies. A series of field studies were thus carried
out at the construction training grounds in Hong Kong during the summer season. A total of
14 construction workers participated in the field experiment, in which their physiological
(core temperature and heart rate) and perceptual (ratings of perceived exertion and thermal
sensation) responses were measured throughout the entire heat exposure. More than 140
construction workers were involved in the on-site questionnaire survey, in which their
subjective assessment of the newly designed cooling vest was collected.
7.2 METHODS OF DATA COLLECTION
7.2.1 Participants
A total of 154 local construction workers from timber formworks group (74 participants) and
bar fixing group (80 participants) were involved in the on-site questionnaire survey.
Meanwhile, 14 local male construction workers (core subjects) from bar fixing group
participated in the field experiment. The participants have no history of major health
problems and symptoms of heat-related illness. All the participants had acclimatised to work
7 Presented in a published paper: Zhao, Y., Yi, W., Chan, A.P.C., Wong D.P. (2018). Impacts of cooling
intervention on the heat strain attenuation of construction workers. International Journal of Biometeorology, 62,
1625-1634.
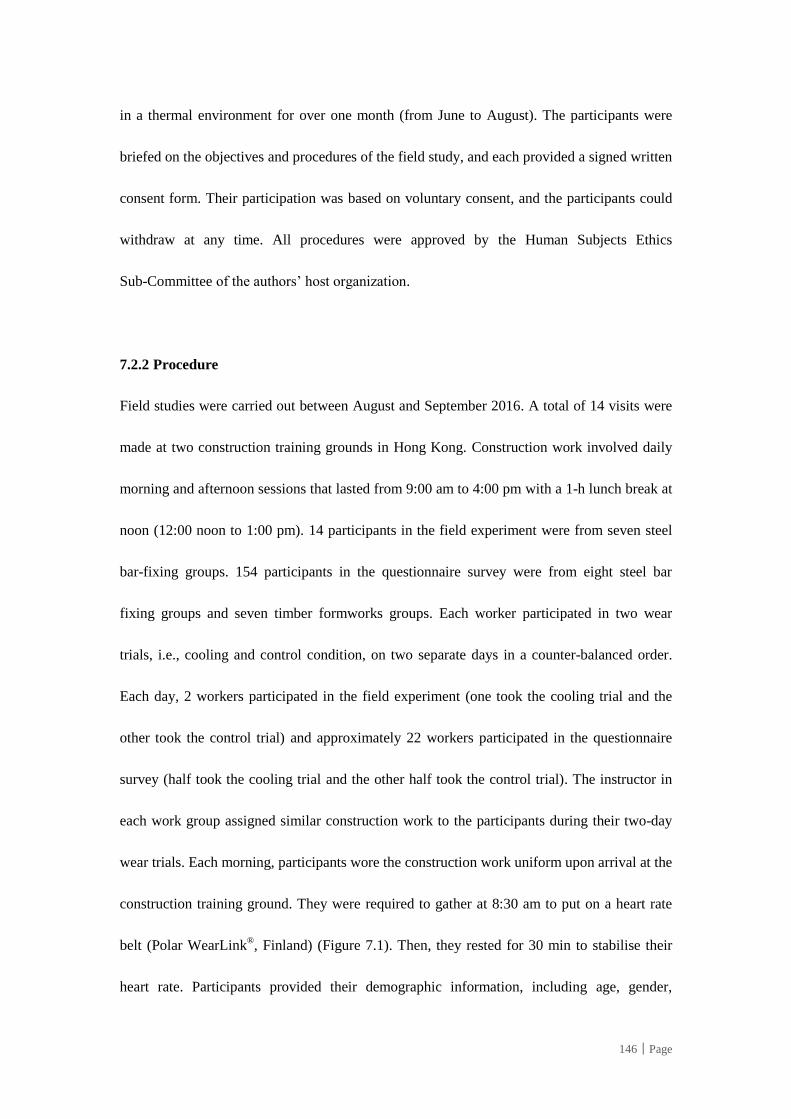
146│Page
in a thermal environment for over one month (from June to August). The participants were
briefed on the objectives and procedures of the field study, and each provided a signed written
consent form. Their participation was based on voluntary consent, and the participants could
withdraw at any time. All procedures were approved by the Human Subjects Ethics
Sub-Committee of the authors’ host organization.
7.2.2 Procedure
Field studies were carried out between August and September 2016. A total of 14 visits were
made at two construction training grounds in Hong Kong. Construction work involved daily
morning and afternoon sessions that lasted from 9:00 am to 4:00 pm with a 1-h lunch break at
noon (12:00 noon to 1:00 pm). 14 participants in the field experiment were from seven steel
bar-fixing groups. 154 participants in the questionnaire survey were from eight steel bar
fixing groups and seven timber formworks groups. Each worker participated in two wear
trials, i.e., cooling and control condition, on two separate days in a counter-balanced order.
Each day, 2 workers participated in the field experiment (one took the cooling trial and the
other took the control trial) and approximately 22 workers participated in the questionnaire
survey (half took the cooling trial and the other half took the control trial). The instructor in
each work group assigned similar construction work to the participants during their two-day
wear trials. Each morning, participants wore the construction work uniform upon arrival at the
construction training ground. They were required to gather at 8:30 am to put on a heart rate
belt (Polar WearLink®, Finland) (Figure 7.1). Then, they rested for 30 min to stabilise their
heart rate. Participants provided their demographic information, including age, gender,
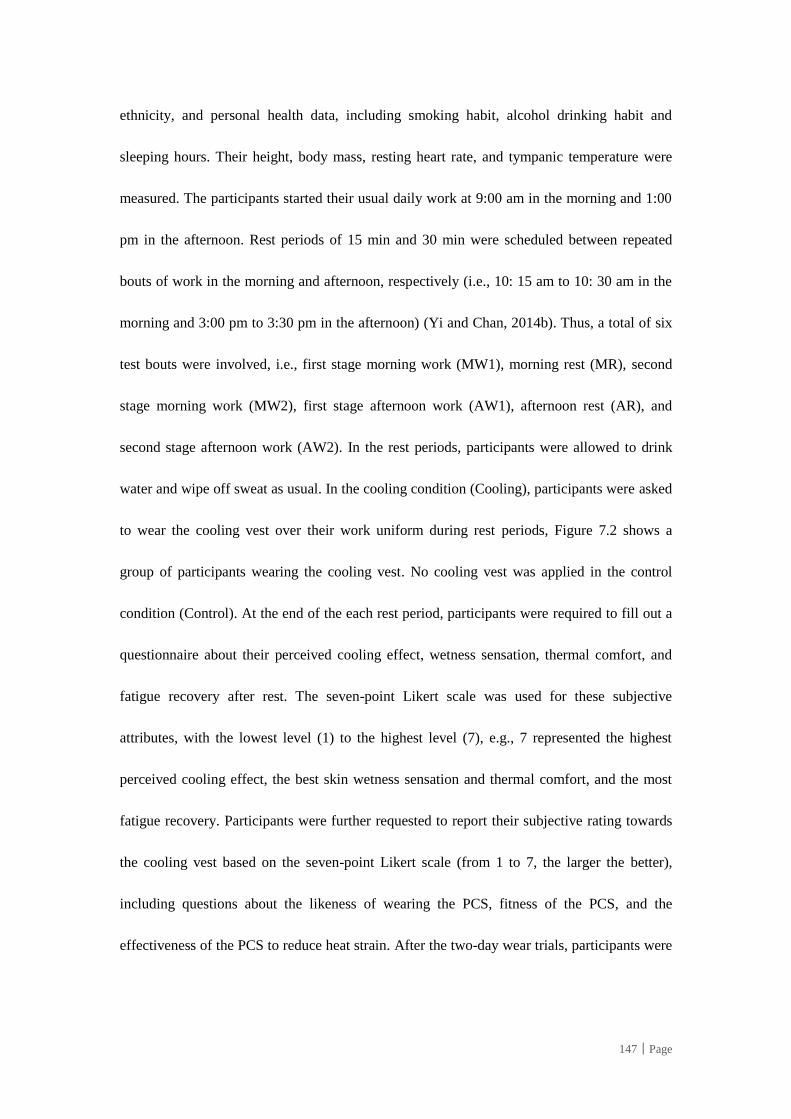
147│Page
ethnicity, and personal health data, including smoking habit, alcohol drinking habit and
sleeping hours. Their height, body mass, resting heart rate, and tympanic temperature were
measured. The participants started their usual daily work at 9:00 am in the morning and 1:00
pm in the afternoon. Rest periods of 15 min and 30 min were scheduled between repeated
bouts of work in the morning and afternoon, respectively (i.e., 10: 15 am to 10: 30 am in the
morning and 3:00 pm to 3:30 pm in the afternoon) (Yi and Chan, 2014b). Thus, a total of six
test bouts were involved, i.e., first stage morning work (MW1), morning rest (MR), second
stage morning work (MW2), first stage afternoon work (AW1), afternoon rest (AR), and
second stage afternoon work (AW2). In the rest periods, participants were allowed to drink
water and wipe off sweat as usual. In the cooling condition (Cooling), participants were asked
to wear the cooling vest over their work uniform during rest periods, Figure 7.2 shows a
group of participants wearing the cooling vest. No cooling vest was applied in the control
condition (Control). At the end of the each rest period, participants were required to fill out a
questionnaire about their perceived cooling effect, wetness sensation, thermal comfort, and
fatigue recovery after rest. The seven-point Likert scale was used for these subjective
attributes, with the lowest level (1) to the highest level (7), e.g., 7 represented the highest
perceived cooling effect, the best skin wetness sensation and thermal comfort, and the most
fatigue recovery. Participants were further requested to report their subjective rating towards
the cooling vest based on the seven-point Likert scale (from 1 to 7, the larger the better),
including questions about the likeness of wearing the PCS, fitness of the PCS, and the
effectiveness of the PCS to reduce heat strain. After the two-day wear trials, participants were
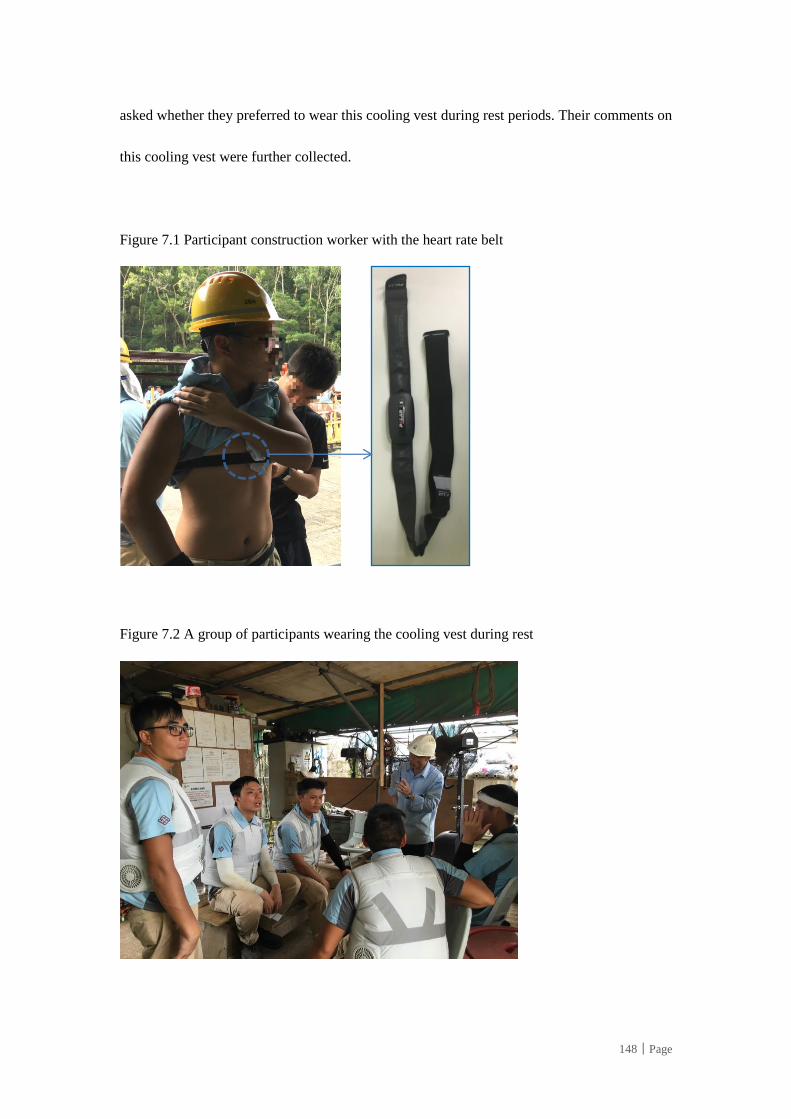
148│Page
asked whether they preferred to wear this cooling vest during rest periods. Their comments on
this cooling vest were further collected.
Figure 7.1 Participant construction worker with the heart rate belt
Figure 7.2 A group of participants wearing the cooling vest during rest
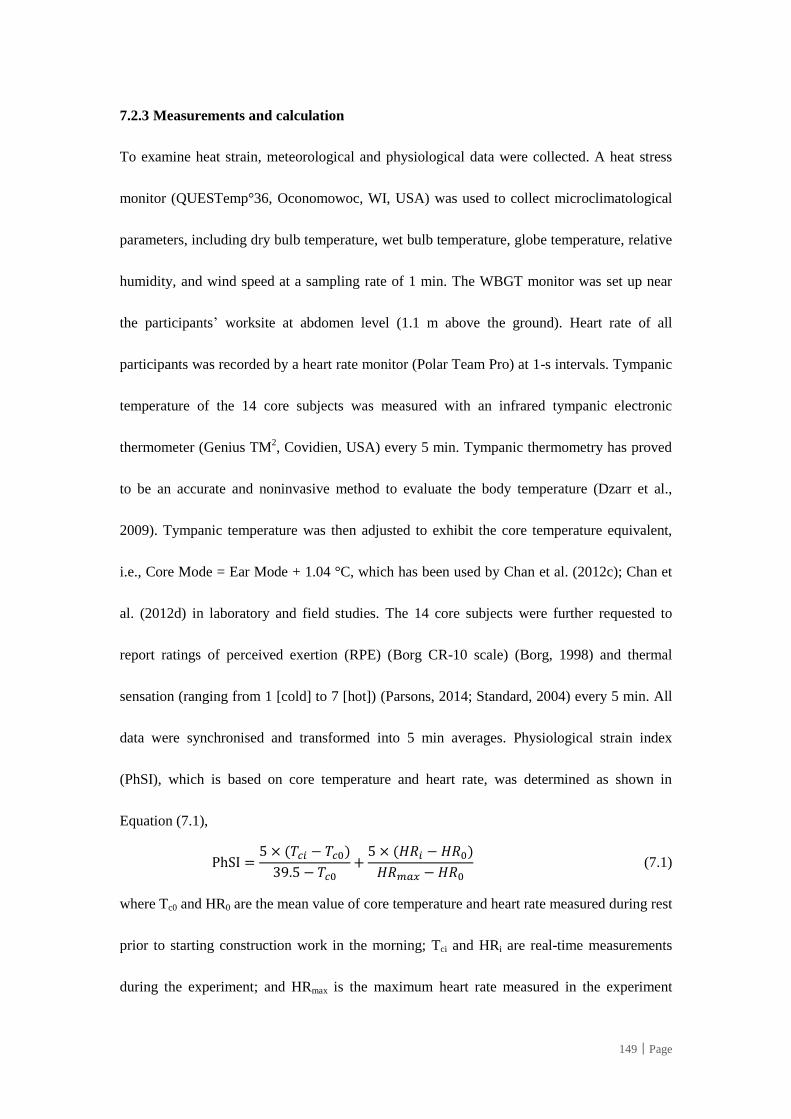
149│Page
7.2.3 Measurements and calculation
To examine heat strain, meteorological and physiological data were collected. A heat stress
monitor (QUESTemp°36, Oconomowoc, WI, USA) was used to collect microclimatological
parameters, including dry bulb temperature, wet bulb temperature, globe temperature, relative
humidity, and wind speed at a sampling rate of 1 min. The WBGT monitor was set up near
the participants’ worksite at abdomen level (1.1 m above the ground). Heart rate of all
participants was recorded by a heart rate monitor (Polar Team Pro) at 1-s intervals. Tympanic
temperature of the 14 core subjects was measured with an infrared tympanic electronic
thermometer (Genius TM2, Covidien, USA) every 5 min. Tympanic thermometry has proved
to be an accurate and noninvasive method to evaluate the body temperature (Dzarr et al.,
2009). Tympanic temperature was then adjusted to exhibit the core temperature equivalent,
i.e., Core Mode = Ear Mode + 1.04 °C, which has been used by Chan et al. (2012c); Chan et
al. (2012d) in laboratory and field studies. The 14 core subjects were further requested to
report ratings of perceived exertion (RPE) (Borg CR-10 scale) (Borg, 1998) and thermal
sensation (ranging from 1 [cold] to 7 [hot]) (Parsons, 2014; Standard, 2004) every 5 min. All
data were synchronised and transformed into 5 min averages. Physiological strain index
(PhSI), which is based on core temperature and heart rate, was determined as shown in
Equation (7.1),
PhSI =5 × (𝑇𝑐𝑖 − 𝑇𝑐0)
39.5 − 𝑇𝑐0+
5 × (𝐻𝑅𝑖 − 𝐻𝑅0)
𝐻𝑅𝑚𝑎𝑥 − 𝐻𝑅0 (7.1)
where Tc0 and HR0 are the mean value of core temperature and heart rate measured during rest
prior to starting construction work in the morning; Tci and HRi are real-time measurements
during the experiment; and HRmax is the maximum heart rate measured in the experiment
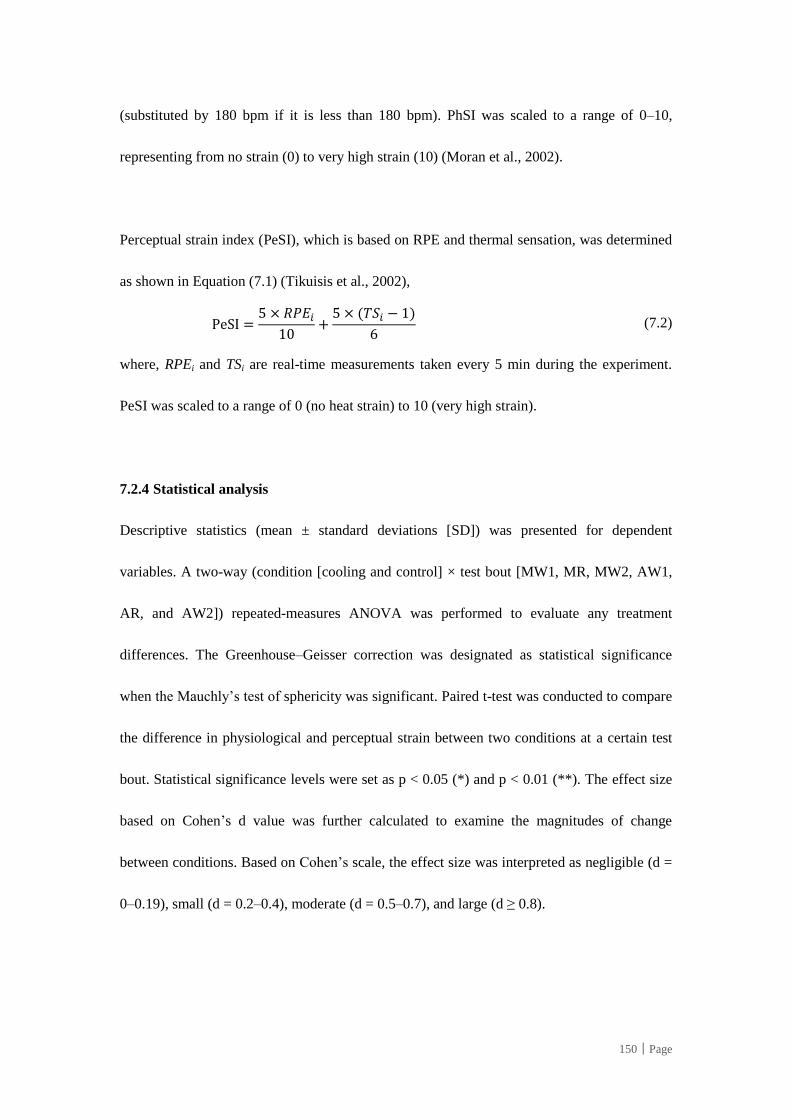
150│Page
(substituted by 180 bpm if it is less than 180 bpm). PhSI was scaled to a range of 0–10,
representing from no strain (0) to very high strain (10) (Moran et al., 2002).
Perceptual strain index (PeSI), which is based on RPE and thermal sensation, was determined
as shown in Equation (7.1) (Tikuisis et al., 2002),
PeSI =5 × 𝑅𝑃𝐸𝑖
10+
5 × (𝑇𝑆𝑖 − 1)
6 (7.2)
where, RPEi and TSi are real-time measurements taken every 5 min during the experiment.
PeSI was scaled to a range of 0 (no heat strain) to 10 (very high strain).
7.2.4 Statistical analysis
Descriptive statistics (mean ± standard deviations [SD]) was presented for dependent
variables. A two-way (condition [cooling and control] × test bout [MW1, MR, MW2, AW1,
AR, and AW2]) repeated-measures ANOVA was performed to evaluate any treatment
differences. The Greenhouse–Geisser correction was designated as statistical significance
when the Mauchly’s test of sphericity was significant. Paired t-test was conducted to compare
the difference in physiological and perceptual strain between two conditions at a certain test
bout. Statistical significance levels were set as p < 0.05 (*) and p < 0.01 (**). The effect size
based on Cohen’s d value was further calculated to examine the magnitudes of change
between conditions. Based on Cohen’s scale, the effect size was interpreted as negligible (d =
0–0.19), small (d = 0.2–0.4), moderate (d = 0.5–0.7), and large (d ≥ 0.8).
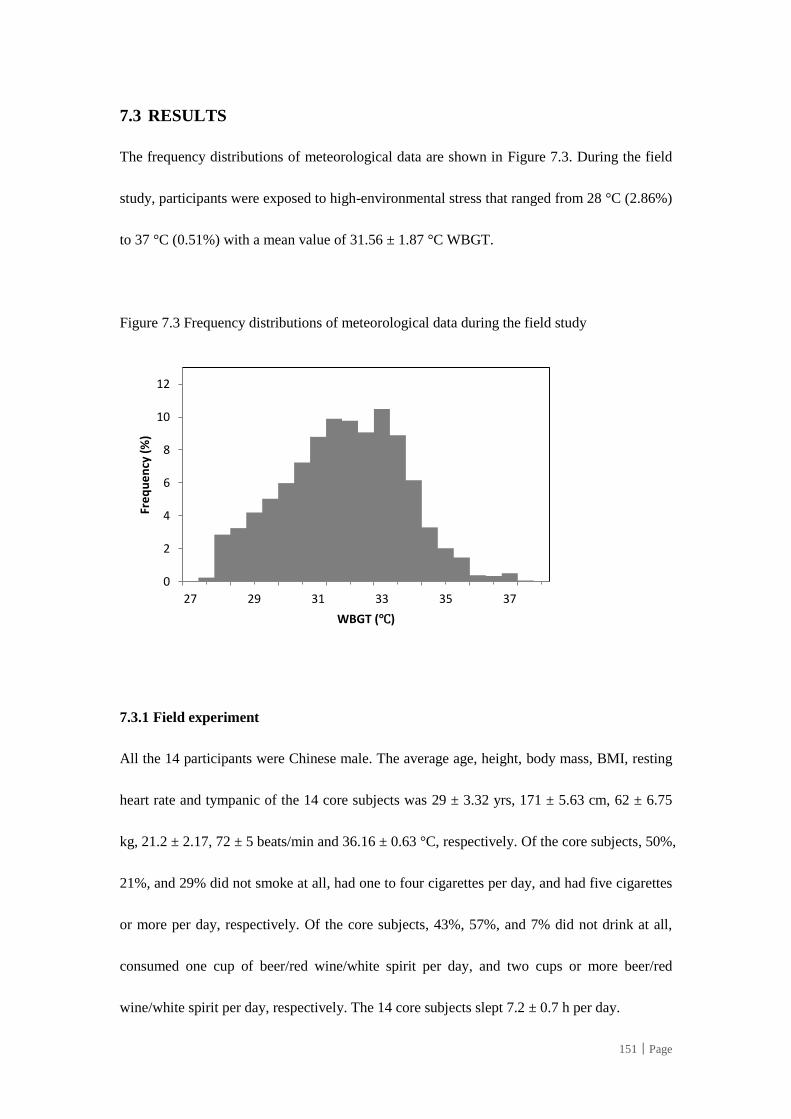
151│Page
7.3 RESULTS
The frequency distributions of meteorological data are shown in Figure 7.3. During the field
study, participants were exposed to high-environmental stress that ranged from 28 °C (2.86%)
to 37 °C (0.51%) with a mean value of 31.56 ± 1.87 °C WBGT.
Figure 7.3 Frequency distributions of meteorological data during the field study
7.3.1 Field experiment
All the 14 participants were Chinese male. The average age, height, body mass, BMI, resting
heart rate and tympanic of the 14 core subjects was 29 ± 3.32 yrs, 171 ± 5.63 cm, 62 ± 6.75
kg, 21.2 ± 2.17, 72 ± 5 beats/min and 36.16 ± 0.63 °C, respectively. Of the core subjects, 50%,
21%, and 29% did not smoke at all, had one to four cigarettes per day, and had five cigarettes
or more per day, respectively. Of the core subjects, 43%, 57%, and 7% did not drink at all,
consumed one cup of beer/red wine/white spirit per day, and two cups or more beer/red
wine/white spirit per day, respectively. The 14 core subjects slept 7.2 ± 0.7 h per day.
0
2
4
6
8
10
12
27 29 31 33 35 37
Fre
qu
en
cy (
%)
WBGT (℃)
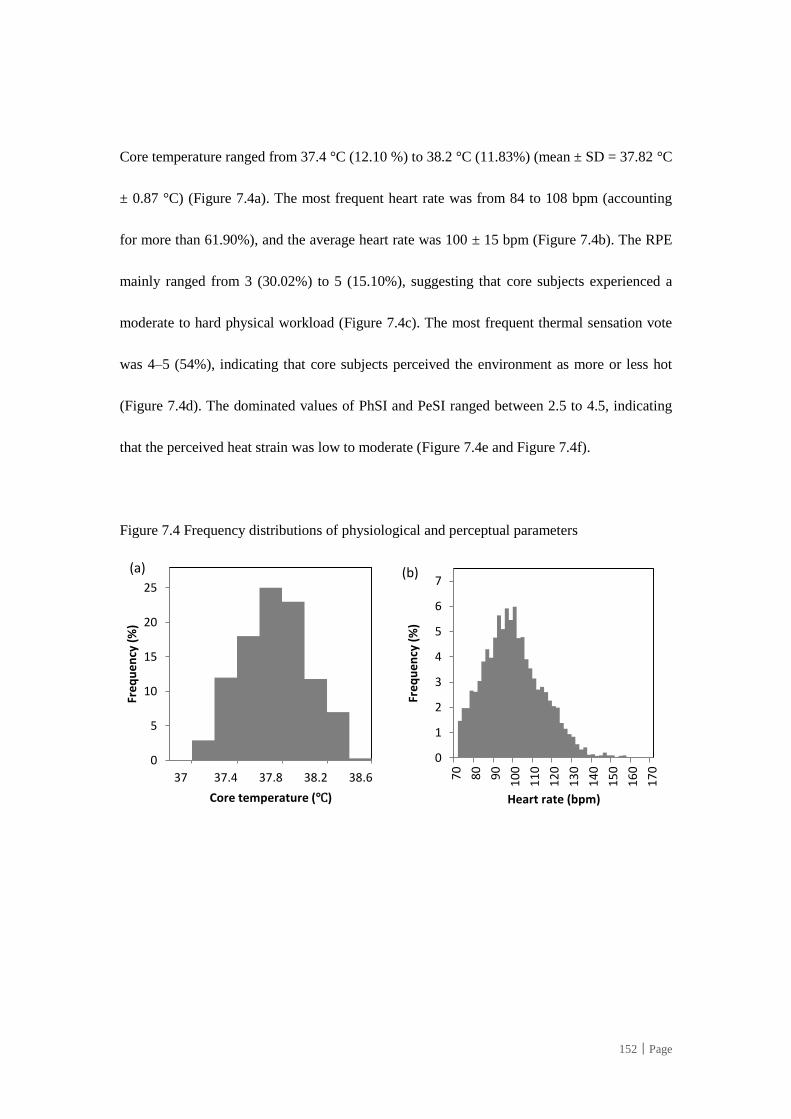
152│Page
Core temperature ranged from 37.4 °C (12.10 %) to 38.2 °C (11.83%) (mean ± SD = 37.82 °C
± 0.87 °C) (Figure 7.4a). The most frequent heart rate was from 84 to 108 bpm (accounting
for more than 61.90%), and the average heart rate was 100 ± 15 bpm (Figure 7.4b). The RPE
mainly ranged from 3 (30.02%) to 5 (15.10%), suggesting that core subjects experienced a
moderate to hard physical workload (Figure 7.4c). The most frequent thermal sensation vote
was 4–5 (54%), indicating that core subjects perceived the environment as more or less hot
(Figure 7.4d). The dominated values of PhSI and PeSI ranged between 2.5 to 4.5, indicating
that the perceived heat strain was low to moderate (Figure 7.4e and Figure 7.4f).
Figure 7.4 Frequency distributions of physiological and perceptual parameters
0
5
10
15
20
25
37 37.4 37.8 38.2 38.6
Fre
qu
en
cy (
%)
Core temperature (℃)
(a)
0
1
2
3
4
5
6
7
70
80
90
10
0
11
0
12
0
13
0
14
0
15
0
16
0
17
0
Fre
qu
en
cy (
%)
Heart rate (bpm)
(b)
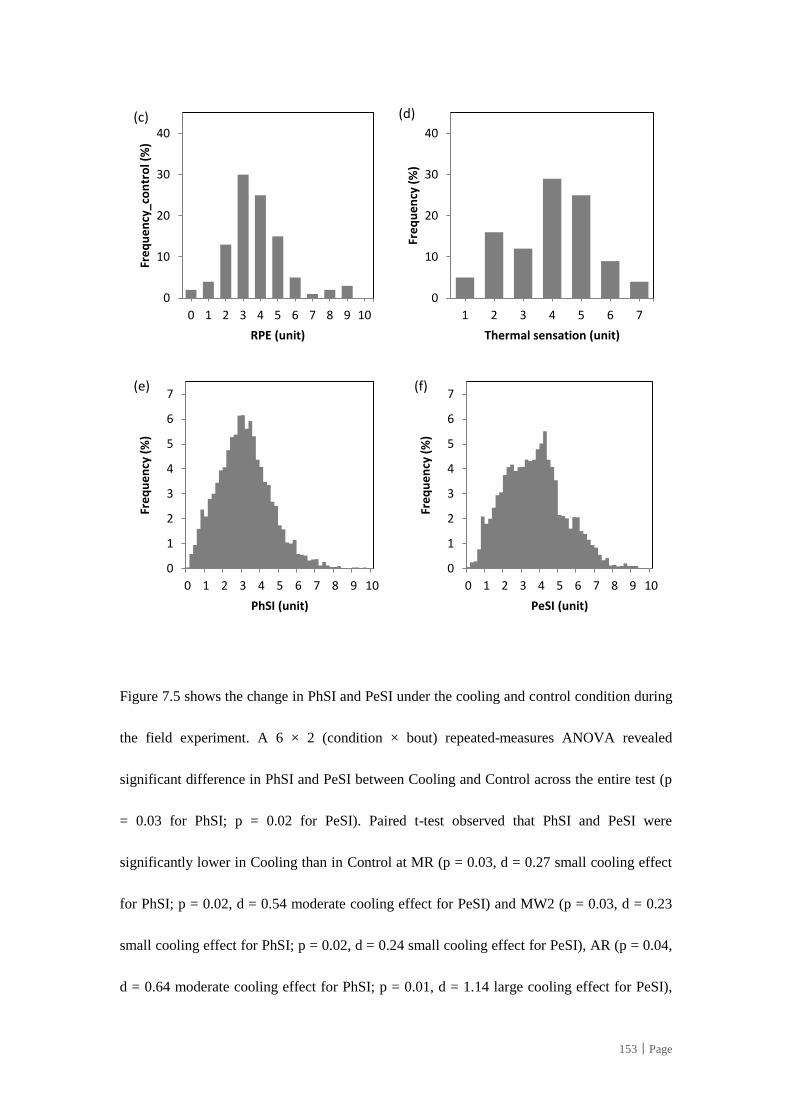
153│Page
Figure 7.5 shows the change in PhSI and PeSI under the cooling and control condition during
the field experiment. A 6 × 2 (condition × bout) repeated-measures ANOVA revealed
significant difference in PhSI and PeSI between Cooling and Control across the entire test (p
= 0.03 for PhSI; p = 0.02 for PeSI). Paired t-test observed that PhSI and PeSI were
significantly lower in Cooling than in Control at MR (p = 0.03, d = 0.27 small cooling effect
for PhSI; p = 0.02, d = 0.54 moderate cooling effect for PeSI) and MW2 (p = 0.03, d = 0.23
small cooling effect for PhSI; p = 0.02, d = 0.24 small cooling effect for PeSI), AR (p = 0.04,
d = 0.64 moderate cooling effect for PhSI; p = 0.01, d = 1.14 large cooling effect for PeSI),
0
10
20
30
40
0 1 2 3 4 5 6 7 8 9 10
Fre
qu
en
cy_c
on
tro
l (%
)
RPE (unit)
(c)
0
10
20
30
40
1 2 3 4 5 6 7
Fre
qu
en
cy (
%)
Thermal sensation (unit)
(d)
0
1
2
3
4
5
6
7
0 1 2 3 4 5 6 7 8 9 10
Fre
qu
en
cy (
%)
PhSI (unit)
(e)
0
1
2
3
4
5
6
7
0 1 2 3 4 5 6 7 8 9 10
Fre
qu
en
cy (
%)
PeSI (unit)
(f)
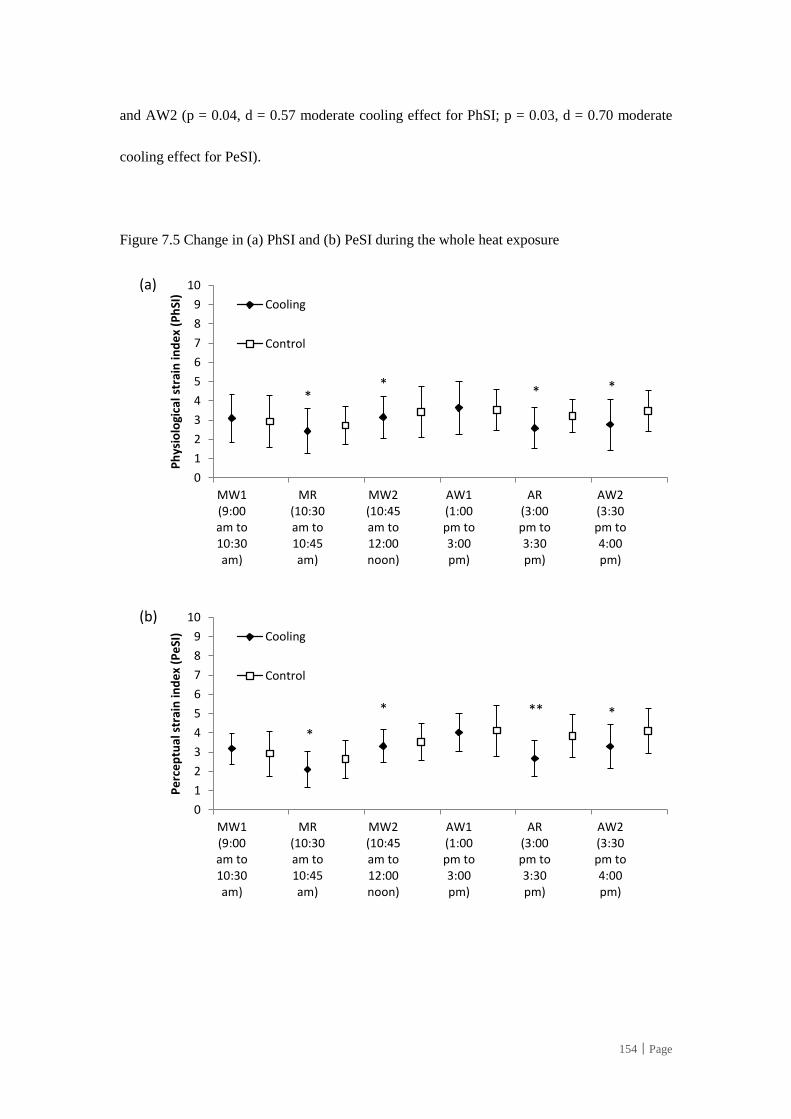
154│Page
and AW2 (p = 0.04, d = 0.57 moderate cooling effect for PhSI; p = 0.03, d = 0.70 moderate
cooling effect for PeSI).
Figure 7.5 Change in (a) PhSI and (b) PeSI during the whole heat exposure
0
1
2
3
4
5
6
7
8
9
10
MW1(9:00am to10:30am)
MR(10:30am to10:45am)
MW2(10:45am to12:00noon)
AW1(1:00pm to3:00pm)
AR(3:00pm to3:30pm)
AW2(3:30pm to4:00pm)
Ph
ysio
logi
cal s
trai
n in
de
x (P
hSI
)
Cooling
Control
(a)
* *
* *
0
1
2
3
4
5
6
7
8
9
10
MW1(9:00am to10:30am)
MR(10:30am to10:45am)
MW2(10:45am to12:00noon)
AW1(1:00pm to3:00pm)
AR(3:00pm to3:30pm)
AW2(3:30pm to4:00pm)
Pe
rce
ptu
al s
trai
n in
de
x (P
eSI
) Cooling
Control
(b)
*
* ** *
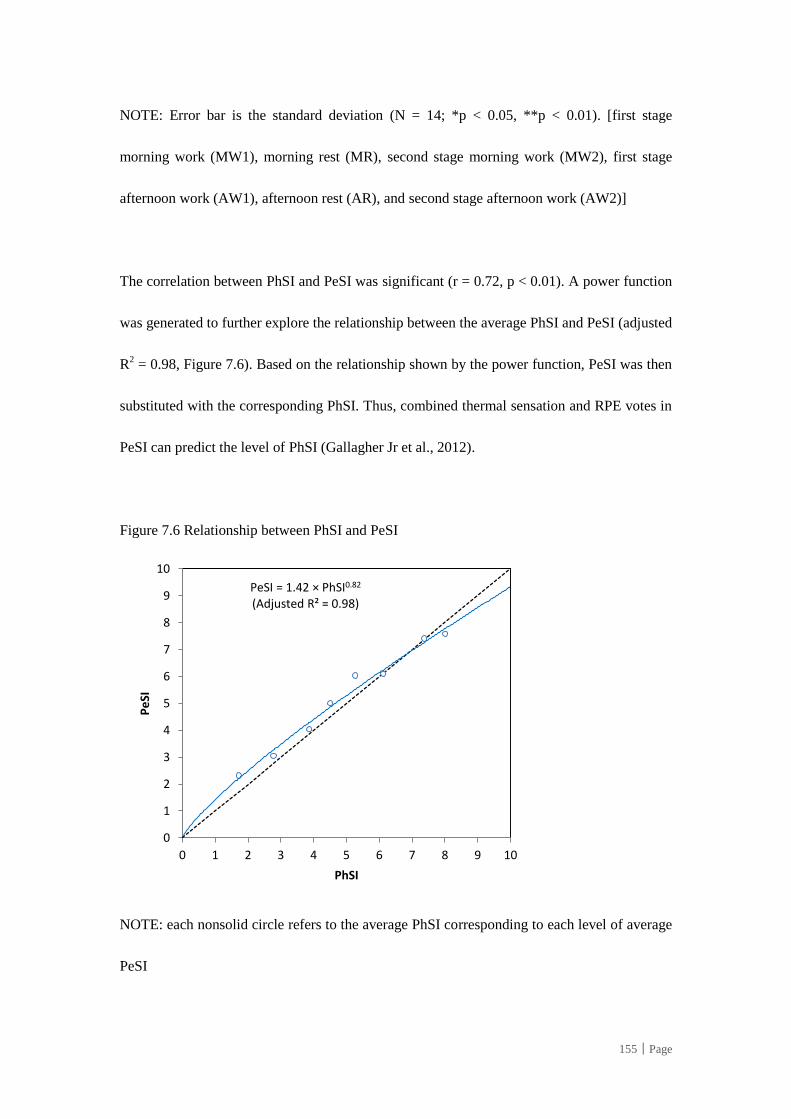
155│Page
NOTE: Error bar is the standard deviation (N = 14; *p < 0.05, **p < 0.01). [first stage
morning work (MW1), morning rest (MR), second stage morning work (MW2), first stage
afternoon work (AW1), afternoon rest (AR), and second stage afternoon work (AW2)]
The correlation between PhSI and PeSI was significant (r = 0.72, p < 0.01). A power function
was generated to further explore the relationship between the average PhSI and PeSI (adjusted
R2 = 0.98, Figure 7.6). Based on the relationship shown by the power function, PeSI was then
substituted with the corresponding PhSI. Thus, combined thermal sensation and RPE votes in
PeSI can predict the level of PhSI (Gallagher Jr et al., 2012).
Figure 7.6 Relationship between PhSI and PeSI
NOTE: each nonsolid circle refers to the average PhSI corresponding to each level of average
PeSI
PeSI = 1.42 × PhSI0.82
(Adjusted R² = 0.98)
0
1
2
3
4
5
6
7
8
9
10
0 1 2 3 4 5 6 7 8 9 10
Pe
SI
PhSI
156│Page
7.3.2 On-site questionnaire
In the on-site questionnaire survey, a total of 143 pairs of completed questionnaires (73 pairs
from bar fixing workers and 70 pairs from timber formworks workers) were finally collected.
Data from 11 participants were excluded due to incomplete record of heart rate (heart rate belt
dropped off during work), incomplete questionnaires, and voluntary withdrawal (workers
were injured or uncomfortable during work). The average age, height, body mass, BMI, and
resting heart rate of the 143 participants was 32.3 ± 8.2 yrs, 171.2 ± 5. 6 cm, 68.5 ± 10.5 kg,
23.3 ± 3.2, and 71 ± 4 beats/min, respectively. Of the participants, 39%, 27%, and 34% did
not smoke at all, had one to four cigarettes per day, and had five cigarettes or more per day,
respectively. Of the participants, 36%, 55%, and 9% did not drink at all, consumed one cup of
beer/red wine/white spirit per day, and two cups or more beer/red wine/white spirit per day,
respectively. The 143 participants slept 7.1 ± 0.6 h per day.
Results of the questionnaire survey in the morning and afternoon sessions are shown in Figure
7.7. Subjective ratings between Control and Cooling were significantly different. In general,
Cooling was rated significantly higher (the higher the better) than Control on all the
subjective items (p < 0.05). Subjective ratings in Cooling ranged from 4 to 6, suggesting a
satisfactory level for the cooling intervention.
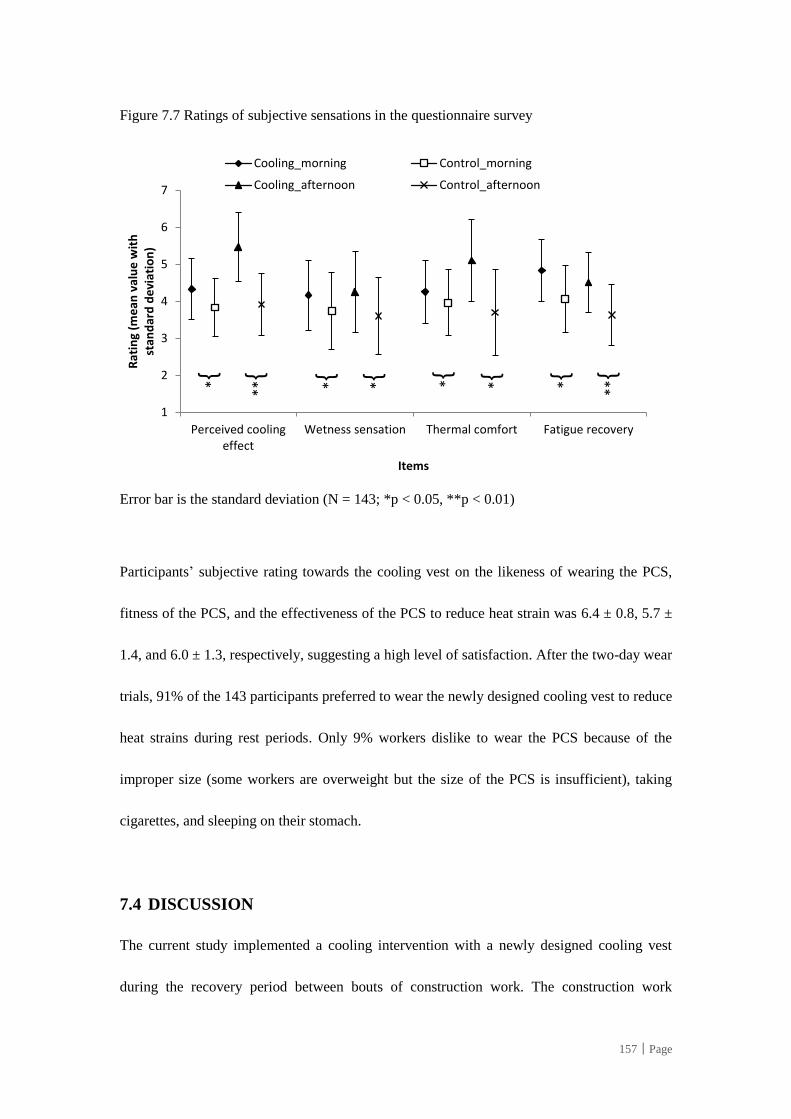
157│Page
Figure 7.7 Ratings of subjective sensations in the questionnaire survey
Error bar is the standard deviation (N = 143; *p < 0.05, **p < 0.01)
Participants’ subjective rating towards the cooling vest on the likeness of wearing the PCS,
fitness of the PCS, and the effectiveness of the PCS to reduce heat strain was 6.4 ± 0.8, 5.7 ±
1.4, and 6.0 ± 1.3, respectively, suggesting a high level of satisfaction. After the two-day wear
trials, 91% of the 143 participants preferred to wear the newly designed cooling vest to reduce
heat strains during rest periods. Only 9% workers dislike to wear the PCS because of the
improper size (some workers are overweight but the size of the PCS is insufficient), taking
cigarettes, and sleeping on their stomach.
7.4 DISCUSSION
The current study implemented a cooling intervention with a newly designed cooling vest
during the recovery period between bouts of construction work. The construction work
1
2
3
4
5
6
7
Perceived coolingeffect
Wetness sensation Thermal comfort Fatigue recovery
Rat
ing
(me
an v
alu
e w
ith
st
and
ard
de
viat
ion
)
Items
Cooling_morning Control_morning
Cooling_afternoon Control_afternoon
*{
**{
*{
*{
*{
*{
*{
**{
158│Page
included morning (9:00 am to 12:00 noon) and afternoon (1:00 pm to 4:00 pm) sessions. In
each session, two repeated bouts of work were intermitted by a period of rest (15 min rest in
the morning and 30 min rest in the afternoon). The cooling intervention significantly reduced
physiological and perceptual strain in recovery and subsequent work periods.
During the rest period, workers recovered from fatigue and prepared for subsequent work. In
a moderate temperature situation (e.g., < 27 °C WBGT), body heat that accumulated during
work is dissipated through the evaporation of sweat (driven by the large water vapour
pressure gradient between the sweating skin [100%] and the environment) and the conduction
of heat from the body core to the ambient environment (driven by the sufficient temperature
gradient between the body and the environment) (Barwood et al., 2009a). However, the local
WBGT reading in Hong Kong’s construction sites during summer season always exceeds
28 °C. Heat conditions are particularly severe on the floor/roof that is directly exposed to
sunlight or in confined places that lacks ventilation. In such an environment, the natural
dissipation of heat from the body to the ambient environment is blocked. Heat storage may
continue to increase to a noncompensable level. Many studies have reported that during
recovery, core temperature is not significantly attenuated and even increases in a hot
environment without appropriate cooling countermeasures (Barr et al., 2011; Kim et al., 2011;
Teunissen et al., 2014). In the current study, a significantly lower physiological/perceptual
strain was observed in the cooling group compared with the control group during rest in the
morning session (p < 0.05, d = 0.27–0.50, small cooling effect). The difference in
physiological and perceptual strain between the cooling and control groups was even larger
159│Page
during rest period in the afternoon session (p < 0.05, d = 0.64–1.07, large cooling effect). The
environment in the afternoon is hotter than that in the morning, which exposes workers in the
control group to a higher risk of heat stress when no cooling intervention is implemented.
The participant workers were from the steel bar-fixing and timber formwork groups. A wide
range of activities were included, such as heavy lifting, forceful pulling, climbing, and bar
fixing. Air temperature, relative humidity, wind speed, and solar radiation varied throughout
time. By contrast, laboratory tests usually use treadmill walking/running and ergometer with
certain intensity under constant environmental conditions (Yi et al., 2017d). Although the
laboratory test can assess the cooling capability and effectiveness of a cooling product, the
field study can further evaluate its applicability under real settings. During the second work
bout in the morning and afternoon sessions, heat strain was significantly attenuated in
Cooling compared with that in Control. The attenuated core temperature by the cooling vest
during recovery could increase the heat storage capacity in the subsequent work (Bongers et
al., 2014). With reduced heat strain in the cooling condition, work performance and
productivity was expected to improve. According to several laboratory studies, exercise
duration is prolonged after a period of cooling. To examine the performance improvement in
practical situations, construction activity (categorised as direct, productive, indirect, and
non-productive activities) was recorded and construction labour productivity was thus
calculated as the unit output divided by labour inputs (Li et al., 2016).
160│Page
The field experiment was conducted during the hot summer season on construction training
grounds. The mean WBGT during the experiment was 31.56 °C. According to occupational
safety and health organizations, preventive measures should be adopted when WBGT exceeds
28 °C, and serious health effects may occur when WBGT exceeds 31 °C (Hong Kong
Observatory). It was observed that WBGT significantly correlated with physiological and
perceptual strain indices (PhSI–WBGT, r = 0.27; PeSI–WBGT, r = 0.33). However, this
correlation was weaker than that those in PhSI–RPE (0.44), PhSI–thermal sensation (0.40),
PeSI–core temperature (r = 0.40), and PeSI–heart rate (r = 0.67). PhSI and PeSI reflect
combined body heat strain from thermoregulatory and cardiovascular systems. Core
temperature, heart rate, RPE, and thermal sensation were taken from human subjects, whereas
WBGT was taken from the environmental condition in which the human subjects worked.
WGBT is the most convenient parameter for use on sites and can be easily interpreted in the
industry (Parsons, 2006). It has been widely used as a heat stress threshold to determine the
maximum allowable exposure duration to hot conditions and to develop benchmarks in
guidelines (Rowlinson et al., 2014). The increase in WBGT significantly contributes to heat
strain level. Other factors, including exercise intensity, clothing insulation, and personal
characteristics (e.g., hydration level, body fat, and smoking/drinking habit) can cause
variations in body heat strain (Chan et al., 2012a). This study applied the cooling vest during
rest under the cooling condition. The cooling vest created a cooler microclimate around the
body and contributed to a difference between the body and the local WBGT. The ideal
situation of assessing heat strain is to collect physiological responses from working
individuals (Chan and Yang, 2016). Wearable early-warning systems (e.g., watch strap) that
161│Page
continuously monitor the workers’ physiological and perceptual responses (heart rate and
RPE) can be developed to safeguard wellbeing (Yi et al., 2016).
7.5 SUMMARY
Although the effectiveness of the cooling intervention has been experimentally investigated in
other studies under strictly controlled conditions in an environmental chamber, its cooling
effect has been rarely assessed in an actual outdoor situation. In this chapter, the applicability
of cooling intervention with the newly designed cooling vest during rest in between bouts of
construction work is tested in an outdoor environment. Results show that physiological and
perceptual strains are significantly attenuated during rest periods and subsequent work periods
after cooling. Moreover, this cooling intervention shows practical contributions. The newly
developed wearable cooling vest may be used as a practical cooling intervention in
construction sites wherein a blower or water reservoir (cold water submission) cannot be
installed due to limited space, uneven ground and lack of electricity and water supply.
Besides, the proposed cooling vest can be used in combination with the existing anti-heat
strain measures such as providing adequate cool and fresh drinking water, arranging
intermittent recovery/rest periods in-between heat exposures, and providing shelters.
162│Page
CHAPTER 8 CONCLUSIONS AND
RECOMMENDATIONS
8.1 INTRODUCTION
This chapter provides an overview of the research findings and highlights the contributions,
significance and limitations of this study. Suggestions and directions for future research are
also presented in this chapter.
8.2 SUMMARY OF MAJOR FINDINGS
This study aims to develop an optimal cooling intervention with a newly designed personal
cooling system (PCS) for the construction industry. Specific objectives are as follows: (1) to
review various PCSs for combating occupational heat stress and improving work performance,
(2) to engineer and design a tailor-made PCS for the construction industry, (3) to assess the
cooling capability of the newly developed PCS by using a sweating thermal manikin, (4) to
evaluate the effectiveness of the newly developed PCS in reducing heat stress and determine
an optimal cooling intervention with the newly developed PCS through wear trials in the
laboratory, and (5) to examine the applicability of the cooling intervention with the newly
developed PCS through field wear trials.
8.2.1 Tailor-made PCS for the construction industry
The newly developed PCS is a two-layer cooling vest that is specifically designed to be worn
over the construction uniform, which was previously designed by our research team. Hybrid
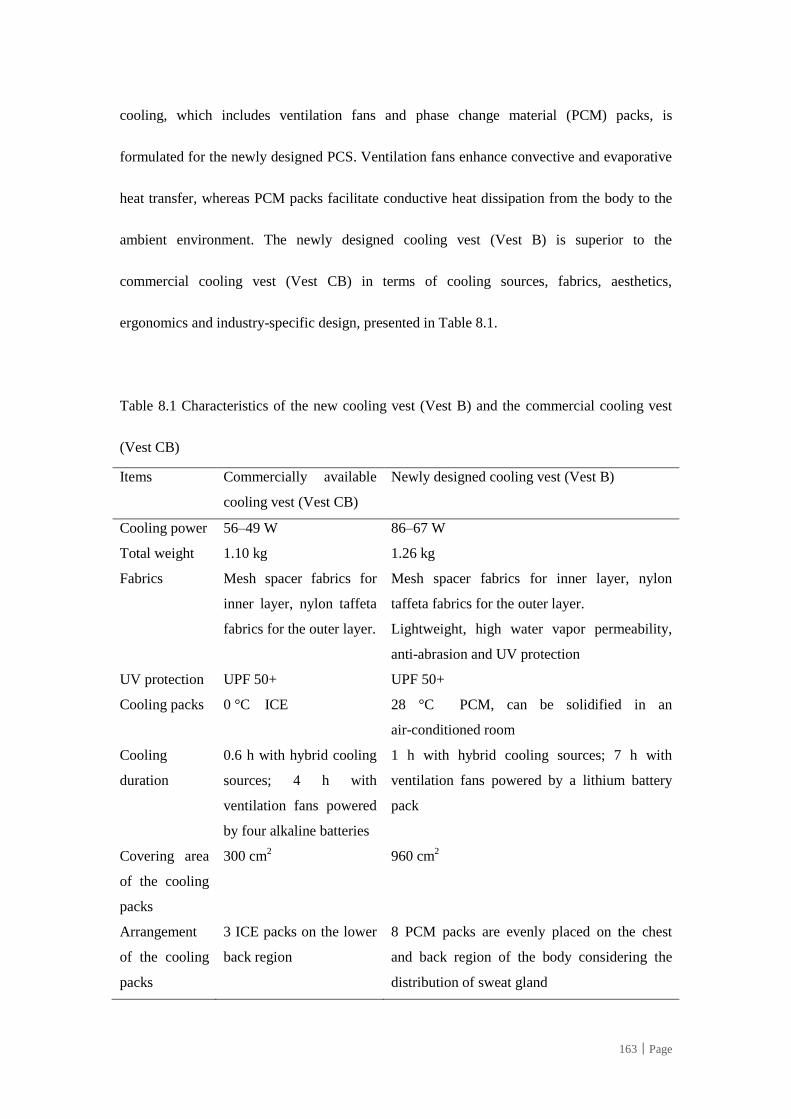
163│Page
cooling, which includes ventilation fans and phase change material (PCM) packs, is
formulated for the newly designed PCS. Ventilation fans enhance convective and evaporative
heat transfer, whereas PCM packs facilitate conductive heat dissipation from the body to the
ambient environment. The newly designed cooling vest (Vest B) is superior to the
commercial cooling vest (Vest CB) in terms of cooling sources, fabrics, aesthetics,
ergonomics and industry-specific design, presented in Table 8.1.
Table 8.1 Characteristics of the new cooling vest (Vest B) and the commercial cooling vest
(Vest CB)
Items Commercially available
cooling vest (Vest CB)
Newly designed cooling vest (Vest B)
Cooling power 56–49 W 86–67 W
Total weight 1.10 kg 1.26 kg
Fabrics Mesh spacer fabrics for
inner layer, nylon taffeta
fabrics for the outer layer.
Mesh spacer fabrics for inner layer, nylon
taffeta fabrics for the outer layer.
Lightweight, high water vapor permeability,
anti-abrasion and UV protection
UV protection UPF 50+ UPF 50+
Cooling packs 0 °C ICE 28 °C PCM, can be solidified in an
air-conditioned room
Cooling
duration
0.6 h with hybrid cooling
sources; 4 h with
ventilation fans powered
by four alkaline batteries
1 h with hybrid cooling sources; 7 h with
ventilation fans powered by a lithium battery
pack
Covering area
of the cooling
packs
300 cm2 960 cm
2
Arrangement
of the cooling
packs
3 ICE packs on the lower
back region
8 PCM packs are evenly placed on the chest
and back region of the body considering the
distribution of sweat gland
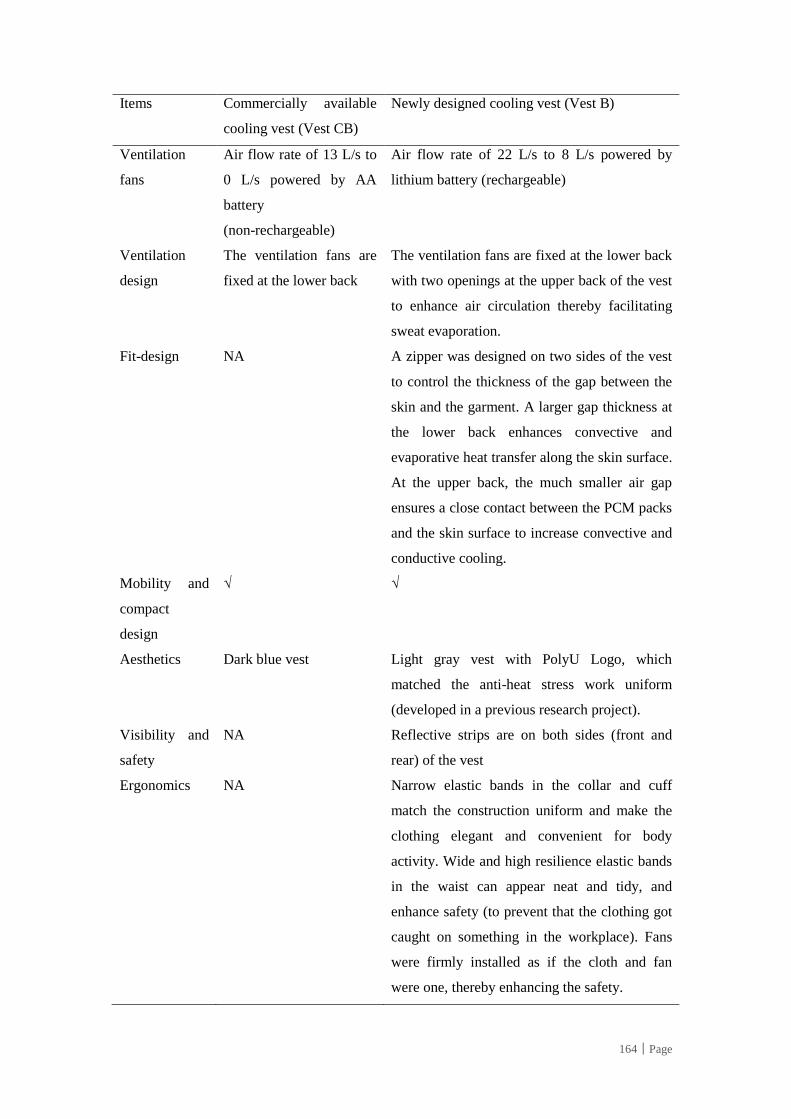
164│Page
Items Commercially available
cooling vest (Vest CB)
Newly designed cooling vest (Vest B)
Ventilation
fans
Air flow rate of 13 L/s to
0 L/s powered by AA
battery
(non-rechargeable)
Air flow rate of 22 L/s to 8 L/s powered by
lithium battery (rechargeable)
Ventilation
design
The ventilation fans are
fixed at the lower back
The ventilation fans are fixed at the lower back
with two openings at the upper back of the vest
to enhance air circulation thereby facilitating
sweat evaporation.
Fit-design NA A zipper was designed on two sides of the vest
to control the thickness of the gap between the
skin and the garment. A larger gap thickness at
the lower back enhances convective and
evaporative heat transfer along the skin surface.
At the upper back, the much smaller air gap
ensures a close contact between the PCM packs
and the skin surface to increase convective and
conductive cooling.
Mobility and
compact
design
√ √
Aesthetics Dark blue vest Light gray vest with PolyU Logo, which
matched the anti-heat stress work uniform
(developed in a previous research project).
Visibility and
safety
NA Reflective strips are on both sides (front and
rear) of the vest
Ergonomics NA Narrow elastic bands in the collar and cuff
match the construction uniform and make the
clothing elegant and convenient for body
activity. Wide and high resilience elastic bands
in the waist can appear neat and tidy, and
enhance safety (to prevent that the clothing got
caught on something in the workplace). Fans
were firmly installed as if the cloth and fan
were one, thereby enhancing the safety.
165│Page
8.2.2 Cooling power of the PCS
After completing the engineering and design of the PCS, a series of thermal manikin tests
were conducted to examine its cooling power. The cooling power of the PCS was measured
on a sweating thermal manikin in a climatic chamber that controlled at 34 °C air temperature
and 60% relative humidity to simulate a typical hot and humid environment at construction
sites in Hong Kong during summer. With combined cooling sources (i.e., PCM + Fan-on), the
newly designed PCS has a much higher cooling power (in the torso region that the vest
covered) of 67–87 W than the trade cooling vest (52–58 W) (Yi et al., 2017c).
8.2.3 Optimal cooling intervention with the PCS
On the basis of the “triangle” evaluation system, human wear trials were performed after
thermal manikin tests to assess the effectiveness of the cooling intervention with the newly
designed PCS in reducing body heat strain and improving work performance.
Laboratory experiments were conducted in a climatic chamber that simulated the outdoor hot
and humid environments with 37 °C and 60% relative humidity. Twelve participants were
randomly assigned to the cooling [VEST] and control condition [CON] in a counterbalanced
order. Human physiological (body core temperature, heart rate, skin temperature and sweat
rate) and perceptual (perceived exertion, thermal sensation, wetness sensation and overall
comfort sensation) responses were measured during the experiment. To investigate how to
employ the cooling intervention with the newly designed PCS (e.g. intervening time and
duration), two protocols were developed. The first protocol consisted of treadmill exercise (up
166│Page
to 48 min jogging/walking) followed by a 30 min recovery. PCS was used during the entire
heat exposure (including exercise and recovery) in the cooling condition in the first protocol.
Physiological (core temperature and heart rate) and perceptual strains (thermal sensation and
perceived exertion) were significantly attenuated during the recovery period (compared with
the control condition; no PCS applied). It was found that the core temperature and heart rate
were not significantly reduced during the exercise period (compared with the control
condition; no cooling applied). Moreover, ergonomic and logistic problems were found in the
construction industry. That is, wearing PCS throughout the work session is considered
impractical for the workers who perform daily tasks during summer. Thus, another protocol
with cooling intervention only at the recovery period (PCS was worn only during the 30 min
recovery) was proposed. The second protocol consisted of two bouts of treadmill exercise
(each was up to 48 min jogging/walking) intermitted by 30 min recovery. The major finding
manifested that PCS significantly alleviates thermo-physiological strain during the recovery
period. Core temperature in VEST is 0.42°C lower than that in CON at the end of recovery
period. Heart rate in VEST is 9 bpm lower than that in CON at the end of recovery period. At
the initial 10 min of the Exe2, heat strain in VEST is significantly lower than that in CON (p
< 0.05). The average duration of Exe2 in VEST was significantly improved as compared with
CON (22.08 ± 12.30 min for VEST; 11.08 ± 3.4 min for CON, p = 0.006; d = 1.22). A
remarkable reduction of body heat storage by 119.9% and an improvement in subsequent
exercise (i.e. second-stage exercise) duration by 99.3% were achieved while wearing the PCS
(compared with the control condition; no PCS applied). Consequently, an optimal cooling
167│Page
intervention was determined in which the newly designed PCS was used during rest between
repeated bouts of work.
8.2.4 Applicability of the cooling intervention with the PCS
Field studies were further executed to evaluate the applicability of the optimal cooling
intervention with the newly designed PCS. More than 140 participants engaged in timber
formworks (42%) and bar bending (58%) participated in on-site wear trials and questionnaire
surveys. In a two-day wear trial study, each participant randomly participated in the Cooling
(cooling intervention with the newly designed PCS was applied during rest between bouts of
work) and Control (no cooling intervention was applied) trials. At the end of the each rest
period, a short questionnaire survey was conducted to assess participants’ subjective ratings
on their perceived cooling effect, thermal comfort, wetness sensation and fatigue recovery
after rest. Participants’ subjective ratings towards the cooling vest, including questions about
the likeness of wearing the PCS, fitness of the PCS and effectiveness of the PCS to reduce
heat strain were also collected. These subjective attributes were measured by using the
seven-point Likert scale, which ranges from the lowest level (1) to the highest level (7) (the
higher the better). For example, 7 indicates the highest perceived cooling effect, the best
thermal comfort and wetness sensation, and the most fatigue recovery. Furthermore, the
participants were asked after two-day wear trials to indicate whether they preferred to wear
the PCS during rest. A significant difference in subjective ratings between Control and
Cooling was observed. In general, the cooling condition was rated significantly higher (a high
rating is favourable) than the control condition on all the subjective items (p < 0.05).
168│Page
Subjective ratings in the cooling condition ranged from 4 to 7, thereby suggesting a
satisfactory to highly satisfactory level on the cooling intervention. Moreover, 91% preferred
to wear the PCS to reduce heat strain during rest periods.
In the field experiment, a total of 14 steel bar fixing workers were invited to participate. In the
cooling condition, the PCS was worn over the rest period (between work bouts) in the
morning and afternoon sessions. The field experiment was conducted to examine the
effectiveness of the cooling intervention with the newly designed PCS in improving
physiological and perceptual responses in a real work setting. Their ear temperature was
measured by using an infrared tympanic electronic thermometer every 5 min. Heart rate was
recorded by a heart rate monitor at 1 s interval. Participants were requested to report RPE
(Borg CR-10 Scale) and thermal sensation (1 [cold] to 7 [hot]) every 5 min. All data were
synchronised and transformed into 5 min averages. Physiological strain index (PhSI) based on
heart rate and core temperature was determined. Perceptual strain index (PeSI) based on RPE
and thermal sensation was further determined. A 6 × 2 (condition × bout) repeated measures
ANOVA revealed a significant difference in PhSI and PeSI between Cooling and Control
during the entire test (p < 0.05). A paired t-test found that PhSI and PeSI were significantly
lower in Cooling than in Control at morning rest (MR), 2nd
bout of morning work (MW2),
afternoon rest (AR), and 2nd
bout of afternoon work (AW2).
Overall, the optimal cooling intervention with the newly designed PCS promotes the
well-being of construction workers given the declined physiological and perceptual strains
169│Page
during rest periods, thereby possibly resulting in improved work performance in the
subsequent work session.
8.3 SIGNIFICANCE AND CONTRIBUTIONS
8.3.1 Alternative approach for conducting construction safety and health research
Traditional safety and health research in the construction industry primarily relied on case
studies and quantitative surveys. In this study, a cooling intervention with the newly designed
PCS was proposed. Experimentation was adopted as a reliable and feasible approach to
conducting construction safety and health research. The efficacy, effectiveness and
applicability of the PCS were examined after its development through a series of laboratory
experiments and field studies. The experimentation adopted in the present study established
the causal relationships between an intervention (independent variable) and an outcome
(dependent variable). Cause–effect relationship is the fundamental of scientific reasoning (Yi
and Chan, 2014c). Nevertheless, traditional methods (including case studies and surveys) in
construction safety and health research typically do not clarify the unambiguous causal
relationship (Yi and Chan, 2014c). Moreover, intervention studies suggest a solution to the
criticism that academia and construction practitioners do not work closely in most
construction research projects. Practitioners argue that the academia frequently focuses on
subjects and issues that may be unrelated to the construction industry (Azhar et al., 2010;
Laufer et al., 2008; Rahman and Kumaraswamy, 2008). Several construction practitioners
perceive that academic research is impractical and inapplicable in actual construction
situations. By contrast, researchers consider that practitioners generally ignore innovation
170│Page
research ideas that can significantly improve the practices and procedures in the industry
(Azhar et al., 2010). An intervention study provides a platform for academic researchers and
practitioners to collaborate in conducting construction safety and health research.
8.3.2 Facilitating cooling intervention research in construction
Numerous previous studies examined the effectiveness of PCS in firefighting, sports events,
military activities and hazmat operations. However, limited research focused on developing a
cooling intervention with the PCS for the construction industry. In view of this, the current
study designed a tailor-made PCS, which can be used in construction sites with confined
spaces, elevated platforms and uneven grounds, where installation of blowers and provision
of cold water reservoirs are typically impractical. An optimal cooling intervention with the
newly designed PCS was determined in this study. The cooling intervention would promote
the well-being of construction workers through a reduced heat strain and improved work
performance. The findings of the current study also demonstrate that the PCS is applicable in
industrial settings and eventually in large populations and locations. Thus, the convincing
research findings enable the academia and practitioners to promote the use of cooling
intervention in the construction industry.
8.4 LIMITATIONS OF THE STUDY
The participants in the present study were all healthy males aged 19 to 35 years old and
represented the main labour force. Thus, the results of the present study are inapplicable to
women and the elderly, who are susceptible to heat strain and sensitive to the improved or
171│Page
worsened thermal/wetness sensation caused by the cooling vest. The sample size in this study
was determined based on the required treatment difference in the core temperature and heart
rate (determined by literature review and expert evaluation) and standard deviation. A large
sample should be included to validate the questionnaire survey results and evaluate the
relationship between personal characteristics (age, drinking/smoking habit and body fat) and
heat strain level.
The duration of the second work bout after rest designed in the present study is shorter than
the regular work duration in actual situations on construction worksites in Hong Kong
according to the CIC guidelines. Heat strain achieved the highest reduction under the cooling
condition at the end of recovery (at the start of subsequent work) and gradually increased to a
value that is similar to that under the control condition at the end of subsequent work. In
prolonged work duration, the cooling effect can be neglected in the later stage of work.
Therefore, frequent intermittent rest with cooling duration was encouraged after considering
the characteristics of the construction work activity (e.g. pouring of concrete should be
continuously conducted once commenced).
In the field study, core temperature was estimated with tympanic ear temperature
measurements given the invasive procedure for measuring core temperature. The estimated
core temperature is less accurate than the direct measurement of core temperature, although
the validity and applicability of an estimated core temperature in describing the variation in
172│Page
physiological heat strain have been demonstrated in laboratory and field studies (Chan et al.,
2012c; Chan et al., 2012d).
8.5 FUTURE RESEARCH DIRECTIONS
This study presents a research framework for developing a cooling intervention with the PCS
in the construction industry. The effectiveness and applicability of the cooling intervention
with the newly designed PCS have been demonstrated through a case study in Hong Kong.
Based on the current research framework, academia and industry practitioners should
replicate research procedures and generate convincing results in other contexts or settings to
formulate guidelines on implementing the cooling intervention. Cost–benefit analysis (Ikpe et
al., 2012) can be introduced in future studies to support decision making in formulating
guidelines at company-, industrial-, or national-levels. Costs are represented by the money
invested by contractors to design and implement cooling intervention to prevent heat stress.
Benefits can be obtained by contractors in terms of reduced heat-related illnesses and
fatalities through the implementation of cooling intervention in the construction industry. A
questionnaire survey is designed to elicit cost-and-benefit information from personnel who
are responsible for safety and health performance in the construction industry (e.g., safety and
health managers). Statistical techniques (e.g. benefit-cost ratio) are adopted to facilitate the
comparison between costs and benefits (Preez, 2004). Upon the identification of benefits
alongside the costs of cooling intervention, the consideration of economic support for cooling
intervention becomes possible.
173│Page
Certain barriers, including the change in cofactors that confound the measurement of
intervention effect (e.g. techniques for measuring exposures), change in participation
(research subjects or partners) and sociopolitical and ethical issues, exist in the intervention
implementation research (Goldenhar et al., 2001). “It may take years to before an
intervention is completely implemented as planned” (Goldenhar et al., 2001). In the present
study, the effectiveness and applicability of the cooling intervention with the newly designed
PCS in alleviating heat strain have been validated through laboratory experiments and field
studies. A longitudinal study is needed in future studies to examine the long-term effects of
the cooling intervention on preventing heat-related illnesses and safety accidents. Compared
with cross-sectional research that analyses multiple variables at a given instance, longitudinal
studies use continuous measures to follow-up on particular individuals over periods (that
usually last for years) (Caruana et al., 2015). Longitudinal studies are designed to identify
changes that a cooling intervention has induced in terms of the rate of heat-related injuries, as
well as attitudes and behaviours towards heat-stress prevention.
8.6 SUMMARY
This chapter summarises the research findings, highlights the significance and contributions,
acknowledges the limitations and suggests future research directions. This study presents a
fresh and rigorous approach to provide considerable scientific evidence on the effectiveness
and applicability of the cooling intervention with the newly designed PCS as a precautionary
measure for alleviating heat stress in the construction industry.
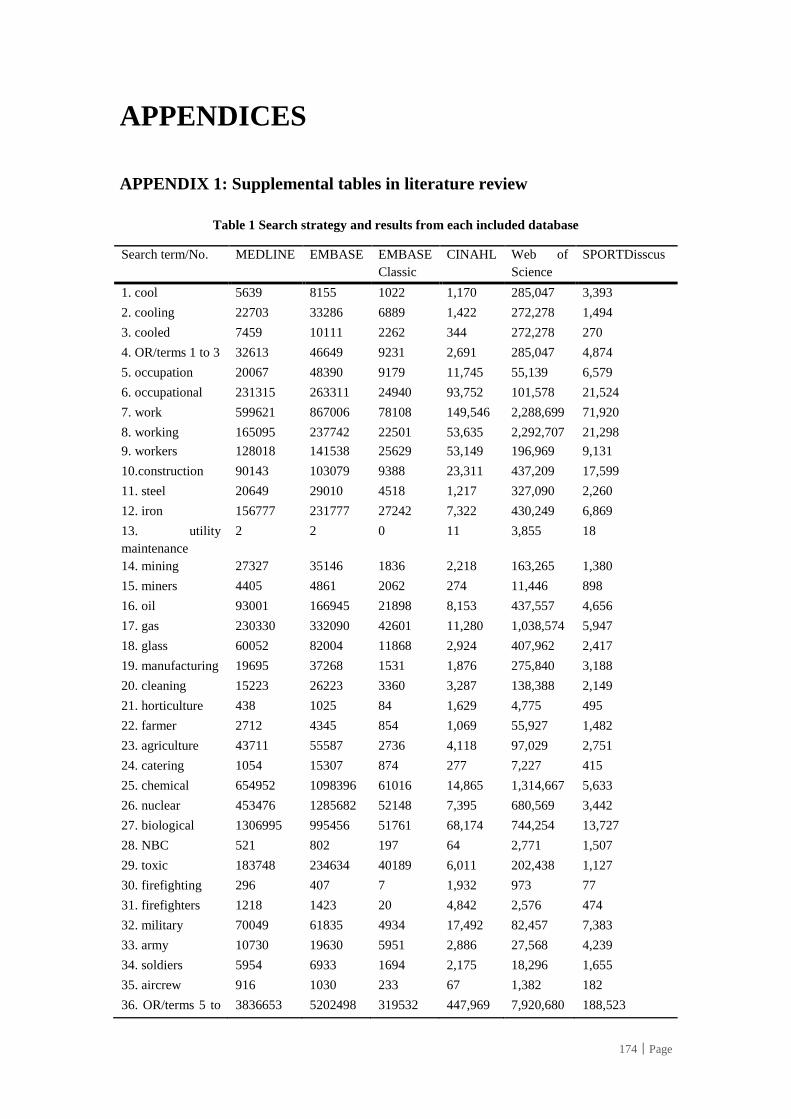
174│Page
APPENDICES
APPENDIX 1: Supplemental tables in literature review
Table 1 Search strategy and results from each included database
Search term/No. MEDLINE EMBASE EMBASE
Classic
CINAHL Web of
Science
SPORTDisscus
1. cool 5639 8155 1022 1,170 285,047 3,393
2. cooling 22703 33286 6889 1,422 272,278 1,494
3. cooled 7459 10111 2262 344 272,278 270
4. OR/terms 1 to 3 32613 46649 9231 2,691 285,047 4,874
5. occupation 20067 48390 9179 11,745 55,139 6,579
6. occupational 231315 263311 24940 93,752 101,578 21,524
7. work 599621 867006 78108 149,546 2,288,699 71,920
8. working 165095 237742 22501 53,635 2,292,707 21,298
9. workers 128018 141538 25629 53,149 196,969 9,131
10.construction 90143 103079 9388 23,311 437,209 17,599
11. steel 20649 29010 4518 1,217 327,090 2,260
12. iron 156777 231777 27242 7,322 430,249 6,869
13. utility
maintenance
2 2 0 11 3,855 18
14. mining 27327 35146 1836 2,218 163,265 1,380
15. miners 4405 4861 2062 274 11,446 898
16. oil 93001 166945 21898 8,153 437,557 4,656
17. gas 230330 332090 42601 11,280 1,038,574 5,947
18. glass 60052 82004 11868 2,924 407,962 2,417
19. manufacturing 19695 37268 1531 1,876 275,840 3,188
20. cleaning 15223 26223 3360 3,287 138,388 2,149
21. horticulture 438 1025 84 1,629 4,775 495
22. farmer 2712 4345 854 1,069 55,927 1,482
23. agriculture 43711 55587 2736 4,118 97,029 2,751
24. catering 1054 15307 874 277 7,227 415
25. chemical 654952 1098396 61016 14,865 1,314,667 5,633
26. nuclear 453476 1285682 52148 7,395 680,569 3,442
27. biological 1306995 995456 51761 68,174 744,254 13,727
28. NBC 521 802 197 64 2,771 1,507
29. toxic 183748 234634 40189 6,011 202,438 1,127
30. firefighting 296 407 7 1,932 973 77
31. firefighters 1218 1423 20 4,842 2,576 474
32. military 70049 61835 4934 17,492 82,457 7,383
33. army 10730 19630 5951 2,886 27,568 4,239
34. soldiers 5954 6933 1694 2,175 18,296 1,655
35. aircrew 916 1030 233 67 1,382 182
36. OR/terms 5 to 3836653 5202498 319532 447,969 7,920,680 188,523
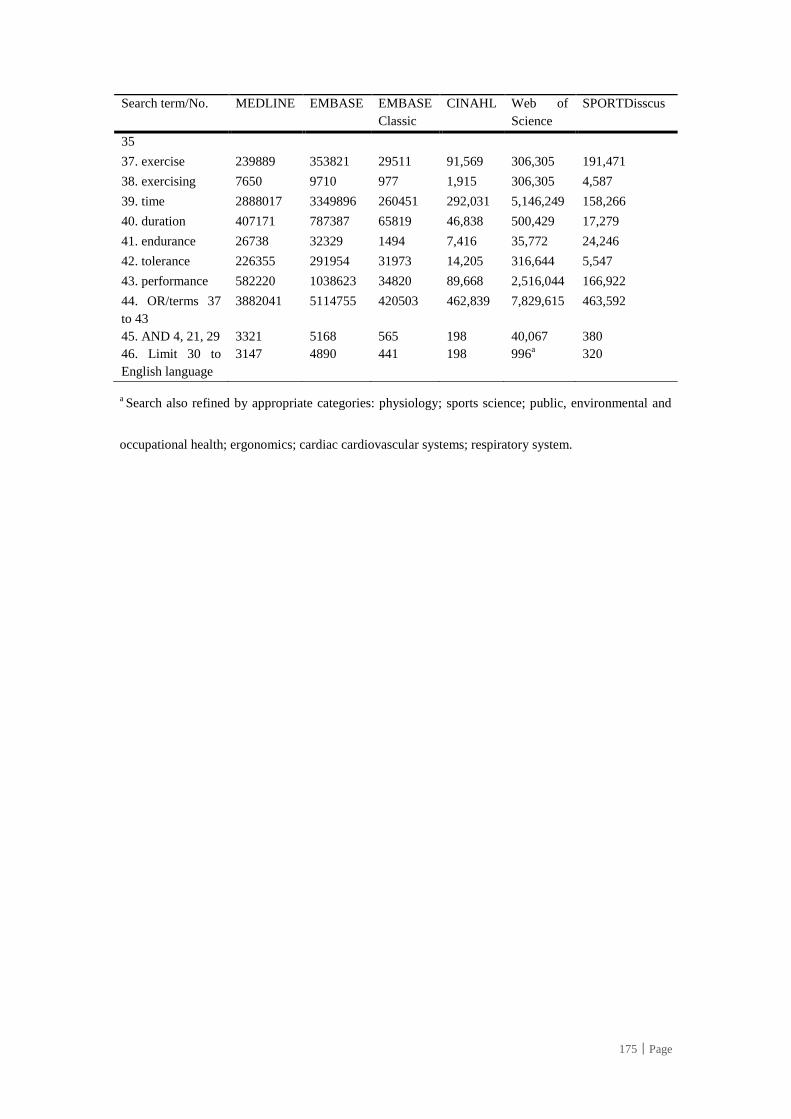
175│Page
Search term/No. MEDLINE EMBASE EMBASE
Classic
CINAHL Web of
Science
SPORTDisscus
35
37. exercise 239889 353821 29511 91,569 306,305 191,471
38. exercising 7650 9710 977 1,915 306,305 4,587
39. time 2888017 3349896 260451 292,031 5,146,249 158,266
40. duration 407171 787387 65819 46,838 500,429 17,279
41. endurance 26738 32329 1494 7,416 35,772 24,246
42. tolerance 226355 291954 31973 14,205 316,644 5,547
43. performance 582220 1038623 34820 89,668 2,516,044 166,922
44. OR/terms 37
to 43
3882041 5114755 420503 462,839 7,829,615 463,592
45. AND 4, 21, 29 3321 5168 565 198 40,067 380
46. Limit 30 to
English language
3147 4890 441 198 996a 320
a Search also refined by appropriate categories: physiology; sports science; public, environmental and
occupational health; ergonomics; cardiac cardiovascular systems; respiratory system.
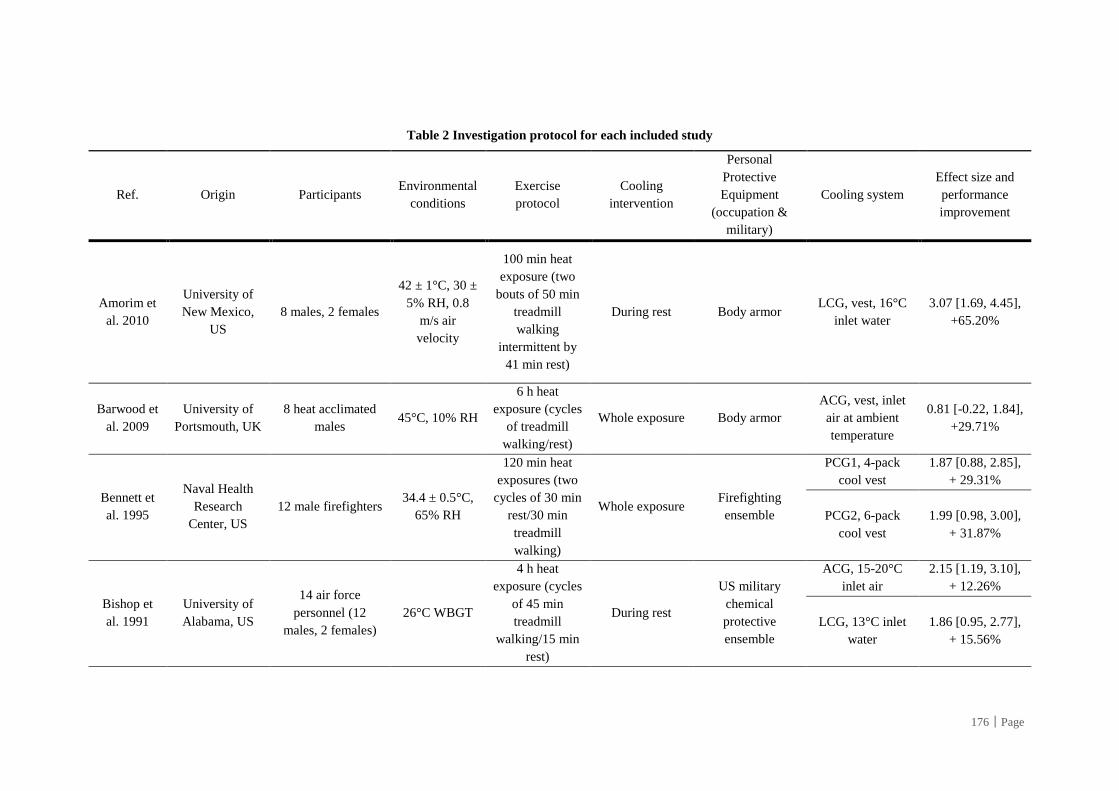
176│Page
Table 2 Investigation protocol for each included study
Ref. Origin Participants Environmental
conditions
Exercise
protocol
Cooling
intervention
Personal
Protective
Equipment
(occupation &
military)
Cooling system
Effect size and
performance
improvement
Amorim et
al. 2010
University of
New Mexico,
US
8 males, 2 females
42 ± 1°C, 30 ±
5% RH, 0.8
m/s air
velocity
100 min heat
exposure (two
bouts of 50 min
treadmill
walking
intermittent by
41 min rest)
During rest Body armor LCG, vest, 16°C
inlet water
3.07 [1.69, 4.45],
+65.20%
Barwood et
al. 2009
University of
Portsmouth, UK
8 heat acclimated
males 45°C, 10% RH
6 h heat
exposure (cycles
of treadmill
walking/rest)
Whole exposure Body armor
ACG, vest, inlet
air at ambient
temperature
0.81 [-0.22, 1.84],
+29.71%
Bennett et
al. 1995
Naval Health
Research
Center, US
12 male firefighters 34.4 ± 0.5°C,
65% RH
120 min heat
exposures (two
cycles of 30 min
rest/30 min
treadmill
walking)
Whole exposure Firefighting
ensemble
PCG1, 4-pack
cool vest
1.87 [0.88, 2.85],
+ 29.31%
PCG2, 6-pack
cool vest
1.99 [0.98, 3.00],
+ 31.87%
Bishop et
al. 1991
University of
Alabama, US
14 air force
personnel (12
males, 2 females)
26°C WBGT
4 h heat
exposure (cycles
of 45 min
treadmill
walking/15 min
rest)
During rest
US military
chemical
protective
ensemble
ACG, 15-20°C
inlet air
2.15 [1.19, 3.10],
+ 12.26%
LCG, 13°C inlet
water
1.86 [0.95, 2.77],
+ 15.56%
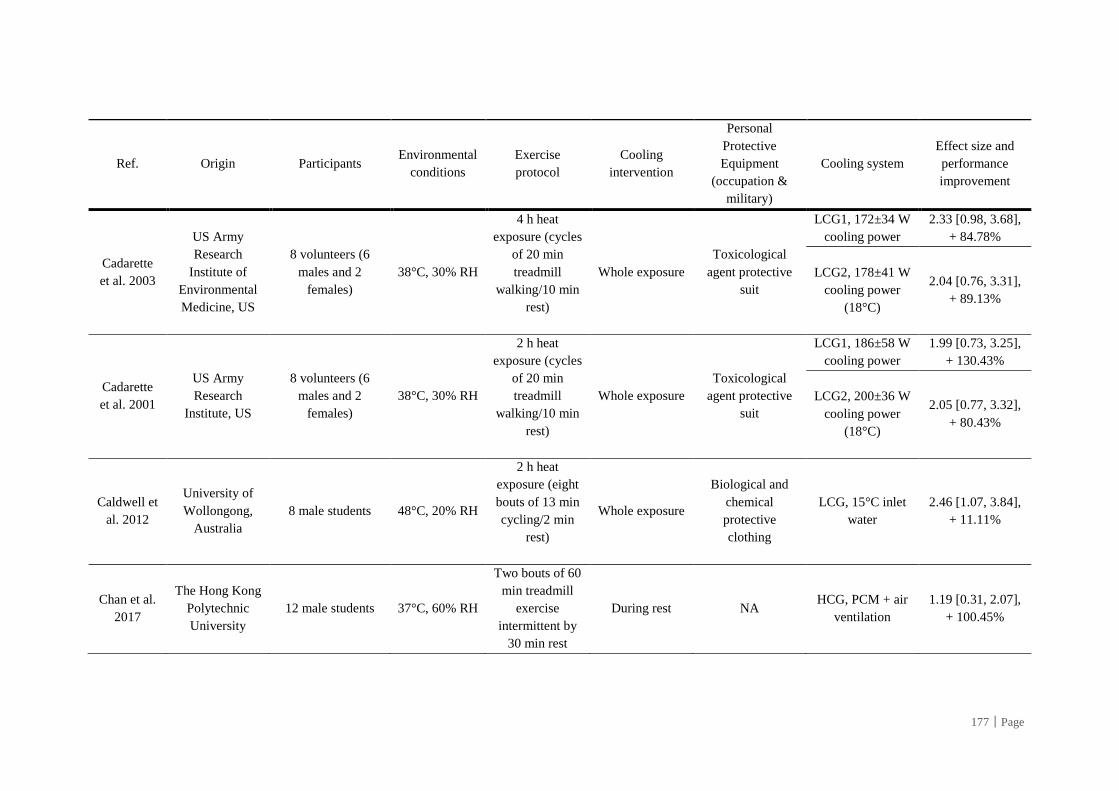
177│Page
Ref. Origin Participants Environmental
conditions
Exercise
protocol
Cooling
intervention
Personal
Protective
Equipment
(occupation &
military)
Cooling system
Effect size and
performance
improvement
Cadarette
et al. 2003
US Army
Research
Institute of
Environmental
Medicine, US
8 volunteers (6
males and 2
females)
38°C, 30% RH
4 h heat
exposure (cycles
of 20 min
treadmill
walking/10 min
rest)
Whole exposure
Toxicological
agent protective
suit
LCG1, 172±34 W
cooling power
2.33 [0.98, 3.68],
+ 84.78%
LCG2, 178±41 W
cooling power
(18°C)
2.04 [0.76, 3.31],
+ 89.13%
Cadarette
et al. 2001
US Army
Research
Institute, US
8 volunteers (6
males and 2
females)
38°C, 30% RH
2 h heat
exposure (cycles
of 20 min
treadmill
walking/10 min
rest)
Whole exposure
Toxicological
agent protective
suit
LCG1, 186±58 W
cooling power
1.99 [0.73, 3.25],
+ 130.43%
LCG2, 200±36 W
cooling power
(18°C)
2.05 [0.77, 3.32],
+ 80.43%
Caldwell et
al. 2012
University of
Wollongong,
Australia
8 male students 48°C, 20% RH
2 h heat
exposure (eight
bouts of 13 min
cycling/2 min
rest)
Whole exposure
Biological and
chemical
protective
clothing
LCG, 15°C inlet
water
2.46 [1.07, 3.84],
+ 11.11%
Chan et al.
2017
The Hong Kong
Polytechnic
University
12 male students 37°C, 60% RH
Two bouts of 60
min treadmill
exercise
intermittent by
30 min rest
During rest NA HCG, PCM + air
ventilation
1.19 [0.31, 2.07],
+ 100.45%
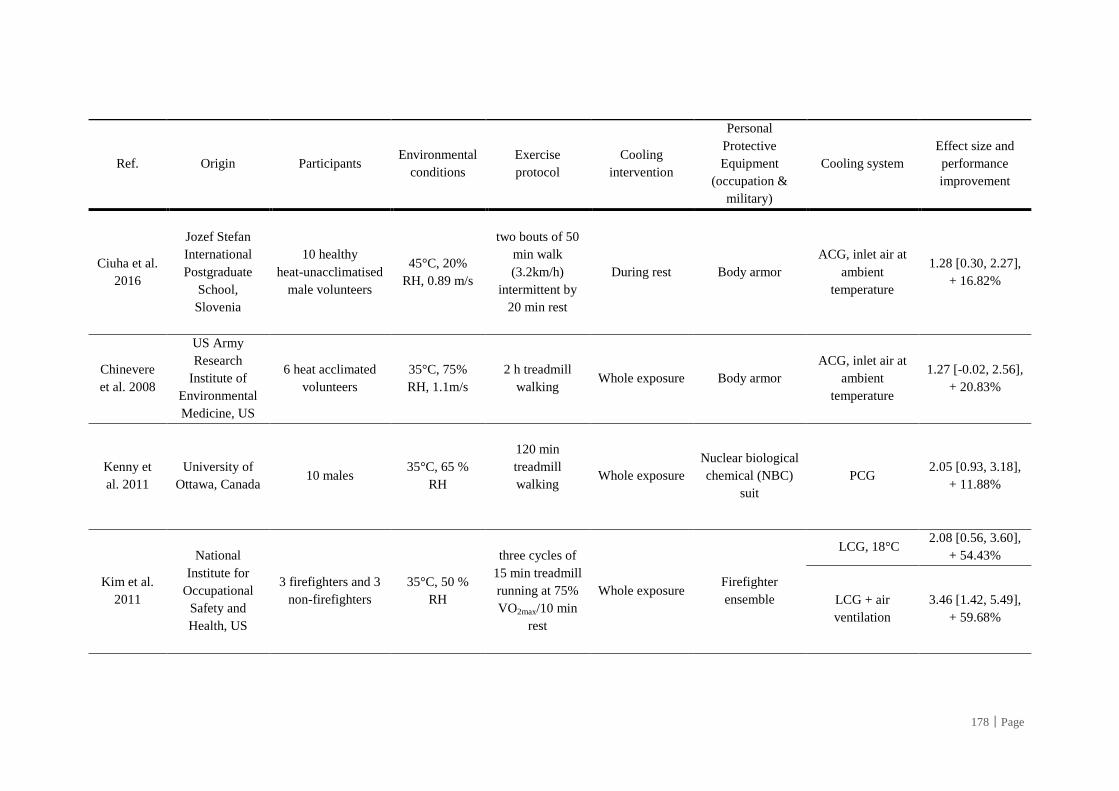
178│Page
Ref. Origin Participants Environmental
conditions
Exercise
protocol
Cooling
intervention
Personal
Protective
Equipment
(occupation &
military)
Cooling system
Effect size and
performance
improvement
Ciuha et al.
2016
Jozef Stefan
International
Postgraduate
School,
Slovenia
10 healthy
heat-unacclimatised
male volunteers
45°C, 20%
RH, 0.89 m/s
two bouts of 50
min walk
(3.2km/h)
intermittent by
20 min rest
During rest Body armor
ACG, inlet air at
ambient
temperature
1.28 [0.30, 2.27],
+ 16.82%
Chinevere
et al. 2008
US Army
Research
Institute of
Environmental
Medicine, US
6 heat acclimated
volunteers
35°C, 75%
RH, 1.1m/s
2 h treadmill
walking Whole exposure Body armor
ACG, inlet air at
ambient
temperature
1.27 [-0.02, 2.56],
+ 20.83%
Kenny et
al. 2011
University of
Ottawa, Canada 10 males
35°C, 65 %
RH
120 min
treadmill
walking
Whole exposure
Nuclear biological
chemical (NBC)
suit
PCG 2.05 [0.93, 3.18],
+ 11.88%
Kim et al.
2011
National
Institute for
Occupational
Safety and
Health, US
3 firefighters and 3
non-firefighters
35°C, 50 %
RH
three cycles of
15 min treadmill
running at 75%
VO2max/10 min
rest
Whole exposure Firefighter
ensemble
LCG, 18°C 2.08 [0.56, 3.60],
+ 54.43%
LCG + air
ventilation
3.46 [1.42, 5.49],
+ 59.68%
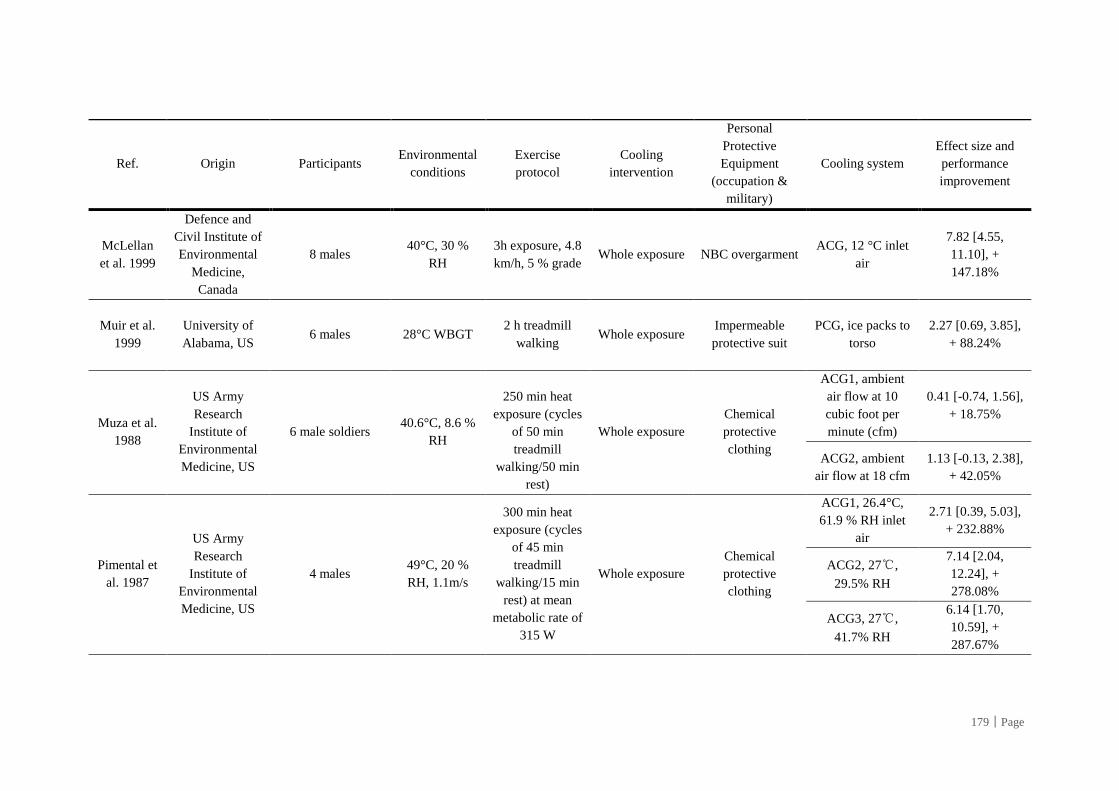
179│Page
Ref. Origin Participants Environmental
conditions
Exercise
protocol
Cooling
intervention
Personal
Protective
Equipment
(occupation &
military)
Cooling system
Effect size and
performance
improvement
McLellan
et al. 1999
Defence and
Civil Institute of
Environmental
Medicine,
Canada
8 males 40°C, 30 %
RH
3h exposure, 4.8
km/h, 5 % grade Whole exposure NBC overgarment
ACG, 12 °C inlet
air
7.82 [4.55,
11.10], +
147.18%
Muir et al.
1999
University of
Alabama, US 6 males 28°C WBGT
2 h treadmill
walking
Whole exposure Impermeable
protective suit
PCG, ice packs to
torso
2.27 [0.69, 3.85],
+ 88.24%
Muza et al.
1988
US Army
Research
Institute of
Environmental
Medicine, US
6 male soldiers 40.6°C, 8.6 %
RH
250 min heat
exposure (cycles
of 50 min
treadmill
walking/50 min
rest)
Whole exposure
Chemical
protective
clothing
ACG1, ambient
air flow at 10
cubic foot per
minute (cfm)
0.41 [-0.74, 1.56],
+ 18.75%
ACG2, ambient
air flow at 18 cfm
1.13 [-0.13, 2.38],
+ 42.05%
Pimental et
al. 1987
US Army
Research
Institute of
Environmental
Medicine, US
4 males 49°C, 20 %
RH, 1.1m/s
300 min heat
exposure (cycles
of 45 min
treadmill
walking/15 min
rest) at mean
metabolic rate of
315 W
Whole exposure
Chemical
protective
clothing
ACG1, 26.4°C,
61.9 % RH inlet
air
2.71 [0.39, 5.03],
+ 232.88%
ACG2, 27℃,
29.5% RH
7.14 [2.04,
12.24], +
278.08%
ACG3, 27℃,
41.7% RH
6.14 [1.70,
10.59], +
287.67%
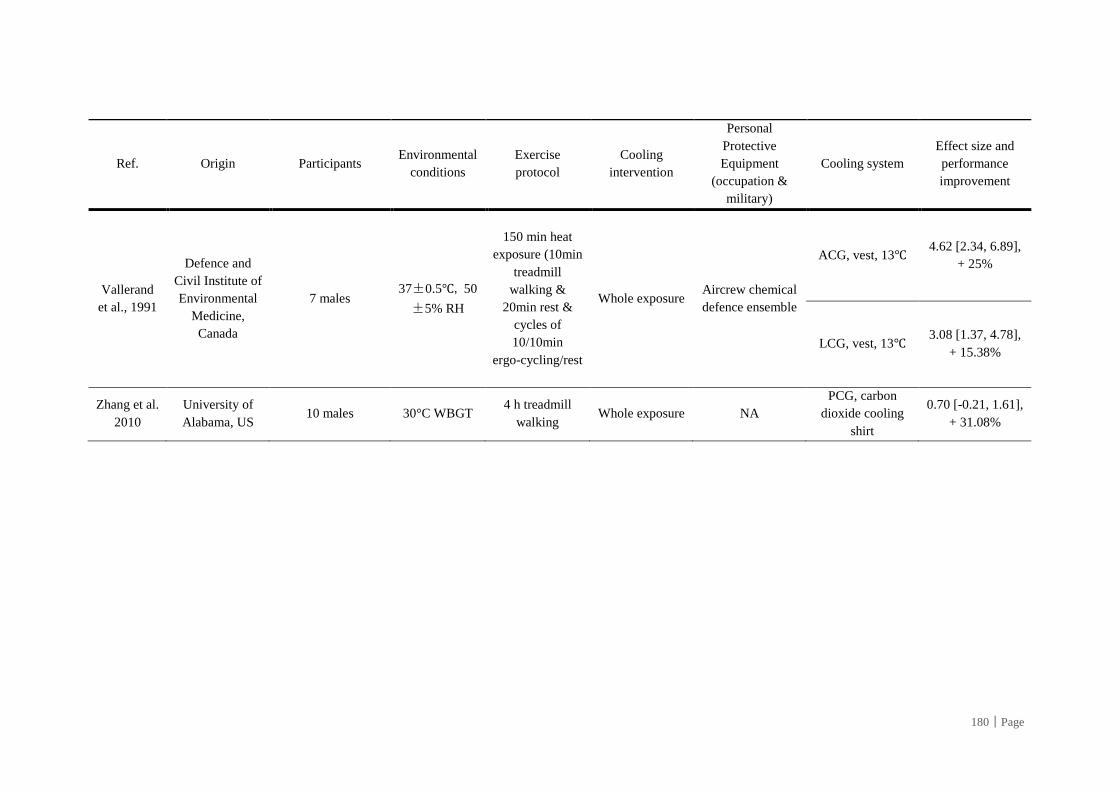
180│Page
Ref. Origin Participants Environmental
conditions
Exercise
protocol
Cooling
intervention
Personal
Protective
Equipment
(occupation &
military)
Cooling system
Effect size and
performance
improvement
Vallerand
et al., 1991
Defence and
Civil Institute of
Environmental
Medicine,
Canada
7 males 37±0.5℃, 50
±5% RH
150 min heat
exposure (10min
treadmill
walking &
20min rest &
cycles of
10/10min
ergo-cycling/rest
Whole exposure Aircrew chemical
defence ensemble
ACG, vest, 13℃ 4.62 [2.34, 6.89],
+ 25%
LCG, vest, 13℃ 3.08 [1.37, 4.78],
+ 15.38%
Zhang et al.
2010
University of
Alabama, US 10 males 30°C WBGT
4 h treadmill
walking Whole exposure NA
PCG, carbon
dioxide cooling
shirt
0.70 [-0.21, 1.61],
+ 31.08%
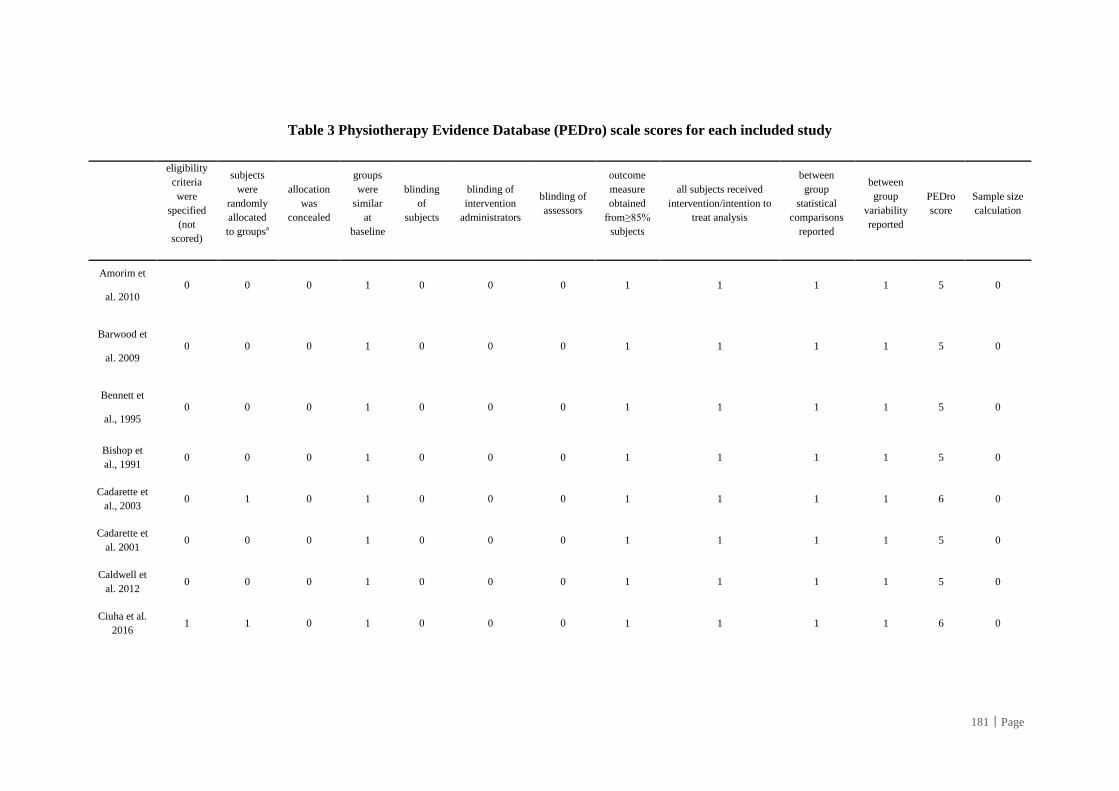
181│Page
Table 3 Physiotherapy Evidence Database (PEDro) scale scores for each included study
eligibility
criteria
were
specified
(not
scored)
subjects
were
randomly
allocated
to groupsa
allocation
was
concealed
groups
were
similar
at
baseline
blinding
of
subjects
blinding of
intervention
administrators
blinding of
assessors
outcome
measure
obtained
from≥85%
subjects
all subjects received
intervention/intention to
treat analysis
between
group
statistical
comparisons
reported
between
group
variability
reported
PEDro
score
Sample size
calculation
Amorim et
al. 2010 0 0 0 1 0 0 0 1 1 1 1 5 0
Barwood et
al. 2009 0 0 0 1 0 0 0 1 1 1 1 5 0
Bennett et
al., 1995 0 0 0 1 0 0 0 1 1 1 1 5 0
Bishop et
al., 1991 0 0 0 1 0 0 0 1 1 1 1 5 0
Cadarette et
al., 2003 0 1 0 1 0 0 0 1 1 1 1 6 0
Cadarette et
al. 2001 0 0 0 1 0 0 0 1 1 1 1 5 0
Caldwell et
al. 2012 0 0 0 1 0 0 0 1 1 1 1 5 0
Ciuha et al.
2016 1 1 0 1 0 0 0 1 1 1 1 6 0
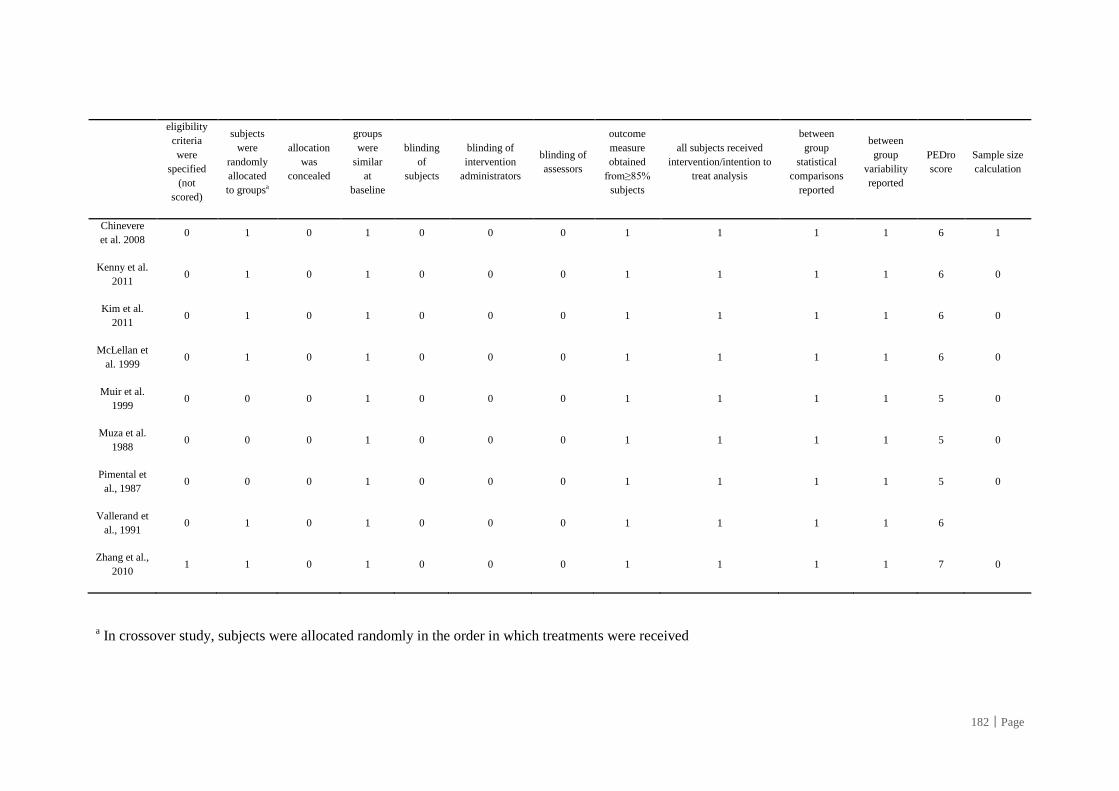
182│Page
eligibility
criteria
were
specified
(not
scored)
subjects
were
randomly
allocated
to groupsa
allocation
was
concealed
groups
were
similar
at
baseline
blinding
of
subjects
blinding of
intervention
administrators
blinding of
assessors
outcome
measure
obtained
from≥85%
subjects
all subjects received
intervention/intention to
treat analysis
between
group
statistical
comparisons
reported
between
group
variability
reported
PEDro
score
Sample size
calculation
Chinevere
et al. 2008 0 1 0 1 0 0 0 1 1 1 1 6 1
Kenny et al.
2011 0 1 0 1 0 0 0 1 1 1 1 6 0
Kim et al.
2011 0 1 0 1 0 0 0 1 1 1 1 6 0
McLellan et
al. 1999 0 1 0 1 0 0 0 1 1 1 1 6 0
Muir et al.
1999 0 0 0 1 0 0 0 1 1 1 1 5 0
Muza et al.
1988 0 0 0 1 0 0 0 1 1 1 1 5 0
Pimental et
al., 1987 0 0 0 1 0 0 0 1 1 1 1 5 0
Vallerand et
al., 1991 0 1 0 1 0 0 0 1 1 1 1 6
Zhang et al.,
2010 1 1 0 1 0 0 0 1 1 1 1 7 0
a In crossover study, subjects were allocated randomly in the order in which treatments were received
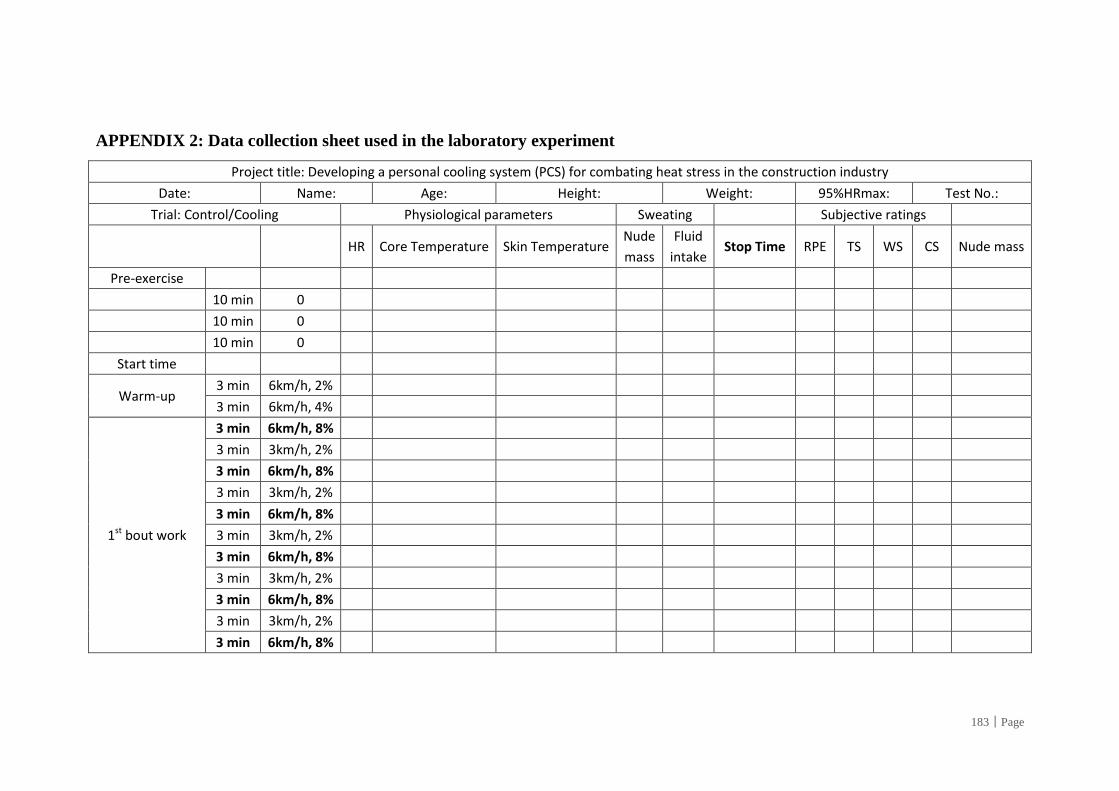
183│Page
APPENDIX 2: Data collection sheet used in the laboratory experiment
Project title: Developing a personal cooling system (PCS) for combating heat stress in the construction industry
Date: Name: Age: Height: Weight: 95%HRmax: Test No.:
Trial: Control/Cooling Physiological parameters Sweating
Subjective ratings
HR Core Temperature Skin Temperature
Nude
mass
Fluid
intake Stop Time RPE TS WS CS Nude mass
Pre-exercise
10 min 0
10 min 0
10 min 0
Start time
Warm-up 3 min 6km/h, 2%
3 min 6km/h, 4%
1st bout work
3 min 6km/h, 8%
3 min 3km/h, 2%
3 min 6km/h, 8%
3 min 3km/h, 2%
3 min 6km/h, 8%
3 min 3km/h, 2%
3 min 6km/h, 8%
3 min 3km/h, 2%
3 min 6km/h, 8%
3 min 3km/h, 2%
3 min 6km/h, 8%
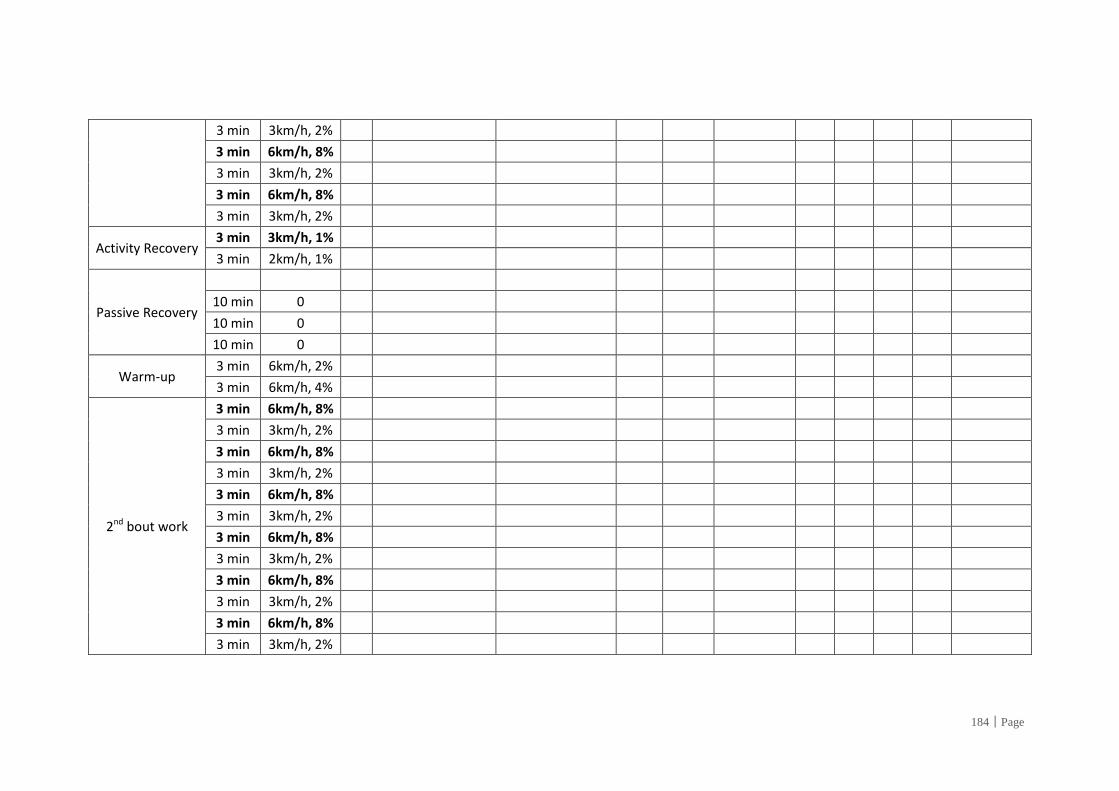
184│Page
3 min 3km/h, 2%
3 min 6km/h, 8%
3 min 3km/h, 2%
3 min 6km/h, 8%
3 min 3km/h, 2%
Activity Recovery 3 min 3km/h, 1%
3 min 2km/h, 1%
Passive Recovery
10 min 0
10 min 0
10 min 0
Warm-up 3 min 6km/h, 2%
3 min 6km/h, 4%
2nd bout work
3 min 6km/h, 8%
3 min 3km/h, 2%
3 min 6km/h, 8%
3 min 3km/h, 2%
3 min 6km/h, 8%
3 min 3km/h, 2%
3 min 6km/h, 8%
3 min 3km/h, 2%
3 min 6km/h, 8%
3 min 3km/h, 2%
3 min 6km/h, 8%
3 min 3km/h, 2%
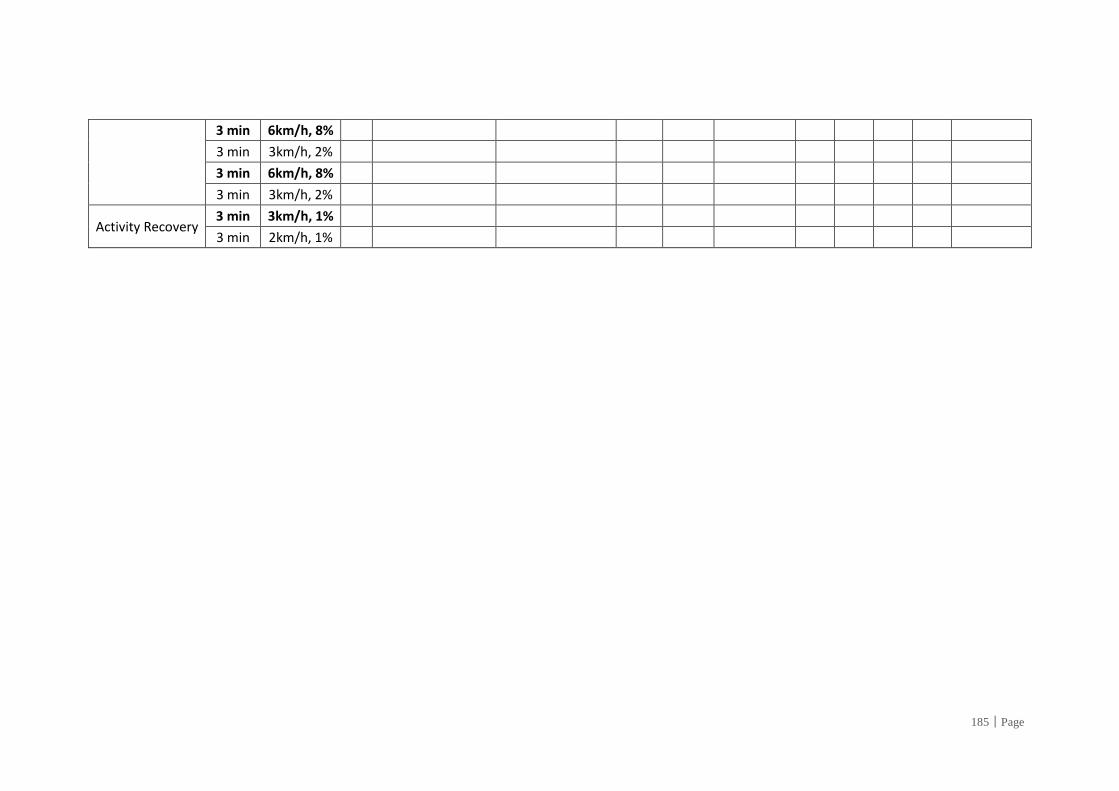
185│Page
3 min 6km/h, 8%
3 min 3km/h, 2%
3 min 6km/h, 8%
3 min 3km/h, 2%
Activity Recovery 3 min 3km/h, 1%
3 min 2km/h, 1%
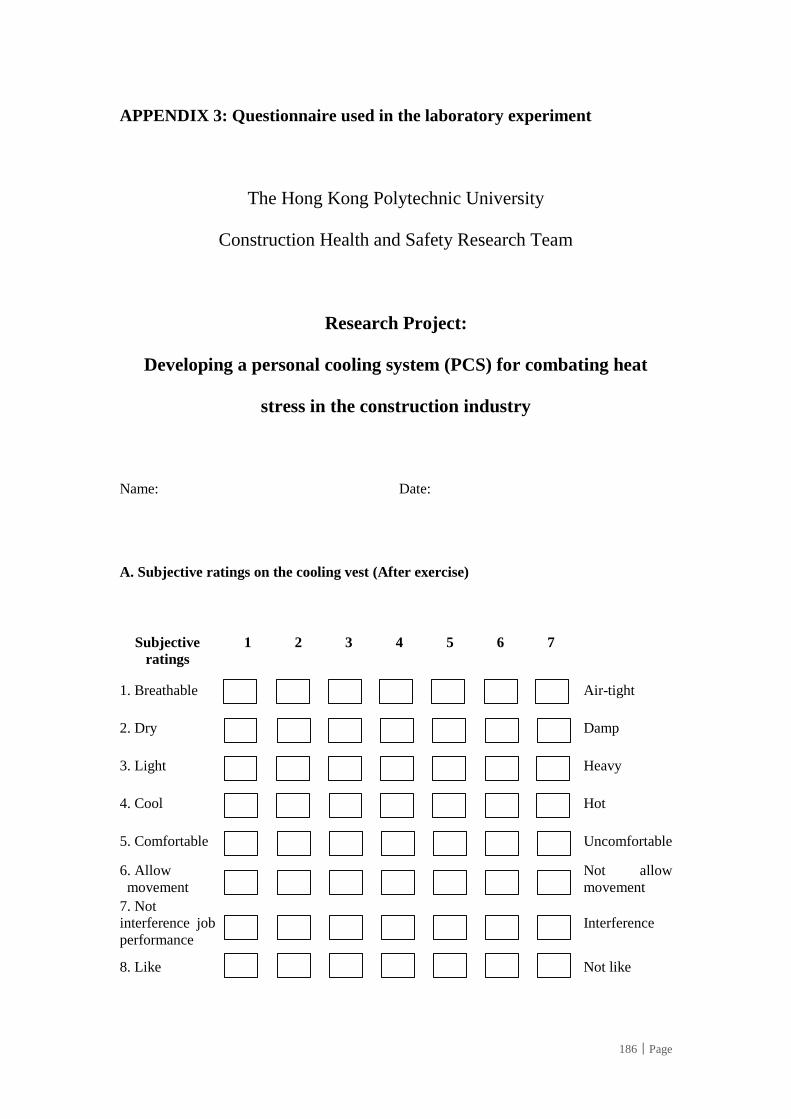
186│Page
APPENDIX 3: Questionnaire used in the laboratory experiment
The Hong Kong Polytechnic University
Construction Health and Safety Research Team
Research Project:
Developing a personal cooling system (PCS) for combating heat
stress in the construction industry
Name: Date:
A. Subjective ratings on the cooling vest (After exercise)
Subjective
ratings
1 2 3 4 5 6 7
1. Breathable
Air-tight
2. Dry
Damp
3. Light
Heavy
4. Cool
Hot
5. Comfortable
Uncomfortable
6. Allow
movement
Not allow
movement
7. Not
interference job
performance
Interference
8. Like
Not like
x x x x x x x
x x x x x x x
x x x x x x x
x x x x x x x
x x x x x x x
x x x x x x x
x x x x x x x
x x x x x x x
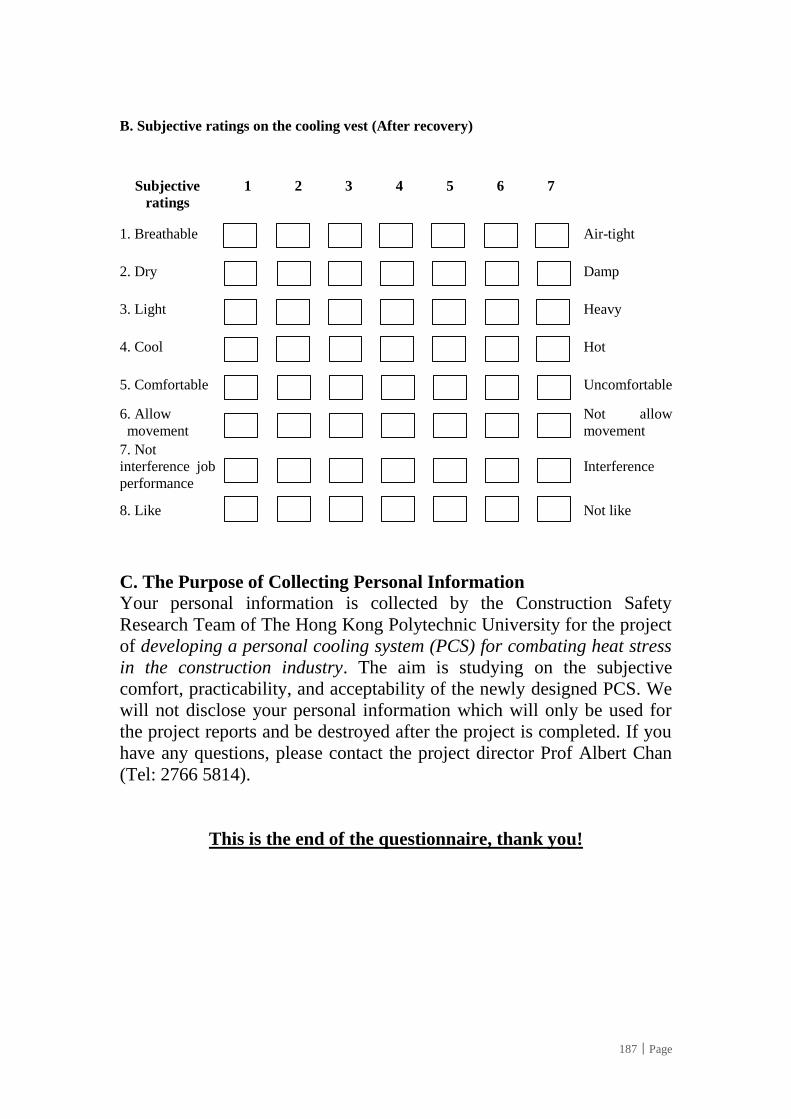
187│Page
B. Subjective ratings on the cooling vest (After recovery)
Subjective
ratings
1 2 3 4 5 6 7
1. Breathable
Air-tight
2. Dry
Damp
3. Light
Heavy
4. Cool
Hot
5. Comfortable
Uncomfortable
6. Allow
movement
Not allow
movement
7. Not
interference job
performance
Interference
8. Like
Not like
C. The Purpose of Collecting Personal Information
Your personal information is collected by the Construction Safety
Research Team of The Hong Kong Polytechnic University for the project
of developing a personal cooling system (PCS) for combating heat stress
in the construction industry. The aim is studying on the subjective
comfort, practicability, and acceptability of the newly designed PCS. We
will not disclose your personal information which will only be used for
the project reports and be destroyed after the project is completed. If you
have any questions, please contact the project director Prof Albert Chan
(Tel: 2766 5814).
This is the end of the questionnaire, thank you!
x x x x x x x
x x x x x x x
x x x x x x x
x x x x x x x
x x x x x x x
x x x x x x x
x x x x x x x
x x x x x x x
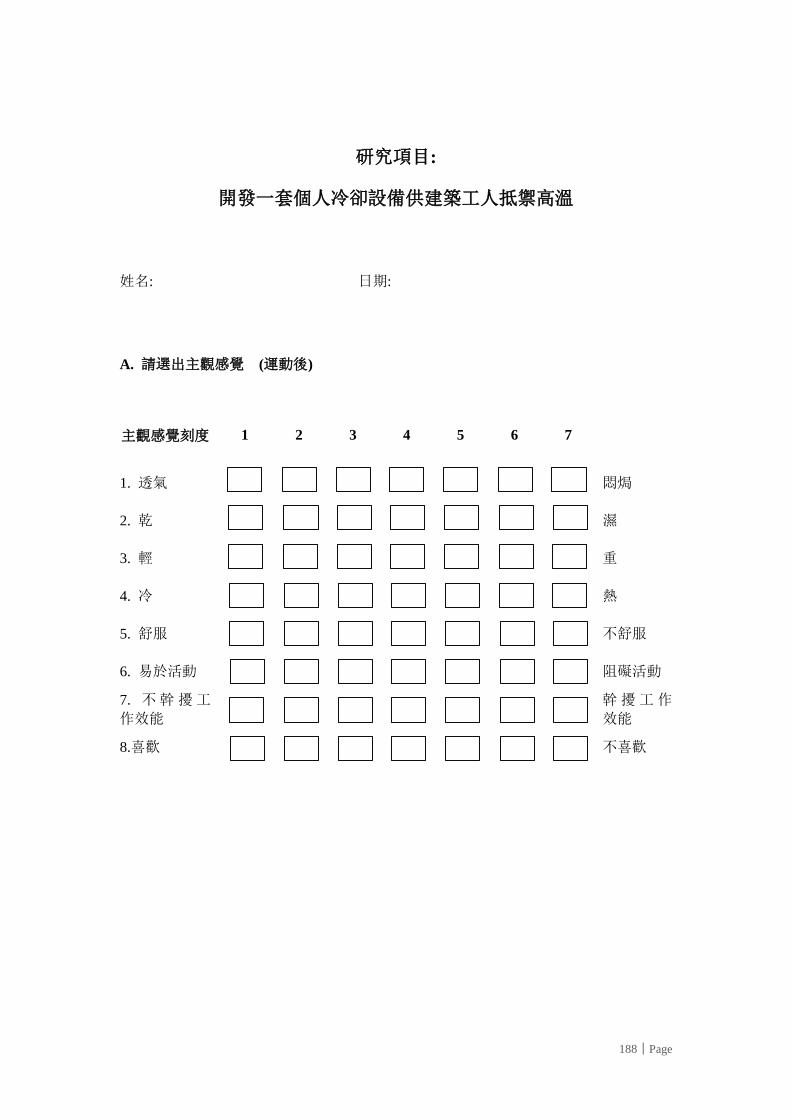
188│Page
研究項目:
開發一套個人冷卻設備供建築工人抵禦高溫
姓名: 日期:
A. 請選出主觀感覺 (運動後)
主觀感覺刻度 1 2 3 4 5 6 7
1. 透氣
悶焗
2. 乾
濕
3. 輕
重
4. 冷
熱
5. 舒服
不舒服
6. 易於活動
阻礙活動
7. 不幹擾工
作效能
幹擾工作
效能
8.喜歡
不喜歡
x x x x x x x
x x x x x x x
x x x x x x x
x x x x x x x
x x x x x x x
x x x x x x x
x x x x x x x
x x x x x x x
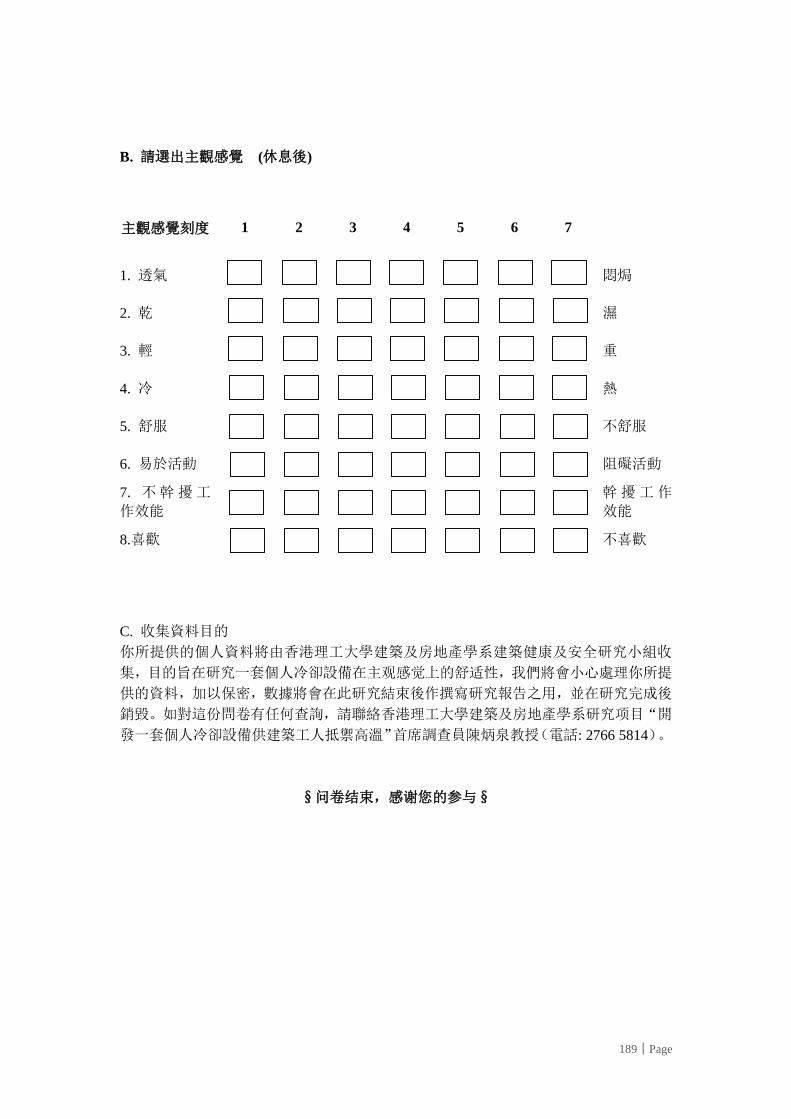
189│Page
B. 請選出主觀感覺 (休息後)
主觀感覺刻度 1 2 3 4 5 6 7
1. 透氣
悶焗
2. 乾
濕
3. 輕
重
4. 冷
熱
5. 舒服
不舒服
6. 易於活動
阻礙活動
7. 不幹擾工
作效能
幹擾工作
效能
8.喜歡
不喜歡
C. 收集資料目的
你所提供的個人資料將由香港理工大學建築及房地產學系建築健康及安全研究小組收
集,目的旨在研究一套個人冷卻設備在主观感觉上的舒适性,我們將會小心處理你所提
供的資料,加以保密,數據將會在此研究結束後作撰寫研究報告之用,並在研究完成後
銷毀。如對這份問卷有任何查詢,請聯絡香港理工大學建築及房地產學系研究项目“開
發一套個人冷卻設備供建築工人抵禦高溫”首席調查員陳炳泉教授(電話: 2766 5814)。
§问卷结束,感谢您的参与§
x x x x x x x
x x x x x x x
x x x x x x x
x x x x x x x
x x x x x x x
x x x x x x x
x x x x x x x
x x x x x x x
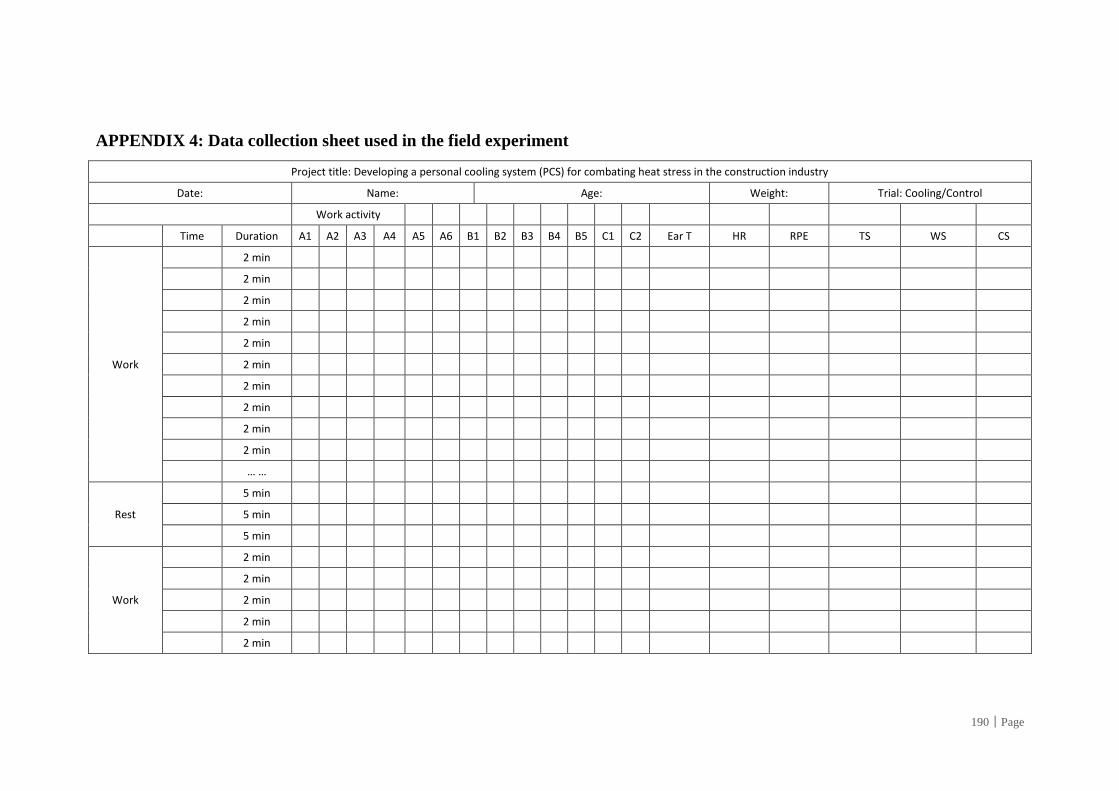
190│Page
APPENDIX 4: Data collection sheet used in the field experiment
Project title: Developing a personal cooling system (PCS) for combating heat stress in the construction industry
Date: Name: Age: Weight: Trial: Cooling/Control
Work activity
Time Duration A1 A2 A3 A4 A5 A6 B1 B2 B3 B4 B5 C1 C2 Ear T HR RPE TS WS CS
Work
2 min
2 min
2 min
2 min
2 min
2 min
2 min
2 min
2 min
2 min
… …
Rest
5 min
5 min
5 min
Work
2 min
2 min
2 min
2 min
2 min

191│Page
2 min
2 min
2 min
2 min
2 min
… …
Lunch break
Work
2 min
2 min
2 min
2 min
2 min
2 min
2 min
2 min
2 min
2 min
2 min
… …
Rest
5 min
5 min
5 min
5 min
5 min
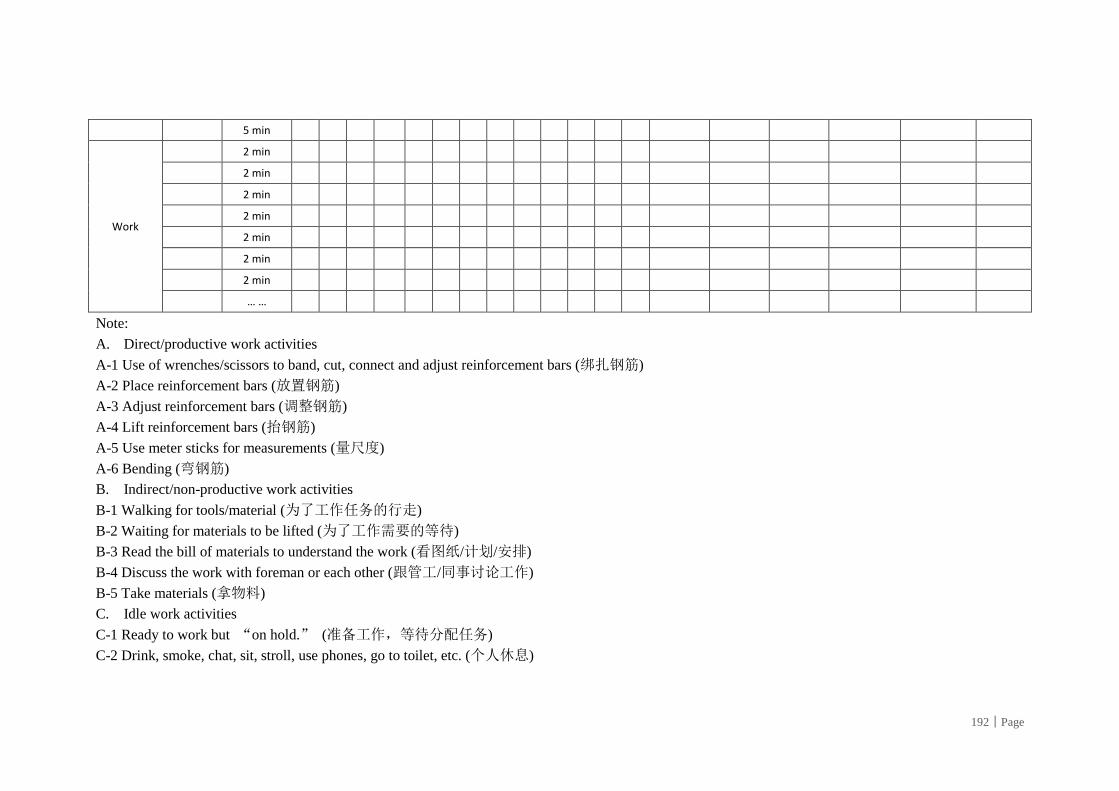
192│Page
5 min
Work
2 min
2 min
2 min
2 min
2 min
2 min
2 min
… …
Note:
A. Direct/productive work activities
A-1 Use of wrenches/scissors to band, cut, connect and adjust reinforcement bars (绑扎钢筋)
A-2 Place reinforcement bars (放置钢筋)
A-3 Adjust reinforcement bars (调整钢筋)
A-4 Lift reinforcement bars (抬钢筋)
A-5 Use meter sticks for measurements (量尺度)
A-6 Bending (弯钢筋)
B. Indirect/non-productive work activities
B-1 Walking for tools/material (为了工作任务的行走)
B-2 Waiting for materials to be lifted (为了工作需要的等待)
B-3 Read the bill of materials to understand the work (看图纸/计划/安排)
B-4 Discuss the work with foreman or each other (跟管工/同事讨论工作)
B-5 Take materials (拿物料)
C. Idle work activities
C-1 Ready to work but “on hold.” (准备工作,等待分配任务)
C-2 Drink, smoke, chat, sit, stroll, use phones, go to toilet, etc. (个人休息)
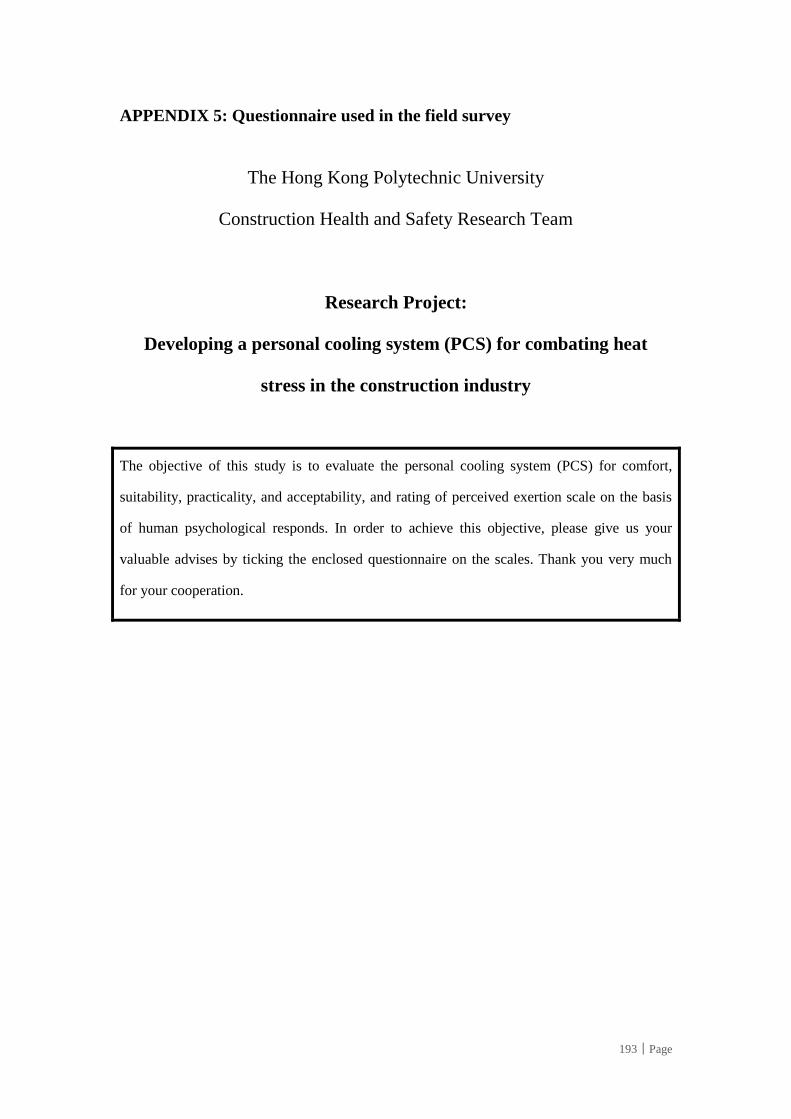
193│Page
APPENDIX 5: Questionnaire used in the field survey
The Hong Kong Polytechnic University
Construction Health and Safety Research Team
Research Project:
Developing a personal cooling system (PCS) for combating heat
stress in the construction industry
The objective of this study is to evaluate the personal cooling system (PCS) for comfort,
suitability, practicality, and acceptability, and rating of perceived exertion scale on the basis
of human psychological responds. In order to achieve this objective, please give us your
valuable advises by ticking the enclosed questionnaire on the scales. Thank you very much
for your cooperation.
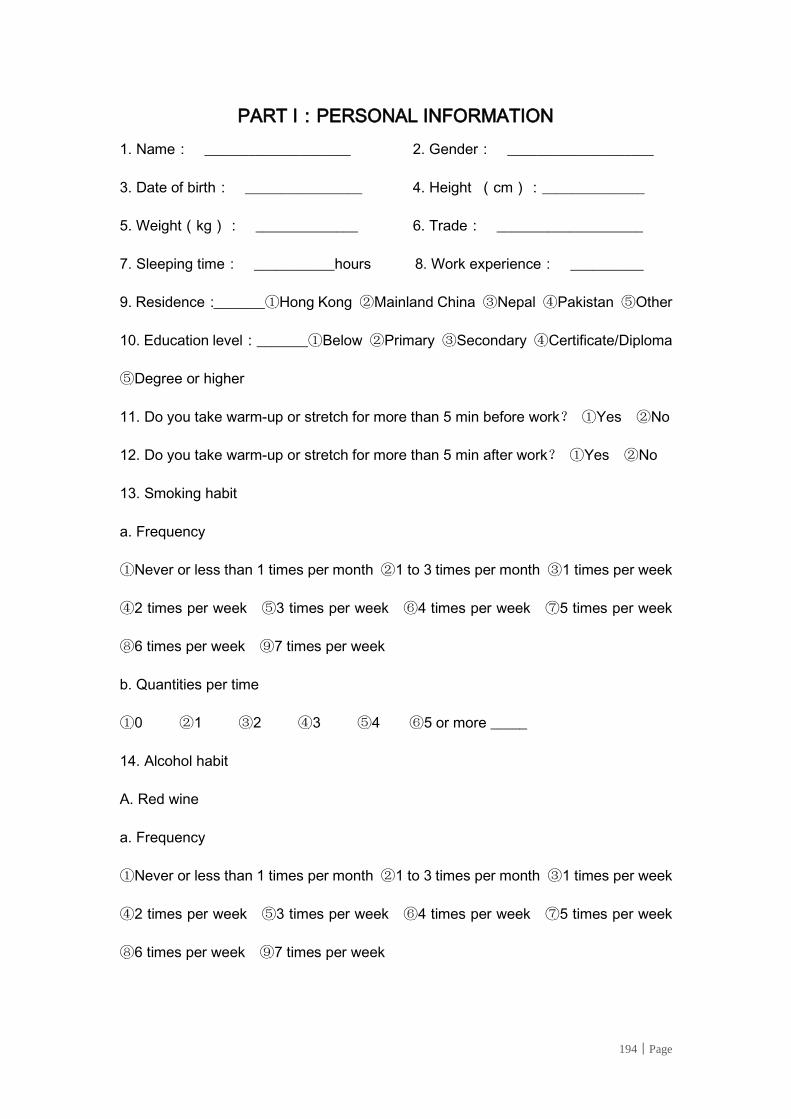
194│Page
PART I:PERSONAL INFORMATION
1. Name: ____________________ 2. Gender: ____________________
3. Date of birth: ________________ 4. Height (cm):______________
5. Weight(kg): ______________ 6. Trade: ____________________
7. Sleeping time: ___________hours 8. Work experience: __________
9. Residence:_______①Hong Kong ②Mainland China ③Nepal ④Pakistan ⑤Other
10. Education level:_______①Below ②Primary ③Secondary ④Certificate/Diploma
⑤Degree or higher
11. Do you take warm-up or stretch for more than 5 min before work? ①Yes ②No
12. Do you take warm-up or stretch for more than 5 min after work? ①Yes ②No
13. Smoking habit
a. Frequency
①Never or less than 1 times per month ②1 to 3 times per month ③1 times per week
④2 times per week ⑤3 times per week ⑥4 times per week ⑦5 times per week
⑧6 times per week ⑨7 times per week
b. Quantities per time
①0 ②1 ③2 ④3 ⑤4 ⑥5 or more _____
14. Alcohol habit
A. Red wine
a. Frequency
①Never or less than 1 times per month ②1 to 3 times per month ③1 times per week
④2 times per week ⑤3 times per week ⑥4 times per week ⑦5 times per week
⑧6 times per week ⑨7 times per week
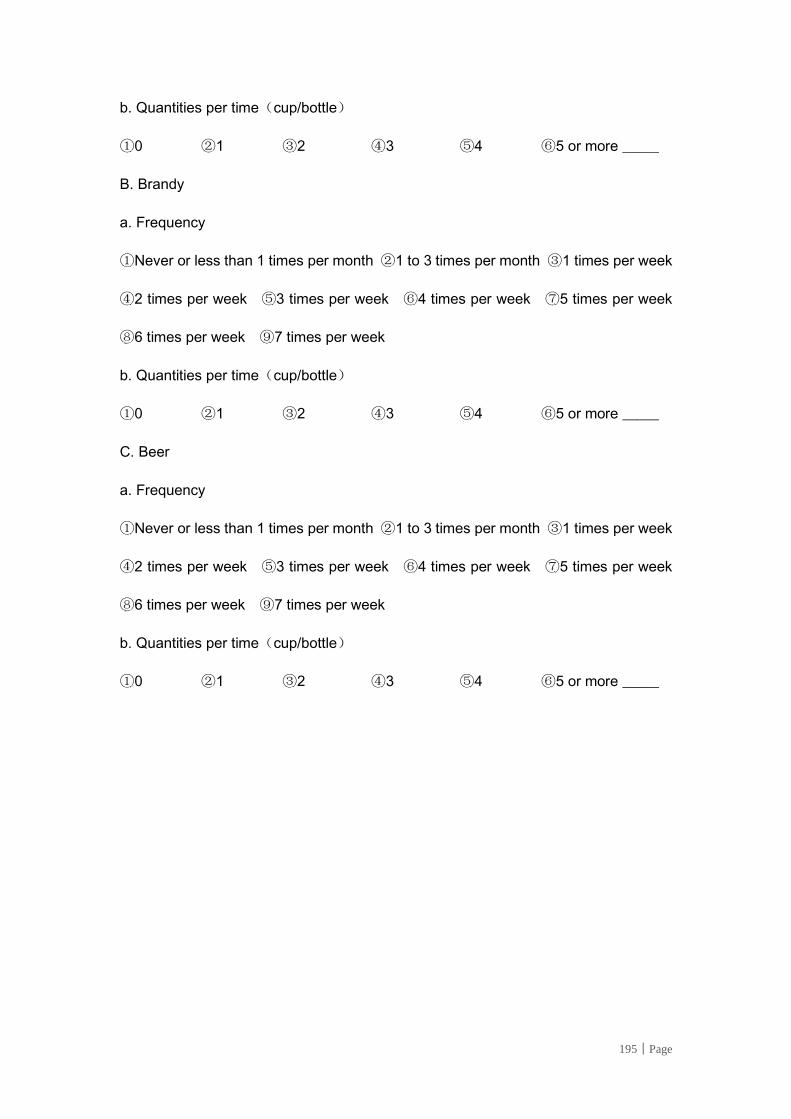
195│Page
b. Quantities per time(cup/bottle)
①0 ②1 ③2 ④3 ⑤4 ⑥5 or more _____
B. Brandy
a. Frequency
①Never or less than 1 times per month ②1 to 3 times per month ③1 times per week
④2 times per week ⑤3 times per week ⑥4 times per week ⑦5 times per week
⑧6 times per week ⑨7 times per week
b. Quantities per time(cup/bottle)
①0 ②1 ③2 ④3 ⑤4 ⑥5 or more _____
C. Beer
a. Frequency
①Never or less than 1 times per month ②1 to 3 times per month ③1 times per week
④2 times per week ⑤3 times per week ⑥4 times per week ⑦5 times per week
⑧6 times per week ⑨7 times per week
b. Quantities per time(cup/bottle)
①0 ②1 ③2 ④3 ⑤4 ⑥5 or more _____
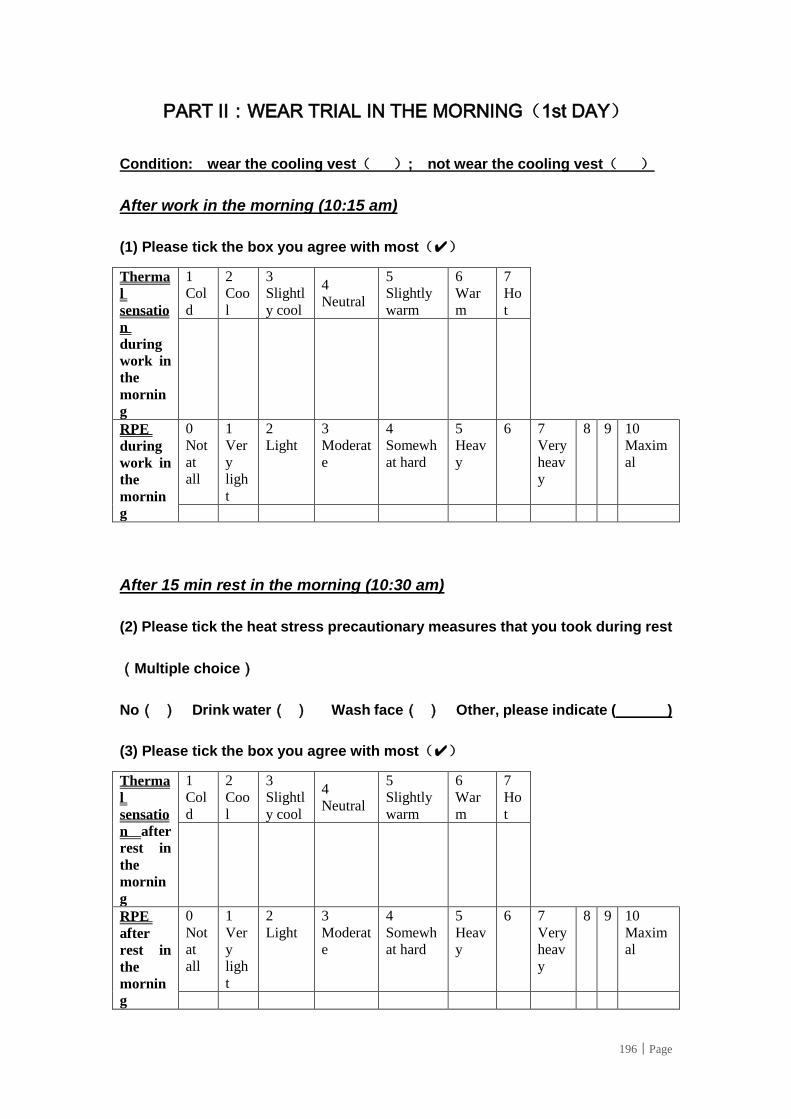
196│Page
PART II:WEAR TRIAL IN THE MORNING(1st DAY)
Condition: wear the cooling vest( ); not wear the cooling vest( )
After work in the morning (10:15 am)
(1) Please tick the box you agree with most(✔)
Therma
l
sensatio
n
during
work in
the
mornin
g
1
Col
d
2
Coo
l
3
Slightl
y cool
4
Neutral
5
Slightly
warm
6
War
m
7
Ho
t
RPE
during
work in
the
mornin
g
0
Not
at
all
1
Ver
y
ligh
t
2
Light
3
Moderat
e
4
Somewh
at hard
5
Heav
y
6 7
Very
heav
y
8 9
10
Maxim
al
After 15 min rest in the morning (10:30 am)
(2) Please tick the heat stress precautionary measures that you took during rest
(Multiple choice)
No ( ) Drink water ( ) Wash face ( ) Other, please indicate ( )
(3) Please tick the box you agree with most(✔)
Therma
l
sensatio
n after
rest in
the
mornin
g
1
Col
d
2
Coo
l
3
Slightl
y cool
4
Neutral
5
Slightly
warm
6
War
m
7
Ho
t
RPE
after
rest in
the
mornin
g
0
Not
at
all
1
Ver
y
ligh
t
2
Light
3
Moderat
e
4
Somewh
at hard
5
Heav
y
6 7
Very
heav
y
8 9
10
Maxim
al
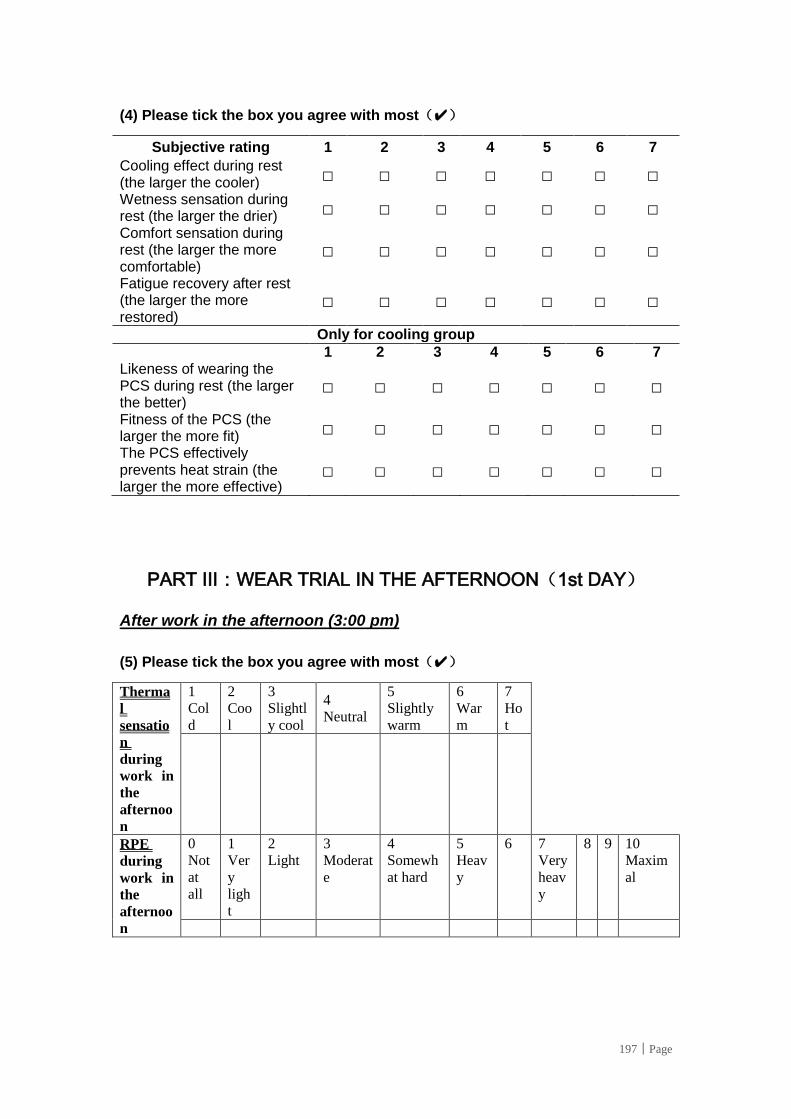
197│Page
(4) Please tick the box you agree with most(✔)
Subjective rating 1 2 3 4 5 6 7
Cooling effect during rest (the larger the cooler) □ □ □ □ □ □ □ Wetness sensation during rest (the larger the drier) □ □ □ □ □ □ □ Comfort sensation during rest (the larger the more comfortable)
□ □ □ □ □ □ □
Fatigue recovery after rest (the larger the more restored)
□ □ □ □ □ □ □
Only for cooling group
1 2 3 4 5 6 7 Likeness of wearing the PCS during rest (the larger the better)
□ □ □ □ □ □ □
Fitness of the PCS (the larger the more fit) □ □ □ □ □ □ □ The PCS effectively prevents heat strain (the larger the more effective)
□ □ □ □ □ □ □
PART III:WEAR TRIAL IN THE AFTERNOON(1st DAY)
After work in the afternoon (3:00 pm)
(5) Please tick the box you agree with most(✔)
Therma
l
sensatio
n
during
work in
the
afternoo
n
1
Col
d
2
Coo
l
3
Slightl
y cool
4
Neutral
5
Slightly
warm
6
War
m
7
Ho
t
RPE
during
work in
the
afternoo
n
0
Not
at
all
1
Ver
y
ligh
t
2
Light
3
Moderat
e
4
Somewh
at hard
5
Heav
y
6 7
Very
heav
y
8 9
10
Maxim
al
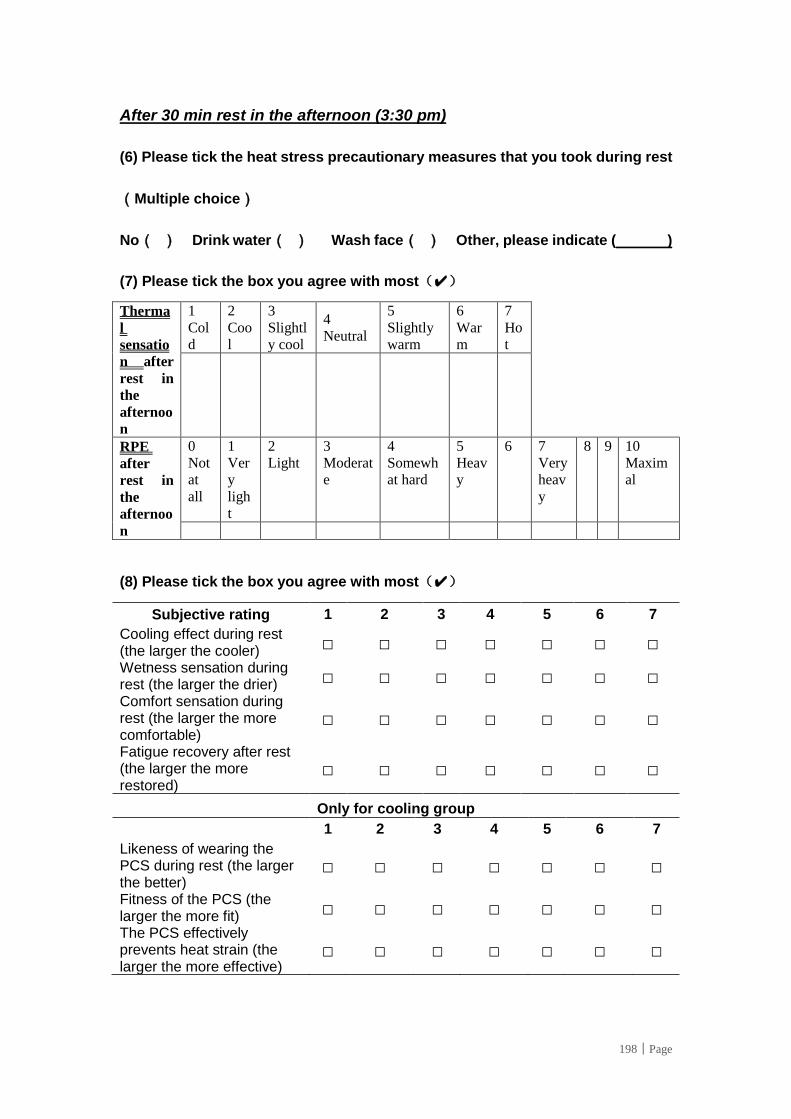
198│Page
After 30 min rest in the afternoon (3:30 pm)
(6) Please tick the heat stress precautionary measures that you took during rest
(Multiple choice)
No ( ) Drink water ( ) Wash face ( ) Other, please indicate ( )
(7) Please tick the box you agree with most(✔)
Therma
l
sensatio
n after
rest in
the
afternoo
n
1
Col
d
2
Coo
l
3
Slightl
y cool
4
Neutral
5
Slightly
warm
6
War
m
7
Ho
t
RPE
after
rest in
the
afternoo
n
0
Not
at
all
1
Ver
y
ligh
t
2
Light
3
Moderat
e
4
Somewh
at hard
5
Heav
y
6 7
Very
heav
y
8 9
10
Maxim
al
(8) Please tick the box you agree with most(✔)
Subjective rating 1 2 3 4 5 6 7
Cooling effect during rest (the larger the cooler) □ □ □ □ □ □ □ Wetness sensation during rest (the larger the drier) □ □ □ □ □ □ □ Comfort sensation during rest (the larger the more comfortable)
□ □ □ □ □ □ □
Fatigue recovery after rest (the larger the more restored)
□ □ □ □ □ □ □
Only for cooling group
1 2 3 4 5 6 7
Likeness of wearing the PCS during rest (the larger the better)
□ □ □ □ □ □ □
Fitness of the PCS (the larger the more fit) □ □ □ □ □ □ □ The PCS effectively prevents heat strain (the larger the more effective)
□ □ □ □ □ □ □
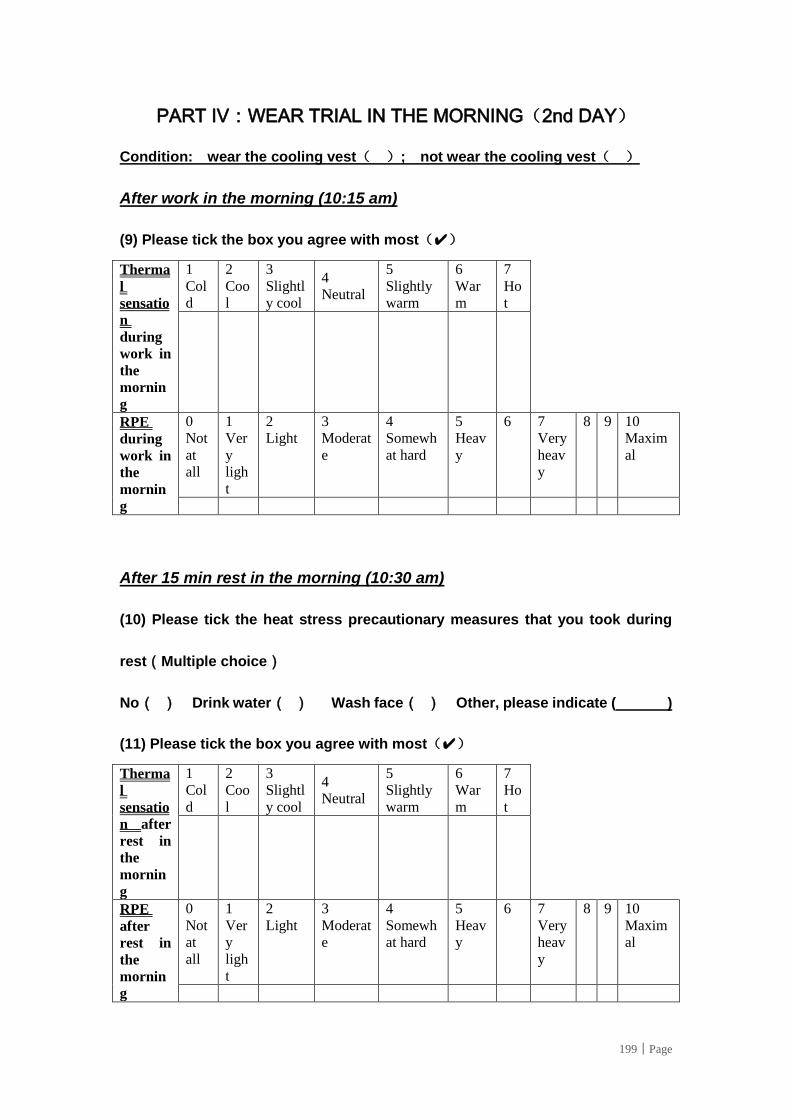
199│Page
PART IV:WEAR TRIAL IN THE MORNING(2nd DAY)
Condition: wear the cooling vest( ); not wear the cooling vest( )
After work in the morning (10:15 am)
(9) Please tick the box you agree with most(✔)
Therma
l
sensatio
n
during
work in
the
mornin
g
1
Col
d
2
Coo
l
3
Slightl
y cool
4
Neutral
5
Slightly
warm
6
War
m
7
Ho
t
RPE
during
work in
the
mornin
g
0
Not
at
all
1
Ver
y
ligh
t
2
Light
3
Moderat
e
4
Somewh
at hard
5
Heav
y
6 7
Very
heav
y
8 9
10
Maxim
al
After 15 min rest in the morning (10:30 am)
(10) Please tick the heat stress precautionary measures that you took during
rest(Multiple choice)
No ( ) Drink water ( ) Wash face ( ) Other, please indicate ( )
(11) Please tick the box you agree with most(✔)
Therma
l
sensatio
n after
rest in
the
mornin
g
1
Col
d
2
Coo
l
3
Slightl
y cool
4
Neutral
5
Slightly
warm
6
War
m
7
Ho
t
RPE
after
rest in
the
mornin
g
0
Not
at
all
1
Ver
y
ligh
t
2
Light
3
Moderat
e
4
Somewh
at hard
5
Heav
y
6 7
Very
heav
y
8 9
10
Maxim
al
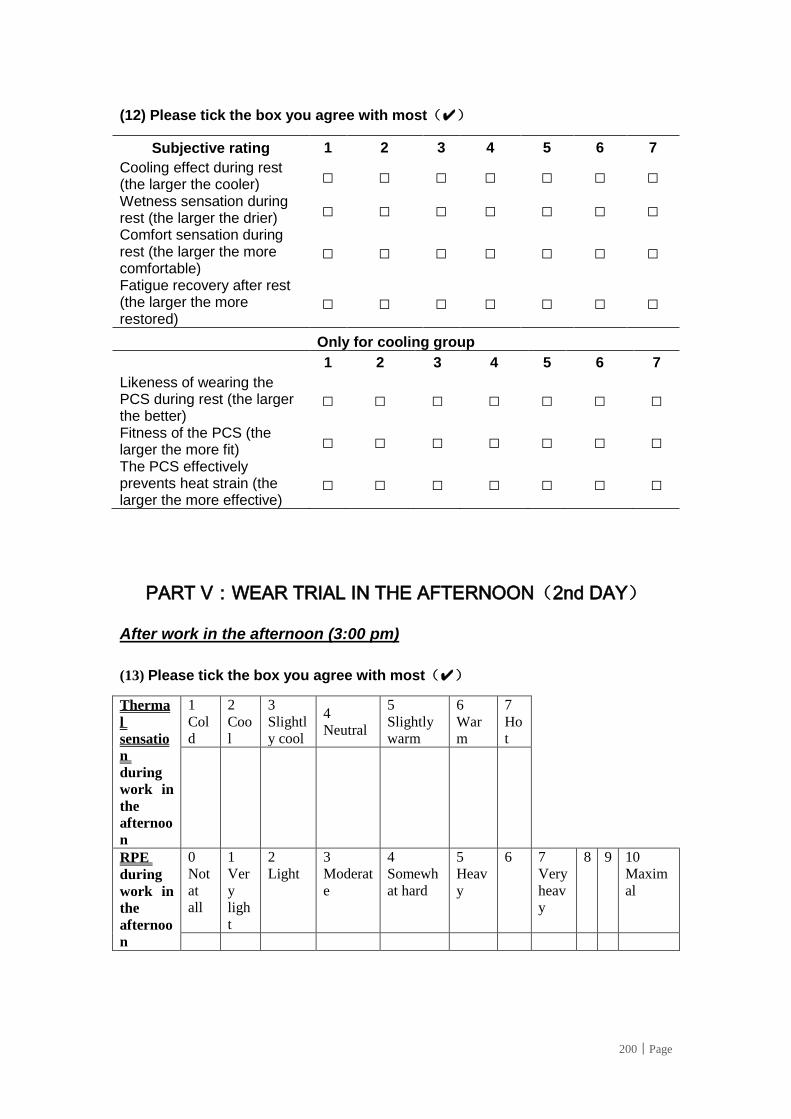
200│Page
(12) Please tick the box you agree with most(✔)
Subjective rating 1 2 3 4 5 6 7
Cooling effect during rest (the larger the cooler) □ □ □ □ □ □ □
Wetness sensation during rest (the larger the drier) □ □ □ □ □ □ □ Comfort sensation during rest (the larger the more comfortable)
□ □ □ □ □ □ □
Fatigue recovery after rest (the larger the more restored)
□ □ □ □ □ □ □
Only for cooling group
1 2 3 4 5 6 7
Likeness of wearing the PCS during rest (the larger the better)
□ □ □ □ □ □ □
Fitness of the PCS (the larger the more fit) □ □ □ □ □ □ □
The PCS effectively prevents heat strain (the larger the more effective)
□ □ □ □ □ □ □
PART V:WEAR TRIAL IN THE AFTERNOON(2nd DAY)
After work in the afternoon (3:00 pm)
(13) Please tick the box you agree with most(✔)
Therma
l
sensatio
n
during
work in
the
afternoo
n
1
Col
d
2
Coo
l
3
Slightl
y cool
4
Neutral
5
Slightly
warm
6
War
m
7
Ho
t
RPE
during
work in
the
afternoo
n
0
Not
at
all
1
Ver
y
ligh
t
2
Light
3
Moderat
e
4
Somewh
at hard
5
Heav
y
6 7
Very
heav
y
8 9
10
Maxim
al
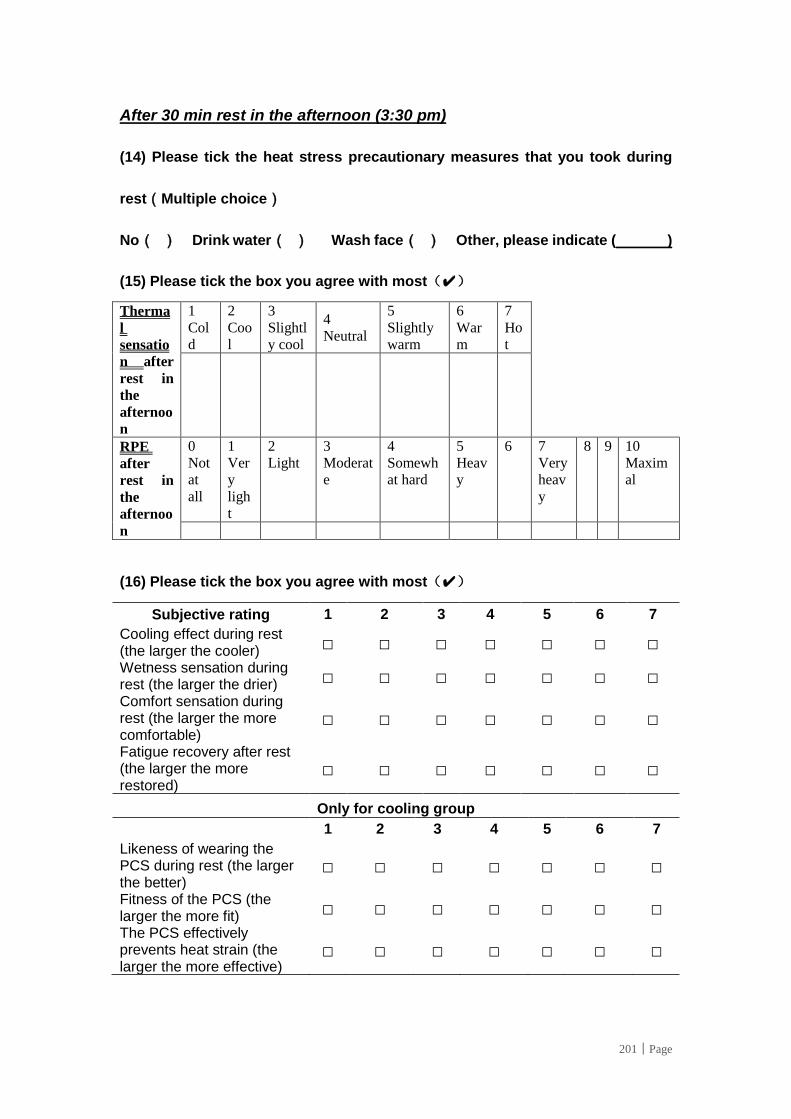
201│Page
After 30 min rest in the afternoon (3:30 pm)
(14) Please tick the heat stress precautionary measures that you took during
rest(Multiple choice)
No ( ) Drink water ( ) Wash face ( ) Other, please indicate ( )
(15) Please tick the box you agree with most(✔)
Therma
l
sensatio
n after
rest in
the
afternoo
n
1
Col
d
2
Coo
l
3
Slightl
y cool
4
Neutral
5
Slightly
warm
6
War
m
7
Ho
t
RPE
after
rest in
the
afternoo
n
0
Not
at
all
1
Ver
y
ligh
t
2
Light
3
Moderat
e
4
Somewh
at hard
5
Heav
y
6 7
Very
heav
y
8 9
10
Maxim
al
(16) Please tick the box you agree with most(✔)
Subjective rating 1 2 3 4 5 6 7
Cooling effect during rest (the larger the cooler) □ □ □ □ □ □ □ Wetness sensation during rest (the larger the drier) □ □ □ □ □ □ □ Comfort sensation during rest (the larger the more comfortable)
□ □ □ □ □ □ □
Fatigue recovery after rest (the larger the more restored)
□ □ □ □ □ □ □
Only for cooling group
1 2 3 4 5 6 7
Likeness of wearing the PCS during rest (the larger the better)
□ □ □ □ □ □ □
Fitness of the PCS (the larger the more fit) □ □ □ □ □ □ □ The PCS effectively prevents heat strain (the larger the more effective)
□ □ □ □ □ □ □
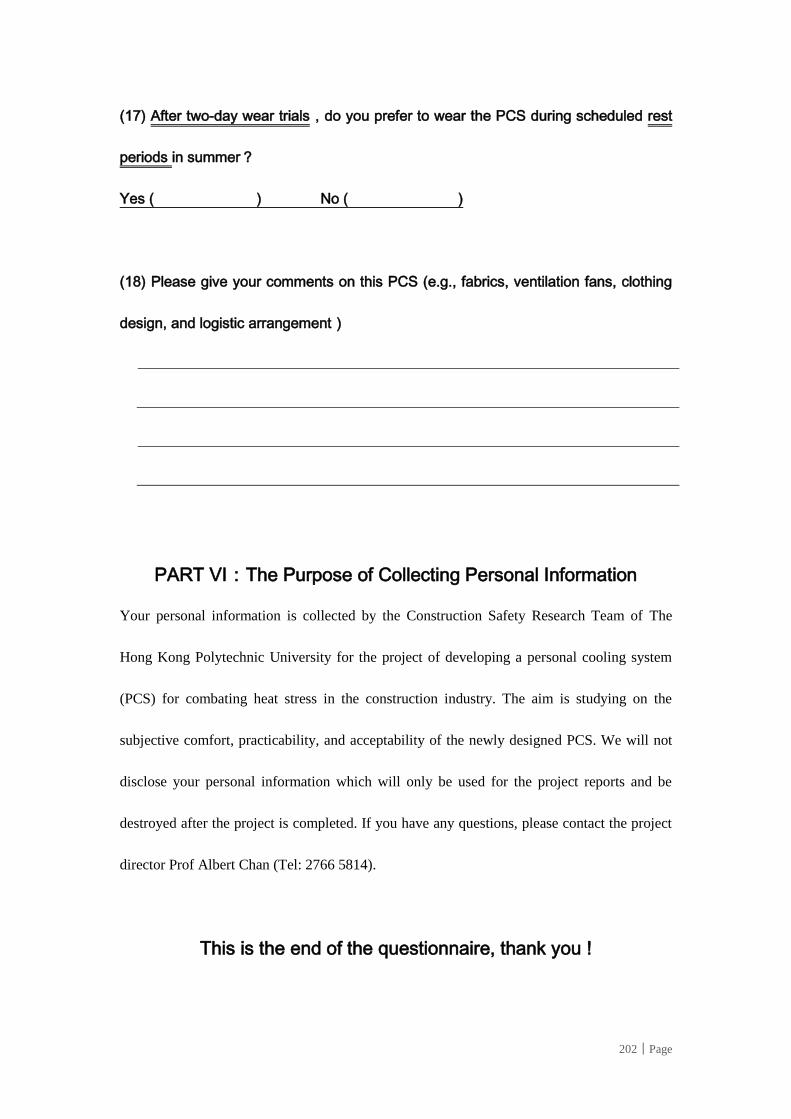
202│Page
(17) After two-day wear trials,do you prefer to wear the PCS during scheduled rest
periods in summer?
Yes ( ) No ( )
(18) Please give your comments on this PCS (e.g., fabrics, ventilation fans, clothing
design, and logistic arrangement)
PART VI:The Purpose of Collecting Personal Information
Your personal information is collected by the Construction Safety Research Team of The
Hong Kong Polytechnic University for the project of developing a personal cooling system
(PCS) for combating heat stress in the construction industry. The aim is studying on the
subjective comfort, practicability, and acceptability of the newly designed PCS. We will not
disclose your personal information which will only be used for the project reports and be
destroyed after the project is completed. If you have any questions, please contact the project
director Prof Albert Chan (Tel: 2766 5814).
This is the end of the questionnaire, thank you !
203│Page
香港理工大學
建築及房地產學系建築安全研究隊伍
開發一套個人冷卻設備供建築工人抵禦高溫
炎熱的夏季工作環境導致中暑及其相關事故頻發,嚴重影響戶外勞動者的健康安全。理
大建造業健康及安全研究小組非常關注工人於酷熱環境工作的健康安全問題,為此專為
地盤工人設計一件混合型抗熱背心。此次研究目的是評估新製混合型抗熱背心的有效
性、舒適度、實用性及可接受度。煩請受試者提供你們寶貴的意見,完成此項問卷調查。
感謝您的合作!
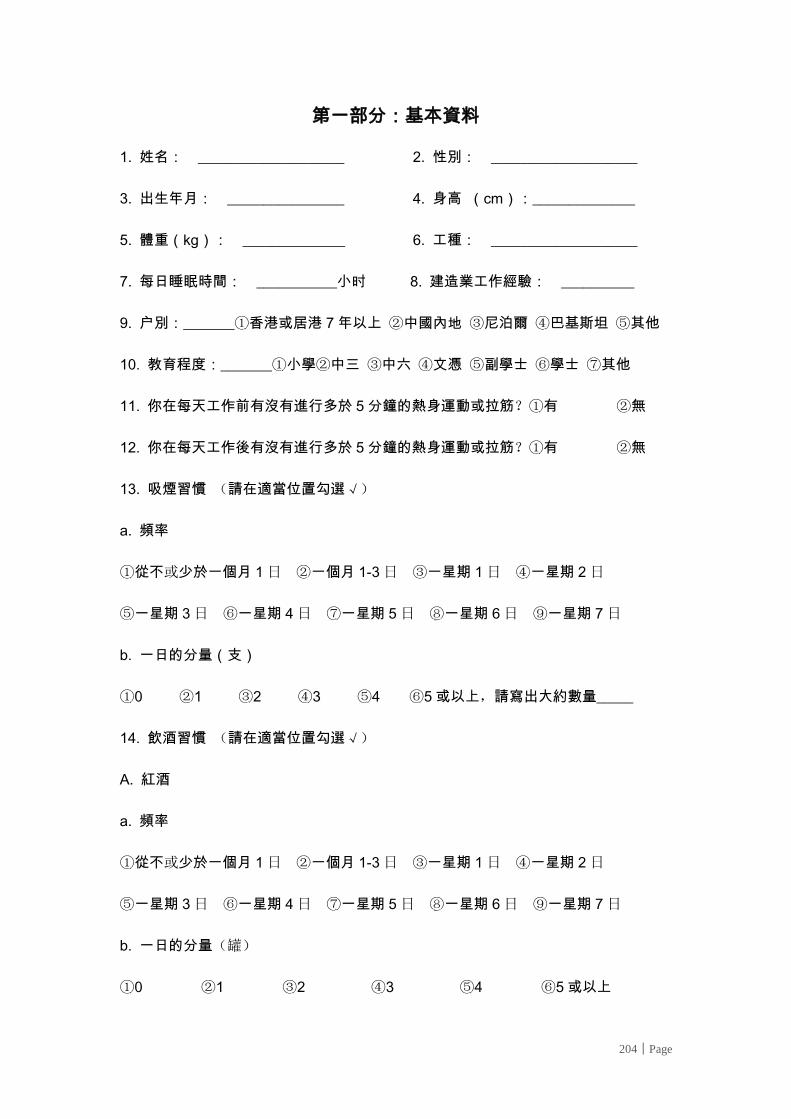
204│Page
第一部分:基本資料
1. 姓名: ____________________ 2. 性別: ____________________
3. 出生年月: ________________ 4. 身高 (cm):______________
5. 體重(kg): ______________ 6. 工種: ____________________
7. 每日睡眠時間: ___________小时 8. 建造業工作經驗: __________
9. 户別:_______①香港或居港 7 年以上 ②中國內地 ③尼泊爾 ④巴基斯坦 ⑤其他
10. 教育程度:_______①小學②中三 ③中六 ④文憑 ⑤副學士 ⑥學士 ⑦其他
11. 你在每天工作前有沒有進行多於 5 分鐘的熱身運動或拉筋?①有 ②無
12. 你在每天工作後有沒有進行多於 5 分鐘的熱身運動或拉筋?①有 ②無
13. 吸煙習慣 (請在適當位置勾選√)
a. 頻率
①從不或少於一個月 1 日 ②一個月 1-3 日 ③一星期 1 日 ④一星期 2 日
⑤一星期 3 日 ⑥一星期 4 日 ⑦一星期 5 日 ⑧一星期 6 日 ⑨一星期 7 日
b. 一日的分量(支)
①0 ②1 ③2 ④3 ⑤4 ⑥5 或以上,請寫出大約數量_____
14. 飲酒習慣 (請在適當位置勾選√)
A. 紅酒
a. 頻率
①從不或少於一個月 1 日 ②一個月 1-3 日 ③一星期 1 日 ④一星期 2 日
⑤一星期 3 日 ⑥一星期 4 日 ⑦一星期 5 日 ⑧一星期 6 日 ⑨一星期 7 日
b. 一日的分量(罐)
①0 ②1 ③2 ④3 ⑤4 ⑥5 或以上
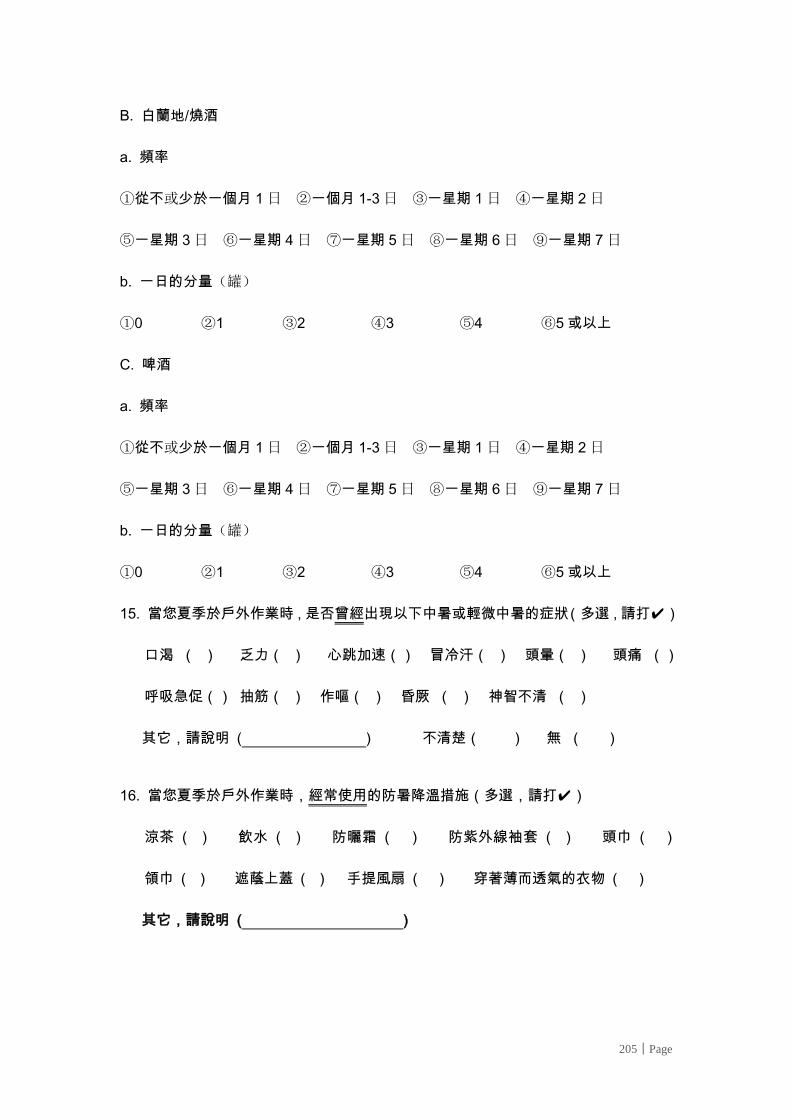
205│Page
B. 白蘭地/燒酒
a. 頻率
①從不或少於一個月 1 日 ②一個月 1-3 日 ③一星期 1 日 ④一星期 2 日
⑤一星期 3 日 ⑥一星期 4 日 ⑦一星期 5 日 ⑧一星期 6 日 ⑨一星期 7 日
b. 一日的分量(罐)
①0 ②1 ③2 ④3 ⑤4 ⑥5 或以上
C. 啤酒
a. 頻率
①從不或少於一個月 1 日 ②一個月 1-3 日 ③一星期 1 日 ④一星期 2 日
⑤一星期 3 日 ⑥一星期 4 日 ⑦一星期 5 日 ⑧一星期 6 日 ⑨一星期 7 日
b. 一日的分量(罐)
①0 ②1 ③2 ④3 ⑤4 ⑥5 或以上
15. 當您夏季於戶外作業時,是否曾經出現以下中暑或輕微中暑的症狀(多選,請打✔)
口渴 ( ) 乏力( ) 心跳加速() 冒冷汗( ) 頭暈( ) 頭痛 ()
呼吸急促() 抽筋( ) 作嘔( ) 昏厥 ( ) 神智不清 ( )
其它,請說明 ( ) 不清楚( ) 無 ( )
16. 當您夏季於戶外作業時,經常使用的防暑降溫措施(多選,請打✔)
涼茶 ( ) 飲水 ( ) 防曬霜 ( ) 防紫外線袖套 ( ) 頭巾 ( )
領巾 ( ) 遮蔭上蓋 ( ) 手提風扇 ( ) 穿著薄而透氣的衣物 ( )
其它,請說明 ( )
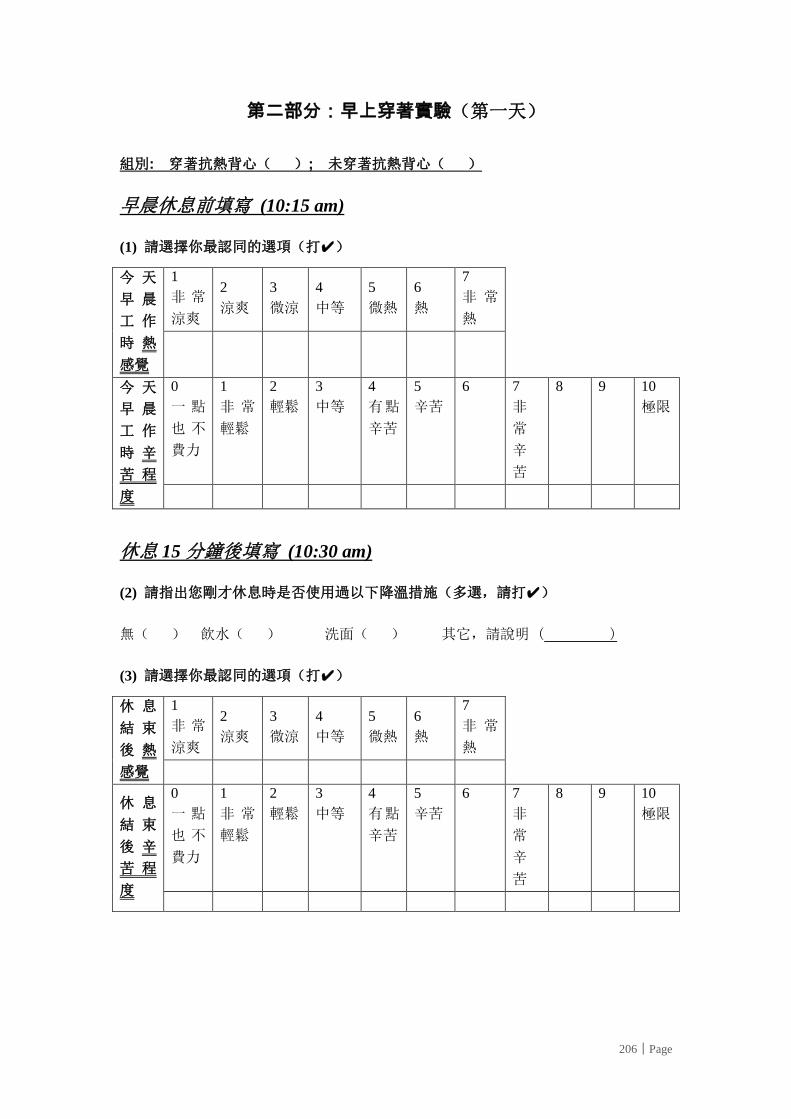
206│Page
第二部分:早上穿著實驗(第一天)
組別: 穿著抗熱背心( ); 未穿著抗熱背心( )
早晨休息前填寫 (10:15 am)
(1) 請選擇你最認同的選項(打✔)
今 天
早 晨
工 作
時 熱
感覺
1
非 常
涼爽
2
涼爽
3
微涼
4
中等
5
微熱
6
熱
7
非 常
熱
今 天
早 晨
工 作
時 辛
苦 程
度
0
一 點
也 不
費力
1
非 常
輕鬆
2
輕鬆
3
中等
4
有點
辛苦
5
辛苦
6 7
非
常
辛
苦
8 9
10
極限
休息 15 分鐘後填寫 (10:30 am)
(2) 請指出您剛才休息時是否使用過以下降溫措施(多選,請打✔)
無( ) 飲水( ) 洗面( ) 其它,請說明 ( )
(3) 請選擇你最認同的選項(打✔)
休 息
結 束
後 熱
感覺
1
非 常
涼爽
2
涼爽
3
微涼
4
中等
5
微熱
6
熱
7
非 常
熱
休 息
結 束
後 辛
苦 程
度
0
一 點
也 不
費力
1
非 常
輕鬆
2
輕鬆
3
中等
4
有點
辛苦
5
辛苦
6 7
非
常
辛
苦
8 9
10
極限
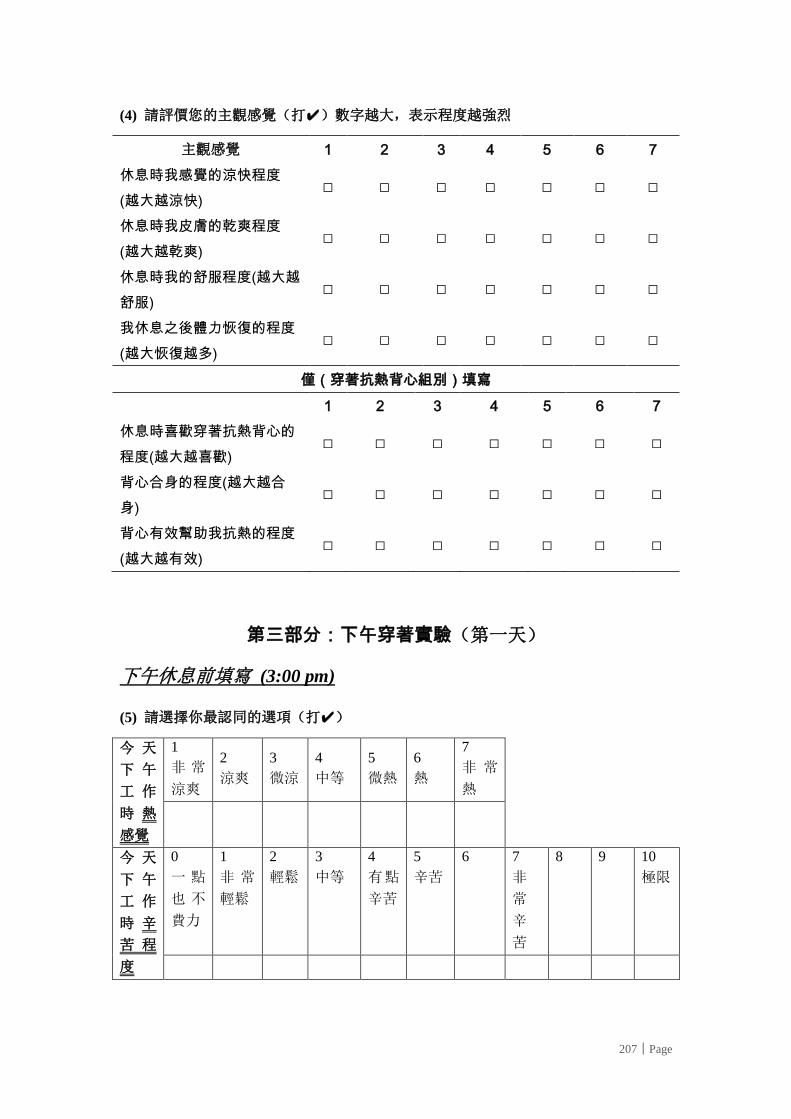
207│Page
(4) 請評價您的主觀感覺(打✔)數字越大,表示程度越強烈
主觀感覺 1 2 3 4 5 6 7
休息時我感覺的涼快程度
(越大越涼快) □ □ □ □ □ □ □
休息時我皮膚的乾爽程度
(越大越乾爽) □ □ □ □ □ □ □
休息時我的舒服程度(越大越
舒服) □ □ □ □ □ □ □
我休息之後體力恢復的程度
(越大恢復越多) □ □ □ □ □ □ □
僅(穿著抗熱背心組別)填寫
1 2 3 4 5 6 7
休息時喜歡穿著抗熱背心的
程度(越大越喜歡) □ □ □ □ □ □ □
背心合身的程度(越大越合
身) □ □ □ □ □ □ □
背心有效幫助我抗熱的程度
(越大越有效) □ □ □ □ □ □ □
第三部分:下午穿著實驗(第一天)
下午休息前填寫 (3:00 pm)
(5) 請選擇你最認同的選項(打✔)
今 天
下 午
工 作
時 熱
感覺
1
非 常
涼爽
2
涼爽
3
微涼
4
中等
5
微熱
6
熱
7
非 常
熱
今 天
下 午
工 作
時 辛
苦 程
度
0
一 點
也 不
費力
1
非 常
輕鬆
2
輕鬆
3
中等
4
有點
辛苦
5
辛苦
6 7
非
常
辛
苦
8 9
10
極限
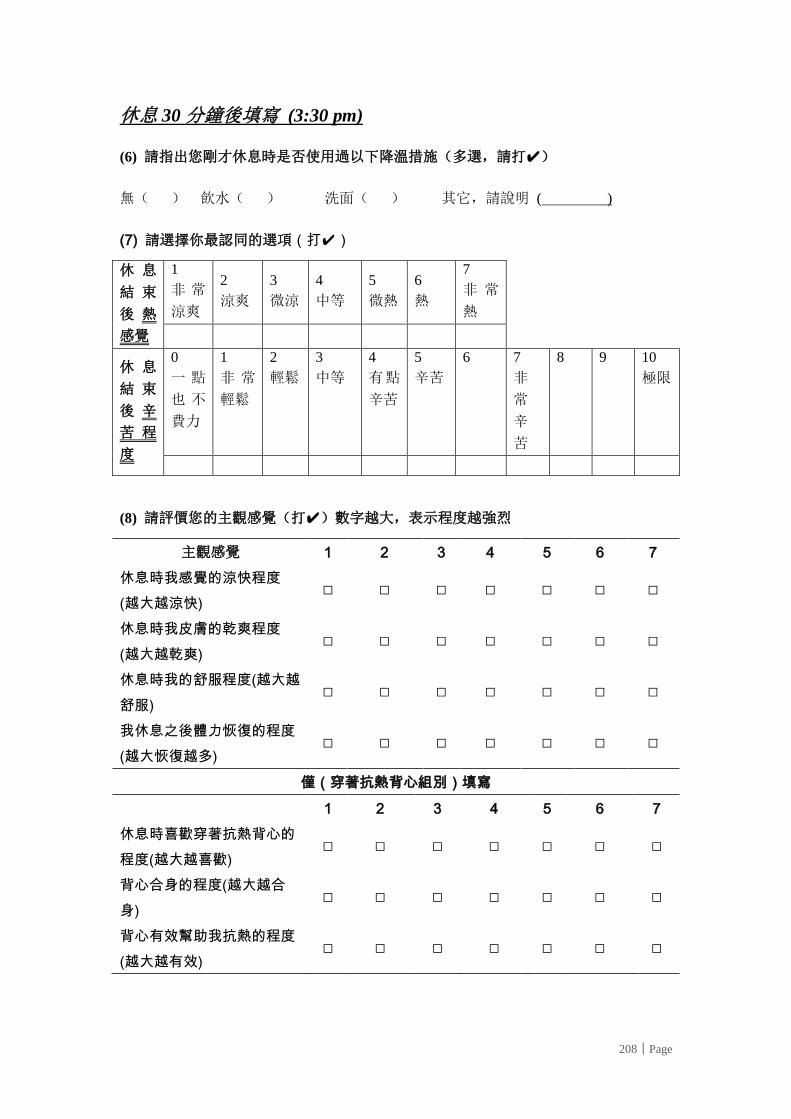
208│Page
休息 30 分鐘後填寫 (3:30 pm)
(6) 請指出您剛才休息時是否使用過以下降溫措施(多選,請打✔)
無( ) 飲水( ) 洗面( ) 其它,請說明 ( )
(7) 請選擇你最認同的選項(打✔)
休 息
結 束
後 熱
感覺
1
非 常
涼爽
2
涼爽
3
微涼
4
中等
5
微熱
6
熱
7
非 常
熱
休 息
結 束
後 辛
苦 程
度
0
一 點
也 不
費力
1
非 常
輕鬆
2
輕鬆
3
中等
4
有點
辛苦
5
辛苦
6 7
非
常
辛
苦
8 9
10
極限
(8) 請評價您的主觀感覺(打✔)數字越大,表示程度越強烈
主觀感覺 1 2 3 4 5 6 7
休息時我感覺的涼快程度
(越大越涼快) □ □ □ □ □ □ □
休息時我皮膚的乾爽程度
(越大越乾爽) □ □ □ □ □ □ □
休息時我的舒服程度(越大越
舒服) □ □ □ □ □ □ □
我休息之後體力恢復的程度
(越大恢復越多) □ □ □ □ □ □ □
僅(穿著抗熱背心組別)填寫
1 2 3 4 5 6 7
休息時喜歡穿著抗熱背心的
程度(越大越喜歡) □ □ □ □ □ □ □
背心合身的程度(越大越合
身) □ □ □ □ □ □ □
背心有效幫助我抗熱的程度
(越大越有效) □ □ □ □ □ □ □
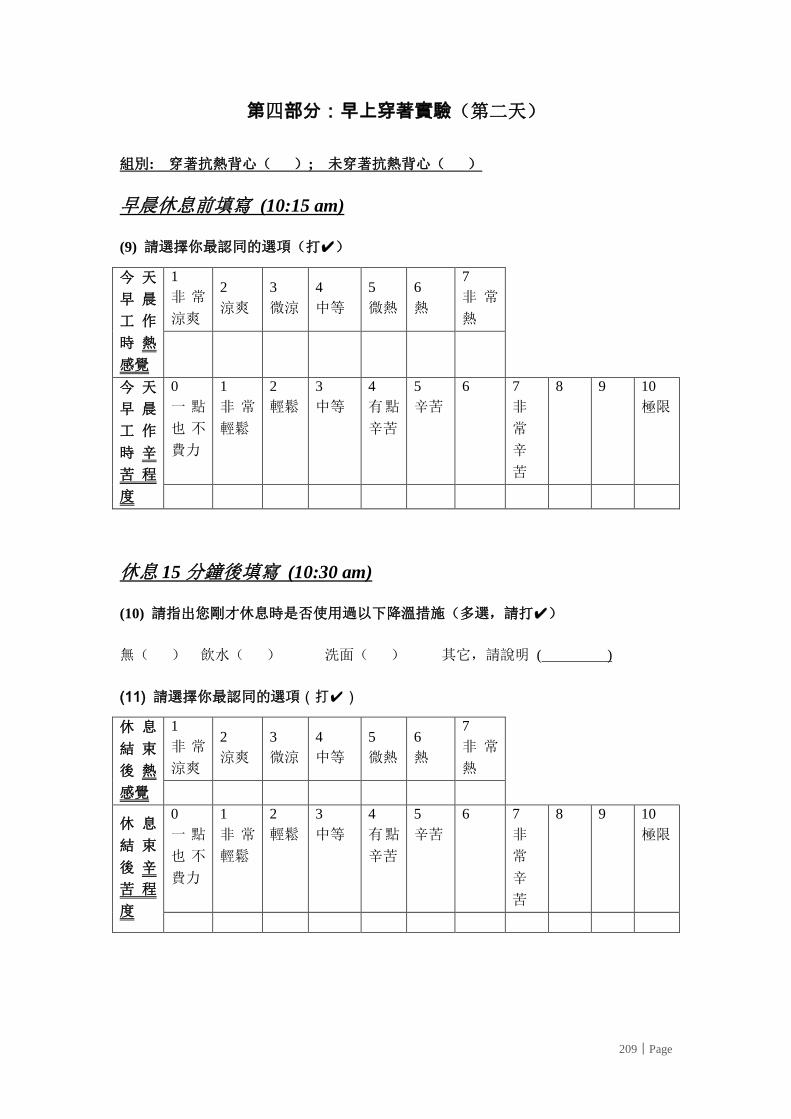
209│Page
第四部分:早上穿著實驗(第二天)
組別: 穿著抗熱背心( ); 未穿著抗熱背心( )
早晨休息前填寫 (10:15 am)
(9) 請選擇你最認同的選項(打✔)
今 天
早 晨
工 作
時 熱
感覺
1
非 常
涼爽
2
涼爽
3
微涼
4
中等
5
微熱
6
熱
7
非 常
熱
今 天
早 晨
工 作
時 辛
苦 程
度
0
一 點
也 不
費力
1
非 常
輕鬆
2
輕鬆
3
中等
4
有點
辛苦
5
辛苦
6 7
非
常
辛
苦
8 9
10
極限
休息 15 分鐘後填寫 (10:30 am)
(10) 請指出您剛才休息時是否使用過以下降溫措施(多選,請打✔)
無( ) 飲水( ) 洗面( ) 其它,請說明 ( )
(11) 請選擇你最認同的選項(打✔)
休 息
結 束
後 熱
感覺
1
非 常
涼爽
2
涼爽
3
微涼
4
中等
5
微熱
6
熱
7
非 常
熱
休 息
結 束
後 辛
苦 程
度
0
一 點
也 不
費力
1
非 常
輕鬆
2
輕鬆
3
中等
4
有點
辛苦
5
辛苦
6 7
非
常
辛
苦
8 9
10
極限
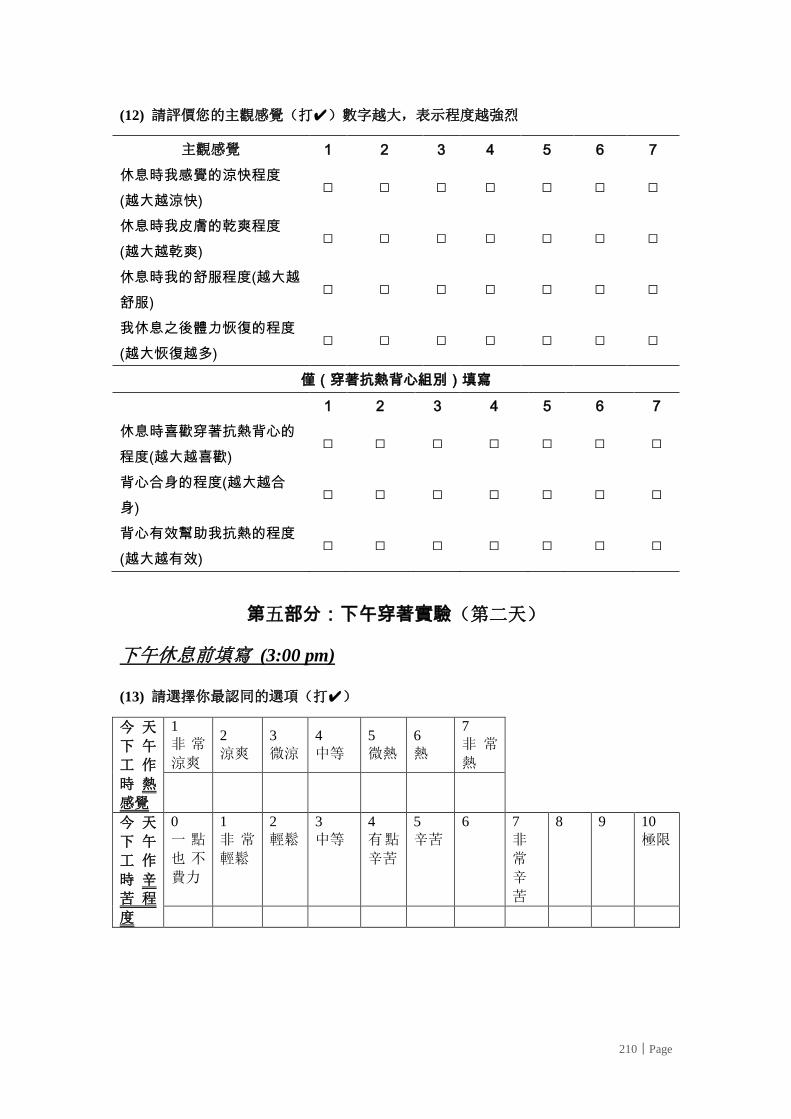
210│Page
(12) 請評價您的主觀感覺(打✔)數字越大,表示程度越強烈
主觀感覺 1 2 3 4 5 6 7
休息時我感覺的涼快程度
(越大越涼快) □ □ □ □ □ □ □
休息時我皮膚的乾爽程度
(越大越乾爽) □ □ □ □ □ □ □
休息時我的舒服程度(越大越
舒服) □ □ □ □ □ □ □
我休息之後體力恢復的程度
(越大恢復越多) □ □ □ □ □ □ □
僅(穿著抗熱背心組別)填寫
1 2 3 4 5 6 7
休息時喜歡穿著抗熱背心的
程度(越大越喜歡) □ □ □ □ □ □ □
背心合身的程度(越大越合
身) □ □ □ □ □ □ □
背心有效幫助我抗熱的程度
(越大越有效) □ □ □ □ □ □ □
第五部分:下午穿著實驗(第二天)
下午休息前填寫 (3:00 pm)
(13) 請選擇你最認同的選項(打✔)
今 天
下 午
工 作
時 熱
感覺
1
非 常
涼爽
2
涼爽
3
微涼
4
中等
5
微熱
6
熱
7
非 常
熱
今 天
下 午
工 作
時 辛
苦 程
度
0
一 點
也 不
費力
1
非 常
輕鬆
2
輕鬆
3
中等
4
有點
辛苦
5
辛苦
6 7
非
常
辛
苦
8 9
10
極限
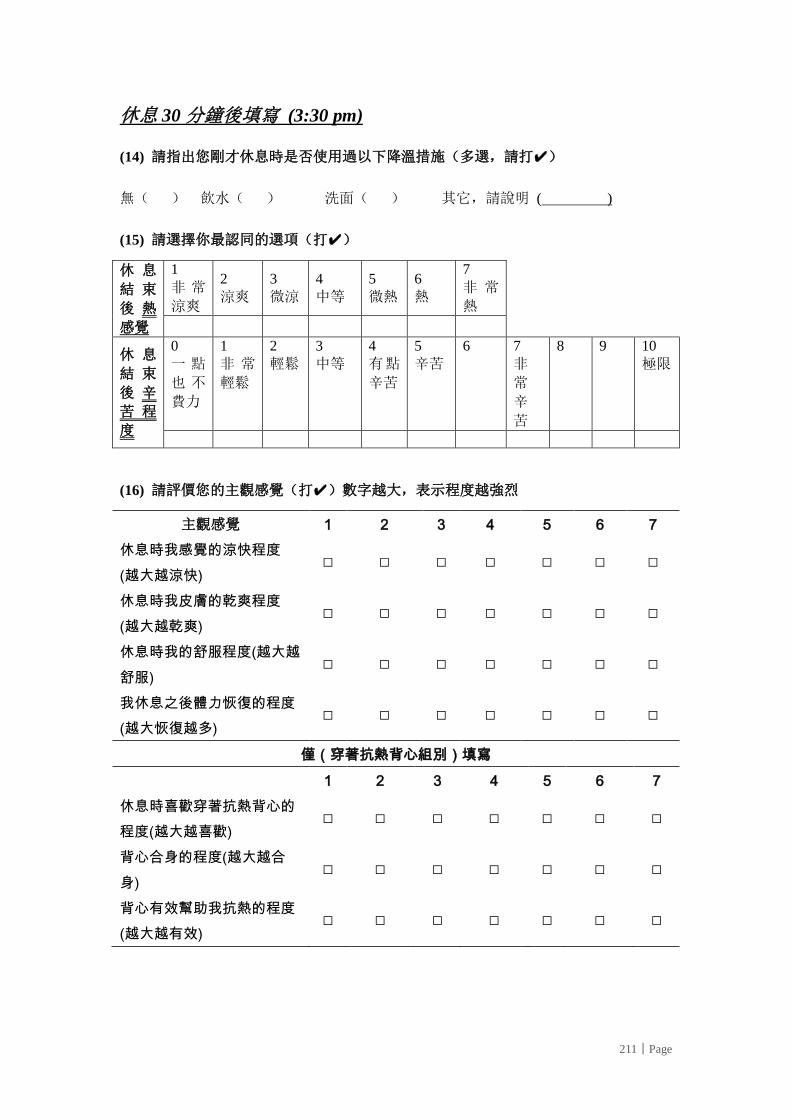
211│Page
休息 30 分鐘後填寫 (3:30 pm)
(14) 請指出您剛才休息時是否使用過以下降溫措施(多選,請打✔)
無( ) 飲水( ) 洗面( ) 其它,請說明 ( )
(15) 請選擇你最認同的選項(打✔)
休 息
結 束
後 熱
感覺
1
非 常
涼爽
2
涼爽
3
微涼
4
中等
5
微熱
6
熱
7
非 常
熱
休 息
結 束
後 辛
苦 程
度
0
一 點
也 不
費力
1
非 常
輕鬆
2
輕鬆
3
中等
4
有點
辛苦
5
辛苦
6 7
非
常
辛
苦
8 9
10
極限
(16) 請評價您的主觀感覺(打✔)數字越大,表示程度越強烈
主觀感覺 1 2 3 4 5 6 7
休息時我感覺的涼快程度
(越大越涼快) □ □ □ □ □ □ □
休息時我皮膚的乾爽程度
(越大越乾爽) □ □ □ □ □ □ □
休息時我的舒服程度(越大越
舒服) □ □ □ □ □ □ □
我休息之後體力恢復的程度
(越大恢復越多) □ □ □ □ □ □ □
僅(穿著抗熱背心組別)填寫
1 2 3 4 5 6 7
休息時喜歡穿著抗熱背心的
程度(越大越喜歡) □ □ □ □ □ □ □
背心合身的程度(越大越合
身) □ □ □ □ □ □ □
背心有效幫助我抗熱的程度
(越大越有效) □ □ □ □ □ □ □
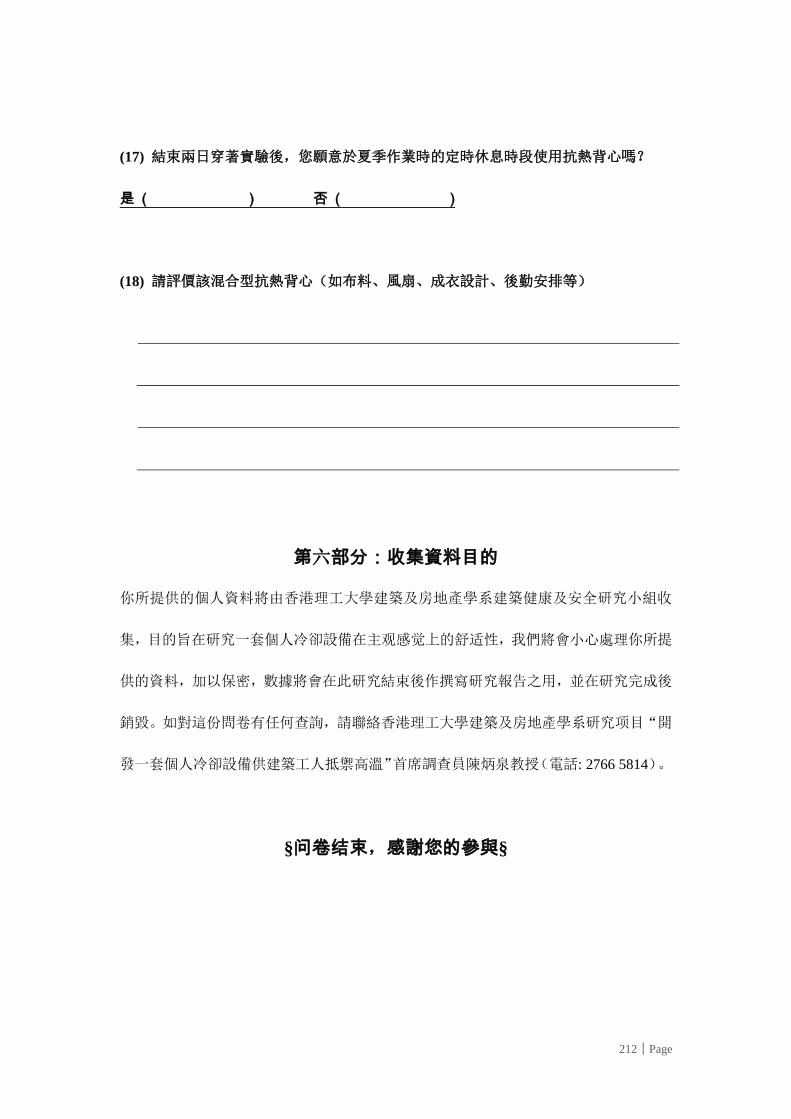
212│Page
(17) 結束兩日穿著實驗後,您願意於夏季作業時的定時休息時段使用抗熱背心嗎?
是 ( ) 否 ( )
(18) 請評價該混合型抗熱背心(如布料、風扇、成衣設計、後勤安排等)
第六部分:收集資料目的
你所提供的個人資料將由香港理工大學建築及房地產學系建築健康及安全研究小組收
集,目的旨在研究一套個人冷卻設備在主观感觉上的舒适性,我們將會小心處理你所提
供的資料,加以保密,數據將會在此研究結束後作撰寫研究報告之用,並在研究完成後
銷毀。如對這份問卷有任何查詢,請聯絡香港理工大學建築及房地產學系研究项目“開
發一套個人冷卻設備供建築工人抵禦高溫”首席調查員陳炳泉教授(電話: 2766 5814)。
§问卷结束,感謝您的參與§
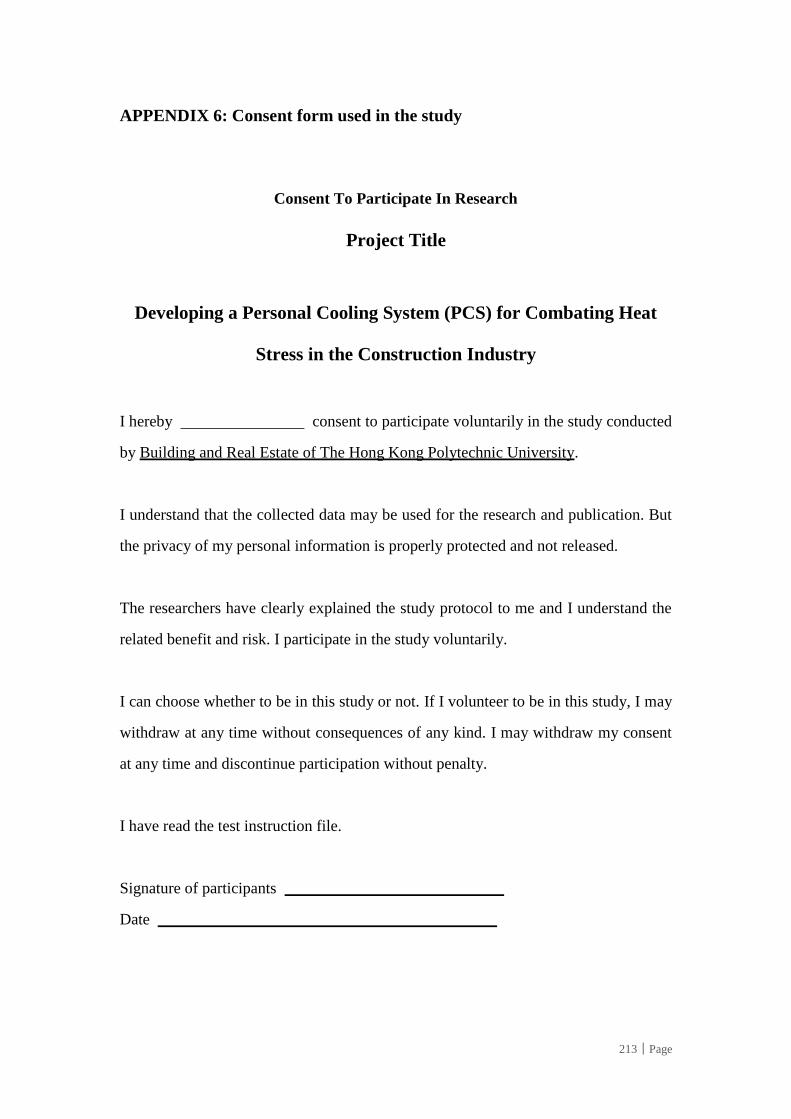
213│Page
APPENDIX 6: Consent form used in the study
Consent To Participate In Research
Project Title
Developing a Personal Cooling System (PCS) for Combating Heat
Stress in the Construction Industry
I hereby consent to participate voluntarily in the study conducted
by Building and Real Estate of The Hong Kong Polytechnic University.
I understand that the collected data may be used for the research and publication. But
the privacy of my personal information is properly protected and not released.
The researchers have clearly explained the study protocol to me and I understand the
related benefit and risk. I participate in the study voluntarily.
I can choose whether to be in this study or not. If I volunteer to be in this study, I may
withdraw at any time without consequences of any kind. I may withdraw my consent
at any time and discontinue participation without penalty.
I have read the test instruction file.
Signature of participants
Date
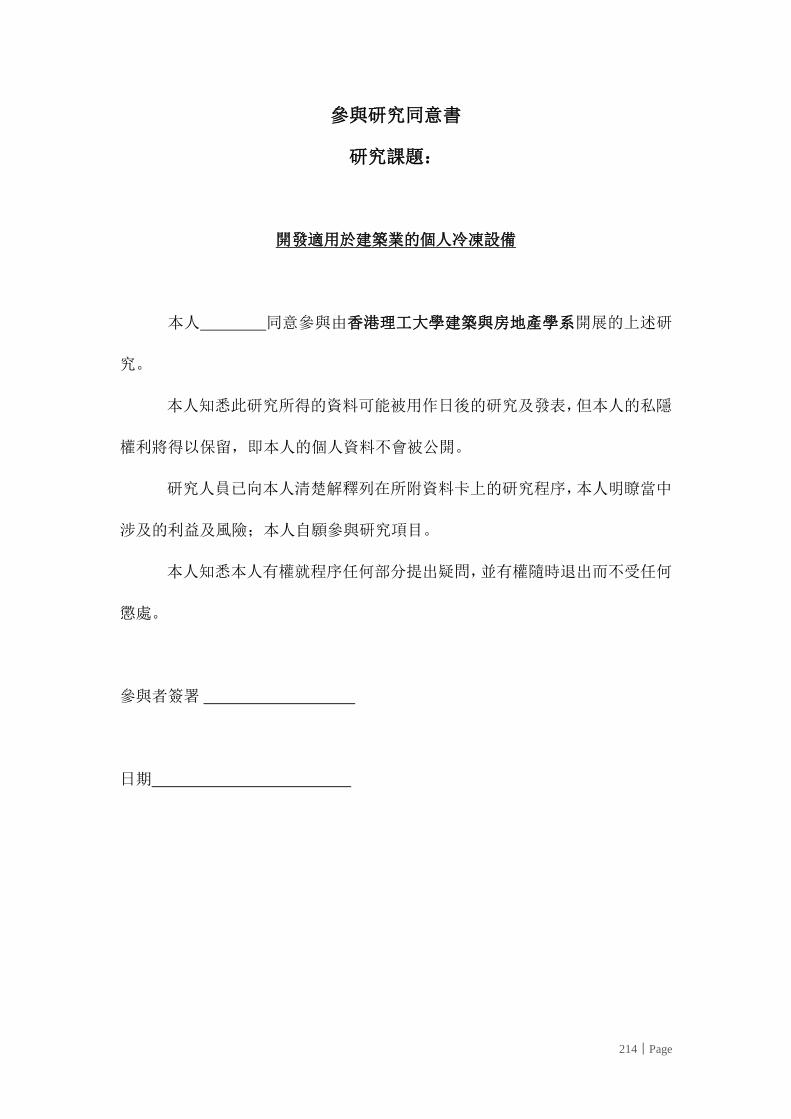
214│Page
參與研究同意書
研究課題:
開發適用於建築業的個人冷凍設備
本人 同意參與由香港理工大學建築與房地產學系開展的上述研
究。
本人知悉此研究所得的資料可能被用作日後的研究及發表,但本人的私隱
權利將得以保留,即本人的個人資料不會被公開。
研究人員已向本人清楚解釋列在所附資料卡上的研究程序,本人明瞭當中
涉及的利益及風險;本人自願參與研究項目。
本人知悉本人有權就程序任何部分提出疑問,並有權隨時退出而不受任何
懲處。
參與者簽署
日期
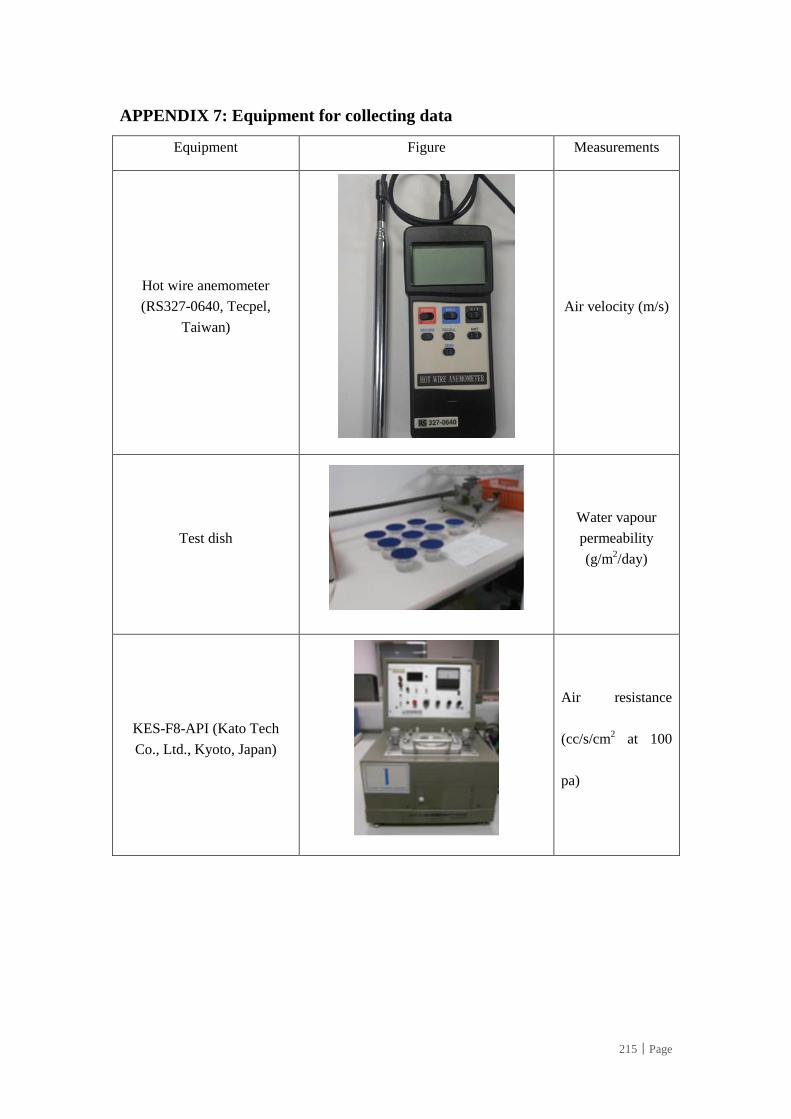
215│Page
APPENDIX 7: Equipment for collecting data
Equipment Figure Measurements
Hot wire anemometer
(RS327-0640, Tecpel,
Taiwan)
Air velocity (m/s)
Test dish
Water vapour
permeability
(g/m2/day)
KES-F8-API (Kato Tech
Co., Ltd., Kyoto, Japan)
Air resistance
(cc/s/cm2 at 100
pa)
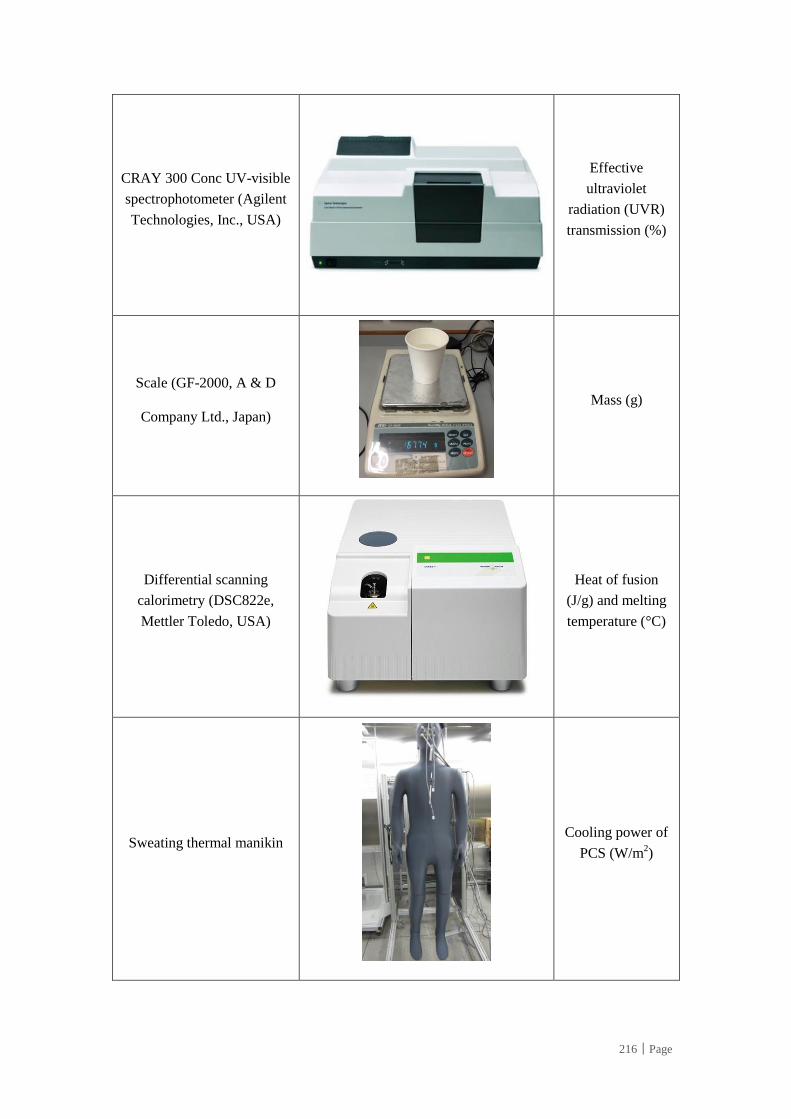
216│Page
CRAY 300 Conc UV-visible
spectrophotometer (Agilent
Technologies, Inc., USA)
Effective
ultraviolet
radiation (UVR)
transmission (%)
Scale (GF-2000, A & D
Company Ltd., Japan)
Mass (g)
Differential scanning
calorimetry (DSC822e,
Mettler Toledo, USA)
Heat of fusion
(J/g) and melting
temperature (°C)
Sweating thermal manikin
Cooling power of
PCS (W/m2)
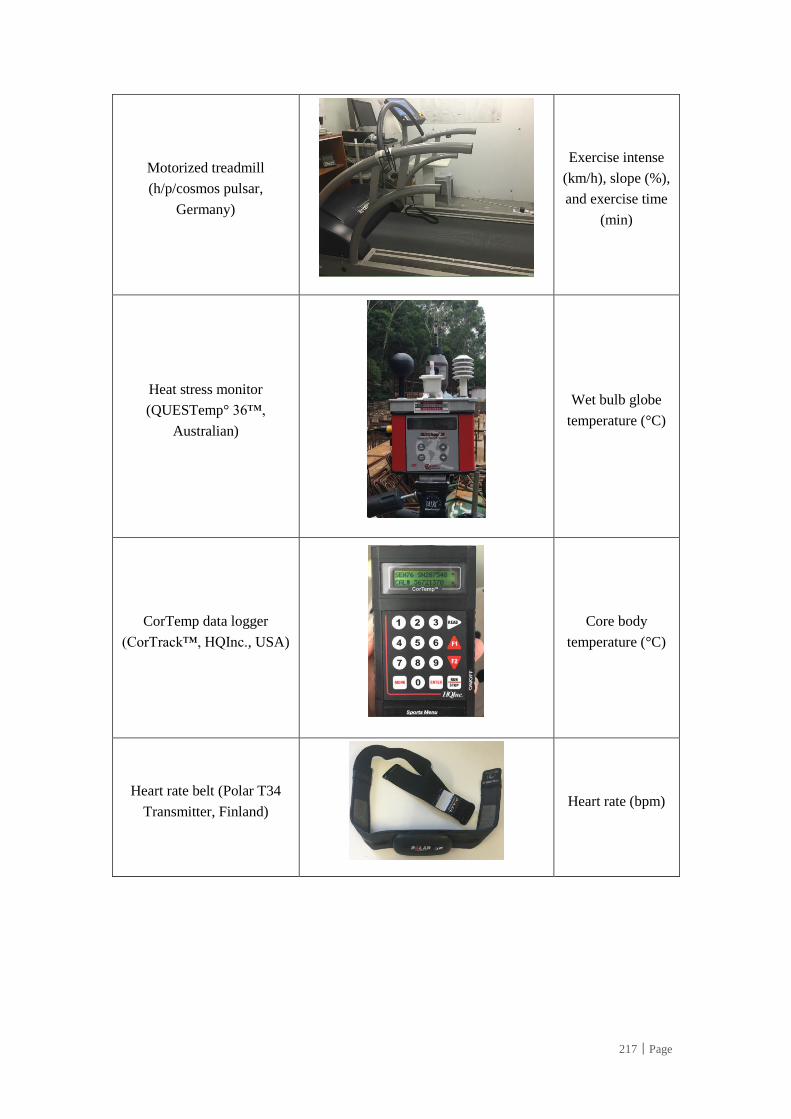
217│Page
Motorized treadmill
(h/p/cosmos pulsar,
Germany)
Exercise intense
(km/h), slope (%),
and exercise time
(min)
Heat stress monitor
(QUESTemp° 36™,
Australian)
Wet bulb globe
temperature (°C)
CorTemp data logger
(CorTrack™, HQInc., USA)
Core body
temperature (°C)
Heart rate belt (Polar T34
Transmitter, Finland)
Heart rate (bpm)
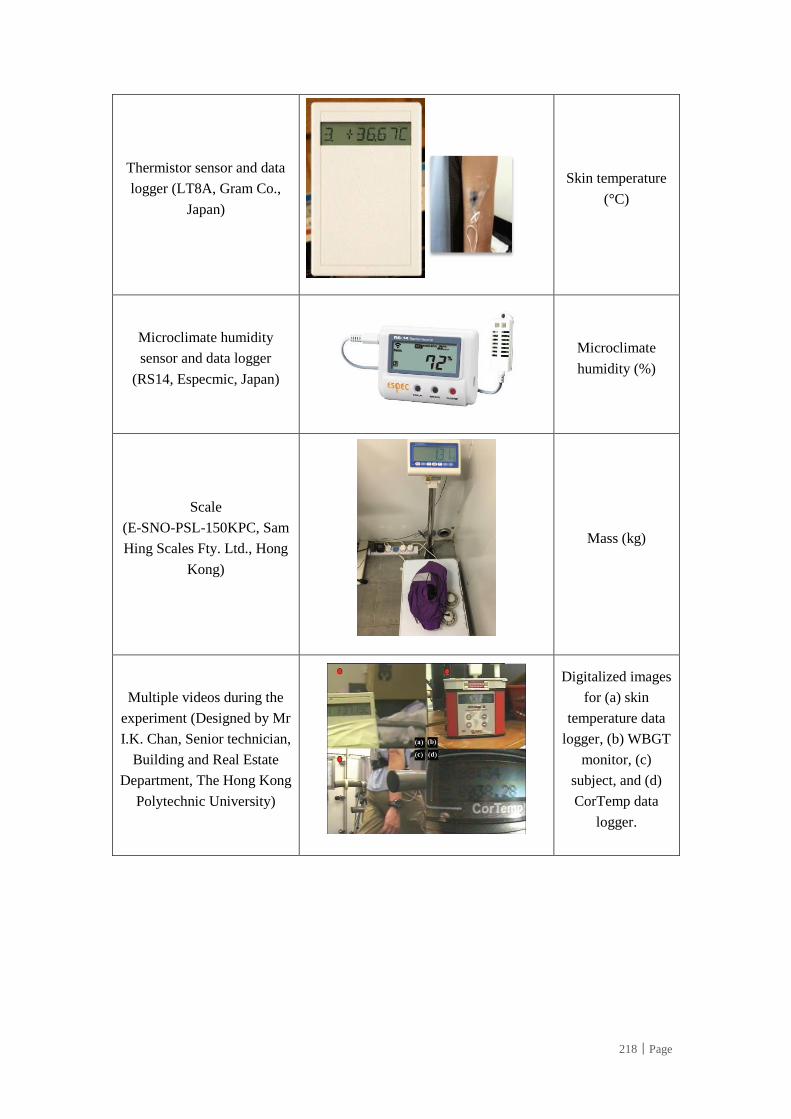
218│Page
Thermistor sensor and data
logger (LT8A, Gram Co.,
Japan)
Skin temperature
(°C)
Microclimate humidity
sensor and data logger
(RS14, Especmic, Japan)
Microclimate
humidity (%)
Scale
(E-SNO-PSL-150KPC, Sam
Hing Scales Fty. Ltd., Hong
Kong)
Mass (kg)
Multiple videos during the
experiment (Designed by Mr
I.K. Chan, Senior technician,
Building and Real Estate
Department, The Hong Kong
Polytechnic University)
Digitalized images
for (a) skin
temperature data
logger, (b) WBGT
monitor, (c)
subject, and (d)
CorTemp data
logger.
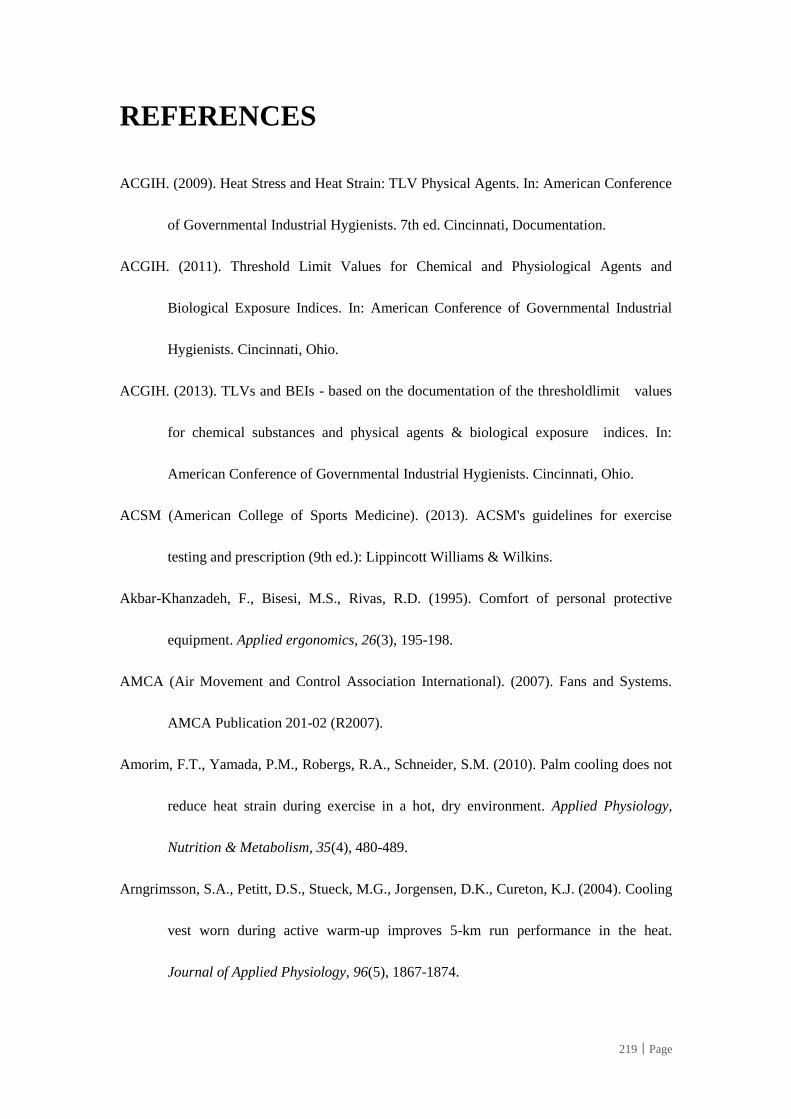
219│Page
REFERENCES
ACGIH. (2009). Heat Stress and Heat Strain: TLV Physical Agents. In: American Conference
of Governmental Industrial Hygienists. 7th ed. Cincinnati, Documentation.
ACGIH. (2011). Threshold Limit Values for Chemical and Physiological Agents and
Biological Exposure Indices. In: American Conference of Governmental Industrial
Hygienists. Cincinnati, Ohio.
ACGIH. (2013). TLVs and BEIs - based on the documentation of the thresholdlimit values
for chemical substances and physical agents & biological exposure indices. In:
American Conference of Governmental Industrial Hygienists. Cincinnati, Ohio.
ACSM (American College of Sports Medicine). (2013). ACSM's guidelines for exercise
testing and prescription (9th ed.): Lippincott Williams & Wilkins.
Akbar-Khanzadeh, F., Bisesi, M.S., Rivas, R.D. (1995). Comfort of personal protective
equipment. Applied ergonomics, 26(3), 195-198.
AMCA (Air Movement and Control Association International). (2007). Fans and Systems.
AMCA Publication 201-02 (R2007).
Amorim, F.T., Yamada, P.M., Robergs, R.A., Schneider, S.M. (2010). Palm cooling does not
reduce heat strain during exercise in a hot, dry environment. Applied Physiology,
Nutrition & Metabolism, 35(4), 480-489.
Arngrimsson, S.A., Petitt, D.S., Stueck, M.G., Jorgensen, D.K., Cureton, K.J. (2004). Cooling
vest worn during active warm-up improves 5-km run performance in the heat.
Journal of Applied Physiology, 96(5), 1867-1874.
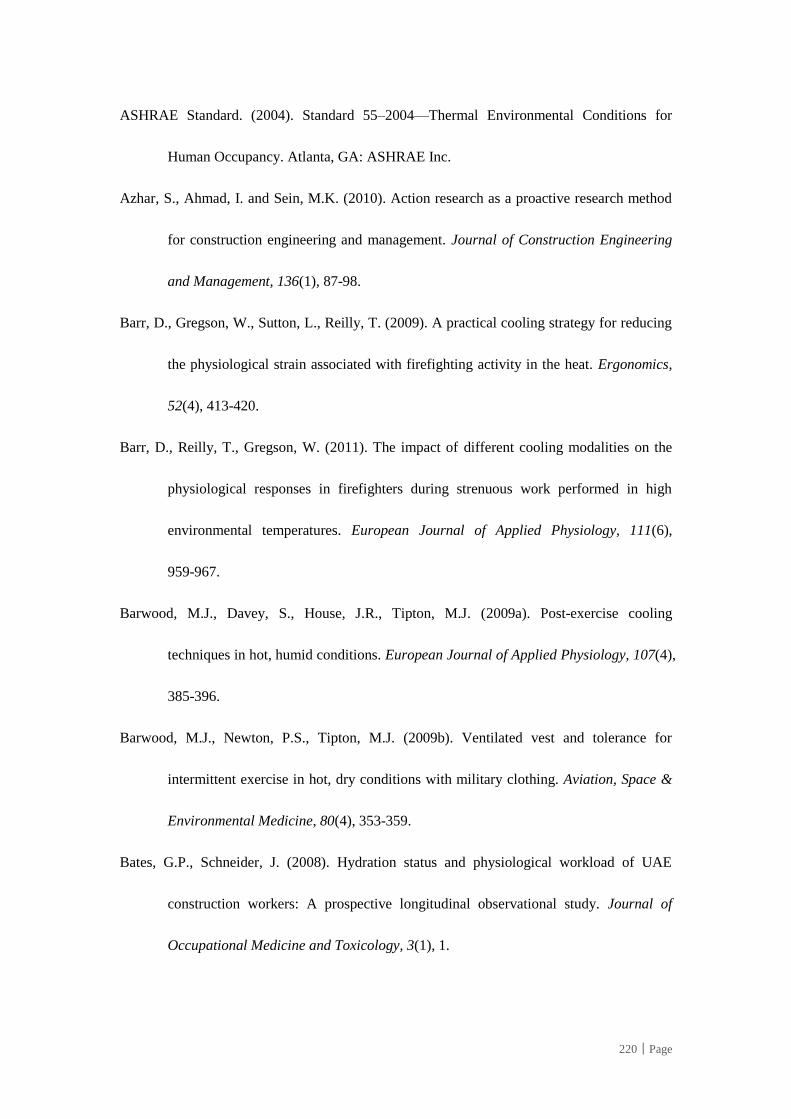
220│Page
ASHRAE Standard. (2004). Standard 55–2004—Thermal Environmental Conditions for
Human Occupancy. Atlanta, GA: ASHRAE Inc.
Azhar, S., Ahmad, I. and Sein, M.K. (2010). Action research as a proactive research method
for construction engineering and management. Journal of Construction Engineering
and Management, 136(1), 87-98.
Barr, D., Gregson, W., Sutton, L., Reilly, T. (2009). A practical cooling strategy for reducing
the physiological strain associated with firefighting activity in the heat. Ergonomics,
52(4), 413-420.
Barr, D., Reilly, T., Gregson, W. (2011). The impact of different cooling modalities on the
physiological responses in firefighters during strenuous work performed in high
environmental temperatures. European Journal of Applied Physiology, 111(6),
959-967.
Barwood, M.J., Davey, S., House, J.R., Tipton, M.J. (2009a). Post-exercise cooling
techniques in hot, humid conditions. European Journal of Applied Physiology, 107(4),
385-396.
Barwood, M.J., Newton, P.S., Tipton, M.J. (2009b). Ventilated vest and tolerance for
intermittent exercise in hot, dry conditions with military clothing. Aviation, Space &
Environmental Medicine, 80(4), 353-359.
Bates, G.P., Schneider, J. (2008). Hydration status and physiological workload of UAE
construction workers: A prospective longitudinal observational study. Journal of
Occupational Medicine and Toxicology, 3(1), 1.
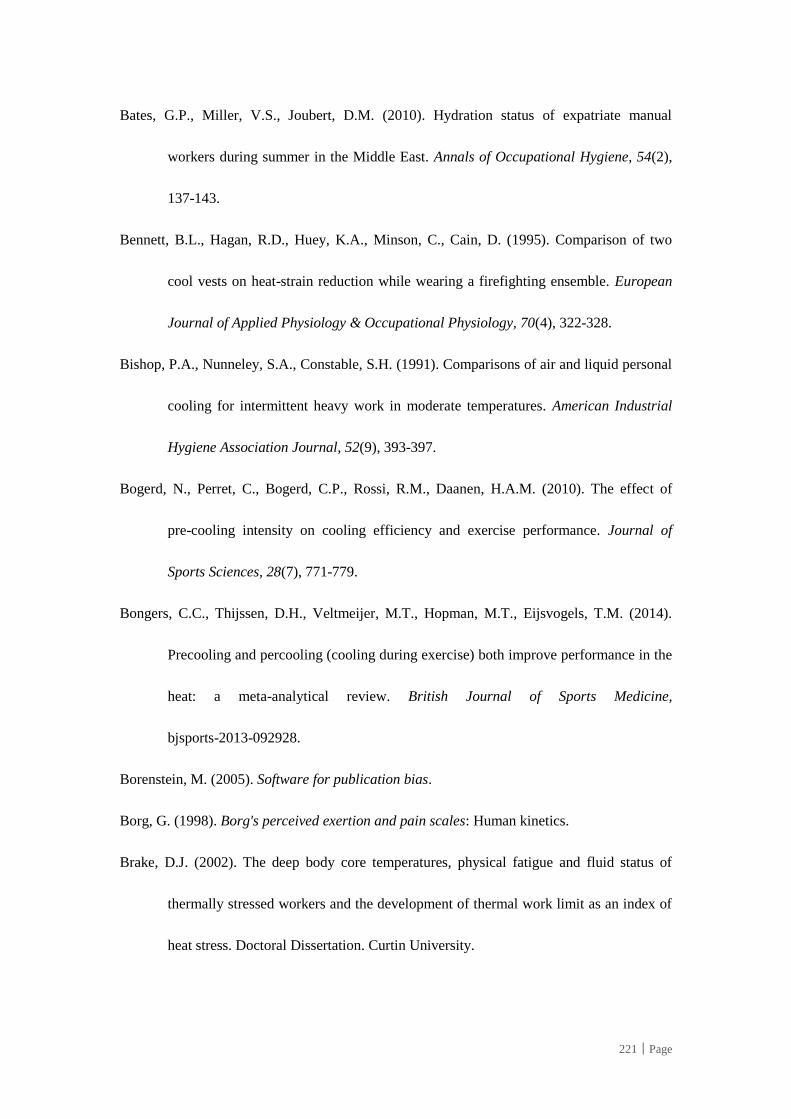
221│Page
Bates, G.P., Miller, V.S., Joubert, D.M. (2010). Hydration status of expatriate manual
workers during summer in the Middle East. Annals of Occupational Hygiene, 54(2),
137-143.
Bennett, B.L., Hagan, R.D., Huey, K.A., Minson, C., Cain, D. (1995). Comparison of two
cool vests on heat-strain reduction while wearing a firefighting ensemble. European
Journal of Applied Physiology & Occupational Physiology, 70(4), 322-328.
Bishop, P.A., Nunneley, S.A., Constable, S.H. (1991). Comparisons of air and liquid personal
cooling for intermittent heavy work in moderate temperatures. American Industrial
Hygiene Association Journal, 52(9), 393-397.
Bogerd, N., Perret, C., Bogerd, C.P., Rossi, R.M., Daanen, H.A.M. (2010). The effect of
pre-cooling intensity on cooling efficiency and exercise performance. Journal of
Sports Sciences, 28(7), 771-779.
Bongers, C.C., Thijssen, D.H., Veltmeijer, M.T., Hopman, M.T., Eijsvogels, T.M. (2014).
Precooling and percooling (cooling during exercise) both improve performance in the
heat: a meta-analytical review. British Journal of Sports Medicine,
bjsports-2013-092928.
Borenstein, M. (2005). Software for publication bias.
Borg, G. (1998). Borg's perceived exertion and pain scales: Human kinetics.
Brake, D.J. (2002). The deep body core temperatures, physical fatigue and fluid status of
thermally stressed workers and the development of thermal work limit as an index of
heat stress. Doctoral Dissertation. Curtin University.
222│Page
Brake, R., Bates, G. (2002). A valid method for comparing rational and empirical heat stress
indices. Annals of Occupational Hygiene, 46(2), 165-174.
Burton, D. R., Collier, L. (1964). The development of water conditioned suits (Tech. Note
ME-400) Farnborough: RoyalAircraft Establishment.
Burton, D. R. (1966). Performance of water conditioned suits. Aerospace Medicine, 37, 500–
504.
Burton, D. R. (1969). Engineering aspects of personal conditioning. Proceedings of the
Symposium on Individual Cooling, Kansas State University, 6,33–49.
Byrne, C., Lim, C.L. (2007). The ingestible telemetric body core temperature sensor: A
review of validity and exercise applications. British Journal of Sports Medicine, 41(3),
126-133.
Cadarette, B.S., Levine, L., Staab, J.E., Kolka, M.A., Correa, M., Whipple, M., Sawka, M.N.
(2001). Heat strain imposed by toxic agent protective systems. Aviation Space and
Environmental Medicine, 72(1), 32-37.
Cadarette, B.S., Levine, L., Staab, J.E., Kolka, M.A., Correa, M.M., Whipple, M. (2003).
Upper body cooling during exercise-heat stress wearing the improved toxicological
agent protective system for HAZMAT operations. American Industrial Hygiene
Association Journal, 64(4), 510-515.
Caldwell, J., Patterson, M., Taylor, N. (2012). Exertional thermal strain, protective clothing
and auxiliary cooling in dry heat: evidence for physiological but not cognitive
impairment. European Journal of Applied Physiology, 112(10), 3597-3606.
223│Page
Camp, C.J. (2001). From efficacy to effectiveness to diffusion: Making the transitions in
dementia intervention research. Neuropsychological Rehabilitation, 11(3-4), 495-517.
Candas, V., Libert, J., Vogt, J. (1979). Influence of air velocity and heat acclimation on
human skin wettedness and sweating efficiency. Journal of Applied Physiology, 47(6),
1194-1200.
Cao, H., Branson, D. H., Peksoz, S., Nam, J., Farr, C. H. (2006). Fabric selection for a liquid
cooling garment. Textile Research Journal, 76, 587–595.
Carter, J.M., Rayson, M.P., Wilkinson, D.M., Richmond, V., Blacker, S. (2007). Strategies to
combat heat strain during and after firefighting. Journal of Thermal Biology, 32(2),
109-116.
Caruana, E. J., Roman, M., Hernández-Sánchez, J., Solli, P. (2015). Longitudinal studies.
Journal of Thoracic Disease, 7(11), E537.
CDC (Centers for Disease Control and Prevention). (1995). Heat-related mortality-Chicago,
July 1995. Vol. 44. Issue 31. Atlanta, GA: Morbidity and Mortality WeeklyReport.
pp. 577–579.
Chan, A.P.C., Yam, M.C., Chung, J.W., Yi, W. (2012a). Developing a heat stress model for
construction workers. Journal of Facilities Management, 10(1), 59-74.
Chan, A.P.C., Yi, W., Chan, D.W., Wong, D.P. (2012b). Using the thermal work limit as an
environmental determinant of heat stress for construction workers. Journal of
Management in Engineering, 29(4), 414-423.
224│Page
Chan, A.P.C., Yang, Y. (2016). Practical on-site measurement of heat strain with the use of a
perceptual strain index. International Archives of Occupational and Environmental
Health, 89(2), 299-306.
Chan, A.P.C., Yang, Y., Guo, Y., Yam, M.C., Song, W. (2016a). Evaluating the physiological
and perceptual responses of wearing a newly designed construction work uniform.
Textile Research Journal, 86(6), 659-673.
Chan, A.P.C., Yi, W. (2016). Heat stress and its impacts on occupational health and
performance. Indoor and Built Environment, 25(1), 3-5.
Chan, A.P.C., Yang, Y., Song, W., Wong, D.P. (2017). Hybrid cooling vest for cooling
between exercise bouts in the heat: Effects and practical considerations. Journal of
Thermal Biology, 63, 1-9.
Chan, A.P.C., Wong, F.K.W., Wong, D.P., Lam, E.W.M., Yi, W. (2012c). Determining an
optimal recovery time after exercising to exhaustion in a controlled climatic
environment: Application to construction works. Building and Environment, 56,
28-37.
Chan, A.P.C., Yi, W., Wong, D.P., Yam, M.C.H., Chan, D.W.M. (2012d). Determining an
optimal recovery time for construction rebar workers after working to exhaustion in a
hot and humid environment. Building and Environment, 58, 163-171.
Chan, A.P.C., Yang, Y., Wong, D.P., Lam, E.W.M., Li, Y. (2013). Factors affecting
horticultural and cleaning workers' preference on cooling vests. Building and
Environment, 66, 181-189.
225│Page
Chan, A.P.C., Song, W., Yang, Y. (2015). Meta-analysis of the effects of microclimate
cooling systems on human performance under thermal stressful environments:
Potential applications to occupational workers. Journal of Thermal Biology, 49-50,
16-32.
Chan, A.P.C., Guo, Y.P., Wong, F.K.W., Li, Y., Sun, S., Han, X. (2016b). The development
of anti-heat stress clothing for construction workers in hot and humid weather.
Ergonomics, 59(4), 479-495.
Chan, A.P.C., Yi, W., Wong, F.K.W. (2016c). Evaluating the effectiveness and practicality of
a cooling vest across four industries in Hong Kong. Facilities, 34(9/10), 511-534.
Chan, A.P.C., Guo, Y., Wong, F.K.W., Li, Y. (2017). Development of cooling vest for
construction workers in hot and humid enviornment. Textile Research Journal, Under
review.
Cheung, S.S., McLellan, T.M. (1998). Heat acclimation, aerobic fitness, and hydration effects
on tolerance during uncompensable heat stress. Journal of Applied Physiology, 84(5),
1731-1739.
Cheung, S.S., McLellan, T.M., Tenaglia, S. (2000). The thermophysiology of uncompensable
heat stress: Physiological manipulations and individual characteristics. Sports
Medicine, 29(5), 329-359.
Cheuvront, S.N., Kolka, M.A., Cadarette, B.S., Montain, S.J., Sawka, M.N. (2003). Efficacy
of intermittent, regional microclimate cooling. Journal of Applied Physiology, 94(5),
1841-1848.
226│Page
Chinevere, T.D., Cadarette, B.S., Goodman, D.A., Ely, B.R., Cheuvront, S.N., Sawka, M.N.
(2008). Efficacy of body ventilation system for reducing strain in warm and hot
climates. European Journal of Applied Physiology, 103(3), 307-314.
Chow, S.-C., Wang, H., Shao, J. (2007). Sample size calculations in clinical research: CRC
press.
Ciuha, U., Grönkvist, M., Mekjavic, I.B., Eiken, O. (2016). Strategies for increasing
evaporative cooling during simulated desert patrol mission. Ergonomics, 59(2),
298-309.
Construction Industry Council (CIC) (2013).Guidelines on site safety measures for working
in hot weather, Version 2. Retrieved from
http://www.hkcic.org/eng/info/publication.aspx
Cotter, J.D., Sleivert, G.G., Roberts, W.S., Febbraio, M.A. (2001). Effect of pre-cooling, with
and without thigh cooling, on strain and endurance exercise performance in the heat.
Comparative biochemistry and physiology. Part A, Molecular & integrative
physiology, 128(4), 667-677.
de Morton, N.A. (2009). The PEDro scale is a valid measure of the methodological quality of
clinical trials: a demographic study. Australian Journal of Physiotherapy, 55(2),
129-133.
DeGroot, D.W., Gallimore, R.P., Thompson, S.M., Kenefick, R.W. (2013). Extremity cooling
for heat stress mitigation in military and occupational settings. Journal of Thermal
Biology, 38(6), 305-310.
227│Page
Department of Health, GovHK. (2010). Preventive measures against heat stroke and sun burn.
Retrieved from http://www.dh.gov.hk/english/press/2010/100706-3.html.
Drust, B., Rasmussen, P., Mohr, M., Nielsen, B., Nybo, L. (2005). Elevations in core and
muscle temperature impairs repeated sprint performance. Acta Physiologica
Scandinavica, 183(2), 181-190. doi: 10.1111/j.1365-201X.2004.01390.x
Dzarr, A.A., Kamal, M., Baba, A.A. (2009). A comparison between infrared tympanic
thermometry, oral and axilla with rectal thermometry in neutropenic adults. European
Journal of Oncology Nursing, 13(4), 250-254.
Edwards, A.M., Clark, N.A. (2006). Thermoregulatory observations in soccer match play:
Professional and recreational level applications using an intestinal pill system to
measure core temperature. British Journal of Sports Medicine, 40(2), 133-138.
Foda, E., Sirén, K. (2012). A thermal manikin with human thermoregulatory control:
Implementation and validation. International Journal of Biometeorology, 56(5),
959-971.
Gagge, A.P., Stolwijk, J., Hardy, J. (1967). Comfort and thermal sensations and associated
physiological responses at various ambient temperatures. Environmental Research,
1(1), 1-20.
Gagge, A.P., Stolwijk, J.A.J., Saltin, B. (1969). Comfort and thermal sensations and
associated physiological responses during exercise at various ambient temperatures.
Environmental Research, 2(3), 209-229.
Gallagher Jr, M., Robertson, R.J., Goss, F.L., Nagle-Stilley, E.F., Schafer, M.A., Suyama, J.,
Hostler, D. (2012). Development of a perceptual hyperthermia index to evaluate heat
228│Page
strain during treadmill exercise. European Journal of Applied Physiology, 112(6),
2025-2034.
Gao, C., Kuklane, K., Holmer, I. (2010). Cooling vests with phase change material packs: the
effects of temperature gradient, mass and covering area. Ergonomics, 53(5), 716-723.
Gao, C.S., Kuklane, K., Holmer, I. (2011). Cooling vests with phase change materials: the
effects of melting temperature on heat strain alleviation in an extremely hot
environment. European Journal of Applied Physiology, 111(6), 1207-1216.
Gavin, T.P. (2003). Clothing and thermoregulation during exercise. Sports Medicine, 33,
941-947.
Goldenhar, L.M., LaMontagne, A.D., Katz, T., Heaney, C., Landsbergis, P. (2001). The
intervention research process in occupational safety and health: an overview from the
National Occupational Research Agenda Intervention Effectiveness Research team.
Journal of Occupational and Environmental Medicine, 43(7), 616-622.
Goldenhar, L.M., Schulte, P.A. (1994). Intervention research in occupational health and
safety. Journal of Occupational and Environmental Medicine, 36(7), 763-778.
Gonzàlez-Alonso, J., Teller, C., Andersen, S.L., Jensen, F.B., Hyldig, T., Nielsen, B. (1999).
Influence of body temperature on the development of fatigue during prolonged
exercise in the heat. Journal of Applied Physiology, 86(3), 1032-1039.
Gubernot, D. M., Anderson, G. B., & Hunting, K. L. (2015). Characterizing occupational
heat‐related mortality in the United States, 2000–2010: An analysis using the
census of fatal occupational injuries database. American Journal of Industrial
Medicine, 58(2), 203-211.
229│Page
Hasegawa, H., Takatori, T., Komura, T., Yamasaki, M. (2005). Wearing a cooling jacket
during exercise reduces thermal strain and improves endurance exercise performance
in a warm environment. Journal of Strength & Conditioning Research (Allen Press
Publishing Services Inc.), 19(1), 122-128.
Hatch, K.L., Woo, S.S., Barker, R.L., Radhakrishnaiah, P., Markee, N.L., Maibach, H.I.
(1990). In vivo cutaneous and perceived comfort response to fabric. Part I.
Thermophysiological comfort determinations for three experimental knit fabrics.
Textile Research Journal, 60(7), 405-412.
HSE (Health and Safety Executive),UK. (2013). Heat stress in the workplace - A brief guide.
Retrieved from http://www.hse.gov.uk/pubns/indg451.pdf.
Higgins, J., Thompson, S.G. (2002). Quantifying heterogeneity in a meta‐analysis. Statistics
in Medicine, 21(11), 1539-1558.
Higgins, J.P., Thompson, S.G., Deeks, J.J., Altman, D.G. (2003). Measuring inconsistency in
meta-analyses. BMJ: British Medical Journal, 327(7414), 557.
Holmér, I. (2004). Thermal manikin history and applications. European Journal of Applied
Physiology, 92(6), 614-618.
Hong Kong Observatory. (2015). Retrieved from
http://www.hko.gov.hk/wxinfo/pastwx/2015/ywx2015.htm
Hoonakkera, P., Loushinea, T., Carayona, P., Kallmanc, J. and Andrew, K., et al. (2005). The
effect of safety initiatives on safety performance: A longitudinal study. Applied
Ergonomics, 36(4), 461-469.
Horie, S. (2013). Prevention of heat stress disorders in the workplace. JMAJ, 56(3), 186-92.
230│Page
Hostler, D., Reis, S.E., Bednez, J.C., Kerin, S., Suyama, J. (2010). Comparison of active
cooling devices with passive cooling for rehabilitation of firefighters performing
exercise in thermal protective clothing: a report from the Fireground Rehab
Evaluation (FIRE) trial. Prehospital Emergency Care, 14(3), 300-309.
House, J.R., Lunt, H., Magness, A., Lyons, J. (2003). Testing the effectiveness of techniques
for reducing heat strain in Royal Navy nuclear, biological and chemical cleansing
stations' teams. Journal of the Royal Naval Medical Service, 89(1), 27-34.
House, J.R., Lunt, H.C., Taylor, R., Milligan, G., Lyons, J.A., House, C.M. (2013). The
impact of a phase-change cooling vest on heat strain and the effect of different
cooling pack melting temperatures. European Journal of Applied Physiology, 113(5),
1223-1231.
IEC (International Electrotechnical Commission). (1986). Performance and Construction of
Electric Circulating Fans and Regulators. IEC Publication. IEC 60879.
Ikpe, E., Hammon, F., Oloke, D. (2012). Cost-benefit analysis for accident prevention in
construction projects. Journal of Construction Engineering and Management, 138,
991-998.
ISO 7243. (1989). Hot Environments – Estimation of the Heat Stress on WorkingMan,
Based on the WBGT-Index (Wet Bulb Globe Temperature). International Standard
Organisation, Geneva.
Jia, Y.A., Rowlinson, S., Ciccarelli, M. (2016). Climatic and psychosocial risks of heat illness
incidents on construction site. Applied ergonomics, 53, 25-35.
231│Page
Jones, P.R., Barton, C., Morrissey, D., Maffulli, N., Hemmings, S. (2012). Pre-cooling for
endurance exercise performance in the heat: A systematic review. BMC Medicine, 10.
doi: 10.1186/1741-7015-10-166
Kenny, G., Flouris, A. (2014). The human thermoregulatory system and its response to
thermal stress. Protective Clothing: Managing Thermal Stress, 319-349.
Kenny, G.P., Schissler, A.R., Stapleton, J., Piamonte, M., Binder, K., Lynn, A., . . .
Hardcastle, S.G. (2011). Ice cooling vest on tolerance for exercise under
uncompensable heat stress. Journal of Occupational and Environmental Hygiene,
8(8), 484-491.
Kim, J.H., Coca, A., Williams, W.J., Roberge, R.J. (2011). Effects of liquid cooling garments
on recovery and performance time in individuals performing strenuous work wearing
a firefighter ensemble. Journal of Occupational and Environmental Hygiene, 8(7),
409-416.
Kjellstrom, T., Holmer, I., Lemke, B. (2009). Workplace heat stress, health and productivity–
an increasing challenge for low and middle-income countries during climate change.
Global Health Action, 2.
Kristensen, T.S. (2005). Intervention studies in occupational epidemiology. Occupational and
Environmental Medicine, 62(3), 205-210.
Laufer, A., Shapira, A. and Telem, D. (2008). Communicating in dynamic conditions: How
do on-site construction project managers do it? Journal of Management in
Engineering, 24(2), 75-86.
232│Page
Li, X., Chow, K.H., Zhu, Y., Lin, Y. (2016). Evaluating the impacts of high-temperature
outdoor working environments on construction labor productivity in China: A case
study of rebar workers. Building and Environment, 95, 42-52.
Lingard, H., & Rowlinson, S. M. (2005). Occupational health and safety in construction
project management. Taylor & Francis.
London, R. C. (1969). A review of work on water cooled suits (Technical Memo EP418),
Royal Aircraft Establishment, Manhattan, KS.
Lu, Y., Wei, F., Lai, D., Shi, W., Wang, F., Gao, C., Song, G. (2015). A novel personal
cooling system (PCS) incorporated with phase change materials (PCMs) and
ventilation fans: An investigation on its cooling efficiency. Journal of Thermal
Biology, 52, 137-146.
Luomala, M.J., Oksa, J., Salmi, J.A., Linnamo, V., Holmer, I., Smolander, J., Dugue, B.
(2012). Adding a cooling vest during cycling improves performance in warm and
humid conditions. Journal of Thermal Biology, 37(1), 47-55.
Maher, C.G., Sherrington, C., Herbert, R.D., Moseley, A.M., Elkins, M. (2003). Reliability of
the PEDro scale for rating quality of randomized controlled trials. Physical Therapy,
83(8), 713-721.
McEntire, S.J., Suyama, J., Hostler, D. (2013). Mitigation and prevention of exertional heat
stress in firefighters: A review of cooling strategies for structural firefighting and
hazardous materials responders. Prehospital Emergency Care, 17(2), 241-260.
233│Page
McLellan, T.M., Frim, J., Bell, D.G. (1999). Efficacy of air and liquid cooling during light
and heavy exercise while wearing NBC clothing. Aviation Space and Environmental
Medicine, 70(8), 802-811.
McLellan, T.M. (2007). The efficacy of an air-cooling vest to reduce thermal strain for Light
Armour Vehicle personnel. Toronto: DTIC Document.
Melnyk, B., Morrison-Beedy, D. (2012). Intervention research: Designing, conducting,
analyzing, and funding: Springer Publishing Company.
Miller, V., Bates, G. (2007a). Hydration of outdoor workers in north-west Australia. Journal
of Occupational Health and Safety Australia and New Zealand, 23(1), 79.
Miller, V.S., Bates, G.P. (2007b). The thermal work limit is a simple reliable heat index for
the protection of workers in thermally stressful environments. Annals of Occupational
Hygiene, 51(6), 553-561.
Miyamoto, T., Oshima, Y., Ikuta, K., Kinoshita, H. (2006). The heart rate increase at the
onset of high-work intensity exercise is accelerated by central blood volume loading.
European Journal of Applied Physiology, 96(1), 86-96.
Mokhtari Yazdi, M., Sheikhzadeh, M. (2014). Personal cooling garments: a review. Journal
of the Textile Institute, 105(12), 1231-1250.
Mondal, S. (2008). Phase change materials for smart textiles–An overview. Applied Thermal
Engineering, 28(11), 1536-1550.
Montazer, S., Farshad, A.A., Monazzam, M.R., Eyvazlou, M., Yaraghi, A.A.S., Mirkazemi, R.
(2013). Assessment of construction workers' hydration status using urine specific
234│Page
gravity. International journal of occupational medicine and environmental health,
26(5), 762.
Moran, D.S., Montain, S.J., Pandolf, K.B. (1998). Evaluation of different levels of hydration
using a new physiological strain index. American Journal of Physiology-Regulatory,
Integrative and Comparative Physiology, 275(3), R854-R860.
Moran, D.S., Kenney, W.L., Pierzga, J.M., Pandolf, K.B. (2002). Aging and assessment of
physiological strain during exercise-heat stress. American Journal of
Physiology-Regulatory, Integrative and Comparative Physiology, 282(4),
R1063-R1069.
Muir, I.H., Bishop, P.A., Ray, P. (1999). Effects of a novel ice-cooling technique on work in
protective clothing at 28 degrees C, 23 degrees C, and 18 degrees C WBGTs.
American Industrial Hygiene Association Journal, 60(1), 96-104.
Muza, S.R., Pimental, N.A., Cosimini, H.M., Sawka, M.N. (1988). Portable, ambient air
microclimate cooling in simulated desert and tropic conditions. Aviation Space and
Environmental Medicine, 59(6), 553-558.
NIOSH. (2009). Approaches to Safe Nanotechnology. U.S. National Institute for
Occupational Safety and Health. Retrieved from
https://www.cdc.gov/niosh/docs/2009-125/pdfs/2009-125.pdf.
NIOSH. (2016). Engineering controls. Centers for Disease Control and Prevention. Retrieved
from https://www.cdc.gov/niosh/engcontrols/
235│Page
Noordzij, M., Tripepi, G., Dekker, F.W., Zoccali, C., Tanck, M.W., Jager, K.J. (2010).
Sample size calculations: basic principles and common pitfalls. Nephrology dialysis
transplantation, gfp732.
Nunneley, S. A. (1970). Water cooled garments–A review. Space Life Sciences, 2, 335–360.
Occupational Safety and Health (OSH) Statistics Bulletin. (2016). Occupational Safety and
Health Branch, Labour Department. Retrieved from
http://www.labour.gov.hk/eng/osh/pdf/Bulletin2015_EN.pdf
OSHA (Occupational Safety and Health Administration). (1999). OSHA technical manual.
TED 1-0.15A, Section III Chapter 4-Heat Stress. Retrieved from
https://www.osha.gov/dts/osta/otm/otm_iii/otm_iii_4.html
OSHC (Occupational Safety and Health Council). (2013). Study on the effectiveness of
personal cooling equipment for protecting workers from heat stroke while working in
a hot environment. Hong Kong: OSHC. Retrieved from
http://www.oshc.org.hk/oshc_data/files/OSHInformation/Personal_Cooling_Equipme
nt_Study_ENG.pdf
Otte, J.W., Merrick, M.A., Ingersoll, C.D., Cordova, M.L. (2002). Subcutaneous adipose
tissue thickness alters cooling time during cryotherapy. Archives of Physical
Medicine and Rehabilitation, 83(11), 1501-1505.
Pandolf, K.B. (1995). An Updated Review, Microclimate Cooling of Protective Overgarments
in the Heat: US Army Research Institute of Environmental Medicine.
Parsons, K. (2006). Heat stress standard ISO 7243 and its global application. Industrial
Health, 44(3), 368-379.
236│Page
Parsons, K. (2014). Human thermal environments: the effects of hot, moderate, and cold
environments on human health, comfort, and performance (third ed.): CRC Press.
Pimental, N.A., Cosimini, H.M., Sawka, M.N., Wenger, C.B. (1987). Effectiveness of an
air-cooled vest using selected air temperature and humidity combinations. Aviation
Space and Environmental Medicine, 58(2), 119-124.
Portney, L.G., Watkins, M.P. (2015). Foundations of clinical research: applications to
practice: FA Davis.
Preez, M. (2004). African development review: The discounting rate for public sector
conservation projects in South Africa, 16(3), 456–471, Blackwell, Oxford, UK.
Price, M.J. (2006). Thermoregulation during exercise in individuals with spinal cord injuries.
Sports Medicine, 36(10), 863-879.
Price, M.J., Boyd, C., Goosey-Tolfrey, V.L. (2009). The physiological effects of pre-event
and midevent cooling during intermittent running in the heat in elite female soccer
players. Applied Physiology, Nutrition & Metabolism, 34(5), 942-949.
Rahman, M.M. and Kumaraswamy, M.M. (2008). Relational contracting and teambuilding:
Assessing potential contractual and noncontractual incentives. Journal of
Management in Engineering, 24 (1), 48-63.
Rappaport, S.M., Goldberg, M., Susi, P., Herrick, R.F. (2003). Excessive exposure to silica in
the US construction industry. Annals of Occupational Hygiene, 47(2), 111-122.
Reese, C. D., & Eidson, J. V. (2006). Handbook of OSHA construction safety and health.
CRC Press.
237│Page
Reinertsen, R.E., Faerevik, H., Holbo, K., Nesbakken, R., Reitan, J., Royset, A., Le Thi, M.S.
(2008). Optimizing the performance of phase-change materials in personal protective
clothing systems. International Journal of Occupational Safety and Ergonomics,
14(1), 43-53.
Rowlinson, S., Jia, Y.A. (2014). Application of the predicted heat strain model in
development of localized, threshold-based heat stress management guidelines for the
construction industry. Annals of Occupational Hygiene, 58(3), 326-339.
Rowlinson, S., YunyanJia, A., Li, B., ChuanjingJu, C. (2014). Management of climatic heat
stress risk in construction: a review of practices, methodologies, and future research.
Accident Analysis & Prevention, 66, 187-198.
Rowlinson, S., Jia, Y.A. (2015). Construction accident causality: An institutional analysis of
heat illness incidents on site. Safety Science, 78, 179-189.
Sawka, M.N., Pandolf, K.B. (1990). Effects of body water loss on physiological function and
exercise performance. Perspectives in exercise science and sports medicine, 3, 1-38.
Sawka, M.N., Young, A.J., Latzka, W.A., Neufer, P.D., Quigley, M.D., Pandolf, K.B. (1992).
Human tolerance to heat strain during exercise: influence of hydration. Journal of
Applied Physiology, 73(1), 368-375.
Schlader, Z.J., Simmons, S.E., Stannard, S.R., Mündel, T. (2011). Skin temperature as a
thermal controller of exercise intensity. European Journal of Applied Physiology,
111(8), 1631-1639.
238│Page
Selkirk, G.A., McLellan, T.M., Wong, J. (2004). Active versus passive cooling during work
in warm environments while wearing firefighting protective clothing. Journal of
Occupational and Environmental Hygiene, 1(8), 521-531.
Semenza, J.C., Rubin, C.H., Falter, K.H., Selanikio, J.D., Flanders, W.D., Howe, H.L.,
Wilhelm, J.L. (1996). Heat-related deaths during the July 1995 heat wave in Chicago.
New England Journal of Medicine, 335(2), 84-90.
Shannon, H.S., Robson, L.S., Guastello, S.J. (1999). Methodological criteria for evaluating
occupational safety intervention research. Safety Science, 31(2), 161-179.
Shim, H., McCullough, E., Jones, B. (2001). Using phase change materials in clothing. Textile
Research Journal, 71(6), 495-502.
Shvartz, E. (1970). Effect of a cooling hood on physiological responses to work in a hot
environment. Journal of Applied Physiology, 29,36–39.
Shvartz, E. (1972). Efficiency and effectiveness of different water cooled suits–A review.
Aerospace Medicine, 43, 488–491.
Shvartz, E., Aldjem, M., Ben-Mordechai, J.,Shapiro, Y. (1974). Objective approach to a
design of a whole-body, water-cooled suit. Aerospace Medicine, 45,711–715.
Song, W., Wang, F. (2016). The hybrid personal cooling system (PCS) could effectively
reduce the heat strain while exercising in a hot and moderate humid environment.
Ergonomics, 59(8), 1009-1018.
Speckman, K.L., Allan, A.E., Sawka, M.N., Young, A.J., Muza, S.R., Pandolf, K.B. (1988).
Perspectives in microclimate cooling involving protective clothing in hot
environments. International Journal of Industrial Ergonomics, 3(2), 121-147.
239│Page
Sunindijo, R., Zou, P. (2012). Political skill for developing construction safety climate.
Journal of Construction Engineering and Management, 138 (5), 605–612.
Teunissen, L.P.J., Wang, L.-C., Chou, S.-N., Huang, C.-H., Jou, G.-T., Daanen, H.A.M.
(2014). Evaluation of two cooling systems under a firefighter coverall. Applied
Ergonomics, 45(6), 1433-1438.
Tikuisis, P., Mclellan, T.M., Selkirk, G. (2002). Perceptual versus physiological heat strain
during exercise-heat stress. Medicine & Science in Sports & Exercise, 34(9),
1454-1461.
Umbach, K.H. (1988). Environmental Ergonomics, Mekjavic, I.B., Banister, E.W. and
Morrison, J.B. (eds), Taylor & Francis, London.
US Department of Labour. (2010). Heat illness Prevention Training Guide. Occupational
Safety and Health Administration. Retrieved from
https://www.osha.gov/SLTC/heatillness/osha_heattraining_guide_0411.pdf.
Vallerand, A.L., Michas, R.D., Frim, J., Ackles, K.N. (1991). Heat balance of subjects
wearing protective clothing with a liquid- or air-cooled vest. Aviation Space and
Environmental Medicine, 62(5), 383-391.
Vedavarz, A., Kumar, S., & Hussain, M. I. (2007). HVAC: handbook of heating, ventilation
and air conditioning for design and implementation. Industrial Press. Assessed on
https://ipfs.io/ipfs/QmXoypizjW3WknFiJnKLwHCnL72vedxjQkDDP1mXWo6uco/
wiki/Ventilation_(architecture).html#cite_note-2
240│Page
Wang, F., Kuklane, K., Gao, C., Holmér, I. (2012). Effect of temperature difference between
manikin and wet fabric skin surfaces on clothing evaporative resistance: How much
error is there? International Journal of Biometeorology, 56(1), 177-182.
Wang, F., Gao, C., Kuklane, K., Holmér, I. (2013). Effects of various protective clothing and
thermal environments on heat strain of unacclimated men: The PHS (Predicted Heat
strain) model revisited. Industrial Health, 51(3), 266-274.
Wang, F.M., Gao, C.S., Kuklane, K., Holmér, I. (2011). Determination of clothing
evaporative resistance on a sweating thermal manikin in an isothermal condition:
Heat loss method or mass loss method? Annals of Occupational Hygiene, 55(7),
775-783.
Wang, F.M, Del Ferraro, S., Molinaro, V., Morrissey, M., Rossi, R. (2014). Assessment of
body mapping sportswear using a manikin operated in constant temperature mode and
thermoregulatory model control mode. International Journal of Biometeorology,
58(7), 1673-1682.
Watson, J. (2001). How to Determine a Sample Size: Tipsheet #60, University Park, PA:
Penn State Cooperative Extension.
Weber, S. (1999). Air cooling garment for medical personnel: Google Patents.
Webster, J., Holland, E.J., Sleivert, G., Laing, R.M., Niven, B.E. (2005). A light-weight
cooling vest enhances performance of athletes in the heat. Ergonomics, 48(7),
821-837.
White, A., Wilson, T., Davis, S., Petajan, J. (2000). Effect of precooling on physical
performance in multiple sclerosis. Multiple sclerosis, 6(3), 176-180.
241│Page
Wilkinson, D.M., Carter, J.M., Richmond, V.L., Blacker, S.D., Rayson, M.P. (2008). The
effect of cool water ingestion on gastrointestinal pill temperature. Medicine &
Science in Sports & Exercise, 40(3), 523-528.
Wolfe, R.M. (2003). Death in heat waves: Beware of fans. BMJ: British Medical Journal,
327(7425), 1228.
Wong, D.P.L., Chung, J.W.Y., Chan, A.P.C., Wong, F.K.W., Yi, W. (2014). Comparing the
physiological and perceptual responses of construction workers (bar benders and bar
fixers) in a hot environment. Applied ergonomics, 45(6), 1705-1711.
Xu, X., Gonzalez, J. (2011). Determination of the cooling capacity for body ventilation
system. European Journal of Applied Physiology, 111(12), 3155-3160.
Yang, Y., Chan, A.P.C. (2017). Heat stress intervention research in construction: gaps and
recommendations. Industrial Health, 55(3), 201-209.
Yazdanirad, S., Dehghan, H. (2016). Designing of the cooling vest from paraffin compounds
and evaluation of its impact under laboratory hot conditions. International Journal of
Preventive Medicine, 7.
Yi, W., Chan, A.P.C. (2013). Critical review of labor productivity research in construction
journals. Journal of Management in Engineering, 30(2), 214-225.
Yi, W., Chan, A.P.C. (2014a). Which environmental indicator is better able to predict the
effects of heat stress on construction workers? Journal of Management in
Engineering. doi: 10.1061/(ASCE)ME.1943-5479.0000284
242│Page
Yi, W., Chan, A.P.C. (2014b). Optimal work pattern for construction workers in hot weather:
a case study in Hong Kong. Journal of Computing in Civil Engineering, 29(5),
05014009.
Yi, W., Chan, A.P.C. (2014c). Alternative approach for conducting construction management
research: quasi-experimentation. Journal of Management in Engineering, 30(6),
05014012.
Yi, W., Chan, A.P.C., Wang, X., Wang, J. (2016). Development of an early-warning system
for site work in hot and humid environments: A case study. Automation in
Construction, 62, 101-113.
Yi, W., Chan, A.P.C., Wong, F.K., Wong, D.P. (2017a). Effectiveness of a newly designed
construction uniform for heat strain attenuation in a hot and humid environment.
Applied Ergonomics, 58, 555-565.
Yi, W., Zhao, Y., Chan, A.P.C. (2017b). Evaluation of the ventilation unit for personal
cooling system (PCS). International Journal of Industrial Ergonomics, 58, 62-68.
Yi, W., Zhao, Y., Chan, A.P.C. (2017c). Evaluating the effectiveness of cooling vest in a hot
and humid environment. Annals of Work Exposures and Health, 61(4), 481-494.
Yi, W., Zhao, Y., Chan, A.P.C., Lam, E.W. (2017d). Optimal cooling intervention for
construction workers in a hot and humid environment. Building and Environment,
118, 91-100.
Zhang, Y., Bishop, P.A., Green, J.M., Richardson, M.T., Schumacker, R.E. (2010).
Evaluation of a carbon dioxide personal cooling device for workers in hot
environments. Journal of Occupational and Environmental Hygiene, 7(7), 389-396.
243│Page
Zhao, M., Gao, C., Wang, F., Kuklane, K., Holmér, I., Li, J. (2013a). The torso cooling of
vests incorporated with phase change materials: A sweat evaporation perspective.
Textile Research Journal, 83(4), 418-425.
Zhao, M., Gao, C., Wang, F., Kuklane, K., Holmer, I., Li, J. (2013b). A study on local cooling
of garments with ventilation fans and openings placed at different torso sites.
International Journal of Industrial Ergonomics, 43(3), 232-237.
Zhao, Y., Hu, G., Tian, Y., Shi, H., Yang, C. (2012). Research on measuring energy
efficiency values for electric fans. Journal of Green Science and Technology,
290-291.
Zhao, Y., Yi, W., Chan, A.P.C., Chan, D.W.M. (2017a). Comparison of heat strain recovery
in different anti-heat stress clothing ensembles after work to exhaustion. Journal of
Thermal Biology, 69, 311-318.
Zhao, Y., Yi, W., Chan, A.P.C., Wong, F.K.W., Yam, M.C.H. (2017b). Evaluating the
physiological and perceptual responses of wearing a newly designed cooling vest for
construction workers. Annals of Work Exposures and Health, 61(7), 883-901.
Zhou, Z., Goh, Y. M., Li, Q. (2015). Overview and analysis of safety management studies in
the construction industry. Safety Science, 72, 337-350.
Related Documents