Compiled and rearranged by Sajit Chandra Shakya 9702/4 M/J/02 1 (a) (i) Define simple harmonic motion. ................................................................................................................................... ................................................................................................................................... ................................................................................................................................... (ii) On the axes of Fig. 4.1, sketch the variation with displacement x of the acceleration a of a particle undergoing simple harmonic motion. [4] Fig. 4.1 (b) A strip of metal is clamped to the edge of a bench and a mass is hung from its free end as shown in Fig. 4.2. Fig. 4.2 clamp metal strip mass 0 a x 0 For Examiner’s Use

9702 p4 Oscillations_all_completed_upto_on_2014
Jul 27, 2015
Welcome message from author
This document is posted to help you gain knowledge. Please leave a comment to let me know what you think about it! Share it to your friends and learn new things together.
Transcript
Compile
d and rearr
anged by S
ajit C
handra Shakya
9702/4 M/J/02
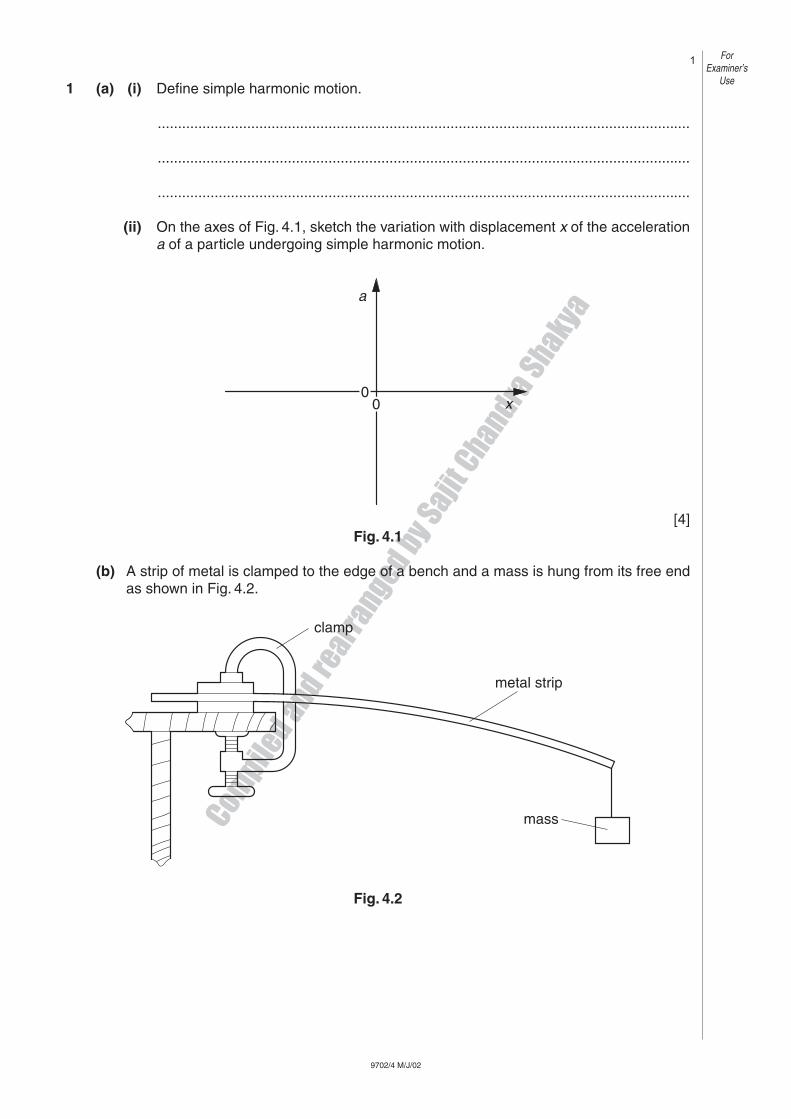
1 (a) (i) Define simple harmonic motion.
...................................................................................................................................
...................................................................................................................................
...................................................................................................................................
(ii) On the axes of Fig. 4.1, sketch the variation with displacement x of the accelerationa of a particle undergoing simple harmonic motion.
[4]Fig. 4.1
(b) A strip of metal is clamped to the edge of a bench and a mass is hung from its free endas shown in Fig. 4.2.
Fig. 4.2
clamp
metal strip
mass
0
a
x0
ForExaminer’s
Use
Compile
d and rearr
anged by S
ajit C
handra Shakya
9702/4 M/J/02
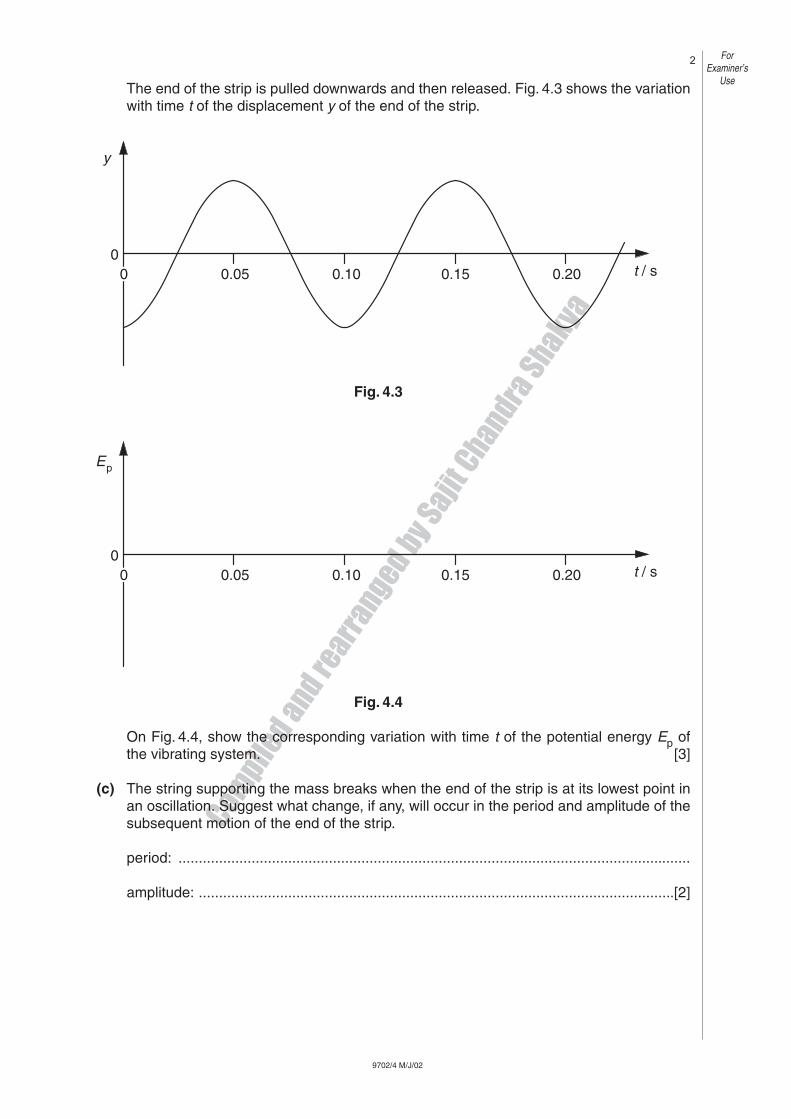
The end of the strip is pulled downwards and then released. Fig. 4.3 shows the variationwith time t of the displacement y of the end of the strip.
Fig. 4.4
On Fig. 4.4, show the corresponding variation with time t of the potential energy Ep ofthe vibrating system. [3]
(c) The string supporting the mass breaks when the end of the strip is at its lowest point inan oscillation. Suggest what change, if any, will occur in the period and amplitude of thesubsequent motion of the end of the strip.
period: ..............................................................................................................................
amplitude: .....................................................................................................................[2]
Ep
0.050
0.10 0.15 0.20 t / s
y
0
0.050
0.10 0.15 0.20 t / s0
ForExaminer’s
Use
Fig. 4.3

Compile
d and rearr
anged by S
ajit C
handra Shakya
Compile
d and rearr
anged by S
ajit C
handra Shakya
Compile
d and rearr
anged by S
ajit C
handra Shakya
9702/04/M/J/04
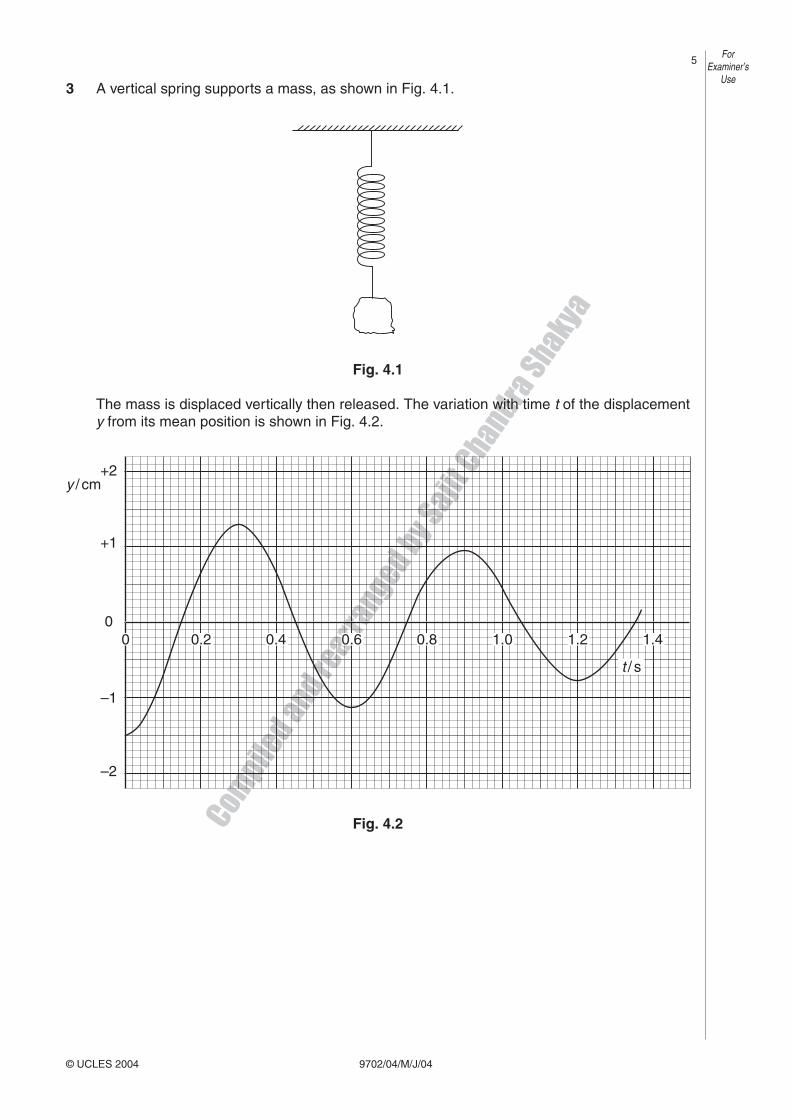
3 A vertical spring supports a mass, as shown in Fig. 4.1.
Fig. 4.1
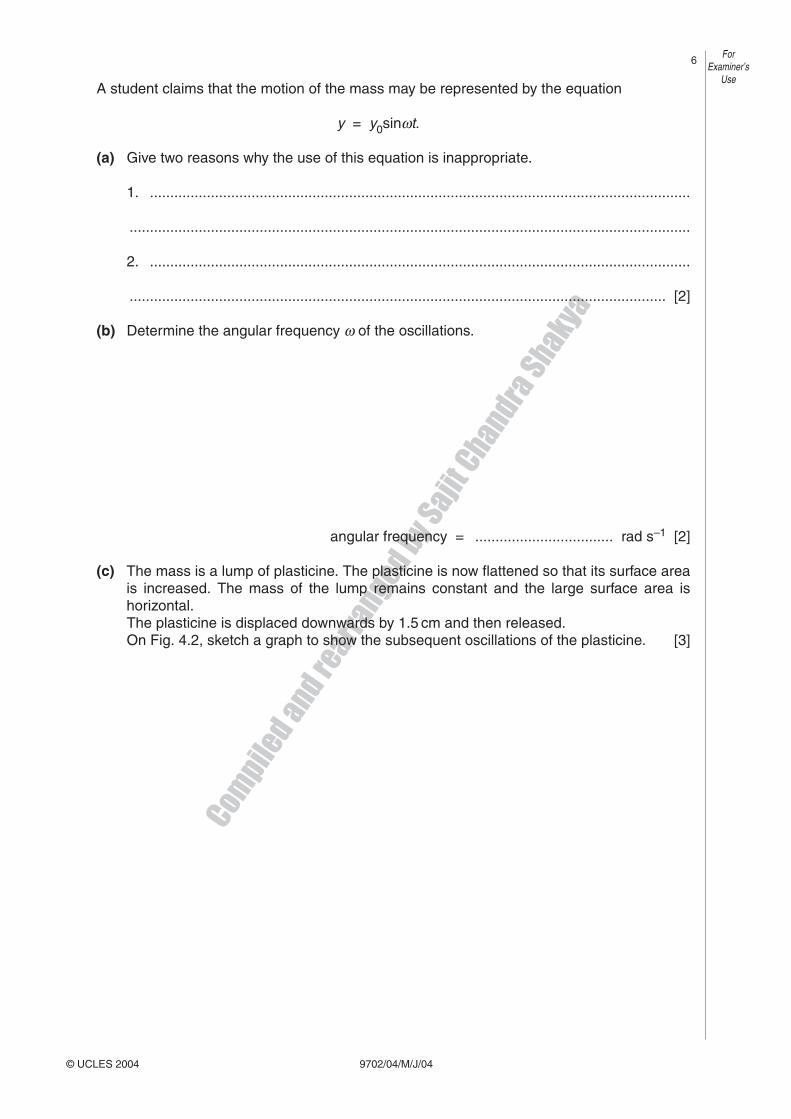
The mass is displaced vertically then released. The variation with time t of the displacementy from its mean position is shown in Fig. 4.2.
Fig. 4.2
ForExaminer’s
Use
© UCLES 2004
y / cm+2
0
–1
–2
+1
1.41.21.00.80.60.40.20
t / s
Compile
d and rearr
anged by S
ajit C
handra Shakya
9702/04/M/J/04
A student claims that the motion of the mass may be represented by the equation
y = y0sinωt.
(a) Give two reasons why the use of this equation is inappropriate.
1. .....................................................................................................................................
..........................................................................................................................................
2. .....................................................................................................................................
.................................................................................................................................... [2]
(b) Determine the angular frequency ω of the oscillations.
angular frequency = .................................. rad s–1 [2]
(c) The mass is a lump of plasticine. The plasticine is now flattened so that its surface areais increased. The mass of the lump remains constant and the large surface area ishorizontal.The plasticine is displaced downwards by 1.5 cm and then released.On Fig. 4.2, sketch a graph to show the subsequent oscillations of the plasticine. [3]
ForExaminer’s
Use
© UCLES 2004
Compile
d and rearr
anged by S
ajit C
handra Shakya
9702/04/M/J/05
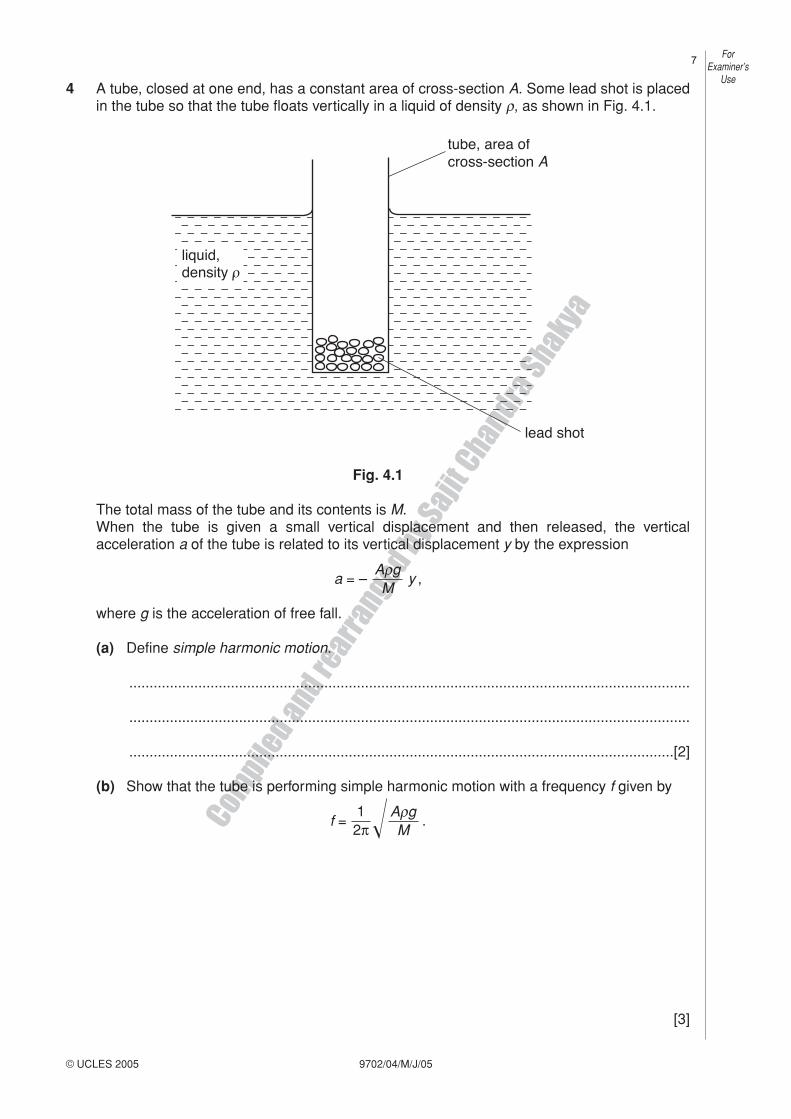
4 A tube, closed at one end, has a constant area of cross-section A. Some lead shot is placedin the tube so that the tube floats vertically in a liquid of density ρ, as shown in Fig. 4.1.
Fig. 4.1
The total mass of the tube and its contents is M.When the tube is given a small vertical displacement and then released, the verticalacceleration a of the tube is related to its vertical displacement y by the expression
a = – y ,
where g is the acceleration of free fall.
(a) Define simple harmonic motion.
..........................................................................................................................................
..........................................................................................................................................
......................................................................................................................................[2]
(b) Show that the tube is performing simple harmonic motion with a frequency f given by
f = � .
[3]
AρgM
12π
AρgM
tube, area ofcross-section A
lead shot
liquid,density
ForExaminer’s
Use
© UCLES 2005
Compile
d and rearr
anged by S
ajit C
handra Shakya
9702/04/M/J/05
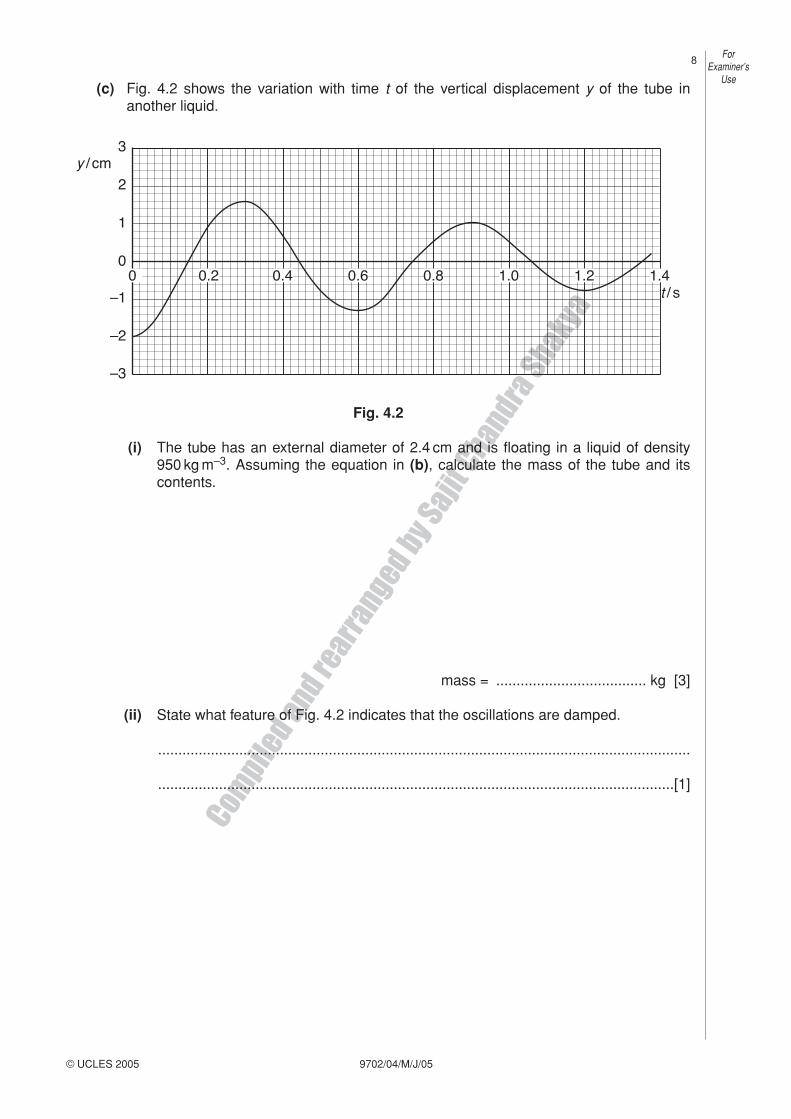
(c) Fig. 4.2 shows the variation with time t of the vertical displacement y of the tube inanother liquid.
Fig. 4.2
(i) The tube has an external diameter of 2.4 cm and is floating in a liquid of density950 kg m–3. Assuming the equation in (b), calculate the mass of the tube and itscontents.
mass = ..................................... kg [3]
(ii) State what feature of Fig. 4.2 indicates that the oscillations are damped.
...................................................................................................................................
...............................................................................................................................[1]
–3
–2
–1
0
1
2
3
0 0.40.2 0.6 0.8 1.0 1.2 1.4
y / cm
t / s
ForExaminer’s
Use
© UCLES 2005
Compile
d and rearr
anged by S
ajit C
handra Shakya
9702/04/M/J/06
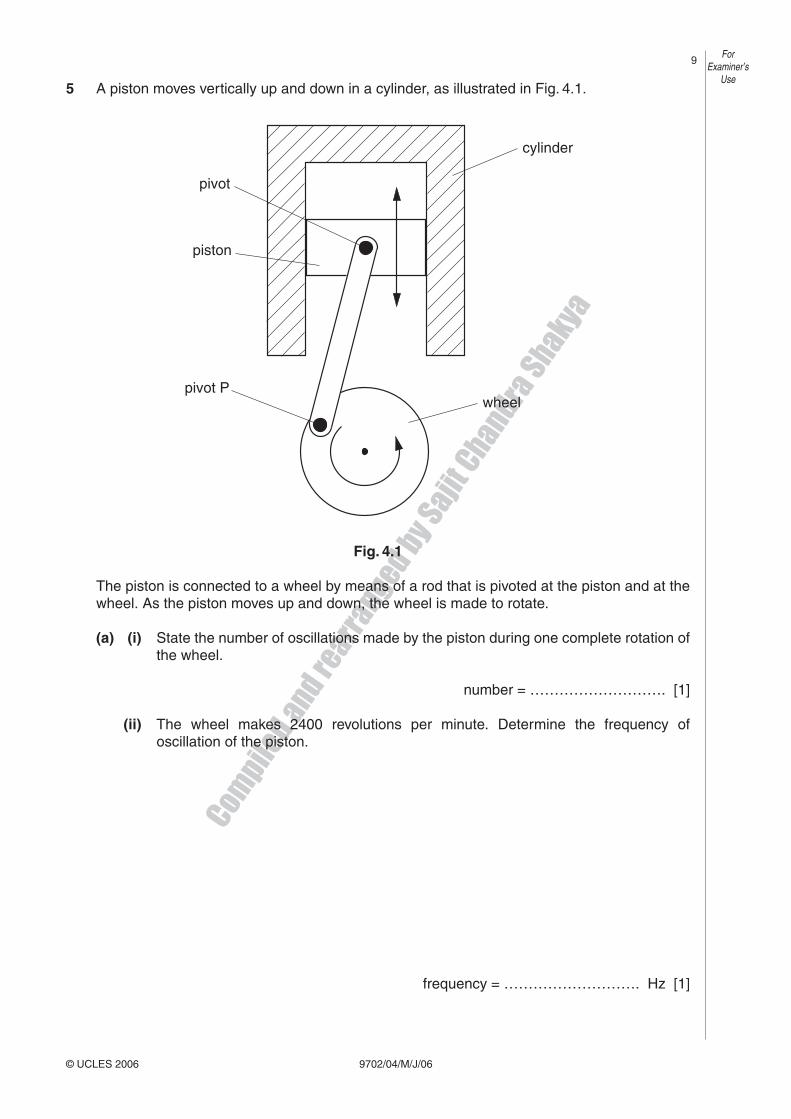
5 A piston moves vertically up and down in a cylinder, as illustrated in Fig. 4.1.
Fig. 4.1
The piston is connected to a wheel by means of a rod that is pivoted at the piston and at thewheel. As the piston moves up and down, the wheel is made to rotate.
(a) (i) State the number of oscillations made by the piston during one complete rotation ofthe wheel.
number = ………………………. [1]
(ii) The wheel makes 2400 revolutions per minute. Determine the frequency ofoscillation of the piston.
frequency = ………………………. Hz [1]
ForExaminer’s
Use
© UCLES 2006
cylinder
wheel
pivot
piston
pivot P
Compile
d and rearr
anged by S
ajit C
handra Shakya
9702/04/M/J/06
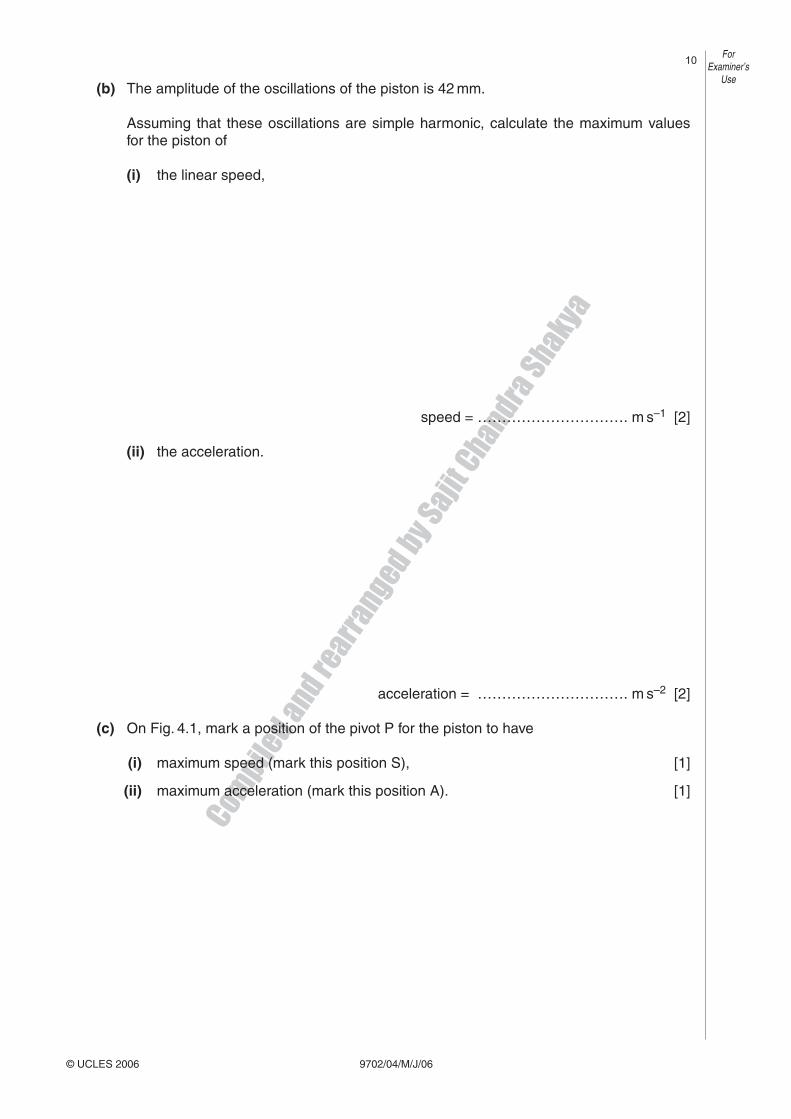
(b) The amplitude of the oscillations of the piston is 42 mm.
Assuming that these oscillations are simple harmonic, calculate the maximum valuesfor the piston of
(i) the linear speed,
speed = …………………………. m s–1 [2]
(ii) the acceleration.
acceleration = …………………………. m s–2 [2]
(c) On Fig. 4.1, mark a position of the pivot P for the piston to have
(i) maximum speed (mark this position S), [1]
(ii) maximum acceleration (mark this position A). [1]
ForExaminer’s
Use
© UCLES 2006

Compile
d and rearr
anged by S
ajit C
handra Shakya
9702/4/M/J03
6 An aluminium sheet is suspended from an oscillator by means of a spring, as illustrated inFig. 3.1.
Fig. 3.1
An electromagnet is placed a short distance from the centre of the aluminium sheet.
The electromagnet is switched off and the frequency f of oscillation of the oscillator isgradually increased from a low value. The variation with frequency f of the amplitude a ofvibration of the sheet is shown in Fig. 3.2.
Fig. 3.2
a
00.9f 0 f 0 f
oscillator
spring
aluminiumsheet
electromagnet
ForExaminer’s
Use
Compile
d and rearr
anged by S
ajit C
handra Shakya
9702/4/M/J03
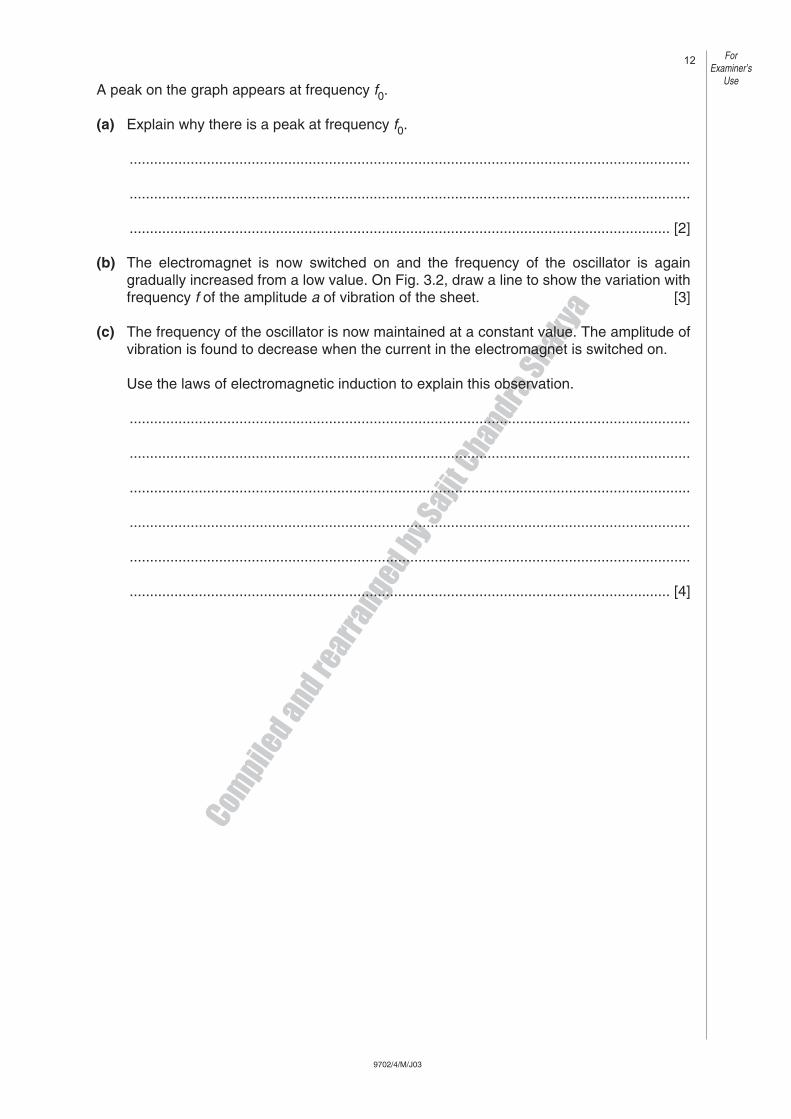
A peak on the graph appears at frequency f0.
(a) Explain why there is a peak at frequency f0.
..........................................................................................................................................
..........................................................................................................................................
..................................................................................................................................... [2]
(b) The electromagnet is now switched on and the frequency of the oscillator is againgradually increased from a low value. On Fig. 3.2, draw a line to show the variation withfrequency f of the amplitude a of vibration of the sheet. [3]
(c) The frequency of the oscillator is now maintained at a constant value. The amplitude ofvibration is found to decrease when the current in the electromagnet is switched on.
Use the laws of electromagnetic induction to explain this observation.
..........................................................................................................................................
..........................................................................................................................................
..........................................................................................................................................
..........................................................................................................................................
..........................................................................................................................................
..................................................................................................................................... [4]
ForExaminer’s
Use
Compile
d and rearr
anged by S
ajit C
handra Shakya
9702/04/M/J/08
ForExaminer’s
Use
© UCLES 2008
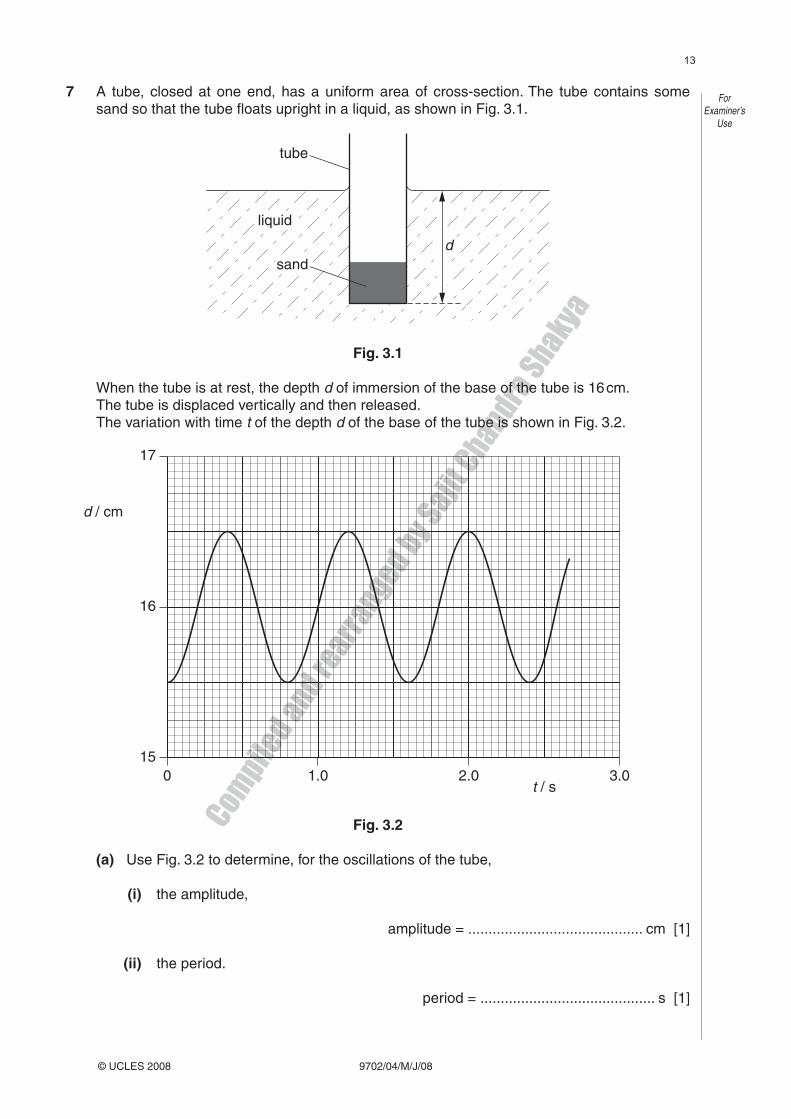
7 A tube, closed at one end, has a uniform area of cross-section. The tube contains some sand so that the tube floats upright in a liquid, as shown in Fig. 3.1.
tube
dsand
liquid
Fig. 3.1
When the tube is at rest, the depth d of immersion of the base of the tube is 16 cm. The tube is displaced vertically and then released. The variation with time t of the depth d of the base of the tube is shown in Fig. 3.2.
15
16
17
0 1.0 2.0 3.0
d / cm
t / s
Fig. 3.2
(a) Use Fig. 3.2 to determine, for the oscillations of the tube,
(i) the amplitude,
amplitude = ........................................... cm [1]
(ii) the period.
period = ........................................... s [1]
Compile
d and rearr
anged by S
ajit C
handra Shakya
9702/04/M/J/08
ForExaminer’s
Use
© UCLES 2008
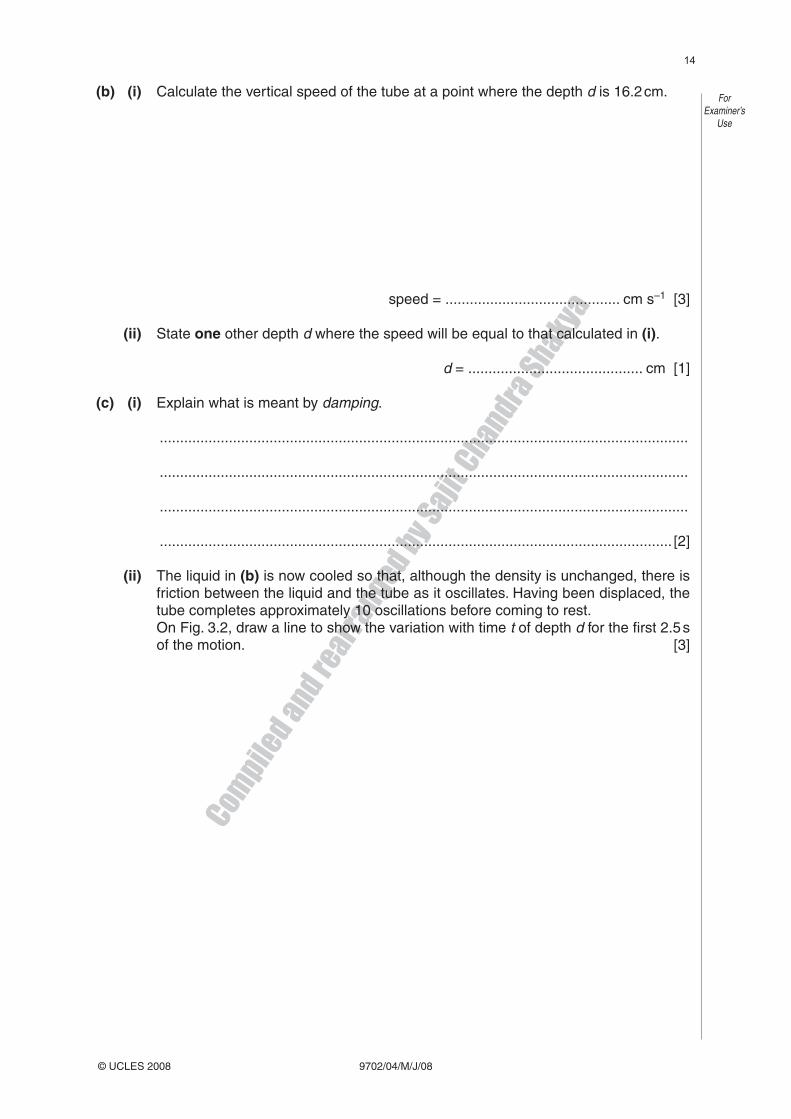
(b) (i) Calculate the vertical speed of the tube at a point where the depth d is 16.2 cm.
speed = ........................................... cm s–1 [3]
(ii) State one other depth d where the speed will be equal to that calculated in (i).
d = ........................................... cm [1]
(c) (i) Explain what is meant by damping.
..................................................................................................................................
..................................................................................................................................
..................................................................................................................................
.............................................................................................................................. [2]
(ii) The liquid in (b) is now cooled so that, although the density is unchanged, there is friction between the liquid and the tube as it oscillates. Having been displaced, the tube completes approximately 10 oscillations before coming to rest.
On Fig. 3.2, draw a line to show the variation with time t of depth d for the first 2.5 s of the motion. [3]
Compile
d and rearr
anged by S
ajit C
handra Shakya
9702/04/M/J/09© UCLES 2009
ForExaminer’s
Use
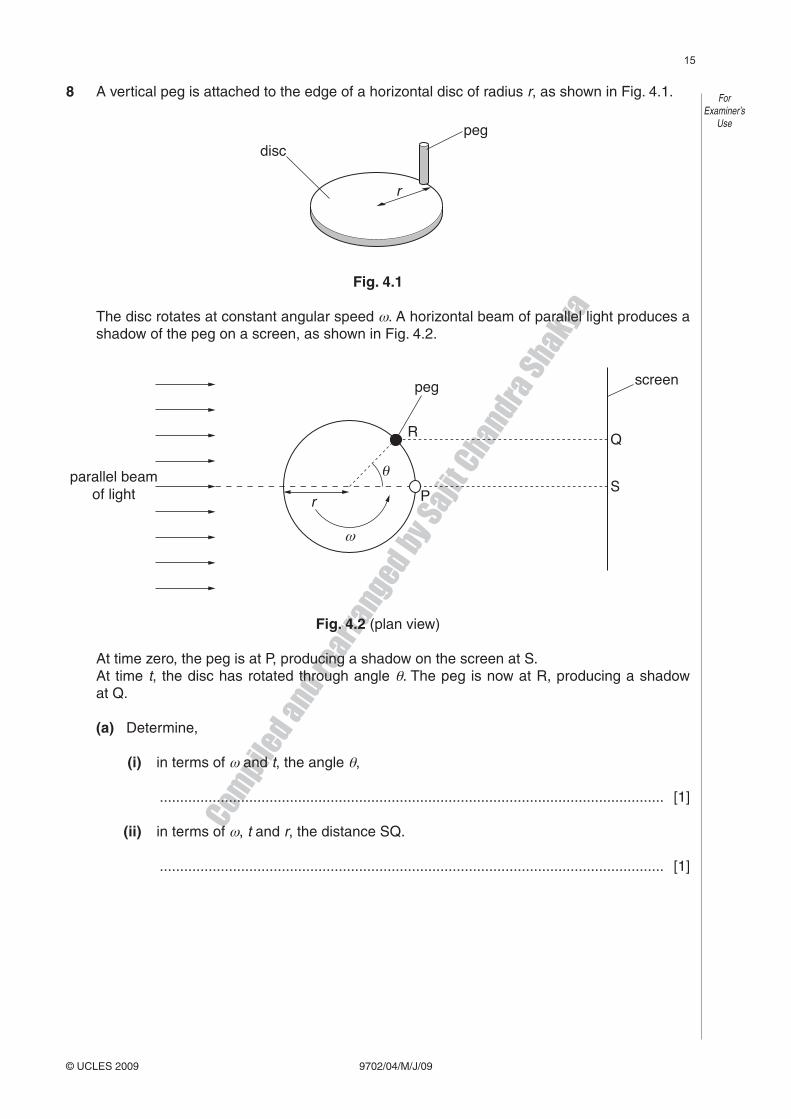
8 A vertical peg is attached to the edge of a horizontal disc of radius r, as shown in Fig. 4.1.
discpeg
r
Fig. 4.1
The disc rotates at constant angular speed . A horizontal beam of parallel light produces a shadow of the peg on a screen, as shown in Fig. 4.2.
peg
R
Pr
screen
parallel beamof light
Q
S
Fig. 4.2 (plan view)
At time zero, the peg is at P, producing a shadow on the screen at S. At time t, the disc has rotated through angle . The peg is now at R, producing a shadow
at Q.
(a) Determine,
(i) in terms of and t, the angle ,
............................................................................................................................ [1]
(ii) in terms of , t and r, the distance SQ.
............................................................................................................................ [1]

Compile
d and rearr
anged by S
ajit C
handra Shakya
9702/04/M/J/09© UCLES 2009
ForExaminer’s
Use
(b) Use your answer to (a)(ii) to show that the shadow on the screen performs simple harmonic motion.
..........................................................................................................................................
..........................................................................................................................................
.................................................................................................................................... [2]
(c) The disc has radius r of 12 cm and is rotating with angular speed of 4.7 rad s–1.
Determine, for the shadow on the screen,
(i) the frequency of oscillation,
frequency = ......................................... Hz [2]
(ii) its maximum speed.
speed = .................................... cm s–1 [2]
Compile
d and rearr
anged by S
ajit C
handra Shakya
9702/4 O/N/02
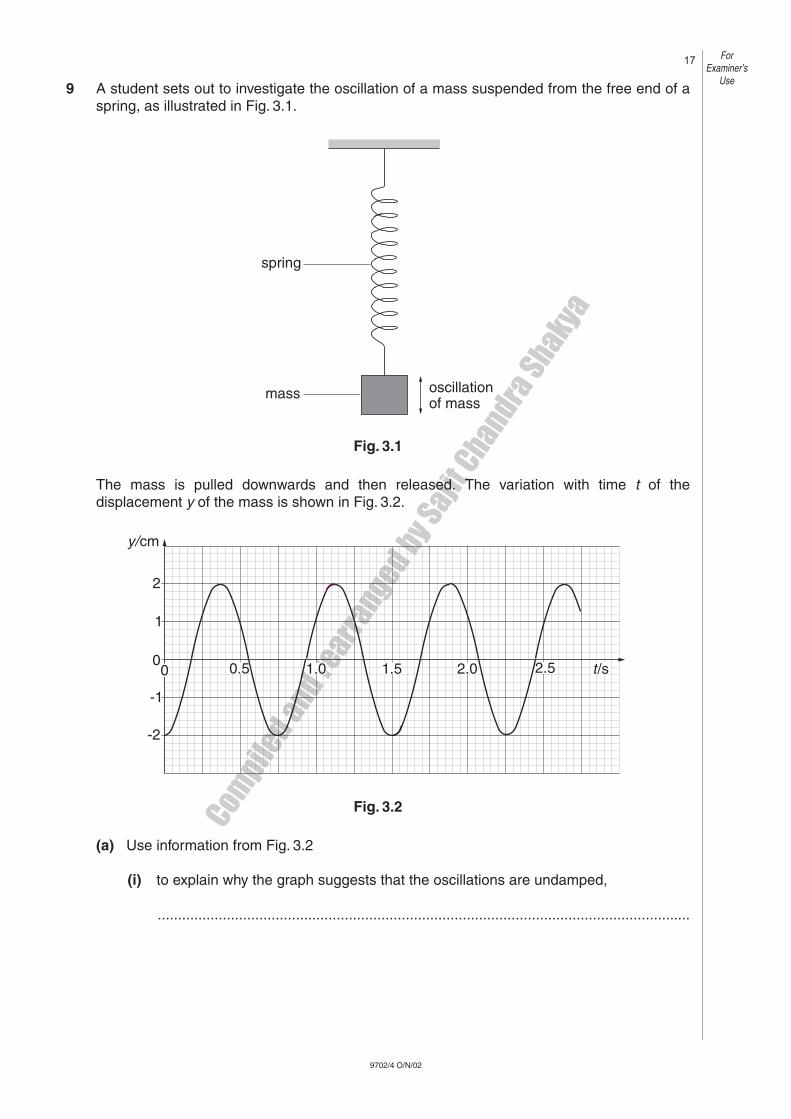
9 A student sets out to investigate the oscillation of a mass suspended from the free end of aspring, as illustrated in Fig. 3.1.
Fig. 3.1
The mass is pulled downwards and then released. The variation with time t of thedisplacement y of the mass is shown in Fig. 3.2.
Fig. 3.2
(a) Use information from Fig. 3.2
(i) to explain why the graph suggests that the oscillations are undamped,
...................................................................................................................................
2
1
-1
-2
00 0.5 1.0 1.5 2.0 2.5 t/s
y/cm
spring
mass oscillationof mass
ForExaminer’s
Use
Compile
d and rearr
anged by S
ajit C
handra Shakya
9702/4 O/N/02
(ii) to calculate the angular frequency of the oscillations,
angular frequency = ........................................ rad s–1
(iii) to determine the maximum speed of the oscillating mass.
speed = ........................................ m s–1
[6]
(b) (i) Determine the resonant frequency f0 of the mass-spring system.
f0 = ........................................ Hz
(ii) The student finds that if short impulsive forces of frequency �� f0 are impressed onthe mass-spring system, a large amplitude of oscillation is obtained. Explain thisobservation.
...................................................................................................................................
...................................................................................................................................
...................................................................................................................................[3]
ForExaminer’s
Use
Compile
d and rearr
anged by S
ajit C
handra Shakya
9702/04/O/N/04© UCLES 2004
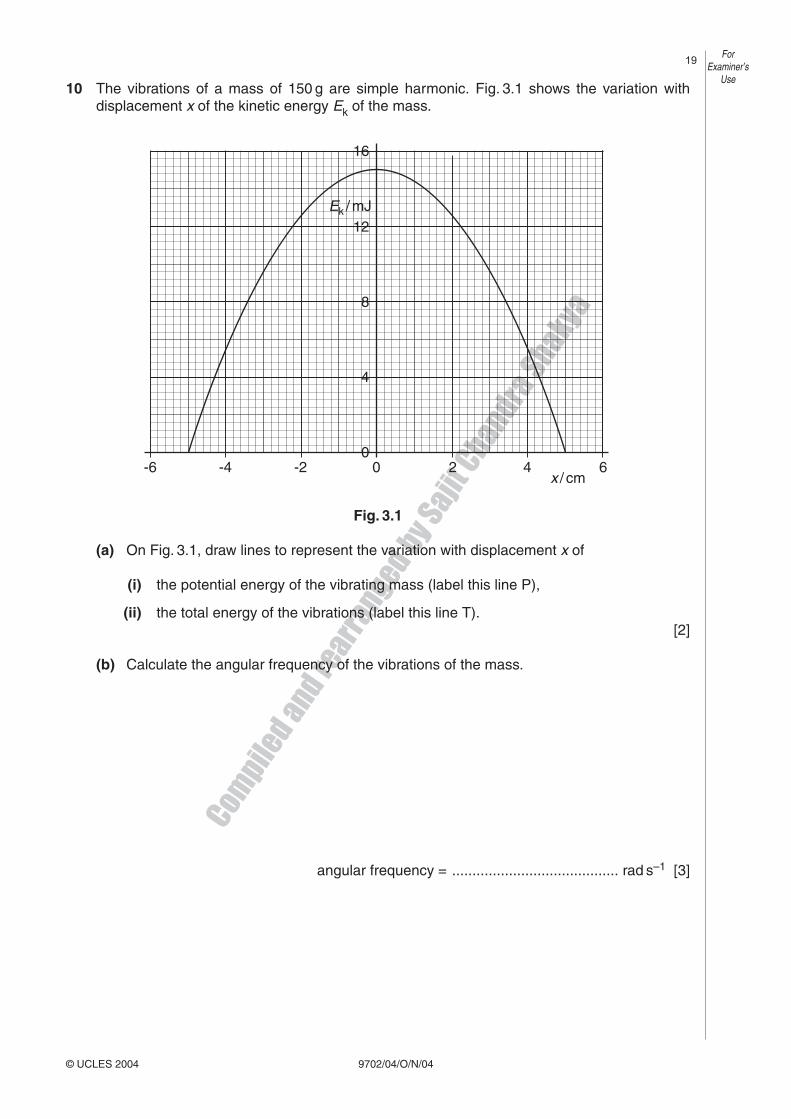
10 The vibrations of a mass of 150 g are simple harmonic. Fig. 3.1 shows the variation withdisplacement x of the kinetic energy Ek of the mass.
Fig. 3.1
(a) On Fig. 3.1, draw lines to represent the variation with displacement x of
(i) the potential energy of the vibrating mass (label this line P),
(ii) the total energy of the vibrations (label this line T).[2]
(b) Calculate the angular frequency of the vibrations of the mass.
angular frequency = ......................................... rad s–1 [3]
0-2-4-6 2 4 60
4
8
12
16
Ek / mJ
x / cm
ForExaminer’s
Use
Compile
d and rearr
anged by S
ajit C
handra Shakya
© UCLES 2004 9702/04/O/N/04
(c) The oscillations are now subject to damping.
(i) Explain what is meant by damping.
...................................................................................................................................
...................................................................................................................................
...............................................................................................................................[2]
(ii) The mass loses 20% of its vibrational energy. Use Fig. 3.1 to determine the newamplitude of oscillation. Explain your working.
amplitude = ............................................... cm [2]
ForExaminer’s
Use
Compile
d and rearr
anged by S
ajit C
handra Shakya
9702/04/O/N/05
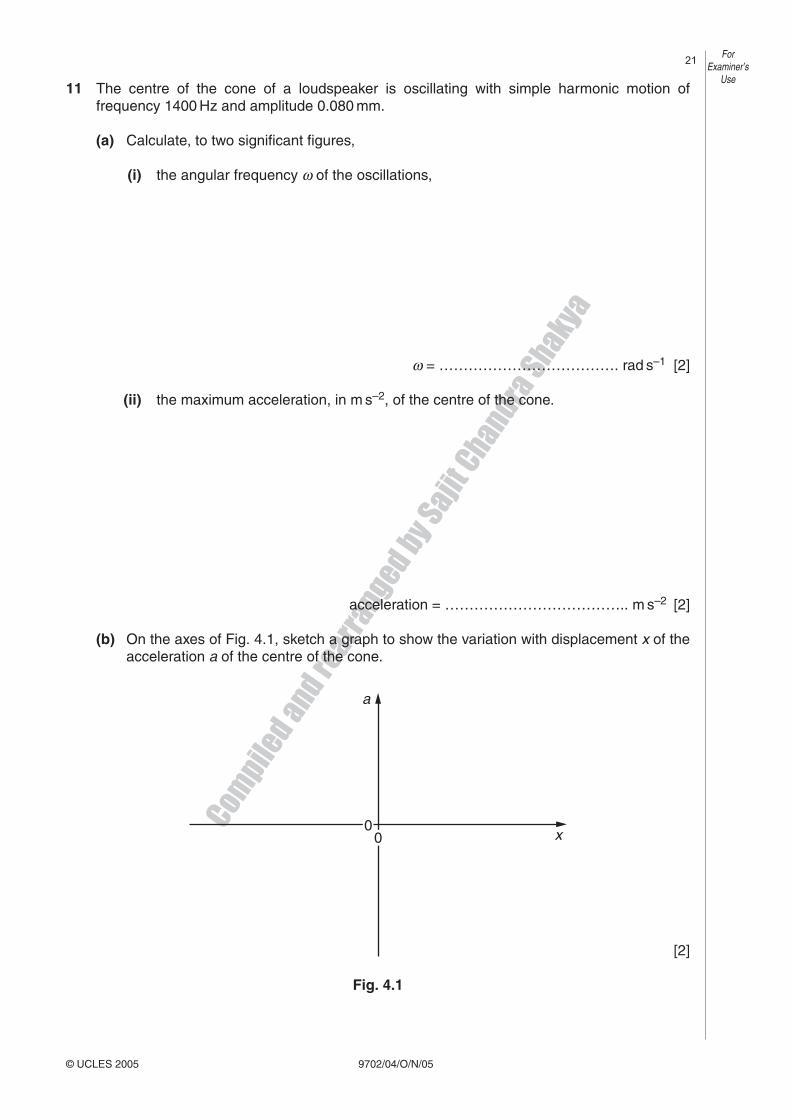
11 The centre of the cone of a loudspeaker is oscillating with simple harmonic motion offrequency 1400 Hz and amplitude 0.080 mm.
(a) Calculate, to two significant figures,
(i) the angular frequency ω of the oscillations,
ω = ………………………………. rad s–1 [2]
(ii) the maximum acceleration, in m s–2, of the centre of the cone.
acceleration = ……………………………….. m s–2 [2]
(b) On the axes of Fig. 4.1, sketch a graph to show the variation with displacement x of theacceleration a of the centre of the cone.
[2]
Fig. 4.1
ForExaminer’s
Use
© UCLES 2005
00 x
a

Compile
d and rearr
anged by S
ajit C
handra Shakya
9702/04/O/N/05
(c) (i) State the value of the displacement x at which the speed of the centre of the coneis a maximum.
x = ……………………………… mm [1]
(ii) Calculate, in m s–1, this maximum speed.
speed = ……………………………. m s–1 [2]
ForExaminer’s
Use
© UCLES 2005
Compile
d and rearr
anged by S
ajit C
handra Shakya
9702/04/O/N/06
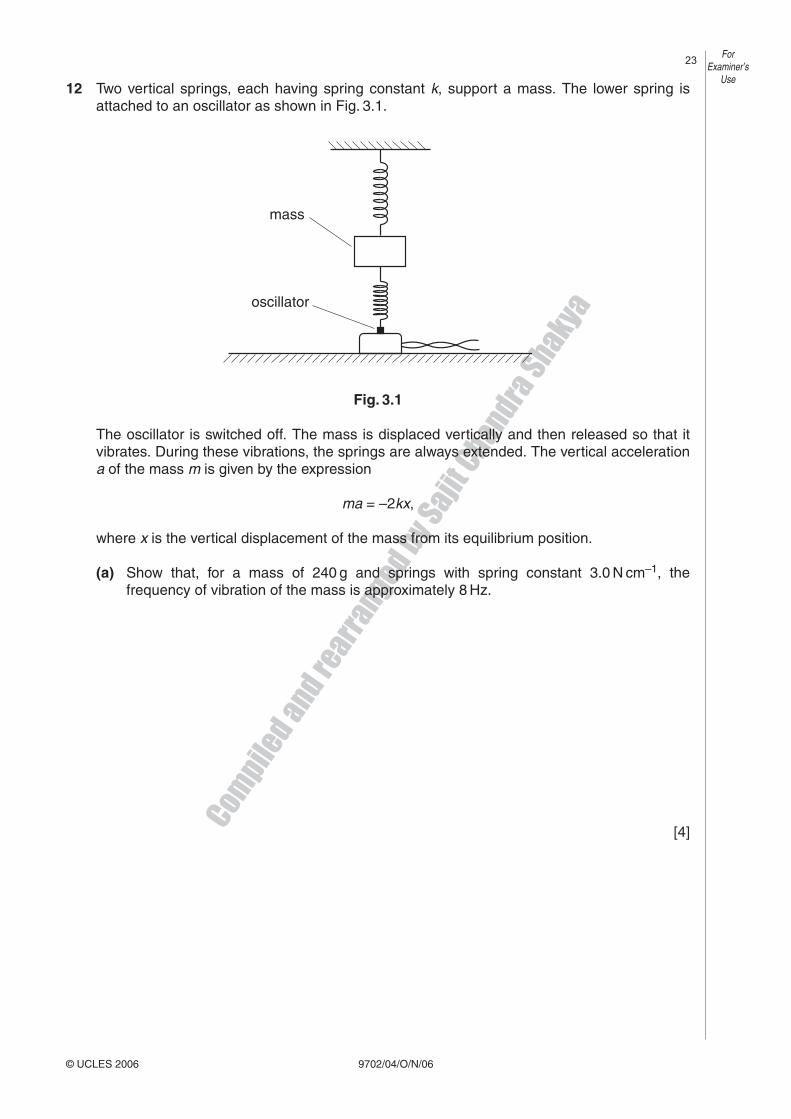
12 Two vertical springs, each having spring constant k, support a mass. The lower spring isattached to an oscillator as shown in Fig. 3.1.
Fig. 3.1
The oscillator is switched off. The mass is displaced vertically and then released so that itvibrates. During these vibrations, the springs are always extended. The vertical accelerationa of the mass m is given by the expression
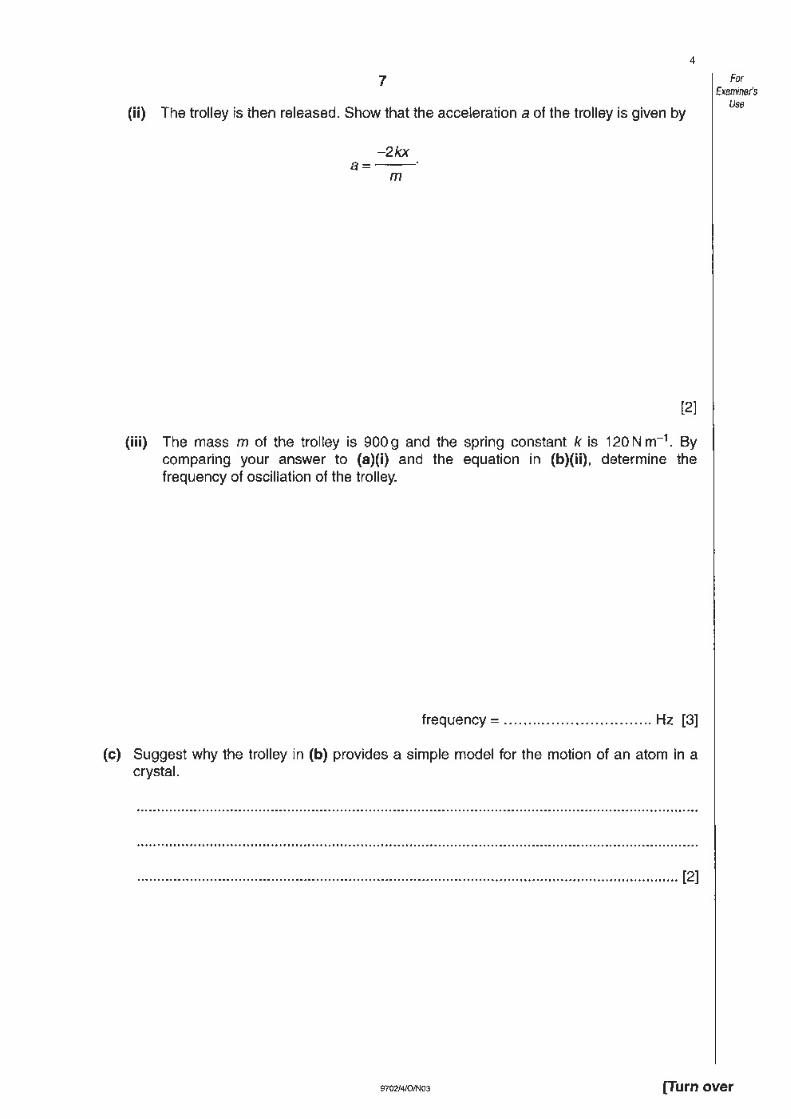
ma = –2kx,
where x is the vertical displacement of the mass from its equilibrium position.
(a) Show that, for a mass of 240 g and springs with spring constant 3.0 N cm–1, thefrequency of vibration of the mass is approximately 8 Hz.
[4]
ForExaminer’s
Use
© UCLES 2006
mass
oscillator
Compile
d and rearr
anged by S
ajit C
handra Shakya
9702/04/O/N/06
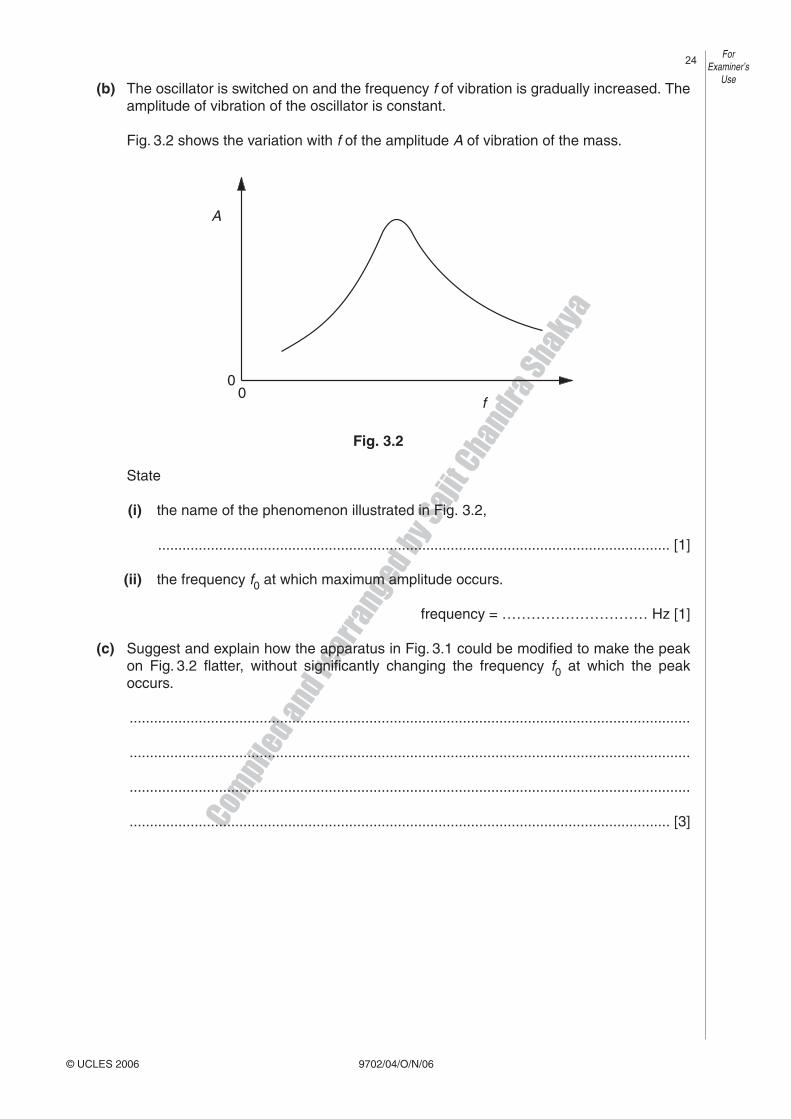
(b) The oscillator is switched on and the frequency f of vibration is gradually increased. Theamplitude of vibration of the oscillator is constant.
Fig. 3.2 shows the variation with f of the amplitude A of vibration of the mass.
Fig. 3.2
State
(i) the name of the phenomenon illustrated in Fig. 3.2,
.............................................................................................................................. [1]
(ii) the frequency f0 at which maximum amplitude occurs.
frequency = ………………………… Hz [1]
(c) Suggest and explain how the apparatus in Fig. 3.1 could be modified to make the peakon Fig. 3.2 flatter, without significantly changing the frequency f0 at which the peakoccurs.
..........................................................................................................................................
..........................................................................................................................................
..........................................................................................................................................
..................................................................................................................................... [3]
ForExaminer’s
Use
© UCLES 2006
0
A
0 f

Compile
d and rearr
anged by S
ajit C
handra Shakya
9702/04/O/N/07
ForExaminer’s
Use
© UCLES 2007
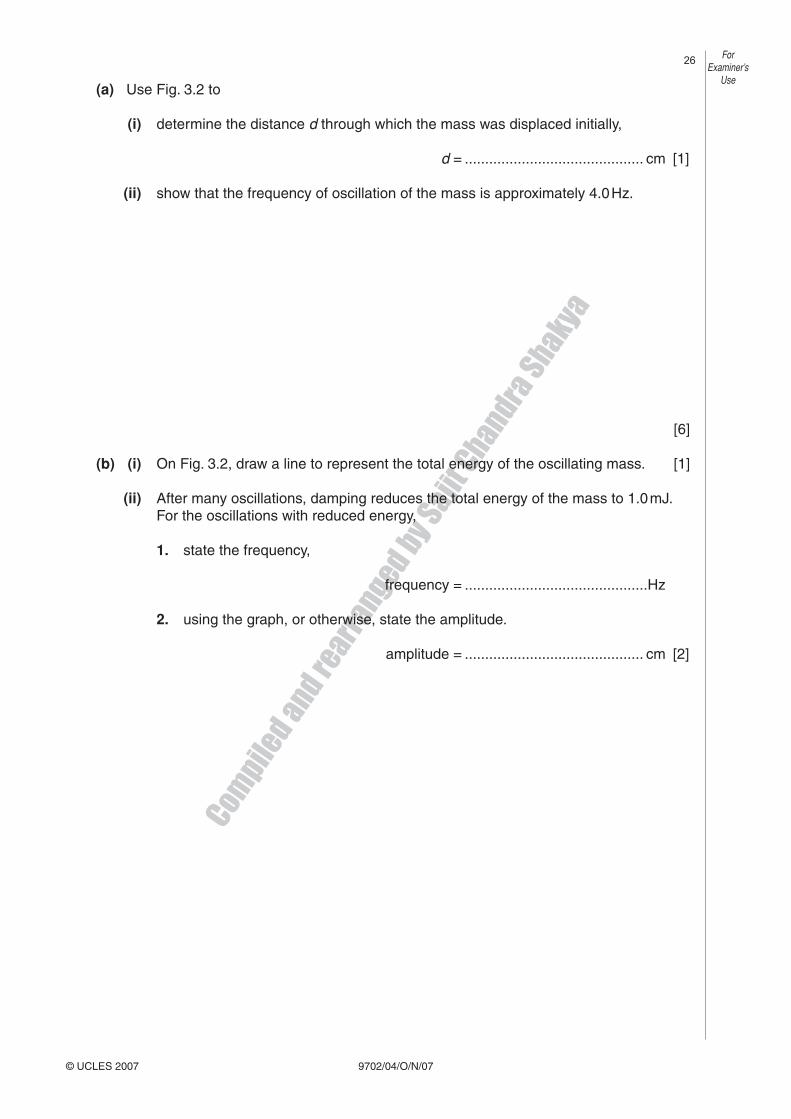
13 A spring is hung from a fixed point. A mass of 130 g is hung from the free end of the spring, as shown in Fig. 3.1.
mass 130 g
spring
Fig. 3.1
The mass is pulled downwards from its equilibrium position through a small distance d and is released. The mass undergoes simple harmonic motion.
Fig. 3.2 shows the variation with displacement x from the equilibrium position of the kinetic energy of the mass.
–1.0 –0.5 0 +0.5 x / cm
+1.0
3.0
2.0
1.0
0
kinetic energy / mJ
Fig. 3.2
Compile
d and rearr
anged by S
ajit C
handra Shakya
9702/04/O/N/07
ForExaminer’s
Use
© UCLES 2007
(a) Use Fig. 3.2 to
(i) determine the distance d through which the mass was displaced initially,
d = ............................................ cm [1]
(ii) show that the frequency of oscillation of the mass is approximately 4.0 Hz.
[6]
(b) (i) On Fig. 3.2, draw a line to represent the total energy of the oscillating mass. [1]
(ii) After many oscillations, damping reduces the total energy of the mass to 1.0 mJ. For the oscillations with reduced energy,
1. state the frequency,
frequency = .............................................Hz
2. using the graph, or otherwise, state the amplitude.
amplitude = ............................................ cm [2]
Compile
d and rearr
anged by S
ajit C
handra Shakya
9702/04/O/N/08© UCLES 2008
ForExaminer’s
Use
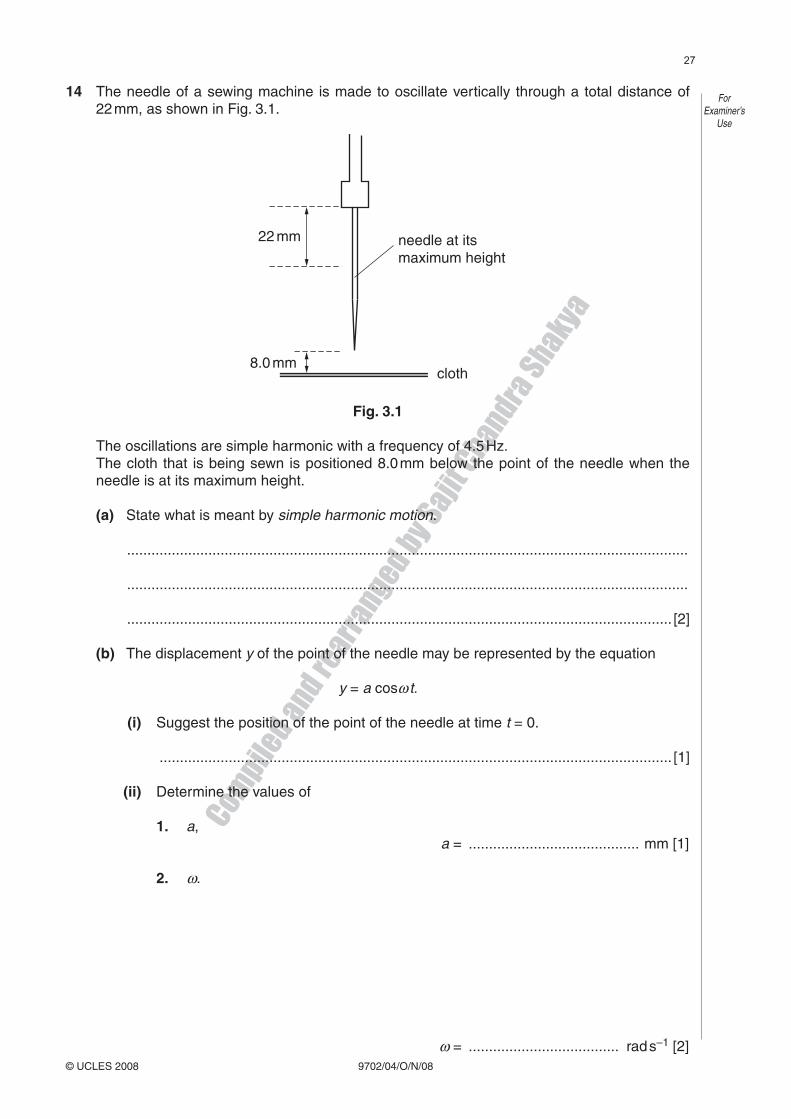
14 The needle of a sewing machine is made to oscillate vertically through a total distance of 22 mm, as shown in Fig. 3.1.
needle at its maximum height
22 mm
8.0 mmcloth
Fig. 3.1
The oscillations are simple harmonic with a frequency of 4.5 Hz. The cloth that is being sewn is positioned 8.0 mm below the point of the needle when the
needle is at its maximum height.
(a) State what is meant by simple harmonic motion.
..........................................................................................................................................
..........................................................................................................................................
...................................................................................................................................... [2]
(b) The displacement y of the point of the needle may be represented by the equation
y = a cosω t.
(i) Suggest the position of the point of the needle at time t = 0.
.............................................................................................................................. [1]
(ii) Determine the values of
1. a, a = .......................................... mm [1]
2. ω.
ω = ..................................... rad s–1 [2]

Compile
d and rearr
anged by S
ajit C
handra Shakya
9702/04/O/N/08© UCLES 2008
ForExaminer’s
Use
(c) Calculate, for the point of the needle,
(i) its maximum speed,
speed = ........................................ m s–1 [2]
(ii) its speed as it moves downwards through the cloth.
speed = ........................................ m s–1 [3]
Compile
d and rearr
anged by S
ajit C
handra Shakya
9702/41/O/N/09© UCLES 2009
ForExaminer’s
Use
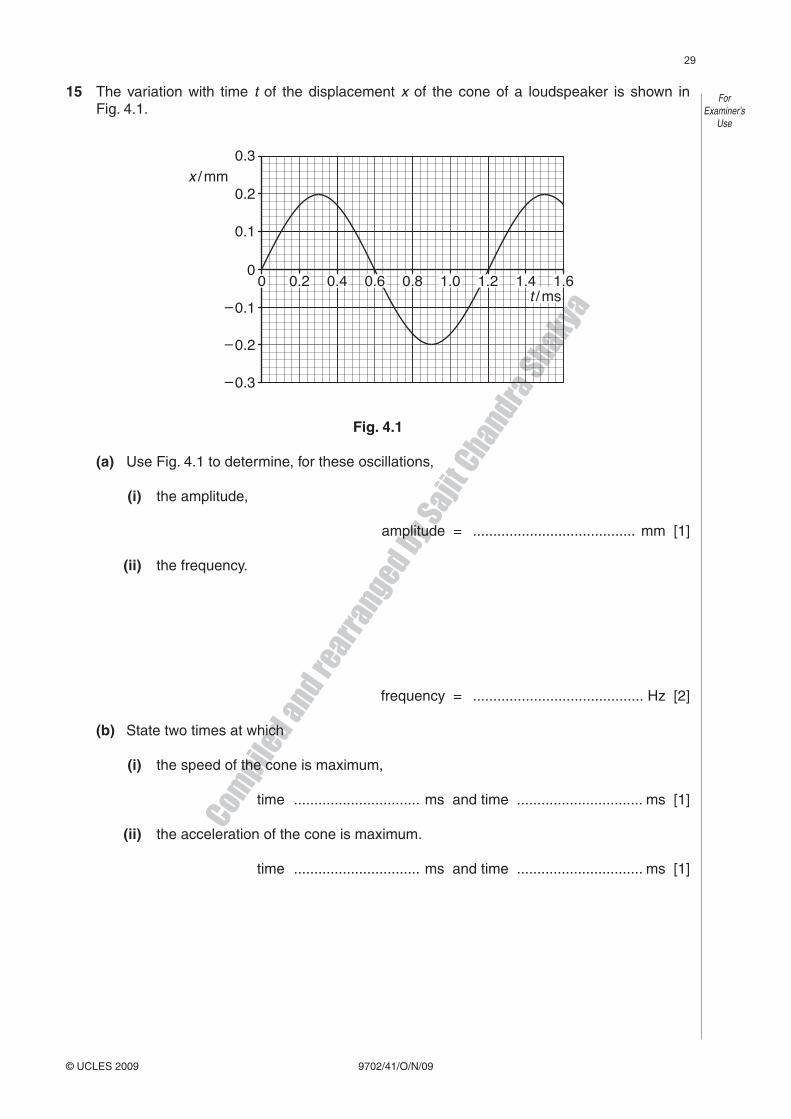
15 The variation with time t of the displacement x of the cone of a loudspeaker is shown in Fig. 4.1.
0
0.2
0.3x / mm
0.1
– 0.2
– 0.1
– 0.3
0.2 0.4 0.6 0.8 1.0 1.2 1.4 1.60t / ms
Fig. 4.1
(a) Use Fig. 4.1 to determine, for these oscillations,
(i) the amplitude,
amplitude = ........................................ mm [1]
(ii) the frequency.
frequency = .......................................... Hz [2]
(b) State two times at which
(i) the speed of the cone is maximum,
time ............................... ms and time ............................... ms [1]
(ii) the acceleration of the cone is maximum.
time ............................... ms and time ............................... ms [1]
Compile
d and rearr
anged by S
ajit C
handra Shakya
9702/41/O/N/09© UCLES 2009
ForExaminer’s
Use
(c) The effective mass of the cone is 2.5 g.
Use your answers in (a) to determine the maximum kinetic energy of the cone.
kinetic energy = ............................................ J [3]
(d) The loudspeaker must be designed so that resonance of the cone is avoided.
(i) State what is meant by resonance.
..................................................................................................................................
..................................................................................................................................
............................................................................................................................ [2]
(ii) State and briefly explain one other situation in which resonance should be avoided.
..................................................................................................................................
..................................................................................................................................
..................................................................................................................................
................................................................................................................. [2]
Compile
d and rearr
anged by S
ajit C
handra Shakya
9702/42/O/N/09© UCLES 2009
ForExaminer’s
Use
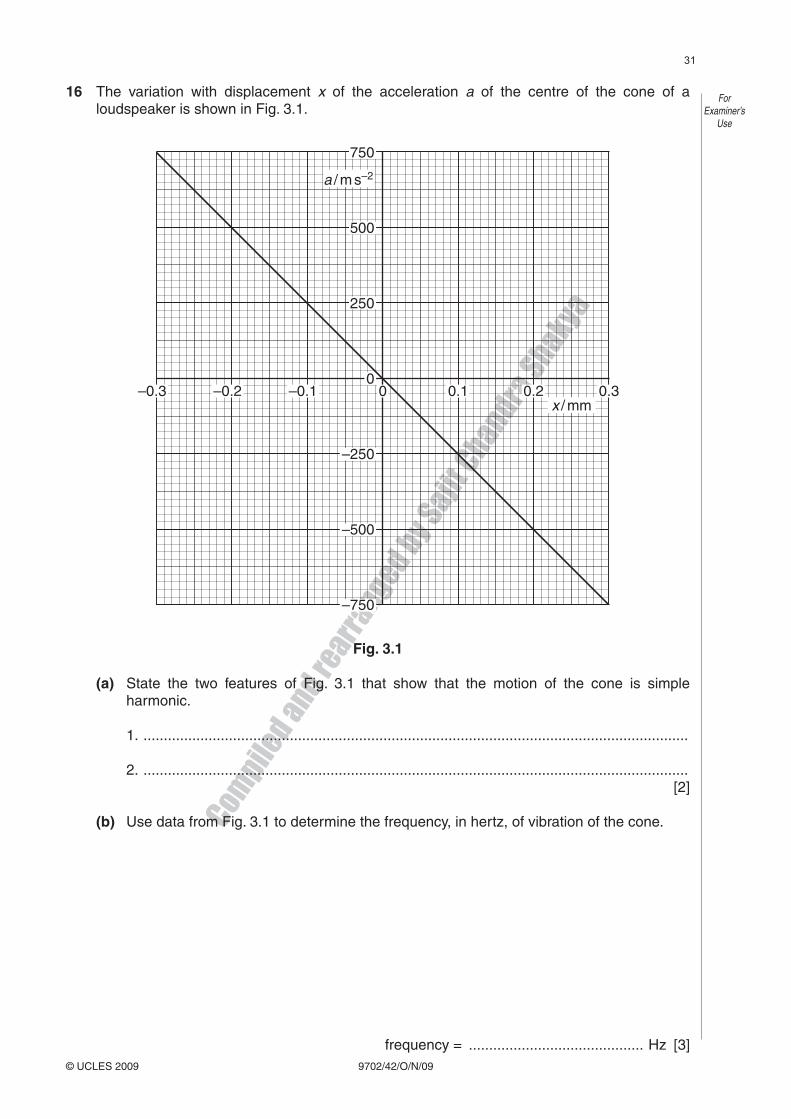
16 The variation with displacement x of the acceleration a of the centre of the cone of a loudspeaker is shown in Fig. 3.1.
–0.3 –0.2 –0.1 0 0.1 0.2 0.3
–750
–500
–250
0
250
500
750
a / m s–2
x / mm
Fig. 3.1
(a) State the two features of Fig. 3.1 that show that the motion of the cone is simple harmonic.
1. ......................................................................................................................................
2. ...................................................................................................................................... [2]
(b) Use data from Fig. 3.1 to determine the frequency, in hertz, of vibration of the cone.
frequency = ........................................... Hz [3]
Compile
d and rearr
anged by S
ajit C
handra Shakya
9702/42/O/N/09© UCLES 2009
ForExaminer’s
Use
(c) The frequency of vibration of the cone is now reduced to one half of that calculated in (b).
The amplitude of vibration remains unchanged.
On the axes of Fig. 3.1, draw a line to represent the variation with displacement x of the acceleration a of the centre of the loudspeaker cone.
[2]
Compile
d and rearr
anged by S
ajit C
handra Shakya
9702/43/M/J/10© UCLES 2010
ForExaminer’s
Use
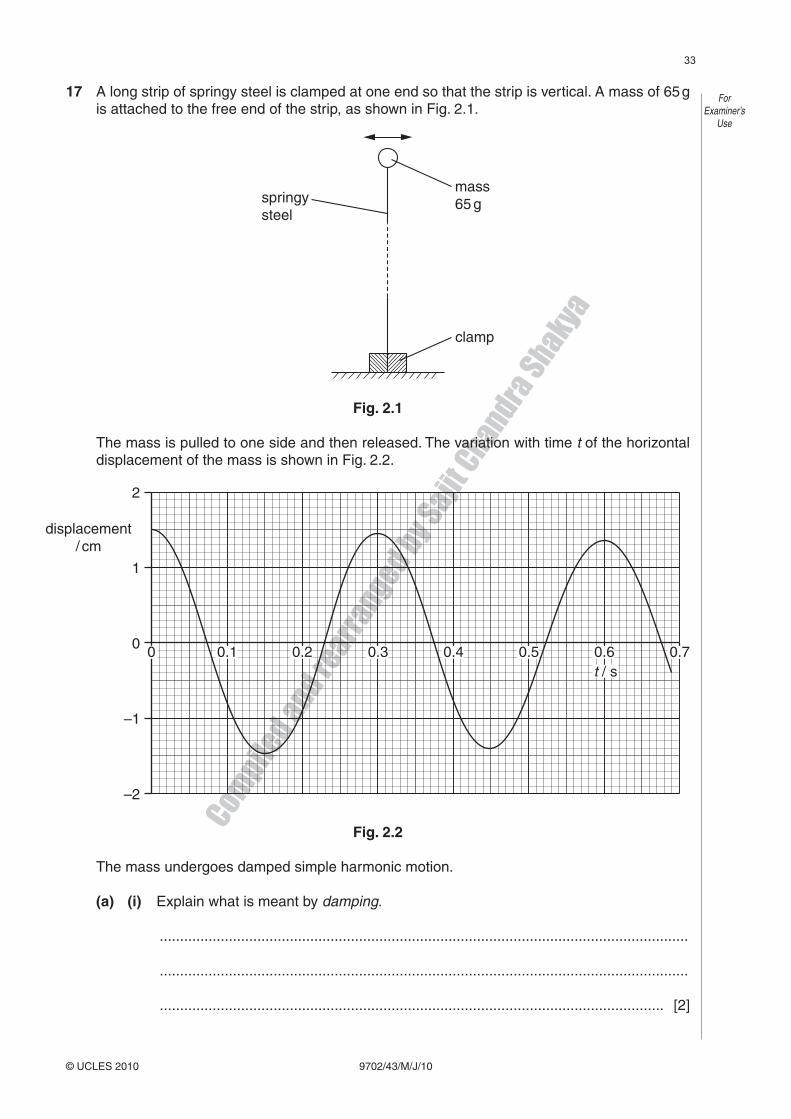
17 A long strip of springy steel is clamped at one end so that the strip is vertical. A mass of 65 g is attached to the free end of the strip, as shown in Fig. 2.1.
mass65 g
clamp
springysteel
Fig. 2.1
The mass is pulled to one side and then released. The variation with time t of the horizontal displacement of the mass is shown in Fig. 2.2.
2
1
displacement/ cm
0
–1
–2
0.10.10.10 0.2 0.3 0.4 0.5 0.6 0.7t / s
Fig. 2.2
The mass undergoes damped simple harmonic motion.
(a) (i) Explain what is meant by damping.
..................................................................................................................................
..................................................................................................................................
............................................................................................................................ [2]
Compile
d and rearr
anged by S
ajit C
handra Shakya
[Turn over9702/43/M/J/10© UCLES 2010
ForExaminer’s
Use
(ii) Suggest, with a reason, whether the damping is light, critical or heavy.
..................................................................................................................................
..................................................................................................................................
............................................................................................................................ [2]
(b) (i) Use Fig. 2.2 to determine the frequency of vibration of the mass.
frequency = ......................................... Hz [1]
(ii) Hence show that the initial energy stored in the steel strip before the mass is released is approximately 3.2 mJ.
[2]
(c) After eight complete oscillations of the mass, the amplitude of vibration is reduced from 1.5 cm to 1.1 cm. State and explain whether, after a further eight complete oscillations, the amplitude will be 0.7 cm.
..........................................................................................................................................
..........................................................................................................................................
.................................................................................................................................... [2]
Compile
d and rearr
anged by S
ajit C
handra Shakya
9702/41/M/J/10© UCLES 2010 [Turn over
ForExaminer’s
Use
18 (a) State what is meant by
(i) oscillations,
..................................................................................................................................
.............................................................................................................................. [1]
(ii) free oscillations,
..................................................................................................................................
.............................................................................................................................. [1]
(iii) simple harmonic motion.
..................................................................................................................................
..................................................................................................................................
.............................................................................................................................. [2]
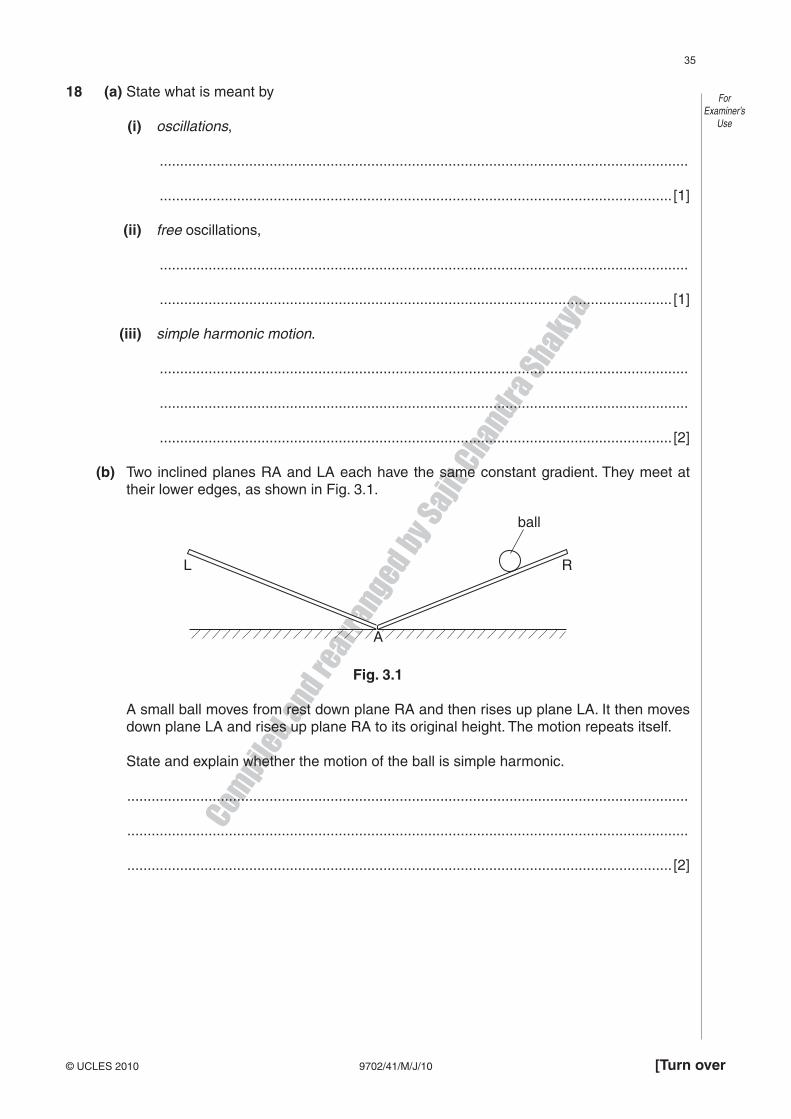
(b) Two inclined planes RA and LA each have the same constant gradient. They meet at their lower edges, as shown in Fig. 3.1.
L R
ball
A
Fig. 3.1
A small ball moves from rest down plane RA and then rises up plane LA. It then moves down plane LA and rises up plane RA to its original height. The motion repeats itself.
State and explain whether the motion of the ball is simple harmonic.
..........................................................................................................................................
..........................................................................................................................................
...................................................................................................................................... [2]
Compile
d and rearr
anged by S
ajit C
handra Shakya
9702/41/O/N/10© UCLES 2010
ForExaminer’s
Use
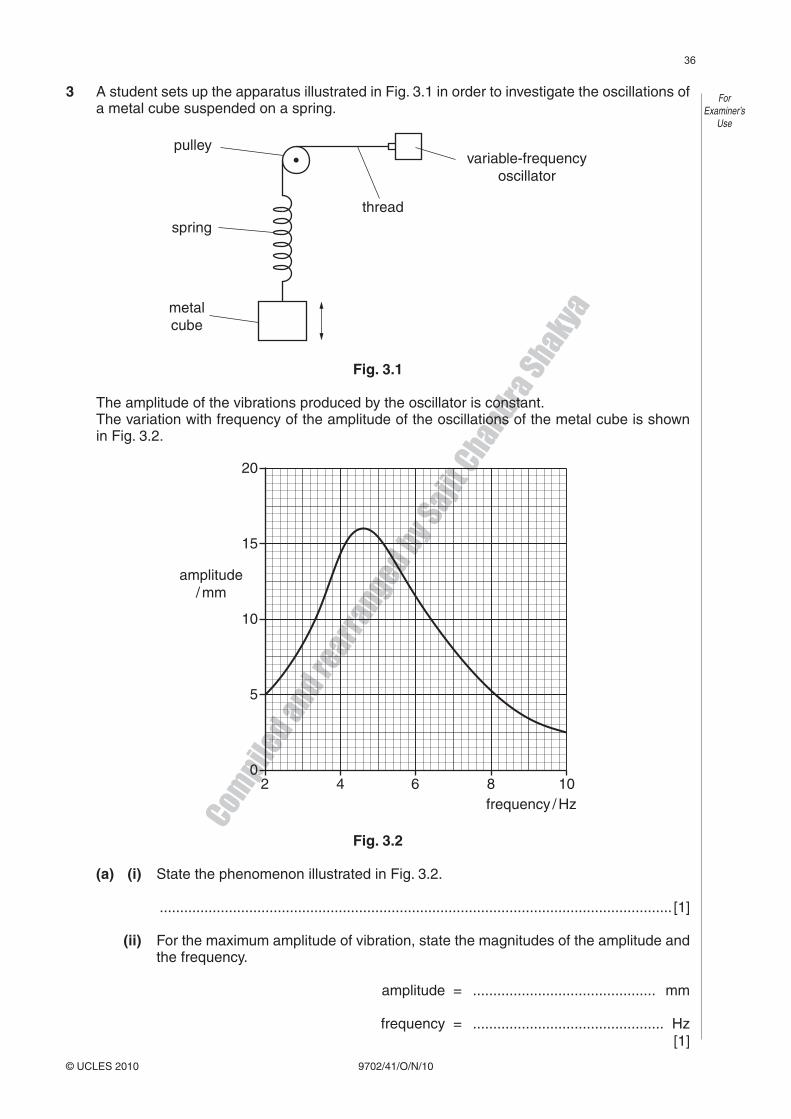
3 A student sets up the apparatus illustrated in Fig. 3.1 in order to investigate the oscillations of a metal cube suspended on a spring.
variable-frequencyoscillator
thread
pulley
spring
metalcube
Fig. 3.1
The amplitude of the vibrations produced by the oscillator is constant. The variation with frequency of the amplitude of the oscillations of the metal cube is shown
in Fig. 3.2.
042 6 8 10
5
10
15
amplitude/ mm
frequency / Hz
20
Fig. 3.2
(a) (i) State the phenomenon illustrated in Fig. 3.2.
.............................................................................................................................. [1]
(ii) For the maximum amplitude of vibration, state the magnitudes of the amplitude and the frequency.
amplitude = ............................................. mm
frequency = ............................................... Hz [1]
Compile
d and rearr
anged by S
ajit C
handra Shakya
9702/41/O/N/10© UCLES 2010 [Turn over
ForExaminer’s
Use
(b) The oscillations of the metal cube of mass 150 g may be assumed to be simple harmonic.
Use your answers in (a)(ii) to determine, for the metal cube,
(i) its maximum acceleration,
acceleration = ...................................... m s–2 [3]
(ii) the maximum resultant force on the cube.
force = .......................................... N [2]
(c) Some very light feathers are attached to the top surface of the cube so that the feathers extend outwards, beyond the vertical sides of the cube.
The investigation is now repeated. On Fig. 3.2, draw a line to show the new variation with frequency of the amplitude of
vibration for frequencies between 2 Hz and 10 Hz. [2]

Compile
d and rearr
anged by S
ajit C
handra Shakya
9702/43/O/N/10© UCLES 2010
ForExaminer’s
Use
3 A cylinder and piston, used in a car engine, are illustrated in Fig. 3.1.
C
A
D
cylinder
piston
B
Fig. 3.1
The vertical motion of the piston in the cylinder is assumed to be simple harmonic. The top surface of the piston is at AB when it is at its lowest position; it is at CD when at its
highest position, as marked in Fig. 3.1.
(a) The displacement d of the piston may be represented by the equation
d = – 4.0 cos(220t )
where d is measured in centimetres.
(i) State the distance between the lowest position AB and the highest position CD of the top surface of the piston.
distance = .......................................... cm [1]
Compile
d and rearr
anged by S
ajit C
handra Shakya
9702/43/O/N/10© UCLES 2010 [Turn over
ForExaminer’s
Use
(ii) Determine the number of oscillations made per second by the piston.
number = ................................................ [2]
(iii) On Fig. 3.1, draw a line to represent the top surface of the piston in the position where the speed of the piston is maximum. [1]
(iv) Calculate the maximum speed of the piston.
speed = ..................................... cm s–1 [2]

Compile
d and rearr
anged by S
ajit C
handra Shakya
9702/43/O/N/10© UCLES 2010
ForExaminer’s
Use
(b) The engine of a car has several cylinders. Three of these cylinders are shown in Fig. 3.2.
C
A
D
B
X Y Z
Fig. 3.2
X is the same cylinder and piston as in Fig. 3.1. Y and Z are two further cylinders, with the lowest and the highest positions of the top
surface of each piston indicated. The pistons in the cylinders each have the same frequency of oscillation, but they are
not in phase. At a particular instant in time, the position of the top of the piston in cylinder X is as
shown.
(i) In cylinder Y, the oscillations of the piston lead those of the piston in cylinder X by a phase angle of 120° (2
3p rad).
Complete the diagram of cylinder Y, for this instant, by drawing
1. a line to show the top surface of the piston, [1]
2. an arrow to show the direction of movement of the piston. [1]
Compile
d and rearr
anged by S
ajit C
handra Shakya
9702/43/O/N/10© UCLES 2010 [Turn over
ForExaminer’s
Use
(ii) In cylinder Z, the oscillations of the piston lead those of the piston in cylinder X by a phase angle of 240° (4
3p rad).
Complete the diagram of cylinder Z, for this instant, by drawing
1. a line to show the top surface of the piston, [1]
2. an arrow to show the direction of movement of the piston. [1]
(iii) For the piston in cylinder Y, calculate its speed for this instant.
speed = ..................................... cm s–1 [2]

Compile
d and rearr
anged by S
ajit C
handra Shakya
9702/42/M/J/11© UCLES 2011
ForExaminer’s
Use
5 A bar magnet is suspended vertically from the free end of a helical spring, as shown in Fig. 5.1.
V
helical
spring
magnet
coil
Fig. 5.1
One pole of the magnet is situated in a coil. The coil is connected in series with a high-resistance voltmeter.
The magnet is displaced vertically and then released. The variation with time t of the reading V of the voltmeter is shown in Fig. 5.2.
0.500
1.0 1.5 2.0 2.5 t / s
V
Fig. 5.2
(a) (i) State Faraday’s law of electromagnetic induction.
..................................................................................................................................
..................................................................................................................................
............................................................................................................................ [2]
Compile
d and rearr
anged by S
ajit C
handra Shakya
9702/42/M/J/11© UCLES 2011 [Turn over
ForExaminer’s
Use
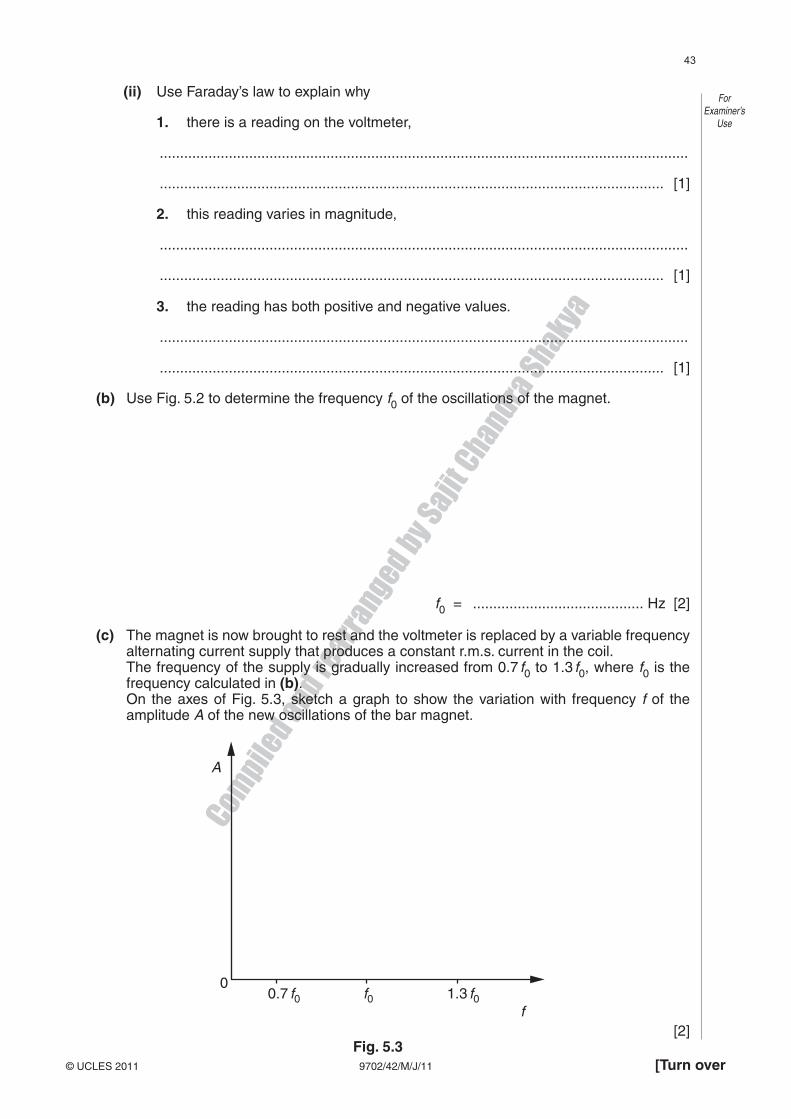
(ii) Use Faraday’s law to explain why
1. there is a reading on the voltmeter,
..................................................................................................................................
............................................................................................................................ [1]
2. this reading varies in magnitude,
..................................................................................................................................
............................................................................................................................ [1]
3. the reading has both positive and negative values.
..................................................................................................................................
............................................................................................................................ [1]
(b) Use Fig. 5.2 to determine the frequency f0 of the oscillations of the magnet.
f0 = .......................................... Hz [2]
(c) The magnet is now brought to rest and the voltmeter is replaced by a variable frequency alternating current supply that produces a constant r.m.s. current in the coil.
The frequency of the supply is gradually increased from 0.7 f0 to 1.3 f0, where f0 is the frequency calculated in (b).
On the axes of Fig. 5.3, sketch a graph to show the variation with frequency f of the amplitude A of the new oscillations of the bar magnet.
0.7 f00
A
f0 1.3 f0f
[2]Fig. 5.3

Compile
d and rearr
anged by S
ajit C
handra Shakya
9702/42/M/J/11© UCLES 2011
ForExaminer’s
Use
(d) (i) Name the phenomenon illustrated on your completed graph of Fig. 5.3.
............................................................................................................................ [1]
(ii) State one situation where the phenomenon named in (i) is useful.
..................................................................................................................................
............................................................................................................................ [1]
Compile
d and rearr
anged by S
ajit C
handra Shakya
© UCLES 2011 9702/41/M/J/11
ForExaminer’s
Use
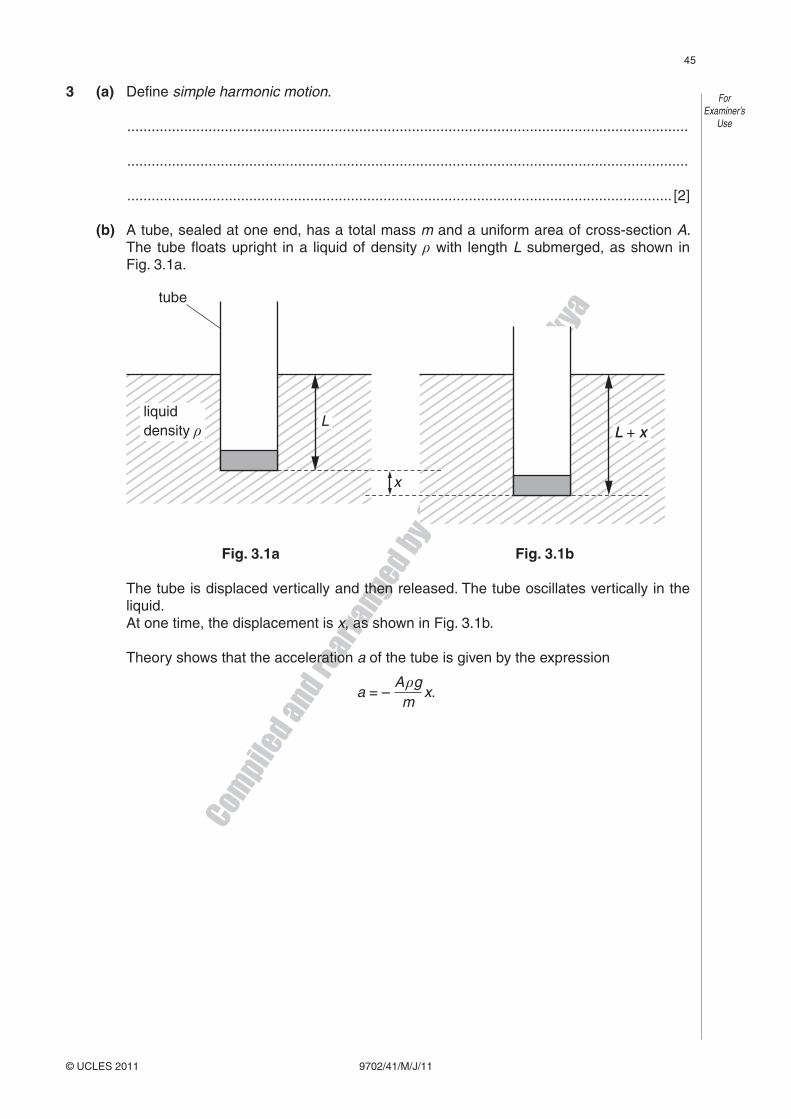
3 (a) Define simple harmonic motion.
..........................................................................................................................................
..........................................................................................................................................
...................................................................................................................................... [2]
(b) A tube, sealed at one end, has a total mass m and a uniform area of cross-section A. The tube floats upright in a liquid of density with length L submerged, as shown inFig. 3.1a.
tube
L
x
liquiddensity ρ L
L + + xL + x
Fig. 3.1a Fig. 3.1b
The tube is displaced vertically and then released. The tube oscillates vertically in the liquid.
At one time, the displacement is x, as shown in Fig. 3.1b.
Theory shows that the acceleration a of the tube is given by the expression
a = – A gm
x.
Compile
d and rearr
anged by S
ajit C
handra Shakya
[Turn over© UCLES 2011 9702/41/M/J/11
ForExaminer’s
Use
(i) Explain how it can be deduced from the expression that the tube is moving with simple harmonic motion.
..................................................................................................................................
..................................................................................................................................
.............................................................................................................................. [2]
(ii) The tube, of area of cross-section 4.5 cm2, is floating in water of density1.0 × 103 kg m–3.
Calculate the mass of the tube that would give rise to oscillations of frequency 1.5 Hz.
mass = ............................................. g [4]

Compile
d and rearr
anged by S
ajit C
handra Shakya
9702/41/O/N/11© UCLES 2011
ForExaminer’s
Use
3 A bar magnet is suspended from the free end of a helical spring, as illustrated in Fig. 3.1.
coil
magnet
helicalspring
Fig. 3.1
One pole of the magnet is situated in a coil of wire. The coil is connected in series with a switch and a resistor. The switch is open.
The magnet is displaced vertically and then released. As the magnet passes through its rest position, a timer is started. The variation with time t of the vertical displacement y of the magnet from its rest position is shown in Fig. 3.2.
0
1.0
–1.0
–2.0
2.0
y / cm
4.03.02.01.00 5.0 6.0 7.0 8.0 9.0 10.0t / s
Fig. 3.2
At time t = 4.0 s, the switch is closed.

Compile
d and rearr
anged by S
ajit C
handra Shakya
9702/41/O/N/11© UCLES 2011 [Turn over
ForExaminer’s
Use
(a) Use Fig. 3.2 to
(i) state the evidence for the magnet to be undergoing free oscillations during the period t = 0 to t = 4.0 s,
..................................................................................................................................
.............................................................................................................................. [1]
(ii) state, with a reason, whether the damping after time t = 4.0 s is light, critical or heavy,
..................................................................................................................................
..................................................................................................................................
.............................................................................................................................. [2]
(iii) determine the natural frequency of vibration of the magnet on the spring.
frequency = ........................................... Hz [2]
(b) (i) State Faraday’s law of electromagnetic induction.
..................................................................................................................................
..................................................................................................................................
.............................................................................................................................. [2]
(ii) Explain why, after time t = 4.0 s, the amplitude of vibration of the magnet is seen to decrease.
..................................................................................................................................
..................................................................................................................................
..................................................................................................................................
..................................................................................................................................
..................................................................................................................................
.............................................................................................................................. [4]

Compile
d and rearr
anged by S
ajit C
handra Shakya
9702/42/O/N/11© UCLES 2011
ForExaminer’s
Use
3 A bar magnet is suspended from the free end of a helical spring, as illustrated in Fig. 3.1.
coil
magnet
helicalspring
Fig. 3.1
One pole of the magnet is situated in a coil of wire. The coil is connected in series with a switch and a resistor. The switch is open.
The magnet is displaced vertically and then released. As the magnet passes through its rest position, a timer is started. The variation with time t of the vertical displacement y of the magnet from its rest position is shown in Fig. 3.2.
0
1.0
–1.0
–2.0
2.0
y / cm
4.03.02.01.00 5.0 6.0 7.0 8.0 9.0 10.0t / s
Fig. 3.2
At time t = 4.0 s, the switch is closed.

Compile
d and rearr
anged by S
ajit C
handra Shakya
9702/42/O/N/11© UCLES 2011 [Turn over
ForExaminer’s
Use
(a) Use Fig. 3.2 to
(i) state the evidence for the magnet to be undergoing free oscillations during the period t = 0 to t = 4.0 s,
..................................................................................................................................
.............................................................................................................................. [1]
(ii) state, with a reason, whether the damping after time t = 4.0 s is light, critical or heavy,
..................................................................................................................................
..................................................................................................................................
.............................................................................................................................. [2]
(iii) determine the natural frequency of vibration of the magnet on the spring.
frequency = ........................................... Hz [2]
(b) (i) State Faraday’s law of electromagnetic induction.
..................................................................................................................................
..................................................................................................................................
.............................................................................................................................. [2]
(ii) Explain why, after time t = 4.0 s, the amplitude of vibration of the magnet is seen to decrease.
..................................................................................................................................
..................................................................................................................................
..................................................................................................................................
..................................................................................................................................
..................................................................................................................................
.............................................................................................................................. [4]
Compile
d and rearr
anged by S
ajit C
handra Shakya
9702/43/O/N/11© UCLES 2011 [Turn over
ForExaminer’s
Use
3 (a) Define simple harmonic motion.
..........................................................................................................................................
..........................................................................................................................................
..................................................................................................................................... [2]
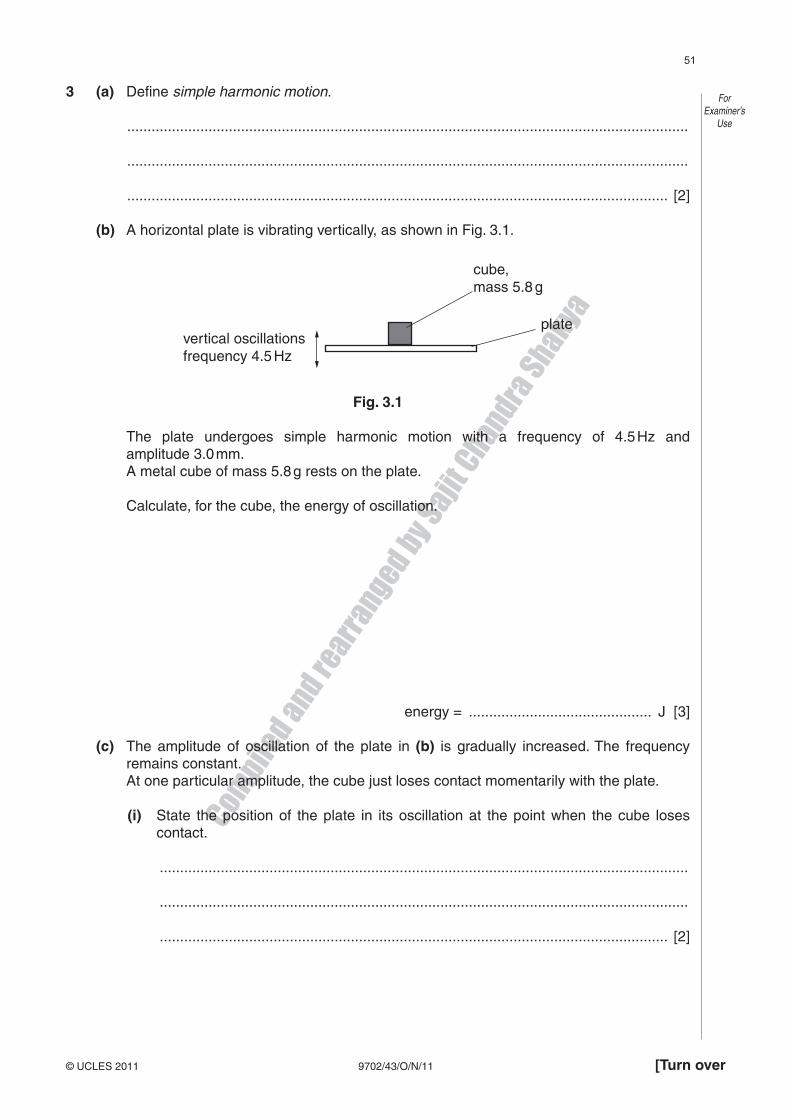
(b) A horizontal plate is vibrating vertically, as shown in Fig. 3.1.
vertical oscillationsfrequency 4.5 Hz
cube,mass 5.8 g
plate
Fig. 3.1
The plate undergoes simple harmonic motion with a frequency of 4.5 Hz and amplitude 3.0 mm.
A metal cube of mass 5.8 g rests on the plate.
Calculate, for the cube, the energy of oscillation.
energy = ............................................. J [3]
(c) The amplitude of oscillation of the plate in (b) is gradually increased. The frequency remains constant.
At one particular amplitude, the cube just loses contact momentarily with the plate.
(i) State the position of the plate in its oscillation at the point when the cube loses contact.
..................................................................................................................................
..................................................................................................................................
............................................................................................................................. [2]
Compile
d and rearr
anged by S
ajit C
handra Shakya
9702/43/O/N/11© UCLES 2011
ForExaminer’s
Use
(ii) Calculate this amplitude of oscillation.
amplitude = ............................................ m [2]

Compile
d and rearr
anged by S
ajit C
handra Shakya
9702/41/O/N/11© UCLES 2011
ForExaminer’s
Use
3 A bar magnet is suspended from the free end of a helical spring, as illustrated in Fig. 3.1.
coil
magnet
helicalspring
Fig. 3.1
One pole of the magnet is situated in a coil of wire. The coil is connected in series with a switch and a resistor. The switch is open.
The magnet is displaced vertically and then released. As the magnet passes through its rest position, a timer is started. The variation with time t of the vertical displacement y of the magnet from its rest position is shown in Fig. 3.2.
0
1.0
–1.0
–2.0
2.0
y / cm
4.03.02.01.00 5.0 6.0 7.0 8.0 9.0 10.0t / s
Fig. 3.2
At time t = 4.0 s, the switch is closed.
Compile
d and rearr
anged by S
ajit C
handra Shakya
9702/41/O/N/11© UCLES 2011 [Turn over
ForExaminer’s
Use
(a) Use Fig. 3.2 to
(i) state the evidence for the magnet to be undergoing free oscillations during the period t = 0 to t = 4.0 s,
..................................................................................................................................
.............................................................................................................................. [1]
(ii) state, with a reason, whether the damping after time t = 4.0 s is light, critical or heavy,
..................................................................................................................................
..................................................................................................................................
.............................................................................................................................. [2]
(iii) determine the natural frequency of vibration of the magnet on the spring.
frequency = ........................................... Hz [2]
(b) (i) State Faraday’s law of electromagnetic induction.
..................................................................................................................................
..................................................................................................................................
.............................................................................................................................. [2]
(ii) Explain why, after time t = 4.0 s, the amplitude of vibration of the magnet is seen to decrease.
..................................................................................................................................
..................................................................................................................................
..................................................................................................................................
..................................................................................................................................
..................................................................................................................................
.............................................................................................................................. [4]

Compile
d and rearr
anged by S
ajit C
handra Shakya
9702/42/O/N/11© UCLES 2011
ForExaminer’s
Use
3 A bar magnet is suspended from the free end of a helical spring, as illustrated in Fig. 3.1.
coil
magnet
helicalspring
Fig. 3.1
One pole of the magnet is situated in a coil of wire. The coil is connected in series with a switch and a resistor. The switch is open.
The magnet is displaced vertically and then released. As the magnet passes through its rest position, a timer is started. The variation with time t of the vertical displacement y of the magnet from its rest position is shown in Fig. 3.2.
0
1.0
–1.0
–2.0
2.0
y / cm
4.03.02.01.00 5.0 6.0 7.0 8.0 9.0 10.0t / s
Fig. 3.2
At time t = 4.0 s, the switch is closed.

Compile
d and rearr
anged by S
ajit C
handra Shakya
9702/42/O/N/11© UCLES 2011 [Turn over
ForExaminer’s
Use
(a) Use Fig. 3.2 to
(i) state the evidence for the magnet to be undergoing free oscillations during the period t = 0 to t = 4.0 s,
..................................................................................................................................
.............................................................................................................................. [1]
(ii) state, with a reason, whether the damping after time t = 4.0 s is light, critical or heavy,
..................................................................................................................................
..................................................................................................................................
.............................................................................................................................. [2]
(iii) determine the natural frequency of vibration of the magnet on the spring.
frequency = ........................................... Hz [2]
(b) (i) State Faraday’s law of electromagnetic induction.
..................................................................................................................................
..................................................................................................................................
.............................................................................................................................. [2]
(ii) Explain why, after time t = 4.0 s, the amplitude of vibration of the magnet is seen to decrease.
..................................................................................................................................
..................................................................................................................................
..................................................................................................................................
..................................................................................................................................
..................................................................................................................................
.............................................................................................................................. [4]

Compile
d and rearr
anged by S
ajit C
handra Shakya
9702/43/O/N/11© UCLES 2011 [Turn over
ForExaminer’s
Use
3 (a) Define simple harmonic motion.
..........................................................................................................................................
..........................................................................................................................................
..................................................................................................................................... [2]
(b) A horizontal plate is vibrating vertically, as shown in Fig. 3.1.
vertical oscillationsfrequency 4.5 Hz
cube,mass 5.8 g
plate
Fig. 3.1
The plate undergoes simple harmonic motion with a frequency of 4.5 Hz and amplitude 3.0 mm.
A metal cube of mass 5.8 g rests on the plate.
Calculate, for the cube, the energy of oscillation.
energy = ............................................. J [3]
(c) The amplitude of oscillation of the plate in (b) is gradually increased. The frequency remains constant.
At one particular amplitude, the cube just loses contact momentarily with the plate.
(i) State the position of the plate in its oscillation at the point when the cube loses contact.
..................................................................................................................................
..................................................................................................................................
............................................................................................................................. [2]

Compile
d and rearr
anged by S
ajit C
handra Shakya
9702/43/O/N/11© UCLES 2011
ForExaminer’s
Use
(ii) Calculate this amplitude of oscillation.
amplitude = ............................................ m [2]

Compile
d and rearr
anged by S
ajit C
handra Shakya
9702/41/M/J/12© UCLES 2012 [Turn over
ForExaminer’s
Use
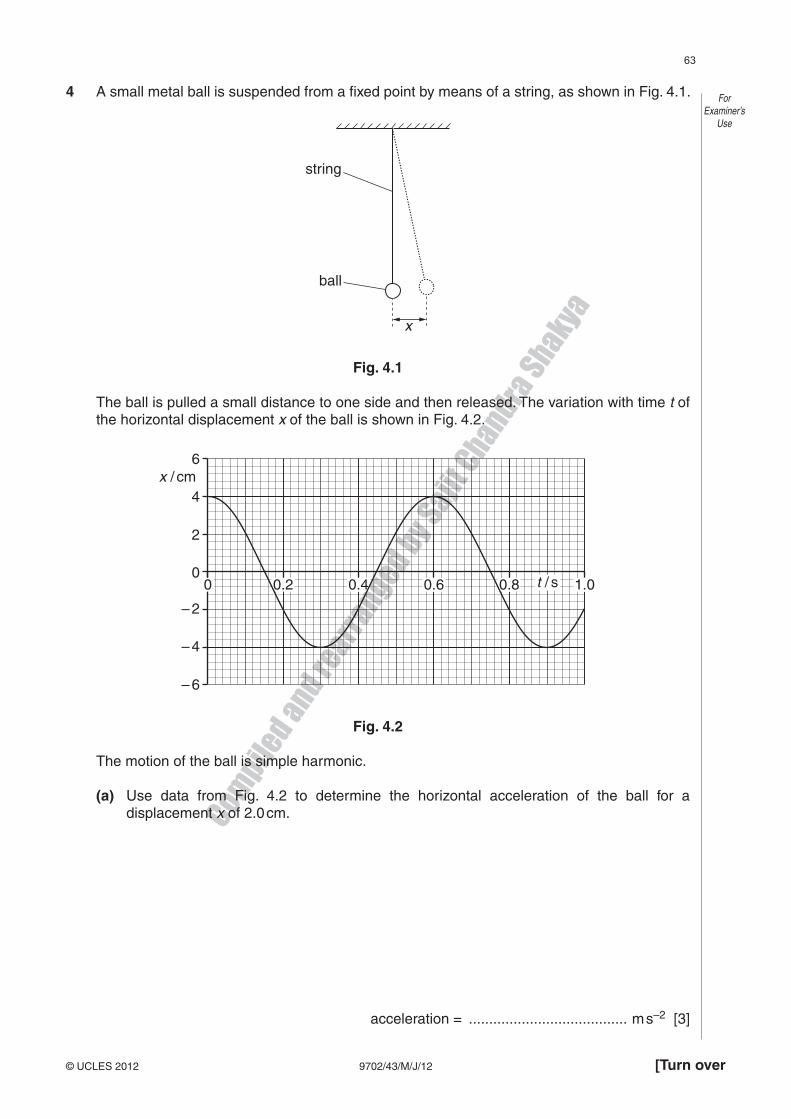
4 A small metal ball is suspended from a fixed point by means of a string, as shown in Fig. 4.1.
string
ball
x
Fig. 4.1
The ball is pulled a small distance to one side and then released. The variation with time t of the horizontal displacement x of the ball is shown in Fig. 4.2.
0
2
4x / cm
6
– 6
– 4
– 2
0 0.2 0.4 0.6 0.8 1.0t / st / s
Fig. 4.2
The motion of the ball is simple harmonic.
(a) Use data from Fig. 4.2 to determine the horizontal acceleration of the ball for a displacement x of 2.0 cm.
acceleration = ....................................... m s–2 [3]

Compile
d and rearr
anged by S
ajit C
handra Shakya
9702/41/M/J/12© UCLES 2012
ForExaminer’s
Use
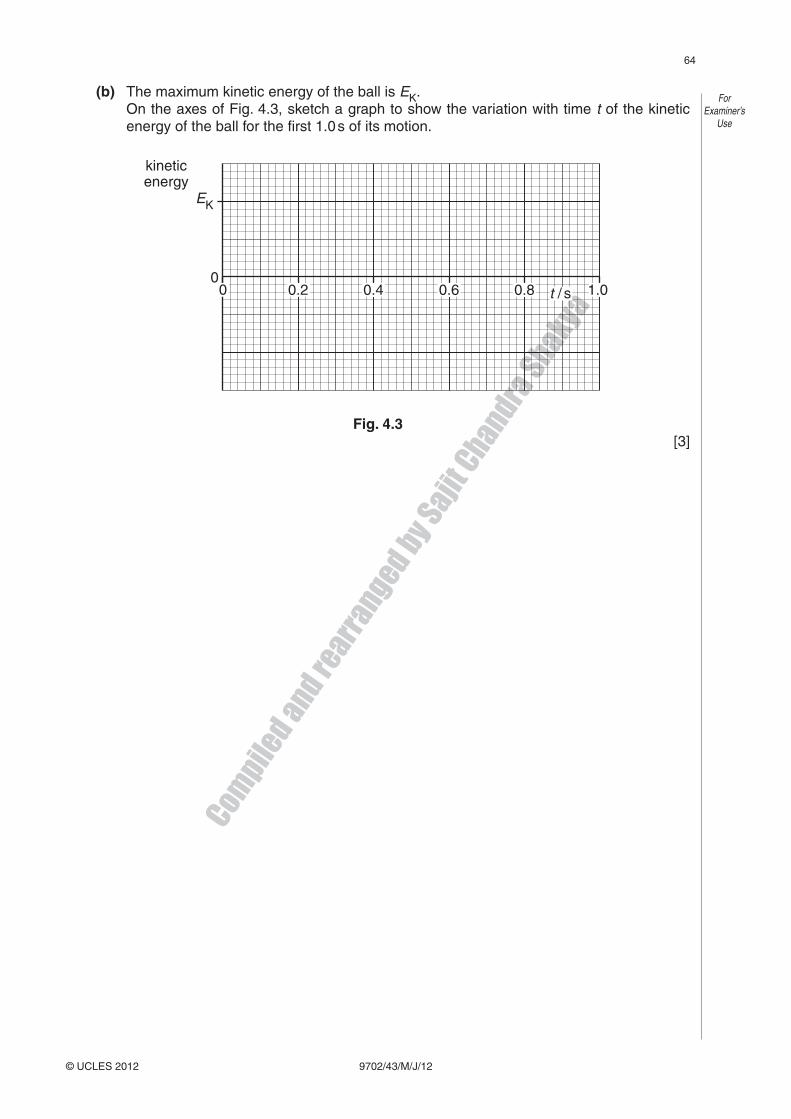
(b) The maximum kinetic energy of the ball is EK. On the axes of Fig. 4.3, sketch a graph to show the variation with time t of the kinetic
energy of the ball for the first 1.0 s of its motion.
EK
00
kineticenergy
t / s0.2 0.4 0.6 0.8 1.0
Fig. 4.3 [3]

Compile
d and rearr
anged by S
ajit C
handra Shakya
9702/42/M/J/12© UCLES 2012
ForExaminer’s
Use
2 A ball of mass 37 g is held between two fixed points A and B by two stretched helical springs, as shown in Fig. 2.1.
ballmass 37 g
A B
Fig. 2.1
The ball oscillates along the line AB with simple harmonic motion of frequency 3.5 Hz and amplitude 2.8 cm.
(a) Show that the total energy of the oscillations is 7.0 mJ.
[2]
(b) At two points in the oscillation of the ball, its kinetic energy is equal to the potential energy stored in the springs.
Calculate the magnitude of the displacement at which this occurs.
displacement = ............................................ cm [3]

Compile
d and rearr
anged by S
ajit C
handra Shakya
9702/42/M/J/12© UCLES 2012 [Turn over
ForExaminer’s
Use
(c) On the axes of Fig. 2.2 and using your answers in (a) and (b), sketch a graph to show the variation with displacement x of
(i) the total energy of the system (label this line T), [1]
(ii) the kinetic energy of the ball (label this line K), [2]
(iii) the potential energy stored in the springs (label this line P). [2]
0 1 2 3–3 –2 –1
2
0
4
6
8
energy/ mJ
x / cm
Fig. 2.2
(d) The arrangement in Fig. 2.1 is now rotated through 90° so that the line AB is vertical and the ball oscillates in a vertical plane.
Suggest one form of energy, other than those in (c), that must be taken into consideration when plotting new graphs to show energy changes with displacement.
...................................................................................................................................... [1]
Compile
d and rearr
anged by S
ajit C
handra Shakya
9702/43/M/J/12© UCLES 2012 [Turn over
ForExaminer’s
Use
4 A small metal ball is suspended from a fixed point by means of a string, as shown in Fig. 4.1.
string
ball
x
Fig. 4.1
The ball is pulled a small distance to one side and then released. The variation with time t of the horizontal displacement x of the ball is shown in Fig. 4.2.
0
2
4x / cm
6
– 6
– 4
– 2
0 0.2 0.4 0.6 0.8 1.0t / st / s
Fig. 4.2
The motion of the ball is simple harmonic.
(a) Use data from Fig. 4.2 to determine the horizontal acceleration of the ball for a displacement x of 2.0 cm.
acceleration = ....................................... m s–2 [3]
Compile
d and rearr
anged by S
ajit C
handra Shakya
9702/43/M/J/12© UCLES 2012
ForExaminer’s
Use
(b) The maximum kinetic energy of the ball is EK. On the axes of Fig. 4.3, sketch a graph to show the variation with time t of the kinetic
energy of the ball for the first 1.0 s of its motion.
EK
00
kineticenergy
t / s0.2 0.4 0.6 0.8 1.0
Fig. 4.3 [3]
Compile
d and rearr
anged by S
ajit C
handra Shakya
9702/43/O/N/12© UCLES 2012
ForExaminer’s
Use
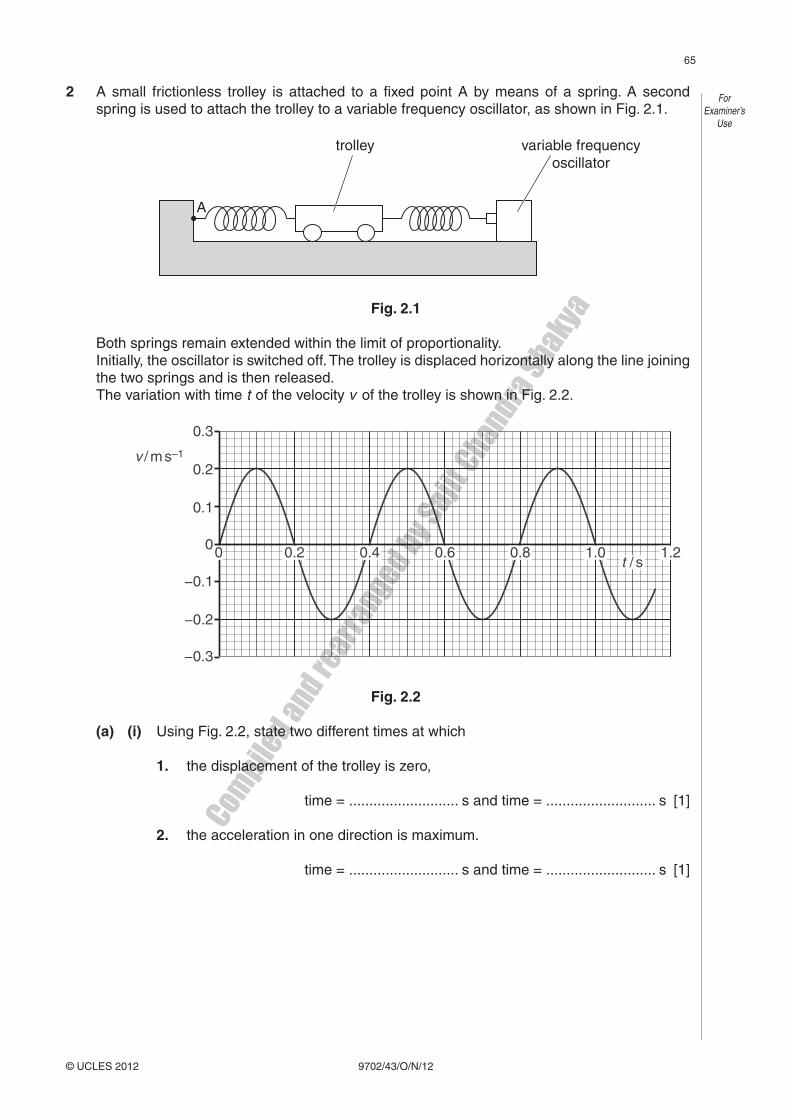
2 A small frictionless trolley is attached to a fixed point A by means of a spring. A second spring is used to attach the trolley to a variable frequency oscillator, as shown in Fig. 2.1.
trolley
A
variable frequencyoscillator
Fig. 2.1
Both springs remain extended within the limit of proportionality. Initially, the oscillator is switched off. The trolley is displaced horizontally along the line joining
the two springs and is then released. The variation with time t of the velocity v of the trolley is shown in Fig. 2.2.
0.3
v / m s–1
0.1
0
0.2
−0.2
−0.3
−0.1
0t / s
0.2 0.4 0.6 0.8 1.0 1.2
Fig. 2.2
(a) (i) Using Fig. 2.2, state two different times at which
1. the displacement of the trolley is zero,
time = ........................... s and time = ........................... s [1]
2. the acceleration in one direction is maximum.
time = ........................... s and time = ........................... s [1]
Compile
d and rearr
anged by S
ajit C
handra Shakya
9702/43/O/N/12© UCLES 2012 [Turn over
ForExaminer’s
Use
(ii) Determine the frequency of oscillation of the trolley.
frequency = ........................................... Hz [2]
(iii) The variation with time of the displacement of the trolley is sinusoidal. The variation with time of the velocity of the trolley is also sinusoidal.
State the phase difference between the displacement and the velocity.
phase difference = ................................................. [1]
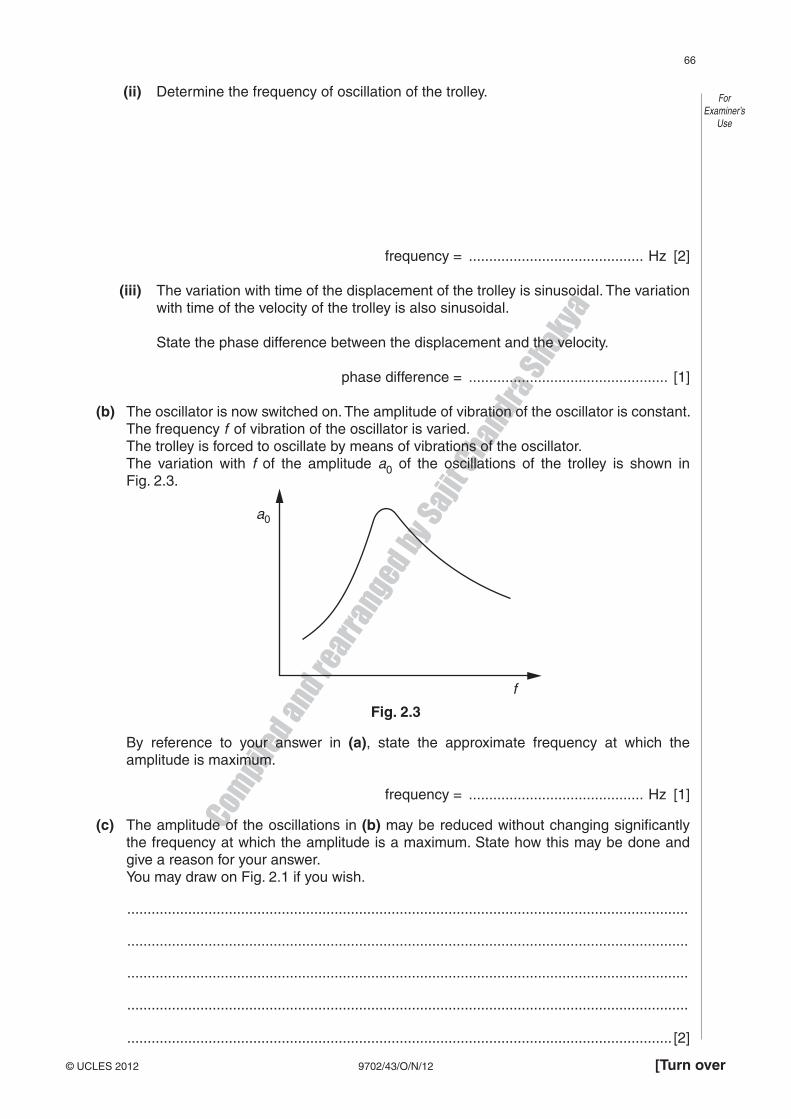
(b) The oscillator is now switched on. The amplitude of vibration of the oscillator is constant. The frequency f of vibration of the oscillator is varied.
The trolley is forced to oscillate by means of vibrations of the oscillator. The variation with f of the amplitude a0 of the oscillations of the trolley is shown in
Fig. 2.3.
f
a0
Fig. 2.3
By reference to your answer in (a), state the approximate frequency at which the amplitude is maximum.
frequency = ........................................... Hz [1]
(c) The amplitude of the oscillations in (b) may be reduced without changing significantly the frequency at which the amplitude is a maximum. State how this may be done and give a reason for your answer.
You may draw on Fig. 2.1 if you wish.
..........................................................................................................................................
..........................................................................................................................................
..........................................................................................................................................
..........................................................................................................................................
...................................................................................................................................... [2]
Compile
d and rearr
anged by S
ajit C
handra Shakya
9702/42/O/N/12© UCLES 2012
ForExaminer’s
Use
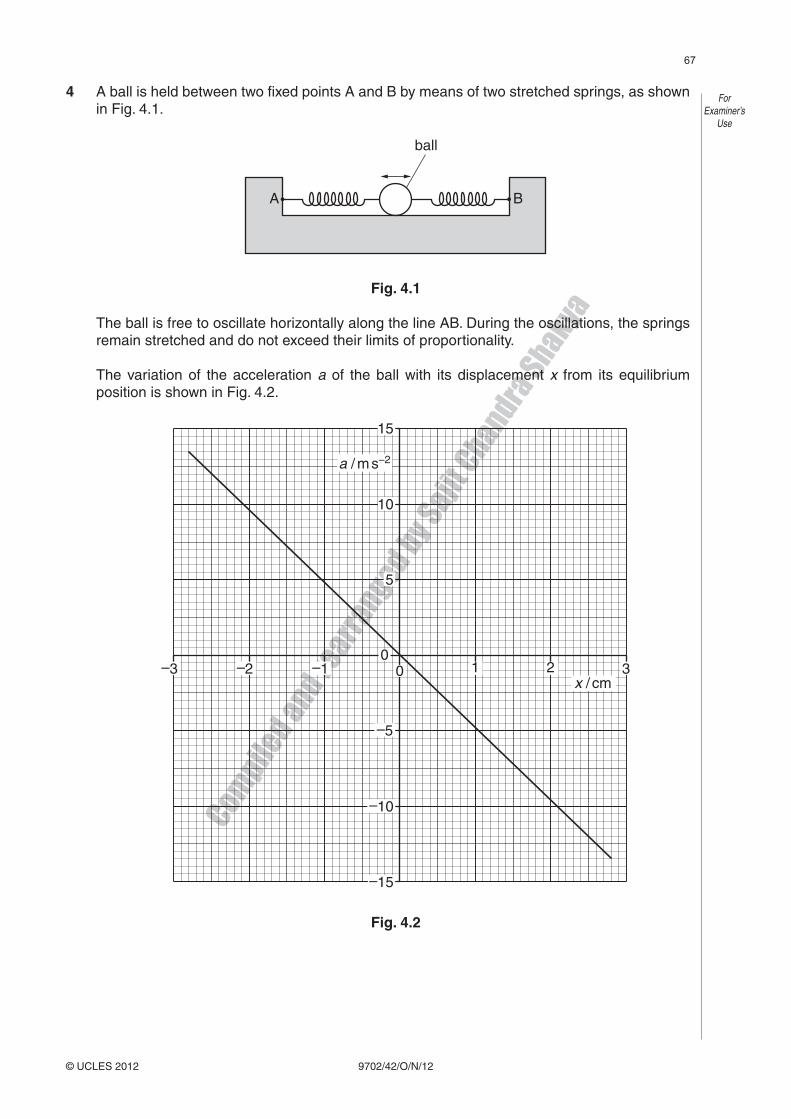
4 A ball is held between two fixed points A and B by means of two stretched springs, as shown in Fig. 4.1.
ball
A B
Fig. 4.1
The ball is free to oscillate horizontally along the line AB. During the oscillations, the springs remain stretched and do not exceed their limits of proportionality.
The variation of the acceleration a of the ball with its displacement x from its equilibrium position is shown in Fig. 4.2.
–3
–5
–10
–15
–2 –1 00
1 2 3
5
10
15
x / cm
a / m s–2
Fig. 4.2

Compile
d and rearr
anged by S
ajit C
handra Shakya
9702/42/O/N/12© UCLES 2012 [Turn over
ForExaminer’s
Use
(a) State and explain the features of Fig. 4.2 that indicate that the motion of the ball is simple harmonic.
..........................................................................................................................................
..........................................................................................................................................
..........................................................................................................................................
..........................................................................................................................................
...................................................................................................................................... [4]
(b) Use Fig. 4.2 to determine, for the oscillations of the ball,
(i) the amplitude,
amplitude = .......................................... cm [1]
(ii) the frequency.
frequency = ........................................... Hz [3]
(c) The arrangement in Fig. 4.1 is now rotated through 90° so that the line AB is vertical. The ball now oscillates in a vertical plane.
Suggest one reason why the oscillations may no longer be simple harmonic.
..........................................................................................................................................
...................................................................................................................................... [1]
Compile
d and rearr
anged by S
ajit C
handra Shakya
9702/42/M/J/13© UCLES 2013 [Turn over
ForExaminer’s
Use
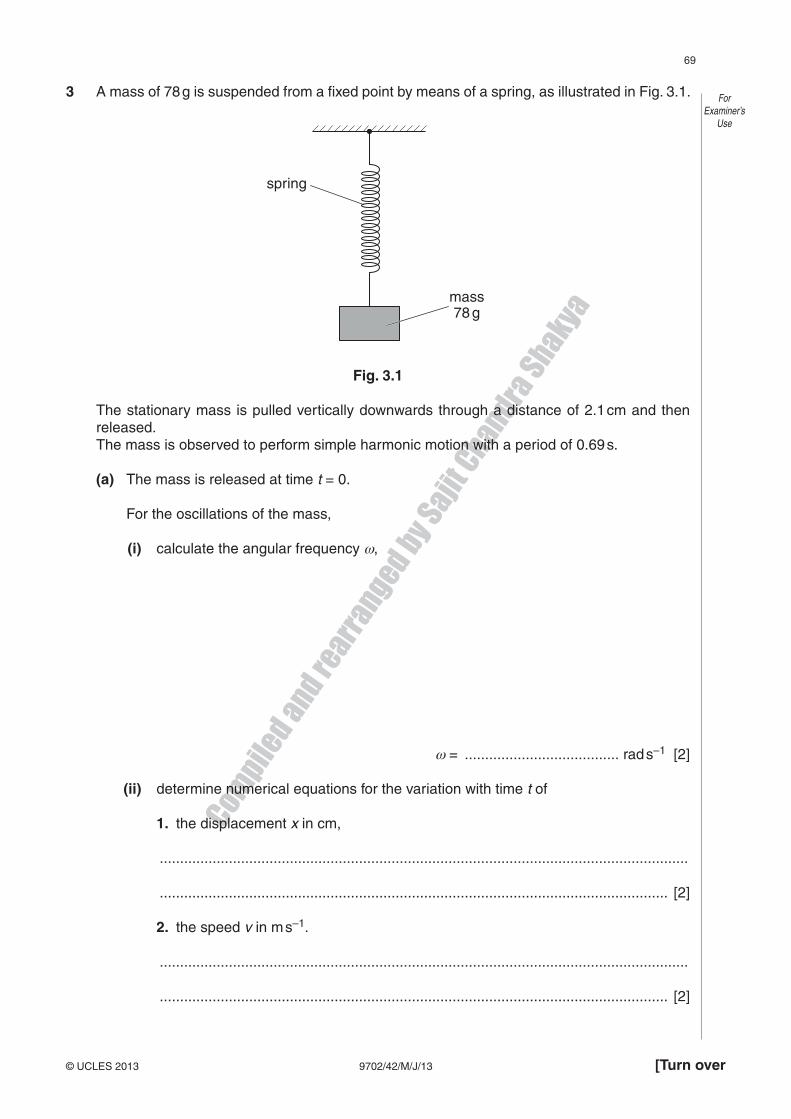
3 A mass of 78 g is suspended from a fixed point by means of a spring, as illustrated in Fig. 3.1.
spring
mass78 g
Fig. 3.1
The stationary mass is pulled vertically downwards through a distance of 2.1 cm and then released.
The mass is observed to perform simple harmonic motion with a period of 0.69 s.
(a) The mass is released at time t = 0.
For the oscillations of the mass,
(i) calculate the angular frequency ,
= ...................................... rad s–1 [2]
(ii) determine numerical equations for the variation with time t of
1. the displacement x in cm,
..................................................................................................................................
............................................................................................................................. [2]
2. the speed v in m s–1.
..................................................................................................................................
............................................................................................................................. [2]
Compile
d and rearr
anged by S
ajit C
handra Shakya
9702/42/M/J/13© UCLES 2013
ForExaminer’s
Use
(b) Calculate the total energy of oscillation of the mass.
energy = ............................................... J [2]
Compile
d and rearr
anged by S
ajit C
handra Shakya
9702/41/M/J/13© UCLES 2013
ForExaminer’s
Use
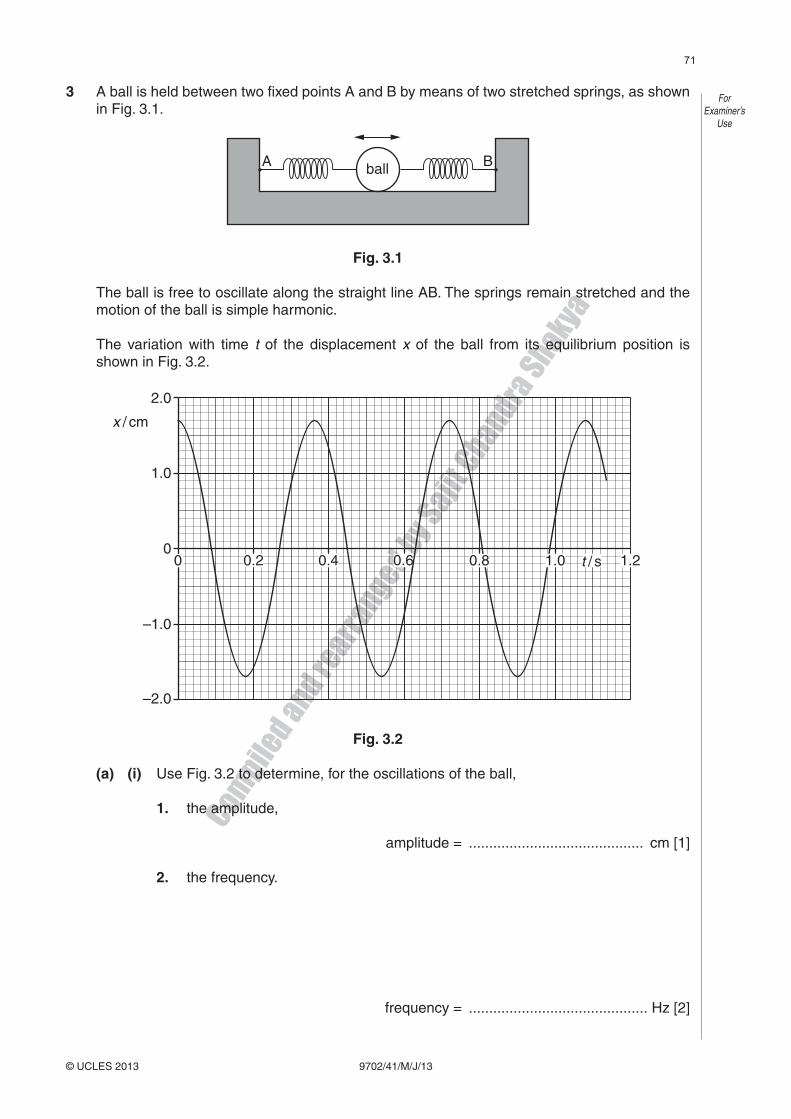
3 A ball is held between two fixed points A and B by means of two stretched springs, as shown in Fig. 3.1.
ballA B
Fig. 3.1
The ball is free to oscillate along the straight line AB. The springs remain stretched and the motion of the ball is simple harmonic.
The variation with time t of the displacement x of the ball from its equilibrium position is shown in Fig. 3.2.
2.0
1.0
0
–1.0
–2.0
0.20 0.4 0.6 1.2t / s
x / cm
0.8 1.0
Fig. 3.2
(a) (i) Use Fig. 3.2 to determine, for the oscillations of the ball, 1. the amplitude,
amplitude = ........................................... cm [1]
2. the frequency.
frequency = ............................................ Hz [2]
Compile
d and rearr
anged by S
ajit C
handra Shakya
9702/41/M/J/13© UCLES 2013 [Turn over
ForExaminer’s
Use
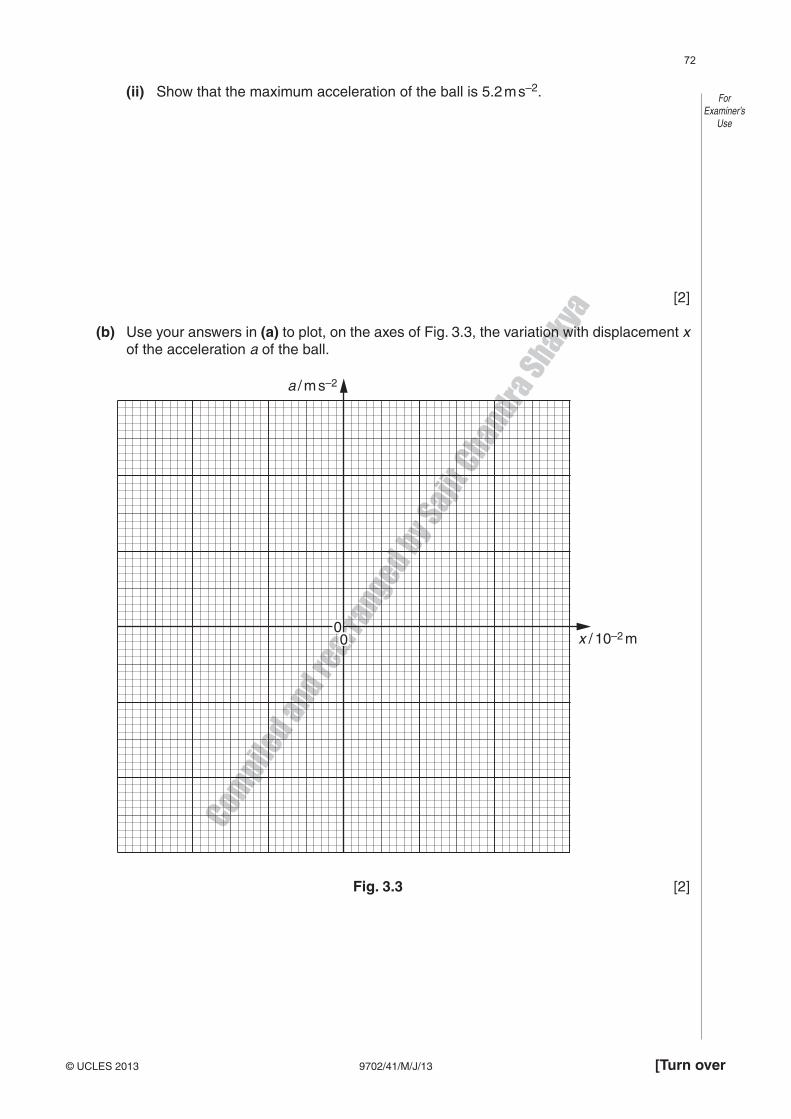
(ii) Show that the maximum acceleration of the ball is 5.2 m s–2.
[2]
(b) Use your answers in (a) to plot, on the axes of Fig. 3.3, the variation with displacement x of the acceleration a of the ball.
00
a / m s–2
x / 10–2 m
Fig. 3.3 [2]

Compile
d and rearr
anged by S
ajit C
handra Shakya
9702/41/M/J/13© UCLES 2013
ForExaminer’s
Use
(c) Calculate the displacement of the ball at which its kinetic energy is equal to one half of the maximum kinetic energy.
displacement = ........................................... cm [3]
Compile
d and rearr
anged by S
ajit C
handra Shakya
9702/42/O/N/13© UCLES 2013
ForExaminer’s
Use
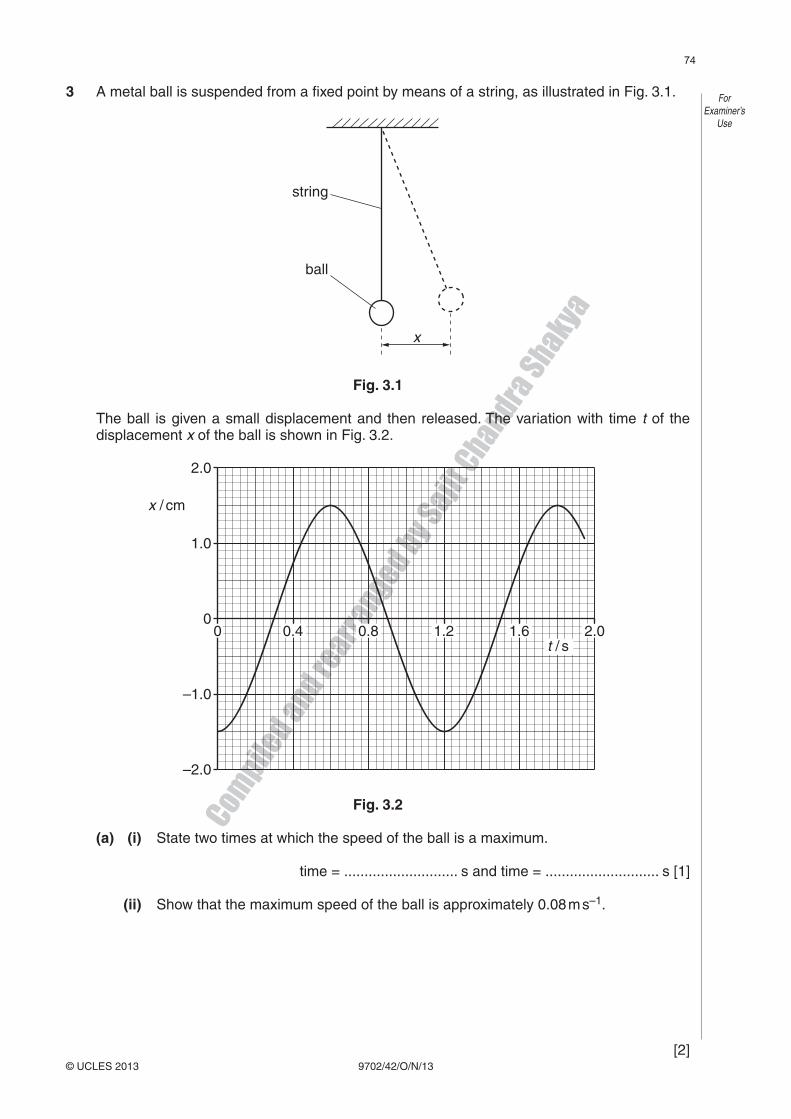
3 A metal ball is suspended from a fixed point by means of a string, as illustrated in Fig. 3.1.
x
ball
string
Fig. 3.1
The ball is given a small displacement and then released. The variation with time t of the displacement x of the ball is shown in Fig. 3.2.
0
–1.0
1.0
x / cm
2.0
–2.0
0.40 0.8 1.2 1.6 2.0t / s
Fig. 3.2
(a) (i) State two times at which the speed of the ball is a maximum.
time = ............................ s and time = ............................ s [1]
(ii) Show that the maximum speed of the ball is approximately 0.08 m s–1.
[2]
Compile
d and rearr
anged by S
ajit C
handra Shakya
9702/42/O/N/13© UCLES 2013 [Turn over
ForExaminer’s
Use
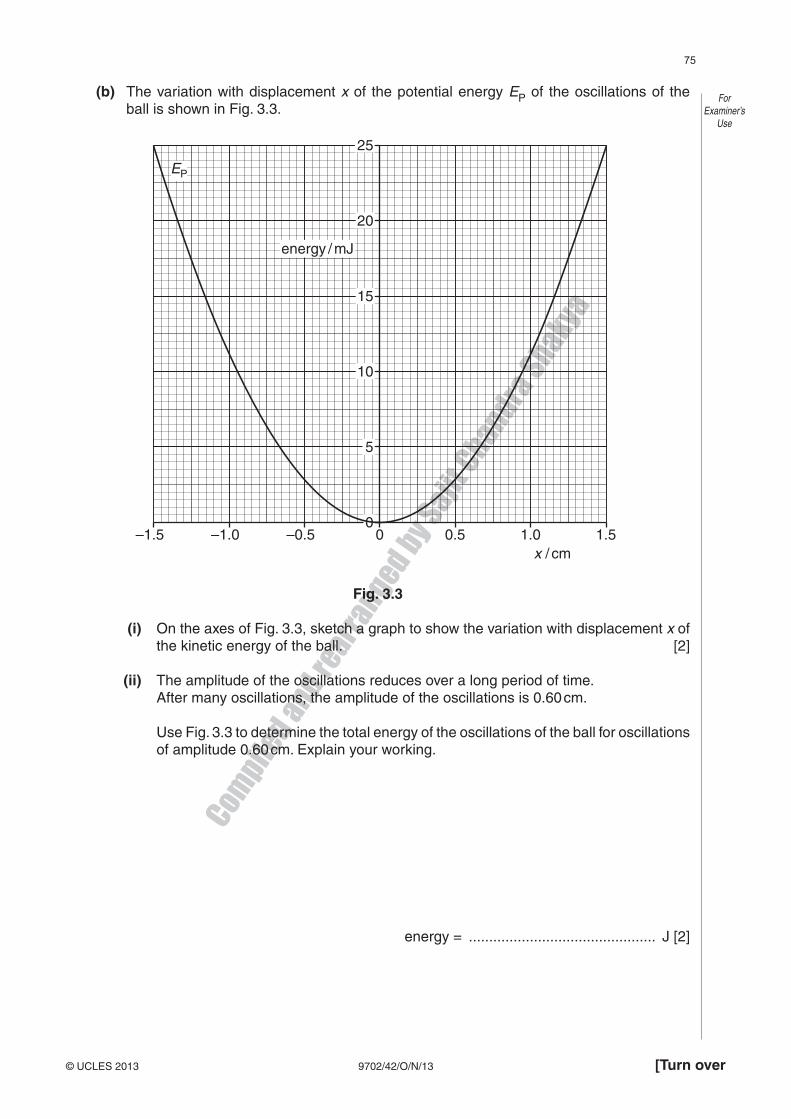
(b) The variation with displacement x of the potential energy EP of the oscillations of the ball is shown in Fig. 3.3.
–1.0–1.5 –0.5 0 0.5 1.0 1.5x / cm
10
5
15
20
25
0
energy / mJ
EP
Fig. 3.3
(i) On the axes of Fig. 3.3, sketch a graph to show the variation with displacement x of the kinetic energy of the ball. [2]
(ii) The amplitude of the oscillations reduces over a long period of time. After many oscillations, the amplitude of the oscillations is 0.60 cm.
Use Fig. 3.3 to determine the total energy of the oscillations of the ball for oscillations of amplitude 0.60 cm. Explain your working.
energy = .............................................. J [2]

Compile
d and rearr
anged by S
ajit C
handra Shakya
9702/42/M/J/14© UCLES 2014
3 A microwave cooker uses electromagnetic waves of frequency 2450 MHz. The microwaves warm the food in the cooker by causing water molecules in the food to oscillate
with a large amplitude at the frequency of the microwaves.
(a) State the name given to this phenomenon.
.............................................................................................................................................. [1]
(b) The effective microwave power of the cooker is 750 W. The temperature of a mass of 280 g of water rises from 25 °C to 98 °C in a time of 2.0 minutes.
Calculate a value for the specific heat capacity of the water.
specific heat capacity = ....................................... J kg−1 K−1 [3]
(c) The value of the specific heat capacity determined from the data in (b) is greater than the accepted value.
A student gives as the reason for this difference: ‘heat lost to the surroundings’.
Suggest, in more detail than that given by the student, a possible reason for the difference.
...................................................................................................................................................
.............................................................................................................................................. [1]

Compile
d and rearr
anged by S
ajit C
handra Shakya
9702/41/M/J/14© UCLES 2014
4 A student investigates the energy changes of a mass oscillating on a vertical spring, as shown in Fig. 4.1.
spring
mass
Fig. 4.1
The student draws a graph of the variation with displacement x of energy E of the oscillation, as shown in Fig. 4.2.
– 1.5 – 1.0 – 0.5x / cm
0 0.5 1.0 1.5
2.0
2.5
1.5
1.0
0.5
0
E / mJ
Fig. 4.2
(a) State whether the energy E represents the total energy, the potential energy or the kinetic energy of the oscillations.
.............................................................................................................................................. [1]

Compile
d and rearr
anged by S
ajit C
handra Shakya
9702/41/M/J/14© UCLES 2014 [Turn over
(b) The student repeats the investigation but with a smaller amplitude. The maximum value of E is now found to be 1.8 mJ.
Use Fig. 4.2 to determine the change in the amplitude. Explain your working.
change in amplitude = .................................................. cm [3]
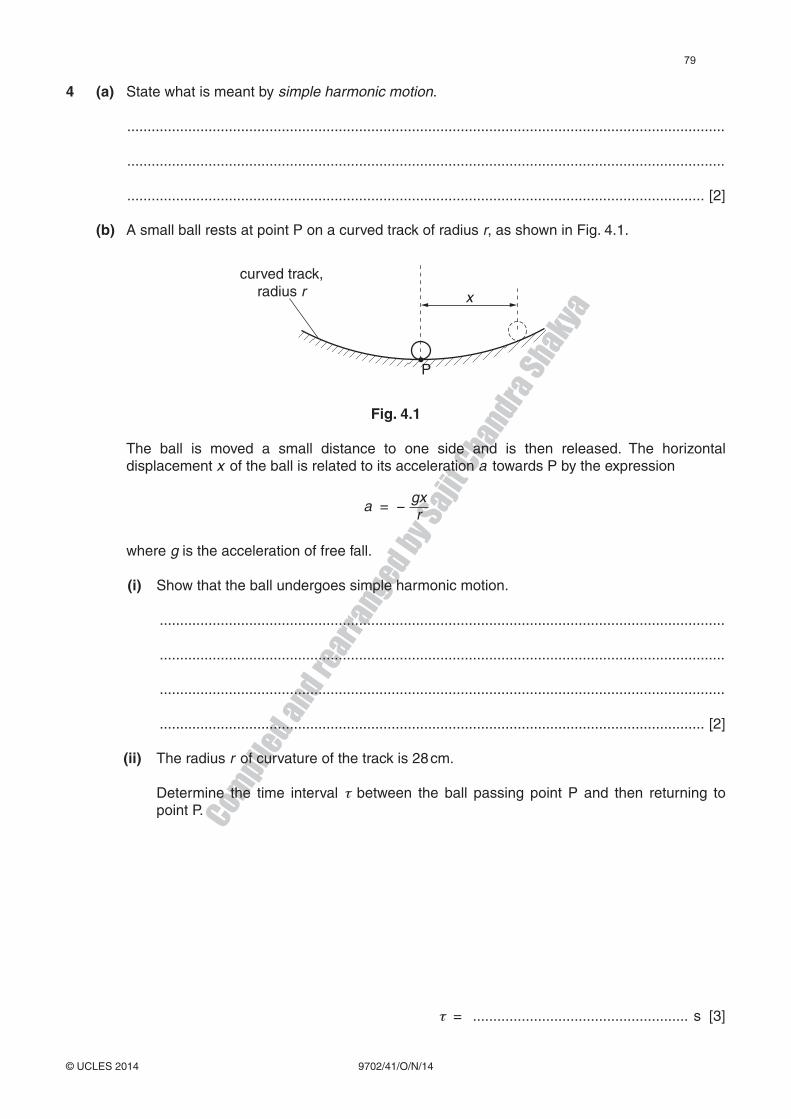
Compile
d and rearr
anged by S
ajit C
handra Shakya
9702/41/O/N/14© UCLES 2014
4 (a) State what is meant by simple harmonic motion.
...................................................................................................................................................
...................................................................................................................................................
.............................................................................................................................................. [2]
(b) A small ball rests at point P on a curved track of radius r, as shown in Fig. 4.1.
x
P
curved track,radius r
Fig. 4.1
The ball is moved a small distance to one side and is then released. The horizontal displacement x of the ball is related to its acceleration a towards P by the expression
a = − gxr
where g is the acceleration of free fall.
(i) Show that the ball undergoes simple harmonic motion.
...........................................................................................................................................
...........................................................................................................................................
...........................................................................................................................................
...................................................................................................................................... [2]
(ii) The radius r of curvature of the track is 28 cm.
Determine the time interval between the ball passing point P and then returning to point P.
= ..................................................... s [3]
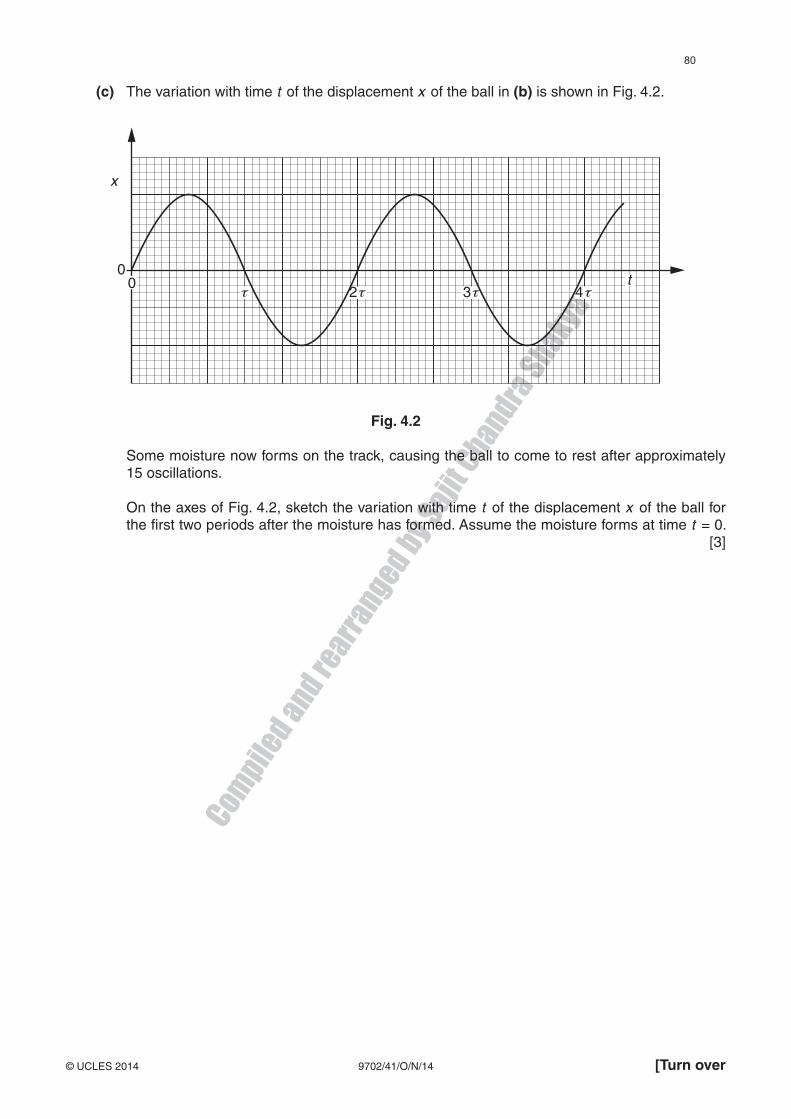
Compile
d and rearr
anged by S
ajit C
handra Shakya
9702/41/O/N/14© UCLES 2014 [Turn over
(c) The variation with time t of the displacement x of the ball in (b) is shown in Fig. 4.2.
2 t
00
3 t 4 tt
x
Fig. 4.2
Some moisture now forms on the track, causing the ball to come to rest after approximately 15 oscillations.
On the axes of Fig. 4.2, sketch the variation with time t of the displacement x of the ball for the first two periods after the moisture has formed. Assume the moisture forms at time t = 0. [3]
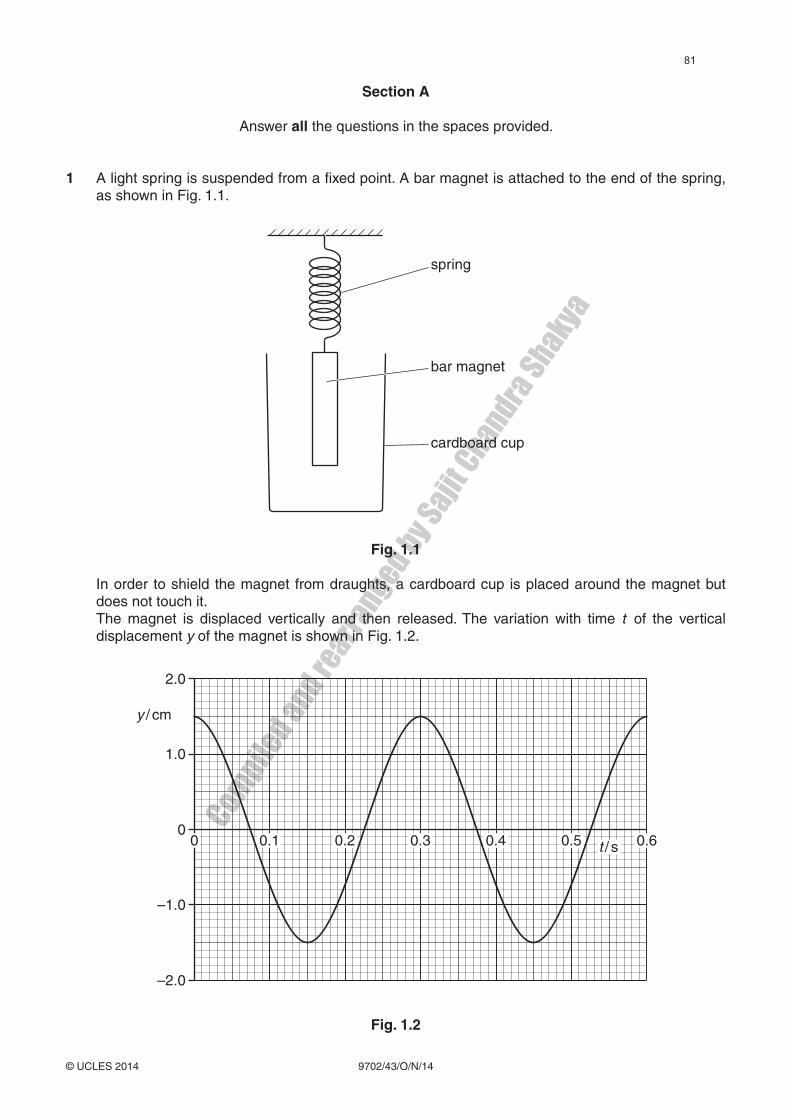
Compile
d and rearr
anged by S
ajit C
handra Shakya
9702/43/O/N/14© UCLES 2014
Section A
Answer all the questions in the spaces provided.
1 A light spring is suspended from a fixed point. A bar magnet is attached to the end of the spring, as shown in Fig. 1.1.
spring
bar magnet
cardboard cup
Fig. 1.1
In order to shield the magnet from draughts, a cardboard cup is placed around the magnet but does not touch it.
The magnet is displaced vertically and then released. The variation with time t of the vertical displacement y of the magnet is shown in Fig. 1.2.
2.0
1.0
y / cm
0
–2.0
–1.0
0 0.1 0.2 0.3 0.4 0.5 0.6t / s
Fig. 1.2

Compile
d and rearr
anged by S
ajit C
handra Shakya
9702/43/O/N/14© UCLES 2014 [Turn over
The mass of the magnet is 130 g.
(a) For the oscillations of the magnet, use Fig. 1.2 to
(i) determine the angular frequency ,
= ............................................. rad s−1 [2]
(ii) show that the maximum kinetic energy of the oscillating magnet is 6.4 mJ.
[2]
(b) The cardboard cup is now replaced with a cup made of aluminium foil. During 10 complete oscillations of the magnet, the amplitude of vibration is seen to decrease
to 0.75 cm from that shown in Fig. 1.2. The change in angular frequency is negligible.
(i) Use Faraday’s law of electromagnetic induction to explain why the amplitude of the oscillations decreases.
...........................................................................................................................................
...........................................................................................................................................
...........................................................................................................................................
...........................................................................................................................................
...................................................................................................................................... [3]

Compile
d and rearr
anged by S
ajit C
handra Shakya
9702/43/O/N/14© UCLES 2014
(ii) Show that the loss in energy of the oscillating magnet is 4.8 mJ.
[2]
(c) The mass of the aluminium cup in (b) is 6.2 g. The specific heat capacity of aluminium is 910 J kg−1 K−1.
The energy in (b)(ii) is transferred to the cup as thermal energy. Calculate the mean rise in temperature of the cup.
temperature rise = ..................................................... K [2]
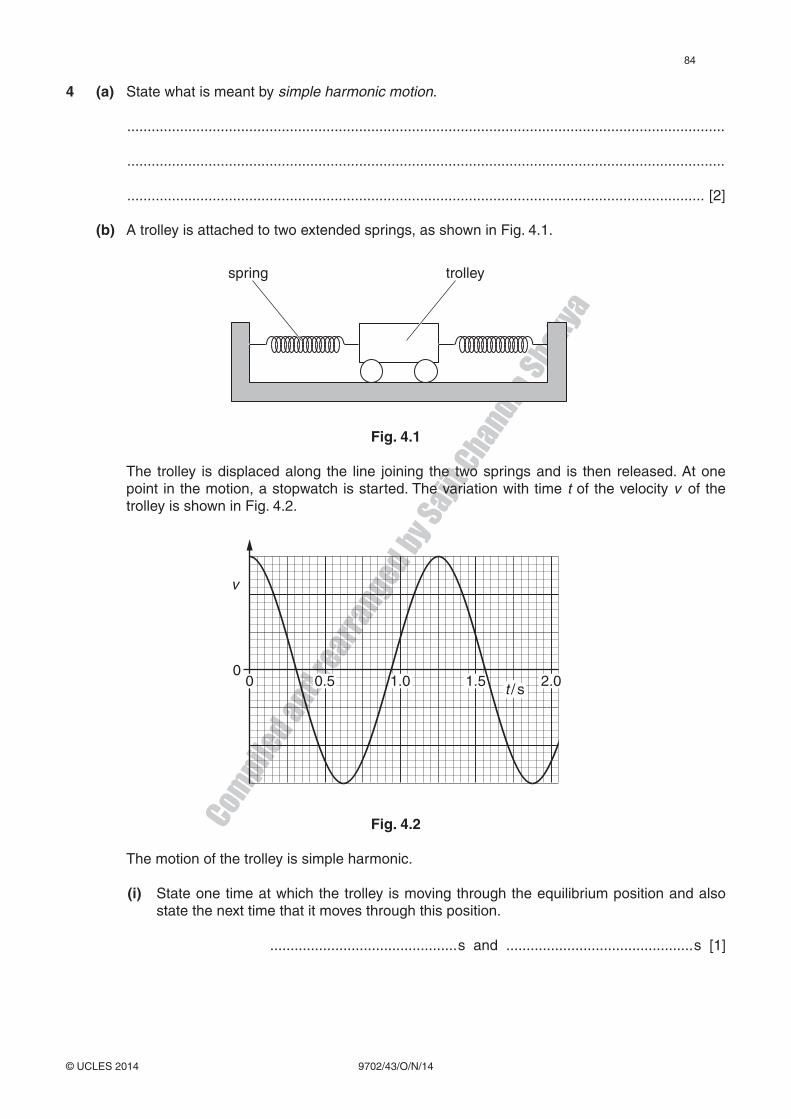
Compile
d and rearr
anged by S
ajit C
handra Shakya
9702/43/O/N/14© UCLES 2014
4 (a) State what is meant by simple harmonic motion.
...................................................................................................................................................
...................................................................................................................................................
.............................................................................................................................................. [2]
(b) A trolley is attached to two extended springs, as shown in Fig. 4.1.
spring trolley
Fig. 4.1
The trolley is displaced along the line joining the two springs and is then released. At one point in the motion, a stopwatch is started. The variation with time t of the velocity v of the trolley is shown in Fig. 4.2.
v
t / s0
0 0.5 1.0 1.5 2.0t / s
Fig. 4.2
The motion of the trolley is simple harmonic.
(i) State one time at which the trolley is moving through the equilibrium position and also state the next time that it moves through this position.
.............................................. s and .............................................. s [1]
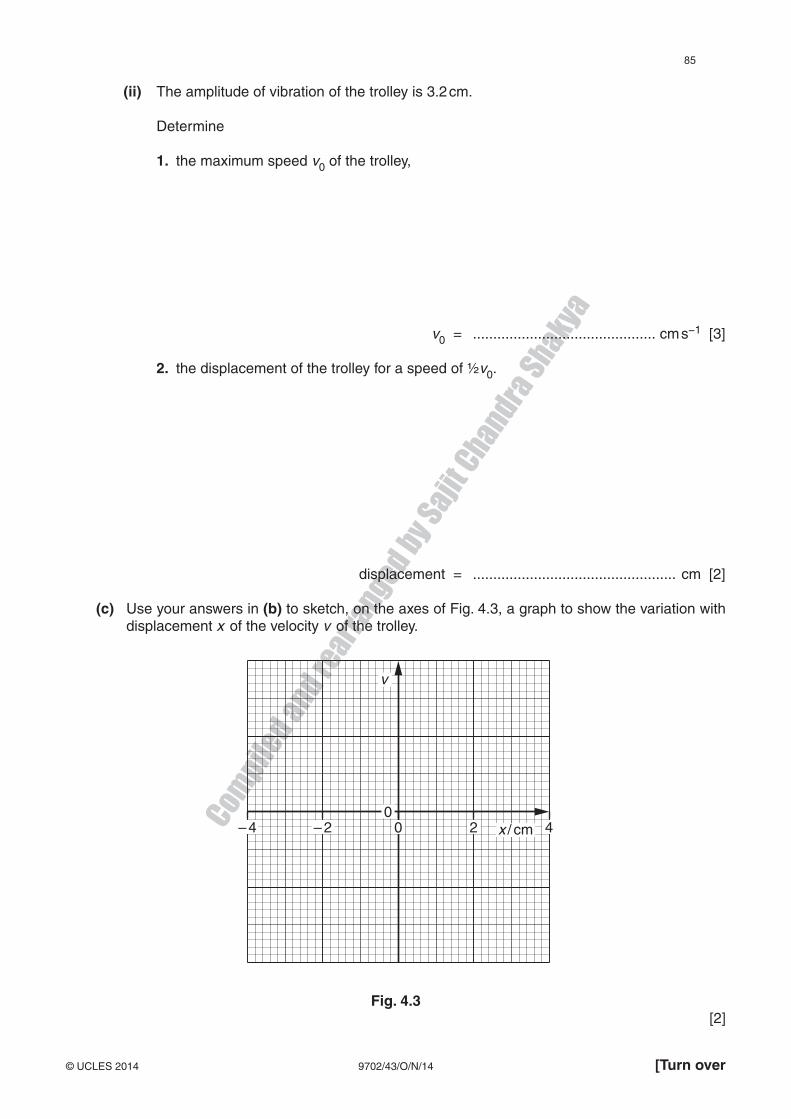
Compile
d and rearr
anged by S
ajit C
handra Shakya
9702/43/O/N/14© UCLES 2014 [Turn over
(ii) The amplitude of vibration of the trolley is 3.2 cm.
Determine
1. the maximum speed v0 of the trolley,
v0 = ............................................. cm s−1 [3]
2. the displacement of the trolley for a speed of ½v0.
displacement = .................................................. cm [2]
(c) Use your answers in (b) to sketch, on the axes of Fig. 4.3, a graph to show the variation with displacement x of the velocity v of the trolley.
00
2 4– 2– 4
v
x / cm
Fig. 4.3 [2]
Related Documents