Authors: J. Eliasson, Y. Eriksson, D. Holmström, F. Nilsson, F. Ojala Tutors: C. Hulteberg, H. T. Karlsson, J Liedberg Lund University, Faculty of Engineering June 4, 2009 Reduction of Continuous Ammonia Emission in a Urea Plant Finishing Section

Welcome message from author
This document is posted to help you gain knowledge. Please leave a comment to let me know what you think about it! Share it to your friends and learn new things together.
Transcript
Authors:
J. Eliasson, Y. Eriksson, D. Holmström,
F. Nilsson, F. Ojala
Tutors:
C. Hulteberg, H. T. Karlsson,
J Liedberg
Lund University,
Faculty of Engineering
June 4, 2009
Reduction of Continuous Ammonia Emission in a Urea
Plant Finishing Section

Disclaimer
This report was prepared as a project in the course ”Feasibility Studies on Industrial Plants, (KET050)”,
Department of Chemical Engineering, Lund University, Faculty of Engineering (LTH), Sweden in cooperation
with the Dutch company Stamicarbon. Neither Lund University nor the authors of this report or Stamicarbon
may be held responsible for the effects following from using the information in this report. Nor the authors,
Lund University or Stamicarbon makes any warranty, expressed or implied, or assumes any legal liability or
responsibility for the accuracy or completeness of this information. No reproduction is authorised without the
written permission from the authors, or Stamicarbon or Lund University.
© Johanna Eliasson, Ylva Eriksson, David Holmström, Filip Nilsson, Frida Ojala - 2009
i
Summary
A study was conducted, assigned by Stamicarbon (one of the world’s leading urea process
licensors) on how to reduce ammonia emissions from the finishing section of urea production.
The aim was to achieve a reduction of ammonia by one order of magnitude in an airstream
containing 100 mg ammonia per Nm3 air. Constraints on the solution were set by
Stamicarbon. The resulting proposal should be economically viable, not lead to another
polluting stream and should not pollute the already existing water-urea stream.
The three main approaches on how to solve the problem were:
flashing off the ammonia before the granulation step
injecting a larger amount of monohydroxymethylurea to react with the ammonia
adsorbing the urea in the airstream using activated carbon or zeolites
A calculation showed that flashing off ammonia from the urea melt was impossible using the
data given. Injection of monohydroxymethylurea was already conducted to some extent, why
optimisation was difficult to achieve without full scale experiments.
Focus was set on removal of ammonia through adsorption using activated carbon or zeolites.
In the proposed solution, adsorbents are injected in the airstream and separated using a
baghouse filter. The baghouse filter also separates the urea dust from the airstream, why the
solution leads to a replacement of the scrubbers.
After the separation of adsorbent and urea from the airstream, the urea needs to be dissolved
in water along with the ammonia. For this purpose a tank with an agitator is used. The solid
adsorbent will be separated from the urea and ammonia mixture in a disc or drum filter. A
part of the effluent stream from the filter will be recirculated back to the dissolution tank to
increase the concentration and lower the required amount of fresh water. The rest of the
mixture will be recycled back to the urea-melt plant. The adsorbent will in turn be injected
back into the airstream. During the start-up, there is a risk for small attritioned adsorbent
particles to pollute the end product, why the effluent stream will not be usable in the urea
plant. After 3-5 days, the attrition has decayed and the plant can be run as normal. The
adsorbent has to be replaced two times in a ten year period.
An economic evaluation of the proposed process has shown that the total cost of this solution
in a new urea plant will be 0.5 €/ton urea in the zeolite case and 1.7 €/ton urea in the activated
carbon case. When applying this solution to an existing plant, the cost will be 2.3 €/ton urea in
the zeolite case and 3.4 €/ton urea in the activated carbon case. Due to the zeolites’ superior
adsorption capacity and economical advantages it is the adsorbent of choice for this process.
The chosen zeolite is type 13X.
The proposed process complies with all constraints set up by Stamicarbon. It removes close to
95 % of the ammonia and 99 % of the urea. It does not produce another polluting stream and
is proven to be economically viable.

ii
iii
Contents
1 Introduction .................................................................................................. 1
2 Background ................................................................................................... 1
2.1 Problem Definition .................................................................................................... 3
2.2 Urea ............................................................................................................................. 3
2.3 Ammonia .................................................................................................................... 3
3 Technologies for Removal of Ammonia ..................................................... 4
3.1 Flashing of Ammonia in the Urea Melt ................................................................... 5
3.1.1 Results .................................................................................................................. 6
3.1.2 Summary of Flashing Technology ....................................................................... 7
3.2 Addition of Monohydroxymethylurea to the Urea Melt ........................................ 7
3.2.1 Results .................................................................................................................. 8
3.2.2 Summary of Adding Monohydroxymethylurea ................................................... 8
3.3 Adsorption .................................................................................................................. 8
3.3.1 Adsorption Models ............................................................................................... 9
3.3.2 Activated Carbon ................................................................................................ 11
3.3.2.1 Production and Structure of Activated Carbon .......................................... 11
3.3.2.2 Properties of Activated Carbon .................................................................. 11
3.3.2.3 Ammonia Removal ...................................................................................... 12
3.3.2.4 Regenerating the Activated Carbon ............................................................ 12
3.3.3 Zeolites ............................................................................................................... 12
3.3.3.1 Production and Structure of Zeolites .......................................................... 13
3.3.3.2 Properties of Zeolites .................................................................................. 13
3.3.3.3 Ammonia Removal ...................................................................................... 14
3.3.3.4 Regenerating Zeolites ................................................................................. 14
3.3.4 Summary of Adsorption ..................................................................................... 15
3.4 Summary of Technologies for Removal ................................................................. 15
4 Process Proposals ........................................................................................ 16
4.1 Airstream Cooling and Adsorbent Injection ......................................................... 16
4.2 Solid-Gas Separation ............................................................................................... 16
4.2.1 Baghouse Filter .................................................................................................. 17
4.2.2 Cyclone ............................................................................................................... 18
4.2.3 Summary ............................................................................................................ 18
4.3 Desorption ................................................................................................................ 19
iv
4.4 Solid-Liquid Separation .......................................................................................... 19
4.4.1 Drum Filter ......................................................................................................... 19
4.4.2 Rotary Disc Filter ............................................................................................... 20
4.4.3 Filtration Centrifuges ......................................................................................... 21
4.4.3.1 Reciprocal Pusher Centrifuge ..................................................................... 21
4.4.3.2 Effectiveness of Filtration Separation ........................................................ 21
4.4.3.3 Sedimentation Centrifuges .......................................................................... 22
4.4.3.4 Vertical Bowl Centrifuge ............................................................................ 22
4.4.3.5 Horizontal Bowl Centrifuges ...................................................................... 23
4.4.3.6 Effectiveness of Sedimentation Separation ................................................. 23
4.4.4 Filter Media ........................................................................................................ 23
4.4.5 Summary ............................................................................................................ 24
5 Selected Process .......................................................................................... 24
5.1 Description of Selected Process .............................................................................. 24
5.2 Loss of Adsorbent .................................................................................................... 26
5.2.1 Loss of Adsorbent in the Baghouse Filter .......................................................... 27
5.2.2 Loss of Zeolites in the Disc/Drum Filter ............................................................ 27
5.3 Process Design .......................................................................................................... 28
5.3.1 Material Balances ............................................................................................... 28
5.3.1.1 Without Recirculation ................................................................................. 29
5.3.1.2 With Recirculation ...................................................................................... 30
5.3.1.3 Heat of Urea Solution in the Dissolution Tank ........................................... 30
5.4 Risk Assessment ....................................................................................................... 30
5.4.1 Baghouse Filter Failure ...................................................................................... 31
5.4.2 Disc/Drum Filter Failure .................................................................................... 31
5.4.3 Regeneration of Zeolites .................................................................................... 31
5.5 Process Economy ..................................................................................................... 32
5.5.1 Investment Costs ................................................................................................ 32
5.5.2 Operating Costs .................................................................................................. 34
5.5.3 Sensitivity Analysis ............................................................................................ 34
5.5.4 Summary of the Economical Evaluation ............................................................ 35
6 Conclusions ................................................................................................. 36
7 Acknowledgements ..................................................................................... 37
8 References.................................................................................................... 38
v
Appendix 1 – Calculations of Streams
Appendix 2 – Results From Mass Balance Calculations
Appendix 3 – Economical Calculations
Appendix 4 – Sensitivity Analysis

vi
vii
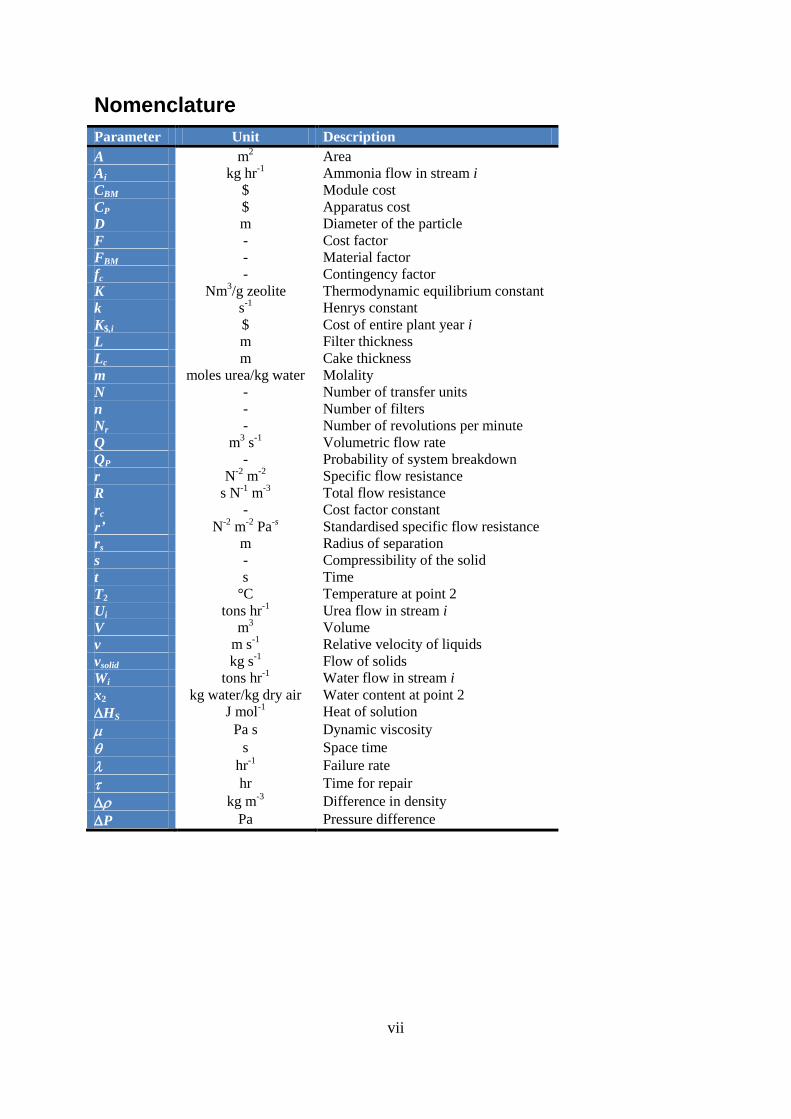
Nomenclature
Parameter Unit Description
A m2
Area
Ai kg hr-1
Ammonia flow in stream i
CBM $ Module cost
CP $ Apparatus cost
D m Diameter of the particle
F - Cost factor
FBM - Material factor
fc - Contingency factor
K Nm3/g zeolite Thermodynamic equilibrium constant
k s-1
Henrys constant
K$,i $ Cost of entire plant year i
L m Filter thickness
Lc m Cake thickness
m moles urea/kg water Molality
N - Number of transfer units
n - Number of filters
Nr - Number of revolutions per minute
Q m3 s
-1 Volumetric flow rate
QP - Probability of system breakdown
r N-2
m-2
Specific flow resistance
R s N-1
m-3
Total flow resistance
rc - Cost factor constant
r’ N-2
m-2
Pa-s
Standardised specific flow resistance
rs m Radius of separation
s - Compressibility of the solid
t s Time
T2 °C Temperature at point 2
Ui tons hr-1
Urea flow in stream i
V m3
Volume
v m s-1
Relative velocity of liquids
vsolid kg s-1
Flow of solids
Wi tons hr-1
Water flow in stream i
x2 kg water/kg dry air Water content at point 2
HS J mol-1
Heat of solution
Pa s Dynamic viscosity
s Space time
hr-1
Failure rate
hr Time for repair
kg m-3
Difference in density
P Pa Pressure difference

viii
1
1 Introduction It is a well known fact that the air around the world is subject to pollution of all sorts of
substances, for example ammonia. High levels of emissions lead to acidification and are
unpleasant to the environment (Gang, 2002, p. 2). In order to handle environmental problems,
restrictions are set on emissions and use of ammonia.
Another well known fact is the growing world population and with that, the increasing
demands of crops and fertile soils. To meet these demands, fertiliser producers increase their
production and hence, their air emissions. A fertiliser producing facility emits hundreds of
tons of ammonia every year. Due to tighter restrictions and ceilings for emissions, fertiliser
producers are forced to find solutions to decreasing the emissions. At present, the urea
industry produces large airstreams with low ammonia concentrations. Because of these low
concentrations it is difficult to find a solution which does not lead to undesired by-products or
another polluting stream.
This study is an assignment appointed by Stamicarbon, one of the world’s leading urea
process licensors. The case studied is a facility with an exhaust rate of 750 000 Nm3 air per
hour, with an ammonia concentration of around 100 mg/Nm3. To reduce the impact on the
environment at Stamicarbon’s facilities, the aim of this study is to find a solution which
decreases the ammonia content in the exhaust air with at least 90 %, to less than 10 mg/Nm3.
The solution shall include process design for the most promising option, as well as estimated
capital and operating costs and hence an economic and technical feasibility analysis.
Demands on the final proposal were set by Stamicarbon. The constraints are:
The proposed solution should be economically viable. The total extra cost per ton
urea must not exceed 5 €.
The technology proposed should not produce another polluting stream.
Contamination of the aqueous urea solution recycle flow from the urea dust
scrubbers to the urea melt plant is not acceptable.
The first part of the study describes the background of urea production and ammonia. The
second part is a comparison between three possible solutions, which are a result of a
brainstorming session, performed in conjunction with Stamicarbon. Finally the most
promising solution to remove the ammonia is chosen and further developed.
2 Background Urea is produced from the slightly exothermic (-101.5 kJ/mol) equilibrium reaction between
carbon dioxide and ammonia:
Non-converted ammonia and carbon dioxide is either recycled or used in other processes
(Stamicarbon, 2009). After the reaction step, the solution is evaporated to concentrate the urea
melt to 98.5 wt % urea. The transport section to the finishing step is carried out at high
temperatures, around 140 ºC, to prevent the melt to solidify. At these high temperatures urea
breaks down to ammonia and biuret according to the following reaction (Meessen, 1996, pp.
334):
NH3
CO2
NH2
O
NH2
OH22 + +
2
The content of biuret in the end-product must not be higher than 1 % (Meessen, 2009). The
ammonia resulting from the breakdown will be transferred to the gas phase in the finishing
step, which, according to Meessen (1996, p. 350), is the major cause of the ammonia
emissions. The focus in this study will therefore be on the finishing section.
Another side reaction that can occur is the hydrolysis reaction of urea. This is the reversed
reaction of the urea formation. This reaction is temperature dependent making it important to
keep the urea away from high temperatures for long periods of time (Meessen J. , 1996, p.
343).
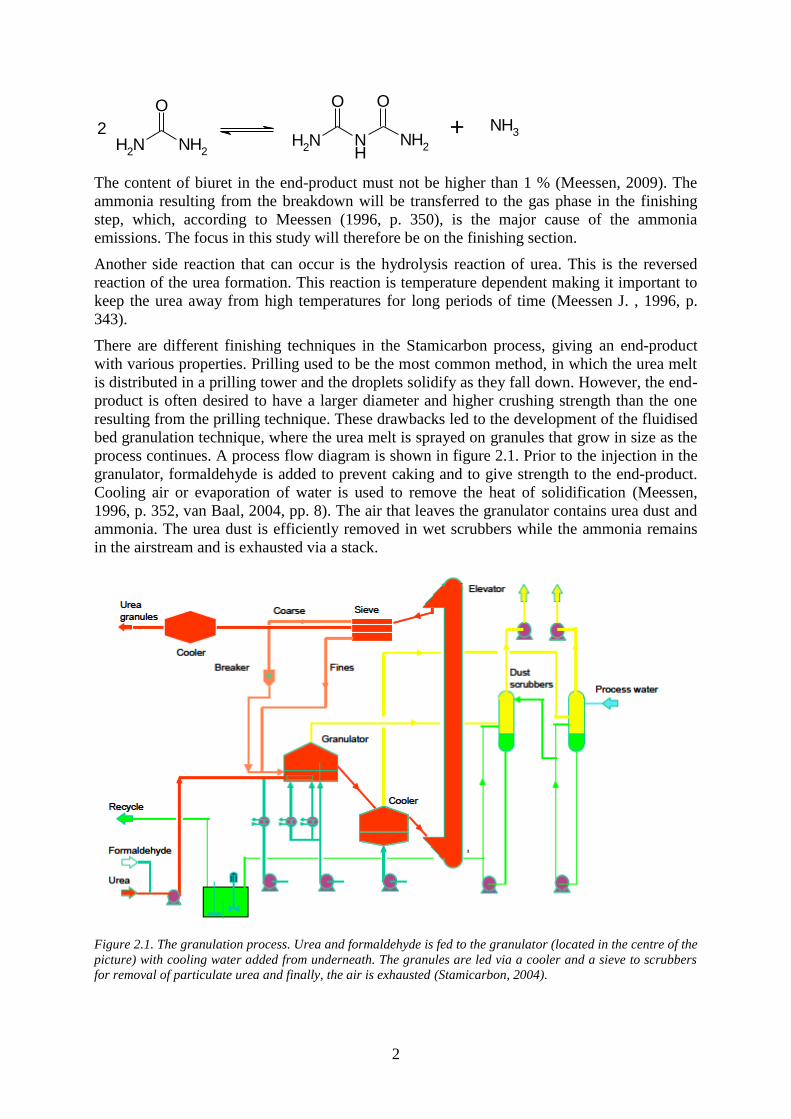
There are different finishing techniques in the Stamicarbon process, giving an end-product
with various properties. Prilling used to be the most common method, in which the urea melt
is distributed in a prilling tower and the droplets solidify as they fall down. However, the end-
product is often desired to have a larger diameter and higher crushing strength than the one
resulting from the prilling technique. These drawbacks led to the development of the fluidised
bed granulation technique, where the urea melt is sprayed on granules that grow in size as the
process continues. A process flow diagram is shown in figure 2.1. Prior to the injection in the
granulator, formaldehyde is added to prevent caking and to give strength to the end-product.
Cooling air or evaporation of water is used to remove the heat of solidification (Meessen,
1996, p. 352, van Baal, 2004, pp. 8). The air that leaves the granulator contains urea dust and
ammonia. The urea dust is efficiently removed in wet scrubbers while the ammonia remains
in the airstream and is exhausted via a stack.
Figure 2.1. The granulation process. Urea and formaldehyde is fed to the granulator (located in the centre of the
picture) with cooling water added from underneath. The granules are led via a cooler and a sieve to scrubbers
for removal of particulate urea and finally, the air is exhausted (Stamicarbon, 2004).
NH2
O
NH2
NH2
O
NH
O
NH2
NH32 +
3
2.1 Problem Definition
The air emissions from the facility contains low concentration of ammonia, but since the
airstreams are in the range of 750 000 Nm3/h, the actual amounts of ammonia will be around
75 kg/h. A frequently used method for ammonia removal is wet scrubbers, although it is not
applicable because of this low concentration of 100 mg/Nm3. According to the constraints
given by Stamicarbon, production of by-products is not accepted, which eliminates other
considered solutions such as acid scrubbing with sulphuric acid. The by-product in this case
could be sold as a fertiliser. However, Stamicarbon’s market is urea-fertiliser, and a sulphuric
fertiliser is not of interest.
Other solutions, listed below, are considered by Stamicarbon as non-solutions. These
alternatives are not further investigated in this study:
formaldehyde scrubbing
flaring
selective catalytic reduction
CO2 recycle by circulation
The problem can be summarised into finding a solution that reduces the low concentration of
ammonia in a large airstream with one order of magnitude. Since techniques for handling
water-ammonia solutions already exist at urea plants an optimal solution would be to dissolve
the ammonia in water. If the biuret-ammonia formation before the granulation could be
prevented, the problem would also be solved.
2.2 Urea
The nitrogen containing compound urea occurs in mammal’s urine as a breakdown product of
the metabolism (Encyclopedia Britannica, 2009). It is also a useful industrial chemical; the
world-wide production is in the range of 100 mega tons per year, over 90 % of it is used in the
production of fertilisers. The nitrogen in the urea is readily converted into ammonia in soil
and it can thus be used as an effective fertiliser. The ammonium form of nitrogen is better
retained in the soil than the nitrate form and is therefore less capable of leaching
(Stamicarbon, 2009). Other applications for urea are melamine production, feed supplement
and manufacturing of adhesives and moulding powders (Meessen, 1996, p. 354, Stamicarbon,
2009).
The urea structure is shown in figure 2.2. Pure urea is normally in the form of white,
odourless “needles”. It has a melting point of nearly 133 ˚C, why the urea melt in the
Stamicarbon process needs to be of a relatively high temperature in the liquid phase. When
heated, urea also decomposes leading to ammonia in the gas phase above the urea solution
(Meessen, 1996, pp. 334).
Figure 2.2. Urea structure.
2.3 Ammonia
Ammonia is a compound consisting of nitrogen and hydrogen according to figure 2.3. It
occurs in nature in the form of ammonium salts which is essential for the growth of plants
(Appl, 2006). However, ammonia also leads to the acidification of the environment by the
4
reaction with acidic aerosols and formation of nitric acid, causing acidic decomposition
(Gang, 2002, p. 2, Petit et al., 2008, p. 3033). Besides this it can be harmful to humans; it is
irritating to the skin, has an irritant smell and can dissolve cellular proteins (Appl, 2006, Petit
et al., 2007, p. 12705, Gang, 2002, p. 2).
Figure 2.3. The structure of ammonia.
The world production of ammonia in 2005 exceeded 168 Mtons (Appl, 2006). As an
industrial chemical it is used in the synthesis of urea, fertilisers, nitric acid and plastics among
others (Helminen et al., 2000, p. 1541). Although, Gang (2002, p. 2) states that the emissions
to the environment, to a great extent, are contributed by farming and livestock manure.
According to the EU there are emission ceilings for the nations regarding ammonia emissions
(European Union, 2001). For the 15 European countries named EC 151 the total emission
ceiling, to be reached 2010, are 3.11 Mtons. Every nation is assigned with its own restrictions;
among them The Netherlands has a ceiling of 128 ktons and Sweden 57 ktons. Sweden’s
emissions of ammonia in 2007 were just over 50 ktons (Naturvårdsverket, 2009).
Ammonia possesses the same electron configuration as water and similar bond angles and
hence, water and ammonia have similar behaviour. This is also a reason for ammonia being
very soluble in water. In aqueous solutions ammonia is a weak base, the equilibrium with the
corresponding ammonium ion (NH4+) is, under normal conditions, strongly shifted to the side
of free ammonia (Appl, 2006).
3 Technologies for Removal of Ammonia In the beginning of this project, several ideas for a solution on how to remove the ammonia
were discussed in a brainstorming session. The main ideas were to:
Flashing off the ammonia before the nozzle in the granulator.
Inject monohydroxymethylurea instead of formaldehyde before the nozzle.
Adsorb the ammonia in the airstream by using activated carbon or zeolites.
Use catalysis to oxidize the ammonia.
Recirculate the air to obtain a higher concentration of ammonia.
Use bio-degradation to remove the ammonia.
Use membrane filtration in either the liquid or the gas phase.
While the three first ideas were considered interesting for further studies, the last four were
discarded without study. The reason for rejecting catalytic removal of ammonia is the lack of
time for performance of scale tests and doubts of finding the proper catalyst. When it comes
to recirculation of the air, the modifications of the plant would result in high costs and
extensive maintenance to keep the conditions airtight. There is also the problem with the
build-up of ammonia in the recirculated air and the removal of such. As for the last two
alternatives, membranes and bio-degradation, the flows are considered to be too great for
these proposals to work.
1 Including Austria, Belgium, Denmark, Finland, France, Germany, Greece, Ireland, Italy, Luxembourg,
Netherlands, Portugal, Spain, Sweden, UK.
5
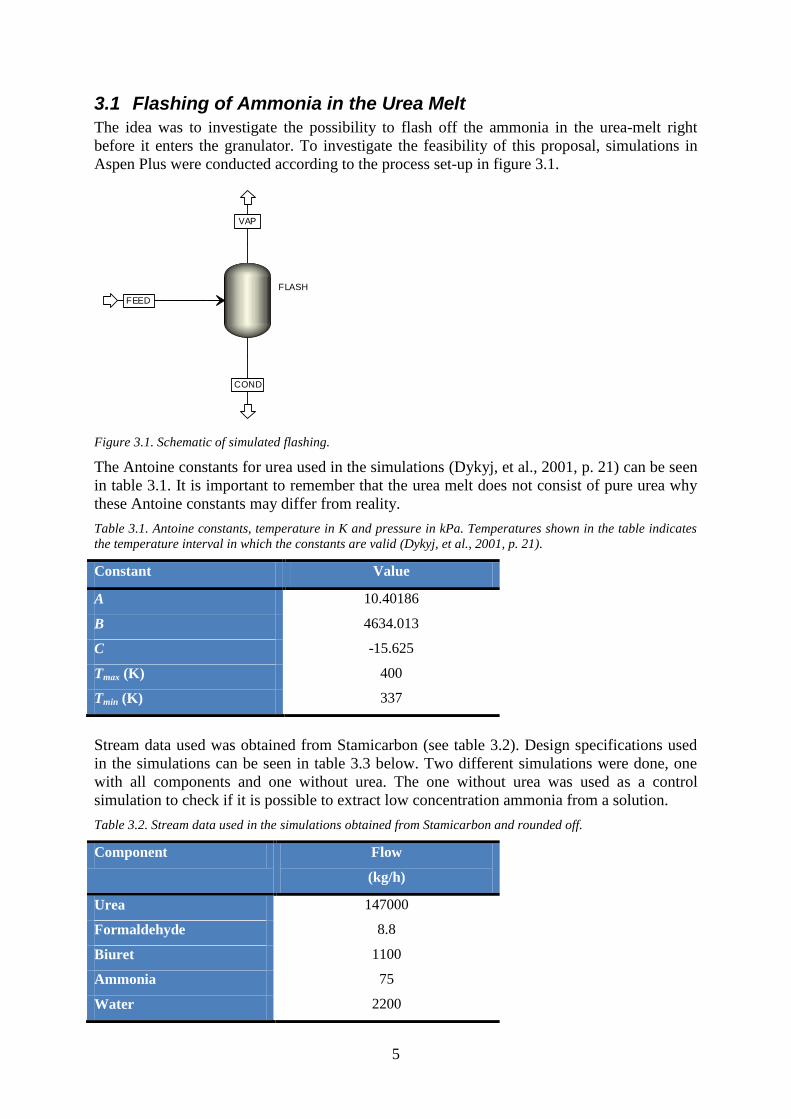
3.1 Flashing of Ammonia in the Urea Melt
The idea was to investigate the possibility to flash off the ammonia in the urea-melt right
before it enters the granulator. To investigate the feasibility of this proposal, simulations in
Aspen Plus were conducted according to the process set-up in figure 3.1.
Figure 3.1. Schematic of simulated flashing.
The Antoine constants for urea used in the simulations (Dykyj, et al., 2001, p. 21) can be seen
in table 3.1. It is important to remember that the urea melt does not consist of pure urea why
these Antoine constants may differ from reality.
Table 3.1. Antoine constants, temperature in K and pressure in kPa. Temperatures shown in the table indicates
the temperature interval in which the constants are valid (Dykyj, et al., 2001, p. 21).
Constant Value
A 10.40186
B 4634.013
C -15.625
Tmax (K) 400
Tmin (K) 337
Stream data used was obtained from Stamicarbon (see table 3.2). Design specifications used
in the simulations can be seen in table 3.3 below. Two different simulations were done, one
with all components and one without urea. The one without urea was used as a control
simulation to check if it is possible to extract low concentration ammonia from a solution.
Table 3.2. Stream data used in the simulations obtained from Stamicarbon and rounded off.
Component Flow
(kg/h)
Urea 147000
Formaldehyde 8.8
Biuret 1100
Ammonia 75
Water 2200
FLASH
FEED
VAP
COND
6
Table 3.3. Design specifications of the simulations.
Input Value
Pressure in feed (bar) 10
Pressure in flashtank (bar) 4
Temperature in feed (˚C) 140
Temperature in flashtank (˚C) 135
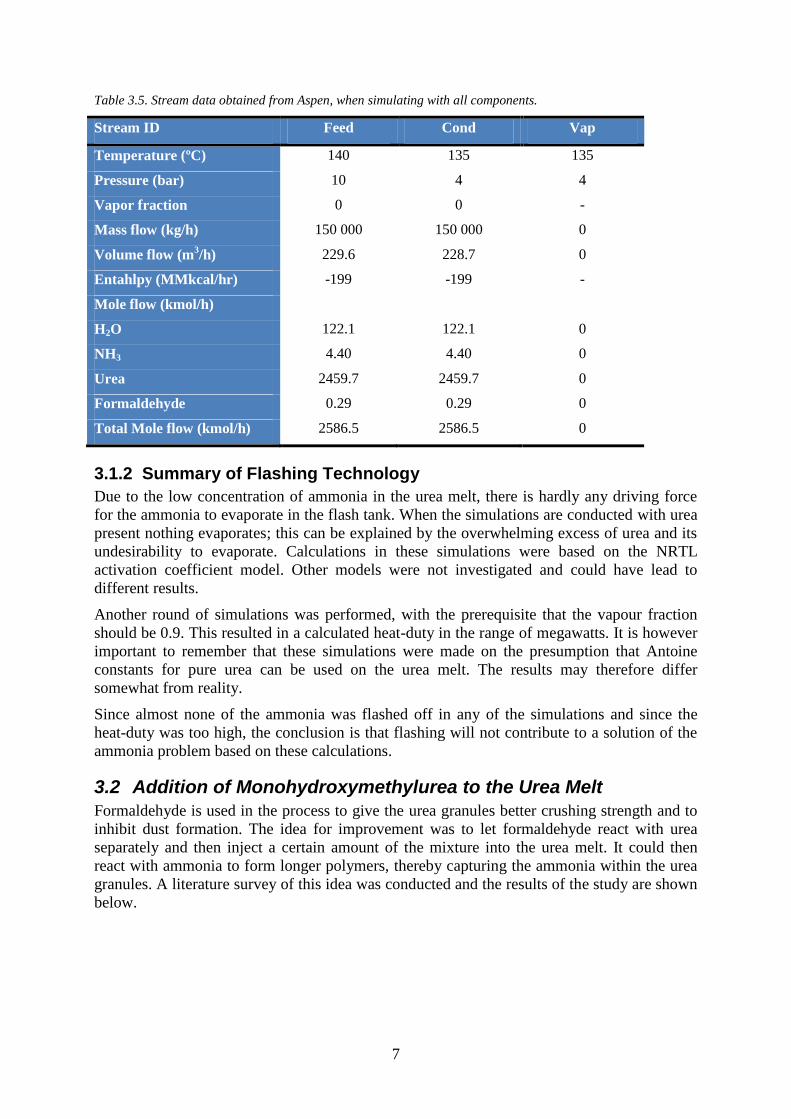
3.1.1 Results
As seen in the table 3.4 below, the results are far from promising. Almost none of the
ammonia could be flashed off when the urea was not present. This leads to the suspicion that
when adding urea, the amount of ammonia flashed off would decrease even further. This is
confirmed in table 3.5.
Table 3.4. Stream data obtained from Aspen, when simulating flash without urea.
Stream ID Feed Cond Vap
Temperature (˚C) 140 135 135
Pressure (bar) 10 4 4
Vapor fraction 0 0 1
Mass flow (kg/h) 2234 2189 45
Volume flow (m3/h) 2.61 2.54 21.22
Entahlpy (MMkcal/hr) -7.93 -7.81 -0.12
Mole flow (kmol/h)
H2O 119.34 117.46 1.88
NH3 4.42 3.89 0.53
Formaldehyde 0.29 0.22 0.07
Total mole flow (kmol/h) 124.05 121.57 2.48
7
Table 3.5. Stream data obtained from Aspen, when simulating with all components.
Stream ID Feed Cond Vap
Temperature (ºC) 140 135 135
Pressure (bar) 10 4 4
Vapor fraction 0 0 -
Mass flow (kg/h) 150 000 150 000 0
Volume flow (m3/h) 229.6 228.7 0
Entahlpy (MMkcal/hr) -199 -199 -
Mole flow (kmol/h)
H2O 122.1 122.1 0
NH3 4.40 4.40 0
Urea 2459.7 2459.7 0
Formaldehyde 0.29 0.29 0
Total Mole flow (kmol/h) 2586.5 2586.5 0
3.1.2 Summary of Flashing Technology
Due to the low concentration of ammonia in the urea melt, there is hardly any driving force
for the ammonia to evaporate in the flash tank. When the simulations are conducted with urea
present nothing evaporates; this can be explained by the overwhelming excess of urea and its
undesirability to evaporate. Calculations in these simulations were based on the NRTL
activation coefficient model. Other models were not investigated and could have lead to
different results.
Another round of simulations was performed, with the prerequisite that the vapour fraction
should be 0.9. This resulted in a calculated heat-duty in the range of megawatts. It is however
important to remember that these simulations were made on the presumption that Antoine
constants for pure urea can be used on the urea melt. The results may therefore differ
somewhat from reality.
Since almost none of the ammonia was flashed off in any of the simulations and since the
heat-duty was too high, the conclusion is that flashing will not contribute to a solution of the
ammonia problem based on these calculations.
3.2 Addition of Monohydroxymethylurea to the Urea Melt
Formaldehyde is used in the process to give the urea granules better crushing strength and to
inhibit dust formation. The idea for improvement was to let formaldehyde react with urea
separately and then inject a certain amount of the mixture into the urea melt. It could then
react with ammonia to form longer polymers, thereby capturing the ammonia within the urea
granules. A literature survey of this idea was conducted and the results of the study are shown
below.
8
3.2.1 Results
According to Diem (2005) the simplified reaction between urea and formaldehyde to form
monohydroxymethylurea (also bi- and trihydroxymethylurea) occur as shown below.
This reaction is industrially performed in an alkaline or slightly acidic solution. The product
shown here is only monohydroxymethylurea but bi- and trihydroxymethylurea is also formed.
The enthalpy of the reaction is somewhat exothermic (ΔH = -23 kJ/mol).
When the formed monohydroxymethylurea is allowed to react with ammonia the following
occurs.
This reaction is slightly exothermic (ΔH = -57 kJ/mol). It is important that the reaction is not
allowed to go too far, as ammonia is reformed after a while.
3.2.2 Summary of Adding Monohydroxymethylurea
When asking Stamicarbon about injecting monohydroxymethylurea instead of formaldehyde
the answer was that this is already being done to some extent. This means that to be able to
improve the ammonia consumption, full scale experiments to find the perfect proportions
between the substances is necessary. A major problem with this proposal is that the reaction
rate and equilibrium constants are hard to determine, which leads to an inability to calculate
the optimal reaction time. Without the knowledge of optimal reaction time, the recirculation
rate of the urea melt with the amino-resin mixed in becomes a tiresome empirical exercise.
There is also the question of how the urea granules are affected by changing the molar ratio
between urea and polymer. It is desirable to have as few changes to the end-product as
possible. Because the effects of an increased addition of monohydroxymethylurea are
unknown, the proposal is considered to be risky and therefore undesired.
3.3 Adsorption
A molecule, as a gas or in a liquid solution, can be joined with another solid or liquid media in
two ways: by adsorption or absorption. Adsorption is when a compound (adsorbate) is
attached to a surface (adsorbent) with either physical or chemical bonds. Physical adsorption,
physisorption, is achieved through van der Waal bonds and is weaker than the bonds achieved
through chemisorption. Absorption, on the other hand, is when a compound is taken up in an
absorbing media, attaching to its internality (Encyclopaedia Britannica, 2009).
Adsorbents are materials with a porous structure and a large surface area per weight unit. The
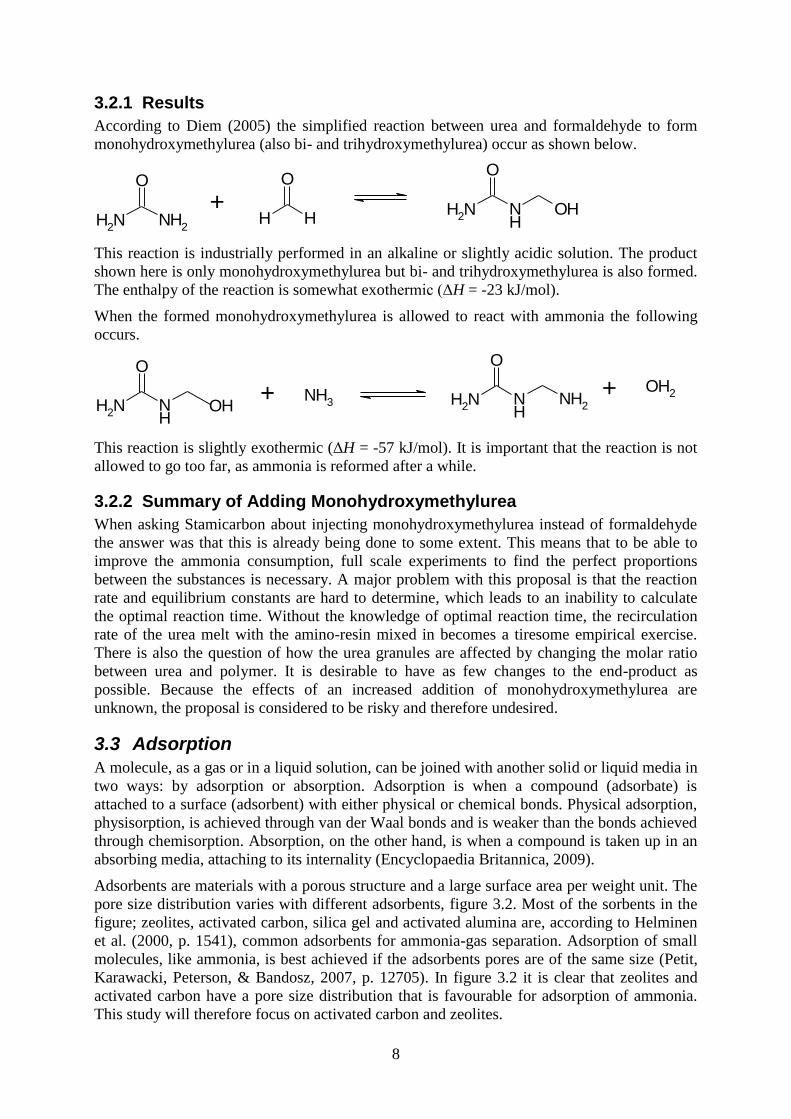
pore size distribution varies with different adsorbents, figure 3.2. Most of the sorbents in the
figure; zeolites, activated carbon, silica gel and activated alumina are, according to Helminen
et al. (2000, p. 1541), common adsorbents for ammonia-gas separation. Adsorption of small
molecules, like ammonia, is best achieved if the adsorbents pores are of the same size (Petit,
Karawacki, Peterson, & Bandosz, 2007, p. 12705). In figure 3.2 it is clear that zeolites and
activated carbon have a pore size distribution that is favourable for adsorption of ammonia.
This study will therefore focus on activated carbon and zeolites.
NH2NH2
O
H H
O
NH2
O
NH
OH+
NH2
NH
O
OHNH
3 NH2
NH
O
NH2
OH2+ +
9
Figure 3.2. Pore size distribution for different adsorbents (Yang, 2003).
An alternative to using activated carbons or zeolites could be to search for a patented solution,
developed to fit the exact conditions at the Stamicarbon facilities. A company called Purafil
Inc. is an American company that is specialised on air filtration media. One of their products,
Purakol AM, is an adsorption media that removes ammonia from gas by chemisorption. In an
interview, a laboratory worker stated that the product is suited to much smaller applications
with lower concentrations in gas streams in the range of 10 000 m3 per hour. Also, it is not
possible to regenerate the product; it is usually sent to landfill (Purafil, 2009). The conclusion
of the interview is that the product is not an option in this case.
3.3.1 Adsorption Models
The equilibrium between the surface and the gas phase of the adsorbate depends on
temperature, but also on the pressure of the gas that is being adsorbed. When calculating the
equilibrium, different approaches can be taken; the problem can be described by an adsorption
isotherm, isobar or isostere (the amount of adsorbed substance is constant). The most common
approach is to present experimental data in adsorption isotherms (Jankowska, Swiatkowski, &
Choma, 1991, pp. 107-108).
Experiments to fit the adsorption isotherm of ammonia to different models have been carried
out by Helminen et al. (2000). The studies were made on activated carbon as well as two
different zeolites at a pressure between 1 to 100 kPa and a temperature ranging between 298
and 393 K.
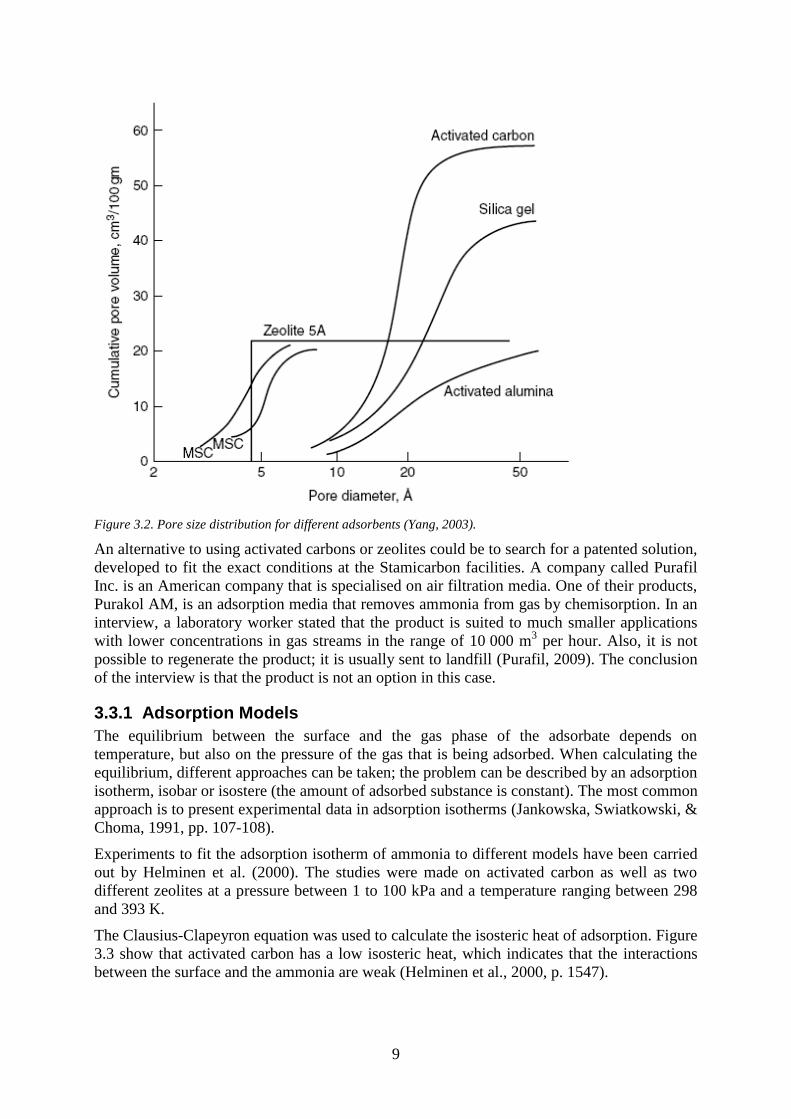
The Clausius-Clapeyron equation was used to calculate the isosteric heat of adsorption. Figure
3.3 show that activated carbon has a low isosteric heat, which indicates that the interactions
between the surface and the ammonia are weak (Helminen et al., 2000, p. 1547).
10
Figure 3.3. Isosteric heat of adsorption for different adsorbents (Helminen et al., 2000).
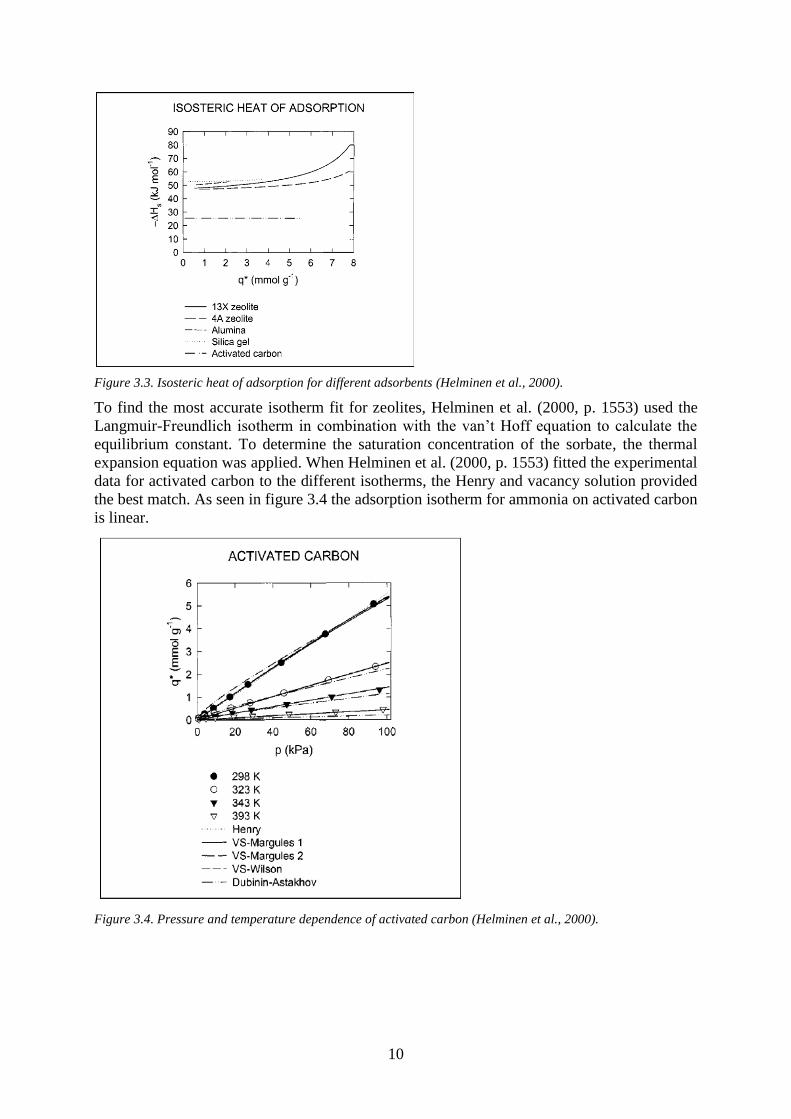
To find the most accurate isotherm fit for zeolites, Helminen et al. (2000, p. 1553) used the
Langmuir-Freundlich isotherm in combination with the van’t Hoff equation to calculate the
equilibrium constant. To determine the saturation concentration of the sorbate, the thermal
expansion equation was applied. When Helminen et al. (2000, p. 1553) fitted the experimental
data for activated carbon to the different isotherms, the Henry and vacancy solution provided
the best match. As seen in figure 3.4 the adsorption isotherm for ammonia on activated carbon
is linear.
Figure 3.4. Pressure and temperature dependence of activated carbon (Helminen et al., 2000).
11
3.3.2 Activated Carbon
Activated carbon is one of the most commonly used adsorbents. It is a porous material with a
large network of pores. This results in good adsorbing qualities depending on its large surface
area. The adsorbent can be derived from several different carbonaceous materials such as
wood, coal, peat and coconut shells (Yang, 2003, p.79). The following section will discuss
production of activated carbons, their properties and its use in ammonia removal.
3.3.2.1 Production and Structure of Activated Carbon
Activated carbons can be divided into different groups. Yang (2003, p. 79) mentions two of
them: powdered activated carbon (PAC) and granulated activated carbon (GAC).
The production includes three steps: raw material preparation, low-temperature carbonisation
and activation. The design of these steps is crucial to get the wanted properties in the final
product. The activation, where the pore size distribution is created, can be done in two
different ways: either by gas activation or by chemical activation. This step is essential to get
the desired properties.
In activation by gas, the carbonisation is performed at 400-500 °C to remove volatile
compounds in the raw material. This is followed by partial gasification at 800-1000 °C. This
step gives the activated carbon its porosity and surface area. Uniform development of the pore
structure is controlled by adding a mild oxidizing gas e.g. CO2 and steam or flue gases.
Gasification is done either in fixed or fluid beds (Jankowska, 1991, p. 13; Yang, 2003, p. 79).
Chemical activation is used on raw materials such as lignin. This process needs no pre-
carbonisation. Raw materials are mixed with activators such as phosphoric acid, potassium
sulphides and etcetera. The activation is carried out at 500-900 °C and is followed by an acid
or water wash. The final product is in powder form (ibid).
3.3.2.2 Properties of Activated Carbon
The adsorbing ability of activated carbon is due to its large surface area, which ranges
between 300-4000 m2/g. The pores can be divided into three different sublevels; macropores,
mesopores and micropores (Jankowska, 1991, p. 132). Mesopores are larger than or near 30 Å
and is important in liquid phase adsorption. In gas-phase adsorption it is important to have
pores in the same sizes as the molecules. Hence, micropores (10-25 Å) play the most
important role in gas-phase adsorption (Yang, 2003, p. 81). The distribution of pore sizes for
activated carbon and other adsorbents are shown in figure 3.4 above. Liquid-phase adsorption
requires larger pores due to slower diffusion in liquid-phase and because many adsorbates
increase in size when dissolved in water.
The surface is non-polar or slightly polar (Yang, 2003, p. 84) depending on the amount of
oxide groups on the surface or because of inorganic impurities. According to Yang (ibid)
these properties leads to three advantages compared to other adsorbents:
Activated carbon works well in moist conditions. It also works well in aqueous
solutions.
It adsorbs more non-polar or weak polar organic compounds than other adsorbents
due to its large internal surface.
The major adsorbing force is due to weak physical van der Waals bonds. This leads
to low heat of adsorption which makes the adsorbent easier to regenerate.
12
3.3.2.3 Ammonia Removal
Adsorption of ammonia occurs in the micropores. The removal is mostly achieved through
weak van der Waal bonds, with an isosteric heat of 30 kJ/mole (Petit et al., 2007, p.12705).
Research is done to develop activated carbons with higher working capacities in ammonia
adsorption through modifications of the surface. Since ammonia is a basic gas, acidification of
the surface would improve the adsorption. According to Yang (2003, p. 89), this could be
done by increasing the amount of oxide groups on the surface.
Experiments, where activated carbon has been impregnated with metal oxides, have been
done by Petit et al. (2007, 2008a, 2008b) and they show an increase in ammonia adsorption.
Maximum workload achieved in these experiments was increased by almost two orders of
magnitude, relative to the untreated carbon (Petit et al., 2007, p. 12708). Additional studies
were done to investigate influence of water on the adsorption efficiency. A comparison
between dry/wet carbon and moist/dry air showed that humidity in the gas flow has little or
positive impact on the results. With wet carbon, however, the result for the adsorption
capacity varies more. For virgin carbon the efficiency increases almost three times (ibid, p.
12707). Although, according to Helminen et al. (2000, p. 1541) the adsorption of ammonia is
easiest to accomplish without the presence of water.
3.3.2.4 Regenerating the Activated Carbon
It is desirable, both in regard to economical and environmental aspects, to recycle activated
carbon. This can be achieved through regeneration, where the adsorbed substances are
removed from the adsorbents surface and the adsorptive properties are regained (Jankowska et
al., 1991, p. 260). The complexity of the regeneration depends on the type of adsorption.
Physisorption is a reversible process with low activation energy, if the desorption energy is
added. Desorption in this case can be achieved through heating, lowering pressure or washing
with solvent (ibid). Although, when desorption is carried out through heating, precautions
should be taken to prevent destruction of the adsorbate.
Used activated carbon with substances adsorbed through chemisorption is harder to regenerate
due to higher bond energy. This process, unlike physisorption, is not reversible. Both
desorption energy and the chemical bond energy must be added to remove the adsorbate
(ibid).
If the used activated carbon has low volatile compounds on its surface, which cannot be
removed through regeneration, it needs to be reactivated. Although the distinction between
regeneration and reactivation is hard to define, reactivation demands higher temperature; up to
900°C (Jankowska et al., 1991, p. 260). Both granular and powdered activated carbon can be
reactivated. Except from heating, reactivation can be achieved with reactivating gas or
chemical reactions in similar ways to the activation process (see chapter 3.3.2.1 above). If
unimpregnated carbon is used, ammonia could most likely be dissolved with water. With an
impregnated carbon the regeneration would be harder to accomplish (ibid).
3.3.3 Zeolites
Zeolites are natural minerals composed of aluminosilicates with adsorbing and ion-exchange
properties. They are among other things used for pollution control, agricultural and mining
purposes (Bernal et al., 1993, p. 27). Zeolites occur naturally in rocks, on the surface of the
earth and on the sea bed (Yang, 2003). It can also be industrially synthesised to achieve
appropriate properties for the considered application (Roland et al., 2005, p. 9).
13
3.3.3.1 Production and Structure of Zeolites
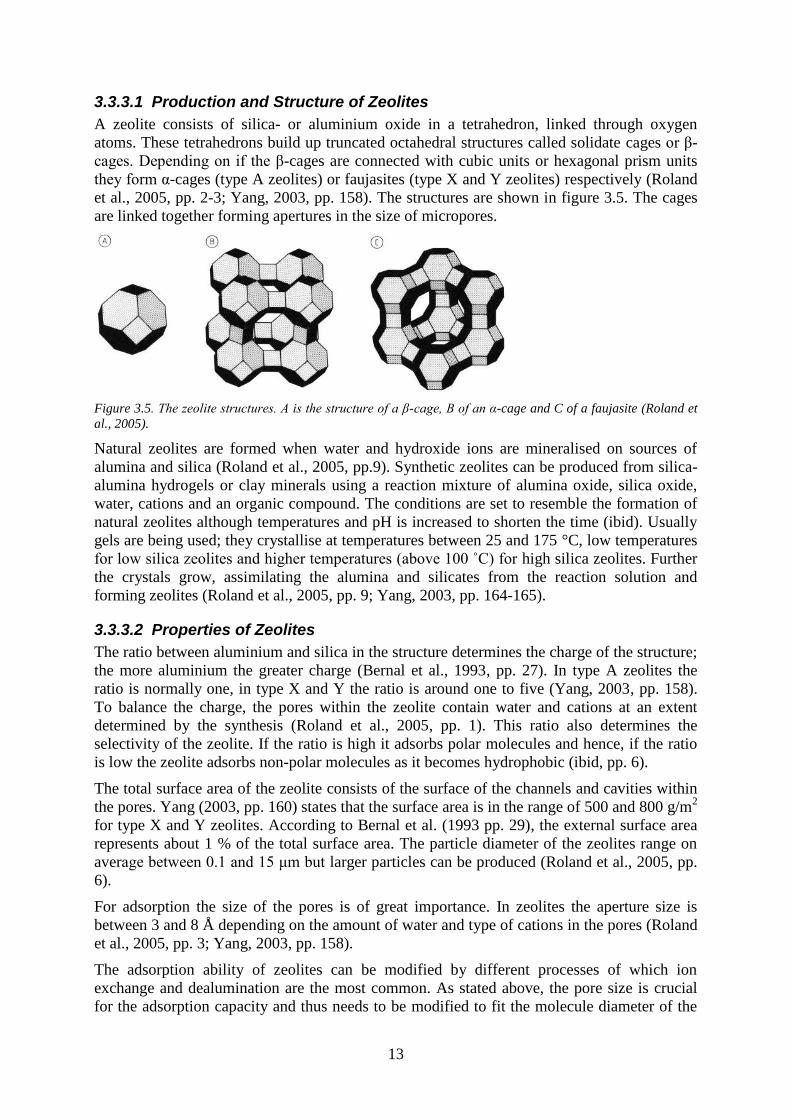
A zeolite consists of silica- or aluminium oxide in a tetrahedron, linked through oxygen
atoms. These tetrahedrons build up truncated octahedral structures called solidate cages or β-
cages. Depending on if the β-cages are connected with cubic units or hexagonal prism units
they form α-cages (type A zeolites) or faujasites (type X and Y zeolites) respectively (Roland
et al., 2005, pp. 2-3; Yang, 2003, pp. 158). The structures are shown in figure 3.5. The cages
are linked together forming apertures in the size of micropores.
Figure 3.5. The zeolite structures. A is the structure of a β-cage, B of an α-cage and C of a faujasite (Roland et
al., 2005).
Natural zeolites are formed when water and hydroxide ions are mineralised on sources of
alumina and silica (Roland et al., 2005, pp.9). Synthetic zeolites can be produced from silica-
alumina hydrogels or clay minerals using a reaction mixture of alumina oxide, silica oxide,
water, cations and an organic compound. The conditions are set to resemble the formation of
natural zeolites although temperatures and pH is increased to shorten the time (ibid). Usually
gels are being used; they crystallise at temperatures between 25 and 175 °C, low temperatures
for low silica zeolites and higher temperatures (above 100 ˚C) for high silica zeolites. Further
the crystals grow, assimilating the alumina and silicates from the reaction solution and
forming zeolites (Roland et al., 2005, pp. 9; Yang, 2003, pp. 164-165).
3.3.3.2 Properties of Zeolites
The ratio between aluminium and silica in the structure determines the charge of the structure;
the more aluminium the greater charge (Bernal et al., 1993, pp. 27). In type A zeolites the
ratio is normally one, in type X and Y the ratio is around one to five (Yang, 2003, pp. 158).
To balance the charge, the pores within the zeolite contain water and cations at an extent
determined by the synthesis (Roland et al., 2005, pp. 1). This ratio also determines the
selectivity of the zeolite. If the ratio is high it adsorbs polar molecules and hence, if the ratio
is low the zeolite adsorbs non-polar molecules as it becomes hydrophobic (ibid, pp. 6).
The total surface area of the zeolite consists of the surface of the channels and cavities within
the pores. Yang (2003, pp. 160) states that the surface area is in the range of 500 and 800 g/m2
for type X and Y zeolites. According to Bernal et al. (1993 pp. 29), the external surface area
represents about 1 % of the total surface area. The particle diameter of the zeolites range on
average between 0.1 and 15 μm but larger particles can be produced (Roland et al., 2005, pp.
6).
For adsorption the size of the pores is of great importance. In zeolites the aperture size is
between 3 and 8 Å depending on the amount of water and type of cations in the pores (Roland
et al., 2005, pp. 3; Yang, 2003, pp. 158).
The adsorption ability of zeolites can be modified by different processes of which ion
exchange and dealumination are the most common. As stated above, the pore size is crucial
for the adsorption capacity and thus needs to be modified to fit the molecule diameter of the
14
desired adsorbate. This is best performed by ion exchange, where the cations captured in the
structure are exchanged for ions of a different size. An example is the use of zeolite NaA
(type A zeolite with sodium ions); the sodium ions are exchanged for calcium ions in order to
increase, or potassium ions in order to decrease the aperture size (Roland et al., 2005, pp. 14).
Dealumination is carried out to increase the silica-ammonia ratio and therefore affects the
selectivity according to Roland et al. (2005, pp. 16) above. Since the application in this case is
removal of ammonia which has similar properties to water dealumination is probably not
appropriate.
3.3.3.3 Ammonia Removal
Bernal et al. (1993, pp. 32) describe the ammonia adsorption process in their article. When the
ammonia is adsorbed on the surface of the internal channels in the zeolite, equilibrium
between the ammonia gas and the ammonia in solution occurs; this is due to the water content
both in the atmosphere and in the solid phase. The ammonia then diffuses through the solution
and there is equilibrium between the ammonia and the ammonium ions. Finally, the
ammonium equilibrium form adsorbs on the cation sites by ion exchange.
The regular and relatively small size of the apertures contributes to zeolites being well
adjusted for ammonia adsorption. Also, high alumina zeolites of type A and X are suitable for
ammonia removal due to their electrostatic interactions and the large dipole moment of
ammonia (Roland et al., 2005, pp. 19). The water in the zeolites has a strong influence on the
cation sites since it can block pores and therefore the zeolites should be dehydrated prior to
adsorption (Yang, 2003, pp. 176), this is also confirmed by Helminen et al. (2000, pp. 1541-
1553). They also emphasise the fact that zeolites of type A and X are the most suited zeolites
for ammonia adsorption at temperatures between 25 and 120 ˚C. Furthermore, they state that
zeolites are applicable for adsorption of ammonia at very low concentrations. Brandin (1996)
shows through experiments that zeolite 13X is highly suitable for ammonia adsorption if
water is present.
According to Bernal et al. (1993, pp. 32) ammonia adsorption can be increased by acid pre-
treatment of the zeolite since the ammonia then can be protonated prior to the ammonium
adsorption and the ammonia adsorption on to the surface then would increase.
3.3.3.4 Regenerating Zeolites
Ammonia adsorbs strongly to the zeolites and is therefore hard to desorb (Helminen et al.,
2000, pp. 1541). Common techniques for regeneration are pressure swing adsorption (PSA)
and temperature swing adsorption (TSA) (Roland et al., 2005, pp. 20). Helminen et al. (2000,
pp. 1553) states that regeneration of zeolites 13X and 4A for ammonia adsorption is difficult
to achieve through depressurisation, why PSA might not be favourable in this case.
Wang et al. (2006, pp. 87) has concluded that high temperature combustion is useful for
regeneration of synthetic zeolites used for organic pollutants removal. The recovery efficiency
in their experiments turned out to be close to 90 % but will depend on the combustion time
and temperature at which it is carried out. A high temperature and a long time could lead to
higher recovery efficiency even though the zeolites will be subject to some deactivation,
mainly through sintering. Roland et al. (2005, pp. 21) points out that zeolites are resistant to
high temperatures and that regeneration is possible even if the adsorbed compounds has high
boiling points.
A study on the regeneration of zeolites with steam shows that hydrophobic zeolites can be
regenerated up to 90 % (Küntzel et al., 1999, pp. 991-995). By flowing steam through the
adsorbents, the bed is heated rapidly and when the heat of steam condensation reaches the
15
pores the solvent is desorbed. As long as the steam is condensing, the desorbed compounds
cannot be swept out of the bed. Although, when the bed is heated enough, the steam will flow
through the bed, taking the desorbed molecules with it (Küntzel et al., 1999, pp. 992). The
mass transport out of the pores decreases due to longer transport distances and condensing
water in the pores leading to decreasing desorption with time. Also, since the pores will be
filled with condensed water, the adsorbents have to be dried before reused.
3.3.4 Summary of Adsorption
Helminen et al. (2000) claim that zeolites have the best capacity when it comes to adsorbing
ammonia, although the reaction is almost irreversible. Hence, the regeneration of zeolites is
more complicated than that of activated carbon. Depressurising is not possible; TSA would
require addition of energy and high temperature combustion would require even more. Using
steam is an alternative, since ammonia is soluble in water, the heat of condensation would
improve the desorption and steam is available at the urea production facility. Regeneration of
activated carbon could be achieved by washing, preferably with water.
The results from Helminen’s studies (2000) show that the two zeolites have the same working
capacity over the entire temperature range whereas activated carbon’s capacity rapidly drops
with increasing temperature. Considering that the temperatures of the airstream will be higher
than room temperature, zeolites might be preferable. The airstream could also be cooled by
water to enhance the adsorption.
The fact that ammonia is a basic compound leads to the conclusion that the adsorption is
enhanced if the adsorbent is subject to acid pre-treatment. The authors state that this is the
case for both activated carbons and zeolites. However, ammonia adsorption on zeolites may
be improved by using a zeolite with a high alumina-silica ratio. Activated carbons, on the
other hand, may be impregnated with metal oxides. Acid pre-treatment could require
reactivation prior to recycling and in that case, the frequency of the reactivation will have to
be investigated.
Helminen et al. (2000) conclude that adsorption of ammonia works best in dry conditions,
both regarding activated carbon and zeolites. According to Petit et al. (2007) adsorption
capacity can increase with addition of water. However, the airstream will contain water and it
is therefore essential that the adsorption is efficient with water present as well. This has to be
evaluated for the chosen adsorbent. Also, as argued above, addition of water can decrease the
temperature in the airstream and hence, improve the adsorption.
The overall conclusion is that ammonia in small concentrations can be removed with either
activated carbon or zeolites. Zeolite 13X seems to be the most promising type to use in this
application.
3.4 Summary of Technologies for Removal
Flashing off ammonia before injection to the granulator proved not to be feasible when urea is
present. When it comes to addition of monohydroxymethylurea, full scale experiments are
required in order to determine the operating conditions. These full scale experiments are not
possible to conduct during this assignment, why the technology will not be investigated any
further. Adsorption proved to be a feasible solution to the emission problem, why the design
of the process will be based on this phenomenon. Considering the discussions in section 3.3
above, both activated carbon and zeolites are possible adsorbents.
16
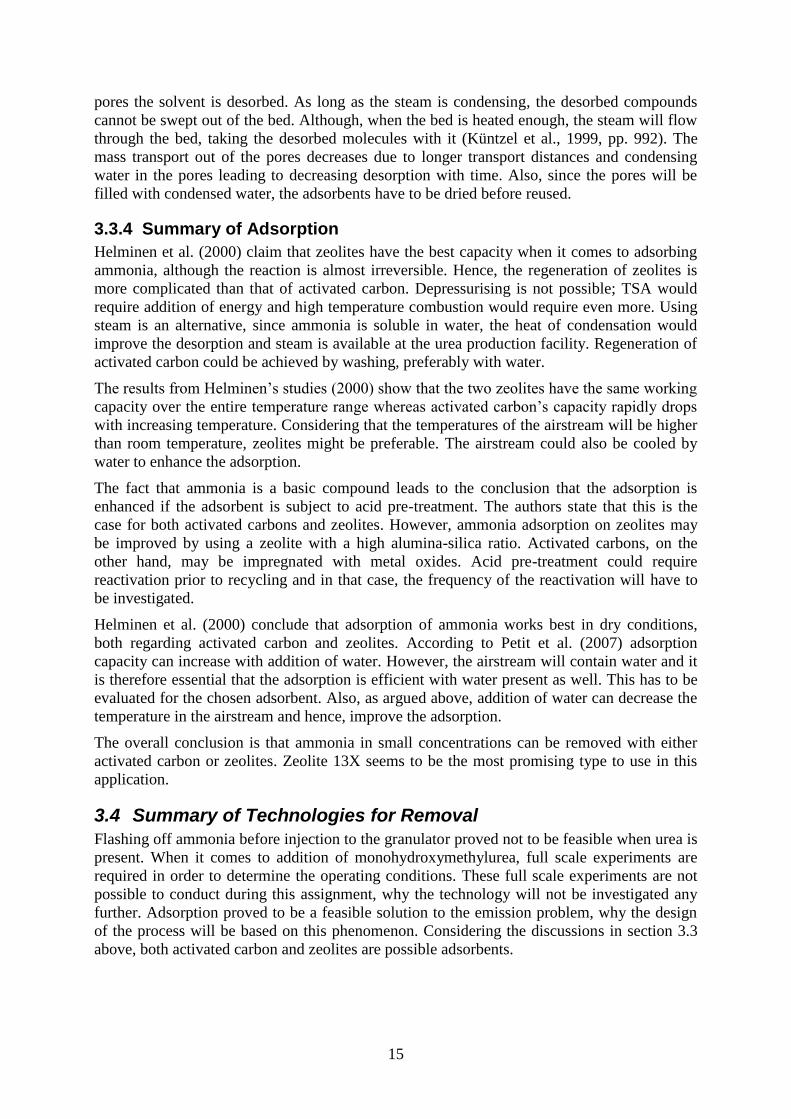
4 Process Proposals The idea is to inject the comminuted adsorbent into the airstream and adsorb the ammonia.
The adsorbent particles will then be separated from the airstream by using a solid-gas
separation. To extract the ammonia from the adsorbent, a solvent, preferably water, will be
added. The solvent will then be separated from the adsorbent through a solid-liquid
separation. Finally, the adsorbent will be re-injected into the airstream. A schematic figure
can be viewed in figure 4.1.
Dissolution
Makeup
Water
Adsorbent
Cycle
Solid-Liquid
Separation
Solid-Gas
Separation
Figure 4.1. Schematic figure of the adsorption process. The adsorbent will be injected into the airstream and
adsorb the ammonia. The particles will then be separated from the airstream using a solid-gas separation. A
solvent will be added to extract the ammonia, and then separated using a solid-liquid separation.
4.1 Airstream Cooling and Adsorbent Injection
It is stated that adsorption of ammonia on activated carbon is favoured at low temperatures
and hence, the airstream should be cooled to enhance the adsorption if activated carbon is
used. This can be achieved by addition of water forcing the temperature to decrease, although
saturation of the air should be avoided. The cooling water is evaporated from the injected
adsorbent and hence, the amount of water in the adsorbent is of great importance to control
the temperature of the airstream. The presence of water has an adverse effect on the
adsorption capacity, although this effect is small compared to the benefits from cooling down
the gas (Karlsson, 2009). In the case of using zeolites as adsorbent, no air cooling is required
since the working capacity is constant over a larger temperature range.
The injection of adsorbent into the airstream can be conducted using a bulk-storage silo
followed by feeders which transports the adsorbent from the silo to the injection point. The
technology can be provided by companies such as Alstom (Alstom Power, 2009) although
specific information about the technology is not officially published.
4.2 Solid-Gas Separation
After the adsorption, the particles will have to be separated from the airstream. Baghouse
filters and cyclones are two ways to conduct this parting. When choosing the way of
separation, the size of the particles and pressure drop is very important to consider.
17
4.2.1 Baghouse Filter
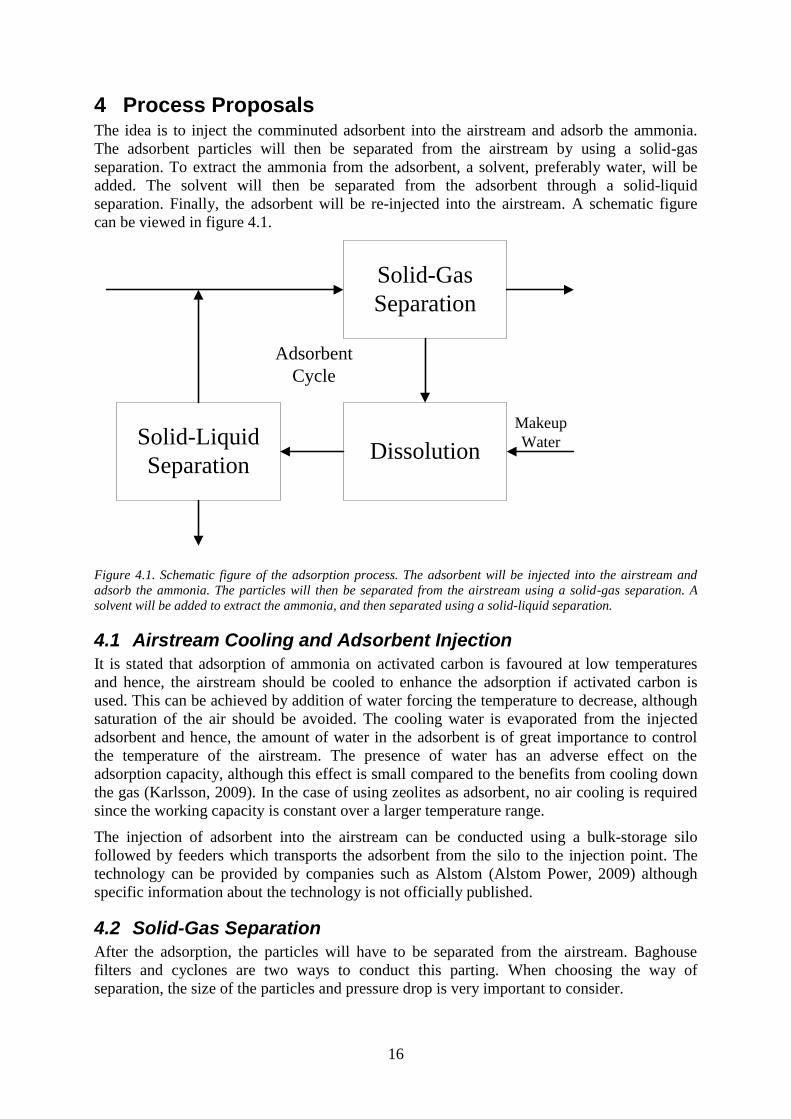
Baghouse filters are used to remove powder or dust particles from airstreams. The airstream
with the particles is blown through the filter, either during a preset time period or until the
pressure drop, due to the thickening filter cake, has reached a certain level (Gabites et al.,
2008, pp. 46). After this the filter is washed, usually by blowing air in pulses, through the
filter in reversed direction. The washing is conducted one section at a time to ensure that the
filtration is continuous. Figure 4.2 shows the principle of a baghouse filter.
Figure 4.2. Baghouse filter (Encyclopedia Britannica, 2009).
There are different design parameters for baghouse filters, such as whether to blow or suck
the air through the filter. When it comes to designing the filter, it is important to have enough
spacing between the bags so that they do not rub against each other causing damage. Another
significant parameter is the ratio between the airstream size and the cloth area. A too large
ratio leads to particles penetrating the cloth, which results in increasing pressure drops. These
particles are also very hard or impossible to wash out. The filtration area is decided by the
number of bags as well as the diameter and length of the bag. Here it is important to
remember that with larger bag sizes, the cleaning becomes more difficult (Gabites et al., 2008,
pp. 46).
The cost of using baghouse filters is highly dependent on the filtration time. Too extensive
filtration times leads to high differences in pressure, resulting in elevated energy costs. But
shortening the filtration time means increased baghouse wear. It should also be taken into
account that the filtration is less efficient in the beginning of the cleaning cycle as the filter
cake is not present (Caputo et al., 2000, pp. 238). A way to get around this problem is to not
remove the entire filter cake each time; only enough to decrease the pressure drop and enable
regeneration of the adsorbent.
The choice of fabric in the bag is another issue. It is important to use bags with the right
permeability and thickness for the process. The bags can be made out of natural or synthetic
materials, and can be improved by different surface treatments (Gabites et al., 2008, pp. 46).
When it comes to the economic point of view, a decision has to be made whether to use
cheaper bags with a shorter bag life or more expensive bags, for example made of Teflon,
which would last for a longer period of time (Caputo et al., 2000, pp. 238).
When deciding what baghouse filter to use, several parameters has to be considered.
According to Gabites et al. (2008, pp. 46), the variation in published optimised parameters
18
can be up to about 90 %, why one of the best ways to find the right filter is through pilot plant
experiments.
4.2.2 Cyclone
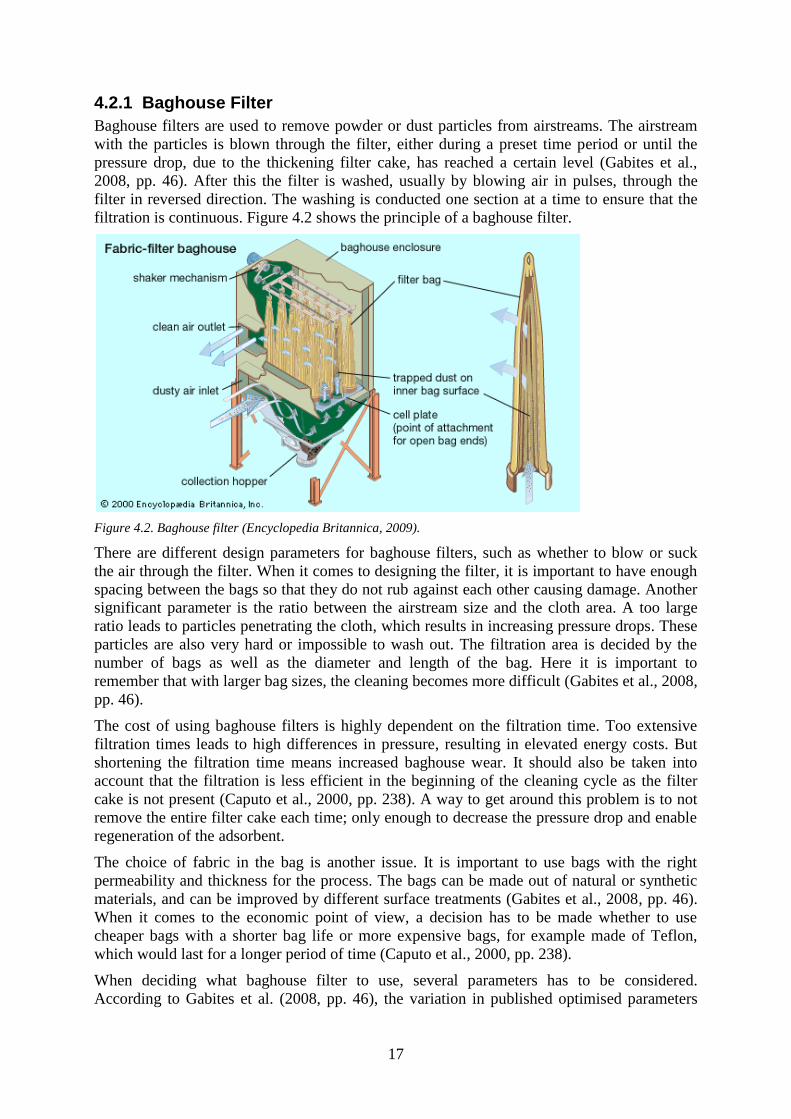
A cyclone is generally, depending on the construction, considered to be able to fully separate
particles with a size above 5 m but 80-85 % of particles with a diameter of 3 m will also be
separated (Perry et al., 1973, pp. 20-81). A schematic picture of a cyclone can be seen in
figure 4.3.
Figure 4.3. The cyclone inlet is tangential, causing the dust filled air to cycle down and leave the dust in the
bottom. The air then moves upwards in the middle of the body, leaving through a gas outlet tube in the top
(HVAC Queensland Pty Ltd, 2008).
The cyclone inlet is tangential, causing a centrifugal force that pushes the dust to the sides as
the air cycles down. The air will then spiral upwards in a tighter spiral in the middle of the
container and through a gas outlet tube in the top. The dust will leave through the bottom.
The pressure drops of the cyclones depend on the inlet gas velocity and density. As of now,
no general correlation is available for calculating the pressure drop. The manufacturer will
give the information needed on the pressure drop of the cyclone in question.
It is not only the size of the dust-particles that decide how well it is separated, but also where
the particle is situated in the inlet and how it moves through the container (McCabe & Smith,
1976, pp. 963). The separation is also highly dependent on airtight conditions at the dust
outlet, especially when it comes to fine dust, as this would cause disturbances in the stream
(Perry et al., 1973, pp. 20-81).
4.2.3 Summary
The way of separating the particles from the airstream is highly dependent on the particles and
the pressure drop. It is of course important that the specification on the vessel chosen fits the
size of the particles that needs to be separated. When it comes to the pressure drop it is
important that it is not extensive as this will lead to high energy costs. However, at present the
major pressure drop occurs in the granulation step. The pressure drop in a baghouse filter is
therefore considered having a minor effect on the overall process energy costs.
Cyclones are a cheap and commonly used way of conducting the solid-gas separation (Perry
et al., 1973, pp. 20-81). The negative part when using cyclones instead of baghouse filters is
the fact that a filter cake is created in the baghouse, making the cleaning of the airstream even
more efficient then when using cyclones.
19
4.3 Desorption
After the dust and adsorbent has been separated from the air, the ammonia needs to be
desorbed and the urea dissolved. To be able to reuse the urea and ammonia that has been
extracted from the airstream, water would be preferred as solvent.
Desorption can be conducted by mixing the adsorbent with the solvent in a well mixed tank.
The ammonia will then be released and mixed with the solvent. Since ammonia is bonded
harder to zeolites than to activated carbon, the desorption methods can differ depending on
what adsorbent that is to be used. Possibly, heat has to be added to desorb ammonia from the
zeolites, whereas activated carbon could be desorbed using cooler water.
The ammonia adsorbed on the zeolites by chemisorption will require large amounts of energy
to be desorbed. However, the amount of ammonia adsorbed by physisorption is considerably
larger than the chemisorbed amount. It can therefore be argued that if the physisorbed
ammonia can be desorbed, a sufficient part of the zeolite is regenerated.
The particulate urea removed from the airstream will also dissolve in the water. The heat of
solution of urea in water is positive, which means that it is important to use a sufficient
amount of water at the right temperature to ensure that the temperature drop is not too great.
The heat of solution for urea at 25 C can be calculated by equation 4.1 (Meessen, 1996, p.
334).
Equation 4.1.
∆𝐻𝑆 = 15.351 − 0.3523𝑚 + 2.327 · 10−2𝑚2 − 1.0106 · 10−3𝑚3 + 1.8853 · 10−5𝑚4
where m is the molality of urea given in moles of urea per kilogram of water. This formula is
only valid for molalities from 0 to 20 mole/kg.
After desorption, the mixture will consist of a slurry of the adsorbent and the solvent with
dissolved ammonia and urea.
4.4 Solid-Liquid Separation
In order to remove the adsorbent from the slurry, created in the mixing tank, a solid-liquid
unit separation must be applied. There are several methods available to extract solid particles
from a liquid. The ones dealt with below are continuous vacuum filter, centrifugal filtration
and centrifugal sedimentation.
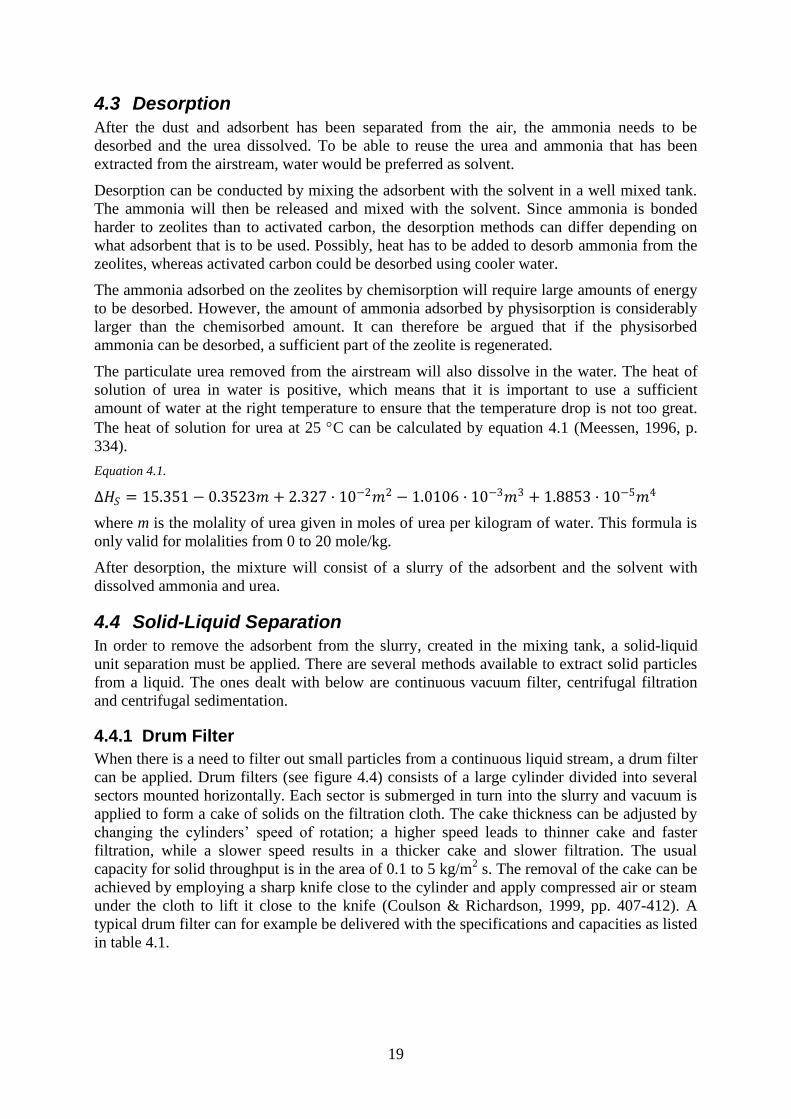
4.4.1 Drum Filter
When there is a need to filter out small particles from a continuous liquid stream, a drum filter
can be applied. Drum filters (see figure 4.4) consists of a large cylinder divided into several
sectors mounted horizontally. Each sector is submerged in turn into the slurry and vacuum is
applied to form a cake of solids on the filtration cloth. The cake thickness can be adjusted by
changing the cylinders’ speed of rotation; a higher speed leads to thinner cake and faster
filtration, while a slower speed results in a thicker cake and slower filtration. The usual
capacity for solid throughput is in the area of 0.1 to 5 kg/m2 s. The removal of the cake can be
achieved by employing a sharp knife close to the cylinder and apply compressed air or steam
under the cloth to lift it close to the knife (Coulson & Richardson, 1999, pp. 407-412). A
typical drum filter can for example be delivered with the specifications and capacities as listed
in table 4.1.
20
Table 4.1. Specifications and capacities of a drum filter example (KMPT, 2009).
Solids throughput 1500 kg solids/m2 h
Filtration capacity 100 – 2000 l/m2 h
Particles that can be removed 1 – 300 µm
Materials available CS, SS, RLS and special materials
Filtration area 0,72 – 100 m2
The advantages and disadvantages of using a drum filter according to Coulson and
Richardsson (1999, p. 411) are as follows.
Advantages
Low operating costs due to the fact that the filter is automatic with low labour
requirements as a consequence.
Large quantities of material can be filtered in a continuous process.
Disadvantages
Difficulties are encountered when hot liquids are to be filtered due to their tendency
to boil.
It is hard to obtain a dry cake.
The capital cost of the equipment is high.
Figure 4.4. Drum filter (PPM Technologies, 2009).
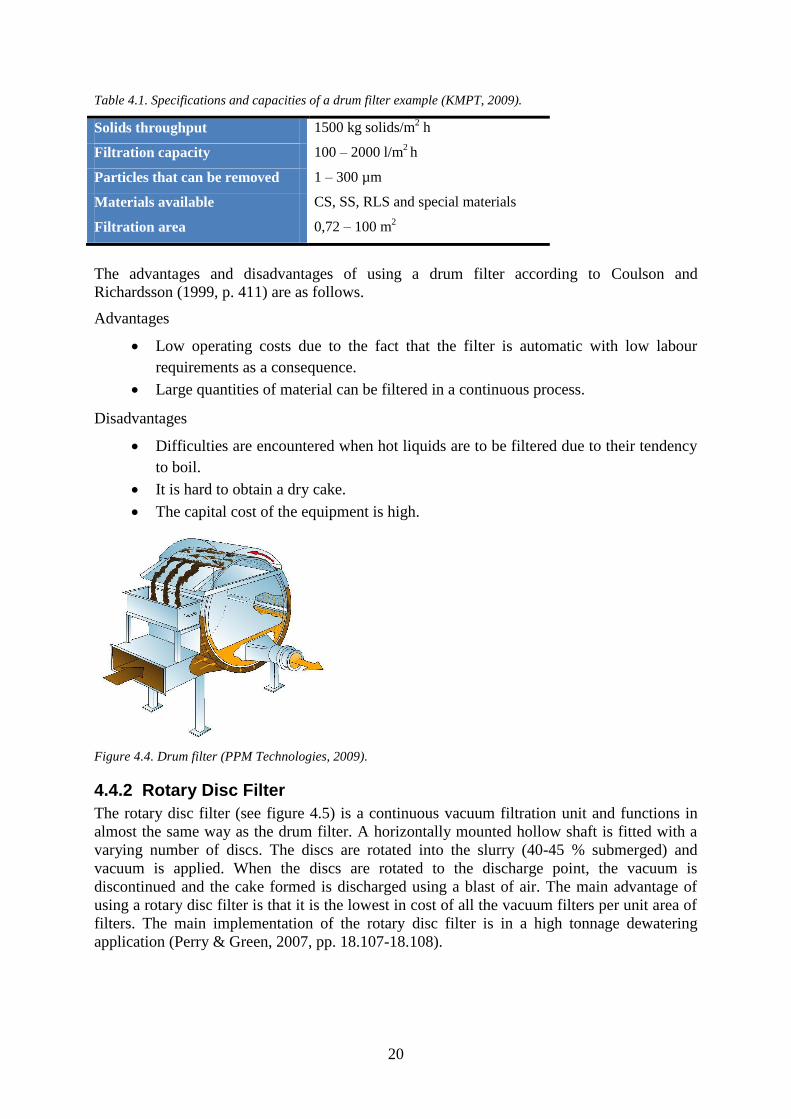
4.4.2 Rotary Disc Filter
The rotary disc filter (see figure 4.5) is a continuous vacuum filtration unit and functions in
almost the same way as the drum filter. A horizontally mounted hollow shaft is fitted with a
varying number of discs. The discs are rotated into the slurry (40-45 % submerged) and
vacuum is applied. When the discs are rotated to the discharge point, the vacuum is
discontinued and the cake formed is discharged using a blast of air. The main advantage of
using a rotary disc filter is that it is the lowest in cost of all the vacuum filters per unit area of
filters. The main implementation of the rotary disc filter is in a high tonnage dewatering
application (Perry & Green, 2007, pp. 18.107-18.108).
21
Figure 4.5. Rotary disc filter (Direct Industry, 2009).
4.4.3 Filtration Centrifuges
There are two main groups of centrifuges: those that use the filtration method and those that
utilise the sedimentation principle. The filtration centrifuge pushes the mixture of solids and
liquids out towards the wall which is perforated and covered with a cloth or metal canvas. The
liquid is forced through the filter and leaves the solids behind. A cake of solids is formed
eventually which, depending on particle size, enacts a resistance to filtration. If the solids
form a porous cake, the resistance will be manageable and vice versa. The cake must then be
removed by mechanical means (Coulson & Richardson, 1999, pp. 490-491).
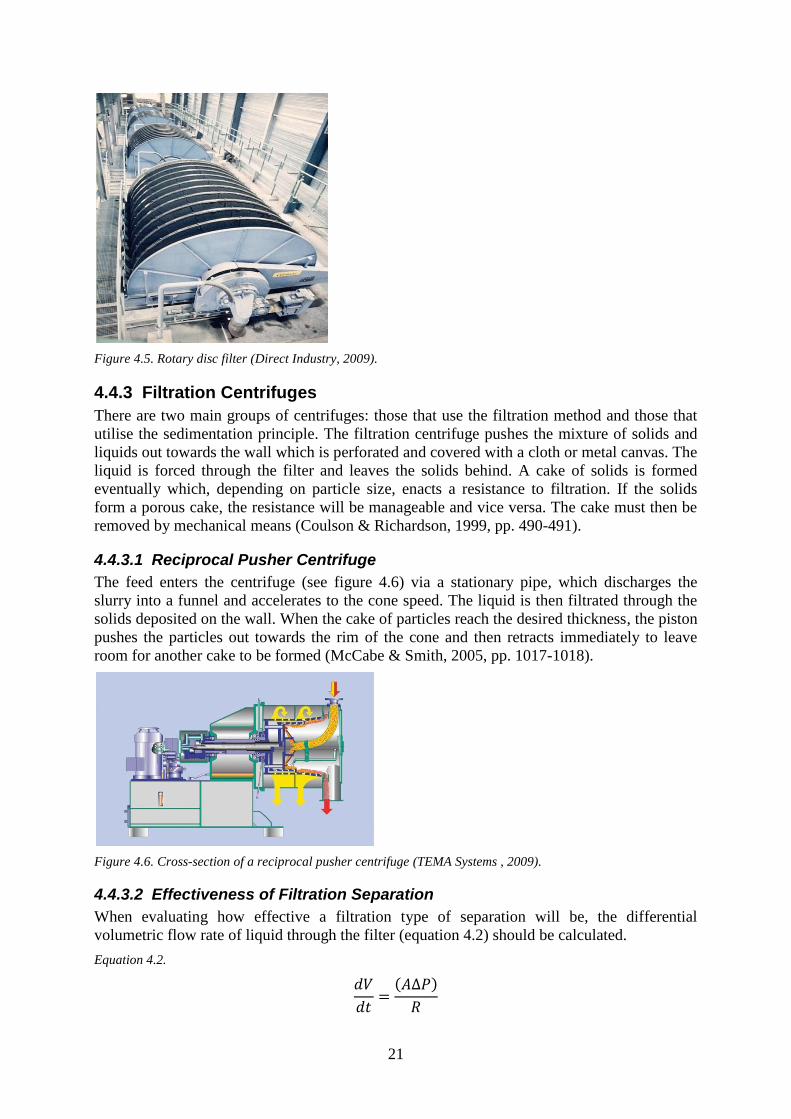
4.4.3.1 Reciprocal Pusher Centrifuge
The feed enters the centrifuge (see figure 4.6) via a stationary pipe, which discharges the
slurry into a funnel and accelerates to the cone speed. The liquid is then filtrated through the
solids deposited on the wall. When the cake of particles reach the desired thickness, the piston
pushes the particles out towards the rim of the cone and then retracts immediately to leave
room for another cake to be formed (McCabe & Smith, 2005, pp. 1017-1018).
Figure 4.6. Cross-section of a reciprocal pusher centrifuge (TEMA Systems , 2009).
4.4.3.2 Effectiveness of Filtration Separation
When evaluating how effective a filtration type of separation will be, the differential
volumetric flow rate of liquid through the filter (equation 4.2) should be calculated.
Equation 4.2.
𝑑𝑉
𝑑𝑡= 𝐴∆𝑃
𝑅
22
Where A is the area of the filter exposed to slurry, ∆P is the pressure difference across the
filter cake and R is resistance to flow through the filter. The most essential parameters to
determine the resistance to flow through the filter (equation 4.3) are the thickness of the cake
(Lc), liquid dynamic viscosity (µ), filter thickness (L) and the cake´s specific resistance to
flow (r).
Equation 4.3.
𝑅 = 𝜇𝑟 𝐿𝑐 + 𝐿
The specific resistance to flow through the cake r under pressure P, can for some solid
materials vary with pressure. This is due to compression as the pressure increases with the
result of a denser cake with fewer passages for flow. The specific resistance can be calculated
by equation 4.4.
Equation 4.4.
𝑟 = 𝑟′∆𝑃𝑠
In equation 4.4, ∆P is the pressure drop over the filter, r´ is the specific resistance under a
pressure drop of 1 atmosphere and s is the compressibility of the solids (The New Zealand
institute of food science and technology, 2009). The specific resistance for a pressure drop of
1 atmosphere along with the compressibility can either be attained in literature or by
experiments.
4.4.3.3 Sedimentation Centrifuges
The sedimentation centrifuges exploit the difference in density of liquids and solids for
separation. In an ordinary sedimentation tank the driving force for separation is gravity and
the component with the highest density will fall to the bottom. This, however, takes time, so
in order to increase the settling rate of the particles the relative weak force of gravity can be
replaced by the much greater centrifugal force (McCabe & Smith, 2005, pp. 1073-1079). The
sedimentation centrifuges can be divided into two main groups: horizontal and vertical
mounted centrifuges.
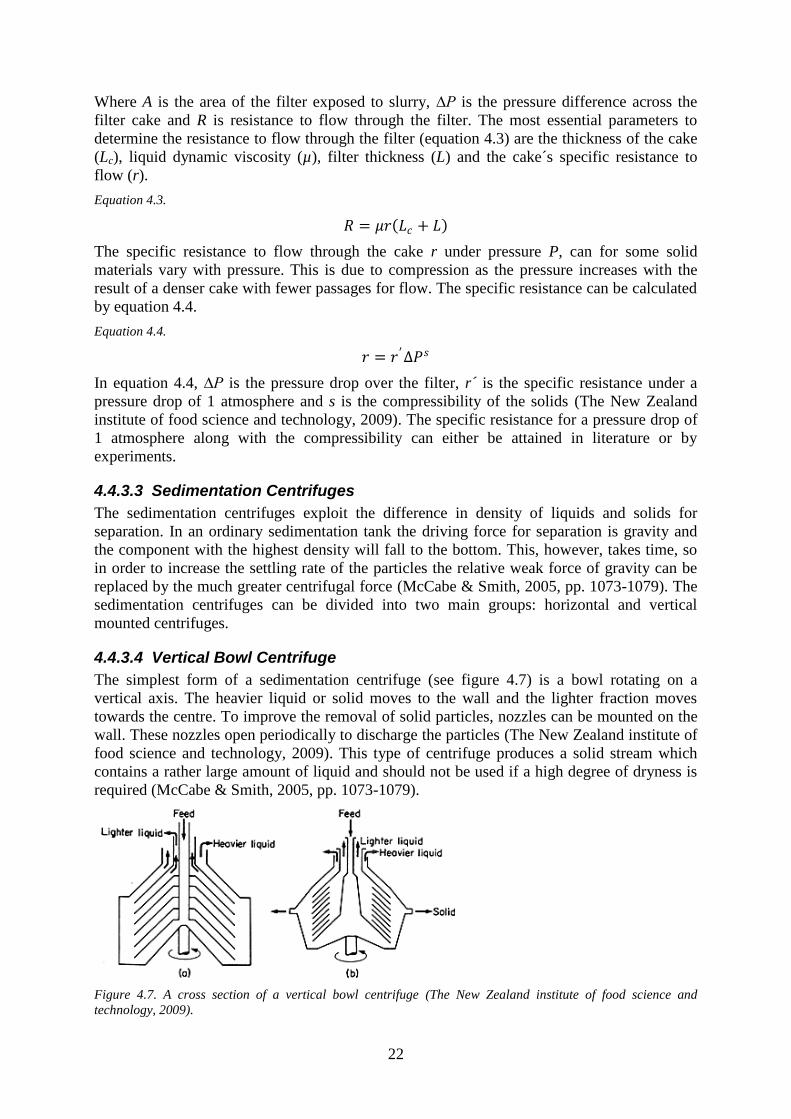
4.4.3.4 Vertical Bowl Centrifuge
The simplest form of a sedimentation centrifuge (see figure 4.7) is a bowl rotating on a
vertical axis. The heavier liquid or solid moves to the wall and the lighter fraction moves
towards the centre. To improve the removal of solid particles, nozzles can be mounted on the
wall. These nozzles open periodically to discharge the particles (The New Zealand institute of
food science and technology, 2009). This type of centrifuge produces a solid stream which
contains a rather large amount of liquid and should not be used if a high degree of dryness is
required (McCabe & Smith, 2005, pp. 1073-1079).
Figure 4.7. A cross section of a vertical bowl centrifuge (The New Zealand institute of food science and
technology, 2009).
23
4.4.3.5 Horizontal Bowl Centrifuges
In the vertical bowl centrifuge (see figure 4.8) with attached nozzles, the particles leave the
bowl under the liquid surface which leads to a high moisture content. In order to produce a
dry stream of solids, the horizontally mounted bowl centrifuge with a helical conveyor can be
applied. The feed enters the cylinder through a stationary pipe and settles near the wall. The
particles are transported by the helical-conveyor into the cone and are discharged. The
conveyor rotates at a slower rate than the cylinder (Coulson & Richardson, 1999, p. 495). This
machine can handle a particle content of maximally 30 % (The New Zealand institute of food
science and technology, 2009).
Figure 4.8. A horizontally mounted centrifuge with a scroll discharge system (Schwarz Global Consulting,
2009).
4.4.3.6 Effectiveness of Sedimentation Separation
To evaluate the effectiveness of a sedimentation separation process, consideration has to be
taken to the difference in centrifugal force enacted upon the components of the system. The
difference in centrifugal force of the components leads to a steady-state velocity of both
through each other. The velocity can be calculated by using equation 4.5.
Equation 4.5.
𝑣 =𝐷2𝑁𝑟
2𝑟𝑠 ∆𝜌
1640𝜇
In equation 4.5, D is the diameter of the particle, N is the number of revolutions per minute, rs
is the radius where the separation will occur, ∆ρ is the difference in density and µ is the
viscosity of the liquid (The New Zealand institute of food science and technology, 2009). A
high velocity is preferable for an effective separation.
4.4.4 Filter Media
The filter media used in all filtration activity must fulfil the following requirements (McCabe
& Smith, 2005, p. 1018):
It must retain the solids to be filtered.
It must not plug.
It must be resistant to both the chemical and physical requirements of the process
used.
It must not be prohibitively expensive.
It must permit the cake formed to discharge cleanly and completely.
The most common filter media used in industrial applications is the fabrics of woven fibres.
The fabrics available are plain weave, twill chain weave and satin. These can be made of
24
either natural or synthetic fibres. If the liquid to be filtered is corrosive or poisonous a filter of
metal fibres has to be used. The metal used in the fibres varies but they all have in common
that they are long lasting. There is also the option to use non woven fabrics made up of plastic
fibres. The fibres are self bonded into sheets directly after the extrusion from the melt which
can consist of polyester, nylon or polyolefin. The weight of the plastic fibres varies from 14 to
369 g/m2. The higher weights are used for particle sizes down to 5 µm (Perry & Green, 2007,
pp. 18.97-18.98).
4.4.5 Summary
The described solid-liquid separations can be divided into two groups: filtration and
sedimentation. The effectiveness of the filtration type of separation is highly dependent on the
area of filter exposed to slurry and the resistance in the filter. The resistance in the cake must
be minimised but the filter must have a sufficient resistance to retain the solids. To achieve
the least resistance in the cake, the particles should be large enough not to be too
compressible. The size of the particles and its subsequent compressibility is therefore essential
knowledge before a choice of filtration process can be made. When, considering filtration, the
resistance in the filter and/or cake is too large, a larger pressure difference must be applied
and/or a larger area that is exposed to the slurry to achieve an effective separation.
The sedimentation type of separation is in turn dependent on the difference in density of the
components and the size of the particles. If the difference in density or the size of the particles
is too small, the radius of the centrifuge and the rotational speed must be increased to achieve
the same separation.
All increases in dimensions and pressure difference of any equipment will increase the cost of
the process selected in terms of material and operational costs. Therefore, before a choice of
separation process can be done there are certain parameters that need to be determined; size of
the particles, compressibility, flow rate, desired dryness and maximum cost.
5 Selected Process The following section will discuss the selected process; how the removal is achieved, the units
involved, their design and the economy of the process. A description of the process results in
mass balances and determination of the unit sizes and thus, the investment costs. Finally,
operational costs are added and the total cost is summarised.
5.1 Description of Selected Process
A schematic figure of the selected process is presented in figure 5.1 and all the required
equipment is listed below:
Baghouse filter with pneumatic dust transmitters
Dust bin with screw feeder
Mixing tank
Rotary vacuum-filter
Feeders with bulk-storage tank
25
Baghouse
Filter
Silo
Dissolution
Tank
Drum/
Disc Filter
Recovered
Solution
Makeup
Water
Adsorbent
Cycle
1 2 3
5
6
7
G = 750 000 Nm /h
U = 3 g/Nm
A = 100 mg/Nm
3
3
3
1
1
B
A
C
4
Bulk-Storage
Tank
Water
Cycle
Figure 5.1. Flow sheet of the process with numbered streams. A way to lower the required amount of makeup
water would be to recirculate part of the recovered solution, hence increasing the urea and ammonia
concentration.
The off-gas from the granulator is mixed with an adsorbent containing water. In order to
separate the adsorbent from the airstream a baghouse filter is used. Here, all the particulate
urea is removed co-currently with most of the gaseous ammonia. The former is removed by
filtration and the latter is adsorbed on the adsorbent. Adsorption of ammonia is accomplished
by a filter cake of the adsorbent on the bags. When the gas passes through the filter cake,
ammonia adsorbs similar to a process using a fixed bed. Design targets are more than 90 %
removal of ammonia and greater than 99.95 % of the particulate urea. Since the urea dust is
removed in the baghouse filter, the presently used scrubbers can be removed.
When the filter cake builds up, the pressure drop increases. By a pressurised jet-pulse the
filter cake is partly removed in cycles controlling the pressure drop at 3500 - 4000 Pa. The
magnitudes of pulses are adjusted in such a way that only small areas of the bags are cleaned
in each cycle. Short cycles are preferable because they deliver the solids at a more continuous
rate and the variations in ammonia emissions are much smaller. It is also important to
remember that to prevent the hydrolysis reaction of the urea, short retention times are
required.
The removed solids drop down to conical hoppers at the bottom of the baghouse filter and fall
by gravitational forces into pneumatic conveyors. The conveyors operate intermittently to
transport the solids into a silo, used as a buffer for the solids. Appropriate amounts of solids
are screw-fed into a mixing tank into which water is added in order to dissolve the urea and
ammonia.
The slurry from the mixing tank is fed to a rotary vacuum-filter which removes a concentrated
water solution of urea and ammonia. Two parallel vacuum-filters is suggested, each capable
of handling 100 % of the total flow, of which one is used at all time. This would make it
possible to clean or repair one of the filters without stopping the process entirely. The
26
recovered solution is recycled back to the urea plant. A possibility could also be to recycle
part of the solution to the dissolution tank to lower the amount of fresh water needed.
Adsorption of ammonia on activated carbon is favoured by low temperature. Hence, the water
content of the recycle stream is adjusted to cool down the off-gas to 60 °C, which is 20 °C
above the adiabatic saturation point. The presence of water has a small adverse effect on the
adsorption capacity. However, this effect is small compared to the benefits from cooling down
the gas.
Adsorption of ammonia on zeolite 13X is affected by the presence of water vapour. Water
affects adsorption adversely by lowering the capacity of ammonia adsorption; however,
concurrently water enhances the rate of adsorption of ammonia. From a detailed analysis of a
report on the study of simultaneous adsorption of water vapour, ammonia and tri-methyl-
ammine the following conclusions can be deduced (Brandin, 1996).
Adsorption of ammonia is fairly independent in a temperature range of 20 to 120 ˚C
as deduced from other literature data (Helminen, Helenius, Paatero, & Turunen,
2000). However, water vapour is more loosely bonded to a zeolite when increasing
the temperature.
At room temperature ammonia has a thermodynamic equilibrium constant, K, of
5.3·10-2
Nm3/g zeolite in the presence of 0.5 % water vapour and assuming a
Henry’s law relationship. Gas saturated with water vapour reduces the constant to
58 % of this value. This adverse effect is less pronounced at higher temperatures.
Water vapour enhances mass transfer of ammonia into the zeolite. The ratio
𝑘 = 𝑁 𝜃 has been evaluated to 260 s-1
for ammonia adsorbed into a bed of 13X
zeolite in the presence of water vapour. N represents the number of transfer units in
the bed and θ represents the space time in the bed.
The injection of adsorbent into the airstream will be conducted by feeders which transports
the adsorbent from a bulk-storage to the airstream.
5.2 Loss of Adsorbent
In the process, the adsorbent is subject to wearing as the particles are rubbed against each
other. Attrition can lead to problems in terms of plugging of equipment, loss of adsorbent and
contamination of end-product (Kokkoris & Turton, 1995, p. 39). Koval’skaya et al. (1983)
stated that attrition increases when water is present, which is confirmed by experiments
conducted during this assignment. The attrition is also more extensive when fresh particles are
managed since their surface is rough and has sharp edges. After some time the surface is
smoothed leading to a decrease in attrition rate (Klett et al., 2007, p. 778). According to
experiments done during this assignment the attrition stagnates after roughly 5 days resulting
in a 10 % loss of particles.
Loss of adsorbent has an adverse effect on the economy of the process. A solution to the
attrition problem can, according to Kokkoris et al. (1995, p. 40), be to coat the particles,
although this can cause a decrease in activity and selectivity. Another solution can be to add
an extra filtration step to the process where the fines are removed. A third solution is to
remove the small particles created before using the adsorbent in the system.
Basically, two sources of adsorbent losses have been identified in the selected process: the
baghouse system and the disc/drum filter. Detailed descriptions of the problems and solutions
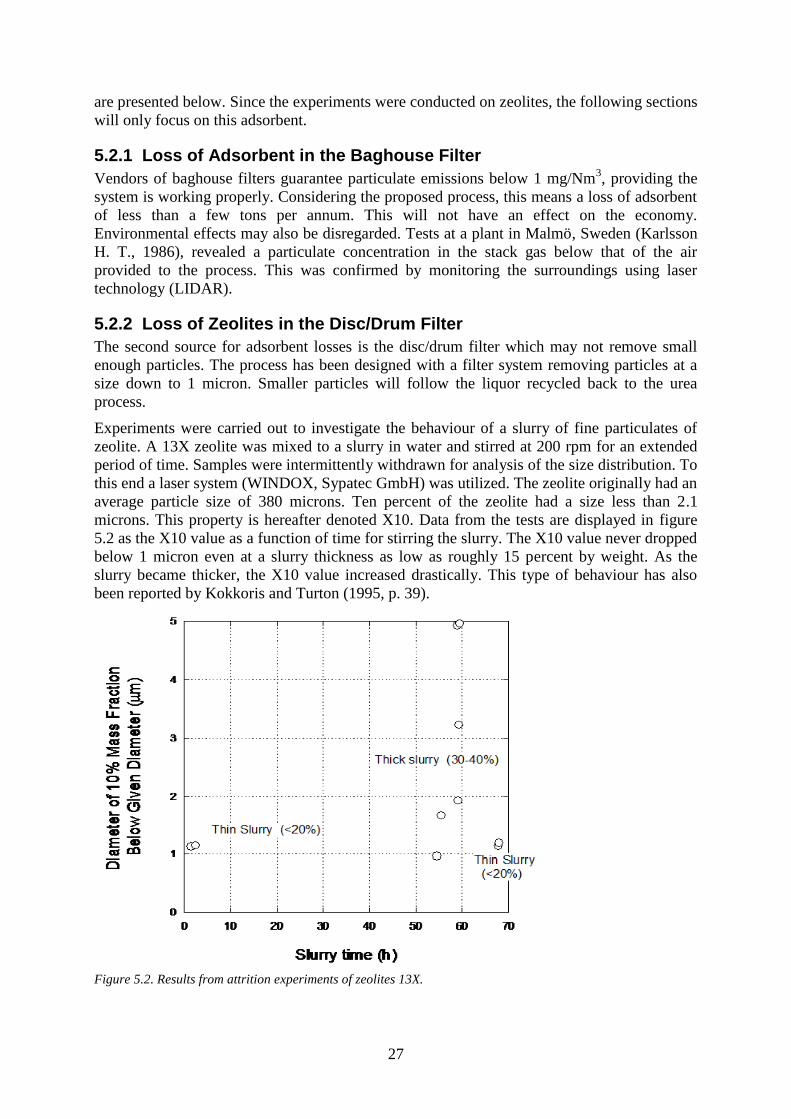
27
are presented below. Since the experiments were conducted on zeolites, the following sections
will only focus on this adsorbent.
5.2.1 Loss of Adsorbent in the Baghouse Filter
Vendors of baghouse filters guarantee particulate emissions below 1 mg/Nm3, providing the
system is working properly. Considering the proposed process, this means a loss of adsorbent
of less than a few tons per annum. This will not have an effect on the economy.
Environmental effects may also be disregarded. Tests at a plant in Malmö, Sweden (Karlsson
H. T., 1986), revealed a particulate concentration in the stack gas below that of the air
provided to the process. This was confirmed by monitoring the surroundings using laser
technology (LIDAR).
5.2.2 Loss of Zeolites in the Disc/Drum Filter
The second source for adsorbent losses is the disc/drum filter which may not remove small
enough particles. The process has been designed with a filter system removing particles at a
size down to 1 micron. Smaller particles will follow the liquor recycled back to the urea
process.
Experiments were carried out to investigate the behaviour of a slurry of fine particulates of
zeolite. A 13X zeolite was mixed to a slurry in water and stirred at 200 rpm for an extended
period of time. Samples were intermittently withdrawn for analysis of the size distribution. To
this end a laser system (WINDOX, Sypatec GmbH) was utilized. The zeolite originally had an
average particle size of 380 microns. Ten percent of the zeolite had a size less than 2.1
microns. This property is hereafter denoted X10. Data from the tests are displayed in figure
5.2 as the X10 value as a function of time for stirring the slurry. The X10 value never dropped
below 1 micron even at a slurry thickness as low as roughly 15 percent by weight. As the
slurry became thicker, the X10 value increased drastically. This type of behaviour has also
been reported by Kokkoris and Turton (1995, p. 39).
Figure 5.2. Results from attrition experiments of zeolites 13X.
28
It may be concluded from the experiments that smaller particles form larger agglomerates.
This phenomenon is enhanced as the slurry thickness increases. Since the considered process
will never be operated below 50 percent of weight of zeolite, an X10 value of 1 micron is a
conservative estimate.
Furthermore, loss of zeolite through the filter may then be estimated as less than 10 percent of
the zeolite batched during start-up. This loss will occur at an early stage. In order to prevent
the loss of fines to end up in the urea process, a by-pass system can be used. Upon start-up,
the liquid effluent can be discharged as a waste until the attrition has stagnated, after 3-5 days.
5.3 Process Design
To verify if the chosen process is feasible, calculations on both activated carbon and zeolites
were conducted.
All units with an exception of the disc/drum filter are constructed of carbon steel due to its
low cost and reasonably high durability. The disc/drum filter is made of stainless steel,
according to recommendations from Hydrotech (Wassvik, 2009).
Calculations based on an initial velocity through the filter cake of 2 cm/s (see appendix 1)
showed that the required area of the baghouse filter is 13400 m2
in the activated carbon case,
while the zeolites requires 14300 m2. With dimensions of the bags specified in appendix 1 the
number of bags would be approximately 5000 and 5310 respectively. After optimising the
initial velocity the activated carbon and zeolites required an area of 4370 m2
(1620 bags) and
4650 m2 (1730 bags) respectively. The baghouse filter has a polymer/paint liner and the bags
are made of a polyamide. The materials chosen increase the life time of the unit.
The silo is designed to be able to handle all the adsorbent in the baghouse system at any given
time. This leads to a total volume of 200 m3 for the activated carbon case, as 73.8 tons sits in
the baghouse filter. The amount of zeolites in the baghouse system at all times is 91.1 tons.
This leads to a silo of 230 m3.
The dissolution tank has to be able to hold equal amounts of water and adsorbent. Since the
silo is designed to hold all the adsorbent in the baghouse filter, the dissolution tank does not
need to hold as much. 10 % of the circulated activated carbon is assumed to be handled in the
mixing tank, leading to an amount of 16 tons at all times, why the calculated volume should
be around 60 m3. The space time in the mixing tank is therefore 6 minutes. Considering that
ammonia is more difficult to desorb from the zeolites, the space time in the dissolution tank is
set to 30 minutes. This results in a volume of around 30 m3. This tank needs an agitator to
keep the slurry well mixed. The power requirement of this component is not known why the
estimated power requirement is chosen to be 10 kW, pilot attempts are required to determine
the optimal power consumption.
The disc filter is estimated to be 120 m2 after consulting Hydrotech. The drum filter needed in
the zeolite case is estimated by rule of thumb to be 6.6 m2.
The calculations for the injection unit are based on a system made up of a bin with a screw
feeder. This bin is set to be able to hold the total amount of circulated adsorbent, which means
370 m3
in the activated carbon case and 60 m3
in the zeolite case.
5.3.1 Material Balances
In these calculations it is assumed and verified that around 95 % of the ammonia will be
adsorbed and removed in the zeolite case and over 90 % in the activated carbon case (see
appendix 1). It is also assumed that all the urea is separated from the airstream in the
baghouse filter.
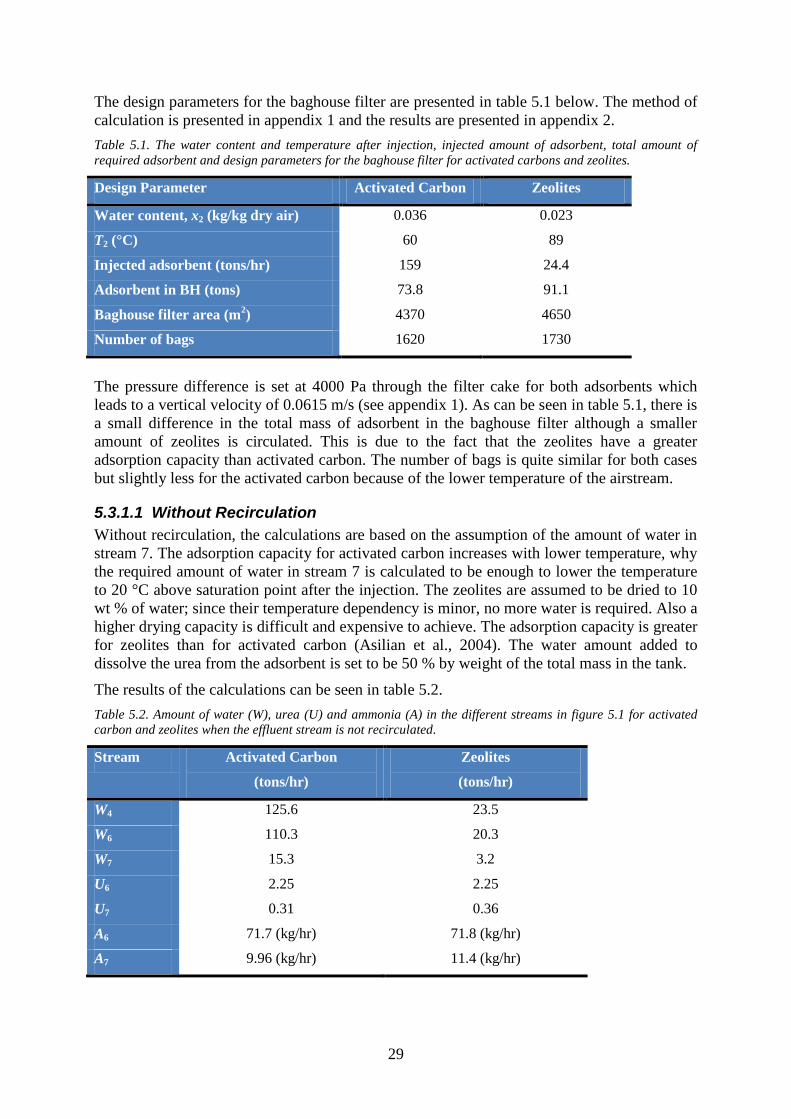
29
The design parameters for the baghouse filter are presented in table 5.1 below. The method of
calculation is presented in appendix 1 and the results are presented in appendix 2.
Table 5.1. The water content and temperature after injection, injected amount of adsorbent, total amount of
required adsorbent and design parameters for the baghouse filter for activated carbons and zeolites.
Design Parameter Activated Carbon Zeolites
Water content, x2 (kg/kg dry air) 0.036 0.023
T2 (°C) 60 89
Injected adsorbent (tons/hr) 159 24.4
Adsorbent in BH (tons) 73.8 91.1
Baghouse filter area (m2) 4370 4650
Number of bags 1620 1730
The pressure difference is set at 4000 Pa through the filter cake for both adsorbents which
leads to a vertical velocity of 0.0615 m/s (see appendix 1). As can be seen in table 5.1, there is
a small difference in the total mass of adsorbent in the baghouse filter although a smaller
amount of zeolites is circulated. This is due to the fact that the zeolites have a greater
adsorption capacity than activated carbon. The number of bags is quite similar for both cases
but slightly less for the activated carbon because of the lower temperature of the airstream.
5.3.1.1 Without Recirculation
Without recirculation, the calculations are based on the assumption of the amount of water in
stream 7. The adsorption capacity for activated carbon increases with lower temperature, why
the required amount of water in stream 7 is calculated to be enough to lower the temperature
to 20 °C above saturation point after the injection. The zeolites are assumed to be dried to 10
wt % of water; since their temperature dependency is minor, no more water is required. Also a
higher drying capacity is difficult and expensive to achieve. The adsorption capacity is greater
for zeolites than for activated carbon (Asilian et al., 2004). The water amount added to
dissolve the urea from the adsorbent is set to be 50 % by weight of the total mass in the tank.
The results of the calculations can be seen in table 5.2.
Table 5.2. Amount of water (W), urea (U) and ammonia (A) in the different streams in figure 5.1 for activated
carbon and zeolites when the effluent stream is not recirculated.
Stream Activated Carbon
(tons/hr)
Zeolites
(tons/hr)
W4 125.6 23.5
W6 110.3 20.3
W7 15.3 3.2
U6 2.25 2.25
U7 0.31 0.36
A6 71.7 (kg/hr) 71.8 (kg/hr)
A7 9.96 (kg/hr) 11.4 (kg/hr)
30
5.3.1.2 With Recirculation
A part of the effluent stream, 6, can be recirculated to the dissolution tank to increase the
concentration of ammonia and urea and decrease the fresh water requirements. Urea is highly
soluble in water. In the considered process the urea concentration is set to 40 % by weight in
the dissolution tank. However, the size of the recirculation stream, WC, is determined in order
to keep a liquid content in the dissolution tank to 50 %. The results from the material balances
when recirculation is applied can be seen in table 5.3.
Table 5.3. Amount of water (W), urea (U) and ammonia (A) in the different streams in figure 5.1 for activated
carbon and zeolites when recirculation is applied.
Stream Activated Carbon
(tons/hr)
Zeolites
(tons/hr)
W4 19.2 5.8
W6 3.4 3.4
W7 15.9 2.4
WB 142.8 21.9
WC 139.4 18.6
U6 2.3 2.3
U7 10.6 1.6
A6 127.4 (kg/hr) 73.9 (kg/hr)
A7 14.2 (kg/hr) 8.2 (kg/hr)
5.3.1.3 Heat of Urea Solution in the Dissolution Tank
According to the discussions in section 4.3 regarding the heat of solution for urea, the
temperature drop has to be calculated. The molality in both the activated carbon case and the
zeolite case is determined to 11.1 moles of urea/kg water. This give a heat of solution of 13.2
kJ/kg, according to equation 4.1, leading to a temperature drop of 3.2 ˚C. Since this
temperature drop is relatively small, no heating of the inlet water is required.
5.4 Risk Assessment
If the gas-cleaning is shut down upon failure, a by-pass duct equipped with three dampers can
be used to by-pass the gas around the gas-cleaning system. The dampers are used to lead the
gas through the by-pass duct so that the urea plant does not need to be shut down.
Two major systems are critical for the reliability of the gas cleaning: the baghouse system and
the disc/drum filter. The most critical mechanism for bag failure is the connection of the
fabrics at the top of the support cages. However, extended operating experience has lead to
proper solutions to this problem, which are presented in section 5.4.1 below.
Another issue is whether the regeneration step, where water is added in order to dissolve urea
and water, is enough to desorb the ammonia from the zeolites. Solutions to this problem are
presented in section 5.4.3 below.
Another risk is the degradation of urea in the baghouse filter. This is time dependent and can
be avoided to some extent by applying a shorter space time. As a result of the degradation,
adsorbtion of unwanted species can occur. No investigation of this potential problem has been
conducted.
31
5.4.1 Baghouse Filter Failure
Failure of a baghouse system follows a bath-tub curve. Upon start-up at the first time,
improper mounting of the fabrics is taken care of. Failure rate then follows a constant pattern
at a fairly low failure rate. Eventually the fabrics have to be replaced due to extended wear.
Modern baghouse systems can be operated up to five years before the fabrics are replaced
according to vendor expertise. Most users choose to replace the bags after three years of
operation. Failure of single bags is taken care of by designing the baghouse with several
compartments which can be shut down separately without shutting down the plant.
5.4.2 Disc/Drum Filter Failure
Failure of the disc/drum filter can be taken care of by designing a redundant system of n
number of parallel filters of which n-1 are in operation and one is at standby. The size of the
filters is selected so that n-1 filters can handle 100 % capacity. If one of the filters fails, the
standby filter is started up. Both cost and reliability depends on the number of filters. The
reliability is lowest for one filter and highest for two. As the number of filters increases above
two the reliability drops slightly. If disregarding failure on start-up, the unreliability of a
redundant system can be estimated from
Equation 5.1.
𝑄𝑃 = 1 − 𝑒−𝜆 ·𝑡· 1−𝑒−𝜆 · 𝑛−1 ·𝜏
where QP is the probability for system breakdown, t is time, λ is the failure rate, n is the
amount of filters used and τ is the time for repair.
The installation cost depends on the number of filters as well as the cost-scale exponent. If the
cost factor, F, for one filter is unity, then the cost factor for n units is
Equation 5.2.
𝐹 = 𝑛 · 𝑛 − 1 𝑟𝑐
As long as rc < 2/3, the optimal n value is two. If r > 2/3 the cost factor decreases as n
increases above 2. According to McKetta (1981), filters have an r value not greater than 0.6.
Hence, the optimal number of disc filters is 2 when considering both cost and reliability.
Suppose a disc filter has a high unreliability, say 0.5 per annum. That is, the chance of failure
is 50 % during one year of operation. This corresponds to a failure rate of approximately 10-4
hr-1
. If the time for repair is 24 h, the unreliability of a redundant system is roughly 1.6·10-3
per annum, or 1.6 % over ten years.
5.4.3 Regeneration of Zeolites
Regeneration of the adsorbent is proposed to be carried out by mixing the adsorbent with
water. In the zeolite case, water and ammonia will be strongly bonded to the adsorbent, why
the regeneration can be difficult to perform. An alternative to the present method is to add an
extra regeneration step where steam is used, according to the method described in section
3.3.3.4. Mixing with water is still necessary in order to dissolve the urea; the steam
regeneration will be added after the solid-liquid separation step. Whether the steam
regeneration is required or not has to be investigated through pilot scale tests, which are
possible to conduct at the Faculty of Engineering at Lund University.
32
5.5 Process Economy
The process economy is divided into investment and operating costs. In addition, a sensitivity
analysis is conducted regarding the water price, electricity price and investment cost. Cost
data are adjusted to the time value of year 2008 and using Euro as currency. Cost escalation is
taken into account by using the Chemical Engineering Plant Cost Index (CEPCI) for
Equipment when US cost data bases are used. A “flat” exchange rate is used for this
millennium since exchange rates have fluctuated substantially and this fluctuation does not
necessarily reflect fluctuations in the cost of manufacturing process equipment. The rate US$
1.36 per Euro is used. This value gives a more conservative estimate compared to the actual
exchange rate close to US$ 1.50 per Euro during the 2008. Cost data retrieved from Swedish
sources were adjusted using the Net Consumer Price Index for Sweden.
5.5.1 Investment Costs
To make an economical evaluation of the proposed solution Ulrich´s method is used for most
of the equipment. The method takes into account both the direct and indirect costs in the
module cost, CBM. The module cost is calculated with the following equation.
Equation 5.3.
𝐶𝐵𝑀 = 𝐶𝑝 · 𝐹𝐵𝑀
Where Cp is the apparatus cost expressed with standard such as carbon steel, normal pressure
and temperature. FBM is an add-on factor which accounts for the construction materials as well
as operational conditions. This add on factor also contains the costs for installation, insurance
etcetera. For the entire plant the costs are calculated with equation 5.4.
Equation 5.4.
𝐾$,1982 = 𝐶𝐵𝑀 𝑖
𝑛
𝑖=1
· 𝑓𝑐
Where fc is the contingency and contracting costs: 15 % according to the rule of thumb. The
cost escalation from 1982 to 2008 is estimated at the ratio 632/299 using the CEPCI.
The investment in baghouse filter is first calculated based on the volumetric flow rate of air.
The number of bags was calculated by using a linear flow rate of 2 cm/s. After optimising the
baghouse filter the linear flow rate was increased to 6.15 cm/s. The cost for the baghouse
filter can be reduced if a high linear velocity rate is used. Equation 5.5 below can be used to
calculate the new cost for the optimised baghouse filter.
Equation 5.5.
𝐾𝑖𝑔 = 𝐾𝑙𝑜𝑤 · 𝑁𝑙𝑜𝑤𝑁𝑖𝑔
23
Where N is the number of bags and K is the cost.
The adsorbent is purchased three times during a ten year period. The first purchase is included
in the investment cost; the other two are calculated as a direct variable cost (see section 5.5.2).
The investment cost for the two scrubbers in Stamicarbons plants is estimated to 2,000,000 €.
The results from the economic calculations on the investment cost for the activated carbon
case are presented in table 5.4 below. For more details see appendix 3.
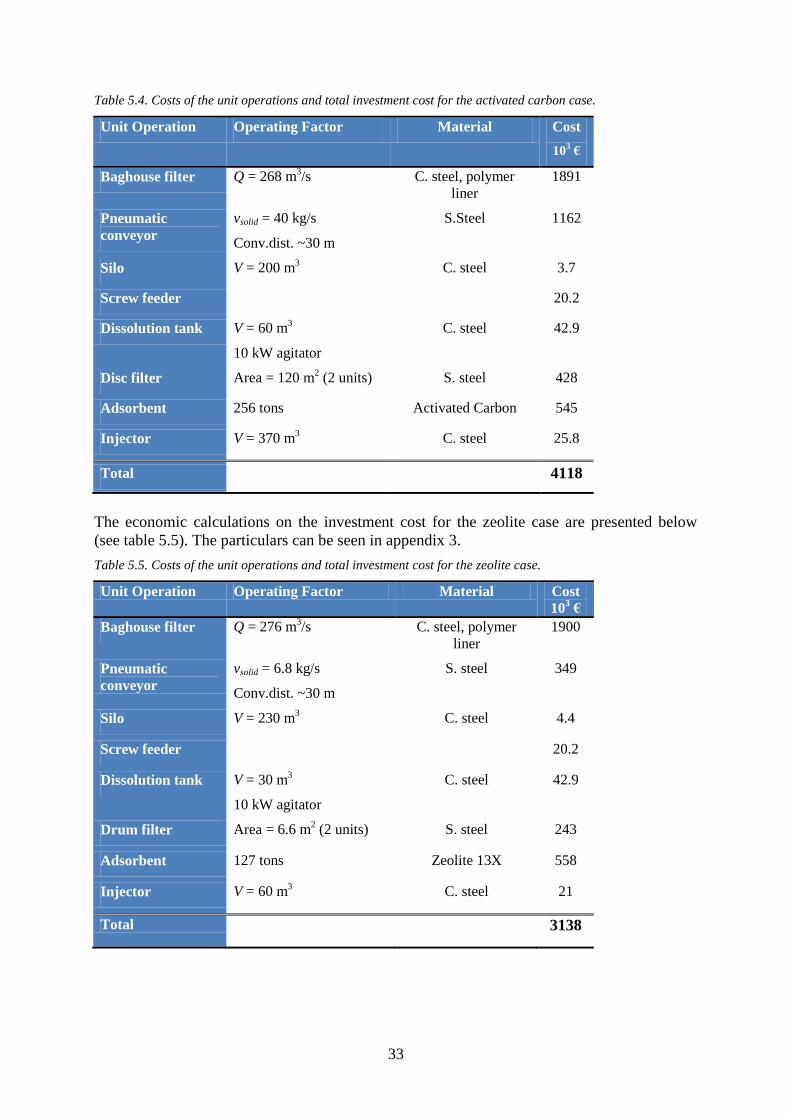
33
Table 5.4. Costs of the unit operations and total investment cost for the activated carbon case.
Unit Operation Operating Factor Material Cost
103 €
Baghouse filter Q = 268 m3/s C. steel, polymer
liner
1891
Pneumatic
conveyor
vsolid = 40 kg/s
Conv.dist. ~30 m
S.Steel 1162
Silo V = 200 m3 C. steel 3.7
Screw feeder 20.2
Dissolution tank V = 60 m3
10 kW agitator
C. steel 42.9
Disc filter Area = 120 m2 (2 units) S. steel 428
Adsorbent 256 tons Activated Carbon 545
Injector V = 370 m3 C. steel 25.8
Total
4118
The economic calculations on the investment cost for the zeolite case are presented below
(see table 5.5). The particulars can be seen in appendix 3.
Table 5.5. Costs of the unit operations and total investment cost for the zeolite case.
Unit Operation Operating Factor Material Cost
103 €
Baghouse filter Q = 276 m3/s C. steel, polymer
liner
1900
Pneumatic
conveyor
vsolid = 6.8 kg/s
Conv.dist. ~30 m
S. steel 349
Silo V = 230 m3 C. steel 4.4
Screw feeder 20.2
Dissolution tank V = 30 m3
10 kW agitator
C. steel 42.9
Drum filter Area = 6.6 m2 (2 units) S. steel 243
Adsorbent 127 tons Zeolite 13X 558
Injector V = 60 m3 C. steel 21
Total 3138
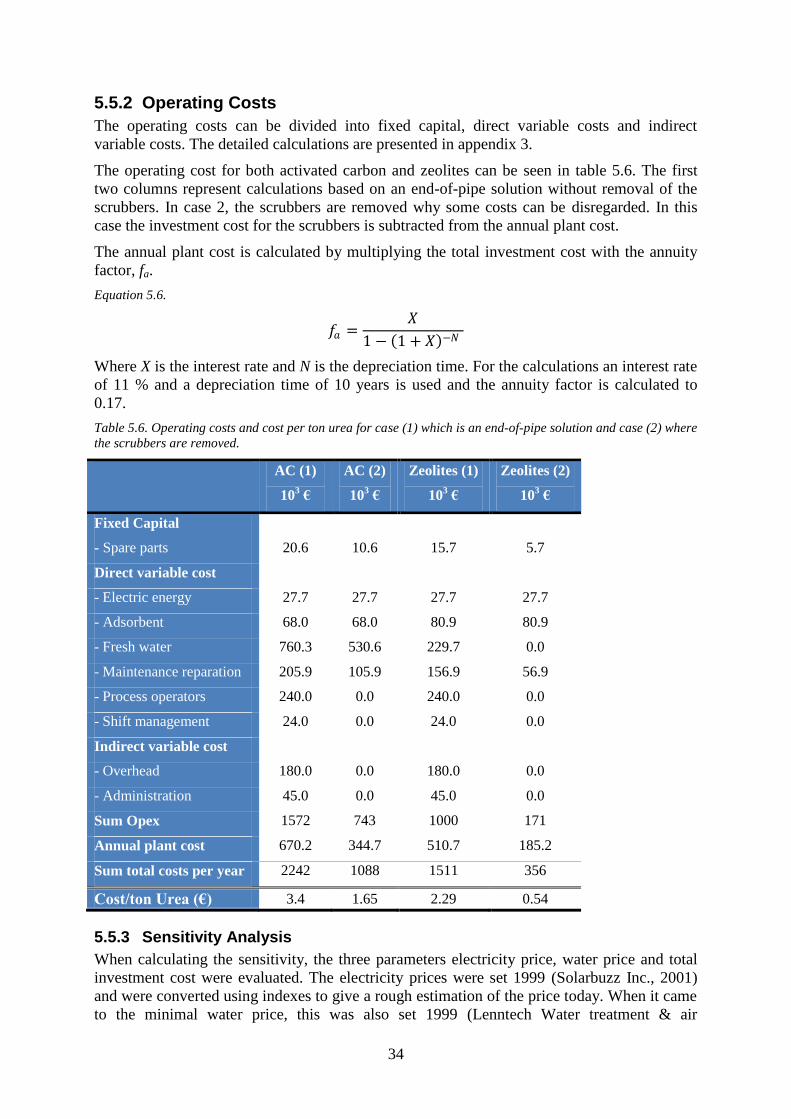
34
5.5.2 Operating Costs
The operating costs can be divided into fixed capital, direct variable costs and indirect
variable costs. The detailed calculations are presented in appendix 3.
The operating cost for both activated carbon and zeolites can be seen in table 5.6. The first
two columns represent calculations based on an end-of-pipe solution without removal of the
scrubbers. In case 2, the scrubbers are removed why some costs can be disregarded. In this
case the investment cost for the scrubbers is subtracted from the annual plant cost.
The annual plant cost is calculated by multiplying the total investment cost with the annuity
factor, fa.
Equation 5.6.
𝑓𝑎 =𝑋
1 − 1 + 𝑋 −𝑁
Where X is the interest rate and N is the depreciation time. For the calculations an interest rate
of 11 % and a depreciation time of 10 years is used and the annuity factor is calculated to
0.17.
Table 5.6. Operating costs and cost per ton urea for case (1) which is an end-of-pipe solution and case (2) where
the scrubbers are removed.
AC (1)
103 €
AC (2)
103 €
Zeolites (1)
103 €
Zeolites (2)
103 €
Fixed Capital
- Spare parts 20.6 10.6 15.7 5.7
Direct variable cost
- Electric energy 27.7 27.7 27.7 27.7
- Adsorbent 68.0 68.0 80.9 80.9
- Fresh water 760.3 530.6 229.7 0.0
- Maintenance reparation 205.9 105.9 156.9 56.9
- Process operators 240.0 0.0 240.0 0.0
- Shift management 24.0 0.0 24.0 0.0
Indirect variable cost
- Overhead 180.0 0.0 180.0 0.0
- Administration 45.0 0.0 45.0 0.0
Sum Opex 1572 743 1000 171
Annual plant cost 670.2 344.7 510.7 185.2
Sum total costs per year 2242 1088 1511 356
Cost/ton Urea (€) 3.4 1.65 2.29 0.54
5.5.3 Sensitivity Analysis
When calculating the sensitivity, the three parameters electricity price, water price and total
investment cost were evaluated. The electricity prices were set 1999 (Solarbuzz Inc., 2001)
and were converted using indexes to give a rough estimation of the price today. When it came
to the minimal water price, this was also set 1999 (Lenntech Water treatment & air
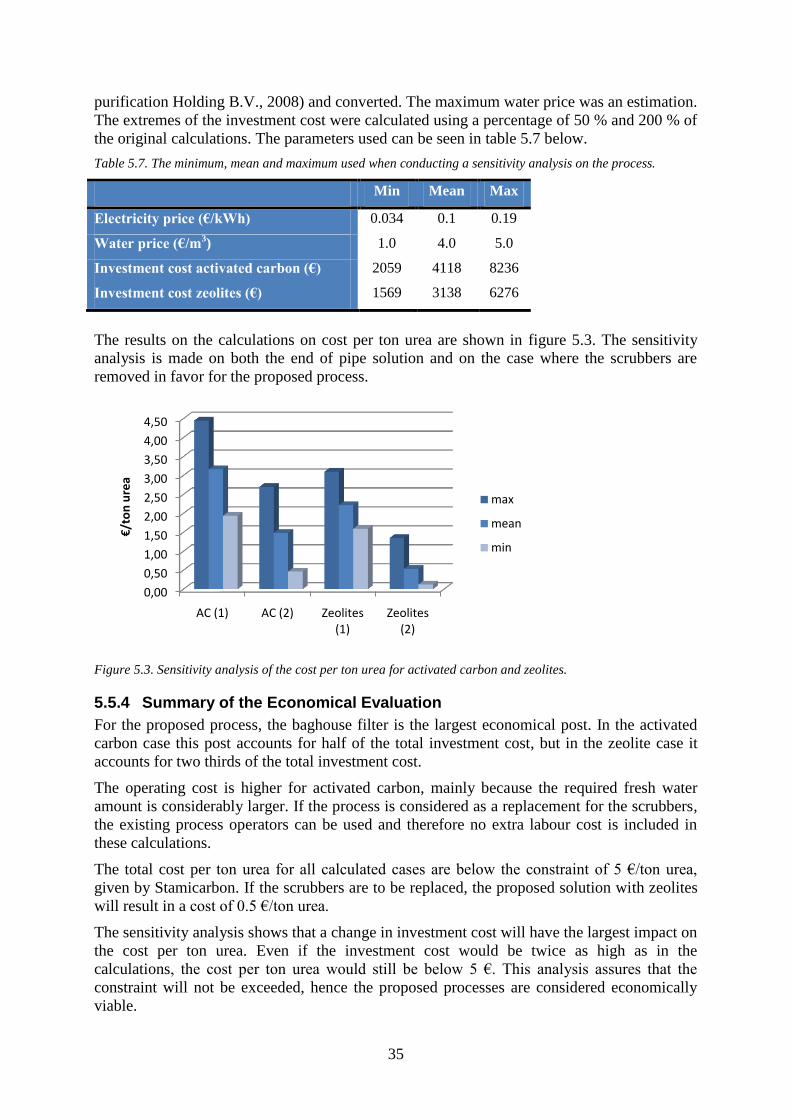
35
purification Holding B.V., 2008) and converted. The maximum water price was an estimation.
The extremes of the investment cost were calculated using a percentage of 50 % and 200 % of
the original calculations. The parameters used can be seen in table 5.7 below.
Table 5.7. The minimum, mean and maximum used when conducting a sensitivity analysis on the process.
Min Mean Max
Electricity price (€/kWh) 0.034 0.1 0.19
Water price (€/m3) 1.0 4.0 5.0
Investment cost activated carbon (€) 2059 4118 8236
Investment cost zeolites (€) 1569 3138 6276
The results on the calculations on cost per ton urea are shown in figure 5.3. The sensitivity
analysis is made on both the end of pipe solution and on the case where the scrubbers are
removed in favor for the proposed process.
Figure 5.3. Sensitivity analysis of the cost per ton urea for activated carbon and zeolites.
5.5.4 Summary of the Economical Evaluation
For the proposed process, the baghouse filter is the largest economical post. In the activated
carbon case this post accounts for half of the total investment cost, but in the zeolite case it
accounts for two thirds of the total investment cost.
The operating cost is higher for activated carbon, mainly because the required fresh water
amount is considerably larger. If the process is considered as a replacement for the scrubbers,
the existing process operators can be used and therefore no extra labour cost is included in
these calculations.
The total cost per ton urea for all calculated cases are below the constraint of 5 €/ton urea,
given by Stamicarbon. If the scrubbers are to be replaced, the proposed solution with zeolites
will result in a cost of 0.5 €/ton urea.
The sensitivity analysis shows that a change in investment cost will have the largest impact on
the cost per ton urea. Even if the investment cost would be twice as high as in the
calculations, the cost per ton urea would still be below 5 €. This analysis assures that the
constraint will not be exceeded, hence the proposed processes are considered economically
viable.
0,00
0,50
1,00
1,50
2,00
2,50
3,00
3,50
4,00
4,50
AC (1) AC (2) Zeolites (1)
Zeolites (2)
€/t
on
ure
a
max
mean
min
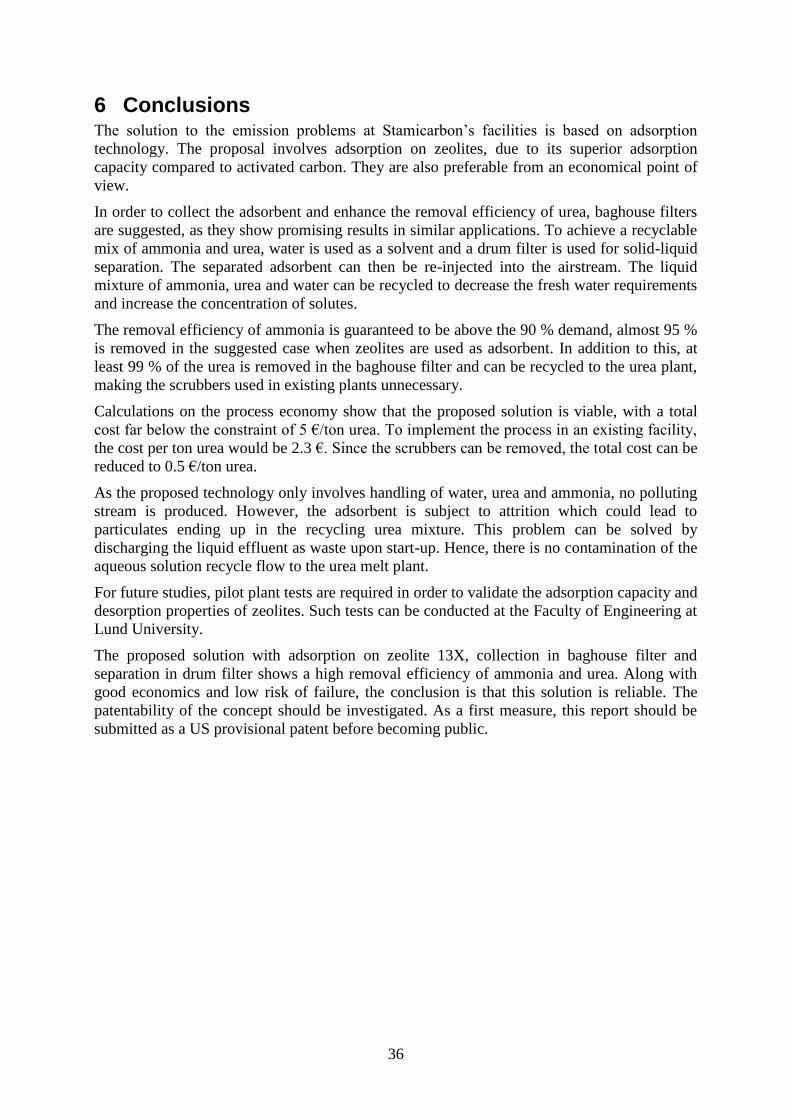
36
6 Conclusions The solution to the emission problems at Stamicarbon’s facilities is based on adsorption
technology. The proposal involves adsorption on zeolites, due to its superior adsorption
capacity compared to activated carbon. They are also preferable from an economical point of
view.
In order to collect the adsorbent and enhance the removal efficiency of urea, baghouse filters
are suggested, as they show promising results in similar applications. To achieve a recyclable
mix of ammonia and urea, water is used as a solvent and a drum filter is used for solid-liquid
separation. The separated adsorbent can then be re-injected into the airstream. The liquid
mixture of ammonia, urea and water can be recycled to decrease the fresh water requirements
and increase the concentration of solutes.
The removal efficiency of ammonia is guaranteed to be above the 90 % demand, almost 95 %
is removed in the suggested case when zeolites are used as adsorbent. In addition to this, at
least 99 % of the urea is removed in the baghouse filter and can be recycled to the urea plant,
making the scrubbers used in existing plants unnecessary.
Calculations on the process economy show that the proposed solution is viable, with a total
cost far below the constraint of 5 €/ton urea. To implement the process in an existing facility,
the cost per ton urea would be 2.3 €. Since the scrubbers can be removed, the total cost can be
reduced to 0.5 €/ton urea.
As the proposed technology only involves handling of water, urea and ammonia, no polluting
stream is produced. However, the adsorbent is subject to attrition which could lead to
particulates ending up in the recycling urea mixture. This problem can be solved by
discharging the liquid effluent as waste upon start-up. Hence, there is no contamination of the
aqueous solution recycle flow to the urea melt plant.
For future studies, pilot plant tests are required in order to validate the adsorption capacity and
desorption properties of zeolites. Such tests can be conducted at the Faculty of Engineering at
Lund University.
The proposed solution with adsorption on zeolite 13X, collection in baghouse filter and
separation in drum filter shows a high removal efficiency of ammonia and urea. Along with
good economics and low risk of failure, the conclusion is that this solution is reliable. The
patentability of the concept should be investigated. As a first measure, this report should be
submitted as a US provisional patent before becoming public.
37
7 Acknowledgements First of all, special thanks to Sigvald Harryson and his team for organising the challenge and
all related events. Thanks are directed to Jakob Liedberg as well, for valuable inputs and
advice. Also, thanks are addressed to Jo Meessen and Hans van den Tillaart for providing this
assignment and giving us information and support.
We would like to thank our tutors Christian Hulteberg and Hans T Karlsson for their priceless
support and encouragement during this assignment.
Thanks to Birgitta Lindén at the Department of Chemical Engineering, Lund University, for
performing lab scale tests and providing us with results.
Finally, special thanks to the ladies in Café Ester at Kemicentrum, LTH, for serving us coffee
every day with a smile.
38
8 References Alstom Power. (2009). Sorbent Injection. Retrieved April 27, 2009, from Alstom Power:
http://www.power.alstom.com/home/equipment___systems/ecs/power/mercury_control/pilot_
plant/sorbentinjection/36674.EN.php?languageId=EN&dir=/home/equipment___systems/ecs/
power/mercury_control/pilot_plant/sorbentinjection/
Appl, M. (2006). Ammonia. Retrieved February 18, 2009, from Ullmann's Encyclopedia of
Industrial Chemistry:
http://mrw.interscience.wiley.com/emrw/9783527306732/ueic/article/a02_143/current/html
Asilian, H., Mortazavi, S., Kazemian, H., Phaghiezadeh, S., Shahtaheri, S., & Salem, M.
(2004). Removal of Ammonia from Air, using Three Iranian Natural Zeolites. Iranian Journal
of Public Health , 33 (1), 45-51.
Bernal, M. P., & Lopez-Real, J. M. (1993). Natural zeolites and sepiolite as ammonium and
ammonia adsorbent materials. Bioresource Technology , 43, 27-33.
Brandin, J. (1996). Phase A, Report on Adsorption Unit for Ammonia. Confidential report.
Caputo, A. C., & Pelaggae, P. M. (2000). System Design based on Economics Optimization.
Enviromental Progress , 19 (4), pp. 238-245.
Coulson, M., & Richardson, J. (1999). Chemical Engineering (3rd ed., Vol. two). Amsterdam:
Butterworth-Heineman.
Diem, H. (2005). Amino Resins. In Ullmann, Ullmann's Encyclopedia of Industrial
Chemistry. Weinheim: Wiley-VHC Verlag GmbH & Co.
Direct Industry. (2009). Products. Retrieved March 10, 2009, from
http://www.directindustry.com/prod/rpa-process-technologies/disc-filter-for-liquid-solid-
separation-31137-209454
Dykyj, J., Dymond, J. H., Hall, K. R., Landholt, H., Börnstein, R., Martienssen, W., et al.
(2001). Numerical data and functional relationships in science and technology. Berlin:
Springer Verlag.
Encyclopedia Britannica. (2009). Adsorption. Retrieved February 26, 2009, from
Encyclopaedia Britannica: http://search.eb.com.ludwig.lu.se/eb/article-9003800
Encyclopedia Britannica. (2009). Baghouse filter technology. Retrieved May 18, 2009, from
http://www.britannica.com/EBchecked/topic/48820/baghouse-filter
Encyclopedia Britannica. (2009). Urea. Retrieved February 19, 2009, from Encyclopaedia
Britannica: http://search.eb.com/eb/article-9074456
European Union. (2001, October 23). Official Journal of the European communities.
Retrieved February 19, 2009, from Directive 2001/81/EC of the European Parliment and of
the Council.
Gabites, J. R., Abrahamson, J., & Winchester, J. (2008). Design of baghouses for fines
collection in milk powder plants. Powder Technology , 187, 46-52.
Gang, L. (2002). Catalytic Oxidation of Ammonia to Nitrogen. Eindhoven University of
Technology. Eindhoven: Universiteitsdrukkerij.
Helminen, J., Helenius, J., Paatero, E., & Turunen, I. (2000). Comparison of sorbents and
isotherm models for NH3-gas separation by adsorption. AICHe Journal , 46 (8), 1541-1555.
HVAC Queensland Pty Ltd. (2008). Retrieved March 6, 2009, from HVAC.

39
Jankowska, H., Swiatkowski, A., & Choma, J. (1991). Active Carbon (English ed.).
Chichester: Ellis Horwood Limited.
Karlsson, H. T. (1981). Mass Transfer and Engineering Aspects on Air Pollution Control
Equipment. Lund: Lund University, Faculty of Engineering.
Karlsson, H. T. (2009, March 19). Project meeting.
Karlsson, H. T. (2009). Rule of thumb for economical evaluation. Course material in
Feasibility Studies on Industrial Plants .
Karlsson, H. T. (1986). Spray dry Scrubbing of Secondary Pollutants from Coal Burning.
Proceedings of the Third Annual Pittsburgh Coal Conference, (p. 237). Pittsburgh.
Karlsson, H. T., Klingspor, J., & Bjerle, I. (1981). Adsorption of hydrochloric acid on solid
slaked lime for flue gas clean up. Journal of Air Pollution Control Association , 31 (11),
1177-1180.
Klett, C., Hartge, E.-U., & Werther, J. (2007). Time-Dependent Behavior of a Catalyst in a
Fluidized Bed/Cyclone Circulation System. Particle Technology and Fluidization , 53 (4),
769-779.
KMPT. (2009). KMPT. Retrieved February 26, 2009, from KMPT general brochure:
http://www.kmpt.net/brochures.aspx
Kokkoris, A., & Turton, R. (1995). A phenomenological model predicting the attrition and the
reduction of attrition due to the addition of solid lubricants in slugging beds. Powder
Technology , 84, 39-47.
Koval'skaya, L. V., & Mirskii, Y. V. (1983). Sturcture and strength properties of zeolitic
cracking catalysts. (pp. 363-364). Plenum Publishing Corporation.
Küntzel, J., Ham, R., & Melin, T. (1999). Regeneration of hydrophobic zeolites with steam.
Chemical Engineering and Technology , 22 (12), 991-995.
Lenntech Water treatment & air purification Holding B.V. (2008). Specific questions on water
quantities. Retrieved May 15, 2009, from Specific questions on water use and the amounts of
available water on earth: http://www.lenntech.com/specific-questions-water-quantities.htm
McCabe, W., & Smith, J. (1976). Unit operations of chemical engineering. Tokyo: McGraw-
Hill Kogakusha LTD.
McCabe, W., & Smith, J. (2005). Unit operations of chemical engineering. New York:
McGraw-Hill .
McKetta, J. J. (1981). Encyclopedia of Chemical Process Design (Vol. 12). (M. Decker, Ed.)
Meessen, J. (2009, January 26). Personal communication .
Meessen, J. (1996). Urea. Retrieved February 19, 2009, from Ullmann's Encyclopedia of
Industrial Chemistry:
http://mrw.interscience.wiley.com/emrw/9783527306732/ueic/article/a27_333/current/html
Naturvårdsverket. (2009). Utsläpp av ammoniak. Retrieved February 19, 2009, from
Naturvårdsverket (The Swedish Enviromental Agency):
http://www.naturvardsverket.se/sv/Tillstandet-i-miljon/Officiell-statistik/Statistik-efter-
amne/Utslapp-till-luft/Utslapp-av-ammoniak/
Perry, R. H., & Chilton, C. H. (1973). Chemical Engineers' Handbook (5th ed.). USA:
McGraw-Hill, inc.
40
Perry, R. H., & Green, D. (2007). Perry's Chemical Engineers' Handbook (4th ed.). New
York: McGraw-Hill.
Petit, C., & Bandosz, T. J. (2008 b). Activated carbons modified with aluminum - zirconium
polycations as adsorbent for ammonia. Micropous and mesoporous materials 114 , 137-147.
Petit, C., & Bandosz, T. J. (2008 a). Removal of ammonia from air on molybdenum and
tungsten oxide modified activated carbons. Environmental Science and Technology , 42 (8),
3033-3039.
Petit, C., Karawacki, C., Peterson, G., & Bandosz, T. J. (2007). Interactions of ammonia with
the surface of microporous carbon impregnated with transition metal chlorides. Journal of
physical chemistry , 12705-12714.
PPM Technologies. (2009). Applications. Retrieved March 10, 2009, from
http://www.ppmtech.com/Applications/Equipment/Continuous-Drum-Filter.aspx
Purafil. (2009, March 4). Adsorbent for ammonia. (Y. Eriksson, Interviewer)
Purafil Inc. (2009). Welcome to Purafil. Retrieved March 17, 2009, from Purafil Inc.:
http://www.purafil.com
Roland, E., & Kleinschmit, P. (2005). Zeolites. In Ullmann's Encyclopedia of Industrial
Chemistry. Weinheim: Wiley VCH GmbH & Co.
Schwarz Global Consulting. (2009). The tricanter centrifuge. Retrieved March 15, 2009, from
http://www.sgconsulting.co.za/Products/Tricanter/Tricanter.htm
Solarbuzz Inc. (2001, June). Solarbuzz. Retrieved 05 15, 2009, from World Electricity Prices:
http://www.solarbuzz.com/Solarpricesworld.htm
Stamicarbon. (2004, June). Brochures. Retrieved March 18, 2009, from Stamicarbon's
Granulation Technology :
http://www.stamicarbon.com/publi_presen/_media/brochures/urea_info/417_granulation.pdf
Stamicarbon. (2009). Urea. Retrieved February 19, 2009, from Stamicarbon:
http://stamicarbon-com.combell-linux2.agency.be/urea/_en/index.htm
TEMA Systems . (2009). Pusher centrifuge. Retrieved March 10, 2009, from
http://www.tema.net/Pusher.aspx
The New Zealand institute of food science and technology. (2009). Centrifuge equipment.
Retrieved February 19, 2009, from
http://www.nzifst.org.nz/unitoperations/mechseparation4.htm#equip
The New Zealand institute of food science and technology. (2009). Mechanical separation.
Retrieved February 19, 2009, from
http://www.nzifst.org.nz/unitoperations/mechseparation4.htm#equip
van Baal, H., Djavdan, P., & Meessen, J. (2004). Stamicarbon's Granulation Technology.
Stamicarbon.
Wang, S., Li, H., Xie, S., Liu, S., & Xu, L. (2006). Physical and chemical regeneration of
zeolitic adsorbents for dye removal in wastewater treatment. Chemosphere , 65, 82-87.
Wassvik, P. (2009, March 24). Sales engineer, Hydrotech, Veolia. (D. Holmström,
Interviewer)
Yang, R. T. (2003). Adsorbents: Fundamentals and Applications. Hoboken: John Wiley &
Sons, Inc.
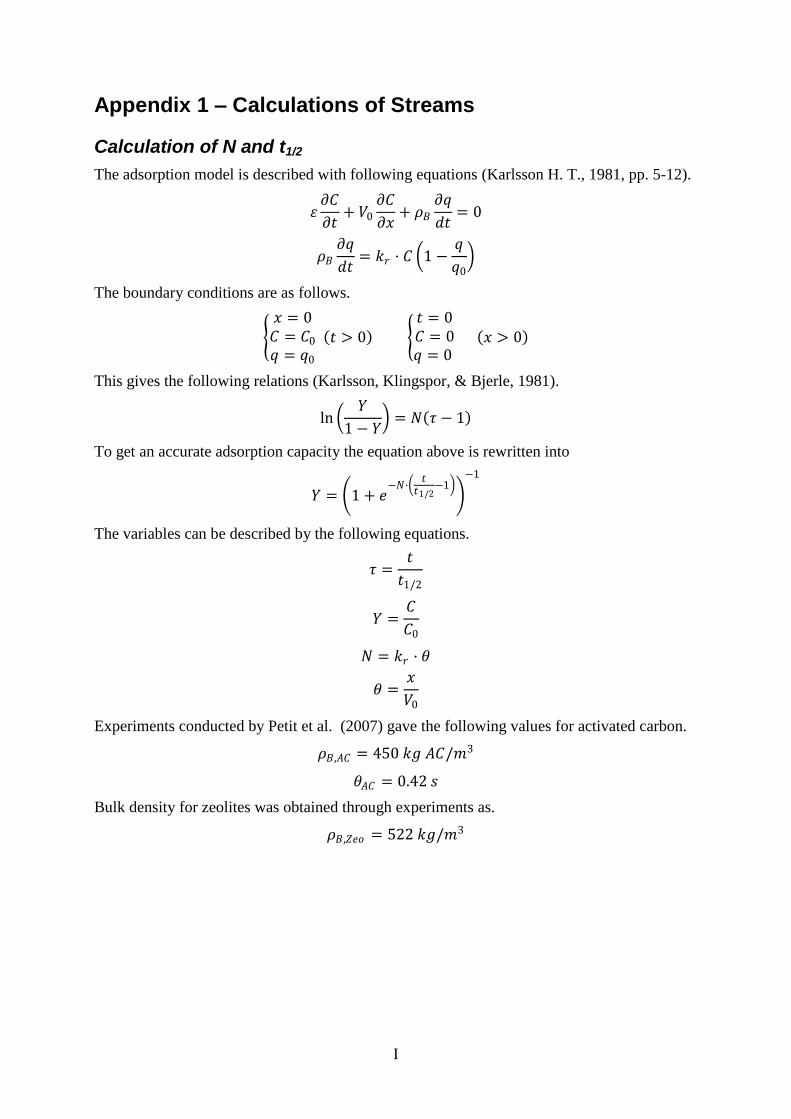
I
Appendix 1 – Calculations of Streams
Calculation of N and t1/2
The adsorption model is described with following equations (Karlsson H. T., 1981, pp. 5-12).
𝜀𝜕𝐶
𝜕𝑡+ 𝑉0
𝜕𝐶
𝜕𝑥+ 𝜌𝐵
𝜕𝑞
𝑑𝑡= 0
𝜌𝐵𝜕𝑞
𝑑𝑡= 𝑘𝑟 · 𝐶 1 −
𝑞
𝑞0
The boundary conditions are as follows.
𝑥 = 0𝐶 = 𝐶0
𝑞 = 𝑞0
𝑡 > 0 𝑡 = 0𝐶 = 0𝑞 = 0
𝑥 > 0
This gives the following relations (Karlsson, Klingspor, & Bjerle, 1981).
ln 𝑌
1 − 𝑌 = 𝑁 𝜏 − 1
To get an accurate adsorption capacity the equation above is rewritten into
𝑌 = 1 + 𝑒−𝑁·
𝑡𝑡1/2
−1
−1
The variables can be described by the following equations.
𝜏 =𝑡
𝑡1/2
𝑌 =𝐶
𝐶0
𝑁 = 𝑘𝑟 · 𝜃
𝜃 =𝑥
𝑉0
Experiments conducted by Petit et al. (2007) gave the following values for activated carbon.
𝜌𝐵,𝐴𝐶 = 450 𝑘𝑔 𝐴𝐶/𝑚3
𝜃𝐴𝐶 = 0.42 𝑠
Bulk density for zeolites was obtained through experiments as.
𝜌𝐵,𝑍𝑒𝑜 = 522 𝑘𝑔/𝑚3
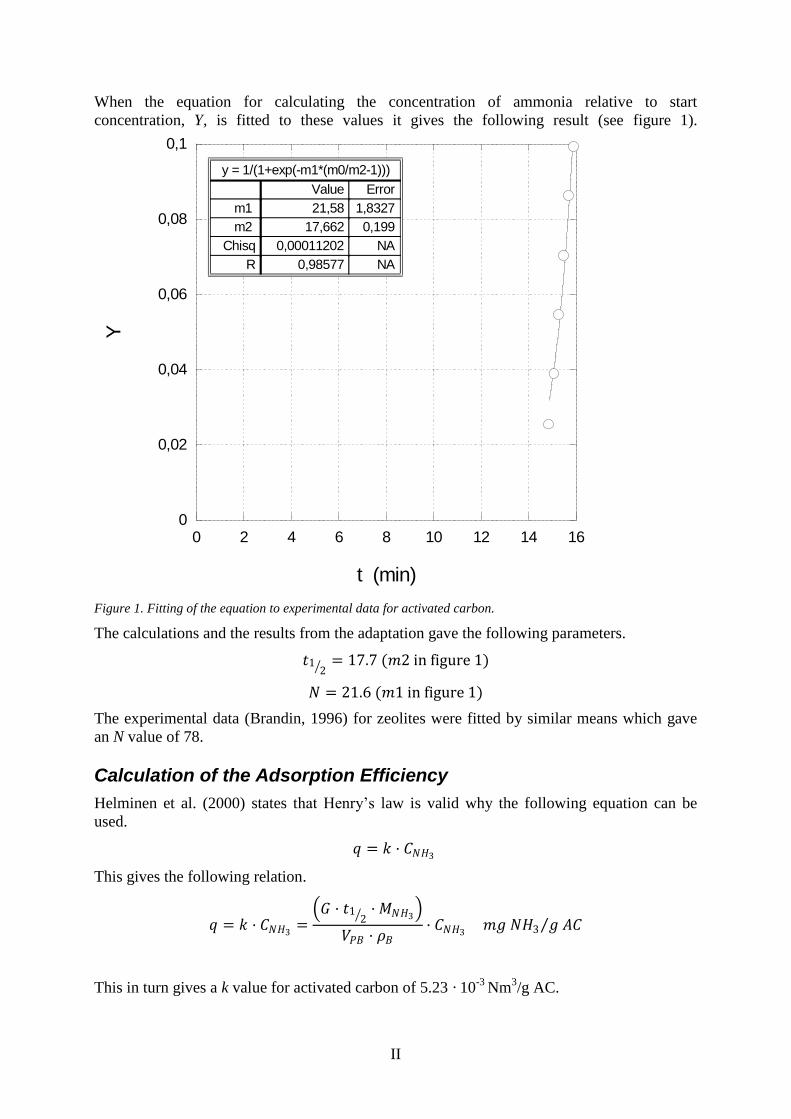
II
When the equation for calculating the concentration of ammonia relative to start
concentration, Y, is fitted to these values it gives the following result (see figure 1).
0
0,02
0,04
0,06
0,08
0,1
0 2 4 6 8 10 12 14 16
Y
t (min)
y = 1/(1+exp(-m1*(m0/m2-1)))
ErrorValue
1,832721,58m1
0,19917,662m2
NA0,00011202Chisq
NA0,98577R
Figure 1. Fitting of the equation to experimental data for activated carbon.
The calculations and the results from the adaptation gave the following parameters.
𝑡12
= 17.7 (𝑚2 in figure 1)
𝑁 = 21.6 (𝑚1 in figure 1)
The experimental data (Brandin, 1996) for zeolites were fitted by similar means which gave
an N value of 78.
Calculation of the Adsorption Efficiency
Helminen et al. (2000) states that Henry’s law is valid why the following equation can be
used.
𝑞 = 𝑘 · 𝐶𝑁𝐻3
This gives the following relation.
𝑞 = 𝑘 · 𝐶𝑁𝐻3= 𝐺 · 𝑡1
2 ·𝑀𝑁𝐻3
𝑉𝑃𝐵 · 𝜌𝐵· 𝐶𝑁𝐻3
𝑚𝑔 𝑁𝐻3 𝑔 𝐴𝐶
This in turn gives a k value for activated carbon of 5.23 · 10-3
Nm3/g AC.
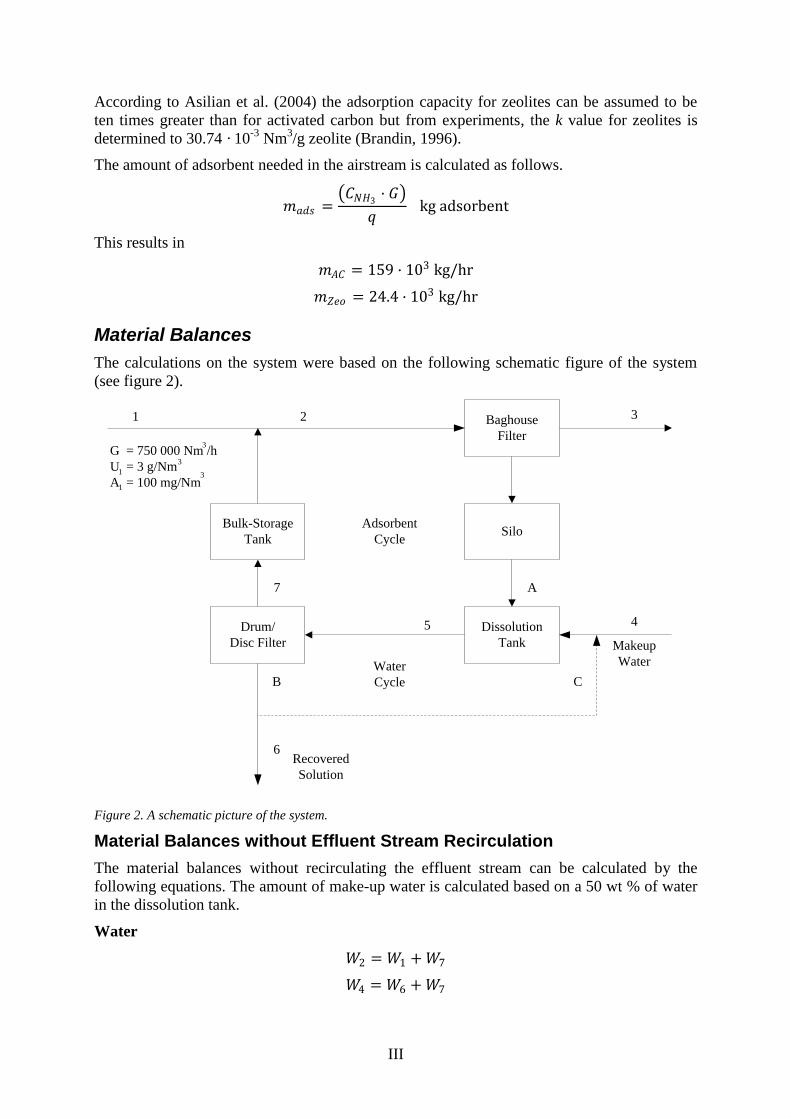
III
According to Asilian et al. (2004) the adsorption capacity for zeolites can be assumed to be
ten times greater than for activated carbon but from experiments, the k value for zeolites is
determined to 30.74 · 10-3
Nm3/g zeolite (Brandin, 1996).
The amount of adsorbent needed in the airstream is calculated as follows.
𝑚𝑎𝑑𝑠 = 𝐶𝑁𝐻3
· 𝐺
𝑞 kg adsorbent
This results in
𝑚𝐴𝐶 = 159 · 103 kg/hr
𝑚𝑍𝑒𝑜 = 24.4 · 103 kg/hr
Material Balances
The calculations on the system were based on the following schematic figure of the system
(see figure 2).
Baghouse
Filter
Silo
Dissolution
Tank
Drum/
Disc Filter
Recovered
Solution
Makeup
Water
Adsorbent
Cycle
1 2 3
5
6
7
G = 750 000 Nm /h
U = 3 g/Nm
A = 100 mg/Nm
3
3
3
1
1
B
A
C
4
Bulk-Storage
Tank
Water
Cycle
Figure 2. A schematic picture of the system.
Material Balances without Effluent Stream Recirculation
The material balances without recirculating the effluent stream can be calculated by the
following equations. The amount of make-up water is calculated based on a 50 wt % of water
in the dissolution tank.
Water
𝑊2 = 𝑊1 +𝑊7
𝑊4 = 𝑊6 +𝑊7
IV
Urea
𝑈2 = 𝑈1 + 𝑈7
𝑈2 = 𝑈5
𝑈5 = 𝑈6 + 𝑈7
Ammonia
𝐴2 = 𝐴1 + 𝐴7
𝐴5 = 𝐴2 · η
𝐴5 = 𝐴6 + 𝐴7
Separation conditions
𝐴7
𝐴6=𝑊7
𝑊6
𝑈7
𝑈6=𝑊7
𝑊6
Material Balances with Effluent Stream Recirculation
The calculations without recirculation lead to extensive amounts of fresh water used. Since
the concentration of urea and ammonia is relatively low recirculation of the effluent stream is
a suggested solution to the problem. This lead to the following relations.
Ammonia
𝐴1 = 𝑥𝐴1· 𝐺
𝐴2 = 𝐴1 + 𝐴7
𝐴3 = 𝐴2 − 𝐴5
𝐴5 = 𝐴2 ·
𝐴7 = 𝐴𝐵 ·𝑊7
𝑊𝐵
𝐴𝐵 = ·𝐴1
1 + − 1 ·𝑊7
𝑊𝐵
Water and Urea
𝐺𝑚 = 𝐺 · 𝑎𝑖𝑟
𝑊1 = 𝐺m · 𝑥1
𝑊2 = 𝑊1 +𝑊7
𝑈1 = 𝐺 · 𝑥𝑈1
𝑈6 = 𝑈1
𝑈6+𝑊6 =𝑈1
𝑥𝑢𝑟𝑒𝑎
𝑈2 = 𝑈1 + 𝑈7
V
Recirculation of water
All the urea will be solved in the water. The calculations are based on the assumption that the
solid-liquid separation can remove 90 % of the water from the adsorbent, giving a water ratio,
wr, of 10 %.
𝑊7 = 𝑤𝑟 ·𝑊5
𝑈7
𝑈5=𝑊7
𝑊5
𝑊𝐵 = 1− 𝑤𝑟 ·𝑊5
𝑈𝐵 = 𝑈5 − 𝑈7
The adsorbent and the urea are assumed to be dry after the baghouse filters.
𝑊5 = 𝑊4 +𝑊𝐶
𝑊4 = 𝑊7 +𝑊6
𝑈5 = 𝑈7 + 𝑈6 + 𝑈𝐶
𝑊𝐵 = 𝑊𝐶 +𝑊6
𝑈5 = 𝑈𝐴 + 𝑈𝐶
The amount of urea into the dissolution tank will be
𝑈𝐴 = 𝑈7 + 𝑈1
The urea content, xurea, in the water after the dissolution tank was set to a value that leads to
an acceptable recirculation of urea back to the airstream.
𝑈5 = 𝑥𝑢𝑟𝑒𝑎 𝑈5 +𝑊5
𝐴𝑑𝑠𝐴 = 𝐴𝑑𝑠7
The calculations on the size of the recirculation stream are based on a water content of 50 wt
% in the dissolution tank.
𝐴𝑑𝑠𝐴 = 𝑊5
Results can be seen in appendix 2.
Calculation of Ammonia Removal Efficiency
The separation efficiency, , has previously been estimated to 95 %. To validate the accuracy
of that statement the following relations was used.
These boundary conditions apply.
𝑥 = 0𝐶 = 𝐶0
𝑞 = 𝑞0
𝑡 > 0 𝑡 = 0𝐶 = 0𝑞 = 0
𝑥 > 0
This gives an average removal efficiency, , of
= 𝑆𝑅 − 𝑆𝑅 · 𝑙𝑛 𝑆𝑅 · 𝑒𝑁 1−
1𝑆𝑅 −1
𝑆𝑅 − 1 /𝑁
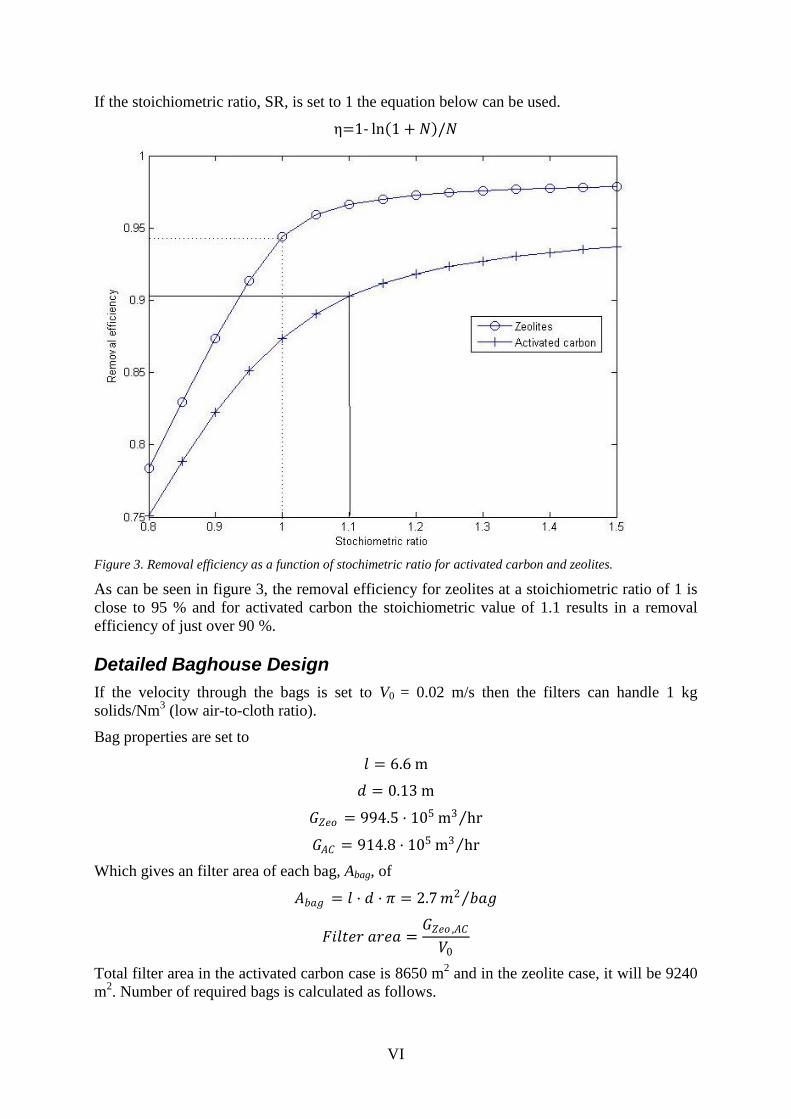
VI
If the stoichiometric ratio, SR, is set to 1 the equation below can be used.
η=1- ln 1 + 𝑁 /𝑁
Figure 3. Removal efficiency as a function of stochimetric ratio for activated carbon and zeolites.
As can be seen in figure 3, the removal efficiency for zeolites at a stoichiometric ratio of 1 is
close to 95 % and for activated carbon the stoichiometric value of 1.1 results in a removal
efficiency of just over 90 %.
Detailed Baghouse Design
If the velocity through the bags is set to V0 = 0.02 m/s then the filters can handle 1 kg
solids/Nm3 (low air-to-cloth ratio).
Bag properties are set to
𝑙 = 6.6 m
𝑑 = 0.13 m
𝐺𝑍𝑒𝑜 = 994.5 · 105 m3 hr
𝐺𝐴𝐶 = 914.8 · 105 m3 hr
Which gives an filter area of each bag, Abag, of
𝐴𝑏𝑎𝑔 = 𝑙 · 𝑑 · 𝜋 = 2.7𝑚2 𝑏𝑎𝑔
𝐹𝑖𝑙𝑡𝑒𝑟 𝑎𝑟𝑒𝑎 =𝐺𝑍𝑒𝑜 ,𝐴𝐶
𝑉0
Total filter area in the activated carbon case is 8650 m2 and in the zeolite case, it will be 9240
m2. Number of required bags is calculated as follows.
VII
𝑁𝑢𝑚𝑏𝑒𝑟 𝑜𝑓 𝑏𝑎𝑔𝑠 =𝐹𝑖𝑙𝑡𝑒𝑟 𝐴𝑟𝑒𝑎
𝐴𝑏𝑎𝑔
The number of bags will be 3210 in the activated carbon case and 3430 in the zeolite case.
The filter cake thickness, x, (containing both adsorbent and urea) is controlled by the pressure
drop. Standard is usually x ≈ 0.05 m at 1200-1500 Pa and 0.02 m/s. The density of the filter
cake can be derived from the following eqation.
𝜌𝐵,𝑓𝑖𝑙𝑡𝑒𝑟 𝑐𝑎𝑘𝑒 ≈ 𝜌𝐵,𝑓𝑖𝑥𝑒𝑑 𝑏𝑒𝑑 · 0.75
In the baghouse filter the filter cake mass can be calculated as
𝑚𝑓𝑖𝑙𝑡𝑒𝑟 𝑐𝑎𝑘𝑒 = 𝐴 · 𝑥 · 𝜌𝐵,𝑓𝑖𝑙𝑡𝑒𝑟 𝑐𝑎𝑘𝑒
When optimising the baghouse filter the same equations as above can be used. The only
difference is the calculations of the linear air speed as can be seen below.
𝑥 =∆𝑃
𝑉0· 𝐾𝐹
Where KF is derived from the Ergun equation and described as
𝐾𝐹 = 𝑑𝑝2 ·
𝜀3
159 · 𝜇𝑔 · 1− 𝜀 2
The same KF can be used in both cases; with a higher pressure drop at 4000 Pa, the linear
velocity is calculated to 0.0615 m/s.
This leads to a constant amount of adsorbent in the baghouse filter of 146 tons of activated
carbon and 181 tons of zeolites.
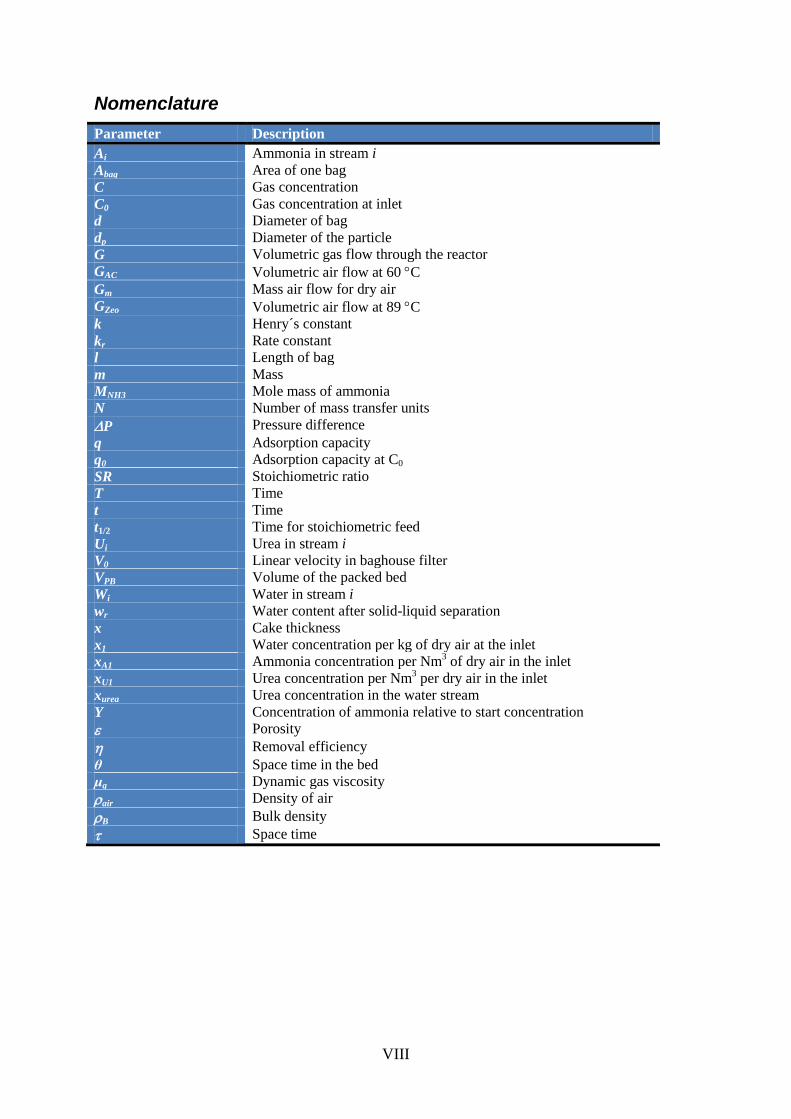
VIII
Nomenclature
Parameter Description
Ai Ammonia in stream i
Abag Area of one bag
C Gas concentration
C0 Gas concentration at inlet
d Diameter of bag
dp Diameter of the particle
G Volumetric gas flow through the reactor
GAC Volumetric air flow at 60 C
Gm Mass air flow for dry air
GZeo Volumetric air flow at 89 C
k Henry´s constant
kr Rate constant
l Length of bag
m Mass
MNH3 Mole mass of ammonia
N Number of mass transfer units
P Pressure difference
q Adsorption capacity
q0 Adsorption capacity at C0
SR Stoichiometric ratio
T Time
t Time
t1/2 Time for stoichiometric feed
Ui Urea in stream i
V0 Linear velocity in baghouse filter
VPB Volume of the packed bed
Wi Water in stream i
wr Water content after solid-liquid separation
x Cake thickness
x1 Water concentration per kg of dry air at the inlet
xA1 Ammonia concentration per Nm3 of dry air in the inlet
xU1 Urea concentration per Nm3 per dry air in the inlet
xurea Urea concentration in the water stream
Y Concentration of ammonia relative to start concentration
Porosity
Removal efficiency
θ Space time in the bed
μg Dynamic gas viscosity
air Density of air
B Bulk density
Space time
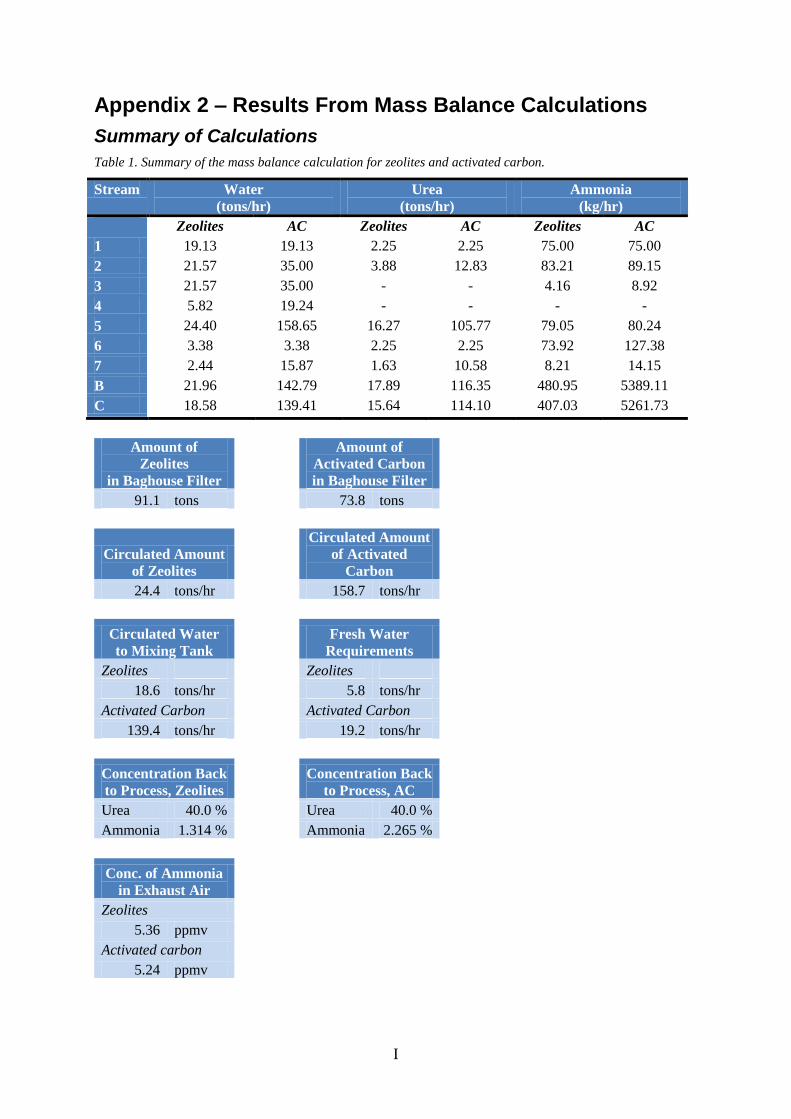
I
Appendix 2 – Results From Mass Balance Calculations
Summary of Calculations
Table 1. Summary of the mass balance calculation for zeolites and activated carbon.
Stream Water
(tons/hr)
Urea
(tons/hr)
Ammonia
(kg/hr)
Zeolites AC Zeolites AC Zeolites AC
1 19.13 19.13 2.25 2.25 75.00 75.00
2 21.57 35.00 3.88 12.83 83.21 89.15
3 21.57 35.00 - - 4.16 8.92
4 5.82 19.24 - - - -
5 24.40 158.65 16.27 105.77 79.05 80.24
6 3.38 3.38 2.25 2.25 73.92 127.38
7 2.44 15.87 1.63 10.58 8.21 14.15
B 21.96 142.79 17.89 116.35 480.95 5389.11
C 18.58 139.41 15.64 114.10 407.03 5261.73
Amount of
Zeolites
in Baghouse Filter
Amount of
Activated Carbon
in Baghouse Filter
91.1 tons
73.8 tons
Circulated Amount
of Zeolites
Circulated Amount
of Activated
Carbon
24.4 tons/hr
158.7 tons/hr
Circulated Water
to Mixing Tank Fresh Water
Requirements
Zeolites
Zeolites
18.6 tons/hr
5.8 tons/hr
Activated Carbon
Activated Carbon
139.4 tons/hr
19.2 tons/hr
Concentration Back
to Process, Zeolites Concentration Back
to Process, AC
Urea 40.0 %
Urea 40.0 %
Ammonia 1.314 %
Ammonia 2.265 %
Conc. of Ammonia
in Exhaust Air
Zeolites
5.36 ppmv
Activated carbon
5.24 ppmv
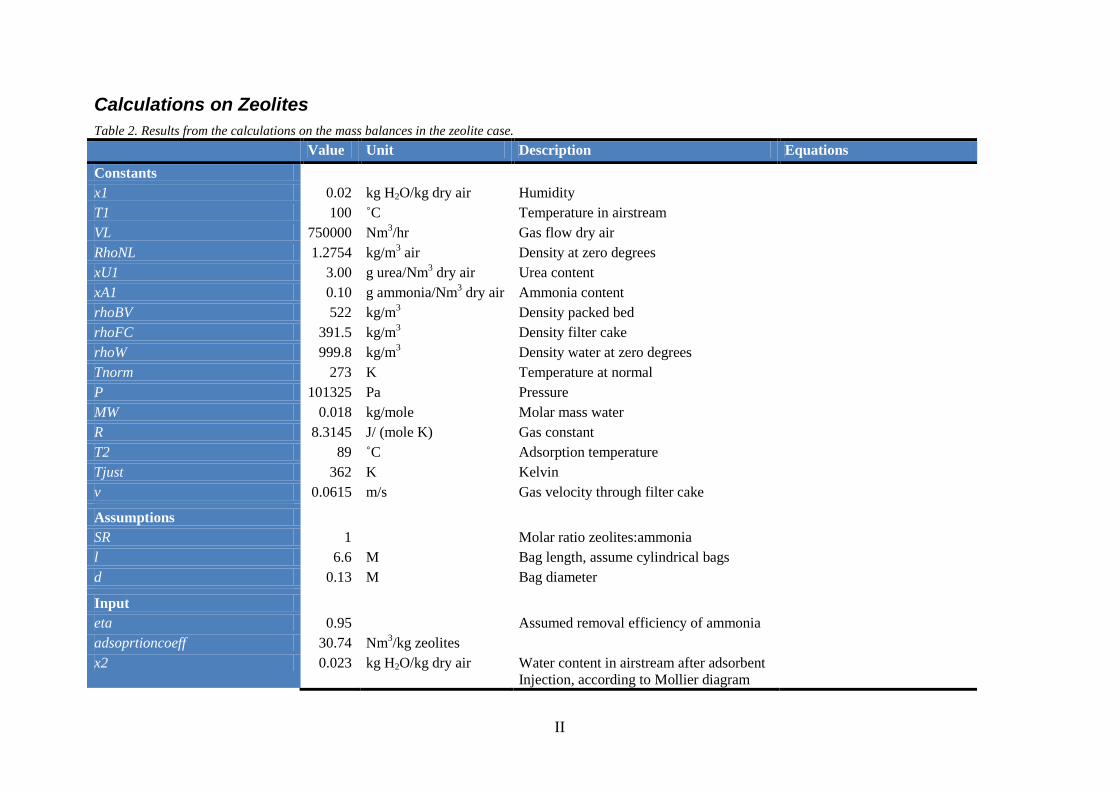
II
Calculations on Zeolites
Table 2. Results from the calculations on the mass balances in the zeolite case.
Value Unit Description Equations
Constants
x1 0.02 kg H2O/kg dry air Humidity
T1 100 ˚C Temperature in airstream
VL 750000 Nm3/hr Gas flow dry air
RhoNL 1.2754 kg/m3 air Density at zero degrees
xU1 3.00 g urea/Nm3 dry air Urea content
xA1 0.10 g ammonia/Nm3 dry air Ammonia content
rhoBV 522 kg/m3 Density packed bed
rhoFC 391.5 kg/m3 Density filter cake
rhoW 999.8 kg/m3 Density water at zero degrees
Tnorm 273 K Temperature at normal
P 101325 Pa Pressure
MW 0.018 kg/mole Molar mass water
R 8.3145 J/ (mole K) Gas constant
T2 89 ˚C Adsorption temperature
Tjust 362 K Kelvin
v 0.0615 m/s Gas velocity through filter cake
Assumptions
SR 1 Molar ratio zeolites:ammonia
l 6.6 M Bag length, assume cylindrical bags
d 0.13 M Bag diameter
Input
eta 0.95 Assumed removal efficiency of ammonia
adsoprtioncoeff 30.74 Nm3/kg zeolites
x2 0.023 kg H2O/kg dry air Water content in airstream after adsorbent
Injection, according to Mollier diagram
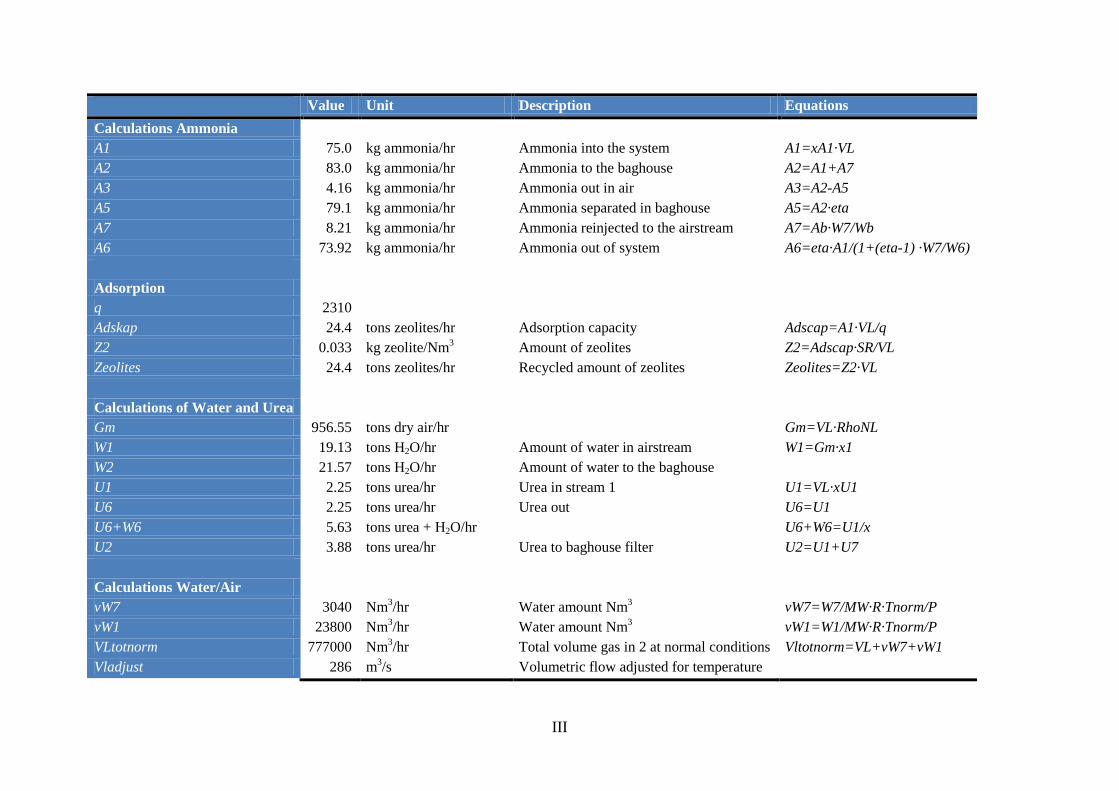
III
Value Unit Description Equations
Calculations Ammonia
A1 75.0 kg ammonia/hr Ammonia into the system A1=xA1·VL
A2 83.0 kg ammonia/hr Ammonia to the baghouse A2=A1+A7
A3 4.16 kg ammonia/hr Ammonia out in air A3=A2-A5
A5 79.1 kg ammonia/hr Ammonia separated in baghouse A5=A2·eta
A7 8.21 kg ammonia/hr Ammonia reinjected to the airstream A7=Ab·W7/Wb
A6 73.92 kg ammonia/hr Ammonia out of system A6=eta·A1/(1+(eta-1) ·W7/W6)
Adsorption
q 2310
Adskap 24.4 tons zeolites/hr Adsorption capacity Adscap=A1·VL/q
Z2 0.033 kg zeolite/Nm3 Amount of zeolites Z2=Adscap·SR/VL
Zeolites 24.4 tons zeolites/hr Recycled amount of zeolites Zeolites=Z2·VL
Calculations of Water and Urea
Gm 956.55 tons dry air/hr Gm=VL·RhoNL
W1 19.13 tons H2O/hr Amount of water in airstream W1=Gm·x1
W2 21.57 tons H2O/hr Amount of water to the baghouse
U1 2.25 tons urea/hr Urea in stream 1 U1=VL·xU1
U6 2.25 tons urea/hr Urea out U6=U1
U6+W6 5.63 tons urea + H2O/hr U6+W6=U1/x
U2 3.88 tons urea/hr Urea to baghouse filter U2=U1+U7
Calculations Water/Air
vW7 3040 Nm3/hr Water amount Nm
3 vW7=W7/MW·R·Tnorm/P
vW1 23800 Nm3/hr Water amount Nm
3 vW1=W1/MW·R·Tnorm/P
VLtotnorm 777000 Nm3/hr Total volume gas in 2 at normal conditions Vltotnorm=VL+vW7+vW1
Vladjust 286 m3/s Volumetric flow adjusted for temperature
IV
Value Unit Description Equations
Design Baghouse
TotAbag 4650 m2 Total area of bags TotAbag=Vladjust/v
Areabag 2.70 m2 Area of 1 bag
Nobags 1730 Number of bags req
Zeolites in Baghouse Filter
ThicknessFC 0.05 m
Totzeolites 233 m3
Totzeolitesmass 91.1 tons
V
Calculations on Activated Carbon
Table 3. Results from the calculations on the mass balances in the activated carbon case.
Value Unit Description Equation
Constants
x1 0.02 kg H2O/kg dry air Humidity
T1 100 ˚C Temperature in airstream
VL 750000 Nm3/hr Gas flow dry air
RhoNL 1.2754 kg/m3 air Density at zero degrees
xU1 3.00 g urea/Nm3 dry air Urea content
xA1 0.10 g ammonia/Nm3 dry air Ammonia content
rhoBV 450 kg/m3 Density packed bed
rhoFC 337.5 kg/m3 Density filter cake
rhoW 999.8 kg/m3 Density water at zero degrees
Tnorm 273 K Temperature at normal
P 101325 Pa Pressure
MW 0.018 kg/mole Molar mass water
R 8.3145 J/ (mole K) Gas constant
T2 60 ˚C Adsorption temperature
Tjust 333 K Kelvin
v 0.0615 m/s Gas velocity through filter cake
Assumptions
SR 1.1 Molar ratio activated carbon:ammonia
l 6.6 m Bag length, assume cylindrical bags
d 0.13 m Bag diameter
Input
eta 0.90 Assumed removal efficiency of ammonia
adsoprtioncoeff 5.2 Nm3/kg activated carbon
x2 0.036 kg H2O/kg dry air Water content in airstream after adsorbent
Injection (Mollier diagram)
VI
Value Unit Description Equation
Calculations Ammonia
A1 75.00 kg ammonia/hr Ammonia into the system A1=xA1·VL
A2 89.2 kg ammonia/hr Ammonia to the baghouse A2=A1+A7
A3 8.92 kg ammonia/hr Ammonia out in air A3=A2-A5
A5 80.2 kg ammonia/hr Ammonia separated in baghouse A5=A2·eta
A7 14.15 kg ammonia/hr Ammonia reinjected to the airstream A7=Ab·W7/Wb
A6 127.38 kg ammonia/hr Ammonia out of system A6=eta·A1/(1+(eta-1) ·W7/W6)
Adsorption
q 390
Adscap 144 tons adsorbent/hr Adsorption capacity Adscap=A1·VL/q
AC2 0.212 kg zeolite/Nm3 Amount of activated carbon AC2=Adscap·SR/VL
AC 159 tons zeolites/hr Recycled amount of activated carbon AC=AC2·VL
Calculations of Water and Urea
Gm 956.55 tons dry air/hr Gm=VL·RhoNL
W1 19.13 tons H2O/hr Amount of water in airstream W1=Gm·x1
W2 35.00 tons H2O/hr
U1 2.25 tons urea/hr Urea in stream1 U1=VL·xU1
U6 2.25 tons urea/hr Urea out U6=U1
U6+W6 5.63 tons urea + H2O/hr U6+W6=U1/x
U2 12.83 tons urea/hr Urea to baghouse filter U2=U1+U7
Calculations Water/Air
vW7 19700 Nm3/hr Water amount Nm
3 vW7=W7/MW·R·Tnorm/P
vW1 23800 Nm3/hr Water amount Nm
3 vW1=W1/MW·R·Tnorm/P
VLtotnorm 794000 Nm3/hr Total volume gas in 2 at normal conditions Vltotnorm=VL+vW7+vW1
Vladjust 269 m3/s Volumetric flow adjusted for temperature
VII
Value Unit Description Equation
Design Baghouse
TotAbag 4730 m2 Total area of bags TotAbag = Vladjust/v
Areabag 2.70 m2 Area of 1 bag
Nobags 1620 Number of bags req
Zeolites in Baghouse Filter
ThicknessFC 0.05 m
TotAC 219 m3
TotACmass 73.8 tons
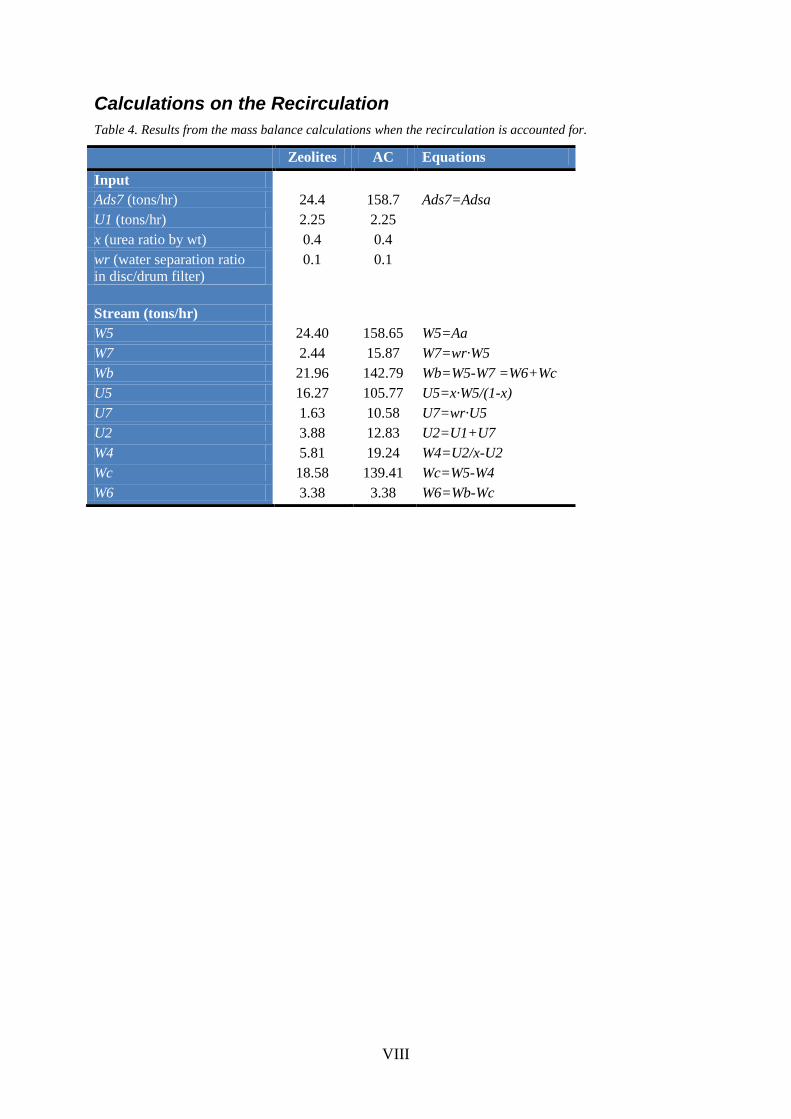
VIII
Calculations on the Recirculation
Table 4. Results from the mass balance calculations when the recirculation is accounted for.
Zeolites AC Equations
Input
Ads7 (tons/hr) 24.4 158.7 Ads7=Adsa
U1 (tons/hr) 2.25 2.25
x (urea ratio by wt) 0.4 0.4
wr (water separation ratio
in disc/drum filter)
0.1 0.1
Stream (tons/hr)
W5 24.40 158.65 W5=Aa
W7 2.44 15.87 W7=wr·W5
Wb 21.96 142.79 Wb=W5-W7 =W6+Wc
U5 16.27 105.77 U5=x·W5/(1-x)
U7 1.63 10.58 U7=wr·U5
U2 3.88 12.83 U2=U1+U7
W4 5.81 19.24 W4=U2/x-U2
Wc 18.58 139.41 Wc=W5-W4
W6 3.38 3.38 W6=Wb-Wc
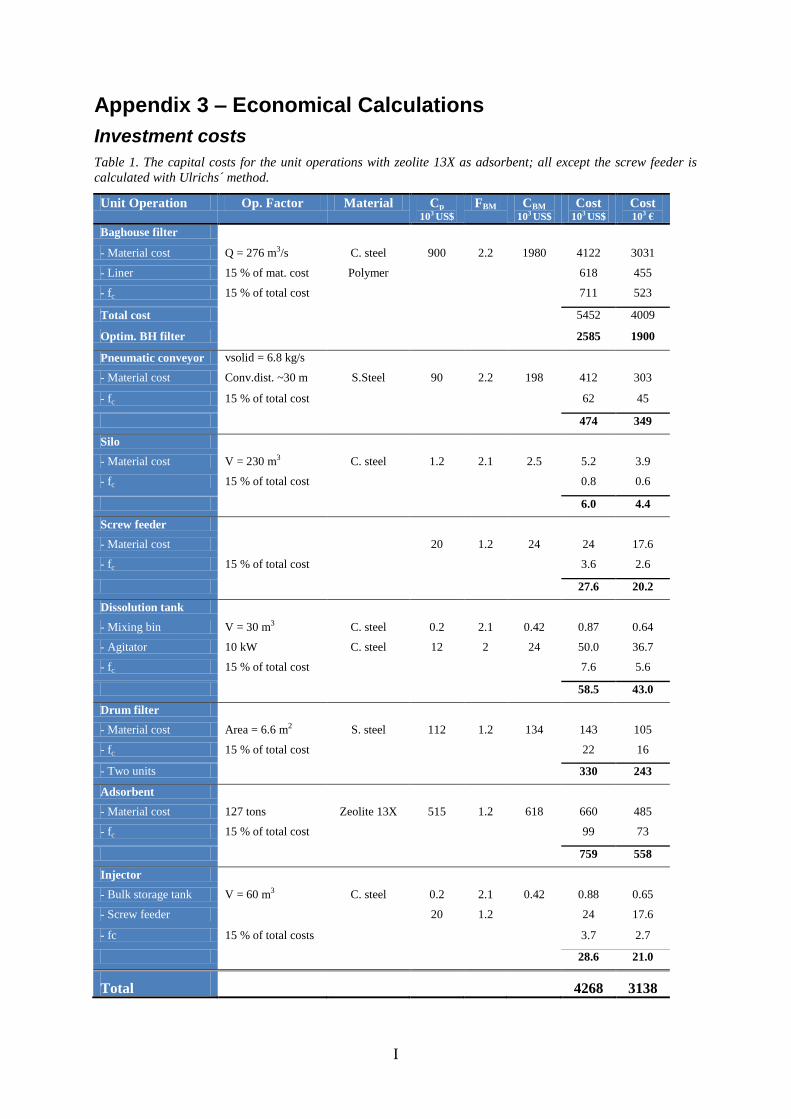
I
Appendix 3 – Economical Calculations
Investment costs
Table 1. The capital costs for the unit operations with zeolite 13X as adsorbent; all except the screw feeder is
calculated with Ulrichs´ method.
Unit Operation Op. Factor Material Cp 103 US$
FBM CBM 103 US$
Cost 103 US$
Cost 103 €
Baghouse filter
- Material cost Q = 276 m3/s C. steel 900 2.2 1980 4122 3031
- Liner 15 % of mat. cost Polymer 618 455
- fc 15 % of total cost 711 523
Total cost 5452 4009
Optim. BH filter 2585 1900
Pneumatic conveyor vsolid = 6.8 kg/s
- Material cost Conv.dist. ~30 m S.Steel 90 2.2 198 412 303
- fc 15 % of total cost 62 45
474 349
Silo
- Material cost V = 230 m3 C. steel 1.2 2.1 2.5 5.2 3.9
- fc 15 % of total cost 0.8 0.6
6.0 4.4
Screw feeder
- Material cost 20 1.2 24 24 17.6
- fc 15 % of total cost 3.6 2.6
27.6 20.2
Dissolution tank
- Mixing bin V = 30 m3 C. steel 0.2 2.1 0.42 0.87 0.64
- Agitator 10 kW C. steel 12 2 24 50.0 36.7
- fc 15 % of total cost 7.6 5.6
58.5 43.0
Drum filter
- Material cost Area = 6.6 m2 S. steel 112 1.2 134 143 105
- fc 15 % of total cost 22 16
- Two units 330 243
Adsorbent
- Material cost 127 tons Zeolite 13X 515 1.2 618 660 485
- fc 15 % of total cost 99 73
759 558
Injector
- Bulk storage tank V = 60 m3 C. steel 0.2 2.1 0.42 0.88 0.65
- Screw feeder 20 1.2 24 17.6
- fc 15 % of total costs 3.7 2.7
28.6 21.0
Total 4268 3138
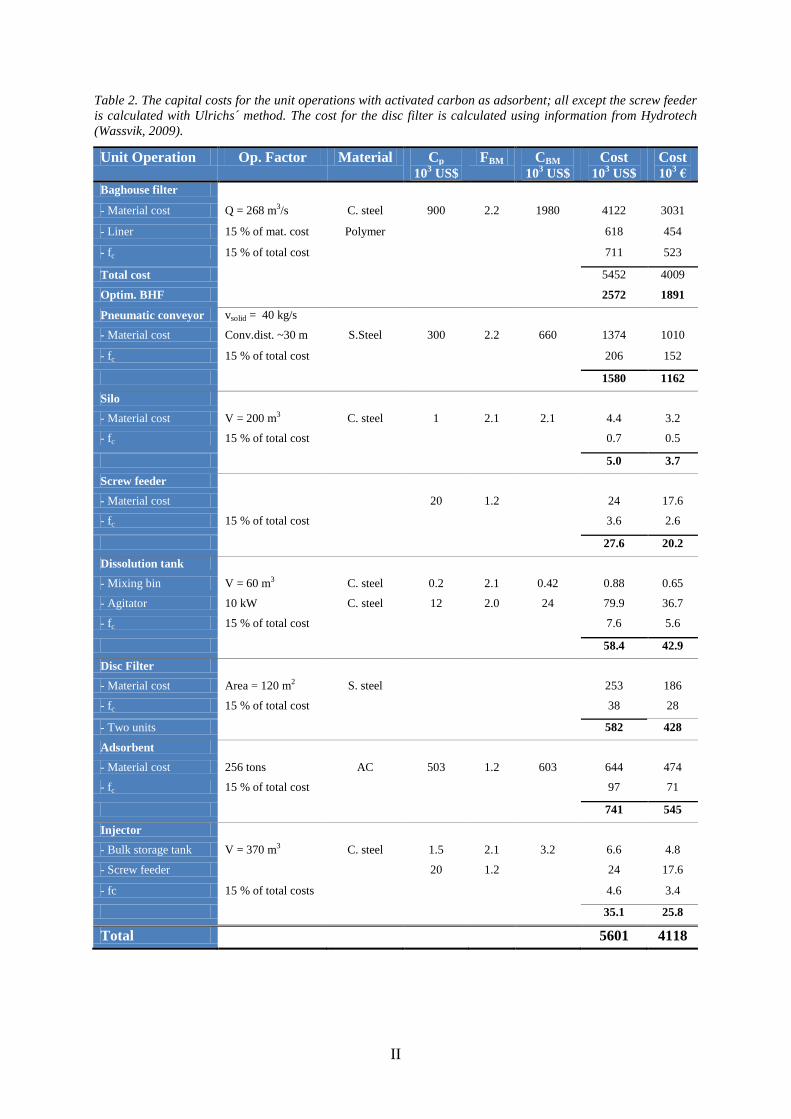
II
Table 2. The capital costs for the unit operations with activated carbon as adsorbent; all except the screw feeder
is calculated with Ulrichs´ method. The cost for the disc filter is calculated using information from Hydrotech
(Wassvik, 2009).
Unit Operation Op. Factor Material Cp 10
3 US$
FBM CBM 10
3 US$
Cost 10
3 US$
Cost 10
3 €
Baghouse filter
- Material cost Q = 268 m3/s C. steel 900 2.2 1980 4122 3031
- Liner 15 % of mat. cost Polymer 618 454
- fc 15 % of total cost 711 523
Total cost 5452 4009
Optim. BHF 2572 1891
Pneumatic conveyor vsolid = 40 kg/s
- Material cost Conv.dist. ~30 m S.Steel 300 2.2 660 1374 1010
- fc 15 % of total cost 206 152
1580 1162
Silo
- Material cost V = 200 m3 C. steel 1 2.1 2.1 4.4 3.2
- fc 15 % of total cost 0.7 0.5
5.0 3.7
Screw feeder
- Material cost 20 1.2 24 17.6
- fc 15 % of total cost 3.6 2.6
27.6 20.2
Dissolution tank
- Mixing bin V = 60 m3 C. steel 0.2 2.1 0.42 0.88 0.65
- Agitator 10 kW C. steel 12 2.0 24 79.9 36.7
- fc 15 % of total cost 7.6 5.6
58.4 42.9
Disc Filter
- Material cost Area = 120 m2 S. steel 253 186
- fc 15 % of total cost 38 28
- Two units 582 428
Adsorbent
- Material cost 256 tons AC 503 1.2 603 644 474
- fc 15 % of total cost 97 71
741 545
Injector
- Bulk storage tank V = 370 m3 C. steel 1.5 2.1 3.2 6.6 4.8
- Screw feeder 20 1.2 24 17.6
- fc 15 % of total costs 4.6 3.4
35.1 25.8
Total 5601 4118
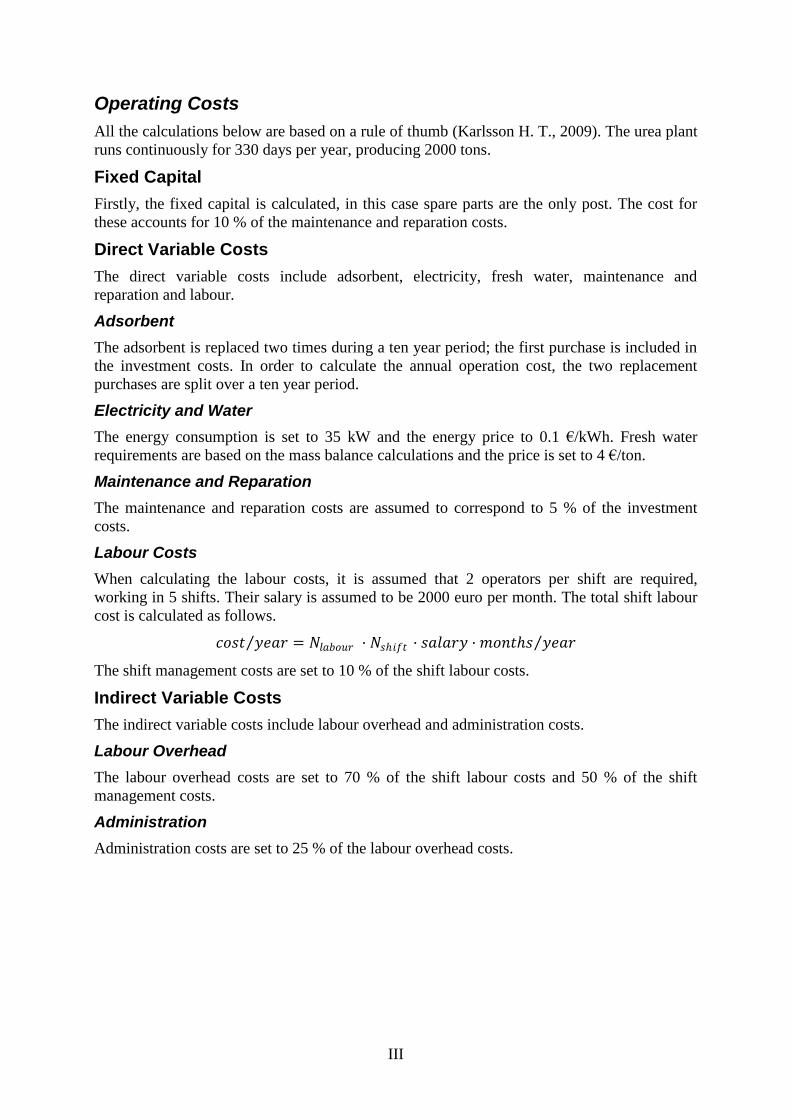
III
Operating Costs
All the calculations below are based on a rule of thumb (Karlsson H. T., 2009). The urea plant
runs continuously for 330 days per year, producing 2000 tons.
Fixed Capital
Firstly, the fixed capital is calculated, in this case spare parts are the only post. The cost for
these accounts for 10 % of the maintenance and reparation costs.
Direct Variable Costs
The direct variable costs include adsorbent, electricity, fresh water, maintenance and
reparation and labour.
Adsorbent
The adsorbent is replaced two times during a ten year period; the first purchase is included in
the investment costs. In order to calculate the annual operation cost, the two replacement
purchases are split over a ten year period.
Electricity and Water
The energy consumption is set to 35 kW and the energy price to 0.1 €/kWh. Fresh water
requirements are based on the mass balance calculations and the price is set to 4 €/ton.
Maintenance and Reparation
The maintenance and reparation costs are assumed to correspond to 5 % of the investment
costs.
Labour Costs
When calculating the labour costs, it is assumed that 2 operators per shift are required,
working in 5 shifts. Their salary is assumed to be 2000 euro per month. The total shift labour
cost is calculated as follows.
𝑐𝑜𝑠𝑡 𝑦𝑒𝑎𝑟 = 𝑁𝑙𝑎𝑏𝑜𝑢𝑟 · 𝑁𝑠𝑖𝑓𝑡 · 𝑠𝑎𝑙𝑎𝑟𝑦 ·𝑚𝑜𝑛𝑡𝑠 𝑦𝑒𝑎𝑟
The shift management costs are set to 10 % of the shift labour costs.
Indirect Variable Costs
The indirect variable costs include labour overhead and administration costs.
Labour Overhead
The labour overhead costs are set to 70 % of the shift labour costs and 50 % of the shift
management costs.
Administration
Administration costs are set to 25 % of the labour overhead costs.

IV
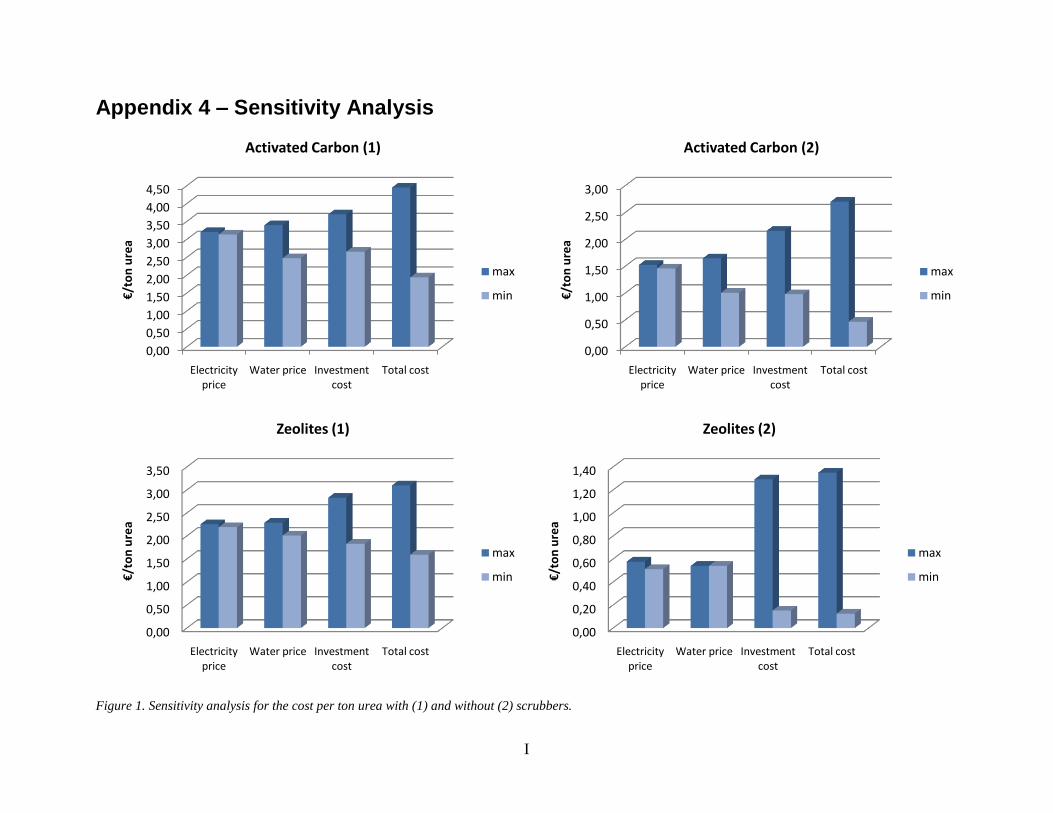
I
Appendix 4 – Sensitivity Analysis
Figure 1. Sensitivity analysis for the cost per ton urea with (1) and without (2) scrubbers.
0,00
0,50
1,00
1,50
2,00
2,50
3,00
3,50
4,00
4,50
Electricity price
Water price Investment cost
Total cost
€/t
on
ure
a
Activated Carbon (1)
max
min
0,00
0,50
1,00
1,50
2,00
2,50
3,00
Electricity price
Water price Investment cost
Total cost
€/t
on
ure
a
Activated Carbon (2)
max
min
0,00
0,50
1,00
1,50
2,00
2,50
3,00
3,50
Electricity price
Water price Investment cost
Total cost
€/t
on
ure
a
Zeolites (1)
max
min
0,00
0,20
0,40
0,60
0,80
1,00
1,20
1,40
Electricity price
Water price Investment cost
Total cost
€/t
on
ure
a
Zeolites (2)
max
min
Related Documents