UNCLASSIFIED AD-A277 060 V RESEARCH REPORT ERL-0692-RR PARALLEL PROCESSING FOR DIFFERENCING AND HISTOGRAMMING p Vaughian Clarkson and Pinaki S. Ra., ? '~ 94-08741 ...... I A ,',"'IIIIII I APPROVED FOR PUBLIC RELEASE UNCLASSIFIED

Welcome message from author
This document is posted to help you gain knowledge. Please leave a comment to let me know what you think about it! Share it to your friends and learn new things together.
Transcript

UNCLASSIFIED
AD-A277 060 V
RESEARCH REPORTERL-0692-RR
PARALLEL PROCESSING FOR
DIFFERENCING AND HISTOGRAMMING p
Vaughian Clarkson and Pinaki S. Ra., ? '~
94-08741
...... I A ,',"'IIIIII I
APPROVED FOR PUBLIC RELEASE
UNCLASSIFIED

UNCLASSIFIED.4-.5
DST0AA T U A L I A
ELECTRONICS RESEARCH LABORATORY
Electronic WarfareDivision
Accetsion For
NTIS QI-.&1
DTiC
RESEARCH REPORTERL-0692-RR By
PARALLEL PROCESSING FOR D I
DIFFERENCING AND HIISTOGRAMMING Av•wab.Uy Ccdes
by Ds AvaiI :
Vaughan Clarkson and Pinaki S. Ray
SUMMARY
Algorithms which take advantage of massively parallel and vector architectures are formulatedfor the calculation of the differences of times-of-arrival derived from a sequence of time samples.The application which generated the work is the classification of pulse trains which are detectedby an electronic support measures receiver.
Four algorithms are proposed, of which three have been implemented and tested on severalmachines. The results obtained through testing are compared with each other and with results formore conventional architectures. It is found-that one of the machines, the massively parallelMASPAR MP-1 computer, is able to perform histogramming fastest through exploitation of itsdata-parallel architecture. Several suggestions are made which could significantly improveperformance on all architectures.
OCT93 © COMMONWEALTH OF AUSTRALIA 1993
APPROVED FOR PUBLIC RELEASE
POSTAL ADDRESS: Director, Electronics Research Laboratory, PO Box 1500, Salisbury. South Australia, 5108, E~JRXfl92
UNCLASSIFIED
ERL-0629-RR UNCLASSIFIED
This work is Copyright. Apart from any fair dealing for the purpose of study, research,
criticism or review, as permitted under the Copyright Act 1968, no part may be
reproduced by any process without written permission. Copyright is the responsibility
of the Director Publishing and Marketing, AGFS. Inquiries should be directed to the
Manager, AGPS Press, Australian Government Publishing Service, GPO Box 84,
Canberra ACT 2601.
i i UNCLASSIFIED
UNCLASSIFIED ERL-0692-RR
CONTENTS
1 INTRODUCTION ....................................... 12 TDOA HISTOGRAMMING .................................. 23 DIFFERENCING AND HISTOGRAMMING USING THE SIMD ARCHITECTURE.. 2
3.1 M ethod 1 . . . . . . . . . . . . . . . . . . . . . . . . . . . . . . . . . . . . . . . . . . 33.2 M ethod 2 . . . . . . . . . . . . . . . . . . . . . . . . . . . . . . . . . . . . . . . . . . 43.3 M ethod 3 . . . . . . . . . . . . . . . . . . . . . . . . . . . . . . . . . . . . . . . . . . 63.4 Comparison of Resource Requirements .......................... 8
4 HISTOGRAMMING USING THE VECTOR PROCESSOR ARCHITECTURE ...... 9
5 NUMERICAL SLIULATIONS ................................ 115.1 The MASPAR Architecture ................................ 115.2 Implementation on the MASPAR ............................. 125.3 The Fujitsu VP-2200 Architecture ............................ 135..4 Ihi-eweat. ation on the Fujitsu VP-2200 Architecture ................. 135.5 Comparisons Between Implementations ......................... 13
6 SUGGESTED IMPROVEMENTS ............................... 14
7 FUTURE DIRECTIONS .................................... 158 CONCLUSIONS ........................................ 159 ACKNOWLEDGEMENTS ................................... 15REFERENCES ... ....................... .............. .... 17
TABLES
I Comparison of resource requirements for SIMD methods ................... 92 Comparisons between architectures and algorithms ...................... 14
FIGURES
I Method 1 for SLMID Architectures ............................... 4.2 Method 2 for SIMD Architectures ............................... 53 Calculation of the partial histograms of first order differences using Method 3 for Np = 5. 74 Example of the merging algorithm of Method 3 for a 4 x 4 processor grid ........... 95 Implementation of parallel histogramming on a vector processor ............... 106 System overview of the MASPAR MP-1 computer ....................... 117 Results of numerical simulations ................................. 12
APPENDICES
I PROGRAM LISTINGS ..................................... 19
1.1 SIMD Method 2 - hist.m ............................... 191.2 SIMD Method 2 - vlc-mpl .h ............................. 201.3 SIMD Method 3 - hist.m ............................... 201.4 Vector/SISD Fortran code ............................... 22
I
UNCLASSIFIED iu

ERL-0692 -RR UNCLASSIFIED
THIS IS A BLANK PAGE
iv UNCLASSIFIED

UNCLASSIFIED ERL-0692--RR
ABBREVIATIONS
ACU Array Control UnitALC Aritihmetic Logic UnitAOA Angle of ArrivalESM Electronic Support MeasuresMIMD Multiple Instruction Multiple DataPDW Pulse Descriptor WordPE Processor Element
PRI Pulse Repetition IntervalPRF Pulse Repetition FrequencyRWR Radax Warning ReceiverSIMD Single Instruction Multiple DataSISD Single Instruction Single DataTOA Time of ArrivalTDOA Time-Difference of Arrival
UNCLASSIFIED v
ERL-0692--RR UNCLASSIFIED
THIS IS A BLANK PAGE
vi UNCLASSIFIED
S... .. .. .. . . . . . . .• • • t i ~ mm m m m m
UNCLASSIFIED ERL-0692-RR
I INTRODUCTION
Passive detection and identification of radars in real time is a critical operational requirementfor Electronics Support Measures (ESM) equipment such as radar warning receivers (RWVR's).Typically, a receiver used in ESM intercepts signals from a number of radars and other emitterswithin its frequency band contemporaneously. In order to identify individual emitters from thiscomposite signal, one radar parameter which is often derived is the pulse repetition interval (PRI)for each emitter, i.e. the interval between the times-of-arrival (TOA's) of consecutive pulses whichit emits.
Other parameters which may be measured are the angle of arrival (AOA), frequency and amplitudeto form a set of pulse descriptor words (PDW). Utilising the AOA data, the pulses could be presortedinto clusters of adjacent angular sectors, each of which could be processed independently. However,the situation can arise in which it is impossible to distinguish emitters on these parameters alonebecause of inadequate resolution. It is then required to extract as much information as possiblefrom the TOA data.
In a dense environment comprising many types of emitters, th2 processing of this information iscritically time intensive, e.g. for real scenarios one could envisage a pulse data rate of 10 millionpulses per second. Thus for real time operation, any improvement in the speed of processing ishighly desirable.
Following this concept, the Information and Signal Processing Group of the Electronic WarfareDivision has proposed the application of parallel processor technology for the study of deinterleavingof the pulse trains. The object of this paper is to outline the formulation of PRI processing, and inparticular time-differencing and histogramming, in this context. The paper assumes that a bufferof TOA's is continuously filling with recorded pulses, and the buffer data is periodically processed(and the buffer emptied) by the processor(s).
In Section 2, time-difference-of-arrival (TDOA) histogramming is introduced. This is a commonprocessing step in ESM equipment and it is useful because it highlights periodicities in the TOAdata. Some of the properties of the TDOA histogram are discussed.
Several methods of performing differencing and histogramming on massively parallel architecturesare proposed in Section 3. The method of implementation on a two-dimensional grid of processors isdiscussed, with particular reference to the MASPAR massively parallel computer. The requirementsin time, memory and number of processors for each method is examined as a function of the numberof TOA's in the buffer.
A method for calculating the TDOA histogram on a vector processor architecture is discussed inSection 4. Again, the requirements in time and memory are examined as a function of the numberof TOA's.
In Section 5, the histogramming methods for massively parallel, vector and traditional processorsare compared and timed. A MASPAR MP-1 is used to implement the massively parallel methods,whereas a Fujitsu VP-2200 is used to implement the vector processor methods. Sun and Hewlett-Packard workstations were used to implement histogramming on traditional processors. Timingcomparisons are presented for various histogram bin widths and pulse densities and the results arereconciled with the theory.
Suggested improvements and future directions are outlined in Sections 6 and 7. In these sections,several suggestions are made that might improve the performance of the algorithms with respectto their speed of computation and areas of ongoing research are highlighted.
UNCLASSIFIED 1

ERL-0692-RR UNCLASSIFIED
Finally, conclusions are drawn in Section 8 where it is found that the M%4SPAR MP-l performs
the fastest histogram of the architectures examined. However, no account has been made for theinput/output time requirements of the machines examined, which in practice could significantlyalter their performance.
2 TDOA HISTOGRAMMING
Histogramming is one of the most widely used processing operations for the detection of pulsedemitters [2,6-91. Let the TOA data for N pulses from the PDW's be arranged in order of arrivalas a vector t where [T
where N; is the number of PDW's in the sample and t, < t, for i < j.
The matrix of the differences in times of arrival, _%, is then defined by its element A, where
-'j=t - t
where 0 < i,j < Np. Note that Ax is antisymmetric.
The TDOA histogram is the vector H of hk (where the individual hk are known as the -histogrambins") of dimension NH such that
hk= #04t •<i <. <(k + 1)t6,0 < i,2 < N,),
tb is the histogram bin width, and k = 0, ,..., Nj - 1 and #{.} represents the cardinality of theset.
The attractive property of the TDOA histogram is that for a pulse train of periodicity T, peaks willappear in histogram bins hk where k = LnT/tbJ for all integers n > 0 where LJ returns the largestinteger smaller than its operand. Further, interference between pulse trains tends to produce a"flat" noise background. That is, bins which do not contain peaks caused by pulse trains or theirharmonics tLave a relatively consLant "uai.tude. It is the:7Jore relatively easy to visually detectpeaks in the histogram from the interference noise under most circumstances.
Automatic detection and estimation methods are currently topics of ongoing research, and falloutside the scope of this report [I]. This report concerns itself only with the calculation of thehistogr,,m.
Further, it is a non-trivial system design problem to decide on the appropriate buffer length forincoming pulses to histogram, the appropriate bin width for the histogram and how to then combine
or interpret the results of consecutive histograms from the buffers. Again, this is considered to be
outside the scope of this report.
3 DIFFERENCING AND HISTOGRAMMING USING THE SIMDARCHITECTURE
The model considered in this section is the Single Instruction Multiple Data architecture (S[MD).
In this computational model, a single instruction is issued, one at a time, to the complete setof processors. Each active processor performs this instruction on its own local data. This is in
2 UNCLASSIFIED
UNCLASSIFIED ERL 0692 RR
contrast to the Single Instruction Single Data (SISD) model or von Neumann model (used in tradi-tional computers such as personal computers and most workstations) and the Multiple InstructionMultiple Data (MIMD) model in which each processor can be executing separate instructions onseparate data.
In particular, a SIMD model is examined in which the processors are arranged in a two-dimensional
matrix, with each processor element able to communicate data with any other processor element,and each having both local (private) and globally shared memory. This is the architecture of the.AIASPAR computer. on which numerical simulations were performed as described in Section 5.
Each element of the matrix is an individual processor, denoted gi, i = 0-. -y - 1; j = 0 .... , NS -1, where N, is the number of columns of the matrix and N, is the number of rows. The totalnumber of processors is therefore N, = .,N1N. It is also possible to -unwrap" the matrix ofprocessors and consider the processors as a linear array. In this case the processors can be denotedpi, i = 0. ..... N, - 1.
Three methods are now proposed to perform differencing of TOA's on this SIMD architecture.
The first method is designed to calculate the matrix of time differences, whereas the latter two aredesigned for histogramming.
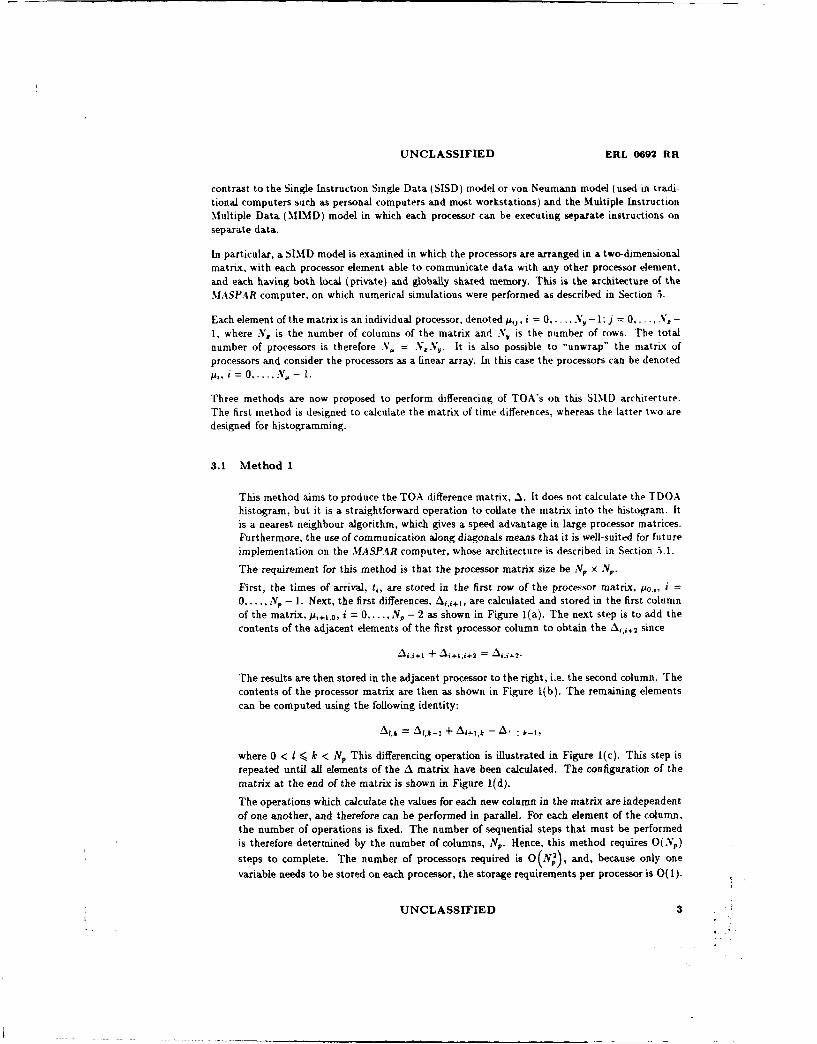
3.1 Method 1
This method aims to produce the TOA difference matrix, A. It does not calculate the TDOAhistogram, but it is a straightforward operation to collate the matrix into the histogram. Itis a nearest neighbour algorithm, which gives a speed advantage in large processor matrices.Furthermore, the use of communication along diagonals means that it is well-suited for futureimplementation on the NIASPAR computer, whose architecture is described in Section 5.1.
The requirement for this method is that the processor matrix size be N, X N,.
First, the times of arrival, ti, are stored in the first row of the processor matrix, PO.., i
0 ..... V, - 1. Next, the first differences, Aj.i÷1, are calculated and stored in the first columnof the matrix, p•+,,, i = 0,..., Np - 2 as shown in Figure 1(a). The next step is to add thecontents of the adjacent elements of the first processor column to obtain the Ai.,+2 since
.•i,i+i + -Ai+l,i+2 = A-i+2.
The results are then stored in the adjacent processor to the right, i.e. the second column. Thecontents of the processor matrix are then as shown in Figure l(b). The remaining elementscan be computed using the following identity:
A1t,k = A1,k-1 + Ar+I,t - A' : k-1,
where 0 < I <_ k < Np This differencing operation is illustrated in Figure t(c). This step isrepeated until all elements of the A matrix have been calculated. The configuration of the
matrix at the end of the matrix is shown in Figure 1(d).
The operations which calculate the values for each new column in the matrix are independentof one another, and therefore can be performed in parallel. For each element of the column,the number of operations is fixed. The number of sequential steps that must be performedis therefore determined by the number of columns, Np. Hence, this method requires O(.N,)
steps to complete. The number of processors required is 0 (N1), and, because only onevariable needs to be stored on each processor, the storage requirements per processor is 0(1).
UNCLASSIFIED 3

ERL -0692 RR ,CLASSIFIED
.. Q,0 Qt'Q', 0•,O QQ,. .,0 ®., Q,.
QQ Q. S. (B., Q.
(a) State of the processor matrix after first time (b) State of the processor matrix alter ýeý7onddifferences have been calculated. time differences have been calculated.
Q0.,
(c) Method for calculating higher order differ- (d) Method for calculating higher order differ-ences. ences.
Figure 1 Method 1 for SIMD Architectures
3.2 Method 2
A method is presented here which calculates the TDOA histogram, instead of the TOAmatrix. The processors are viewed as a 1-dimensional array rather than as a matrix. Thetimes of arrival t, are mapped onto the processors Aj so that each processor holds one time ofarrival. Each processor also holds one histogram bin, i.e. hi is stored on Aj. This is illustratedin Figure 2(a).
For the first step of the algorithm, each processor passes - "shifts" - a copy of its TOA toits neighbour on the right, i.e. t, and t,_ are now stored on pi. The differences, di, of thepairs are now calculated so.that the pj now also contain Aj-1.j, i > 0. Note that pn becomesinactive since t-. is not recorded. The histogram bin to which the difference belongs is givenby the expression
pi = Ldi/tbJ. (2)
.1 UNCLASSIFIED

UNCLASSIFIED ERL-0692 RR
Ao PI 92 .'3 ý4
(a) Initiation of the histogram with tirst order dif-ferences us~ing Method 2 for Vv s.
to t3 t4
Si to 12t3
0 t
ho h
h, h2 3q,
(b) Updating the histogram with second order dif-
ferences using Method 2 for N, = 5.
Figure 2 Method 2 for SIM) Architectures
The processor which stores the relevant histogram bin for the difference stored in pi is there-
fore pr,. Hence, j, sends a signal to j, so that the bin is incremented. However, if p >A
then no processor is responsible for the histogram bin and no processor is signalled. The
second order differences are then computed by again passing the copy of the received TOAon to its neighbour so that pA, i > 1, now holds t, and i Both po and a, are now inactive.
Again, the difference of the t's are calculated and the appropriate histogram bin signalled (if
in range). This is shown in Figure 2(b).
The action of shifting, differencing and signalling is repeated in that order until all processorsare inactive (i.e. all differences have been calculated), or until a stage is reached where all
the pi are out of range. If the p> are all out of range, then no changes will be made tothe computed histogram in current or future iterations. Once one of these criteria has beensatisfied, the histogram has been formed.
The operations in each processor are independent of the others, and so O(N.) sequentialsteps are required for this method, assuming that all differences are calculated and that the
UNCLASSIFIED 5

ERL-0692-RR UNCLASSIFIED
signalling between processors can be performed entirely in parallel. The storage requirementsare O(1) per processor since only one TOA and one histogram bin need to be stored locallyon a processor.
When implementing this method on the MASPAR, consideration must be made of the factthat the signalling required by this Method cannot be performed entirely in parallel since aprocessor can only accept one signal at a time. In the worst case, in which a single periodicpulse train is present in the data, each processor will wish to contact the same histogrambin/processor. Hence, the time requirement for signalling is then O(NV), and the overall timerequired is 0 (N)).
Note that it is to be expected that this method would be sensitive to bin width because thevariable number of differences which must be formed until the histogram is complete for agiven pulse density (or mean pulse arrival rate). When the bin width is narrow, or the meanpulse rate is low, the number of orders of differences required is small because, after only afew orders, the differences are large enough that none fall within the range of the histogram.A roughly linear relation between time required and histogram bin width is expected becauseof the roughly linear relation between number of orders of differences required and histogrambin width. Similarly, a linear relation is expected between time required and mean pulse rate.
3.3 Method 3
The method of forming the histogram in parallel discussed above makes extensive use of aglobal communications system to notify processors when a histogram bin is to be incremented.On the MASPAR computer, such global communications are considered a precious resource.Local communication is much to be preferred.
A second problem with the previous method is that there is significant latency in the pro-cessors if all differences are to be calculated. In fact, on average, half of the processors areinactive.
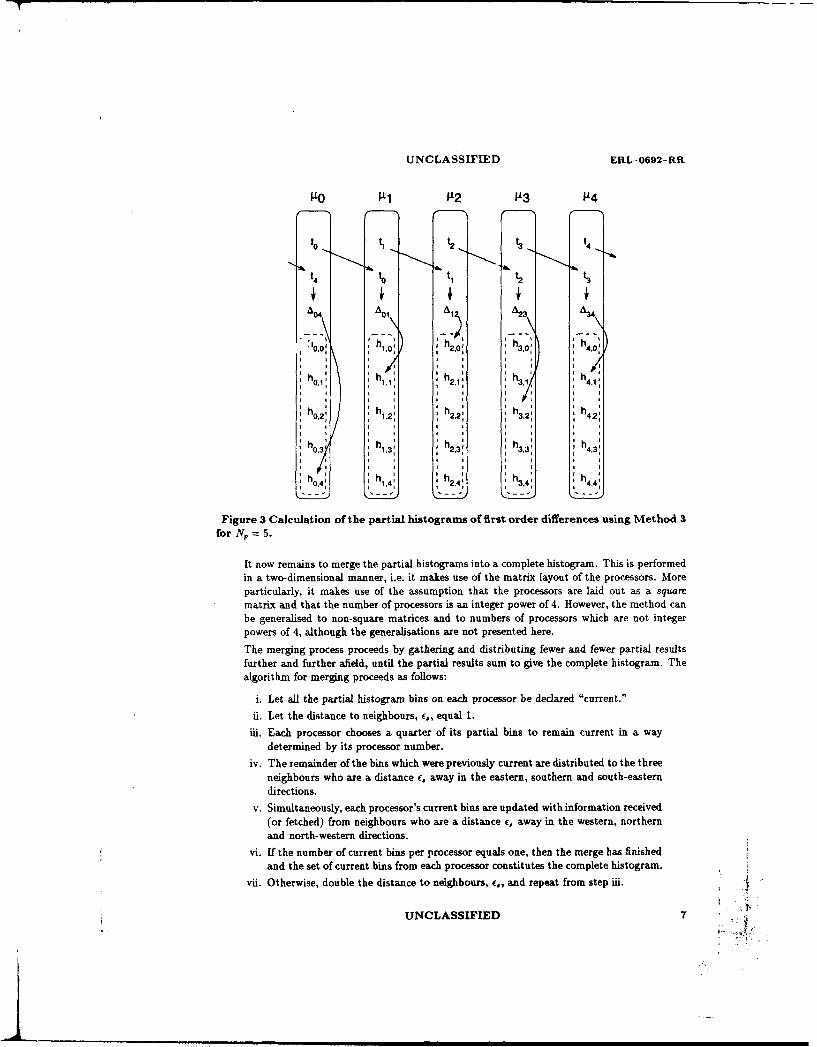
To avoid global communication as much as possible, a partial histogram is stored in a completeset of bins on each processor, and merged in an orderly fashion after all differencing has beenperformed. The partial histograms are denoted hij, 0 < i,j < N, where the first indexdenotes the processor number on which it is stored, and the second index is the histogrambin within the processor. To maximise processor utilisation, the TOAs are "rotated" throughthe processor array rather than shifted. By "rotated" it is meant that the data are passedas previously described, except that the last processor in the array also passes its TOA datato the first element in the array, as illustrated in Figure 3. Hence, after the first rotation, Asholds t4 and ti_1, for i > 0, and u0 holds t o and t
N,-_.
The method proceeds by first rotating the data. The absolute differences di are then formed.Hence, pu holds Ajij, for i > 0 and uo holds Aol,-i. The index into each processor'sown private partial histogram is pi from (2). Thus, h. is incremented. The rotation anddifferencing steps are performed again so that ii now holds ti, ti_2 and A_-2,j, for i > 1, andti, ti+,-2, and Ai..+N,- 2 for i = 0,1. The index is calculated and the appropriate partialhistogram bin is incremented as before if it is within the range of bins stored.
These steps are repeated until N,/2 rotations have been performed, assuming N, is an evennumber. After the final rotation, each processor p. contains t, and tj+N,12, where j = i, fori < N,/2, or j = i - NV,/2 otherwise. Hence, ui and Pi+N,/2 contain the same pair of TOAs.For this reason, on the last step, half of the processors are made inactive to avoid duplicatedifferences. However, for those processors remaining active the final step proceeds as before.
6 UNCLASSIFIED
UNCLASSIFIED ERL-0692-RR
'O 912 93 114
t, ti t, t4
h h 2 h32 h
0,:, 2,0 3.0o 40, 1 o 1 '.
hh' h2.1: 3
0. 3/ 4,1h. h1.2:, h2,2: 32 h42:
;h,3 h13 h2,3 : h3,3:,4.3
h, 4: h1,4,: h2.4: h3,4:. h ,:
Figure 3 Calculation of the partial histograms of first order differences using Method 3for NJ = 5.
It now remains to merge the partial histograms into a complete histogram. This is performedin a two-dimensional manner, i.e. it makes use of the matrix layout of the processors. Moreparticularly, it makes use of the assumption that the processors are laid out as a squarematrix and that the number of processors is an integer power of 4. However, the method canbe generalised to non-square matrices and to numbers of processors which are not integerpowers of 4, although the generalisations are not presented here.
The merging process proceeds by gathering and distributing fewer and fewer partial resultsfurther and further afield, until the partial results sum to give the complete histogram. Thealgorithm for merging proceeds as follows:
i. Let all the partial histogram bins on each processor be declared "current."
ii. Let the distance to neighbours, c., equal 1.
iii. Each processor chooses a quarter of its partial bins to remain current in a waydetermined by its processor number.
iv. The remainder of the bins which were previously current are distributed to the threeneighbours who are a distance c, away in the eastern, southern and south-easterndirections.
v. Simultaneously, each processor's current bins are updated with information received(or fetched) from neighbours who are a distance c, away in the western, northernand north-western directions.
vi. If the number of current bins per processor equals one, then the merge has finishedand the set of current bins from each processor constitutes the complete histogram.
vii. Otherwise, double the distance to neighbours, e, and repeat from step iii.
UNCLASSIFIED 7

ERL-0692-RR UNCLASSIFIED
The algorithm is now explained in greater detail. For each step s, s = 1, .... log14 N, thepartial histogram on each processor is updated thus
h"k., when i mod 2, = k mod 2e.,+hs+ý"k'O j mod 2c, = I mod 2c,,h'i,k, -- h',•,kj + +hi÷,.j+,.,k,1. (3)
0, otherwise,
where h4.,I = h ijodN.)N.+(jrAdN.),kN.+l, for all 0 < i,k < N5 , 0 < j,l < N, and , = 2"- .After all steps have been completed, h)zi = hi and the histogram is complete.
For step s of the merging process, each process must fetch 3N,/4E2, data elements over a matrixdistance of c, processors: horizontally, vertically, and diagonally. If a cost of T! = O((,) isassigned to fetching data over a distance c, (as it is on the MASPAR), then the total timerequirement for the merging process is
3ogN, 5 "T 2
4 Z 4-
3N, tog. N,= F o(2-)
0=1
3N,0 )4
= O(Np).
Hence, the time required for merging is not dependent on the form of the data as it is inMethod 2, but on the size of the data. This may be an advantage in system design, since thetime required to compute the histogram can be predicted with a high degree of accuracy.
An example of the merging algorithm for the case of a small processor matrix (Np = 16,Ný = NV = 4) is shown in Figure 4. The figure illustrates the two merging steps which arerequired to merge the partial histograms into a complete histogram. The pairs of numbersdisplayed in each processor circle represent the ij pairs of the h'.,,, which are to be fetchedfrom other processors. The arrows indicate from which processors the data is being sent.Dashed arrows indicate that the toroidal nature of the matrix is being exploited.
Both the differencing and merging processes require O(N,) steps to complete and so Method 3requires O(N,) steps. The storage requirements per processor are now O(N,) also since apartial histogram is stored on each processor. However, the linear relation between pulserates or bin widths and time required is no longer expected as it was for Method 2. Rather,it is to be expected that the algorithm would require a fixed amount of time, depending onlyon the number of pulses in the buffer, because all loops in the algorithm iterate for a fixednumber of times, independent of bin widths and pulse arrival rates.
3.4 Comparison of Resource Requirements
It is possible to compare the methods described above in terms of their usage of importantcomputing resources, such as time, processors and memory. Such a comparison is presentedin Table I, where time, processors and local and global memory have been listed as functionsof the number of data points in order notation. Note that the stated requirements for localmemory are per processor.
8 UNCLASSIFIED
______________________

UNCLASSIFIED ERL-0692-RR
S A 't A Nk A '0 AA It-,5 *
1 0$
(a) First merge. (b) Second and final merge.
Figure 4 Example of the merging algorithm of Method 3 for a 4 × 4 processor grid.
Table 1 Comparison of resource requirements for SIMD methods.
Method Time Processors Local meme. Global mem.
Method 1 0(Np) O(N) 0(1) 0(1)
Method 20o(Nl) O(Np) 0(1) 0(1)
Method 3-0(N-) O(Np) O(N) 0(1)
4 HISTOGRAMMING USING THE VECTOR PROCESSOR ARCHITECTURE
The vector processor model is in some ways similar to the SIMD model. A vector processor typicallyconsists of a number of vector "units". Each of these units is roughly analogous to a simple,
specialised SIMD processor array. Within the vector unit, a simple hard-coded operation, specificto the unit, is performed on an array or vector of data, either in a pipeline or in parallel or both.
Typically, vector units are built for vector addition, subtraction, multiplication and division andoperations which cannot make use of the specialised vector units are performed serially accordingto the usual von Neumann SISD model. The economies of scale which are achieved by using vector
units over a standard arithmetic logic unit (ALU) are very significant, and this is why they wereand are stirM popular with manufacturers of superomputers.
The method of performing histogramming here is somewhat naive. The vectors v0 , i -0...., N/2 - I
are formed, where vm is the vector t of (1) rotated i places. Hence
s UNCLASSIFIED 9 simple -.
to th nt i efrmdo nara.rvetro ateteri ipln rinprlelo oh

ERL-0692-RR UNCLASSIFIED
V1 = tN,-. to tl t,... - ]2
V2 = tN,-2 tN, -. t tO tN,-. ]r
The algorithm proceeds from step s = I,..., Np/2 - 1. At each step s, the operation
a. = Iv. - v0o
is performed, where a, is a vector of absolute time differences and in this case I11 is the absolute valueof each element of the vector. This operation can be efficiently performed in a vector difference unit.The method of rotation and absolute differencing is analogous to that performed in Method 3 inSection 3.3. It results in all of the A,, being calculated except for the Ai~i+],/2. As with Method 3above, a final special step, a = Np/2, must be performed in which two vectors of rank Np/2 areformed and differenced so that
aN,/2 = lrow(t, Np/2, Np/2) - row(t, 0, N,/2)1,
where row(z.i,j) is the vector formed from j rows of vector z starting from row i.
At the end of each step, the elements of the vector a, are sorted into the appropriate histogram bins.The division which is required to calculate the appropriate bins for each element can make use ofa vector division unit. On the Fujitsu VP-2200 (which was used to implement this algorithm), thevector difference and division units were the only two used. All other operations were performed inthe traditional serial manner. An illustration of the implementation of the algorithm on a vectorprocessor with Np = 5 is shown in Figure 5.
1
to t3 aOd b ho
12to A2 tb h.,
4ry t2 34•, t • ,
Rf,* RM,, I t tI h4
Vecdor Vesor Main
Diference DiNaio MemmsUnit Unit
Figure 5 Implementation of parallel histogramming on a vector processor.
The time required for vector processing in the way described above requires 0 (N;2) computational .steps and the storage requirements are O(N,) + O(Nff) (since it is not necessary for this algorithm
to have N., = NO).
10 UNCLASSIFIED
UNCLASSIFIED ERL-0692-RR
5 NUMERICAL SIMULATIONS
Numerical simulations were performed on several types of computers using the algorithms describedpreviously. A most important feature of deinterleaving from an operational perspective is the timerequired for deinterleaving a given number of points. Throughout the following discussions, setsof data points containing the times of arrival of 4096 pulses in double precision real numbers werehistogrammed. This number of pulses was chosen because it matched the number of processors onthe MASPAR computer. The time required to perform the histogram only was measured. Hence,the measurements take no account of the time required to read the TOA's off disk or to displayor otherwise process the results of the histogram subsequently. While these times may indeed becritical to the performance of a deinterleaving system, it is outside the scope of this report.
5.1 The MASPAR Architecture
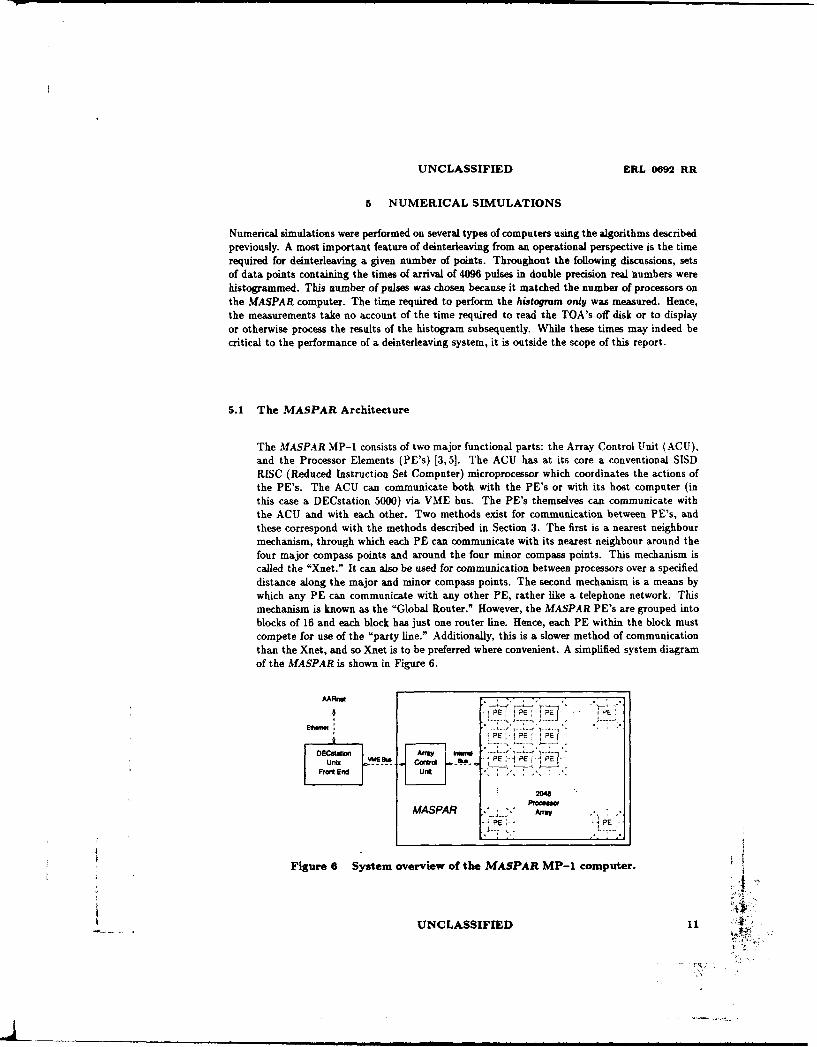
The MASPAR MP-1 consists of two major functional parts: the Array Control Unit (ACU),and the Processor Elements (PE's) [3,5]. The ACU has at its core a conventional SISDRISC (Reduced Instruction Set Computer) microprocessor which coordinates the actions ofthe PE's. The ACU can communicate both with the PE's or with its host computer (inthis case a DECstation 5000) via VME bus. The PE's themselves can communicate withthe ACU and with each other. Two methods exist for communication between PE's, andthese correspond with the methods described in Section 3. The first is a nearest neighbourmechanism, through which each PE can communicate with its nearest neighbour around thefour major compass points and around the four minor compass points. This mechanism iscalled the "Xnet." It can also be used for communication between processors over a specifieddistance along the major and minor compass points. The second mechanism is a means bywhich any PE can communicate with any other PE, rather like a telephone network. Thismechanism is known as the "Global Router." However, the MASPAR PE's are grouped intoblocks of 16 and each block has just one router line. Hence, each PE within the block mustcompete for use of the "party line." Additionally, this is a slower method of communicationthan the Xnet, and so Xnet is to be preferred where convenient. A simplified system diagramof the MASPAR is shown in Figure 6.
AAFrnt
PE
2048
MASPAR . ."....
S PE E
Figure 6 System overview of the MASPAR MP-1 computer.
UNCLASSIFIED 11`

ERL-0692-RR UNCLASSIFIED
5.2 Implementation on the MASPAR
Methods 2 & 3 of the SIMD algorithms were implemented on a MASPAR computer in MPL(MASPAR Programming Language) [4). The MASPAR which was used for the numericalsimulations has 4096 individual processors (N, = 4096), laid out as a 64 x 64 two-dimensionalgrid. Method 2 makes use of both the Xnet for the data shifting and the global router forincrementing histogram bins. Method 3 makes use of the Xnet only, both for data rotation andthe final histogram merge. Listings of the MPL code are contained in Appendix Sections 1.1-1.3.
The two methods were trialled for two pulse data sets, and for various histogram bin widths.Each pulse data set contains 4096 pulses. The first data set contained 20 separate periodicemitters with PRI's ranging from 10.1 to 19.3 arbitrary time units, with an average Pal of14.91 units and a mean pulse rate of one pulse per 0.7161 units. The second data set containsa single periodic emitter with a PRI of 15 units. Histogram bin widths were varied between0.01 units and 0.2 units
The times required to compute the TDOA histograms for each method were measured, andthese are plotted in Figure 7(a). From the plot, it can be seen that Method 2 is sensitive
8o-.--o d 2.N, .20 .
.6 G--Osdh 3. 22 2 '. ..A~d -~.M o3N. Il
'5S2 .... .. ................ . .
00.00 0.05 0.10 0.15 0.20
Bin width
(a) Computation time vs. histogram bin width for MASPARsimulations.
2.0
15~
. 0 .5 ...........
0.00.00 0.05 0.10 0.15 0.20
Bin width
(b) Computation time vs. histogram bin width for Fujitsu simu-lations.
Figure 7 Results of numerical simulations.
to both bin width and mean pulse rate, whereas Method 3 is completely insensitive to bothof these factors, as predicted in Sections Section 3.2 and Section 3.3. That is, Method 2 is
sensitive to bin width and mean pulse rate because its main loop terminates as soon as the .
12 UNCLASSIFIED v;4

UNCLASSIFIED ERL-0692-RR
minimum difference at that order is larger than the maximum PRI being recorded in thehistogram. Method 3 is insensitive to both factors since the complete set of differences isalways calculated. It is also found that the histogram merging operation offers substantialtime savings over contacting processors individually after each difference operation (as used inMethod 2) if the full set of "Iiffereaces is calculated. The time required for histogram mergingin Method 3 is 0.2943 seconds whereas Method 2 requires 0.0054 seconds for interprocessorcommunication after each round of differencing. Hence if more than about the 54th order ofdifferences is required, the communication time required for Method 3 will be less than thatrequired by Method 2.
5.3 The Fujitsu VP-2200 Architecture
The Fujitsu VP-2200 is a traditional vector processor. It consists of several specialisedprocessing units, along with a general von Neumann-type SISD processor.
5.4 Implementation on the Fujitsu VP-2200 Architecture
The method as outlined in Section 4 was implemented in Fortran on the Fujitsu VP-2200. Itwas compiled using all vectorising options turned on to maximise the use of the vector units.
A listing of the Fortran subroutine which was used to calculate the histogram is oresented inSection 1.4.
The method was tested for both data sets described in Section 5.2. As for the MASPAR,the times required for histogramming were measured and they are graphed in Figure 7(b).Again, there is a linear relation between binwidth and time required, and the relationshipis also dependent on mean pulse repetition frequency. The dependency on both binwidthand mean PRF is much reduced, since all differences are calculated, regardless of the formof the data. The dependency occurs in the step where differences are sorted into bins. If thehistogram array index is out of bounds, no increment can be performed. In situations wherethe mean PRF is low compared with the binwidth, the indices will all be out of bounds aftera few iterations, so the histogram will be formed in slightly less time.
5.5 Comparisons Between Implementations
A comparison between architectures and algorithms can be made by selecting a certain set ofparameters, running the algorithms on each of the architectures with these parameters, andmeasuring the time required to compute the histogram. This was done for the MASPAR MP-1for M1ethods 2 and 3, and on the Fujitsu VP-2200, Hewlett-Packard Series 9000 Models 720and 730 workstation, and on the Sun SPARC 2 workstation using the Fortran algorithm. The
parameters used in the tests were a bin width of 0.1 units and the first data set (consistingof 4096 pulses from 20 periodic emitters with mean PRI of 0.7161 units).
The following table summarises the results obtained. The results show that the best algo-rithm and architecture in this case is the MASPAR using Meth A 3. The rate of calculationcorresponds to approximately 4000 pulses per second.
UNCLASSIFIED 13
• mmm mu mmmm • •• mu |
ERL-O692-RR UNCLASSIFIED
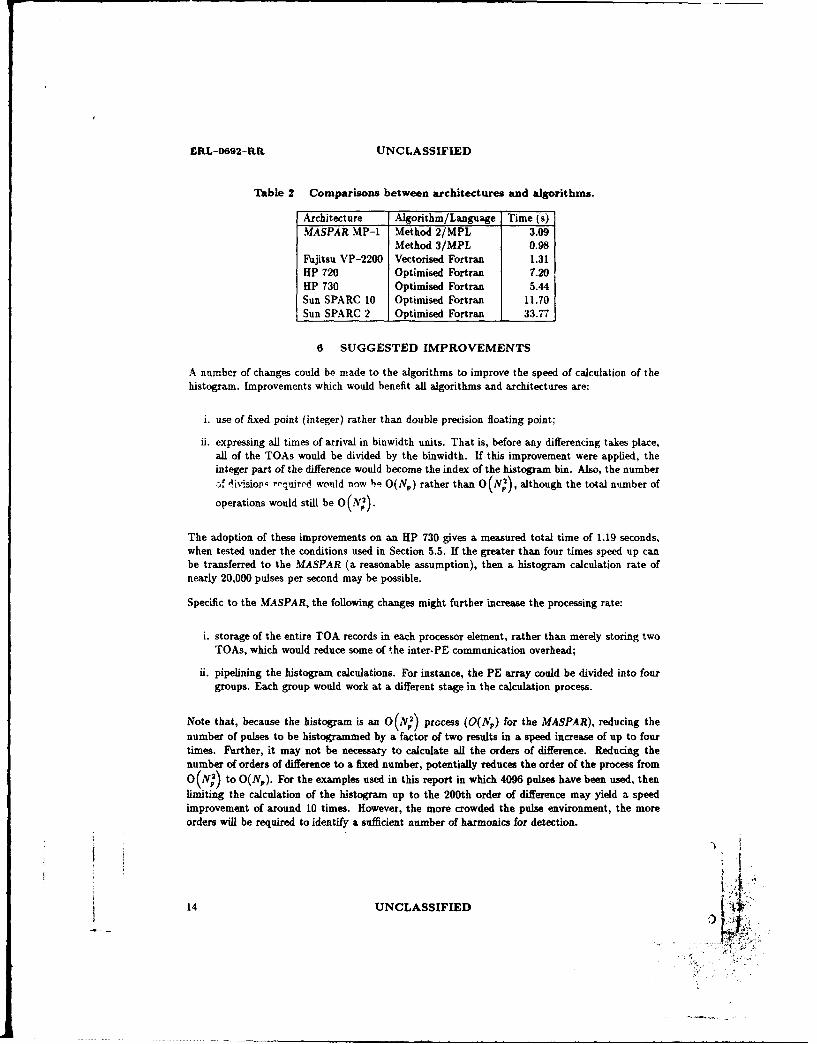
Table 2 Comparisons between architectures and algorithms.
Architecture Algorithm/Language Time (s)MASPAR MP-1 Method 2/MPL 3.09
Method 3/MPL 0.98Fujitsu VP-2200 Vectorised Fortran 1.31HP 720 Optimised Fortran 7.20HP 730 Optimised Fortran 5.44Sun SPARC 10 Optimised Fortran 11.70Sun SPARC 2 Optimised Fortran 33.77
6 SUGGESTED IMPROVEMENTS
A number of changes could be made to the algorithms to improve the speed of calculation of thehistogram. Improvements which would benefit all algorithms and architectures are:
i. use of fixed point (integer) rather than double precision floating point;
ii. expressing all times of arrival in binwidth units. That is, before any differencing takes place,all of the TOAs would be divided by the binwidth. If this improvement were applied, theinteger part of the difference would become the index of the histogram bin. Also, the numberaf 'ivisior. rrquirod would now be O(N,) rather than O(N.2), although the total number of
operations would still be 0(N2).
The adoption of these improvements on an HP 730 gives a measured total time of 1.19 seconds,when tested under the conditions used in Section 5.5. If the greater than four times speed up canbe transferred to the MASPAR (a reasonable assumption), then a histogram calculation rate ofnearly 20,000 pulses per second may be possible.
Specific to the MASPAR, the following changes might further increase the processing rate:
i. storage of the entire TOA records in each processor element, rather than merely storing twoTOAs, which would reduce some of the inter-PE communication overhead;
ii. pipelining the histogram calculations. For instance, the PE array could be divided into fourgroups. Each group would work at a different stage in the calculation process.
Note that, because the histogram is an O(NY,) process (O(N5 ) for the MASPAR), reducing thenumber of pulses to be histogrammed by a factor of two results in a speed increase of up to fourtimes. Further, it may not be necessary to calculate all the orders of difference. Reducing thenumber of orders of difference to a fixed number, potentially reduces the order of the process fromO(N;) to O(N.). For the examples used in this report in which 4096 pulses have been used, thenlimiting the calculation of the histogram up to the 200th order of difference may yield a speedimprovement of around 10 times. However, the more crowded the pulse environment, the moreorders will be required to identify a sufficient number of harmonics for detection.
.F
14 UNCLASSIFIED
UNCLASSIFIED ERL-0692- RR
7 FUTURE DIRECTIONS
Many improvements have been discussed which have not yet been rigorously implemented andtested. It is planned that some or all of these will be tested. Further, there are some architectureswhich have not been examined and which deserve attention. Notable amongst these are the hyper-cube SIMD architecture employed by the Connection Machine, and MIMD architectures such astransputer arrays.
The related question of how to perform detection of PRI's from the histograms once they have beencomputed is an important topic for further research. In particular, the use of neural networks indetection, and how to present TOA data to a neural network needs to be investigated.
It is hoped that Method 1. discussed in Section 3.1, being a nearest neighbour algorithm, will besuitable for ready implementation on a hypercube architecture, &nd with further work, may beuseful in neural network investigations.
8 CONCLUSIONS
Four methods have been presented for calculating the time of arrival histogram for a pulse dataset. Two architectures have been considered: a SIMD parallel processor (the MASPAR MP-1) anda vector processor (the Fujitsu VP-2200). Three of the algorithms and each of the architectureswere tested under various conditions. Comparisons were made between the described algorithmsand architectures and with more well-known architectures such as Hewlett-Packard and Sun work-stations. One algorithm (Method 1) was considered unsuitable for testing and comparison becauseit does not calculate a histogram.
It was found that the MASPAR was able to calculate the histogram fastest. The speed of thealgorithms on all architectures was limited by the use of double precision arithmetic and the largenumber of pulses used in the processing. Given these restrictions, and given also that no account ofthe time required for input and output of the data, a maximum processing rate of about 4000 pulsesper second was achieved.
Several improvements were suggested. The incorporation of these improvements into algorithmson the MASPAR may lead to a calculation rate for the full histogram of around 20,000 pulses persecond. With the recent release of the new, faster MASPAR MP-2, even this number could well beexceeded. However, this has yet to be confirmed.
9 ACKNOWLEDGEMENTS
The authors axe grateful to the Center for Information Technology Research (CiTR), Universityof Queensland, and the Australian Nuclear Science and Technology Organisation (ANSTO), LucasHeights, for the generous donation of time on their MASPAR and Fujitsu computers, respectively.
UNCLASSIFIED 15

ERL-0692-RR UNCLASSIFIED
THIS IS A BLANK PAGE
16 UNCLASSIFIED i.

UNCLASSIFIED ERL 0692 RR
REFERENCES
I. Vaughan Clarkson, Jane Perkins, and Iven Mareels. On the novel application of number the-oretic methods to radar detection. Proceedings of the International Conference on Signal Pro-
cessing Applications and Technology, October 1993.
2. H. K. Mardia. New techniques for the deinterleaving of repetitive sequences. IEE Proceedings-F,136(4):149-154, August 1989.
3. MasPar Computer Corporation, Sunnyvale, California. Data-Parallel Programming Guide,1991.
4. MasPar Computer Corporation, Sunnyvale, California. MasPar .P-1 MPL Programming .an-uals, July 1991. Part Number 9300-9005-00 Rev A2.
5. MasPar Computer Corporation, Sunnyvale, California. .1lasPar lIP-I System Overview e,,MPPE Manuals, July 1991. Part Number 9300-9001-00 Rev AS.
6. D. J. Milojevii and B. M. Popovik. Improved algorithm for the deinterleaving of radar pulses.
IEE Proceedings-F, 139(1):98-104, February 1992.
7. J. A. V. Rogers. ESM processor system for high pulse density radar environments. IEE Pro-ceedings, 132, Pt. F(7):621-625, December 1985.
8. Ralph 0. Schmidt. On separating interleaved pulse trains. IEEE Transactions on Aerospaceand Electronic Systems, pages 162-166, January 1974.
9. Richard G. Wiley. Electronic Intelligence: The Analysis of Radar Signals, pages 160-163.
Artech House, Norwood, Massachusetts, 1982.
UNCLASSIFIED 17
ERL-0692 RR UNCLASSIFIED
THIS IS A BLANK PAGE
18 UNCLASSIFIED
UNCLASSIFIED ERL-0692- RR
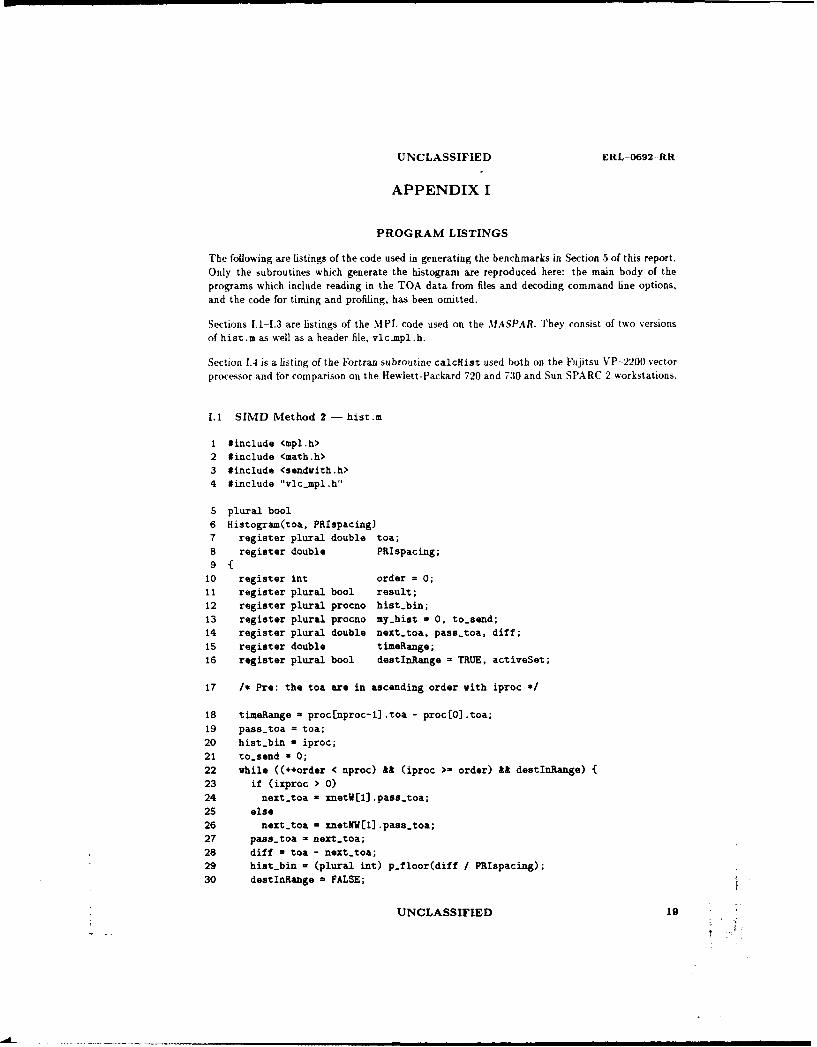
APPENDIX I
PROGRAM LISTINGS
The following are listings of the code used in generating the benchmarks in Section 3 of this report.Only the subroutines which generate the histogram are reproduced here: the main body of theprograms which include reading in the TOA data from files and decoding command line options,and the code for timing and profiling, has been omitted.
Sections 1.1-1.3 are listings of the MPL code used on the %fASPAR. They consist of two versionsof hist.m as well as a header file, vlcimplJ.h.
Section 1.4 is a listing of the Fortran subroutine calcHist used both on the Fujitsu VP-2200 vector
processor and for comparison on the Hewlett-Packard 720 and 730 and Sun SPARC 2 workstations.
1.1 SIMD Method 2 - hist.m
1 #include <mpl.h>2 #include <math.h>3 $include <sendwith.h>4 *include "vlc.mpl.h"
5 plural bool6 Histogram(toa, PRIspacing)7 register plural double toa;8 register double PRIspacing;910 register int order = 0;11 register plural bool result;12 register plural procno hist-bin;13 register plural procno my-hist = 0, to-send;14 register plural double next-toa, pass-toa, diff;15 register double timeRange;16 register plural bool destInRange = TRUE, activeSet;
17 /* Pre: the toa are in ascending order with iproc */
18 timeRange procEnproc-1] .toa - proc[0) .toa;19 pass-toa = toa;20 hist-bin = iproc;21 to-send - 0;22 while ((++order < nproc) && (iproc >- order) U destInRange) {23 if (ixproc > 0)24 next.toa - xnetW[l] .pass.toa;25 else26 nextgtoa = xnetNW[1 .pass.toa;27 pass.toa = next-toa;28 diff - toa - next-toa;
29 hist-bin = (plural int) p.Iloor(diff / PRIspacing);30 destInRange FALSE;
UNCLASSIFIED 19

ERL-0692-RR UNCLASSIFIED
31 to-send * 0;32 if (hist.bin < nproc) {33 destInRange = TRUE;34 to-send = 1;3536 all{37 my.hist + sendwithAddl6u(to.send, hist-bin);38 hist-bin * iproc;39 to-send = 0;4041 }42 return(my.hist);43 )
1.2 SIMD Method 2 - vlcimpl.h
1 /* Useful MPL declarations.
2 Written by Vaughan Clarkson, April, 1991.3 Copyright (c) 1991.4 */
5 /* Definitions for boolean variables. Should be an enumerated type but6 presently MPPE can't cope with enums7 */8 #define FALSE 09 #define TRUE (!FALSE)
10 /* This awkward construction overcomes the limitation of the natural11 MPL while statement by removing the restriction that the active set12 is non-increasing13 */14 #define FULLwhile(pvar) while(reduceOrSu(pvar)) if (pvar)
15 /* Wrap around xnet so that PE are arranged linearly */16 #define xnetLEFT(pvar) (ixproc > 0 ? (xnetW[1] .pvar) : (xnetNWE1l .pvar))17 #define xnetRIGHT(pvar) (ixproc < nxproc-1 ? (xnetE[1] .pvar) (xnetSEEI] .pvar))
18 typedef unsigned char bool;19 typedef unsigned short procno;
1.3 SIMD Method 3 - hist.m
1 #include <mpl.h>2 #include <math.h>
3 *define NULL 0
20 UNCLASSIFIED

UNCLASSIFIED ERL-0692-RR
4 plural int histogram(/* register plural double .1 toa,5 /* register double */ binWidth)6 register plural double toa;7 register double binWidth;8f
9 plural unsigned short myHist[4096);10 int order;11 plural double nextTOA, passTOA, diff;12 plural int histBin;13 int foundationlask, upperMask, lower~ask, distance;14 int numToSend, upper, lower;15 plural int foundation, mylndex;
16 passTOA a toa;17 for (order = 0; order < nproc / 2 - 1; order++) {18 if (ixproc > 0)19 nextTOA = =netW[1].passTOA;20 else21 nextTOA = xnetNWEl).passTOA;22 passTOA = nextTOA;23 diff = p-fabs(toa - nextTOA);24 histBin = (plural int) p-floor(diff / binWidth);25 if (histBin < nproc)26 MyHist[histBin)++;27 }28 /* And again for the final iteration, though now with just half the PEs s/
29 if (iproc < nproc / 2) {30 if (ixproc > 0)31 nextTOA a xnetW[l) .passTOA;
32 else33 nextTOA a xnetNW[l).passTOA;34 passTOA = nextTOA;
35 diff = p-fabs(toa - nextTOA);36 histBin a (plural int) p-floor(diff I binWidth);37 if (histBin < nproc)38 myHist~histBin]++;
39 }
40 /* Now redistribute the histograms */41 /* Assumptions: nxproc fi nyproc and nproc is an integer power of 4 */
42 /* Can be generalised. */43 foundationNask = nxproc J 1;44 upperMask = nxproc << 1;45 loverMask = 2;46 distance - 1;47 for (numToSend = nproc >> 2; numToSend > 0; nuaToSend >>- 2) {48 foundation a iproc & foundationNask;
49 for (upper a 0; upper < nproc; upper +- upperMask)s0 for (lower a 0; lower < nxproc; lower -= lowerMask) {51 plural unsigned short duumyE, du~myS. dummySE;52 plural int indexE, indexS, indexSE;
UNCLASSIFIED 21

ERL-0692-RR UNCLASSIFIED
53 mylndex a foundation I upper I lover;54 indaxE - xnetW~distance] .mylndex;55 indexS = xnetX[distance) .mylndex;56 indexSE a xnetNW[distance] .mylndex;57 dumayE = xnetE[distancej .myHist[indexE];58 dummyS a xnetS [distance) .myHist[indexSJ;59 duamySE a xnetSE[distance) .myHist[indexSE ;60 myHist[mylndex] +- duumyE + dummyS + dummySE;61 }62 foundationMask I= foundationMask << 1;63 upperMask <<- 1;
64 lowerMask <<- 1;65 distance <<= 1;66 }67 return(myHist [iprocD);68 }
1.4 Vector/SISD Fortran code
I subroutine calcHist(toa, hist, copy, diff, index)2 real*8 toa(*), copy(*), diff(*)3 integer hist(*), index(*)4 c5 c Calculate the histogram from the times of arrival (TOAs) in toa6 c and place the results in hist. The arrays copy, diff and index
7 c are scratch arrays. All arrays except hist must be at least of8 c dimension numtoa, and hist must have a minimum dimension of nunhist.9 c
10 common /histparams/ numtoa, numhist, binwidth11 integer numtoa, numhist
12 real*8 binvidth
13 integer i, j
14 c Assume even number of toas15 do 200 i = 1, numtoa / 2 - 116 do 300 j = 1, numtoa17 if Qj .16. i) then18 copy(j) a toa(numtoa - i + j)19 else20 copy(j) - toaQj - i)21 endif22 diff(j) = abs(toa(j) - copy(j))23 index(j) * int(diff(j) / binvidth) + 124 if (index(j) .le. numhist) then25 hist(index(j)) = hist(index(j)) + 126 endif27 300 continue28 200 continue29 do 400 j 1, numtoa/ 2
22 UNCLASSIFIED• .

UNCLASSIFIED ERL-0692-RR
30 diff(j) - abs(toa(j + numtoa / 2) - toa(j))31 index(j) - int(diff(j) / binvidth) + 132 if (index(j) .1e. nunhist) then33 hist(index(j)) a hist(index(j)) + 134 endif35 400 continue36 end
UNCLASSIFIED 23
-v

ERL-0692-RR UNCLASSIFIED
THIS IS A BLANK PAGE
24 UNCLASSIFIED

UNCLASSIFIED ERL-0692-RR
DISTRIBUTION
No of CopiesDefence Science and Technology Organisation
Cif Defence SenstCentral Office Executive ) I shared copyCounsellor, Defence Science, London Cont ShtCounsellor, Defence Science, Washington Cont Sht
Scientific Adviser POLCOMSenior Defence Scientific Adviser 1Assistant Secretary Scientific Analysis 1
Navy OfficeNavy Scientific Adviser 1
Air OfficeAir Force Scientific Adviser
Army OfficeScientific Adviser, Army
Electronics Research Laboratory
Director IChief, Communications Division Cont ShtChief, Information Technology Division Cont Sht
Chief, Guided Weapons Division Cont ShtChief, Electronic Warfare Division 1
Research Leader, Signal and Information Processing 1Head, Signal and Information Processing 1
Mr V. Clarkson (Co-author) 1Dr P.S. Ray(Co-author) 3
Head, Electronic Support Measures Systems I
Dr G.P. Noone 1
Dr S.D. Elton IDr D. Sweet 1
Cooperative Research Centre for Robust and Adaptive SystemsDr I.M.Y. Mareels, Department of Systems Engineering
Australian National University, ACT 2000 1Prof D.A. Gray CSSIP, SPRI Building, Warrendi Road,
Technology Park, The Levels 5095 1
Dr J.E. Perkins Building 71 Labs DSTO Salisbury IM. Balin Building 71 Labs DSTO Salisbury 1
B.J. Slocumb Electronic Systems LaboratoryGeorgia Tech Research Institute
Atlanta, Georgia 30332, USA I
U I
S~~~~~UNCLASSIFIED 2 '• :.

ERL-0692-RR UNCLASSIFIED
No of CopiesLibraries and Information Services
Australian Government Publishing Service I
Defence Central Library, Technical Reports Centre 1Manager, Document Exchange Centre, (for retention) I
National Technical Information Service, United States 2Defence Research Information Centre, United Kingdom 2
Director Scientific Information Services, Canada 1Ministry of Defence, New Zealand 1
National Library of Australia 1Defence Science and Technology Organisation Salisbury, Research Library 2Library Defence Signals Directorate, Melbourne IBritish Library Document Supply Centre I
SparesDefence Science and Technology Organisation Salisbury, Research Library 6
26 UNCLASSIFIED
.... -• .•W

1. Page ClassfllcatlonDepartment of Defence CLASS•atD
DOCUMENT CONTROL DATA SHEET 2. P dacyMarougCavent( oi document)
N/A
3a. AR Number 3b. Laboratory Number 3c. Type of Report 4. Task Number
AR-008-135 ERL-0692-RR RESEARCH REPORT ADF 9 1/136
5. Document Date 6. Cost Code 7. Security Classification S. No. of Pages 32
October 1993 819908 "[-- E E .No ofRefs 910. TitleL] L i 9.N.oRas9Document Title Abstract
PARALLEL PROCESSING FOR DIFFERENCINGAND HISTOGRAMMING S (Secret) C (Confi) R (Rest) U (Unciass)
For UNCLASSIFIED docs with a secondary distributionLIMITATION, use (L) in document box.
11. Author(s) 12. Downgrading/Delimiting Instructions
Vaughan Clarkson and Pinaki S. Ray NIA
13a. Corporate Author and Address 14. Officer/PositIon responsible for
Electronics Research Laboratory Security: ....................... NIA .................................PO Box 1500, Salisbury SA 5108
Dow ngrading: ...................... A...............................13b. Task Sponsor Approval for Release: ......... .ER .............................
ADF
15. Secondary Release Statement of this Document
APPROVED FOR PUBLIC RELEASE
16a. Deliberate Announcement
No limitation
16b. Casual Announcement (for citation In other documents)
iNo Limitation E Ref. by Author, Doc No. and date only.
17. DEFTEST Descriptors 18. DISCAT Subject Codes
Parallel processing, Histograms, Time of arrival (signals) 1711
19. Abstract
Algorithms which take advantage of massively parallel and vector architectures are formulatedfor the calculation of the differences of times-of-arrival derived from a sequence of time samples.The application which generated the work is the classification of pulse trains which are detectedby an electronic support measures receiver.
Four algorithms are proposed, of which three have been implemented and tested on severalmachines. The results obtained through testing are compared with each other and with results formore conventional architectures. It Is found that one of the machines, the massively parallelMASPAR MP-1 computer, is able to perform histogramming fastest through exploitation of itsdata-parallel architecture. Several suggestions are made which could significantly improveperformance on all architectures.
esei.5e*~ .4SIO Ds•WF 4
Related Documents