UvA-DARE is a service provided by the library of the University of Amsterdam (http://dare.uva.nl) UvA-DARE (Digital Academic Repository) Detecting and disrupting criminal networks Duijn, P.A.C. Link to publication Citation for published version (APA): Duijn, P. A. C. (2016). Detecting and disrupting criminal networks: A data driven approach General rights It is not permitted to download or to forward/distribute the text or part of it without the consent of the author(s) and/or copyright holder(s), other than for strictly personal, individual use, unless the work is under an open content license (like Creative Commons). Disclaimer/Complaints regulations If you believe that digital publication of certain material infringes any of your rights or (privacy) interests, please let the Library know, stating your reasons. In case of a legitimate complaint, the Library will make the material inaccessible and/or remove it from the website. Please Ask the Library: http://uba.uva.nl/en/contact, or a letter to: Library of the University of Amsterdam, Secretariat, Singel 425, 1012 WP Amsterdam, The Netherlands. You will be contacted as soon as possible. Download date: 26 Jan 2017

Welcome message from author
This document is posted to help you gain knowledge. Please leave a comment to let me know what you think about it! Share it to your friends and learn new things together.
Transcript

UvA-DARE is a service provided by the library of the University of Amsterdam (http://dare.uva.nl)
UvA-DARE (Digital Academic Repository)
Detecting and disrupting criminal networks
Duijn, P.A.C.
Link to publication
Citation for published version (APA):Duijn, P. A. C. (2016). Detecting and disrupting criminal networks: A data driven approach
General rightsIt is not permitted to download or to forward/distribute the text or part of it without the consent of the author(s) and/or copyright holder(s),other than for strictly personal, individual use, unless the work is under an open content license (like Creative Commons).
Disclaimer/Complaints regulationsIf you believe that digital publication of certain material infringes any of your rights or (privacy) interests, please let the Library know, statingyour reasons. In case of a legitimate complaint, the Library will make the material inaccessible and/or remove it from the website. Please Askthe Library: http://uba.uva.nl/en/contact, or a letter to: Library of the University of Amsterdam, Secretariat, Singel 425, 1012 WP Amsterdam,The Netherlands. You will be contacted as soon as possible.
Download date: 26 Jan 2017
PAUL DUIJN
Detecting and DisruptingCriminal NetworksA Data Driven Approach
Detecting and Disrupting Criminal N
etworks
A Data Driven ApproachPA
UL D
UIJN

Detecting and DisruptingCriminal Networks
A Data Driven Approach
Paul Duijn

This thesis was printed with support of the Co van Ledden Hulsebosch Center, Amsterdam
Center for Forensic Science and Medicine
© 2016, P.A.C. Duijn, Amsterdam, the Netherlands
All rights reserved. No parts of this thesis may be reproduced, stored in a retrieval system or
transmitted in any form or by any means electronic, mechanical, photocopying, recording
or otherwise, without prior permission of the author or copyright owning journal.
Academic Thesis University of Amsterdam
ISBN: ISBN: 978-90-77595-41-1
Cover design: P.A.C. Duijn, Optima Grafische Communicatie, Rotterdam, the Netherlands
Layout and printing: Optima Grafische Communicatie, Rotterdam, the Netherlands
Detecting and DisruptingCriminal Networks
A Data Driven Approach
ACADEMISCH PROEFSCHRIFT
Ter verkrijging van de graad van doctor
Aan de Universiteit van Amsterdam
Op gezag van de Rector Magnificus
Prof. Dr. Ir. K.I.J. Maex
Ten overstaan van het College voor Promoties ingestelde
commissie, in het openbaar te verdedigen in de Agnietenkapel
op donderdag 22 december 2016, te 12:00 uur
door
Paulus Anthonius Cornelis Duijn
geboren te Heemskerk
Promotiecommissie:
Promotoren:
Prof. Dr. Ir. A.G. Hoekstra Universiteit van Amsterdam
Prof. Dr. Ing. Z.J.M.H. Geradts Universiteit van Amsterdam
Overige leden:
Prof. Dr. E.W. Kleemans Vrije Universiteit Amsterdam
Prof. Dr. A.C. Van Asten Universiteit van Amsterdam
Prof. Dr. H.L.J. Van der Maas Universiteit van Amsterdam
Dr. M.L. Lees Universiteit van Amsterdam
Dr. T. Vis Universiteit van Tilburg/ Nederlandse Politie
Faculteit: Natuurwetenschappen, Wiskunde en Informatica

“Friendship is everything. Friendship is more than talent. It is more than government.
It is almost the equal of family. Never forget that.”
– Mario Puzo, The Godfather

table of contents
Chapter 1 Introduction 9
Chapter 2 The application of Social Network Analysis;
Recent developments within Dutch Police
39
Chapter 3 Bridging science and investigations: the application of Social
Network Analysis in Dutch criminal investigative practice.
83
Chapter 4 The Relative Ineffectiveness of Criminal Network Disruption 119
Chapter 5 Inference of the Russian drug community from one of the largest
social networks in the Russian Federation.
169
Chapter 6 Fluid connections within an old boys’ network?;
An empirical study of tie-strength in organized crime
193
Chapter 7 Synthesis: from data to disruption 239
Chapter 8 Discussion 253
Chapter 9 Summary
Nederlandse Samenvatting
Dankwoord
About the Author
List of Publications
Contributions
275
283
289
293
295
297

UvA-DARE is a service provided by the library of the University of Amsterdam (http://dare.uva.nl)
UvA-DARE (Digital Academic Repository)
Detecting and disrupting criminal networks
Duijn, P.A.C.
Link to publication
Citation for published version (APA):Duijn, P. A. C. (2016). Detecting and disrupting criminal networks: A data driven approach
General rightsIt is not permitted to download or to forward/distribute the text or part of it without the consent of the author(s) and/or copyright holder(s),other than for strictly personal, individual use, unless the work is under an open content license (like Creative Commons).
Disclaimer/Complaints regulationsIf you believe that digital publication of certain material infringes any of your rights or (privacy) interests, please let the Library know, statingyour reasons. In case of a legitimate complaint, the Library will make the material inaccessible and/or remove it from the website. Please Askthe Library: http://uba.uva.nl/en/contact, or a letter to: Library of the University of Amsterdam, Secretariat, Singel 425, 1012 WP Amsterdam,The Netherlands. You will be contacted as soon as possible.
Download date: 26 Jan 2017

Chapter 1Introduction

Chapter 1: Introduction
11
Criminals organized in networks operate most of the time anonymously behind the scenes.
The harm caused by their activities becomes however strongly visible on a global scale. It is
estimated that transnational criminal networks generate $870 billion a year, which is equal
to 1,5 percent of the GDP and 7 per cent of the world’s exports of merchandise (UNODC,
2011). At the same time numerous lives are lost as a result of organized crime activities,
due to drug related health problems, the use of firearms and violence, human trafficking,
or the smuggling of migrants. The strong presence of organize crime networks in particular
countries (e.g. Mexico, Italy) is also associated with diminishing levels of social, cultural,
economic, political and civil development and threatens world peace and democracy.
Although organized crime is considered a global phenomenon, its origins are often retrace-
able to local communities. Criminal networks are embedded in local social network struc-
tures formed by neighborhoods, high schools, youth gangs, and sport clubs (Kleemans
and Van de Bunt, 1999; Klerks, 2001; Kleemans and De Poot, 2008; Morselli, 2009; Von
Lampe, 2009). Within these local settings youth gang members converge with experienced
criminals to form local organized crime networks (Von Lampe and Johanson, 2004). En-
abled by increased mobility and globalization, local networks can evolve into transnational
criminal networks over time (Williams, 2001). The money and power achieved through
this development provides them with the opportunity to infiltrate local politics or legal
businesses leading to corruption and money laundering (Morselli, 2009). Local influence
provides security against the consequences of financial loss associated transnational illicit
trafficking operations. Disputes within transnational criminal networks can therefore easily
result in violent encounters in local settings, putting innocent peoples lives at risk. Criminal
networks on a transnational and local level are therefore inextricably linked.
A typical feature of organized crime networks is that its members and their interactions
remain rather opaque and hidden. They are therefore also referred to as ‘dark’ networks’
(Milward and Raab, 2003). Criminal networks use counterstrategies to protect their secrecy
in defensive (e.g. using encrypted telecommunication) or offensive ways (e.g., by assassi-
nating criminal informants, by threatening public prosecutors). Law enforcement agencies
tasked with reducing the damage and harm caused by criminal networks are therefore
struggling with important questions: How can we detect these dark criminal networks and
their dynamic structures and activities? What are the most efficient strategies to disrupt
and control them efficiently and effectively? How can we prevent them from recovering or
adapting to these interventions?
The key to answering these questions lies in understanding how criminal networks emerge
and evolve over time within their social settings. This phenomenon has already been stud-
ied by criminologists for many years and has provided many useful theoretical insights that
12
shape the policies and law enforcement strategies of today. At the same time researchers
and analysts from other scientific disciplines are confronted with similar network problems
and have developed theories and policies for network detection and disruption as well
(Newman, 2010). Epidemiologists seek ways to identify the spread of viruses through global
networks and try to identify high-risk groups to apply specialized treatment or education
(Epstein, 2009; Zarrabi et al., 2013). Neuroscientists study the structure of neurological
networks in order to identify specific neuron cells responsible for malfunction of informa-
tion transfer in the brain in support of treatment of Alzheimer or Schizophrenia (Palop
and Mucke, 2010, Liu et al, 2008). Complexity science is a scientific field that addresses
such complex network problems across many scientific disciplines. It seeks for universal
features in the structure and behavior of complex networks trough data-driven methods of
computer simulation and combines these insights to create a generic theoretical paradigm
in the study of networks (Mitchel, 2009; Newman, 2010). Although this paradigm contains
many relevant concepts, methods and ideas for the study of organized crime, it has mainly
been neglected in criminal network research.
This chapter starts with a description of the traditional theoretical perspectives on organized
crime and introduces complexity theory as an additional theoretical framework in Section
1.1. Section 1.2 introduces what is currently known about criminal network dynamics in
terms of emergence and adaptation. Section 1.3 then introduces the empirical research
methods for the study of criminal networks and how methods derived from complexity
science contribute to a deeper empirical understanding of network dynamics. Finally, the
relevance and central aim of this thesis are presented in Section 1.4.
1.1 theoretical PersPectives on organized crime
Scientific progress depends on the continuing interaction between the analysis of the em-
pirical reality and scientific theory (Popper, 1972). Although many scientific theories about
crime have been developed and empirically tested in the past century, theoretical insights
about the typical phenomenon of organized crime have remained largely undeveloped.
The main cause lies in its complexity; ‘organized crime’ is a catchall concept, which is used
to label a diversity of criminal groups and different criminal activities at different scales
(Kleemans, 2014). Empirical research in the field of criminology has however led to three
main theoretical models about the structure of organized crime, which also influenced the
public debate and control strategies in the last four decades: The bureaucracy model, the
illegal enterprise model, and the criminal network model.
Chapter 1: Introduction
13
the bureaucracy model
The bureaucracy-model describes organized crime in terms of pyramid-shaped structures,
with a strict hierarchy, code of conduct, internal and external sanction system and a clear
division of tasks (Cressey, 1969). This theoretical perspective was developed in the 1960s
and is mainly based on the study of Italian Mafia syndicates with strict leadership ranks
operating in the United States.
Many criminologists have rejected the bureaucracy model and there is a general agreement
that this does not represent the social complex reality of organized crime. Some authors,
however, emphasis that researchers should not completely exclude the existence of hierar-
chies in criminal networks, which is undeniably a feature of criminal networks concerning
the Sicilian Mafia, the Hong Kong Triads or the Russian Mafia (Campana, 2011; Varese,
2011; Kleemans, 2014). Such hierarchies are preserved by underlying brotherhoods, which
are based on status or fraternization contracts with have their own rewarding system
(Paoli, 2003). Within such brotherhoods members obey the hierarchical ranks and can
demonstrate a strong intrinsic loyalty to their leaders. Nevertheless, more in-depth studies
of the underlying social structures within such brotherhoods (such as the Hells Angels) also
demonstrate that the formal hierarchies are easily undermined by informal social connec-
tions in the day-to-day operation of criminal activities (e.g. Morselli, 2009). Hierarchical
criminal groups are therefore considered more the exception rather than the rule.
illegal enterprise model
In response to the bureaucracy model, criminologists in the 1970s developed the illegal
enterprise model. This model compares organized crime with legal business structures.
Scholars emphasize that organized crime should be understood as ‘disorganized crime’,
since it is not dominated by one or more criminal groups but by multiple criminal enti-
ties that are continuously competing for market share (Reuter, 1983). This model has a
strong emphasis on rationally driven offenders and their interactions are explained by the
laws of demand and supply. Consequently, opportunities for organized crime arise from a
high demand for services and commodities, which have been criminalized or restricted by
governments (Kleemans, 2014).
The illegal enterprise-model has contributed to the study of illegal activities in terms of
business processes. It is based on the idea that initiation and management of illicit business
process requires a coordinated effort by multiple individuals over a certain period of time
similar to legitimate companies (Van Duyne and Levi, 2005; Spapens, 2006). Structural
analysis of the separate elements of the criminal value chain could reveal ‘weak spots’
within the criminal organization, which provide opportunities for effective countermeasures
(Cornish and Clark, 1996; Bruinsma and Bernasco, 2004). Although this model is useful
14
for explaining supply and demand within illicit markets, its power for explaining predatory
forms of organized crime (e.g. racketeering or extortion) is limited since these crimes are
not based on the laws of demand- and supply (Spapens, 2010; Kleemans, 2014). Another
critique of this approach is that it fails in describing the entities that constitute illegal
markets and how they are formed.
criminal network theory
The unexplained questions following the illegal enterprise model prompted the develop-
ment of criminal network theory in the late 1990s (e.g. Kleemans and Van de Bunt, 1999;
Klerks, 2000). Its main concept is that organized crime is a fundamental part of a larger
social environment. Organized crime can only be explained by understanding the underly-
ing social ties and interactions (Ianni and Reus-Ianni, 1972; Kleemans and Van de Bunt,
1999; Coles, 2001; Klerks, 2001; Morselli, 2009; Von Lampe, 2009). Criminal networks
are considered non-hierarchical, fluid and flexible and are based on family, neighborhood,
or friendship relationships that provide the social opportunity structure to find trustworthy
accomplishes. Social relationships are not formed at random but are restricted by social
and geographical distances and boundaries (Feld, 1981).
The criminal network model explains how networks are formed on a local level and how
they can evolve into fixed elements in the global criminal economy. It also explains how
network positioning or specific attributes of individual actors can enable or limit the
criminal opportunities of individual actors within the overall system ((Kleemans en Van
de Bunt, 1999; Klerks, 2001; Morselli, 2009; Spapens, 2010). It does not solely focus on
finding out who is in charge, but merely raises the question: who is dependent on whom?
and for what reason? (Kleemans, 2014). Taking into account network topology makes it
possible to identify key individuals, who occupy broker positions in-between different parts
of the overall network. Identification of such key players creates excellent opportunities for
network disruption (Sparrow, 1991; Bright et al., 2015). Supported by the findings of a fast
growing number of empirical studies, there is a common consensus that criminal groups
should be understood as flexible and tightly knit networks (e.g. Natarajan, 2006, Morselli,
2009; Carrington, 2010; Nash at al., 2013).
A limitation of criminal network theory is tha social embeddedness is a very broad topic
that leads to many different views amongst scholars about it should be defined and stud-
ied. Especially the functionality of technical social network analysis (SNA) has led to debate
within organized crime research. A common critique is that it is too much aimed at static
network representations instead of answering relevant theoretical questions about the dy-
namics of criminal cooperation following from network theory (Spapens, 2010; Kleemans,
2014). Another critique is that empirical observations are too much focused on networks
Chapter 1: Introduction
15
at a micro-level, while criminal network theory seeks to understand the interaction with
embedded social networks at a meso- and macro level (Soudijn, 2014; Von Lampe, 2015).
Regardless of these internal methodological discussions, the general concepts comprising
criminal network theory have provided a consistent theoretical framework for under-
standing the underlying complex mechanisms, which are at the heart of organized crime
existence. This line of theoretical thinking has encouraged researchers to improve their
methods for empirically capturing criminal network dynamics and its emergent features.
Traditional criminological methodologies have their limitations in support of this endeavor
and have steered criminal network researchers to seek for theoretical frameworks and
methodologies within other scientific disciplines. Recently, a new paradigm known as
complexity science has been introduced in the field of criminology, which aims to answer
the questions associated with the dynamics and complexity of criminal networks.
complexity theory
Network theory is considered one of the models within a wider theoretical framework,
known as complexity theory. This paradigm is increasingly used as a general language
for understanding complex systems across various scientific disciplines, such as economy,
ecology, biology, sociology and computer science. It studies how relationships between
different parts give rise to complex collective behaviors of a system, and how the system
interacts with its environment that is also observed in criminal networks (Gell-Mann, 1995).
In complexity science there is no universal definition of complexity, which is why it is mainly
described by its distinctive properties. A first property of complex systems is non-linearity.
Non-linearity means that the whole is different from the sum of its parts (Mitchel, 2009).
Complex systems consist of many, diverse and autonomous components that are highly
interconnected and interdependent, which can lead to unpredictable outcomes if they
form connections (Chan, 2001). A second property of complex systems is self-organization,
which is a form of distributed nonlinear pattern formation. This happens when other actors
copy the specific state of a particular actor in the network (e.g. opinions, ideas, behavior).
Positive feedback loops (e.g. financial profits) are the key engines behind this process,
Via positive feedback loops a random event can be amplified into a macroscopic level of
organization. Negative feedback loops can also emerge if a counterbalancing force (e.g.
law enforcement interventions) prevents the system to grow nonlinearly (Mitchel, 2009).
Negative feedback contributes to the controllability of complex systems. A fourth property
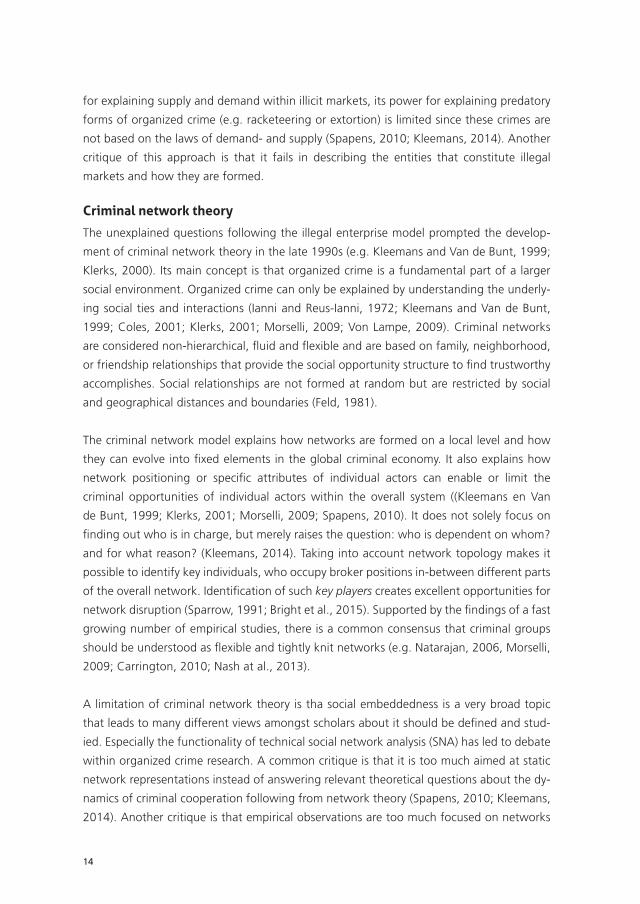
is that self-organization can lead to emergence, which means that large entities, patterns
and regularities emerge out of interactions amongst smaller or less complex entities that
do not exhibit such properties (Sloot et al. 2013). Because the macroscopic system emerges
out of the independent behaviors and feedback loops amongst its individual elements,
complex systems are unpredictable by nature (Figure 1.1).
16
The emergence of patterns of trans-
national organized crime can also be
explained by complexity theory, which can
be demonstrated by an example derived
from law enforcement practice:
The red light district in Amsterdam is a
common meeting area for criminals from
various cultural backgrounds. Within one
of the bars a Spanish-speaking member
of a Dutch criminal group by coincidence meets a member of a Dutch Colombian
drugs cartel and because they regularly visit the same bar a friendship is formed
over time. This friendship leads to mutual trust creating the opportunity to set up a
trafficking route from Colombia to the Europe. The result is an exclusive connection
between two local criminal clusters along the lines of this individual friendship.
The cocaine trafficking operation is successful and expands over time in frequency
and quantities. As more people get involved other interdependent social connec-
tions emerge between other members of both clusters by the mechanism of self-
organization. Subsequently, the positive feedback loops resulting from the financial
profits, attracts other local criminal clusters from Belgium, Germany or the UK to
engage in the cocaine trafficking activities as well. The result is the emergence of
a complex macroscopic system involving many local clusters at the two sides of the
Atlantic. This enables the local clusters to control global cocaine trafficking logics
at the same time in different points in space. In other words, their sum is more and
different than sum of its parts (Anderson, 1972).
However, if one of the individual members within a local cluster autonomously
decides to leak information to the police the trafficking ring, the complete network
and its local clusters may become compromised. This may cause a negative feedback
loop (e.g. fear of detection), which may result in the collapse of the organization at
a macro level. Alternatively, the criminal network could adapt or evolve to increased
law enforcement attention, by shifting to another form of crime or change their
trafficking routes (e.g. local production of synthetic drugs). Subsequently, changes
in the behavior of individual members could lead to topological evolution of the
network, leading to a more dispersed instead of a dense network topology. This
could make the individual members and their criminal behaviors harder to detect
and disrupt by law enforcement.
Figure 1.1: Emergence of complex systems
Chapter 1: Introduction
17
This example demonstrates how microscopic and macroscopic patterns of behavior are
in constant interaction with each other and with the elements of their environment. Ad-
aptation and evolution as a result of external pressures are part of a specific area within
complexity science: complex adaptive systems theory.
complex adaptive systems theory
Complex adaptive systems (CAS) are defined as complex systems that have the capacity
for adaptation. CAS are studied as an environment within which many and diverse actors
act and react to each other’s behaviors, as their combined macroscopic structures adapt
and evolve over time (Holland, 2000, Gell-Man, 1995). Typical examples of CAS are stock
markets and the complex web of cross border holding companies, the internet that is com-
posed and managed by a complex mix of human and computer interactions, ant colonies,
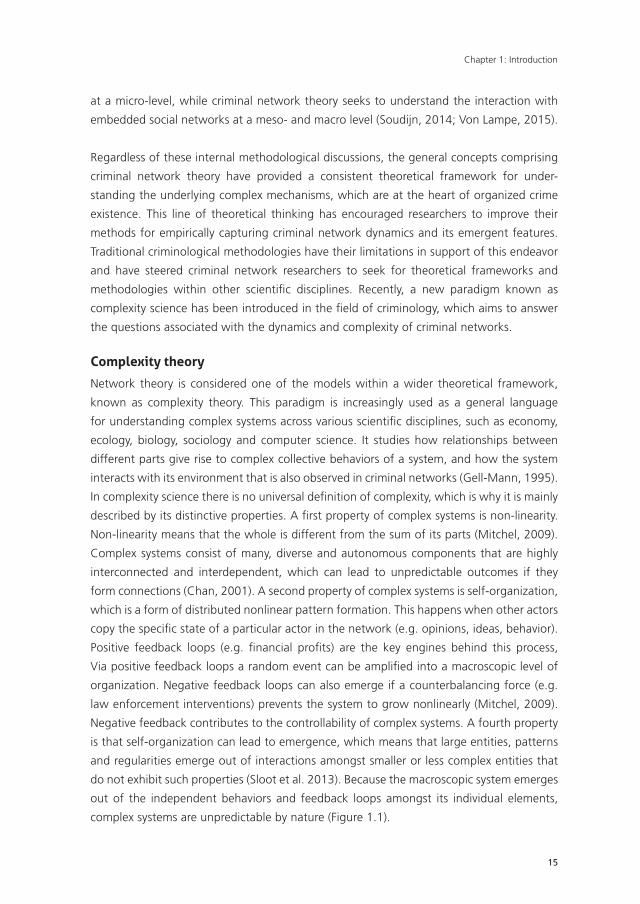
and flocks of starlings displaying deceptive macroscopic behaviors to distract their natural
enemy: the peregrine falcon (see Figure 1.2).
Criminal networks and law
enforcement organizations
also form a CAS, in which
the process of complex adap-
tation unfolds from criminal
networks learning behavior
as a result from targeted law
enforcement operations and
visa versa. Kenney (2007) ap-
plies the theoretical concept
of complex adaptation to
explain why the leadership
interdiction (targeting of
kingpins) strategies applied
to the global cocaine traf-
ficking network of Pablo
Escobar’s Cali Cartel has
been ineffective. On the basis of numerous interviews with intelligence experts and some
convicted members of these two groups, he found that both networks learned -through
a process he defines as competitive adaptation- that a strong reliance on crucial hub
positions makes the overall system vulnerable to deliberate attacks aimed at leadership
positions. Instead they learned through trial and error that a flat organizational structure is
harder to detect and disrupt by law enforcement agencies.
Figure 1.2: Pelegrine Falcon and a flock of starlings caught in a CAS of hunter and prey. Microscopic shifts in the behavior of a few starlings may trigger macroscopic changes in the behavior of the entire system as a survival mechanism to the vicious attack of the falcon. Similar complex hunter and prey interaction occurs between law enforcement organizations and criminal networks (Image: Manuel Presti
18
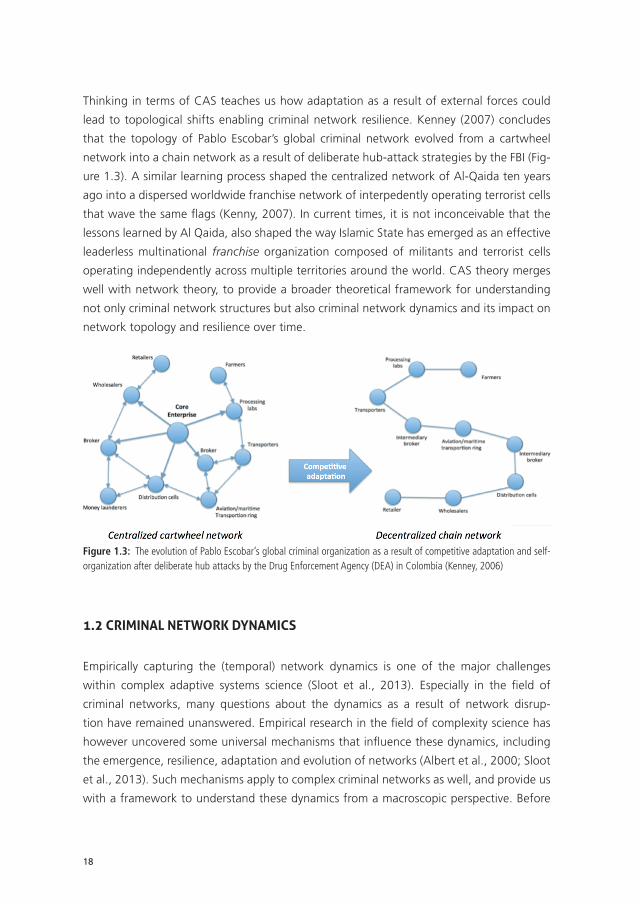
Thinking in terms of CAS teaches us how adaptation as a result of external forces could
lead to topological shifts enabling criminal network resilience. Kenney (2007) concludes
that the topology of Pablo Escobar’s global criminal network evolved from a cartwheel
network into a chain network as a result of deliberate hub-attack strategies by the FBI (Fig-
ure 1.3). A similar learning process shaped the centralized network of Al-Qaida ten years
ago into a dispersed worldwide franchise network of interpedently operating terrorist cells
that wave the same fl ags (Kenny, 2007). In current times, it is not inconceivable that the
lessons learned by Al Qaida, also shaped the way Islamic State has emerged as an effective
leaderless multinational franchise organization composed of militants and terrorist cells
operating independently across multiple territories around the world. CAS theory merges
well with network theory, to provide a broader theoretical framework for understanding
not only criminal network structures but also criminal network dynamics and its impact on
network topology and resilience over time.
Figure 1.3: The evolution of Pablo Escobar’s global criminal organization as a result of competitive adaptation and self-organization after deliberate hub attacks by the Drug Enforcement Agency (DEA) in Colombia (Kenney, 2006)
1.2 criminal network dynamics
Empirically capturing the (temporal) network dynamics is one of the major challenges
within complex adaptive systems science (Sloot et al., 2013). Especially in the fi eld of
criminal networks, many questions about the dynamics as a result of network disrup-
tion have remained unanswered. Empirical research in the fi eld of complexity science has
however uncovered some universal mechanisms that infl uence these dynamics, including
the emergence, resilience, adaptation and evolution of networks (Albert et al., 2000; Sloot
et al., 2013). Such mechanisms apply to complex criminal networks as well, and provide us
with a framework to understand these dynamics from a macroscopic perspective. Before
Chapter 1: Introduction
19
the current state of knowledge concerning these dynamics is discussed, the difference
between dynamics ‘on and of’ networks will be explained in the following Section.
dynamics on an of networks
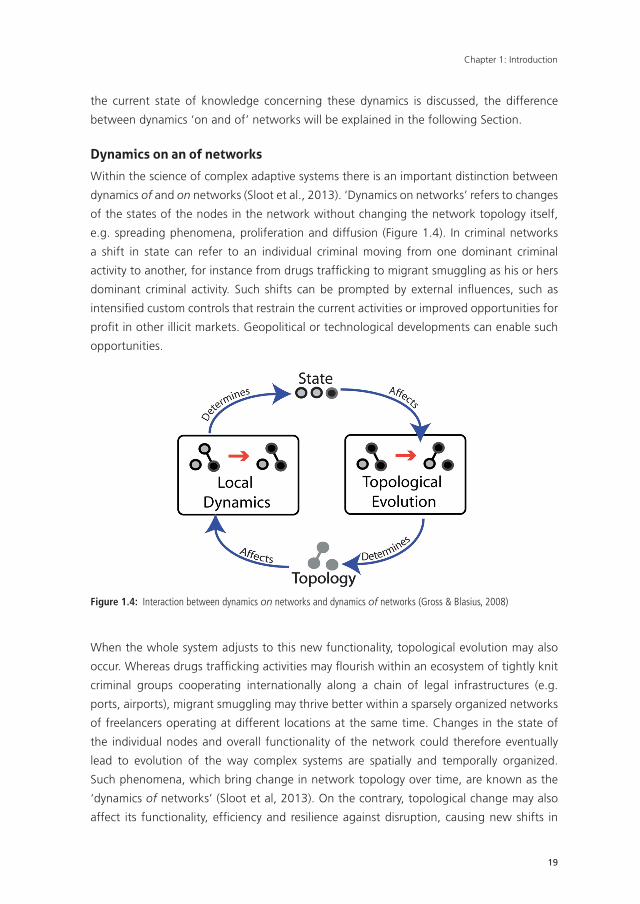
Within the science of complex adaptive systems there is an important distinction between
dynamics of and on networks (Sloot et al., 2013). ‘Dynamics on networks’ refers to changes
of the states of the nodes in the network without changing the network topology itself,
e.g. spreading phenomena, proliferation and diffusion (Figure 1.4). In criminal networks
a shift in state can refer to an individual criminal moving from one dominant criminal
activity to another, for instance from drugs traffi cking to migrant smuggling as his or hers
dominant criminal activity. Such shifts can be prompted by external infl uences, such as
intensifi ed custom controls that restrain the current activities or improved opportunities for
profi t in other illicit markets. Geopolitical or technological developments can enable such
opportunities.
Figure 1.4: Interaction between dynamics on networks and dynamics of networks (Gross & Blasius, 2008)
When the whole system adjusts to this new functionality, topological evolution may also
occur. Whereas drugs traffi cking activities may fl ourish within an ecosystem of tightly knit
criminal groups cooperating internationally along a chain of legal infrastructures (e.g.
ports, airports), migrant smuggling may thrive better within a sparsely organized networks
of freelancers operating at different locations at the same time. Changes in the state of
the individual nodes and overall functionality of the network could therefore eventually
lead to evolution of the way complex systems are spatially and temporally organized.
Such phenomena, which bring change in network topology over time, are known as the
‘dynamics of networks’ (Sloot et al, 2013). On the contrary, topological change may also
affect its functionality, effi ciency and resilience against disruption, causing new shifts in

20
the state of individual nodes. ‘Dynamics on networks’ and ‘dynamics of networks’ are
therefore inextricably linked and particularly relevant to understand the dynamical ecosys-
tem of (transnational) organized crime. The next Section describes how these mechanisms
contribute to the emergence and evolution of criminal networks.
Macroscopic dynamics on criminal networks following the European migrant crisisAn example of a dynamical shift was recently observed during the European migrant crisis. The unstable situation and dependence of migrants on local infrastructures provided criminal networks with the opportunity to gain easy profits through the smuggling of migrants to the EU. Criminal networks originally specialized in controlling drugs trafficking routes redirect their logistics and control over border crossings (e.g. across the Western Balkan route), towards the smuggling of migrants. Such shifts start within a local context, initiated by just a few criminal groups. As these local shifts turned out to be very profitable, this news spread across other European countries and networks. It may have triggered other local criminal groups along the transnational trafficking routes to shift from drugs traf-ficking to migrant smuggling as well, resulting in macroscopic shifts in the functionality of a chain of transnational criminal network as a whole. (Source: Europol- Interpol, 2016).
the emergence of criminal networks
Criminal networks do not emerge randomly. To cope with uncertainties, deception, and the
threat of violence, trust is a necessary condition for initiating criminal cooperation. Building
trust takes time and is established within a local social context that was established well
before the actual criminal career. Criminal networks therefore rely on deeper layers of
durable social relationships of which its origin is often retraceable to school classes, youth
gangs, sports teams and local diaspora communities (Von Lampe and Johansson, 2004).
Once a newcomer is accepted as a trustworthy member of the criminal network his or hers
social- and criminal network (ego-network) may further expand over time (Kleemans and
van de Bunt, 1999; Klerks 2001; Morselli, 2009). It is not uncommon that criminals who
collaborated in the past will do so again in the future (Von Lampe, 2015). New criminal
ties therefore also emerge from past co-offending or out of shared loyalty to the same
criminal group. This process is enabled by the presence of offender convergence settings,
which can be represented by physical or virtual meeting places, such as local bars, private
parties, sports clubs, prisons or Darknet forums, where criminal accomplishes can be found
or disclosed information can easily be exchanged (Felson, 2006). According to Felson this
is where criminal cooperation persists, even though the actors may vary. The social op-
portunity structures, which also emerge within these offender convergence settings, shape
the evolution of criminal networks and the recruitment of new members. Not occasionally
this happens in the later stages of a person’s life course, or even after a legitimate career
(Kleemans and Van de Poot, 2008).
Chapter 1: Introduction
21
On the long term these local dynamics can expand in non-linear ways, best described
as a social snowball-effect (Kleemans and Van de Bunt, 1999). As one’s network grows
over time the dependence on other criminal’s resources (money, contacts and knowledge)
gradually declines to a point were membership of the network does not provide new
opportunities or resources any more. Well-established network members may therefore
start of independently by attracting people from their own social environment to form new
criminal clusters.
Spapens (2010) provides a framework to understand these micro-macro interactions by
distinguishing between the micro-, meso- and macro networks. Following the global scale
of transnational illegal markets, macro networks are defined as a worldwide network
composed of interconnected regional clusters (meso-networks). Meso-networks are em-
bedded in local settings and are defined as regional pools of latent criminal connections
out of which new co-offending emerges. Micro-level criminal networks are defined as local
operational collectives consisting of a little number of actors cooperating for one or several
criminal endeavors. Afterwards these collectives may fall apart due to arrests, seizures,
or internal disputes. Shortly after such a collapse new accomplishes are found within the
embedding meso- networks, which remain robust sources of new emerging co-offending
initiatives over time (Kleemans and van de Bunt, 1999; Klerks, 2001; Spapens, 2010; Von
Lampe, 2015).
The emergence of the criminal macro-network out of the interactions between its individual
parts is mainly driven by connectivity. Globalization, technology and enhanced transporta-
tion enable connections between meso-networks and break away the geographical or
cultural barriers between separate pools of co-offending. This can eventually result in the
emergence of small-world networks (Milgram, 1967; Watts and Strogatz, 1998; Coles,
2001). A small-world network is a type of network in which most actors are not neighbors
of one another, but most actors can be reached from every other actor through a small
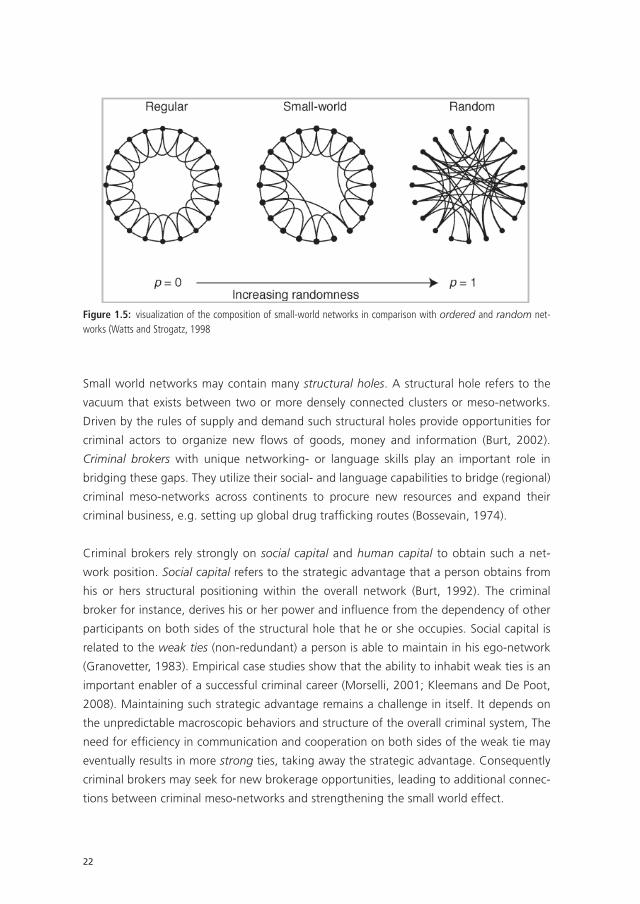
number of steps (Watts and Strogatz, 1998). Its structure is somewhere in-between regular
networks and random networks (see Figure 1.5) and the overall topology is best described
as loose connections between densely connected clusters.
22
Figure 1.5: visualization of the composition of small-world networks in comparison with ordered and random net-works (Watts and Strogatz, 1998
Small world networks may contain many structural holes. A structural hole refers to the
vacuum that exists between two or more densely connected clusters or meso-networks.
Driven by the rules of supply and demand such structural holes provide opportunities for
criminal actors to organize new fl ows of goods, money and information (Burt, 2002).
Criminal brokers with unique networking- or language skills play an important role in
bridging these gaps. They utilize their social- and language capabilities to bridge (regional)
criminal meso-networks across continents to procure new resources and expand their
criminal business, e.g. setting up global drug traffi cking routes (Bossevain, 1974).
Criminal brokers rely strongly on social capital and human capital to obtain such a net-
work position. Social capital refers to the strategic advantage that a person obtains from
his or hers structural positioning within the overall network (Burt, 1992). The criminal
broker for instance, derives his or her power and infl uence from the dependency of other
participants on both sides of the structural hole that he or she occupies. Social capital is
related to the weak ties (non-redundant) a person is able to maintain in his ego-network
(Granovetter, 1983). Empirical case studies show that the ability to inhabit weak ties is an
important enabler of a successful criminal career (Morselli, 2001; Kleemans and De Poot,
2008). Maintaining such strategic advantage remains a challenge in itself. It depends on
the unpredictable macroscopic behaviors and structure of the overall criminal system, The
need for effi ciency in communication and cooperation on both sides of the weak tie may
eventually results in more strong ties, taking away the strategic advantage. Consequently
criminal brokers may seek for new brokerage opportunities, leading to additional connec-
tions between criminal meso-networks and strengthening the small world effect.
Chapter 1: Introduction
23
Another factor leading to strong network positions is human capital. Human capital does
not rely on structural network positioning, but on the personal resources an individual is
able to provide the network, such as unique skills, knowledge or reputation (Hagen and
McCarthy, 1998; Von Lampe, 2009; Robins, 2009; Bouchard and Nguyen, 2010). Specific
skills may be needed for organizing or completing a specific criminal logistical process, such
as building up illegal cannabis cultivation sites or setting up a money laundering scheme.
Typical examples are lawyers, accountants, bankers and other financial professionals, who
utilize their knowledge and legal position to facilitate criminals with investing their criminal
proceeds (Williams, 2001).
Individuals with high human capital may increase in social capital as well. There may be
a high demand for their unique skills, knowledge or resources amongst different criminal
groups. The individuals providing such resources may end up providing crime-as-a-service
for multiple ‘clients’, and as this unfolds naturally become a criminal broker between
isolated criminal groups within the criminal macro-network (Robins, 2009; Kleemans and
Van de Poot, 2008; Spapens, 2010). Without proper protection within the opportunistic
criminal underworld such positions can become extremely vulnerable, since removal of
these key-individuals could also be seen as a strategy of one criminal group to frustrate the
criminal logistics of another.
The increased connectivity associated with social- and human capital on a micro-level,
fuels the emergence of global patterns within the criminal macro network. Moreover,
the diffusion of social- and human capital within criminal networks, leads to bottom-up
self-organizing behavior that shapes the overall macroscopic patterns of the overall system.
Research has shown that such topologies, which emerge from the bottom-up, can become
highly robust and resilient against disruption and noise (Quax and Sloot, 2013; Czaplicka
et al., 2014).
resilience and adaptation of criminal networks
The emergence of complex adaptive systems doesn’t happen out of the blue; on every
level of organization (micro-macro) there is a continuous interaction with its environment
(Chen, 2001). Social networks, competing criminal groups, and law enforcement agencies
are also in continuous interaction with each other, which shapes the overall structure,
growth or decline of the criminal network over time. Network resilience is key to surviving
disruption. It is defined as ‘the capacity to absorb and thus withstand disruption and the
capacity to adapt, when necessary, to changes arising from that disruption’ (Bouchard,
2007; Ayling, 2009).
24
Adaptation is an important element of network resilience, however, if a network’s topology
is robust enough to withstand disruption adaptation will not occur. In criminal networks
this happens when the impact of an intervention does not affect its primary criminal
operation or exposure of its members. This capability depends strongly on the emerged
topological advantage of the network as a whole (Barabasi et al., 2000; Sloot et al., 2013).
Scale free networks, which are centralized around nodes with many direct connections
(hubs), are highly resilient against random attacks. The hubs provide many alternatives
for information to flow through the network if any random node is removed. However, if
these hubs are deliberately disrupted, such alternatives will soon dry out. By removing just
a few hubs, different parts of the network therefore become separated and may lead to
complete collapse of the network (Barabasi et al., 2000). Alternatively, the network may
survive through adaptation and shift from a scale-free structure into a more robust form.
Adaptation varies from minor evolutionary modifications within its topology to complete
displacement from its primary criminal activities or geographical area of operation (Ayling,
2009). The ability to adapt to disruption is a typical feature of criminal networks.
Contrarily to licit network, the resilience of illicit networks depends on the dynamical bal-
ance between efficiency and security (Baker and Faulker, 1993; Morselli et al., 2006). Ef-
ficiency of the criminal network refers to the efficient exchange of information and goods
amongst its actors that is necessary in order to coordinate complex criminal operations
across different geographical areas at the same time. Secrecy refers to the shielding of the
flow of information about criminal activities across the network. The tradeoff between
these two elements has a strong effect on network topology (Erickson, 1981; Milward and
Raab, 2006).
The high demand for efficiency leads to increased density and redundancy in the networks
overall structure. The necessity for tight security on the other hand leads to sparse network
topologies, in which information travels via different non-redundant compartments. The
balance between efficiency and security depends on the network’s objective and func-
tionality. Criminal networks with the objective of maximizing financial profit, will have to
trade efficiency for security to coordinate different criminal activities in short periods of
time. Terrorist network, for which accomplishing their objective depends on the long-term
planning of one successful terrorist attack, can afford themselves more investments in
security (Morselli et al. 2006).
The level of external pressure that threatens the criminal network’s existence may fluctuate
over time (e.g. by law enforcement priorities). By trading efficiency for security criminal
networks naturally anticipate to such fluctuating pressures in a flexible way. A response to
a single arrest may be to seek for a suitable replacement outside of the criminal networks
Chapter 1: Introduction
25
trusted core, temporary resulting in increased network efficiency at the cost of security.
In case of multiple arrests at the same time, however, the pressure may exceed a certain
tipping point at which the risks of seeking replacements becomes too high. Then the
whole system may fall apart. Under what circumstances such tipping points occur remains
uncertain. More extended empirical research of the dynamics of and on criminal networks
is needed to understand this mechanism. The next Section describes the different steps and
methodologies, which support the development of such a deeper empirical understanding.
1.3 methodologies for studying criminal networks
The previous paragraph shows that criminal networks could be understood as complex
adaptive systems. To understand the dynamics inherent to this type of networks, more
empirical research is needed. Since criminal networks show different levels of complexity
and actively hide their activities at the same time, this is not an easy endeavor. Particularly
when the objective is to detect and disrupt them effectively. This Section gives an introduc-
tion to the current and potential future approaches for empirical research in this field. In
this regard, a distinction can be made between three different steps for studying criminal
networks: inference, analysis, and simulation.
inference of criminal networks
Criminal network data is inevitably incomplete (Sparrow, 1991; Borgatti, 2013; Campana,
2016). Contrary to licit networks, dark networks are generally not easily observed. They are
naturally distrustful and generally not committed to self-surveys about their relations with
main accomplishes. Criminologists have therefore adopted many strategies to increase the
likelihood of observing criminal behavior and interaction. Some went to prisons to interview
inmates (Morselli and Trembley, 2004) while others committed to participant observation
methods to observe the criminal and social behaviors from within the network themselves
(e.g. Zaitch, 2009). Such studies led to unique case descriptions of criminal networks at
the individual level, but were not intended to create an overview of the criminal network
at a macro level. For creating such a system-level perspective on criminal networks, many
researchers found access to law enforcement data. Inference of criminal networks out of
such data sources is unavoidably biased towards the initial purpose for which the data
was collected (e.g. evidence, intelligence). In criminal network research attention needs to
be paid to such limitations and its impact on the inference of criminal networks. Inferring
reliable criminal network representations out of incomplete data has therefore become a
research topic in itself.
26
Law enforcement and intelligence agencies are the only legal entities with the authority to
utilize advanced investigative methods that infringe on a suspects personal privacy, such
as wiretapping, surveillance, and recruitment of informants. The intelligence-led policing
doctrine that has become introduced within many law enforcement agencies in the past
years has resulted in vast amounts of network data that become more and more acces-
sible for network researchers. The majority of criminal network studies are therefore based
on law enforcement and intelligence data. The observations retrieved from these sources
provides unique structured data about an offender’s personal and criminal activities and
his/hers cooperation with other criminals, but are most likely biased towards the aim of the
investigation or intelligence collection purposes. The binary network data retrieved from
such data-sources should therefore always be analyzed in combination with the contextual
content of the links (Varese, 2012).
Raw law enforcement data comes in many formats. Most often the data needs to be
cleaned and parsed in order to extract the relevant criminal relations. It is not uncommon
that the data is structured in a 2-mode format, meaning that persons in a database are
mutually linked to the same piece of information (i.e. document) but not directly to each
other. In such cases a 1-mode co-affiliation projection (person- person links) needs to be
created out of 2-mode network (person- document links) (Borgatti and Halgin, 2012). For
reliable inference of criminal networks it is therefore essential to understand the way each
data-source is processed. Persons may for instance be linked to the same document for
administrative reasons (e.g. database cleaning), without having a real-life criminal relation-
ship. If not processed properly, such artifacts could lead to a distorted criminal reality. The
reliability of such co-affiliation network projections might however be refined by adding
weights to the links based on the number of documents that links two persons in the
network (Swartz and Rousselle, 2008; Campana, 2016).
In addition to law enforcement data representing the connections amongst criminals
in the physical world, there is an increasingly vast amount of (semi-) open source data
available which provides insight into criminal networks within the virtual world. Darknet
marketplaces and other online forums represent new places for offenders to convergence
into networks,. These for a can however be accessed by criminals, law enforcement ex-
perts and researchers alike. Automated methods for inference of networks out of such
increasing amounts of data are becoming increasingly important. These procedures are
based on specific software that automatically indexes and searches all content available
on such forums or servers. Webcrawling (i.e. mirroring) is such a method that concerns
the indexing and copying of webpages (Olston and Najork, 2010). First, all hyperlinks on
a single webpage are downloaded and indexed. The crawler then visits all linked pages
and downloads all links on these pages as well. Webcrawlers are used in conjunction with
Chapter 1: Introduction
27
webscrapers, which seek for specific pieces of information in the content of webpages.
Web scrapers need to be taught what to search for (e.g. dates, names, content) and how
to store that information in a database or spreadsheet (Decary-Hetu and Aldridge, 2015).
Outside of the online environment Diesner and Carley (2004) developed a text-analysis
algorithm that automatically creates network representations out of unstructured text,
such as law enforcement reporting. Such techniques have already provided criminologists
with unique one-on-one network observations of hacker-networks (e.g. Decary-Hetu et
al., 2014), online drugs forums (Christin, 2013), and online child-pornography networks
(Bouchard et al, 2014).
Another method for inference of criminal networks is the simulation of criminal networks
through complex agent network models (Mei et al, 2015). This method is originally devel-
oped to capture the multi-scale spatial-temporal characteristics of complex systems, mean-
ing the interaction between individual-level and global-level dynamics of a system. Agent-
based models consist of two key components: a population of agents and a simulated
environment in which they are situated. Agents are defined as a member of the population
represented by an autonomous decision making entity. Similar to a real population, agents
exhibit individual preferences, characteristics, and behaviors (e.g. gender, age, preferred
social group). Agent behavior is defined by a series of action rules, outlining how agents
act under certain conditions. The spectrum of decisions is often inspired by theoretical con-
cepts. The behavior of an individual ‘particle’ (network member) and its interaction with
other ‘particles’ is then analyzed and translated into rules for agent behavior simulation
(Bonabeau, 2002). By simulating a set of agent behavior rules and making them interact
macroscopic system level phenomena start to emerge.
Agent-based modeling has already become an experimental field in computational
criminology and may become an important method for analyzing the complex macro-
scopic systems of crime (Birks et al, 2012; Davia and Weber, 2013). So far this method
has mainly been applied to high volume street crime (e.g. burglary) that relies heavily
on routine activity theory (Cohen and Felson, 1979) rational choice theory (Cornish and
Clarke, 1986) and crime pattern theory (Bratingham and Brantingham, 1993). The rational
offender behaviors that follow from these perspectives are suitable for modeling offender
decision-making processes in target selection.
This method also holds a strong potential for studying the dynamics in social networks,
such as criminal networks. There is also a growing knowledge about how offenders
choose their co-offenders. If this leads to the development of parameters for the decision
to co-offend, it may hold a strong potential for inference of simulated criminal network
formation as well. The macroscopic phenomena can be simulated as a result of changes
28
on a microscopic level (e.g. removal of agents). Reliability of this approach is however
strongly dependent on a set of rules that represent the rational behavior of agents, while
emotional irrational decision-making is also part of the offender behavior. The outcome of
this procedure should therefore always be interpreted as an approximation of the criminal
reality. Real-life data should always provide the necessary validation of the generic criminal
network structures developed by ways of computer simulation.
analyzing criminal networks
Although there is a general consensus that criminal groups should be studies in terms of
networks, some scholars disagree about the empirical methodology by which this should
be observed (Spapens, 2010). Traditionally, research in the field of organized crime has
relied mainly on qualitative methods involving the manual analysis of court- and police files
and interviews with law enforcement professionals (e.g Reuter, 1983, Fijnaut et al, 1998;
Kleemans and van de Bunt, 1999; Klerks, 2001; Spapens, 2006). Recently, other methods
have been added to the toolkit for organized crime research, such as social network analy-
sis (SNA). This is a method by which criminal networks are structurally analyzed in terms of
actors (nodes) and relationships (edges). By coding network data in a binary format within
a matrix structure, it is possible to visualize networks and calculate some of its features
with the help of mathematical metrics. The application of SNA is however also not without
limitations, and often leads to discussions about the validity of the findings. This Section
introduces and compares these two approaches.
Theory-driven qualitative approachTheoretical frameworks mainly drive the qualitative approach in the study of organized
crime. These frameworks provide the necessary definitions to consistently identify the
elements of criminal cooperation within a predominantly top-down approach. Empirical
research is often based on an individualistic and manual analysis process, consisting of the
collection of case studies inferred from interviews, surveys or police and court files. The
analysis of data is guided by a list of research questions also derived from a theoretical
framework. The strength of this method is that it provides a collection of detailed empirical
case studies and narratives that after clustering and further interpretation lead to more
general insights into the embedding social factors behind organized crime (Kleemans,
Van Brienen and Van de Bunt, 2002; Klerks, 2000; Spapens, 2006). It is an approved
method within the study of organized crime and has led to important contributions to its
understanding, especially in relation to the social embeddedness (Kleemans and Van de
Bunt, 1999), local breeding grounds for organized crime (Klerks, 2000), different levels of
structure in organized crime (Spapens, 2006), and careers in organized crime (Kleemans
and De Poot, 2009; Van Koppen, 2010).
Chapter 1: Introduction
29
Although this approach has formed an important foundation for putting the study of
organized crime on the agenda of criminology practice, it is not without limitations. A first
practical concern is that the method is very time-consuming and therefore less suitable for
studying large datasets in which criminal structure and dynamics remain hidden (Kleemans,
Van de Bunt and Kruisbergen, 2012). Because the data is analyzed manually, researchers
need to make selections within the available data for practical reasons. Researchers there-
fore need to choose between a ‘broad and global’ or ‘selective and intensive’ approach
for analyzing the data (Van de Bunt et al. 2007). Although the complexity of organized
crime thrives on the interaction between the microscopic individual properties of network
members and the macroscopic properties of the networks they form, qualitative research
is limited in empirically integrating both perspectives at the same time.
Alternatively observations within individual case studies are extrapolated to draw con-
clusions about organized crime as a whole. These extrapolations rely strongly on set
theoretical frameworks, which increase the risk of viewing such case studies trough a
certain predetermined lens. Consequently, aberrant macroscopic patterns of co-offending
or adapted mechanisms of criminal network emergence may be overlooked.
Many qualitative studies of organized crime are based on police- or court files, which may
be strongly affected by legislation. For instance, article 140 in the Dutch penal law is spe-
cifically aimed at prosecuting membership of a criminal organization, strongly resembles
the elements of the traditional hierarchical criminal organizations. Data that is irrelevant to
these elements may therefore be left out of the final case file. This may have an effect on
the individual researcher’s observation of the structure and dynamics presented by criminal
justice data.
Lastly, not all qualitative empirical studies explain precisely how the process from raw data
to conclusions has unfolded, meaning how the complex data has been processed, clus-
tered and interpreted. This limits the extent to compare the findings with other qualitative
studies.
Data-driven approachIn addition to the theory-driven approach there is the data-driven approach.1 The data-
driven approach seeks rather than assumes structure, by taking nodes and their ties as
the starting point for the bottom-up structural analysis of criminal networks (Campana
and Varese, 2013; Campana, 2016). Social network analysis (SNA) is one of the primary
data-driven methods in criminal network research, which originates from anthropology
1 also known as instrumental approach (Von Lampe, 2009; Campana, 2016)
30
and was further developed by sociologists to understand complex social networks (e.g.
cyber networks, school networks and neighborhood networks).
Sparrow (1991) was the first to introduce this methodology within organized crime re-
search and also stimulated its application within law enforcement practice. SNA allows
criminologists to add network visualizations (graphs) and mathematical measures (metrics)
of centrality, density and clustering to the researchers toolkit, to help create a deeper
and data-driven understanding of large amounts of criminal network data.2 It combines
quantitative mathematical techniques to explore large datasets of criminal associations
to identify relevant topological features that require further qualitative in-depth analysis.
Since 2000 this field of research is growing fast, with many studies aimed at unraveling
network structure, identifying key players, network resilience and network adaptation (e.g.
Morselli, 2009, Natarjan, 2006; Papachristos and Smith, 2014; Calderoni, 2014; Bouchard,
2007; Malm and Bichler, 2011, Bright and Delany, 2013).
The main limitation of the data-driven approach is that its results are sensitive to miss-
ing data, and exactly this is one of the inevitable aspects of law enforcement data on
which most SNA research is based (Campana, 2016). Some criminologists have therefore
become skeptic towards the quantitative application of SNA, or hold the opinion that SNA
should completely be excluded from the criminal network research field (Kleemans, 2014;
Spapens, 2013, Soudijn, 2014).
Network researchers within other scientific disciplines have however made the ‘missing
data issue’ a line of research in itself and study its impact on the results or seek ways for
improvement. In this regard two types of missing data can be distinguished: missing links
and missing nodes. Both can have different impact on the validity of criminal network
representations. Borgatti et al. (2006) tested whether statistical network features remain
robust when ten percent of the known links and nodes were added or ten percent of
unknown links or nodes were removed from different types of criminal networks. Ad-
ditionally, Xu and Chen (2006) looked at the removal of more than ten nodes and links on
network topology for dark networks. Both studies conclude that macroscopic properties of
the networks observed did not change when missing links were added or known links were
removed. The networks identified through law enforcement sources were robust despite
the likelihood of missing data. Campana and Varese (2011) and Berlusconi (2013) specifi-
cally studied the effects of missing data in networks inferred from wiretap data. They also
found that general network measures within criminal networks, such as betweenness- and
degree- centrality, remain robust against missing data.
2 A more technical description of social network analysis methodology is provided in chapter 2 and 3.
Chapter 1: Introduction
31
Other results suggest that the impact of missing data depends on the size of the network.
Hence, for small networks consisting of less than ten nodes the results become highly
sensitive to missing data as the absence or presence of one node can change the topology
of the network as a whole (Burcher and Whelan, 2015). The impact of missing data is
therefore dependent on the level of analysis: individual, group or system level.
Although missing data in criminal network research is unavoidable, these studies suggest
that its impact can be measured or controlled when the datasets become larger. A data-
driven approach is therefore optimally utilized in research that concerns large criminal
networks, which are studied at the group or system level. Internal and external validity
checks should however always be performed at the start of network analysis at any level
(Campana and Varese, 2012). It is important to combine data sources when inferring
criminal networks and relational meta-data should always be checked against its qualita-
tive content.
Another relevant method for unraveling criminal networks in a data-driven approach is
crime script analysis. Its application is used to obtain insight into the individual positions
of actors within a criminal network. Cornish (1994) was one of the pioneers describing
criminal markets in terms of crime scripts. A crime script is defined as a systematical blue-
print of the different phases of a criminal business process, which each consist of different
facets (i.e. steps). The permutation of the possible combinations to pass all phases, results
in a combinatorial explosion of possibilities, which is an indicator for the flexibility and
resilience of the criminal operation. In other words, the more options (facets) build into
the crime script to pass the different phases, the more resilient the crime script is against
disruption.
Bruinsma and Bernasco (2004) combined crime script analysis and social network analysis
to describe the flexibility within the criminal markets of heroin trade, human trafficking,
and car theft. They found some evidence that the structure of criminal networks was
shaped according to the features of the criminal activities and illegal markets, for instance
the possible legal and economic consequences of the specific criminal activities. Addition-
ally, Morselli and Roy (2008) integrated crime scripting with SNA methodology in labeling
different actors within a criminal network according to their involvement in the different
phases and facets of the crime script of organized car theft. They identified the importance
of brokers between the different roles in the crime script. According to Sparrow (1991)
these actors have low ‘substitutability’ and are therefore interesting targets for network
disruption, because most of the criminal network depends on just a few actors for a suc-
cessful outcome. Sparrow (1991) emphasizes that disruption of actors with specific skills
might have major consequences for the criminal network, as compared to actors involved
32
in more general tasks or roles. The notion within law enforcement that scripting helps to
detect weak spots within criminal networks, has led to advances in the way data is pro-
cessed in databases. More role-specific information concerning the involvement of persons
in crime scripts is therefore becoming available to researchers. This makes it possible to
analyze vast amounts of network data in conjunction with crime script data together in
one data-driven approach, which creates the ‘third generation’ network analysis as previ-
ously announced by Klerks (2001).
modeling and simulating criminal networks
Fuelled by increased computational capacity and sophisticated quantitative models the use
of mathematical and computer models have grown considerably in many scientific fields.
In the field of computational social sciences it uncovers dynamical crime patterns that
could not have been detected 20 years ago (Lazer, 2009; Devia and Weber, 2013). Com-
putational models allow researchers to construct simulations of dynamical social systems,
which capture their key elements at a controllable level of complexity (Birks et al., 2012
Lazer, 2009). This provides researchers with the opportunity to experiment with different
manipulations of one or more components of a particular system (e.g. criminal network)
and measure how this impacts others. It provides opportunities to conduct experiments,
which would be technically, financially, or ethically difficult to conduct in real-life.
Computational models can be divided into explanatory models that aim to increase under-
standing of how that system might function and predictive models that aim to predict the
outcome of a system (Birks et al., 2012). Explanatory models are more theoretical in nature
and act as formalized thought experiments aimed at identifying under what circumstances
certain outcomes of a system may arise. One of such methods is agent-based modeling
described above, by which virtual worlds are created through simulated populations of
heterogeneous, autonomous agents (actors) (Epstein, 1999). Moon and Carley (2007) used
agent-based simulation to predict the evolution of a terrorist network across time and
space. They added the dimension of space by also simulating the emergence of relation-
ships between agents and locations, which led to insights into effects of geospatial change
on the structure of terrorist networks.
Predictive models rely on detailed and well-collected parameter data to estimate macro-
scopic systems behavior. Based on these historical data it is possible to generate scenarios
for future dynamics of and on criminal networks. The study of criminal network dynamics
by scenario generation through predictive computational modeling is still in its infancy.
There is however an increasing number of studies concerning its application in the field
of terrorist network research. Prompted by the events of 9-11 and the terrorist attacks
in Madrid, London, Paris, and Brussels many computational and network scientists have
Chapter 1: Introduction
33
developed models for predicting terrorist activities and the emergence and evolution of
terrorist networks.
Allanach et al. (2004) for instance developed a transaction-based model, which relies on
the significant links between events and entities in the data that might involve suspicious
terrorist network activities. An event in which a person withdraws a vast amount of money
from her/his bank account and then shortly buys a plane ticket together with explosive
chemicals forms a tell-tale (i.e. signal) for the planning of a terrorist attack. The algorithm
uses the data from historic terrorist attacks to identify such tell-tales in future data con-
cerning flight bookings, financial transactions or border crossings.
Such algorithms can also be programmed to identify patterns between entities in the data
themselves, which is known as machine learning. As the vast amounts of network data
concerning persons, goods, money, vehicles, locations, and events are becoming more and
more complex over time, machine learning will inevitably become a standardized method
in criminal network research and law enforcement practice. Phua et al. (2004), for instance,
already demonstrate how such techniques of machine learning can identify fraud schemes
and -networks in multiplex data.
1.4 the relevance and aim of this thesis
Based on the observations described in this introductory chapter, we can conclude that
there is a gap between the theoretical perspectives and the empirical understanding of
criminal network dynamics. Unraveling the complexity hidden within criminal networks is
the key to effective detection and potential disruption and therefore very relevant to law
enforcement control of organized crime. The data-driven methods available to uncover this
complexity and dynamics are promising, but still in its infancy. Therefore, its added value to
the understanding of criminal networks needs further evaluation and exploration.
This thesis explores the possibilities and limitations of this data-driven approach to the
study of organized crime. The aim of this thesis is to contribute to a further empirical
data-driven understanding of the structure and dynamics of criminal networks, in order to
detect and disrupt them more effectively.
34
references
Albert, R., Jeong, H., & Barabási, A. L. (2000). Error and attack tolerance of complex networks. nature,
406(6794), 378-382.
Allanach, J., Tu, H., Singh, S., Willett, P., & Pattipati, K. (2004). Detecting, tracking, and counteracting
terrorist networks via hidden Markov models. In Aerospace Conference, 2004. Proceedings.
2004 IEEE (Vol. 5). IEEE.
Anderson, P. (1972) The whole is more and also different from the sum of parts, Science 177, 4047,
1972.
Ayling, J. (2009). Criminal organizations and resilience. International Journal of Law, Crime and Justice,
37(4), 182-196..
Baker, W. E. & Faulkner, R. R. (1993) The social organization of conspiracy: illegal networks in the
heavy electrical equipment industry. American Sociological Review 58, 837–860.
Berlusconi, G. (2013). Do all the pieces matter? Assessing the reliability of law enforcement data
sources for the network analysis of wire taps. Global Crime, 14(1), 61-81.
Birks, D., Townsley, M., & Stewart, A. (2012). Generative explanations of crime: Using simulation to
test criminological theory*. Criminology, 50(1), 221-254.
Boissevain, J. (1974). Friends of friends: Networks, manipulators and coalitions (p. 192). Oxford:
Blackwell.
Bonabeau E., (2002) Agent-based modeling: methods and techniques for simulating human systems.
Proc. Natl. Acad. Sci. U. S. A., 99 (Suppl. 3), pp. 7280–7287.
Bouchard, M., & Nguyen, H. (2010). Is it who you know, or how many that counts? Criminal networks
and cost avoidance in a sample of young offenders. Justice Quarterly, 27(1), 130-158.
Bouchard, M. (2009) On the resilience of illegal drug markets. Global Crime 8(4), 325–344 (2007). 47.
Ayling, L. Criminal Organizations and resilience. Int. J. of Law Crime and Justice 37, 182–196.
Borgatti, S.P., Carley, K., and Krackhardt, D. (2006). Robustness of Centrality Measures under Condi-
tions of Imperfect Data. Social Networks 28: 124–136.
Borgatti, S.P. & Halgin, D.S. (2012) Analyzing Affiliation Networks In: J. Scott & P.J. Carrington, The
Age Handbook of Social Network Analysis, SAGE, 2012
Bright, D. A., & Delaney, J. J. (2013). Evolution of a drug trafficking network: Mapping changes in
network structure and function across time. Global Crime, 14(2-3), 238-260.
Bruinsma G, Bernasco W (2004) Criminal groups and transnational illegal markets. Crime, Law, Soc
Change 41:79–94.
Burcher, M., & Whelan, C. (2015). Social network analysis and small group ‘dark’networks: an analysis
of the London bombers and the problem of ‘fuzzy’ boundaries. Global Crime, 16(2), 104-122..
Burt R.S. (2002) Structural holes versus network closure as social capital. In: Lin N, Cook KS, Burt RS
(eds) Social capital: theory and research. Transaction, New Brunswick, pp 31–56.
Calderoni, F. (2014). Identifying mafia bosses from meeting attendance. In Networks and Network
Analysis for Defence and Security (pp. 27-48). Springer International Publishing.
Campana, P. (2011). Eavesdropping on the Mob: The Functional Diversification of Mafia Activities
across Territories. European Journal of Criminology 8(3): 213-228.
Chapter 1: Introduction
35
Campana, P. (2016a). Explaining criminal networks: Strategies and potential pitfalls. Methodological
Innovations, 9, 2059799115622748.
Campana, P., & Varese, F. (2012). Listening to the wire: criteria and techniques for the quantitative
analysis of phone intercepts. Trends in organized crime, 15(1), 13-30.
Campana, P., & Varese, F. (2013). Cooperation in criminal organizations: Kinship and violence as cred-
ible commitments. Rationality and society, 25(3), 263-289.
Chan, S. (2001). Complex adaptive systems. In ESD. 83 Research Seminar in Engineering Systems (pp.
1-9).
Christin N. (2013) Traveling the Silk Road: A measurement analysis of a large anonymous online mar-
ketplace. Proceedings of the 22nd International Conference on World Wide Web. International
World Wide Web Conferences Steering Committee: 213-224.
Coles, N. (2001). It’s Not What You Know—It’s Who You Know That Counts. Analysing Serious Crime
Groups as Social Networks. British Journal of Criminology, 41(4), 580-594.
Cornish DB (1994) The procedural analysis of offending and its relevance for situational prevention.
Crime Prevention Stud 3:151–196
Cornish, D. B. (1994). The procedural analysis of offending and its relevance for situational prevention.
Crime prevention studies, 3, 151-196.
Czaplicka, A., Holyst, J. A. and Sloot, P. M. A. (2013) Noise enhances information transfer in hierarchi-
cal network. Sci. Rep. 3, 1223. (DOI: 10.1038/srep01223).
Devia, N., & Weber, R. (2013). Generating crime data using agent-based simulation. Computers,
Environment and Urban Systems, 42, 26-41.
Decary-Hetu D. & Aldridge, D. D. H. J. (2015) Sifting through the Net: Monitoring of Online Offenders
by Researchers. The European Review of Organized Crime 2(2), pp 122-141
Decary-Hetu D, Morselli C, and Leman-Langlois S (2012) Welcome to the Scene: A Study of Social
Organization and Recognition among Warez Hackers. Journal of Research in Crime and Delin-
quency 49: 359-382.
Diesner, J., & Carley, K. M. (2004). Using network text analysis to detect the organizational structure of
covert networks. In Proceedings of the North American Association for Computational Social
and Organizational Science (NAACSOS) Conference.
Epstein J.M., (2009) Modelling to contain pandemics. Nature, 460 (7256) , p. 687.
Erickson, B. (1981) Secret societies and social structure. Social Forces 60, 188–210.
Europol-Interpol (2016). Migrant Smuggling Networks- Joint Europol- INTERPOL Report, May 2016.
Felson, M. (2006). Crime and nature. Sage publications.
Gell-Mann, M. (1995). Complex adaptive systems. In Sante Fe Instutute Studies in the sciences of
complexity-proeceedings Vol. 22, pp. 11-11). Addison- Wesley Publishing Co.
Granovetter M (1983) The strength of weak ties: a network theory revisited. Sociol Theory 1:201–233.
Gross, T., & Blasius, B. (2008). Adaptive coevolutionary networks: a review. Journal of the Royal Society
Interface, 5(20), 259-271.
Holland, J. H. (2000). Emergence: From chaos to order. OUP Oxford.
Ianni, F.A.J., and Reuss-Ianni., E. (1972). A Family Business: Kinship and Social Control in Organized
Crime. London: Routledge and Kegan Paul.
36
Kenney M. (2007) From Pablo to Osama: trafficking and terrorist networks, government bureaucra-
cies, and competitive adaptation. Penn State Press; 2007.
Kleemans, E. R., & Van De Bunt, H. G. (1999). The social embeddedness of organized crime. Transna-
tional organized crime, 5(1), 19-36.
Kleemans, E. R., & de Poot, C. J. (2008). Criminal careers in organized crime and social opportunity
structure. European Journal of Criminology, 5(1), 69-98.
Kleemans, E. R. (2014). Theoretical perspectives on organized crime. In: L. Paoli (ed.) Oxford handbook
of organized crime, p. 32-52.
Klerks, P. (2001). The network paradigm applied to criminal organizations: Theoretical nitpicking or
a relevant doctrine for investigators? Recent developments in the Netherlands. Connections,
24(3), 53-65.
Lazer D, et al. (2009). Computational social science. Science 323(5915):721–723.
Levi, M., & van Duyne, P. C. (2005). Drugs and money: Managing the drug trade and crime money in
Europe. Routledge.
Liu, Y., Liang, M., Zhou, Y., He, Y., Hao, Y., Song, M., ... & Jiang, T. (2008). Disrupted small-world
networks in schizophrenia. Brain, 131(4), 945-961.
Malm, A., & Bichler, G. (2011). Networks of collaborating criminals: Assessing the structural vulner-
ability of drug markets. Journal of Research in Crime and Delinquency, 48(2), 271-297.
Makarenko, T. (2004). The crime-terror continuum: tracing the interplay between transnational orga-
nized crime and terrorism. Global crime, 6(1), 129-145.
McCarthy B, Hagan J (1995) Getting into street crime: the structure and process of criminal embed-
dedness. Soc Sci Res 24:63–95
Mei, S., N. Zarrabi; M.H. Lees and P.M.A. Sloot (2015) Complex agent networks: An emerging ap-
proach for modeling complex systems, Applied Soft Computing/ Vol 37, Pg 311- 321.
Mei, S., R. Quax, Van De Vijver, D., Zhu Y., Sloot P.M.A. (2011) Increasing risk behaviour can outweigh
the benefits of antiretroviral drug treatment on the HIV incidence among men-having-sex-
with-men in Amsterdam BMC Infect. Dis., 11 (1), p. 118
Milgram, S. (1967). The small world problem. Psychology today, 2(1), 60-67.
Milward H.B., Raab J. (2006) Dark networks as organizational problems: elements of a theory. Int Pub
Manage J 9(3):333–360
Mitchell, M. (2009). Complexity: A guided tour. Oxford University Press.
Moon, I. C., & Carley, K. M. (2007). Modeling and simulating terrorist networks in social and geospa-
tial dimensions. Intelligent Systems, IEEE, 22(5), 40-49.
Morselli C (2001) Structuring Mr. Nice: entrepreneurial opportunities and brokerage positioning in
the cannabis trade. Crime, Law Soc Change 35:203–244
Morselli C, Petit K (2007) Law enforcement disruption of a drug importation network. Glob Crime
8(2):109–130
Raab, J., & Milward, H. B. (2003). Dark networks as problems. Journal of public administration re-
search and theory, 13(4), 413-439.
Morselli C. (2001). Structuring Mr. Nice: entrepreneurial opportunities and brokerage positioning in
the cannabis trade. Crime, Law Soc Change 35:203–244
Chapter 1: Introduction
37
Morselli C, Giguère C, Petit K. (2006). The efficiency/security trade-off in criminal networks. Soc Netw
29(1):143–153
Morselli, C., & Roy, J. (2008). Brokerage qualifications in ringing operations*. Criminology, 46(1),
71-98.
Morselli, C. (2009). Inside criminal networks. New York: Springer.
Nash, R., Bouchard, M., & Malm, A.. (2013). Investing in people: The role of social networks in the
diffusion of a large-scale fraud. Social Networks, 35(4), 686-698.
Natarajan, M. (2006). Understanding the structure of a large heroin distribution network: A quantita-
tive analysis of qualitative data. Journal of Quantitative Criminology, 22(2), 171-192.
Newman, M. (2010). Networks: an introduction. OUP Oxford.
Olston C and Najork M. (2010). Web crawling. Foundations and Trends in Information Retrieval 4:
175-246.
Palop, J. J., & Mucke, L. (2010). Amyloid-[beta]-induced neuronal dysfunction in Alzheimer’s disease:
from synapses toward neural networks. Nature neuroscience, 13(7), 812-818.
Paoli, L. (2003). Mafia Brotherhoods: Organized Crime, Italian Style. New York: Oxford University
Press.
Papachristos, A. V., & Smith, C. M. (2014). The embedded and multiplex nature of Al Capone. Crime
and networks, 97-115.
Pastor-Satorras, R., Vespignani A. (2010) Complex networks: patterns of complexity. Nat. Phys., 6, pp.
480–481.
Phua, C., Alahakoon, D., & Lee, V. (2004). Minority report in fraud detection: classification of skewed
data. Acm sigkdd explorations newsletter, 6(1), 50-59.
Popper, K. R. (1972). Objective Knowledge: An Evolutionary Approach. Oxford: Clarendon Press.
Quax, R., Apolloni, A., & Sloot, P. M. A. (2013). The diminishing role of hubs in dynamical processes
on complex networks. Journal of The Royal Society Interface, 10(88), 20130568.
Quax R., Apolloni A., Sloot P. M. A. (2013) Towards understanding the behavior of physical systems
using information theory. Eur Phys J Special Top;222(6):1389e401. ISSN 1951-6355 and 1951-
6401.
Robins, G. (2009). Understanding individual behaviors within covert networks: the interplay of indi-
vidual qualities, psychological predispositions, and network effects. Trends in Organized Crime,
12(2), 166-187.
Reuter, P. (1983). Disorganized Crime: Illegal Markets and the Mafia. Cambridge, MA: MIT Press.
Spapens A.C. (2006). Interactie tussen criminaliteit en opsporing: De gevolgen van opsporingsac-
tiviteiten voor de organisatie en afscherming van xtc-productie en -handel in Nederland.
Intersentia, Antwerpen.
Spapens, T. (2010). Macro networks, collectives, and business processes: An integrated approach to
organized crime. Eur. J. Crime Crim. L. & Crim. Just., 18, 185.
Spapens, T. (2013). Netwerken op niveau; Criminele micro-, meso- en macronetwerken, Rede uit-
gesproken bij de openbare aanvaarding vsn het ambt hoogleraar in de criminologie aan de
Universiteit van Tilburg op 28 september 2012.

38
Sloot, P. M., Kampis, G., & Gulyás, L. (2013). Advances in dynamic temporal networks: understanding
the temporal dynamics of complex adaptive networks. The European Physical Journal Special
Topics, 222(6), 1287-1293.
Sparrow M. (1991). The application of network analysis to criminal intelligence: an assessment of the
prospects. Soc Netw 13:251–274
Spapens A.C.M. (2010). Macro networks, collectives, and business processes: an integrated approach
to organized crime. Eur J Crime, Crim Law, Crim Justice 18(2):185–215
Soudijn, M. R. J. (2014). Using strangers for money: a discussion on money-launderers in organized
crime. Trends in Organized Crime, 17(3), 199-217.
UNODC (2011)., Research report: estimating illicit fi nancial fl ows rEsulting from drug traffi cking and
othEr transnational organized crimes, Vienna
Varese, F. (2011). Mafi as on the Move. Princeton, NJ / Oxford: Princeton University Press.
Von Lampe, K., & Ole Johansen, P. (2004). Organized Crime and Trust:: On the conceptualization and
empirical relevance of trust in the context of criminal networks. Global Crime, 6(2), 159-184.
Von Lampe, K. (2009). Human capital and social capital in criminal networks: introduction to the
special issue on the 7th Blankensee Colloquium. Trends in Organized Crime, 12(2), 93-100.
Von Lampe, K (2015) In book: Ektraordinære Tider: Festskrift til Per Ole Johansen 70 år, Publisher:
Novus Forlag, Editors: Lars Korsell, Paul Larsson, Jan G. Christophersen, pp.127-142
Van Koppen, M. Vere, Christianne J. De Poot, Edward R. Kleemans, and Paul Nieuwbeerta. (2010).
Criminal Trajectories in Organized Crime. British Journal of Criminology 50(1): 102-123.
Watts, D. J., & Strogatz, S. H. (1998). Collective dynamics of ‘small-world’networks. nature, 393(6684),
440-442.
Williams, P. (2001). Transnational Criminal Networks. In: Networks and netwars: the future of terror,
crime, and militancy, 1382, 61.
Xu, J., & Chen, H. (2008). The topology of dark networks. Communications of the ACM, 51(10),
58-65.
Zarrabi, N., Prosperi, M. C., Belleman, R. G., Di Giambenedetto, S., Fabbiani, M., De Luca, A., & Sloot,
P. M. A. (2013). Combining social and genetic networks to study HIV transmission in mixing risk
groups. The European Physical Journal Special Topics, 222(6), 1377-1387.

UvA-DARE is a service provided by the library of the University of Amsterdam (http://dare.uva.nl)
UvA-DARE (Digital Academic Repository)
Detecting and disrupting criminal networks
Duijn, P.A.C.
Link to publication
Citation for published version (APA):Duijn, P. A. C. (2016). Detecting and disrupting criminal networks: A data driven approach
General rightsIt is not permitted to download or to forward/distribute the text or part of it without the consent of the author(s) and/or copyright holder(s),other than for strictly personal, individual use, unless the work is under an open content license (like Creative Commons).
Disclaimer/Complaints regulationsIf you believe that digital publication of certain material infringes any of your rights or (privacy) interests, please let the Library know, statingyour reasons. In case of a legitimate complaint, the Library will make the material inaccessible and/or remove it from the website. Please Askthe Library: http://uba.uva.nl/en/contact, or a letter to: Library of the University of Amsterdam, Secretariat, Singel 425, 1012 WP Amsterdam,The Netherlands. You will be contacted as soon as possible.
Download date: 26 Jan 2017

Chapter 2Social Network Analysis applied to criminal NetworksRecent developments in Dutch law enforcement 3
3 This Chapter is based on the published bookchapter Duijn, P. A. C. & Klerks, P. M. M. The Application of Social Network Analysis, Recent developements within Dutch Police. In: Masys, A. (Ed.) Networks and Network Analy-sis for Defence and Security, Series: Lecture Notes in Social Networks, 2014, XIV, 301 Elsevier (2014).
40
abstract
Objective: This chapter examines the application of social network theory in Dutch law
enforcement. Increasing amounts of information about habitual lawbreakers and criminal
networks are collected under the paradigm of Intelligence-Led Policing. Combined with
data gathered from open sources such as social media, such resources allow criminal
analysts trained in social network analysis (SNA) at the Police Academy of The Netherlands
to apply advanced network analysis methodology and crime scripting. The objective of this
chapter is twofold: 1) to inform the reader about recent developments of the application of
network analysis in controlling crime in the Netherlands; 2) To offer insight into the practi-
cal application of network analysis in law enforcement, specifically applied to effectively
target criminal networks.
Method: A case study of the ’Blackbird’ crime network, involved in the wholesale cultiva-
tion of cannabis is presented to illustrate the power of SNA when combined with crime
script analysis. Using a mix of quantitative and qualitative analysis, the topology of the
86- strong Blackbird network is laid out and its substructures and key individuals exposed.
In detailing the network’s social embeddedness, the importance of female actors for the
flexibility and efficiency of the network structure is clarified and thereby for the continuity
of criminal business.
Network data: N= 86 nodes
Results and Conclusion: Applying SNA is already helping criminal intelligence units of
the Dutch police in identifying intelligence gaps and potential informants. Working in
symbiosis, analysts and informant handlers develop a better understanding of strategic
targeting and access points to relatively unknown criminal communities and –markets. To
be delivered in a timely way to be useful in ongoing criminal investigations, SNA products
require even faster data processing. Also, when applied to dark networks SNA should be
tailored to better take network dynamics into account, in particular regarding the adapt-
ability to network disruption.
Chapter 2: Social Network Analysis applied to criminal Networks
41
2.1 introduction
Criminal networks can be defined as networks operating outside the boundaries of the law,
for which network achievements come at the cost of other individuals, groups or societies
(Milward & Raab, 2006; Morselli, 2009). Across the globe criminal networks have a significant
impact on national defense and security. Criminal networks try to infiltrate legal businesses
and governments, infecting economic branches with violence and corruption. Moreover,
upcoming threats like cybercrime, child pornography, maritime piracy, match fixing, illegal
logging and identity theft, cause substantial harm to society and require proactive interven-
tions to target the criminal networks underlying them (Europol, 2011; UNODC, 2010).
Government and law enforcement agencies therefore seek ways to effectively disrupt
criminal network structures, preferably at an early stage. Since criminal networks face
a constant threat from government agencies as well as aggressive criminal competitors,
network members tend to evade detection and intervention (Milward & Raab, 2006). This
makes it difficult to assess and collect reliable criminal network data. Therefore criminal
network structures remain largely unknown as compared to other types of empirical net-
works (Morselli et al., 2006; Xu et al., 2009, Lindelauf et al., 2009). Consequently, little
empirical knowledge concerning the impact of different disruption strategies on criminal
networks is available to policymakers and law enforcement agencies.
The Netherlands has a relatively long tradition in controlling and studying organized
crime. Over the years different paradigms have shaped the way in which law enforcement
strategies against organized crime were applied. In the late 1980s Dutch law enforcement
agencies thought of criminal organizations as hierarchical structures, leading to prolonged
and extensive investigations targeting the presumed ‘Capo di Tutti Capi’ at top of the
pyramid. Only recently have criminologists acknowledged organized crime from a different
perspective through the social network paradigm [Sparrow, 1991; Kleemans et al., 2002;
Morselli et al., 2009; Spapens, 2010). Gradually this paradigm is being adopted within the
Dutch law enforcement intelligence community, now leading to innovative ideas about law
enforcement strategies.
Two important opportunities for network analysis have contributed to this development.
First the Dutch Police have invested in the process of Intelligence- Led Policing, leading
to an increased focus on collecting information in the frontlines of law enforcement.
Consequently, more detailed data about network members and their illicit activities now
become available within different police databases. Secondly research shows that more
and more information about criminal network members can be found in bright networks,
e.g. within online communities (Décay-Hétu & Morselli, 2011; Dijkstra et al., 2012). Dutch
42
law enforcement agencies are experimenting with the retrieval of such open source intel-
ligence for operational purposes.
The increased availability of data on criminal networks enables network analysis on two
levels. First, it offers opportunities for scientific research in network analysis, aimed at
revealing how these criminal networks operate and how they react following network
disruption. These insights offer a better understanding for law enforcement decision mak-
ers in estimating the effectiveness of different criminal disruption strategies in general (e.g.
Morselli & Petit, 2007; Bright & Delaney, 2013). Secondly, network analysis is becoming an
important method within operational intelligence projects, leading to more strategic ways
of targeting criminal networks. To stimulate this development, the Dutch Police Academy
currently offers police analysts special training in Social Network Analysis (SNA), aimed
at applying this additional analysis tool in both criminal investigations and strategic intel-
ligence projects. Which lessons can be learned from this application of network analysis in
crime control? What are the practical implications of applying network analysis in targeting
criminal networks and strategic intelligence gathering? What does dynamical network
analysis research tell us about the effectiveness of criminal network disruption? How does
the network paradigm connect with law enforcement decision-making? These are the
questions this chapter aims to address.
The aim of this chapter is thus twofold: First, to inform the reader about recent develop-
ments of the application of network analysis in controlling crime in the Netherlands. Sec-
ondly, to offer insight into the practical application of network analysis in law enforcement,
specifically applied to effectively target criminal networks.
The remainder of this chapter is as follows: Section 2 describes the evolution of three dif-
ferent paradigms for organized crime and how this shaped control strategies across time.
Section 3 describes the results of a case study of SNA used to understand the structure and
resilience of a cannabis cultivation network. Following the limitations and challenges of
this case study, Section 4 describes the recent progress and developments within overcom-
ing these challenges within the application of SNA in Dutch law enforcement. Section 5
ends of this chapter with an overall conclusion.
2.2 three Paradigms of organized crime
This Section discusses the evolution of three different paradigms of organized crime, as
well as their impact on control strategies. This is illustrated by developments within Dutch
law enforcement over the last 30 years.
Chapter 2: Social Network Analysis applied to criminal Networks
43
Organized crime was first recognized as a relevant phenomenon for Dutch law enforce-
ment in the mid-1980s, when narcotics traffickers were found to engage in worldwide
smuggling operations connecting dozens of operators and making enormous profits
(Klerks, 2000). When the first crime analysts began to draw up their reports on criminal
gangs around 1988, they portrayed mostly hierarchical groups in which often dozens of
criminals worked under a division of labor on (most often) the import and distribution of
hashish, heroin and cocaine. Every group had a clearly identified leadership, and the strat-
egy by which the police attempted to tackle them was mostly to intercept and confiscate
drug shipments and arrest those involved. The idea was to build up pressure on a group’s
business, and thus force the supposed organizers in the background to expose themselves
and show their hand. ‘Dismantling criminal structures’ and sentencing ringleaders to long
prison sentences, so it was thought, would counter organized crime. This strategy resulted
in major confiscations and some prison sentences of ten years, but it soon became clear
that the intercept rate never reached more than about 20 percent of the estimated total
drug markets.
In the early 1990s, while most academic researchers still shied away from studying or-
ganized crime, the police and public prosecutor’s office began to understand the Dutch
narcotics underworld through such metaphors as a ‘monkey rock’ or ‘octopus’: a more
or less integrated and hierarchical criminal conglomerate in which markets were divided
and coordinated through negotiations and occasional conflicts. This called for a ‘war on
crime’, including drastic measures such as the deployment of criminal informants who
were allowed to grow into a position where they would be able to provide incriminat-
ing information on the supposed premier league of criminal masterminds. Such ‘growing
informants’ could not always be kept under control. One such resourceful informant was
permitted by his police handlers to bring shipments of thousands of kilos of cannabis,
hashish, ecstasy and cocaine on the market while customs authorities conveniently looked
away. When this came to light in 1994, a traumatizing scandal erupted of which the shock
waves are noticeable even today. A parliamentary inquiry followed, and by the year 2000
Dutch criminal investigation procedures had become as strict as anywhere in the world.
This hierarchical pyramid or bureaucracy model of organized crime, while appealing to
enforcement practitioners and some journalists, has never attracted interest or support
from Dutch academic researchers. Their interest was raised substantially however when,
in the wake of the ‘IRT affair’, four of the leading Dutch criminologists were tasked with
writing a thorough and comprehensive study of organized crime in The Netherlands. In
1996 their authoritative report changed the perception of organized crime. Criminal gangs
and entrepreneurs were found to have gained footholds in several inner-city areas and
branches such as prostitution and parts of the catering industry. There was however no
44
sinister master mind at work: most criminal markets were relatively open for competition,
with varying sets of illegal entrepreneurs often profiting from lax or gullible branches of
local government. Thus, organized crime became conceptualized as mostly entrepreneurial
in nature, with fluid criminal groups working in clandestine logistical arrangements to
overcome the challenges of serving illegal markets. Consequently, crime control strate-
gies became more sophisticated with an explicit responsibility for administrative bodies
to impose tighter controls on permits in vulnerable branches and city areas (Van de Bunt
& Van der Schoot, 2003). Also, attempts were made to increase the financial investiga-
tive capacities of the police and more interventions were aimed at reducing criminal op-
portunity structures and controlling chokepoints in criminal business processes. Criminal
‘facilitators’ were targeted that bridge the gap between illegal entrepreneurs and their
legitimate environment providing them with financial and logistical services, thus blocking
money laundering channels and the acquisition of apparatuses for producing narcotics
(Nelen & Lankhorst, 2008).
From the mid-1990s onwards, dozens of researchers in the Netherlands became involved in
empirical studies of organized crime phenomena [Kleemans et al. 1998; 2002; Van de Bunt
& Kleemans, 2007). With the police now more open to outside scrutiny and public debate,
it had become much easier for serious scholars and their students to gain access to police
files. Many detailed and extensive studies appeared, allowing for a more knowledge-based
crime control policy. Both the police and the justice department commissioned their own
periodical crime monitors and threat reports and gradually, a mild consensus formed on
the approximate size and shape of the organized crime problem (Kruisbergen et al 2013;
Nationaal Dreigingsbeeld 2004; Korps landelijke politiediensten (2008); Boerman et al
2012; Staring et al (2005); Soudijn 2006; Spapens 2006; Spapens et al (2007); Zaitch
2002) . Since around 2002 the social network approach to organized crime has become
increasingly popular, initially among academic students of organized crime and through
their teaching and involvement in crime control projects, also among a new generation of
analysts and investigators. Where initially the concept of ‘criminal networks’ was amply
defined, serving rather as an antithesis to the traditional paradigm of rigid hierarchical
organizations, researchers like Klerks (2000, 2001), Kleemans (Kleemans et al. 2002)
and Spapens (2006, 2010) advanced this to include the micro-level of networks (criminal
groups or ‘collectives’) forming and operating in the context of criminal macro- and meso-
networks. The macro network in theory is worldwide and connects all able and willing
(potential) offenders through criminal relations. In practice this macro network clusters into
smaller meso-networks, thus establishing criminal opportunity structures located in specific
periods times and areas.
Chapter 2: Social Network Analysis applied to criminal Networks
45
From the academic literature through teaching and intellectual osmosis, the social network
model gradually began to permeate police reports. In 2005, the Board of Chiefs of Police
brought out their strategic vision paper ‘Politie in ontwikkeling’ (Police in development)
which contained concepts like the ‘nodal orientation’ inspired by the thinking of Manuel
Castells ((Projectgroep Visie op de politiefunctie, Raad van Hoofdcommissarissen 2005). .
This nodal orientation implied that the police can only be effective in a network society
if they organize surveillance and intervention capabilities on the ‘nodes’ through which
streams of people, products, money and information flow such as airports, seaports,
highway inter- changes and the Internet. A popular handbook on net-centric strategies
in law enforcement, distributed for free among policymakers and practitioners, further
helped to familiarize these audiences with networking concepts (Roobeek & Van der Helm
2010). Police researchers and analysts gradually became acquainted with more technical
network applications through social network analysis courses given at the Police Academy
and from internal reports such as Neve (2010), and they began to use them in their work.
Currently, nearly one hundred law enforcement analysts have passed the Police Academy
exams in SNA and an increasing number of them apply their SNA skills in either opera-
tional or strategic intelligence work. Some of them publish their experiences in articles and
internal reports, such as Bosveld (2010) on the application of forensic SNA in cold case
investigations, Visser (2013) on post-intervention re-adjustments in the modus operandi of
a criminal network, and Van der Horst et al. (2013) on the time-saving application of SNA
for targeting criminal youth gangs.
Current conceptualization of organized crime in the Netherlands centers on the notion of
illegal entrepreneurship serving illegitimate markets including narcotics, human traffick-
ing, stolen vehicles, illegal arms trade and irregular waste disposal. Holland being a trade
and transit rather than a production economy, its mirroring illegal economy also has a
predominant character of international trade with the important exception of producing
marihuana and synthetic drugs. Four conceptual dimensions are now considered important
in combating organized crime:
1. the criminal business processes and logistics (and the ways to disrupt them);
2. the physical infrastructures enabling illegal entrepreneurs to unobtrusively produce and
ship their merchandise;
3. the social networks that spawn criminal cooperation and conflicts;
4. the financial streams that provide energy and motivation to the ‘underworld’, con-
nect it with the ‘upperworld’ and allow investigators to link discrete organizers and
their social entourage to the repellent crimes from which they profit (Verantwoording
aanpak georganiseerde criminaliteit 2012, 2013) .
All four of these dimensions profit from the tools and techniques of social network analysis,
and the insights they can provide.
46
2.3 a case examPle: unraveling the blackbird network with sna
The previous Section explained how network theory is getting increasing attention within
both criminology and Dutch law enforcement agencies involved in organized crime con-
trol. The interest for this paradigm among intelligence analysts also influences the way
some police commanders and public prosecutors in the Netherlands think about the cur-
rent control strategies for organized crime. As described above, the development of a
practical SNA training course for intelligence analysts at the Dutch Police Academy has
stimulated this development and leads to a growing number of explorative case studies.
Besides empirical knowledge of criminal network problems, these case studies offer great
lessons for the operational application of SNA. In this Section one of these case studies
is presented, specifically demonstrating the advantages, limitations and challenges of the
practical implementation of SNA within Dutch law enforcement.
description of operation blackbird and research Questions
In the autumn of 2007 an investigation team within a regional police department in the
Netherlands started criminal investigation Blackbird against a criminal group involved in
organized cannabis cultivation. This operation was part of project Umbrella, the goal of
which was to target a regionally active but extensive criminal network involved in multiple
forms of organized crime, such as cannabis cultivation, ecstasy production, cocaine trade,
extortion, violence and even first degree murder. The objective of operation Blackbird was
twofold: (1) to target the core members (‘big fish’) of the criminal network that were
specifically involved in organized cannabis cultivation; (2) to retrieve additional intelligence
about criminal network members within the embedding criminal network. Operation
Blackbird lasted for nine months in total, leading to the initial arrest of eleven suspects and
a final conviction of the three presumed core members (the big fish) for involvement within
a criminal organization.4 The operation was considered a success, because the first goal of
catching the big fish was achieved.
However analysts and detectives working within project Umbrella soon retrieved signals
that although the three important network members were convicted and detained, this
didn’t stop the remainder of the criminal network to continue their cannabis cultivation
activities. It showed that the cultivation network was highly resilient against network dis-
ruption and didn’t fall apart as implicitly expected at the start. Therefore public prosecutors
and law enforcement managers evaluating the case asked themselves how the network’s
4 Within Dutch Penal law, ‘participation within a criminal organization’ is an independent misdemeanor punishable under article 140 of the Dutch Penal Code.
Chapter 2: Social Network Analysis applied to criminal Networks
47
resilience could be explained. An answer to this intelligence question might contribute to
the adjustment of future law enforcement strategies.
A team of three analysts involved in the Social Network Analysis (SNA) training program
at the Dutch Police Academy started a search for the answers using SNA methodology.
The primary question of the analysis was twofold: what is the structure of the Blackbird
network and how did it contribute to the observed resilience against law enforcement
interventions? An implicit third question was: can SNA methodology help in targeting
these criminal network structures more effectively from the start?
data sources and research design
As usual, the analysis process started with the identification of possible data sources and
collection of data. In conventional SNA research, data are mostly collected by taking surveys
from all members of the studied social network, including questions about the origin and
nature of their mutual social relationships (Hanneman and Riddle, 2005). Unfortunately
.most criminal network members don’t like to be asked questions about their criminal
activities, nor are they easily approached to discuss their mutual criminal relationships
(Van der Hulst, 2009) . Therefore the first challenge in the criminal network analysis field
is collecting substantive relational data with enough content to interpret the nature of
mutual relationships. In general, most SNA practitioners within criminology therefore turn
to criminal investigations as a main source of data. These investigations involve wiretap
data, eyewitness and suspect statements and surveillance data over a certain period of
time, containing valuable clues about the nature of social and criminal relationships,
specific language used, ways of communication and participation in (criminal) activities
of members in a criminal network (Klerks, 2001, Kleemans et al. 2002; Natarajan, 2006;
Morselli, 2009).
Data CollectionOperation Blackbird was part of a larger operation Umbrella, covering multiple criminal
investigations aiming at different criminal hotshots at the same time. Additional relational
data about the Blackbird network members could therefore also be retrieved from four
other operations during that same time period. This strengthened the validity of our ob-
servations, because every network representation based on criminal investigations data is
biased to a certain extent toward its initial objectives (Morselli, 2009). Because these four
operations had different objectives, this validity problem could be confined. Initial relational
data were therefore retrieved from extensive wiretap data sets, eyewitness statements,
suspect statements and surveillance data from these four investigations, to be combined
into one dataset.
48
In addition to these primary data sources data from social media were also obtained. A
quick scan within different Internet communities such as Facebook and Hyves, showed
that several members of the Blackbird network were actively participating in these social
network sites.5 These data contained additional relational information revealing other
(social) relationships within the embedding Blackbird network.
Data ProcessingThe data where processed using different actor-by-actor matrices and graphs as described
by Scott (2000) and Hanneman and Riddle (2005). In addition, we used the UCINET 6 and
Netdraw software package (Borgatti, Everett and Freeman, 2002) . One of the central
research questions was to reveal features from the network structure that contribute to its
resilience. Some detectives of the investigative team pointed already at the importance of
family—and affective relationships for its social structure. Following this hypothesis, it was
decided to distinguish between the following types of connection according to the type of
relationship between actors, including:
1. Criminal ties
2. Kinship ties
3. Affective ties.
For every type of relationship another actor-by-actor matrix was processed, in order to
compare the different networks at a later stage.
Combing SNA with Crime Script AnalysisIn addition to exposing the criminal network structure through the social network analysis
method, ‘crime script analysis’ adds insight into the individual positions of actors within a
criminal network. Cornish (1994) was one of the pioneers describing criminal markets in
terms of crime scripts. Following this method a crime script is a systematical blueprint of
the different phases of a criminal business process, that each consist of different facets.
The permutation (possible combinations to pass all phases) is an indicator of its flexibility.
In other words, the more options (facets) built into the crime script to pass the different
phases, the more resilient the crime script is against disruption. Sparrow (1991) already
emphasized that this method could be very useful in intelligence analysis to identify actors
with unique roles.
Bruinsma and Bernasco (2004) combined crime script analysis and social network analysis
to describe the flexibility within the criminal markets of heroin trade, trafficking in women
and car theft. They found some evidence that the structure of criminal networks was shaped
according to the features of the criminal activities and illegal markets, for instance the
5 www.Hyves.nl and www.netlog.nl were popular Internet communities in the Netherlands in 2007 and 2008.
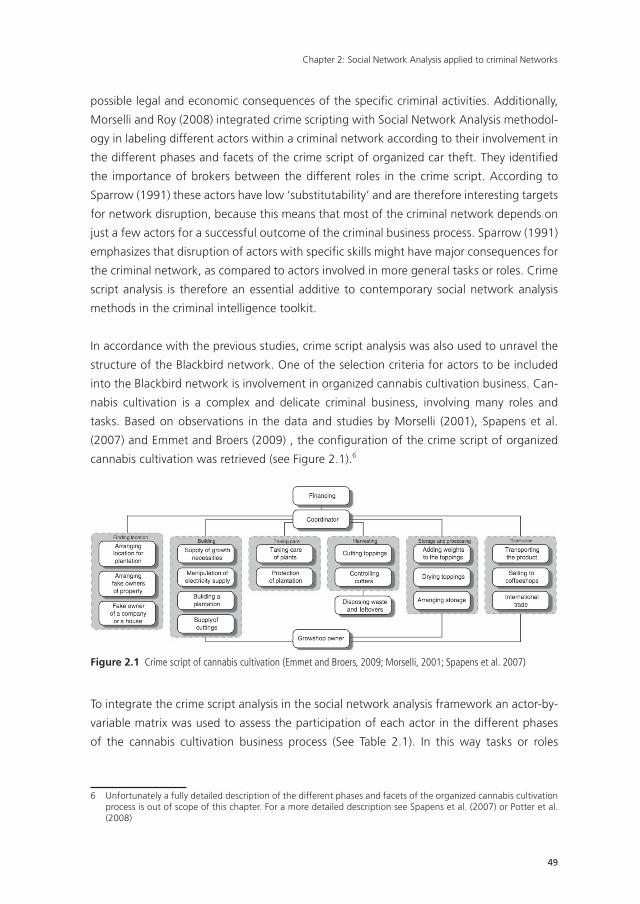
Chapter 2: Social Network Analysis applied to criminal Networks
49
possible legal and economic consequences of the specifi c criminal activities. Additionally,
Morselli and Roy (2008) integrated crime scripting with Social Network Analysis methodol-
ogy in labeling different actors within a criminal network according to their involvement in
the different phases and facets of the crime script of organized car theft. They identifi ed
the importance of brokers between the different roles in the crime script. According to
Sparrow (1991) these actors have low ‘substitutability’ and are therefore interesting targets
for network disruption, because this means that most of the criminal network depends on
just a few actors for a successful outcome of the criminal business process. Sparrow (1991)
emphasizes that disruption of actors with specifi c skills might have major consequences for
the criminal network, as compared to actors involved in more general tasks or roles. Crime
script analysis is therefore an essential additive to contemporary social network analysis
methods in the criminal intelligence toolkit.
In accordance with the previous studies, crime script analysis was also used to unravel the
structure of the Blackbird network. One of the selection criteria for actors to be included
into the Blackbird network is involvement in organized cannabis cultivation business. Can-
nabis cultivation is a complex and delicate criminal business, involving many roles and
tasks. Based on observations in the data and studies by Morselli (2001), Spapens et al.
(2007) and Emmet and Broers (2009) , the confi guration of the crime script of organized
cannabis cultivation was retrieved (see Figure 2.1).6
Figure 2.1 Crime script of cannabis cultivation (Emmet and Broers, 2009; Morselli, 2001; Spapens et al. 2007)
To integrate the crime script analysis in the social network analysis framework an actor-by-
variable matrix was used to assess the participation of each actor in the different phases
of the cannabis cultivation business process (See Table 2.1). In this way tasks or roles
6 Unfortunately a fully detailed description of the different phases and facets of the organized cannabis cultivation process is out of scope of this chapter. For a more detailed description see Spapens et al. (2007) or Potter et al. (2008)
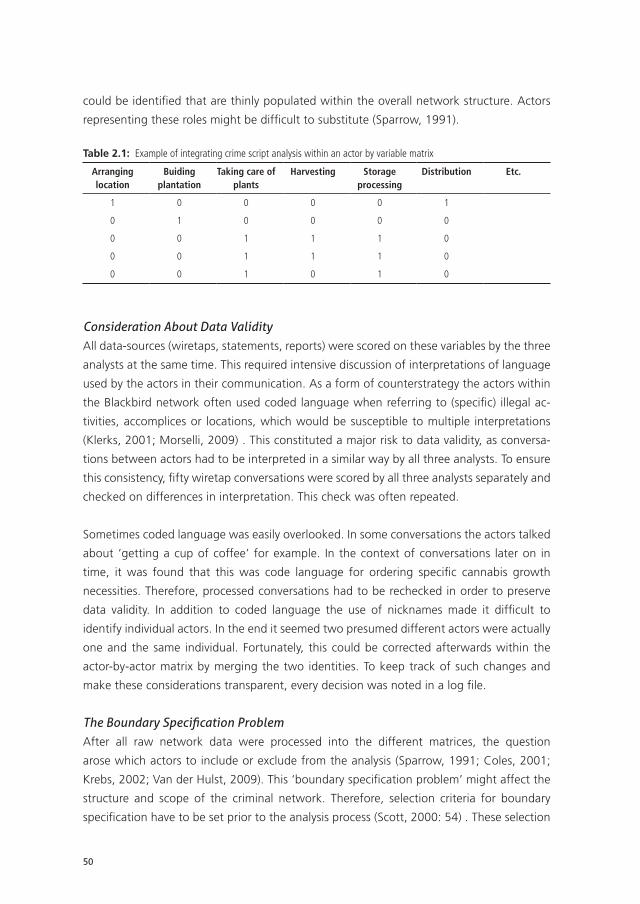
50
could be identified that are thinly populated within the overall network structure. Actors
representing these roles might be difficult to substitute (Sparrow, 1991).
Table 2.1: Example of integrating crime script analysis within an actor by variable matrix
Arranging location
Buiding plantation
Taking care of plants
Harvesting Storage processing
Distribution Etc.
1 0 0 0 0 1
0 1 0 0 0 0
0 0 1 1 1 0
0 0 1 1 1 0
0 0 1 0 1 0
Consideration About Data ValidityAll data-sources (wiretaps, statements, reports) were scored on these variables by the three
analysts at the same time. This required intensive discussion of interpretations of language
used by the actors in their communication. As a form of counterstrategy the actors within
the Blackbird network often used coded language when referring to (specific) illegal ac-
tivities, accomplices or locations, which would be susceptible to multiple interpretations
(Klerks, 2001; Morselli, 2009) . This constituted a major risk to data validity, as conversa-
tions between actors had to be interpreted in a similar way by all three analysts. To ensure
this consistency, fifty wiretap conversations were scored by all three analysts separately and
checked on differences in interpretation. This check was often repeated.
Sometimes coded language was easily overlooked. In some conversations the actors talked
about ‘getting a cup of coffee’ for example. In the context of conversations later on in
time, it was found that this was code language for ordering specific cannabis growth
necessities. Therefore, processed conversations had to be rechecked in order to preserve
data validity. In addition to coded language the use of nicknames made it difficult to
identify individual actors. In the end it seemed two presumed different actors were actually
one and the same individual. Fortunately, this could be corrected afterwards within the
actor-by-actor matrix by merging the two identities. To keep track of such changes and
make these considerations transparent, every decision was noted in a log file.
The Boundary Specification ProblemAfter all raw network data were processed into the different matrices, the question
arose which actors to include or exclude from the analysis (Sparrow, 1991; Coles, 2001;
Krebs, 2002; Van der Hulst, 2009). This ‘boundary specification problem’ might affect the
structure and scope of the criminal network. Therefore, selection criteria for boundary
specification have to be set prior to the analysis process (Scott, 2000: 54) . These selection
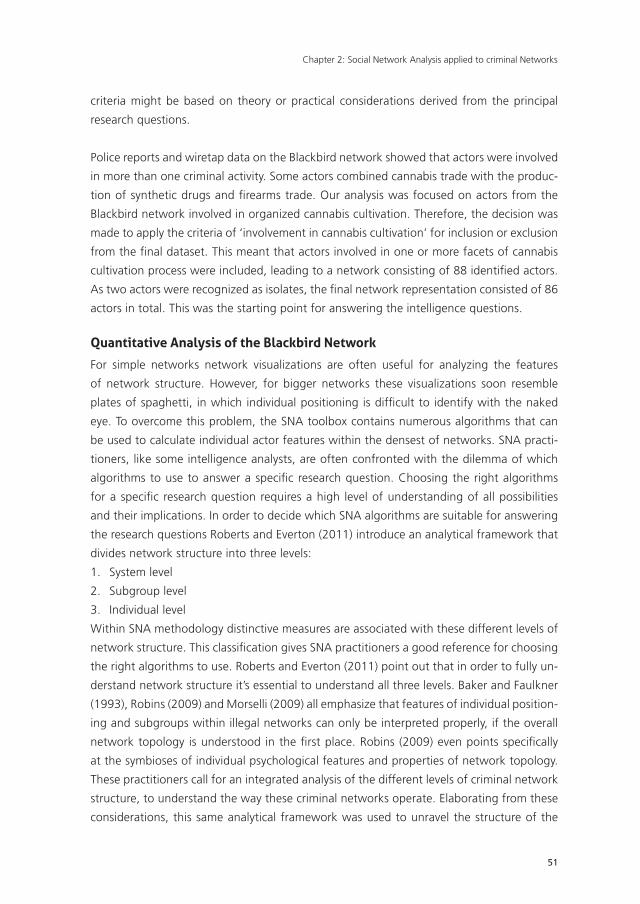
Chapter 2: Social Network Analysis applied to criminal Networks
51
criteria might be based on theory or practical considerations derived from the principal
research questions.
Police reports and wiretap data on the Blackbird network showed that actors were involved
in more than one criminal activity. Some actors combined cannabis trade with the produc-
tion of synthetic drugs and firearms trade. Our analysis was focused on actors from the
Blackbird network involved in organized cannabis cultivation. Therefore, the decision was
made to apply the criteria of ‘involvement in cannabis cultivation’ for inclusion or exclusion
from the final dataset. This meant that actors involved in one or more facets of cannabis
cultivation process were included, leading to a network consisting of 88 identified actors.
As two actors were recognized as isolates, the final network representation consisted of 86
actors in total. This was the starting point for answering the intelligence questions.
Quantitative analysis of the blackbird network
For simple networks network visualizations are often useful for analyzing the features
of network structure. However, for bigger networks these visualizations soon resemble
plates of spaghetti, in which individual positioning is difficult to identify with the naked
eye. To overcome this problem, the SNA toolbox contains numerous algorithms that can
be used to calculate individual actor features within the densest of networks. SNA practi-
tioners, like some intelligence analysts, are often confronted with the dilemma of which
algorithms to use to answer a specific research question. Choosing the right algorithms
for a specific research question requires a high level of understanding of all possibilities
and their implications. In order to decide which SNA algorithms are suitable for answering
the research questions Roberts and Everton (2011) introduce an analytical framework that
divides network structure into three levels:
1. System level
2. Subgroup level
3. Individual level
Within SNA methodology distinctive measures are associated with these different levels of
network structure. This classification gives SNA practitioners a good reference for choosing
the right algorithms to use. Roberts and Everton (2011) point out that in order to fully un-
derstand network structure it’s essential to understand all three levels. Baker and Faulkner
(1993), Robins (2009) and Morselli (2009) all emphasize that features of individual position-
ing and subgroups within illegal networks can only be interpreted properly, if the overall
network topology is understood in the first place. Robins (2009) even points specifically
at the symbioses of individual psychological features and properties of network topology.
These practitioners call for an integrated analysis of the different levels of criminal network
structure, to understand the way these criminal networks operate. Elaborating from these
considerations, this same analytical framework was used to unravel the structure of the
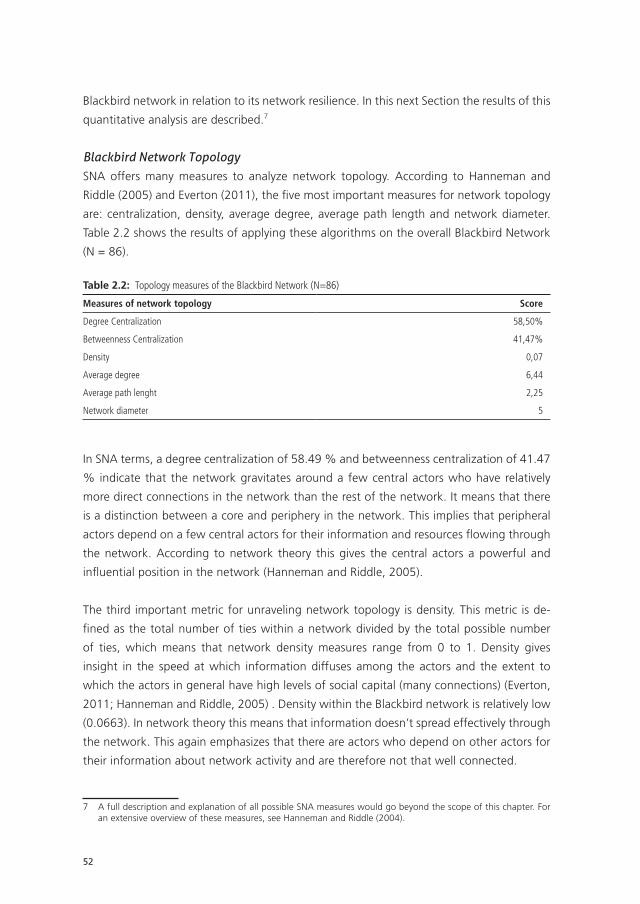
52
Blackbird network in relation to its network resilience. In this next Section the results of this
quantitative analysis are described.7
Blackbird Network TopologySNA offers many measures to analyze network topology. According to Hanneman and
Riddle (2005) and Everton (2011), the five most important measures for network topology
are: centralization, density, average degree, average path length and network diameter.
Table 2.2 shows the results of applying these algorithms on the overall Blackbird Network
(N = 86).
Table 2.2: Topology measures of the Blackbird Network (N=86)
Measures of network topology Score
Degree Centralization 58,50%
Betweenness Centralization 41,47%
Density 0,07
Average degree 6,44
Average path lenght 2,25
Network diameter 5
In SNA terms, a degree centralization of 58.49 % and betweenness centralization of 41.47
% indicate that the network gravitates around a few central actors who have relatively
more direct connections in the network than the rest of the network. It means that there
is a distinction between a core and periphery in the network. This implies that peripheral
actors depend on a few central actors for their information and resources flowing through
the network. According to network theory this gives the central actors a powerful and
influential position in the network (Hanneman and Riddle, 2005).
The third important metric for unraveling network topology is density. This metric is de-
fined as the total number of ties within a network divided by the total possible number
of ties, which means that network density measures range from 0 to 1. Density gives
insight in the speed at which information diffuses among the actors and the extent to
which the actors in general have high levels of social capital (many connections) (Everton,
2011; Hanneman and Riddle, 2005) . Density within the Blackbird network is relatively low
(0.0663). In network theory this means that information doesn’t spread effectively through
the network. This again emphasizes that there are actors who depend on other actors for
their information about network activity and are therefore not that well connected.
7 A full description and explanation of all possible SNA measures would go beyond the scope of this chapter. For an extensive overview of these measures, see Hanneman and Riddle (2004).
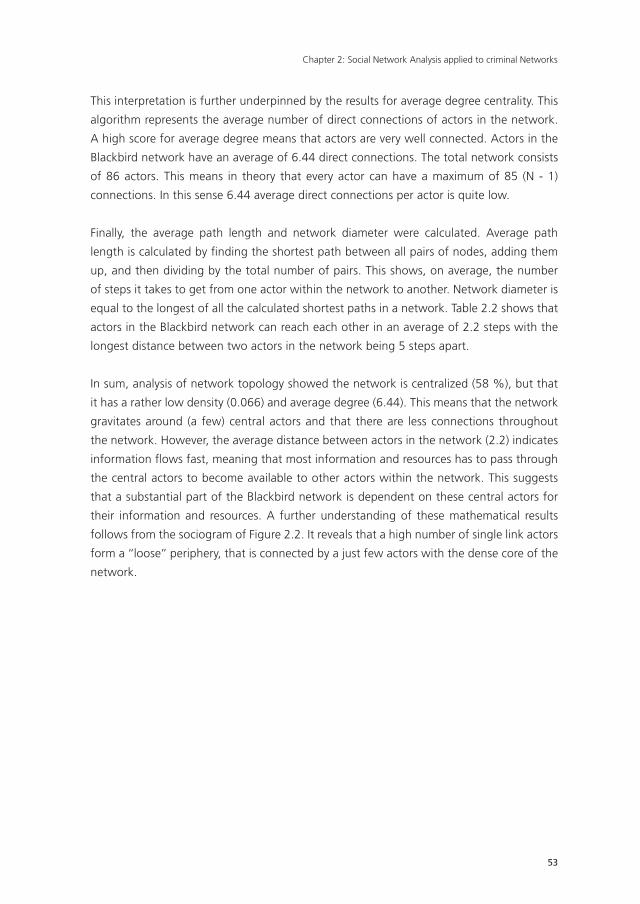
Chapter 2: Social Network Analysis applied to criminal Networks
53
This interpretation is further underpinned by the results for average degree centrality. This
algorithm represents the average number of direct connections of actors in the network.
A high score for average degree means that actors are very well connected. Actors in the
Blackbird network have an average of 6.44 direct connections. The total network consists
of 86 actors. This means in theory that every actor can have a maximum of 85 (N - 1)
connections. In this sense 6.44 average direct connections per actor is quite low.
Finally, the average path length and network diameter were calculated. Average path
length is calculated by finding the shortest path between all pairs of nodes, adding them
up, and then dividing by the total number of pairs. This shows, on average, the number
of steps it takes to get from one actor within the network to another. Network diameter is
equal to the longest of all the calculated shortest paths in a network. Table 2.2 shows that
actors in the Blackbird network can reach each other in an average of 2.2 steps with the
longest distance between two actors in the network being 5 steps apart.
In sum, analysis of network topology showed the network is centralized (58 %), but that
it has a rather low density (0.066) and average degree (6.44). This means that the network
gravitates around (a few) central actors and that there are less connections throughout
the network. However, the average distance between actors in the network (2.2) indicates
information flows fast, meaning that most information and resources has to pass through
the central actors to become available to other actors within the network. This suggests
that a substantial part of the Blackbird network is dependent on these central actors for
their information and resources. A further understanding of these mathematical results
follows from the sociogram of Figure 2.2. It reveals that a high number of single link actors
form a ‘‘loose’’ periphery, that is connected by a just few actors with the dense core of the
network.
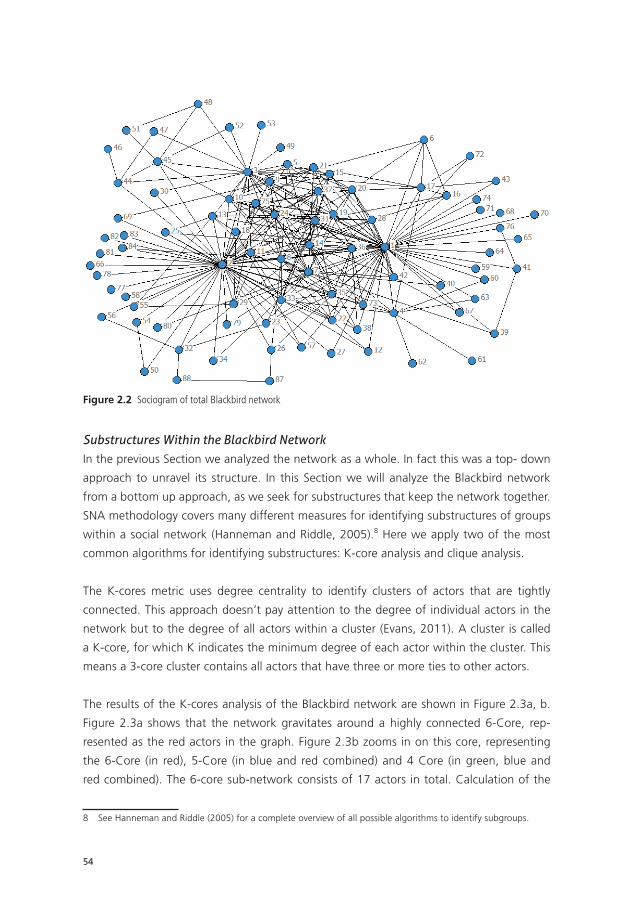
54
Figure 2.2 Sociogram of total Blackbird network
Substructures Within the Blackbird NetworkIn the previous Section we analyzed the network as a whole. In fact this was a top- down
approach to unravel its structure. In this Section we will analyze the Blackbird network
from a bottom up approach, as we seek for substructures that keep the network together.
SNA methodology covers many different measures for identifying substructures of groups
within a social network (Hanneman and Riddle, 2005).8 Here we apply two of the most
common algorithms for identifying substructures: K-core analysis and clique analysis.
The K-cores metric uses degree centrality to identify clusters of actors that are tightly
connected. This approach doesn’t pay attention to the degree of individual actors in the
network but to the degree of all actors within a cluster (Evans, 2011). A cluster is called
a K-core, for which K indicates the minimum degree of each actor within the cluster. This
means a 3-core cluster contains all actors that have three or more ties to other actors.
The results of the K-cores analysis of the Blackbird network are shown in Figure 2.3a, b.
Figure 2.3a shows that the network gravitates around a highly connected 6-Core, rep-
resented as the red actors in the graph. Figure 2.3b zooms in on this core, representing
the 6-Core (in red), 5-Core (in blue and red combined) and 4 Core (in green, blue and
red combined). The 6-core sub-network consists of 17 actors in total. Calculation of the
8 See Hanneman and Riddle (2005) for a complete overview of all possible algorithms to identify subgroups.
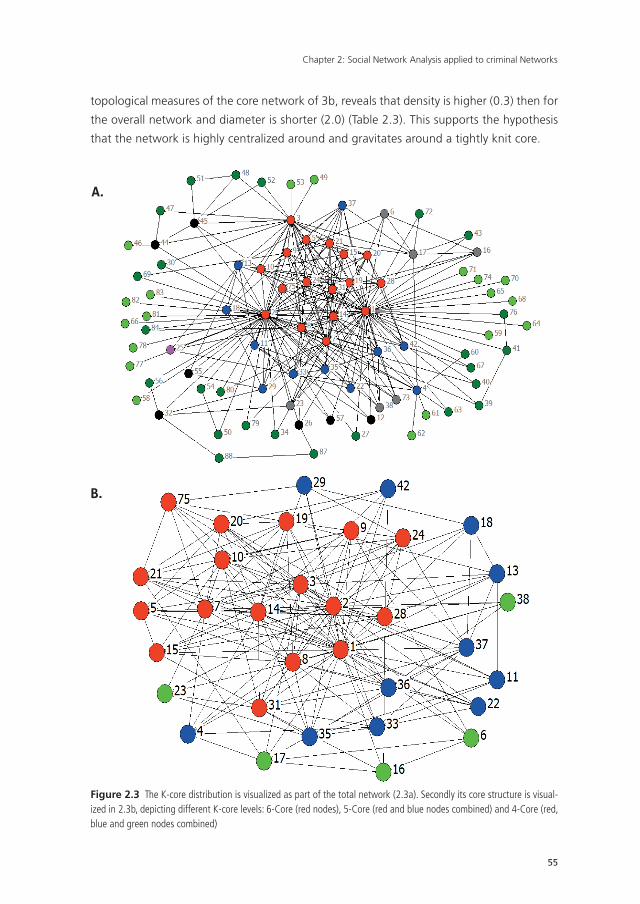
Chapter 2: Social Network Analysis applied to criminal Networks
55
topological measures of the core network of 3b, reveals that density is higher (0.3) then for
the overall network and diameter is shorter (2.0) (Table 2.3). This supports the hypothesis
that the network is highly centralized around and gravitates around a tightly knit core.
a.
b.
Figure 2.3 The K-core distribution is visualized as part of the total network (2.3a). Secondly its core structure is visual-ized in 2.3b, depicting different K-core levels: 6-Core (red nodes), 5-Core (red and blue nodes combined) and 4-Core (red, blue and green nodes combined)
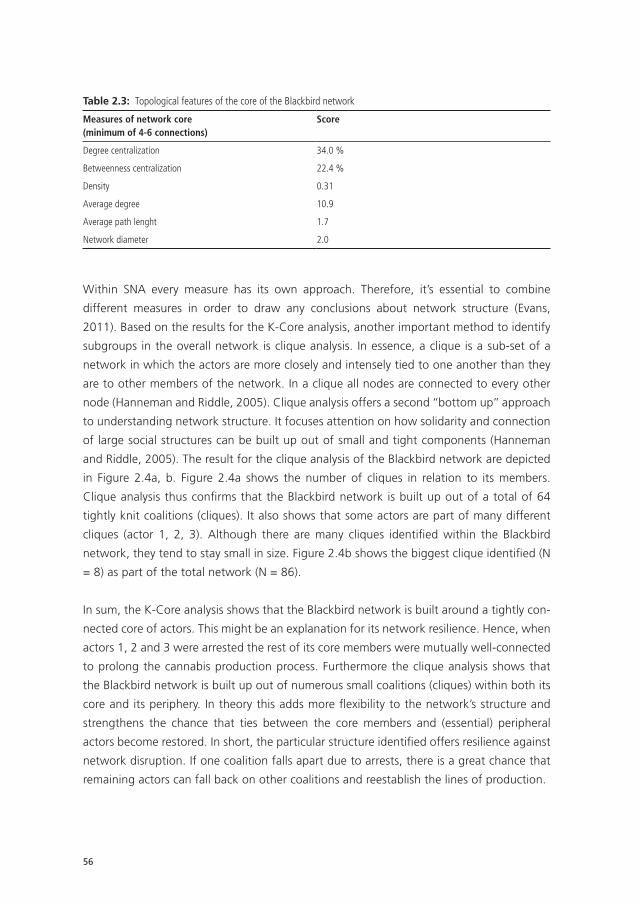
56
Table 2.3: Topological features of the core of the Blackbird network
Measures of network core(minimum of 4-6 connections)
Score
Degree centralization 34.0 %
Betweenness centralization 22.4 %
Density 0.31
Average degree 10.9
Average path lenght 1.7
Network diameter 2.0
Within SNA every measure has its own approach. Therefore, it’s essential to combine
different measures in order to draw any conclusions about network structure (Evans,
2011). Based on the results for the K-Core analysis, another important method to identify
subgroups in the overall network is clique analysis. In essence, a clique is a sub-set of a
network in which the actors are more closely and intensely tied to one another than they
are to other members of the network. In a clique all nodes are connected to every other
node (Hanneman and Riddle, 2005). Clique analysis offers a second ‘‘bottom up’’ approach
to understanding network structure. It focuses attention on how solidarity and connection
of large social structures can be built up out of small and tight components (Hanneman
and Riddle, 2005). The result for the clique analysis of the Blackbird network are depicted
in Figure 2.4a, b. Figure 2.4a shows the number of cliques in relation to its members.
Clique analysis thus confirms that the Blackbird network is built up out of a total of 64
tightly knit coalitions (cliques). It also shows that some actors are part of many different
cliques (actor 1, 2, 3). Although there are many cliques identified within the Blackbird
network, they tend to stay small in size. Figure 2.4b shows the biggest clique identified (N
= 8) as part of the total network (N = 86).
In sum, the K-Core analysis shows that the Blackbird network is built around a tightly con-
nected core of actors. This might be an explanation for its network resilience. Hence, when
actors 1, 2 and 3 were arrested the rest of its core members were mutually well-connected
to prolong the cannabis production process. Furthermore the clique analysis shows that
the Blackbird network is built up out of numerous small coalitions (cliques) within both its
core and its periphery. In theory this adds more flexibility to the network’s structure and
strengthens the chance that ties between the core members and (essential) peripheral
actors become restored. In short, the particular structure identified offers resilience against
network disruption. If one coalition falls apart due to arrests, there is a great chance that
remaining actors can fall back on other coalitions and reestablish the lines of production.
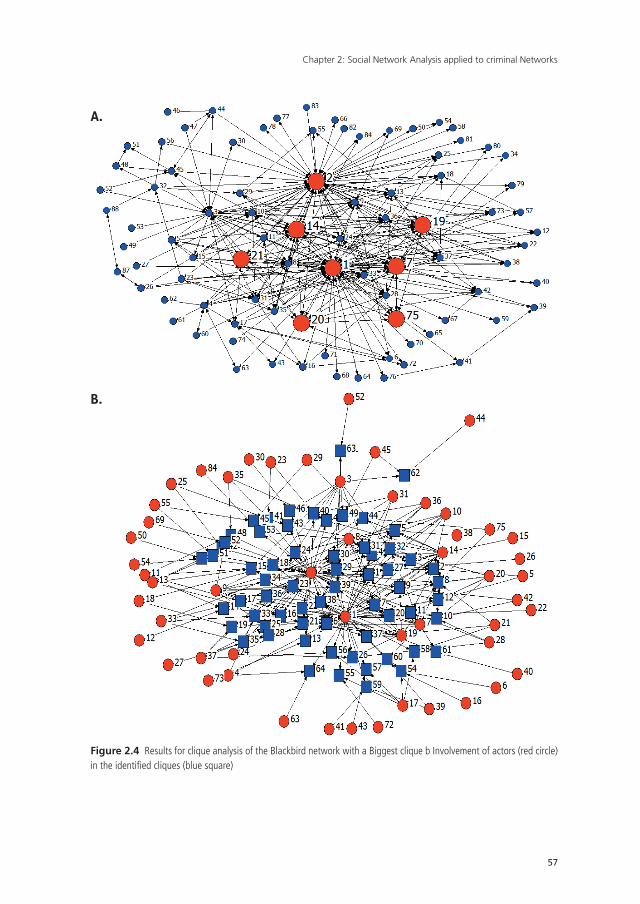
Chapter 2: Social Network Analysis applied to criminal Networks
57
a.
b.
Figure 2.4 Results for clique analysis of the Blackbird network with a Biggest clique b Involvement of actors (red circle) in the identified cliques (blue square)
58
Individual Positioning Within the Blackbird NetworkThe previous Section offered one explanation for the network’s flexibility against disruption
caused by the criminal investigation. In order to find additional evidence for this hypothesis,
we need to zoom in on the individual level of the network. Networks consist of individuals
that have different influence and power within the network. Understanding individual
actors’ properties in terms of influence and power is important for understanding overall
network structure. One of the most significant measures related to influence and power
is actor centrality (Hanneman and Riddle, 2005) . There are many different measures to
estimate centrality. The most commonly used centrality measures are listed and explained
in Table 2.4.9
Table 2.4 Common measures to estimate centrality (Hanneman and Riddle. 2005)
Degree centrality: Number of direct contacts that an actor has
Bonacich Power The extent to which an actor is connected to other actors that score high in degree centrality
Closeness centrality Indicates how close each actor is to all others
Betweenness centrality The number of paths that connect pairs of nodes that pass through a given node
Table 2.5 shows all scores for the top 15 actors on these centrality measures. Not surpris-
ingly these different measures for centrality reveal that actor 1 and 2 are in highly central
positions within the network. Although they might have a lot of influence within the
network, the relatively low scores for Bonacich Power (32 %) reveal that they might in fact
not be all that powerful in network terms. Bonacich (1991) argued that being connected
to others that are not well connected makes someone powerful, since such actors are
dependent on you—whereas well-connected actors are not. So according to Bonacich an
actor’s power in networks depends not solely on their own connections, but mostly on the
connections of their direct neighbors.
We can explain this further by looking at the graph of Figure 2.4a representing the size
of the nodes according to the scores for degree centrality. Although actor 1 and 2 score
high on degree centrality, a representative part of their direct neighbors within the core
of the network, are well-connected themselves. This means that these neighbors aren’t
solely dependent on actor 1 and actor 2 for their resources or information. According to
network theory this reduces the power that actor 1 and 2 have over the core members, as
they are self-sufficient for their resources and information. However, Figure 2.2 reveals that
the actors in the periphery of the network are often dependent on actor 1 or 2 for their
9 For a full description of these measures see Hanneman and Riddle (2005).
Chapter 2: Social Network Analysis applied to criminal Networks
59
participation in the cannabis cultivation process. This might give actors 1 and 2 a strategic
advantage and an opportunity to apply power to these peripheral actors.
Table 2.5: Distribution of different actor centrality measures (top 15)
Actor Degree Bonacich Power Closeness Betweenness
2 55 32.3 73.9 0.444
1 53 31.8 70.8 0.388
3 36 20.4 57.4 0.132
14 23 21.9 56.3 0.018
8 21 20.4 55.9 0.019
7 20 18.3 55.3 0.034
10 13 15.7 52.5 0.005
19 13 15.2 52.1 0.002
31 13 14.4 51.8 0.006
20 12 13.6 51.8 0.005
9 12 13.5 51.5 0.008
24 11 13.5 51.5 0.002
36 11 12.8 51.2 0.002
4 11 10.2 50.6 0.056
13 11 10.0 51.2 0.007
More evidence for this assumption can be found in the individual scores for betweenness
centrality (Table 2.5). The size of the nodes in Figure 2.5b represents the score on between-
ness centrality. It reveals that actor 1, 2 and 3 score high on betweenness as opposed to the
remainder of the network. The graph indicates they form a bridge between the network’s
periphery and core. According to network theory, betweenness centrality is associated with
strategic advantage. Burt (1992) offers a theoretical framework for understanding this
phenomenon and found that having quick access to information offers some actors abili-
ties to fill positions that allow them to seize rewarding opportunities. The entrepreneurial
opportunity that follows from the position of ‘bridge’ between two separated parties is
called a structural hole. According to Burt (1992), actors with the capacity to enrich their
personal network with a proportionally higher set of structural holes may come to control
other actors in the network. Morselli (2001) specifically studied brokerage positioning in
criminal networks of career criminal Howard Marks in the international cannabis trade.
Morselli found that the key to Marks’s successful criminal career was that he structurally
stayed in between different criminal groups. This brokerage position contributed to his
reputation and strategic advantage in the worldwide criminal macro network.
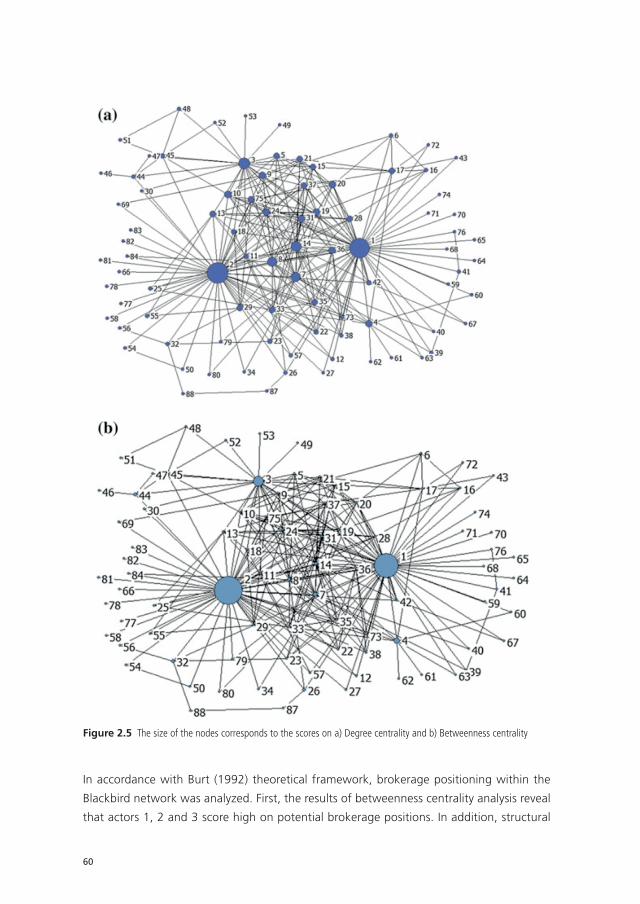
60
Figure 2.5 The size of the nodes corresponds to the scores on a) Degree centrality and b) Betweenness centrality
In accordance with Burt (1992) theoretical framework, brokerage positioning within the
Blackbird network was analyzed. First, the results of betweenness centrality analysis reveal
that actors 1, 2 and 3 score high on potential brokerage positions. In addition, structural
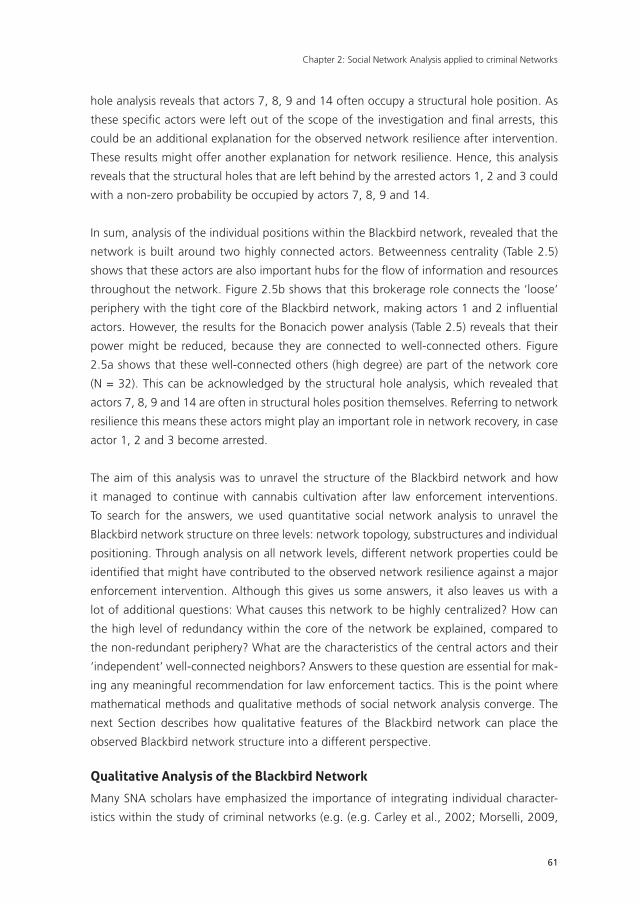
Chapter 2: Social Network Analysis applied to criminal Networks
61
hole analysis reveals that actors 7, 8, 9 and 14 often occupy a structural hole position. As
these specific actors were left out of the scope of the investigation and final arrests, this
could be an additional explanation for the observed network resilience after intervention.
These results might offer another explanation for network resilience. Hence, this analysis
reveals that the structural holes that are left behind by the arrested actors 1, 2 and 3 could
with a non-zero probability be occupied by actors 7, 8, 9 and 14.
In sum, analysis of the individual positions within the Blackbird network, revealed that the
network is built around two highly connected actors. Betweenness centrality (Table 2.5)
shows that these actors are also important hubs for the flow of information and resources
throughout the network. Figure 2.5b shows that this brokerage role connects the ‘loose’
periphery with the tight core of the Blackbird network, making actors 1 and 2 influential
actors. However, the results for the Bonacich power analysis (Table 2.5) reveals that their
power might be reduced, because they are connected to well-connected others. Figure
2.5a shows that these well-connected others (high degree) are part of the network core
(N = 32). This can be acknowledged by the structural hole analysis, which revealed that
actors 7, 8, 9 and 14 are often in structural holes position themselves. Referring to network
resilience this means these actors might play an important role in network recovery, in case
actor 1, 2 and 3 become arrested.
The aim of this analysis was to unravel the structure of the Blackbird network and how
it managed to continue with cannabis cultivation after law enforcement interventions.
To search for the answers, we used quantitative social network analysis to unravel the
Blackbird network structure on three levels: network topology, substructures and individual
positioning. Through analysis on all network levels, different network properties could be
identified that might have contributed to the observed network resilience against a major
enforcement intervention. Although this gives us some answers, it also leaves us with a
lot of additional questions: What causes this network to be highly centralized? How can
the high level of redundancy within the core of the network be explained, compared to
the non-redundant periphery? What are the characteristics of the central actors and their
‘independent’ well-connected neighbors? Answers to these question are essential for mak-
ing any meaningful recommendation for law enforcement tactics. This is the point where
mathematical methods and qualitative methods of social network analysis converge. The
next Section describes how qualitative features of the Blackbird network can place the
observed Blackbird network structure into a different perspective.
Qualitative analysis of the blackbird network
Many SNA scholars have emphasized the importance of integrating individual character-
istics within the study of criminal networks (e.g. (e.g. Carley et al., 2002; Morselli, 2009,
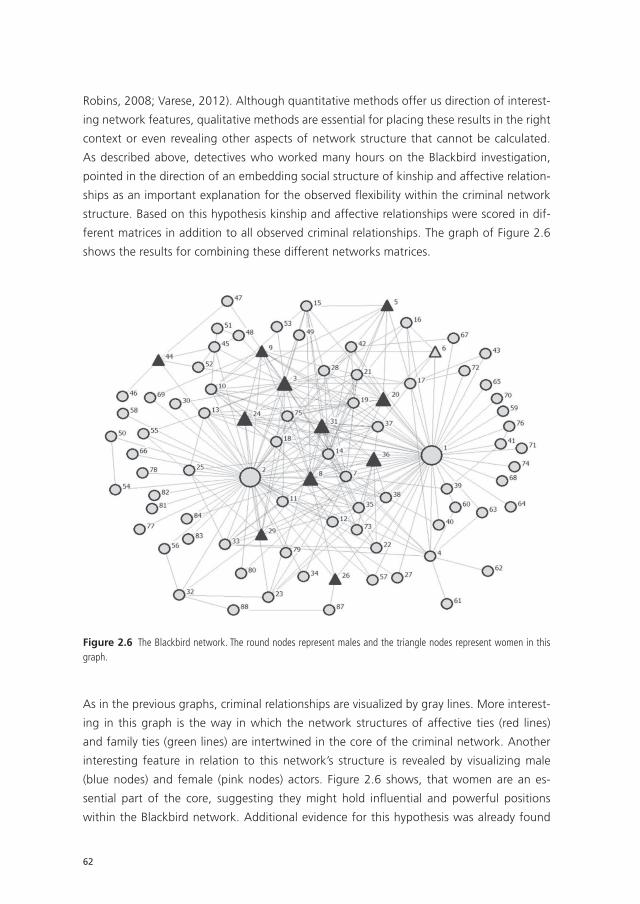
62
Robins, 2008; Varese, 2012). Although quantitative methods offer us direction of interest-
ing network features, qualitative methods are essential for placing these results in the right
context or even revealing other aspects of network structure that cannot be calculated.
As described above, detectives who worked many hours on the Blackbird investigation,
pointed in the direction of an embedding social structure of kinship and affective relation-
ships as an important explanation for the observed fl exibility within the criminal network
structure. Based on this hypothesis kinship and affective relationships were scored in dif-
ferent matrices in addition to all observed criminal relationships. The graph of Figure 2.6
shows the results for combining these different networks matrices.
Figure 2.6 The Blackbird network. The round nodes represent males and the triangle nodes represent women in this graph.
As in the previous graphs, criminal relationships are visualized by gray lines. More interest-
ing in this graph is the way in which the network structures of affective ties (red lines)
and family ties (green lines) are intertwined in the core of the criminal network. Another
interesting feature in relation to this network’s structure is revealed by visualizing male
(blue nodes) and female (pink nodes) actors. Figure 2.6 shows, that women are an es-
sential part of the core, suggesting they might hold infl uential and powerful positions
within the Blackbird network. Additional evidence for this hypothesis was already found
Chapter 2: Social Network Analysis applied to criminal Networks
63
in the quantitative results on individual centrality measures (Table 2.5), for which five of
the most central actors are female. But how do these women end up in these influential
positions in the network? The answer can be found in the social network in which the
criminal activities were embedded.
The Social Embeddedness of the Blackbird NetworkFigure 2.7a displays this embedded social network of combined affective (red lines) and
kinship (green lines). It reveals that actor 2 is most important for introducing women in
the network. Evidence for this is found in many wiretap conversations over the six-month
time period and in statements made by some of these women after the final arrests. These
police reports show that actor 2 was a skilled networker who applied his organizational
skills not only in his criminal environment but also in his social life, as he managed to
maintain affective relationships with different women at the same time. Furthermore it
shows that as these women were introduced into the network by actor 2 over time, they
became accepted within the tight social core surrounding actor 1 and 2. Some women
even started new love affairs within this social network, after their relationship with actor
2 had ended. An important factor in this respect, deriving from the surveillance reports
and wiretap data, is that all activities within this social structure seem to gravitate around
a small geographic infrastructure of cafés, hangouts and restaurants.
Furthermore, as these women became members of this social core, they became connected
to other women in the network (see Figure 2.7b). Various wiretap conversations and sur-
veillance reports show that besides their progressing influence in the social network, most
women were introduced to the illegal activities of cannabis cultivation. The development
of trust seemed to play an important role in this. Different suspect statements reveal that
as these women proved themselves to be reliable and loyal members of the embedding
social network, they were allowed to participate in criminal activities. Moreover, newly-
introduced women began to establish mutual criminal relationships between themselves.
Figure 2.7b presents the criminal relationships observed between female actors.
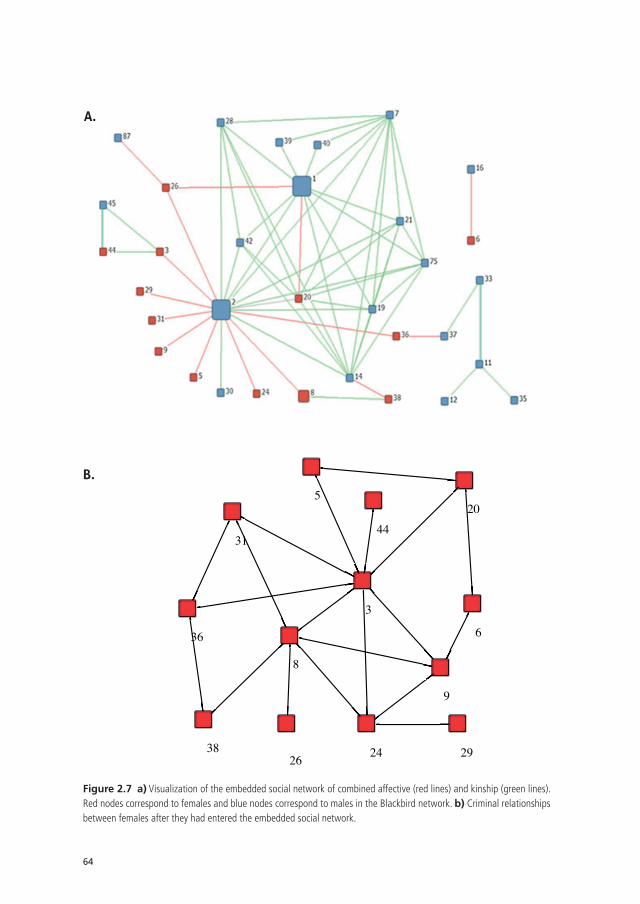
64
a.
b.
Figure 2.7 a) Visualization of the embedded social network of combined affective (red lines) and kinship (green lines). Red nodes correspond to females and blue nodes correspond to males in the Blackbird network. b) Criminal relationships between females after they had entered the embedded social network.
Chapter 2: Social Network Analysis applied to criminal Networks
65
Although some of the women played important roles in coordinating different phases of
the cannabis cultivation process, they were ignored as serious suspects in the Blackbird
operation. These fi ndings are consistent with a study of Kleemans and Van de Bunt (1999)
on the ‘social embeddedness’ of organized crime. Based on their analysis of 40 cases of
organized crime, they found that women were not only important for maintaining and
establishing contacts between different parts of the criminal network, but were in some
cases in charge of a whole criminal association. They concluded that the importance and
infl uence of women in terms of social embeddedness in organized crime is often a blind
spot in law enforcement control strategies.
In addition to these affective relationships, another important part of the embedding
structure of the Blackbird network was formed by kinship ties, as indicated by green lines
in Figures 2.6 and 2.7a. These graphs show that Kinship ties play an important role for
the observed redundancy within the network’s core. In addition, based on quantitative
measures for network positioning, it was already concluded that actor 14 is an infl uential
actor often positioned on a ‘structural hole’ position within the network. In fact, qualita-
tive analysis shows that actor 2 is his father. These fi ndings support the idea that actor
14 might have inherited his father’s criminal achievements (and possibly reputation) and
therefore his social and criminal capital. This observed generational heritage in criminal
career opportunities, is consistent with observations made by Spapens (2010) based on his
study of criminal ecstasy networks operating in the south of the Netherlands.
The importance of social ties for criminal network development was fi rst addressed by
Granovetter (1983). He introduced the theoretical concept of ‘the strength of weak ties’.
According to Granovetter strong ties are important for illegal as well as legal transactions,
because trust is built between like-minded actors. Especially within the hostile and uncer-
tain environment of organized crime, strong ties of family, friendship and even love often
offer a necessary fundament of trust. Different studies show that trust in criminal networks
is often found in an embedded network of social ties (Hagan and McCarthy, 1995; Kl-
eemans and Van de Bunt, 1999; Klerks, 2000; Morselli, 2001; 2009; Spapens, 2010).. This
is in accordance with our fi ndings in the Blackbird network. The tight core of this network
is formed not only through criminal relationships, but more importantly through affective
and family relationships. Additional empirical evidence is found in the analysis of a high
number of wiretap conversations between core members. Most conversations concern
a mixture of social and criminal activities. In general it can be concluded that strong ties
of affective and kinship ties form an important framework of trust, from which criminal
activities in the Blackbird network originated.
66
Granovetter (1983) also emphasizes the importance of weak ties for expanding business
opportunities. Weak ties are connections between people who are not intimate or close. In
these relations mutual trust is not easily attained. But precisely because of this, these ties
are not redundant and are therefore essential for access to new resources and information.
Weak ties can therefore offer new opportunities, especially within an illegal enterprise
(Kleemans and Van de Bunt, 1999; Klerks, 2000, Morselli, 2001).
Besides strong ties, the Blackbird network also consists of a high number of weak ties.
The introduction of women in the Blackbird network is an example of this ‘strength of
weak ties’ principle. In the beginning they are recognized as weak ties, but as the number
of connections with the redundant core increases over time, these actors become trusted
and serious participants in the criminal activities. Another example of this mechanism
within the Blackbird network is the difference in observed redundancy between the core
of the network and the embedding periphery. Most actors in the periphery of the Blackbird
network are connected with the core of the network through a single tie with actors 1, 2
or 3 (Figure 2.5b). These connections are in fact non-redundant, but part of the network
because of their direct involvement within the cannabis cultivation process. Qualitative
analysis of these weak ties in the Blackbird network reveals that most of these actors are
not ‘isolated’ freelancers, but often representatives or even brokers between the Blackbird
network and other criminal networks that are connected with actor 2 for expanding their
criminal business.
For instance, based on additional content analysis of wiretap data, it was recognized that
actor 87 is an important representative of a foreign mafia organization and an important
buyer of cannabis from actor 2 from the Blackbird network. Besides his criminal relation-
ship with actor 2, he also had a short love affair with female actor 26 (Figure 2.5a). Female
26 seemed to have had an intimate relationship with actor 2 in the past. Although the
investigative data doesn’t allow drawing a timeline of the initiation of these criminal and
affective relationships, it’s evident that this social connection played an important role
in the initiation of an export route of cannabis from the Blackbird network to Italy. The
weak ties between the Blackbird network and the Italian Mafia network that offered new
opportunities for the Blackbird network to market their illegal product, developed into
a stronger tie over time due to social embeddedness. Based on these findings it can be
concluded that the social embeddedness observed within the Blackbird network structure
offers another explanation of its flexibility and resilience against disruption.
The ‘Division of Labor’ Within the Blackbird NetworkIn the beginning of this chapter the application of crime script analysis was explained to
identify unique roles in the cannabis cultivation process. In Figure 2.8 the actor-by-variable
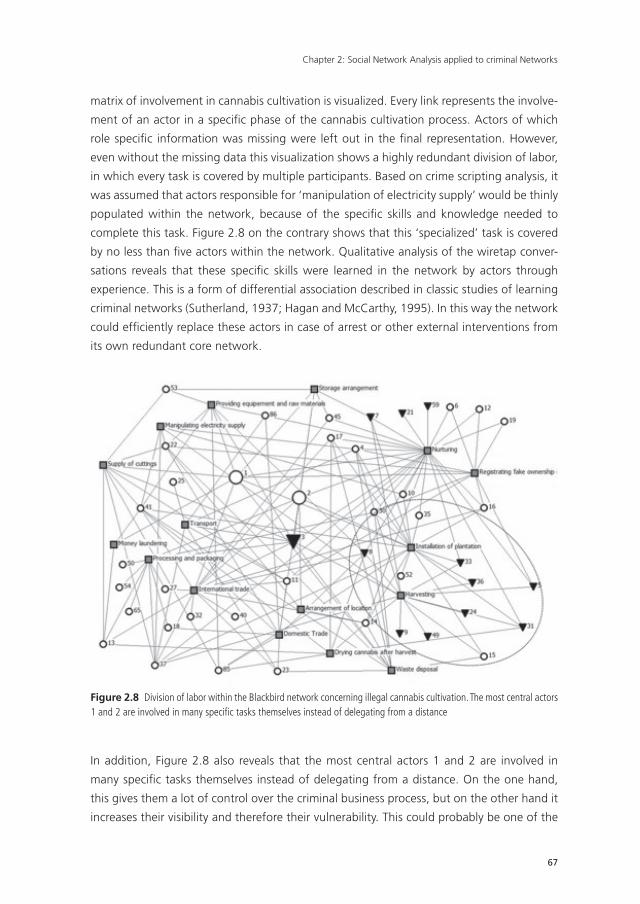
Chapter 2: Social Network Analysis applied to criminal Networks
67
matrix of involvement in cannabis cultivation is visualized. Every link represents the involve-
ment of an actor in a specific phase of the cannabis cultivation process. Actors of which
role specific information was missing were left out in the final representation. However,
even without the missing data this visualization shows a highly redundant division of labor,
in which every task is covered by multiple participants. Based on crime scripting analysis, it
was assumed that actors responsible for ‘manipulation of electricity supply’ would be thinly
populated within the network, because of the specific skills and knowledge needed to
complete this task. Figure 2.8 on the contrary shows that this ‘specialized’ task is covered
by no less than five actors within the network. Qualitative analysis of the wiretap conver-
sations reveals that these specific skills were learned in the network by actors through
experience. This is a form of differential association described in classic studies of learning
criminal networks (Sutherland, 1937; Hagan and McCarthy, 1995). In this way the network
could efficiently replace these actors in case of arrest or other external interventions from
its own redundant core network.
Figure 2.8 Division of labor within the Blackbird network concerning illegal cannabis cultivation. The most central actors 1 and 2 are involved in many specific tasks themselves instead of delegating from a distance
In addition, Figure 2.8 also reveals that the most central actors 1 and 2 are involved in
many specific tasks themselves instead of delegating from a distance. On the one hand,
this gives them a lot of control over the criminal business process, but on the other hand it
increases their visibility and therefore their vulnerability. This could probably be one of the
68
explanations for their final arrests, which raises the question: might there be an external
‘supervisor’ from the periphery who was missed in this investigation? Unfortunately, an-
swers to this question are out of the scope of the dataset.
Another interesting aspect of this division of labor is the position of women within the
criminal process. Figure 2.8 shows that most females are involved in simple tasks, such
as ‘harvesting’ and ‘helping with the installation’ of the plantation. The specific task of
harvesting requires that these women were working together in a small and closed room
for several hours. Qualitative analysis of the surveillance-, wiretap- data and eyewitness
statements reveals that this was one of the reasons these women developed mutual social
and criminal connections. Moreover it seemed that females 3 and 8 were also involved in
tasks of coordination and leadership within the whole network. This is also observed within
the ‘women network’ of Figure 2.7b, in which these females occupy a central position.
Although female 3 got arrested in the end, female 8 might have played an important role
in network recovery and reestablishing the division of labor within the whole process.
These findings for ‘division of labor’ are in line with research associated with the tradeoff
between efficiency and security that is revealed within previous research (Erickson, 1973;
Baker and Faulker, 1993, Morselli et al, 2006; Lindelauf, 2009). On the one hand illicit
networks try to keep their illegal activities concealed from the government or criminal
competitors. This means that direct communication between co-conspirators concerning
illegal activities needs to be restricted to a minimum. On the other hand, risks have to be
taken in times of action, often demanding highly efficient communication and trust among
its participants (Erickson, 1981; Morselli, Giguère and Petit, 2006). This tradeoff shapes the
way illicit networks are structured. For instance, criminal networks demanding high levels
of action and therefore efficiency are often characterized by high levels of redundancy.
Terrorist networks on the contrary often demand just one successful action to reach its
network objectives. These network structures are therefore characterized by high levels
of non-redundancy and compartmentalization in different cells (Krebs, 2001; Morselli and
Petit, 2007). Terrorist networks use this strategy to decrease the risk of becoming detected
by the arrest or detection of a single actor. Criminal networks also try to build in security,
but as times-to-task are much shorter efficiency often predominates.
Analysis of the Blackbird network according to this theoretical framework reveals that a
certain level of compartmentalization can be found in its network structure. Hence, there
seems to be a clear separation between the network’s core and periphery, which might
offer some security to core members if peripheral actors become arrested. However, the
crime script analysis in combination with SNA reveals that tasks are divided in a highly
redundant way, which is typical for ‘action-minded’ criminal networks (e.g. Morselli and
Chapter 2: Social Network Analysis applied to criminal Networks
69
Petit, 2008). On the one hand this gives the network the advantage of flexibility in replac-
ing actors after arrests or seizures, which is also observed in our analysis of the Blackbird
network. On the other hand, this increases the risk for exposing the network as a whole
if a single actor gets arrested. Hence, due to the high level of redundancy, chances are
substantial that a single arrested actor is directly connected to the central actors 1 and 2.
This increases the risk of exposing these important actors, for instance by tracking previ-
ous telephone calls. Apparently the low level of security within their network structure is
exactly what ultimately caused the arrest of actors 1 and 2.
conclusion
By combining quantitative and qualitative methods of SNA, the structure of the Blackbird
network was unraveled. Quantitative analysis revealed that its overall network structure
gravitates around a few central actors. These actors form a redundant core that is con-
nected with a non-redundant periphery by just a few highly connected actors. These actors
occupy strategic positions, but because they are connected to well-connected others their
positions are not irreplaceable. Qualitative analysis reveals that the core of the criminal
network is embedded in family and affective relationships. Women and children play an
important role in this embedded and criminal network, as they add to overall network
redundancy and fulfill coordinating tasks that become specifically important after their
husbands and fathers become arrested. Crime script analysis revealed that this redundancy
is also translated to the division of labor, for which all tasks can be fulfilled by multiple
actors. In part this offers an explanation for the observed flexibility and resilience against
disruption. On the other hand, it has been shown that this redundancy increases network
visibility and offered opportunities for arrests. However, it can be concluded that these
control strategies were ineffective, as the process of cannabis cultivation continued due
to the flexibility and efficiency that is built into its network structure. Based on these
conclusions it could be recommended in search for effective control strategies in the future
to take notice of the active and important participation of women and direct relatives in
the organization of criminal activities.
discussion
As described in the beginning, this case example demonstrates how the application of
Social Network Analysis (SNA) could be of value in understanding the effects of current
control strategies and creating and adjusting future strategies aimed at these complex
criminal network problems. This case study also demonstrates that applying SNA on
criminal networks demands a twofold approach, integrating quantitative and qualitative
methods. As was demonstrated in this case study, this is essential in understanding not
only the answers to the ‘what’ questions, but also the important ‘why’ questions. For
instance, an additional qualitative interpretation was crucial to understanding why women
70
occupied central positions in the core of the network. Answers to these ‘why-questions’ are
therefore the key to really understanding the ‘covert’ mechanisms associated with criminal
networks and for the translation of such insights into concise recommendations for law
enforcement control strategies. This case-study therefore shows that the application of
quantitative and qualitative methods of SNA together with crime script analysis constitutes
a powerful tool for agencies confronted with criminal network problems. However, in
addition to such advantages, the case study also revealed some important limitations.
First, practitioners should realize that the final representation of the criminal network is to
a large extent a product of the boundary specification criterion and available data (Krebs,
2002; Morselli, 2009; Sparrow, 1999; Van der Hulst, 2009;). For instance, we observed
based on qualitative analysis, that some ‘isolated’ actors in the periphery that were selected
for their involvement in the cannabis cultivation process, were in fact representatives of
other criminal groups. This emphasizes the fact that our observed Blackbird network is in
fact part of a bigger macro-network (Spapens, 2010). Another important point to address
is missing data. Our observations are solely based on investigative data. This naturally filters
the data collection process and therefore the network representation to a certain degree
according to the initial goal of the investigation (Morselli, 2009). This becomes especially
important when interpreting the results from quantitative measures, such as centrality and
individual positioning. The fact that actors occupy strategic positions in the local setting
of the Blackbird network, doesn’t necessarily mean that they are powerful or influential
in general. Placing quantitative results in a qualitative context is therefore crucial when
using this method. The challenge for the practical application of SNA would therefore
be to combine different sources of relational data, for instance intelligence data, street
cop data, arrest records and ‘online’ data. Every source has its own filter through which
we observe ‘reality’. Combining ‘filters’ might increase the reliability of the final network
representation.
Secondly, one of the critical success factors within intelligence-led-policing is timely
intelligence products. Time in this context is related to law enforcement demanding
swift decision-making. Decision makers in law enforcement settings therefore want fast,
reliable and concise advice (Ratcliffe, 2008). Social network analysis on the contrary is a
time-consuming exercise. As shown in this case example, data have to be collected and
processed in a structured way. Additionally, results need to be interpreted in the right
context. The application of SNA within an operational law enforcement environment might
therefore become problematic. The final results might only come available too little too
late. The challenge for the practical application of SNA within organized crime control is
therefore to find a way of processing data in a faster way.
Chapter 2: Social Network Analysis applied to criminal Networks
71
Thirdly, like any social network, criminal networks aren’t static but dynamic (Carley et al.,
2002). The structure of the network as well as its activities is ever-changing. Our case study
focuses on the network configuration before the final arrests. This offers unique insights
into the properties of network structure that explains its flexibility, but it doesn’t offer us
insight in the way the network really adapted to the arrests. The challenge for the practical
application of SNA in organized crime control would therefore be to find ways of observing
these network dynamics and the network’s adaptability to network disruption.
These are tough challenges that are not easy to translate into practice. However, in the
Netherlands these challenges are slowly becoming reality. In the next Section the progress
and developments in the Dutch Police in answering these challenges will be discussed.
2.4 sna and recent develoPments in dutch law enforcement
As described above, this case study is one of the recent experimental examples of the
practical application of SNA in current Dutch law enforcement. However, the issues and
challenges that were addressed are no novelty, as they were already recognized before
by Sparrow (1991). It can therefore be concluded that the implementation of SNA within
the operational law enforcement environment is a major challenge, as two decades after
Sparrow introduced and addressed these issues they are still topical in Dutch law enforce-
ment. Yet this isn’t a lost cause, as there are promising developments that might help to
translate network theory into SNA practice: the increasing availability of data on criminal
cooperation and advances in SNA methods from computational science.
ilP and the increasing availability of criminal network data
One of the important challenges for the practical application of SNA within criminal intel-
ligence that Sparrow (1991) identified is creating an automated data- management system
for parallel processing technologies in which different databases can be linked together in
a structured way. Klerks (2001) was confronted with this challenge in his SNA-based study
of Dutch criminal networks involved in international drugs smuggling. The initial coded
data within the police databases turned out to be unreliable for SNA practice. For instance,
specific persons were registered multiple times. The data had to be recoded all over again,
requiring a lot of time and effort.
One reason for these data validity problems in Dutch police databases is that information
gathering and processing aren’t always recognized as one of the primary tasks of law
enforcement officers in the frontlines of police work. This often results in poor quality of
data, especially about the more circumstantial features of observed criminal cooperation
72
and communication which are important for SNA. For instance, within the Blackbird opera-
tion ‘social’ conversations between women in the network were labeled ‘irrelevant’ by
detectives, but SNA of the Blackbird network revealed that these conversations specifically
emphasized the importance of these women as ‘mediators’ in case of internal conflict.
Therefore, the practical application of SNA within law enforcement in general depends for
an important part on the ‘information-mindedness’ of police officers and detectives.
Still, compared to 10 years ago the general information quality and quantity in Dutch law
enforcement shows progress. One reason is the introduction of the concept ‘intelligence
led policing’ (ILP), which increased the general awareness of specific intelligence tasks
involving daily police work (Ratcliff, 2008). This has resulted in the introduction of specified
intelligence tasks during police surveillance, aimed at retrieving information from the direct
observation and registration of ‘local heroes’ or ‘hot spots’ (e.g. bars, restaurants) associ-
ated with local organized crime. In practice, this has led to the recognition of ties between
high profile criminals that weren’t observed before. Information collection is therefore
increasingly recognized within Dutch law enforcement as a primary task of regular police
work. It also helps that the 25 regional police forces in Holland were merged into one
National Police in January 2013, facilitating the implementation of shared doctrine, ICT,
and decision-making.
Another important development associated with the introduction of ILP is an increased
awareness of the importance of powerful ICT tools for ‘user-friendly’ data processing in
criminal investigations. Although data quality in general is still a concern, these tools are
already showing increased uniformity and quality in data processing. These developments
are still in their infancy, but they are promising for the effective application of SNA in the
law enforcement environment. A more specific aspect of this development is the effective
use of human intelligence (HUMINT) and social media intelligence (SOCMINT) for proactive
law enforcement intelligence purposes. These developments will be discussed in the next
Section.
human intelligence
Every regional police unit in the Netherlands maintains a Criminal Intelligence Unit (CIU).
These CIU’s are specifically tasked with retrieving ‘human intelligence’ from criminal infor-
mants and have primarily been focused on assisting ongoing criminal investigations with
supporting evidence. More recently, it is recognized that the CIU’s are also important for
delivering proactive intelligence products aimed at discovering strategic trends in illegal
criminal markets and the translation of such trends in effective operational targeting of
subjects at the start of investigative operations. The growing symbiosis between analysts
and handlers in the criminal intelligence process has strengthened this development. This
Chapter 2: Social Network Analysis applied to criminal Networks
73
leads to a more goal-oriented intelligence collection process. For many years the search for
criminal informants has been rather opportunistic, often the result of sudden opportunities
following arrests in criminal investigations or conflicts between known criminal rivals. Al-
though this remains a fruitful tactic for recruiting motivated informants, it mostly leads to
more information on already familiar actors and well-known criminal markets. The biggest
challenge for CIU’s is therefore to find potential informants in criminal networks or criminal
topics that are still relatively unknown to the police, for instance cybercrime networks or
human trafficking rings.
Following these considerations, SNA is increasingly recognized as an important method for
intelligence analysts in profiling such potential informants and identifying opportunities
for approaching them. For instance, SNA helps to identify criminal brokers within criminal
networks that might function as potential ‘points of access’ to relatively unknown criminal
communities and –markets. It needs no further explanation that these brokers might be
high-potential sources of criminal intelligence. In this way SNA stimulates strategic thinking
about proactively shaping intelligence positions according to novel trends in the criminal
environment, as opposed to the traditional opportunistic selection of informants based
on ongoing operations. Moreover, as this increases the validity and reliability of human
intelligence databases, this offers chances for a more concise application of SNA with the
aim of targeting criminal networks effectively.
social media intelligence
A second development that offers improved opportunities for SNA in law enforcement
is the increasing usage of open source intelligence in Dutch law enforcement. A grow-
ing number of studies reveal that Internet communities such as Facebook, Twitter and
Googleare not only used by criminals for ordinary social reasons, but also for expanding
their criminals markets or even threatening criminal rivals (Décary-Hétu and Morselli, 2011;
Decker and Pyrooz, 2009). Social Media Intelligence (SOCMINT) is therefore recognized
as an indispensable source of operational intelligence about criminal network structures
(Omand, Bartlett and Miller, 2012).
In practice, social media intelligence offers an opportunity to peek behind the social
network structures embedding the criminal cooperation. For instance, it was found that
some members of the Blackbird network shared the same hobby: sport fishing. Combining
police information with the pictures they posted on social media posing with their fishing
trophies, some new (criminal) ties in the criminal network could be revealed that had not
been observed before. SOCMINT therefore offers a different perspective on underlying
social network structures, often unknown to law enforcement. Still, the application of
SOCMINT is associated with some difficulties. First, it takes some time to adjust legisla-
74
tion for the use of intelligence to encompass such exponentially expanding technological
developments. This problem leads to tension between public goods of security on the one
hand and citizens rights to the rule of law, liberty and privacy on the other (Omand et al.
2012). Secondly, Intelligence analysts are confronted with big data, which is near- impos-
sible to analyze using traditional SNA analysis methods. Therefore, computational methods
are essential in addition to traditional SNA for mining these big sources of data for relevant
information, which will be demonstrated in chapter 5.
Validation of the results of these data mining methods on the Internet needs to be achieved
by comparing them with other criminal intelligence sources and placing it in the context of
the specific characteristics of the target (criminal) subgroup and social media platform. By
using this data and knowledge to ‘train’ these computational models, validity and reliability
of the results will increase over time.
towards a ‘real-time’ sna approach to organized crime
Following these previous considerations, it can be concluded that HUMINT and SOCMINT
are in themselves important pieces for constructing the criminal network representation.
However, this intelligence puzzle cannot be completed based on these data sources alone.
Moreover, as criminal networks are dynamic in nature the developments within criminal
networks following from these data-sources need to be monitored continuously. In Dutch
law enforcement, these considerations have lead to a ‘real-time’ SNA approach for ana-
lyzing criminal networks. In essence, this approach consists of the structural integration
and analysis of multiple data sources into one relational database. This method offers the
opportunity of assessing ‘missing data’ in the criminal network representation (Morselli,
2009). This leads to the identification of ‘intelligence gaps’, which can be translated into
topical intelligence collection plans (McDowell, 2009). For instance, an identified social tie
between two known criminals that is identified based on SOCMINT can be translated into
concise intelligence questions for criminal informants from a HUMINT approach to assess
the nature of this relationship. Although verifying information in this way is already part
of everyday police work, continuously and structurally combining multiple sources in the
context of previously collected intelligence aimed at identifying criminal networks, is not
always a matter of course. Because new information is continuously interpreted in the
light of previous developments in the criminal environment, opportunities for identifying
recent change in such networks arise. Identifying these changes is an important part of
effectively targeting criminal networks at a certain point in time. However, it needs no
further explanation that continuously monitoring different information sources by hand
would be very time-consuming. Powerful ICT tools are therefore essential to this approach,
because different data sources with varying data formats have to be integrated and merged
Chapter 2: Social Network Analysis applied to criminal Networks
75
automatically into one relational database. State of the art database analysis tools, such as
IBM’s i2 iBase, offer these ICT solutions with integrated visualization and SNA applications.
This approach has some important advantages for the application of SNA in law enforce-
ment:
1. Data from different data sources can easily be validated with other data sources, lead-
ing to a more strategic approach for data collection.
2. Because data is collected and processed in an ongoing and automated process in a
structured format suitable for SNA methodology, time is saved for actual SNA practice
and making recommendations. This results in timely intelligence products that find
the connection with the time-dependent decision-making cycle that characterizes
operational law enforcement management.
3. Because new data are continuously analyzed, changes in criminal networks or criminal
markets can be identified. The flexibility offered by this approach is important for
recognizing chances for effective interventions at a certain point in time and offers
the possibility to analyze criminal networks as dynamic structures instead of static
snapshots.
combining computational methods with sna
Besides the application in retrieving relevant data from social media, computational meth-
ods are increasingly important for understanding the complex dynamics of criminal net-
works. Appreciating these dynamics may have major consequences for the way we think
about the effectiveness of control strategies aimed at criminal networks. SNA scholars
agree however that capturing network dynamics is one of the most difficult challenges in
criminal network research (e.g. Morselli, 2009; Sparrow,1991; Xu et al, 2004). The limited
number of studies on this topic identifies four methods for capturing network dynamics:
descriptive, statistical, simulation and visualization methods (Doreian 1997; Xu et al., 2004).
Descriptive methods are focused on structural changes in social networks by comparing
structural properties across time. These structural changes are associated with changes
in nodes, links or groups within the network. The statistical approach is not only focused
on structural changes but also involves an evaluation of the reasons for such changes, for
instance the effect of gender for preference in social bonding. Simulation methods rely on
multi-agent technology, for which actors are modeled as agents making decisions based
on specific criteria. These criteria are translated into algorithms. Visualization methods aim
at comparing network maps at certain points in time through visual inspection (Doreian,
1997; Xu et al. 2004).
An example of the application of descriptive and visualization method was recently
presented by Bright and Delaney (2013). These authors studied the evolution of a drug
76
trafficking network and found that participants change their specific role in the crime script
based on needs, as opposed to simply recruiting replacements to fill those needs. Secondly,
they found that these changes have a direct impact on the centrality of single actors
in the network. Bright and Delaney (2013) emphasize that law enforcement needs to
respond flexibly to these changes in network composition. However, one of the important
limitations of this study was that the observed changes in the network could be artifacts
of intelligence collection methods.
Capturing network dynamics with simulation modeling is less sensitive to this type of bias,
as network behavior is not empirically observed but simulated with multi-agent technol-
ogy. This method offers the opportunity to perform ‘‘what-if’’ scenarios to study how
social networks adapt to different external shocks (Xu et al., 2004). A computer simulation
methodology applied to a large criminal network (N=29,345 nodes) will be presented in
chapter 4.
Although study presented in chapter 4 aims to understand these criminal network dynam-
ics in general, this multi-disciplinary method might have direct relevance to the operational
law enforcement environment. As these models can be ‘trained’ and adjusted over time by
the increased availability of empirical criminal network data, this approach might become a
powerful method for pro-actively experimenting with ‘‘what-if’’ scenarios and strategically
thinking about intervening effects on live criminal networks. Secondly, these models might
contribute to the identification of ‘telltales’ often hidden in the data, which might function
as an early warning for upcoming criminal activity, travel movements, unusual financial
transactions or changes in criminal network structures. These early warnings might be
translated into proactive, well-timed and specifically targeted control strategies. Combin-
ing SNA and practical law enforcement knowledge with simulation methods and the
increased availability of data may therefore become an integral part of proactive organized
crime control in the near future.
2.5 conclusion
The aim of this chapter is to inform about recent developments of the application of
network analysis in controlling crime in the Netherlands. It offers insight into the practical
application of network analysis in Dutch law enforcement, specifically applied to effectively
targeting criminal networks. Based on the developments described in the chapter, some
conclusions can be drawn about the practical implementation of SNA: (1) It can be con-
cluded that SNA is a useful method for unraveling the structure of criminal networks. It
offers renewed understanding of hidden social structures that might be of direct relevance
Chapter 2: Social Network Analysis applied to criminal Networks
77
to strategic planning within organized crime control. (2) The strength of SNA within law
enforcement becomes most evident if quantitative and qualitative methods are combined.
This places the quantitative results in the necessary context. (3) The biggest limitations of
traditional SNA methodology (as applied in the case study) are that it’s time consuming,
static and often too little too late in the eyes of law enforcement decision makers. (4)
Due to an increasing ‘information mindedness’ within Dutch law enforcement in general
and availability of advanced ICT applications, new opportunities arise for a data driven
approach to SNA in law enforcement. This makes it possible to combine multiple data-
sources, which can be connected and integrated automatically. (5) The progress with this
approach is strengthened by strategic planning in the field of human intelligence (HUMINT)
and social media intelligence (SOCMINT) gathering. The ultimate goal of this approach
is to establish a ‘real-time’ intelligence position on organized crime, from which topical
changes in criminal network structures, compositions and activities can be monitored and
identified. This offers timely opportunities for proactive control strategies. (6) Simulation
methods from computational science might play an important role in understanding these
complex criminal network dynamics in the near future. Not exclusively in contribution to
the field of science, but also towards operational organized crime control.
In resemblance with the fluidity observed in such criminal network structures, these devel-
opments show that the practical application of SNA in Dutch law enforcement is not at all
static. Moreover, as the net-centric doctrine of organizing law enforcement cooperation
between various agencies and partners becomes more accepted and implemented, flexible
criminal networks and law enforcement networks begin to show increasing similarities.
While government agencies will always be restrained by legal requirements and subject
to budget restrictions, they appear to become somewhat more attuned to the fluid and
opportunistic tactics of illicit entrepreneurs. Aided by advanced analytical methods such
as SNA, they may become increasingly effective in tackling vital elements of the criminal
machinery.
For the near future, law enforcement organizations will at least formally continue to re-
semble the geometric hierarchy that every civil servant knows as the line-and-block chart,
while criminal entrepreneurs will operate in the fluid, random and seemingly chaotic en-
vironment that we have come to conceptualize as networks. It is not hard to comprehend
that agile and flexible entities unrestricted by laws will often succeed in outsmarting rigid
and policy-obese government agencies, even though the latter have the law on their side.
Social network analysis provides the guardians of society with a better understanding of
the mechanics of criminal networks. As they gradually learn to appreciate some of the
benefits of networking, law enforcement and intelligence organizations may become more
effective at their core business of safeguarding society.

78
This chapter demonstrates the application of SNA in Dutch Law Enforcement and its ad-
ditive value following the in-depth case example of the Blackbird network. In order to
fully understand SNA’s opportunities and limitations however, we need to look further its
application across the different types of criminal networks and within the different settings
that are typical for Law Enforcement practice (e.g. youth gangs, organized crime, fraud
schemes). The next chapter therefore provides an empirical overview of recent SNA case
studies applied to different criminal network problems in Dutch law enforcement. Based
on the structural aggregated analysis of these case studies (N=39) we elaborate on the
feasibility and potential of SNA as part of a data-driven approach to the study, detection
and disruption of criminal networks.
Chapter 2: Social Network Analysis applied to criminal Networks
79
references
Baker WE, Faulkner RR (1993) The social organization of conspiracy: illegal networks in the heavy
electrical equipment industry. American Sociological Review 58:837–860
Boerman F, Grapendaal M, Nieuwenhuis F, Stoffers E (2012) Nationaal dreigingsbeeld 2012 Georgani-
seerde criminaliteit. Dienst IPOL, Zoetermeer
Bonacich P (1987) Power and Centrality: A Family of Measures, The American Journal of Sociology
92(5):1170–1182
Borgatti SP, Everett MG, Freeman LC (2002) Ucinet for Windows: Software for Social Network Analysis.
Analytic Technologies, Harvard, MA
Bosveld M (2010) Van je vrienden moet je het hebben… Een verkennend onderzoek naar de to-
epassing van Forensisch Sociale Netwerk Analyse in Cold Case onderzoeken. Student paper,
Politieacademie, Apeldoorn
Bright DA, Delaney JJ (2013) Evolution of a drug trafficking network: Mapping changes in network
structure and functions across time. Global Crime, 14:2-3, 238-260
Bruinsma G, Bernasco W (2004) Criminal groups and transnational illegal markets. Crime, Law, and
Social Change 41:79-94
Van de Bunt HG, Van der Schoot C (eds) (2003) Prevention of organized crime: A situational approach.
Boom Juridische uitgevers, Den Haag
Van de Bunt HG, Kleemans ER et al (2007). Georganiseerde criminaliteit in Nederland: Derde rapport-
age op basis van de Monitor Georganiseerde Criminaliteit. Boom Juridische Uitgevers, Den
Haag
Burt RS (2002) Structural holes versus network closure as social capital. In: Lin N, Cook KS, Burt RS
(Eds). Social Capital: Theory and Research. Transaction, New Brunswick, p 31-56
Carley, KM, Ju-Sung L, Krackhardt D (2002) Destabilizing networks. Connections 24(3):79–92
Coles N (2001) It’s not what you know, but who you know that counts: Analyzing criminal crime
groups as social networks. British Journal of Criminology 41:580–594
Cornish DB (1994) The Procedural Analysis of Offending and Its Relevance for situational prevention.
IN: Clarke R (Ed) Crime Prevention Studies 3: 151–196
Décay-Hétu D and Morselli C (2011) Gang Presence in Social Network Sites. Journal of Cyber Criminol-
ogy 5(2):876–890
Emmet I, Broers J (2008) The Green Gold: Report of a Study of the cannabis sector for the National
Threat assessment of Organized Crime. KLPD-IPOL, Zoetermeer
Erickson B (1981) Secret Societies and Social Structure. Social Forces 60:188 - 210
Europol (2011) OCTA: EU Organized Crime Threat Assessment. European Police Office,The Hague
Granovetter M (1983) The strength of weak ties: a network theory revisited. Sociological Theory
1:201–233
Hanneman RA, Riddle M (2005) Introduction to social network methods. University of California,
Riverside, Riverside, CA (published in digital form at http://faculty.ucr.edu/~hanneman/)
Kleemans ER, Van den Berg EAIM, Van de Bunt HG et al (1998) Georganiseerde criminaliteit in Neder-
land: Rapportage op basis van de WODC-monitor. WODC, Den Haag
80
Kleemans ER, Brienen MEI, Van de Bunt HG et al (2002) Georganiseerde criminaliteit in Nederland:
Tweede rapportage op basis van de WODC-monitor. WODC, Den Haag
Kleemans ER., Van de Bunt HG (1999) The social embeddedness of organized crime. Transnational
Organized Crime 5:19-36
Klerks PPHM (2000) Groot in de hasj: Theorie en praktijk van de georganiseerde criminaliteit. Samsom
Kluwer Rechtswetenschappen, Antwerpen
Klerks P (2001) The Network Paradigm Applied to Criminal Organisations: Theoretical Nitpicking or
a Relevant Doctrine for Investigators? Recent Developments in the Netherlands. Connections
24(3):53–65
Korps landelijke politiediensten (2008) Nationaal dreigingsbeeld 2008: Georganiseerde criminaliteit.
KLPD Dienst IPOL, Zoetermeer
Kruisbergen EW, Van de Bunt HG, Kleemans ER et al (2013) Georganiseerde criminaliteit in Nederland:
Vierde rapportage op basis van de Monitor Georganiseerde Criminaliteit. WODC, Den Haag
Lindelauf R, Borm P, Hamers H (2009) The influence of secrecy on the communication structure of
covert networks. Social Networks 31(2):126-137
McCarthy B, Hagan J (1995) Getting into Street Crime: The structure and process of criminal embed-
dedness. Social Science Research 24:63–95
McDowell D (2009) Strategic Intelligence: A Handbook for Practitioners, Managers and Users. Scare-
crow professional intelligence education series; no 5.
Milward HB, Raab J (2006) Dark Networks as Organizational Problems: Elements of a Theory. Interna-
tional Public Management Journal 9(3):333-360
Morselli C (2009) Inside Criminal Networks. Springer, New York
Morselli C, Giguère C, Petit K (2006) The efficiency/security trade-off in criminal networks.
Social Networks 29(1):143–153
Morselli C, and Petit K (2007) Law Enforcement Disruption of a drug importation network. Global
Crime 8, no.2: 109-130
Morselli C (2001) Structuring Mr. Nice: Entrepreneurial opportunities and brokerage positioning in the
cannabis trade. Crime, Law and Social Change 35:203–244
Morselli C, Roy J (2008) Brokerage Qualifications in ringing operations. Criminology 46(1):71-98
Natarajan M (2006) Understanding the Structure of a large Heroin Distribution Network: A Quantitive
Analysis of Qualitative data. Journal of Quantitative Criminology 22(2):171–192
Nationaal dreigingsbeeld zware of georganiseerde criminaliteit: Een eerste proeve (2004). Dienst
Nationale Recherche Informatie, Zoetermeer
Nelen H, Lankhorst F (2008) Facilitating organized crime: The role of lawyers and notaries. In: Siegel D,
Nelen H (eds) Organized crime: Culture, markets and policies. Springer, New York, p 127-142
Neve R (2010) Netwerken op de stromen. KLPD-IPOL, Zoetermeer
Ormand D, Bartlett J, Miller C (2012) Introducing Social Media Intelligence (SOCMINT), Intelligence
and National Security, 1-23.
Projectgroep Visie op de politiefunctie, Raad van Hoofdcommissarissen (2005) Politie in ontwikkeling:
Visie op de politiefunctie. NPI, Den Haag
Chapter 2: Social Network Analysis applied to criminal Networks
81
Potter GR (2010) Weed, need and greed: A study of domestic cannabis cultivation. Free Association,
London
Raab J, Milward HB (2003) Dark Networks as Organizational Problems: Elements of a Theory. Journal
of Public Administration and Theory 13(4):413 - 439
Ratcliffe, JH (2008) ‘Intelligence-Led Policing’. Willan Publishing: Cullompton
Robins G (2008) Understanding individual behaviours within covert networks: the interplay of indi-
vidual qualities, psychological predispositions, and network effects. Trends in Organized Crime
12:166–187
Roberts N, Everton SF (2011) Strategies for combating dark networks. Journal of social structure
12(2):1–32
Roobeek AJM, Van der Helm M (2010) Netwerkend werken en intelligent opsporen: een meervoudige
uitdaging voor de Nederlandse Politie. Free Musketeers, Zoetermeer
Scott J (2000) Social network analysis: A handbook. Sage, Newbury Park CA
Soudijn M (2006) Chinese human smuggling in transit. Boom Juridische uitgevers, Den Haag
Spapens AC (2006). Interactie tussen criminaliteit en opsporing: De gevolgen van opsporingsactivite-
iten voor de organisatie en afscherming van xtc-productie en -handel in Nederland. Intersentia,
Antwerpen
Spapens AC, Van de Bunt HG, Rastovac L et al (2007) De wereld achter de wietteelt. Boom Juridische
uitgevers, Den Haag
Spapens ACM (2010) Macro networks, collectives, and business processes: An integrated approach to
organized crime. European Journal of Crime, Criminal Law and Criminal Justice 18(2):185-215
Sparrow M (1991) The Application of Network Analysis to Criminal Intelligence: an Assessment of the
Prospects. Social Networks 13:251- 274
Staring R, Engbersen G, Moerland H et al (2005) De sociale organisatie van mensensmokkel.
Kerckebosch, Zeist
Sutherland E (1937) The Professional Thief- By a Professional Thief: Annotated and Interpretated by
Edwin Sutherland. University of Chicago, Chicago IL
United Nations Office on Drugs and Crime (2010) The globalization of crime: A transnational orga-
nized crime threat assessment. United Nations publications, Vienna
Van der Horst PH, Sutmuller AD, Vredengoor S (2013) Real-time op alle niveaus: Snel tot de kern!
Politieacademie, s.l.
Van der Hulst R (2009) Introduction to Social Network Analysis (SNA) as an investigative tool. Trends
in organized crime 12:101-121
Verantwoording aanpak georganiseerde criminaliteit 2012 (2013) Openbaar Ministerie & Politie, s.l.
Visser R (2013) Effecten van politie-interventies: Onderzoek naar de ontwikkeling van een crimineel
network na een politie-interventie. Student paper. Politieacademie, Apeldoorn
Xu J, Marchall B, Kaza S and Chen H. (2004) Analyzing and Visualizing Criminal Network Dynamics:
A Case Study. In Intelligence and Security Informatics. Vol 2072. Proceedings of the ISI 2004
Second Symposium, 359- 377, Tucson.
Xu KS, Kliger M, Chen Y, Woolf PJ, Hero III AO (2009) Revealing Social Networks of Spammers Through
Spectral Clustering. In: Proceedings IEEE Conference Communications

82
Zaitch D (2002) Traffi cking cocaine: Colombian drug entrepreneurs in the Netherlands. Kluwer Law
International, Den Haag.

UvA-DARE is a service provided by the library of the University of Amsterdam (http://dare.uva.nl)
UvA-DARE (Digital Academic Repository)
Detecting and disrupting criminal networks
Duijn, P.A.C.
Link to publication
Citation for published version (APA):Duijn, P. A. C. (2016). Detecting and disrupting criminal networks: A data driven approach
General rightsIt is not permitted to download or to forward/distribute the text or part of it without the consent of the author(s) and/or copyright holder(s),other than for strictly personal, individual use, unless the work is under an open content license (like Creative Commons).
Disclaimer/Complaints regulationsIf you believe that digital publication of certain material infringes any of your rights or (privacy) interests, please let the Library know, statingyour reasons. In case of a legitimate complaint, the Library will make the material inaccessible and/or remove it from the website. Please Askthe Library: http://uba.uva.nl/en/contact, or a letter to: Library of the University of Amsterdam, Secretariat, Singel 425, 1012 WP Amsterdam,The Netherlands. You will be contacted as soon as possible.
Download date: 26 Jan 2017

Chapter 3Bridging science and investigative practiceThe application of social network analysis in criminal investigation10
10 An earlier version of this article was published in Dutch in the December 2014 issue as Duijn, P.A.C. & Klerks, P.M.M. Bridging science and investigations: the application of Social Network Analysis in Dutch criminal investi-gative practice. Tijdschrift voor Criminologie 2014(4)
84
abstract
Objective: Social network analysis (SNA) is conquering its place in criminological tradecraft,
with an emphasis on conceptual contributions in current Dutch criminology. Meanwhile,
the domain of criminal investigation and intelligence witnesses the emergence of a
flourishing SNA practice. The academic and investigative domains have largely remained
separated, with analysts borrowing from cutting-edge methodological scholarship while
giving little in return. Their classified products remain inaccessible to academic researchers.
This article endeavors to bridge the two worlds.
Method: Systematic review of SNA studies aimed at various criminal networks. These stud-
ies are performed by law enforcement analysts working for the Dutch Police. Additionally
a survey was taken from the responsible analysts about the use of SNA within their profes-
sional environment.
Network data: meta-analysis of 34 criminal networks
Results and conclusions: Although it has much potential, an important limitation of SNA
is that it mainly provides a static observation of a dynamical phenomenon. Subsequently
the application of SNA has mostly been limited to criminal networks observed on a micro-
level. For more deliberate targeting of criminal networks we need a better understanding
of its macroscopic patterns of resilience and the dynamics that fuels its typical complex
adaptation over time.
Chapter 3: Bridging science and investigative practice
85
3.1 introduction
Like in many other countries, major organized crime investigations in The Netherlands
at least until the early 1990s focused on the supposed leaders of perceived mafia-like
pyramidal organizations. Gradually criminologists with access to empirical data began to
question the pyramid paradigm, indicating, inter alia, the importance of social network
structures (Kleemans et al 1998; Van de Bunt et al 1999; Klerks 2000a, 2000b, 2001).
Intensive criminological research began to expose the dynamics of organized crime with its
constantly changing roles and positions, often resulting from local social structures such
as neighborhoods, schools or sports clubs (Spapens 2006; Kleemans & De Poot, 2008).
This resulted in recommendations for other types of crime control, such as the integrated
approach involving the mobilization of other government agencies like municipalities and
fiscal investigators. In practical crime control however, such innovative criminological con-
cepts are only gradually changing traditional beliefs (Spapens 2006; Huisman et al .2011;
Duijn 2013).
social network analysis
We proclaim that social network analysis (SNA), a systematic method to analyze networks
of individuals, has the potential to bring science and investigative analytical practice closer
together (Scott & Carrington 2011). SNA requires the processing of relational data in matri-
ces and graphs (Hanneman & Riffle 2011). This forms the basis for specific quantitative and
qualitative analytical techniques. For quantitative analysis, relational data are processed in
a matrix table, wherein all the persons in a network are placed on the rows and columns.
In the matrix, the presence of a relationship between the players is designated by ‘1’ and
the absence thereof with ‘0’. With this incorporation of all relational data in the matrix, a
digitized version of the network emerges, the characteristics of which can be calculated by
means of algorithms. Additional qualitative analysis is possible based on the specificities
(attributes) of individual actors. These attributes are also processed in a matrix in which
the players are placed on the y-axis and their attributes on the x-axis; the presence of an
attribute for any actor is indicated by ‘1’ and the absence with ‘0’. For qualitative analysis,
this matrix is read into a visualization program for creating relational diagrams (graphs).
Here the actors and relationships are presented, while specific characteristics of actors can
be distinguished by color or shape and can be combined. For example, by combining the
attribute gender with the quantitative results for centrality, the relative position of women
in a criminal network can be analyzed. The visual representation of relationships, actors
and attributes allow for the interpretation of abstract mathematical results in their context:
the qualitative analysis is thus complementary to the quantitative analysis.11 Characteristics
11 Cf. Scott (2013) and Scott & Carrington (2011) for an extensive explanation of SNA methodology.
86
of the entire network, specific subgroups and features of individual actors can thus be
distinguished and associated with each other. Many criminologists have begun to apply
SNA to gain insight into criminal or terrorist network structures (Klerks 2001; Krebs 2002;
Natarajan 2006; Morselli 2009 2014; Calderoni 2014; Duijn & Klerks 2014).
Analyzing criminal cooperation through the visualization of suspects in relation to criminal
offenses and accomplices is a common research method (Van Hartskamp s.a.; Fijnaut &
Moerland 2000; Klerks 2000a, 2000b). The difference between this ‘traditional’ form
of criminal group analysis and social network analysis is firstly that SNA uses advanced
concepts and algorithms to visualize interdependence and influence. This approach re-
veals that supposed leaders do not always determine the strength and continuity of the
network. Where the offender group analysis focuses on criminal behavior, SNA looks to
broader social embeddedness of criminal cooperation and the often multi-dimensional na-
ture of relationships. Finally, offender group analysis has only limited concern for individual
traits, characteristics and skills of actors, while SNA applies such attributes precisely to gain
deeper understanding of the cohesion, strengths and weaknesses of a network. Since the
widely used analysis package Analyst’s Notebook (AN) has begun to offer some basic SNA
features, offender group analyses have shown a methodological development. AN now
allows the calculation of some basic centrality measures, but the responsible application
and interpretation of this requires a solid training in SNA.
Interest in SNA within the police dates from the early nineties (Sparrow 1991; Klerks 1994,
2000b). The Dutch Police Academy has developed and propagated SNA through research
and seminars. Since 2008, the course “Applying Social Science in Social Network Analysis
(SWISNA)” has been part of the Criminal Science curriculum. Over 19 weeks, the SNA
method is learned and enriched by a social science perspective on human relations and
(criminal) cooperation. The demand for such a training is fueled by the greatly increased
availability of data (big data). Traditional information from police registers, complemented
with data from open sources and social media becomes increasingly important for under-
standing deviant network structures (Dijkstra et al 2013). SNA allows for making smart
selections from this flow of information, which are qualitatively reworked into intervention
proposals. The SWISNA training produces a variety of exam papers in which SNA is applied
to practical cases, from problematic youth groups to criminal and extremist associations.
These papers and various practical experiences show that SNA allows concrete recom-
mendations for alternative intervention strategies to combat crime.
Dutch criminologists still appear reluctant to apply SNA methodology, focusing instead on
underlying theoretical concepts. While their insights may inspire the practical application
of SNA by analysts, the lessons thus learned are rarely fed back into the academic realm.
Chapter 3: Bridging science and investigative practice
87
Outsiders might assume that the sensitivity of the data used stands in the way of greater
academic involvement in investigative SNA practice. However, the interaction between
investigators and academics is more intensive in The Netherlands than elsewhere, thanks
to the seminal work of the research-group of Fijnaut (Fijnaut et al 1995). The fact that
Dutch criminologists rarely apply SNA, seems to be a more important factor. For the mo-
ment, there appears to be little to gain in methodological support and conceptual progress
from academic involvement.
From our position at the cutting edge of investigative practice, policy and research, it
seems useful to provide insight into the current application of SNA within the police.
Thus, we attempt to identify where the two worlds can be brought closer together when
SNA bridges the gap between science and criminal investigative practice. This requires
answering four questions:
1. How is SNA used in the investigative practice?
2. Which restrictions are experienced in this use?
3. To what extent are these practices grounded in scientific theory?
4. Are the insights thus gained applicable in criminological science?
Systematic analysis of current SNA practice should yield some answers. Our research
remains exploratory and descriptive; only some aspects, such as the applicability of SNA
algorithms to specific crime problems, allow for preliminary explanations. We do interpret
our research findings wherever possible.
First, we describe the empirical material used: 34 exam papers, and 8 theses from students
at the Police Academy of the Netherlands, plus 28 responses to a survey on operational use
of SNA obtained from SNA-certified Dutch police analysts. This is followed by the analytical
framework, findings on the use of sources, network boundary definition, data analysis
on three network levels, forms of qualitative interpretation and findings concerning the
overall applicability of SNA. In the concluding Section we discuss differences between SNA
application in the investigations and the intelligence environment, possible connections
with the scientific domain and future prospects, including the exploration of big data.
3.2 sources and methodology
To answer to the problem, we commenced with a study of relevant literature. An extensive
search in scientific literature databases produced studies on the application of SNA in the
security domain. The insights thus collected have been used for constructing an analytical
framework, as well as for synthesizing the findings from the material under study. This
empirical material consists of the following sources:
88
Examination Papers from the Social Network Analysis course: the first empirical
source consists of exam papers of the (partly very experienced) students who attended the
SWISNA course module at the Police Academy between 2008 and 2014, and completed
the course with the application of SNA on a practical case study.12 The educational team
for Intelligence responsible for the SNA training identified 35 papers (N=35) as relevant
for answering our research questions. In this selection process, the papers were examined
for quality and relevance. Despite their primary operational focus, almost all examination
reports contain recommendations regarding the practical applicability of SNA.13 Following
this preselection, all remaining 35 papers were found sufficiently relevant to be included
in our research.14
The second criterion was the quality of the papers. The students are tested by an indepen-
dent board of examiners consisting of two SNA experts from the field. The exams evaluate
research design, data collection, analysis, synthesis, scientific substantiation and the con-
clusions and recommendations. To ensure the quality of this empirical material, solely those
reports evaluated as ‘sufficient’ or better have been included in this study. Finally, all the
students were personally requested to seek permission for the use their paper. Only one
of the reports was withheld for security reasons involving ongoing investigations, bringing
the number of available reports for this study at 34 (N=34).
Analysts working within law enforcement are involved in various disciplines. Some are
spiders in the web of criminal investigations. Others operate in the first phase of the inves-
tigative process preparing intelligence reports, project proposals or integrated intervention
strategies. Yet others play a role in public order maintenance, focusing on nuisance by
youth groups of violent soccer hooligans. Table 3.1 provides an overview of the central
themes in the analyzed SNA papers.
12 By early 2014, almost 100 students had completed the SNA course. Part of the Proof of Competence is the writing of a paper in which social scientific knowledge and the SNA method are applied on a problem in the context of a criminal investigation. These research papers are written by groups of 2 to 4 students and number about 40 pages plus addenda. The end of 2013 had presented 40 papers for examination.
13 Forming a well-founded opinion on the applicability of SNA was part of the examination assignment of the SNA course.
14 The exam papers used for his research are listed in the first part of the Sources list and identified by a number plus the central theme of the paper. Since all these papers are of a confidential nature, the authors and further details have been withheld.
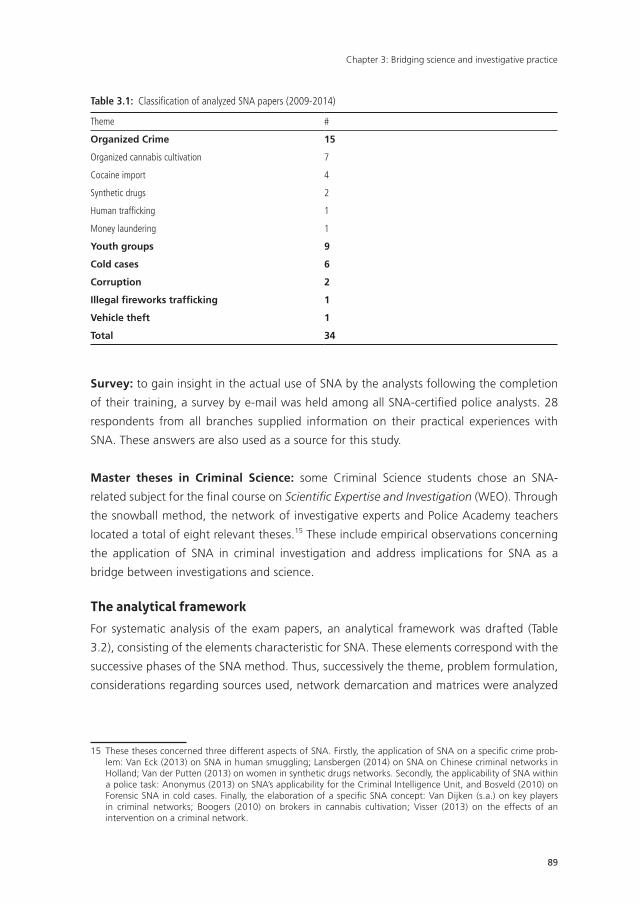
Chapter 3: Bridging science and investigative practice
89
Table 3.1: Classification of analyzed SNA papers (2009-2014)
Theme #
Organized Crime 15
Organized cannabis cultivation 7
Cocaine import 4
Synthetic drugs 2
Human trafficking 1
Money laundering 1
Youth groups 9
Cold cases 6
Corruption 2
Illegal fireworks trafficking 1
Vehicle theft 1
Total 34
Survey: to gain insight in the actual use of SNA by the analysts following the completion
of their training, a survey by e-mail was held among all SNA-certified police analysts. 28
respondents from all branches supplied information on their practical experiences with
SNA. These answers are also used as a source for this study.
Master theses in Criminal Science: some Criminal Science students chose an SNA-
related subject for the final course on Scientific Expertise and Investigation (WEO). Through
the snowball method, the network of investigative experts and Police Academy teachers
located a total of eight relevant theses.15 These include empirical observations concerning
the application of SNA in criminal investigation and address implications for SNA as a
bridge between investigations and science.
the analytical framework
For systematic analysis of the exam papers, an analytical framework was drafted (Table
3.2), consisting of the elements characteristic for SNA. These elements correspond with the
successive phases of the SNA method. Thus, successively the theme, problem formulation,
considerations regarding sources used, network demarcation and matrices were analyzed
15 These theses concerned three different aspects of SNA. Firstly, the application of SNA on a specific crime prob-lem: Van Eck (2013) on SNA in human smuggling; Lansbergen (2014) on SNA on Chinese criminal networks in Holland; Van der Putten (2013) on women in synthetic drugs networks. Secondly, the applicability of SNA within a police task: Anonymus (2013) on SNA’s applicability for the Criminal Intelligence Unit, and Bosveld (2010) on Forensic SNA in cold cases. Finally, the elaboration of a specific SNA concept: Van Dijken (s.a.) on key players in criminal networks; Boogers (2010) on brokers in cannabis cultivation; Visser (2013) on the effects of an intervention on a criminal network.
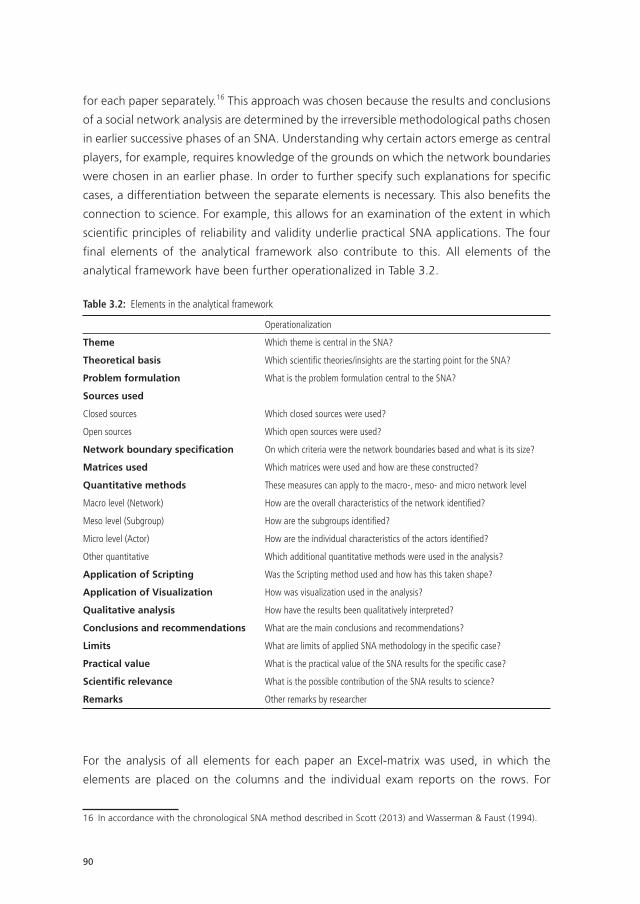
90
for each paper separately.16 This approach was chosen because the results and conclusions
of a social network analysis are determined by the irreversible methodological paths chosen
in earlier successive phases of an SNA. Understanding why certain actors emerge as central
players, for example, requires knowledge of the grounds on which the network boundaries
were chosen in an earlier phase. In order to further specify such explanations for specific
cases, a differentiation between the separate elements is necessary. This also benefits the
connection to science. For example, this allows for an examination of the extent in which
scientific principles of reliability and validity underlie practical SNA applications. The four
final elements of the analytical framework also contribute to this. All elements of the
analytical framework have been further operationalized in Table 3.2.
Table 3.2: Elements in the analytical framework
Operationalization
Theme Which theme is central in the SNA?
Theoretical basis Which scientific theories/insights are the starting point for the SNA?
Problem formulation What is the problem formulation central to the SNA?
Sources used
Closed sources Which closed sources were used?
Open sources Which open sources were used?
Network boundary specification On which criteria were the network boundaries based and what is its size?
Matrices used Which matrices were used and how are these constructed?
Quantitative methods These measures can apply to the macro-, meso- and micro network level
Macro level (Network) How are the overall characteristics of the network identified?
Meso level (Subgroup) How are the subgroups identified?
Micro level (Actor) How are the individual characteristics of the actors identified?
Other quantitative Which additional quantitative methods were used in the analysis?
Application of Scripting Was the Scripting method used and how has this taken shape?
Application of Visualization How was visualization used in the analysis?
Qualitative analysis How have the results been qualitatively interpreted?
Conclusions and recommendations What are the main conclusions and recommendations?
Limits What are limits of applied SNA methodology in the specific case?
Practical value What is the practical value of the SNA results for the specific case?
Scientific relevance What is the possible contribution of the SNA results to science?
Remarks Other remarks by researcher
For the analysis of all elements for each paper an Excel-matrix was used, in which the
elements are placed on the columns and the individual exam reports on the rows. For
16 In accordance with the chronological SNA method described in Scott (2013) and Wasserman & Faust (1994).
Chapter 3: Bridging science and investigative practice
91
each of the papers, the findings relating to each element are described in the matrix.
This structured overview allows for comparisons between papers (on the rows), but also
between elements (on the columns). This has two advantages. Firstly, papers can be filtered
on specific themes. Because the papers are exploratory in nature, the techniques used
can vary greatly. By filtering on a theme, the effect of different approaches on the final
result become clear and best practices for each theme come to light. Secondly, correlations
between individual elements are easily identified. The matrix for example allows for the
analysis of how the element ‘network demarcation’ can account for varying results on
macro level analyses. Details of specific applications, considered in a wider context, allow
for conclusions on the practical applicability of SNA and to the identification of elements
that are influential.
3.3 results
For a systematic analysis of the exam papers, Section 3.1 discusses their theoretical basis,
after which Section 3.2 considers the sources used. Section 3.3 deals with coding, network
demarcation and building matrices. Section 3.4 discusses the analysis from the SNA meth-
odology, as well as the qualitative interpretation. Finally, in Section 3.5 the applicability of
SNA is examined.
As described above, the exam papers are analyzed on the basis of the elements given in
Table 3.2. In the element ‘Problem formulation’, we distinguish three perspectives. Some
of the papers focus on applicability of SNA to arrive at new operational insights. Oth-
ers explore the overall network structure to come up with recommendations. Yet others
restrict themselves to formulating an operational problem, focusing on identifying actors
suitable for effective interventions or further investigation. The formulation of the problem
proves a crucial stage in the analysis process. Problem stipulation and research questions
set the framework for the analysis that follows, including the selection of sources, network
delineation, quantitative measures and qualitative interpretation.
theoretical basis
Social network analysis as a research method for social reality is scientifically based and
constantly tested and expanded. Nearly every SNA exam paper refers to SNA handbooks
such as Scott (2013). The use of SNA is often argued with theories on social capital (Burt
2001), weak relationships (Granovetter 1973) and other familiar SNA-related concepts.
Furthermore, all the authors apply scientific knowledge and concepts relevant to the cen-
tral issues in their papers. We find references to literature on juvenile crime, specific deviant
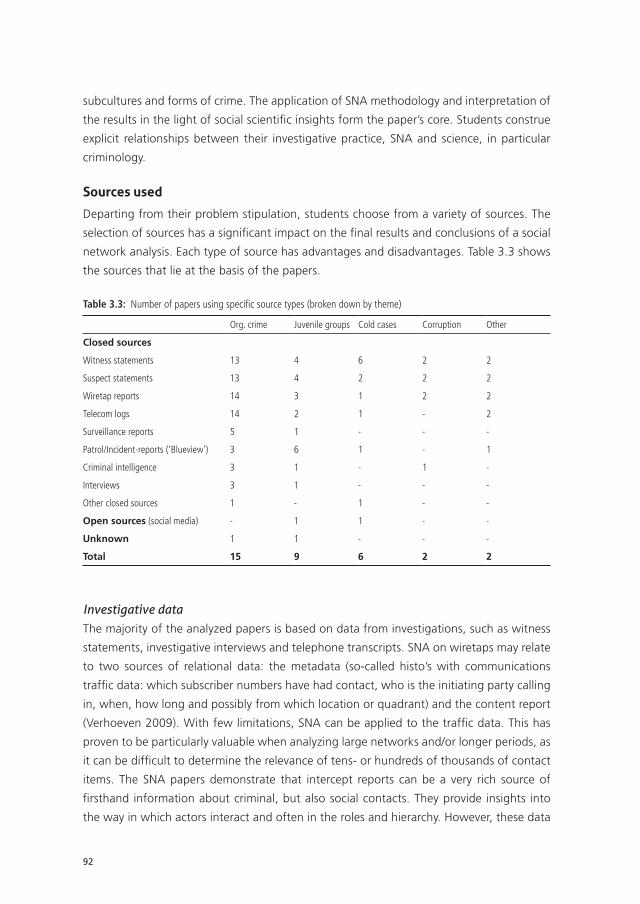
92
subcultures and forms of crime. The application of SNA methodology and interpretation of
the results in the light of social scientific insights form the paper’s core. Students construe
explicit relationships between their investigative practice, SNA and science, in particular
criminology.
sources used
Departing from their problem stipulation, students choose from a variety of sources. The
selection of sources has a significant impact on the final results and conclusions of a social
network analysis. Each type of source has advantages and disadvantages. Table 3.3 shows
the sources that lie at the basis of the papers.
Table 3.3: Number of papers using specific source types (broken down by theme)
Org. crime Juvenile groups Cold cases Corruption Other
Closed sources
Witness statements 13 4 6 2 2
Suspect statements 13 4 2 2 2
Wiretap reports 14 3 1 2 2
Telecom logs 14 2 1 - 2
Surveillance reports 5 1 - - -
Patrol/Incident-reports (‘Blueview’) 3 6 1 - 1
Criminal intelligence 3 1 - 1 -
Interviews 3 1 - - -
Other closed sources 1 - 1 - -
Open sources (social media) - 1 1 - -
Unknown 1 1 - - -
Total 15 9 6 2 2
Investigative dataThe majority of the analyzed papers is based on data from investigations, such as witness
statements, investigative interviews and telephone transcripts. SNA on wiretaps may relate
to two sources of relational data: the metadata (so-called histo’s with communications
traffic data: which subscriber numbers have had contact, who is the initiating party calling
in, when, how long and possibly from which location or quadrant) and the content report
(Verhoeven 2009). With few limitations, SNA can be applied to the traffic data. This has
proven to be particularly valuable when analyzing large networks and/or longer periods, as
it can be difficult to determine the relevance of tens- or hundreds of thousands of contact
items. The SNA papers demonstrate that intercept reports can be a very rich source of
firsthand information about criminal, but also social contacts. They provide insights into
the way in which actors interact and often in the roles and hierarchy. However, these data
Chapter 3: Bridging science and investigative practice
93
are obtained mainly from the viewpoint of evidence. Investigators often assess social talk
as irrelevant which, if observed through the SNA lens, may contain interesting indica-
tions (Sparrow 1991; Klerks 2000a; Morselli 2009). Many students therefore chose to
reassess and code the intercepts. In most of the papers, this led to unique insights into
the functioning and stability of criminal network structures and the important role of the
surrounding social network of family and love relationships, friendships or membership of
an association (such as an outlaw motorcycle gang).
Such insights generate innovative operational and strategic recommendations, but the
students also address the limitations of the usability of criminal investigative data for SNA.
Firstly, the information available on the actors within a network is often unbalanced due
to the objectives of the investigation. The evidence gathering after all is focused on one
or more (main) suspects, who will thereby show up more prominently in a network recon-
struction. Secondly, with intercept reports there may be a reliability problem when criminals
suspect that they are being intercepted. Disinformation or guarded conversations may
affect the reliability of the eventual network composition. Thirdly investigative information
may be interpreted subjectively or incorrectly, when misleading or code language is used
in intercepted telephone conversations. Such interpretations depend on the investigator’s
personal perception and experience.17 Fourthly, the investigative information is often
outdated, which limits the usefulness of recommendations for the current practice. Finally,
investigative information provides a predominantly static image, while criminal networks
are dynamic in nature. Later on, we will discuss possibilities to correct for such biases.
Sparrow (1991) and later Verhoeven (2009) already suggested that in a final network
presentation based on investigative information, suspects whose communications have
been intercepted will always come out in central positions. To what extent then can SNA,
based on investigative data, still contribute to new insights? While taking into account
such limitations, students still sought for possible value. As should be expected, this search
did not yield new insights into the positions of prime suspects, but it can shed new light on
how the immediate periphery organizes itself around those central actors.
With evidence collection on the main suspects as the primary goal, it is logical that the
periphery in many investigations gets less attention. Some groups of students therefore
focused explicitly on the periphery of the ego network (e.g., papers 3, 6, 12, 15 and 34).18
17 To reduce bias due to differences in interpretation among coders, students in the SNA course are taught to apply a consistency analysis on the actual coding of intercept reports. Two or more students simultaneously analyze an identical data set and afterwards note the differences in interpretation. These differences are recorded in a coding journal that serves as a guideline for further coding.
18 Egocentric networks consist of all direct relations of one actor, referred to as ‘Ego’ (Scott and Carrington 2011).
94
This can for instance lead to a better understanding of the importance of women to the
resilience of criminal cooperation. Although they are not always directly involved in criminal
activities, women in some networks contributed to internal conflict resolution or brought
in outsiders as reliable replacements after a crucial actor had disappeared (papers 1, 11
and 21). One of the papers illustrates the significance of transfer between generations: the
offspring of the central criminal actors had assumed brokering positions in the periphery of
a criminal network (paper 11). The students concerned suggested an explanation built on
Sutherland’s (1939) theory of social differentiation, pointing out that criminal activities may
be transmitted from father to son. Another group of students took the continuity of the
periphery as a starting point and examined two investigations focused on the same Ego.
The data came from one investigation that was done before Ego was arrested, and one
investigation held a year later after Ego was taken into custody (paper 15). Changes in the
composition of the periphery were observed, from which new actors could be identified
for further investigation.
Investigative information was also chosen by other researchers as a source for scientific
SNA applications. Morselli (2009) researched the Canadian ‘Caviar’ network, on which
multiple interventions were executed over a longer period. Investigative science student of
the Dutch Police Academy Visser (2013) considered the effects of repeated police interven-
tions on a Dutch network of bank fraudsters and established that the modus operandi after
arrests were readjusted, so that the criminal activities could be continued almost instantly.
Remaining network members attempted to become invisible to the police. Evidence was
made to disappear, cellphones were discarded and protagonists urged their contacts to no
longer address them as “boss” and moved to the background. Suspects who after their
pre-trial detention returned to the criminal network, lost their centrality in SNA terms and
ended up in the periphery.
Van der Putten (2013) examined the role of women in synthetic drugs networks from a
social network perspective, again based on investigative data, and found predominantly
wives, girlfriends or mistresses of criminals.19 Women fulfilled various roles in the supply
chain, but most remarkable was their position change once the male protagonist disap-
peared. “They then act as an intermediary, facilitating, passing along information, bringing
others into position organize practical matters”. Van der Putten also mentions several
examples of wives and daughters who run the criminal enterprise on behalf of the criminal
protagonist, doing business on his behalf. Van der Putten states that this important role of
women is still not recognized by prosecutors and law enforcement officers. Female care-
19 Van der Putten’s empirical material came primarily from an extensive analysis of police registers, combined with interviews with police and other experts, as well as a survey among criminal informants with insider knowledge of criminal networks.
Chapter 3: Bridging science and investigative practice
95
takers are often not prosecuted and they are six times less likely to receive an unconditional
conviction compared to males for similar offenses. It is partly through this mechanism that
criminal activities and structures can be maintained for prolonged periods.
In all these case examples the quantitative SNA of the raw data pointed out interest-
ing elements of network structure and composition that were subsequently qualitatively
analyzed. Quantitative and qualitative analysis were complementary and facilitated seeking
rather than assuming structure.
Enforcement informationSome students chose to compensate for the bias of investigative information by com-
bining data sources. An important additional source of information is enforcement data,
mainly consisting of patrol and incident reports made up by street officers. Table 3.3
shows that such enforcement information was used mainly for studying juvenile groups.
Often, community-policing officers were interviewed to enable further interpretation of
system information. The emergence of the intelligence-led policing doctrine and practice
has made frontline officers more aware of their task of contributing information. This is
achieved e.g., through briefings urging personnel to actively collect information on specific
problems in order to determine an intervention strategy. Thus, information is collected
about specific members of juvenile groups and their position in the group (Duijn & Klerks
2014). This simplified the network reconstruction for a number of papers.
However, such enforcement information also has certain disadvantages for SNA. What
police officers perceive is partly determined by which incidents occur during their shifts
in the area, which produces a special form of selection. Also, not all observations are
registered, due to time constraints or perceived lack of relevance. Furthermore, observa-
tions are selective in nature: the most visible actors in the streets can be hangers-on and
wannabees, while core members remain less noticeable in the background. One group
of students attempted to have three community policing officers score on an actor by
actor matrix, based on their knowledge of a youth group. Their scores of each particular
relationship, when compared with the information from police registers, appeared to be
based too much on assumptions. The input of the community police officers proved more
useful as background knowledge from a historical perspective (paper 30).
Human Intelligence information (HUMINT)In addition to investigative and enforcement information, there is human intelligence
information (HUMINT). The gathering of criminal intelligence by handling informants is or-
ganized within the Teams Criminal Intelligence (TCI) of the Collection department at every
Police Unit (Van der Bel et al. 2013). For SNA applications, criminal intelligence information
96
has a major advantage: it is collected for the purpose of building an information position,
relatively independent of criminal investigative or enforcement objectives. Provided that
the analyst has access to the handlers who gather the information, the gathering process
can be tasked for SNA-specific aspects by asking particular questions about roles, tasks and
social aspects, or by requesting to seek out new informants.
A disadvantage is that the information that is collected may only be used if it does not
compromise the informant’s anonymity. From most raw informant debriefing reports, only
a few chunks of shareable information remain (Vis, 2012). Nonetheless, several pieces on
different network actors, once combined, may offer a unique perspective on a network
compared to investigative or enforcement information. Access to intelligence informa-
tion, however, requires an additional authorization which not all analysts possess. This
may explain why intelligence information was used in only five of the exam papers (Table
3.3). Intelligence information can be sanitized for use in SNA by substituting all data on
individuals using an encryption code. Duijn et al. (2014) for example built their study on
interventions on criminal networks partly on anonymized criminal intelligence data. This
University of Amsterdam study provided a best practice for criminal intelligence work,
thus demonstrating that intelligence data are not entirely inaccessible for scientific SNA
purposes.
Social MediaFinally, two papers also looked at information from open sources, in particular social
media. In paper 33, only one actor from a population of fifty people was found to be
active on social media. The students saw a relationship with the age structure of this actor
population, since social media use is less common among those over fifty years of age.
A second group attempted to integrate social media information when reconstructing a
juvenile group. Here the interpretation of such information posed a problem: mere occur-
rence in a list of friends on Facebook is inconclusive about the possible criminal nature of
a relationship. Still, social media information is sometimes useful to supplement data from
closed systems. This was illustrated by two actors in a criminal network who appeared
intimately embraced in a picture published on social media with the caption “friends for
life”, while their connection could not be discerned from police systems (paper 11). Based
on such open source information, an assumed relationship can be added to the network in
order to be verified through a more refined search in closed systems. Utilizing more than
just investigative information can help to understand the social embeddedness of criminal
behavior and open up a bridge to scientific analysis of crime and its causes.
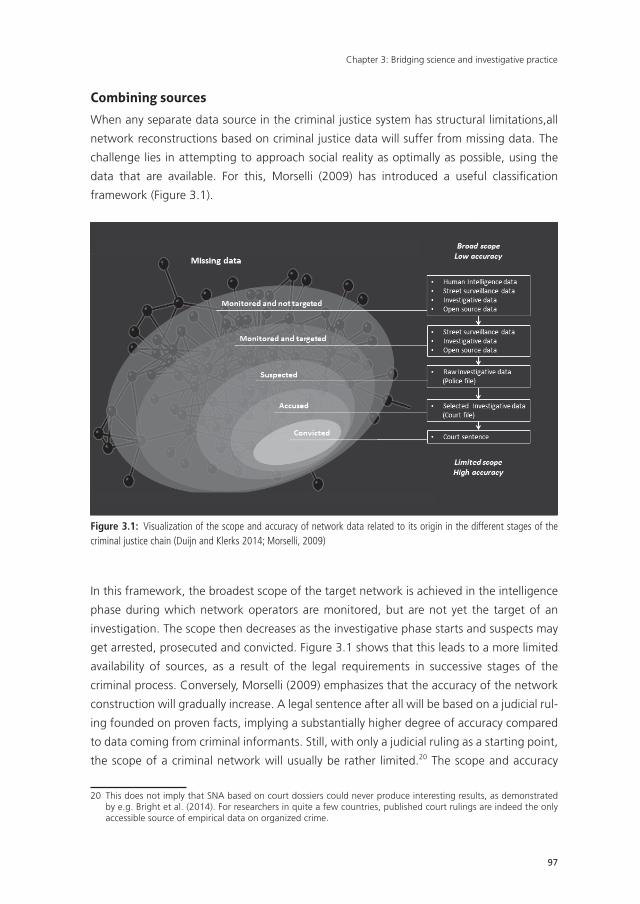
Chapter 3: Bridging science and investigative practice
97
combining sources
When any separate data source in the criminal justice system has structural limitations,all
network reconstructions based on criminal justice data will suffer from missing data. The
challenge lies in attempting to approach social reality as optimally as possible, using the
data that are available. For this, Morselli (2009) has introduced a useful classification
framework (Figure 3.1).
Figure 3.1: Visualization of the scope and accuracy of network data related to its origin in the different stages of the criminal justice chain (Duijn and Klerks 2014; Morselli, 2009)
In this framework, the broadest scope of the target network is achieved in the intelligence
phase during which network operators are monitored, but are not yet the target of an
investigation. The scope then decreases as the investigative phase starts and suspects may
get arrested, prosecuted and convicted. Figure 3.1 shows that this leads to a more limited
availability of sources, as a result of the legal requirements in successive stages of the
criminal process. Conversely, Morselli (2009) emphasizes that the accuracy of the network
construction will gradually increase. A legal sentence after all will be based on a judicial rul-
ing founded on proven facts, implying a substantially higher degree of accuracy compared
to data coming from criminal informants. Still, with only a judicial ruling as a starting point,
the scope of a criminal network will usually be rather limited.20 The scope and accuracy
20 This does not imply that SNA based on court dossiers could never produce interesting results, as demonstrated by e.g. Bright et al. (2014). For researchers in quite a few countries, published court rulings are indeed the only accessible source of empirical data on organized crime.
98
of a criminal network reconstruction, according to Morselli (2009), are therefore inversely
proportional to the use of sources from successive stages of the criminal justice process.
He prefers data from the later stages of the criminal process, because the accuracy of the
network composition is then secured.
Like Morselli (2009), many students focus on sources from the investigative stages of the
criminal justice system, but they report major drawbacks because of the limited scope that
this creates. Especially in papers that focus on a single investigation, the final conclusions
come with a caveat. The student’s detailed knowledge of the files and their investigative
expertise may be influential in their critical claim that the limited sources used result in a
filtered image of the actors in the criminal network. A number of students suggest that
combining different sources can provide a solution (papers 1, 11, 12, 13, 15 and others).
Students see the best opportunity for this in the intelligence phase, when the legal context
allows for such combinations of various data. Intelligence analysts may exploit surplus
information from earlier criminal investigations, patrol and incident reports, and open
sources, which once combined can compensate for the limited accuracy of each separate
source. Comparison of network constructs based on single sources allow for the assess-
ment of the reliability and accuracy of those particular sources. This ultimately results in a
more valid and reliable reconstruction of the network under study. Furthermore, merging
different data sources in a comprehensive relational database contributes significantly to
an understanding of criminal cooperation and modi operandi across single criminal inves-
tigations, police regions and national borders. SNA can thus help to clarify links between
local criminal networks and identify connecting key persons.
Matrix and boundary specification
After the identification and scoring of sources, the data are encoded in a matrix structure.21
All the analyzed exam papers use the actor by actor matrix to establish mutual relations.
Frequently, different matrices have been created to distinguish between types of relation-
ship (criminal, friendship, love) or kind of criminal activity. Different overlapping layers may
bring new aspects of network structure to attention, such as the relationship between
family ties and criminal cooperation. In a number of papers relating to organized crime,
this leads to the identification of underlying social structures; in the caravan-dwelling com-
munity of (former) so-called ‘travelers’ for example, family ties often constitute the social
framework in which various criminal networks are grounded (papers 11 and 12).
Another illustration of the value of distinguishing between types of relationships is found
in the application of SNA on cold-case investigations (papers 18, 19, 23, 31, 32 and 33).
21 An extended discussion of the relevant methodology is found in e.g. Scott & Carrington (2011).
Chapter 3: Bridging science and investigative practice
99
Paper 19, for example, distinguishes between types of relationships such as love, mutual
hobbies, neighborship and work colleagues. In addition to an overall matrix of all relation-
ships, separate matrices were made for each type of relationship. By combining matrices,
subgroups around the murder victim can be highlighted and compared for overlap. Us-
ing the Forensic SNA methodology (Spreen & Vermeulen 2008), students could identify
individuals who were part of multiple subsets around a victim and could therefore have
valuable information. Individuals fitting this profile who had not been interviewed earlier,
can be prioritized as new witnesses upon the reopening of the cold case.
In addition to the standard actor by actor matrix, all the papers examined also applied actor
by attribute matrices, in which actors are coupled with individual characteristics. Often the
researchers opted for apparent attributes such as gender, location, age, suspect/no sus-
pect, criminal record and so on. Highlighting the presence of certain attributes in network
visualizations can produce interesting insights. Figure 2.6 (see p. 46) of the previous chap-
ter demonstrated how the ‘gender’ attribute provides insight in the well-embeddedness
of women in the information currents flowing through the particular criminal network.
The visualization algorithm applied for this purpose places actors with many connections
automatically in central positions in the diagram. Such visualization facilitates an initial
exploration of the scored data. A further quantitative analysis of centrality measures (de-
gree, betweenness, closeness, eigenvector etc.) is required before firm conclusions may be
drawn.
With all the matrices filled, the network boundaries must be defined before starting the
analysis. This demarcation can strongly influence the analysis results; an effect referred
to as the boundary specification problem (Sparrow 1991; Van der Hulst 2008; Morselli
2009). It is therefore important to derive a criterion from the central problem posed, on
which actors can be included. In the papers, the boundary specification and definition
is invariably determined by the central research question. For research questions aiming
at specific types of organized crime activities (e.g. migrant smuggling, counterfeiting,
drug trafficking), students decided to delineate the network by actors with determent
involvement in a specific criminal market. Sometimes the individuals formally considered
as suspects form the starting point for inference of the core network, which is then further
extended in numbers while the scoring of the data. The risk with this approach however,
is that the network boundary becomes too wide. This approach should be followed by a
point of assessment which actors to include or exclude in the final network representation
following the central research question.
100
In cold-case papers the network composition is on average determined by all individuals
emerging from witness statements.22 In one case, the first degree contacts of those initial
network members, based on patrol and incident information, were also included. This led
to the identification of previously unknown parties.
For juvenile groups, network boundaries are often determined by what was already known
about the group, most often based on the shortlist approach (Ferwerda 2009). In these
cases, the members of the juvenile group were taken as the starting point and their first
degree contacts, based on patrol/incident information, was added to the network com-
position. In one case, the snowball method as described by Scott (2013) was applied on
the patrol/incident database. This method is discussed in more detail in the next Section.
In nearly all of the papers under study, the students demonstrate awareness of the fact
that network boundary specification determines the eventual results. In several papers, this
artificial boundary specification is mentioned as a limitation to understanding the positions
of the individuals in the network.
the analysis
After all the data have been scored and the network is demarcated, the analysis can be
performed using the multitude of algorithms available to the SNA practitioner. To deter-
mine the most useful measurements, it can be helpful to distinguish three network levels:
1. characteristics of the overall network (macro);
2. characteristics on the subnetwork level (meso);
3. characteristics on the individual level (micro).
Many SNA specialists believe that individual characteristics of actors can only be properly
interpreted if the general characteristics of the network in question are known (Baker &
Faulkner 1993; Robins 2008; Morselli 2009). The three levels cannot actually be considered
separately. This means for example that the benefit, which an individual actor can derive
from a bridging position between two parts of a network (high betweenness score), can
only truly be strategic if the embedding macro network has a low density (with overall
few reciprocal links). This makes it of essential importance to continuously combine the
understanding of three levels. In most of the papers studied, the three network levels and
their interaction have been analyzed, as shown in Table 3.4.
Analysis on system levelTable 3.4 shows that on the macro network (systems) level, density is the measure most
often used. Density indicates how the total number of observed connections relates to the
theoretical maximum number of possible connections in the entire network, which says
22 This is in accordance with the Forensic SNA methodology developed by Spreen & Vermeulen (2008).
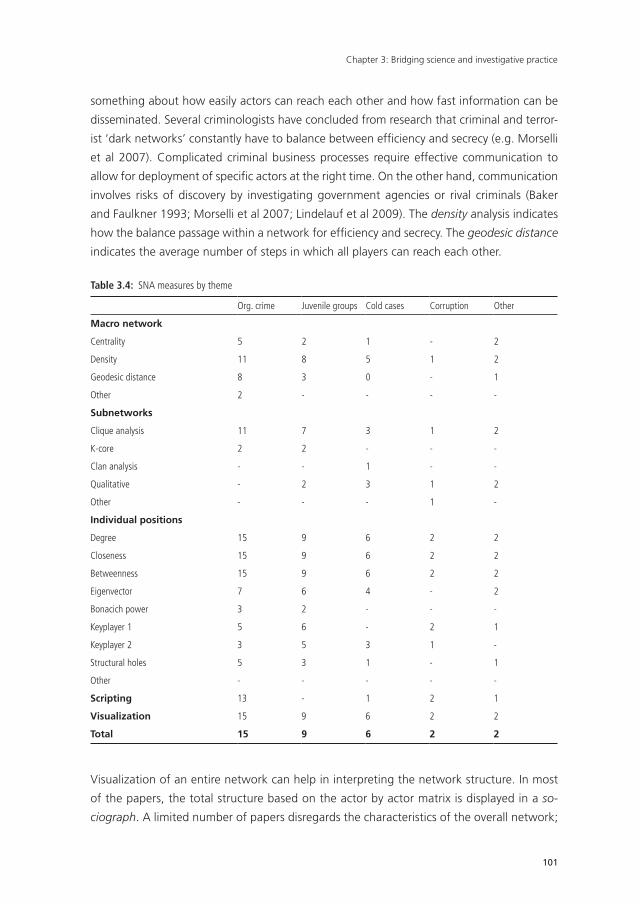
Chapter 3: Bridging science and investigative practice
101
something about how easily actors can reach each other and how fast information can be
disseminated. Several criminologists have concluded from research that criminal and terror-
ist ‘dark networks’ constantly have to balance between efficiency and secrecy (e.g. Morselli
et al 2007). Complicated criminal business processes require effective communication to
allow for deployment of specific actors at the right time. On the other hand, communication
involves risks of discovery by investigating government agencies or rival criminals (Baker
and Faulkner 1993; Morselli et al 2007; Lindelauf et al 2009). The density analysis indicates
how the balance passage within a network for efficiency and secrecy. The geodesic distance
indicates the average number of steps in which all players can reach each other.
Table 3.4: SNA measures by theme
Org. crime Juvenile groups Cold cases Corruption Other
Macro network
Centrality 5 2 1 - 2
Density 11 8 5 1 2
Geodesic distance 8 3 0 - 1
Other 2 - - - -
Subnetworks
Clique analysis 11 7 3 1 2
K-core 2 2 - - -
Clan analysis - - 1 - -
Qualitative - 2 3 1 2
Other - - - 1 -
Individual positions
Degree 15 9 6 2 2
Closeness 15 9 6 2 2
Betweenness 15 9 6 2 2
Eigenvector 7 6 4 - 2
Bonacich power 3 2 - - -
Keyplayer 1 5 6 - 2 1
Keyplayer 2 3 5 3 1 -
Structural holes 5 3 1 - 1
Other - - - - -
Scripting 13 - 1 2 1
Visualization 15 9 6 2 2
Total 15 9 6 2 2
Visualization of an entire network can help in interpreting the network structure. In most
of the papers, the total structure based on the actor by actor matrix is displayed in a so-
ciograph. A limited number of papers disregards the characteristics of the overall network;
102
the focus is then on ego-networks, especially in cold case networks where the victim is
the central focal point. In these cases, analyzing the total network has little added value.
Analysis at subnetwork levelOnce the big picture has been made clear, the analysis can shift to substructures within
the network. For this, again, multiple approaches are possible. Identifying subnetworks
had added value when applying SNA in criminal investigations. In organized crime for
instance, it enables identification of clusters of people specializing in certain phases of
the criminal logistical process. Papers on juvenile crime groups demonstrate that with the
core sequence collapse or K-core analysis, the core of such groups can be identified. In
cold cases, identification of subnetworks around the victim may provide new paths of
investigation. In a number of cases, sub-networks have been identified through qualitative
analysis based on attributes of edges (e.g. family tie, intimate relationship, teammates in
sports, working relationships).
Table 4 shows that clique analysis was the measure most often used for identifying subnet-
works. Clique analysis constitutes a strict delineation of a subnetwork; a clique consists of
actors that are maximally connected to each other. In most papers, clique analysis produces
a multitude of subnetworks. These are sometimes related to analysis at the individual level,
as actors appearing in multiple cliques can occupy central network positions. The less
commonly used core collapse sequence has proven to be very valuable for distinguishing
the network core from its periphery.
The exam papers restrict themselves mainly to basic techniques when discovering substruc-
tures in larger criminal network structures, such as cliques and K-cores. One investigative
science student of the Police Academy specifically focused on the identification of more
advanced SNA techniques that could contribute to identifying subnetworks in a complex
criminal network based on intelligence information ([Anonymous] 2013). In this research,
a total of seventeen SNA measures were tested for their applicability in identifying meso
networks. Three measures were found particularly suitable: HiClus, HiClus + NewmanCom-
munities and GirvanNewmanPartitions (Girvan & Newman 2002). The manner in which
these measures managed to bring clarity in a very sizeable intelligence database made the
researcher to conclude that: “Without SNA it is virtually impossible to identify the various
meso-networks in the macro network”.
Subnetworks within juvenile groups
Because relatively many of the analyzed papers (N = 9) involved the application of SNA on
juvenile criminal groups, we can come to establish a best practice. As already mentioned,
the papers often departed from the shortlist method, in which community policing officers
Chapter 3: Bridging science and investigative practice
103
periodically filled out questionnaires in a systematic way to describe the nature and extent
of problematic youth groups (Ferwerda 2009). Subsequently, according to their impact
on the environment these groups are classified as annoying, troublemaking or outright
criminal in nature.
A number of SNA papers contrasted the results of this shortlist method with the applica-
tion of SNA directly based on police registers (both patrol/incident and investigative data).
Such comparisons show that the composition of the juvenile groups can be different,
according to the method used (papers 24, 25 and 30). The main reason appears to be that
the network boundary specification of youth groups through SNA is not related to the
specific community boundaries in which the police officers filling out the questionnaires
operate, but the clusters are identified using SNA measures on the available data sets.
These clusters are then qualitatively assessed and labeled. Like the meso networks found
in organized crime (see below), juvenile criminal groups can transcend the local domain. A
number of papers point out which actors establish the connections between subnetworks,
thus contributing to a better understanding of core members and followers. This SNA best
practice consists of two steps.
1. The snowball method (Scott 2013): a number of persons are considered as the start-
ing point of a network (e.g., known juvenile group members). Of these individuals,
the related (criminal) contacts are identified using information from police registers.
Then the same snowballing operation is performed on these newly found criminal
contacts. The researcher determines how often this step is repeated. This is usually
until no more new individuals are identified or when the new individuals do not meet
certain predefined criteria for belonging to the network (such as multiple co-offending,
involvement in specific criminal activities, or age).
2. The Core Collapse Sequence (Seidman 1983): This method can be helpful in the
identification of core members. Seidman states that the structure of a network can
be considered on the basis of a certain minimum degree, so that groups with a higher
or less high density are distinguished (Scott & Carrington 2011). By increasing the
minimum degree parameter, a cluster of core actors will be distinguished from the pe-
riphery. The result is a limited set of actors, to be considered for qualitative analysis and
labeling in order to achieve the identification of core members and followers (Figure
3.2).
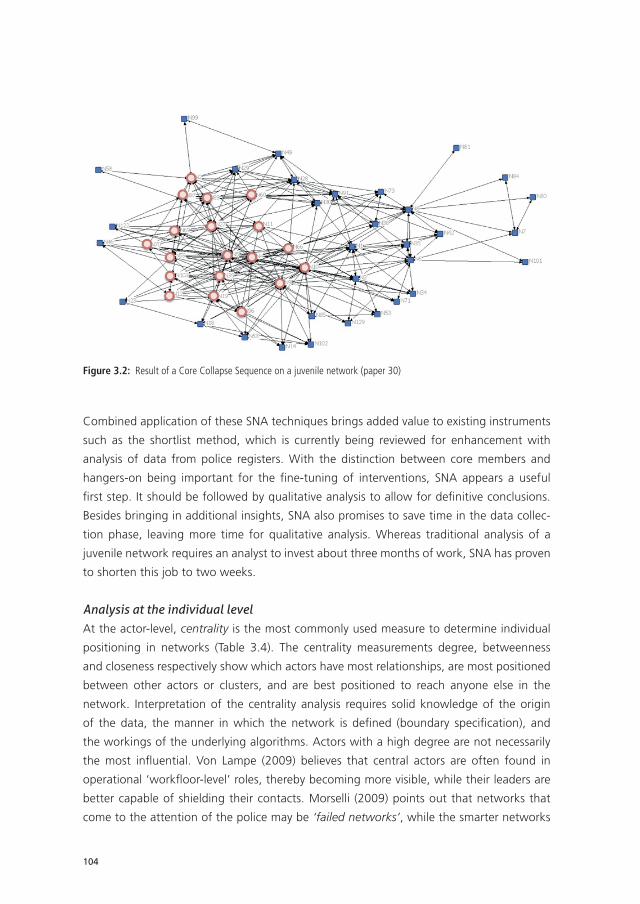
104
Figure 3.2: Result of a Core Collapse Sequence on a juvenile network (paper 30)
Combined application of these SNA techniques brings added value to existing instruments
such as the shortlist method, which is currently being reviewed for enhancement with
analysis of data from police registers. With the distinction between core members and
hangers-on being important for the fine-tuning of interventions, SNA appears a useful
first step. It should be followed by qualitative analysis to allow for definitive conclusions.
Besides bringing in additional insights, SNA also promises to save time in the data collec-
tion phase, leaving more time for qualitative analysis. Whereas traditional analysis of a
juvenile network requires an analyst to invest about three months of work, SNA has proven
to shorten this job to two weeks.
Analysis at the individual levelAt the actor-level, centrality is the most commonly used measure to determine individual
positioning in networks (Table 3.4). The centrality measurements degree, betweenness
and closeness respectively show which actors have most relationships, are most positioned
between other actors or clusters, and are best positioned to reach anyone else in the
network. Interpretation of the centrality analysis requires solid knowledge of the origin
of the data, the manner in which the network is defined (boundary specification), and
the workings of the underlying algorithms. Actors with a high degree are not necessarily
the most influential. Von Lampe (2009) believes that central actors are often found in
operational ‘workfloor-level’ roles, thereby becoming more visible, while their leaders are
better capable of shielding their contacts. Morselli (2009) points out that networks that
come to the attention of the police may be ‘failed networks’, while the smarter networks
Chapter 3: Bridging science and investigative practice
105
could succeed in remaining invisible. Interpreting the results therefore requires a more in-
depth qualitative examination before conclusions can be reached. An interesting measures
in this context is known are Eigenvector and Bonacich power centrality (Bonacich, 1987).
Both calculate positions of network operators that are in between the central actors. Even
with only a few contacts, such well-connected actors can have significant impact on the re-
sources across the network. Papers 11 and 21 associate distinctive scores on such positions
with the role of women, but influential people in the background can also get high scores
on this centrality measure. For ego networks in cold cases, this measure is less relevant.
Analyzes at the individual level often lead to interesting actors as targets for interventions
or to obtain strategic information positions. With these purposes in mind, Borgatti (2006)
developed the keyplayer-analyses (KPP1 and KPP2). KPP1 calculates which set of persons
can best be removed from the network to achieve maximum fragmentation. KPP2 identifies
individuals suitable for recruitment as informants due to their optimal information position
in the network. The keyplayer analysis involves a sequence of interventions executed on
a network. Following each intervention, a recalculation is made for a repeated maximal
fragmentation effect or information position. The exam papers in which the keyplayer
analysis was applied in combination with a qualitative interpretation, yielded concrete
recommendations for interventions or strengthening of the information position (papers
5, 20, 29, and others).
Qualitative interpretation
An essential phase in applying SNA on criminal networks is the qualitative interpretation.
Between data collection and analysis, the social and criminal reality can get distorted.
Analysis of the papers shows that the qualitative assessment of the information in particu-
lar proves to be the most powerful element in the SNA methodology as applied on criminal
networks. Quantitative SNA helps in making relevant selections from large amounts of
data. The qualitative study of these selections based on network- and criminological theory
then provides insight into the mechanisms that sustain network structures, and suggests
opportunities for operational interventions.
Identifying key people: scripting and SNAA significant enhancement to the actor by actor relationship diagrams is the connection
of quantitative results to qualitative attributes (characteristics of individual actors). As
mentioned earlier, this is done by constructing an actor by attribute matrix. For qualitative
enrichment on issues like organized crime, it has been found useful to combine SNA with
the scripting method. Scripting is an analytical technique whereby criminal logistics are
divided into separate parts of a ‘script’ in order to assign vulnerable elements (Cornish
1994; Bruinsma & Bernasco 2004; Morselli & Roy 2008; Tompson s.a.). By scoring actors
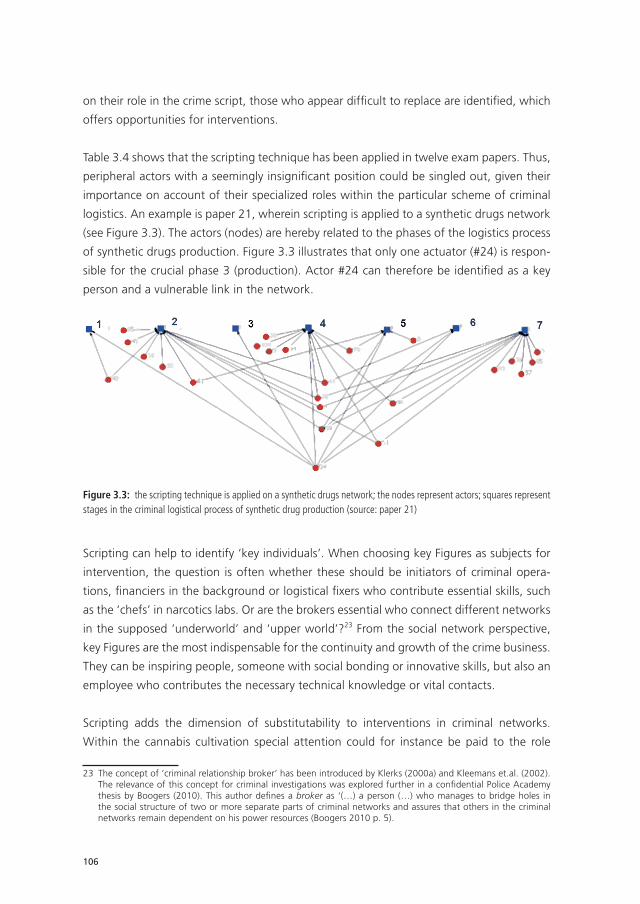
106
on their role in the crime script, those who appear diffi cult to replace are identifi ed, which
offers opportunities for interventions.
Table 3.4 shows that the scripting technique has been applied in twelve exam papers. Thus,
peripheral actors with a seemingly insignifi cant position could be singled out, given their
importance on account of their specialized roles within the particular scheme of criminal
logistics. An example is paper 21, wherein scripting is applied to a synthetic drugs network
(see Figure 3.3). The actors (nodes) are hereby related to the phases of the logistics process
of synthetic drugs production. Figure 3.3 illustrates that only one actuator (#24) is respon-
sible for the crucial phase 3 (production). Actor #24 can therefore be identifi ed as a key
person and a vulnerable link in the network.
Figure 3.3: the scripting technique is applied on a synthetic drugs network; the nodes represent actors; squares represent stages in the criminal logistical process of synthetic drug production (source: paper 21)
Scripting can help to identify ‘key individuals’. When choosing key Figures as subjects for
intervention, the question is often whether these should be initiators of criminal opera-
tions, fi nanciers in the background or logistical fi xers who contribute essential skills, such
as the ‘chefs’ in narcotics labs. Or are the brokers essential who connect different networks
in the supposed ‘underworld’ and ‘upper world’?23 From the social network perspective,
key Figures are the most indispensable for the continuity and growth of the crime business.
They can be inspiring people, someone with social bonding or innovative skills, but also an
employee who contributes the necessary technical knowledge or vital contacts.
Scripting adds the dimension of substitutability to interventions in criminal networks.
Within the cannabis cultivation special attention could for instance be paid to the role
23 The concept of ‘criminal relationship broker’ has been introduced by Klerks (2000a) and Kleemans et.al. (2002). The relevance of this concept for criminal investigations was explored further in a confi dential Police Academy thesis by Boogers (2010). This author defi nes a broker as ‘(…) a person (…) who manages to bridge holes in the social structure of two or more separate parts of criminal networks and assures that others in the criminal networks remain dependent on his power resources (Boogers 2010 p. 5).
Chapter 3: Bridging science and investigative practice
107
of electricians in the organized cultivation of cannabis. Draining electric current from the
grid in an unobtrusive manner requires a professional with specific knowledge and skills.
Cannabis growers usually manage to locate an electrician prepared to do such a deviant
job in their immediate social network, and even a replacement can often be found in
their network should the need arise. Should both these skilled individuals become unavail-
able however, a replacement would have to be found outside their social circle in order
to ensure the continuity of cannabis production. This would result in stress, unexpected
costs and even conflicts. Things a criminal entrepreneur can hardly afford, especially if
the concealment of operations is put a risk. Such electricians have often been involved
in setting up dozens of plantations, implying that a single police investigation aimed at
an electrician could reveal a large part of the criminal infrastructure. A long-term control
strategy focused on such key Figures can thoroughly disrupt a criminal industry. Other
criminal industries have similar vital functions, such as laboratory technicians, document
falsifiers, money laundering consultants and underground bankers. Most exam papers on
organized crime networks contained clues for the implementation of this control strategy.
3.4 insights regarding aPPlicability
the practitioners’ perspective
Crime analysts recognize the added value of SNA at the tactical and strategic levels of
analysis, e.g. in (preparation for) investigations and in the periodical Inventory of Criminal
Groups. For example, the authors of paper 12 state: “By applying network analysis on
various subjects and criminal groups in a major regional or national database, subjects
fulfilling key positions within and between the networks become visible on a larger scale”.
Periodical application of SNA also emphasizes the dynamics in criminal networks.
Our survey among SNA practitioners made clear that six of the ten regional police units
as well as the National Unit and the Military Police applied SNA in the areas of organized
crime, criminal juvenile groups, cybercrime, child pornography, cold cases and terrorism.
The direct value lies on the one hand in the “broad look” SNA offers on criminal networks:
how did actors get to know each other, what is the nature of their relationships and what
does it imply for their modi operandi, collaboration and interdependence? In combination
with scripting, this provides meaningful insights. In addition, analysts report the use of
SNA for selecting key Figures suitable for interventions during project preparation, as well
as for finding new potential informants and identifying hard-core members among soccer
hooligans and juvenile crime groups. SNA allows for much quicker analysis of extensive
network data compared to traditional methods.
108
However, due to the lack of knowledge about SNA’s benefits among police chiefs and
prosecutors, the potential is still insufficiently recognized. This explains why necessary con-
ditions involving computer hardware and software remain a bottleneck seven years after
SNA was first introduced. SNA processing of large data sets requires substantial computing
power. The suboptimal police systems require that raw data must first be ‘scrubbed and
cleaned’ before being fed into SNA software. This requires extra time, causing analysts and
their managers to stick to traditional analysis methods.
the scientists’ perspective
After Sparrow (1991) had first written about SNA applications in investigative practice in
a public intelligence journal, such empirical analysis of criminal networks did not immedi-
ately become popular overnight. The first empirical SNA publications in fact only began to
appear after Coles (2001) had questioned the lack of interest in SNA in scientific organized
crime research, writing in a much better-read criminological journal. Gradually, Morselli
& Giguere (2006), Morselli et al (2007), Malm et al (2010), Varese (2013) and Calderoni
(2014) began to do the groundwork on SNA in their field of expertise.
Dutch criminologists have so far limited themselves to mostly theoretical discussions about
organized crime from a social network perspective (Fijnaut et al 1995; Klerks 2001; Kl-
eemans & Van de Bunt 2002; Kleemans & De Poot 2008; Spapens 2006; 2012). Spapens
(2012) introduced a useful theoretical distinction between micro, meso and macro networks
in international organized crime, with micro networks involving the individuals actually
involved in criminal business processes in a coordinated manner, in other words all active
criminal relationships. Spapens sees no added value in SNA, applied on micro networks
compared to traditional criminal group analyses. He argues that apparently crucial links
could prove to be easily replaceable on the (then invisible) meso level. Kleemans (2014)
emphasizes validity and reliability issues hindering ‘technical’ SNA based on investigative
information (mainly wiretaps) at the micro level. He advocates analysis “that looks critically
at the position of individuals in criminal networks in a qualitative way, while taking such
limits into consideration”.
The analyzed SNA exam papers demonstrate that the ability to draw valid conclusions
about individual network positions is indeed dependent on insight in the larger networks
in which such operators participate. Several students explicitly consider combining various
data sources as an essential condition for valid network reconstructions, and in the exam
papers quantitative SNA is usually followed by qualitative interpretation of network posi-
tions. Overall, the SNA papers and investigative science theses on SNA discussed in this
article provide solid illustrations of a scientifically grounded SNA practice in the domain of
criminal investigations in The Netherlands.
Chapter 3: Bridging science and investigative practice
109
3.5 conclusions and discussion
For this article, we have studied the application of social network analysis in the investiga-
tive domain, and have described the extent in which this practice is scientifically sound. In
these concluding remarks, we highlight some final interesting aspects.
intelligence vs. investigation
Most SNA-certified analysts subscribe to the view that SNA bring an added value to their
work, but they also point to certain limitations. In the detection phase of the investigative
process, SNA often produces insights that investigative teams are already familiar with,
which can be explained by the fact that data collection is often focused on a limited
number of prime suspects. Zooming in on the immediate periphery of prime suspects
can accentuate how professional criminals actually organize their criminal activities. The
forensic SNA method developed for cold-case investigations also creates new opportunities
for additional investigative work, with the data collection often immediately centered at
the Ego network of the victim (Spreen & Vermeulen 2008; Bosveld 2010).
The main added value of SNA appears to be in the intelligence phase, where combining and
merging of data partly compensates for the bias of separate data sources. In intelligence
work, data collection can be targeted at specific criminal networks at the meso and macro
levels through informants, with a focus on specific SNA aspects. Linking large amounts of
data necessitates the use of quantitative SNA for the argued designation of actors that,
given their network position, require more in-depth qualitative scrutiny. The application
of SNA has no direct consequences for the suspects in this initial phase of primary selec-
tion, before the eventual investigation and possible interventions are initiated. SNA only
contributes to the forming of hypotheses for strategic and tactical decision-making, after
which the criminal detection process might produce evidence.
sna practice and academia
In the context of criminal investigations in The Netherlands, SNA is predominantly car-
ried out by ‘embedded academics’: often trained criminologists, lawyers, administrative,
political and social scientists who subsequently received additional training in investigative
science or security analysis at the Police Academy. Their analyses and conclusions can
stand the test of scientific criticism provided that their methodology is sound and applied
in a responsible manner. They are taught a set scientifically developed and tested SNA
methods and techniques, presented in a context of social science insights grounded in the
academic literature. The SWISNA exam requires a solid scientific foundation as a condition
for students to succeed.
110
Such scientifically based and empirically robust network analyses present an exciting
challenge to the established scientific community. Data-driven analysis of juvenile criminal
groups for example produces different results compared to the hitherto prevailing shortlist
method developed by Beke (Ferwerda 2009). This standard method, now under revision,
has mainly confirmed the concept of divergent groups by relying primarily on interviews
with locally-oriented police officials, thus ‘scientifically validating’ the prevailing concept
of separate offender groups. In studying organized crime, SNA ties in well with current
scientific knowledge, but also requires rethinking the prevailing concept of rather rigid
criminal organizations, which is still the premise underlying many criminal investigations
targeting organized crime (Huisman et al 2011). All this requires a dialogue and perhaps an
enhanced cooperation between academia and police practice. Police embedded academ-
ics, often positioned at the edge between different communities of practice, are ideally
positioned to exploit the high betweenness, credibility and trust that allows them to initiate
collaboration and stimulate the sharing of expertise and resources. Sharing anonymized
datasets and exchanging insights at the network level becomes particularly interesting
when criminologists start to look into advanced SNA applications and are prepared to
share their knowledge with police analysts.
future prospects
SNA offers additional value when compared to traditional analytical techniques, primar-
ily because social and criminal relationships are calculated mathematically. This answers
questions about the strength of networks and variations in concentration therein, their
dynamic development and interactions, the role of key Figures, et cetera. In addition, SNA
embedded in multidisciplinary social science relates socio-psychological and criminological
knowledge to network patterns, thus providing a conceptual framework for understand-
ing the embeddedness of criminal activities in social relationships. This approach values
aspects such as trust and loyalty, power and secrecy, rituals in secluded communities and
economic interests. Departing from these insights, we learn how unlawful behavior can
best be countered. This area of expertise is now developing into a data-driven ‘interven-
tion criminology’ by combining SNA with the scripting of criminal business processes. It
supports an awareness of which agencies in the integrated fight against crime at what
point can best seek cooperation by sharing information pooling resources and combining
specific interventions. Building on the police strategy of ‘nodal orientation’, SNA and the
scripting technique are combined with analysis of the physical criminal infrastructure to
attain a ‘laminate model’ of overlapping criminal dimensions, in which critical nodes of
organized crime are linked to interventions (Klerks & Kop 2004; Klerks 2008).
SNA is also applicable to cyber and financial-economic crime, where oceans of data await
analysis (Visser 2013). Analysts currently try out SNA to unravel networks behind scam-
Chapter 3: Bridging science and investigative practice
111
mers, hackers and producers of child pornography. Van Eck (2013) combined investigative
information with intelligence on human smuggling networks from the Middle East, thus
exposing irregular migration chains within a transnational network of transporters, safe
houses and document providers.
The so-called ‘big data’ revolution characterizing the present era opens new windows of
opportunity to multidisciplinary research (Mayer-Schonberger & Cukier 2013). The term
‘big data’ refers to the ever-increasing diversity, quantity and of accelerated availability of
data available to us. Big data on criminal networks has the potential of revealing answers
about its dynamics and meso/macro structures, which can be difficultly analyzed by the
traditional manual methods of qualitative research. SNA becomes increasingly important
to make sensible selections in these large amounts of data and also opens the door to
a computational approach. Recent studies utilizing computer simulations in combination
with SNA for instance (e.g. Bright et al 2014) help us understand the dynamics of the
complexity behind criminal networks as a result of law enforcement interventions. Such
studies offer the perspective of computational criminology as new criminological discipline.
However, this will never lead to computers deciding which interventions are to be carried
out, provided that the quantitative approach is restricted to providing the means to allow
for theory-driven qualitative interpretation. A multidisciplinary approach is indispensable
because numerical output in itself says little about the ways to approach and control a
criminal network. In forming and testing hypotheses about types of relationships, roles and
positions, the bridge between investigative practice and academia can best be expressed.
A final word of caution seems appropriate. Social network analysis is fairly complex, and
a responsible use will profit from thorough quality control through a peer review process.
An active and well-informed intelligence community, well-connected with the academic
domain, forms the best guarantee for mutual help, inspiration and the dissemination of
innovative knowledge.
This chapter provided an empirical overview of the feasibility and potential of
SNA as a method for detecting and disrupting criminal networks. Although it
has much potential, an important limitation of SNA is that it mainly provides a
static observation of a dynamical phenomenon. Subsequently the application of
SNA has mostly been limited to criminal networks observed on a micro-level. For
more deliberate targeting of criminal networks we need a better understanding
of its macroscopic patterns of resilience and the dynamics that fuels its typical
complex adaptation over time. In the next chapter we use SNA in combination
with modeling macroscopic network behavior through computer simulation to
112
obtain a better understanding of these dynamics and its consequences for effec-
tive disruption strategies.
references
swisna papers
The papers produced during the SWISNA training at the Police Academy are, without
exception, classified as (highly) confidential. Usually, the analyses and reports are based on
individualized data drawn from operational police registers and involve active investiga-
tions that fall within the legal regime of the Law on Police Data. Furthermore, the reports
provide insights into current information positions, resources, and (experimental) detection
methods. Finally, the papers are written by students of the Police Academy in the context
of their training, and as such are not subject to the usual procedures of quality control and
supervision by police management and the Public Prosecutor.

Chapter 3: Bridging science and investigative practice
113
SWISNA exam paper titles
Title (anonymized)
1 Cocaine smuggling
2 Juvenile group
3 Organized cannabis cultivation
4 Chinese human trafficking
5 Import of narcotics
6 Organized cannabis cultivation
7 Juvenile group
8 Juvenile group
9 Juvenile group
10 Organized vehicle theft
11 Organized cannabis cultivation
12 Organized cannabis cultivation
13 Real estate and organized cannabis cultivation
14 Illegal fireworks trafficking
15 Ego network of professional criminal in cocaine trafficking
16 Organized cannabis cultivation
17 Juvenile group
18 Cold case
19 Cold case
20 Juvenile group and street trafficking
21 Production and trafficking of synthetic drugs
22 Cocaine importing
23 Cold case
24 Juvenile group
25 Juvenile group
26 Cannabis and outlaw motorcycle gangs
27 Corruption on airport
28 Organized cannabis cultivation
29 Corruption in the civil service
30 Juvenile group
31 Cold case
32 Cold case
33 Cold case
34 Production of synthetic drugs

114
other literature
[Anonymus] (2013) Criminele netwerken. Onderzoek naar de inzet van sociale netwerkanalyse (SNA)
voor het identificeren van criminele mesonetwerken bij het Team Criminele Inlichtingen (TCI).
WEO-scriptie. Politieacademie, Apeldoorn
Baker WE, Faulkner RR (1993) The social organization of conspiracy: Illegal networks in the heavy
electrical equipment industry. Am Socio Rev, 58 837-860
Bel D van der, Hoorn AM van, Pieters JJTM (2013) Informatie en opsporing. Handboek informatiever-
werving, -verwerking en -verstrekking ten behoeve van de opsporingspraktijk. Kerckebosch,
Zeist
Bonacich P (1987) Power and centrality: A family of measures. Am J Sociol 1170-1182
Boogers JFM (2010) De verbindende schakel. WEO-scriptie. Politieacademie, Apeldoorn
Borgatti SP (2006) Identifying sets of key players in a social network. Comput Math Organiz Theor
12 21–34
Bosveld M (2010) Van je vrienden moet je het hebben… Een verkennend onderzoek naar de to-
epassing van Forensisch Sociale Netwerk Analyse in Cold Case onderzoeken. WEO-scriptie.
Politieacademie, Apeldoorn
Bright DA, Greenhill C, Levenkova N (2014) Dismantling criminal networks: Can node attributes play
a role? In: Morselli C (ed) Crime and Networks. Routledge, New York
Bruinsma G, Bernasco W (2004) Criminal groups and transnational illegal markets. Crime Law Soc
Change 41 79-94
Burt RS (2001) Structural holes versus network closure as social capital. In: Lin N, Cook K, Burt RS (eds)
Social Capital: Theory and research. Transaction, New Brunswick
Bunt H van de, Berg E van den, Kleemans E (1999) Georganiseerde criminaliteit en het opsporingsap-
paraat: een wapenwedloop? Tijdschr Criminol 41 395-408
Calderoni F (2014) Identifying Mafia Bosses from Meeting Attendance. In: Masys A (ed.) Networks and
Network Analysis for Defence and Security. Springer, Cham
Coles N (2001) It’s not what you know – it’s who you know that counts: Analysing serious crime
groups as social networks. Br J Criminol 41 580-594
Cornish D (1994) The procedural analysis of offending and its relevance for situational prevention. In:
Clarke RV (ed.) Crime Prevention Studies (Vol. 3). Criminal Justice Press, Monsey
Dijken B van (sa) SleutelFiguren. Een onderzoek naar sociale netwerkanalyse als instrument binnen de
opsporing. WEO-scriptie. Politieacademie, Apeldoorn
Dijkstra LJ, Yakushev AV, Duijn PAC, Boukhanovsky AV, Sloot PM (2013) Inference of the Russian drug
community from one of the largest social networks in the Russian Federation. Quality and
Quantity 37 1-17
Duijn PAC (2013) Stilstaan of meebewegen? Over de effectiviteit van het opsporingsproces binnen
de politie, belicht vanuit de bestrijding van georganiseerde hennepteelt. Proces 92 176-189.
Duijn PAC, Kashirin VV, Sloot PMA (2014) The Relative Ineffectiveness of Criminal Network Disruption.
Sci Rep 4
Chapter 3: Bridging science and investigative practice
115
Duijn PAC, Klerks PPHM (2014) Social Network Analysis applied to criminal networks: Recent develop-
ments in Dutch law enforcement. In: Masys AJ (ed) Networks and network analysis for defence
and security. Springer, Cham.
Eck R van (2013) Mensenstromen. Sociale processen als bouwsteen voor georganiseerde mensensmok-
kel. WEO-scriptie. Politieacademie, Apeldoorn.
Ferwerda H (2009) Shortlistmethodiek in 7 stappen. Bureau Beke, Arnhem.
Fijnaut CJCF, Bovenkerk F, Bruinsma GJN, Bunt HG van de (1995) Eindrapport georganiseerde criminal-
iteit in Nederland. Enquete opsporingsmethoden. Handelingen Tweede Kamer 1995/96 24072
16.
Fijnaut C, Moerland H (2000) Achtergronden, geschiedenis en praktijk van de criminaliteitsanalyse. In:
Moerland H, Rovers B (red). Criminaliteitsanalyse in Nederland. Elsevier, Den Haag.
Girvan M, Newman ME (2002) Community structure in social and biological networks. Proc Natl Acad
Sci Unit States Am 99 7821-7826
Granovetter MS (1973) The strength of weak ties. Am J Sociol 78 1360-1380
Hanneman RA, Riddle M (2011) A Brief Introduction to Analyzing Social Network Data. In: Scott J,
Carrington P (eds) The SAGE Handbook of Social Network Analysis. SAGE, London
Hartskamp J van (sa) Charting techniques in offender group analysis. In: Heijden T van der, Kolthoff
E (eds) Crime analysis: A tool for crime control. Proc first International Crime Analysis Confer-
ence. Rechercheschool, Zutphen
Huisman S, Duijn PAC, Vis T, Ardon H (2011) Voorkom mismatch tussen Intelligenceproces en de
criminele werkelijkheid. Tijdschr Politie 73(8)
Hulst RC van der (2008) Sociale netwerkanalyse en de bestrijding van criminaliteit en terrorisme.
Justitiële Verkenningen 34(5) 10-32
Kleemans ER (2014) De structuur en dynamiek van criminele netwerken. Boekbespreking van T.
Spapens, ‘Netwerken op niveau’. Tijdschr Criminol 56 91-95
Kleemans ER, Berg EAIM van den, Bunt HG van de (1998) Georganiseerde criminaliteit in Nederland:
Rapportage op basis van de WODC-monitor. WODC, Den Haag
Kleemans ER, Bunt HG van de (1999) The social embeddedness of organized crime. Transnat Organize
Crime 5 19-36
Kleemans ER, Brienen MEI, Bunt HG van den, Kouwenberg RF, Paulides G, Barendsen J (2002) Ge-
organiseerde criminaliteit in Nederland: tweede rapportage op basis van de WODC-monitor.
WODC, Den Haag
Kleemans ER, Poot CJ de (2008) Criminal careers in organized crime and social opportunity structure.
Eur J Criminol 5 69-98
Klerks P (1994) Sociale netwerkanalyse. Een literatuurstudie teneinde de bruikbaarheid vast te stellen
voor politiële onderzoeken. Erasmus Universiteit/Regiokorps Haaglanden, Rotterdam/Den Haag
Klerks PPHM (2000a) Groot in de hasj: theorie en praktijk van de georganiseerde criminaliteit. Samson
Kluwer Rechtswetenschappen, Antwerpen
Klerks P (2000b) Criminele samenwerking. In: Moerland H, Rovers B (red) Criminaliteitsanalyse in
Nederland. Elsevier, Den Haag
116
Klerks P (2001) The network paradigm applied to criminal organisations: Theoretical nitpicking or
a relevant doctrine for investigators? Recent developments in the Netherlands. Connections
53-65
Klerks P (2008) Het Laminaatmodel. Een analytisch kader voor georganiseerde criminaliteit. Presenta-
tie voor analisten G4 en DNRI. Utrecht, January 17 2008
Klerks P, Kop N (2004) De analyse van criminele infrastructuren. Verslag van een pilotproject. Poli-
tieacademie, Apeldoorn
Krebs VE (2002) Mapping networks of terrorist cells. Connections 24 43-52
Lampe K von (2009) Human Capital in Criminal Networks: Introduction to the Special Issue on the
7thBlankensee Colloqium. Trends Organize Crime 12 93-100
Lansbergen J (2014) De veelkoppige draak. Doelwitselectie en bestrijding van Chinese criminele
netwerken in Nederland. WEO-scriptie. Politieacademie, Apeldoorn
Lindelauf R, Borm P, Hamers H (2009) The influence of secrecy on the communication structure of
covert networks. Soc Network 31 126-137
Malm A, Bichler G, Walle S. van de (2010) Comparing the Ties That Bind Criminal Networks: Is Blood
Thicker Than Water? Secur J 23 52-74
Mayer-Schonberger V, Cukier K (2013) Big Data: A Revolution That Will Transform How We Live,
Work, and Think. Houghton Mifflin Harcourt, Boston
Morselli C (2009) Inside Criminal Networks. Springer, New York
Morselli C (ed) (2014) Crime and networks. Routledge, New York
Morselli C, Giguere C (2006) Legitimate Strengths in Criminal Networks. Crime Law Soc Change 43
185-200
Morselli C, Giguere C, Petit K (2007) The efficiency/security trade-off in criminal networks. Soc Net-
work 29 143-153
Morselli C, Roy J (2008) Brokerage qualifications in ringing operations. Criminology 46 71-98
Natarajan M (2006) Understanding the structure of a large heroin distribution network: A quantitative
analysis of qualitative data. J Quant Criminol 22 171-192
Neve R, Moerenhout L (2009) Sociale netwerkanalyse: een mogelijk hulpmiddel voor criminaliteits-
analyse? KLPD Dienst IPOL, Zoetermeer
Putten C van der (2013) Roofkip of stille kracht? Een onderzoek naar de rol van vrouwen binnen
criminele netwerken die zich in de periode van 2005 tot en met 2010 bezighielden met ge-
organiseerde synthetische drugsproductie in Zuid-Nederland. WEO-scriptie. Politieacademie,
Apeldoorn
Robins G (2008) Understanding individual behaviours within covert networks: The interplay of indi-
vidual qualities, psychological predispositions, and network effects. Trends Organize Crime 12
166-187
Scott J (2013) Social Network Analysis (third edition). SAGE, London
Scott J, Carrington P (eds) (2011) The SAGE Handbook of Social Network Analysis. SAGE, London
Seidman SB (1983) Network structure and minimum degree. Soc Network 53 269-287
Chapter 3: Bridging science and investigative practice
117
Spapens ACM (2006) Interactie tussen criminaliteit en opsporing: de gevolgen van opsporingsac-
tiviteiten voor de organisatie en afscherming van XTC-productie en -handel in Nederland.
Intersentia, Antwerpen
Spapens T (2012) Netwerken op niveau. Criminele micro-, meso- en macronetwerken. Inaugurele rede
Tilburg University
Sparrow MK (1991) Network Vulnerabilities and Strategic Intelligence in Law Enforcement. Int J Intel-
ligence Counterintelligence 5 255-274
Spreen M, Vermeulen Th (2008) Netwerkprofilering in ‘cold cases’. Justitiële Verkenningen 34 5 51-59
Sutherland EH (1939) Principles of Criminology. Lippincott, Philadelphia
Tompson L (sa) Crime script analysis. UCL Jill Dando Institute of Crime Science, London. www.ucl.
ac.uk/jdi/events/int-CIA-conf/ICIAC11_Slides/ICIAC11_5D_LTompson Retrieved March 6, 2016
Toth N, Gulyas L, Legendi RO, Duijn PAC, Sloot PMA, Kampis G. (2013) The importance of centralities
in dark network value chains. Eur Phys J Spec Top 222 6 1413-1439
Varese F (2013) The Structure and the Content of Criminal Connections: The Russian Mafia in Italy.
Eur Sociol Rev 29 899-909
Verhoeven WJ (2009) Telefoontaps als netwerkdata? Mogelijkheden en beperkingen om telefoontaps
te gebruiken voor SNA van georganiseerde criminaliteit. Tijdschr Veiligh 8 2 41-51
Vis T (2012) Intelligence, Politie en Veiligheidsdienst: Verenigbare Grootheden? Ticc Ph.D No 22
Visser R (2013) Effecten van politie-interventies. Onderzoek naar de ontwikkeling van een crimineel
netwerk na een politie-interventie. WEO-scriptie. Politieacademie, Apeldoorn
Wasserman S, Faust K (1994) Social Network Analysis: Methods and Applications. Cambridge Univer-
sity Press, New York.

UvA-DARE is a service provided by the library of the University of Amsterdam (http://dare.uva.nl)
UvA-DARE (Digital Academic Repository)
Detecting and disrupting criminal networks
Duijn, P.A.C.
Link to publication
Citation for published version (APA):Duijn, P. A. C. (2016). Detecting and disrupting criminal networks: A data driven approach
General rightsIt is not permitted to download or to forward/distribute the text or part of it without the consent of the author(s) and/or copyright holder(s),other than for strictly personal, individual use, unless the work is under an open content license (like Creative Commons).
Disclaimer/Complaints regulationsIf you believe that digital publication of certain material infringes any of your rights or (privacy) interests, please let the Library know, statingyour reasons. In case of a legitimate complaint, the Library will make the material inaccessible and/or remove it from the website. Please Askthe Library: http://uba.uva.nl/en/contact, or a letter to: Library of the University of Amsterdam, Secretariat, Singel 425, 1012 WP Amsterdam,The Netherlands. You will be contacted as soon as possible.
Download date: 26 Jan 2017

Chapter 4The Relative Ineffectiveness of Criminal Network Disruption 24
24 A previous version of this chapter was published as Duijn, P.A.C.; V. Kashirin and P.M.A. Sloot: The Relative Ineffectiveness of Criminal Network Disruption. Scientifi c Reports, vol. 4, pp. 4238+15. Nature Publishing Group/Macmillan, 2014. ISSN 2045-2322.
120
abstract
Objective: Researchers, policymakers and law enforcement agencies across the globe
struggle to find effective strategies to control criminal networks. The effectiveness of
disruption strategies is known to depend on both network topology and network resil-
ience. However, as these criminal networks operate in secrecy, data-driven knowledge
concerning the effectiveness of different criminal network disruption strategies is very
limited. The first objective is to unravel the dynamics of the interaction between disruption
and resilience within criminal networks. The second objective is to find the most effective
criminal network disruption strategy according to this model, by simulating the effects of
different network disruption strategies on network topology.
Methods: We combine methods of computational modeling and social network analysis
to simulate the behavior of a criminal network involved in organized cannabis cultivation
based on intelligence data from the Dutch Police.
Network data: N=22.000 Nodes
Results and Conclusions: By combining computational modeling and social network analy-
sis with unique criminal network intelligence data from the Dutch Police, we discovered,
in contrast to common belief, that criminal networks might even become ‘stronger’,
after targeted attacks. On the other hand increased efficiency within criminal networks
decreases its internal security, thus offering opportunities for law enforcement agencies to
target these networks more deliberately. Our results emphasize the importance of criminal
network interventions at an early stage, before the network gets a chance to (re-)organize
to maximum resilience. In the end disruption strategies force criminal networks to become
more exposed, which causes successful network disruption to become a long-term effort.
Chapter 4: The Relative Ineffectiveness of Criminal Network Disruption
121
4.1 introduction
Organized crime forms a great threat to societies across the globe. International criminal
drugs organizations try to infiltrate legal businesses and governments, infecting economic
branches with corruption and violence. Moreover, upcoming threats like cybercrime, child
porn, maritime piracy, match fixing and identity theft cause substantial harm and ask
for proactive interventions to control the criminal organizations behind them (Europol,
2011; UNODC, 2010). Government and law enforcement agencies worldwide seek ways
to disrupt these criminal organizations effectively, preferably at an early stage. Over the
past decade a growing number of studies emerged that provide empirical evidence of the
use of social network analyses to get a better understanding of organized crime. These
studies show that criminal organizations need to be considered as social networks that
form collectives rather than organizations with unique features, such as flexible and non-
hierarchical internal relations (Klerks, 2001; Krebs, 2001; Natarajan, 2006; Morselli, 2009;
Spapens, 2010; Sparrow, 1991; UNODC, 2010; . This approach has serious implications
for the way we think about law enforcement control of organized crime. It has long been
assumed that targeting the ‘kingpin’ leader at the top of the pyramid structured mafia
organization, would result in the collapse of the entire criminal organization (Klerks, 2001;
Raab & Milward, 2003; Spapens, 2010). However, new insights from social network analy-
ses emphasize that the fluidity and flexibility of the social structure of criminal networks
makes them highly resilient against these traditional law enforcement strategies (Morselli,
2009) For instance, it was found that even though a drug trafficking network was structur-
ally targeted over a substantial period of time, the trafficking activities continued and its
network structure adapted (Morselli & Petit, 2007). Research concerning the resilience of
criminal networks involved in the production of ecstasy in the Netherlands lead to the same
conclusions (Spapens, 2010). How can this be explained?
the complexity of criminal networks
An answer to this question can be found within the specific features of the associated
‘dark’ network structures and, more importantly, the conditions under which these exist
(Erickson, 1991; Raab & Milward, 2003). Criminal network structures are known to be
very complex systems. As Morselli describes it “Criminal networks are not simply social
networks operating in criminal contexts. The covert settings that surround them call for
specific interactions and relational features within and beyond the network” (Morselli,
2009). Criminal networks therefore differ from legal networks in that they face a constant
trade-off between security and efficiency which directly affects its network structure (. On
the one hand illegal activities need to stay concealed from the government or criminal
competition. This means that direct communication between co-conspirators concerning
illegal activities needs to be restricted to a minimum. On the other hand, risks have to be
122
taken in times of action, often demanding highly efficient communication and trust among
the participants (Erickson, 1981; Morselli et el., 2006)(12,14). Criminal networks therefore
continuously balance between efficiency and security according to the given circumstances
of the illegal activities.
This trade-off has a direct effect on its network structure as revealed by a study from
Baker and Faulkner (1993)). They found that within a covert network, involved in a
price-fixing scheme, the most important actors deliberately operated from the peripheries
of the network, thus protecting these essential players from immediate detection after
government intervention. In addition, Morselli et al. found that the balance between ef-
ficiency and security within covert networks was influenced by its network objective. They
compared the structure of a criminal network with terrorist networks and showed that
criminal networks need more efficiency in their direct lines of communication as compared
to terrorist networks. Consequently, this made them less secure and more vulnerable to
disruption (Morselli et al., 2006). This can be explained by the fact that economically driven
criminal networks need shorter time frames between action (time-to-task) as opposed to
ideologically driven terrorist networks. Terrorist networks might achieve their goals by just
one successful terrorist attack. Criminal networks are often action oriented, resulting in
higher levels of risk of becoming detected. In response, criminal networks try to remain
flexible and agile. This flexibility gives them the ability to adapt quickly to external shocks
(Raab & Milward, 2003; Kleemans & Van de Bunt, 1999) .
Although these studies help us to understand that remaining flexible is the key to criminal
network resilience against disruption, little is known about how these flexible network
structures actually recover from an attack and continue their illegal activities. In other words:
What actually makes these flexible criminal network structures so difficult to disrupt? In
search for an answer, we first need to understand that like every social network, criminal
networks are not static, but dynamic in nature (Sparrow, 1991; Morselli, 2009). Criminal
networks can change for several reasons: as a result of new business opportunities, as a
consequence of competition that requires a defensive orientation or as a direct result of
law enforcement controls that may lead to the downfall, stagnation or adaptation of the
network (Morselli, 2009). The changing effects of network disruption can therefore only be
understood within its dynamics; these networks are truly complex adaptive systems (Sloot
et al., 2013). Many researchers of criminal networks agree that “studying … the dynamics
in criminal networks is probably the most challenging obstacle facing anyone approaching
this area.” (Sparrow, 1991; Morselli, 2009) Although we recognize the complexity and
difficulty that is associated with studying change within social networks, we attempt to
capture these dynamics within a computational framework.
Chapter 4: The Relative Ineffectiveness of Criminal Network Disruption
123
research aim
The aim of this study is twofold. The first aim is to unravel the dynamics of the interaction
between disruption and resilience within criminal networks. Understanding these dynam-
ics might have major implications for the way we think about control strategies aimed at
organized crime. The second aim is to find the most effective criminal network disruption
strategy according to this model, by simulating the effects of different network disruption
strategies on network topology. We combine methods of computational modeling and so-
cial network analysis to simulate the behavior of a criminal network involved in organized
cannabis cultivation based on intelligence data from the Dutch Police.
organized cannabis cultivation as a criminal network problem
Organized cannabis cultivation is one of the growing problems concerning international
organized crime throughout different continents (Bouchard, 2007b; Decorte, 2010; Malm
et al., 2011; Potter, 2010). Recent studies show that cannabis cultivation is associated with
the use of more sophisticated methods, from outdoor cannabis sites towards sophisticated
indoor settings. A Dutch study based on a study of 19 closed police investigations reveals
that cannabis cultivation is a hard crime, involving extreme violence and mutual rip-offs
and is rapidly expanding internationally (Spapens et al., 2007). Different studies concern-
ing cannabis cultivation reveal expanding co-operations between criminal networks from
Belgium, the Netherlands, Germany and the UK (Spapens et al., 2007; Potter et al., 2011).
Outside the EU these trends are also observed within Canada and the US (Malm et al.,
2011). These trends of worldwide expansion and increased levels of sophistication and
violence, indicates that cannabis cultivation involves professional criminal cooperation with
many roles and functions.
Although different countries recognize organized cannabis cultivation as a serious problem,
different studies show that law enforcement efforts do not seem to have reduced the prob-
lem (Decorte, 2010; Spapens et al., 2007; Wouters, 2008)). Current interventions show no
significant effect on large-scale growers, although proximately 6000 cannabis cultivation
sites are being dismantled annually. A first reason is that thorough investigations of the
criminal networks behind large-scale cannabis cultivation are extremely time-consuming
and costly (Wouters, 2008). Secondly law enforcement interventions in for instance The
Netherlands aimed at cannabis cultivation can be described as a hit-and-run practice,
busting a maximum number of sites with maximum efficiency without paying attention
to the potential impact on the associated criminal networks (Decorte, 2010; Wouters,
2008). This seemingly lack of effective strategy within law enforcement interventions was
also recognized for the UK situation (Potter, 2010). It was observed that law enforce-
ment strategies focused on cannabis cultivation was largely reactive in nature, instead of
proactively disrupting the responsible criminal networks. These studies all recognize the
124
fact that law enforcement control strategies aimed at organized cannabis cultivation lack
a focused direction and strategy.
These criminal network problems do not exclusively relate to the control of criminal net-
works involving organized cannabis cultivation, rather they are observed within the control
of criminal networks at large (Klerks, 2001; Morselli, 2009; Spapens, 2011). Understand-
ing how the observed cannabis cultivation network adapts to network disruption, might
therefore contribute to a better understanding of the effectiveness of disruption strategies
and network resilience. Before we discuss our research design in detail, we introduce the
concepts of criminal network disruption and criminal network resilience.
the concept of criminal network disruption
According to previous studies, three indicators of network destabilization can be distin-
guished: a reduction in the rate of information flow in the network, a reduction in the
ability to conduct its tasks or a failure or significant slowing down of the decision making
process (Carley et al., 2002). Therefore network disruption can be defined in general as
the state of a network that cannot efficiently diffuse information, goods and knowledge
(Carley et al., 2003). Based on previous studies, strategies for criminal network disruption
can be divided into two main approaches: The social capital approach and the human
capital approach.
The social capital approachThe social capital approach aims at strategic positions that individual actors occupy within
criminal networks (Sparrow, 1991; Klerks, 2001; Natarajan, 2006; Carley et al., 2002;
Schwartz & Rouselle, 2009) ). Like legal business, criminal networks depend to a large
extent on social contacts and the ability to extract the necessary resources for their op-
erations. The advantages that result from having social networks is called social capital
(Coleman, 1990; Hulst, 2009). Research in this field is often based on social network
analysis (SNA) to identify central actors in the network, that are associated with influential
or powerful positions of social capital (Cook & Burt, 2001). There are many ways within
SNA to measure network centrality, but the two most common centrality measures that
relate to strategic positions are degree centrality and betweenness centrality (Sparrow,
1991; Klerks, 2001).
Degree centrality measures the number of direct contacts surrounding an actor (Wasser-
man & Faust, 1994). Because high scores on degree centrality as associated with better
access to resources, these actors are associated with influential and powerful positions
within social networks. Since they are important for the flow of information and resources
throughout the network, these actors are called hubs. Hubs have major influence on
Chapter 4: The Relative Ineffectiveness of Criminal Network Disruption
125
overall network structure, networks that gravitate around a few hubs, for instance, are
defined as ‘scale-free’ (centralized) networks. In social network terms these networks are
characterized by a power-law degree distribution, which means that a small percentage
of actors have a large number of links (Albert et al., 2000). In addition, it was found that
scale-free networks are resistant against random attacks, because the majority of less con-
nected nodes will more likely be targeted (Watts & Strogatz, 1998.). Moreover, the loss of
peripheral nodes for networks with central hubs is less significant for its network survival.
On the contrary, decentralized networks are mostly affected by random attacks because
the loss of any single actor will be more important for the remainder of the network.
Ironically, in the context of targeted attacks, network vulnerability inverses: central actors
are more likely targeted, making centralized networks more vulnerable than decentralized
networks. Knowledge of a network’s structural features is therefore essential before the
effects of any network intervention can be understood.
As opposed to degree centrality, betweenness-centrality incorporates the indirect contacts
that surround an actor and is calculated by the number of times that an actor serves as a
bridge (shortest paths) between other pairs of actors (Albert et al, 2000; Freeman, 1979)).
Therefore betweenness centrality represents the ability of some actors to control the flow
of connectivity (information, resources etc.) within the network. ((Burt et al., 1998; Burt,
2008))). Because these actors often bridge the ‘structural holes’ between disconnected
(sub)groups, these actors are called ‘brokers’. Burt explained the importance of brokers for
an increase of social capital within entrepreneurial networks. Entrepreneurs on either side
of the brokerage position rely on the broker for indirect access to resources and informa-
tion beyond their reach (Burt et al., 1998; Burt, 2008). There is empirical evidence that
brokers play important roles in connecting criminal networks connecting separate criminal
collectives within illegal markets (e.g. Boissevain, 1994; Coles, 2001; Morselli & Roy, 2009;
Morselli, 2001; Klerks, 2000). By attacking these brokers, important non-redundant op-
portunities to expand an illegal business might decrease. This is especially relevant for
decentralized networks, such as terrorist networks (Krebs, 2002). Based on these studies
betweenness centrality attack is recognized as another important strategy for criminal
network disruption. In line with these studies, both centrality strategies will be applied
to the organized cannabis cultivation network within our models for network disruption
(Section 6.3).
Although centrality strategies can be a very effective approach for disrupting centralized
or decentralized networks in general, the application of this approach within criminal
networks is not without discussion (Morselli, 2009). Peterson argues that the most cen-
tral actors in covert networks might also be the most visible. Therefore, they might be
the most likely to be detected. According to Peterson (1994) high degree centrality can
126
therefore also be associated with vulnerability instead of strength ). In addition, Carley, Lee
and Krackhardt (2001) also demonstrate that the most central actor isn’t necessarily the
network member with the most leadership potential. For instance, they found that in net-
works where leadership and centrality are fulfilled by different actors, targeting the central
node would not necessarily lead to a downfall of the network and that a targeted leader is
not necessarily replaced by the most central actor (Carlet et al., 2002). Robins emphasizes
that features of network topology also interact with individual-level factors. Therefore,
qualities of individual actors (e.g. skills, expertise, information and knowledge) cannot be
ignored in understanding the complex dynamics within criminal networks(Robins, 2008).
In addition, a recent finding by Quax, Appoloni and Sloot (2013) show the diminishing role
of hubs in dynamical processes on complex networks, indicating the need for alternative
intervention strategies . These studies illustrate that although the centrality approach is a
useful approach to identify potentially ‘critical’ actors for criminal network disruption, an
additional qualitative assessment on the individual level is essential for understanding the
effects of network disruption. Moreover, besides centrality propositions, individual qualities
(human capital) might be a vital criterion for selecting critical actors for network disruption
by itself. This is called the ’human capital’ approach.
The human capital approachThe importance of the human capital approach to criminal network disruption has been
addressed by several authors (e.g. Sparrow, 1991; Klerks, 2001; Tsvetovat & Carley, 2003)).
Human capital is a term originated from economics that is defined as the stock of com-
petencies, knowledge, social and personality attributes, including creativity, embodied in
the ability to perform labor so as to produce economic value. Equal to legal business,
every criminal market consists of a business process involving different steps of production
or activity. (klerks, 2001; Morselli, 2009; Spapens, 2011). In each sequent step of the
process different information, goods and human capital is exchanged and added to the
next, following a chainlike structure. This process can therefore be defined as a value chain
(Gottschalk, 2009). Every step of the value chain requires a different range of skills and
knowledge human capital, depending on the specific characteristics of the illegal activity
(Morselli & Roy, 2008; Cornish, 1994; Bruinsma en Bernasco, 2004). Illegal entrepreneurs
involved in different criminal markets find these ‘human resources’ in embedding trusted
social networks. In this way human capital is assembled and integrated into tight goal-
oriented criminal collectives.
Sparrow suggested that identifying the actors fulfilling the most specialized tasks offers
great opportunities for destabilizing the criminal network. Hence, as these are often thinly
populated within the embedding social networks, they are the most difficult to replace if
extracted from the network. Sparrow argues that ‘substitutability’ might therefore be an
Chapter 4: The Relative Ineffectiveness of Criminal Network Disruption
127
important criterion for network disruption (Sparrow, 1991). To understand the structure
of a criminal value chain Cornish introduced the crime scripting method (Cornish, 1994)).
This method helps systematize knowledge about the procedural aspects and procedural re-
quirements of crime commission, by generating a blueprint of all sequential phases within
the value chain. In addition, Bruinsma and Bernasco (2004) combined this crime scripting
method with social network analysis, to identify ‘human capital’ and ‘substitutability’
within criminal networks. They found that specific specialized roles could be identified
in different criminal markets by analyzing crime scripts within the context of the criminal
network. Morselli and Roy (2008) applied this method to study ‘brokerage roles’ within
criminal value chains. Their observations reveal that ‘value chain brokers’ were essential
for integrating ‘human capital’ from the criminal network, within the different phases of
the value chain. In addition, Spapens identified this brokerage role within Dutch ecstasy
production value chains and observed that these brokers not only increased ‘social capital’
within these criminal collectives, but added ‘human capital’ as well (Spapens, 2010).
Hence, these brokers possessed sufficient resources and reputation that is essential to initi-
ate and coordinate a ecstasy production value chain. In fact, these findings emphasize that
combining social capital approach and the human capital approach the effects of network
disruption might be amplified. It can be concluded therefore that crime script analysis is an
important method for identifying ‘human capital’ within criminal value chains.
the concept of criminal network resilience
As a consequence of being disrupted, criminal networks develop the capacity to absorb
and withstand disruption and to adapt to change when necessary, that is called network
resilience. According to several authors the concept of resilience consists of two aspects:
first, the capacity to absorb and thus withstand disruption and secondly the capacity to
adapt, when necessary, to changes arising from that disruption (Bouchard, 2007; Ayling,
2009).
The first aspect of the resilience concept depends on the level of redundancy that is inhab-
ited in its criminal network structure. The more its network structure is characterized by
high levels of redundancy in sense of diversity of relationships between actors, the more
options there are to compensate for loses in ‘human capital’ or finding new methods to
continue the value chain (Williams, 2001). Redundancy enables members of the network
to take over tasks of actors that are targeted by successful law enforcement operations.
Even if some connections are broken, the diversity of different ties between actors allows
the network to function. Redundancy in the network is associated with strong ties between
network members. Strong criminal ties offer reciprocated trust, which is essential within
the uncertain and hostile criminal environment (Morselli, 2009). Replacements with a reli-
able reputation are therefore often found within the social connections directly embedding
128
the actors involved within the criminal business process. These cohesive criminal collectives
often initiate from already established social networks of for instance kinship, friendship
or affective ties (McCarthy et al., 1998; Kleemans & De Poot, 2008). This means that
replacements are often found in short social distances, from this cohesive core.
However, actors with essential skills or knowledge might have to be replaced. If these
specialists are thinly populated within these redundant collectives, replacements have to
come from the ‘external’ criminal environment. In these settings non-redundant social
connections within the embedding network become important for finding ‘human capital’
at a greater social distance from the trusted criminal core. As described above ‘criminal
brokers’ are essential catalysts for finding these replacements within the embedding net-
work (Morselli & Petit, 2007). This principle is called the ‘strength of weak ties’, were non-
redundant ties within the embedding network offer access to new opportunities, resources
and information, that are not available within redundant networks (Granovetter, 1983;
Hagen & McCarthy, 1995) work offers a framework for understanding criminal network
phenomena, such as criminal careers in organized crime. For instance, is was found that
the social opportunity structure of social ties offers an explanation for late-onset offend-
ing and people switching from conventional jobs to organized crime, also later in life
(Kleemans & De Poot, 2008).
Although weak ties might reveal new business opportunities, finding replacements across
these connections inhabits great risks to network security for two reasons. First, trust is
more easily built between like-minded individuals, as compared to outsiders from differ-
ent social and ethnic backgrounds (Spapens, 2010; Kleemans & Van de Bunt, 1999). This
means that criminal networks in search for capable and trustworthy replacements might
need to cooperate with criminal actors for who reliability is difficult to assess. Secondly,
coordinating the search for replacements from the embedding network demands more
efficient ways of internal and external communication. This increased transfer of informa-
tion as a result of disruption or internal ‘noise’ within social networks in general, was
also observed in a study of artificial complex networks (Czlaplicka et al., 2013). This study
shows that stochastic resonance in the presence of noise can actually enhance information
transfer in hierarchical complex social networks, such as illegal networks . However, this
increased transfer of information containing potential incriminating evidence throughout
the network, also increases the risk of exposing the whole network by a single arrest
(Lindelauf et al., 2009; Lauchs et al., 2012)). The capacity to adapt to these changed
circumstances of increased risk refers to the second aspect of the resilience concept.
In adapting to these changed security settings, controlling the flow of information becomes
the number one priority within illegal networks (Ayling, 2009). Based on previous studies,
Chapter 4: The Relative Ineffectiveness of Criminal Network Disruption
129
this is often achieved through ‘compartmentalization’, meaning that important information
is isolated within different compartments or ‘organizational cells’. This strategy prevents
that the whole network becomes exposed, if one compartment becomes detected and dis-
rupted (Williams, 2001). As described above, this compartmentalization is often found in
terrorist networks with longer times to task (Krebs, 2002). In addition, Baker and Faulkner
(1993) also found a level of compartmentalization between the core and periphery within
illegal price-fixing networks as a result of disruption . By deliberately separating the flow of
information between members within the periphery and the ‘visible’ core, the price-fixing
network decreased the chance of the ‘leaders’ becoming exposed after a single arrest.
These studies show that in order to adapt to the changing circumstances after disruption,
criminal networks tend to organize a form of non-redundancy within their internal flow
of information in order to protect their important members from becoming discovered.
In fact, these features make criminal network resilience a paradoxical concept. On the
one hand it depends on redundancy, that’s essential for finding trustworthy replacements
after losses due to disruption. On the other hand it depends on non-redundancy, as the
increased risks associated with the search replacement, demand compartmentalization of
the flow of information to prevent further detection. The importance of either aspect
depends on the given network objectives of recovery or security at a certain moment. This
demonstrates again that criminal network resilience is a dynamical process that evolves
along the tradeoff between efficiency and security which shapes its network structure
accordingly.
4.2 research design and datasets
As described above, the aim of this study is to unravel the dynamics of resilience within
criminal networks, as a consequence of network disruption. This is done by simulating and
observing the mechanisms of disruption and –resilience in a criminal network involved in
cannabis cultivation. First, we introduce five different approaches for network disruption,
according to strategies based on the ‘social capital’- and ‘human capital’ approach previ-
ously described. Secondly, we introduce three models for network recovery, according to
the principles associated with the resilience concept described above. These include redun-
dancy and non-redundancy in relation to the social structure embedded in the disrupted
criminal network. By simulating these disruption strategies and resilience mechanisms at
the same time, we observe the way this affects its network structure in terms of efficiency
and security. Our simulations are aimed at a real life criminal cannabis cultivation network
that we analyzed from a large unique dataset obtained by a regional criminal intelligence
unit resorting under the Dutch Police. This dataset contains information on criminals, crimi-
130
nal relationships and criminal activities collected over the period January 2008 – December
2011. The details of the datasets are described in the next Section, followed by a descrip-
tion of the final network representation and its properties in terms of degree distribution.
datasets
The dataset utilized in this research is built by the aggregation of two distinct datasets:
Dataset Soft and Dataset Hard, details of these datasets are provided in Appendix 4A (p.
125)
Dataset Soft (Dsoft)The data for this dataset was collected by a regional criminal intelligence unit resorting
under the Dutch police over the period January 2008 – January 2012. The data is primar-
ily retrieved from criminal informants and consists of anonymous intelligence reports on
criminals and their criminal relationships involved in serious- and organized crime (N =
6020). Secondly, it contains information and reports from closed criminal cases aimed at
organized crime. Both data sources contain specific variables on the individual roles that
network actors occupy within different illegal markets in relation to the specific crime
scripts (e.g. cannabis cultivation and trade, cocaine trade, heroin trade, ecstasy production
and trade, trafficking of human beings etc.). These role variables are scored by intelligence
analysts through structural analysis of intelligence reports on role specific information.
Criminal informants have different motives to talk to the police and their identities stay
covered for security reasons. In some cases, this makes it difficult to check the facts. For
this reason this data is called soft data. Therefore we call this dataset soft (Dsoft). However,
based on detailed intelligence reports written after every conversation, the reliability of
facts were checked by intelligence analysts by comparing this soft information with facts
covered in other police data sources, such as criminal investigations data or street police
reports. In addition to intelligence retrieved from criminal informants the dataset therefore
also contains observations from street police officers during their duty and information from
(closed) criminal investigations. This includes detailed data from wiretaps and surveillance
reports, as well as eyewitness and suspect statements containing additional information
about criminal relationships. Incidentally information retrieved from online communities
(e.g. Facebook) was also used in addition to construct relations between all known actors
in the criminal network.
The main strength of this dataset is therefore that it contains detailed narrative infor-
mation on criminal cooperation, individual roles and involvement within illegal markets
from multiple data sources, including informants that are sometimes part of the criminal
network themselves. This offers the opportunity to combine methods of crime scripting
Chapter 4: The Relative Ineffectiveness of Criminal Network Disruption
131
with social network analysis. Moreover it involves information about important criminal
individuals that were never arrested nor detected within criminal investigations. In addition
to previous studies on criminal networks that are based on closed criminal investigations,
this dataset might give a unique perspective on criminal network structure, including the
role of actors that are never observed before.
A weakness of this dataset is that it is in part biased; there is a reasonable possibility that
there are some blind spots within the criminal network we do not know about, because
there aren’t informants within these networks. Another point of concern is that data col-
lection is affected by police priorities. Secondly, not all facts that are written within the
intelligence reports can be checked. This might be a risk to reliability of the data, if we
want to look at a single criminal relationship in detail. However, for this study we are only
interested in features of the overall network structure, therefore our results will not be
affected by one or two false reports. Moreover, informants that turn out to be unreliable
are fired directly; this results in a kind of natural selection of the most reliable informants.
In order to alleviate some of these weak aspects we introduce a second dataset: Dataset
Hard.
Dataset Hard (Dhard)This dataset consists of arrest records over the period 2008 – 2011. The dataset on arrest
information consists of persons with a police arrest registration dating from the period
2008 until 2011 (N = 24.284) within the same police region from which the soft data was
collected. Every police suspect is registered into a police database with a connection to her
or his arrest registrations. This arrest record contains variables of the date, time, place and
law article for which they were arrested. This means that in case more actors are arrested
for the same felony, they are connected to the same arrest record. Therefore, it can be
assumed with a reasonable level of certainty, that these actors have a criminal relationship
at the time of the arrest registration.
The strength of this dataset is that it was retrieved from police officers themselves, which
makes it reliable. For instance, every personal identity is being checked on the bases of
identification. In practice police officers need more hard evidence than solely a criminal
intelligence report to arrest a potential suspect. Therefore, all potential criminal relation-
ships following this dataset are based on more concrete evidence as opposed to dataset
soft. Therefore, we’ll call this dataset hard (Dhard). Secondly it is bulk data over a relatively
long period of time containing many criminal relationships. This offers the opportunity
two recover a network structure based on arrests. Unfortunately arrest registrations do not
contain much narrative information. Another weakness of this dataset is that important
network actors might be under represented in this dataset, because they don’t get arrested
132
easily as opposed to the more visible working roles in these networks. In addition, these
arrest records are also to a certain extend biased towards police priorities.
The description of both datasets reveals that this study isn’t immune to the same dark Figure
problem that influenced previous criminal network research (e.g. 7). However, every source
of data offers another perspective on the criminal network that is the focus of this study.
By combining intelligence reports (soft) with criminal investigations data, surveillance data
and arrest data (hard), different perspectives of the same criminal network complement
each other in offering us the most optimal observation of the criminal network possible.
the criminal network structure
As described above, the key property of the current dataset is the presence of information
about criminal activities of actors, their individual roles and connections to other actors.
By combining the two datasets we have recovered the structure of a criminal network
involved in multiple criminal markets operating within the Netherlands. In accordance
criminal network theory described above, we can distinguish between two network levels:
the criminal network involved in a specific illegal market and the (social) embedding macro-
network from which criminal cooperation originates (McCarthy et al., 1998; Kleemans &
Van de Bunt, 1999; Spapens, 2010). The embedding macro network contains all actors
and criminal relationships between all actors disregarding their illegal activities. A criminal
relationship is defined as the social links that enable individual members of the network
to freely exchange information about potential illegal activities. Therefore this embedding
network is called the ‘macro network’, and we will denote it byGMacro. By itself, GMacro is
built up from the dataset Dsoft, which is collected by criminal intelligence operations as
well as the dataset Dhard , which is gathered from arrest registrations. In constructingGMacro,
the two datasets show little overlap (see Table 1). This can be explained by the fact that
central key players are often protected by the network structure, and therefore have a
lower chance of becoming arrested, as compared to actors directly involved in the value
chain. As a consequence these actors are generally underrepresented within investigative
or arrest data, which also characterizes dataset Dhard. In contrast dataset Dsoft is built from
criminal intelligence gathering and is collected with the specific aim of identifying the
invisible actors, who stay largely unknown within criminal investigations. Both datasets
therefore offer a different observation of the same criminal network. The combination
of these two observations provides us with a unique empirical perspective of a criminal
network structure.
The second level of network structure consists of all actors involved in the specific value
chain of organized cannabis cultivation. This second level micro-network is obtained by
removals of all actors and connections from GMacro, which are not involved in the value
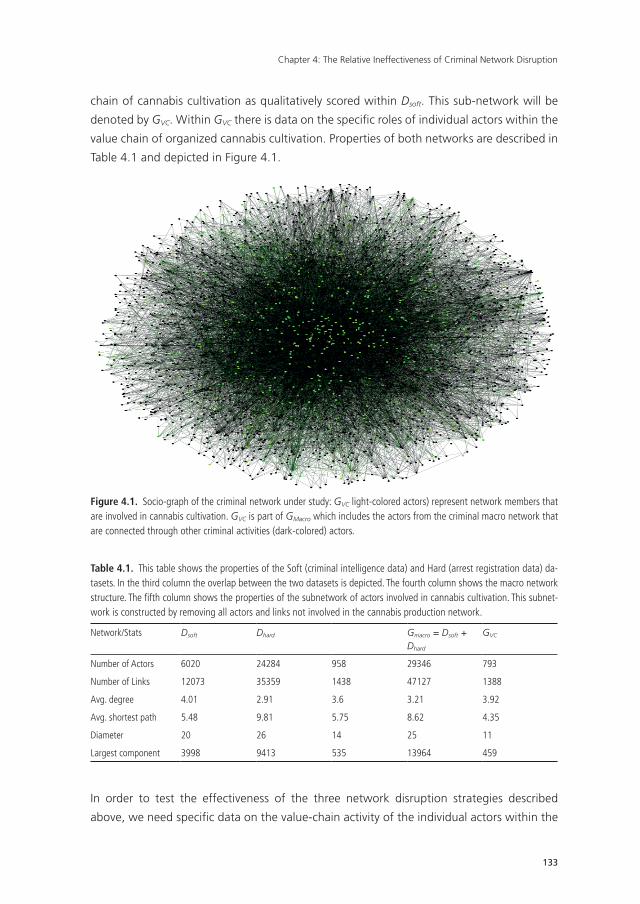
Chapter 4: The Relative Ineffectiveness of Criminal Network Disruption
133
chain of cannabis cultivation as qualitatively scored within Dsoft. This sub-network will be
denoted by GVC. Within GVC there is data on the specifi c roles of individual actors within the
value chain of organized cannabis cultivation. Properties of both networks are described in
Table 4.1 and depicted in Figure 4.1.
Figure 4.1. Socio-graph of the criminal network under study: GVC light-colored actors) represent network members that are involved in cannabis cultivation. GVC is part of GMacro which includes the actors from the criminal macro network that are connected through other criminal activities (dark-colored) actors.
Table 4.1. This table shows the properties of the Soft (criminal intelligence data) and Hard (arrest registration data) da-tasets. In the third column the overlap between the two datasets is depicted. The fourth column shows the macro network structure. The fi fth column shows the properties of the subnetwork of actors involved in cannabis cultivation. This subnet-work is constructed by removing all actors and links not involved in the cannabis production network.
Network/Stats Dsoft Dhard Gmacro = Dsoft + Dhard
GVC
Number of Actors 6020 24284 958 29346 793
Number of Links 12073 35359 1438 47127 1388
Avg. degree 4.01 2.91 3.6 3.21 3.92
Avg. shortest path 5.48 9.81 5.75 8.62 4.35
Diameter 20 26 14 25 11
Largest component 3998 9413 535 13964 459
In order to test the effectiveness of the three network disruption strategies described
above, we need specifi c data on the value-chain activity of the individual actors within the
134
network. Because data on value chain roles is qualitatively scored for all individual actors
involved in cannabis cultivation, we focus mainly on the effectiveness of disrupting the
cannabis cultivation network GVC as part of the criminal macro network GMacro.
Identical to any social network, criminal networks have no strict boundaries (Williams,
2001). Therefore, we emphasize that the embedding macro network is in theory a world-
wide network (10). However, our observations of the embedding criminal network are
limited to where the data collection process within the police region ends. Within social
network analysis methodology this is called the ‘boundary specification problem’ (e.g.
Klerks, 2001; Morselli, 2009)), meaning that setting a boundary of the network as a result
of the available data, might affect the results of the applied SNA methodology. But, as
described above, replacements are preferably found in the ‘trusted’ and ‘like-minded’
network directly embedding the disrupted criminal network, instead of replacements from
outside through other backgrounds. Moreover, from a practical point of view, finding
replacements within substantial physical distances would be counterproductive (Klerks,
2001; Spapens, 2010).
degree distribution
For one part the effect of different disruption strategies depends on network topology.
As described above, one important measure for network topology is the network degree
distribution. If the network degree distribution follows a power law, then the network is
scale-free. This means, besides other implications, that network robustness depends on
actors with a relatively high degree, so-called hubs. If these hubs are attacked the network
will fall apart into subnetworks (Albert, 2000). We estimate the power-law distribution
P(x) = Cx-λ to fit the degree distributions in the GMacro and GVC networks using maximum
likelihood estimators as well as a goodness-of-fit based approach to estimate the lower
cutoff for the scaling region (61). The results of this analysis are shown in Figure 4.2.
Analysis of the graphs show that for GMacro the degree distribution fits a power-law with
a lower cutoff of xmin = 34 and λ = 1.55 . For GVC the lower cutoff equals 1 and λ =
1.5λ = 1.5 λ = 1.5. In both cases the p value is relatively high, indicating that with high likeli-
hood these distributions follow a power law distribution. This means that both networks
are probably scale-free and might therefore be vulnerable to deliberate attacks, targeting
actors with high degree centrality (hubs).
In the next paragraph we describe in more detail how the networks are structured with
respect to the value chain structure of the cannabis cultivation.
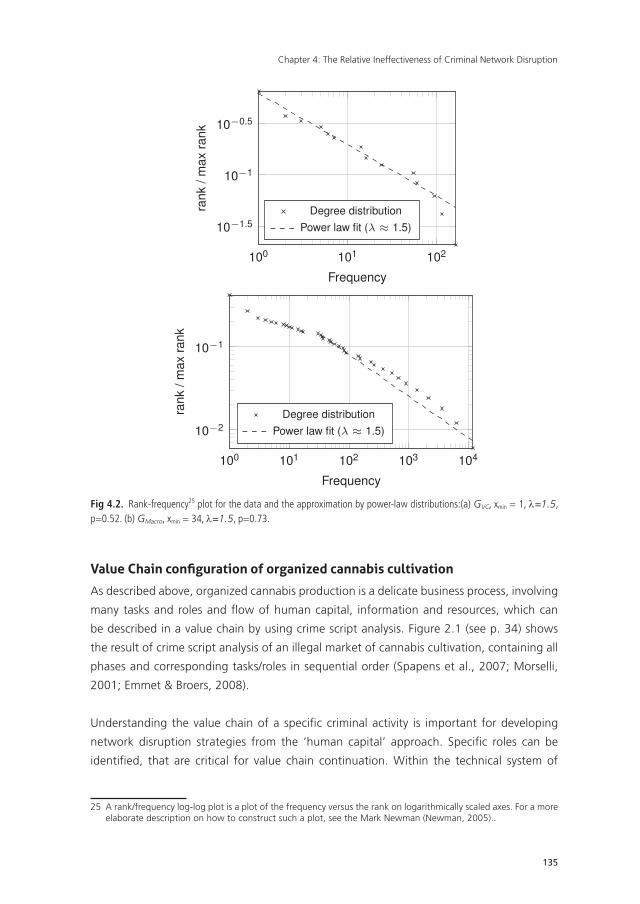
Chapter 4: The Relative Ineffectiveness of Criminal Network Disruption
135
Value Chain configuration of organized cannabis cultivation
As described above, organized cannabis production is a delicate business process, involving
many tasks and roles and flow of human capital, information and resources, which can
be described in a value chain by using crime script analysis. Figure 2.1 (see p. 34) shows
the result of crime script analysis of an illegal market of cannabis cultivation, containing all
phases and corresponding tasks/roles in sequential order (Spapens et al., 2007; Morselli,
2001; Emmet & Broers, 2008).
Understanding the value chain of a specific criminal activity is important for developing
network disruption strategies from the ‘human capital’ approach. Specific roles can be
identified, that are critical for value chain continuation. Within the technical system of
25 A rank/frequency log-log plot is a plot of the frequency versus the rank on logarithmically scaled axes. For a more elaborate description on how to construct such a plot, see the Mark Newman (Newman, 2005)..
10
0
10
1
10
2
10
1.5
10
1
10
0.5
Frequency
rank
/m
ax
rank
Degree distribution
Power law fit ( ⇡ 1.5)
10
0
10
1
10
2
10
3
10
4
10
2
10
1
Frequency
rank
/m
ax
rank
Degree distribution
Power law fit ( ⇡ 1.5)
Fig 4.2. Rank-frequency25 plot for the data and the approximation by power-law distributions:(a) GVC, xmin = 1, λ=1.5, p=0.52. (b) GMacro, xmin = 34, λ=1.5, p=0.73.
136
cannabis cultivation the roles of ‘coordinator’ and ‘growshop owner’ are essential for
initiating a criminal collective (Figure 2.1, p. 34). They control almost every stage of the
value chain and operate as criminal brokers in bringing essential roles together at the
right place and time. Coordinators and Growshop owners are important for the flow of
information and keeping the value chain participants together. Therefore these roles can
be marked as vulnerable for network disruption from both a ‘human capital’- and ‘social
capital’ approach, as they might also score high on degree and betweenness centrality
within the value chain network.
Secondly specialists can be identified within the criminal collective, that bring specific
knowledge or skills needed to complete the value chain (Morselli, 2009; Spapens, 2010)).
These specialists are often sparsely populated within the embedding macro-network and
are therefore often part of more than one value chain at a certain point in time. Within
the value chain of cannabis cultivation the network members that fulfill the role of di-
verting electricity can be identified as specialists for two reasons: First this role requires
specific knowledge and technical skills needed for illegally diverting electricity that fits the
needs within cannabis cultivation. Secondly these roles demand high levels of trust and
reputation. Hence, these ‘electricians’ might retrieve sensitive information about critical
locations and participants that is related to their flexible role of specialist (Spapens et al.,
2007; Emmet & Broers, 2008) . Therefore, involvement of these actors increases the risk
of information being leaked to competitors or the government (Kleemans et al., 2002). A
trustworthy reputation is therefore essential for these specialists to operate freely. For can-
nabis networks, finding or replacing these ‘specialists’ is not an easy task because reliability
and integrity is not particularly part of the ethics within criminal networks. Therefore,
network members involved within ‘diverting electricity’ can also be identified as vulnerable
targets for network disruption from a ‘human capital’ approach. This will be included as a
specific strategy within the disruption model discussed in a later Section.
As was previously described criminal network resilience against disruption depends on
network redundancy. Redundant criminal networks offer many alternatives to replace
targeted actors within the network. Figure 4.3 shows the direct relationships between
value chain roles that are derived from the value chain network of cannabis cultivation
(Gvc). In this Figure the VC roles are also connected if one actor in the social system fulfills
more than one role within the value chain. The size of the actors is proportional to the
amount of actors having this role within the data. The thickness of the links corresponds to
the number of direct connections between actors with these roles within the Gvc network.
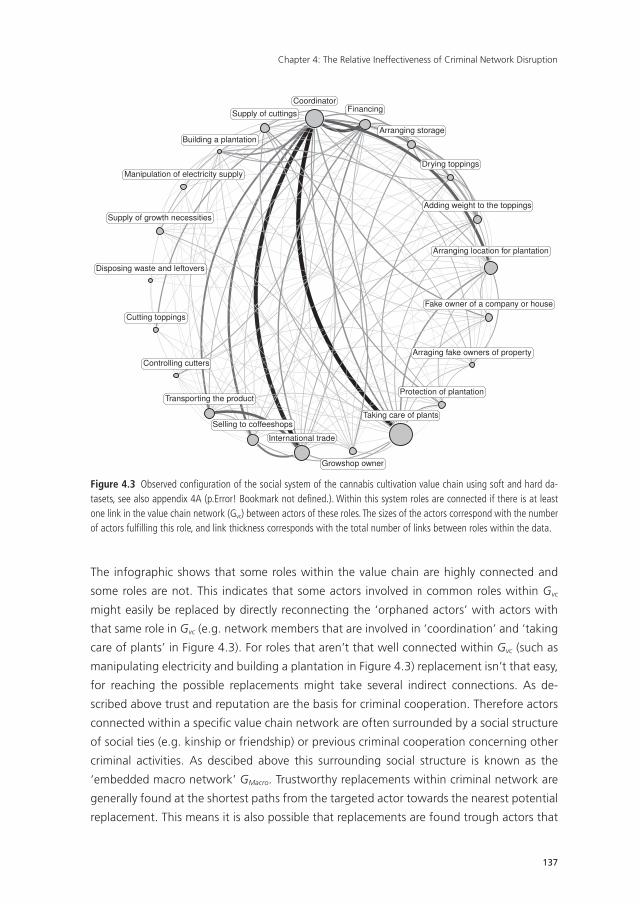
Chapter 4: The Relative Ineffectiveness of Criminal Network Disruption
137
Financing
Coordinator
Supply of cuttings
Supply of growth necessities
Manipulation of electricity supply
Building a plantation
Disposing waste and leftovers
Cutting toppings
Controlling cutters
Transporting the product
Selling to coffeeshops
International trade
Growshop owner
Taking care of plants
Protection of plantation
Arraging fake owners of property
Fake owner of a company or house
Arranging location for plantation
Adding weight to the toppings
Drying toppings
Arranging storage
Figure 4.3 Observed configuration of the social system of the cannabis cultivation value chain using soft and hard da-tasets, see also appendix 4A (p.Error! Bookmark not defined.). Within this system roles are connected if there is at least one link in the value chain network (Gvc) between actors of these roles. The sizes of the actors correspond with the number of actors fulfilling this role, and link thickness corresponds with the total number of links between roles within the data.
The infographic shows that some roles within the value chain are highly connected and
some roles are not. This indicates that some actors involved in common roles within Gvc
might easily be replaced by directly reconnecting the ‘orphaned actors’ with actors with
that same role in Gvc (e.g. network members that are involved in ‘coordination’ and ‘taking
care of plants’ in Figure 4.3). For roles that aren’t that well connected within Gvc (such as
manipulating electricity and building a plantation in Figure 4.3) replacement isn’t that easy,
for reaching the possible replacements might take several indirect connections. As de-
scribed above trust and reputation are the basis for criminal cooperation. Therefore actors
connected within a specific value chain network are often surrounded by a social structure
of social ties (e.g. kinship or friendship) or previous criminal cooperation concerning other
criminal activities. As descibed above this surrounding social structure is known as the
‘embedded macro network’ GMacro. Trustworthy replacements within criminal network are
generally found at the shortest paths from the targeted actor towards the nearest potential
replacement. This means it is also possible that replacements are found trough actors that
138
are part of the embedding macro network but have no involvement in the value chain
network of cannabis cultivation at all. These actors from the embedding macro network
form a ‘bridge’ between the ‘orphaned actors’ and replacements with the same role in
Gvc. Therefore replacement follows the shortest paths through actors from the embedding
macro network, instead of solely the value chain network. This interaction between the
embedding macro network (GMacro ) and the value chain network is therefore important for
understanding criminal network recovery after intervention and will be explained further
in the next paragraphs.
4.3 methodology
The second aim of our research is to test the effectiveness of different strategies to disrupt
an illegal cannabis cultivation network Gvc, taking into account that the network will try to
recover itself by replacing targeted actors and relations using ties and connections of the
embedding criminal network GMacro. Therefore, a modeling framework for both network
disruption and network resilience is needed.
modeling network disruption
From a law enforcement perspective criminal network disruption aims at stopping or
frustrating the value chain of a criminal activity by removing active actors from the criminal
network. In practice this can be obtained by strategically targeting and arresting individual
actors involved in the value chain. The sequential order in which actors are targeted de-
pends on the disruption strategy applied. For this study five different disruption strategies
are selected according to the general disruption approaches described above:
Random Disruption1. The Random strategy follows no preference or ranking during selection of candidates
for removal. This strategy can be associated with opportunistic law enforcement con-
trol lacking any form of strategy. As describes in the previous Section, this is sometimes
the case within the control of organized cannabis cultivation, for instance randomly
busting cannabis cultivation sites and making arrests on the spot.
Two types of Social Capital DisruptionThe social capital approach aims at strategic positions within criminal networks. As de-
scribed above, this can be divided in two main strategies: degree centrality attack (hubs)
and betweenness centrality attack (brokers).
2. The Total degree strategy aims at the actors with highest degree centrality (hubs)
within the Gvc network. From this approach the order of actors being targeted follows
Chapter 4: The Relative Ineffectiveness of Criminal Network Disruption
139
individual degree centrality scores from high to low. Both GMacro and Gvc networks have
heavy-tailed degree distributions, which might make them vulnerable to these hub
attacks (Figure 4.2). This strategy is associated with control strategies that focus on
‘the kingpin’. However, as described above the most central actor does not necessarily
have to be the most powerful. Leaders might be hidden in anonymous periphery, but
because we use intelligence data in addition to investigative data, degree centrality
might correlate with powerful positioning (e.g. 64).
3. The Betweenness strategy aims at actors with the highest betweenness centrality
(bridges) within the Gvc network. From this approach the order of actors being targeted
follows individual betweenness centrality scores from high to low. This strategy is asso-
ciated with the ‘key player’ control strategy in law enforcement. This strategy might be
highly correlated with coordinators of growshop owners, but could also involve actors
in other roles that might be of importance because of their informal social capital
within the value chain. It aims at strategically positioned brokers, connecting several
criminal groups.
Two types of Human Capital DisruptionBesides targeting actors based on their general positioning within the criminal network,
this approach aims at targeting actors by their individual specific characteristics (Human
Capital).
4. The Value chain degree strategy aims at individuals with the highest Value Chain
(VC) degree within the Gvc network. The VC degree of a particular actor is measured by
the amount of links defined within the social system of the value chain configuration
(see Figure 4.3). This strategy is associated law enforcement controls aimed at actors
that inhabit a great reputation. It can be assumed that actors with a higher reputation
will be involved within more and different value chains within the value chain network.
From a network perspective this means that these actors will automatically have a
higher degree centrality and will be more visible within the network.
5. The Specific Value Chain Role strategy aims at specific ‘human capital’ within a
specific criminal value chain. As compared to other strategies, actors are targeted quali-
tatively based special skills or knowledge and the presumed ‘substitutability’ within the
value chain. Based on observations within the data under study and the literature on
the cannabis cultivation value chain (Spapens et al., 2007; Emmet & Broers, 2008)
the role of ‘diverting electricity’ was selected to analyze this strategy. From this ap-
proach the sequence of actors being targeted follows all actors that are labeled for the
‘diverting electricity’ role within the value chain of cannabis cultivation. This strategy is
associated with the ‘facilitator’ strategy within law enforcement control, for targeting
thinly populated specialists in order to frustrate the operational criminal process.
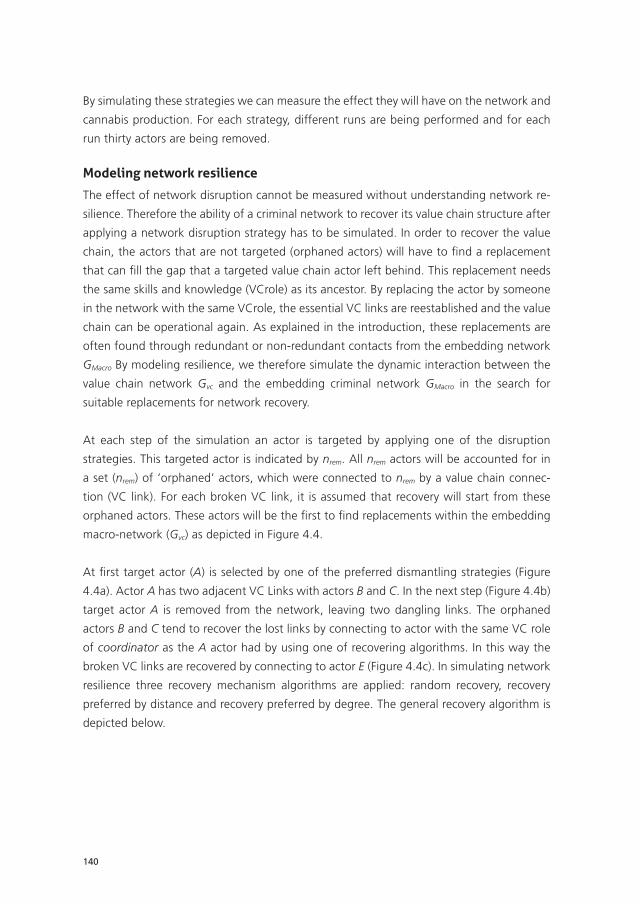
140
By simulating these strategies we can measure the effect they will have on the network and
cannabis production. For each strategy, different runs are being performed and for each
run thirty actors are being removed.
modeling network resilience
The effect of network disruption cannot be measured without understanding network re-
silience. Therefore the ability of a criminal network to recover its value chain structure after
applying a network disruption strategy has to be simulated. In order to recover the value
chain, the actors that are not targeted (orphaned actors) will have to find a replacement
that can fill the gap that a targeted value chain actor left behind. This replacement needs
the same skills and knowledge (VCrole) as its ancestor. By replacing the actor by someone
in the network with the same VCrole, the essential VC links are reestablished and the value
chain can be operational again. As explained in the introduction, these replacements are
often found through redundant or non-redundant contacts from the embedding network
GMacro By modeling resilience, we therefore simulate the dynamic interaction between the
value chain network Gvc and the embedding criminal network GMacro in the search for
suitable replacements for network recovery.
At each step of the simulation an actor is targeted by applying one of the disruption
strategies. This targeted actor is indicated by nrem. All nrem actors will be accounted for in
a set (nrem) of ‘orphaned’ actors, which were connected to nrem by a value chain connec-
tion (VC link). For each broken VC link, it is assumed that recovery will start from these
orphaned actors. These actors will be the first to find replacements within the embedding
macro-network (Gvc) as depicted in Figure 4.4.
At first target actor (A) is selected by one of the preferred dismantling strategies (Figure
4.4a). Actor A has two adjacent VC Links with actors B and C. In the next step (Figure 4.4b)
target actor A is removed from the network, leaving two dangling links. The orphaned
actors B and C tend to recover the lost links by connecting to actor with the same VC role
of coordinator as the A actor had by using one of recovering algorithms. In this way the
broken VC links are recovered by connecting to actor E (Figure 4.4c). In simulating network
resilience three recovery mechanism algorithms are applied: random recovery, recovery
preferred by distance and recovery preferred by degree. The general recovery algorithm is
depicted below.
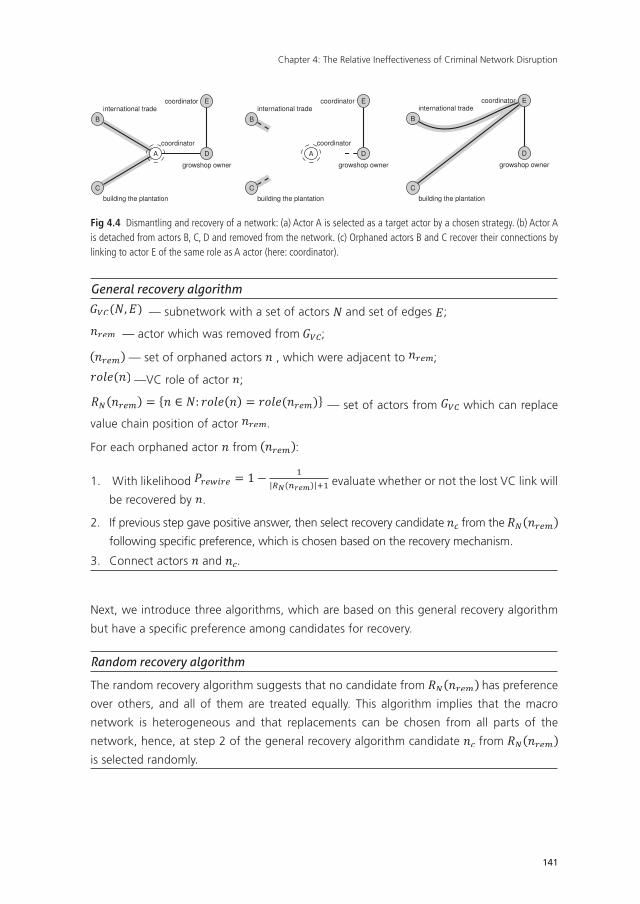
Chapter 4: The Relative Ineffectiveness of Criminal Network Disruption
141
General recovery algorithm
At first target actor (A) is selected by one of the preferred dismantling strategies (Figure 4.4a). Actor A has two adjacent VC Links with actors B and C. In the next step (Figure 4.4b) target actor A is removed from the network, leaving two dangling links. The orphaned actors B and C tend to recover the lost links by connecting to actor with the same VC role of coordinator as the A actor had by using one of recovering algorithms. In this way the broken VC links are recovered by connecting to actor E (Figure 4.4c). In simulating network resilience three recovery mechanism algorithms are applied: random recovery, recovery preferred by distance and recovery preferred by degree. The general recovery algorithm is depicted below. General recovery algorithm 𝐺𝐺!"(𝑁𝑁,𝐸𝐸) — subnetwork with a set of actors N and set of edges E; 𝑛𝑛!"# — actor which was removed from 𝐺𝐺!"; 𝑛𝑛!"# — set of orphaned actors 𝑛𝑛, which were adjacent to 𝑛𝑛!"#; 𝑟𝑟𝑟𝑟𝑟𝑟𝑟𝑟(𝑛𝑛) —VC role of actor n; 𝑅𝑅! 𝑛𝑛!"# = 𝑛𝑛 ∈ 𝑁𝑁: 𝑟𝑟𝑟𝑟𝑟𝑟𝑟𝑟 𝑛𝑛 = 𝑟𝑟𝑟𝑟𝑟𝑟𝑟𝑟(𝑛𝑛!"#) — set of actors from 𝐺𝐺!" which can replace value chain position of actor 𝑛𝑛!"#. For each orphaned actor 𝑛𝑛 from 𝑛𝑛!"# :
1. With likelihood 𝑃𝑃!"#$!" = 1− !!! !!"# !!
evaluate whether or not the lost VC link will be recovered by 𝑛𝑛 .
2. If previous step gave positive answer, then select recovery candidate 𝑛𝑛! from the 𝑅𝑅! 𝑛𝑛!"# following specific preference, which is chosen based on the recovery mechanism.
3. Connect actors 𝑛𝑛 and 𝑛𝑛! . Next, we introduce three algorithms, which are based on this general recovery algorithm but have a specific preference among candidates for recovery. See also figure 6. Random recovery algorithm The random recovery algorithm suggests that no candidate from 𝑅𝑅! 𝑛𝑛!"# has preference over others, and all of them are treated equally. This algorithm implies that the macro network is heterogeneous and that replacements can be chosen from all parts of the network, hence, at step 2 of the general recovery algorithm candidate 𝑛𝑛! from 𝑅𝑅! 𝑛𝑛!"# is selected randomly. Preference by distance recovery algorithm Trust and skills are important criteria for selecting suitable replacements. Therefore it’s more likely that preferred replacements are preferably found within the redundant network of the actors involved in the value chain. This means that candidates with the shortest path from orphaned actors within the macro network (GMacro) will have more chance of becoming a replacement than actors further away. This can be translated into a preference by distance recovery algorithm, in which the selection of replacement of actors from 𝑅𝑅! 𝑛𝑛!"# in step 2 depends on the distance between a possible candidate actor and an orphaned actor. Within this preferential recovery algorithm the likelihood
— subnetwork with a set of actors
At first target actor (A) is selected by one of the preferred dismantling strategies (Figure 4.4a). Actor A has two adjacent VC Links with actors B and C. In the next step (Figure 4.4b) target actor A is removed from the network, leaving two dangling links. The orphaned actors B and C tend to recover the lost links by connecting to actor with the same VC role of coordinator as the A actor had by using one of recovering algorithms. In this way the broken VC links are recovered by connecting to actor E (Figure 4.4c). In simulating network resilience three recovery mechanism algorithms are applied: random recovery, recovery preferred by distance and recovery preferred by degree. The general recovery algorithm is depicted below. General recovery algorithm 𝐺𝐺!"(𝑁𝑁,𝐸𝐸) — subnetwork with a set of actors N and set of edges E; 𝑛𝑛!"# — actor which was removed from 𝐺𝐺!"; 𝑛𝑛!"# — set of orphaned actors 𝑛𝑛, which were adjacent to 𝑛𝑛!"#; 𝑟𝑟𝑟𝑟𝑟𝑟𝑟𝑟(𝑛𝑛) —VC role of actor n; 𝑅𝑅! 𝑛𝑛!"# = 𝑛𝑛 ∈ 𝑁𝑁: 𝑟𝑟𝑟𝑟𝑟𝑟𝑟𝑟 𝑛𝑛 = 𝑟𝑟𝑟𝑟𝑟𝑟𝑟𝑟(𝑛𝑛!"#) — set of actors from 𝐺𝐺!" which can replace value chain position of actor 𝑛𝑛!"#. For each orphaned actor 𝑛𝑛 from 𝑛𝑛!"# :
1. With likelihood 𝑃𝑃!"#$!" = 1− !!! !!"# !!
evaluate whether or not the lost VC link will be recovered by 𝑛𝑛 .
2. If previous step gave positive answer, then select recovery candidate 𝑛𝑛! from the 𝑅𝑅! 𝑛𝑛!"# following specific preference, which is chosen based on the recovery mechanism.
3. Connect actors 𝑛𝑛 and 𝑛𝑛! . Next, we introduce three algorithms, which are based on this general recovery algorithm but have a specific preference among candidates for recovery. See also figure 6. Random recovery algorithm The random recovery algorithm suggests that no candidate from 𝑅𝑅! 𝑛𝑛!"# has preference over others, and all of them are treated equally. This algorithm implies that the macro network is heterogeneous and that replacements can be chosen from all parts of the network, hence, at step 2 of the general recovery algorithm candidate 𝑛𝑛! from 𝑅𝑅! 𝑛𝑛!"# is selected randomly. Preference by distance recovery algorithm Trust and skills are important criteria for selecting suitable replacements. Therefore it’s more likely that preferred replacements are preferably found within the redundant network of the actors involved in the value chain. This means that candidates with the shortest path from orphaned actors within the macro network (GMacro) will have more chance of becoming a replacement than actors further away. This can be translated into a preference by distance recovery algorithm, in which the selection of replacement of actors from 𝑅𝑅! 𝑛𝑛!"# in step 2 depends on the distance between a possible candidate actor and an orphaned actor. Within this preferential recovery algorithm the likelihood
and set of edges
At first target actor (A) is selected by one of the preferred dismantling strategies (Figure 4.4a). Actor A has two adjacent VC Links with actors B and C. In the next step (Figure 4.4b) target actor A is removed from the network, leaving two dangling links. The orphaned actors B and C tend to recover the lost links by connecting to actor with the same VC role of coordinator as the A actor had by using one of recovering algorithms. In this way the broken VC links are recovered by connecting to actor E (Figure 4.4c). In simulating network resilience three recovery mechanism algorithms are applied: random recovery, recovery preferred by distance and recovery preferred by degree. The general recovery algorithm is depicted below. General recovery algorithm 𝐺𝐺!"(𝑁𝑁,𝐸𝐸) — subnetwork with a set of actors N and set of edges E; 𝑛𝑛!"# — actor which was removed from 𝐺𝐺!"; 𝑛𝑛!"# — set of orphaned actors 𝑛𝑛, which were adjacent to 𝑛𝑛!"#; 𝑟𝑟𝑟𝑟𝑟𝑟𝑟𝑟(𝑛𝑛) —VC role of actor n; 𝑅𝑅! 𝑛𝑛!"# = 𝑛𝑛 ∈ 𝑁𝑁: 𝑟𝑟𝑟𝑟𝑟𝑟𝑟𝑟 𝑛𝑛 = 𝑟𝑟𝑟𝑟𝑟𝑟𝑟𝑟(𝑛𝑛!"#) — set of actors from 𝐺𝐺!" which can replace value chain position of actor 𝑛𝑛!"#. For each orphaned actor 𝑛𝑛 from 𝑛𝑛!"# :
1. With likelihood 𝑃𝑃!"#$!" = 1− !!! !!"# !!
evaluate whether or not the lost VC link will be recovered by 𝑛𝑛 .
2. If previous step gave positive answer, then select recovery candidate 𝑛𝑛! from the 𝑅𝑅! 𝑛𝑛!"# following specific preference, which is chosen based on the recovery mechanism.
3. Connect actors 𝑛𝑛 and 𝑛𝑛! . Next, we introduce three algorithms, which are based on this general recovery algorithm but have a specific preference among candidates for recovery. See also figure 6. Random recovery algorithm The random recovery algorithm suggests that no candidate from 𝑅𝑅! 𝑛𝑛!"# has preference over others, and all of them are treated equally. This algorithm implies that the macro network is heterogeneous and that replacements can be chosen from all parts of the network, hence, at step 2 of the general recovery algorithm candidate 𝑛𝑛! from 𝑅𝑅! 𝑛𝑛!"# is selected randomly. Preference by distance recovery algorithm Trust and skills are important criteria for selecting suitable replacements. Therefore it’s more likely that preferred replacements are preferably found within the redundant network of the actors involved in the value chain. This means that candidates with the shortest path from orphaned actors within the macro network (GMacro) will have more chance of becoming a replacement than actors further away. This can be translated into a preference by distance recovery algorithm, in which the selection of replacement of actors from 𝑅𝑅! 𝑛𝑛!"# in step 2 depends on the distance between a possible candidate actor and an orphaned actor. Within this preferential recovery algorithm the likelihood
;
At first target actor (A) is selected by one of the preferred dismantling strategies (Figure 4.4a). Actor A has two adjacent VC Links with actors B and C. In the next step (Figure 4.4b) target actor A is removed from the network, leaving two dangling links. The orphaned actors B and C tend to recover the lost links by connecting to actor with the same VC role of coordinator as the A actor had by using one of recovering algorithms. In this way the broken VC links are recovered by connecting to actor E (Figure 4.4c). In simulating network resilience three recovery mechanism algorithms are applied: random recovery, recovery preferred by distance and recovery preferred by degree. The general recovery algorithm is depicted below. General recovery algorithm 𝐺𝐺!"(𝑁𝑁,𝐸𝐸) — subnetwork with a set of actors N and set of edges E; 𝑛𝑛!"# — actor which was removed from 𝐺𝐺!"; 𝑛𝑛!"# — set of orphaned actors 𝑛𝑛, which were adjacent to 𝑛𝑛!"#; 𝑟𝑟𝑟𝑟𝑟𝑟𝑟𝑟(𝑛𝑛) —VC role of actor n; 𝑅𝑅! 𝑛𝑛!"# = 𝑛𝑛 ∈ 𝑁𝑁: 𝑟𝑟𝑟𝑟𝑟𝑟𝑟𝑟 𝑛𝑛 = 𝑟𝑟𝑟𝑟𝑟𝑟𝑟𝑟(𝑛𝑛!"#) — set of actors from 𝐺𝐺!" which can replace value chain position of actor 𝑛𝑛!"#. For each orphaned actor 𝑛𝑛 from 𝑛𝑛!"# :
1. With likelihood 𝑃𝑃!"#$!" = 1− !!! !!"# !!
evaluate whether or not the lost VC link will be recovered by 𝑛𝑛 .
2. If previous step gave positive answer, then select recovery candidate 𝑛𝑛! from the 𝑅𝑅! 𝑛𝑛!"# following specific preference, which is chosen based on the recovery mechanism.
3. Connect actors 𝑛𝑛 and 𝑛𝑛! . Next, we introduce three algorithms, which are based on this general recovery algorithm but have a specific preference among candidates for recovery. See also figure 6. Random recovery algorithm The random recovery algorithm suggests that no candidate from 𝑅𝑅! 𝑛𝑛!"# has preference over others, and all of them are treated equally. This algorithm implies that the macro network is heterogeneous and that replacements can be chosen from all parts of the network, hence, at step 2 of the general recovery algorithm candidate 𝑛𝑛! from 𝑅𝑅! 𝑛𝑛!"# is selected randomly. Preference by distance recovery algorithm Trust and skills are important criteria for selecting suitable replacements. Therefore it’s more likely that preferred replacements are preferably found within the redundant network of the actors involved in the value chain. This means that candidates with the shortest path from orphaned actors within the macro network (GMacro) will have more chance of becoming a replacement than actors further away. This can be translated into a preference by distance recovery algorithm, in which the selection of replacement of actors from 𝑅𝑅! 𝑛𝑛!"# in step 2 depends on the distance between a possible candidate actor and an orphaned actor. Within this preferential recovery algorithm the likelihood
— actor which was removed from
At first target actor (A) is selected by one of the preferred dismantling strategies (Figure 4.4a). Actor A has two adjacent VC Links with actors B and C. In the next step (Figure 4.4b) target actor A is removed from the network, leaving two dangling links. The orphaned actors B and C tend to recover the lost links by connecting to actor with the same VC role of coordinator as the A actor had by using one of recovering algorithms. In this way the broken VC links are recovered by connecting to actor E (Figure 4.4c). In simulating network resilience three recovery mechanism algorithms are applied: random recovery, recovery preferred by distance and recovery preferred by degree. The general recovery algorithm is depicted below. General recovery algorithm 𝐺𝐺!"(𝑁𝑁,𝐸𝐸) — subnetwork with a set of actors N and set of edges E; 𝑛𝑛!"# — actor which was removed from 𝐺𝐺!"; 𝑛𝑛!"# — set of orphaned actors 𝑛𝑛, which were adjacent to 𝑛𝑛!"#; 𝑟𝑟𝑟𝑟𝑟𝑟𝑟𝑟(𝑛𝑛) —VC role of actor n; 𝑅𝑅! 𝑛𝑛!"# = 𝑛𝑛 ∈ 𝑁𝑁: 𝑟𝑟𝑟𝑟𝑟𝑟𝑟𝑟 𝑛𝑛 = 𝑟𝑟𝑟𝑟𝑟𝑟𝑟𝑟(𝑛𝑛!"#) — set of actors from 𝐺𝐺!" which can replace value chain position of actor 𝑛𝑛!"#. For each orphaned actor 𝑛𝑛 from 𝑛𝑛!"# :
1. With likelihood 𝑃𝑃!"#$!" = 1− !!! !!"# !!
evaluate whether or not the lost VC link will be recovered by 𝑛𝑛 .
2. If previous step gave positive answer, then select recovery candidate 𝑛𝑛! from the 𝑅𝑅! 𝑛𝑛!"# following specific preference, which is chosen based on the recovery mechanism.
3. Connect actors 𝑛𝑛 and 𝑛𝑛! . Next, we introduce three algorithms, which are based on this general recovery algorithm but have a specific preference among candidates for recovery. See also figure 6. Random recovery algorithm The random recovery algorithm suggests that no candidate from 𝑅𝑅! 𝑛𝑛!"# has preference over others, and all of them are treated equally. This algorithm implies that the macro network is heterogeneous and that replacements can be chosen from all parts of the network, hence, at step 2 of the general recovery algorithm candidate 𝑛𝑛! from 𝑅𝑅! 𝑛𝑛!"# is selected randomly. Preference by distance recovery algorithm Trust and skills are important criteria for selecting suitable replacements. Therefore it’s more likely that preferred replacements are preferably found within the redundant network of the actors involved in the value chain. This means that candidates with the shortest path from orphaned actors within the macro network (GMacro) will have more chance of becoming a replacement than actors further away. This can be translated into a preference by distance recovery algorithm, in which the selection of replacement of actors from 𝑅𝑅! 𝑛𝑛!"# in step 2 depends on the distance between a possible candidate actor and an orphaned actor. Within this preferential recovery algorithm the likelihood
;
At first target actor (A) is selected by one of the preferred dismantling strategies (Figure 4.4a). Actor A has two adjacent VC Links with actors B and C. In the next step (Figure 4.4b) target actor A is removed from the network, leaving two dangling links. The orphaned actors B and C tend to recover the lost links by connecting to actor with the same VC role of coordinator as the A actor had by using one of recovering algorithms. In this way the broken VC links are recovered by connecting to actor E (Figure 4.4c). In simulating network resilience three recovery mechanism algorithms are applied: random recovery, recovery preferred by distance and recovery preferred by degree. The general recovery algorithm is depicted below. General recovery algorithm 𝐺𝐺!"(𝑁𝑁,𝐸𝐸) — subnetwork with a set of actors N and set of edges E; 𝑛𝑛!"# — actor which was removed from 𝐺𝐺!"; 𝑛𝑛!"# — set of orphaned actors 𝑛𝑛, which were adjacent to 𝑛𝑛!"#; 𝑟𝑟𝑟𝑟𝑟𝑟𝑟𝑟(𝑛𝑛) —VC role of actor n; 𝑅𝑅! 𝑛𝑛!"# = 𝑛𝑛 ∈ 𝑁𝑁: 𝑟𝑟𝑟𝑟𝑟𝑟𝑟𝑟 𝑛𝑛 = 𝑟𝑟𝑟𝑟𝑟𝑟𝑟𝑟(𝑛𝑛!"#) — set of actors from 𝐺𝐺!" which can replace value chain position of actor 𝑛𝑛!"#. For each orphaned actor 𝑛𝑛 from 𝑛𝑛!"# :
1. With likelihood 𝑃𝑃!"#$!" = 1− !!! !!"# !!
evaluate whether or not the lost VC link will be recovered by 𝑛𝑛 .
2. If previous step gave positive answer, then select recovery candidate 𝑛𝑛! from the 𝑅𝑅! 𝑛𝑛!"# following specific preference, which is chosen based on the recovery mechanism.
3. Connect actors 𝑛𝑛 and 𝑛𝑛! . Next, we introduce three algorithms, which are based on this general recovery algorithm but have a specific preference among candidates for recovery. See also figure 6. Random recovery algorithm The random recovery algorithm suggests that no candidate from 𝑅𝑅! 𝑛𝑛!"# has preference over others, and all of them are treated equally. This algorithm implies that the macro network is heterogeneous and that replacements can be chosen from all parts of the network, hence, at step 2 of the general recovery algorithm candidate 𝑛𝑛! from 𝑅𝑅! 𝑛𝑛!"# is selected randomly. Preference by distance recovery algorithm Trust and skills are important criteria for selecting suitable replacements. Therefore it’s more likely that preferred replacements are preferably found within the redundant network of the actors involved in the value chain. This means that candidates with the shortest path from orphaned actors within the macro network (GMacro) will have more chance of becoming a replacement than actors further away. This can be translated into a preference by distance recovery algorithm, in which the selection of replacement of actors from 𝑅𝑅! 𝑛𝑛!"# in step 2 depends on the distance between a possible candidate actor and an orphaned actor. Within this preferential recovery algorithm the likelihood
— set of orphaned actors
At first target actor (A) is selected by one of the preferred dismantling strategies (Figure 4.4a). Actor A has two adjacent VC Links with actors B and C. In the next step (Figure 4.4b) target actor A is removed from the network, leaving two dangling links. The orphaned actors B and C tend to recover the lost links by connecting to actor with the same VC role of coordinator as the A actor had by using one of recovering algorithms. In this way the broken VC links are recovered by connecting to actor E (Figure 4.4c). In simulating network resilience three recovery mechanism algorithms are applied: random recovery, recovery preferred by distance and recovery preferred by degree. The general recovery algorithm is depicted below. General recovery algorithm 𝐺𝐺!"(𝑁𝑁,𝐸𝐸) — subnetwork with a set of actors N and set of edges E; 𝑛𝑛!"# — actor which was removed from 𝐺𝐺!"; 𝑛𝑛!"# — set of orphaned actors 𝑛𝑛, which were adjacent to 𝑛𝑛!"#; 𝑟𝑟𝑟𝑟𝑟𝑟𝑟𝑟(𝑛𝑛) —VC role of actor n; 𝑅𝑅! 𝑛𝑛!"# = 𝑛𝑛 ∈ 𝑁𝑁: 𝑟𝑟𝑟𝑟𝑟𝑟𝑟𝑟 𝑛𝑛 = 𝑟𝑟𝑟𝑟𝑟𝑟𝑟𝑟(𝑛𝑛!"#) — set of actors from 𝐺𝐺!" which can replace value chain position of actor 𝑛𝑛!"#. For each orphaned actor 𝑛𝑛 from 𝑛𝑛!"# :
1. With likelihood 𝑃𝑃!"#$!" = 1− !!! !!"# !!
evaluate whether or not the lost VC link will be recovered by 𝑛𝑛 .
2. If previous step gave positive answer, then select recovery candidate 𝑛𝑛! from the 𝑅𝑅! 𝑛𝑛!"# following specific preference, which is chosen based on the recovery mechanism.
3. Connect actors 𝑛𝑛 and 𝑛𝑛! . Next, we introduce three algorithms, which are based on this general recovery algorithm but have a specific preference among candidates for recovery. See also figure 6. Random recovery algorithm The random recovery algorithm suggests that no candidate from 𝑅𝑅! 𝑛𝑛!"# has preference over others, and all of them are treated equally. This algorithm implies that the macro network is heterogeneous and that replacements can be chosen from all parts of the network, hence, at step 2 of the general recovery algorithm candidate 𝑛𝑛! from 𝑅𝑅! 𝑛𝑛!"# is selected randomly. Preference by distance recovery algorithm Trust and skills are important criteria for selecting suitable replacements. Therefore it’s more likely that preferred replacements are preferably found within the redundant network of the actors involved in the value chain. This means that candidates with the shortest path from orphaned actors within the macro network (GMacro) will have more chance of becoming a replacement than actors further away. This can be translated into a preference by distance recovery algorithm, in which the selection of replacement of actors from 𝑅𝑅! 𝑛𝑛!"# in step 2 depends on the distance between a possible candidate actor and an orphaned actor. Within this preferential recovery algorithm the likelihood
, which were adjacent to
At first target actor (A) is selected by one of the preferred dismantling strategies (Figure 4.4a). Actor A has two adjacent VC Links with actors B and C. In the next step (Figure 4.4b) target actor A is removed from the network, leaving two dangling links. The orphaned actors B and C tend to recover the lost links by connecting to actor with the same VC role of coordinator as the A actor had by using one of recovering algorithms. In this way the broken VC links are recovered by connecting to actor E (Figure 4.4c). In simulating network resilience three recovery mechanism algorithms are applied: random recovery, recovery preferred by distance and recovery preferred by degree. The general recovery algorithm is depicted below. General recovery algorithm 𝐺𝐺!"(𝑁𝑁,𝐸𝐸) — subnetwork with a set of actors N and set of edges E; 𝑛𝑛!"# — actor which was removed from 𝐺𝐺!"; 𝑛𝑛!"# — set of orphaned actors 𝑛𝑛, which were adjacent to 𝑛𝑛!"#; 𝑟𝑟𝑟𝑟𝑟𝑟𝑟𝑟(𝑛𝑛) —VC role of actor n; 𝑅𝑅! 𝑛𝑛!"# = 𝑛𝑛 ∈ 𝑁𝑁: 𝑟𝑟𝑟𝑟𝑟𝑟𝑟𝑟 𝑛𝑛 = 𝑟𝑟𝑟𝑟𝑟𝑟𝑟𝑟(𝑛𝑛!"#) — set of actors from 𝐺𝐺!" which can replace value chain position of actor 𝑛𝑛!"#. For each orphaned actor 𝑛𝑛 from 𝑛𝑛!"# :
1. With likelihood 𝑃𝑃!"#$!" = 1− !!! !!"# !!
evaluate whether or not the lost VC link will be recovered by 𝑛𝑛 .
2. If previous step gave positive answer, then select recovery candidate 𝑛𝑛! from the 𝑅𝑅! 𝑛𝑛!"# following specific preference, which is chosen based on the recovery mechanism.
3. Connect actors 𝑛𝑛 and 𝑛𝑛! . Next, we introduce three algorithms, which are based on this general recovery algorithm but have a specific preference among candidates for recovery. See also figure 6. Random recovery algorithm The random recovery algorithm suggests that no candidate from 𝑅𝑅! 𝑛𝑛!"# has preference over others, and all of them are treated equally. This algorithm implies that the macro network is heterogeneous and that replacements can be chosen from all parts of the network, hence, at step 2 of the general recovery algorithm candidate 𝑛𝑛! from 𝑅𝑅! 𝑛𝑛!"# is selected randomly. Preference by distance recovery algorithm Trust and skills are important criteria for selecting suitable replacements. Therefore it’s more likely that preferred replacements are preferably found within the redundant network of the actors involved in the value chain. This means that candidates with the shortest path from orphaned actors within the macro network (GMacro) will have more chance of becoming a replacement than actors further away. This can be translated into a preference by distance recovery algorithm, in which the selection of replacement of actors from 𝑅𝑅! 𝑛𝑛!"# in step 2 depends on the distance between a possible candidate actor and an orphaned actor. Within this preferential recovery algorithm the likelihood
;
At first target actor (A) is selected by one of the preferred dismantling strategies (Figure 4.4a). Actor A has two adjacent VC Links with actors B and C. In the next step (Figure 4.4b) target actor A is removed from the network, leaving two dangling links. The orphaned actors B and C tend to recover the lost links by connecting to actor with the same VC role of coordinator as the A actor had by using one of recovering algorithms. In this way the broken VC links are recovered by connecting to actor E (Figure 4.4c). In simulating network resilience three recovery mechanism algorithms are applied: random recovery, recovery preferred by distance and recovery preferred by degree. The general recovery algorithm is depicted below. General recovery algorithm 𝐺𝐺!"(𝑁𝑁,𝐸𝐸) — subnetwork with a set of actors N and set of edges E; 𝑛𝑛!"# — actor which was removed from 𝐺𝐺!"; 𝑛𝑛!"# — set of orphaned actors 𝑛𝑛, which were adjacent to 𝑛𝑛!"#; 𝑟𝑟𝑟𝑟𝑟𝑟𝑟𝑟(𝑛𝑛) —VC role of actor n; 𝑅𝑅! 𝑛𝑛!"# = 𝑛𝑛 ∈ 𝑁𝑁: 𝑟𝑟𝑟𝑟𝑟𝑟𝑟𝑟 𝑛𝑛 = 𝑟𝑟𝑟𝑟𝑟𝑟𝑟𝑟(𝑛𝑛!"#) — set of actors from 𝐺𝐺!" which can replace value chain position of actor 𝑛𝑛!"#. For each orphaned actor 𝑛𝑛 from 𝑛𝑛!"# :
1. With likelihood 𝑃𝑃!"#$!" = 1− !!! !!"# !!
evaluate whether or not the lost VC link will be recovered by 𝑛𝑛 .
2. If previous step gave positive answer, then select recovery candidate 𝑛𝑛! from the 𝑅𝑅! 𝑛𝑛!"# following specific preference, which is chosen based on the recovery mechanism.
3. Connect actors 𝑛𝑛 and 𝑛𝑛! . Next, we introduce three algorithms, which are based on this general recovery algorithm but have a specific preference among candidates for recovery. See also figure 6. Random recovery algorithm The random recovery algorithm suggests that no candidate from 𝑅𝑅! 𝑛𝑛!"# has preference over others, and all of them are treated equally. This algorithm implies that the macro network is heterogeneous and that replacements can be chosen from all parts of the network, hence, at step 2 of the general recovery algorithm candidate 𝑛𝑛! from 𝑅𝑅! 𝑛𝑛!"# is selected randomly. Preference by distance recovery algorithm Trust and skills are important criteria for selecting suitable replacements. Therefore it’s more likely that preferred replacements are preferably found within the redundant network of the actors involved in the value chain. This means that candidates with the shortest path from orphaned actors within the macro network (GMacro) will have more chance of becoming a replacement than actors further away. This can be translated into a preference by distance recovery algorithm, in which the selection of replacement of actors from 𝑅𝑅! 𝑛𝑛!"# in step 2 depends on the distance between a possible candidate actor and an orphaned actor. Within this preferential recovery algorithm the likelihood
—VC role of actor
At first target actor (A) is selected by one of the preferred dismantling strategies (Figure 4.4a). Actor A has two adjacent VC Links with actors B and C. In the next step (Figure 4.4b) target actor A is removed from the network, leaving two dangling links. The orphaned actors B and C tend to recover the lost links by connecting to actor with the same VC role of coordinator as the A actor had by using one of recovering algorithms. In this way the broken VC links are recovered by connecting to actor E (Figure 4.4c). In simulating network resilience three recovery mechanism algorithms are applied: random recovery, recovery preferred by distance and recovery preferred by degree. The general recovery algorithm is depicted below. General recovery algorithm 𝐺𝐺!"(𝑁𝑁,𝐸𝐸) — subnetwork with a set of actors N and set of edges E; 𝑛𝑛!"# — actor which was removed from 𝐺𝐺!"; 𝑛𝑛!"# — set of orphaned actors 𝑛𝑛, which were adjacent to 𝑛𝑛!"#; 𝑟𝑟𝑟𝑟𝑟𝑟𝑟𝑟(𝑛𝑛) —VC role of actor n; 𝑅𝑅! 𝑛𝑛!"# = 𝑛𝑛 ∈ 𝑁𝑁: 𝑟𝑟𝑟𝑟𝑟𝑟𝑟𝑟 𝑛𝑛 = 𝑟𝑟𝑟𝑟𝑟𝑟𝑟𝑟(𝑛𝑛!"#) — set of actors from 𝐺𝐺!" which can replace value chain position of actor 𝑛𝑛!"#. For each orphaned actor 𝑛𝑛 from 𝑛𝑛!"# :
1. With likelihood 𝑃𝑃!"#$!" = 1− !!! !!"# !!
evaluate whether or not the lost VC link will be recovered by 𝑛𝑛 .
2. If previous step gave positive answer, then select recovery candidate 𝑛𝑛! from the 𝑅𝑅! 𝑛𝑛!"# following specific preference, which is chosen based on the recovery mechanism.
3. Connect actors 𝑛𝑛 and 𝑛𝑛! . Next, we introduce three algorithms, which are based on this general recovery algorithm but have a specific preference among candidates for recovery. See also figure 6. Random recovery algorithm The random recovery algorithm suggests that no candidate from 𝑅𝑅! 𝑛𝑛!"# has preference over others, and all of them are treated equally. This algorithm implies that the macro network is heterogeneous and that replacements can be chosen from all parts of the network, hence, at step 2 of the general recovery algorithm candidate 𝑛𝑛! from 𝑅𝑅! 𝑛𝑛!"# is selected randomly. Preference by distance recovery algorithm Trust and skills are important criteria for selecting suitable replacements. Therefore it’s more likely that preferred replacements are preferably found within the redundant network of the actors involved in the value chain. This means that candidates with the shortest path from orphaned actors within the macro network (GMacro) will have more chance of becoming a replacement than actors further away. This can be translated into a preference by distance recovery algorithm, in which the selection of replacement of actors from 𝑅𝑅! 𝑛𝑛!"# in step 2 depends on the distance between a possible candidate actor and an orphaned actor. Within this preferential recovery algorithm the likelihood
;
At first target actor (A) is selected by one of the preferred dismantling strategies (Figure 4.4a). Actor A has two adjacent VC Links with actors B and C. In the next step (Figure 4.4b) target actor A is removed from the network, leaving two dangling links. The orphaned actors B and C tend to recover the lost links by connecting to actor with the same VC role of coordinator as the A actor had by using one of recovering algorithms. In this way the broken VC links are recovered by connecting to actor E (Figure 4.4c). In simulating network resilience three recovery mechanism algorithms are applied: random recovery, recovery preferred by distance and recovery preferred by degree. The general recovery algorithm is depicted below. General recovery algorithm 𝐺𝐺!"(𝑁𝑁,𝐸𝐸) — subnetwork with a set of actors N and set of edges E; 𝑛𝑛!"# — actor which was removed from 𝐺𝐺!"; 𝑛𝑛!"# — set of orphaned actors 𝑛𝑛, which were adjacent to 𝑛𝑛!"#; 𝑟𝑟𝑟𝑟𝑟𝑟𝑟𝑟(𝑛𝑛) —VC role of actor n; 𝑅𝑅! 𝑛𝑛!"# = 𝑛𝑛 ∈ 𝑁𝑁: 𝑟𝑟𝑟𝑟𝑟𝑟𝑟𝑟 𝑛𝑛 = 𝑟𝑟𝑟𝑟𝑟𝑟𝑟𝑟(𝑛𝑛!"#) — set of actors from 𝐺𝐺!" which can replace value chain position of actor 𝑛𝑛!"#. For each orphaned actor 𝑛𝑛 from 𝑛𝑛!"# :
1. With likelihood 𝑃𝑃!"#$!" = 1− !!! !!"# !!
evaluate whether or not the lost VC link will be recovered by 𝑛𝑛 .
2. If previous step gave positive answer, then select recovery candidate 𝑛𝑛! from the 𝑅𝑅! 𝑛𝑛!"# following specific preference, which is chosen based on the recovery mechanism.
3. Connect actors 𝑛𝑛 and 𝑛𝑛! . Next, we introduce three algorithms, which are based on this general recovery algorithm but have a specific preference among candidates for recovery. See also figure 6. Random recovery algorithm The random recovery algorithm suggests that no candidate from 𝑅𝑅! 𝑛𝑛!"# has preference over others, and all of them are treated equally. This algorithm implies that the macro network is heterogeneous and that replacements can be chosen from all parts of the network, hence, at step 2 of the general recovery algorithm candidate 𝑛𝑛! from 𝑅𝑅! 𝑛𝑛!"# is selected randomly. Preference by distance recovery algorithm Trust and skills are important criteria for selecting suitable replacements. Therefore it’s more likely that preferred replacements are preferably found within the redundant network of the actors involved in the value chain. This means that candidates with the shortest path from orphaned actors within the macro network (GMacro) will have more chance of becoming a replacement than actors further away. This can be translated into a preference by distance recovery algorithm, in which the selection of replacement of actors from 𝑅𝑅! 𝑛𝑛!"# in step 2 depends on the distance between a possible candidate actor and an orphaned actor. Within this preferential recovery algorithm the likelihood
— set of actors from
At first target actor (A) is selected by one of the preferred dismantling strategies (Figure 4.4a). Actor A has two adjacent VC Links with actors B and C. In the next step (Figure 4.4b) target actor A is removed from the network, leaving two dangling links. The orphaned actors B and C tend to recover the lost links by connecting to actor with the same VC role of coordinator as the A actor had by using one of recovering algorithms. In this way the broken VC links are recovered by connecting to actor E (Figure 4.4c). In simulating network resilience three recovery mechanism algorithms are applied: random recovery, recovery preferred by distance and recovery preferred by degree. The general recovery algorithm is depicted below. General recovery algorithm 𝐺𝐺!"(𝑁𝑁,𝐸𝐸) — subnetwork with a set of actors N and set of edges E; 𝑛𝑛!"# — actor which was removed from 𝐺𝐺!"; 𝑛𝑛!"# — set of orphaned actors 𝑛𝑛, which were adjacent to 𝑛𝑛!"#; 𝑟𝑟𝑟𝑟𝑟𝑟𝑟𝑟(𝑛𝑛) —VC role of actor n; 𝑅𝑅! 𝑛𝑛!"# = 𝑛𝑛 ∈ 𝑁𝑁: 𝑟𝑟𝑟𝑟𝑟𝑟𝑟𝑟 𝑛𝑛 = 𝑟𝑟𝑟𝑟𝑟𝑟𝑟𝑟(𝑛𝑛!"#) — set of actors from 𝐺𝐺!" which can replace value chain position of actor 𝑛𝑛!"#. For each orphaned actor 𝑛𝑛 from 𝑛𝑛!"# :
1. With likelihood 𝑃𝑃!"#$!" = 1− !!! !!"# !!
evaluate whether or not the lost VC link will be recovered by 𝑛𝑛 .
2. If previous step gave positive answer, then select recovery candidate 𝑛𝑛! from the 𝑅𝑅! 𝑛𝑛!"# following specific preference, which is chosen based on the recovery mechanism.
3. Connect actors 𝑛𝑛 and 𝑛𝑛! . Next, we introduce three algorithms, which are based on this general recovery algorithm but have a specific preference among candidates for recovery. See also figure 6. Random recovery algorithm The random recovery algorithm suggests that no candidate from 𝑅𝑅! 𝑛𝑛!"# has preference over others, and all of them are treated equally. This algorithm implies that the macro network is heterogeneous and that replacements can be chosen from all parts of the network, hence, at step 2 of the general recovery algorithm candidate 𝑛𝑛! from 𝑅𝑅! 𝑛𝑛!"# is selected randomly. Preference by distance recovery algorithm Trust and skills are important criteria for selecting suitable replacements. Therefore it’s more likely that preferred replacements are preferably found within the redundant network of the actors involved in the value chain. This means that candidates with the shortest path from orphaned actors within the macro network (GMacro) will have more chance of becoming a replacement than actors further away. This can be translated into a preference by distance recovery algorithm, in which the selection of replacement of actors from 𝑅𝑅! 𝑛𝑛!"# in step 2 depends on the distance between a possible candidate actor and an orphaned actor. Within this preferential recovery algorithm the likelihood
which can replace
value chain position of actor
At first target actor (A) is selected by one of the preferred dismantling strategies (Figure 4.4a). Actor A has two adjacent VC Links with actors B and C. In the next step (Figure 4.4b) target actor A is removed from the network, leaving two dangling links. The orphaned actors B and C tend to recover the lost links by connecting to actor with the same VC role of coordinator as the A actor had by using one of recovering algorithms. In this way the broken VC links are recovered by connecting to actor E (Figure 4.4c). In simulating network resilience three recovery mechanism algorithms are applied: random recovery, recovery preferred by distance and recovery preferred by degree. The general recovery algorithm is depicted below. General recovery algorithm 𝐺𝐺!"(𝑁𝑁,𝐸𝐸) — subnetwork with a set of actors N and set of edges E; 𝑛𝑛!"# — actor which was removed from 𝐺𝐺!"; 𝑛𝑛!"# — set of orphaned actors 𝑛𝑛, which were adjacent to 𝑛𝑛!"#; 𝑟𝑟𝑟𝑟𝑟𝑟𝑟𝑟(𝑛𝑛) —VC role of actor n; 𝑅𝑅! 𝑛𝑛!"# = 𝑛𝑛 ∈ 𝑁𝑁: 𝑟𝑟𝑟𝑟𝑟𝑟𝑟𝑟 𝑛𝑛 = 𝑟𝑟𝑟𝑟𝑟𝑟𝑟𝑟(𝑛𝑛!"#) — set of actors from 𝐺𝐺!" which can replace value chain position of actor 𝑛𝑛!"#. For each orphaned actor 𝑛𝑛 from 𝑛𝑛!"# :
1. With likelihood 𝑃𝑃!"#$!" = 1− !!! !!"# !!
evaluate whether or not the lost VC link will be recovered by 𝑛𝑛 .
2. If previous step gave positive answer, then select recovery candidate 𝑛𝑛! from the 𝑅𝑅! 𝑛𝑛!"# following specific preference, which is chosen based on the recovery mechanism.
3. Connect actors 𝑛𝑛 and 𝑛𝑛! . Next, we introduce three algorithms, which are based on this general recovery algorithm but have a specific preference among candidates for recovery. See also figure 6. Random recovery algorithm The random recovery algorithm suggests that no candidate from 𝑅𝑅! 𝑛𝑛!"# has preference over others, and all of them are treated equally. This algorithm implies that the macro network is heterogeneous and that replacements can be chosen from all parts of the network, hence, at step 2 of the general recovery algorithm candidate 𝑛𝑛! from 𝑅𝑅! 𝑛𝑛!"# is selected randomly. Preference by distance recovery algorithm Trust and skills are important criteria for selecting suitable replacements. Therefore it’s more likely that preferred replacements are preferably found within the redundant network of the actors involved in the value chain. This means that candidates with the shortest path from orphaned actors within the macro network (GMacro) will have more chance of becoming a replacement than actors further away. This can be translated into a preference by distance recovery algorithm, in which the selection of replacement of actors from 𝑅𝑅! 𝑛𝑛!"# in step 2 depends on the distance between a possible candidate actor and an orphaned actor. Within this preferential recovery algorithm the likelihood
.
For each orphaned actor
At first target actor (A) is selected by one of the preferred dismantling strategies (Figure 4.4a). Actor A has two adjacent VC Links with actors B and C. In the next step (Figure 4.4b) target actor A is removed from the network, leaving two dangling links. The orphaned actors B and C tend to recover the lost links by connecting to actor with the same VC role of coordinator as the A actor had by using one of recovering algorithms. In this way the broken VC links are recovered by connecting to actor E (Figure 4.4c). In simulating network resilience three recovery mechanism algorithms are applied: random recovery, recovery preferred by distance and recovery preferred by degree. The general recovery algorithm is depicted below. General recovery algorithm 𝐺𝐺!"(𝑁𝑁,𝐸𝐸) — subnetwork with a set of actors N and set of edges E; 𝑛𝑛!"# — actor which was removed from 𝐺𝐺!"; 𝑛𝑛!"# — set of orphaned actors 𝑛𝑛, which were adjacent to 𝑛𝑛!"#; 𝑟𝑟𝑟𝑟𝑟𝑟𝑟𝑟(𝑛𝑛) —VC role of actor n; 𝑅𝑅! 𝑛𝑛!"# = 𝑛𝑛 ∈ 𝑁𝑁: 𝑟𝑟𝑟𝑟𝑟𝑟𝑟𝑟 𝑛𝑛 = 𝑟𝑟𝑟𝑟𝑟𝑟𝑟𝑟(𝑛𝑛!"#) — set of actors from 𝐺𝐺!" which can replace value chain position of actor 𝑛𝑛!"#. For each orphaned actor 𝑛𝑛 from 𝑛𝑛!"# :
1. With likelihood 𝑃𝑃!"#$!" = 1− !!! !!"# !!
evaluate whether or not the lost VC link will be recovered by 𝑛𝑛 .
2. If previous step gave positive answer, then select recovery candidate 𝑛𝑛! from the 𝑅𝑅! 𝑛𝑛!"# following specific preference, which is chosen based on the recovery mechanism.
3. Connect actors 𝑛𝑛 and 𝑛𝑛! . Next, we introduce three algorithms, which are based on this general recovery algorithm but have a specific preference among candidates for recovery. See also figure 6. Random recovery algorithm The random recovery algorithm suggests that no candidate from 𝑅𝑅! 𝑛𝑛!"# has preference over others, and all of them are treated equally. This algorithm implies that the macro network is heterogeneous and that replacements can be chosen from all parts of the network, hence, at step 2 of the general recovery algorithm candidate 𝑛𝑛! from 𝑅𝑅! 𝑛𝑛!"# is selected randomly. Preference by distance recovery algorithm Trust and skills are important criteria for selecting suitable replacements. Therefore it’s more likely that preferred replacements are preferably found within the redundant network of the actors involved in the value chain. This means that candidates with the shortest path from orphaned actors within the macro network (GMacro) will have more chance of becoming a replacement than actors further away. This can be translated into a preference by distance recovery algorithm, in which the selection of replacement of actors from 𝑅𝑅! 𝑛𝑛!"# in step 2 depends on the distance between a possible candidate actor and an orphaned actor. Within this preferential recovery algorithm the likelihood
from
At first target actor (A) is selected by one of the preferred dismantling strategies (Figure 4.4a). Actor A has two adjacent VC Links with actors B and C. In the next step (Figure 4.4b) target actor A is removed from the network, leaving two dangling links. The orphaned actors B and C tend to recover the lost links by connecting to actor with the same VC role of coordinator as the A actor had by using one of recovering algorithms. In this way the broken VC links are recovered by connecting to actor E (Figure 4.4c). In simulating network resilience three recovery mechanism algorithms are applied: random recovery, recovery preferred by distance and recovery preferred by degree. The general recovery algorithm is depicted below. General recovery algorithm 𝐺𝐺!"(𝑁𝑁,𝐸𝐸) — subnetwork with a set of actors N and set of edges E; 𝑛𝑛!"# — actor which was removed from 𝐺𝐺!"; 𝑛𝑛!"# — set of orphaned actors 𝑛𝑛, which were adjacent to 𝑛𝑛!"#; 𝑟𝑟𝑟𝑟𝑟𝑟𝑟𝑟(𝑛𝑛) —VC role of actor n; 𝑅𝑅! 𝑛𝑛!"# = 𝑛𝑛 ∈ 𝑁𝑁: 𝑟𝑟𝑟𝑟𝑟𝑟𝑟𝑟 𝑛𝑛 = 𝑟𝑟𝑟𝑟𝑟𝑟𝑟𝑟(𝑛𝑛!"#) — set of actors from 𝐺𝐺!" which can replace value chain position of actor 𝑛𝑛!"#. For each orphaned actor 𝑛𝑛 from 𝑛𝑛!"# :
1. With likelihood 𝑃𝑃!"#$!" = 1− !!! !!"# !!
evaluate whether or not the lost VC link will be recovered by 𝑛𝑛 .
2. If previous step gave positive answer, then select recovery candidate 𝑛𝑛! from the 𝑅𝑅! 𝑛𝑛!"# following specific preference, which is chosen based on the recovery mechanism.
3. Connect actors 𝑛𝑛 and 𝑛𝑛! . Next, we introduce three algorithms, which are based on this general recovery algorithm but have a specific preference among candidates for recovery. See also figure 6. Random recovery algorithm The random recovery algorithm suggests that no candidate from 𝑅𝑅! 𝑛𝑛!"# has preference over others, and all of them are treated equally. This algorithm implies that the macro network is heterogeneous and that replacements can be chosen from all parts of the network, hence, at step 2 of the general recovery algorithm candidate 𝑛𝑛! from 𝑅𝑅! 𝑛𝑛!"# is selected randomly. Preference by distance recovery algorithm Trust and skills are important criteria for selecting suitable replacements. Therefore it’s more likely that preferred replacements are preferably found within the redundant network of the actors involved in the value chain. This means that candidates with the shortest path from orphaned actors within the macro network (GMacro) will have more chance of becoming a replacement than actors further away. This can be translated into a preference by distance recovery algorithm, in which the selection of replacement of actors from 𝑅𝑅! 𝑛𝑛!"# in step 2 depends on the distance between a possible candidate actor and an orphaned actor. Within this preferential recovery algorithm the likelihood
:
1. With likelihood
At first target actor (A) is selected by one of the preferred dismantling strategies (Figure 4.4a). Actor A has two adjacent VC Links with actors B and C. In the next step (Figure 4.4b) target actor A is removed from the network, leaving two dangling links. The orphaned actors B and C tend to recover the lost links by connecting to actor with the same VC role of coordinator as the A actor had by using one of recovering algorithms. In this way the broken VC links are recovered by connecting to actor E (Figure 4.4c). In simulating network resilience three recovery mechanism algorithms are applied: random recovery, recovery preferred by distance and recovery preferred by degree. The general recovery algorithm is depicted below. General recovery algorithm 𝐺𝐺!"(𝑁𝑁,𝐸𝐸) — subnetwork with a set of actors N and set of edges E; 𝑛𝑛!"# — actor which was removed from 𝐺𝐺!"; 𝑛𝑛!"# — set of orphaned actors 𝑛𝑛, which were adjacent to 𝑛𝑛!"#; 𝑟𝑟𝑟𝑟𝑟𝑟𝑟𝑟(𝑛𝑛) —VC role of actor n; 𝑅𝑅! 𝑛𝑛!"# = 𝑛𝑛 ∈ 𝑁𝑁: 𝑟𝑟𝑟𝑟𝑟𝑟𝑟𝑟 𝑛𝑛 = 𝑟𝑟𝑟𝑟𝑟𝑟𝑟𝑟(𝑛𝑛!"#) — set of actors from 𝐺𝐺!" which can replace value chain position of actor 𝑛𝑛!"#. For each orphaned actor 𝑛𝑛 from 𝑛𝑛!"# :
1. With likelihood 𝑃𝑃!"#$!" = 1− !!! !!"# !!
evaluate whether or not the lost VC link will be recovered by 𝑛𝑛 .
2. If previous step gave positive answer, then select recovery candidate 𝑛𝑛! from the 𝑅𝑅! 𝑛𝑛!"# following specific preference, which is chosen based on the recovery mechanism.
3. Connect actors 𝑛𝑛 and 𝑛𝑛! . Next, we introduce three algorithms, which are based on this general recovery algorithm but have a specific preference among candidates for recovery. See also figure 6. Random recovery algorithm The random recovery algorithm suggests that no candidate from 𝑅𝑅! 𝑛𝑛!"# has preference over others, and all of them are treated equally. This algorithm implies that the macro network is heterogeneous and that replacements can be chosen from all parts of the network, hence, at step 2 of the general recovery algorithm candidate 𝑛𝑛! from 𝑅𝑅! 𝑛𝑛!"# is selected randomly. Preference by distance recovery algorithm Trust and skills are important criteria for selecting suitable replacements. Therefore it’s more likely that preferred replacements are preferably found within the redundant network of the actors involved in the value chain. This means that candidates with the shortest path from orphaned actors within the macro network (GMacro) will have more chance of becoming a replacement than actors further away. This can be translated into a preference by distance recovery algorithm, in which the selection of replacement of actors from 𝑅𝑅! 𝑛𝑛!"# in step 2 depends on the distance between a possible candidate actor and an orphaned actor. Within this preferential recovery algorithm the likelihood
evaluate whether or not the lost VC link will
be recovered by
At first target actor (A) is selected by one of the preferred dismantling strategies (Figure 4.4a). Actor A has two adjacent VC Links with actors B and C. In the next step (Figure 4.4b) target actor A is removed from the network, leaving two dangling links. The orphaned actors B and C tend to recover the lost links by connecting to actor with the same VC role of coordinator as the A actor had by using one of recovering algorithms. In this way the broken VC links are recovered by connecting to actor E (Figure 4.4c). In simulating network resilience three recovery mechanism algorithms are applied: random recovery, recovery preferred by distance and recovery preferred by degree. The general recovery algorithm is depicted below. General recovery algorithm 𝐺𝐺!"(𝑁𝑁,𝐸𝐸) — subnetwork with a set of actors N and set of edges E; 𝑛𝑛!"# — actor which was removed from 𝐺𝐺!"; 𝑛𝑛!"# — set of orphaned actors 𝑛𝑛, which were adjacent to 𝑛𝑛!"#; 𝑟𝑟𝑟𝑟𝑟𝑟𝑟𝑟(𝑛𝑛) —VC role of actor n; 𝑅𝑅! 𝑛𝑛!"# = 𝑛𝑛 ∈ 𝑁𝑁: 𝑟𝑟𝑟𝑟𝑟𝑟𝑟𝑟 𝑛𝑛 = 𝑟𝑟𝑟𝑟𝑟𝑟𝑟𝑟(𝑛𝑛!"#) — set of actors from 𝐺𝐺!" which can replace value chain position of actor 𝑛𝑛!"#. For each orphaned actor 𝑛𝑛 from 𝑛𝑛!"# :
1. With likelihood 𝑃𝑃!"#$!" = 1− !!! !!"# !!
evaluate whether or not the lost VC link will be recovered by 𝑛𝑛 .
2. If previous step gave positive answer, then select recovery candidate 𝑛𝑛! from the 𝑅𝑅! 𝑛𝑛!"# following specific preference, which is chosen based on the recovery mechanism.
3. Connect actors 𝑛𝑛 and 𝑛𝑛! . Next, we introduce three algorithms, which are based on this general recovery algorithm but have a specific preference among candidates for recovery. See also figure 6. Random recovery algorithm The random recovery algorithm suggests that no candidate from 𝑅𝑅! 𝑛𝑛!"# has preference over others, and all of them are treated equally. This algorithm implies that the macro network is heterogeneous and that replacements can be chosen from all parts of the network, hence, at step 2 of the general recovery algorithm candidate 𝑛𝑛! from 𝑅𝑅! 𝑛𝑛!"# is selected randomly. Preference by distance recovery algorithm Trust and skills are important criteria for selecting suitable replacements. Therefore it’s more likely that preferred replacements are preferably found within the redundant network of the actors involved in the value chain. This means that candidates with the shortest path from orphaned actors within the macro network (GMacro) will have more chance of becoming a replacement than actors further away. This can be translated into a preference by distance recovery algorithm, in which the selection of replacement of actors from 𝑅𝑅! 𝑛𝑛!"# in step 2 depends on the distance between a possible candidate actor and an orphaned actor. Within this preferential recovery algorithm the likelihood
.
2. If previous step gave positive answer, then select recovery candidate
At first target actor (A) is selected by one of the preferred dismantling strategies (Figure 4.4a). Actor A has two adjacent VC Links with actors B and C. In the next step (Figure 4.4b) target actor A is removed from the network, leaving two dangling links. The orphaned actors B and C tend to recover the lost links by connecting to actor with the same VC role of coordinator as the A actor had by using one of recovering algorithms. In this way the broken VC links are recovered by connecting to actor E (Figure 4.4c). In simulating network resilience three recovery mechanism algorithms are applied: random recovery, recovery preferred by distance and recovery preferred by degree. The general recovery algorithm is depicted below. General recovery algorithm 𝐺𝐺!"(𝑁𝑁,𝐸𝐸) — subnetwork with a set of actors N and set of edges E; 𝑛𝑛!"# — actor which was removed from 𝐺𝐺!"; 𝑛𝑛!"# — set of orphaned actors 𝑛𝑛, which were adjacent to 𝑛𝑛!"#; 𝑟𝑟𝑟𝑟𝑟𝑟𝑟𝑟(𝑛𝑛) —VC role of actor n; 𝑅𝑅! 𝑛𝑛!"# = 𝑛𝑛 ∈ 𝑁𝑁: 𝑟𝑟𝑟𝑟𝑟𝑟𝑟𝑟 𝑛𝑛 = 𝑟𝑟𝑟𝑟𝑟𝑟𝑟𝑟(𝑛𝑛!"#) — set of actors from 𝐺𝐺!" which can replace value chain position of actor 𝑛𝑛!"#. For each orphaned actor 𝑛𝑛 from 𝑛𝑛!"# :
1. With likelihood 𝑃𝑃!"#$!" = 1− !!! !!"# !!
evaluate whether or not the lost VC link will be recovered by 𝑛𝑛 .
2. If previous step gave positive answer, then select recovery candidate 𝑛𝑛! from the 𝑅𝑅! 𝑛𝑛!"# following specific preference, which is chosen based on the recovery mechanism.
3. Connect actors 𝑛𝑛 and 𝑛𝑛! . Next, we introduce three algorithms, which are based on this general recovery algorithm but have a specific preference among candidates for recovery. See also figure 6. Random recovery algorithm The random recovery algorithm suggests that no candidate from 𝑅𝑅! 𝑛𝑛!"# has preference over others, and all of them are treated equally. This algorithm implies that the macro network is heterogeneous and that replacements can be chosen from all parts of the network, hence, at step 2 of the general recovery algorithm candidate 𝑛𝑛! from 𝑅𝑅! 𝑛𝑛!"# is selected randomly. Preference by distance recovery algorithm Trust and skills are important criteria for selecting suitable replacements. Therefore it’s more likely that preferred replacements are preferably found within the redundant network of the actors involved in the value chain. This means that candidates with the shortest path from orphaned actors within the macro network (GMacro) will have more chance of becoming a replacement than actors further away. This can be translated into a preference by distance recovery algorithm, in which the selection of replacement of actors from 𝑅𝑅! 𝑛𝑛!"# in step 2 depends on the distance between a possible candidate actor and an orphaned actor. Within this preferential recovery algorithm the likelihood
from the
At first target actor (A) is selected by one of the preferred dismantling strategies (Figure 4.4a). Actor A has two adjacent VC Links with actors B and C. In the next step (Figure 4.4b) target actor A is removed from the network, leaving two dangling links. The orphaned actors B and C tend to recover the lost links by connecting to actor with the same VC role of coordinator as the A actor had by using one of recovering algorithms. In this way the broken VC links are recovered by connecting to actor E (Figure 4.4c). In simulating network resilience three recovery mechanism algorithms are applied: random recovery, recovery preferred by distance and recovery preferred by degree. The general recovery algorithm is depicted below. General recovery algorithm 𝐺𝐺!"(𝑁𝑁,𝐸𝐸) — subnetwork with a set of actors N and set of edges E; 𝑛𝑛!"# — actor which was removed from 𝐺𝐺!"; 𝑛𝑛!"# — set of orphaned actors 𝑛𝑛, which were adjacent to 𝑛𝑛!"#; 𝑟𝑟𝑟𝑟𝑟𝑟𝑟𝑟(𝑛𝑛) —VC role of actor n; 𝑅𝑅! 𝑛𝑛!"# = 𝑛𝑛 ∈ 𝑁𝑁: 𝑟𝑟𝑟𝑟𝑟𝑟𝑟𝑟 𝑛𝑛 = 𝑟𝑟𝑟𝑟𝑟𝑟𝑟𝑟(𝑛𝑛!"#) — set of actors from 𝐺𝐺!" which can replace value chain position of actor 𝑛𝑛!"#. For each orphaned actor 𝑛𝑛 from 𝑛𝑛!"# :
1. With likelihood 𝑃𝑃!"#$!" = 1− !!! !!"# !!
evaluate whether or not the lost VC link will be recovered by 𝑛𝑛 .
2. If previous step gave positive answer, then select recovery candidate 𝑛𝑛! from the 𝑅𝑅! 𝑛𝑛!"# following specific preference, which is chosen based on the recovery mechanism.
3. Connect actors 𝑛𝑛 and 𝑛𝑛! . Next, we introduce three algorithms, which are based on this general recovery algorithm but have a specific preference among candidates for recovery. See also figure 6. Random recovery algorithm The random recovery algorithm suggests that no candidate from 𝑅𝑅! 𝑛𝑛!"# has preference over others, and all of them are treated equally. This algorithm implies that the macro network is heterogeneous and that replacements can be chosen from all parts of the network, hence, at step 2 of the general recovery algorithm candidate 𝑛𝑛! from 𝑅𝑅! 𝑛𝑛!"# is selected randomly. Preference by distance recovery algorithm Trust and skills are important criteria for selecting suitable replacements. Therefore it’s more likely that preferred replacements are preferably found within the redundant network of the actors involved in the value chain. This means that candidates with the shortest path from orphaned actors within the macro network (GMacro) will have more chance of becoming a replacement than actors further away. This can be translated into a preference by distance recovery algorithm, in which the selection of replacement of actors from 𝑅𝑅! 𝑛𝑛!"# in step 2 depends on the distance between a possible candidate actor and an orphaned actor. Within this preferential recovery algorithm the likelihood
following specific preference, which is chosen based on the recovery mechanism.
3. Connect actors
At first target actor (A) is selected by one of the preferred dismantling strategies (Figure 4.4a). Actor A has two adjacent VC Links with actors B and C. In the next step (Figure 4.4b) target actor A is removed from the network, leaving two dangling links. The orphaned actors B and C tend to recover the lost links by connecting to actor with the same VC role of coordinator as the A actor had by using one of recovering algorithms. In this way the broken VC links are recovered by connecting to actor E (Figure 4.4c). In simulating network resilience three recovery mechanism algorithms are applied: random recovery, recovery preferred by distance and recovery preferred by degree. The general recovery algorithm is depicted below. General recovery algorithm 𝐺𝐺!"(𝑁𝑁,𝐸𝐸) — subnetwork with a set of actors N and set of edges E; 𝑛𝑛!"# — actor which was removed from 𝐺𝐺!"; 𝑛𝑛!"# — set of orphaned actors 𝑛𝑛, which were adjacent to 𝑛𝑛!"#; 𝑟𝑟𝑟𝑟𝑟𝑟𝑟𝑟(𝑛𝑛) —VC role of actor n; 𝑅𝑅! 𝑛𝑛!"# = 𝑛𝑛 ∈ 𝑁𝑁: 𝑟𝑟𝑟𝑟𝑟𝑟𝑟𝑟 𝑛𝑛 = 𝑟𝑟𝑟𝑟𝑟𝑟𝑟𝑟(𝑛𝑛!"#) — set of actors from 𝐺𝐺!" which can replace value chain position of actor 𝑛𝑛!"#. For each orphaned actor 𝑛𝑛 from 𝑛𝑛!"# :
1. With likelihood 𝑃𝑃!"#$!" = 1− !!! !!"# !!
evaluate whether or not the lost VC link will be recovered by 𝑛𝑛 .
2. If previous step gave positive answer, then select recovery candidate 𝑛𝑛! from the 𝑅𝑅! 𝑛𝑛!"# following specific preference, which is chosen based on the recovery mechanism.
3. Connect actors 𝑛𝑛 and 𝑛𝑛! . Next, we introduce three algorithms, which are based on this general recovery algorithm but have a specific preference among candidates for recovery. See also figure 6. Random recovery algorithm The random recovery algorithm suggests that no candidate from 𝑅𝑅! 𝑛𝑛!"# has preference over others, and all of them are treated equally. This algorithm implies that the macro network is heterogeneous and that replacements can be chosen from all parts of the network, hence, at step 2 of the general recovery algorithm candidate 𝑛𝑛! from 𝑅𝑅! 𝑛𝑛!"# is selected randomly. Preference by distance recovery algorithm Trust and skills are important criteria for selecting suitable replacements. Therefore it’s more likely that preferred replacements are preferably found within the redundant network of the actors involved in the value chain. This means that candidates with the shortest path from orphaned actors within the macro network (GMacro) will have more chance of becoming a replacement than actors further away. This can be translated into a preference by distance recovery algorithm, in which the selection of replacement of actors from 𝑅𝑅! 𝑛𝑛!"# in step 2 depends on the distance between a possible candidate actor and an orphaned actor. Within this preferential recovery algorithm the likelihood
and
At first target actor (A) is selected by one of the preferred dismantling strategies (Figure 4.4a). Actor A has two adjacent VC Links with actors B and C. In the next step (Figure 4.4b) target actor A is removed from the network, leaving two dangling links. The orphaned actors B and C tend to recover the lost links by connecting to actor with the same VC role of coordinator as the A actor had by using one of recovering algorithms. In this way the broken VC links are recovered by connecting to actor E (Figure 4.4c). In simulating network resilience three recovery mechanism algorithms are applied: random recovery, recovery preferred by distance and recovery preferred by degree. The general recovery algorithm is depicted below. General recovery algorithm 𝐺𝐺!"(𝑁𝑁,𝐸𝐸) — subnetwork with a set of actors N and set of edges E; 𝑛𝑛!"# — actor which was removed from 𝐺𝐺!"; 𝑛𝑛!"# — set of orphaned actors 𝑛𝑛, which were adjacent to 𝑛𝑛!"#; 𝑟𝑟𝑟𝑟𝑟𝑟𝑟𝑟(𝑛𝑛) —VC role of actor n; 𝑅𝑅! 𝑛𝑛!"# = 𝑛𝑛 ∈ 𝑁𝑁: 𝑟𝑟𝑟𝑟𝑟𝑟𝑟𝑟 𝑛𝑛 = 𝑟𝑟𝑟𝑟𝑟𝑟𝑟𝑟(𝑛𝑛!"#) — set of actors from 𝐺𝐺!" which can replace value chain position of actor 𝑛𝑛!"#. For each orphaned actor 𝑛𝑛 from 𝑛𝑛!"# :
1. With likelihood 𝑃𝑃!"#$!" = 1− !!! !!"# !!
evaluate whether or not the lost VC link will be recovered by 𝑛𝑛 .
2. If previous step gave positive answer, then select recovery candidate 𝑛𝑛! from the 𝑅𝑅! 𝑛𝑛!"# following specific preference, which is chosen based on the recovery mechanism.
3. Connect actors 𝑛𝑛 and 𝑛𝑛! . Next, we introduce three algorithms, which are based on this general recovery algorithm but have a specific preference among candidates for recovery. See also figure 6. Random recovery algorithm The random recovery algorithm suggests that no candidate from 𝑅𝑅! 𝑛𝑛!"# has preference over others, and all of them are treated equally. This algorithm implies that the macro network is heterogeneous and that replacements can be chosen from all parts of the network, hence, at step 2 of the general recovery algorithm candidate 𝑛𝑛! from 𝑅𝑅! 𝑛𝑛!"# is selected randomly. Preference by distance recovery algorithm Trust and skills are important criteria for selecting suitable replacements. Therefore it’s more likely that preferred replacements are preferably found within the redundant network of the actors involved in the value chain. This means that candidates with the shortest path from orphaned actors within the macro network (GMacro) will have more chance of becoming a replacement than actors further away. This can be translated into a preference by distance recovery algorithm, in which the selection of replacement of actors from 𝑅𝑅! 𝑛𝑛!"# in step 2 depends on the distance between a possible candidate actor and an orphaned actor. Within this preferential recovery algorithm the likelihood
.
Next, we introduce three algorithms, which are based on this general recovery algorithm
but have a specific preference among candidates for recovery.
Random recovery algorithm
The random recovery algorithm suggests that no candidate from
At first target actor (A) is selected by one of the preferred dismantling strategies (Figure 4.4a). Actor A has two adjacent VC Links with actors B and C. In the next step (Figure 4.4b) target actor A is removed from the network, leaving two dangling links. The orphaned actors B and C tend to recover the lost links by connecting to actor with the same VC role of coordinator as the A actor had by using one of recovering algorithms. In this way the broken VC links are recovered by connecting to actor E (Figure 4.4c). In simulating network resilience three recovery mechanism algorithms are applied: random recovery, recovery preferred by distance and recovery preferred by degree. The general recovery algorithm is depicted below. General recovery algorithm 𝐺𝐺!"(𝑁𝑁,𝐸𝐸) — subnetwork with a set of actors N and set of edges E; 𝑛𝑛!"# — actor which was removed from 𝐺𝐺!"; 𝑛𝑛!"# — set of orphaned actors 𝑛𝑛, which were adjacent to 𝑛𝑛!"#; 𝑟𝑟𝑟𝑟𝑟𝑟𝑟𝑟(𝑛𝑛) —VC role of actor n; 𝑅𝑅! 𝑛𝑛!"# = 𝑛𝑛 ∈ 𝑁𝑁: 𝑟𝑟𝑟𝑟𝑟𝑟𝑟𝑟 𝑛𝑛 = 𝑟𝑟𝑟𝑟𝑟𝑟𝑟𝑟(𝑛𝑛!"#) — set of actors from 𝐺𝐺!" which can replace value chain position of actor 𝑛𝑛!"#. For each orphaned actor 𝑛𝑛 from 𝑛𝑛!"# :
1. With likelihood 𝑃𝑃!"#$!" = 1− !!! !!"# !!
evaluate whether or not the lost VC link will be recovered by 𝑛𝑛 .
2. If previous step gave positive answer, then select recovery candidate 𝑛𝑛! from the 𝑅𝑅! 𝑛𝑛!"# following specific preference, which is chosen based on the recovery mechanism.
3. Connect actors 𝑛𝑛 and 𝑛𝑛! . Next, we introduce three algorithms, which are based on this general recovery algorithm but have a specific preference among candidates for recovery. See also figure 6. Random recovery algorithm The random recovery algorithm suggests that no candidate from 𝑅𝑅! 𝑛𝑛!"# has preference over others, and all of them are treated equally. This algorithm implies that the macro network is heterogeneous and that replacements can be chosen from all parts of the network, hence, at step 2 of the general recovery algorithm candidate 𝑛𝑛! from 𝑅𝑅! 𝑛𝑛!"# is selected randomly. Preference by distance recovery algorithm Trust and skills are important criteria for selecting suitable replacements. Therefore it’s more likely that preferred replacements are preferably found within the redundant network of the actors involved in the value chain. This means that candidates with the shortest path from orphaned actors within the macro network (GMacro) will have more chance of becoming a replacement than actors further away. This can be translated into a preference by distance recovery algorithm, in which the selection of replacement of actors from 𝑅𝑅! 𝑛𝑛!"# in step 2 depends on the distance between a possible candidate actor and an orphaned actor. Within this preferential recovery algorithm the likelihood
has preference
over others, and all of them are treated equally. This algorithm implies that the macro
network is heterogeneous and that replacements can be chosen from all parts of the
network, hence, at step 2 of the general recovery algorithm candidate
At first target actor (A) is selected by one of the preferred dismantling strategies (Figure 4.4a). Actor A has two adjacent VC Links with actors B and C. In the next step (Figure 4.4b) target actor A is removed from the network, leaving two dangling links. The orphaned actors B and C tend to recover the lost links by connecting to actor with the same VC role of coordinator as the A actor had by using one of recovering algorithms. In this way the broken VC links are recovered by connecting to actor E (Figure 4.4c). In simulating network resilience three recovery mechanism algorithms are applied: random recovery, recovery preferred by distance and recovery preferred by degree. The general recovery algorithm is depicted below. General recovery algorithm 𝐺𝐺!"(𝑁𝑁,𝐸𝐸) — subnetwork with a set of actors N and set of edges E; 𝑛𝑛!"# — actor which was removed from 𝐺𝐺!"; 𝑛𝑛!"# — set of orphaned actors 𝑛𝑛, which were adjacent to 𝑛𝑛!"#; 𝑟𝑟𝑟𝑟𝑟𝑟𝑟𝑟(𝑛𝑛) —VC role of actor n; 𝑅𝑅! 𝑛𝑛!"# = 𝑛𝑛 ∈ 𝑁𝑁: 𝑟𝑟𝑟𝑟𝑟𝑟𝑟𝑟 𝑛𝑛 = 𝑟𝑟𝑟𝑟𝑟𝑟𝑟𝑟(𝑛𝑛!"#) — set of actors from 𝐺𝐺!" which can replace value chain position of actor 𝑛𝑛!"#. For each orphaned actor 𝑛𝑛 from 𝑛𝑛!"# :
1. With likelihood 𝑃𝑃!"#$!" = 1− !!! !!"# !!
evaluate whether or not the lost VC link will be recovered by 𝑛𝑛 .
2. If previous step gave positive answer, then select recovery candidate 𝑛𝑛! from the 𝑅𝑅! 𝑛𝑛!"# following specific preference, which is chosen based on the recovery mechanism.
3. Connect actors 𝑛𝑛 and 𝑛𝑛! . Next, we introduce three algorithms, which are based on this general recovery algorithm but have a specific preference among candidates for recovery. See also figure 6. Random recovery algorithm The random recovery algorithm suggests that no candidate from 𝑅𝑅! 𝑛𝑛!"# has preference over others, and all of them are treated equally. This algorithm implies that the macro network is heterogeneous and that replacements can be chosen from all parts of the network, hence, at step 2 of the general recovery algorithm candidate 𝑛𝑛! from 𝑅𝑅! 𝑛𝑛!"# is selected randomly. Preference by distance recovery algorithm Trust and skills are important criteria for selecting suitable replacements. Therefore it’s more likely that preferred replacements are preferably found within the redundant network of the actors involved in the value chain. This means that candidates with the shortest path from orphaned actors within the macro network (GMacro) will have more chance of becoming a replacement than actors further away. This can be translated into a preference by distance recovery algorithm, in which the selection of replacement of actors from 𝑅𝑅! 𝑛𝑛!"# in step 2 depends on the distance between a possible candidate actor and an orphaned actor. Within this preferential recovery algorithm the likelihood
from
At first target actor (A) is selected by one of the preferred dismantling strategies (Figure 4.4a). Actor A has two adjacent VC Links with actors B and C. In the next step (Figure 4.4b) target actor A is removed from the network, leaving two dangling links. The orphaned actors B and C tend to recover the lost links by connecting to actor with the same VC role of coordinator as the A actor had by using one of recovering algorithms. In this way the broken VC links are recovered by connecting to actor E (Figure 4.4c). In simulating network resilience three recovery mechanism algorithms are applied: random recovery, recovery preferred by distance and recovery preferred by degree. The general recovery algorithm is depicted below. General recovery algorithm 𝐺𝐺!"(𝑁𝑁,𝐸𝐸) — subnetwork with a set of actors N and set of edges E; 𝑛𝑛!"# — actor which was removed from 𝐺𝐺!"; 𝑛𝑛!"# — set of orphaned actors 𝑛𝑛, which were adjacent to 𝑛𝑛!"#; 𝑟𝑟𝑟𝑟𝑟𝑟𝑟𝑟(𝑛𝑛) —VC role of actor n; 𝑅𝑅! 𝑛𝑛!"# = 𝑛𝑛 ∈ 𝑁𝑁: 𝑟𝑟𝑟𝑟𝑟𝑟𝑟𝑟 𝑛𝑛 = 𝑟𝑟𝑟𝑟𝑟𝑟𝑟𝑟(𝑛𝑛!"#) — set of actors from 𝐺𝐺!" which can replace value chain position of actor 𝑛𝑛!"#. For each orphaned actor 𝑛𝑛 from 𝑛𝑛!"# :
1. With likelihood 𝑃𝑃!"#$!" = 1− !!! !!"# !!
evaluate whether or not the lost VC link will be recovered by 𝑛𝑛 .
2. If previous step gave positive answer, then select recovery candidate 𝑛𝑛! from the 𝑅𝑅! 𝑛𝑛!"# following specific preference, which is chosen based on the recovery mechanism.
3. Connect actors 𝑛𝑛 and 𝑛𝑛! . Next, we introduce three algorithms, which are based on this general recovery algorithm but have a specific preference among candidates for recovery. See also figure 6. Random recovery algorithm The random recovery algorithm suggests that no candidate from 𝑅𝑅! 𝑛𝑛!"# has preference over others, and all of them are treated equally. This algorithm implies that the macro network is heterogeneous and that replacements can be chosen from all parts of the network, hence, at step 2 of the general recovery algorithm candidate 𝑛𝑛! from 𝑅𝑅! 𝑛𝑛!"# is selected randomly. Preference by distance recovery algorithm Trust and skills are important criteria for selecting suitable replacements. Therefore it’s more likely that preferred replacements are preferably found within the redundant network of the actors involved in the value chain. This means that candidates with the shortest path from orphaned actors within the macro network (GMacro) will have more chance of becoming a replacement than actors further away. This can be translated into a preference by distance recovery algorithm, in which the selection of replacement of actors from 𝑅𝑅! 𝑛𝑛!"# in step 2 depends on the distance between a possible candidate actor and an orphaned actor. Within this preferential recovery algorithm the likelihood
is selected randomly.
B
international trade
C
building the plantation
A
coordinator
D
growshop owner
Ecoordinator
B
international trade
C
building the plantation
A
coordinator
D
growshop owner
Ecoordinator
B
international trade
C
building the plantation
D
growshop owner
Ecoordinator
Fig 4.4 Dismantling and recovery of a network: (a) Actor A is selected as a target actor by a chosen strategy. (b) Actor A is detached from actors B, C, D and removed from the network. (c) Orphaned actors B and C recover their connections by linking to actor E of the same role as A actor (here: coordinator).
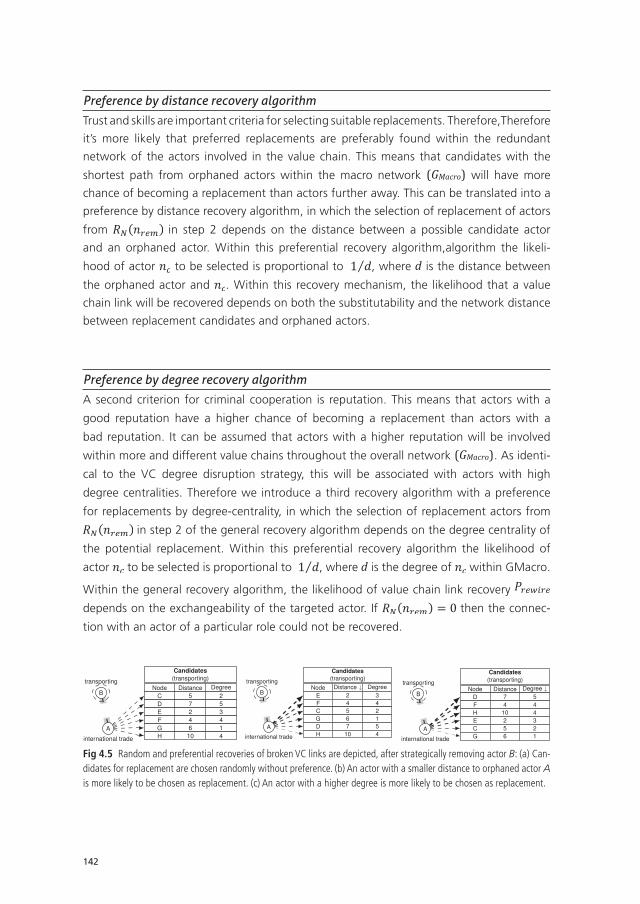
142
Preference by distance recovery algorithm
Trust and skills are important criteria for selecting suitable replacements. Therefore,Therefore
it’s more likely that preferred replacements are preferably found within the redundant
network of the actors involved in the value chain. This means that candidates with the
shortest path from orphaned actors within the macro network
of actor 𝑛𝑛! to be selected is proportional to 1 𝑑𝑑, where d is the distance between the orphaned actor and 𝑛𝑛! . Within this recovery mechanism, the likelihood that a value chain link will be recovered depends on both the substitutability and the network distance between replacement candidates and orphaned actors. Preference by degree recovery algorithm A second criterion for criminal cooperation is reputation. This means that actors with a good reputation have a higher chance of becoming a replacement than actors with a bad reputation. It can be assumed that actors with a higher reputation will be involved within more and different value chains throughout the overall network (GMacro). As identical to the VC degree disruption strategy, this will be associated with actors with high degree centralities. Therefore we introduce a third recovery algorithm with a preference for replacements by degree-‐centrality, in which the selection of replacement actors from 𝑅𝑅! 𝑛𝑛!"# in step 2 of the general recovery algorithm depends on the degree centrality of the potential replacement. Within this preferential recovery algorithm the likelihood of actor 𝑛𝑛! to be selected is proportional to 1 𝑑𝑑, where d is the degree of 𝑛𝑛! within GMacro. Within the general recovery algorithm, the likelihood of value chain link recovery 𝑃𝑃!"#$!"depends on the exchangeability of the targeted actor. If 𝑅𝑅! 𝑛𝑛!"# = 0 then the connection with an actor of a particular role could not be recovered. The difference between random recovery (a), distance recovery (b) and degree recovery (c) is depicted in figure 4.5. Here, actor B is targeted by one of the disruption strategies. As a result, the orphaned actor A has lost its value chain connection ‘international trade–transporting’, and will therefore try to re-‐establish a link with a suitable candidate in order to restore the value chain. The list of candidates, who can fulfill the same role as A, is shown in the first column. In case (a) the candidates are chosen randomly and have no preference between each other to be chosen as a candidate for recovery. In case (b) the actors with the shortest distance to A, are more likely to be selected for replacement. In case (c) the actors with the highest degree are more likely to be selected for replacement. Measuring the effects on network structure After the disruption strategies and the recovery strategies are applied at the same time, after a number of attacks following the same strategy, we want to measure the impact this has on its networks structure, in terms of efficiency and security. Therefore we introduce the measure of efficiency within the Value Chain network that is computed by the following metric: Efficiency = !
!(!!!)!!!,!
!!,!!!!!!
(1)
In this metric dij corresponds to the distance between actors i and j of GVC and N equals the amount of actors in GVC. The denominator creates a measure that varies from 0 to 1, where 1 is complete connectivity and 0 indicates that the network is completely separated into isolated components. Note that in this metric the distance between actors
VCG
will have more
chance of becoming a replacement than actors further away. This can be translated into a
preference by distance recovery algorithm, in which the selection of replacement of actors
from
At first target actor (A) is selected by one of the preferred dismantling strategies (Figure 4.4a). Actor A has two adjacent VC Links with actors B and C. In the next step (Figure 4.4b) target actor A is removed from the network, leaving two dangling links. The orphaned actors B and C tend to recover the lost links by connecting to actor with the same VC role of coordinator as the A actor had by using one of recovering algorithms. In this way the broken VC links are recovered by connecting to actor E (Figure 4.4c). In simulating network resilience three recovery mechanism algorithms are applied: random recovery, recovery preferred by distance and recovery preferred by degree. The general recovery algorithm is depicted below. General recovery algorithm 𝐺𝐺!"(𝑁𝑁,𝐸𝐸) — subnetwork with a set of actors N and set of edges E; 𝑛𝑛!"# — actor which was removed from 𝐺𝐺!"; 𝑛𝑛!"# — set of orphaned actors 𝑛𝑛, which were adjacent to 𝑛𝑛!"#; 𝑟𝑟𝑟𝑟𝑟𝑟𝑟𝑟(𝑛𝑛) —VC role of actor n; 𝑅𝑅! 𝑛𝑛!"# = 𝑛𝑛 ∈ 𝑁𝑁: 𝑟𝑟𝑟𝑟𝑟𝑟𝑟𝑟 𝑛𝑛 = 𝑟𝑟𝑟𝑟𝑟𝑟𝑟𝑟(𝑛𝑛!"#) — set of actors from 𝐺𝐺!" which can replace value chain position of actor 𝑛𝑛!"#. For each orphaned actor 𝑛𝑛 from 𝑛𝑛!"# :
1. With likelihood 𝑃𝑃!"#$!" = 1− !!! !!"# !!
evaluate whether or not the lost VC link will be recovered by 𝑛𝑛 .
2. If previous step gave positive answer, then select recovery candidate 𝑛𝑛! from the 𝑅𝑅! 𝑛𝑛!"# following specific preference, which is chosen based on the recovery mechanism.
3. Connect actors 𝑛𝑛 and 𝑛𝑛! . Next, we introduce three algorithms, which are based on this general recovery algorithm but have a specific preference among candidates for recovery. See also figure 6. Random recovery algorithm The random recovery algorithm suggests that no candidate from 𝑅𝑅! 𝑛𝑛!"# has preference over others, and all of them are treated equally. This algorithm implies that the macro network is heterogeneous and that replacements can be chosen from all parts of the network, hence, at step 2 of the general recovery algorithm candidate 𝑛𝑛! from 𝑅𝑅! 𝑛𝑛!"# is selected randomly. Preference by distance recovery algorithm Trust and skills are important criteria for selecting suitable replacements. Therefore it’s more likely that preferred replacements are preferably found within the redundant network of the actors involved in the value chain. This means that candidates with the shortest path from orphaned actors within the macro network (GMacro) will have more chance of becoming a replacement than actors further away. This can be translated into a preference by distance recovery algorithm, in which the selection of replacement of actors from 𝑅𝑅! 𝑛𝑛!"# in step 2 depends on the distance between a possible candidate actor and an orphaned actor. Within this preferential recovery algorithm the likelihood
in step 2 depends on the distance between a possible candidate actor
and an orphaned actor. Within this preferential recovery algorithm,algorithm the likeli-
hood of actor
At first target actor (A) is selected by one of the preferred dismantling strategies (Figure 4.4a). Actor A has two adjacent VC Links with actors B and C. In the next step (Figure 4.4b) target actor A is removed from the network, leaving two dangling links. The orphaned actors B and C tend to recover the lost links by connecting to actor with the same VC role of coordinator as the A actor had by using one of recovering algorithms. In this way the broken VC links are recovered by connecting to actor E (Figure 4.4c). In simulating network resilience three recovery mechanism algorithms are applied: random recovery, recovery preferred by distance and recovery preferred by degree. The general recovery algorithm is depicted below. General recovery algorithm 𝐺𝐺!"(𝑁𝑁,𝐸𝐸) — subnetwork with a set of actors N and set of edges E; 𝑛𝑛!"# — actor which was removed from 𝐺𝐺!"; 𝑛𝑛!"# — set of orphaned actors 𝑛𝑛, which were adjacent to 𝑛𝑛!"#; 𝑟𝑟𝑟𝑟𝑟𝑟𝑟𝑟(𝑛𝑛) —VC role of actor n; 𝑅𝑅! 𝑛𝑛!"# = 𝑛𝑛 ∈ 𝑁𝑁: 𝑟𝑟𝑟𝑟𝑟𝑟𝑟𝑟 𝑛𝑛 = 𝑟𝑟𝑟𝑟𝑟𝑟𝑟𝑟(𝑛𝑛!"#) — set of actors from 𝐺𝐺!" which can replace value chain position of actor 𝑛𝑛!"#. For each orphaned actor 𝑛𝑛 from 𝑛𝑛!"# :
1. With likelihood 𝑃𝑃!"#$!" = 1− !!! !!"# !!
evaluate whether or not the lost VC link will be recovered by 𝑛𝑛 .
2. If previous step gave positive answer, then select recovery candidate 𝑛𝑛! from the 𝑅𝑅! 𝑛𝑛!"# following specific preference, which is chosen based on the recovery mechanism.
3. Connect actors 𝑛𝑛 and 𝑛𝑛! . Next, we introduce three algorithms, which are based on this general recovery algorithm but have a specific preference among candidates for recovery. See also figure 6. Random recovery algorithm The random recovery algorithm suggests that no candidate from 𝑅𝑅! 𝑛𝑛!"# has preference over others, and all of them are treated equally. This algorithm implies that the macro network is heterogeneous and that replacements can be chosen from all parts of the network, hence, at step 2 of the general recovery algorithm candidate 𝑛𝑛! from 𝑅𝑅! 𝑛𝑛!"# is selected randomly. Preference by distance recovery algorithm Trust and skills are important criteria for selecting suitable replacements. Therefore it’s more likely that preferred replacements are preferably found within the redundant network of the actors involved in the value chain. This means that candidates with the shortest path from orphaned actors within the macro network (GMacro) will have more chance of becoming a replacement than actors further away. This can be translated into a preference by distance recovery algorithm, in which the selection of replacement of actors from 𝑅𝑅! 𝑛𝑛!"# in step 2 depends on the distance between a possible candidate actor and an orphaned actor. Within this preferential recovery algorithm the likelihood
to be selected is proportional to of actor 𝑛𝑛! to be selected is proportional to 1 𝑑𝑑, where d is the distance between the orphaned actor and 𝑛𝑛! . Within this recovery mechanism, the likelihood that a value chain link will be recovered depends on both the substitutability and the network distance between replacement candidates and orphaned actors. Preference by degree recovery algorithm A second criterion for criminal cooperation is reputation. This means that actors with a good reputation have a higher chance of becoming a replacement than actors with a bad reputation. It can be assumed that actors with a higher reputation will be involved within more and different value chains throughout the overall network (GMacro). As identical to the VC degree disruption strategy, this will be associated with actors with high degree centralities. Therefore we introduce a third recovery algorithm with a preference for replacements by degree-‐centrality, in which the selection of replacement actors from 𝑅𝑅! 𝑛𝑛!"# in step 2 of the general recovery algorithm depends on the degree centrality of the potential replacement. Within this preferential recovery algorithm the likelihood of actor 𝑛𝑛! to be selected is proportional to 1 𝑑𝑑, where d is the degree of 𝑛𝑛! within GMacro. Within the general recovery algorithm, the likelihood of value chain link recovery 𝑃𝑃!"#$!"depends on the exchangeability of the targeted actor. If 𝑅𝑅! 𝑛𝑛!"# = 0 then the connection with an actor of a particular role could not be recovered. The difference between random recovery (a), distance recovery (b) and degree recovery (c) is depicted in figure 4.5. Here, actor B is targeted by one of the disruption strategies. As a result, the orphaned actor A has lost its value chain connection ‘international trade–transporting’, and will therefore try to re-‐establish a link with a suitable candidate in order to restore the value chain. The list of candidates, who can fulfill the same role as A, is shown in the first column. In case (a) the candidates are chosen randomly and have no preference between each other to be chosen as a candidate for recovery. In case (b) the actors with the shortest distance to A, are more likely to be selected for replacement. In case (c) the actors with the highest degree are more likely to be selected for replacement. Measuring the effects on network structure After the disruption strategies and the recovery strategies are applied at the same time, after a number of attacks following the same strategy, we want to measure the impact this has on its networks structure, in terms of efficiency and security. Therefore we introduce the measure of efficiency within the Value Chain network that is computed by the following metric: Efficiency = !
!(!!!)!!!,!
!!,!!!!!!
(1)
In this metric dij corresponds to the distance between actors i and j of GVC and N equals the amount of actors in GVC. The denominator creates a measure that varies from 0 to 1, where 1 is complete connectivity and 0 indicates that the network is completely separated into isolated components. Note that in this metric the distance between actors
VCG
, where of actor 𝑛𝑛! to be selected is proportional to 1 𝑑𝑑, where d is the distance between the orphaned actor and 𝑛𝑛! . Within this recovery mechanism, the likelihood that a value chain link will be recovered depends on both the substitutability and the network distance between replacement candidates and orphaned actors. Preference by degree recovery algorithm A second criterion for criminal cooperation is reputation. This means that actors with a good reputation have a higher chance of becoming a replacement than actors with a bad reputation. It can be assumed that actors with a higher reputation will be involved within more and different value chains throughout the overall network (GMacro). As identical to the VC degree disruption strategy, this will be associated with actors with high degree centralities. Therefore we introduce a third recovery algorithm with a preference for replacements by degree-‐centrality, in which the selection of replacement actors from 𝑅𝑅! 𝑛𝑛!"# in step 2 of the general recovery algorithm depends on the degree centrality of the potential replacement. Within this preferential recovery algorithm the likelihood of actor 𝑛𝑛! to be selected is proportional to 1 𝑑𝑑, where d is the degree of 𝑛𝑛! within GMacro. Within the general recovery algorithm, the likelihood of value chain link recovery 𝑃𝑃!"#$!"depends on the exchangeability of the targeted actor. If 𝑅𝑅! 𝑛𝑛!"# = 0 then the connection with an actor of a particular role could not be recovered. The difference between random recovery (a), distance recovery (b) and degree recovery (c) is depicted in figure 4.5. Here, actor B is targeted by one of the disruption strategies. As a result, the orphaned actor A has lost its value chain connection ‘international trade–transporting’, and will therefore try to re-‐establish a link with a suitable candidate in order to restore the value chain. The list of candidates, who can fulfill the same role as A, is shown in the first column. In case (a) the candidates are chosen randomly and have no preference between each other to be chosen as a candidate for recovery. In case (b) the actors with the shortest distance to A, are more likely to be selected for replacement. In case (c) the actors with the highest degree are more likely to be selected for replacement. Measuring the effects on network structure After the disruption strategies and the recovery strategies are applied at the same time, after a number of attacks following the same strategy, we want to measure the impact this has on its networks structure, in terms of efficiency and security. Therefore we introduce the measure of efficiency within the Value Chain network that is computed by the following metric: Efficiency = !
!(!!!)!!!,!
!!,!!!!!!
(1)
In this metric dij corresponds to the distance between actors i and j of GVC and N equals the amount of actors in GVC. The denominator creates a measure that varies from 0 to 1, where 1 is complete connectivity and 0 indicates that the network is completely separated into isolated components. Note that in this metric the distance between actors
VCG
is the distance between
the orphaned actor and
At first target actor (A) is selected by one of the preferred dismantling strategies (Figure 4.4a). Actor A has two adjacent VC Links with actors B and C. In the next step (Figure 4.4b) target actor A is removed from the network, leaving two dangling links. The orphaned actors B and C tend to recover the lost links by connecting to actor with the same VC role of coordinator as the A actor had by using one of recovering algorithms. In this way the broken VC links are recovered by connecting to actor E (Figure 4.4c). In simulating network resilience three recovery mechanism algorithms are applied: random recovery, recovery preferred by distance and recovery preferred by degree. The general recovery algorithm is depicted below. General recovery algorithm 𝐺𝐺!"(𝑁𝑁,𝐸𝐸) — subnetwork with a set of actors N and set of edges E; 𝑛𝑛!"# — actor which was removed from 𝐺𝐺!"; 𝑛𝑛!"# — set of orphaned actors 𝑛𝑛, which were adjacent to 𝑛𝑛!"#; 𝑟𝑟𝑟𝑟𝑟𝑟𝑟𝑟(𝑛𝑛) —VC role of actor n; 𝑅𝑅! 𝑛𝑛!"# = 𝑛𝑛 ∈ 𝑁𝑁: 𝑟𝑟𝑟𝑟𝑟𝑟𝑟𝑟 𝑛𝑛 = 𝑟𝑟𝑟𝑟𝑟𝑟𝑟𝑟(𝑛𝑛!"#) — set of actors from 𝐺𝐺!" which can replace value chain position of actor 𝑛𝑛!"#. For each orphaned actor 𝑛𝑛 from 𝑛𝑛!"# :
1. With likelihood 𝑃𝑃!"#$!" = 1− !!! !!"# !!
evaluate whether or not the lost VC link will be recovered by 𝑛𝑛 .
2. If previous step gave positive answer, then select recovery candidate 𝑛𝑛! from the 𝑅𝑅! 𝑛𝑛!"# following specific preference, which is chosen based on the recovery mechanism.
3. Connect actors 𝑛𝑛 and 𝑛𝑛! . Next, we introduce three algorithms, which are based on this general recovery algorithm but have a specific preference among candidates for recovery. See also figure 6. Random recovery algorithm The random recovery algorithm suggests that no candidate from 𝑅𝑅! 𝑛𝑛!"# has preference over others, and all of them are treated equally. This algorithm implies that the macro network is heterogeneous and that replacements can be chosen from all parts of the network, hence, at step 2 of the general recovery algorithm candidate 𝑛𝑛! from 𝑅𝑅! 𝑛𝑛!"# is selected randomly. Preference by distance recovery algorithm Trust and skills are important criteria for selecting suitable replacements. Therefore it’s more likely that preferred replacements are preferably found within the redundant network of the actors involved in the value chain. This means that candidates with the shortest path from orphaned actors within the macro network (GMacro) will have more chance of becoming a replacement than actors further away. This can be translated into a preference by distance recovery algorithm, in which the selection of replacement of actors from 𝑅𝑅! 𝑛𝑛!"# in step 2 depends on the distance between a possible candidate actor and an orphaned actor. Within this preferential recovery algorithm the likelihood
. Within this recovery mechanism, the likelihood that a value
chain link will be recovered depends on both the substitutability and the network distance
between replacement candidates and orphaned actors.
Preference by degree recovery algorithm
A second criterion for criminal cooperation is reputation. This means that actors with a
good reputation have a higher chance of becoming a replacement than actors with a
bad reputation. It can be assumed that actors with a higher reputation will be involved
within more and different value chains throughout the overall network
of actor 𝑛𝑛! to be selected is proportional to 1 𝑑𝑑, where d is the distance between the orphaned actor and 𝑛𝑛! . Within this recovery mechanism, the likelihood that a value chain link will be recovered depends on both the substitutability and the network distance between replacement candidates and orphaned actors. Preference by degree recovery algorithm A second criterion for criminal cooperation is reputation. This means that actors with a good reputation have a higher chance of becoming a replacement than actors with a bad reputation. It can be assumed that actors with a higher reputation will be involved within more and different value chains throughout the overall network (GMacro). As identical to the VC degree disruption strategy, this will be associated with actors with high degree centralities. Therefore we introduce a third recovery algorithm with a preference for replacements by degree-‐centrality, in which the selection of replacement actors from 𝑅𝑅! 𝑛𝑛!"# in step 2 of the general recovery algorithm depends on the degree centrality of the potential replacement. Within this preferential recovery algorithm the likelihood of actor 𝑛𝑛! to be selected is proportional to 1 𝑑𝑑, where d is the degree of 𝑛𝑛! within GMacro. Within the general recovery algorithm, the likelihood of value chain link recovery 𝑃𝑃!"#$!"depends on the exchangeability of the targeted actor. If 𝑅𝑅! 𝑛𝑛!"# = 0 then the connection with an actor of a particular role could not be recovered. The difference between random recovery (a), distance recovery (b) and degree recovery (c) is depicted in figure 4.5. Here, actor B is targeted by one of the disruption strategies. As a result, the orphaned actor A has lost its value chain connection ‘international trade–transporting’, and will therefore try to re-‐establish a link with a suitable candidate in order to restore the value chain. The list of candidates, who can fulfill the same role as A, is shown in the first column. In case (a) the candidates are chosen randomly and have no preference between each other to be chosen as a candidate for recovery. In case (b) the actors with the shortest distance to A, are more likely to be selected for replacement. In case (c) the actors with the highest degree are more likely to be selected for replacement. Measuring the effects on network structure After the disruption strategies and the recovery strategies are applied at the same time, after a number of attacks following the same strategy, we want to measure the impact this has on its networks structure, in terms of efficiency and security. Therefore we introduce the measure of efficiency within the Value Chain network that is computed by the following metric: Efficiency = !
!(!!!)!!!,!
!!,!!!!!!
(1)
In this metric dij corresponds to the distance between actors i and j of GVC and N equals the amount of actors in GVC. The denominator creates a measure that varies from 0 to 1, where 1 is complete connectivity and 0 indicates that the network is completely separated into isolated components. Note that in this metric the distance between actors
VCG
. As identi-
cal to the VC degree disruption strategy, this will be associated with actors with high
degree centralities. Therefore we introduce a third recovery algorithm with a preference
for replacements by degree-centrality, in which the selection of replacement actors from
At first target actor (A) is selected by one of the preferred dismantling strategies (Figure 4.4a). Actor A has two adjacent VC Links with actors B and C. In the next step (Figure 4.4b) target actor A is removed from the network, leaving two dangling links. The orphaned actors B and C tend to recover the lost links by connecting to actor with the same VC role of coordinator as the A actor had by using one of recovering algorithms. In this way the broken VC links are recovered by connecting to actor E (Figure 4.4c). In simulating network resilience three recovery mechanism algorithms are applied: random recovery, recovery preferred by distance and recovery preferred by degree. The general recovery algorithm is depicted below. General recovery algorithm 𝐺𝐺!"(𝑁𝑁,𝐸𝐸) — subnetwork with a set of actors N and set of edges E; 𝑛𝑛!"# — actor which was removed from 𝐺𝐺!"; 𝑛𝑛!"# — set of orphaned actors 𝑛𝑛, which were adjacent to 𝑛𝑛!"#; 𝑟𝑟𝑟𝑟𝑟𝑟𝑟𝑟(𝑛𝑛) —VC role of actor n; 𝑅𝑅! 𝑛𝑛!"# = 𝑛𝑛 ∈ 𝑁𝑁: 𝑟𝑟𝑟𝑟𝑟𝑟𝑟𝑟 𝑛𝑛 = 𝑟𝑟𝑟𝑟𝑟𝑟𝑟𝑟(𝑛𝑛!"#) — set of actors from 𝐺𝐺!" which can replace value chain position of actor 𝑛𝑛!"#. For each orphaned actor 𝑛𝑛 from 𝑛𝑛!"# :
1. With likelihood 𝑃𝑃!"#$!" = 1− !!! !!"# !!
evaluate whether or not the lost VC link will be recovered by 𝑛𝑛 .
2. If previous step gave positive answer, then select recovery candidate 𝑛𝑛! from the 𝑅𝑅! 𝑛𝑛!"# following specific preference, which is chosen based on the recovery mechanism.
3. Connect actors 𝑛𝑛 and 𝑛𝑛! . Next, we introduce three algorithms, which are based on this general recovery algorithm but have a specific preference among candidates for recovery. See also figure 6. Random recovery algorithm The random recovery algorithm suggests that no candidate from 𝑅𝑅! 𝑛𝑛!"# has preference over others, and all of them are treated equally. This algorithm implies that the macro network is heterogeneous and that replacements can be chosen from all parts of the network, hence, at step 2 of the general recovery algorithm candidate 𝑛𝑛! from 𝑅𝑅! 𝑛𝑛!"# is selected randomly. Preference by distance recovery algorithm Trust and skills are important criteria for selecting suitable replacements. Therefore it’s more likely that preferred replacements are preferably found within the redundant network of the actors involved in the value chain. This means that candidates with the shortest path from orphaned actors within the macro network (GMacro) will have more chance of becoming a replacement than actors further away. This can be translated into a preference by distance recovery algorithm, in which the selection of replacement of actors from 𝑅𝑅! 𝑛𝑛!"# in step 2 depends on the distance between a possible candidate actor and an orphaned actor. Within this preferential recovery algorithm the likelihood
in step 2 of the general recovery algorithm depends on the degree centrality of
the potential replacement. Within this preferential recovery algorithm the likelihood of
actor
At first target actor (A) is selected by one of the preferred dismantling strategies (Figure 4.4a). Actor A has two adjacent VC Links with actors B and C. In the next step (Figure 4.4b) target actor A is removed from the network, leaving two dangling links. The orphaned actors B and C tend to recover the lost links by connecting to actor with the same VC role of coordinator as the A actor had by using one of recovering algorithms. In this way the broken VC links are recovered by connecting to actor E (Figure 4.4c). In simulating network resilience three recovery mechanism algorithms are applied: random recovery, recovery preferred by distance and recovery preferred by degree. The general recovery algorithm is depicted below. General recovery algorithm 𝐺𝐺!"(𝑁𝑁,𝐸𝐸) — subnetwork with a set of actors N and set of edges E; 𝑛𝑛!"# — actor which was removed from 𝐺𝐺!"; 𝑛𝑛!"# — set of orphaned actors 𝑛𝑛, which were adjacent to 𝑛𝑛!"#; 𝑟𝑟𝑟𝑟𝑟𝑟𝑟𝑟(𝑛𝑛) —VC role of actor n; 𝑅𝑅! 𝑛𝑛!"# = 𝑛𝑛 ∈ 𝑁𝑁: 𝑟𝑟𝑟𝑟𝑟𝑟𝑟𝑟 𝑛𝑛 = 𝑟𝑟𝑟𝑟𝑟𝑟𝑟𝑟(𝑛𝑛!"#) — set of actors from 𝐺𝐺!" which can replace value chain position of actor 𝑛𝑛!"#. For each orphaned actor 𝑛𝑛 from 𝑛𝑛!"# :
1. With likelihood 𝑃𝑃!"#$!" = 1− !!! !!"# !!
evaluate whether or not the lost VC link will be recovered by 𝑛𝑛 .
2. If previous step gave positive answer, then select recovery candidate 𝑛𝑛! from the 𝑅𝑅! 𝑛𝑛!"# following specific preference, which is chosen based on the recovery mechanism.
3. Connect actors 𝑛𝑛 and 𝑛𝑛! . Next, we introduce three algorithms, which are based on this general recovery algorithm but have a specific preference among candidates for recovery. See also figure 6. Random recovery algorithm The random recovery algorithm suggests that no candidate from 𝑅𝑅! 𝑛𝑛!"# has preference over others, and all of them are treated equally. This algorithm implies that the macro network is heterogeneous and that replacements can be chosen from all parts of the network, hence, at step 2 of the general recovery algorithm candidate 𝑛𝑛! from 𝑅𝑅! 𝑛𝑛!"# is selected randomly. Preference by distance recovery algorithm Trust and skills are important criteria for selecting suitable replacements. Therefore it’s more likely that preferred replacements are preferably found within the redundant network of the actors involved in the value chain. This means that candidates with the shortest path from orphaned actors within the macro network (GMacro) will have more chance of becoming a replacement than actors further away. This can be translated into a preference by distance recovery algorithm, in which the selection of replacement of actors from 𝑅𝑅! 𝑛𝑛!"# in step 2 depends on the distance between a possible candidate actor and an orphaned actor. Within this preferential recovery algorithm the likelihood
to be selected is proportional to of actor 𝑛𝑛! to be selected is proportional to 1 𝑑𝑑, where d is the distance between the orphaned actor and 𝑛𝑛! . Within this recovery mechanism, the likelihood that a value chain link will be recovered depends on both the substitutability and the network distance between replacement candidates and orphaned actors. Preference by degree recovery algorithm A second criterion for criminal cooperation is reputation. This means that actors with a good reputation have a higher chance of becoming a replacement than actors with a bad reputation. It can be assumed that actors with a higher reputation will be involved within more and different value chains throughout the overall network (GMacro). As identical to the VC degree disruption strategy, this will be associated with actors with high degree centralities. Therefore we introduce a third recovery algorithm with a preference for replacements by degree-‐centrality, in which the selection of replacement actors from 𝑅𝑅! 𝑛𝑛!"# in step 2 of the general recovery algorithm depends on the degree centrality of the potential replacement. Within this preferential recovery algorithm the likelihood of actor 𝑛𝑛! to be selected is proportional to 1 𝑑𝑑, where d is the degree of 𝑛𝑛! within GMacro. Within the general recovery algorithm, the likelihood of value chain link recovery 𝑃𝑃!"#$!"depends on the exchangeability of the targeted actor. If 𝑅𝑅! 𝑛𝑛!"# = 0 then the connection with an actor of a particular role could not be recovered. The difference between random recovery (a), distance recovery (b) and degree recovery (c) is depicted in figure 4.5. Here, actor B is targeted by one of the disruption strategies. As a result, the orphaned actor A has lost its value chain connection ‘international trade–transporting’, and will therefore try to re-‐establish a link with a suitable candidate in order to restore the value chain. The list of candidates, who can fulfill the same role as A, is shown in the first column. In case (a) the candidates are chosen randomly and have no preference between each other to be chosen as a candidate for recovery. In case (b) the actors with the shortest distance to A, are more likely to be selected for replacement. In case (c) the actors with the highest degree are more likely to be selected for replacement. Measuring the effects on network structure After the disruption strategies and the recovery strategies are applied at the same time, after a number of attacks following the same strategy, we want to measure the impact this has on its networks structure, in terms of efficiency and security. Therefore we introduce the measure of efficiency within the Value Chain network that is computed by the following metric: Efficiency = !
!(!!!)!!!,!
!!,!!!!!!
(1)
In this metric dij corresponds to the distance between actors i and j of GVC and N equals the amount of actors in GVC. The denominator creates a measure that varies from 0 to 1, where 1 is complete connectivity and 0 indicates that the network is completely separated into isolated components. Note that in this metric the distance between actors
VCG
, where of actor 𝑛𝑛! to be selected is proportional to 1 𝑑𝑑, where d is the distance between the orphaned actor and 𝑛𝑛! . Within this recovery mechanism, the likelihood that a value chain link will be recovered depends on both the substitutability and the network distance between replacement candidates and orphaned actors. Preference by degree recovery algorithm A second criterion for criminal cooperation is reputation. This means that actors with a good reputation have a higher chance of becoming a replacement than actors with a bad reputation. It can be assumed that actors with a higher reputation will be involved within more and different value chains throughout the overall network (GMacro). As identical to the VC degree disruption strategy, this will be associated with actors with high degree centralities. Therefore we introduce a third recovery algorithm with a preference for replacements by degree-‐centrality, in which the selection of replacement actors from 𝑅𝑅! 𝑛𝑛!"# in step 2 of the general recovery algorithm depends on the degree centrality of the potential replacement. Within this preferential recovery algorithm the likelihood of actor 𝑛𝑛! to be selected is proportional to 1 𝑑𝑑, where d is the degree of 𝑛𝑛! within GMacro. Within the general recovery algorithm, the likelihood of value chain link recovery 𝑃𝑃!"#$!"depends on the exchangeability of the targeted actor. If 𝑅𝑅! 𝑛𝑛!"# = 0 then the connection with an actor of a particular role could not be recovered. The difference between random recovery (a), distance recovery (b) and degree recovery (c) is depicted in figure 4.5. Here, actor B is targeted by one of the disruption strategies. As a result, the orphaned actor A has lost its value chain connection ‘international trade–transporting’, and will therefore try to re-‐establish a link with a suitable candidate in order to restore the value chain. The list of candidates, who can fulfill the same role as A, is shown in the first column. In case (a) the candidates are chosen randomly and have no preference between each other to be chosen as a candidate for recovery. In case (b) the actors with the shortest distance to A, are more likely to be selected for replacement. In case (c) the actors with the highest degree are more likely to be selected for replacement. Measuring the effects on network structure After the disruption strategies and the recovery strategies are applied at the same time, after a number of attacks following the same strategy, we want to measure the impact this has on its networks structure, in terms of efficiency and security. Therefore we introduce the measure of efficiency within the Value Chain network that is computed by the following metric: Efficiency = !
!(!!!)!!!,!
!!,!!!!!!
(1)
In this metric dij corresponds to the distance between actors i and j of GVC and N equals the amount of actors in GVC. The denominator creates a measure that varies from 0 to 1, where 1 is complete connectivity and 0 indicates that the network is completely separated into isolated components. Note that in this metric the distance between actors
VCG
is the degree of
At first target actor (A) is selected by one of the preferred dismantling strategies (Figure 4.4a). Actor A has two adjacent VC Links with actors B and C. In the next step (Figure 4.4b) target actor A is removed from the network, leaving two dangling links. The orphaned actors B and C tend to recover the lost links by connecting to actor with the same VC role of coordinator as the A actor had by using one of recovering algorithms. In this way the broken VC links are recovered by connecting to actor E (Figure 4.4c). In simulating network resilience three recovery mechanism algorithms are applied: random recovery, recovery preferred by distance and recovery preferred by degree. The general recovery algorithm is depicted below. General recovery algorithm 𝐺𝐺!"(𝑁𝑁,𝐸𝐸) — subnetwork with a set of actors N and set of edges E; 𝑛𝑛!"# — actor which was removed from 𝐺𝐺!"; 𝑛𝑛!"# — set of orphaned actors 𝑛𝑛, which were adjacent to 𝑛𝑛!"#; 𝑟𝑟𝑟𝑟𝑟𝑟𝑟𝑟(𝑛𝑛) —VC role of actor n; 𝑅𝑅! 𝑛𝑛!"# = 𝑛𝑛 ∈ 𝑁𝑁: 𝑟𝑟𝑟𝑟𝑟𝑟𝑟𝑟 𝑛𝑛 = 𝑟𝑟𝑟𝑟𝑟𝑟𝑟𝑟(𝑛𝑛!"#) — set of actors from 𝐺𝐺!" which can replace value chain position of actor 𝑛𝑛!"#. For each orphaned actor 𝑛𝑛 from 𝑛𝑛!"# :
1. With likelihood 𝑃𝑃!"#$!" = 1− !!! !!"# !!
evaluate whether or not the lost VC link will be recovered by 𝑛𝑛 .
2. If previous step gave positive answer, then select recovery candidate 𝑛𝑛! from the 𝑅𝑅! 𝑛𝑛!"# following specific preference, which is chosen based on the recovery mechanism.
3. Connect actors 𝑛𝑛 and 𝑛𝑛! . Next, we introduce three algorithms, which are based on this general recovery algorithm but have a specific preference among candidates for recovery. See also figure 6. Random recovery algorithm The random recovery algorithm suggests that no candidate from 𝑅𝑅! 𝑛𝑛!"# has preference over others, and all of them are treated equally. This algorithm implies that the macro network is heterogeneous and that replacements can be chosen from all parts of the network, hence, at step 2 of the general recovery algorithm candidate 𝑛𝑛! from 𝑅𝑅! 𝑛𝑛!"# is selected randomly. Preference by distance recovery algorithm Trust and skills are important criteria for selecting suitable replacements. Therefore it’s more likely that preferred replacements are preferably found within the redundant network of the actors involved in the value chain. This means that candidates with the shortest path from orphaned actors within the macro network (GMacro) will have more chance of becoming a replacement than actors further away. This can be translated into a preference by distance recovery algorithm, in which the selection of replacement of actors from 𝑅𝑅! 𝑛𝑛!"# in step 2 depends on the distance between a possible candidate actor and an orphaned actor. Within this preferential recovery algorithm the likelihood
within GMacro.
Within the general recovery algorithm, the likelihood of value chain link recovery
of actor 𝑛𝑛! to be selected is proportional to 1 𝑑𝑑, where d is the distance between the orphaned actor and 𝑛𝑛! . Within this recovery mechanism, the likelihood that a value chain link will be recovered depends on both the substitutability and the network distance between replacement candidates and orphaned actors. Preference by degree recovery algorithm A second criterion for criminal cooperation is reputation. This means that actors with a good reputation have a higher chance of becoming a replacement than actors with a bad reputation. It can be assumed that actors with a higher reputation will be involved within more and different value chains throughout the overall network (GMacro). As identical to the VC degree disruption strategy, this will be associated with actors with high degree centralities. Therefore we introduce a third recovery algorithm with a preference for replacements by degree-‐centrality, in which the selection of replacement actors from 𝑅𝑅! 𝑛𝑛!"# in step 2 of the general recovery algorithm depends on the degree centrality of the potential replacement. Within this preferential recovery algorithm the likelihood of actor 𝑛𝑛! to be selected is proportional to 1 𝑑𝑑, where d is the degree of 𝑛𝑛! within GMacro. Within the general recovery algorithm, the likelihood of value chain link recovery 𝑃𝑃!"#$!"depends on the exchangeability of the targeted actor. If 𝑅𝑅! 𝑛𝑛!"# = 0 then the connection with an actor of a particular role could not be recovered. The difference between random recovery (a), distance recovery (b) and degree recovery (c) is depicted in figure 4.5. Here, actor B is targeted by one of the disruption strategies. As a result, the orphaned actor A has lost its value chain connection ‘international trade–transporting’, and will therefore try to re-‐establish a link with a suitable candidate in order to restore the value chain. The list of candidates, who can fulfill the same role as A, is shown in the first column. In case (a) the candidates are chosen randomly and have no preference between each other to be chosen as a candidate for recovery. In case (b) the actors with the shortest distance to A, are more likely to be selected for replacement. In case (c) the actors with the highest degree are more likely to be selected for replacement. Measuring the effects on network structure After the disruption strategies and the recovery strategies are applied at the same time, after a number of attacks following the same strategy, we want to measure the impact this has on its networks structure, in terms of efficiency and security. Therefore we introduce the measure of efficiency within the Value Chain network that is computed by the following metric: Efficiency = !
!(!!!)!!!,!
!!,!!!!!!
(1)
In this metric dij corresponds to the distance between actors i and j of GVC and N equals the amount of actors in GVC. The denominator creates a measure that varies from 0 to 1, where 1 is complete connectivity and 0 indicates that the network is completely separated into isolated components. Note that in this metric the distance between actors
VCG
depends on the exchangeability of the targeted actor. If
of actor 𝑛𝑛! to be selected is proportional to 1 𝑑𝑑, where d is the distance between the orphaned actor and 𝑛𝑛! . Within this recovery mechanism, the likelihood that a value chain link will be recovered depends on both the substitutability and the network distance between replacement candidates and orphaned actors. Preference by degree recovery algorithm A second criterion for criminal cooperation is reputation. This means that actors with a good reputation have a higher chance of becoming a replacement than actors with a bad reputation. It can be assumed that actors with a higher reputation will be involved within more and different value chains throughout the overall network (GMacro). As identical to the VC degree disruption strategy, this will be associated with actors with high degree centralities. Therefore we introduce a third recovery algorithm with a preference for replacements by degree-‐centrality, in which the selection of replacement actors from 𝑅𝑅! 𝑛𝑛!"# in step 2 of the general recovery algorithm depends on the degree centrality of the potential replacement. Within this preferential recovery algorithm the likelihood of actor 𝑛𝑛! to be selected is proportional to 1 𝑑𝑑, where d is the degree of 𝑛𝑛! within GMacro. Within the general recovery algorithm, the likelihood of value chain link recovery 𝑃𝑃!"#$!"depends on the exchangeability of the targeted actor. If 𝑅𝑅! 𝑛𝑛!"# = 0 then the connection with an actor of a particular role could not be recovered. The difference between random recovery (a), distance recovery (b) and degree recovery (c) is depicted in figure 4.5. Here, actor B is targeted by one of the disruption strategies. As a result, the orphaned actor A has lost its value chain connection ‘international trade–transporting’, and will therefore try to re-‐establish a link with a suitable candidate in order to restore the value chain. The list of candidates, who can fulfill the same role as A, is shown in the first column. In case (a) the candidates are chosen randomly and have no preference between each other to be chosen as a candidate for recovery. In case (b) the actors with the shortest distance to A, are more likely to be selected for replacement. In case (c) the actors with the highest degree are more likely to be selected for replacement. Measuring the effects on network structure After the disruption strategies and the recovery strategies are applied at the same time, after a number of attacks following the same strategy, we want to measure the impact this has on its networks structure, in terms of efficiency and security. Therefore we introduce the measure of efficiency within the Value Chain network that is computed by the following metric: Efficiency = !
!(!!!)!!!,!
!!,!!!!!!
(1)
In this metric dij corresponds to the distance between actors i and j of GVC and N equals the amount of actors in GVC. The denominator creates a measure that varies from 0 to 1, where 1 is complete connectivity and 0 indicates that the network is completely separated into isolated components. Note that in this metric the distance between actors
VCG
then the connec-
tion with an actor of a particular role could not be recovered.
B
transporting
A
international trade
Candidates(transporting)
Node Distance
Degree
C
5 2
D 7 5
E 2 3
F 4 4
G 6 1
H 10 4
B
transporting
A
international trade
Candidates(transporting)
Node
Distance # Degree
E 2 3
F 4 4
C
5 2
G 6 1
D 7 5
H 10 4
B
transporting
A
international trade
Candidates(transporting)
Node Distance
Degree #D 7 5
F 4 4
H 10 4
E 2 3
C
5 2
G 6 1
Fig 4.5 Random and preferential recoveries of broken VC links are depicted, after strategically removing actor B: (a) Can-didates for replacement are chosen randomly without preference. (b) An actor with a smaller distance to orphaned actor A is more likely to be chosen as replacement. (c) An actor with a higher degree is more likely to be chosen as replacement.
Chapter 4: The Relative Ineffectiveness of Criminal Network Disruption
143
The difference between random recovery (a), distance recovery (b) and degree recovery (c)
is depicted in Figure 4.5. Here, actor B is targeted by one of the disruption strategies. As a
result, the orphaned actor A has lost its value chain connection ‘international trade–trans-
porting’, and will therefore try to re-establish a link with a suitable candidate in order to
restore the value chain. The list of candidates, who can fulfill the same role as A, is shown
in the first column. In case (a) the candidates are chosen randomly and have no preference
between each other to be chosen as a candidate for recovery. In case (b) the actors with the
shortest distance to A, are more likely to be selected for replacement. In case (c) the actors
with the highest degree are more likely to be selected for replacement.
Measuring the effects on network structure
After the disruption strategies and the recovery strategies are applied at the same time,
after a number of attacks following the same strategy, we want to measure the impact this
has on its networks structure, in terms of efficiency and security. Therefore,Therefore we
introduce the measure of efficiency within the Value Chain network
At first target actor (A) is selected by one of the preferred dismantling strategies (Figure 4.4a). Actor A has two adjacent VC Links with actors B and C. In the next step (Figure 4.4b) target actor A is removed from the network, leaving two dangling links. The orphaned actors B and C tend to recover the lost links by connecting to actor with the same VC role of coordinator as the A actor had by using one of recovering algorithms. In this way the broken VC links are recovered by connecting to actor E (Figure 4.4c). In simulating network resilience three recovery mechanism algorithms are applied: random recovery, recovery preferred by distance and recovery preferred by degree. The general recovery algorithm is depicted below. General recovery algorithm 𝐺𝐺!"(𝑁𝑁,𝐸𝐸) — subnetwork with a set of actors N and set of edges E; 𝑛𝑛!"# — actor which was removed from 𝐺𝐺!"; 𝑛𝑛!"# — set of orphaned actors 𝑛𝑛, which were adjacent to 𝑛𝑛!"#; 𝑟𝑟𝑟𝑟𝑟𝑟𝑟𝑟(𝑛𝑛) —VC role of actor n; 𝑅𝑅! 𝑛𝑛!"# = 𝑛𝑛 ∈ 𝑁𝑁: 𝑟𝑟𝑟𝑟𝑟𝑟𝑟𝑟 𝑛𝑛 = 𝑟𝑟𝑟𝑟𝑟𝑟𝑟𝑟(𝑛𝑛!"#) — set of actors from 𝐺𝐺!" which can replace value chain position of actor 𝑛𝑛!"#. For each orphaned actor 𝑛𝑛 from 𝑛𝑛!"# :
1. With likelihood 𝑃𝑃!"#$!" = 1− !!! !!"# !!
evaluate whether or not the lost VC link will be recovered by 𝑛𝑛 .
2. If previous step gave positive answer, then select recovery candidate 𝑛𝑛! from the 𝑅𝑅! 𝑛𝑛!"# following specific preference, which is chosen based on the recovery mechanism.
3. Connect actors 𝑛𝑛 and 𝑛𝑛! . Next, we introduce three algorithms, which are based on this general recovery algorithm but have a specific preference among candidates for recovery. See also figure 6. Random recovery algorithm The random recovery algorithm suggests that no candidate from 𝑅𝑅! 𝑛𝑛!"# has preference over others, and all of them are treated equally. This algorithm implies that the macro network is heterogeneous and that replacements can be chosen from all parts of the network, hence, at step 2 of the general recovery algorithm candidate 𝑛𝑛! from 𝑅𝑅! 𝑛𝑛!"# is selected randomly. Preference by distance recovery algorithm Trust and skills are important criteria for selecting suitable replacements. Therefore it’s more likely that preferred replacements are preferably found within the redundant network of the actors involved in the value chain. This means that candidates with the shortest path from orphaned actors within the macro network (GMacro) will have more chance of becoming a replacement than actors further away. This can be translated into a preference by distance recovery algorithm, in which the selection of replacement of actors from 𝑅𝑅! 𝑛𝑛!"# in step 2 depends on the distance between a possible candidate actor and an orphaned actor. Within this preferential recovery algorithm the likelihood
that is computed
by the following metric:
of actor 𝑛𝑛! to be selected is proportional to 1 𝑑𝑑, where d is the distance between the orphaned actor and 𝑛𝑛! . Within this recovery mechanism, the likelihood that a value chain link will be recovered depends on both the substitutability and the network distance between replacement candidates and orphaned actors. Preference by degree recovery algorithm A second criterion for criminal cooperation is reputation. This means that actors with a good reputation have a higher chance of becoming a replacement than actors with a bad reputation. It can be assumed that actors with a higher reputation will be involved within more and different value chains throughout the overall network (GMacro). As identical to the VC degree disruption strategy, this will be associated with actors with high degree centralities. Therefore we introduce a third recovery algorithm with a preference for replacements by degree-‐centrality, in which the selection of replacement actors from 𝑅𝑅! 𝑛𝑛!"# in step 2 of the general recovery algorithm depends on the degree centrality of the potential replacement. Within this preferential recovery algorithm the likelihood of actor 𝑛𝑛! to be selected is proportional to 1 𝑑𝑑, where d is the degree of 𝑛𝑛! within GMacro. Within the general recovery algorithm, the likelihood of value chain link recovery 𝑃𝑃!"#$!"depends on the exchangeability of the targeted actor. If 𝑅𝑅! 𝑛𝑛!"# = 0 then the connection with an actor of a particular role could not be recovered. The difference between random recovery (a), distance recovery (b) and degree recovery (c) is depicted in figure 4.5. Here, actor B is targeted by one of the disruption strategies. As a result, the orphaned actor A has lost its value chain connection ‘international trade–transporting’, and will therefore try to re-‐establish a link with a suitable candidate in order to restore the value chain. The list of candidates, who can fulfill the same role as A, is shown in the first column. In case (a) the candidates are chosen randomly and have no preference between each other to be chosen as a candidate for recovery. In case (b) the actors with the shortest distance to A, are more likely to be selected for replacement. In case (c) the actors with the highest degree are more likely to be selected for replacement. Measuring the effects on network structure After the disruption strategies and the recovery strategies are applied at the same time, after a number of attacks following the same strategy, we want to measure the impact this has on its networks structure, in terms of efficiency and security. Therefore we introduce the measure of efficiency within the Value Chain network that is computed by the following metric: Efficiency = !
!(!!!)!!!,!
!!,!!!!!!
(1)
In this metric dij corresponds to the distance between actors i and j of GVC and N equals the amount of actors in GVC. The denominator creates a measure that varies from 0 to 1, where 1 is complete connectivity and 0 indicates that the network is completely separated into isolated components. Note that in this metric the distance between actors
VCG
(1)
In this metric dij corresponds to the distance between actors i and j of
At first target actor (A) is selected by one of the preferred dismantling strategies (Figure 4.4a). Actor A has two adjacent VC Links with actors B and C. In the next step (Figure 4.4b) target actor A is removed from the network, leaving two dangling links. The orphaned actors B and C tend to recover the lost links by connecting to actor with the same VC role of coordinator as the A actor had by using one of recovering algorithms. In this way the broken VC links are recovered by connecting to actor E (Figure 4.4c). In simulating network resilience three recovery mechanism algorithms are applied: random recovery, recovery preferred by distance and recovery preferred by degree. The general recovery algorithm is depicted below. General recovery algorithm 𝐺𝐺!"(𝑁𝑁,𝐸𝐸) — subnetwork with a set of actors N and set of edges E; 𝑛𝑛!"# — actor which was removed from 𝐺𝐺!"; 𝑛𝑛!"# — set of orphaned actors 𝑛𝑛, which were adjacent to 𝑛𝑛!"#; 𝑟𝑟𝑟𝑟𝑟𝑟𝑟𝑟(𝑛𝑛) —VC role of actor n; 𝑅𝑅! 𝑛𝑛!"# = 𝑛𝑛 ∈ 𝑁𝑁: 𝑟𝑟𝑟𝑟𝑟𝑟𝑟𝑟 𝑛𝑛 = 𝑟𝑟𝑟𝑟𝑟𝑟𝑟𝑟(𝑛𝑛!"#) — set of actors from 𝐺𝐺!" which can replace value chain position of actor 𝑛𝑛!"#. For each orphaned actor 𝑛𝑛 from 𝑛𝑛!"# :
1. With likelihood 𝑃𝑃!"#$!" = 1− !!! !!"# !!
evaluate whether or not the lost VC link will be recovered by 𝑛𝑛 .
2. If previous step gave positive answer, then select recovery candidate 𝑛𝑛! from the 𝑅𝑅! 𝑛𝑛!"# following specific preference, which is chosen based on the recovery mechanism.
3. Connect actors 𝑛𝑛 and 𝑛𝑛! . Next, we introduce three algorithms, which are based on this general recovery algorithm but have a specific preference among candidates for recovery. See also figure 6. Random recovery algorithm The random recovery algorithm suggests that no candidate from 𝑅𝑅! 𝑛𝑛!"# has preference over others, and all of them are treated equally. This algorithm implies that the macro network is heterogeneous and that replacements can be chosen from all parts of the network, hence, at step 2 of the general recovery algorithm candidate 𝑛𝑛! from 𝑅𝑅! 𝑛𝑛!"# is selected randomly. Preference by distance recovery algorithm Trust and skills are important criteria for selecting suitable replacements. Therefore it’s more likely that preferred replacements are preferably found within the redundant network of the actors involved in the value chain. This means that candidates with the shortest path from orphaned actors within the macro network (GMacro) will have more chance of becoming a replacement than actors further away. This can be translated into a preference by distance recovery algorithm, in which the selection of replacement of actors from 𝑅𝑅! 𝑛𝑛!"# in step 2 depends on the distance between a possible candidate actor and an orphaned actor. Within this preferential recovery algorithm the likelihood
and
At first target actor (A) is selected by one of the preferred dismantling strategies (Figure 4.4a). Actor A has two adjacent VC Links with actors B and C. In the next step (Figure 4.4b) target actor A is removed from the network, leaving two dangling links. The orphaned actors B and C tend to recover the lost links by connecting to actor with the same VC role of coordinator as the A actor had by using one of recovering algorithms. In this way the broken VC links are recovered by connecting to actor E (Figure 4.4c). In simulating network resilience three recovery mechanism algorithms are applied: random recovery, recovery preferred by distance and recovery preferred by degree. The general recovery algorithm is depicted below. General recovery algorithm 𝐺𝐺!"(𝑁𝑁,𝐸𝐸) — subnetwork with a set of actors N and set of edges E; 𝑛𝑛!"# — actor which was removed from 𝐺𝐺!"; 𝑛𝑛!"# — set of orphaned actors 𝑛𝑛, which were adjacent to 𝑛𝑛!"#; 𝑟𝑟𝑟𝑟𝑟𝑟𝑟𝑟(𝑛𝑛) —VC role of actor n; 𝑅𝑅! 𝑛𝑛!"# = 𝑛𝑛 ∈ 𝑁𝑁: 𝑟𝑟𝑟𝑟𝑟𝑟𝑟𝑟 𝑛𝑛 = 𝑟𝑟𝑟𝑟𝑟𝑟𝑟𝑟(𝑛𝑛!"#) — set of actors from 𝐺𝐺!" which can replace value chain position of actor 𝑛𝑛!"#. For each orphaned actor 𝑛𝑛 from 𝑛𝑛!"# :
1. With likelihood 𝑃𝑃!"#$!" = 1− !!! !!"# !!
evaluate whether or not the lost VC link will be recovered by 𝑛𝑛 .
2. If previous step gave positive answer, then select recovery candidate 𝑛𝑛! from the 𝑅𝑅! 𝑛𝑛!"# following specific preference, which is chosen based on the recovery mechanism.
3. Connect actors 𝑛𝑛 and 𝑛𝑛! . Next, we introduce three algorithms, which are based on this general recovery algorithm but have a specific preference among candidates for recovery. See also figure 6. Random recovery algorithm The random recovery algorithm suggests that no candidate from 𝑅𝑅! 𝑛𝑛!"# has preference over others, and all of them are treated equally. This algorithm implies that the macro network is heterogeneous and that replacements can be chosen from all parts of the network, hence, at step 2 of the general recovery algorithm candidate 𝑛𝑛! from 𝑅𝑅! 𝑛𝑛!"# is selected randomly. Preference by distance recovery algorithm Trust and skills are important criteria for selecting suitable replacements. Therefore it’s more likely that preferred replacements are preferably found within the redundant network of the actors involved in the value chain. This means that candidates with the shortest path from orphaned actors within the macro network (GMacro) will have more chance of becoming a replacement than actors further away. This can be translated into a preference by distance recovery algorithm, in which the selection of replacement of actors from 𝑅𝑅! 𝑛𝑛!"# in step 2 depends on the distance between a possible candidate actor and an orphaned actor. Within this preferential recovery algorithm the likelihood
equals
the amount of actors in GVC. The denominator creates a measure that varies from 0 to 1,
where 1 is complete connectivity and 0 indicates that the network is completely separated
into isolated components. Note that in this metric the distance between actors is measured
by the shortest paths within the embedding network
of actor 𝑛𝑛! to be selected is proportional to 1 𝑑𝑑, where d is the distance between the orphaned actor and 𝑛𝑛! . Within this recovery mechanism, the likelihood that a value chain link will be recovered depends on both the substitutability and the network distance between replacement candidates and orphaned actors. Preference by degree recovery algorithm A second criterion for criminal cooperation is reputation. This means that actors with a good reputation have a higher chance of becoming a replacement than actors with a bad reputation. It can be assumed that actors with a higher reputation will be involved within more and different value chains throughout the overall network (GMacro). As identical to the VC degree disruption strategy, this will be associated with actors with high degree centralities. Therefore we introduce a third recovery algorithm with a preference for replacements by degree-‐centrality, in which the selection of replacement actors from 𝑅𝑅! 𝑛𝑛!"# in step 2 of the general recovery algorithm depends on the degree centrality of the potential replacement. Within this preferential recovery algorithm the likelihood of actor 𝑛𝑛! to be selected is proportional to 1 𝑑𝑑, where d is the degree of 𝑛𝑛! within GMacro. Within the general recovery algorithm, the likelihood of value chain link recovery 𝑃𝑃!"#$!"depends on the exchangeability of the targeted actor. If 𝑅𝑅! 𝑛𝑛!"# = 0 then the connection with an actor of a particular role could not be recovered. The difference between random recovery (a), distance recovery (b) and degree recovery (c) is depicted in figure 4.5. Here, actor B is targeted by one of the disruption strategies. As a result, the orphaned actor A has lost its value chain connection ‘international trade–transporting’, and will therefore try to re-‐establish a link with a suitable candidate in order to restore the value chain. The list of candidates, who can fulfill the same role as A, is shown in the first column. In case (a) the candidates are chosen randomly and have no preference between each other to be chosen as a candidate for recovery. In case (b) the actors with the shortest distance to A, are more likely to be selected for replacement. In case (c) the actors with the highest degree are more likely to be selected for replacement. Measuring the effects on network structure After the disruption strategies and the recovery strategies are applied at the same time, after a number of attacks following the same strategy, we want to measure the impact this has on its networks structure, in terms of efficiency and security. Therefore we introduce the measure of efficiency within the Value Chain network that is computed by the following metric: Efficiency = !
!(!!!)!!!,!
!!,!!!!!!
(1)
In this metric dij corresponds to the distance between actors i and j of GVC and N equals the amount of actors in GVC. The denominator creates a measure that varies from 0 to 1, where 1 is complete connectivity and 0 indicates that the network is completely separated into isolated components. Note that in this metric the distance between actors
VCG
. This implies that some es-
sential values can flow through criminal relationships that are not directly derived from the
subnetwork of cannabis cultivation (GVC). The metric shows how efficiently actors within
the network can communicate and exchange values (information, goods) between each
other(Bienenstock & Bonacich, 2003; Memon & Larsen, 2006).
In addition to the efficiency of the network we introduce a second metric that estimates
the influence of network disruption on the secrecy within the value chain network. Criminal
network structures arrange a level of secrecy by minimizing the direct transfer of information,
thereby reducing the risk of exposing direct involvement in illegal activities of individual
members to police surveillance- or intelligence services. Secrecy is strongly associated with the
metric of ‘network density’. This measurement is intended to give a sense of how well com-
munication pathways in the network are capable of getting information out to the network’s
participants. Density (or the equivalent ‘brightness’) is calculated by dividing the number
of direct connections by the maximum possible connections within the observed network.
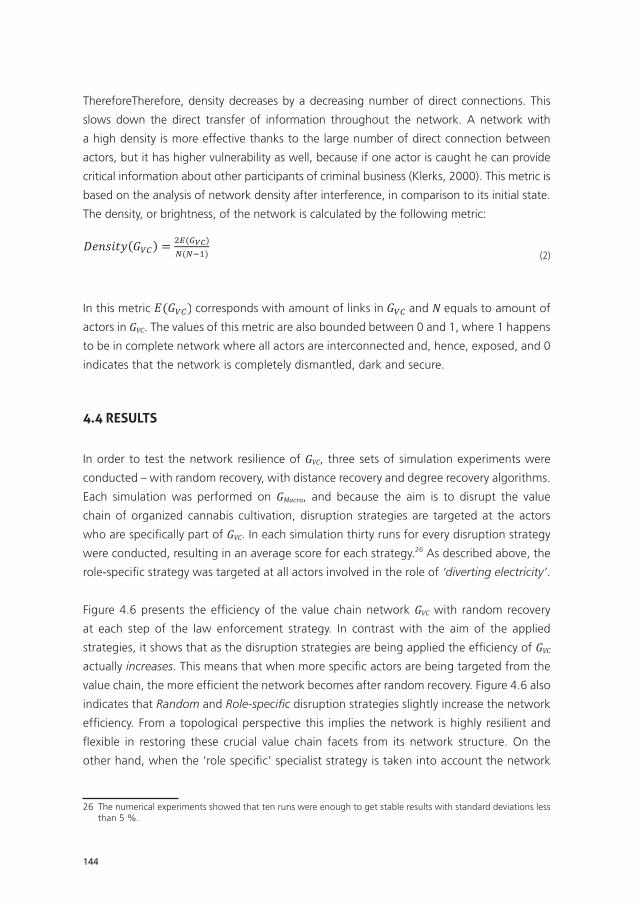
144
ThereforeTherefore, density decreases by a decreasing number of direct connections. This
slows down the direct transfer of information throughout the network. A network with
a high density is more effective thanks to the large number of direct connection between
actors, but it has higher vulnerability as well, because if one actor is caught he can provide
critical information about other participants of criminal business (Klerks, 2000). This metric is
based on the analysis of network density after interference, in comparison to its initial state.
The density, or brightness, of the network is calculated by the following metric:
is measured by the shortest paths within the embedding network (GMacro). This implies that some essential values can flow through criminal relationships that are not directly derived from the subnetwork of cannabis cultivation (GVC). The metric shows how efficiently actors within the network can communicate and exchange values (information, goods) between each other (Bienenstock & Bonacich, 2003; Memon & Larsen, 2006). In addition to the efficiency of the network we introduce a second metric that estimates the influence of network disruption on the secrecy within the value chain network. Criminal network structures arrange a level of secrecy by minimizing the direct transfer of information, thereby reducing the risk of exposing direct involvement in illegal activities of individual members to police surveillance-‐ or intelligence services. Secrecy is strongly associated with the metric of ‘network density’. This measurement is intended to give a sense of how well communication pathways in the network are capable of getting information out to the network's participants. Density (or the equivalent ‘brightness’) is calculated by dividing the number of direct connections by the maximum possible connections within the observed network. Therefore, density decreases by a decreasing number of direct connections. This slows down the direct transfer of information throughout the network. A network with a high density is more effective thanks to the large number of direct connection between actors, but it has higher vulnerability as well, because if one actor is caught he can provide critical information about other participants of criminal business (Klerks, 2000). This metric is based on the analysis of network density after interference, in comparison to its initial state. The density, or brightness, of the network is calculated by the following metric:
𝐷𝐷𝐷𝐷𝐷𝐷𝐷𝐷𝐷𝐷𝐷𝐷𝐷𝐷 𝐺𝐺!" = !!(!!")!(!!!)
(2)
In this metric 𝐸𝐸(𝐺𝐺!") corresponds with amount of links in GVC and N equals to amount of actors in GVC. The values of this metric are also bounded between 0 and 1, where 1 happens to be in complete network where all actors are interconnected and, hence, exposed, and 0 indicates that the network is completely dismantled, dark and secure. 4.4 Results In order to test the network resilience of GVC, three sets of simulation experiments were conducted – with random recovery, with distance recovery and degree recovery algorithms. Each simulation was performed on GMacro, and because the aim is to disrupt the value chain of organized cannabis cultivation, disruption strategies are targeted at the actors who are specifically part of GVC.. In each simulation thirty runs for every disruption strategy were conducted, resulting in an average score for each strategy.1 As described above, the role-‐specific strategy was targeted at all actors involved in the role of ‘diverting electricity’.
1 The numerical experiments showed that ten runs were enough to get stable results with standard deviations less than 5 %.
(2)
In this metric
is measured by the shortest paths within the embedding network (GMacro). This implies that some essential values can flow through criminal relationships that are not directly derived from the subnetwork of cannabis cultivation (GVC). The metric shows how efficiently actors within the network can communicate and exchange values (information, goods) between each other (Bienenstock & Bonacich, 2003; Memon & Larsen, 2006). In addition to the efficiency of the network we introduce a second metric that estimates the influence of network disruption on the secrecy within the value chain network. Criminal network structures arrange a level of secrecy by minimizing the direct transfer of information, thereby reducing the risk of exposing direct involvement in illegal activities of individual members to police surveillance-‐ or intelligence services. Secrecy is strongly associated with the metric of ‘network density’. This measurement is intended to give a sense of how well communication pathways in the network are capable of getting information out to the network's participants. Density (or the equivalent ‘brightness’) is calculated by dividing the number of direct connections by the maximum possible connections within the observed network. Therefore, density decreases by a decreasing number of direct connections. This slows down the direct transfer of information throughout the network. A network with a high density is more effective thanks to the large number of direct connection between actors, but it has higher vulnerability as well, because if one actor is caught he can provide critical information about other participants of criminal business (Klerks, 2000). This metric is based on the analysis of network density after interference, in comparison to its initial state. The density, or brightness, of the network is calculated by the following metric:
𝐷𝐷𝐷𝐷𝐷𝐷𝐷𝐷𝐷𝐷𝐷𝐷𝐷𝐷 𝐺𝐺!" = !!(!!")!(!!!)
(2)
In this metric 𝐸𝐸(𝐺𝐺!") corresponds with amount of links in GVC and N equals to amount of actors in GVC. The values of this metric are also bounded between 0 and 1, where 1 happens to be in complete network where all actors are interconnected and, hence, exposed, and 0 indicates that the network is completely dismantled, dark and secure. 4.4 Results In order to test the network resilience of GVC, three sets of simulation experiments were conducted – with random recovery, with distance recovery and degree recovery algorithms. Each simulation was performed on GMacro, and because the aim is to disrupt the value chain of organized cannabis cultivation, disruption strategies are targeted at the actors who are specifically part of GVC.. In each simulation thirty runs for every disruption strategy were conducted, resulting in an average score for each strategy.1 As described above, the role-‐specific strategy was targeted at all actors involved in the role of ‘diverting electricity’.
1 The numerical experiments showed that ten runs were enough to get stable results with standard deviations less than 5 %.
corresponds with amount of links in
At first target actor (A) is selected by one of the preferred dismantling strategies (Figure 4.4a). Actor A has two adjacent VC Links with actors B and C. In the next step (Figure 4.4b) target actor A is removed from the network, leaving two dangling links. The orphaned actors B and C tend to recover the lost links by connecting to actor with the same VC role of coordinator as the A actor had by using one of recovering algorithms. In this way the broken VC links are recovered by connecting to actor E (Figure 4.4c). In simulating network resilience three recovery mechanism algorithms are applied: random recovery, recovery preferred by distance and recovery preferred by degree. The general recovery algorithm is depicted below. General recovery algorithm 𝐺𝐺!"(𝑁𝑁,𝐸𝐸) — subnetwork with a set of actors N and set of edges E; 𝑛𝑛!"# — actor which was removed from 𝐺𝐺!"; 𝑛𝑛!"# — set of orphaned actors 𝑛𝑛, which were adjacent to 𝑛𝑛!"#; 𝑟𝑟𝑟𝑟𝑟𝑟𝑟𝑟(𝑛𝑛) —VC role of actor n; 𝑅𝑅! 𝑛𝑛!"# = 𝑛𝑛 ∈ 𝑁𝑁: 𝑟𝑟𝑟𝑟𝑟𝑟𝑟𝑟 𝑛𝑛 = 𝑟𝑟𝑟𝑟𝑟𝑟𝑟𝑟(𝑛𝑛!"#) — set of actors from 𝐺𝐺!" which can replace value chain position of actor 𝑛𝑛!"#. For each orphaned actor 𝑛𝑛 from 𝑛𝑛!"# :
1. With likelihood 𝑃𝑃!"#$!" = 1− !!! !!"# !!
evaluate whether or not the lost VC link will be recovered by 𝑛𝑛 .
2. If previous step gave positive answer, then select recovery candidate 𝑛𝑛! from the 𝑅𝑅! 𝑛𝑛!"# following specific preference, which is chosen based on the recovery mechanism.
3. Connect actors 𝑛𝑛 and 𝑛𝑛! . Next, we introduce three algorithms, which are based on this general recovery algorithm but have a specific preference among candidates for recovery. See also figure 6. Random recovery algorithm The random recovery algorithm suggests that no candidate from 𝑅𝑅! 𝑛𝑛!"# has preference over others, and all of them are treated equally. This algorithm implies that the macro network is heterogeneous and that replacements can be chosen from all parts of the network, hence, at step 2 of the general recovery algorithm candidate 𝑛𝑛! from 𝑅𝑅! 𝑛𝑛!"# is selected randomly. Preference by distance recovery algorithm Trust and skills are important criteria for selecting suitable replacements. Therefore it’s more likely that preferred replacements are preferably found within the redundant network of the actors involved in the value chain. This means that candidates with the shortest path from orphaned actors within the macro network (GMacro) will have more chance of becoming a replacement than actors further away. This can be translated into a preference by distance recovery algorithm, in which the selection of replacement of actors from 𝑅𝑅! 𝑛𝑛!"# in step 2 depends on the distance between a possible candidate actor and an orphaned actor. Within this preferential recovery algorithm the likelihood
and N equals to amount of
actors in GVC. The values of this metric are also bounded between 0 and 1, where 1 happens
to be in complete network where all actors are interconnected and, hence, exposed, and 0
indicates that the network is completely dismantled, dark and secure.
4.4 results
In order to test the network resilience of GVC, three sets of simulation experiments were
conducted – with random recovery, with distance recovery and degree recovery algorithms.
Each simulation was performed on GMacro, and because the aim is to disrupt the value
chain of organized cannabis cultivation, disruption strategies are targeted at the actors
who are specifically part of GVC. In each simulation thirty runs for every disruption strategy
were conducted, resulting in an average score for each strategy.26 As described above, the
role-specific strategy was targeted at all actors involved in the role of ‘diverting electricity’.
Figure 4.6 presents the efficiency of the value chain network GVC with random recovery
at each step of the law enforcement strategy. In contrast with the aim of the applied
strategies, it shows that as the disruption strategies are being applied the efficiency of GVC
actually increases. This means that when more specific actors are being targeted from the
value chain, the more efficient the network becomes after random recovery. Figure 4.6 also
indicates that Random and Role-specific disruption strategies slightly increase the network
efficiency. From a topological perspective this implies the network is highly resilient and
flexible in restoring these crucial value chain facets from its network structure. On the
other hand, when the ‘role specific’ specialist strategy is taken into account the network
26 The numerical experiments showed that ten runs were enough to get stable results with standard deviations less than 5 %.
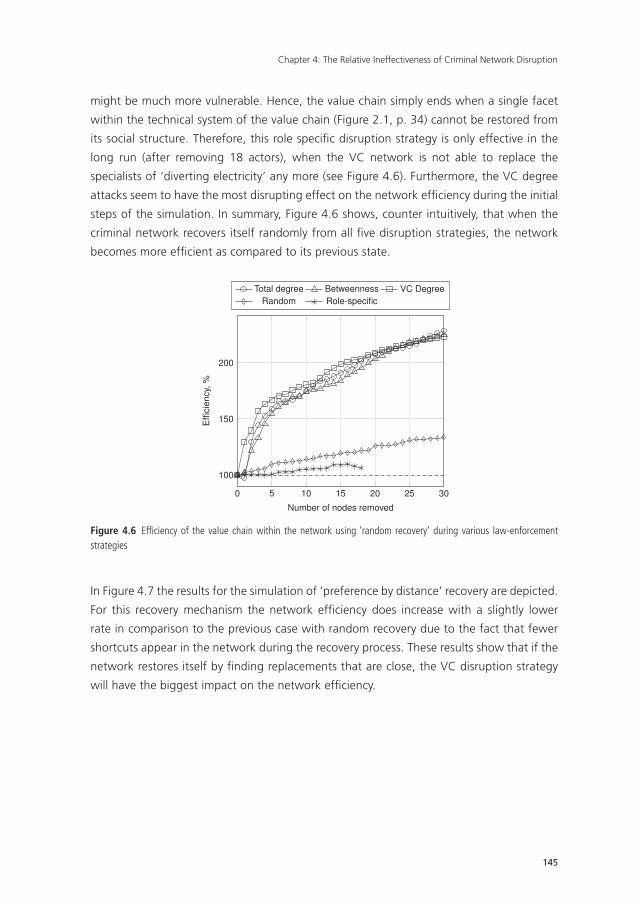
Chapter 4: The Relative Ineffectiveness of Criminal Network Disruption
145
might be much more vulnerable. Hence, the value chain simply ends when a single facet
within the technical system of the value chain (Figure 2.1, p. 34) cannot be restored from
its social structure. Therefore, this role specific disruption strategy is only effective in the
long run (after removing 18 actors), when the VC network is not able to replace the
specialists of ‘diverting electricity’ any more (see Figure 4.6). Furthermore, the VC degree
attacks seem to have the most disrupting effect on the network efficiency during the initial
steps of the simulation. In summary, Figure 4.6 shows, counter intuitively, that when the
criminal network recovers itself randomly from all five disruption strategies, the network
becomes more efficient as compared to its previous state.
0
5
10 15 20 25 30
100
150
200
Number of nodes removed
Efficiency,%
Total degree Betweenness VC Degree
Random Role-specific
Figure 4.6 Efficiency of the value chain within the network using ‘random recovery’ during various law-enforcement strategies
In Figure 4.7 the results for the simulation of ‘preference by distance’ recovery are depicted.
For this recovery mechanism the network efficiency does increase with a slightly lower
rate in comparison to the previous case with random recovery due to the fact that fewer
shortcuts appear in the network during the recovery process. These results show that if the
network restores itself by finding replacements that are close, the VC disruption strategy
will have the biggest impact on the network efficiency.
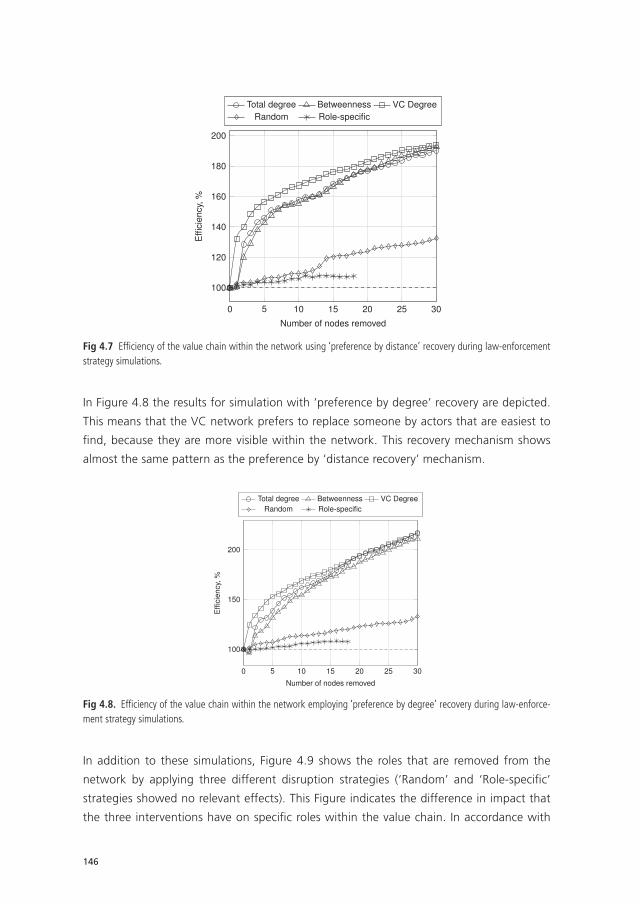
146
0
5
10 15 20 25 30
100
120
140
160
180
200
Number of nodes removed
Efficiency,%
Total degree Betweenness VC Degree
Random Role-specific
Fig 4.7 Efficiency of the value chain within the network using ‘preference by distance’ recovery during law-enforcement strategy simulations.
In Figure 4.8 the results for simulation with ‘preference by degree’ recovery are depicted.
This means that the VC network prefers to replace someone by actors that are easiest to
find, because they are more visible within the network. This recovery mechanism shows
almost the same pattern as the preference by ‘distance recovery’ mechanism.
0
5
10 15 20 25 30
100
150
200
Number of nodes removed
Efficie
ncy,
%
Total degree Betweenness VC Degree
Random Role-specific
Fig 4.8. Efficiency of the value chain within the network employing ‘preference by degree’ recovery during law-enforce-ment strategy simulations.
In addition to these simulations, Figure 4.9 shows the roles that are removed from the
network by applying three different disruption strategies (‘Random’ and ‘Role-specific’
strategies showed no relevant effects). This Figure indicates the difference in impact that
the three interventions have on specific roles within the value chain. In accordance with
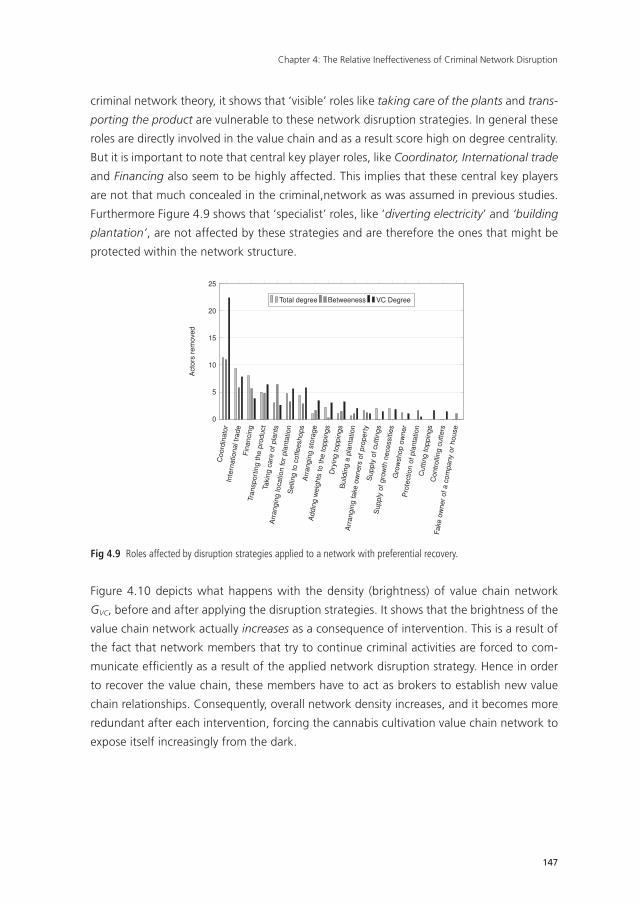
Chapter 4: The Relative Ineffectiveness of Criminal Network Disruption
147
criminal network theory, it shows that ‘visible’ roles like taking care of the plants and trans-
porting the product are vulnerable to these network disruption strategies. In general these
roles are directly involved in the value chain and as a result score high on degree centrality.
But it is important to note that central key player roles, like Coordinator, International trade
and Financing also seem to be highly affected. This implies that these central key players
are not that much concealed in the criminal,network as was assumed in previous studies.
Furthermore Figure 4.9 shows that ‘specialist’ roles, like ‘diverting electricity’ and ‘building
plantation’, are not affected by these strategies and are therefore the ones that might be
protected within the network structure.
C
o
o
r
d
i
n
a
t
o
r
F
i
n
a
n
c
i
n
g
A
r
r
a
n
g
i
n
g
l
o
c
a
t
i
o
n
f
o
r
p
l
a
n
t
a
t
i
o
n
F
a
k
e
o
w
n
e
r
o
f
a
c
o
m
p
a
n
y
o
r
h
o
u
s
e
A
r
r
a
n
g
i
n
g
f
a
k
e
o
w
n
e
r
s
o
f
p
r
o
p
e
r
t
y
S
u
p
p
l
y
o
f
g
r
o
w
t
h
n
e
c
e
s
s
i
t
i
e
s
B
u
i
l
d
i
n
g
a
p
l
a
n
t
a
t
i
o
n
G
r
o
w
s
h
o
p
o
w
n
e
r
S
u
p
p
l
y
o
f
c
u
t
t
i
n
g
s
C
u
t
t
i
n
g
t
o
p
p
i
n
g
s
C
o
n
t
r
o
l
l
i
n
g
c
u
t
t
e
r
s
A
d
d
i
n
g
w
e
i
g
h
t
s
t
o
t
h
e
t
o
p
p
i
n
g
s
D
r
y
i
n
g
t
o
p
p
i
n
g
s
A
r
r
a
n
g
i
n
g
s
t
o
r
a
g
e
T
r
a
n
s
p
o
r
t
i
n
g
t
h
e
p
r
o
d
u
c
t
S
e
l
l
i
n
g
t
o
c
o
f
f
e
e
s
h
o
p
s
I
n
t
e
r
n
a
t
i
o
n
a
l
t
r
a
d
e
T
a
k
i
n
g
c
a
r
e
o
f
p
l
a
n
t
s
P
r
o
t
e
c
t
i
o
n
o
f
p
l
a
n
t
a
t
i
o
n
0
5
10
15
20
25
Acto
rs
re
move
d
Total degree Betweeness VC Degree
Fig 4.9 Roles affected by disruption strategies applied to a network with preferential recovery.
Figure 4.10 depicts what happens with the density (brightness) of value chain network
GVC, before and after applying the disruption strategies. It shows that the brightness of the
value chain network actually increases as a consequence of intervention. This is a result of
the fact that network members that try to continue criminal activities are forced to com-
municate efficiently as a result of the applied network disruption strategy. Hence in order
to recover the value chain, these members have to act as brokers to establish new value
chain relationships. Consequently, overall network density increases, and it becomes more
redundant after each intervention, forcing the cannabis cultivation value chain network to
expose itself increasingly from the dark.
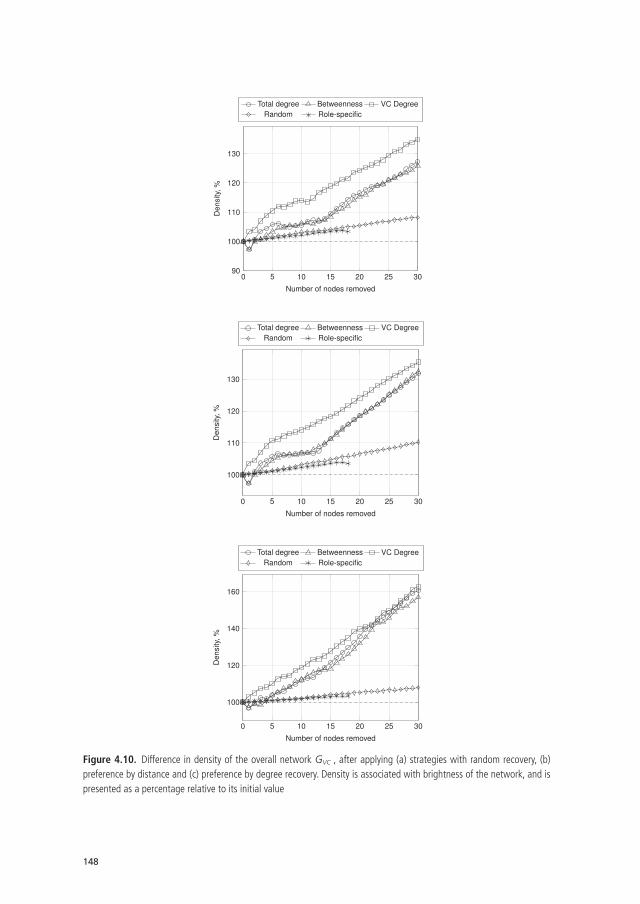
148
0 5 10 15 20 25 3090
100
110
120
130
Number of nodes removed
Den
sity
,%
Total degree Betweenness VC DegreeRandom Role-specific
0 5 10 15 20 25 30
100
110
120
130
Number of nodes removed
Den
sity
,%
Total degree Betweenness VC DegreeRandom Role-specific
0 5 10 15 20 25 30
100
120
140
160
Number of nodes removed
Den
sity
,%
Total degree Betweenness VC DegreeRandom Role-specific
Figure 4.10. Difference in density of the overall network GVC , after applying (a) strategies with random recovery, (b) preference by distance and (c) preference by degree recovery. Density is associated with brightness of the network, and is presented as a percentage relative to its initial value
Chapter 4: The Relative Ineffectiveness of Criminal Network Disruption
149
4.5 discussion
In this paper we present the impact of dynamic network recovery on the effectiveness of
four different criminal network disruption strategies. A unique dataset of a large complex
criminal network involved in organized cannabis cultivation was the starting point for the
simulation and analyses of these disruption strategies. In addition, three different network
recovery mechanisms were investigated, in order to assess the effects on network structure
in terms of network efficiency and security (i.e. higher connectivity is more visibility is less
security)
Previous studies of criminal network resilience showed that coordinators try to keep a
social distance from the actual flow of illicit goods within the value chain. These key players
therefore limit their direct connections to actors involved in executive tasks, to minimize
the risk of exposure (e.g. Baker & Faulker, 1993; Klerks, 2000; Dorn et al., 1998). Based on
these studies, high scores for degree and betweenness centrality were expected for execu-
tive actors directly involved within the technical value chain of cannabis cultivation. This
hypothesis is partly consistent with our observations for the roles of ‘transport’ and ‘taking
care of plantation’ (see Figure 4.10), which are vulnerable to degree- and betweenness
attacks. However, our results also show, that central key-player roles within the value chain
of cannabis cultivation, such as ‘coordinator’, ‘financing’ and ‘(inter)national trade’, are
highly visible and therefore vulnerable to degree centrality attacks as well (see Figure 4.4
and Figure 4.10). From an efficiency/security perspective, this implies that the structure of
the observed cannabis cultivation network is very efficient and flexible, but rather insecure.
Hence, if these key players become exposed, the whole value chain might become visible.
How can this be explained? The answer to this question is concealed into two factors:
a) specific features of the cannabis cultivation process b) the observed properties of the
dataset.
Cannabis cultivation is a delicate process, involving many roles and functions. In order to
bring these roles together at a certain time and place, the role of ‘coordinator’ is essential
for retaining the technical system of the value chain (Figure 4.2). To fulfill this role, informa-
tion needs to be exchanged efficiently through the value chain network. Coordinators
therefore need to occupy strategic hub or bridge positions within the network, naturally
resulting in higher than average scores on degree and betweenness centrality observed
within our data.
However, in practice this doesn’t necessary make these actors easy targets for network
disruption strategies that focus on high degree- or betweenness positions, since these
vulnerable positions are also recognized by criminal networks themselves. Non-redundant
150
and compartmentalized ways of communication are applied, keeping these central key
players highly concealed from direct involvement within the value chain (Erickson, 1981);
Baker and Faulker, 1993; Morselli et al., 2006; Ayling, 2009). As a consequence, reliable
incriminating evidence of involvement of the direct involvement of these ‘critical actors’
within illegal markets and activities is harder to retrieve, as compared to actors directly
involved within operational activities of the value chain. This explains why these actors can
operate from the core of the network but stay concealed in the dark at the same time.
However, this is still in contrast with the high levels of ‘visibility’ these key players seem to
have as we observed from the data (see also Appendix 4A, p.122). An explanation can be
found within the detailed properties of our dataset:
Empirical criminal network research is often based on a single source of data, such as closed
criminal investigations (e.g. Klerks, 2001; Spapens, 2010; Kleemans et al., 2002). These
datasets often contain detailed observations of the behaviors and roles of the suspects
under investigation. However, due to limited resources and time, criminal investigations
generally start off with a specified and restricted objective. Depending on this objective,
the scope of data collection within these investigations is naturally confined by the jurisdic-
tion, money or law enforcement capacity (Morselli, 2009). Because of these investigative
boundaries, chances that powerful or influential actors become exposed within criminal
investigation data are relatively low. To overcome this potential bias in our study, multiple
data sources were combined to retrieve the final network representation. Some of the
data-sources were criminal informants, who sometimes are part of the criminal activities
themselves and operate as direct eyewitnesses for ‘unknown’ criminal cooperation. One
of the initial goals of this specific intelligence process is deliberately discovering ‘hidden’
critical actors, who try to keep their identities concealed in the dark. These unique data
properties offer us a different perspective on the criminal network structure, often hidden
within data solely retrieved from criminal investigations. This offers another explanation for
the visibility of the ‘hubs’ observed within our results.
We recognize that our dataset is not immune to missing data and boundary specifica-
tion problems and we understand the difficulty involved with retrieving reliable criminal
network data. But, interestingly our results emphasize the importance of ‘no boundary’
intelligence gathering focused on criminal networks at a ‘macro’ level and the multiplicity
of criminal relationships, for retrieving a better strategic understanding of the way these
networks operate and react. Combining multiple sources of data on criminal cooperation
seems to be essential in confining these data validity problems. The importance of a ‘no
boundary’ intelligence gathering strategy, will be presented in chapter 5. Such a strategy
opens the door for actually seeking rather than assuming criminal network structure. In
addition, our study shows the importance of applying combinations of methods to unravel
Chapter 4: The Relative Ineffectiveness of Criminal Network Disruption
151
the complex dynamic network structures. The knowledge generated by combining social
network analysis with computational simulation in this paper, might be of direct relevance
for thinking about the effectiveness of control strategies of organized crime on an opera-
tional level.
thinking ahead: introducing the notion of value chain centrality27
The analysis and simulations in this chapter inspired us to think ahead about new ap-
proaches to detect and disrupt criminal networks. We based the current approach on two
notions of the importance of a criminal actor as a suitable target for network disruption:
1. Structural importance: the importance of an actor derived from its connectivity and
positioning in the overall network. This is based on the structure and composition of
an actor’s ego network together with the structure and composition of the overall
network.
2. Valued importance: the importance of an actor derived from the unique set of skills,
knowledge or tools and actor possesses to fulfill a certain role or function in the criminal
value chain. This is derived from the number of other actors in the overall network who
may fulfill the same role or function. A low number of potential replacements means
that an actor scores high on ‘irreplacebility’ and therefore gets more important for the
network.
Actors that are important because of their structural importance can be identified trough
quantitative measures of social network analysis (i.e. degree centrality for identification of
hubs, betweenness centrality for identification of brokers, closeness centrality for identi-
fication of well-informed individuals). Actors that are important because of their valued
importance are now measured by manual analysis. By analyzing the content of the data,
actors could be labeled in a specific role and then be cherry-picked for targeting. For
large criminal network datasets, this can become a very time-consuming exercise. With
datasets growing in size, there is a need for quantitative methods measuring an actor’s
irreplaceability. However, topological measures such as degree centrality fail to incorporate
qualitative data such as roles and skills. So are there any parameters that could serve as
quantitative indicators for irreplacibility?
A paradigm that combines structural and valued features of networks is known as mul-
tiplexity, which refers to the fact that a connection between two actors can constitute
multiple types of relationships. Some criminal ties represent a long lasting friendship, a
family connection, and an essential connection between two phases in de production of
27 With the consent of the senior author (G. Kampis), this paragraph was added as an edited copy of the published work: N. Toth; L. Gulyás; R.O. Legendi; P. Duijn; P.M.A. Sloot and G. Kampis: The importance of centralities in dark network value chains, The European Physical Journal - Special Topics, vol. 222, nr 6 pp. 1413-1439. 2013. ISSN 1951-6355 and 1951-6401, with only minor formatting done to fit the style of this manuscript.
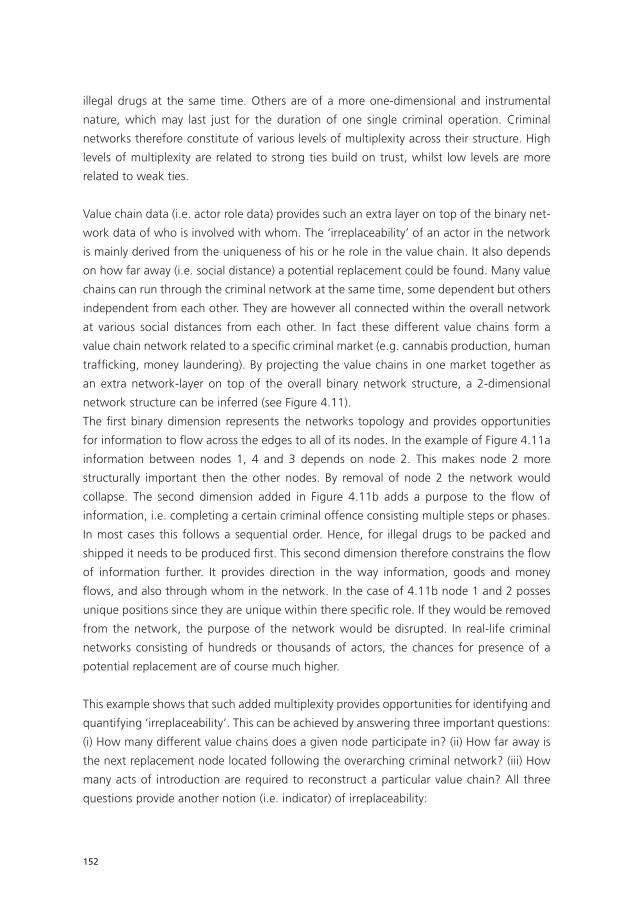
152
illegal drugs at the same time. Others are of a more one-dimensional and instrumental
nature, which may last just for the duration of one single criminal operation. Criminal
networks therefore constitute of various levels of multiplexity across their structure. High
levels of multiplexity are related to strong ties build on trust, whilst low levels are more
related to weak ties.
Value chain data (i.e. actor role data) provides such an extra layer on top of the binary net-
work data of who is involved with whom. The ‘irreplaceability’ of an actor in the network
is mainly derived from the uniqueness of his or he role in the value chain. It also depends
on how far away (i.e. social distance) a potential replacement could be found. Many value
chains can run through the criminal network at the same time, some dependent but others
independent from each other. They are however all connected within the overall network
at various social distances from each other. In fact these different value chains form a
value chain network related to a specific criminal market (e.g. cannabis production, human
trafficking, money laundering). By projecting the value chains in one market together as
an extra network-layer on top of the overall binary network structure, a 2-dimensional
network structure can be inferred (see Figure 4.11).
The first binary dimension represents the networks topology and provides opportunities
for information to flow across the edges to all of its nodes. In the example of Figure 4.11a
information between nodes 1, 4 and 3 depends on node 2. This makes node 2 more
structurally important then the other nodes. By removal of node 2 the network would
collapse. The second dimension added in Figure 4.11b adds a purpose to the flow of
information, i.e. completing a certain criminal offence consisting multiple steps or phases.
In most cases this follows a sequential order. Hence, for illegal drugs to be packed and
shipped it needs to be produced first. This second dimension therefore constrains the flow
of information further. It provides direction in the way information, goods and money
flows, and also through whom in the network. In the case of 4.11b node 1 and 2 posses
unique positions since they are unique within there specific role. If they would be removed
from the network, the purpose of the network would be disrupted. In real-life criminal
networks consisting of hundreds or thousands of actors, the chances for presence of a
potential replacement are of course much higher.
This example shows that such added multiplexity provides opportunities for identifying and
quantifying ‘irreplaceability’. This can be achieved by answering three important questions:
(i) How many different value chains does a given node participate in? (ii) How far away is
the next replacement node located following the overarching criminal network? (iii) How
many acts of introduction are required to reconstruct a particular value chain? All three
questions provide another notion (i.e. indicator) of irreplaceability:
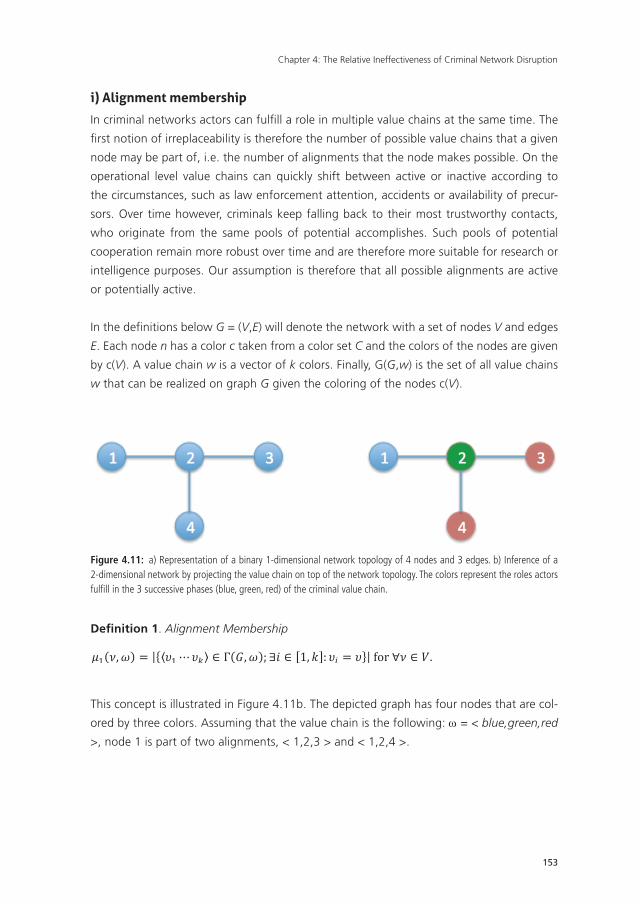
Chapter 4: The Relative Ineffectiveness of Criminal Network Disruption
153
i) alignment membership
In criminal networks actors can fulfi ll a role in multiple value chains at the same time. The
fi rst notion of irreplaceability is therefore the number of possible value chains that a given
node may be part of, i.e. the number of alignments that the node makes possible. On the
operational level value chains can quickly shift between active or inactive according to
the circumstances, such as law enforcement attention, accidents or availability of precur-
sors. Over time however, criminals keep falling back to their most trustworthy contacts,
who originate from the same pools of potential accomplishes. Such pools of potential
cooperation remain more robust over time and are therefore more suitable for research or
intelligence purposes. Our assumption is therefore that all possible alignments are active
or potentially active.
In the defi nitions below G = (V,E) will denote the network with a set of nodes V and edges
E. Each node n has a color c taken from a color set C and the colors of the nodes are given
by c(V). A value chain w is a vector of k colors. Finally, G(G,w) is the set of all value chains
w that can be realized on graph G given the coloring of the nodes c(V).
Defi nition 1. Alignment Membership
The first binary dimension represents the networks topology and provides opportunities for information to flow across the edges to all of its nodes. In the example of figure 4.11a information between nodes 1, 4 and 3 depends on node 2. This makes node 2 more structurally important then the other nodes. By removal of node 2 the network would collapse. The second dimension added in figure 4.11b adds a purpose to the flow of information, i.e. completing a certain criminal offence consisting multiple steps or phases. In most cases this follows a sequential order. Hence, for illegal drugs to be packed and shipped it needs to be produced first. This second dimension therefore constrains the flow of information further. It provides direction in the way information, goods and money flows, and also through whom in the network. In the case of 4.11b node 1 and 2 posses unique positions since they are unique within there specific role. If they would be removed from the network, the purpose of the network would be disrupted. In real-‐life criminal networks consisting of hundreds or thousands of actors, the chances for presence of a potential replacement are of course much higher.
This example shows that such added multiplexity provides opportunities for identifying and quantifying ‘irreplaceability’. This can be achieved by answering three important questions: (i) How many different value chains does a given node participate in? (ii) How far away is the next replacement node located following the overarching criminal network? (iii) How many acts of introduction are required to reconstruct a particular value chain? All three questions provide another notion (i.e. indicator) of irreplaceability:
i) Alignment membership
In criminal networks actors can fulfill a role in multiple value chains at the same time. The first notion of irreplaceability is therefore the number of possible value chains that a given node may be part of, i.e. the number of alignments that the node makes possible. On the operational level value chains can quickly shift between active or inactive according to the circumstances, such as law enforcement attention, accidents or availability of precursors. Over time however, criminals keep falling back to their most trustworthy contacts, who originate from the same pools of potential accomplishes. Such pools of potential cooperation remain more robust over time and are therefore more suitable for research or intelligence purposes. Our assumption is therefore that all possible alignments are active or potentially active.
In the definitions below G = (V,E) will denote the network with a set of nodes V and edges E. Each node ν has a color c taken from a color set C and the colors of the nodes are given by c(V). A value chain ω is a vector of k colors. Finally, Γ(G,ω) is the set of all value chains ω that can be realized on graph G given the coloring of the nodes c(V).
Definition 1. Alignment Membership 𝜇𝜇! 𝜈𝜈,𝜔𝜔 = 𝜐𝜐!⋯ 𝜐𝜐! ∈ Γ 𝐺𝐺,𝜔𝜔 ;∃𝑖𝑖 ∈ 1, 𝑘𝑘 : 𝜐𝜐! = 𝜐𝜐 for ∀𝜈𝜈 ∈ 𝑉𝑉.
This concept is illustrated in Figure 4.11b. The depicted graph has four nodes that are colored by three colors. Assuming that the value chain is the following: ω = < blue,green,red >, node 1 is part of two alignments, < 1,2,3 > and < 1,2,4 >.
ii) Distance of replacements
This concept is illustrated in Figure 4.11b. The depicted graph has four nodes that are col-
ored by three colors. Assuming that the value chain is the following: ω = < blue,green,red
>, node 1 is part of two alignments, < 1,2,3 > and < 1,2,4 >.
Figure 4.11: a) Representation of a binary 1-dimensional network topology of 4 nodes and 3 edges. b) Inference of a 2-dimensional network by projecting the value chain on top of the network topology. The colors represent the roles actors fulfi ll in the 3 successive phases (blue, green, red) of the criminal value chain.
154
ii) distance of replacements
Our next centrality notion will consider how much damage a node’s removal may cause
in the active value chains (i.e., alignments). To assess this, we consider the distance to the
closest replacement (i.e., the closest replacement node with the same color).
Definition 2.Closest Replacement Node
Our next centrality notion will consider how much damage a node’s removal may cause in the active value chains (i.e., alignments). To assess this, we consider the distance to the closest replacement (i.e., the closest replacement node with the same color).
Definition 2. Closest Replacement Node 𝜌𝜌 𝜐𝜐 = 𝑢𝑢 ∈ 𝑉𝑉 such that 𝐶𝐶 𝜐𝜐 = 𝐶𝐶(𝑢𝑢) and 𝛿𝛿 𝜐𝜐,𝑢𝑢 = 𝑚𝑚𝑚𝑚𝑚𝑚 𝛿𝛿 𝜐𝜐, 𝑡𝑡 𝑡𝑡 ∈ 𝑉𝑉,𝐶𝐶(𝜐𝜐 = 𝐶𝐶(𝑡𝑡) , where 𝛿𝛿 𝜐𝜐,𝑢𝑢 is the shortest distance between nodes u and ν or ∞ if ν is unreachable from u.
Definition 3. Distance of Replacements
𝜇𝜇! 𝜈𝜈,𝜔𝜔 = 𝜇𝜇! 𝜈𝜈 = 𝛿𝛿(𝜐𝜐,𝜌𝜌 𝜐𝜐 ). Remark 1. The closest replacement of a node is not necessarily unique. However, the distance of replacements is.
Remark 2. Notice that this centrality measure is independent of the value chain at hand. It only depends on the coloring of the graph.
Remark 3. If node v has no replacement in the network, by definition, μ2(v) = ∞. This corresponds to the natural interpretation that node v is indispensable.
As an illustration, let us revisit Fig. 4.11b. Since node 1 is the only blue node in the network, its centrality will be ∞. The same is true for node 2. Node 3 and 4, however, have the same color and are thus (the closest) replacements of one another: ρ(n3) = n4 and ρ(n4) = n3. Since their mutual distance is 2, μ2(n3) = μ2(n4) = 2.
iii) Introduction distance
Our third and last centrality measure elaborates on the ideas of the previous definition. We want nodes to score high if their replacement is difficult. However, in this case, we assume that the search for replacement happens inside the network (using existing connections). That is, after the removal of the node in question, the nodes preceding it and following it in the value chain (alignment) will independently look for another node with the same color, exploring the network’s social structure. The motivation here is that we are dealing with a clandestine network where a publicly announced or “global search” for a replacement can be infeasible.
Within dark networks, trust is essential in order to prevent secret information about illegal activity from being leaked outside the circle of people involved. Therefore, involving a replacement with this information is a risky business. Dark network members usually seek replacements within the close by regions of their own social and criminal network (e.g., friends, family). The further away of the personal social network a replacement is found, the more risk is being taken. Therefore, social distance within the network is an important estimate of the riskiness of the replacement for the value chain member (Coles, 2001; Kleemans & Van de Poot, 2008; McCarthy et al., 1998)
For our new centrality measure, we will assume that members of the value chain who lost their connection (preceding or succeeding member) will ask their neighbors (and nobody else) for a suggestion of a replacement. If a replacement is not directly available, the neighbors will ask their own neighbors and so on. The replacement process is completed when the preceding and the succeeding nodes find a replacement
such that
Our next centrality notion will consider how much damage a node’s removal may cause in the active value chains (i.e., alignments). To assess this, we consider the distance to the closest replacement (i.e., the closest replacement node with the same color).
Definition 2. Closest Replacement Node 𝜌𝜌 𝜐𝜐 = 𝑢𝑢 ∈ 𝑉𝑉 such that 𝐶𝐶 𝜐𝜐 = 𝐶𝐶(𝑢𝑢) and 𝛿𝛿 𝜐𝜐,𝑢𝑢 = 𝑚𝑚𝑚𝑚𝑚𝑚 𝛿𝛿 𝜐𝜐, 𝑡𝑡 𝑡𝑡 ∈ 𝑉𝑉,𝐶𝐶(𝜐𝜐 = 𝐶𝐶(𝑡𝑡) , where 𝛿𝛿 𝜐𝜐,𝑢𝑢 is the shortest distance between nodes u and ν or ∞ if ν is unreachable from u.
Definition 3. Distance of Replacements
𝜇𝜇! 𝜈𝜈,𝜔𝜔 = 𝜇𝜇! 𝜈𝜈 = 𝛿𝛿(𝜐𝜐,𝜌𝜌 𝜐𝜐 ). Remark 1. The closest replacement of a node is not necessarily unique. However, the distance of replacements is.
Remark 2. Notice that this centrality measure is independent of the value chain at hand. It only depends on the coloring of the graph.
Remark 3. If node v has no replacement in the network, by definition, μ2(v) = ∞. This corresponds to the natural interpretation that node v is indispensable.
As an illustration, let us revisit Fig. 4.11b. Since node 1 is the only blue node in the network, its centrality will be ∞. The same is true for node 2. Node 3 and 4, however, have the same color and are thus (the closest) replacements of one another: ρ(n3) = n4 and ρ(n4) = n3. Since their mutual distance is 2, μ2(n3) = μ2(n4) = 2.
iii) Introduction distance
Our third and last centrality measure elaborates on the ideas of the previous definition. We want nodes to score high if their replacement is difficult. However, in this case, we assume that the search for replacement happens inside the network (using existing connections). That is, after the removal of the node in question, the nodes preceding it and following it in the value chain (alignment) will independently look for another node with the same color, exploring the network’s social structure. The motivation here is that we are dealing with a clandestine network where a publicly announced or “global search” for a replacement can be infeasible.
Within dark networks, trust is essential in order to prevent secret information about illegal activity from being leaked outside the circle of people involved. Therefore, involving a replacement with this information is a risky business. Dark network members usually seek replacements within the close by regions of their own social and criminal network (e.g., friends, family). The further away of the personal social network a replacement is found, the more risk is being taken. Therefore, social distance within the network is an important estimate of the riskiness of the replacement for the value chain member (Coles, 2001; Kleemans & Van de Poot, 2008; McCarthy et al., 1998)
For our new centrality measure, we will assume that members of the value chain who lost their connection (preceding or succeeding member) will ask their neighbors (and nobody else) for a suggestion of a replacement. If a replacement is not directly available, the neighbors will ask their own neighbors and so on. The replacement process is completed when the preceding and the succeeding nodes find a replacement
and
Our next centrality notion will consider how much damage a node’s removal may cause in the active value chains (i.e., alignments). To assess this, we consider the distance to the closest replacement (i.e., the closest replacement node with the same color).
Definition 2. Closest Replacement Node 𝜌𝜌 𝜐𝜐 = 𝑢𝑢 ∈ 𝑉𝑉 such that 𝐶𝐶 𝜐𝜐 = 𝐶𝐶(𝑢𝑢) and 𝛿𝛿 𝜐𝜐,𝑢𝑢 = 𝑚𝑚𝑚𝑚𝑚𝑚 𝛿𝛿 𝜐𝜐, 𝑡𝑡 𝑡𝑡 ∈ 𝑉𝑉,𝐶𝐶(𝜐𝜐 = 𝐶𝐶(𝑡𝑡) , where 𝛿𝛿 𝜐𝜐,𝑢𝑢 is the shortest distance between nodes u and ν or ∞ if ν is unreachable from u.
Definition 3. Distance of Replacements
𝜇𝜇! 𝜈𝜈,𝜔𝜔 = 𝜇𝜇! 𝜈𝜈 = 𝛿𝛿(𝜐𝜐,𝜌𝜌 𝜐𝜐 ). Remark 1. The closest replacement of a node is not necessarily unique. However, the distance of replacements is.
Remark 2. Notice that this centrality measure is independent of the value chain at hand. It only depends on the coloring of the graph.
Remark 3. If node v has no replacement in the network, by definition, μ2(v) = ∞. This corresponds to the natural interpretation that node v is indispensable.
As an illustration, let us revisit Fig. 4.11b. Since node 1 is the only blue node in the network, its centrality will be ∞. The same is true for node 2. Node 3 and 4, however, have the same color and are thus (the closest) replacements of one another: ρ(n3) = n4 and ρ(n4) = n3. Since their mutual distance is 2, μ2(n3) = μ2(n4) = 2.
iii) Introduction distance
Our third and last centrality measure elaborates on the ideas of the previous definition. We want nodes to score high if their replacement is difficult. However, in this case, we assume that the search for replacement happens inside the network (using existing connections). That is, after the removal of the node in question, the nodes preceding it and following it in the value chain (alignment) will independently look for another node with the same color, exploring the network’s social structure. The motivation here is that we are dealing with a clandestine network where a publicly announced or “global search” for a replacement can be infeasible.
Within dark networks, trust is essential in order to prevent secret information about illegal activity from being leaked outside the circle of people involved. Therefore, involving a replacement with this information is a risky business. Dark network members usually seek replacements within the close by regions of their own social and criminal network (e.g., friends, family). The further away of the personal social network a replacement is found, the more risk is being taken. Therefore, social distance within the network is an important estimate of the riskiness of the replacement for the value chain member (Coles, 2001; Kleemans & Van de Poot, 2008; McCarthy et al., 1998)
For our new centrality measure, we will assume that members of the value chain who lost their connection (preceding or succeeding member) will ask their neighbors (and nobody else) for a suggestion of a replacement. If a replacement is not directly available, the neighbors will ask their own neighbors and so on. The replacement process is completed when the preceding and the succeeding nodes find a replacement
,
where
Our next centrality notion will consider how much damage a node’s removal may cause in the active value chains (i.e., alignments). To assess this, we consider the distance to the closest replacement (i.e., the closest replacement node with the same color).
Definition 2. Closest Replacement Node 𝜌𝜌 𝜐𝜐 = 𝑢𝑢 ∈ 𝑉𝑉 such that 𝐶𝐶 𝜐𝜐 = 𝐶𝐶(𝑢𝑢) and 𝛿𝛿 𝜐𝜐,𝑢𝑢 = 𝑚𝑚𝑚𝑚𝑚𝑚 𝛿𝛿 𝜐𝜐, 𝑡𝑡 𝑡𝑡 ∈ 𝑉𝑉,𝐶𝐶(𝜐𝜐 = 𝐶𝐶(𝑡𝑡) , where 𝛿𝛿 𝜐𝜐,𝑢𝑢 is the shortest distance between nodes u and ν or ∞ if ν is unreachable from u.
Definition 3. Distance of Replacements
𝜇𝜇! 𝜈𝜈,𝜔𝜔 = 𝜇𝜇! 𝜈𝜈 = 𝛿𝛿(𝜐𝜐,𝜌𝜌 𝜐𝜐 ). Remark 1. The closest replacement of a node is not necessarily unique. However, the distance of replacements is.
Remark 2. Notice that this centrality measure is independent of the value chain at hand. It only depends on the coloring of the graph.
Remark 3. If node v has no replacement in the network, by definition, μ2(v) = ∞. This corresponds to the natural interpretation that node v is indispensable.
As an illustration, let us revisit Fig. 4.11b. Since node 1 is the only blue node in the network, its centrality will be ∞. The same is true for node 2. Node 3 and 4, however, have the same color and are thus (the closest) replacements of one another: ρ(n3) = n4 and ρ(n4) = n3. Since their mutual distance is 2, μ2(n3) = μ2(n4) = 2.
iii) Introduction distance
Our third and last centrality measure elaborates on the ideas of the previous definition. We want nodes to score high if their replacement is difficult. However, in this case, we assume that the search for replacement happens inside the network (using existing connections). That is, after the removal of the node in question, the nodes preceding it and following it in the value chain (alignment) will independently look for another node with the same color, exploring the network’s social structure. The motivation here is that we are dealing with a clandestine network where a publicly announced or “global search” for a replacement can be infeasible.
Within dark networks, trust is essential in order to prevent secret information about illegal activity from being leaked outside the circle of people involved. Therefore, involving a replacement with this information is a risky business. Dark network members usually seek replacements within the close by regions of their own social and criminal network (e.g., friends, family). The further away of the personal social network a replacement is found, the more risk is being taken. Therefore, social distance within the network is an important estimate of the riskiness of the replacement for the value chain member (Coles, 2001; Kleemans & Van de Poot, 2008; McCarthy et al., 1998)
For our new centrality measure, we will assume that members of the value chain who lost their connection (preceding or succeeding member) will ask their neighbors (and nobody else) for a suggestion of a replacement. If a replacement is not directly available, the neighbors will ask their own neighbors and so on. The replacement process is completed when the preceding and the succeeding nodes find a replacement
is the shortest distance between nodes u and n or
Our next centrality notion will consider how much damage a node’s removal may cause in the active value chains (i.e., alignments). To assess this, we consider the distance to the closest replacement (i.e., the closest replacement node with the same color).
Definition 2. Closest Replacement Node 𝜌𝜌 𝜐𝜐 = 𝑢𝑢 ∈ 𝑉𝑉 such that 𝐶𝐶 𝜐𝜐 = 𝐶𝐶(𝑢𝑢) and 𝛿𝛿 𝜐𝜐,𝑢𝑢 = 𝑚𝑚𝑚𝑚𝑚𝑚 𝛿𝛿 𝜐𝜐, 𝑡𝑡 𝑡𝑡 ∈ 𝑉𝑉,𝐶𝐶(𝜐𝜐 = 𝐶𝐶(𝑡𝑡) , where 𝛿𝛿 𝜐𝜐,𝑢𝑢 is the shortest distance between nodes u and ν or ∞ if ν is unreachable from u.
Definition 3. Distance of Replacements
𝜇𝜇! 𝜈𝜈,𝜔𝜔 = 𝜇𝜇! 𝜈𝜈 = 𝛿𝛿(𝜐𝜐,𝜌𝜌 𝜐𝜐 ). Remark 1. The closest replacement of a node is not necessarily unique. However, the distance of replacements is.
Remark 2. Notice that this centrality measure is independent of the value chain at hand. It only depends on the coloring of the graph.
Remark 3. If node v has no replacement in the network, by definition, μ2(v) = ∞. This corresponds to the natural interpretation that node v is indispensable.
As an illustration, let us revisit Fig. 4.11b. Since node 1 is the only blue node in the network, its centrality will be ∞. The same is true for node 2. Node 3 and 4, however, have the same color and are thus (the closest) replacements of one another: ρ(n3) = n4 and ρ(n4) = n3. Since their mutual distance is 2, μ2(n3) = μ2(n4) = 2.
iii) Introduction distance
Our third and last centrality measure elaborates on the ideas of the previous definition. We want nodes to score high if their replacement is difficult. However, in this case, we assume that the search for replacement happens inside the network (using existing connections). That is, after the removal of the node in question, the nodes preceding it and following it in the value chain (alignment) will independently look for another node with the same color, exploring the network’s social structure. The motivation here is that we are dealing with a clandestine network where a publicly announced or “global search” for a replacement can be infeasible.
Within dark networks, trust is essential in order to prevent secret information about illegal activity from being leaked outside the circle of people involved. Therefore, involving a replacement with this information is a risky business. Dark network members usually seek replacements within the close by regions of their own social and criminal network (e.g., friends, family). The further away of the personal social network a replacement is found, the more risk is being taken. Therefore, social distance within the network is an important estimate of the riskiness of the replacement for the value chain member (Coles, 2001; Kleemans & Van de Poot, 2008; McCarthy et al., 1998)
For our new centrality measure, we will assume that members of the value chain who lost their connection (preceding or succeeding member) will ask their neighbors (and nobody else) for a suggestion of a replacement. If a replacement is not directly available, the neighbors will ask their own neighbors and so on. The replacement process is completed when the preceding and the succeeding nodes find a replacement
if n is unreachable
from u.
Definition 3. Distance of Replacements
Our next centrality notion will consider how much damage a node’s removal may cause in the active value chains (i.e., alignments). To assess this, we consider the distance to the closest replacement (i.e., the closest replacement node with the same color).
Definition 2. Closest Replacement Node 𝜌𝜌 𝜐𝜐 = 𝑢𝑢 ∈ 𝑉𝑉 such that 𝐶𝐶 𝜐𝜐 = 𝐶𝐶(𝑢𝑢) and 𝛿𝛿 𝜐𝜐,𝑢𝑢 = 𝑚𝑚𝑚𝑚𝑚𝑚 𝛿𝛿 𝜐𝜐, 𝑡𝑡 𝑡𝑡 ∈ 𝑉𝑉,𝐶𝐶(𝜐𝜐 = 𝐶𝐶(𝑡𝑡) , where 𝛿𝛿 𝜐𝜐,𝑢𝑢 is the shortest distance between nodes u and ν or ∞ if ν is unreachable from u.
Definition 3. Distance of Replacements
𝜇𝜇! 𝜈𝜈,𝜔𝜔 = 𝜇𝜇! 𝜈𝜈 = 𝛿𝛿(𝜐𝜐,𝜌𝜌 𝜐𝜐 ). Remark 1. The closest replacement of a node is not necessarily unique. However, the distance of replacements is.
Remark 2. Notice that this centrality measure is independent of the value chain at hand. It only depends on the coloring of the graph.
Remark 3. If node v has no replacement in the network, by definition, μ2(v) = ∞. This corresponds to the natural interpretation that node v is indispensable.
As an illustration, let us revisit Fig. 4.11b. Since node 1 is the only blue node in the network, its centrality will be ∞. The same is true for node 2. Node 3 and 4, however, have the same color and are thus (the closest) replacements of one another: ρ(n3) = n4 and ρ(n4) = n3. Since their mutual distance is 2, μ2(n3) = μ2(n4) = 2.
iii) Introduction distance
Our third and last centrality measure elaborates on the ideas of the previous definition. We want nodes to score high if their replacement is difficult. However, in this case, we assume that the search for replacement happens inside the network (using existing connections). That is, after the removal of the node in question, the nodes preceding it and following it in the value chain (alignment) will independently look for another node with the same color, exploring the network’s social structure. The motivation here is that we are dealing with a clandestine network where a publicly announced or “global search” for a replacement can be infeasible.
Within dark networks, trust is essential in order to prevent secret information about illegal activity from being leaked outside the circle of people involved. Therefore, involving a replacement with this information is a risky business. Dark network members usually seek replacements within the close by regions of their own social and criminal network (e.g., friends, family). The further away of the personal social network a replacement is found, the more risk is being taken. Therefore, social distance within the network is an important estimate of the riskiness of the replacement for the value chain member (Coles, 2001; Kleemans & Van de Poot, 2008; McCarthy et al., 1998)
For our new centrality measure, we will assume that members of the value chain who lost their connection (preceding or succeeding member) will ask their neighbors (and nobody else) for a suggestion of a replacement. If a replacement is not directly available, the neighbors will ask their own neighbors and so on. The replacement process is completed when the preceding and the succeeding nodes find a replacement
Remark 1. The closest replacement of a node is not necessarily unique. However, the
distance of replacements is.
Remark 2. Notice that this centrality measure is independent of the value chain at hand. It
only depends on the coloring of the graph.
Remark 3. If node v has no replacement in the network, by definition, μ2(v) =
Our next centrality notion will consider how much damage a node’s removal may cause in the active value chains (i.e., alignments). To assess this, we consider the distance to the closest replacement (i.e., the closest replacement node with the same color).
Definition 2. Closest Replacement Node 𝜌𝜌 𝜐𝜐 = 𝑢𝑢 ∈ 𝑉𝑉 such that 𝐶𝐶 𝜐𝜐 = 𝐶𝐶(𝑢𝑢) and 𝛿𝛿 𝜐𝜐,𝑢𝑢 = 𝑚𝑚𝑚𝑚𝑚𝑚 𝛿𝛿 𝜐𝜐, 𝑡𝑡 𝑡𝑡 ∈ 𝑉𝑉,𝐶𝐶(𝜐𝜐 = 𝐶𝐶(𝑡𝑡) , where 𝛿𝛿 𝜐𝜐,𝑢𝑢 is the shortest distance between nodes u and ν or ∞ if ν is unreachable from u.
Definition 3. Distance of Replacements
𝜇𝜇! 𝜈𝜈,𝜔𝜔 = 𝜇𝜇! 𝜈𝜈 = 𝛿𝛿(𝜐𝜐,𝜌𝜌 𝜐𝜐 ). Remark 1. The closest replacement of a node is not necessarily unique. However, the distance of replacements is.
Remark 2. Notice that this centrality measure is independent of the value chain at hand. It only depends on the coloring of the graph.
Remark 3. If node v has no replacement in the network, by definition, μ2(v) = ∞. This corresponds to the natural interpretation that node v is indispensable.
As an illustration, let us revisit Fig. 4.11b. Since node 1 is the only blue node in the network, its centrality will be ∞. The same is true for node 2. Node 3 and 4, however, have the same color and are thus (the closest) replacements of one another: ρ(n3) = n4 and ρ(n4) = n3. Since their mutual distance is 2, μ2(n3) = μ2(n4) = 2.
iii) Introduction distance
Our third and last centrality measure elaborates on the ideas of the previous definition. We want nodes to score high if their replacement is difficult. However, in this case, we assume that the search for replacement happens inside the network (using existing connections). That is, after the removal of the node in question, the nodes preceding it and following it in the value chain (alignment) will independently look for another node with the same color, exploring the network’s social structure. The motivation here is that we are dealing with a clandestine network where a publicly announced or “global search” for a replacement can be infeasible.
Within dark networks, trust is essential in order to prevent secret information about illegal activity from being leaked outside the circle of people involved. Therefore, involving a replacement with this information is a risky business. Dark network members usually seek replacements within the close by regions of their own social and criminal network (e.g., friends, family). The further away of the personal social network a replacement is found, the more risk is being taken. Therefore, social distance within the network is an important estimate of the riskiness of the replacement for the value chain member (Coles, 2001; Kleemans & Van de Poot, 2008; McCarthy et al., 1998)
For our new centrality measure, we will assume that members of the value chain who lost their connection (preceding or succeeding member) will ask their neighbors (and nobody else) for a suggestion of a replacement. If a replacement is not directly available, the neighbors will ask their own neighbors and so on. The replacement process is completed when the preceding and the succeeding nodes find a replacement
. This
corresponds to the natural interpretation that node v is indispensable.
As an illustration, let us revisit Fig. 4.11b. Since node 1 is the only blue node in the network,
its centrality will be
Our next centrality notion will consider how much damage a node’s removal may cause in the active value chains (i.e., alignments). To assess this, we consider the distance to the closest replacement (i.e., the closest replacement node with the same color).
Definition 2. Closest Replacement Node 𝜌𝜌 𝜐𝜐 = 𝑢𝑢 ∈ 𝑉𝑉 such that 𝐶𝐶 𝜐𝜐 = 𝐶𝐶(𝑢𝑢) and 𝛿𝛿 𝜐𝜐,𝑢𝑢 = 𝑚𝑚𝑚𝑚𝑚𝑚 𝛿𝛿 𝜐𝜐, 𝑡𝑡 𝑡𝑡 ∈ 𝑉𝑉,𝐶𝐶(𝜐𝜐 = 𝐶𝐶(𝑡𝑡) , where 𝛿𝛿 𝜐𝜐,𝑢𝑢 is the shortest distance between nodes u and ν or ∞ if ν is unreachable from u.
Definition 3. Distance of Replacements
𝜇𝜇! 𝜈𝜈,𝜔𝜔 = 𝜇𝜇! 𝜈𝜈 = 𝛿𝛿(𝜐𝜐,𝜌𝜌 𝜐𝜐 ). Remark 1. The closest replacement of a node is not necessarily unique. However, the distance of replacements is.
Remark 2. Notice that this centrality measure is independent of the value chain at hand. It only depends on the coloring of the graph.
Remark 3. If node v has no replacement in the network, by definition, μ2(v) = ∞. This corresponds to the natural interpretation that node v is indispensable.
As an illustration, let us revisit Fig. 4.11b. Since node 1 is the only blue node in the network, its centrality will be ∞. The same is true for node 2. Node 3 and 4, however, have the same color and are thus (the closest) replacements of one another: ρ(n3) = n4 and ρ(n4) = n3. Since their mutual distance is 2, μ2(n3) = μ2(n4) = 2.
iii) Introduction distance
Our third and last centrality measure elaborates on the ideas of the previous definition. We want nodes to score high if their replacement is difficult. However, in this case, we assume that the search for replacement happens inside the network (using existing connections). That is, after the removal of the node in question, the nodes preceding it and following it in the value chain (alignment) will independently look for another node with the same color, exploring the network’s social structure. The motivation here is that we are dealing with a clandestine network where a publicly announced or “global search” for a replacement can be infeasible.
Within dark networks, trust is essential in order to prevent secret information about illegal activity from being leaked outside the circle of people involved. Therefore, involving a replacement with this information is a risky business. Dark network members usually seek replacements within the close by regions of their own social and criminal network (e.g., friends, family). The further away of the personal social network a replacement is found, the more risk is being taken. Therefore, social distance within the network is an important estimate of the riskiness of the replacement for the value chain member (Coles, 2001; Kleemans & Van de Poot, 2008; McCarthy et al., 1998)
For our new centrality measure, we will assume that members of the value chain who lost their connection (preceding or succeeding member) will ask their neighbors (and nobody else) for a suggestion of a replacement. If a replacement is not directly available, the neighbors will ask their own neighbors and so on. The replacement process is completed when the preceding and the succeeding nodes find a replacement
. The same is true for node 2. Node 3 and 4, however, have the same
color and are thus (the closest) replacements of one another: ρ(n3) = n4 and ρ(n4) = n3.
Since their mutual distance is 2, μ2(n3) = μ2(n4) = 2.
iii) introduction distance
Our third and last centrality measure elaborates on the ideas of the previous definition. We
want nodes to score high if their replacement is difficult. However, in this case, we assume
that the search for replacement happens inside the network (using existing connections).
That is, after the removal of the node in question, the nodes preceding it and following it in
the value chain (alignment) will independently look for another node with the same color,
exploring the network’s social structure. The motivation here is that we are dealing with
a clandestine network where a publicly announced or “global search” for a replacement
can be infeasible.
Chapter 4: The Relative Ineffectiveness of Criminal Network Disruption
155
Within dark networks, trust is essential in order to prevent secret information about illegal
activity from being leaked outside the circle of people involved. Therefore, involving a
replacement with this information is a risky business. Dark network members usually seek
replacements within the close by regions of their own social and criminal network (e.g.,
friends, family). The further away of the personal social network a replacement is found,
the more risk is being taken. Therefore, social distance within the network is an important
estimate of the riskiness of the replacement for the value chain member (Coles, 2001;
Kleemans & Van de Poot, 2008; McCarthy et al., 1998)
For our new centrality measure, we will assume that members of the value chain who lost
their connection (preceding or succeeding member) will ask their neighbors (and nobody
else) for a suggestion of a replacement. If a replacement is not directly available, the
neighbors will ask their own neighbors and so on. The replacement process is completed
when the preceding and the succeeding nodes find a replacement that can perform the
same task (i.e., node with the same color). We are interested in the minimum number of
steps (i.e., “introduction events”) that are needed to accomplish this. Naturally, to replace
nodes at the start or at the end of the value chain (alignment) only one alignment neighbor
will need to find the replacement.
In network terms, we are interested in the sum of distances from the preceding node in
the alignment to the replacement and from there to the succeeding node. To be more
consistent with the “introduction” concept, we will subtract 1 from each distance: a node
introduces two of its neighbors, thus one “introduction event” connects the nodes at two
steps’ distance. It is important to emphasize however, that the distances are calculated
after the removal of the examined node. (The act of removal may disrupt possible paths.)
Since the same nodes can be part of several alignments, there will be an introduction score
for each of these value chain instances. Since all of these alignments could be disrupted
if an actor with unique skills is removed from the value chain, all alignments need to be
restored. Therefore the introduction distance of the node is calculated by the sum of these
scores for this paper. Alternatives could be the average, minimum, or maximum introduc-
tion distance. Empirical testing of these models could provide the necessary information
for how to fine-tune this metric.
Let
that can perform the same task (i.e., node with the same color). We are interested in the minimum number of steps (i.e., “introduction events”) that are needed to accomplish this. Naturally, to replace nodes at the start or at the end of the value chain (alignment) only one alignment neighbor will need to find the replacement.
In network terms, we are interested in the sum of distances from the preceding node in the alignment to the replacement and from there to the succeeding node. To be more consistent with the “introduction” concept, we will subtract 1 from each distance: a node introduces two of its neighbors, thus one “introduction event” connects the nodes at two steps’ distance. It is important to emphasize however, that the distances are calculated after the removal of the examined node. (The act of removal may disrupt possible paths.)
Since the same nodes can be part of several alignments, there will be an introduction score for each of these value chain instances. Since all of these alignments could be disrupted if an actor with unique skills is removed from the value chain, all alignments need to be restored. Therefore the introduction distance of the node is calculated by the sum of these scores for this paper. Alternatives could be the average, minimum, or maximum introduction distance. Empirical testing of these models could provide the necessary information for how to fine-‐tune this metric.
Let 𝛿𝛿!(𝑢𝑢, 𝑡𝑡) denote the distance between u and t after the removal of v (and its links) or ∞ if there is no replacement. We continue by defining the first replacement that node u finds for node v after its deletion.
Definition 4. First replacement for v from u 𝜚𝜚 𝑢𝑢, 𝜈𝜈 = 𝑡𝑡 ∈ 𝑉𝑉 such that 𝐶𝐶 𝜐𝜐 = 𝐶𝐶(𝑡𝑡) and 𝛿𝛿! 𝑢𝑢, 𝑡𝑡 = 𝑚𝑚𝑚𝑚𝑚𝑚 𝛿𝛿!(𝑢𝑢, 𝑠𝑠) 𝑠𝑠 ∈ 𝑉𝑉,𝐶𝐶 𝜐𝜐 = 𝐶𝐶(𝑠𝑠) .
Definition 5. Introduction Score
𝜆𝜆 𝜈𝜈, 𝛾𝛾 =𝛿𝛿! 𝛾𝛾!, 𝜚𝜚 𝛾𝛾!, 𝜈𝜈 − 1, if 𝜈𝜈 = 𝛾𝛾!𝛿𝛿! 𝛾𝛾!!!, 𝜚𝜚 𝛾𝛾!!!, 𝜈𝜈 − 1, if 𝜈𝜈 = 𝛾𝛾!𝛿𝛿! 𝛾𝛾!!!, 𝜚𝜚 𝛾𝛾!!!, 𝜈𝜈 + 𝛿𝛿! 𝛾𝛾!!!, 𝜚𝜚 𝛾𝛾!!!, 𝜈𝜈 − 2, if 𝜈𝜈 = 𝛾𝛾! , 𝑖𝑖 ∈ 2, 𝑘𝑘 − 1
,
𝜈𝜈 ∈ 𝑉𝑉, 𝛾𝛾 ∈ Γ(𝜈𝜈,𝜔𝜔).
Remark 4. The first replacement for v from u is not necessarily unique. However, the introduction score is.
Definition 6. Introduction Distance 𝜇𝜇!(𝜐𝜐,𝜔𝜔) = 𝜆𝜆(𝜈𝜈, 𝛾𝛾)!∈! !,! ,!∈! . Remark 5. Notice that while the closest replacement value was independent of the value chain and only depended on the graph’s coloring, introduction distance is intimately connected to the value chain.
As said before, in the graph on Fig. 4.11b, nodes 1 and 2 have no replacement. Thus their
denote the distance between u and t after the removal of v (and its links) or
Our next centrality notion will consider how much damage a node’s removal may cause in the active value chains (i.e., alignments). To assess this, we consider the distance to the closest replacement (i.e., the closest replacement node with the same color).
Definition 2. Closest Replacement Node 𝜌𝜌 𝜐𝜐 = 𝑢𝑢 ∈ 𝑉𝑉 such that 𝐶𝐶 𝜐𝜐 = 𝐶𝐶(𝑢𝑢) and 𝛿𝛿 𝜐𝜐,𝑢𝑢 = 𝑚𝑚𝑚𝑚𝑚𝑚 𝛿𝛿 𝜐𝜐, 𝑡𝑡 𝑡𝑡 ∈ 𝑉𝑉,𝐶𝐶(𝜐𝜐 = 𝐶𝐶(𝑡𝑡) , where 𝛿𝛿 𝜐𝜐,𝑢𝑢 is the shortest distance between nodes u and ν or ∞ if ν is unreachable from u.
Definition 3. Distance of Replacements
𝜇𝜇! 𝜈𝜈,𝜔𝜔 = 𝜇𝜇! 𝜈𝜈 = 𝛿𝛿(𝜐𝜐,𝜌𝜌 𝜐𝜐 ). Remark 1. The closest replacement of a node is not necessarily unique. However, the distance of replacements is.
Remark 2. Notice that this centrality measure is independent of the value chain at hand. It only depends on the coloring of the graph.
Remark 3. If node v has no replacement in the network, by definition, μ2(v) = ∞. This corresponds to the natural interpretation that node v is indispensable.
As an illustration, let us revisit Fig. 4.11b. Since node 1 is the only blue node in the network, its centrality will be ∞. The same is true for node 2. Node 3 and 4, however, have the same color and are thus (the closest) replacements of one another: ρ(n3) = n4 and ρ(n4) = n3. Since their mutual distance is 2, μ2(n3) = μ2(n4) = 2.
iii) Introduction distance
Our third and last centrality measure elaborates on the ideas of the previous definition. We want nodes to score high if their replacement is difficult. However, in this case, we assume that the search for replacement happens inside the network (using existing connections). That is, after the removal of the node in question, the nodes preceding it and following it in the value chain (alignment) will independently look for another node with the same color, exploring the network’s social structure. The motivation here is that we are dealing with a clandestine network where a publicly announced or “global search” for a replacement can be infeasible.
Within dark networks, trust is essential in order to prevent secret information about illegal activity from being leaked outside the circle of people involved. Therefore, involving a replacement with this information is a risky business. Dark network members usually seek replacements within the close by regions of their own social and criminal network (e.g., friends, family). The further away of the personal social network a replacement is found, the more risk is being taken. Therefore, social distance within the network is an important estimate of the riskiness of the replacement for the value chain member (Coles, 2001; Kleemans & Van de Poot, 2008; McCarthy et al., 1998)
For our new centrality measure, we will assume that members of the value chain who lost their connection (preceding or succeeding member) will ask their neighbors (and nobody else) for a suggestion of a replacement. If a replacement is not directly available, the neighbors will ask their own neighbors and so on. The replacement process is completed when the preceding and the succeeding nodes find a replacement
if there is no replacement. We continue by defining the first replacement that node u finds
for node v after its deletion.

156
Definition 4. First replacement for v from u
that can perform the same task (i.e., node with the same color). We are interested in the minimum number of steps (i.e., “introduction events”) that are needed to accomplish this. Naturally, to replace nodes at the start or at the end of the value chain (alignment) only one alignment neighbor will need to find the replacement.
In network terms, we are interested in the sum of distances from the preceding node in the alignment to the replacement and from there to the succeeding node. To be more consistent with the “introduction” concept, we will subtract 1 from each distance: a node introduces two of its neighbors, thus one “introduction event” connects the nodes at two steps’ distance. It is important to emphasize however, that the distances are calculated after the removal of the examined node. (The act of removal may disrupt possible paths.)
Since the same nodes can be part of several alignments, there will be an introduction score for each of these value chain instances. Since all of these alignments could be disrupted if an actor with unique skills is removed from the value chain, all alignments need to be restored. Therefore the introduction distance of the node is calculated by the sum of these scores for this paper. Alternatives could be the average, minimum, or maximum introduction distance. Empirical testing of these models could provide the necessary information for how to fine-‐tune this metric.
Let 𝛿𝛿!(𝑢𝑢, 𝑡𝑡) denote the distance between u and t after the removal of v (and its links) or ∞ if there is no replacement. We continue by defining the first replacement that node u finds for node v after its deletion.
Definition 4. First replacement for v from u 𝜚𝜚 𝑢𝑢, 𝜈𝜈 = 𝑡𝑡 ∈ 𝑉𝑉 such that 𝐶𝐶 𝜐𝜐 = 𝐶𝐶(𝑡𝑡) and 𝛿𝛿! 𝑢𝑢, 𝑡𝑡 = 𝑚𝑚𝑚𝑚𝑚𝑚 𝛿𝛿!(𝑢𝑢, 𝑠𝑠) 𝑠𝑠 ∈ 𝑉𝑉,𝐶𝐶 𝜐𝜐 = 𝐶𝐶(𝑠𝑠) .
Definition 5. Introduction Score
𝜆𝜆 𝜈𝜈, 𝛾𝛾 =𝛿𝛿! 𝛾𝛾!, 𝜚𝜚 𝛾𝛾!, 𝜈𝜈 − 1, if 𝜈𝜈 = 𝛾𝛾!𝛿𝛿! 𝛾𝛾!!!, 𝜚𝜚 𝛾𝛾!!!, 𝜈𝜈 − 1, if 𝜈𝜈 = 𝛾𝛾!𝛿𝛿! 𝛾𝛾!!!, 𝜚𝜚 𝛾𝛾!!!, 𝜈𝜈 + 𝛿𝛿! 𝛾𝛾!!!, 𝜚𝜚 𝛾𝛾!!!, 𝜈𝜈 − 2, if 𝜈𝜈 = 𝛾𝛾! , 𝑖𝑖 ∈ 2, 𝑘𝑘 − 1
,
𝜈𝜈 ∈ 𝑉𝑉, 𝛾𝛾 ∈ Γ(𝜈𝜈,𝜔𝜔).
Remark 4. The first replacement for v from u is not necessarily unique. However, the introduction score is.
Definition 6. Introduction Distance 𝜇𝜇!(𝜐𝜐,𝜔𝜔) = 𝜆𝜆(𝜈𝜈, 𝛾𝛾)!∈! !,! ,!∈! . Remark 5. Notice that while the closest replacement value was independent of the value chain and only depended on the graph’s coloring, introduction distance is intimately connected to the value chain.
As said before, in the graph on Fig. 4.11b, nodes 1 and 2 have no replacement. Thus their
such that
that can perform the same task (i.e., node with the same color). We are interested in the minimum number of steps (i.e., “introduction events”) that are needed to accomplish this. Naturally, to replace nodes at the start or at the end of the value chain (alignment) only one alignment neighbor will need to find the replacement.
In network terms, we are interested in the sum of distances from the preceding node in the alignment to the replacement and from there to the succeeding node. To be more consistent with the “introduction” concept, we will subtract 1 from each distance: a node introduces two of its neighbors, thus one “introduction event” connects the nodes at two steps’ distance. It is important to emphasize however, that the distances are calculated after the removal of the examined node. (The act of removal may disrupt possible paths.)
Since the same nodes can be part of several alignments, there will be an introduction score for each of these value chain instances. Since all of these alignments could be disrupted if an actor with unique skills is removed from the value chain, all alignments need to be restored. Therefore the introduction distance of the node is calculated by the sum of these scores for this paper. Alternatives could be the average, minimum, or maximum introduction distance. Empirical testing of these models could provide the necessary information for how to fine-‐tune this metric.
Let 𝛿𝛿!(𝑢𝑢, 𝑡𝑡) denote the distance between u and t after the removal of v (and its links) or ∞ if there is no replacement. We continue by defining the first replacement that node u finds for node v after its deletion.
Definition 4. First replacement for v from u 𝜚𝜚 𝑢𝑢, 𝜈𝜈 = 𝑡𝑡 ∈ 𝑉𝑉 such that 𝐶𝐶 𝜐𝜐 = 𝐶𝐶(𝑡𝑡) and 𝛿𝛿! 𝑢𝑢, 𝑡𝑡 = 𝑚𝑚𝑚𝑚𝑚𝑚 𝛿𝛿!(𝑢𝑢, 𝑠𝑠) 𝑠𝑠 ∈ 𝑉𝑉,𝐶𝐶 𝜐𝜐 = 𝐶𝐶(𝑠𝑠) .
Definition 5. Introduction Score
𝜆𝜆 𝜈𝜈, 𝛾𝛾 =𝛿𝛿! 𝛾𝛾!, 𝜚𝜚 𝛾𝛾!, 𝜈𝜈 − 1, if 𝜈𝜈 = 𝛾𝛾!𝛿𝛿! 𝛾𝛾!!!, 𝜚𝜚 𝛾𝛾!!!, 𝜈𝜈 − 1, if 𝜈𝜈 = 𝛾𝛾!𝛿𝛿! 𝛾𝛾!!!, 𝜚𝜚 𝛾𝛾!!!, 𝜈𝜈 + 𝛿𝛿! 𝛾𝛾!!!, 𝜚𝜚 𝛾𝛾!!!, 𝜈𝜈 − 2, if 𝜈𝜈 = 𝛾𝛾! , 𝑖𝑖 ∈ 2, 𝑘𝑘 − 1
,
𝜈𝜈 ∈ 𝑉𝑉, 𝛾𝛾 ∈ Γ(𝜈𝜈,𝜔𝜔).
Remark 4. The first replacement for v from u is not necessarily unique. However, the introduction score is.
Definition 6. Introduction Distance 𝜇𝜇!(𝜐𝜐,𝜔𝜔) = 𝜆𝜆(𝜈𝜈, 𝛾𝛾)!∈! !,! ,!∈! . Remark 5. Notice that while the closest replacement value was independent of the value chain and only depended on the graph’s coloring, introduction distance is intimately connected to the value chain.
As said before, in the graph on Fig. 4.11b, nodes 1 and 2 have no replacement. Thus their
and
that can perform the same task (i.e., node with the same color). We are interested in the minimum number of steps (i.e., “introduction events”) that are needed to accomplish this. Naturally, to replace nodes at the start or at the end of the value chain (alignment) only one alignment neighbor will need to find the replacement.
In network terms, we are interested in the sum of distances from the preceding node in the alignment to the replacement and from there to the succeeding node. To be more consistent with the “introduction” concept, we will subtract 1 from each distance: a node introduces two of its neighbors, thus one “introduction event” connects the nodes at two steps’ distance. It is important to emphasize however, that the distances are calculated after the removal of the examined node. (The act of removal may disrupt possible paths.)
Since the same nodes can be part of several alignments, there will be an introduction score for each of these value chain instances. Since all of these alignments could be disrupted if an actor with unique skills is removed from the value chain, all alignments need to be restored. Therefore the introduction distance of the node is calculated by the sum of these scores for this paper. Alternatives could be the average, minimum, or maximum introduction distance. Empirical testing of these models could provide the necessary information for how to fine-‐tune this metric.
Let 𝛿𝛿!(𝑢𝑢, 𝑡𝑡) denote the distance between u and t after the removal of v (and its links) or ∞ if there is no replacement. We continue by defining the first replacement that node u finds for node v after its deletion.
Definition 4. First replacement for v from u 𝜚𝜚 𝑢𝑢, 𝜈𝜈 = 𝑡𝑡 ∈ 𝑉𝑉 such that 𝐶𝐶 𝜐𝜐 = 𝐶𝐶(𝑡𝑡) and 𝛿𝛿! 𝑢𝑢, 𝑡𝑡 = 𝑚𝑚𝑚𝑚𝑚𝑚 𝛿𝛿!(𝑢𝑢, 𝑠𝑠) 𝑠𝑠 ∈ 𝑉𝑉,𝐶𝐶 𝜐𝜐 = 𝐶𝐶(𝑠𝑠) .
Definition 5. Introduction Score
𝜆𝜆 𝜈𝜈, 𝛾𝛾 =𝛿𝛿! 𝛾𝛾!, 𝜚𝜚 𝛾𝛾!, 𝜈𝜈 − 1, if 𝜈𝜈 = 𝛾𝛾!𝛿𝛿! 𝛾𝛾!!!, 𝜚𝜚 𝛾𝛾!!!, 𝜈𝜈 − 1, if 𝜈𝜈 = 𝛾𝛾!𝛿𝛿! 𝛾𝛾!!!, 𝜚𝜚 𝛾𝛾!!!, 𝜈𝜈 + 𝛿𝛿! 𝛾𝛾!!!, 𝜚𝜚 𝛾𝛾!!!, 𝜈𝜈 − 2, if 𝜈𝜈 = 𝛾𝛾! , 𝑖𝑖 ∈ 2, 𝑘𝑘 − 1
,
𝜈𝜈 ∈ 𝑉𝑉, 𝛾𝛾 ∈ Γ(𝜈𝜈,𝜔𝜔).
Remark 4. The first replacement for v from u is not necessarily unique. However, the introduction score is.
Definition 6. Introduction Distance 𝜇𝜇!(𝜐𝜐,𝜔𝜔) = 𝜆𝜆(𝜈𝜈, 𝛾𝛾)!∈! !,! ,!∈! . Remark 5. Notice that while the closest replacement value was independent of the value chain and only depended on the graph’s coloring, introduction distance is intimately connected to the value chain.
As said before, in the graph on Fig. 4.11b, nodes 1 and 2 have no replacement. Thus their
.
Definition 5.Introduction Score
that can perform the same task (i.e., node with the same color). We are interested in the minimum number of steps (i.e., “introduction events”) that are needed to accomplish this. Naturally, to replace nodes at the start or at the end of the value chain (alignment) only one alignment neighbor will need to find the replacement.
In network terms, we are interested in the sum of distances from the preceding node in the alignment to the replacement and from there to the succeeding node. To be more consistent with the “introduction” concept, we will subtract 1 from each distance: a node introduces two of its neighbors, thus one “introduction event” connects the nodes at two steps’ distance. It is important to emphasize however, that the distances are calculated after the removal of the examined node. (The act of removal may disrupt possible paths.)
Since the same nodes can be part of several alignments, there will be an introduction score for each of these value chain instances. Since all of these alignments could be disrupted if an actor with unique skills is removed from the value chain, all alignments need to be restored. Therefore the introduction distance of the node is calculated by the sum of these scores for this paper. Alternatives could be the average, minimum, or maximum introduction distance. Empirical testing of these models could provide the necessary information for how to fine-‐tune this metric.
Let 𝛿𝛿!(𝑢𝑢, 𝑡𝑡) denote the distance between u and t after the removal of v (and its links) or ∞ if there is no replacement. We continue by defining the first replacement that node u finds for node v after its deletion.
Definition 4. First replacement for v from u 𝜚𝜚 𝑢𝑢, 𝜈𝜈 = 𝑡𝑡 ∈ 𝑉𝑉 such that 𝐶𝐶 𝜐𝜐 = 𝐶𝐶(𝑡𝑡) and 𝛿𝛿! 𝑢𝑢, 𝑡𝑡 = 𝑚𝑚𝑚𝑚𝑚𝑚 𝛿𝛿!(𝑢𝑢, 𝑠𝑠) 𝑠𝑠 ∈ 𝑉𝑉,𝐶𝐶 𝜐𝜐 = 𝐶𝐶(𝑠𝑠) .
Definition 5. Introduction Score
𝜆𝜆 𝜈𝜈, 𝛾𝛾 =𝛿𝛿! 𝛾𝛾!, 𝜚𝜚 𝛾𝛾!, 𝜈𝜈 − 1, if 𝜈𝜈 = 𝛾𝛾!𝛿𝛿! 𝛾𝛾!!!, 𝜚𝜚 𝛾𝛾!!!, 𝜈𝜈 − 1, if 𝜈𝜈 = 𝛾𝛾!𝛿𝛿! 𝛾𝛾!!!, 𝜚𝜚 𝛾𝛾!!!, 𝜈𝜈 + 𝛿𝛿! 𝛾𝛾!!!, 𝜚𝜚 𝛾𝛾!!!, 𝜈𝜈 − 2, if 𝜈𝜈 = 𝛾𝛾! , 𝑖𝑖 ∈ 2, 𝑘𝑘 − 1
,
𝜈𝜈 ∈ 𝑉𝑉, 𝛾𝛾 ∈ Γ(𝜈𝜈,𝜔𝜔).
Remark 4. The first replacement for v from u is not necessarily unique. However, the introduction score is.
Definition 6. Introduction Distance 𝜇𝜇!(𝜐𝜐,𝜔𝜔) = 𝜆𝜆(𝜈𝜈, 𝛾𝛾)!∈! !,! ,!∈! . Remark 5. Notice that while the closest replacement value was independent of the value chain and only depended on the graph’s coloring, introduction distance is intimately connected to the value chain.
As said before, in the graph on Fig. 4.11b, nodes 1 and 2 have no replacement. Thus their
Remark 4. The first replacement for v from u is not necessarily unique. However, the
introduction score is.
Definition 6.Introduction Distance
that can perform the same task (i.e., node with the same color). We are interested in the minimum number of steps (i.e., “introduction events”) that are needed to accomplish this. Naturally, to replace nodes at the start or at the end of the value chain (alignment) only one alignment neighbor will need to find the replacement.
In network terms, we are interested in the sum of distances from the preceding node in the alignment to the replacement and from there to the succeeding node. To be more consistent with the “introduction” concept, we will subtract 1 from each distance: a node introduces two of its neighbors, thus one “introduction event” connects the nodes at two steps’ distance. It is important to emphasize however, that the distances are calculated after the removal of the examined node. (The act of removal may disrupt possible paths.)
Since the same nodes can be part of several alignments, there will be an introduction score for each of these value chain instances. Since all of these alignments could be disrupted if an actor with unique skills is removed from the value chain, all alignments need to be restored. Therefore the introduction distance of the node is calculated by the sum of these scores for this paper. Alternatives could be the average, minimum, or maximum introduction distance. Empirical testing of these models could provide the necessary information for how to fine-‐tune this metric.
Let 𝛿𝛿!(𝑢𝑢, 𝑡𝑡) denote the distance between u and t after the removal of v (and its links) or ∞ if there is no replacement. We continue by defining the first replacement that node u finds for node v after its deletion.
Definition 4. First replacement for v from u 𝜚𝜚 𝑢𝑢, 𝜈𝜈 = 𝑡𝑡 ∈ 𝑉𝑉 such that 𝐶𝐶 𝜐𝜐 = 𝐶𝐶(𝑡𝑡) and 𝛿𝛿! 𝑢𝑢, 𝑡𝑡 = 𝑚𝑚𝑚𝑚𝑚𝑚 𝛿𝛿!(𝑢𝑢, 𝑠𝑠) 𝑠𝑠 ∈ 𝑉𝑉,𝐶𝐶 𝜐𝜐 = 𝐶𝐶(𝑠𝑠) .
Definition 5. Introduction Score
𝜆𝜆 𝜈𝜈, 𝛾𝛾 =𝛿𝛿! 𝛾𝛾!, 𝜚𝜚 𝛾𝛾!, 𝜈𝜈 − 1, if 𝜈𝜈 = 𝛾𝛾!𝛿𝛿! 𝛾𝛾!!!, 𝜚𝜚 𝛾𝛾!!!, 𝜈𝜈 − 1, if 𝜈𝜈 = 𝛾𝛾!𝛿𝛿! 𝛾𝛾!!!, 𝜚𝜚 𝛾𝛾!!!, 𝜈𝜈 + 𝛿𝛿! 𝛾𝛾!!!, 𝜚𝜚 𝛾𝛾!!!, 𝜈𝜈 − 2, if 𝜈𝜈 = 𝛾𝛾! , 𝑖𝑖 ∈ 2, 𝑘𝑘 − 1
,
𝜈𝜈 ∈ 𝑉𝑉, 𝛾𝛾 ∈ Γ(𝜈𝜈,𝜔𝜔).
Remark 4. The first replacement for v from u is not necessarily unique. However, the introduction score is.
Definition 6. Introduction Distance 𝜇𝜇!(𝜐𝜐,𝜔𝜔) = 𝜆𝜆(𝜈𝜈, 𝛾𝛾)!∈! !,! ,!∈! . Remark 5. Notice that while the closest replacement value was independent of the value chain and only depended on the graph’s coloring, introduction distance is intimately connected to the value chain.
As said before, in the graph on Fig. 4.11b, nodes 1 and 2 have no replacement. Thus their
.
Remark 5. Notice that while the closest replacement value was independent of the value
chain and only depended on the graph’s coloring, introduction distance is intimately con-
nected to the value chain.
As said before, in the graph on Fig. 4.11b, nodes 1 and 2 have no replacement. Thus
their introduction distance will be μ3(n1) = μ3(n2) =
Our next centrality notion will consider how much damage a node’s removal may cause in the active value chains (i.e., alignments). To assess this, we consider the distance to the closest replacement (i.e., the closest replacement node with the same color).
Definition 2. Closest Replacement Node 𝜌𝜌 𝜐𝜐 = 𝑢𝑢 ∈ 𝑉𝑉 such that 𝐶𝐶 𝜐𝜐 = 𝐶𝐶(𝑢𝑢) and 𝛿𝛿 𝜐𝜐,𝑢𝑢 = 𝑚𝑚𝑚𝑚𝑚𝑚 𝛿𝛿 𝜐𝜐, 𝑡𝑡 𝑡𝑡 ∈ 𝑉𝑉,𝐶𝐶(𝜐𝜐 = 𝐶𝐶(𝑡𝑡) , where 𝛿𝛿 𝜐𝜐,𝑢𝑢 is the shortest distance between nodes u and ν or ∞ if ν is unreachable from u.
Definition 3. Distance of Replacements
𝜇𝜇! 𝜈𝜈,𝜔𝜔 = 𝜇𝜇! 𝜈𝜈 = 𝛿𝛿(𝜐𝜐,𝜌𝜌 𝜐𝜐 ). Remark 1. The closest replacement of a node is not necessarily unique. However, the distance of replacements is.
Remark 2. Notice that this centrality measure is independent of the value chain at hand. It only depends on the coloring of the graph.
Remark 3. If node v has no replacement in the network, by definition, μ2(v) = ∞. This corresponds to the natural interpretation that node v is indispensable.
As an illustration, let us revisit Fig. 4.11b. Since node 1 is the only blue node in the network, its centrality will be ∞. The same is true for node 2. Node 3 and 4, however, have the same color and are thus (the closest) replacements of one another: ρ(n3) = n4 and ρ(n4) = n3. Since their mutual distance is 2, μ2(n3) = μ2(n4) = 2.
iii) Introduction distance
Our third and last centrality measure elaborates on the ideas of the previous definition. We want nodes to score high if their replacement is difficult. However, in this case, we assume that the search for replacement happens inside the network (using existing connections). That is, after the removal of the node in question, the nodes preceding it and following it in the value chain (alignment) will independently look for another node with the same color, exploring the network’s social structure. The motivation here is that we are dealing with a clandestine network where a publicly announced or “global search” for a replacement can be infeasible.
Within dark networks, trust is essential in order to prevent secret information about illegal activity from being leaked outside the circle of people involved. Therefore, involving a replacement with this information is a risky business. Dark network members usually seek replacements within the close by regions of their own social and criminal network (e.g., friends, family). The further away of the personal social network a replacement is found, the more risk is being taken. Therefore, social distance within the network is an important estimate of the riskiness of the replacement for the value chain member (Coles, 2001; Kleemans & Van de Poot, 2008; McCarthy et al., 1998)
For our new centrality measure, we will assume that members of the value chain who lost their connection (preceding or succeeding member) will ask their neighbors (and nobody else) for a suggestion of a replacement. If a replacement is not directly available, the neighbors will ask their own neighbors and so on. The replacement process is completed when the preceding and the succeeding nodes find a replacement
. Nodes 3 and 4 are, on the other
hand, the replacements of each other. Since both of them are directly connected to node
2, their introduction distance will both be μ3(n3) = μ(n4) = 0 (i.e., no introduction events
are necessary).
Remark 6. There is a distinction between the technical system of the value chain and the
social system of the value chain (Gottschalk, 2009). The technical system consists of all
the sequential production steps in order to produce an illegal product. The social system
consists of all criminal relationships, but also other relationships (e.g. friendship, other
criminal activity) that link the value chain members involved within these different produc-
tion steps together. It might be that a person in step 1 is socially connected to a person
involved in step 5 or 8. So the technical system explains the flow of goods and the flow of
people, where the social system explains the flow of information. This means that in case
of replacements, all nodes within a single value chain might seek a replacement instead
of only the ‘orphaned’ ones. However, due to its complexity this option is not explored in
the present paper. In further exploration of these metrics such complexity may be included
Chapter 4: The Relative Ineffectiveness of Criminal Network Disruption
157
Remark 7. The minimum and maximum possible values of the introduced centralities are
the following:
introduction distance will be μ3(n1) = μ3(n2) = ∞. Nodes 3 and 4 are, on the other hand, the replacements of each other. Since both of them are directly connected to node 2, their introduction distance will both be μ3(n3) = μ(n4) = 0 (i.e., no introduction events are necessary).
Remark 6. There is a distinction between the technical system of the value chain and the social system of the value chain (Gottschalk, 2009). The technical system consists of all the sequential production steps in order to produce an illegal product. The social system consists of all criminal relationships, but also other relationships (e.g. friendship, other criminal activity) that link the value chain members involved within these different production steps together. It might be that a person in step 1 is socially connected to a person involved in step 5 or 8. So the technical system explains the flow of goods and the flow of people, where the social system explains the flow of information. This means that in case of replacements, all nodes within a single value chain might seek a replacement instead of only the ‘orphaned’ ones. However, due to its complexity this option is not explored in the present paper. In further exploration of these metrics such complexity may be included
Remark 7. The minimum and maximum possible values of the introduced centralities are the following:
min 𝐷𝐷𝐷𝐷𝐷𝐷!! = 0 min 𝐷𝐷𝐷𝐷𝐷𝐷!! = 1 min 𝐷𝐷𝐷𝐷𝐷𝐷!! = 0
max 𝐷𝐷𝐷𝐷𝐷𝐷!! = 𝜂𝜂 = 𝑚𝑚𝑚𝑚𝑚𝑚!∈!! 𝜐𝜐 ∈ 𝑉𝑉 𝑐𝑐 𝜐𝜐 = 𝑑𝑑!∈!!\!
max 𝐷𝐷𝐷𝐷𝐷𝐷!! = ∞, when there is a color that is only assinged to a single node𝑙𝑙!"# , otherwise
where lmax is the longest shortest path between connected node pairs in G.
max 𝐷𝐷𝐷𝐷𝐷𝐷!! =∞, when there is a color that is only assinged to a single node or when the network becomes disconnected𝜂𝜂(𝑙𝑙!"# − 1), otherwise
In the calculation of the maximum value for μ1, we need to estimate the maximum number of alignments a node can take part of. For this, we take the colors of the value chain, except the color of the node in question. We count how many nodes of the network have each of the colors and multiply these values. This is an upper bound for the possible number of alignments the node can be part of in the given colored network. To get η, we pick the color in the value chain that yields the highest multiplied value.
For a statistic comparison of these value chain centrality scores with traditional centrality scores on theoretical networks we would like to refer further to our research paper on which this paragraph is based (see Toth et al., 2013). By using the Spearman rank correlation we found in this additional analysis that these three new notions of value chain centrality provide new insights in network positioning as compared the traditional notions. The next step is to apply these models to empirical criminal networks and compare it’s application with the manual analysis of multiplexity. At the more abstract, theoretical level, we are interested in studying such graphs in the future, where the color distribution is non-‐uniform, or where the nodes may have more than a single color. Moreover, we also plan to study value chains that have more complex structures, i.e., allowing for branches and repetitions, such as observed in real systems.
where lmax is the longest shortest path between connected node pairs in G.
introduction distance will be μ3(n1) = μ3(n2) = ∞. Nodes 3 and 4 are, on the other hand, the replacements of each other. Since both of them are directly connected to node 2, their introduction distance will both be μ3(n3) = μ(n4) = 0 (i.e., no introduction events are necessary).
Remark 6. There is a distinction between the technical system of the value chain and the social system of the value chain (Gottschalk, 2009). The technical system consists of all the sequential production steps in order to produce an illegal product. The social system consists of all criminal relationships, but also other relationships (e.g. friendship, other criminal activity) that link the value chain members involved within these different production steps together. It might be that a person in step 1 is socially connected to a person involved in step 5 or 8. So the technical system explains the flow of goods and the flow of people, where the social system explains the flow of information. This means that in case of replacements, all nodes within a single value chain might seek a replacement instead of only the ‘orphaned’ ones. However, due to its complexity this option is not explored in the present paper. In further exploration of these metrics such complexity may be included
Remark 7. The minimum and maximum possible values of the introduced centralities are the following:
min 𝐷𝐷𝐷𝐷𝐷𝐷!! = 0 min 𝐷𝐷𝐷𝐷𝐷𝐷!! = 1 min 𝐷𝐷𝐷𝐷𝐷𝐷!! = 0
max 𝐷𝐷𝐷𝐷𝐷𝐷!! = 𝜂𝜂 = 𝑚𝑚𝑚𝑚𝑚𝑚!∈!! 𝜐𝜐 ∈ 𝑉𝑉 𝑐𝑐 𝜐𝜐 = 𝑑𝑑!∈!!\!
max 𝐷𝐷𝐷𝐷𝐷𝐷!! = ∞, when there is a color that is only assinged to a single node𝑙𝑙!"# , otherwise
where lmax is the longest shortest path between connected node pairs in G.
max 𝐷𝐷𝐷𝐷𝐷𝐷!! =∞, when there is a color that is only assinged to a single node or when the network becomes disconnected𝜂𝜂(𝑙𝑙!"# − 1), otherwise
In the calculation of the maximum value for μ1, we need to estimate the maximum number of alignments a node can take part of. For this, we take the colors of the value chain, except the color of the node in question. We count how many nodes of the network have each of the colors and multiply these values. This is an upper bound for the possible number of alignments the node can be part of in the given colored network. To get η, we pick the color in the value chain that yields the highest multiplied value.
For a statistic comparison of these value chain centrality scores with traditional centrality scores on theoretical networks we would like to refer further to our research paper on which this paragraph is based (see Toth et al., 2013). By using the Spearman rank correlation we found in this additional analysis that these three new notions of value chain centrality provide new insights in network positioning as compared the traditional notions. The next step is to apply these models to empirical criminal networks and compare it’s application with the manual analysis of multiplexity. At the more abstract, theoretical level, we are interested in studying such graphs in the future, where the color distribution is non-‐uniform, or where the nodes may have more than a single color. Moreover, we also plan to study value chains that have more complex structures, i.e., allowing for branches and repetitions, such as observed in real systems.
In the calculation of the maximum value for μ1, we need to estimate the maximum number
of alignments a node can take part of. For this, we take the colors of the value chain,
except the color of the node in question. We count how many nodes of the network
have each of the colors and multiply these values. This is an upper bound for the possible
number of alignments the node can be part of in the given colored network. To get η, we
pick the color in the value chain that yields the highest multiplied value.
For a statistic comparison of these value chain centrality scores with traditional centrality
scores on theoretical networks we would like to refer further to our research paper on
which this paragraph is based (see Toth et al., 2013). By using the Spearman rank cor-
relation we found in this additional analysis that these three new notions of value chain
centrality provide new insights in network positioning as compared the traditional notions.
The next step is to apply these models to empirical criminal networks and compare it’s
application with the manual analysis of multiplexity. At the more abstract, theoretical level,
we are interested in studying such graphs in the future, where the color distribution is
non-uniform, or where the nodes may have more than a single color. Moreover, we also
plan to study value chains that have more complex structures, i.e., allowing for branches
and repetitions, such as observed in real systems.
4.6 conclusion
The aim of this study is to unravel the dynamics of resilience within criminal networks,
as a consequence of network disruption. Based on the numerical studies of four differ-
ent disruption strategies and three different recovery mechanisms presented here, it can
be concluded that disruption of the criminal cannabis network is relatively ineffective.
158
After applying multiple removals of actors the network efficiency is hardly affected. On
the contrary, efficiency actually increases over time for the value chain degree disruption
strategy, as a direct result of efficient network recovery. It was shown that the integration
of a replacement within the network leads to new shortcuts, which in turn reduces overall
dimensionality. Our results point out that a delicate criminal process, such as cannabis cul-
tivation, is organized in a flexible and adaptive network structure, which is highly resilient
against network disruption.
In part these results can be explained by the natural evolution of these criminal networks
over time. As reciprocal connections within the embedding macro-network expand over
time, existing connections between value chain members might have become sub-optimal.
However, if the value chain itself is still functional, these ‘inefficient’ connections within
the value chain configuration might not cause any problems for a criminal value chain to
evolve. In fact, they might even increase security within the value chain, by naturally shap-
ing the network in non-redundant way. Within these settings, chances are that in search
for a replacement non-redundant value chain connections become optimized (redundant),
leaving the network more efficient then in its previous state.
Previous criminal network studies attribute this phenomenon to a ‘snowball effect’, by
which ‘structural holes’ between different criminal subnetworks dry out by increasing
reciprocal social relationships over time (e.g. friendship, kinship, affective) (Granovetter,
1983). As new illegal opportunities for criminal network expansion emerges, this process
starts all over again leading to further network expansion (Kleemans & Van de Bunt, 1999).
According to this interpretation, our results emphasize that interference in an established
‘old’ value chain network will be less effective than intervening in a recently established
criminal network or value chain. In fact, the best way to disrupt a criminal network might
be not to apply any disruption strategy at all.
These conclusions might sound disturbing for government- and law enforcement that fight
to control criminal networks on a daily basis. However, we need to realize that network
effectiveness depends on both efficiency as well as secrecy. The capability of criminal
networks to organize secrecy after an attack depends on the flexibility of the network to
benefit both from the redundancy as well as the non-redundancy that’s inhabited within
its network structure, according to the circumstances. Redundancy is needed when looking
for trustworthy replacements within the embedding network. In addition, non-redundancy
is essential for finding replacements that are difficult to find at a greater social distance
and for keeping critical roles and information differentiated and secret, in order to prevent
revealing the whole network by one arrest. From this perspective, Fig 11 shows that the
number of actors close to the average degree centrality increases, meaning that also ‘not
Chapter 4: The Relative Ineffectiveness of Criminal Network Disruption
159
so well-connected’ actors will become more visible than before disruption strategies were
applied. This means that after every attack the criminal network becomes more and more
redundant. Forcing the network to become efficient, but at the price of a higher visibility
(brightness), the network becomes less ‘dark’. The criminal network might even become
imbalanced, leading to progressively more exposure after replacements are integrated
within its structure.
From a network resilience perspective, overall network exposure increases the risk to reveal
the critical actors for value chain survival, such as specialists from which multiple criminal
value chains have become dependent. Because these specialists are underrepresented
within the macro-network, these roles are hard to replace. Moreover replacing specialists
demands direct interference of central brokers (coordinators) within the value chain, lead-
ing to even more exposure of these strategic network positions. In this sense, our results
indicate that network disruption causes these networks to become more efficient at first,
but rather ineffective in the end as recovery forces them to light up more and more from
the dark.
This increased visibility might induce a serious change within agencies involved in con-
temporary law enforcement control of organized crime, as new opportunities for surveil-
lance and advanced intelligence gathering arise to identify and target more critical actors,
specialists or even potential future replacements. With this strategy, the network resilience
progressively declines and additional cracks within network structure will emerge in the
long run, offering more specific disruption opportunities in the end. Our results emphasize
the importance of considering these criminal network structures within their complex
adaptive dynamics, instead of focusing on a snapshot of a group at a certain point in time.
In practice this means that disrupting a criminal network demands a long-term consistent
intervening effort.
In this chapter we demonstrated how computer simulation in combination with
SNA provides understanding of the complex macroscopic dynamics that fuel the
resilience of criminal networks against network disruption at a micro-level. The
use of such methodology within the criminological research field is however in
its infancy. One reason lies within a lack of access to reliable criminal network
data by scientific researchers. Until law enforcement agencies have been willing
to create a legal- and technical framework by which disclosed databases could be
made accessible for scientific purposes, scientists need to rely on their creativity
to obtain empirical illicit network data. In the next chapter we demonstrate how
the techniques of web crawling and text scraping can contribute to the inference
of hidden community networks (i.e. drugs networks) from the openly accessible

160
online world. This methodology may also provide law enforcement professionals
with a methodology to create a deeper data-driven understanding of the social
dimensions behind illicit networks outside of the law enforcement context.
Chapter 4: The Relative Ineffectiveness of Criminal Network Disruption
161
references
Albert, R., Hawoong J., Barabási A., (2000). Error and Attack Tolerance of Complex Networks. Nature
406, 378–382.
Ayling, L., (2009). Criminal Organizations and resilience. International Journal of Law Crime and
Justice 37, 182–196.
Baker, W.E., Faulkner, R.R., (1993). The social organization of conspiracy: illegal networks in the heavy
electrical equipment industry.American Sociological Review 58, 837–860.
Bakker, R.M., Raab, J., Brinton Milward, H. (2012). A Preliminary Theory of Dark Network Resilience.
Journal of Policy Analysis and Management, Vol 31, No. 1 33-62
Bienenstock, E.J.,Bonacich, P., (2003). Balancing efficiency and vulnerability in social networks.
Dynamic social network modeling and analysis: Workshop summary and papers, 253–264.
Washington, DC: The National Academy of Sciences.
Borgatti, S.P., (2003). The Key Player Problem. Dynamic Social Network Modeling and Analysis: Work-
shop Summary and Papers, R. Breiger, K. Carley, & P. Pattison, (Eds.) National Academy of
Sciences Press, 241–252.
Borgatti, S.P. (2006). Identiying sets of key players in a social network. Computational and Mathemati-
cal Organization Theory, 12(1), 21-34.
Bouchard, M., (2007).On the resilience of illegal drug markets. Global Crime 8 (4), 325–344.
Bouchard, (2007b). M. A capture-recapture derived method to estimate cannabis production in indus-
trialized countries. First annual conference of the International Society for the Study of Drug
Policy, Oslo, Norway.
Burt, R.S., Joseph, E.J. & James, T.M. (1998). Personality correlates of structural holes. Social Networks,
20. 63-87.
Burt, R.S., (2001). Structural holes versus network closure as social capital. In N. Lin, K.S. Cook &
R.S. Burt (Eds.). Social Capital: Theory and Research (pp.31-56). New Brunswick: Transaction
Punblishers.
Cook K. and Burt R. S. (2001) Social capital: Theory and Research. New York: Aldine de Gruyter, 2001,
31–56.
Carley, K.M., Ju-Sung, L., D. Krackhardt, (2002). Destabilizing network. Connections 24(3), 79–92.
Carley, K.M., Dombroski, M., Tvetovat, M., Reminga, J., Kamneva, N., (2003). Destabilizing Dynamic
Covert Networks. In Proceedings of the 8th International Command and Control Research and
Technology Symposium.
Clauset A., Shalizi C.R., Newman M.E.J., (2009). Power-law distributions in empirical data.SIAM
Review51(4), 661–703.
Coles, N., (2001).It’s not what you know, but who you know that counts: Analyzing criminal crime
groups as social networks. British Journal or Criminology 41, 580–594.
Cornish, D.B., (1994). The Procedural Analysis of Offending and Its Relevance for situational
prevention.R. Clarcke (Ed.) Crime Prevention Studies 3, 151–196.
Czaplicka, A., Holyst, J. A. & Sloot, P. M. A. (2013) Noise enhances information transfer in hierarchical
network. Nature Scientific Reports3, 1223. (DOI: 10.1038/srep01223)
162
Decorte, T., (2010).The case of small-scale domestic cannabis cultivation. Int J. of Drug Policy21,
271-275
Dorn, N., Oette, L. & White, S., (1998). Drugs Importation And The Bifurcation Of Risk: Capitalization,
Cut Outs and Organized Crime. Brit. J. of Criminology38, 537-560
Emmet, I. & Broers, J. (2008). The Green Gold. Report of a Study of the cannabis sector for the
National Threat assessment of Organized Crime. Zoetermeer: KLPD-IPOL.
Erickson, B. , (1981). Secret societies and social structure, Social Forces60, 188-210
Europol (2011).“OCTA: EU Organized Crime Threat Assessment”. European Police Office, Hag, Ned-
erland.
Freeman, L. C., (1979). Centrality in social networks conceptual clarification. Social networks1, 215-
239
Granovetter, M., 1983.The strength of weak ties: a network theory revisited. Sociological Theory 1,
201–233.
Gottschalk P., 2009. Value configurations in organized crime. Policing & Society 19 (1), 47–57.
Holme, P., Beom, J. K., Chang, N. Y.,Seung, K. H., (2002). Attack Vulnerability of Complex Networks.
Physical Review. E, Statistical, Nonlinear, and Soft Matter Physics 65(5).
Hun, D., Kaza, S. Chen, H.,(2009). Identifying Significant Facilitators of Dark Network Evolution.
Journal of The American Society for Information Science and Technology 20(4),655–665.
Milward, H.B.,Raab,J., (2006). Dark Networks as Organizational Problems: Elements of a Theory.
International Public Management Journal 9(3), 333–360.
Kleemans, E.R., Brienen, M.E.I. & Bunt, H.G. van de (2002). Georganiseerde criminaliteit in Nederland.
Tweede rapportage op basis van de WODC monitor. Den Haag: BJU. http://www.wodc.nl
Kleemans, E.R.,De Poot,C. J.,(2008). Criminal careers in organized crime and social opportunity struc-
ture. European Journal of Criminology 5, 69–98
Klerks, P.P.H.M., (2000). Big in Hash: theory and practice of organized crime Antwerpen: Samsom en
Kluwer Rechtswetenschappen.
Klerks, P. (2001). The network paradigm applied to criminal organizations. Connections, 24, 53-65.
Kossinets, G., Watts, D.J., (2006). Empirical Analysis of an Evolving Social Network. Science 311,
88–90.
Krebs, V.E., (2001).Mapping networks of terrorist cells. Connections 24(3), 43–52.
Lauchs, M.A., Keast, R.L., Chamberlain, D.,(2012). Resilience of a corrupt police network: the first and
second jokes in Queensland. Crime, Law and Social Change 57(2), 195–207.
Liben-Nowell, D., Kleinberg, J.,(2007).The link predictionproblem for social networks. Journal of the
American Society for Information Science and Technology 58(7),1019–1031.
Lindelauff, R.,Borm, P.,Hamers,H.,(2011). Understanding Terrorist Network Topologies and Their
Resilience Against Disruption.Counterterrorism and Open Source Intelligence
Lecture Notes in Social Networks 2, 2011, 61–72.
Malm, A., Nash, R. & Vickovic, S., (2011). Co-offending networks in cannabis cultivation. World Wide
Weed: Global Trends in Cannabis Cultivation and Its Control127,
Chapter 4: The Relative Ineffectiveness of Criminal Network Disruption
163
McCarthy, B., Hagan, J.,Cohen, L.,(1998).Uncertainty, Cooperation, and crime: Understanding the
Decision to Co-offend. Social Forces 77(1), 155–176.
Memon N., Larsen, H. L.,(2006). Structural Analysis and Destabilizing Terrorist Networks. Conference
on Data Mining DMIN’06, 296–302.
Moiseyev, A., Solberg, B., Michie, B., Kallio, A.M.I. (2008) Modeling the impacts of policy measure
stop revent import of illegal wood and wood products. Forest Policy and Economics 12(1),
24–30.
Morselli, C., (2001).Structuring Mr. Nice: Entrepreneurial opportunities and brokerage positioning in
the cannabis trade. Crime, Law and Social Change 35, 203–44.
Morselli, C., Giguère, C., Petit, K.,(2006). The efficiency/security trade-off in criminal networks. Social
Networks 29(1), 143–153.
Morselli, C. & Petit, K. Law enforcement disruption of a drug importation network. Global Crime8 (2),
109 – 130 (2007).
Morselli, C.,(2009).Inside Criminal Networks.New York: Springer.
Morselli, C., (2010). Assessing vulnerable and Strategic positions in a criminal network. Journal of
Contemporary Criminal Justice 26(4), 382–392.
Natarajan, M.,(2006).Understanding the Structure of a large Heroin Distribution Network: A Quanti-
tive Analysis of Qualitative data. Journal of Quantitative Criminology 22(2), 171–192.
Newman, M.E.J, (2005). Power laws, Pareto distributions and Zipf’s law. Contemporary Physics 46(5),
323–351.
Peterson, M.,(1994). Applications in Criminal Analysis: A Sourcebook. Westport: Greenwood Press.
Potter, G. R., Bouchard, M. & Decorte, T., (2011). The globalization of cannabis cultivation. World
Wide Weed: Global Trends in Cannabis Cultivation and Its Control. 1-20.
Raab, J. & Milward, H.B., (2003). Dark Networks as Organizational Problems: Elements of a Theory. J.
of Publ. Administr. and Theory13(4), 413 - 439
Roberts, N., Everton, S.F., (2011). Strategies for combating dark networks. Journal of social structure
12.
Robins, G., (2008). Understanding individual behaviours within covert networks: the interplay of
individual qualities, psychological predispositions, and network effects. Trends in Organized
Crime 12, 166–187.
Spapens, T., (2010). Macro networks, Collectives, and Business Processes: An integrated approach to
Organized Crime. European Journal of Crime, Criminal Law and Criminal Justice 18, 185–215.
Spapens, T., (2011).Interaction between criminal groups and law enforcement: the case of ecstasy in
the Netherlands. Global Crime 12(1), 19–40.
Sparrow, M. (1991), The Application of Network Analysis to Criminal Intelligence: an Assessment of
the Prospects’, Social Networks 13: 251- 274.
Schwartz, D. M. & Rouselle T. D. A., (2009). Using social network analysis to target criminal networks.
Trends in Organized Crime12: 188- 207
Tsvetovat, M.,Carley, K.C., (2005).Structural Knowledge and Success of Anti-Terrorist Activity: The
Downside of Structural Equivalence. Institute for Software Research. Paper 43. Available
at:http://repository.cmu.edu/isr/43.
164
Tsvetovat, M., Carley, K.C.,(2003). Bouncing back: Recovery mechanisms of covert networks.NAAC-
SOS Conference, Pittsburgh, PA, June 22-25, 2003, Day 3, Electronic Publication. Available at:
http://www.casos.cs.cmu.edu/events/conferences/2003/proceedings.html.
United Nations Office on Drugs and Crime, (2010).The globalization of crime: A transnational orga-
nized crime threat assessment. United Nations publication, Vienna.
Van Calster, P., (2008). Netwerkonderzoek als perspectief op georganiseerde criminaliteit. Justitiele
verkenningen, 34(5).
Watts, D.J.,Strogatz, S.H., (1998). Collective dynamics of small world networks. Nature 393(6684),
440–442.
Wouters, M. ,(2008). Controlling cannabis cultivation in the netherlands. In: Korf, D. J. (ed.) Cannabis
in Europe: dynamics in perception, policy and markets. Lengerich: Pabst Science Publishers.
Xu, J.,Chen, H., (2008). The Topology of Dark Networks. Communications of the ACM 51: 58–65.
VPRO. http://www.youtube.com/watch?v=ZbFGrq9mWmU (date of access: December 17, 2013).
Chapter 4: The Relative Ineffectiveness of Criminal Network Disruption
165
Appendix 4A: desCription of hArd- And soft- dAtAsets
The dataset used for our simulations consists of two data sources. First dataset consists of
the data collected by criminal intelligence operations and criminal investigations. Because
it is harder to estimate the reliability of this data, we call it soft data. The second dataset
consists of arrest record data and is denoted as hard data.
soft dataset information
The soft data is collected over the period January 2008 – January 2012 within a criminal
intelligence unit. Detectives collected this data by systematically gathering intelligence
from criminal informants, who are often part of the criminal network themselves or the
social network surrounding it. We call this data ‘soft’ information. Criminal informants
have different motives to talk to the police that are not always clear and their identities
stay covered for security reasons. In some cases, this makes it difficult to check the facts.
In order to check the facts detectives write a detailed report after every conversation. The
facts written in these reports are checked by other informant intelligence and other police
data sources, such as criminal investigations data or street police reports. If informants
turn out to be unreliable, they are ‘fired’. In addition to intelligence retrieved from criminal
informants, this dataset also consists of information from closed criminal investigations
and observations from street police officers during their duty. The data therefore contains
detailed information on criminal cooperation and individual roles and criminal activities of
the actors within the criminal network we observed.
After processing the reports police obtain information about records such as:
– Person (anonymous)
– Link Person – Registration (Soft)
– Link Person – Person
This kind of data has various aspects that contribute to its usefulness:
Strengths:
– Data is retrieved from criminals themselves within the social context of the criminal
network. This gives us a unique observation of a criminal network.
– The data is checked with other information (police registrations) and has an indication
on the value and importance detectives give to the information.
– The data also consists of person – person link records and detailed information about
individual cooperation, roles and criminal activities.
Weaknesses:
166
– The dataset is in part selective; There is a reasonable possibility that there are some
blind spots within the criminal network we do not know about, because we don’t have
any informants within these networks. Another point of concern is that data collection
is affected by police priorities. Fortunately cannabis cultivation has been a top priority
over the period our data was collected.
Not every informant is reliable. Not all facts that are written within the intelligence reports
can be checked. This might be a risk if we want to look at only one criminal relationship
on a micro level. For our research we are only interested in the network on a macro level,
therefore our results won’t be affected by one or two false reports. Moreover, informants
that turn out to be unreliable, are fired directly, this results in a kind of natural selection of
the best informants.
hard (arrest) dataset information
The dataset on arrest information consists of persons with a police arrest registration dat-
ing from the period 2008 until 2011 (80.000 records) within the police region of The
Hague. Every police suspect has a unique number and is put into a police database with
a link to his or her arrest registrations. Every registration contains tag indicating the date
when and the law article for which the suspect was arrested. If more than one person
was arrested they are all linked to the same registration. Because of this, by connecting
persons linked to the same arrest registrations, it was possible to recover the hard network
structure. This offered us another perspective of the criminal network. Since this data was
retrieved from police officers themselves, it is highly reliable. This means that personal
identity is being checked on the bases of identification. Unfortunately arrest registrations
do not contain lot information. It consists of the date and the law article for which a
suspect was arrested. In addition to our cannabis cultivation network under observation,
there are arrest registrations for Opium 1 (cocaine, heroin, XTC) and Opium 2 (soft drugs,
almost always cannabis and hash).
After processing the reports, the police obtain information about records such as:
– Person
– Criminal card
– Registration (arrest) for Opium (hard and soft)
– Link Person – Registration (Arrest)
– Link Person – Criminal card
– Link Person – Person
Strengths:
– The data is reliable in that its observed and collected by police officers themselves
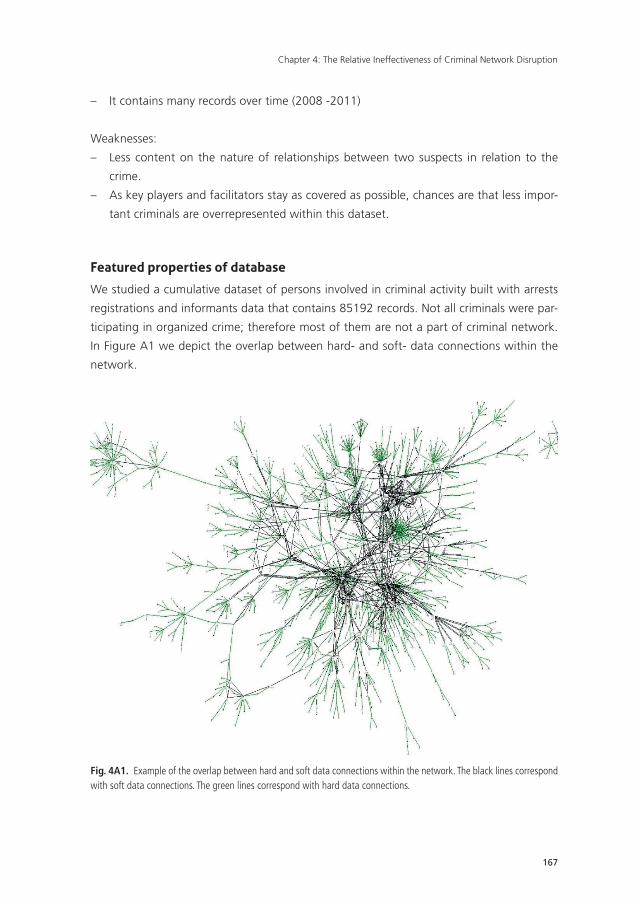
Chapter 4: The Relative Ineffectiveness of Criminal Network Disruption
167
– It contains many records over time (2008 -2011)
Weaknesses:
– Less content on the nature of relationships between two suspects in relation to the
crime.
– As key players and facilitators stay as covered as possible, chances are that less impor-
tant criminals are overrepresented within this dataset.
featured properties of database
We studied a cumulative dataset of persons involved in criminal activity built with arrests
registrations and informants data that contains 85192 records. Not all criminals were par-
ticipating in organized crime; therefore most of them are not a part of criminal network.
In Figure A1 we depict the overlap between hard- and soft- data connections within the
network.
Fig. 4A1. Example of the overlap between hard and soft data connections within the network. The black lines correspond with soft data connections. The green lines correspond with hard data connections.
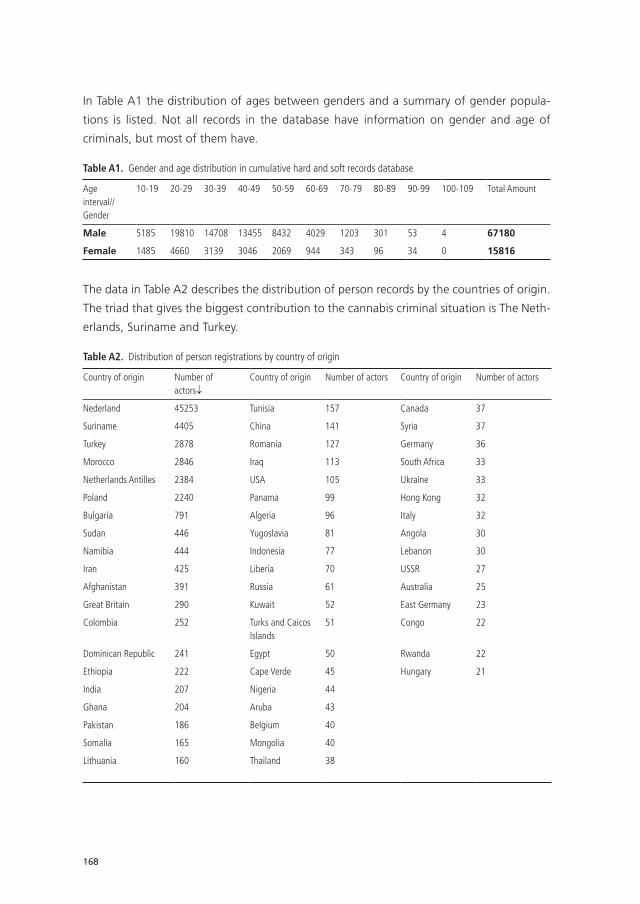
168
In Table A1 the distribution of ages between genders and a summary of gender popula-
tions is listed. Not all records in the database have information on gender and age of
criminals, but most of them have.
Table A1. Gender and age distribution in cumulative hard and soft records database
Age interval//Gender
10-19 20-29 30-39 40-49 50-59 60-69 70-79 80-89 90-99 100-109 Total Amount
Male 5185 19810 14708 13455 8432 4029 1203 301 53 4 67180
Female 1485 4660 3139 3046 2069 944 343 96 34 0 15816
The data in Table A2 describes the distribution of person records by the countries of origin.
The triad that gives the biggest contribution to the cannabis criminal situation is The Neth-
erlands, Suriname and Turkey.
Table A2. Distribution of person registrations by country of origin
Country of origin Number of actors↓
Country of origin Number of actors Country of origin Number of actors
Nederland 45253 Tunisia 157 Canada 37
Suriname 4405 China 141 Syria 37
Turkey 2878 Romania 127 Germany 36
Morocco 2846 Iraq 113 South Africa 33
Netherlands Antilles 2384 USA 105 Ukraine 33
Poland 2240 Panama 99 Hong Kong 32
Bulgaria 791 Algeria 96 Italy 32
Sudan 446 Yugoslavia 81 Angola 30
Namibia 444 Indonesia 77 Lebanon 30
Iran 425 Liberia 70 USSR 27
Afghanistan 391 Russia 61 Australia 25
Great Britain 290 Kuwait 52 East Germany 23
Colombia 252 Turks and Caicos Islands
51 Congo 22
Dominican Republic 241 Egypt 50 Rwanda 22
Ethiopia 222 Cape Verde 45 Hungary 21
India 207 Nigeria 44
Ghana 204 Aruba 43
Pakistan 186 Belgium 40
Somalia 165 Mongolia 40
Lithuania 160 Thailand 38
UvA-DARE is a service provided by the library of the University of Amsterdam (http://dare.uva.nl)
UvA-DARE (Digital Academic Repository)
Detecting and disrupting criminal networks
Duijn, P.A.C.
Link to publication
Citation for published version (APA):Duijn, P. A. C. (2016). Detecting and disrupting criminal networks: A data driven approach
General rightsIt is not permitted to download or to forward/distribute the text or part of it without the consent of the author(s) and/or copyright holder(s),other than for strictly personal, individual use, unless the work is under an open content license (like Creative Commons).
Disclaimer/Complaints regulationsIf you believe that digital publication of certain material infringes any of your rights or (privacy) interests, please let the Library know, statingyour reasons. In case of a legitimate complaint, the Library will make the material inaccessible and/or remove it from the website. Please Askthe Library: http://uba.uva.nl/en/contact, or a letter to: Library of the University of Amsterdam, Secretariat, Singel 425, 1012 WP Amsterdam,The Netherlands. You will be contacted as soon as possible.
Download date: 26 Jan 2017

Chapter 5Inference of the Russian Drug Community from One of the Largest Social Networks in the Russian Federation 28
28 This chapter is included with the specifi c intention to show the relevance of network inference from open social media, in contrast to the previous chapters where specifi c police/law enforcement data has been used. With the consent of the lead author (L.J. Dijkstra), this chapter was added as an integral copy of the published work: L.J. Dijkstra; A.V. Yakushev; P.A.C. Duijn; A.V. Boukhanovsky and P.M.A. Sloot: Inference of the Russian drug community from one of the largest social networks in the Russian Federation, Quality & Quantity, International Journal of Methodology, pp. 1-17. Springer Netherlands, 2013. ISSN 0033-5177. (DOI: 10.1007/s11135-013-9921-6) , with only minor formatting done to fi t the style of this manuscript.
170
abstract
Objectives: This study aims to gain insight into what constitutes the drug community in the
Russian Federation; in- formation that is absent in official governmental data but is vital
for developing effective and much needed intervention strategies to counter the on-going
‘drug epidemic’. Methods Members of the on-line drug community are identified from
a crawled set of almost 100,000 users from the social network ‘LiveJournal’ by context
sensitive text mining of the users’ blogs using a dictionary of known drug- related official
and ‘slang’ terminology. The interests that are more (or less) common within this sub-
community are determined using Fisher’s exact tests and Hochberg and Benjamini’s false
discovery rate control procedure. A ‘psychological portrait’ of the ‘average’ Russian drug
user is created by clustering these indicative interests.
Methods: A naive Bayesian classifier is presented for assessing one’s susceptibility to the
‘drug virus’.Results A total of 268 significant interests separating between users that most
actively spread information on narcotics and the rest of the network and a set of themes
summarizing these interests. Three sub-networks of users which can be uniquely classified
as being either ‘infectious’, ‘susceptible’ or ‘immune’ to the ‘drug virus’.
Network-data: N = 23 106 Nodes
Results and Conclusions: The ‘average’ drug user in the Russian Federation is generally
more interested in topics such as Russian rock, non-traditional medicine, UFOs, Buddhism,
yoga and the occult. The three sub-networks are all scale-free. The presented method
seems to be fruitful for assessing opaque communities within society and could be utilized
for scraping darknet criminal fora, such as Silkroad, to infer criminal networks from online
data.
Chapter 5: Inference of the Russian Drug Community
171
5.1. introduction
Since the fall of the Soviet Union in the early nineties drug abuse has seen a dramatic
increase in the Russian Federation. From 1990 to 2001 the number of registered drug
addicts and drug-related crimes went up a nine- and fifteen- fold respectively (Sunami,
2007) and continued to rise over the last decade (Mityagin, 2012). The rapid spread and
ex- tent of this ‘drug epidemic’ is of immediate concern to the Russian government and
finding effective ways to halt this trend is considered to be of outmost importance.
Due to the criminal nature and general social disapproval of drug use it is complicated to
assess the drug community directly. Official governmental statistics do provide an insight
into the general trend, but only manage to scratch the surface of the entire drug com-
munity in the Russian Federation. The drug users registered in their databases are often
among the extreme cases: they have been in one (or more) rehabilitation programs or
were arrested for using and/or selling illicit narcotics. The (still) ‘moderate’ user stays out of
the picture, making it difficult to obtain reliable information on the drug community as a
whole. Within criminological research this non-registered crime is often referred to as dark
number, see Coleman and Moynihan (1996), and Rhodes et al. (2006).
Gaining a better understanding of what constitutes the drug community in the Russian
Federation and in which ways its members can influence (or even inspire) others to start
using might prove valuable for devising more effective intervening strategies that can turn
the current situation for the better.
In order to handle the drug society’s inherent complexity, we will partition the Russian
population into (roughly) three groups varying in their involvement in illicit drug use:
1. The immune: the group of people that because of, for example, social commitments
(e.g., marriage, children, job) and/or strongly held (religious) convictions will not be
persuaded to start using drugs.
2. The infectious, i.e., the drug community: the group consisting of all individuals involved
with drug abuse in one way or another (i.e., using, selling or producing).
3. The susceptible containing all individuals that are not a member of one of the previ-
ously mentioned groups. They are not involved in any way with illicit drug use at the
moment, but might, due to their social position and environment be drawn toward
drug use in the future.
The idea to divide the population into these three groups was inspired by the division
often used in models for virus spread, see for example the SIR-model of Daley and Kendall
(1964), since a similar process seems to underlie the spread of drug addiction through so-
ciety: infectious (drug users/ dealers) can infect susceptible others with the (drug) virus by
172
means of direct and personal contact (i.e., sharing or selling drugs). This analogy has been
made before, not only between virus spread and drug addictionaddiction (Agar, 2005;
Been- stock and Rahav, 2004; Mityagin, 2012), but also in the field of ‘obesity spreading’
(Gallos et al. 2012) and for modeling the spread of information (Iribarren and Moro, 2009;
Onnela et al., 2007; Bernardes et al., 2012).
Social network sites (SNSs) have proved over the years that they provide means to uncover
social structures and processes that were difficult to observe before (Scott, 2011). In this
paper we investigate the social network site Live- Journal29. With approximately 2.6 mil-
lion registered Russian users and over 39 million registered users worldwide, it is one of
the largest and most popular SNSs in the Russian Federation. The site offers its users an
easy-to-use blog- platform where people can read and share their articles with others.
In contrast to micro-blogging SNSs such as Facebook30 (Wilson et al., 2012; Ferri et al.,
2012) or Twitter31 often mentioned in the literature, the site offers a tremendous amount
of large user-written texts, making it extremely suitable for text-mining and, consequently,
a unique source of data. Maybe because of having the impression to be among ‘friends’,
LiveJournal users write sometimes quite openly about their personal lives in their blogs.
Some even comment on their use of drugs and their experiences with various kinds of
narcotics. Others (the extreme cases) describe in detail the production process. These
openly online expressions can be ascribed to the on-line disinhibition effect (Suler, 2004);
the invisible and anonymous qualities of on- line interaction lead to disinhibited, more in-
tensive, self- disclosing and aggressive uses of language. Furthermore, recent studies show
that criminal organizations are actively using on-line communities as a new ‘business’ tool
for communication, research, logistics, marketing, recruitment, distribution of drugs and
monetarization (Decary-He étu and Morselli, 2011; EUROPOL, 2011; Walsh, 2011; Choo
and Smith, 2008; Williams, 2001). Research of on-line communities, therefore, might aid
in gaining a better understanding of the behavior of opaque networks within a society.
In order to get a better insight into the drug community in the Russian Federation, we
crawl a large randomly selected group of Russian LiveJournal users. Every blog entry of
every user is associated with a weight indicating to what extent it refers to illicit forms
of drug use by overlaying the document word-for-word with a dictionary consisting of
known drug-related terminology (both official as well as informal/‘slang’). When the sum
of ‘indicator’ weights of all the blog entries of a specific user reaches a certain threshold,
the user is considered to be a member of the on-line drug community. The idea behind this
29 LiveJournal is available at http://www.livejournal.com (English) and http://www.livejournal.ru (Russian).
30 Facebook is available at http://www.facebook.com.
31 Twitter is available at http://www.twitter.com.
Chapter 5: Inference of the Russian Drug Community
173
approach is that drug users are more likely to use drug-related terminology in their blog
entries than others. We will return to this assumption extensively in Section 5.3. The way
users are classified and the drug-dictionary are discussed in detail in Section 5.5.
After identifying the on-line drug community, we might ask ourselves what kind of people
are generally to be found in this sub-network? In order to get a better picture of the
‘average’ user in this sub-community, we gather all the interests mentioned on each user’s
profile page and compare how often they appear within the on-line drug community with
the frequency of appearance in the rest of the network. We limit ourselves here to inter-
ests, due to the fact that it is rather unclear how to automatically construct a ‘psychological
profile’ of a user based solely on his or her texts. That way, we try to isolate those interests
that are truly more common in one of these two distinct groups of users. In Section 5.3 we
describe the used methodology in more detail.
The susceptibility of people to the ‘drug virus’ is thought to depend on their exposure to
drug-related information and their own interest in this topic. This social mechanism of
transmission is called differential association in which drives, techniques, motives, ratio-
nalizations and attitudes toward deviant behavior are learned and exchanged by social
inter- action (Sutherland, 1947; Lanier and Henry, 1998; Haynie, 2002). From this perspec-
tive the number of interests a user has in common with the on-line drug community might
indicate a higher susceptibility, since 1) this person is more likely to stumble upon blog
entries published by member of the on-line drug community (which are more often about
drug use), and 2) it might indicate a certain lifestyle more prone to drugs. Following this
reasoning, we present a naive Bayesian classifier using the log-likelihood ratio method
(Kantardzic, 2011; Hastie et al., 2009) in Section 3.4 that assesses the susceptibility of a
user to drugs given his/her personal interests. When a user’s interests overlap more with
the interests in the on-line drug community than the interests of the rest of the population,
they are considered to be susceptible.
Users that were not identified as being a member of the on-line drug community on the
basis of their written texts or as susceptible due to a large similarity with their interests
and the interests common in the on-line drug community are considered to be immune.
They do not write (much) about illicit drug use and their interests do not suggest a lean
to- wards the on-line drug community.
After having (roughly) identified the three subgroups (i.e., immune, infectious and sus-
ceptible) in the social network LiveJournal, we might wonder whether there are structural
differences between the corresponding subnetworks. In Section 5.5 we will describe and
compare them.

174
The remainder of this paper is organized as follows. In Section 5.2 we discuss the social
network site LiveJournal, describe the kind of information users put out about them- selves
and point to several unique features this SNS has over others often studied in the literature.
Section 5.3 describes the crawled LiveJournal data set and the methods used to partition
its users and determine significant interests. The results are presented in Section 5.4. We
will finish with several conclusions, a rather extensive discussion and a few pointers for
future research. In Appendix 5A (p. 149) we explore the frequency with which interests
appear in the network and show that this probability distribution follows a power-law.
5.2 the sns liveJournal
The social network site LiveJournal with over 39 million worldwide and approximately 2.6
million registered Russian users is by far the most popular blog-platform in the Russian
Federation. With 1.7 million active users and (approximately) 130,000 new posts every
day the site offers a fast body of data for studying social structures and processes.32 In
addition to publishing their own articles, the users are offered the possibility to enter
information on their whereabouts (e.g. hometown), demographics (e.g. birthday), their
personal interests (e.g. favorite books, films and music) and even their current mood (e.g.
happy, sad). Articles can be tagged and an extensive comment system provides the readers
with the possibility to respond and exchange opinions and ideas.
Users can unilaterally declare any other registered user as a ‘friend’, i.e., ties are unidirec-
tional. A tie reflects the desire of a user to keep up-to-date with the articles of the other.
Consequently, every profile contains two lists of ties: 1) a list of alters that currently follow
the articles published by the ego, and 2) a list of alters whose articles the ego follows.
(Note the similarity with Twitter). We will refer to these lists as the list of followers and
following friends, respectively.
LiveJournal differs from other (large) social network sites in two important aspects: 1) it has
a large number of users that actively write in Russian, and 2) the texts are large in contrast
to the micro-blogging SNSs often considered in the literature (Wilson et al., 2012). The
latter makes LiveJournal exceptionally suitable for text-mining and, as such might provide
insights into social structures and processes where other SNSs cannot.
32 LiveJournal’s own statistics page can be found at http://www.livejournal.com/stats.bml
Chapter 5: Inference of the Russian Drug Community
175
5.3 methods
The next describes the data collected from the SNS Live- Journal. Then we discuss the
drug-dictionary and procedure used for classifying those users who are most likely to be
involved in drug abuse. After coloring the sub-network of the on-line drug community, we
proceed with identifying those interests that are more common for this set of users or the
rest of the on-line. These indicative interests are used by the nave Bayesian classifier are
then introduced for identifying the ‘susceptible’ and ‘immune’ subnetworks. We will later
analyze the structure of these three subnetworks later in Section 5.4.
the liveJournal data set
On the 9th of September 2012 we crawled 98602 randomly selected Russian user profiles.
For each profile we stored its username, the last 25 posted blog entries, personal interests
and the lists of followers and following ‘friends’. In addition, we stored (when available)
the user’s birthday and place of living.
In order to collect this data, we developed a distributed crawler that employs the MapRe-
duce Model (Lāmmel, 2007) and the open source framework Apache Hadoop (White,
2009). The system is similar to the Apache Nutch crawler (Cafarella and Cutting, 2004) but
allows for multiple users to collect and process data at the same time; the fetcher module
is moved outside the Hadoop framework making it a separate application that can run on
various machine architectures simultaneously.
A total of 22357 users fully specified their birthday on their public profile (ages higher than
80 were regarded to be reported falsely). In Section 4.1 we explore some characteristics of
the crawled population and compare it with the Russian population.
the on-line drug community
Users are classified as being a member of the on-line drug community by comparing their
last 25 blog entries with a dictionary of known drug-related terminology collected by
drug experts at the Saint Petersburg Information and Analytical Center.33 The total of
368 words in this dictionary are split up into two categories: official and informal/‘slang’
terminology. Official terminology are words that are unmistakingly related to illicit drug
use (e.g., cocaine and heroin) and are assigned a high weight, i.e., 5. Informal/‘slang’
expressions can often be interpreted in various ways and can- not be directly related to
drug use. For example, the Russian word ‘kolesa’ refers normally to wheels while it also can
be used (in rather dubious circumstances) as a word for pills. To account for this ambiguity,
33 The homepage of SPb IAC can be found at http://iac.spb.ru (in Russian)
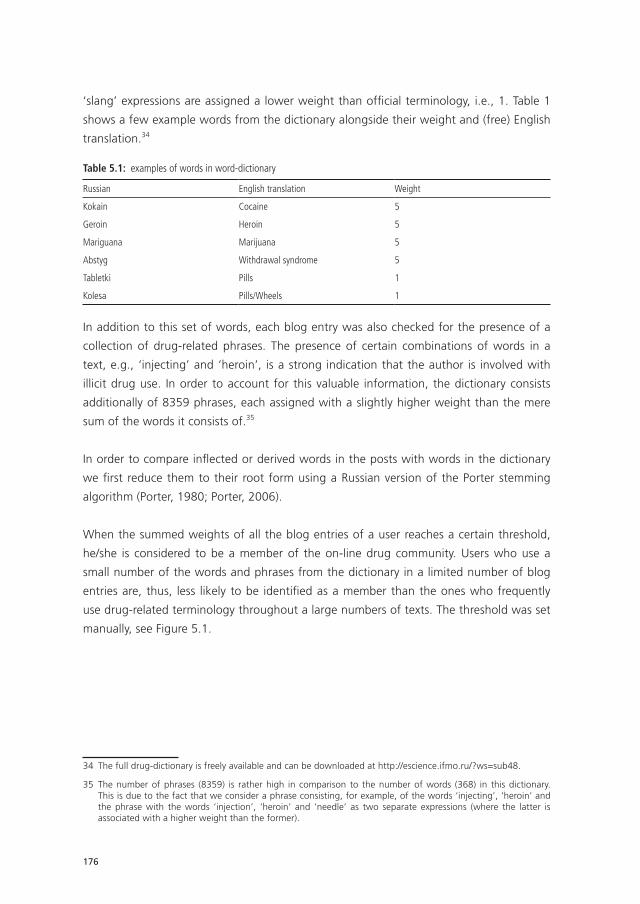
176
‘slang’ expressions are assigned a lower weight than official terminology, i.e., 1. Table 1
shows a few example words from the dictionary alongside their weight and (free) English
translation.34
Table 5.1: examples of words in word-dictionary
Russian English translation Weight
Kokain Cocaine 5
Geroin Heroin 5
Mariguana Marijuana 5
Abstyg Withdrawal syndrome 5
Tabletki Pills 1
Kolesa Pills/Wheels 1
In addition to this set of words, each blog entry was also checked for the presence of a
collection of drug-related phrases. The presence of certain combinations of words in a
text, e.g., ‘injecting’ and ‘heroin’, is a strong indication that the author is involved with
illicit drug use. In order to account for this valuable information, the dictionary consists
additionally of 8359 phrases, each assigned with a slightly higher weight than the mere
sum of the words it consists of.35
In order to compare inflected or derived words in the posts with words in the dictionary
we first reduce them to their root form using a Russian version of the Porter stemming
algorithm (Porter, 1980; Porter, 2006).
When the summed weights of all the blog entries of a user reaches a certain threshold,
he/she is considered to be a member of the on-line drug community. Users who use a
small number of the words and phrases from the dictionary in a limited number of blog
entries are, thus, less likely to be identified as a member than the ones who frequently
use drug-related terminology throughout a large numbers of texts. The threshold was set
manually, see Figure 5.1.
34 The full drug-dictionary is freely available and can be downloaded at http://escience.ifmo.ru/?ws=sub48.
35 The number of phrases (8359) is rather high in comparison to the number of words (368) in this dictionary. This is due to the fact that we consider a phrase consisting, for example, of the words ‘injecting’, ‘heroin’ and the phrase with the words ‘injection’, ‘heroin’ and ‘needle’ as two separate expressions (where the latter is associated with a higher weight than the former).
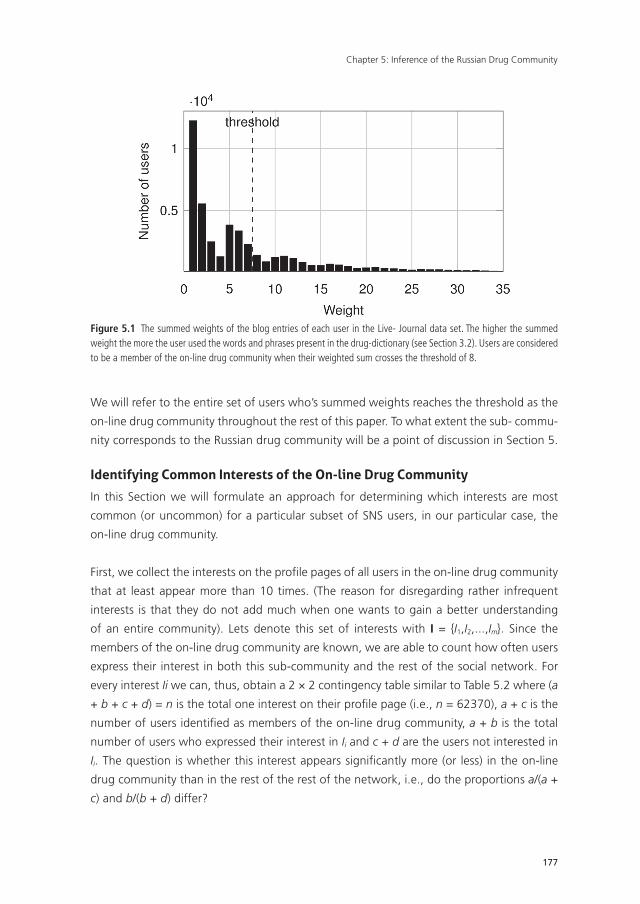
Chapter 5: Inference of the Russian Drug Community
177
Figure 5.1 The summed weights of the blog entries of each user in the Live- Journal data set. The higher the summed weight the more the user used the words and phrases present in the drug-dictionary (see Section 3.2). Users are considered to be a member of the on-line drug community when their weighted sum crosses the threshold of 8.
We will refer to the entire set of users who’s summed weights reaches the threshold as the
on-line drug community throughout the rest of this paper. To what extent the sub- commu-
nity corresponds to the Russian drug community will be a point of discussion in Section 5.
identifying common interests of the on-line drug community
In this Section we will formulate an approach for determining which interests are most
common (or uncommon) for a particular subset of SNS users, in our particular case, the
on-line drug community.
First, we collect the interests on the profi le pages of all users in the on-line drug community
that at least appear more than 10 times. (The reason for disregarding rather infrequent
interests is that they do not add much when one wants to gain a better understanding
of an entire community). Lets denote this set of interests with I = {I1,I2,...,Im}. Since the
members of the on-line drug community are known, we are able to count how often users
express their interest in both this sub-community and the rest of the social network. For
every interest Ii we can, thus, obtain a 2 × 2 contingency table similar to Table 5.2 where (a
+ b + c + d) = n is the total one interest on their profi le page (i.e., n = 62370), a + c is the
number of users identifi ed as members of the on-line drug community, a + b is the total
number of users who expressed their interest in Ii and c + d are the users not interested in
Ii. The question is whether this interest appears signifi cantly more (or less) in the on-line
drug community than in the rest of the rest of the network, i.e., do the proportions a/(a +
c) and b/(b + d) differ?
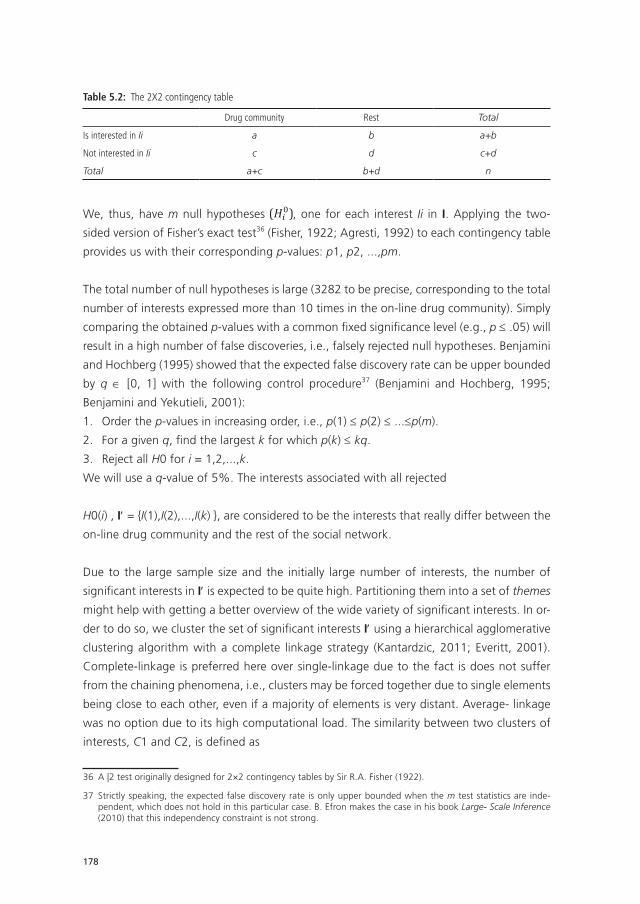
178
Table 5.2: The 2X2 contingency table
Drug community Rest Total
Is interested in Ii a b a+b
Not interested in Ii c d c+d
Total a+c b+d n
We, thus, have m null hypotheses We, thus, have m null hypotheses (𝐻𝐻!!), one for each interest Ii in I. Applying the two-‐sided version of Fisher’s exact test1 (Fisher, 1922; Agresti, 1992) to each contingency table provides us with their corresponding p-‐values: p1, p2, ...,pm.
The total number of null hypotheses is large (3282 to be precise, corresponding to the total number of interests expressed more than 10 times in the on-‐line drug community). Simply comparing the obtained p-‐values with a common fixed significance level (e.g., p ≤ .05) will result in a high number of false discoveries, i.e., falsely rejected null hypotheses. Benjamini and Hochberg (1995) showed that the expected false discovery rate can be upper bounded by q ∈ [0, 1] with the following control procedure2 (Benjamini and Hochberg, 1995; Benjamini and Yekutieli, 2001):
1. Order the p-‐values in increasing order, i.e., p(1) ≤ p(2) ≤ ...≤p(m). 2. For a given q, find the largest k for which p(k) ≤ kq.
3. Reject all H0 for i = 1,2,...,k.
We will use a q-‐value of 5%. The interests associated with all rejected
H0(i) , I′ = {I(1),I(2),...,I(k) }, are considered to be the interests that really differ between the on-‐line drug community and the rest of the social network.
Due to the large sample size and the initially large number of interests, the number of significant interests in I′ is expected to be quite high. Partitioning them into a set of themes might help with getting a better overview of the wide variety of significant interests. In order to do so, we cluster the set of significant interests I′ using a hierarchical agglomerative clustering algorithm with a complete linkage strategy (Kantardzic, 2011; Everitt, 2001). Complete-‐linkage is preferred here over single-‐linkage due to the fact is does not suffer from the chaining phenomena, i.e., clusters may be forced together due to single elements being close to each other, even if a majority of elements is very distant. Average-‐ linkage was no option due to its high computational load. The similarity between two clusters of interests, C1 and C2, is defined as
𝑠𝑠𝑠𝑠𝑠𝑠 𝐶𝐶!,𝐶𝐶! = ! !!∩!!! !!)∙!(!!
(1)
where S1 and S2 are the sets of users that expressed their interest in at least one of the topics in, respectively, C1 and C2. n(·) returns the number of users. This similarity measure is known as cosine similarity or more commonly known in biology as the Ochiaicoefficient (Ochiai, 1957). We will refer to the resulting clusters of significant interests as themes throughout the rest of this paper.
Assessing Susceptibility
1 A ⎟2 test originally designed for 2×2 contingency tables by Sir R.A. Fisher (1922).
2 Strictly speaking, the expected false discovery rate is only upper bounded when the m test statisticsare independent, which does not hold in this particular case. B. Efron makes the case in his bookLarge- Scale Inference (2010) that this independency constraint is not strong.
, one for each interest Ii in I. Applying the two-
sided version of Fisher’s exact test36 (Fisher, 1922; Agresti, 1992) to each contingency table
provides us with their corresponding p-values: p1, p2, ...,pm.
The total number of null hypotheses is large (3282 to be precise, corresponding to the total
number of interests expressed more than 10 times in the on-line drug community). Simply
comparing the obtained p-values with a common fixed significance level (e.g., p ≤ .05) will
result in a high number of false discoveries, i.e., falsely rejected null hypotheses. Benjamini
and Hochberg (1995) showed that the expected false discovery rate can be upper bounded
by q ∈ [0, 1] with the following control procedure37 (Benjamini and Hochberg, 1995;
Benjamini and Yekutieli, 2001):
1. Order the p-values in increasing order, i.e., p(1) ≤ p(2) ≤ ...≤p(m).
2. For a given q, find the largest k for which p(k) ≤ kq.
3. Reject all H0 for i = 1,2,...,k.
We will use a q-value of 5%. The interests associated with all rejected
H0(i) , I′ = {I(1),I(2),...,I(k) }, are considered to be the interests that really differ between the
on-line drug community and the rest of the social network.
Due to the large sample size and the initially large number of interests, the number of
significant interests in I′ is expected to be quite high. Partitioning them into a set of themes
might help with getting a better overview of the wide variety of significant interests. In or-
der to do so, we cluster the set of significant interests I′ using a hierarchical agglomerative
clustering algorithm with a complete linkage strategy (Kantardzic, 2011; Everitt, 2001).
Complete-linkage is preferred here over single-linkage due to the fact is does not suffer
from the chaining phenomena, i.e., clusters may be forced together due to single elements
being close to each other, even if a majority of elements is very distant. Average- linkage
was no option due to its high computational load. The similarity between two clusters of
interests, C1 and C2, is defined as
36 A |2 test originally designed for 2×2 contingency tables by Sir R.A. Fisher (1922).
37 Strictly speaking, the expected false discovery rate is only upper bounded when the m test statistics are inde-pendent, which does not hold in this particular case. B. Efron makes the case in his book Large- Scale Inference (2010) that this independency constraint is not strong.
Chapter 5: Inference of the Russian Drug Community
179
We, thus, have m null hypotheses (𝐻𝐻!!), one for each interest Ii in I. Applying the two-‐sided version of Fisher’s exact test1 (Fisher, 1922; Agresti, 1992) to each contingency table provides us with their corresponding p-‐values: p1, p2, ...,pm.
The total number of null hypotheses is large (3282 to be precise, corresponding to the total number of interests expressed more than 10 times in the on-‐line drug community). Simply comparing the obtained p-‐values with a common fixed significance level (e.g., p ≤ .05) will result in a high number of false discoveries, i.e., falsely rejected null hypotheses. Benjamini and Hochberg (1995) showed that the expected false discovery rate can be upper bounded by q ∈ [0, 1] with the following control procedure2 (Benjamini and Hochberg, 1995; Benjamini and Yekutieli, 2001):
1. Order the p-‐values in increasing order, i.e., p(1) ≤ p(2) ≤ ...≤p(m). 2. For a given q, find the largest k for which p(k) ≤ kq.
3. Reject all H0 for i = 1,2,...,k.
We will use a q-‐value of 5%. The interests associated with all rejected
H0(i) , I′ = {I(1),I(2),...,I(k) }, are considered to be the interests that really differ between the on-‐line drug community and the rest of the social network.
Due to the large sample size and the initially large number of interests, the number of significant interests in I′ is expected to be quite high. Partitioning them into a set of themes might help with getting a better overview of the wide variety of significant interests. In order to do so, we cluster the set of significant interests I′ using a hierarchical agglomerative clustering algorithm with a complete linkage strategy (Kantardzic, 2011; Everitt, 2001). Complete-‐linkage is preferred here over single-‐linkage due to the fact is does not suffer from the chaining phenomena, i.e., clusters may be forced together due to single elements being close to each other, even if a majority of elements is very distant. Average-‐ linkage was no option due to its high computational load. The similarity between two clusters of interests, C1 and C2, is defined as
𝑠𝑠𝑠𝑠𝑠𝑠 𝐶𝐶!,𝐶𝐶! = ! !!∩!!! !!)∙!(!!
(1)
where S1 and S2 are the sets of users that expressed their interest in at least one of the topics in, respectively, C1 and C2. n(·) returns the number of users. This similarity measure is known as cosine similarity or more commonly known in biology as the Ochiaicoefficient (Ochiai, 1957). We will refer to the resulting clusters of significant interests as themes throughout the rest of this paper.
Assessing Susceptibility
1 A ⎟2 test originally designed for 2×2 contingency tables by Sir R.A. Fisher (1922).
2 Strictly speaking, the expected false discovery rate is only upper bounded when the m test statisticsare independent, which does not hold in this particular case. B. Efron makes the case in his bookLarge- Scale Inference (2010) that this independency constraint is not strong.
(1)
where S1 and S2 are the sets of users that expressed their interest in at least one of the
topics in, respectively, C1 and C2. n(·) returns the number of users. This similarity measure
is known as cosine similarity or more commonly known in biology as the Ochiai coeffi cient
(Ochiai, 1957). We will refer to the resulting clusters of signifi cant interests as themes
throughout the rest of this paper.
assessing susceptibility
A large number of common interests between a user and the on-line drug community might
indicate a higher susceptibility to drugs, since 1) the user is more likely to stumble upon blog
entries published by members of this sub-community, and 2) it might indicate a certain lifestyle
more prone to drug use. Certain interests might, on the other hand, indicate a low susceptibil-
ity. Think of interests that suggest that the user in question has certain social commitments
(e.g., marriage, children, job) or strong-held (religious) convictions. The idea that interests
are related to susceptibility underlies the classifi cation method in this section: an individual is
considered to be a susceptible user when his/her personal interests resemble the interests com-
mon for the drug com- munity more than the interests of the rest of the on-line population.
A naive Bayesian classifi er was used (Kantardzic, 2011). Due to the fact that certain combi-
nations of interests are rare, we are forced to assume conditional independence between
each pair of interests and use the log-likelihood ratio method.
Let us fi rst defi ne k feature variables, one for each interest in the set I’:
A large number of common interests between a user and the on-‐line drug community might indicate a higher susceptibility to drugs, since 1) the user is more likely to stumble upon blog entries published by members of this sub-‐community, and 2) it might indicate a certain lifestyle more prone to drug use. Certain interests might, on the other hand, indicate a low susceptibility. Think of interests that suggest that the user in question has certain social commitments (e.g., marriage, children, job) or strong-‐held (religious) convictions. The idea that interests are related to susceptibility underlies the classification method in this section: an individual is considered to be a susceptible userwhen his/her personal interests resemble the interests common for the drug com-‐munity more than the interests of the rest of the on-‐line population.
A naive Bayesian classifier was used (Kantardzic, 2011). Due to the fact that certain combinations of interests are rare, we are forced to assume conditional independence between each pair of interests and use the log-‐likelihood ratio method.
Let us first define k feature variables, one for each interest in the set I’:
F = {F1,F2,...,Fk}
where Fi is true when the user is interested in Ii in I’ and otherwise false. The set offeature variables F is used to describe the personal interests of each user in the network.
The chance that a user belongs to the drug community (D) given his/her interests is given by the conditional chance P(D | F). Given the assumption that each feature variableFi is conditionally independent of Fjwhen i = j, i.e., P(Fi | D,Fj) = P(Fi | D), this probabilitycan be expressed as
𝑃𝑃 𝐷𝐷 𝐅𝐅 = !(!)!(𝐅𝐅)
𝑃𝑃 𝐹𝐹! 𝐷𝐷!!!! (2)
Similarly, the chance of not being a member of the drug community given the users interests is
𝑃𝑃 ¬𝐷𝐷 𝐅𝐅 = !(¬!)!(𝐅𝐅)
𝑃𝑃 𝐹𝐹! ¬𝐷𝐷!!!! (3)
By applying the log-‐likelihood ratio method, i.e., dividing eq. (2) by eq. (3) and taking the natural logarithm of both sides, we find that the inequality P(D | F) > P(¬D | F), i.e., the user is more likely to belong to the drug community given the user’s interests, is equivalent to the inequality:
log !(!)!(¬!)
+ log ! !! !! !! ¬!
> 0!!!! (4)
A user is considered to be susceptible when he/she does not belong to the drug community and this inequality holds. Users that are not a member of the on-‐line drugcommunity or considered to be susceptible are immune.
where Fi is true when the user is interested in Ii in I’ and otherwise false. The set of feature
variables F is used to describe the personal interests of each user in the network.
The chance that a user belongs to the drug community (D) given his/her interests is given
by the conditional chance P(D | F). Given the assumption that each feature variable Fi is
conditionally independent of Fj when i/ = j, i.e., P(Fi | D,Fj) = P(Fi | D), this probability can
be expressed as
A large number of common interests between a user and the on-‐line drug community might indicate a higher susceptibility to drugs, since 1) the user is more likely to stumble upon blog entries published by members of this sub-‐community, and 2) it might indicate a certain lifestyle more prone to drug use. Certain interests might, on the other hand, indicate a low susceptibility. Think of interests that suggest that the user in question has certain social commitments (e.g., marriage, children, job) or strong-‐held (religious) convictions. The idea that interests are related to susceptibility underlies the classification method in this section: an individual is considered to be a susceptible userwhen his/her personal interests resemble the interests common for the drug com-‐munity more than the interests of the rest of the on-‐line population.
A naive Bayesian classifier was used (Kantardzic, 2011). Due to the fact that certain combinations of interests are rare, we are forced to assume conditional independence between each pair of interests and use the log-‐likelihood ratio method.
Let us first define k feature variables, one for each interest in the set I’:
F = {F1,F2,...,Fk}
where Fi is true when the user is interested in Ii in I’ and otherwise false. The set offeature variables F is used to describe the personal interests of each user in the network.
The chance that a user belongs to the drug community (D) given his/her interests is given by the conditional chance P(D | F). Given the assumption that each feature variableFi is conditionally independent of Fjwhen i = j, i.e., P(Fi | D,Fj) = P(Fi | D), this probabilitycan be expressed as
𝑃𝑃 𝐷𝐷 𝐅𝐅 = !(!)!(𝐅𝐅)
𝑃𝑃 𝐹𝐹! 𝐷𝐷!!!! (2)
Similarly, the chance of not being a member of the drug community given the users interests is
𝑃𝑃 ¬𝐷𝐷 𝐅𝐅 = !(¬!)!(𝐅𝐅)
𝑃𝑃 𝐹𝐹! ¬𝐷𝐷!!!! (3)
By applying the log-‐likelihood ratio method, i.e., dividing eq. (2) by eq. (3) and taking the natural logarithm of both sides, we find that the inequality P(D | F) > P(¬D | F), i.e., the user is more likely to belong to the drug community given the user’s interests, is equivalent to the inequality:
log !(!)!(¬!)
+ log ! !! !! !! ¬!
> 0!!!! (4)
A user is considered to be susceptible when he/she does not belong to the drug community and this inequality holds. Users that are not a member of the on-‐line drugcommunity or considered to be susceptible are immune.
(2)
Similarly, the chance of not being a member of the drug community given the users inter-
ests is
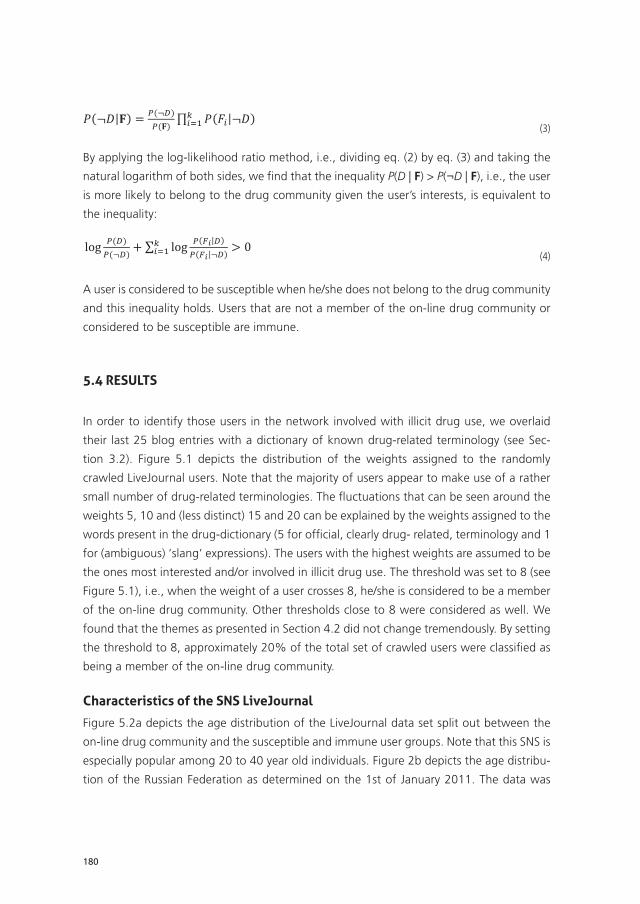
180
A large number of common interests between a user and the on-‐line drug community might indicate a higher susceptibility to drugs, since 1) the user is more likely to stumble upon blog entries published by members of this sub-‐community, and 2) it might indicate a certain lifestyle more prone to drug use. Certain interests might, on the other hand, indicate a low susceptibility. Think of interests that suggest that the user in question has certain social commitments (e.g., marriage, children, job) or strong-‐held (religious) convictions. The idea that interests are related to susceptibility underlies the classification method in this section: an individual is considered to be a susceptible userwhen his/her personal interests resemble the interests common for the drug com-‐munity more than the interests of the rest of the on-‐line population.
A naive Bayesian classifier was used (Kantardzic, 2011). Due to the fact that certain combinations of interests are rare, we are forced to assume conditional independence between each pair of interests and use the log-‐likelihood ratio method.
Let us first define k feature variables, one for each interest in the set I’:
F = {F1,F2,...,Fk}
where Fi is true when the user is interested in Ii in I’ and otherwise false. The set offeature variables F is used to describe the personal interests of each user in the network.
The chance that a user belongs to the drug community (D) given his/her interests is given by the conditional chance P(D | F). Given the assumption that each feature variableFi is conditionally independent of Fjwhen i = j, i.e., P(Fi | D,Fj) = P(Fi | D), this probabilitycan be expressed as
𝑃𝑃 𝐷𝐷 𝐅𝐅 = !(!)!(𝐅𝐅)
𝑃𝑃 𝐹𝐹! 𝐷𝐷!!!! (2)
Similarly, the chance of not being a member of the drug community given the users interests is
𝑃𝑃 ¬𝐷𝐷 𝐅𝐅 = !(¬!)
!(𝐅𝐅)𝑃𝑃 𝐹𝐹! ¬𝐷𝐷!
!!! (3)
By applying the log-‐likelihood ratio method, i.e., dividing eq. (2) by eq. (3) and taking the natural logarithm of both sides, we find that the inequality P(D | F) > P(¬D | F), i.e., the user is more likely to belong to the drug community given the user’s interests, is equivalent to the inequality:
log !(!)!(¬!)
+ log ! !! !! !! ¬!
> 0!!!! (4)
A user is considered to be susceptible when he/she does not belong to the drug community and this inequality holds. Users that are not a member of the on-‐line drugcommunity or considered to be susceptible are immune.
(3)
By applying the log-likelihood ratio method, i.e., dividing eq. (2) by eq. (3) and taking the
natural logarithm of both sides, we fi nd that the inequality P(D | F) > P(¬D | F), i.e., the user
is more likely to belong to the drug community given the user’s interests, is equivalent to
the inequality:
A large number of common interests between a user and the on-‐line drug community might indicate a higher susceptibility to drugs, since 1) the user is more likely to stumble upon blog entries published by members of this sub-‐community, and 2) it might indicate a certain lifestyle more prone to drug use. Certain interests might, on the other hand, indicate a low susceptibility. Think of interests that suggest that the user in question has certain social commitments (e.g., marriage, children, job) or strong-‐held (religious) convictions. The idea that interests are related to susceptibility underlies the classification method in this section: an individual is considered to be a susceptible userwhen his/her personal interests resemble the interests common for the drug com-‐munity more than the interests of the rest of the on-‐line population.
A naive Bayesian classifier was used (Kantardzic, 2011). Due to the fact that certain combinations of interests are rare, we are forced to assume conditional independence between each pair of interests and use the log-‐likelihood ratio method.
Let us first define k feature variables, one for each interest in the set I’:
F = {F1,F2,...,Fk}
where Fi is true when the user is interested in Ii in I’ and otherwise false. The set offeature variables F is used to describe the personal interests of each user in the network.
The chance that a user belongs to the drug community (D) given his/her interests is given by the conditional chance P(D | F). Given the assumption that each feature variableFi is conditionally independent of Fjwhen i = j, i.e., P(Fi | D,Fj) = P(Fi | D), this probabilitycan be expressed as
𝑃𝑃 𝐷𝐷 𝐅𝐅 = !(!)!(𝐅𝐅)
𝑃𝑃 𝐹𝐹! 𝐷𝐷!!!! (2)
Similarly, the chance of not being a member of the drug community given the users interests is
𝑃𝑃 ¬𝐷𝐷 𝐅𝐅 = !(¬!)!(𝐅𝐅)
𝑃𝑃 𝐹𝐹! ¬𝐷𝐷!!!! (3)
By applying the log-‐likelihood ratio method, i.e., dividing eq. (2) by eq. (3) and taking the natural logarithm of both sides, we find that the inequality P(D | F) > P(¬D | F), i.e., the user is more likely to belong to the drug community given the user’s interests, is equivalent to the inequality:
log !(!)!(¬!)
+ log ! !! !! !! ¬!
> 0!!!! (4)
A user is considered to be susceptible when he/she does not belong to the drug community and this inequality holds. Users that are not a member of the on-‐line drugcommunity or considered to be susceptible are immune.
(4)
A user is considered to be susceptible when he/she does not belong to the drug community
and this inequality holds. Users that are not a member of the on-line drug community or
considered to be susceptible are immune.
5.4 results
In order to identify those users in the network involved with illicit drug use, we overlaid
their last 25 blog entries with a dictionary of known drug-related terminology (see Sec-
tion 3.2). Figure 5.1 depicts the distribution of the weights assigned to the randomly
crawled LiveJournal users. Note that the majority of users appear to make use of a rather
small number of drug-related terminologies. The fl uctuations that can be seen around the
weights 5, 10 and (less distinct) 15 and 20 can be explained by the weights assigned to the
words present in the drug-dictionary (5 for offi cial, clearly drug- related, terminology and 1
for (ambiguous) ‘slang’ expressions). The users with the highest weights are assumed to be
the ones most interested and/or involved in illicit drug use. The threshold was set to 8 (see
Figure 5.1), i.e., when the weight of a user crosses 8, he/she is considered to be a member
of the on-line drug community. Other thresholds close to 8 were considered as well. We
found that the themes as presented in Section 4.2 did not change tremendously. By setting
the threshold to 8, approximately 20% of the total set of crawled users were classifi ed as
being a member of the on-line drug community.
characteristics of the sns liveJournal
Figure 5.2a depicts the age distribution of the LiveJournal data set split out between the
on-line drug community and the susceptible and immune user groups. Note that this SNS is
especially popular among 20 to 40 year old individuals. Figure 2b depicts the age distribu-
tion of the Russian Federation as determined on the 1st of January 2011. The data was
Chapter 5: Inference of the Russian Drug Community
181
made available by Rosstat.38 The major dip around the ages 62-70 is a refl ection of the
impact that the Second World War had on the Russian population.
Note the difference between the Russian LiveJournal community and the Russian popula-
tion as a whole. Using Live- Journal to sample the Russian population poses two problems:
1) one only samples those individuals who are registered as a user in this SNS, and 2) we
seriously oversample the age group 20-40. Both aspects might not pose a real threat; the
Russian drug community is, as mentioned before, diffi cult (or even impossible) to sample
directly, making sampling a SNS one of the limited options one has, when one wants to
gain a better insight into this sub-community. In addition, illicit drug use is known to occur
especially in this particular age group (Mityagin, 2012). The strong presence of this group,
thus, might help in gathering more information on the community of interest.
Of the total number of 98602 users studied in the Live- Journal data set, 16553 and 3586
were identifi ed as, respectively, members of the drug community and susceptible users.
Susceptible users are identifi ed using the naive Bayesian classifi er as described above, which
makes use of the interests the user posted on his/her profi le page. Common interests can
be shown to be rare. In fact, the frequency with which an interest is mentioned by users
of this SNS can be shown to follow a power-law distribution with coeffi cient λ≈ 1.54, see
Appendix 5A. With a low number of common interests, there is often not enough to go on
in order to reliably classify a user as being susceptible, which explains the relatively small
number of susceptible users found.
38 The governmental statistics agency of the Russian Federation. They can be found at http://www.gks.ru (in Rus-sian) with links to their rather extensive database.
Figure 5.2 a The age distribution of the LiveJournal data set (2012) split out between the on-line drug community, and the susceptible and immune user groups. Note that this SNS is especially popular in Russia among 20 to 40 year olds b The age distribution of the Russian Federation on the 1st of January 2011 (the data was made available by Rosstat). Note the difference between the two age distributions. LiveJournal does, thus, not provide a good sample of the Russian population, although, while investigating illicit drug use it might be useful to sample especially that fraction of the population known to be most involved with narcotics (Mityagin 2012)
182
drug indicators
After applying Fisher’s exact test and Benjamini and Hochberg’s false discovery rate control
procedure with a q-value of 5% (see Section 5.3, p. 136), we found 268 of the 3282 initial
interests to be significant, i.e., the on-line drug community is, thus, more/less interested
in these topics than the rest of the Live- Journal users. In order to assess to what extent
an interest I is indicative for being a member of the drug community (D) or the rest of the
population, we use the conditional probability P(D | I). Among the interests most indicative
for the on-line drug community (i.e., P(D | I) > .5), we found interests such as: the White
Movement (a loose confederation of anti-communist forces who fought the Bolsheviks in
the Russian civil war; now often associated with the Russian nationalistic movement), hu-
manistic psychology, partisans, Aryan (ancient people that partly inhabited current Russian
territory), Stalinism, Dadaism, narcology and Magadan (a city in the far east of the Russian
territory, famous for its large jail). Among interests most indicative for not belonging to
the drug community (i.e., P(D | I) < .5), we found interests such as: accessories, beads,
jewellery, London, clothing, glamour, handmade, shoes, beach and interior design.
In order to get a better view on the wide variety of significant indicative interests, we
clustered them using the cluster algorithm described in Section 5.3. We found 42 different
themes in total. In this Section we will only discuss the ones most prominent within the
on-line drug community and the rest of the LiveJournal population.
Figure 5.3 shows the various themes and to what extent they appear in the on-line drug
community and the rest of the LiveJournal population. We consider users to be interested
in a theme, when they mention at least one of the interests contained in that theme on
their profile page.
The names assigned to each theme were determined by the writers of this article. In order
to overcome some of the inevitable subjectivity inherent to this process, we will describe
the themes shortly in Table 3, where the second column denotes the number of significant
interests in each theme. When the number of interests in a theme is small, we will sum up
all the interests (translated to English); otherwise we will suffice with a short description.
In both Figure 5.3 and Table 5.3 the last three themes (Mainstream music, Accessories/
Clothing and Glamour) appear more often in the non-drug Section of the network. The
others are more common for the on-line drug community.
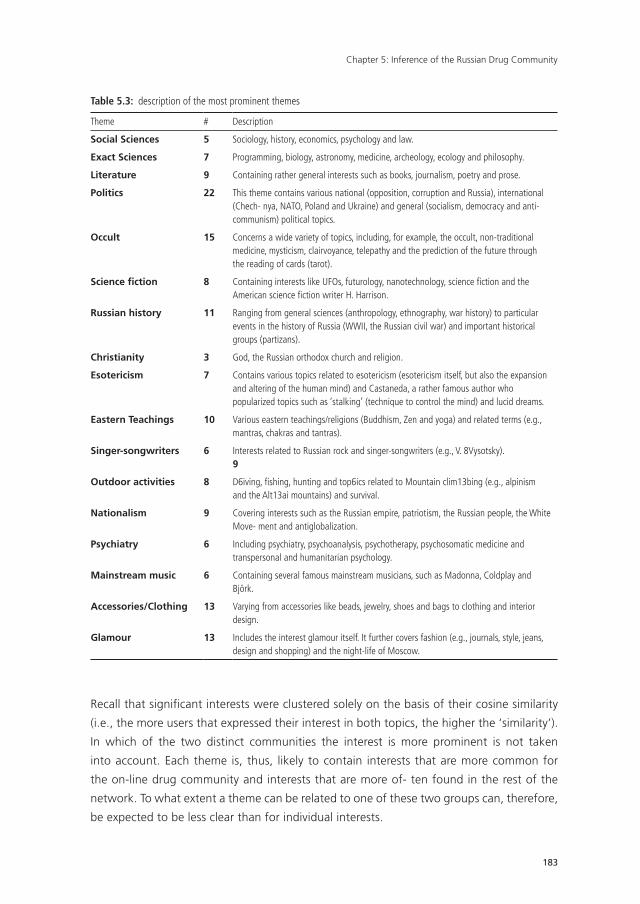
Chapter 5: Inference of the Russian Drug Community
183
Table 5.3: description of the most prominent themes
Theme # Description
Social Sciences 5 Sociology, history, economics, psychology and law.
Exact Sciences 7 Programming, biology, astronomy, medicine, archeology, ecology and philosophy.
Literature 9 Containing rather general interests such as books, journalism, poetry and prose.
Politics 22 This theme contains various national (opposition, corruption and Russia), international (Chech- nya, NATO, Poland and Ukraine) and general (socialism, democracy and anti-communism) political topics.
Occult 15 Concerns a wide variety of topics, including, for example, the occult, non-traditional medicine, mysticism, clairvoyance, telepathy and the prediction of the future through the reading of cards (tarot).
Science fiction 8 Containing interests like UFOs, futurology, nanotechnology, science fiction and the American science fiction writer H. Harrison.
Russian history 11 Ranging from general sciences (anthropology, ethnography, war history) to particular events in the history of Russia (WWII, the Russian civil war) and important historical groups (partizans).
Christianity 3 God, the Russian orthodox church and religion.
Esotericism 7 Contains various topics related to esotericism (esotericism itself, but also the expansion and altering of the human mind) and Castaneda, a rather famous author who popularized topics such as ‘stalking’ (technique to control the mind) and lucid dreams.
Eastern Teachings 10 Various eastern teachings/religions (Buddhism, Zen and yoga) and related terms (e.g., mantras, chakras and tantras).
Singer-songwriters 6 Interests related to Russian rock and singer-songwriters (e.g., V. 8Vysotsky).9
Outdoor activities 8 D6iving, fishing, hunting and top6ics related to Mountain clim13bing (e.g., alpinism and the Alt13ai mountains) and survival.
Nationalism 9 Covering interests such as the Russian empire, patriotism, the Russian people, the White Move- ment and antiglobalization.
Psychiatry 6 Including psychiatry, psychoanalysis, psychotherapy, psychosomatic medicine and transpersonal and humanitarian psychology.
Mainstream music 6 Containing several famous mainstream musicians, such as Madonna, Coldplay and Björk.
Accessories/Clothing 13 Varying from accessories like beads, jewelry, shoes and bags to clothing and interior design.
Glamour 13 Includes the interest glamour itself. It further covers fashion (e.g., journals, style, jeans, design and shopping) and the night-life of Moscow.
Recall that significant interests were clustered solely on the basis of their cosine similarity
(i.e., the more users that expressed their interest in both topics, the higher the ‘similarity’).
In which of the two distinct communities the interest is more prominent is not taken
into account. Each theme is, thus, likely to contain interests that are more common for
the on-line drug community and interests that are more of- ten found in the rest of the
network. To what extent a theme can be related to one of these two groups can, therefore,
be expected to be less clear than for individual interests.
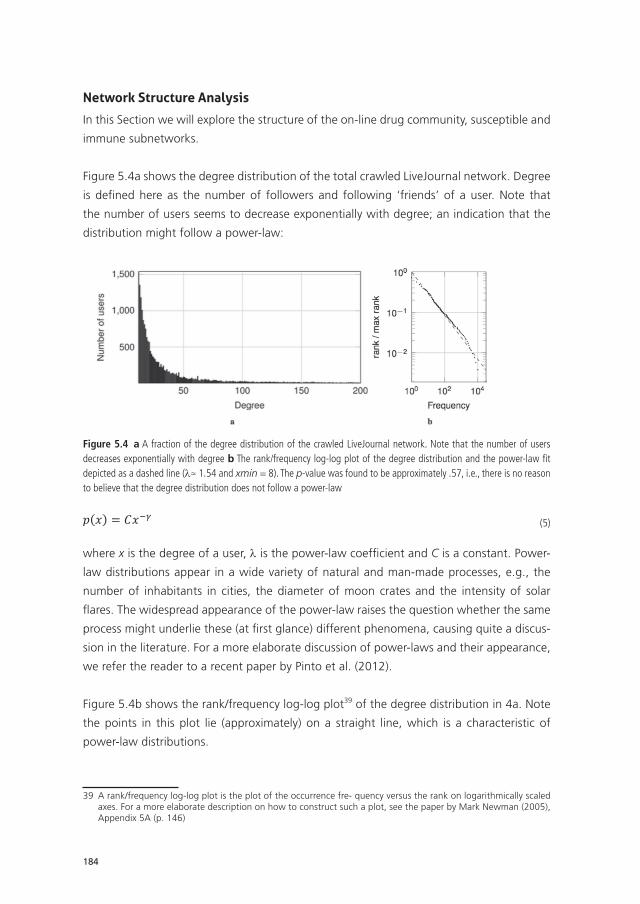
184
network structure analysis
In this Section we will explore the structure of the on-line drug community, susceptible and
immune subnetworks.
Figure 5.4a shows the degree distribution of the total crawled LiveJournal network. Degree
is defi ned here as the number of followers and following ‘friends’ of a user. Note that
the number of users seems to decrease exponentially with degree; an indication that the
distribution might follow a power-law:
Figure 5.4 a A fraction of the degree distribution of the crawled LiveJournal network. Note that the number of users decreases exponentially with degree b The rank/frequency log-log plot of the degree distribution and the power-law fi t depicted as a dashed line (λ≈ 1.54 and xmin = 8). The p-value was found to be approximately .57, i.e., there is no reason to believe that the degree distribution does not follow a power-law
Network Structure Analysis
In this section we will explore the structure of the on-‐line drug community, susceptible and immune subnetworks.
Figure 5.4a shows the degree distribution of the total crawled LiveJournal network.Degree is defined here as the number of followers and following ‘friends’ of a user. Note that the number of users seems to decrease exponentially with degree; an indication that the distribution might follow a power-‐law:
𝑝𝑝 𝑥𝑥 = 𝐶𝐶𝑥𝑥!! (5)
where x is the degree of a user, λ is the power-‐law coefficient and C is a constant. Power-‐law distributions appear in a wide variety of natural and man-‐made processes, e.g., the number of inhabitants in cities, the diameter of moon crates and the intensity of solar flares. The widespread appearance of the power-‐law raises the question whether the same process might underlie these (at first glance) different phenomena, causing quite a discussion in the literature. For a more elaborate discussion of power-‐laws and theirappearance, we refer the reader to a recent paper by Pinto et al. (2012).
Figure 5.4b shows the rank/frequency log-‐log plot4 of the degree distribution in 4a. Note the points in this plot lie (approximately) on a straight line, which is a characteristic of power-‐law distributions.
Very few real-‐word networks display a power-‐law distribution over the entire degreerange, making it necessary to determine where the degree distribution is most likely to start following a power-‐law (denoted here with xmin). The power-‐law exponent λ andxmin were determined using the maximum likelihood method as described in the paper by Clauset et al. (2009) and were found to be equal to 1.54 and 8, respectively. The fit isshown in Figure 5.4b as a dashed line. Note that the line seems to fit the data quite well. The standard statistical test for the quality of fit as proposed by A. Clauset, C. Shalizi and M. Newman (2009) shows that the data gives no raise to believe that the degree distribution does not follow a power-‐law (i.e., p = .57 with 1000 repetitions).
Figure 5.5 shows the rank/frequency log-‐log plots of the degree distributions of the on-‐line drug community, susceptible and immune network together with their power-‐law fits. Note that these sub-‐networks also follow a power-‐law distribution, only withslightly different λ’s.
Table 5.4 shows various characteristics of the LiveJournal network and its three subnetworks. Standard deviations are reported between parentheses. Note that the mean age does not differ much. The large differences between the maximum degrees of these networks are common for heavy right-‐ tailed distributions. The best fits for λ, xmin and the p-‐value of the goodness of fit test are reported as well.
4 A rank/frequency log-‐log plot is the plot of the occurrence frequency versus the rank on logarithmicallyscaled axes. For a more elaborate description on how to construct such a plot, see the paper by MarkNewman (2005), Appendix B (p. 180)
(5)
where x is the degree of a user, λ is the power-law coeffi cient and C is a constant. Power-
law distributions appear in a wide variety of natural and man-made processes, e.g., the
number of inhabitants in cities, the diameter of moon crates and the intensity of solar
fl ares. The widespread appearance of the power-law raises the question whether the same
process might underlie these (at fi rst glance) different phenomena, causing quite a discus-
sion in the literature. For a more elaborate discussion of power-laws and their appearance,
we refer the reader to a recent paper by Pinto et al. (2012).
Figure 5.4b shows the rank/frequency log-log plot39 of the degree distribution in 4a. Note
the points in this plot lie (approximately) on a straight line, which is a characteristic of
power-law distributions.
39 A rank/frequency log-log plot is the plot of the occurrence fre- quency versus the rank on logarithmically scaled axes. For a more elaborate description on how to construct such a plot, see the paper by Mark Newman (2005), Appendix 5A (p. 146)
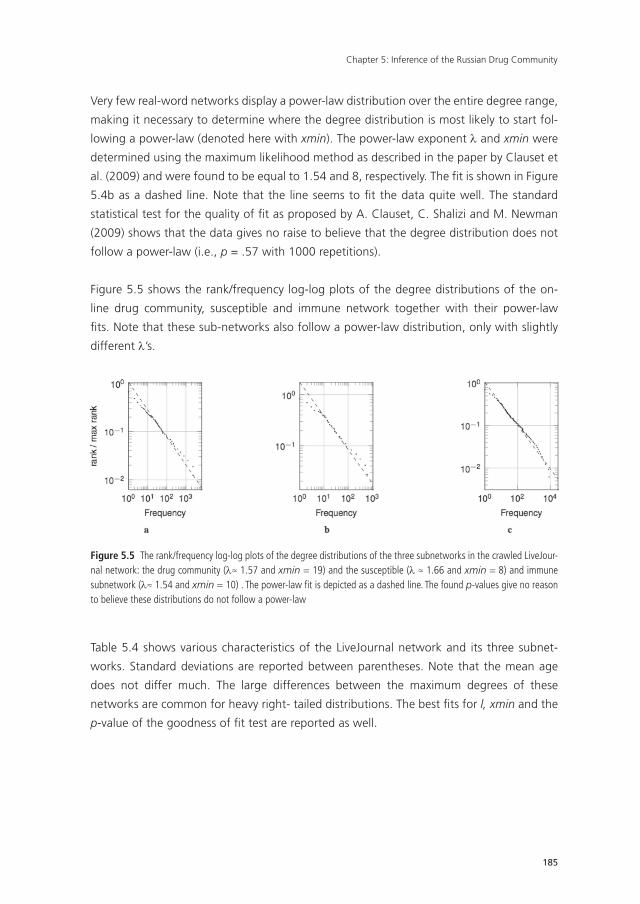
Chapter 5: Inference of the Russian Drug Community
185
Very few real-word networks display a power-law distribution over the entire degree range,
making it necessary to determine where the degree distribution is most likely to start fol-
lowing a power-law (denoted here with xmin). The power-law exponent λ and xmin were
determined using the maximum likelihood method as described in the paper by Clauset et
al. (2009) and were found to be equal to 1.54 and 8, respectively. The fi t is shown in Figure
5.4b as a dashed line. Note that the line seems to fi t the data quite well. The standard
statistical test for the quality of fi t as proposed by A. Clauset, C. Shalizi and M. Newman
(2009) shows that the data gives no raise to believe that the degree distribution does not
follow a power-law (i.e., p = .57 with 1000 repetitions).
Figure 5.5 shows the rank/frequency log-log plots of the degree distributions of the on-
line drug community, susceptible and immune network together with their power-law
fi ts. Note that these sub-networks also follow a power-law distribution, only with slightly
different λ’s.
Figure 5.5 The rank/frequency log-log plots of the degree distributions of the three subnetworks in the crawled LiveJour-nal network: the drug community (λ≈ 1.57 and xmin = 19) and the susceptible (λ ≈ 1.66 and xmin = 8) and immune subnetwork (λ≈ 1.54 and xmin = 10) . The power-law fi t is depicted as a dashed line. The found p-values give no reason to believe these distributions do not follow a power-law
Table 5.4 shows various characteristics of the LiveJournal network and its three subnet-
works. Standard deviations are reported between parentheses. Note that the mean age
does not differ much. The large differences between the maximum degrees of these
networks are common for heavy right- tailed distributions. The best fi ts for l, xmin and the
p-value of the goodness of fi t test are reported as well.
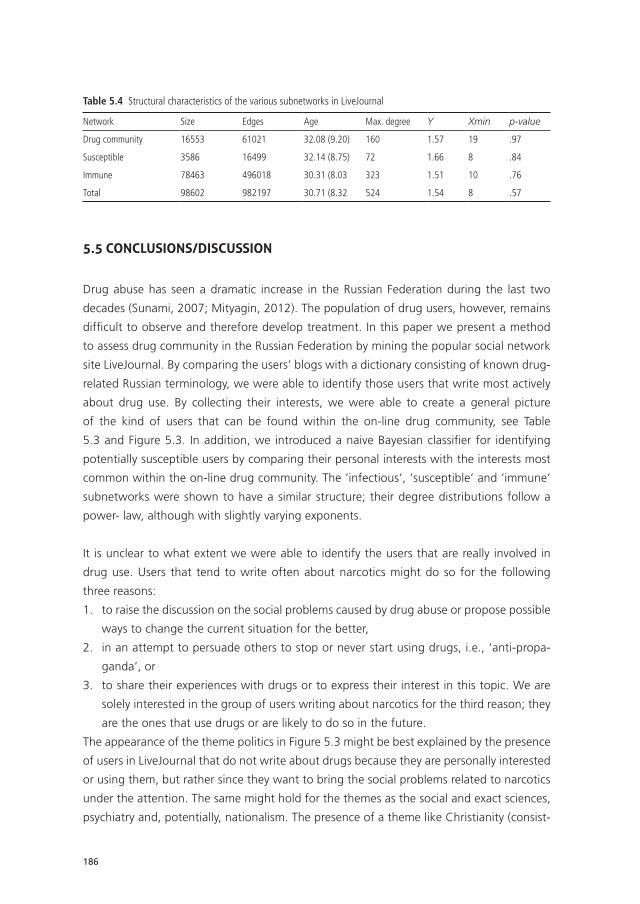
186
Table 5.4 Structural characteristics of the various subnetworks in LiveJournal
Network Size Edges Age Max. degree Y Xmin p-value
Drug community 16553 61021 32.08 (9.20) 160 1.57 19 .97
Susceptible 3586 16499 32.14 (8.75) 72 1.66 8 .84
Immune 78463 496018 30.31 (8.03 323 1.51 10 .76
Total 98602 982197 30.71 (8.32 524 1.54 8 .57
5.5 conclusions/discussion
Drug abuse has seen a dramatic increase in the Russian Federation during the last two
decades (Sunami, 2007; Mityagin, 2012). The population of drug users, however, remains
difficult to observe and therefore develop treatment. In this paper we present a method
to assess drug community in the Russian Federation by mining the popular social network
site LiveJournal. By comparing the users’ blogs with a dictionary consisting of known drug-
related Russian terminology, we were able to identify those users that write most actively
about drug use. By collecting their interests, we were able to create a general picture
of the kind of users that can be found within the on-line drug community, see Table
5.3 and Figure 5.3. In addition, we introduced a naive Bayesian classifier for identifying
potentially susceptible users by comparing their personal interests with the interests most
common within the on-line drug community. The ‘infectious’, ‘susceptible’ and ‘immune’
subnetworks were shown to have a similar structure; their degree distributions follow a
power- law, although with slightly varying exponents.
It is unclear to what extent we were able to identify the users that are really involved in
drug use. Users that tend to write often about narcotics might do so for the following
three reasons:
1. to raise the discussion on the social problems caused by drug abuse or propose possible
ways to change the current situation for the better,
2. in an attempt to persuade others to stop or never start using drugs, i.e., ‘anti-propa-
ganda’, or
3. to share their experiences with drugs or to express their interest in this topic. We are
solely interested in the group of users writing about narcotics for the third reason; they
are the ones that use drugs or are likely to do so in the future.
The appearance of the theme politics in Figure 5.3 might be best explained by the presence
of users in LiveJournal that do not write about drugs because they are personally interested
or using them, but rather since they want to bring the social problems related to narcotics
under the attention. The same might hold for the themes as the social and exact sciences,
psychiatry and, potentially, nationalism. The presence of a theme like Christianity (consist-
Chapter 5: Inference of the Russian Drug Community
187
ing of the interests ‘God’, ‘the Russian orthodox church’ and ‘religion’) is more likely to be
explained by the presence of users that spread anti-propaganda, especially when taking
the negative stance of the church towards drugs into account.
Themes such as the occult, esotericism, science fiction and eastern teachings, however, are
hardly explained by stating that the users interested in these topics are heavily concerned
with the social impact of drug abuse, or actively spreading anti-propaganda. With some
probability we caught a glimpse of the actual drug community.
The explanations of why certain themes are presented in the online drug community are,
of course, based solely on e view of the authors and, therefore, subjective. Further research
is required to establish what themes are truly related to the Russian drug community. In
order to establish the validity of the approach described in this paper, one might compare
the presented results with law enforcement data, e.g., it would be interesting to compare
the number of convictions for drug-related crimes between the on-line drug community
and the rest of the crawled LiveJournal population.
The susceptibility of an individual to drugs was determined on the basis of the similarity
between his/her personal interests and the interests common in the on-line drug com-
munity. We limited ourselves here to their interests, since it was unclear how to relate the
susceptibility of a user and his/her texts.
The number of susceptible users is relatively small due to the small number of common
interests present in the Live- Journal network. In fact, it can be shown that the frequency
with which a certain interest occurs follows a power-law with exponent λ≈ 1.54, see Ap-
pendix 5A. With a low number of common interests, there is often not enough to go on to
identify a user as being susceptible. It is, thus, very well possible that we overlooked several
immune users who should have been noted as being susceptible.
Users were considered to be a member of the on-line drug community when the weighted
sum of their blog entries crossed the threshold of 8, see Figure 1. We experimented with
different thresholds and found that, although the list of significant interests does vary,
the resulting clusters/themes remain stable. The weights assigned to the official and
informal/‘slang’ terminology in the drug-dictionary were not varied. Since the final themes
did not vary much while varying the threshold, it is unlikely that they would now.
As mentioned before, we found that the LiveJournal network and the infectious, suscep-
tible and immune sub-networks are most likely scale-free (i.e., their degree distributions
follow a power-law). Although the performed goodness of fit test (Clauset et al., 2009)
188
does not exclude other possibilities, e.g., Poisson, we can state with certainty that the
distributions are heavy right-tailed, which entails that the network has hubs, i.e., users
with a far higher degree than the rest of the network. This knowledge might be of major
importance when one wants to disrupt the network to, for example, limit the spread of
drug-related information on the network. Removing the hubs would heavily disrupt the
information flow (Bollobas and Riordan, 2004; Albert et al., 2000; Crucitti et al., 2003).
This paper has shown the promise of ‘crawling social networks’ in delineating and analyz-
ing social groups that hitherto have eluded such research, because of the fundamentally
opaque nature of membership of such groups. The case in point is the Russian drugs
community. We hope that continuing research along the lines we set out in this paper will
help to map the dynamics of this group, and will ultimately contribute to halting, if not
reverting its tragic trend to grow.
In this chapter we presented a data-driven approach for inference of hidden
networks within vast amounts of online network data. Such a methodology
contributes to creating realistic criminal network representations out of a com-
bination of data-sources, which is essential for a reliable and valid output of the
computer network simulations presented in chapter 4. The vast growing amounts
of network data do not only require the development of advanced methods for
networks inference, also the methods and approaches by which they are analyzed
need further improvement. An important element to include in computational
models could be tie-strenght, which is suggested to be unevenly distributed across
criminal networks. Therefore we need empirical research about how to measure
tie-strenght in criminal networks and what this teaches us about the emerging
structures of organized crime.
Chapter 5: Inference of the Russian Drug Community
189
references
Agar, M. (2005). Agents in living color: towards emic agent-based models. Journal of Artificial Societ-
ies and Social Simulation 8(4). http://jasss.soc.surrey.ac.uk/8/1/4.html . Accessed 19 November
2012.
Agresti A (1992) A survey of exact inference for contingency ta- bles. Statistical Science 7(1):131–177.
Albert R, Jeong H, Barabasi, AL (2000) Error and attack tolerance of complex networks. Nature
406:378–382.
Beenstock M, Rahav G (2004) Immunity and susceptibility in illicit drug initiation in Israel. Journal of
Quantitative Criminology 20(2):117–142.
Benjamini Y, Hochberg Y (1995) Controlling the false discovery rate: a practical and powerful ap-
proach to multiple testing. Journal of the Royal Statistical Society, Series B (Methodological)
57(1):289– 300.
Benjamini Y, Yekutieli D (2001) The control of the false discov- ery rate in multiple testing under
dependency. Annals of Statistics 29(4):1165–1188.
Bollobas B, Riordan O (2004) Robustness and vulnerability of scale-free random graphs. Internet
Mathematics, 1(1): 1–35.
Cafarella M, Cutting D. (2004)BuildingNutch:opensourcesearch. ACM Queue 2(2):54–61. doi:
10.1145/988392.988408.
Choo KR, Smith RG (2008) Criminal exploitation of online systems by organized crime groups. Asian
Journal of Criminology 3(1):37–59.
Clauset A, Shalizi C, Newman M (2009) Power-law dis- tributions in empirical data. SIAM review
51:661–703. doi: 10.1137/070710111.
Coleman C, Moynihan J (1996) Understanding crime data: haunted by the dark Figure. Open Univer-
sity Press. ISBN 0-335- 19519-9.
Crucitti P, Latora V, Marchiori M, Rapisarda A (2003) Efficiency of scale-free networks: error and attack
tolerance. Physica A: Statis- tical Mechanics and it Applications 320:622–642.
Daley D, Kendall D (1964) Epidemics and rumours. Nature 204:1118. doi: 10.1038/2041118a0.
De écary-He étu D, Morselli C (2011) Gang presence in social net- work sites. International journal of
cyber criminology 5(2):876–890 16.
Efron B (2010) Large-scale inference: empirical Bayes methods for estimation, testing and prediction.
Cambridge University Press.
EUROPOL (2011) Internet facilitated organized crime. iOCTA (abridged). The Hague: European Police
Office.
Everitt B, Landau S, Leese M (2001) Cluster Analysis. Arnold, London.
Ferri F, Grifoni P, Guzzo T (2012) New forms of social and professional digital relationships: the case of
Facebook. Social network analysis and mining 2(2):121–137.
Fisher R (1922) On the interpretation 2 from contingency tables, and the calculation of p. Journal of
the Royal Statistical Society 85(1):87–94.
Gallos LK, Barttfield P, Havlin S, Sigman M, Makse HA (2012) Collective behavior in the spatial spread-
ing of obesity. Scientific Reports 2(45):1–9.
190
Haynie D (2002) Friendship networks and delinquency: The relative nature of peer delinquency. Journal
of Quantitative Criminology 18(2):99–134.
Hastie T, Tibshirani R, Friedman J (2009) The elements of statistical learning. Springer, New York.
Iribarren JB, Moro E (2009) Impact of human activity patterns on the dynamics of information diffu-
sion. Physical Review Letters 103(3):8–11.
Kantardzic M (2011) Data mining: concepts, models, methods, and algorithms. IEEE Press, Wiley-
Interscience.
Lämmel R (2007) Google’s MapReduce programming model — Revisted. Science of Computer Pro-
gramming 70:1–30.
Mityagin SA (2012) Modeling the spread of drug-addiction through the population on the basis of
complex networks (in Russian - Modelirovanie processov narkotizatsiya nasileniya na osnove
kom- pleksnix cetei). Dissertation, National Research University of Infor- mation Technologies,
Mechanics and Optics (NRU ITMO).
Newman M (2005) Power laws, Pareto distributions and Zipf’s law. Contemporary Physics 46:323–351.
Ochiai A (1957) A zoogeographic studies on the solenoid fishes found in Japan and its neighbouring
regions. Bulletin of the Japanese Society of Fish Sciences 22:526–530.
Onnela J, Saramäki J, Hyvönen J, Szabo é G, Lazer D, Kaski K, Kerte ész J, Baraba ési AL (2007)
Structure and tie strengths in mobile communication networks. Proceedings of the National
Academy of Sciences of the United States of America 104(8):7332–7336.
Pinto C, Mendes Lopez A, Machado J (2012) A review of power laws in real life phenomena. Com-
munications in Nonlinear Science and Numerical Simulation 17(9):3558–3578.
Porter MF (1980) An algorithm for suffix stripping. Program 14(3):130–137.
Porter MF (2006) Stemming algorithms for various European languages. http://www.snowball.tarta-
rus.org/texts/stemmersoverview.html . Accessed 19 November 2012.
Rhodes W, Kling R, Johnson P (2006) Using booking data to model drug user arrest rates: a pre-
liminary to estimating the prevalence of chronic drug use. Journal of Quantitative Criminology
23(1):1–22.
Scott J (2011) Social network analysis: developments, advances, and prospects. Social network analysis
and mining 1(1):21–26.
Suler J (2004) The online disinhibition effect. Journal of Cyberpsychology and Behaviour 7(3):321–326
Sunami AN (2007) Drugconflict management in the context of information warfare (in Russian -
Politika upravleniya narkokonflik- tom v kontekste informatsionnoi voiny). Saint Petersburg
State Uni- versity.
Sutherland EH (1947) Principles of criminology. Philidelphia: JB Lippincott.
Walsh C (2011) Drugs, the internet and change. Journal of Psychoactive Drugs 43(1):55–63.
Williams P (2001) Organized crime and cybercrime: synergies, trends and responses. Arresting Trans-
national Crime 6(2).
Wilson RE, Gosling SD, Graham LT (2012) A review of Face- book research in the social sciences.
Perspectives on Psychological Science 7(3):203–220
White T (2009) Hadoop:the definitive guide. O’ReillyMedia, Yahoo! Press.
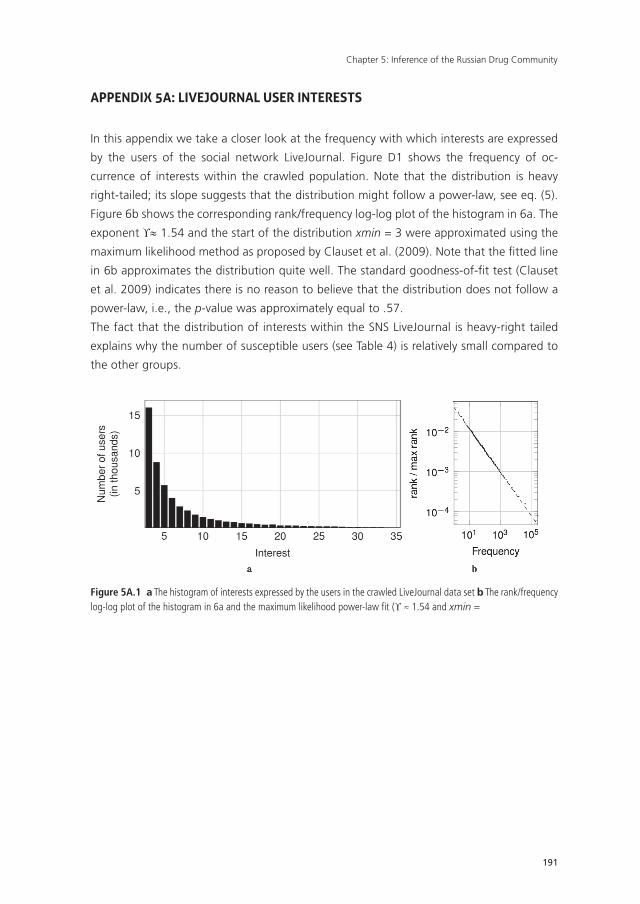
Chapter 5: Inference of the Russian Drug Community
191
aPPendix 5a: liveJournal user interests
In this appendix we take a closer look at the frequency with which interests are expressed
by the users of the social network LiveJournal. Figure D1 shows the frequency of oc-
currence of interests within the crawled population. Note that the distribution is heavy
right-tailed; its slope suggests that the distribution might follow a power-law, see eq. (5).
Figure 6b shows the corresponding rank/frequency log-log plot of the histogram in 6a. The
exponent ϒ≈ 1.54 and the start of the distribution xmin = 3 were approximated using the
maximum likelihood method as proposed by Clauset et al. (2009). Note that the fi tted line
in 6b approximates the distribution quite well. The standard goodness-of-fi t test (Clauset
et al. 2009) indicates there is no reason to believe that the distribution does not follow a
power-law, i.e., the p-value was approximately equal to .57.
The fact that the distribution of interests within the SNS LiveJournal is heavy-right tailed
explains why the number of susceptible users (see Table 4) is relatively small compared to
the other groups.
Figure 5A.1 a The histogram of interests expressed by the users in the crawled LiveJournal data set b The rank/frequency log-log plot of the histogram in 6a and the maximum likelihood power-law fi t (ϒ ≈ 1.54 and xmin =

UvA-DARE is a service provided by the library of the University of Amsterdam (http://dare.uva.nl)
UvA-DARE (Digital Academic Repository)
Detecting and disrupting criminal networks
Duijn, P.A.C.
Link to publication
Citation for published version (APA):Duijn, P. A. C. (2016). Detecting and disrupting criminal networks: A data driven approach
General rightsIt is not permitted to download or to forward/distribute the text or part of it without the consent of the author(s) and/or copyright holder(s),other than for strictly personal, individual use, unless the work is under an open content license (like Creative Commons).
Disclaimer/Complaints regulationsIf you believe that digital publication of certain material infringes any of your rights or (privacy) interests, please let the Library know, statingyour reasons. In case of a legitimate complaint, the Library will make the material inaccessible and/or remove it from the website. Please Askthe Library: http://uba.uva.nl/en/contact, or a letter to: Library of the University of Amsterdam, Secretariat, Singel 425, 1012 WP Amsterdam,The Netherlands. You will be contacted as soon as possible.
Download date: 26 Jan 2017
Chapter 6: Fluid connections within an old boys’ network? An empirical study of tie-strength in organized crime (Embargo until 22 December 2017)

Chapter 7Synthesis: From data to disruption49
49 A previous version of this chapter was published as Duijn, P. A. C., & Sloot, P. M. A. (2015). From data to disrup-tion. Digital Investigation, 15, 39-45.
Chapter 7: Synthesis: From data to disruption
241
Organized crime groups impose a continuous threat to global society, by causing harm to
our economic, social, technological, political and environmental infrastructures (Europol,
2013, 2015). Their existence depends on optimizing efficiency and profit from their illegal
activities, while remaining undetected by the government at the same time (Raab and Mil-
ward, 2003, Erickson, 1981, Morselli et al., 2006). Law enforcement agencies on the other
hand are struggling with important questions: How can we detect these criminal groups
and their activities? What are the best strategies to disrupt them effectively? And how do
they develop resilience against interventions? Within the law enforcement organization
a key element to answering these questions has remained largely unexploited: big data
and big data analytics. Since data are becoming more and more available from a plethora
of new sources, they will provide opportunities for data-driven analysis towards under-
standing organized crime in terms of criminal network structures, dynamics, and resilience
against law enforcement interventions (see chapter 2 (p. 27) and chapter 3 (p.62)). This
chapter discusses the opportunities and the limitations of this data- driven approach and
its implications for both law enforcement practice and scientific research.
7.1 understanding organized crime
Theories about organized crime have changed over time. Early perceptions of organized
crime focused on hierarchical pyramid structures with kingpin leaders con- trolling their
criminal enterprise from the top. Criminal organizations were perceived and analyzed
as separate entities on a micro-level, leading to an oversimplified perspective of criminal
reality (Chapter 3, p. 62). In the early nineties organized crime received serious scientific
attention for the first time, which led to empirical studies of organized crime. A selection of
court files and case studies from multiple criminal investigations were analyzed manually.
These studies uncovered mechanisms of trust, expertise, reputation and social opportunity
structures, which shape the way organized crime groups and individual actors become
connected and adapted to fast changing illegal markets (Fijnaut et al., 1991; Kleemans and
Van de Bunt, 1999, Klerks, 2001). It was also revealed that organized crime is an integral
part of the global net- worked society and it was emphasized to study organized crime
from a network perspective (Klerks, 2001; Kleemans and De Poot, 2008).
Due to practical limitations of manual analysis techniques, a macro-level understanding of
the structure of organized crime currently consists of theoretical assumptions instead of
empirical observations. On the other hand, datasets about terrorist- and criminal actors
and their mutual connections are growing, due to more deliberate strategies for collecting,
242
storing and sharing information within day-to-day law enforcement practice since 2001.50
Moreover, the influx of embedded academics within law enforcement has these datasets
more easily accessible for scientific purposes (Chapter 2). At the same time scientific
disciplines such as social science and complexity science have started to exchange ideas
and methodologies, leading to advanced network analysis methods being introduced into
social science. This opens the door towards a data-driven approach to create an empirical
understanding of organized crime.
7.2 comPlex adaPtive systems
From a macro-perspective criminal network structures can best be understood as complex
adaptive systems. The concept of complex adaptive systems (CAS) derived from systems
theory and was first introduced by Holland (1999). A complex adaptive system is a self-
organizing network, which constantly adapts its structure and behavior ac- cording to
change in the behavior of its individual components (agents). These agents constantly act
and react to each others behaviors and the environment, meaning nothing is fixed. This
makes the behavior and structure of CAS highly unpredictable, but effective in adapting to
changed environments (Chan, 2001).
While CAS is an established theoretical concept for understanding complex networks in
biology and economy, CAS theory also applies to criminal networks that constantly adapt
to changing law enforcement strategies and government regulations (Kenney, 2007).
Criminal network structures continuously balance between efficiency in the collaboration
of its parts and security in staying undetected by law enforcement organizations. Shifts in
law enforcement strategies may destabilize this balance and trigger shifts in the way the
independent criminals in the network interact and adapt. How this affects the structure of
the overall criminal network depends on how the independent actors interact with each
other to adapt to these external factors from the bottom up. There are no explicit rules
about how a criminal network is formed or changed. Criminal networks are emergent
self- organizing systems, which changes structure at any point in time due to how its parts
react to external pressures.
Criminal networks have for instance quickly adapted to the opportunities created by
the Darknet that provides anonymity and access to worldwide online marketplaces for
50 The terrorist attacks in New York, London, and Madrid promtedprompted the introductionfast implementation of intelligence-led policing within many national police departments. ItThis involves a process for which every deci-sion within law enforcement should be preceded by a structural analysis of the situation based on deliberately collected information in the frontline of police practice (see Ratcliffe, 2016).
Chapter 7: Synthesis: From data to disruption
243
selling illegal commodities in large quantities. Law enforcement agencies responded by
successfully taking down some of the most active online marketplaces (Soska and Christin,
2015). The criminal cyber networks active on these online marketplaces adapted to these
interventions by increasing the number of online marketplaces and servers, out- weighing
the limited capacity of law enforcement to target them all effectively. The interactions of
the individual actors changed the shape of the Darknet towards a more dispersed network
structure. Such a continuous evolution driven by non-linear feedback mechanisms is an
important feature of complex adaptive systems. The practical reality is that law enforce-
ment will always be one or more steps behind (Soska and Christin, 2015).
To narrow this gap, researchers should focus more on capturing criminal network dynamics
instead of focusing on static network representations. Understanding these dynamics can
have implications for uncovering mechanisms of competitive adaptation, criminal network
resilience and the effectiveness of law enforcement interventions (Chapter 1 and 2). Social
network analysis and computational modeling can help to uncover these dynamics, but
before we can understand the output of these methodologies we need to obtain a better
understanding of the sources: the data.
7.3 data sources
law enforcement data
Criminal networks actively try to avoid detection from law enforcement. As compared
with legitimate social systems, they are particularly hard to detect leading to inevitable
missing data in the final network representation. The completeness of a criminal network
representation is therefore highly dependent on the strengths and weaknesses of the data
sources from which it is obtained. Many criminal network studies necessarily rely directly or
indirectly on law enforcement data, which is not primarily collected for scientific purposes
(Morselli, 2009). Two important factors should therefore be taken into account to retrieve
a reliable and valid network representation from these data.
First, the accuracy of the data source is a critical consideration (Morselli, 2009). Every piece
of law enforcement data is collected in the context of a specific policing task, for instance
collecting evidence, preparing investigations or monitoring a situation which shapes the
information collection process and the bias embedded within. To overcome these biases,
researchers need to understand the background of the data collection and take into ac-
count the policing priorities while drawing conclusions (See Chapter 3).
244
Before criminal networks are monitored and targeted (investigative phase), law enforce-
ment tries to detect their structures and activities (intelligence phase). Figure 3.1 (p. 72)
demonstrates how the different phases of the intelligence and investigative processes in
law enforcement relates to the accuracy of the final network representation. It is obvious
that a more accurate and confirmed network representation can be retrieved from actors
that are found guilty based on evidence, rather than about actors that are monitored but
not targeted in the intelligence collection phase preceding a criminal investigation. Many
researchers therefore exclude intelligence data from their data collection process. So why
even consider using intelligence data in the first place?
The answer to this questions lies in the second factor: the scope. The scope of the network
representation can be limited by investigative priorities (Morselli, 2009). If the aim of an
investigation is to target three main suspects, data collection will be focused on their
activities including their first line contacts. Second line contacts, potentially important for
connecting the micro-level network with the embedding meso- and macro criminal net-
work structures are often not included. Moreover, evidence will be structured in the final
court file in a way that fits into the legal framework of a criminal organization, strongly
suggesting a certain (artificial) network structure.
Intelligence data on the other hand is collected with the aim of improving the overall intel-
ligence picture and pre- paring criminal investigations, without setting preliminary target-
ing specific suspects. In many jurisdictions across the globe, data from different sources can
be more easily combined in the intelligence phase as compared to the investigative phase.
In Dutch law for instance, investigative data can be combined with street cop data and
data from criminal informants (human intelligence) to complete the intelligence picture. In
certain cases criminal informants can even be directed or asked specifically in order to fill
in intelligence gaps about the missing dots in criminal network representations (Chapter
2 and 3).
In the trade-off between accuracy and scope the best solution is to merge as many data
sources as possible into one relational database in which data are merged based on unique
identifiers (e.g. Names, ID-numbers). For instance, arrest records could be combined with
unconfirmed human intelligence data, to check the accuracy and reliability of relationships
found in each database (Chapter 2 and 3). However, there will always be missing data. A
further step towards creating accurate network representations would be to add weight
to relationships based on the reliability of the underlying sources or the duration and
frequency by which a connection is observed in the data (Schwartz and Rouselle, 2009,
Perer and Schneiderman, 2009).
Chapter 7: Synthesis: From data to disruption
245
open source data
Important pieces of data about criminal cooperation can also be found outside of the
law enforcement context. Social media provides unique observations of the social context
embedding criminal networks outside the law enforcement context. However, a lot of
information posted in social media remains unconfirmed or simply doesn’t resemble real-
life social relations. By using it in addition to law enforcement data, it can fill in holes
within the final network representation. In some cases, social media data can also be
mined for text indicating the presence of a criminal network structure. In chapter 5 (p.
125) we identified a drug-users network within a large social media forum located in the
Russian Federation by using web crawler techniques and text mining developed around
specific drug-use vocabulary. Similar techniques could be utilized for mining communica-
tions within online marketplaces on the Darknet, which inhibits a unique observation of
dark network structures outside the scope of law enforcement (Décary-Hétu et al., 2014).
7.4 analyzing criminal networks
If the final network representation is constructed out of different data sources combined, it
can easily contain thousands of entities and connections (see Figure 7.1). Manually analyz-
ing these data would require a long-term commitment. Three methods can be utilized
together to analyze such data in a way that combines automated analysis together with a
manual assessment.
social network analysis
Social network analysis (SNA) consists of a combination of network theory and mathemati-
cal techniques to uncover patterns hidden in social networks consisting of actors and their
mutual connections. Raw network data is processed in matrixes in a binary format that
subsequently can be visualized in a sociogram, e.g. chapter 2, (p.27) (Sparrow, 1991, Van
der Hulst, 2009). To analyze the data, different algorithms can be calculated uncover-
ing network features on a micro- level (e.g. centrality, key players, and brokerage roles),
meso-level (e.g. cliques, k-cores) and the macro-level (e.g. density, geodesic distance). By
combining these different levels of analysis with visualizations and adding qualitative at-
tribute data to the entities, hidden patterns within criminal networks can be uncovered.
It could for instance reveal central positions of females, such as within the Blackbird
network. SNA contributed to the understanding that these women were important for
consolidating the criminal activities (cannabis cultivation, synthetic drugs production) after
the two central actors werewhere arrested (See chapter 1 and 2). These females came
into the network via romances with core members and became part of the core members
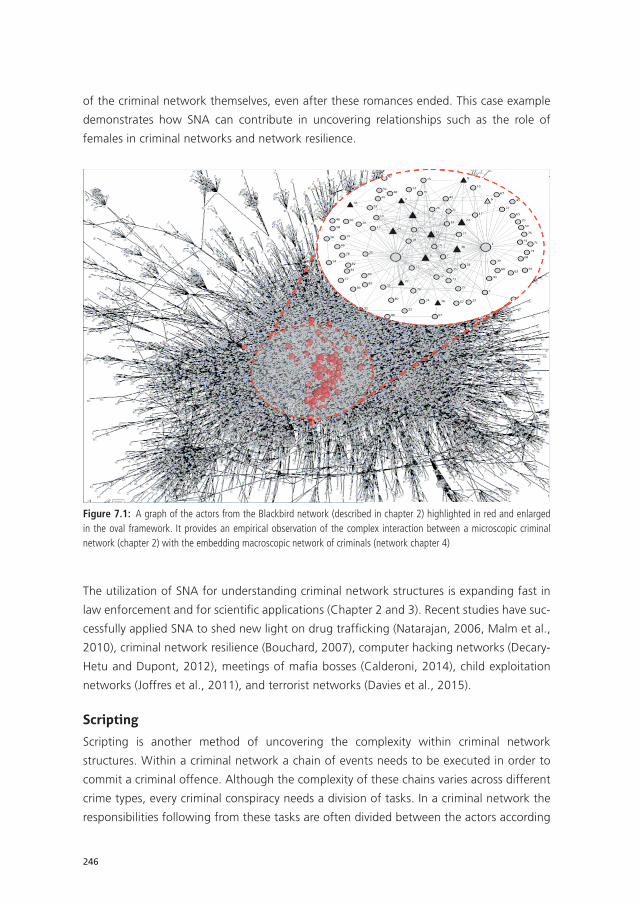
246
of the criminal network themselves, even after these romances ended. This case example
demonstrates how SNA can contribute in uncovering relationships such as the role of
females in criminal networks and network resilience.
Figure 7.1: A graph of the actors from the Blackbird network (described in chapter 2) highlighted in red and enlarged in the oval framework. It provides an empirical observation of the complex interaction between a microscopic criminal network (chapter 2) with the embedding macroscopic network of criminals (network chapter 4)
The utilization of SNA for understanding criminal network structures is expanding fast in
law enforcement and for scientifi c applications (Chapter 2 and 3). Recent studies have suc-
cessfully applied SNA to shed new light on drug traffi cking (Natarajan, 2006, Malm et al.,
2010), criminal network resilience (Bouchard, 2007), computer hacking networks (Decary-
Hetu and Dupont, 2012), meetings of mafi a bosses (Calderoni, 2014), child exploitation
networks (Joffres et al., 2011), and terrorist networks (Davies et al., 2015).
scripting
Scripting is another method of uncovering the complexity within criminal network
structures. Within a criminal network a chain of events needs to be executed in order to
commit a criminal offence. Although the complexity of these chains varies across different
crime types, every criminal conspiracy needs a division of tasks. In a criminal network the
responsibilities following from these tasks are often divided between the actors according
Chapter 7: Synthesis: From data to disruption
247
to experience, skills or knowledge. By mapping the roles of these actors within the network
structure different crime- scripts of the criminal activities can be identified (Cornish, 1994,
Bruinsma and Bernasco, 2004). A combination between SNA and scripting is useful for
under- standing the deeper operational structures within criminal networks and the inter-
dependences between actors within their illegal activities. More operational applications of
scripting help to identify actors who are more difficult to replace because of the skills and
expertise they bring into the crime script, in combination with their network position (See
chapter 2 and 3). Scripting is mainly used as an attribute to perform more in-depth manual
analysis on a micro-level. However, practitioners have developed metrics that combine the
crime script data and network data for more automated network analysis on a meso- and
macro level as well (see Chapter 4, p. 88).
7.5 simulating criminal network disruPtion
Although SNA and scripting can be used to unravel mechanisms within criminal networks
that contribute to resilience, adaptation and operational activity, they are mainly based
on static observations of dynamic phenomena. Some scholars have used SNA to capture
the dynamics of criminal networks by monitoring change within different snapshots in
time, for instance before and after law enforcement or military interventions (Morselli and
Petit, 2007, Bush and Bichler, 2015). This provides interesting perspectives on network
resilience and the effects of interventions on a micro-level. However, to understand the
effects of interventions on a meso- and macro level more advanced methods are needed.
Computational modeling is a method to simulate complex network behavior with the help
of mathematical models that are used as input for computer simulations. The parameters
of these models are developed from previous research or by collecting knowledge from
field experts. Real-life data are used as input for the computer simulations to experiment
with different scenarios in a virtual environment.
In chapter 4 we used this method to unravel the effects of different law enforcement in-
tervention strategies, while also taking into account network recovery. Data were collected
over a five year’s timeyear period and contained a combination of human intelligence
data, criminal investigations data, street cop data, social media data, and arrest record
data. All actors in this criminal network representation were manually labeled with the
roles they performed within the different crime scripts. The aim of the simulations was to
analyze how a specific part of the criminal network involved in cannabis cultivation could
be disrupted, taken into account that recovery could also involve actors from the embed-
ding network. Mathematical models were created for four different intervention scenarios
(degree-,betweenness-, crimescript degree- and specific role attack) and three different
248
replacement scenarios (shortest distance, most visible and random). By simulating interven-
tions and replacement at the same time, results showed that network disruption made its
internal flow of information even more efficient. However, this also caused its network
structure to ‘light-up’ since efficient communication exposed the key players that tried to
limit their exposure. These simulations contributed to a better understanding of the effects
of law enforcement interventions and how disrupting a criminal network takes a long-term
effort. Bright and Delaney (2013) used a similar technique to simulate the disruption of a
methamphetamine production network. They found that a shift of intervention strategies
at a certain threshold could be effective in disrupting the criminal network more effectively.
Although these methods bring us closer to understanding the complex criminal reality, it is
important to realize this is a form of applied science. Such methods help us create effective
scenarios for law enforcement practice, but do not provide a target list for the upcoming
months. It does point law enforcement agencies in the right direction however. Moreover,
criminal reality can be oversimplified by using these methods. For instance, the removal
of criminals from a criminal network in practice does not necessarily mean that they are
incapable of controlling the criminal activities. Examination of Dutch police intelligence on
13 cases revealed that there are numerous possibilities for criminal leaders to manage their
criminal network structures from prison (Van der Laan, 2012). Such factors cannot be easily
included in computational models.
7.6 discussion
The aim of this paper is to provide a short overview of the current developments in the field
of big data analysis in the study of organized crime. It shows that for studying organized
crime it is important to seek rather than assume structure (Morselli, 2009). The different
examples in this paper demonstrate that criminal networks should be un- derstood as
complex adaptive systems, which are unpredictable in their structures, behaviors, and
criminal activities. By combining data from different law enforcement sources, the differ-
ent limitations inherent to each individual network data-source can partially be dissolved.
Although there will always be missing data. An under- standing of the law enforcement
environment, the criminal environment, as well as complexity science is therefore needed
to draw meaningful conclusions about criminal network structures, -resilience, and -dy-
manics, without losing sight of the limitations of the data or the methodologies on which
they are based.
Another open issue remains the fundamental question on the controllability of complex
networks. Ashby’s law of requisite variety states that a controller must have at least as
much variety (complexity) as the controlled (Ashby, 1958). Within the bureaucratically or-
ganized law enforcement environment, variety in strategies and different kinds of expertise
Chapter 7: Synthesis: From data to disruption
249
to detect and disrupt criminal networks remains limited (Vis, 2012; Huisman et al. 2011).
Moreover, recent research indicates that novel information metrics need to be developed
to understand the (side-) effects of manipulating nodes in complex networks (Quax et
al., 2013a, 2013b). More research is therefore needed for a deeper understanding in the
effects of different disruption strategies.
We conclude that law enforcement agencies and researchers in this field should focus more
on monitoring and uncovering the mechanisms of criminal network dynamics, instead of
aiming at static observations of criminal reality. This is not an easy endeavor, however
a deeper integration of different scientific disciplines could bring together the proper
knowledge and tools to uncover this dynamic complexity. We conjecture that a symbiosis
between scientific and law enforcement embedded academics could open doors to the
exponentially growing amount of empirical data, which is needed to develop a common
understanding (Chapter 2, 3 and 4). Current developments are hopeful, but not without
limitations. Models need to be validated through empirical research and data collection
on criminal networks over time. Accurate longitudinal criminal network data remains an
exception. Keeping a long-term intelligence picture of a criminal network and its actors
remains an issue for law enforcement agencies. Network studies aiming at identifying
durable information positions (e.g. criminal informants) within criminal network structures
could help law enforcement agencies towards a data- driven approach in the right direc-
tion.
250
references
Ashby WR. (1958) Requisite variety and its implications for the control of com- plex systems. Cyber-
netica (Namur);1(2).
Bouchard M. (2007) On the resilience of illegal drug markets. Glob Crime 2007; 8(4):325e44.
Bright DA, Delaney JJ. (2013) Evolution of a drug trafficking network: mapping changes in network
structure and function across time. Glob Crime 2013;14(2e3):238e60.
Bruinsma G, Bernasco W. Criminal groups and transnational illegal markets. Crime, Law, Soc Change
2004;41:79e94.
Bush S, Bichler G. Measuring disruption in terrorist communications. In: Bichler G, Malm AE, editors.
Disrupting criminal networks, network analysis in crime prevention; March 2015.
Calderoni F. (2014)Identifying mafia bosses from meeting attendance. In: Networks and network
analysis for defence and security. Springer In- ternational Publishing;. p. 27e48.
Chan S., (2001). In: Complex adaptive systems, ESD.83 Research Seminar in En- gineering Systems;
2001.
Cornish DB. (1994) The procedural analysis of offending and its relevance for situational prevention.
In: Clarcke R, editor. Crime prevention studies, vol. 3;,. p. 151e96.
Davies G, Bouchard M, Wu E, Joffres K, Frank R. (2015) Terrorist and extremist organizations’ use of
the Internet for recruitment. 7. Social Networks, Terrorism and Counter-terrorism: Radical and
Connected, vol. 105;.
Decary-Hetu D,Dupont B. (2012) The social network of hackers. Glob Crime;13(3):160e75.
Decary-Hetu D, Dupont B, Fortin F. ,(2014). Policing the hackers by hacking them: studying online de-
viants in IRC chat rooms. In: Networks and network analysis for defence and security. Springer
International Publishing;. p. 63e82.
Dijkstra LJ, Yakushev AV, Duijn PAC, Boukhanovsky AV, Sloot PMA. (2013) Inference of the Russian
drug community from one of the largest social networks in the Russian Federation. Qual
Quant;37:1e17.
Erickson B. (1981) Secret societies and social structure. Soc Forces;60: 188e210.
Europol (2015). Exploring tomorrows organized crime.
Europol. (2013) Serious organized crime threat assessment (SOCTA). May 2013.
Fijnaut C, Bovenkerk F, Bruinsma G, van de Bunt H. Organized Crime in the Netherlands. 1998.
Holland John H. (1999) Emergence: from chaos to order. Reading, Mass: Perseus Books; ISBN 0-7382-
0142-1.
Huisman S, Duijn PAC, Vis T, Ardon H (2011) Voorkom mismatch tussen Intelligenceproces en de
criminele werkelijkheid. Tijdschr Politie 73(8)
Joffres K, Bouchard M, Frank R, Westlake B. (2011) Strategies to disrupt online child pornography
networks. In: Intelligence and Security Informatics Conference (EISIC), European. IEEE; 2011
September. p. 163e70.
Kenney M. (2007) From Pablo to Osama: trafficking and terrorist networks, government bureaucra-
cies, and competitive adaptation. Penn State Press; 2007.
Chapter 7: Synthesis: From data to disruption
251
Kleemans ER, Bunt HG. (1999) The social embeddedness of organized crime. Transnatl Organ Crime;
5:19e36.
Kleemans ER, De Poot CJ. (2008) Criminal careers in organized crime and social opportunity structure.
Eur J Criminol 8;5:69e98.
Klerks PPHM. (2001) The network paradigm applied to criminal networks; theoretical nitpicking or
a relevant doctrine for investigators? Recent developments in the Netherlands. Connections
24(3):53e65.
Malm A, Bichler G, Van de Walle S. (2010) Comparing the ties that bind criminal networks: is blood
thicker than water? Secur J 23(1):52e74.
Morselli C. Inside criminal networks. Springer; 2009.
Morselli C, Petit K. (2007) Law-enforcement disruption of a drug importation network. Glob Crime
8(2):109e30.
Morselli C, Giguere C, Petit K. (2006) The efficiency/security trade-off in criminal networks. Soc
Netw;29(1):143e53.
Natarajan M. (2006) Understanding the structure of a large heroin distribution network: a quantitative
analysis of qualitative data. J Quant Criminol 22(2):171e92.
Perer A, Schneiderman B. (2009) Integrating statistics and visualization for exploratory power: from
long-term case studies to design guidelines. IEEE Comput Graph Appl 39e51. http://dx.doi.
org/10.1109/ MCG.2009.44.
Quax R, Apolloni A, Sloot PMA. (2013) Towards understanding the behavior of physical systems using
information theory. Eur Phys J Special Top ;222(6):1389e401. ISSN 1951-6355 and 1951-6401.
Quax R, Apolloni A, Sloot PMA. (2013) The diminishing role of hubs in dynamical processes on complex
networks. J R Soc Interface ;10(88): 1742e5662. http://dx.doi.org/10.1098/rsif.2013.0568.
Raab J, Milward HB. (2003) Dark networks as organizational problems: elements of a theory. J Publ
Adm Theory 13(4):413e39.
Ratcliffe, J. H. (2016). Intelligence-led policing. Routledge. Second Edition
Schwartz DM, Rouselle TDA. (2009) Using social network analysis to target criminal networks. Trends
Organ Crime 12:188e207.
Soska L, Christin N. (2015) Measuring the longitudinal evolution of the online anonymous marketplace
ecosystem. In: 24th USENIX security Symposium 33; August 2015.
Sparrow M. (1991) The application of network analysis to criminal intelligence: an assessment of the
prospects. Soc Netw 13:251e74.
Van der Hulst RC. (2009) Introduction to Social Network Analysis (SNA) as an investigative tool. Trends
Organ Crime 12(2):101e21.
Van der Laan F. (2012) “Prison doesn’t stop them” Orchestrating criminal acts from behind bars.
Trends Organ Crime 15(2e3):130e45.
Vis T (2012) Intelligence, Politie en Veiligheidsdienst: Verenigbare Grootheden? Ticc Ph.D No 22

UvA-DARE is a service provided by the library of the University of Amsterdam (http://dare.uva.nl)
UvA-DARE (Digital Academic Repository)
Detecting and disrupting criminal networks
Duijn, P.A.C.
Link to publication
Citation for published version (APA):Duijn, P. A. C. (2016). Detecting and disrupting criminal networks: A data driven approach
General rightsIt is not permitted to download or to forward/distribute the text or part of it without the consent of the author(s) and/or copyright holder(s),other than for strictly personal, individual use, unless the work is under an open content license (like Creative Commons).
Disclaimer/Complaints regulationsIf you believe that digital publication of certain material infringes any of your rights or (privacy) interests, please let the Library know, statingyour reasons. In case of a legitimate complaint, the Library will make the material inaccessible and/or remove it from the website. Please Askthe Library: http://uba.uva.nl/en/contact, or a letter to: Library of the University of Amsterdam, Secretariat, Singel 425, 1012 WP Amsterdam,The Netherlands. You will be contacted as soon as possible.
Download date: 26 Jan 2017

Chapter 8Discussion

Chapter 8: Discussion
255
This thesis explores the possibilities and limitations of a data-driven approach to study crimi-
nal networks. The aim of this thesis is to create an empirical understanding of the complexity
of criminal networks in order to detect and disrupt them more effectively. As this is relevant
for the scientific world as well as for law enforcement practice, an additional purpose of
this thesis is to bridge the gap between these two worlds. To investigate possibilities to
bridge this gap chapter 2 and 3 first assess the use of a data-driven approach in under-
standing criminal networks (i.e. social network analysis) for law enforcement and compares
this with existing applications in science. Following up on lessons learned in chapter 2 and
3, chapter 4 introduces the combination of SNA and computer simulations, and aims to
identify elements typical for complex resilience found in criminal networks, i.e. processes of
self-organization, emergence and non-linearity. Chapters 4-6 aimed to refine this approach
and the understanding of complex criminal networks by introducing and exploring other
data-driven methods for inference and analysis Finally, chapter 7 reviews the studies in this
thesis by contextualizing the main findings and identification of, limitations, and results in
recommendations for future approaches in the study of criminal networks (chapter 7).
8.1 main findings
The first study (chapter 2) explored the opportunities and limitations of social network
analysis (SNA) for unraveling criminal networks. SNA was applied to a local criminal micro-
network (N=86) involved in transnational drug trafficking (i.e. cannabis). In line with previ-
ous empirical research (e.g. Kleemans and Van de Bunt, 1999; Klerks, 2001; Bouchard and
Morselli, 2014), our findings show that the criminal network gravitates and evolves around
strong embedded social structures (i.e. affective- and family relationships). Our findings
demonstrate how SNA contributes to understanding the emergence of transnational crimi-
nal networks emerging from of these local social network structures, emphasizing social
ties and affective relationships in regard to resilience against disruption. We also addressed
The problem of fuzzy boundaries in relation to the use of wiretap data and its negative
effect on the validity of quantitative SNA metrics was assessed, in line with Campana and
Varese (2012), Berlusconi (2013) and Campana (2016). It was concluded that quantitative
SNA on micro networks (<100 actors) is useful for identifying relevant hidden elements
(nodes and ties) in the periphery of the network, in addition to the qualitative in-depth
analysis elements to explain the nature and relevance of such elements.
The second study (chapter 3) examines more extensively the methodology of SNA and
its application in law enforcement, specifically in investigations. For this purpose, 34 SNA
case studies were collected and compared from The Netherlands Police in a structural
meta-analysis framework. Our findings resulted in the identification of several specific best
256
practices for the application of SNA. We show that SNA is of additive value to traditional
analysis techniques in investigations concerning organized crime, youth gangs, corruption
rings and cold cases. These empirical findings resulted in the following conclusions on the
usefulness of SNA to detect and disrupt criminal networks:
1. Manual qualitative analysis of the increasing quantity of network data has its limitations
in uncovering the characteristics of criminal networks at systems level, as it mainly relies
on extrapolations of case studies to theorize about the overall structure of organize
crime. SNA provides the opportunity to link patterns of individual properties to ele-
ments of criminal network topology, which is key to understanding its complexity.
2. The added value of SNA applied to micro-level criminal networks is limited. In small
networks (N<30 actors) core membership and key players could be observed by
traditional analysis techniques. In larger networks the outcomes of quantitative SNA
should also be evaluated by the qualitative assessment of the content of relationships
in order to reduce the effects of selection bias due to unilateral data availability. This is
especially the case for wiretap and surveillance data, as was also previously emphasized
by Campana and Varese (2013) and Berlusconi (2013).
3. Collecting and merging various relational data from different stages of the criminal
justice chain should always form the basis for inference of criminal networks out of law
enforcement data. This leads to a broad scope and high reliability of the final criminal
network representation.
4. As previously emphasized by Sparrow (1991), Bruinsma and Bernasco (2008), Morselli
and Petit (2007), and Malm and Bichler (2011) we also found that scripting is of ad-
ditional value in the application of SNA. It adds a logistical dimension to network repre-
sentations, which contributes to identification of role substitutability. This is particularly
relevant for deliberate network disruption strategies. Empirically role data supports the
interpretation of quantitative centrality measures (Campana, 2016) or understanding
the multiplicity (complexity) of criminal connections (Bright et al, 2015). The collection
and processing of role-specific data should therefore become an integral part of every
intelligence collection procedure.
5. SNA applied in investigations should aim more at understanding the bigger picture at a
meso- (inter-group) and macro (illegal market) level. The interaction of a criminal micro-
network with the embedding meso-structures uncovers the driving forces behind its
resilience. Such understanding is particularly relevant for the development of network
disruption strategies.
6. A limitation of SNA is that it provides a static observation of dynamic phenomena on and
of networks. Our findings emphasize that advanced methods in addition to SNA should
be developed to capture social dynamics in order to understand the emergence and
evolution of criminal networks. In line with Carley et al. (2007) and Bright et al. (2013) we
recommended to combine SNA with computational simulation to capture such dynamics.
Chapter 8: Discussion
257
7. Embedded academics (pracademics) employed within law enforcement agencies are
key brokers between science and investigations. Their access to empirical network data
as well as their understanding of the academic language could bridge science and the
operational law enforcement field, resulting in a deeper empirical understanding of
criminal networks.
These seven conclusions formed the starting point for the design of the third study
(Chapter 4), aimed to understand the dynamics of a criminal meso-network in response
to different disruption strategies. Our findings -based on the combination of SNA and
computer simulations- revealed that deliberately targeting vulnerable positions in a large
meso- network (N=22.000 nodes) increases its overall efficiency instead of reducing it. It
was observed that this is the result of a complex interaction between manifest criminal
networks and their embedded social environment. Social ties of trust facilitate effective
replacement. However, it was also found that the increased efficiency results in exposure
of the network from ‘the dark’, leaving it vulnerable for subsequent law enforcement
detection and targeting of its key players. Our findings emphasize that timing and strategic
alignment of detection and persistent disruption efforts lead to more effective disruption
strategies of criminal networks in the long run. Strategic thinking about how to structurally
monitor criminal networks over time (i.e. strategic thinking in intelligence) therefore lies
at the heart of effective criminal network disruption. This makes it possible to estimate
the threshold where one disruption strategy becomes more effective in fragmentizing the
network over the other (see Bright, Greenhill and Levenkova, 2011).
To support of these findings the fourth study (Chapter 5) presents a method to infer
dark networks (i.e. population of drug-users) on the basis of scraping online social media
networks, i.e. ‘Livejournal’ (N = 23 106). Criminals in the 21th century are not bounded to
the physical world, but manifest themselves in the virtual world as well. This often requires
big data methods to detect crime networks in online forums and social media. Our findings
show that careful assessment of ‘slang’ terminology on drug-abuse as input for context
sensitive text mining can be very effective for inference and profiling dark communities
from online forums. It was also found that the content of communications can be mined
to categorize its members into three different risk-groups for additional prioritization in
targeted response. Similar techniques have recently been applied to infer networks from
hacking forums (Décary-Hétu et al., 2014 ), online child pornography networks (Westerlake
et al. 2012), and jihadist recruitment forums (Bouchard et al., 2014). Although new insights
into these virtual dark networks are created, these studies also emphasize the sensitivity
of such methods to the selection of key words used for crawling the online content. False
negatives or -positives are the result of too specific or too broad combinations of keywords.
258
An in-depth study of specific ‘slang’ and keyword combinations used in target networks
should therefore precede the scraping process to achieve reliable network representations.
At the end of the fourth study we aimed to contribute to thought ahead multiplexity and
the identification of key players. The qualitative scripting approach introduced by Bruinsma
and Bernasco (2008) and Morselli and Roy (2009) has proven to be very useful in criminal
networks consisting of less than 75 actors. The quantitative scripting approach is however
particularly relevant for the analysis of large complex criminal networks (N>75) inclosing
many different criminal value chains at the same time. We therefore introduced three
different notions for centrality by adding the value-chain dimension to binary network
representations. This procedure however requires that intelligence is not only restricted
to structural collection and procession of data on criminals and their social relations, but
also on information on the individual roles they play in the criminal value chain (logistics)
such as coordinator, producer of illicit drugs or supplier of precursors for drugs production.
The fifth study (Chapter 6) examines the strength of ties in organized crime. We inves-
tigated and compared three dimensions of tie-strength: structural, temporal and demo-
graphical. Our results show that weak ties are important for exchange of information to
secluded communities, but not exclusively. Due to a small-world phenomenon there are
many alternative pathways for information to flow between its remote parts. Moreover,
most weak ties are too temporary and opportunistic to fulfill bridge positions. Furthermore,
a categorization of criminal ties - based on intensity and duration- was introduced, which
contributes to the identification of general structures of consistency and fluidity within the
total network. This categorization might also contribute to a more deliberate approach in
detecting criminal networks through human intelligence- or infiltration strategies.
Finally, in the sixt study (chapter 7) the implications of our findings for the future of
criminal network research and law enforcement disruption strategies are discussed. The
main conclusion from this chapter is that there are still some knowledge gaps in the con-
trollability of complex networks. The controller must have at least as much complexity as
the controlled in order to succeed. In practice the organizations tasked with detecting and
disrupting such networks are just exploring more fluid ways of co-operation outside of the
bureaucratic boundaries, which limits their own variety (complexity).
8.2 general conclusion
Traditionally research on criminal organizations evolves around qualitative (narrative)
studies of three separate organizational levels (i.e. micro-meso-macro). The complexity
Chapter 8: Discussion
259
of dynamically changing criminal organizations however requires new scientific quantita-
tive methods that integrate the complex patterns connecting these three levels within
one empirical framework. Social network analysis (SNA) has been proposed as such a
method. SNA also received much critique, since its application is in most cases restricted
to investigation of isolated and artificially bounded networks based on individual cases
without taking into account the embedding networks structures mainly due to limited
data availability. However, the exponentially growing amount of criminal- and social data
routinely collected by law enforcement agencies is gradually becoming accessible for sci-
entific research, enabling the inclusion of embedded network structures. At the same time,
embedded police academics are introducing empirically derived data-analysis techniques
within law enforcement practice. In this thesis we have contributed to this development by
introducing new methods to integrate these different data levels, to infer networks, and to
make valid and relevant selections of data in support of a data-driven approach. Based on
our findings we can conclude that criminal network structures (micro-, meso- and macro)
cannot be presumed but emerge. Quantitative analyses of these emerging networks can
drive qualitative interpretations and assessment in order to seek rather than assume struc-
ture. As such we can consider this to be a paradigm shift in law enforcement practice as
well as in organized crime research.
8.3 Practical imPlications of the findings
The studies presented in this thesis demonstrate the flexible and adaptive nature of crimi-
nal networks under continuously changing environment. This flexibility and adaptability
through levels of self-organization makes them highly effective and efficient in achieving
their aim: maximizing profit and escaping from government repression. In contrast, , laws
and regulations constrain law enforcement agencies to operate in an equally flexible man-
ner. Opportunities for improvement therefore lies in building strategies for detecting and
disrupting criminal networks at an early stage. This requires not only a shift in approach,
but also a shift in culture.
Law enforcement officers are generally selected and trained for resolute action in case of
unexpected emergencies (Rathcliff, 2008; Vis, 2013). Although this reflex is essential for day-
to-day police work on the streets, it has become a general characteristic of police culture. As
a result the same action-reflex becomes dominant in other law enforcement disciplines as
well, such as intelligence work and criminal investigations (Vis, 2013). In general, this leads to
reactive rather than proactive operations, for instance with regards to detecting and disrupt-
ing criminal networks which is best described as ad hoc, predictable, and therefore most
likely ineffective. The findings in this thesis however emphasize that detecting and disrupting
260
criminal networks requires dedicated timing and strategic long term planning for which dif-
ferent intelligence- and intervention strategies should be aligned.
Strategic thinking in the detection and disruption of criminal networks can be divided into
two phases: the detection phase (i.e. intelligence) and the disruption phase (i.e. interven-
tion). Before strategically deciding about the most effective approach about how to target
a criminal network (detection phase) it is required to first answer the questions of what,
who and where to target (disruption phase). This requires strategic thinking as well: where
and how do I get information? How do I combine this information? What information is
missing? How do I make sense of this information in supporting the operational objective?
And how do I maintain an up-to-date information position? To answer these questions,
law enforcement organization should invest more in developing strategies for detecting
criminal networks before disrupting them.
strategies for detecting criminal networks
The development of every intelligence strategy starts with the identification of the main
elements out of which a problem consists and their mutual connections. In intelligence
practice such elements are fitted into a conceptual model or -framework (McDowell,
2008). The conceptual model helps to direct the intelligence collection process. The
empirical findings presented in this thesis have contributed to the creation of a generic
conceptual model for criminal networks, which is currently used in The Dutch Police to
manage the collection and analysis of intelligence (Figure 1). This model consists of three
main elements:
1. Networks: Who is involved with who? What is the strength, the criminal nature, and
the social context of these relationships? What are the specific attributes of the actors
in the network?
2. Logistics: In what criminal activities is the network involved? How does this process
unfold in a value chain (i.e. crime script)? What roles do the actors play in this value
chain? How does money flow through the network and how is it laundered?
3. Infrastructures: Where does the network commit these criminal activities? In what
places do the actors meet and find new accomplishes? On what legal entities does the
network rely in executing the crime script? What is the nature of these places and in
what way are they connected?
Continuous intelligence collection on these three elements answers the questions of ‘who’,
‘what’ and ‘where’ allows for a look under the hood of the criminal network. The ‘who’
question creates insight in the social dimension behind criminal cooperation. The ‘what’
question creates insight in how the different actors work together in the criminal logisti-
cal process (e.g. drugs trafficking, money laundering, migrant smuggling). The ‘where’
question provides insight into the geographical or virtual environment, out of which the
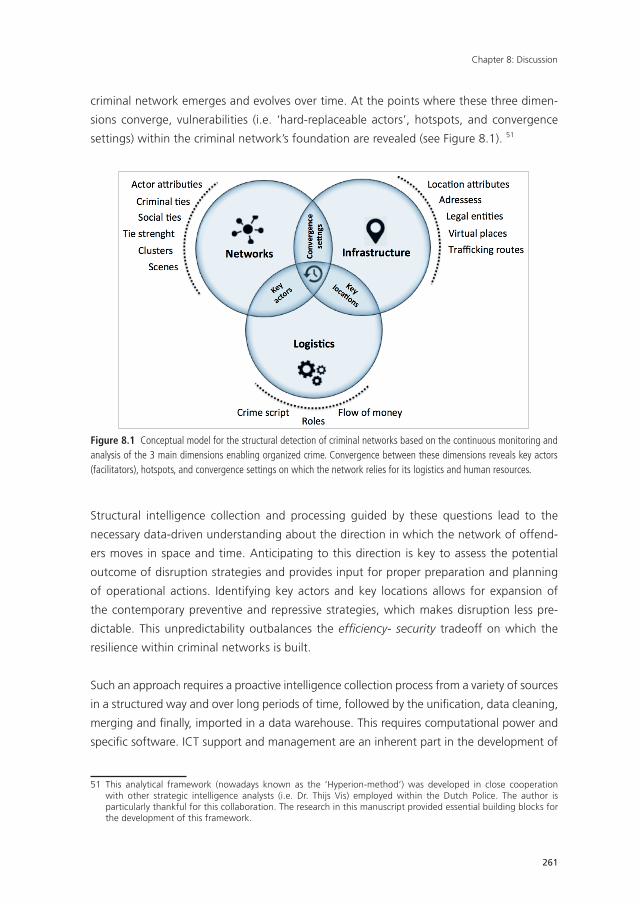
Chapter 8: Discussion
261
criminal network emerges and evolves over time. At the points where these three dimen-
sions converge, vulnerabilities (i.e. ‘hard-replaceable actors’, hotspots, and convergence
settings) within the criminal network’s foundation are revealed (see Figure 8.1). 51
!!
201!
2. Logistics:! In! what! criminal! activities! is! the! network! involved?! How! does! this! process!unfold! in! a! value! chain! (i.e.! crime! script)?!What! roles! do! the! actors! play! in! this! value!chain?!How!does!money!flow!through!the!network!and!how!is!it!laundered?!!
3. Infrastructures:!Where! does! the! network! commit! these! criminal! activities?! In! what!places!do! the! actors!meet! and! find!new!accomplishes?!On!what! legal! entities!does! the!network! rely! in! executing! the! crime! script?!What! is! the! nature! of! these! places! and! in!what!way!are!they!connected?!!
!Continuous!intelligence!collection!on!these!three!elements!answers!the!questions!of!‘who’,!‘what’!and!‘where’!allows!for!a!look!under!the!hood!of!the!criminal!network.!The!‘who’!question!creates!insight!in!the!social!dimension!behind!criminal!cooperation.!The!‘what’!question!creates!insight!in!how!the!different!actors!work!together!in!the!criminal!logistical!process!(e.g.!drugs!trafficking,!money! laundering,! migrant! smuggling).! The! ‘where’! question! provides! insight! into! the!geographical! or! virtual! environment,! out! of!which! the! criminal! network! emerges! and! evolves!over! time.! At! the! points! where! these! three! dimensions! converge,! vulnerabilities! (i.e.! ‘hard^replaceable! actors’,! hotspots,! and! convergence! settings)! within! the! criminal! network’s!foundation!are!revealed!(see!Figure!8.1).!51!!
!Structural! intelligence! collection! and!processing! guided!by! these!questions! lead! to! the!necessary! data^driven! understanding! about! the! direction! in! which! the! network! of! offenders!moves!in!space!and!time.!Anticipating!to!this!direction!is!key!to!assess!the!potential!outcome!of!disruption! strategies! and! provides! input! for! proper! preparation! and! planning! of! operational!
!!!!!!!!!!!!!!!!!!!!!!!!!!!!!!!!!!!!!!!!!!!!!!!!!!!!!!!!51!This!analytical!framework!(nowadays!known!as!the!‘Hyperion^method’)!was!developed!in!close!cooperation!with!other!strategic!intelligence!analysts!(i.e.!Dr.!Thijs!Vis)!employed!within!the!Dutch!Police.!!The!author!is!particularly!thankful!for!this!collaboration.!The!research!in!this!manuscript!provided!essential!building!blocks!for!the!development!of!this!framework..!
Figure! 8.4! Conceptual! model! for! the! structural! detection! of! criminal! networks! based! on! the! continuous!monitoring! and! analysis! of! the! 3!main! dimensions! enabling! organized! crime.! Convergence! between! these!dimensions!reveals!key!actors!(facilitators),!hotspots,!and!convergence!settings!on!which!the!network!relies!for!its!logistics!and!human!resources.!!!!
Figure 8.1 Conceptual model for the structural detection of criminal networks based on the continuous monitoring and analysis of the 3 main dimensions enabling organized crime. Convergence between these dimensions reveals key actors (facilitators), hotspots, and convergence settings on which the network relies for its logistics and human resources.
Structural intelligence collection and processing guided by these questions lead to the
necessary data-driven understanding about the direction in which the network of offend-
ers moves in space and time. Anticipating to this direction is key to assess the potential
outcome of disruption strategies and provides input for proper preparation and planning
of operational actions. Identifying key actors and key locations allows for expansion of
the contemporary preventive and repressive strategies, which makes disruption less pre-
dictable. This unpredictability outbalances the effi ciency- security tradeoff on which the
resilience within criminal networks is built.
Such an approach requires a proactive intelligence collection process from a variety of sources
in a structured way and over long periods of time, followed by the unifi cation, data cleaning,
merging and fi nally, imported in a data warehouse. This requires computational power and
specifi c software. ICT support and management are an inherent part in the development of
51 This analytical framework (nowadays known as the ‘Hyperion-method’) was developed in close cooperation with other strategic intelligence analysts (i.e. Dr. Thijs Vis) employed within the Dutch Police. The author is particularly thankful for this collaboration. The research in this manuscript provided essential building blocks for the development of this framework.
262
this process. Current criminal intelligence practice relies mostly on a top-down approach for
classifying criminal groups, which is frequently driven by a set of general criteria and indica-
tors. In this manuscript it was shown however, that microscopic self-organization within
complex networks can lead to unpredictable macroscopic outcomes. A top-down approach
is therefore at risk of creating an assumed- instead of an empirical criminal reality. A bot-
tom up approach is therefore essential in identifying the unexpected macroscopic patterns
from the behaviors of its individual parts. In support of such a bottom-up analysis, a data
warehouse can be created that allows for smart selections of data. This enables analysts to
study the three dimensions of the criminal network in conjunction or in isolation.
Another contemporary tendency related to the increasing importance of ICT for intelligence
professionalization, is the idea that computers will take over all of the criminal analysis
work. Data science is seen as the new solution to the growing problem of how to create
meaningful understanding of the criminal reality out of the growing amounts of (unstruc-
tured) data within the police databases. It creates the expectation that numerous amounts
of data will be fitted into models that directly inform the operational police officer on how,
where and when to respond to prevent crime from happening. For common types of crime
(e.g. vandalism, bicycle theft), such models have already proven to be useful and have re-
sulted into a more effective and efficient law enforcement practice. To understand complex
phenomena such as organized crime, in which models are generated from incomplete and
unconfirmed data, operationally following up on computer models could be dangerous.
As shown in this thesis, computer models assist the researcher in selecting appropriate
sources of data, but it is always the contextual human knowledge that provides the correct
interpretation of the outcomes. Therefore it is not suggested that data scientists should
replace analysts or vice versa, instead the combination of both strengthens the intelligence
profession towards a reliable and validated data-driven approach.
According to Sutherland (1947) every crime phenomenon must be approached in terms of
its uniqueness and specific characteristics. Change and evolution of criminal behaviors are
therefore best detected from raw data that is collected from sources close to the actual
criminal environment. This approach has inspired criminologists to infiltrate prison com-
munities or become a participant observer in situations where social relationships with key
members of criminals networks are build (e.g. Zaitch, 2002). In a law enforcement context
such methods are called human intelligence or HUMINT (i.e. information from human
informants). HUMINT can be directed towards the blind spots in the overall intelligence
position, which gives it an advantage as compared with other sources of law enforcement
data primarily collected for other purposes (e.g. evidence, safety, patrols). HUMINT can be
directed by recruitment of specific informants or by asking specific questions to reliable
informants (see also Kenney, 2007).
Chapter 8: Discussion
263
The reliability of HUMINT is not witout debate, since informants can be misleading or
manipulative. Researchers unfamiliar with HUMINT do not always know that the reliabil-
ity of HUMINT is a topic of criminal intelligence analysis in itself. For instance, the ‘one
source is no source’ principle is applied to prevent the spread of misinformation after every
conversation with an informant. Additional crosschecks with external data sources allow
for further assessment of an informant’s reliability. Non-reliable informants are directly
placed on blacklist to make sure they are not approached again. Non-law enforcement
sources -such as financial information or data from open sources- are also used to verify
the information provided by informants. This also adds new dimensions (e.g. financial
flows between nodes) to the overall intelligence picture.
The chapters of this manuscript also show that criminal networks have no boundaries.
Contrarily, there is a common tendency amongst law enforcement agencies to keep
things small and break them up in manageable pieces for budget or operational reasons.
In many countries the analysis of organized crime is characterized by artificial clustering
into separately labeled organized crime groups, which remain static and unevaluated over
time. The outcome of this oversimplification is that the complex overarching macroscopic
patterns of the criminal network structures remain unexposed. Essential weak ties between
the artificial criminal groups and elements of the specific social context are labeled as
irrelevant and deleted from further analysis. As a result the potential outcomes of any
disruption strategy become difficult to capture from ‘the bigger picture’ and the critical
vulnerabilities of the criminal system remain hidden. In line with Spapens (2010) and Von
Lampe (2014) we therefore emphasize that intelligence strategies should start off with the
aim of achieving this bigger picture, even when disruption strategies continue to focus
on the investigation and targeting of its individual parts. Understanding the functioning,
structure and dynamics of criminal networks at a meso- and macro system level, is required
to maximize the effect of different micro-interventions on the long term.
Nevertheless, detections- and disruption strategies should not be developed in isolation, but
in a network of intelligence- and operational specialists working together in parallel as the
operations unfold. Thinking in terms of complexity is essential in this sense: what could be
the effects of a single arrest (micro-level) on the functioning of the overall criminal network
(macro-level)? What does this require in terms of intelligence? And what opportunities does
the operational strategy provide for collecting this intelligence? Operational action (e.g.
wiretapping, surveillance, arrests, house searches) could also be applied as part of an intelli-
gence strategy instead of disruption strategy in order to learn more about the organizational
background and vulnerabilities of the network, before its disruption at a later stage.
264
Criminal opportunities that emerge from the fast expanding cyber environment (i.e.
darknet marketplaces) shorten the social distance within global criminal markets and may
lead to recruitment of ICT specialists which provide ‘crime-as-a-service’. Law enforcement
agencies should therefore proactively respond to such developments by recruiting similar
ICT expertise to monitor virtual illicit activities at an early stage. Additionally, international
cooperation and data sharing –especially on a tactical level- is key to such a planning
process. This is not an easy endeavor since trust is more easily built along strong- instead
of weak ties, equivalent to criminal networks. Organizations such as Europol and Interpol
facilitate such trustful cooperation by creating platforms for effective intelligence shar-
ing. In order to detect criminal network activities across borders, such services should be
utilized more often when the opportunity arises.
strategies for disrupting criminal networks
Strategic thinking in the disruption phase requires thinking in scenarios: assessing each
strategy’s potential success influenced by the specific momentum and circumstances. Net-
works can be disrupted structurally, by removing nodes and/or links. Another strategy is to
disrupt them functionally, by cutting of the networks access to operational requirements,
such as cutting of the flow of money to finance terrorist activities or by frustrating the
supply chain for precursors for the illegal production of narcotics (Strang, 2014). The dif-
ferent studies presented in this thesis demonstrate how network analysis helps to develop
scenarios in which both approaches are combined.
Understanding of the network’s topology (i.e. scale free, small world, random) provides
essential input for strategic thinking about structural disruption. Hub-attacks are most
effective in disrupting criminal networks with topological scale-free features (Albert and
Barabasi, 2000). Bridge-attacks (nodes with high betweenness) are most effective for net-
works with small world features. Role-attacks are the most effective strategy for networks
that constitute various connected value chains. Functionally frustrating the value chain of
a criminal process by taking into account node-substitutability proved to be most effective
in breaking small world networks as well. In this case the disruption strategy is aimed at
frustrating value chain network topology instead of the topology of the overall network.
Disruption strategies could therefore be aimed at frustrating the overall macroscopic
network or specific dimensions or sub-communities. This decision depends on the desired
effect and objective of the strategy.
Finding ways to outbalance the networks trade-off between efficiency and security fuel
such structural disruption strategies. For this it is important to seek for ‘the point of gravity’
in a criminal network (Von Clausewitz, 1873). In dark networks this involves for example
codes of silence, reputation, family relationships, profit sharing, loyalty to neighborhood
Chapter 8: Discussion
265
communities, radical ideologies, or a charismatic leader (Strang, 2014). By targeting such
points of gravity the network’s social foundation of trust becomes disrupted, potentially
leading to a tipping point in its structure’s cohesiveness that eventually enables it’s collapse
(see case example 1 and 2).
In some instances, locations can also
be identified as points of gravity. Net-
works of freelance career criminals
who provide ‘crime-as- a-service’
often get engaged in short-term op-
portunistic criminal alliances. In most
of these cases the independent ac-
tors gravitate around a certain point
in physical or virtual space, which
function as hubs out of which new
instant alliances emerge (e.g. club-
houses, cafés, restaurants, brothels,
sport clubs, chat rooms, online
marketplaces). Targeting locations
(or legal entities representing these
locations) could then be a more
effective strategy (Felson, 2006). Ad-
ministrative measures have already
been developed to close down cafés,
restaurants, brothels and casinos, if
there is an legal indication that such
properties are owned by members of
Case example 2: breaking Bald Fred’s reputationA regional police unit was confronted with an in-creasing illicit cannabis cultivation industry in dense urban areas, including violent rages of cannabis culti-vation sites and serious risks for fire safety. Efforts to stop this development consisted of clearing as many cannabis cultivation sites as possible without investi-gating the criminal networks that were responsible for building these sites. Twice as much sites were built as could be cleared, making it a lucrative business de-spite the law enforcement efforts. Partly inspired by the findings presented in this thesis, a regional intel-ligence unit decided to use scripting in combination with SNA to identify the actors responsible for build-ing the cannabis cultivation site. It turned out that just a few of them held a strong reputation for installing the electricity supply without the risk of detection by energy companies. One of them was nicknamed ‘Bald Fred’. He provided his services to at least six criminal groups. An investigation led to his arrest and recov-ery of his criminal assets. Intercepted wiretap data revealed that the various criminal groups relying on his expertise started to doubt his reputation after his arrest, but were struggling in finding a trustworthy replacement for building new plantations. Breaking Bald Fred’s reputation appeared to have more effect than clearing many cultivation sites.
Case example 1: in the name of ‘love’In chapter 2 we identified that the center of gravity of the Blackbird network consisted of the role of females, love- and family relationships. In the end it turned out that the females were the glue that kept the individual parts together. Ironically, it were also the females who -out of jealousy and self protection- provided detailed statements to the investigators, which finally made the network fall apart. It was however not the subsequent sentence and imprisonment of the main male sus-pects which made the network collapse, but the lack of trust amongst the members of the network as a result of these incriminating statements. The love relationships turned out to be as fluid as the networks out of which they emerged. The investigators may not have even realized that their most effective intervention was in fact taking these statements within their investigative routine. It broke the trust underlying the social ties, causing a ‘tipping point’ within the dynamics on the criminal networks and ushering its collapse.
266
organized crime or facilitate their illicit activities (Fijnaut et al., 1996, Kleemans, 2007). Network
analysis, which includes links between persons and locations or legal entities could facilitate
such an approach, by identifying the main meeting points or vulnerable locations within the
criminal logistical process (See case example 3). More empirical research is needed to under-
stand the connection between criminal networks and the physical- and virtual infrastructure in
which they operate.
Within law enforcement practice
interventions are mostly aimed at
the nodes (i.e. persons, locations),
while the links are in fact the most
essential building blocks for net-
work formation. Link attacks can be
aimed at disrupting the networks
communications, for instance by
taking down encrypted telecom cir-
cuits popular in criminal networks.
Another approach is changing the
nature of relationships. This can
be achieved by manipulating the
underlying mechanisms of trust
and reputation. In this context
we emphasized in chapter 6 that
criminal networks may also be in-
fluenced from the outside by actively targeting the fluid and weak latent ties, which form
the bridges from the outside to its inner dense core. This could for instance be an effective
strategy through infiltration of networks in cyberspace or networks that operate on online
internet, such as cybercriminals or jihadist recruitment networks. Such a strategy could
however have severe ethically unjustifiable consequences, such as a wave of violence.
Distrust within the Amsterdam organized crime scene following one stolen shipment of
cocaine in the port of Antwerp has for instance contributed to a sequence of assassinations
within the Amsterdam underworld. This unfolded in a non-linear way, which often puts
innocent civilian bystander’s life at risk.
Strategic thinking in operations aimed at criminal networks should therefore always start
with creating a ‘script’ containing what-if scenarios for every separate intervention. Such
a script reveals how the potential outcomes of separate interventions could reinforce or
contradict each other’s outcome. Evaluation of such outcomes could be mapped and
then aligned in chronological order to achieve the maximum synergy. Computer simula-
Case example 3: disruption infrastructuresDutch project Emergo was aimed at disrupting the in-creased economic power and influence of organized crime networks within the Amsterdam Red Light dis-trict. Instead of targeting the networks directly it was aimed at critical points of the criminal infrastructure following an administrative approach. An experiment with data-mining and network analysis contributed to a targeted application of administrative measures (Spapens, 2013). The project proved to be successful. Neighborhoods, which were controlled by organized crime, have now become popular touristic hotspots. This project also revealed that legislation for com-bining confidential data from separate sources (e.g. police, tax-services, local government) is still undevel-oped and rather opaque to fully exploit these fast-growing technological opportunities for a data-driven approach.
Chapter 8: Discussion
267
tion through predictive modeling supports in assessing the interdependent outcomes of
multiple strategies, especially when the range of what-if scenarios becomes too complex.
In Dutch criminal justice practice financial
investigations generally start after the
criminal investigation has been complet-
ed. In some scenarios it is however more
effective to turn this around. Suspicious
bank accounts of key criminal network
members could for instance be ‘freezed’
on ground of suspected money launder-
ing, prior to an actual investigation or ar-
rest. A criminal network’s financial means
for doing business may then dry out. As
a result, the network becomes outbal-
anced and in an attempt to set things
straight financial facilitators supporting
the network in the background may
become exposed (e.g. corrupt notaries).
Such corrupt and reliable facilitators are
not easy to find in criminal circles and are
therefore harder to replace, providing op-
portunities to disrupt the financial flows
further through specifically by targeting
these facilitators in succession. Strategic
thinking in terms of networks and sce-
narios therefore requires re-evaluation of the contemporary in which interventions and
tactics are applied (see case example 4).
Measuring the efficacy of these various disruption approaches remains a challenge within
law enforcement practice. Although indicators (i.e number of seizures, number of arrests,
number of assassinations) for assessing the outcome of certain interventions have been
developed, measuring the exact effect on criminal network structure remains difficult to
determine. Validation of the effectiveness of certain strategies often follows from feed-
back from the criminal environment itself, for instance via deliberate HUMINT collection
(see case example 4). Generally, criminal networks tend to become more dispersed after
deliberate attacks, such as the example of Darknet marketplaces described chapter 7 (p.
188). Such complex systems may shift from order to chaos, showing increased levels of
self-organization, and changes in their general network topology as a result of external
Case example 4: drying out the expertiseInspired by the outcome of the research in chap-ter 4, a police unit in one of the larger Dutch cit-ies experimented with functionally targeting a sequence of criminal production specialists pro-viding their synthetic drug production expertise to a large criminal network involved in the trade of synthetic drugs. The aim was to structurally break the value chain based on role substitut-ability. A deliberate intelligence strategy based on SNA and scripting led to the identification of four ‘chemists’ interchangeable in the value chain. Three of them were effectively targeted. Several informants from within these criminal networks informed the police, independently from each other, that replacements were dry-ing out as a result of the interventions. As a consequence the network needed to recruit specialists with poor reputations to keep the production going and customers satisfied. This resulted in major delays of the synthetic drugs production, and disruption of the network. As a side effect, separated parts of this criminal network replaced their criminal activities to a different drugs market, demonstrating com-petitive adaptation on a higher level.
268
pressures or interventions, which increases their overall complexity and makes them more
unpredictable and harder to detect afterwards. As a result, criminal informants may loose
their perspective on the networks activities or become demotivated as a result of disruption
strategies that also affect their personal lives. This makes it difficult to monitor the effects
and validate the simulations of specific network disruption strategies over longer periods
of time.
The chapters in this manuscript focused on the disruption of criminal networks that already
emerged. The best approach however would be a strategy that prevents them emerging
or becoming too complex to control in the first place. This means that interventions should
particularly aim for local pools of youth gangs, which provide breeding grounds and essen-
tial career paths to organized crime (Moffit, 1993, Loeber and Farrington, 1998). The social
trust which is created in these networks forms the basis of future criminal cooperation at
a transnational level (see case example 5).
Case example 5: towards a ‘white’ ChristmasIn a middle-sized city in the Netherlands it was a famous tradition at the end of the year to build a big fire from Christmas trees. Because the neighborhoods with the biggest fires would receive the most respect, it led to rivalry be-tween different neighborhoods. Youth would come together and steel the Christmas trees from other neighborhoods, leading to violent encounters. One of these youth groups from a less developed neighborhood, build a particularly infamous reputation die to there their excessive use of violence. Since the police reacted with equal levels of violence and arrests, the members clustered more and more together and soon developed into a youth gang responsible for multiple crimes across the city. The mutual trust the members built within their younger years turned out to form the basis for later criminal cooperation at an transnational level. Almost twenty years later some of the members were identified as the primary suspects for running an international cocaine trafficking ring from South-America to Europe. How would this criminal network evolved if repression would have been traded for prevention and aimed at building ties of trust with the government and the local community?
Convergence between youth gangs and organized crime networks is sometimes facili-
tated through family ties, in which the reputation of the oldest brother in transnational
drug trafficking provides the youngest brother with the status and mentorship to take in
powerful positions in a local youth gang (Morselli et al, 2006). Prisons may also provide
unwillingly opportunities for networking and learning criminal behaviors and modus ope-
randi. Convergence between members of youth gangs and well-established members of
organized crime networks may become enabled in this way. The latter is however receiving
increased competition from Jihadist prison communities, who master the art of grooming
and providing lost youth gang members with offering them an alternative path in life. This
is where the necessary application of violence, contra-strategies and building criminal alli-
ances are learned, in order to become respected members of organized crime networks. If
the government therefore fails to become part of these networking processes and provide
Chapter 8: Discussion
269
a reasonable alternative to these young offenders today, a whole generation of young
offenders may become the organized crime- or terrorist leaders of tomorrow.
In this regard, a balance between prevention and repression remains important, espe-
cially in the case of late-onset offending in organized crime, which is relatively recently
discovered as a phenomenon in the career trajectories to organized crime (Kleemans and
De Poot, 2008; Van Koppen et al., 2010). These studies show that the decisions made
by people to become a member of organized crime networks is strongly influenced by
complex social opportunity structures that occur randomly. Future membership to criminal
networks is therefore not something that is prevented or controlled easily by law enforce-
ment or policy measures.
Thinking in terms of complexity therefore teaches us that problems of local youth gangs,
late-onset offenders, radicalized jihadist networks and transnational organized crime
networks should be analyzed, prevented and disrupted in conjunction, which requires a
holistic long-term strategy. With some exceptions, the leading management-style within
contemporary Dutch law enforcement operations is known as the ‘firefighter-model’. Many
‘fires’ (e.g. terrorist threats, violent gang wars, cyber attacks) have to be extinguished at
the same time, resulting in a very reactive instead of proactive approach to crime control.
External pressures from the media, politics and the public influence the many shifts in
priorities that direct intelligence- and law enforcement practice. It will therefore take cour-
age and strong leadership to swim up against this stream, but it is the only effective route
to follow in countering the growing threat that dark networks pose to the integrity, safety
and democracy of our society.
8.4 future directions
Future research in the field of criminal networks should be aimed at three directions: the
empirical, methodological, and practical direction. This thesis shows how our general un-
derstanding of complex systems provides a framework for creating an improved empirical
understanding of criminal network dynamics. It has led to new strategies for detecting
and disrupting criminal networks in law enforcement practice. There is however still little
evidence on the side effects of node manipulation in complex networks (Quax et al., 2013).
Future research should therefore be aimed at creating a universal understanding of the
controllability of complex systems. This is not only relevant for findings ways to effectively
control criminal networks, it could also prevent the collapse of ecological, biological, eco-
nomical and social systems. In chapter 7 it was emphasized that controllability will only
be achieved if the controller has at least as much variety (complexity) as the controlled
270
(Ashby, 1958). Understanding controllability remains therefore one of the most challenging
research topics in complexity science. A recent study by Gao et al. (2016) aimed at finding
universal resilience patterns in complex networks is an example of research focused on
this direction. It shows that resilience depends on the interconnected dynamics on and
off networks. Such a scientific understanding can have a direct impact on the ways we
organize the control of criminal networks as well.
The combination of computer stimulation and network analysis could in particular be of
additional value in the criminological research field where it can enhance the empirical
understanding of the dynamics of on and off criminal networks. Studies based on SNA
are mostly based on descriptive analysis (Scott and Carrington, 2011; Papachristos, 2011;
Campana, 2016). Some scholars therefore stimulate the development of a ‘networked
criminology’, which involves the utilization of SNA in criminological research (Papachristos,
2011; 2014). Network concepts such as social bonding, diffusion, peer influence, control,
and cohesion are already part of the dominant theories of crime. Future SNA based re-
search that is more etiological in nature could bring theory-driven and data-driven research
closer together. Integration of SNA with statistical significance tests such as Quadratic
Assignment Procedure (QAP) regression models have for instance already been applied to
overcome the problems of non-independence of observations in criminal network data
and have led to new empirical insights of underlying causes of crime (Dekker et al. 2007;
Campana, 2016).
Methodologically, future research should focus on the development of (=dubbel op)
methodologies and metrics to study complex criminal networks. Methodological research
should for example aim to improve methodologies of criminal network inference. Missing
data remains a central issue of technical criminal network research. The development of
link prediction models based on network topology is already an important step in the right
direction (See Berlusconi et al., 2016). Similar link prediction models are developed in the
field of terrorist network research (Chen et al., 2011). Also methods of machine learn-
ing based on complex agent-based models could benefit from this type of development,
specifically to simulate the emergence of macroscopic dark networks and learn about
mechanisms of criminal and terrorist network formation (Mei et al, 2015).
Whilst struggling with similar methodological issues of missing data, it appears that terror-
ist- and criminal networks are mainly studied separately, and as aresult the development of
different fields of research. Methodological improvement could be reinforced by integrat-
ing terrorist- and criminal network research. This could for instance result in increased
knowledge of the synergy between organized crime and terrorism. Especially since this
Chapter 8: Discussion
271
xxx appears to be an essential part of the facilitation of terrorists plotting attacks, and the
pursuit for political power by members of criminal networks (Makarenko, 2004).
A second line of methodological research should aim for further improvement of metrics
for analyzing complex network data. As criminal network data is expected to grow and
improve in quality, the need for additional metrics that identify critical nodes or ties based
on multiple network dimensions (e.g. links or node attributes) will increase. Chapter 6
presented an alternative metric for the identification of key players based on value chain
positioning as opposed to the standard metrics of centrality. Also within large network rep-
resentations (e.g. scraped from online data), community detection algorithms are becom-
ing increasingly important and particularly in criminal network research. Future research
should aim to further refine such models. Newman and Girvan’s algorithm for identifying
community structures in complex networks is for instance already regularly applied within
the law enforcement environment to identify sub-communities in macroscopic criminal
networks (Newman and Girvan, 2004).
Practically, there is a strong need for research aimed at the empirically evaluating of differ-
ent detection and disruption strategies in terms of impact and effectiveness. This requires
effective monitoring of criminal networks over time, which is a challenge as network
composition and topology may change after intervention. A direction of future research
could be aimed at building robust intelligence positions -preferably based on human intel-
ligence- which remain intact even after single elements of the overall network become
disrupted. Models for identifying optimal observers in dark networks could assist human
intelligence units by recruiting informants with overlapping views on network activities.
Besides the practical challenges, such insight could support the development of more
robust and long-term intelligence positions needed to detect adaptation and evolution
over time. The generated data is particularly relevant for the validation and fine-tuning
of the disruption models through simulation. Additionally, the practical law enforcement
field could benefit from studies that compare the current network structure and dynamics
of law enforcement agencies and compare that with the structure and dynamics of the
criminal networks they try to control. This might lead to a more empirical basis for strategic
development of optimal law enforcement organization and management in the task of
disruption and detection criminal networks.
Although these recommendations for future research could bring us closer to understand-
ing the dynamics and evolution of criminal networks on a macroscopic level, the micro-
scopic interactions between individual propositions will remain unpredictable in nature.
Law enforcement agencies and criminal networks are therefore caught in an intricate web
of complex adaptively. Preventing criminal networks from adapting and growing towards a

272
state-in-a-state through corruption, violence, and infiltration of the legal economy, is how-
ever one of the main parts of the legitimacy of law enforcement organizations. Improving
and adjusting the methods to detect and disrupt criminal networks will therefore always
remain an essential part of that endeavor.
Chapter 8: Discussion
273
references
Albert, R., Jeong, H., & Barabási, A. L. (2000). Error and attack tolerance of complex networks. nature,
406(6794), 378-382.
Berlusconi, G. (2013). Do all the pieces matter? Assessing the reliability of law enforcement data
sources for the network analysis of wire taps. Global Crime, 14(1), 61-81.
Berlusconi G, Calderoni F, Parolini N, Verani M, Piccardi C (2016). Link Prediction in Criminal Networks:
A Tool for Criminal Intelligence Analysis. PLoS ONE 11(4): e0154244. doi:10.1371/ journal.
pone.0154244.
Bouchard, M., Joffres, K., & Frank, R. (2014). Preliminary analytical considerations in designing a ter-
rorism and extremism online network extractor. In Computational Models of Complex Systems
(pp. 171-184). Springer International Publishing.
Bouchard, M., & Morselli, C. (2014). Opportunistic structures of organized crime. Oxford handbook
of organized crime, 288-302.
Bright, D. A., Greenhill, C., & Levenkova, N. (2014). Dismantling criminal networks: Can node at-
tributes play a role. Crime and Networks. Rouletdge, 148-162.
Bruinsma G., Bernasco W. (2004). Criminal groups and transnational illegal markets. Crime, Law, Soc
Change 41:79–94.
Campana, P., & Varese, F. (2012). Listening to the wire: criteria and techniques for the quantitative
analysis of phone intercepts. Trends in organized crime, 15(1), 13-30.
Campana, P., & Varese, F. (2013). Cooperation in criminal organizations: Kinship and violence as cred-
ible commitments. Rationality and society, 25(3), 263-289.
Campana, P. (2016). Explaining criminal networks: Strategies and potential pitfalls. Methodological
Innovations, 9, 2059799115622748..
Carley, K. M., Diesner, J., Reminga, J., & Tsvetovat, M. (2007). Toward an interoperable dynamic
network analysis toolkit. Decision Support Systems, 43(4), 1324-1347.
Chen A, Gao S, Karampelas P, Alhajj R, Rokne J. (2011). Finding hidden links in terrorist networks by
checking indirect links of different sub-networks. In: Wiil, U K, editor. Counterterrorism and
Open Source Intelligence. Lecture Notes in Social Networks. Springer, 2011. p. 143–158.
Decary-Hetu, D., Dupont, B., & Fortin, F. (2014). Policing the hackers by hacking them: Studying online
deviants in IRC chat rooms. In Networks and Network Analysis for Defence and Security (pp.
63-82). Springer International Publishing.
Dekker D., Krackhardt D. and Snijders T.A. (2007). Sensitivity of MRQAP tests to collinearity and
autocorrelation conditions. Psychometrika 72: 563–581.
Felson, M. (2006). Crime and nature. Sage publications.
Fijnaut, C. J. C. F., Bovenkerk, F., Bruinsma, G. J. N., & van de Bunt, H. G.. (1996). Eindrapport geor-
ganiseerde criminaliteit in Nederland. Enquête Opsporingsmethoden, 1995-1996.
Gao, J., Barzel, B., & Barabási, A. L. (2016). Universal resilience patterns in complex networks. Nature,
530(7590), 307-312.
Kenney M. (2007). From Pablo to Osama: trafficking and terrorist networks, government bureaucra-
cies, and competitive adaptation. Penn State Press.
274
Kleemans, E. R., & Van De Bunt, H. G. (1999). The social embeddedness of organized crime. Transna-
tional organized crime, 5(1), 19-36.
Kleemans, E.R. (2014). Theoretical perspectives on organized crime. In: L. Paoli (ed.). Oxford Hand-
book on Organized Crime. Oxford: Oxford University Press.
Kleemans, E. R. (2007). Organized crime, transit crime, and racketeering. Crime and Justice, 35(1),
163-215..
Kleemans, E. R., & de Poot, C. J. (2008). Criminal careers in organized crime and social opportunity
structure. European Journal of Criminology, 5(1), 69-98..
Kleemans, E. R. (2014). Theoretical perspectives on organized crime. Oxford handbook of organized
crime, 32-52.
Klerks, P. (2001). The network paradigm applied to criminal organizations: Theoretical nitpicking or
a relevant doctrine for investigators? Recent developments in the Netherlands. Connections,
24(3), 53-65..
Loeber, R., & Farrington, D. P. (Eds.). (1998). Serious and violent juvenile offenders: Risk factors and
successful interventions. Sage Publications.
Malm, A., & Bichler, G. (2011). Networks of collaborating criminals: Assessing the structural vulner-
ability of drug markets. Journal of Research in Crime and Delinquency, 48(2), 271-297.
Makarenko, T. (2004). The crime-terror continuum: tracing the interplay between transnational orga-
nized crime and terrorism. Global crime, 6(1), 129-145.
McDowell, D. (2008). Strategic intelligence: a handbook for practitioners, managers, and users.
Scarecrow Press.
Mei S. ; N. Zarrabi; M.H. Lees and P.M.A. Sloot (2015). Complex agent networks: An emerging ap-
proach for modeling complex systems, Applied Soft Computing/ Vol 37, Pp 311- 321..
Moffi tt, T. E. (1993). Adolescence-limited and life-course-persistent antisocial behavior: a develop-
mental taxonomy. Psychological review, 100(4), 674.
Morselli C., Petit K. (2007). Law enforcement disruption of a drug importation network. Glob Crime
8(2): pp 109–130.
Morselli, C., Tremblay, P., & McCarthy, B. (2006). MENTORS AND CRIMINAL ACHIEVEMENT*. Criminol-
ogy, 44(1), 17-43.
Newman, M. E., & Girvan, M. (2004). Finding and evaluating community structure in networks. Physi-
cal review E, 69(2), 026113.
Papachristos, A. V. (2011). The coming of a networked criminology. Measuring Crime & Criminality:
Advances in Criminological Theory, 17, 101-140.
Papachristos, A. V. (2014). The network structure of crime. Sociology Compass, 8(4), 347-357.
Quax, R., Appoloni, A. & Sloot, P. M. A. (2013). The diminishing role of hubs in dynamical processes
on complex networks. J. R. Soc. Interface, in press.
Von Lampe, K. (2015). The Grey zones of criminal networks. In book: Ektraordinære Tider: Festskrift
til Per Ole Johansen 70 år, Publisher: Novus Forlag, Editors: Lars Korsell, Paul Larsson, Jan G.
Christophersen, pp.127.

UvA-DARE is a service provided by the library of the University of Amsterdam (http://dare.uva.nl)
UvA-DARE (Digital Academic Repository)
Detecting and disrupting criminal networks
Duijn, P.A.C.
Link to publication
Citation for published version (APA):Duijn, P. A. C. (2016). Detecting and disrupting criminal networks: A data driven approach
General rightsIt is not permitted to download or to forward/distribute the text or part of it without the consent of the author(s) and/or copyright holder(s),other than for strictly personal, individual use, unless the work is under an open content license (like Creative Commons).
Disclaimer/Complaints regulationsIf you believe that digital publication of certain material infringes any of your rights or (privacy) interests, please let the Library know, statingyour reasons. In case of a legitimate complaint, the Library will make the material inaccessible and/or remove it from the website. Please Askthe Library: http://uba.uva.nl/en/contact, or a letter to: Library of the University of Amsterdam, Secretariat, Singel 425, 1012 WP Amsterdam,The Netherlands. You will be contacted as soon as possible.
Download date: 26 Jan 2017

Chapter 9Summary
Detecting and Disrupting Criminal NetworksA data-driven approach

Chapter 9: Summary
277
It is estimated that transnational organized crime generates around EUR 900 billion a year
worldwide, at the cost of numerous human lives, economic development, social stability
and democratic peace. The root of this global problem lies within local social settings (e.g.
neighborhoods, schools, sport clubs, prisons, nightclubs and casinos) in which different
generations of (potential) criminals from various backgrounds find mutual trust to converge
into networks. As compared to legitimate networks, criminal networks deliberately oper-
ate under covert conditions and outside the boundaries of law. Detecting and disrupting
criminal networks is therefore one of the biggest challenges for law enforcement agencies
across the globe. The aim of this thesis is to contribute to this endeavor by introducing a
data-driven approach to the empirical study of organized crime.
how do criminal networks emerge and evolve?
The first studies of organized crime in the 70s and 80s relied on the image of hierarchical
mafia pyramid structures, with strict leadership, ranks, and an internal system of rules
and punishment. In the early 90s this image was rejected based of scientific research that
showed that organized crime constitutes fluid networks that emerge along social lines of
overlapping kinship, friendship and neighborhood ties. Criminal networks do however not
emerge randomly, but rely on mutual trust that provides a level of security in the uncer-
tain and unpredictable criminal environment. Over time local networks expand due to a
small-world phenomenon that connects them with many other local networks, resulting
in regional networks at meso-level. Particular actors within these meso-networks may pos-
sess strong networking-abilities, high reputation or special skills that make them essential
for initiation and continuation of the various criminal value chains (i.e. crime commission
processes) that run through these meso-networks.
In chapter 2 we analyzed the social framework behind a criminal network (N=86) involved
in drugs trafficking. We found that the network gravitates around a strong embedded social
structure of kinship and affective ties. Females within this social structure fulfill important
internal mediator roles and external gatekeeper functions. This fosters the resilience of
the network as a whole and leads to the external expansion of the micro-network into a
transnational trafficking operation from the Netherlands to Italy. Actors who fulfill similar
brokerage roles in criminal networks further enable connectivity through which various
meso-networks across regions, countries, and continents become connected. This leads
to the emergence of the macroscopic transnational patterns of criminal cooperation we
observe today.
278
At this macro-level criminal networks are best understood as complex adaptive systems.
Similar to complex networks observed in biology, economy, ecology and computer science,
they display non-linearity. This means the whole is different then the sum of its parts. All
criminal actors in the network can operate autonomously and interact with each other
at the same time, resulting in highly unpredictable outcomes. Within complex adaptive
criminal systems external pressures, such as law enforcement operations, prompts change
in the individual behaviors may result in changes in the structure of the network as a
whole. This is known as self-organization.
Moreover, within criminal networks these dynamics are marked by a continuous trade-
off between efficiency and security in sharing information. Efficiency means the network
needs to communicate efficiently amongst its members to coordinate the crime commis-
sion process. This contrasts with maintaining undetected by law enforcement (i.e. security)
and demands information exchange reduced to a minimum. Criminal networks therefore
constantly balance between these two, which makes them ‘light on their feet’ and there-
fore highly adaptable to law enforcement interventions.
In chapter 4 we analyzed these dynamics within an empirical meso-network (N= 22.000
actors) by using computer simulation. We found that, following removal of the most cen-
tral actors, the tradeoff between efficiency and security makes criminal networks stronger
and more efficient. This effect increased when multiple actors were removed sequentially.
Our results show that nobody is irreplaceable within criminal networks and as a result
networks easily adapt after disruption.
The presence of weak ties has a strong effect on this process. Weak ties are defined as
the bridges that connect remote parts of the network. Their presence enables the dy-
namical flow of non-redundant information and resources throughout the network and
thus contributes to finding replacements. Strong ties also have an important function in
criminal networks. They provide security though an internal network or trusties against
detection from the outside. The distribution of tie-strength is therefore an important factor
in understanding the structure and emergence of criminal networks.
In chapter 6 we measured and compared three dimensions of tie-strength (structural,
temporal and demographical) within a criminal meso-network (N= 5000 actors). We found
that weak-ties based on structural positioning (i.e. edge-betweenness) are indeed impor-
tant for linking sub communities in the network, but not exclusively. Many alternative
pathways exist due to small-world effect. Moreover, our study showed that the majority of
weak ties is fluid, meaning short duration and rarely observed by law enforcement. They
often represent instrumental interactions mostly orchestrated by third-party intermediaries
Chapter 9: Summary
279
for settling disputes or during the course of one criminal interest (e.g. mutual investment in
trafficking illegal drugs). Furthermore, criminal ties characterized by homophily (i.e. similar-
ity) and multiplexity (i.e. more types of relationships at the same time) are significantly
more likely to cluster within the meso-network. These clusters form the pools of potential
criminal cooperation, suggesting a preference for criminal co-operation of individuals with
similar ethnic backgrounds. This could however also be a side effect of the ethnic composi-
tion of neighborhood and it does not exclude the presence of mixed ethnicity groups that
emerge on a micro-level. Within this highly dynamical underworld more durable old-boys’
networks are also detected. Fostered by strong and loyal kinship ties we found that a few
of these co-offending ties last over 20 years.
Overall it can be concluded that organized crime is a dynamic and multi-dimensional
phenomenon that demands an equivalent dynamic and multi-dimensional approach and
response in respectively science and law enforcement.
how to detect and analyze criminal networks?
The empirical findings in this thesis rely on a data-driven approach. This means that the
data is analyzed bottom-up to provide resulting in a more unbounded perspective of
criminal networks, without restricting the perspective through theoretical constructs that
classify the data in advance.
In chapter 2 and 3 we explored the opportunities and limitations of social network analysis
(SNA) for studying criminal networks by comparing 34 case studies. SNA is defined as the
process of analyzing social structures through the use of network and graph theories. It
defines networked structures in terms of nodes (actors, subgroups, or things within the
network) and ties, edges, or links (relationships or interactions) that connect them.
Our findings showed that the main advantage of SNA in the study of organized crime
lies in the ability to study microscopic properties of individuals and macroscopic patterns
of criminal co-operation independently but also in conjunction. The application of SNA
–as compared to manual analysis- is becoming a necessity, especially with the increasing
amount of criminal network data that is currently available. The various case studies show
that combining different data sources is required to optimize reliability and validity of
criminal network representations. On the micro-level there is a significant risk for selec-
tion bias, as less data is available. This means that the outcome is strongly affected by
the initial priorities of law enforcement data-collection, such as the investigation of few
main suspects. The organized crime research field therefore benefits especially from the
280
application of SNA at meso-level, for which more types of available data-sources can be
combined (i.e. patrol data, surveillance data, human intelligence, open source intelligence).
The quantitative analysis of SNA helps to explore the overall structure of the network and
identify its distinctive elements, after which further qualitative assessment of the output
on the basis of network- and criminological theory is required to put these results in the
relevant context.
In addition to SNA the application of crime scripting was explored in chapter 2 and 3. This
involved analysis of the crime commission process by breaking it down into a sequence of
chronological phases and events. By combining SNA with crime scripting we found that
a deeper of the independencies between actors can be created. From a law enforcement
perspective, our study indicated that found that assigning roles to actors based on this
combination of methods assists the identification of uniquely skilled actors whom are dif-
ficult to replace.
However, the case studies also showed that the combined use of SNA and scripting is mainly
used in a manual qualitative way. In chapter 4 we therefore present a novel quantitative
approach that combines SNA and scripting into a new measure for network centrality, so
called value chain centrality. It is based on the notion that the importance of an actor is
depended on the number of value chains that will be disrupted following its removal.
Since SNA and crime scripting still provide a static observation of a dynamical phenom-
enon, the application of computational modeling was explored in chapter 4.This involves
a method to simulate complex network behavior with the help of algorithms as input for
computer simulations. Empirical criminal network data (n=22.000) is used as input for
these simulations to experiment with different scenarios in a virtual criminal environment.
We found that by combining intervention algorithms with replacement algorithms in the
same model, the effects of four different law enforcement disruption strategies could
be simulated on a criminal network. Although these methods are promising for criminal
network dynamics research, validation of these models through empirical network research
remains indispensible.
Such validation and the validation of network representations and models in general,
require a comparison of different data sources. The majority of criminal network studies
rely on law enforcement data. Chapter 5 demonstrates how context sensitive text-mining
techniques contribute to inference of covert networks, in this case a network of drug-users
networks active on social media platforms, i.e. Life journal (N=23 106). Such methods can
be utilized to detect hacking networks, online child pornography networks or Darknet drug
traffickers to provide insight into their structures outside of the law enforcement context.
Chapter 9: Summary
281
Chapter 6 showed that a data-driven approach based on the combination of these three
methods could also benefit from a focus on ties instead of nodes. We present a more
effective approach to detect criminal networks through surveillance or intelligence, by
categorization of ties based on duration and intensity: fluid, manifest, latent and durable.
Since fluid and manifest ties chance very rapidly, our results emphasize to redirect intel-
ligence resources on identifying and focusing on the latent and durable ties in the network.
This leads to a more robust and sustainable information position over time.
Based on the chapters presented in this thesis it can be concluded that criminal network
structures on any level (micro, meso and macro) can not be presumed but emerge. Data-
driven analysis of these emerging networks can drive qualitative interpretations and assess-
ment to seek- rather than assume structure. Therefore these findings can be considered a
paradigm shift in law enforcement as well as in organized crime research.
how to disruPt criminal networks?
The simulations in chapter 4 show that effectively disrupting criminal networks requires
strategic planning and long-term consistent effort. The search for replacements after every
intervention (i.e. removal of an actor) increased criminal network efficiency, but also the
general visibility of actors at the same time, making them more vulnerable for detection on
the long run. While the network tries to recover, important actors on the background be-
come exposed. This effect is amplified when intervention strategies are aimed at targeting
specialists within the value chain, who are most difficult to replace. Disruption and detec-
tion strategies should therefore be developed in conjunction to create such momentum.
Within law enforcement practice this means that intelligence services and intervention
units should strategically co-operate more frequently in a ‘networked’ and parallel strategy
to effectively disrupt criminal networks.
However, the fundamental question on the controllability of complex criminal networks
remains an open issue beyond the scope of this thesis. Ashby’s law of requisite variety
states that the controller must have as much variety as the controlled. Such variety within
the bureaucratically organized law enforcement is constraint by law, organizational struc-
ture and internal culture. More empirical research is therefore needed to understand the
complex and continuous interplay between law enforcement and criminal networks, in
other words, between hunter and prey (or the other way around).

Chapter 9: Nederlandse samenvatting
283
nederlandse samenvatting
het detecteren en verstoren van criminele netwerken: een dAtA-gestuurde benAdering
De totale omzet van internationale georganiseerde misdaad wordt wereldwijd geschat
op 900 miljard Euro op jaarbasis. Dit gaat in veel landen gepaard het verlies van vele
mensenlevens, stagnerende economische ontwikkeling, fragiele sociale stabiliteit en een
structurele ondermijning van de democratische rechtstaat. De oorsprong van dit mondiale
probleem is herleidbaar tot de lokale omgeving bestaande uit buurten, scholen, sportver-
enigingen, gevangenissen en nachtclubs, waarin criminelen van verschillende generaties
en culturele achtergronden het vertrouwen vinden om zich in netwerken te verenigen.
In vergelijking met bonafide netwerken, opereren criminele netwerken onder heimelijke
condities en buiten de grenzen van de wet. Het bestrijden van criminele netwerken vormt
daarom een grote uitdaging voor vele rechtshandhavingsinstanties wereldwijd en is op vele
fronten voor verbetering vatbaar. Dit proefschrift draagt bij aan de ontwikkeling van een
effectieve strategie voor het detecteren en verstoren van criminele netwerken waarin een
data-gestuurde benadering centraal staat.
hoe ontstaan criminele netwerken en hoe ontwikkelen ze zich?
De eerste studies naar georganiseerde misdaad in de jaren ‘70 en ‘80 waren sterk geba-
seerd op het beeld van vooraf bedachte hiërarchische piramide structuren, met een strak
leiderschap, een gelaagdheid in rangen en een intern systeem van regels en sancties. In
de vroege jaren ’90 werd dit beeld verworpen door onderzoek dat aantoonde dat ge-
organiseerde misdaad juist voortvloeit uit een complex geheel van overlappende sociale
relaties van vriendschap, familie en buurtgemeenschappen, dat zich niet laat uittekenen
op een tekentafel. Het ontstaan van criminele relaties verloopt echter niet willekeurig,
maar is gebaseerd op basis van wederzijds vertrouwen dat een minimale garantie geeft
in de onzekere en onvoorspelbare criminele onderwereld. Lokale netwerken bereiden zich
naar verloop van tijd uit als gevolg van het kleine-wereld-effect dat hen in contact brengt
met andere lokale netwerken, resulterend in netwerken op mesoniveau. Een klein aantal
actoren in deze mesonetwerken onderscheiden zich door sterke netwerkvaardigheden,
goede reputatie, of unieke vaardigheden een kunnen daardoor onmisbaar worden voor
de voortgang van verschillende criminele bedrijfsprocessen die deze meso-netwerken
doorkruizen.
In hoofdstuk 2 analyseren we het sociale geraamte dat achter een crimineel drugsnetwerk
schuil gaat. We vonden dat het netwerk graviteert rondom een sterke sociale structuur

284
bestaande uit familiebanden en affectieve relaties. Vrouwen vervullen belangrijke rollen als
mediator binnen het netwerk, maar ook als poortwachter naar buiten toe. Dit bevordert
de weerbaarheid van het netwerk als geheel en draagt eraan bij dat dit micro-netwerk zich
ontwikkelde naar een internationaal drugssmokkel netwerk tussen Nederland en Italië.
Actoren die dergelijke brugfuncties vervullen bekrachtigen de algehele connectiviteit in
netwerken waardoor verscheidene meso-netwerken in verschillende regio’s, landen en
continenten op den duur met die met elkaar verbonden raken. Dit resulteert uiteindelijk in
de macroscopische transnationale patronen van criminele samenwerking die vandaag de
dag zichtbaar zijn.
Op het macroniveau kunnen criminele netwerken het beste worden beschouwd als
complexe adaptieve systemen. Vergelijkbaar met complexe netwerken in de biologie,
economie, ecologie en natuur, vertonen dergelijke netwerken non-lineariteit. Dit betekent
dat het geheel van deze netwerken meer is dan de som der delen. De actoren in zo’n
netwerk kunnen autonoom opereren, maar zijn tegelijkertijd ook met elkaar in interactie
wat resulteert in een zeer onvoorspelbare uitkomst van gedrag. Voor complexe adaptieve
systemen geldt dat externe druk, zoals overheidsoptreden, verandering van individueel
gedrag in beweging kan zetten resulterend in verandering van het systeem als geheel. Dit
proces wordt zelforganisatie genoemd.
In vergelijking met legiteme sociale networken, wordt deze dynamiek bij criminele netwer-
ken gekenmerkt door een voortdurende afweging tussen efficiëntie en afscherming in het
onderling delen van informatie. Efficiëntie betekent dat de actoren in het netwerk goed
met elkaar moeten communiceren om het criminele bedrijfsproces te kunnen coördineren.
Dit druist echter in tegen de noodzaak om verborgen te blijven voor politie en justitie
(afscherming) door de onderlinge informatie uitwisseling tot een minimum te beperken.
Criminele netwerken moeten in hun dagelijkse activiteiten daarom constant balanceren
tussen deze twee uitersten, dat hun tevens lichtvoetig maakt en daarom flexibel ten aan-
zien van netwerkinterventies.
In hoofdstuk 4 hebben we deze dynamiek binnen een crimineel meso-netwerk van 22.000
actoren geanalyseerd met behulp van computersimulaties. We ontdekten dat de wissel-
werking tussen afscherming and efficiëntie die volgt op verwijdering van de meest centrale
actoren uit het netwerk (veronderstelde leiders), de netwerken tegen de verwachting in
efficiënter en daardoor sterker maakt. Dit effect wordt zelfs versterkt bij het herhaaldelijk
verwijderen van deze veronderstelde leiders. Onze simulaties laten zien dat niemand on-
vervangbaar is in criminele netwerken en dat deze netwerken zich makkelijk aanpassen na
verstoring door de overheid.

Chapter 9: Nederlandse samenvatting
285
De aanwezigheid van zwakke verbindingen in sterk op dit proces van invloed. Zwakke
verbindingen zijn in essentie de bruggen tussen afgelegen delen van het netwerk. Hun
vertegenwoordiging maakt de dynamische stroom van niet redundante informatie en
hulpbronnen mogelijk en draagt daarom bij aan het vinden van vervangers. Sterke verbin-
dingen hebben eveneens een belangrijke functie in criminele netwerken. Deze zorgen voor
afscherming binnen interne vertrouwensrelaties en daarmee voor detectie van buitenaf.
De verdeling van de strekte van relaties over het netwerk is daarom een belangrijke factor
voor het begrijpen van de structuur en het ontstaan van criminele netwerken.
In hoofdstuk 6 hebben we drie dimensies (structureel, temporeel en demografisch) van
de kracht van criminele relaties in een crimineel mesonetwerk (n=5.000 actoren) gemeten
en met elkaar vergeleken. We vonden dat zwakke relaties gebaseerd op positionering
in het netwerk (o.b.v. edge-betweenness) weliswaar belangrijk zijn voor het verbinden
van sub-netwerken, maar niet exclusief. Er bestaan vele alternatieve paden als gevolg
van het kleine-wereld-effect. Bovendien vonden we dat de meeste zwakke verbindingen
fluïde zijn, dit betekent dat ze kort in stand blijven en weinig worden waargenomen door
de rechtshandhaving organisaties. Ze vertegenwoordigen vaak instrumentele interacties
veelal opgezet door een externe derde partij die als intermediair optreed bij het oplossen
van onderlinge conflicten of een gezamenlijk crimineel belang (b.v. bij investering in de
import van een lading verdovende middelen).
Criminele relaties die worden gekenmerkt door een gelijke achtergrond en multiplexiteit
(meerdere relaties tegelijkertijd) clusteren vaker samen, wat veronderstelt dat er een
voorkeur bestaat om met actoren van dezelfde etnische achtergrond samen te werken
op mesoniveau. Dit kan echter ook een bijeffect zijn van de etnische samenstelling van
buurten en het sluit ook het ontstaan van gemixt-etnische samenwerking op micro-niveau
niet uit. In deze sterk dynamische onderwereld kunnen ook meer duurzame ‘old-boys’s
networks’ geïdentificeerd worden. Gesterkt door loyale familiebanden vinden wij enkele
criminele relaties die al meer dan 20 jaar standhouden.
We concluderen dat georganiseerde misdaad een sterk dynamisch en multidimensionaal
fenomeen betreft dat een gelijkwaardig dynamische en multidimensionale benadering en
reactie vereist, respectievelijk in de wetenschap en binnen de rechtshandhaving.
hoe kunnen criminele netwerken worden gedetecteerd en geanalyseerd?
De empirische bevindingen in dit proefschrift zijn gebaseerd op een data-gestuurde be-
nadering. Dit betekent dat de data bottom-up is geanalyseerd om een zo onbegrensd
mogelijk perspectief op criminele netwerken te verkrijgen, zonder ons te beperken door
theoretische constructen die de data op voorhand al classificeren.

286
In hoofdstuk 2 en 3 worden de mogelijkheden en beperkingen van sociale netwerk analyse
(SNA) verkend voor het bestuderen van criminele netwerken middels een vergelijking van
34 case studies. Onder SNA wordt het proces verstaan, waarbij sociale structuren worden
geanalyseerd door gebruik te maken van netwerk- en graph theorieën. Het beschrijft net-
werkstructuren in termen van noden (actoren, subgroepen) en relaties die hen verbinden.
Deze studies laten zien dat in de studie van georganiseerde misdaad de belangrijkste meer-
waarde van SNA ligt in het afzonderlijk- en in samenhang bestuderen van microscopische
individuele kenmerken en macroscopische patronen van criminele samenwerking. Vooral
voor het begrijpen van de toenemende beschikbaarheid van criminele netwerk data, is
SNA onmisbaar ten opzichte van de traditionele, handmatige analyse. De verscheidene
case studies laten zien dat het combineren van bronnen belangrijk is voor het optimaliseren
van de betrouwbaarheid en validiteit van criminele netwerk visualisatie.
Op microniveau kent de toepassing van SNA een hoog risico op selectie bias. Dit bete-
kent dat de uitkomst van de analyse sterk bepaald kan worden door de prioriteiten van
politie en justitie, zoals bijvoobeeld bij de opsporing van slechts enkele vooraf bepaalde
hoofdverdachten. Het onderzoeksveld van de georganiseerde criminaliteit is daarom het
meest gebaad bij de toepassing van SNA op het mesoniveau, waarvoor meerde soorten
databronnen beschikbaar gecombineerd kunnen worden (b.v. data uit observatie, -cri-
minele inlichtingen data, -open bronnen etc.). De kwantitatieve analyse van SNA helpt
bij het verkennen van de overall structuur van het netwerk en identificeert uitzonderlijke
elementen, waarna de kwalitatieve evaluatie van de resultaten noodzakelijk is op basis van
netwerk- en criminologische theorieën om de bevindingen in context te plaatsen.
In aanvulling op SNA verkennen we in hoofdstuk 2 en 3 de toepassing van crime scripting.
Dit omvat de analyse van het criminele bedrijfsvoering proces door het chronologisch op te
breken in verschillende fases en sub-elementen. Door SNA te combineren met crime scrip-
ting ondervonden we dat er een diepere betekenis aan de onderlinge afhankelijkheden
van de actoren in het netwerk gegeven kan worden. Vanuit en rechtshandhavingsoogpunt
kan het toekennen van rollen aan de actoren in het netwerk op basis van de combinatie
van deze methodieken helpen bij het identificeren van moeilijk vervangbare actoren in het
netwerk.
Onze studies laten echter ook zien dat de combinatie van SNA en scripting voornamelijk op
een handmatige kwalitatieve wijze wordt toegepast. Hoofdstuk 4 presenteert daarom een
kwantitatieve benadering die beide methoden combineert in een nieuwe centraliteit-maat,
genaamd ‘bedrijfsmatige centraliteit’. Dit is gebaseerd op het idee dat de invloed van een
persoon afhangt van het aantal bedrijfsprocessen dat door zijn wegvallen wordt verstoord.
Chapter 9: Nederlandse samenvatting
287
Desondanks, verschaffen SNA en scripting een statisch beeld van een dynamisch feno-
meen. De toepassing van computersimulaties wordt daarom verkend in Hoofdstuk 4,
waarin wiskundige algoritmen worden gebruikt om complex netwerk gedrag te vangen in
een computermodel. Empirische data van een crimineel meso-netwerk (N=22.000 actoren)
wordt als input gebruikt voor deze simulaties waarin verschillende scenario’s getest wor-
den in een virtuele omgeving. Deze studie laat zien dat het combineren van interventie-
algoritmen in hetzelfde model met vervangings-algoritmen, het mogelijk werd om de
verschillende uitkomsten van criminele netwerk interventies te simuleren. Ondanks dat
deze methoden veelbelovend zijn voor onderzoek naar dynamiek in criminele netwerken,
is validatie van deze modellen met behulp van empirisch onderzoek onontbeerlijk.
Dergelijke validatie, evenals de validatie van netwerk weergaven en modellen in het alge-
meen, vereist een vergelijking op basis van verschillende databronnen. Veel studies naar
criminele netwerken zijn echter uitsluitend gebaseerd op opsporingsdata. In hoofdstuk 5
demonstreren we daarom hoe context-gevoelige text-mining technieken kan bijdragen
aan het in kaart brengen van criminele netwerken, in dit geval drugsgebruikers netwer-
ken actief op het social media platform Life Journal (N=23 106). Zulke methoden kunnen
ingezet worden bij het detecteren van hackers netwerken, kinderporno netwerken of
Darknet drugshandel netwerken om inzicht te verschaffen in hun structuren buiten de
rechtshandhavingscontext om.
In aanvulling hierop laat hoofdstuk 6 zien dat een data-gestuurde benadering ook gebaad
kan zijn bij focus op de relaties in plaats van de actoren. Hierin presenteren we een cate-
gorisatie van criminele relaties: fluïde, manifest, latent en duurzaam dat kan bijdragen aan
een effectievere detectie van criminele netwerken door observatie of inlichtingen. Omdat
fluïde en manifeste relaties zeer veranderlijk zijn, benadrukken onze resultaten het belang
van de detectie en focus van inlichtingencapaciteit op latente en duurzame relaties in het
netwerk. Dit leidt tot een meer duurzame en robuuste informatie positie.
Op basis van de hoofdstukken gepresenteerd in dit proefschrift kunnen we concluderen dat
criminele netwerk structuren op ieder niveau (micro, meso en macro) niet vooraf kunnen
worden bedacht, maar ontstaan. Een data-gestuurde analyse van deze emergente netwer-
ken kan richting geven aan kwalitatieve interpretaties en onderzoek, om naar structuur te
zoeken in plaats van deze te veronderstellen. Dit kan daarom beschouwd worden als een
paradigm-verschuiving in de praktijk van de rechtshandhaving alsmede in onderzoek naar
georganiseerde criminaliteit.
288
hoe kunnen criminele netwerken worden verstoord?
In dit proefschrift is onderzocht welke interventiestrategieen het meest effectief zijn
voor het verstoren van criminele netwerken. De simulaties in hoofdstuk 4 laten zien dat
het effectief verstoren van criminele netwerken een strategische planning en een lange
adem vereisen. De zoektocht naar vervangers na iedere interventie (verwijdering van
een actor) vergroot de efficiëntie van het netwerk, maar tegelijkertijd ook de algemene
zichtbaarheid van actoren. Dit maakt het netwerk kwetsbaar voor detectie op de langere
termijn. Terwijl het netwerk herstelt van herhaalde interventies, worden de belangrijke
actoren op de achtergrond steeds beter zichtbaard. Dit effect wordt versterkt wanneer
interventie-strategieën zich richten op de specialisten binnen het criminele bedrijfsproces
die het moeilijkst vervangbaar zijn. Detectie- en interventie strategieën behoren daarom in
samenhang ontwikkeld te worden om deze impuls optimaal te benutten. Binnen de rechts-
handhavingspraktijk betekent dit dat inlichtingenafdelingen en interventie-eenheden (bv
opsporingsteams) op strategisch niveau zouden moeten samenwerken in een genetwerkte
en parallelle strategie om criminele netwerken maximaal te verstoren.
Desondanks blijft er enkele fundamentele vragen over de controleerbaarheid van criminele
netwerken onbeantwoord. Dit blijft een openstaande kwestie in complexity onderzoek
in meerdere disciplines en dragen daarom verder dan de reikwijdte van dit proefschrift.
Ashby’s wetmatigheid van ‘vereiste verscheidenheid’ stelt als voorwaarde dat de controller
hiervoor evenveel variëteit moet bevatten als de gecontroleerde. Zulke variëteit is bin-
nen het bureaucratisch georganiseerde rechtshandhavingsapparaat sterk beperkt door de
wet, de organisatie structuur en de interne cultuur. Verder empirisch onderzoek is daarom
noodzakelijk om te voortdurende en continue wisselwerking tussen rechtshandhavings-
organisaties en criminele netwerken te begrijpen, met andere woorden het spel tussen
roofdier en prooi (of andersom).

Chapter 9: Dankwoord
289
dankwoord
Elf jaar geleden verliet ik met een Master-diploma de universiteit. Als je mij destijds had
gezegd dat ik ooit zou promoveren had ik je voor gek verklaard. Ik wilde vooral ‘de opera-
tie’ in en ‘een echte’ bijdrage leveren aan de veiligheid in Nederland. Het luidde de start in
van mijn carrière bij de Nederlandse Politie. Ik heb er een geweldige tijd gehad en enorm
veel geleerd, maar ik ben ook tot een ruimer inzicht gekomen. Voor de operatie is een visie
gebaseerd op kritisch en onafhankelijk verkregen empirisch inzicht in veiligheidsproblemen
van essentieel belang. Dit inzicht dreef mij de afgelopen jaren van de operatie terug naar
de academische wereld, met dit proefschrift als gevolg.
Uiteraard ben ik dit pad niet zomaar gaan bewandelen. Een verzameling aan lieve en
bijzondere mensen heeft mij geïnspireerd, gemotiveerd, kansen gegeven, waardevol
geadviseerd, door moeilijke tijden heen geloodst, de noodzakelijke afleiding gegeven en
onvoorwaardelijk in mij geloofd. Ik wil al deze mensen graag van harte bedanken. Een
aantal mensen wil ik graag in het bijzonder noemen.
Als eerste gaat mijn dank uit naar mijn twee promotoren prof. dr. ir. A.G. Hoekstra, en
prof. dr. ing. Z.J.M.H. Gerardts. Beste Alfons, bedankt voor je voortvarende begeleiding
en sturing op mijn planning, je flexibiliteit en je oog voor detail in de totstandkoming van
dit proefschrift. Beste Zeno, dankjewel voor je positieve en waardevolle feedback en je
flexibiliteit in drukke tijden.
De leden van de promotiecommissie, prof. dr. E.W. Kleemans, prof. dr. A.C. Van Asten,
prof. dr. H.L.J. Van der Maas en Dr. T. Vis wil ik bedanken voor het lezen en beoordelen
van mijn proefschrift en dat zij zitting hebben willen nemen in mijn promotiecommissie.
Dr. M.L. Lees, thank you for your willingness to read and review my thesis and for being a
member of the Doctorate Committee.
Een aantal co-auteurs heeft een belangrijke bijdrage geleverd aan de verschillende studies.
Dr. P.H.M.M. Klerks, Beste Peter, dankjewel voor de prettige samenwerking, het delen van
je waardevolle kennis en ervaring en de enerverende etentjes. Ik bewonder hoe jij vanuit
je gevarieerde kennis en ervaring altijd weer tot verfrissend nieuwe inzichten en ideeën
weet te komen. Dr. R. Quax, Beste Rick, bedankt voor je waardevolle ideeën, geduld en
behulpzaamheid. Als ik je even niet meer kon volgen, was je altijd bereid om mij weer op
het juiste spoor te zetten. Dr. V. Kashirin, Dear Victor, thank you for the nice cooperation
during our research project. I believe that the combination of our different backgrounds,
knowledge, and skills contributed to the succes of our research project. Drs L.J. Dijkstra,
dankjewel voor de prettige samenwerking.

290
Veel dank ben ik verschuldigd aan mijn oud-collega’s van mijn oude afdeling bij de Politie
Eenheid Den Haag. Ik kwam binnen als een ‘vreemde eend’ en ik vrees dat ik dat ook
altijd ben gebleven, maar ik ervoer openheid voor mijn ideeën en een sterk wederzijds
respect. In het bijzonder wil ik hiervoor mijn voormalig leidinggevenden Peter, Ab en Henk
bedanken voor de ruimte en het vertrouwen dat jullie mij gaven tijdens mijn werk voor de
afdeling en voor het verrichten van dit onderzoek.
Tevens ben ik mijn voormalig coördinatoren, Dirk en Sascha, en collega’s van het Openbaar
Ministerie, Rick, Sophie en Hester, graag bedanken voor de prettige samenwerking, het
vertrouwen en de kansen die jullie mij hebben gegeven om mijn wetenschappelijke inzich-
ten te vertalen naar de praktijk. Dankzij jullie en de overige oud-collega’s op de werkvloer,
heb ik tevens de unieke mogelijkheid gekregen om het operationele werkveld te leren
kennen en begrijpen. Ook wil ik graag René Hesseling en Janine Janssen bedanken, voor
het delen van jullie ervaring en de vele waardevolle adviezen voor het werk.
Vooral voor de momenten buiten het werk wil ik graag mijn zeer gewaardeerde ‘lotge-
noten’, Dominique, Eveline, Charisse, Eliza, Joanna, Ivar en Ruth bedanken. De gezellige,
relativerende (en soms therapeutische) borrels, etentjes en lunchafspraken gaven lucht en
energie om op volle kracht verder te gaan. I would also like to thank my former colleagues
(and friends), Camille, Nora, Maryse, Miroslav, Monica and Sacha, who made my time at
Europol a better experience.
Bijzonder veel dank gaat uit naar mijn collega Thijs Vis. Zes jaar geleden kenden we elkaar
nog niet en bleken we afzonderlijk van elkaar een revolutie voor te bereiden binnen ons
werkveld. Een gedeelde sterke ambitie, passie voor ons vak en een voorliefde voor de
Antilliaanse rapcultuur brachten een mooie en succesvolle samenwerking tot stand. We
trokken samen door het land en zetten een nieuw paradigma op de kaart. Ik hoop dat
we onze vruchtbare samenwerking nog lang kunnen voortzetten. Hester, ik wil jou ook in
het bijzonder bedanken voor onze professionele samenwerking en je warme vriendschap.
Daarnaast wil ik graag mijn overige landelijke collega’s Brenda, Bart, Linda, Hans, Mari-
anne bedanken voor de hechte samenwerking, humor, betrokkenheid, en uitwisseling van
ideeën in de doorontwikkeling van onze gezamenlijke werkwijze en producten.
Dank gaat tevens uit naar mijn huidige collega’s bij de FIOD. Ik dank jullie voor de warme
ontvangst vertrouwen aan het begin van een nieuwe uitdaging. Onno en Harwin, jullie wil
ik graag in het bijzonder bedanken voor jullie ruimdenkendheid en flexibiliteit. Daarnaast
wil ik graag mijn collega’s van de politieacademie bedanken voor de prettige samenwerk-
ing in de afgelopen jaren, in het bijzonder Willeke Feenstra.

Chapter 9: Dankwoord
291
Tussendoor spreek ik graag een woord van dank uit aan Eddy Vedder, The Foo Fighters,
Passenger, The Kings of Leon, Ludovico Einaudi en Chet Baker voor de muzikale omlijsting
van dit proefschrift. Zonder dat jullie dat ooit zullen weten hebben jullie een belangrijke
boost gegeven aan mijn productiviteit en mijn mentale gezondheid tijdens de hectische
perioden.
Heel blij ben ik met mijn vrienden die in verschillende gradaties en wellicht soms zonder
het zelf te weten de juiste balans geven tussen werk en de dingen waar het echt om draait.
Vrienden van FC Castricum 3, ik heb genoten van alle mooie sportieve hoogte en diepte
punten en vooral van de heerlijke uitlaatklep op de zaterdagmiddag. Mijn vrienden van
Tantoe Boeng en B*Ster Belgrado, waar we in de eerste twee helften steeds vaker voor
onze leeftijd moeten corrigeren, maken we dat in de derde helft goed. Bedankt voor jullie
sympathieke gezelschap. Dominique, bedankt voor de goede gesprekken in de kroeg en
in het bijzonder voor de katers de volgende morgen. Ook Lars, Jan J., Ferdinand, Paul B.
en de overige IJzervreters bedankt voor de slopende maar ook heerlijke momenten in de
sportschool, het park, of elders in de stad. In het bijzonder wil ik hierbij rapper Thijssie M.
noemen die mij met zijn vlijmscherpe freestyle sessies altijd weer met de beide benen op
de grond weet te zetten. Anton en Gijs, al zien we elkaar niet heel vaak, het is altijd weer
mooi om samen herinneringen op te halen, in het moment te leven, of vooruit te kijken.
Mijn matties Renaud en Mark, het klikte meteen goed zowel op als buiten de werkvloer.
Het is heerlijk om met jullie ervaringen uit te wisselen m.b.t. duiken en reizen en ik hoop
nog steeds met jullie de ruige wildernis van Noorwegen te verkennen. Renaud, hoe vaak
we ook tegenover elkaar staan op de mat of in de ring, ik blijf je betrokkenheid, interesse
en humor als goede vriend zeer waarderen. Niemand anders zou de rol van mijn paranimf
beter kunnen vervullen.
Bart, Bart, Bart, Bas en Tjebbe, we zijn inmiddels al ruim 12 jaar bevriend en hebben vele
mooie, hilarische en bizarre momenten gedeeld. Ook al zijn onze levens de afgelopen paar
jaar sterk veranderd, ik blijf altijd nog van onze bourgondische weekendjes en avondjes
genieten. De heerlijke sarcastische humor is ook altijd gebleven en zou ik nooit willen
missen.
Natuurlijk wil ik ook graag mijn schoonfamilie bedanken. Peter, bedankt voor de kansen
die je mij hebt gegeven en het vertrouwen dat je in mij hebt getoond zowel buiten als
tijdens mijn promotietraject. Jouw onuitputtelijke nieuwsgierigheid, kennis en ervaring
maakten de meeste diners tot een boeiend en interactief hoorcollege. Wat meestal als
een spontane brainstormsessie aan de eettafel begon, mondde uit in een gezamenlijke
publicatie. Onze muzikale projecten waren voor mij (en ik denk ook voor jou) misschien

nog wel het meest bijzonder. Ik hoop dat we die samenwerking kunnen voortzetten. Lieve
Monique, Job en Emy, bedankt voor jullie gastvrijheid, openheid, humor, belangstelling en
warmte. Ik heb mij altijd zeer thuis gevoeld bij jullie.
Lieve pap en mam, bedankt voor alles dat mij heeft gemaakt tot de persoon die ik vandaag
ben. De onvoorwaardelijke liefde, zorg, vertrouwen en kracht die ik van jullie heb ont-
vangen voel ik elke dag en sterken mij in de wegen die ik bewandel waar ook ter wereld.
Mam, voor jou heb ik buitengewoon veel respect. Ik heb van dichtbij meegemaakt hoe jij
dankzij je kracht en doorzettingsvermogen weer wat van je leven hebt gemaakt nadat alles
was ingestort. Ik hoop dat je samen met Henk nog lang het geluk weet te vinden dat je
verdient. Lieve pap, helaas heb ik je al een groot gedeelte van mijn leven moeten missen,
maar ik voel je liefde en hoor je stem nog iedere dag. Je was de meest trotse vader van de
wereld en ik weet zeker dat je dat nu nog steeds bent, helemaal als de ochtend van mijn
promotie is aangebroken. Lieve broer, wat jij voor mij betekent is bijna niet in woorden
uit te drukken. Ik ben super trots op wie je bent en wat je doet. Onze gedeelde passies,
gezamenlijke verre reizen en het feit dat je er altijd voor mij bent, maken jou niet alleen
familie maar ook tot mijn beste vriend. Onze band is alleen maar sterker gegroeid in de
afgelopen jaren en ik hoop dat we dat nog heel lang kunnen voorzetten. Ik hoop dat jij
samen met je lieve Agi een mooie toekomst tegemoet gaat.
De laatste woorden van dit proefschrift zijn voor jou lieve Rosa. We kennen elkaar al 13
jaar en hebben zoveel meegemaakt samen. Ik ben ontzettend trots en bevoorrecht dat jij
in mijn leven bent gekomen. Jouw ambitie, doorzettingsvermogen en levenslust zijn een
belangrijke inspiratiebron geweest tijdens een groot deel van mijn leven en ook mede voor
de totstandkoming van dit proefschrift. Dankjewel voor al je liefde, steun en positiviteit. Al
onze grensverleggende ervaringen, avontuurlijke reizen, verdrietige, grappige en intieme
momenten samen spelen zich in mijn herinnering af als een prachtige film en zullen voor
altijd in mijn hart gesloten blijven.
Chapter 9: About the Author
293
about the author
Paul Duijn was born on 10 February 1982 in Heemskerk, the Netherlands. After completing
his pre-university education at the Bonhoeffer College in Castricum, he started his studies
in 2001 at the VU University Amsterdam. Here he received his Bachelor’s and Master’s
degree in Criminology, for which an internship was completed at The Dutch Police and
the Scientific Research and Documentation Centre (WODC) of the Ministery of Justice.
Paul conducted his Master’s thesis on the differences between attempted and completed
homicide in the Netherlands.
In 2006 Paul started his career at the Dutch Police, working in the field of threat assessment,
terrorism and public safety. At the same time he started working as a freelance lecturer at
the Police Academy of the Netherlands and developed courses in intelligence-led- policing
and effective crime control aimed at police management levels.
In 2008 he moved from the National Police Department (KLPD) to a regional police depart-
ment, where he worked in the position of Senior Analyst within the criminal investigations
unit. In this occupation he worked on several homicide and serious- and organized crime
cases, and was responsible of assisting police management levels in operational decision
making. In 2009 he received his Master’s degree in Criminal Investigation at the Police
Academy of the Netherlands and did an internship at the Royal Canadian Mountain Police
(RCMP). Paul conducted his Master’s thesis on the influence of intelligence products on
decision making within organized crime control.
In 2010 Paul accepted the position of strategic analyst at the Criminal Intelligence Unit
of the The Hague Police Region. In support of his operational tasks he initiated several
research projects together with in University of Amsterdam, aimed at creating a reliable
intelligence picture on criminal networks in the region. These efforts contributed to the
development of a new approach for the analysis of criminal networks based on criminal
intelligence collection. Together with other strategic analysts working for the Dutch Police
this model was further developed to become a standard paradigm for the analysis of
serious and organized crime in the Netherlands. During this period Paul was a visiting
lecturer at the Criminology Faculty of the VU University Amsterdam, providing courses in
social network analysis (SNA) at the Police Academy of the Netherlands. In 2014 he was
registered as PhD candidate at the University of Amsterdam.
In 2015 Paul accepted a position at Europol where he worked as a Strategic Analyst in
the Serious- and Organized Crime Analysis Unit, responsible for delivering the threat as-
sessments, related to organized crime and terrorism, to the European Commission and

294
the EU Member States. Currently he works for the Fiscal Intelligence and Investigations
Department (FIOD) of the Ministry of Finance and is tasked with strengthening the intel-
ligence position on criminal networks involved in corruption, money laundering and fraud
at a national- and international level.
Chapter 9: List of Publications
295
list of Publications
1. Duijn, P. A. C. & Klerks, P. M. M. (2014) The Application of Social Network Analysis,
Recent developements within Dutch Police. In: Masys, A. (Ed.) Networks and Network
Analysis for Defence and Security, Series: Lecture Notes in Social Networks, 2014, XIV,
301 Elsevier (2014).
2. Duijn, P.A.C. & Klerks, P.M.M. (2014) Bridging science and investigations: the applica-
tion of Social Network Analysis in Dutch criminal investigative practice. Tijdschrift voor
Criminologie 14(4)
3. Duijn, P.A.C.; V. Kashirin and P.M.A. Sloot. (2014) The Relative Ineffectiveness of
Criminal Network Disruption. Scientific Reports, vol. 4, pp. 4238+15. Nature Publishing
Group/Macmillan. ISSN 2045-2322.
4. Dijkstra, L.J.; A.V. Yakushev; P.A.C. Duijn; A.V. Boukhanovsky and P.M.A. Sloot (2013)
Inference of the Russian drug community from one of the largest social networks in
the Russian Federation. Quality & Quantity, International Journal of Methodology, pp.
1-17. Springer Netherlands. ISSN 0033-5177.
5. Toth, N.; L. Gulyás; R.O. Legendi; P.A.C. Duijn; P.M.A. Sloot and G. Kampis. (2013) The
importance of centralities in dark network value chains. The European Physical Journal
– Special Topics, vol. 222, nr 6 pp. 1413-1439. 2013. ISSN 1951-6355 and 1951-6401.
6. Duijn, P.A.C.; R. Quax; P.M.A. Sloot. (2016) Fluid networks within an old boys’ net-
work?; An empirical network study on tie-strength in organized crime. (Submitted)
7. Duijn, P.A.C., & Sloot, P.M.A. (2015). From data to disruption. Digital Investigation, 15,
39-45.


Chapter 9: Contributions
297
contributions
Chapter 2
P.A.C. Duijn collected the data and performed the social network analysis and interpreted
the technical and qualitative results. P.A.C. Duijn and P. Klerks wrote the paper. P.A.C. Duijn
prepared the Figures. Both others reviewed the paper.
Chapter 3
P.A.C. Duijn and P. Klerks collected the data. P.A.C. Duijn developed the methodology for
meta-analysis and analyzed the data. P.A.C. Duijn and P. Klerks interpreted the data. P. A.C.
Duijn and P. Klerks wrote the paper. Both authors reviewed and edited the Dutch version of
the paper. P. Klerks translated the paper to English.
Chapter 4
This chapter is based on the combination of two published papers:
P.M.A. Sloot conceived and directed the research, P.A.C. Duijn provided the data and
interpreted the social-criminal dynamics, V. Kashirin performed the data mining and the
value-chain network simulations. P.M.A. Sloot and P.A.C. Duijn wrote the manuscript,
Kashirin prepared the Figures. All authors reviewed the manuscript.
G. Kampis conceived and directed the research, P.A.C. Duijn, G. Kampis and P.M.A. Sloot
provided the initial idea and concept. N. Toth, L. Gulyas, O. Legendi and G. Kampis, created
the models, collected the data and analyzed the data. N. Toth, L. Gulyas, O. Legendi and
G. Kampis wrote initial version of the paper. P.A.C. Duijn reviewed the paper and provided
the criminological context and interpretation. All authors reviewed the paper.
Chapter 5
P.M.A. Sloot conceived and directed the research; L.J. Dijkstra and A.V. Dijkstra performed
the datamining and scraping of the data. L.J. Dijkstra, and P.M.A. Sloot first interpreted
and wrote the paper. P.A.C. Duijn reviewed the paper and interpreted the criminological
context and relevance for law enforcement. L.J. Dijkstra prepared the Figures. All authors
reviewed the paper.

298
Chapter 6
P.M.A conceived and directed the research; P.A.C. Duijn collected the data. R. Quax parsed
and processed the data; P.A.C. Duijn analysed and interpreted the data. P.A.C. Duijn, R.
Quax and P.M.A. Sloot drafted the paper. Duijn prepared the figures.
Chapter 7
P.M.A. Sloot conceived and directed the research. P.A.C. Duijn performed the research and
wrote the first version of the paper. P.M.A. Sloot and P.A.C. Duijn reviewed and edited the
paper.
Related Documents


