9000 Area Planning / Documentation - Table of Contents 9000 Appendices ......................................................................................................... 1 9100 Emergency Notification..............................................................................................1 9110 Initial Awareness, Assessment & Notification Sequence .........................................1 9200 Personnel and Services Directory.............................................................................2 9210 Federal Resources/Agencies ...................................................................................2 9220 State Resources/Agencies .......................................................................................2 9230 Local Resources/Agencies........................................................................................3 9240 Private Resources ....................................................................................................3 9250 Stakeholders ............................................................................................................3 9300 Draft Incident Action Plan (IAP).................................................................................3 9400 Area Planning Documentation ..................................................................................3 9410 Discharge and Release History................................................................................3 Summary of Statistical Data ........................................................................................3 9420 Risk Assessment......................................................................................................5 9420.1 North Coast...................................................................................................5 9420.2 San Francisco Bay and Delta .......................................................................6 9420.3 Central Coast................................................................................................9 9430 Planning Assumptions – Background Information..................................................11 9430.1 Navigational Hazards..................................................................................11 9430.2 Potential Spill Risks ....................................................................................13 9440 Planning Scenarios ................................................................................................14 9440.1 North Coast.................................................................................................14 Scenario Development.......................................................................................14 Most Probable Discharge...................................................................................14 Maximum Most Probable Discharge..................................................................17 Maximum Most Probable Discharge..................................................................17 Discharge of Maximum Impact..........................................................................51 9440.2 San Francisco Bay and Delta Scenarios ....................................................52 Scenario Development.......................................................................................52 Most Probable Discharge...................................................................................52 Maximum Most Probable Discharge..................................................................55 Worst Case Discharge ......................................................................................68 Worst Case Discharge #1 ...........................................................................71 Worst Case Discharge #2 ...........................................................................80 Worst Case Discharge #3 ...........................................................................93 Worst Case Discharge #4 .........................................................................112 9440.3 Central Coast Scenarios...........................................................................128 9500 Agreements List (Memorandums of Agreement/Understanding) ......................132 9600 Conversions ............................................................................................................165 9700 Response References List.....................................................................................165 9710 Relevant Statute/Regulations/Authorities List ......................................................165 9720 Relevant Instructions/Guidelines/Standard Procedures and Practices ................165 9720.1 NRDA Procedures ....................................................................................165 Introduction......................................................................................................166 Background And Structure ..............................................................................166 Assessment Procedures..................................................................................167 Injuries and Lost Services................................................................................167 Preliminary Damage Estimates........................................................................167 NRDA Process .................................................................................................168 NRDA and the ICS ...........................................................................................168 Sector SF Section 9000-1 October 1, 2014

Welcome message from author
This document is posted to help you gain knowledge. Please leave a comment to let me know what you think about it! Share it to your friends and learn new things together.
Transcript
9000 Area Planning / Documentation - Table of Contents
9000 Appendices ......................................................................................................... 1 9100 Emergency Notification..............................................................................................1
9110 Initial Awareness, Assessment & Notification Sequence .........................................1 9200 Personnel and Services Directory.............................................................................2
9210 Federal Resources/Agencies ...................................................................................2 9220 State Resources/Agencies .......................................................................................2 9230 Local Resources/Agencies........................................................................................3 9240 Private Resources ....................................................................................................3 9250 Stakeholders ............................................................................................................3
9300 Draft Incident Action Plan (IAP).................................................................................3 9400 Area Planning Documentation ..................................................................................3
9410 Discharge and Release History................................................................................3 Summary of Statistical Data ........................................................................................3
9420 Risk Assessment......................................................................................................5 9420.1 North Coast...................................................................................................5 9420.2 San Francisco Bay and Delta .......................................................................6 9420.3 Central Coast................................................................................................9
9430 Planning Assumptions – Background Information..................................................11 9430.1 Navigational Hazards..................................................................................11 9430.2 Potential Spill Risks ....................................................................................13
9440 Planning Scenarios ................................................................................................14 9440.1 North Coast.................................................................................................14
Scenario Development.......................................................................................14 Most Probable Discharge...................................................................................14 Maximum Most Probable Discharge..................................................................17 Maximum Most Probable Discharge..................................................................17 Discharge of Maximum Impact..........................................................................51
9440.2 San Francisco Bay and Delta Scenarios ....................................................52 Scenario Development.......................................................................................52 Most Probable Discharge...................................................................................52 Maximum Most Probable Discharge..................................................................55 Worst Case Discharge ......................................................................................68
Worst Case Discharge #1 ...........................................................................71 Worst Case Discharge #2 ...........................................................................80 Worst Case Discharge #3 ...........................................................................93 Worst Case Discharge #4 .........................................................................112
9440.3 Central Coast Scenarios...........................................................................128 9500 Agreements List (Memorandums of Agreement/Understanding) ......................132 9600 Conversions ............................................................................................................165 9700 Response References List.....................................................................................165
9710 Relevant Statute/Regulations/Authorities List ......................................................165 9720 Relevant Instructions/Guidelines/Standard Procedures and Practices ................165
9720.1 NRDA Procedures ....................................................................................165 Introduction......................................................................................................166 Background And Structure ..............................................................................166 Assessment Procedures..................................................................................167 Injuries and Lost Services................................................................................167 Preliminary Damage Estimates........................................................................167 NRDA Process .................................................................................................168 NRDA and the ICS ...........................................................................................168
Sector SF Section 9000-1 October 1, 2014

THIS PAGE INTENTIONALLY BLANK
Sector SF Section 9000-2 October 1, 2014

Notification Procedure for Initiating NRDA .......................................................169 Identification of Lead Administrative Trustee ...................................................169
9720.2 Funding Issues..........................................................................................170 Oil Spill Liability Trust Fund (OPA Fund)...........................................................170 California Oil Spill Response Trust Fund...........................................................170 Contacts With Responsible Party(ies)...............................................................170
9720.3 Public Affairs Procedures..........................................................................170 Check-list for Public Affairs Response to Pollution Incidents...........................170 Suggested Equipment Needs for JIC/Public Affairs:........................................171 Public Affairs Section Staffing .........................................................................172 Logistical Concerns For News Conferences ...................................................175 Internal Information .........................................................................................177 Photo Documentation.......................................................................................178 Administration...................................................................................................178 Community Relations .......................................................................................179
9720.4 GRAs/Site Strategies................................................................................181 9730 Geographic Response Plans................................................................................181
9730.1 Fish and Wildlife Response Plans ............................................................181 Wildlife Recovery Plan .....................................................................................181 Introduction.......................................................................................................181 Primary Response............................................................................................182 Secondary Response - Hazing.........................................................................183 Tertiary Response............................................................................................183 Wildlife Operations ...........................................................................................184 Wildlife OPS: Equipment and Personnel..........................................................184 Facilities and organizations participating in the Oiled Wildlife Care Network to be
activated as needed through the Wildlife OPS Branch: ..........................185 Cooperating Organizations with trained volunteers..........................................188 Sea Otter - Oil Spill Contingency Plan for California ........................................189 USFWS Permit Requirements and NMFS Guidelines for Oiled Wildlife Response
Activities..................................................................................................192 9740 Technical References List....................................................................................193
9800 Vol II: Sensitive Sites..............................................................................................193 9900 Reserved for Area/District......................................................................................193
Sector SF Section 9000-3 October 1, 2014

9000 Area Planning / Documentation
9100 Emergency Notification
9110 Initial Awareness, Assessment & Notification Sequence
INITIAL INFORMATION Complete all required sections of the pollution incident folder
Reporting Party Name:_______________________________________________________
Reporting Party Address: _______________________________________________________________ _________ Reporting Party Phone Number_______________________________________________
Responsible Party Name:_____________________________________________________
Responsible Party Address: _________________________________________________________________________ Responsible Party Phone Number: ___________________________________________
What happened? ___________________________________________________________
___________________________________________________________________________ What material was released?_________________________________________________
How much was released? ________________________________________________ _
Where material was released (City, County, State) ________________________________________________________________________ Location to nearest street corner or landmark: ________________________________________________________________________ When did it happen?________________________________________________________
When was it discovered?_____________________________________________________
How did it happen? __________________________________ __________________
What caused the discharge?
__________________________________________________________________________________
____________________________________________________________________
Sector SF Section 9000-4 October 1, 2014

ACTION CHECKLIST
Upon receiving notification of a spill, complete a Pollution Incident Case Folder Ask reporting party if NRC & California OES have been notified Notify NRC, 1-800-424-8802 Notify California OES, 1-800-852-7550 Is spill in our Zone? If not notify the EPA, 1-800-300-2193 Consider if reporting party is a reliable source. If not, then try to have a local agency
(fire, police, harbor master, etc.) confirm the spill. If possible, determine if spill is cleanable and if Responsible Party is taking sufficient
removal action Notify Pollution Team Leader and ensure they are making further notifications, assist as
necessary. Notify Chief of Incident Management Division (Team Leader should make this notification.
Remind them that you haven’t. Assist as necessary.) Notify Chief of Response Is Responsible Party taking sufficient action? If not, initiate federal cleanup if cleanup is
feasible or source is in immanent danger of spilling further. Pollution Team leader will work directly with Chief of Incident Management Division in making determination.
Notify duty Investigating Officer if tankerman or licensed person in charge is involved. Notify duty Investigating Officer if incident involves a commercial vessel and spill is over
10,000 gallons of oil, and confirm alcohol/drug testing. If spill is greater than 100 gallons or a there is significant public/media interest, send
POLREP COMMENTS: Under Section 311 of the Clean Water Act, the Coast Guard has the responsibility to provide a safe and adequate response to oil discharges, or potential threats of discharges in the Navigable Waters and connecting tributaries of the United States. Responders will investigate source, cause, and any other violations of laws; assess discharge severity and cleanup feasibility; ensure cleanup action is undertaken. ADDITIONAL REFERENCES: (a) 40 CFR 300, National Contingency Plan Link (b) Sector San Francisco Area Contingency Plans (c) Region IX, Regional Contingency Plan (d) Sector San Francisco, OSLTF and CERCLA access guidelines (IMD bookshelf).
9200 Personnel and Services Directory
9210 Federal Resources/Agencies Refer to Section 5010 of the Region 9 Contingency Plan.
9220 State Resources/Agencies Refer to Section 5011 of the Region 9 Contingency Plan.
Sector SF Section 9000-5 October 1, 2014
9230 Local Resources/Agencies
For a list of local resources/agencies, contact Sector SF 415-399-7320
9240 Private Resources
For a list of private regional resources, please see the Western Response Resource List.
9250 Stakeholders See section 1330 for a list of area stakeholders.
9300 Draft Incident Action Plan (IAP) Refer to the Region 9 Contingency Plan.
9400 Area Planning Documentation
9410 Discharge and Release History
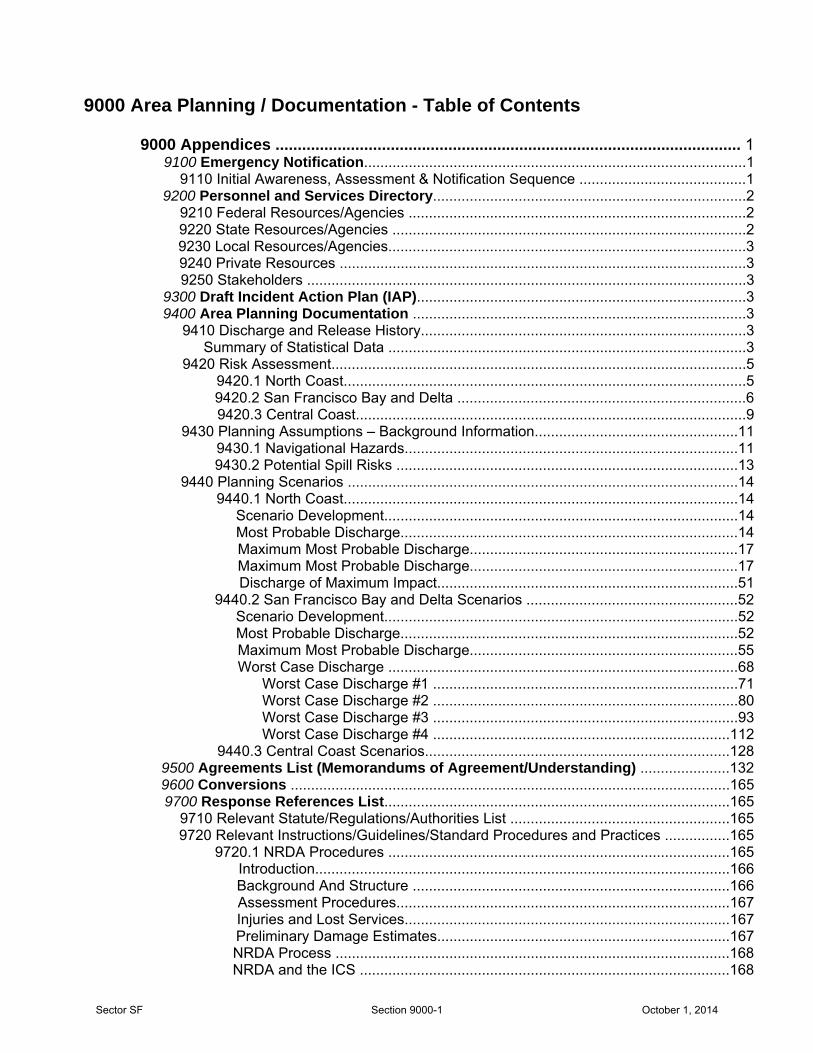
Summary of Statistical DataData extracted from the Coast Guard Marine Information for Safety and Law Enforcement.
Total Reported Oil Pollution Incidents for Sector San Francisco/Year - Chart 1
2003 Year
2004 Year
2005Year
2006 Year
2007Year Total Avg
Total Number of Oil Pollution Incidents 192 196 196 303 412 1,299 259.8
Total Reported Oil Spills By Source/Year - Chart 2
2003 Year
2004 Year
2005Year
2006 Year
2007 Year Total Avg
Facilities (All non-vessels) 30 34 38 73 121 296 59.2Military / Public Vessel 6 8 2 16 13 45 9 Fishing Vessel 20 18 11 23 16 88 17.6 Commercial Vessel 2 18 27 37 28 112 22.4 Non-Commercial Vessel 50 30 48 51 72 251 50.2
Unknown Source 81 87 82 111 162 523 104.6
Total Reported Oil Pollution Incidents/Month for 2007 - Chart 3 Total Avg
Total Number of Oil Pollution Incidents 412 34
Sector SF Section 9000-6 October 1, 2014

Total Amount of Oil Discharged and/or Hazardous Material Released (gallons) 60,945
5078 Total Amount of Oil and/or Hazardous Material Released by Vessels/Month for 2007 - Chart 4 Total Avg
Total Amount of Oil and/or Hazardous Material Released 59,957 4,996
Total Amount of Oil and/or Hazardous Material Released by Non-Vessel Sources/Month for 2007 - Chart 5 Total* Avg
Total Amount of Oil and/or Hazardous Material Released 1,000 83.3
Total Reported Oil Spills by Size/Month for 2007 - Chart 6 Total Avg # of Spills between 0 - 10 gallons 361 30.1 # of Spills between 10 - 100 gallons 36 3# of Spills between 100 - 1,000 gallons 5 .4 # of Spills 1,000 gallons > 1 .1 Total Reported Oil Spills By Source/Month for 2007 - Chart 7 Total Avg Facility / Non-Vessel Source 121 10.1 Military / Public Vessel 13 1.1 Fishing Vessel 16 1.3 1.50 Commercial Vessel 28 2.3 Non-Commercial Vessel 72 6 Unknown Source 162 13.5 Penalty Action: Total Avg Civil Penalty (MV) 1 .1 Civil Penalty (TK) 15 1.25 Letter of Warning (LOW) 33 2.75 No Action Required 364 30.3 Please Note: Oil Discharge data includes all discharges within the USCG response zone, including wetlands and adjacent waterways. *Approx. 58000 gallons discharged due to the M/V Cosco Busan
Sector San Francisco Pollution Statistics: 2003 to 2007
Year 2003 2004 2005 2006 2007 Totals Average Total Reported Oil Pollution Incidents for Sector SF 192 196 196 303 412 1,299 259.8
Sector SF Section 9000-7 October 1, 2014

Penalty Action: 2003 2004 2005 2006 2007 Totals Average Civil Penalty (MV) 18 4 1 4 1 28 6 Civil Penalty (TK) 25 9 20 19 15 88 18 Letter of Warning 31 40 42 48 33 194 39 No Action Required 99 132 133 232 364 960 192
Spill Source 2003 2004 2005 2006 2007 Totals Average Facility / Non Vessel 30 34 38 73 121 296 59 Military/Public Vessel 6 8 2 16 13 45 9 Fishing Vessel 20 18 11 23 16 88 18 Commercial Vessel 2 18 27 37 28 112 22 Non-Commercial Vessel 50 30 48 51 72 251 50 Unknown Source 81 87 82 111 162 523 105
For the year to date July 2005, Sector San Francisco had responded to 73 FPN cases totaling $ 24 million in costs.
9420 Risk Assessment
9420.1 North Coast Spill history for the North Coast Area was obtained primarily from the Coast Guard’s MSIS Marine Pollution Information Product. Data was retrieved via the G-MIM Field Access Reporting System for the period 1 January 1984 through 30 June 1991. Data for the period 1 July 1991 through the present cannot be accessed and, therefore, have not been analyzed as part of the area spill history. EPA, State and local records supplied no additional data and have records that are less complete and detailed than the MSIS data.
Analysis of the spill history shows that 150 spill cases were documented during the aforementioned period for a total of 11,516 gallons. Based on these figures, the average spill size was calculated to be 77 gallons (1.8 barrels). The highest volume spill, 60,000 gallons, was not included in this average slice it would significantly skew results. The second largest spill volume, 3,000 gallons, was included, though. The majority of spills were in the 5 to 25 gallon range.
Humboldt Bay is the only harbor between San Francisco and Coos Bay with channels deep enough to permit passage of large, commercial oceangoing vessels. In 1991, Humboldt Bay received 227 commercial vessels; 104 foreign cargo ships, 42 cargo barges, and 80 chemical and petroleum vessels. Approximately 2.5 million barrels of petroleum products are delivered annually via tank barges and tank vessels to three petroleum-receiving facilities (Chevron, UNOCAL, and PG & E).
Sector SF Section 9000-8 October 1, 2014
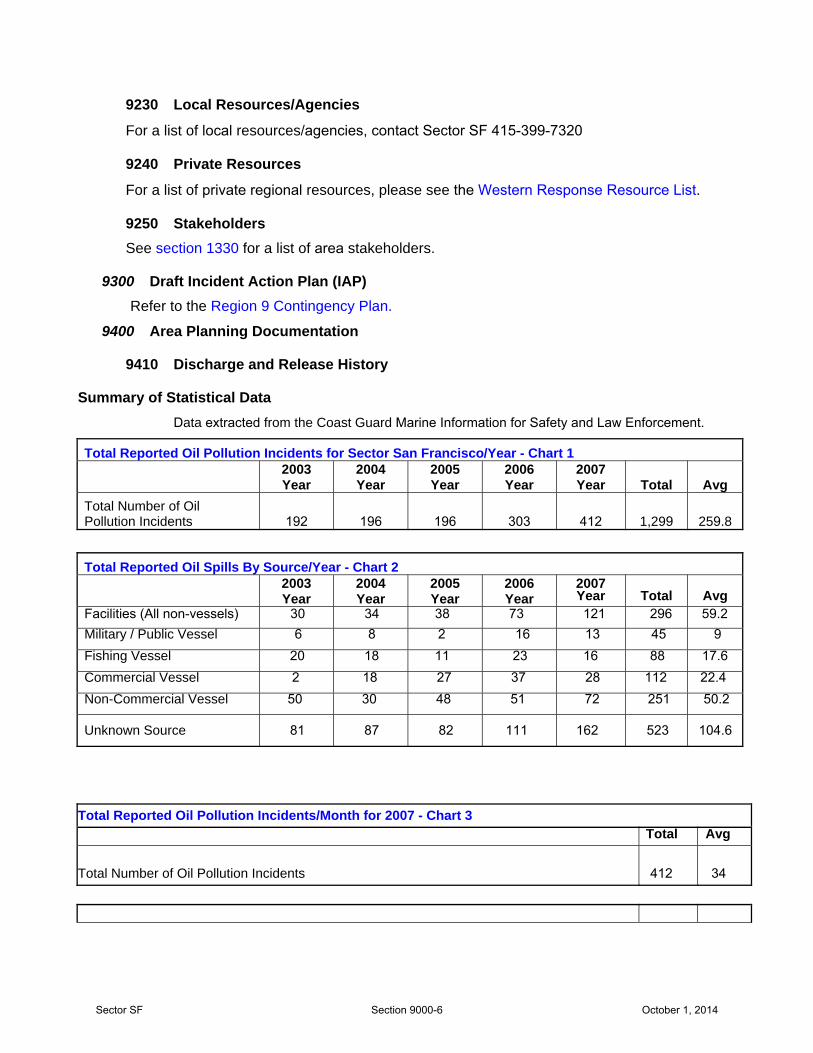
Although Humboldt Bay is the only harbor with petroleum facilities and tank vessel and tank barge traffic, it is clear that the possibility of a large petroleum spill exists along the entire North Coast. Heavy coastwise tanker traffic transits this area on runs between Alaska and the ports of San Francisco and Los Angeles. While it 18 recognized that the majority of this tanker traffic has voluntarily agreed to transit 50 miles off the California coast, many vessels transit much closer. Furthermore, tugs with tank barges typically do not transit 50 miles offshore when making runs between various ports along the West Coast.
Based on definitions contained in Encl (l) to COMDTNOTE 16471, the most probable and maximum most probable spill amounts for the North Coast Area would be 1.8 barrels and 71 barrels, respectively. 9420.2 San Francisco Bay and Delta Description of Major Oil Spills The following six major oil spills are of historical importance to this planning area:
Date of Spill Name of Spill 01/18/71 Oregon Standard & Arizona Standard
10/31/84 Puerto Rican
04/23/88 Shell Carquinez
10/27/96 Cape Mohican 04/27/04 Kinder Morgan Pipeline 11/07/07 Cosco Busan
Oregon Standard & Arizona Standard (18 January 1971) Size of Spill: 27,600 barrels (1,159,200 gallons).
Type of Oil: Bunker fuel oil
Location of Spill: Golden Gate Bridge
Trajectory of Oil: “Within a few hours, oil had been transported with the flood tide to the north side of Angel Island. Soon after, the current started to ebb carrying most of the spilled oil out to sea. Most of the oil left inside the bay was stranded on the northern shore area of the San Francisco peninsula. Some oil impacted the western shore of the South Bay down to 3 mi south of the Oakland Bay Bridge. Oil was also found on the south shore of the Tiburon peninsula and a small amount entered Richardson Bay. The South Bay was not impacted due to its sluggish circulation and north moving surface flow.”
“The heavy concentration of oil which moved seaward split after passing the bay headlands sending an estimated 50% to the north and the remainder to the south.”
Amplifying Information: The spill was caused by the collision of the Oregon Standard and the Arizona Standard near the Golden Gate Bridge. 4,000 seabirds were killed as a result of the spill. The collision led to the Bridge to Bridge Radiotelephone Act, which requires all vessels to monitor Channel 13 VHF-FM.
Puerto Rican (31 October 1984) Size of spill: 25,000-35,000 barrels (1,000,000 - 1,500,000 gallons)
Type of oil: Lubricating oil and bunker fuel oil. Location of Spill: 11 miles south of the Farallon Islands, 25 miles west of Half Moon Bay. Trajectory of Oil: “Although the spilled oil moved south during the first 3 days after the breakup as predicted by the NOAA spill trajectory experts and did not make landfall, suddenly, on he third night, the oil reversed direction and moved north, first encircling the Farallon Islands and then coming ashore in Bodega
Sector SF Section 9000-9 October 1, 2014

Bay and Bodega Harbor.”
Ecological Impacts: In the Gulf of the Farallones 1,310 oiled birds were picked up. 310 were treated and released. The remainder perished. Based on aerial survey estimates, about 4,500 murres and auklets were killed or disabled. 15 oiled elephant seals were observed.
Cleanup: No containment methods were used due to weather and sea conditions. Skimming and shoreline cleanup were used to recover 1,460 barrels (61,320 gallons) of oil (4-6%). 2,000 gallons of Corexit 9527 Dispersant was applied by aircraft at a rate of 2-5 gallons/acre on the leading edge of the main body of the oil slick. “The overflight conducted the next morning (November 4) revealed that 60-70% of the oil sighted on November 3 had been dispersed by a combination of the chemical dispersant and wind and sea action.”
Cause: A violent explosion on board the Puerto Rican caused the ship to break in two, with the stern section eventually sinking. Corrosion had caused a pinhole leak in a tank containing caustic chemicals. These chemicals spilled into the next void and reacted with the coating of that tank to generate Hydrogen gas, which exploded. Better inspection of voids and better accounting for cargo were implemented as a response.
Shell/Carquinez (23 April 1988) Size of Spill: 8,700 barrels (365,400 gallons).
Type of Oil: Crude
Location of Spill: Tank farm on Shell Refinery in Martinez, about 1 mi inland from the Carquinez Strait.
Trajectory of Spill Release: “The oil drained from the open valve in the containment levee into nearby Peyton Slough and Shell Marsh and eventually out into the Carquinez Straits.
Oil discharged into the Carquinez Straits contaminated shoreline as fare east as Ryer and Roe Islands and as far west as the Carquinez Bridge, a distance of about 11 miles, with heavy sheening observed further west into San Pablo Bay as far as Pt. San Pablo. Oil in the Straits was also forced up numerous small sloughs adjacent to Peyton Slough by tidal action causing extensive contamination of wetland habitat in Peyton Marsh and providing additional sources of discharge into the Straits. A total of about fifty miles of shoreline subject to tidal action was contaminated amounting to about 100 acres. In addition, about two-thirds of the 170 acre non-tidal Shell Marsh was contaminated by oil.”
Ecological Impact: 589 birds were collected of which 171 were found dead and 418 were taken to one of two wildlife cleaning centers. Fifty-five mammals were collected (mostly muskrats) of which 48 were found dead and seven were taken to cleaning centers. Mortality rates for all birds at the cleaning centers was 33% (50% for wild birds) and 57% for mammals.”
Containment Methods: “Containment methods included booming the mouths of Peyton and adjacent contaminated sloughs and the installation of four siphon dams above Peyton Slough’s tide gate. Efforts were also made to protect uncontaminated wetlands and marinas - with limited success.”
Cleanup Methods: Skimming, vacuum trucks, sorbents, vegetation removal.
Amount of Oil Recovered: 7,800 barrels (90%). Duration of Response: 107 days.
Cause of Spill: “A valve in the containment levee surrounding the tank that was allowed to remain open during periods of rainfall provided an escape route for oil leaking from the storage tank. After the spill, better monitoring of berm and floating tank roof drainage, as well as periodic testing of floating roof drain hoses were implemented.”
Cape Mohican (27 October 1996) Size of Spill: 1,950 barrels (81,900 gallons)
Type of Oil: Intermediate Fuel Oil
Sector SF Section 9000-10 October 1, 2014

Location of Spill: San Francisco Drydock, San Francisco CA
Trajectory of Spill Release: The heaviest concentration of oil was located along the SF waterfront from Pier 70 to the South Beach Marina, with patches of sheen and oil globules located between Treasure Island, Angel Island and Alcatraz Island, spreading to Bluff Point, Raccoon Strait, the SF Deep Water Ship Channel to Arch Rock, the Oakland Outer Harbor Entrance Channel, and Rincon Point. These isolated patches of oil eventually fouled ocean beaches from Ocean Beach in San Francisco to as far north as Point Reyes.
Ecological Impact: 110 birds were found dead. 50 oiled birds were captured. 1 sea turtle was found dead and one captured sea turtle had to be euthanized.
Containment Methods: 22,000 feet of boom were deployed to contain the spill and then protect sensitive sites within the Bay.
Cleanup Methods: 6 open water skimming vessels and 12 shallow water skimming vessels were employed to remove oil from the Bay. Cleanup operations along the San Francisco waterfront centered on flushing under piers with outgoing tide, maintaining in-place containment boom and recovering free-floating oil.
Cause of Spill: The inner valve of a stabilizer tank was left open by ships personnel. As a result, when the outer valve was opened by shipyard personnel in the course of the drydocking, the entire contents of the tank drained into the drydock, with a considerable percentage (from 20-80%) entering the Bay through the drydock gates.
Kinder Morgan Pipeline Spill (27 April 2004) Size of spill: 60,000 gallons Type of oil: Diesel Fuel Location of spill: Cordelia Slough, Suisun Marsh, south of Fairfield Trajectory of spill release: Fuel release contained within 240 acres of the marsh Ecological impact: 8 dead animals observed (3 muskrats, 1 beaver, 1 plover, and 3 sandpipers). Potential impact was high due to the location and sensitivity of the Suisun Marsh wetlands Cleanup methods: Ruptured pipeline was shut-off upon abnormally low pressure indications in the Kinder Morgan control room in Concord. Stopple plugs were installed ½ mile on each side of the rupture. Vacuum trucks recovered the oil that had leaked into the marsh and the fuel remaining in the affected 1 mi of pipe. Absorbent booms and pads were used to recover the remainder of the fuel. MSRC was the hired contractor on-scene effecting recovery. Amount recovered: 42,000 gallons Duration of response: 4 days Cause of spill: Failure/rupture of underground pipeline M/V Cosco Busan (7 November 2007) Size of spill: 53,569 gallons (1,275 bbls) Type of oil: Intermediate Fuel Oil (IFO) 380 Location of spill: The Cosco Busan, a 900-foot container carrier vessel owned and operated by Regal Stone Limited and Fleet Management LTD, allided with the Delta Span Tower of the Oakland-Bay Bridge at approx.
Sector SF Section 9000-11 October 1, 2014
0830 in heavy fog. The vessel initially anchored at Anchorage 7 but upon the relief pilot’s concern that about under-keel clearance the vessel was moved to Anchorage 9. Trajectory of spill release: The tidal effects and strong winds of the San Francisco Bay caused a widespread extent of oil, spreading to as far south as Pacifica and as far north as Point Reyes National Seashore. Inside the Bay, At least 30 beaches were closed, including Ocean Beach, Angel Island, Crissy Field, Black Sand Beach, Rodeo Beach, Fort Point, Muir Beach, Fort Baker, China Beach, Tennessee Valley, Keller Beach, Point Isabel, Ferry Point, Cesar Chavez Beach, Middle Harbor and Shimada Park. Ecological impact: Numerous resources were affected or at risk, including archeological sensitive areas, the Gulf of the Farallones and Cordell Bank National Marine Sanctuaries, multiple park service waterside reservations, bayside sensitive wetlands, and private beaches. Endangered species impacted included brown pelicans (2 dead, 3 oiled), snowy plovers (1 dead, 15-18 oiled), sea lions, northern fur seals, and marbled murrelets (3 dead). The majority of impacted species were seabirds and seaducks that use the bays, estuaries, and nearshore marine environment for foraging, as well as shorebirds that forage along sandy or rocky beaches. The timing of the spill also exasperated the impact since the San Francisco Bay and central coast are vitally important wintering areas for vast numbers of birds. Known impacts to wildlife include 1081 birds recovered alive, 783 cleaned, 389 released, 634 died in facility, 1803 dead on arrival, 1 dead harbor seal, and 1 northern fur pup recovered and taken to rehabilitation. Cleanup methods: On-water recovery through use of numerous skimming vessels, manual collection on the shores, hot-water/pressure-washing rock and cliff areas. At its peak, 41 response vessels were assigned and 38,200 feet of boom deployed (not including city/county/private boom) Amount recovered: 19, 466 gallons (36.3%) recovered on water during first two weeks; 22,972 gallons recovered (total, with 17,788 in liquid form and 5,184 gallons from solid waste) The amount recovered was 42.8% of amount spilled. Duration of response: On-water recovery lasted for 14 days and then transitioned to beach cleanup; by early January 2008 most beaches and impacted areas transitioned to active maintenance phase; by early May 2008 all affected shoreline segments had been surveyed and approved for natural weather phase; as of this update (October 2008), all but 4 of the affected 226 shoreline segments had met end-point criteria, and the 4 open segments remain on environmental hold due to bird activity. Cause of spill: Allision between the container vessel and the Oakland-Bay Bridge Delta Tower in heavy fog, causing a 140’ foot breach in the vessel’s hull, puncturing a fuel tank.
9420.3 Central Coast Information on oil spill history for the Central Coast presented here is a combination of data retrieved from the U.S. Coast Guard’s Marine Information for Safety and Law Enforcement (MISLE) pollution data and narrative information compiled from past news articles in the San Jose Mercury News, San Francisco Chronicle, and Santa Cruz Sentinel by Save Our Shores for Monterey and Santa Cruz counties’ oil spill element of their county multi-hazard emergency operations plan.
For data extracted from 1983 through 2003, the U.S. Coast Guard utilized its legacy Marine Safety Information System (MSIS).
Over the period described above, there were a total of 340 reported spills which totaled 8,194 gallons, for an “average” spill of 24.1 gallons. This calculation excluded two spills; one of 16,000 gallons in 1984 and one of 18,000 gallons in 1987, so as not to unduly skew the average figure. However, even this figure is misleading, as well over 50% of the spills over that period were of five gallons or less, and many recorded “spills” were cases where a potential for pollution existed (for example, fishing vessel or pleasure boat grounding) but no actual spill occurred. The most frequent source of small spills are fishing or pleasure boats in which an
Sector SF Section 9000-12 October 1, 2014
automatic bilge pump kicks on and pumps oily bilge water over the side while the vessel is moored and unattended at a marina or harbor. The circumstances of ten spills which were of a substantial amount are summarized below:
1) On 6 October 1986, the fishing vessel TONY K ran aground near Watsonville in Monterey Bay; as the tide receded the vessel rolled over on its side. Before the owner could have the fuel removed it all leaked out, spilling approximately 300 gallons of diesel.
2) On January 28 - February 2, 1986, the APEX HOUSTON, an unmanned barge towed by a tug spilled approximately 616 bbls of oil through a dislodged deck lid while in transit from Martinez to Long Beach. Since there was no grounding or collision, the incident was first known as mystery spill. Coastal areas extending between Salmon Creek in Sonoma County to Point Lobos in Monterey County were affected by the spill. Half Moon Bay and Santa Cruz were heavily oiled, especially in the vicinity of Ano Nuevo State Reserve. Approximately 9,856 birds were injured or killed.
3) On 10 May 1987, the 85 foot tug CHALLENGER sank approximately twenty miles offshore west of the Santa Maria river entrance. 18,000 gallons of diesel was onboard and assumed spilled, since no salvage effort was possible due to the depth of water.
4) On 12 August 1987, a CG helicopter on patrol sighted a patchy slick which appeared to be bunker or crude oil, in an area approximately 4-6 miles in diameter, 15 miles west of Point Lopez. The total amount of product was estimated to be 100 gallons. A vessel ten miles south of the slick was suspected but unable to be linked to the spill.
5) On 19 May 1989, the M/V NORTHERN LIGHTS exploded in Santa Cruz Harbor. 160 gallons of gasoline were on fire on the surface of the water. The fire was extinguished by the Fire Department and the incident was responded to by U.S. Coast Guard and CA Dept. of Fish & Game personnel, who determined that the remaining gas was not feasible for cleanup. 12 quarts of oil remaining on the vessel were removed by CG personnel.
6) On 15 December 1989, the Coast Guard sighted a sheen 1 to 5 miles offshore, west of Lopez Point, estimated to be three square miles in size. There was no apparent source and the sheen was judged to be not feasible for cleanup. The weather on scene included 1-2 foot seas which aided in the dissipation of the product.
7) On 8 June 1990, the F/V Hey Mama went aground at Sand Hill Bluff (south of Davenport) and ruptured its integral fuel tanks. Approximately 700 gallons of fuel entered the Pacific Ocean, but the fuel dissipated before any cleanup or recovery effort could be mounted.
8) On 15 September 1990, the F/V Slabtown sank 6 miles off the coast of Davenport. A 10' by 25' sheen was spotted from the air but was judged not feasible for cleanup.
9) On 15 October 1990, the dredge ART REIDEL sank off the coast of Pt. Pinos. Approximately 3267 gallons of diesel and lube oil was believed to have been on board, but the resulting sheen was not judged feasible for cleanup and dissipated rapidly. 10) On 31 January 2005, the wooden hull vessel ALBION took on water and sank while under tow by Maritime Logistics Towing Vessel MICHAEL UHL. The vessel sank to a depth of 180 feet within the Monterey Bay National Marine Sanctuary and discharged approximately 20 gallons of diesel fuel but had a potential of approximately 1700 gallons of diesel onboard. Salvage and dive contractor were hired and recovered approximately 1170 gallons of diesel fuel from the vessel.
Sector SF Section 9000-13 October 1, 2014

The following oil spill history was compiled by Save Our Shores by searching through past news articles in the San Jose Mercury News, San Francisco Chronicle and Santa Cruz Sentinel:
1 December 1979 - The T/V ARCO ENDEAVOR spilled 80 barrels of oil into Monterey Bay while unloading at the PG&E moss landing marine terminal. Environmental impact: Beach inspection found globules of oil in Elkhorn Slough, in the wetlands of the Pajaro and Salinas Rivers, and from Sunset to Marina State Beaches. Oil soaked dead birds also washed ashore. Aerial surveys conducted on 27 February 1980 for a separate scientific study identified a remaining oil slick approximately 100 m x 200 main size and observed 4 NM northwest of Point Pinos at the southern margin of Monterey Bay.
May 1986 - The barge APEX HOUSTON spilled approximately 616 bbls of oil off the central California Coast. Only 420 gallons (1.6%) were recovered. Oil soaked birds washed ashore along the Santa Cruz and Monterey County coast.
December 1987 - A 300 foot barge, 13, miles off Ano Nuevo spilled 16,400 gallons of oil, leaving a three mile long, one hundred yard wide slick. No cleanup was attempted because of high seas. Luckily, the slick drifted out to sea instead of coming ashore.
July 1989 - A diesel oil slick one-half mile long was spotted off Capitola. A visiting Navy ship was implicated, but no link was established.
February 1990 - In Santa Cruz County 60 oiled birds were killed with an additional 100 oiled birds surviving. The oil was fingerprinted as Alaskan crude but no source was found.
June 1990 - Twenty-five oiled birds washed ashore in Santa Cruz County. Oil Leaked from an unidentified damaged tanker under tow.
October 1990 - A dredge vessel being towed to Rio Vista for repairs sank in 250 of water, 1.5 miles of Pt. Pinos. A three mile long slick of 500-1,000 gallons of diesel and lube oils was observed. Beaches between Pt. Joe and Pt. Pinos were closed.
January 1991 - Approximately 100 oiled birds, mostly Murres, came ashore on San Mateo, Santa Cruz and Monterey Count Beaches. Although U.S. Coast Guard fingerprinted the oil as North Slope crude, no source and no volume of oil spilled was determined.
9430 Planning Assumptions – Background Information
9430.1 Navigational Hazards There are many coastal and inland navigational hazards to consider when planning for an oil spill. Each is unique and the dynamic conditions of tide, current and weather can make them all the more dangerous.
Coastal hazards include the approach to San Francisco Bay. All vessels must pass under the Golden Gate Bridge which is marked by two headlands, Point Bonita on the north and Point Lobos on the south. Outside the span of the bridge the distance between the two points is approximately 2 miles.
The San Francisco Bar has been created by the sediment from rivers entering San Francisco Bay. It is semicircular in shape with depths less than 36 feet over much of the area. The shallowest portion follows a curve of radius approximately 7 miles from the Golden Gate Bridge. When large swells from offshore storms encounter the shallow water, they make the bar and main ship channel extremely dangerous. At mean low low water, the main ship channel entering San Francisco Bay has a project depth of 55 feet. It has been dredged through the bar from the San Francisco Approach Lighted Horn Buoy.
Sector SF Section 9000-14 October 1, 2014

Point Reyes is approximately 25 miles northwest of Point Bonita and is marked by Point Reyes Light (265 feet above the water). It is also approximately 1.7 miles from the northern outbound traffic lane used by vessels leaving the traffic separation scheme (TSS). Rocks extend offshore of the point, but depths do increase rapidly, with the 30-fathom line being less than a mile offshore. Point Reyes is part of a National Marine Sanctuary.
Together with Point Reyes, the Farallon Islands are also part of a National Marine Sanctuary. The islands are 23 miles west of the San Francisco Bay entrance, and Southeast Farallon Island is nearly 15 miles from the San Francisco Approach Lighted Horn Buoy. At 358 feet above the water, Farallon Light is on the highest peak of Southeast Farallon Island. The Farallon Islands and associated shoal waters extend approximately 10 miles northwest of Southeast Farallon Island to Fanny Shoal.
Fanny Shoal is the largest of the many shoals which are located around and between the islands. It is located 9.8 miles northwest of Farallon Light and 14 miles southwest of Point Reyes.
The TSS precautionary area is a 6 mile circle centered on the San Francisco Approach Lighted Buoy. The buoy is located at 37_45.0’N and 122_41.6’W, approximately 10 miles west of the Golden Gate Bridge. The eastern portion of the area does overlap the San Francisco Bar. Within the precautionary area, there is a circular separation zone, mile in radius, centered on the buoy for the buoy’s own protection. The pilot boat cruising area is 1 mile east of the buoy. The TSS can be congested at times since all major incoming and outgoing vessels pass through it.
Other hazards in the area include the San Francisco Approach Lighted Buoy itself. Potatopatch Shoal is to the north of the approach and has reported depths of < 23 feet. Approximately mile south of Point Lobos are Mile Rocks. Continuing south are Piller Point, Colorado Reef, Point Montara, Pescadero Point, Bolsa Point, Pigeon Point (marked by a light), and Ano Nuevo Point. The shoreline is generally shoal and rocky, particularly so around Ano Nuevo Island off Ano Nuevo Point.
Inland hazards include the Golden Gate Bridge. It has a clearance of 225 feet at the center of the span, which is marked by a fixed green light with three fixed white lights above it. The distance between the piers of the bridge is < 0.7 mile. Significant currents, winds, and fog can be experienced while transiting this area.
Alcatraz Island is 2 miles east of the Golden Gate Bridge. Alcatraz is 148 feet high and marked by Alcatraz Light, which is 214 feet above the water. Due to strong tidal influences heavy riptides occur in the vicinity of Alcatraz Island. Deep-draft vessels inbound and making for the deep-water anchorages north and south of the San Francisco-Oakland Bay Bridge, with the permission of the Vessel Traffic Service, pass north of Alcatraz Island in opposition to the established TSS. A passenger ferry, which operates frequently, uses a dock on the southeast side of the island. There are rocky patches in 33 to 35 feet of water northwest of the island that should be avoided by deep-draft vessels. The northwesternmost of these is Harding Rock, which is marked by a lighted buoy.
Angel Island is 3 miles northeast of the Golden Gate Bridge. It is separated from the mainland at Tiburon by Raccoon Strait. Raccoon Strait is nearly mile wide and is used by ferries and pleasure craft. Tidal currents within the strait can be strong with riptides and swirls at times. Large vessels usually avoid the strait.
Sector SF Section 9000-15 October 1, 2014

Yerba Buena Island is 2 miles southeast of Alcatraz Island and is connected by a causeway to Treasure Island, a low area of fill to the northeast. The San Francisco-Oakland Bay Bridge runs through Yerba Buena Island. The midspan clearance for the segment of bridge on the San Francisco side is 204 feet. The midspan clearance for the segment of bridge on the Oakland side is 220 feet; however, this distance may be up to 10 feet less under conditions of heavy vehicle traffic and high temperatures. The bridge experiences large current eddies near the foundation piers that may cause ships to shear off course.
The Richmond-San Rafael Bridge is 8.8 miles northeast of the Golden Gate Bridge. It has a fixed span at each end. The west span has a 1,000 foot opening and a clearance of 185 feet. The east span has an opening of 970 feet and is 135 feet high. This well lighted bridge has channels to it marked with navigational aids. There are various rocks and shoals in the Richmond area, including Red Rock and Castro Rocks.
The Carquinez Bridge spans Carquinez Strait. The channel on either side of the center pier is 998 feet wide. The clearance for the north span is 146 feet and the southern span is 134 feet.
There is also a fixed highway bridge and a rail bridge between Benicia and Martinez, the Benicia-Martinez Bridges, which span the Carquinez Strait at its eastern end. The highway bridge has a clearance of 135 feet. The rail bridge is a drawbridge. It has a clearance of 70 feet closed, 135 feet open.
In the south bay, the San Mateo-Hayward Bridge connects these two communities. The fixed center span has a height of 135 feet.
9430.2 Potential Spill Risks To fully understand the potential magnitude or possibility of a spill, the quantity and type of petroleum products transferred, as well as, the number of transfers that occur within the area is needed. The following data was compiled for the month of January 1994. It was compiled from transfer notifications given to Marine Safety Office San Francisco Bay and a phone survey of refineries and other waterfront facilities. Most facilities reported that the numbers for January 1994 were somewhat below their average monthly totals.
The numbers reflect the total amount and number of transfers, not necessarily what was actually transported into San Francisco Bay. For example, if a tanker enters the Bay and lighters 750,000 barrels of crude to another tanker and then that vessel transports this amount to a facility and off-loads the cargo, the total amount transferred would be 1.5 million barrels and would be counted as two transfers. This method was used to describe the risk more accurately. Tables 1 and 2 graphically display the total amount transferred by product and operation.
Table 1 -- Total Number of Transfers in January 1994:
Type of Product Lighter Bunker Facs. Mobile Totals: Crude 17 0 355 0 372 Diesel 5 67 125 31 228 Gas 0 0 130 0 130 Jet Fuel 2 9 57 0 68 Lube 0 8 60 10 78 Bunkers 0 1 140 0 141
Sector SF Section 9000-16 October 1, 2014

Type of Product Lighter Bunker Facs. Mobile Totals: Totals: 24 85 867 41 1017
Table 2 -- Total Amount Transferred: (In Barrels)
Type of Product Lighter Bunker Facs. Mobile Totals: Crude 4.35 M 0 35.4 M 0 39.9 M Diesel 178000 701000 9.8 M 8216 10.6 M Gas 0 0 10 M 0 10 M Jet Fuel 11524 37572 1.1 M 0 1.15 M Lube 0 549 1.2 M 530 1.2 M Bunkers 0 20000 4.8 M 0 4.8 M Totals: 4.5 M 759648 62.5 M 8746 67.7 M
9440 Planning Scenarios
9440.1 North Coast
Scenario Development As required by OPA-90, a most probable discharge, a maximum most probable discharge, and a worst case discharge are presented. An additional scenario for the North Coast Area, a “Discharge of Maximum Impact”, is also included.
Most Probable Discharge The Coast Guard has determined that 0-50 barrels is a reasonable volume for planning the most probable discharge because it is based on national operational spill data and evaluation of historical trends in smaller-sized spills. This value was adopted for consistency with Federal and State Vessel and Facility Contingency Plans.
Historical Spill Considerations: The North Coast’s historical average spill size of 77 gallons (1.8 barrels) is at the lower end of the 0-50 barrel national average range. A spill of this size is considered “routine” and insufficient for planning purposes. As such, the North Coast Area Contingency Plan has adopted a larger value (approximately 33 barrels) within the 0-50 barrel range.
The most likely reason for a spill of this size is the loss of diesel fuel from a grounded or sunken vessel. Accidents of this nature normally occur as a result of human error, poor visibility, a difficult sea state, mechanical failure, or a combination thereof. Several spills involving a sunken vessel have occurred while the vessel is moored. Historically, such spills involve the failure of a fishing vessel’s automatic bilge pump and poor watertight integrity. Other possible causes for a spill of this size include tank or pipeline ruptures at petroleum facilities and overturned tank trucks spilling into creeks or storm drains.
Hazard and Risk Assessments: As mentioned above, a spill of 33 barrels would likely involve a sunken or grounded fishing vessel (recreational vessels tend to have fuel capacities less than 33 barrels). In the North Coast area, fishing vessels operate from harbors located within each of the three counties and transit the entire coastline. As such, a spill of this size could occur anywhere along the North Coast.
Sector SF Section 9000-17 October 1, 2014
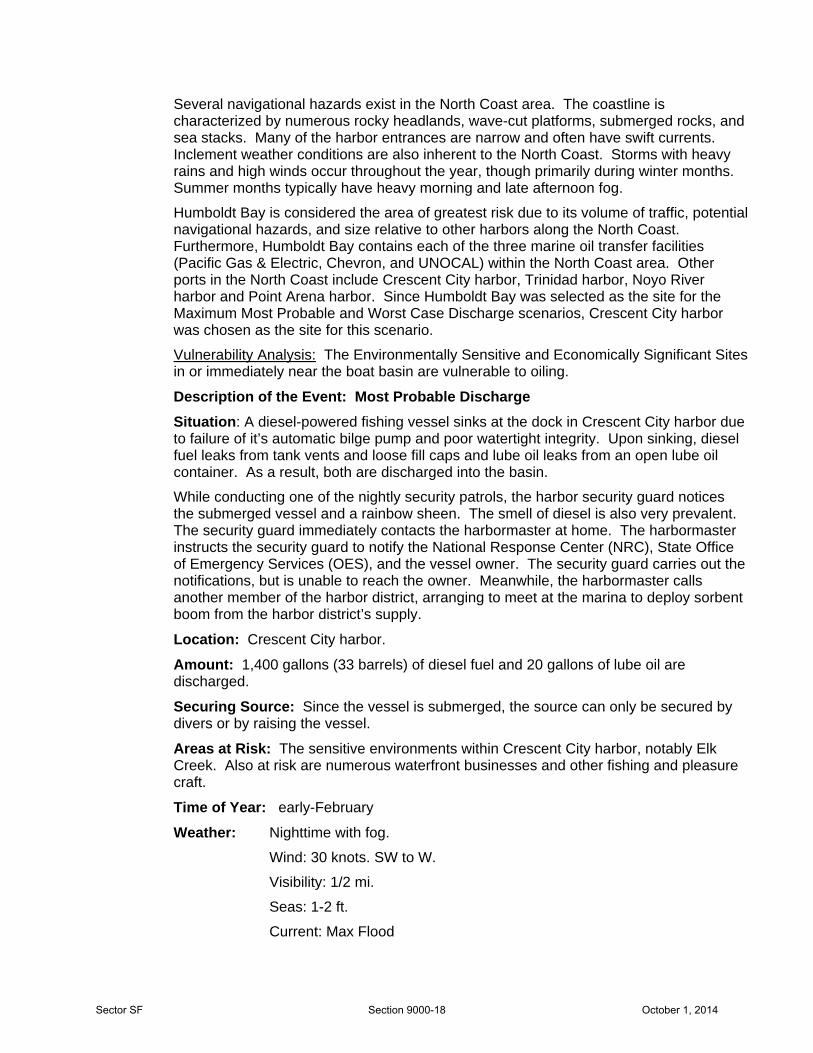
Several navigational hazards exist in the North Coast area. The coastline is characterized by numerous rocky headlands, wave-cut platforms, submerged rocks, and sea stacks. Many of the harbor entrances are narrow and often have swift currents. Inclement weather conditions are also inherent to the North Coast. Storms with heavy rains and high winds occur throughout the year, though primarily during winter months. Summer months typically have heavy morning and late afternoon fog.
Humboldt Bay is considered the area of greatest risk due to its volume of traffic, potential navigational hazards, and size relative to other harbors along the North Coast. Furthermore, Humboldt Bay contains each of the three marine oil transfer facilities (Pacific Gas & Electric, Chevron, and UNOCAL) within the North Coast area. Other ports in the North Coast include Crescent City harbor, Trinidad harbor, Noyo River harbor and Point Arena harbor. Since Humboldt Bay was selected as the site for the Maximum Most Probable and Worst Case Discharge scenarios, Crescent City harbor was chosen as the site for this scenario.
Vulnerability Analysis: The Environmentally Sensitive and Economically Significant Sites in or immediately near the boat basin are vulnerable to oiling.
Description of the Event: Most Probable Discharge Situation: A diesel-powered fishing vessel sinks at the dock in Crescent City harbor due to failure of it’s automatic bilge pump and poor watertight integrity. Upon sinking, diesel fuel leaks from tank vents and loose fill caps and lube oil leaks from an open lube oil container. As a result, both are discharged into the basin.
While conducting one of the nightly security patrols, the harbor security guard notices the submerged vessel and a rainbow sheen. The smell of diesel is also very prevalent. The security guard immediately contacts the harbormaster at home. The harbormaster instructs the security guard to notify the National Response Center (NRC), State Office of Emergency Services (OES), and the vessel owner. The security guard carries out the notifications, but is unable to reach the owner. Meanwhile, the harbormaster calls another member of the harbor district, arranging to meet at the marina to deploy sorbent boom from the harbor district’s supply.
Location: Crescent City harbor. Amount: 1,400 gallons (33 barrels) of diesel fuel and 20 gallons of lube oil are discharged. Securing Source: Since the vessel is submerged, the source can only be secured by divers or by raising the vessel. Areas at Risk: The sensitive environments within Crescent City harbor, notably Elk Creek. Also at risk are numerous waterfront businesses and other fishing and pleasure craft.
Time of Year: early-February Weather: Nighttime with fog.
Wind: 30 knots. SW to W.
Visibility: 1/2 mi.
Seas: 1-2 ft.
Current: Max Flood
Sector SF Section 9000-18 October 1, 2014

Initial Actions
Notification: Key notifications are made to the National Response Center (NRC), State Office of Emergency Services (OES) and the sunken vessel’s owner. NRC immediately notifies Coast Guard Sector San Francisco (SSF) via “flash fax”, while State OES notifies California’s Office of Oil Spill Prevention and Response (OSPR) and Del Norte County Sheriff’s Office (the county’s designated local emergency contact after hours). Coast Guard Sector Humboldt Bay is notified by SSF. Sector Humboldt Bay recalls the Sector liaison assigned to SSF and OSPR notifies the warden and biologist assigned to its Eureka office. The likelihood that a spill of this nature would be federalized prompts the SSF to begin mobilizing additional response resources. As such, Humboldt Bay Response Corporation (formerly Pacific Affiliates) and the Coast Guard Pacific Strike Team are called to respond.
Activation of Response:
The harbormaster and harbor district employee arrive on-scene and begin deploying the harbor district’s sorbent boom and several sorbent pads. Meanwhile, the SSF liaison is dispatched to Crescent City, to arrive within two hours. The warden and biologist are also dispatched from Eureka and will arrive within two hours of notification. After loading equipment, Humboldt Bay Response Corporation will arrive on-scene within three hours of notification. Pacific Strike Team personnel and equipment will be on-scene within 4-8 hours depending on mode of travel (air or truck/trailer).
The SSF establishes communications with the individual that reported the discharge to continue assessing the situation. After ensuring safety of life, further attempts to contact the vessel owner are made to no avail. Unable to determine the vessel owner’s intentions regarding response to the discharge, the SSF opens the Oil Spill Liability Trust Fund (OSLTF). An initial ceiling of $10,000 is requested. The SSF Command Duty Officer and watchstander also arrange to have an SSF pollution investigator flown to Crescent City via CG helicopter and begin contracting a local diving/salvage company to secure the discharge source and refloat the vessel. If unable to contract a local salvage outfit, a company with a Basic Ordering Agreement (BOA) contract in place will be contacted. However, the closest BOA-contracted salvage company is located in the Bay Area. As such, it could take up to 8 hours for a salvor to arrive on-scene.
Investigation: The initial investigation is conducted by the SSF liaison assigned to Group Humboldt Bay and the local OSPR warden. Once on-scene, the SSF representative will continue conducting the investigation and monitoring cleanup operations.
Response Organization: For a spill of this size, the Unified Command System (UCS) will not be staffed. The individuals identified above carry out the response without breaking into specific sections of the UCS (i.e. Planning, Operations, Logistics and Finance). However, the SSF liaison and the local OSPR warden assume the role of Federal On-scene Coordinator (FOSC) and State On-scene Coordinator (SOSC), respectively.
Sector SF Section 9000-19 October 1, 2014

Containment, Countermeasures, and Cleanup Stragegies: The sorbent boom and pads deployed by the harbormaster and harbor district employee cannot contain the discharged product. Containment boom must also be deployed to keep the oil from spreading throughout the harbor, particularly to Elk Creek. (Details of the Elk Creek environmentally sensitive site may be found in Volume II of this plan. However, since the harbor district does not have containment boom in their supply of response equipment, containment boom will not be deployed for at least two hours (when the SSF liaison assigned to Group arrives with the trailer keys or Humboldt Bay Response Corporation personnel and equipment arrive). Until that time, cleanup will continue with available sorbent boom and pads. A decision not to employ dispersants or in-situ burning is concurrently made based on the type and quantity of oil discharged and its location.
Resources Required and Shortfalls: The vessel is roughly 50 feet in length, therefore approximately 150 feet of boom would be required for containment. Due to the delays discussed above and the subsequent spreading of the oil, however, the spill will actually require 2,000-4,000 feet of boom to effectively contain the diesel. Additional boom may be required to protect Elk Creek and economically significant sites. The Elk Creek protection strategy calls for the construction of a sediment dike at Elk Creek. The backup strategy recommends that 300 feet of intertidal boom be deployed at the creek mouth to exclude oil. In order to complete the above booming in a timely manner, 2-4 small boats with at least two-person boat crews are required. In addition, one to two skimmers and 2-3 vacuum trucks are required.
Response shortfalls are addressed at the end of this section.
Estimated Time to Cleanup the Spill: The entire cleanup is expected to take 1-3 days. The spill site is considered “clean” when all the fuel is removed from the vessel and all visible product is removed from the water (no sheen).
Maximum Most Probable Discharge Model Limitations and Caveats
For this Area Plan oil spill scenario, only user-specified winds were used.
For offshore areas, current patterns are based on average seasonal conditions. Current perturbations from wind events, shelf waves, and eddy events are not predictable and therefore not included in the model. Similarly, local small scale phenomena, such as eddies off spits or in rivers and local convergences or divergences are not modeled.
Tidal information is based on NOS Tide Tables and does not reflect short term episodic events such as heavy runoff from floods or storm surges.
The model does not account for oil that picks up sediment and sinks. This occurs in high sediment rivers and along high energy sand beaches.
For large spills of the type being modeled for these scenarios, secondary sources of oil, such as refloating of oil from the shoreline, can be a significant problem. In this model, shorelines were coded so that the oil would not “stick” but would refloat after each tidal cycle. This allows more oil to move with tidal action and provides a more widespread impact. This procedure is used to enhance the “worst-case” scenario. In actual fact, wherever the model indicates shoreline impacts, the oil would mostly remain beached. However, some of the oil would refloat on high tides and be available to impact other areas.
Sector SF Section 9000-20 October 1, 2014

Additional Notes
The model was run for 48 hours (May 5 - May 7,1993) using the following spill scenario:
An accident occurs while diesel fuel is being transferred via pipelines at the Chevron Facility on Humboldt Bay. 2,500 barrels of Fuel Oil No. 2 are quickly spilled into the water.
Winds are constant at a stiff 30 knots from the WSW throughout the spill. Due to the short duration of the scenario (48 hours), only userspecified winds were used. No statistical winds were used.
The predicted tidal currents at Humboldt Bay (NOS Tidal Station No. 801), for the dates of the modeled spill, were used. The ebb and flood currents, at their maximum velocity, range from about 1.6 knots to 2.9 knots during this period. The modeled spill begins before a flood tide.
The oil type used in this scenario is No. 2 Fuel Oil, of which furnace, auto diesel, and stove fuels are common types. A spill of this kind of oil will typically form a heavy sheen, with lots of oil streamers. Shoreline impacts can usually be characterized as “bathtub ring” type stains. No. 2 Fuel Oil is toxic, so some of the fish and other marine life in the affected areas will probably be killed. In this scenario, the sensitive mud flats of Arcata Bay will probably suffer some fish kills.
Due to the strong 30 knot winds, the oil will be largely evaporated and/or dispersed after about 40 hours.
As shown on the oil spill scenario maps, the areas most probably impacted during this modeled spill will be the western and northern shores of the city of Eureka. No oil is expected to leave Humboldt Bay and impact the outer beaches. Although not shown in the results of the model run, the eastern side of Arcata Bay would also probably receive some oiling. The oil, pushed by the prevailing winds, would probably have more of a beach “staining” effect here than a more severe effect. In addition, some of the oil will probably flood back into the Elk River entrance.
Oil Budget Table
Oil Name: FUEL OIL NO.2 (DTF~EL), CHEVRDN API: 35.3
Pour Point: 0.O F Wind Speed: Constant at 30 kn
Emul. Const.:No emulsification expected
Water Temperature: 70 F
Instantaneous release of 2500 bbl
*Insufficient distillation & emulsification data, answers may be inaccurate.
Time hours
Total Released barrels
Evaporated percent
Dispersed percent
Floating percent
0 2,500 0 0 100 3 2,500 24 1 75 6 2,500 35 4 61 9 2,500 42 8 50 12 2,500 46 12 42
Sector SF Section 9000-21 October 1, 2014
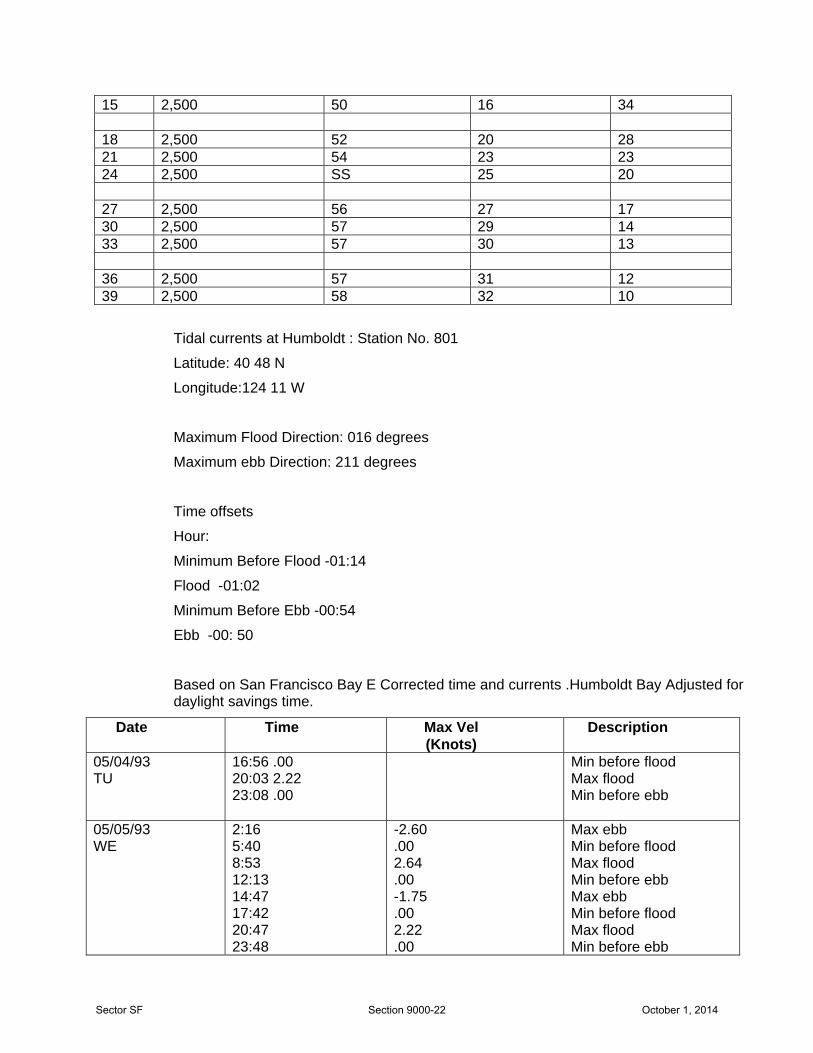
15 2,500 50 16 34 18 2,500 52 20 28 21 2,500 54 23 23 24 2,500 SS 25 20 27 2,500 56 27 17 30 2,500 57 29 14 33 2,500 57 30 13 36 2,500 57 31 12 39 2,500 58 32 10
Tidal currents at Humboldt : Station No. 801
Latitude: 40 48 N
Longitude:124 11 W
Maximum Flood Direction: 016 degrees
Maximum ebb Direction: 211 degrees
Time offsets
Hour:
Minimum Before Flood -01:14
Flood -01:02
Minimum Before Ebb -00:54
Ebb -00: 50
Based on San Francisco Bay E Corrected time and currents .Humboldt Bay Adjusted for daylight savings time.
Date Time Max Vel (Knots)
Description
05/04/93 TU
16:56 .00 20:03 2.22 23:08 .00
Min before flood Max flood Min before ebb
05/05/93 WE
2:16 5:40 8:53 12:13 14:47 17:42 20:47 23:48
-2.60 .00 2.64 .00 -1.75 .00 2.22 .00
Max ebb Min before flood Max flood Min before ebb Max ebb Min before flood Max flood Min before ebb
Sector SF Section 9000-22 October 1, 2014
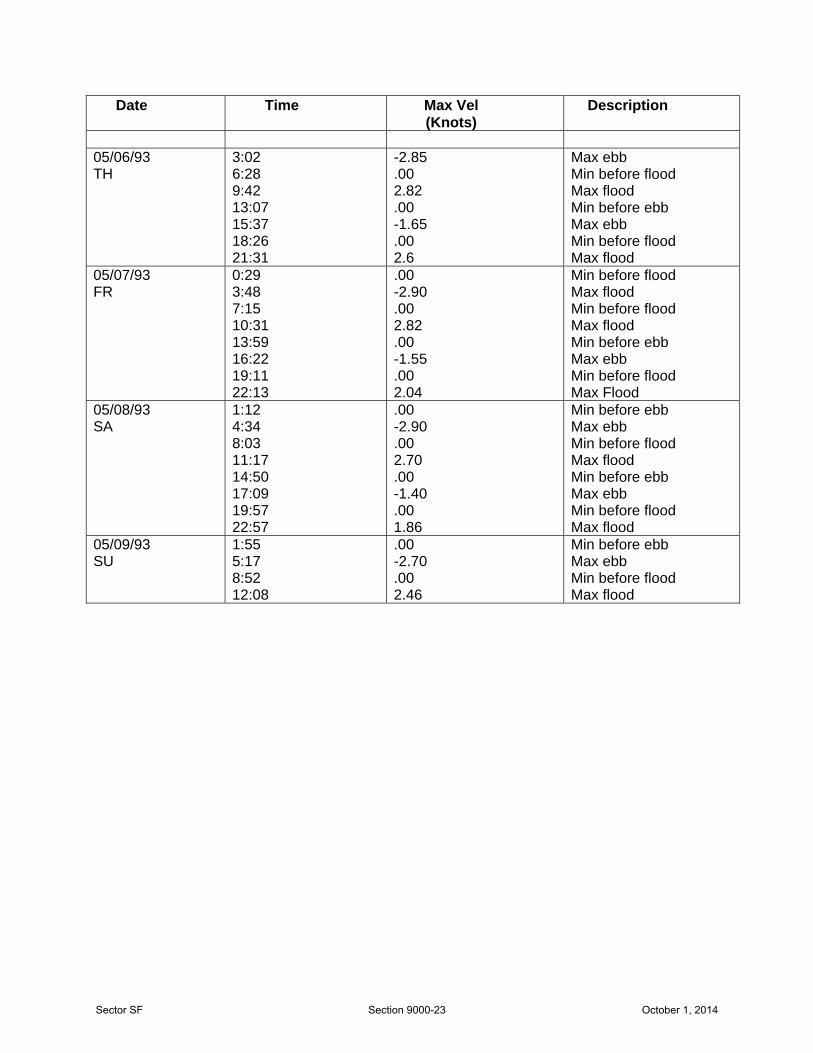
Date Time Max Vel (Knots)
Description
05/06/93 TH
3:02 6:28 9:42 13:07 15:37 18:26 21:31
-2.85 .00 2.82 .00 -1.65 .00 2.6
Max ebb Min before flood Max flood Min before ebb Max ebb Min before flood Max flood
05/07/93 FR
0:29 3:48 7:15 10:31 13:59 16:22 19:11 22:13
.00 -2.90 .00 2.82 .00 -1.55 .00 2.04
Min before flood Max flood Min before flood Max flood Min before ebb Max ebb Min before flood Max Flood
05/08/93 SA
1:12 4:34 8:03 11:17 14:50 17:09 19:57 22:57
.00 -2.90 .00 2.70 .00 -1.40 .00 1.86
Min before ebb Max ebb Min before flood Max flood Min before ebb Max ebb Min before flood Max flood
05/09/93 SU
1:55 5:17 8:52 12:08
.00 -2.70 .00 2.46
Min before ebb Max ebb Min before flood Max flood
Sector SF Section 9000-23 October 1, 2014
Maximum Most Probable Discharge
The maximum most probable discharge takes into account such factors as the size of the largest recorded spill, traffic flow through the area, hazard assessment, risk assessment, seasonal considerations, spill histories, and operating records of facilities and vessels in the area.
Historical Spill Considerations: Spill history indicates a maximum most probable spill of approximately 3000 gallons (71 barrels). While this value is greater than the value adopted for the most probable spill discussed in the preceding pages, it is considered insufficient for planning purposes. A higher value (2,500 barrels) within the national average of 50-2,500 barrels has therefore been adopted for planning considerations.
There are very few potential sources for a discharge of this size within the North Coast. However, the possibility of such a spill cannot be disregarded. Possible causes include a tank or pipeline rupture at one of the three North Coast marine oil transfer facilities, a catastrophic error during transfer operations between a facility and a tank barge or tank vessel, and the holing of a loaded tank barge or tank vessel.
Hazard and Risk Assessment: As mentioned above, a discharge of this magnitude would likely involve a marine oil transfer facility, tank barge or tank vessel. Humboldt Bay is the only port within the North Coast that contains marine oil transfer facilities. It is also the only port in the area that receives tank vessels or tank barges. As such, it is considered the area of greatest risk.
The expanse of waters offshore is another possible location for a 2,500 barrel spill of diesel. Tank vessels and tugs with tank barges frequently transit the coast going to and from Alaska, San Francisco, Los Angeles and other West Coast ports. Although many tank vessels have voluntarily agreed to transit fifty or more nautical miles offshore, many transit within fifty nautical miles. Furthermore, coastwise tug and tank barge traffic almost exclusively transits within fifty nautical miles, as the short voyages relative to those of tankers make such measures unrealistic and tremendously cost prohibitive.
Several navigational hazards exist in these waters. The coastline is characterized by numerous rocky headlands, wave-cut platforms, submerged rocks, and sea stacks. Inclement weather conditions are also inherent to the entire North Coast. Storms with heavy rains and high winds occur throughout the year, though primarily during winter months. Summer months typically have heavy morning and late afternoon fog.
While the maximum most probable spill could occur as a result of any of the previously discussed accidents, a mishap during transfer operations was selected for this scenario. The relative ease in securing the spill source during transfer operations (versus tank ruptures and vessel groundings or collisions) make itthe logical choice. Vessel scenarios were selected for both the worst case discharge and discharge of maximum impact.
Vulnerability Analysis: Most of the numerous environmentally sensitive sites throughout Humboldt Bay are at risk. These sites include wildlife refuges, sheltered tidal flats, salt marshes, commercial oyster beds and farmed wetlands.
SCENARIO: MAXIMUM MOST PROBABLE DISCHARGE
Sector SF Section 9000-31 October 1, 2014

Situation: An accident occurs during the transfer of diesel from a tank barge to the Chevron Facility in Eureka. Diesel is discharged into Humboldt Bay for several minutes until the transfer line is secured. (The facility was chosen at random and the fact that it is used in this scenario should not be interpreted to mean that historical spill data indicates a potentially higher risk at this facility.) The two barge personnel begin deploying boom in an effort to contain the spill. Meanwhile, the Chevron employee calls the terminal manager to inform him of the spill. The terminal manager initiates notifications by calling the National Response Center (NRC), State of California Office of Emergency Services (OES), and Humboldt Bay Response Corporation (formerly Pacific Affiliates). Although not required by law, the terminal manager would likely call Coast Guard Group Humboldt Bay as well.
Location: Humboldt Bay, Chevron Facility Amount: 2,500 barrels of diesel enter the water. (Note: Due to the ability to secure the source at a transfer facility, it is recognized that a spill at a facility could arguably be less than the 2,500 barrel volume. However, this value was chosen as the maximum most probable quantity for planning purposes.) Securing Source: Transfer piping is secured by the Chevron employee overseeing the transfer operation.
Areas at Risk: All of Humboldt Bay is at risk. Due to weather and tidal conditions, the areas in the immediate vicinity and north of the Chevron facility are particularly at risk. These areas include
Palco Marsh, Indian, Woodley and Daby Islands, Eureka Slough,
Elk River, and the entire North Bay (Arcata Bay).
Time of Year: Early-May Weather: Nighttime with fog.
Wind: 30 knots, SW to W
Visibility: 1/2 mi.
Seas: 1-2 ft.
Current: Max Flood
INITIAL ACTIONS: Notification: As mentioned above, key notifications are made by the terminal manager to NRC, State OES, CG Group Humboldt Bay, and Humboldt Bay Response Organization. NRC notifies Coast Guard Sector San Francisco (SSF) via “flash fax”. Coast Guard Group also notifies the MSO, recalls the SSF liaison assigned to the Group, and notifies the local State Office of Oil Spill Prevention and Response (OSPR) warden. State OES notifies
OSPR headquarters in Sacramento and Humboldt County Sheriff’s Dispatch Center (the county’s designated local emergency contact). SSF notifies the Eleventh Coast Guard District Office and alerts the Pacific Strike Team.
Activation of Response: The facility implements their facility response plan and initiates appropriate response actions. The major questions to be answered, after ensuring the safety of life, are:
Has the source been secured?
Sector SF Section 9000-32 October 1, 2014

How much time remains to effectively boom the area?
The facility has 1100 feet of boom which is immediately deployed to contain as much oil as possible. Marine Safety Office San Francisco Bay’s liaison (attached to Group Humboldt Bay) is dispatched to assess the situation, arriving on scene within 30 minutes. The local OSPR warden and a Humboldt Bay Response Corporation representative also arrive on scene within 30 minutes to assess the situation. Upon arriving on scene, these individuals meet with the Chevron’s Incident Commander to develop immediate strategies and priorities (taking into consideration wind and sea state) to minimize the spread of oil. The local OSPR Biologist is called to assist with this prioritization.
The SSF arranges to fly 2-3 command representatives to the scene via CG helicopter. The SSF Command Duty Officer (CDO) and watchstander issue a Broadcast Notice to Mariners, establish a safety zone to prevent vessel traffic from transiting the area, and open the Oil Spill Liability Trust Fund (OSLTF) requesting an initial ceiling of $25,000. Inbound traffic is monitored by Coast Guard Station Humboldt Bay.
Pre-loaded equipment from Humboldt Bay Response Corporation is transported to the site via tractor trailers and/or small boats launched from the City of Eureka boat launch (east side of Route 255 bridge) or the Fields Landing launch ramp. The personnel and equipment arrive on scene within 1.5 hours.
With a spill of this magnitude, a significant quantity of oil will likely spread from the source. As such, additional personnel and equipment are requested from nearby facilities, Coast Guard Group Humboldt Bay, California Conservation Corps, Coast Guard Pacific Strike Team, Marine Spill Response Corporation and local fishermen’s organizations. Nearby facilities could have their personnel and equipment on scene within 1.5 hours of notification. CG personnel and equipment could arrive within 2 hours of notification. Trained response personnel from California Conservation Corps could arrive within 2 hours of notification. Personnel and equipment from the Pacific Strike Team and MSRC are dispatched via truck to arrive in approximately 5-8 hours. Local fishing vessels capable of deploying MSRC or CG VOSS systems are outfitted with a VOSS and ready to be deployed within 5 hours.
Initial Response Actions: On-water recovery of product at the leading edge of the slick will be performed by MSRC skimming vessels and fishing vessels equipped with a VOSS. However, time delays in the deployment of will be experienced. MSRC has no personnel in Humboldt Bay and Humboldt Bay Response Organization personnel have not yet been trained in the use of MSRC equipment. Also, as mentioned above, VOSS systems generally take 5-7 hours to install and will not be available for initial response. As such, booming strategies allowing for shoreside collection and skimming of product (vacuum trucks) must be implemented.
The three Palco Marsh culverts north of the Chevron facility should be closed immediately to prevent oiling of sensitive marshlands. These culverts currently have no floodgates; therefore, they must be manually blocked using sandbags, sediment or rocks. Exclusionary booming should also be performed at each of these culverts and at Elk River.
Sector SF Section 9000-33 October 1, 2014

Preventing oil from entering the northern portion of Humboldt Bay (Arcata Bay) should be given a very high priority. Not only is the area extremely sensitive, but it is comprised mainly of shallow water and mud flats, which significantly reduce the ability to respond. Deflection booming could be implemented at locations south of Woodley Island, south of Indian Island, and along the Eureka waterfront to deflect product toward various collection sites south of Arcata Bay. Due to natural pooling in the area, the southwestern tip of Woodley Island should receive consideration as a site to collect and skim recovered product. Additional collection and skimming sites in this area might include the Louisiana Pacific and Simpson docks along the Samoa Peninsula.
As much skimming and protective booming as possible is completed during the night with available boom. At first light, a CG Group Humboldt Bay helicopter conducts an overflight with CG, State of California and Responsible Party representatives aboard. Planning for any adjustments to the initial response strategies occurs immediately.
Response Organization: The response organization is a modified Unified Command System (UCS) involving primarily the Operations and Planning sections. A public information team is also part of the response organization. Until additional personnel arrive from Alameda and Sacramento, respectively, the SSF liaison will assume the role of Federal On-Scene Coordinator (FOSC) and the local OSPR warden will assume the role of State On-Scene Coordinator (SOSC). The Responsible Party’s Incident Commander will likely be the terminal manager until a member of the company’s regional headquarters or corporate spill management team arrives.
The Operations section will be staffed primarily by Humboldt Bay Response Corporation personnel with Coast Guard and State of California monitors. A command post could be located either at the facility at one of the command center sites detailed in Annex F. The forward staging area is located at the Humboldt Bay Response Corporation/MSRC dock.
CONTAINMENT, COUNTERMEASURES, AND CLEANUP STRATEGIES: Prior to implementing any cleanup operations, the FOSC ensures that personnel involved in these operations have the appropriate level of training and are using appropriate personal protective equipment.
Containment is accomplished by implementing the booming strategies discussed above. The goals of containment are to hold and recover the spilled product to minimize shoreline impact. Since this spill is within the bay, it is decided not to use dispersants or in-situ burning. The open-water recovery is accomplished by skimmers and sorbents. The Pacific Strike Team may deploy the Coast Guard On-water Containment and Recovery System (OWCRS) for skimming operations within Humboldt Bay, if appropriate towing vessels are available and if water depths permit. One difficulty encountered in open water recovery is the shallowness of certain areas in the bay, which are often left exposed at low tide. Considering that more severe damage may result, the Unified Command should decide to what extent any impacted marshlands will be cleaned. If shoreline cleanup is necessary, it will involve the usual raking and shoveling of debris and product.
Sector SF Section 9000-34 October 1, 2014

Resources Required and Estimated Shortfalls: The facility’s boom and boat is likely to be overwhelmed by a spill of this size. Humboldt Bay Response Organization can supply approximately 10,000 feet of boom, in addition to the facility boom. Depending on the success of initial containment efforts, additional boom and skimmers, in excess of that available from Humboldt Bay Response Corporation, may be required. MSRC and the CG have pre-staged additional boom and skimming equipment at the Humboldt Bay Response Corporation warehouse. The local MSO trailer can provide an additional 2,700 feet of boom and the CGC EDISTO (homeported in Crescent City) has 1,800 feet.
Four to eight skimmers, storage bladders, and roughly five tank trucks could be required.
Additional personnel will most likely be required for a spill of this magnitude. California Conservation Corps should be contacted to augment the personnel that Humboldt Bay Response Organization and local facilities provide. Personnel from MSRC, MSO San Francisco Bay and the Pacific Strike Team will also be required.
Response shortfalls are addressed at the end of this section.
Estimated Time to Cleanup the Spill: The time to complete cleanup will depend on the effectiveness of the initial containment efforts. Open water recovery will take approximately 2 weeks, while shoreline cleanup can be expected to take 30-45 days.
WORST CASE DISCHARGE
Model Limitations and Caveats
For the Area Plan oil spill scenarios a combination of user-specified and statistical winds are often used. The user-specified winds can be fine tuned to some degree to imitate an actual storm event. However, the statistical winds used in the model are based on wind histograms taken from the U.S. Navy Marine Climatic Atlas. Using the histogram data, the model generates a simulation of it that is random, but has the same statistical distribution. It must be understood, however, that using statistical wind patterns in a scenario gives an illustration of what areas could possibly be impacted, not what areas will be impacted. Also, statistical winds do not take into account local topographic-induced effects that could significantly alter wind patterns.
For offshore areas, the current patterns are based on average seasonal conditions. Current perturbations from wind events, shelf waves, and eddy events are not predictable and therefore not included in the model. Similarly, local small scale phenomena, such as eddies off spits or in rivers and local convergences or divergences are not modeled.
Tidal information is based on NOS Tide Tables and does not reflect short term episodic events such as heavy runoff from floods or storm surges.
For large spills of the type being modeled for these scenarios secondary sources of oil, such as refloating of oil from the shoreline, can be a significant problem. While the model does allow the oil to refloat the details are not exact.
The model does not account for oil that picks up sediment and sinks. This occurs in high sediment rivers and along high energy sand beaches.
Sector SF Section 9000-35 October 1, 2014

Finally, and most important, moderate to large sized spills of a heavy oil (e.g., Bunker C or heavy crudes) will persist for weeks or months after the initial spill event. Depending on local wind and current conditions, these spills can impact shoreline several hundred miles downstream from the source. For these scenarios, even though the model is run for only one week and for one specific area does not mean that there will not be impacts felt far afield.
Additional notes
The model was run for 72 hours (2/3 - 2/6/92) using the following scenario:
A towed barge containing 40,000 barrels of Bunker C oil (bound for the power plant) was inbound into Humboldt Bay. The barge ended up on the south jetty of the entrance to the bay and before it could be pulled off it lost its entire cargo.
SE winds (30 knots with higher gusts) were blowing in advance of strong cold front at the time of the spill. These winds continued to blow for 24 hours until the frontal passage. The winds began to &inish at this point and shift to the W and NW at 20 knots. The winds continued to blow from the NW for the remainder of the model run.
NOTE: User-specified winds were the only winds used for this scenario. Due to the short duration of the scenario (72 hours) no statistical winds were used. This particular weather scenario was chosen because it provide a realistic wind pattern for this particular area during the winter season (reference: John Henderson, Marine Forecaster, National Weather Service, Long Beach, California).
The product spilled was 40,000 barrels of Bunker C fuel oil.
The time of the spill (0600 hr’s on 2/3/92) was chosen to occur during a flood tide cycle.
Shorelines were coded so that the oil would not “stick” but would refloat after each tidal cycle. This allows more oil to move with tidal action and provide a more widespread impact. This procedure is used to enhance the “worst-case” scenario.
The model indicates that any remaining floating oil will be taken out to sea during the first ebb tide after the spill. However, the winds were such that the heavy oiling along the western shore of North Bay Channel from the southern end of North Spit to Samoa will remain along the shore. Once the winds changed direction (from SE to W to NW) the oil spread onto the eastern shore and was taken out to sea on subsequent ebb tides. Towards the end of the scenario the exact movement of the oil in Humboldt Bay was unclear especially through the bay entrance.
The model indicated little or no impact in South Bay due to the strong southerly winds used in the model. Oiling in Arcata Bay, to the north, was relatively minor, according to the model, because most of the oil beached along the western side of North Bay Channel.
Sector SF Section 9000-36 October 1, 2014
Discharge of Maximum Impact
The Discharge of Maximum Impact occurs off Cape Mendocino when a fully laden tanker loses power and grounds spilling some of it’s cargo before a tug is able to arrive on scene to render assistance. This spill was chosen for the Area Committee to consider and evaluate the response actions to be taken if such a spill, however likely, was to occur.
Historical Spill Considerations: Recent spill history for this area does not contain a spill of this magnitude. However, recently several serious tanker casualties have occurred throughout the world and considering tanker traffic that transits the California coast, the Area Committee chose to include a similar scenario for this area for planning purposes.
Hazard Assessment: Large tankers transit the coastline from Alaska to call on the various California ports including San Francisco and Los Angles. Approximately 85% of all oil tankers serving California have voluntarily agreed to remain at least 50 nautical miles from the coast when transiting up or down the California coastline. However, there are several land points that extend beyond the mainland (such as Point Arena, Punta Gorda and Cape Mendocino) that almost certainly have tankers transiting within the 50 nm range. However unlikely, it is possible that a tanker could lose power or steering and ground along the North Coast of California. It is also possible that a tanker could experience a fire or explosion while transiting similar to the T/V PUERTO RICAN or T/V MEGA BORG. Depending on the exact location, the transit time for a tug to reach a tanker in distress between Point Arena and Humboldt Bay could be up to 12 hours. Weather can play a key role in an event such as this. The Northern California coast frequently experience high winds and sea states throughout the year. The coast normally if very foggy during the summer months. The weather combined with the rugged terrain can be expected to make salvage and cleanup operations very difficult.
Vulnerability Analysis: Essentially the entire California coastline is a highly sensitive environment. While the coast is not as sensitive to oiling as inland wetlands and marshes, it is an ecology with numerous wildlife species, including sea otters and grey whales. In addition, the coast in this area is difficult, if not impossible, to access by land. The entire list of environmentally sensitive sites is too numerous to identify individually here, but are included in detail in Annex E of this plan. Mendocino County alone, has 39 environmentally sensitive sites identified. Many of these are creeks and river inlets. The offshore environmental resources were not identified this planning cycle, but could potentially be impacted by a spill of this magnitude.
SCENARIO: DISCHARGE OF MAXIMUM IMPACT
Situation: A tanker fully laden 1.5 million barrel of North Slope crude oil experiences complete loss of power. Oceangoing tugs are not able to reach the vessel before it grounds near Cape Mendocino. The tanker sustains significant damage to it’s wing cargo and ballast tanks, spilling 500,000 barrels of North Slope crude oil immediately and the rest of its cargo over the next 12 hours. Location: Cape Mendocino Amount: 500,000 barrels North Slope Crude initially, with an additional 1 million barrels over the next 12 hours.
Sector SF Section 9000-54 October 1, 2014
Securing Source: The tank vessel is unstable; tugs on scene. Areas at Risk: Entire North Coastline. Wind and tide will likely carry the spill to impact Cape Mendocino and adjacent coastlines. Time of Year: Winter Weather: Cloudy
Wind: 30+ knots, with gusts to 40 SW to W
Visibility: 1/2 mi.
Seas: 10-15 feet.
Current: Max Flood
(Note: This scenario is not a required element of this plan and is a large SONS event potentially involving more than one planning area. During the next planning cycle, it is expected that additional guidance will be available on the SONS response and it is anticipated that the cascading of resources within the state will be further defined. Furthermore, an accurate trajectory was not available prior the printing deadline. Therefore, the details of the response strategy were left for the next planning cycle. However, all elements of this plan apply to this, or any similar event, if it were to actually occur.)
9440.2 San Francisco Bay and Delta Scenarios
Scenario Development As required by OPA-90, the maximum most probable discharges, and a worst case discharge are presented.
Most Probable Discharge The worst case discharge scenario is based on the size of the average spill in the area. When determining the most probable discharge, any unusually large spill which would skew the value was specified to not be included in the average figure.
Historical Spill Considerations: During the period 1974-1979, 97% of all reported spills were less than 25 bbls. During the period 1980-1990, the majority of oil spills reported were less than 750 gallons (17.86 bbls), with only 36 spills being greater than 17.86 bbls and none greater than 1000 bbls. Also during the 1980-1990 period, there were only 25 Hazardous Chemical spills greater than 1 gal. Reported.
These averages both support the Federal and California required Vessel and Contingency Plan maximum most probable discharge size established as 0-50 barrels. This range will therefore be adopted for the most probable spill scenario.
A majority of the most probable spills occur in Oakland or Alameda. The most likely reason is due to an automatic bilge pump discharging bilge water.
Other common causes of these 0-50 bbl most probable spills include human error, mechanical failure, or tank or pipe rupture.
Sector SF Section 9000-55 October 1, 2014

Hazard Assessments: These type spills occur throughout the Bay area including the ports and harbors of San Francisco, Richmond, Berkeley, Emeryville, S. San Francisco, Redwood City, Carquinez, Vallejo, Martinez, Sausalito, San Rafael, San Leandro, Pittsburg, Antioch, Rio Vista, Half Moon Bay, bodega Bay, and Tomales Bay. These are all locations where there are marinas, industrial areas and marine transfer facilities.
Vulnerability Analysis: Proximity of these hazards to the most sensitive areas, i.e. environmentally sensitive areas is of primary concern. The most environmentally sensitive areas are those containing wetlands. There are large wetland areas in San Pablo Bay, Suisun Bay, and Carquinez Straits in close proximity to a number of refineries with marine transfer facilities and large storage tanks. Transfer facilities located near Point San Pablo, Richmond, Oakland, South San Francisco, and Redwood City are also in close proximity to wetlands.
Risk Assessments: Spill history tells us that a majority of the most probable spills occur due to a bilge pump from a recreational or fishing boat in the central bay. The hazard assessment section shows that proximity to sensitive wetlands makes locations near San Pablo Bay, Suisun Bay, and the South Bay the most damaging. The marinas in those more remote areas also tend to have lower slip fees and often older boats that receive less maintenance or attention are drawn away from the large concentration of boats in the central bay. The operation of a vessel in such a state of repair in such a close proximity to a wetland is the most significant risk. Such a location is the most significant even though most common spills occur in the central bay. A location in the Napa River was chosen as one of the best examples of such an incident.
Seasonal Considerations: December is the most sensitive time of the year due to the large number of migratory birds including diving ducks. This time of the year has the highest tides which reach the farthest into the wetland habitat of the endangered species of Rails and Saltmarsh Harvest Mouse.
Sector SF Section 9000-56 October 1, 2014

Scenario: Situation: A small diesel powered boat sinks up the Napa River, in South Slough above Vallejo on an incoming tide.
Location: The boat is well up into the marsh area, a remote location accessible only by boat (38-08’ N, 122-18’W) Amount: The boat is sunk with 500 gallons of fuel and 20 gallons of lube oil on board. The fuel is leaking through tank vents and loose fill caps. All of the lube oil has come out of the open lube oil container. Securing Source: Since the vessel is sunk, the source can only be secured by divers or raising the vessel. Areas at Risk: The wetlands up the Napa River are at immediate risk.
Time of Year: December Weather: Nighttime with fog.
Sector SF Section 9000-57 October 1, 2014

Maximum Most Probable Discharge The worst case discharge scenario is based on the size of the largest recorded spill for the area. The maximum most probable discharge takes into account such factors as the size of the largest recorded spill, traffic flow through the area, hazard assessment, risk assessment, seasonal considerations, spill histories, and operating records of facilities and vessels in the area.
Historical Spill Considerations: In January 1971, two tankers, the ARIZONA STANDARD and the OREGON STANDARD collided under the Golden Gate spilling 26,700 bbls of bunker fuel. During the period 1974-1979, 29 of the 43 reported spills between 23.8 and 238 bbls and 5 of the 8 reported spills between 238 and 1000 bbls were centrally located in San Francisco Bay. No spills greater than 1000 bbls occurred. During the period 1980-1990, there were 36 petroleum spills being greater than 17.86 bbls, none with any greater than 1000 bbls. Three of the incidents were particularly large. These included 40,000 gallons of aviation gasoline and 35,000 gallons of crude oil caused by tank ruptures and 30,000 gallons of aviation gasoline caused by a dike failure. No. 2 fuel oil/diesel fuel was the most commonly spilled, 12 of 36 incidents, while jet fuel accounted for 7 of 36 inicidents.
These averages both support the Federal and California required Vessel and Contingency Plan maximum most probably discharge size established as 50-2,500 barrels. The collision of the ARIZONA STANDARD and the OREGON STANDARD is roughly ten times greater than this range, but is only 2% of a 1.2 million bbl worst case spill. This range will therefore be adopted for the maximum most probable spill scenario.
A major portion (42%) of the maximum most probable spills during the 1980-1990 period occurred near Oakland Naval Supply Center.
Hazard Assessments: While a majority (55%) of the maximum most probable incidents during 1980-1990 were due to unknown sources, tank overflow or unintentional discharge accounted for 15% of the 36 incidents. Another 14% was due to equipment failure while tank or pipe ruptures and other mechanical causes accounted for 16%.
Vulnerability Analysis: Proximity of these hazards to the most sensitive areas,, i.e. environmentally sensitive areas is of primary concern. The most environmentally sensitive areas are those containing wetlands. There are large wetland areas in San Pablo Bay, Suisun Bay, and Carquinez Straits in close proximity to a number of refineries with marine transfer facilities and large storage tanks. Transfer facilities located near Point San Pablo, Richmond, Oakland, South San Francisco, and Redwood City are also in close proximity to wetlands.
Risk Assessments: Based on the location of the marine transfer facilities, the volume of traffic, and the proximity to wetlands, a location in the Carquinez Strait area has the most significant risk.
Seasonal Considerations: December is the most sensitive time of the year due to the large number of migratory birds including diving ducks. This time of the year has the highest tides which reach the farthest into the wetland habitat of the endangered species of Rails and Saltmarsh Harvest Mouse.
Sector SF Section 9000-58 October 1, 2014

Scenario: Situation: An accident results in transfer piping rupturing at a marine facility above Carquinez Strait. Although the segregating valve near the storage tank is quickly closed, 2,500 bbls of North Slope crude oil drains directly into the river on an incoming tide.
Location: Above Carquinez Strait near Martinez (31-01.9’ N, 122-07.8’W) Amount: 2,500 bbls of North Slope crude in the water. Securing Source: Transfer piping is secured rapidly, but 2,500 bbls have reached the water. Areas at Risk: The shoreline along Carquinez Strait, wetlands along the Martinez and Benicia shores, as well as Suisun Bay wetlands are at immediate risk. Several Marina’s and water intakes are also threatened.
Time of Year: December Weather: Nighttime with fog.
Sector SF Section 9000-59 October 1, 2014
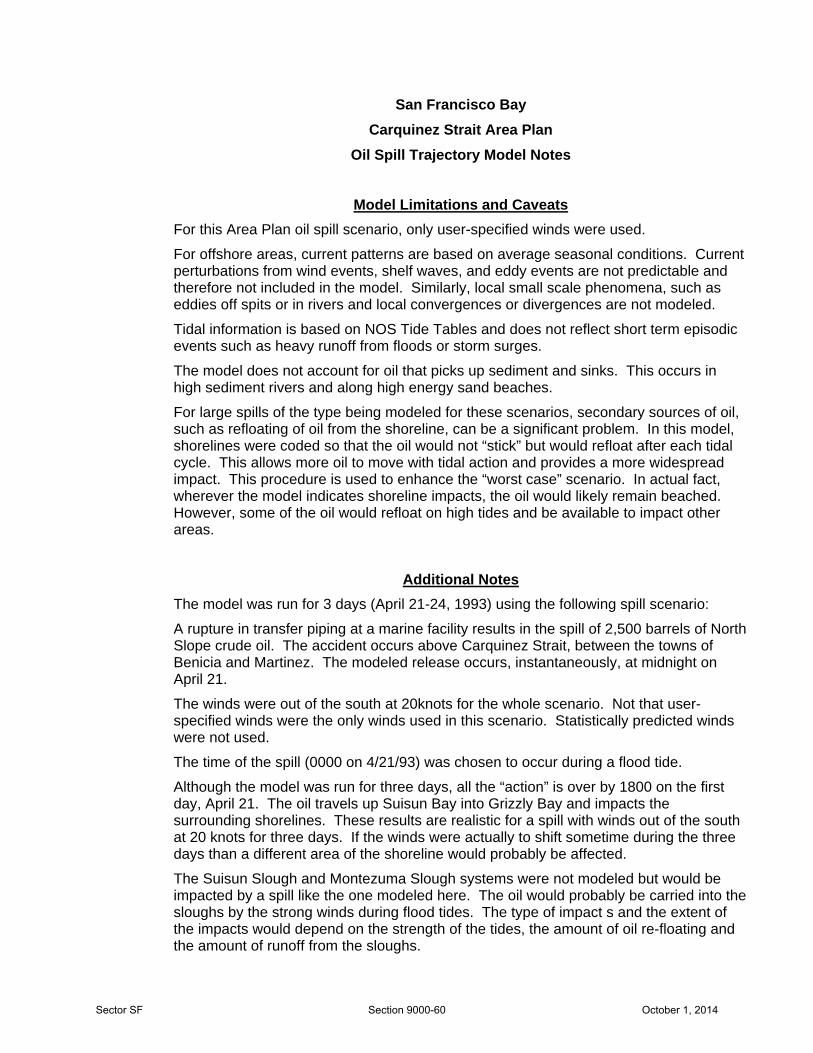
San Francisco Bay Carquinez Strait Area Plan
Oil Spill Trajectory Model Notes
Model Limitations and Caveats For this Area Plan oil spill scenario, only user-specified winds were used.
For offshore areas, current patterns are based on average seasonal conditions. Current perturbations from wind events, shelf waves, and eddy events are not predictable and therefore not included in the model. Similarly, local small scale phenomena, such as eddies off spits or in rivers and local convergences or divergences are not modeled.
Tidal information is based on NOS Tide Tables and does not reflect short term episodic events such as heavy runoff from floods or storm surges.
The model does not account for oil that picks up sediment and sinks. This occurs in high sediment rivers and along high energy sand beaches.
For large spills of the type being modeled for these scenarios, secondary sources of oil, such as refloating of oil from the shoreline, can be a significant problem. In this model, shorelines were coded so that the oil would not “stick” but would refloat after each tidal cycle. This allows more oil to move with tidal action and provides a more widespread impact. This procedure is used to enhance the “worst case” scenario. In actual fact, wherever the model indicates shoreline impacts, the oil would likely remain beached. However, some of the oil would refloat on high tides and be available to impact other areas.
Additional Notes The model was run for 3 days (April 21-24, 1993) using the following spill scenario:
A rupture in transfer piping at a marine facility results in the spill of 2,500 barrels of North Slope crude oil. The accident occurs above Carquinez Strait, between the towns of Benicia and Martinez. The modeled release occurs, instantaneously, at midnight on April 21.
The winds were out of the south at 20knots for the whole scenario. Not that user-specified winds were the only winds used in this scenario. Statistically predicted winds were not used.
The time of the spill (0000 on 4/21/93) was chosen to occur during a flood tide.
Although the model was run for three days, all the “action” is over by 1800 on the first day, April 21. The oil travels up Suisun Bay into Grizzly Bay and impacts the surrounding shorelines. These results are realistic for a spill with winds out of the south at 20 knots for three days. If the winds were actually to shift sometime during the three days than a different area of the shoreline would probably be affected.
The Suisun Slough and Montezuma Slough systems were not modeled but would be impacted by a spill like the one modeled here. The oil would probably be carried into the sloughs by the strong winds during flood tides. The type of impact s and the extent of the impacts would depend on the strength of the tides, the amount of oil re-floating and the amount of runoff from the sloughs.
Sector SF Section 9000-60 October 1, 2014

North Slope crude is a medium crude oil with a typical API of about 27. It tends to form water-in-oil emulsions and so may persist for months after a spill. In this scenario, the oil will probably be emulsify at some point.
Sector SF Section 9000-61 October 1, 2014

Worst Case Discharge The worst case discharge scenario is based on:
1. In the case of a vessel, a discharge of its entire cargo in adverse weather conditions.
2. In the case of a facility, the largest foreseeable discharge in adverse weather conditions.
For determining the worst case discharge scenario from a vessel, the largest vessel which calls at the port must be considered. Examination of the vessel’s route identifies hazards and the risk of collision. For considering the worst case discharge scenarios from facilities, the amount of cargo transferred and stored as well as the facilities operating histories are significant. Choice of the worst case discharge between a vessel and a facility scenario must be evaluated from the likely impact on sensitive areas, water intakes, pollution centers, beaches and what is considered the most devastating impact.
Historical Spill Considerations: In January 1971, two tankers, the ARIZONA STANDARD and the OREGON STANDARD collided under the Golden Gate spilling 26,700 bbls of bunker fuel. During the period 1980-1990, three particularly large incidents occurred. These included 40,000 gallons of aviation gasoline and 35,000 gallons of crude oil caused by tank ruptures and 30,000 gallons of aviation gasoline caused by a dike failure.
Hazard and Risk Assessments: The largest tankships that call on San Francisco carry 1.2 million barrels of North Slope crude oil. These vessels lighter in Anchorage 9, offloading approximately 545,000 bbls, and then proceed to the refineries in Benicia, Martinez, Carquinez, and Richmond areas. The collision of the ARIZONA STANDARD and the OREGON STANDARD is roughly 10 times greater than the maximum most probable spill but is only 2% of the deadweight of the largest tankers that call.
Spill history shows that the loss of an entire tanker and it’s cargo is possible as evidenced by the PUERTO RICAN. Since the loss of the entire vessel and cargo id dependent on fire and explosion or sever grounding and break-up of the hull, the grounding at the Farallons is one risk that could result in such an incident.
The initial hazards that a tanker encounters approaching San Francisco are shoal waters by the Farallon Islands, the approach lanes with increased vessel traffic, and the bar outside San Francisco Bay’s Golden Gate. During severe winter storms, the bar may become hazardous with breaking surf. Depending on draft, the shoals creating the bar can be considered a proximate grounding hazard. Approaching the Golden Gate, a jagged and rocky coastline with numerous submerged rocks, the initial rock hazards exist at Point Bonita and Mile Rocks. Rocky coastline borders the shipping channel on through the constriction of the Golden Gate Bridge. A vessel traffic service (VTS) is provided for the heavy traffic in this port. Within San Francisco Bay, Harding, Arch, and Shag Rocks each present a significant pinnacle grounding hazard. The Bay Area is a complex harbor with numerous islands, bridges, and channels with a number of turns. Large tankers must lighter cargo at Anchorage 9 in order to make the transit to Richmond or through San Pablo Bay to refineries by the Carquinez Strait.
Sector SF Section 9000-72 October 1, 2014
Vulnerability Analysis: A truly worst case spill where loss of the entire vessel cargo is plausible occurs outside San Francisco Bay approaches. A location along the coast would impact vast amounts of coastline as well as inside the Bay. Considering weather and sea-state, loss of an entire vessel due to grounding is more likely outside the Bay. Within the Bay, collisions with other vessel traffic, fixed objects such as bridges, and proximity of grounding hazards to the shipping channels are prime concerns for a worst case spill. There are numerous environmentally sensitive areas throughout San Francisco and surrounding bays. The most environmentally sensitive areas are those containing wetlands. There are large wetland areas in San Pablo Bay, Suisun Bay, and the Carquinez Straits in close proximity to a number of refineries with marine transfer facilities and large storage tanks. Transfer facilities located near Point San Pablo, Richmond, Oakland, South San Francisco, and Redwood City are also proximate to wetlands.
The worst time of year in this location is April-June during seabird breeding season. This is also when harbor seals are pupping and elephant seal pups are first taking to the water.
Sector SF Section 9000-73 October 1, 2014

Worst Case Discharge #1 Description of the Event:
Situation: A 1.2 million bbl tanker loses power in a winter storm on approach to San Francisco Bay. The vessel grounds and breaks up on the Farallon Islands. All cargo is spilled.
Location: Farallon Islands. Amount: 1.2 million bbls of North Slope crude. Securing Source: Entire cargo spilled, vessel breaks up and sinks. Areas at Risk: The coastline from Fort Bragg south to Santa Cruz County and beyond. Wind and tide may eventually carry the spill throughout San Francisco Bay and tributaries.
Time of Year: April Weather: Severe storm with 35+ knot winds, 1 mile visibility, and seas 15-20 ft. offshore.
Farallon Islands Oil Spill Trajectory Model Notes
Model Limitations and Caveats For this Area Plan oil spill scenario, only user-specified winds were used.
For offshore areas, current patterns are based on average seasonal conditions. Current perturbations from wind events, shelf waves, and eddy events are not predictable and therefore not included in the model. Similarly, local small scale phenomena, such as eddies off spits or in rivers and local convergences or divergences are not modeled.
The model does not account for oil that picks up sediment and sinks. This occurs in high sediment rivers and along high energy sand beaches.
For large spills of the type being modeled for these scenarios, secondary sources of oil, such as refloating of oil from the shoreline, can be a significant problem. In this model, shorelines were coded so that the oil would not “stick” but would refloat after each tidal cycle. This allows more oil to move with tidal action and provides a more widespread impact. This procedure is used to enhance the “worst case” scenario. In actual fact, wherever the model indicates shoreline impacts, the oil would likely remain beached. However, some of the oil would refloat on high tides and be available to impact other areas.
Additional Notes The model was run for 3 days (April 21-24, 1993) using the following spill scenario:
A vessel runs aground off Southeast Farallon Island, losing 120,00 barrels of North Slope crude oil immediately. Over the next twelve hours, 1.08 million more barrels leak from the ship.
Sector SF Section 9000-74 October 1, 2014

Winds are constant at a stiff 30-35 knots from the SW throughout the spill. The seas are 15-20 feet. Only user-specified winds were used, not statistical winds.
The strong southwesterly winds, which push the spilled oil onto the shoreline, dominate the results of this scenario. Heavy beach oiling of the coast between Bolinas Bay and Drakes Bay will occur.
North Slope crude is a medium crude oil with a typical API of about 27. It tends to form water-in-oil emulsions and so may persist for months after a spill. In this scenario, the oil will probably be emulsified within about six hours of the spill.
For this oil spill scenario, the refloating of oil is a strong possibility. Because the model does not take into account longshore currents (those currents inside the surf zone) it cannot predict the probable full impact of the spill. If a real oil spill occurred with these conditions, heavy beach impacts would occur when and where the model predicts, but over the span of several days oil could refloat and be moved northwards and/or southwards by longshore currents, to impact beaches further along the coast. Oil originally deposited on sand beaches could pick up sand and possibly form emulsions or tarballs. The tarballs could move along the ocean bottom near the shore. Oil originally deposited on rocky coasts would refloat relatively easily, to move up or down the coast. Oil moving further offshore would be influenced by daily winds and normal offshore currents.
Sector SF Section 9000-75 October 1, 2014

Sector SF Section 9000-76 October 1, 2014

Additional Scenarios
Three additional scenarios that are also considered Discharges of Maximum Impact because of location within San Francisco Bay and proximity to wetlands are as follows:
Worst Case Discharge #2 Description of the Event:
Situation: Harding Rock: A fully laden 1.2 million bbl tanker suffers a steering casualty as it approaches Harding Rock. It goes hard aground on Harding Rock and breaches number 1-5 center cargo tanks.
Location: Harding Rock (37-50.3’N, 122-26.8’W). Amount: 12,000 bbls of North Slope crude (1/100th of its cargo). Securing Source: Vessel stabilized, but aground. Can be offloaded but cannot offload involved tanks before contents released.
Time of Year: Winter
Areas At Risk: Entire San Francisco Bay and tributaries and some coastline outside. Wind and tied will likely carry the spill throughout San Francisco Bay and tributaries. Weather: Cloudy with wind at 20+ kts SW to W, visability at 1 mile, seas at 3-5 feet, and current at max flood.
San Francisco Bay Oil Spill Trajectory Model Notes
Model Limitations and Caveats
For the Area Plan oil spill scenario, a combination of user-specified and statistical winds are used. The user-specified winds can be fine tuned to some degree to imitate an actual storm event. However, the statistical winds used in the model are based on wind histograms taken by the U.S. Navy Marine Climatic Atlas. Using the histogram data, the model generates a simulation of it that is random, but has the same statistical distribution. It must be understood, however, that using statistical wind patterns in a scenario gives an illustration of what areas could possibly be impacted, not what areas will be impacted. Also, statistical winds do not take into account local topographic-induced effects that could significantly alter wind patterns.
For offshore areas, current patterns are based on average seasonal conditions. Current perturbations from wind events, shelf waves, and eddy events are not predictable and therefore not included in the model. Similarly, local small scale phenomena, such as eddies off spits or in rivers and local convergences or divergences are not modeled.
Tidal information is based on NOS Tide Tables and does not reflect short term episodic events such as heavy runoff from floods or storm surges.
For large spills of the type being modeled for these scenarios, secondary sources of oil, such as refloating of oil from the shoreline, can be a significant problem. While the model does allow the oil to refloat the details are not exact.
Sector SF Section 9000-83 October 1, 2014

The model does not account for oil that picks up sediment and sinks. This occurs in high sediment rivers and along high energy beaches.
Finally, and most important, moderate to large sized spills of a heavy oil (e.g., Bunker C or heavy crudes) will persist for weeks or months after the initial spill event. Depending on local wind and current conditions, these spills can impact shoreline several hundred miles downstream from the source. For these scenarios, even though the model is run for only one week and for one specific area does not mean that there will not be impacts felt far afield.
Additional Notes
The model was run for 72 hours (2/3-2/6, 1992) using the following weather scenario:
Winds were blowing 15-20 knots from the west-southwest for 24 hours. Directions and speed were varied after this time but predominantly came from the west.
For the Carquinez Strait spill scenario, during the first 24 hours, winds were blowing from the west at 20 knots. After that, the winds moved to the nothrwest and lightened finally ending up from the south at about 5 knots. This weather scenario was chosen to provide a more realistic trajectory in this area.
12,000 barrels of Alaska North Slope crude oil was the product spilled for all three scenarios.
The time of the spill (0600 hours on 2/3/1992) was chosen to occur during a flood tide.
The model indicates that some oil was transported out of the Golden Gate area during ebb tide events. Since there is a net flow out of the bay, it is likely that there will be offshore impacts felt as the spill progresses beyond 72 hours.
Shorelines were coded so that the oil would not “stick” but would refloat after each tidal cycle. This allows more oil to move with tidal action and provide a more widespread impact. This procedure is used to enhance the “worst-case” scenario.
Sector SF Section 9000-84 October 1, 2014

Worst Case Discharge #3 Situation: Anchorage 9: A fully laden 1.2 million bbl tanker gets rammed broadside by a large containership which suffers complete loss of power while attempting to anchor. One wing cargo and one wing ballast tanks are punctured, spilling 12,000 bbls of North Slope crude oil.
Location: Anchorage 9 (37-46.6’N, 122-20.4’W). Amount: 12,000 bbls of North Slope crude (1/100th of its cargo). Securing Source: Vessel stable and anchored. Can be offloaded but cannot offload involved tanks before contents released.
Time of Year: Winter
Areas At Risk: Entire San Francisco Bay and tributaries and some coastline outside. Wind and tied will likely carry the spill throughout San Francisco Bay and tributaries. Weather: Cloudy with wind at 20+ kts SW to W, visability at 1 mile, seas at 3-5 feet, and current at max flood.
Sector SF Section 9000-97 October 1, 2014

San Francisco Bay
Oil Spill Trajectory Model Notes
Model Limitations and Caveats For the Area Plan oil spill scenario, a combination of user-specified and statistical winds are used. The user-specified winds can be fine tuned to some degree to imitate an actual storm event. However, the statistical winds used in the model are based on wind histograms taken by the U.S. Navy Marine Climatic Atlas. Using the histogram data, the model generates a simulation of it that is random, but has the same statistical distribution. It must be understood, however, that using statistical wind patterns in a scenario gives an illustration of what areas could possibly be impacted, not what areas will be impacted. Also, statistical winds do not take into account local topographic-induced effects that could significantly alter wind patterns.
For offshore areas, current patterns are based on average seasonal conditions. Current perturbations from wind events, shelf waves, and eddy events are not predictable and therefore not included in the model. Similarly, local small scale phenomena, such as eddies off spits or in rivers and local convergences or divergences are not modeled.
Tidal information is based on NOS Tide Tables and does not reflect short term episodic events such as heavy runoff from floods or storm surges.
For large spills of the type being modeled for these scenarios, secondary sources of oil, such as refloating of oil from the shoreline, can be a significant problem. While the model does allow the oil to refloat the details are not exact.
The model does not account for oil that picks up sediment and sinks. This occurs in high sediment rivers and along high energy beaches.
Finally, and most important, moderate to large sized spills of a heavy oil (e.g., Bunker C or heavy crudes) will persist for weeks or months after the initial spill event. Depending on local wind and current conditions, these spills can impact shoreline several hundred miles downstream from the source. For these scenarios, even though the model is run for only one week and for one specific area does not mean that there will not be impacts felt far afield.
Sector SF Section 9000-98 October 1, 2014
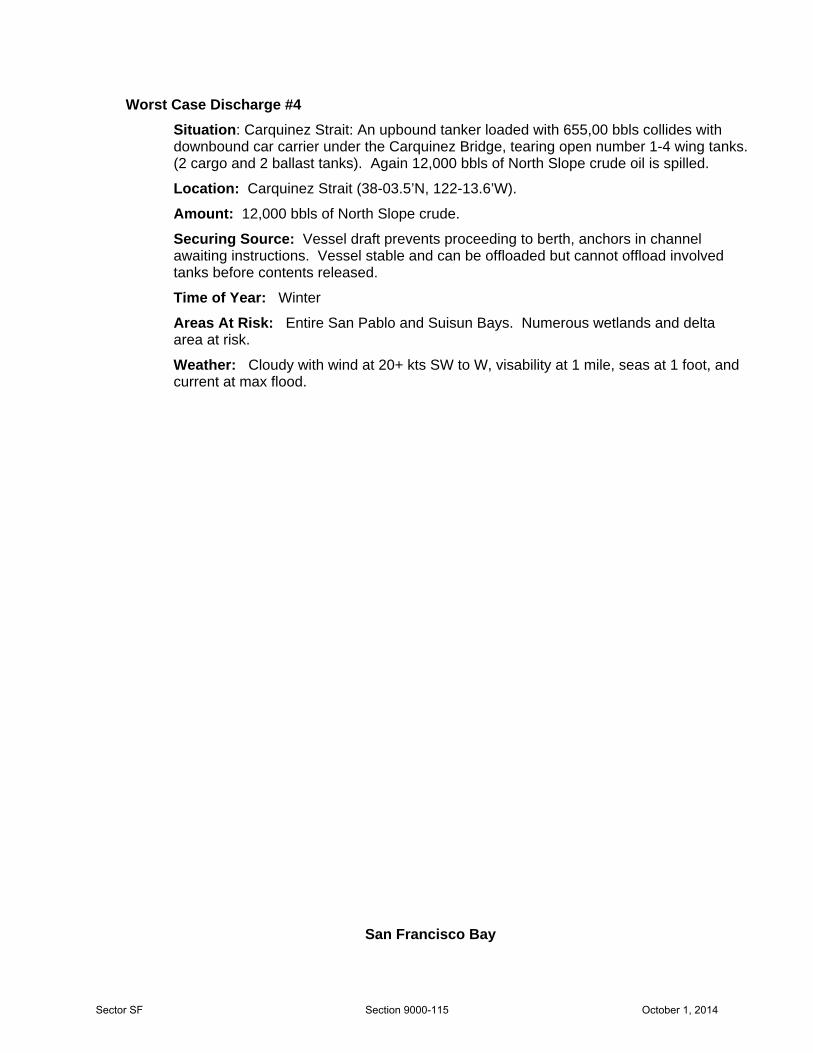
Worst Case Discharge #4 Situation: Carquinez Strait: An upbound tanker loaded with 655,00 bbls collides with downbound car carrier under the Carquinez Bridge, tearing open number 1-4 wing tanks. (2 cargo and 2 ballast tanks). Again 12,000 bbls of North Slope crude oil is spilled.
Location: Carquinez Strait (38-03.5’N, 122-13.6’W). Amount: 12,000 bbls of North Slope crude. Securing Source: Vessel draft prevents proceeding to berth, anchors in channel awaiting instructions. Vessel stable and can be offloaded but cannot offload involved tanks before contents released.
Time of Year: Winter
Areas At Risk: Entire San Pablo and Suisun Bays. Numerous wetlands and delta area at risk. Weather: Cloudy with wind at 20+ kts SW to W, visability at 1 mile, seas at 1 foot, and current at max flood.
San Francisco Bay
Sector SF Section 9000-115 October 1, 2014

Oil Spill Trajectory Model Notes
Model Limitations and Caveats
For the Area Plan oil spill scenario, a combination of user-specified and statistical winds are used. The user-specified winds can be fine tuned to some degree to imitate an actual storm event. However, the statistical winds used in the model are based on wind histograms taken by the U.S. Navy Marine Climatic Atlas. Using the histogram data, the model generates a simulation of it that is random, but has the same statistical distribution. It must be understood, however, that using statistical wind patterns in a scenario gives an illustration of what areas could possibly be impacted, not what areas will be impacted. Also, statistical winds do not take into account local topographic-induced effects that could significantly alter wind patterns.
For offshore areas, current patterns are based on average seasonal conditions. Current perturbations from wind events, shelf waves, and eddy events are not predictable and therefore not included in the model. Similarly, local small scale phenomena, such as eddies off spits or in rivers and local convergences or divergences are not modeled.
Tidal information is based on NOS Tide Tables and does not reflect short term episodic events such as heavy runoff from floods or storm surges.
For large spills of the type being modeled for these scenarios, secondary sources of oil, such as refloating of oil from the shoreline, can be a significant problem. While the model does allow the oil to refloat the details are not exact.
The model does not account for oil that picks up sediment and sinks. This occurs in high sediment rivers and along high energy beaches.
Finally, and most important, moderate to large sized spills of a heavy oil (e.g., Bunker C or heavy crudes) will persist for weeks or months after the initial spill event. Depending on local wind and current conditions, these spills can impact shoreline several hundred miles downstream from the source. For these scenarios, even though the model is run for only one week and for one specific area does not mean that there will not be impacts felt far afield.
Sector SF Section 9000-116 October 1, 2014
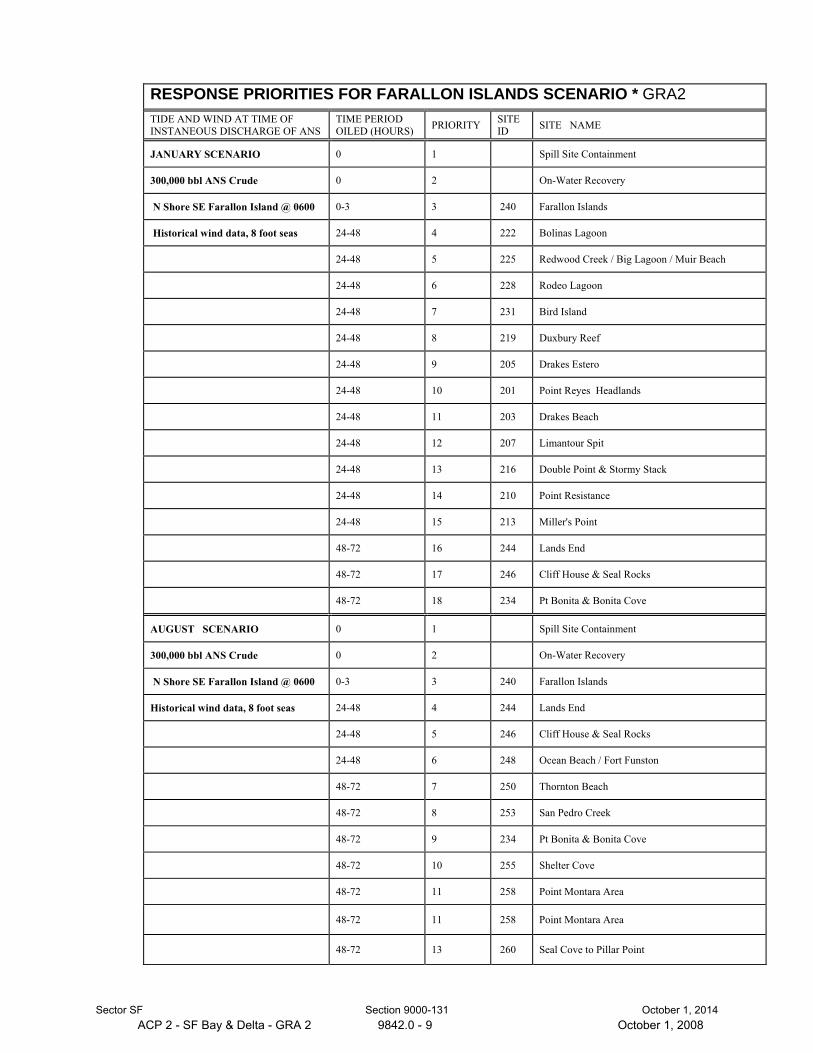
RESPONSE PRIORITIES FOR FARALLON ISLANDS SCENARIO * GRA2TIDE AND WIND AT TIME OF INSTANEOUS DISCHARGE OF ANS
TIME PERIOD OILED (HOURS) PRIORITY SITE
ID SITE NAME
JANUARY SCENARIO 0 1 Spill Site Containment
300,000 bbl ANS Crude 0 2 On-Water Recovery
N Shore SE Farallon Island @ 0600 0-3 3 240 Farallon Islands
Historical wind data, 8 foot seas 24-48 4 222 Bolinas Lagoon
24-48 5 225 Redwood Creek / Big Lagoon / Muir Beach
24-48 6 228 Rodeo Lagoon
24-48 7 231 Bird Island
24-48 8 219 Duxbury Reef
24-48 9 205 Drakes Estero
24-48 10 201 Point Reyes Headlands
24-48 11 203 Drakes Beach
24-48 12 207 Limantour Spit
24-48 13 216 Double Point & Stormy Stack
24-48 14 210 Point Resistance
24-48 15 213 Miller's Point
48-72 16 244 Lands End
48-72 17 246 Cliff House & Seal Rocks
48-72 18 234 Pt Bonita & Bonita Cove
AUGUST SCENARIO 0 1 Spill Site Containment
300,000 bbl ANS Crude 0 2 On-Water Recovery
N Shore SE Farallon Island @ 0600 0-3 3 240 Farallon Islands
Historical wind data, 8 foot seas 24-48 4 244 Lands End
24-48 5 246 Cliff House & Seal Rocks
24-48 6 248 Ocean Beach / Fort Funston
48-72 7 250 Thornton Beach
48-72 8 253 San Pedro Creek
48-72 9 234 Pt Bonita & Bonita Cove
48-72 10 255 Shelter Cove
48-72 11 258 Point Montara Area
48-72 11 258 Point Montara Area
48-72 13 260 Seal Cove to Pillar Point
ACP 2 - SF Bay & Delta - GRA 2 9842.0 - 9 October 1, 2008Sector SF Section 9000-131 October 1, 2014

PRO
BA
BIL
ITY
OF
OIL
RE
AC
HIN
G E
AC
H S
ITE
ST
RA
TE
GY
IN G
RA
3
1 2 2 °
3 0 ' W
1 2 2 °
2 0 ' W
122°10'W
122°0'W
3 7 ° 4
0 ' N
3 7 ° 4
5 ' N
3 7 ° 5
0 ' N
T A P
I I ™
- T r a
j e c t
o r y
A n a
lysis Planner
M o d e
: S h o r
e l i n e
I m p a
c t A n a l
y s i s
T i m e
: 6 h o u r
s S e a s
o n : M a r
- A u g
Oil Ty
pe: Me
dium
Crude
Amount
Released: 30
0000
bbl
Level of
Concern:
5 bbl
0
1 0
2 0
3 0
4 0
5060
7080
90100
P e r c
e n t Of
Spills
122° 3 0 '
W 122°20'W
122°10'W
122°0'W
37°45'N
37°50'N
37°55'N
38°0'N
TAP II™ - T r a
j e c t
ory Analysis Planner
Mode: Sh
orel i n e
I m p a
c t A n a l
ysis
Time: 12
hou r s
Season: Ma
r - A u g
Oil Ty
pe: Me
dium
Crude
Amount
Released: 30
0000
bbl
Level of
Concern:
5 bbl
010
20
3 0
4050
6070
8090
100
Percent Of
Spills
12 h
ours
from
sta
rt of
spill
6 ho
urs f
rom
sta
rt of
spill
GR
A 3
– A
ncho
rage
9
TA
P II
Map
s for
GR
A3
Scen
ario
: Spi
ll of
300
,000
bbl
s of c
rude
at A
ncho
rage
9 in
the
Sprin
g. T
he sh
ades
of g
rey
at e
ach
impa
cted
site
cor
resp
ond
to a
per
cent
age
in th
e le
gend
of t
he n
umbe
r of s
pill
scen
ario
s (fr
om 5
00 ru
ns o
fva
rious
win
d, ti
des a
nd c
urre
nts)
that
bro
ught
mor
e th
an 5
bbl
s ( =
Lev
el O
f Con
cern
) of o
il to
that
site
in th
e sp
ecifi
edtim
e fr
ame
(6 h
ours
or 1
2 ho
urs)
.
Sector SF Section 9000-132 October 1, 2014

PR
OB
AB
ILIT
Y O
F O
IL R
EA
CH
ING
EA
CH
SIT
E S
TR
AT
EG
Y IN
GR
A 3
48 h
ours
from
sta
rt of
spill
24 h
ours
from
sta
rt of
spill
TA
P II
Map
s for
GR
A3
Scen
ario
: Spi
ll of
300
,000
bbl
s of c
rude
at A
ncho
rage
9 in
the
Sprin
g. T
he sh
ades
of g
rey
at e
ach
impa
cted
site
cor
resp
ond
to a
per
cent
age
in th
e le
gend
of t
he n
umbe
r of s
pill
scen
ario
s (fr
om 5
00 ru
ns o
fva
rious
win
d, ti
des a
nd c
urre
nts)
that
bro
ught
mor
e th
an 5
bbl
s ( =
Lev
el O
f Con
cern
) of o
il to
that
site
in th
e sp
ecifi
edtim
e fr
ame
(24
hour
s or 4
8 ho
urs)
.
1 2 2 °
3 0 ' W
1 2 2 °
20'W
122°10'W
122°0'W
3 7 ° 4
5 ' N
3 7 ° 5
0 ' N
3 7 ° 5
5 ' N
3 8 ° 0
' N
T A P
I I ™
- T r a
j e c t
o r y
A n a
lysis Planner
M o d e
: S h o r
e l i n e
I m p a
c t A n a l
y s i s
T i m e
: 1 d a y
S e a s
o n : M a r
- A u g
Oil Ty
pe: Me
dium
Crude
Amount
Released: 30
0000
bbl
Level of
Concern:
5 bbl
0
1 0
2 0
3 0
4 0
5060
7080
90100
P e r c
e n t Of
Spills
122°40'W
1 2 2 °
3 0 ' W
122°20'W
122°10'W
122°0'W
37°45'N
37°50'N
37°55'N
38°0'N
TAP I I ™
- T r a
jectory Analysis Planner
Mode: Sh
o r e l i n
e I m p a
c t Analysis
Time: 2
d a y s
Season: M a r
- A u g
Oil Ty
pe: Me
dium
Crude
Amount
Released: 30
0000
bbl
Level of
Concern:
5 bbl
010
2 0
3 0
4050
6070
8090
100
Percent Of
Spills
GR
A 3
– A
ncho
rage
9
Sector SF Section 9000-133 October 1, 2014

Tabl
e of
per
cent
of s
pills
that
brin
g oi
l (>5
bbl
s) to
eac
h si
te fr
om th
e G
RA
3 sc
enar
io (A
ncho
rage
9).
AC
P SI
TE#
ES
SITE
NA
ME
LAT
W
(D
eg.
Min
.) LO
NG
W (
Deg
. M
in.)
6 H
OU
RS
(%
prob
) 12
HO
UR
S (%
pro
b)
24 H
OU
RS
(% p
rob)
2-35
1 B
/A
Yer
ba B
uena
Isla
nd
37
48
122
22
6286
952-
353
A
Her
on's
Hea
d P
ark
- Ind
ia B
asin
3
7 44
.3
122
22.5
47
5458
2-35
4 A
Is
lais
Cre
ek -
Pie
r 94
Sal
tmar
sh
37
44.3
12
2 22
.5
4654
562-
400
C
San
Fra
ncis
co W
ater
front
3
7 46
12
2 23
45
6169
2-40
2 B
A
lcat
raz
Isla
nd
37
50
122
25
3856
762-
307
C/A
A
lam
eda
Eel
gras
s B
eds
37
45
122
16
3579
952-
402
B
Alc
atra
z Is
land
3
7 50
12
2 25
35
5375
2-49
5 A
E
mer
yvill
e La
goon
/Mud
flats
3
7 50
12
2 29
27
6686
2-35
2 B
S
outh
Bas
in, H
unte
rs P
oint
3
7 43
12
2 23
24
2729
2-23
6 C
P
t. D
oabl
e to
Lim
e P
oint
3
7 49
12
2 30
22
3255
2-40
1 B
P
ier 3
9 3
7 48
12
2 22
19
4057
2-24
4 A
La
nd's
End
3
7 47
12
2 30
19
2851
2-24
6 A
C
liff H
ouse
and
Sea
l Roc
ks
37
47
122
31
1523
442-
309
A
San
Lea
ndro
Bay
3
7 45
12
2 13
12
5182
2-42
3 C
A
ngel
Isla
nd
37
54
122
27
1234
602-
310
C/A
B
ay F
arm
Isla
nd E
elgr
ass
Bed
s 3
7 44
12
2 15
.5
1136
642-
490
A
Ber
kele
y E
elgr
ass
Bed
s 3
7 51
12
2 19
8.
629
732-
234
C
Poi
nt B
onita
and
Bon
ita C
ove
37
49
122
31
7.6
1626
2-22
8 A
R
odeo
Lag
oon
37
50
122
32
612
222-
231
A
Bird
Isla
nd
37
49
122
32
612
222-
248
A
Oce
an B
each
/For
t Fun
ston
3
7 45
12
2 30
4.
612
232-
312
to
2-32
4 A
O
yste
r Bay
Mar
shes
to
Cog
swel
l, H
ayw
ard,
and
HA
RD
Mar
shes
3
7 29
12
2 02
0.
43.
621
2-42
2 B
K
eil C
ove
37
55
122
27
0.04
1524
2-42
1 C
P
arad
ise
Cov
e &
Tib
uron
Pen
insu
la
37
54
122
27
0.01
2237
2-42
0 A
R
icha
rdso
n Ba
y M
arsh
es
36
56
122
30
0.01
4.6
102-
420
A
Ric
hard
son
Bay
Mar
shes
3
6 56
12
2 30
0.
0119
292-
480
A
Alb
any
Mar
sh
37
54
122
19
9.4
532-
453
A
Bro
ok's
Isla
nd
37
54
122
21.5
21
552-
455
C
San
ta F
e C
hann
el
37
55
122
22
1748
2-45
1 A
C
astro
Roc
ks
37
50
122
24
1743
Sector SF Section 9000-134 October 1, 2014

2-45
2 A
R
ichm
ond
Eel
gras
s B
eds
37
58
122
24
1537
2-42
4 B
P
arad
ise
Cay
Eel
gras
s &
Mar
ina
37
54
122
27
1524
2-50
1 A
C
astro
Cre
ek a
nd M
arsh
es
37
58
122
24
1128
2-45
4 A
R
ichm
ond
Inne
r Har
bor/H
offm
an M
arsh
3
7 54
.5
122
20
4.4
382-
506
A
San
Pab
lo B
ay E
elgr
ass
Bed
3
7 59
12
2 25
2.
86.
82-
551
A
McN
ear's
Bea
ch M
arsh
es
38
00
122
27
2.8
6.8
2-42
7 A
M
arin
Isla
nds
37
58
122
28
1.6
3.6
2-50
2 A
S
an P
ablo
Cre
ek M
arsh
es
37
58.5
12
2 23
4.
22-
503
A
Pin
ole
Pt.
Mar
shes
-Sou
th
37
59
122
21.6
4
2-50
4 A
P
inol
e P
t. M
arsh
es -
Nor
th
38
05
122
21
2.6
2-42
5 A
C
orte
Mad
era
Mar
shes
3
8 56
12
2 30
1.
82-
426
A
San
Raf
ael C
reek
Mar
sh
37
58
122
29
1.8
2-58
3 A
N
apa
Riv
er M
arsh
es
38
12
122
19
0.4
2-25
0 A
Th
ornt
on B
each
Sta
te P
ark
37
42
122
30
0.2
Sector SF Section 9000-135 October 1, 2014
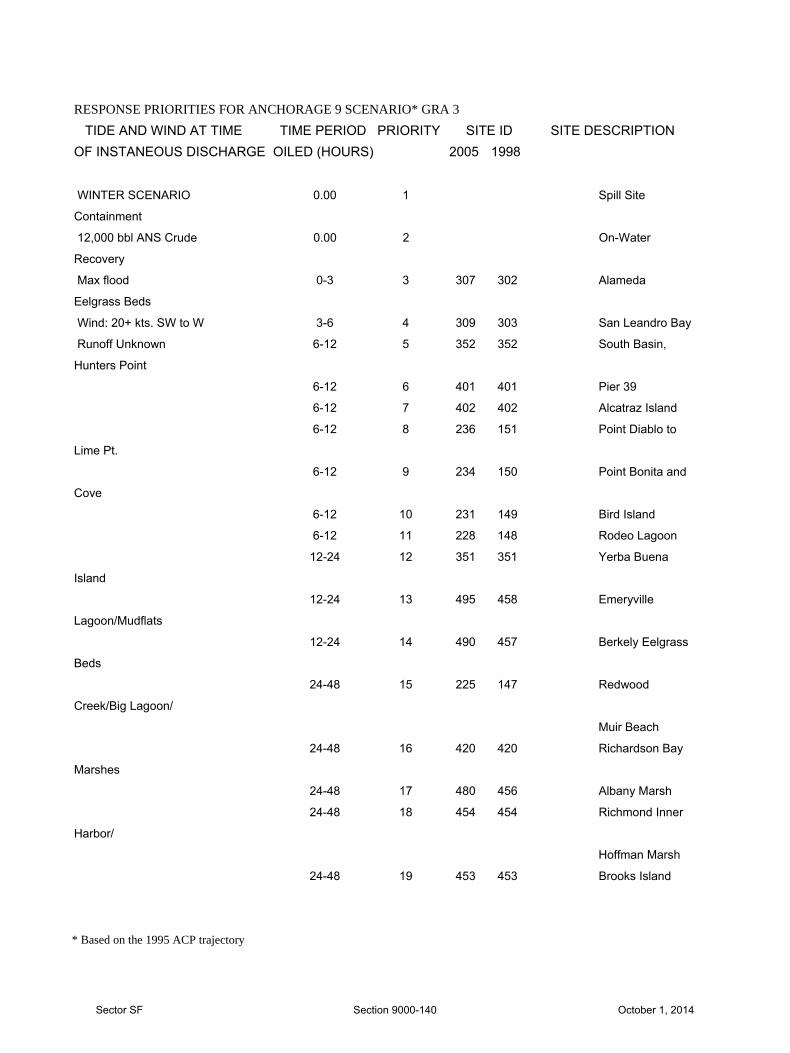
RESPONSE PRIORITIES FOR ANCHORAGE 9 SCENARIO* GRA 3 TIDE AND WIND AT TIME TIME PERIOD PRIORITY SITE ID SITE DESCRIPTION OF INSTANEOUS DISCHARGE OILED (HOURS) 2005 1998
WINTER SCENARIO 0.00 1 Spill Site
Containment
12,000 bbl ANS Crude 0.00 2 On-Water
Recovery
Max flood 0-3 3 307 302 Alameda
Eelgrass Beds
Wind: 20+ kts. SW to W 3-6 4 309 303 San Leandro Bay
Runoff Unknown 6-12 5 352 352 South Basin,
Hunters Point
6-12 6 401 401 Pier 39
6-12 7 402 402 Alcatraz Island
6-12 8 236 151 Point Diablo to
Lime Pt.
6-12 9 234 150 Point Bonita and
Cove
6-12 10 231 149 Bird Island
6-12 11 228 148 Rodeo Lagoon
12-24 12 351 351 Yerba Buena
Island
12-24 13 495 458 Emeryville
Lagoon/Mudflats
12-24 14 490 457 Berkely Eelgrass
Beds
24-48 15 225 147 Redwood
Creek/Big Lagoon/
Muir Beach
24-48 16 420 420 Richardson Bay
Marshes
24-48 17 480 456 Albany Marsh
24-48 18 454 454 Richmond Inner
Harbor/
Hoffman Marsh
24-48 19 453 453 Brooks Island
* Based on the 1995 ACP trajectory
Sector SF Section 9000-140 October 1, 2014

PRO
BA
BIL
ITY
OF
OIL
RE
AC
HIN
G E
AC
H S
ITE
ST
RA
TE
GY
IN G
RA
3
1 2 2 ° 4
0 ' W 1 2 2 ° 3
0 ' W 1 2 2 ° 2
0 ' W 122°10'W
122°0'W
121°50'W
3 7 ° 3 0
' N
3 7 ° 3 5
' N
3 7 ° 4 0
' N
3 7 ° 4 5
' N
3 7 ° 5 0
' N
T A P
I I ™
-
T r a
j e c
t o r
y A n a
lysis Planner
M o d e :
S h o r e
l i n e I m p a c
t A n a l y
s i s T i m e :
6 h o u r s
S e a s o
n : M a r
- A u g
Oil Ty
pe: Di
esel
Amount
Released: 10
000 bb
lLevel of
Concern:
5 bbl
0
1 0
2 0
3 0
4 0
5060
7080
90100
P e r c e
n t Of
Spills
122°40'W
122°30'W
1 2 2°2
0'W
122°10'W
122°0'W
37°30'N
37°35'N
37°40'N
37°45'N
37°50'N
TAP II™ - T r a
j e c
t o r
y Analysis Planner
Mode: Sh
oreline I
m p a c t A n a l y
s i s Time: 12
hours
Season: Ma
r - Aug
Oil Ty
pe: Di
esel
Amount
Released: 10
000 bb
lLevel of
Concern:
5 bbl
010
203 0
4050
6070
8090
Percent Of
Spills
12 h
ours
from
sta
rt of
spill
6 ho
urs f
rom
sta
rt of
spill
GR
A 3
– D
umba
rton
Bri
dge
TA
P II
Map
s for
GR
A3
Scen
ario
: Sp
ill o
f 10,
000
bbls
of d
iese
l at t
he D
umba
rton
Brid
ge in
the
Sprin
g. A
rrow
In
dica
tes s
pill
orig
in.
The
shad
es o
f gre
y at
eac
h im
pact
ed si
te c
orre
spon
d to
a p
erce
ntag
e in
the
lege
nd o
f the
num
ber
of sp
ill sc
enar
ios (
from
500
runs
of v
ario
us w
ind,
tide
s and
cur
rent
s) th
at b
roug
ht m
ore
than
5 b
bls (
= L
evel
Of
Con
cern
) of o
il to
that
site
in th
e sp
ecifi
ed ti
me
fram
e (6
hou
rs o
r 12
hour
s).
Sector SF Section 9000-141 October 1, 2014
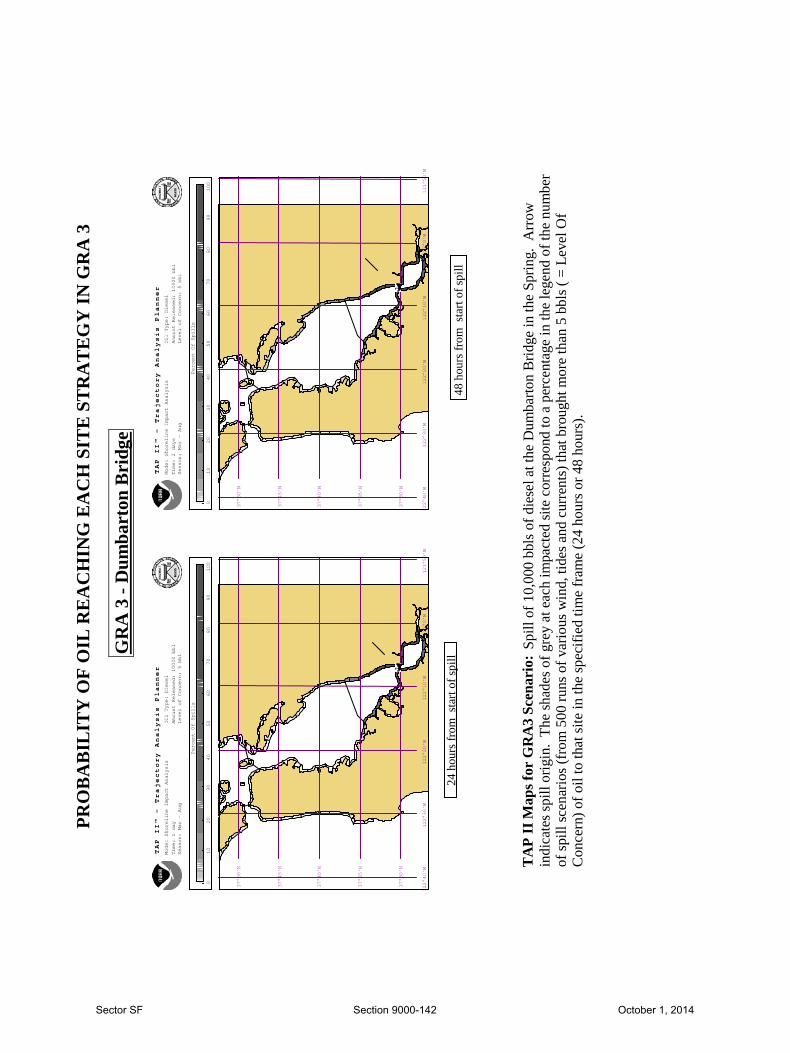
PRO
BA
BIL
ITY
OF
OIL
RE
AC
HIN
G E
AC
H S
ITE
ST
RA
TE
GY
IN G
RA
3
1 2 2 ° 4
0 ' W 1 2 2 ° 3
0 ' W 1 2 2 ° 2
0 ' W 122°10'W
122°0'W
121°50'W
3 7 ° 3 0
' N
3 7 ° 3 5
' N
3 7 ° 4 0
' N
3 7 ° 4 5
' N
3 7 ° 5 0
' N
T A P
I I ™
- T r a
j e c
t o r
y A n a
l ys
is Planner
M o d e :
S h o r e
l i n e I m p a c
t A n a l y
s i s T i m e :
1 d a y
S e a s o
n : M a r
- A u g
Oil Ty
pe: Di
esel
Amount
Released:
10000 bb
lLevel of
Concern: 5 bb
l
0
1 0
2 0
3 0
4 0
5060
70
8090
100
P e r c e
n t O f Sp
ills
122°40'W
1 2 2 ° 3
0 ' W 122°20'W
122°10'W
122°0'W
121°50'W
37°30'N
37°35'N
37°40'N
37°45'N
37°50'N
TAP II ™
- T
r a j ec
tory Analysis Planner
Mode:
Shor e l i n
e I m p a c
t A naly
sis
Time:
2 da y s
Season: Ma
r - A u g
Oil Ty
pe: Di
esel
Amount
Released:
10000 bb
lLevel of
Concern: 5 bb
l
010
2 0
3 0
4050
6070
8090
100
Percent
Of Sp
ills
48 h
ours
from
sta
rt of
spill
24 h
ours
from
sta
rt of
spill
TA
P II
Map
s for
GR
A3
Scen
ario
: Sp
ill o
f 10,
000
bbls
of d
iese
l at t
he D
umba
rton
Brid
ge in
the
Sprin
g. A
rrow
indi
cate
s spi
ll or
igin
. Th
e sh
ades
of g
rey
at e
ach
impa
cted
site
cor
resp
ond
to a
per
cent
age
in th
e le
gend
of t
he n
umbe
rof
spill
scen
ario
s (fr
om 5
00 ru
ns o
f var
ious
win
d, ti
des a
nd c
urre
nts)
that
bro
ught
mor
e th
an 5
bbl
s ( =
Lev
el O
fC
once
rn) o
f oil
to th
at si
te in
the
spec
ified
tim
e fr
ame
(24
hour
s or 4
8 ho
urs)
.
GR
A 3
- D
umba
rton
Bri
dge
Sector SF Section 9000-142 October 1, 2014

Tabl
e of
per
cent
of s
pills
that
brin
g oi
l (>
5bbl
s) to
eac
h si
te fr
om th
e G
RA
3 sc
enar
io (D
umba
rton
Brid
ge).
AC
P
SIT
E#
ES
SITE
NAM
E LA
T N
(Deg
. Min
.) LO
NG
W
(Deg
. Min
.) 6
HO
UR
S
(%
pro
b)
12 H
OU
RS
(% p
rob)
24
HO
UR
S
(%
pro
b)
2-36
7 A
Gre
co Is
land
/Rav
ensw
ood
Slo
ugh
37
31
122
12
100
100
100
2-34
0
A D
umba
rton
Poi
nt M
arsh
/Mud
flat
37
30
122
06
9510
010
02-
326
A C
oyot
e H
ills S
loug
h –
Alam
eda
Floo
d C
ontro
l Cha
nnel
3
7 29
12
2 02
80
9295
2-34
2 A
New
ark/
Plu
mm
er C
reek
3
7 30
12
2 05
60
7890
2-32
5 A
Eden
Lan
ding
Eco
logi
cal R
eser
ve –
Al
amed
a C
reek
3
7 29
12
2 02
35
5880
2-37
0
A P
alo
Alto
Mar
sh
37
28
122
06
3549
552-
372
A
Cha
rlest
on a
nd M
ayfie
ld S
loug
hs
37
27
122
05
3549
552-
344
A
Mow
ry S
loug
h 3
7 29
12
2 02
34
5983
2-36
4 A
B
air I
slan
d 3
7 32
12
2 14
31
4556
2-36
6 A
C
orks
crew
Slo
ugh
37
31
122
14
3145
562-
346
A
Coy
ote
Cre
ek
37
28
122
02
2755
842-
373
A
Mou
ntai
n Vi
ew S
loug
h 3
7 27
12
2 05
22
3747
2-36
3 A
S
tein
berg
er S
loug
h 3
7 32
12
2 14
14
2525
2-36
2 A
B
elm
ont S
loug
h 3
7 33
12
2 15
9.
617
252-
374
A
Ste
vens
Cre
ek
37
27
122
04
5.6
3048
2-37
5
A G
uada
lupe
Slo
ugh
37
27
122
02
2.4
2553
2-37
6
A A
lvis
o S
loug
h 3
7 27
12
2 01
0.
0513
402-
378
A M
alla
rd S
loug
h 3
7 27
12
1 58
0.
0513
40
Sector SF Section 9000-143 October 1, 2014

PRO
BA
BIL
ITY
OF
OIL
REA
CH
ING
EA
CH
SIT
E ST
RA
TEG
Y IN
GR
A 4
1 2 2 ° 4
0 ' W 1 2 2 ° 3
0 ' W 122°20'W
122°10'W
3 7 ° 4 5
' N
3 7 ° 5 0
' N
3 7 ° 5 5
' N
T A P
I I ™
- T r a
j e c
t o r
y A n a
lysis Planner
M o d e :
S h o r e
l i n e I m p a c
t A n a l y
s i s T i m e :
6 h o u r s
S e a s o
n : M a r
- A u g
Oil Ty
pe: Me
dium
Crude
Amount
Released: 30
0000
bbl
Level of
Concern:
5 bbl
0
1 0
2 0
3 0
4 0
5060
7080
90100
P e r c e
n t Of
Spills
122°40'W
122°30'W
122°20'W
122°10'W
37°45'N
37°50'N
37°55'N
TAP II™ - T r a
j e c
tory Analysis Planner
Mode: Sh
ore l i n e
I m p a c
t A n aly
sis
Time: 12
ho u r s
Season: Ma
r - A u g
Oil Ty
pe: Me
dium
Crude
Amount
Released: 30
0000
bbl
Level of
Concern:
5 bbl
010
2 0
3 0
4050
6070
8090
100
Percent Of
Spills
12 h
ours
from
sta
rt of
spill
6 ho
urs f
rom
sta
rt of
spill
GR
A 4
TA
P II
Map
s for
GR
A4
Scen
ario
: Spi
ll of
300
,000
bbl
s of c
rude
at H
ardi
ng R
ock
in th
e Sp
ring.
The
shad
es o
f gre
yat
eac
h im
pact
ed si
te c
orre
spon
d to
a p
erce
ntag
e in
the
lege
nd o
f the
num
ber o
f spi
ll sc
enar
ios (
from
500
runs
of
vario
us w
ind,
tide
s and
cur
rent
s) th
at b
roug
ht m
ore
than
5 b
bls (
= L
evel
Of C
once
rn) o
f oil
to th
at si
te in
the
spec
ified
time
fram
e (6
hou
rs o
r 12
hour
s).
Sector SF Section 9000-144 October 1, 2014

1 2 2 ° 4
0 ' W 1 2 2 ° 3
0 ' W 122°20'W
122°10'W
3 7 ° 4 5
' N
3 7 ° 5 0
' N
3 7 ° 5 5
' N
T A P
I I ™
- T r a
j e c
t o r
y A n a
lysis Planner
M o d e :
S h o r e
l i n e I m p a c
t A n a l y
s i s T i m e :
1 d a y
S e a s o
n : M a r
- A u g
Oil Ty
pe: Me
dium
Crude
Amount
Released: 30
0000
bbl
Level of
Concern:
5 bbl
0
1 0
2 0
3 0
4 0
5060
7080
90100
P e r c e
n t Of
Spills
122°40'W
122°30'W
122°20'W
122°10'W
37°45'N
37°50'N
37°55'N
TAP II™ - T r a
j e c
tory Analysis Planner
Mode: Sh
ore l i n e
I m p a c
t A n aly
sis
Time: 2 da
y s
Season: Ma
r - A u g
Oil Ty
pe: Me
dium
Crude
Amount
Released: 30
0000
bbl
Level of
Concern:
5 bbl
010
2 0
3 0
4050
6070
8090
100
Percent Of
Spills
48 h
ours
from
sta
rt of
spill
24 h
ours
from
sta
rt of
spill
GR
A 4
TA
P II
Map
s for
GR
A 4
Sce
nari
o: Spi
ll of
300
,000
bbl
s of c
rude
at H
ardi
ng R
ock
in th
e Sp
ring.
The
shad
es o
f gre
yat
eac
h im
pact
ed si
te c
orre
spon
d to
a p
erce
ntag
e in
the
lege
nd o
f the
num
ber o
f spi
ll sc
enar
ios (
from
500
runs
of
vario
us w
ind,
tide
s and
cur
rent
s) th
at b
roug
ht m
ore
than
5 b
bls (
= L
evel
Of C
once
rn) o
f oil
to th
at si
te in
the
spec
ified
time
fram
e (2
4 ho
urs o
r 48
hour
s).
Sector SF Section 9000-145 October 1, 2014

Tabl
e of
Per
cent
of S
pills
that
brin
g oi
l (>
5bbl
s) to
eac
h si
te fr
om th
e G
RA
4 sc
enar
io.
AC
P SI
TE#
ES
SITE
NA
ME
LAT
N
(D
eg. M
in.)
LON
G W
(D
eg. M
in.)
6 H
OU
RS
(%
pro
b)
12 H
OU
RS
(%
pro
b)
24 H
OU
RS
(%
pro
b)
2-42
3 C
A
ngel
Isla
nd
37
54
122
27
7998
100
2-23
6 C
P
t. D
iabl
o to
Lim
e P
t. 3
7 49
12
2 30
64
8195
2-42
2 B
K
eil C
ove
37
55
122
27
5455
802-
351
A
Yer
ba B
uena
Isla
nd
37
48
122
22
5388
972-
402
B
Alc
atra
z Is
land
3
7 50
12
2 25
50
8796
2-24
4 A
La
nd's
End
3
7 47
12
2 30
46
6994
2-24
6 A
C
liff H
ouse
and
Sea
l Roc
ks
37
47
122
31
4669
942-
234
C
Poi
nt B
onita
and
Bon
ita C
ove
37
49
122
31
3759
742-
228
A
Rod
eo L
agoo
n 3
7 50
12
2 32
34
5370
2-23
1 A
B
ird Is
land
3
7 49
12
2 32
34
5370
2-42
1 C
Ti
buro
n P
enin
sula
3
7 54
12
2 27
12
3155
2-42
4 B
P
arad
ise
Cov
e 3
7 54
12
2 27
12
3155
2-42
0 A
R
icha
rdso
n B
ay M
arsh
es
36
56
122
30
1546
732-
248
A
Oce
an B
each
/For
t Fun
ston
3
7 45
12
2 30
29
4468
2-45
2 A
R
ichm
ond
Eel
gras
s B
eds
37
58
122
24
2644
812-
455
C
San
ta F
e C
hann
el
37
55
122
22
2542
792-
451
A
Cas
tro R
ocks
3
7 50
12
2 24
25
3678
2-45
2 A
R
ichm
ond
Eel
gras
s B
eds
37
58
122
24
2536
782-
453
A
Bro
ok's
Isla
nd
37
54
122
21.5
23
4486
2-22
5 A
R
edw
ood
Cre
ek/M
uir B
each
3
7 52
12
2 35
21
3759
2-22
2 A
B
olin
as L
agoo
n 3
7 55
12
2 40
20
3151
2-40
1 B
P
ier 3
9 3
7 48
12
2 22
15
5481
2-42
0 A
R
icha
rdso
n B
ay M
arsh
es
36
56
122
30
152-
219
B
Dux
bury
Ree
f 3
7 53
12
2 40
14
2238
2-50
1 A
C
astro
Cre
ek a
nd M
arsh
es
37
58
122
24
1416
442-
495
A
Em
eryv
ille L
agoo
n/M
udfla
ts
37
50
122
29
1238
822-
400
C
San
Fra
ncis
co W
ater
front
3
7 46
12
2 23
8.
636
712-
506
A
San
Pab
lo B
ay E
elgr
ass
Bed
3
7 59
12
2 25
6.
816
442-
490
A
Ber
kele
y E
elgr
ass
Bed
s 3
7 51
12
2 19
4.
833
72
Sector SF Section 9000-146 October 1, 2014
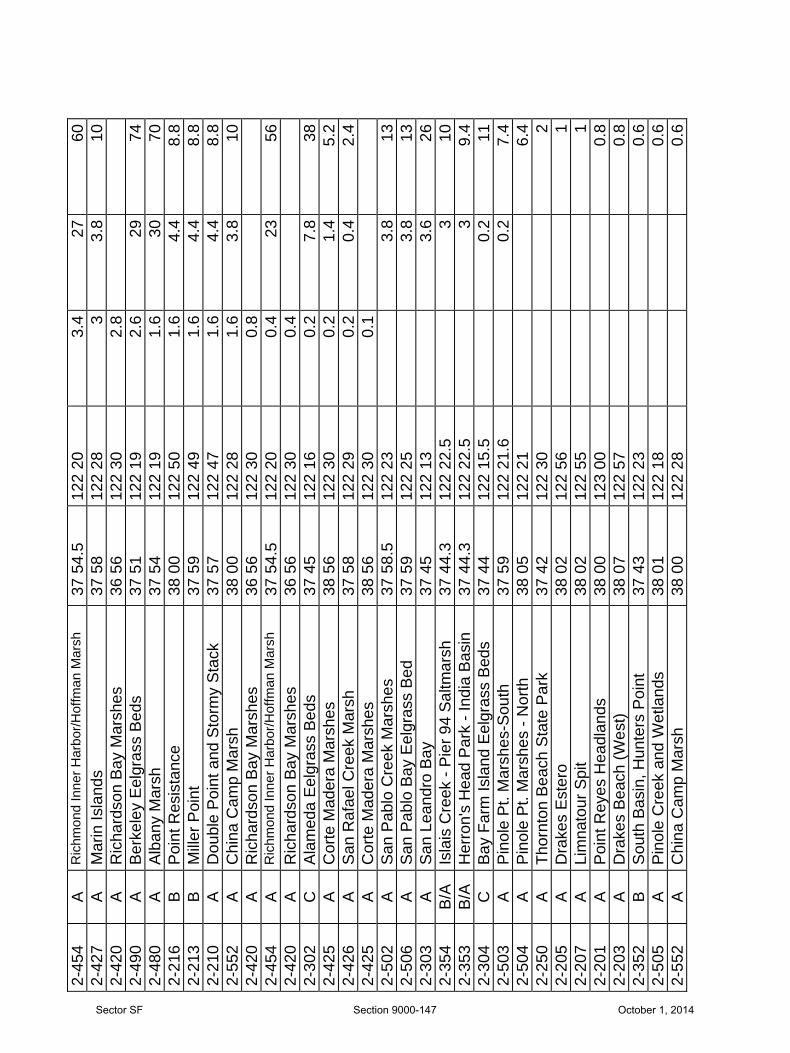
2-45
4 A
R
ichm
ond
Inne
r Har
bor/H
offm
an M
arsh
3
7 54
.5
122
20
3.4
2760
2-42
7 A
M
arin
Isla
nds
37
58
122
28
33.
810
2-42
0 A
R
icha
rdso
n B
ay M
arsh
es
36
56
122
30
2.8
2-49
0 A
B
erke
ley
Eel
gras
s B
eds
37
51
122
19
2.6
2974
2-48
0 A
A
lban
y M
arsh
3
7 54
12
2 19
1.
630
702-
216
B
Poi
nt R
esis
tanc
e 3
8 00
12
2 50
1.
64.
48.
82-
213
B
Mille
r Poi
nt
37
59
122
49
1.6
4.4
8.8
2-21
0 A
D
oubl
e P
oint
and
Sto
rmy
Sta
ck
37
57
122
47
1.6
4.4
8.8
2-55
2 A
C
hina
Cam
p M
arsh
3
8 00
12
2 28
1.
63.
810
2-42
0 A
R
icha
rdso
n B
ay M
arsh
es
36
56
122
30
0.8
2-45
4 A
R
ichm
ond
Inne
r Har
bor/H
offm
an M
arsh
3
7 54
.5
122
20
0.4
2356
2-42
0 A
R
icha
rdso
n B
ay M
arsh
es
36
56
122
30
0.4
2-30
2 C
A
lam
eda
Eel
gras
s B
eds
37
45
122
16
0.2
7.8
382-
425
A
Cor
te M
ader
a M
arsh
es
38
56
122
30
0.2
1.4
5.2
2-42
6 A
S
an R
afae
l Cre
ek M
arsh
3
7 58
12
2 29
0.
20.
42.
42-
425
A
Cor
te M
ader
a M
arsh
es
38
56
122
30
0.1
2-50
2 A
S
an P
ablo
Cre
ek M
arsh
es
37
58.5
12
2 23
3.
813
2-50
6 A
S
an P
ablo
Bay
Eel
gras
s B
ed
37
59
122
25
3.8
132-
303
A
San
Lea
ndro
Bay
3
7 45
12
2 13
3.
626
2-35
4 B
/A
Isla
is C
reek
- P
ier 9
4 S
altm
arsh
3
7 44
.3
122
22.5
3
102-
353
B/A
H
erro
n's
Hea
d P
ark
- Ind
ia B
asin
3
7 44
.3
122
22.5
3
9.4
2-30
4 C
B
ay F
arm
Isla
nd E
elgr
ass
Bed
s 3
7 44
12
2 15
.5
0.2
112-
503
A
Pin
ole
Pt.
Mar
shes
-Sou
th
37
59
122
21.6
0.
27.
42-
504
A
Pin
ole
Pt.
Mar
shes
- N
orth
3
8 05
12
2 21
6.
42-
250
A
Thor
nton
Bea
ch S
tate
Par
k 3
7 42
12
2 30
2
2-20
5 A
D
rake
s E
ster
o 3
8 02
12
2 56
1
2-20
7 A
Li
mna
tour
Spi
t 3
8 02
12
2 55
1
2-20
1 A
P
oint
Rey
es H
eadl
ands
3
8 00
12
3 00
0.
82-
203
A
Dra
kes
Bea
ch (W
est)
38
07
122
57
0.8
2-35
2 B
S
outh
Bas
in, H
unte
rs P
oint
3
7 43
12
2 23
0.
62-
505
A
Pin
ole
Cre
ek a
nd W
etla
nds
38
01
122
18
0.6
2-55
2 A
C
hina
Cam
p M
arsh
3
8 00
12
2 28
0.
6
Sector SF Section 9000-147 October 1, 2014

Response Priorities For Harding Rock Scenario* - GRA 4 TIDE AND WIND AT TIME OF INSTANEOUS DISCHARGE
TIME PERIOD OILED (HOURS)
PRIORITY
SITE ID
SITE DESCRIPTION
FEBRUARY SCENARIO
0
1
Spill Site Containment
300,000 bbl ANS Crude
0
2
On-Water Recovery
Slack < flood @ 0600
0-3
3
2-402
Alcatraz Island
Historical wind data
3-6
4
2-420
Richardson Bay Marshes
Runoff unknown
3-6
5
2-495
Emeryville Lagoon and Mudflats
3-6
6
2-490
Berkeley Eelgrass Beds
3-6
7
2-424
Paradise Cove
3-6
8
2-452
Castro Rocks
3-6
9
2-35-
Yerba Buena Island
3-6
10
2-252
Richmond Eelgrass Beds
6-12
11
2-454
Richmond Inner Harbor & Hoffman Marsh
6-12
12
2-401
Pier 39
12-24
13
2-453
Brook's Island
12-24
14
2-480
Albany Marsh
12-24
15
2-425
Corte Madera Marsh
12-24
16
2-426
San Rafael Creek Marsh
12-24
17
2-427
Marin Islands
12-24
18
2-352
South Basin, Hunters Pt.
12-24
19
2-244
Land's End
12-24
20
2-236
Pt. Diablo - Lime Pt
12-24
21
2-307
Alameda Eelgrass Beds
24-48
22
2-234
Pt. Bonita & Bonita Cove
24-48
23
2-246
Cliff House and Seal Rocks
24-48
24
2-248
Ocean Beach/Fort Funston
48-72
25
2-309
San Leandro Bay
AUGUST SCENARIO
0
1
Spill Site Containment
300,000 bbl ANS Crude
0
2
On-Water Recovery
Slack < flood @ 0600
6-12
3
2-402
Alcatraz Island
Historical wind data
12-24
4
2-236
Pt. Diablo - Lime Pt
Runoff unknown
24-48
5
2-350
Yerba Buena Island
24-48
6
2-424
Paradise Cove
48-72
7
2-425
Corte Madera Marsh
48-72
8
2-420
Richardson Bay Marshes
48-72
9
2-453
Brooks Island
48-72
10
2-452
Richmond Eelgrass Beds
48-72 11 2-495 Emeryville Lagoon and Mudflats 48-72 12 2-490 Berkeley Eelgrass Beds
* Based on the NOAA trajectory model run 29 June 1994
Sector SF Section 9000-148 October 1, 2014

PRO
BA
BIL
ITY
OF
OIL
REA
CH
ING
EA
CH
SEN
SITI
VE S
ITE
IN G
RP
5
122°30'W
122°20'W
122°10'W
122°0'W
37°55'N
38°0'N
38°5'N
38°10'N
TAP II™ - Trajectory Analysis Planner
Mode: Shoreline Impact Analysis
Time: 6 hours
Season: Mar - Aug
Oil Type: Medium Crude
Amount Released: 125000 bbl
Level of Concern: 5 bbl
010
20
30
40
50
60
70
80
90
100
Percent Of Spills
122°30'W
122°20'W
122°10'W
122°0'W
37°55'N
38°0'N
38°5'N
38°10'N
TAP II™ - Trajectory Analysis Planner
Mode: Shoreline Impact Analysis
Time: 12 hours
Season: Mar - Aug
Oil Type: Medium Crude
Amount Released: 125000 bbl
Level of Concern: 5 bbl
010
20
30
40
50
60
70
80
90
100
Percent Of Spills
12 h
ours
from
sta
rt of
spill
6 ho
urs f
rom
sta
rt of
spill
GR
P 5
TA
P II
Map
s for
GR
P5 S
cena
rio:
Sp
ill o
f 125
,000
bbl
s of c
rude
at P
inol
e Sh
oal,
San
Pabl
o B
ay in
the
Sprin
g. T
hesh
ades
of g
rey
at e
ach
impa
cted
site
cor
resp
ond
to a
per
cent
age
in th
e le
gend
of t
he n
umbe
r of s
pill
scen
ario
s (fr
om 5
00ru
ns o
f var
ious
win
d, ti
des a
nd c
urre
nts)
that
bro
ught
mor
e th
an 5
bbl
s ( =
Lev
el O
f Con
cern
) of o
il to
that
site
in th
esp
ecifi
ed ti
me
fram
e (6
hou
rs o
r 12
hour
s).
Sector SF Section 9000-153 October 1, 2014

122°30'W
122°20'W
122°10'W
122°0'W
37°55'N
38°0'N
38°5'N
38°10'N
TAP II™ - Trajectory Analysis Planner
Mode: Shoreline Impact Analysis
Time: 1 day
Season: Mar - Aug
Oil Type: Medium Crude
Amount Released: 125000 bbl
Level of Concern: 5 bbl
010
20
30
40
50
60
70
80
90
100
Percent Of Spills
122°30'W
122°20'W
122°10'W
122°0'W
37°55'N
38°0'N
38°5'N
38°10'N
TAP II™ - Trajectory Analysis Planner
Mode: Shoreline Impact Analysis
Time: 2 days
Season: Mar - Aug
Oil Type: Medium Crude
Amount Released: 125000 bbl
Level of Concern: 5 bbl
010
20
30
40
50
60
70
80
90
100
Percent Of Spills
48 h
ours
from
sta
rt of
spill
24 h
ours
from
sta
rt of
spill
GR
P 5
TA
P II
Map
s for
GR
P5 S
cena
rio:
Sp
ill o
f 125
,000
bbl
s of c
rude
at P
inol
e Sh
oal,
San
Pabl
o B
ay in
the
Sprin
g. T
hesh
ades
of g
rey
at e
ach
impa
cted
site
cor
resp
ond
to a
per
cent
age
in th
e le
gend
of t
he n
umbe
r of s
pill
scen
ario
s (fr
om 5
00ru
ns o
f var
ious
win
d, ti
des a
nd c
urre
nts)
that
bro
ught
mor
e th
an 5
bbl
s ( =
Lev
el O
f Con
cern
) of o
il to
that
site
in th
esp
ecifi
ed ti
me
fram
e (2
4 ho
urs o
r 48
hour
s).
Sector SF Section 9000-154 October 1, 2014

Tabl
e of
Per
cent
of S
pills
that
brin
g oi
l (>
5 bb
ls) t
o ea
ch si
te fr
om th
e G
RP5
scen
ario
. A
CP
SITE
# ES
SI
TEN
AM
E LA
T W
(Deg
. Min
.) LO
NG
W
(Deg
. Min
.) 6
HO
UR
S
(% p
rob)
12
HO
UR
S
(% p
rob)
24
HO
UR
S
(% p
rob)
2-
582
A
N.E
. San
Pab
lo B
ay
38
05
122
17
5092
992-
583
A
Nap
a R
iver
Mar
shes
3
8 12
12
2 19
47
8898
2-50
1 A
C
astro
Cre
ek a
nd M
arsh
es
37
58
122
24
4370
902-
506
A
San
Pab
lo B
ay E
elgr
ass
Bed
3
7 59
12
2 25
43
7090
2-45
2 A
R
ichm
ond
Eel
gras
s B
eds
37
58
122
24
4369
892-
427
A
Mar
in Is
land
s 3
7 58
12
2 28
42
7095
2-55
1 A
M
cNea
r's B
each
Mar
shes
3
8 00
12
2 27
42
7095
2-55
2 A
C
hina
Cam
p M
arsh
3
8 00
12
2 28
42
7095
2-65
1 A
S
outh
ham
pton
Bay
3
8 04
12
2 11
38
7694
2-45
1 A
C
astro
Roc
ks
37
50
122
24
3048
802-
652
A
Ben
icia
Mar
sh
38
02.7
12
2 09
.7
2853
862-
504
A
Pin
ole
Pt.
Mar
shes
- N
orth
3
8 05
12
2 21
27
7690
2-50
3 A
P
inol
e P
t. M
arsh
es-S
outh
3
7 59
12
2 21
.6
2572
892-
421
C
Tibu
ron
Pen
nins
ula
37
54
122
27
2137
642-
422
B
Kei
l Cov
e 3
7 55
12
2 27
21
3764
2-42
4 B
P
arad
ise
Cov
e 3
7 54
12
2 27
21
376
2-42
3 C
A
ngel
Isla
nd
37
54
122
27
2132
592-
601
A
Mar
tinez
Mar
sh
38
02
122
08
1629
632-
654
A
Goo
dyea
r Mar
sh
38
04
122
07
1629
612-
502
A
San
Pab
lo C
reek
Mar
shes
3
7 58
.5
122
23
1539
722-
420
A
Ric
hard
son
Bay
Mar
shes
3
6 56
12
2 30
13
2339
2-60
3 A
B
ulls
Hea
d M
arsh
and
Pac
heco
Cre
ek
38
03
122
07
1123
612-
505
A
Pin
ole
Cre
ek a
nd W
etla
nds
38
01
122
18
1039
742-
425
A
Cor
te M
ader
a M
arsh
es
38
56
122
30
922
362-
455
C
San
ta F
e C
hann
el
37
55
122
22
823
532-
630
A
Sui
sun
Sho
al
38
03.5
12
2 0
6 5
1450
2-15
1 C
P
t. D
iabl
o to
Lim
e P
t.
37
49
122
30
58
232-
453
A
Bro
ok's
Isla
nd
37
54
122
21.5
2
2048
2-42
6 A
S
an R
afae
l Cre
ek M
arsh
3
7 58
12
2 29
2
614
2-60
5 A
H
astin
gs S
loug
h, P
oint
Edi
th a
nd S
eal
Is.
38
03
122
03
23
34
2-45
4 A
R
ichm
ond
Inne
r Har
bor/H
offm
an
Mar
sh
37
54.5
12
2 20
11
40
2-55
3 A
G
allin
as C
reek
Mar
shes
3
8 01
12
2 30
3
Sector SF Section 9000-155 October 1, 2014

2-15
0 C
P
oint
Bon
ita a
nd B
onita
Cov
e 3
7 49
12
2 31
2
32-
458
A
Em
eryv
ille L
agoo
n/M
udfla
ts
37
50
122
29
828
2-40
2 B
A
lcat
raz
Isla
nd
37
50
122
25
824
2-45
6 A
A
lban
y M
arsh
3
7 54
12
2 19
6
302-
457
A
Ber
kele
y E
elgr
ass
Bed
s 3
7 51
12
2 19
6
302-
401
B
Pie
r 39
37
48
122
22
510
2-15
3 A
La
nd's
End
3
7 47
12
2 30
2
92-
154
A
Clif
f Hou
se a
nd S
eal R
ocks
3
7 47
12
2 31
2
92-
400
C
San
Fra
ncis
co W
ater
front
3
7 46
12
2 23
2
52-
581
A
Son
oma
Cre
ek /
Nap
a S
loug
h 3
8 09
12
2 24
1
112-
572
A
Tola
y C
reek
Mar
shes
3
8 07
12
2 02
.7
14
2-57
3 B
M
idsh
ipm
an P
oint
3
8 07
12
2 37
1
42-
155
A
Oce
an B
each
/For
t Fun
ston
3
7 45
12
2 30
1
22-
571
A
Pet
alum
a R
iver
Mar
shes
3
8 06
12
2 29
3
2-55
4 A
N
ovat
o C
reek
Mar
shes
3
8 06
12
2 29
2
2-35
1 A
Y
erba
Bue
na Is
land
3
7 48
12
2 22
13
2-60
7 A
B
ello
ma
Slo
ugh
38
03
122
01
112-
302
C
Ala
med
a E
elgr
ass
Bed
s 3
7 45
12
2 16
9
2-63
3 A
M
iddl
e G
roun
d Is
land
3
8 03
.7
121
59
62-
667
A
Free
man
& S
nag
Isla
nds
38
08.8
12
1 59
.5
62-
303
A
San
Lea
ndro
Bay
3
7 45
12
2 13
5
2-60
8 A
S
hore
Acr
es M
arsh
3
8 08
12
1 58
.8
42-
304
C
Bay
Far
m Is
land
Eel
gras
s B
eds
37
44
122
15.5
3
2-66
8 A
D
utto
n Is
land
3
8 08
.8
121
59.5
3
2-14
8 A
R
odeo
Lag
oon
37
50
122
32
22-
149
A
Bird
Isla
nd
37
49
122
32
22-
660
A
Griz
zly
Bay
3
8 08
12
2 02
2
2-66
5 A
S
imm
ons
Isla
nd
38
05.4
12
2 00
2
2-65
5 A
Jo
ice
Isla
nd/S
uisu
n &
Mon
tezu
ma
Slo
ughs
3
8 08
12
2 04
1
2-67
0 A
H
onke
r Bay
3
8 04
12
1 56
.3
12-
673
A
Hon
ker B
ay E
ast -
Chi
pps
Isla
nd
Sho
re
38
04
121
56.3
1
Sector SF Section 9000-156 October 1, 2014

RESPONSE PRIORITIES FOR GRP 5*
TIDE AND WIND AT TIME OF INSTANEOUS DISCHARGE
TIME PERIOD OILED (HOURS) PRIORITY SITE ID SITE DESCRIPTION
0000 hrs 10 January 1998 1 Spill Site Containment 12000 Barrels 2 On -Water Recovery
Prudhoe Bay Crude 4 hrs 3 551 McNear’s Beach Marshes
Point San Pablo 6 hrs 4 552 China Camp Marsh
Channel Marker 7 6 hrs 5 553 Gallinas Creek Marshes
122 22.64' W 12 hrs 6 572 Tolay Creek
38 1.82' N 12 hrs 7 573 Midshipman Pt
2 hours after slack before ebb 16 hrs 8 582 NE San Pablo Bay
wind 10 - 20 kts from South 16 hrs 9 581 Sonoma Cr / Napa Slough
First 24 hours only 18 hrs 10 554 Novato Creek Marshes
18 hrs 11 571 Petaluma River Marshes
12
13
14
15
16
17
18
19
20
21
22
23
24
25
26
27
28
29
30 * Based on a 1998 BlueWater trajectory using the Oil Map Trajectory Model
Sector SF Section 9000-157 October 1, 2014
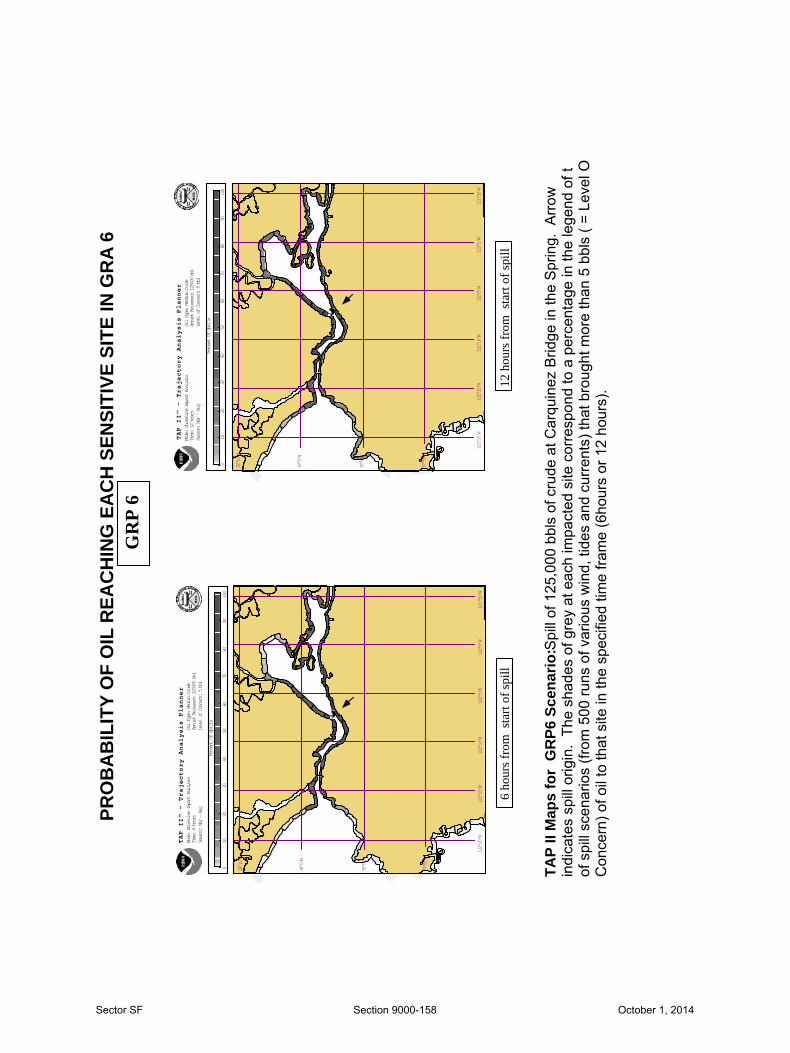
PRO
BA
BIL
ITY
OF
OIL
REA
CH
ING
EA
CH
SEN
SITI
VE S
ITE
IN G
RA
6
12 h
ours
from
sta
rt of
spill
6 ho
urs f
rom
sta
rt of
spill
GR
P 6
122°20'W
122°15'W
122°10'W
122°5'W
122°0'W
121°55'W
37°55'N
38°0'N
38°5'N
38°10'N
TAP II™ - Trajectory Analysis Planner
Mode: Shoreline Impact Analysis
Time: 6 hours
Season: Mar - Aug
Oil Type: Medium Crude
Amount Released: 125000 bbl
Level of Concern: 5 bbl
010
2030
4050
6070
8090
100
Percent Of Spills
122°20'W
122°15'W
122°10'W
122°5'W
122°0'W
121°55'W
37°55'N
38°0'N
38°5'N
38°10'N
TAP II™ - Trajectory Analysis Planner
Mode: Shoreline Impact Analysis
Time: 12 hours
Season: Mar - Aug
Oil Type: Medium Crude
Amount Released: 125000 bbl
Level of Concern: 5 bbl
010
2030
4050
6070
8090
100
Percent Of Spills
TAP
II M
aps
for
GR
P6 S
cena
rio: S
pill
of 1
25,0
00 b
bls
of c
rude
at C
arqu
inez
Brid
ge in
the
Spr
ing.
Arr
owin
dica
tes
spill
orig
in.
The
shad
es o
f gre
y at
eac
h im
pact
ed s
ite c
orre
spon
d to
a p
erce
ntag
e in
the
lege
nd o
f tof
spi
ll sc
enar
ios
(from
500
runs
of v
ario
us w
ind,
tide
s an
d cu
rren
ts) t
hat b
roug
ht m
ore
than
5 b
bls
( = L
evel
OC
once
rn) o
f oil
to th
at s
ite in
the
spec
ified
tim
e fra
me
(6ho
urs
or 1
2 ho
urs)
.
Sector SF Section 9000-158 October 1, 2014

24 h
ours
from
sta
rt of
spill
GR
P 6
TA
P II
Map
s for
GR
P6 S
cena
rio:
Sp
ill o
f 125
,000
bbl
s of c
rude
at C
arqu
inez
Brid
ge in
the
Sprin
g. A
rrow
indi
cate
s spi
ll or
igin
. Th
e sh
ades
of g
rey
at e
ach
impa
cted
site
cor
resp
ond
to a
per
cent
age
in th
e le
gend
of t
he n
umbe
rof
spill
scen
ario
s (fr
om 5
00 ru
ns o
f var
ious
win
d, ti
des a
nd c
urre
nts)
that
bro
ught
mor
e th
an 5
bbl
s ( =
Lev
el O
fC
once
rn) o
f oil
to th
at si
te in
the
spec
ified
tim
e fr
ame
(24
hour
s or 4
8 ho
urs)
.
48 h
ours
from
sta
rt of
spill
122°20'W
122°15'W
122°10'W
122°5'W
122°0'W
121°55'W
37°55'N
38°0'N
38°5'N
38°10'N
TAP II™ - Trajectory Analysis Planner
Mode: Shoreline Impact Analysis
Time: 1 day
Season: Mar - Aug
Oil Type: Medium Crude
Amount Released: 125000 bbl
Level of Concern: 5 bbl
010
2030
4050
6070
8090
100
Percent Of Spills
122°30'W
122°20'W
122°10'W
122°0'W
37°55'N
38°0'N
38°5'N
TAP II™ - Trajectory Analysis Planner
Mode: Shoreline Impact Analysis
Time: 2 days
Season: Mar - Aug
Oil Type: Medium Crude
Amount Released: 125000 bbl
Level of Concern: 5 bbl
010
2030
4050
6070
8090
100
Percent Of Spills
Sector SF Section 9000-159 October 1, 2014

Tabl
e of
Per
cent
of S
pills
that
brin
g oi
l ( >
5bb
ls) t
o ea
ch si
te fr
om th
e G
RA
6 sc
enar
io.
AC
P SI
TE#
ES
SITE
NA
ME
LAT
N
(D
eg. M
in.)
LON
G W
(D
eg. M
in.)
6 H
OU
RS
(% p
rob)
12
HO
UR
S
(% p
rob)
24
HO
UR
S
(% p
rob)
2-
630
A
Sui
sun
Sho
al
38
03.5
12
2 0
6 10
010
010
0 2-
654
A
Goo
dyea
r Mar
sh
38
04
122
07
100
100
100
2-60
3 A
B
ulls
Hea
d M
arsh
and
Pac
heco
Cre
ek
38
03
122
07
9910
010
0 2-
605
A
Has
tings
Slo
ugh,
Poi
nt E
dith
and
Sea
l Isl
and
38
03
122
03
7093
97
2-60
1 A
M
artin
ez M
arsh
3
8 02
12
2 08
66
9099
2-
652
A
Ben
icia
Mar
sh
38
02.7
12
2 09
.7
6286
96
2-63
1 A
R
oe Is
land
3
8 04
12
2 02
54
7887
2-
607
A
Bel
lom
a S
loug
h 3
8 03
12
2 01
48
7080
2-
632
A
Rye
r Isl
and
38
05
122
02
4768
78
2-65
1 A
S
outh
ham
pton
Bay
3
8 04
12
2 11
46
7596
2-
608
A
Sho
re A
cres
Mar
sh
38
08
121
58.8
40
5664
2-
633
A
Mid
dle
Gro
und
Isla
nd
38
03.7
12
1 59
40
5664
2-
667
A
Free
man
& S
nag
Isla
nds
38
08.8
12
1 59
.5
4054
69
2-58
3 A
N
apa
Riv
er M
arsh
es
38
12
122
19
3760
83
2-66
0 A
G
rizzl
y B
ay
38
08
122
02
3748
56
2-66
5 A
S
imm
ons
Isla
nd
38
05.4
12
2 00
37
4856
2-
670
A
Hon
ker B
ay
38
04
121
56.3
36
2126
2-
702
A
Sta
ke P
oint
Mar
shes
3
8 03
12
1 57
34
4662
2-
582
A
N.E
. San
Pab
lo B
ay
38
05
122
17
3352
77
2-66
8 A
D
utto
n Is
land
3
8 08
.8
121
59.5
31
4458
2-
705
A
Mal
lard
Isla
nd
38
02
121
55
3042
60
2-75
2 A
C
hips
Isla
nd, S
outh
ern
Sid
e 3
8 04
12
1 55
27
3657
2-
673
A
Hon
ker B
ay E
ast -
Chi
pps
Isla
nd S
hore
3
8 04
12
1 56
.3
2635
52
2-65
5 A
Jo
ice
Isla
nd, S
uisu
n an
d M
onte
zum
a S
loug
hs
38
08
122
04
1525
29
2-67
1 A
H
onke
r Bay
Wes
t - W
heel
er Is
land
Sho
re
38
04
121
56.3
8.
827
35
2-67
2 A
H
onke
r Bay
Nor
th -
Van
Sic
kle
Isla
nd S
hore
3
8 04
12
1 56
.3
3.6
2126
2-
504
A
Pin
ole
Pt.
Mar
shes
- N
orth
3
8 05
12
2 21
8.
812
2-
503
A
Pin
ole
Pt.
Mar
shes
-Sou
th
37
59
122
21.6
7.
210
2-
501
A
Cas
tro C
reek
and
Mar
shes
3
7 58
12
2 24
3.
65
2-50
6 A
S
an P
ablo
Bay
Eel
gras
s B
ed
37
59
122
25
3.6
5 2-
452
A
Ric
hmon
d E
elgr
ass
Bed
s 3
7 58
12
2 24
3.
45.
6 2-
427
A
Mar
in Is
land
s 3
7 58
12
2 28
2.
67.
6 2-
552
A
Chi
na C
amp
Mar
sh
38
00
122
28
2.6
7.6
2-50
5 A
P
inol
e C
reek
and
Wet
land
s 3
8 01
12
2 18
2.
63.
6
Sector SF Section 9000-160 October 1, 2014

RESPONSE PRIORITIES FOR BENICIA BRIDGE SCENARIO * GRA 6 TIDE AND WIND AT TIME OF INSTANEOUS DISCHARGE OF ANS
TIME PERIOD OILED (HOURS)
PRIORITY SITE ID SITE DESCRIPTION
SLACK < EBB - 10 NW 0 1 Spill Site Containment WINTER RUNOFF 0 2 On-Water Recovery 125,000 bbl ANS crude 0-3 3 601 Martinez Marsh 0-3 4 654 Southampton Bay 3-6 5 603 Bull's Head Marsh 6-12 6 582 NE San Pablo Bay (jetty) 6-12 7 605 Hasting's Slough & Pt Edith 6-12 8 631 Roe Island 12-24 9 505 Pinole Creek 12-24 10 503 Pinole Point 12-24 11 632 Ryer Island SLACK < EBB - 20 S 0 1 Spill Site Containment WINTER RUNOFF 0 2 On-Water Recovery 125,000 bbl ANS crude 0-3 3 651 Southampton Bay 6-12 2 601 Martinez Marsh 6-12 3 603 Bull's Head Marsh 6-12 4 582 NE San Pablo Marsh (jetty) SLACK < FLOOD TIDE 0 1 Spill Site Containment 10 KNOT NW WIND 0 2 On-Water Recovery WINTER RUNOFF 0-3 3 603 Bull's Head Marsh 125,000 bbl ANS crude 0-3 4 605 Hasting's Slough 0-3 5 607 Weapons Station Marshes 0-3 6 631 Roe Island 0-3 7 601 Martinez Marsh 3-6 8 608 Shore Acres 3-6 9 632 Ryer Island 3-6 10 633 Middle Ground 6-12 11 702/705 Stake Pt. Marsh / Mallard Island 6-12 12 708 Chipp's Island SLACK < FLOOD TIDE 0 1 Spill Site Containment 20 KNOT S WIND 0 2 On-Water Recovery WINTER RUNOFF 0-3 3 654 Goodyear Marsh 125,000 bbl ANS crude 3-6 4 655 Joice Island 6-12 5 660 Grizzly Bay 12-24 6 632 Ryer Island 12-24 7 631 Roe Island 12-24 8 603 Bull's Head Marsh 12-24 9 601 Martinez Marsh 12-24 10 662 Simmon's Island
* Based on Oil map trajectory model run by BlueWater Consultants in 1996 ¤ Response strategy not yet written
Sector SF Section 9000-161 October 1, 2014

9440.3 Central Coast Scenarios As required by OPA 90 the worst case discharge is portrayed in this section. The trajectories presented here were prepared by Carl Jochums, of OSPR, using GNOME software. Experience with small spills along the Monterey peninsula indicates these trajectories are reasonable. The spills include groundings at or near Point Pinos and an illegal discharge at Anchorage B. We present two possible cases: one in which the spill moves north, and one in which the spill moves to the south. There are several locations where a spill might originate near Monterey Harbor. They are closely located, so a spill at one location will behave in manner to a spill at it near-by neighbor, although time of spreading and arrival at shore locations may be slightly different. Weather in the Monterey area is fairly typical of coastal weather patterns. Winds are calm in the morning, and a breeze begins to move in mid-morning hours, which, in the mid- to late afternoon, turns into a wind of between ten and twenty knots, usually from the southwest. Storm winds are usually more southerly. Occasionally, in autumn months, there is a Santa Ana condition, during which winds blow from the east. The California Current flows from north to south during summer months. This flow probably causes the counter-clockwise gyre noted in the south bay during summer months, according to the USGS (http://walrus.wr.usgs.gov/mcgaw/). The Davidson Current (or California Undercurrent) flows from south to north in winter. A discussion of these currents and other water-circulation phenomena can be found at: http://bonita.mbnms.nos.noaa.gov/sitechar/phys23.html . There is a fueling dock at Breakwater Cove, close to the USCG pier. All boats, including USCG’s refuel at this dock Breakwater Cove has a boat-repair yard next to the fuel dock. The boat yard has two 8,000 gallon underground storage tanks, one for gasoline, one for diesel fuel. Fuel is delivered by pump through a fueling hose. There is an emergency cutoff close at hand. There is no water-side storage. Therefore, we believe the likelihood for a spill of 50 bbl., or larger, is extremely remote. On the other hand, Monterey Harbor is the busiest port within the Central Coast ACP, and recently has become a port-of -call for cruise ships. For this reason, Monterey Harbor is the most probable location for an oil spill of any magnitude.
Trajectory Images are shown below
Sector SF Section 9000-162 October 1, 2014

Monterey Bay Spill -- Southerly Current Trajectory Study – by Carl Jochums, OSPR The diagram below (diagram 1) below shows the two locales provided by Larry Espinosa, OSPR, Monterey, designated by Monterey Harbor as anchorages for cruise ships: "A" = 36 - 36.780 N 121 - 53.130 W and "B" = 36 - 37.300 N 121 - 52.300 W. The point NE of Pt Pinos shows the zone from which oil will move “rapidly” southward and down coast by southerly currents.
Below is release sequence from Anchorage A with no wind at 6/12 hr intervals (release 10/4: 2300)
Movement at + 6 hours at + 12 hours at + 18 hours Monterey Bay Southerly Spill Trajectory (continued)
Sector SF Section 9000-163 October 1, 2014

Movement at + 24 hours at + 36 hours at + 48 hours (little southerly movement in + 60 hours) After modeling spills with winds, tides and currents, Carl Jochums concluded the worst case southerly trajectory resulted from a spill at Anchorage A (36 - 36.780 N 121 - 53.130 W ) with no wind. He further concluded that, although there may be minor variations in slick, the general pattern and extent of this release is very representative of the adverse-conditions consequences to living natural resources and sensitive sites in this area.
Spill Trajectory Study for Monterey with Northward Currents – Carl Jochums December 2002 Trajectory release points include two anchorages for large ships in Monterey Bay and Cypress Pt
Sector SF Section 9000-164 October 1, 2014

After comparisons of trajectories with and without winds, Carl Jochums determined the worst case northerly trajectory is with no winds. The diagrams that follow illustrate instantaneous, simultaneous releases from Cypress Pt and Anchorage A, beginning at 6 hours after release from the two locales with no wind influence (only currents and tides), and continuing through 30 hours.
Simultaneous release from Cypress Pt At 12 hrs Cypress Pt slick is just passing at 18 hrs top half of the Anchorage A Slick and Anchorage A with no winds the Anchorage A slick has overlapped the bottom third of the Cypress Pt slick
At 30 hrs, the Anchorage A slick is just passing Elkhorn Slough and the Cypress Pt slick is from Elkhorn Slough past Santa Cruz.
Sector SF Section 9000-165 October 1, 2014

9500 Agreements List (Memorandums of Agreement/Understanding) Several other interagency agreements can be found in COMDTINST M16000.15, Marine Safety Manual, Volume 10.
*MOA on Oil Pollution and Response Between Commander, Eleventh Coast Guard District and the State of California—Signed 1997
*MOA between Department of Fish and Game’s Office of Oil Spill Prevention and Response and the State Water Resources Control Board Relating to Discharges Associated with Response Activities Conducted Pursuant to CH. 7.4, Division 1 of the Government Code.
*Memorandum Of Understanding Relating To The Handling And Transport Of Materials Used Or Recovered During An Oil Spill Between The Department Of Fish And Game’s Office Of Oil Spill Prevention And Response And The Department Of Toxic Substances Control. 1997
LOA Among U.S. Coast Guard (USCG), Environmental Protection Agency (USEPA), National Oceanic and Atmospheric Administration (NOAA), and Department of Interior (USDOI) Concerning the Use of In-Situ Burning as a Response Method to Oil Pollution for the Area 35-200 Nautical Miles Off the Coast of California.—Signed 10 April 1997.
MOU Between U.S. Coast Guard and the Environmental Protection Agency — Signed 4 January 1982
MOU Between the Departments of Interior and Transportation Concerning Respective Responsibilities Under the National Oil and Hazardous Substances Pollution Contingency Plan — Signed 16 August 1971
Interagency Agreement between the U.S. Fish and Wildlife Service and the U.S. Coast Guard for Participation in Pollution Incidents — Signed 24 July 1979
Instrument of Redelegation of Sections 2(d), 2(f), 2(g), 3(a), and 4(b) of Executive Order 12316 of October 2, 1981 from the U.S. Coast Guard to the Environmental Protection Agency on Response Actions.
Interagency Agreement (IAA) between the United States Navy and the United States Coast Guard for Cooperation in Oil Spill Clean-up Operations and Salvage Operations — Signed 15 September 1980
MOU Among the National Institute for Occupational Safety and Health, the Occupational Safety and Health Administration, the United States Coast Guard and the United States Environmental Protection Agency – Signed 18 December 1980
MOU Between the Minerals Management Service of the Department of the Interior and the United States Coast Guard of the Department of Transportation Concerning Regulation Activities and Facilities on the Outer Continental Shelf of the United States — Signed 29 August 1989
MOU Between the Environmental Protection Agency and the United States Coast Guard Concerning the Mitigating of Damage to the Public Health or Welfare Caused by a Discharge of a Hazardous Substance under Section 311 of the Clean Water Act (33 USC 1321) — Signed 3 October 1979
MOU Between the Environmental Protection Agency and the United States Coast Guard on Assessment of Civil Penalties for Discharges of Oil and Designated Hazardous Substances — Signed 17 August 1979
Sector SF Section 9000-166 October 1, 2014

MOU Between the Department of Transportation and the Department of the Interior Regarding Offshore
Pipelines — Signed 6 May 1976
MOU Between the Department of Transportation, Department of Interior and the Environmental Protection Agency Regarding Jurisdictional Responsibilities for Offshore Facilities — Signed 14 December 1993
MOU Between the [CA] Department of Fish and Game’s Office of Oil Spill Prevention and Response and the [CA] State Lands Commission.
MOU Between the California Department of Fish and Game and California Department of Forestry and Fire Protection.
MOA on Oil Spill Prevention and Response Between Wildlife Protection Division and Office of Oil Spill Prevention and Response.
(* Copy of MOU/MOA text is included in this ACP; Many are included in RCP Appdx VIII. )
Sector SF Section 9000-167 October 1, 2014

MEMORANDUM OF AGREEMENT ON
OIL POLLUTION PREVENTION AND RESPONSE BETWEEN
THE COMMANDER, ELEVENTH COAST GUARD DISTRICT AND
THE-STATE-OF CALIFORNIA
WHEREAS, Congress enacted the Oil Pollution Act of 1990 (OPA 90) to protect the waters of the United States from oil pollution and to plan for the effective and immediate response in the event of an oil spill, and the President subsequently designated the Coast Guard as the Federal On Scene Coordinator ZOSC) within the California coastal zone; and
WHEREAS, Congress has decided in a number of enactments, including OPA 90, not to preempt the various States from regulating certain matters associated with the protection of waters within their jurisdiction from oil pollution, which matters are also subject to regulation by the Coast Guard under OPA 90 and other statutes; an
WHEREAS, Congress explicitly provided that the provisions of OPA 90 do not: (1) preempt or affect the authority of any state to impose additional liability or requirements respecting oil discharges or other oil pollution within such a state or removal activities in connection with such a discharge; (2) affect the authority of any state to establish or continue to fund, any purpose of which, is to pay for oil pollution or the substantial threat of oil pollution costs or damages, or to require any person to contribute to such a fund; or (3) affect the authority of any state to impose any fine or penalty for violation of law relating to a discharge; and
WHEREAS, the State of California has enacted the LempertKeene-Seastrand Oil Spill Prevention and Response Act of 1990, hereinafter referred to as the California Act, to protect the waters of the State from oil pollution and to plan for the effective and immediate response, removal, abatement, and cleanup in the event of an oil spill and to augment State authority for the prevention and response to spills in waters under the jurisdiction of the State; and
WHEREAS, the California Act provides that the Administrator of the Office of Oil Spill Prevention and Response (OSPR) is appointed by and acts at the direction of the Governor. The Administrator acts as chairperson of the State Interagency Oil Spill Committee (SIOSC) and coordinates actions through the State committee and review subcommittee; and
WHEREAS, the Administrator, subject to the Governor, and through the Department of Fish and Game, has the primary State authority to direct prevention, removal, abatement, response containment and cleanup efforts, with regard to all aspects of any oil spill in the State waters, in accordance with any applicable marine facility or vessel contingency plan, and the State Oil Spill Contingency Plan; and
WHEREAS, the State Lands Commission has the primary State authority to adopt rules, regulation, guidelines and commission leasing policies for reviewing the location, type, character, performance standards, size, and operation of all marine facilities on lands leased from the Commission and all existing and proposed marine terminals within the State; and
Sector SF Section 9000-168 October 1, 2014

WHEREAS, the Commander, Eleventh Coast Guard District is the senior Coast Guard officer within the State of California, exercising Federal authority under the Oil Pollution Act of 1990 and other Federal laws with respect to oil pollution planning and response in waters subject to the jurisdiction of the United States in and outside the State of California and matters dealing with areas of vessel manning and safety equipage; and
WHEREAS, marine oil spills require a rapid, efficient, and coordinated response and cleanup by Federal, State, and local agencies as well as from private entities to minimize the deleterious effects on human, wildlife, and other natural resources; and
WHEREAS, both the Coast Guard and the State recognize the critical roles each has within their respective areas of authority in preventing oil-spills and in planning for and responding to oil spills; and
WHEREAS, the Parties recognize the cooperation between them in the implementation and exercise of their respective statutory and regulatory authority is essential to avoid conflict and unnecessary duplication; and
WHEREAS, the Parties believe and intend that by acting in a cooperative and coordinated manner, the effect will be a synergistically enhanced oil spill prevention and response effort in the State of California;
NOW THEREFORE, the Parties agree, to the extent permitted by law, and as consistent with their respective policies and available resources, to cooperate and to coordinate their efforts in implementing and exercising their respective statutory and regulatory duties related to oil spill prevention and response.
I PARTIES
The Parties to this Memorandum of Agreement are the Eleventh Coast Guard District (“Coast Guard”) and the State of California (“State”).
II PURPOSE OF THE AGREEMENT
The purpose of this Memorandum of Agreement (MOA) is to ensure the Parties exercise their respective authorities regarding oil spill prevention, planning, and response in a manner so as to avoid unnecessary duplication and conflict and to ensure best achievable protection from the impact of pollution incidents for the navigable waters of the United States which are within or may impact the State waters of California; subject to each Party’s statutory, regulatory, and policy requirements.
III DEFINITIONS
Sector SF Section 9000-169 October 1, 2014

Except where otherwise specifically defined in the context of its use herein, or where specifically set forth below, terms used in this Memorandum of Agreement (MOA) shall have the meaning as set forth in Federal law and applicable State law.
A. Specific definitions:
1. State Waters: Federal regulations designate the Coast Guard as the Federal On Scene Coordinator (OSC) within the California coastal zone. The Environmental Protection Agency (EPA) is the OSC for oil spills within the inland zone. The jurisdictional boundary between these zones is specified in the Federal Region IX Regional Response Team Contingency Plan. The term “State waters” shall mean those navigable waters of the United States which lie within the jurisdiction of the State of California and over which the Coast Guard has concurrent Federal authority for oil spill response.
2. Marine Oil Spill Contingency Plan: The Marine Oil Spill Contingency Plan is an addendum to the State Oil Spill Contingency Plan, which in turn is a part of the State Hazardous Materials Incident Contingency Plan. Under this scheme the Department of Fish and Game Director is the State Incident Commander for inland oil spills and the Administrator of OSPR is the State Incident Commander for marine oil spills.
IV INFORMATION SHARING
The exchange of information between the Federal government and the State relative to historic pollution events and current risks is necessary to develop appropriate prevention and response systems. Both Parties maintain information systems that are relevant to both historical and real-time incidents. The Parties require the fullest degree of information sharing from available and pertinent data bases in order to make accurate and timely decisions to prevent and or respond to oil pollution.
Transmissions of information shall be in accordance with procedures adopted by the Parties for that purpose.
A. Action:
1. The Parties agree to share information on Prevention Through People (PTP) programs sponsored by Coast Guard, or other human factor initiatives that either party may undertake.
2. The Eleventh Coast Guard District will advise the State of information it receives of the following events occurring in the navigable waters, or that may impact the State, involving vessel disablings, collisions, groundings, explosions, rammings, allisions, distress and other events when oil pollution or substantial threat of oil pollution results. The State will ensure that its emergency notification systems report these incidents to the Coast Guard.
Sector SF Section 9000-170 October 1, 2014
3. The Parties agree to identify and share existing data bases, including the Marine Safety Information System (MSIS), and work toward developing risk management programs that provide risk data sharing for vessels and access by both parties to all data, subject to the requirements of applicable law, regulation, and policy, in a manner to conserve and leverage agency resources.
4. Initiatives taken to limit the introduction on nonindigenous aquatic nuisance species into State waters will be sought through appropriate State or federal regulation. Information concerning aquatic nuisance species programs shall be shared by the Parties as appropriate.
5. The Parties agree, subject to limitations imposed by applicable law or regulations, to share information from relevant studies.
V OIL SPILL RESPONSE PREPAREDNESS
The National Contingency Plan (NCP) establishes the response organization within the United States and requires tiered contingency planning efforts. The State, consistent with the NCP, defines its response organization through the State Hazardous Material Plan and addenda to the Oil Spill Contingency Plan.
A. Planning Documents
1. National Oil and Hazardous Substances Pollution Contingency Plan (“National Contingency Plan - NCP”):
The Environmental Protection Agency (EPA) is the lead agency in drafting, and the Coast Guard and EPA are jointly responsible for implementing, the NCP which governs actions concerning spill response and cleanup for Federal, State, local agencies, responsible parties, clean-up contractors and others participating in such actions in United States waters.
a. Action: The State will work with the Coast Guard to ensure State plans and policies for marine environmental protection are consistent with the NCP.
2. State Hazardous Material Incident Contingency Plan and the State Oil Spill Contingency Plan:
The State Office of Emergency Services (OES) is responsible for developing and maintaining the Statewide Contingency Plan that details State responsibilities, policies, and actions governing response to spills in waters of the State. The OSPR has specific statutory authority and responsibility concerning oil spills.
a. Action: The Coast Guard will consult with the State to ensure State plans and policies for marine environmental protection are consistent with the NCP.
3. Area Contingency Plan:
Sector SF Section 9000-171 October 1, 2014

The Area Committees, established by the President under the authority of the Oil Pollution Act of 1990, are responsible for the development of Area Contingency Plans for those Areas under the direction of the Federal On Scene Coordinator (OSC). The Area Contingency Plans describe the responsibilities of owners, operators and Federal, State and local agencies in responding to oil spills or threats of spills, list equipment and personnel available to respond, describe procedures for the use of dispersants and describe how the Area Contingency Plan integrates with other plans. Area Contingency Plans are adopted by amendments to the State Contingency Plan to facilitate and coordinate on-going work with local municipalities and coastal counties. Through the OSPR Local Grant Program, municipal and county governments are also included in State and Federal planning documents. The objective is to create consistency between the local, State, and national contingency plans.
a. Action: The Parties agree to consult with each other to enhance contingency planning and to ensure that the Area Contingency Plans and Statewide Master Plan are consonant and uniform, subject to the requirements of existing law.
4. Facility Oil Spill Response Plans:
Facility Oil Spill Response Plans are required by both Federal and State law. These plans describe facility capabilities to prevent and respond to pollution emergencies. The State and the Coast Guard will coordinate with the Department of Transportation (DOT), Mineral Management Service (MMS), and the Environmental Protection Agency (EPA) in assessing facility contingency plans.
a. Action:
(i) Subject to the requirements of applicable law, regulations and policy, the Parties will develop a system to coordinate, to the extent practicable, the Parties’ cooperative review and approval of facility contingency plans. The Parties agree to conduct reviews of facility contingency plans in as much of a coordinated and non-duplicative manner as is permitted by applicable laws, regulations and procedures.
(ii) The Coast Guard and the State will cooperate to ensure that requirements for facility response plans are compatible and do not conflict. The Parties will work together to determine the feasibility of the Coast Guard accepting State review of facility contingency plans, subject to Coast Guard oversight.
5. Vessel Oil Spill Response Plans:
Vessel oil spill response plans are required by both
Federal and State law. These plans describe vessel capabilities to prevent and respond to pollution emergencies.
a. Action:
Sector SF Section 9000-172 October 1, 2014

(i) Although the Parties recognize the need to independently review vessel plans for compliance with their respective laws and regulations, the Parties agree to conduct reviews of vessel contingency plans in as much of a coordinated and non-duplicative manner as permitted by applicable laws, regulations and procedures.
(ii) The State shall accept to the maximum extent practicable the Federal vessel contingency plan requirements and shall prepare supplementary forms for parties to comply with State requirements in areas such as preventive measures which are in addition to Federal requirements.
(iii) The Parties will cooperate to ensure that requirements for vessel contingency plans are compatible and do not conflict. The Parties will work together to determine the feasibility of the Coast Guard accepting State review of vessel contingency plans, subject to Coast Guard oversight.
B. Government Committees
The National Contingency Plan (NCP) directs the organization of government committees to prevent and respond to pollution emergencies.
1. Regional Response Team:
The Region IX - Regional Response Team (RRT) is
established as a coordinating committee by the NCP and includes the State along with the Federal agencies with pollution prevention and pollution response responsibilities.
a. Action: The Parties agree to jointly participate as members of the Regional Response Team (RRT). RRT participation includes both attending regularly scheduled meetings and responding during incident specific RRT mobilization.
2. Area Committees:
Area Committees were established by OPA 90 to maximize
State and local participation in contingency planning.
a. Action: The Parties agree to coordinate local response planning by jointly participating in the Area Committee planning process. Both Parties are strongly committed to participating in Area Committee Plan development and the use of the Area Committees in conducting exercises and drills, consistent with the provisions of the NCP and applicable State contingency plan.
3. Mexico/United States Pact (MEXUSPAC) Joint Regional Response Team:
The MEXUSPAC Joint Regional Response Team (JRRT) is established in accordance with the NCP to prepare for and respond to pollution emergencies that may impact the international border area between the United States and Mexico on the Pacific coast.
Sector SF Section 9000-173 October 1, 2014

a. Action: The Coast Guard will advise the State of all agreements, plans, and standard operating procedures (SOP) developed to coordinate pollution response with Mexico. During an incident specific mobilization of the MEXUSPAC JRRT, the State will be represented through the State RRT representative who will be from the Department of Fish and Game.
4. State Interagency Oil Spill Committee (SIOSC): SIOSC is responsible for coordinating oil spill prevention, response, planning and policy at the State level.
a. Action: The Coast Guard is invited to provide input and recommendations to the SIOSC.
5. State Harbor Safety Committees: State Harbor Safety Committees are responsible to evaluate and recommend ways to improve the safety of navigation in harbors and harbor approaches.
a. Action: The Coast Guard is invited to provide input and recommendations to the Harbor Safety Committees.
C. Drills and Exercises:
Drills and exercises are required by both Parties to ensure the readiness and interoperability of pollution response organizations. It is the intention of the Parties to encourage coordination, participation, and cross-training in periodic drills and exercises to facilitate a better understanding of each Party’s duties and responsibilities as well as to ensure a combined, effective, familiar working relationship at oil spill incidents.
a. Action:
(i) The Parties agree to interact in the planning, scheduling, design, conduct and evaluation of exercises as time and resources permit. In this context, the Parties recognize the role of the National Strike Force Coordination Center, as the focal point for exercise strategy for all elements of the National Response System, in scheduling, designing, executing, evaluating and providing feedback on all National Response System PREP exercises in conjunction with the appropriate RRT and Area Committees.
(ii) The Parties agree to make available, as time and resources permit, any published annual reports as required by OPA 90 and State statutes concerning evaluations of drills and recommended changes to the National and Area Contingency Plans.
D. Certification of Oil Spill Response Organizations:
Both Parties evaluate, categorize, and certify oil spill response organizations.
1. Action:
a. The Coast Guard and the State will cooperate to the maximum extent practicable to evaluate, categorize, and certify oil spill response organizations. The Parties will develop joint certification guidelines and conduct independent or joint reviews as necessary or desirable.
Sector SF Section 9000-174 October 1, 2014
b. The State shall accept to the maximum extent practicable the Federal compliance documents for Federal certification and shall prepare supplementary forms for compliance with State regulations.
VI PREVENTION OF OIL SPILLS
A. Cooperative Implementation:
The Parties are coordinating their efforts to prevent oil spills in the marine environment.
1. Action: To the extent permitted under applicable laws, the Parties agree to cooperate in the execution of their respective regulatory responsibilities, to minimize duplication of effort, and to identify opportunities for innovative implementation of casualty prevention plans. Both Parties recognize the importance to encouraging cross-training in each other’s regulations and rules including the areas of inspection and response. Each Party must exercise its own rulemaking implementation responsibilities independently and in accordance with applicable rulemaking procedures. Federal inspection requirements associated with vessel safety are not subject to supplemental State regulation.
B. Vessel Inspections:
Each Party recognizes that the other must independently exercise its respective examination responsibilities in accordance with applicable law, regulations and policies. The Coast Guard conducts inspection programs for the purpose of enforcing both international agreements and domestic law aboard United States and foreign flagged vessels. The State, under the California Act, is required to evaluate that inspection process and make recommendations for improvement.
1. Action:
a. The Parties agree to work together to avoid inconsistent requirements and to find ways to conduct vessel inspections in such a way that disruption to the industry is minimized and efficiency and safety maximized.
b. In implementing any State examination programs, the State agrees to avoid conflicts and unnecessary duplication in reviewing Federal inspection programs by on-going consultation with the Coast Guard.
c. Review of inspection records: The Parties agree to make inspection records available to the other and to cooperatively review inspection results, subject to applicable laws, regulations, and procedures.
d. The State shall report to the responsible officer in charge, marine inspection (OCMI), recognized discrepancies in meeting the requirements of international agreements believed to exist aboard United States and foreign flagged vessels.
Sector SF Section 9000-175 October 1, 2014

e. Requirements in State Waters: The Parties will cooperate to establish consistent pollution prevention requirements, and to cooperatively monitor, examine and exchange information relative to those requirements, for vessels to operate in State waters.
f. The State will promptly inform the cognizant OCMI, and the Coast Guard will promptly inform the Administrator or his designee, of any situation or circumstance relative to a vessel whose condition or equipment may significantly increase the potential for an unauthorized discharge or create an unusual or an unacceptable risk to public health and safety or the safety of navigation within State waters.
g. The Parties agree to share all applicable information obtained from their respective vessel inspections and examinations.
C. Vessel Screening:
The Coast Guard, under Federal law, through the District Commander and the Captain of the Port (COTP), has the authority to regulate the entry of vessels, including those determined to be a threat to the environment. The State may establish the means by which it can determine whether tank vessels entering the State waters pose a substantial risk of harm to public health and safety and the environment.
1. Action: When the State determines that a particular vessel or vessels pose a substantial risk, that determination will be forwarded to the cognizant Captain of the Port (COTP). The COTP shall consider that information in making a determination under Federal law as to appropriate action to be taken, if any, including the possibility of denial of entry.
D. Tank Vessel Equipment:
The Coast Guard conducts inspections and examinations to ensure compliance with requirements for equipment to ensure safety of life at sea aboard vessels. The California Act authorizes the Administrator to conduct vessel inspections. Both Parties conduct examinations to ensure compliance with requirements for pollution prevention and pollution response equipment.
1. Action: The Parties will cooperatively examine pollution prevention and pollution response equipment aboard vessels and report noncompliance to the other Party.
E. Tank Vessel Manning:
The Coast Guard establishes and enforces requirements for manning, competence, and documentation of personnel aboard tank vessels.
1. Action:
a. The State will assist the Coast Guard to evaluate and coordinate additional requirements for manning, training, and qualification requirements through the manning standards process.
Sector SF Section 9000-176 October 1, 2014

b. The Parties agree to actively promote and coordinate research projects, such as PTP, to identify human factors which need to be regulated to prevent pollution incidents.
F. Tank Vessel Transfer Operations:
Monitoring tank vessel transfer operations has been identified as an effective pollution prevention action.
1. Action:
a. The Parties will cooperate to monitor transfer operations aboard tank vessels, including, but not limited to, dockside transfers at facilities and lightering and bunkering operations. The Coast Guard acting through the Marine Safety Offices (MSO’s) and the State agree to cooperate in the scheduling of monitoring vessel transfer operations to make best use of limited resources and avoid redundant oversight and disruptions to industry. Each Party will advise the other of violations observed.
b. The Parties will cooperatively monitor and examine pollution prevention and pollution response equipment during transfer operations. Each Party will advise the other of violations observed.
c. The Parties agree to make transfer monitor records available to each other and to cooperatively review monitoring results, subject to applicable laws, regulations and procedures.
G. MARPOL 73/78
MARPOL 73/78 is the International Convention for the Prevention of Pollution from Ships, 1973, as modified by the Protocol of 1978 relating thereto:
MARPOL 73/78 is an international agreement implemented to reduce pollution from vessels.
1. Action: The Parties will cooperate in the enforcement of existing MARPOL requirements. The Coast Guard will keep the State informed concerning MARPOL regulations, and both Parties will work together to develop disposal services adequate to support port operations.
H. Facility Inspections:
Facility,inspections are conducted by both Parties to ensure compliance with pollution prevention and pollution response regulations. The State has statutory responsibility for oil transfer facilities and their operation within the State. Included in this responsibility is the requirement to establish regulation and inspection programs governing oil transfer facilities. This includes regulation and inspection of oil transfer operations between marine facilities and tank vessels.
1. Action:
a. Facility Inspection: The Parties will coordinate their respective inspection and monitoring activities to the extent practicable to utilize the resources of both Parties efficiently and effectively. Cognizant inspectors from both Parties may carry out inspections and other activities jointly where appropriate.
Sector SF Section 9000-177 October 1, 2014

b. Equipment: The Parties will cooperatively enforce requirements for pollution
prevention and pollution response equipment at marine facilities.
c. Manning: The Parties will cooperatively enforce requirements for trained and
qualified personnel to be responsible for transfer operations at marine facilities.
d. MARPOL Reception Facilities: The Parties will work together to ensure adequate facilities are present to receive garbage, sewage, and oily wastes from vessels.
e. The State will promptly inform the COTP, and the USCG will promptly inform the State, of any situation or circumstance relative to facilities whose operation or equipment may significantly increase the potential for an unauthorized discharge or create an unusual or an unacceptable risk to public health and safety, or the safety of navigation within State waters.
I. Waterways Management:
1. Port and Waterways Safety
The Captain of the Port (COTP) is the predesignated Federal official with primary responsibility to exercise control of vessels to ensure the safety and security of ports and waterways. Under the California Act, Harbor Safety Committees are created and are responsible for the planning of safe navigation and operation of tankers, barges, and other vessels in harbors and harbor approaches.
a. Action
(i) The State will promptly inform the COTP, and the Coast Guard will promptly inform the appropriate State authority, of any situation or circumstance relative to vessels whose operation or equipment may significantly increase the potential for an unauthorized discharge or create an unusual or an unacceptable risk to public health and safety, or the safety of navigation within State waters.
(ii) The State is guided by recommendations from the Harbor Safety Committee for the planning of safe navigation and operation of tankers, barges and other vessels within each harbor. The State, in adopting regulations to implement the Harbor Safety Plan will coordinate with the COTP.
2. Vessel Traffic Services (VTS)
The Ports and Waterways Safety Act authorizes the Coast
Sector SF Section 9000-178 October 1, 2014

Guard to construct, operate and maintain vessel traffic services in the areas subject to the jurisdiction of the United States. The Federal system of VTS is designed and empowered to inform, advise, and direct marine traffic in designated areas. Federal VTSs require the participation of certain classes of vessels and may direct the movement of those vessels to reduce navigational risks.
In 1991, the Coast Guard completed a VTS Ports Needs Study to determine which United States ports would gain the most benefit from the presence of a Federal VTS. The California ports and waterways included in the Port Needs Study were Los Angeles/Long Beach, Santa Barbara Channel and the ports in and around San Francisco Bay.
a. Action:
(i) The Coast Guard maintains a Federal VTS in San Francisco Bay. The State will cooperate with the Coast Guard to ensure expansion of the existing VTS system within San Francisco, San Pablo, Suisun Bays as well as the Gulf of the Farallones.
(ii) A Vessel Traffic Information System (VTIS) for Los Angeles/Long Beach is maintained under a joint partnership between the Marine Exchange, the State and the Coast Guard.
3. Pilots
Federal law requires pilots aboard vessels sailing within the coastwise trade. Foreign vessels or United States vessels engaged in foreign trade may be controlled by State pilotage requirements. In the absence of State pilotage regulations, the Federal government may impose pilotage requirements on those vessels.
a. Action: The Coast Guard and the State intend to enter into a memorandum of agreement with California’s port and harbor authorities for the purpose of creating a state pilotage system ; except for the port and harbor authorities falling under pilotage jurisdiction of the Board of Pilot Commissioners for San Francisco, San Pablo and Suisun Bays, where the Coast Guard recognizes the State regulation of pilotage.
4. Tug Escorts
Federal and State law authorize the regulation of the
use of tug escorts and may require either equipment or standards of performance deemed necessary for the function.
a. Action:
(i) The State and the Coast Guard agree to consult with each other in issuing any regulations requiring tug escorts to ensure that they are consistent to the extent permitted by law.
(ii) Towing Equipment: The Parties agree to review requirements for tow equipment for barges and tank vessels carrying oil in bulk, with the purpose of determining whether additional standards for equipment, maintenance, operation, and inspection should be adopted.
5. Aids to Navigation (ATON)
Sector SF Section 9000-179 October 1, 2014
The Coast Guard establishes, regulates, and maintains a uniform system of aids to navigation within the United States.
Action: The State will assist the Coast Guard by recommending changes, improvements, or repairs that may improve aids to navigation, in cooperation with the Harbor Safety Committees.
J. Public Information/Education
The Parties agree that public education in areas of pollution prevention, which includes oil, hazardous substances and garbage, is a high priority and that each agency shall seek opportunities to coordinate pollution prevention public awareness and education programs.
1. Action:
a. Marinas: Public information and education will be cooperatively developed and implemented targeting marina operations to reduce pollution from oil, toxic substances, garbage, and sewage.
b. Small Oil Transfer Facilities: Public information and education will be cooperatively developed and implemented targeting small oil transfer facilities to reduce pollution from oil, toxic substances, garbage, and sewage.
c. Recreational Vessels: Public information and education will be cooperatively developed and implemented targeting the recreational boating community to reduce pollution from oil, toxic substances, garbage, and sewage.
VII RESPONSE
Federal law established the Coast Guard as the primary Federal agency tasked with responding to oil spills on the navigable waters of the United States. In such cases, the Federal On Scene Coordinator (OSC) is the predesignated official responsible for directing response actions. The OSC may direct or monitor all Federal, State, and private actions in response to an oil spill or a potential oil spill in State waters. The Parties will respond to marine oil spills as required by and in accordance with the National Contingency Plan (NCP). The OSC will consult, as required by OPA 90 and other applicable Federal law, with the OSPR Administrator or designee concerning oil spill response activities. State law provides that OSPR is responsible for coordinating State oil spill cleanup efforts.
A. Notification:
Sector SF Section 9000-180 October 1, 2014
The Parties agree to provide the earliest possible notification of discharges of oil and hazardous substances and imminent threats of such discharges to each other in accordance with applicable law, regulations and policies consistent with the National Oil and Hazardous Substances Pollution Contingency Plan and applicable area contingency plans. In order to provide a single point of contact for the OSC in the event of a marine oil spill, the OSPR Admini-strator or designee will represent all State agencies and will be the primary point of contact.
B. Incident Command System (ICS)/Unified Command Structures (UCS):
The Incident Command System (ICS)/Unified Command Structure (UCS) establishes functional responsibilities, lines of communication, information sharing and control for the conduct of an oil spill response operation.
1. Action:
a. The Parties agree to work together within the framework of their respective authorities to ensure a coordinated effort with a minimum of duplication in response to oil spills.
b. The Parties agree to implement an ICS/UCS to ensure coordination of emergency response decision-making during a pollution incident. In those circumstances where governmental action is required to develop and direct action to clean up or abate the effects of an oil spill, the Parties agree to consider best utilization of existing resources, avoiding duplication, while taking advantage of resource availability. The OSC may request the State to undertake response actions on a case-by-case basis. If the State assumes responsibility for response activity, the State will conduct those activities, as directed by the OSC, in accordance with the National Contingency and Area Contingency Plans.
c. Response Decisions: The OSC will coordinate with the State in decision-making relating to the conduct of oil spill response operations including, but not limited to: salvage, lightering, safe haven and other matters affecting the discharge of spilled oil, its containment or its cleanup.
d. The Parties agree to establish a joint public information center to provide for the coordinated dissemination of information during a response operation. This provision does not preclude the Parties from making independent responses to the media and the public.
C. Natural Resource Protection
Both Parties recognize the importance of protecting and preserving natural resources in responding to an oil spill. Both Parties agree that response strategies and procedures will be established through the Unified Command Structure (UCS), in accordance with applicable laws, regulations, and policies, and procedures. The Area Contingency Plan (ACP) will be used as the primary guidance document regarding resource protection.
D. Response Monitoring and Technology
Sector SF Section 9000-181 October 1, 2014

Both Parties agree that the methods used to clean up oil and oily debris shall be established through the Incident Command System (ICS)/UCS which will determine the level of action which is required.
1. Action:
a. Both Parties agree, through the Incident Command System, to provide timely input and recommendations to the Unified Command, to the extent practicable, on dispersant usage, in situ burning, bioremediation, and other non-mechanical cleanup technologies.
b. Both Parties agree that decisions to discontinue clean up operations and demobilize response activities shall be made through the Unified Command Structure. The State retains the right to undertake response, remedial or mitigating actions beyond the response actions completed by the OSC.
E. Incident Command System (ICS) Training
Both Parties acknowledge the necessity for increased and ongoing training in ICS procedures to maintain a qualified pool of response personnel.
1. Action:
a. Both Parties agree to establish training criteria appropriate to their agencies.
b. Both Parties agree to pursue joint training opportunities and instruction.
c. To better prepare for an oil spill where a responsible party is not present or not identified, the State and each COTP shall prepare an action plan for, and exercise the Incident Command System. Such action plans shall be reviewed, updated, and exercised as needed.
VIII NATIONAL POLLUTION FUNDS CENTER INFORMATION
A. The Oil Spill Liability Trust Fund (The Fund).
The Fund provides funding under certain conditions for oil discharge removal actions. The Fund is available in certain circumstances to compensate the State for incurred costs and damages associated with oil discharges. To the extent allowed, a State may access the Fund under current regulations and National Pollution Fund Center (NPFC) procedures.
1. Action: Upon the publication of regulations implementing Section 1012(d)(2) of OPA 90, the State may negotiate directly with the NPFC to establish a cooperative agreement to provide access to the Fund under Section 1012(d)(2). Any agreement between the State of California and the National Pollution Fund Center shall be attached as an annex to this MOA.
B. The National Pollution Fund Center (NPFC)
Sector SF Section 9000-182 October 1, 2014

1. The NPFC administers the Oil Spill Liability Trust Fund (The Fund) in order to: provide funding for oil removal activities, provide State access to the Fund, conduct cost recovery, accept and process claims, and evaluate requests by Federal trustees to fund initiation of natural resource damage assessments. The NPFC also administers Certificates of Financial Responsibility and provides CERCLA/Superfund funding to Coast Guard On Scene Coordinators (OSC) responding to hazardous material incidents.
2. The State may receive payment from the Fund in the State’s role as a response organization engaged in removal activities consistent with the National Contingency Plan, as an appropriate claimant for damages, and in the State’s role as a natural resource trustee. In addition to the text herewith concerning Section 1012(d)(2) of the Oil Pollution Act of 1990 (OPA 90), the State recognizes the following provisions outline alternative funding methods for State removal activity:
a. Section 1012(d)(1). Regulations under Section 1012(d)(1) of OPA 90 allow the NPFC, upon request of the Governor of a State and as authorized by the Federal On Scene Coordinator (OSC), to obligate The Fund for payment in an amount not to exceed $250,000 for removal costs, consistent with the National Contingency Plan (NCP), required for the immediate removal of a discharge, or the mitigation or prevention of a substantial threat of a discharge, of oil. The NPFC’s Technical Operating Procedures (TOPS) for State access under Section 1012(d)(1) of OPA 90, and the TOPS for resource documentation under OPA 90 are approved guidelines for State use to access the Fund under this section.
b. Claims. Regulations under Section 1012(a)(4) of OPA 90 authorize use of The Fund for the “payment of claims in accordance with Section 1013 of OPA 90 for uncompensated removal costs determined by the President [Coast Guard] to be consistent with the NCP or [for] uncompensated damages.” Procedures for claims are found in 33 CFR Part 136. States have a special status under Section 1013 of OPA 90 regarding claims for uncompensated costs which allows States to make such claims directly to The Fund rather than first to the responsible party.
c. The State agrees to eliminate excessive overhead expenses associated with the cost recovery program so that only those individual claims in excess of a dollar amount to be determined through consultation with the Coast Guard and eligible for compensation shall be submitted to the Fund.
d. Working Directly for the OSC. State agencies may work directly for the On Scene Coordinator (OSC) in performing removal actions. In these situations, the OSC issues a Pollution Removal Funding Authorization (PRFA) to the State to establish a contractual relationship and to obligate The Fund. The OSC actively directs and is responsible for the response actions. The OSC may request State assistance and participation in emergency removal actions under CERCLA in response to a hazardous materials incident or threatened incident and where funding for these actions is established in a PRFA.
3. Natural Resource Damage Assessments. A State natural resource Trustee may request access to the Fund for the initiation of an assessment of natural resource damages resulting from a discharge of oil, through a Federal Lead Administrative Trustee (one of the Federal Trustees designated in the NCP), in accordance with the procedures established by the NPFC (Section 6002(b) of OPA 90).
Sector SF Section 9000-183 October 1, 2014

IX ENFORCEMENT
Enforcement action by either Party may include civil and criminal penalties. The Coast Guard may also take action against Coast Guard merchant marine licenses and seamen’s documents.
A. Action:
1. Subject to the requirements and limitations of applicable State and Federal law, the Parties agree to cooperate to the fullest extent possible in marine casualty investigations and pollution investigations including, but not limited to: the sharing of information regarding witnesses, reports, analyses, and other available information, or evidence that may assist in determining the cause of the casualty or pollution incident.
2. Enforcement action undertaken by each of the Parties must occur independently in accordance with applicable laws and regulations. The Parties agree that to the extent they can, they will consult with each other as to intended enforcement action.
3. The Parties agree to investigate the feasibility of the Coast Guard utilizing the Department of Fish and Game Petroleum Chemistry Laboratory for the analysis of Coast Guard oil samples.
X RULEMAKING
A. Issuance of Regulations
The Oil Pollution Act of 1990 and other-Federal law provides for the issuance of regulations pertaining to the prevention of oil spills from vessels. The Commandant of the Coast Guard has the authority to promulgate such regulations. The Commander, Eleventh Coast Guard District, and the respective Captains of the Port have limited authority to promulgate local regulations. Acting under its inherent regulatory authority and under authority not preempted by Federal law, the State has the authority to promulgate regulations concerning oil spill prevention which do not conflict with, and which are not otherwise preempted, by Federal law. It is the intention of the parties to maintain close communications to reduce conflict between each Party’s permits, directives, and instructions.
1. Action:
a. The intent of this section is to avoid conflict and inconsistent regulation in rulemaking wherever possible, subject to applicable procedural rules, and to endeavor to provide a coordinated, synergistic response to oil pollution planning and response. It is the intent of the Parties to endeavor under their respective authorities to assure the best achievable protection for the waters of the State.
Sector SF Section 9000-184 October 1, 2014

b. In addition, the respective Federal and State procedures for noticing the opportunity to comment on proposed rules, the Parties anticipate that through their participation on committees and day-to-day working communications, the concerns of each will be discussed and given due consideration.
B. Containment and cleanup for refueling, bunkering or lightering operations OPA 90 and other Federal laws regulate refueling, bunkering and lightering operations. Federal regulations enforced by the Coast Guard govern these operations. Subject to the requirement that they be consistent with Federal regulations, the State may issue its own regulations relating to these same operations.
C. Tank Vessel Response Equipment Rules
Federal law governs the standards for response equipment. State law authorizes the adoption of State standards for spill response equipment to be maintained on tank vessels operating in waters of the State. State rules must be consistent with Federal spill response equipment standards.
XI AGREEMENT
A. This agreement represents a voluntary understanding between the Eleventh Coast Guard District and the State of California.
B. The terms of this agreement may be changed at any time by the Parties by a written, signed amendment hereto with or without notice to any other person.
C. The agreement may be terminated by either party at any time without notice to any person other than the other party.
D. No rights, duties, obligations, or liabilities enforceable at law are created by this agreement.
E. No action based upon this agreement may be brought against the United States or the State of California by any person.
F. This agreement does not alter, modify, abridge, or in any way affect any rights, duties, obligations, or liabilities of any person under the laws of the United States or the State of California.
G. In the event that individual and severable portions of this agreement are found to be in conflict with either State or Federal law, regulations or policies, and therefore of no effect, the agreement will remain in effect without those provisions, unless either Party notifies the other in writing that the entire agreement is terminated.
H. Any action to modify, amend or terminate this agreement may only be taken by the Governor of the State of California or the Commander, Eleventh Coast Guard District or person to who this,authority is specifically delegated by them.
I. This MOA supercedes and replaces the MOA signed on June 2, 1993.
Sector SF Section 9000-185 October 1, 2014

FOR THE STATE OF CALIFORNIA: FOR THE UNITED STATES COAST GUARD:
PETE WILSONGovernor State of California Date:
R. T. RUFE Vice Admiral, USCG Commander, Eleventh Coast Guard District Date:
Sector SF Section 9000-186 October 1, 2014

MEMORANDUM OF UNDERSTANDING BETWEEN THE
DEPARTMENT OF FISH AND GAME’S OFFICE OF OIL SPILL PREVENTION AND RESPONSE
AND THE STATE WATER RESOURCES CONTROL BOARD
RELATING TO DISCHARGES ASSOCIATED WITH RESPONSE ACTIVITIES
CONDUCTED PURSUANT TO CH. 7.4, DIVISION 1 OF THE GOVERNMENT CODE
WHEREAS, The Administrator; of the Office of Oil Spill Prevention and Response (hereinafter referred to as OSPR) and the Executive Director of the State Water Resources Control Board (hereinafter referred to as SWRCB), acting for the SWRCB and the Regional Water Quality Control Boards (RWQCBs), are directed by Government Code section 8670.7, as amended by Stats. 1993, ch. 736, to enter into a memorandum of understanding (MOU) to address discharges, other than dispersants, that are incidental to, or directly associated with, the response, containment, and clean up of an existing or threatened oil spill in marine waters, conducted pursuant to Chapter 7.4, Division 1 of the Government Code; and WHEREAS, It is the intent of this MOU that all incidental discharges as defined herein shall occur within the response area in or proximate to the area in which the oil recovery activities are taking place for the purpose of returning any oily water back into the response area; and WHEREAS, Both the Administrator of OSPR and the SWRCB share the same goal of minimizing any unnecessary deleterious impacts to the environment, or to the public health and safety; and WHEREAS, The Administrator of OSPR has the primary authority to direct prevention, removal, abatement, response, containment, and cleanup efforts with regard to all aspects of any oil spill in or threatening the marine waters of the State; and WHEREAS, The SWRCB and the RWQCBs have the primary authority for regulating and ensuring the quality of the waters of the State; and WHEREAS, This MOU is not effective until approved by the SWRCB and the Administrator of OSPR; and NOW, THEREFORE, the Administrator of OSPR and the Executive Director of SWRCB (the Parties) have reached the following agreement and clarification of existing law concerning discharges, other than dispersants, that are incidental to, or directly associated with, the response, containment, and clean of an oil spill in marine waters, pursuant to Chapter 7.4, Division 1 of the Government Code. Definitions The Parties agree that for the purposes of this MOU the following definitions shall apply: a. Incident Command System or Unified Command Structure:
Sector SF Section 9000-187 October 1, 2014
For the purpose of this section the terms “Incident Command System or Unified Command Structure” mean the procedures established for directing personnel, facilities, equipment, and communications during the response, containment, and cleanup of an oil spill incident in marine waters.
b. Incidental Discharge
“Incidental discharge” means the release of oil and/or oily water within the response area in or proximate to the area in which the oil recovery activities are taking place during and attendant to oil spill response activities. Incidental discharges include, but are not limited to, the decanting of oily water; in order to conserve oil storage capacity, and the wash down of vessels, facilities, and equipment used in the response
c. Marine Waters:
“Marine waters” include all waters defined as marine waters in California Government Code Section 8670.3(h) and all water otherwise within the jurisdiction of the Administrator of OSPR. under Chapter 7.4, Division 1 of the Government Code.
d. National Pollution Discharge Elimination System Permit (NPDES Permit):
An NPDES Permit is any permit issued by the SWRCB or the RWQCBs pursuant to California Water Code section 13370 et seq., as required or authorized by the Federal Clean water Act, Title 33 U.S.C. 1251 et seq.
e. Oily water:
Oily Water means any substance, matter, or medium containing or permeated with any kind of petroleum, liquid hydrocarbons, or petroleum products or any fraction or residues therefrom, including, but not limited to, crude oil, bunker fuel, gasoline, diesel fuel, aviation fuel, oil sludge, oil refuse, oil mixed with waste, and liquid distillates from unprocessed natural gas. Waste includes, but is not limited to, seaweed, driftwood, debris, and other similar types of materials.
f. Response:
Response means the time period when response personnel, acting under the authority of the Administrator, the Federal On-Scene Coordinator, the State On-Scene Coordinator, through the Incident Command System or Unified Command Structure, are performing Response Activities that are reasonably necessary to prevent, reduce, or mitigate damages to persons, property, and/or natural resources of this State due to an oil spill incident in marine waters.
g. Response Activities:
Response Activities means those activities, consistent with the National Contingency Plan, the State Oil Spill Contingency Plan, or taken at the direction of the Administrator or Federal On-Scene Coordinator through the Incident Command System or Unified Command Structure, in response to a spill, that entail the removal of oil from marine waters of the State. This includes all activities conducted on-water or onshore relating to the separation, recovery, containment, transfer, or treatment of marine waters of the State contaminated by oil and/or oily materials.
Sector SF Section 9000-188 October 1, 2014

h. Response Area:
Response Area means the area of marine waters where response activities are occurring as defined by the daily work plan approved under the Incident Command System or Unified Command Structure by the Administrator, Federal On-Scene Coordinator, or State On-Scene Coordinator.
i. Waste Discharge Requirements
“Waste Discharge Requirements” are a set of requirements issued by the RWQCBs, pursuant to California water Code section 13260 et seq., regulating the discharge of waste which could affect state waters. Waste Discharge Requirements may be issued by the SWRCB upon the review of an action or failure to act by a RWQCB, pursuant to Water Code section 13320.
II. NPDES Permits The Parties agree that:
The incidental discharges covered by this MOU are consistent with the State Contingency Plan and the National Contingency Plan. Incidental discharges as described in this MOU which are in compliance with the instructions of the On-Scene Coordinator, pursuant to the National Contingency Plan or the applicable Coast Guard regulations, are excluded from regulation under an NPDES permit, as provided by the Federal Environmental Protection Agency regulation 40 C.F.R. 122.3(d), are consistent with Federal laws and regulations, and do not constitute a prohibited discharge.
III. Waste Discharge Requirements The Parties agree that:
a. It is in the public interest for the RWQCBs for the North Coast, San Francisco Bay, Central Coast, Los Angeles, Santa Ana and San Diego Regions to waive the issuance of waste discharge requirements for incidental discharges, within the response area during a spill response as provided in Water Code section 13269. The SWRCB will recommend such action to the RWQCBs.
b. Such discharges do not create a vested right to discharge, but rather such discharges are privileges, as provided by California Water Code section 13263(g).
IV. Miscellaneous
a. The terms of this agreement may be changed at any time by the Parties by a written, signed amendment hereto with or without notice to any other person.
b. The agreement may be terminated by either party at any time without notice to any person other than the other party.
c. No rights, duties, obligations, or liabilities enforce able at law are created by this
agreement.
Sector SF Section 9000-189 October 1, 2014

d. This agreement does not alter, modify, abridge, or in any way affect any rights, duties, obligations, or liabilities of any person under the laws of the State of California. e. In the event that individual and severable portions of this agreement are found to be in conflict with either state or federal law, regulations or policies, and, therefore, of no effect, the agreement will remain in effect without those provisions unless either party notifies the other in writing that the entire agreement is terminated..
f. Any action to modify, amend, or terminate this agreement may only be taken by the Administrator of OSPR and the Executive Director of SWRCB, or persons to whom this authority is specifically delegated by them. Any such modification is not effective until approved by the SWRCB.
FOR THE OFFICE OF OIL SPILL FOR THE STATE WATER RESOURCES PREVENTION AND RESPONSE: CONTROL BOARD: Pete Bontadelli Walt Pettit Administrator Executive Director Date: Date: State of California M e m o r a n d u m To : Ben D. Kor, NCRWQCB Date: APR 28 1995 Steven R. Ritchie, SFBRWQCB Roger Briggs, CCRWQCB Robert P. Ghirelli, LARWQCB Gerard J. Thibeault, SARWQCB Arthur L. Coe, SDRWQCB
Sector SF Section 9000-190 October 1, 2014

From : STATE WATER RESOURCES CONTROL BOARD 901 P Street, Sacramento. CA 95814 Mail Code G-8 Subject: WAIVER OF WASTE DISCHARGE REQUIREMENTS FOR INCIDENTAL DISCHARGES ASSOCIATED WITH OIL SPILL RESPONSE ACTIVITIES In 1993 the Lempert-Keene-Seastrand Oil Spill Prevention and Response Act was amended to require that the Administrator of the Office of Oil Spill Prevention and Response (OSPR) and the Executive Director of the State Water Re-sources Control Board (SWRCB) enter into a memorandum of understanding (MOU), which addresses all permits and other requirements pertaining to the incidental discharge of wastewater during oil spill response activities. An MOU was subsequently signed in 1995. A copy is attached for your reference as Attachment l. The MOU addresses discharges of oily water which occur during oil spill response activities within or proximate to oil spill response areas. The MOU finds that these discharges are exempt from regulation under a National Pollutant Discharge Elimination System (NPDES) permit. The MOU also provides that the SWRCB will recommend that the coastal Regional Water Quality Control Boards (RWQCBs) waive the issuance of waste discharge requirements for these types of discharges. The purpose of this memorandum is to request that you take appropriate action to amend the waiver resolution or water quality control plan, as appropriate, for your region to include incidental discharges on the list of discharges for which waste discharge requirements are waived. Waiver of this type of discharge would be in the public interest, as provided’ in Water Code section 13269, because the issuance of waste discharge requirements under the circumstances could significantly impede oil spill cleanup. Also, the addition of incidental discharges to an RWQCB’s waiver list could be considered categorically exempt from the California Executive Officers. Environmental Quality Act, Public Resources Code section 21000, et seq. under the emergency project exemption. See 14 C.C.R. § 15269. The addition of incidental discharges to an RWQCB’s waiver list would also be exempt from review by the Office of Administrative Law under the Administrative Procedure Act, Government Code section 11340, et seq. See Gov. Code § 11352(b). Sample language for inclusion in the RWQCB’s waiver resolution is contained in Attachment 2. Please contact Sheila Vassey, Senior Staff Counsel, in the Office of the Chief Counsel at (916) 657-2408 or Calnet 8-437-2408 if you would like further information regarding this matter. Attachments (2) cc: Pete Bontadelli Administrator Office of Oil Spill Prevention and Response Department of Fish and Game 1700 K Street, Suite 250 Sacramento, CA 95814 Barry R. Ogilby Carlsmith, Ball, Wichman, Murray, Case & Ichiki 555 South Flower Street, 25th Floor Los Angeles, CA 90071-2326
Sector SF Section 9000-191 October 1, 2014
MEMORANDUM OF UNDERSTANDING RELATING TO
THE HANDLING AND TRANSPORT OF MATERIALS USED OR RECOVERED DURING AN OIL SPILL
BETWEEN THE DEPARTMENT OF FISH AND GAME’S
OFFICE OF OIL SPILL PREVENTION AND RESPONSE AND
THE DEPARTMENT OF TOXIC SUBSTANCES CONTROL
WHEREAS, The Administrator of the Office of Oil Spill Prevention and Response within the Department of Fish and Game (hereinafter referred to as OSPR) and the Director of the Department of Toxic Substances Control (hereinafter referred to as DTSC) are interested in developing a preapproved process for the handling and transport of materials used or recovered during an oil spill response, including materials that may be classified as hazardous waste; and
WHEREAS, Both the Administrator of OSPR and the Director of DTSC share the same goal of minimizing any unnecessary deleterious impacts to the environment, or to the public health and safety; and
WHEREAS, The Administrator of OSPR has the primary authority to direct prevention, removal, abatement, response, containment, and cleanup efforts with regard to all aspects of any oil spill in the marine waters of the State; and
WHEREAS, The Director of DTSC has the primary authority for regulating the handling, transport, recycling, treatment, and disposal of all hazardous waste within the State; and
WHEREAS, Both the Administrator of OSPR and the Director of DTSC are required under State law to establish a process for the handling and transport of materials used or recovered during an oil spill response.
NOW, THEREFORE, the Administrator of OSPR and the Director of DTSC (the Parties) have reached the following Memorandum of Understanding (MOU) and clarification of existing law concerning the handling and transport of materials used, collected, or recovered during an oil spill response. I. Definitions
The Parties agree that for the purposes of this MOU the following definitions will apply: a. Emergency Permit
“Emergency permit” means a permit issued by the DTSC in accordance with Title 22, California Code of Regulations, Section 66270.61.
b. Federal On Scene Coordinator c. “Federal On Scene Coordinator” means the federal designated representative from the U.S. Coast Guard or the U.S. Environmental Protection Agency who represents the federal government within the Unified Command.
Sector SF Section 9000-192 October 1, 2014

c. Immediate Response
“Immediate response” means the time period when response activities are undertaken that are reasonably necessary to prevent, reduce, or mitigate damages to persons, property, or natural resources of this State due to a threatened or actual spill of oil and/or oily materials.
d. Incident action plan
“Incident action plan” means the document(s) that describe those response activities approved by the Incident Commander or Unified Command.
e. Incident Commander
“Incident Commander” means the state designated representative for coordinating response to oil spills. The Administrator of OSPR or his or her designee is the Incident Commander during a spill and represents the state within the Unified Command.
f. Oil and/or oily materials
“Oil and/or oily materials” means any substance, matter, or medium containing or permeated with any kind of petroleum, liquid hydrocarbons, or petroleum products or any fraction or residues therefrom, including, but not limited to, crude oil, bunker fuel, gasoline, diesel fuel, aviation fuel, oil sludge, oil refuse, oily water, oil mixed with waste, and liquid distillates from unprocessed natural gas.
g. Orphan spill
“Orphan spill” means a situation where a Responsible Party does not exist, is unknown, or the Responsible Party is unable or unwilling to provide adequate and timely cleanup and/or to pay for the damages resulting from the spill.
h. Response Activities
“Response activities” means those activities that render care, assistance, or advice in accordance with the National Contingency Plan (40 CFR 300 et seq.), the State Oil Spill Contingency Plan, or at the direction of the Incident Commander or Unified Command during an immediate response to a spill or threatened spill of oil and/or oily materials. Response activities are approved in the incident action plan and include for the purposes of this MOU, but are not limited to, separation, recovery, containment, transfer, or transport of oil and/or oily materials to temporary storage sites.
i. Response Area
“Response area” means the area where response activities are occurring or will be occurring as designated and approved by the Incident Commander or Unified Command within the incident action plan. Response area may include, but is not limited to, the location(s) of temporary storage sites and areas associated with a response vessels or other vehicle routes to such sites.
j. Response personnel
Sector SF Section 9000-193 October 1, 2014

“Response personnel” are those individuals or entities performing response activities. Response personnel includes, but is not limited to, all employees, agents, designess, or subcontractors of the Responsible Party, including oil spill cleanup organizations as well as local, state or federal agency employees, volunteer workers, or individuals or entities acting under the direction of the Incident Commander or the Unified Command.
k. Responsible Party
For the purposes of this MOU, “Responsible Party” means any of the following:
(1) The owner or transporter of oil and/or oily materials or a person or entity accepting responsibility for the oil and/or oily materials; or
(2) The owner, operator, or lessee of, or person who charters by demise, any vessel or marine facility; or
(3) A person or entity who, as a shore-based representative of a vessel or facility
owner or operator, has full written authority to implement an oil spill contingency plan or otherwise accepts responsibility for the vessel or marine facility.
To the extent permitted by law, oil spill response organizations are not considered a Responsible Party solely due to their performance of response activities authorized in this MOU.
l. Spill or discharge
“Spill” or “discharge” means any release of oil and/or oily materials into or that impacts state waters that is not authorized by any federal, state, or local government entity.
m. Temporary Storage Site
“Temporary storage site” means an area or facility approved by the Incident Commander or Unified Command for characterizing and temporarily storing recovered oil and/or oily materials used, collected, or recovered during an oil spill response. Such an area may include, but is not limited to, permitted or interim status hazardous waste storage facilities, other non-permitted facilities, vessels, barges, tanks, barrels, containers, storage piles, or other appropriate containment methods and locations that may be used to hold recovered oil and/or oily materials. Temporary storage sites need not be owned, operated, or leased by a Responsible Party.
n. Unified Command
“Unified Command” consists of the state Incident Commander, the Federal On Scene Coordinator and the Responsible Party. The Unified Command determines the procedures for directing personnel, facilities, equipment, and communications during the response, containment, and cleanup of an oil spill.
II. Implementation
The Parties agree that:
Sector SF Section 9000-194 October 1, 2014

a. The Director of DTSC will designate individual(s) (hereinafter DTSC representative(s)) in
advance or when notified by OSPR, the Office of Emergency Services, or the U.S. Coast Guard that a threatened or actual spill or discharge of oil and/or oily materials has occurred who are authorized to implement and ensure compliance with all terms and conditions of this MOU.
b. The DTSC representative(s) will immediately report to the Incident Commander or
Unified Command for assignment where needed and represent the DTSC throughout the response, containment, and cleanup of the spill.
c. The DTSC representative(s) will ensure that all appropriate federal, state, and local
agencies are kept informed of potential or actual hazardous waste issues throughout the response and related disposal activities.
d. The Administrator of OSPR agrees to take appropriate efforts to ensure that a
Responsible Party reimburses DTSC for all reasonable and necessary response costs incurred and to fund the positions of all reasonably necessary DTSC personnel throughout the duration of an orphan spill.
III. Immediate Response Exemption
The Parties agree that:
a. During an immediate response, all response activities conducted on water within the
response area will be exempt from obtaining a hazardous waste facility permit pursuant to section 66270.1(c)(3)(A), Title 22, California Code of Regulations, Division 4.5,and 66263 (hazardous waste manifesting)for treatment or containment activities.
b. Response personnel will use the generator identification number issued for emergency
response actions. However, other than the Responsible Party, owners and operators of response equipment, including but not limited to, tanker vessels, barges, or other waterborne craft, vacuum trucks, or other vehicles performing response activities shall not be deemed hazardous waste generators for the purposes of this MOU and shall not require generator identification numbers.
c. During an immediate response all oil and/or oily materials used, collected, or recovered
within the response area will be allowed to be expeditiously removed, transferred, or transported to temporary storage sites without uniform hazardous waste manifests.
d. The immediate response exemption created in Article III shall be in effect at all times, for
a period of up to thirty (30) days, while oil and/or oily materials are being recovered, transported, or transferred to temporary storage sites for material characterization. Additional thirty (30) day extensions may be granted under appropriate circumstances.
IV . Temporary Storage Sites
The Parties agree that:
Sector SF Section 9000-195 October 1, 2014

a. As soon as practicable once an immediate response has commenced, the Incident Commander or Unified Command will designate or approve temporary storage sites for storing all oil and/or oily materials used, collected, or recovered during a spill response.
b. The Incident Commander will notify DTSC of all designated or approved temporary
storage sites, and, to the extent practicable and feasible, will work in conjunction with the DTSC representative(s) and other state and local agencies to avoid any unnecessary deleterious impacts to the environment or threats to the public health and safety when designating or approving temporary storage sites.
c. The Incident Commander will ensure that DTSC representatives have full access to all
temporary storage sites to perform all appropriate regulatory activities.
d. Permitted or interim status hazardous waste facilities, or other authorized facilities will obtain an emergency permit from DTSC to modify or necessitate modifying any existing permits issued by DTSC for acting as a temporary storage site. The Responsible Party will be liable for all costs associated with the emergency permit.
f. Oil and/or oily materials stored or otherwise contained at temporary storage sites may
not be transferred, transported, treated, disposed, processed, used or re-used, or otherwise utilized until the Incident Commander or Unified Command authorizes such activities. Authorization will not be given until such such materials have been characterized (as described in Article V.), and a volumetric determination of the amount of such materials recovered has been made or approved by the Incident Commander.
V. Material Characterization
The Parties agree that:
a. Once the oil and/or oily materials have been contained at the temporary storage site, the Responsible Party, or, in the event of an orphan spill, the Incident Commander in conjunction with DTSC, must expeditiously determine:
(1) Those materials that are capable of being processed, used or re-used, or
otherwise utilized as an ingredient in the manufacture of petroleum products or other products and therefore not a waste or hazardous waste; or
(2) Those materials that are waste but are nonhazardous waste; or
(3) Those materials that are hazardous waste. b. Materials capable of being processed, used or re-used, or otherwise utilized as an
ingredient in the manufacture of petroleum products or other products will be expeditiously transported to any facility that is otherwise authorized during non-spills to perform such activities. Facilities performing such activities will obtain emergency permits from DTSC before processing, using or re-using, or utilizing such materials. The Responsible Party will be liable for all costs associated with the emergency permit.
c. Recovered oil and/or oily materials deemed a waste by the Responsible Party, or by
DTSC, must undergo chemical waste characterization as provided in Title 22, California Code of Regulations, sections 66264.13 and 66265.13, to determine whether the materials recovered are hazardous waste.
Sector SF Section 9000-196 October 1, 2014
d. Materials characterized as hazardous waste after undergoing characterization will be
managed in accordance with all applicable statutes, regulations, or permits prior to and during transfer, or transport to a hazardous waste management facility.
e. Notwithstanding V.(a)-(d) or any other provision of law, debris that is contaminated only
with petroleum or any of its fractions is exempt from regulation under Chapter 6.5, of Division 20 of the Health and Safety Code if all of the following conditions are met: (1) The debris consists exclusively of wood, paper, textile materials, concrete rubble,
metallic objects, or other solid manufactured objects.
(2) The debris is not subject to regulation as a hazardous waste under the federal act.
(3) The debris does not contain any free liquids, as determined by the paint filter test specified in the regulations adopted by the department.
(4) The debris is disposed of in a composite lined portion of a waste management unit which is classified as either a Class I or Class II landfill in accordance with Article 3 (commencing with Section 2530) of Chapter 15 of Division 3 of Title 23 of the California Code of Regulations, the disposal is made in accordance with the applicable requirements of the California regional water quality control board and the California Integrated Waste Management Board, and, if the waste management unit is a Class II landfill, it is sited, designed, constructed, and operated in accordance with the minimum standards applicable on or after October 9, 1993, to new or expanded municipal solid waste landfills, which are contained in Part 258 (commencing with Section 258.1) of Subchapter I of Chapter 1 of Title 40 of the Code of Federal Regulations, as those regulations read on January 1, 1996.
VI. Emergency Permit
The Parties agree that:
a. Once oil and/or oily materials have been deemed hazardous waste at the temporary storage site(s), the DTSC representative will expeditiously determine if the storage of such materials creates an imminent and substantial endangerment to human health or the environment.
b. If such determination is made, the DTSC representative will immediately issue an emergency permit to the Responsible Party, or to the Incident Commander in the event of an orphan spill, for the temporary storage site(s).
c. The emergency permit will thereafter be valid throughout the duration of the response
activities but in no case in excess of ninety (90) days unless extended in writing by DTSC pursuant to Title 22, California Code of Regulations, Section 66270.61.
d. The emergency permit shall allow all response personnel to expeditiously perform all
other response activities (within the scope of DTSC’s authority) that are reasonably necessary to prevent, reduce, or mitigate damages to persons, property, or natural resources of this State including transfer, treatment, storage, resource recovery, or disposal of materials used, collected, or recovered during the oil spill response.
Sector SF Section 9000-197 October 1, 2014

VII. Miscellaneous
The Parties agree that: a. The terms of this MOU may be changed at any time by the mutual consent of both
Parties by a written, signed amendment hereto. b. In the event that individual and severable portions of this MOU are found to be in conflict
with either State or Federal law, regulations or policies, and, therefore, of no effect, the MOU will remain in effect without those provisions unless either party notifies the other in writing that the entire MOU is terminated.
c. Any action to modify, amend, or terminate this MOU may only be taken by the
Administrator of OSPR and the Director of DTSC, or persons to whom this authority is specifically delegated by them.
FOR THE OFFICE OF OIL SPILL FOR THE DEPARTMENT OF PREVENTION AND RESPONSE: TOXIC SUBSTANCES CONTROL: Pete Bontadelli Jesse Huff Administrator Director FOR THE DEPARTMENT OF FISH AND GAME: Jacqueline E. Schafer Director
Sector SF Section 9000-198 October 1, 2014
9600 Conversions
Refer to Appendix XXXI of the Region 9 Contingency Plan
9700 Response References List Currently under development in Section 4015.01 of the Region 9 Contingency Plan
9710 Relevant Statute/Regulations/Authorities List Refer to Section 1002 of the Region 9 Contingency Plan
9720 Relevant Instructions/Guidelines/Standard Procedures and Practices
9720.1 NRDA Procedures
Introduction The overall goals of the natural resource damage assessment (NRDA) process are to restore the injured natural resources to pre-spill conditions and to obtain compensation for all documented losses and is a separate process from response. In general, this process may require several phases to complete, including the individual phases of documenting injuries, assessing damages, settling claims, and undertaking restoration programs. This document addresses the NRDA process only during the initial stages while response efforts are underway. This document attempts to describe the NRDA process, identify the principle participants in NRDA activities, and clarify the relationship of NRDA within the framework of the Incident Command System (ICS). NRDA is separate from the response; therefore it fits in under liaison. This information provided here is to allow an RP to understand the NRDA process. Additional information is provided concerning funding for NRDA activities and the requirements for specific federal, state, and local permits necessary to collect information for assessments of natural resource damages. It is highly desirable for natural resource trustees to coordinate their NRDA activities and to consult with local governments and interest groups from the affected area to produce a single NRDA for all injuries to public trust resources. The trustees are encouraged to coordinate these activities with the efforts of a cooperative responsible party (RP) to the extent that trustee responsibilities are not compromised.
Sector SF Section 9000-199 October 1, 2014

Background And Structure Significant oil spill incidents initially lead to two primary actions: a response to contain and cleanup the spilled oil, and an assessment of the injuries to natural resources caused by the pollutant. In 1990, Congress enacted the Oil Pollution Act (OPA 90; 33 U.S.C. 2701 et. seq.). OPA 90 authorizes Federal resource trustees (Department of Agriculture, Department of Commerce, Department of Defense, Department of Energy, Department of the Interior), State resource trustees (designated by the governor of each state), federally-recognized Indian tribes, and foreign trustees to seek compensation for injuries to natural resources caused by the discharge of oil. For purposes of this document, these groups are referred to as either “trustees” or “trustee agencies”. In California, the Governor has designated the Secretary of the Resources Agency and the Secretary of the California Environmental Protection Agency as the State Trustees for natural resources within their purview. The Lead State Trustee generally is selected based upon the types of natural resources affected by the spill.
Damage assessments for natural resources shall be coordinated by representatives from each of the trustee agencies with affected resources. These trustee agencies typically work as a team to develop a single approach to the assessment process. The “NRDA Team” consults with members of government and interest groups from the affected area to address local concerns. Cooperative RP(s) may be invited to participate with the NRDA Team activities to develop one unified NRDA plan for public trust resources. A cooperative damage assessment could reduce costs by eliminating parallel assessments by the trustees and the RP. However, due to the statutory responsibilities, the trustees must maintain management and oversight of any cooperative damage assessment.
Assessment Procedures The assessment procedures set forth in the DOI rules are not mandatory. However, they must be used by trustees to obtain a rebuttable presumption that a specific assessment of damages is correct. The DOI rules set out two types of assessment procedures. The “Type A” procedures uses a computer model to calculate damages and is a simplified assessment process. The “Type B” procedures involve more comprehensive assessment activities but, may be tailored for individual cases.
Five steps are described in the DOI rules for determining and quantifying injury to resources and assessing monetary damages. The steps include: (1) conducting an initial preassessment; (2) conducting a preassessment screen; (3) preparing an assessment plan; (4) conducting the assessment following either the “Type A” or “Type B” rule; and, (5) preparing a post-assessment report. Although the regulations provide the option for the trustees to use either “Type A” or “Type B” procedures in a given case, both may be employed in practice as long as there is no double recovery of damages. The speed and simplicity of the “Type A” procedures may prove useful for certain spills or types of injury, whereas the “Type B” procedures may be used if a full assessment is warranted.
NOAA has identified three phases to a damage assessment: (1) Preassessment; (2) Restoration Planning; and, (3) Restoration Implementation. If injuries to natural resources or the services provided by natural resources are expected to continue following response actions, and feasible restoration alternatives exist to address those injuries, then trustees may proceed beyond the Preassessment phase to Restoration Planning and Implementation.
Sector SF Section 9000-200 October 1, 2014

Injuries and Lost Services Initial steps in the NRDA process require documentation of a pathway for the spilled oil, demonstration of oil exposure (direct and indirect) with specific resources along the pathway, and quantification of the injuries caused by the spilled oil. Natural resources and/or the services provided by such resources may be injured or disrupted through direct or indirect exposure to released substances.
The methods used to assess the injuries arise largely from scientific practices and best professional judgement. The DOI rules and NOAA rule provide guidance on specific types of biological injuries (e.g., death, physiological malfunctions such as decreased reproductive capacity) that may be used to claim damages. The scope of possible injuries extends beyond impacts to single organisms and may include effects on populations, habitats, and ecosystems.
“Services” include physical and biological functions provided by the natural resources to the ecosystem as well as other functions related to human use of the resources. Production of food, protection from predators, maintenance of community diversity, and provision of habitats are examples of some services provided to the ecosystem or its constituents. Examples of services provided to humans by natural resources include recreational opportunities such as fishing, wildlife viewing and beach activities. Other services provided by resources to humans are often less visible and can relate to the knowledge that a resource exists and is healthy or will continue to exist for the benefit of future generations.
Preliminary Damage Estimates Expected damages should be estimated as soon as possible to determine the potential scope of the case and the prudence of undertaking certain types of studies. Preliminary damage estimates should include: (1) the reasonable costs of injury assessment, (2) the cost of restoring, rehabilitating, replacing or acquiring the equivalent of the injured resources; and, (3) the value of interim losses including both direct use (e.g., recreational) and passive use (e.g., existence value) of resources pending restoration or natural recovery.
NRDA Process Successful pursuit of NRDA actions, either by the trustees alone or in cooperation with the RP(s), is a complex process comprising numerous tasks that generally involve the interaction of scientists, economists, lawyers, and administrators. The DOI rules and NOAA rule reduce some of the complexity by establishing an assessment process and providing a mechanism for determining the merits of going forth with the assessment and claim. The process provides a record of the trustees’ decisions.
Other advantages to following the federal regulatory assessment processes may warrant use of the procedures. Results obtained by following the DOI and NOAA rules are presumed correct. The rebuttable presumption shifts the burden of proof to the party challenging the correctness of those results. Additionally, these rules provide national standards on injury measurement, describe methods for quantifying natural resource injuries into monetary values, and assist trustees in planning restoration of impacted resources.
Sector SF Section 9000-201 October 1, 2014

NRDA and the ICS The Incident Command System (ICS) is an organizational framework designed to efficiently and effectively manage personnel and resources during emergency incidents. The system is designed to be adaptable to any size event, and can be changed in structure to conform to the needs of the response. One objective of the ICS is to reduce or eliminate the duplication of efforts by the numerous response agencies while attempting to control or contain the spill and mitigate possible impacts of the spilled oil. A small group consisting of the Federal On-Scene Coordinator (FOSC), the State Incident Commander (State IC), and a representative of the RP form the Unified Command (UC), coordinates and directs the actions of the response.
Concerns of the affected local governments related to spill response or cleanup are generally presented to the UC through a Multi-Agency Coordination (MAC) group representative. The local government claims for spill damages associated with services provided by natural resources should be coordinated with the Trustee NRDA Team to avoid overlap within assessments. For additional details on the ICS see section 1000.
Assessment of injuries and damages resulting from spilled oil need to begin as soon as possible following the initial release of the pollutant. This necessitates that NRDA activities be conducted simultaneously with response efforts and coordinated through the UC. Portions of the NRDA process should be integrated into the ICS to improve communication, expedite both response and NRDA activities, and make efficient use of personnel and equipment. To avoid potential conflicts in duties, it is recommended that members of the NRDA Team not have responsibilities for the spill cleanup or general response activities.
The primary role of the NRDA Team is to document a pathway for the spilled oil, measure levels of injuries resulting from the spill, and determine damages. The UC, in contrast to the NRDA Team, focuses primarily on response, cleanup, and minimizing impacts of the oil spill. Although the UC and NRDA Team often have different responsibilities and needs, some of their activities overlap and require coordination. Examples of activities to be coordinated immediately following a spill include collecting samples (e.g., access to restricted sites, sampling prior to cleanup), gathering information pertinent to measuring actual or potential adverse changes to natural resources, using equipment (boats, helicopters, etc.), communications, surveying spill sites, identification of protective measures and potential need for emergency restoration.
Uninterrupted communication between the UC and the NRDA Team is essential to ensure that needs and efforts of the NRDA Team are not in conflict with response strategies and activities selected by the UC. Information concerning, for example, the spill trajectory forecasts, cleanup strategies, and beach and port closures should be made available to the NRDA Team to assist sample and data collection in a timely fashion. Conversely, information concerning potential injuries to natural resources caused by oiling or response techniques should be made available to the Planning Section before implementation of cleanup responses by the Operations Section.
Sector SF Section 9000-202 October 1, 2014

It is important to note that the RP is part of the UC but may not necessarily be part of the trustees’coordinated NRDA activities. For this reason, the NRDA Team must remain separate from the ICS to ensure that statutory responsibilities of the trustees are not compromised. The trustees retain the option of inviting the RP to participate in all or part of the damage assessment process. Some NRDA activities, however, are best coordinated through the UC. The NRDA Team will provide a Representative(s) to the Liaison Officer of the ICS to present the needs of the NRDA Team and other response information to the incident command. The NRDA Representative(s) will also act as historian or recorder of information critical for an accurate assessment of spill damages and will attend appropriate incident command meetings to secure knowledge of the up-to-date response activities.
Notification Procedure for Initiating NRDA In the event of a spill, each trustee is responsible for notifying its own members of the NRDA Team. Individual federal, state, and local agencies may be notified through various channels depending on the size and location of the spill. In all incidents that might require NRDA action, the Office of Spill Prevention and Response (OSPR) of the California Department of Fish and Game (CDF&G) will attempt to notify representatives from each of the trustee agencies expected to participate in the NRDA process.
Identification of Lead Administrative Trustee
Executive Order 12777 (October 22, 1991) requires the federal natural resource trustees to select a representative as the federal lead administrative trustee (LAT). In general, the LAT serves as the federal contact for all aspects related to damage assessment, resource restoration, and federal funding for NRDA activities. Depending on the resources affected and other relevant factors, it might be appropriate for most administrative duties to be undertaken by a lead trustee from a non-federal agency. In such cases, a federal LAT would still be selected to work with the representatives of the Oil Spill Liability Trust Fund to secure federal funds to initiate the damage assessment. All other administrative duties regarding damage assessment activities would be coordinated by the non-federal lead trustee. This lead trustee or trustee agency shall be selected by consensus of all participating trustees. The trustees will notify the Coast Guard of the federal LAT selection and, when applicable, non-federal lead trustee as soon as possible after an oil spill.
The trustees intend to execute a general Memorandum of Agreement (MOA) to coordinate their damage assessment and restoration activities. Among other things, the MOA will identify trustees, establish criteria for selecting the LAT, and provide procedures for decision making between the trustees signing the agreement.
Sector SF Section 9000-203 October 1, 2014

9720.2 Funding Issues
Oil Spill Liability Trust Fund (OPA Fund) The federal LAT will contact the OSC or his/her representative to secure money to initiate the assessment of natural resource damages following an oil spill. The LAT will provide an outline jointly agreed upon by the participating trustees describing funding needs and how such funds will be allocated among the trustees. Each participating trustee will provide documentation of all expenditures, costs, and activities. The LAT is responsible for coordinating the submission of all such documentation to the representatives of the OSTLF. Please see the NPFC users guide to see what can be funded from the OSTLF for NRDA.
California Oil Spill Response Trust Fund
If the federal funds are not available, or will not be available in an adequate period of time, and an RP does not exist or is unable or unwilling to provide adequate and timely payment for cleanup and damage assessment activities, the State Administrator of OSPR may access the California Oil Spill Response Trust Fund (COSRTF). Money from the COSRTF may be used to cover State damage assessment costs.
Contacts With Responsible Party(ies) The trustees will need early access to representatives of the RP(s) to determine the availability of funding, personnel, and equipment for damage assessment activities. The federal LAT or non-federal lead trustee will first notify the appropriate representative of the USCG or UC and request a meeting between the trustees and the RP’s representative. Should the USCG or UC fail to arrange a timely meeting, the trustees will establish contact directly with the RP’s representative.
9720.3 Public Affairs Procedures
Check-list for Public Affairs Response to Pollution Incidents 1. Where a potential risk to the health & safety of local communities exists, consider coordinating an EDIS broadcast through the local Office of Emergency Services (OES).
2. The Federal On-Scene Commander (FOSC) designates an incident Lead Information Officer (IO) — generally a Public Affairs Officer (PAO) from either the Coast Guard or DFG-OSPR, experienced in California spill response. Ensure that all PAOs know who the IO is, and understand that they report to him or her. The IO reports directly to the three Unified Commanders.
3. Complete a basic fact sheet and prepare a 30-second media statement (about 150 words, maximum).
4. Establish Joint Information Center (JIC) if the size or impact of the incident generates enough media or public interest in the spill and response. (Also see Section 2330 for additional JIC information.)
5. Contact District Eleven and DFG-OSPR at outset of any medium-to-large spill to arrange for PA back-up. (See Section 2330 for contacts and phone numbers).
Sector SF Section 9000-204 October 1, 2014

6. Establish phone bank for answering media calls (on large spills, consider staffing on 24-hour basis during initial crisis), and deploy adequate PA staff to answer all incoming phones.
7. Have a minimum of four phone lines available for public affairs use: Two each, incoming (published) and outgoing (unpublished) phone and FAX.
8. Schedule a media availability with the UC at least daily when media interest is great. Preference is immediately following UCS operations meeting. This allows the three key parties (FOSC, SOSC & RP) to attend and field questions.
9.Contact the Coast Guard’s National Strike Force Coordination Center (NSFCC), Public Information Assistance Team (PIAT) to alert for back-up, in case of any potential major incident. Note: FOSC may request PIAT at any time, regardless of spill size. (See Section 5612.3 for information and phone contact for PIAT)
10. In major spills, designate a Protocol Officer to handle VIP visitors. Do not, under any circumstances, assign this function to the Information Officer or JIC staff as a collateral responsibility.
Suggested Equipment Needs for JIC/Public Affairs:
1. Minivans (six passenger or greater) and a fuel-purchase card
2. FAX machine, scanner
3. At least four phone lines with voicemail capability
4. Internet access or aircards (one for each person in the JIC)
5. Office supplies (paper, pens, file folders, tape, paper clips, push-pins, easels, felt pens, etc.)
6. Desks, chairs, file boxes, erasable white boards, pens, & erasers, wastebaskets
7. Cellular phones, batteries, & charging units
8. VHF-FM radios (at least one)
9. Scanners for VHF-FM (to monitor response activities)
10. Printers,ink cartridges and paper
11. Photocopiers and paper
12. Televisions/DVD player
13. Podium w/PA system (for news conferences)
14. Charts, maps, and a way to display them (easels, tape to walls, magnets, etc.)
15. Bulletin boards / Erasable boards and supplies
16. Cameras and video cameras
17. Pain relievers (aspirin, acetaminophen, and ibuprophen)
18. Bottled water, coffee, juices, soft drinks (caffeine)
Sector SF Section 9000-205 October 1, 2014
19
19. DVD player and monitor on tall, movable stand, for use in Press Room (or news conferences)
20. Security (for JIC when unstaffed, and for news conferences)
21. Paper towels, facial tissues (Kleenex)
Public Affairs Section Staffing In accordance with the Incident Management Handbook (IMH) ICS-OS-420-1, there will be one Lead Information Officer (IO), assigned from either the USCG or OSPR. The IO heads the entire public affairs effort, and is responsible for developing and releasing information about the incident to the news media, to incident personnel, and to other appropriate agencies and organizations. S/he has direct contact with the Unified Command (UC), attends UC meetings, and informs the UC of the news media’s focus and areas of particular interest. S/he answers directly to the State and Federal On-Scene Commanders, and ensures that information flows in both directions between the UC, PA staff, and media/public. S/he supervises the Deputy Information Officer, Joint Information Center (JIC) Manager, and Community Relations Officer.
Only one Information Officer will be assigned for each incident, including incidents operating under Unified Command (UC) and multi-jurisdictional incidents. The IO may have as many assistants, responsible for specific public affairs tasks, as necessary. The assistants my also represent assisting agencies or jurisdictions. The assistants will fill the following positions within a JIC, under the direction of the lead IO. The IO should make these assignments in consultation with ICS, based on the expertise of each assistant. All assistant positions may be filled by qualified PA personnel from the USCG, OSPR, RP, or other responding organizations, and no single agency should dominate the lead positions.
1. Deputy Information Officer — Assists the IO directly, and serves as facilitator between the IO and the JIC Manager, Media Relations Supervisor, and others as needed. Is responsible for internal information flow from JIC to the response community (ICS responders & “home office” staff).
2. JIC Manager— This should be an experienced, well-organized PA specialist with working knowledge of oil spill response issues, ICS, basic supervision, and, if possible, the local media. The JIC Manager is responsible for managing the JIC, under the direct guidance of the lead IO. The JIC Manager will:
a. Determine staffing needs for the JIC. Assess the experience, skills, capabilities, and interests of available PA staff, and match staff with appropriate positions within the JIC (telephones, information coordinators, media relations, writing/production, support, etc.);
b. Review information supplied by information coordinators and determine appropriate method for dissemination (to writers/production for news releases, fact sheets & updates, copying and writing on status board for JIC staff, etc.);
c. Elevate sensitive or unresolved issues to the Lead IO;
d. Ensure news releases, fact sheets, and media advisories are distributed to JIC staff, Command staff, on- and off-site news media, and other interested parties;
e. Provide orientation for newly-arriving or assigned staff (this task may be delegated to the Assistant JIC Manageror other staff as appropriate).
Sector SF Section 9000-206 October 1, 2014

3. Assistant JIC Manager — Reports to JIC Chief and carries out assignments as given. Should be from a different organization than Chief. Supervises media relations, production and support groups, and must be able to carry out all the responsibilities of the JIC Chief when necessary. May be called on to be JIC Manager during night shifts.
4. Information Gatherers — Report to the JIC Manager and gather information about the spill response effort directly from Operations, Planning, Logistics, and Finance sections. Information gatherers will work closely with the appropriate section supervisor and/or designated public information contact. Information gathered is provided to the JIC Manager immediately, for dissemination to the media, public, and entire response community. Information gatherers are assigned to Operations (on- and off-shore, as needed), Planning/Environmental (wildlife, habitat, NRDA), Planning/Situation, Logistics, and Finance, and will use status sheets to help determine what information and activities should be recorded. Specific information to be collected by Information Gatherers includes the following:
a. Off-Shore Operations —
Information on the vessel(s) involved in the incident (ie: name, ownership, registry, destination) Size and type (single hull, double hull, freighter, tanker, barge, yacht.)
Cargo and fuel type
Extent of damage to vessel(s), and (if known) cause of damage
Information on crew status (injuries, missing) and search & rescue operations
Size (area covered) and volume of spill
Information on the spilled material
Safety restrictions or advisories (Notice to Mariners, closed air space, etc.)
Number & activities of oil skimmers and other on-water response operations (amount of boom deployed & location, types of equipment, names of contractors, etc.).
Amount of spilled material recovered
Stabilization, salvage, and other activities directed at the vessel(s) involved in the incident.
b. On-Shore Operations —
Locations of equipment and staging areas
Number and activities of shoreline clean-up crews
Amount of oil and oiled debris recovered
Waste storage and disposal activities
Any special provisions for local residents (medical monitoring, decontamination stations, etc.)
c. Environmental —
Number, status and description of oiled wildlife (species, # captured, collected dead, estimated oiled)
Sector SF Section 9000-207 October 1, 2014

Status and description of oil slick (trajectories, from NOAA)
Environmentally sensitive areas impacted or threatened by spill
Protective actions that will be taken in sensitive areas
Activities taking place at wildlife care centers and OSPR vet van
Volunteer activities (if any) and desirability of convergent volunteers (give 800 phone #)
d. Planning-Logistics-Finance —
Weather and tides
Incident Action Plan (overall response objectives)
Noteworthy logistical activities (equipment from out-of-state, etc.)
Claims processing information (telephone number for 3rd party claims against spiller)
Total number of people involved in response effort (and organizational breakdowns)
5. Media Relations — Positions in this group are filled by experienced PA staff that have media experience and local knowledge (particularly geographical features), if possible. The media relations group, headed by a Media Relations Supervisor (MRS), answers news media questions, sets up facilities for news conferences, and reports to the Assistant JIC Manager. The MRS ensures that all media relations staff have the most current information available on the spill response effort.
Media Phone Staff must include at least one representative each from the USCG, OSPR, and RP. Other affected, local governments and organizations may also provide staff. Typically this might include PAs from the National Park Service or State Dept. Of Parks and Recreation (closed beaches or parks), impacted city or county, NOAA, etc. Phone staff will answer inquiries from the news media, direct calls to appropriate staff when an “agency” or “RP” response is warranted, and provide the MRS with questions and “rumors” that need to be checked-out. There must be enough phone staff on duty to answer all phone lines in the JIC.
On-Site Media Staff will monitor news coverage and:
a. Assist reporters at command post or spill site;
b. Work with MRS to locate appropriate staff for interviews;
c. Escort reporters and photographers through command post and/or spill site;
d. Set-up facility for news conferences and facilitate pool coverage when necessary;
e. Provide directions to field locations as appropriate;
f. In absence of clerical support staff, do clerical support tasks, as needed.
Sector SF Section 9000-208 October 1, 2014

6. Information Products Staff consists of writers and a graphic designer/artist, and reports to the Assistant JIC Manager. The Production staff prepares news releases, updates, fact sheets, media advisories, maps, and other graphics materials for the news media and public. The Production Supervisor ensures written and graphics materials are produced as needed for public dissemination, news conferences, and public meetings. Writers must have solid journalistic abilities, know AP Style, and be proficient with computers and word processing programs (ie: WordPerfect and/or MS Word). Writers prepare materials as directed by the Production Group Supervisor or JIC Manager. The Graphic Designer prepares maps, status boards, and other graphic materials for use in news conferences, public meetings, and for dissemination through the media.
7. JIC Support Staff are PAs or knowledgeable clerical support personnel with above-average communication skills, and report to the JIC Deputy Chief. The Jic Support staff will:
a. Make copies of news releases, fact sheets, maps, advisories, etc.;
b. Disseminate materials as directed to internal OSCs, Operations, Planning, Logistics, Finance sections, Liaison & Safety Officers) and external recipients (media and off-site agency/company representatives);
c. Maintain status boards (update hourly) and map of spill response actions (update hourly);
d. Answer phones & take messages, ensure the JIC has necessary office supplies, perform other support duties as required by the JIC Deputy Chief.
Note: Two staff groups that are sometimes associated with Public Affairs — Community Relations and Government Relations — are handled in California by the Liaison Officers (LO), who are part of the Unified Command Staff. The lead IO and LO communicate frequently, sharing information regarding media and VIP tours of the spill site, most frequently-asked questions, and information updates from areas within the response organization. Efforts should be made to keep VIP and media tours separate, so officials aren’t tempted to use the occasion to “grandstand,” and reporters aren’t tempted to use the occasion to interrogate officials, or interview them regarding unrelated issues. We want to keep everyone on-track. Under no circumstances should VIP/protocol or community relations be a collateral duty of the media relations staff, during a major incident.
Logistical Concerns For News Conferences Pollution incidents that generate significant media interest require news conferences, at least in the first few days of emergency response. These media gatherings provide an opportunity for the three Incident Commanders (FOSC, SOSC, & RP) to tell the media what has happened and what they’re doing about it. It also gives reporters a chance to photograph and ask questions of senior response officials.
Sector SF Section 9000-209 October 1, 2014

If the incident is large enough for the JIC to have a Media Relations Supervisor (MRS), s/he is responsible for scheduling news conferences, managing the “press room” or conference site, advising the media in advance of upcoming news conferences, and ensuring that news releases, updated fact sheets, or press packets, podium & PA system (if needed), and visual aids (large charts, maps, diagrams) are in place before news conferences begin. In absence of a MRS, the lead Information Officer or a PAO s/he designates will be responsible for media relations activities.
News conferences should, ideally, be held in a dedicated “press room,” preferably in the same building as the command post, but completely separated from the Unified Command’s room or area where operations and planning staff are working. (The JIC should be between the press room and UC’s meeting room.) Ideally, it would be near the entrance to the building and have entries from both sides of the room. Such a dedicated room allows the MRS to leave charts, maps, and diagrams posted for reporters and photographers to see, throughout the response phase. These must be updated, as often as new information becomes available, and would typically include enlarged aerial photos, spill trajectories, NOAA-generated displays, wildlife injury/mortality counts, and maps indicating the locations of oil, boom, skimming operations, closed beaches, and environmentally-sensitive areas (Threatened & Endangered Species’ habitats).
If a room at the command post is not available, news conferences could also be conducted next to a mobile command post, such as the Pacific Strike Force trailer. The outer walls of the trailer can be posted with the maps, charts, etc. A major drawback to outdoor news conferences is a lack of acoustics. It is more difficult to hear a speaker outside, especially if there is much wind or any ambient sound (such as traffic, surf, clean-up equipment, etc.). Even a slight breeze will cause papers to blow away, and wind can make a distracting noise when it blows across a microphone. News conferences held at a spill site must be carefully controlled, to mitigate safety hazards and prevent any interference with clean-up operations.
Both print and TV photographers will want access to the spill site. California Penal Code Title 11, Section 409.5(d) exempts “duly authorized representatives of any news service, newspaper, or radio or television station or network from entering the areas closed” to the public by law enforcement, because of any calamity or disaster. Reporters may not interfere, but they may observe and photograph an incident site. The UC may require media to check-in and -out, and provide proof that they represent legitimate media outlets. A business card that matches some photo I.D., or letter of introduction on company letterhead will suffice, for those who lack official CHP press credentials. They are responsible for their own safety. (Exceptions to the media exemption from PC 409.5 are crime scenes and air crashes, where an investigation is necessary.)
Direct access to private property such as facilities, vessels, or barges will remain under the control of the owner. If possible, a Coast Guard vessel should be made available for media tours of the affected area from the water-side. When media interest exceeds the capacity of the vessel, it will be necessary to form a press pool. The selection of participants is best left to members of the media, but generally includes equal representation from print, TV, Radio, and “wire” service (AP, UPI, et al.). News organizations may also obtain their own vessel, plane, or helicopter for surveillance. Unless granted specific access by appropriate authority (FOSC), they will continue to be governed by any security or safety zones around the site.
Sector SF Section 9000-210 October 1, 2014

The lead Information Officer is responsible for briefing the three Incident Commanders (ICS) in advance, advising them of the subjects in which media seem most interested that day, and facilitating the news conference. (S/he may delegate the latter task.) One successful format has been this:
1. Lead IO welcomes media, introduces self and ICs (who should be seated at a front table, if possible), then describes the format.
2. S/he explains that each IC will make a statement regarding his/her organization’s area of responsibility, then answer questions from reporters.
3. After all three ICs have made their statements, the IO will request that reporters who have questions raise their hands, and when s/he recognizes them, identify themselves and their organization, before asking their questions. S/he will have assigned a member of the Media staff to record the names and organizations of each reporter, for the record.
4. If a time limit has been established prior to the news conference, the IO should say so, while describing the format. When the allotted time has nearly passed, the IO should tell the reporters (ie: “We only have a few minutes before the Incident Commanders need to get back to the spill response...”). At the end of the available time, the IO wraps it up, thanks the reporters for coming, and points out Media Staff who can answer additional questions. A uniformed USCG or OSPR law enforcement officer will escort the ICs from the press room or site.
The lead IO or his/her designee should request security at news conferences, escalating the degree if there is any indication of possible demonstrations or “gate-crashing” by people outside the legitimate media.
Internal Information Purpose Informing the members of the response community of the status of the response is vital, if consistent and accurate information is to be conveyed to all interested parties. Likewise, the UCs need to know what subjects are of greatest interest to the media and community. Internal information is the process of informing our own people of the status of our activities, and of public interest in the incident.
Discussion At a minimum, all personnel assigned to response duties should be provided with access to the daily fact sheet(s) prepared by the media relations supervisor. Conversely, all PAs need frequent updates on the response activities, wildlife casualty counts, etc. This will help ensure a consistent and accurate flow of information. The Deputy Information Officer shall be responsible for internal information dissemination.
Action
Sector SF Section 9000-211 October 1, 2014

1. Distributing copies of the fact sheets and news releases to the cooperating agencies and their employees is a function of the internal information staff. During clean-up operations of a lengthy duration, consideration may be given to a computer-generated or hard copy publication, published at regular intervals.
2. To facilitate the flow of information and ensure that the information given to the media by JIC staff is the most current available, the Support unit of the Logistics section will provide the JIC with at least one “runner.” The runner(s) will gather updated information from other units (Situation, Wildlife, Ops, Planning) for use by the JIC writers, and take updated fact sheets and news releases to each section or branch in and near the Command Post.
Photo Documentation
Purpose Photo documentation, both still and video, has a three-fold purpose: (1) Additional resource material for news media outlets, (2) briefing materials for town meetings and protocol-sanctioned visits, and (3) historical documentation. It is not the intention of establishing this unit to provide documentation for a legal action against the responsible party or spiller. Separate arrangements must be made by legal entities to provide this function for litigation.
Discussion As a unit reporting directly to the Deputy Information Officer, the needs of the Unified Command are prioritized and assigned by this individual. When the news media cannot visit locations due to safety concerns, it is the responsibility of the photo documentation unit to provide this information.
Action Resources available to fill this requirement begin with the three lead agencies of USCG, OSPR, and the RP. Access and assistance from the DOD’s Combat Camera should be solicited by the FOSC by message traffic, early in the clean-up effort.
1. One person should be designated Chief Photographer for each incident. Depending on the size and complexity of the incident, s/he may request assistance. If additional photographers (still and/or video) are employed, consideration should be given to balancing the organizations represented (ie: USCG, OSPR, and RP). The resulting photographic record should represent as many areas of response as possible, and all response organizations (not just the photographer’s own organization).
Administration
Purpose
Sector SF Section 9000-212 October 1, 2014

Provide administrative support to the various branches of the public affairs effort. This includes the JIC, Community Relations, and Photo Documentation units. Record-keeping, purchasing, and logistical support is provided by the Support branch of the Logistics section.
Action Support staff report directly to the Deputy IO and are assigned tasking, according to the needs of the Public Affairs branches.
Staffing Immediate staffing (first 48 hours) should consist of at least one (1) Yeoman and one (1) Storekeeper with District, Reserve, and Auxiliary (See Section 5612 for CG Personnel Resources) augmentation following for the longer duration. Support staff may also be provided by the DFG/OSPR, the RP, and volunteers.
Community Relations
Background Providing information directly to members of the impacted community, free of the filtering and potentially distorting effect of the media, is critical to public understanding of the incident response. Community relations may include scheduling of public meetings, preparing speeches and coordinating public activities with the Liaison Officer and local government MAC representative. If a spill’s impact justifies a Community Relations branch, it should be within the Public Affairs section.
Discussion In order to ensure that important constituencies are not overlooked or slighted during a major response, it is important that a Community Relations Officer (CRO) and necessary support staff be assigned within the public affairs branch. Under no circumstances should community relations be a collateral duty of the media relations staff, during a major incident. A local government official should be considered for the position. Additional community relations officers should be sought from the RRT and regional EPA office, to provide expertise to this important aspect of the public affairs program.
Action Important considerations for establishing a separate Community Relations branch include public health & safety, damage claims, and transportation disruptions. The media may not provide detailed information to their audiences on issues that affect smaller groups of individuals. It is incumbent on community relations staff to provide answers to the impacted communities.
Sector SF Section 9000-213 October 1, 2014
A well-run community relations program is a two-way street in a successful public affairs program. Authoritative answers to important individual questions are given and the UC gains a “grass-roots” feel for the concerns of the individuals directly impacted by the spill. Those concerns can then be addressed by the Command Staff to mitigate problems before the problems begin to drive the clean-up effort.
1. Public Health and Safety
The primary, initial concern of the community relations staff should be addressing the public health & safety issues. When warranted, an EDIS alert should be issued, outlining the specific health & safety concerns.
2. Phone Banks
Consideration should be given to establishing an “800” telephone bank for general public inquires, which should be answered by community relations staff (not the media relations staff). Information about public health & safety, transportation disruptions, third-party claims, etc., would be disseminated by a team of operators separate from media phone staff. Ideal staffing would include representatives from Federal, State, and local governments, and community affairs personnel from the responsible party. This conduit would serve as rumor control and provide the UCs with the current concerns of local citizens. Spokespersons should use the “Rumor Inquiry” form to track these.
The OSPR has an “800” number for the OSPR Volunteer Coordinator (VC), in the Planning Section’s Resources unit (800-228-4544). It has voice mail, for times the VC is not available.
3. Town Meetings
Local community meetings should be considered by the UC when communities suffer severe environmental, recreational, economic, or cultural impact. In extremely large communities, arrangements should be made for teleconference sites in addition to the “live” site. The CRO should arrange town meetings with the Liaison Officers, in consultation with the UC.
4. Claims
Questions about damage to private property, loss of income, and disruption of transportation become real concerns in a major oil spill. Information directing individual recourse must be addressed early in the clean-up process. The Responsible Party will take the lead on addressing these issues and provide the Community Relations branch with information that alleviates and mitigates these real concerns. It is imperative that the JIC staff (all PAs) know the “claims phone” number, to give media and other callers who request information.
Sector SF Section 9000-214 October 1, 2014

9720.4 GRA/Site Strategies Due to the great length of the Site Strategies for this planning area, strategies are bound in Section 9800 in a separate cover as Volume II of this Area contingency Plan.
9730 Geographic Response Plans - Section 9800 includes all the site protection strategies.
9730.1 Fish and Wildlife Response Plans
California Wildlife Response Plan is provided in full Appendix XXII of the RCP.
California’s Lempert-Keene-Seastrand Oil Spill Prevention and Response Act of 1990, Senate Bill (SB) 2040, parallels some provisions of OPA-90 in requiring the Administrator of the California Department of Fish and Game (DFG), Office of Oil Spill Prevention and Response (OSPR) to develop contingency plans for the protection of fish and wildlife, assess damages to natural resources, establish rescue and rehabilitation stations for marine wildlife, and require restoration plans for wildlife habitat following spills. See the California Wildlife Response Plan for more details.
Sector SF Section 9000-215 October 1, 2014

I
9740 Technical Reference Refer to Section 9890, and/or the Region 9 Contingency Plan.
9800 Volume II: Sensitive Sites and Other Resources at Risk A catalog of the specific details of Resources at Risk for each ACP AOR and details
about response and protection.
9900 Reserved for Area/District
Sector SF Section 9000-216 October 1, 2014
Related Documents