9.1 Chapter 9 Making Capital Investment Decisions

9.0 Chapter 9 Making Capital Investment Decisions.
Dec 21, 2015
Welcome message from author
This document is posted to help you gain knowledge. Please leave a comment to let me know what you think about it! Share it to your friends and learn new things together.
Transcript

9.1
Chapter
9Making Capital Investment Decisions
9.2
Key Concepts and Skills
Understand how to determine the relevant cash flows for a proposed investment
Understand how to analyze a project’s projected cash flows
Understand how to evaluate and estimate NPV

9.3
Chapter Outline
Project Cash Flows: A First LookIncremental Cash FlowsPro Forma Financial Statements and Project
Cash FlowsMore on Project Cash FlowEvaluating NPV EstimatesScenario and Other What-If AnalysesAdditional Considerations in Capital Budgeting
9.4
Relevant Cash Flows
The cash flows that should be included in a capital budgeting analysis are those that will only occur if the project is accepted
These cash flows are called incremental cash flows
The stand-alone principle allows us to analyze each project in isolation from the firm simply by focusing on incremental cash flows
9.5
Asking the Right Question
You should always ask yourself “Will this cash flow occur ONLY if we accept the project?”If the answer is “yes”, it should be included in the
analysis because it is incrementalIf the answer is “no”, it should not be included in the
analysis because it will occur anywayIf the answer is “part of it”, then we should include
the part that occurs because of the project
9.6
Common Types of Cash FlowsSunk costs – costs that have accrued in the pastOpportunity costs – costs of lost optionsSide effects: Externalities
Positive side effects – benefits to other projectsNegative side effects – costs to other projects
Changes in net working capitalFinancing costsShipping & InstallationTaxes
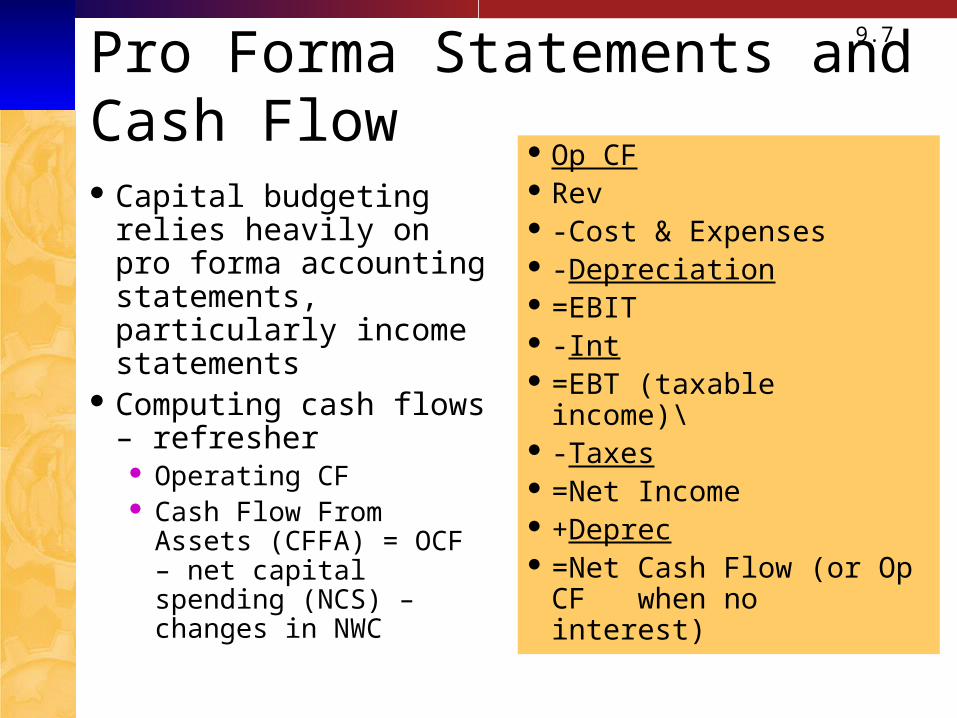
9.7Pro Forma Statements and Cash Flow Capital budgeting relies
heavily on pro forma accounting statements, particularly income statements
Computing cash flows – refresher
Operating CF Cash Flow From Assets
(CFFA) = OCF – net capital spending (NCS) – changes in NWC
Op CF Rev -Cost & Expenses -Depreciation =EBIT -Int =EBT (taxable income)\ -Taxes =Net Income +Deprec =Net Cash Flow (or Op CF
when no interest)
9.8
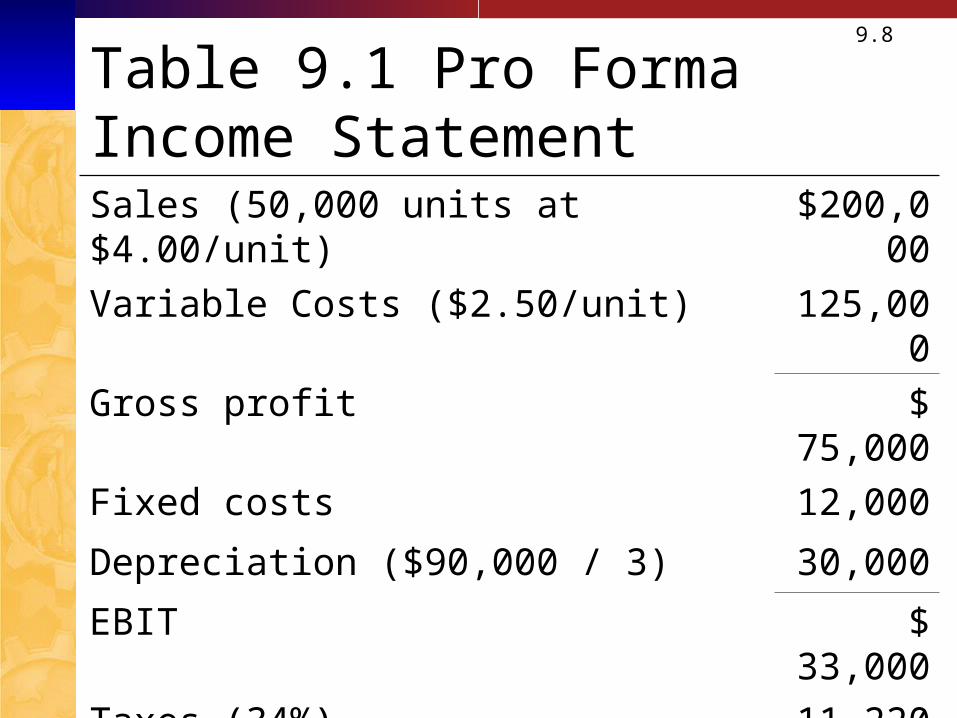
Table 9.1 Pro Forma Income StatementSales (50,000 units at $4.00/unit) $200,000
Variable Costs ($2.50/unit) 125,000
Gross profit $ 75,000
Fixed costs 12,000
Depreciation ($90,000 / 3) 30,000
EBIT $ 33,000
Taxes (34%) 11,220
Net Income $ 21,780

9.9
Table 9.2 Projected Capital Requirements
Year
0 1 2 3
NWC $20,000 $20,000# $20,000# $20,000#
Net Fixed Assets
90,000 60,000* 30,000* 0
Total Investment
$110,000 $80,000@ $50,000@ $20,000@
9.10
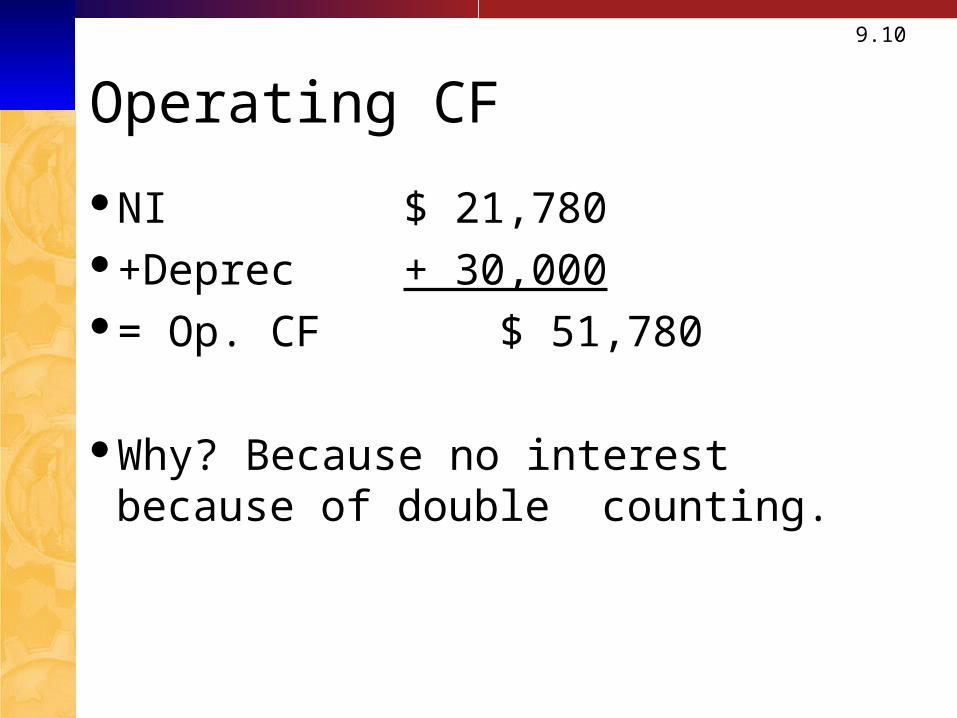
Operating CF
NI $ 21,780+Deprec + 30,000= Op. CF $ 51,780
Why? Because no interest because of double counting.

9.11
Table 9.5 Projected Total Cash Flows
Year
0 1 2 3
Change in NWC
-$20,000 20,000
Capital Spending
-$90,000
OCF $51,780 $51,780 $51,780
CFFA -$110,00 $51,780 $51,780 $71,780

9.12
Making The Decision
Now that we have the cash flows, we can apply the techniques that we learned in chapter 8
Enter the cash flows into the calculator and compute NPV and IRRCF0 = -110,000; CF1 = 51,780; CF2 = 71,780I = 20; NPV =?= 10,648IRR = ? = 25.8%
Should we accept or reject the project?
9.13
More on NWC
Why do we have to consider changes in NWC separately?GAAP requires that sales be recorded on the income
statement when made, not when cash is receivedGAAP also requires that we record cost of goods
sold when the corresponding sales are made, regardless of whether we have actually paid our suppliers yet
Finally, we have to buy inventory to support sales although we haven’t collected cash yet
9.14
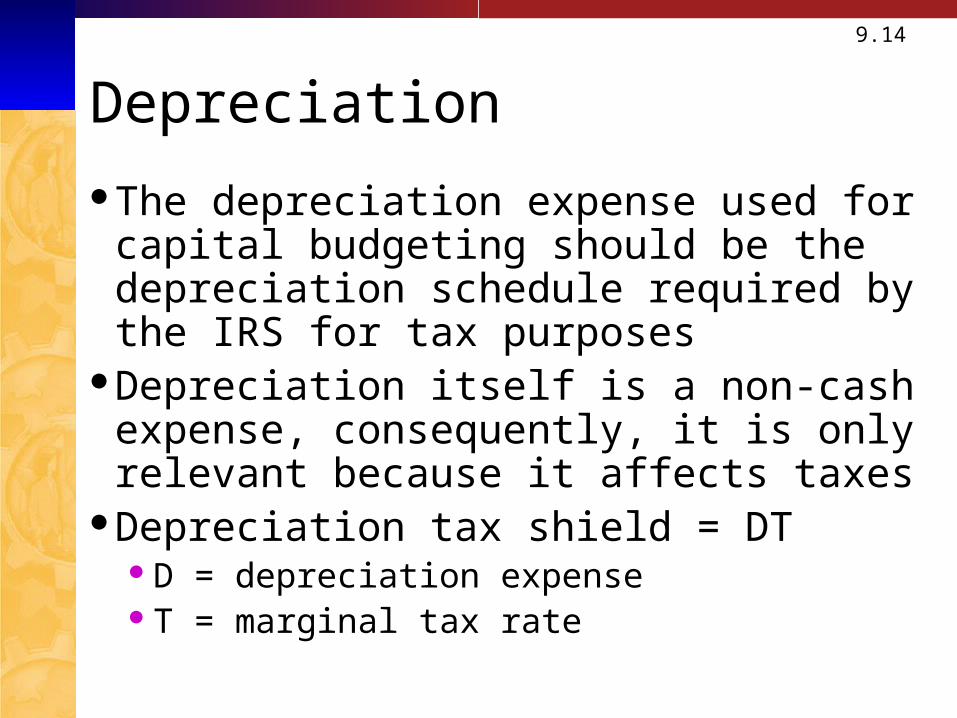
Depreciation
The depreciation expense used for capital budgeting should be the depreciation schedule required by the IRS for tax purposes
Depreciation itself is a non-cash expense, consequently, it is only relevant because it affects taxes
Depreciation tax shield = DTD = depreciation expenseT = marginal tax rate
9.15
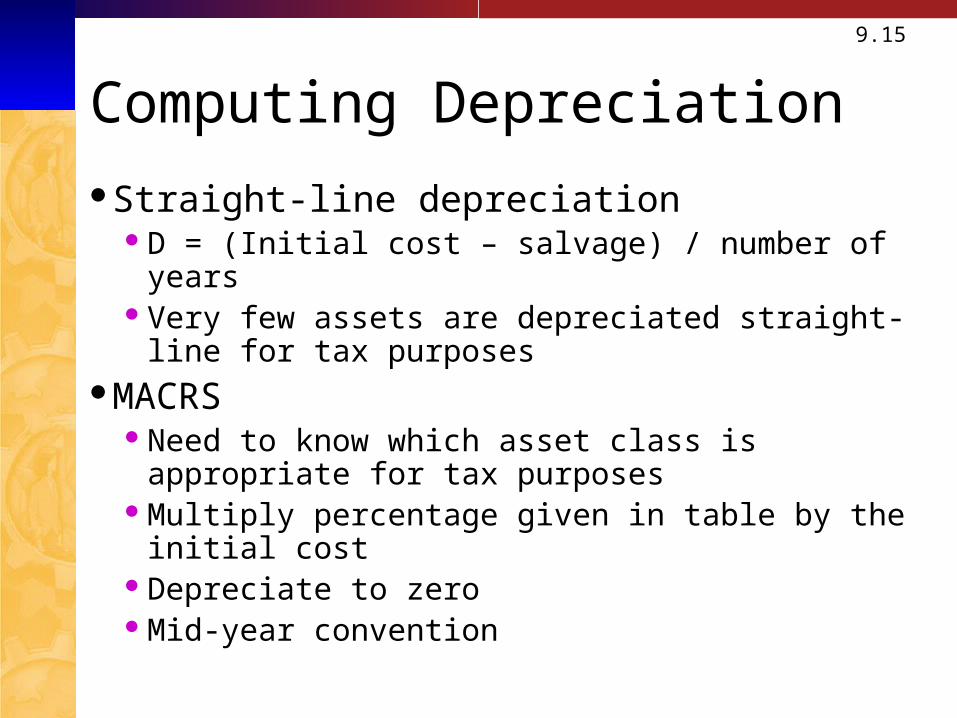
Computing Depreciation
Straight-line depreciationD = (Initial cost – salvage) / number of yearsVery few assets are depreciated straight-line for tax
purposesMACRS
Need to know which asset class is appropriate for tax purposes
Multiply percentage given in table by the initial costDepreciate to zeroMid-year convention

9.16
MACRS CLASSES & RATES CLASS
5-year Autos, computers7-year Most industrial equipment3-year Equipment used in research
RATESPROPERTY CLASS
Year 3-year 5-year 7-year1 33.33% 20.00% 14.29%2 44.44 32.00 24.493 14.82 19.20 17.494 7.41 11.52 12.495 11.52 8.936 5.76 8.937 8.938 4.45

9.17After-tax Salvage Cash Flow: If salvage value is different from book value of the asset, then there is a tax effect on CF.Book Value Initial cost paid
to acquire &
get running
– accum deprec.
= Book Value
After-tax Salv. Val. CF
Scrap or selling value CF (salvage or disposal value)
–Book value
=Taxable gain/loss
x Tax rate
= Tax effect CF on disposal
+ Scrap or salvage value CF
= CF from disposal $
9.18
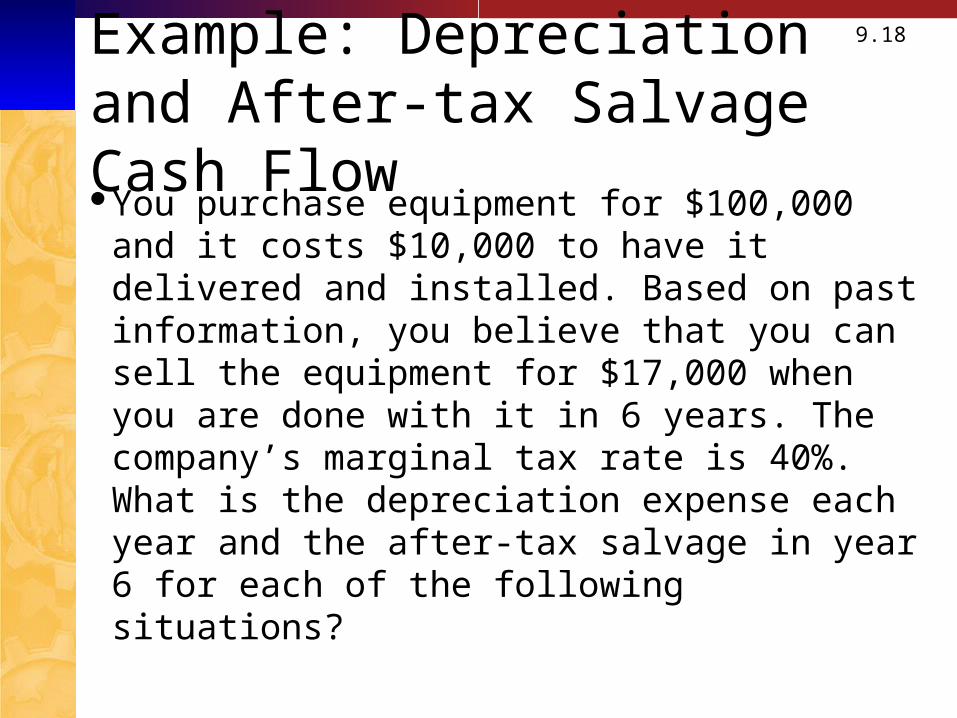
Example: Depreciation and After-tax Salvage Cash FlowYou purchase equipment for $100,000 and it
costs $10,000 to have it delivered and installed. Based on past information, you believe that you can sell the equipment for $17,000 when you are done with it in 6 years. The company’s marginal tax rate is 40%. What is the depreciation expense each year and the after-tax salvage in year 6 for each of the following situations?

9.19
Example: Straight-line Depreciation
Suppose the appropriate depreciation schedule is straight-lineD = (110,000 – 17,000) / 6 = 15,500 every year for 6
yearsBV in year 6 = 110,000 – 6(15,500) = 17,000After-tax salvage = 17,000 - .4(17,000 – 17,000) =
17,000

9.20
Example: Three-year MACRS
Year MACRS percent
D
1 .3333 .3333(110,000) = 36,663
2 .4444 .4444(110,000) = 48,884
3 .1482 .1482(110,000) = 16,302
4 .0741 .0741(110,000) = 8,151
BV in year 6 = ?
After-tax salvage Cash Flow = ?
9.21
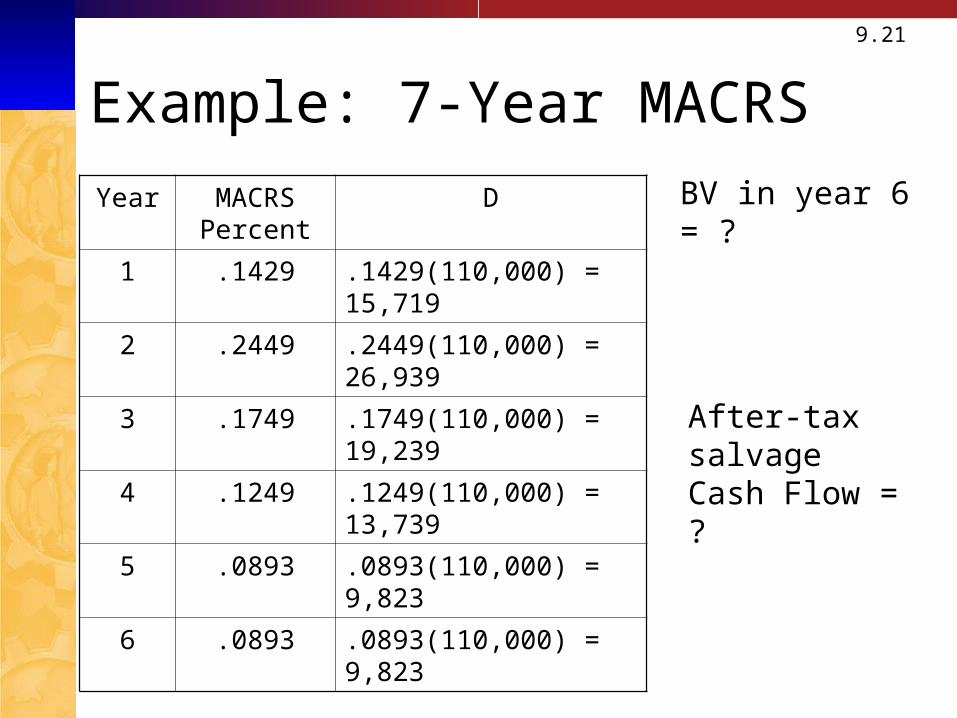
Example: 7-Year MACRS
Year MACRS Percent
D
1 .1429 .1429(110,000) = 15,719
2 .2449 .2449(110,000) = 26,939
3 .1749 .1749(110,000) = 19,239
4 .1249 .1249(110,000) = 13,739
5 .0893 .0893(110,000) = 9,823
6 .0893 .0893(110,000) = 9,823
BV in year 6 = ?
After-tax salvage Cash Flow = ?
9.22
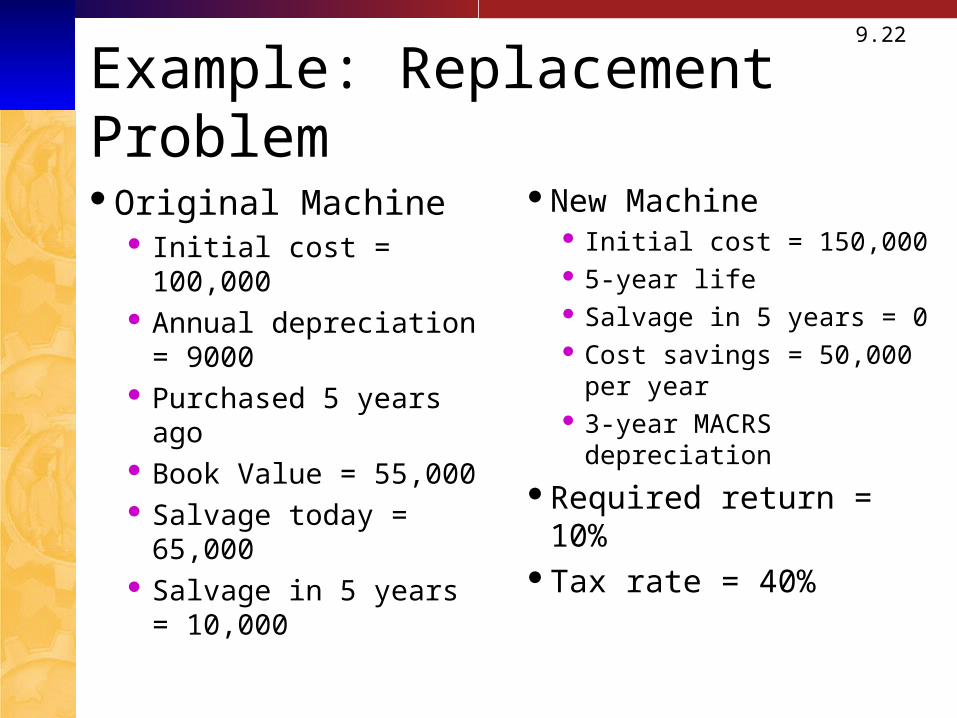
Example: Replacement Problem
Original Machine Initial cost = 100,000 Annual depreciation =
9000 Purchased 5 years ago Book Value = 55,000 Salvage today = 65,000 Salvage in 5 years =
10,000
New Machine Initial cost = 150,000 5-year life Salvage in 5 years = 0 Cost savings = 50,000 per
year 3-year MACRS
depreciation
Required return = 10%Tax rate = 40%

9.23
Replacement Problem – Computing Cash FlowsRemember that we are interested in
incremental cash flowsIf we buy the new machine, then we will sell
the old machineWhat are the cash flow consequences of selling
the old machine today instead of in 5 years?
9.24
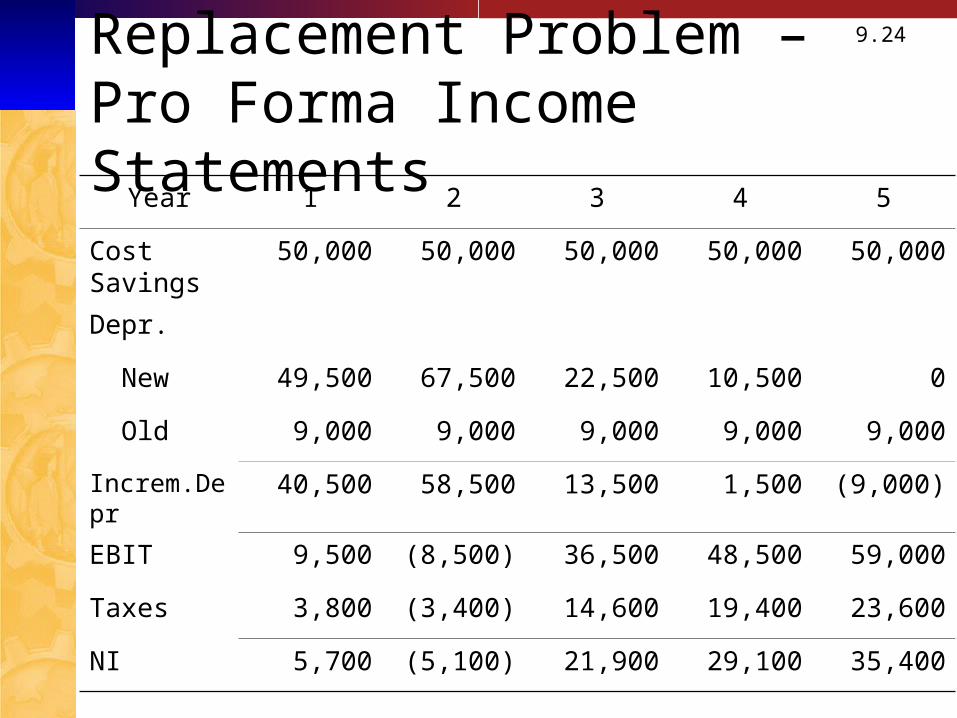
Replacement Problem – Pro Forma Income Statements
Year 1 2 3 4 5
Cost Savings
50,000 50,000 50,000 50,000 50,000
Depr.
New 49,500 67,500 22,500 10,500 0
Old 9,000 9,000 9,000 9,000 9,000
Increm.Depr 40,500 58,500 13,500 1,500 (9,000)
EBIT 9,500 (8,500) 36,500 48,500 59,000
Taxes 3,800 (3,400) 14,600 19,400 23,600
NI 5,700 (5,100) 21,900 29,100 35,400

9.25
Replacement Problem – Incremental Net Capital SpendingYear 0
Cost of new machine = 150,000 (outflow)After-tax salvage on old machine = 65,000
- .4(65,000 – 55,000) = 61,000 (inflow)Incremental net capital spending = 150,000 – 61,000
= 89,000 (outflow)Year 5
After-tax salvage on old machine = 10,000 - .4(10,000 – 10,000) = 10,000 (outflow because we no longer receive this)

9.26
Replacement Problem – Cash Flow From AssetsYear 0 1 2 3 4 5
OCF 46,200 53,400 35,400 30,600 26,400
NCS -89,000 -10,000
In NWC
0 0
CFFA -89,000 46,200 53,400 35,400 30,600 16,400

9.27
Replacement Problem – Analyzing the Cash FlowsNow that we have the cash flows, we can
compute the NPV and IRREnter the cash flowsCompute NPV = 54,812.10Compute IRR = 36.28%
Should the company replace the equipment?
9.28
Evaluating NPV Estimates
The NPV estimates are just that – estimatesA positive NPV is a good start – now we need
to take a closer lookForecasting risk – how sensitive is our NPV to
changes in the cash flow estimates, the more sensitive, the greater the forecasting risk
Sources of value – why does this project create value?
9.29
Scenario Analysis
What happens to the NPV under different cash flows scenarios?
At the very least look at:Best case – revenues are high and costs are lowWorst case – revenues are low and costs are highMeasure of the range of possible outcomes
Best case and worst case are not necessarily probable, they can still be possible

9.30
Sensitivity Analysis
What happens to NPV when we vary one variable at a time
This is a subset of scenario analysis where we are looking at the effect of specific variables on NPV
The greater the volatility in NPV in relation to a specific variable, the larger the forecasting risk associated with that variable and the more attention we want to pay to its estimation
9.31
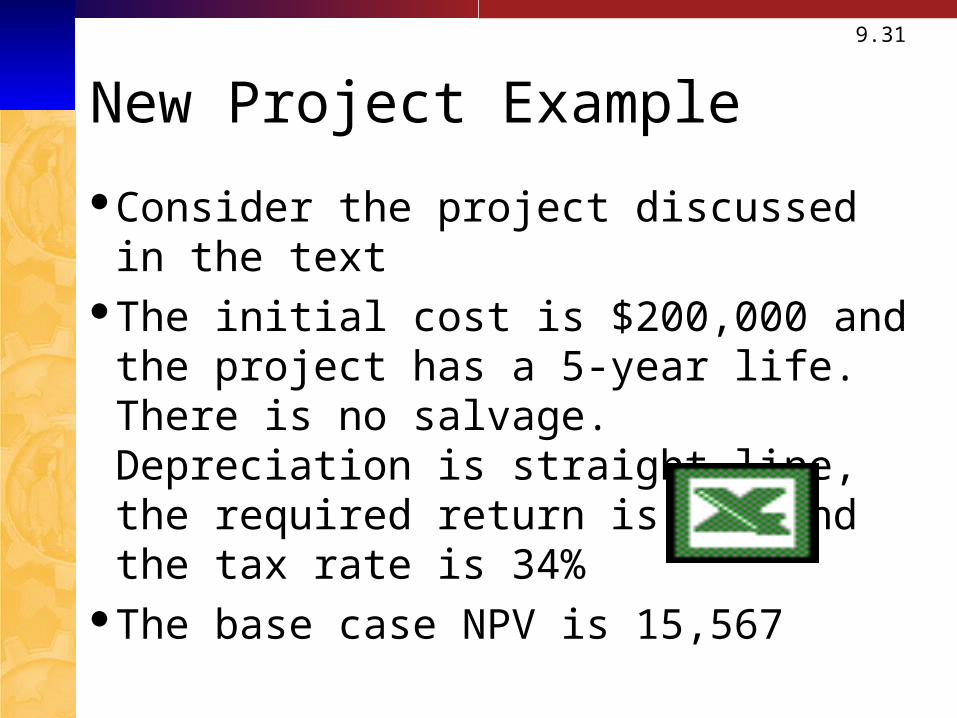
New Project Example
Consider the project discussed in the textThe initial cost is $200,000 and the project has
a 5-year life. There is no salvage. Depreciation is straight-line, the required return is 12% and the tax rate is 34%
The base case NPV is 15,567

9.32
Summary of Scenario Analysis
Scenario Net Income
Cash Flow
NPV IRR
Base case 19,800 59,800 15,567 15.1%
Worst Case
-15,510 24,490 -111,719 -14.4%
Best Case 59,730 99,730 159,504 40.9%
9.33
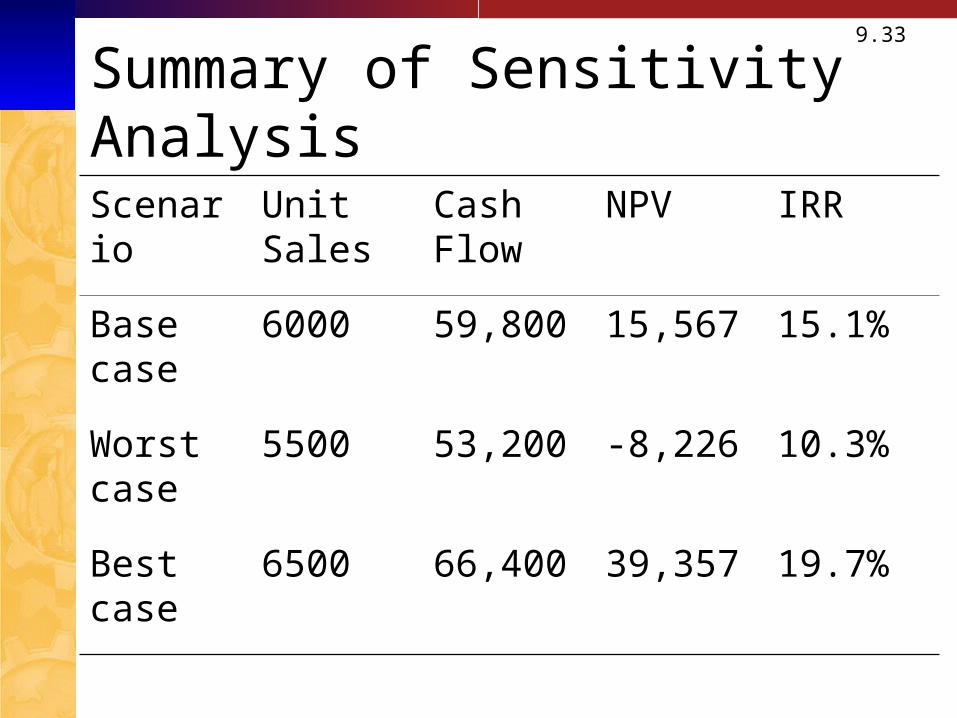
Summary of Sensitivity Analysis
Scenario Unit Sales
Cash Flow
NPV IRR
Base case 6000 59,800 15,567 15.1%
Worst case
5500 53,200 -8,226 10.3%
Best case 6500 66,400 39,357 19.7%
9.34
Making A Decision
Beware “Paralysis of Analysis”At some point you have to make a decisionIf the majority of your scenarios have positive
NPVs, then you can feel reasonably comfortable about accepting the project
If you have a crucial variable that leads to a negative NPV with a small change in the estimates, then you may want to forego the project

9.35
Managerial Options
Capital budgeting projects often provide other options that we have not yet consideredContingency planningOption to expandOption to abandonOption to waitStrategic options
9.36
Capital Rationing
Capital rationing occurs when a firm or division has limited resourcesSoft rationing – the limited resources are temporary,
often self-imposedHard rationing – capital will never be available for
this project
The profitability index is a useful tool when faced with soft rationing

9.37
Quick Quiz
How do we determine if cash flows are relevant to the capital budgeting decision?
What is scenario analysis and why is it important?
What is sensitivity analysis and why is it important?
What are some additional managerial options that should be considered?
Related Documents


