9 th Population Health & Disease Management Colloquium David Mirkin, MD Kathryn Fitch, RN, MEd Principals, Milliman New York Chronic Condition Management & Wellness: Measuring Financial Outcomes

9 th Population Health & Disease Management Colloquium David Mirkin, MD Kathryn Fitch, RN, MEd Principals, Milliman New York Chronic Condition Management.
Dec 29, 2015
Welcome message from author
This document is posted to help you gain knowledge. Please leave a comment to let me know what you think about it! Share it to your friends and learn new things together.
Transcript

9th Population Health & Disease Management Colloquium
David Mirkin, MDKathryn Fitch, RN, MEd
Principals, Milliman New York
Chronic Condition Management & Wellness:Measuring Financial Outcomes
-2-March 3, 2009
Presentation Outline
Introduction – Who is Milliman and who are we
The problems with measuring financial outcomes for– Chronic condition management
– Wellness
Milliman research
Q&A

-3-March 3, 2009
Milliman Inc
Actuarial and consulting firm
Health discipline– Consult to almost all US based health insurers
– Health Cost Guidelines™ (used by most US payers for cost & utilization benchmarking)
– Care Guidelines™ (used by most US payers to determine best clinical practice and medical necessity)
– Hospital Inpatient Profiler – shows potentially avoidable admissions and LOS

-4-March 3, 2009
Milliman New York – Kate & David
Milliman’s largest consulting office
Kate & David’s work portfolio – All major national US health insurance companies & associations
– Many Northeast regional health insurers
– NYC & New England hospitals and hospital systems
– Advocacy organizations – ACS, CF Foundation, Hospice
– A majority of large pharma
– UK NHS and the major private medical insurers
– Kate has authored over 20 publications
– David is the only “healthcare expert” shorter than David Nash

-5-March 3, 2009
The Problem
General skepticism due to past history of producing inaccurate forecasts and results for financial outcomes
Producing credible forecasts and measuring actual financial outcomes is not easy and methods are not straightforward
Marketplace continues to expect cost savings from chronic disease management and wellness

-6-March 3, 2009
DMAA: The Care Continuum AllianceOutcomes Guidelines Report III - 2008 Guidelines for measuring outcomes for the five most common
chronic condition management programs; Diabetes, asthma, COPD, CAD and CHF
Major Recommendations for measuring financial outcomes– Matched control - Pre-post study design with an internal or external
comparison group that is “equivalent” to and assessed over the same time period.
– Annual qualification using 24 months of claims
– Use of non-chronic population for trend calculation
– Adjust trend for current year chronic condition by the average difference between historical chronic and non-chronic trends
– Financial outcomes should be reported both as per member per month (PMPM) and per participant per month (PPPM)

-7-March 3, 2009
Practical Issues
The most readily available methods are the non-participating and trended historical control models
Non-participating control suffers from significant potential selection bias and poor credibility of causality statements
As a result, trended historical control method is often selected and accurate estimation of trend becomes critical
-8-March 3, 2009
Trend for Chronic Conditions
Milliman has published and unpublished research showing that trends for populations with chronic condition are less than for non-chronic populations and that the relationship between non-chronic and chronic trends may vary significantly from year to year
“Cost trends for chronic condition cohorts with Medicare benefits” – May 2008, Milliman Research Report – Kathryn Fitch, et al.

-9-March 3, 2009
Medicare Chronic & Non-chronic Condition Cost Trends – Milliman Research
0.0%1.0%2.0%3.0%4.0%5.0%6.0%7.0%8.0%9.0%
10.0%
2002-2003 2003-2004 2004-2005 2005-2006
CAD
DM
COPD
CHF
Asthma
Non-chronic
-10-March 3, 2009
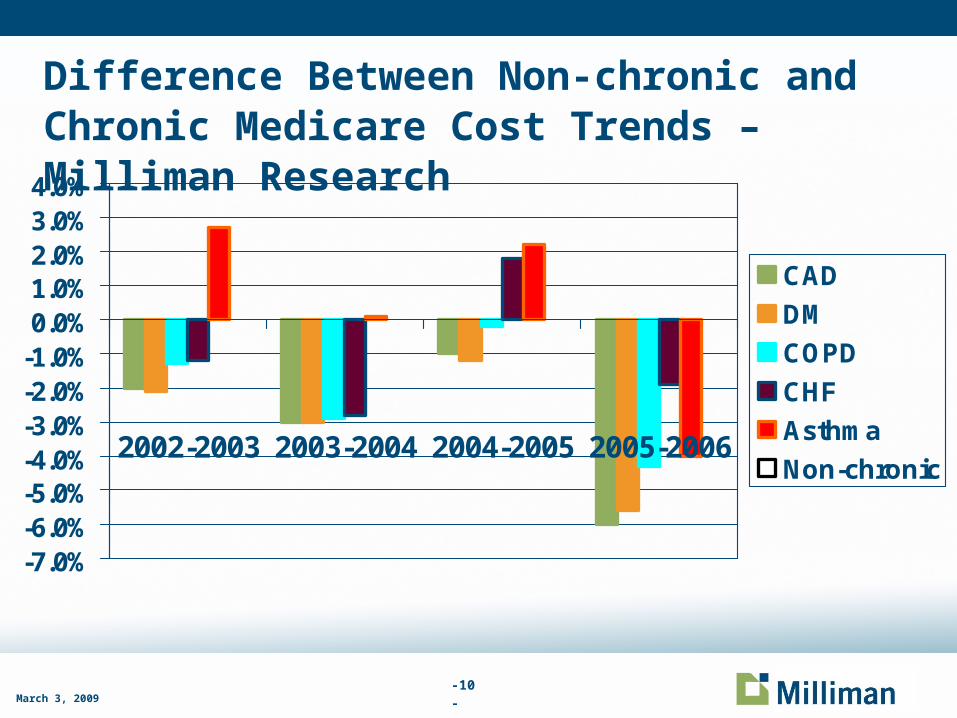
Difference Between Non-chronic and Chronic Medicare Cost Trends – Milliman Research
-7.0%-6.0%-5.0%-4.0%-3.0%-2.0%-1.0%0.0%1.0%2.0%3.0%4.0%
2002-2003 2003-2004 2004-2005 2005-2006
CAD
DM
COPD
CHF
Asthma
Non-chronic
-11-March 3, 2009
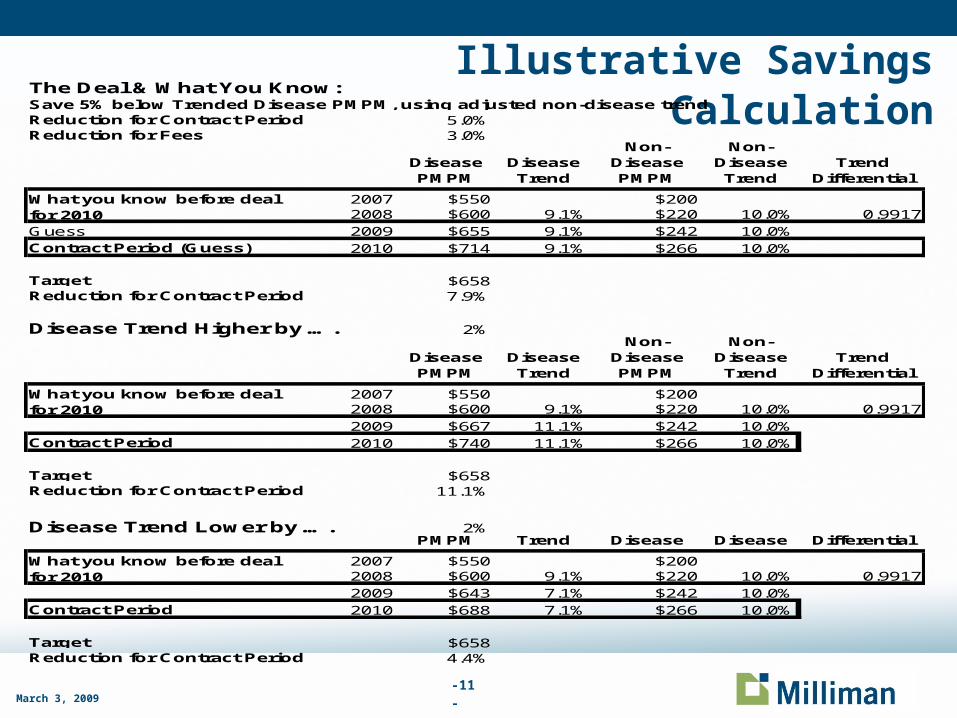
Illustrative Savings CalculationThe Deal & What You Know:Save 5% below Trended Disease PMPM, using adjusted non-disease trendReduction for Contract Period 5.0%Reduction for Fees 3.0%
Disease PMPM
Disease Trend
Non-Disease PMPM
Non- Disease Trend
Trend Differential
2007 $550 $2002008 $600 9.1% $220 10.0% 0.9917
Guess 2009 $655 9.1% $242 10.0%Contract Period (Guess) 2010 $714 9.1% $266 10.0%
Target $658Reduction for Contract Period 7.9%
Disease Trend Higher by …. 2%
Disease PMPM
Disease Trend
Non-Disease PMPM
Non- Disease Trend
Trend Differential
2007 $550 $2002008 $600 9.1% $220 10.0% 0.9917
2009 $667 11.1% $242 10.0%Contract Period 2010 $740 11.1% $266 10.0%
Target $658Reduction for Contract Period 11.1%
Disease Trend Lower by …. 2%Disease PMPM
Disease Trend
Non-Disease
Non- Disease
Trend Differential
2007 $550 $2002008 $600 9.1% $220 10.0% 0.9917
2009 $643 7.1% $242 10.0%Contract Period 2010 $688 7.1% $266 10.0%
Target $658Reduction for Contract Period 4.4%
What you know before deal for 2010
What you know before deal for 2010
What you know before deal for 2010

-12-March 3, 2009
Plausibility of DM Savings Targets Contract
– 5% savings guarantee
– Must recover DM program fees -may need an additional 3% to 5% savings
– Total required savings = 8% to 10%
Is this plausible??

-13-March 3, 2009
Plausibility of DM Savings Guarantees If program impacts 10% of those enrolled (highest risk), the
amount of required savings per person increases 10 fold
Using our previous example - $56 PMPM ($714 – $658) reduction is required to meet target or $560 PMPM for the 10% highest risk = $6720 annually
A significant amount of savings is typically due to avoiding ambulatory care sensitive admissions (exacerbations of asthma, COPD, CHF, complications of poorly controlled diabetes, etc.)
ACSAs on average $7,000 per admission
Need to reduce 1 admission for each high risk individual to meet target
Also need to consider additional costs from increased compliance, prevention uptake etc.

-14-
Ambulatory Care Sensitive Admissions: A Plausible Outcome Metric for DM?
ConditionACSA per 1,000 W M
ACSA per 1,000 LM
Manage-ment
MarginCost Per
ACSABACTERIAL PNEUMONIA 9.3 13.5 31% $7,000CHF 8.9 16.5 46% $10,300URINARY INFECTION 3.6 5.7 37% $7,200COPD 2.9 5.5 46% $4,900DEHYDRATION 1.2 2.3 48% $7,600DIABETES LONG-TERM COMPLICATION 0.8 1.6 47% $5,400ADULT ASTHMA 0.7 1.3 47% $7,600ANGINA 0.5 0.7 26% $5,800HYPERTENSION 0.4 0.9 60% $4,200LOWER EXTREMITY AMPUTATION 0.2 0.3 46% $6,000DIABETES UNCONTROLLED 0.1 0.3 49% $6,200DIABETES SHORT-TERM COMPLICATION 0.1 0.2 47% $18,400Total ACSA 28.7 48.7 41% $7,200Total Adm iss ions (ACSA and non-ACSA) 202.7 330.6 39%% ACSA In Total Adm iss ions 14.1% 14.7%
Costs are based on Medicare 5% paid claims and trended to 2009 by 3% annual trend rate
Management Margin = (ACSA per 1,000 LM – ACSA per 1,000 WM)/ACSA per 1,000 LM, which suggests the percentage of potential savings for LM
Categories of diseases follow the definition by AHRQ of Prevention Quality Indicators, version 3.2,
Data Sources: Milliman analysis of Medicare 5% sample data, 2006;
Milliman Health Cost Guidelines and DRG models; and AHRQ Prevention Quality Indicators, version 3.2.
March 3 2009

-15-March 3 2009
ACSA Illustration with Prevalence Adjustment for Global Measurement for a Commercial Population - Alternatively measure for DM population only
Taken from presentation by Iver Juster, MD - Active Health Management

-16-March 3, 2009
Measuring Financial Outcomes for Wellness
DMAA recommends: – Process measures:
• Contact frequency, duration and type, participation rates, type and number of contacts
– Behavior change for modifiable risk factors/unhealthy lifestyle choices
– Productivity/quality of life (absenteeism)
– Utilization and medical costs• Medical claims, short and long term disability, absentee days, workers’
comp

-17-March 3, 2009
How are Financial Outcomes for Wellness Programs Measured
– Monetize Behavior change:– Weight loss
– Smoking cessation
– Hypertension control
– Hyperlipidemia control
– Flu shots
– Cancer screening
Cost of doing business:– Employee morale
– Attracting and retaining employees
-18-March 3, 2009
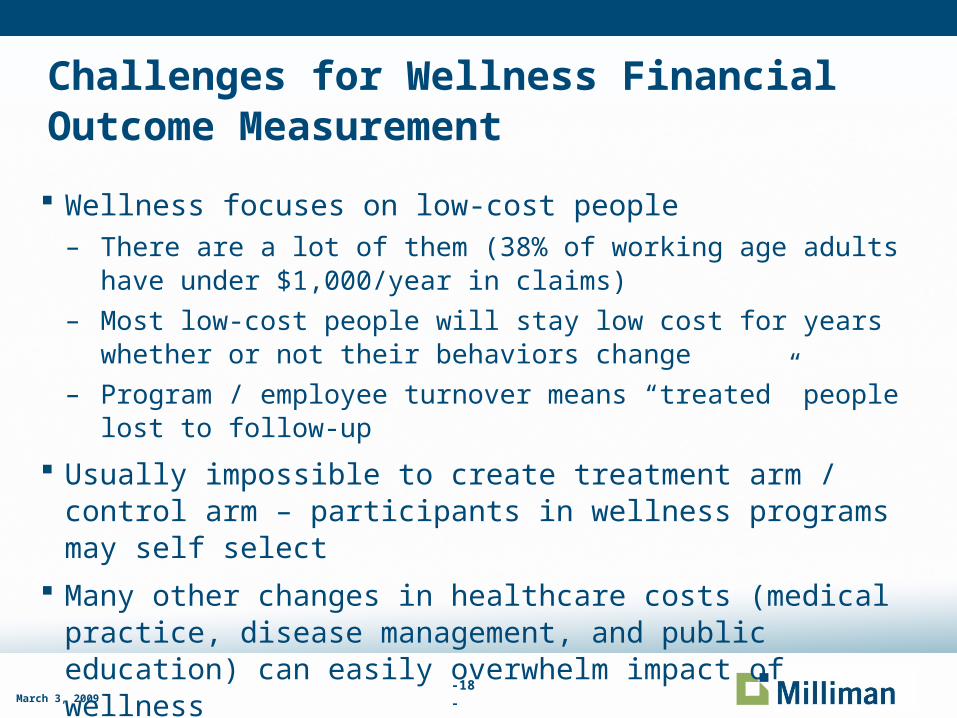
Challenges for Wellness Financial Outcome Measurement
Wellness focuses on low-cost people – There are a lot of them (38% of working age adults have under
$1,000/year in claims)
– Most low-cost people will stay low cost for years whether or not their behaviors change
– Program / employee turnover means “treated” people lost to follow-up
Usually impossible to create treatment arm / control arm – participants in wellness programs may self select
Many other changes in healthcare costs (medical practice, disease management, and public education) can easily overwhelm impact of wellness
-19-March 3, 2009
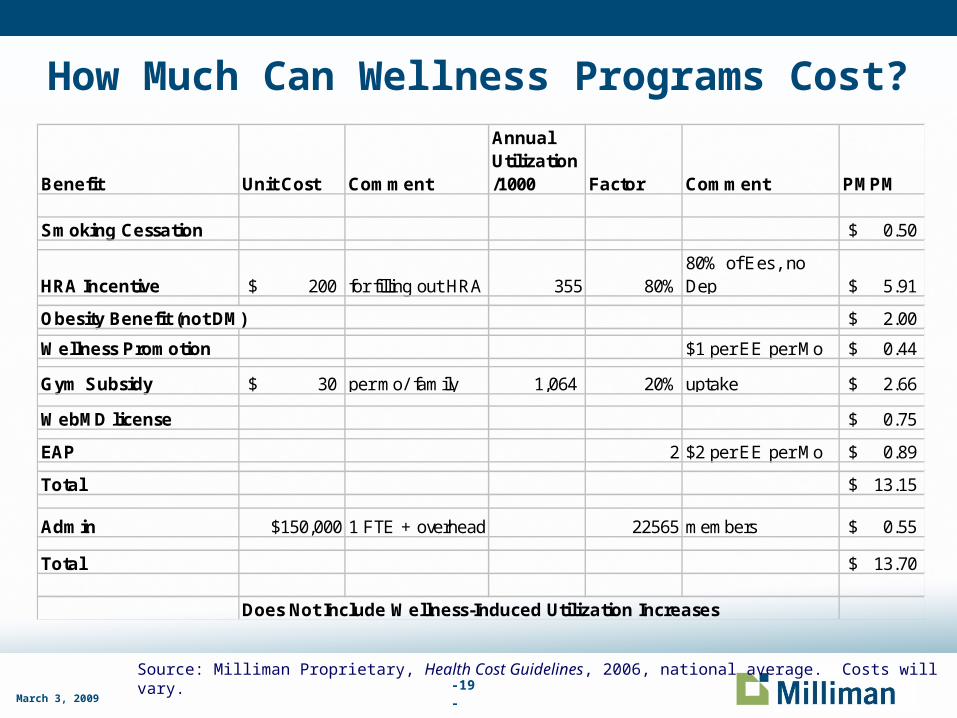
How Much Can Wellness Programs Cost?
Source: Milliman Proprietary, Health Cost Guidelines, 2006, national average. Costs will vary.
Benefit Unit Cost Comment
Annual Utilization/1000 Factor Comment PMPM
Smoking Cessation 0.50$
HRA Incentive 200$ for filling out HRA 355 80%80% of Ees, no Dep 5.91$
Obesity Benefit (not DM) 2.00$
Wellness Promotion $1 per EE per Mo 0.44$
Gym Subsidy 30$ per mo/ family 1,064 20% uptake 2.66$
WebMD license 0.75$
EAP 2 $2 per EE per Mo 0.89$
Total 13.15$
Admin $150,000 1 FTE + overhead 22565 members 0.55$
Total 13.70$
Does Not Include Wellness-Induced Utilization Increases
-20-March 3, 2009
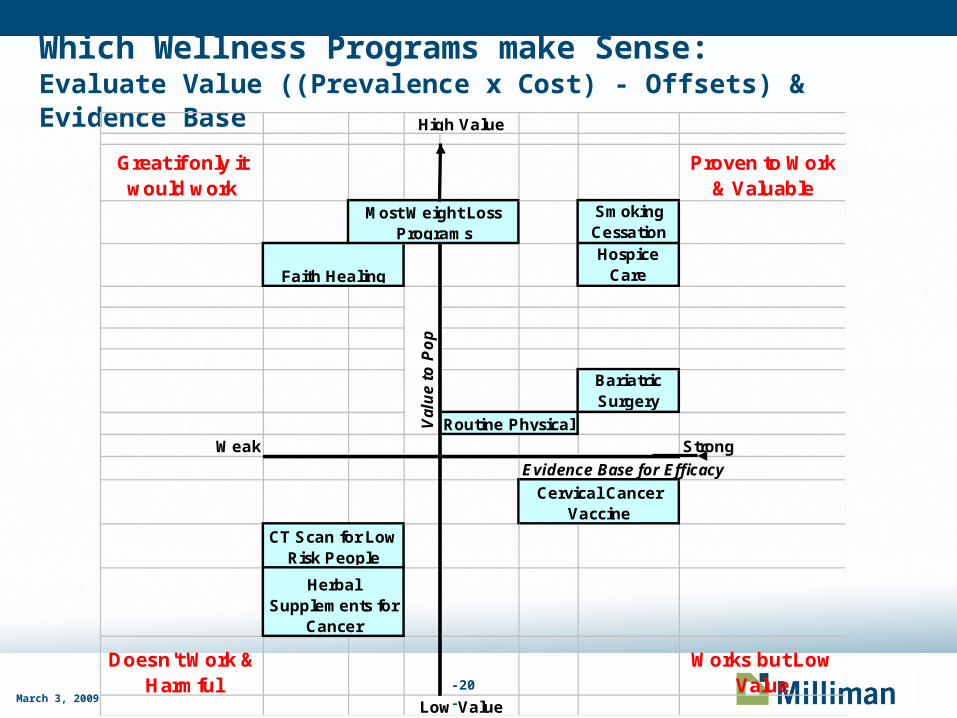
Which Wellness Programs make Sense:Evaluate Value ((Prevalence x Cost) - Offsets) & Evidence Base
Great if only it would work
Proven to Work & Valuable
Smoking CessationHospice
Care
Bariatric Surgery
Weak Strong
Evidence Base for Efficacy
Doesn't Work & Harmful
Works but Low Value
High Value
Cervical Cancer Vaccine
Low Value
Faith Healing
Routine PhysicalVal
ue
to P
op
CT Scan for Low Risk People
Herbal Supplements for
Cancer
Most Weight Loss Programs
-21-March 3, 2009
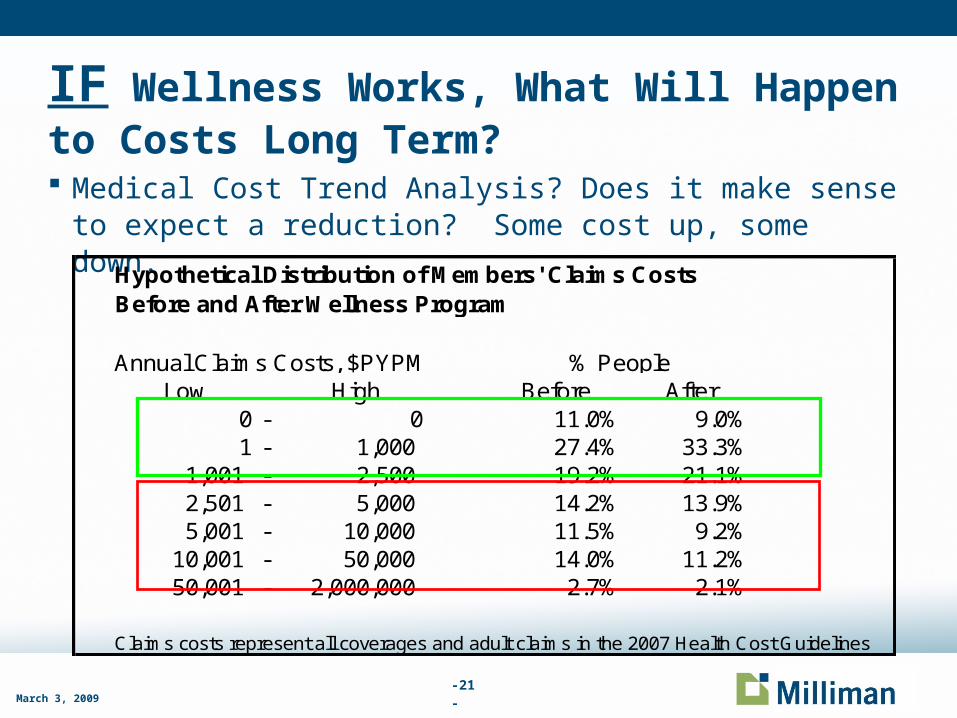
IF Wellness Works, What Will Happen to Costs Long Term? Medical Cost Trend Analysis? Does it make sense to expect a
reduction? Some cost up, some down.
Low High Before After0 - 0 11.0% 9.0%1 - 1,000 27.4% 33.3%
1,001 - 2,500 19.2% 21.1%2,501 - 5,000 14.2% 13.9%5,001 - 10,000 11.5% 9.2%
10,001 - 50,000 14.0% 11.2%50,001 - 2,000,000 2.7% 2.1%
Claims costs represent all coverages and adult claims in the 2007 Health Cost Guidelines
% PeopleAnnual Claims Costs, $PYPM
Hypothetical Distribution of Members' Claims Costs Before and After Wellness Program
-22-March 3, 2009
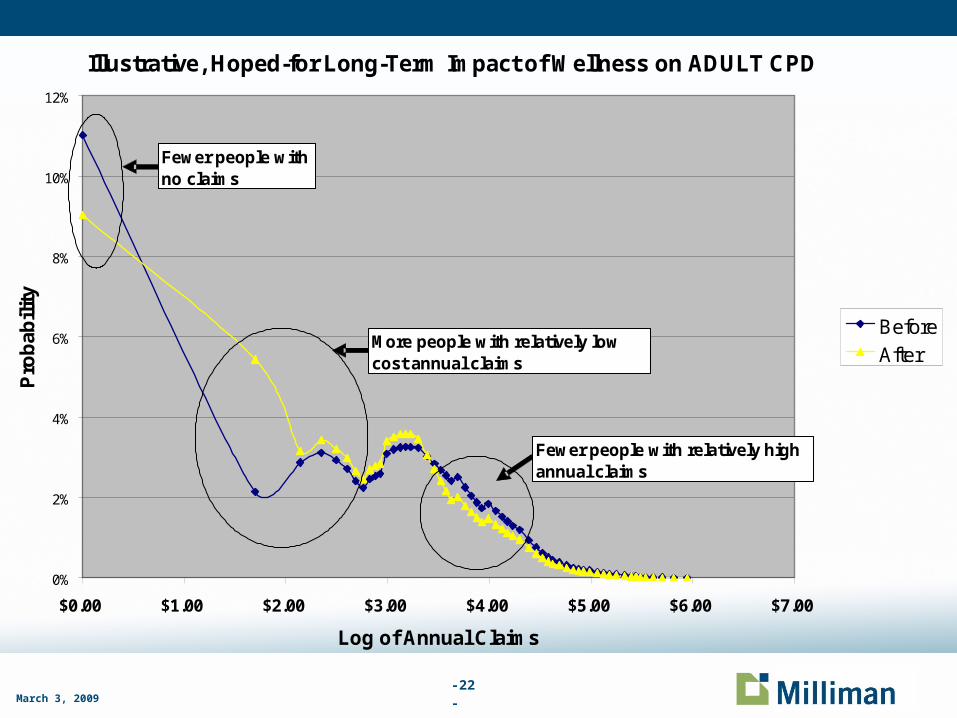
Illustrative, Hoped-for Long-Term Impact of Wellness on ADULT CPD
0%
2%
4%
6%
8%
10%
12%
$0.00 $1.00 $2.00 $3.00 $4.00 $5.00 $6.00 $7.00
Log of Annual Claims
Pro
bab
ility
BeforeAfter
Fewer people with no claims
More people with relatively low cost annual claims
Fewer people with relatively high annual claims

-23-March 3, 2009
Status Report
Current methods for measuring financial outcomes for DM and Wellness program are less than ideal and often produce inaccurate results
Marketplace is unlikely to stop expecting to obtain net financial savings from DM and Wellness programs
We have no magic solution other than;
Purchasers – be skeptical of reported savings, these are unlikely to ever show up as real medical claims cost reductions for healthplans or plan sponsors
Vendors – try and avoid overly optimistic savings calculation methods and caveat reported financial “savings”.

-24-March 3, 2009
Cutting Edge Research
Is there a better way to monitor outcomes for people with chronic conditions?
A subset of the advisory board for the Value Based Insurance Design Institute in Ann Arbor decided to tackle this question during 2007 and came up with this conclusion;– Current methods for measuring outcomes for populations (including
those with chronic conditions) do not produce information helpful to physicians because the process is designed from an actuarial and financial perspective, not a clinical one. People requiring very different clinical management strategies are grouped together in the same “bucket” so it is difficult to decide what to do clinically if costs or utilization are higher than expected.

-25-March 3, 2009
Value Based Management Groups
In late 2007 the group, composed of Michael Chernew (Harvard), Mark Fendrick (Univ. of Mich), Lonnie Reisman (Aetna), Patricia Sabler (Center for Practical Health Reform) and David Mirkin (Milliman) – completed the initial stage of setting design parameters for a new grouping system called “Value Based Management Groups” or VBMGs. The core principle is people should fall into unique groups based on the condition that has the greatest impact on clinical decisions.
During 2008 Milliman working with Fendrick and Chernew developed the grouper and used it to analyze MedStat data for 1999, 2002, 2004 and 2006

-26-March 3, 2009
Value Based Management Groups
33 discrete categories including 24 for specific chronic conditions, 1 for “all other” (chronic conditions) and 8 for “healthy” individuals.
Grouping hierarchy based on the impact of a condition on clinical decision making. For example, a patient with both a major psychosis and CAD would be grouped as Major Psychosis since this conditions would drive clinical decision making. The CAD can not be managed effectively without out first managing the Major Psychosis.
The 24 specific chronic conditions account for approximately 76% of total cost for a commercial group insurance population

-27-March 3, 2009
VBMG Chronic Condition Category Hierarchy Major psychosis
Severe dementia
Active cancer
Renal failure
Liver disease
HIV
Connective tissue disease
HF
Chronic blood disorders
CAD & diabetes
CAD without diabetes
Diabetes without CAD
HTN alone
COPD Asthma Neurologic disorders Developmental disorder Musculoskeletal Mental health (other) GI TB Thyroid disease Dermatologic disorders Unhealthy newborns Other chronic conditions

-28-March 3, 2009
Trend Drivers Per VBMG System
Categories with largest share or cost growth 1999 to 2006 – Preliminary Figures for a Commercially Insured Population
VBMG Category % of Population (2006)
% of Total Cost Growth From 1999 to 2006
HTN 9.4% 14.0%
Active Cancer 2.6% 13.5%
CAD & Diabetes 4.6% 10.5%
Heart Failure 1.9% 6.4%
Musculoskeletal 3.8% 6.3%
All numbers are subject to revision as results are still under development

-29-March 3, 2009
Recommended Reading
Outcomes Guidelines Report – dmaa/The Care Continuum Alliance
http://www.milliman.com/expertise/healthcare/publications/rr/cost-trends-for-chronic-condition-RR5-1-08.php
Related Documents