AD-A283 845 (9 Preliminary Corrosion Studies of Candidate Materials for Supercritical Water Oxidation Reactor Systems by John Clarke Orzalli M.S. in Systems Management Golden Gate University, 1990 B.S. in Marine Engineering United States Naval Academy, 1978 Submitted to the Department of Ocean Engineering and the Department of Materials Science and Engineering in Partial Fulfillment of the Requirements for the Degrees of Naval Engineer and Master of Science in Materials Science and Engineerin Massachusetts Institute of Technology 0 John Clarke Orzalli. All rights reserved The author hereby grants to MIT permission to reproduce and to . distribute publicly paper and electronic copies of this thesis document in whole or in part. Signature of Author. .. Certified by . . . . . . . . .. .. .. . . . . . ... Ronald M. Latanision, Professor of Materials Science Department of Materials Science and Engineering Thesis Advisor Certified by ... . . . ... . . . . . . . . . . . .. . . Koichi Masubuchi, Kawasaki Professor of Engineering Department of Ocean Engineering Thesis Reader Accepted by ... ..... .C..-.-. .V ...... Carl V. Thompson II, Professor of Electronic Materials Chair, Departmental Committee on Graduate Students Accepted by. ............ _. A. Douglas Carmichael, Profssor of Power Engineering Chair, Departmental Committee on Graduate Students 94-27506 MC 94 8 26 004

Welcome message from author
This document is posted to help you gain knowledge. Please leave a comment to let me know what you think about it! Share it to your friends and learn new things together.
Transcript
AD-A283 845 (9Preliminary Corrosion Studies of Candidate Materials for
Supercritical Water Oxidation Reactor Systems
by
John Clarke Orzalli
M.S. in Systems ManagementGolden Gate University, 1990
B.S. in Marine EngineeringUnited States Naval Academy, 1978
Submitted to the Department of Ocean Engineering and theDepartment of Materials Science and Engineering in Partial
Fulfillment of the Requirements for the Degrees of
Naval Engineer
and
Master of Science in Materials Science and Engineerin
Massachusetts Institute of Technology
0 John Clarke Orzalli. All rights reserved
The author hereby grants to MIT permission to reproduce and to .
distribute publicly paper and electronic copies of this thesisdocument in whole or in part.
Signature of Author. ..
Certified by . . . . . . .. . ... .. . . . . . ...Ronald M. Latanision, Professor of Materials Science
Department of Materials Science and EngineeringThesis Advisor
Certified by ... . . . ... . . . . . . . . . . . .. . .Koichi Masubuchi, Kawasaki Professor of Engineering
Department of Ocean EngineeringThesis Reader
Accepted by ... ..... .C..-.-. .V ......
Carl V. Thompson II, Professor of Electronic MaterialsChair, Departmental Committee on Graduate Students
Accepted by. ............ _.A. Douglas Carmichael, Profssor of Power Engineering
Chair, Departmental Committee on Graduate Students
94-27506 MC
94 8 26 004

-DI CLANOTICE
THIS DOCUMENT IS BEST
QUALITY AVAILABLE. THE COPY
F[RNISHED TO DTIC CONTAINED
A SIGNIFICANT NUMBER OF
COLOR PAGES WHICH DO NOT
REPRODUCE LEGIBLY ON BLACK
AND WHITE MICROFICHE.

AD NUMBER DATE DTIC ACCESSION8/23/94 NOTICE
1. REPORT IDENTIFYING INFORMATIONI. Pit yourmai/ng address
A. ORIGINATING AGENCY 93943 on mverse of form
NAVAL POSTGRAUTE SCHOOL, MONTEREY, CA 2. Compiet Items 1 and2
PRIIA T U OF CANDIDATE 3. Affach loin to reportsSMATERIALS FOR SUPERCRITICAL WATER OXIDATIO mairoDTIC.
C. MONITOR REPORT NUMBER M. I.T. 4. UseunckssaAid
BY: JOHN ORZALLI MAY 94 THESIS kdormation only.5. Do not order documentD. PREPARED UNDER CONTRACT NUMBER for 6 to 8 weeks.'oo / Q 2 -'s9 -c-- -o 0!ý90
2. DISTRIBUTION STATEMEN" T . _hLQ-D ..P ,-. ý,IL, 1. AssignADNunmer.
2. Return to requester.
DTIC Form 50 PREVIOUS EDITIONS ARE OBSOLETEDEC 81
/
//

PRELIMINARY CORROSION STUDIES OF CANDIDATE MATERIALS FORSUPER TICAL WATER OXIDATION REACTOR SYSTEMS
by
John Clarke Orzalli
submitted to the Departments of Ocean Engineering and Materials Science andEngineering on 6 May, 1994 in partial fulfillment of the requirements for the Degrees
of Naval Engineer and Master of Science in Materials Science and Engineering.
ABSTRACT
An experimental test facility has -'. '. .gned and constructed for investigation of thecorrosion behavior of candidate materiz'- :n a supercritical water oxidationenvironment. The high temperatures (5,X)iC, and high pressures (300 atm) required inthis process, made the experimental apparatus :onstruction and control a complexengineering problem.
The facility consists of two systems. The first is an e;xposure auttclave ,internalvolume 850 ml, with associated monitoring and control systems for conducting longterm exposure testing of test coupons and U-bends. The second is an e;&ctrochemicalcell with a potentiostat and frequency response analyzer for conductinp ElectronicImpedance Spectroscopy (EIS) in the supercritical water environment.
Exposure testing of three candidate materials; Inconel 625, Hastelloy C-276 and 316stainless steel was conducted at three temperature regimes corresponding to threelocations in a SCWO waste treatment system. Preliminary results are presented in anenvironment of demineralized water as a control.
Experimental results indicate evidence of a film on the materials characterized byslight weight gain. Light and confocal laser light microscopic evaluations revealed thepresence of localized pitting corrosion on the Inconel 625.
AcceSion ForNITIS CRA&I
Thesis Supervisor: Dr. Ronald M. Latanision DTIC TABUnannounced
Title: Professor of Materials Science Justification --------
Distribution
Availability codes. _
Dist Special
2

TABLE OF CONTENTS
Page NumberTITLE PAGE 1ABSTRACT 2TABLE OF CONTENTS 3LIST OF ILLUSTRATIONS AND FIGURES 6LIST OF TABLES 10ACKNOWLEDGEMENTS 1I
Chapter 1: Introduction 15
Chapter 2: Background Literature Survey 192.1 Basic Description of Cycle 192.2 Theoretical Background 21
2.2.1 Basic Corrosion Principles 212.2.2 Properties of Supercritical Water 252.2.3 Supercritical Electrochemical Studies 26
2.3 Possible Corrosion Mechanisms 302.3.1 Uniform Attack 302.3.2 Stress Corrosion Cracking 322.3.3 Hydrogen Embrittlement 34
2.4 Monitored Effluent Surveys 352.5 Exposure Studies 372.6 Areas for further investigation 41
Chapter 3: Experimental Apparatus 423.1 Basic System Design 423.2 General Guidelines 443.3 Exposure Vessel 45
3.3.1 Vessel Design Calculations 463.3.2 Vessel Testing and Certification 49
3.4 Fittings and Tubing Selection 503.5 Preheater 523.6 Heat Exchanger 533.7 Heaters 543.8 Pumps 553.9 Insulation 553.10 Sensors 56
3.10.1 Pressure 563.10.2 Temperature 573.10.3 Sensor Output Processing 58
3

TABLE OF CONTENTS (Continued)
Page Number3.11 Control 59
3.11.1 Back Pressure Regulator 603.11.2 Temperature Control System 603.11.3 Backup Pressure Control 61
3.12 Safety Features 623.12.1 Component Design 623.12.2 Labview Control Shutdowns 633.12.3 Safety Heads 643.12.3 Shielding 65
3.13 Sample Holder 663.14 Support Systems 67
3.14.1 Tools 673.14.2 Enclosure 683.14.3 Fluid Support 703.14.4 Sample Support Equipment 70
3.15 Electrochemical System Differences 723.15.1 Component Sizing Differences 723.15.2 Different Equipment 73
3.16 Omitted Equipment 74
Chapter 4: Description of Experiment 754.1 Sample Selection and Preparation 754.2 Exposure Testing 77
4.2.1 System Reassembly 774.2.2 System Heat up 784.2.3 Exposure Testing 794.2.4 Cool down and Depressurization 79
4.2.5 Disassembly and Sample Removal 804.3 Sample Analysis Techniques 80
Chapter 5: Results and Discussion of Results 825.1 Visual Observations 835.2 Fibre Optic Microscopic Observation 845.3 Laser Confocal Microscope Observations 865.4 Light Microscope Analysis 875.5 Laser Surface Profiling 885.6 Cross Sectional Analysis 905.7 Discussion of Results 90
5.7.1 316 stainless steel 915.7.2 Hastelloy C-276 915.7.3 Inconel 625 91
4
TABLE OF CONTENTS (Continued)Page Number
Chapter 6: Conclusions and Considerations for Future Work 926.1 System Performance 926.2 Materials Evaluation 936.3 Considerations for Future Work 94
6.3.1 Improvements 946.3.2 Testing Matrix 966.3.3 Electrochemical Corrosion Test Facility 96
APPENDIX A: COMPOSITION OF ALLOYS AND WASTE STREAMS 97
APPENDIX B: PARTS LISTING 98
APPENDIX C: PHOTOGRAPHS OF SYSTEM COMPONENTS 103
APPENDIX D: STRENGTH CALCULATIONS FOR PRESSURE VESSEL 108
APPENDIX E: LABVIEW® VIRTUAL INSTRUMENT SCHEMATICS 110
APPENDIX F: SAMPLE WEIGHT LOSS DATA 142
APPENDIX G: PHOTOGRAPHS OF SAMPLE SURFACES 145
Bibliography 151Biographical Note 157
5
LIST OF ILLUSTRATIONS AND FIGURES
Figure No. TitleP
1-1 Concept of Future Navy Ship 17
2-1 MODAR SCWO Process 20
2-2 Pourbaix Diagram for Iron at 25'C 23
2-3 Pourbaix Diagram for Chromium at 25°C 23
2-4 Schematic of Commonly Used Polarization Cell 24
2-5 Polarization Diagram 25
2-6 Properties of Water in the Supercritical Region for Pressure 26Range of 218 - 300 atm.
2-7 Pourbaix Diagram for Iron at the Critical Point 27
2-8 Pourbaix Diagram for Chromium at the Critical Point 28
2-9 Polarization Curves for 304 Stainless Steel in Pure Water 29and 0.005 mol/l Na2SO 4
2-10 Temperature Effect on Exchange Current Density of 29304 S. S. in Pure Water
2-11 Schematic Polarization Curve of Fe-Cr-Ni Alloy in an 33Environment that Might Promote Stress Corrosion Cracking
2-12 Sketch of Deepest Pit with Relation to Average Metal 41Penetration and the Pitting Factor
3-1 Schematic of Exposure Autoclave System 43
3-2 Exposure Vessel Drawing 45
3-3 Exposure Vessel End Closure 46
3-4 Graph of Crack Geometry vs. Flaw Shape Parameter 48
3-5 Low Temperature Block 51
6

Figure No. Tite PA
3-6 High Temperature Block 51
3-7 Mechanical Seal Detail 52
3-8 Heat Exchanger Detail 54
3-9 Pressure Detector Sensing Circuit 57
3-10 Safety Head Detail 64
3-11 Sample Holder Assembly 67
3-12 UNISTRUT® Enclosure Detail 69
3-13 Fiber Optic Microscope Components 71
3-14 Confocal Laser Microscope Schematic 72
3-15 Electrochemical Autoclave Vessel Schematic 73
3-16 Externally Cooled Reference Electrode 74
4-1 Sample Initial and Final Configuration 76
5-1 Confocal Laser Microscope Surface Profile of Inconel 625 89Exposed to Deionized Water at 400'C, 241.5 atm; for a Periodof 24 hours. (800 x)
5-2 Confo.4Al Laser Microscope Image of Inconel 625 Exposed to 89Deionized Water at 400'C, 241.5 atm; for a Period of 24 hours.(800 x)
C-1 Pressure Vessel Side View 103
C-2 Pressure Vessel End View 103
C-3 End Closure and Seal Ring 104
C-4 Clamp Assembly 104
C-5 Pump Connections 105
7

C-6 Preheater Coil 105
C-7 Heater Element 106
C-8 Vessel Heaters and Partial Insulation 106
C-9 Preheater Heater and Partial Insulation 107
C-10 Sample Holder with Sample 107
E-1 Labview® Exposure System Controller 110
E-2 Labview® Temperature Read Instrument 114
E-3 Labview® Pressure Read Instrument 123
E-4 Labview® Temperature Controller 125
E-5 Labview® Pressure Controller 128
E-6 Labview® Relay Controller 136
E-7 Labview® Relay Shutoff Controller 137
E-8 Labview® Alarm Warning Circuit 138
E-9 Labview® Audible Alarm Circuit 141
G-1 Fibre-Optic Microscope View of Inconel 625, Exposed to 145Deionized Water for 96 hrs. at 500'C, 241.5 atm, WasherTransition Region. (100 x)
G-2 Fibre-Optic Microscope View of Hastelloy C-276, Exposed to 145Deionized Water for 96 hrs at 500'C, 241.5 atm, WasherTransition region. (100 x)
G-3 Fibre-Optic Microscope View of 316 SS, Exposed to Deionized 146Water for 96 hrs at 300'C, 241.5 atm, Washer TransitionRegion. (100 x)
G-4 Confocal Laser Microscope View of Inconel 625 Exposed to 146Deionized Water for 96 hours at 300°C, 241.5 atm (400 x)
8

Figure NQ. Tie re..
G-5 Pit and Shiny Areas Evident in Light Microscope View of 147Inconc! 625 Exposed to Deionized Water for 96 hours at5(0 C, 241.5 atm, (500 x )
G-6 Surface of Inconel 625, Light Microscope View, Exposed to 147Deionized Water for 96 hours at 300TC, 241.5 atm (500 x )
G-7 Sharp Features in 316 Stainless Steel Exposed to Deionized 148Water for 96 hours at 300TC, 241.5 atm (500 x. Light Microscope)
G-8 Pit in Inconel 625 Exposed to Deionized Water for 24 hours 148at 400TC, 241.5 atm (500 x, Light Microscope)
G-9 Pit in Inconel 625 Exposed to Deionized Water for 24 hours 149at 400TC, 241.5 atm (1000 x, Light Microscope)
G-10 Confocal Laser Microscope Profile of Raised Surface on 149Inconel 625 Exposed to Deionized Water for 24 hoursat 400TC, 241.5 atm (800 x)
G- 11 Confocal Laser Microscope Profile of Irregularity on 150Inconel 625 Exposed to Deionized Water for 24 hoursat 400TC, 241.5 atm (800 x)
G-12 Confocal Laser Microscope Profile of Shiny Area on 150Inconel 625 Exposed to Deionized Water for 96 hoursat 500'C, 241.5 atm (800 x)
G- 13 Confocal Laser Microscope Profile of Irregular Surface on 151316 SS Exposed to Deionized Water for 96 hours at300TC, 241.5 atm (800 x)
G-14 Confocal Laser Microscope Profile of Rough Surface on 151Hastelloy C-276 Exposed to Deionized Water for 96 hoursat 500TC, 241.5 atm (800 x)
9

LIST OF TABLESTable No, Tit Page2-1 Corrosion in 60% HO, 40% HCI 31
2-2 Effluent Samples of Various Waste Streams in 36SCWO Reactors.
2-3 Effluent Samples of Ammonium Perchlorate and 37Nitromethane Feedstock in Hastelloy C-276 Reactor
2-4 Corrosion of Witness Wires in SCWO Processing Stream 38
2-5 High Grade Alloy Corrosion Study Results 40
3-1 System Components 44
5-1 S. pie Testing Conditions 82
5-2 Visual Sample Results 83
5-3 Fibre Optic Sample Observations (250 x) 85
5-4 Summary of Laser Images 87
5-5 Light Microscope Sample Results 88
F-I Sample Dimensions and Weights, Run 1 142
F-2 Sample Dimensions and Weights, Run 2 143
F-3 Sample Dimensions and Weights, Run 3 144
10

ACKNOWLEDGEMENTS
This experimental facility has been a joint effort between the members of the
H. H. Uhlig Corrosion Laboratory and the Chemical Engineering Department. The
design and construction of the system was possible due the technical expertise and
guidance of chemical engineers Matt DiPippo, Phil Marrone, Brian Phenix, CPT Jerry
Meyer, U.S. Army, and CPT Russ Lachance, U. S. Army. Steve Attanasio of the
Materials Science Department helped to devise sample preparation and evaluation
techniques, in addition to tolerating my presence in his laboratory.
Haynes International, specifically Galen Hodge, provided not only the sample
material but also technical advise which was invaluable. The laboratory of Professor
Ron Ballinger and technical advise of Martin Morra were essential in the preparation
of quality samples.
The machine shops at the Massachusetts Institute of Technology were
instrumental in accomplishment of this project. Not only did they train me in
operation of the equipment, but they were willing to help out to ensure the work was
completed properly. For this I am grateful to Mike Aloisi and his crew in the
Laboratory for Nuclear Science machine shop, and Guenter Arndt in the Materials
Science and Engineering Department machine shop.
The Energy Laboratory has been a source of constant support, not only
technically but emotionally. The constant encouragement of Professor Jeff
Tester has helped me to see the practical aspects of the project and made me wonder
why I am not a chemical engineer. His support staff of Rosemary Fleming and Beth
11
Ann McCain walked me through the details of the procurement process, without which
this project would still be in the design stage.
The technical advice, and encouragement from the Ocean Engineering
Department has been instrumental in meaningful results for this project. Gokhan
Goktug graciously took the time to train me in the use of the special microscopes used
for sample evaluation. The encouragement and helpful suggestions of Professor Koici
Masubuchi, have allowed me remain focused throughout this effort.
Professor Ronald Latanision, my thesis advisor, has consistently provided the
direction needed to see the project through to fruition. His ability to diagnose and
provide the "cure" for the ailments which tend to derail an experimental project were
key in the success to date. His staff of Connie Beal and Kelly Fischer have provided
administrative support surpassed only by their cheerful attitudes and smiles which have
been greatly appreciated.
The majority of the work documented here is a collaboration between Dr. D.
Bryce Mitton and myself. His technical expertise, wise counsel, and attention to detail
are not only evident by his design of many of the special components of the system,
but also were key in production of documents such as this thesis. His daily interest in
my progress, has been the consistency which has ensured the completion of my portion
of this project. I leave, knowing the project is in his able hands.
The individuals in the Navy Academic Office have been outstanding in their
support. Jennifer Liable administrative support and untiring efforts to make the Navy
students' lives bearable is gratefully noted. LCDR Jeff Reed's interest in the project,
12

from faithful attendance at briefings on the subject, to even monitoring of the initial
approach to supercritical conditions, falls into above and beyond the call of duty
category. His positive approach to everything rubs off, and it is evident in this project.
Without CAPT Alan Brown, this project would never have started. His insight into
future Navy and environmental needs, allowed me to pursue a project in which I had
high interest. Throughout the course of this research, his encouragement and
reinforcement of Navy interest has kept me moving towards the goal.
I am indebted to my fellow classmates, especially the members of my design
team; CDR Mark Lusted, LCDR Greg Thomas, and LT Dave Fox. Their flexibility
in scheduling, and untiring effort has made my work on this project possible.
My motivation and inspiration to study Naval applications of corrosion
phenomena stem from my high school chemistry teacher in McLean Virginia, Mrs.
Marjorie Green. My interests in engineering applications of materials, and my
motivation to pursue an advanced engineering degree were instilled by Professor
Dennis Hasson, at the United States Naval Academy. The confidence they showed in
me at an early age has propelled me to do better.
Success of this project is also due, in part, to my computer repairman who just
happens to be my father, Jack Orzalli. He and my mother, Myrtle, have supported me
in all my efforts and instilled in me the desire for excellence. Their encouragement
has kept me focused on the important qualities of life rather than the day to day
trivialities that tend to bog one down. Additionally, my thanks are due to my mother-
in-law, Peggy McComas, who has come to the rescue many times in sitting with the
13

children because their father was always studying. She also has helped me maintain
the proper perspective for this thesis.
Without the support, and encouragement of my children, this thesis would not
have been possible. Sarah, Ian and Robbie have looked at their fathers back too long
as I have spent countless hours in front of the computer screen. They have been told
to be quiet more often than any children should be. They have even eaten meals in
the lab on the weekends just to be with me. Their tolerance, and constant love has
lifted me through this effort.
No acknowledgement would be complete without heartfelt thanks, and love to
my wife, Dale. Without her devotion, patience, tolerance and flexibility, this thesis
would never have happened. Her ability to get all us kids off to school has been
remarkable. She has sacrificed too many of her own opportunities to allow me to take
advantage of mine. I only hope I can somehow make it up to her. Her love and
support has sustained me throughout this effort, for which I am thankful.
Finally I must acknowledge the gifts I have been given by God. The love he
has expressed through his son, Jesus Christ, has been my strength through this project.
The knowledge that through Him, I can do anything, has been a constant in the
completion of this thesis and the course of study at MIT. For these gifts, I am ever
grateful.
DEDICATION:
To Dale, this project is as much yours as it is mine.
14
Chapter 1
Introduction
Details of the impact of man's industrialization of the planet earth are being
revealed at an alarming rate. What is becoming clearer with each discovery is that we,
as a civilization must learn not only to monitor our impact, but develop new
technologies to limit production of harmful effects or efficiently eliminate ha?
products before they are released to our environment.' Ships at sea, especially ,aval
Ships, have historically had exemptions from even the limited environmental
regulations in effect.2 In the future for the United States Navy to have access to the
oceans of the world, we must develop technologies to eliminate dumping of any
material over the side.
From a ship designer's perspective, elimination of overboard dumping creates a
significant stowage space requirement unless there is a waste processing capability on
the ship. Any processing plant must be able to handle a wide variety of wastes, in a
marine environment, safely and efficiently utilizing a minimum amount of space. As
the principle mission of U. S. Navy Ships is warfare, any support system which
occupies a large volume, reduces the weapons systems the ship can carry.
The supercritical water oxidation (SCWO) process is an emerging technology
which may be a solution for destruction of shipboard wastes at sea. The waste
destruction technology utilizes water above the critical point (374°C, 218 atm) as a
solvent for organic compounds and oxygen. Unlike water below the critical point, the
solubility of organic materials is almost complete in supercritical water. By
15

introduction of oxygen into this environment, complete destruction of the compounds
to basic components of water, carbon dioxide and nitrogen rapidly occurs. Inorganic
compounds are insoluble in the conditions such that they can be precipitated out and
removed.-"
Pilot scale and laboratory plants have demonstrated this technology on a wide
variety of compounds. The resultant destruction efficiency and short residence times
of this process make it a serious alternative to incineration for treatment of many
hazardous waste.6 Additionally due to the relatively low temperature of this process,
off gassing of nitrous oxides are not a problem as in incineration.7 These properties
have resulted in investigation and development of SCWO reactors for use in biological
waste collection and processing in the space program.8
The potential for application on ships seems unlimited. Vessels could be
installed with small plants capable of processing large amounts of not only biological
and food wastes but also plastics, black and grey water and bilge water contaminated
with oil. This would effectively reduce dumping without large capacity on board
tanks. Additionally current ship designs, which have holding tanks for these types of
waste, would be able to reduce their capacity. Future Navy ships have been
envisioned, which would be outfitted with a SCWO reactor for waste processing .9
Figure 1-1 is a conceptual design of a Destroyer/Frigate (DDG/FFG) with emphasis on
minimizing overboard discharge of water. Experiments in destruction of Naval wastes
have been conducted'° and there is currently an effort to develop large scale land
based SCWO reactors for processing of Navy wastes by the Civil Engineering Corps."
16

B.'D
-, z ,F '
0 '
CDW
_O a:0 CL
LC)
w~ CU
LL CI0
0
LL
LL 'U 2
U)0cc0
'UD
FIGURE 1-1 Concept of Future Navy Ship
17

The application of this technology for any use, however, hinges on an
investigation not only of the kinetics of the reaction process, but also of the materials
of construction of the reactor system. As the potential waste streams include a wide
range of hazardous materials including chemical weapons, the behavior of the reactor
materials must be clearly understood prior to building full scale operational plants.
Current research in this area at the Massachusetts Institute of Technology is
sponsored by the U.S. Army Research Office as part of a University Research
Initiative for developing chemical weapons destruction technology. The goal of this
preliminary research was to develop a testing apparatus, determine test materials and
test solutions, and run initial corrosion testing of a limited number of materials to
demonstrate the operability of the system.
18
Chapter 2
Background Literature Survey
The supercritical water oxidation process for the destruction of hazardous
wastes is a relatively recent technological development.' 2 Numerous compounds have
been tested to determine destruction efficiency of the process, but very limited specific
corrosion testing has been accomplished. The difficulty in performing corrosion
testing at high temperatures and pressures, as well as the relatively small size of many
test reactors contributes to this lack of data. As different components in the SCWO
process experience a wide range of temperatures and pressures, some corrosion data
from other high temperature and high pressure environments may help to evaluate
material performance of certain sections of the reactor system.
2.1 Basic Description of Cycle.
An understanding of the basic SCWO cycle is necessary to address corrosion
problems in the different sections. Figure 2-1 is a representative schematic diagram of
one of the processes currently in use.6 The components of the process are similar in
the many different variations of the system. The basic cycle consists of seven major
steps 13:
1) Feed preparation and pressurization2) Preheating3) Reaction4) Salt Formation and Separation5) Quenching, cooling and energy/heat recovery6) Pressure Letdown and phase disengagement7) Effluent water polishing
While there are seven identifiable subprocesses in the system, for the purposes of
19

FIGURE 2-1 MODAR SCWO Process. From Tester et. a1 13
identifying and analyzing corrosion problems three general areas are addressed. The
pretreatment region where water, waste and oxidant are mixed, pressurized and heated
to supercritical or near supercritical conditions. The materials in this region see, at
different times, a wide range of temperatures, pressures, and chemical environments.
The reactor region itself experiences supercritical conditions while orperating and a
range in temperatures during heat up and cool down. Salt insolubility in the
supercritical region may result in sticky salt depositsj'4 which could affect material
performance of the reactor itself. Finally, the letdown or cool down section is exposed
to a wide range of temperatures as well as pressures. Concentrated brine of
redissolved salts can occur at subcritical temperatures'5 , thus, adding to the complexity
of the corrosion environment in the letdown section. Understanding the material
20
m~ m m m • m mlmlllll In • I~llll • Ai

properties in each of these sections under the operating conditions is a critical
component in the selection of the best material for the specific application.
2.2 Theoretical Background.
2.2.1 Basic Corrosion Principles. Corrosion itself is a chemical or electrochemical
reaction between a metal and its environment.' 6 in a specific environment, the change
in the Gibbs free energy determines thermodynamically whether chemical reactions can
occur. In the following example:
Cu + H120 (1) + 1/202(g) - Cu(OR) 2(s) AGX = -28,000 ca1' 6
The large negative value of AG' indicates the reaction will occur as written at standard
conditions of 25'C, although it does not indicate a rate of reaction. The change in
Gibbs free energy can be equated to a specific electromotive force, (emf) by use of the
relationship AG = -EnF . Where E is the emf, n is the number of electrons and
F is the Faraday. Any electrochemical reaction can be written as the sum of two half
cell reactions each with an associated Gibbs free energy and therefore an emf with
each half cell reaction. Values of emf for various reactions are available at standard
conditions of temperature, pressure and concentration. In order to modify standard
values to existing conditions, the Nernst equation must be applied. For a given
reaction of the form: IL +mM +. . . -*qQ + rR +. .
21

E = E 0 - _Rln-izF
Where the activity aM is expressed as concentration in molality times an activity
coefficient. R is the ideal gas constant and T is the absolute temperature. For
reactions in aqueous solutions which involve the reduction of hydrogen or oxygen as
the cathodic half cell, the concentration of hydrogen ion is a critical factor in
determining the overall emf and thus the thermodynamic tendency to corrode, pH is
defined as - log (H÷), the hydrogen half cell emf is reduced as pH increases by the
following relationship in an environment of 1 atmosphere of hydrogen."7
2H" + 2e - H2 EH-2 = 0 I2 F(H÷)
(8.314 Jl* inooe)(298.2* K) .lO.l _._ I2 • 96500 C/eq (H ÷)
eq is the equivalent number of moles of the ion, C is a coulomb
Ef, = 0.0592 .log(H ) = -0.0592 pH
Direct application of the Nernst equation and the Gibbs free energy associated
with various compounds of a metal leads to development of the Pourbaix diagram,' 7
which plot the potential versus pH at a given temperature. Figures 2-2 and 2-3 depict
pH versus potential diagrams for iron and chromium at 25TC.
22

2 25.0 °C
1.6 1.0 arm
1.4 e
1.0"- . m•
0.6I
"0. Fes*`'0. FeZ03
-0.2
-0.6
-1.0
-1.4 Fe
-1.8
-2 0 2 4 6 8 10 12 14 16
pH
FIGURE 2-2 Pourbaix Diagram For Iron at 250C. From Huang et. al. 18
2.2 . . . . . . . . .25.0 "C
A Crao-,' 1.0 atm
1.4 Cr I" - c-o I
1.0 CrO4 -Cr'
0.6
•Z 0 .20.2 I
S • • L• Cr2O3 7
-0.6 Crrs+ =
-1.0
-1.4Cr I
-1.6
-2.2 A 1A-2 0 2 4 6pl 8 o 10 1 4 16pH
FIGURE 2-3 Pourbaix Diagram For Chromium at 250C. From Huang et. al. 18
23

While helpful in predicting the thermodynamic tendency for corrosion mechanisms to
occur, the Pourbaix diagram is not kinetically based, thus rates of corrosion are not
available from this tool. To determine corrosion rates, polarization or
Evans diagrams are necessary. These curves are developed at low temperatures and
pressures, using a test apparatus similar to Figure 2-4. The apparatus measures values
of current from a working electrode at various applied emf values. The resultant plots
can provide a value for the corrosion current density. See Figure 2-5. The corrosion
current density can then be directly c.inverted to weight loss of the metal if the surface
area in contact with the electrolyte is known.
THERMOMETERGAS OUTLET
SALT BRIDGE
/GASINLET
COUNTERELECTRODE
COUNTERPROBE ~ELECTRODE
WORKINGELECTRODE
FIGURE 2-4 Schematic of Commonly Used Polarization Cell (Annual Book of
ASTM Standards)19
24

ILO
to X
k 0 A> O .... ..... ...
evB
4 "'corr
log Z
FIGURE 2-5 Polarization Diagram From Uhlig, Corrosion and CorrosionControl16
2.2.2 Properties of Supercritical Water. Development of meaningful data in the
supercritical region is dependent on understandirg the properties of the environment.
Those properties which allow dissolution and subsequent oxidation of organic wastes
and precipitation of inorganic and ionic compounds, create corrosive environments
which may no, be described in strictly aqueous terms. The dielectric constant of water
is drastically reduced in the supercritical state and ionic species are virtually non-
existent. The density of the fluid, though significantly higher than steam, is much
lower than water, such that frequency of molecular interactions may prohibit aqueous
corrosion modeling. Figure 2-6 depicts some of the physical properties of water as it
transitions to the supercritical region.' 2
25

Properties of SCW
T(C) liquid ' acrltL I supercriticaI25-370 370-400 400 -0
* I I
Density,,0.1 waon3 '
1.0 II
0%
*
Idrganin Solty
I I
1042' '
FIGURE 2-6 Properties of Water in the Supercritical Region for Pressure Rangeof 218 to 300 atm. Michael Modell, MODAR, INC.12
2.2.3 Supercriticall Electrochemical Studies. Thermodynamic models of the
supercritical water environment which can be utilized to help analyze corrosion
behavior are limited.'8 The lack of electrochemical measurements in the supercriticalS~region has made development of a reasonable model very difficult. Huang et. al.'8,
developed Pourbaix diagrams for iron and chromium based upon a computer model of
26
I.. ... ..

extrapolation of chemical potentials to dissolution temperature and pressure conditions.
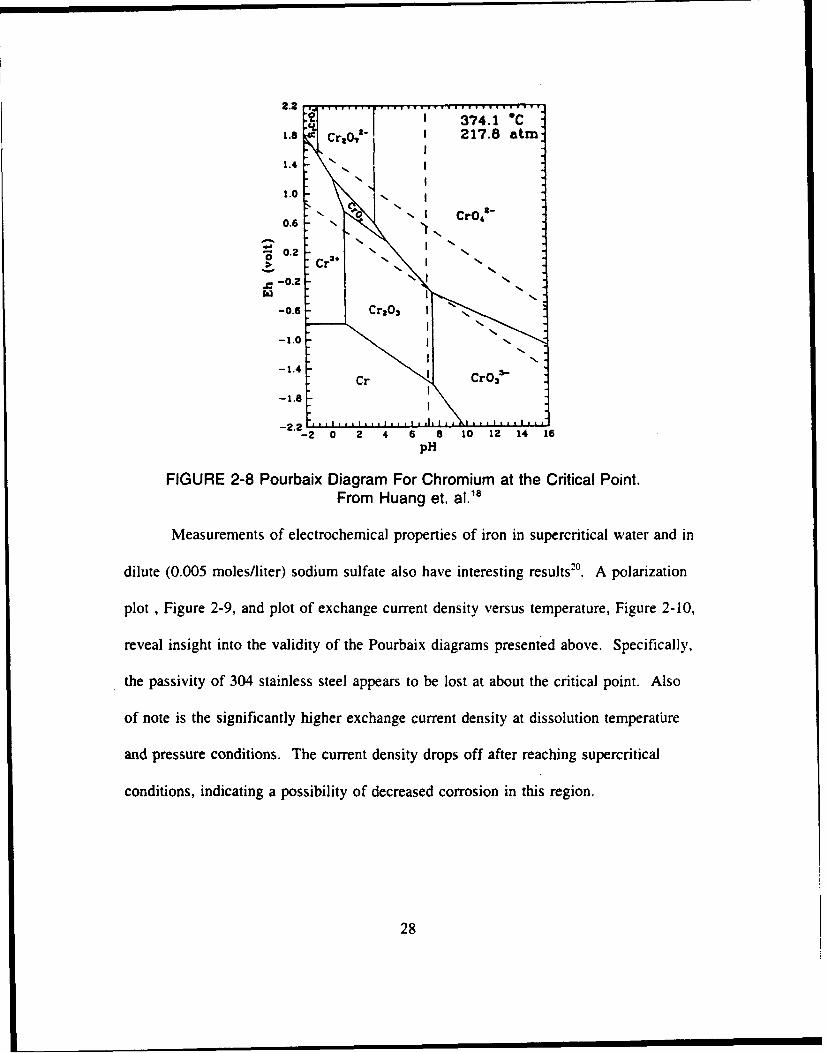
Figures 2-7 and 2-8 depict the results of these calculations. For clarity in discussion,
the Pourbaix diagrams for iron and chromium at room temperature were included as
Figures 2-2 and 2-3. The Pourbaix diagrams for iron and chromium at the critical
point reveal some interesting results. Neutral pH is 7.2 at the conditions depicted
(374.1°C, 217.8 Atm). The potential region for the stable phase of iron (Fe203) in
neutral pH, is much narrower than at ambient conditions. It also encompasses
negative potentials. Even more significant, is the observation that chromium does not
exhibit passivity in the neutral and basic pH ranges at supercritical conditions which
indicates potential for pitting or other attack in this region.
2.2 ..... .... ... .... .... .......
374.1 C1.8 I 217.8 atm
1.4 INI
1.0 I FeO .'-
0.6 - FezO -
" 0.2 " ,
Fez-0.2-0.6; e '"
-1.0
-1.4 Fe
-2.2-1.8 IHFeOz-
-2 0 2 4 6 8 10 12 14 16
pH
FIGURE 2-7 Pourbaix Diagram For Iron at the Critical Point. From Huang
et. al. '8
27
2.2 . -.. .. .374.1 "C1.s CrXO,=- 217.8 atm1.4 •
1.0 -
0 06 CrO4 -
0.2 .
-0.2 I
-0._ Cr203 IN"-
-1.4 -ICr 3-1.0 N
-2.2-2 0 2 4 6 8 10 12 14 16
pH
FIGURE 2-8 Pourbaix Diagram For Chromium at the Critical Point.From Huang et. al.' 8
Measurements of electrochemical properties of iron in supercritical water and in
dilute (0.005 moles/liter) sodium sulfate also have interesting results2 °. A polarization
plot , Figure 2-9, and plot of exchange current density versus temperature, Figure 2-10,
reveal insight into the validity of the Pourbaix diagrams presented above. Specifically,
the passivity of 304 stainless steel appears to be lost at about the critical point. Also
of note is the significantly higher exchange current density at dissolution temperatiure
and pressure conditions. The current density drops off after reaching supercritical
conditions, indicating a possibility of decreased corrosion in this region.
28

0.018
0.014 - calculated..... experimental
0.012
-0,010WE
,0 006
0.004
0,002
0.000 L .- ,--' . . ! . .
300 400 Soo 600 700 800Temperature (K)
FIGURE 2-9 Polarization Curves for type 304 Stainless Steel in Pure Waterand 0.005 motl/ Na 2SO4
400 "C240 atm
0.2aN.O
---- O.OO5mol/1 NaSO#- Pure Water
0.001I
-1.0 0.0 1.0 2.0 3.0Over Potential (Volts)
FIGURE 2-10 Temperature effect on exchange current density of 304 S.S.
in pure water. From Huang et. al.'
The information available from supercritical conditions for iron is limited, but
is beneficial to help evaluate the potential effects in a supercritical water environment.
29

The effects of contaminants, complex alloys and the unique properties of the
supercritical state make extrapolation of proven technology from the subcritical region,
suspect in the supercritical region.
2.3 Possible Corrosion Mechanisms.
An examination of materials in high temperature environments in other
applications is beneficial for determining the types of possible corrosion mechanisms
in the SCWO reactor system. Significantly more data exists in lower temperature
conditions found in the preheater and letdown sections. Based upon experience in sour
gas wells, and currently utilized materials in SCWO systems12, high nickel alloys and
stainless steels are examined for behavior in various conditions which might be similar
to those found in the three sections of the system. Alloying compositions of metals
discussed in this section are listed in Appendix A for reference.
2.3.1 Uniform Attack. Nickel is inert in deaerated water at room temperature. It also
exhibits passive behavior in aerated solutions. The passive layer however for nickel is
not as stable as that for chromium.' 6 The high temperature behavior of nickel based
alloys however is of most interest. Nickel alloys have numerous applications in high
temperature environments due to the stability of the passive layer. The SCWO process
is nominally aqueous, at least in all but the reactor section, thus high temperature data
in this environment is considered pertinent. General corrosion rates have been
obtained in a gaseous environment of 60% H20, 40% HC121. Table 2-1 summarizes
the results of these tests for some candidate materials. Of particular note, is that nickel
alloys are not normally resistant to chloride solutions, but these alloys include
30

molybdenum which improves the resistance to the pitting condition."6 In this
environment passivity occurs due to formation of a film on the surface.
Corrosion Rate (Lrn/y)
Temperature 0C 316L SS Inconel 625 Hastelloy C-276
500 483 132
400 15 _
380 13-23
375 10-15 _
365 13 3
350 - 8-15 _
315 8 _
310 0 _
300 3 - _
290 !
260 8
200 7 _
195 0 0
190 5 0 0
180 4 0 1
175 9 - _
170 10 0 1
160 27 - _
155 - 3 3
140 -_112 91
115 - 869 315
110 485 - 307
100 - 2200 1600
95 12100
indicates no data taken
Table 2-1 Corrosion in 60% H20, 40% HCI, From Carter et. al.2'
The above samples were either rubbed or acid cleaned to remove the corrosion
products prior to weighing. In addition the samples were examined by Auger electron
31

spectroscopy to determine the composition of the film following the attack. No
characterization of the type of attack was provided, but the mechanism appeared to be
HCI attack thinning the passive oxide layer.
Though the HCI environment is a single data point, there are a wide range of
chlorinated compounds, which are candidates for destruction by SCWO technology. In
this specific environment (150 - 400*C at ambient pressure), which is significantly
lower in pressure than the SCWO process, the resistance to general corrosion of nickel
based alloys is excellent. The specific environments of the SCWO system covers a
wide range of temperatures and based upon these results it is evident that a material
that exhibits good general corrosion properties at one temperature may have drastically
different properties at a different temperature. Localized corrosion phenomena
however may occur in these materials at different temperature and pressure conditions,
and was not addressed in this study.
2.3.2 Stress Corrosion Cracking The wide variety of conditions in the various
sections of the SCWO system increase the probability of stress corrosion cracking.
High stresses exist in potentially susceptible materials due not only to high pressures
but also to thermal gradients. The multitude of chemical environments seen by reactor
materials may create the combination necessary for initiation of stress corrosion
cracking.
High nickel alloys have been utilized in pressurized water reactors with a
relatively pure water environment. In certain conditions in this environment, stress
corrosion cracking has been observed, although nickel alloys are not as susceptible as
32

stainless steel originally utilized in this application.22 The presence of oxygen,
inherent in the SCWO process, is also a key contributor to conditions for stress
corrosion cracking. The high nickel alloys, including Inconel 625, experience stress
corrosion cracking in oxygenated water when crevices are present22 . Critical potential
ranges over which stress corrosion cracking exists at ambient temperatures' 6, seem to
exist for high temperatures as well. Development of electrochemical procedures for
analysis of this phenomenon in the dissolution temperature range seems a vital area for
investigation. Development of curves similar to Figure 2-11, may help to predict the
onset of cracking behavior in any environment including the supercritical region.
"ao i
- • iImmun~y An'Current Density
FIGURE 2-11 Schematic Polarization Curve of Fe-Cr-Ni Alloy in anEnvironment that Might Promote Stress Corrosion Cracking. From Berry 22
In this representation, the two circled regions are areas susceptible to cracking. The
first is the region just above the anodic peak where the passive layer is not completely
formed, and the second at the beginning of the transpassive region where breakdown
of the passive film initiates22 . Development of environmentally specific curves for
potential waste streams in a similar manner would help to define the susceptibility of
33

a particular material to stress corrosion cracking in that environment and aid in
determining material/waste stream compatibility. This task would be immense, but
investigation by exposure testing may present candidate combinations for examination
by this method.
2.3.3 Hydrogen Embrittlement. The various wastes expected to be processed by this
technology include compounds containing oxygen, chloride, ammonia, sulfate , fluoride
phosphate and carbonate.23 The materials technology developed for sour gas (H 2S)
wells is therefore beneficial in analyzing the effect of exposure to this potential
hydrogen rich environment. One material in common use in these wells is Hastelloy
C-276 which is also a material of construction of many SCWO reactors24 . This
material has demonstrated susceptibility to hydrogen embrittlement. Of particular note,
with increased cold working, and subsequent heat treatment, the susceptibility of the
material to hydrogen embrittlement increases. 24 The redistribution of impurity
elements (phosphorus) to the grain boundaries during heat treatment, results in and
increased susceptibility to hydrogen embrittlement. Since the temperatures
encountered in SCWO reactors are at or above the aging temperatures (149 - 482'C)
examined by Berkowitz 24, any cold working of the reactor piping would in effect
increase its susceptibility to hydrogen embrittlement in a similar environment. In
related studies of another high nickel based alloy(MP35N), the effects of migration of
impurities to the grain boundaries could be reduced by heat treatment at higher
temperatures (732 - 816'C) than experienced in SCWO reactors.25
34

Cold work and heat treatments thus plays a significant role in the susceptibility
of these materials to hydrogen embrittlement. Of note, these tests were conducted at
room temperature. Normally effects of hydrogen embrittlement are reduced at elevated
temperatures as the diffusivity of hydrogen increases. Operating procedures in heat
up and cool down of the SCWO system would be significant in reduction of the risks
of this type of attack. In essence, the materials should be at a high temperature before
introduction of a hydrogen rich environment, thus reducing the effect of hydrogen
embrittlement.
2.4 Monitored Effluent Surveys
A majority of corrosion studies in SCWO reactors to date have been
monitoring of effluent streams for the presence of materials of construction of the
system. This method may help to determine whether a particular waste stream causes
corrosion, but it does not aid in determination of the mechanism of corrosion or the
portion of the system under attack. Table 2-2 lists some of the effluent monitoring of
SCWO reactions.
The presence of reactor materials in the effluent is not encouraging if
one desires a system that will last any significant period of time. The wide range in
reported values is somewhat misleading as neither the waste concentration or reactor
residence time is universally reported. Additionally there is very little correlation of
corrosion products in the effluent to a specific temperature of reaction. The results of
Buelow et. al. 27 detailed in table 2-3, present both the concentration of the feed stock,
the flow rate and the temperature of the reaction in addition to the chemistry of the
35

effluent. This data is helpful in identifying conditions which amplify corrosion rates,
but is not helpful in determining the mechanisms in which operate. In addition to
monitored effluent samples, many researchers note colored effluents, some with
particulate. 28 These qualitative findings help stress the need for further research
Reactor Material Waste Stream Effluent Sample Source
Hastelloy C-276 Ammonium Perchlorate Cr (130 ppm) Dyer, et. al., 1992400-600"C Mo (54 ppm) Reference 26
Ni (39 ppm)
Gold Lined 316 SS Ammonium Perchlorate Au (1622 ppm) Dyer, et. al. 1992Acidified 400-600"C Cr (3.36 ppm) (26)
Fe (65.38 ppm),._Ni (55.04 ppm)
Gold Lined 316 SS Ammonium Perchlorate Au (0 ppm) Dyer. et. al. 1992Alkaline 400-600"C Cr (0.99 ppm) (26)
Fe (0.99 ppm)Ni (3.73 ppm)
Inconel 625 Methanol Ni (none detectable) Rice et. al. 1993472-574"C Cr (0.07-.3 ppm) (10)
Inconel 625 Methyl Ethyl Ketone Ni (none detectable) Rice et. al. 1993445-568"C Cr (1.01 ppm) (10)
Inconel 625 Acetic Acid Ni (none detectable) Rice et. al. 1993441-533"C Cr (3.01 ppm) (10)
Inconel 625 Methylene Chloride Ni (30.7 ppm) Rice et. al. 1993447-570"C Cr (0.02 ppm) (10)
Inconel 625 Trichloroethane Ni (49.0 ppm) Rice et. al. 1993409-474"C Cr (0.55 ppm) (10)
Inconel 625 NaCI Ni (0.359 ppm) Armellini and Tester.Hastelloy C-276 Various Temperatures Cr (0.036 ppm) 1993 (15)
Mo (0.093 ppm)Fe (0.124 ppm)Nb (0.043 ppm)
Inconel 625 NaSO4 Ni (0.042 ppm) Armellini and TesterHastelloy C-276 Various Timperatures Cr (0.534 ppm) 1993 (15)
Mo (0.429 ppm) Represent AverageFe (0.017 ppm) Values of 15 runsNb (0.043 ppm)
Hastelloy C-276 Distilled Water Mo (4.80 mg/liter) Takahasi et. al. 1989450"C for 60 minutes Cr (6.75 mg/liter) (8)
Ni (2.60 mg/liter)
Hastelloy C-276 Ammonium Hydroxide Mo (18.1 mg/liter) Takahasi et. al. 1989and Acetic Acid Cr (11.5 mgfliter) (8)
450'C for 60 minutes Ni (15.0 mg/liter)
Hastelloy C-276 Human Waste Feed Mo (45 mg/liter) Takahasi et. al 1989400"C for 60 minutes Cr (8.4 mg/liter) (8)
_ Ni (7.4 rmg/liter)
Table 2-2 Effluent Samples of Various Waste Streams in SCWO reactors
36

into the corrosion mechanisms at work in this unique environment and have led to
more sophisticated specific corrosion testing.
Feedstock Flow Rate Tern "C Cr (ppm) Mo (ppm) Ni (ppm)
0.1 M Ammonium Perchlorate 2 ml/min 500 59 10 26
0.1 M Ammonium Perchlorate 4 ml/min 500 130 54 39
0.1 M Ammonium Perchlorate 8 m/min 500 101 48 35
0.1 M Ammonium Perchlorate 2 m/min 400 4.4 9.6 <0.4
0.1 M Ammonium Perchlorate 8 ml/min 400 1.2 3.8 <0.4
0.16 M Nitromethane 2 mi/mn 500 <0.4 <0.4 <0.4
0.16 M Nitromethane 8 mi/min 580 <0.4 <0.4 <0.4
Water 8 ml/min 580 <0.4 <0.4 <0.4
Table 2-3 Effluent Samples of Ammonium Perchlorate and NitromethaneFeedstock in Hastelloy C-276 Reactor. From Buelow et. al.27
2.5 Exposure Studies
Exposure studies in supercritical water oxidation reactors are difficult. Most of
the experimental work, even some of that devoted specifically to materials evaluation
occurs in plug flow tubular reactors with a relatively small diameter tubing as the
reactor itself.29 There simply is not enough room for standard sized exposure samples
in these types of reactors. There have been limited tests performed in larger reactors
many of them stimulated by the results of effluent samples of either analytical or
visual nature.
Brownish, and golden colored effluents indicative of ionic iron and chromium,
with some solid material present, prompted researchers to place long witness wires into
an operating SCWO reactor. The witness wires were removed after testing and cut into
pieces. Subsequently the surface of the wire was analyzed by various methods. The
witness wires were exposed to the environment in each of the three system areas and,
37

thus, provide an indication of the corrosion present in that section 8 . Table 2-4
summarizes the results of this experiment.
Wire Material Waste Material Section of Reactor Results
Inconel 625 Hanford Preheater Upper Temp Reduction in Nickel andZone Chromium concentrations and
deposition of Iron
Inconel 625 Hanford Reactor Inlet Deposition of Iran and feedsolution met,,
Inconel 625 Hanford Reactor Outlet and Dissolution of Chromium/Cool down Molybdenum
Inconel `25 Hanford/ NaNO, Preheater Upper Temp Dissolution of Chromium__ Zone
Inconel 625 Hanford/ NaNOG, Reactor Inlet Dissolution of Chromium- someIron deposition
Inconel 625 Hanford/ NaNO, Reactor Outlet and Dissolution of Chromium but toCool down a lesser degree
Hastelloy C-276 Hanford/ NaNO-, Reactor after Max Drastic dissolution ofTemp Molybdenum, Tungsten and
Chromium
Titanium Hanford/ NaNO, Preheater Upper Temp Chromium and NickelZone deposition
Titanium Hanford/ NaNO, Reactor Chromium and Nickel_ I _Deposition
Table 2-4 Corrosion of Witness Wires in SCWO Processing Stream. Bramletteet. al.28
These results indicate a change in surface composition within identifiable
regions of the reactor system. Since the Hanford waste simulant is a combination of a
variety of compounds (Appendix A), the mechanism of corrosion is difficult to infer.
Visual analysis was performed on the wire sections, but damage to wires as a result of
removal from the system masked some of the results. Most of the wires which
exhibited depletion were described by the author as being etched on the surface28,
indicating the possibility of some localized form of corrosion.
Standard corrosion coupons have been tested in SCWO reactors for limited
materials in some waste streams. Results from early tests on the MODAR bench scale
38
plant indicated no evidence of corrosion in the Inconel 625 and Hastelloy C-276
system after several hundred hours of operation in a variety of waste streams.
Prestressed coupons were exposed to chloride levels of 5000-10000 ppm by oxidation
of trichloroethylene, and then examined by microscopic and metallurgical methods.
Corrosion of the Inconel 625 reactor vessel was termed insignificant while
considerable corrosion was evident in the letdown region.' 3
Coupons of high grade alloys were tested in industrial sludge at the University
of Texas Center for Research in Water Resources 3°. A temperature profile up to a
maximum of 4570C within the reactor presented different conditions for the samples.
Twelve different combinations of sludge concentration, feed rate and oxygen
concentration were introduced to the single set of samples. Some samples were
removed after 67.5 hours as the system was opened for clearing of blockage. The
samples were subjected to heat up and cool down in each of the twelve runs. Table
2-5 summarizes the results of this test in which the maximum exposure time was 106.5
hours.
The table represents the maximum value calculated from six coupons of each
metal exposed to sludge at a range of temperatures from 2500C to 457°C. The weight
loss was determined following cleaning in a light acid solution with non-metallic
brushes. The author summarized the findings stating that corrosion rates were highest
in the hottest portion of the reactor. When analyzed in some detail, specifically for
Inconel 625, it is noted that the maximum corrosion rate was measured on a sample
placed in one of the coolest sections of the reactor, and that at the maximum
39

temperature, Inconel 625 had one of the lowest values of corrosion rate (-1.1 mpy).
Additionally, the characterization of pitting and crevice corrosion was only observed
on the points of attachment. For this experiment every point of attachment failed,
possibly due to multiple heat up and cool down cycles.
Alloy Corrosion Rate Types of Corrosion
SS 316 5.9 mpy Pittingi, Crevice
SS 316L 7.6 mpy Pitting. Crevice
2205 0.2 mpy Uniform. Crevice
20CB3 7.1 mpy Severe Pitting
C-276 1. 1 mpy Uniform
C-22 2.6 mpy UniformInconel 625 1.7 mpy Pitting, Crevice
Inconel 825 12.0 mpy Pitting. Crevice
G-3 6.5 mpy Pitting. Crevice
G-30 2.2 mpy Pitting. Crevice
Titanium Grade 9 0 None detectable
Titanium Grade 12 -0.2 mpv None detectable
Table 2-5 High Grade Alloy Corrosion Study Results. From Thomas andGloyna3°
These results indicate further analysis is needed even with this environment.
The high corrosion rate noted on a single sample of Inconel 625 in a lower
temperature region, contrary to the trends of all the other data, indicates the possibility
of an erroneous data point. In weight loss calculations, multiple samples in similar
environments would identify abnormalities as well as some statistical distribution.
Additionally, weight loss results with negative corrosion rates suggests that removal of
scale is not complete and these values should be questioned. Finally, characterizing
corrosion by weight loss when there is evidence of localized corrosion may be
40

misleading, as the actual penetration in the vicinity of the attack may be much higher.
A pitting factor would be appropriate to report as well in instances of localized
attack.' 6 (Figure 2-12)
Original
-------------------- surface
Pitting factor - --d
FIGURE 2-12 Sketch of Deepest Pit with Relation to Average Metal Penetration andthe Pitting Factor. From Uhlig, Corrosion and Corrosion Control. "6
Other corrosion studies have been conducted3', but the results are proprietary
and are not available for comparison.
2.6 Areas for further investigation. Based upon the research published to date, there
is a great need for investigation into the material properties in SCWO reactor systems.
Not only is a relatively large exposure vessel needed which can hold larger samples,
but also such a vessel needs to be dedicated to corrosion studies. Specific waste
streams at different temperatures as well as exposure times need to be examined.
Additionally electrochemical methods to determine polarization curves or provide other
data would be very beneficial. Finally Electrochemical Impedance Spectroscopy (EIS)
could help to characterize the mechanisms of corrosion if parallel exposure studies
were performed for validation of the results.32
41

Chapter 3
Experimental Apparatus
The experimental apparatus for this research was designed and constructed as
part of the project. The actual research is part of a larger corrosion testing program,
such that the design discussed here includes some equipment which has yet to be
tested. The overall corrosion testing program for SCWO at the Massachusetts Institute
of Technology will attempt to address the issues presented in the previous chapter of
this thesis. Specifically, when all systems are operational, D.C. electrochemical
measurements, as well as A. C. Electrochemical Impedance Spectroscopy (EIS) will be
conducted in the SCWO environment in addition to the companion testing in the
exposure autoclave currently in use. The SCWO environment includes a temperature
range of 25°C to 600'C as these temperatures are experienced in the operational cycle.
For discussion purposes, the exposure autoclave system will be addressed in detail,
then differences in the electrochemical system design will be mentioned separately.
As the goal is to have comparable environments for each of the systems, a majority of
the components are identical in the two systems.
3.1 Basic System Design.
For corrosion testing, a simple SCWO system was needed. The primary
purpose of the system is to determine the mechanisms and conditions leading to
corrosion of candidate materials of construction. A test system apparatus similar to
that currently employed in a salt study' 4, was chosen to achieve the required
conditions. Figure 3-1 is a schematic of the developed corrosion testing system.
42

Pros- So
?0tI@9141 .,e"$aet Cacke#hW
T] O-ev OrilTdvWVeter W Vter
I s aet t y.t tI t
*bottleICue~s~ae VqSS$4
t. ... re,•e,., 9., e lS~
FIGURE 3-1 Schematic of Exposure Autoclave System
The simplicity of the system becomes evident when compared with Figure 2-1.
The corrosion testing system does not have an oxygen source, a heat recovery' system,
or much of the effluent monitoring and processing equipment. For a laboratory'
apparatus, the requirement was for simplicity in construction and maintenance. The
design, procurement and testing of the system components required almost 15 months,
and reflects a majority of the effort of this project to date. Table 3-1 lists the
components of the system which will be addressed in this document. A complete
material list appears as Appendix B.
43
... ... ...

Exposure Vessel Tubing/Fittings Preheater
Heat Exchanger Heaters Pumps
Insulation Sensors Control System
Safety Features Sample Holder Support Systems
Electrochemical Equipment Omitted Equipment
TABLE 3-1 System Components
3.2 General Guidelines.
The corrosion testing loop was designed for ease of construction and
maintenance. A single material of construction, Inconel 625, was chosen, based
upon the high temperature strength characteristics, corrosion experience of other
researchers .1.13 , and availability of the material at a reasonable cost. The use of a
single material was desired to minimize the possibility of any galvanic action, and to
limit the effects of differences in thermal coefficient of expansion on fittings. For
certain applications, components were not manufactured out of Inconel 625.
Components of other materials were chosen, and the system designed to ensure that
such a component did not experience a high temperature, high pressure condition.
Additionally, to reduce the probability of leaks, the system was designed minimizing
the overall number of high temperature fittings. Unlike previous SCWO testing
schemes which require an operator, this system is required to function unattended for
long periods of time. For long term corrosion studies, even those of days in length, a
system which can safely be left unattended was required. Equipment previously
proven in the SCWO research environment was preferred, but as noted earlier,
research in the area has been limited, thus , some components are new to this application.
44

3.3 Exposure Vessel.
The exposure vessel is a modification of a design currently in use at MODAR
for testing of corrosion in the effluent section of the pilot scale reactor system.33 The
vessel, manufactured by REFLANGE Inc. of Houston Texas and designated as R-CON
4, is shown schematically as figure 3-2. The vessel has openings at both ends to
45 -0.625
•116x 4" • "*11/16 X 45"
56 Break
Break
FIGURE 3-2 Exposure Vessel Drawing
facilitate inspection, and if necessary, to marry to additional cylinder for an increased
internal volume capability. The wall thickness of the vessel is nominally 1.75 inches
with a constriction to 1.25 inches at the clamp seating surface. The vessel heads,
shown in figure 3-3, are attached with a double clamp assembly and four bolts.
Photographs of the vessel, the heads and the clamps appear in Appendix C for clarity.
The mechanical seal is made with a diamond shaped seal ring also made of Inconel
625. When assembled the vessel has an internal volume of 850 ml, and a total dry
45

weight of vessel, heads and clamps of approximately 180 pounds. Connections to the
heads at the top and bottom are with HF-6, % inch high pressure fittings
manufactured by High Pressure Equipment Corporation.
4.
H=F-T6=;[5]
3/8 INCHHiP FEMALE
FIGURE 3-3 Exposure Vessel End Closure
3.3.1. Vessel Design Calculations. The vessel was designed to operate in an
environment of 5000 psi (340 atm) at a temperature of 600'C. Stresses in the vessel
were calculated using thick walled pressure vessel theory.3' The resultant stress field
is three dimensional, therefore a Mises equivalent stress was calculated as the
maximum resolved stress3-. With a distinct possibility of corrosion requiring
machining of the vessel walls, a corrosion allowance was included. The following
calculations for the vessel were utilized to specify the system design.
46

Goo = P O -O=r = -PL-.(r)2 - 1]2•
r,
P = 5000 psi r. = 2.5 inches r= 1.25 inches t = 1.25 inches
(7ee = 8333.3 psi (Yz, = 2500 psi a,, = -5000 psi
Where a., is defined as the hoop stress, oa is the axial stress and a, is the maximum
radial stress which occurs at the inside vessel wall. The Mises stress is defined as:
CF= I~ f(O1., - Oa +(o, - o0)? +(a. - 088h9
CF.= 11577 psi
The yield strength of Inconel 625 at 600°C is 60000 psi.3 6 Thus the calculated factor
of safety is about 5. Additional calculations were performed to determine, with a
factor of safety of 4, that the corrosion allowance is .373 inches, almost % inch. Some
sample calculations appear in Appendix D.
In addition to failure by yielding, the vessel was designed to leak before
fracture. For analysis purposes, the worst case crack geometry of an elliptical crack
was assumed. The crack is one in which crack depth is the same dimension as half of
the major axis dimension. Figure 3-4 shows the crack geometry and a flaw shape
parameter."
47

0.5
0.4-oI,-
-- a/o,, = 0.4
i0.3 - aloo = 0.6-• . •-- a/o,, = 0.8 .
0.2 - a/oY, = 1.0 -
0.2
01wh~ere0 >2-0.2 12 (To)0.1 "
0.7 1.0 1.5 2.0 2.5
Flaw shape parameter, 0
FIGURE 3-4 Graph of Crack Geometry versus Flaw Shape Parameter. FromApplication of Fracture Mechanics 37
The a/2c parameter is 0.5 in this worst shape crack situation. The other
entering argument for this curve is the ratio of applied stress to the yield stress of the
material. The ratio in this case is 11577/60000 or 0.19. The value of Q from the
graph is 2.38. The flaw shape parameter, Q, is then converted to critical crack size
using the following equation. 7
K,, -1.1oj[_! 1]J/2 a = 29.89 inches
A lower end value of 80000 psi Fin was estimated for Kic of Inconel 625. The
actual value is probably much higher, but sample testing of tough materials is not
routinely performed." When compared to the wall thickness of 1.25 inches, it is
48

evident the vessel will leak long before a crack of 30 inches is formed. These
calculations demonstrate that the vessel is adequately designed and should a crack
develop, the vessel will leak before fracturing.
3.3.2 Vessel Testing and Certification. In order to meet Massachusetts Institute of
Technology Safety Office and insurance company standards, the vessel was required to
be tested. The vessel does not meet the size requirements for ASME code section
VIII, as: (1) the internal volume is less than one liter (2) there are no welded seams,
and (3) the pipe size is less than six inches 39; thus no state certification was required.
As there is no applicable code for the size and construction of the vessel, the insurance
company and, thus, the safety office, required that the vessel should be tested to the
satisfaction of those operating it. To meet this objective, the vessel was tested to
ASME CODE VIII section 1, as the requirements could be met. For the vessel to be
certified to 5000 psi (Pwoc)at 600'C, the maximum hoop stress (aee) must be less than
the code allowable stress at this temperature. The allowable stress is 19,300 psi 36
(aco. 600c) at this temperature, and the maximum hoop stress is 8333.33 psi. T,- ting
was accomplished at room temperature where the maximum allowable stress is 25000
Psi 36 (GCnaow mom crmp). The test pressure was determined by the ratio:
TestPrewire = lallow roe m,.p.,c = 25000 5000 = 6477
Gl,• 6W0¢ 19300
The limiting component for this vessel is, in fact, the closure clamp assembly which
has an allowable vessel pressure at room temperature of 6480 psi.Y4
The vessel was tested at Thielsch Engineering, Inc. in Cranston Rhode Island
49
on 15 December 1993, with no noted leakage. Coupled with additional safety features,
the vessel and system was certified for use by the MIT Safety Office on 19 January
1994.41
3.4 Fittings and Tubing Selection.
An extensive search for available Inconel 625 tubing revealed it would have to
be manufactured to order. This significantly increased the cost, as all companies have
a minimum order requirement to mill a specific lot of tubing. Seamless tubing was
required to minimize the possibility of corrosion at the welded seams. An outside
diameter of 0.125 inches and a wall thickness of 0.040 inches were selected. The
maximum tubing size considered was 1/4 inch because of the need to be able to bend
the tubing into a coiled preheater heat exchanger within the lab. When comparing 1/6
inch tubing and fittings to ¼/4 inch components, the cost differential was significant,
which was an additional factor in the ultimate selection of the 1/a inch diameter. A
single tubing size was needed throughout the exposure system, and the concurrent
search for a pump selected one with discharge fittings I/a inch outer diameter.
Smaller diameter tubing was not considered sturdy enough for the exposure testing
system. The maximum inside diameter was selected to allow for a corrosion
allowance given recent experience with preheater tubing failure. 2
The fittings chosen for the system are of High Pressure Equipment design and
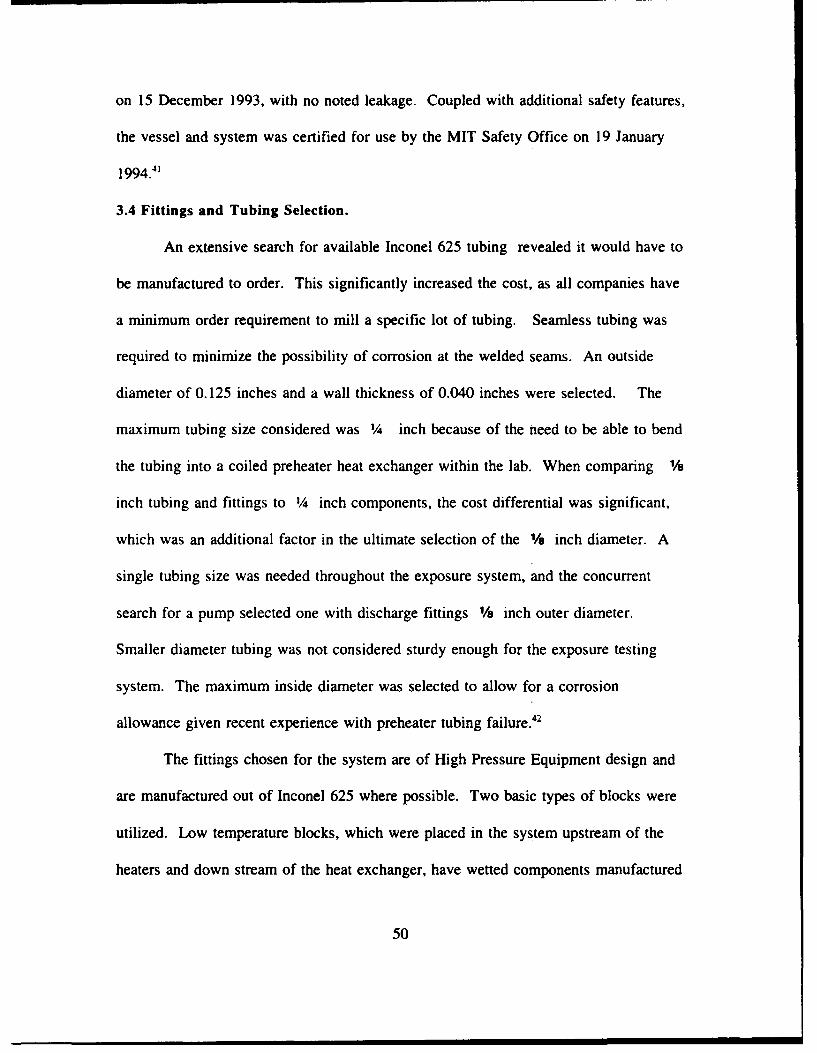
are manufactured out of Inconel 625 where possible. Two basic types of blocks were
utilized. Low temperature blocks, which were placed in the system upstream of the
heaters and down stream of the heat exchanger, have wetted components manufactured
50
of Inconel 625, with the remaining parts manufactured of 316 stainless steel to reduce
cost. High temperature blocks have both wetted and non wetted parts constructed of
Inconel 625 to minimize the effects of differences in thermal expansion. Rather than
have a series of adapters to attach the various inlets to the blocks, each block was
specially designed and ordered for the application. This, in fact reduced the cost, as
all parts would have been special ordered because of the required material of
construction. Figure 3-5 is a schematic of the low temperature fitting, while Figure 3-
6 is a schematic of the high temperature fitting.
A D
A A 2# A jA
BcLe gend
1 112'- A - 1/8" R;P FemateB - 3/8' HIP FemaleC - Safety HeadD - 1/4 NPT Femaie
FIGURE 3-5 Low Temperature Block FIGURE 3-6 High Temperature Block
Inlet and outlet fittings for the reactor are % inch High Pressure Equipment
fittings vice %, inch. This larger size was selected due to concern for possible
blockage in the Me inch tubing from salt deposits after introduction of the corrosive
into the system. These deposits are anticipated due to the reduction in solubility of
ionic compounds at supercritical conditions. The % inch High Pressure Equipment
51
type seal housing was machined into the vessel heads.
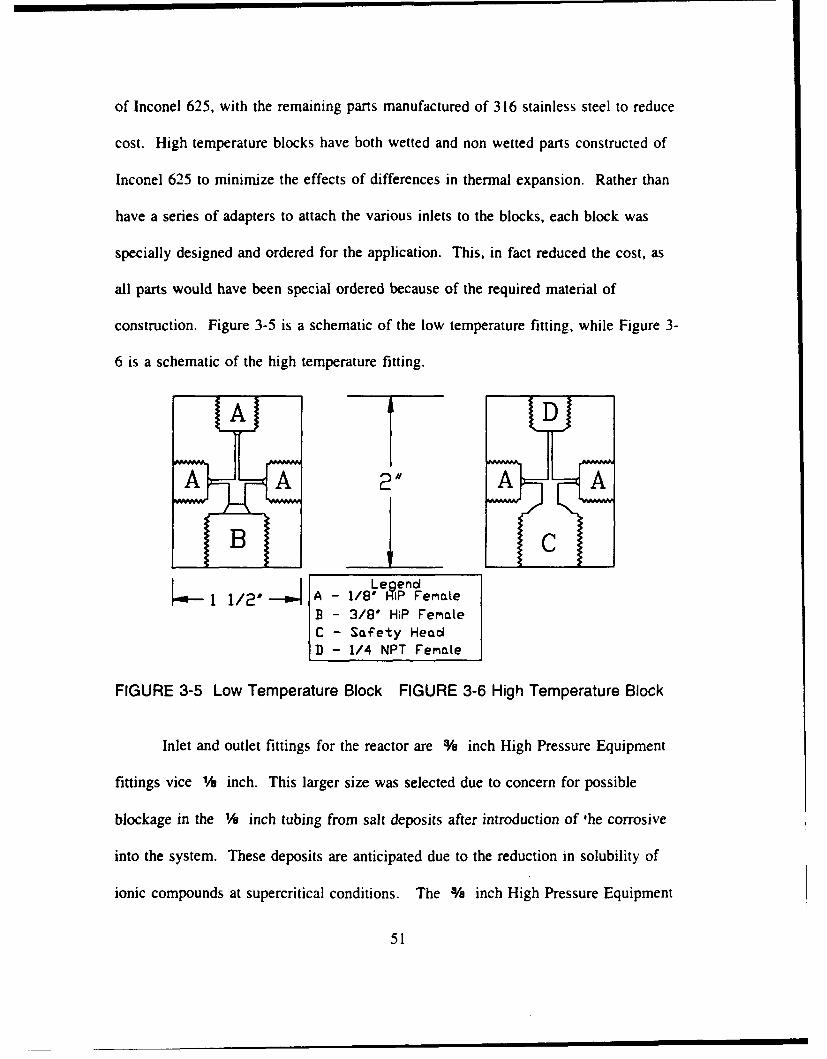
The ends of the tubing were coned and threaded using High Pressure
Equipment dies and SULFLO8 cutting compound. The mechanical seal is made by
threading a collar over the end of the tubing and then tightening a backing nut into the
threaded portion of the fitting. 'or the low temperature fittings, the collar and backing
nut, which experience no liquid, are manufactured out of 316 stainless steel. Figure 3-
7 is a schematic of the mechanical seals.
COLLAR
G/ LAND TUBING
FIGURE 3-7 Mechanical Seal Detail
3.5 Preheater
To raise the temperature of the water feed from ambient to maximum
temperature conditions, a preheater is utilized. The preheater was fabricated by rolling
a 24 foot section of 1/a inch tubing around a cylinder on a slowly turned lathe. The
resultant coil was then checked to ensure it fit inside the radiant heaters. Elastic
52

deformation of the Inconel 625 material was significant, such that a coil wound around
a four inch cylinder, expanded to five and one half inches upon removal. The wound
coils were then subjected to a post cold working heat treatment of 1725°C for 15
minutes and then a vacuum cooled by Hooven Metal Treatments Incorporated of
Ipswich, MA. The heat treatment was performed because of prior knowledge of
increased corrosion rates in high nickel alloys following cold working2l25.
3.6 Heat Exchanger.
The system does not attempt to recover any of the heat from the heaters or the
destruction process. Commercial applications of this technology would naturally
require a heat recovery system for reduction of costs. For corrosion studies,
preheating the water inlet with reactor effluent added complexity to the design. A
regenerative heat exchanger would have required an additional size of tubing for the
shell, and would have required a high pressure, high temperature seal of the outer
tubing to the inner tubing. Experience with regenerative heat exchangers in operating
nuclear power plants, indicates this arrangement would lead to reduced system
reliability.
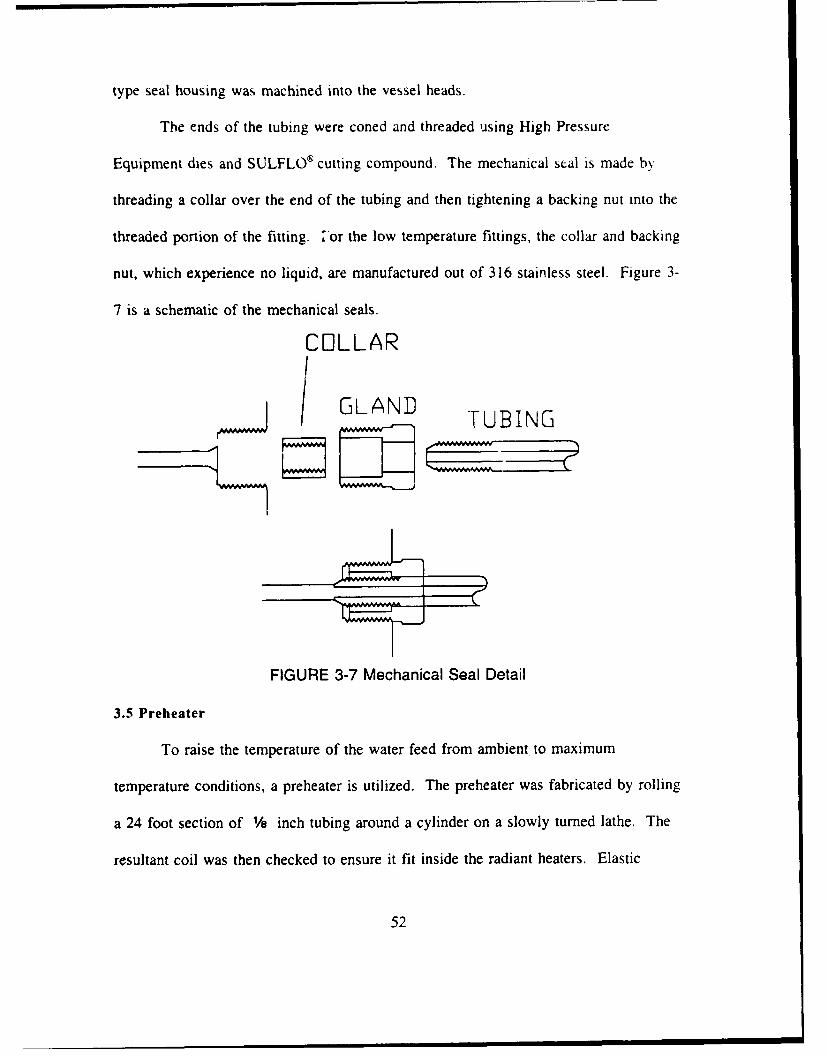
The cool down heat exchanger used in the system was manufactured with %
inch stainless steel tubing and Swagelok® mechanical fittings. Swagelok® fittings are
acceptable as the pressure of the cooling water supply is only that of the building
chilled water system. Bored through, reducing fittings allow a mechanical seal on the
outside of the '/b inch Inconel 625 tubing. Both ends of the heat exchanger are
formed by % inch union tees allowing cooling water to flow around the hot discharge
53
piping. A detailed drawing of the heat exchanger appears as Figure 3-8. A throttle
valve was added to the building chill water supply outlet :o allow control of flow and
thus temperature of the system outlet.
11S INCH TO 3/S INCHZORED THROUGH 3/9 INCH
REDUE SWAGELREDUCERUNION TEES
NOTTLET
CHILL WATER OUTLETINLET
FIGURE 3-8 Heat Exchanger Detail
3.7 Heaters.
The heaters are placed around the preheater tubing and around the vessel. The
heaters are Omega ceramic radiant heaters. The preheater is cylindrical and rated at
1350 watts, up to a temperature of I 100"C. To ensure the preheater tubing coil does
not touch the heating elements, strips of insulation were cut and placed at the four
quadrants of the heaters. Contact with the heater would cause the elements to short
out. The coil diameter is slightly larger than ideal for the heaters due to the spring
back of the coil following bending mentioned previously. The vessel heater consists
of two semicylindrical sections rated at 950 watts each. The inside diameter of the
heater pair is seven inches allowing for the ideal distance of 1/2 inch from heater
element to heating surface."3 All heaters are supplied with 220 volt AC from the
building power supply. Appendix C contains photographs of the heating elements.
54

3.8 Pumps.
The pump in the exposure system is a three head HPLC (High Pressure Liquid
Chromatograph) model manufactured by Eldex Inc. Three inlet and outlet ports are
equipped with % inch Swagelok stainless steel fittings. The outlet fittings are
connected to the Inconel 625 tubing. The pump is a positive displacement pump with
adjustable stroke pistons. Each piston has a micrometer with a locking ring for
accurate control of output volume per stroke. The maximum capacity of the pump is
100 ml/min. Pump wetted parts are manufactured of 316 stainless steel with Kel-FI
seating surfaces. Two pump outlets are combined into the inlet of the preheater.
These two pump heads are utilized for distilled water only. The third pump head is
configured for corrosive solution and the outlet is piped directly into the mixing block
just prior to the vessel inlet. A three way valve was placed on the outlet of one
pump head to allow for rapid depressurization of the system, if necessary, from outside
the vessel enclosure. The pump power supply is 120 volt AC from the building power
supply. Appendix C contains photographs of the pump connections.
3.9 Insulation.
To minimize heating losses, reduce electrical costs, and reduce temperature of
the shielded enclosure, insulation was added to the system. Fiberglass tape is wrapped
around the reactor inlet piping and the inlet junction block. Insulating bricks form the
pedestal on which the preheater rests. Ceramic fiberboard is used under the vessel,
and as a support for the vessel heaters. The remainder of the heated portions of the
system are wrapped with one to three inches of Kaowool® ceramic fiber cloth.
55

Photographs in Appendix C detail some of the insulation. Though necessary for heat
loss considerations, the insulation made it difficult to discover leakage locations
during the initial testing and subsequently during experiments.
3.10 Sensors
The requirement to maintain the system unattended lead to the selection of
pressure and temperature sensors. Sensors were selected with voltage outputs which
can be converted to digital signals for computer processing. The potential for plugging
of the system,",'"' led to three pressure sampling points. Temperature is sampled
inside the reactor, at the outlet of the preheater, and against the outer wall of the
exposure vessel. Leads of up to 15 feet in length are required to provide signals to the
read and control circuitry as it was placed in the adjacent room for safety
considerations. The signals are scanned and converted to temperature and pressure
readings by LABVIEW® a computer instrument developed by National Instruments
Corporation.
3.10.1 Pressure. The pressure transducers are a model PX613 manufactured by
Omega Engineering. A separate 24 Volt DC unregulated power supply is required for
excitation of the transducer. With excitation, the output voltage ranges from 1 to 5
volts corresponding to 0 to 5000 psi. Detectors were chosen with volt range output
vice current or millivolt output to minimize the impact of electrical noise on the
signals from the nearby power supply voltages of the heaters and pumps. The
detector is connected to the power supply and the scanning circuitry by a 4 pin twist
type connector and 4 wire cable. A schematic of the electrical connection appears in
56

Figure 3-9. (Note: one of the wires in the cable is not utilized). The maximum
working temperature of the detectors is 80'C, such that low temperature fluid is a
necessity. The low temperature junction block fittings have one port machined with a
1/4 inch 18 National Pipe Thread (NPT) female connection. The pressure sensor has
male V/ NPT threads. A pressure snubber is installed between the junction block and
the pressure detector to minimize fluctuations due to the pulsing of the positive
displacement pump. The wetted parts of the pressure transducer are made of 17-4 PH
and 300 series stainless steels. Signals produced by the transducers are scanned by
the LABVIEW® software and then converted to pressure output signals.
24 VDC + RED (+EXC) AUNREGULATED - WHITE (COMMON) D OMEGAP OWER
D-O EG
SUPPLY PX613GREEN (+OUTPUT) B TRANSDUCER
INPT/INSTOUT UTAMUX64T i
on ULTI-
Cuab PLEXER
FIGURE 3-9 Pressure Detector Sensing Circuit
3.10.2 Temperature. The temperature detectors are the 1/16 inch K type, chromel-
alumel subminiature thermocouple manufactured by Omega Engineering. The selected
thermocouples are ungrounded and have an Inconel 600 sheath. The K type
ivermocouple was selected because it covers the temperature range of -200°C to
1200"C, and for commonality with other projects in the SCWO research initiative.
Ungrounded thermocouples were selected for improved accuracy and compatibility
with the data acquisition system. High temperature block fittings provide junctions for
57

the thermocouple adapter fittings. The thermocouple at the preheater outlet is
positioned in one of the side ports of the lower block. It extends to the center of the
block. The thermocouple at the top of the vessel passes through the high temperature
block, and the % inch tubing into the top of the pressure vessel. To clear the sample
holder this thermocouple is positioned slightly off center. High Pressure Equipment
thermocouple adapters provide the pressure seal around the thermocouple sheath. The
vessel external thermocouple was installed after commencement of operations due to
concern that the exterior of the vessel may be reaching excessive temperatures.
Millivolt signals are carried by chromel/alumel thermocouple wire through the Lexan®
shielding to the input of the read and control computer. The voltage output of the
thermocouples is amplified, scanned and converted to temperature readings by the
LABVIEW® software package.
3.10.3 Sensor Output Processing. The voltage sensors for the three temperature and
three pressure instruments are connected to an input/output board on a Macintosh® IIvx
computer via a multiplexer board which quadruples the number of input signals that
an be processed. The thermocouple output is in millivolts such that the signal is
amplified by the software prior to processing. The pressure signal requires no
amplification. The signal processing is a series of virtual instruments assimilated
specifically for this application.
LABVIEW® software allows the user to interactively create virtual instruments
for a wide variety of uses. The virtual instrument is one developed within the
software using a icon driven menu. The software can display a front panel with
58

desired information. Additionally, the software can show signal flow paths in wiring
diagrams. In the SCWO sensor system, the temperature read virtual instrument is a
modification to a sample instrument provided with the software. The pressure read
instrument, however was developed from basic components. Schematics of the
software virtual instruments developed for this project are included as Appendix E.
The thermocouple processing is automatically temperature compensated by a
temperature probe on the multiplexer board. The temperature output is an average
reading of sixteen samples read over a 100 millisecond period. The output of the
temperature instrument is an input to an alarm circuit, a heater control circuit and a
system shutdown circuit.
The pressure readout is an average of 10 successive pressure signals over a 100
millisecond period. The otitput of the pressure instrument is an. input to an alarm
circuit, a pump control circuit and a system shutdown circuit. The alarms of the
individual temperature and pressure monitoring points appear as a red light on the read
out panel and an audible alarm. The frequency of the audible alarm was progranu-ned
to provide a different tone for each of the different alarm conditions to aid in
recognition.
3.11 Control
Primary pressure control of the system is provided by a back pressure
regulator at the low temperature outlet of the system. Temperature control is provided
by control virtual instruments developed in the LABVIEWO system. Backup pressure
control is provided by virtual instrumentation in LABVIEWO as well. Individual
59

pressure and temperature controllers were considered, but with the total number of
sensing functions required for both the exposure and electrochemical corrosion testing
loops, and the control functions desired, the LABVIEW® system was in fact less
expensive, and provides data recording functions as well as control functions.
3.11.1 Back Pressure Regulator. Pressure is controlled by an adjustable back
pressure regulator at the exit of the cool down heat exchanger. A TESCOM model
26-1722 rated up to 6000 psi is installed. The wetted parts of the back pressure
regulator are 300 series stainless steel with Kel-F-81® seats. Both the inlet and outlet
are 1A inch - 18 NPT female threaded ports. A Mb inch high pressure fitting to ¼14
inch NPT adapter made of Inconel 625 provides the transition into the back pressure
regulator. The outlet port is a ¼/4 inch NPT to % inch Swagelok® adapter made of
316 stainless steel. The remainder of the discharge piping is 316 stainless steel. The
back pressure regulator is directly mounted to the Lexan® protective barrier with the
valve bonnet and control screw accessible from the side of the enclosure. A locking
nut is also installed to secure the position of the control screw.
3.11.2 Temperature Control System. A virtual instrument was c. ,eloped on the
LABVIEW® software to control the temperature. Control signals from the software are
sent via a digital input/output board to a relay board. The relays provide a power
path for 220 volt AC current to the heater elements. The preheater outlet temperature
is compared to a preheater control set point. If the temperature is lower than the
setpoint, a signal is sent to maintain the preheater relay closed. If the temperature is
higher than the setpoint, the signal opens the relay. To prevent rapid cycling of the
60

breaker, once the setpoint is reached, the rei;ys will not reclose until a temperature
drop of 20'C is sensed. The vessel heater circuit is similar except both the clamshell
heaters work together based upon the internal vessel temperature. The vessel heaters
also only have a 3 'C temperature drop for the heaters to re-energize. The large
vessel and large internal volume is such that even with only a 3°C temperature drop,
the cycle time (heaters off until next cycle of heaters off) is about 30 minutes. The
temperature overshoot past the setpoint is insignificant on the preheaters, and is 2-3°C
with the vessel heaters. The temperature response lags as well once the heaters turn
back on such that the total cycle temperature band of the vessel is only 7-9°C.
3.11.3 Backup Pressure Control. Should the back pressure regulator fail, a
LABVIEW® virtual instrument was added to secure the pump if the pressure exceeds
an operator selected setpoint. The control mechanism is similar to the heaters except
the relays control the 120 volt power to the pump. This is not the preferred method of
pressure control because the pump cycling on and off reduces both relay and pump
life; however, the backup system allows the corrosion test facility to remain
operational before reaching a pressure shutdown criteria. The pressure control setpoint
is normally 150-250 psi higher than the desired back pressure regulator control
pressure. During the heat up cycle, at high pump flow rates, the pressure excursion at
the pump outlet occasionally causes the pump to cycle off momentarily. Unlike the
temperature circuitry in which a cycle band is present to prevent rapid cycling of the
relays, no pressure band was placed in the pump control circuitry. During the sensing
interval of 1 second with the pump secured, pressure is reduced rapidly such that the
61

pump would come back on even with a control band. As this is not the primary
means of pressure control, the complexity of the circuit is not necessary. Detailed
schematics of both the pressure and temperature LABVIEW® virtual controller
instruments appear with the other LABVIEW® instruments in Appendix E.
3.12 Safety Features
A primary concern of the design of the system was operator and equipment
safety. The large internal volume at high temperatures and pressures contains a
significant amount of stored energy. Rapid release of this energy could seriously
injure the operator or destroy the equipment. Safety of the system is a multilevel
approach. The system design was conservative, in fact over designed in many
components. The LABVIEW® system was programmed with system shutdowns when
operator selected setpoints are reached. A safety head pressure relief system is
included should other systems fail to control the pressure. And finally the system is
surrounded by a high strength Lexan® shield.
3.12.1 Component Design. As mentioned in many previous descriptions, most
components are designed for larger stresses than should be experienced in the system.
Specifically, even with a safety factor of 4, the vessel still has a corrosion allowance
of % inch. The vessel is designed to leak before fracture. All high pressure fittings
are rated to at least 30,000 psi. The tubing has been tested to 11000 psi. The back
pressure regulator is rated to 6000 psi. The pumps and pressure detectors are only
rated to 5000 psi (340 atm), but the maximum pressure expected in the system is about
4400 psi (300 atm).
62
3.12.2 LABVIEW® Control Shutdowns. A temperature signal greater than an
operator selected setpoint will shut down both the heaters and the pump. If a
shutdown condition exists, a subsequent reduction in the temperature signal will not
cause the heaters or pumps to restart. This programming was incorporated to prevent
the system from coming back on and causing system damage by cycling back to a
shutdown condition. Normally the operator selected high temperature shutdown is set
at 550'C as read on the vessel internal and preheater temperatures. The external vessel
temperature sensor was installed for information only and is not part of the high
temperature shutdown circuitry. A high pressure shutdown is also included. It is
normally set 200 psi lower than the pressure at which the burst disks will rupture, and
controls both the pumps and the heaters. A low pressure shutdown was added after
the initial test run. If a leak occurs in the system, which unfortunately has occurred,
the pressure is rapidly reduced to the saturated conditions for the temperature of the
fluid. To ensure the system shuts down in the leak scenario, during the startup once
the system is at operating pressure, the operator depresses a button on the virtual
instrument front panel which activates the low pressure shutdown. Depending on the
operating temperature, the amount of pressure drop necessary to cause a shutdown can
be adjusted. The drop is normally 1000 - 1500 psi below the operating pressure, such
that small pressure fluctuations will not cause a shutdown. To alert the operator to a
potential problem, audible and visual alarms on the front panel are initiated based
upon proximity to the shutdown alarm setpoints. Thus, the pressure alarms sound
when within 100 psi of the shutdown condition, while the temperature alarms sound
63
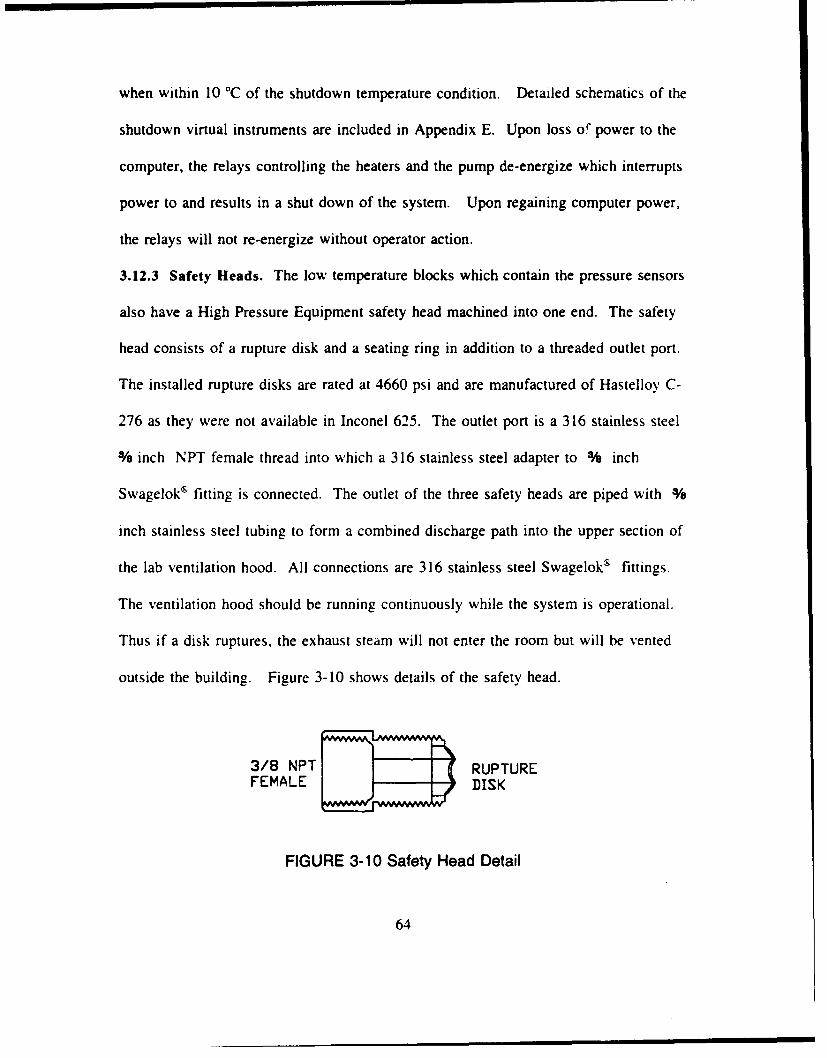
when within 10 'C of the shutdown temperature condition. Detailed schematics of the
shutdown virtual instruments are included in Appendix E. Upon loss or power to the
computer, the relays controlling the heaters and the pump de-energize which interrupts
power to and results in a shut down of the system. Upon regaining computer power,
the relays will not re-energize without operator action.
3.12.3 Safety Heads. The low temperature blocks which contain the pressure sensors
also have a High Pressure Equipment safety head machined into one end. The safety
head consists of a rupture disk and a seating ring in addition to a threaded outlet port.
The installed rupture disks are rated at 4660 psi and are manufactured of Hastelloy C-
276 as they were not available in Inconel 625. The outlet port is a 316 stainless steel
% inch NPT female thread into which a 316 stainless steel adapter to % inch
Swagelok® fitting is connected. The outlet of the three safety heads are piped with %
inch stainless steel tubing to form a combined discharge path into the upper section of
the lab ventilation hood. All connections are 316 stainless steel Swagelok' fittings.
The ventilation hood should be running continuously while the system is operational.
Thus if a disk ruptures, the exhaust steam will not enter the room but will be vented
outside the building. Figure 3-10 shows details of the safety head.
3/8 NPT RUPTUREFEMALE Dw ISK
FIGURE 3-10 Safety Head Detail
64
3.12.4 Shielding. All portions of the system which contain high temperature, high
pressure fluid are surrounded by one inch of Lexan® shielding. This material,
sometimes referred to as bulletproof glass, provides a barrier to a projectile if one was
created during a casualty. The only high pressure component not inside the shield is
the HPLC pump due to the requirement to adjust the micrometer stroke controls during
operation. As the pump only experiences the low temperature fluid, it does not need
to be inside the shield from a safety perspective. The shielding consists of two layers
of 1/2 inch Lexan® panels which were cut from 4' by 8' sheets. The panels are
attached to framing with either I/2 inch bolts with nuts or with 5/16 inch bolts into
threaded angle fittings. The threaded fittings were utilized for the panels which are
routinely removed for access to the system. All panels could not be fastened with nuts
and bolts because when installing the final panel, the nuts would not be accessible to
hold while tightening. The panel routinely removed for access is 4' by 2' and has a
weight of 50 pounds. Penetrations through the shielding are limited to the holes for
the hold down bolts, back pressure regulator bonnet, pump discharge tubing, heat
exchanger cooling water supply, and the system discharge stainless steel tubing. All
power and control leads are introduced into the shielded area through the holes in the
framing. The shield is not pressure tight, nor is it required to be. The shield limits
projectile flight, and would knock down a stream of steam from a leak. The total
volume of the system is not such that steam in the room would be an issue.
The control system computer components are in the adjacent room separated by
a single layer of % inch Lexan® . Holes are drilled through this viewing window for
65

power and sensor leads. Normal operation of the system has the operator inside the
inner room only for adjustment of the back pressure regulator, pump flow rate, to refill
the fluid supply bottles, or to empty the collection bottle. Otherwise the operator can
observe and control all functions outside a total of 1 % inches of shielding.
3.13 Sample Holder.
The sample holder utilized is a modification to a design developed by Metal
Samples Incorporated . As Inconel 625 components were not available, the holder is
manufactured out of Hastelloy C-276. There are no welded parts, a requirement, given
the experience of welded sample holders of Thomas and Gloyna30 in industrial sludge.
The holder consists of two end plates separated by threaded rods covered by zirconia
insulators. A center threaded rod holds the samples, which are separated by '/a inch
zirconia washers. Both U-Bend and flat coupon samples can be supported by the
sample holder. If fully loaded, the holder can support 17, 1/6 inch coupons and I I
U-Bend samples. A smaller number of samples can be held snugly by using more
than a single spacer between samples. The sample holder sets into the vessel and rests
on the nuts holding the support rods. The end plates -are cutout such that only a small
section of metal remains for attachment of the support rods, and flow can pass without
difficulty. Figure 3-11 is a drawing of the sample holder assembly.
66

Insulator Detail4::End View
Sampte Detait (Insuators not shown)
U Coupons U-Bends
FIGURE 3-11 Sample Holder Assembly
3.14 Support Systems
The corrosion testing loop requires specific support systems and equipment not
only for operation but also for analysis of results. For the purposes of discussion. the
support systems are divided into four areas. Special equipment and tools were
required for the system. A special enclosure was constructed to support the testing
facility and protective shielding. The fluids utilized as a test medium have specific
equipment requirements for storage and analysis. Finally some unique equipment was
utilized in sample analysis which warrants more detailed description.
3.• 4.1 Tools Coning and threading tools were purchased for preparation of tubing
ends to make the high pressure mechanical seals. The strength, toughness and
hardness of the Inconel 625 alloy presented problems when trying to machine the
67
tubing. The dies and cutters degraded rapidly such that replacements were required
during the construction process. During operation of the system, leaks developed at
some of the unions due to temperature differences associated with the cool down. The
steam leaks resulted in damage to the mechanical seal seating surface. Reseating tools
were purchased to repair this damage. Finally, the closure clamps have a torquing
requirement of 160 foot-pounds, requiring purchase of a large torque wrench and box
end wrench to anchor the bolts when tightening..
3.14.2 Enclosure. Construction of a sturdy enclosure to hold not only the test
equipment but also the shielding was a significant part of the project. The enclosure is
a box 3 ft 7 ½2 inches wide and 5 feet long. The total height of the enclosure is 7
feet 1 inch. All of the supports are made of UNISTRUT", 1000 (1 % inch) channel,
except the top section which is 4000 series ( ¾ inch) channel. The channel is
connected with UNISTRUT® fittings to form two major sections of the enclosure. The
first section is enclosed by shielding, the second is open and holds the pump as well as
the supply and collection bottles. On first appearance there seems to be more space
than required, but room was provided for future growth if needed and the serviceable
temperature (180'C) of the shielding is such that it cannot be in close proximity to
any of the heated components. Figure 3-12 shows the details of the enclosure.
68

3/-7 i2"#
FIGURE 3-12 UNISTRUI Enclosure Detail
69

3.14.3 Fluid Support. Deionized water must be supplied to the pump suction. Due
to the length of time the system can run, the limitation on length of unattended
operation is determined by the size of the supply and collection bottles. To ensure
adequate Net Positive Suction Head (NPSH) to the pump, the supply bottles are placed
above the pump. This prevents difficulty in priming the pump on initial fill, and
allows gravity fill of the system as the pump does not prevent flow through when
secured. The supply containers are 20 liter Nalgene® bottles which are connected to
the '/a inch stainless steel suction tubing with % inch polyethylene tubing through
Swagelok® adapters. The bottles have shut off valves installed. The collection bottle
is also of the 20 liter Nalgene® variety. It is located under the discharge piping such
that the effluent is allowed to drip into it.
No sample analysis equipment has been installed in the effluent stream as in
many SCWO reactors. A Corning Model 340 pH meter was purchased for effluent
batch sampling. More detailed analysis have been performed for dissolved metal ions
by taking samples to the Massachusetts Institute of Technology, Industrial Hygiene
Laboratory.
3.14.4 Sample Support Equipment. The details of the procedure on sample
preparation will be described in the next chapter, but some of the specific equipment
utilized for analysis needs further explanation. The optical tools utilized to
characterize the nature of the surface of the samples include a fiber optic microscope
and a laser confocal light microscope. The fiber optic microscope, manufactured by
Hirox, provides a clear color image of the surface with magnifications up to 250 X.
70

The output of the microscope is connected to a digital color printer allowing rapid
recording of surface sample images. A drawing of components of the microscope is
included as Figure 3-13. The laser confocal microscope, manufactured by
LASERTECH, allows magnification up to 6000 X without surface preparation
requirements. The laser allows for precise focusing, and the controller has the ability
to scan a view and store the highest response for each pixel on the screen. In this way
the output is a composite image with each pixel in focus even though the surface may
not be smooth."r Additionally the microscope has the ability to determine depth while
scanning by correlating focus intensity to position of the lens. In this way a profile of
a surface can be obtained. A simple schematic of the laser focused microscope is
included as Figure 3-14.
VIDEO PRINTER TV MONITOR
113 oo0 0 1 I., o I
MAIN CONTROL BOX
FIBRE-CABLE MX 250ZLENS
FIGURE 3-13 Fiber Optic Microscope Components
71
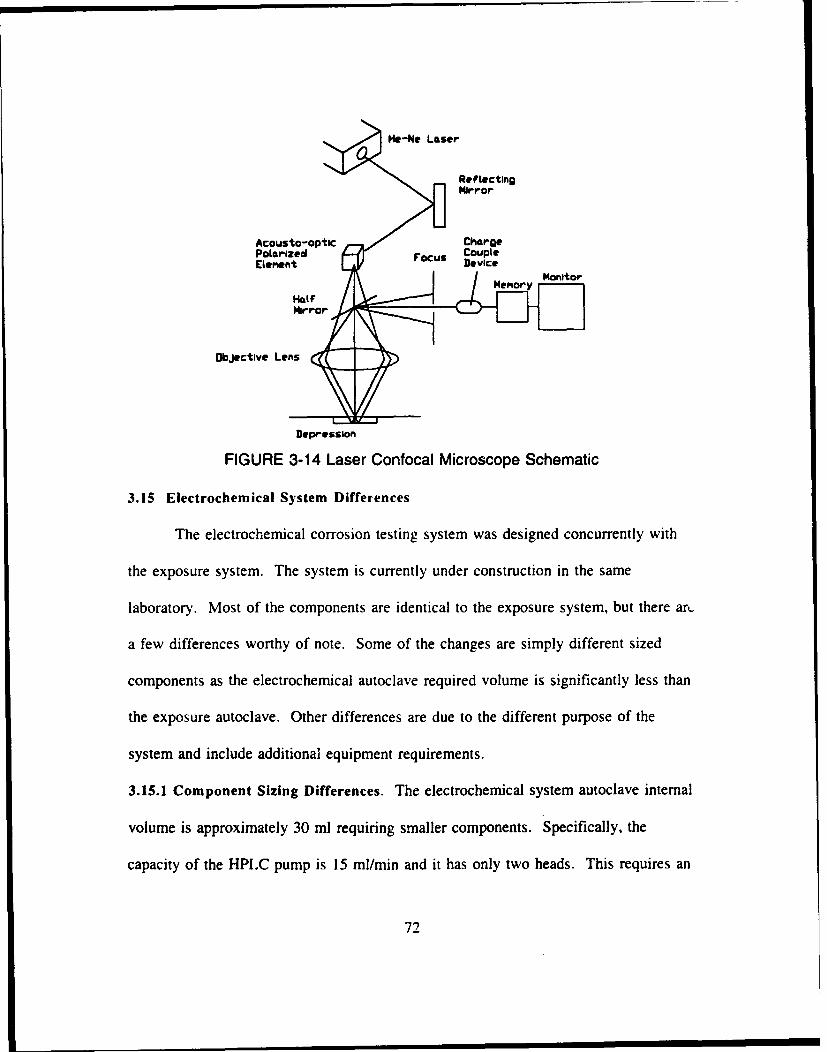
He,-No Latser
ReftectingMirror
Acousto-optic ChgePolarized Focus CoupleElement . D3evice
Objective Lens
Depression
FIGURE 3-14 Laser Confocal Microscope Schematic
3.15 Electrochemical System Differences
The electrochemical corrosion testing system was designed concurrently with
the exposure system. The system is currently under construction in the same
laboratory. Most of the components are identical to the exposure system, but there aru
a few differences worthy of note. Some of the changes are simply different sized
components as the electrochemical autoclave required volume is significantly less than
the exposure autoclave. Other differences are due to the different purpose of the
system and include additional equipment requirements.
3.15.1 Component Sizing Differences. The electrochemical system autoclave internal
volume is approximately 30 ml requiring smaller components. Specifically, the
capacity of the HPLC pump is 15 ml/min and it has only two heads. This requires an
72

adapter from the 1/16 inch outlet tubing to the '/b inch system tubing size. The
heaters required for the preheater are reduced to 900 watts and the vessel heaters are
reduced to 850 watts each. The reduced size of the autoclave also allows for
reduction in the shielding to 1/2 inch Lexan®, and the support structure is reduced to
4000 ( ¾/4 inch) series UNISTRUT®.
3.15.2 Different Equipment. The electrochemical autoclave is drastically different
from the exposure autoclave. The autoclave was designed by Dr. D. Bryce Mitton of
the H. H. Uhlig Corrosion Laboratory at MIT. It has connections for a reference
electrode, as well as a working electrode. Thermocouples are installed at the inlet
and outlet of the autoclave. The externally cooled reference electrode has been
developed at Penn State University4 5 for use in supercritical water power generation
plants in Europe. The electrochemical system also has additional analysis equipment
in a Sclumberger 1286 potentiostat and 1260 Frequency Response Analyzer for
pertormance of EIS. Sketches of the electrochemical autoclave and reference electrode
appear as Figures 3-15 and 3-16.
reermocoupLe InLet
Flow
ReferenceElectrode
Working
T _ _ _ _ _ _ _ _ _ _ - -Electrode
OutletFlow Counter Thermocouple
Electrode
FIGURE 3-15 Electrochemical Autoclave (Schematic of design by D. Bryce Mitton)
73

COOLINGrATER INLET
ELECTRICAL
S~ ZIRCONIA
REFERENCEPROBiE
COOLINGVATFR OUTLET
FIGURE 3-16 Externally Cooled Reference Electrode, developed from
Macdonald .
3.16 Omitted Equipment
The original corrosion testing system design is without an oxygen source,
although one will need to be added at a later time to allow a wider range of
environments to be studied. Dissolved oxygen in the feed water can be enough to
oxidize some waste streams without the added complexity and cost of an oxygen
supply."6 Testing of The SCWO process for waste destruction nominally monitors
the effluent for waste concentration to determine efficiency and adjust the operational
parameters of the system. The corrosion test system does not monitor the effluent for
residual of waste inlet. Only compounds for which destruction efficiency and kinetic
data are available will be tested in the corrosion loop. The only testing performed on
the effluent will be to determine the presence of metallic ions for indication of
corrosion, and to meet requirements for disposal.47
74
Chapter 4
Description of Experiment
The exposure autoclave is designed for long term corrosion studies. The first
series of experiments were initiated to test the operability of the system in addition to
testing some metal samples. The experiment basically consists of three distinct
procedures. Sample preparation, exposure and sample analysis.
4.1 Sample Selection and Preparation.
To demonstrate operability of the system, samples were selected of the three
materials of construction; Inconel 625, Hastelloy C-276 and 316 stainless steel.
Samples were provided free of charge from Haynes International but had to be
modified to fit inside the exposure vessel. Specifically, the provided samples, shown
in Figure 4-1, were 1/6 inches thick, 1 1/2 inches wide and 2 1/2 inches long. A weld
bead was present through the center of the sample, ond a % inch hole was drilled in
one end. Modifications to the samples to allow placement into the sample holder,
included stamping with a material identification code, cutting along the width and
drilling additional % inch holes. Figure 4-1 also contains the resultant sample size.
The cutting and drilling were accomplished in the Laboratory for Nuclear Science
machine shop. The final sample size is 1ka inch thick, ¾ inches wide and 1 '/2
inches long with a % inch diameter hole drilled in the center.
Prior to placement into the sample holder, the samples were prepared in
accordance with procedure G-4 of ASTM Standards 48 . The samples were hand
polished on a grinding wheel with 320 grit carborundum grinding paper. After the
75

initial two runs the finish was modified to 800 grit to reduce the interference from the
grinding lines during visual analysis. The samples were then measured with a
micrometer. Following polishing and measuring, the samples were cleaned in an
ultrasonic bath with ALCONOX detergent , Acetone and then demineralized water.
The samples were rapidly dried in forced air. Pre-exposure visual images were
obtained on some of the samples as a reference. The samples were then weighed with
a precision balance. After polishing, the samples were maintained in a desiccator
except for the small amount of time when being weighed, measured or photographed.
f.2--- 1/2'-- - -3/4 03/8'
11/2' 03/8" + i 1 1/2
03/8'j WELl -- '---3/4
ORIGINAL SAMPLE WITH TWO
SAMPLE CUTS AND ADDITIONALHOLE
FIGURE 4-1 Sample Initial and Final Configuration
For the initial test runs, the entire capacity of the sample holder was not
utilized. The samples were placed on the center rod of the sample holder separated by
three to five ceramic washers. Double nuts on the ends of the rod were tightened and
the sample holder immediately placed in the vessel.
76

4.2 Exposure Testing
To insert the samples into the exposure autoclave, some portions of the system
must be disassembled. The sequence of events following insertion of the samples
includes reassembly of the system, pressurization and heat up, exposure testing, cool
down and depressurization, disassembly and finally sample removal.
4.2.1 System Reassembly. When the samples are placed inside the vessel, the lower
head is already tightened to the required torque. The upper head is lowered onto the
vessel cautiously to ensure the thermocouple clears the sample holder. Ideally the only
connection broken between testing runs is the top head clamp assembly such that the
discharge piping is attached to the upper head when it is lowered onto the vessel.
Testing in more aggressive environments, however may require complete removal of
the vessel for adequate inspection between each sample run. The upper head is
torqued to thc required 160 foot pounds alternately on the four bolts. There is a
tendency for the clamp to get hung up on the angled exterior of the vessel; therefore,
the clamp must be tapped with a hammer to ensure the clamps are properly seated.
Once the clamps are in place, the system can be filled. The supply valves to
the pump from the deionized water source are opened and the LABVIEW® controller
is turned on with a control pressure set 150-250 psi above the target pressure for the
specific run. The pump will operate continuously until that pressure is reached. When
water appears at the discharge tubing, the system is full, and the back pressure
regulator is adjusted slowly until the desired pressure is reached. The lock nut is
tightened to prevent drifting of the back pressure regulator. As the lagging covers
77

indications of problems, the system is monitored for leakage before all of the lagging
is installed.
With the system satisfactorily operating at pressure, the clamshell heaters are
installed around the vessel. Installation prior to this time could cause damage to the
heaters especially during the torquing process, as the clearances are small and the
vessel moves slightly during tightening. The heaters should be approximately 1/2 inch
from the vessel and then connected electrically with spade type connectors. The
external thermocouple is placed at the upper end of the vessel against the wall and
held in place with the lagging. The remainder of the lagging on the top of the vessel
is then installed.
4.2.2 System Heat up The heater power cord is plugged into the 220 volt outlet, and
the LABVIEW® heater controller is set to the desired temperature on the preheater and
the vessel heaters. Proper operation of the heaters is verified by rising temperature on
the preheater outlet thermocouple and the exterior vessel thermocouple. Once proper
operation of the heaters is verified, the Lexan® shielding removed for access to the
vessel, is replaced and tightened down. The shielding should be in place before
temperature in the vessel exceeds 100 TC so that an unobstructed steam jet would not
be released into the room should a failure occur. Cooling water to the heat exchanger
is initiated prior to vessel temperature reaching 80'C, to protect the pressure sensors
and back pressure regulator. The temperature of the effluent is maintained cool by
controlling the flow of the cooling water.
78

The system heats up to operating temperature without required action from the
operator. Effluent flow rate can be monitored, but it is not accurate during the heat up
due to the changes in density of the fluid. Once the system is cycling around the
desired temperature, the level in the collection bottle can be monitored to determine a
flow rate. A discrepancy between this value and the flow rate from pump piston
micrometer settings can be an indicator of leakage in the system.
4.2.3 Exposure Testing Once the system is at temperature, the flow of the corrosive
fluid can be initiated. Since there is a volume of distilled water which must be
displaced, the actual time of initiation of the corrosive media is calculated based upon
pump flow rate and volume of the system upstream of the exposure vessel This
method may not be exact, but with testing runs which are days in length the error
becomes insignificant. Similarly, at the end of the run once the corrosive is secured,
the system is operated long enough to purge the system prior to commencing the cool
down. The only action required of the operator once at temperature is to monitor the
level of fluid in the supply bottle and the collection bottle. Depending on the flow
rate, the system has been left unattended success-",.y for periods of up to 44 hours.
4.2.4 Cool down and Depressurization. The cool down is the most critical portion
of the operational cycle. Temperature gradients can cause differences in thermal
expansion, resulting in mechanical seals failing to hold pressure. This condition was
experienced on two occasions in the proof testing phase and was remedied by
maintaining the preheaters energized for portions of the cool down cycle. To
commence cool down, the control setpoint for the vessel heaters is reduced to 0 'C.
79

The controller for the preheaters is adjusted as necessary to prevent temperature
differences of 100'C from developing between the vessel and the preheater outlet. In
this way cold water is not pumped into the vessel, causing the inlet fitting to leak.
Once the temperature of the vessel is less than 1000C, all heaters are secured,
and the 220 volt receptacle is unplugged. The Lexan® shield is removed and lagging
and the clam shell heaters are carefully opened up to expose the vessel to additional
air. The suction hose from the ventilation hood can also be rigged to evacuate the air
around the vessel. This helps significantly in reducing the temperature of the vessel.
When the vessel temperature is less than 80 °C the pressure is relieved by setting the
control pressure to 0, switching off the pump, and fully opening the back pressure
regulator. The pump must be shut off because the pressure instruments sometimes
register negative pressure when the system is at ambient, and the controller would turn
the pump on if the switch was not turned off.
4.2.5 Disassembly and Sample Removal. Once the vessel temperature is less than
about 45 'C and lagging and the clamshell heaters are removed, the upper head
clamps can be removed and the vessel upper head removed. The thermocouple
adapter fitting is also removed to allow the vessel head to be placed on a platform
adjacent to the vessel. The sample holder is removed from the vessel without draining
the standing water. To minimize exposure to the atmosphere, the samples are
immediately removed from the sample holder, dried using forced air, and then placed
in sample boxes inside a desiccator. The samples, and sample holder are handled with
rubber gloves or plastic forceps at all times to maintain cleanliness
80
4.3 Sample Analysis Techniques
The samples are analyzed by weight loss and visual methods. For the initial
operability testing, weight loss measurements were taken but no attempts to remove
corrosion products were conducted, though they may be in future testing. The visual
evaluation is by multiple means.
The appearance of the samples with the unaided eye was roted and recorded
with a r'amera. The samples were then examined with the fiber optic microscope
described *n the previous section. The laser confocal microscope was then utilized to
examine specific areas identified in the previous examinations. -A profile map of areas
of concern was utilize the level of the surface. A light microscope was also utilized to
obtain more detailed photographs of some of the samples as the video printer
associated with the laser and optical microscopes does not present the same detail.
Finally specific samples were mounted in epoxy and examined in cross section to
determine the nature of the surface layer.
81

Chapter 5
Experimental Results and Discussion of Results
The exposure autoclave system achieved supercritical conditions at 1230 on 2
March 1994. No samples were in the vessel during this initial cycle, and only
deionized water was utilized. The system operated well and reached conditions of
500°C at 3550 psi (241.5 atm). An initial series of tests in deionized water at three
temperature regions was conducted to demonstrate the functionality of the system and
develop a methodology for sample preparation and evaluation. The three temperature
regions were chosen to represent the subcritical (300'C) range, the low supercritical
(400'C) and the higher supercritical range (500'C). Table 5-1 details the conditions
for the testing sequence.
Run No. Temp Pressure Samples Flow Medium Duration
I 5000C 341.5 atm Inc 625 8 ml/min DI Water 96 hoursC-276
316 SS
2 300'C 341.5 atm Inc 625 8 ml/min DI Water 96 hoursC-276
316 SS
3 4000C 341.5 atm Inc 625 8 ml/min DI Water 24 hoursC-276
316 SS
Table 5-1 Sample Testing Conditions
The third run was truncated from the desired 96 hours due to development of a steam
leak at the high temperature block at the vessel inlet which subsequently required
repairs.
82

5.1 Visual Observations
The overall general appearance of the samples was noted following removal
from the vessel. All samples displayed some degree of discoloratinn with marked
changes at the area around the insulating washer. Table 5-2 details the results of the
visual observations of the samples.
Run Material Visual Observation
1 Inconel 625 Patchy bronze colored appearance over exposed region, areaunder insulator washer is not as dark in color.
1 Hastelloy Greyish uniform appearance over the entire exposed surface.C-276 Area under the insulator is somewhat lighter and shinier.
1 316 SS Surface has a blue tint. Area under the insulating washer isshiny.
2 Inconel 625 Very Patchy bronze colored surface, area under insulatingwasher is still shiny similar to conditions prior to exposure.
2 Hastelloy Grey appearance over exposed surface, with shiny area underC-276 insulator.
2 316 SS Surface has a blue tint with many splotches of brownishcolor, the area under the washer is not as shiny as pre-exposed metal.
3 Inconel 625 Relatively uniform bronze colored surface with slightly lighterand shiny area under the insulator.
3 Hastelloy Milky grey uniform appearance over the entire exposedC-276 surface. Area under the insulator is somewhat lighter and
shinier.
3 316 SS Bluish tint is not as apparent as in previous samples. Areaunder the insulator is shiny with patches of brown.
Table 5-2 Visual Sample Results
The visual observation though not precise in nature, allows a basis for
comparison of one sample to another. Of note, 2 samples of each material were
83

placed into the vessel. In each case, the visual observation of the two samples was
either the same or of the same character. Observed changes were slightly intensified
for the sample located higher in the vessel. It appears the higher position corresponds
to a somewhat higher temperature due to discoloration of the vessel.
Following visual observations, the samples were weighed. Details of the
weighing are presented in Appendix F. For each of the samples in this series, a slight
weight gain of 0.0001 to 0.0016 gram was experienced. This is probably attributable
to the formation of the previously mentioned film on the surface of each of the
samples. The procedure of determination of weight change is one requirement of the
experimentation process.
5.2 Fibre Optic Microscopic Observation
Each of the samples was examined with the 250 x fibre optic microscope. The
colors and details presented by this tool, help to identify anomalies on the surface to
facilitate further investigation. Some of the images of this microscope, in a black and
white form, are presented in Appendix G. These images were produced with a video
printer, such that the 250 x available on the local monitor is reduced to 100 x on the
hard copy output. Table 5-3 summarizes the observations made with this microscope.
Of particular note are the colors of the surface and the apparent masking of the
polishing lines by a film on the surface. Additionally, the photographs of the areas
around the insulating washer show not only a characterization of the surface in both
the exposed and masked areas, but also a detail of the transition region. The slight
differences between samples of the same material at different heights in the reactor are
84

noticeable in these views. The degree of tightness of the washer in addition to the
probable temperature differences may contribute to the slightly different nature of the
surfaces of similar materials in the same basic environment.
Run Material Visual Observation
1 Inconel 625 Dark Brown appearance with shiny patches and dark spotscovering the entire exposed surface. No polishing linesremain in the exposed area. The transition region to the areaunder the insulation washer shows polishing scratches. Thearea under the insulator has a lower density of shiny spots,and has a bluish color. Polishing lines are barely presentunder the insulated area. (G - 1)
1 Hastelloy Greyish appearance with small shiny spots over the entireC-276 exposed surface Area under the insulator is brownish with
some evidence of polishing lines remaining. (G - 2)
1 316 SS Polishing lines on the surface are detailed, similar topreexposed sample. The area under the insulator is somewhatgrey in nature with softened polishing lines.
2 Inconel 625 Brown appearance on exposed region, with some evidence ofpolishing lines. There are no dark spots noted. The areaunder the insulating washer is shiny and shows polishingscratches similar to conditions prior to exposure.
2 Hastelloy Brownish appearance over exposed surface, with someC-276 evidence of polishing scratches. The area under the insulator
is similar to preexposed conditions.
2 316 SS Exposed area is dark with slight evidence of polishingscratches. The area under the washer is shiny with polishingscratches but also contains areas of brown material. (G - 3)
3 Inconel 625 Similar in appearance to run 1 sample, but the shiny patchesare not as pronounced or numerous.
3 Hastelloy Similar in appearance to run 1 sample.C-276
3 316 SS Similar in appearance to run 1 sample.
Table 5-3 Fibre Optic Sample Observations (250 x)
85

5.3 Laser Confocal Microscope Observations
The sample surfaces were observed at magnifications up to 6000 x using the
laser confocal microscope. The images were compared to preexposure images to note
differences. The preexposed images were dominated by polishing scratches, but were
focused without difficulty. For the exposed samples, the difficulty in focusing the
microscope, especially in the higher magnifications, demonstrated the irregular nature
of the surface. The ability of the microscope to form a composite focused image, was
beneficial in characterizing the surface, but the images were sometimes still not clear
because of the surface irregularity. Table 5-4 summarizes the results of the laser
microscope survey. The video printer output produces an image with a maximum
magnification of 2000 x . A sample image of this survey appears in Appendix G.
The laser images themselves, while interesting, did not present any conclusive
evidence as to the characterization of the surface or the irregularities. Additionally, the
lack of color in these images made identification of differences in the nature of the
surface difficult.
86

Run Material Visual Observation
1 Inconel 625 There is a dark covering over most of the exposed surface.Shiny spots and darker spots are present. Insulated area hasdark areas in an otherwise polishing scratch background.Unable to get a good representation at higher magnificationdue to irregularity of surface.
Hastelloy Uniform dark surface without evidence of polishing lines.C-276 The surface is not smooth however. Under insulation
polishing scratches are partially masked by dark circles.
316 SS Surface has some evidence of polishing scratches, some areasmore prevalent than others. There are some dark patcheswithin and around shiny spots. The area under the insulatorshows few dark spots.
2 Inconel 625 Image is dominated by polishing lines with some evidence ofdark spots distributed over the surface. (G - 4)
2 Hastelloy Surface is somewhat uniform in appearance with a few darkC-276 spots and minor evidence of polishing scratches.
2 316 SS Polishing scratches appear partially filled in with roughmaterial, rather than circular spots.
3 Inconel 625 The surface is somewhat uniform, free from scratches but hasnumerous shiny spots as well as dark spots.
3 Hastelloy The surface is free from scratches, and spots but is notC-276 smooth as indicated by difficulty in focusing.
3 316 SS The surface has some evidence of polishing scratches whichare masked by a dark rough material.
Table 5-4 Summary of Laser Images
5.4 Light Microscope Analysis
The samples were examined using a light microscope to determine if the nature
of the surface irregularities could be classified. The clarity and color of the light
images allowed identification of raised portions and pits on the surface of some
sample-. .'able 5-5 is a summary of the results of the light microscope observations.
87
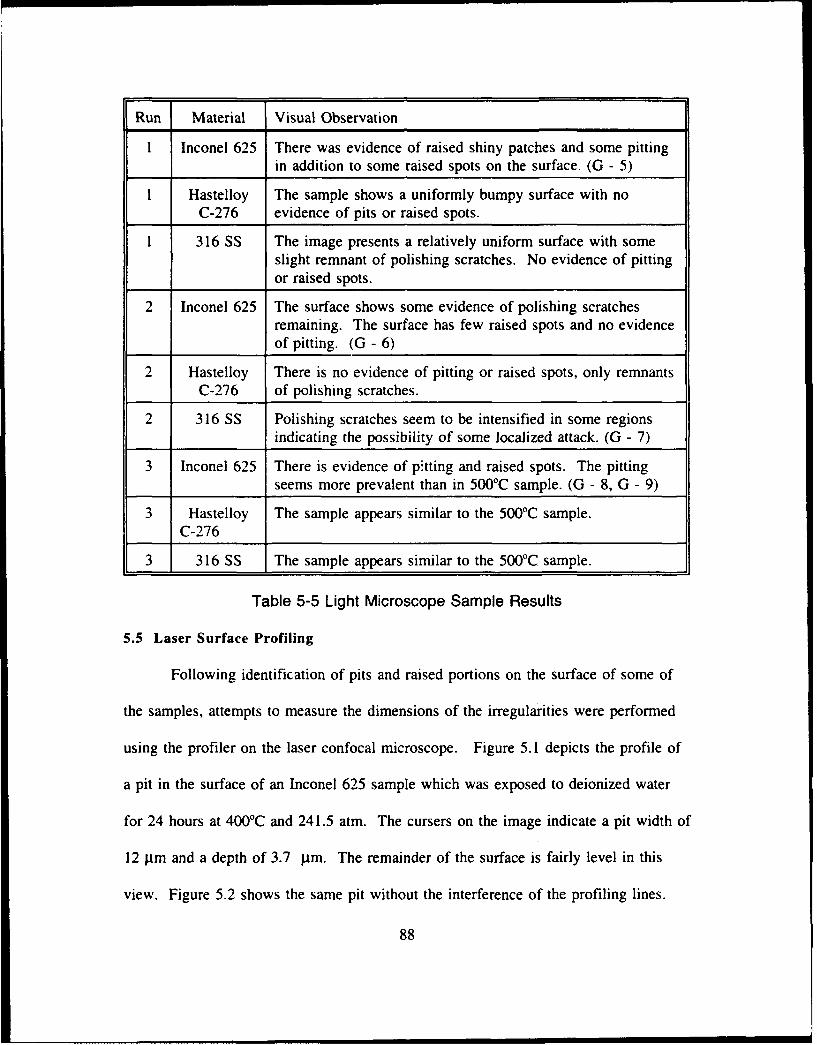
Run Material Visual Observation
1 Inconel 625 There was evidence of raised shiny patches and some pittingin addition to some raised spots on the surface. (G - 5)
1 Hastelloy The sample shows a uniformly bumpy surface with noC-276 evidence of pits or raised spots.
1 316 SS The image presents a relatively uniform surface with someslight remnant of polishing scratches. No evidence of pittingor raised spots.
2 Inconel 625 The surface shows some evidence of polishing scratchesremaining. The surface has few raised spots and no evidenceof pitting. (G - 6)
2 Hastelloy There is no evidence of pitting or raised spots, only remnantsC-276 of polishing scratches.
2 316 SS Polishing scratches seem to be intensified in some regionsindicating the possibility of some localized attack. (G - 7)
3 Inconel 625 There is evidence of p-tting and raised spots. The pittingseems more prevalent than in 5000C sample. (G - 8, G - 9)
3 Hastelloy The sample appears similar to the 500'C sample.C-276
3 316 SS The sample appears similar to the 500'C sample.
Table 5-5 Light Microscope Sample Results
5.5 Laser Surface Profiling
Following identification of pits and raised portions on the surface of some of
the samples, attempts to measure the dimensions of the irregularities were performed
using the profiler on the laser confocal microscope. Figure 5.1 depicts the profile of
a pit in the surface of an Inconel 625 sample which was exposed to deionized water
for 24 hours at 4000C and 241.5 atm. The cursers on the image indicate a pit width of
12 ptm and a depth of 3.7 pm. The remainder of the surface is fairly level in this
view. Figure 5.2 shows the same pit without the interference of the profiling lines.
88
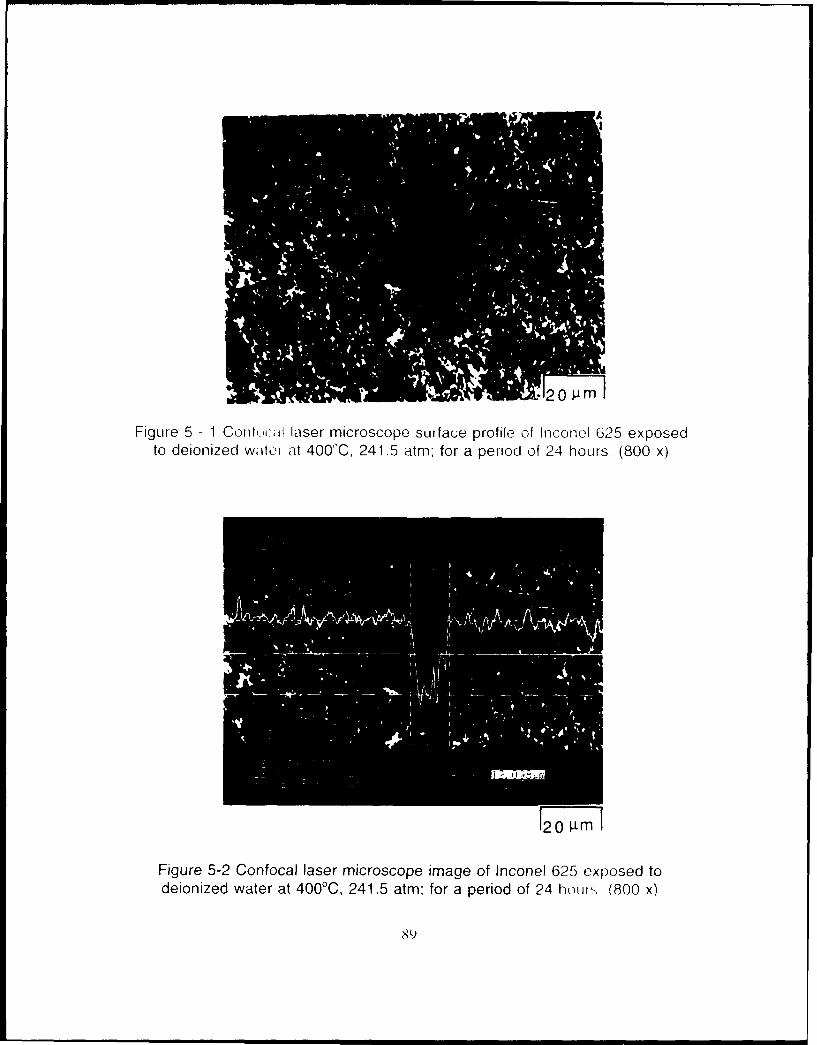
iA
S200 ,uLIm
Figure 5 - 1 Confttr l laser microscope surface profile of Inconel 625 exposedto deionized wlitei at 400'C, 241.5 atm: for a period of 24 hours (800 x)
120 11M]I
Figure 5-2 Confocal laser microscope image of Inconel 625 exposed todeionized water at 400°C, 241.5 atm: for a period of 24 homjrs (800 x)
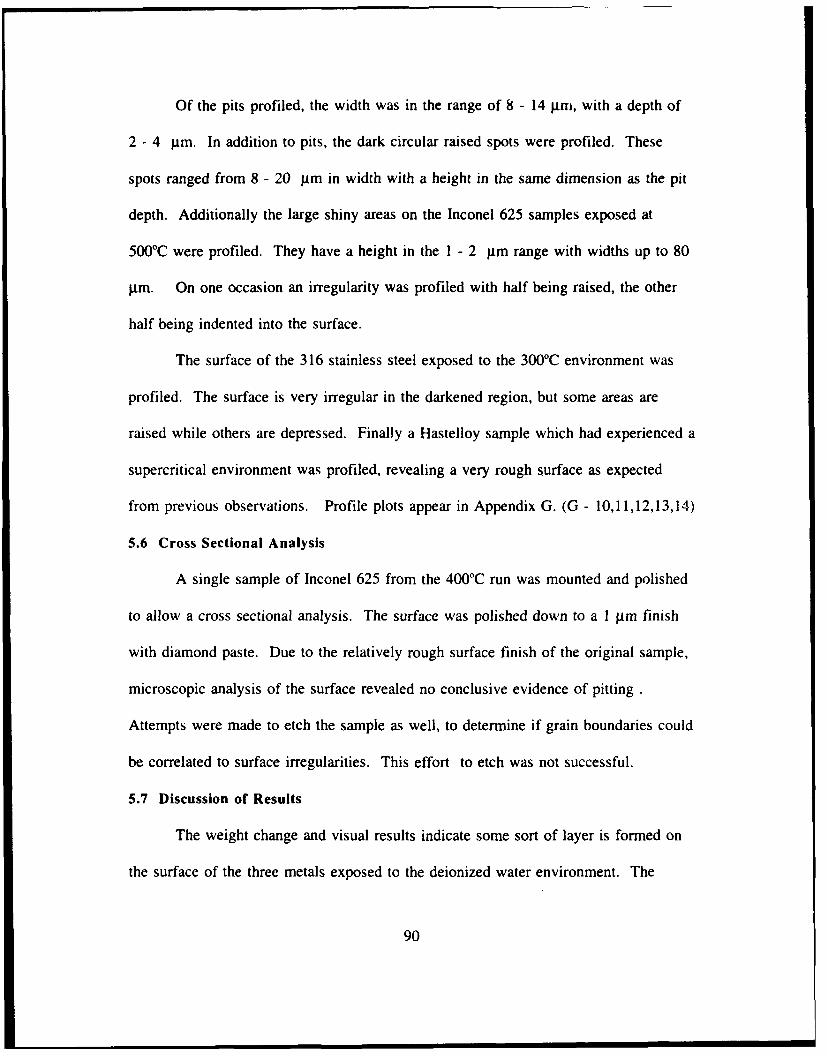
Of the pits profiled, the width was in the range of 8 - 14 Am, with a depth of
2 - 4 Am. In addition to pits, the dark circular raised spots were profiled. These
spots ranged from 8 - 20 Am in width with a height in the same dimension as the pit
depth. Additionally the large shiny areas on the Inconel 625 samples exposed at
500TC were profiled. They have a height in the 1 - 2 pm range with widths up to 80
am. On one occasion an irregularity was profiled with half being raised, the other
half being indented into the surface.
The surface of the 316 stainless steel exposed to the 300'C environment was
profiled. The surface is very irregular in the darkened region, but some areas are
raised while others are depressed. Finally a Hastelloy sample which had experienced a
supercritical environment was profiled, revealing a very rough surface as expected
from previous observations. Profile plots appear in Appendix G. (G - 10,11,12,13,14)
5.6 Cross Sectional Analysis
A single sample of Inconel 625 from the 400'C run was mounted and polished
to allow a cross sectional analysis. The surface was polished down to a 1 Am finish
with diamond paste. Due to the relatively rough surface finish of the original sample,
microscopic analysis of the surface revealed no conclusive evidence of pitting.
Attempts were made to etch the sample as well, to determine if grain boundaries could
be correlated to surface irregularities. This effort to etch was not successful.
5.7 Discussion of Results
The weight change and visual results indicate some sort of layer is formed on
the surface of the three metals exposed to the deionized water environment. The
90

appearance of the surface is different in the three materials. As the only environment
tested was deionized water, any conclusions as to acceptability of a particular material
for use in another SCWO environment would be premature.
5.7.1 316 stainless steel The stainless steel samples seemed to form a surface layer
more readily in the subcritical environment. Specifically the polishing scratches, are
more evident in the supercritical samples, and the appearance of the subcritical sample
has large irregularities on the surface. There appears to be no evidence of pitting in
this environment of deionized water.
5.7.2 Hastelloy C-276 The C-276 samples appeared to form a relatively complete
rough surface layer in the supercritical region. The surface layer as evidenced by
remaining polishing scratches, is not formed as readily in the high subcritical
condition.
5.7.3 Inconel 625 In the supercritical environments, Inconel 625 forms a surface
layer, but is also susceptible to pitting. Finding, what may be a partially filled in pit
indicates the pits are probably related to raised spots which also form on the surface.
Either the pits form under the spots, and then the raised portion is knocked off, or the
pit fills up to form the raised area. Cross sectional views were unable to determine the
composition of the area under the raised spots. Large shiny raised areas were also
evident on the 500°C samples. In the subcritical environment, the layer on the Inconel
625 surface does not seem to form as readily as evidenced by remnants of polishing
scratches.
91

Chapter 6
Conclusions and Considerations for Future Work
An exposure corrosion test facility is in operation in the H. H. Uhlig Corrosion
Laboratory at the Massachusetts Institute of Technology. The ability of the system to
achieve and maintain supercritical water conditions for extended periods of time has
been demonstrated and selected samples have been tested in various temperature
regimes. The system now serves as a prototype for a companion electrochemical
facility nearing completion. When in operation the two systems will provide the
ability to test a wide variety of materials in a matrix of chemical and temperature
environments. The results of these tests will be crucial in the design and selection of
materials for use in developing large scale SCWO hazardous waste destruction
facilities.
6.1 System Performance
The exposure test facility has worked well in service to date. Differences in
temperature at mechanical fittings have lead to steam leaks requiring repairs or two
occasions. Modifications to the operating procedure to limit temperature differcnces
should improve the reliability of the system. Additionally the control system is
conservatively based, such that a single erroneous signal can cause a system shutdown.
With experience, it should be possible to modify the system to provide more reliability
for continuity of operation.
The system, as constructed, functioned properly from the beginning. Minor
modifications were made to improve system operation. Specifically the heat exchanger
92

was moved about 20 cm further away from outlet high temperature block. This was
done to allow some ambient heat loss from the effluent before being cooled by the
heat exchanger. The stainless steel Swagelok fitting on the heat exchanger inlet was
becoming discolored due to the excessive temperature. Moving the heat exchanger has
resolved the problem. Additionally, a thermocouple was added to monitor the exterior
temperature of the vessel, to ensure maximum material temperatures are not exceeded.
Finally additional insulation was added to limit the heat loss and reduce the heater
breaker cycling times.
The system is simple to use as was the intention and control of the operation is
essentially automatic during operation. The heat up can proceed without operator
action once all system components are assembled and adequate cooling water is
flowing through the heat exchanger. At the test temperature and pressure, only
replenishment of the fluid supply and discarding of effluent are required operator
actions. The cool down process requires some monitoring to ensure large temperature
differences do not exist which might cause mechanical fittings to leak. Loading and
unloading of samples is a somewhat cumbersome task, requiring partial system
disassembly and removal of the vessel head.
6.2 Materials Evaluation
The three significant materials of system construction were tested in a
deionized water environment. All materials formed a layer, as yet to be identified, on
the surface in one or more of the conditions tested. The Inconel 625 apparently
exhibited shallow pitting behavior at the supercritical temperatures. This is a concern
93

because all of the elevated temperature strength bearing portions of the system are
constructed of this material.
The fibre optical and laser confocal microscopes provide additional insight into
the characterization of the surface of the samples. The profiling capability on the laser
microscope, provides a relatively accurate surface topography without elaborate sample
preparation requirements. The fibre optic microscope, in addition to being employed
in an initial observation of the sample, was utilized to examine the interior of the
vessel for the presence of localized corrosion following discovery of pitting on the
samples. Only the end regions of the vessel are accessible with the microscope, and
no conclusive evidence of pitting on the vessel was observed.
6.3 Considerations for future work
This facility can provide a significant amount of information required to help
answer the questions of material selection and design of SCWO reactors. There are
improvements in the tools and methodology which should be incorporated into the
subsequent testing schemes. A matrix of test solutions and materials should be
developed for evaluation in this reactor. Finally corresponding tests with this reactor
and the electrochemical reactor should be performed to better understand the
mechanisms of the corrosion processes.
6.3.1 Improvements The system can provide additional information than was
obtained from the initial runs of system proof testing even in the same environments.
The initial sample run at 500'C may have had some contamination of the system due
to materials utilized in the construction process. Specifically the SULFO® cutting fluid
94

contains a variety of compounds which could have affected the initial sample results.
The initial run should be repeated to determine if contamination was a factor for the
first samples.
Samples should be polished to a finer finish prior to placement in the cell. The
polishing scratches, though helpful in determining the evidence of a surface film,
prevent identification of small surface irregularities when viewed in a cross section.
The apparent pitting identified on the Inconel 625 surface had depths in the 2-4 A.m
range, which cannot easily be discerned from polishing scratches made with 320 or
even 800 grit paper. Additionally, the polishing scratches may provide initiation sites
for some of the corrosion processes. It could be argued that any components placed in
service will not be polished, thus the results obtained using polished specimens would
not accurately reflect of susceptibility of the metal to an environment. The purpose of
the testing is to determine mechanisms and conditions leading to corrosion, and
polishing scratches may interfere with this determination. Finally, the electrochemical
testing, which will be performed concurrently with this facility will have polished
samples, thus correlation would be more accurate.
An evaluation of the layer on the surface of the samples might be beneficial to
determine its chemical composition. The layer may in fact be a beneficial oxide. If
that is the case, a period of time of preconditioning in a deionized water environment
to establish the oxide layer prior to introduction of more aggressive solution, might be
beneficial, establishing some operational parameters for a large scale system.
Preconditioned samples may be utilized in some future materials testing matrix.
95

The operating procedures need to be evaluated over a longer period of time to
determine the extent of damage to the vessel and piping. During periods of long term
inactivation, the system should be flushed and purged to limit the concentration of
potentially damaging solutions. Other operational limitations and restrictions may
become apparent as experience with the system is obtained.
6.3.1 Testing matrix A wide variety of materials and solutions can be tested in the
corrosion facility. In addition to the flat sample coupons, creviced samples and
stressed samples should be included. The use of witness wires in other portions of
the system may be a possibility, to obtain a general indication of corrosion in another
temperature regime. Initial test solutions should be limited to those for which kinetic
studies have been performed, to reduce the potential of inadvertently employing a
solution which could severely damage the system. The materials to be tested should
include not only metallic alloys, but also ceramic materials and other possible liners.
A high pressure oxygen source may ultimately need to be added to allow testing of all
environments expected in a SCWO reactor hazardous waste destruction system.
6.3.3 Electrochemical corrosion test facility Lessons have been learned from the
construction and operability testing of the exposure test faci!ity which can be
incorporated into the electrochemical system. The development of high temperature
reference and working electrodes for use in the cell provides an additional area of
challenge. Once the joint facility is operational, materials can be evaluated in both
systems in similar environments, such that results can be compared to gain a better
understanding of corrosion processes.
96
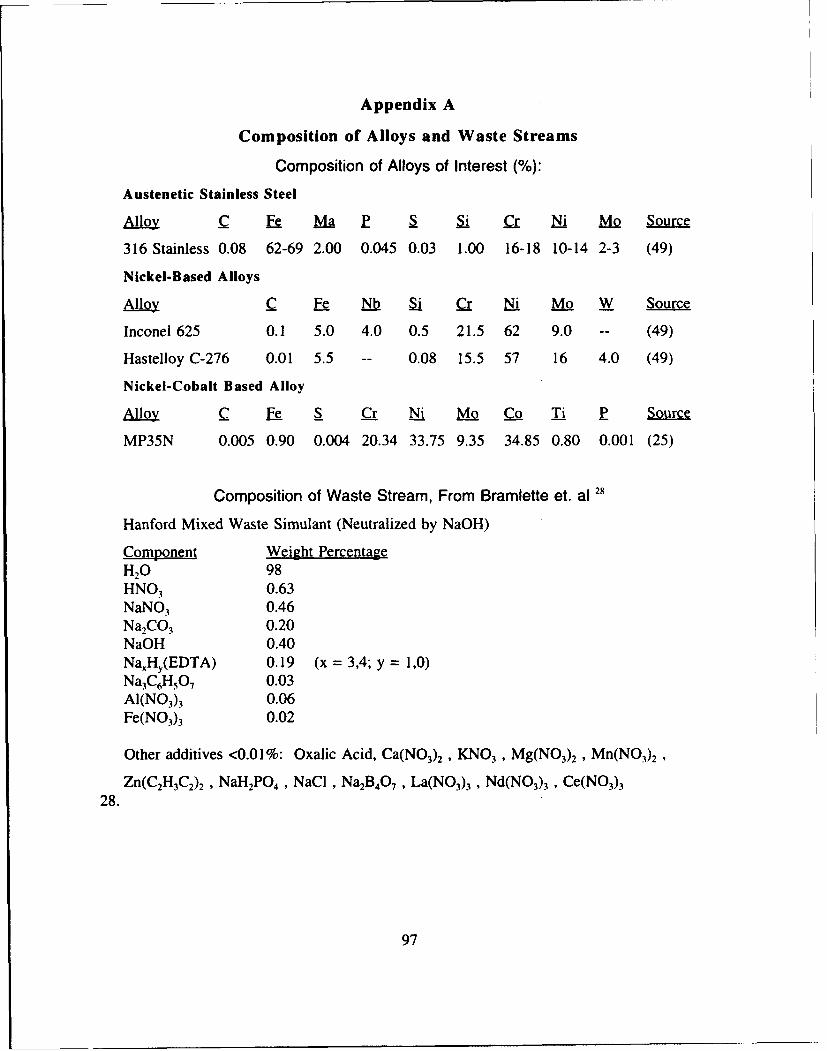
Appendix A
Composition of Alloys and Waste Streams
Composition of Alloys of Interest (%):
Austenetic Stainless Steel
Alloy _C Ma P Si Cr Ni Mo Source
316 Stainless 0.08 62-69 2.00 0.045 0.03 1.00 16-18 10-14 2-3 (49)
Nickel-Based Alloys
Aly C E NF Si Cr W, Mo W Source
Inconel 625 0.1 5.0 4.0 0.5 21.5 62 9.0 -- (49)
Hastelloy C-276 0.01 5.5 -- 0.08 15.5 57 16 4.0 (49)
Nickel-Cobalt Based Alloy
Allo-0y C Fe S Cr N.i Mo Co Ti P Source
MP35N 0.005 0.90 0.004 20.34 33.75 9.35 34.85 0.80 0.001 (25)
Composition of Waste Stream, From Bramlette et. al 28
Hanford Mixed Waste Simulant (Neutralized by NaOH)
Component Weight PercentageH20 98HNO 3 0.63NaNO3 0.46NaCO3 0.20NaOH 0.40Na•HY(EDTA) 0.19 (x = 3,4; y = 1,0)Na 3C 6H5 07 0.03A1(N0 3)3 0.06Fe(N0 3)3 0.02
Other additives <0.01%: Oxalic Acid, Ca(N0 3)2 , KNO 3 , Mg(N0 3)2 , Mn(N0 3)2
Zn(C 2H3C2)2 , NaH2PO4 , NaCI , Na2B40 7 , La(N0 3)3 , Nd(N0 3)3 , Ce(N0 3)328.
97

Appendix B
0-rts List
Manufacturer D-scription Part Number Application
Reflange 6" OD Vessel R-CON-4 PressureVessel
Omega Engineering24 VDC Power Supply U24V101 Pressure Inst.6 Pressure Transducers PX-613-5KGI Pressure Inst.Ceramic Heater CRFC-66/240 Preheat (EXP)Ceramic Heater CRFr-46/240 Preheat (EC)2 Ceramic Heaters CI -tb- 40 Vessel HeatTwist Lock Connector FYI -l - ..s Pressure InstShielded Cable TX-4-) O' Pres sure Inst.10 K-Type Thermocouples KMQIN-062-U-12 Temp Inst.6 Pressure Snubber PS-4D Pressure Inst.100 ft Thermocouple wire GG-K-20 Temp Inst.Hole, Fish Spine (1000) FS- 110-20 Heater Wire
Metal SamplesC-276 Sample Rack Special Order Sample (EXP)Zirconia Spacers 905 Sample (EXP)
Apple ComputerMacintosh Ilvx M 1358 ControlRGB Monitor M0297 ControlMonitor Stand M0403 ControlApple Ext. Keyboard M0142 Control
Eldex Laboratories100 ml/min HPLC Pump BBB-4 Pump (EXP)10 ml/min HPLC Pump AA-100s Pump (EC)
National InstrumentsLABVIEW for Macintosh ver 2.2.1 ControlAnalog Input/Output board NB-MIO- 16L-9 ControlAnalog Multiplexer AMUX-64T ControlDigital Input/Output board NB-DIO-24 Relay ControlCable Adapter SC-2051 Relay ControlRelay Module SC-2062 Power ControlPID Control Software Control (EC)
98

National Instruments (continued)Rack Mount Kit 181080-2 Control
Tube Methods 200 ft Inconel 625 Tubing 0.125 OD/ 0.040 ID Tubing
Swagelok4 Bored Through Reducers SS-200-R-6-BT Heat Exch4 Union Tees SS-600-3 Heat Exch2 Union Tees SS-600-3 Safety piping2 % to ¼ NPT adapters SS-600-1-4 BPR Outlet4 % to % NPT adapters SS-600-1-6 Safety piping3 1/e to % reducers SS-600-6-2 Pump suction10 % tube inserts SS-605-4 Poly Tube4 % Union elbows SS-600-9 Safety Piping3 % Unions SS-600-6 Chilled Water
Northeast Engineering2 Backpressure Regulators TESCOM 26-1722 Press Control
Eagle Stainless Steel 100 ft % stainless steel tube316 seamless Heat ExchSafety Piping
Cole Parmer InstrumentpH meter with probe G-58903-10 Sample outlet
Unistrut Northeast Corporation8 U brackets P-1047 Support Box4 Post braces P-1887 Support Box8 Z shaped fittings P-1736 Support Box1 Flat plate fitting P-1925 Support Box1 Flat plate fitting P-1953 Support Box28 Winged shape fittings P-2223 Support Box4 Winged shape fittings P-2227 Support Box4 Wing shape fittings P-2345 Support Box200 Spring nuts P-1010 Support Box100 Hex head nuts HHXN050 Support Box200 Flat washers HFLW050 Support Box300 Hex head bolts HHCS050094 Support Box22 90 degree braces P-1026 Support Box100 ft 1 %" channel P-1000HS Support Box110 ft 3/" channel P-4000HS Support Box8 Z shaped fittings P-1734 Support Box8 U brackets P-1732 Support Box80 Spring nuts P-4010 Support Box
99
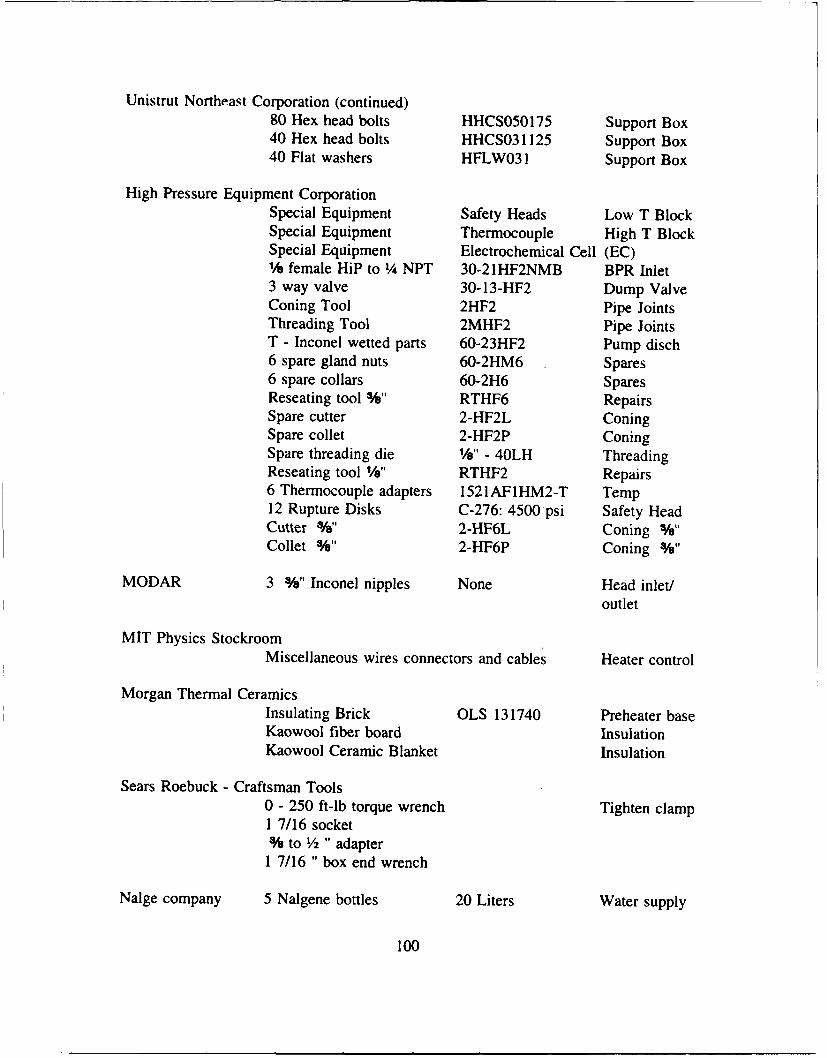
Unistrut Northeast Corporation (continued)80 Hex head bolts HHCS050175 Support Box40 Hex head bolts HHCS031125 Support Box40 Flat washers HFLW031 Support Box
High Pressure Equipment CorporationSpecial Equipment Safety Heads Low T BlockSpecial Equipment Thermocouple High T BlockSpecial Equipment Electrochemical Cell (EC)1'/ female HiP to ¼ NPT 30-21HF2NMB BPR Inlet3 way valve 30-13-HF2 Dump ValveConing Tool 2HF2 Pipe JointsThreading Tool 2MHF2 Pipe JointsT - Inconel wetted parts 60-23HF2 Pump disch6 spare gland nuts 60-2HM6 Spares6 spare collars 60-2H6 SparesReseating tool %" RTHF6 RepairsSpare cutter 2-HF2L ConingSpare collet 2-HF2P ConingSpare threading die %e" - 40LH ThreadingReseating tool hg" RTHF2 Repairs6 Thermocouple adapters 1521AF1HM2-T Temp12 Rupture Disks C-276: 4500 psi Safety HeadCutter W4' 2-HF6L Coning W"Collet ¾" 2-HF6P Coning %"
MODAR 3 %" Inconel nipples None Head inlet/outlet
MIT Physics StockroomMiscellaneous wires connectors and cables Heater control
Morgan Thermal CeramicsInsulating Brick OLS 131740 Preheater baseKaowool fiber board InsulationKaowool Ceramic Blanket Insulation
Sears Roebuck - Craftsman Tools0 - 250 ft-lb torque wrench Tighten clamp1 7/16 socket% to ½ " adapter1 7/16 " box end wrench
Nalge company 5 Nalgene bottles 20 Liters Water supply
100

General Electric Plastics Division9 4' x 8' Lexan sheets MR-5 Shielding
MIT Office of Lab SuppliesTygon Tubing % inch Chilled WaterPoly Tubing % inch Pump suction
Notes:
EXP - Component is present in Exposure System OnlyEC - Component is present in Electrochemical System Only
101

Trademark Listings
Kel-F70 and Kel-F-81® are registered trademarks of the 3M company
UNISTRUT' is a registered trademark of the Unistrut Company
LABVIEW® is a registered trademark of National Instruments
Kaowool® is a registered trademark of Morgan Thermal Ceramics Company
Lexan® is a registered trademark of General Electrics, Plastics Division
Swagelok® is a registered trademark of the Swagelok Company
Macintosh® is a registered trademark of the Apple® Computer Company
Nalgene® is a registered trademark of the Nalge Company
SULFLO® is a registered trademark of SULFLO Inc.
102

Appendix C
Photographs of System Components
Figure C-1 Pressure Vessel Side View
Figure C-2 Pressure Vessel End View
103
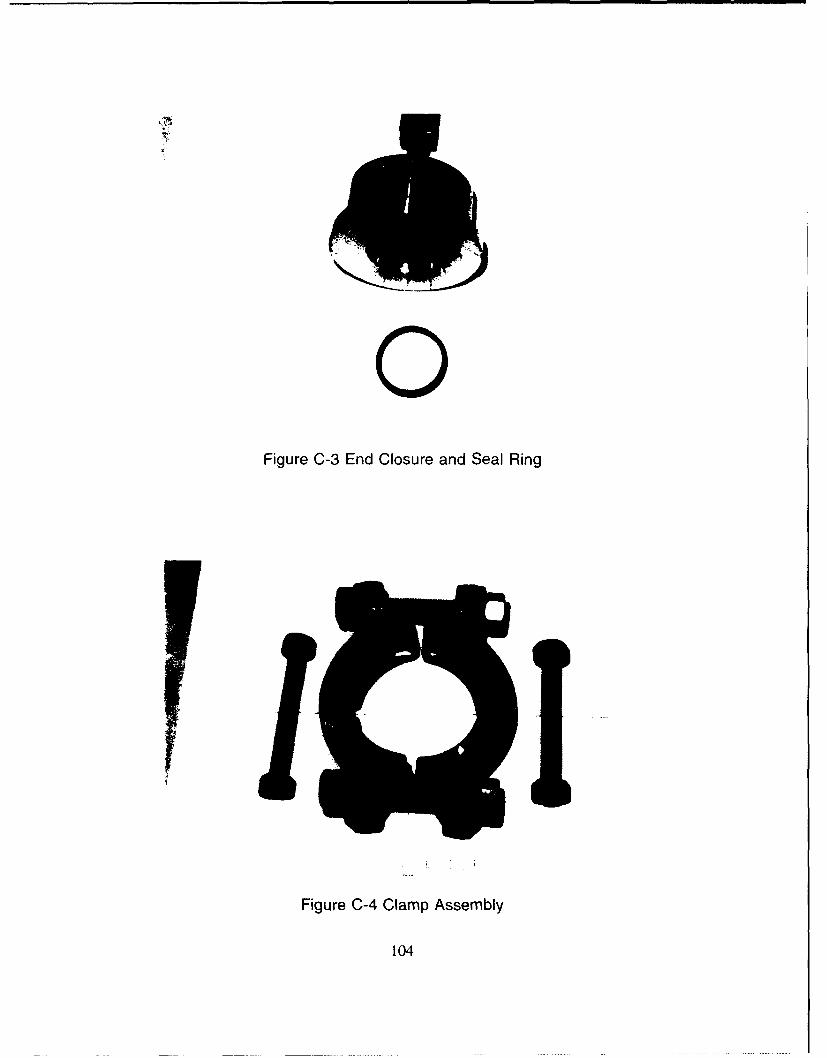
0Figure C-3 End Closure and Seal Ring
Figure C-4 Clamp Assembly
104

Figure C-5 Pump Connections
C-6 Preheater Coil
105

A.2
C-- Heater Element
C-8 Vessel Heaters and Partial Insulation
1(06
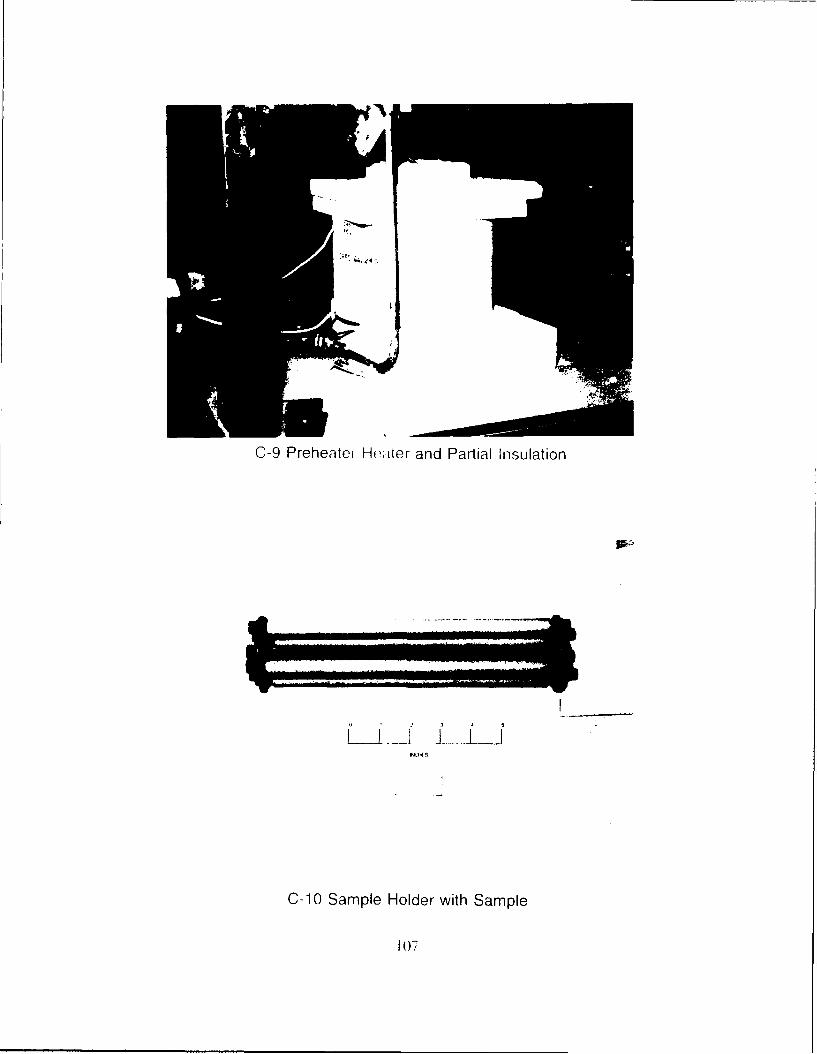
C-9 Preheatei Heýtter and Partial Insulation
C-10 Sample Holder with Sample
1()7

Appendix D
Strength Calculations for Pressure Vessel
From Thick Walled Theory:P :5000.psi ri:= 1.25.in ro :=2.5in t:= 1.25.in
ro2
2-ti ri
P~r
77 - :P. a rr :--P
Szz = 2.5• 103 "psi (F o = 8.333l •03 -psi a IT = -5' 10 3 psi
Oys :=60"0.psi a e j I[ (FarT r Z)2 + (a r_(F0)2 +(a z U00)2]
_e ays-F =0.193 SF -- SF =5.183Cys ae
For Corrosion Allowance: Iterate until Safety Factor is 4.
P := 5000.psi ri :=i.623.in ro :-2.5-n C:=r - ri
2
P 2.t [(r)2 I]
a 72 = 4.627" 103 -psi a 00 = 1.228" 104 -psi O f =-5"103 psi
ays :=60000) psi aeca:= I'[ (rr- (
-- = 0.25 SF: SF = 4ay YSaeca
Thus the corrosion allowance is .373 inches or abdat 3/8 inch.
108

Leak before break criteriaFrom the graph with a/2c = .5 and ratio of equivalent stress to yield strength of 0.19 thevalue of Q is 2.38. Q :=2.38.in KIc =80000.psi
Critical Crack Size:a(K IC2 Q
a(- "I.-. - a 29.897-in
109

Appendix E
Labview Virtual Instrument Schematics
Connector Pane
T1Hi T iUm Temp Ti
T2TEMPERATURE HISTORY
T2
exposure Ipsd clarke version
Figure E-1 Labview" Exposure System Controller
110

IIIIl l
LI.
I.-U .
-. ........... - ....IL.
011
.J
0
I,-
0. U
U.0
Figure E-1 Labviewe Exposure System Controller (continued)
III

EE
90 E C
0CL N
Q
CL
e doU
LiM a
.............. L i
I- A A S -MIR;-4 1 !
Ecy
CL
Li
a LEI
cc 13C
CD
B I
Figure E-1 Labviee Exposure System Controller (continued)
112
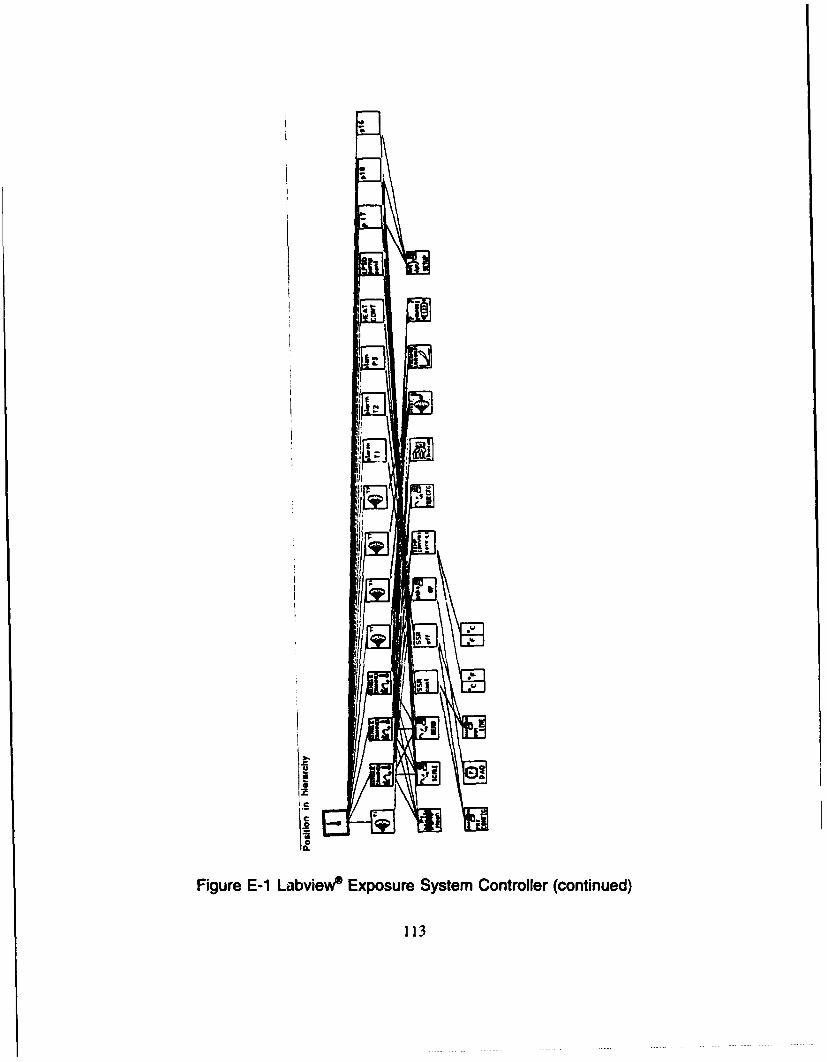
iic
Figure E-1 Labviewe Exposure System Controller (continued)
113

Connector Pane
Temperature ScaleNume~r of Amux boards
Number of Averages
Board INLThormocoule Channel ,NL omensation Temperature
Thermo oupleomestn •Ie" • lermomeler~roTh¶o din~h Error
CompenaoR•Cannel
T2 Read
Reads the temperature from the selected channel.
Figure E-2 Labview® Temperature Read Instrument
114

8 00Q0V f . 000r
4)
M
E
4) II- 0
w E E rZ0 0 0 ~
C Eu EFL 0L7 U 0
0)0
CC
4C .
.0 0 .
tfFigureWE E- .v epraueRa ntumn cniud
C b115


INI 1 ol I ý gil
Figur E- Readve Tempersature Readu Infrumueste(otiud
117- --- -- -- ---

4
-crcl
SC__
Figure E-2 Labviewe Temperature Read Instrument (continued)
118

L
No compensation desired, sent
0 as compensation temperatu
No LabDriver errc
Figure E-2 Labviewe Temperature Read Instrument (continued)
119

Linearize and scale the data if neccesary
O.alsel'
hermnocouple channel . Cold Ju _________
Channel, return the cold junction
.rKLICompensationK P Temperature
0.0
Figure E-2 Labview* Temperature Read Instrument (continued)
120
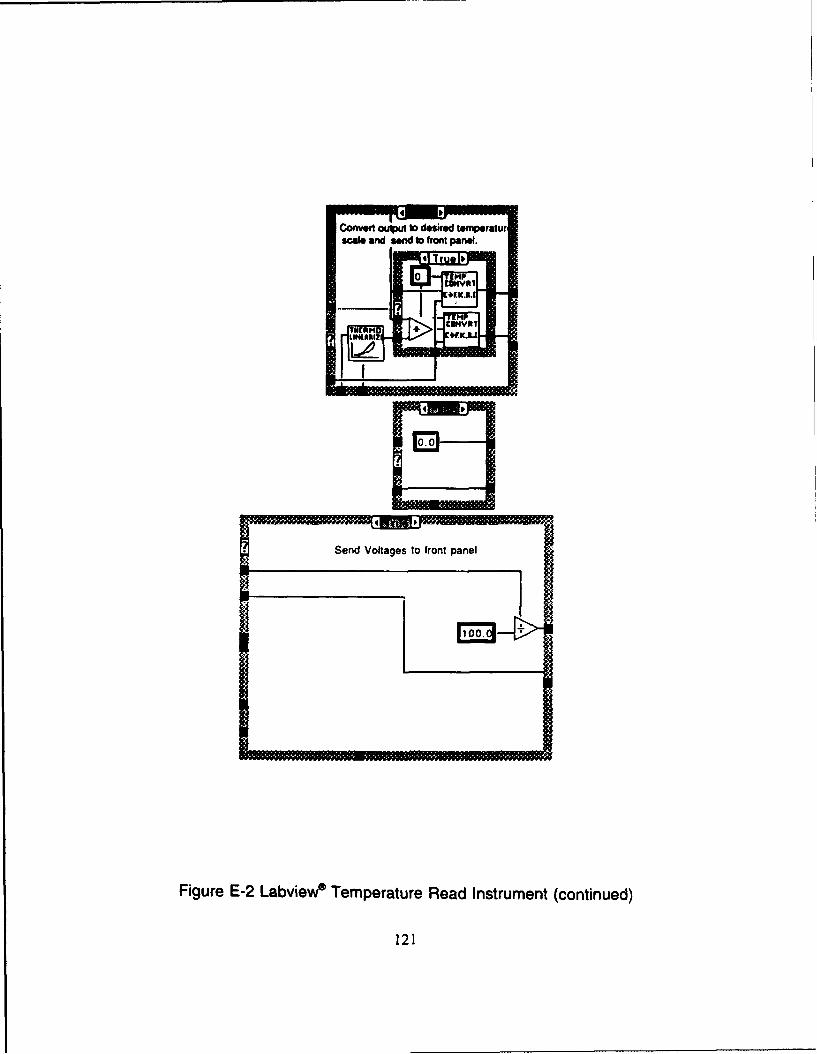
Convert outpu so desired temnper~u
sAe and Vlae to front panel
0 i
Figure E-2 Labview Temperature Read Instrument (continued)
121
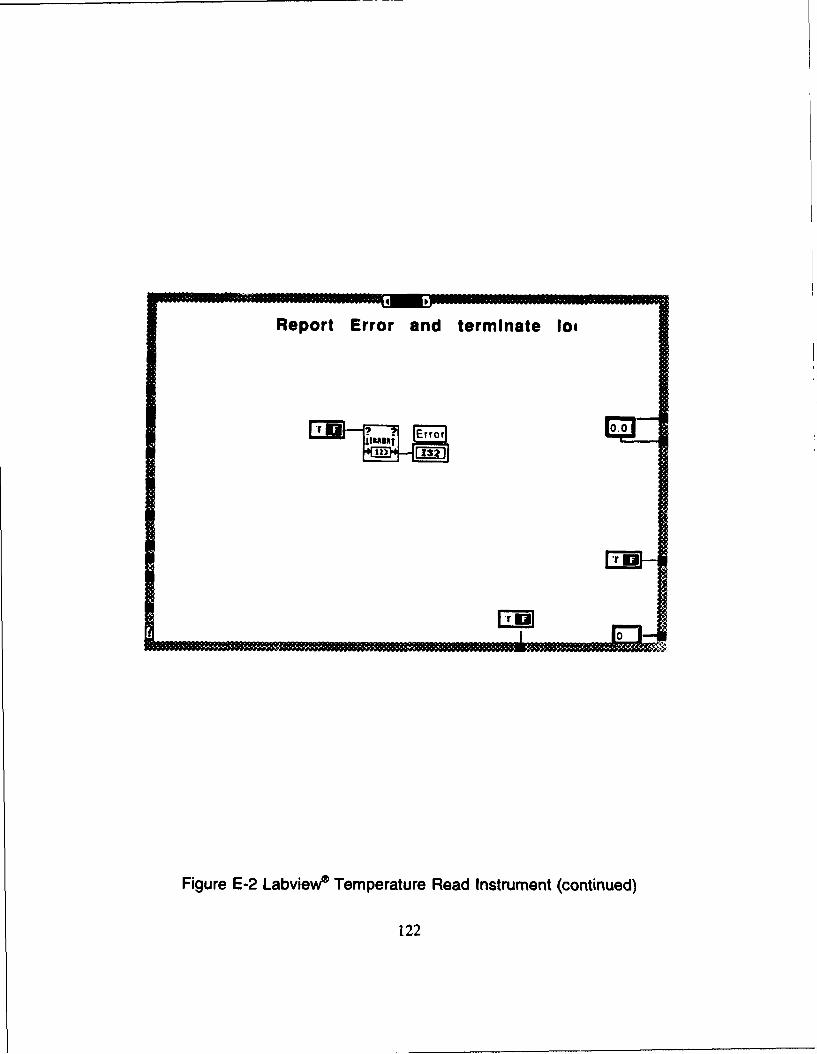
Report Error and terminate loo
Error
Figure E-2 Labview Temperature Read Instrument (continued)
122
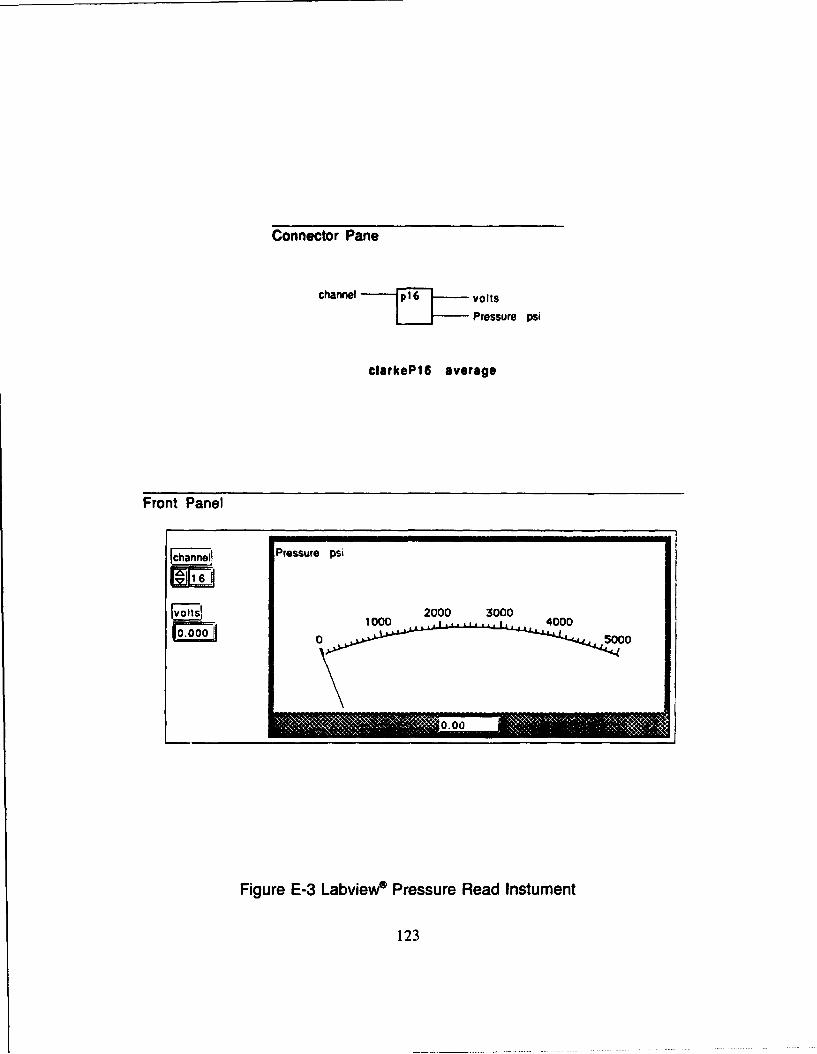
Connector Pane
charnel ' voltsJ-Pressure psi
clarkeP16 average
Front Panel
[ nPressure psi
"F . -,,,- 2000 3000yoI s 1000 4000
Figure E-3 Labview4 Pressure Read Instument
123
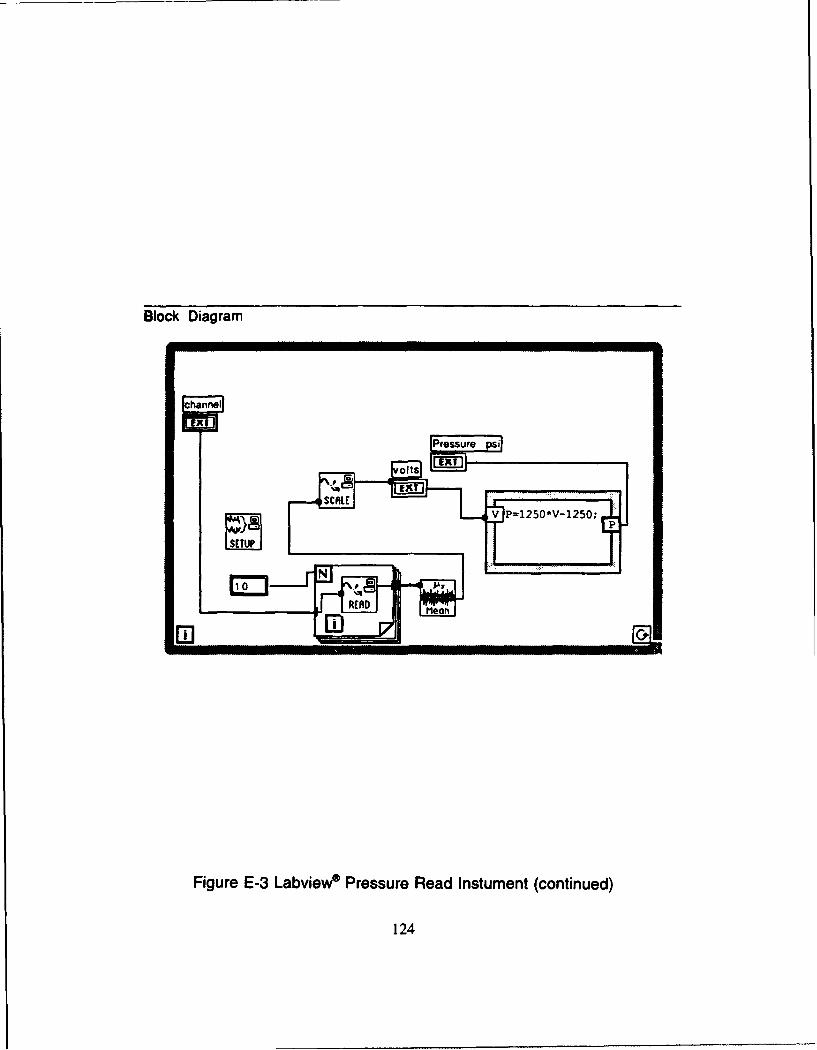
Block Diagram
hannel
00I
Figure E-3 Labviewe Pressure Read Instument (continued)
124

Connector Pane
SET POINT
TEMP Ti AT
TEMP T2
PREHEATER OONTROL
4partempcontrol
Front Panel
TE T2'
~j J Vessel Heaters JPreheater'
TE-MP TI
FSET -POINT!
FP -7R CONTROL;
Figure E-4 Labviewe Temperature Controller
125

Block Diagram
Ossem Healerp
fEMP Ti11I~u
EXT N2
SET
EXTE
FiueE-4 ve Teprtr CoTroler (cntnud
12
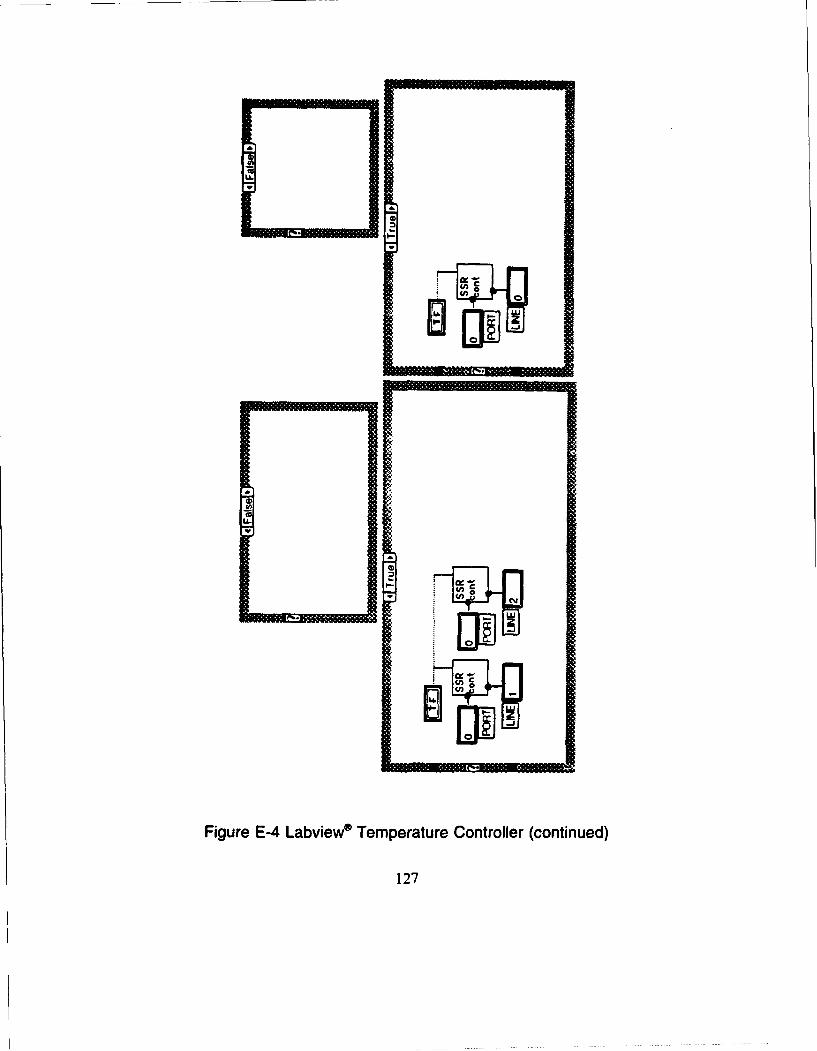
C4
0
ILIM
Figure E-4 Labview® Temperature Controller (continued)
127

Connector Pane
SET POINTPressure IPressure 2Pressure 3
LP SD ON
Ipsdcontrol
Front Panel
fPressure 1i
E=526
!Pressure 21
52=6
[Pressure 3P
Figure E-5 Labviewe Pressure Controller
128
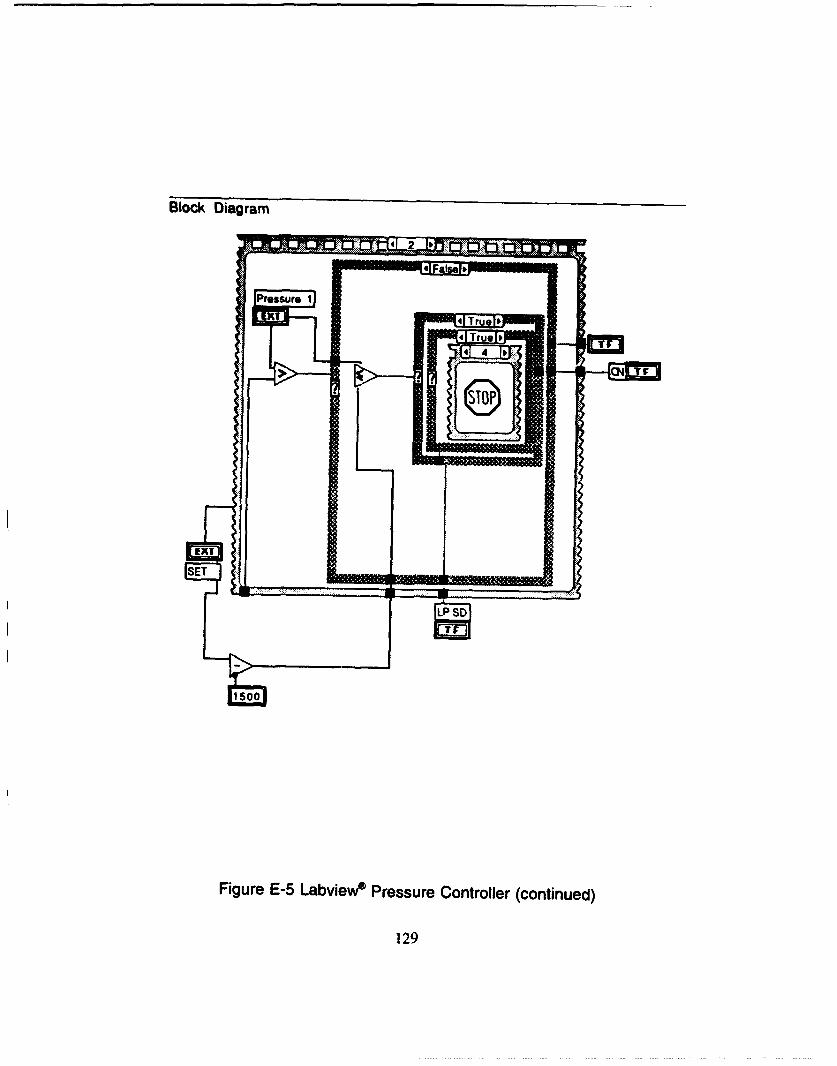
Block Diagram
4 I
EXT
SETF
Figure E-5 Labview* Pressure Controller (continued)
129

SS[I
Figure E-5 Labviewe Pressure Controller (continued)
130

or e
0SR
Ont
line
3
Figure E-5 Labviewe Pressure Controller (continued)
131

IMI
4 -
40'
LSJ
Figure E-5 Labview® Pressure Controller (continued)
132

I
2
E S
SSR
133
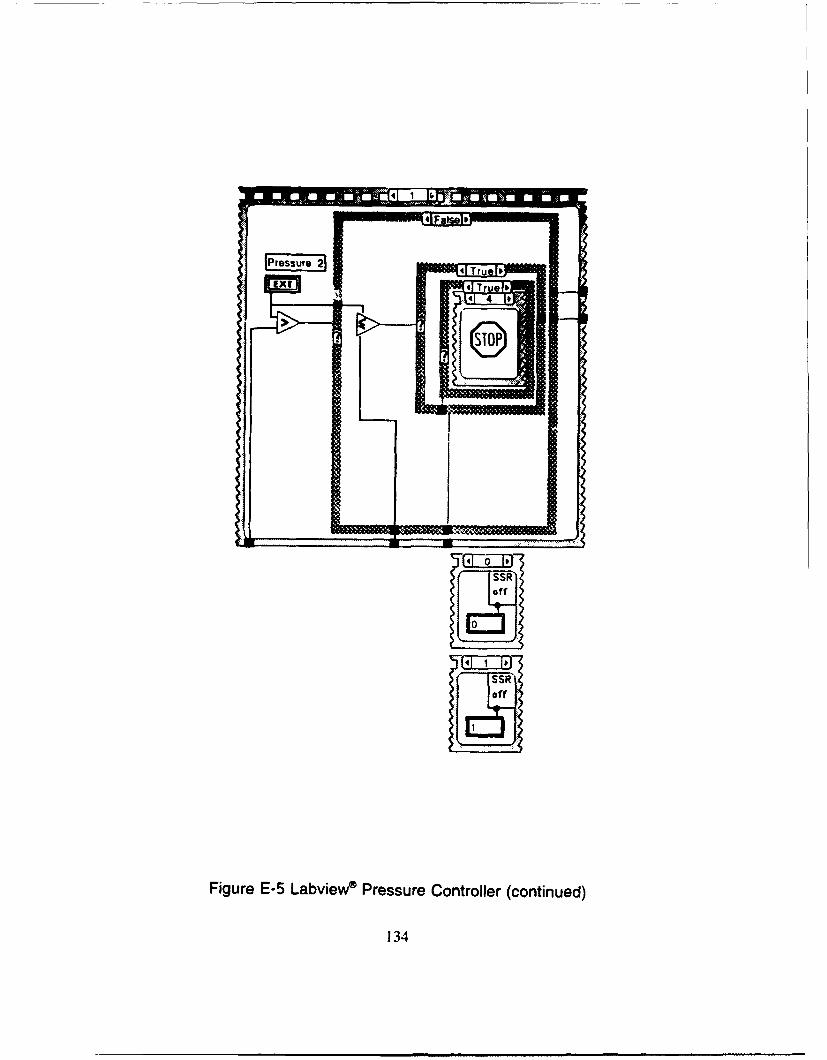
]4F
Pressure 21 ----
EXT 1Tu b
R0SSW~
Figure E-5 Labviewl Pressure Controller (continued)
134

1 2 I0,
U 35

Connector Pane
portIOntiline
SSR control
Front Panel
IboardF7,F -- [aWýIo - --I • @
Block Diagram
Figure E-6 Labviewe Relay Controller
136

Connector Pane
T inf
T rira Warning
Warning
Front Panel
0.00 0.00
Figure E-8 Labview® Alarm Warning Circuit
I 38
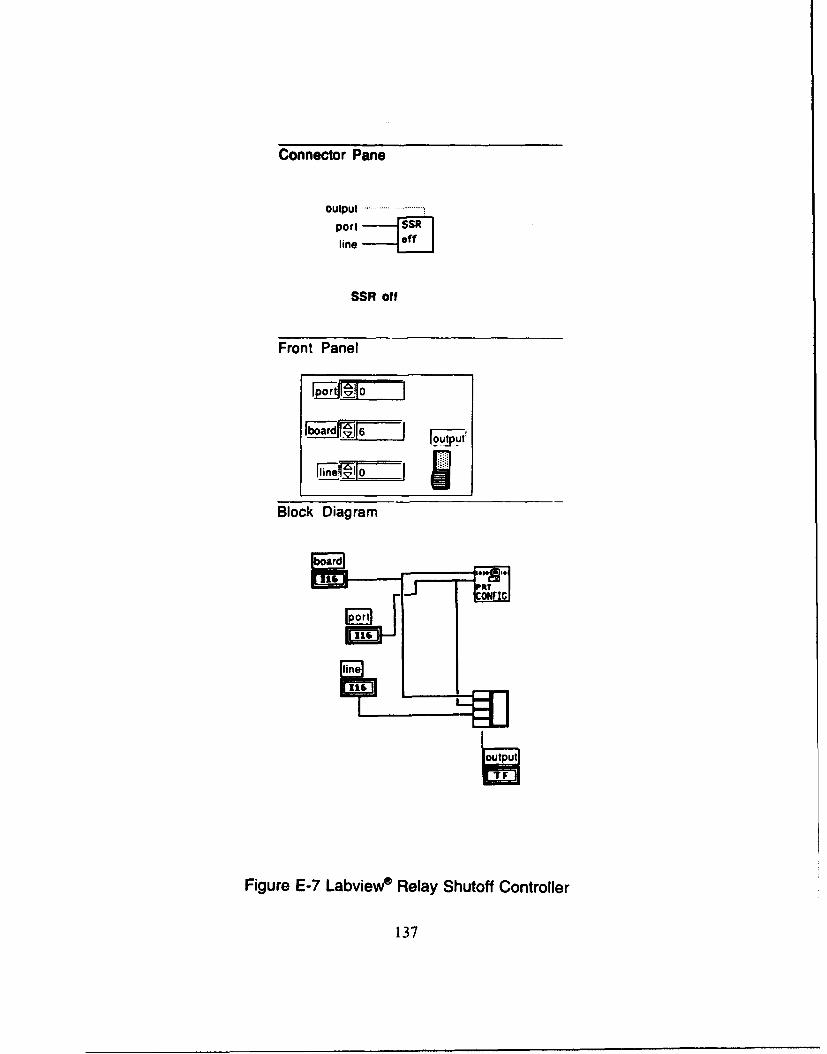
Connector Pane
output .................
port
line
SSR off
Front Panel
Block Diagram
rd
61
43y
Figure E-7 Labviee Relay Shutoff Controller
137

Block Di-Am
T , -- -------- -T in IIEXT
I[ II II
EJ off
Figure E-8 Labview Alarm Warning Circuit (continued)
139

Figure E-8 Labviewe Alarm Warning Circuit (continued)
140

Connector Pane
Frequency (Hz)Duration (Ticks)
Intensity
BEEP T II
Front Panel
1Frequency (Hz)!
Duration (Ticks)l
linte it1'1200S 10',
Block Diagram
Frequency (Hz)j j
16 intervals u~2-6 doubling 64
Duratin (Tckl /2mssec
I(1/ms)/secl 2000.
Figure E-9 Labview* Audible Alarm Circuit
141

Appendix F
Sample Weight Loss Data
Run 1: 96 hours at 500'C, 241.5 atm
Sample Number Height I Width Length
1 Inconel 625) 3.15mm 19.51mm 37.83mm
2(Inconel 625) 3.15mm 21.76mm 38.25mm
3(C-276) 3.11 mm 20.14mm 38.20mm
4(C-276) 3.20mm 20.37mm 38.04mm
5(316 SS) 3.05mm 19.99mm 37.72mm
6(316 SS) 2.95mm 19.48mm 37.72mm
Sur area is reduced by drilling of a 9.525 mm diameter inch hole in the sample.The , an insulated washer covering 15.977 mm diameter circle on each flat surface.
Sample Number Surface Area Exposed Area Shielded Area
1 18.45 cm 2 14.36 cm 2 4.09 cm 2
2 20.50 cm 2 16.41 cm2 4.09 cm 2
3 19.09 cm 2 15.01 cm 2 4.09 cm 2
4 19.32 cm2 15.23 cm 2 4.09 cm 2
5 18.68 cm 2 14.59 cm 2 4.09 cm2
6 18.14 cm 2 14.06 cm2 4.08 cm2
Weight is the average of three values on a precision balance
Sample Number Initial Weight Final Weight Weight Change
1 17.6255 gm 17.6265 gm +0.0010 gm
2 17.2980 gm 17.2996 gm +0.0016 gm
3 19.0449 gm 19.0465 gm +0.0016 gm
4 19.0604 gm 19.0610 Rm +0.0004 gm
5 15.8525 gm 15.8529 gm +0.0004 gm
6 14.9066 gin 14.9068 gm +0.0003 gm
Table F-1 Dimensions and Weight Change for Run 1
142

Run 2: 96 hours at 300'C, 241.5 atm
Sample Number Height Width Length
1 (Inconel 625) 3.25mm 20.04mm 38.10mm
2(Inconel 625) 3.18mm 19.7 1mm 38.79mm
3(C-276) 3.18mm 20.60mm 38.15mm
4(C-276) 3. 10mm 20.47mm 37.92mm
5(316 SS) 3.0mm 19.5 1mm 38.23mm
6(316 SS) 2.9mm 20.19mm 38.71mm
Surface area is reduced by drilling of a 9.525 mm diameter inch hole in the sample.There is an insulated washer covering 15.977 mm diameter circle on each flat surface.
I Sample Number Surface Area Exvosed Area Shielded Area
1 19.13 cm 2 15.04 cm2 4.09 cm 2
2 19.09 cm 2 15.00 cm 2 4.09 cm 2
3 19.54 cm 2 15.45 cm 2 4.09 cm 2
4 19.28 cm2 15.19 cm2 4.09 cm2
5 18.46 cm 2 14.37 cm 2 4.09 cm 2
6 19.12 cm 2 15.04 cm 2 4.08 cm 2
Weight is the average of three values on a precision balance
Sample Number Initial Weight Final Weight Weight Change
1 18.1993 gm 18.1996 gm +0.0003 gm
2 18.5079 gm 18.5082 gm +0.0003 gm
3 19.5607 gm 19.5606 gm +0.0001 gm4 19.2290 gm 19.2295 gm +0.0005 gm
5 15.7449 gm 15.7456 gm +0.0006 gm6 15.9877 gm 15.9885 gm +0.0007 gm
Table F-2 Dimensions and Weight Change for Run 2
143
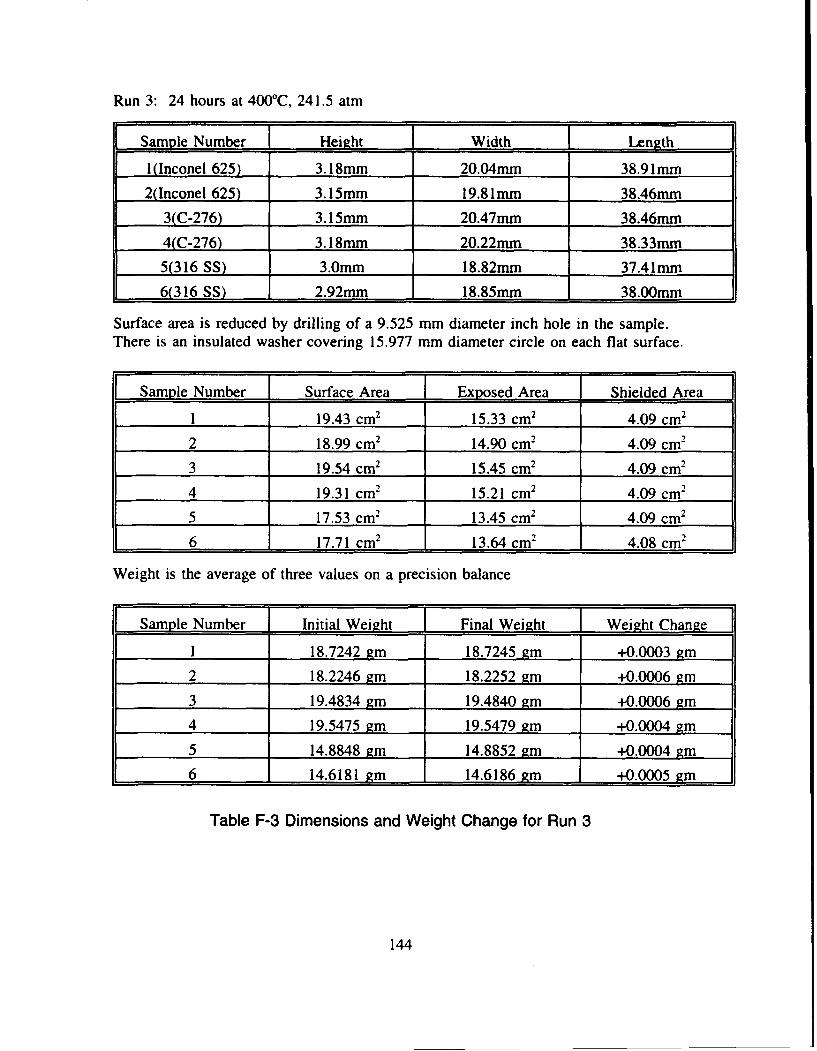
Run 3: 24 hours at 400°C, 241.5 atm
Sample Number Height Width Length
1 (Inconel 625) 3.18mm 20.04mm 38.91 mm
2(Inconel 625) 3.15mm 19.81mm 38.46mm
3(C-276) 3.15mm 20.47mm 38.46mm
4(C-276) 3.18mm 20.22mm 38.33mm
5(316 SS) 3.0mm 18.82mm 37.41mm
6(316 SS) 2.92mm 18.85mm 38.00mm
Surface area is reduced by drilling of a 9.525 mm diameter inch hole in the sample.There is an insulated washer covering 15.977 mm diameter circle on each flat surface.
Sample Number Surface Area Exposed Area Shielded Area
1 19.43 cm 2 15.33 cm 2 4.09 cm 2
2 18.99 cm 2 14.90 cm 2 4.09 cm 2
3 19.54 cm 2 15.45 cm 2 4.09 cm 2
4 19.31 cm" 15.21 cm 2 4.09 cm2
5 17.53 cm 2 13.45 cm 2 4.09 cm2
6 17.71 cm 2 13.64 cm 2 4.08 cm 2
Weight is the average of three values on a precision balance
Sample Number Initial Weight Final Weight Weight Change
1 18.7242 gm 18.7245 gm +0.0003 gm
2 18.2246 gm 18.2252 gm +0.0006 gm
3 19.4834 gm 19.4840 gm +0.0006 gm
4 19.5475 gm 19.5479 gm +0.0004 gm
5 14.8848 gm 14.8852 gm +0.0004 gm
6 14.6181 gm 14.6186 gm +0.0005 gm
Table F-3 Dimensions and Weight Change for Run 3
144

Appendix (C
Sample Photographs
Figure G-1 Fibre-Optic microscope view of Inconel 625, exposed to deionizedwater for 96 hrs at 5000C, 241.5 atm, washer transition region. (100 x)
Figure G-2 Fibre-Optic microscope view of Hastelloy C-276, exposed to
deionized water for 96 hrs at 5000C, 241.5 atm, washer transition region. (100 x)
145

• 1 9
. ~1200Mr I
Figure G-3 Fibre-Optic microscope view of 316 SS, exposed to deionized waterfor 96 hrs at 300C, 241.5 atm, washer transition region. (100 x)
410 gml
Figure G-4 Laser confocal microscope view of Inconel 625 exposed todeionized water for 96 hours at 3000C. 241 5 atm (400 x)
146
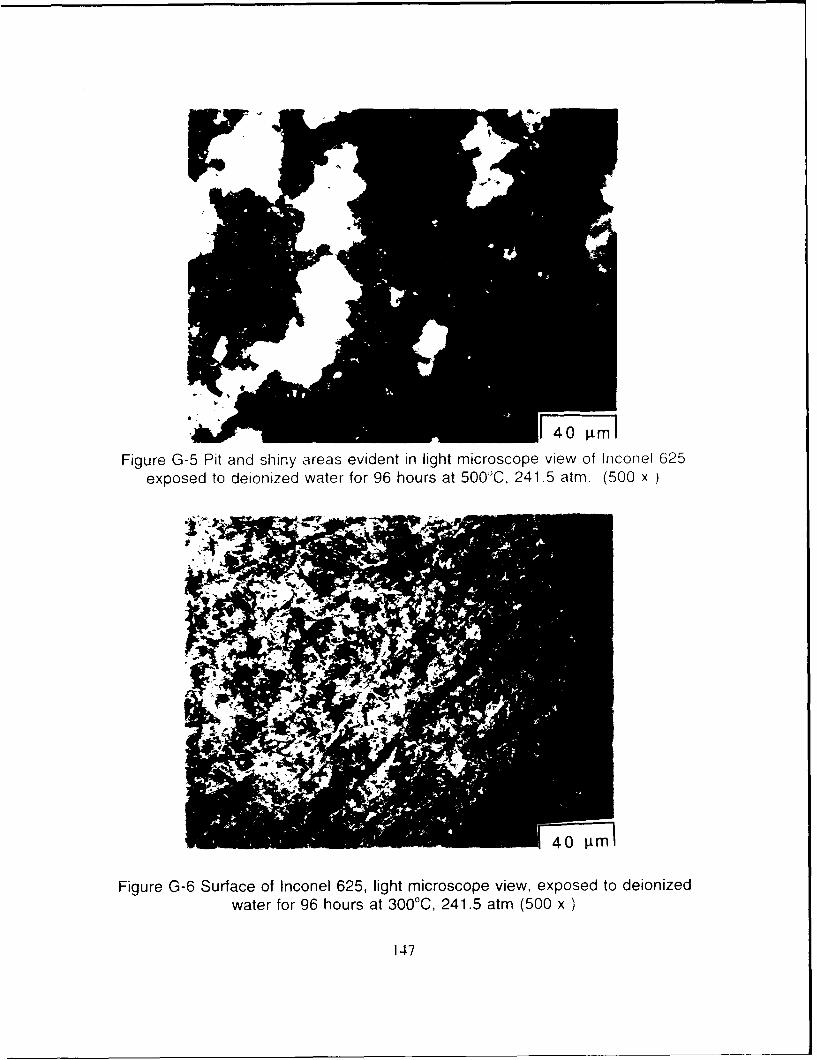
Figure G-5 Pit and shiny areas evident in light microscope view of Inconel 625exposed to deionized water for 96 hours at 500C, 241.5 atm. (500 x
----
Figure G-6 Surface of Inconel 625, light microscope view, exposed to deionizedwater for 96 hours at 3000C, 241.5 atm (500 x
147

F40 ltmm
Figure G-7 Sharp features in 316 stainless steel exposed to deionizedwater for 96 hours at 300"C, 241.5 atm (500 x, light microscope)
I40 pJr
Figure G-8 Pit in Inconel 625 exposed to deionized water for 24 hoursat 4000C, 241.5 atm (500 x, light microscope)
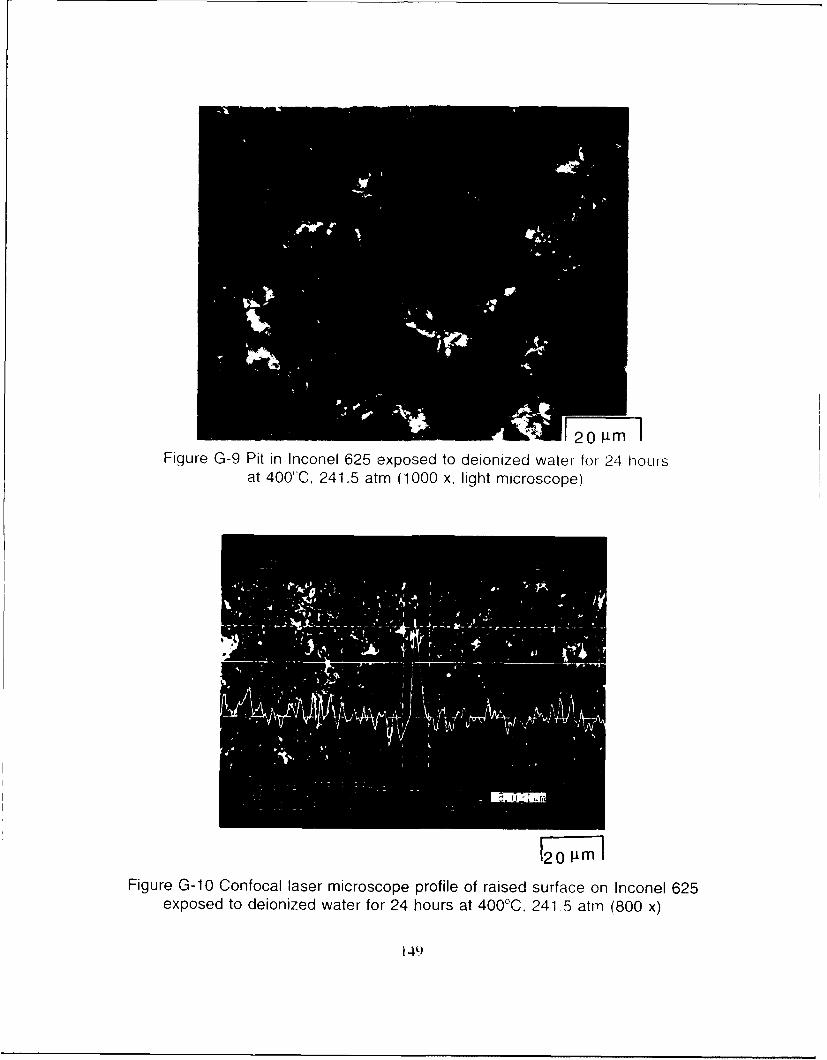
S20 4~m
Figure G-9 Pit in Inconel 625 exposed to deionized water for 24 hoursat 400"C, 241.5 atm (1000 x, light microscope)
Figure G-10 Confocal laser microscope profile of raised surface on Inconel 625exposed to deionized water for 24 hours at 4000C, 241 5 atm (800 x)
149

120 rt IFigure G-1 1 Confocal laser microscope profile of irregularity on Inconel 625
exposed to deionized water for 24 hours at 4000C, 241.5 atm (800 x)
120 ;rm IFigure G-12 Confocal laser microscope profile of shiny area on Inconel 625
exposed to deionized water for 96 hours at 5000C. 241.5 atm (800 x)
150

F20•lFigure G-13 Confocal laser microscope profile of irregular surface on 316 SSexposed to deionized water for 96 hours at 300 C. 241.5 atm (800 x)
i;P~;1
Figure G-14 Confocal laser microscope profile of rough surface on HastelloyC-276 exposed to deionized water for 96 hours at 5000C, 241.5 atm (800 x)
'5i

BIBLIOGRAPHY
1. Kotas, Gerald, "Total Quality Management and Pollution Prevention". CorporateQuality/Environmental Management: The First Conference, Global EnvironmentalManagement Initiative, Washington DC, Jan 9-10 1990, page 193.
2. OPNAVINST 5090.1A Environmental and Natural Resources ProgramManagement, Washington DC, 2 October 1990.
3. Markle, S. P, F. Colberg, M. A. Bracco, M. Smoot, G. Margelis, "Fleet LogisticsEnvironmental Ship," Design Project for Massachusetts Institute of Technology,Department of Ocean Engineering Course 13.414, May 1994.
4. Brooks R. , "Principles of Naval Ship Design" course notes from MassachusettsInstitute of Technology, Ocean Engineering Department Course 13.412, Sept 1992.
5. Martynova, 0. I.: "Solubility of Inorganic Compounds in Subcritical andSupercritical Water", In High Temperature High Pressure Electrochemistry in AqueousSolutions, Jones, D de G., and Staele, R. W.., Eds., National Association of CorrosionEngineers, Houston, TX 1976, pp. 131-138.
6. Modell, M. " Detoxification and Disposal of Hazardous Organic Chemicals byProcessing in Supercritical Water". US Army Medical Research and DevelopmentCommand, Fort Dietrick, Frederick Maryland. November 1985.
7. Jain, Vinod K. "Supercritical Fluids Tackle Hazardous Wastes", EnvironmentalScience Technology, Volume 27 No. 5, 1993. pp. 806-808.
8. Takahasi, Y, T. Wydeven and C. Koo. "Subcritical and Supercritical WaterOxidation of CELSS Model Wastes", Advanced Space Research, Vol.9 No. 8, 1989 p.99-110.
9. Moran, David, Office of Naval Research, Presentation to Massachusetts Instituteof Technology, Joint Industry and Academic Workshop sponsored by the OceanEngineering Department March 1992.
10. Rice, S. F., Steeper, R. R., and LaJeurnesse, C. A., " Destruction of RepresentativeNavy Wastes Using Supercritical Water Oxidation", Sandia National Laboratory paperSAND94-8203, printed October 1993.
11. Kurts, Richard, Naval Civil Engineering Laboratory, Port Hueneme CA,discussions February 1993.
152

12. Modell, Michael, "Supercritical Water Oxidation", Standard Handbook ofHazardous Waste Treatment and Disposal. McGraw-Hill, Inc., New York, NY, 1989,pp.8 .153-8.167.
13. Tester, Jefferson W., H. Richard Holgate, Fred J. Armellini, Paul A. Webley,William R. Killilia, Glen T. Hong, and Herbert E. Barner. "Supercritical WaterOxidation Technology, Process Development and Fundamental Research", EmergingTechnologies in Hazardous Waste Management 111, American Chemical SocietyWashington D.C. 1993, pp. 35-76.
14. Armellini, F. J., J. W. Tester, "Experimental Methods for Studying SaltNucleation and Growth from Supercritical Water", Journal of Supercritical Fluids,Volume 4, 1991, p. 254.
15. Armellini, F. J. and J. W. Tester, "Solubility of Sodium Chloride and Sulfate inSub- and Supercritical Water Vapor from 450 - 550(0C and 100-250 Bar", FluidPhase Equilibria, Volume 84, 1993, p. 139.
16. Uhlig, Herbert H., Corrosion and Corrosion Control, 3rd Ed., John Wiley andSons, New York, 1985.
17. Pourbaix, M. Atlas of Electrochemical Equilibria in Aqueous Solutions,Pergamon Press, New York, 1966.
18. Huang, Shaoping, Kirk Daehling, Thomas Carlson, Pat Taylor, Chien Wai andAlan Prop. "Thermodynamic Analysis of Corrosion of Iron Alloys in SupercriticalWater". Supercritical Fluid Science and Technology, American Institute of ChemicalEngineers Annual Meeting, Washington D.C., Nov 27 - Dec 2 1988, p. 276-286.
19. N. D. Greene, Experimental Electrode Kinetics, Renssalaer Polytechnic Institute,Troy N. Y, 1965; "Standard Reference Method for Making Potentiostatic andPotentiodynamic Anodic Polarization Measurements, G5-87, 1992 Annual Book ofASTM Standards, Vol 03.02, American Society for Testing and Materials, Philadelphia,PA, 1992. p. 72.
20. Huang, Shaoping, Kirk Daehling, Thomas Carlson, Masud Abdel-Latif, PatTaylor, Chien Wai and Alan Prop, "Electrochemical Measurements of Corrosion ofIron Alloys in Supercritical Water", Supercritical Fluid Science and Technology,American Institute of Chemicdl Engineers Annual Meeting, Washington D.C., Nov 27-Dec 2 1988, p. 287-300.
21. Carter J.P., B.S. Covino, Jr., J. T. Driscoll, W. D. Riley and M. Rosen. "GaseousCorrosion of Metals in a 60% H20, 40% HCl", Corrosion, Vol. 40, No. 5, May 1984,pp. 205-214.
153

22. Berry, Warren E.," The Corrosion Behavior of Fe-Cr-Ni Alloys in HighTemperature Water", in High Temperature High Pressure Electrochemistry in AqueousSolutions, University of Surrey, England, January 7-12, 1973. pp.48-66.23. Tester, Jefferson W., Proposal for "Chemical Reactors for Supercritical WaterOxidation of Military Toxic Wastes, Fundamental and Applied Studies," Submitted toU. S. Army Research Office 1991.
24. Berkowitz, B. J. and R. D. Kane, "The Effect of Impurity Segregation of theHydrogen Embrittlement of a High Strength Nickel Based Alloy in H2SEnvironments", Corrosion, Vol. 36, No. 1, January 1980, pp. 25-29.
25. Kane, R. D. and B. J. Berkowitz, "Effect of Heat Treatment and Impurities onthe Hydrogen Embrittlement of a Nickel Cobalt Base Alloy", Corrosion, Vol. 36, No.1, January 1980, pp. 29-36.
26. Dyer, R. B., S. J. Buelow, D. M. Harradine, J. M. Robinson, B. R. Foy, J. H.Atencio, P. C. Dell'Orco, K. A. Funk, R. E. Mcllroy. "Destruction of Explosives andRocket Fuels by Supercritical Water Oxidation", Los Alamos National Laboratorypaper LA-UR-92-2378, June 1992.
27. Buelow, Steven J., R. Brian Dyer, Cheryl K. Rofer, Jerry H. Atencio, and JosephD. Wander, "The Destruction of Propellant Components in Supercritical Water", LosAlamos National Laboratory paper LA-UR-90-1338 Printed May 1990.
28. Bramlette, T. T., B. E. Mills, K. R. Hencken, M. E. Brynildson, S. C. Johnson,J. M. Hruby, H. C. Feemster, B. C. Odegard, and M. Modell. "Destruction ofDOE/DP Surrogate Wastes with Supercritical Water Oxidation Technology", SandiaNational Laboratory paper SAND90-8229, Printed November 1990.
29. LaJuenesse, C. A., S.F. Rice, J.J. Bartel , M. Kelley, C. A. Seibel, L. G. Hoffa, T.F. Ekelund, and B. C. Ode!rd, A Supercritical Water Oxidation Reactor: TheMaterials Evaluation React (MER)", Sandia National Laboratory paper SAND91-8623, Printed February 1992.
30. Thomas, Albert Janney III, and Earnest F. Gloyna. "Corrosion Behavior of HighGrade Alloys in the Supercritical Water Oxidation of Sludges", Technical ReportCRWR 229, Center for Research in Water Resources. The University of Texas atAustin, February 1991.
31. Hazlebeck, D. A., K. W. Downey, D. D. Jensen, and M. H. Spritzer,"Supercritical Water Oxidation of Chemical Agents, solid Propellants, and Other DODHazardous Wastes", General Atomics paper released March 1993, pp. 11-13.
154
32. Walter, G. W., "A Review of Impedance Plot Methods Used for CorrosionPerformance Analysis of Painted Metals", Corrosion Science, Vol 26, No. 9, 1986, pp.681-703.
33. Barner, H. E., C. Y. Huang, T. Johnson, G. Jacobs, M. A. Martch and W. R.Killilea, "Supercritical water oxidation: An emerging technology", Journal ofHazardous Materials, Vol 31, 1992, pp. 1-17.
34. Crandall, S. H., N. C. Dahl, and T. J. Lardner ed, An Introduction to theMechanics of Solids. McGraw-Hill Publishing Co, NY, 1978. p. 276.
35. McClintock, F. A. and A. S. Argon, editors, Mechanical Behavior of Materials.Addison Wesley Publishing Company, Inc. 1971, Reprinted 1993, p. 276.
36. Inco Alloys, Inconel Alloy 625 Physical Properties Data pamphlet. Fifth Edition1985.
37. Campbell, J. E, W. E. Gerberich, and J. H. Underwood editors, Application ofFracture Mechanics for Selection of Metallic Structural Materials. American Societyfor Metals, Metals Park OH. p. 316.
38. Brown, Stuart, Professor of Materials Science, Massachusetts Institute ofTechnology discussions March 1993.
39. American Society of Mechanical Engineers Boiler and Pressure Vessel CODEVIII Division 1, section UG-101, ASME, New York, 1992. pp 79.
40. Reflange INC, Design Stress Calculations for R-CON clamp type connectors perASME Code VIII.
41. Blass, Kathryn, "Exposure Test Vessel in 8-235", memo to file for MassachusettsInstitute of Technology Safety Office, 19 Jan 1994.
42. Mitton, D. B., R. M. Latanision, J. C. Orzalli, P. A. Marrone, B. D. Phenix, J.C. Meyer, J. W. Tester. "Preliminary Failure Analysis of a Supercritical WaterOxidation Preheater Tube", presented to University Research Initiate meeting August17, 1994, University of Delaware, Newark, Delaware.
43. Omega Engineering Incorporated Heater Manual Volume 28, 1992. p.K- 11.
44. Masubuchi, K, "Laser Microscope Opens Up New Opportunities for WeldingResearch", Welding Journal, Sept 1992, p. 69-71.
155
45. Macdonald, D. D., Uhlig Corrosion Lab Lecture at Massachusetts Institute ofTechnology, Feb 1994.
46. Rofer, Cheryl K, Steven J. Buelow, Richard B. Dwyer and Joseph D. Wander."Conversion of Hazardous Materials Using Supercritical Water Oxidation", U. S.Patent 5,133,877, July 28, 1992.
47. Massachusetts Water Resources Authority (MWRA) 320 Code of MassachusettsRegulations (CMR) 10.024.
48. Standard Recommended Practice for Conducting Plant Corrosion Tests.(G4-84)1993 Annual Book of ASTM Standards part 03.02. American Society of TestingMaterials, Philadelphia, 1992, p. 66.
49. Jones, Denny A., Principles of Prevention of Corrosion, Macmillian, New York,1992. Inside back cover.
156
BIOGRAPHICAL NOTE
John Clarke Orzalli, Commander, United States Navy.
Born: December 26, 1955, Marysville California
Institutions Attended:
United States Naval Academy: July 1974 - June 1978B. S. in Marine EngineeringAmerican Society of Naval Engineers Prize
Golden Gate University: Jan 1989 - August 1990M. S. in Systems Management
Professional Training:
United States Navy Nuclear Power School: 1979United States Navy Nuclear Power Prototype: 1979US Naval Submarine Officer Basic Course: 1980
L. Y. Spear AwardUS Naval Submarine Officer Advance Course: 1985
L. Y. Spear Award
Professional Experience:
USS Snook (SSN 592) 1980-1983Completed Regular Overhaul and Deploymentsto South America and the Mediterranean.Reactor Controls Assistant, Main Propulsion Assistant and WeaponsOfficer.
United States Naval Academy 1983-198529th Company Officer
USS Helena (SSN 725) 1986-1988Chief Engineer Officer, Completed New Construction Shakedown andPost Shakedown Availability.
Submarine Development Group One, 1988-1991Detachment Mare Island Officer in Charge
Professional Awards:Meritorious Service MedalNavy Commendation Medal (2 Awards)Navy Achievement Medal (4 Awards)
157

Other Recognition:1988 White House Fellowship, Regional Finalist
Family:Married to Joanne Dale (McComas) OrzalliThree children; Sarah, Ian and Robbie.
158
Related Documents