265 9 NASICON: Synthesis, Structure and Electrical Characterization Umaru Ahmadu Department of Physics, Federal University of Technology, Minna, Nigeria Abstract NASICON (Na-Super-Ioni-CONductor) has the general formula Na 1-x Zr 2 P 3- x Si x O 12 (0 ≤ x ≤3) and is derived from the parent compound sodium zirconium phosphate, NaZr 2 (PO 4 ) 3 , i.e., NZP. It belongs to the class of superionic conduc- tors, materials that have high ionic conductivity at elevated or room temperatures, similar to those of liquid electrolytes at room temperatures. NASICON is special due to its unique structural features (three-dimensional), which confer on it high conductivity and diverse physical and chemical characteristics suitable for various applications in many fields. e Na, Zr and P can be substitutted by atoms of dif- fering sizes and oxidation states, up to about forty or more of such atoms, leading to its tailorability for targetted applications in recahargeable lithium ion batter- ies, gas sensors, low-zero-and even negative thermal expansion materials, nuclear waste immobilization, among others. In the present work we survey some classes of ionic conductors and the theoretical models of their conduction. A review of the electrical conductivity, dielectric relaxation, methods of synthesis, together with characterization techniques of NASICON, DTA/TGA, Impedance spectros- copy, NMR, FT-IR, among others, are highlighted. Case studies of some experi- mental results have been presented. Keywords: NASICON, superionic conductors, theoretical models, synthesis, structure and electrical properties 9.1 Introduction Ionic materials are in recent times at the forefront of materials research. ey are part and parcel of our electronic industry in that they complement *Corresponding author: [email protected] Ashutosh Tiwari and Mustafa M. Demir (eds.) Advanced Sensor and Detection Materials, (265–308) 2014 © Scrivener Publishing LLC

Welcome message from author
This document is posted to help you gain knowledge. Please leave a comment to let me know what you think about it! Share it to your friends and learn new things together.
Transcript
265
9
NASICON: Synthesis, Structure and Electrical Characterization
Umaru Ahmadu
Department of Physics, Federal University of Technology, Minna, Nigeria
Abstract NASICON (Na-Super-Ioni-CONductor) has the general formula Na1-xZr2P3-
xSixO12 (0 ≤ x ≤3) and is derived from the parent compound sodium zirconium phosphate, NaZr2(PO4)3, i.e., NZP. It belongs to the class of superionic conduc-tors, materials that have high ionic conductivity at elevated or room temperatures, similar to those of liquid electrolytes at room temperatures. NASICON is special due to its unique structural features (three-dimensional), which confer on it high conductivity and diverse physical and chemical characteristics suitable for various applications in many fi elds. Th e Na, Zr and P can be substitutted by atoms of dif-fering sizes and oxidation states, up to about forty or more of such atoms, leading to its tailorability for targetted applications in recahargeable lithium ion batter-ies, gas sensors, low-zero-and even negative thermal expansion materials, nuclear waste immobilization, among others. In the present work we survey some classes of ionic conductors and the theoretical models of their conduction. A review of the electrical conductivity, dielectric relaxation, methods of synthesis, together with characterization techniques of NASICON, DTA/TGA, Impedance spectros-copy, NMR, FT-IR, among others, are highlighted. Case studies of some experi-mental results have been presented.
Keywords: NASICON, superionic conductors, theoretical models, synthesis, structure and electrical properties
9.1 Introduction
Ionic materials are in recent times at the forefront of materials research. Th ey are part and parcel of our electronic industry in that they complement
*Corresponding author: [email protected]
Ashutosh Tiwari and Mustafa M. Demir (eds.) Advanced Sensor and Detection Materials, (265–308) 2014 © Scrivener Publishing LLC
266 Advanced Sensor and Detection Materials
the all-ubiquitous electronically-based semiconductor devices as a result of the alternative they off er as renewable energy sources, low cost, environ-mental friendliness, fl exibility, and potential applications. Th ey are used in various applications such as rechargeable lithium ion batteries for laptop computers, mobile phones, and as electrodes and electrolyte materials. As electrolytes, the materials should have high room temperature ionic con-ductivity, transference number close to 1 and temperature stability, among others [1–3]. Whearas as electrodes they should have mixed conduction properties, i.e., electronic and ionic. Superionic conductors are materials whose electrical conductivity approaches that of liquid electrolytes at high and room temperatures, with their conductivity approaching that of the molten state or acqueous solution at room temperature, of the order of 10–1
to 10–3 S/m [4]. Th e conductivity is due to delocalization of one or more of the ionic species in the sublattice of the framework structure of the materi-als, which move them under an applied electric fi eld. Th e mobile ions are usually Li+ or Na+ and are generally monovalent and cationic. However, recently [5] high Hf4+ ion conductivity in HfNbP3−xVxO12 and Hf1−y/4NbP3−
yWyO12, by partially replacing the P5+ site in a HfNb(PO4)3 solid with larger V5+ or W6+ ions through lattice volume expansion, has been demonstrated. Th e highest conductivity of 2.8 × 10⁻² S m−1 at 873 K was recorded in the systems. Anionic mobile ions can also conduct electricity in compounds like ZrO2, Ce2O3, AgF, among others, where O2- and F- are the principal mobile species. Such is the case in Solid Oxide Fuel cells (SOFCs), which normally operate at high temperatures, ~873 K, so-called intermediate temperature [6], e.g., yitrium stabilized zirconia.
Ionic conductors may be solid, glassy, or polymer in nature, prop-erty that gives them a good advantage over the liquid electrolytes. Glassy ionics are very important due to their high conductivity and have been widely studied as a result of their potential applications [1, 7]. Th e conductivity in these compounds is enhanced on introduc-tion of a crystalline phase into the superionic glass matrix [8]. Work has also been reported on polymer electrolytes and biopolymers, with the latter reported to show evidence of superionic properties in gum Arabica [9]. Side-by-side with these developments is the trend in min-iaturization of these materials, which has resulted in the new fi eld of nanoionics [10] and their subsequent fabrication into thin fi lms [11] due to their enormous advantages. Th e production of thin fi lms of NASICON at relatively low temperatures with good physical properties has recently been reported, together with other alternative methods of production of the thin fi lms of NASICON [12].Th e high conductivity in superionic conductors is due to thermal activation oft en associated
NASICON and Its Properties 267
with phase transitions to a structural state that enhances conductivity by several orders of magnitude. Structural phase change may be related to particle size [7] and pressure, density, and microstructure aff ect the electrical performance of these materials. A principal challenge in this area is their electrical characterization, i.e, how to reduce the conduct-ing temperature to ambient conditions so that they can be favorable for applications, together with an understanding and development of the appropriate theoretical models that would explain their superionic character from the microscopic point of view. Further, the appropriate synthesis of these materials is also very important in order to obtain materials with the desired physical and chemical characteristics. We focus our discussions on the physical properties of the family of ionic conductors called NASICON (Na-Super-Ioni-CON-ductor), which have been synthesized by various methods in order to optimize their electrical and microstructural properties [13–15].
Zirconium phosphate, NaZr2(PO4)3, so–called NZP, is a member of a broad family of compounds known as NASICON (Na1+xZr2P3-xSixO12)(0 ≤ x ≤3), where the P has been partially replaced by Si and a further addition has been made to the Na to balance the overall charge of the system (P5+, Si4+). Henceforth, NZP shall refer to the former chemical formula while NASICON shall refer to the latter, unless otherwise stated. NZP structure [16] was fi rst determined by Hangman and Kierkegaad in 1967 and belongs to the rhombohedral crystal system with several interesting features and potential applications, some of which include high ionic conductivity [3], low thermal expansion coeffi cient [16–18], thermodynamic stability [19], nuclear waste immobilization potentials [15, 20] and use in environmental gas sensors for detection of pollutant gases [21, 22]. NZP has other potential applications in the automobile industries, e.g., for block engines and exhaust pipes of cars, space tele-scope technology, catalysts and catalytic supports [19], among others. It also has a unique property of enormously varied ionic substitution in its structure, accomodating forty to forty-fi ve elements in the periodic table in its lattice without altering the basic structure [15]. Some of the elements that can be substituted in the NZP include: Li, Cs, Ca, Ba, and others for Na; Ti, Ge, Hf for Zr and Si for P. Th e stability of the structure for a wide range of chemical elements makes it a universal sponge for nuclear waste host material [15, 20]. Th e electrical properties of these materials are of considerable interest in that by replacing P with Si in NASICON, a material is produced that rivals b - alumina, one of the best Na ion conductors, for industrial solid state electrolyte applications in high temperature batteries.
268 Advanced Sensor and Detection Materials
9.2 Th eretical Survey of Superionic Conduction
Many theoretical approaches have evolved over the years which have been successfully applied to some of these materials and have reproduced the experimental details, particularly for one-dimensional systems. Challenges, however, remain in the understanding of the origin of this behavior and in particular in the case of three-dimensional NASICON materials, thus spurring a lot of theoretical postulations to explain the conductivity mech-anisms and other properties. Propositions have been put forward to study and explain the superionic phenomena in simple binary ionic systems and complex ones. We shall review some of the highpoints, including mod-eling and simulation techniques as general background to understanding NASICON.
An indepth review of various classes of superionic conductors, their properties and theoretical models, particularly the AgX (X = Cl, Br, I) family, have been reported [23]. Most of the models demonstrate a good correlation with experimental data, though in certain superionics such as glasses, non-Arrhenius behavior in their d.c. conductivities have been observed and appropriate theoretical models have been proposed which explained most of them [24]. Ionic materials have also been categorized into classes by conduction mechanisms and characterization techniques [25] for ease of analysis, with the authors emphasizing the increasing power and use of simulation [26, 27] techniques, such as Monte Carlo (MC) and Molecular Dynamics (MD), among others, for studying the properties of NASICON and related ionic materials. Th e application of these techniques in the determination of the electrical conductivity and phase transition temperature of LiZr2(PO4)3, among others, were extensively reviewed and accurate results were obtained, which compare favorably with experimen-tal values, such as the case of CaF2 [28].
One of the most widely studied ionic materials is zirconia, stabilized in its high-temperature cubic form. Molecular dynamics simulation and static dynamics have been applied to study the grain boundary conductiv-ity, producing very good results, which correlates with experimental val-ues [29]. Other simulation techniques have been discussed [30] and the mode of implimentation and conditions of use explained, together with their applications in highly disordered systems such as CaF2, AgI, CeO2, and ZrO2. Th ese provided very valuable data on the phase transition tem-peratures and conductivity. Th e application of quantum mechanical den-sity functional theory (DFT) [25, 30–32] in the MD simulations of these materials and similar ones have also been carried out. Atomic dynamics have been studied in superionic conductors by ab initio MD technique on
NASICON and Its Properties 269
CuI, Ag2Se, and the ionic conductivity was successfully reproduced [33], including the temperature dependence of the diff usion coeffi cient of the mobile ions, in good agreement with experimental data.
Th e determination of phase transition temperatures in superionic con-ductors is important as it is associated with a large increase in conductivity due to changes in activation energy, specifi c heat, among other parameters. However, some reports indicate such a transition could take place with-out any changes in activation energy, contrary to the expected results [34]. Many physical properties of materials change with structural transforma-tions; however, in superionic conductors, a high conductivity is associated with this state and the increase in conductivity is abrupt and fi rst order. NZP is not associated with structural phase transformation at the high conducting state or specifi c heat changes [19] in the temperature range 298 to 1123 K. Th ese transitions could be detected accurately using photo-acoustic technique [35] as it has been applied successfully to many super-ionic materials of the AgX family and the results agreed well with literature data on superionic transition temperatures. Work has also been carried out on how to increase the room temperature conductivity to between 10 to 10–1 S/m [4] or 10 to 10–3 S/m [36], the range that will make it suitable for applications in devices such as lithium ion batteries, with the sugges-tion that the non-Arrhenius behavior observed in glassy ionic conductors, which limits their conductivity, could be improved by annealing and den-sifi cation of the electrolytes, since it reduces the saturation that may be responsible for the loss of Arrhenius behavior [37].
Study of the ionic conductivity of (1-x)Li2SO4:(x)Me2SO4 (where Me = Na, K, Rb, and Ag; x= 0.025 to 0.09) investigated by impedance spectros-copy [38] found that partial replacement of Li+ with Me+ of bigger ionic size increases the conductivity due to lattice loosening, and maximum con-ductivity enhancement was achieved by Ag+ substitution. Application of a simple model based on change in entropy and Coulomb interaction found that in addition to valence, the ionic size and electronic structure of doped cations play an important role in ion transport through solid and that the mismatch in the ionic radii of host and guest cations altered inter-ionic distance and so infl uenced Coulomb interactions and internal energy asso-ciated with lattice vibration. A Space Charge Potential model used in the study of BaCe0.8Y0.2O2.9−δ and cerium oxide [39, 40], respectively, showed that in ionic compounds the composition at the surface or interface may diff er from that in the bulk, resulting in a diff erence in electric potential between the grain boundary and the bulk due to the presence of excess ions at the grain boundary under equilibrium. Th is is due to space charge potential developed to compensate for the excess charges. Other studies
270 Advanced Sensor and Detection Materials
highlighted the role played by carrier concentration, mobility, tempera-ture, dynamics, and compositions in order to understand their high values of ionic conductivity [37].
Using a Chemical Bond approach [41], three conditions have been enu-merated for a material to exhibit the superionic character: 1) it must have an open structure within which the mobile ion should have low coordina-tion number; 2) the superionic conducting material must show a structural phase transition at relatively low pressures and 3) for a material composed
of atoms A and B, a parameter defi ned as 0
* BA
Zz Zε
= exhibits a small
value, where ZA, ZB are the valencies and e0 is the static dielectric constant. Th ese criteria have been fulfi lled by many superionic materials from experimental data. Other conditions include that the empty and occupied sites should have similar energies with a low activation energy for jumping between neighboring sites; that the structure should have a framework, preferably 3D, which is fulfi lled by NASICON, with open channels through which ions could migrate; and that the anion framework should be highly polarizable [42], among others.
Another model is that of “coupling and decoupling” by Angel [4], which is a guideline for searching for high ionic conductivity in complex mate-rials. Th e model assumes the mobile ion should be decoupled from the surrounding other ions and molecules by optimizing the chemical bond strength and coordination number. A good example is found in the so-called “mixed ion eff ect,” where ionic conductivity shows drastic decrease when two mobile ions are mixed or present in the same substance, e.g., Na and Li in B2O3 glasses. Th e mobile ion is found to be decoupled from the surrounding counter anions to allow the ion to move fast. However, the observed conductivity shows very low values, almost insulating in some compositions. Th is anomalous behavior of conductivity is believed to be related to a “percolation transition,” which is a special feature of complex materials not observed in simple liquids or single crystals of homogenous structure.
Real Space Pseudo Potential [41] method has been applied to study Cu and Ag Halides with the zinc-blende structure, using the Bond Model from the electronic theory of superionic conductors, which provided further insight into the concept of a “mobile ion in a cage formed by the immobile ion.” In a related study [43] using the the Pseudo Potential method, AgI, a well-known superionic conductor and GaAs, a well-known semiconduc-tor, results show that the bonding in AgI is mainly determined by the iodine and suggests that the local electronic excitations from the bonding to the
NASICON and Its Properties 271
antibonding orbitals can trigger the migration of the mobile ion species and thus initiate the superionic transport. Recent interest in the electron substructure [44, 45] to explain the behavior of superionic materials led to a suggestion that the change of bonding that occurs locally and fl uctuates in time plays an important role in the understanding of the phenomenon of superionic conduction. Th is is because the fl uctuation of the bond cre-ates fi elds of forces which move the ions and which in turn trigger new bond fl uctuations. Th e model has been used successfully and applied in the interpretation of many experimental observations. Another major area of ionic conductors currently receiving attention is composites. Composite materials are heteregenous mixtures of various phases. Work on the review [46] of the theoretical framework of the ionic conduction in various classes of these materials at the interface, ion trapping, depletion levels and their relationship to conductivity changes has also been reported.
Th ere is the screening concept and strain [47] in ionic conductors, which are relevant for the understanding of the defect and thermal properties of these compounds due to their relationship to conductivity, amongst many other contending theories of ionic conduction. In summary, the theoreti-cal implications show that many factors aff ect ion motion: concentration of charge carriers, defects or mobile ions, the distance between available positions, temperature, the correlation between charge carriers, the change of the thermodynamic potential of the motion of ions, and the change of thermodynamic potential of origin of defects [48].
9.3 NASICON Synthesis
NASICON has been synthesized by many routes depending on the applica-tion in view, stability, and parameters reguired. Nanocrystalline and thin fi lms [49–51] have been prepared but most have been prepared in poly-crystalline (microcrystalline) forms due to various advantages. Some of the methods of preparation are solid state reaction [52, 69], solution–gel [53–55], hydrothermal [13, 56, 57], Ion exchanges [58–60], Microwave [15, 61, 62], Spark Plasma Sintering [63, 64], solution combustion [65] and the relatively new Pechini–type Sol-Gel [66], among others.
9.3.1 Sol-Gel MethodTh is method is found to be better in most cases because the mixing of the components is achieved at a molecular level and is the most successful tech-nique to get very fi ne powders, low sintering temperature and Na and P
272 Advanced Sensor and Detection Materials
losses are minimized or completely avoided [67]. Further, it has the ability to achieve oxygen and ionic stoichiometry during the formation reaction, there is ease of synthesizing complex compositions, single phase materials, forma-tion of higher purity products through the use of high purity reagents [68, 69], and to provide coatings over complex geometries including the insides of tubes. Th ese advantages, however, are to be viewed in balance with the raw materials’ high cost, the long processing time involved, the non-uniformity of the fi lms, and the formation of cracks upon drying [69]. Th e principle of sol-gel technique consists of converting the sol, a suspension of colloidal or polymeric particles in a solvent, into a semisolid phase known as gel.
9.3.2 Hydrothermal MethodTh is is a low-temperature route for synthesis of ultra fi ne powders of NZP [25]. Hydrothermal synthesis is considered as a high-temperature technique, even though the temperatures are low compared to most traditional melt techniques. It has the advantage of rapid growth rates because of the rapid diff usion processes and it is a method of growth technique from liquid solu-tion with lower viscosity of liquid [70]. Further advantage is that reactions do not require much time compared to conventional methods and compounds that have elements with an unusual oxidation state can be synthesized [71].
9.3.3 Ion Exchange Solid electrolytes are ideal materials for carrying out ion exchange reac-tions since they have mobile ions of one type within a rigid host frame-work. With ion exchnage methods, new materials can be synthesized that, thermodynamically, are metastable and could not be synthesized by other means, such as direct reactions of the components [59]. Some of these new materials may have proprties or structures that are of technological importance.
9.3.4 Microwave SynthesisA more eff ective method of synthesis has been proposed using micro-wave heating, which results in products exhibiting high phase purity, good crystallinity, and minimal loss of volatile constituents. It has been used to prepare NZP compositions [15, 61, 72], Alumina, Ziconia, ZnO, among others. It is low cost, has high heating rates, low sintering time, uniform and volumetric heating, low temperatures and improved mechanical prop-erties, among others [73].
NASICON and Its Properties 273
9.3.5 Spark Plasma SinteringNASICON has been prepared by the Spark Plasma Sintering (SPS) method with the promise of lots of advantages. In other to activate mass transport during sintering process, the application of a current, that is electrical dis-charges between the particles under pressure through the sample during heating, presents a promising technique for rapid densifi cation of ceramics at relatively low temperatures to almost the theoretical density [63]. Th is is the most novel and increasingly used method, which has clear advantages over the conventional sintering method that makes it possible to sinter nanomeric powders to near full desifi cation with little grain growth [64].
9.3.6 Solid State Synthesis Generally, inorganic solids are prepared by the reaction of a solid with another solid, a liquid or a gas usually at high temperatures. Solids do not react with each other at room temperatures; high temperatures are required to reach the suitable reaction rates. Generally, two-thirds of the melting temperature of one component is enough to activate diff usion suffi ciently and to enable solid state reaction [74]. Th e advantages of solid state reac-tion are the availability of precursors and low cost for powder produc-tion on the industrial scale. Th e disadvantages of the solid state reaction method are that undesirable phases may be formed, the homogenous dis-tribution of dopants is sometimes diffi cult to achieve, and there are limited opportunities for in situ monitoring of the progress of the reaction; instead, physical measurements, such as XRD, are periodically carried out. Th is dif-fi culty results in mixtures of reactants and products frequently obtained. Th e separation of the desired product from these mixtures is generally dif-fi cult, if not impossible [74]. Further, in many compounds the reaction temperatures cannot be raised as high as necessary for reasonable reaction rates because one or more component of the reacting mixture may volatil-ize. Detailed description of solid state reaction theory and other methods have been discussed [74] and experimental details and results of the solid state synthesis of NaZr2(PO4)3 have been reported [75].
9.4 NASICON Structure and Properties
Th e structure of NZP is such that the Na+ is located in the interstitial sites in the framework and ionic conduction takes place when Na+ ions move from one site to another through bottlenecks formed by oxygen ions [76]

274 Advanced Sensor and Detection Materials
with a strong covalent bond. Th e total electrical conductivity strongly depends on the density and nature of the grain boundaries. NASICON compounds exhibit a few crystalline forms depending on temperature and composition. Th e structural formula of NASICON can be written as [M′1][M″3][A2
VI][B3IV]O12, where M′1, and M″3 are interstitial sites occu-
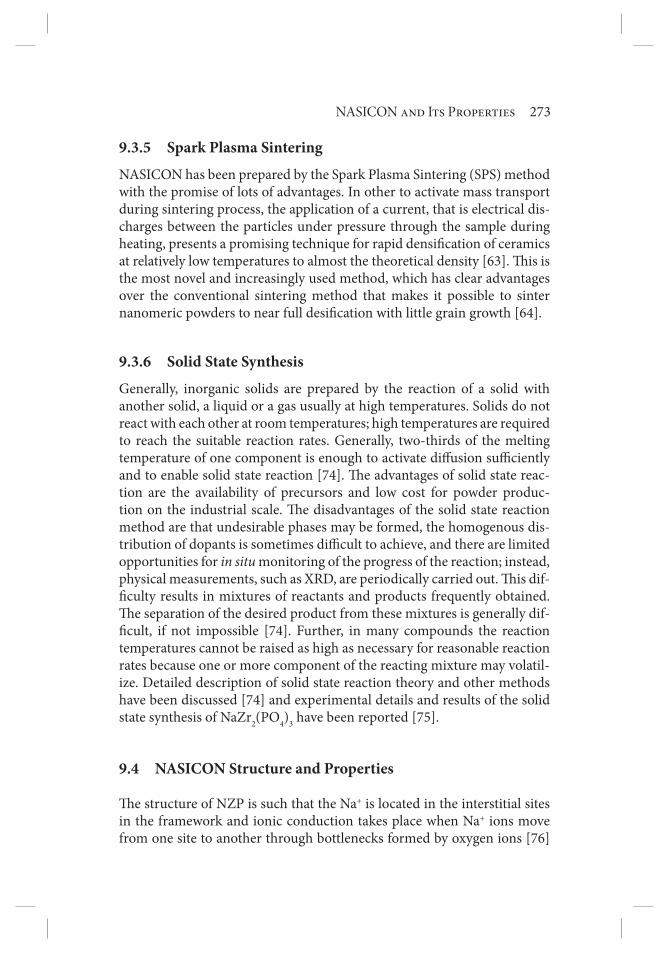
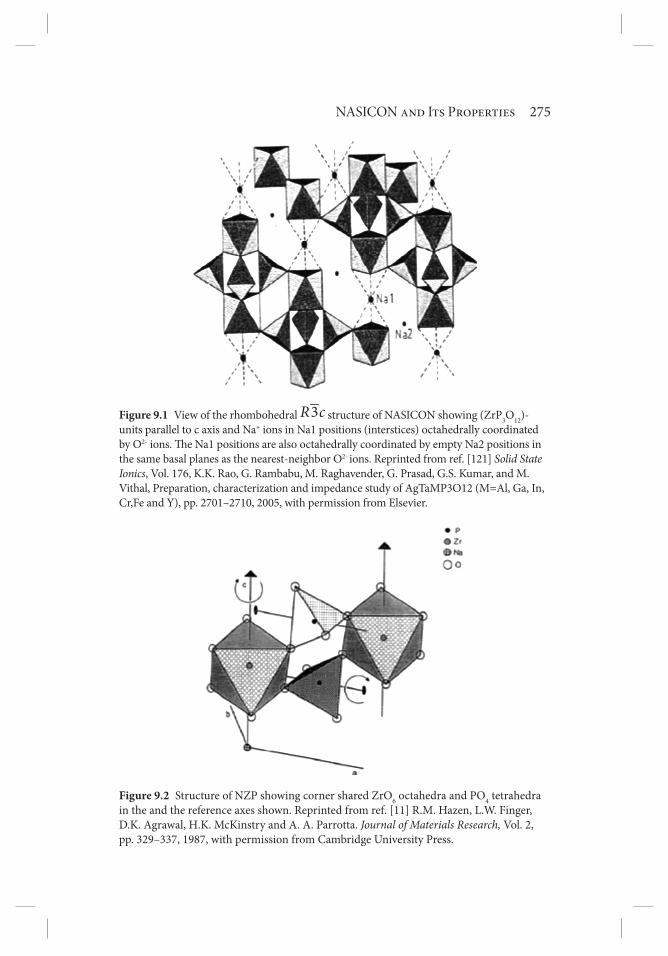
pied partially or fully by Na or other substituting ions. A and B lattice sites are primarily occupied by Zr and P or by possible substituting ions. Th e crystallographic structure of the parent composition NaZr2(PO4)3 was fi rst determined by Hangman and Kierkgaad [77] in 1967. NASICON is a solid solution derived from NaZr2(PO4)3 by partial replacement of P by Si, with Na excess to balance the negatively charged framework [58]. Th e network structure of NASICON can be modifi ed by using double phosphates and silicates to give the general formula Na1+xZr2P3-xSixO12 (0 ≤ x ≤ 3). In the skeleton of the complex anion (Zr2P3-xSixO12)(1+x)-, each ZrO6 octahedron shares its six corners with tetrahedra of PO4 or SiO4, and each tetrahedron shares its four corners with the octahedron. Th us each O2- bonds strongly to a tetrahedral and an octahedral cation. Th e compound has two sym-metries in the range 1.8 ≤ x ≤ 2.2, the material is monoclinic with space group C2/c; the rest of x yields rhombohedral unit cells of the 3R c space group at room temperature, with the x = 2 having the highest conductivity [78]. At higher temperatures (~473 K), NASICON takes the rhombohedral symmetry in the entire x-range and a phase transition involving rearrange-ment of Na+ ion sublattice occurs. Th e geometrical features of the skeleton and its interstitial space therefore satisfy the criteria for fast Na+ ion trans-port. Figure 9.1 shows the structure of NASICON with the Na1+ ions in the interstitial sites within the ZrO6 octahedron and PO4/SiO4 tetrahedra, while Figure 9.2 is the structure of NZP, with the atomic positions of vari-ous atoms shown. Th e oxygen is seen bridging the P and Zr polyhedra. Th e counter ion Na1+ is located in the specifi c M(1) site inside the framework.
Another way of representing the general structural formula of NZP in order to refl ect the atomic sites is simply M(I), M(II), M(III) A2n(XO4)3n, in which [A2n(XO4)3n]m- is the rigid framework and M(I), M(II), and M(III), the three distinct empty sites in the framework. In compounds with the highest symmetry ( 3R c), the MI site has three symmetries and coordina-tion number is 6 and lies on the c-axis and is generally fully or partially occupied [82]. Th e M(II) site has two symmetries and the coordination number is 14 and it lies between the columns and is connected to the M(I) site allowing ionic conductivity.
Th e Na+ cations may occupy the M(I) sites while the M(II) sites, situated outside the chains-polyhedra, remain empty [17]. Further, as the M(II) site is very big, in some cases two cations may fi t into the site. Th e M(III) site is
NASICON and Its Properties 275
Figure 9.1 View of the rhombohedral 3R c structure of NASICON showing (ZrP3O12)-units parallel to c axis and Na+ ions in Na1 positions (interstices) octahedrally coordinated by O2- ions. Th e Na1 positions are also octahedrally coordinated by empty Na2 positions in the same basal planes as the nearest-neighbor O2- ions. Reprinted from ref. [121] Solid State Ionics, Vol. 176, K.K. Rao, G. Rambabu, M. Raghavender, G. Prasad, G.S. Kumar, and M. Vithal, Preparation, characterization and impedance study of AgTaMP3O12 (M=Al, Ga, In, Cr,Fe and Y), pp. 2701–2710, 2005, with permission from Elsevier.
Figure 9.2 Structure of NZP showing corner shared ZrO6 octahedra and PO4 tetrahedra in the and the reference axes shown. Reprinted from ref. [11] R.M. Hazen, L.W. Finger, D.K. Agrawal, H.K. McKinstry and A. A. Parrotta. Journal of Materials Research, Vol. 2, pp. 329–337, 1987, with permission from Cambridge University Press.
276 Advanced Sensor and Detection Materials
a trigonal prism and has thirty-two symmetries. It can only accommodate small ions and in most cases it is empty. A and X can be substituted with many diff erent elements, forming hundreds of diff erent compositions [78]. For example, the M can be substituted with H+, Li+, Na+, K+, Rb+, Cs+, while A can be substituted with Nb5+, Ta5+, V5+, Sb5+, Ti4+, Zr4+, Hf4+, Ge4+, Sr4+, and X can be substituted with A5+, Si4+, Ge4+, S6+, Mo6+, Al3+. Substitution of monava-lent Na cation by a divalent Ca or Sr creates an ordering of cations and vacan-cies in the M1 sites, lowering the symmetry to 3R [17]. When substitution of Na by a larger cation is made, such as by K, forming KZP, the unit cell contracts in the A lattice direction and expands in the C direction. Th is is also true when the Na is substituted by NH4
+, the lattice parameter A decreases and while the C parameter increases [83]. Similarly, when the Na-O bond length increases with Ti, coupled rotations of the TiO6 and PO4 polyhedra lead to an expansion in the C and contraction in the A lattice directions. Th e diff erent compositions give several diff erent properties to the structure, e.g., ionic conductivity, low and negative thermal expansion, ability to immobilize radioactive nuclides, ferroelectricity, and catalytic property. Th e substitution of M site ions can be done at relatively low temperatures (573 K) and the framework ions A and X can be done at higher temperatures >1073 K. As the oxidation state of A and X gets higher the framework becomes stronger and the number of diff erent substitutions to the M site increases.
Inside the framework [A2n(XO4)3n]m-, M1+ counter ion fully occupy the M(I) vacancy which is located in the c-axis, between two ZrO6. Zr4+ ion has radius of 0.72 Å [84]. In addition, as the M1+ ion gets bigger the c-axis expands and PO4 tetrahedra distorts. Th is distortion increases the O-P-O angle through c-axis and shortens the axis. In an ion exchange study [58] on Na1+xTi2-xAlx(PO4)3 (x = 0.60–0.80), where the Na was substituted by Li, two mobile ions were pres-ent in the structure and aff ected the lattice parameters a, c, and other physical properties like conductivity diff erently, depending on their position on the M sites. Th e Li entered the M(II) sites, which decreased the length of the lattice parameter a axis. Th e c axis is however more sensitive to the M(I) site com-position and therefore the presence of Na in this site caused a variation of the length of the c axis upon ion exchange to be negligible. Th e presence of Na in the M(I) site is very important as it results in the so-called “mixed alkali eff ect,” or “mixed cation eff ect,” as it has been variously referred to. Since the occupancy of Na at the M(I) site is high this made the conductivity due to lithium cations highly diffi cult across M(I)–M(II) bottlenecks, since the Na+
may block Li+ diff usion along the M(I)–M(II) pathway, which may be related to the “mixed cation eff ect” observed mainly in glasses. A pronounced reduc-tion in conductivity is observed in oxide glasses with two or more types of dif-ferent alkali components when compared to the analogue single oxide glasses.

NASICON and Its Properties 277
Lithium-conducting solid electrolytes are the most important due to the special physical properties of lithium such as its small size and low density, which leads to increased electrical conductivity on partial as well as full substitutions in the NZP system, resulting in lithium zirconium phosphate LiZr2(PO4)3. NZP is thermally stable to 1773 K [85] whereas NASICON, depending on its composition, has melting point higher than 2073 K [86]. Th e substitution of Na becomes necessary since it is not a good ionic conductor for structural reasons [87]. Other compositions are obtained by replacing the Zr with Ge, Sc, In, Ti, etc., with the result that several orders of magnitude increment in conductivity at room tempera-ture is obtained, amongst other substitutions in the P system. Some stud-ies carried out on NZP refl ect current and potential applications, such as in corrosion-resistant coating material for silicon-based ceramics and thermal barrier coatings [86]; in the development of C-C composites due to the matching of its thermal expansion properties [88] and as a nuclear waste immobilization host material [16, 89, 90]. Recently, new materi-als of the NZP family have been developed and structurally characterized showing high ionic conductivity and optical property, an uncharacteristic property of these compounds. Some of these include, Na3Al2(PO4)3 with bulk conductivity 5.0 S/m at 600 K [91], Rb3Yb2(PO4)3 [92], a cubic sys-tem and Pb0.5Ti2(PO4)3 [93], a hexagonal system of the 3R c space group, respectively. Similarly, new NASICON-related Potassium Iron (III) Pyrophosphate has been synthesized and characterized [56], an example of which is is rhombohedral Li3Fe2 (PO4)3, a potential electrode insertion material in lithium polymer batteries based on its good ionic conductivity and low cost [94]. Th e thermal expansion properties of these compounds are very important due to their relevance in the synthesis of the materials and their relationship to microstructure and density. NZP has the lowest tailorable thermal expansion coeffi cients and exhibit anisotropy in their thermal expansion, spurring several theoretical models to explain the thermal properties [16, 95–98] and studies on the coeffi cients of thermal expansion [16, 99].
Microcracking is another property that occurs in these materials due to internal stresses among grains, which results in signifi cant lowering of strength and coeffi cient of thermal expansion [95]. Th e microcracks begin when a critical grain size of 2 μm is exceeded, which is related to the maxi-mum thermal expansion diff erence between the lattice parameters [100]. In low-density ceramics, these microcracks and pores can absorb some expansion thereby causing a reduction in the thermal expansion. It has been suggested that the anisotropic thermal expansion gives rise to poor sinterability [18] and that the compositions with high degrees of thermal

278 Advanced Sensor and Detection Materials
anisotropy are the ones prone to microcracking upon cooling at room tem-perature [96], since the onset of microcracking is related to the sintering temperature and hence grain size. Th ey suggest that microcracking may be delayed or enhanced by controlling the atmosphere in which the ceramic is heated and cooled and that thermomechanical properties in general can be improved by compositional and microstructure designs [95], all of which refl ect in the way and manner the materials are synthesized. Th us the use of appropriate atmosphere is important in the characterization and perfor-mance of these materials.
9.5 Characterization Techniques
NASICON materials have been characterized by various techniques depending on the problem being investigated. Whatever the problem of investigation there are certain characterizations that are regarded as fun-damental due to the information they provide about the pristine nature of the compound being investigated. Th e prominent ones are X-ray/neu-tron diff raction (XRD/ND) studies, including Rietveld analysis, which are used for phase, stoichiometry, and structural analysis. Elemental (EDX/XPS, energy dispersive spectroscopy/X-ray photoelectron spectroscopy) analysis are used for ascertaining the stoichiometry or chemical compo-sition, including valence state in the case of XPS. Microstructure (SEM/TEM, scanning electron microscopy/transmission electron microscopy) explores the morphological features of materials, grain/grain boundaries sizes and shapes. Th ermal technique such as TGA (thermogravimetric analysis) is generally used in solid state reactions to determine the sinter-ing temperatures, i.e., decompsition temeperatures of mixtures. Typical TGA plot is shown in Figure 9.3 for Na0.5Li0.75Zr2(PO4)3 between room temperature and 1273 K showing stability around 600 K. For the pur-poses of studies, however, techniques such as IS together with dielectric relaxation/permititvity and mobility have been used for the analysis of the electrical properties, such as ac/dc conductivity. DTA (diff erential thermal analysis) is used for structural /phase transformation studies in conjunction with XRD. Typical DTA plot for Na0.5Li0.75Zr2(PO4)3 is shown in Figure 9.4 over a temperature range of 1273 K. No signifi cant thermal eff ect is observed as earlier mentioned, except the peak around 400 K. FT-IR/Raman/NMR (Fourier Transform-Infrared/Raman spectroscopy/Nuclear Magenetic Resonance) spectroscopies are used for studies of vibrations of atoms and constituent molecules in NASICON, together with that of groups, such as phosphates or silicates, while NMR is used

NASICON and Its Properties 279
100
95
90
85
80
75
70
Mas
s lo
ss/%
0 200 400 600
Temperature/K
800 1000
Figure 9.3 TGA plot of mass loss vs temperature (K) at diff erent temperatures for Na0.25Li0.75Zr2(PO4)3. Th e mass becomes stable at around 600 K [97], reproduced with kind permission from Springer Science+Business Media, Journal of Th ermal Analysis and Calorimetry, Synthesis and thermal characterization of NZP compounds Na1-xLixZr2(PO4)3 (x= 0.00–0.75), Vol. 101, pp. 175–179, 2010. Ahmadu, U., A. O. Musa, S. A. Jonah and N. Rabiu, Figure 8.
200
Hea
rt fl
ow/m
w
0
0–20
Exo
–40–60–80
–100–120–140–160–180–200
400 600 800 1000
Temperature/K
1200 1400
Figure 9.4 Typical DTA plot of Na0.25Li0.75Zr2(PO4)3 at diff erent temperatures with small visible peak at 201.7 K, but there is no signifi cant thermal eff ect at this temperature [97], reproduced with kind permission from Springer Science+Business Media, Journal of Th ermal Analysis and Calorimetry, Synthesis and thermal characterization of NZP compounds Na1-xLixZr2(PO4)3 (x= 0.00–0.75), Vol. 101, , 2010, pp. 175–179, Ahmadu, U., A.O. Musa,S. A. Jonah and N. Rabiu, Figure 4.
for transport studies: mobility and diff usion, in particular, distribution of Li ions over diff erent sites (octahedral, tetrahedral) in the NASICON, together with activation energy and relaxation times. UV-vis spectros-copy has been used for absorption and valence state determination while Vibrating Sample Magnetometer (VSM) has been used for magnetic properties, among others.

280 Advanced Sensor and Detection Materials
Th e compound Li1+xAlxGeyTi2-x-y(PO4)3 [101] has been studied by XRD using Rietveld refi nement, while AgTaMP3O12 (M=Al, Ga, In, Cr, Fe and Y) [79] was studied by XRD, IR and IS (impedance spectroscopy). Th e sys-tems LiTi2(PO4)3, Li1.3Al0.3Ti1.7(PO4)2.9(VO4)0.1, and A3M2(PO4)3 (A = Li, Na and M = Cr, Fe) [65] have been investigated by XRD (Rietveld refi nement), FT-IR, TEM, DSC (diff erential scanning calorimetry)/DTA, UV-VIS and VSM techniques. ND has been used to investigate the structural properties of Ca1- xBaxZr4P6O24 [97], including Rietveld refi nement. Similarly, struc-tural phase transformations [34] in Li3In2(PO4)3 by XRD, DTA, and DSC have been reported, while [102] and [103] studied Li1.3Al0.15Y0.15Ti1.7(PO4)3 and LiM2(PO4)3, M = Ge, Ti, Sn, Zr, and Hf by NMR for Li ion mobility. Work has also been reported [87] on Li1+xAlxTi2−x(PO4)2.9(VO4)0.1, using 7Li, 27Al and 31P NMR and 27Al Magic Angle Spining NMR. Ionic conductivity [104] in Li1.3Al0.15Y0.15Ti1.7(PO4)3 by XPS has been reported. Diff usion stud-ies on single crystals of Na1+x+4yZr2-ySixP3-xO12, 0<x< 3, 0<y<1 0 found that in some of the compositions, Na interstitial sites were not involved in the diff usion [105] process but were correlated with oxygen split positions, and thus they argue that the rigid framework picture of NASICON is not tena-ble. Several other studies have been reported on these and other techniques. In the following sections, we discuss in detail the most used and important techniques for NASICON characterization, electrical conductivity using IS, dielectric properties and NMR, which uses mobility and relaxation.
9.5.1 Electrical ConductivityIt is important to know how much current can be passed through an elec-trode-electrolyte interface since some interfaces are non-polarizable or reversible while others are polarizable or non-reversible. A non-polariz-able interface thus acts reversibly to the species under consideration and both ionic and electronic species may cross the interface unobstructed. Polarizable interfaces have blocking eff ects on the species under consider-ation and to a fi rst approximation, act like a capacitor [106]. Several meth-ods have been used to measure ionic conductivity, including far infrared and Raman spectroscopies in which the vibrations of atoms provide hop attempt frequencies. Similarly, motional narrowing of the NMR absorp-tion lines, among others, also provides transport information. Studies on superionic conductors have been carried out at the d.c., low, microwave, and far infrared frequencies but not much is found in radio frequency (RF) range and microwave (GHz) regions. Conductivity in microwave range through theoretical studies reveal that motion of ions through the

NASICON and Its Properties 281
lattice in superionic conductors is intimately linked with microwave con-ductivity and thus frequency range expectedly corresponds to the time scale of ionic motion. Defects or interstitial spaces provide empty sites through which ions can migrate in a hoping mechanism in which the ions move sequentially into adjacent energy-equivalent vacant sites, or by cooperative motion of the ions. Conductivity may be fully or partly ionic, in the former it may be due to the positive and negative ion spe-cies, while in the latter case it may be due to electronic contribution due to negative electrons and positive holes that may be present. Th us total ionic conductivity may not be the true bulk ionic conductivity due to fac-tors, such as electrode–material contact resistance, which are generally of negligible fraction of total resistance in high-resistance samples, which is useful only if it is ensured that the signal makes the electrode-material system linear. Th ere is also the problem of grain-boundary resistance whose only solution is to carry out measurements on single crystals [25]. For most superionic conductors, the art of growing single crystals is far from developed, and measurements are therefore carried out on pressed pellets. Another factor is grain boundaries, which can either increase or decrease the conductivity, depending upon whether or not the activation energy for conduction of the grain boundary is less or more than the bulk conduction. In d.c. conduction, polarization eff ects at the nearby elec-trodes are a major problem in the evaluation of ionic transport but they are useful in separating electronic components of conductivity. Simple models [107] have been presented that explains theoretically a.c. conduc-tivity based on relaxation concepts, which illustrate some of the features of the ionic a.c. conduction in solids and helped in clarifying their origin. Th e models, which are applied to NASICON materials, show how long-range motion of the charges can occur in a system composed of ions that are confi ned by the coulomb potentials of the neighboring ions, with the condition that the position of these neighbors can also relax. At low frequencies, the long-range displacements of carriers give the frequency independent (dc) conduction s
0. As the frequency increases, the conduc-
tivity gradually increases and over a frequency range from mHz to GHz it is well approximated by Jonscher and Almond:
s(w) = s0 [(1 + w/wc)s
] (9.1)
where wc is the frequency of the onset of ac conduction and s is a variable parameter. Th is equation treats the a.c. and d.c. as independent phenom-ena. However, both contributions should supposedly arise from the same
282 Advanced Sensor and Detection Materials
microscopic mechanism. Another form [108] of eq. (9.1) has been pro-vided to describe the a.c. behavior:
s(w) = s(0) + Awa (9.2)
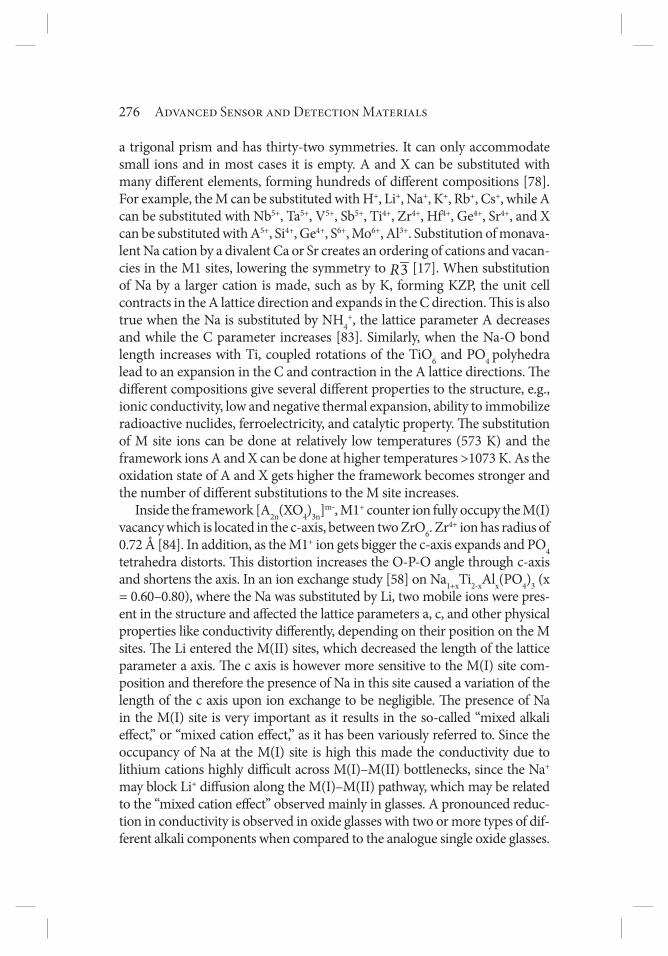
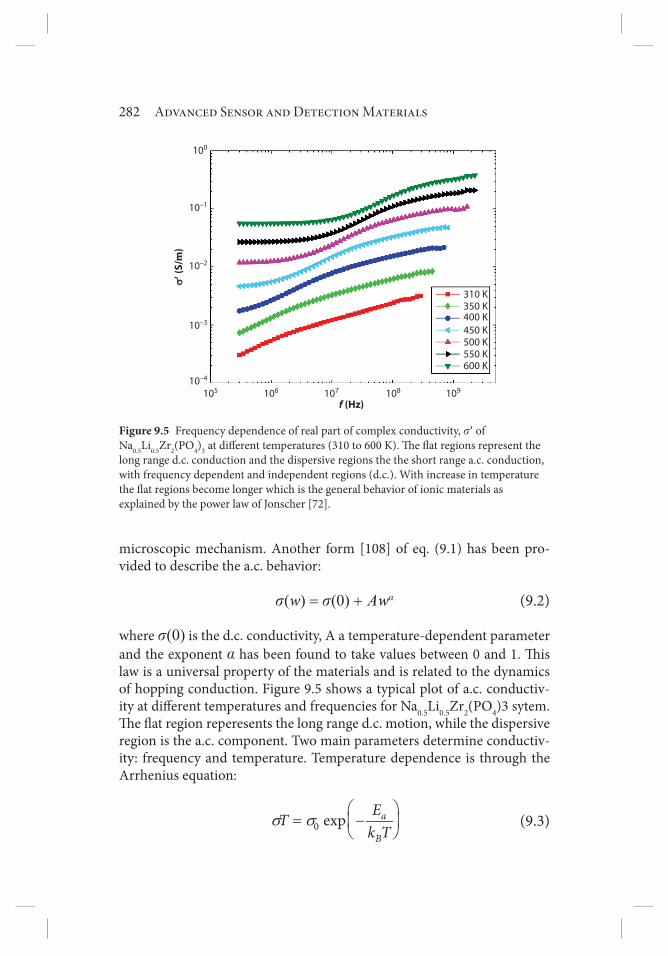
where s(0) is the d.c. conductivity, A a temperature-dependent parameter and the exponent a has been found to take values between 0 and 1. Th is law is a universal property of the materials and is related to the dynamics of hopping conduction. Figure 9.5 shows a typical plot of a.c. conductiv-ity at diff erent temperatures and frequencies for Na0.5Li0.5Zr2(PO4)3 sytem. Th e fl at region reperesents the long range d.c. motion, while the dispersive region is the a.c. component. Two main parameters determine conductiv-ity: frequency and temperature. Temperature dependence is through the Arrhenius equation:
σ σ
⎛ ⎞= −⎜ ⎟
⎝ ⎠0 exp a
B
ETk T
(9.3)
100
10–1
10–2
10–3
10–4
105
σ′σ′ (S
/m)
106 107
f (Hz)108 109
310 K350 K400 K450 K500 K550 K600 K
Figure 9.5 Frequency dependence of real part of complex conductivity, s′ of Na0.5Li0.5Zr2(PO4)3 at diff erent temperatures (310 to 600 K). Th e fl at regions represent the long range d.c. conduction and the dispersive regions the the short range a.c. conduction, with frequency dependent and independent regions (d.c.). With increase in temperature the fl at regions become longer which is the general behavior of ionic materials as explained by the power law of Jonscher [72].
NASICON and Its Properties 283
where s0 is a pre-exponential factor, s, T, Ea and kB are the conductiv-
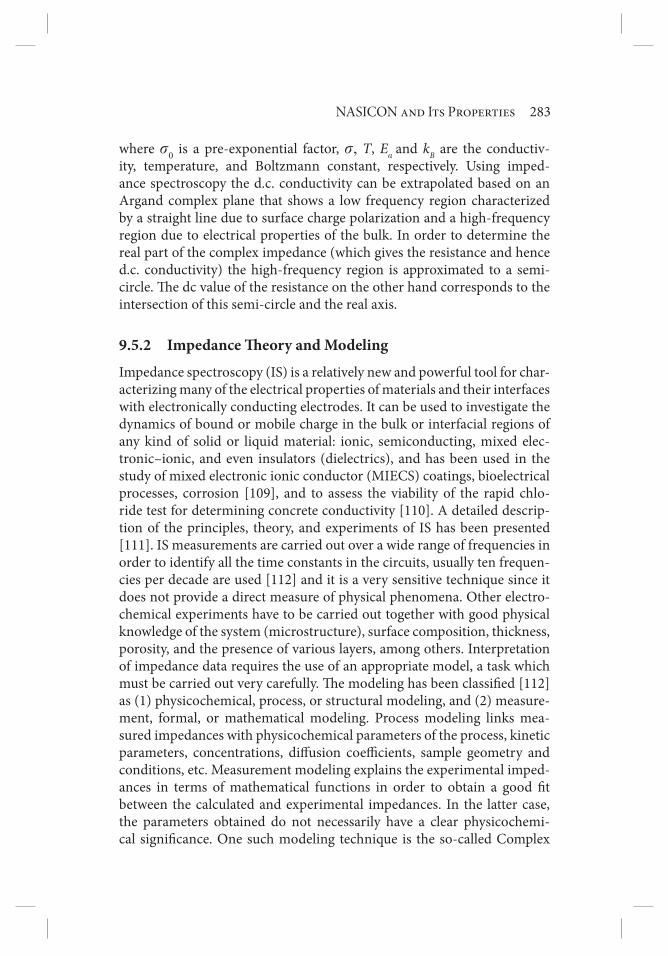
ity, temperature, and Boltzmann constant, respectively. Using imped-ance spectroscopy the d.c. conductivity can be extrapolated based on an Argand complex plane that shows a low frequency region characterized by a straight line due to surface charge polarization and a high-frequency region due to electrical properties of the bulk. In order to determine the real part of the complex impedance (which gives the resistance and hence d.c. conductivity) the high-frequency region is approximated to a semi-circle. Th e dc value of the resistance on the other hand corresponds to the intersection of this semi-circle and the real axis.
9.5.2 Impedance Th eory and ModelingImpedance spectroscopy (IS) is a relatively new and powerful tool for char-acterizing many of the electrical properties of materials and their interfaces with electronically conducting electrodes. It can be used to investigate the dynamics of bound or mobile charge in the bulk or interfacial regions of any kind of solid or liquid material: ionic, semiconducting, mixed elec-tronic–ionic, and even insulators (dielectrics), and has been used in the study of mixed electronic ionic conductor (MIECS) coatings, bioelectrical processes, corrosion [109], and to assess the viability of the rapid chlo-ride test for determining concrete conductivity [110]. A detailed descrip-tion of the principles, theory, and experiments of IS has been presented [111]. IS measurements are carried out over a wide range of frequencies in order to identify all the time constants in the circuits, usually ten frequen-cies per decade are used [112] and it is a very sensitive technique since it does not provide a direct measure of physical phenomena. Other electro-chemical experiments have to be carried out together with good physical knowledge of the system (microstructure), surface composition, thickness, porosity, and the presence of various layers, among others. Interpretation of impedance data requires the use of an appropriate model, a task which must be carried out very carefully. Th e modeling has been classifi ed [112] as (1) physicochemical, process, or structural modeling, and (2) measure-ment, formal, or mathematical modeling. Process modeling links mea-sured impedances with physicochemical parameters of the process, kinetic parameters, concentrations, diff usion coeffi cients, sample geometry and conditions, etc. Measurement modeling explains the experimental imped-ances in terms of mathematical functions in order to obtain a good fi t between the calculated and experimental impedances. In the latter case, the parameters obtained do not necessarily have a clear physicochemi-cal signifi cance. One such modeling technique is the so-called Complex

284 Advanced Sensor and Detection Materials
Nonlinear Least Squares (CNLS) fi tting. Experimentally obtained imped-ance data for a given electrode–material system may be analyzed by using an exact mathematical model based on a plausible physical theory that predicts theoretical impedance or by a relatively empirical equivalent cir-cuit whose experimental impedance predictions are given [111]. In either the case of the relatively empirical equivalent circuit or of the exact math-ematical model, the parameters can be estimated and the experimen-tal impedance data compared to either the predicted equivalent circuit impedance or to the theoretical impedance. Analysis of experimental data that yield a full semicircular arc in the complex plane can lead to quantita-tive estimates of conductivity, relaxation times, and interfacial capacitance. In practice, however, experimental data are only rarely found to yield a full semicircle with its center on the real axis of the complex plane. Th ree com-mon perturbations that may lead to at least part of a semicircular arc in the complex plane are: 1) the arc does not pass through the origin because there are other arcs appearing at higher frequencies; 2) the center of an experimental arc is frequently displaced below the real axis because of the presence of distributed elements in the material–electrode system. Th e relaxation time is then not single valued, but is distributed continuously or discretely around a mean value and the angle by which such a semicircular arc is depressed below the real axis is related to the width of the relaxation time distribution and as such is an important parameter; 3) the arcs can also be substantially distorted by other relaxations whose mean time con-stants are within two orders of magnitude or less of that for the arc under consideration. Th e experimentally obtained spectra oft en diff er strongly from the idealized ones presented. Th e semi-circles may overlap and the degree of overlapping depends on the relative time constants; the closer they are, the bigger is the mixing [113]. In an ideal polycrystalline sample, the Nyquist plot ( z′ vs z″ exhibits an arc at high frequency, a second arc at lower frequencies, and a linear portion at the lowest frequencies, as shown in Figure 9.6.
Th e real and imaginary components of impedance are plotted as para-metric functions of frequency; w0 is the relaxation frequency and Rg(R1), and Cg are the bulk resistance and capacitance, respectively while Rgb(R2) is the resistance of the grain boundary. Th e corresponding circuit model is that of two parallel RC (R1 C1, R2 C2) circuits connected in parallel together with a constant phase element Qe (used as equivalent circuit element instead of the conventional capacitance) whose property varies from that of resistance and inductor, depending on the value of some exponents. Th e absence of this component has been attributed to why impedance arcs terminate at the origin [114] in some cases. Qe represents
NASICON and Its Properties 285
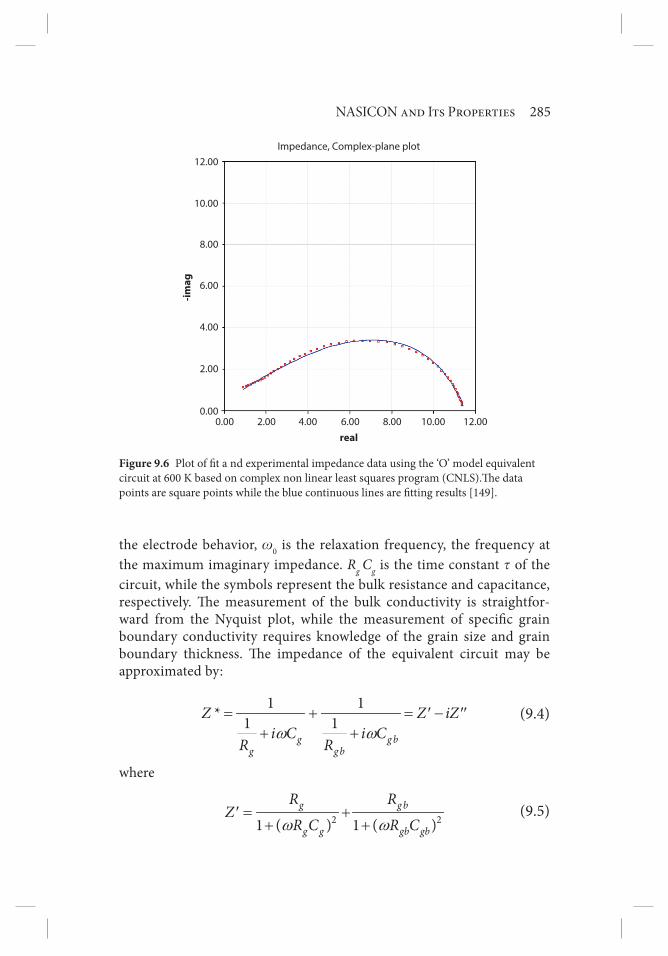
the electrode behavior, w0 is the relaxation frequency, the frequency at the maximum imaginary impedance. Rg Cg is the time constant t of the circuit, while the symbols represent the bulk resistance and capacitance, respectively. Th e measurement of the bulk conductivity is straightfor-ward from the Nyquist plot, while the measurement of specifi c grain boundary conductivity requires knowledge of the grain size and grain boundary thickness. Th e impedance of the equivalent circuit may be approximated by:
1 1* 1 1g g b
g g b
Z Z iZi C i C
R Rω ω
= + = −′ ′′+ +
(9.4)
where
2 21 ( ) 1 ( )
g g b
g g gb gb
R RZ
R C R Cω ω= +′
+ + (9.5)
12.00Impedance, Complex-plane plot
10.00
8.00
6.00
4.00
2.00
0.000.00 2.00 4.00 6.00
real
-imag
8.00 10.00 12.00
Figure 9.6 Plot of fi t a nd experimental impedance data using the ‘O’ model equivalent circuit at 600 K based on complex non linear least squares program (CNLS).Th e data points are square points while the blue continuous lines are fi tting results [149].

286 Advanced Sensor and Detection Materials
and
2 21 ( ) 1 ( )g g gb gb
g gbg g gb gb
R C R CZ R R
R C R Cω ω
ω ω
⎡ ⎤ ⎡ ⎤= +′′ ⎢ ⎥ ⎢ ⎥
+ +⎢ ⎥ ⎢ ⎥⎣ ⎦ ⎣ ⎦
(9.6)
Eq. (9.6) can be applied to the response peaks of the grain and grain
boundaries which are located at 1
2 g gR Cπand 1
gb gbR C, respectively. Th e
frequency of the peaks in the z′ vs z″ plots have been found based on the conditions wt = 1, RC = t, and w = 2pf, which give
12
fRCπ
= , where w
is the angular frequency and t is the relaxation time. Th e peak values are found to be proportional to the associated resistances, but in general the peak frequencies of the grain boundaries are lower than those of grains due to their large resistances and capacitances compared with those of grains. Th e plot of experimental impedance data on a complex plane is shown in Figure 9.7 in CNLS modeling has been used to fi t the data and the grain boundary arc is seen to dominate. Figure 9.8 shows the the generic bat-tery model fi tting results for experimental data based on MEISP (Multiple Electrochemical Impedance Spectroscopy Parameterization). Th e results
Fit and experimental data impedance plot
12
14
10
8
6
4
2
00 2 4 6 8 10 12 14
Figure 9.7 Typical fi tting result of experimental data using the generic battery model of the Multiple Impedance Spectroscopy Parameterization program (MEISP) at 600 K. Th e fi t is the continuous line while the observed data are crosses [149].
NASICON and Its Properties 287
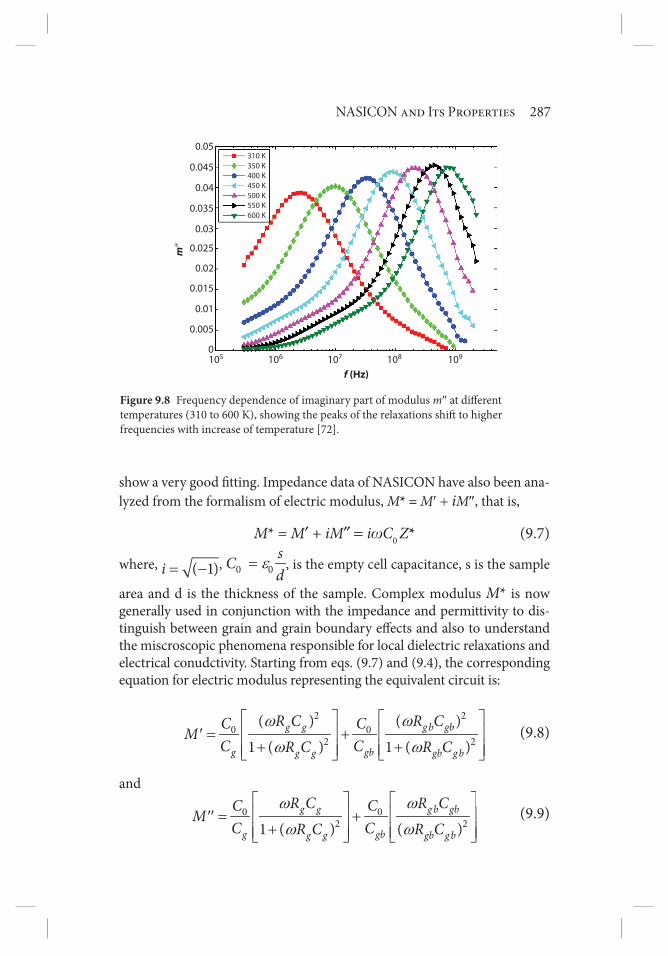
show a very good fi tting. Impedance data of NASICON have also been ana-lyzed from the formalism of electric modulus, M* = M′ + iM″, that is,
M* = M′ + iM″ = iwC0 Z* (9.7)
where, = −( 1)i , ε=0 0sCd
, is the empty cell capacitance, s is the sample
area and d is the thickness of the sample. Complex modulus M* is now generally used in conjunction with the impedance and permittivity to dis-tinguish between grain and grain boundary eff ects and also to understand the miscroscopic phenomena responsible for local dielectric relaxations and electrical conudctivity. Starting from eqs. (9.7) and (9.4), the corresponding equation for electric modulus representing the equivalent circuit is:
2 20 0
2 2
( ) ( )1 ( ) 1 ( )
g g g b gb
g gbg g gb g b
R C R CC CMC CR C R C
ω ω
ω ω
⎡ ⎤ ⎡ ⎤= +′ ⎢ ⎥ ⎢ ⎥
+ +⎢ ⎥ ⎢ ⎥⎣ ⎦ ⎣ ⎦ (9.8)
and
0 02 21 ( ) ( )
g g g b gb
g gbg g gb g b
R C R CC CMC CR C R C
ω ω
ω ω
⎡ ⎤ ⎡ ⎤= +′′ ⎢ ⎥ ⎢ ⎥
+⎢ ⎥ ⎢ ⎥⎣ ⎦ ⎣ ⎦ (9.9)
0.05310 K350 K400 K450 K500 K550 K600 K
0.045
0.04
0.035
0.03
0.025
0.02
0.015
0.01
0.005
0105 106 107
f (Hz)
m″
108 109
Figure 9.8 Frequency dependence of imaginary part of modulus m″ at diff erent temperatures (310 to 600 K), showing the peaks of the relaxations shift to higher frequencies with increase of temperature [72].
288 Advanced Sensor and Detection Materials
Eq. (9.9) shows that there is relaxation in the M″ representation, similar to the z″ representation and the response peaks for the grains and grain
boundaries also occur at frequencies 12 g gR Cπ
and 12π gb gbR C
, respec-
tively. Th e typical plot using the modulus formalism is shown in Figure 9.9, which shows relaxations increasing to higher frequency with increase in temperature from 350 to 600 K. In order to determine the grain boundary conductivity without detailed micro-structural and electrical information, a “Brick Layer Model” (BLM) has been conventionally adopted [115]. Th is model is used owing to its high symmetry and the simplicity of the grain shape although its validity and limits have been highlighted [116, 117].
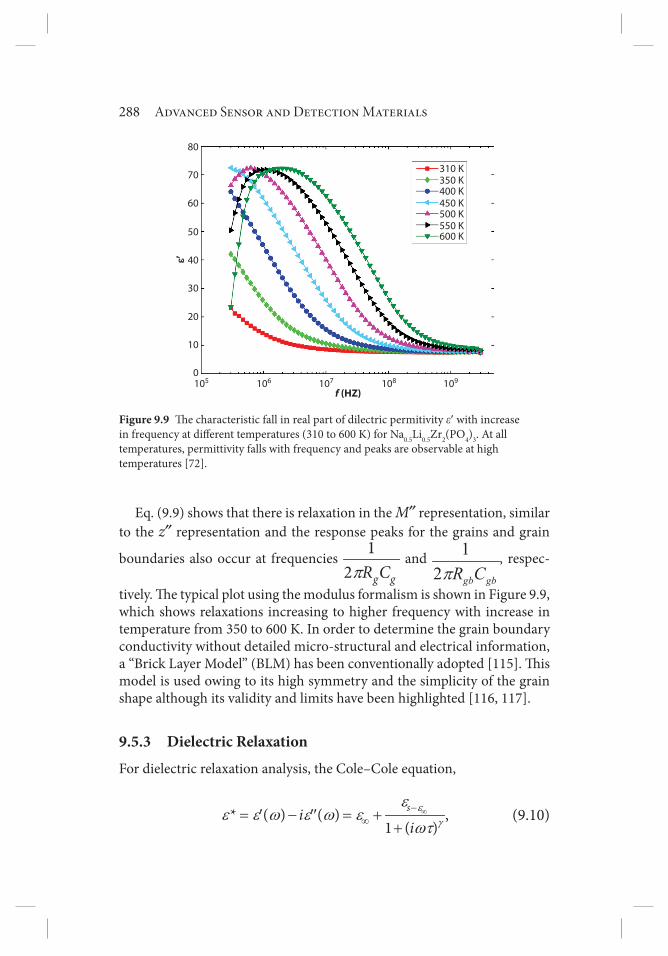
9.5.3 Dielectric RelaxationFor dielectric relaxation analysis, the Cole–Cole equation,
* ( ) ( )
1 ( )sii
εγ
εε ε ω ε ω ε
ωτ∞−
∞= − = +′ ′′+
, (9.10)
80
70
60
50
40
30
20
10
0105 106 107 108
f (HZ)109
310 K350 K400 K450 K500 K550 K600 K
ε′ε′
Figure 9.9 Th e characteristic fall in real part of dilectric permitivity e′ with increase in frequency at diff erent temperatures (310 to 600 K) for Na0.5Li0.5Zr2(PO4)3. At all temperatures, permittivity falls with frequency and peaks are observable at high temperatures [72].
NASICON and Its Properties 289
where es and e• are the static and high-frequency limits of the dielectric con-stant, respectively, t is the most probable relaxation time, and g is a constant with values between 0 and 1 are generally used for analysis. Th e imaginary
parts of dielectric loss have been explained based on 0
dc
sσ
εω
=′′ , where e0 is
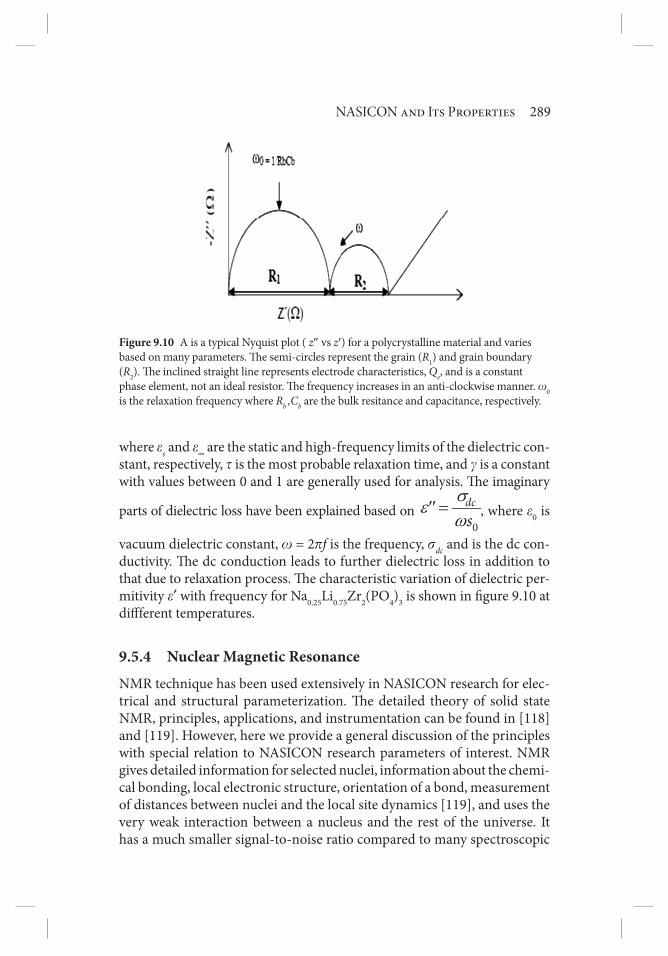
vacuum dielectric constant, w = 2pf is the frequency, sdc and is the dc con-ductivity. Th e dc conduction leads to further dielectric loss in addition to that due to relaxation process. Th e characteristic variation of dielectric per-mitivity e¢ with frequency for Na0.25Li0.75Zr2(PO4)3 is shown in fi gure 9.10 at diff ferent temperatures.
9.5.4 Nuclear Magnetic ResonanceNMR technique has been used extensively in NASICON research for elec-trical and structural parameterization. Th e detailed theory of solid state NMR, principles, applications, and instrumentation can be found in [118] and [119]. However, here we provide a general discussion of the principles with special relation to NASICON research parameters of interest. NMR gives detailed information for selected nuclei, information about the chemi-cal bonding, local electronic structure, orientation of a bond, measurement of distances between nuclei and the local site dynamics [119], and uses the very weak interaction between a nucleus and the rest of the universe. It has a much smaller signal-to-noise ratio compared to many spectroscopic
Figure 9.10 A is a typical Nyquist plot ( z″ vs z′) for a polycrystalline material and varies based on many parameters. Th e semi-circles represent the grain (R1) and grain boundary (R2). Th e inclined straight line represents electrode characteristics, Qe, and is a constant phase element, not an ideal resistor. Th e frequency increases in an anti-clockwise manner. w0 is the relaxation frequency where Rb ,Cb are the bulk resitance and capacitance, respectively.
290 Advanced Sensor and Detection Materials
techniques and the weak interaction yields an extremely high resolution. Solid state NMR oft en employs a 200–750 MHz NMR spectrometer.
In solid state NMR nuclei, the parameters of interest are dipolar and quadrupolar coupling, chemical shift anisotrophy, Magic Angle Spining (MAS) NMR, T1 and T1r relaxation, and dynamics. Chemical shift of a nucleus is due to the core and valence electrons in that nucleus and is usu-ally described in a principal axis system in which the chemical shift ten-sor is diagonal and the elements contribute to the NMR spectrum via two equations [118]. In NASICON, the nuclei of interest are usually 23Na (S=3/2, where S is the spin), 7Li (3/2), 27Al (5/2), and P (1/2). Th e quadrupolar inter-action is described by a tensor while the electronic fi eld gradient (EFG) is described by the size, shape, and orientation parameters. Th e size of the EFG tensor is given by the quadrupolar coupling constant in Hz, variously labeled CQ or Cq, among others. Th e shape of the EFG tensor is given by the asymmetry parameter η. For quadrupole nucleus, the important parame-ters are spin and quadrupole moment, where S = 1, 3/2, 5/2, 7/2 and 9/2 are frequently encountered. Th e nuclear electric quadrupole moment is given by Q in units of m2. Generally, one selects a nucleus (S,Q), then measures Cq and η as a function of structure with comparisons to calculated EFG tensors for molecular orbital calculations as Cq and η orientations, which is given by another expression for quadrupolar Hamiltonian [118].
In MAS NMR, quadrupolar and chemical shift powder patterns provide much insight into local chemical structure and dynamics. However, if the sample contains two or more nuclear sites, then the overlapping patterns can be diffi cult to interpret [118]. Th is is oft en resolved by MAS NMR, which consists of rapid rotation of the sample about an axis set at 54.7356o to the aplied external magetic fi eld B0. Th e MAS rotation rate is usually not fast with respect to dipolar coupling. Th us a pulse sequence, which incorporates dipolar decoupling and cross polarization is used in S = 1/2 nuclei, such as 31P, to reduce the linewidth. In NMR experiments there are many relaxation paths and experiments to measure the relaxation kinetics, but the commonly used relaxations are T1, spin-lattice relaxation, which measures the rate of energy exchange between the spin system and the vibrational and phonon modes with B0 dependence. T1r is spin-lattice in the rotation frame relaxation. Th e most effi cient spin-lattice relaxation, i.e., shortest T1 value, occurs when the correlation time tco is approximately equal to the increase of the resonance frequency, 1τ ≅co ow . When slow frequency motions are separated, i.e., moderate temperatures and high activation energies, then T1r at variable B1 (where B1 is the amplitude of the RF pulse) fi elds are more convinient. Other measurements have been carried out in the dynamic mode.

NASICON and Its Properties 291
9.6 Experimental Results
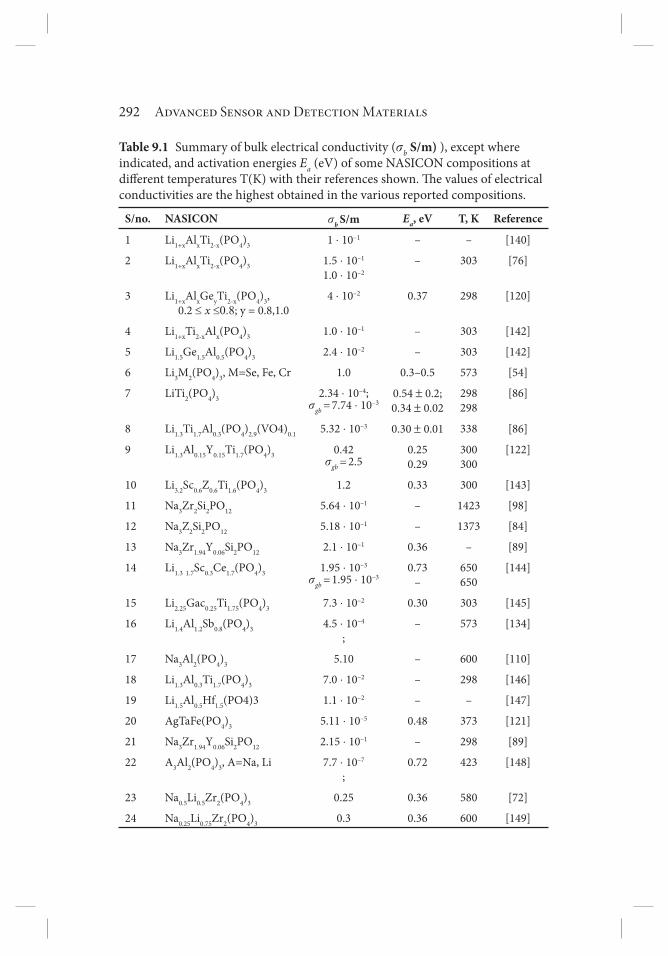
Conductivity data for diff erent NASICON compositions are highly vari-able, depending on preparation, electrode, microstructure, temperature, pressure, and mobile ion, even for the same composition. Table 9.1 is a summary of bulk electrical conductivity (sb, S/m), except where indicated, and activation energies Ea (eV) of some NASICON compositions at diff er-ent temperatures T(K) with their references shown. Th e values of activation energies are the highest obtained in the various reported compositions. Th ey are generally Li or Na ion conductors, although some higher charge ions have been found to also conduct.
In an extensive study on lithium conducting Li1.3Al0.3Ti1.7(PO4)3-x(Z= V, Nb) system (LATP) [130] in which V and Nb were substituted for P, an increase in conductivity of the system was observed. Previous work shows the grain boundary component of impedance producing an arc extending to above 1 MHz down to the kHz region and literature could not provide clear information on the mechanism of conductivity enhancement, whether the grain boundary or the bulk conductivity of the system is enhanced. Th e nature of the electrodes was crucial in resolving the grain boundary arc in the Cole-Cole plot. Th ey thus compared [130] graphite, silver, and gold electrodes, as well as their combinations in order to obtain well-defi ned impedance arcs and observed that graphite alone was too resistive, tending to dominate the impedance, whilst silver ink did not produce good adher-ent electrodes even though the fi lm resistance was quite low. Th e best elec-trodes were obtained by a combination of sputtered gold layer over which silver ink was applied. Evidence of large porosity was found and showed that sintering was incomplete, hence a large grain boundary resistance was inevitable. It was demonstrated in the study of Li1+x[AlxGe2-x(PO4)3] glass-ceramics that heat treatments with shorter nucleation times leads to higher grain size and subsequently higher ionic conductivity [131]. A correlation exists between the extent of sintering and total conductivity as demonstrated in the study of two NASICON compositions [132]. Previous reports showed that the substitutions investigated led to an increment in densifi cation, attributed to the extra intergranular low melting or glassy phases, which can act as fl uxes to improve sinterability and connectiv-ity. Th e use of Ar and O2 atmospheres, however, resulted in lower con-ductivities. Work on Lithium-ion conducting ceramics (LATP–Lithium Aluminum Titanium Phosphate) and glasses [133] show an advantage over polymer-based systems because their conduction can be solely attributed to the lithium species. In addition, high room temperature conductivities, up to 1×10⁻¹ S/m, have been reported and that the ionic conductivity can
292 Advanced Sensor and Detection Materials
Table 9.1 Summary of bulk electrical conductivity (sb S/m) ), except where indicated, and activation energies Ea (eV) of some NASICON compositions at diff erent temperatures T(K) with their references shown. Th e values of electrical conductivities are the highest obtained in the various reported compositions.
S/no. NASICON sb S/m Ea, eV T, K Reference
1 Li1+xAlxTi2-x(PO4)3 1 ⋅ 10–1 – – [140]
2 Li1+xAlxTi2-x(PO4)3 1.5 ⋅ 10–1
1.0 ⋅ 10–2– 303 [76]
3 Li1+xAlxGeyTi2-x(PO4)3, 0.2 ≤ x ≤0.8; y = 0.8,1.0
4 ⋅ 10–2 0.37 298 [120]
4 Li1+xTi2-xAlx(PO4)3 1.0 ⋅ 10–1 – 303 [142]
5 Li1.5Ge1.5Al0.5(PO4)3 2.4 ⋅ 10–2 – 303 [142]
6 Li3M2(PO4)3, M=Se, Fe, Cr 1.0 0.3–0.5 573 [54]
7 LiTi2(PO4)3 2.34 ⋅ 10–4;sgb = 7.74 ⋅ 10–3
0.54 ± 0.2;0.34 ± 0.02
298 298
[86]
8 Li1.3Ti1.7Al0.3(PO4)2.9(VO4)0.1 5.32 ⋅ 10–3 0.30 ± 0.01 338 [86]
9 Li1.3Al0.15Y0.15Ti1.7(PO4)3 0.42 sgb = 2.5
0.250.29
300 300
[122]
10 Li3.2Sc0.6Z0.6Ti1.6(PO4)3 1.2 0.33 300 [143]
11 Na3Zr2Si2PO12 5.64 ⋅ 10–1 – 1423 [98]
12 Na3Z2Si2PO12 5.18 ⋅ 10–1 – 1373 [84]
13 Na3Zr1.94Y0.06Si2PO12 2.1 ⋅ 10–1 0.36 – [89]
14 Li1.3 1.7Sc0.3Ce1.7(PO4)3 1.95 ⋅ 10–3
sgb = 1.95 ⋅ 10–30.73
–650 650
[144]
15 Li2.25Gac0.25Ti1.75(PO4)3 7.3 ⋅ 10–2 0.30 303 [145]
16 Li1.4Al1.2Sb0.8(PO4)3 4.5 ⋅ 10–4
;– 573 [134]
17 Na3Al2(PO4)3 5.10 – 600 [110]
18 Li1.3Al0.3Ti1.7(PO4)3 7.0 ⋅ 10–2 – 298 [146]
19 Li1.5Al0.5Hf1.5(PO4)3 1.1 ⋅ 10–2 – – [147]
20 AgTaFe(PO4)3 5.11 ⋅ 10–5 0.48 373 [121]
21 Na3Zr1.94Y0.06Si2PO12 2.15 ⋅ 10–1 – 298 [89]
22 A3Al2(PO4)3, A=Na, Li 7.7 ⋅ 10–7
;0.72 423 [148]
23 Na0.5Li0.5Zr2(PO4)3 0.25 0.36 580 [72]
24 Na0.25Li0.75Zr2(PO4)3 0.3 0.36 600 [149]

NASICON and Its Properties 293
be altered by controlling the channel sizes via one or more substitutions (Al, Sc, Nb, and V) since the lattice dimensions depend on the size of the structural cations. Using NMR technique, changes in ionic conductivity were observed by measuring the mobility of Lithium ions by 7LiNMR. With increasing V content, the 7Li static line width was found to steadily increase, indicating a decrease in lithium ion mobility [133]. Th e authors subsequently predicted that V substitutions in LATP will not enhance the bulk conductivity of the electrolyte.
Th e study of LixMPO4(M = Mn, Fe, Co, Ni) [134] with NASICON struc-ture in Ar atmosphere using 4-probe conductivity measurement showed that higher sintering temperature of the sample at 1123 K ensured higher sample density. Th ree of the undoped samples showed diff erent values of conductivity and were attributed to the measurement method. Th e diff er-ences in the absolute values of carrier concentration were attributed to heat treatment conditions. Computed activation energies for all samples were within 0.39–0.50 eV, pointing to a common mechanism of conduction due to its narrow range. Th e use of blocking electrodes in d.c. measurements was found to make the conductivity predominantly electronic. IS study of NASICON in aqueous solution (0.1M NaCl for diff erent times) using Randle’s equivalent circuit for modeling and ion exchange method [135] found three semi-circles in the impedance plots: the fi rst at high frequency (HF), which they attributed to the bulk electrical properties of the material and to inhomogeneity of the sample, since it did not show an ideal semi-circle shape but a fl attened one. Th e second one at medium frequency (MF) was attributed to the NASICON/solution interface process, which was also not a perfect semi-circle, but became fl atter when the ion exchange time increased. Th e third semi-circle at low frequency (LF) was assigned to slow transport processes, such as diff usion. Th e bulk resistance increased while the bulk capacitance decreased when ion exchange time increased and was ascribed to leaching of Na+ ions from NASICON, which resulted in an increase in charge carrier concentration of electrolyte. Th e constant phase element (CPE) exponent was found to decrease and was attributed to growth of pores in the material. Contrastingly however, the interface resistance decreased while the interface capacitance increased. Th is was attributed to the collection of Na+ ions at the NASICON/solution interface.
NASICON synthesized through hot-press sintering to prepare Na3Zr2Si2PO12 [76] ceramics using the sol-gel method showed that sam-ples obtained contain mainly monoclinic NASICON, and no ZrO2 phase was found, no matter the sintering temperature. At the sintering tempera-ture of 1423 K, the high ionic conductivity of the sample (3.6×10⁻¹ S/m) was attributed to its highest density and least grain boundary due to the

294 Advanced Sensor and Detection Materials
large crystal size. A variant of the sol-gel method, the so-called “drop gen-eration” method, is said to overcome the limitations due to conventional compacting method of ceramics that leads to structural modifi cations as a result of variations in size, density, and non-uniformity in shape, which in turn is caused by the processing parameters [136]. A comparison of sinter-ing techniques by solid state reaction (conventional sintering, or CS) and “Spark Plasma Sintering” (SPS) [63] has been reported in which SPS gave dense materials with high electrical conductivity at relatively low sintering temperature of 1373 K, while the highest conductivity of 1.8×10⁻¹ S/m was achieved for the stoichiometric SPS composition, a value that is compara-ble to the best results reported in literature, 2.0×10⁻¹ S/m. With increments of sintering temperature, the dc conductivity improved and reached 5.64 x10⁻¹ S/m at 1423 K, higher than reported results. Th e sintered NASICON ceramics’ grain boundary impedance dominated due to its very small crys-tallite size, while the density of the sample sintered at 1273 K was the low-est and crystallite size the smallest, thus the ion conductivity of the sample is the lowest. A similar comparative study carried out on diff erent zirconia precursors to evaluate their eff ect on electrical properties of NASICON (Na3Si2Zr2(PO4)3) and NASICON-TZP (Na3Zr1.94Y0.06Si2PO12) [67] shows that NASICON exhibits diff erent grain sizes and the presence of a liquid phase was confi rmed, which suggests high sintering temperature result-ing in low temperature ion-blocking phenomenon. Th e NASICON-TZP has the advantage of sintering to full densifi cation at lower temperatures. Th e computed conductivities and activation energies for the NASICON and NASICON-TZP are respectively, 4.10–2 S/m at 0.39 eV, and 2.1.10–1
S/m at 0.36 eV at room temperature. Correlation studies [40] have been carried out in which the sintering temperature, time, density, and cool-ing mode (air or furnace) were related to conductivity on the so-called Hong et al. NASICON, Na1+xZr2SixP3-XO12(0<x<3) (H-type), and Von-Alphen-type NASICON, Na1+xZr2-x/3SixP3-xO12–2x/3, (A-type) with little ZrO2 second phase. Most sintered NASICON contain certain amounts of ZrO2 second phases and have a monoclinic-tetrahedral phase transition at 1373 K, below the usual sintering temperature of NASICON. Th e monoclinic-rhombohedral phase transition of crystalline NASICON around 473 K has been associated with a dilatometric anomaly unfavourable for applications [40]. One suggestion to overcome the problem is to eff ect modifi cations in the compositions in order to improve its microstructure and physical properties. Impedance measurements carried out at diff erent frequen-cies, together with conductivity measurements, found signifi cant changes in the activation energy for Na+, the highest of which occurred at about 473 K, attributed to the structural change between monoclinic (C2/c) and

NASICON and Its Properties 295
rhombohedral ( 3R c) crystal systems, as against a second-order transition that has been suggested.
NASCON-type materials, LiM2(PO4)3 (where M = Ge, Zr, Ti) have been studied with Li1.3 1.7Sc0.3Ce1.7(PO4)3 synthesized by solid state reaction [124] where the low frequency dispersion regions were attributed to blocking Pt electrodes at 650 K.Th e values of total (st) and grain (sg) conductivities were found to be st = 8.59×10⁻⁴ S/m and sg = 1.95×10⁻³ S/m respectively, and corresponding activation energies, Et =1.34 eV and 0.73 eV, respec-tively. Conductivity studies of LiTi2(PO4)3 (sg ~10–4 S/m at room tempera-ture) show that it could be increased by at least two orders of magnitude upon partial substitutions of Ti4+ by trivalent cations Al, Ga, In, Sc, Y, La, Cr, or Fe [58]; the increase is attributed to a higher charge carrier number resulting from lower porosity of the pellets. Th e conductivities of Li1+xTi2-
xAlx(PO4)3 are as high as 10–1 S/m at room temperature and are due to the fact that the ionic radius of Al3+ is likely to lie within the tolerability limit of the NASICON framework. Th e maximum amount of Ti that could be replaced with Al3+ with the concomitant insertion of Li to balance the charges is 0.4 per formula unit. A similar study of Lithium-ion conductor Li1.3Al0.3Ti1.7(PO4)3 showed high ionic conductivity based on novel method of preparation, even at low temperatures [137].
Th e compounds LiM2(PO4)3 (M = Ge, Zr, Ti) of the NASICON-type struc-ture have high ionic conductivity when Zr4+ in the LiZr2(PO4)3 was replaced by a smaller Ti4+ ion [123], a phenomenon attributed to the suitability of the tunnels and size in the LiTi2(PO4)3 for Li ion migration. Partial substitutions of Ti4+ by Sc3+ and Cr3+ ions in the NASICON-type structure of LiTi2(PO4)3 is said to also cause an increase of the value of the Li ion conductivity of the substituted systems. Substitution of Zr4+ by Ti4+ and trivalent ion Sc3+ in the compound causes a drastic increase of σ at room temperature in com-parison to the values of ionic conductivity of Li1+xZr2-xTix(PO4)3. Th e room temperature value of σ for Li1+1.2Sc0.6Z0.6Ti1.6(PO4)3 is 1.2 S/m and increases with temperature with activation energy Eg = 0.33 eV. Th e crystal structure of LiZr2(PO4)3 depends on the technological condition of its preparation because the X-ray pattern of sample prepared at 1323–1373 K greatly diff ered from rhombohedral, and is thought to possibly correspond to a triclinic cell [123]. Similarly, Li1.3 1.7Sc0.3Ce1.7(PO4)3 studied by XRD, SEM, and IS [123] reported st and sgb (grain boundary) conductivities at 650 K to be 8.59⋅10–4 S/m and 1.95⋅10–3 S/m, respectively. Th e space represents diffi ciency in the structure (non-stoichiometry). Th e characterization of Li1+4xTi2-xNbyP3-yO12 (x = 0.1, 0.2, 0.3; y = 0, 0.1, 0.2, 0.3) by XPS, XRD, and IS has been reported [126] and the total conductivity of Li1+x+yAlx(Yy)Ti2-x-y(PO4)3 at 298 K was

296 Advanced Sensor and Detection Materials
found for the systems Li1+xAlxTi2-x(PO4)3 (x = 0.3) and Li1+yYyTi2-y(PO4)3 (y = 0.4) to be 7⋅10–2 S/m and 6⋅10–2S/m, respectively [102].
Lithium hafnium phosphate (LiHf2(PO4)3) (LHP) has a very high lith-ium ion conductivity compared to NASICON-type LiM2(PO4)3 (MIV = Ge, Sn, Ti, Zr) owing to the presence of highly mobile lithium ions [127]. Th e Hf4+ ion is more stable toward a lithium metal and reductive gases than the Ti4+ ion, which is an additional advantage for battery applications, though most works have been carried out on LTP (LiTi2(PO4)3) systems due to the poor sinterability and controversial phase transitions with susbstitution in the LHP system [127]. However, it has been demonstrated that NASICON-type Li1+x[Ta1-xGexAl](PO4)3 could be a prospective candidate for all solid state batteries since Ta and Al-oxides and phospshates are inert to chemical attack by Li metal or alloys, unlike Ti4+ compounds [82].
At 1423–1473 K, however, sintered LiZr2(PO4)3 pellets belong to rhom-bohedral symmetry and at room temperature the value of ionic conduc-tivity is lower than 10–7 S/m. Two dispersion regions, which shift toward higher frequencies with increase of temperature, were observed in all the investigated samples: a high frequency part attributed to the relaxation time in grains and a low frequency region corresponding to grain boundary processes, which are thermally activated [123]. A study of NASICON-type Li1+xGaxTi2-x(PO4)3(x = 0.1–0.9) show maximum conductivity of 7.3×10⁻²
S/m at 303 K and activation energy of 0.30 eV for Li1+1.25Ga0.25Ti1.75(PO4)3 [125], and the addition of Li3PO4 or TiO2 (rutile-type) as binder did not increase the conductivity in all the samples. Th is indicates the added mate-rials have no eff ect on the values of the measured parameters, even though such phases may be present in the compound. Elecrical properties of new NASICON-type Li3–2xAl2–xSbx(PO4)3 (x = 0⋅6 to 1⋅4) [114] show Cole–Cole plots without any spikes on the lower frequency side, indicating negligible electrode eff ects. A maximum conductivity of 4⋅5 × 10–4 S/m at 573 K was obtained for x = 0⋅8. Th e presence of a single peak in the plots of both log f vs. z≤ and log f vs. M≤ is said to indicate bulk conductivity and absence of any grain boundary contribution to impedance. While frequency varia-tion of conductivity, which showed two shapes at all temperatures were suggested, low frequency and low temperature conductivity, to be due to intrinsic defects and charge agglomerations present in the sample. Th e variation of slope with conductivity at lower frequency, on the other hand, is an indication of presence of such defects.
Lithium mobility in LiM2(PO4)3 compounds, M = Ge, Sn was investi-gated by 7Li NMR spectroscopy [103] in the temperature range 100–500 K. Analysis of the NMR quadrupole intensities, Cq and η parameters, spin-spin T1 and spin-lattice T2 relaxation rates, stuctural sites occupancy
NASICON and Its Properties 297
and mobility of lithium show that below 250 K, Li ions are preferentially located at M (1) sites in rhombohedral phases but occupy intermediate M (1, 2) sites (between M (1) and M (2)) in triclinic phases. Whereas in high temperature rhombohedral phase, a superionic phase was achieved when residence times at M(1) and M(1, 2) sites become similar and correlation eff ects on Li motion decreases, which are due to large order-disorder trans-formations in rhombohedral phases or to sharp fi rst order transitions in triclinic phases. Th e presence of two relaxation mechanisms in T1 plots of rhombohedral phases were attributted to departures of conductivity from Arrhenius behavior.
Th e presence of only one Li site in the lattice of Li1.3Al0.15Y0.15Ti1.7(PO4)3 [102] with spin-lattice relaxation time T1 showing only one ion motion (Ea = 0.14 eV, t0 = 6⋅10–12 s, ) has been reported. Th e T1 of 7Li and of 6Li at room temperature were 6 ms and 2 s, respectively, which showed that the relaxation of the 7Li nucleus occured through quadrupolar fl uctuations while the relaxation of the 6Li occured through dipolar interactions. Th e MAS experiments were caried out at room temperature while dynamic studies were carried out on static samples without spining. Th e 7Li spec-trum and relaxation times T1 were measured as a function of temperature between 170 and 420 K.
Studies of 7Li and 31P nuclei in the temperature range 150–900 K for Li1-xLax/3 2x/3Zr2(PO4)3 at x = 0.8, 0.7, 0.6, and 0.3 [138] have been inves-tigated.Th e spectra recorded in the MAS mode, at room temperature, showed that Li ions occupy three chemical sites, which were sensitive to the values of x but insensitive to the coexistence of the two crystallographic varieties c1 or 3R cobserved in compounds with x ≤ 0.5. Th e 31P MAS spec-tra, however, were very sensitive to lithium content but also to the variety of coexistence. T1 measurements performed in the static mode for 7Li and 31P showed that the 7Li spin-lattice relaxation time exhibited two branches with several minima, which indicated a complex dynamics for this ion. Th e observation that one of these minima appeared in the same tempera-ture range as the minimum of the 31P nuclei T1, is said to suggest strongly a cross-relaxation process between the nuclei. T1 r measurements on 7Li (static mode) were used to probe slow motion distribution of T1.
Th e positions of Na ions in two doped NASICON systems using 23Na NMR showed a 23Na spectra with the characteristic powder pattern of quadrupole interaction in Na1-xZr2-xNbxP3O12 system [139], which is an indication that Na ions occupied Na (1) sites in the crystal structure. However, in the Na1+xZr2-xMgxP3O12(x = 0.0), system, Gaussian lineshapes were observed due to the distribution of quadrupole parameters, with the occupation of both Na (1) and Na (2) sites in the system confi rmed.
298 Advanced Sensor and Detection Materials
MAS NMR for the system A3Al2(PO4)3 (A = Na, Li) for 31P, 27Al, 23Na, and 7Li [128] showed that Al was the most abundant in octahedral envi-ronments, in the form of AlO4. While the 31P was ascribed to the 1Al and 2Al environments with spining satellite bands and the 23Na MAS NMR spectra exhibited large assymetric bands, which indicate low mobility due to its presence in diff erent environments. Th e 7Li MAS NMR displayed the characteristic central position with spining satellite bands while the widths suggest low mobility for the NASICON compound.
Work has also been reported [87] on 27Al, 31P, and 7Li NMR measure-ments on Li ion conductivity in LiTi2(PO4)3 structure with Al, V, or Nb metal ions subtituted for either Ti or P. Th e MAS NMR showed that although Al was intended for substitution at the octahedral Ti sites, additional substitu-tions into tetrahedral environments (e.g., P sites) occured with increasing amount of Al susbstitution. Th e tetrahedral susbtitution appeared to occur more readily in the presence of V in Li1+xAlxTi2-x(PO4)2.9(VO4)0.1.Whereas similar Nb additions to replace V appeared to stifl e tetrahedral substitu-tion. Static 7Li NMR spectra showed quadrupolar stucture with Cq ~ 42 kHz, which was largely independent of linewidth and tended to decrease with Al substitution but increased with increasing V or Nb substitution.
Investigations of Na1+xZr2(PO4)3-x(SiO4)x by 23Na NMR [140] showed quadrupole positions of Na (1) in NaZr2(PO4)3 at vq = 1.2 ± 0.1 MHz and h = 0.04 ± 0.04 , whereas those for the Na (1) and Na (2) sites in Na4Zr.2(SiO4)3 were at Na (1): vq = 1.03 ± 0.01 MHz, h = 0.84 ± 0.7; Na (2): vq = 0.87 ± 0.05 MHz, h = 0.53 ± 0.4, with an intensity ratio for the lines ~1.3, as expected. Further, the random substitution of P atoms on their lattice sites by Si atoms, for increasing x values, led to a distribution of the parameters of the quadrupole tensors, and that increasing substitution strongly aff ected the asymmetry of the electric fi eld gradient.
Studies of Na positions in doped NASICON solid solution Na3Zr2-xYxSi2-
xP1+xO12 by 23Na NMR [141] showed that the surroundings of the Na cat-ions were diff erent for diff erent compositions and the network structures were disordered by replacement of Y3+ by Zr4+ ions in the crystal structure. But as x increased, the surroundings of the Na cations changed and the positions of the Na cations became only of one kind at x = 1.2.
NASICON-related phosphates of the type Na(1+x)CrxM(2−x)P3O12 (M = Ti, Hf, Zr), and A(1+x)/2CrxZr(2−x)P3O12 (A = Cd, Ca, Sr) [142] were studied, together with the polarizing eff ect of the two diff erent metal ions A and M on the phosphorus atom and the P-O bond by both 31P MAS NMR, XRD, Rietveld refi nement and infrared spectroscopy. Th e electron density on the phosphorus, and thus the strength of the P-O bonds, were found to be aff ected by the interstitial (A) and structural (M) metal ions.
NASICON and Its Properties 299
9.7 Problems, Applications, and Prospects
Th e above discussion, although basically limited by space to electrical properties, with a view to applications in solid electrolytes, did not cover many other useful potential applications and emerging trends. NASICON has generally low dielectric permitivity of ~100 and above, compared to barium titanate compositions, which are preferred. It exhibits ferroelec-tric phase transitions at certain temperatures and thus needs further investigations. Similarly, NASICON does not exhibit good optical prop-erties suitable for applications, but with variations in microstructure and appropriate doping, this can be improved. However, the excellent thermo-dynamic and thermal properties have been relatively studied [143, 144] due to the potential application as thermal barrier coatings and heat fi lters. It is a very good host for immobilization of chemical wastes, apart from nuclear wastes, due its high corrosion resistance and therefore open for further investigations and improvement. Th e viability of using NASICON membranes as Low Activity Waste recycling has been demonstrated sev-eral times by CERAMATEC [145, 146]. In terms of its energy applications as electrodes and electrolytes, Li3V2(PO4)3 is a highly promising electrode material if problems like corrosion and thermal stability are worked out [147]. One signifi cant area in which progress has been made recently is in fabrication of NASICON-based gas sensors. Th ere is a need for chemical sensors that work in extreme conditions and which must be stable at high temperatures, all of which are easily fulfi lled by NASICON with SOx, CO2 sensors, and polymer-NASICON composites being fabricated and demon-strated successfully [148–152].
On the theoretical front, however, progrees is also being made. Th e issue of alkali ion disorder in NASICON over the available sites is being debated with contradicting results, such as the case for (Na, Li) FeTi(PO4)3, Na2FeZr(PO4)3, [153] and A0.5SbFe(PO4)3 [154]. What is the solubility limit of alkali in NASICON and how far can the substitutions of various atomic radii into the host go? Th is is not a settled question either as it seems to depend on composition, among other factors, even though it is asserted that the largest transition metal ion soluble in NZP is dysprosium [155], but again it is arguable. Various battery model parameters (voltage, stabil-ity, and diff usion) have been optimized and compared for Li- and Na-ion systems [156]. Recently, a new modeling approach for impedance spec-tra analysis has been proposed, which gives more accurate results than previous ones [157, 158]. We seem to have come close to the reality of a practical, high density/capacity and cyclability lithium ion battery based

300 Advanced Sensor and Detection Materials
on NASICON, as has been demonstrated recently by CERAMATEC [159, 160].Th ere is currently work being carried out on the possibility of using NASICON for bioceramics applications due to its suitable properties in bonding to tissues, according to some preliminary studies.
9.8 Conclusion
NASICON materials are the most versatile, with unique properties and diverse applications. Although various methods of synthesis and charac-terization have been used in order to enhance their physical and micro-structural properties, more vigourous eff orts are needed in the coming years to produce better results. Areas such as thin fi lm and nanoparticle/structure synthesis have seen little progress comparatively and need fur-ther exploration in order to explore the benefi ts of minaturization through nanotechnology. Ferroelectric and optical properties of the materials are key areas that lacked attention and subsequently produced little positive results. Th e application of NASICON for large-scale energy production, cheapness, and environmental friendliness is almost at the doorstep with CERAMATEC’s recent successful prototypical demonstration.
Acknowledgments
Th e author expresses his appreciation to Professor Masaru Aniya, Department of Physics, Kumamoto University, Japan, for providing many of his insightful publications in the fi eld of theoretical models of super-ionic conductivity. Similar gestures were extended by Professor V.I. Pet’kov, Department of Chemsitry, Nizhni Novgorod State University, Russia, on his publications on NASICON, which is immensely appreciated too.
References
1. E. Kartini, T. Sakuma, A. Purwanto, T. Kamiyama and M.F. Collins, Atom Indonesia Journal, Vol. 31, p. 27–34, 2005.
2. D.R. Sadoway and A.M. Mayes (eds.), MRS Bulletin, August 2002. 3. G. Pasciak, J. Chmielowiec and P. Bujlo, Materials Science-Poland, Vol. 23,
pp. 209–219, 2005. 4. J. Kawamura, N. Kuwata, K. Hattori, and J. Misuzaki, Reports of the Institute
of Fluid Science, Vol.19, p.1–2, 2007.
NASICON and Its Properties 301
5. N. Nunotani, M. Sawada, S. Tamura, and N. Imanaka, Bull. Chem. Soc. Jpn.,Vol. 83, pp. 415–418, 2010.
6. H.J. Park, Z.A. Munir and S. Kim, Journal of the Korean Ceramic Society,Vol. 47, p. 71, 2010.
7. S. Sumiata, E.K. Mariyanto and A. Adi, Atom Indonesia, Vol., 31, pp.111–125, 2005.
8. J.L. Nowinski, M. Mrocczkwoska, J.E. Garbarczyk and M. Wasiucionek, Material Science-Poland, Vol. 24, 2006.
9. H. Mallick and A. Sarkar, Bull. Mater. Sci.,Vol. 23, pp. 319–324, 2000. 10. J. Maier, Nature Materials, Vol. 4, pp. 805–815, 2005. 11. C. Furusawa “Fabrication and ionic conduction of ionic conducting thin
fi lms,” In T. Sakuma and H. Takahashi, eds., Physics of Solid State Ionics. Research Signpost, Kerala, India, pp. 273–283, 2006.
12. Y. Shimizu and T. Ushijima, Sol-Gel Processing of NASICON Th in Film Using Aqueous Complex Precursor. Institute of Technology Academic Repository. http://hdl.handle.net/10228/422.kYUTU, 2013.
13. M.K. Dongare, P. Singh and P.M. Suryavanshi, Mater. Res. Bull., Vol. 27, pp. 637–645, 1992.
14. J.V. Bothe and P.W. Brown. Low Temperature Formation of NZP Ceramics. http:www.netl.doe.gov/publications/processing/03/ucr-hcbu/Brown.pdf., 2013.
15. A.H. Naik, N.V. Th akkar, S.R. Darwadkhar, K.D.S. Mudher and V. Venegopal. Journal of Th ermal Analysis and Calorimetry,Vol. 78, pp. 707–713, 2004.
16. R.M. Hazen, L.W. Finger, D.K. Agrawal, H.K. McKinstry and A.A. Parrotta, Journal of Materials Research, Vol. 2, pp. 329–337,1987.
17. D.A. Woodcock, P. Lightfoot and R.I. Smith, Journal of Materials Chemistry, Vol. 9, p. 2631, 1999.
18. P.S. Tantri, K. Greetha, A.M. Umarji and S.K. Ramasesha, Bulletin of Materials Science, Vol. 23, pp. 491–499,2000.
19. V.I. Pet’kov, E.A. Asabina, A.V. Markin and N.N. Smirnova, Journal of Th ermal Analysis and Calorimetry,Vol. 91, pp. 157–8, 2008.
20. V.I. Petkov, A.I. Orlova, I.G. Trucbach, Y.A. Asabina, V.T. Demarin and V.S. Kurazhkovskaya, Czechoslovak Journal of Physics,Vol. 53, pp. A639–A648, 2003.
21. G. Jasinski, P. Jasinski, B. Chachulski, A. Nowakowski, Materials Science-Poland, Vol. 24, p. 263, 2006.
22. S. Akbar, P. Dutta and C. Lee, International Journal of Applied Ceramic Technology, Vol. 3, p. 306, 2006.
23. C.S. Sunandana and P.S. Kumar, Bulletin of Materials Science, Vol. 27, pp. 1–17, 2004.
24. P. Mass, M. Meyer, A. Bunde and W. Dieterich. Physical Review Letters, Vol. 7, pp. 1528–1531, 1996.
25. P.P. Kumar and S. Yashonath, Journal of Chemical Science, Vol. 118, pp.135–154, 2006.
302 Advanced Sensor and Detection Materials
26. A.J. Battacharya, T.R. Middya and S.A. Tarafdar. Pramana Journal of Physics, Vol. 50, pp. 1–14, 1998.
27. M. Calleja and M.T. Dove (2004). “Calculating activation energies in dif-fusion processes using a monte carlo approach in a grid environment.” in M. Mubarak et al eds., ICCS 2004, LNCS 309. Springer-Verlag, Berlin, Heidelberg, Germany, pp. 483–490.
28. N.L. Allan, G.B. Barera, J.A. Purton, C.E. Smiss and M.B. Taylor. Physical Chemistry and Chemical Physics, Vol. 2, pp. 1094–1111, 2000.
29. C.A.J. Fisher and H. Mastubara. Oxide ion diff usion along grain boundaries in zirconia: A molecular dynamics study http://www.eng.hawaii.edu/~ssi11/SSI-11Papers/B72/B72.pdf, 2010.
30. S. Yip, Handbook of Materials Modeling: Vol. 1, Methods and Models, Springer, Netherlands, 2005.
31. Z. Mao, S.B. Sinnott and E.C. Dickey. Journal of American Ceramic Society, Vol. 85, pp. 1594–1600, 2002.
32. E. Holmström, K. Nordlund, and A. Kuronen. Physica Scripta, Vol. 81, pp. 1–5, 2010.
33. F. Shimojo, “Atomic dynamics in superionic conductors, ab initio molecular dynamics simulations.” in T. Sakuma and H. Takahashi eds., Physics of solid state ionics, Research signpost, Keralla, India. pp. 70–86,2006.
34. Y.K. Naganovsky and S.E. Sigaryov, Solid State Ionics, Vol. 50, pp. 1–9, 1992. 35. A. Zurawaski, Physics and Chemistry of Solid State, Vol. 7, pp. 21–24, 2006. 36. S. Ramasesha, Resonance,? pp. 23–24, 1999. 37. M. Maliki, M. Micoulat, F. Chaimbault and Y. Vaills, Physical Review Letters,
Vol. 96, 2006. 38. K. Singh and S. S. Bhoga, Applied Physics A: Materials Science & Processing,
Vol. 67, pp. 475, 1998. 39. S.-J.S. Moon, T.H. Lee, S.E. Dorris and U. Balachandran, Journal of Ceramic
Processing Research,Vol. 9, p. 377, 2008. 40. A. Tschope, “Space Charge Layers in Polycrystalline Cerium Oxide,” Material
Research Society Symposium Proceedings, Vol. 756, 2003. 41. M. Aniya, Journal of Physics and Chemistry of Solids, Vol. 57,
pp.1811–1816,1996. 42. P. Slater, “Design of ionic and mixed cation conductors.” in S. Keay-Bright
ed., Accelerated Materials Discovery for Energy Storage and Conversion Devices. Meeting Report. St Antony’s College, Oxford, UK, 2nd–4th April, REF: UKERC/MR/MP/2007/012., UKERC Meeting Place. pp. 15–16, 2007.
43. M. Aniya, Journal of Physical Society of Japan, Vol. 61, pp. 4474–4483,1992. 44. M. Aniya, Solid State Ionics, Vol. 50, pp. 125–129, 1992. 45. M. Aniya, Journal of Physical Society of Japan, Vol. 65, pp. 3406–3407, 1996. 46. P. Knauth, Journal of Electroceramics, Vol. 5, pp. 111–125, 2000. 47. A. Grey-Weal, Faraday Discuss, Vol. 134, pp. 297–313, 2007. 48. I. Vitioo, Ph.D Th esis. Inst. of Solid State Physics, University of Latvia, Latvia,
1999.
NASICON and Its Properties 303
49. B.J. Ward, C.C. Liu, G.W. Hunter, Journal of Materials Science,Vol. 38, pp. 4289–4292, 2003.
50. P.A Lessing and G. Huestis. Journal of Ceramic Processing Research, Vol. 7, pp.1–2, 2006.
51. S.V. Kesapragada, S. Bhaduri, S. B. Bhaduri, E. G. Baburaj, P. A. Lessing, “Preparation and Characterization of Nanocrystalline Nasicon Powders and Th in Films,” in: 26th Annual Conference on Composites, Advanced Ceramics, Materials, and Structures: B: Ceramic Engineering and Science Proceedings, Vol. 23, No. 4, 2008. DOI:10.1002/9780470294758.
52. U. Ahmadu, T. Salkus, A.O. Musa and K.U. Isah, Open Journal of Physical Chemistry, Vol. 1, pp. 94–103, 2011.
53. E. Traversa, H. Aono, Y. Sadaoka and L. Montanaro, Sensors and Actuators B, Vol. 65, pp. 204–208, 2000.
54. A. Ahmad, C. Glasgow, T.A. Wheat, Solid State Ionics, Vol. 76, pp. 143–154, 1995.
55. M. Kotobuki, Preparation of Li-ion conductive ceramics through a sol-gel route. 2nd International Conference on Electrical, Electronics and Civil Engineering (ICEECE’2012) Singapore April 28–29, 2012.
56. G.S. Gopalakrishna, B.H. Doreswamy, M.J. Mahendra, M.A. Sridhar, J.S. Prasad and K.G. Ashamanjari, Bulletin of Materials Science, Vol. 28, pp. 1–7, 2005.
57. L. Sebastian and J. Gopalakrishnan, J. Mater. Chem., Vol. 13, p. 433, 2003. 58. F.E. Mouahid., M. Zahir, P.M. Maldonado-Manso, S. Bruque, E.R. Losilla,
M.A.G. Aranda, A. Rivera, C. Leona, J. Santamaria, Journal of Materials Chemistry, Vol. 11, pp. 3258–3263, 2001.
59. R.W. Anthony, J. Mater. Chem., Vol. 1, pp. 157–162, 1991. 60. N. Hirose and J. Kuwano, J. Mater. Chem., Vol. 4, pp. 9–12, 1994. 61. A.H. Naik, S.S. Deb, A.B. Chalke, M.K. Saxena, K.L. Ramakumar, V.
Venugopal and S.R. Dharwadkar, Journal of Chemical Science, Vol. 122, pp. 71–82, 2010.
62. Y. Fang, J. Cheng, R. Roy, D.M. Roy, D.K. Agrawal, Journal of Materials Science, Vol. 32, pp. 4923–4930, 1997.
63. J.S. Lee, C.M. Chang, Y.I. Lee, J.H. Lee and S.H. Hong, Journal of American Ceramic Society, Vol. 87, pp. 305–307, 2004.
64. T. Hungrı, J. Galy, and A. Castro, Advanced Engineering Materials, Vol. 11, 2009.
65. L. Vijayan and G. Govindaraj, NASICON Materials: Structure and Electrical Properties, Polycrystalline Materials—Th eoretical and Practical Aspects, Prof. Zaharii Zakhariev ed., ISBN:978-953-307-934-9, InTech,: http://www.intechopen.com/books/polycrystalline-materials-theoretical-andpractical-aspects/nasicon-materials-structure-and-electrical-proper-ties, 2012.
66. F. Ejehia, S.P.H. Marashia, D. Haghshenasa, M. Ghaanib, A. Nekahia, Proceedings of the 4th International Conference on Nanostructures (ICNS4),

304 Advanced Sensor and Detection Materials
12–14 March, 2012, Kish Island, I.R. Iran. Synthesis of a New NASICON Structure by Pechini-Type Sol-Gel Method.
67. R.O. Fuentes, F.M.B. Marques and J.I. Franco, Boletin de la sociedad Espanola de Ceramica Y Vidrio, Vol. 38, pp. 631–634, 1999.
68. T.C. Nguyen, M.Sc. thesis, Virginia Polytechnic Institute and State University, Blacksburg, Virginia, 1998.
69. U. Ahmadu, Ph.D. Dissertation, Ahmadu Bello University, Zaria, Nigeria, 2010.
70. A. Şahin, M.Sc. Th esis, İzmir Institute of Technology, Turkey, 2004. 71. A. Rabenau, Angew. Chem., Int. Eng. Ed., Vol. 24, pp. 1026–1040, 1985. 72. D. Agrawal, J. Cheng, Y. Fang, and R. Roy, “Microwave processing of ceram-
ics, composites and metallic materials.” in D.E. Clark, D.C. Folz, C.E. Fogar and M.M. Mahmoud, eds., Microwave Solutions for Ceramic Engineers, Th e American Ceramic Society, Ohio, USA. p. 213, 2006.
73. D. Agrawal, “Microwave sintering development spur emergence of new materials and technologies,” Industrial Heating, June Vol. 72, 2005.
74. B. Ozmen, M.Sc. Th esis, Izmir Institute of Technology, Izmir, Turkey, 2004. 75. U. Ahmadu, A.O. Musa, S.A. Jonah. and N. Rabiu, Journal of Th ermal
Analysis and Calorimetry, Vol. 101, pp. 175–179, 2010. 76. Z. Dong-mei, L. Fa, X. Zang-Long, Z. Wang-Cheng, Transactions of
Nonferrous Metal Society of China, Vol. 17, pp. s1156–s1159, 2007. 77. E. Breval, G. Harshe and D.K. Agrawal, Journal of Material Science Letters,
Vol. 14, pp. 728–731,1995. 78. M.N. Kutucktu, M.Sc. Th esis, Georgia Institute of Technology, Georgia,
USA, 2005. 79. K.K. Rao, G. Rambabu, M. Raghavender, G. Prasad, G.S. Kumar and M.
Vithal, Solid State Ionics, Vol. 176, pp. 2701–2710, 2005. 80. D. Gautham, Ph.D. Dissertation, Max-Planck-Institut für Metallforschung,
Stuttgart, Germany, 2006. 81. T. Chen, Preparation, thermal expansion, and dielectric properties of
MTi4P6O24(M = Ba, Sr): http://www.etdncku.lib.ncku.edu.tw/ETD-Searchc/view-etd?URN=etd-0674103-163524, 2013.
82. C.J. Leo, G.V.S. Rao and B.V.R. Chowdari, Journal of Materials Chemistry, Vol. 12, pp. 1848–1853, 2002.
83. S. Kormaneni, E. Lenain, R. Roy, Journal of Materials Science Letters, Vol. 5, pp.1–3, 1986.
84. W. Wang and N. Zhou, Study of Mineral Fast Ion Conductors of Al-Sm-Nasicon: http://www.eng.hawaii.edu/¬ssiII/SSI-II papers/A44.pdf, 2013.
85. P. Brown, Nanostructured Ceramics and Composites, fi nal progress report, Penn State University, 2005.
86. W.Y. Lee, K.M. Cooley, C.C. Berndt, D.L. Joslin and D.P. Stinton, J. Am. Ceram. Soc., Vol. 79, p. 2759, 1996.
87. M. Forsyth, S. Wong, K.M. Nairn, A.S. Best, P.J. Newman and D.R. MacFarlane, Solid State Ionics, Vol. 124, pp. 213–219, 1999.

NASICON and Its Properties 305
88. D. K. Agrawal, G. Harshe, E. Breval and R. Roy, J. Mater. Res., Vol. 11, p. 3158, 1996.
89. S. Nakayama and K. Itoh, J. Nucl. Sci. Tech., Vol. 40, pp. 631–633,2003. 90. http://library.iem.ac.ru/exper/vol10–1/151–152.pdf., 2013. 91. F. Brunet, N.Bagdassarov and R. Miletich, Solid State Ionics, Vol. 159, pp.
35–47, 2003. 92. J.J. Carvajal, I. Pareu, R. Sale, X. Solarus, F. Dianz and M. Aguilo, Chem.
Mater., Vol. 17, pp. 6746–6754, 2005. 93. A. El Bouari and A. El Jazouli, Phosporus Research Bulletin, Vol.15, p. 136,
2004. 94. A.S. Andersson, B. Kalska,P. Jonson, L. Hagstrom, P. Nardhblad, P. Tellgreen
and J.O. Th omas, J.Mater. Chem., Vol.10, p. 2542, 2000. 95. Z. Biao, G. Jingkum and Z. Peinan, Science in China (series E), pp.
337–339,1996. 96. T.B. Jackson and W.A. Porter. Environmental microcracking of [nzp]
type ceramics, http://www.osti.gov./bridge/servelets/purl/102178-4Smo9M/102178.pdf., 2013.
97. S.N. Achary, O.D. Jayakumar, S.J. Patwe, A.B. Shinde, P.B.R. Krishna, S.K. Kulshreshtha and A.K. Tyagi, PRAMANA J. Phys., Vol. 71, pp.941–946, 2008.
98. C. Huang, D.K. Agrawal, H.A. McKinstry and S. Limaye, J. Mater. Res., Vol. 9, pp. 2005–2013, 1994.
99. D.A. Woodcock, P. Lightfoot and C. Ritter, Chem. Commun., pp. 107–108, 1998.
100. B. Angadi, V.M. Jali, M.T. Lagare, N.S. Kini and A.M. Umarji, Bull.Mater. Sci., Vol. 25, pp.191–196, 2002.
101. P. Maldonado-Manso, E.R. Losilla, M. Martínez-Lara, M.A.G. Aranda, S. Bruque, F. E. Mouahid and M. Zahir, Chem. Mater.,Vol. 15, pp. 1879–1885, 2003.
102. T. Salkus, E. Kazakevičius, A. Kežionis, A. Dindune, Z. Kanepe, J. Ronis, J. Emery, A. Boulant, O. Bohnke and A.F. Orliukas, Journal of Physics: Condens Matter Vol. 21, p. 185502, 2009.
103. K. Arbi , M.A. París , J. Sanz, Dalton Trans., Vol. 40, pp. 10195–202, 2011.104. T. Šalkus, E. Kazakevičius, A. Kežionis, V. Kazlauskienė, J. Miškinis, A.
Dindune, Z. Kanepe, J. Ronis, M. Dudek, M. Bućko, J. R. Dygas, W. Bogusz, A. F. Orliukas, Ionics, Vol.16, pp. 631–637, 2010.
105. H. Kohler, H. Schulz, Materials Research Bulletin, Vol. 20, pp. 1461–1471, December 1985.
106. E.D. Tsagarakis, Ph.D Th esis, Kiel University, 2004.107. J. Bisquert, V. Halparn and F. Hern, J. Chem. Phys., Vol. 122, p. 151101, 2005.108. M. Vijayakumar, and S. Selvasekarapandian, Crystal Research Technolology,
Vol. 39, pp.611–616,2004.109. W. Lai and S.M. Haile, Journal of American Ceramic Society, Vol. 88, p. 2979,
2005.110. K.A. Synder, C. Ferraris, N.S. Martys and E.J. Garboczi, Journal of Research of
the National Institute of Standards and Technology, Vol. 105, 2000.

306 Advanced Sensor and Detection Materials
111. J.R. Macdonald and W.B. Johnson (2005), “Fundamentals of impedance spec-troscopy.” in E. Barsoukov. and J.R. Macdonald, eds., Impedance Spectroscopy Th eory, Experiment, and Applications, Second Edition, A John Wiley & Sons, Inc., Publication, Hoboken, New Jersey, USA
112. A. Lasia, “Electrochemical Impedance spectroscopy and its applications.” In B.E. Conway, J.O.M. Bockris and R.E. White, eds., Modern Aspects of Electrochemistry, no. 32. Kluwer Academic Publishers, New York, p. 143–231, 1999.
113. D. Vladicova, Impedance contributions online, Vol. 1, pp. l3-1–l3-34, 2003.114. N. Anantharamulu, G. Prasad and M. Vithal, Bulletin of Materials Science,
Vol. 31, pp. 133–138, 2008.115. N. Bonanos, B.C.H. Steele and E.P. Butler, “Microstructural Models for
Impedance Spectra of Materials.” in E. Barsoukov and J.R. Macdonald, eds., Impedance Spectroscopy Th eory, Experiment, and Applications, Second Edition. A John Wiley & Sons, Inc., Publication, Hoboken, New Jersey, USA pp. 1–47, 2005.
116. J. Fleig and J. Maier, Th e infl uence of the microstructure on the impedance of ceramics studied by fi nite element calculations: http://www.fk f.mpg.de/maier/people/fl eig/webjur3.pdf., 2010.
117. J. Fleig, J. Jaminik and J. Maier, On the validity and limits of the brick layer model in impedance spectroscopy: http://www.fk f.mpg.de/maier/people/fl eig/rio98b.pdf., 2010.
118. G.L. Butler, “An Introduction to Solution, Solid-State, and Imaging NMR Spectroscopy,” in Handbook of Spectroscopy, eds. G. Gauglitz and T. Vo-Dinh, WILEY-VCH Verlag GmbH & Co. KGaA, Weinheim, 2003.
119. J. Kauppinen, J. Partanen, Fourier Transforms in Spectroscopy, Wiley-VCH Verlag GmbH, Federal Republic of Germany, 2001.
120. X. Xu, Z. Wien, X. Wu, X. Yang and Z. Gu, J. Am. Cer. Soc., Vol. 90, p. 2820, 2007.
121. J. Fu, Solid State Ionics, Vol. 96, p.195, 1997.122. M. Cretin and P.J. Fabry, J. Eur. Cer. Soc., Vol. 19, p. 2931, 1999.123. T. Salkus, A. Dindune, Z. Kanepe, J. Ronis, A. Kazeonis and A.E. Orliukas,
Lithuanian Journal of Physics, Vol. 46, pp. 361–366, 2006.124. T. Salkus, A. Dindune, Z. Kanepe, J. Ronis, A. Kezionis, E. Kazakevicius, L.J.
Gaukckler, U.P. Mucke and A.F. Orliukas, Lithuanian Journal of Physics, Vol. 46, pp. 483–488, 2006.
125. K. Oda, S. Takase and Y. Shimizu, Material Science Forum, Vol. 544–5, pp. 1033–1036, 2007.
126. V. Venckute, J. Banyte, V. Kazlauskiene, J. Miškinis,T. Šalkus, A. Kežionis, E. E. Kazakevičius, A. Dindune, Z. Kanepe, J. Ronis, A.F. Orliukas, Lithuanian Journal of Physics, Vol. 50, pp. 435–443, 2010.
127. C. Chae-Myung, H. Seong-Hyeon, P. Hyun-Min, Solid State Ionics, Vol. 176, pp. 2583– 2587, 2005.
128. L. Moreno-Real, P. Maldonado-Manso, L. Leon-Reina, E.R. Losilla, F.E. Mouahid, M. Zahir and J. Sanz, J. Mater. Chem., Vol. 12, pp. 3681–3687, 2002.
NASICON and Its Properties 307
129. U. Ahmadu, Ŝ. Tomas, S.A. Jonah, A.O. Musa, N. Rabiu, Adv. Mat. Lett. Vol. 4, pp. 185–195, 2013 .
130. M. Forsyth, S. Wong, K.M. Nairn, A.S. Best, P.J. Newman and D.R. MacFarlane, Solid State Ionics, Vol. 124, pp. 213–219, 1999.
131. A.M. Cruz and A.C.S. Rodriques, Ceramica, Vol. 53, pp. 180, 2007.132. H.B. - Kang, and N.H. Cho, J. Mater. Sci., Vol. 34, pp. 5005–5013, 1999.133. M. Forsyth, S. Wong, K.M. Nairn, D.R. MacFarlene, P.J. Newman and A.S.
Best, J. Mater. Chem., Vol. 8, pp. 2199, 1998.134. Y. Nian Xu, S.Y. Chung, J.T. Bloking, Y.M. Chiang and W.Y. Ching, Electrical
and Solid State Letters,Vol. 76, pp. A131–A134, 2004.135. N.T. Nga, and T. Son, Communication in Physics, Vol. 4, pp.105–110,2004.136. J. Judes and V. Kamaraj, Materials Science-Poland, Vol. 27, p.407, 2009.137. L. Zhang, P. Chen, Z. Hu, and C. Chen, Chin. J. Chem. Phys. Vol. 25, p. 703,
2012. 138. M. Barré, J. Emery , P. Florian, F. Le Berre , M.-P Crosnier-Lopez and J.-L.
Fourquet, Journal of Physics: Condensed Matter, Vol. 21, pp. 175404, 2002. 139. Y. Yue, F. Deng, H. Hu, C. Ye, Chem Phys Lett, Vol. 235, pp. 503–507, 1995.140. C. Jäger, S. Barth, A. Feltz, Chemical Physics Letters, Vol. 154, pp. 45–48,1989. 141. Y. Yong, D. Feng, H. Hong-Bing, Y. Zhao-Hui, Acta Phys. Chim. Sin., Vol. 11,
pp. 484–487, 1995.142. J.B. Frank, C. Nicola and E.S. Lesley (2006), Solid State Ionics, Vol. 177, pp.
2889–2896, 2006.143. R.P. Forbes, D.G. Billing, 26th European Crystallographic Meeting, ECM 26,
Darmstadt, 2010, Acta Cryst. Vol. A66, p. s159, 2010.144. M.V. Krishnaiah, J. Joseph, G. Seenivasan, K.V. Govindan Kutty, Journal of
Alloys and Compounds, Vol. 351,pp. 212–216, 2003.145. S.H. Balagopal, R.M. Flinders, S.V. Bhavaraju, D.A. Clay, K.L. Schatten,
Recycling Caustic from LAW Stream using NaSICON Membrane based Electrochemical Technology— 9127WM2009 Conference, March 1–5, 2009, Phoenix, AZ, http://www.ceramatec.com/documents/Solid-State-Ionic; A.P. Poloski, G.J. Sevigny, D.E. Kurath, M.S. Fountain, L.K. Holton, Economic Feasibility of Electrochemical Caustic Recycling at the Hanford Site March 2009, Prepared for the U.S. Department of Energy under Contract DE-AC05-76RL01830, Pacifi c Northwest National Laboratory, Richland, Washington 99352, http://www.pnl.gov/main/publications/external/technical_reports/PNNL-18265.pdf, 2013.
146. W.R. Wilmarth, D.T. Hob’s, W.A. Averill, E. Fox, R.A. Peterson, Review of Ceramatec’s caustic recovery technology, July 20.Washington savannah river company, savannah river site, Aiken, SC 29808. Prepared for the U.S. Department of Energy Under Contract Number DE-AC09-96SR18500, 2007.
147. Q. Chao-Qun, W. Ying-Jin, J. Tao, Journal of Inorganic Materials, Vol. 27, pp. 561–56, 2012.
148. R. Akila, K.T. Jacob, Journal of Applied Electrochemistry, Vol. 18, pp. 245–251, 1988.
308 Advanced Sensor and Detection Materials
149. S. Yao and J. R. Stetter, Solid Electrolyte Sensors for Emissions, Monitoring, http://www.electrochem.org/dl/ma/201/pdfs/1573.pdf, 2013.
150. G.W. Hunter, J.C. Xu, C.C. Liu, J.W. Hammond, B. Ward, D. Lukco, P. Lampard, M. Artale, and D. Miniaturized Amperometric Solid Electrolyte Carbon Dioxide Sensors http://ntrs.nasa.gov/archive/nasa/casi.ntrs.nasa.gov/20090014003_2009013126.pdf, 2013.
151. K.M. Nairn A.S. Best, P.J. Newman, D.R. MacFarlane and M. Forsyth, Ceramic-Polymer Interface in Composite Electrolytes of Lithium Aluminium Titanium Phosphate and Polyetherurethane Polymer Electrolyte. www4.eng.hawaii.edu/~ssi11/SSI-11Papers/C58.pdf, 2013.
152. S. Baliteaua, A-L. Sauvetb, C. Lopeza and P. Fabry, Characterization of a NASICON based potentiometric CO2 sensor, http://web1.see.asso.fr/elec-troceramics/html/cdrom/pdf/Papers/D08-02-Ora.pdf, 2013.
153. M. Sommariva, M. Catti, and A. Comotti, 22nd European Crystallographic Meeting, ECM22, Budapest, Acta Cryst., Vol. A60, p. s258, 2004.
154. B. Haggouch, A. Aatiq, Structure and spectroscopic study of Nasicon phosphates series, First Euro-Mediterranean Conference on Materials and Renewable Energies (EMCMRE-1), 21–25 November, 2011.
155. G. Hitz, K.T. Lee and E.D. Wachsman, Synthesis and characterization of Na3+xMxZr2-xSi2P3O12 for solid state Na-ion battery applications, Abstract #1863, Honolulu PRiME 2012, Th e Electrochemical Society, http://ma.ecsdl.org/content/MA2012-02/15/1863.full.pdf, 2013.
156. S. Ping Ong, V.L. Chevrier, G. Hautier, A. Jain, C. Moore, S. Kim, X. Ma and G. Ceder, Energy & Environmental Science, DOI: 10.1039/c1ee01782a,Voltage, stability and diff usion barrier diff erences between sodium-ion and lithium-ion intercalation materials.
157. J. Ross Macdonald, J. Phys.: Condens. Matter., Vol. 24, p. 17504, 2012.158. W. Bogusz, F. Krok, W. Piszczatowski, Solid State Ionics, Vol. 119, pp. 165–
171, 1999.159. Ceramatic sodium battery technology, http://swenergyforum.com/pdfs/
Grover%20Coors%20-%20330pm%20breakout.pdf, 2013.160. J. Salton, New solar battery technology off ers household power at 2.5c per
kWh, September 2, 2009, http://www.gizmag.com/solar-battery-cheap-power/12676/, 2013.
Related Documents


