9: Benefit Cost Analysis Dr. Mohsin Siddique Assistant Professor [email protected] Ext: 2943 1 Date: Engineering Economics University of Sharjah Dept. of Civil and Env. Engg.

Welcome message from author
This document is posted to help you gain knowledge. Please leave a comment to let me know what you think about it! Share it to your friends and learn new things together.
Transcript

9: Benefit Cost Analysis
Dr. Mohsin Siddique
Assistant Professor
Ext: 29431
Date:
Engineering Economics
University of SharjahDept. of Civil and Env. Engg.

2
Part I

Outcome of Today’s Lecture
3
� After completing this lecture…
� The students should be able to:
� Use benefit-cost ratio to solve engineering economy problem
� Mathematically develop the benefit-cost ratio, and use this model to select alternatives and make economic choices.

Techniques for Cash Flow Analysis
4
� Present Worth Analysis
� Annual Cash Flow Analysis
� Rate of Return Analysis
� Incremental Analysis
� Other Techniques:
� Future Worth Analysis
� Benefit-Cost Ratio Analysis
� Payback Period Analysis
Benefit-Cost Analysis
5
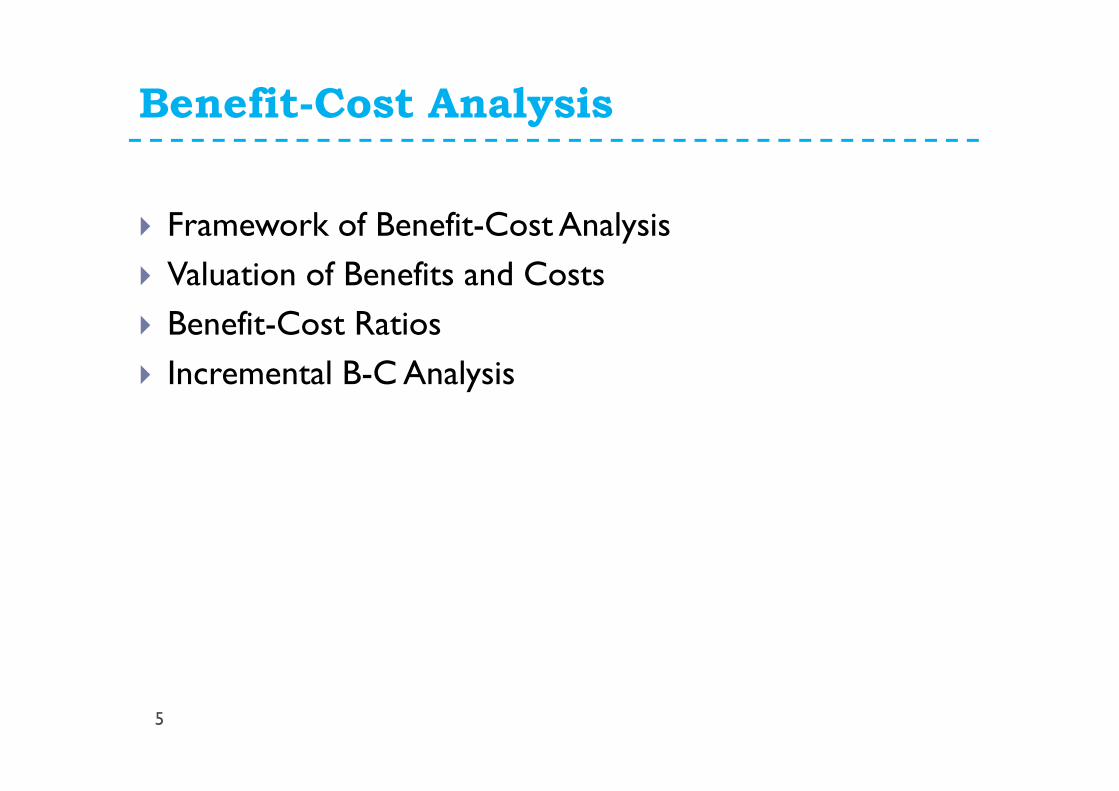
� Framework of Benefit-Cost Analysis
� Valuation of Benefits and Costs
� Benefit-Cost Ratios
� Incremental B-C Analysis

Benefit-Cost Analysis
6
� The Benefit-cost analysis is commonly used to evaluate public (government) projects.
� Benefits of a nonmonetary nature need to be quantified in dollar terms as much as possible and factored into the analysis.
� A broad range of project users distinct from the sponsor should be considered—benefits and costs to all these users can (and should) be taken into account.
Framework of Benefit-Cost Analysis
7
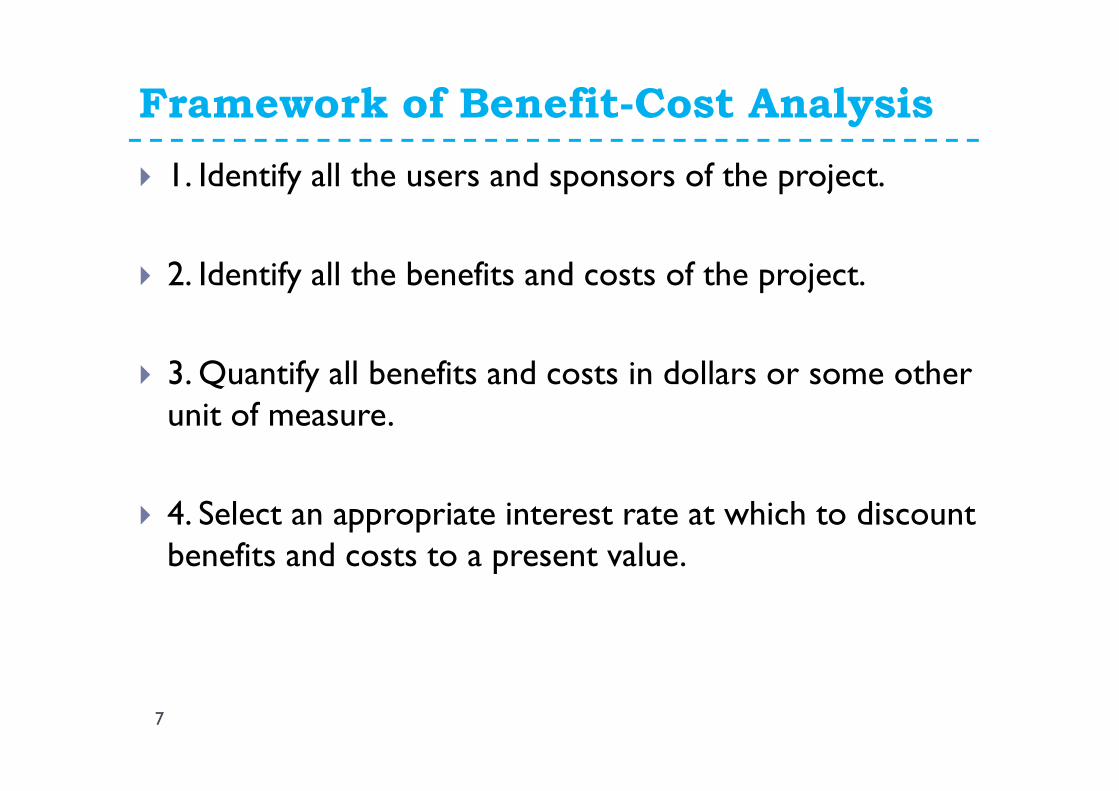
� 1. Identify all the users and sponsors of the project.
� 2. Identify all the benefits and costs of the project.
� 3. Quantify all benefits and costs in dollars or some other unit of measure.
� 4. Select an appropriate interest rate at which to discount benefits and costs to a present value.

Benefit-Cost Ratio Criterion
8
� The Net B/C ratio expresses the net benefit expected per dollar invested.
� Decision Rule: If B/C ratio > 1, the project can be justified/acceptable.

Example 1: Benefit-Cost Ratio Computation
9
� Compute Benefit-Cost Ratio for given CFD:
� Solution:
� Benefit, B = $20 (P/F,10%,2) + $30 (P/F,10%,3) + $30 (P/F,10%,4) + $20 (P/F,10%,5) = $71.98
� Cost, C = $10 + $10 (P/F,10%,1) + $5 (P/A,10%,4) (P/F,10%,1) = $25
� Benefit-cost ratio=B/C = 72/25 = 2.88 => Accept the project

Example 2: B/C Ratio Analysis
10
� Each of the five mutually exclusive alternatives presented below will last for 20 years and has no salvage value. MARR = 6%.
� The steps are the same as in incremental ROR, except that the criterion is now B/C, and the cutoff is 1 instead of the MARR:
� 1. Be sure you identify all alternatives.
� 2. (Optional) Compute the B/C ratio for each alternative. Discard any with a B/C < 1. (We can discard F).
� 3. Arrange the remaining alternatives in ascending order of investment.

Example 2: Cost Ratio Analysis
11

Example 2: Cost Ratio Analysis
12
Example 3: Cost Ratio Analysis
13
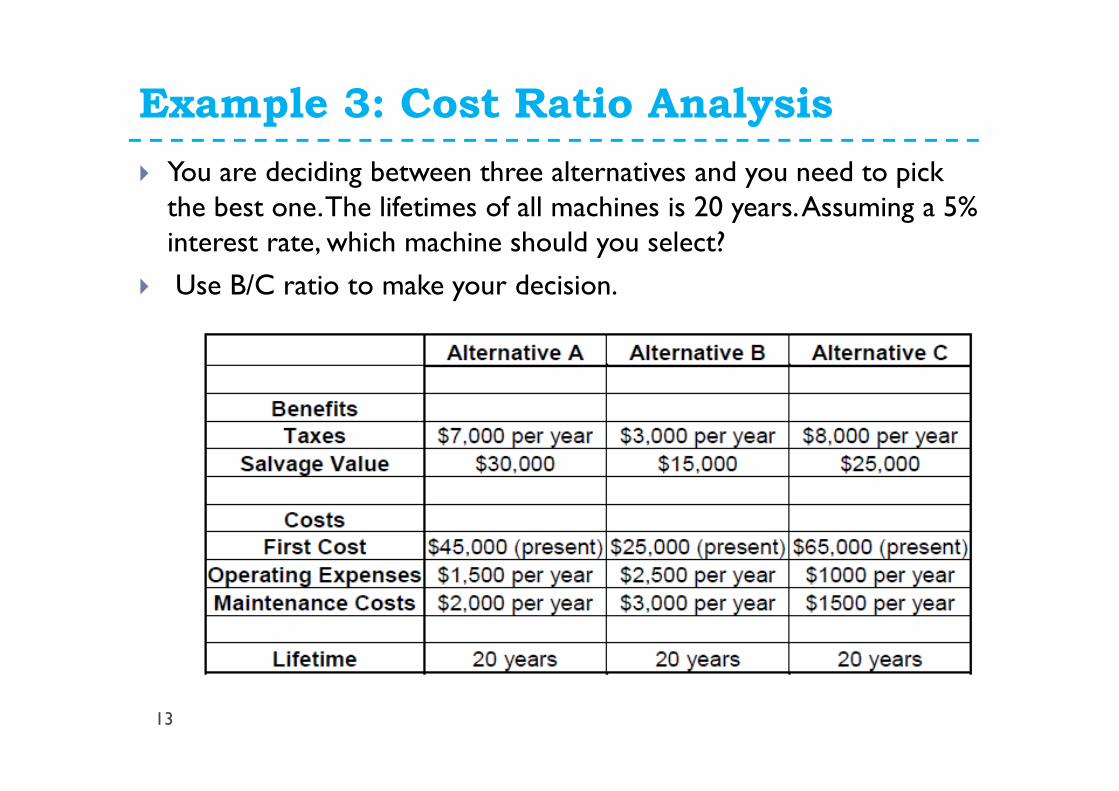
� You are deciding between three alternatives and you need to pick the best one. The lifetimes of all machines is 20 years. Assuming a 5% interest rate, which machine should you select?
� Use B/C ratio to make your decision.

Example 3: Benefit-Cost Ratio Analysis
14
� Solution:
� Analysis of Alternative A
� B/C ratio for Alt A = Benefits/Cost
� = [7,000 (P/A, 5%, 20) + 30,000 (P/F, 5%, 20)] / [45,000 + (1,500+2000) (P/A, 5%, 20)]
� = 98,542/88,617 = 1.1199 > 1 (Good)
� Analysis of Alternative B
� B/C ratio for Alt B = Benefits/Cost
� = [3000 (P/A, 5%, 20) + 15,000 (P/F, 5%, 20)] / [25,000 + (2,500+3000) (P/A, 5%, 20) ]
� = 43,040 / 93,542 = 0.4601 < 1 (Bad, Not good)
� If we do the same for Alternative C we get a B/C ratio of 1.135, which is > 1 (Good)

Example 3: Cost Ratio Analysis
15

Example 3: Cost Ratio Analysis
16
� Note that the benefits and costs are obtained from the previous analysis (we made the analysis in terms of Present Worth).
� For example, for Alternative A:
� Benefits = 7,000 (P/A, 5%, 20) + 30,000 (P/F, 5%, 20)= $98,542
� Costs = 45,000 + (1,500+2000) (P/A, 5%, 20) = $88,617
� In this case, since Incremental B/C of (C-A) = 1.40 we prefer Alternative C over Alternative A.
� Since we have no more alternatives we decide that Alternative C is the best one.

Other Analysis Techniques
17
� Future worth analysis is equivalent to present worth analysis. There are many situations where we want to know what a future situation will be, if we take some particular course of action now. This is called future worth analysis.
� Payback period is an approximate analysis method. For example, if a $1000 investment today generates $500 annually in savings, we say its payback period is 1000/500 = 2 years.
� Sensitivity analysis identifies how sensitive economic conclusions are to the values of the data, and allows making decisions for an entire range of the data.
� Breakeven analysis is closely related to sensitivity analysis, and determines conditions when two alternatives are equivalent (as well as when each is better than the other). It can be viewed as a type of sensitivity analysis.
18
Part II
Problem: 9-29, 9-30, 9-31, 9-33

9-29
19
� A project will cost $50,000. The benefits at the end of the first year are estimated to be $10,000, increasing at a 10% uniform rate in subsequent years. Using an 8-year analysis period and a 10% interest rate, compute the benefit-cost ratio.
� Geometric gradient at a 10% uniform rate.
�
� A1 = $10,000
� i = 10%
� g = 10%
� n = 8 yrs
� Where i = g: P = A1n (1 + i)-1
� B/C = PW of Benefits/PW of Cost = [$10,000 (8) (1 + 0.10)-1]/$50,000
� B/C = 1.45
A1
P = $50,000

9-30
20
� B/COF A = $158.3/[$600 (A/P, 10%, 5)] = 1.00
� B/COF B = $138.7/[$500 (A/P, 10%, 5)] = 1.05
� B/COF C = $58.3/[$200 (A/P, 10%, 5)] = 1.11
� All alternatives have a B/C ratio > 1.00. Proceed with incremental analysis.

9-30
21
B- C A- BCost $300 $100Uniform Annual Benefit $80.4 $19.6
B/COF B-C = $80.4/[$300 (A/P, 10%, 5)] = 1.02Desirable increment. Reject C.
B/COF A-B = $19.6/[$100 (A/P, 10%, 5)] = 0.74Undesirable increment. Reject A.
Conclusion: Select B.
Incremental Analysis

9-31
22
� Consider three alternatives, each with a 10-year useful life. If the MARR is 10%, which alternative should be selected? Solve the problem by benefit-cost ratio analysis.
B/CA = ($142 (P/A, 10%, 10))/$800 = 1.09B/CB = ($60 (P/A, 10%, 10))/$300 = 1.23B/CC = ($33.5 (P/A, 10%, 10))/$150 = 1.37
B/C ratio

9-31
23
� Incremental Analysis
� B- C Increment
� ∆ Cost (B- C) = $150
� ∆ UAB= $26.5
� ∆B/∆C= ($26.5 (P/A, 10%, 10))/$150 = 1.09
� This is a desirable increment. Reject C.
� A- B Increment
� ∆ Cost (A- B) = $500
� ∆ UAB =$82
� ∆B/∆C = ($82 (P/A, 10%, 10))/$500 = 1.01
� This is a desirable increment. Reject B.
Conclusion: Select A.

9-33
24
Alternative A: B/C = [$140 (P/A, 10%, 6)]/[$560 - $40 (P/F, 10%, 6)]= [$140 (4.355)]/($560 - $40 (0.5645)]= 1.13
Alternative B: B/C = [$100 (P/A, 10%, 6)]/$340= 1.28
Alternative C: B/C = [$40 (P/A, 10%, 6)]/$120= 1.45
B/C ratio

9-33
25
B- C A- B∆ First Cost $220 $220∆ Uniform Annual Benefit $60 $40
∆ Salvage Value $0 $40Compute ∆B/∆C value 1.19 0.88
Incremental Analysis
B- C ∆B/∆C = [$60 (P/A, 10%, 6)]/$220 = 1.19 B- C is a desirable increment.
A- B ∆B/∆C = [$40 (P/A, 10%, 6)/[$220 - $40 (P/F, 10%, 6)] = 0.88 A- B is an undesirable increment.
Conclusion: Choose B.

9-33
26
� NPW Solution
� NPWA = $140 (P/A, 10%, 6) + $40 (P/F, 10%, 6) - $560
� = $140 (4.355) + $40 (0.5645) - $560
� = +$72.28
� NPWB = $100 (P/A, 10%, 6) - $340
� = +$95.50
� NPWC = $40 (P/A, 10%, 6) - $120
� = +$54.20
Select B

9-33
27
� Rate of Return Solution
B- C A- B
∆ Cost $220 $220
∆ Uniform Annual Benefit $60 $40
∆ Salvage Value $0 $40
Computed ∆ ROR 16.2% 6.6%
Decision > 10%Accept B. Reject C.
< 10%Reject A.
Select B.

Related Documents


![Principles and Standards for Benefit–Cost Analysis] Introduction- Professionalizing Benefit–Cost Analysis](https://static.cupdf.com/doc/110x72/56d6beb21a28ab30169333bb/principles-and-standards-for-benefitcost-analysis-introduction-professionalizing.jpg)