1 This paper is accepted on 19 July 2015 in the Journal of Informetrics http://dx.doi.org/10.1016/j.joi.2015.07.009 Is the expertise of evaluation panels congruent with the research interests of the research groups: A quantitative approach based on barycenters A.I.M. Jakaria Rahman a , Raf Guns b , Ronald Rousseau b c and Tim C.E. Engels a d a Centre for R&D Monitoring (ECOOM), Faculty of Social Sciences, University of Antwerp, Middelheimlaan 1, B-2020 Antwerp, Belgium b Informatie- en Bibliotheekwetenschap, University of Antwerp, Venusstraat 35, B-2000, Antwerp, Belgium c KU Leuven, Dept. of Mathematics, B-3000 Leuven, Belgium d Antwerp Maritime Academy, Noordkasteel Oost 6, B-2030 Antwerp, Belgium Abstract Discipline-specific research evaluation exercises are typically carried out by panels of peers, known as expert panels. To the best of our knowledge, no methods are available to measure overlap in expertise between an expert panel and the units under evaluation. This paper explores bibliometric approaches to determine this overlap, using two research evaluations of the departments of Chemistry (2009) and Physics (2010) of the University of Antwerp as a test case. We explore the usefulness of overlay mapping on a global map of science (with Web of Science subject categories) to gauge overlap of expertise and introduce a set of methods to determine an entity’s barycenter according to its publication output. Barycenters can be calculated starting from a similarity matrix of subject categories (N-dimensions) or from a visualization thereof (2-dimensions). We compare the results of the N-dimensional method with those of two 2-dimensional ones (Kamada-Kawai maps and VOS maps) and find that they yield very similar results. The distance between barycenters is used as an indicator of expertise overlap. The results reveal that there is some discrepancy between the panel’s and the groups’ publications in both the Chemistry and the Physics departments. The panels were not as diverse as the groups that were assessed. The match between the Chemistry panel and the Department was better than that between the Physics panel and the Department. Keywords: Research assessment; Research evaluation; Expert panel; Research group; Barycenter; Overlay map; Matching research expertise; Similarity matrix; VOS-map; Kamada-Kawai map

Welcome message from author
This document is posted to help you gain knowledge. Please leave a comment to let me know what you think about it! Share it to your friends and learn new things together.
Transcript

1
This paper is accepted on 19 July 2015
in the Journal of Informetrics
http://dx.doi.org/10.1016/j.joi.2015.07.009
Is the expertise of evaluation panels congruent with the research interests
of the research groups: A quantitative approach based on barycenters
A.I.M. Jakaria Rahman a, Raf Guns
b, Ronald Rousseau
b c
and Tim C.E. Engels a d
a Centre for R&D Monitoring (ECOOM), Faculty of Social Sciences, University of Antwerp, Middelheimlaan 1,
B-2020 Antwerp, Belgium
b Informatie- en Bibliotheekwetenschap, University of Antwerp, Venusstraat 35, B-2000, Antwerp, Belgium
c KU Leuven, Dept. of Mathematics, B-3000 Leuven, Belgium
d Antwerp Maritime Academy, Noordkasteel Oost 6, B-2030 Antwerp, Belgium
Abstract
Discipline-specific research evaluation exercises are typically carried out by panels of peers,
known as expert panels. To the best of our knowledge, no methods are available to measure
overlap in expertise between an expert panel and the units under evaluation. This paper
explores bibliometric approaches to determine this overlap, using two research evaluations of
the departments of Chemistry (2009) and Physics (2010) of the University of Antwerp as a
test case. We explore the usefulness of overlay mapping on a global map of science (with
Web of Science subject categories) to gauge overlap of expertise and introduce a set of
methods to determine an entity’s barycenter according to its publication output. Barycenters
can be calculated starting from a similarity matrix of subject categories (N-dimensions) or
from a visualization thereof (2-dimensions). We compare the results of the N-dimensional
method with those of two 2-dimensional ones (Kamada-Kawai maps and VOS maps) and
find that they yield very similar results. The distance between barycenters is used as an
indicator of expertise overlap. The results reveal that there is some discrepancy between the
panel’s and the groups’ publications in both the Chemistry and the Physics departments. The
panels were not as diverse as the groups that were assessed. The match between the
Chemistry panel and the Department was better than that between the Physics panel and the
Department.
Keywords: Research assessment; Research evaluation; Expert panel; Research group;
Barycenter; Overlay map; Matching research expertise; Similarity matrix; VOS-map;
Kamada-Kawai map

2
Highlights
1. We present methods to measure overlap of expertise in research evaluation.
2. An entity’s expertise can be summarized as its barycenter in cognitive space.
3. Barycenters can be calculated in two or more dimensions.
4. The distance between barycenters is an indicator of cognitive distance and hence
expertise overlap.
5. The method is applied to two research evaluations at the University of Antwerp.

3
1. Introduction
Discipline-specific research evaluations carried out by panels of peers are a common practice
at many universities. The focus of these evaluations is research, in particular research quality.
Expert panel review is considered the standard for determining research quality of individuals
and groups (Nedeva et al., 1996; Rons et al., 2008; Butler & McAllister, 2011; Lawrenz et
al., 2012), but also, for instance, for research proposals submitted to research funding
organizations (Li & Agha, 2015). In 2007, the University of Antwerp, Belgium, decided to
introduce evaluative site visits by expert panels, during which the panel meets the
spokesperson of each research group and other relevant stakeholders, and panel members are
given the opportunity to ask additional questions or request clarification of specific points
described in the self-evaluation report they received in advance. The site visits thus guarantee
interaction and involvement between experts and research groups.
Using data collected in the framework of two completed research evaluations, this paper
studies the expertise overlap between expert panels and the research groups involved in the
evaluation. To the best of our knowledge, no methods are available to measure and quantify
overlap in expertise between panels and units under assessment. Yet, a sufficiently high
degree of congruence between the expertise of the panel members charged with research
assessment and the research of the units is a prerequisite for a sound, reliable assessment
(Engels et al., 2013). Only panel members who are credible experts in the field will be able to
provide valuable, relevant recommendations and suggestions that should lead to improved
research quality. In this respect, Langfeldt (2004) explored expert panel evaluation and
decision-making processes, and concluded that overlap of expertise between experts is highly
desirable in order to foster cooperation among panel members. Moreover, each group expects
its research interests to be well covered by the expertise of at least one panel member.
Research groups at the University of Antwerp (Belgium) consist of professors (of all ranks),
research and teaching assistants, and researchers (PhD students and postdocs). A research
group consists either of one professor assisted by junior and/or senior researchers, or of a
group of professors and a number of researchers linked to them. The overall annual research
output of the University of Antwerp comprises over 2000 peer-reviewed publications, the
large majority of which are included in the Web of Science (Engels et al., 2013).
Research evaluations carried out at the University of Antwerp are organized by its
Department of Research Affairs. At the start of a research evaluation, a department –
typically encompassing several research groups – is invited to suggest potential panel chairs
in addition to those suggested by the Department of Research Affairs. Preferably, chairs are
appointed as full professor, have an excellent publication record, have experience in research
evaluations, are editors or board members of important journals, and possess academic
management experience. The Department of Research Affairs verifies whether proposed
panel chairs and members have no prior involvement (i.e. no prior joint affiliations, no co-
publications, no common projects) with the assessed research groups, and further checks if
they are scholars with a prominent publication record in recent years, a proven track record of
training young researchers, and sufficient experience in research policy, preferably in
4
academic leadership positions. Furthermore, proposed panel chairs and members are
preferably not affiliated with any Flemish institution of higher education and have no formal
links to the University of Antwerp. The department that is being evaluated is also allowed to
suggest potential panel members, but it should be noted that it is eventually the chair’s
prerogative to decide on the final composition of the panel.
The combined expertise of all panel members is to cover all subdomains in the discipline that
is being evaluated and the panel is preferably balanced in terms of gender and nationality.
When a sufficient number of professors have agreed to be on the panel, the university’s
research council ratifies the panel composition. Furthermore, all research groups belonging to
a specific department (e.g., Physics) are to be evaluated by the same panel and the language
of communication is English. Following the Dutch Standard Evaluation Protocol (SEP:
VSNU, 2003, 2009), the peer panels assess the quality, the productivity, the relevance and the
viability of each research group.
An expert panel, typically consists of independent specialists, and is multidisciplinary and/or
interdisciplinary in its composition; each of the members are recognized experts in at least
one of the fields addressed by the department under evaluation. Surprisingly, the degree to
which the expertise of the panel (members) overlaps with the expertise of the research groups
has not been quantified to date. The goal of this paper is therefore to present a bibliometric
methodology to assess the congruence of panel expertise and research interests in the units
under assessment. As such, we present a bibliometric analysis of the overlap of expertise
between research groups in the Departments of Chemistry and Physics and the respective
expert panels based on two research evaluations carried out at the University of Antwerp. We
focus on the following research questions:
i) How can we visualize the expertise of two entities (e.g., a research group and a
panel) using publication data?
ii) How can we quantify the overlap of expertise between two entities (e.g., a
research group and a panel) using publication data?
We address these questions in the context of expert panel reviews. Specifically, we focus on
comparing:
- panel and individual research group;
- panel member and individual research group (even if the panel does not cover a
group’s expertise well, it may suffice that one panel member does);
- panel and all reviewed research groups (e.g., all physics research groups).
This article is an improved and extended version of (Rahman, et al., 2014) presented at the
2014 STI-ENID conference in Leiden, the Netherlands.

5
2. Data
The data in this paper stem from the 2009 assessment of the twelve research groups (referred
to as CHEM-A, CHEM-B and so on) belonging to the Department of Chemistry, and the
2010 assessment of the nine research groups (referred to as PHYS-A, PHYS-B and so on)
belonging to the Department of Physics, University of Antwerp. The reference period
encompasses eight years preceding the evaluation. In principle all articles, letters, notes,
proceedings papers, and reviews by the research groups published during the reference period
and included in the Science Citation Index Expanded (SCIE), the Social Sciences Citation
Index (SSCI) and the Arts and Humanities Citation Index (AHCI) of the Web of Science
(WoS) were considered in the evaluation. In practice only SCIE indexed papers occurred for
these particular groups.
The Chemistry and Physics panels were composed of seven and six members (both including
the chair), respectively. All the publications of the individual panel members up to the year of
assessment were taken into account. The combined publication output of the Physics panel
members is 1,104 publications, none of which are co-authored publications between panel
members. The number of publications per panel member ranges from 117 to 282. In total,
these publications appeared in 204 different journals. The Chemistry panel members’
publication output amounts to 2,150 publications in 248 different journals. The number of
publications per panel member ranges from 113 to 694. Panel members one and seven have
two joint publications.
Table 1: Publication profile of the Chemistry and Physics research groups
Group code Number of
Publications
Number of
Journals
Number of WoS
categories
Chemistry research groups (2001-2008)
CHEM-A 129 47 27
CHEM-B 65 24 17
CHEM-C 156 52 26
CHEM-D 32 17 13
CHEM-E 70 39 23
CHEM-F 21 17 8
CHEM-G 161 47 42
CHEM-H 62 33 28
CHEM-I 51 24 19
CHEM-J 27 11 15
CHEM-K 97 66 48
CHEM-L 92 42 24
Total 920 300 94
Physics research groups (2002-2009) PHYS-A 125 53 44
PHYS-B 486 66 25
PHYS-C 525 147 46
PHYS-D 269 17 7
PHYS-E 159 55 28
PHYS-F 42 23 13
PHYS-G 43 26 12
PHYS-H 132 31 12
PHYS-I 115 63 49
Total 1,732 353 108

6
Table 1 lists the number of publications of the research groups during the eight years
preceding their evaluation. The Chemistry research groups published 920 publications in 300
journals, including 43 joint publications between Chemistry groups, while the Physics
research groups generated 1,732 publications in 353 journals, with 164 publications
co-authored by members of two or more Physics research groups.
3. Methods
3.1 Subject category similarity matrix and maps
Each journal in Thomson Reuters’ Web of Science (WoS) is assigned to one or more WoS
subject categories (SCs). Our method is based on the assumption that entities with more
publications in the same or similar SCs have greater expertise overlap. While WoS categories
have been criticized for being crude (Leydesdorff & Rafols, 2009; Leydesdorff & Bornmann,
2015) they are considered sufficient for evaluation of a given discipline (van Leeuwen &
Calero-Medina, 2012), and are widely accepted and used by bibliometric practitioners.
Moreover, the categories cover all disciplines (Rehn, et. al., 2014; Leydesdorff & Bornmann,
2015).
We determine the correlation between the publication output of two entities using
Spearman’s rank correlation coefficient for the numbers of publications per SC. To calculate
Spearman’s rank correlation, the value zero was kept on the corresponding categories in
which either the panel or the groups had no publications (but not both). We argue that such
correlations provide a first impression yet are insufficient, since they do not take into account
the relatedness of SCs. One can intuitively understand that some categories are much more
closely related than others. If a panel member has many publications in a closely related SC,
she may still have relevant expertise, even if she has no publications in the exact same
category as the group to be evaluated.
To operationalize the relatedness or similarity of SCs, we draw upon data made available by
Rafols, Porter, & Leydesdorff (2010) at http://www.leydesdorff.net/overlaytoolkit/map10.paj.
These authors created a matrix of citing to cited SCs based on the Science Citation Index
(SCI) and Social Sciences Citation Index (SSCI), which was subsequently normalized in the
citing direction. Only cosine values > 0.15 were retained. The result is a symmetric N×N
similarity matrix (here, N=224). If we interpret it as an adjacency matrix, we see that it is
equivalent to a weighted network, in which similar categories are linked (the higher the link
weight, the stronger the similarity). The two most similar SCs are Nanoscience &
Nanotechnology and Materials Science, Multidisciplinary, which have a cosine similarity of
0.978.
The information in the similarity matrix can be visualized. The subfield of bibliometric
mapping is dedicated to the visualization, clustering and interpretation of similarity matrices
or networks like the one we use. Many different algorithms or layout techniques have been
developed for this purpose. In this paper, we use two:
7
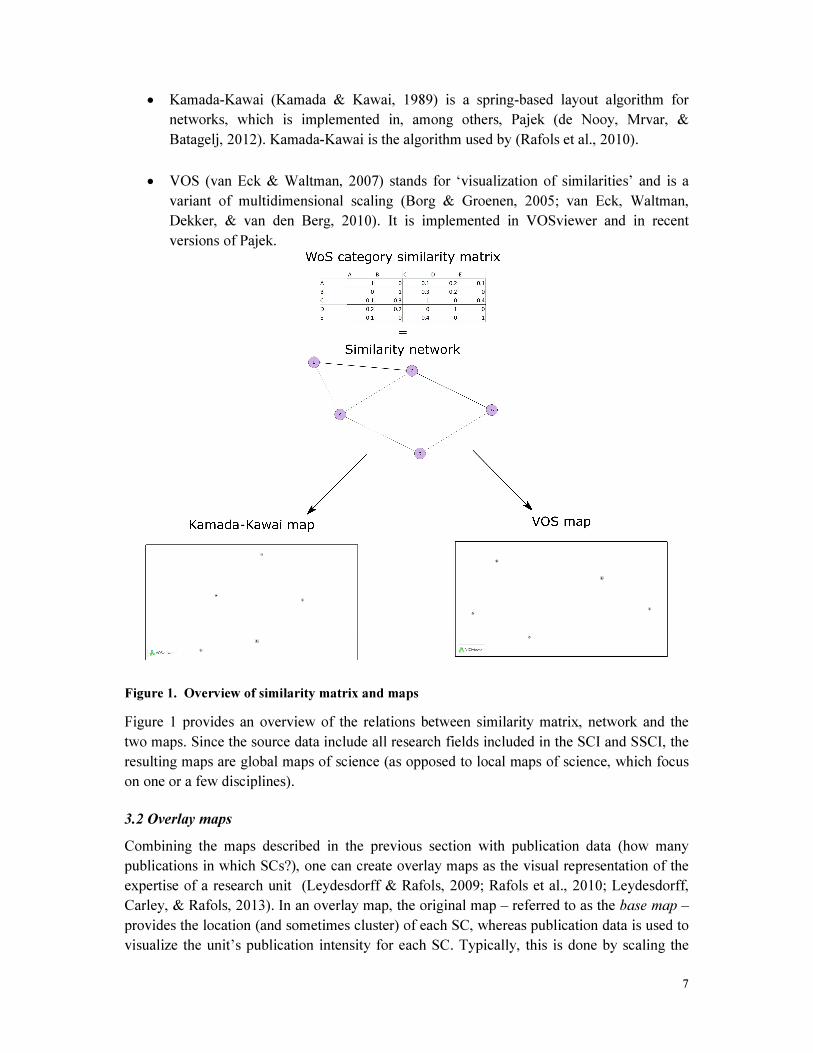
• Kamada-Kawai (Kamada & Kawai, 1989) is a spring-based layout algorithm for
networks, which is implemented in, among others, Pajek (de Nooy, Mrvar, &
Batagelj, 2012). Kamada-Kawai is the algorithm used by (Rafols et al., 2010).
• VOS (van Eck & Waltman, 2007) stands for ‘visualization of similarities’ and is a
variant of multidimensional scaling (Borg & Groenen, 2005; van Eck, Waltman,
Dekker, & van den Berg, 2010). It is implemented in VOSviewer and in recent
versions of Pajek.
Figure 1. Overview of similarity matrix and maps
Figure 1 provides an overview of the relations between similarity matrix, network and the
two maps. Since the source data include all research fields included in the SCI and SSCI, the
resulting maps are global maps of science (as opposed to local maps of science, which focus
on one or a few disciplines).
3.2 Overlay maps
Combining the maps described in the previous section with publication data (how many
publications in which SCs?), one can create overlay maps as the visual representation of the
expertise of a research unit (Leydesdorff & Rafols, 2009; Rafols et al., 2010; Leydesdorff,
Carley, & Rafols, 2013). In an overlay map, the original map – referred to as the base map –
provides the location (and sometimes cluster) of each SC, whereas publication data is used to
visualize the unit’s publication intensity for each SC. Typically, this is done by scaling the

8
size of each node according to the number of publications. Hence, overlay maps can also be
used for visual comparison and estimation of the degree of overlap of two or more entities in
exploratory analysis.
In the ‘Results’ section, we present several overlay maps. Some of these are zoomed in to
better highlight places of interest. All distances presented are taken from the barycenter
calculations (see further) and hence independent of whether the figures are enlarged.
For our purposes, however, overlay maps have an important limitation. Despite their value in
an exploratory analysis, overlay maps are hard to compare. It is not always obvious, for
instance, which of several candidate panel members has better overlap of expertise with a
given group or department. This is especially the case if the entities publish in many different
categories or in categories that are quite close to one another. We therefore propose using the
barycenter method to estimate an entity’s ‘average’ or ‘overall’ position. Consequently, one
can determine and compare the cognitive distance between entities, thus adding a measure to
the qualitative visual comparison facilitated by overlay maps.
3.3 Barycenter and distance calculation
An entity’s barycenter is the center of weight (Rousseau, 1989, 2008) of the SCs in which it
has published, where a SC’s weight is the entity’s number of publications therein.
Barycenters can be determined in any arbitrary number of dimensions. For our purposes,
there are two different ways of calculating a barycenter: either we calculate the barycenter in
N dimensions (starting from the original similarity matrix) or we calculate it in two
dimensions (starting from a map).
First, we explain calculation of the barycenter in N dimensions. In this case, each row of the
similarity matrix is interpreted as a set of N coordinates for the corresponding SC. In the five-
dimensional example in Figure 1, for instance, A has N=5 coordinates (1, 0, 0.1, 0.2, 0.1).
The barycenter in N dimensions is determined as the point � = ���,��, … ,���, where:
�� =∑ ����,�����
�
(1)
Here ��,� denotes the �-th coordinate of WoS subject category (that is, ��,� is element �,�
in the similarity matrix A), �� is the number of publications in subject category , and � = ∑ ��
���� . Note that M is larger than the total number of publications as we use full
counting of WoS subject categories: if a publication appears in a journal belonging to two
categories, it will be counted twice. For further elaboration on the barycenter method, we
refer to (Rousseau, 1989; Jin & Rousseau, 2001; Verleysen & Engels, 2013, 2014).
Having obtained barycenters for each entity in the similarity matrix, we can determine the
distance between (the barycenters of) the expert panel as a whole, individual panel members,
the combined group, and individual groups. The Euclidean distance between two barycenters
a and b is:
���, � = ���� − ��� +⋯+ ��� − ��� (2)

9
Let us now turn to the barycenter calculation in two dimensions, using the Kamada-Kawai or
VOS map. Reusing formula (1), the barycenter on a two-dimensional base map is defined as
the point � = (��,��) where
�� =∑ ����,�����
�; �� =
∑ ����,�����
�
(3)
The Euclidean distance between points � = ���,������� = (��,��) is calculated with the
formula:
� = ���� − ���� + ��� − ����. (4)
The distances thus obtained should be interpreted as having arbitrary units on a ratio scale
(Egghe & Rousseau, 1990). This means there is a fixed meaningful zero (distance zero in the
map), and distances can be compared in terms of percentage or fraction (e.g. the distance
between A and B is 1.5 times larger than the distance between C and D).
The latter, two-dimensional approach allows for easy visualization of barycenters: �� and �� are, respectively, horizontal and vertical coordinates. A barycenter that is obtained using the
former, N-dimensional approach cannot be visualized as easily, since it has N coordinates
itself. However, visualization is possible if one expands the similarity matrix with one extra
row and column, containing the barycenter’s coordinates. The expanded (� + 1) × (� + 1)
matrix can then be visualized using, for instance, VOSviewer. Note that this approach works
well for visualizing the location of one barycenter but cannot be used for multiple barycenters
at the same time, for two reasons:
• Adding extra rows/columns affects the layout algorithm and may distort the original
base map. The effect of one extra point turns out to be quite limited.
• It is unclear what similarity score should be assigned to two barycenters.
In the following section, we determine the barycenters of all entities and the distances
between them using both the N-dimensional and the two-dimensional approach. For the
latter, we employ both the Kamada-Kawai map and the VOS-map. We also calculate the
average of the shortest barycenter distances as a comparative measure between two case
studies.
4. Results
We start by calculating barycenters and distances to gauge the differences between the
techniques. As we will see, the comparison leads us to conclude that we can use the Kamada-
Kawai map as a basis for visual exploration and barycenter calculation and comparison. This
map is implemented in Pajek and forms the basis for the map of science as introduced by
Leydesdorff and Rafols (2009) and also available as base map in Leydesdorff’s overlay
toolkit (http://www.leydesdorff.net/overlaytoolkit). Hence, the Kamada-Kawai map is used
for the overlay maps in the second part of this section.

10
4.1. Barycenter distances
All the coordinates of the barycenters are provided in the supplementary online material, part
1. The distances between groups and individual panel members are calculated for both case
studies using the three approaches described before (similarity matrix, VOS-map, Kamada-
Kawai map). Tables 2 and 3 provide the distances in the Kamada-Kawai maps, while the
distances in the similarity matrix and in the VOS-map are provided in the supplementary
online material, part 2.
Table 2: Barycenter distances between Chemistry groups, panel and panel members in the
Kamada-Kawai map
Group CHEM-
A CHEM-
B CHEM-
C CHEM-
D CHEM-
E CHEM-
F CHEM-
G CHEM-
H CHEM-
I CHEM-
J CHEM-
K CHEM-
L
Panel 0.113 0.151 0.118 0.186 0.106 0.274 0.347 0.114 0.173 0.061 0.265 0.357 0.141
PM 1 0.178 0.175 0.130 0.210 0.148 0.329 0.397 0.185 0.244 0.131 0.335 0.428 0.126
PM 2 0.189 0.305 0.299 0.330 0.136 0.082 0.158 0.137 0.111 0.172 0.194 0.226 0.337
PM 3 0.060 0.144 0.131 0.175 0.112 0.244 0.320 0.052 0.112 0.003 0.203 0.295 0.169
PM 4 0.115 0.229 0.225 0.255 0.110 0.156 0.232 0.063 0.059 0.099 0.164 0.231 0.265
PM 5 0.104 0.047 0.022 0.083 0.208 0.355 0.431 0.146 0.201 0.106 0.258 0.363 0.069
PM 6 0.208 0.289 0.261 0.323 0.040 0.171 0.229 0.170 0.196 0.156 0.302 0.361 0.282
PM 7 0.201 0.148 0.100 0.177 0.220 0.398 0.468 0.225 0.286 0.172 0.362 0.463 0.070
Shortest distances between a group and a panel member are underlined and printed in bold.
Comparing the results for the three approaches, we find that 6 out of 12 Chemistry groups are
most closely located to the same PM in the similarity matrix and VOS-map approach and 9
out of 12 groups are most closely located to the same PM in the VOS-map and Kamada-
Kawai map approach. Likewise, 5 out of 9 Physics groups are most closely located to the
same PM in the matrix and VOS-map approach and 8 out of 9 groups are most closely
located to the same PM in the VOS-map and Kamada-Kawai map approach.
Table 3: Barycenter distances between Physics groups, panel and panel members in the
Kamada-Kawai map
Groups
PHYS-
A
PHYS-
B
PHYS-
C
PHYS-
D
PHYS-
E
PHYS-
F
PHYS-
G
PHYS-
H
PHYS
-I
Panel 0.134 1.115 0.030 0.066 0.123 0.038 0.249 0.377 0.043 0.608
PM 1 0.206 1.151 0.106 0.195 0.013 0.123 0.195 0.471 0.105 0.643
PM 2 0.217 1.196 0.069 0.111 0.154 0.120 0.318 0.445 0.058 0.690
PM 3 0.131 1.047 0.137 0.187 0.090 0.105 0.112 0.389 0.147 0.539
PM 4 0.119 0.982 0.213 0.131 0.286 0.174 0.316 0.204 0.225 0.491
PM 5 0.157 1.136 0.033 0.065 0.135 0.063 0.273 0.391 0.037 0.630
PM 6 0.176 1.156 0.031 0.084 0.130 0.078 0.280 0.412 0.026 0.649
Shortest distances between a group and a panel member are underlined and printed in bold.
Spearman’s rank-order correlation coefficient was calculated between the barycenter
distances of the three approaches, considering the barycenter distances between groups and
individual panel members only. Although there are co-publications between groups, the
barycenter distances between panel and combined group and separate groups, and combined
11
groups and individual panel member can be (or at least are) considered independent, and have
been included in the correlation calculation.
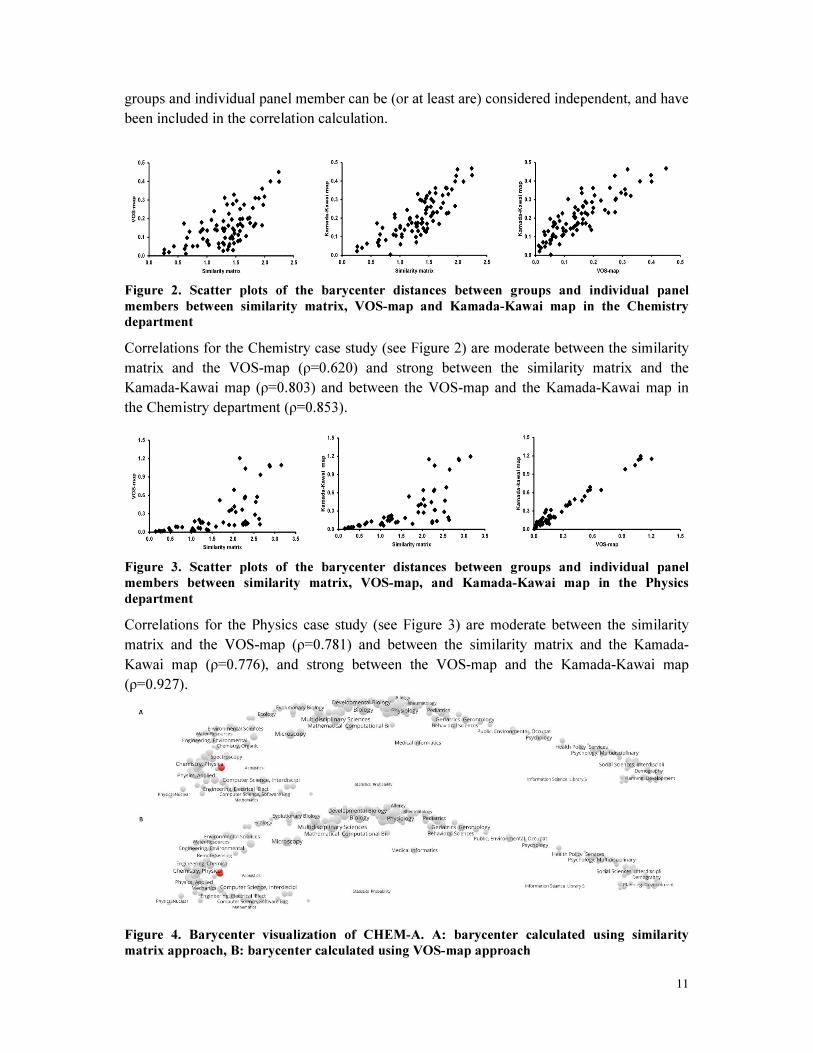
Figure 2. Scatter plots of the barycenter distances between groups and individual panel
members between similarity matrix, VOS-map and Kamada-Kawai map in the Chemistry
department
Correlations for the Chemistry case study (see Figure 2) are moderate between the similarity
matrix and the VOS-map (ρ=0.620) and strong between the similarity matrix and the
Kamada-Kawai map (ρ=0.803) and between the VOS-map and the Kamada-Kawai map in
the Chemistry department (ρ=0.853).
Figure 3. Scatter plots of the barycenter distances between groups and individual panel
members between similarity matrix, VOS-map, and Kamada-Kawai map in the Physics
department
Correlations for the Physics case study (see Figure 3) are moderate between the similarity
matrix and the VOS-map (ρ=0.781) and between the similarity matrix and the Kamada-
Kawai map (ρ=0.776), and strong between the VOS-map and the Kamada-Kawai map
(ρ=0.927).
Figure 4. Barycenter visualization of CHEM-A. A: barycenter calculated using similarity
matrix approach, B: barycenter calculated using VOS-map approach

12
As explained in the Methods section, the most fundamental distinction is the question
whether one determines a barycenter in N dimensions (starting from the similarity matrix) or
in two dimensions (starting from a map). Figure 4 provides a visual comparison, using the
barycenter of CHEM-A as an example. The similarity matrix map was obtained from the
expanded (� + 1) × (� + 1) matrix (see above for details). While not exactly identical, the
two locations are very close nonetheless. The supplementary online material, part 3, provides
a total of 114 maps that allow for visual comparison of the similarity matrix map, the VOS
map and the Kamada-Kawai map for each of the units (panel, panel members, groups)
included in the case studies in this paper.
The above findings show that barycenters and the Euclidean distance between barycenters
can be calculated both in two and more dimensions, and the results are quite similar.
Especially the barycenter distances between the VOS-map and the Kamada-Kawai map are
strongly correlated. Since the Kamada-Kawai map is readily available for creating overlay
maps, in the remainder of this paper, calculations of barycenters, Euclidean distances,
comparisons, and visual explorations are based on the Kamada-Kawai maps.
4.2 Case studies of University of Antwerp research assessments
4.2.1. Chemistry assessment
4.2.1.1 Panel profile versus Group profile
Together, the Chemistry panel and groups have published in 108 WoS subject categories;
when considered separately, panel publications appear in 66 categories, and group
publications in 94 categories. Furthermore, the Chemistry panel and groups have 51 WoS
subject categories in common and 14 categories have panel publications only, but no group
publications, while 43 WoS subject categories contain group publications but no panel
publications.
Table 4: Top ten WoS subject categories for the Chemistry panels and the groups
Panel publications Group publications
Web of Science Categories Records % of 2150 Web of Science Categories Records % of 920
Chemistry inorganic & nuclear 798 37.11 Chemistry physical 198 21.52
Chemistry organic 458 21.30 Chemistry analytical 194 21.08
Chemistry analytical 350 16.27 Spectroscopy 164 17.82
Chemistry multidisciplinary 324 15.0 Physics atomic molecular & chemical 100 10.87
Chemistry physical 177 8.23 Physics applied 77 8.37
Physics atomic molecular & chemical 115 5.34 Materials science multidisciplinary 75 8.15
Environmental sciences 93 4.32 Environmental sciences 59 6.41
Spectroscopy 63 2.93 Biochemical research methods 43 4.67
Biochemical research methods 57 2.65 Physics condensed matter 43 4.67
Engineering chemical 41 1.90 Chemistry multidisciplinary 39 4.23

13
Table 4 shows seven common categories in the top ten of WoS subject categories between
the Chemistry panel and groups. More than half of the Chemisty panel publications belong to
the Chemistry inorganic nuclear (37.11%) and Chemistry organic (21.30%) categories,
whereas surprisingly, these two categories do not appear in the top ten of WoS subject
categories for publications by the research groups.
Figure 5. Scatter plot of the number of publications (log-log scale) per WoS subject category for
the members of the Chemistry panel (horizontal axis) and all scientists of the Chemistry
department (vertical axis), excluding those for which at least one of the two has no publications
(51 common subject categories)
A scatter plot of the number of publications per common WoS subject category (n=51) for
the members of the Chemistry panel and all scientists of the Chemistry department is shown
in Figure 5. For the 108 WoS subject categories in which the Chemistry panel and/or the
department have publications (51 common categories, plus 57 categories in which either the
department or the panel has publications) the Spearman rank correlation coefficient is
positive but low (ρ=0.36).
Figure 6. Chemistry panel members’ publication overlay map

14
Figure 7. Chemistry groups’ publication overlay map
The overlay maps for the Chemistry panel (Figure 6) and the combined groups (Figure 7)
clearly show that the publication scope of the combined chemistry groups is wider than that
of the panel. The panel publications are strongly (74.67%) represented in the WoS subject
categories of Chemistry inorganic & nuclear, Chemistry organic, and Chemistry analytical,
whereas the research group publications are predominantly clustered (60.43%) in Chemistry
physical, Chemistry analytical, and Spectroscopy.
4.2.1.2 Panel profile versus Individual group profile
Overlay maps of the publications of the individual groups were created, and subsequently
compared with the panel overlay map (see Figure 6).
Figure 8. Overlay map of CHEM-A research group’s publications

15
We present the data for CHEM-A as an example. Figure 8 shows the corresponding overlay
map. The majority of the publications of the CHEM-A group fall in Chemistry physical
(48.06%) and Physics atomic molecular & chemical (34.88%) WoS subject categories. We
have found that the research output of six (CHEM-A, CHEM-B, CHEM-D, CHEM-G,
CHEM-I, and CHEM-L) of the twelve research groups, are thematically well covered by the
panel’s expertise, i.e., the majority of the panel’s publications can be classified in WoS
subject categories, where also the majority of the corresponding group publications is found.
Figure 9. Overlay map of CHEM-H research group’s publications
Furthermore, the majority of the CHEM-C group publications falls in Physics applied
(35.25%) and Spectroscopy (23.71%); CHEM-H group: Spectroscopy (40.32%) and
Chemistry analytical (27.41%; Figure 9) WoS subject categories. These two research groups
have a large number of publications in WoS subject categories where the publications output
of the panel tends to be limited. Therefore, the research output of these two research groups
only partially covered by the panel’s expertise.
Figure 10. Overlay map of CHEM-E research group’s publications
16
Likewise, the majority of the publications of CHEM-E group (Figure 10) fall in Chemistry
Analytical (38.57%) and Spectroscopy (34.28%); CHEM-F group: Chemistry analytical
(66.66%) and Biochemical research methods (23.81%); CHEM-J group: Chemistry
analytical (48.14%) and Instruments Instrumentation (33.33%); CHEM-K group: Microscopy
(81.48%) and Computer science artificial intelligence (70.37%) WoS subject categories.
Therefore, these four research groups hardly have any overlap in terms of the share of their
publications in WoS categories where the evaluation panel has publications.
In summary, of the twelve Chemistry groups, six groups are well covered, two groups are
partially covered, and the remaining four groups seem poorly covered by the Chemistry
panel’s expertise as far as publication output is described via WoS subject categories.
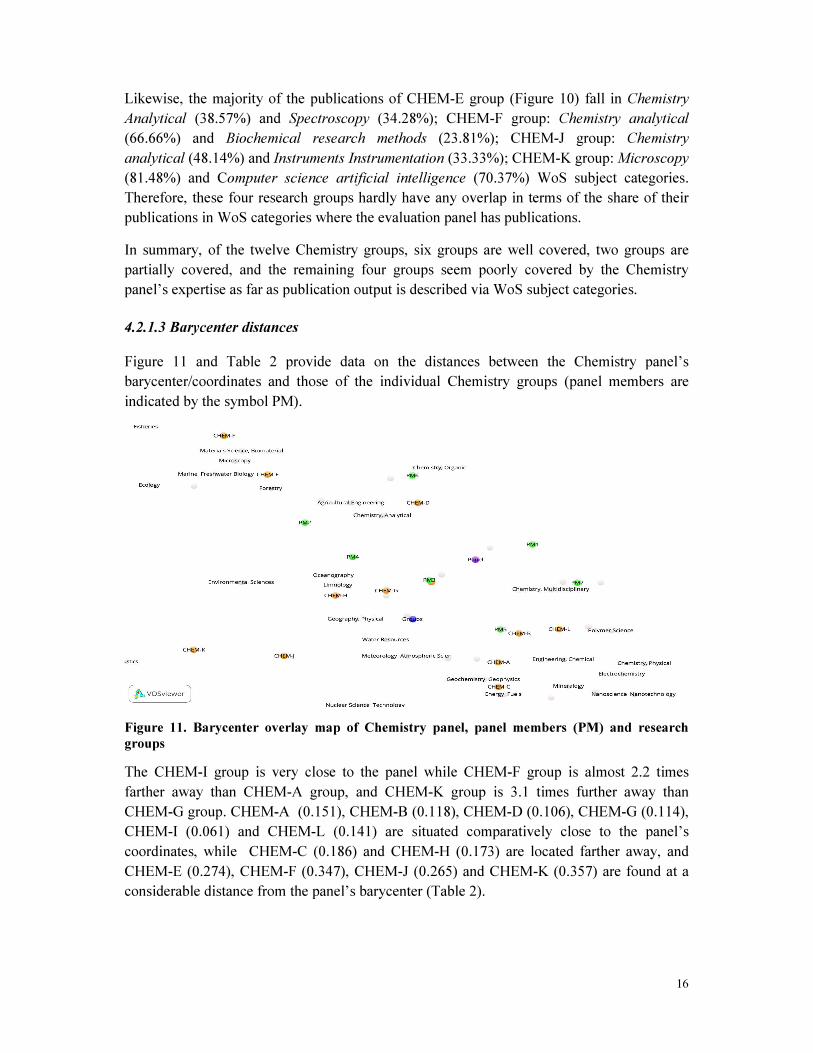
4.2.1.3 Barycenter distances
Figure 11 and Table 2 provide data on the distances between the Chemistry panel’s
barycenter/coordinates and those of the individual Chemistry groups (panel members are
indicated by the symbol PM).
Figure 11. Barycenter overlay map of Chemistry panel, panel members (PM) and research
groups
The CHEM-I group is very close to the panel while CHEM-F group is almost 2.2 times
farther away than CHEM-A group, and CHEM-K group is 3.1 times further away than
CHEM-G group. CHEM-A (0.151), CHEM-B (0.118), CHEM-D (0.106), CHEM-G (0.114),
CHEM-I (0.061) and CHEM-L (0.141) are situated comparatively close to the panel’s
coordinates, while CHEM-C (0.186) and CHEM-H (0.173) are located farther away, and
CHEM-E (0.274), CHEM-F (0.347), CHEM-J (0.265) and CHEM-K (0.357) are found at a
considerable distance from the panel’s barycenter (Table 2).

17
A further comparison of the distances between the Chemistry groups and individual
Chemistry panel members as presented in Table 2 reveals that the partially covered CHEM-C
and CHEM-H groups, while located moderately far away from the panel, are relatively close
to PM5 (0.083) and PM4 (0.059), respectively. Similarly, the less covered groups CHEM-E
and CHEM-F are found relatively close to PM2, CHEM-J close to PM4, and CHEM-K
situated at a remote distance from the panel’s coordinates. In Table 2, the shortest distance
between the Chemistry groups and a panel member is printed in bold and underlined. The
average of these distances is 0.084 and can be used as a measure of the fit between the
expertise of the Chemistry panel and the research interests of the Chemistry research groups.
4.2.2. Physics assessment
4.2.2.1 Panel profile versus Group profile
Physics panel and group publications are found in 112 WoS subject categories, with Physics
panel publications appearing in 46 categories, and group publications in 108 categories.
Furthermore, 42 WoS subject categories were common, 4 categories contained panel
publications, but no group publications, and 66 categories have group publications but no
panel publications.
Table 5: Top ten WoS subject categories for the Physics panels and the groups
Panel publications Group publications
Web of Science Categories Records % of 1104 Web of Science Categories Records % of 1732
Physics condensed matter 410 37.13 Physics condensed matter 515 29.73
Physics multidisciplinary 188 17.02 Physics applied 252 14.55
Chemistry physical 182 16.48 Physics multidisciplinary 231 13.33
Physics applied 159 14.40 Materials science multidisciplinary 226 13.04
Optics 124 11.23 Chemistry physical 193 11.14
Physics atomic molecular chemical 113 10.23 Physics particles fields 154 8.89
Materials science multidisciplinary 99 8.96 Nanoscience nanotechnology 111 6.40
Physics particles fields 65 5.88 Microscopy 72 4.15
Instruments instrumentation 50 4.52 Physics atomic molecular & chemical 66 3.81
Spectroscopy 38 3.44 Otorhinolaryngology 65 3.75
Table 5 shows seven common categories in the top ten of WoS subject categories between
the Physics panel and groups. The majority of the publications by the Physics panel and the
groups are found in Physics condensed matter (panel: 37.13%; groups: 29.73%), followed by
Physics multidisciplinary (panel: 17.02%; groups: 13.33%), Chemistry physical (panel:
16.48%; groups: 11.14%) and Physics applied (panel: 14.40%; groups 14.55%). The top ten
lists of the Physics panel and of the Physics groups have seven WoS subject categories in
common.

18
Figure 12. Scatter plot of the number of publications (log-log scale) per WoS subject category
for the members of the Physics panel (horizontal axis) and all scientists of the Physics
department (vertical axis), excluding those for which at least one of the two has no publications
(42 common subject categories)
A scatter plot of the number of publications per common WoS subject category (n = 42) for
the members of the Physics panel and all scientists of the Physics department is shown in
Figure 12. For the 112 WoS subject categories in which the Physics panel and/or the
department have publications (42 common categories, plus, 70 categories in which either the
department or the panel has publications) the Spearman rank correlation coefficient is
positive but low (ρ=0.524).
Figure 13. Physics groups’ publication overlay map

19
Figure 14. Physics panel members’ publication overlay map
The overlay maps for physics similarly revealed a wider publication scope for the combined
research groups (Figure 14) compared to the Physics panel (Figure 13). The panel’s
publications are strong (68.75%) in Physics condensed matter, Physics multidisciplinary,
Chemistry physical, and Physics applied, whereas the groups’ publications tend to be mainly
clustered (57.62%) in Physics condensed matter, Physics multidisciplinary, Physics applied,
and Materials science multidisciplinary.
4.2.2.2 Panel profile versus Individual group profile
Overlay maps of the publications of the individual groups were created, and subsequently
compared with the panel overlay maps (Figure 14).
Figure 15. Overlay map of PHYS-B group’s publications

20
PHYS-B group: Physics condensed matter (59.67%) and Physics applied (19.34% Figure
15); PHYS-C: Materials science multidisciplinary (35.61%) and Chemistry physical (29.9%);
PHYS- D: Physics particles fields (56.87%) and Physics multidisciplinary (40.89%); PHYS-
E: Physics multidisciplinary (25.15%), Physics particles fields (24.52%), and Physics
condensed matter (20.75%); PHYS-H: Physics condensed matter (61.06%) and Physics
applied (19.08%).
These data show that five of the nine Physics groups (PHYS-B, PHYS-C, PHYS-E, PHYS-F,
and PHYS-H) are thematically well covered by the panels’ expertise as the majority of the
groups publications are found in WoS subject categories where the majority of the panels’
publications have been classified.
Figure 16. Overlay map of PHYS-G research group’s publications
PHYS-F: Physics multidisciplinary (59.52%) and Physics mathematical (42.85%); PHYS-G:
Physics atomic molecular chemical (34.88%) and Chemistry physical (32.55%; Figure 16).
Two physics groups (PHYS-F and PHYS-G) have a large number of publications in WoS
subject categories where the publication output of their respective panels tends to be limited.
The research output of these four groups is therefore only partially covered by the respective
panels’ expertise.
21
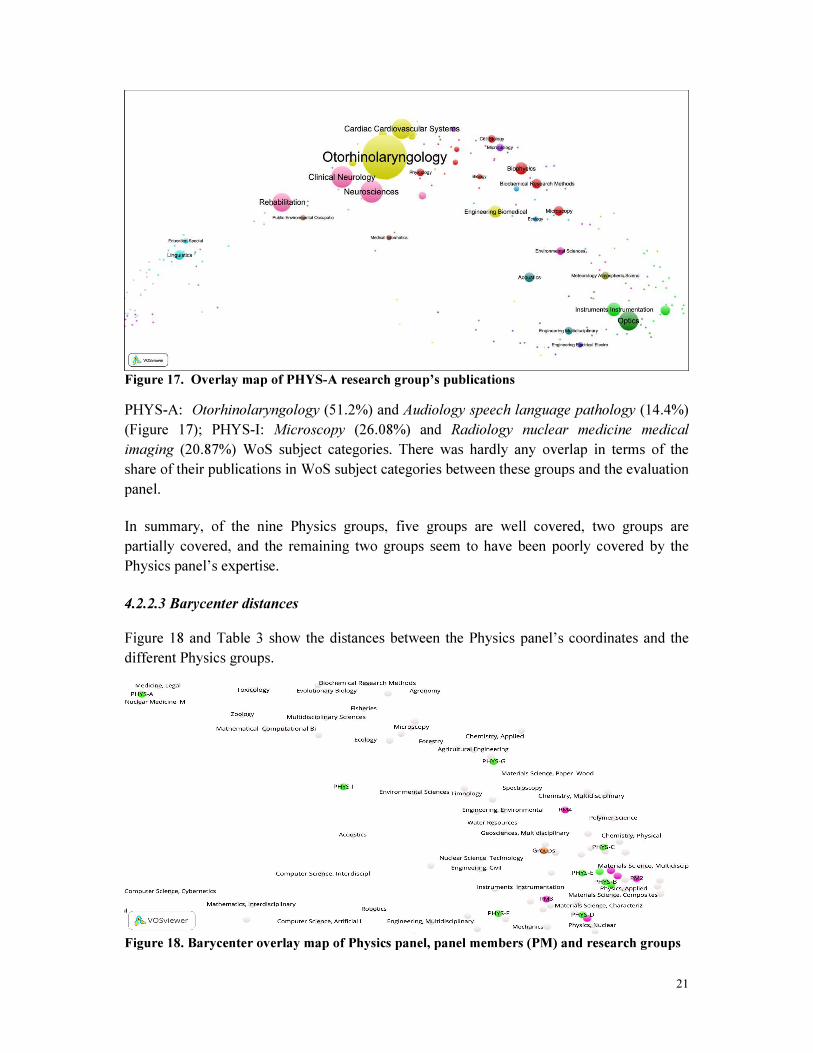
Figure 17. Overlay map of PHYS-A research group’s publications
PHYS-A: Otorhinolaryngology (51.2%) and Audiology speech language pathology (14.4%)
(Figure 17); PHYS-I: Microscopy (26.08%) and Radiology nuclear medicine medical
imaging (20.87%) WoS subject categories. There was hardly any overlap in terms of the
share of their publications in WoS subject categories between these groups and the evaluation
panel.
In summary, of the nine Physics groups, five groups are well covered, two groups are
partially covered, and the remaining two groups seem to have been poorly covered by the
Physics panel’s expertise.
4.2.2.3 Barycenter distances
Figure 18 and Table 3 show the distances between the Physics panel’s coordinates and the
different Physics groups.
Figure 18. Barycenter overlay map of Physics panel, panel members (PM) and research groups
22
The Physics panel is very near to the PHYS-B group, while the PHYS-F group is 12.5 times
and PHYS-I is 20.2 times further away from the panel than PHYS-B. PHYS-B group (0.030),
PHYS-C (0.066), PHYS-E (0.038), and PHYS-H (0.043) are found closest to the panel’s
coordinates, while PHYS-D (0.123), PHYS-F (0.249) and PHYS-G (0.377) are still
moderately close. It should be noted that PHYS-D emerged as well covered and PHYS-F and
PHYS-G as partially covered by the panel’s expertise from the comparative individual group
vs. panel profile. Furthermore, although PHYS-D is situated moderately far away from the
panel’s coordinates, PM1 is located in the immediate (0.013) neighborhood of PHYS-D, with
the majority of the publications of PHYS-D D and PM1 belonging to the same subject
categories.
Similar observations can be made for the other moderately close groups, PHYS-G and
PHYS-F, which also have individual panel members in their immediate neighborhood, i.e.,
PM4 (0.204) and PM3 (0.112), respectively, and also have the majority of their publications
in the same WoS subject categories as these two panel members. Further, PHYS-A (1.115),
and PHYS-I (0.608) are located at a considerable distance from the panel’s coordinates, have
no individual panel members in their neighborhoods, and are poorly covered by the panel’s
expertise. Table 3 shows that the distances between PHYS-A and PM3 (1.047) and PM4
(0.982), and between PHYS-I and PM3 (0.539) and PM4 (0.491) are smaller compared to
other panel members. However, the expertise of PM3 and PM4 is even less aligned with the
publication output of PHYS-A and PHYS-I. The average of the shortest distances of the
barycenters of the Physics panel members to the barycenters of the Physics research group is
0.221.
5. Conclusion
We have explored not only overlap of expertise between research groups and an expert panel
but also applied the barycenter method to calculate the distances between groups and panel
(members). The barycenter method is well compatible with the WoS subject category-based
overlay mapping, since it offers a simple way of representing the location of the panel and
groups in a global science map based on WoS subject categories. Our results indicate that
barycenters – and Euclidean distances between barycenters – can be calculated both in two
and more dimensions and the results are very similar. Each map of science “contains a
projection from a specific perspective” (Leydesdorff & Rafols, 2009). Therefore, different
layout techniques may produce different outputs. An exploration of two different layout
techniques from the similarity matrix exposes that the Kamada-Kawai map is strongly
correlated with the VOS-map.
Overlay maps constitute an interesting tool to visualize the position of panel and group
publications in a fixed map based on WoS subject categories. The results reveal a number of
discrepancies in WoS subject categories between panel and group publications in both the
Chemistry and Physics departments. This could be expected, since panel members are
selected primarily because of their expertise and not necessarily because of the match thereof
with the research in the groups. Overall, group publications are found in a wider range of SCs
than panel publications, which might be due to the interdisciplinary orientation of some of the
23
groups. The Spearman’s rank correlation coefficients point to a positive but low overlap of
expertise between the Chemistry panel and groups, and to a moderate correlation between the
Physics panel and groups. The barycenter analysis showed that six Chemistry groups and five
Physics groups are well covered by the respective panels’ expertise and are located close to
the panel’s coordinates while the remaining groups are not, although this gap is sometimes
filled by the expertise of individual panel members. Furthermore, in some cases, neither the
individual panel members nor the panels (as a whole) are situated close to the groups, in
which case the panel seems to possess only partial expertise to evaluate these research
groups. These barycenter findings are hence well in line with the results of the comparative
analysis of individual group versus panel profile. Overall, the Chemistry panel, with an
average barycenter distance of the nearest panel member to the research groups of 0.084
seemed to be better aligned with the research interest of the units under assessment studied in
this paper. Note that the conclusion from Spearman’s rank correlation is the opposite. This
confirms the necessity of a method that moves beyond correlation coefficients, since they do
not capture relatedness between SCs. The application of the barycenter method in the
similarity matrix, VOS-map and Kamada-Kawai allows to identify the Euclidean distances
between the panel, combined research groups, individual panel members and individual
research groups. It also allows calculation of average distances, comparison of distance and
visual exploration of the barycenters on the map. Thus, the barycenter method provides
information about the relevance of the expertise of an individual panel member to the
assessment of both individual and combined research groups in a coherent way.
A similar, though less pronounced difference emerges from the comparison of the distance
between the combined Chemistry groups and the Chemistry panel (0.113, see Table 2), and
that between the combined Physics groups and the panel (0.134, see Table 3). These findings
clearly demonstrate that in both cases, the majority of the panel publications appears in the
categories in which group publications are found, while the groups have publications in a
substantial number of WoS subject categories that have no panel publications. There is a
visible discrepancy between panel and group publications as far as WoS subject categories
are concerned. Overall, group publications are found in a wider range of subject categories
than panel publications, which might be due to the interdisciplinary orientation of some of the
groups.
In this investigation, we used distances between barycenters as a determinant for the
correspondence between the publications by the group of panel members and the publications
of a research group. Within this framework a distance of zero would mean a perfect
correspondence. As pointed out by a reviewer one could envision other frameworks. One
such framework would measure the correspondence between these two sets of publications
by the similarity-weighted cosine measure as introduced in (Zhou et al., 2012). In this
framework perfect correspondence would be obtained when the similarity is one. We believe
that this too is a valid approach in particular because the barycenter and the weighted-
similarity approach, as illustrated in (Zhou et al., 2012), use the same input. Further
investigations will have to show which of these two leads in practice to the best results.

24
A limitation of this paper arises from the question whether it is really relevant to have panel
and groups publishing in the same subject categories, since one category may comprise a
wide array of different subfields and topics. At present, this question cannot be answered with
the methods outlined in this article, but instead would require a journal level analysis, as
journals cover more closely related subfields and topics. A subsequent analysis will hence
focus on fractional counting in WoS subject categories (Bornmann, 2014), and overlay maps
at the journal level (Leydesdorff, Rafols, & Chen, 2013), with special attention to the
quantification of similarity between groups and panel at this level for different disciplines. In
addition, we will investigate how panel composition could be improved in terms of cohesion
and expertise of panel members (Langfeldt, 2004). This comprehensive approach should
allow us to define which overlap leads to the best standards for evaluation and hence permit
us to propose the most appropriate expert panel composition for a collection of units of
assessment. More generally, the matching of research expertise in several contexts might
benefit from a comprehensive bibliometric approach.
Acknowledgments
This investigation has been made possible by the financial support of the Flemish
Government to ECOOM, among others. The opinions in the paper are the authors’ and not
necessarily those of the government. The authors thank Nele Dexters, Ella Roelant and
Danny Vindevogel for their assistance. We are also grateful to the editor of the Journal of
Informetrics and to two anonymous reviewers for their comments, which helped to improve
the paper.
References Borg, I., & Groenen, P. J. F. (2005). Modern Multidimensional Scaling. New York, NY: Springer
New York. Retrieved from http://link.springer.com/10.1007/0-387-28981-X
Bornmann, L. (2014). Assigning publications to multiple subject categories for bibliometric analysis:
An empirical case study based on percentiles. Journal of Documentation, 70(1), 52–61.
Butler, L., & McAllister, I. (2011). Evaluating University research performance using metrics.
European Political Science, 10(1), 44–58. http://doi.org/doi:10.1057/eps.2010.13
De Nooy, W., Mrvar, A., & Batagelj, V. (2012). Exploratory Social Network Analysis with Pajek (2nd
edition). England ; New York: Cambridge University Press.
Egghe, L., & Rousseau, R. (1990). Introduction to Informetrics. Elsevier Science Publishers.
Retrieved from https://uhdspace.uhasselt.be/dspace/handle/1942/587
Engels, T. C. E., Goos, P., Dexters, N., & Spruyt, E. H. J. (2013). Group size, h-index, and efficiency
in publishing in top journals explain expert panel assessments of research group quality and
productivity. Research Evaluation, 22(4), 224–236. http://doi.org/doi: 10.1093/reseval/rvt013

25
Jin, B., & Rousseau, R. (2001). An introduction to the barycentre method with an application to
China’s mean centre of publication. Libri, 51(4), 225–233. http://doi.org/doi:
10.1515/LIBR.2001.225
Kamada, T., & Kawai, S. (1989). An algorithm for drawing general undirected graphs. Information
Processing Letters, 31(1), 7–15. http://doi.org/10.1016/0020-0190(89)90102-6
Langfeldt, L. (2004). Expert panels evaluating research: decision-making and sources of bias.
Research Evaluation, 13(1), 51–62. http://doi.org/doi: 10.3152/147154404781776536
Lawrenz, F., Thao, M., & Johnson, K. (2012). Expert panel reviews of research centers: The site visit
process. Evaluation and Program Planning, 35(3), 390–397.
http://doi.org/doi:10.1016/j.evalprogplan.2012.01.003
Leydesdorff, L., & Bornmann, L. (2015). The operationalization of “fields” as WoS subject categories
(WCs) in evaluative bibliometrics: The cases of “library and information science” and
“science & technology studies.” Journal of the Association for Information Science and
Technology. http://doi.org/10.1002/asi.23408
Leydesdorff, L., Carley, S., & Rafols, I. (2013). Global maps of science based on the new Web-of-
Science categories. Scientometrics, 94(2), 589–593. http://doi.org/10.1007/s11192-012-0784-8
Leydesdorff, L., & Rafols, I. (2009). A global map of science based on the ISI subject categories.
Journal of the American Society for Information Science and Technology, 60(2), 348–362.
http://doi.org/10.1002/asi.20967
Leydesdorff, L., Rafols, I., & Chen, C. (2013). Interactive overlays of journals and the measurement
of interdisciplinarity on the basis of aggregated journal–journal citations. Journal of the
American Society for Information Science and Technology, 64(12), 2573–2586.
http://doi.org/doi:10.1002/asi.22946
Li, D. , & Agha, L. (2015). Big names or big ideas: Do peer-review panels select the best science
proposals? Science, 348(6233), 434-438. DOI: 10.1126/science.aaa0185
Nedeva, M., Georghiou, L., Loveridge, D., & Cameron, H. (1996). The use of co-nomination to
identify expert participants for Technology Foresight. R&D Management, 26(2), 155–168.
http://doi.org/10.1111/j.1467-9310.1996.tb00939.x
Rafols, I., Porter, A. L., & Leydesdorff, L. (2010). Science Overlay Maps: A New Tool for Research
Policy and Library Management. Journal of the American Society for Information Science
and Technology, 61(9), 1871–1887. http://doi.org/10.1002/asi.21368
Rahman, A. I. M. J., Guns, R., Rousseau, R., & Engels, T. C. E. (2014). Assessment of expertise
overlap between an expert panel and research groups. In Ed Noyons (Ed.), Context Counts:
Pathways to Master Big and Little Data. Proceedings of the Science and Technology
Indicators Conference 2014 Leiden (pp. 295–301). Leiden: Universiteit Leiden.
26
Rehn, C., Kronman, U., Gornitzki, C., Larsson, A., & Wadskog, D. (2014). Bibliometric handbook for
Karolinska Institutet. Stockholm, Sweden: Karolinska Institute.
Rons, N., De Bruyn, A., & Cornelis, J. (2008). Research evaluation per discipline: A peer-review
method and its outcomes. Research Evaluation, 17(1), 45–57.
http://doi.org/10.3152/095820208X240208
Rousseau, R. (1989). Kinematic of statistics of scientific output. Part I: Geographical approach. Revue
Française de Bibliométrie, 4, 50–64.
Rousseau, R. (2008). Triad or Tetrad: another representation. ISSI Newsletter, 4(1), 5–7.
Van Eck, N. J., & Waltman, L. (2007). VOS: A new method for visualizing similarities between
objects. In R. Decker & H.-J. Lenz (Eds.), Advances in Data Analysis (pp. 299–306). Springer
Berlin Heidelberg. Retrieved from http://link.springer.com/chapter/10.1007/978-3-540-
70981-7_34
Van Eck, N. J., Waltman, L., Dekker, R., & van den Berg, J. (2010). A comparison of two techniques
for bibliometric mapping: Multidimensional scaling and VOS. Journal of the American
Society for Information Science and Technology, 61(12), 2405–2416.
http://doi.org/10.1002/asi.21421
Van Leeuwen, T. N., & Calero-Medina, C. (2012). Redefining the field of economics: Improving field
normalization for the application of bibliometric techniques in the field of economics.
Research Evaluation, 21(1), 61–70.
Verleysen, F. T., & Engels, T. C. E. (2013). Measuring internationalisation of book publishing in the
Social Sciences and Humanities using the barycentre method. In 14th Iinternational society
for scientometrics and infometrics conference (15th–19th of July 2013, Vienna, Austria) (pp.
1170–1175).
Verleysen, F. T., & Engels, T. C. E. (2014). Barycenter representation of book publishing
internationalization in the Social Sciences and Humanities. Journal of Informetrics, 8(1),
234–240. http://doi.org/10.1016/j.joi.2013.11.008
VSNU. (2003). Standard Evaluation Protocol 2003-2009 for Public Research Organisations.
Utrecht/den Haag/Amsterdam: VSNU, NWO and KNAW.
VSNU. (2009). Standard evaluation Protocol 2009-2015: protocol for research assessment in The
Netherlands. Utrecht/den Haag/Amsterdam: VSNU, NWO and KNAW.
Zhou, Q., Rousseau, R., Yang, L., Yue, T., & Yang, G. (2012). A general framework for describing
diversity within systems and similarity between systems with applications in informetrics.
Scientometrics, 93(3), 787–812. http://doi.org/10.1007/s11192-012-0767-9

1
Supplementary Online materials, Part 2:
Barycenter distances in Similarity matrix and VOS-map
SOM Table1: Barycenter distances between Chemistry groups, panel and panel members based on the
similarity matrix
Group CHEM-
A
CHEM-
B
CHEM-
C
CHEM-
D
CHEM-
E
CHEM-
F
CHEM-
G
CHEM-
H
CHEM-
I
CHEM-
J
CHEM-
K
CHEM-
L
Panel 0.708 0.984 0.96 1.169 0.48 1.413 1.735 1.029 0.935 0.818 1.177 1.602 1.224
PM 1 1.224 1.202 1.209 1.535 0.699 1.836 2.097 1.573 1.448 1.314 1.615 1.972 1.452
PM 2 0.83 1.447 1.347 1.306 0.93 0.755 1.005 1.079 0.887 0.604 1.167 1.446 1.512
PM 3 0.818 1.476 1.43 1.308 1.033 1.124 1.466 0.636 0.656 0.836 0.912 1.378 1.678
PM 4 1.179 1.839 1.806 1.707 1.359 1.285 1.641 0.43 1.009 1.276 1.14 1.571 1.952
PM 5 0.712 0.265 0.259 0.638 1.295 1.896 2.246 1.403 1.174 0.931 1.471 1.793 0.615
PM 6 1.276 1.577 1.532 1.737 0.346 1.37 1.573 1.467 1.379 1.296 1.541 1.809 1.746
PM 7 1.157 1.004 1.034 1.391 0.909 1.953 2.239 1.57 1.429 1.273 1.613 1.994 1.283
Shortest distances between a group and a panel member are underlined and printed in bold.
SOM Table 2: Barycenter distances between Chemistry groups, panel and panel members in the VOS-map Group CHEM-
A
CHEM-
B
CHEM-
C
CHEM-
D
CHEM-
E
CHEM-
F
CHEM-
G
CHEM-
H
CHEM-
I
CHEM-
J
CHEM-
K
CHEM-
L
Panel 0.050 0.087 0.072 0.113 0.081 0.262 0.352 0.037 0.102 0.052 0.128 0.232 0.077
PM 1 0.086 0.066 0.044 0.079 0.130 0.311 0.401 0.083 0.147 0.097 0.160 0.274 0.030
PM 2 0.193 0.278 0.276 0.312 0.143 0.051 0.136 0.193 0.129 0.174 0.164 0.093 0.296
PM 3 0.066 0.121 0.105 0.146 0.061 0.240 0.329 0.011 0.097 0.053 0.138 0.226 0.106
PM 4 0.096 0.172 0.159 0.200 0.033 0.187 0.275 0.051 0.083 0.070 0.142 0.197 0.164
PM 5 0.072 0.033 0.014 0.055 0.133 0.309 0.399 0.095 0.137 0.092 0.137 0.257 0.037
PM 6 0.087 0.172 0.164 0.204 0.019 0.162 0.252 0.068 0.051 0.061 0.113 0.159 0.176
PM 7 0.131 0.075 0.058 0.063 0.180 0.361 0.451 0.134 0.195 0.147 0.199 0.318 0.026
Shortest distances between a group and a panel member are underlined and printed in bold.
2
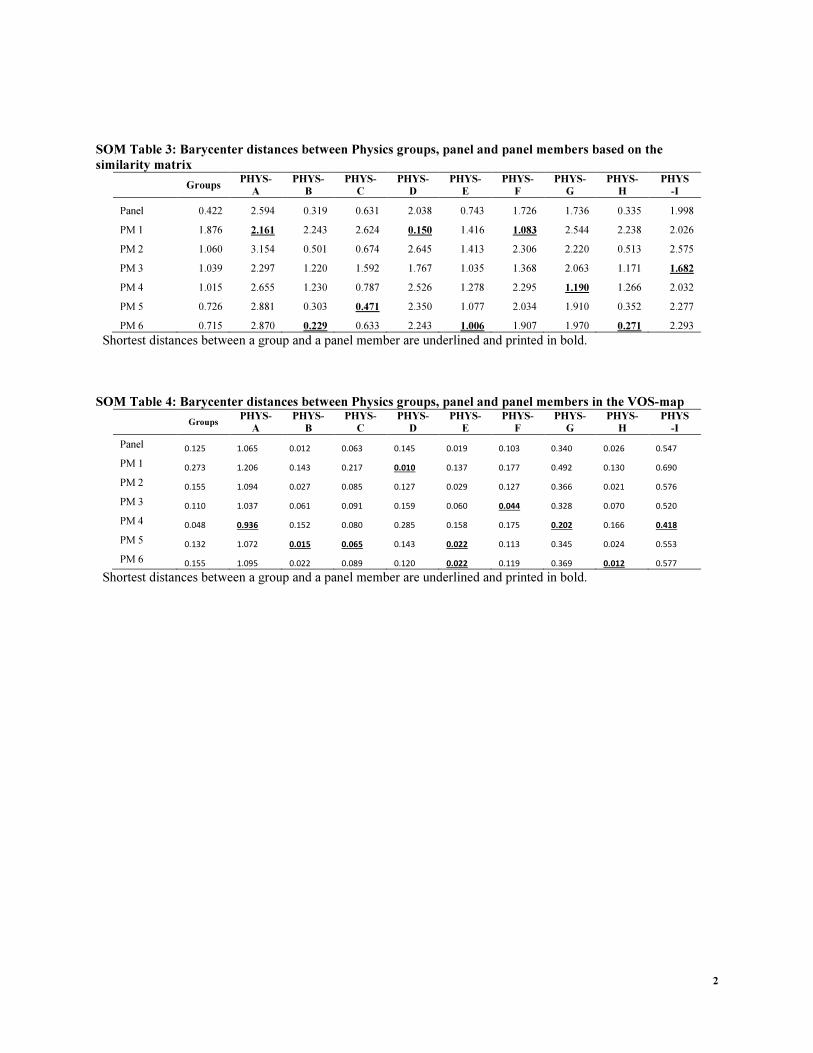
SOM Table 3: Barycenter distances between Physics groups, panel and panel members based on the
similarity matrix
Groups
PHYS-
A
PHYS-
B
PHYS-
C
PHYS-
D
PHYS-
E
PHYS-
F
PHYS-
G
PHYS-
H
PHYS
-I
Panel 0.422 2.594 0.319 0.631 2.038 0.743 1.726 1.736 0.335 1.998
PM 1 1.876 2.161 2.243 2.624 0.150 1.416 1.083 2.544 2.238 2.026
PM 2 1.060 3.154 0.501 0.674 2.645 1.413 2.306 2.220 0.513 2.575
PM 3 1.039 2.297 1.220 1.592 1.767 1.035 1.368 2.063 1.171 1.682
PM 4 1.015 2.655 1.230 0.787 2.526 1.278 2.295 1.190 1.266 2.032
PM 5 0.726 2.881 0.303 0.471 2.350 1.077 2.034 1.910 0.352 2.277
PM 6 0.715 2.870 0.229 0.633 2.243 1.006 1.907 1.970 0.271 2.293
Shortest distances between a group and a panel member are underlined and printed in bold.
SOM Table 4: Barycenter distances between Physics groups, panel and panel members in the VOS-map
Groups
PHYS-
A
PHYS-
B
PHYS-
C
PHYS-
D
PHYS-
E
PHYS-
F
PHYS-
G
PHYS-
H
PHYS
-I
Panel 0.125 1.065 0.012 0.063 0.145 0.019 0.103 0.340 0.026 0.547
PM 1 0.273 1.206 0.143 0.217 0.010 0.137 0.177 0.492 0.130 0.690
PM 2 0.155 1.094 0.027 0.085 0.127 0.029 0.127 0.366 0.021 0.576
PM 3 0.110 1.037 0.061 0.091 0.159 0.060 0.044 0.328 0.070 0.520
PM 4 0.048 0.936 0.152 0.080 0.285 0.158 0.175 0.202 0.166 0.418
PM 5 0.132 1.072 0.015 0.065 0.143 0.022 0.113 0.345 0.024 0.553
PM 6 0.155 1.095 0.022 0.089 0.120 0.022 0.119 0.369 0.012 0.577
Shortest distances between a group and a panel member are underlined and printed in bold.

1
Supplementary Online Materials, Part 3
Overlay maps of Chemistry and Physics research groups and Panel members barycenter
Overlay maps of Chemistry research groups and Panel members barycenter
a) In Similarity Matrix
SOM Figure 3.1.1: Barycenter of CHEM-A research group publications in Similarity matrix
SOM Figure 3.1.2: Barycenter of CHEM-B research group publications in Similarity matrix
2
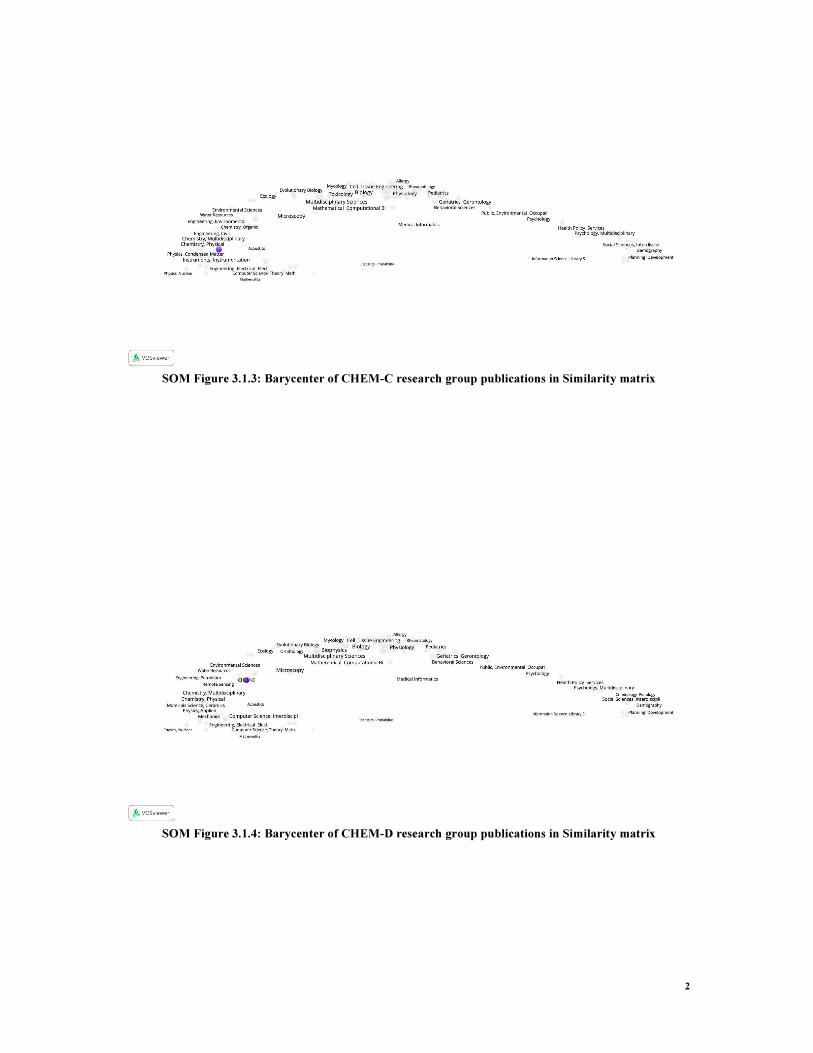
SOM Figure 3.1.3: Barycenter of CHEM-C research group publications in Similarity matrix
SOM Figure 3.1.4: Barycenter of CHEM-D research group publications in Similarity matrix

3
SOM Figure 3.1.5: Barycenter of CHEM-E research group publications in Similarity matrix
SOM Figure 3.1.6: Barycenter of CHEM-F research group publications in Similarity matrix
4
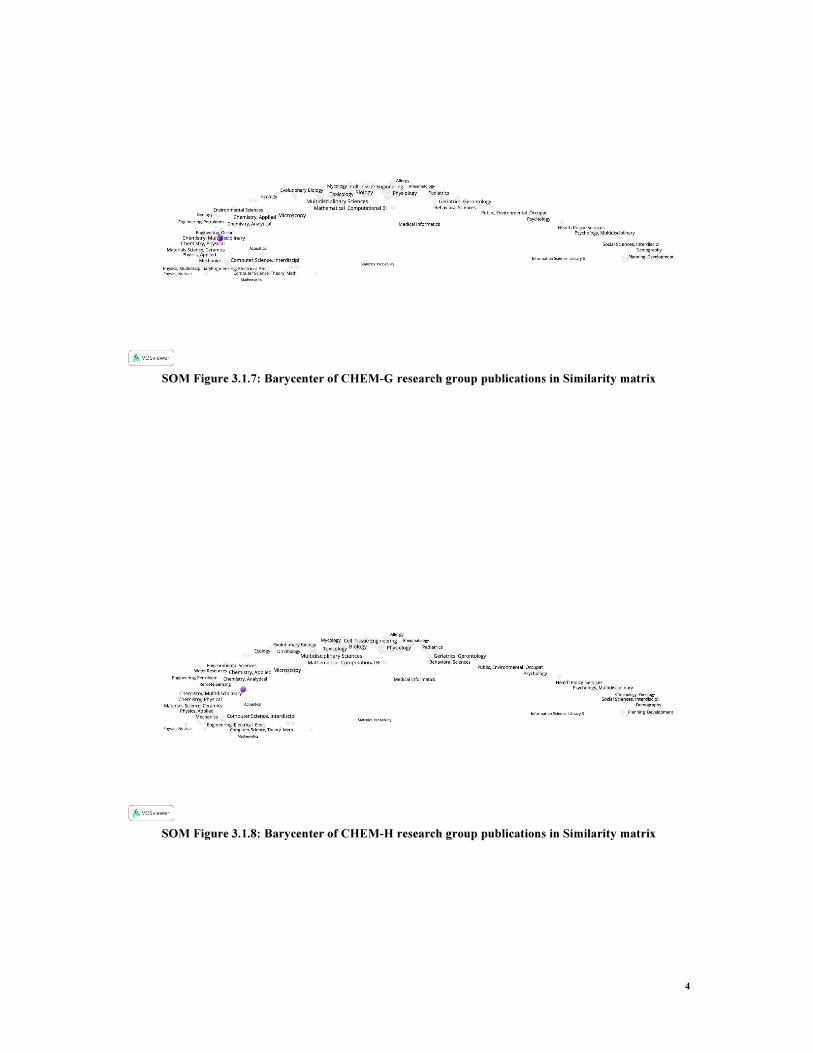
SOM Figure 3.1.7: Barycenter of CHEM-G research group publications in Similarity matrix
SOM Figure 3.1.8: Barycenter of CHEM-H research group publications in Similarity matrix

5
SOM Figure 3.1.9: Barycenter of CHEM-I research group publications in Similarity matrix
SOM Figure 3.1.10: Barycenter of CHEM-J research group publications in Similarity matrix

6
SOM Figure 3.1.11: Barycenter of CHEM-K research group publications in Similarity matrix
SOM Figure 3.1.12: Barycenter of CHEM-L research group publications in Similarity matrix
7
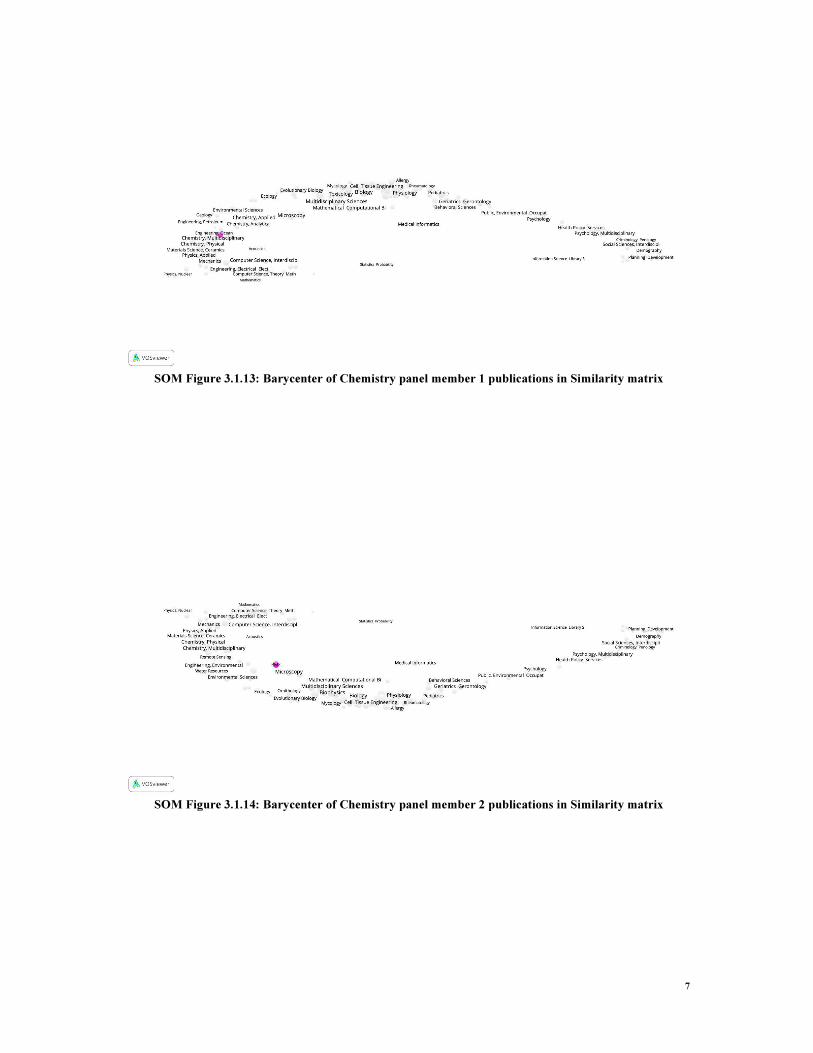
SOM Figure 3.1.13: Barycenter of Chemistry panel member 1 publications in Similarity matrix
SOM Figure 3.1.14: Barycenter of Chemistry panel member 2 publications in Similarity matrix

8
SOM Figure 3.1.15: Barycenter of Chemistry panel member 3 publications in Similarity matrix
SOM Figure 3.1.16: Barycenter of Chemistry panel member 4 publications in Similarity matrix
9
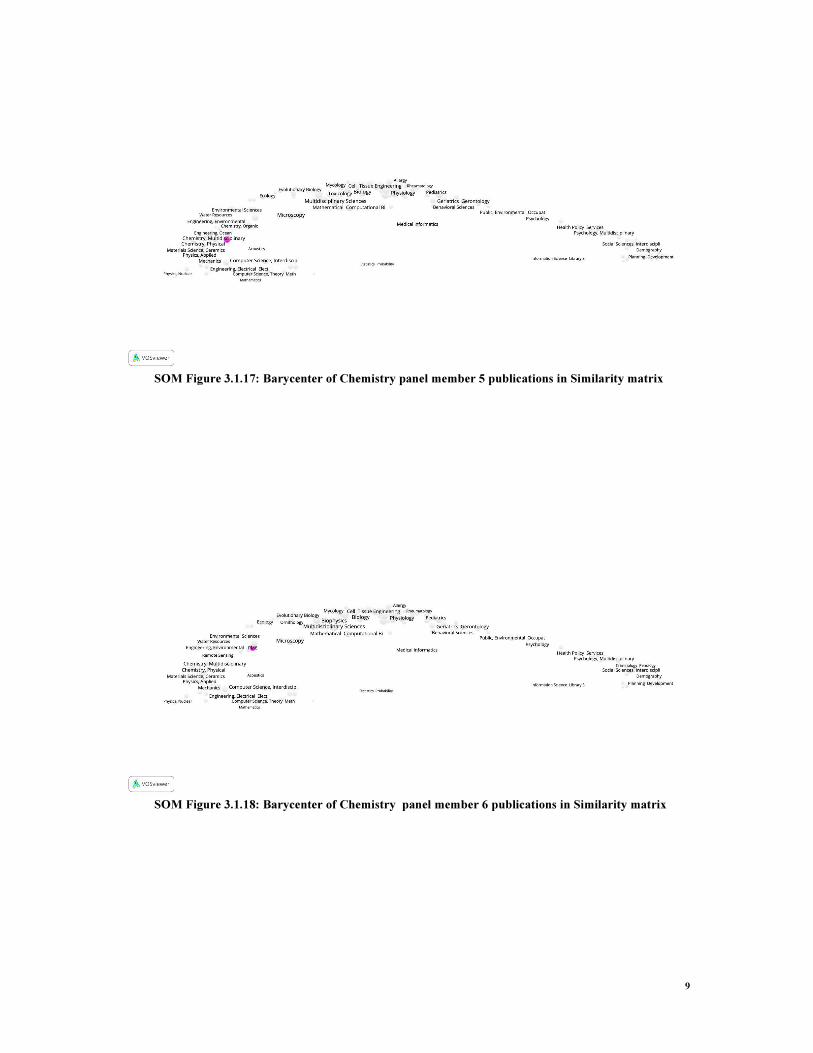
SOM Figure 3.1.17: Barycenter of Chemistry panel member 5 publications in Similarity matrix
SOM Figure 3.1.18: Barycenter of Chemistry panel member 6 publications in Similarity matrix
10
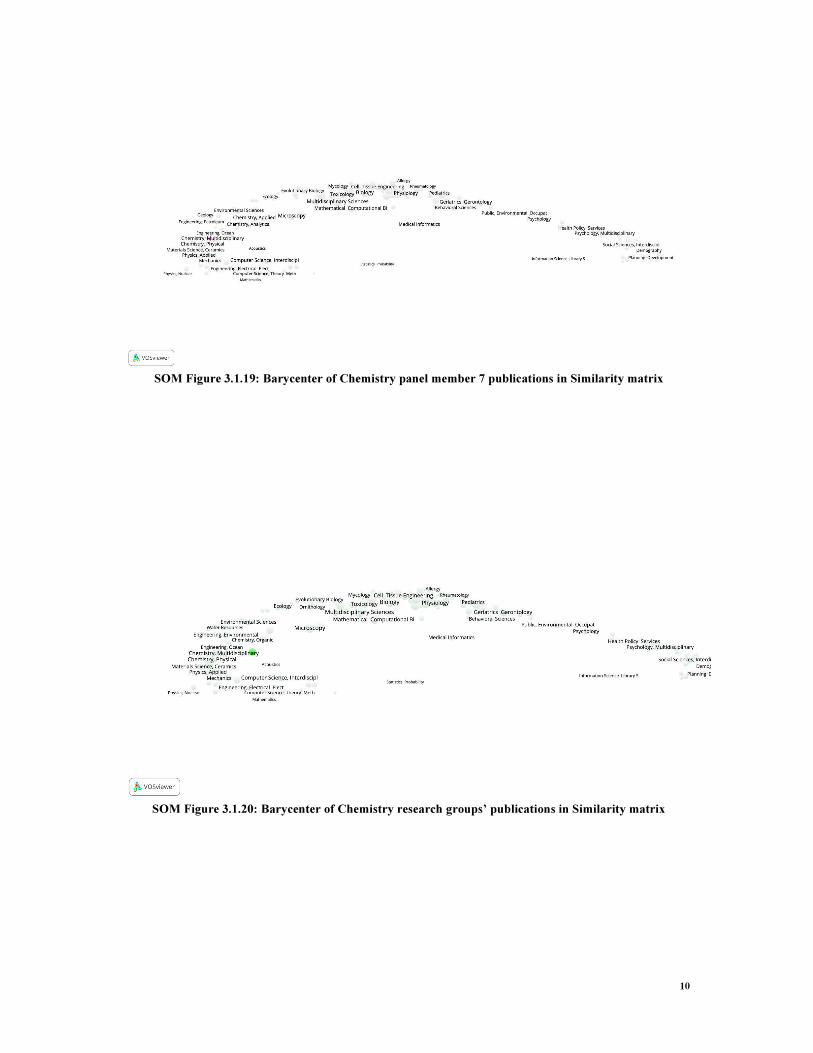
SOM Figure 3.1.19: Barycenter of Chemistry panel member 7 publications in Similarity matrix
SOM Figure 3.1.20: Barycenter of Chemistry research groups’ publications in Similarity matrix
11
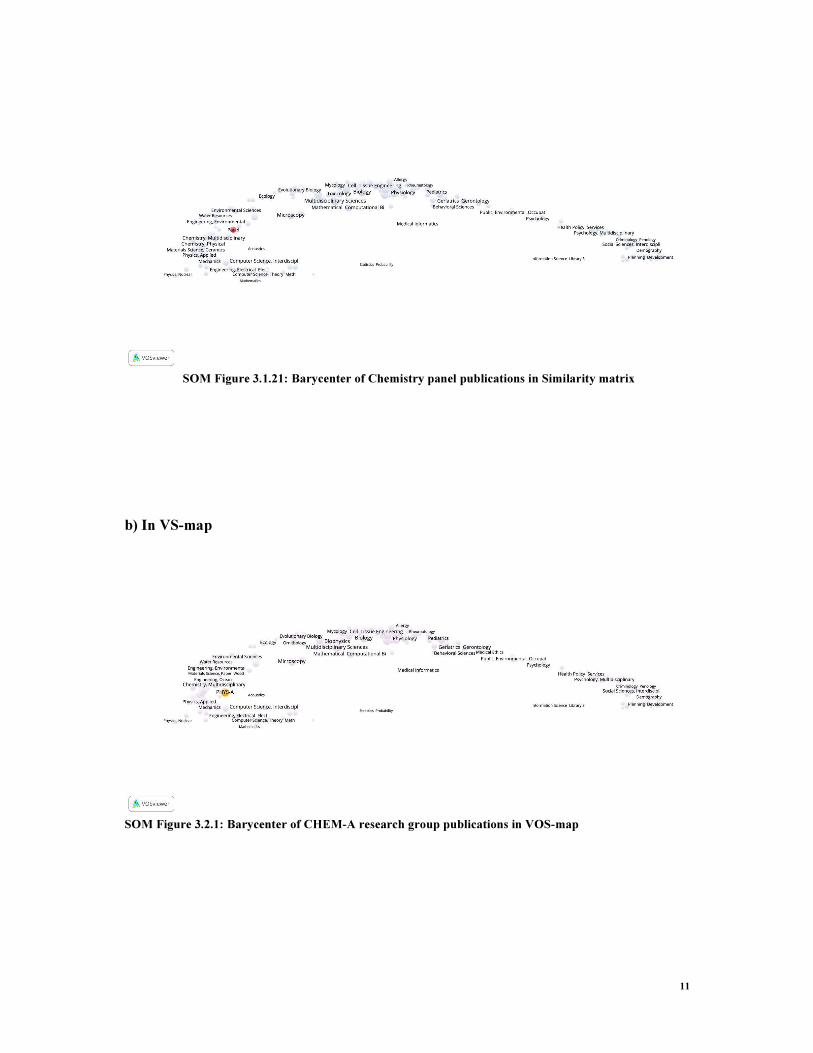
SOM Figure 3.1.21: Barycenter of Chemistry panel publications in Similarity matrix
b) In VS-map
SOM Figure 3.2.1: Barycenter of CHEM-A research group publications in VOS-map

12
SOM Figure 3.2.2: Barycenter of CHEM-B research group publications in VOS-map
SOM Figure 3.2.3: Barycenter of CHEM-C research group publications in VOS-map

13
SOM Figure 3.2.4: Barycenter of CHEM-D research group publications in VOS-map
SOM Figure 3.2.5: Barycenter of CHEM-E research group publications in VOS-map

14
SOM Figure 3.2.6: Barycenter of CHEM-F research group publications in VOS-map
SOM Figure 3.2.7: Barycenter of CHEM-G research group publications in VOS-map
15
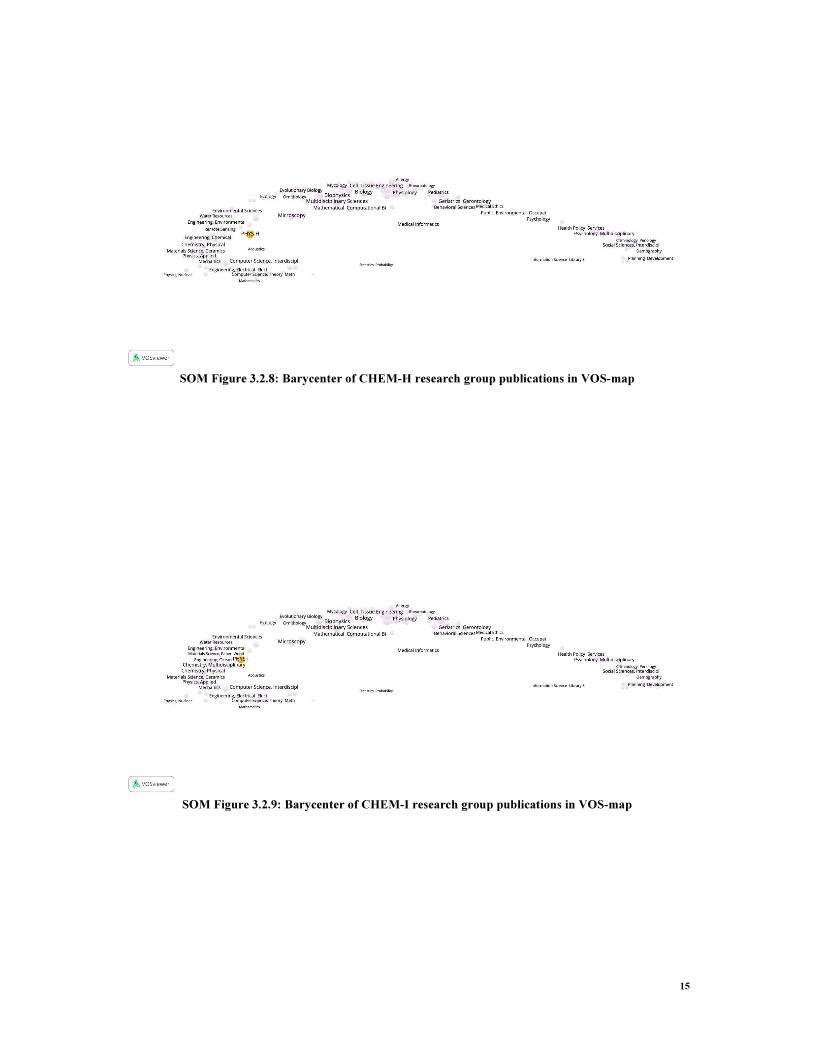
SOM Figure 3.2.8: Barycenter of CHEM-H research group publications in VOS-map
SOM Figure 3.2.9: Barycenter of CHEM-I research group publications in VOS-map

16
SOM Figure 3.2.10: Barycenter of CHEM-J research group publications in VOS-map
SOM Figure 3.2.11: Barycenter of CHEM-K research group publications in VOS-map

17
SOM Figure 3.2.12: Barycenter of CHEM-L research group publications in VOS-map
SOM Figure 3.2.13: Barycenter of Chemistry panel member 1 publications in VOS-map

18
SOM Figure 3.2.14: Barycenter of Chemistry panel member 2 publications in VOS-map
SOM Figure 3.2.15: Barycenter of Chemistry panel member 3 publications in VOS-map

19
SOM Figure 3.2.16: Barycenter of Chemistry panel member 4 publications in VOS-map
SOM Figure 3.2.17: Barycenter of Chemistry panel member 5 publications in VOS-map

20
SOM Figure 3.2.18: Barycenter of Chemistry panel member 6 publications in VOS-map
SOM Figure 3.2.19: Barycenter of Chemistry panel member 7 publications in VOS-map

21
SOM Figure 3.2.20: Barycenter of Chemistry research groups’ publications in VOS-map
SOM Figure 3.2.21: Barycenter of Chemistry Panel publications in VOS-map
22
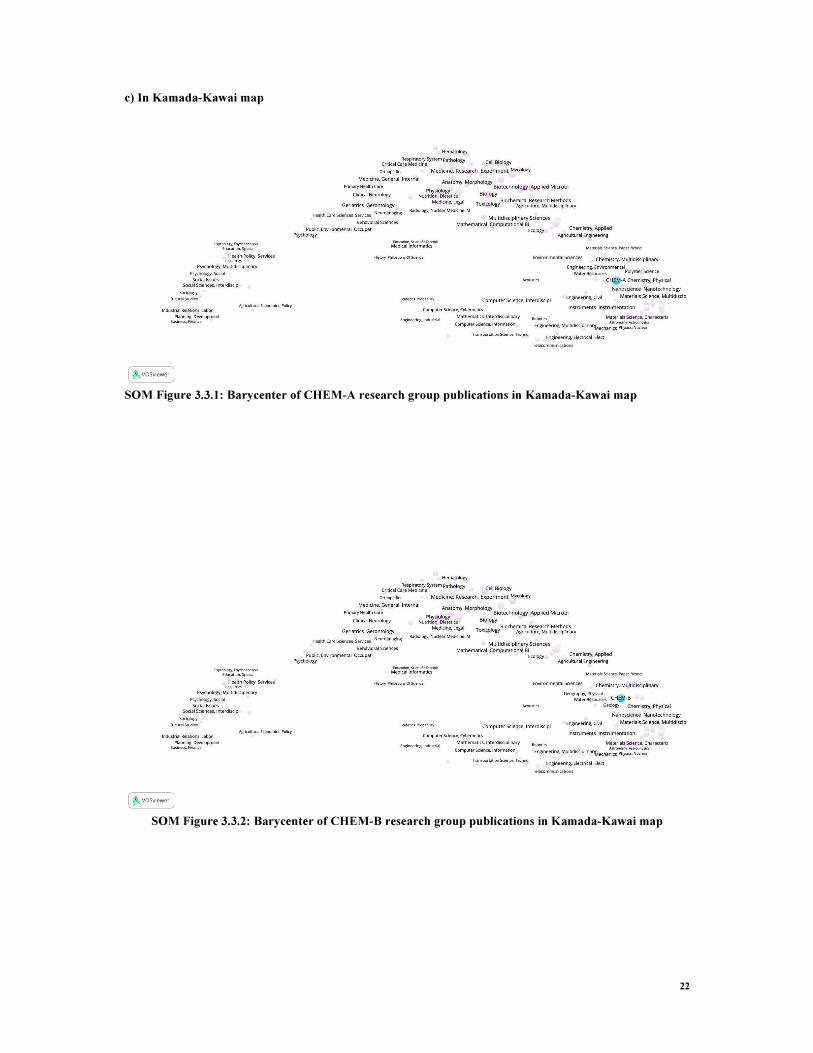
c) In Kamada-Kawai map
SOM Figure 3.3.1: Barycenter of CHEM-A research group publications in Kamada-Kawai map
SOM Figure 3.3.2: Barycenter of CHEM-B research group publications in Kamada-Kawai map
23
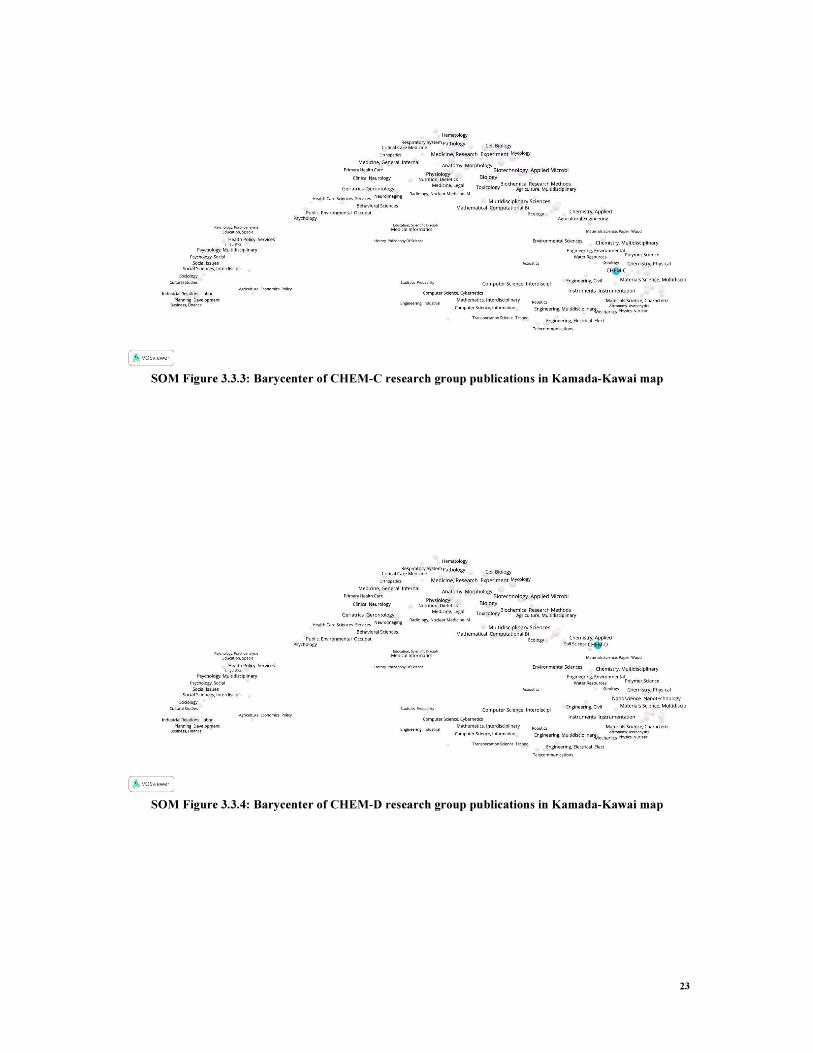
SOM Figure 3.3.3: Barycenter of CHEM-C research group publications in Kamada-Kawai map
SOM Figure 3.3.4: Barycenter of CHEM-D research group publications in Kamada-Kawai map

24
SOM Figure 3.3.5: Barycenter of CHEM-E research group publications in Kamada-Kawai map
SOM Figure 3.3.6: Barycenter of CHEM-F research group publications in Kamada-Kawai map

25
SOM Figure 3.3.7: Barycenter of CHEM-G research group publications in Kamada-Kawai map
SOM Figure 3.3.8: Barycenter of CHEM-H research group publications in Kamada-Kawai map

26
SOM Figure 3.3.9: Barycenter of CHEM-I research group publications in Kamada-Kawai map
SOM Figure 3.3.10: Barycenter of CHEM-J research group publications in Kamada-Kawai map
27
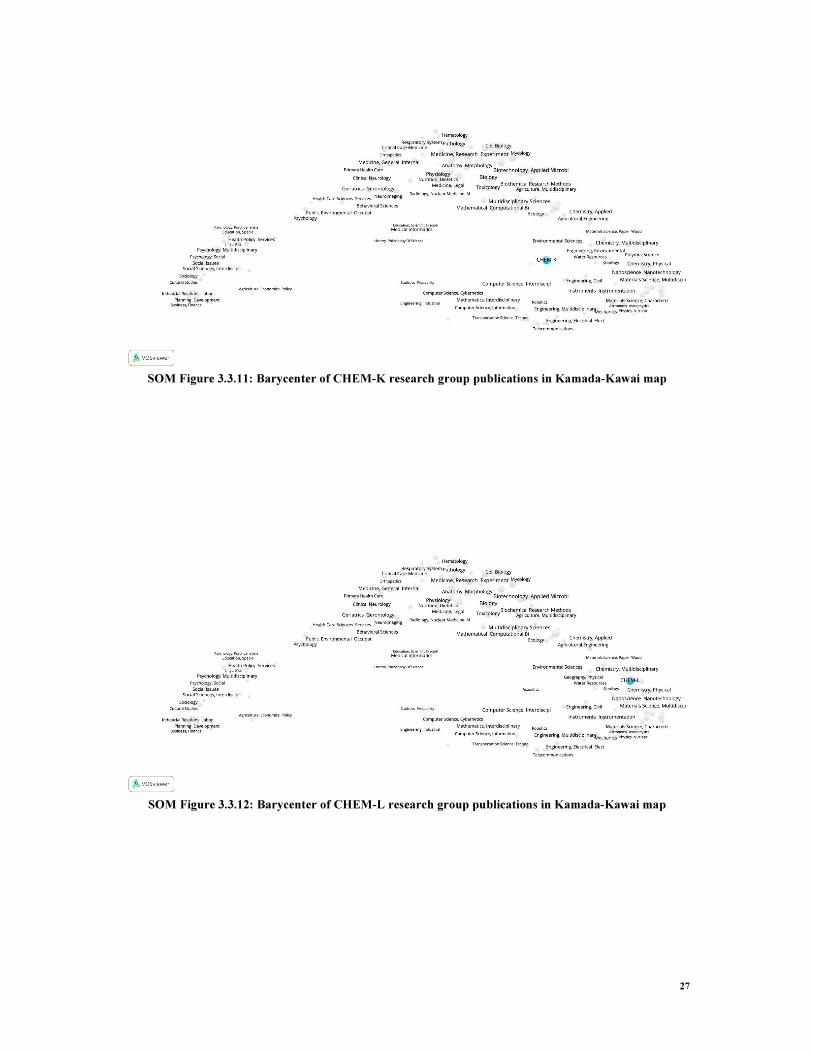
SOM Figure 3.3.11: Barycenter of CHEM-K research group publications in Kamada-Kawai map
SOM Figure 3.3.12: Barycenter of CHEM-L research group publications in Kamada-Kawai map

28
SOM Figure 3.3.13: Barycenter of Chemistry panel member 1 publications in Kamada-Kawai map
SOM Figure 3.3.14: Barycenter of Chemistry panel member 2 publications in Kamada-Kawai map

29
SOM Figure 3.3.15: Barycenter of Chemistry panel member 3 publications in Kamada-Kawai map
SOM Figure 3.3.16: Barycenter of Chemistry panel member 4 publications in Kamada-Kawai map
30
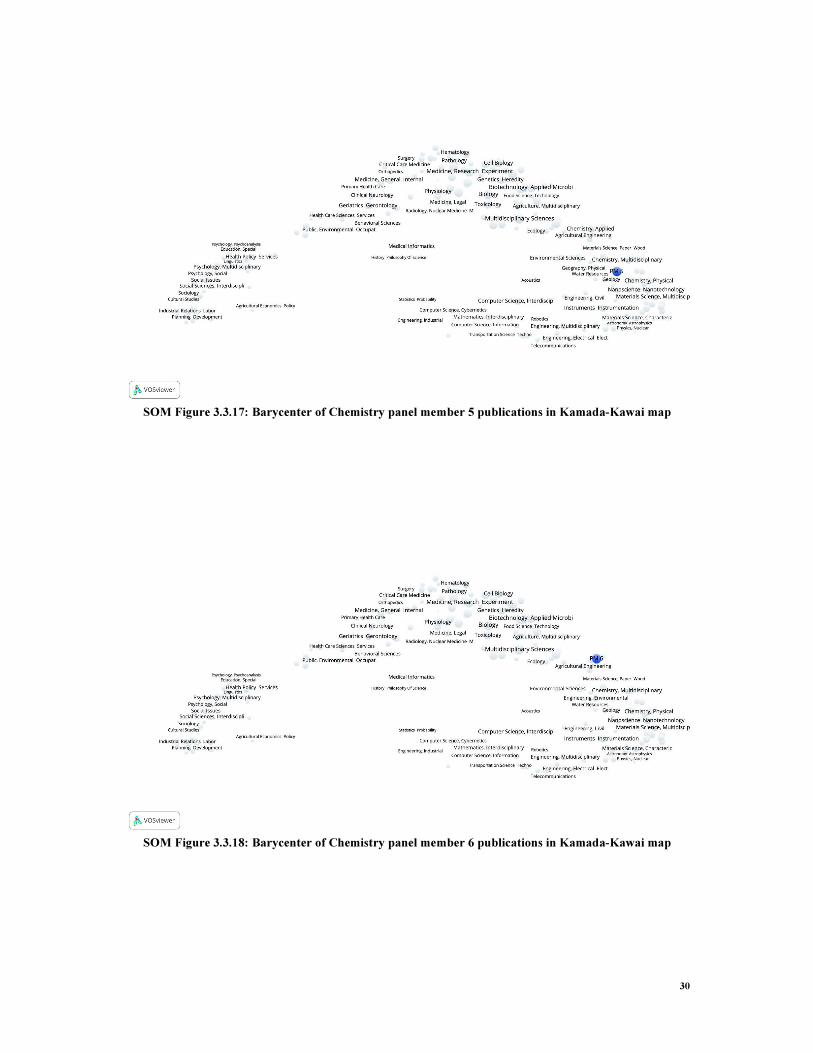
SOM Figure 3.3.17: Barycenter of Chemistry panel member 5 publications in Kamada-Kawai map
SOM Figure 3.3.18: Barycenter of Chemistry panel member 6 publications in Kamada-Kawai map
31
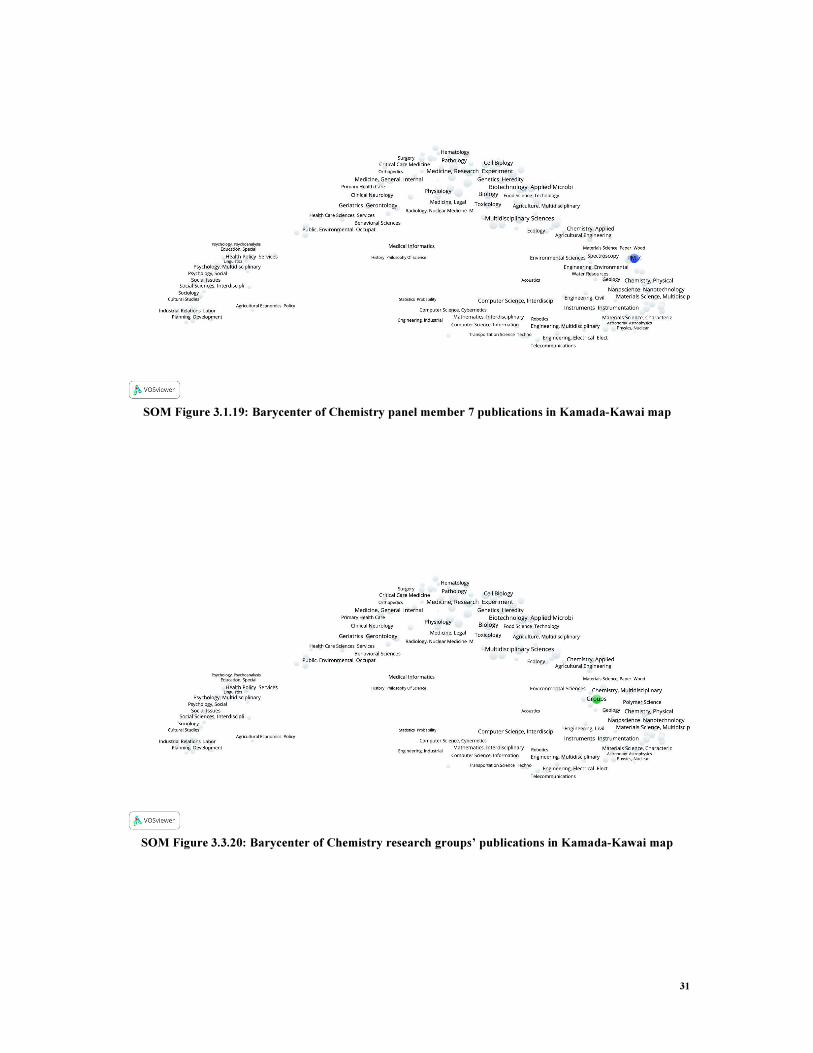
SOM Figure 3.1.19: Barycenter of Chemistry panel member 7 publications in Kamada-Kawai map
SOM Figure 3.3.20: Barycenter of Chemistry research groups’ publications in Kamada-Kawai map

32
SOM Figure 3.3.21: Barycenter of Chemistry panel publications in Kamada-Kawai map

33
Overlay maps of Physics research groups and Panel members barycenter
a) In Similarity matrix
SOM Figure 4 .1.1: Barycenter of PHYS-A research group publications in Similarity matrix
SOM Figure 4.1.2: Barycenter of PHYS -B research group publications in Similarity matrix
34
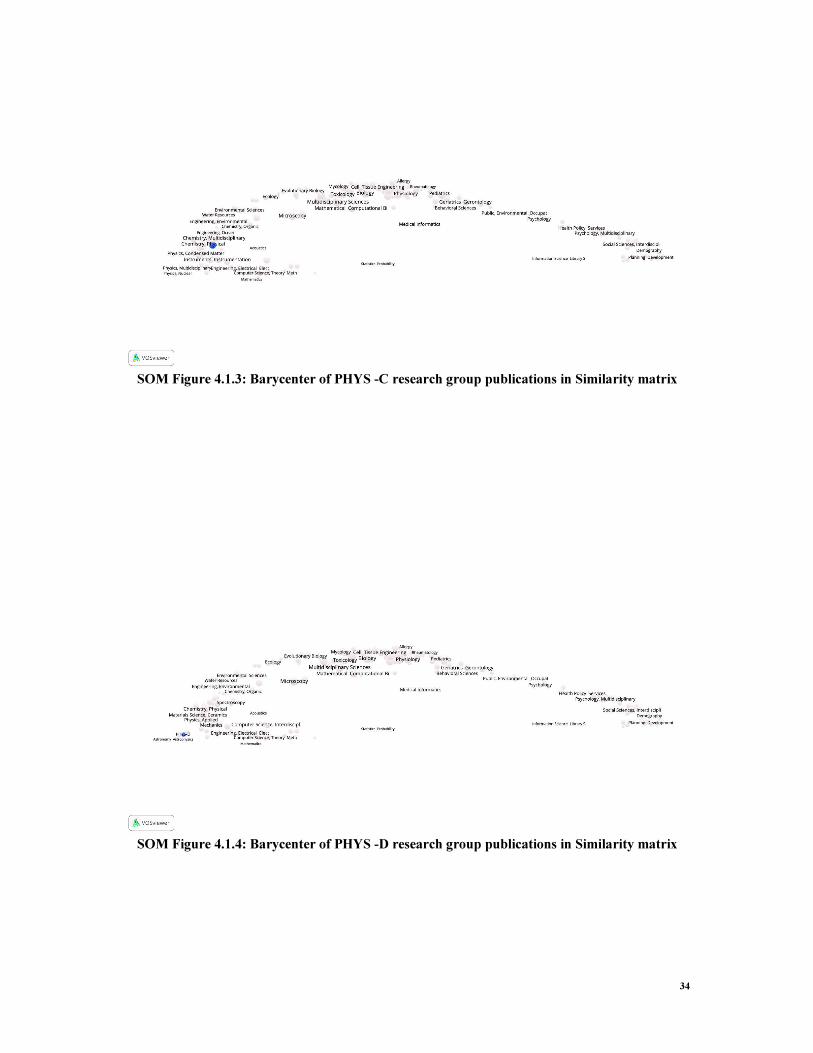
SOM Figure 4.1.3: Barycenter of PHYS -C research group publications in Similarity matrix
SOM Figure 4.1.4: Barycenter of PHYS -D research group publications in Similarity matrix
35
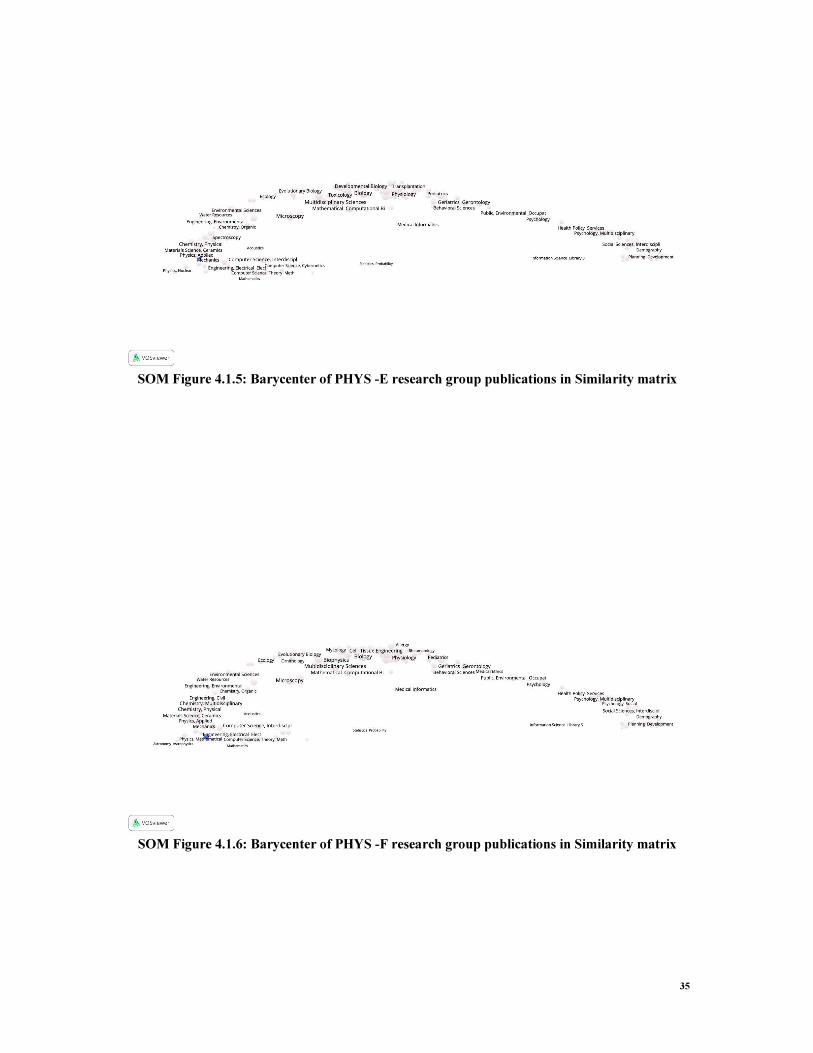
SOM Figure 4.1.5: Barycenter of PHYS -E research group publications in Similarity matrix
SOM Figure 4.1.6: Barycenter of PHYS -F research group publications in Similarity matrix

36
SOM Figure 4.1.7: Barycenter of PHYS -G research group publications in Similarity matrix
SOM Figure 4.1.8: Barycenter of PHYS -H research group publications in Similarity matrix
37
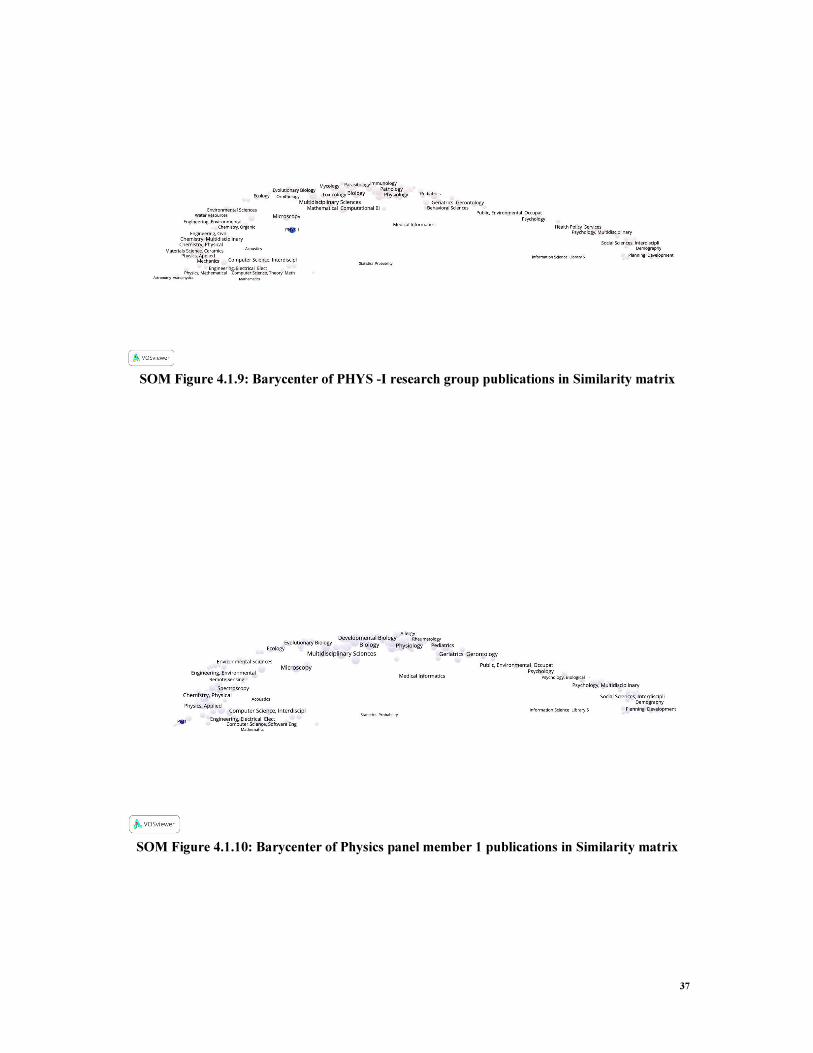
SOM Figure 4.1.9: Barycenter of PHYS -I research group publications in Similarity matrix
SOM Figure 4.1.10: Barycenter of Physics panel member 1 publications in Similarity matrix

38
SOM Figure 4.1.11: Barycenter of Physics panel member 2 publications in Similarity matrix
SOM Figure 4.1.12: Barycenter of Physics panel member 3 publications in Similarity matrix

39
SOM Figure 4.1.13: Barycenter of Physics panel member 4 publications in Similarity matrix
SOM Figure 4.1.14: Barycenter of Physics panel member 5 publications in Similarity matrix
40
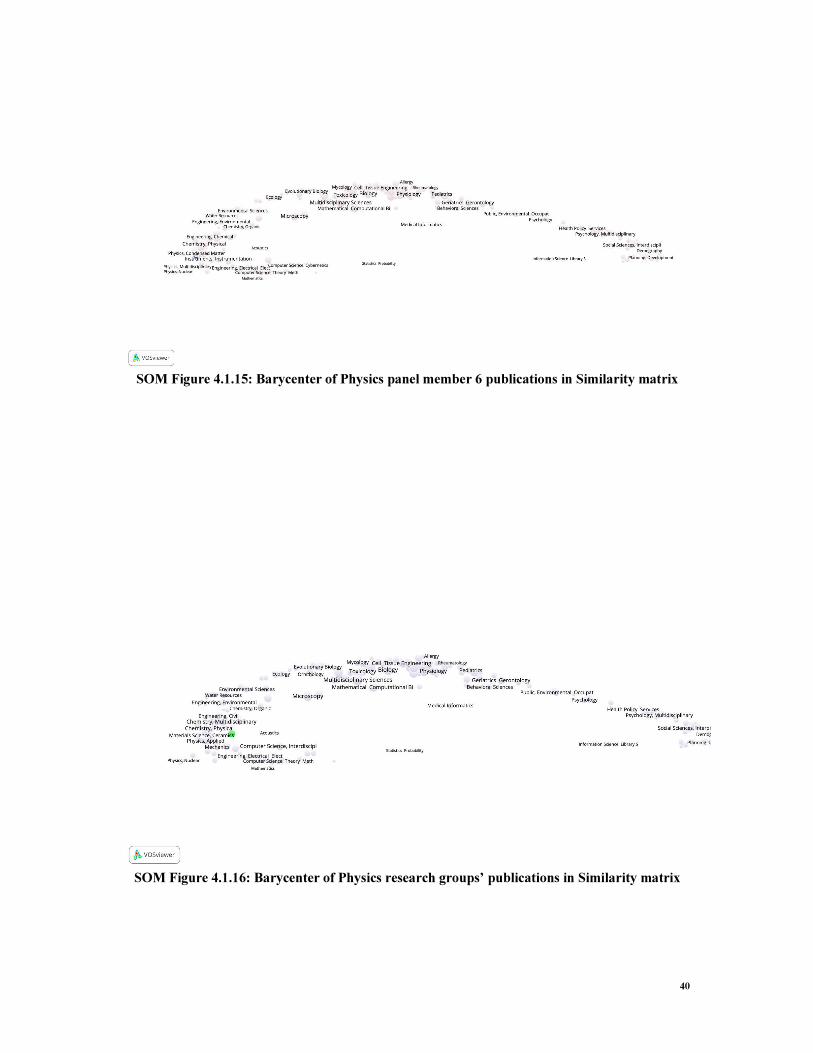
SOM Figure 4.1.15: Barycenter of Physics panel member 6 publications in Similarity matrix
SOM Figure 4.1.16: Barycenter of Physics research groups’ publications in Similarity matrix

41
SOM Figure 4.1.17: Barycenter of Physics panel publications in Similarity matrix
b) In VOS-map
SOM Figure 4.3.1: Barycenter of PHYS -A research group publications in VOS-map

42
SOM Figure 4.3.2: Barycenter of PHYS -B research group publications in VOS-map
SOM Figure 4.3.3: Barycenter of PHYS -C research group publications in VOS-map
43
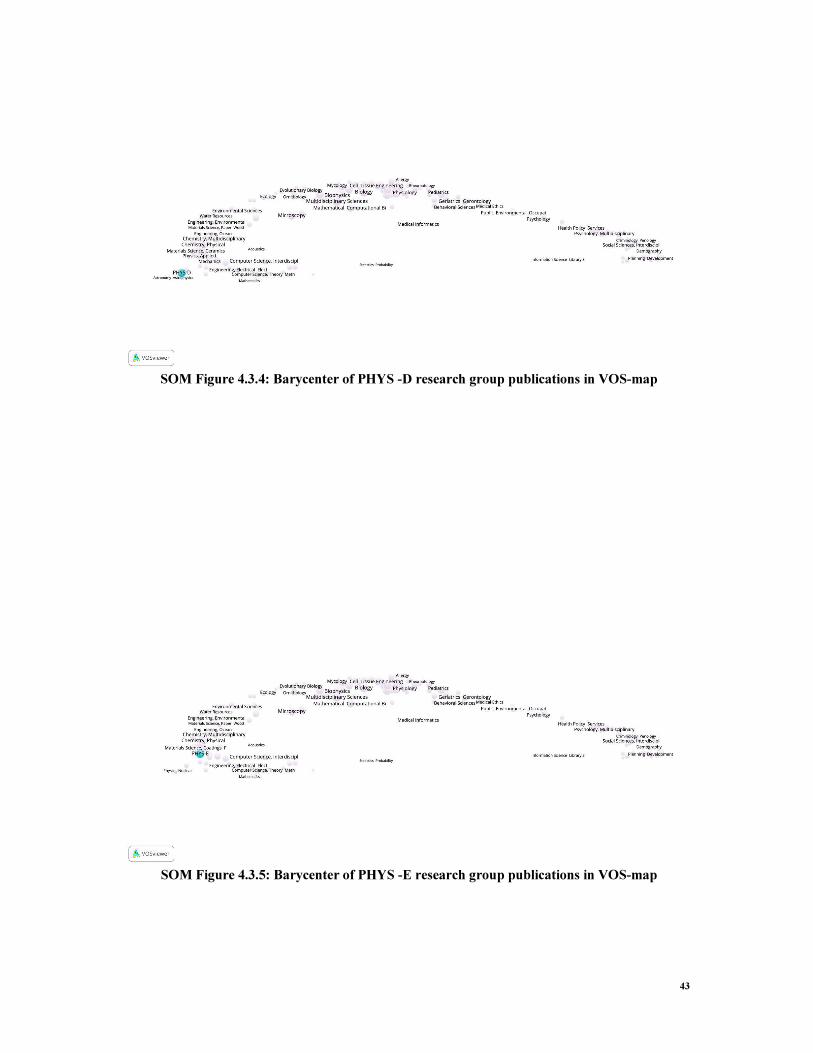
SOM Figure 4.3.4: Barycenter of PHYS -D research group publications in VOS-map
SOM Figure 4.3.5: Barycenter of PHYS -E research group publications in VOS-map

44
SOM Figure 4.3.6: Barycenter of PHYS -F research group publications in VOS-map
SOM Figure 4.3.7: Barycenter of PHYS -G research group publications in VOS-map
45
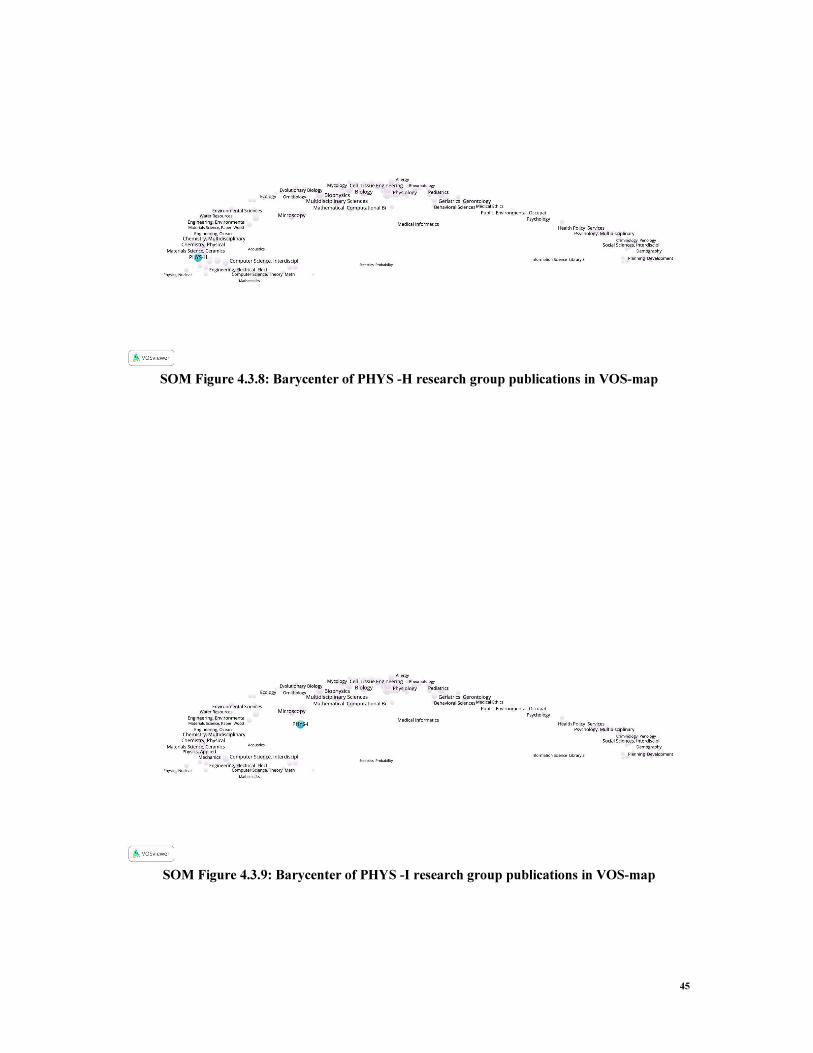
SOM Figure 4.3.8: Barycenter of PHYS -H research group publications in VOS-map
SOM Figure 4.3.9: Barycenter of PHYS -I research group publications in VOS-map

46
SOM Figure 4.3.10: Barycenter of Physics panel member 1 publications in VOS-map
SOM Figure 4.3.11: Barycenter of Physics panel member 2 publications in VOS-map

47
SOM Figure 4.3.12: Barycenter of Physics panel member 3 publications in VOS-map
SOM Figure 4.3.13: Barycenter of Physics panel member 4 publications in VOS-map

48
SOM Figure 4.3.14: Barycenter of Physics panel member 5 publications in VOS-map
SOM Figure 4.3.15: Barycenter of Physics panel member 6 publications in VOS-map
49
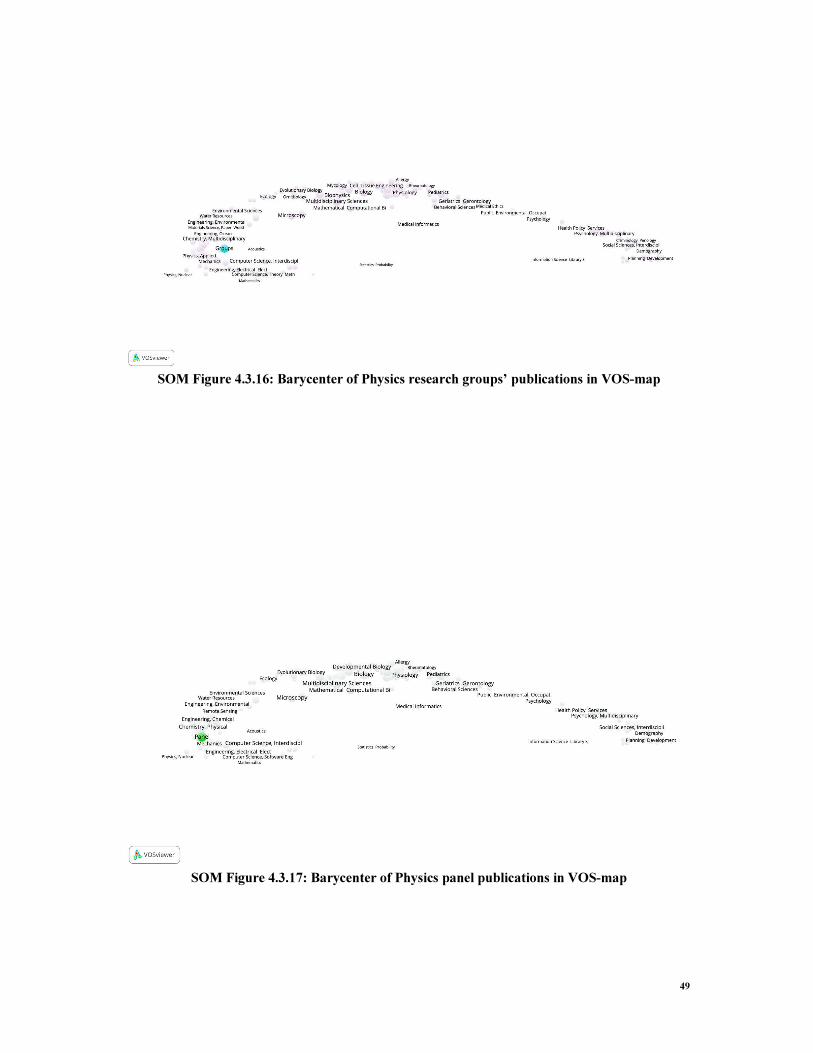
SOM Figure 4.3.16: Barycenter of Physics research groups’ publications in VOS-map
SOM Figure 4.3.17: Barycenter of Physics panel publications in VOS-map
50
c) In Kamada-Kawai map
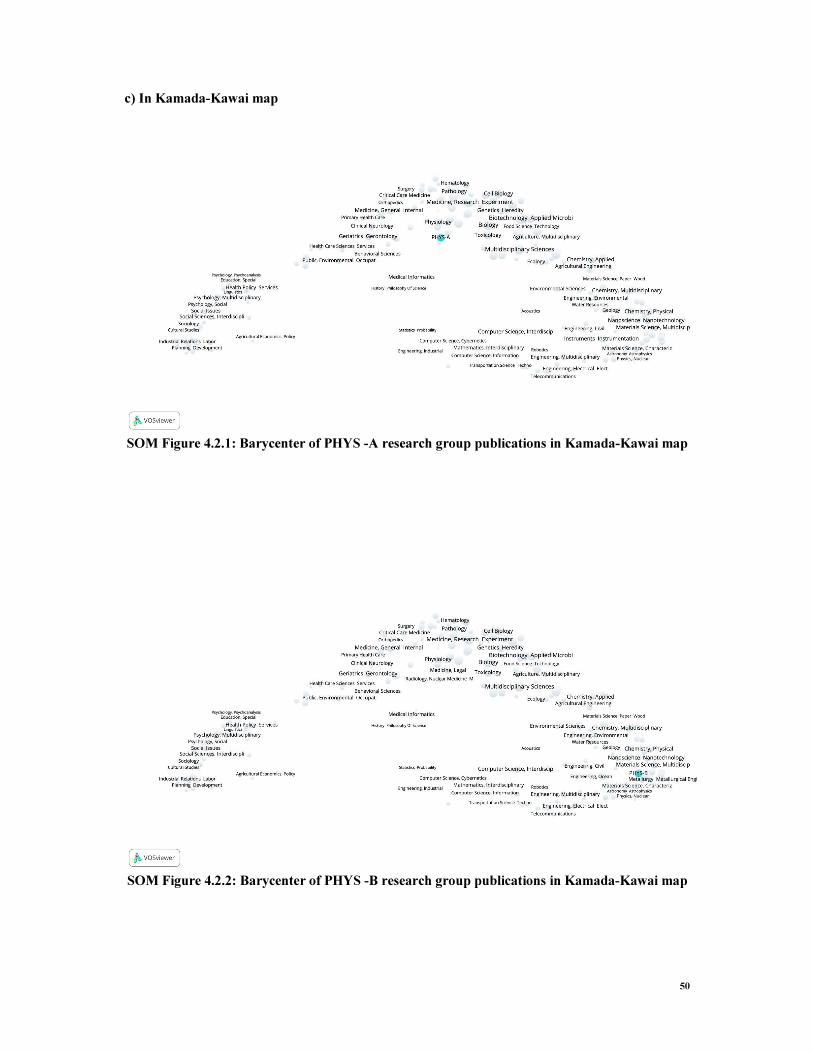
SOM Figure 4.2.1: Barycenter of PHYS -A research group publications in Kamada-Kawai map
SOM Figure 4.2.2: Barycenter of PHYS -B research group publications in Kamada-Kawai map

51
SOM Figure 4.2.3: Barycenter of PHYS -C research group publications in Kamada-Kawai map
SOM Figure 4.2.4: Barycenter of PHYS -D research group publications in Kamada-Kawai map
52
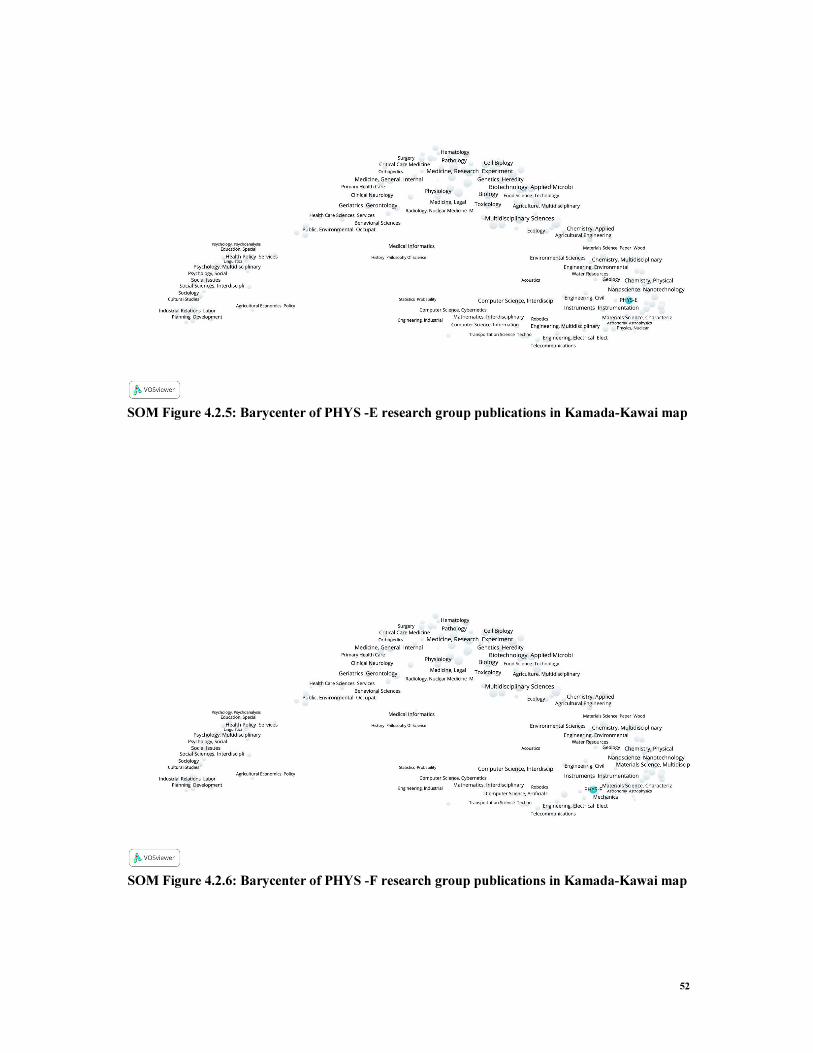
SOM Figure 4.2.5: Barycenter of PHYS -E research group publications in Kamada-Kawai map
SOM Figure 4.2.6: Barycenter of PHYS -F research group publications in Kamada-Kawai map

53
SOM Figure 4.2.7: Barycenter of PHYS -G research group publications in Kamada-Kawai map
SOM Figure 4.2.8: Barycenter of PHYS -H research group publications in Kamada-Kawai map

54
SOM Figure 4.2.9: Barycenter of PHYS -I research group publications in Kamada-Kawai map
SOM Figure 4.2.10: Barycenter of Physics panel member 1 publications in Kamada-Kawai map

55
SOM Figure 4.2.11: Barycenter of Physics panel member 2 publications in Kamada-Kawai map
SOM Figure 4.2.12: Barycenter of Physics panel member 3 publications in Kamada-Kawai map

56
SOM Figure 4.2.13: Barycenter of Physics panel member 4 publications in Kamada-Kawai map
SOM Figure 4.2.14: Barycenter of Physics panel member 5 publications in Kamada-Kawai map

57
SOM Figure 4.2.15: Barycenter of Physics panel member 6 publications in Kamada-Kawai map
SOM Figure 4.2.16: Barycenter of Physics research groups’ publications in Kamada-Kawai map
58
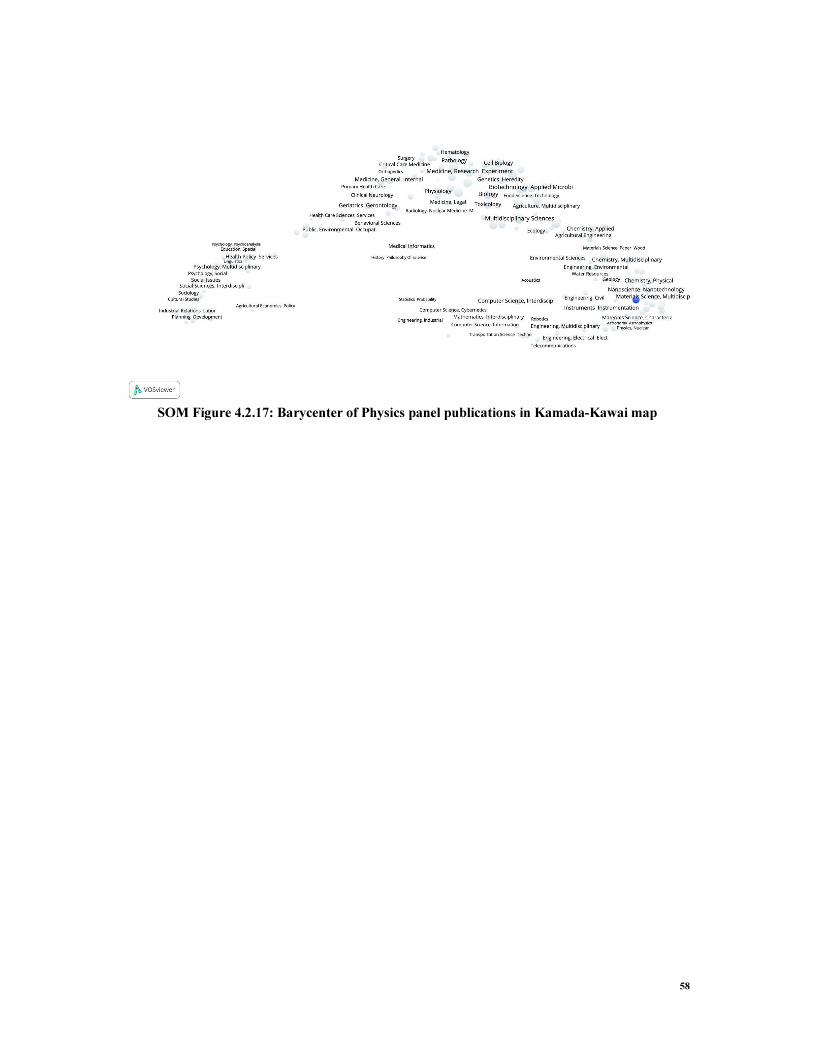
SOM Figure 4.2.17: Barycenter of Physics panel publications in Kamada-Kawai map
Related Documents