OPERATIONAL EXCELLENCE C O N S U L T I N G 1 11/3/2011 – v5.0 Operational Excellence – 8D Problem Solving Process Workshop Instructor: Frank Adler, Ph.D. Managing Partner & LSS MBB Operational Excellence Consulting

Welcome message from author
This document is posted to help you gain knowledge. Please leave a comment to let me know what you think about it! Share it to your friends and learn new things together.
Transcript
OPERATIONAL EXCELLENCE
C O N S U L T I N G
1 11/3/2011 – v5.0
Operational Excellence – 8D Problem Solving Process
Workshop Instructor: Frank Adler, Ph.D.
Managing Partner & LSS MBB
Operational Excellence Consulting
OPERATIONAL EXCELLENCE
C O N S U L T I N G
4 11/3/2011 – v5.0
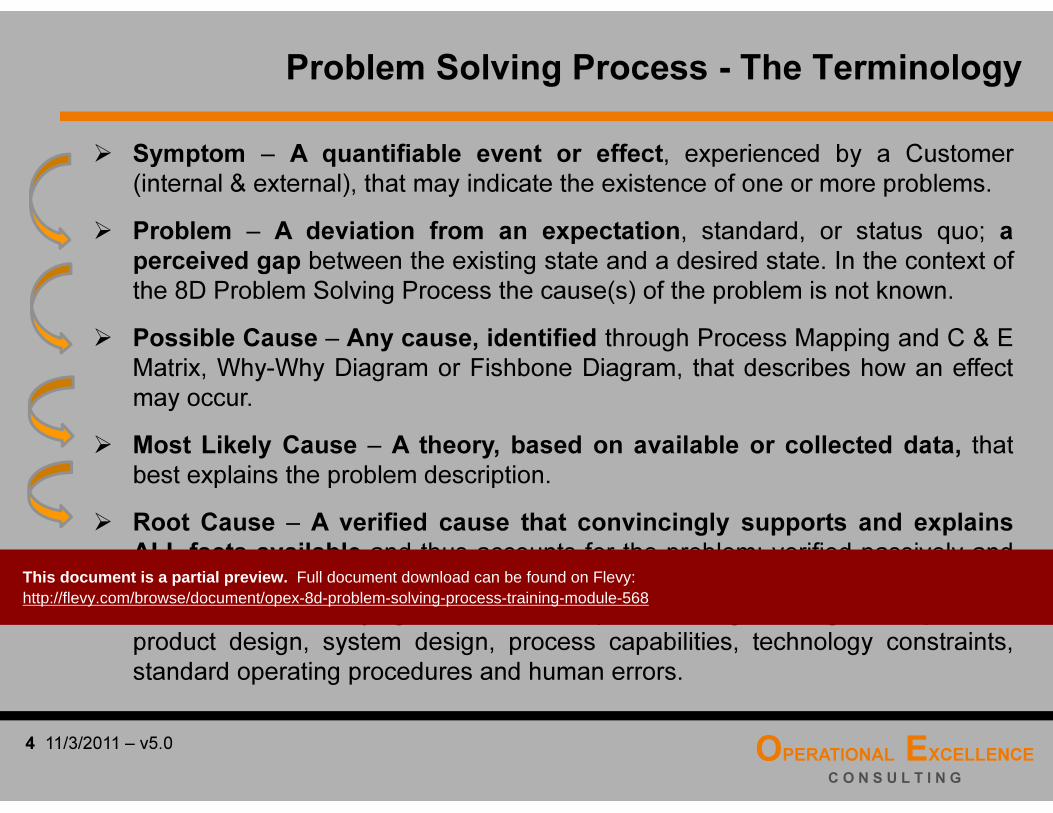
Problem Solving Process - The Terminology
� Symptom – A quantifiable event or effect, experienced by a Customer
(internal & external), that may indicate the existence of one or more problems.
� Problem – A deviation from an expectation, standard, or status quo; a
perceived gap between the existing state and a desired state. In the context of
the 8D Problem Solving Process the cause(s) of the problem is not known.
� Possible Cause – Any cause, identified through Process Mapping and C & E
Matrix, Why-Why Diagram or Fishbone Diagram, that describes how an effect
may occur.
� Most Likely Cause – A theory, based on available or collected data, that
best explains the problem description.
� Root Cause – A verified cause that convincingly supports and explains
ALL facts available and thus accounts for the problem; verified passively and
actively, by making the problem come and go. Root causes are the
fundamental, underlying reasons for a problem, e.g. management policies,
product design, system design, process capabilities, technology constraints,
standard operating procedures and human errors.
This document is a partial preview. Full document download can be found on Flevy: http://flevy.com/browse/document/opex-8d-problem-solving-process-training-module-568
OPERATIONAL EXCELLENCE
C O N S U L T I N G
7 11/3/2011 – v5.0
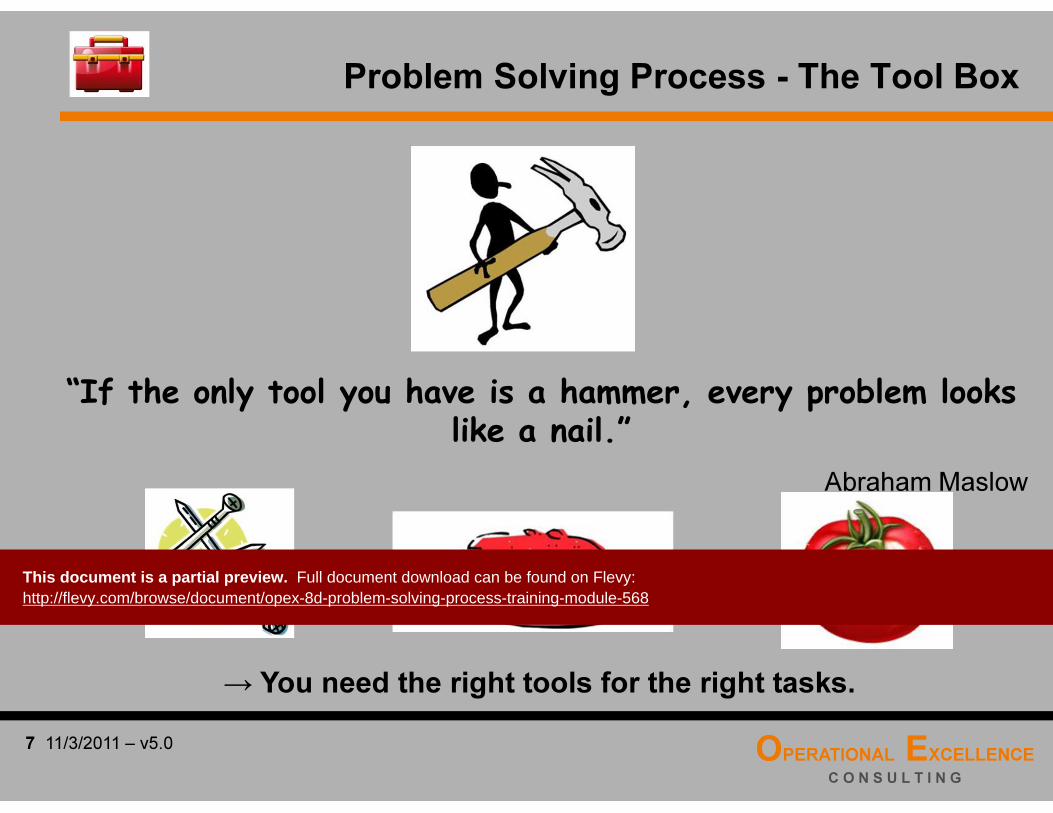
Problem Solving Process - The Tool Box
“If the only tool you have is a hammer, every problem looks like a nail.”
Abraham Maslow
→ You need the right tools for the right tasks.
This document is a partial preview. Full document download can be found on Flevy: http://flevy.com/browse/document/opex-8d-problem-solving-process-training-module-568
OPERATIONAL EXCELLENCE
C O N S U L T I N G
10 11/3/2011 – v5.0
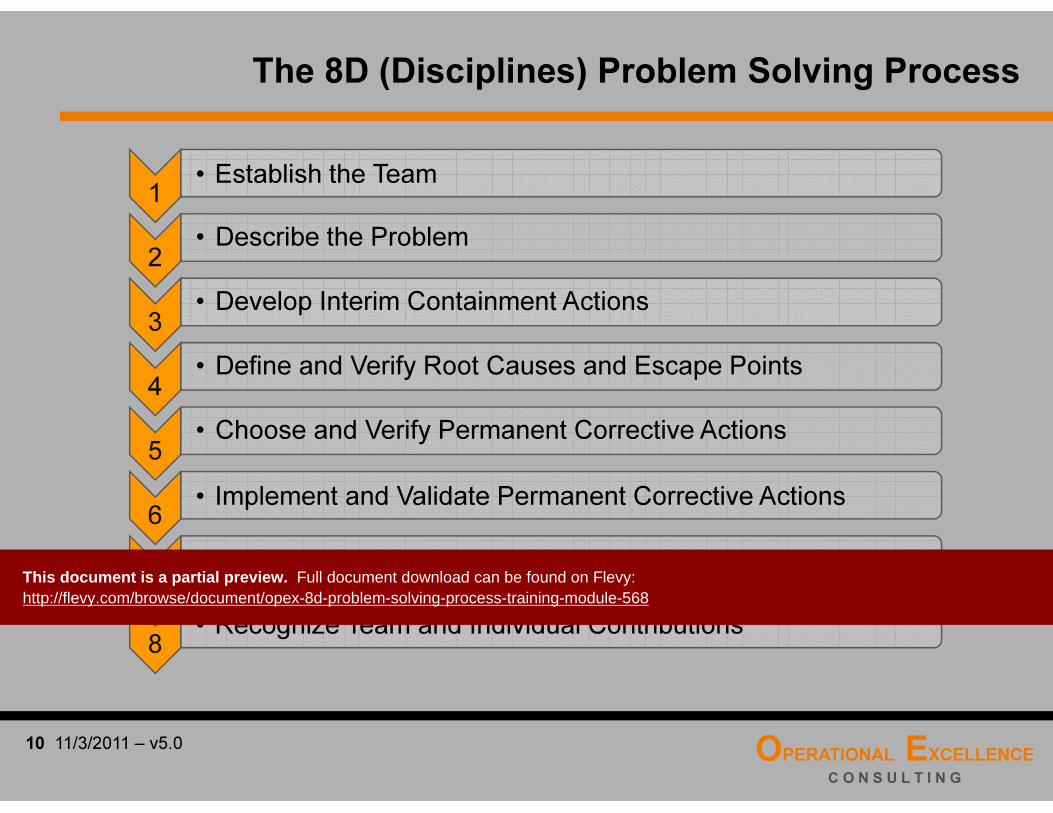
The 8D (Disciplines) Problem Solving Process
1• Establish the Team
2• Describe the Problem
3• Develop Interim Containment Actions
4• Define and Verify Root Causes and Escape Points
5• Choose and Verify Permanent Corrective Actions
6• Implement and Validate Permanent Corrective Actions
7• Prevent Recurrence
8• Recognize Team and Individual Contributions
This document is a partial preview. Full document download can be found on Flevy: http://flevy.com/browse/document/opex-8d-problem-solving-process-training-module-568

OPERATIONAL EXCELLENCE
C O N S U L T I N G
13 11/3/2011 – v5.0
Problem Solving & Improvement Project Selection
� Is the problem or improvement opportunity related to the organization’sstrategic and operational objectives?
� Does the problem impact customer satisfaction?
� Does a Champion or Owner exist that is responsible for the problem?
� Do we have the resources (people, time, money) to successfully completethe project?
� Is there an objective measure or metrics in place to be improved?
� Can the project been completed in a reasonable amount of time?
� What is the likelihood of success?
� …
Every organization should develop its own Project Selection Criteria to ensure it works on the right projects at the right time.
This document is a partial preview. Full document download can be found on Flevy: http://flevy.com/browse/document/opex-8d-problem-solving-process-training-module-568
OPERATIONAL EXCELLENCE
C O N S U L T I N G
16 11/3/2011 – v5.0
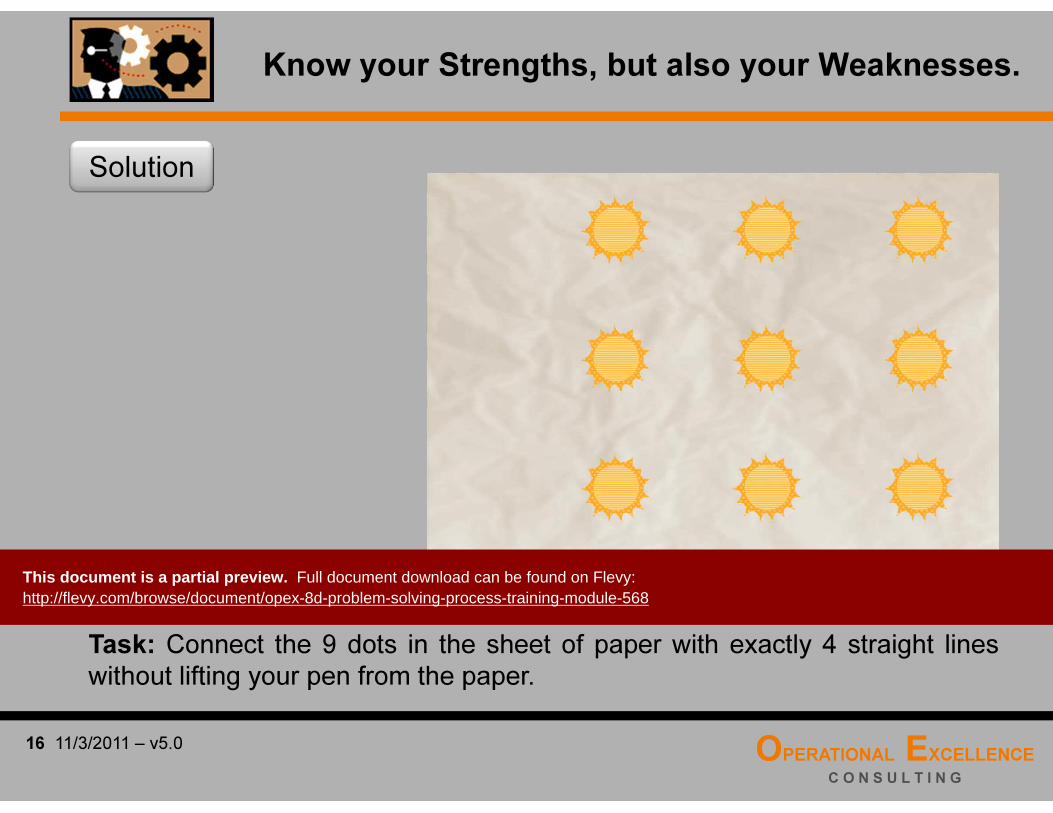
Know your Strengths, but also your Weaknesses.
Solution
Task: Connect the 9 dots in the sheet of paper with exactly 4 straight lineswithout lifting your pen from the paper.
This document is a partial preview. Full document download can be found on Flevy: http://flevy.com/browse/document/opex-8d-problem-solving-process-training-module-568
OPERATIONAL EXCELLENCE
C O N S U L T I N G
19 11/3/2011 – v5.0
Basic Team Guidelines
Develop Basic Team Guidelines that the team commits to …
� Talk from personal experience and examples
� Speak to, not about, people present
� Say “I” – not “we”, “you”, “one”, “the team”, …
� Say “I would like …” or “it would help me if …” – not “you should …” or“we should …”
� Make statements before questions
� Trace opinions to observations
� Describe not judge
� Restate and build on proposals
� Recognize that feelings affect team meetings
� …
This document is a partial preview. Full document download can be found on Flevy: http://flevy.com/browse/document/opex-8d-problem-solving-process-training-module-568
OPERATIONAL EXCELLENCE
C O N S U L T I N G
22 11/3/2011 – v5.0
Purpose: Describe the internal or external problem by identifying “what is wrongwith what” and detailing the problem in quantifiable terms.
� Develop a Problem Statement
� Develop a Problem Description using the “IS – IS NOT Matrix”
� Develop a flowchart of the process and identify critical process steps with respect to the Problem Description
� Develop a Cause & Effect Matrix, Why-Why Diagram or Fishbone Diagram to identify possible causes?
� Determine whether this problem describes a “something changed” or a “never been there” situation
� Establish a high-level project plan, including milestones, project goals and objectives
“Describe the Problem” Key Activities
This document is a partial preview. Full document download can be found on Flevy: http://flevy.com/browse/document/opex-8d-problem-solving-process-training-module-568
OPERATIONAL EXCELLENCE
C O N S U L T I N G
25 11/3/2011 – v5.0
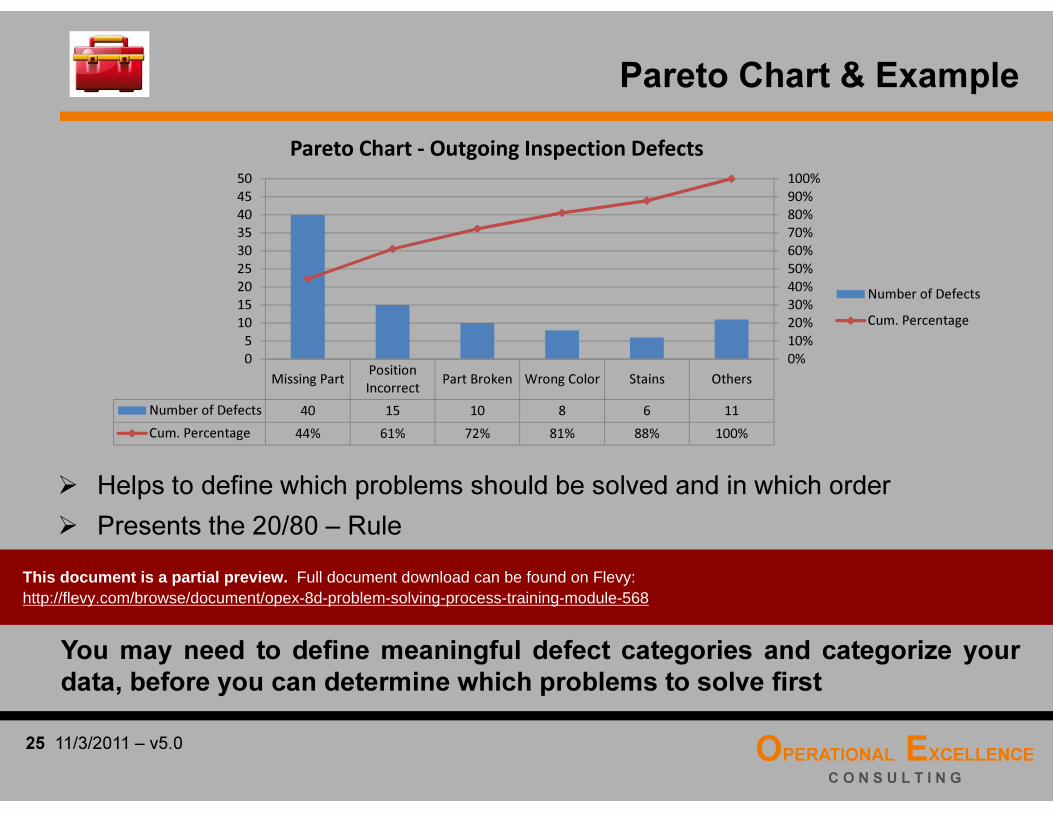
Pareto Chart & Example
� Helps to define which problems should be solved and in which order
� Presents the 20/80 – Rule
� 20% of the problems often create 80% of all the costs and/or complaints
� Analyzes defect categories over a specific time frame (e.g. 3 months)
Missing PartPosition
IncorrectPart Broken Wrong Color Stains Others
Number of Defects 40 15 10 8 6 11
Cum. Percentage 44% 61% 72% 81% 88% 100%
0%
10%
20%
30%
40%
50%
60%
70%
80%
90%
100%
0
5
10
15
20
25
30
35
40
45
50
Pareto Chart - Outgoing Inspection Defects
Number of Defects
Cum. Percentage
You may need to define meaningful defect categories and categorize yourdata, before you can determine which problems to solve first
This document is a partial preview. Full document download can be found on Flevy: http://flevy.com/browse/document/opex-8d-problem-solving-process-training-module-568
OPERATIONAL EXCELLENCE
C O N S U L T I N G
28 11/3/2011 – v5.0
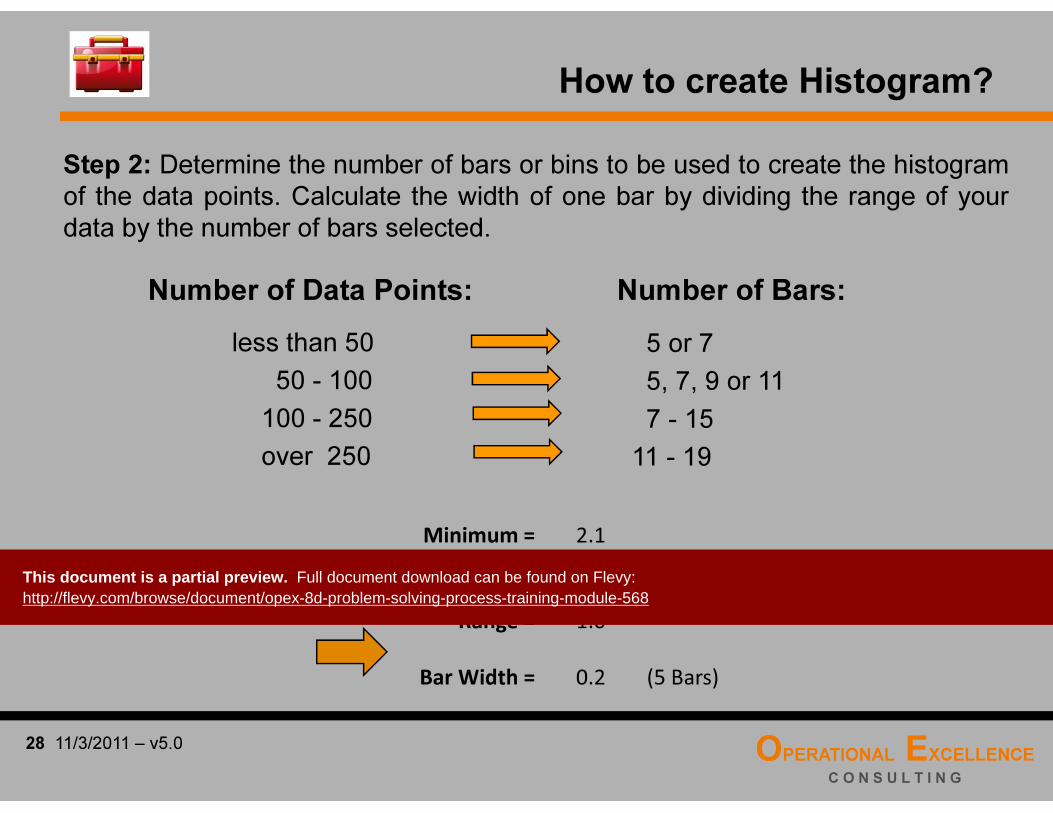
How to create Histogram?
Step 2: Determine the number of bars or bins to be used to create the histogramof the data points. Calculate the width of one bar by dividing the range of yourdata by the number of bars selected.
Number of Bars:
less than 50
50 - 100
100 - 250
over 250
5 or 7
5, 7, 9 or 11
7 - 15
11 - 19
Number of Data Points:
Minimum = 2.1
Maximum = 3.1
Range = 1.0
Bar Width = 0.2 (5 Bars)
This document is a partial preview. Full document download can be found on Flevy: http://flevy.com/browse/document/opex-8d-problem-solving-process-training-module-568
OPERATIONAL EXCELLENCE
C O N S U L T I N G
31 11/3/2011 – v5.0
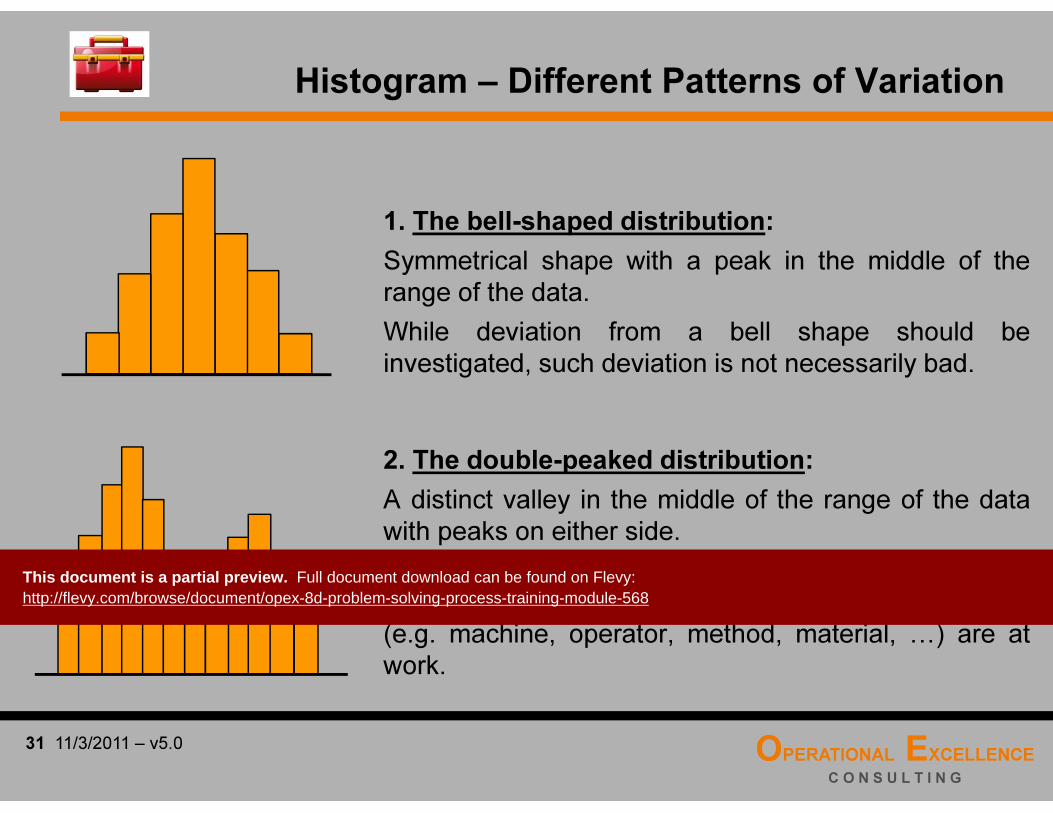
Histogram – Different Patterns of Variation
1. The bell-shaped distribution:
Symmetrical shape with a peak in the middle of therange of the data.
While deviation from a bell shape should beinvestigated, such deviation is not necessarily bad.
2. The double-peaked distribution:
A distinct valley in the middle of the range of the datawith peaks on either side.
This pattern is usually a combination of two bell-shapeddistributions and suggests that two distinct processes(e.g. machine, operator, method, material, …) are atwork.
This document is a partial preview. Full document download can be found on Flevy: http://flevy.com/browse/document/opex-8d-problem-solving-process-training-module-568

OPERATIONAL EXCELLENCE
C O N S U L T I N G
34 11/3/2011 – v5.0
The 5 Why’s
Description: The 5 Why’s Analysis helps to identify the final problem statement or in
some cases even the root cause. It helps to distinguish between the symptom of a
problem and the problem itself and it encourages the team to reach an answer that is
fundamental and actionable.
Procedure:
Step 1: Develop an initial problem statement of the specific problem to be solved. Write it
in the upper left corner of a piece of paper, flip chart or white board.
Step 2: Ask “Why?” this problem does or could occur. Write the cause (object & defect)
underneath the initial problem statement.
Step 3: The cause identified in Step 2 now becomes a new problem statement. Repeat
Step 2 and ask “Why?”, e.g. “Why would this situation occur?", again.
Step 4: Continue Step 2 and Step 3 until you cannot for certain answer the question or
reach an answer that is fundamental and actionable.This document is a partial preview. Full document download can be found on Flevy: http://flevy.com/browse/document/opex-8d-problem-solving-process-training-module-568

OPERATIONAL EXCELLENCE
C O N S U L T I N G
37 11/3/2011 – v5.0
Problem Statement – Example 1
What is the Problem Statement (Object & Defect)?
WHY? → The tool was not in inventory.
WHY? → The Supplier did not deliver the replacement tools.
WHY? → The Supplier did not receive our Purchase Order on-time.
WHY? → We did not submit the Purchase Order on time.
WHY? → We did not have the “right” rework tool.
WHY? → We don’t know.
Initial Problem Statement
Final Problem Statement
This document is a partial preview. Full document download can be found on Flevy: http://flevy.com/browse/document/opex-8d-problem-solving-process-training-module-568

OPERATIONAL EXCELLENCE
C O N S U L T I N G
40 11/3/2011 – v5.0
Case Study Group Work 1
The Task:
� Read the introduction to the “Felt Tip Marker” Case Study
� Develop the Problem Statement for the Case Study
5 Minutes
This document is a partial preview. Full document download can be found on Flevy: http://flevy.com/browse/document/opex-8d-problem-solving-process-training-module-568
OPERATIONAL EXCELLENCE
C O N S U L T I N G
43 11/3/2011 – v5.0
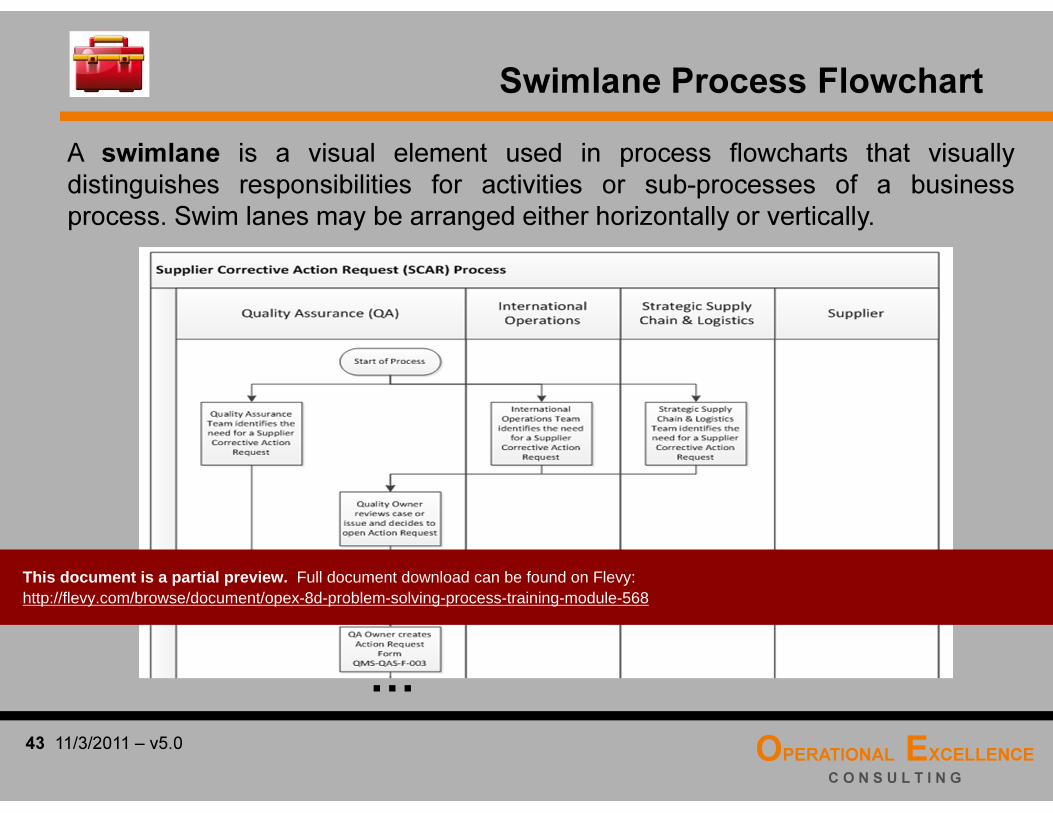
Swimlane Process Flowchart
…
A swimlane is a visual element used in process flowcharts that visuallydistinguishes responsibilities for activities or sub-processes of a businessprocess. Swim lanes may be arranged either horizontally or vertically.
This document is a partial preview. Full document download can be found on Flevy: http://flevy.com/browse/document/opex-8d-problem-solving-process-training-module-568
OPERATIONAL EXCELLENCE
C O N S U L T I N G
46 11/3/2011 – v5.0
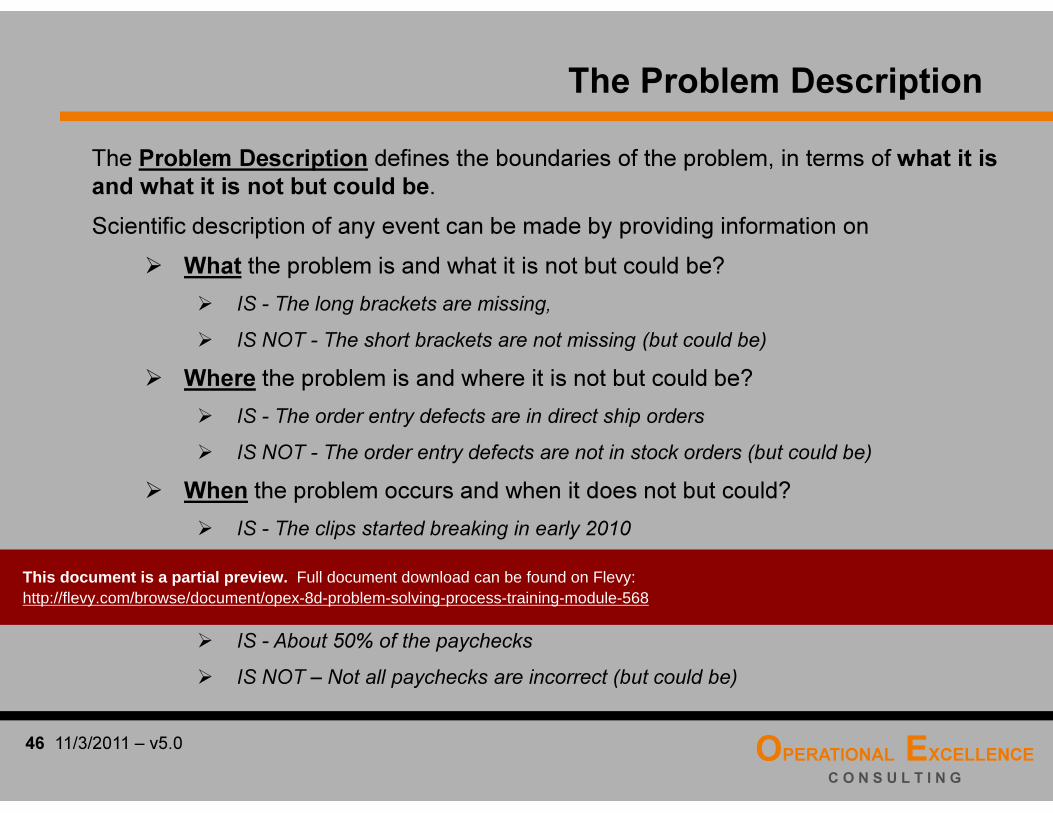
The Problem Description
The Problem Description defines the boundaries of the problem, in terms of what it is
and what it is not but could be.
Scientific description of any event can be made by providing information on
� What the problem is and what it is not but could be?
� IS - The long brackets are missing,
� IS NOT - The short brackets are not missing (but could be)
� Where the problem is and where it is not but could be?
� IS - The order entry defects are in direct ship orders
� IS NOT - The order entry defects are not in stock orders (but could be)
� When the problem occurs and when it does not but could?
� IS - The clips started breaking in early 2010
� IS NOT – The clips did not break before early 2010 (but could have)
� How big the problem is and how big it is not but could be?
� IS - About 50% of the paychecks
� IS NOT – Not all paychecks are incorrect (but could be)
This document is a partial preview. Full document download can be found on Flevy: http://flevy.com/browse/document/opex-8d-problem-solving-process-training-module-568
OPERATIONAL EXCELLENCE
C O N S U L T I N G
49 11/3/2011 – v5.0
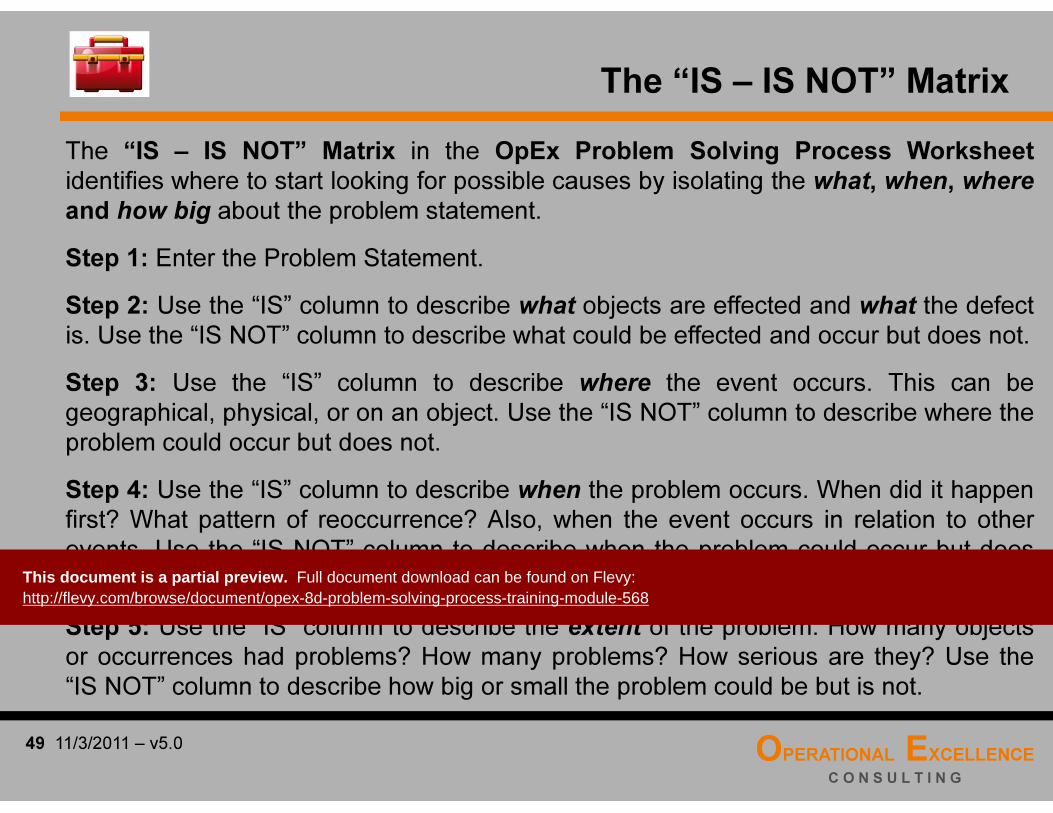
The “IS – IS NOT” Matrix
The “IS – IS NOT” Matrix in the OpEx Problem Solving Process Worksheet
identifies where to start looking for possible causes by isolating the what, when, where
and how big about the problem statement.
Step 1: Enter the Problem Statement.
Step 2: Use the “IS” column to describe what objects are effected and what the defect
is. Use the “IS NOT” column to describe what could be effected and occur but does not.
Step 3: Use the “IS” column to describe where the event occurs. This can be
geographical, physical, or on an object. Use the “IS NOT” column to describe where the
problem could occur but does not.
Step 4: Use the “IS” column to describe when the problem occurs. When did it happen
first? What pattern of reoccurrence? Also, when the event occurs in relation to other
events. Use the “IS NOT” column to describe when the problem could occur but does
not.
Step 5: Use the “IS” column to describe the extent of the problem. How many objects
or occurrences had problems? How many problems? How serious are they? Use the
“IS NOT” column to describe how big or small the problem could be but is not.
This document is a partial preview. Full document download can be found on Flevy: http://flevy.com/browse/document/opex-8d-problem-solving-process-training-module-568

OPERATIONAL EXCELLENCE
C O N S U L T I N G
52 11/3/2011 – v5.0
Cause & Effect Matrix – Phase 1
2. Score (0 – 100) the Importance or Criticality of each Problem Statement, with the total score equal to 100
3. List the Process Steps or Activities
4. List Inputs for each Process Step
1. List the Problem Statement(s)
We will cover this later.This document is a partial preview. Full document download can be found on Flevy: http://flevy.com/browse/document/opex-8d-problem-solving-process-training-module-568
OPERATIONAL EXCELLENCE
C O N S U L T I N G
55 11/3/2011 – v5.0
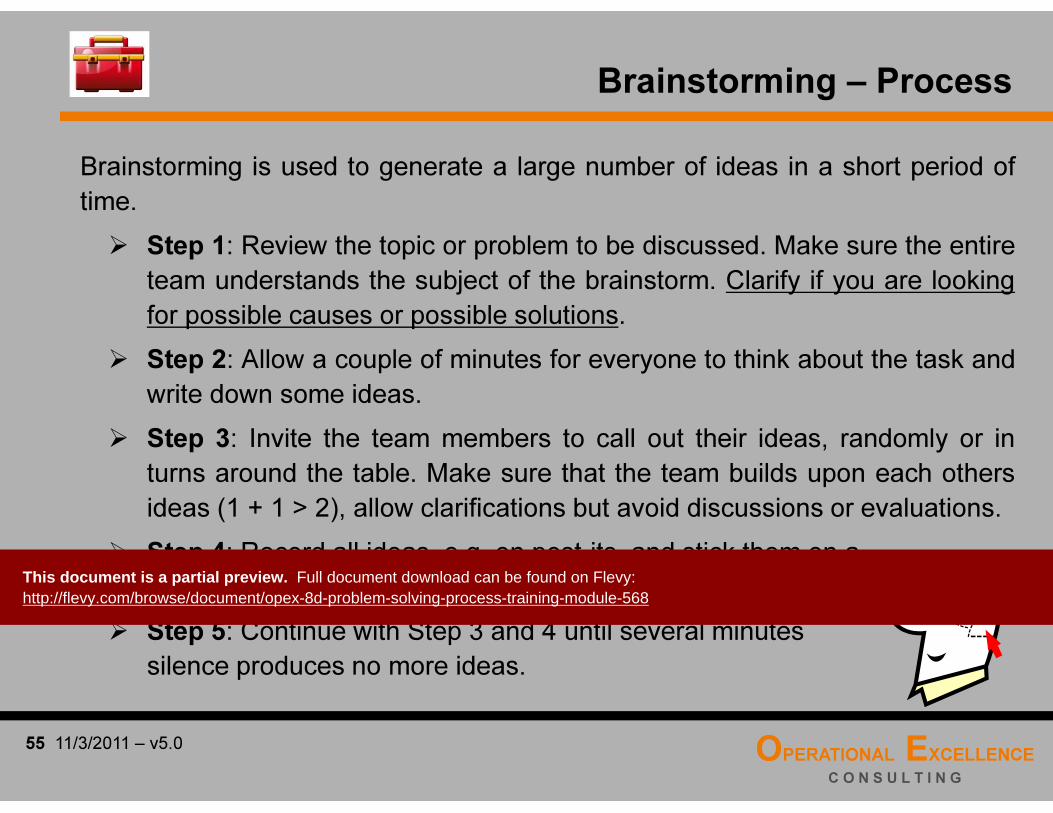
Brainstorming is used to generate a large number of ideas in a short period of
time.
� Step 1: Review the topic or problem to be discussed. Make sure the entire
team understands the subject of the brainstorm. Clarify if you are looking
for possible causes or possible solutions.
� Step 2: Allow a couple of minutes for everyone to think about the task and
write down some ideas.
� Step 3: Invite the team members to call out their ideas, randomly or in
turns around the table. Make sure that the team builds upon each others
ideas (1 + 1 > 2), allow clarifications but avoid discussions or evaluations.
� Step 4: Record all ideas, e.g. on post-its, and stick them on a
flip chart visible to everyone.
� Step 5: Continue with Step 3 and 4 until several minutes
silence produces no more ideas.
Brainstorming – Process
This document is a partial preview. Full document download can be found on Flevy: http://flevy.com/browse/document/opex-8d-problem-solving-process-training-module-568

OPERATIONAL EXCELLENCE
C O N S U L T I N G
58 11/3/2011 – v5.0
Fishbone Diagram – Phase 1
Alternative 2 (Team-defined Categories)
Step 1: Draw a horizontal trunk line and to
the right end of this line write the
Problem Statement.
Step 2: Brainstorm for all possible causes.
Step 3: Group the possible causes into
categories and give each category a
name (min. 2, max. 6 categories).
Step 4: Draw a main branch for each
category and put a category name at
the end of each branch.
Step 5: Add minor branches and the
identified possible causes under
each major branch.
Step 6: Check that the diagram is complete
and logical.
Alternative 1 (Pre-defined Categories)
Step 1: Draw a horizontal trunk line and
to the right end of this write the
Problem Statement.
Step 2: Draw the main branches and put
the name of the main categories,
e.g. 4Ms & 1E, at the end of the
main branches.
Step 3: Brainstorm for all possible causes
Step 4: Add minor branches and the
identified possible causes under
each major branch.
Step 5: Check that the diagram is
complete and logical.
This document is a partial preview. Full document download can be found on Flevy: http://flevy.com/browse/document/opex-8d-problem-solving-process-training-module-568
OPERATIONAL EXCELLENCE
C O N S U L T I N G
61 11/3/2011 – v5.0
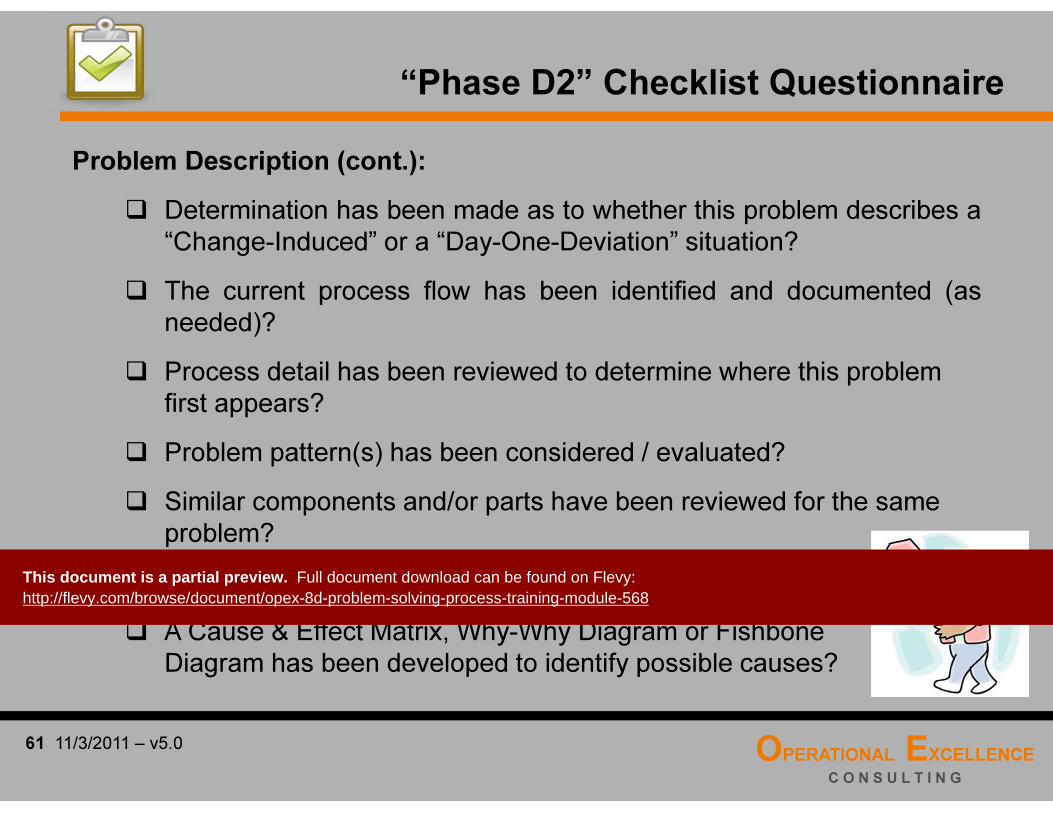
“Phase D2” Checklist Questionnaire
Problem Description (cont.):
� Determination has been made as to whether this problem describes a“Change-Induced” or a “Day-One-Deviation” situation?
� The current process flow has been identified and documented (asneeded)?
� Process detail has been reviewed to determine where this problem first appears?
� Problem pattern(s) has been considered / evaluated?
� Similar components and/or parts have been reviewed for the same problem?
� All required data has been collected and analyzed?
� A Cause & Effect Matrix, Why-Why Diagram or Fishbone Diagram has been developed to identify possible causes?
This document is a partial preview. Full document download can be found on Flevy: http://flevy.com/browse/document/opex-8d-problem-solving-process-training-module-568

OPERATIONAL EXCELLENCE
C O N S U L T I N G
64 11/3/2011 – v5.0
“Develop Interim Containment Actions” Key Activities
Purpose: Define, verify and implement Interim Containment Action toisolate the effects of the problem from any internal and/or externalCustomer until Permanent Corrective (Preventive) Action are implemented.
� Define potential Interim Containment Action
� Verify effectiveness of potential Interim Containment Action
� Select and implement Interim Containment Action
� Validate effectiveness of implemented Interim Containment Action with the Customer
This document is a partial preview. Full document download can be found on Flevy: http://flevy.com/browse/document/opex-8d-problem-solving-process-training-module-568

OPERATIONAL EXCELLENCE
C O N S U L T I N G
67 11/3/2011 – v5.0
PDCA or Deming Management Cycle
The “Develop Interim Containment Actions” Phase follows the PDCA Cycle
1. Plan
(Plan & Re-Plan)
2. Do
(Implement)
3. Check
(Monitor)
4. Act
(Evaluate)
Deming
PDCA Cycle
Determine which steps must be completed to achieve the plan’s objectives by the target date.
Implement and manage the implementation plan.
Record the results of the implementation phase.
Evaluate the results and decide if additional actions need to be developed.
This document is a partial preview. Full document download can be found on Flevy: http://flevy.com/browse/document/opex-8d-problem-solving-process-training-module-568

OPERATIONAL EXCELLENCE
C O N S U L T I N G
70 11/3/2011 – v5.0
1• Establish the Team
2• Describe the Problem
3• Develop Interim Containment Actions
4• Define and Verify Root Causes and Escape Points
5• Choose and Verify Permanent Corrective Actions
6• Implement and Validate Permanent Corrective Actions
7• Prevent Recurrence
8• Recognize Team and Individual Contributions
The 8D Problem Solving Process
This document is a partial preview. Full document download can be found on Flevy: http://flevy.com/browse/document/opex-8d-problem-solving-process-training-module-568
OPERATIONAL EXCELLENCE
C O N S U L T I N G
73 11/3/2011 – v5.0
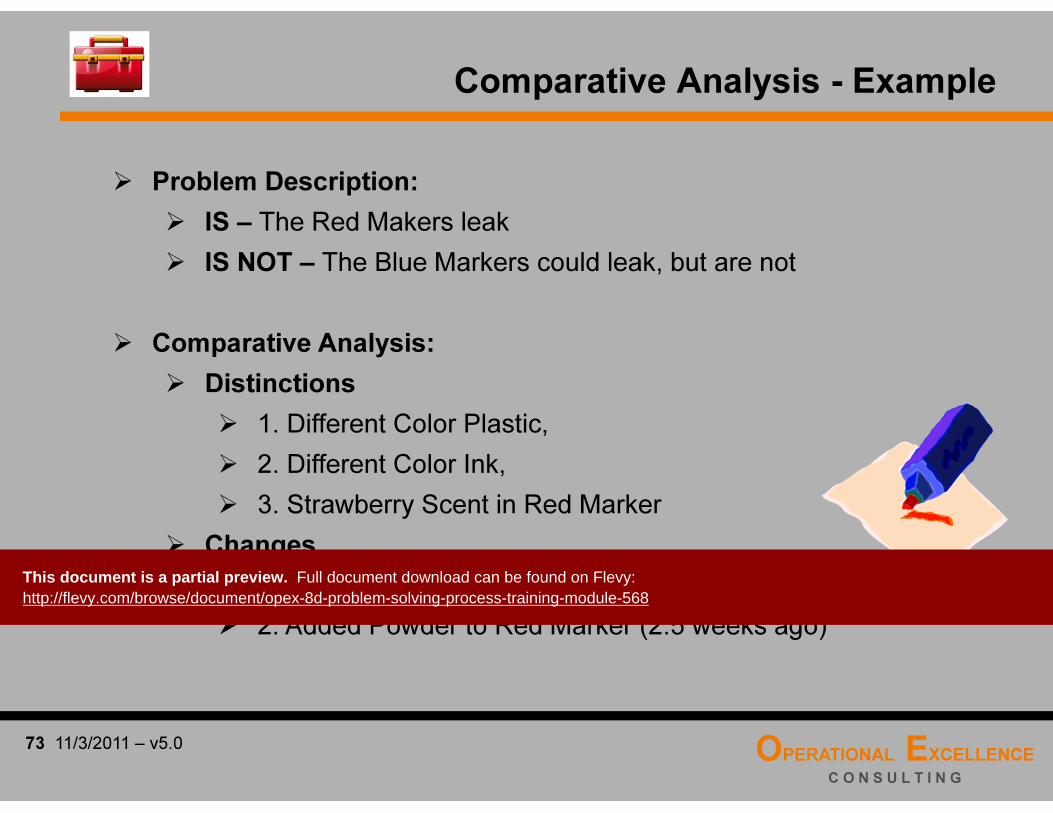
Comparative Analysis - Example
� Problem Description:
� IS – The Red Makers leak
� IS NOT – The Blue Markers could leak, but are not
� Comparative Analysis:
� Distinctions
� 1. Different Color Plastic,
� 2. Different Color Ink,
� 3. Strawberry Scent in Red Marker
� Changes
� 1. New Plastic Supplier (5 weeks ago),
� 2. Added Powder to Red Marker (2.5 weeks ago)
This document is a partial preview. Full document download can be found on Flevy: http://flevy.com/browse/document/opex-8d-problem-solving-process-training-module-568

OPERATIONAL EXCELLENCE
C O N S U L T I N G
76 11/3/2011 – v5.0
Cause & Effect Matrix – Phase 2
5. Score Correlation
between Process
Inputs and Problem
Statement or Defect3. List the Process Steps or Activities
4. List Inputs for each Process Step
1. List the Problem Statement(s)
2. Score (0 – 100) the Importance or Criticality of each Problem Statement, with the total equal to 100
This document is a partial preview. Full document download can be found on Flevy: http://flevy.com/browse/document/opex-8d-problem-solving-process-training-module-568

OPERATIONAL EXCELLENCE
C O N S U L T I N G
79 11/3/2011 – v5.0
Fishbone Diagram – Phase 2
In Phase 2 of the Fishbone Diagram, the team tries to reduce the large number ofpossible causes to a short list of most likely causes, using the Problem Description,data analysis and the team’s combined process knowledge and experience.
Remember, the root cause(s) convincingly supports and explains ALL facts availableand thus accounts for the problem. So, you need to ask yourself “If this would bethe root cause of the problem, would it explain the Problem Description?”
4M’s = MEN
METHODS
MATERIALS
MACHINES
+ ENVIRONMENT
4P’s = PEOPLE
PLANT
POLICIES
PROCEDURES
Machines
Materials Methods
Environment
Trunk
Primary Possible Cause Category
Main Branch
Minor Branch
Second-Level
Possible Causes
Men/People
Problem Statement
Most Likely
Cause #1
Most Likely
Cause #3
Most Likely
Cause #2
This document is a partial preview. Full document download can be found on Flevy: http://flevy.com/browse/document/opex-8d-problem-solving-process-training-module-568
OPERATIONAL EXCELLENCE
C O N S U L T I N G
82 11/3/2011 – v5.0
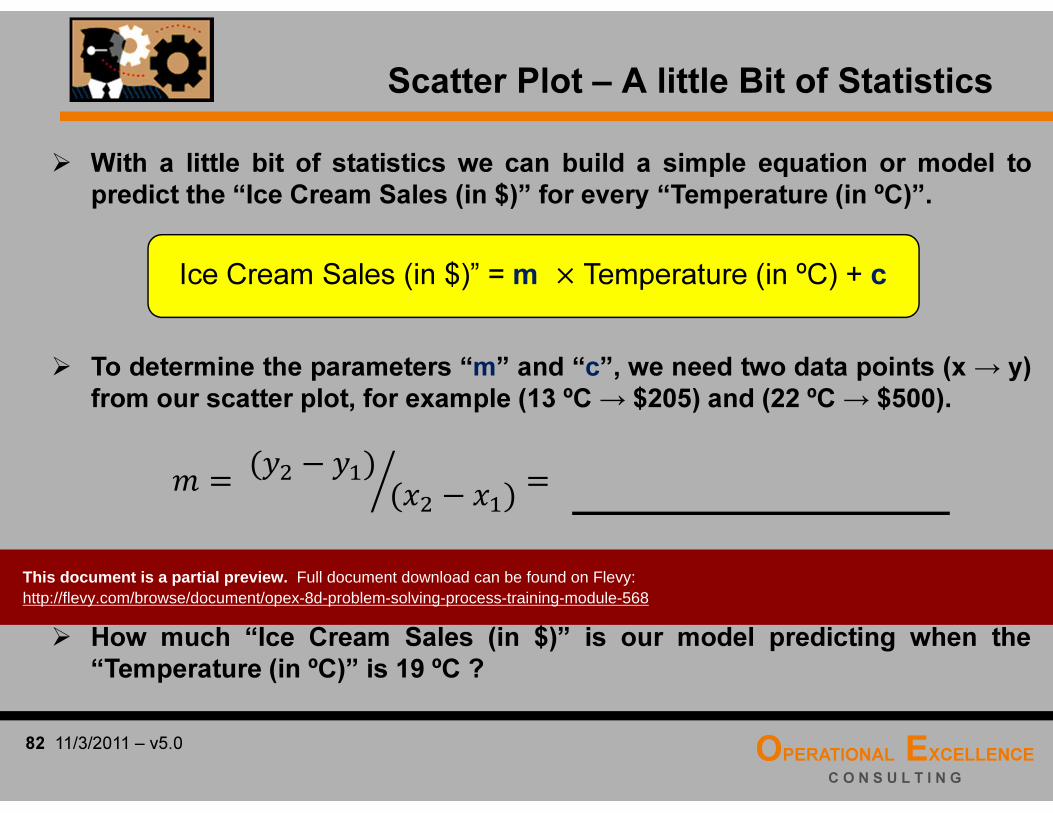
Scatter Plot – A little Bit of Statistics
� With a little bit of statistics we can build a simple equation or model topredict the “Ice Cream Sales (in $)” for every “Temperature (in ºC)”.
Ice Cream Sales (in $)” = m � Temperature (in ºC) + c
� To determine the parameters “m” and “c”, we need two data points (x → y)from our scatter plot, for example (13 ºC → $205) and (22 ºC → $500).
� � ��� � ��� ��� � ��� �
� �� �� � �� �� How much “Ice Cream Sales (in $)” is our model predicting when the
“Temperature (in ºC)” is 19 ºC ?
This document is a partial preview. Full document download can be found on Flevy: http://flevy.com/browse/document/opex-8d-problem-solving-process-training-module-568

OPERATIONAL EXCELLENCE
C O N S U L T I N G
85 11/3/2011 – v5.0
Root Cause Theory Testing
PROBLEM SOLVING PROCESS WORKSHEET
Problem Statement
(What is wrong with what?):Red Felt Tip Marker Leaks
IS IS NOT DISTINCTIONS CHANGESTEST FOR MOST LIKELY CAUSES
(+) (-) (?)
Describe what does occurDescribe what does not occur, but
could occur
What could explain the IS-IS NOT?
(People, Methods, Material,
Machines, Environment)
What has changed in, on, around or
about this distinction? When
did it change?
<Define Possible Root Cause
Theory>
What?
Object:
Defect:
Where?
Where is the object when the
defect is observed? Where is the
defect on the object? Are there
any pattern or trends identifiable?
When?
When was the defect observed
first? Can or was the defect be
observed before, during or after
other events? When since has the
defect occurred? Are there any
pattern or trends identifiable?
How Big?
How many objects have the
defect? What is the size of a single
defect? How many defects are on
each object? Are there any
pattern or trends identifiable?
2
3
3
3
3+ - ?
This document is a partial preview. Full document download can be found on Flevy: http://flevy.com/browse/document/opex-8d-problem-solving-process-training-module-568

OPERATIONAL EXCELLENCE
C O N S U L T I N G
88 11/3/2011 – v5.0
Root Cause Verification
� Active Verification is a process where …
� … the problem solver uses the variable thought to be the root cause tomake the effect come and go. Both coming and going are important teststo confirm root causes.
� Passive Verification is done by observation.
� With passive verification, you look for the presence of the root causewithout changing anything. If you cannot prove the presence of the rootcause, then chances are great that this most likely cause is not the rootcause.
Step 1: Identify, document and perform a passive and/or active
root cause verification method.
Step 2: Continue with the 8D Problem Solving Process if the
passive and/or active root cause verification was successful.
Otherwise, develop and test additional Root Cause Theories.
This document is a partial preview. Full document download can be found on Flevy: http://flevy.com/browse/document/opex-8d-problem-solving-process-training-module-568
OPERATIONAL EXCELLENCE
C O N S U L T I N G
91 11/3/2011 – v5.0
“Phase D4” Checklist Questionnaire
Escape Points:
� The process flow was reviewed and control points associated with theroot cause(s) identified.
� A determination was made as to the existence of a control system todetect the problem?
� If a control system exists, changes from its original design (if any) havebeen identified?
Project Management:
� The Project Champion has reviewed and supports the analysis, findings and conclusions?
� 8D Problem Solving Process Worksheet & Project Documentation has been updated?
This document is a partial preview. Full document download can be found on Flevy: http://flevy.com/browse/document/opex-8d-problem-solving-process-training-module-568
OPERATIONAL EXCELLENCE
C O N S U L T I N G
94 11/3/2011 – v5.0
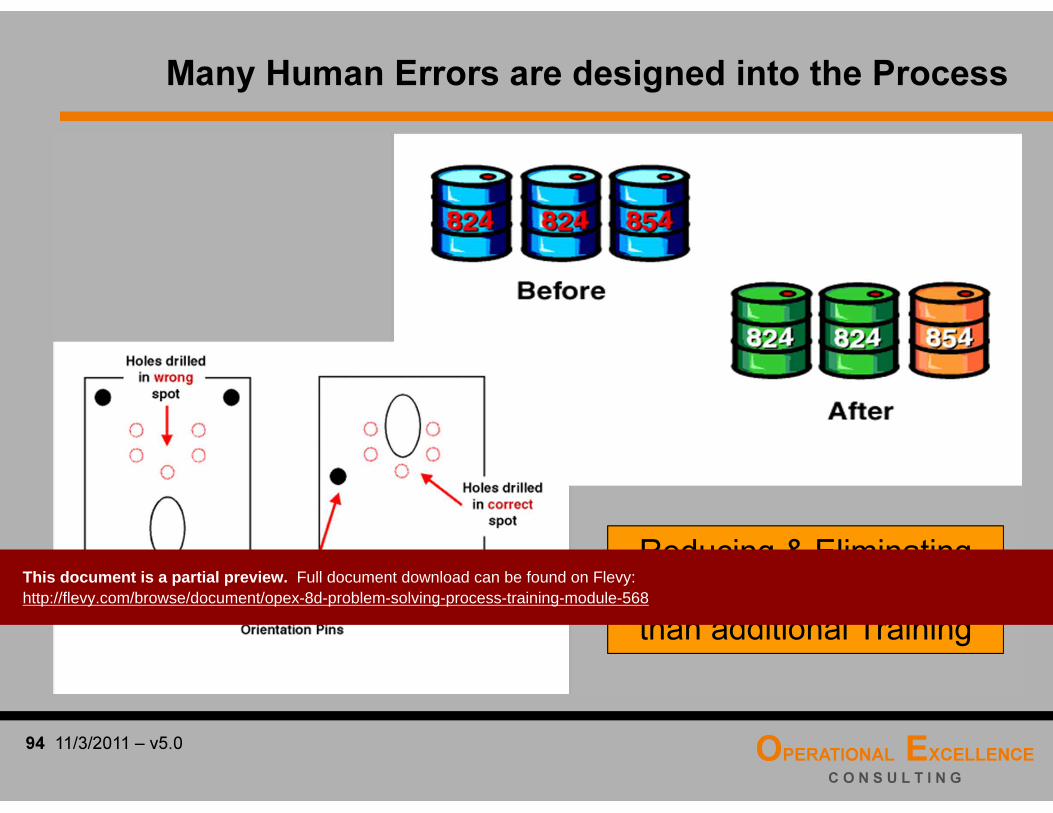
Many Human Errors are designed into the Process
Reducing & Eliminating
Human Error needs more
than additional Training
This document is a partial preview. Full document download can be found on Flevy: http://flevy.com/browse/document/opex-8d-problem-solving-process-training-module-568
OPERATIONAL EXCELLENCE
C O N S U L T I N G
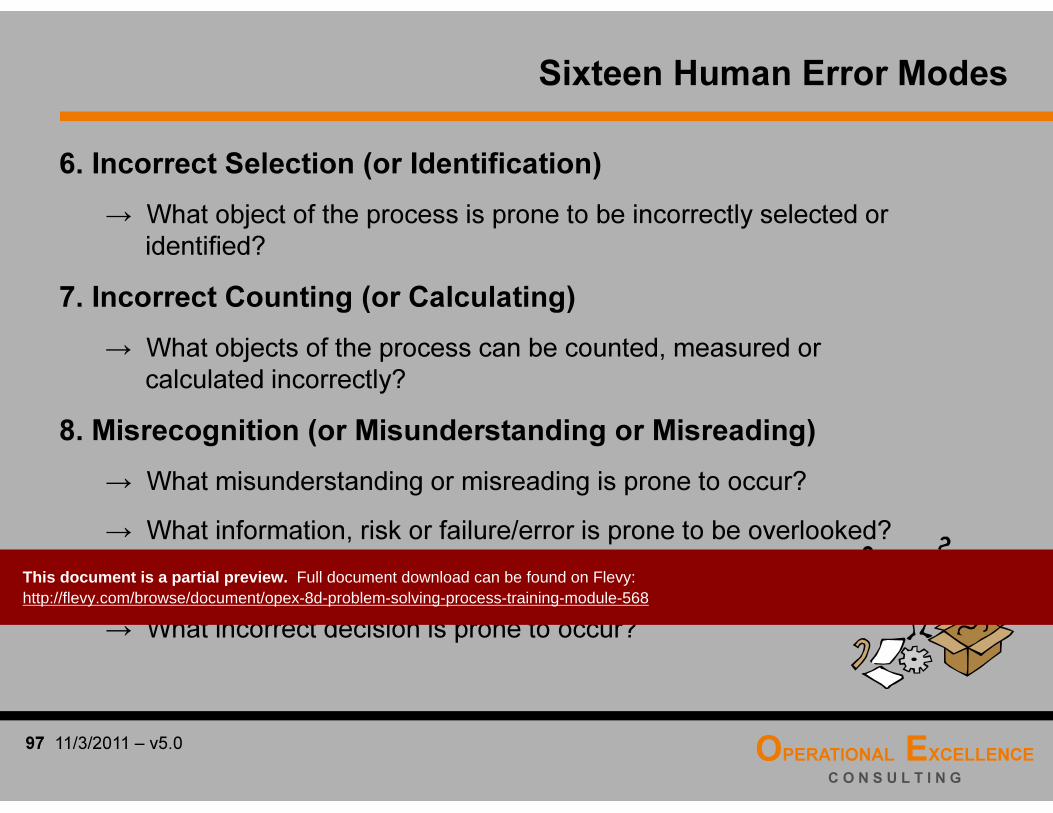
97 11/3/2011 – v5.0
6. Incorrect Selection (or Identification)
→ What object of the process is prone to be incorrectly selected or identified?
7. Incorrect Counting (or Calculating)
→ What objects of the process can be counted, measured or calculated incorrectly?
8. Misrecognition (or Misunderstanding or Misreading)
→ What misunderstanding or misreading is prone to occur?
→ What information, risk or failure/error is prone to be overlooked?
→ What miscommunication is prone to occur?
→ What incorrect decision is prone to occur?
Sixteen Human Error Modes
This document is a partial preview. Full document download can be found on Flevy: http://flevy.com/browse/document/opex-8d-problem-solving-process-training-module-568

OPERATIONAL EXCELLENCE
C O N S U L T I N G
100 11/3/2011 – v5.0
Six Mistake Proofing Principles
1. Elimination seeks to eliminate an error-prone process step by redesigning the product
or process so that the task or part is no longer necessary.
Example: An example of elimination is the use of ambient-light sensors to turn outside
lighting on and off.
2. Prevention modifies the product or process so that it is impossible to make a mistake
or that a mistake becomes a defect.
Example: An example would be the implementation of an automatic dispenser to insure
the correct amount of adhesive is applied during an assembly process or the coin
dispenser in food stores preventing that customers are getting short changed.
3. Replacement substitutes a more reliable process to improve repeatability. This
includes use of robotics or automation that prevents a manual assembly error.
Example: An example would be a camera that will not function when there is not enough
light to take a picture. Also some clothes dryers shut down when they detect an
overheating situation.
This document is a partial preview. Full document download can be found on Flevy: http://flevy.com/browse/document/opex-8d-problem-solving-process-training-module-568

OPERATIONAL EXCELLENCE
C O N S U L T I N G
103 11/3/2011 – v5.0
Poka (= inadvertent error) - Yoke (= avoid)
devices help us avoid defects, even when inadvertent errors are made.
Poka - Yoke Devices help build Quality
into Processes and Products
Human Errors - Poka-Yoke Mistake Proofing
The term Poka-yoke (poh-kah yoh-keh) was coined inJapan during the 1960s by Shigeo Shingo who was oneof the industrial engineers at Toyota.
Toyota: 80-90% of problems
are resolved on the floor
This document is a partial preview. Full document download can be found on Flevy: http://flevy.com/browse/document/opex-8d-problem-solving-process-training-module-568
OPERATIONAL EXCELLENCE
C O N S U L T I N G
106 11/3/2011 – v5.0
Seven Best Poka-Yoke Devices – Guide Pins
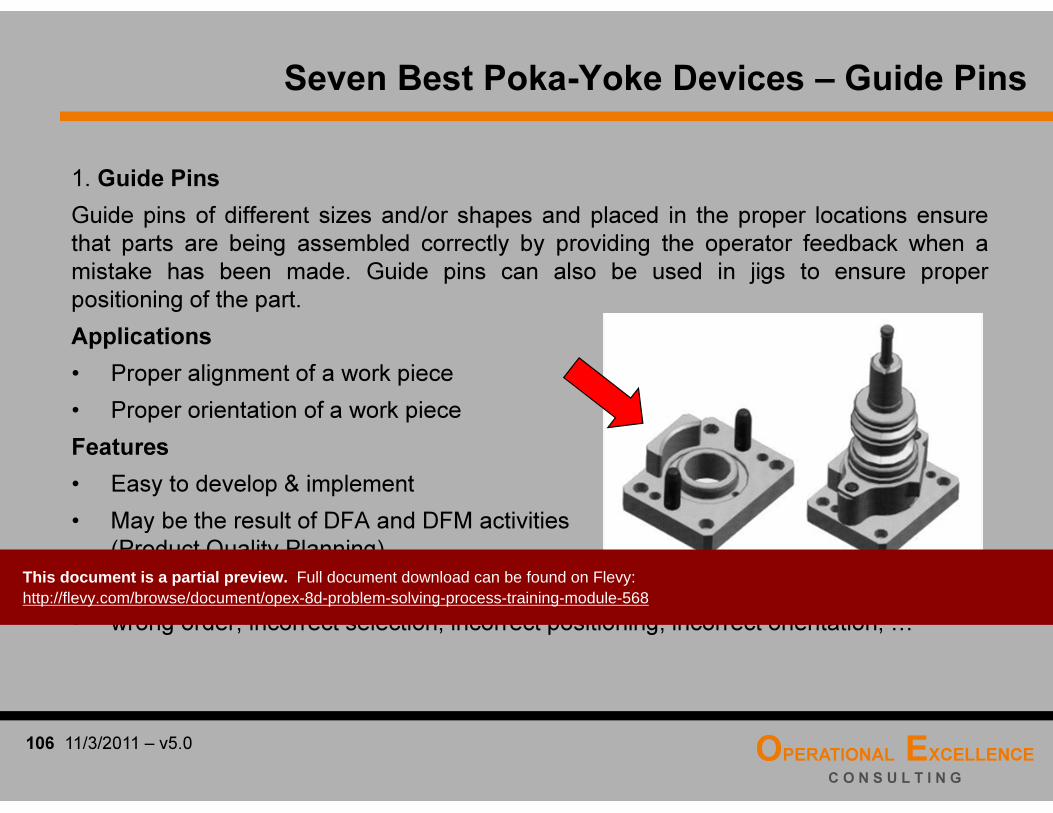
1. Guide Pins
Guide pins of different sizes and/or shapes and placed in the proper locations ensure
that parts are being assembled correctly by providing the operator feedback when a
mistake has been made. Guide pins can also be used in jigs to ensure proper
positioning of the part.
Applications
• Proper alignment of a work piece
• Proper orientation of a work piece
Features
• Easy to develop & implement
• May be the result of DFA and DFM activities
(Product Quality Planning)
Human Error Prevention
• wrong order, incorrect selection, incorrect positioning, incorrect orientation, …
This document is a partial preview. Full document download can be found on Flevy: http://flevy.com/browse/document/opex-8d-problem-solving-process-training-module-568
OPERATIONAL EXCELLENCE
C O N S U L T I N G
109 11/3/2011 – v5.0
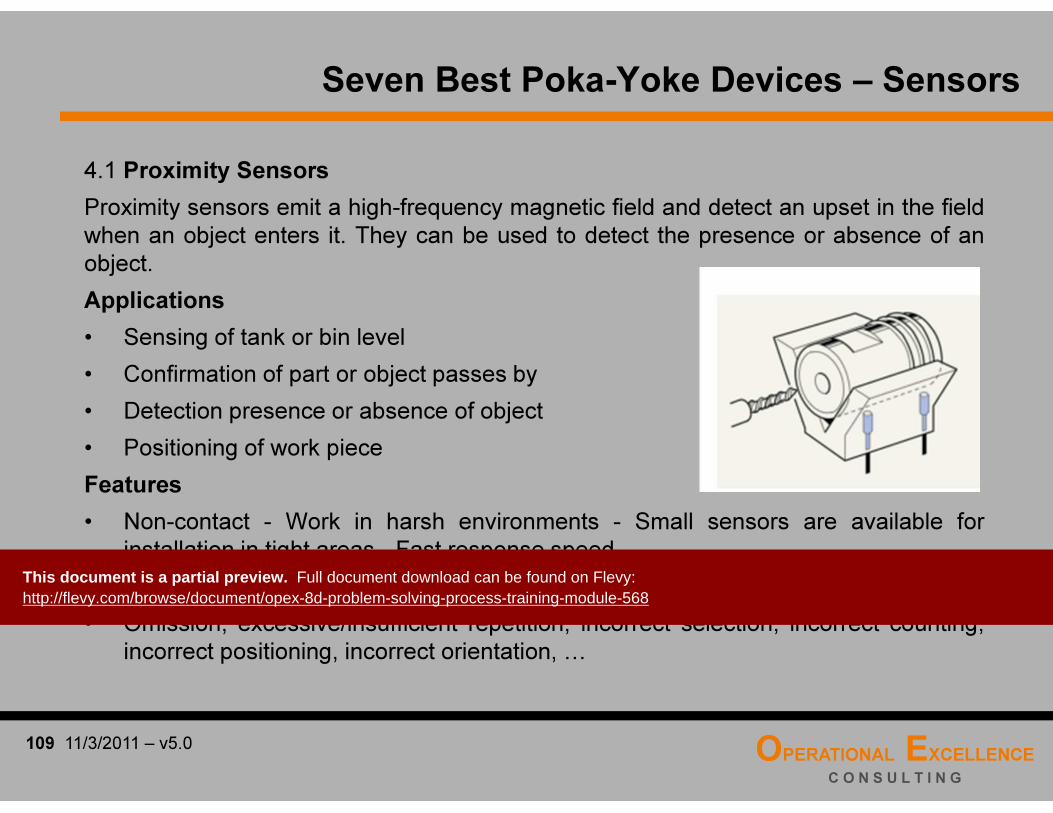
4.1 Proximity Sensors
Proximity sensors emit a high-frequency magnetic field and detect an upset in the field
when an object enters it. They can be used to detect the presence or absence of an
object.
Applications
• Sensing of tank or bin level
• Confirmation of part or object passes by
• Detection presence or absence of object
• Positioning of work piece
Features
• Non-contact - Work in harsh environments - Small sensors are available for
installation in tight areas - Fast response speed
Human Error Prevention
• Omission, excessive/insufficient repetition, incorrect selection, incorrect counting,
incorrect positioning, incorrect orientation, …
Seven Best Poka-Yoke Devices – Sensors
This document is a partial preview. Full document download can be found on Flevy: http://flevy.com/browse/document/opex-8d-problem-solving-process-training-module-568
OPERATIONAL EXCELLENCE
C O N S U L T I N G
112 11/3/2011 – v5.0
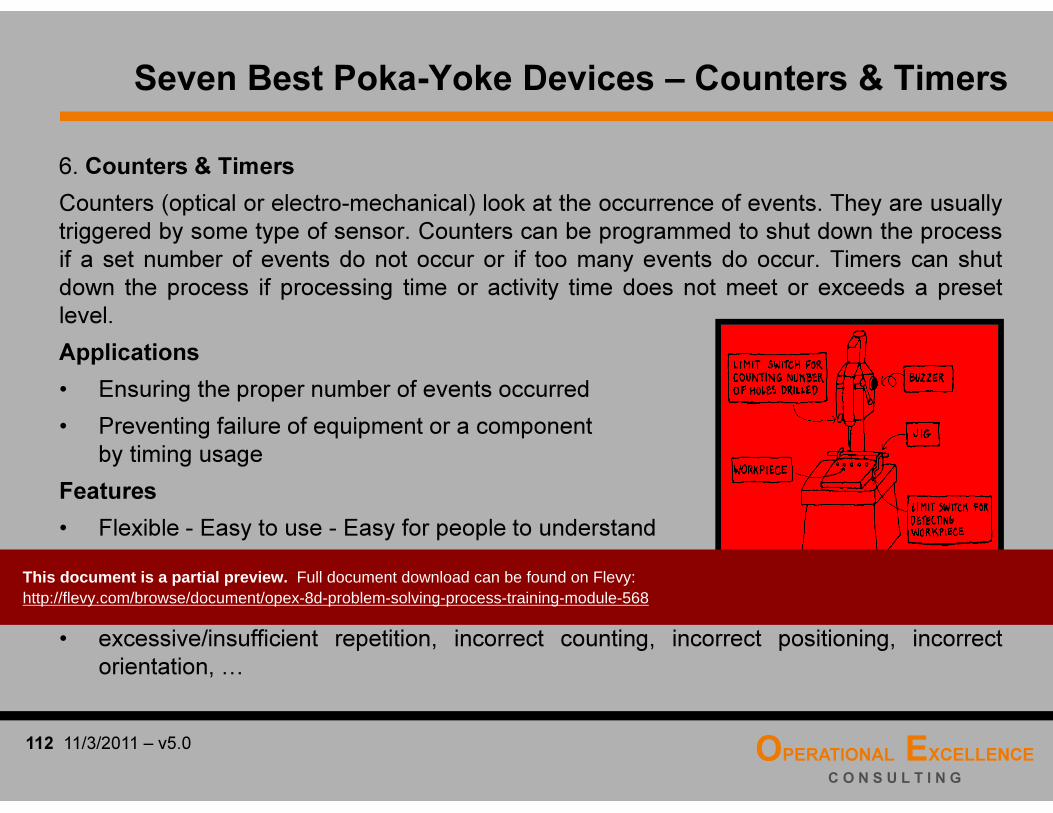
6. Counters & Timers
Counters (optical or electro-mechanical) look at the occurrence of events. They are usually
triggered by some type of sensor. Counters can be programmed to shut down the process
if a set number of events do not occur or if too many events do occur. Timers can shut
down the process if processing time or activity time does not meet or exceeds a preset
level.
Applications
• Ensuring the proper number of events occurred
• Preventing failure of equipment or a component
by timing usage
Features
• Flexible - Easy to use - Easy for people to understand
Human Error Prevention
• excessive/insufficient repetition, incorrect counting, incorrect positioning, incorrect
orientation, …
Seven Best Poka-Yoke Devices – Counters & Timers
Correct Number of HolesThis document is a partial preview. Full document download can be found on Flevy: http://flevy.com/browse/document/opex-8d-problem-solving-process-training-module-568
OPERATIONAL EXCELLENCE
C O N S U L T I N G
115 11/3/2011 – v5.0
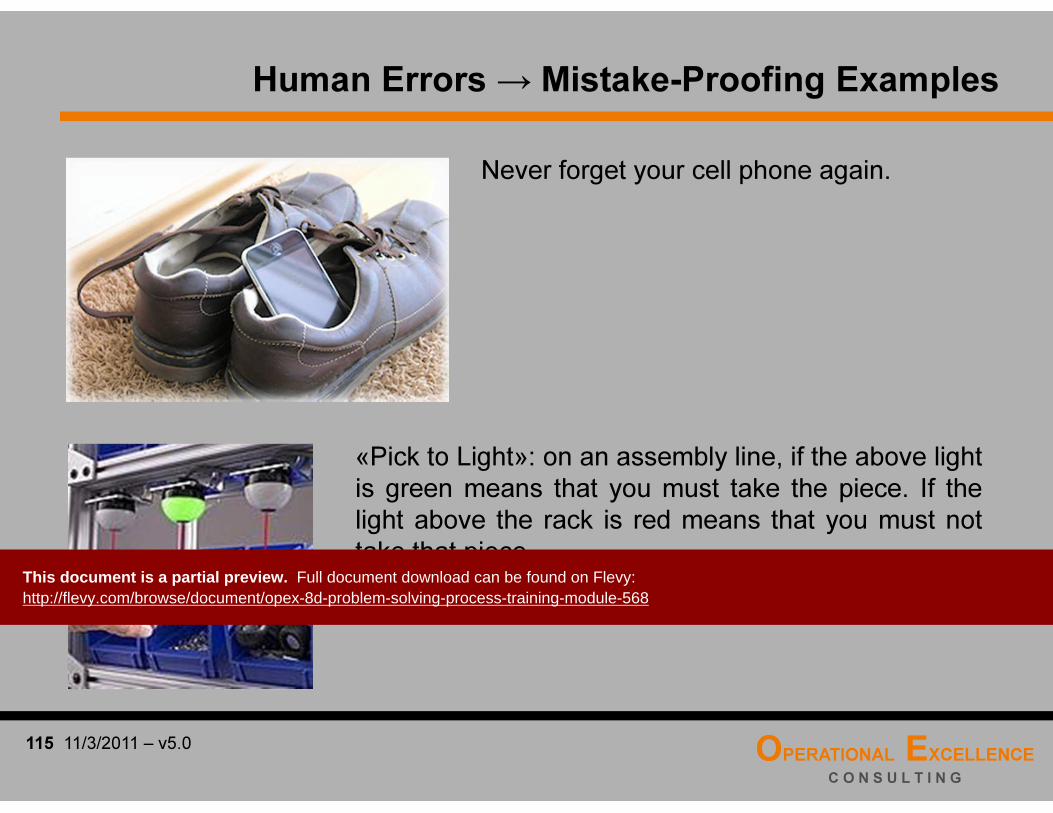
Human Errors → Mistake-Proofing Examples
Never forget your cell phone again.
«Pick to Light»: on an assembly line, if the above lightis green means that you must take the piece. If thelight above the rack is red means that you must nottake that piece.
This document is a partial preview. Full document download can be found on Flevy: http://flevy.com/browse/document/opex-8d-problem-solving-process-training-module-568

OPERATIONAL EXCELLENCE
C O N S U L T I N G
118 11/3/2011 – v5.0
Human Errors → Mistake-Proofing Examples
An oil change facility puts the dip stick on thefender protector.
Removing the fender protector will cause thedip stick to clatter on the floor unless it has beenreinserted. → Workplace Organization
After a patient died from receiving a medicationthat was not properly diluted, all of that medicationwas diluted before being stored. → Pre-Kitting
This document is a partial preview. Full document download can be found on Flevy: http://flevy.com/browse/document/opex-8d-problem-solving-process-training-module-568

OPERATIONAL EXCELLENCE
C O N S U L T I N G
121 11/3/2011 – v5.0
Human Errors → Mistake-Proofing Examples
Consumer friendly Mistake-Proofing productdesign improves usability and CustomerSatisfaction.
… and many more.
Preventing missing weld nuts, with a sensorlinked to a visual & audio alarm. Process willstop automatically and a corrective action isrequired.
This document is a partial preview. Full document download can be found on Flevy: http://flevy.com/browse/document/opex-8d-problem-solving-process-training-module-568

OPERATIONAL EXCELLENCE
C O N S U L T I N G
124 11/3/2011 – v5.0
Solution Selection Matrix – Basic Example
• Effectiveness Effectiveness of the solution to resolve the root cause or escape
point of the problem
• Cost in local currency Cost to implement the solution
• Time in weeks Time to implement the solution
• Resources Yes = enough resources (own)
Partly = not enough own resources, but more available in the
organization
No = no resources available in the organization
SOLUTION # 1
SOLUTION # 2
SOLUTION # 3
SOLUTION # 4
Effectiveness Cost Time Resources
70 %
90 %
50 %
65 %
20 000
52 000
24 000
18 000
14
5
12
15
Yes
Partly
No
Yes
This document is a partial preview. Full document download can be found on Flevy: http://flevy.com/browse/document/opex-8d-problem-solving-process-training-module-568
OPERATIONAL EXCELLENCE
C O N S U L T I N G
127 11/3/2011 – v5.0
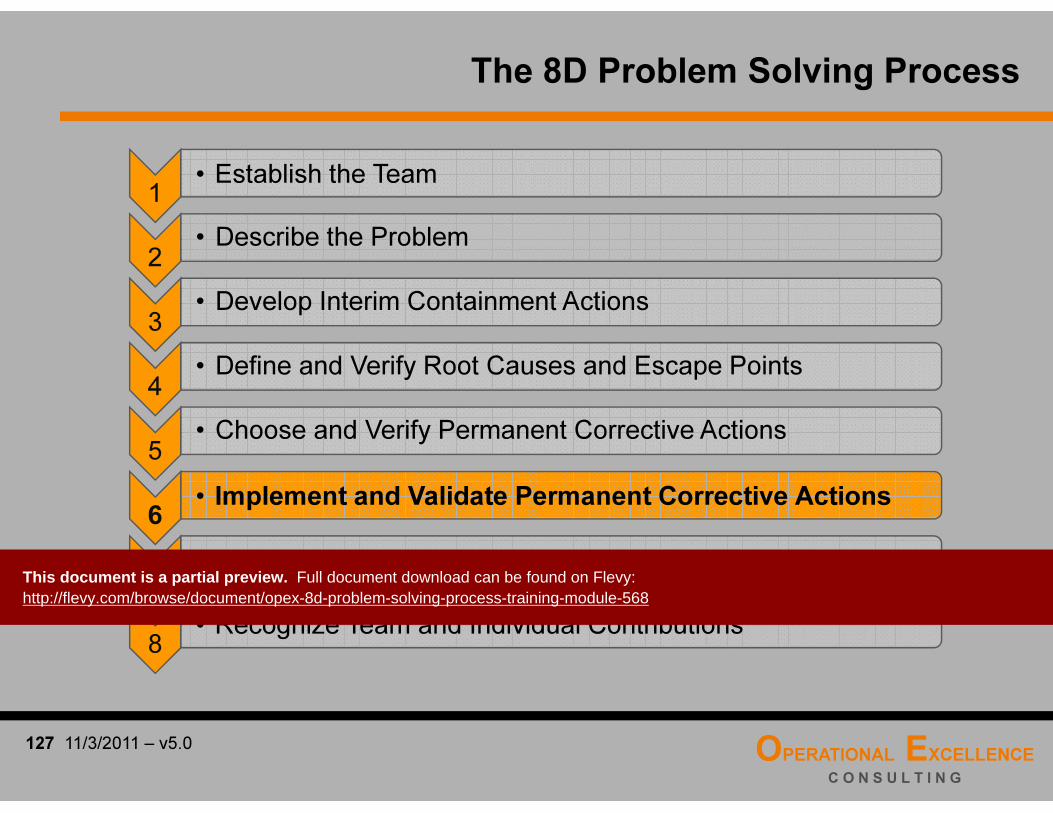
1• Establish the Team
2• Describe the Problem
3• Develop Interim Containment Actions
4• Define and Verify Root Causes and Escape Points
5• Choose and Verify Permanent Corrective Actions
6• Implement and Validate Permanent Corrective Actions
7• Prevent Recurrence
8• Recognize Team and Individual Contributions
The 8D Problem Solving Process
This document is a partial preview. Full document download can be found on Flevy: http://flevy.com/browse/document/opex-8d-problem-solving-process-training-module-568
OPERATIONAL EXCELLENCE
C O N S U L T I N G
130 11/3/2011 – v5.0
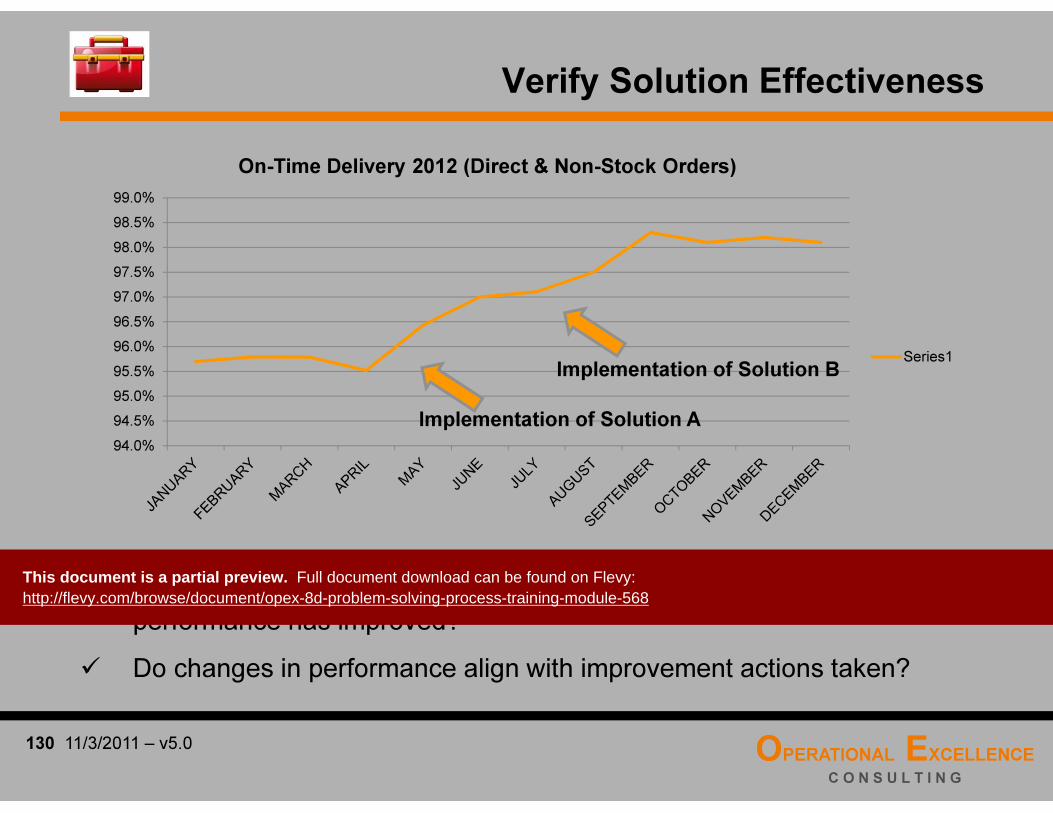
Verify Solution Effectiveness
� Does the data indicate that the problem has been solved or thatperformance has improved?
� Do changes in performance align with improvement actions taken?
94.0%
94.5%
95.0%
95.5%
96.0%
96.5%
97.0%
97.5%
98.0%
98.5%
99.0%
On-Time Delivery 2012 (Direct & Non-Stock Orders)
Series1
Implementation of Solution A
Implementation of Solution B
This document is a partial preview. Full document download can be found on Flevy: http://flevy.com/browse/document/opex-8d-problem-solving-process-training-module-568

OPERATIONAL EXCELLENCE
C O N S U L T I N G
133 11/3/2011 – v5.0
B vs. C Experiment
� In the B vs. C experiment, the symbols “B” and “C” stand for twoprocesses or methods or policies that need to be compared.
� “C” is, generally, the current process or method, and “B” is, supposedly,a better process or method.
� The power of the B vs. C experiment is that often with just a few units -most frequently, three “B” units and three “C” units - we can determinewhether the two process, methods or policies are leading to differentresults or not.
� A unit can consist of only one product or a small batch of products, usingthe average of each batch as the result for further analysis.
B B B C C C
This document is a partial preview. Full document download can be found on Flevy: http://flevy.com/browse/document/opex-8d-problem-solving-process-training-module-568

OPERATIONAL EXCELLENCE
C O N S U L T I N G
136 11/3/2011 – v5.0
How to Perform a B vs. C Experiment?
Step 2: Randomize and Conduct the Experiment
Randomizing the sequence of testing, say, three “B” units and three “C” units, is amust.
Randomizing filters out other variables, so that the test results can be correctlyattributed to the potential root cause - namely, the variable altered from “C” to “B”.
It is tempting, in production, to run three “C” units with the existing process andthen switching over to the “B” process to produce the “B” units. But that woulddefeat randomization, and the results could be invalid.
This document is a partial preview. Full document download can be found on Flevy: http://flevy.com/browse/document/opex-8d-problem-solving-process-training-module-568
OPERATIONAL EXCELLENCE
C O N S U L T I N G
139 11/3/2011 – v5.0
B vs. C Experiment – Exercise
The “Company XYZ Screw Production Process”
Task: Perform a B vs. C experiment to convince the company XYZ’s management team
that the new process will indeed produce shorter screws and resolve the received
Customer complaints.
Conduct Experiment & Collect Data:
Analysis & Conclusion:
This document is a partial preview. Full document download can be found on Flevy: http://flevy.com/browse/document/opex-8d-problem-solving-process-training-module-568

OPERATIONAL EXCELLENCE
C O N S U L T I N G
142 11/3/2011 – v5.0
1• Establish the Team
2• Describe the Problem
3• Develop Interim Containment Actions
4• Define and Verify Root Causes and Escape Points
5• Choose and Verify Permanent Corrective Actions
6• Implement and Validate Permanent Corrective Actions
7• Prevent Recurrence
8• Recognize Team and Individual Contributions
The 8D Problem Solving Process
This document is a partial preview. Full document download can be found on Flevy: http://flevy.com/browse/document/opex-8d-problem-solving-process-training-module-568
OPERATIONAL EXCELLENCE
C O N S U L T I N G
145 11/3/2011 – v5.0
Standard Work – Why should we bother?
We need to do away with the notion that standards necessarily mean rigidity.Rather, standard work can help people do their jobs consistently andreliably, and then improve how they do it.
The traditional view that efficiency requires bureaucracy and that bureaucracyimpedes flexibility needs to be replaced with a new model: clever applicationof standard work allows you to have efficiency and flexibility.
Our ability to improve the ways we do things depends on defining andshaping our daily habits of mind and practice — our "standard work.“
This document is a partial preview. Full document download can be found on Flevy: http://flevy.com/browse/document/opex-8d-problem-solving-process-training-module-568

OPERATIONAL EXCELLENCE
C O N S U L T I N G
148 11/3/2011 – v5.0
Process Control Plan – Objective
A Control Plan is a written statement of an organization’s quality planningactions for a specific process, product, or service.
The Objective of an effective Process Control Plan is to
� operate processes consistently on target with minimum variation,which results in minimum waste and rework
� assure that product and process improvements that have beenidentified and implemented become institutionalized
� provide for adequate training in all standard operating procedures,work instructions and tools
CustomerRequirements
Product & PartCharacteristics
ProcessInput & OutputCharacteristics
ProcessControls
ProcessControl
Plan
This document is a partial preview. Full document download can be found on Flevy: http://flevy.com/browse/document/opex-8d-problem-solving-process-training-module-568
OPERATIONAL EXCELLENCE
C O N S U L T I N G
151 11/3/2011 – v5.0
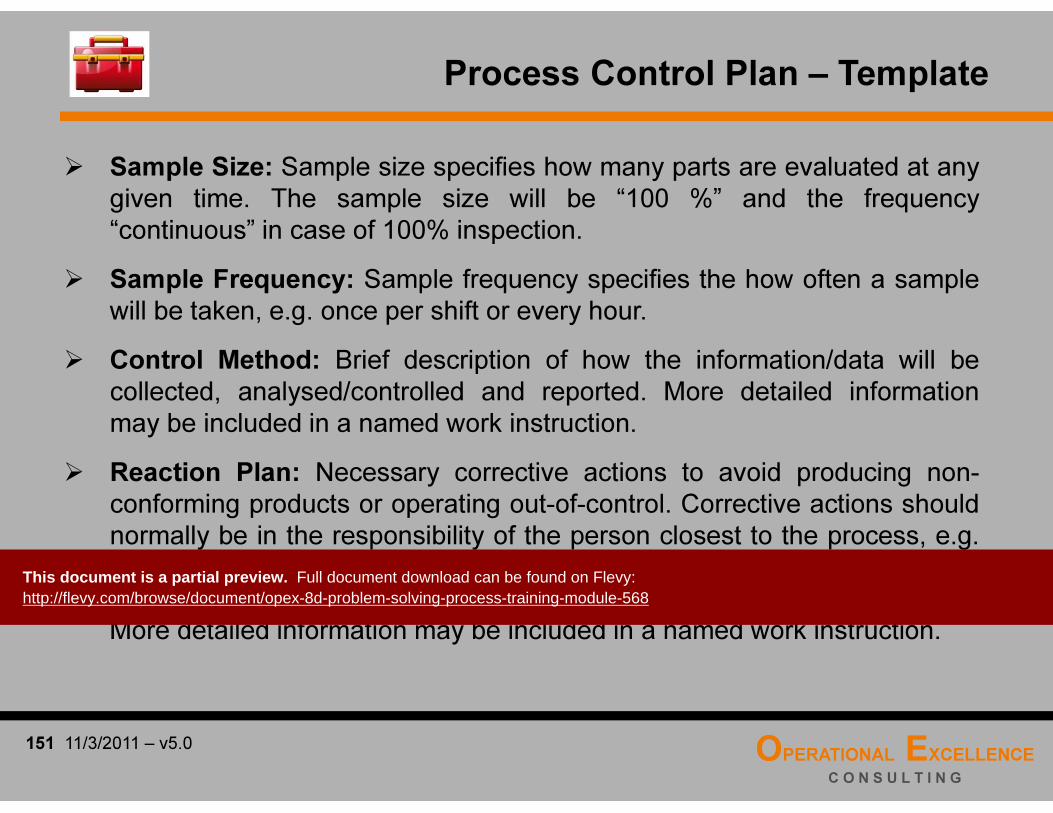
� Sample Size: Sample size specifies how many parts are evaluated at anygiven time. The sample size will be “100 %” and the frequency“continuous” in case of 100% inspection.
� Sample Frequency: Sample frequency specifies the how often a samplewill be taken, e.g. once per shift or every hour.
� Control Method: Brief description of how the information/data will becollected, analysed/controlled and reported. More detailed informationmay be included in a named work instruction.
� Reaction Plan: Necessary corrective actions to avoid producing non-conforming products or operating out-of-control. Corrective actions shouldnormally be in the responsibility of the person closest to the process, e.g.the machine operator. This is to secure, that immediate corrective actionswill take place and the risk of non-conforming products will be minimized.More detailed information may be included in a named work instruction.
Process Control Plan – Template
This document is a partial preview. Full document download can be found on Flevy: http://flevy.com/browse/document/opex-8d-problem-solving-process-training-module-568
OPERATIONAL EXCELLENCE
C O N S U L T I N G
154 11/3/2011 – v5.0
� The OCAP is a systematic and ideal problem-solving tool forprocess problems because it reacts to out-of-control situations inreal time.
� OCAPs standardize the best problem-solving approaches from themost skilled and successful problem solvers (experts/operators).
� The OCAP also allows (and requires) off-line analysis of theterminators to continually improve OCAP efficiency.
Some Benefits of Out-of-Control-Action-Plans
This document is a partial preview. Full document download can be found on Flevy: http://flevy.com/browse/document/opex-8d-problem-solving-process-training-module-568

OPERATIONAL EXCELLENCE
C O N S U L T I N G
157 11/3/2011 – v5.0
“Phase D7” Checklist Questionnaire
Corrective & Preventive Solutions (cont.):
� Plans have been written to coordinate preventive actions andstandardize the practices?
� A method for communicating to those affected by the changes in thenew practices has been determined?
� The Champion concurs with the identified corrective & preventiveactions and plans?
Project Management:
� 8D Problem Solving Process Worksheet & Project Documentation has been updated?
This document is a partial preview. Full document download can be found on Flevy: http://flevy.com/browse/document/opex-8d-problem-solving-process-training-module-568
OPERATIONAL EXCELLENCE
C O N S U L T I N G
160 11/3/2011 – v5.0
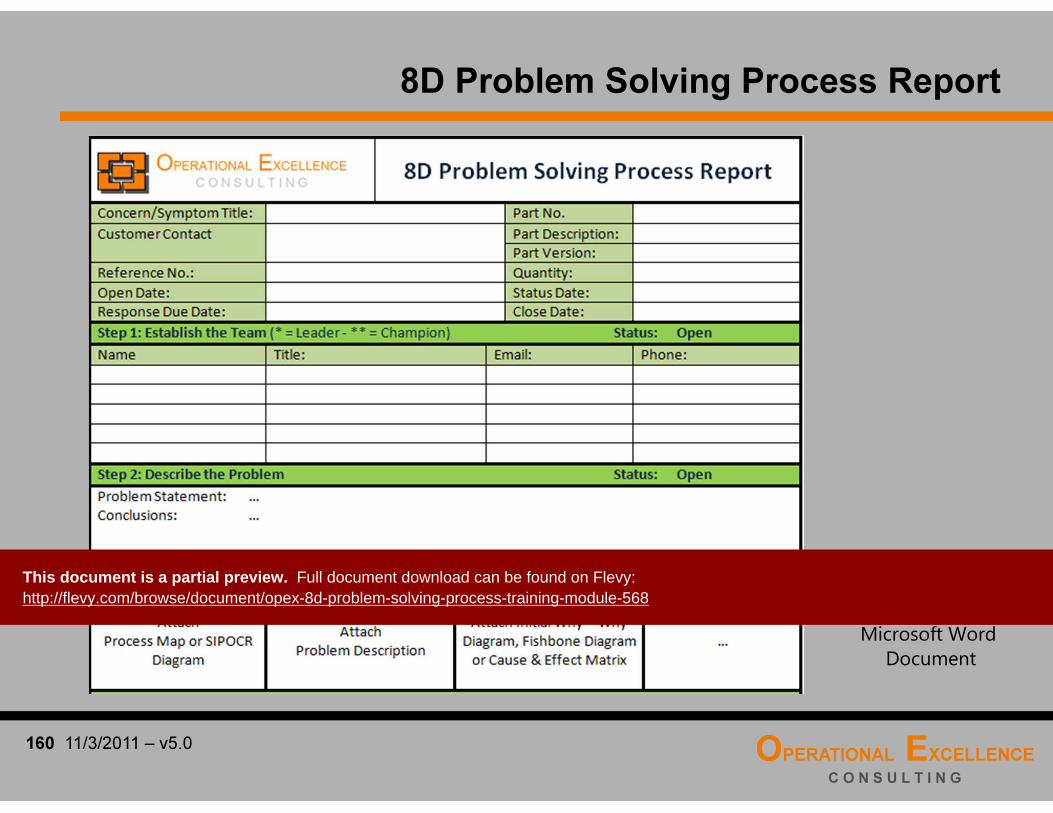
8D Problem Solving Process Report
Microsoft Word
Document
This document is a partial preview. Full document download can be found on Flevy: http://flevy.com/browse/document/opex-8d-problem-solving-process-training-module-568

OPERATIONAL EXCELLENCE
C O N S U L T I N G
163 11/3/2011 – v5.0
Additional Material
This document is a partial preview. Full document download can be found on Flevy: http://flevy.com/browse/document/opex-8d-problem-solving-process-training-module-568
1
Flevy (www.flevy.com) is the marketplace
for premium documents. These
documents can range from Business
Frameworks to Financial Models to
PowerPoint Templates.
Flevy was founded under the principle that
companies waste a lot of time and money
recreating the same foundational business
documents. Our vision is for Flevy to
become a comprehensive knowledge base
of business documents. All organizations,
from startups to large enterprises, can use
Flevy— whether it's to jumpstart projects, to
find reference or comparison materials, or
just to learn.
Contact Us
Please contact us with any questions you may have about our company.
• General [email protected]
• Media/[email protected]
Related Documents
![Knowledge Management System for Failure Analysis in Hard ...piak/paper/2017/prinya-snpd2017.pdf · Eight disciplines problem solving (8D) [10] is a problem-solving method that is](https://static.cupdf.com/doc/110x72/5ee3cc10ad6a402d666d68c9/knowledge-management-system-for-failure-analysis-in-hard-piakpaper2017prinya-.jpg)