1. Report No. 2. Government Accession No. 3. Recipient's Catalog No. 4. Title and Subtitle Alkali Silica Reaction Mitigation & Prevention Measures-Phase I 5. Report Date December 2016 6. Performing Organization Code AHTD and MBTC 7. Authors Richard Deschenes, Jr. and W. Micah Hale 8. Performing Organization Report No. MBTC 4000 9. Performing Organization Name and Address 4190 Bell 1 University of Arkansas Fayetteville, AR 72701 10. Work Unit No. (TRAIS) 11. Contract or Grant No. 12. Sponsoring Agency Name and Address Arkansas Highway and Transportation Department P. O. Box 2261 Little Rock, AR 72203 13. Type of Report and Period Covered Final Report 14. Sponsoring Agency Code 15. Supplementary Notes Supported by a grant from the Arkansas Highway and Transportation Department and the Mack Blackwell Rural Transportation Center 16. Abstract In 2012 it was discovered that roughly 4 miles of interstate median barrier along Interstate 540 had rapidly deteriorated. After the initial inspection, a sample was submitted for analysis, and found to contain evidence of alkali-silica reaction (ASR). A research program was implemented with the goal of determining the cause of ASR and developing a program for mitigating the ongoing deterioration. The median barrier had not deteriorated equally throughout the 4 miles, and the level of damage varied considerable throughout the length. A visual inspection of the median barrier was conducted and the median barrier was divided into sections based on the visible damage. A research program was implemented to evaluate several treatment methods, with the goal of slowing or arresting the deterioration within the median barrier and in the concrete pavement. 17. Key Words Alkali silica reaction, silane, concrete 18. Distribution Statement NO RESTRICTIONS. THIS DOCUMENT IS AVAILABLE FROM THE NATIONAL TECHNICAL INFORMATION SERVICE, SPRINGFIELD, VA. 22161 19. Security Classif. (of this report) UNCLASSIFIED 20. Security Class. (of this page) UNCLASSIFIED 21. No. of Pages 86 22. Price N/A

Welcome message from author
This document is posted to help you gain knowledge. Please leave a comment to let me know what you think about it! Share it to your friends and learn new things together.
Transcript

1. Report No.
2. Government Accession No. 3. Recipient's Catalog No.
4. Title and Subtitle
Alkali Silica Reaction Mitigation & Prevention Measures-Phase I
5. Report Date December 2016
6. Performing Organization Code
AHTD and MBTC 7. Authors
Richard Deschenes, Jr. and W. Micah Hale
8. Performing Organization Report No.
MBTC 4000
9. Performing Organization Name and Address 4190 Bell 1 University of Arkansas Fayetteville, AR 72701
10. Work Unit No. (TRAIS)
11. Contract or Grant No.
12. Sponsoring Agency Name and Address
Arkansas Highway and Transportation Department P. O. Box 2261 Little Rock, AR 72203
13. Type of Report and Period Covered
Final Report
14. Sponsoring Agency Code
15. Supplementary Notes
Supported by a grant from the Arkansas Highway and Transportation Department and the Mack Blackwell Rural Transportation Center
16. Abstract In 2012 it was discovered that roughly 4 miles of interstate median barrier along Interstate 540 had rapidly deteriorated. After the initial inspection, a sample was submitted for analysis, and found to contain evidence of alkali-silica reaction (ASR). A research program was implemented with the goal of determining the cause of ASR and developing a program for mitigating the ongoing deterioration. The median barrier had not deteriorated equally throughout the 4 miles, and the level of damage varied considerable throughout the length. A visual inspection of the median barrier was conducted and the median barrier was divided into sections based on the visible damage. A research program was implemented to evaluate several treatment methods, with the goal of slowing or arresting the deterioration within the median barrier and in the concrete pavement.
17. Key Words
Alkali silica reaction, silane, concrete
18. Distribution Statement
NO RESTRICTIONS. THIS DOCUMENT IS AVAILABLE FROM THE NATIONAL TECHNICAL INFORMATION SERVICE, SPRINGFIELD, VA. 22161
19. Security Classif. (of this report)
UNCLASSIFIED
20. Security Class. (of this page)
UNCLASSIFIED
21. No. of Pages
86
22. Price
N/A

Abstract
Alkali-silica reaction (ASR) is an expansive reaction between the alkalis in the cement
and reactive silica in the aggregates. AHTD has witnessed the detrimental effects of ASR in the
I-440 bridge substructure over the AR River in East Little Rock and is now witnessing the
deterioration of the barrier wall along I-49 in Northwest Arkansas. The proposed research
program identified reactive aggregates in AR, investigated measures to prevent ASR, and
reviewed methods to mitigate ASR damage. Standard laboratory tests were conducted on local
aggregates, cements, and fly ashes. The laboratory testing revealed that Arkansas River sand
from Van Buren, Arkansas is potentially deleteriously reactive when used in combination with
high alkali (>0.6% Na2Oe) cements. The test results confirm that Van Buren sand can cause
ASR deterioration in concrete, and that care should be taken to use cements with lower alkalis.
Alternatively, a cement replacement greater than 30% with Class C fly ash can prevent ASR.
The Arkansas River sand is safe for use in concrete so long as these recommendations are
followed. Sections of the barrier wall were treated with commercially available products, which
reduce the relative humidity (RH) of the concrete and slow the ASR process. The barrier wall
monitoring results indicate that silane treatments beneficially reduced expansion in sections of all
deterioration levels. Finally, the Potential for Further Expansion (PFE) and field testing indicate
that freezing and thawing were the cause of the moderate to severe deterioration in the wall. The
PFE results indicate that the available alkalis within the pavement have been adsorbed into
reaction products and there are not enough alkalis remaining for ASR gel to develop.

i
Table of Contents
Chapter 1 Introduction ............................................................................................................. 1
Chapter 2 Literature Review ................................................................................................... 4 2.1 Alkali-Silica Reaction ...................................................................................................... 4 2.1.1 Mitigation of ASR .................................................................................................. 8 2.2 Laboratory Tests ............................................................................................................. 12 2.2.1 Accelerated Mortar Bar Test (AMBT) .................................................................. 13 2.2.2 Concrete Prism Test .............................................................................................. 14
2.2.3 Damage Rating Index (DRI) ................................................................................. 14 2.2.4 Potential for Further Expansion (PFE) ................................................................. 15
2.2.5 Alkali Extraction ................................................................................................... 17
2.3 Field Monitoring ............................................................................................................ 18 2.3.1 Barrier Wall .......................................................................................................... 21
2.3.2 Pavement ............................................................................................................... 22
Chapter 3 Materials and Methods ......................................................................................... 23 3.1 Preliminary Investigation .............................................................................................. 23
3.1.1 Petrographic Analysis ........................................................................................... 23 3.1.2 Visual Inspection of Median Barrier ..................................................................... 24
3.2 Laboratory Tests ............................................................................................................. 25
3.2.1 Material Sources ................................................................................................... 26 3.2.2 Accelerated Mortar Bar Test (AMBT) ................................................................. 26
3.2.3 Concrete Prism Test (CPT) ................................................................................... 30 3.2.4 Alkali Extraction and PFE .................................................................................... 33
3.2.5 Damage Rating Index (DRI) ................................................................................. 34 3.3 Barrier Wall .................................................................................................................... 36
3.3.1 Instrumentation ..................................................................................................... 36 3.3.2 Treatment .............................................................................................................. 39 3.3.3 Monitoring ............................................................................................................ 40
3.4 Pavement ........................................................................................................................ 43
3.4.1 Instrumentation .................................................................................................... 43
3.4.2 Treatment .............................................................................................................. 46
3.4.3 Samples ................................................................................................................. 47
Chapter 4 Results and Discussion .......................................................................................... 48 4.1 Laboratory Tests ............................................................................................................. 49
4.1.1 Accelerated Mortar Bar Test (AMBT) and Concrete Prism Test (CPT) .............. 50
4.1.2 Alkali Extraction and PFE .................................................................................... 54 4.1.3 Damage Rating Index ........................................................................................... 56
4.2 Barrier Wall .................................................................................................................... 58 4.2.1 Minimal Deterioration .......................................................................................... 59
4.2.2 Moderate Deterioration ......................................................................................... 60 4.2.3 Severe Deterioration ............................................................................................. 62 4.2.4 Relative Humidity ................................................................................................. 56
4.3 Pavement ........................................................................................................................ 66
4.3.1 Average ................................................................................................................. 67 4.3.2 Relative Humidity ................................................................................................. 70

ii
4.3.3 Enviroseal ............................................................................................................. 73 4.3.4 Baracade ................................................................................................................ 74
4.3.5 Sikagard ................................................................................................................ 74
Chapter 5 Conclusions ............................................................................................................ 78 5.1 Laboratory Tests ............................................................................................................. 78 5.2 Barrier Wall .................................................................................................................... 79 5.3 Pavement ........................................................................................................................ 79
Acknowledgements ..................................................................................................................... 80
References……………………………………………………………………………………….81

iii
List of Figures
Figure 2.1-1 Concrete element showing map cracking ................................................................ 6 Figure 2.3-1 Typical DEMEC gauage measurment and grid ..................................................... 19
Figure 3.1-1 Barrier wall section minimal deterioration ............................................................ 24
Figure 3.1-2 Barrier wall section moderate deterioration ........................................................... 25 Figure 3.2-1 Mortar-bar mold with gage studs (left) and three mortar bars (right) .................... 27 Figure 3.2-2 Mortar-bars (left) and mortar-bar in storage container (right) ............................... 28 Figure 3.2-3 Typical CPT prism molds (left) and storage containers (right) ............................. 31
Figure 3.2-4 Typical prepared DRI sample with grid ................................................................. 35 Figure 3.3-1 Typical length-change grid (left) and dimensions (right) ...................................... 36 Figure 3.3-2 Typical gage stud (left) and humidity port with cap (right) ................................... 37
Figure 3.3-3 DEMEC gage during length-change measurement ................................................ 38 Figure 3.4-1 Pavement treatment location and numbering ......................................................... 47 Figure 4.1 Median barrier deterioration level ............................................................................. 49
Figure 4.1-1 Strain with respect to time for AMBT and CPT ..................................................... 51 Figure 4.1-2 Strain with respect to time for AMBT with fly ash ................................................ 53
Figure 4.1-3 Alkali concentration ................................................................................................ 55 Figure 4.1-4 Potential for further expansion in concrete pavement ............................................. 56 Figure 4.1-5 DRI results for core samples from I49 .................................................................... 58
Figure 4.2-1 Strain with respect to time for barrier wall sections exhibiting minimal
deterioration .................................................................................................................................. 60
Figure 4.2-2 Strain with respect to time for barrier wall sections exhibiting moderate
deterioration .................................................................................................................................. 62
Figure 4.2-3 Strain with respect to time for barrier wall sections exhibiting severe deterioration
....................................................................................................................................................... 63
Figure 4.2-4 Strain (%) with respect to time (days) for barrier wall control sections, with seasons
highlighted to indicate the increase in strain rate over winter months ......................................... 64
Figure 4.2-5 RH (%) with respect to time (days) for barrier wall sections exhibiting minimal
deterioration (Top). Moderate deterioration (Bottom).................................................................. 66 Figure 4.3-1 Average travel strain (%) with respect to time (days) for pavement control panels
(Top). Transverse strain (%) (Bottom) ......................................................................................... 68 Figure 4.3-2 Average travel strain (%) with respect to time (days) for treated pavement panels
(Top). Transverse strain (%) (Bottom). ........................................................................................ 69 Figure 4.3-3 Average RH (%) with respect to time (days) for treated pavement panels (Top).
Enviroseal treated panels (Bottom) ............................................................................................... 71
Figure 4.3-4 RH (%) with respect to time (days) for Baracade treated pavement panels (Top).
Sikagard treated panels (Bottom) .................................................................................................. 72 Figure 4.3-5 Travel strain (%) with respect to time (days) for Enviroseal treated pavement
panels (Top). Transverse strain (%) (Bottom) .............................................................................. 74
Figure 4.3-6 Travel strain (%) with respect to time (days) for Baracade treated pavement panels
(Top). Transverse strain (%) (Bottom) ......................................................................................... 75 Figure 4.3-7 Travel strain (%) with respect to time (days) for Sikagard treated pavement panels
(Top). Transverse strain (%) (Bottom) ......................................................................................... 76

iv
List of Tables
Table 3.2-1 ASTM C1260 standard gradation and batch weights ............................................... 27 Table 3.2-2 ASTM C1293 mixture deisgn specifications and typical batch weights .................. 32
Table 3.2-3 Petrographic features of interest for the DRI test method ........................................ 35 Table 3.3-1 Material cost and application rate for surface treatments ......................................... 39 Table 3.3-4 Application of surface treatment (left) and crack sealant (right) ............................. 40 Table 3.4-1 Silane treatments and application rates .................................................................... 47 Table 4.1 Length of mdian barrier sections ................................................................................. 49

1
1. INSTRODUCTION
A concrete barrier and pavement along Interstate 49 in Northwest Arkansas deteriorated
prematurely by 2011. A preliminary inspection of the wall and adjacent pavement revealed that
visible cracking was present along the wall and pavement. Core samples were sent to CTLGroup
for petrographic analysis. The cause of deterioration was diagnosed as Alkali-Silica Reaction
(ASR) and freezing and thawing. The Arkansas State Highway and Transportation Department
(AHTD) and University of Arkansas Department of Civil Engineering initiated Project No. MBTC
4000 to determine the cause of deterioration and to develop mitigation measures. A laboratory
and field testing program was established to determine the source of alkali-silica reactive materials,
to develop measures to prevent future cases of ASR, and to develop mitigation measures to extend
the service life of the pavement and wall.
Standard laboratory tests were conducted on local aggregates, cements, and fly ashes. The
laboratory testing revealed that Arkansas River sand from Van Buren, Arkansas is potentially
deleteriously reactive when used in combination with high alkali (>0.6% Na2Oe) cements. The
test results confirm that Van Buren sand can cause ASR deterioration in concrete, and that care
should be taken to use cements with lower alkalis. Alternatively, a cement replacement greater
than 30% with Class C fly ash can prevent ASR. The Arkansas River sand is safe for use in
concrete so long as these recommendations are followed.
Alkali extraction tests confirmed that the alkalinity of the concrete was sufficient for ASR to
develop. However, the Potential for Further Expansion (PFE) and field testing indicate that
freezing and thawing were the cause of the moderate to severe deterioration in the wall. The PFE
results indicate that the available alkalis within the pavement have been adsorbed into reaction
products and there are not enough alkalis remaining for ASR gel to develop. However, the existing

2
gel products adsorb water and lead to continued expansion. There is also sufficient silica
remaining in the concrete to sustain ASR if an outside source of alkalis were introduced.
The Damage Rating Index (DRI) test results confirm that ASR and freezing and thawing
distress are occurring in the pavement. The coarse aggregate contains closed cracks from the
crushing process. However, the concrete exhibits open cracks in the aggregate and cement matrix,
as well as ASR gel products. This indicates that ASR has developed in the pavement and that
freezing and thawing has resulted as a secondary deterioration mechanism.
Sections of the barrier wall were treated with commercially available products, which reduce
the relative humidity (RH) of the concrete and slow the ASR process. The barrier wall monitoring
results indicate that silane treatments beneficially reduced expansion in sections of all deterioration
levels. Treating the barrier with silane will reduce the relative humidity (RH) of the concrete,
inhibiting the development of ASR and slowing the expansion of ASR gel within the concrete. As
an additional benefit, the silane may reduce the saturation state of the concrete thereby reducing
the stress that occurs during freezing events. This benefit will prevent deterioration and increase
the useful life of the concrete. The elastomeric paint and linseed oil treatments provided
inconclusive results. In some of the section, the treatments reduced deterioration as compared to
the control sections. However, this result was not consistent for all deterioration levels and the
products are not recommended as compared to silane treatment.
The pavement monitoring results are inconclusive at this time. After two years of monitoring,
the pavement does not appear to be expanding. Although panels of the pavement were treated
with silane, the results did not indicate a beneficial reduction in expansion as compared to the
control sections. This does not mean that silane will not benefit the pavement. Silane is a
breathable surface barrier, which prevents liquid water from entering the concrete, while allowing

3
water vapor to escape. This process dries the pavement over time preventing the concrete from
becoming saturated. Freezing and thawing deterioration occurs when the pavement is saturated,
and preventing the pavement from remaining saturated will limit the progression of ASR gel
expansion and limit freezing and thawing distress.

4
2. LITERATURE REVIEW
Deterioration of a concrete barrier wall along Interstate 49 in Northwest Arkansas was noted
in 2011. During a preliminary inspection of the wall and adjacent pavement it was noted that
visible cracking was present along the wall and pavement. Core samples were extracted from the
pavement and wall and sent to CTLGroup for petrographic analysis. The cause of deterioration
was attributed to Alkali-Silica Reaction (ASR) and freezing and thawing. In 2012 the Arkansas
State Highway and Transportation Department (AHTD), Mack-Blackwell Rural Transportation
Center (MBTC), and University of Arkansas Department of Civil Engineering initiated Project
No. MBTC 4000 (TRC 1401) to determine the cause of deterioration and to develop mitigation
measures. The project was initially two years long; however, the project was twice extended due
to the required time for assessing mitigation measures.
The project included two (2) phases: (1) laboratory testing of local aggregates, cements, and
fly ash to determine the source of materials which lead to the development of ASR. (2)
Instrumentation and field monitoring of barrier wall and pavement sections to assess mitigation
measures and prolong the service life of the barrier wall and pavement. The expected project
outcomes are (1) methods for preventing or minimizing future cases of ASR and (2) methods for
mitigating the progression of ASR in existing concrete elements.
2.1.Alkali-Silica Reaction (ASR)
ASR occurs in concrete due to the dissolution of siliceous minerals, present within some
aggregates, under the action of hydroxides present within the cement pore solution (ACI, 1998;
Diamond, 1989). The pore solution alkalinity is influenced most readily by the cement alkalinity
and cement content of the mixture (Diamond, 1989). The alkalinity affects the rate and likelihood

5
of silica dissolution, higher alkali cements lead to higher alkalinity, and therefore pH (hydroxide
concentration) of the pore solution, which increases the ability of the solution to dissolve silica.
The reaction also requires siliceous minerals that readily dissolve under the action of hydroxides.
Some common minerals include opal, chalcedony, chert, and quartz. More structured minerals,
such as quartz, dissolve slower than amorphous minerals such as opal (Powers & Steinour, 1955;
Helmuth et al., 1993). The dissolution of silica at the aggregate-cement boundary leads to the
formation of an alkali-silica complex (Powers & Steinour, 1955). When sufficient calcium
hydroxide is transported to the reaction cite, alkalis are released from the complex, and further
dissolve the silica structure allowing the reaction to proceed. Although the exact mechanism of
the reaction has not been explained, the alkali-silicate-calcium complex adsorbs solution from the
cement-paste solution, through an osmotic gradient (Powers & Steinour, 1955). The osmotic
pressure causes the alkali-silicate-calcium complex to expand, exerting pressure on the
surrounding cement-aggregate matrix leading to the development of microcracks (Diamond,
1989). As the process continues microcracks grow and interconnect to form visible deterioration
within the concrete. The reaction can proceed as long as silica, alkalis, and moisture are available.
The symptoms of ASR include map cracking at the surface, pop-outs, discoloration, and gel
deposits. These symptoms are typical of other deterioration mechanisms, and a petrographic
analysis is required to determine the presence of ASR (Stark 1990; Fournier et al., 2010; ACI,
1998; Fournier et al., 2004). Concrete elements that are exposed to ambient weather often develop
visible cracking that forms either as map-cracking or larger cracks parallel to the direction of
restraint (Stark, 1990; Fournier et al., 2010; ACI, 1998; Fournier et al., 2004). Concrete exposed
to ambient weather dries over time, and as a result a moisture gradient is present between the
exposed surface and interior of the concrete. The internal concrete contains more moisture and

6
expands, while the exposed surface dries and shrinks. As a result, map-cracking forms on the
surface, which does not expand at the same rate as the interior concrete (Fournier et al., 2004).
This can be seen in Fig. 2.1-1 below, which shows the formation of cracks along the surface as
drying occurs.
Fig. 2.1-1 Concrete element showing map cracking at the surface and microcracks parallel to the
surface, due to the moisture gradient between the exposed surface and the internal concrete.
Picture recreated from ACI (1998).
The risk of ASR developing in concrete can be mitigated through several methods. When
an alkali-silica reactive aggregate must be used in concrete, the first option for limiting the risk of
ASR is to reduce the alkalinity of the concrete. This can be achieved by reducing the cement
alkalinity below 0.6% Na2Oe (Thomas et al., 2006a; ACI, 1998). The ACI State of the Art Report
on Alkali-Aggregate Reactivity (1998) includes recommendations on limiting cement alkalis below
0.60%, with the warning that some reactive aggregates have been shown to react when cement
alkalis were as low as 0.40%. Many researchers have since moved to a limit of alkali content
rather than percentage, as it better reflects the available, or soluble, alkalis within the mixture that
may be introduced by SCMs or other sources. The Portland Cement Association and Canadian

7
Standards Association place a limit of 3 kg/m3 on cement alkalis (ACI, 1998). However, other
researchers have shown that certain aggregates react with alkali contents as low as 2.3 kg/m3.
Another method for limiting the risk of ASR is through the use of Supplementary Cementitious
Materials (SCMs). Some examples of SCMs that are effective in preventing ASR include fly ash,
slag cement, and silica fume. Chatterji (1989) offers an explanation of the mechanism by which
pozzolans (SCMs) inhibit the formation of reactive alkali silica. The proposed mechanism is the
conversion of pozzolans and calcium hydroxide into hydration products, which binds alkalis and
calcium lowering the pore solution alkalinity. Duchesne (1994) conducted a deeper analysis of
the mechanisms by which ASR is inhibited by SCMs. The samples containing fly ash, either Class
C or Class F, all showed a reduction in pore solution alkalis over time, which was explained by
alkalis bound within additional hydration products.
Mitigating ASR in concrete is more difficult than preventing the formation of ASR in new
concrete. The only available methods for mitigation involve reducing one of the constituents
required for ASR to occur: water, alkalis, or silica. Transportation structures such as pavements,
bridge decks and elements, and median barriers often have large surface areas compared to volume.
In structures with thin cross sections, and high surface area to volume ratios, controlling internal
moisture is often the best method of mitigating ASR (ACI 1998, Fournier et al., 2004). The
expansive ASR reaction will continue when the internal Relative Humidity (RH) is greater than
80%, and expansion will continue (ACI, 1998; Stark, 1990). In some concrete elements protection
from rain or groundwater is possible, and will reduce expansion. The most promising method of
moisture protection for bridge elements and median barriers has been silane (ACI, 1998; Berube
et al., 2002b; Drimalas et al., 2012; Thomas et al., 2012; Fournier et al., 2004). However, there is
very little published literature on the long term efficacy of silane on concrete pavements.

8
Mitigation of ASR
Topical applications of breathable vapor barriers have proven more effective in reducing
ASR expansion in some concrete elements. Topical application of silane or siloxane can reduce
internal RH within thin concrete elements for five or more years (Berube et al., 2002b). Additional
researchers included elastomeric paint treatments to control internal humidity in concrete with
wide cracks (Drimalas et al., 2012; Thomas et al., 2012; Fournier et al., 2004).
Silane is a penetrating sealer consisting of silicon molecules which have a number of functional
groups that react with cement alkalis to bond to the surface of the concrete and develop a silicone
resin network. The silicone also contains hydrocarbons attached to the silicone network, which
provide a hydrophobic network along the exposed surface of the concrete. The advantage of
penetrating sealers, such as silane, is that they remain breathable thereby allowing water vapor to
escape from the substrate while preventing liquid water from entering (Rust, 2009). Several
workers have conducted research regarding silane surface treatment. Researchers primarily
evaluated silane, and other, treatments applied to concrete transportation structures, such as median
barriers, bridge elements, and columns. Stark et al. (1993), provides short term results of silane
treatments applied to concrete pavement. The following sections discuss the beneficial
conclusions from research into silane surface treatments, followed by limitations of the research.
The mitigation of ASR in concrete pavements is mentioned by Stark et al. (1993), in a
study of concrete bridge decks and pavements. The monitoring program consisted of Falling
Weight Deflectometer (FWD) and internal RH (RH) measurements (Stark et al., 1993). Internal
RH was monitored through a method developed by Stark (1990) in which powder concrete samples
were removed by drilling into the concrete and collecting samples at selected depths within the
concrete (Stark et al., 1993). The samples were then stored in a bottle and the equilibrium RH

9
within the bottle was measured with a probe (Stark et al., 1993). Samples from various depths
were then assembled to produce a RH gradient with respect to depth of concrete (Stark et al.,
1993). Deflection measurements were taken before treatment and then again one year after
treatment (Stark et al., 1993). These measurements were then correlated to elastic modulus of the
concrete, and used to monitor the progression of ASR within the concrete (Stark et al., 1993). The
surface treatments evaluated in the study included lithium, silane, and linseed oil. Unfortunately,
only one year of monitoring was provided, and no conclusions were made on the effectiveness of
the sealers (Stark et al., 1993). However, Stark et al. (1993) did conclude that FWD was a valid
method of monitoring the deterioration of pavements due to ASR.
Stark et al. (1993) reported that silane treatment of concrete pavements only provided a
reduction in internal RH within the top 0.5 to 1 inch of pavement. Stark et al. (1993) postulated
that the silane was ineffective at mitigating expansion in concrete pavements due to moisture
moving into the pavement from the subgrade. However, only one year of monitoring was available
to develop this conclusion, which is not long enough to provide conclusive results on the efficacy
of a surface treatment. The report also determined that topical lithium produced the greatest
reduction in expansion, again from one year of monitoring. Several publications have reported
that the penetration of lithium into hardened concrete was not sufficient to provide a beneficial
reduction in expansion (Stokes et al., 2002; Johnston et al., 2000; Folliard et al., 2012). More
recent publications on the efficacy of topical silane mitigation in concrete transportation structures
agree that silane provides a reduction in internal RH (Bérubé et al., 2002a; Drimalas et al., 2012;
Thomas et al., 2012). However, none of these publications specifically address concrete
pavements treated with silane.

10
Berube et al. (2002a) provided conclusive results on the efficacy of silane and siloxane
sealers from over 10 years of expansion and internal RH monitoring of median barriers. The
monitoring program involved selecting sections for treatment and control and then instrumenting
the sections with expansion monitoring grids and internal RH and temperature probes (Berube et
al., 2002a). Gage reference studs were affixed to the wall, with drilled points in the gage reference
studs which were matched up with the points on the ends of a Detachable Mechanical Strain
(DEMEC) gage. The length-change between two gage reference studs was then used to monitor
expansion. Gage reference studs were positioned for vertical and thickness length-change
measurements. In addition, holes were drilled in each section to monitor internal RH and
temperature with a commercial humidity probe (Berube et al., 2002a). Results from 10 years of
monitoring indicate that both silane and siloxane produce a reduction in expansion and internal
RH for treated sections as compared to the control (Berube et al., 2002a). The silane treatments
were more effective than the siloxanes at reducing expansion. The treatments decreased internal
RH for 6 years, and then had reduced effectiveness (Berube et al., 2002a). Therefore, Berube et
al. (2002a) recommends a reapplication of silane after 5 to 6 years of service. In addition, silane
was effective in reducing expansion in moderately deteriorated median barriers for 10 years and 6
years, respectively. However, the siloxane treatment was less effective when used on severely
deteriorations sections, and only provided 1 to 2 years of protection (Berube et al., 2002a). These
results are based on the evaluation of concrete median barriers; however, they are applicable to
concrete members with similar thickness and exposure conditions (Berube et al., 2002a).
Freezing and thawing cycles exacerbate the deterioration of deterioration in concrete which
has cracked due to ASR (Berube et al., 2002a). However, treating the samples with silane,
siloxane, or linseed oil can protect the concrete from moisture, and therefore expansion (Berube et

11
al., 2002a). An extensive laboratory evaluation of the effectiveness of sealers on concrete samples
affected with ASR and subjected to freezing and thawing cycles was conducted by Berube et al.
(2002a). Samples treated with silane, siloxane, or linseed oil and subjected to freezing and thawing
and ASR expansion in the laboratory exhibited a reduction in expansion as compared to untreated
control samples (Berube et al., 2002a). A strong correlation between ASR expansion and internal
RH was also noted (Berube et al., 2002b). Silane showed the greatest ability to reduce expansion
in concrete which had ASR and was subjected to freezing and thawing cycles (Berube et al.,
2002b). The concrete sealed with linseed oil exhibited a reduction in expansion; however, the
expansion still resulted in cracking when subjected to freezing and thawing (Berube et al., 2002b).
The results showed that any reduction in expansion correlated to a reduction in moisture, and
therefore humidity, within the concrete after it was sealed (Berube et al., 2002b).
Several mitigation methods were evaluated under the FHWA Alkali-Silica Reactivity (ASR)
Development and Deployment Program. Preliminary results from this program are summarized
by Drimalas et al. (2012). The first mitigation evaluation involved several bridge columns in Texas
which had expansion due to ASR, and the second involved a median barrier in Massachusetts
which also exhibited ASR (Drimalas et al., 2012). The column treatments included silane, or
lithium applied through vacuum impregnation or electrochemical migration. The median barrier
treatments included lithium, silane, penetrating membrane, and lithium vacuum impregnation
(Drimalas et al., 2012). The columns treated with lithium did not develop sufficient penetration
of lithium or a reduction in expansion. Silane produced the only reduction in expansion for both
the columns and median barrier (Drimalas et al., 2012). As with all ASR field research, several
years of monitoring are required to produce conclusive results. Both the columns and median
barriers were monitored for 5 years; therefore, results on the sealer durability were not available.

12
However, the results demonstrate the efficacy of silane in protecting concrete from moisture and
reducing expansion.
Some additional research projects included under the FHWA Program were reported by
Thomas et al. (2012). These projects included a bridge structure in Maine, and a bridge in
Vermont. Surface treatments evaluated in the study included silane or elastomeric paint (Thomas
et al., 2012). Several columns were also treated with lithium nitrate through either vacuum or
electrochemical impregnation, or with topical silane. The bridge in Maine was treated in 2009 and
the bridge in Vermont was treated in 2010. Unfortunately, the study did not provide any
preliminary results on the efficacy of the surface treatments.
These few case studies on the efficacy of surface treatment methods show promising results
with methods such as silane, siloxane, and elastomeric paint. However, no conclusive case studies
were available on the efficacy of surface treatments applied to pavement structures. There is
concern that moisture will enter the concrete pavement from the subgrade. Especially after
treatment, when a humidity gradient is present within the concrete pavement. The humidity
gradient may provide suction, and draw moisture out of the subgrade. In addition, the pavement
is subject to traffic wear which may reduce the effective life of the treatment. Unfortunately, at
this time, no conclusive long term results were published on the efficacy of surface treatments
applied to pavements affected by ASR.
2.2.Laboratory Tests
The laboratory testing included ASTM C1260 Standard Test Method for Potential Alkali
Reactivity of Aggregates (Mortar-Bar Method) and ASTM C1293 Standard Test Method for
Determination of Length Change of Concrete Due to Alkali Silica Reaction. These test were

13
conducted on regionally available aggregate sources and fresh samples of the aggregates used
within the barrier wall and pavement. Fly ash was used in both the pavement and median barrier,
and cement-aggregate combinations with fly ash were tested in accordance with ASTM C1567
Standard Test Method for Determining the Potential Alkali-Silica Reactivity of Combinations of
Cementitious Materials and Aggregate (Accelerated Mortar-Bar Method). The tests were
conducted with a range of fly ash replacement rates to determine the critical replacement rate that
is required to inhibit the development of ASR in concrete.
Accelerated Mortar Bar Test (AMBT)
The Accelerated Mortar Bar (AMBT) was developed to assess the potential alkali-silica
reactivity of aggregates (Davies & Oberholster, 1988). The test method requires that aggregates
be crushed and sieved to a standard gradation. The aggregate is then mixed into a standard mortar
mixture and cast into standard sized bars. The bars are cured in an environment that accelerates
the formation of ASR and the development of expansion. If the bar expands more than 0.10%
within 16 days of casting, the aggregate is deemed potentially deleteriously reactive. The test
method produces rapid results, with the limitation of being overly aggressive and sometimes
causing false-positive test results (Thomas et al., 2006a; Ideker et al., 2012a; Touma et al., 2001).
Due to this limitation additional testing is recommended along with field performance records for
the aggregate (Thomas et al., 2006a; Ideker et al., 2012a; Fournier et al., 2000). The AMBT test
method can also be used to asses fly ash-cement mixtures for preventing ASR (Fournier et al.,
2000; Thomas et al., 2006a).

14
Concrete Prism Test (CPT)
The Concrete Prism Test (CPT) is used to test cement-aggregate combinations in a concrete
mixture. The coarse aggregate is sieved to a specific gradation and the concrete is mixed according
to the standard design. The test method is applicable to both coarse and fine aggregates, when
used with a non-reactive fine or coarse companion aggregate. The CPT is a more accurate test
method for assessing the potential reactivity of a concrete mixture (ACI, 1998; Ideker et al.,
2012a). The CPT takes one to two years to conduct and can also be used to assess concrete
mixtures containing fly ash (Ideker et al., 2012a; Ideker et al., 2012b; Touma et al., 2001; Fournier
et al., 2000). One of the major limitations of the CPT occurs when alkalis are leached from the
concrete samples resulting in lower expansion than would occur in the field (Rogers & Hooton,
1991; Thomas et al., 2006a; Ideker et al., 2012a). Alkali-leaching can be minimized by following
the standard test method and accelerating conditions.
Damage Rating Index (DRI)
The Damage Rating Index (DRI) test method consists of cutting and polishing concrete cores
to produce a surface for petrographic examination. The polished surface is then then analyzed
under stereoscopic magnification (≈ 15x) to identify petrographic features of ASR deterioration.
Several petrographic features are identified and weighted based on the significance of the
deterioration mechanism. The DRI provides a quantifiable index of deterioration and the particular
deterioration mechanism present within the concrete. Although the test method can distinguish
between concrete of different deterioration states, the test method is subjective to operator
experience (Sanchez, 2014; Rivard et al., 2002; Grattan-Bellew and Mitchell, 2006).

15
Dunbar and Grattan-Bellew (1995) developed and proposed the DRI as a method for
quantifying deterioration mechanisms in concrete. The test involves extracting core samples and
then cutting and polishing the samples. A grid of 1 cm squares is drawn on the polished surface,
and each square is inspected with a stereomicroscope at 15-16x magnification. Each deterioration
feature is counted and then multiplied by a weighting factor (Shrimer, 2000). The weighted total
is then normalized to an area of 100 cm2 and reported as the DRI. Several typical features of ASR
deterioration are counted and weighted separately, and the DRI is often reported as a bar graph,
composed of individual features present within the sample (Sanchez, 2014). This system allows
the specific deterioration mechanism to be compared between samples of various states of
deterioration (Rivard et al., 2002; Shrimer, 2000). Work has shown a correlation between
expansion and DRI, and values have been established to distinguish deterioration levels between
multiple concretes (Sanchez, 2014).
Several authors have proposed potential lists of features, or defects, and weighting factor for
the DRI method. Originally, Dunbar and Grattan-Bellew (1995) included seven features and
weighting factors that were influenced heavily by gel deposits and reaction rims. However, recent
authors have proposed weighting factors that reduce operator subjectivity and account for the
greater deterioration caused by cracking in the cement paste (Villeneuve et al., 2012; Sanchez,
2014).
Potential for Further Expansion (PFE)
Laboratory test methods are useful for assessing the current level of deterioration within a
concrete structure. However, it is often necessary to determine the potential future deterioration
in a concrete element and the residual properties of the concrete. The future deterioration, along

16
with past expansion, is useful when developing monitoring and remediation measures. Berube et
al. (2002c) proposed a method for predicting the potential further expansion in concrete. The
Potential for Further Expansion (PFE) method involves a combination of in-situ and laboratory
test methods, with the combined result offering an estimate of the Potential Rate of ASR Expansion
in Service (PRE). The prediction requires a measure of residual expansion of concrete cores
subjected to accelerating conditions, a measure of absolute degree of reactivity in cores subject to
unlimited alkalis, and a measure of the residual water-soluble alkali content within the concrete.
There are many factors that influence the outcome of the PFE test method including the direction
of coring, the actual moisture conditions in the field, the method used for accelerating ASR, and
the conditioning period between coring and testing (Multon et al., 2008). These results, along with
parameters to account for in-situ temperature, humidity, and restraint, are combined to produce an
estimated potential rate of expansion.
A combination of test methods, both laboratory and in-situ, have been proposed for use when
assessing the PFE. Fournier et al. (2010) discusses this proposed method and warns of its
limitations. However, the test method does have the potential to assess the additional deterioration
within concrete elements. Berube et al. (2002c) summarized the test method, which involves a
conglomeration of test results from several laboratory and field methods. First, core samples of
the concrete element are subjected to accelerating conditions to determine the potential rate of
expansion and the absolute reactivity of the aggregate (Berube et al., 2002c). The soluble alkali
content is then estimated through hot-water extraction. Finally, the ambient humidity,
temperature, and applied stresses are factored to determine how the concrete will act in the field.
The test method offers the potential to predict additional expansion in the field. To assess the
potential rate of expansion and absolute reactivity, concrete cores are subjected to accelerating

17
conditions in the laboratory. At least three cores are required, with the first core submerged in
water, the second stored in air, and the final stored in NaOH solution. All the containers are stored
at 38 °C to accelerate expansion. The expansion attained in the cores stored in water are used to
correct for expansion caused during saturation of the concrete, the cores in air are used to determine
the potential rate of expansion, and the cores in NaOH are used to determine the absolute reactivity
of the aggregates in the presence of unlimited alkalis (Berube et al., 2002c). The method for
measuring water-soluble alkalis will be discussed in the following section.
Alkali Extraction
The soluble alkali test is another method that may be useful for estimating future deterioration
in concrete structures. The test method involves crushing a sample of concrete to pass the 160 µm
sieve, submerging a 10-gram sample of crushed concrete in boiling water for 10 minutes, allowing
the sample to cool for 24 hours, and then filtering the sample. After the sample cools to room
temperature (21 °C), the sample is filtered to produce a solution of water and soluble ions. The
concentration of alkalis (Na and K) within the solution is then measured using one of a number of
techniques (e.g. atomic absorption, emission, or flame photometry) (Berube et al., 2002d). The
test method is subject to variability, and multiple samples should be evaluated to produce better
results. In addition, alkalis may be expressed from other sources, which would not otherwise be
available in the pore solution (e.g. alkalis from aggregates, which become available after grinding)
(Berube and Fournier, 2004).
Some of the variables affecting the accuracy of the method include soluble alkalis derived from
the aggregates, insoluble alkalis absorbed by reaction products, and the fineness of the ground
sample. The test method provides an estimate of alkalis available for reaction; however, the results

18
are highly variable (Berube et al., 2002d). Other test methods are available for measuring alkali
concentrations within the pore solution (e.g. pore solution expression and analysis).
2.3.Field Monitoring
Monitoring the progression of deterioration in the field is an effective method for assessing the
development of ASR and for determining the potential reactivity of concrete mixtures. Concrete
exposed to the ambient environment is the best predictor for how similar concrete mixtures will
perform in the future. This method of assessing concrete performance takes years to decades
because no accelerating conditions are applied to the concrete (Thomas et al., 2006b; Ideker et al.,
2012a; Ideker et al., 2012b). Monitoring concrete in natural conditions is considered the most
accurate test method, and is useful for validating the results of laboratory test methods.
Expansion of concrete elements is a readily quantifiable symptom of ASR distress. Several
methods are available for monitoring expansion and the most practical method depends on the
concrete element. Surface strain gauges are a practical method for monitoring expansion within
concrete transportation structures. Periodic strain measurements provide the surface expansion
and a prognosis of expansion rate and potential further expansion.
Several methods are available for monitoring the rate of expansion within concrete elements
(Fournier et al., 2004; Fournier et al., 2010). The recommended method for measuring expansion
in transportation structures involves placing a grid, 0.5 m (20 in.) square, on the face of the concrete
element (Fournier et al., 2010). At each corner of the grid, a gauge pin is affixed to the concrete
with epoxy. The pin has a pre drilled indentation on the exposed face, which matches up with the
points on the DEMEC gauge. The DEMEC gauge has one fixed end and a pivoting arm on the
free end. The points on both ends are inserted into the indented pins on the concrete, and the length

19
change is reported on the digital gauge. The strain is then determined from the length change and
the initial gauge length. Another method for measuring expansion in concrete pavements involves
instrumenting across the joints and measure relative displacements between the concrete sections.
A square grid allows two strain measurements from each perpendicular axis. The advantage
of multiple measurements along each axis is reduced error, and the additional measurement also
acts as a redundancy if a pin is deteriorations. Typical DEMEC gauges provide an accuracy of +/-
0.00005 in., or +/- 0.00025 % strain. A typical expansion grid and DEMEC gauge are shown in
Fig. 2.3-1.
Fig. 2.3-1 Typical DEMEC gauge measurement and grid.
Moisture is one of the fundamental components required for alkali-silica gel to form and the
expansive mechanism to occur. Moisture within the concrete relates to the internal RH. Internal
RH is a quantifiable measure of the potential for ASR expansion to continue within a concrete
element. Stark (1990) proposed and developed a relationship between moisture within concrete
and expansion due to ASR. When the internal RH of concrete decreases below 80 %, referenced
to 21 to 24 °C, the expansion ceases. These findings were confirmed through laboratory and field-
testing reported by Berube et al. (2002b).
Stark (1990) and Berube et al. (2002b) developed different methods for measuring internal
RH. The method developed by Stark (1990) involved drilling through the concrete element and

20
collecting the pulverized concrete at selected depths. The concrete powder was immediately stored
in hermetic containers, and the containers transferred to a temperature controlled environment.
After the container reached temperature equilibrium, a capacitive type humidity probe was inserted
into the container, and the RH of the air above the sample was measured. This method had the
advantage of providing internal RH measurements at a controlled temperature of 21 °C. The
system also provided RH measurements throughout the thickness of the concrete element. The
disadvantages of this method are heating of the concrete sample and destruction of the
microstructure during drilling, which may result in loss of moisture and an artificially low
measurement.
Berube et al. (2002a) reported a method, developed by Berube et al. (1996), for conducting
internal RH measurements in the field. Researchers first drilled a 150 mm (6 in.) deep hole into
the concrete element. A humidity probe was then inserted into the concrete and allowed to reach
temperature equilibrium with the surrounding concrete. The advantage of this test method is a
direct measure of the internal RH in the field concrete. However, the method is subject to several
limitations. First, the concrete temperature fluctuates with ambient temperature to the point where
temperature changes occur during measurements (Thomas et al., 2013). Second, as temperature
fluctuates, moisture condenses within the port and cause artificially high values. Finally, the RH
is only measured at a single depth within the concrete, while internal RH varies throughout the
concrete element.
A modified method for measuring RH, evaluated by Deschenes (2014), involves drilling holes
to the selected depth, cleaning the hole with compressed air, and then sealing the hole with a 50
mm (2 in.) section of PVC and a tight fitting cap. After the air in the hole reaches temperature and
RH equilibrium with the surrounding concrete, the cap is removed and a capacitive probe inserted.

21
Additional time is allowed for the probe to reach temperature equilibrium, less time than required
for a freshly drilled hole, and then the RH and temperature are recorded. Unfortunately, the system
used for sealing the hole was not sufficiently airtight. Moisture entered the system and condensed
within the port. Therefore, RH values were artificially high in comparison with that of the
concrete. The system could be improved with a plug inserted into the port, which protects the hole
from outside moisture condensation and temperature fluctuations. Again, the system only provides
a RH measurement at the selected depth of the port.
Barrier Wall
The I49 barrier wall was cast in 1998 using a slip-former and a standard AHTD concrete
mixture. The wall was 6.7 km (4.2 mi.) long with variability in the level of deterioration. The
deterioration ranged from minimal visible cracking to severe map cracking, crushing, and
deterioration. The petrographic examination of the concrete indicate that ASR first developed
when chalcedony minerals present within the fine aggregate dissolved to form alkali-silica gel. As
the gel expanded and microcracks developed the freeze thaw resistance of the concrete decreased,
and the concrete experienced freezing and thawing related deterioration. In 2013 the barrier wall
was instrumented for monitoring surface strains and internal RH. Sections of the wall were treated
with various surface treatments to reduce the internal RH and control the development of ASR
related deterioration. Strain and RH were measured periodically for three years until the wall was
demolished in March 2016.

22
Pavement
The I49 pavement was placed in 1998 using a standard AHTD concrete mixture, and contained
the same aggregates, cement, and fly ash as the barrier wall. The pavement mixture was air
entrained to limit freezing and thawing deterioration. The deterioration in the pavement consisted
of map cracking present near the joints, which was in a typical D-cracking pattern. Core samples
of the pavement were sent for petrographic analysis, and cracks within the top 25 mm (1 in.) were
noted and ASR gel deposits were present throughout the concrete. Air entrainment was not
uniform throughout the concrete and varied from 2 to 4%. The concrete showed minor
deterioration in 2012; however, there were concerns that the pavement would continue to
deteriorate. In January 2014 panels of the pavement were instrumented similarly to the barrier
wall for strain and RH measurements. The panels were treated with silane in an effort to reduce
the RH of the concrete and minimize ASR related expansion. Three commercially available silane
products were used in the research. The panels have been monitored periodically for two years to
determine the efficacy of the silane products in mitigating ASR.

23
3. MATERIALS AND METHODS
The research program began in May, 2012 with the laboratory testing program. The
construction documents from the pavement and barrier wall program were reviewed and then
aggregate samples were collected for evaluation. The first phase of the research included
determining the sources of reactive minerals that caused ASR to form in the concrete and
evaluating potential measures for preventing future cases of ASR. The second phase started in
January 2013 and involved instrumenting, treating, and monitoring the barrier wall. This was
followed by the pavement investigation beginning in January 2014.
3.1.Preliminary Investigation
After deterioration was noted in the wall core samples were collected and sent for petrographic
analysis. After the diagnosis of possible ASR deterioration, a visual survey of the wall was
conducted to determine the level of deterioration along the length of the wall. Sections were then
chosen for instrumentation and monitoring. The deterioration ranged from minimal to severe
deterioration, and sections were chosen from sections with minimal, moderate, and severe
deterioration. The apparent environmental condition had caused the different deterioration
conditions, and it was hypothesized that variations in material properties had caused the different
levels of deterioration observed along the wall. Material and concrete tests were conducted to
evaluate the hypothesis and determine mitigation measures
Petrographic Analysis
Core samples were sent to CTLGroup for petrographic examination. The analysis results
showed evidence of ASR and freezing and thawing distress in the wall and minor evidence of ASR

24
in the pavement. The concrete contained sand from the Arkansas River and crushed limestone
from West Fork, Arkansas. The ASR evidence within the samples pointed to chalcedony minerals
present within the coarse fraction of the fine aggregate. Which reacted with the high alkali cements
and formed ASR gel deposits and expansion. As expansion continued and interconnected cracks
formed, freezing and thawing deterioration exacerbated the deterioration within the concrete.
Visual Inspection of Median Barrier
In August 2012 a visual inspection of the barrier was conducted to determine the extent of
deterioration along the wall and to classify sections of the wall into deterioration categories. Three
deterioration categories were selected based on visual symptoms of deterioration. Minimal
deterioration was noted in the majority of the wall, which exhibited minor map cracking. A typical
section of minimal deterioration is shown in section Fig. 3.1-1. There were 3.7 km (2.3 mi.) of the
wall categorized with minimal deterioration.
Fig. 3.1-1 Barrier wall section minimal deterioration, (e.g. no visible map cracking).
A typical section with moderate deterioration is shown in Fig. 3.1-2 (Top), which exhibits map
cracking and longitudinal cracks parallel to the internal restraint. The wall is expanding vertically,
due to the lesser restraint in the vertical direction as compared to the longitudinal direction which
25
is restrained externally and internally. There were 2.25 km (1.4 mi.) of wall that exhibited
moderate deterioration. Several sections of the wall had severe deterioration with map cracking,
multiple longitudinal cracks, crushing and alkali silica gel deposits on the surface. There were
1.13 km (1.4 mi.) of wall with severe deterioration a typical section with severe deterioration is
shown in Fig. 3.1-2 (Bottom).
Fig. 3.1-2 Barrier wall section moderate deterioration, (e.g. moderate visible map cracking, and a
longitudinal crack along the full length of the section) (Top). Barrier wall section severe
deterioration, (e.g. severe map cracking, longitudinal cracks, crushing at the joints, and visible
alkali-silica gel exudation) (Bottom).
3.2.Laboratory Tests
Laboratory tests were conducted to evaluate the potential alkali-silica reactivity of the
aggregates used in the wall and pavement. The laboratory tests followed existing ASTM standards
for proposed test methods from the literature. The tests were used to evaluate the potential

26
reactivity of aggregates, the required replacement of cement with fly ash to prevent ASR, and the
deterioration mechanisms present within the wall and pavement.
Material Sources
Fine aggregate from Van Buren, Arkansas is commonly used for concrete throughout the
region, and was readily available for evaluation. The sand used for laboratory evaluation was
dredged from the Arkansas River in 2012 and was representative of the sand used in the concrete
median barrier in 1998. The limestone coarse aggregate quarry in West Fork Arkansas was no
longer in operation. However, some representative material was stockpiled at the quarry and was
available for laboratory evaluation. The original cement used in the median barrier was not
available for evaluation. However, accelerated laboratory test methods are not affected by cement
chemistry. Therefore, the original cement is not required for laboratory evaluation. The cement
used in the median barrier concrete was manufactured in Pryor Oklahoma between 1998 and 1999.
Records of cement chemistry were available and utilized to determine the cause of ASR within the
median barrier concrete. The fly ash used within the median barrier concrete was Class C fly ash
produced at the OG&E coal power plant in Muskogee, Oklahoma. Fly ash chemistry records for
1998 to 1999 were available for the median barrier concrete.
Accelerated Mortar Bar Test (AMBT)
The AMBT has a short test duration (16 days) which allows for rapid evaluation of aggregates
for potential alkali-silica reactivity. The test method was conducted in accordance with ASTM
C1260 Standard Test Method for Potential Alkali Reactivity of Aggregates (Mortar-Bar Method).
The aggregate was first sieved to the standard gradation and then a standard batch of mortar was

27
mixed. When evaluating coarse aggregates, the aggregate was first crushed and then sieved to
match the gradation. The aggregate gradation and batch weights to produce three mortar bars are
summarized below in Table 3.2-1.
Table 3.2-1 ASTM C1260 standard gradation and batch weights.
No. 8 No. 16 No. 30 No. 50 No. 100 Cement Water
Fraction 10 25 25 25 15 -- 0.47
Mass (g) 99 247.5 247.5 247.5 148.5 440 206.8
The standard batch produced enough mortar for three mortar-bars with standard dimensions of
25 x 25 x 285 mm (1 x 1 x 11.25 in). The mortar bars were cured for 24 hours in an environmental
chamber with ambient temperature of 23 ± 2° C and 95% RH. The mortar-bar molds are displayed
in Fig. 3.2-1 (left), and typical cured mortar-bars are displayed in Fig. 3.2-1 (right).
Fig. 3.2-1 Mortar-Bar mold with gage studs (left) and mortar-bar mold with three mortar-bars
(right).
The mortar bars were removed from the molds after 24 hours of curing. The mortar-bars were
then placed in 80° C water for 24 hours. A typical set of cured mortar bars are displayed in Fig.

28
3.2-2 (left), and a typical set of mortar-bars in the storage containers are displayed in Fig. 3.2-2
(right).
Fig. 3.2-2 Mortar-bars (left) and mortar-bar in storage container (right).
The initial length-change of each mortar-bar was measured after 24 hours in the water bath.
The mortar-bar temperature equilibrates when exposed to air, and the length-change for each
mortar-bar is measured within 15 ± 5 seconds of being removed from the container to reduce
thermal shrinkage. The three mortar-bars were measured, and then moved to a container of 1N
sodium hydroxide (NaOH) solution which was stored at 80° C. The mortar-bars were stored in
the sodium hydroxide (NaOH) solution for 14 days. Length-change measurements were
ascertained a minimum of three times during the 14-day storage period.
The sodium hydroxide (NaOH) solution was produced by dissolving 40 grams of sodium
hydroxide (NaOH) pellets in 900 ml of water. After the sodium hydroxide (NaOH) pellets
dissolved, the solution was diluted to obtain 1.0 L of solution. The required volume of solution
within the storage container is four times the volume of the mortar-bars. The sealed containers
were stored in a water bath at 80° C for the duration of the test.
The final length-change was determined after 14 days of storage. The interim measurements
were ascertained at 4 and 7 days of storage. The length-change was measured with a comparator
and digital gage with a precision of 0.001% of the effective gage length. The length-change of the

29
three mortar-bars was averaged, and reported to the nearest 0.01%. The final length-change was
then compared to the expansion limits. Expansions less than 0.10% at 16 days indicate innocuous
aggregates. Expansion between 0.1 and 0.2% at 16 days require additional information to establish
aggregate reactivity. In addition, the specification allows a test duration of 28 days for samples
with 14 day expansions between 0.1% and 0.2%. Mortar-bars with 14 or 28-day expansion greater
than 0.20% indicate potentially deleteriously expansive aggregates.
The results of each AMBT was compiled and plotted with time (days) on the abscissa and
length-change (percent) on the ordinate axis. The AMBT storage conditions necessary to
accelerate ASR and prevent alkali-leaching are harsh and often produce excessive expansion in
aggregates with proven field performance. Therefore, the AMBT results were compared to CPT
results to confirm the aggregate classification.
The AMBT method accelerates the development of ASR by storing the mortar-bars at 80° C.
The sodium hydroxide solution prevents alkalis from leaching from the mortar bars during storage.
The storage environment accelerates the development of ASR and provides results in 16 days.
Due to the harsh storage conditions the test method can produce expansion in cement-aggregate
combinations which have a good field performance history. However, when evaluating
preventative measures against ASR the test method can produce conservative estimates on the
required level of prevention. The AMBT method allows for the evaluation of cement-aggregate
mixtures with a partial replacement of cement with SCMs. The test was conducted in accordance
with ASTM C1567 Standard Test Method for Determining the Potential Alkali-Silica Reactivity
of Combinations of Cementitious Materials and Aggregate (Accelerated Mortar-Bar Method). The
test method is identical to the AMBT with the exception of the cementitious materials. Fly ash,
silica fume, slag cement, and metakaolin are evaluated at various replacement rates to determine

30
the minimum safe replacement rate which will prevent ASR expansion. A 16-day expansion less
than 0.10% signifies a safe replacement rate. Some SCMs, such as fly ash, delay alkali-silica
reactivity and the AMBT duration is extended to 28 days to allow for any delayed reactions.
Fine aggregate from the Arkansas River was evaluated in combination with class C fly ash.
The fly ash was sourced from the same location as the fly ash used within the median barrier, and
had a similar chemical composition. Tests were conducted at several fly ash replacement rates
ranging from 10% to 40% replacement by weight of cement. The safe replacement rate was
determined through an evaluation of replacement rates below and above the safe range. The
replacement rate which provided 30-day expansion below 0.10% was then determined.
Concrete Prism Test (CPT)
The CPT was conducted in accordance with ASTM C1293. The requirements for a CPT
standard concrete mixture were provided in the specification. The coarse aggregate was sieved to
the standard gradation as specified in ASTM C1293. The concrete mixture required a coarse
aggregate oven-dry-rodded unit volume of 0.70% ± 0.2%. The water to cementitious material
ratio (w/cm) was specified between 0.42 and 0.45 (by mass). The volume fraction of sand was
selected to produce a unit volume of concrete. The cement content was specified as 420 kg/m3
(708 lb/yd3), and the cement alkali content was limited to 0.90% ± 0.1% Na2Oe.The alkali content
was increased to 1.25% Na2Oe by the addition of sodium hydroxide (NaOH) to the mixture water
before batching. The required sodium hydroxide was determined from the cement and cement
alkali content. Unfortunately, the only available cement at the time of testing was 0.53% Na2Oe
by mass, and additional sodium hydroxide (NaOH) was required to achieve the required alkali
level. The mixture proportions used for the CPT are summarized below in Table 3.2-2.

31
After the concrete mixture was batched, slump, unit weight, and air content tests were
performed in accordance with ASTM C143, and ASTM C138, respectively. Concrete was then
placed into the prism molds in two lifts, with rodding and tamping after each lift to ensure sufficient
compaction. The prisms are 75 x 75 x 285 mm (3 x 3 x 11.25 in) and are displayed below in Fig.
3.2-3. A total of three prisms were required for each concrete mixture evaluated. After troweling
the top of the prisms, the molds were placed and cured in the environmental chamber for 24 hours.
After curing, the prisms were removed from the molds and the initial length-change was
measured using a length-change comparator with a digital gage. The prisms were then placed in
the storage containers and placed in a water bath at 38° C. The duration of length-change
monitoring was one year, with interim readings taken at 7, 28, 56 days, 3, 6, 9, and 12 months.
The storage containers were removed from the water bath 16 ± 4 hours before length-change
readings to allow the temperature of the prisms to equilibrate to room temperature. The storage
containers must also maintain a high RH (ASTM, 2012). The containers used for storage had
dimensions of 225 x 300 x 112 mm (9 x 12 x 4.5 in.) with a water tight cover. The prisms were
elevated 25 mm (1 inch) from the bottom of the container with small blocks of wood, and then
12.5 mm (1/2 inch) of water was placed in the bottom of the container. The containers were sealed
and placed in a water bath to maintain a temperature of 38° C.
Fig. 3.2-3 Typical CPT prism molds (left), and storage containers (right).

32
Table 3.2-2 ASTM C1293 mixture design specifications and typical batch weights.
Notes kg/m3 (lb/yd3)
Coarse 0.70 ± 0.05 D.R.U.W. 1110 (1871)
1/2 33% 370 (624)
3/8 33% 370 (624)
No. 4 33% 370 (624)
Sand F.M ~ 2.7 629 (1060)
Cement ~ 0.90% Na2Oe 420 (708)
Water w/cm ~ 0.45 189 (319)
NaOH 1.25% Na2Oe 1.90 (3.20)
No wicking material was used along the inside edges of the containers. Therefore, there was
some concern that water precipitated on the surface of the prisms and transported alkalis from the
surface of the prism into the water at the bottom of the container. Additionally, some of the
containers leaked during storage and allowed water within the container to make contact with the
bottom of the prisms. Therefore, alkalis likely leached out of the prisms during storage. Alkali
leaching may have reduced the validity of the results from the concrete prism tests. This is
discussed in greater detail in Chapter 3. The ASTM C1293 specification recommends 19 to 21 L
(5 gallon) pails with sealed covers for storage of concrete prisms. The specification also
recommends polypropylene fabric used along the inside of the containers to wick moisture and
prevent alkalis from being leached out of the prisms. However, the recommended pails require a
large water bath or environmental chamber for storage of several samples. Due to limited

33
availability of space, smaller containers were selected to increase the number of samples evaluated
simultaneously.
After one year of monitoring, results from the three prisms were averaged to produce a single
plot. The data were plotted with time (days) on the abscissa and length-change (percent) on the
ordinate axis. A one-year expansion greater than 0.04% indicates a concrete mixture with
potentially deleterious expansion. The CPT provides the most reliable accelerated method of
evaluating aggregates for alkali-silica reactivity. However, precautions are necessary to prevent
or reduce alkali-leaching. The effects of alkali-leaching were not apparent until 6 to 9 months of
monitoring. Additional tests of the Arkansas River sand aggregate were performed using the
ASTM C1293 recommended containers.
Alkali Extraction and PFE
Soluble alkali extraction is a method for measuring the alkalis within a concrete sample which
remain soluble. The method was developed by Berube (2002c) and involves crushing core samples
of concrete to pass through a 160 µm sieve. A 10-gram sample is then added to 100 mL of water
and boiled for 10 minutes. The sample is then filtered and evaluated using ion chromatography or
a spectroscopy method to determine the concentration of dissolved Na and K. The method is
useful for evaluating the remaining soluble alkalis within a sample; however, the test does not
release insoluble alkalis that have been bound within hydrations or ASR reaction products. The
test method releases approximately 60% of the original soluble alkalis that were available in the
cement.
The PFE test was performed on core samples from the Interstate 49 pavement. The core
samples are 4 in. (100 mm) diameter and 12 in. (300 mm) long. The sample preparation for PFE

34
testing consisted of first cutting the sample to 11.25 in. (285 mm) length. Holes (5/16 in. [8 mm]
diameter by ½ in. [12.5 mm] depth) were then drilled into the center of each end of the cylinder.
Metal gauge studs were then affixed with epoxy. After sufficient time for the epoxy hardening,
the initial length of each cylinder was measured using a length comparator. Nine cylinders were
prepared in this fashion. Three were then placed in a 5 gallon (19 L) pail over water (similar to
ASTM C1293 conditions), three were placed in 1 N NaOH solution (similar to ASTM C1260
conditions), and three were placed in water. The pail used for storing specimens over water, was
lined with a wicking material and sealed with a watertight cover to ensure high humidity within
the container and to prevent humidity gradients from developing. The containers were then placed
in a water bath at 38 °C. Periodic length change measurements were conducted for one year. Prior
to each measurement, the containers were removed from the water bath and cooled to 23 °C for
16±4 hours.
Damage Rating Index (DRI)
The DRI method was performed on several core samples from the Interstate 49 pavement.
Additional samples will be evaluated from post treatment, and laboratory samples will be
evaluated as part of an accelerated laboratory testing program. The DRI sample preparation
involved first cutting the samples axially into two equal halves. This process provided two exposed
faces of dimensions 100 mm (4 in.) by 300 mm (12 in.). The exposed faces were then polished
using a hand grinder and diamond impregnated polishing pads. The samples were prepared using
polishing pads of 50, 100, 200, 400, 800, 1500, and 3000 grit. After polishing, a grid of 1 cm
squares was drawn onto the face of each sample. The first 5 mm at the edges of the sample were
not included in the grid, leaving 90 mm by 290 mm of grid space for inspection (Fig. 3.2-4). The

35
inspection procedure involves placing each grid square within the view finder of the stereo
microscope. A magnification of 15x provides a viewable area roughly the same size as a 1 cm
square. The square is then inspected for petrographic features, and the features recorded on a
spreadsheet. Petrographic features of interest were counted and multiplied by the weighing factors
proposed by Sanchez (2014). The list of features is included in Table 3.2-3. The total features
present within the sample were then normalized to a surface area of 100 cm2, and this number
reported as the DRI.
Fig. 3.2-4 Typical prepared DRI sample with grid.
Table 3.2-3 Petrographic features of interest for the DRI test method.
Petrographic Feature Weighing factor
Closed crack in the coarse aggregate (CCA) 0.25
Open crack in the coarse aggregate (OCA) 2
Open crack in the coarse aggregate with reaction product (OCAG) 2
Coarse aggregate debonded (CAD) 3
Corroded aggregate particle (DAP) 2
Crack in the cement paste (CCP) 3
Crack in the cement paste with reaction product (CCPG) 3

36
3.3.Barrier Wall
The next phase of research involved monitoring expansion and RH within several sections of
the median barrier followed by surface treatment. The sections were monitored for one year, with
periodic interim measurements. Each of the surface treatments was evaluated on median barrier
sections of each deterioration level, and compared to a control section at each deterioration level.
The median barrier was instrumented with monitoring equipment on January 31, 2013 and then
treated on March 12, 2013. The final measurements were performed in March 2016.
Instrumentation
The first stage of field monitoring required instrumenting the median barrier for length-change
and internal RH monitoring. A total of 15 sections were selected for instrumentation. Five sections
were selected from each deterioration level. Length-change was measured with a DEMEC gauge
which measures the distance between two gage studs which were affixed to the median barrier.
The points were affixed to the median barrier by drilling 9.5 mm (3/8 inch) diameter holes, 75 mm
(3 inch) into the vertical face of the median barrier. Four holes were drilled at the corners of a 500
x 500 mm (20 inch) square grid. A typical length-change grid is shown in Fig. 3.2-1.
Fig. 3.3-1 Typical length-change grid (left) and dimensions (right).

37
Stainless steel gage studs were machined with dimensions of 8 mm (5/16 inch) diameter by 75
mm long. A small point (1 mm by 3 mm deep) was drilled into the end of the gage stud. The
points on the DEMEC gage were inserted into the points in the gage studs when measuring the
distance between two gage studs. A gage stud which was affixed to the median barrier is shown
in Fig. 3.3-2 (left) and a humidity port is shown in Fig. 3.3-2 (right).
Fig. 3.3-2 Typical gage stud (left) and humidity port with cap (right).
The length-change was measured along the four sides of the grid, and then the DEMEC gage
was reversed and the four sides measured again. The length-change for each side of the grid was
then determined from the average of the two measurements. The DEMEC gage reports the length-
change with a precision of ±0.00005%. The length-change was subtracted from the previous
reading to determine the difference. The difference was then divided by the gage length (500 mm)
and multiplied by 100%. The final value was reported as percent strain with a precision of
0.0001%. The DEMEC gage is displayed in Fig. 3.3-3 (right) while measuring length-change in
the longitudinal direction.
A hole was also drilled to the left of each length-change grid for inserting the internal RH
probe. The hole was 16 mm (5/8 inch) diameter and 125 mm (5 inches) deep. The port was capped
with a 12.5 mm inside diameter CPVC pipe and tight-fitting plastic cap. The cap was easily

38
removed for measurements and was intended to prevent moisture from entering or exiting the port.
During measurements, the humidity probe was inserted into the port and allowed to equilibrate
with the concrete for 30 minutes. The probe was left in the port until there was less than ±1%
change in internal RH over a five-minute period, but no less than 15 minutes total time. Ideally,
one hour was required to allow the conditions within the port to reach equilibrium with the
concrete. However, time was limited and only 30 minutes was available to measure each median
barrier section. In addition, because the ports were sealed before measurements were taken; the
ambient conditions within the port were already in equilibrium with the concrete. Once the
humidity probe was inserted into the port and the temperature of the probe reached equilibrium
with the concrete no additional time was required for equilibrium to occur. After the probe
temperature reached equilibrium with the concrete, subsequent sections took less time because no
additional time for equilibrium conditions was required. The portable humidity indicator and
humidity probe are shown in Fig. 3.3-3 (center) and Fig. 3.3-3 (right), respectively.
Fig. 3.3-3 DEMEC gage during length-change measurement (left), portable humidity indicator
(center), and humidity probe inserted into a humidity port (right).

39
Treatment
Two months after instrumenting the median barrier for monitoring length-change and internal
RH the selected sections were treated with a surface treatment. The goal of surface treatment was
to reduce the internal RH within the concrete to a level below 80%. Several commercial surface
treatments were available for protecting concrete from external moisture. Due to the variability in
the level of deterioration throughout the length of the median barrier, three surface treatments were
selected based on information collected during the literature review. The first treatment method
evaluated was silane, which was used successfully by Berube et al. (2002b) to treat concrete
median barriers with ASR deterioration. However, silane has proven less effective in extensively
cracked sections. Therefore, an elastomeric breathable vapor barrier was also examined to
evaluate moisture protection for sections with wider cracks. The third treatment, boiled linseed
oil, was selected because of its accessibility and proven history as a method of protecting bridge-
decks from moisture. The application rate and material cost for each treatment is summarized in
Table 3.3-1. The silane and linseed oil were applied with hand sprayers while the elastomeric
paint was applied with paint rollers. An additional consideration was the much more labor-
intensive application of elastomeric paint which required paint rollers.
Table 3.3-1 Material cost and application rate for surface treatments.
Treatment Silane Elastomeric Paint Linseed Oil
Brand Enviroseal 40 Sikagard 550w Euclid Linseed Oil
Cost, 19L (5 gal) $217 $248 $174
Application Rate, m2/L (ft2/gal) 3.7 (150) 2.5 (100) 7.4 (300)
Cost, $/m2 ($/ft2) $3.12 ($0.29) $5.34 ($0.50) $1.25 ($0.12)

40
There were five sections of median barrier selected for treatment from each of the three
deterioration levels. The first section was left untreated as a control, the second section was
sprayed with a single application of silane, the third section was sprayed with a single application
of linseed oil, the fourth section was painted with elastomeric paint, and the fifth section was
sprayed with a single application of silane and then an additional application of silane six months
later. A typical application of surface treatments is shown in Fig. 3.3-4 (left). To ensure the correct
application rate, the required amount of each respective treatment for a single section was
measured and then applied to the section. The sections were allowed to dry for 24 hours, and then
initial length-change and internal RH were measured. Several of the moderately and severely
deteriorated sections exhibited wide cracks (> 2 mm) which were sealed with silicon sealant to
prevent excess moisture from entering the concrete. The silicon crack sealant is shown as applied
in Fig. 3.3-4 (right).
Fig. 3.3-4 Application of surface treatment (left) and crack sealant (right).
Monitoring
Periodic measurements of length-change and internal RH were performed on the fifteen
median barrier sections. Measurements were performed monthly for the first six months and then
at nine months and one year. Measurements included vertical and longitudinal length-change for

41
each median barrier section. The measurements were performed as described above, and each
length-change axis represents the average of four measurements. The DEMEC gage reference
points were first inserted into gage studs ‘A’ and ‘O’ (Fig. 3.3-1) of the length-change grid and the
length-change was reported to ±0.00005. This process was then repeated for the three remaining
sides of the grid. The DEMEC gage was then reversed and a second measurement taken for each
side of the grid. Therefore, the length-change was measured twice on each side of the length-
change grid. The two length-change measurements for each side of the grid were then averaged
to minimize error. After the average percent strain for each side of the grid was determined, the
two vertical sides were averaged to produce a single value which represents the percent strain in
the vertical axis of the median barrier section. This process was repeated for the two longitudinal
sides of the length-change grid to produce an average percent strain in the longitudinal direction.
However, the longitudinal strain results were not useful because expansion was prevented by the
internal and external restraint on the median barrier sections. The raw longitudinal strain data is
provided in Appendix A1.4. Simultaneous to length-change measurements, the internal RH and
temperature were measured using a Vaisala SHM40 portable humidity indicator and probe. The
probe was inserted into the port and allowed to equilibrate with the conditions within the concrete.
A minimum of fifteen minutes was allowed for equilibrium to occur, and the reading was reported
after the internal RH changed less than ±1% within five minutes. This process was repeated for
all fifteen median barrier sections.
After measuring internal RH and strain, the data was normalized and plotted for each section.
The sections of each deterioration level were plotted in the same graph to allow for comparison of
each treatment method. The strain rate and differential strain for each section was determined to
describe the efficacy of each treatment in reducing strain as compared to the control.

42
The first step in reducing the DEMEC measurements into strain was to apply a unit multiplier
of 0.80 to the raw measurement. The DEMEC gage utilizes a lever between the point which is
inserted into the gage stud and the point which actuates the digital strain gage. The lever has a
ratio of 0.8:1.0 and an increment of 1.0 at the gage stud represents an increment of 0.8 at the strain
gage. After applying the multiplier, the percent strain was determined by first subtracting the strain
at the current date from the initial strain at day-0. The difference was then divided by the DEMEC
gage length and then multiplied by 100%. The actual gauge length was 500 mm ± the day-0
reading, to account for the initial variation between the DEMEC gage and the measurement grid.
The process for percent strain is shown below in Equation 3.3-1.
Strain (%) =∆i − ∆0Lg + ∆0
× 100%
∆i = 0.8 × DEMECi
∆0 = 0.8 × DEMEC0
Lg = 500 mm = 19.685 in.
Equation 3.3-1
The strain data was then normalized for an ambient temperature of 21° C to remove thermal
strains. A coefficient of thermal expansion (CTE) of 10x10-6/°C was selected for the concrete.
Although the actual CTE was not measured for the median barrier, the CTE for concrete typically
falls between 8x10⁻⁶ and 12x10-6/°C. Multiple strain measurements were recorded at each site
visit, one set in the morning and another in the afternoon when the temperature had increased
several degrees. The strain results where normalized using a linear CTE of 10x10-6/°C. The CTE
was then adjusted to minimize the difference between the morning and afternoon measurements,
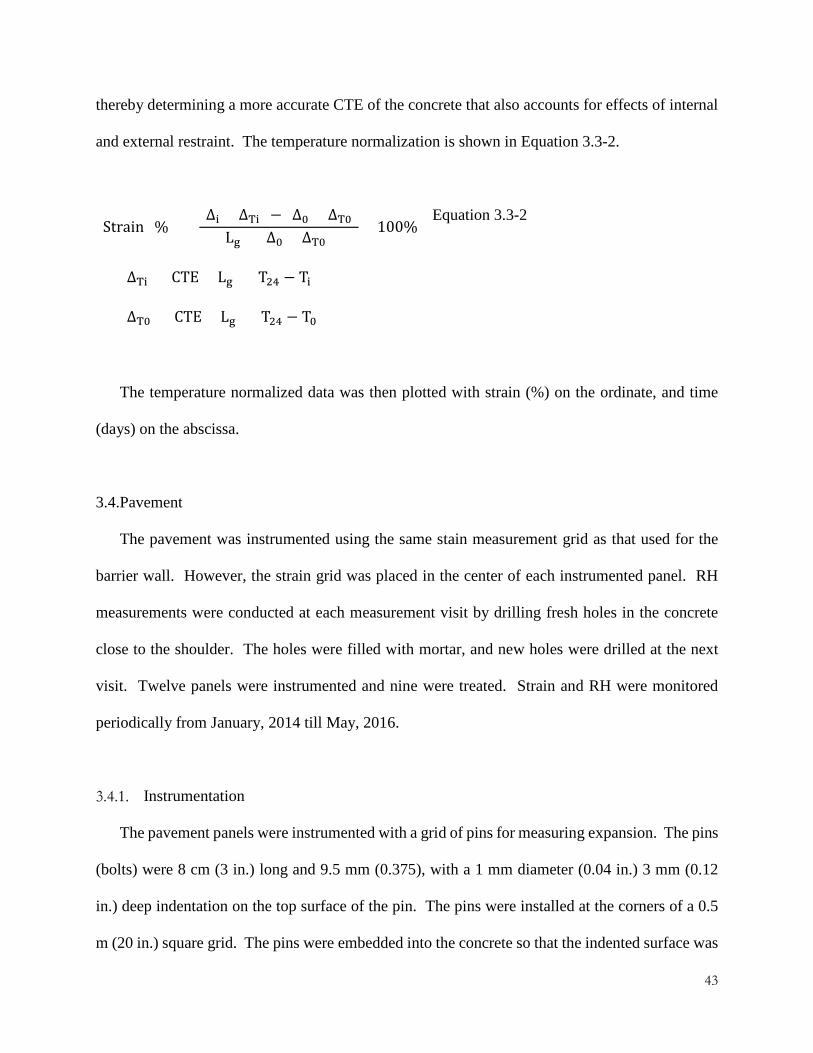
43
thereby determining a more accurate CTE of the concrete that also accounts for effects of internal
and external restraint. The temperature normalization is shown in Equation 3.3-2.
Strain (%) = (∆i + ∆Ti) − (∆0 + ∆T0)
Lg + (∆0 + ∆T0) × 100%
∆Ti = CTE × Lg × (T24 − Ti)
∆T0 = CTE × Lg × (T24 − T0)
Equation 3.3-2
The temperature normalized data was then plotted with strain (%) on the ordinate, and time
(days) on the abscissa.
3.4.Pavement
The pavement was instrumented using the same stain measurement grid as that used for the
barrier wall. However, the strain grid was placed in the center of each instrumented panel. RH
measurements were conducted at each measurement visit by drilling fresh holes in the concrete
close to the shoulder. The holes were filled with mortar, and new holes were drilled at the next
visit. Twelve panels were instrumented and nine were treated. Strain and RH were monitored
periodically from January, 2014 till May, 2016.
Instrumentation
The pavement panels were instrumented with a grid of pins for measuring expansion. The pins
(bolts) were 8 cm (3 in.) long and 9.5 mm (0.375), with a 1 mm diameter (0.04 in.) 3 mm (0.12
in.) deep indentation on the top surface of the pin. The pins were installed at the corners of a 0.5
m (20 in.) square grid. The pins were embedded into the concrete so that the indented surface was

44
2 mm (0.08 in.) below the pavement surface. This was done to ensure that the pins were not
damaged during maintenance, plowing, or grinding of the pavement surface. The grid was placed
in the middle of the pavement panel, between the tire paths to avoid wearing. The grid was aligned
to provide two strain measurements in the travel direction and two in the transverse direction.
However, some of the pins were installed incorrectly or damaged and the redundant measurement
is no longer available. Expansion measurements are conducted using a DEMEC Gauge, which
has points that are aligned with the indentations on the pre-installed pins.
RH was also measured within each pavement panel. Two methods of measuring RH were used
over the course of monitoring. The first method involved drilling holes to a depth of 15 cm (6 in.)
near the shoulder of the pavement. Portable RH probes were inserted into the holes during
measurements and allowed to equilibrate for four hours. The holes were capped with a plastic
insert between measurements. This method caused several issues that severely limited the
accuracy of the measurements. The plastic caps did not fill the volume of the hole, which allowed
water vapor to condense within the hole. When the cap was removed and a humidity probe
inserted, the liquid water caused an artificially high RH.
The method was abandoned after one year, and subsequent measurements were conducted by
drilling fresh holes to a depth of 7.5 cm (3 in.) at each visit. A humidity probe was inserted into
the hole and temporarily sealed with silicon caulk. The probes were allowed to equilibrate for four
hours, and provided a more accurate measure of the concrete internal RH. To validate this method,
probes were installed into concrete slab specimens are the University of Arkansas. The probes
were monitored continuously for 72 hours after installation. The results indicate that within the
first 3 to 4 hours after installation, the probe had reached equilibrium with the surrounding
concrete.
45
There are a range of commercial RH probes available for measuring internal RH in concrete.
The capacitive type probes are accurate and have an equilibration time of only a few hours.
However, probes are available with a range of accuracies and affordability. In this research
program three Vaisala HMP40S probes were available. The probes are accurate throughout the
full 100 % RH range, with an accuracy of ± 2.5% RH at 90 to 100% RH for temperatures of 0 to
40 °C. However, the Vaisala probes are expensive, which limits the quantity available. An
additional 18 LabJack EI-1050 probes were purchased for comparison, due to the lower cost. The
LabJack probes have an initial accuracy of ± 3.5% over a range of 0% to 100% RH for temperatures
of 0 to 40 °C. The probes were evaluated through laboratory testing in concrete slabs and in sealed
containers over saturated salt solutions. The LabJack probes were generally as accurate as the
Vaisala probes, however the LabJack probes require calibration every six months rather than two
years. A benefit of the LabJack probes is the exposed sensor, which allows for greater airflow and
faster equilibration. The LabJack sensor is encased in a 12 mm diameter 75 mm long plastic
sleeve, which is contains a large volume of air. When the probes are embedded into concrete for
an extended period of time, water vapor condenses on the inside the sleeve and causes the RH to
increase towards 100% over a few weeks. Therefore, the probes work better if left in the concrete
over a four-hour period each day.
The strain measurements were processed and normalized using the same method as described
for the barrier wall. The results were temperature normalized to a temperature of 21° C to allow
comparison of strain over the monitoring period. The temperature normalization ignores the
effects of internal or external restraint. To determine an appropriate Coefficient of Thermal
Expansion (CTE) for normalizing the data, strain measurements were recorded twice at each site
visit. Strain was measured in the morning and afternoon when the temperature had increased

46
several degrees. The results where then plotted and normalized using a linear CTE. The CTE was
then adjusted to minimize the difference between morning and afternoon measurements, resulting
in the smallest possible temperature error.
Treatment
Each of the twelve instrumented panels were treated with one of the selected silanes in March,
2014. The panels were treated the same day as instrumentation. The silanes were selected from
different manufacturers that are readily available in the United States. Each silane was applied by
spraying, using a hand operated pressure canister. The application rate was regulated by applying
a predetermined volume of silane to each panel, based on the surface area of the panel. The silane
was applied consistently over the surface area until a thin film of excess material was on the entire
surface. The commercial brand name, application rate, and composition are summarized in Table
3.4-1. Of the twelve pavements panels, three remained untreated as controls. Each silane
treatment was applied to three panels over the test section. The manufacturer recommended
dosage was 3.7 m2/L (150 ft2/gal), and 6.1 m2/L (250 ft2/gal) for the 40% and 100% silane
solutions, respectively. Two of the silanes were 40% silane by solution and the remaining silane
was 100%. The 40% silane solutions are alkylalkoxysilane water emulsions, while the 100%
solution is 100% alkyltrialkoxysilane in methanol solution. The silanes were applied to the panels
as summarized below in Fig. 3.4-1.

47
Figure 3.4-1. Pavement treatment location and numbering.
Table 3.4-1. Silane treatments and application rates.
Treatment Silane 40 Silane 40 Silane 40
Brand Enviroseal 40 Sikagard 740W Baracade 100
Application Rate, m2/L (ft2/gal) 3.7 (150) 3.7 (150) 6.1 (250)
Chemical Composition alkylalkoxysilane alkylalkoxysilane alkyltrialkoxysilane
Samples
Core samples from the pavement were extracted in August 2013 and March 2016. The samples
were 100 mm diameter and 325 mm long. Samples were collected for DRI, PFE, and Petrography
testing. Sixteen cores were collected in 2013, three were sent for petrography, four were used for
DRI, and nine for PFE testing. An additional 24 cores were collected in 2016, of which three were
used for PFE tests, and the remainder for DRI testing.
1 2 3 4 5 6
Control 1
Enviroseal1
Enviroseal2
Baracade1
Baracade1
Control2
7 8 9 10 11 12
Control 3
Sikagard1
Sikagard2
Enviroseal3
Baracade3
Sikagard3
North

48
4. RESULTS AND DISCUSSION
A petrographic examination of concrete core samples extracted from the median barrier was
performed in 2012 by Construction Technology Laboratories Group (CTLGroup). The
petrographic examination concluded that the concrete contained 1.0 in crushed limestone coarse
aggregates and natural sand fine aggregates. The concrete was not air-entrained and contained 3%
to 4% air in randomly distributed voids. The concrete contained an estimated 10% to 15% fly ash
by weight.
Deposits of alkali-silica gel were found associated with chalcedony fine aggregate particles.
The chalcedony fine aggregate particles were primarily located within the coarse portion of the
fine aggregates. The chalcedony particles had alkali-silica reaction rims, and gel deposits had
filled some air voids. Micro-cracking was discovered throughout the depth of the concrete, with
cracks originating from alkali-silica gel deposits. Freezing and thawing deterioration was noted
as a secondary form of distress, which exacerbated the deterioration. Micro-cracking due to ASR
allowed excess water to enter the concrete and freeze, which then increased the extent of
deterioration.
A visual inspection of the median barrier was conducted in January 2013 to determine the
extent of deterioration throughout the length of the median barrier. Sections of median barrier
were divided into one of three categories based on the level of visible distress. The classification
was logged with respect to mile marker of interstate and then plotted in Google Earth to visualize
the extent of distressed sections. The plot of deterioration along the median barrier is shown in
Fig. 4.1. The length of median barrier which exhibited distress of each deterioration designation
is summarized in Table 4.1. The color corresponding to each deterioration designation is the same

49
as shown in Fig. 4.1. Five median barrier sections of each deterioration designation were selected
for monitoring and treatment.
Table 4.1 Length of median barrier sections which correspond to each deterioration designation.
Deteriorated Sections (Miles)
Minimal Moderate Severe Total
2.3 1.40 0.7 4.40
Fig. 4.1 Median barrier deterioration level along Interstate 49. Figure produced in Google Earth.
4.1.Laboratory Tests
The Class C fly ash contained roughly 25% lime (CaO) by weight, and available alkalis of
1.31% Na2Oe. The cement alkali level varied, which explains the variation in deterioration along
the median barrier. The actual alkalis in each section of median barrier were unknown. However,
the sections of moderate or severe deterioration likely contained higher alkali cement than the
sections of minimal deterioration.
The laboratory research phase included ASTM C1260 and ASTM C1293 tests, which are
common standard test methods for evaluating aggregates for deleterious expansion due to ASR.
Additional tests were conducted, in accordance with ASTM C1567, to evaluate fly ash as a
N

50
preventative measure. The aggregates tested included those from the original sources used during
the median barrier construction, as well as several samples of regionally available aggregates
which are used in concrete.
Original samples of the aggregates and cementitious material used during the construction of
the median barrier were no longer available. Therefore, new samples of Van Buren river sand
were collected from the original source. In addition, a stockpile of West Fork limestone was
available for testing. The cement used during laboratory tests contained 0.53% Na2Oe, as
compared to the median barrier cement which contained between 0.46% and 1.0% Na2Oe.
Fortunately, the cement alkali level does not affect the outcome of the AMBT. In addition, the
cement alkalis were increased to 1.25% Na2Oe for the CPT concrete mixtures. Several additional
aggregate sources from the region were evaluated during laboratory testing to locate any additional
potential sources of ASR. However, these tests were not vital to determining the cause of ASR,
or developing mitigation methods for ASR in the median barrier.
Accelerated Mortar Bar Test (AMBT) and Concrete Prism Test (CPT)
Several aggregates were samples for ASR testing. Sand from the Arkansas River at Van Buren
and Pine Bluff, Arkansas and Muskogee, Oklahoma were tested as potential sources of ASR
reactive aggregates. Limestone from West Fork, Arkansas was also evaluated to determine if it
was a factor in the development of ASR. Crushed rock from Granite Mountain and Sharps and
Ottawa sand were tested as potential sources of non-reactive companion aggregates for CPT mixes.
The results from AMBT tests are summarized in Fig. 4.1-1 (Top). The Arkansas River sands
from Pine Bluff (PB) and Van Buren (VB) had final expansions of 0.18% and 0.17%, respectively
and were classified as Potentially Deleteriously Reactive. The remaining aggregates, including

51
sand from Muskogee (MK), Oklahoma; crushed granite from Granite Mountain (GM), Arkansas;
crushed limestone from West Fork (WF) and Sharps (SL), Arkansas; and sand from Ottawa (NR)
all had less than 0.10% expansion and were classified as Inert.
Fig. 4.1-1 Strain (%) with respect to time (days) for AMBT (ASTM C1260) test results (Top).
CPT (ASTM C1293) test results (Bottom).
The results from CPT tests are summarized in Fig. 4.1-1 (Bottom). The concrete mixture,
containing sand from Van Buren and inert coarse aggregate from Sharps (VB + SL), had a one-
year expansion of 0.028% and was classified as inert. Similarly, the mixture, containing sand from
Pine Bluff and inert coarse aggregate from Sharps (PB + SL) had a final expansion of 0.021% and
was classified as Inert. The test conducted with sand from Muskogee and Sharps limestone (MK
0.000.020.040.060.080.100.120.140.160.180.20
0 2 4 6 8 10 12 14
Stra
in (%
)
Time (days)
VB PBMK WFSL GMNR
0.000
0.005
0.010
0.015
0.020
0.025
0.030
0.035
0.040
0.045
0 90 180 270 360
Stra
in (%
)
Time (days)
VB + SLVB + SL 2VB + GMPB + SLMK + SLGM + NR

52
+SL) and the test with Granite Mountain and Ottawa sand (GM + NR) had a final expansion of
0.020% and 0.010%, respectively and were classified as Inert. As noted earlier, the containers
used for these tests were not those recommended in ASTM C1293. Therefore, the resulting
expansion may be lower than would have been observed using the standard containers. An
additional round of tests for the Van Buren sand was conducted using the recommended containers.
The sample containing Van Buran sand and Granite Mountain coarse aggregate (VB + GM) had a
final expansion of 0.039% and was classified as Potentially Deleteriously Reactive. The sample
(VB + SL 2) had a final expansion similar to that of the original test (using the non-standard
container) and indicates that alkali leaching did not significantly alter the results when using a non-
standard container for the CPT.
In addition to the standard AMBT, tests were conducted with mortar bars containing a Class
C fly ash similar to the fly ash used in the pavement in median barrier. The fly ash contained 24%
CaO and was used at replacement rates of 10%, 15%, 30%, and 40%. The results, as summarized
in Fig. 4.1-2 (Top) indicate that fly ash replacement rates greater than 30% are sufficient to
suppress ASR from occurring in the concrete. The 28-day expansions of samples with 30% or
more fly ash were less than 0.10% and the samples were classified as Inert. However, replacement
rates of 15 to 20% as used in the pavement and barrier were not sufficient to prevent ASR.
To compare the outcomes of AMBT and CPT results, Fig. 4.1-2 (Bottom) is a summary of the
final expansion of each aggregate test. The line of equality indicates the relative equality of
expansions developed during CPT testing as comparted to that developed during AMBT testing.
Results that fall on or near this line (such as MK + SL) indicate that both the CPT and AMBT
indicate the aggregate to have similar reactivity. However, results that fall far from the line (such
as PB + SL) indicate that one of the test results indicated either a false positive or false negative

53
test result. This indicates that either the AMBT or CPT expansion was higher, or lower, than the
result for the corresponding CPT or AMBT test, respectively. In the case of the VB and PB sands
all of the test results were within the bottom-right quadrant, indicating that the aggregate expanded
more deleteriously in the AMBT as compared to the CPT. This indicates that the sand is mildly
reactive when sufficient alkalis are available to attack the siliceous minerals present as chalcedony.
The sand does not readily react in concrete, unless the conditions are adequate for ASR to develop.
Fig. 4.1-2 Strain (%) with respect to time (days) for AMBT with fly ash (ASTM C1567) test
results (Top). Comparison of CPT and AMBT test results with failure criteria (Bottom).
0.00
0.05
0.10
0.15
0.20
0.25
0.30
0.35
0.40
0 7 14 21 28
Stra
in (%
)
(days)
VBPBVB + 10% FAVB + 15% FAVB + 30% FAVB + 40% FA
0
0.04
0.08
0 0.05 0.1 0.15 0.2
One
-Yea
r CPT
Exp
ansio
n (%
)
14-Day AMBT Expansion (%)
VB + SLVB + GMPB +SLMK + SLWF + NRGM + NR

54
Alkali Extraction and PFE
Limited documentation from the construction of the median barrier was available at the start
of the research program. However, information was available on the sources of aggregate, cement,
and fly ash. Cement and fly ash chemistry were recovered from the original manufacturers. As
discussed earlier, the fine aggregate was obtained from the Arkansas River in Van Buren, AR. The
coarse aggregate was acquired from the limestone quarry in West Fork, AR. The cement was
obtained from Pryor, Oklahoma and the Class C fly ash from Muskogee, Oklahoma. The cement
alkali levels, as %Na2Oe, for the cement used in the median barrier are summarized in Fig. 4.1-3
(Bottom).
The existing alkalinity of the concrete within the barrier wall was tested following the hot water
alkali extraction method. This method involved pulverizing concrete samples and then exposing
the powdered sample to boiling water. The sample is then filtered and analyzed to measure the Na
and K concentration. Core samples were extracted from the control sections of the barrier wall in
2015. The samples were crushed, sieved, boiled, filtered and analyzed. The analysis results are
summarized in Fig. 4.1-3 (Top), the plot shows the minimum, maximum and average of six tests
that were run on samples from each of the control sections. Interestingly, the alkali concentration
was higher in the section of minimal deterioration as compared to those of moderate or severe
deterioration. This occurs as alkalis are bound within cement hydration products and alkali-silica
gel products. Therefore, the soluble alkali concentration decreases in the concrete as ASR
proceeds. In addition, soluble alkalis are removed from the concrete due to moisture transport
through the concrete, which increases with deterioration. The soluble alkali concentration of the
concrete with minimal deterioration was 2.5 Kg/m3, this indicates that the alkali concentration of

55
the pore solution during hydration was 4.1 kg/m3. This concentration is higher than the
recommended limits and likely contributed to the formation of ASR.
Fig. 4.1-3 Alkali concentration Na2Oe (kg/m3) (Top). Historic alkali concentration of cement
Na2Oe (%) (Bottom).
The PFE test was conducted on nine core samples from the I49 pavement. The cores were
extracted in 2013, before treatments were applied. Three of the cores were stored in water at 38°
C, three were stored in 1.0N NaOH solution at 38° C, and the remaining three were stored in air at
38° C and 100% RH. The results for 370 days of testing are provided in Fig. 4.1-4. The samples
in NaOH have continued to expand over the test duration, due to the unlimited supply of alkalis
provided to the concrete. However, the samples in air did not expand over the test duration,
0.0
0.5
1.0
1.5
2.0
2.5
3.0
Minimal Moderate Severe
Na 2
Oe
(Kg/
m3 )
MaximumAverageMinimum
0.00
0.20
0.40
0.60
0.80
1.00
1.20
0 50 100 150 200 250
Tota
l Alk
alis,
Na 2
Oe
(%)
March 1998 - December 1998
Type I Cement Alkalis

56
indicating that there are limited alkalis remaining in the concrete, preventing ASR products from
forming. The samples stored in water, adsorbed water and expanded due to saturation. The results
were then subtracted from the expansion of the samples stored in NaOH. The NaOH-H2O results
indicate the potential free expansion that could occur in the concrete if sufficient alkalis were
available. However, the results from samples stored in air indicate that no additional expansion
will occur in the field due to a lack of soluble alkalis. Additional core samples were extracted
from the pavement two years after treatment and the samples will be sent for pore solution
expression and analysis to determine the soluble alkalis within the concrete.
Fig. 4.1-4 Potential for further expansion in concrete pavement.
Damage Rating Index (DRI)
Core samples extracted from the pavement in 2013 were prepared for DRI analysis. The
samples were cut and polished to produce a flat surface for inspection at 15X magnification. A
grid of 1 cm cells was drawn on the surface. Each cell was then inspected and the petrographic
features counted. The results are summarized below in Fig. 4.1-5. Core samples from the I49
pavement at Lane Mile (LM) 46, 47.5, and 48 were analyzed. The results indicate that the majority
0.00
0.02
0.04
0.06
0.08
0.10
0 100 200 300 400
Expa
nsio
n (%
)
Time (days)
AirNaOHH2ONaOH - H2O

57
of petrographic features include closed cracks in the coarse aggregate. The core from LM 48 (I49
M48C) had primarily closed cracks in the coarse aggregate, which were caused by aggregate
processing when the rock was crushed. No additional deterioration due to ASR or other
mechanisms was present in the concrete. The core from LM 47.5 (I49 M47.5C) had open cracks
in the coarse aggregate and cracks in the cement paste indicating that deterioration had occurred.
The presence of ASR gel and corroded aggregate particles indicates that ASR has caused
deterioration in the pavement. There are also additional closed cracks in the coarse aggregate as
compared to the undamaged sample from LM 48, indicating that additional deterioration of the
aggregate has occurred. The core from LM 46 (I49 M46C) exhibited similar deterioration as the
core from LM 47, with additional cracking in the coarse aggregate and signs of ASR deterioration.
Due to the presence of multiple interconnected cracks, running parallel to the surface of the
pavement, there is evidence of freezing and thawing distress in the pavement, and expansion
occurring in the thickness direction of the pavement. This expansion has caused the concrete to
develop interconnected cracks parallel to the surface, which occur near the middle portion of the
pavement depth (75 to 225 mm). It is hypothesized that ASR gel products caused microcracking
in the pavement, reducing the freezing and thawing resistance of the concrete and leading to
additional deterioration during winter months.
One of the core samples from the PFE testing was also prepared for DRI analysis. The core
had been exposed to ASR accelerating conditions for one year. The core was from LM 46.5 (I49
M46.5 (A)), and the core showed an increase in closed cracks in the coarse aggregate after one
year. However, the core did not expand during this exposure period, and indicates that additional
cracking in the coarse aggregate is due to existing cracks in the concrete which are propagating
from the cement paste and through the coarse aggregate.

58
Fig. 4.1-5 Deterioration rating index (DRI) results for core samples from I49 (pretreatment).
4.2.Barrier Wall
The barrier wall was instrumented for expansion (%) and RH (%) monitoring in January, 2013.
Three years of periodic monitoring results have been compiled to evaluate the efficacy of surface
treatments applied to the wall. The treatments include silane, linseed oil, and elastomeric paint.
The wall was treated in March, 2013 and the final measurements were made in March, 2016 before
the wall was demolished. The results indicate that some of the treatments produced a statistically
significant reduction in expansion as compared to the untreated control sections. Even in the
sections with moderate or severe deterioration the treatments reduced expansion. However, due
to the extensive deterioration within the wall before treatments were applied, the sections of
moderate to severe deterioration were beyond repair and required demolition. The results,
however, indicate that surface treatment with silane products is a viable method for extending the
service life of concrete median barriers if the treatment is applied before deterioration is too
extensive.
0 100 200 300 400 500 600
I49 M46C
I49 M47.5C
I49 M48C
I49 M46.5 (A)
DRIClosed cracks in aggregates (CCA)Open cracks in aggregates (OCA)Open cracks in aggregates+ gel (OCAG)Coarse aggregate debonded (CAD)Disaggregated/corroded aggregate particle (DAP)Cracks in cement paste (CCP)Cracks in cement paste + gel (CCPG)

59
Minimal Deterioration
The sections with minimal deterioration expanded for the first year and then contracted
over the remaining two years, to end with negligible expansion. The results are summarized in
Fig. 4.2-1 (Top). The control section (C-1) had a final strain of 0.01%, which was not sufficient
to produce cracking in the concrete. The section treated with silane (S-1) expanded faster than the
control for the first year and then slowed and contracted to end with a final strain of -0.006%.
Similarly, the section treated with two applications of silane (S2-1) had a final strain of -0.015%
indicating that silane reduced the rate of expansion in the treated sections as compared to the
control. The sections treated with elastomeric paint (EP-1) and linseed (L-1) had final strains of -
0.005% and -0.014%, respectively. These two treatments also benefited the wall as compared to
the control sections.
Fig. 4.2-1 (Bottom) summarized the control indexed strain for the wall sections with minimal
deterioration. All of the treated sections had lower strain than the control section after two years,
with silane (S2-1) having a final strain 0.024% lower than that of the control, and (S-1) having a
final strain 0.016% less than the control. Elastomeric paint (EP-1) and linseed (L-1) had a final
strain of 0.020% and 0.015% less than the control, respectively.

60
Fig. 4.2-1 Strain (%) with respect to time (days) for barrier wall sections exhibiting minimal
deterioration (Top). Control-indexed strain (%) (Bottom).
Moderate Deterioration
The sections with moderate deterioration has significantly higher (up to 10 times higher) strains
that those of minimal deterioration. The results are summarized in Fig. 4.2-2 (Top). The control
section (C-2) had a final strain of 0.1%, which was sufficient to produce visible cracking the
concrete beyond what was present before treatment. The two silane treated sections had lower
strain than that of the control with 0.088% and 0.056% in sections S-2 and S2-2, respectively. The
sections treated with elastomeric paint (EP-2) and linseed (L-2) fared worse than the control with
final strains of 0.127% and 0.168%, respectively. An interesting observation from the strain data,
is the comparatively higher strain rate during winter months as compared to summer months. The
-0.030
-0.020
-0.010
0.000
0.010
0.020
0.030
01/13 05/13 09/13 01/14 05/14 09/14 01/15 05/15 09/15 01/16
Stra
in (%
)Control (C-1)Silane (S-1)Linseed (L-1)Elastomeric Paint (EP-1)Silane 2 (S2-1)
-0.030
-0.025
-0.020
-0.015
-0.010
-0.005
0.000
0.005
0.010
01/13 05/13 09/13 01/14 05/14 09/14 01/15 05/15 09/15 01/16
Stra
in (%
)
Time (days since January 31, 2013)

61
barrier expanded more rapidly in the winter of 2013 and 2014 than the summer months. ASR
accelerates in warmer weather and this trend is the opposite of what would be expected. However,
the trend can be explained by an increase in freezing and thawing deterioration, which occurred
during the winter months. The wall sections exhibited extensive cracking and ASR gel deposits.
Water within the gel and cement paste could not escape during freezing and caused deterioration.
This trend was not observed in the sections with minimal deterioration because cracking and gel
deposits were not present to allow saturation of the concrete between freezing events.
The control indexed strain, Fig. 4.2-2 (Bottom), indicates that the sections treated with linseed
oil or elastomeric paint fared worse than the control, with final strains 0.078% and 0.028% greater
than that of the control, respectively. These two treatments trapped additional moisture within the
concrete, which could not escape during freezing and caused additional deterioration. The silane
treated section S-2 and S2-2, however, had final strains 0.011% and 0.043% less than that of the
control, respectively. The silane was viscous enough to enter the cracks and produce a breathable
barrier on the exposed surface area of the concrete. The concrete dried between rain events, and
was not saturated during freezing, allowing the concrete to perform better than the control section.

62
Fig. 4.2-2 Strain (%) with respect to time (days) for barrier wall sections exhibiting moderate
deterioration (Top). Control-indexed strain (%) (Bottom).
Severe Deterioration
The sections with severe deterioration had final expansions up to 3 times greater than the
sections of moderate and up to 30 times greater than the minimal deterioration. The results are
summarized in Fig. 4.2-3 (Top). The final strain in the control section (C-3) was 0.328%, which
was sufficient to produce wide (6 mm) longitudinal cracks, crushing, and severe map cracking.
The silane treated sections S-3 and S2-3 had final strains of 0.19% and 0.13%, respectively, which
although less than the control section, is still substantial and sufficient to cause additional
deterioration. The section treated with linseed (L-3) had a final strain of 0.168%, which was less
than the control. The section treated with elastomeric paint (EP-3) had a final strain of 0.372%
0.0000.0200.0400.0600.0800.1000.1200.1400.1600.1800.200
01/13 05/13 09/13 01/14 05/14 09/14 01/15 05/15 09/15 01/16
Stra
in (%
)
Control (C-2)Silane (S-2)Linseed (L-2)Elastomeric Paint (EP-2)Silane 2 (S2-2)
-0.060
-0.040
-0.020
0.000
0.020
0.040
0.060
0.080
0.100
01/13 05/13 09/13 01/14 05/14 09/14 01/15 05/15 09/15 01/16
Stra
in (%
)
Time (days since January 31, 2013)

63
and expanded more than the control section. The sections with severe deterioration also had higher
expansion rates in the winter months than the summer, again suggesting that freezing and thawing
deterioration caused more of the deterioration than ASR alone.
The control indexed strain results are summarized in Fig. 4.2-3 (Bottom). The sections treated
with silane, S-3 and S2-3 had final strains 0.138% and 0.198% less than the control section. The
section treated with linseed oil (L-3) had a final strain 0.160% less than the control, while the
section treated with elastomeric paint (EP-3) had a final strain 0.044% higher than the control.
The section treated with two applications of silane fared the best, while the elastomeric paint
actually trapped moisture within the concrete and caused more deterioration in the winter months.
Fig. 4.2-3 Strain (%) with respect to time (days) for barrier wall sections exhibiting severe
deterioration (Top). Control-indexed strain (%) (Bottom).
0.000
0.050
0.100
0.150
0.200
0.250
0.300
0.350
0.400
01/13 05/13 09/13 01/14 05/14 09/14 01/15 05/15 09/15 01/16
Stra
in (%
)
Control (C-3)Silane (S-3)Linseed (L-3)Elastomeric Paint (EP-3)Silane 2 (S2-3)
-0.250
-0.200
-0.150
-0.100
-0.050
0.000
0.050
0.100
01/13 05/13 09/13 01/14 05/14 09/14 01/15 05/15 09/15 01/16
Stra
in (%
)
Time (days since January 31, 2013)

64
For the treatments applied to sections of minimal, moderate, and severe, deterioration, two
applications of silane had the most consistent results. The treatment beneficially reduced
expansion as compared to the control at all three deterioration levels. Had the silane been applied
before the concrete reached this high level of deterioration, the service live of the concrete would
have been extended significantly.
A summary of the control strains for sections of minimal, moderate, and severe deterioration
is provided in Fig. 4.2-4. The plot is divided into winter and summer seasons, which reveals the
increase in strain rate over the winter months, and then decrease in the summer. This is counter
intuitive, as ASR should accelerate during the warmer summer months. However, the increased
deterioration over the winter is actually due to freezing and thawing strains, when moisture trapped
within the concrete expands during freezing. The presence of ASR in the concrete causes cracks,
which cause more moisture to enter the concrete leaving the concrete in a saturated state during
freezing. In addition, ASR gel deposits fill air and capillary spaces, reducing the available volume
were water normally escapes during freezing. These two factors reduce the freezing and thawing
resistance of the concrete, leading to additional deteriorating in the winter.
Fig. 4.2-4 Strain (%) with respect to time (days) for barrier wall control sections, with seasons
highlighted to indicate the increase in strain rate over winter months.
Winter 2014
Summ
er 2014
Winter 2015
Summ
er 2015
01/13 05/13 09/13 01/14 05/14 09/14 01/15 05/15 09/15 01/160.00
0.05
0.10
0.15
0.20
0.25
0.30
0.35
Date
Stra
in (%
)
Control (C-1)Control (C-2)Control (C-3)

65
Relative Humidity (RH)
The RH results for the sections of minimal and moderate deterioration are summarized in Fig.
4.2-5 (Top) and (Bottom), respectively. The sections treated with silane S-1 and S2-1 showed
decreased RH as compared to the control section over the monitoring period. However, the
reduction in RH was not constant and does not indicate that silane beneficially reduced the RH.
The other treated sections, L-1 and EP-1, did not exhibit any reduction in RH. The moderately
deteriorated sections did not indicate any change in RH for any of the treated sections. The level
of deterioration in the concrete prevented the treatments from developing a breathable surface
barrier over the exposed surface area of the concrete. Although no beneficial reduction in RH was
measured for the sections of moderate or severe deterioration, the strain results strongly support
silane as a viable treatment method.
There were difficulties in accurately measuring RH in the field. The first method for measuring
RH involved pre-drilled and capped ports, which were 150 mm deep. During measurements, the
cap was removed and a probe inserted. The probe remained in the port for one hour during
equilibration, and then the temperature and RH were recorded. The problem with this method was
moisture condensation within the port and on the probe during and between measurements. The
volume of air in the port contained water vapor, which condensed when the temperature decreased,
and liquid water precipitated within the port. Additional water was transported from the concrete
into the port over time causing artificially high RH within the port.
The second method involved drilling fresh holes into the concrete at each visit. The holes were
75 mm deep, and a probe was inserted into the hole and epoxied in place. The probe remained in
place for four hours, while equilibrating. This method provided more accurate measurements and
was used between May, 2014 and March, 2016. The results, however, were still inaccurate due to

66
moisture precipitation on the sensors within the LabJack EI-1050 probes. The probes contain a
volume of air around the sensor, and the temperature changed several degrees during the four-hour
equilibration period, during which moisture condensed causing inaccurate RH measurements.
Fig. 4.2-5 RH (%) with respect to time (days) for barrier wall sections exhibiting minimal
deterioration (Top). Moderate deterioration (Bottom).
4.3.Pavement
The pavement strain and RH were monitored from January, 2014 until May, 2016. Strain was
measured in the travel direction and transverse direction. Each figure summarizes the travel
direction strain followed by the transverse direction. There was less external restraint on the
concrete in the transverse direction, and so the concrete expands more feely. There were three
50556065707580859095
100
01/13 05/13 09/13 01/14 05/14 09/14 01/15 05/15 09/15 01/16
Rela
tive
Hum
idity
(%
)
Control (C-1)Silane (S-1)Linseed (L-1)Elastomeric Paint (EP-1)Silane 2 (S2-1)
50556065707580859095
100
01/13 05/13 09/13 01/14 05/14 09/14 01/15 05/15 09/15 01/16
Rela
tive
Hum
idity
(%
)
Time (days since January 31, 2013)
Control (C-2)Silane (S-2)Linseed (L-2)Elastomeric Paint (EP-2)Silane 2 (S2-2)

67
pavement panels left untreated as control panels, three treated with Enviroseal 40, three with
Baracade 100, and three with Sikagard 740W. The RH was measured by drilling a 75 mm deep
hole near the edge of the pavement, and inserting a LabJack EI-1050 probe. The probe was
epoxied in place and allowed to equilibrate for 4 hours before RH was recorded.
Average
The travel direction strain for the three control sections is summarized in Fig. 4.3-1 (Top). The
strain for each panel is included along with the average strain from the three sections. Control 1
had the highest strain at 0.012% while Control 2 contracted 0.003%. The average control
expansion was 0.005% after two years. This strain rate is low compared to the barrier wall, and it
will take 15 years at this rate for visible cracking to appear in the untreated control panels.
However, the strain rate within the pavement was likely faster before instrumentation and
monitoring, and has since slowed as the available alkalis decreased over time. As reported in the
PFE test results, there are no longer sufficient alkalis within the pavement to sustain expansion.
The transverse direction strain was lower, despite the lesser restraint. The average strain for
the control panels was 0.004%, while the highest strain occurred in Control 1 at 0.009% and the
lowest strain in Control 3 at -0.005%. The limited strain in the control panels indicates that
deterioration will not continue within the pavement unless an external supply of alkalis is available.
The results make it difficult to assess the efficacy of silane treatments because the strain rate is
already low and will not be beneficially reduced by silane treatment.

68
Fig. 4.3-1 Average travel strain (%) with respect to time (days) for pavement control panels
(Top). Transverse strain (%) (Bottom).
Each treatment was applied to three pavement panels. The results from three panels were then
averaged and summarized in Fig. 4.3-2. The results for travel direction strains are summarized in
the Top figure, and indicate that the Enviroseal and Baracade treated panels have lower overall
strain than the control panels. The final average strain in the Enviroseal panels was 0.002%, while
that of the Baracade treated panels was 0.003%. Although the strain was less than that of the
untreated control panels, the difference is not significant enough to indicate that silane provided a
beneficial reduction.
The strain results for the transverse direction are summarized in the Bottom figure, and indicate
that only the Sikagard treated panel is performing better than the control. Although the strain in
-0.005
-0.003
0.000
0.003
0.005
0.008
0.010
0.013
0.015
1/14 4/14 7/14 10/14 1/15 4/15 7/15 10/15 1/16 4/16 7/16
Expa
nsio
n (%
)
Average ControlControl 1Control 2Control 3
-0.010
-0.008
-0.005
-0.003
0.000
0.003
0.005
0.008
0.010
0.013
0.015
1/14 4/14 7/14 10/14 1/15 4/15 7/15 10/15 1/16 4/16 7/16
Expa
nsio
n (%
)
Time (days since January 14, 2014)

69
this panel started out higher than the others, the strain was 0.000% after two years. The Enviroseal
treated panel had 0.008%, while the Baracade treated panel had 0.004% after two years. The
results from both travel and transverse direction do not reveal any significant reduction in
expansion for any of the treatments. However, only two years of monitoring have occurred and
ASR mitigation measures require more than three years of monitoring to assess the efficacy of
treatment.
Fig. 4.3-2 Average travel strain (%) with respect to time (days) for treated pavement panels
(Top). Transverse strain (%) (Bottom).
-0.005
-0.003
-0.001
0.001
0.003
0.005
0.007
0.009
1/14 4/14 7/14 10/14 1/15 4/15 7/15 10/15 1/16 4/16 7/16
Expa
nsio
n (%
)
Average ControlAve EnvirosealAve BaracadeAve Sikagard
-0.010
-0.005
0.000
0.005
0.010
0.015
0.020
1/14 4/14 7/14 10/14 1/15 4/15 7/15 10/15 1/16 4/16 7/16
Expa
nsio
n (%
)
Time (days since January 14, 2014)

70
Relative Humidity (RH)
The results of RH testing from all of the panels are provided in Fig. 4.3-3 (Top), with the
average results from the control and treated panels. The results indicate that the average RH within
the pavement was similar between all panels with little variability. None of the treated panels had
a beneficial reduction in RH two years after treatment. The variation between panels is within the
tolerance of the LabJack EI-1050 probes and no conclusions can be made from the results. The
fluctuations in RH over the monitoring period are due to temperature differences at the time of
measurements.
The summary of RH measurements for The Enviroseal treated panels is provided in Fig. 4.3-3
(Bottom). The panel Enviroseal 3 has lower RH than Enviroseal 1 and 2 likely because this panel
is at the end of the test panels, whereas panels 1 and 2 are adjacent. The RH in the control panels
was 87% at the end of monitoring, while it was 100% and 96% in panels 1 and 2, respectively.
The RH in the Enviroseal panels varied between 85% and 100% over the monitoring period and
none of the panels exhibited a beneficial reduction in RH as compared to the untreated control
panels.

71
Fig. 4.3-3 Average RH (%) with respect to time (days) for treated pavement panels (Top).
Enviroseal treated panels (Bottom).
The RH results for the panels treated with Baracade are summarized in Fig. 4.3-4 (Top). With
the exception of panel Baracade 1, the panels had similar RH as compared to the control panels.
The Rh fluctuated between 80% and 100% over the monitoring period. However, the RH was
within the tolerance of the probe as compared to the control panels indicating that the fluctuations
were due to ambient temperature and not changes in concrete RH. The RH results for the
Sikagard treated panels are summarized in Fig. 4.3-4 (Bottom) and again indicates no beneficial
reduction in RH as compared to the control panels. The RH fluctuated between 81% and 100%,
however, the panels all followed the same RH trend indicating that the fluctuations were again due
to ambient temperature and not changes in concrete RH.
70
75
80
85
90
95
100
1/14 4/14 7/14 10/14 1/15 4/15 7/15 10/15 1/16 4/16 7/16
Rela
tive
Hum
idity
(%
)Average ControlAve EnvirosealAve BaracadeAve Sikagard
70
75
80
85
90
95
100
1/14 4/14 7/14 10/14 1/15 4/15 7/15 10/15 1/16 4/16 7/16
Rela
tive
Hum
idity
(%
)
Time (days since January 14, 2014)
Average ControlEnviroseal 1Enviroseal 2Enviroseal 3

72
Measuring RH in the pavement resulted in similar difficulties as mentioned in the section on
barrier wall monitoring. The probes contain a volume of air, in which moist air cools causing
moisture to condense onto the sensor and causing inaccuracies in measurements. In addition,
temperature fluctuates several degrees over the four-hour equilibration period, which decreases
the accuracy of the RH measurements. The sensor cannot equilibrate to a single constant
temperature because the concrete temperature is changing constantly. RH is a function of
temperature and cannot be accurately measures unless temperature remains constant. The RH
between panels and over the monitoring period is difficult to compare because temperature
normalization of the data is not possible.
Fig. 4.3-4 RH (%) with respect to time (days) for Baracade treated pavement panels (Top).
Sikagard treated panels (Bottom).
70
75
80
85
90
95
100
1/14 4/14 7/14 10/14 1/15 4/15 7/15 10/15 1/16 4/16 7/16
Rela
tive
Hum
idity
(%
)
Average ControlBaracade 1Baracade 2Baracade 3
70
75
80
85
90
95
100
1/14 4/14 7/14 10/14 1/15 4/15 7/15 10/15 1/16 4/16 7/16
Rela
tive
Hum
idity
(%
)
Time (days since January 14, 2014)
Average ControlSikagard 1Sikagard 2Sikagard 3

73
Enviroseal
The results for travel and transverse direction strains for the Enviroseal treated panels are
summarized in Fig. 4.3-5 Top and Bottom, respectively. The panel Enviroseal 3 had lower strain
in the transverse and travel direction compared to the control sections. However, the panel
Enviroseal 2 had higher strain in the travel direction and lower in the transverse, while the panel
Enviroseal 1 had the opposite. The final strain in panel Enviroseal 1 was -0.006% and 0.010% in
the travel and transverse directions, respectively. The strain in panel Enviroseal 2 and 3 were
0.006% and 0.004% in the travel direction and 0.001% and 0.002% in the transverse direction.
Again, the Enviroseal product does not provide a beneficial reduction in strain as compared to the
untreated control sections. The variability in the results and the low rate of strain in the pavement
prevent conclusions on the efficacy of this silane product applied to concrete pavements.

74
Fig. 4.3-5 Travel strain (%) with respect to time (days) for Enviroseal treated pavement panels
(Top). Transverse strain (%) (Bottom).
Baracade
The results for travel and transverse direction strain in panels treated with Baracade are
summarized in Fig. 4.3-6 Top and Bottom, respectively. The results indicate that Baracade did
not reduce strain as compared to the untreated control section. The strain rate in the control section
is too low for silane to provide a measureable difference. The final strain in panel Baracade 1 was
-0.003% and -0.008% for the travel and transverse directions. The strain in Baracade 2 was
0.006% and 0.002% for the travel and transverse direction. Panel Baracade 3 had final strains of
0.005% and -0.009% in the travel and transverse directions, respectively.
-0.010
-0.005
0.000
0.005
0.010
0.015
1/14 4/14 7/14 10/14 1/15 4/15 7/15 10/15 1/16 4/16 7/16
Expa
nsio
n (%
)
-0.010
-0.005
0.000
0.005
0.010
0.015
1/14 4/14 7/14 10/14 1/15 4/15 7/15 10/15 1/16 4/16 7/16
Expa
nsio
n (%
)
Time (days since January 14, 2014)
Average ControlEnviroseal 1Enviroseal 2Enviroseal 3

75
Fig. 4.3-6 Travel strain (%) with respect to time (days) for Baracade treated pavement panels
(Top). Transverse strain (%) (Bottom).
Sikagard
The strain results for travel and transverse direction strain in panels treated with Sikagard are
summarized in Fig. 4.3-7 Top and Bottom, respectively. The results again indicate that the
Sikagard treatment does not provide a beneficial reduction in strain as compared to the control
section. This result is not due to the inability of silane to decrease strain, but because the pavement
is no longer expanding even for the untreated control panels. The final strain for panel Sikagard
1 was 0.001% and 0.009% for the travel and transverse direction. The strain in panel Sikagard 2
was 0.008% and 0.005% in the travel and transverse direction. The panel Sikagard 3 had final
strains of 0.004% and 0.016% in the travel and transverse direction. The variability in the strain
-0.010
-0.005
0.000
0.005
0.010
0.015
1/14 4/14 7/14 10/14 1/15 4/15 7/15 10/15 1/16 4/16 7/16
Expa
nsio
n (%
)Average ControlBaracade 1Baracade 2Baracade 3
-0.020
-0.015
-0.010
-0.005
0.000
0.005
0.010
0.015
0.020
1/14 4/14 7/14 10/14 1/15 4/15 7/15 10/15 1/16 4/16 7/16
Expa
nsio
n (%
)
Time (days since January 14, 2014)

76
for the Sikagard treated sections was much higher than that of the Enviroseal or Baracade sections.
However, there was no apparent reason for the increased variability. The highest strain for any of
the treated panels was 0.022%, which is not sufficient to produce deterioration in the pavement.
Fig. 4.3-7 Travel strain (%) with respect to time (days) for Sikagard treated pavement panels
(Top). Transverse strain (%) (Bottom).
Visible cracking is present in all of the pavement panels, especially near the joints.
Petrographic and DRI analysis confirm that the majority of cracking is short-random hairline
cracking within the top 25 to 50 mm of the pavement. These cracks are more evident near the
joints, where some of the cracks appear discolored due to dirt and salts within the cracks. The
salts deposited on the roadway during winter maintenance are dissolved in solution. The solution
gets into the cracks and the water evaporates leaving behind salt crystals. Salts attract moisture
-0.003
-0.001
0.001
0.003
0.005
0.007
0.009
0.011
0.013
0.015
1/14 4/14 7/14 10/14 1/15 4/15 7/15 10/15 1/16 4/16 7/16
Expa
nsio
n (%
)Average ControlSikagard 1Sikagard 2Sikagard 3
-0.005
0.000
0.005
0.010
0.015
0.020
0.025
1/14 4/14 7/14 10/14 1/15 4/15 7/15 10/15 1/16 4/16 7/16
Expa
nsio
n (%
)
Time (days since January 14, 2014)

77
during rain events and the crystals expand leading to additional cracking. In addition, the moisture
within the cracks cannot readily escape during freezing, causing freezing and thawing distress at
the joints.

78
5. CONCLUSIONS
5.1.Laboratory Tests
Laboratory testing indicates that the Arkansas River sand from Van Buren, Arkansas is
potentially deleteriously reactive when used in combination with high alkali (>0.6% Na2Oe)
cements. The test results confirm that Van Buren sand can lead to ASR deterioration in concrete,
and care should be taken to use cements with lower alkalis or greater than 30% Class C fly ash.
The sand is safe for use in concrete so long as these recommendations are followed to limit the
risk of ASR.
The alkali extraction tests confirm that the alkalinity of the concrete was sufficient for ASR to
develop. However, the PFE and field testing show that freezing and thawing were the cause of the
moderate to severe deterioration in the wall. The PFE results indicate that the available alkalis
within the pavement have been adsorbed into reaction products and there are not enough alkalis
remaining for ASR gel to develop. However, the existing gel products adsorb water and lead to
continued expansion. There is sufficient silica remaining in the concrete to sustain ASR if an
outside source of alkalis were introduced.
The DRI test results confirm that ASR and freezing and thawing distress are occurring in the
pavement. The coarse aggregate contains closed cracks from the crushing process. However, in
the cores from LM 46 and 47 the concrete exhibits open cracks in the aggregate and cement matrix,
as well as ASR gel products. This indicates that ASR has developed in the pavement and that
freezing and thawing has resulted as a secondary deterioration mechanism.

79
5.2.Barrier Wall
The barrier wall results indicate that silane treatments beneficially reduced expansion in
sections of all deterioration levels. Treating the barrier with silane will reduce the RH of the
concrete, inhibiting the development of ASR and slowing the expansion of ASR gel within the
concrete. As an additional benefit, the silane may reduce the saturation state of the concrete
thereby reducing the stress that occurs during freezing events. This benefit will prevent
deterioration and increase the useful life of the concrete.
The elastomeric paint and linseed oil treatments provided inconclusive results. In some of the
section the treatments reduced deterioration as compared to the control sections. However, this
result was not consistent for all deterioration levels and the products are not recommended as
compared to silane treatment.
5.3.Pavement
The pavement monitoring results are inconclusive at this time. After two years of monitoring,
the pavement does not appear to be expanding. Although panels of the pavement were treated
with silane, the results did not indicate a beneficial reduction in expansion as compared to the
control sections. This does not mean that silane will not benefit the pavement. Silane is a
breathable surface barrier, which prevents liquid water from entering the concrete, while allowing
water vapor to escape. This process dries the pavement over time preventing the concrete from
becoming saturated. Freezing and thawing deterioration occurs when the pavement is saturated,
and preventing the pavement from remaining saturated will limit the progression of ASR gel
expansion and limit freezing and thawing distress.

80
6. ACKNOWLEDGEMENTS
Funding for this project was provided by the Arkansas State Highway and Transportation
Department (AHTD) and the Mack-Blackwell Rural Transportation Center (MBTC). The Dr. W.
Micah Hale acted as the principal investigator for the project and graduate research assistants
Casey Jones, Richard Deschenes, William Philips, Cameron Murray, Remington Reed, and
Matthew Weidner worked to implement the research program in the laboratory and field. The
AHTD Research Division and Maintenance Division provided lane closures and access to the
barrier wall and pavement for all of the cite visits.

81
7. REFERENCES
ACI Committee 221. (1998). “State-of-the-art report on alkali-aggregate reactivity” (Report No.
ACI 221.1R-98). American Concrete Institute, Farmington Hills, MI, 1998, 31 pp.
Berube, M.A., Chounard, D., Boisvert, L., Frenetter, J., and Pigeon, M. (1996). “Influence of
wetting-drying and freezing-thawing cycles, and effectiveness of sealers on ASR”.
Proceedings of the 10th International Conference on Alkali-Aggregate Reaction (ICAAR),
Melbourne, Australia, August 18-23, 1056-1063.
Bérubé, M.-A., Chouinard, D., Pigeon, M., Frenette, J., Rivest, M., & Vézina D. (2002a)
“Effectiveness of sealers in counteracting alkali–silica reaction in highway median barriers
exposed to wetting and drying, freezing and thawing, and deicing salt.” Canadian Journal of
Civil Engineering, 29, 2002a, pp. 329-337.
Bérubé, M-A., Chouinard, D., Pigeon, M., Frenette, J., Boisvert, L., & Rivest, M. (2002b).
“Effectiveness of sealers in counteracting alkali–silica reaction in plain and air-entrained
laboratory concretes exposed to wetting and drying, freezing and thawing, and salt water.”
Canadian Journal of Civil Engineering, 29, 2002b, pp. 289-300.
Berube, M.A., Frenette, J., Pedneault, A., Rivest, M. (2002c). “Laboratory Assessment of the
Potential Rate of ASR Expansion of Field Concrete”. Cement, Concrete and Aggregates, 24(1),
13-19.
Bérubé, M.A., Frenette, J., Rivest, M. and Vézina, D. (2002c). "Measurement of the Alkali Content
of Concrete Using Hot Water Extraction." Cement, Concrete, and Aggregates, 24 (1): 28-36.
Chatterji, S. (1989) “Mechanisms of Alkali-Silica Reaction and Expansion”. Proceeding of the 8th
International Conference on Alkali-Aggregate Reaction (ICAAR), Kyoto, Japan, 101-105.

82
Davies, G., & Oberholster, R. E. (1988). “Alkali-silica reaction products and their development.”
Cement and Concrete Research, 18(4), 621-635.
Deschenes, R.A. (2014). “Mitigation of Alkali-Silica Reaction (ASR) in an Interstate Median
Barrier”. Master’s Thesis, University of Arkansas, Fayetteville Arkansas, 108 pp.
Diamond, S. (1989). “ASR—another look at mechanisms.” Proceedings from 8th international
Conference on Alkali-Aggregate Reaction (ICAAR), Kyoto, Japan, 83-94.
Drimalas, T., Folliard, K.J., Thomas, M.D.A., Fournier, B., & Bentivegna, A. (2012). “Study of
the effectiveness of lithium and silane treatments on field structures affected by ASR.”
Proceedings of the 14th International Conference on Alkali-Aggregate Reaction (ICAAR),
Austin, Texas.
Duchesne, J., & Berube, M-A. (1994). “The effectiveness of supplementary cementing materials
in suppressing expansion due to ASR: Another look at the reaction mechanisms part 2: Pore
solution chemistry.” Cement and Concrete Research, 24(2), 221-230.
Dunbar, P.A.; Grattan-Bellew, P.E. (1995). “Results of damage rating evaluation of condition of
concrete from a number of structures affected by ASR”. CANMET/ACI International
Workshop on Alkali-Aggregate Reactions in Concrete, Dartmouth, Canada, October.
Folliard, K.J., Thomas, M.D.A., Fournier, B., Resendez, Y., Drimalas, T., & Bentivegna, A.
(2012). “Evaluation of mitigation measures applied to ASR-affected concrete elements:
preliminary findings from Austin, TX Exposure Site.” Proceeding of the 14th International
Conference on Alkali Aggregate Reaction (ICAAR), Austin, Texas.
Fournier, B., Bérubé, M.-A., & Frenette, J. (2000). “Laboratory investigations for evaluating
potential alkali-reactivity of aggregates and selecting preventive measures against alkali-

83
aggregate reaction (AAR) - what do they really mean?” Proceedings of the 11th International
Conference on Alkali-Aggregate Reaction (ICAAR), Quebec, Canada, 287-296.
Fournier, B., Bérubé, M.A., Thomas, M.D.A., Smaoui, N. & Folliard, K.J. (2004). Evaluation and
Management of Concrete Structures Affected by Alkali-Silica Reaction - A Review. MTL
2004-11 (OP). Natural Resources Canada. Ottawa (Canada), 59 pp.
Fournier, B., Bérubé, M-A., Folliard, K.J., & Thomas, M.D.A. (2010). Report on the Diagnosis,
Prognosis, and Mitigation of Alkali- Silica Reaction (ASR) in Transportation Structures
(Report No. FHWA-HIF-09-004). Federal Highway Administration, U.S. Department of
Transportation, Washington DC, 154 pp.
Grattan-Bellew, P.E., Mitchell, L.D. (2006). “Quantitative petrographic analysis of concrete –The
Damage Rating Index (DRI) method, a review”. Proc. Marc-André Bérubé symposium on
AAR in concrete, CANMET/ACI Advances in concrete technology seminar, Montréal,
Canada, 321-334.
Helmuth, R., Stark, D., Diamond, S., & Moranville-Regourd, M. (1993). “Alkali-silica reactivity:
an overview of research (Report No. SHRP-C-342).” Strategic Highway Research Program
(SHRP), National Research Council, Washington, DC, 105 pp.
Ideker, J.H., Bentivegna, A.F., Folliard, K.J., & Juenger, M.C.G. (2012a). “Do current laboratory
test methods accurately predict alkali-silica reactivity?” ACI Materials Journal, 109(4), 395-
402.
Ideker, J.H., Drimalas, T., Bentivegna, A.F., Folliard, K.J., Fournier, B., Thomas, M.D.A., Hooton,
R.D., & Rogers, C.A., (2012b). “The importance of outdoor exposure site testing.” Proceeding
of the 14th International Conference on Alkali Aggregate Reaction (ICAAR), Austin, Texas.

84
Johnston, D. P., Surdahl, R., & Stokes, D. B. (2000). “A case study of a lithium-based treatment
of an ASR-affected pavement.” Proceedings of the 11th International Conference on Alkali-
Aggregate Reaction (ICAAR), Quebec, Canada, 1149-1158.
Multon, S. Barin, F.-X., Godart, B., Toutlemonde, F. (2008). “Estimation of the Residual
Expansion of Concrete Affected by Alkali Silica Reaction).” Journal of Materials in civil
engineering, ASCE, 20(1), 54-62.
Powers, T. C., & Steinour, H. H. (1955). “An interpretation of some published researches on the
Alkali-Aggregate Reaction, Part 1-the chemical reactions and mechanism of expansion.”
Journal of the American Concrete Institute., 26(6), 497-516.
Rivard, P., Founrier, B., Ballivy, G. (2002). “The Damage Rating Index Method for ASR Affected
Concrete—A Critical Review of Petrographic Features of Deterioration and Evaluation
Criteria”. Cement, Concrete, and Aggregates, 24(2), 1-11.
Rogers, C.A., & Hooton, R.D. (1991). “Reduction in mortar and concrete expansion with reactive
aggregates due to alkali leaching.” Cement, Concrete, and Aggregates, 13(1), 42-49.
Sanchez, L. (2014) “Contribution to the Assessment of Damage in Aging Concrete Infrastructures
Affected by Alkali-Aggregate Reaction”. Doctoral Thesis, Université Laval, Quebec, Canada,
401 pp.
Sanchez, L.F.M., Fournier, B., Jolin, M, Bastien, J. (2014). “Evaluation of the Stiffness Damage
Test (SDT) as a tool for assessing damage in concrete due to ASR: test loading and output
responses for concretes incorporating fine or coarse reactive aggregates.” Cement and
Concrete Research, 56, 213-229.

85
Shrimer, F. (2000). “Application and use of damage rating index in assessment of AAR-affected
concrete-selected case studies.” Proceeding of the 11th International Conference on Alkali
Aggregate Reaction (ICAAR), Quebec, Canada, 899-907.
Stark, D. (1990). “The moisture condition of field concrete exhibiting alkali-silica reactivity.”
CANMET/ACI International Workshop on Alkali-Aggregate Reaction in Concrete, Halifax,
Nova Scotia, 19 pp.
Stark, D. (1991). “Handbook for the identification of alkali silica reactivity in highway structures
(Report No. SHRP-C/FR-91-101).” Strategic Highway Research Program, National Research
Council, Washington, DC, 49 pp.
Stark, D. C., Morgan, B., Okamoto, P., & Diamond, S. (1993). Eliminating or minimizing alkali-
silica reactivity (Report No. SHRP-C-343). Strategic Highway Research Program (SHRP),
National Research Council, Washington, DC, 266 pp.
Stokes, D., Pappas, J., Thomas, M., & Folliard, K., (2002). “Field cases involving treatment or repair of
ASR affected concrete using lithium.” Proceedings of the 6th CANMET/ACI International Conference
on Durability of Concrete, Greece.
Thomas, M.D.A., Folliard, K.J., Fournier, B., Rivard, P., and Drimalas, T. (2013a). “Methods for
Evaluating and Treating ASR-Affected Structures: Results of Field Application and Demonstration
Projects” (Report No. FHWA-HIF-14-0002). Federal Highway Administration, U.S. Department of
Transportation, Washington DC, 80 pp.
Thomas, M.D.A., Fournier, B., Folliard, K.J. (2013b). “Alkali-aggregate reactivity (AAR) facts book.
Federal Highway Administration (FHWA), U.S. Dept of Transportation, FHWA-HIF-13-019, 212p.
Thomas, M., Fournier, B., Folliard, K., Ideker, J., & Shehata, M. (2006a). “Test methods for evaluating
preventive measures for controlling expansion due to alkali–silica reaction in concrete.” Cement and
Concrete Research, 36(10), 1842-1856.

86
Touma, W. E., Fowler, D. W., Carrasquillo, R. L., Folliard, K. J., & Nelson, N. R. (2001). “Characterizing
alkali-silica reactivity of aggregates using ASTM C 1293, ASTM C 1260, and their modifications
(Paper No. 01-3019).” Transportation Research Record: Journal of the Transportation Research Board,
1757, 157-165.
Villeneuve, V.; Fournier, B.; Duchesne, J. (2012). “Determination of the damage in concrete affected by
ASR – The damage rating index (DRI)”. Proceedings of the 14th International conference on alkali-
aggregate reaction (ICAAR). Austin, Texas.
Related Documents