8.3 THE ACCURACY OF WEATHER FORECASTS FOR MELBOURNE, AUSTRALIA Harvey Stern* Bureau of Meteorology, Melbourne, Australia 1. INTRODUCTION With the ongoing availability and increasing capacity of high performance computing, improved techniques for data assimilation and new sources and better use of satellite information, improvements in the skill of Numerical Weather Prediction (NWP) systems have been well documented (refer, for example, to Wilks, 2006). Although one might expect that these improvements would naturally translate into improved public weather forecasts of surface temperature, precipitation, and qualitative descriptions of expected weather, quantitative assessment of the improvement in forecasts of these weather elements are not generally available. The primary aim of the current study is to provide such an assessment to serve: (a) As a quantitative history of improvements in weather forecasting, and (b) As a benchmark and current state-of-the- art of actual weather forecasting for Melbourne, Australia. 2. BACKGROUND Some years ago, Stern (1999a) presented the results of an experiment conducted in 1997 to establish the then limits of predictability. The experiment involved verifying a set of subjectively derived quantitative forecasts for Melbourne out to 14 days. These forecasts were based upon an interpretation of the National Center for Environmental Prediction (NCEP) ensemble mean predictions. The verification data suggested that, at that time, routinely providing skilful day-to-day forecasts beyond day 4 would be difficult, but that it might be possible to provide some useful information on the likely weather up to about one week in advance for some elements and in some situations. The data also suggested that in some circumstances even the 3 to 4 day forecasts would lack skill. ________________________________________ *Corresponding author address: Dr Harvey Stern, Bureau of Meteorology, Box 1636, Melbourne, 3001, Australia; e-mail: [email protected] In April 1998, the Victorian Regional Forecasting Centre (RFC) of the Australian Bureau of Meteorology commenced a formal trial of forecasts for Melbourne out to 7 days. Dawkins and Stern (2003) presented analyses of results of these forecasts that show an increase in forecast skill over the first four years of the trial. Since then, in addition to advances in NWP, there have also been improvements in techniques for statistically interpreting the NWP model output for weather variables utilising objective methods. Utilising data from the formal trial, as well as a set of experimental forecasts for beyond seven days, Stern (2005) found that, for the first time, there was preliminary evidence of some skill out to Lorenz's 15-day limit (Lorenz, 1963, 1969a,b, 1993), particularly for temperature. 3. PURPOSE The purpose of the current paper is to present comprehensive verification statistics for forecasts of weather elements, and to thereby document the accuracy, and trends in accuracy, of day-to-day medium range forecasts of weather for Melbourne. The forecasts are those prepared by operational meteorologists at the Australian Bureau of Meteorology’s Victorian Regional Forecasting Centre. The data cover forecasts for (a) Minimum and maximum temperature since the 1960s, (b) Rainfall since the late 1990s, and (c) Qualitative descriptions of expected weather over the past year. The paper is an update of work presented earlier by the author (Stern, 1980, 1986, 1999a, and 2005) and to his knowledge, this is the first time such comprehensive statistics have been presented for any city on the level of skill and trends in accuracy of weather forecasts. Similar studies carried out by other authors for other locations have tended to be far less comprehensive in their coverage (see, for example, Sanders, 1979, and Lashley et al., 2008). A unique aspect of Melbourne weather is its variability (see later discussion). To illustrate, the average error of a forecast based upon the assumption of persistence (that tomorrow’s maximum temperature will be the same as today’s) averages about 3° C. This makes forecasting rather challenging even at short lead times.

Welcome message from author
This document is posted to help you gain knowledge. Please leave a comment to let me know what you think about it! Share it to your friends and learn new things together.
Transcript
8.3 THE ACCURACY OF WEATHER FORECASTS FOR MELBOURNE, AUSTRALIA Harvey Stern*
Bureau of Meteorology, Melbourne, Australia
1. INTRODUCTION
With the ongoing availability and increasing capacity of high performance computing, improved techniques for data assimilation and new sources and better use of satellite information, improvements in the skill of Numerical Weather Prediction (NWP) systems have been well documented (refer, for example, to Wilks, 2006). Although one might expect that these improvements would naturally translate into improved public weather forecasts of surface temperature, precipitation, and qualitative descriptions of expected weather, quantitative assessment of the improvement in forecasts of these weather elements are not generally available. The primary aim of the current study is to provide such an assessment to serve:
(a) As a quantitative history of improvements in weather forecasting, and
(b) As a benchmark and current state-of-the-art of actual weather forecasting for Melbourne, Australia.
2. BACKGROUND
Some years ago, Stern (1999a) presented the results of an experiment conducted in 1997 to establish the then limits of predictability. The experiment involved verifying a set of subjectively derived quantitative forecasts for Melbourne out to 14 days. These forecasts were based upon an interpretation of the National Center for Environmental Prediction (NCEP) ensemble mean predictions. The verification data suggested that, at that time, routinely providing skilful day-to-day forecasts beyond day 4 would be difficult, but that it might be possible to provide some useful information on the likely weather up to about one week in advance for some elements and in some situations. The data also suggested that in some circumstances even the 3 to 4 day forecasts would lack skill.
________________________________________
*Corresponding author address: Dr Harvey Stern, Bureau of Meteorology, Box 1636, Melbourne, 3001, Australia; e-mail: [email protected]
In April 1998, the Victorian Regional Forecasting Centre (RFC) of the Australian Bureau of Meteorology commenced a formal trial of forecasts for Melbourne out to 7 days. Dawkins and Stern (2003) presented analyses of results of these forecasts that show an increase in forecast skill over the first four years of the trial. Since then, in addition to advances in NWP, there have also been improvements in techniques for statistically interpreting the NWP model output for weather variables utilising objective methods. Utilising data from the formal trial, as well as a set of experimental forecasts for beyond seven days, Stern (2005) found that, for the first time, there was preliminary evidence of some skill out to Lorenz's 15-day limit (Lorenz, 1963, 1969a,b, 1993), particularly for temperature.
3. PURPOSE
The purpose of the current paper is to present comprehensive verification statistics for forecasts of weather elements, and to thereby document the accuracy, and trends in accuracy, of day-to-day medium range forecasts of weather for Melbourne. The forecasts are those prepared by operational meteorologists at the Australian Bureau of Meteorology’s Victorian Regional Forecasting Centre. The data cover forecasts for
(a) Minimum and maximum temperature since the 1960s,
(b) Rainfall since the late 1990s, and
(c) Qualitative descriptions of expected weather over the past year.
The paper is an update of work presented earlier by the author (Stern, 1980, 1986, 1999a, and 2005) and to his knowledge, this is the first time such comprehensive statistics have been presented for any city on the level of skill and trends in accuracy of weather forecasts. Similar studies carried out by other authors for other locations have tended to be far less comprehensive in their coverage (see, for example, Sanders, 1979, and Lashley et al., 2008).
A unique aspect of Melbourne weather is its variability (see later discussion). To illustrate, the average error of a forecast based upon the assumption of persistence (that tomorrow’s maximum temperature will be the same as today’s) averages about 3° C. This makes forecasting rather challenging even at short lead times.
4. RESULTS AND DISCUSSION
Until the 1980s, temperature forecasts in Australia were prepared for just the next 24 hours. At about that time, worded forecasts and predictions of maximum temperature out to four days were first issued to the public. From the late 1990s, this service was extended to minimum temperature. Experimental worded forecasts out to seven days, with corresponding predictions of minimum temperature, maximum temperature, and rainfall amount, were also commenced. Around 2000, these predictions were made available to special clients and, since early in 2006, they have been issued officially to the public.
Table 1 presents a summary of the current level of accuracy of Melbourne Day-1 to Day-7 forecasts (based on the most recent 12 months’ of data – to 31 May 2007). The percentage variance explained by the forecasts provides a measure of how successfully the predictions described the observed variations in the particular weather element. To explain: the verification statistic, ‘percentage variance explained’ is most easily understood in the context of regression. For example, “… the smaller the variability of the residual values around the regression line relative to the overall variability, the better is our prediction … if there is no relationship between the X and Y variables, then the ratio of the residual variability of the Y variable to the original variance is equal to 1.0. If X and Y are perfectly related then there is no residual variance and the ratio of variance would be 0.0. In most cases, the ratio would fall somewhere between these extremes, that is, between 0.0 and 1.0. 1.0 minus this ratio is referred to as R-square … if we have an R-square of 0.4 then … we have explained 40% of the original variability, and are left with 60% residual variability. Ideally, we would like to explain most if not all of the original variability. The R-square value is an indicator of how well the model fits the data (e.g., an R-square close to 1.0 indicates that we have accounted for almost all of the variability with the variables specified in the model)” (StatSoft, Inc., 2006). Where the verification statistic, ‘percentage variance explained’ is quoted in the present paper in the context of evaluating performance, the statistic therefore refers to the ‘percentage variance of the observations explained’ by the predictions in a regression relationship between observed and forecast values.
Therefore, a perfect set of predictions explains 100% of the variance. By contrast, a set of predictions, that provides no better indication of future weather than climatology, explains 0% of the variance. The data therefore suggest that predictions of rainfall amount, minimum temperature, and maximum temperature all display positive skill out to Day-7. In contrast, verification of persistence forecasts, an indication of how variable the weather in Melbourne is, reveals little skill. For example, Day-1 persistence
forecasts of maximum temperature explain only 19.7% of the variance of that element’s departure from the climatological norm - this is a clear indication of the maximum temperature variability and forecast difficulty. By comparison, the official forecasts explain nearly 80% of the variance.
The forecasts of √(observed rain), rather than (observed rain), are verified. This is because the distribution of the observed variable rain amount is highly skewed, the variable √(observed rain) being preferred for forecast verification purposes on account of its more normal distribution.
To verify forecasts of thunder and fog, the Critical Success Index (the percentage correct forecasts when the event is either forecast or observed) is used. From this it can be shown that a set of predictions of thunder that display no useful skill (that is, a set of predictions made under the assumption that there will be thunder on every day, or a randomly generated set of predictions of thunder) achieves a Critical Success Index of 10.1%. Results from Table 1 thus suggest that only forecasts of thunder out to Day-5 display useful skill. Similarly a randomly generated set of predictions of fog achieves a Critical Success Index of 9.0%, suggesting that only forecasts of fog out to Day-4 display useful skill. The verification statistics for fog and thunder are, nevertheless, rather encouraging.
To verify predictions of precipitation, worded forecasts have been assigned to one of five categories:
1. Fine or Fog then fine (no precipitation either specifically referred to or implied in the forecast);
2. Mainly fine or a Change later (no precipitation specifically referred to in the forecast, but the wording implies that it is expected);
3. Drizzle or a shower or two (light precipitation expected at some time during the forecast period);
4. Showers or Few showers (moderate, intermittent precipitation expected during the forecast period);
5. Rain or Thunder (moderate to heavy precipitation expected during the forecast period).
Figure 1a shows verification of Day-1 to Day-7 forecasts of measurable precipitation (0.2 mm or greater) over a 24-hour midnight-to-midnight period expressed as a probability. For category 1, “Fine or Fog then fine”, small probabilities indicate skilful forecasts. For category 5, “Rain or Thunder”, large probabilities indicate skilful forecasts. It can be seen that a forecast of “Fine or
Fog then fine” (category 1) is associated with only about a 5% chance of precipitation at Day-1 and that, even for Day-7, there is only about a 25% chance of precipitation occurring following a forecast of category 1 weather. For category 5, even seven days in advance, the results indicate an 80% chance of precipitation when the forecast is indicating “Rain or Thunder”.
Figure 1b shows verification of Day-1 to Day-7 forecasts of precipitation expressed as amount of precipitation. It can be seen that a forecast of “Fine or Fog then fine” for Day-7 is associated with an average fall of only about 1 mm of rain, whilst a forecast of “Rain or Thunder” is associated with about 3.5 mm of rain.
Figure 2a and Figure 2b show, respectively, 12-month running (calculated over the preceding 365 days) average errors of the minimum and maximum temperature forecasts, for which data back to the 1960s are available. The graphs show a clear long-term trend in the accuracy of these forecasts. For example, Day-3 forecasts of minimum temperature in recent years (average error ~ 1.6°C) are as skilful as Day-1 forecasts of minimum temperature were in the 1960s and 1970s, whilst Day-4 forecasts of maximum temperature in recent years (average error ~ 2.0°C) are more skilful than Day-1 forecasts of maximum temperature were in the 1960s and 1970s.
Figure 2c and Figure 2d show, respectively, scatter plots of forecast versus observed maximum temperatures during the first ten years and last ten years of available data. That the plot of the data for the last ten years (Figure 2d) is very much less scattered than the plot of the data for the first ten years (Figure 2c) underlines the increasing accuracy of the forecasts.
Figure 3 compares the 12-month running average error (calculated over the preceding 365 days) of a Day-1 forecast of maximum temperature based upon the assumption of persistence, with the actual forecasts. A number (but not all) of the troughs and peaks in the two graphs correspond - for example, note the coinciding troughs on the two graphs around 1970 and also around 1980. This indicates that, when the day-to-day variability in maximum temperature is high, the actual forecasts have relatively large errors. In contrast, when the day-to-day variability in maximum temperature is low, the actual forecasts have relatively small errors. Overall, the errors in the official forecasts are of smaller magnitude than the errors in the corresponding persistence forecasts.
Figure 4 shows time series of verification of Quantitative Precipitation Forecasts (QPFs) over the past 8 years for Day-1 to Day-7 forecasts - the QPFs are expressed in categorical ranges (Range 0=0 mm, Range 1=0.2 mm-2.4 mm, Range 2=2.5 mm-4.9 mm, Range3=5 mm-9.9 mm, Range 4=10 mm-19.9 mm, etc.) and verified assuming that the
mid-point has been forecast. Because running means are used for verification, the consequences of individual major forecast failures are evident in the Figure – for example, early in 2005, there was a major failure to predict a very heavy rainfall event, and the sharp decrease in skill evident around that time is a consequence of that major single-day forecast failure The graphs still show a clear trend in the accuracy of these forecasts. Since the year 2000, the percent inter-diurnal variance explained by the forecasts has increased from about 20% to 30% at Day-1, and from close to zero to about 15% at Day-7.
Stern (1980 and 1986) and de la Lande et al. (1982), in their analyses of trends in the accuracy of temperature forecasts, note that forecast accuracy is a function of both forecast skill and forecast difficulty and that fluctuations and long term trends in the accuracy of predictions may be in part due to variations in the level of difficulty associated with the prediction of that element.
5. CONCLUDING REMARKS
This paper documents the trends in accuracy and the current skill level of forecasts of weather elements at Melbourne, Australia. The city is famous for its highly variable weather and thus provides a challenge for day-to-day weather forecasting. Day-3 forecasts of minimum temperature are currently as skilful as day-1 forecasts of minimum temperature were in the 1960s and 1970s, whilst Day-4 forecasts of maximum temperature are currently more skilful than Day-1 forecasts of minimum temperature were in the 1960s and 1970s. By Day-7 there is of course reduced skill, however the average error in the forecasts is below that of the persistence forecasts, which suggests that the forecasts display positive skill. Figure 1 demonstrates that worded forecasts of precipitation, even at Day-7, possess positive skill.
The skill displayed by quantitative precipitation forecasts has also shown a marked improvement during recent years. The percentage of variance explained has increased by between 5% and 10% for most lead times. However, the verification statistics suggest that incorrect forecasts of significant rain events still remains a major forecasting problem. The results suggest that further prediction and diagnostic research on this important problem would be valuable.
Stern (1996b) suggested that improvements in weather forecasts are likely related to improved capability in predicting the broad scale flow, and to maintaining forecaster experience in the forecast office.
The former can be largely attributed to a combination of an enhancement in the description of the atmosphere's initial state, provided by remote sensing and other observational technologies, and to advances in broad scale
NWP. The latter may be related to improvements in the forecast process that are supported by good organisational management, including careful succession planning and the development and implementation of new prediction techniques. To achieve further improvement in the prediction of weather, an ongoing commitment to research into NWP, specification of the atmosphere, and to maintaining forecaster experience in the office – the importance of forecaster experience is underlined by the results of a study by Gregg (1969) - seems desirable.
Acknowledgments. The author thanks colleagues Noel Davidson and Mark Williams for encouraging this work, internal Bureau of Meteorology reviewers Bob Seaman, Tony Bannister and Evan Morgan, and two anonymous external reviewers for their helpful advice, and Terry Adair and Robert Dahni, for their development of the forecast verification data sets.
6. REFERENCES
Dawkins SS and Stern H. 2003. Trends and volatility in the accuracy of temperature forecasts. 7th Int. Conf. On Southern Hemisphere Meteorology and Oceanography, Wellington, New Zealand, 24-28 Mar., 2003.
de la Lande J Hagger RJ and Stern H. 1982. Melbourne forecasts - good or bad? Meteorology Australia, Vol. 2, No. 1, 2.
Gregg GT. 1969. On comparative rating of forecasters. ESSA Technical Memorandum WBTM SR-48.
Lashley S Lammers A Fisher L Simpson R Taylor Weisser J and Logsdon D. 2008. Observing verification trends and applying a methodology to probabilistic precipitation forecasts at a National Weather Service forecast office. 19th Conference on Probability and Statistics, American Meteorology Society, New Orleans, 20-24 Jan., 2008.
Lorenz EN. 1963. Deterministic, non-periodic flow. J. Atmos. Sci. 20: 130-141.
Lorenz EN. 1969a. Atmospheric predictability as revealed by naturally occurring analogues. J. Atmos. Sci. 26: 636-46.
Lorenz EN. 1969b. The predictability of a flow which possesses many scales of motion. Tellus. 21: 289-307.
Lorenz EN. 1993. The essence of chaos. University of Washington Press.
Sanders F. 1979. Trends in skill of daily forecasts of temperature and precipitation. Bull. Amer. Meteor. Soc., 60, 763-769.
StatSoft, Inc., 2006: Residual Variance and R-square. This account is available via the StatSoft, Inc. website http://www.statsoft.com/textbook/stmulreg.html#cresidual, which was accessed on 30 September 2006.
Stern H. 1980. An increase in the skill of Australian temperature forecasts. Aust. Meteor. Mag. 28:223-228.
Stern H. 1986. A trend in the skill of Australian temperature forecasts. Meteorology Australia, Vol. 4, No. 2.
Stern H. 1996. Statistically based weather forecast guidance. Ph. D. Thesis, School of Earth Sciences, University of Melbourne.
Stern H. 1999a. An experiment to establish the limits of our predictive capability for Melbourne. Aust. Met. Mag. 48:159-167.
Stern H. 1999b. Statistically based weather forecast guidance. Meteorological Study 43, Bureau of Meteorology, Australia.
Stern H. 2005. Establishing the limits of predictability at Melbourne, Australia, using a knowledge based forecasting system and NOAA's long-range NWP model. Aust. Meteor. Mag. 54:203-211.
Wilks DS. 2006. Statistical methods in the atmospheric sciences, 2nd Ed. Elsevier.
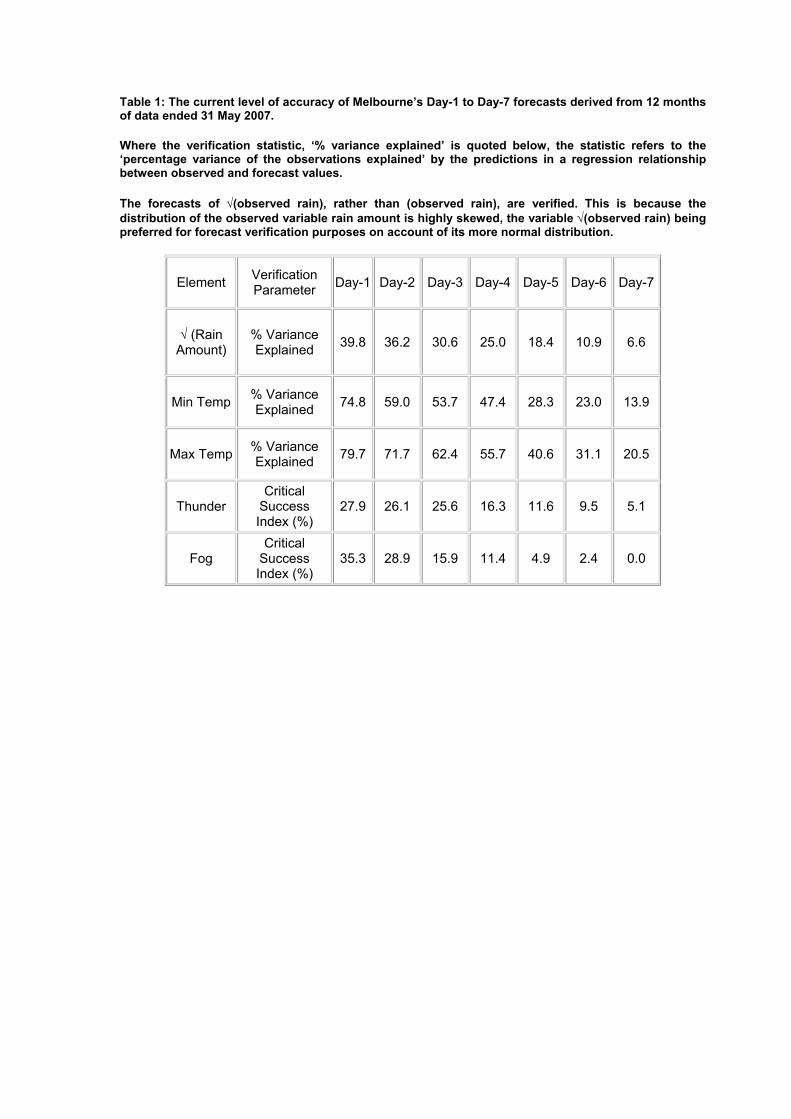
Table 1: The current level of accuracy of Melbourne’s Day-1 to Day-7 forecasts derived from 12 months of data ended 31 May 2007.
Where the verification statistic, ‘% variance explained’ is quoted below, the statistic refers to the ‘percentage variance of the observations explained’ by the predictions in a regression relationship between observed and forecast values.
The forecasts of √(observed rain), rather than (observed rain), are verified. This is because the distribution of the observed variable rain amount is highly skewed, the variable √(observed rain) being preferred for forecast verification purposes on account of its more normal distribution.
Element Verification Parameter Day-1 Day-2 Day-3 Day-4 Day-5 Day-6 Day-7
√ (Rain Amount)
% Variance Explained 39.8 36.2 30.6 25.0 18.4 10.9 6.6
Min Temp % Variance Explained 74.8 59.0 53.7 47.4 28.3 23.0 13.9
Max Temp % Variance Explained 79.7 71.7 62.4 55.7 40.6 31.1 20.5
Thunder Critical
Success Index (%)
27.9 26.1 25.6 16.3 11.6 9.5 5.1
Fog Critical
Success Index (%)
35.3 28.9 15.9 11.4 4.9 2.4 0.0
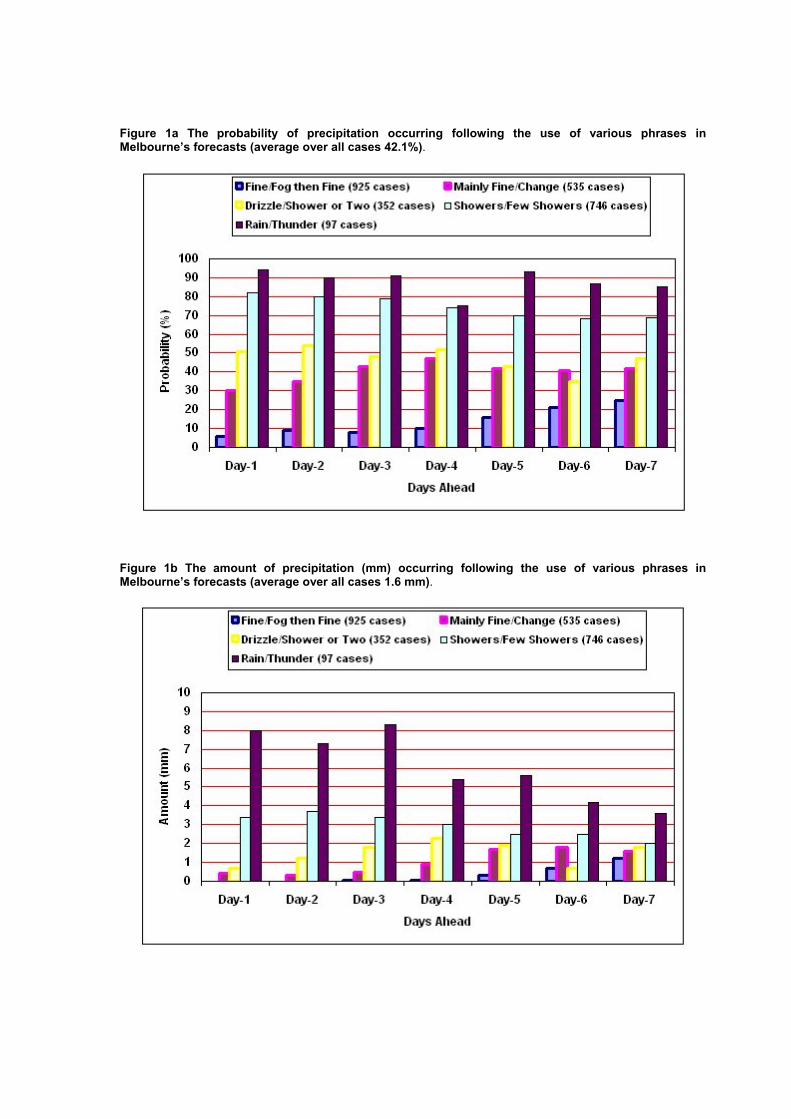
Figure 1a The probability of precipitation occurring following the use of various phrases in Melbourne’s forecasts (average over all cases 42.1%).
Figure 1b The amount of precipitation (mm) occurring following the use of various phrases in Melbourne’s forecasts (average over all cases 1.6 mm).
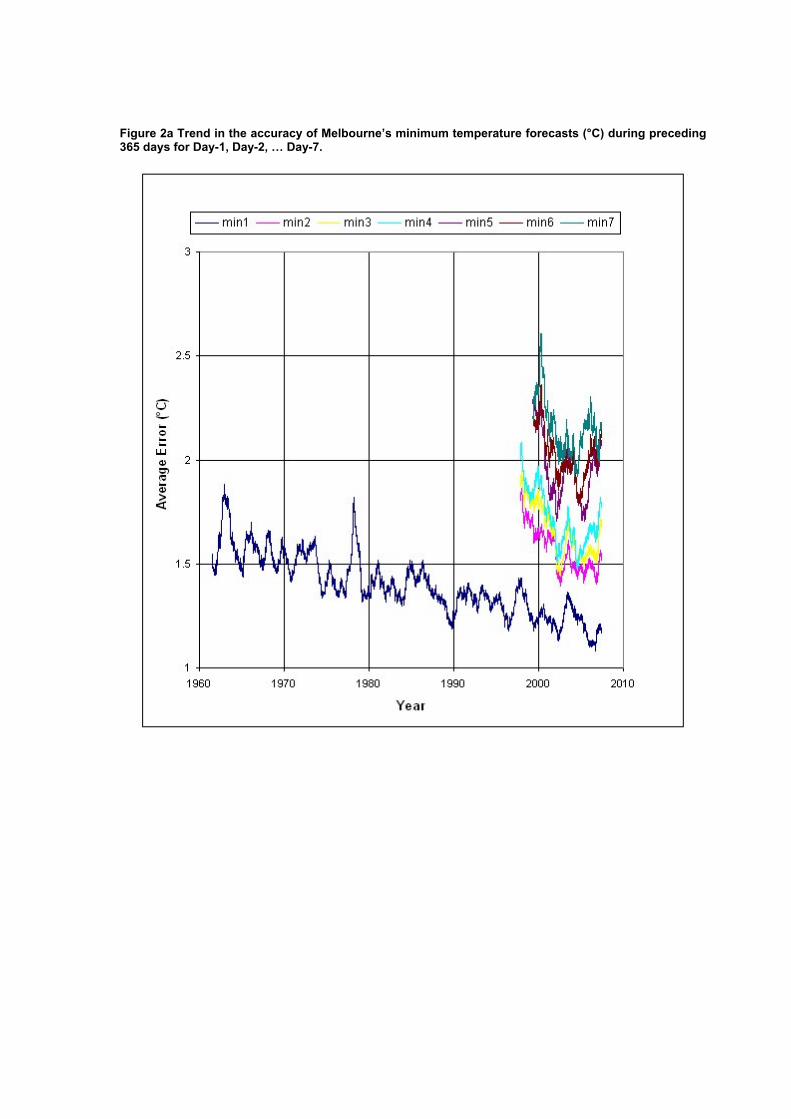
Figure 2a Trend in the accuracy of Melbourne’s minimum temperature forecasts (°C) during preceding 365 days for Day-1, Day-2, … Day-7.
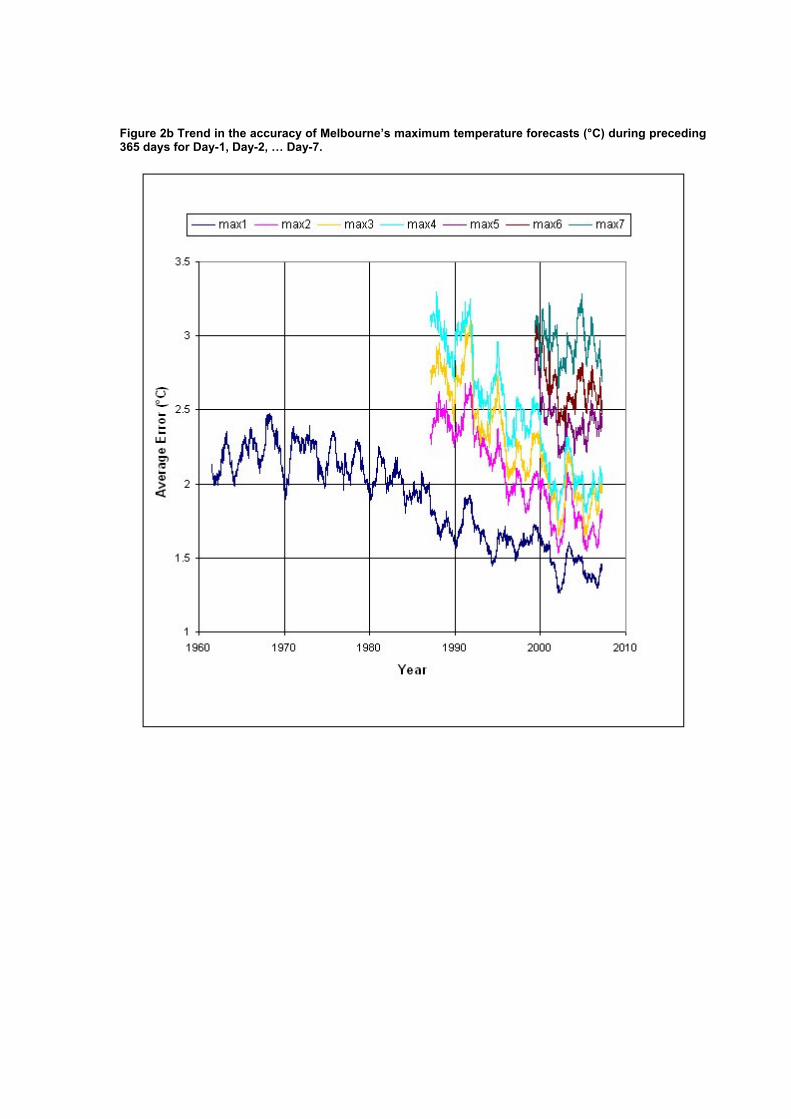
Figure 2b Trend in the accuracy of Melbourne’s maximum temperature forecasts (°C) during preceding 365 days for Day-1, Day-2, … Day-7.
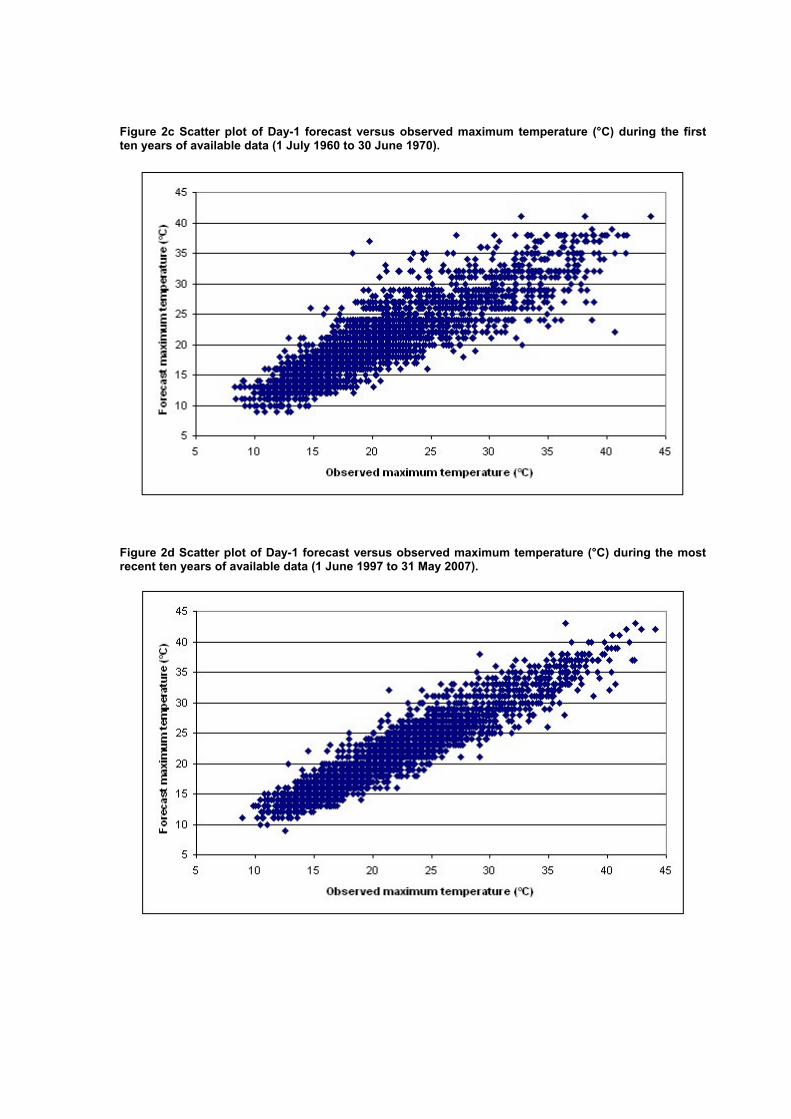
Figure 2c Scatter plot of Day-1 forecast versus observed maximum temperature (°C) during the first ten years of available data (1 July 1960 to 30 June 1970).
Figure 2d Scatter plot of Day-1 forecast versus observed maximum temperature (°C) during the most recent ten years of available data (1 June 1997 to 31 May 2007).
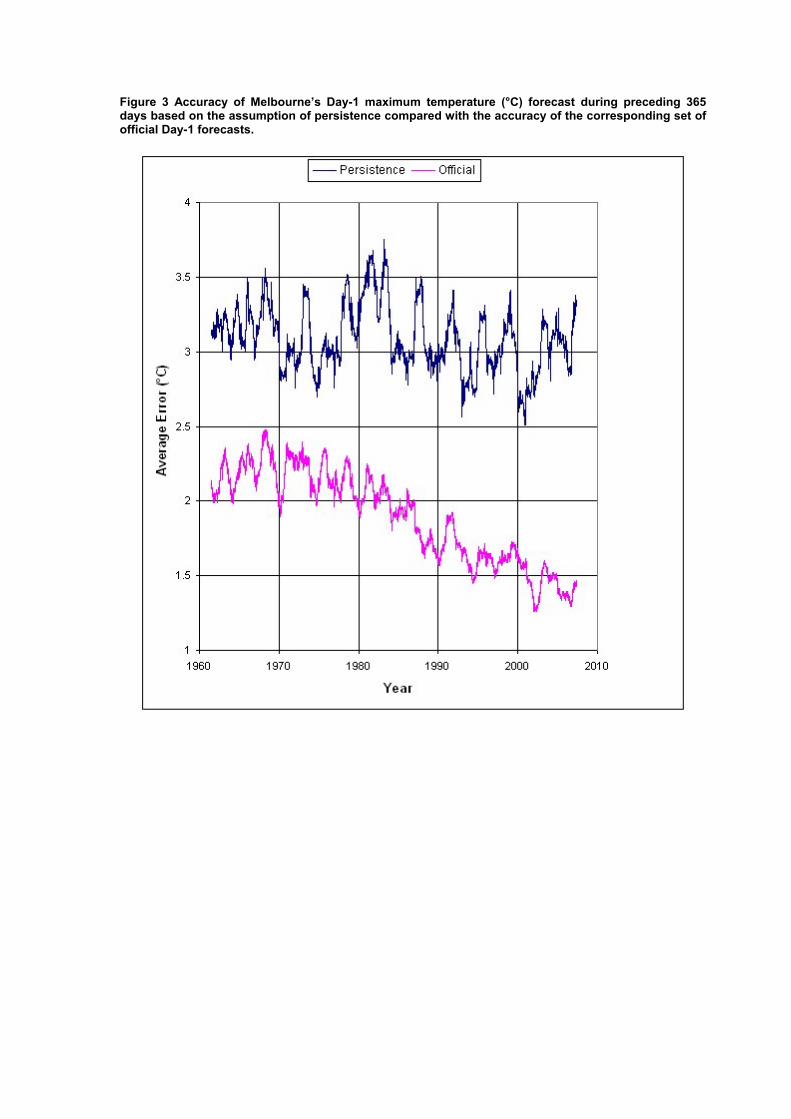
Figure 3 Accuracy of Melbourne’s Day-1 maximum temperature (°C) forecast during preceding 365 days based on the assumption of persistence compared with the accuracy of the corresponding set of official Day-1 forecasts.
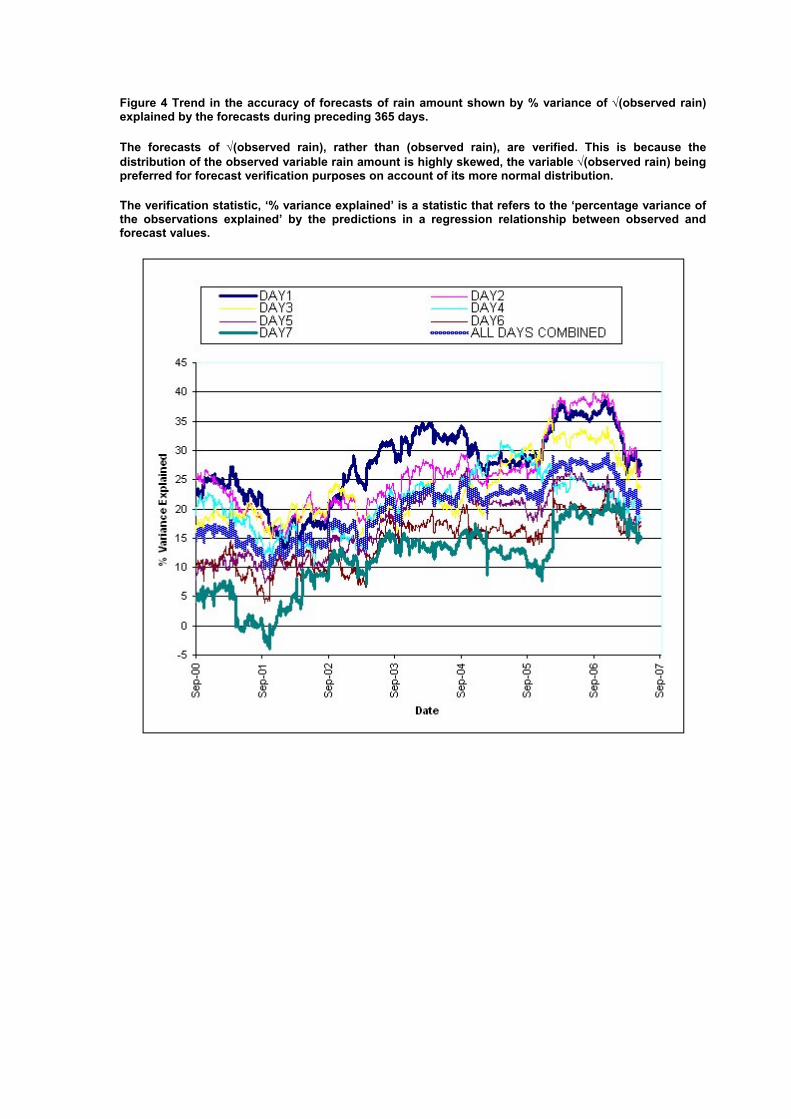
Figure 4 Trend in the accuracy of forecasts of rain amount shown by % variance of √(observed rain) explained by the forecasts during preceding 365 days.
The forecasts of √(observed rain), rather than (observed rain), are verified. This is because the distribution of the observed variable rain amount is highly skewed, the variable √(observed rain) being preferred for forecast verification purposes on account of its more normal distribution.
The verification statistic, ‘% variance explained’ is a statistic that refers to the ‘percentage variance of the observations explained’ by the predictions in a regression relationship between observed and forecast values.
Related Documents

![Metabolis m Photosynthesis [8.2] Cell Respiration [8.3] Fermentation [8.3]](https://static.cupdf.com/doc/110x72/56649ef95503460f94c0b06c/metabolis-m-photosynthesis-82-cell-respiration-83-fermentation-83.jpg)