2006 www.global-reports.com

Welcome message from author
This document is posted to help you gain knowledge. Please leave a comment to let me know what you think about it! Share it to your friends and learn new things together.
Transcript
2006
www.global-reports.com
www.global-reports.com

Theory says the aerospace industry will continue to consolidate. Customers will seek more solutions from a single source while they seek
greater cost advantages. It’s the theory we used to re-engineer our
company. It’s the theory we’ve successfully put into practice.
www.global-reports.com
TO OUR SHAREHOLDERS
Page 2. Letter to Shareholders Esterline
For Esterline, 2006 was another year of steady progress in de-veloping and applying the solutions that make us more valu-able to our customers—the major companies, governmental agencies, key integrators, and large OEMs that drive our in-dustry. We continued to see positive results from our consistent investment in research and development. This commitment aligns us directly with our customers’ view of the future as they seek suppliers with the substantial resources and capa-bilities to turn their vision into reality. Following through on that commitment, we completed two strategic acquisitions as we continued to add new capabilities and technologies to the toolkit of solutions our customers need.
www.global-reports.com

Tier 1Our theory of becoming a more comprehensive resource for our customers is proving success-ful in practice. The proof is in the number of new programs in which Esterline acts as a
DEEPER RELATIONSHIPS :
Tier 1 supplier. Due to our expanded range of capabilities and capacity, Esterline is now delivering not only components but complete systems and sub-assemblies to the world’s top
commercial and military aero-space companies. This level of success opens doors of oppor-tunity to add to our skills and stay ahead of the needs of our customers.
www.global-reports.com

Make/BuyIn the search for greater efficien-cy, our customers are cutting back on what they make and are look-ing to Esterline not only to create the solutions that new aircraft de-mand but to find better ways to in-tegrate the manufacture of those
CREATING ADVANTAGE :
new solutions. In our formula, the Make decision means invest-ing in the talent and resources to develop a solution and to then build the capability to engineer and manufacture that solution in-house. The Buy part of the
equation refers to customers rec-ognizing our cost advantage and turning to Esterline for solutions. Our comprehensive toolkit saves customers effort, time and money while freeing them to concentrate on their core competencies.
www.global-reports.com
Page 5. Letter to Shareholders Esterline
Esterline produces thousands of different components and subsystems for hundreds of different pro-grams or platforms. This diversification enables long-term balance and stability as we ply traditional-ly cyclical markets. Short-term customer requirements—what we refer to as mix shifts—have always tended to skew quarterly results and comparisons. However, regardless of these mix shifts or their short-term consequences, we are always focused on strengthening Esterline’s long-term prospects.
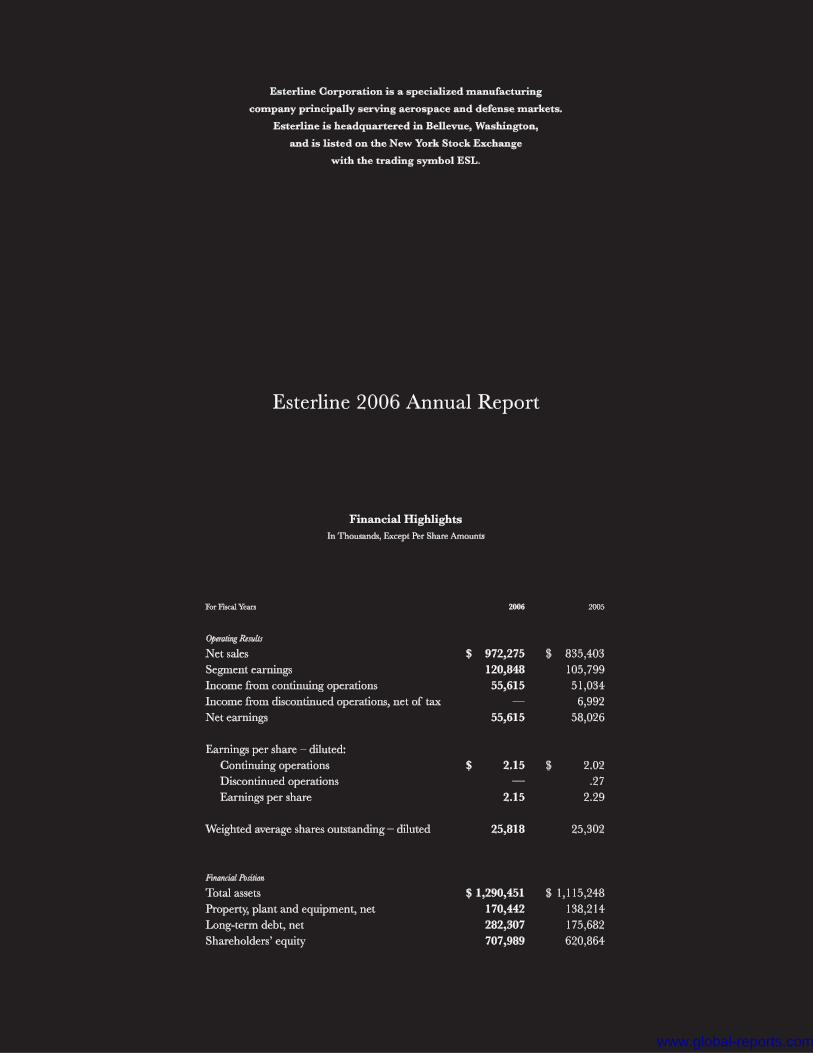
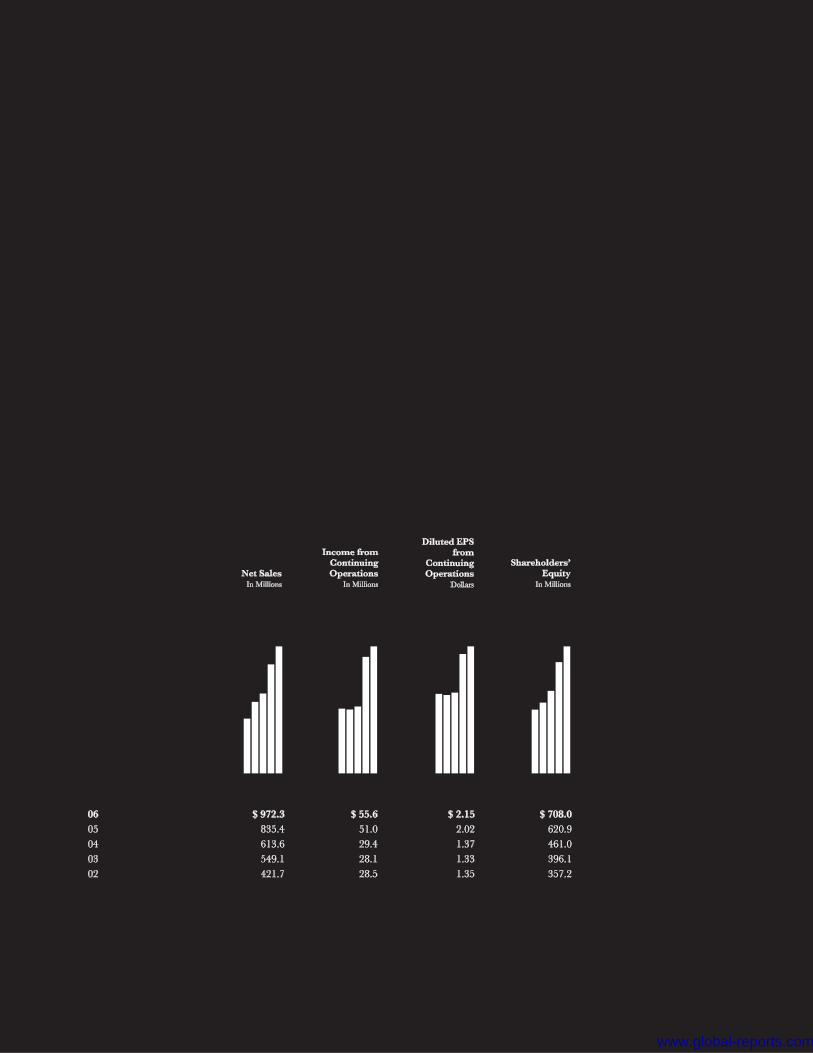
That said, I believe we turned in an excellent performance for fiscal 2006. Income from continuing operations was a record $55.6 million, or $2.15 per diluted share, on sales of $972.3 million. That’s a sales growth rate of about 16%, with about 7% organic growth and the balance from acquisitions. This performance is the direct result of walking the walk when it comes to new product and program investments and plant consolidations. As we study the trends in our industry and work to solve the myriad issues our customers face, there’s only one conclusion: by being true to the course we have set, Esterline has arrived at the right point at absolutely the right time. We are well-positioned to partici-pate in the improving outlook of all facets of the aerospace industry.
As I indicated at the start of this letter, we have been steadily amassing capabilities that make us—and will continue to make us—increasingly valuable to our customers. Our capabilities keep pace with the industry through our own investment in targeted R&D—research, development and engineer-ing—dedicated to the specific solutions our customers seek and through adding to our portfolio of solutions and skills by acquisition.
Focused research and development
We are now quite far along on some major R&D programs. One is the entire sensor suite for the TP400 turboprop, the engine that will power the Airbus A400M Airlifter, Europe’s new tactical military transport. Concurrently, we are developing the primary electrical power distribution system for the A400 airframe. Additionally, our work as a Tier 1 supplier for Boeing’s new 787 Dreamliner cockpit control panels is on schedule and on budget. These programs solidly demonstrate how we are putting our theory of becoming a single source for our customers into practice.
In each of these programs, we are not simply building products; we are investing in technology that will enable us to advance these products for years to come. Because we own the technologies we de-velop, we can leverage investments in those technologies to derivative platforms, as well as develop further applications within the aerospace industry—or even for related high-end niche markets, such as medical and rail. In the medical arena, for example, we have developed an innovative new key-board for use in hospitals to help reduce the serious problem of hospital acquired infections. This keyboard not only leverages our know-how in specialized human-machine interface technology, but also our expertise in sensors and advanced materials. This balance is a tried and true way for us to consistently improve performance over the long term.
www.global-reports.com
Page 6. Letter to Shareholders Esterline
Two key new acquisitions
While our primary focus remains organic growth, from time to time we supplement what our cus-tomers need in capabilities through selective acquisitions. During fiscal 2006, we completed two such strategic purchases: Darchem Holdings Limited and Wallop Defence Systems Ltd., both in the U.K. We acquired Darchem in December 2005, significantly expanding our advanced materials capability and market coverage by adding a global leader in the manufacture of thermally engineered compo-nents for critical aerospace and defense applications. Darchem’s thermal design know-how comple-ments our existing expertise in developing specialized materials that operate at temperatures up to 2,000 degrees Fahrenheit. The addition of Darchem’s product lines significantly expands the global reach for our already market-leading advanced materials capabilities, fits our “engineered-to-order” model, and provides opportunities for additional bolt-on acquisitions. An important benefit of this acquisition is the experienced, capable, and dedicated management team that joined us.
In March of this year, we finalized our acquisition of Wallop Defence Systems. Wallop is a leading international producer of military countermeasure flares, while Esterline is the leading domestic pro-ducer. The transaction brings to our customers the advantages of a global entity sharply focused on world-class research, and support of countermeasure flares technology. Unfortunately, two months after the acquisition, an explosion at a Wallop facility resulted in one fatality and an entire plant shut-down for several months. Production at one of Wallop’s facilities has now returned to pre-accident levels. And although the second facility is still closed—and will remain so for some time—insurance negotiations are going well.
Previous acquisitions are paying off as well. Palomar, acquired in early 2005 for example, recently won two contracts to provide secure communications systems related to critical command control and logistics modernization programs. Lockheed awarded Palomar “Star Supplier” status and selected a Palomar Secure Intercommunications System for deployment on the U.S. Coast Guard’s HC-130J long-range surveillance aircraft under the Coast Guard’s Integrated Deepwater System, a program to recapitalize its older vessels, aircraft, and electronics. Previously they were selected to provide a state-of-the-art secure communications system for the fleet of U.S. presidential helicopters.
Solid year ahead
The aerospace industry is in an unprecedented cycle of investment in new airframes across the com-mercial and defense spectrum, and Esterline is well-positioned on virtually every one of them.
As a result, we see 2007 as a solid year for Esterline. The commercial aircraft cycle is particularly strong. I’ve even heard it referred to as a “super cycle.” Passenger traffic and aircraft utilization are both on the rise—positive industry-wide indicators, especially for increasing demand within our spare parts business.
www.global-reports.com

New CycleMany of the traditional precon-ceptions about the aerospace/defense industry are being set aside. Just as the needs of our customers have driven us to re-shape our business, the typical business cycles of the aerospace
MARKET EVOLUTION :
industry are changing. Driven by an unprecedented utilization of both defense and commercial fleets, and a steady need for re-placement parts, industry cycles are smoothing and lengthening. Esterline is ideally positioned as
an integral resource to fulfill this sustained demand. And as en-tirely new aircraft join an ever-expanding flying fleet, Esterline will play an increasingly critical role in providing the solutions necessary to sustain growth.
www.global-reports.com
Robert W. Cremin
Chairman, President and Chief Executive Officer
Page 8. Letter to Shareholders Esterline
Our defense market also remains solid, both domestically and internationally. Spares, repairs, and retrofit work comprise much of this growth as equipment is worn by the extra hours of usage and the ever-present menace of sand in the Middle East—especially our components used in helicopter and armored vehicle cockpits. Much of this work has been postponed because these vehicles are in constant use, but this kind of work can only be delayed for so long. In addition, countermeasure flare demand continues to escalate. New flare technology is in high demand both domestically and inter-nationally. And our Wallop operation benefits particularly from its extensive customer relations with the British Ministry of Defence and in the Middle East. Also, the U.S. military may leave equipment behind in Iraq to help with a transition, providing another extension of our market.
There’s no doubt we’ve had some growing pains during the year, particularly in our Sensors group. But I believe we’ve turned the corner there. We now have the right people in place, plant productiv-ity is back to normal levels, and we are again focusing on execution. We’re not the only ones that see improvement. Our customers are noticing too. They place increasingly higher value on our ability to execute, and on the willingness and capability Esterline demonstrates in developing the special-ized solutions they have come to rely on. One measure is the way our market share continues to grow. Another is in the recognition we receive in the form of Tier 1 assignments and still another is customer recognition. When Lockheed awarded “Star Supplier” status to Palomar, our secure mili-tary communications operation, it wasn’t simply because Esterline has a broad range of companies and technologies. It’s due to the way in which we combine and apply all our capabilities to serve the highly specific needs of each customer and every program.
A personal note
We are keenly aware of the many contributions our more than 8,000 employees make on a daily basis. That’s why we work so hard to maintain environments where both people and their ideas can flourish. We are committed to fostering these environments, because it is the ideas of Esterline people around the world that make our company strong today and ensure a bright future for tomorrow. That’s not a theory. I see it in practice every day.
www.global-reports.com

Theory in Practice
www.global-reports.com

To date our more than 8,000 employees have developed, engineered and manufactured tens of thousands of
products on hundreds of different platforms.
www.global-reports.com

APPLYING AND LEVERAGING OUR SOLUTIONS :
The long and the short of
our R&D efforts.
Just to be accurate, we refer to our R&D as RD&E—Research, Development and Engineering. Our focus never strays from solv-ing specific problems for specific applications. It is an investment
in talent and time that our cus-tomers expect us to make. And because we often own the solu-tion, the effort can often lead to even more answers for more customers more quickly. This
process creates positive returns in both the short and the long term. R&D at Esterline oper-ates as a powerful way to com-bine discovery, delivery and profit.
Page 11.
www.global-reports.com

COMBINING ACQUISITIONS AND ORGANIC GROWTH :
Growth that comes from the
inside and outside.
In the last ten years Esterline has acquired over 30 compa-nies, adding approximately $550 million in annual revenue while simultaneously divesting non-core businesses that generated
more than $200 million. These moves added crucial capabilities to more comprehensively address the needs of our customers. But we grow from the inside as well as the outside. In these same ten
years, organically created new business accounted for half of our total growth. It’s a disciplined approach to sustained and bal-anced growth that never favors one factor over the other.
Page 12.
www.global-reports.com

Esterline has realized consistent organic growth as well as growth through acquisition.
www.global-reports.com

Esterline excels whenever demanding tolerances meet demanding schedules.
www.global-reports.com

AHEAD OF THE TREND :
It’s all
custom work, on demand
and on time.
We can predict the way our solu-tions will perform at 40,000 feet. We can also predict that once Esterline becomes part of a new program, we’ll have the tools needed to meet the specifications
and the schedule. This is because the work we do is essentially custom. And the infrastructure we’ve developed is all about re-sponse. Our combination of sci-ence and technology, along with
our capacity for putting in place the manufacturing processes es-sential to deliver highly engi- neered solutions, is seamless. Which means we deliver whatever our customers need us to build.
Page 15.
www.global-reports.com

LEAN MANUFACTURING + HIGH VELOCITY FACTORIES :
We measure everything, including
our reflexes.
The levels of performance de-manded of our engineered solu-tions are in many ways no more or less challenging than meeting the business and schedule de-mands of our customers. Their needs provide the basis for our emphasis on lean manufacturing
efforts—part of what we call the Esterline Performance System (EPS). Building ever greater velocity into our operations is key to our success. The faster we can move product through our plants, the more capac-ity we create to meet increasing
customer demand. All we do is measured for accuracy, for reli-ability and for response time. And Esterline’s managerial dis-cipline matches this need for speed with the ability to turn en-tire factories on a dime. Without missing a beat or a deadline.
Page 16.
www.global-reports.com

The tolerances we apply to the solutions we manufacture are the same we apply to our business.
www.global-reports.com

Esterline’s people, backed by a global network of manufacturing and engineering facilities, all share a focus on the customer.
www.global-reports.com

A CUSTOMER-DRIVEN CULTURE :
Our thinking
and our actions align
with our customers.
The forces that are reshaping the aerospace industry are reshaping our company as well. Change is the new constant. And the capa-bilities this new era demands are predicated on the need to excel
in every phase of development, engineering and manufacturing. The goal is to better integrate resources and offer the broad-est possible range of capabilities within our areas of expertise. All
this is set in a framework that is consistent, highly responsive and flexible. But the focal point hasn’t changed. As always, that remains the customer—the sole reason Esterline continues to evolve.
Page 19.
www.global-reports.com
www.global-reports.com

Esterline 2006 Financial Report
22. Management’s Discussion and Analysis38. Selected Financial Data
40. Consolidated Statements47. Notes to Consolidated Financial Statements
84. Corporate Information
2 o
o 6www.global-reports.com
Page 22. Management’s Discussion and Analysis Esterline
Management’s Discussion and Analysis of Financial Condition and Results of Continuing Operations
Overview
We operate our businesses in three segments: Avionics & Controls, Sensors & Systems and Advanced Materials. The Avi-onics & Controls segment designs and manufactures technology interface systems for military and commercial aircraft and land- and sea-based military vehicles, secure communications systems, specialized medical equipment, and other industrial applications. The Sensors & Systems segment produces high-precision temperature and pressure sensors, electrical power switching, control and data communication devices, micro-motors, motion control sensors, and other related systems, princi-pally for aerospace and defense customers. The Advanced Materials segment develops and manufactures high-performance elastomer products used in a wide range of commercial aerospace and military applications, combustible ordnance com-ponents and electronic warfare countermeasure devices for military customers, and thermally engineered components for critical aerospace applications. All segments include sales to domestic, international, defense and commercial customers. Our current business and strategic plan focuses on the continued development of our products in three key tech-nologies: avionics and controls, sensors and systems and specialized high-performance elastomers and other complex ma-terials, principally for aerospace and defense markets. We are concentrating our efforts to expand our capabilities in these markets and to anticipate the global needs of our customers and respond to such needs with comprehensive solutions. These efforts focus on continuous research and new product development, acquisitions and establishing strategic realignments of operations to expand our capabilities as a more comprehensive supplier to our customers across our entire product offering. We acquired Wallop Defence Systems Limited (Wallop) and FR Countermeasures on March 24, 2006 and December 23, 2005, respectively, from Cobham plc. Wallop and FR Countermeasures are manufacturers of military pyrotechnic counter-measure devices. We paid approximately $65.0 million for both companies, including acquisition costs and an adjustment based on the amount of indebtedness and net working capital as of closing. In addition, we may pay an additional purchase price of up to U.K. £10.0 million, or approximately $19.0 million, depending on the achievement of certain objectives. The acquisitions strengthen our international and U.S. position in countermeasure devices. Wallop and FR Countermeasures are included in our Advanced Materials segment. On December 16, 2005, we acquired Darchem Holdings Limited (Darchem), a manufacturer of thermally engineered components for critical aerospace applications, for U.K. £68.7 million (approxi-mately $121.7 million), including acquisition costs and an adjustment based on the amount of cash and net working capital of Darchem as of closing. Darchem holds a leading position in its niche market and fits our engineered-to-order model and is included in our Advanced Materials segment. On January 28, 2005, we completed the sale of our wholly-owned subsidiary Fluid Regulators Corporation (Fluid Regulators), which was included in our Sensors & Systems segment, for approximately $21.4 million. As a result of the sale, we recorded a gain of approximately $7.0 million, net of tax of $2.4 million, in fiscal 2005. The disposition is reported as discon-tinued operations and the consolidated financial statements for all prior periods have been adjusted to reflect this presentation. Income from continuing operations for fiscal 2006 was $55.6 million, or $2.15 per diluted share, compared with $51.0 million, or $2.02 per diluted share, in fiscal 2005, principally reflecting strong results in Avionics & Controls, weaker earnings in Sensors & Systems and increased earnings in Advanced Materials. Avionics & Controls earnings were stronger from cockpit controls reflecting new OEM programs, higher aftermarket spares sales and improved margins on medical equipment devices. The decrease in Sensors & Systems earnings was principally due to the completion of a pressure sensor retrofit program in fiscal 2005, excess production costs and increased research and development expenses for the A400M program. Advanced Materials earnings mainly reflected incremental earnings from our Darchem acquisition and improved sales and earnings from our Arkansas flare countermeasure operations. On June 26, 2006, an explosion occurred at our Wallop facility, which resulted in one fatality and several minor injuries. The incident destroyed an oven complex for the production of advanced flares and significantly damaged the advanced flare facility. Although the advanced flare facility is expected to be closed for about 18 months due to the require-ments of the Health Safety Executive (HSE) to review the cause of the accident, operations will continue at a portion of our facility located on the same site as the advanced flare facility. The HSE investigation will not be completed until the Coroner’s Inquest is filed possibly in July or August 2007. Although it is not possible to determine the results of the HSE investigation or how the Coroner will rule, management does not expect to be found in breach of the Health & Safety Act related to the accident and, accordingly, no amounts have been recorded for any potential fines to be assessed by the HSE. The HSE will also review and approve the plans and construction of the new flare facility.
www.global-reports.com
Page 23. Management’s Discussion and Analysis Esterline
The operation is insured under a property, casualty and business interruption insurance policy. The damaged building and inventory is fully covered by insurance and, accordingly, no loss as a result of the accident has been recorded related to these assets in fiscal 2006. We have recorded business interruption insurance recoveries of $4.9 million for losses in-curred in fiscal 2006. As we continue to incur losses in future periods as a result of the accident, business interruption insurance recoveries that can be estimated and are probable of collection will be recorded in our consolidated financial statements. Non-operating expense in the first fiscal quarter of 2006 included a $1.4 million, net of tax, prepayment penalty arising from the $40.0 million prepayment of our 6.77% Senior Notes. Net income was $55.6 million, or $2.15 per share on a diluted basis, compared with $58.0 million, or $2.29 per share on a diluted basis, in fiscal 2005. Net income in fiscal 2005 included income from discontinued operations of $7.0 million, or $0.27 per share on a diluted basis.
Results of Continuing Operations
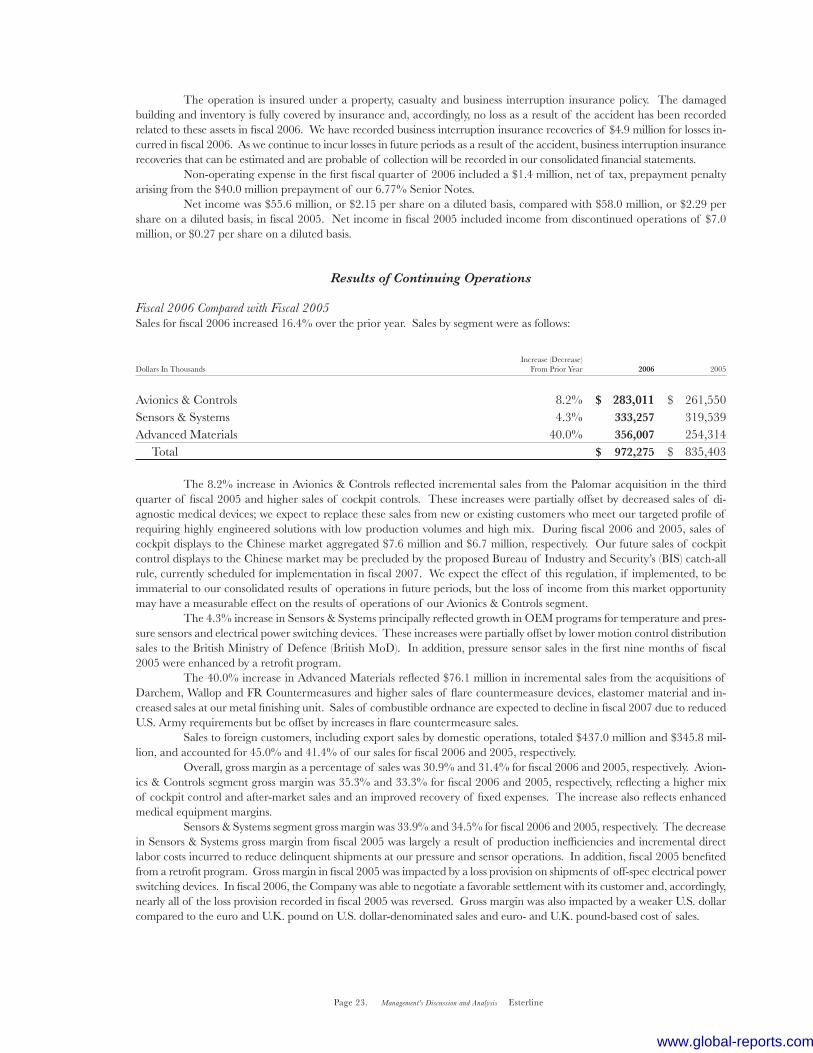
Fiscal 2006 Compared with Fiscal 2005Sales for fiscal 2006 increased 16.4% over the prior year. Sales by segment were as follows:
Increase (Decrease)
Dollars In Thousands From Prior Year 2006 2005
Avionics & Controls 8.2% $ 283,011 $ 261,550Sensors & Systems 4.3% 333,257 319,539Advanced Materials 40.0% 356,007 254,314 Total $ 972,275 $ 835,403
The 8.2% increase in Avionics & Controls reflected incremental sales from the Palomar acquisition in the third quarter of fiscal 2005 and higher sales of cockpit controls. These increases were partially offset by decreased sales of di-agnostic medical devices; we expect to replace these sales from new or existing customers who meet our targeted profile of requiring highly engineered solutions with low production volumes and high mix. During fiscal 2006 and 2005, sales of cockpit displays to the Chinese market aggregated $7.6 million and $6.7 million, respectively. Our future sales of cockpit control displays to the Chinese market may be precluded by the proposed Bureau of Industry and Security’s (BIS) catch-all rule, currently scheduled for implementation in fiscal 2007. We expect the effect of this regulation, if implemented, to be immaterial to our consolidated results of operations in future periods, but the loss of income from this market opportunity may have a measurable effect on the results of operations of our Avionics & Controls segment. The 4.3% increase in Sensors & Systems principally reflected growth in OEM programs for temperature and pres-sure sensors and electrical power switching devices. These increases were partially offset by lower motion control distribution sales to the British Ministry of Defence (British MoD). In addition, pressure sensor sales in the first nine months of fiscal 2005 were enhanced by a retrofit program. The 40.0% increase in Advanced Materials reflected $76.1 million in incremental sales from the acquisitions of Darchem, Wallop and FR Countermeasures and higher sales of flare countermeasure devices, elastomer material and in-creased sales at our metal finishing unit. Sales of combustible ordnance are expected to decline in fiscal 2007 due to reduced U.S. Army requirements but be offset by increases in flare countermeasure sales. Sales to foreign customers, including export sales by domestic operations, totaled $437.0 million and $345.8 mil-lion, and accounted for 45.0% and 41.4% of our sales for fiscal 2006 and 2005, respectively. Overall, gross margin as a percentage of sales was 30.9% and 31.4% for fiscal 2006 and 2005, respectively. Avion-ics & Controls segment gross margin was 35.3% and 33.3% for fiscal 2006 and 2005, respectively, reflecting a higher mix of cockpit control and after-market sales and an improved recovery of fixed expenses. The increase also reflects enhanced medical equipment margins. Sensors & Systems segment gross margin was 33.9% and 34.5% for fiscal 2006 and 2005, respectively. The decrease in Sensors & Systems gross margin from fiscal 2005 was largely a result of production inefficiencies and incremental direct labor costs incurred to reduce delinquent shipments at our pressure and sensor operations. In addition, fiscal 2005 benefited from a retrofit program. Gross margin in fiscal 2005 was impacted by a loss provision on shipments of off-spec electrical power switching devices. In fiscal 2006, the Company was able to negotiate a favorable settlement with its customer and, accordingly, nearly all of the loss provision recorded in fiscal 2005 was reversed. Gross margin was also impacted by a weaker U.S. dollar compared to the euro and U.K. pound on U.S. dollar-denominated sales and euro- and U.K. pound-based cost of sales.
www.global-reports.com
Page 24. Management’s Discussion and Analysis Esterline
Advanced Materials segment gross margin was 24.7% and 25.3% for fiscal 2006 and 2005, respectively. Gross margin was impacted by the explosion at our Wallop facility, as explained above and start-up costs at our FR Counter-measures unit. This decrease in gross margin was partially offset by improved operating efficiencies at our Arkansas flare countermeasure operation. Additionally, gross margins improved at our elastomer material operations, reflecting increased recovery of fixed expenses and a shift in sales mix to higher margin space and defense products. Selling, general and administrative expenses (which include corporate expenses) increased to $159.6 million in fiscal 2006 compared with $137.4 million in fiscal 2005. Selling, general and administrative expenses include stock option expense of $5.4 million resulting from accounting for stock option expense under Financial Accounting Standards No. 123(R), “Share-Based Payment,” (Statement No. 123(R)). For information on our adoption of Statement No. 123(R), see Note 13 of the consolidated financial statements. In fiscal 2005, we recorded $2.8 million of stock option expense under the variable method of accounting. The increase in selling, general and administrative expenses primarily reflected incremental selling, general and administrative expenses from the Darchem, Wallop, FR Countermeasures and Palomar acquisitions. In addition, pension expense was $4.3 million and $3.0 million in fiscal 2006 and 2005, respectively. Pension expense in fiscal 2006 included a $1.2 million increase in the Leach pension obligation existing as of the acquisition of Leach in August 2004, which was identified during an audit of its pension plan. The increase in selling, general and administrative expense also reflected a $1.0 million charge as a result of a customer contract termination and higher commission expense from increased sales. As a percentage of sales, selling, general and administrative expenses were 16.4% and 16.5% in fiscal 2006 and 2005, respectively. Research, development and related engineering spending increased to $52.6 million, or 5.4% of sales, in fiscal 2006 compared with $42.2 million, or 5.1% of sales, in fiscal 2005. Darchem’s research and development and engineering spending as a percentage of sales is lower than our other operating units. If research, development and engineering spending as a percentage of sales is calculated excluding Darchem, the percentage is 5.8%, which we consider to be a better compari-son to the prior year. The increase in research, development and related engineering largely reflects spending on the A400M primary power distribution assembly, TP400 engine sensors, 787 overhead panel control and 787 environmental control programs. Research, development and engineering expense in fiscal 2006 is net of a $5.2 million government subsidy due from France. Research, development and related engineering spending is expected to return to more historical levels during the second half of fiscal 2007. Segment earnings (which exclude corporate expenses and other income and expense) increased 14.2% during fis-cal 2006 to $120.8 million compared to $105.8 million in the prior year. Avionics & Controls segment earnings were $45.1 million for fiscal 2006 compared with $37.3 million in fiscal 2005 and reflected incremental earnings from the Palomar acquisition completed in June 2005 and strong earnings from our cockpit control and medical equipment operations. Sensors & Systems segment earnings were $29.3 million for fiscal 2006 compared with $34.5 million in fiscal 2005. The decrease in Sensors & Systems earnings from fiscal 2005 reflected manufacturing inefficiencies and incremental direct labor costs incurred to reduce delinquent shipments at our pressure and temperature sensors operations. Sensors & Systems earnings were also impacted by a $1.0 million charge as a result of a customer contract termination as well as a $4.6 million increase in research, development and engineering spending which was principally incurred by our Leach units. Sensors & Systems earnings also reflected the impact of a weaker U.S. dollar relative to the euro on U.S. dollar-denominated sales and euro-based operating expenses. Advanced Materials segment earnings were $46.5 million for fiscal 2006 compared with $34.0 million for fiscal 2005. Advanced Materials earnings reflected incremental earnings from the Darchem acquisition and improved earnings from our elastomer and Arkansas flare countermeasure operations. Advanced Materials earnings were impacted by lower sales and earnings at our combustible ordnance operations, start-up costs at our FR Countermeasures unit and the incident at our Wallop operations described above. Business interruption insurance recoveries of $4.9 million were recorded during fiscal 2006. Interest income decreased to $2.6 million during fiscal 2006 compared with $4.1 million in fiscal 2005, reflecting lower balances of cash and cash equivalents and short-term investments. Interest expense increased to $21.3 million during fiscal 2006 compared with $18.2 million in the prior year, reflecting increased borrowings to finance acquisitions and work-ing capital requirements. In February 2006, we entered into an interest rate swap agreement on the full principal amount of our U.K. £57.0 million term loan, exchanging the variable interest rate for a fixed interest rate of 4.75% plus an additional margin amount determined by reference to the Company’s leverage ratio. In September 2003, we entered into an interest rate swap agreement on $75.0 million of our Senior Subordinated Notes due in 2013. The swap agreement exchanged the fixed interest rate for a variable interest rate on $75.0 million of the $175.0 million principal amount outstanding. The effective income tax rate for continuing operations for fiscal 2006 was 22.8% compared with 24.1% in fiscal 2005. The effective tax rate was lower than the statutory rate, as both years benefited from various tax credits and deduc-tions. In addition, in fiscal 2006, we recognized a $4.5 million reduction of previously estimated tax liabilities, which was the result of the following items: $1.6 million due to the expiration of the statute of limitations and adjustments resulting from a reconciliation of prior year’s U.S. income tax return to the U.S. income tax return’s provision for income taxes, $2.0 million as a result of receiving a Notice of Proposed Adjustment (NOPA) from the State of California Franchise Tax Board
www.global-reports.com

Page 25. Management’s Discussion and Analysis Esterline
covering, among other items, the examination of research and development tax credits for fiscal years 1997 through 2002 and $0.9 million as a result of a favorable conclusion of a tax examination. In fiscal 2005, we recognized a $2.0 million reduc-tion of previously estimated tax liabilities due to the expiration of the statute of limitations and adjustments resulting from a reconciliation of prior year’s U.S. income tax return to the U.S. income tax return’s provision for income taxes. While the effective tax rate in fiscal 2006 was impacted by the expiration of the U.S. Research and Experimentation Credit at Decem-ber 31, 2005, the impact was partially offset by increased benefits from various tax credits and foreign interest deductions. On December 21, 2006, the Tax Relief and Health Care Act of 2006 (the Act) was signed into law. The Act retroactively extends the Federal Research and Experimentation tax credit from January 1, 2006 through December 31, 2007. As a result of the extension of the Research and Experimentation tax credit, during the first quarter of fiscal 2007, we anticipate that the Company will recognize approximately $2.0 million of tax benefits related to fiscal 2006. In addition, we expect that the Company will recognize approximately $2.0 million of research and experimentation tax benefits related to fiscal 2007 in our full year results of operations. New orders for fiscal 2006 were $1,143.0 million compared with $894.4 million for fiscal 2005. Avionics & Con-trols orders for fiscal 2006 increased 7.2% from the prior-year period. Sensors & Systems orders for fiscal 2006 decreased 4.0% from the prior-year period, principally reflecting the timing of receiving orders. Advanced Materials orders for fiscal 2006 increased 92.3% from the prior-year period, principally reflecting the Darchem and Wallop acquisitions. Backlog at the end of fiscal 2006 was $653.5 million compared with $482.8 million at the end of the prior year. Approximately $165.8 million is scheduled to be delivered after fiscal 2007. Backlog is subject to cancellation until delivery.
Fiscal 2005 Compared with Fiscal 2004
Sales for fiscal 2005 increased 36.1% over the prior year. Sales by segment were as follows:
Increase (Decrease)
Dollars In Thousands From Prior Year 2005 2004
Avionics & Controls 24.8% $ 261,550 $ 209,498Sensors & Systems 76.8% 319,539 180,768Advanced Materials 13.9% 254,314 223,344 Total $ 835,403 $ 613,610
The 24.8% increase in Avionics & Controls reflected incremental sales from the Leach medical and Palomar busi-ness units, higher sales of cockpit controls, and increased sales volumes of aftermarket cockpit switches. These increases were partially offset by lower sales of technology interface systems for land-based military vehicles. The 76.8% increase in Sensors & Systems principally reflected $107.7 million in incremental sales from the Leach acquisition, enhanced sales of temperature and pressure sensors, and motion control distribution sales to the British Ministry of Defence (British MoD). The increase also reflected a stronger euro relative to the U.S. dollar, as the average exchange rate from the euro to the U.S. dollar increased from 1.22 in fiscal 2004 to 1.27 in fiscal 2005. The 13.9% increase in Advanced Materials reflected higher sales of flare countermeasure devices, elastomer ma-terial and increased sales at our metal finishing unit. These increases were partially offset by lower sales of combustible ordnance due to reduced U.S. Army requirements. Sales to foreign customers, including export sales by domestic operations, totaled $345.8 million and $244.2 mil-lion, and accounted for 41.4% and 39.8% of our sales for fiscal 2005 and 2004, respectively. Overall, gross margin as a percentage of sales was 31.4% and 31.8% for fiscal 2005 and 2004, respectively. Avion-ics & Controls segment gross margin was 33.3% and 33.7% for fiscal 2005 and 2004, respectively, reflecting a higher mix of lower margin medical equipment sales. The impact from medical equipment sales was partially offset by a higher mix of aftermarket products and cockpit controls sales and software support services performed by our AVISTA unit. Additionally, gross margin in fiscal 2004 reflected plant relocations and consolidation of facilities. Mason Electric Co. and Janco Cor-poration moved from their respective facilities to one new facility. This move required more time to execute than originally anticipated, resulting in higher than expected moving expenses, operating inefficiencies and delayed shipments. Sensors & Systems segment gross margin was 34.5% and 36.5% for fiscal 2005 and 2004, respectively. The decrease in Sensors & Systems gross margin from fiscal 2004 was largely a result of a higher sales mix of electrical power switching, control and data communication devices sold by Leach. Leach products tend to have a lower gross margin on average than other products included in the Sensors & Systems segment. A loss provision on shipments of off-spec products also contributed to the decrease in gross margin. Gross margin was also impacted by a weaker U.S. dollar compared to the euro on U.S. dollar-denominated sales and euro-based cost of sales.
www.global-reports.com

Page 26. Management’s Discussion and Analysis Esterline
Advanced Materials segment gross margin was 25.3% and 26.1% for fiscal 2005 and 2004, respectively. Lower sales volumes of combustible ordnance and incremental start-up costs on certain flare countermeasure devices were partially offset by improved gross margins at our elastomer material and metal finishing operations. Comparing fiscal 2005 and fiscal 2004, our elastomer material gross margins were aided by lower integration and workers’ compensation expenses and higher sales volumes to aerospace customers, resulting in an increased recovery of fixed expenses. In fiscal 2004, our elastomer material operations were impacted by certain operational inefficiencies from integrating acquired businesses, which resulted in higher labor costs. Improved gross margins at our metal finishing operations reflected an improved recovery of fixed expenses due to higher sales and increased selling prices. Selling, general and administrative expenses (which include corporate expenses) increased to $137.4 million in fiscal 2005 compared with $118.7 million in fiscal 2004. Selling, general and administrative expenses include stock option expense of $2.8 million and $4.3 million in fiscal 2005 and 2004, respectively. These are non-cash charges resulting from mark-to-market adjustments under the variable method of accounting. The increase in selling, general and administrative expenses primarily reflected incremental selling, general and administrative expenses from the Leach acquisition partially offset by certain expense reductions at our Sensors & Systems operations and the decrease in stock option expense. As a percentage of sales, selling, general and administrative expenses were 16.5% and 19.4% in fiscal 2005 and 2004, respectively. The decrease in selling, general and administrative expense as a percentage of sales principally reflected $4.5 million in sev-erance expense in our Sensors & Systems segment incurred in the prior-year period, lower stock option expense and higher sales volumes without a proportional increase in the expense during fiscal 2005. Research, development and related engineering spending increased to $42.2 million, or 5.1% of sales, in fiscal 2005 compared with $25.9 million, or 4.2% of sales, in fiscal 2004. The increase in research, development and related en-gineering largely reflects spending on the A400M primary power distribution assembly, TP400 engine sensors, 787 overhead panel control and 787 environmental control programs. Segment earnings (which exclude corporate expenses and other income or expense) increased 55.8% during fiscal 2005 to $105.8 million compared to $67.9 million in the prior year. Avionics & Controls segment earnings were $37.3 million for fiscal 2005 compared with $32.1 million in fiscal 2004 and reflected increased earnings from higher sales of cockpit con-trols to the aftermarket and OEM customers. These earnings included a $3.1 million increase in research, development and engineering spending. Avionics & Controls results were partially offset by weaker earnings from medical equipment operations. Comparatively, fiscal 2004 Avionics & Controls earnings were impacted by the relocation and consolidation of facilities. Sensors & Systems segment earnings were $34.5 million for fiscal 2005 compared with $7.8 million in fiscal 2004. The increase in Sensors & Systems earnings from fiscal 2004 reflected incremental earnings from the Leach acquisition, higher sales volumes, and lower severance expenses. Sensors & Systems earnings also reflected a $13.1 million increase in research, development and engineering spending which was principally incurred by our Leach units. The decrease in sever-ance expense compared with fiscal 2004 reflected $4.5 million in severance and legal costs incurred in the first fiscal quarter of 2004. Sensors & Systems earnings also reflected the impact of a weaker U.S. dollar relative to the euro on U.S. dollar-denominated sales and euro-based operating expenses. Advanced Materials segment earnings were $34.0 million for fiscal 2005 compared with $28.0 million for fiscal 2004. Advanced Materials earnings reflected higher sales and earnings from our elastomer and metal finishing operations. Advanced Materials earnings were impacted by lower sales and earnings at our combustible ordnance operations, and higher operating expenses at our flare countermeasure operations. During the fourth quarter of fiscal 2004, we sold a product line in our Sensors & Systems segment and recorded a gain of $3.4 million. The gain is reflected in Other Expense, Net. Interest income increased to $4.1 million during fiscal 2005 compared with $2.0 million in fiscal 2004, reflecting interest earned on increased balances of cash and cash equivalents and short-term investments. Interest expense increased to $18.2 million during fiscal 2005 compared with $17.3 million in the prior year, due to the increased interest rate on our variable rate borrowing. In September 2003, we entered into an interest rate swap agreement on $75.0 million of our Senior Subordinated Notes due in 2013. The swap agreement exchanged the fixed interest rate for a variable interest rate on $75.0 million of the $175.0 million principal amount outstanding. The effective income tax rate for continuing operations for fiscal 2005 was 24.1% compared with 24.6% in fiscal 2004. The effective tax rate was lower than the statutory rate, as both years benefited from various tax credits and deduc-tions. In addition, in fiscal 2005, we recognized a $2.0 million reduction of previously estimated tax liabilities due to the expiration of the statute of limitations and adjustments resulting from a reconciliation of U.S. and non-U.S. tax returns to the provision for income taxes. In fiscal 2004, we recognized a $1.9 million reduction of previously estimated tax liabilities as a result of receiving a Notice of Proposed Adjustment (NOPA) from the Internal Revenue Service covering the audit of research and development tax credits for fiscal years 1997 through 1999. Due to the NOPA and the expectation of a similar
www.global-reports.com

Page 27. Management’s Discussion and Analysis Esterline
result for fiscal years 2000 through 2003, we revised our estimated liability for income taxes as of January 30, 2004. The cur-rent year’s results benefited from the 18-month extension by the U.S. Congress of the Research and Experimentation Credit (R&D credit) from June 30, 2004 to December 31, 2005. Income from continuing operations was $51.0 million, or $2.02 per share on a diluted basis, compared with $29.4 million, or $1.37 per share, in fiscal 2004. Net earnings were $58.0 million, or $2.29 per share on a diluted basis in fiscal 2005, compared with net earnings of $39.6 million, or $1.84 per share, in fiscal 2004. Net earnings in fiscal 2005 included net income of $7.0 million, or $.27 per share, from discontinued operations. Net earnings in fiscal 2004 included net income of $10.2 million, or $.47 per share, from discontinued operations. New orders for fiscal 2005 were $894.4 million compared with $742.8 million for fiscal 2004. Avionics & Controls orders for fiscal 2005 increased 24.4% from the prior-year period and reflected the acquisitions of the Leach medical and Palomar units. Sensors & Systems orders for fiscal 2005 increased 26.5% from the prior-year period and reflected the acqui-sition of Leach. Advanced Materials orders for fiscal 2005 increased 9.1% from the prior-year period and reflected increased aerospace orders and was partially offset by lower program requirements for combustible ordnance. Backlog at the end of fiscal 2005 was $482.8 million compared with $423.8 million at the end of the prior year. The increase in backlog principally reflects the Palomar acquisition.
Liquidity and Capital Resources
WORKING CAPITAL AND STATEMENT OF CASH FLOWS
Cash and cash equivalents and short-term investments at the end of fiscal 2006 totaled $42.6 million, a decrease of $138.3 million from the prior year. Net working capital increased to $267.7 million at the end of fiscal 2006 from $265.2 million at the end of the prior year. Sources of cash flows from operating activities principally consist of cash received from the sale of products offset by cash payments for material, labor and operating expenses. Cash flows from operating activities were $36.7 million and $76.4 million in fiscal 2006 and 2005, respectively. The decrease principally reflected lower cash flows from operating activities of our non-U.S. units, including the $5.2 million research and development subsidy from France not yet received in cash. In addition, the decrease reflects increased cash payments for inventory. Customers are now requiring shorter lead times and higher levels of safety stock which have resulted in a significantly higher investment in inventory. The decrease also reflects higher payments of taxes and interest, the $2.2 million prepayment penalty on the 6.77% Senior Notes and increased cash payments for incentive compensation, which is paid annually in December. Cash flows used by investing activities were $153.0 million and $91.5 million in fiscal 2006 and 2005, respectively. The increase in the use of cash for investing activities mainly reflected cash paid for acquisitions. Additionally, fiscal 2005 included $21.4 million in proceeds from the sale of our discontinued operations. Cash flows provided by financing activities were $39.1 million and $105.1 million in fiscal 2006 and 2005, respec-tively. The decrease in cash provided by financing activities principally reflected the net proceeds of $108.5 million from our public offering of 3.7 million shares of common stock completed in fiscal 2005. Additionally, the decrease reflected the repayment of our $30.0 million 6.40% Senior Notes in accordance with terms and the $40.0 million prepayment of our 6.77% Senior Notes in the first fiscal quarter of 2006. These decreases were partially offset by our borrowing of $100.0 mil-lion under our term loan facility in fiscal 2006.
CAPITAL EXPENDITURES
Net property, plant and equipment was $170.4 million at the end of fiscal 2006 compared with $138.2 million at the end of the prior year. Capital expenditures for fiscal 2006 were $26.5 million (excluding acquisitions) and included machinery and equipment and enhancements to information technology systems. Capital expenditures are anticipated to approximate $27.5 million for fiscal 2007. We will continue to support expansion through investments in infrastructure including machin-ery, equipment, buildings and information systems.
DEBT FINANCING
Total debt increased $47.3 million from the prior year to $295.9 million at the end of fiscal 2006. Total debt outstanding including the fair value of the interest rate swap at the end of fiscal 2006 consisted of $174.3 million under our Senior Sub-ordinated Notes, $108.1 million under our GBP Term Loan and $13.5 million under our credit facility and various foreign currency debt agreements, including capital lease obligations. The Senior Subordinated Notes are due June 15, 2013 at an interest rate of 7.75%. The Senior Subordinated Notes are general unsecured obligations of the Company and are subor-dinated to all existing and future senior debt of the Company. In addition, the Senior Subordinated Notes are effectively
www.global-reports.com

Page 28. Management’s Discussion and Analysis Esterline
subordinated to all existing and future senior debt and other liabilities (including trade payables) of the Company’s foreign subsidiaries. The Senior Subordinated Notes are guaranteed, jointly and severally, by all the existing and future domestic subsidiaries of the Company unless designated as an “unrestricted subsidiary” under the indenture covering the Senior Subordinated Notes. In September 2003, we entered into an interest rate swap agreement on $75.0 million of our Senior Subordinated Notes due in 2013. The swap agreement exchanged the fixed interest rate for a variable interest rate on $75.0 million of the $175.0 million principal amount outstanding. On November 15, 2005, $30.0 million of the 6.4% Senior Notes matured and was paid. Additionally, on November 15, 2005, we exercised our option under the terms of the Note Purchase Agreement, dated as of November 1, 1998, to prepay the outstanding principal amount of $40.0 million of the 6.77% Senior Notes due November 15, 2008. Under the terms of the Note Purchase Agreement, we paid an additional $2.0 million to the holders of the 6.77% Senior Notes as a prepayment penalty and wrote off debt issuance costs associated with the 6.77% Senior Notes. The payment of the prepayment penalty and the write-off of the debt issuance costs were accounted for as a loss on extinguishment of debt in the first quarter of fiscal 2006. On February 10, 2006, we amended the credit agreement to provide a $100.0 million term loan facility, which may be drawn in U.S. dollars, U.K. pounds or euros. In addition to the $100.0 million term loan facility, we have a $100.0 million revolving credit facility that provides up to $25.0 million of the credit facility and up to $50.0 million of the letter of credit may be drawn in U.K. pounds or euros in addition to U.S. dollars. Available credit under the above credit facilities was $111.0 million at fiscal 2006 year end, when reduced by outstanding borrowings of $8.1 million and letters of credit of $0.6 million. On February 10, 2006, we borrowed U.K. £57.0 million, or approximately $100.0 million, under the term loan facility. We used the proceeds from the loan as working capital for our U.K. operations and to repay a portion of our out-standing borrowings under the revolving credit facility. The principal amount of the loan is payable quarterly commencing on March 31, 2007 through the termination date of November 14, 2010, according to a payment schedule by which 1.25% of the principal amount is paid in each quarter of 2007, 2.50% in each quarter of 2008, 5.00% in each quarter of 2009 and 16.25% in each quarter of 2010. The loan accrues interest at a variable rate based on the British Bankers Association Interest Settlement Rate for deposits in U.K. pounds plus an additional margin amount that ranges from 1.13% to 0.50% depending upon the Company’s leverage ratio. As of October 27, 2006, the interest rate on the term loan was 5.72%. We entered into an interest rate swap agreement on the full principal amount by which the variable interest rate was exchanged for a fixed interest rate of 4.75% plus an additional margin amount determined by reference to the Company’s leverage ratio. At October 27, 2006, the fair value of the interest rate swap was a $1.5 million asset. The interest rate swap is accounted for as a cash flow hedge and the fair value is included in Other Comprehensive Income. We believe cash on hand, funds generated from operations and other available debt facilities are sufficient to fund operat-ing cash requirements and capital expenditures through fiscal 2007; however, we may periodically utilize our lines of credit for work-ing capital requirements. In addition, we believe we have adequate access to capital markets to fund future acquisitions.
PENSION OBLIGATIONS
Our pension plans, which principally includes a U.S. pension plan maintained by Esterline and U.S. and non-U.S. plans maintained by Leach, were under-funded $20.5 million at October 27, 2006. This under-funding principally resulted from the acquisition of Leach and assumption of its under-funded pension plans. We account for pension expense using the end of the fiscal year as our measurement date and we make actuarially computed contributions to our pension plans as neces-sary to adequately fund benefits. Our funding policy is consistent with the minimum funding requirements of ERISA. In fiscal 2006, operating cash flow included $0.7 million of cash funding to these pension plans. We expect pension funding requirements to be approximately $5.3 million in fiscal 2007 for the plans maintained by Leach, and we do not expect the U.S. Esterline pension plan to require any contributions in fiscal 2007. The rate of increase in future compensation levels is consistent with our historical experience and salary administration policies. The expected long-term rate of return on plan assets is based on long-term target asset allocations of 70% equity and 30% fixed income. We periodically review allocations of plan assets by investment type and evaluate external sources of information regarding long-term historical returns and expected future returns for each investment type and, accordingly, believe an 8.5% assumed long-term rate of return on plan assets is appropriate. Current allocations are consistent with the long-term targets. We made the following assumptions with respect to our pension obligation in 2006 and 2005:
2006 2005
Principal assumptions as of fiscal year end:Discount Rate 5.75 – 6.0% 5.5%Rate of increase in future compensation levels 4.5% 4.5%Assumed long-term rate of return on plan assets 8.5% 8.5%
www.global-reports.com
Page 29. Management’s Discussion and Analysis Esterline
We use a discount rate for expected returns that is a spot rate developed from a yield curve established from high-quality corporate bonds and matched to plan-specific projected benefit payments. Although future changes to the discount rate are unknown, had the discount rate increased or decreased by 25 basis points, pension liabilities in total would have decreased $4.7 million or increased $4.9 million, respectively. If all other assumptions are held constant, the estimated effect on fiscal 2007 pension expense from a hypothetical 25 basis point increase or decrease in both the discount rate and expected long-term rate of return on plan assets would not have a material effect on our pension expense. We are not aware of any legislative or other initiatives or circumstances that will significantly impact our pension obligations in fiscal 2007.
RESEARCH AND DEVELOPMENT EXPENSE
For the three years ended October 27, 2006, research and development expense has averaged 4.9% of sales. In fiscal 2005 and 2004, we began bidding and winning new aerospace programs which will result in increased company-funded research and development. These programs included the A400M primary power distribution assembly, TP400 engine sensors, 787 overhead panel control and 787 environmental control programs. We estimate that research and development expense in fiscal 2007 will be approximately 5.0% of sales for the full year.
EQUITY OFFERING
On August 3, 2004, we filed a shelf registration statement on Form S-3 registering $300.0 million of equity and debt securi-ties, which was declared effective on August 25, 2004. The shelf registration statement enables us to issue equity and debt securities in response to market conditions. On November 24, 2004 we completed a public offering of 3.7 million shares of common stock, including shares sold under the underwriters’ over-allotment option, priced at $31.25 per share, generating net proceeds of $108.5 million, of which $5.0 million was used to retire existing credit facilities. The funds provided addi-tional financial resources for acquisitions and general corporate purposes.
CONTRACTUAL OBLIGATIONS
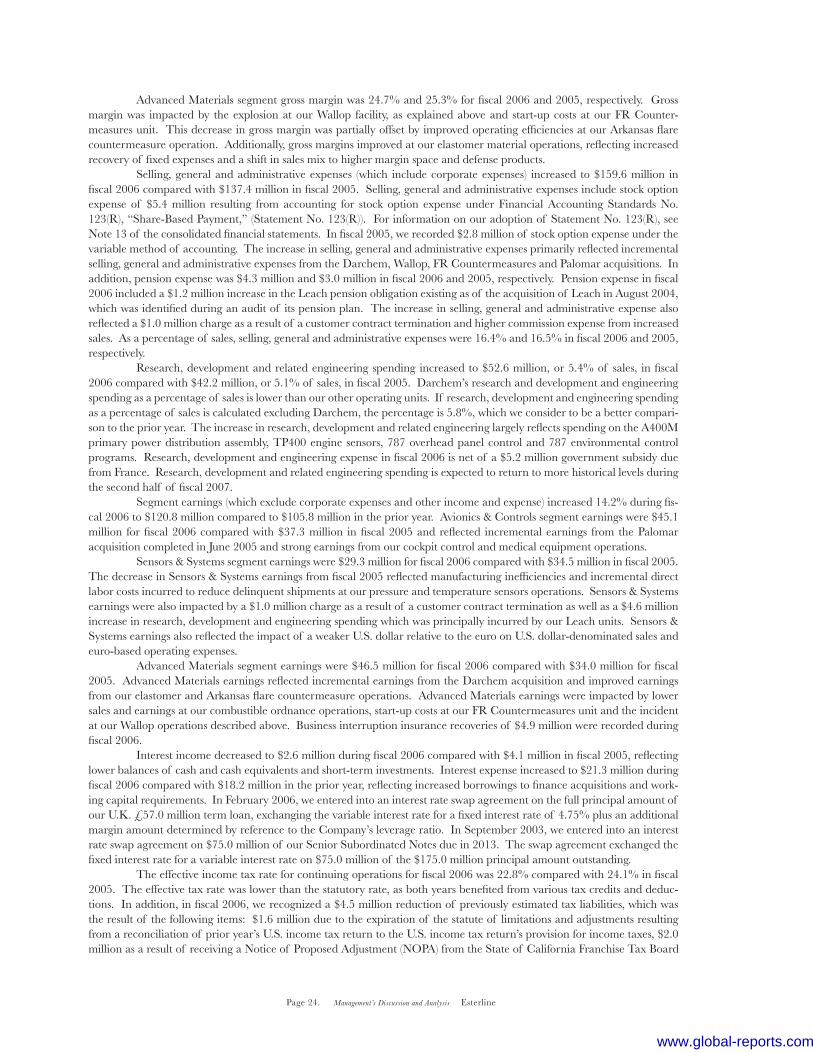
The following table summarizes our outstanding contractual obligations as of fiscal year end.
Less than 1-3 4-5 After 5
In Thousands Total 1 year years years years
Long-term debt $ 287,845 $ 5,538 $ 31,844 $ 76,014 $ 174,449Credit facilities 8,075 8,075 — — —Operating lease obligations 65,982 10,602 18,731 16,785 19,864Purchase obligations 289,679 278,396 6,823 4,460 —Total contractual obligations $ 651,581 $ 302,611 $ 57,398 $ 97,259 $ 194,313
SEASONALITY
The timing of our revenues is impacted by the purchasing patterns of our customers and, as a result, we do not generate reve-nues evenly throughout the year. Moreover, our first fiscal quarter, November through January, includes significant holiday vaca-tion periods in both Europe and North America. This leads to decreased order and shipment activity; consequently, first quarter results are typically weaker than other quarters and not necessarily indicative of our performance in subsequent quarters.
Disclosures About Market Risk
INTEREST RATE RISKS
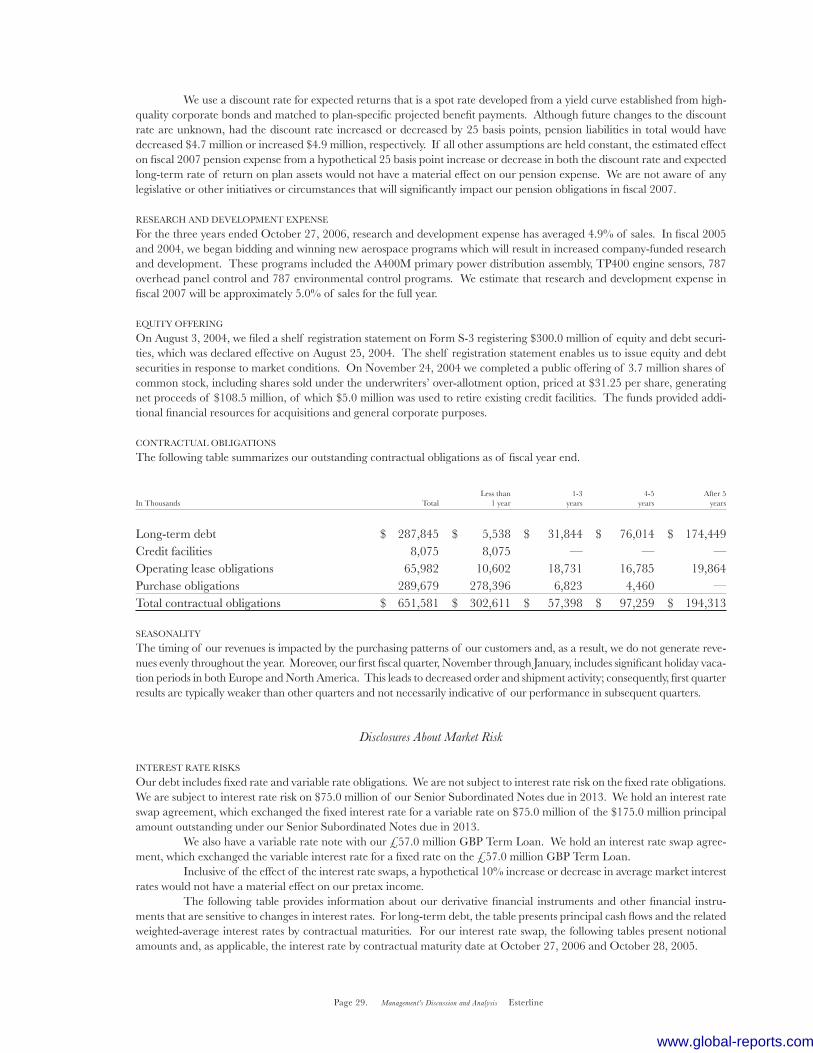
Our debt includes fixed rate and variable rate obligations. We are not subject to interest rate risk on the fixed rate obligations. We are subject to interest rate risk on $75.0 million of our Senior Subordinated Notes due in 2013. We hold an interest rate swap agreement, which exchanged the fixed interest rate for a variable rate on $75.0 million of the $175.0 million principal amount outstanding under our Senior Subordinated Notes due in 2013. We also have a variable rate note with our £57.0 million GBP Term Loan. We hold an interest rate swap agree-ment, which exchanged the variable interest rate for a fixed rate on the £57.0 million GBP Term Loan. Inclusive of the effect of the interest rate swaps, a hypothetical 10% increase or decrease in average market interest rates would not have a material effect on our pretax income. The following table provides information about our derivative financial instruments and other financial instru-ments that are sensitive to changes in interest rates. For long-term debt, the table presents principal cash flows and the related weighted-average interest rates by contractual maturities. For our interest rate swap, the following tables present notional amounts and, as applicable, the interest rate by contractual maturity date at October 27, 2006 and October 28, 2005.
www.global-reports.com
Page 30. Management’s Discussion and Analysis Esterline
At October 27, 2006Dollars In Thousands
Long-Term Debt – Fixed Rate Interest Rate Swap
Principal Average Notional Average Average
Maturing in: Amount Rates Amount Pay Rate (1) Receive Rate
2007 $ 1,484 6.04% $ — * 7.75%2008 2,346 5.87% — * 7.75%2009 1,117 7.50% — * 7.75%2010 210 7.69% — * 7.75%2011 122 7.64% — * 7.75%Thereafter 175,147 7.75% 75,000 * 7.75%Total $ 180,426 $ 75,000
Fair Value at 10/27/2006 $ 192,439 $ (698)
(1) The average pay rate is LIBOR plus 2.56%.
At October 27, 2006Dollars In Thousands
Long-Term Debt – Variable Rate Interest Rate Swap
Principal Average Notional Average Average
Maturing in: Amount Rates (1) Amount Pay Rate Receive Rate (1)
2007 $ 4,054 * $ 4,054 4.755% *2008 9,460 * 9,460 4.755% *2009 18,921 * 18,921 4.755% *2010 58,113 * 58,113 4.755% *2011 17,569 * 17,569 4.755% *Total $ 108,117 $ 108,117
Fair Value at 10/27/2006 $ 108,117 $ 1,498
(1) The average rate on the long-term debt and the average receive rate on the interest rate swap is the British Bankers Association Interest Settlement Rate for deposits in U.K. pounds plus an additional margin of 1.13% to 0.50% depending on the Company’s leverage ratio.
www.global-reports.com

Page 31. Management’s Discussion and Analysis Esterline
At October 28, 2005Dollars In Thousands
Long-Term Debt – Fixed Rate Interest Rate Swap
Principal Average Notional Average Average
Maturing in: Amount Rates Amount Pay Rate (1) Receive Rate
2006 $ 70,934 6.62% $ — * 7.75%2007 763 5.79% — * 7.75%2008 464 7.20% — * 7.75%2009 390 7.08% — * 7.75%2010 22 7.18% — * 7.75%Thereafter 175,055 7.75% 75,000 * 7.75%Total $ 247,628 $ 75,000
Fair Value at 10/28/2005 $ 252,330 $ (1,012)
(1) The average pay rate is LIBOR plus 2.56%.
CURRENCY RISKS
To the extent that sales are transacted in a foreign currency, we are subject to foreign currency fluctuation risk. Furthermore, we have assets denominated in foreign currencies that are not offset by liabilities in such foreign currencies. We own signifi-cant operations in France, Germany and the United Kingdom and, accordingly, we may experience gains or losses due to foreign exchange fluctuations. Comparing October 27, 2006 and October 28, 2005, the foreign exchange rate for the dollar relative to the euro decreased to .785 from .829, or 5.2%, and the dollar relative to the U.K. pound decreased to .527 from .564, or 6.5%. Comparing October 28, 2005 to October 29, 2004, the foreign exchange rate for the dollar relative to the euro increased to .829 from .781, or 6.1%, and the dollar relative to the U.K. pound increased to .564 from .544, or 3.6%. Our policy is to hedge a portion of our forecasted transactions using forward exchange contracts with maturities up to fifteen months. The Company does not enter into any forward contracts for trading purposes. At October 27, 2006 and October 28, 2005, the notional value of foreign currency forward contracts was $52.8 million and $38.5 million, respectively. The fair value of these contracts was a $0.8 million asset and a $0.9 million liability at October 27, 2006 and October 28, 2005, respectively. If the U.S. dollar increased or decreased in value against all hedged currencies by a hypothetical 10%, the effect on the fair value of the foreign currency contracts would not be material. The following tables provide information about our derivative financial instruments, including foreign currency forward exchange agreements and certain firmly committed sales transactions denominated in currencies other than the functional currency at October 27, 2006 and October 28, 2005. The information about certain firmly committed sales con-tracts and derivative financial instruments is in U.S. dollar equivalents. For forward foreign currency exchange agreements, the following tables present the notional amounts at the current exchange rate and weighted-average contractual foreign currency exchange rates by contractual maturity dates.
www.global-reports.com

Page 32. Management’s Discussion and Analysis Esterline
Firmly Committed Sales ContractsOperations with Foreign Functional Currency
At October 27, 2006
Principal Amount by Expected Maturity
In Thousands
Euro U.K. Pound
Firmly Committed Firmly Committed Sales Contracts in Sales Contracts in
Fiscal Years United States Dollar United States Dollar
2007 $ 55,135 $ 28,2192008 8,074 6,7142009 109 5,2022010 — 8612011 — 757 Total $ 63,318 $ 41,753
Derivative ContractsOperations with Foreign Functional Currency
At October 27, 2006
Notional Amount by Expected MaturityAverage Foreign Currency Exchange Rate (USD/Foreign Currency) (1)
Dollars in Thousands, Except for Average Contract Rate
Related Forward Contracts to Sell U.S. Dollar for Euro
United States Dollar
Fiscal Years Notional Amount Avg. Contract Rate
2007 $ 31,800 1.265 2008 5,470 1.294 Total $ 37,270
Fair Value at 10/27/2006 $ 297
Related Forward Contracts to Sell U.S. Dollar for U.K. Pound
United States Dollar
Fiscal Years Notional Amount Avg. Contract Rate
2007 $ 26,675 1.841 2008 3,015 1.868 Total $ 29,690
Fair Value at 10/27/2006 $ 311
(1) The Company has no derivative contracts maturing after fiscal 2008.
www.global-reports.com

Page 33. Management’s Discussion and Analysis Esterline
Firmly Committed Sales ContractsOperations with Foreign Functional Currency
At October 28, 2005
Principal Amount by Expected Maturity
In Thousands
Euro U.K. Pound
Firmly Committed Firmly Committed Sales Contracts in Sales Contracts in
Fiscal Years United States Dollar United States Dollar
2006 $ 26,883 $ 15,7052007 6,153 2,0722008 2,094 4022009 — 2,9092010 — 46 Total $ 35,130 $ 21,134
Derivative ContractsOperations with Foreign Functional Currency
At October 28, 2005
Notional Amount by Expected MaturityAverage Foreign Currency Exchange Rate (USD/Foreign Currency) (1)
Dollars in Thousands, Except for Average Contract Rate
Related Forward Contracts to Sell U.S. Dollar for Euro
United States Dollar
Fiscal Years Notional Amount Avg. Contract Rate
2006 $ 17,800 1.266 2007 2,090 1.244 Total $ 19,890
Fair Value at 10/28/2005 $ (501)
Related Forward Contracts to Sell U.S. Dollar for U.K. Pound
United States Dollar
Fiscal Years Notional Amount Avg. Contract Rate
2006 $ 16,370 1.824 2007 2,240 1.800 Total $ 18,610
Fair Value at 10/28/2005 $ (433)
(1) The Company has no derivative contracts maturing after fiscal 2007.
www.global-reports.com
Page 34. Management’s Discussion and Analysis Esterline
As more fully described under Note 11 of the consolidated financials statements, on February 10, 2006, we bor-rowed U.K. £57.0 million, or approximately $100.0 million, under our term loan facility. We designated the U.K. £57.0 million loan as a hedge of the investment in a certain U.K. business unit. The foreign currency gain or loss that is effective as a hedge is reported as a component of Other Comprehensive Income in shareholders’ equity. A 10% increase or decrease in the U.K. pound would increase or decrease Other Comprehensive Income by $6.8 million, net of tax. We also hold an interest rate swap agreement, which exchanged the variable interest rate for a fixed rate on the £57.0 million GBP Term Loan. At October 27, 2006, the fair value of the interest rate swap was a $1.5 million asset.
Critical Accounting Policies
Our financial statements and accompanying notes are prepared in accordance with U.S. generally accepted accounting principles. Preparing financial statements requires management to make estimates and assumptions that affect the reported amounts of assets, liabilities, revenues and expenses. Actual results may differ from estimates under different assumptions or conditions. These estimates and assumptions are affected by our application of accounting policies. Our critical accounting policies include revenue recognition, accounting for the allowance for doubtful accounts receivable, accounting for inven-tories at the lower of cost or market, accounting for goodwill and intangible assets in business combinations, impairment of goodwill and intangible assets, accounting for legal contingencies, accounting for pension benefits, and accounting for income taxes.
REVENUE RECOGNITION
We recognize revenue when the title and risk of loss have passed to the customer, there is persuasive evidence of an agree-ment, delivery has occurred or services have been rendered, the price is determinable, and the collectibility is reasonably assured. We recognize product revenues at the point of shipment or delivery in accordance with the terms of sale. Sales are net of returns and allowances. Returns and allowances are not significant because products are manufactured to customer specification and are covered by the terms of the product warranty. Revenues and profits on fixed-price contracts with significant engineering as well as production requirements are recorded based on the ratio of total actual incurred costs to date to total estimated costs for each contract (cost-to-cost method) in accordance with the American Institute of Certified Public Accountants Statement of Position 81-1, “Account-ing for Performance of Construction-Type and Certain Production-Type Contracts.” We review cost performance and estimates to complete on our ongoing contracts at least quarterly. The impact of revisions of profit estimates are recognized on a cumulative catch-up basis in the period in which the revisions are made. Provisions for anticipated losses on contracts are recorded in the period they become evident. Amounts representing contract change orders, claims or other items are included in revenue only when they can be reliably estimated and realization is probable, and are determined on a percent-age-of-completion basis measured by the cost-to-cost method.
ALLOWANCE FOR DOUBTFUL ACCOUNTS
We establish an allowance for doubtful accounts for losses expected to be incurred on accounts receivable balances. Judg-ment is required in estimation of the allowance and is based upon specific identification, collection history and creditworthi-ness of the debtor.
INVENTORIES
We account for inventories on a first-in, first-out or average cost method of accounting at the lower of its cost or market. The determination of market requires judgment in estimating future demand, selling prices and cost of disposal.
GOODWILL AND INTANGIBLE ASSETS IN BUSINESS COMBINATIONS
We account for business combinations, goodwill and intangible assets in accordance with Financial Accounting Standards No. 141, “Business Combinations” (Statement No. 141) and Financial Accounting Standards No. 142, “Goodwill and Other Intangible Assets” (Statement No. 142). Statement No. 141 specifies the types of acquired intangible assets that are required to be recognized and reported separately from goodwill.
IMPAIRMENT OF GOODWILL AND INTANGIBLE ASSETS
Statement No. 142 requires goodwill and certain indefinite-lived intangible assets to be tested for impairment at least annually. We are also required to test goodwill for impairment between annual tests if events occur or circumstances change that would more likely than not reduce our enterprise fair value below its book value. These events or circumstances could include a signifi-cant change in the business climate, including a significant sustained decline in an entity’s market value, legal factors, operating performance indicators, competition, sale or disposition of a significant portion of the business, or other factors.
www.global-reports.com
Page 35. Management’s Discussion and Analysis Esterline
The valuation of reporting units requires judgment in estimating future cash flows, discount rates and estimated product life cycles. In making these judgments, we evaluate the financial health of the business, including such factors as industry performance, changes in technology and operating cash flows. Statement No. 142 outlines a two-step process for testing goodwill for impairment. The first step (Step One) of the goodwill impairment test involves estimating the fair value of a reporting unit. Statement No. 142 defines fair value (Fair Value) as “the amount at which an asset (or liability) could be bought (or incurred) or sold (or settled) in a current transaction between willing parties, that is, other than in a forced liquidation sale.” A reporting unit is generally defined at the operating segment level or at the component level one level below the operating segment, if said component constitutes a business. The Fair Value of a reporting unit is then compared to its carrying value, which is defined as the book basis of total assets less total liabilities. In the event a reporting unit’s carrying value exceeds its estimated Fair Value, evidence of potential impairment exists. In such a case, the second step (Step Two) of the impairment test is required, which involves allocating the Fair Value of the reporting unit to all of the assets and liabilities of that unit, with the excess of Fair Value over allocated net assets representing the Fair Value of goodwill. An impairment loss is measured as the amount by which the carrying value of the reporting unit’s goodwill exceeds the estimated Fair Value of goodwill. We preformed our impairment review for fiscal 2006 as of July 29, 2006, and our Step One analysis indicates that no impairment of goodwill exists in any of the Company’s reporting units. Our Step One test was based upon a market and discounted cash flow valuation method. As we have grown through acquisitions, we have accumulated $366.2 million of goodwill and $29.3 million of indefinite-lived intangible assets out of total assets of $1,290.5 million at October 27, 2006. The amount of any annual or interim impairment could be significant and could have a material adverse effect on our reported financial results for the period in which the charge is taken.
IMPAIRMENT OF LONG-LIVED ASSETS
We account for the impairment of long-lived assets to be held and used in accordance with Financial Accounting Standards No. 144, “Accounting for the Impairment or Disposal of Long-Lived Assets” (Statement No. 144). Statement No. 144 re-quires that a long-lived asset to be disposed of be reported at the lower of its carrying amount or fair value less cost to sell. An asset (other than goodwill and indefinite-lived intangible assets) is considered impaired when estimated future cash flows are less than the carrying amount of the asset. In the event the carrying amount of such asset is not deemed recoverable, the asset is adjusted to its estimated fair value. Fair value is generally determined based upon estimated discounted future cash flows. As we have grown through acquisitions, we have accumulated $212.3 million of intangible assets. The amount of any annual or interim impairment could be significant and could have a material adverse effect on our reported financial results for the period in which the charge is taken.
CONTINGENCIES
We are party to various lawsuits and claims, both as plaintiff and defendant, and have contingent liabilities arising from the conduct of business. We are covered by insurance for general liability, product liability, workers’ compensation and certain environmental exposures, subject to certain deductible limits. We are self-insured for amounts less than our deductible and where no insurance is available. Financial Accounting Standards No. 5, “Accounting for Contingencies,” requires that an estimated loss from a contingency should be accrued by a charge to income if it is probable that an asset has been impaired or a liability has been incurred and the amount of the loss can be reasonably estimated. Disclosure of a contingency is re-quired if there is at least a reasonable possibility that a loss has been incurred. We evaluate, among other factors, the degree of probability of an unfavorable outcome and the ability to make a reasonable estimate of the amount of loss.
PENSION BENEFITS
We account for employee pension benefit costs and obligations in accordance with the applicable statements issued by the Financial Accounting Standards Board. In accordance with these statements, we select appropriate assumptions including discount rate, rate of increase in future compensation levels and assumed long-term rate of return on plan assets. Our as-sumptions are based upon historical results, the current economic environment and reasonable expectations of future events. Actual results which vary from our assumptions are accumulated and amortized over future periods and, accordingly, are recognized in expense in these periods. Significant differences between our assumptions and actual experience or significant changes in assumptions could impact the pension costs and the pension obligation.
www.global-reports.com
Page 36. Management’s Discussion and Analysis Esterline
INCOME TAXES
We account for income taxes in accordance with Financial Accounting Standards No. 109, “Accounting for Income Taxes.” The objectives of accounting for income taxes are to recognize the amount of taxes payable or refundable for the current year and deferred tax liabilities and assets for the future tax consequences of events that have been recognized in our financial statements or tax returns. Judgment is required in assessing the future tax consequences of events that have been recognized in our financial statements or tax returns. Variations in the actual outcome of these future tax consequences could materially impact our financial position and results of operations.
RECENT ACCOUNTING PRONOUNCEMENTS
In October 2006, the Financial Accounting Standards Board issued Statement of Financial Accounting Standards No. 158, “Employers’ Accounting for Defined Benefit Pension and Other Postretirement Plans, an amendment of FASB Statements No. 87, 88, 106 and 123(R).” Statement No. 158 requires an entity to:
• Recognize in its statements of financial position an asset for a defined benefit postretirement plan’s overfunded status or a liability for a plan’s underfunded status.
• Measure a defined benefit postretirement plan’s assets and obligations that determine its funded status as of the end of the employer’s fiscal year.
• Recognize changes in the funded status of a defined benefit postretirement plan in comprehensive income in the year in which the changes occur.
Statement No. 158 does not change the amount of net periodic benefit cost included in net income or address the various measurement issues associated with postretirement benefit plan accounting. The requirement to recognize the funded status of a defined benefit postretirement plan and the disclosure requirements are effective as of October 26, 2007. If we had implemented Statement No. 158 as of October 27, 2006, the effect on our balance sheet would be an increase in pension liabilities and a decrease in accumulated other comprehensive income of approximately $8.5 million. In September 2006, the Financial Accounting Standards Board issued Statement of Financial Accounting Stan-dards No. 157, “Fair Value Measurements.” Statement No. 157 defines fair value, establishes a framework for measuring fair value in generally accepted accounting principles, and expands disclosures about fair value measurements. Statement No. 157 applies under other accounting pronouncements that require or permit fair value measurements. Statement No. 157 indicates, among other things, that a fair value measurement assumes the transaction to sell the asset or transfer the liability occurs in the principal market for the asset or liability or, in the absence of a principal market, the most advantageous market for the asset or liability. Statement No. 157 is effective for the Company’s year ending October 30, 2009. The Company is currently evaluating the impact of Statement No. 157 on the Company’s financials statements. In June 2006, the Financial Accounting Standards Board issued FIN No. 48, “Accounting for Uncertainty in In-come Taxes – an interpretation of FASB Statement No. 109,” which clarifies the accounting for uncertainty in income taxes recognized in an enterprise’s financial statements in accordance with FASB Statement No. 109, “Accounting for Income Taxes.” The interpretation prescribes a recognition method and measurement attribute for the financial statement recog-nition and measurement of a tax position taken or expected to be taken in a tax return. FIN No. 48 requires recognition of tax benefits that satisfy a greater than 50% probability threshold. FIN No. 48 also provides guidance on derecognition, classification, interest and penalties, accounting in interim periods, disclosure, and transition. FIN No. 48 is effective for us beginning October 27, 2007. We are assessing the potential impact that the adoption of FIN No. 48 will have on our finan-cial statements. In March 2005, the Financial Accounting Standards Board issued FASB Interpretation No. (FIN) 47 – “Account-ing for Conditional Asset Retirement Obligations, an interpretation of FASB Statement No. 143,” which clarifies the term “conditional asset retirement obligation” as used in SFAS No. 143, “Accounting for Asset Retirement Obligations.” Spe-cifically, FIN No. 47 provides that an asset retirement obligation is conditional when either the timing and (or) method of settling the obligation is conditioned on a future event. Accordingly, an entity is required to recognize a liability for the fair value of a conditional asset retirement obligation if the fair market value of the liability can be reasonably estimated. Un-certainty about the timing and (or) method of settlement of a conditional asset retirement obligation should be factored into the measurement of the liability when sufficient information exists. This interpretation also clarifies when an entity would have sufficient information to reasonably estimate the fair value of an asset retirement obligation. FIN No. 47 was effective for fiscal years ending after December 15, 2005. Our adoption of FIN No. 47 on October 27, 2006 did not have a material impact on our consolidated results of operation and financial condition.
www.global-reports.com
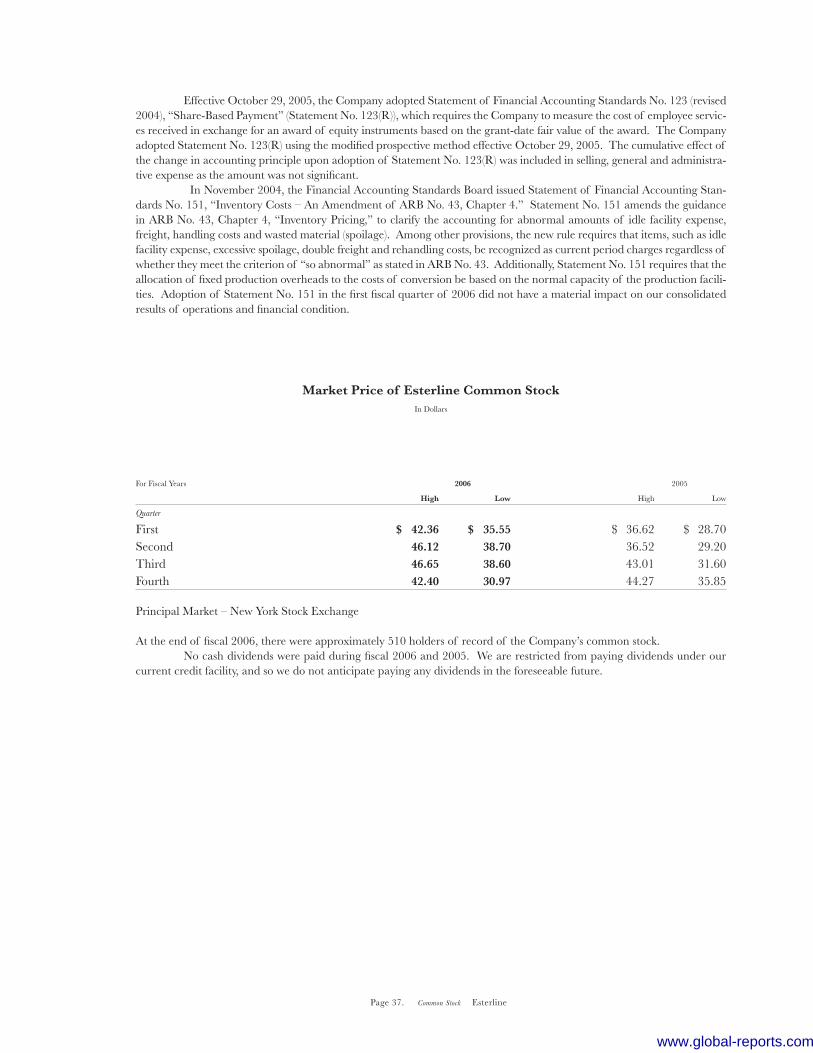
Page 37. Common Stock Esterline
Effective October 29, 2005, the Company adopted Statement of Financial Accounting Standards No. 123 (revised 2004), “Share-Based Payment” (Statement No. 123(R)), which requires the Company to measure the cost of employee servic-es received in exchange for an award of equity instruments based on the grant-date fair value of the award. The Company adopted Statement No. 123(R) using the modified prospective method effective October 29, 2005. The cumulative effect of the change in accounting principle upon adoption of Statement No. 123(R) was included in selling, general and administra-tive expense as the amount was not significant. In November 2004, the Financial Accounting Standards Board issued Statement of Financial Accounting Stan-dards No. 151, “Inventory Costs – An Amendment of ARB No. 43, Chapter 4.” Statement No. 151 amends the guidance in ARB No. 43, Chapter 4, “Inventory Pricing,” to clarify the accounting for abnormal amounts of idle facility expense, freight, handling costs and wasted material (spoilage). Among other provisions, the new rule requires that items, such as idle facility expense, excessive spoilage, double freight and rehandling costs, be recognized as current period charges regardless of whether they meet the criterion of “so abnormal” as stated in ARB No. 43. Additionally, Statement No. 151 requires that the allocation of fixed production overheads to the costs of conversion be based on the normal capacity of the production facili-ties. Adoption of Statement No. 151 in the first fiscal quarter of 2006 did not have a material impact on our consolidated results of operations and financial condition.
Market Price of Esterline Common StockIn Dollars
For Fiscal Years 2006 2005
High Low High Low
Quarter
First $ 42.36 $ 35.55 $ 36.62 $ 28.70Second 46.12 38.70 36.52 29.20Third 46.65 38.60 43.01 31.60Fourth 42.40 30.97 44.27 35.85
Principal Market – New York Stock Exchange
At the end of fiscal 2006, there were approximately 510 holders of record of the Company’s common stock. No cash dividends were paid during fiscal 2006 and 2005. We are restricted from paying dividends under our current credit facility, and so we do not anticipate paying any dividends in the foreseeable future.
www.global-reports.com

Page 38. Selected Financial Data Esterline
Selected Financial DataIn Thousands, Except Per Share Amounts
For Fiscal Years 2006 2005 2004 2003 2002
Operating Results (1)
Net sales $ 972,275 $ 835,403 $ 613,610 $ 549,132 $ 421,706Cost of sales 671,419 573,453 418,590 376,931 285,900Selling, general and administrative 159,624 137,426 118,746 105,301 79,085Research, development and engineering 52,612 42,238 25,856 17,782 13,829Other (income) expense (490) 514 (509) — —Insurance recovery (4,890) — — — —Loss (gain) on sale of product line — — (3,434) 66 —Loss (gain) on derivative financial instruments — — — (2,676) 1Interest income (2,642) (4,057) (1,964) (868) (1,814)Interest expense 21,290 18,159 17,336 11,991 7,117Loss on extinguishment of debt 2,156 — — — —Income from continuing operations before income taxes 73,196 67,670 38,989 40,605 37,588
Income tax expense 16,716 16,301 9,592 12,458 9,111Income from continuing operations 55,615 51,034 29,375 28,147 28,477Income (loss) from discontinued operations, net of tax — 6,992 10,208 (5,312) (25,264)Cumulative effect of a change in accounting principle — — — — (7,574)Net earnings (loss) 55,615 58,026 39,583 22,835 (4,361)
Earnings (loss) per share – diluted: Continuing operations $ 2.15 $ 2.02 $ 1.37 $ 1.33 $ 1.35 Discontinued operations — .27 .47 (.25) (1.20) Cumulative effect of a change in accounting principle — — — — (.36) Earnings (loss) per share – diluted 2.15 2.29 1.84 1.08 (.21)
Financial Structure
Total assets $ 1,290,451 $ 1,115,248 $ 935,348 $ 802,827 $ 573,678Long-term debt, net 282,307 175,682 249,056 246,792 102,133Shareholders’ equity 707,989 620,864 461,028 396,069 357,164
Weighted average shares outstanding – diluted 25,818 25,302 21,539 21,105 21,021
(1) Operating results for 2005 through 2002 and balance sheet items for 2003 through 2002 reflect the segregation of continuing operations from discontinued operations. See Note 3 to the Consolidated Financial Statements.
www.global-reports.com
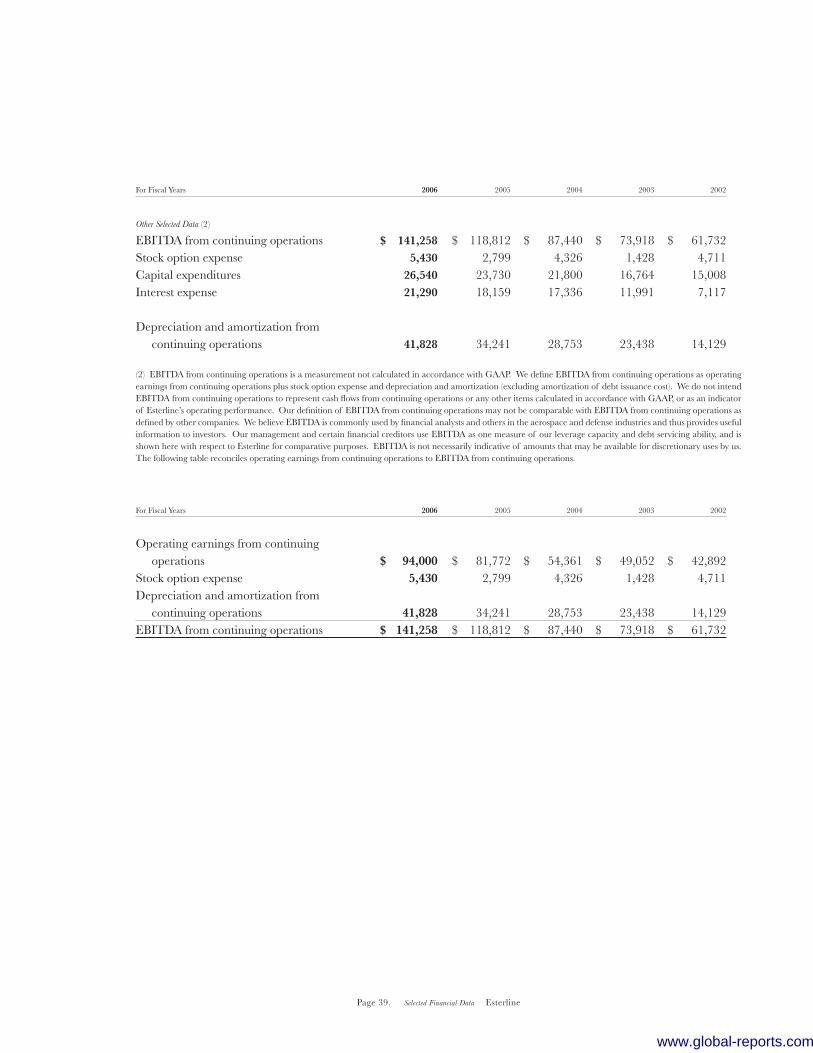
Page 39. Selected Financial Data Esterline
For Fiscal Years 2006 2005 2004 2003 2002
Other Selected Data (2)
EBITDA from continuing operations $ 141,258 $ 118,812 $ 87,440 $ 73,918 $ 61,732Stock option expense 5,430 2,799 4,326 1,428 4,711Capital expenditures 26,540 23,730 21,800 16,764 15,008Interest expense 21,290 18,159 17,336 11,991 7,117
Depreciation and amortization from continuing operations 41,828 34,241 28,753 23,438 14,129
(2) EBITDA from continuing operations is a measurement not calculated in accordance with GAAP. We define EBITDA from continuing operations as operating earnings from continuing operations plus stock option expense and depreciation and amortization (excluding amortization of debt issuance cost). We do not intend EBITDA from continuing operations to represent cash flows from continuing operations or any other items calculated in accordance with GAAP, or as an indicator of Esterline’s operating performance. Our definition of EBITDA from continuing operations may not be comparable with EBITDA from continuing operations as defined by other companies. We believe EBITDA is commonly used by financial analysts and others in the aerospace and defense industries and thus provides useful information to investors. Our management and certain financial creditors use EBITDA as one measure of our leverage capacity and debt servicing ability, and is shown here with respect to Esterline for comparative purposes. EBITDA is not necessarily indicative of amounts that may be available for discretionary uses by us. The following table reconciles operating earnings from continuing operations to EBITDA from continuing operations.
For Fiscal Years 2006 2005 2004 2003 2002
Operating earnings from continuing operations $ 94,000 $ 81,772 $ 54,361 $ 49,052 $ 42,892Stock option expense 5,430 2,799 4,326 1,428 4,711Depreciation and amortization from continuing operations 41,828 34,241 28,753 23,438 14,129EBITDA from continuing operations $ 141,258 $ 118,812 $ 87,440 $ 73,918 $ 61,732
www.global-reports.com

Page 40. Consolidated Statement of Operations Esterline
Consolidated Statement of OperationsIn Thousands, Except Per Share Amounts
For Each of the Three Fiscal Years in the Period Ended October 27, 2006 2006 2005 2004
Net Sales $ 972,275 $ 835,403 $ 613,610Cost of Sales 671,419 573,453 418,590 300,856 261,950 195,020Expenses Selling, general and administrative 159,624 137,426 118,746 Research, development and engineering 52,612 42,238 25,856 Total Expenses 212,236 179,664 144,602Other Other (income) expense (490) 514 (509) Insurance recovery (4,890) — — Gain on sale of product line — — (3,434) Total Other (5,380) 514 (3,943)Operating Earnings From Continuing Operations 94,000 81,772 54,361
Interest income (2,642) (4,057) (1,964) Interest expense 21,290 18,159 17,336 Loss on extinguishment of debt 2,156 — —Other Expense, Net 20,804 14,102 15,372
Income From Continuing Operations Before Income Taxes 73,196 67,670 38,989Income Tax Expense 16,716 16,301 9,592Income From Continuing Operations Before Minority Interest 56,480 51,369 29,397
Minority Interest (865) (335) (22)Income From Continuing Operations 55,615 51,034 29,375
Income From Discontinued Operations, Net of Tax — 6,992 10,208
Net Earnings $ 55,615 $ 58,026 $ 39,583
www.global-reports.com

Page 41. Consolidated Statement of Operations Esterline
For Each of the Three Fiscal Years in the Period Ended October 27, 2006 2006 2005 2004
Earnings Per Share – Basic: Continuing operations $ 2.19 $ 2.05 $ 1.39 Discontinued operations — .28 .48
Earnings Per Share – Basic $ 2.19 $ 2.33 $ 1.87
Earnings Per Share – Diluted: Continuing operations $ 2.15 $ 2.02 $ 1.37 Discontinued operations — .27 .47
Earnings Per Share – Diluted $ 2.15 $ 2.29 $ 1.84
See Notes to Consolidated Financial Statements.
www.global-reports.com

Page 42. Consolidated Balance Sheet Esterline
Consolidated Balance SheetIn Thousands, Except Share and Per Share Amounts
As of October 27, 2006 and October 28, 2005 2006 2005
Assets
Current Assets
Cash and cash equivalents $ 42,638 $118,304Cash in escrow 4,409 11,918Short-term investments — 62,656Accounts receivable, net of allowances of $4,338 and $4,462 191,737 149,751Inventories 185,846 130,469Income tax refundable 6,231 —Deferred income tax benefits 27,932 26,868Prepaid expenses 9,545 7,533 Total Current Assets 468,338 507,499
Property, Plant and Equipment
Land 16,903 15,869Buildings 96,451 79,219Machinery and equipment 226,037 187,022 339,391 282,110Accumulated depreciation 168,949 143,896 170,442 138,214Other Non-Current Assets
Goodwill 366,155 261,167Intangibles, net 241,657 166,118Debt issuance costs, net of accumulated amortization of $2,277 and $1,602 4,469 5,144Deferred income tax benefits 14,790 13,320Other assets 24,600 23,786 Total Assets $ 1,290,451 $ 1,115,248
See Notes to Consolidated Financial Statements.
www.global-reports.com
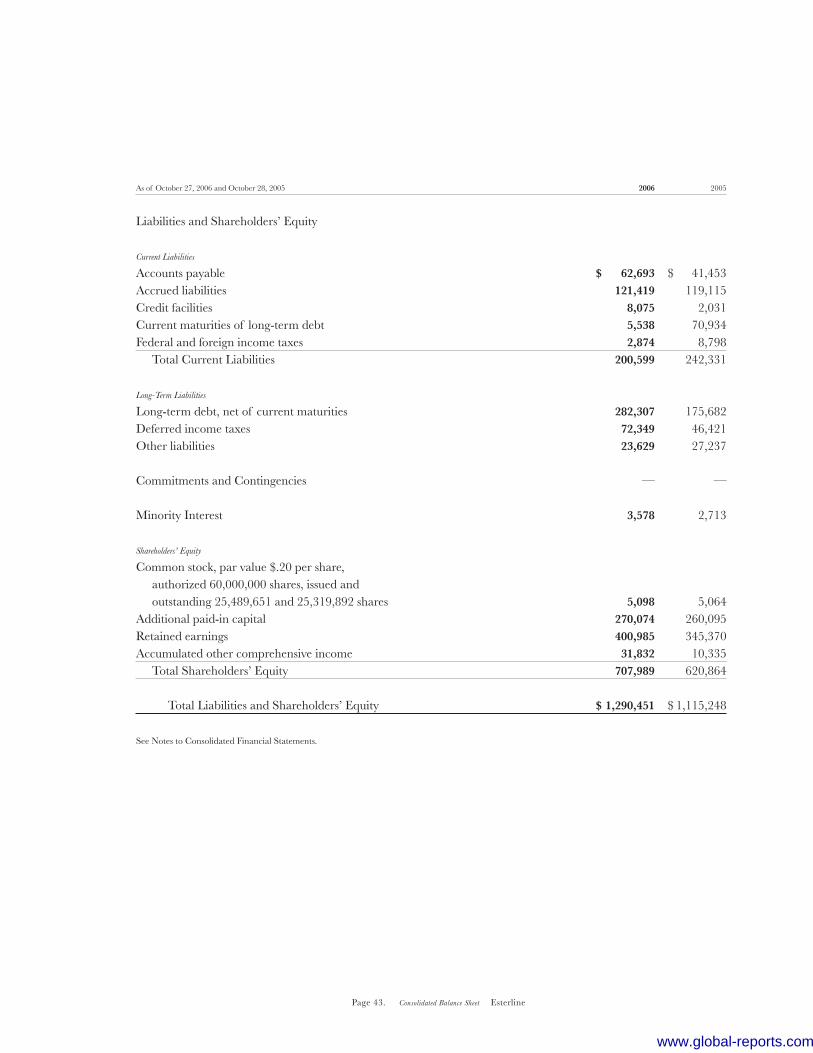
Page 43. Consolidated Balance Sheet Esterline
As of October 27, 2006 and October 28, 2005 2006 2005
Liabilities and Shareholders’ Equity
Current Liabilities
Accounts payable $ 62,693 $ 41,453Accrued liabilities 121,419 119,115Credit facilities 8,075 2,031Current maturities of long-term debt 5,538 70,934Federal and foreign income taxes 2,874 8,798 Total Current Liabilities 200,599 242,331
Long-Term Liabilities
Long-term debt, net of current maturities 282,307 175,682Deferred income taxes 72,349 46,421Other liabilities 23,629 27,237
Commitments and Contingencies — —
Minority Interest 3,578 2,713
Shareholders’ Equity
Common stock, par value $.20 per share, authorized 60,000,000 shares, issued and outstanding 25,489,651 and 25,319,892 shares 5,098 5,064Additional paid-in capital 270,074 260,095Retained earnings 400,985 345,370Accumulated other comprehensive income 31,832 10,335 Total Shareholders’ Equity 707,989 620,864 Total Liabilities and Shareholders’ Equity $ 1,290,451 $ 1,115,248
See Notes to Consolidated Financial Statements.
www.global-reports.com

Page 44. Consolidated Statement of Cash Flows Esterline
Consolidated Statement of Cash FlowsIn Thousands
For Each of the Three Fiscal Years in the Period Ended October 27, 2006 2006 2005 2004
Cash Flows Provided (Used) by Operating Activities
Net earnings $ 55,615 $ 58,026 $ 39,583Minority interest 865 335 22Depreciation and amortization 42,833 35,308 31,145Deferred income tax (1,623) (4,501) 3,264Stock-based compensation 5,430 2,799 4,326Loss (gain) on disposal and holding period loss on discontinued operations — — (12,521)Loss (gain) on sale of discontinued operations — (9,456) —Loss (gain) on sale of building — 59 —Loss (gain) on sale of land — — (892)Loss (gain) on sale of product line — — (3,434)Loss (gain) on sale of short-term investments (610) (1,397) —Working capital changes, net of effect of acquisitions Accounts receivable (16,511) (17,645) (9,032) Inventories (39,241) (11,636) (9,095) Prepaid expenses (1,305) 1,702 (659) Other current assets — 435 — Accounts payable 8,106 4,166 2,600 Accrued liabilities (646) 19,916 10,240 Federal and foreign income taxes (12,530) 5,169 8,951Other liabilities (1,677) (6,414) 4,359Other, net (2,030) (454) (5,530) 36,676 76,412 63,327
Cash Flows Provided (Used) by Investing Activities
Purchases of capital assets (26,540) (23,776) (22,126)Proceeds from sale of discontinued operations — 21,421 10,000Proceeds from sale of building — 2,319 —Proceeds from sale of product line — — 3,475Proceeds from sale of land — — 1,654Escrow deposit — (4,207) (12,500)Proceeds from sale of capital assets 643 2,312 778Purchase of short-term investments — (173,273) —Proceeds from sale of short-term investments 63,266 112,014 12,797Acquisitions of businesses, net of cash acquired (190,344) (28,261) (138,811) (152,975) (91,451) (144,733)
www.global-reports.com

Page 45. Consolidated Statement of Cash Flows Esterline
For Each of the Three Fiscal Years in the Period Ended October 27, 2006 2006 2005 2004
Cash Flows Provided (Used) by Financing Activities
Proceeds provided by stock issuance under employee stock plans 4,038 3,519 2,267Excess tax benefits from stock option exercise 545 1,208 540Proceeds provided by sale of common stock — 108,490 —Net change in credit facilities 5,905 (4,829) 4,122Repayment of long-term debt, net (71,372) (3,302) (29,429)Proceeds from issuance of long-term debt 100,000 — —Debt and other issuance costs — — (268) 39,116 105,086 (22,768)
Effect of foreign exchange rates on cash 1,517 (1,222) 2,290
Net increase (decrease) in cash and cash equivalents (75,666) 88,825 (101,884)Cash and cash equivalents – beginning of year 118,304 29,479 131,363Cash and cash equivalents – end of year $ 42,638 $ 118,304 $ 29,479
Supplemental Cash Flow Information
Cash paid for interest $ 21,548 $ 16,610 $ 17,394Cash paid (refunded) for taxes 23,710 14,193 (1,909)
See Notes to Consolidated Financial Statements.
www.global-reports.com
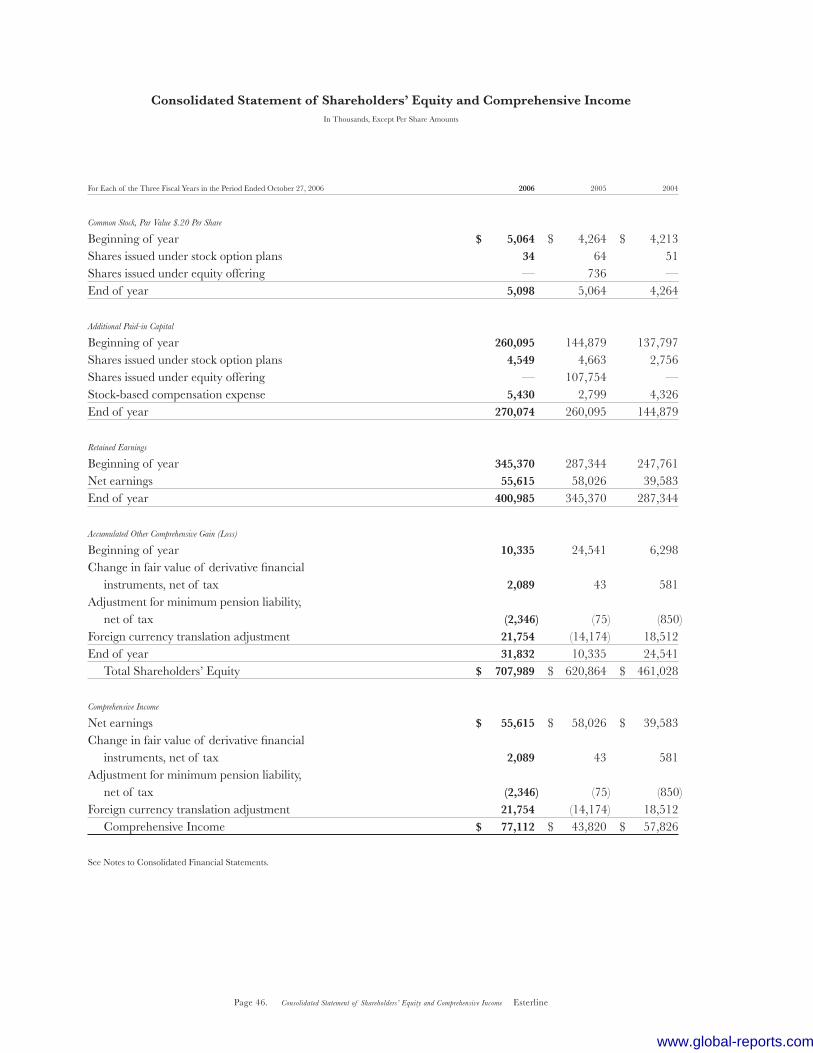
Page 46. Consolidated Statement of Shareholders’ Equity and Comprehensive Income Esterline
Consolidated Statement of Shareholders’ Equity and Comprehensive IncomeIn Thousands, Except Per Share Amounts
For Each of the Three Fiscal Years in the Period Ended October 27, 2006 2006 2005 2004
Common Stock, Par Value $.20 Per Share
Beginning of year $ 5,064 $ 4,264 $ 4,213Shares issued under stock option plans 34 64 51Shares issued under equity offering — 736 —End of year 5,098 5,064 4,264
Additional Paid-in Capital
Beginning of year 260,095 144,879 137,797Shares issued under stock option plans 4,549 4,663 2,756Shares issued under equity offering — 107,754 —Stock-based compensation expense 5,430 2,799 4,326End of year 270,074 260,095 144,879
Retained Earnings
Beginning of year 345,370 287,344 247,761Net earnings 55,615 58,026 39,583End of year 400,985 345,370 287,344
Accumulated Other Comprehensive Gain (Loss)
Beginning of year 10,335 24,541 6,298Change in fair value of derivative financial instruments, net of tax 2,089 43 581Adjustment for minimum pension liability, net of tax (2,346) (75) (850)Foreign currency translation adjustment 21,754 (14,174) 18,512End of year 31,832 10,335 24,541 Total Shareholders’ Equity $ 707,989 $ 620,864 $ 461,028
Comprehensive Income
Net earnings $ 55,615 $ 58,026 $ 39,583Change in fair value of derivative financial instruments, net of tax 2,089 43 581Adjustment for minimum pension liability, net of tax (2,346) (75) (850)Foreign currency translation adjustment 21,754 (14,174) 18,512 Comprehensive Income $ 77,112 $ 43,820 $ 57,826
See Notes to Consolidated Financial Statements.
www.global-reports.com
Page 47. Notes to Consolidated Financial Statements Esterline
Notes to Consolidated Financial Statements
Note 1 : Accounting Policies
NATURE OF OPERATIONS
Esterline Technologies Corporation (the Company) designs, manufactures and markets highly engineered products. The Company serves the aerospace and defense industry, primarily in the United States and Europe. The Company also serves the industrial/commercial and medical markets.
PRINCIPLES OF CONSOLIDATION AND BASIS OF PRESENTATION
The consolidated financial statements include the accounts of the Company and all subsidiaries. All significant intercom-pany accounts and transactions have been eliminated. Classifications have been changed for certain amounts in prior periods to conform with the current year’s presentation. The Company’s fiscal year ends on the last Friday of October.
MANAGEMENT ESTIMATES
To prepare financial statements in conformity with U.S. generally accepted accounting principles, management is required to make estimates and assumptions that affect the reported amounts of assets and liabilities, disclosure of contingent assets and liabilities at the date of the financial statements, and the reported amounts of revenues and expenses during the report-ing period. Actual results could differ from those estimates.
CONCENTRATION OF RISKS
The Company’s products are principally focused on the aerospace and defense industry, which includes military and com-mercial aircraft original equipment manufacturers and their suppliers, commercial airlines, and the United States and foreign governments. Accordingly, the Company’s current and future financial performance is dependent on the economic condition of the aerospace and defense industry. The commercial aerospace market has historically been subject to cyclical downturns during periods of weak economic conditions or material changes arising from domestic or international events. Management believes that the Company’s sales are fairly well balanced across its customer base, which includes not only aerospace and defense customers but also medical and industrial commercial customers. However, material changes in the economic conditions of the aerospace industry could have a material effect on the Company’s results of operations, financial position or cash flows.
REVENUE RECOGNITION
The Company recognizes revenue when the title and risk of loss have passed to the customer, there is persuasive evidence of an agreement, delivery has occurred or services have been rendered, the price is determinable, and the collectibility is reasonably assured. The Company recognizes product revenues at the point of shipment or delivery in accordance with the terms of sale. Sales are net of returns and allowances. Returns and allowances are not significant because products are manufactured to customer specification and are covered by the terms of the product warranty. Revenues and profits on fixed-price contracts with significant engineering as well as production requirements are recorded based on the ratio of total actual incurred costs to date to total estimated costs for each contract (cost-to-cost method) in accordance with the American Institute of Certified Public Accountants Statement of Position 81-1, “Account-ing for Performance of Construction-Type and Certain Production-Type Contracts.” The Company reviews cost perfor-mance and estimates to complete on its ongoing contracts at least quarterly. The impact of revisions of profit estimates are recognized on a cumulative catch-up basis in the period in which the revisions are made. Provisions for anticipated losses on contracts are recorded in the period they become evident. Amounts representing contract change orders, claims or other items are included in revenue only when they can be reliably estimated and realization is probable, and are determined on a percentage-of-completion basis measured by the cost-to-cost method.
www.global-reports.com
Page 48. Notes to Consolidated Financial Statements Esterline
Financial Instruments
Fair Value of Financial InstrumentsThe Company’s financial instruments consist primarily of cash and cash equivalents, accounts receivable, accounts pay-able, short-term borrowings, long-term debt, foreign currency forward contracts, and interest rate swap agreements. The carrying amounts of cash and cash equivalents, accounts receivable, and accounts payable approximate their respective fair values because of the short-term maturities or expected settlement dates of these instruments. The fair market value of the Company’s long-term debt and short-term borrowings was estimated at $300.6 million and $252.3 million at fiscal year end 2006 and 2005, respectively. These estimates were derived using discounted cash flows with interest rates currently available to the Company for issuance of debt with similar terms and remaining maturities.
Foreign Currency Exchange Risk ManagementThe Company is subject to risks associated with fluctuations in foreign currency exchange rates from the sale of products in currencies other than its functional currency. The Company’s policy is to hedge a portion of its forecasted transactions using forward exchange contracts, with maturities up to fifteen months. These forward contracts have been designated as cash flow hedges. The portion of the net gain or loss on a derivative instrument that is effective as a hedge is reported as a component of other comprehensive income in shareholders’ equity and is reclassified into earnings in the same period during which the hedged transaction affects earnings. The remaining net gain or loss on the derivative in excess of the present value of the expected cash flows of the hedged transaction is recorded in earnings immediately. If a derivative does not qualify for hedge accounting, or a portion of the hedge is deemed ineffective, the change in fair value is recorded in earnings. The amount of hedge ineffectiveness has not been material in any of the three fiscal years in the period ended October 27, 2006. At October 27, 2006 and October 28, 2005, the notional value of foreign currency forward contracts was $52.8 million and $38.5 million, respectively. The fair value of these contracts was a $0.8 million asset and a $0.9 million liability at October 27, 2006 and October 28, 2005, respectively. The Company does not enter into any forward contracts for trading purposes. In February 2006, the Company entered into a term loan for U.K. £57.0 million. The Company designated the term loan as a hedge of the investment in a certain U.K. business unit. The foreign currency gain or loss that is effective as a hedge is reported as a component of other comprehensive income in shareholders’ equity. The amount of foreign cur-rency transaction loss included in Other Comprehensive Income at October 27, 2006 was $5.1 million net of taxes. To the extent that this hedge is ineffective, the foreign currency gain or loss is recorded in earnings. There was no ineffectiveness in 2006.
Interest Rate Risk ManagementDepending on the interest rate environment, the Company may enter into interest rate swap agreements to convert the fixed interest rates on notes payable to variable interest rates or terminate any swap agreements in place. These interest rate swap agreements have been designated as fair value hedges. Accordingly, gain or loss on swap agreements as well as the offsetting loss or gain on the hedged portion of notes payable are recognized in interest expense during the period of the change in fair values. The Company attempts to manage exposure to counterparty credit risk by only entering into agree-ments with major financial institutions which are expected to be able to fully perform under the terms of the agreement. In September 2003, the Company entered into an interest rate swap agreement on $75.0 million of its Senior Subordinated Notes due in 2013. The swap agreement exchanged the fixed interest rate for a variable interest rate on $75.0 million of the $175.0 million principal amount outstanding. The fair market value of the Company’s interest rate swap was a liability of $0.7 million and $1.0 million at October 27, 2006 and October 28, 2005, respectively. Depending on the interest rate environment, the Company may enter into interest rate swap agreements to con-vert the variable interest rates on notes payable to fixed interest rates. These swap agreements are accounted for as cash flow hedges and the fair market value of the hedge instrument is included in Other Comprehensive Income. In February 2006, the Company entered into an interest rate swap agreement on the full principal amount of its U.K. £57.0 million term loan facility. The swap agreement exchanged the variable interest rate for a fixed interest rate of 4.75% plus an ad-ditional margin amount determined by reference to the Company’s leverage ratio. The fair value of the interest rate swap was a $1.5 million asset at October 27, 2006. The fair market value of the interest rate swaps was estimated by discounting expected cash flows using quoted market interest rates.
FOREIGN CURRENCY TRANSLATION
Foreign currency assets and liabilities are translated into their U.S. dollar equivalents based on year-end exchange rates. Revenue and expense accounts are translated at average exchange rates. Aggregate exchange gains and losses arising from the translation of foreign assets and liabilities are included in shareholders’ equity as a component of comprehensive in-come. Accumulated foreign currency translation adjustment was $38.5 million, $16.7 million and $30.9 million as of the
www.global-reports.com

Page 49. Notes to Consolidated Financial Statements Esterline
fiscal years ended October 27, 2006, October 28, 2005, and October 29, 2004, respectively. Foreign currency transaction gains and losses are included in results of operations and have not been significant in amount in any of the three fiscal years in the period ended October 27, 2006.
CASH EQUIVALENTS AND CASH IN ESCROW
Cash equivalents consist of highly liquid investments with maturities of three months or less at the date of purchase. Fair value of cash equivalents approximates carrying value. Cash in escrow represents amounts held in escrow pending finaliza-tion of a purchase transaction. Cash equivalents include $10.0 million in cash under a letter of credit facility at October 27, 2006 and October 28, 2005.
SHORT-TERM INVESTMENTS
Short-term investments consist of highly liquid debt securities with maturities of more than three months at the date of purchase. Short-term investments are classified as available for sale securities and are carried at fair value. Unrealized gains and losses are reported as a net amount in a separate component of stockholders’ equity until realized. The gains or losses on short-term securities sold were determined under the specific identification method. Unrealized gains and losses were not significant at October 28, 2005. At October 28, 2005, short-term investments having maturities within one year aggregated $28.9 million, after one year through five years aggregated $1.0 million and after ten years aggregated $32.8 million.
ACCOUNTS RECEIVABLE
Accounts receivable are recorded at the net invoice price for sales billed to customers. Accounts receivable are considered past due when outstanding more than normal trade terms allow. An allowance for doubtful accounts is established when losses are expected to be incurred. Accounts receivable are written off to the allowance for doubtful accounts when the balance is considered to be uncollectible.
INVENTORIES
Inventories are stated at the lower of cost or market using the first-in, first-out (FIFO) or average cost method. Inventory cost includes material, labor and factory overhead.
PROPERTY, PLANT AND EQUIPMENT, AND DEPRECIATION
Property, plant and equipment is carried at cost and includes expenditures for major improvements. Depreciation is gener-ally provided on the straight-line method based upon estimated useful lives ranging from 15 to 30 years for buildings, and 3 to 10 years for machinery and equipment. Depreciation expense was $26,757,000, $23,578,000 and $21,609,000 for fiscal years 2006, 2005 and 2004, respectively.
DEBT ISSUANCE COSTS
Costs incurred to issue debt are deferred and amortized as interest expense over the term of the related debt using a method that approximates the effective interest method.
LONG-LIVED ASSETS
The carrying amount of long-lived assets is reviewed periodically for impairment. An asset (other than goodwill and in-definite lived intangible assets) is considered impaired when estimated future cash flows are less than the carrying amount of the asset. In the event the carrying amount of such asset is not deemed recoverable, the asset is adjusted to its estimated fair value. Fair value is generally determined based upon estimated discounted future cash flows.
GOODWILL AND INTANGIBLES
Goodwill is not amortized under Statement No. 142, but is tested for impairment at least annually. A reporting unit is generally defined at the operating segment level or at the component level one level below the operating segment, if said component constitutes a business. Goodwill and intangible assets are allocated to reporting units based upon the purchase price of the acquired unit, the valuation of acquired tangible and intangible assets, and liabilities assumed. When a report-ing unit’s carrying value exceeds its estimated fair value, an impairment test is required. This test involves allocating the fair value of the reporting unit to all of the assets and liabilities of that unit, with the excess of fair value over allocated net assets representing the fair value of goodwill. An impairment loss is measured as the amount by which the carrying value of goodwill exceeds the estimated fair value of goodwill. Intangible assets are amortized using the straight-line method over their estimated period of benefit, ranging from 2 to 20 years. The Company periodically evaluates the recoverability of intangible assets and takes into account events or circumstances that warrant revised estimates of useful lives or that indicate that an impairment exists. Indefinite lived intangible assets (other than goodwill) are tested annually for impairment or more frequently on an interim basis if circumstances require. This test is comparable to the impairment test for goodwill described above.
www.global-reports.com
Page 50. Notes to Consolidated Financial Statements Esterline
ENVIRONMENTAL
Environmental exposures are provided for at the time they are known to exist or are considered probable and reasonably estimable. No provision has been recorded for environmental remediation costs which could result from changes in laws or other circumstances currently not contemplated by the Company. Costs provided for future expenditures on environmental remediation are not discounted to present value.
SHARE-BASED COMPENSATION
Prior to October 29, 2005, the Company accounted for its share-based compensation in accordance with Accounting Prin-ciples Board Opinion No. 25, “Accounting for Stock Issued to Employees.” The variable method of accounting was used to account for stock option plans where the option holders were permitted to exercise options by surrendering the option subject to the grant in payment of the exercise price of the option and the related statutory taxes. No compensation ex-pense was recognized at the date of grant because the exercise price of all stock option grants is equal to the market price of the Company’s common stock as of the date of grant. However, subsequent changes in the market price of the Company’s stock to the date of exercise or forfeiture resulted in a change in the measurement of compensation costs. Effective October 29, 2005, the Company adopted Statement of Financial Accounting Standards No. 123 (revised 2004), “Share-Based Pay-ment” (Statement No. 123(R)), which requires the Company to measure the cost of employee services received in exchange for an award of equity instruments based on the grant-date fair value of the award. The Company adopted Statement No. 123(R) using the modified prospective method effective October 29, 2005. The cumulative effect of the change in ac-counting principle upon adoption of Statement No. 123(R) was included in selling, general and administrative expense as the amount was not significant. The following table illustrates the effect on net income and earnings per share as if the Company had applied the fair value method for the fiscal years ended in 2005 and 2004:
In Thousands, Except Per Share Amounts 2005 2004
Net earnings as reported $ 58,026 $ 39,583Share-based compensation cost, net of income tax included in net earnings as reported 1,862 2,906Share-based compensation cost, net of income tax under the fair value method of accounting (2,504) (1,784)Pro forma net earnings $ 57,384 $ 40,705
Basic earnings per share as reported $ 2.33 $ 1.87Pro forma basic earnings per share 2.30 1.92
Diluted earnings per share as reported $ 2.29 $ 1.84Pro forma diluted earnings per share 2.26 1.89
PRODUCT WARRANTIES
Estimated product warranty expenses are recorded when the covered products are shipped to customers and recognized as revenue. Product warranty expense is estimated based upon the terms of the warranty program.
EARNINGS PER SHARE
Basic earnings per share is computed on the basis of the weighted average number of common shares outstanding during the year. Diluted earnings per share also includes the dilutive effect of stock options. Common shares issuable from stock options that are excluded from the calculation of diluted earnings per share because the exercise price was greater than the closing market price for fiscal 2006 and 2005 were 346,800 and 180,400, respectively. The weighted average number of shares outstanding used to compute basic earnings per share was 25,413,000, 24,927,000 and 21,195,000 for fiscal years 2006, 2005 and 2004, respectively. The weighted average number of shares outstanding used to compute diluted earnings per share was 25,818,000, 25,302,000 and 21,539,000 for fiscal years 2006, 2005 and 2004, respectively.
www.global-reports.com
Page 51. Notes to Consolidated Financial Statements Esterline
RECENT ACCOUNTING PRONOUNCEMENTS
In October 2006, the Financial Accounting Standards Board issued Statement of Financial Accounting Standards No. 158, “Employers’ Accounting for Defined Benefit Pension and Other Postretirement Plans, an amendment of FASB Statements No. 87, 88, 106 and 123(R).” Statement No. 158 requires an entity to:
• Recognize in its statements of financial position an asset for a defined benefit postretirement plan’s overfunded status or a liability for a plan’s underfunded status.
• Measure a defined benefit postretirement plan’s assets and obligations that determine its funded status as of the end of the employer’s fiscal year.
• Recognize changes in the funded status of a defined benefit postretirement plan in comprehensive income in the year in which the changes occur.
Statement No. 158 does not change the amount of net periodic benefit cost included in net income or address the various measurement issues associated with postretirement benefit plan accounting. The requirement to recognize the funded status of a defined benefit postretirement plan and the disclosure requirements are effective for the Company on October 26, 2007. If the Company had implemented Statement No. 158 as of October 27, 2006, the effect on the balance sheet would be an increase in pension liabilities and a decrease in accumulated other comprehensive income of approxi-mately $8.5 million. In September 2006, the Financial Accounting Standards Board issued Statement of Financial Accounting Stan-dards No. 157, “Fair Value Measurements.” Statement No. 157 defines fair value, establishes a framework for measuring fair value in generally accepted accounting principles, and expands disclosures about fair value measurements. Statement No. 157 applies under other accounting pronouncements that require or permit fair value measurements. Statement No. 157 indicates, among other things, that a fair value measurement assumes the transaction to sell the asset or transfer the liability occurs in the principal market for the asset or liability or, in the absence of a principal market, the most advanta-geous market for the asset or liability. Statement No. 157 is effective for the Company’s year ending October 30, 2009. The Company is currently evaluating the impact of Statement No. 157 on the Company’s financial statements. In June 2006, the Financial Accounting Standards Board issued FIN No. 48, “Accounting for Uncertainty in In-come Taxes – an interpretation of FASB Statement No. 109,” which clarifies the accounting for uncertainty in income taxes recognized in an enterprises’ financial statements in accordance with FASB Statement No. 109, “Accounting for Income Taxes.” The interpretation prescribes a recognition method and measurement attribute for the financial statement recog-nition and measurement of a tax position taken or expected to be taken in a tax return. FIN No. 48 requires recognition of tax benefits that satisfy a greater than 50% probability threshold. FIN No. 48 also provides guidance on derecognition, classification, interest and penalties, accounting in interim periods, disclosure, and transition. FIN No. 48 is effective for the Company beginning October 27, 2007. Management is assessing the potential impact that the adoption of FIN No. 48 will have on the Company’s consolidated financial statements. In March 2005, the Financial Accounting Standards Board issued FASB Interpretation No. (FIN) 47 – “Ac-counting for Conditional Asset Retirement Obligations, an interpretation of FASB Statement No. 143,” which clarifies the term “conditional asset retirement obligation” as used in SFAS No. 143, “Accounting for Asset Retirement Obligations.” Specifically, FIN No. 47 provides that an asset retirement obligation is conditional when either the timing and (or) method of settling the obligation is conditioned on a future event. Accordingly, an entity is required to recognize a liability for the fair value of a conditional asset retirement obligation if the fair market value of the liability can be reasonably estimated. Uncertainty about the timing and (or) method of settlement of a conditional asset retirement obligation should be factored into the measurement of the liability when sufficient information exists. This interpretation also clarifies when an entity would have sufficient information to reasonably estimate the fair value of an asset retirement obligation. FIN No. 47 is ef-fective for fiscal years ending after December 15, 2005. Implementation of FIN No. 47 did not have a material impact on the consolidated results of operations and financial condition. Effective October 29, 2005, the Company adopted Statement of Financial Accounting Standards No. 123 (re-vised 2004), “Share-Based Payment” (Statement No. 123(R)), which requires the Company to measure the cost of employee services received in exchange for an award of equity instruments based on the grant-date fair value of the award. The Company adopted Statement No. 123(R) using the modified prospective method effective October 29, 2005. The cumula-tive effect of the change in accounting principle upon adoption of Statement No. 123(R) was included in selling, general and administrative expense as the amount was not significant.
www.global-reports.com
Page 52. Notes to Consolidated Financial Statements Esterline
In November 2004, the Financial Accounting Standards Board issued Statement of Financial Accounting Stan-dards No. 151, “Inventory Costs – An Amendment of ARB No. 43, Chapter 4.” Statement No. 151 amends the guidance in ARB No. 43, Chapter 4, “Inventory Pricing,” to clarify the accounting for abnormal amounts of idle facility expense, freight, handling costs and wasted material (spoilage). Among other provisions, the new rule requires that items, such as idle facility expense, excessive spoilage, double freight and rehandling costs, be recognized as current period charges regardless of whether they meet the criterion of “so abnormal” as stated in ARB No. 43. Additionally, Statement No. 151 requires that the allocation of fixed production overheads to the costs of conversion be based on the normal capacity of the pro-duction facilities. Adoption of Statement No. 151 in the first fiscal quarter of 2006 did not have a material impact on the Company’s consolidated results of operations and financial condition.
Note 2 : Recovery of Insurance Claims
On June 26, 2006, an explosion occurred at the Company’s Wallop facility, which resulted in one fatality and several minor injuries. The incident destroyed an oven complex for the production of advanced flares and significantly damaged the advanced flare facility. Although the advanced flare facility is expected to be closed for about 18 months due to the require-ments of the Health Safety Executive (HSE) to review the cause of the accident, operations will continue at a portion of the facility located on the same site as the advanced flare facility. The HSE investigation will not be completed until the Coroner’s Inquest is filed possibly in July or August 2007. Although it is not possible to determine the results of the HSE investigation or how the Coroner will rule, management does not expect to be found in breach of the Health & Safety Act related to the accident and, accordingly, no amounts have been recorded for any potential fines that may be assessed by the HSE. The HSE will also review and approve the plans and construction of the new flare facility. The operation is insured under a property, casualty and business interruption insurance policy. The damaged building and inventory is fully covered by insurance and, accordingly, no loss as a result of the accident has been recorded on these assets in fiscal 2006. Repairs and incremental costs related to the accident, which are fully covered by insurance, are recorded on the consolidated balance sheet as a receivable from the insurance carrier. The Company recorded business interruption insurance recoveries of $4.9 million for losses incurred in fiscal 2006. As the Company continues to incur losses in future periods as a result of the incident, business insurance recoveries which can be estimated and are probable of collection will be recorded in the consolidated financial statements.
Note 3 : Discontinued Operations
On July 25, 2002, the Board of Directors adopted a formal plan for the sale of the assets and operations of the Company’s Automation segment. As a result, the consolidated financial statements present the Automation segment as a discontinued operation. On August 31, 2004, the Company sold the stock of W. A. Whitney for $10.0 million in cash. Upon the final disposition of its discontinued operations, the Company recorded an $8.0 million gain, net of $4.5 million in tax, includ-ing the reversal of estimated reserves, which were recognizable upon the sale of the business. On January 28, 2005, the Company completed the sale of the outstanding stock of its wholly owned subsidiary Fluid Regulators Corporation (Fluid Regulators), which was included in the Sensors & Systems segment, for approximately $21.4 million. As a result of the sale, the Company recorded a gain of approximately $7.0 million, net of tax of $2.4 million, in the first fiscal quarter of 2005. On May 13, 2005, the Company closed a small unit in its Other segment and incurred $0.4 million in severance, net of $0.2 million in tax, in the second quarter of fiscal 2005. Sales of the discontinued operations were $4,421,000 and $31,451,000 in fiscal years 2005 and 2004, respectively. The operating results of the discontinued segment for fiscal years 2005 and 2004 consist of the following:
In Thousands 2005 2004
Income (loss) before taxes $ (52) $ 3,261Tax expense (benefit) (13) 1,067
Net income (loss) (39) 2,194Gain on disposal, including tax expense of $2,435 and $4,507 7,031 8,014Income from discontinued operations $ 6,992 $ 10,208
www.global-reports.com

Page 53. Notes to Consolidated Financial Statements Esterline
Note 4 : Inventories
Inventories at the end of fiscal 2006 and 2005 consisted of the following:
In Thousands 2006 2005
Raw materials and purchased parts $ 89,480 $ 64,377Work in process 66,333 45,798Finished goods 30,033 20,294 $ 185,846 $ 130,469
Note 5 : Goodwill
The following table summarizes the changes in goodwill by segment for fiscal 2006 and 2005:
Avionics & Sensors & Advanced
In Thousands Controls Systems Materials Total
Balance, October 29, 2004 $ 78,113 $ 86,239 $ 83,465 $ 247,817Goodwill from acquisitions 20,180 3,611 — 23,791Sale of business — (7,070) — (7,070)Foreign currency translation adjustment (1,169) (2,202) — (3,371)
Balance, October 28, 2005 $ 97,124 $ 80,578 $ 83,465 $ 261,167Goodwill from acquisitions 3,519 — 89,854 93,373Goodwill adjustments 143 176 — 319Foreign currency translation adjustment 1,238 3,207 6,851 11,296Balance, October 27, 2006 $ 102,024 $ 83,961 $ 180,170 $ 366,155
Note 6 : Intangible Assets
Intangible assets at the end of fiscal 2006 and 2005 were as follows:
2006 2005
Weighted Gross Gross
Average Years Carrying Accum. Carrying Accum.In Thousands Useful Life Amount Amort. Amount Amort.
Programs 18 $ 204,817 $ 31,932 $ 140,460 $ 20,307 Core technology 16 8,981 2,728 8,976 2,105 Patents and other 14 56,467 23,280 37,329 20,135 Total $ 270,265 $ 57,940 $ 186,765 $ 42,547
Indefinite-lived Intangible Assets Trademark $ 29,332 $ 21,900 Amortization of intangible assets was $14,899,000, $10,690,000 and $8,533,000 in fiscal years 2006, 2005 and 2004, respectively.
www.global-reports.com
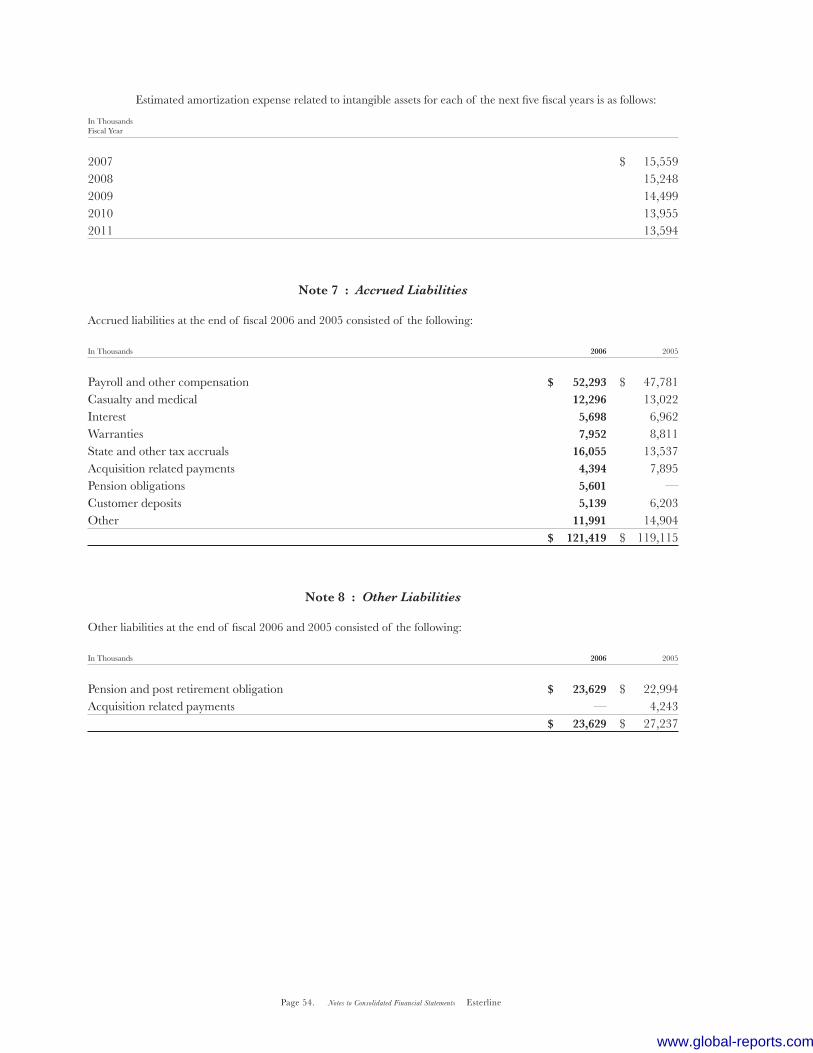
Page 54. Notes to Consolidated Financial Statements Esterline
Estimated amortization expense related to intangible assets for each of the next five fiscal years is as follows:
In ThousandsFiscal Year
2007 $ 15,5592008 15,2482009 14,4992010 13,9552011 13,594
Note 7 : Accrued Liabilities
Accrued liabilities at the end of fiscal 2006 and 2005 consisted of the following:
In Thousands 2006 2005
Payroll and other compensation $ 52,293 $ 47,781Casualty and medical 12,296 13,022Interest 5,698 6,962Warranties 7,952 8,811State and other tax accruals 16,055 13,537Acquisition related payments 4,394 7,895Pension obligations 5,601 —Customer deposits 5,139 6,203Other 11,991 14,904 $ 121,419 $ 119,115
Note 8 : Other Liabilities
Other liabilities at the end of fiscal 2006 and 2005 consisted of the following:
In Thousands 2006 2005
Pension and post retirement obligation $ 23,629 $ 22,994Acquisition related payments — 4,243 $ 23,629 $ 27,237
www.global-reports.com
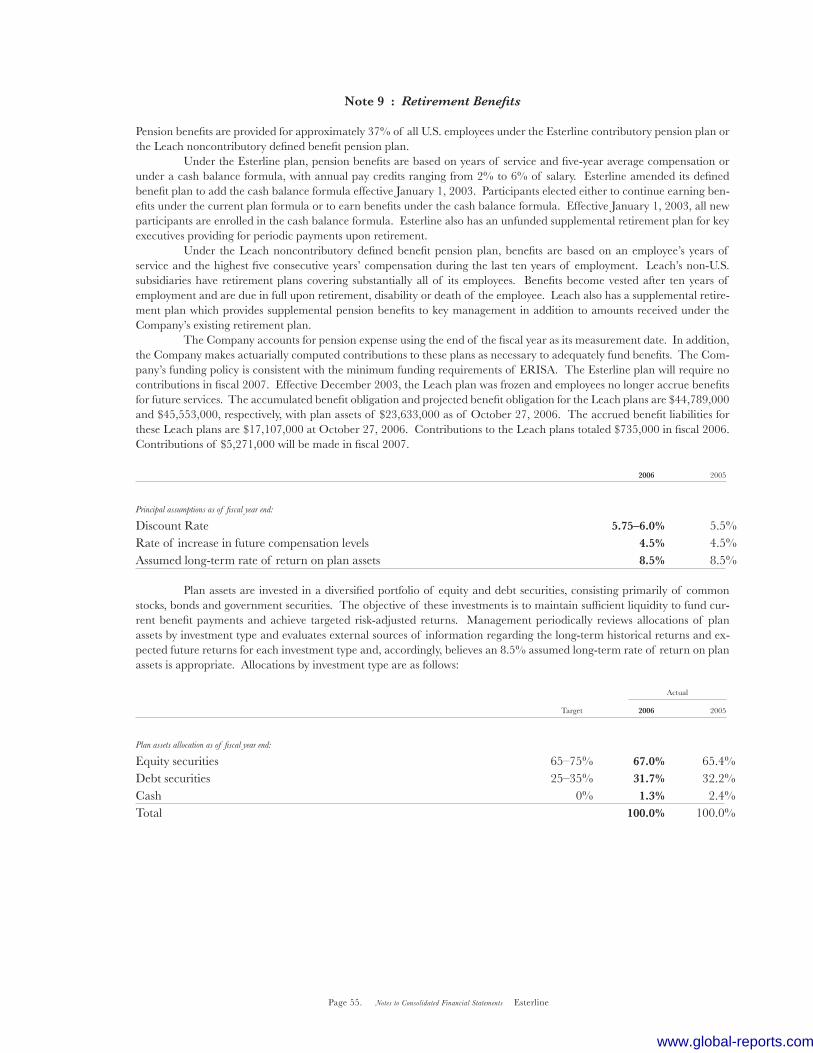
Page 55. Notes to Consolidated Financial Statements Esterline
Note 9 : Retirement Benefits
Pension benefits are provided for approximately 37% of all U.S. employees under the Esterline contributory pension plan or the Leach noncontributory defined benefit pension plan. Under the Esterline plan, pension benefits are based on years of service and five-year average compensation or under a cash balance formula, with annual pay credits ranging from 2% to 6% of salary. Esterline amended its defined benefit plan to add the cash balance formula effective January 1, 2003. Participants elected either to continue earning ben-efits under the current plan formula or to earn benefits under the cash balance formula. Effective January 1, 2003, all new participants are enrolled in the cash balance formula. Esterline also has an unfunded supplemental retirement plan for key executives providing for periodic payments upon retirement. Under the Leach noncontributory defined benefit pension plan, benefits are based on an employee’s years of service and the highest five consecutive years’ compensation during the last ten years of employment. Leach’s non-U.S. subsidiaries have retirement plans covering substantially all of its employees. Benefits become vested after ten years of employment and are due in full upon retirement, disability or death of the employee. Leach also has a supplemental retire-ment plan which provides supplemental pension benefits to key management in addition to amounts received under the Company’s existing retirement plan. The Company accounts for pension expense using the end of the fiscal year as its measurement date. In addition, the Company makes actuarially computed contributions to these plans as necessary to adequately fund benefits. The Com-pany’s funding policy is consistent with the minimum funding requirements of ERISA. The Esterline plan will require no contributions in fiscal 2007. Effective December 2003, the Leach plan was frozen and employees no longer accrue benefits for future services. The accumulated benefit obligation and projected benefit obligation for the Leach plans are $44,789,000 and $45,553,000, respectively, with plan assets of $23,633,000 as of October 27, 2006. The accrued benefit liabilities for these Leach plans are $17,107,000 at October 27, 2006. Contributions to the Leach plans totaled $735,000 in fiscal 2006. Contributions of $5,271,000 will be made in fiscal 2007.
2006 2005
Principal assumptions as of fiscal year end:
Discount Rate 5.75–6.0% 5.5%Rate of increase in future compensation levels 4.5% 4.5%Assumed long-term rate of return on plan assets 8.5% 8.5%
Plan assets are invested in a diversified portfolio of equity and debt securities, consisting primarily of common stocks, bonds and government securities. The objective of these investments is to maintain sufficient liquidity to fund cur-rent benefit payments and achieve targeted risk-adjusted returns. Management periodically reviews allocations of plan assets by investment type and evaluates external sources of information regarding the long-term historical returns and ex-pected future returns for each investment type and, accordingly, believes an 8.5% assumed long-term rate of return on plan assets is appropriate. Allocations by investment type are as follows:
Target 2006 2005
Plan assets allocation as of fiscal year end:
Equity securities 65–75% 67.0% 65.4%Debt securities 25–35% 31.7% 32.2%Cash 0% 1.3% 2.4%Total 100.0% 100.0%
Actual
www.global-reports.com
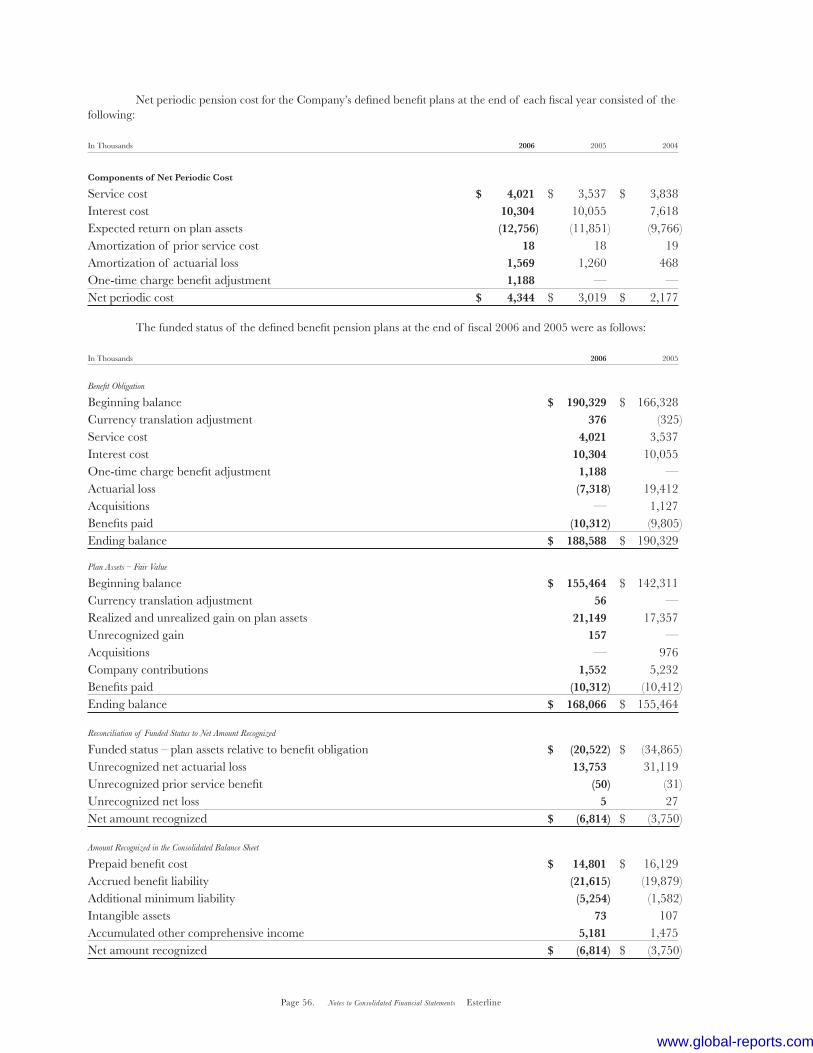
Page 56. Notes to Consolidated Financial Statements Esterline
Net periodic pension cost for the Company’s defined benefit plans at the end of each fiscal year consisted of the following:
In Thousands 2006 2005 2004
Components of Net Periodic Cost
Service cost $ 4,021 $ 3,537 $ 3,838Interest cost 10,304 10,055 7,618Expected return on plan assets (12,756) (11,851) (9,766)Amortization of prior service cost 18 18 19Amortization of actuarial loss 1,569 1,260 468One-time charge benefit adjustment 1,188 — —Net periodic cost $ 4,344 $ 3,019 $ 2,177 The funded status of the defined benefit pension plans at the end of fiscal 2006 and 2005 were as follows:
In Thousands 2006 2005
Benefit Obligation
Beginning balance $ 190,329 $ 166,328Currency translation adjustment 376 (325)Service cost 4,021 3,537Interest cost 10,304 10,055One-time charge benefit adjustment 1,188 —Actuarial loss (7,318) 19,412Acquisitions — 1,127Benefits paid (10,312) (9,805)Ending balance $ 188,588 $ 190,329
Plan Assets – Fair Value
Beginning balance $ 155,464 $ 142,311Currency translation adjustment 56 —Realized and unrealized gain on plan assets 21,149 17,357Unrecognized gain 157 —Acquisitions — 976Company contributions 1,552 5,232Benefits paid (10,312) (10,412)Ending balance $ 168,066 $ 155,464
Reconciliation of Funded Status to Net Amount Recognized
Funded status – plan assets relative to benefit obligation $ (20,522) $ (34,865)Unrecognized net actuarial loss 13,753 31,119Unrecognized prior service benefit (50) (31)Unrecognized net loss 5 27Net amount recognized $ (6,814) $ (3,750)
Amount Recognized in the Consolidated Balance Sheet
Prepaid benefit cost $ 14,801 $ 16,129Accrued benefit liability (21,615) (19,879)Additional minimum liability (5,254) (1,582)Intangible assets 73 107Accumulated other comprehensive income 5,181 1,475Net amount recognized $ (6,814) $ (3,750)
www.global-reports.com
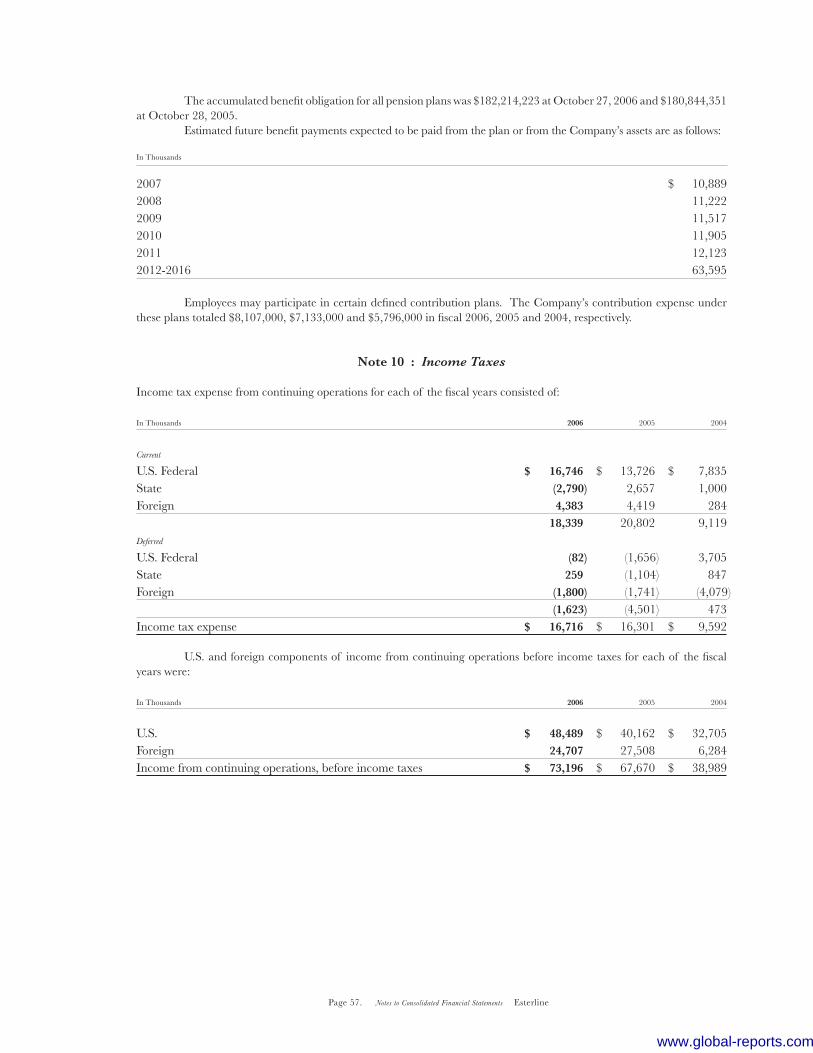
Page 57. Notes to Consolidated Financial Statements Esterline
The accumulated benefit obligation for all pension plans was $182,214,223 at October 27, 2006 and $180,844,351 at October 28, 2005. Estimated future benefit payments expected to be paid from the plan or from the Company’s assets are as follows:
In Thousands
2007 $ 10,8892008 11,2222009 11,5172010 11,9052011 12,1232012-2016 63,595
Employees may participate in certain defined contribution plans. The Company’s contribution expense under these plans totaled $8,107,000, $7,133,000 and $5,796,000 in fiscal 2006, 2005 and 2004, respectively.
Note 10 : Income Taxes
Income tax expense from continuing operations for each of the fiscal years consisted of:
In Thousands 2006 2005 2004
Current
U.S. Federal $ 16,746 $ 13,726 $ 7,835State (2,790) 2,657 1,000Foreign 4,383 4,419 284 18,339 20,802 9,119Deferred
U.S. Federal (82) (1,656) 3,705State 259 (1,104) 847Foreign (1,800) (1,741) (4,079) (1,623) (4,501) 473Income tax expense $ 16,716 $ 16,301 $ 9,592
U.S. and foreign components of income from continuing operations before income taxes for each of the fiscal years were:
In Thousands 2006 2005 2004
U.S. $ 48,489 $ 40,162 $ 32,705Foreign 24,707 27,508 6,284Income from continuing operations, before income taxes $ 73,196 $ 67,670 $ 38,989
www.global-reports.com
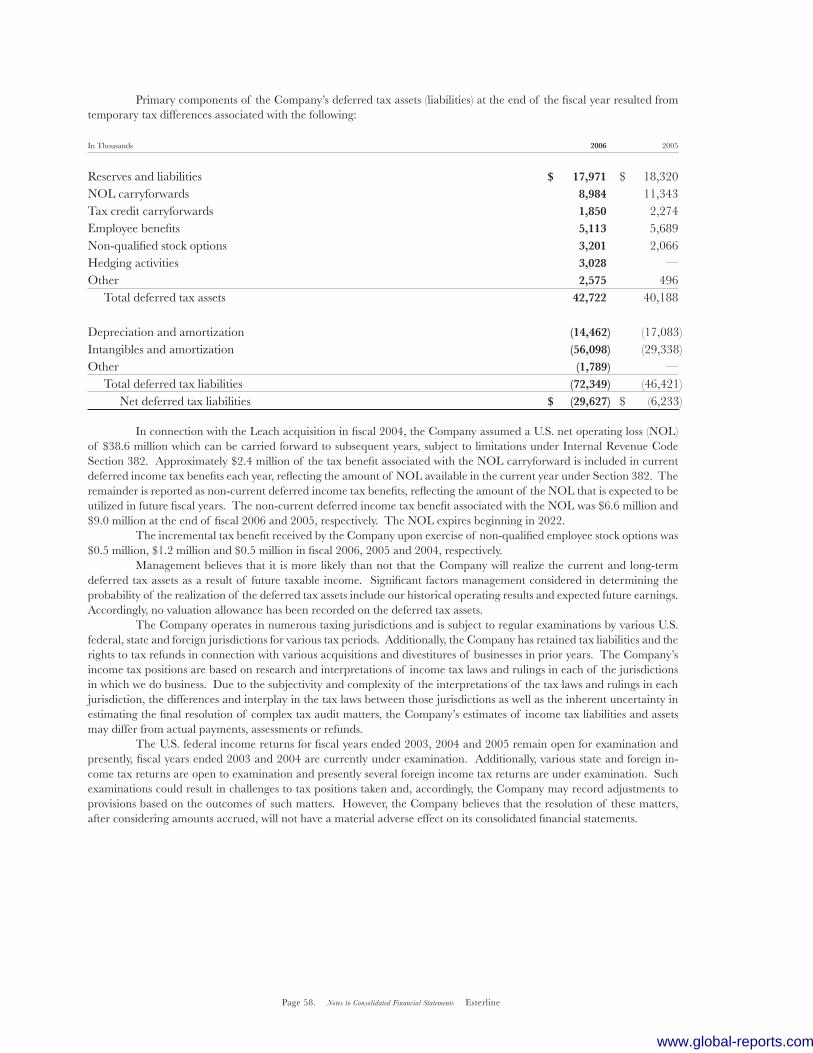
Page 58. Notes to Consolidated Financial Statements Esterline
Primary components of the Company’s deferred tax assets (liabilities) at the end of the fiscal year resulted from temporary tax differences associated with the following:
In Thousands 2006 2005
Reserves and liabilities $ 17,971 $ 18,320NOL carryforwards 8,984 11,343Tax credit carryforwards 1,850 2,274Employee benefits 5,113 5,689Non-qualified stock options 3,201 2,066Hedging activities 3,028 —Other 2,575 496 Total deferred tax assets 42,722 40,188
Depreciation and amortization (14,462) (17,083)Intangibles and amortization (56,098) (29,338)Other (1,789) — Total deferred tax liabilities (72,349) (46,421) Net deferred tax liabilities $ (29,627) $ (6,233)
In connection with the Leach acquisition in fiscal 2004, the Company assumed a U.S. net operating loss (NOL) of $38.6 million which can be carried forward to subsequent years, subject to limitations under Internal Revenue Code Section 382. Approximately $2.4 million of the tax benefit associated with the NOL carryforward is included in current deferred income tax benefits each year, reflecting the amount of NOL available in the current year under Section 382. The remainder is reported as non-current deferred income tax benefits, reflecting the amount of the NOL that is expected to be utilized in future fiscal years. The non-current deferred income tax benefit associated with the NOL was $6.6 million and $9.0 million at the end of fiscal 2006 and 2005, respectively. The NOL expires beginning in 2022. The incremental tax benefit received by the Company upon exercise of non-qualified employee stock options was $0.5 million, $1.2 million and $0.5 million in fiscal 2006, 2005 and 2004, respectively. Management believes that it is more likely than not that the Company will realize the current and long-term deferred tax assets as a result of future taxable income. Significant factors management considered in determining the probability of the realization of the deferred tax assets include our historical operating results and expected future earnings. Accordingly, no valuation allowance has been recorded on the deferred tax assets. The Company operates in numerous taxing jurisdictions and is subject to regular examinations by various U.S. federal, state and foreign jurisdictions for various tax periods. Additionally, the Company has retained tax liabilities and the rights to tax refunds in connection with various acquisitions and divestitures of businesses in prior years. The Company’s income tax positions are based on research and interpretations of income tax laws and rulings in each of the jurisdictions in which we do business. Due to the subjectivity and complexity of the interpretations of the tax laws and rulings in each jurisdiction, the differences and interplay in the tax laws between those jurisdictions as well as the inherent uncertainty in estimating the final resolution of complex tax audit matters, the Company’s estimates of income tax liabilities and assets may differ from actual payments, assessments or refunds. The U.S. federal income returns for fiscal years ended 2003, 2004 and 2005 remain open for examination and presently, fiscal years ended 2003 and 2004 are currently under examination. Additionally, various state and foreign in-come tax returns are open to examination and presently several foreign income tax returns are under examination. Such examinations could result in challenges to tax positions taken and, accordingly, the Company may record adjustments to provisions based on the outcomes of such matters. However, the Company believes that the resolution of these matters, after considering amounts accrued, will not have a material adverse effect on its consolidated financial statements.
www.global-reports.com

A reconciliation of the U.S. federal statutory income tax rate to the effective income tax rate for each of the fiscal years was as follows:
2006 2005 2004
U.S. statutory income tax rate 35.0% 35.0% 35.0%State income taxes 1.3 1.5 1.7Foreign taxes (8.6) (6.6) (5.8)Export sales benefit (0.7) (1.2) (1.7)Pass-through entities 0.4 0.9 6.8Domestic manufacturing deduction (0.7) — —Foreign tax credits — — (5.6)Research & development credits (0.5) (3.8) (4.4)Tax accrual adjustment (4.0) (2.5) (1.8)Other, net 0.6 0.8 0.4Effective income tax rate 22.8% 24.1% 24.6%
No provision for federal income taxes has been made on accumulated earnings of foreign subsidiaries, since such earnings are considered indefinitely reinvested. The amount of the unrecognized deferred tax liability for temporary dif-ferences related to investments in foreign subsidiaries is not practical to determine because of the complexities regarding the calculation of unremitted earnings and the potential for tax credits. In fiscal 2005, the Company completed its evaluation of the repatriation provision of the American Jobs Creation Act (the Act), signed into law on October 22, 2004. The Act created a special one-time deduction related to the repatriation of certain foreign earnings. Based upon its evaluation, the Company has elected to not repatriate earnings from its foreign subsidiaries.
Note 11 : Debt
Long-term debt at the end of fiscal 2006 and 2005 consisted of the following:
In Thousands 2006 2005
GBP Term Loan, due November 2010 $ 108,117 $ —7.75% Senior Subordinated Notes, due June 2013 175,000 175,0006.77% Senior Notes, due November 2008 — 40,0006.40% Senior Notes, due November 2005 — 30,000Other 5,426 2,628 288,543 247,628
Fair value of interest rate swap agreement (698) (1,012)Less current maturities 5,538 70,934Carrying amount of long-term debt $ 282,307 $ 175,682
In June 2003, the Company sold $175.0 million of 7.75% Senior Subordinated Notes due in 2013 and requir-ing semi-annual interest payments in December and June of each year until maturity. The net proceeds from this offering were used to acquire the Weston Group from The Roxboro Group PLC for U.K. £55.0 million (approximately $94.6 million based on the closing exchange rate and including acquisition costs) and for general corporate purposes, including
Page 59. Notes to Consolidated Financial Statements Esterline
www.global-reports.com

Page 60. Notes to Consolidated Financial Statements Esterline
the repayment of debt and possible future acquisitions. The Senior Subordinated Notes are general unsecured obliga-tions of the Company and are subordinated to all existing and future senior debt of the Company. In addition, the Senior Subordinated Notes are effectively subordinated to all existing and future senior debt and other liabilities (including trade payables) of the Company’s foreign subsidiaries. The Senior Subordinated Notes are guaranteed, jointly and severally, by all the existing and future domestic subsidiaries of the Company unless designated as an “unrestricted subsidiary” under the indenture covering the Senior Subordinated Notes. The Senior Subordinated Notes are subject to redemption at the option of the Company, in whole or in part, on or after June 28, 2008 at redemption prices starting at 103.875% of the principal amount plus accrued interest during the period beginning June 28, 2003 and declining annually to 100% of principal and accrued interest on June 15, 2011. In September 2003, the Company entered into an interest rate swap agreement on $75.0 million of its Senior Subordinated Notes due in 2013. The swap agreement exchanged the fixed interest rate for a variable interest rate on $75.0 million of the $175.0 million principal amount outstanding. The variable interest rate is based upon LIBOR plus 2.56% and was 7.98% at October 27, 2006. The fair market value of the Company’s interest rate swap was a $698,000 liability at October 27, 2006 and was estimated by discounting expected cash flows using quoted market interest rates. On November 15, 2005, the Company exercised its option under the terms of the Note Purchase Agreement, dated as of November 1, 1998, to prepay the outstanding principal amount of $40,000,000 of the 6.77% Senior Notes due November 15, 2008. Under the terms of the Note Purchase Agreement, the Company paid an additional $1,984,000 to the holders of the 6.77% Senior Notes as a prepayment penalty and wrote off $172,000 of debt issuance costs associated with the 6.77% Senior Notes. The payment of the prepayment penalty and write-off of debt issuance costs are accounted for as a loss on extinguishment of debt. On February 10, 2006, the Company amended its credit agreement to provide a $100.0 million term loan facility, which may be drawn in U.S. dollars, U.K. pounds or euros. In addition to the $100.0 million term loan facility, the Com-pany has a $100.0 million revolving credit facility that provides up to $25.0 million of the credit facility and up to $50.0 million of the letter of credit may be drawn in U.K. pounds or euros in addition to U.S. dollars. On February 10, 2006, the Company borrowed U.K. £57.0 million, or approximately $100.0 million, under the term loan facility. The Company used the proceeds from the loan as working capital for its U.K. operations and to repay a portion of its outstanding borrowings under the revolving credit facility. The principal amount of the loan is payable quarterly commencing on March 31, 2007 through the termination date of November 14, 2010, according to a payment schedule by which 1.25% of the principal amount is paid in each quarter of 2007, 2.50% in each quarter of 2008, 5.00% in each quarter of 2009 and 16.25% in each quarter of 2010. The loan accrues interest at a variable rate based on the British Bankers Association Interest Settlement Rate for deposits in U.K. pounds plus an additional margin amount that ranges from 1.13% to 0.50% depending upon the Company’s leverage ratio. As of October 27, 2006, the interest rate on the term loan was 5.72%. The Company entered into an interest rate swap agreement on the full principal amount by which the variable interest rate was exchanged for a fixed interest rate of 4.75% plus an additional margin amount determined by reference to the Company’s leverage ratio. At October 27, 2006, the fair value of the interest rate swap was a $1,498,000 asset. The interest rate swap is accounted for as a cash flow hedge and is included in Other Comprehensive Income.
Maturities of long-term debt at October 27, 2006, were as follows:
In ThousandsFiscal Year
2007 $ 5,5382008 11,8062009 20,0382010 58,3232011 17,6912012 and thereafter 175,147 $ 288,543
www.global-reports.com

Page 61. Notes to Consolidated Financial Statements Esterline
Short-term credit facilities at the end of fiscal 2006 and 2005 consisted of the following:
2006 2005
Outstanding Interest Outstanding Interest
In Thousands Borrowings Rate Borrowings Rate
U.S. $ 5,000 6.07% $ — —Foreign 3,075 3.98% 2,031 2.76% $ 8,075 $ 2,031
At October 27, 2006, the Company’s primary U.S. dollar credit facility totals $100,000,000 and is made available through a group of banks. The credit agreement is secured by substantially all of the Company’s assets and interest is based on standard inter-bank offering rates. An additional $19,646,000 of unsecured foreign currency credit facilities have been extended by foreign banks for a total of $119,646,000 available companywide. A number of underlying agreements contain various covenant restrictions which include maintenance of net worth, payment of dividends, interest coverage and limitations on additional borrowings. The Company was in compli-ance with these covenants at October 27, 2006. Available credit under the above credit facilities was $110,987,000 at fiscal 2006 year end, when reduced by outstanding borrowings of $8,075,000 and letters of credit of $584,000.
Note 12 : Commitments and Contingencies
Rental expense for operating leases totaled $11,462,000, $9,651,000 and $9,482,000 fiscal years 2006, 2005 and 2004, respectively. At October 27, 2006, the Company’s rental commitments for noncancelable operating leases with a duration in excess of one year were as follows:
In ThousandsFiscal Year
2007 $ 10,6022008 9,5392009 9,1922010 8,6572011 8,1282012 and thereafter 19,864 $ 65,982
The Company is a party to various lawsuits and claims, both as plaintiff and defendant, and has contingent li-abilities arising from the conduct of business, none of which, in the opinion of management, is expected to have a material effect on the Company’s financial position or results of operations. The Company believes that it has made appropriate and adequate provisions for contingent liabilities. Approximately 989 U.S.-based employees or 21% of total U.S.-based employees were represented by various labor unions. In June 2006, a collective bargaining agreement covering about 200 employees expired and a successor agreement was reached with the labor union. A second agreement covering about 100 employees expired in September 2006 and a successor agreement covering about 150 employees was reached. Management believes that the Company has established a good relationship with these employees and their union. The Company’s European operations are subject to national trade union agreements and to local regulations governing employment.
www.global-reports.com

Page 62. Notes to Consolidated Financial Statements Esterline
Note 13 : Employee Stock Plans
The Company has two share-based compensation plans, which are described below. The compensation cost that has been charged against income for those plans for fiscal 2006 was $5.4 million. The total income tax benefit recognized in the income statement for the share-based compensation arrangement was $1.5 million. In March 2002, the Company’s shareholders approved the establishment of an Employee Stock Purchase Plan (ESPP) under which 300,000 shares of the Company’s common stock are reserved for issuance to employees. On March 1, 2006, the Company’s shareholders authorized an additional 150,000 shares of the Company’s stock under the ESPP. The plan qualifies as a noncompensatory employee stock purchase plan under Section 423 of the Internal Revenue Code. Employees are eligible to participate through payroll deductions subject to certain limitations. At the end of each offering period, usually six months, shares are purchased by the participants at 85% of the lower of the fair market value on the first day of the offering period or the purchase date. During fiscal 2006, employees purchased 70,683 shares at a fair market value price of $36.55 per share, leaving a balance of 202,295 shares available for issuance in the future. As of October 27, 2006, deductions aggregating $937,679 were accrued for the purchase of shares on December 15, 2006. The fair value of the awards under the employee stock purchase plan was estimated using a Black-Scholes pricing model which uses the assumptions noted in the following table. The Company uses historical data to estimate volatility of the Company’s common stock. The risk-free rate for the contractual life of the option is based on the U.S. Treasury zero coupon issues in effect the time of grant.
2006 2005 2004
Volatility 30.0–30.7% 30.7% 30.7–38.8%Risk-free interest rate 3.20–5.15% 1.64–2.44% 0.94–1.01%Expected life (months) 6 6 6Dividends — — —
The Company also provides a nonqualified stock option plan for officers and key employees. On March 1, 2006, the Company’s shareholders authorized the issuance of an additional 1,000,000 shares of the Company’s common stock under the equity incentive plan. At the end of fiscal 2006, the Company had 2,586,950 shares reserved for issuance to of-ficers and key employees, of which 1,117,950 shares were available to be granted in the future. The Board of Directors authorized the Compensation Committee to administer awards granted under the equity incentive plan, including option grants, and to establish the terms of such awards. Awards under the equity incentive plan may be granted to eligible employees of the Company over the 10-year period ending March 3, 2014. Options granted become exercisable ratably over a period of four years following the date of grant and expire on the tenth anniversary of the grant. Option exercise prices are equal to the fair market value of the Company’s common stock on the date of grant. The weighted-average grant date fair value of the options granted in fiscal 2006 and 2005, was $22.04 per share and $19.56 per share, respectively. The fair value of each option granted by the Company was estimated using a Black-Scholes pricing model which uses the assumptions noted in the following table. The Company uses historical data to estimate volatility of the Company’s common stock and option exercise and employee termination assumptions. The range of the expected term reflects the results from certain groups of employees exhibiting different behavior. The risk-free rate for the periods within the contrac-tual life of the grant is based upon the U.S. Treasury zero coupon issues in effect at the time of the grant.
2006 2005 2004
Volatility 44.26–44.95% 45.3% 47.1%Risk-free interest rate 4.53–5.18% 4.48–4.60% 3.12–3.84%Expected life (years) 6.5–9.5 6–9 5–8Dividends — — —
www.global-reports.com

Page 63. Notes to Consolidated Financial Statements Esterline
The following table summarizes the changes in outstanding options granted under the Company’s stock option plans:
2006 2005 2004
Weighted Weighted Weighted Shares Average Shares Average Shares Average
Subject to Exercise Subject to Exercise Subject to Exercise Option Price Option Price Option Price
Outstanding, beginning of year 1,401,100 $ 23.56 1,438,000 $ 18.34 1,497,750 $ 16.25Granted 176,400 38.87 347,400 36.36 229,000 25.09Exercised (90,500) 16.54 (340,050) 14.93 (278,250) 12.53Cancelled (18,000) 25.92 (44,250) 20.65 (10,500) 21.99Outstanding, end of year 1,469,000 $ 25.80 1,401,100 $ 23.56 1,438,000 $ 18.34
Exercisable, end of year 886,300 $ 20.61 738,200 $ 18.32 877,750 $ 16.39
The aggregate intrinsic value of the option shares outstanding and exercisable at October 27, 2006 was $15.4 million and $13.3 million, respectively. The number of option shares vested or that are expected to vest at October 27, 2006 was 1.4 million and the ag-gregate intrinsic value was $17.7 million. The weighted average exercise price and weighted average remaining contractual term of option shares vested or that are expected to vest at October 27, 2006 was $25.67 and 6.24 years, respectively. The weighted-average remaining contractual term of option shares currently exercisable is 4.9 years as of October 27, 2006.
The table below presents stock activity related to stock options exercised in fiscal 2006 and 2005:
In Thousands 2006 2005
Proceeds from stock options exercised $ 1,497 $ 2,539Tax benefits related to stock options exercised $ 797 $ 2,690Intrinsic value of stock options exercised $ 2,266 $ 7,575
Total unrecognized compensation expense for options that have not vested as of October 27, 2006, is $4.6 mil-lion, which will be recognized over a weighted average period of 1.3 years. The total fair value of option shares vested during the year ended October 27, 2006 was $3.3 million.
The following table summarizes information for stock options outstanding at October 27, 2006:
Options Outstanding Options Exercisable
Weighted Average Weighted Weighted
Range of Remaining Average Average Exercise Prices Shares Life (years) Price Shares Price
$ 11.38 – 15.82 266,000 3.95 $ 13.89 266,000 $ 13.89 15.83 – 19.88 284,200 4.93 18.78 239,200 18.81 19.89 – 23.85 264,500 5.27 22.53 206,500 22.16 23.86 – 35.12 307,500 7.45 30.56 130,750 29.01 35.13 – 40.80 346,800 8.86 38.97 43,850 38.90
www.global-reports.com
Page 64. Notes to Consolidated Financial Statements Esterline
Note 14 : Capital Stock
The authorized capital stock of the Company consists of 25,000 shares of preferred stock ($100 par value), 475,000 shares of serial preferred stock ($1.00 par value), each issuable in series, and 60,000,000 shares of common stock ($.20 par value). At the end of fiscal 2006, there were no shares of preferred stock or serial preferred stock outstanding. On November 24, 2004 the Company completed a public offering of 3.7 million shares of common stock, includ-ing shares sold under the underwriters’ over-allotment option, priced at $31.25 per share, generating net proceeds of ap-proximately $109 million, of which $5.0 million was used to pay off existing credit facilities. The funds provided additional financial resources for acquisitions and general corporate purposes. Effective December 5, 2002, the Board of Directors adopted a Shareholder Rights Plan, providing for the distri-bution of one Series B Serial Preferred Stock Purchase Right (Right) for each share of common stock held as of December 23, 2002. Each Right entitles the holder to purchase one one-hundredth of a share of Series B Serial Preferred Stock at an exercise price of $161.00, as may be adjusted from time to time. The Right to purchase shares of Series B Serial Preferred Stock is triggered once a person or entity (together with such person’s or entity’s affiliates) beneficially owns 15% or more of the outstanding shares of common stock of the Company (such person or entity, an Acquiring Person). When the Right is triggered, the holder may purchase one one-hundredth of a share of Series B Serial Preferred Stock at an exercise price of $161.00 per share. If after the Rights are triggered, (i) the Company is the surviving corporation in a merger or similar transaction with an Acquiring Person, (ii) the Acquiring Person beneficially owns more than 15% of the outstanding shares of common stock or (iii) the Acquiring Person engages in other “self-dealing” transactions, holders of the Rights can elect to purchase shares of common stock of the Company with a market value of twice the exercise price. Similarly, if after the Rights are triggered, the Company is not the surviving corporation of a merger or similar transaction or the Company sells 50% or more of its assets to another person or entity, holders of the Rights may elect to purchase shares of common stock of the surviving corporation or that person or entity who purchased the Company’s assets with a market value of twice the exercise price.
Note 15 : Acquisitions and Sale of Product Line
ACQUISITIONS
The Company acquired Wallop Defence Systems Limited (Wallop) and FR Countermeasures from Cobham plc on March 24, 2006 and December 23, 2005, respectively. Wallop and FR Countermeasures, manufacturers of military pyrotechnic countermeasure devices, strengthen the Company’s international and U.S. position in countermeasure devices. The Com-pany paid $65.0 million for both companies, including acquisition costs and an adjustment based on the amount of indebt-edness and net working capital as of closing. The Company assumed a $4.2 million obligation at FR Countermeasures. In addition, the Company may pay an additional purchase price up to U.K. £10.0 million, or approximately $19.0 million, depending on the achievement of certain objectives. At the time of the acquisition of Wallop, the Company and the seller agreed that some environmental remedial activities may need to be carried out, and these activities are currently on-going. Under the terms of the Stock Purchase Agreement, a portion of the costs of any environmental remedial activities will be reimbursed by the seller if the cost is incurred within five years of the consummation of the acquisition. Wallop and FR Countermeasures are included in the Advanced Materials segment. The following summarizes the estimated fair market value of the assets acquired and liabilities assumed at the date of acquisition. The allocation of the purchase price was based upon a preliminary independent valuation report, as management continues to finalize the valuation of certain assets. The amount allocated to goodwill is not expected to be deductible for income tax purposes.
www.global-reports.com

Page 65. Notes to Consolidated Financial Statements Esterline
In ThousandsAs of March 24, 2006 (Wallop) and December 23, 2005 (FR Countermeasures)
Current Assets $ 11,479Property, plant and equipment 20,963Intangible assets subject to amortization Programs (17 year weighted average useful life) 20,921
Goodwill 29,544Deferred income tax benefit 2,151Total assets acquired 85,058
Debt assumed 4,212Current liabilities assumed 9,182Deferred tax liabilities 6,648Net assets acquired $ 65,016
On December 16, 2005, the Company acquired Darchem Holdings Limited (Darchem), a manufacturer of ther-mally engineered components for critical aerospace applications for U.K. £68.7 million (approximately $121.7 million), including acquisition costs and an adjustment based on the amount of cash and net working capital of Darchem as of clos-ing. Darchem holds a leading position in its niche market and fits the Company’s engineered-to-order model. Darchem is included in the Advanced Materials segment. The following summarizes the estimated fair market value of the assets acquired and liabilities assumed at the date of acquisition. The allocation of the purchase price was based upon a preliminary independent valuation report, as management continues to finalize the value of certain acquired assets. The amount allocated to goodwill is not expected to be deductible for income tax purposes.
In ThousandsAs of December 16, 2005
Current Assets $ 21,864Property, plant and equipment 8,499Intangible assets subject to amortization Programs (18 year weighted average useful life) 46,441 Customer relationships (6 year weighted useful life) 2,215 Patents (11 year weighted average useful life) 3,083 Other (1 year useful life) 284 52,023
Trade name 6,219Other 171Goodwill 60,313Total assets acquired 149,089
Current liabilities assumed 8,499Deferred tax liabilities 18,933Net assets acquired $ 121,657
www.global-reports.com

On June 3, 2005, the Company acquired Palomar Products, Inc. (Palomar), a California-based manufacturer of secure military communications products, for $29.1 million, including a $4.2 million escrow deposit. Palomar’s products extend the Company’s avionics and controls product lines. Palomar is included in the Avionics & Controls segment. The following summarizes the estimated fair market value of the assets acquired and liabilities assumed at the date of acquisition. The allocation of the purchase price was based upon a valuation report. The amount allocated to goodwill is not expected to be deductible for income tax purposes.
In ThousandsAs of June 3, 2005
Current Assets $ 8,079Property, plant and equipment 2,151Intangible assets subject to amortization Programs (16 year weighted average useful life) 9,001 Patents (15 year weighted average useful life) 2,082 Other (3 year useful life) 5 11,088
Deferred income tax benefits 1,526Goodwill 17,166Total assets acquired 40,010
Current liabilities assumed 6,571Deferred tax liabilities 4,317Net assets acquired $ 29,122
On August 27, 2004, the Company acquired Leach Holding Corporation (Leach), a manufacturer of electrical power switching, control and data communication devices for the aerospace industry for approximately $147.4 million including acquisition costs. Leach also manufactures medical diagnostic, therapeutic and patient monitoring devices, and analytical, optical and biosensor instruments for medical, laboratory and industrial applications. The aerospace business is included in the Sensors & Systems segment and the medical business is included in the Avionics & Controls segment.
Page 66. Notes to Consolidated Financial Statements Esterline
www.global-reports.com
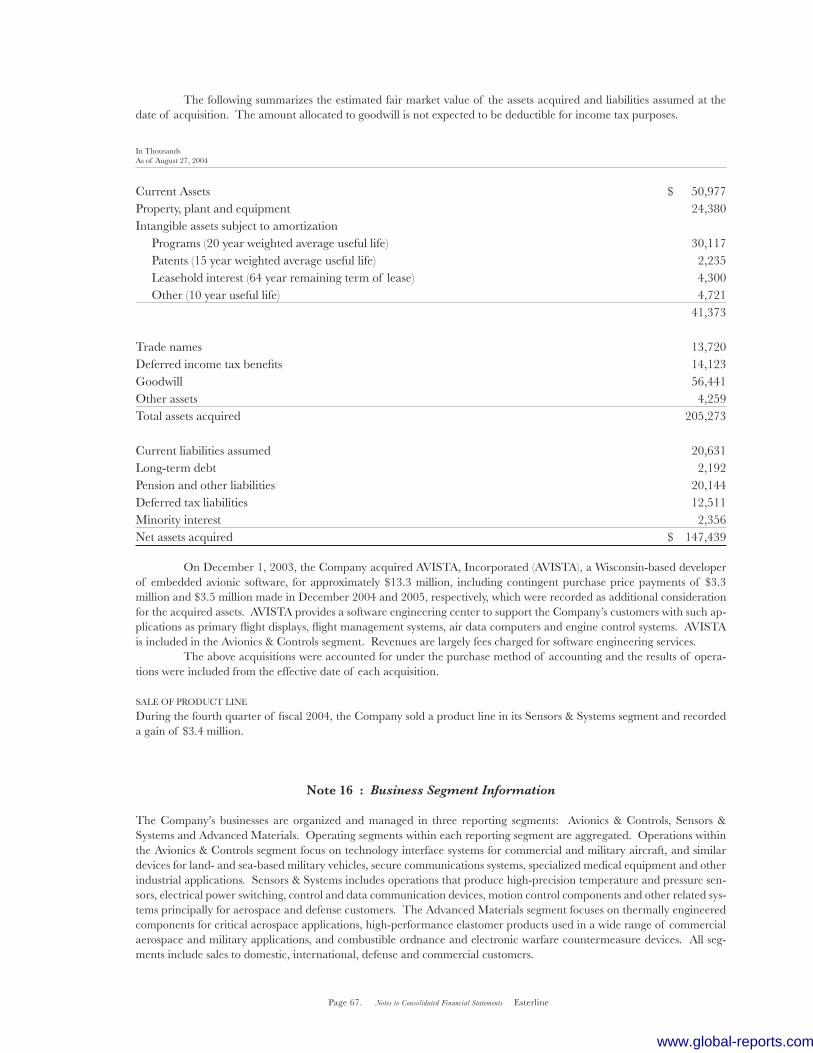
The following summarizes the estimated fair market value of the assets acquired and liabilities assumed at the date of acquisition. The amount allocated to goodwill is not expected to be deductible for income tax purposes.
In ThousandsAs of August 27, 2004
Current Assets $ 50,977Property, plant and equipment 24,380Intangible assets subject to amortization Programs (20 year weighted average useful life) 30,117 Patents (15 year weighted average useful life) 2,235 Leasehold interest (64 year remaining term of lease) 4,300 Other (10 year useful life) 4,721 41,373
Trade names 13,720Deferred income tax benefits 14,123Goodwill 56,441Other assets 4,259Total assets acquired 205,273
Current liabilities assumed 20,631Long-term debt 2,192Pension and other liabilities 20,144Deferred tax liabilities 12,511Minority interest 2,356Net assets acquired $ 147,439
On December 1, 2003, the Company acquired AVISTA, Incorporated (AVISTA), a Wisconsin-based developer of embedded avionic software, for approximately $13.3 million, including contingent purchase price payments of $3.3 million and $3.5 million made in December 2004 and 2005, respectively, which were recorded as additional consideration for the acquired assets. AVISTA provides a software engineering center to support the Company’s customers with such ap-plications as primary flight displays, flight management systems, air data computers and engine control systems. AVISTA is included in the Avionics & Controls segment. Revenues are largely fees charged for software engineering services. The above acquisitions were accounted for under the purchase method of accounting and the results of opera-tions were included from the effective date of each acquisition.
SALE OF PRODUCT LINE
During the fourth quarter of fiscal 2004, the Company sold a product line in its Sensors & Systems segment and recorded a gain of $3.4 million.
Note 16 : Business Segment Information
The Company’s businesses are organized and managed in three reporting segments: Avionics & Controls, Sensors & Systems and Advanced Materials. Operating segments within each reporting segment are aggregated. Operations within the Avionics & Controls segment focus on technology interface systems for commercial and military aircraft, and similar devices for land- and sea-based military vehicles, secure communications systems, specialized medical equipment and other industrial applications. Sensors & Systems includes operations that produce high-precision temperature and pressure sen-sors, electrical power switching, control and data communication devices, motion control components and other related sys-tems principally for aerospace and defense customers. The Advanced Materials segment focuses on thermally engineered components for critical aerospace applications, high-performance elastomer products used in a wide range of commercial aerospace and military applications, and combustible ordnance and electronic warfare countermeasure devices. All seg-ments include sales to domestic, international, defense and commercial customers.
Page 67. Notes to Consolidated Financial Statements Esterline
www.global-reports.com

Geographic sales information is based on product origin. The Company evaluates these segments based on seg-ment profits prior to net interest, other income/expense, corporate expenses and federal/foreign income taxes.
Details of the Company’s operations by business segment for the last three years were as follows:
In Thousands 2006 2005 2004
Sales
Avionics & Controls $ 283,011 $ 261,550 $ 209,498Sensors & Systems 333,257 319,539 180,768Advanced Materials 356,007 254,314 223,344 $ 972,275 $ 835,403 $ 613,610
Income From Continuing Operations
Avionics & Controls $ 45,050 $ 37,325 $ 32,077Sensors & Systems 29,305 34,482 7,809Advanced Materials 46,493 33,992 28,004 Segment Earnings 120,848 105,799 67,890
Corporate expense (27,338) (23,513) (17,472)Other income (expense) 490 (514) 509Loss on extinguishment of debt (2,156) — —Gain on sale of product line — — 3,434Interest income 2,642 4,057 1,964Interest expense (21,290) (18,159) (17,336) $ 73,196 $ 67,670 $ 38,989
Identifiable Assets
Avionics & Controls $ 266,090 $ 245,016 $ 198,142Sensors & Systems 431,091 398,801 374,123Advanced Materials 518,841 266,327 267,811Other — — 2Corporate (1) 74,429 205,104 95,270 $ 1,290,451 $ 1,115,248 $ 935,348
Capital Expenditures
Avionics & Controls $ 4,890 $ 3,538 $ 6,483Sensors & Systems 10,093 11,155 3,335Advanced Materials 11,424 8,283 11,492Discontinued Operations — 46 326Corporate 133 754 490 $ 26,540 $ 23,776 $ 22,126
Depreciation and Amortization
Avionics & Controls $ 6,904 $ 6,972 $ 5,525Sensors & Systems 15,097 14,311 10,337Advanced Materials 19,164 12,469 12,394Discontinued Operations — 141 1,452Corporate 1,668 1,415 1,437 $ 42,833 $ 35,308 $ 31,145
(1) Primarily cash, prepaid pension expense (see Note 9) and deferred tax assets (see Note 10).
Page 68. Notes to Consolidated Financial Statements Esterline
www.global-reports.com
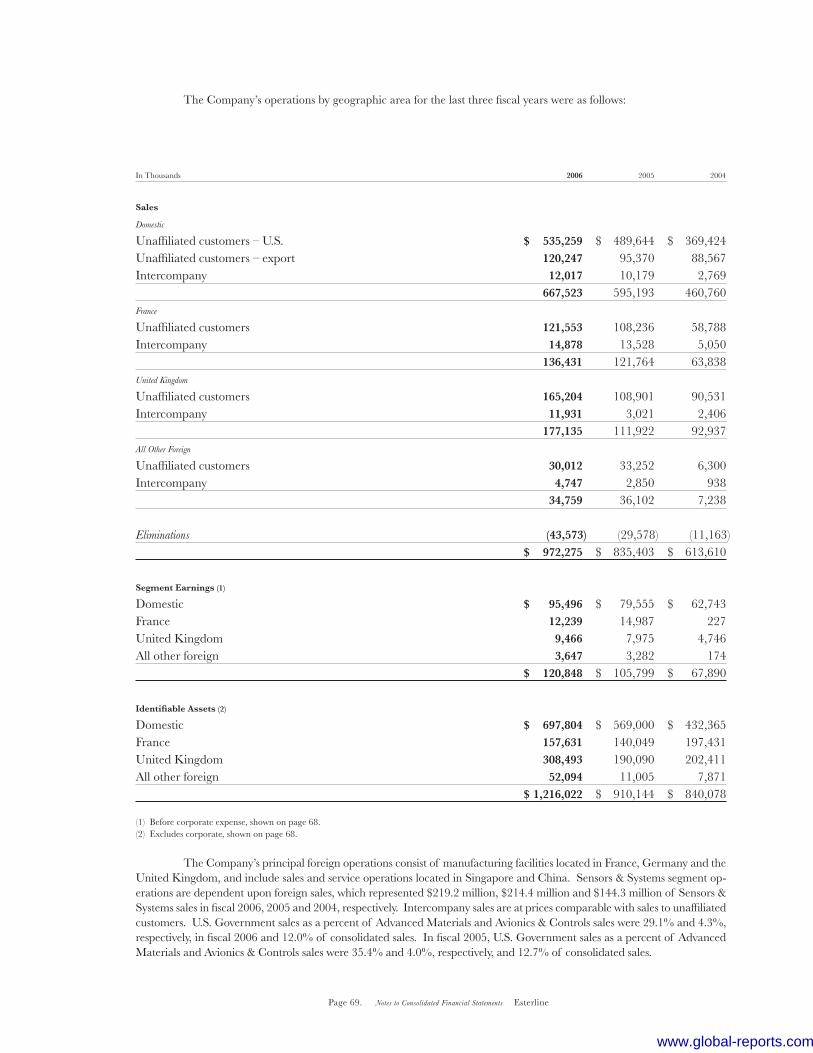
The Company’s operations by geographic area for the last three fiscal years were as follows:
In Thousands 2006 2005 2004
Sales
Domestic
Unaffiliated customers – U.S. $ 535,259 $ 489,644 $ 369,424Unaffiliated customers – export 120,247 95,370 88,567Intercompany 12,017 10,179 2,769 667,523 595,193 460,760France
Unaffiliated customers 121,553 108,236 58,788Intercompany 14,878 13,528 5,050 136,431 121,764 63,838United Kingdom
Unaffiliated customers 165,204 108,901 90,531Intercompany 11,931 3,021 2,406 177,135 111,922 92,937 All Other Foreign
Unaffiliated customers 30,012 33,252 6,300Intercompany 4,747 2,850 938 34,759 36,102 7,238
Eliminations (43,573) (29,578) (11,163) $ 972,275 $ 835,403 $ 613,610
Segment Earnings (1)
Domestic $ 95,496 $ 79,555 $ 62,743France 12,239 14,987 227United Kingdom 9,466 7,975 4,746All other foreign 3,647 3,282 174 $ 120,848 $ 105,799 $ 67,890
Identifiable Assets (2)
Domestic $ 697,804 $ 569,000 $ 432,365France 157,631 140,049 197,431United Kingdom 308,493 190,090 202,411All other foreign 52,094 11,005 7,871 $ 1,216,022 $ 910,144 $ 840,078
(1) Before corporate expense, shown on page 68.(2) Excludes corporate, shown on page 68.
The Company’s principal foreign operations consist of manufacturing facilities located in France, Germany and the United Kingdom, and include sales and service operations located in Singapore and China. Sensors & Systems segment op-erations are dependent upon foreign sales, which represented $219.2 million, $214.4 million and $144.3 million of Sensors & Systems sales in fiscal 2006, 2005 and 2004, respectively. Intercompany sales are at prices comparable with sales to unaffiliated customers. U.S. Government sales as a percent of Advanced Materials and Avionics & Controls sales were 29.1% and 4.3%, respectively, in fiscal 2006 and 12.0% of consolidated sales. In fiscal 2005, U.S. Government sales as a percent of Advanced Materials and Avionics & Controls sales were 35.4% and 4.0%, respectively, and 12.7% of consolidated sales.
Page 69. Notes to Consolidated Financial Statements Esterline
www.global-reports.com
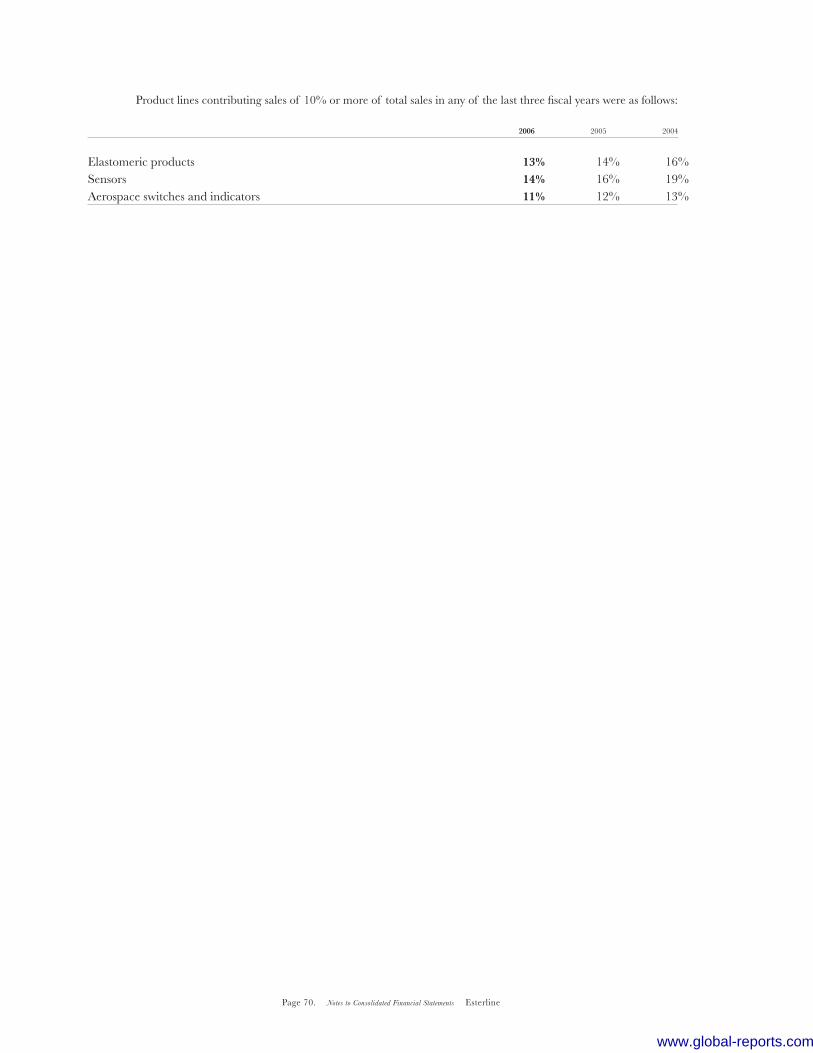
Product lines contributing sales of 10% or more of total sales in any of the last three fiscal years were as follows: 2006 2005 2004
Elastomeric products 13% 14% 16%Sensors 14% 16% 19%Aerospace switches and indicators 11% 12% 13%
Page 70. Notes to Consolidated Financial Statements Esterline
www.global-reports.com

Note 17 : Quarterly Financial Data (Unaudited)
The following is a summary of unaudited quarterly financial information:
In Thousands, Except Per Share Amounts Fourth Third Second First
Fiscal Year 2006
Net sales $ 270,273 $ 248,398 $ 247,939 $ 205,665Gross margin 81,901 75,357 80,739 62,859
Income from continuing operations (1) 18,369 11,223(2) 17,659(3) 8,364(4),(5)
Net earnings $ 18,369 $ 11,223(2) $ 17,659(3) $ 8,364(4),(5)
Earnings per share – basic Continuing operations $ .72 $ .44 $ .70 $ .33Earnings per share – basic $ .72 $ .44 $ .70 $ .33
Earnings per share – diluted Continuing operations (6) $ .71 $ .43 $ .68 $ .32Earnings per share – diluted (6) $ .71 $ .43 $ .68 $ .32
Fiscal Year 2005 Net sales $ 224,146 $ 209,873 $ 211,592 $ 189,792Gross margin 69,619 65,693 68,538 58,100
Income from continuing operations 15,366 11,859(7) 13,726 10,083Income from discontinued operations 24 3 (562) 7,527Net earnings $ 15,390 $ 11,862(7) $ 13,164 $ 17,610
Earnings per share – basic Continuing operations $ .61 $ .47 $ .55 $ .42 Discontinued operations — — (.03) .31Earnings per share – basic $ .61 $ .47 $ .52 $ .73
Earnings per share – diluted Continuing operations (6) $ .60 $ .46 $ .54 $ .41 Discontinued operations (6) — — (.02) .31Earnings per share – diluted (6) $ .60 $ .46 $ .52 $ .72
(1) The effects of the business interruption insurance recovery are included in income from continuing operations and presented below:
Fourth Third Second First
Fiscal Year 2006 $ 4,104 $ 786 $ — $ —
(2) Included a $1.6 million reduction of previously estimated tax liabilities due to the expiration of the statute of limitations and adjustments resulting from a reconciliation of the prior year’s U.S. income tax return to the provision for income taxes.
(3) Included a $2.0 million reduction of previously estimated tax liabilities as a result of receiving a Notice of Proposed Adjustment (NOPA) from the State of California Franchise Tax Board covering, among other items, the examination of research and development tax credits for fiscal years 1997 through 2002.
(4) Included a $0.9 million reduction of previously estimated tax liabilities as a result of a favorable tax audit which concluded on December 23, 2005.
(5) Included a $2.2 million loss on early extinguishment of debt.
(6) The sum of the quarterly per share amounts may not equal per share amounts reported for year-to-date periods. This is due to changes in the number of weighted average shares outstanding and the effects of rounding for each period.
(7) Included a $2.0 million reduction of previously estimated tax liabilities due to the expiration of the statute of limitations and adjustments resulting from a reconciliation of U.S. and non-U.S. tax returns to the provision for income taxes.
Page 71. Notes to Consolidated Financial Statements Esterline
www.global-reports.com

Page 72. Notes to Consolidated Financial Statements Esterline
Note 18 : Guarantors
The following schedules set forth condensed consolidating financial information as required by Rule 3-10 of Securities and Exchange Commission Regulation S-X for fiscal 2006, 2005 and 2004 for (a) Esterline Technologies Corporation (the Par-ent); (b) on a combined basis, the subsidiary guarantors (Guarantor Subsidiaries) of the Senior Subordinated Notes which include Advanced Input Devices, Inc., Amtech Automated Manufacturing Technology, Angus Electronics Co., Armtec Countermeasures Co., Armtec Countermeasures TNO Co., Armtec Defense Products Co., AVISTA, Incorporated, BVR Technologies Co., EA Technologies Corporation, Equipment Sales Co., Esterline Sensors Services Americas, Inc., Esterline Technologies Holdings Limited, H.A. Sales Co., Hauser Inc., Hytek Finishes Co., Janco Corporation, Kirkhill-TA Co., Korry Electronics Co., Leach Holding Corporation, Leach International Corporation, Leach Technology Group, Inc., Mason Electric Co., MC Tech Co., Memtron Technologies Co., Norwich Aero Products, Inc., Palomar Products, Inc., Pressure Systems, Inc., Pressure Systems International, Inc., Surftech Finishes Co., UMM Electronics Inc., and (c) on a combined basis, the subsidiary non-guarantors (Non-Guarantor Subsidiaries), which include Advanced Input Devices Ltd. (U.K.), Auxitrol S.A., Auxitrol Technologies S.A., Darchem Engineering Limited, Darchem Holdings Ltd., Esterline Acqui-sition Ltd. (U.K.), Esterline Input Devices Asia Ltd. (Barbados), Esterline Input Devices Ltd. (Shanghai), Esterline Sensors Services Asia PTD, Ltd., Esterline Technologies Denmark Aps (Denmark), Esterline Technologies Ltd. (England), Esterline Technologies Ltd. (Hong Kong), Guizhou Leach-Tianyi Aviation Electrical Company Ltd. (China), Leach International Asia-Pacific Ltd. (Hong Kong), Leach International Europe S.A. (France), Leach International Germany GmbH (Germa-ny), Leach International Mexico S. de R.L. de C.V. (Mexico), Leach International U.K. (England), Leach Italia Srl. (Italy), LRE Medical GmbH (Germany), ML Wallop Defence Systems Ltd. (U.K.), Muirhead Aerospace Ltd., Norcroft Dynam-ics Ltd., Pressure Systems International Ltd., Wallop Defence Systems Limited, Weston Aero Ltd. (England), and Weston Aerospace Ltd. (England). The guarantor subsidiaries are direct and indirect wholly-owned subsidiaries of Esterline Tech-nologies and have fully and unconditionally, jointly and severally, guaranteed the Senior Subordinated Notes.
www.global-reports.com
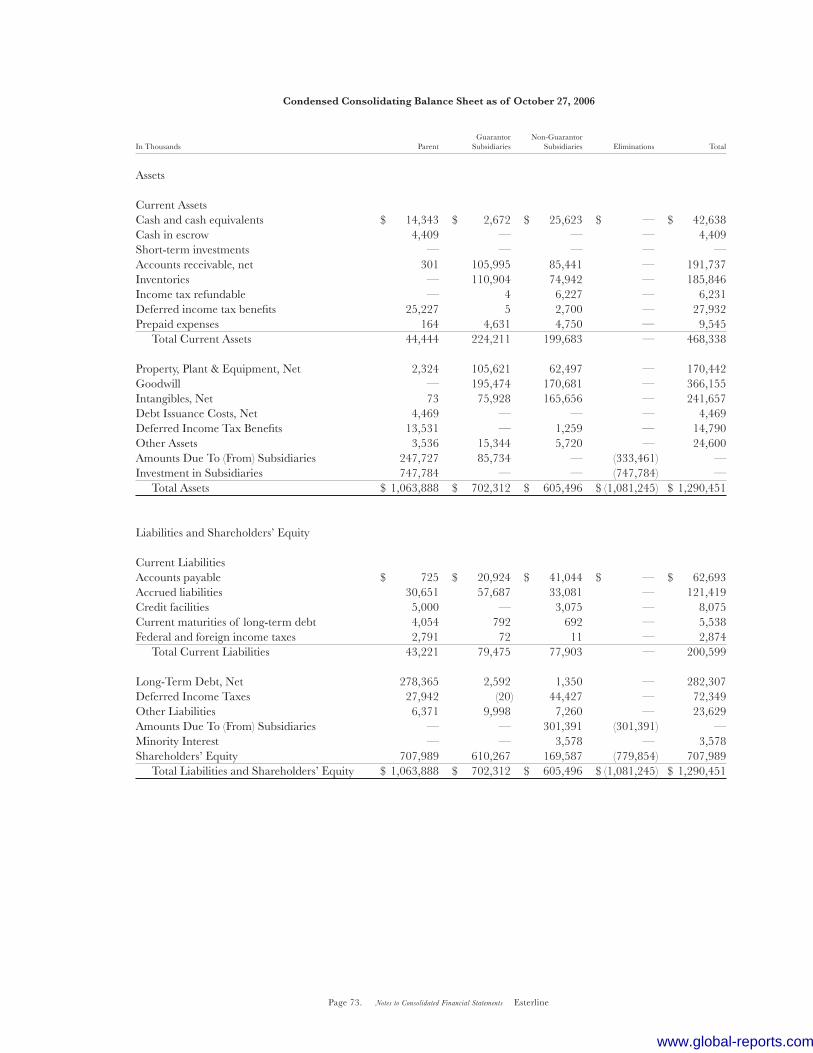
Page 73. Notes to Consolidated Financial Statements Esterline
Condensed Consolidating Balance Sheet as of October 27, 2006
Guarantor Non-Guarantor
In Thousands Parent Subsidiaries Subsidiaries Eliminations Total
Assets
Current AssetsCash and cash equivalents $ 14,343 $ 2,672 $ 25,623 $ — $ 42,638Cash in escrow 4,409 — — — 4,409Short-term investments — — — — —Accounts receivable, net 301 105,995 85,441 — 191,737Inventories — 110,904 74,942 — 185,846Income tax refundable — 4 6,227 — 6,231Deferred income tax benefits 25,227 5 2,700 — 27,932Prepaid expenses 164 4,631 4,750 — 9,545 Total Current Assets 44,444 224,211 199,683 — 468,338
Property, Plant & Equipment, Net 2,324 105,621 62,497 — 170,442Goodwill — 195,474 170,681 — 366,155Intangibles, Net 73 75,928 165,656 — 241,657Debt Issuance Costs, Net 4,469 — — — 4,469Deferred Income Tax Benefits 13,531 — 1,259 — 14,790Other Assets 3,536 15,344 5,720 — 24,600Amounts Due To (From) Subsidiaries 247,727 85,734 — (333,461) —Investment in Subsidiaries 747,784 — — (747,784) — Total Assets $ 1,063,888 $ 702,312 $ 605,496 $ (1,081,245) $ 1,290,451
Liabilities and Shareholders’ Equity
Current LiabilitiesAccounts payable $ 725 $ 20,924 $ 41,044 $ — $ 62,693Accrued liabilities 30,651 57,687 33,081 — 121,419Credit facilities 5,000 — 3,075 — 8,075Current maturities of long-term debt 4,054 792 692 — 5,538Federal and foreign income taxes 2,791 72 11 — 2,874 Total Current Liabilities 43,221 79,475 77,903 — 200,599
Long-Term Debt, Net 278,365 2,592 1,350 — 282,307Deferred Income Taxes 27,942 (20) 44,427 — 72,349Other Liabilities 6,371 9,998 7,260 — 23,629Amounts Due To (From) Subsidiaries — — 301,391 (301,391) —Minority Interest — — 3,578 — 3,578Shareholders’ Equity 707,989 610,267 169,587 (779,854) 707,989 Total Liabilities and Shareholders’ Equity $ 1,063,888 $ 702,312 $ 605,496 $ (1,081,245) $ 1,290,451
www.global-reports.com

Condensed Consolidating Statement of Operations for the fiscal year ended October 27, 2006
Guarantor Non-Guarantor
In Thousands Parent Subsidiaries Subsidiaries Eliminations Total
Net Sales $ — $ 640,688 $ 346,884 $ (15,297) $ 972,275Cost of Sales — 442,497 244,219 (15,297) 671,419 — 198,191 102,665 — 300,856Expenses Selling, general and administrative — 96,183 63,441 — 159,624 Research, development and engineering — 22,298 30,314 — 52,612 Total Expenses — 118,481 93,755 — 212,236Other Other income — — (490) — (490) Insurance recovery — — (4,890) — (4,890) Total Other — — (5,380) — (5,380)Operating Earnings from Continuing Operations — 79,710 14,290 — 94,000
Interest income (20,857) (2,522) (3,959) 24,696 (2,642) Interest expense 20,551 4,029 21,406 (24,696) 21,290 Loss on extinguishment of debt 2,156 — — — 2,156Other Expense, Net 1,850 1,507 17,447 — 20,804
Income (Loss) from Continuing Operations Before Taxes (1,850) 78,203 (3,157) — 73,196Income Tax Expense (Benefit) (517) 18,387 (1,154) — 16,716Income (Loss) From Continuing Operations Before Minority Interest (1,333) 59,816 (2,003) — 56,480Minority Interest — — (865) — (865)Income (Loss) From Continuing Operations (1,333) 59,816 (2,868) — 55,615
Equity in Net Income of Consolidated Subsidiaries 56,948 — — (56,948) —Net Income (Loss) $ 55,615 $ 59,816 $ (2,868) $ (56,948) $ 55,615
Page 74. Notes to Consolidated Financial Statements Esterline
www.global-reports.com
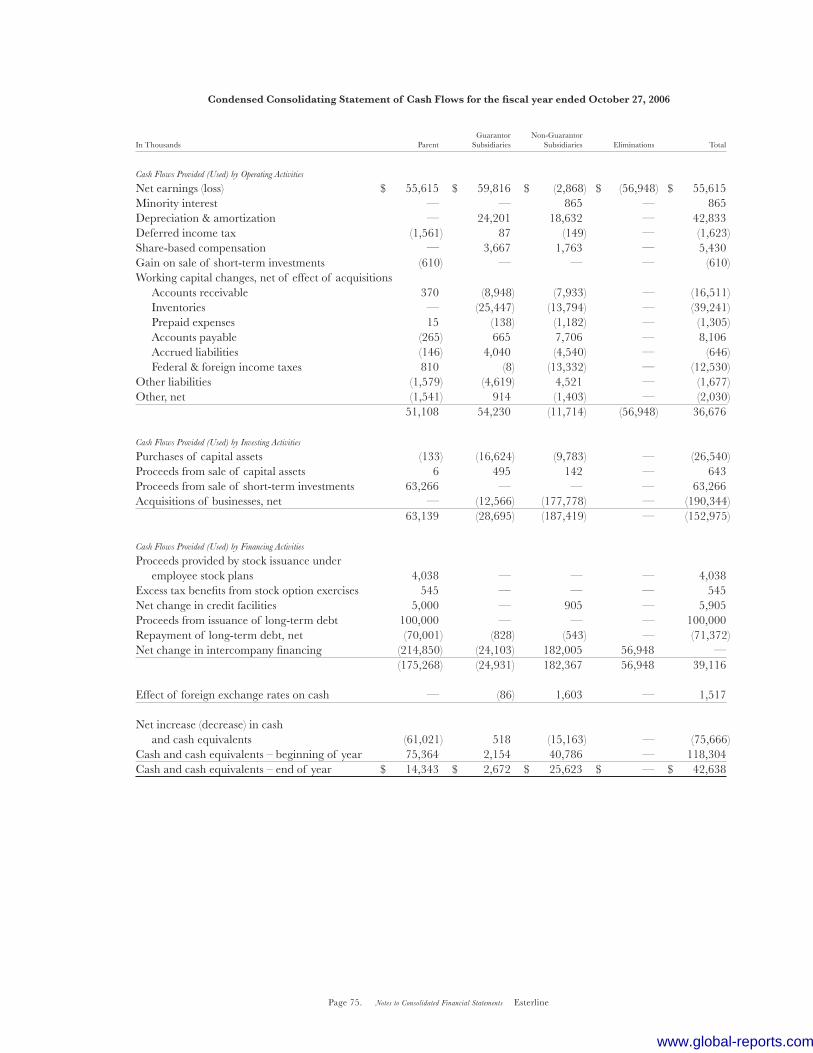
Condensed Consolidating Statement of Cash Flows for the fiscal year ended October 27, 2006
Guarantor Non-Guarantor
In Thousands Parent Subsidiaries Subsidiaries Eliminations Total
Cash Flows Provided (Used) by Operating Activities
Net earnings (loss) $ 55,615 $ 59,816 $ (2,868) $ (56,948) $ 55,615Minority interest — — 865 — 865Depreciation & amortization — 24,201 18,632 — 42,833Deferred income tax (1,561) 87 (149) — (1,623)Share-based compensation — 3,667 1,763 — 5,430Gain on sale of short-term investments (610) — — — (610)Working capital changes, net of effect of acquisitions Accounts receivable 370 (8,948) (7,933) — (16,511) Inventories — (25,447) (13,794) — (39,241) Prepaid expenses 15 (138) (1,182) — (1,305) Accounts payable (265) 665 7,706 — 8,106 Accrued liabilities (146) 4,040 (4,540) — (646) Federal & foreign income taxes 810 (8) (13,332) — (12,530)Other liabilities (1,579) (4,619) 4,521 — (1,677)Other, net (1,541) 914 (1,403) — (2,030) 51,108 54,230 (11,714) (56,948) 36,676
Cash Flows Provided (Used) by Investing Activities
Purchases of capital assets (133) (16,624) (9,783) — (26,540)Proceeds from sale of capital assets 6 495 142 — 643Proceeds from sale of short-term investments 63,266 — — — 63,266Acquisitions of businesses, net — (12,566) (177,778) — (190,344) 63,139 (28,695) (187,419) — (152,975)
Cash Flows Provided (Used) by Financing Activities
Proceeds provided by stock issuance under employee stock plans 4,038 — — — 4,038Excess tax benefits from stock option exercises 545 — — — 545Net change in credit facilities 5,000 — 905 — 5,905Proceeds from issuance of long-term debt 100,000 — — — 100,000Repayment of long-term debt, net (70,001) (828) (543) — (71,372)Net change in intercompany financing (214,850) (24,103) 182,005 56,948 — (175,268) (24,931) 182,367 56,948 39,116
Effect of foreign exchange rates on cash — (86) 1,603 — 1,517
Net increase (decrease) in cash and cash equivalents (61,021) 518 (15,163) — (75,666)Cash and cash equivalents – beginning of year 75,364 2,154 40,786 — 118,304Cash and cash equivalents – end of year $ 14,343 $ 2,672 $ 25,623 $ — $ 42,638
Page 75. Notes to Consolidated Financial Statements Esterline
www.global-reports.com

Condensed Consolidating Balance Sheet as of October 28, 2005
Guarantor Non-Guarantor
In Thousands Parent Subsidiaries Subsidiaries Eliminations Total
Assets
Current AssetsCash and cash equivalents $ 75,364 $ 2,154 $ 40,786 $ — $ 118,304Cash in escrow 11,918 — — — 11,918Short-term investments 62,656 — — — 62,656Accounts receivable, net 671 96,931 52,149 — 149,751Inventories — 84,351 46,118 — 130,469Deferred income tax benefits 25,115 102 1,651 — 26,868Prepaid expenses 179 4,481 2,873 — 7,533 Total Current Assets 175,903 188,019 143,577 — 507,499
Property, Plant & Equipment, Net 2,687 95,001 40,526 — 138,214Goodwill — 191,919 69,248 — 261,167Intangibles, Net 107 82,196 83,815 — 166,118Debt Issuance Costs, Net 5,144 — — — 5,144Deferred Income Tax Benefits 11,257 — 2,063 — 13,320Other Assets 2,638 16,266 4,882 — 23,786Amounts Due To (From) Subsidiaries 134,964 64,835 — (199,799) —Investment in Subsidiaries 615,599 129 (128) (615,600) — Total Assets $ 948,299 $ 638,365 $ 343,983 $ (815,399) $ 1,115,248
Liabilities and Shareholders’ Equity
Current LiabilitiesAccounts payable $ 990 $ 19,877 $ 20,586 $ — $ 41,453Accrued liabilities 38,620 53,246 27,249 — 119,115Credit facilities — — 2,031 — 2,031Current maturities of long-term debt 70,000 — 934 — 70,934Federal and foreign income taxes 3,634 76 5,088 — 8,798 Total Current Liabilities 113,244 73,199 55,888 — 242,331
Long-Term Debt, Net 173,988 — 1,694 — 175,682Deferred Income Taxes 30,880 (10) 15,551 — 46,421Other Liabilities 9,323 11,209 6,705 — 27,237Amounts Due To (From) Subsidiaries — — 195,829 (195,829) —Minority Interest — — 2,713 — 2,713Shareholders’ Equity 620,864 553,967 65,603 (619,570) 620,864 Total Liabilities and Shareholders’ Equity $ 948,299 $ 638,365 $ 343,983 $ (815,399) $ 1,115,248
Page 76. Notes to Consolidated Financial Statements Esterline
www.global-reports.com

Condensed Consolidating Statement of Operations for the fiscal year ended October 28, 2005
Guarantor Non-Guarantor
In Thousands Parent Subsidiaries Subsidiaries Eliminations Total
Net Sales $ — $ 574,864 $ 278,767 $ (18,228) $ 835,403Cost of Sales — 403,823 187,858 (18,228) 573,453 — 171,041 90,909 — 261,950Expenses Selling, general and administrative — 90,892 46,534 — 137,426 Research, development and engineering — 17,399 24,839 — 42,238 Total Expenses — 108,291 71,373 — 179,664Other Other expense 50 86 378 — 514 Total Other 50 86 378 — 514Operating Earnings from Continuing Operations (50) 62,664 19,158 — 81,772
Interest income (15,940) (3,015) (2,679) 17,577 (4,057) Interest expense 18,261 4,642 12,833 (17,577) 18,159Other Expense, Net 2,321 1,627 10,154 — 14,102
Income (Loss) from Continuing Operations Before Taxes (2,371) 61,037 9,004 — 67,670Income Tax Expense (Benefit) (728) 14,409 2,620 — 16,301Income (Loss) From Continuing Operations Before Minority Interest (1,643) 46,628 6,384 — 51,369Minority Interest — — (335) — (335)Income (Loss) From Continuing Operations (1,643) 46,628 6,049 — 51,034
Income From Discontinued Operations, Net of Tax — 6,992 — — 6,992Equity in Net Income of Consolidated Subsidiaries 59,669 — — (59,669) —Net Income (Loss) $ 58,026 $ 53,620 $ 6,049 $ (59,669) $ 58,026
Page 77. Notes to Consolidated Financial Statements Esterline
www.global-reports.com
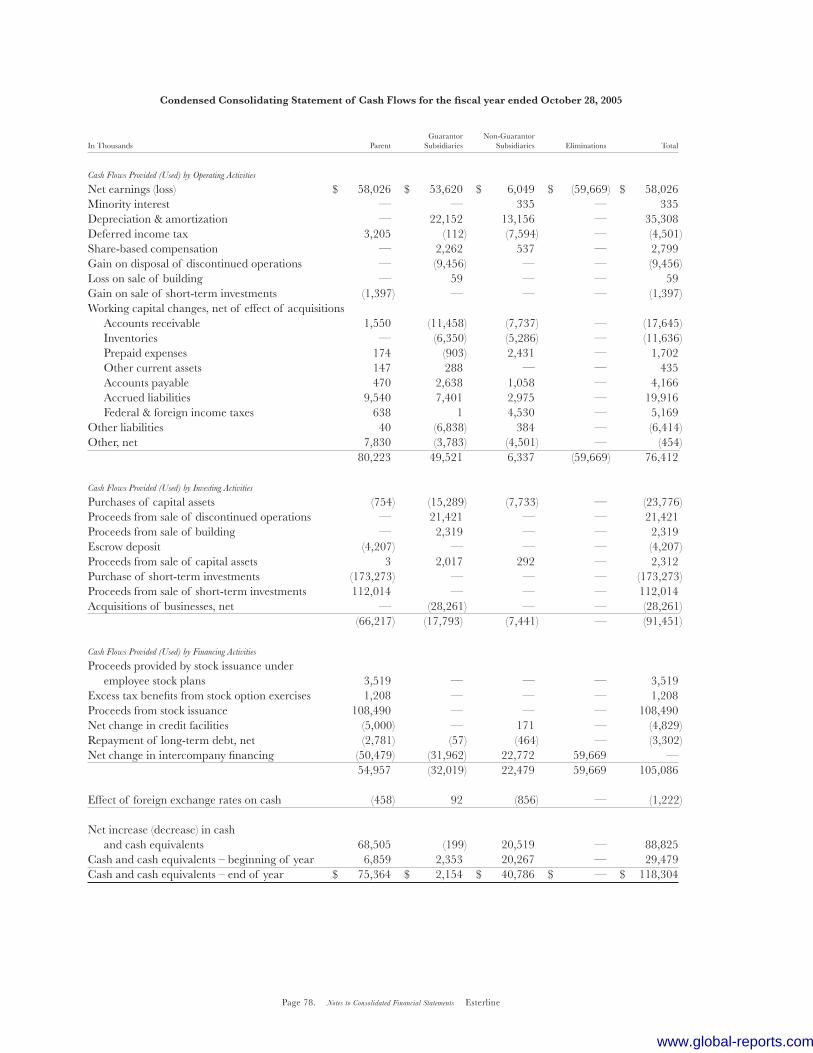
Condensed Consolidating Statement of Cash Flows for the fiscal year ended October 28, 2005
Guarantor Non-Guarantor
In Thousands Parent Subsidiaries Subsidiaries Eliminations Total
Cash Flows Provided (Used) by Operating Activities
Net earnings (loss) $ 58,026 $ 53,620 $ 6,049 $ (59,669) $ 58,026Minority interest — — 335 — 335Depreciation & amortization — 22,152 13,156 — 35,308Deferred income tax 3,205 (112) (7,594) — (4,501)Share-based compensation — 2,262 537 — 2,799Gain on disposal of discontinued operations — (9,456) — — (9,456)Loss on sale of building — 59 — — 59Gain on sale of short-term investments (1,397) — — — (1,397)Working capital changes, net of effect of acquisitions Accounts receivable 1,550 (11,458) (7,737) — (17,645) Inventories — (6,350) (5,286) — (11,636) Prepaid expenses 174 (903) 2,431 — 1,702 Other current assets 147 288 — — 435 Accounts payable 470 2,638 1,058 — 4,166 Accrued liabilities 9,540 7,401 2,975 — 19,916 Federal & foreign income taxes 638 1 4,530 — 5,169Other liabilities 40 (6,838) 384 — (6,414)Other, net 7,830 (3,783) (4,501) — (454) 80,223 49,521 6,337 (59,669) 76,412
Cash Flows Provided (Used) by Investing Activities
Purchases of capital assets (754) (15,289) (7,733) — (23,776)Proceeds from sale of discontinued operations — 21,421 — — 21,421Proceeds from sale of building — 2,319 — — 2,319Escrow deposit (4,207) — — — (4,207)Proceeds from sale of capital assets 3 2,017 292 — 2,312Purchase of short-term investments (173,273) — — — (173,273)Proceeds from sale of short-term investments 112,014 — — — 112,014Acquisitions of businesses, net — (28,261) — — (28,261) (66,217) (17,793) (7,441) — (91,451)
Cash Flows Provided (Used) by Financing Activities
Proceeds provided by stock issuance under employee stock plans 3,519 — — — 3,519Excess tax benefits from stock option exercises 1,208 — — — 1,208Proceeds from stock issuance 108,490 — — — 108,490Net change in credit facilities (5,000) — 171 — (4,829)Repayment of long-term debt, net (2,781) (57) (464) — (3,302)Net change in intercompany financing (50,479) (31,962) 22,772 59,669 — 54,957 (32,019) 22,479 59,669 105,086
Effect of foreign exchange rates on cash (458) 92 (856) — (1,222)
Net increase (decrease) in cash and cash equivalents 68,505 (199) 20,519 — 88,825Cash and cash equivalents – beginning of year 6,859 2,353 20,267 — 29,479Cash and cash equivalents – end of year $ 75,364 $ 2,154 $ 40,786 $ — $ 118,304
Page 78. Notes to Consolidated Financial Statements Esterline
www.global-reports.com

Condensed Consolidating Statement of Operations for the fiscal year ended October 29, 2004
Guarantor Non-Guarantor
In Thousands Parent Subsidiaries Subsidiaries Eliminations Total
Net Sales $ — $ 461,067 $ 155,073 $ (2,530) $ 613,610Cost of Sales — 320,285 100,835 (2,530) 418,590 — 140,782 54,238 — 195,020Expenses Selling, general and administrative — 79,038 39,708 — 118,746 Research, development and engineering — 10,275 15,581 — 25,856 Total Expenses — 89,313 55,289 — 144,602Other Other expense (income) (520) (239) 250 — (509) Gain on sale of business (1,700) — (1,734) — (3,434) Total Other (2,220) (239) (1,484) — (3,943)Operating Earnings from Continuing Operations 2,220 51,708 433 — 54,361
Interest income (14,316) (3,017) (828) 16,197 (1,964) Interest expense 17,010 3,272 13,251 (16,197) 17,336Other Expense, Net 2,694 255 12,423 — 15,372
Income (Loss) from Continuing Operations Before Taxes (474) 51,453 (11,990) — 38,989Income Tax Expense (Benefit) (140) 12,934 (3,202) — 9,592Income (Loss) From Continuing Operations Before Minority Interest (334) 38,519 (8,788) — 29,397Minority Interest — — (22) — (22)Income (Loss) From Continuing Operations (334) 38,519 (8,810) — 29,375
Income From Discontinued Operations, Net of Tax — 10,208 — — 10,208Equity in Net Income of Consolidated Subsidiaries 39,917 — — (39,917) —Net Income (Loss) $ 39,583 $ 48,727 $ (8,810) $ (39,917) $ 39,583
Page 79. Notes to Consolidated Financial Statements Esterline
www.global-reports.com

Condensed Consolidating Statement of Cash Flows for the fiscal year ended October 29, 2004
Guarantor Non-Guarantor
In Thousands Parent Subsidiaries Subsidiaries Eliminations Total
Cash Flows Provided (Used) by Operating Activities
Net earnings (loss) $ 39,583 $ 48,727 $ (8,810) $ (39,917) $ 39,583Minority interest — — 22 — 22Depreciation & amortization — 22,320 8,825 — 31,145Deferred income tax 3,375 — (111) — 3,264Share-based compensation — 3,191 1,135 — 4,326Gain on disposal of discontinued operations — (12,521) — — (12,521)Gain on sale of land — (892) — — (892)Gain on sale of product line (1,700) — (1,734) — (3,434)Working capital changes, net of effect of acquisitions Accounts receivable (2,126) (5,513) (1,393) — (9,032) Inventories — (6,897) (2,198) — (9,095) Prepaid expenses (219) 760 (1,200) — (659) Accounts payable 382 (684) 2,902 — 2,600 Accrued liabilities 11,800 (1,444) (116) — 10,240 Federal & foreign income taxes 8,935 (804) 820 — 8,951Other liabilities 9,283 (923) (4,001) — 4,359Other, net (9,734) 5,668 (1,464) — (5,530) 59,579 50,988 (7,323) (39,917) 63,327
Cash Flows Provided (Used) by Investing Activities
Purchases of capital assets (490) (18,881) (2,755) — (22,126)Proceeds from sale of discontinued operations — 10,000 — — 10,000Proceeds from sale of product line 1,700 — 1,775 — 3,475Proceeds from sale of land — 1,654 — — 1,654Escrow deposit (12,500) — — — (12,500)Proceeds from sale of capital assets 23 1,190 (435) — 778Proceeds from sale of short-term investments 12,797 — — — 12,797Acquisitions of businesses, net — (50,855) (87,956) — (138,811) 1,530 (56,892) (89,371) — (144,733)
Cash Flows Provided (Used) by Financing Activities
Proceeds provided by stock issuance under employee stock plans 2,267 — — — 2,267Excess tax benefits from stock option exercises 540 — — — 540Net change in credit facilities 5,000 (180) (698) — 4,122Repayment of long-term debt, net (27,996) (77) (1,356) — (29,429)Debt and other issuance costs (268) — — — (268)Net change in intercompany financing (143,641) 5,573 98,151 39,917 — (164,098) 5,316 96,097 39,917 (22,768)
Effect of foreign exchange rates on cash 14 (89) 2,365 — 2,290
Net increase (decrease) in cash and cash equivalents (102,975) (677) 1,768 — (101,884)Cash and cash equivalents – beginning of year 109,834 3,030 18,499 — 131,363Cash and cash equivalents – end of year $ 6,859 $ 2,353 $ 20,267 $ — $ 29,479
Page 80. Notes to Consolidated Financial Statements Esterline
www.global-reports.com

Page 81. Management’s Report on Internal Control Over Financial Reporting Esterline
Management’s Report on Internal Control Over Financial Reporting
Our management is responsible for establishing and maintaining adequate internal control over financial reporting as defined in Rules 13a-15(f) and 15d-15(f) under the Securities Exchange Act of 1934. Our internal control system over financial reporting is designed by, or under the supervision of, our chief executive officer and chief financial officer, and is effected by our board of directors, management and other personnel to provide reasonable assurance regarding the reli-ability of financial reporting and the preparation of financial statements for external purposes in accordance with generally accepted accounting principles. Our internal control over financial reporting includes those policies and procedures that:
(i) pertain to the maintenance of records that, in reasonable detail, accurately and fairly reflect the assets of the company;
(ii) provide reasonable assurance that transactions are recorded as necessary to permit preparation of financial statements in accordance with U.S. generally accepted accounting principles and that transactions are made only in accordance with the authorization of our management and directors; and
(iii) provide reasonable assurance regarding prevention or timely detection of unauthorized transactions that could have a material effect on the financial statements.
Because of inherent limitations, internal control over financial reporting may not prevent or detect misstatements. Therefore, even those systems determined to be effective can provide only reasonable assurance with respect to financial statement preparation and presentation. Also, projections of any evaluation of effectiveness to future periods are subject to risk that controls may become inadequate because of changes in condition, or that the degree of compliance with the policies or procedures may deteriorate. Our management assessed the effectiveness of Esterline’s internal control over financial reporting as of October 27, 2006. In making this assessment, our management used the criteria set forth by the Committee of Sponsoring Organiza-tions of the Treadway Commission (COSO) in Internal Control-Integrated Framework. On March 27, 2006, the company completed the acquisition of Wallop Defence Systems Ltd. As permitted by applicable rules promulgated by the Securities and Exchange Commission, our management excluded the Wallop Defence Systems Ltd. operations from its assessment of internal control over financial reporting as of October 27, 2006. Wallop Defence Systems Ltd. constituted approximately 6.0% and 7.7% of consolidated total assets and total shareholders’ equity, respectively, as of October 27, 2006, and 0.9% and (1.4%) of consolidated net sales and net earnings, respectively, for the year then ended. Wallop Defence Systems Ltd. will be included in the company’s assessment as of October 26, 2007. Based on management’s assessment and those criteria, our management concluded that our internal control over financial reporting was effective as of October 27, 2006. Our independent registered public accounting firm, Ernst & Young LLP, has issued an audit report on our assess-ment and the effectiveness of our internal control over financial reporting. This report appears on page 82.
Robert W. CreminChairman, President and Chief Executive Officer(Principal Executive Officer)
Robert D. GeorgeVice President, Chief Financial Officer,Secretary and Treasurer(Principal Financial Officer)
Gary J. PosnerCorporate Controller andChief Accounting Officer(Principal Accounting Officer)
www.global-reports.com
Page 82. Report of Independent Registered Public Accounting Firm Esterline
Report of Independent Registered Public Accounting Firm
The Board of Directors and ShareholdersEsterline Technologies CorporationBellevue, Washington
We have audited management’s assessment, included in the accompanying Management’s Report on Internal Control Over Financial Reporting, that Esterline Technologies Corporation maintained effective internal control over financial reporting as of October 27, 2006, based on criteria established in Internal Control—Integrated Framework issued by the Commit-tee of Sponsoring Organizations of the Treadway Commission (the COSO criteria). Esterline Technologies Corporation’s management is responsible for maintaining effective internal control over financial reporting and for its assessment of the effectiveness of internal control over financial reporting. Our responsibility is to express an opinion on management’s assess-ment and an opinion on the effectiveness of the company’s internal control over financial reporting based on our audit. We conducted our audit in accordance with the standards of the Public Company Accounting Oversight Board (United States). Those standards require that we plan and perform the audit to obtain reasonable assurance about whether effective internal control over financial reporting was maintained in all material respects. Our audit included obtaining an understanding of internal control over financial reporting, evaluating management’s assessment, testing and evaluating the design and operating effectiveness of internal control, and performing such other procedures as we considered necessary in the circumstances. We believe that our audit provides a reasonable basis for our opinion. A company’s internal control over financial reporting is a process designed to provide reasonable assurance regard-ing the reliability of financial reporting and the preparation of financial statements for external purposes in accordance with generally accepted accounting principles. A company’s internal control over financial reporting includes those policies and procedures that (1) pertain to the maintenance of records that, in reasonable detail, accurately and fairly reflect the transactions and dispositions of the assets of the company; (2) provide reasonable assurance that transactions are recorded as necessary to permit preparation of financial statements in accordance with generally accepted accounting principles, and that receipts and expenditures of the company are being made only in accordance with authorizations of management and directors of the company; and (3) provide reasonable assurance regarding prevention or timely detection of unauthorized acquisition, use, or disposition of the company’s assets that could have a material effect on the financial statements. Because of its inherent limitations, internal control over financial reporting may not prevent or detect misstatements. Also, projections of any evaluation of effectiveness to future periods are subject to the risk that controls may become inad-equate because of changes in conditions, or that the degree of compliance with the policies or procedures may deteriorate. As indicated in the accompanying Management’s Report on Internal Control Over Financial Reporting, man-agement’s assessment of and conclusion on the effectiveness of internal control over financial reporting did not include the internal controls of Wallop Defence Systems Ltd., which is included in the 2006 consolidated financial statements of Esterline Technologies Corporation and constituted 6.0% and 7.7% of consolidated total assets and total shareholders’ equity, respectively, as of October 27, 2006 and 0.9% and (1.4%) of consolidated net sales and net earnings, respectively, for the year then ended. Our audit of internal control over financial reporting of Esterline Technologies Corporation also did not include an evaluation of the internal control over financial reporting of Wallop Defence Systems Ltd. In our opinion, management’s assessment that Esterline Technologies Corporation maintained effective internal control over financial reporting as of October 27, 2006, is fairly stated, in all material respects, based on the COSO criteria. Also, in our opinion, Esterline Technologies Corporation maintained, in all material respects, effective internal control over financial reporting as of October 27, 2006, based on the COSO criteria. We have also audited, in accordance with the standards of the Public Company Accounting Oversight Board (United States), the consolidated balance sheets of Esterline Technologies Corporation as of October 27, 2006 and October 28, 2005, and the related consolidated statements of operations, shareholders’ equity and comprehensive income, and cash flows for each of the three years in the period ended October 27, 2006 of Esterline Technologies Corporation and our report dated December 18, 2006 expressed an unqualified opinion thereon.
Seattle, Washington
December 18, 2006
www.global-reports.com
Page 83. Report of Independent Registered Public Accounting Firm Esterline
Report of Independent Registered Public Accounting Firm
The Board of Directors and ShareholdersEsterline Technologies CorporationBellevue, Washington
We have audited the accompanying consolidated balance sheets of Esterline Technologies Corporation as of October 27, 2006 and October 28, 2005, and the related consolidated statements of operations, shareholders’ equity and comprehen-sive income, and cash flows for each of the three years in the period ended October 27, 2006. These financial statements are the responsibility of the Company’s management. Our responsibility is to express an opinion on these financial state-ments based on our audits. We conducted our audits in accordance with the standards of the Public Company Accounting Oversight Board (United States). Those standards require that we plan and perform the audit to obtain reasonable assurance about whether the financial statements are free of material misstatement. An audit includes examining, on a test basis, evidence supporting the amounts and disclosures in the financial statements. An audit also includes assessing the accounting principles used and significant estimates made by management, as well as evaluating the overall financial statement presentation. We believe that our audits provide a reasonable basis for our opinion. In our opinion, the financial statements referred to above present fairly, in all material respects, the consolidated financial position of Esterline Technologies Corporation at October 27, 2006 and October 28, 2005, and the consolidated results of its operations and its cash flows for each of the three years in the period ended October 27, 2006, in conformity with U.S. generally accepted accounting principles. We also have audited, in accordance with the standards of the Public Company Accounting Oversight Board (United States), the effectiveness of Esterline Technologies Corporation’s internal control over financial reporting as of October 27, 2006, based on criteria established in Internal Control – Integrated Framework issued by the Committee of Sponsoring Organizations of the Treadway Commission, and our report dated December 18, 2006, expressed an unquali-fied opinion thereon. As discussed in Note 1 to the financial statements, in 2006 the Company changed its method of accounting for share-based payments.
Seattle, Washington
December 18, 2006
www.global-reports.com

Page 84. Officers Esterline
Robert W. CreminChairman, President
and Chief Executive Officer
Robert D. GeorgeVice President,
Chief Financial Officer,
Secretary and Treasurer
Marcia J. M. GreenbergVice President
Human Resources
Frank E. HoustonGroup Vice President
Larry A. KringSr. Group Vice President
Stephen R. LarsonVice President
Strategy and Technology
Gary J. PosnerCorporate Controller and
Chief Accounting Officer
Richard J. WoodGroup Vice President
Marcia J. M. GreenbergStephen R. LarsonRobert D. George
Officers
www.global-reports.com

Gary J. PosnerRobert W. CreminLarry A. Kring Richard J. Wood Frank E. Houston
www.global-reports.com

Page 86. Investor Information Esterline
Directors
Robert W. CreminChairman, President
and Chief Executive Officer
Esterline Technologies
Lewis E. BurnsPresident and
Chief Executive Officer (Retired)
Dover Industries, Inc.
John F. ClearmanSpecial Advisor to the Board
(Retired)
Milliman USA
Robert S. ClineChairman and
Chief Executive Officer (Retired)
Airborne Freight Corporation
Anthony P. FranceschiniDirector, President
and Chief Executive Officer
Stantec Inc.
Paul V. HaackSenior Partner (Retired)
Deloitte & Touche LLP
Charles R. LarsonAdmiral (Retired)
United States Navy
Jerry D. LeitmanChairman
FuelCell Energy, Inc.
James L. PierceChairman (Retired)
ARINC Incorporated
Annual Meeting of ShareholdersThe 2007 annual meeting of shareholders
will be held at the Harbor Club – Bellevue
777 108th Avenue N.E., Bellevue, WA
on Wednesday, March 7, 2007.
The meeting will start at 10:00 a.m.
10-K reportA copy of Esterline’s annual report on Form 10-K
filed with the Securities and Exchange Commis-
sion will be provided without charge upon written
request to the corporate headquarters, attention:
Director, Corporate Communications or through
our website: www.esterline.com
Stock Held in Street NameEsterline maintains a direct mailing list to help
ensure that shareholders whose stock is held in street
name (broker or similar accounts) receive informa-
tion on a timely basis. If you would like your name
added to this list, please send your request to the
corporate headquarters, attention: Director, Corpo-
rate Communications.
Stock Exchange CertificationsEsterline has filed the CEO and CFO certifications
required by Section 302 of the Sarbanes-Oxley Act
of 2002 as exhibits to its Annual Report on Form
10-K for the fiscal year ended October 27, 2006
and has submitted to the NYSE the annual CEO
certification required by Section 303A.12 (a) of the
NYSE listing standards.
Investor Information
Corporate Headquarters500 108th Avenue N.E.
Bellevue, WA 98004
(425) 453-9400
Stock Exchange ListingNew York Stock Exchange
Symbol – ESL
Transfer Agent and RegistrarMellon Investor Services
Shareholder Services L.L.C.
www.mellon-investor.com
Shareholder Relations
(800) 522-6645
Outside of the U.S.
(201) 329-8660
TDD Hearing Impaired
(800) 231-5469
TDD Hearing Impaired
Outside of the U.S.
(201) 329-8534
Shareholder Correspondence
P.O. Box 3315
South Hackensack, NJ 07606
Overnight Delivery
85 Challenger Road
Ridgefield Park, NJ 07660
www.global-reports.com
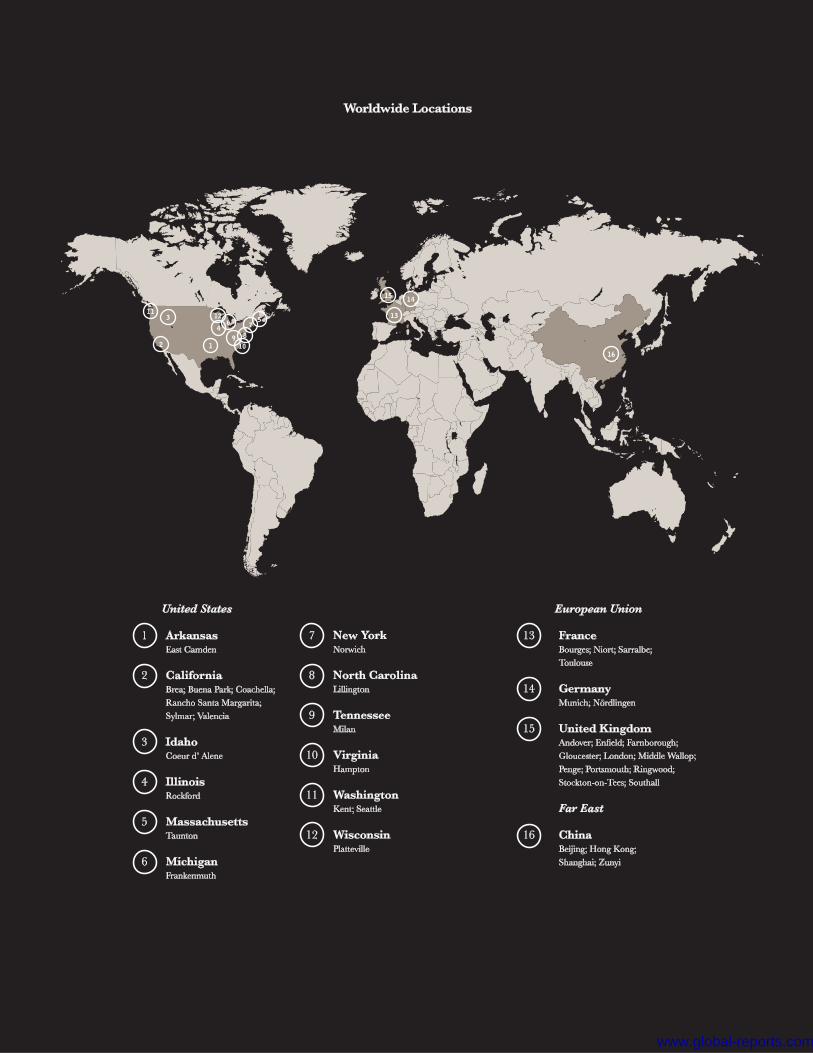
www.global-reports.com

www.global-reports.com
Related Documents