AGRONOMY GUIDE FOR FIELD CROPS Publication 811

Welcome message from author
This document is posted to help you gain knowledge. Please leave a comment to let me know what you think about it! Share it to your friends and learn new things together.
Transcript
AGRONOMY GUIDE FOR FIELD CROPS
Publication 811

Page intentionally left blank
Publication 811
AGRONOMY GUIDE FOR FIELD CROPS
Agronomy Guide for Field CropsPublication 811
EditorChristine Brown, OMAFRA
Co-EditorsJoanna Follings, OMAFRAMeghan Moran, OMAFRABen Rosser, OMAFRA
Contributing AuthorsOMAFRA Field Crop Team: Joel Bagg, Dr. Bonnie Ball, Scott Banks, Tracey Baute, Horst Bohner, Christine Brown, Mike Cowbrough, James Dyck, Thomas Ferguson, Joanna Follings, Brian Hall, Adam Hayes, Peter Johnson, Jack Kyle, Dr. Ian McDonald, Meghan Moran, Jake Munroe, Gilles Quesnel, Nicole Rabe, Ben Rosser, Helmut Spieser, Greg Stewart, Albert Tenuta, Anne Verhallen.
AcknowledgementsThe authors would like to thank the following for their contributions to this publication: Keith Reid, Owen Wally, Tom Welacky (AAFC), Jonathan Brinkman, Dr. Bill Deen, Dr. Hugh Earl, Dr. Duane Falk, Dr. Rebecca Hallett, Ken Janovicek, Dr. John Lauzon (University of Guelph), Chris Gillard, Dr. Dave Hooker, Dr. Art Schaafsma, Christy Shropshire, Dr. Peter Sikkema, Jocelyn Smith (University of Guelph, Ridgetown Campus).
External reviewers provided guidance to each of the chapters by identifying missing information, verifying technical concepts, and ensuring readability. We thank the following reviewers for enhancing this publication.
Chad Anderson, Anderson Agronomy Services, Mooretown; Dr. Tom Bruulsema, International Plant Nutrition Institute (IPNI), Guelph; Deb Campbell CCA-ON, Agronomy Advantage, Dundalk; Dale Cowan, CCA-ON, Senior Agronomist, Agris Cooperative, Chatham; Jennifer Doelman, Barclay Dick & Son Farm Supply, Douglas; Blair Freeman, DuPont Pioneer Area Agronomist, Central Ontario; Alan McCallum, McCallum Agronomic Services, Elgin County; Adam Pfeffer, Monsanto, Chatham; Eric Richter, Syngenta, Thorndale; Craig Reid, Agronomist, Sprucedale Agromart, Sprucedale; Aaron Stevanus, CCA-ON Pride Seeds; Paul Sullivan CCA-ON, P.T. Sullivan Agro Inc. Kinburn; Bob Thirlwall, Dekalb Agronomist, Monsanto, Glencoe; Walt Vermunt, Hensall District Co-op, Hensall; Kate Withers, Graduate Studies, University of Guelph.
The Tillage Database resource information, found at www.tillageontario.com is a product of the initiative and funding provided by the Innovative Farmers Association of Ontario, OMAFRA, the University of Guelph, and by Canada and the Province of Ontario under the Canada-Ontario Research and Development (CORD) Program.
Need Technical or Business Information?
Contact the Agricultural Information Contact Centre at 1-877-424-1300 or [email protected].
Looking for field crop production information on the Internet?
ontario.ca/crops
It’s one-stop shopping for factsheets, articles and photos regarding the production and maintenance of field crops.
To obtain copies of this or any other OMAFRA publication, please order:
• Online at ontario.ca/publications• By phone through the ServiceOntario Contact Centre, Monday to Friday, 8:30 a.m. to 5:00 p.m. ET
• 416-326-5300• 416-326-3408 (TTY)• 1-800-668-9938, toll-free across Ontario• 1-800-368-7095 TTY, toll-free across Ontario
Published by the Ministry of Agriculture, Food and Rural Affairs© Queen’s Printer for Ontario, 2017
Toronto, CanadaISBN 978-1-4606-9017-8 (Print) ISBN 978-1-4606-9019-2 (HTML) ISBN 978-1-4606-9021-5 (PDF)
Introduction
Field crops are produced in Ontario under diverse soil and climatic conditions. The goal is sustainable crop production using proven techniques that include: scouting and pest management, soil and fertility management, tillage, variety selection, planting and harvesting practices. These techniques also take into consideration the responsible use of natural resources. These, combined with in-field trials, help producers determine which practices warrant adoption. Good agronomic practices are essential for helping Ontario farmers produce food, fibre and fuel. Successful crop production is dependent upon many inter-related management practices. A little good luck and good weather helps too.
Publication 811, the Agronomy Guide for Field Crops is designed to be a technical resource for field crop production. This third edition replaces the 2009 edition. It has been updated with current Ontario research and production guidelines as approved by the Ontario Soil Management Research and Services Committee (OSMRSC), which is represented by researchers, industry, producers and extension staff.
Some information used in the Agronomy Guide for Field Crops originates from other sources, including the University of Guelph, the Ontario Soil and Crop Improvement Association (OSCIA), the Innovative Farmers Association of Ontario (IFAO), seed companies, the United States Department of Agriculture (USDA), U.S. universities and other research institutions. Data presented in this publication — both new and old — represents the most relevant and current knowledge available.
The Agronomy Guide for Field Crops is available in its entirety, on the OMAFRA website. Additional or updated information on many of the topics discussed throughout this guide can often be found on the crops pages of the OMAFRA website at ontario.ca/crops or at fieldcropnews.com.
This publication does not provide information regarding specific pesticide products for the control of insects, diseases or weeds. For pesticide product information, see OMAFRA Publication 812, Field Crop Protection Guide and Publication 75, Guide to Weed Control.
Integrated Cropping Systems
Sustainable Crop Production Publication 811, the Agronomy Guide for Field Crops is organized by crop and by discipline. Each chapter has detailed information that is current, Ontario specific and promotes sustainable crop production. Crop production is not just about one crop or one specific discipline (e.g., pest management). Crop production requires an integrated approach that looks at all aspects of the farm and production practices, with an eye to maintaining or improving the land.
Sustainable crop production can be defined as “developing and utilizing crop production systems that meet the need of present producers without compromising the ability of future generations of producers to do the same” (adapted definition from Dr. G. Brundtland — Director-General of the World Health Organization).
There are three segments to sustainable crop production: economic, social and environmental.
Economic sustainability focuses on: • profit/loss of operation• supply and demand — product marketability• operation capacity and long-term availability
of resources (e.g., soil)• maintaining a viable business for the future
Social sustainability focuses on: • succession planning for the next generation• ability to engage with and support the community
(e.g., rural/urban)• maintaining a viable business/family life balance
Environmental sustainability focuses on: • ensuring continued resources to sustain crop
production activities• ability to communicate the use of sustainable,
traceable production practices to the public • maintaining soil health and decreasing negative
impact of crop inputs on the environment (e.g., nutrient/pest management)
Sustainability = Systems Thinking
v
Sustainable crop production requires an integrated systems approach. Every field has unique and site-specific characteristics that influence management, inputs and profitability. Integrated crop management takes all aspects of crop production into consideration, including:
• soil management — texture and tillage requirements• crop rotation• crop fertility • nutrient (waste) management• water management• crop protection• wildlife management• site management • scouting and record-keeping• labour/equipment management• energy consumption• economic analysis (e.g., determining thresholds for
action, cost of production, return on investment)
The Agronomy Guide for Field Crops covers many aspects of the sustainable crop production considerations listed above. Chapter 1, Corn discusses the aspects of tillage, while soil management, crop rotations and improving soil health is explored in Chapter 8, Managing for Healthy Soils. Scouting and record keeping are covered in Chapter 10, Field Scouting, while crop fertility and nutrient management are discussed in Chapter 9, Soil Fertility and Nutrient Use. Crop protection issues are covered in detail in Chapter 13, Weed Control, Chapter 14, IPM and Protecting Natural Enemies and Pollinators, Chapter 15, Insects and Pests of Field Crops and Chapter 16, Diseases of Field Crops.
The paragraphs below summarize how the aspects listed above integrate into the production of Ontario field crops.
It Starts With a Healthy SoilSoil health is often described as the soil’s capacity to support crop growth, without becoming degraded or otherwise harming the environment. Physical, chemical and biological indicators are measured to determine a soil’s health. Physical indicators include aggregate stability, available water holding capacity, soil structure and soil compaction. Soil nutrient levels and soil pH are chemical indicators. Biological indicators include soil organic matter, microbial respiration and soil life populations.
In simple terms a healthy soil will:
• have good soil structure, minimal compaction and resist crusting
• have good drainage, water movement and water-holding capacity
• have nutrient levels, pH and organic matter (OM) in the optimal range
• be resistant to wind, water or tillage erosion• encourage seedling emergence and root growth• produce uniform crop growth • have an abundance of earthworms• have a fresh, earthy odour• readily decompose residue
Most of the characteristics of a healthy soil have a direct or indirect link to other aspects of integrated crop management. More information on healthy soils can be found in Chapter 8, Managing for Healthy Soils.
Crop Rotation Crop rotation is an integral part of the crop production system. A well-planned crop rotation will:
• increase yields• aid in maintaining or improving soil structure
and organic matter levels• protect against soil erosion • improve soil resilience against weather extremes• provide residual nitrogen from legumes in
the rotation • help to disrupt insect and disease cycles• reduce weed pressure• spread out workload
The basic rule of crop rotation is that a crop should never follow itself. Continuous cropping of any crop will increase the buildup of diseases and insects specific to that crop and will potentially result in heavier infestations and reduced yields. The more often the same crop type has been grown in the same field, the greater the potential risk.
The greatest benefit from crop rotation comes when crops, including cover crops, grown in sequence are from different families; monocots (grasses) and dicots (broadleaves). The fibrous root systems of cereal and forage crops (including red clover) are excellent for building soil structure. The advantage of including wheat in the rotation often goes beyond the wheat year. Table Intro–1, Management considerations for various crop rotations provides an example of response to a crop following various crops in a rotation. More information about crop rotations can be found in Chapter 8, Managing for Healthy Soils.
vi
Agronomy guide for field Crops
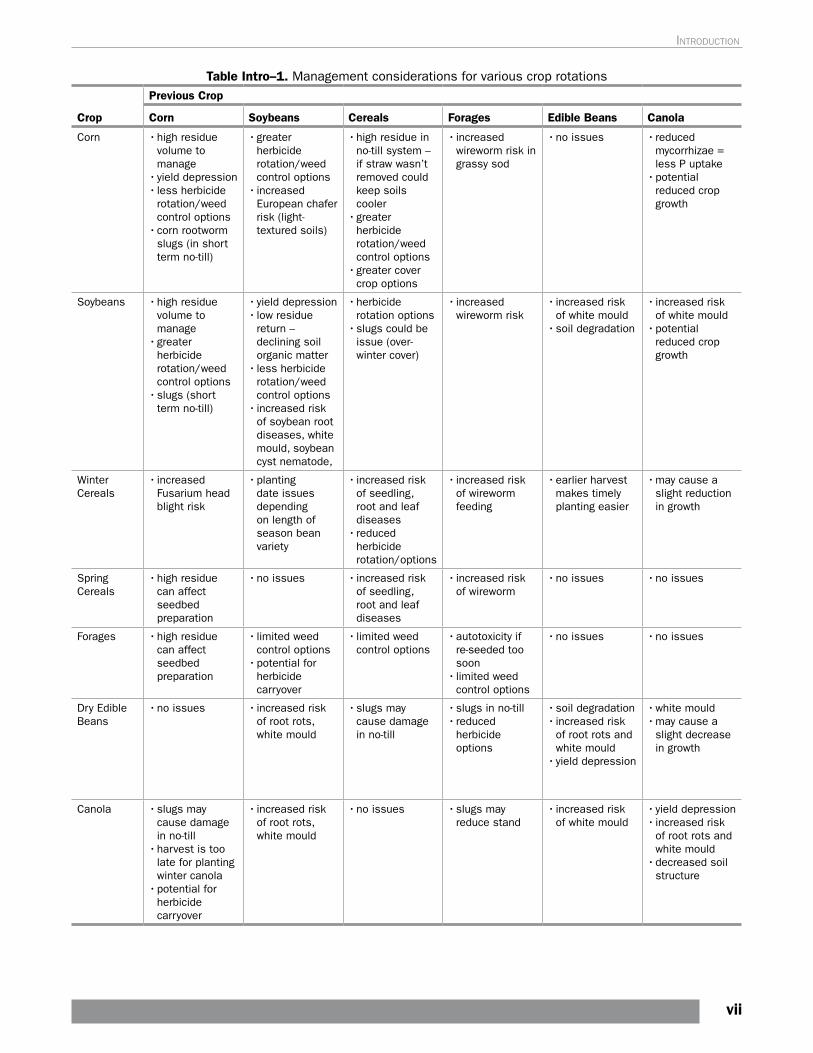
Table Intro–1. Management considerations for various crop rotations
Crop
Previous Crop
Corn Soybeans Cereals Forages Edible Beans Canola
Corn • high residue volume to manage
• yield depression• less herbicide
rotation/weed control options
• corn rootworm slugs (in short term no-till)
• greater herbicide rotation/weed control options
• increased European chafer risk (light-textured soils)
• high residue in no-till system – if straw wasn’t removed could keep soils cooler
• greater herbicide rotation/weed control options
• greater cover crop options
• increased wireworm risk in grassy sod
• no issues • reduced mycorrhizae = less P uptake
• potential reduced crop growth
Soybeans • high residue volume to manage
• greater herbicide rotation/weed control options
• slugs (short term no-till)
• yield depression• low residue
return – declining soil organic matter
• less herbicide rotation/weed control options
• increased risk of soybean root diseases, white mould, soybean cyst nematode,
• herbicide rotation options
• slugs could be issue (over-winter cover)
• increased wireworm risk
• increased risk of white mould
• soil degradation
• increased risk of white mould
• potential reduced crop growth
Winter Cereals
• increased Fusarium head blight risk
• planting date issues depending on length of season bean variety
• increased risk of seedling, root and leaf diseases
• reduced herbicide rotation/options
• increased risk of wireworm feeding
• earlier harvest makes timely planting easier
• may cause a slight reduction in growth
Spring Cereals
• high residue can affect seedbed preparation
• no issues • increased risk of seedling, root and leaf diseases
• increased risk of wireworm
• no issues • no issues
Forages • high residue can affect seedbed preparation
• limited weed control options
• potential for herbicide carryover
• limited weed control options
• autotoxicity if re-seeded too soon
• limited weed control options
• no issues • no issues
Dry Edible Beans
• no issues • increased risk of root rots, white mould
• slugs may cause damage in no-till
• slugs in no-till• reduced
herbicide options
• soil degradation• increased risk
of root rots and white mould
• yield depression
• white mould• may cause a
slight decrease in growth
Canola • slugs may cause damage in no-till
• harvest is too late for planting winter canola
• potential for herbicide carryover
• increased risk of root rots, white mould
• no issues • slugs may reduce stand
• increased risk of white mould
• yield depression• increased risk
of root rots and white mould
• decreased soil structure
vii
IntroductIon
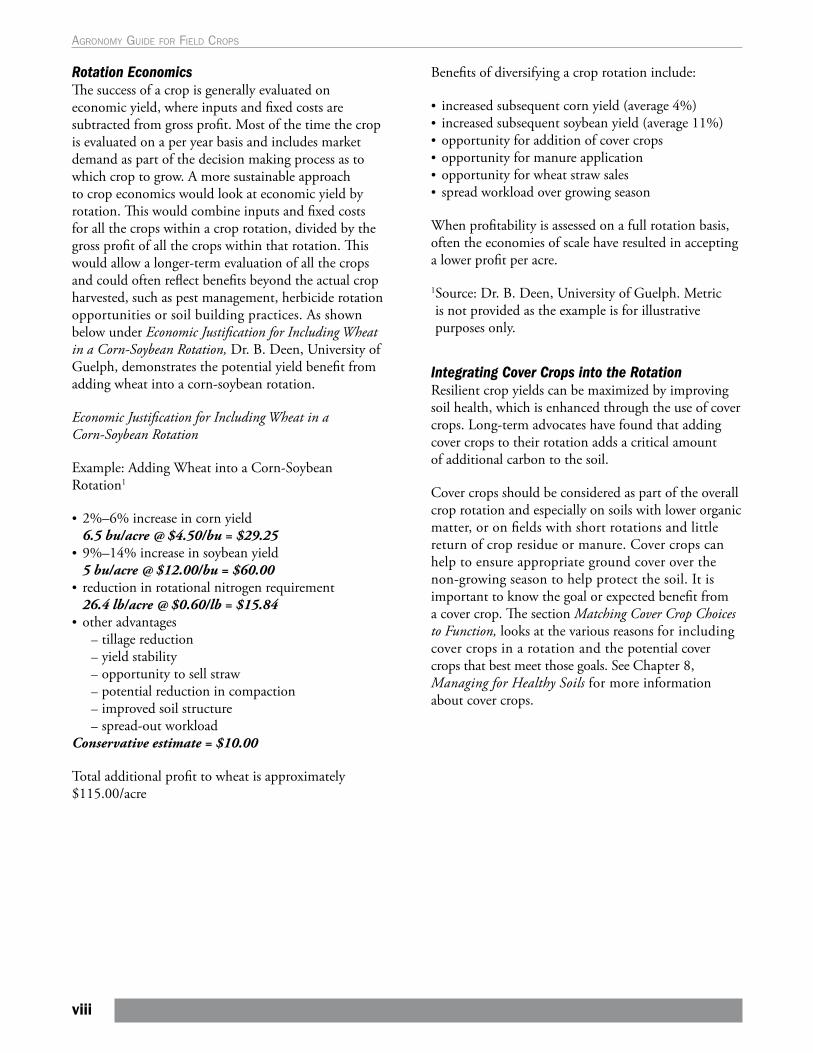
Rotation EconomicsThe success of a crop is generally evaluated on economic yield, where inputs and fixed costs are subtracted from gross profit. Most of the time the crop is evaluated on a per year basis and includes market demand as part of the decision making process as to which crop to grow. A more sustainable approach to crop economics would look at economic yield by rotation. This would combine inputs and fixed costs for all the crops within a crop rotation, divided by the gross profit of all the crops within that rotation. This would allow a longer-term evaluation of all the crops and could often reflect benefits beyond the actual crop harvested, such as pest management, herbicide rotation opportunities or soil building practices. As shown below under Economic Justification for Including Wheat in a Corn-Soybean Rotation, Dr. B. Deen, University of Guelph, demonstrates the potential yield benefit from adding wheat into a corn-soybean rotation.
Economic Justification for Including Wheat in a Corn-Soybean Rotation
Example: Adding Wheat into a Corn-Soybean Rotation1
• 2%–6% increase in corn yield 6.5 bu/acre @ $4.50/bu = $29.25
• 9%–14% increase in soybean yield 5 bu/acre @ $12.00/bu = $60.00
• reduction in rotational nitrogen requirement 26.4 lb/acre @ $0.60/lb = $15.84
• other advantages – tillage reduction – yield stability – opportunity to sell straw – potential reduction in compaction – improved soil structure – spread-out workload
Conservative estimate = $10.00
Total additional profit to wheat is approximately $115.00/acre
Benefits of diversifying a crop rotation include:
• increased subsequent corn yield (average 4%)• increased subsequent soybean yield (average 11%)• opportunity for addition of cover crops• opportunity for manure application • opportunity for wheat straw sales• spread workload over growing season
When profitability is assessed on a full rotation basis, often the economies of scale have resulted in accepting a lower profit per acre.
1 Source: Dr. B. Deen, University of Guelph. Metric is not provided as the example is for illustrative purposes only.
Integrating Cover Crops into the Rotation Resilient crop yields can be maximized by improving soil health, which is enhanced through the use of cover crops. Long-term advocates have found that adding cover crops to their rotation adds a critical amount of additional carbon to the soil.
Cover crops should be considered as part of the overall crop rotation and especially on soils with lower organic matter, or on fields with short rotations and little return of crop residue or manure. Cover crops can help to ensure appropriate ground cover over the non-growing season to help protect the soil. It is important to know the goal or expected benefit from a cover crop. The section Matching Cover Crop Choices to Function, looks at the various reasons for including cover crops in a rotation and the potential cover crops that best meet those goals. See Chapter 8, Managing for Healthy Soils for more information about cover crops.
viii
Agronomy guide for field Crops
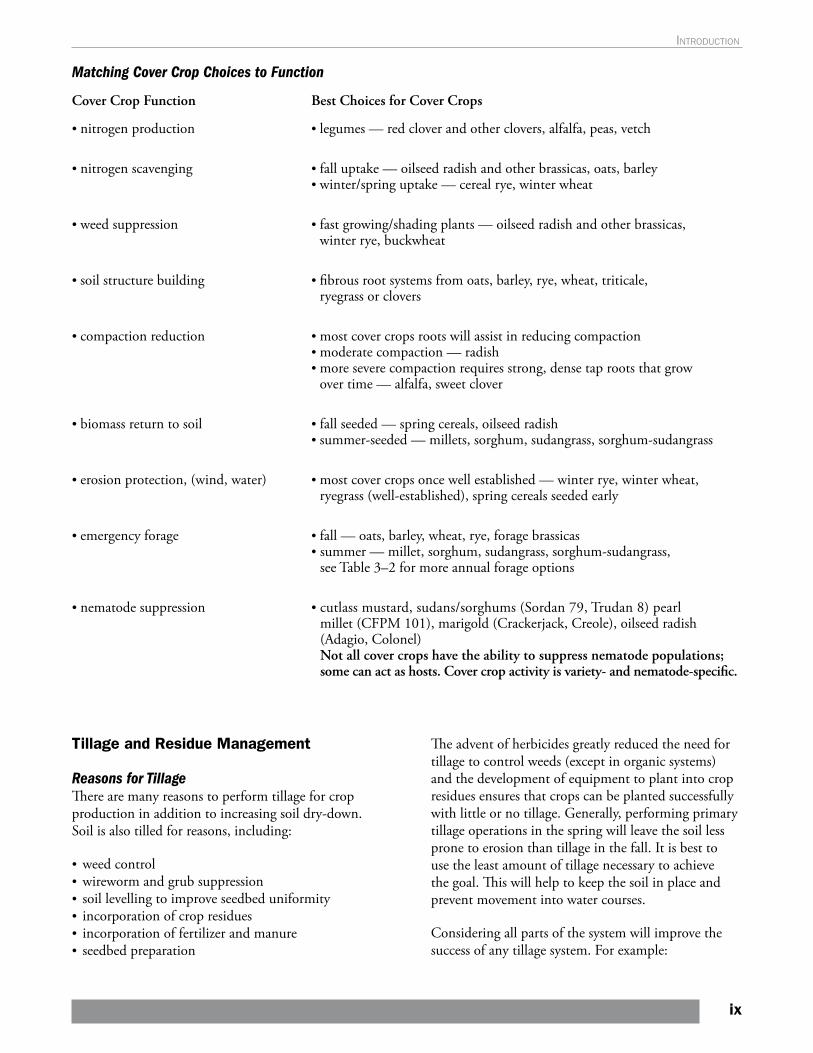
Matching Cover Crop Choices to Function
Cover Crop Function Best Choices for Cover Crops
• nitrogen production • legumes — red clover and other clovers, alfalfa, peas, vetch
• nitrogen scavenging • fall uptake — oilseed radish and other brassicas, oats, barley • winter/spring uptake — cereal rye, winter wheat
• weed suppression • fast growing/shading plants — oilseed radish and other brassicas, winter rye, buckwheat
• soil structure building • fibrous root systems from oats, barley, rye, wheat, triticale, ryegrass or clovers
• compaction reduction • most cover crops roots will assist in reducing compaction • moderate compaction — radish • more severe compaction requires strong, dense tap roots that grow
over time — alfalfa, sweet clover
• biomass return to soil • fall seeded — spring cereals, oilseed radish • summer-seeded — millets, sorghum, sudangrass, sorghum-sudangrass
• erosion protection, (wind, water) • most cover crops once well established — winter rye, winter wheat, ryegrass (well-established), spring cereals seeded early
• emergency forage • fall — oats, barley, wheat, rye, forage brassicas • summer — millet, sorghum, sudangrass, sorghum-sudangrass,
see Table 3–2 for more annual forage options
• nematode suppression • cutlass mustard, sudans/sorghums (Sordan 79, Trudan 8) pearl millet (CFPM 101), marigold (Crackerjack, Creole), oilseed radish (Adagio, Colonel) Not all cover crops have the ability to suppress nematode populations; some can act as hosts. Cover crop activity is variety- and nematode-specific.
Tillage and Residue Management
Reasons for TillageThere are many reasons to perform tillage for crop production in addition to increasing soil dry-down. Soil is also tilled for reasons, including:
• weed control • wireworm and grub suppression• soil levelling to improve seedbed uniformity• incorporation of crop residues• incorporation of fertilizer and manure • seedbed preparation
The advent of herbicides greatly reduced the need for tillage to control weeds (except in organic systems) and the development of equipment to plant into crop residues ensures that crops can be planted successfully with little or no tillage. Generally, performing primary tillage operations in the spring will leave the soil less prone to erosion than tillage in the fall. It is best to use the least amount of tillage necessary to achieve the goal. This will help to keep the soil in place and prevent movement into water courses.
Considering all parts of the system will improve the success of any tillage system. For example:
ix
IntroductIon
• Spreading residue and chaff evenly at harvest will improve tillage and planting operations.
• A diverse crop rotation can reduce insect and disease issues and can increase the potential success with reduced tillage.
• Adapting the planter or drill for specific soil texture and/or crop residue type, over and above the addition of coulters or residue wheels, will improve seed placement.
A number of different tillage systems are used in Ontario. These are summarized below. Additional information can be found in the tillage section of Chapter 1, Corn.
Conventional TillageConventional tillage in Ontario generally consists of fall mouldboard or chisel plowing followed in spring by secondary tillage, usually with a field cultivator or tandem disc. Most plowing is targeted to an operating depth of 15 cm (6 in.), since plowing deeper often results in unwanted mixing of subsoil into the seedbed. The more uniform and level a field is left after fall plowing, the greater the opportunities to reduce secondary tillage costs and improve planter or drill performance. One disadvantage is that the lack of surface residue in conventional tillage exposes fields to greater erosion risks from water and wind. On complex slopes, tillage can be responsible for causing large quantities of topsoil to move to lower slope positions (tillage erosion).
Fall Mulch TillageThe chisel plow, disc-ripper and discs (either tandem or offset) are the most widely adopted fall primary tillage tools in Ontario. These tools usually leave more residue on the soil surface while leaving the surface level in the fall, so that single-pass planting (no secondary tillage) becomes a viable option in the spring.
Vertical TillageVertical tillage is used to reduce any pushing or smearing action that may be caused by tillage tools. Many vertical tillage tools are designed to size residue into more manageable pieces and distribute crop residue, while causing some soil fracturing and mixing of soil with residue at the surface. A number of tillage tools embrace the concept of “vertical” tillage, but use shallow concavity discs, low profile sweeps and extensive harrows to provide some additional soil
disturbance — all the while attempting to remain true to the idea of tillage without significant inversion and soil smearing.
Spring Mulch TillageThe best practice for reducing erosion and input costs is to eliminate fall tillage. Producers working on fine-textured soils, where crop residues are high following corn, wheat or other crops, may be apprehensive about leaving soils untouched in the fall. Following soybeans or dry edible beans, there is little justification for doing fall tillage on most fields in Ontario. Considerations following other crops include risk of soil erosion, availability of equipment to handle spring residue and field drainage. Producer experience with spring mulch tillage systems has shown that working undisturbed soils in the spring obtained better results when using high-clearance tines, narrow teeth and/or when packers or rollers were used in conjunction with the field cultivator.
Fall Strip-TillagePerforming fall tillage, confined to narrow zones that correspond to next year’s corn rows, has received considerable attention in the past few years. The strips of soil are loosened, cleared of residue and often elevated, while leaving the rest of the field covered with protective crop residue. The following spring, the strips are drier, less dense and more suited to “no-till” planting.
Strip-tillage systems also provide an opportunity to band fertilizers that must be broadcast in a no-till system. Applying fertilizer using the strip-tillage system may also replace the need to apply banded starter fertilizers through the planter. Fall banding of phosphorus and potassium in strip-tillage systems, with adequate fertility levels, can produce higher yields than when similar rates of fertilizer are broadcast in no-till systems.
Spring Strip-Tillage Spring strip-tillage offers an opportunity to prepare fine, residue-free seedbeds in which a planter can operate. Most spring strip-tillage operations are restricted to the lighter textured soils but in some cases medium textured soils that are well drained are suitable for this one pass tillage option. The spring strip-tillage operation usually precedes the planter by no more than 6–12 hours in order to prevent the seed zone from drying out excessively. Producers have also used
x
Agronomy guide for field Crops
spring strip-tillage as a technique for applying all or part of a corn crop’s nitrogen (N), phosphorus (P) and potassium (K) requirements.
From a soil conservation perspective, spring strip-tillage also offers the advantage of eliminating the presence of fall strips that can potentially funnel water and be susceptible to erosion, especially if implemented up and down the slope.
Deep Tillage Increasing axle loads of farm machinery, and the general concern that soils have become more compacted, have increased the use of deep tillage systems. The main reason offered for deep tillage is that elimination of compacted sub-soil layers and/or tillage pans will promote rapid and deep root growth and improve drainage. However, in Ontario, subsoils loosened using deep tillage are often easily re-compacted by wheel traffic. Moreover, it is possible that deep-tilled soils receiving wheel traffic end up with poorer drainage because deep tillage destroyed the natural pores created by worms or previous crop roots. Deep tillage into dry soils combined with deep rooted crops (alfalfa, sweet clover) offer the best opportunity for repairing compacted soils.
No-Till SystemsIn no-till systems, tillage is not used to prepare a seedbed. Minimal soil loosening in a narrow band immediately ahead of the seed opener is performed by planter-mounted coulters and/or residue clearing devices. Successful no-till crop production is partially dependent on effective use of alternative production practices and field management strategies that deal with yield-limiting factors that otherwise would have been corrected with tillage.
For successful no-till production it is important to:
• have good soil drainage and water infiltration• maintain a multi-crop crop rotation• incorporate residue management to maintain some
soil cover all year• incorporate weed control strategies without use of
tillage• manage diseases and insects • start with adequate soil fertility levels and consider
fertilizer placement• minimize soil compaction
Field Scouting and Integrated Pest ManagementIntegrated Pest Management (IPM) is an approach to weed, insect and disease management that uses all available control strategies to manage pest populations, keeping them below economic thresholds. This results in a cropping system that is more resilient to failures since it does not exclusively rely on the use of pesticides to control pests. For example, integrated weed management strategies include field scouting, tillage and nutrient management practices, crop rotations and cover crops.
Ongoing monitoring of fields and crops, throughout the growing season and beyond, allows a farmer to observe issues and apply remediation in a timely manner to minimize any negative economic impact, while improving field operation efficiencies. Some problems cannot be addressed when observed, but the information can still be recorded for future use.
While traditionally field scouting has been solely associated with pest monitoring and management, it has many other benefits, including:
• pre-planting field walks that identify drainage issues• post-planting field walks to look at equipment
performance (planters delivering desired population, depth, placement across the entire unit)
• nutrient management (specific areas with nutrient deficiency symptoms)
• crop variety selection (evaluation of in-field comparisons of variety performance)
• scouting as part of soil sampling, which allows observation of field conditions (erosion, drainage) outside the cropping window
Additional information about field scouting can be found in Chapter 10, Field Scouting.
Record KeepingNew tools are available to increase the value of scouting and to assist in record keeping. With the adoption of smartphones and tablets, a large number of apps are available to assist with scouting. Selected apps should address all the information parameters of interest and integrate with other software/hardware systems on the farm. An app that isolates data on a phone or tablet offers little value. Many of the crop and whole farm management systems have developed field apps that integrate with their main programs. Many of these also take advantage of Global Positioning Systems (GPS) capabilities to
xi
IntroductIon
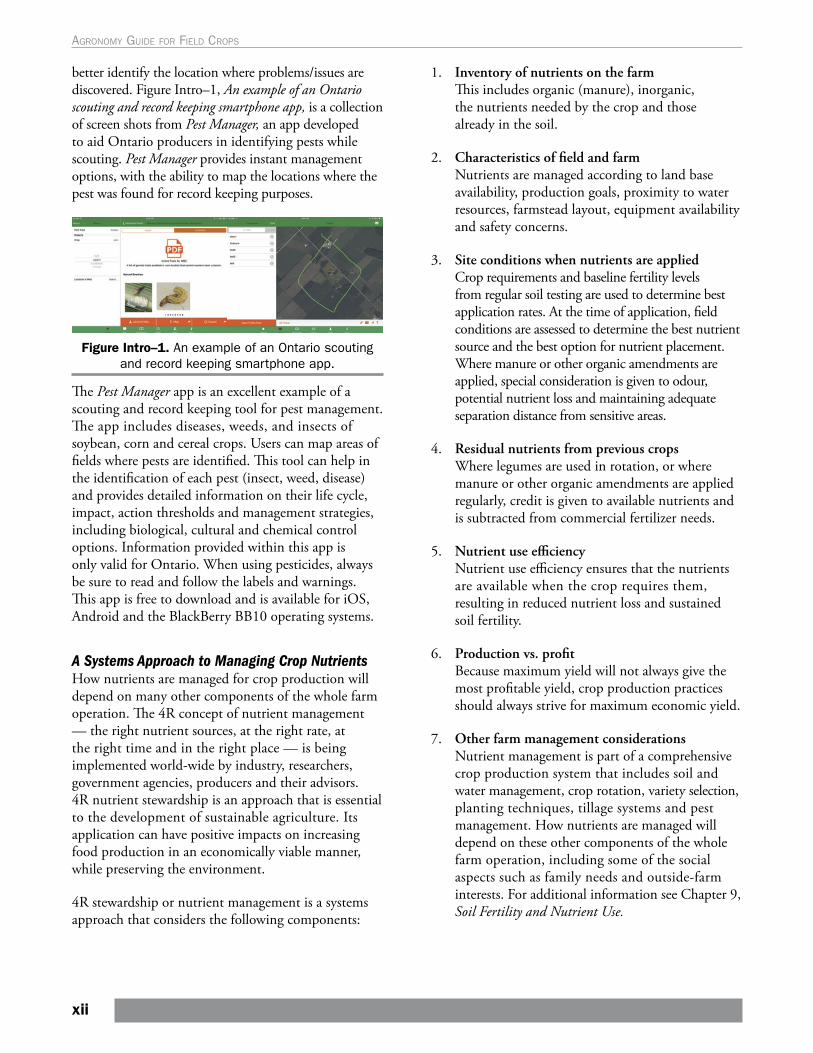
better identify the location where problems/issues are discovered. Figure Intro–1, An example of an Ontario scouting and record keeping smartphone app, is a collection of screen shots from Pest Manager, an app developed to aid Ontario producers in identifying pests while scouting. Pest Manager provides instant management options, with the ability to map the locations where the pest was found for record keeping purposes.
Figure Intro–1. An example of an Ontario scouting and record keeping smartphone app.
The Pest Manager app is an excellent example of a scouting and record keeping tool for pest management. The app includes diseases, weeds, and insects of soybean, corn and cereal crops. Users can map areas of fields where pests are identified. This tool can help in the identification of each pest (insect, weed, disease) and provides detailed information on their life cycle, impact, action thresholds and management strategies, including biological, cultural and chemical control options. Information provided within this app is only valid for Ontario. When using pesticides, always be sure to read and follow the labels and warnings. This app is free to download and is available for iOS, Android and the BlackBerry BB10 operating systems.
A Systems Approach to Managing Crop NutrientsHow nutrients are managed for crop production will depend on many other components of the whole farm operation. The 4R concept of nutrient management — the right nutrient sources, at the right rate, at the right time and in the right place — is being implemented world-wide by industry, researchers, government agencies, producers and their advisors. 4R nutrient stewardship is an approach that is essential to the development of sustainable agriculture. Its application can have positive impacts on increasing food production in an economically viable manner, while preserving the environment.
4R stewardship or nutrient management is a systems approach that considers the following components:
1. Inventory of nutrients on the farm This includes organic (manure), inorganic, the nutrients needed by the crop and those already in the soil.
2. Characteristics of field and farm Nutrients are managed according to land base availability, production goals, proximity to water resources, farmstead layout, equipment availability and safety concerns.
3. Site conditions when nutrients are applied Crop requirements and baseline fertility levels from regular soil testing are used to determine best application rates. At the time of application, field conditions are assessed to determine the best nutrient source and the best option for nutrient placement. Where manure or other organic amendments are applied, special consideration is given to odour, potential nutrient loss and maintaining adequate separation distance from sensitive areas.
4. Residual nutrients from previous crops Where legumes are used in rotation, or where manure or other organic amendments are applied regularly, credit is given to available nutrients and is subtracted from commercial fertilizer needs.
5. Nutrient use efficiency Nutrient use efficiency ensures that the nutrients are available when the crop requires them, resulting in reduced nutrient loss and sustained soil fertility.
6. Production vs. profit Because maximum yield will not always give the most profitable yield, crop production practices should always strive for maximum economic yield.
7. Other farm management considerations Nutrient management is part of a comprehensive crop production system that includes soil and water management, crop rotation, variety selection, planting techniques, tillage systems and pest management. How nutrients are managed will depend on these other components of the whole farm operation, including some of the social aspects such as family needs and outside-farm interests. For additional information see Chapter 9, Soil Fertility and Nutrient Use.
xii
Agronomy guide for field Crops
Contents
IntroductionIntegrated Cropping Systems . . . . . . . . . . . . . . . . . . . . .vCrop Rotation . . . . . . . . . . . . . . . . . . . . . . . . . . . . . . . . . . . . viTillage and Residue Management . . . . . . . . . . . . . . . . ixConventional Tillage . . . . . . . . . . . . . . . . . . . . . . . . . . . . . . .xFall Mulch Tillage . . . . . . . . . . . . . . . . . . . . . . . . . . . . . . . . . .xVertical Tillage . . . . . . . . . . . . . . . . . . . . . . . . . . . . . . . . . . . .xSpring Mulch Tillage . . . . . . . . . . . . . . . . . . . . . . . . . . . . . .xFall Strip-Tillage . . . . . . . . . . . . . . . . . . . . . . . . . . . . . . . . . . .xSpring Strip-Tillage . . . . . . . . . . . . . . . . . . . . . . . . . . . . . . . .xDeep Tillage . . . . . . . . . . . . . . . . . . . . . . . . . . . . . . . . . . . . . . xiNo-Till Systems . . . . . . . . . . . . . . . . . . . . . . . . . . . . . . . . . . . xi
1. CornTillage . . . . . . . . . . . . . . . . . . . . . . . . . . . . . . . . . . . . . . . . . . . . . . . 1
Soil Texture and Drainage . . . . . . . . . . . . . . . . . . . . . . . . 1Crop Rotation . . . . . . . . . . . . . . . . . . . . . . . . . . . . . . . . . . . . 1Other Reasons for Tillage . . . . . . . . . . . . . . . . . . . . . . . . 1Conventional Tillage . . . . . . . . . . . . . . . . . . . . . . . . . . . . . . 2Fall Mulch Tillage . . . . . . . . . . . . . . . . . . . . . . . . . . . . . . . . 2Vertical Tillage . . . . . . . . . . . . . . . . . . . . . . . . . . . . . . . . . . . 3Spring Mulch Tillage . . . . . . . . . . . . . . . . . . . . . . . . . . . . . 3Fall Strip Tillage . . . . . . . . . . . . . . . . . . . . . . . . . . . . . . . . . . 4Spring Strip Tillage . . . . . . . . . . . . . . . . . . . . . . . . . . . . . . 5Deep Tillage . . . . . . . . . . . . . . . . . . . . . . . . . . . . . . . . . . . . . 5No-Till Systems . . . . . . . . . . . . . . . . . . . . . . . . . . . . . . . . . . 6
Hybrid Selection . . . . . . . . . . . . . . . . . . . . . . . . . . . . . . . . . . . . . 9Maturity Ratings . . . . . . . . . . . . . . . . . . . . . . . . . . . . . . . . . 9Selecting the Most Profitable Hybrids . . . . . . . . . . . 10
Planting . . . . . . . . . . . . . . . . . . . . . . . . . . . . . . . . . . . . . . . . . . . . 14Seeding Date . . . . . . . . . . . . . . . . . . . . . . . . . . . . . . . . . . . 14Population . . . . . . . . . . . . . . . . . . . . . . . . . . . . . . . . . . . . . . 14Planting Depth . . . . . . . . . . . . . . . . . . . . . . . . . . . . . . . . . . 15
Corn Development . . . . . . . . . . . . . . . . . . . . . . . . . . . . . . . . . 16Corn Leaf Stages . . . . . . . . . . . . . . . . . . . . . . . . . . . . . . . 17Uniformity of Emergence . . . . . . . . . . . . . . . . . . . . . . . . 18Uniformity of Spacing . . . . . . . . . . . . . . . . . . . . . . . . . . . 18Row Widths . . . . . . . . . . . . . . . . . . . . . . . . . . . . . . . . . . . . . 19Replant Decisions . . . . . . . . . . . . . . . . . . . . . . . . . . . . . . 20
Fertility Management . . . . . . . . . . . . . . . . . . . . . . . . . . . . . . . 21Nitrogen (N) . . . . . . . . . . . . . . . . . . . . . . . . . . . . . . . . . . . . . 21Phosphate and Potash . . . . . . . . . . . . . . . . . . . . . . . . . . 27Maximum Safe Rates of Fertilizer . . . . . . . . . . . . . . . 28Phosphorus (P): Band vs . Broadcast . . . . . . . . . . . . 29Secondary and Micronutrients . . . . . . . . . . . . . . . . . . 30Plant Analysis . . . . . . . . . . . . . . . . . . . . . . . . . . . . . . . . . . . 31Foliar Fertilization . . . . . . . . . . . . . . . . . . . . . . . . . . . . . . . 31
Harvesting and Storage . . . . . . . . . . . . . . . . . . . . . . . . . . . . 31Corn Harvest . . . . . . . . . . . . . . . . . . . . . . . . . . . . . . . . . . . . 31Corn Storage . . . . . . . . . . . . . . . . . . . . . . . . . . . . . . . . . . . . 32
Other Crop Problems . . . . . . . . . . . . . . . . . . . . . . . . . . . . . . . 34Insects and Diseases . . . . . . . . . . . . . . . . . . . . . . . . . . . 34Cold Weather . . . . . . . . . . . . . . . . . . . . . . . . . . . . . . . . . . . 36Heat Stress . . . . . . . . . . . . . . . . . . . . . . . . . . . . . . . . . . . . . 37Hail . . . . . . . . . . . . . . . . . . . . . . . . . . . . . . . . . . . . . . . . . . . . . 37Flooding . . . . . . . . . . . . . . . . . . . . . . . . . . . . . . . . . . . . . . . . . 37Drought . . . . . . . . . . . . . . . . . . . . . . . . . . . . . . . . . . . . . . . . . 39Bird Damage . . . . . . . . . . . . . . . . . . . . . . . . . . . . . . . . . . . . 39
2. SoybeansTillage Options . . . . . . . . . . . . . . . . . . . . . . . . . . . . . . . . . . . . . 41
No-Till and Minimum Tillage . . . . . . . . . . . . . . . . . . . . . 41Managing Crop Residue . . . . . . . . . . . . . . . . . . . . . . . . . 42
Variety Selection . . . . . . . . . . . . . . . . . . . . . . . . . . . . . . . . . . . 44Maturity Group (MG) . . . . . . . . . . . . . . . . . . . . . . . . . . . . 45Hilum Colour . . . . . . . . . . . . . . . . . . . . . . . . . . . . . . . . . . . . 45
Planting and Crop Development . . . . . . . . . . . . . . . . . . . . 47Seed Quality . . . . . . . . . . . . . . . . . . . . . . . . . . . . . . . . . . . . 47Planting Date . . . . . . . . . . . . . . . . . . . . . . . . . . . . . . . . . . . 49Delayed Planting . . . . . . . . . . . . . . . . . . . . . . . . . . . . . . . . 50Row Width and Seeding Equipment . . . . . . . . . . . . . 51Seeding Rates . . . . . . . . . . . . . . . . . . . . . . . . . . . . . . . . . . . 52Seed Treatments . . . . . . . . . . . . . . . . . . . . . . . . . . . . . . . . 54Planting Depth . . . . . . . . . . . . . . . . . . . . . . . . . . . . . . . . . . 54Replant Decisions . . . . . . . . . . . . . . . . . . . . . . . . . . . . . . 56Compensation and Plant Spacing (Gaps) . . . . . . . 56Plant Development . . . . . . . . . . . . . . . . . . . . . . . . . . . . . 57
Fertility Management . . . . . . . . . . . . . . . . . . . . . . . . . . . . . . . 60Nitrogen and Sulphur . . . . . . . . . . . . . . . . . . . . . . . . . . . 60Phosphate and Potash . . . . . . . . . . . . . . . . . . . . . . . . . . 60Methods of Application . . . . . . . . . . . . . . . . . . . . . . . . . 61Plant Analysis . . . . . . . . . . . . . . . . . . . . . . . . . . . . . . . . . . . 62Micronutrients . . . . . . . . . . . . . . . . . . . . . . . . . . . . . . . . . . 62
Harvest and Storage . . . . . . . . . . . . . . . . . . . . . . . . . . . . . . . 62Minimize Harvest Losses . . . . . . . . . . . . . . . . . . . . . . . 62Quality and Identity Preservation (IP) . . . . . . . . . . . . 63Soybean Drying . . . . . . . . . . . . . . . . . . . . . . . . . . . . . . . . . 64
Other Crop Problems . . . . . . . . . . . . . . . . . . . . . . . . . . . . . . . 66Insects and Diseases . . . . . . . . . . . . . . . . . . . . . . . . . . 66Frost and Hail Damage . . . . . . . . . . . . . . . . . . . . . . . . . . 66Late Season Cold Temperature and Frost Injury . . . . . . . . . . . . . . . . . . . . . . . . . . . . . . . . . 68Lightning Damage . . . . . . . . . . . . . . . . . . . . . . . . . . . . . . . 68Mature Green Seed . . . . . . . . . . . . . . . . . . . . . . . . . . . . . 69
xiii
3. ForagesSpecies . . . . . . . . . . . . . . . . . . . . . . . . . . . . . . . . . . . . . . . . . . . . 71
Perennial Legumes . . . . . . . . . . . . . . . . . . . . . . . . . . . . . . 71Perennial Grasses . . . . . . . . . . . . . . . . . . . . . . . . . . . . . . 73Species Selection . . . . . . . . . . . . . . . . . . . . . . . . . . . . . . . 75Annual Forages . . . . . . . . . . . . . . . . . . . . . . . . . . . . . . . . . 78Warm-Season Annual Grasses . . . . . . . . . . . . . . . . . . 79
Establishment (Planting) . . . . . . . . . . . . . . . . . . . . . . . . . . . 82Seedbed Preparation . . . . . . . . . . . . . . . . . . . . . . . . . . . 82Seeding Rates and Depth . . . . . . . . . . . . . . . . . . . . . . . 82Seeding Equipment Options . . . . . . . . . . . . . . . . . . . . 83Direct Seeding or Seeding With a Companion Crop . . . . . . . . . . . . . . . . . . . . . . . . . . . . . . . . 84Seeding Time . . . . . . . . . . . . . . . . . . . . . . . . . . . . . . . . . . . 85Alfalfa Autotoxicity . . . . . . . . . . . . . . . . . . . . . . . . . . . . . . 86Frost Seeding Pastures . . . . . . . . . . . . . . . . . . . . . . . . . 86Inoculation . . . . . . . . . . . . . . . . . . . . . . . . . . . . . . . . . . . . . . 86
Fertility Management . . . . . . . . . . . . . . . . . . . . . . . . . . . . . . 87Nitrogen . . . . . . . . . . . . . . . . . . . . . . . . . . . . . . . . . . . . . . . . . 87Phosphate and Potash . . . . . . . . . . . . . . . . . . . . . . . . . . 87Micronutrients . . . . . . . . . . . . . . . . . . . . . . . . . . . . . . . . . . 89Plant Analysis . . . . . . . . . . . . . . . . . . . . . . . . . . . . . . . . . . . 90Liming . . . . . . . . . . . . . . . . . . . . . . . . . . . . . . . . . . . . . . . . . . . 91
Harvest and Storage . . . . . . . . . . . . . . . . . . . . . . . . . . . . . . . 91Pasture Management . . . . . . . . . . . . . . . . . . . . . . . . . . . 91Forage Quality . . . . . . . . . . . . . . . . . . . . . . . . . . . . . . . . . . . 91Measuring Corn Silage Digestible Energy . . . . . . . 92Forage Harvest Timing . . . . . . . . . . . . . . . . . . . . . . . . . . 92Forage Harvesting Methods . . . . . . . . . . . . . . . . . . . . 93Haylage and Corn Silage . . . . . . . . . . . . . . . . . . . . . . . . 98
Other Crop Problems . . . . . . . . . . . . . . . . . . . . . . . . . . . . . 103Forage Winterkill . . . . . . . . . . . . . . . . . . . . . . . . . . . . . . 105Factors That Affect Winter Survival . . . . . . . . . . . . 105
4. CerealsTillage . . . . . . . . . . . . . . . . . . . . . . . . . . . . . . . . . . . . . . . . . . . . 109
Tillage Options . . . . . . . . . . . . . . . . . . . . . . . . . . . . . . . . 109No-Till Seeding . . . . . . . . . . . . . . . . . . . . . . . . . . . . . . . . 109Conventional Tillage . . . . . . . . . . . . . . . . . . . . . . . . . . . 110Frost Seeding of Spring Cereals . . . . . . . . . . . . . . 110Aerial Seeding Winter Wheat . . . . . . . . . . . . . . . . . . 111Broadcast Seeding . . . . . . . . . . . . . . . . . . . . . . . . . . . . 111
Variety Selection . . . . . . . . . . . . . . . . . . . . . . . . . . . . . . . . . 111Harvest Sprout Tolerance . . . . . . . . . . . . . . . . . . . . . 112Winter Hardiness and Cold Tolerance . . . . . . . . . 112Factors Unique to Cereal Crops . . . . . . . . . . . . . . . 112Cereal Species . . . . . . . . . . . . . . . . . . . . . . . . . . . . . . . . 113Biotechnology and Cereal Crops . . . . . . . . . . . . . . 116
Planting and Crop Development . . . . . . . . . . . . . . . . . . 117Depth of Seeding . . . . . . . . . . . . . . . . . . . . . . . . . . . . . 117Cereal Development . . . . . . . . . . . . . . . . . . . . . . . . . . 118Planting Dates . . . . . . . . . . . . . . . . . . . . . . . . . . . . . . . . 119Replanting . . . . . . . . . . . . . . . . . . . . . . . . . . . . . . . . . . . . 121Seeding Rates . . . . . . . . . . . . . . . . . . . . . . . . . . . . . . . . 121
Row Widths . . . . . . . . . . . . . . . . . . . . . . . . . . . . . . . . . . . 123Crop Rotation for Winter Wheat . . . . . . . . . . . . . . 123
Additional Management Opportunities . . . . . . . . . . . 124Growth Regulators . . . . . . . . . . . . . . . . . . . . . . . . . . . . 124Fungicides . . . . . . . . . . . . . . . . . . . . . . . . . . . . . . . . . . . . 124Fusarium Head Blight . . . . . . . . . . . . . . . . . . . . . . . . . 125Spraying Basics: Fusarium Control in Wheat . . . . . . . . . . . . . . . . . . . . . . . . . . . . . . . . . . . . . . 125Maximize Spray Coverage of Wheat Heads . . . 125
Fertility Management . . . . . . . . . . . . . . . . . . . . . . . . . . . . . 127Nitrogen . . . . . . . . . . . . . . . . . . . . . . . . . . . . . . . . . . . . . . . 127Phosphate and Potash . . . . . . . . . . . . . . . . . . . . . . . . 131Corn Row Syndrome . . . . . . . . . . . . . . . . . . . . . . . . . . 132Plant Analysis . . . . . . . . . . . . . . . . . . . . . . . . . . . . . . . . . 134Micronutrients . . . . . . . . . . . . . . . . . . . . . . . . . . . . . . . . 135
Harvest and Storage . . . . . . . . . . . . . . . . . . . . . . . . . . . . . 136Optimizing Combine Adjustments . . . . . . . . . . . . . 136Fusarium-Damaged Grain . . . . . . . . . . . . . . . . . . . . . 136Lodged Grain Crops . . . . . . . . . . . . . . . . . . . . . . . . . . . 137Bunt-Infected Wheat . . . . . . . . . . . . . . . . . . . . . . . . . . 137
Drying and Storing Wheat . . . . . . . . . . . . . . . . . . . . . . . . 138Drying Systems . . . . . . . . . . . . . . . . . . . . . . . . . . . . . . . 138
Other Crop Problems . . . . . . . . . . . . . . . . . . . . . . . . . . . . . 140Insects and Diseases . . . . . . . . . . . . . . . . . . . . . . . . 140Winterkill . . . . . . . . . . . . . . . . . . . . . . . . . . . . . . . . . . . . . . 140Frost Heaving . . . . . . . . . . . . . . . . . . . . . . . . . . . . . . . . . 142Ice . . . . . . . . . . . . . . . . . . . . . . . . . . . . . . . . . . . . . . . . . . . . 142Cold Injury . . . . . . . . . . . . . . . . . . . . . . . . . . . . . . . . . . . . 142
5. Dry Edible BeansTillage Options . . . . . . . . . . . . . . . . . . . . . . . . . . . . . . . . . . . 143
Site Selection and Crop Rotation . . . . . . . . . . . . . 143Soil Type and Structure . . . . . . . . . . . . . . . . . . . . . . . 143Disease History . . . . . . . . . . . . . . . . . . . . . . . . . . . . . . . 144Weed Control . . . . . . . . . . . . . . . . . . . . . . . . . . . . . . . . . 144
Variety Selection . . . . . . . . . . . . . . . . . . . . . . . . . . . . . . . . . 144Planting . . . . . . . . . . . . . . . . . . . . . . . . . . . . . . . . . . . . . . . . . . 145
Seed Quality . . . . . . . . . . . . . . . . . . . . . . . . . . . . . . . . . . 145Planting Date . . . . . . . . . . . . . . . . . . . . . . . . . . . . . . . . . 145Seeding Rates . . . . . . . . . . . . . . . . . . . . . . . . . . . . . . . . 146Seeding Depth . . . . . . . . . . . . . . . . . . . . . . . . . . . . . . . . 147Row Width . . . . . . . . . . . . . . . . . . . . . . . . . . . . . . . . . . . . 147Inoculation . . . . . . . . . . . . . . . . . . . . . . . . . . . . . . . . . . . . 147Dealing with Soil Crusting . . . . . . . . . . . . . . . . . . . . . 147Stand Assessment and Replant Decisions . . . 148Plant Development . . . . . . . . . . . . . . . . . . . . . . . . . . . . 148
Fertility Management . . . . . . . . . . . . . . . . . . . . . . . . . . . . . 149Nitrogen . . . . . . . . . . . . . . . . . . . . . . . . . . . . . . . . . . . . . . . 149Phosphate and Potash . . . . . . . . . . . . . . . . . . . . . . . 150Plant Analysis . . . . . . . . . . . . . . . . . . . . . . . . . . . . . . . . . 151Micronutrients . . . . . . . . . . . . . . . . . . . . . . . . . . . . . . . . 151
Harvest and Storage . . . . . . . . . . . . . . . . . . . . . . . . . . . . . 152Dockage and Pick . . . . . . . . . . . . . . . . . . . . . . . . . . . . . 152Pulling, Windrowing, Combining . . . . . . . . . . . . . . . 152
xiv
Agronomy guide for field Crops
Direct Combining . . . . . . . . . . . . . . . . . . . . . . . . . . . . . . 152Quality Preservation at Harvest . . . . . . . . . . . . . . . 153
Other Crop Problems . . . . . . . . . . . . . . . . . . . . . . . . . . . . . 153Insects and Diseases . . . . . . . . . . . . . . . . . . . . . . . . . 153Frost and Hail Damage . . . . . . . . . . . . . . . . . . . . . . . . 154Bald Heads . . . . . . . . . . . . . . . . . . . . . . . . . . . . . . . . . . . 154Soil Compaction and Soil Structure . . . . . . . . . . . 154Sunscald and Bronzing . . . . . . . . . . . . . . . . . . . . . . . 156
6. Spring and Winter CanolaTillage Options . . . . . . . . . . . . . . . . . . . . . . . . . . . . . . . . . . . 157
Conventional Tillage . . . . . . . . . . . . . . . . . . . . . . . . . . . 157Reduced Tillage and No-Till . . . . . . . . . . . . . . . . . . . 157Site Selection and Crop Rotation . . . . . . . . . . . . . 157
Variety Selection . . . . . . . . . . . . . . . . . . . . . . . . . . . . . . . . . 158Planting . . . . . . . . . . . . . . . . . . . . . . . . . . . . . . . . . . . . . . . . . . 158
Seed Quality . . . . . . . . . . . . . . . . . . . . . . . . . . . . . . . . . . 158Seed Treatments . . . . . . . . . . . . . . . . . . . . . . . . . . . . . . 159Winter Canola Seeding . . . . . . . . . . . . . . . . . . . . . . . . 159Spring Canola Seeding . . . . . . . . . . . . . . . . . . . . . . . 159Seeding Conditions . . . . . . . . . . . . . . . . . . . . . . . . . . . 160Seeding Rate . . . . . . . . . . . . . . . . . . . . . . . . . . . . . . . . . 160Checking Conventional Drill Calibration . . . . . . . 161Seed Bulking . . . . . . . . . . . . . . . . . . . . . . . . . . . . . . . . . . 162Seeding Depth . . . . . . . . . . . . . . . . . . . . . . . . . . . . . . . . 162Packing . . . . . . . . . . . . . . . . . . . . . . . . . . . . . . . . . . . . . . . 162Assessing Canola Stands and Replant Decisions . . . . . . . . . . . . . . . . . . . . . . . . . . . . 162Crop Development . . . . . . . . . . . . . . . . . . . . . . . . . . . . 163
Fertility Management . . . . . . . . . . . . . . . . . . . . . . . . . . . . . 165Placement and Timing . . . . . . . . . . . . . . . . . . . . . . . . 165Nitrogen . . . . . . . . . . . . . . . . . . . . . . . . . . . . . . . . . . . . . . . 165Phosphate and Potash . . . . . . . . . . . . . . . . . . . . . . . . 166Phosphorus (P) Requirements . . . . . . . . . . . . . . . . 166Maximum Safe Rates of Seed-Placed Nutrients for Canola . . . . . . . . . . . . . . . . . . . . . . . . . . 167Sulphur . . . . . . . . . . . . . . . . . . . . . . . . . . . . . . . . . . . . . . . 167Boron . . . . . . . . . . . . . . . . . . . . . . . . . . . . . . . . . . . . . . . . . 167Plant Analysis . . . . . . . . . . . . . . . . . . . . . . . . . . . . . . . . . 167Harvest and Storage . . . . . . . . . . . . . . . . . . . . . . . . . . 168Direct Harvest . . . . . . . . . . . . . . . . . . . . . . . . . . . . . . . . 168Swathing . . . . . . . . . . . . . . . . . . . . . . . . . . . . . . . . . . . . . . 168Pre-Harvest Herbicides to Assist Canola Harvest . . . . . . . . . . . . . . . . . . . . . . . . . . . . . . . 169Combining Canola . . . . . . . . . . . . . . . . . . . . . . . . . . . . 169Storage of Canola . . . . . . . . . . . . . . . . . . . . . . . . . . . . . 169
Other Crop Problems . . . . . . . . . . . . . . . . . . . . . . . . . . . . . 170Insects and Diseases . . . . . . . . . . . . . . . . . . . . . . . . . 170Frost . . . . . . . . . . . . . . . . . . . . . . . . . . . . . . . . . . . . . . . . . . 170Hail Damage . . . . . . . . . . . . . . . . . . . . . . . . . . . . . . . . . . 171Brown Seed (Heat Damaged) . . . . . . . . . . . . . . . . . 171Temperature Stress (Heat Blast) . . . . . . . . . . . . . 171
Green Seed . . . . . . . . . . . . . . . . . . . . . . . . . . . . . . . . . . 172Winterkill . . . . . . . . . . . . . . . . . . . . . . . . . . . . . . . . . . . . . . 172Cross-Pollination . . . . . . . . . . . . . . . . . . . . . . . . . . . . . . 172
7. Other CropsBuckwheat . . . . . . . . . . . . . . . . . . . . . . . . . . . . . . . . . . . . . . . 173
Production Requirements . . . . . . . . . . . . . . . . . . . . . 173Tillage Options and Seedbed Preparation . . . . . 173Variety Selection . . . . . . . . . . . . . . . . . . . . . . . . . . . . . . 174Planting . . . . . . . . . . . . . . . . . . . . . . . . . . . . . . . . . . . . . . . 174Fertility Management . . . . . . . . . . . . . . . . . . . . . . . . . . 174Harvest and Storage . . . . . . . . . . . . . . . . . . . . . . . . . . 175Weed Control . . . . . . . . . . . . . . . . . . . . . . . . . . . . . . . . . 176Insects and Diseases . . . . . . . . . . . . . . . . . . . . . . . . . 176
Camelina . . . . . . . . . . . . . . . . . . . . . . . . . . . . . . . . . . . . . . . . . 176Production Requirements . . . . . . . . . . . . . . . . . . . . . 176Planting . . . . . . . . . . . . . . . . . . . . . . . . . . . . . . . . . . . . . . . 176Fertility Management . . . . . . . . . . . . . . . . . . . . . . . . . . 176Harvest and Storage . . . . . . . . . . . . . . . . . . . . . . . . . . 177Insects and Diseases . . . . . . . . . . . . . . . . . . . . . . . . . 177
Flax . . . . . . . . . . . . . . . . . . . . . . . . . . . . . . . . . . . . . . . . . . . . . . 177Production Requirements . . . . . . . . . . . . . . . . . . . . . 177Tillage and Seedbed Preparation . . . . . . . . . . . . . . 177Variety Selection . . . . . . . . . . . . . . . . . . . . . . . . . . . . . . 177Planting . . . . . . . . . . . . . . . . . . . . . . . . . . . . . . . . . . . . . . . 177Crop Development . . . . . . . . . . . . . . . . . . . . . . . . . . . . 178Fertility Management . . . . . . . . . . . . . . . . . . . . . . . . . . 178Harvest and Storage . . . . . . . . . . . . . . . . . . . . . . . . . . 178Straw Removal . . . . . . . . . . . . . . . . . . . . . . . . . . . . . . . . 178Weed Control . . . . . . . . . . . . . . . . . . . . . . . . . . . . . . . . . 178Insects and Diseases . . . . . . . . . . . . . . . . . . . . . . . . . 179
Hemp . . . . . . . . . . . . . . . . . . . . . . . . . . . . . . . . . . . . . . . . . . . . . 179Production Requirements . . . . . . . . . . . . . . . . . . . . . 179Description . . . . . . . . . . . . . . . . . . . . . . . . . . . . . . . . . . . . 179Soil Conditions . . . . . . . . . . . . . . . . . . . . . . . . . . . . . . . 179Tillage and Seedbed Preparation . . . . . . . . . . . . . . 179Planting . . . . . . . . . . . . . . . . . . . . . . . . . . . . . . . . . . . . . . . 179Fertility Management . . . . . . . . . . . . . . . . . . . . . . . . . . 180Weed Control . . . . . . . . . . . . . . . . . . . . . . . . . . . . . . . . . 180Harvest and Storage . . . . . . . . . . . . . . . . . . . . . . . . . . 180Retting and Turning . . . . . . . . . . . . . . . . . . . . . . . . . . . 180Baling and Storing . . . . . . . . . . . . . . . . . . . . . . . . . . . . 181Insects and Diseases . . . . . . . . . . . . . . . . . . . . . . . . . 181
Miscanthus . . . . . . . . . . . . . . . . . . . . . . . . . . . . . . . . . . . . . . 181Production Requirements . . . . . . . . . . . . . . . . . . . . . 181Variety Selection . . . . . . . . . . . . . . . . . . . . . . . . . . . . . . 181Planting . . . . . . . . . . . . . . . . . . . . . . . . . . . . . . . . . . . . . . . 182Fertility Management . . . . . . . . . . . . . . . . . . . . . . . . . . 182Harvest and Storage . . . . . . . . . . . . . . . . . . . . . . . . . . 182Weed Control . . . . . . . . . . . . . . . . . . . . . . . . . . . . . . . . . 183Insects and Diseases . . . . . . . . . . . . . . . . . . . . . . . . . 183
Quinoa . . . . . . . . . . . . . . . . . . . . . . . . . . . . . . . . . . . . . . . . . . . 183
xv
contents
Production Requirements . . . . . . . . . . . . . . . . . . . . . 183Planting . . . . . . . . . . . . . . . . . . . . . . . . . . . . . . . . . . . . . . . 183Fertility Management . . . . . . . . . . . . . . . . . . . . . . . . . . 183Harvest and Storage . . . . . . . . . . . . . . . . . . . . . . . . . . 184Pest Management . . . . . . . . . . . . . . . . . . . . . . . . . . . . 184Weeds . . . . . . . . . . . . . . . . . . . . . . . . . . . . . . . . . . . . . . . . 184Insects and Diseases . . . . . . . . . . . . . . . . . . . . . . . . . 184
Sunflower . . . . . . . . . . . . . . . . . . . . . . . . . . . . . . . . . . . . . . . . 184Production Requirements . . . . . . . . . . . . . . . . . . . . . 184Variety Selection . . . . . . . . . . . . . . . . . . . . . . . . . . . . . . 185Rotation . . . . . . . . . . . . . . . . . . . . . . . . . . . . . . . . . . . . . . . 185Tillage and Seedbed Preparation . . . . . . . . . . . . . . 185Planting . . . . . . . . . . . . . . . . . . . . . . . . . . . . . . . . . . . . . . . 185Fertility Management . . . . . . . . . . . . . . . . . . . . . . . . . 185Harvest and Storage . . . . . . . . . . . . . . . . . . . . . . . . . . 186Weed Control . . . . . . . . . . . . . . . . . . . . . . . . . . . . . . . . . 187Insects and Diseases . . . . . . . . . . . . . . . . . . . . . . . . . 187
Switchgrass . . . . . . . . . . . . . . . . . . . . . . . . . . . . . . . . . . . . . . 187Production Requirements . . . . . . . . . . . . . . . . . . . . . 187Rotation . . . . . . . . . . . . . . . . . . . . . . . . . . . . . . . . . . . . . . . 187Tillage and Seedbed Preparation . . . . . . . . . . . . . . 188Planting . . . . . . . . . . . . . . . . . . . . . . . . . . . . . . . . . . . . . . . 188Fertility Management . . . . . . . . . . . . . . . . . . . . . . . . . . 188Harvest and Storage . . . . . . . . . . . . . . . . . . . . . . . . . . 189Insects and Diseases . . . . . . . . . . . . . . . . . . . . . . . . . 189Weed Control . . . . . . . . . . . . . . . . . . . . . . . . . . . . . . . . . . 189Other Biomass Crops . . . . . . . . . . . . . . . . . . . . . . . . . 189
8. Managing for Healthy Soils Healthy Soils are Productive Soils . . . . . . . . . . . . 191Good Soil Management . . . . . . . . . . . . . . . . . . . . . . . 191Building a Healthy Soil . . . . . . . . . . . . . . . . . . . . . . . . 192Crop Rotation . . . . . . . . . . . . . . . . . . . . . . . . . . . . . . . . . 192Crop Rotation Provides Yield Stability in Adverse Years . . . . . . . . . . . . . . . . . . . . . . . . . . . . . . 194Crop Rotation Increases Soil Organic Matter . . . . . . . . . . . . . . . . . . . . . . . . . . . . . . . . 195Crop Rotation Increases Productivity and Nutrient Cycling . . . . . . . . . . . . . . . . . . . . . . . . . . 195Cover Crops . . . . . . . . . . . . . . . . . . . . . . . . . . . . . . . . . . . 195Choosing a Cover Crop . . . . . . . . . . . . . . . . . . . . . . . . 196Characteristics of Cover Crops . . . . . . . . . . . . . . . . 197Reducing Tillage . . . . . . . . . . . . . . . . . . . . . . . . . . . . . . 200Fertility Management . . . . . . . . . . . . . . . . . . . . . . . . . . 201Applying Organic Materials (Residues) to the Land . . . . . . . . . . . . . . . . . . . . . . . . . . . . . . . . . . . 202Preventing Soil Degradation . . . . . . . . . . . . . . . . . . . 205Soil Compaction . . . . . . . . . . . . . . . . . . . . . . . . . . . . . . 206Soil Health: Measure to Manage . . . . . . . . . . . . . . 207Soil Health Check . . . . . . . . . . . . . . . . . . . . . . . . . . . . . 207The Foundations of Soil Management . . . . . . . . 210Soil Life . . . . . . . . . . . . . . . . . . . . . . . . . . . . . . . . . . . . . . . 211Soil Structure . . . . . . . . . . . . . . . . . . . . . . . . . . . . . . . . . 211Granular . . . . . . . . . . . . . . . . . . . . . . . . . . . . . . . . . . . . . . 211
Platy . . . . . . . . . . . . . . . . . . . . . . . . . . . . . . . . . . . . . . . . . . 211Blocky . . . . . . . . . . . . . . . . . . . . . . . . . . . . . . . . . . . . . . . . . 212Columnar or prismatic . . . . . . . . . . . . . . . . . . . . . . . . 212Structureless . . . . . . . . . . . . . . . . . . . . . . . . . . . . . . . . . 212Aggregate Stability . . . . . . . . . . . . . . . . . . . . . . . . . . . . 213
Soil Quality and Soil Genesis . . . . . . . . . . . . . . . . . . . . 213Soil Quality . . . . . . . . . . . . . . . . . . . . . . . . . . . . . . . . . . . . 213Soil Formation . . . . . . . . . . . . . . . . . . . . . . . . . . . . . . . . 213Soil Variability . . . . . . . . . . . . . . . . . . . . . . . . . . . . . . . . 213
9. Soil Fertility and Nutrient UsePrinciples for Optimum Management of Nutrients . . . . . . . . . . . . . . . . . . . . . . . . . . . . . . . . . . . . . . 215Soil Testing . . . . . . . . . . . . . . . . . . . . . . . . . . . . . . . . . . . . . . . 215
Other Methods of Assessing Nutrient Needs . . . . . . . . . . . . . . . . . . . . . . . . . . . . . . . . 215The OMAFRA-Accredited Soil-Testing Program . . . . . . . . . . . . . . . . . . . . . . . . . . . . . . . . . . . . . . 215Technology Options for Soil Testing . . . . . . . . . . . 216Geo-Referenced and Directed Sampling . . . . . . 217Defining Soil Sampling Zones (i .e ., management zones) . . . . . . . . . . . . . . . . . . . . . 218Using the Soil Test Results . . . . . . . . . . . . . . . . . . . 219How Often to Sample . . . . . . . . . . . . . . . . . . . . . . . . . 219Time of Year . . . . . . . . . . . . . . . . . . . . . . . . . . . . . . . . . . 219Micronutrient Tests . . . . . . . . . . . . . . . . . . . . . . . . . . . 220Plant Analysis . . . . . . . . . . . . . . . . . . . . . . . . . . . . . . . . . 220
Fertilizer Guidelines . . . . . . . . . . . . . . . . . . . . . . . . . . . . . . 220Soil Acidity and Liming . . . . . . . . . . . . . . . . . . . . . . . . 220Limestone Quality . . . . . . . . . . . . . . . . . . . . . . . . . . . . . 221Magnesium . . . . . . . . . . . . . . . . . . . . . . . . . . . . . . . . . . . 224Calcium . . . . . . . . . . . . . . . . . . . . . . . . . . . . . . . . . . . . . . . 225Sulphur . . . . . . . . . . . . . . . . . . . . . . . . . . . . . . . . . . . . . . . 225
Micronutrient Fertilizers . . . . . . . . . . . . . . . . . . . . . . . . . . 225Manganese . . . . . . . . . . . . . . . . . . . . . . . . . . . . . . . . . . . 225Zinc . . . . . . . . . . . . . . . . . . . . . . . . . . . . . . . . . . . . . . . . . . . 226Copper . . . . . . . . . . . . . . . . . . . . . . . . . . . . . . . . . . . . . . . . 226Boron . . . . . . . . . . . . . . . . . . . . . . . . . . . . . . . . . . . . . . . . . 226Iron and Molybdenum . . . . . . . . . . . . . . . . . . . . . . . . . 226
Adjustments to Fertilizer Guidelines . . . . . . . . . . . . . . 227Adjustment for Legumes Plowed Down . . . . . . . . 227Adjustments for Manure Application . . . . . . . . . . 227
Manure Management . . . . . . . . . . . . . . . . . . . . . . . . . . . . 230The Value of Manure . . . . . . . . . . . . . . . . . . . . . . . . . . 230Nutrient Management Plans . . . . . . . . . . . . . . . . . . 230
Availability of Manure Nitrogen to Crops . . . . . . . . . 230Manure Analysis . . . . . . . . . . . . . . . . . . . . . . . . . . . . . . 233Long-Term Value of Manure . . . . . . . . . . . . . . . . . . . 237Crop Requirements . . . . . . . . . . . . . . . . . . . . . . . . . . . 237Environmental Concerns With Manure . . . . . . . . 239Nitrogen Risk Mitigation . . . . . . . . . . . . . . . . . . . . . . 240Phosphorus Risk Assessment . . . . . . . . . . . . . . . . 240Manure and No-Till . . . . . . . . . . . . . . . . . . . . . . . . . . . . 241Calibrating Application Equipment . . . . . . . . . . . . 241
xvi
Agronomy guide for field Crops
Use of Non-Agricultural Sourced Materials on Agricultural Land . . . . . . . . . . . . . . . . . . . . . . . . . . . . . . 242Fertilizer Materials . . . . . . . . . . . . . . . . . . . . . . . . . . . . . . . 243
Soluble Salts in Farm Soils . . . . . . . . . . . . . . . . . . . 244Foliar Fertilizers . . . . . . . . . . . . . . . . . . . . . . . . . . . . . . . 247Calculating Fertilizer Requirements . . . . . . . . . . . 247Citations . . . . . . . . . . . . . . . . . . . . . . . . . . . . . . . . . . . . . . 248
10. Field ScoutingField Scouting . . . . . . . . . . . . . . . . . . . . . . . . . . . . . . . . . . . . 249
Traditional Field Scouting . . . . . . . . . . . . . . . . . . . . . 249Timing of Field Scouting Operations . . . . . . . . . . 249Scouting Tools and Techniques . . . . . . . . . . . . . . . 250New Tools for Field Scouting . . . . . . . . . . . . . . . . . . 250Scouting for Insects . . . . . . . . . . . . . . . . . . . . . . . . . . . 251Using a Drop Cloth . . . . . . . . . . . . . . . . . . . . . . . . . . . . 251Using an Insect Trap . . . . . . . . . . . . . . . . . . . . . . . . . . 251Using Sweep Nets . . . . . . . . . . . . . . . . . . . . . . . . . . . . 251Number of Sampling Locations . . . . . . . . . . . . . . . 251Scouting Pattern . . . . . . . . . . . . . . . . . . . . . . . . . . . . . . 252Plant Population and Pest Infestation Levels . . . . . . . . . . . . . . . . . . . . . . . . . . . . . . . . . . . . . . . . . 253Recording Field Observations . . . . . . . . . . . . . . . . . 254Sample Handling and Submission . . . . . . . . . . . . 254
Using Growing Degree Days and Crop Heat Units . . . . . . . . . . . . . . . . . . . . . . . . . . . . . . . . . . . . . . . . . . 254
Growing Degree Days . . . . . . . . . . . . . . . . . . . . . . . . .254Crop Heat Units (CHU) . . . . . . . . . . . . . . . . . . . . . . . . 255Calculating Daily CHU . . . . . . . . . . . . . . . . . . . . . . . . . 256Mapping Tools . . . . . . . . . . . . . . . . . . . . . . . . . . . . . . . . 256
11. Precision AgriculturePrecision Tools . . . . . . . . . . . . . . . . . . . . . . . . . . . . . . . . . . . 259
Real Time Kinematic (RTK) and Global Positioning Systems (GPS) . . . . . . . . . . . . . . . . . . . . 259Applications for Precision Agriculture . . . . . . . . . 259Variable Rate Application . . . . . . . . . . . . . . . . . . . . . 260Technology Challenges . . . . . . . . . . . . . . . . . . . . . . . . 261Real-Time Management . . . . . . . . . . . . . . . . . . . . . . . 261Remote Sensing . . . . . . . . . . . . . . . . . . . . . . . . . . . . . . 261Unmanned Aerial Vehicles / Unmanned Aerial Systems . . . . . . . . . . . . . . . . . . . . . . . . . . . . . . . . 261
12. On-Farm Stored Grain ManagementStoring Grain in Bins . . . . . . . . . . . . . . . . . . . . . . . . . . . . . 265
Good Bin Management Suggestions . . . . . . . . . . 265Grain Storage Monitoring . . . . . . . . . . . . . . . . . . . . . 266
Insect Management for Farm-Stored Grain . . . . . . . 267Keep a Clean Facility . . . . . . . . . . . . . . . . . . . . . . . . . . 267Maintain Sound Storage Facilities . . . . . . . . . . . . 267Store Clean, Dry Grain . . . . . . . . . . . . . . . . . . . . . . . . 267Monitor Storage Temperature and Sample for Insects . . . . . . . . . . . . . . . . . . . . . . . . . . . . . . . . . . . . 267Identify Pests Properly . . . . . . . . . . . . . . . . . . . . . . . . 268
Stored-Grain Insects . . . . . . . . . . . . . . . . . . . . . . . . . . . . . 268Scouting Technique for Stored-Grain Insects . . 268
13. Weed ControlCrop Yield Losses Due to Weeds . . . . . . . . . . . . . . . . 273
Integrated Weed Management Strategies . . . . . 273Crop Competitiveness Against Weeds . . . . . . . . 276Mechanical Weed Control . . . . . . . . . . . . . . . . . . . . . 278Herbicide Resistance . . . . . . . . . . . . . . . . . . . . . . . . . 279Herbicide Injury . . . . . . . . . . . . . . . . . . . . . . . . . . . . . . . 279Injury Symptoms at Various Plant Locations Caused by Different Herbicide Families . . . . . . . 280Bibliography and Citations . . . . . . . . . . . . . . . . . . . . 290
14. Integrated Pest Management and Protecting Natural Enemies and Pollinators
Integrated Pest Management . . . . . . . . . . . . . . . . . . . . 293Promoting and Protecting Natural Enemies . . . . 294Predators . . . . . . . . . . . . . . . . . . . . . . . . . . . . . . . . . . . . . 295Vertebrates . . . . . . . . . . . . . . . . . . . . . . . . . . . . . . . . . . . 297Parasitoids . . . . . . . . . . . . . . . . . . . . . . . . . . . . . . . . . . . . 297Pathogens . . . . . . . . . . . . . . . . . . . . . . . . . . . . . . . . . . . . 298Protecting Pollinators and Beneficials . . . . . . . . . 299Related Information . . . . . . . . . . . . . . . . . . . . . . . . . . . 300
15. Insects and Pests of Field CropsSoil Insects and Pests of Field Crops . . . . . . . . . 301Grub Species That impact Field Crops . . . . . . . . 303
Corn Insects and Pests . . . . . . . . . . . . . . . . . . . . . . . . . . 311Below Ground Corn Pests . . . . . . . . . . . . . . . . . . . . . 312Above Ground Corn Pests . . . . . . . . . . . . . . . . . . . . . 312Stink Bugs . . . . . . . . . . . . . . . . . . . . . . . . . . . . . . . . . . . . 316Ear Feeding Insects . . . . . . . . . . . . . . . . . . . . . . . . . . . 322
Soybean Insects and Pests . . . . . . . . . . . . . . . . . . . . . . 326Below Ground Soybean Pests . . . . . . . . . . . . . . . . . 327Above Ground Soybean Pests . . . . . . . . . . . . . . . . . 327Assessing Defoliation in Soybeans . . . . . . . . . . . 333Pod-Feeding Insects . . . . . . . . . . . . . . . . . . . . . . . . . . . 334
Forage Insects and Pests . . . . . . . . . . . . . . . . . . . . . . . . 336Below Ground Forage Pests . . . . . . . . . . . . . . . . . . . 337Above Ground Forage Pests . . . . . . . . . . . . . . . . . . . 338Cereal Insects and Pests . . . . . . . . . . . . . . . . . . . . . 343Below Ground Cereal Pests . . . . . . . . . . . . . . . . . . . 344Above Ground Cereal Pests . . . . . . . . . . . . . . . . . . . 344Head And Stem Cereal Pests . . . . . . . . . . . . . . . . . 347Dry Edible Bean Insects and Pests . . . . . . . . . . . 349Below-Ground Dry Edible Bean Pests . . . . . . . . . 349Above-Ground Dry Edible Bean Pests . . . . . . . . . 349Assessing Defoliation in Dry Edible Beans . . . . 350Pod-Feeding Insects . . . . . . . . . . . . . . . . . . . . . . . . . . . 351Canola Insects and Pests . . . . . . . . . . . . . . . . . . . . . 353Below Ground Canola Pests . . . . . . . . . . . . . . . . . . . 354Above Ground Canola Pests . . . . . . . . . . . . . . . . . . 354Pod-Feeding Insect . . . . . . . . . . . . . . . . . . . . . . . . . . . . 357Tarnished Plant Bug . . . . . . . . . . . . . . . . . . . . . . . . . . . 359
xvii
contents
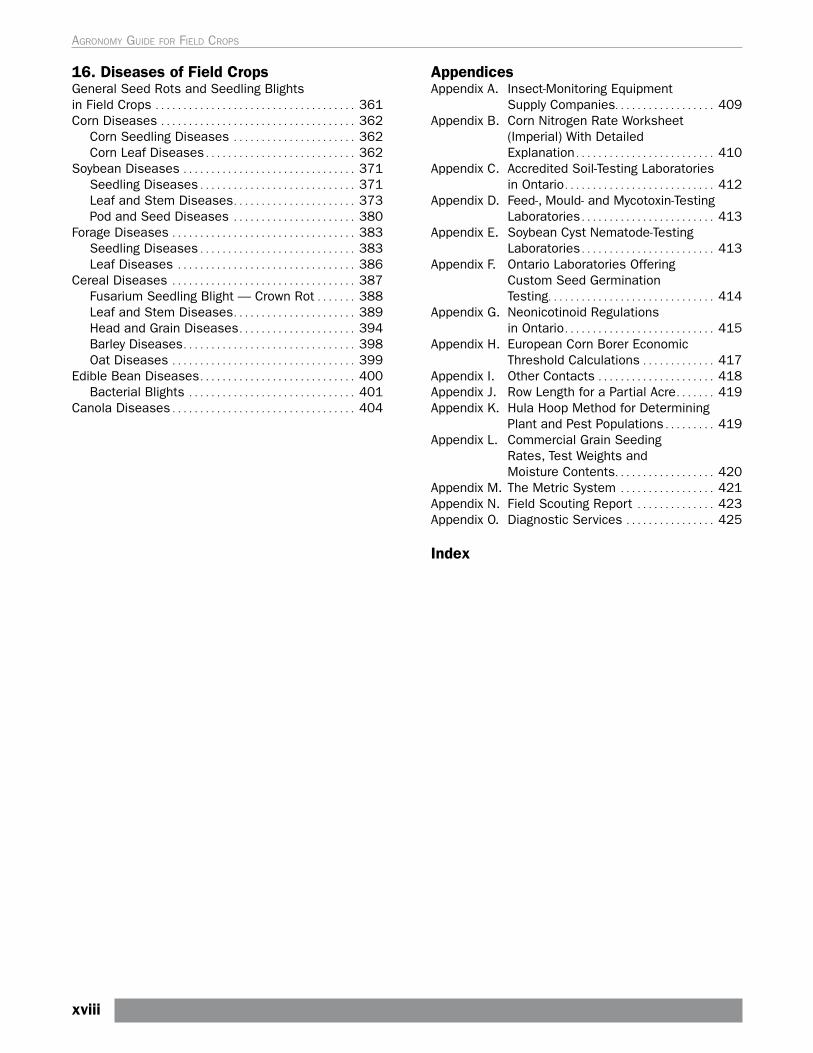
16. Diseases of Field CropsGeneral Seed Rots and Seedling Blights in Field Crops . . . . . . . . . . . . . . . . . . . . . . . . . . . . . . . . . . . . 361Corn Diseases . . . . . . . . . . . . . . . . . . . . . . . . . . . . . . . . . . . 362
Corn Seedling Diseases . . . . . . . . . . . . . . . . . . . . . . 362Corn Leaf Diseases . . . . . . . . . . . . . . . . . . . . . . . . . . . 362
Soybean Diseases . . . . . . . . . . . . . . . . . . . . . . . . . . . . . . . 371Seedling Diseases . . . . . . . . . . . . . . . . . . . . . . . . . . . . 371Leaf and Stem Diseases . . . . . . . . . . . . . . . . . . . . . . 373Pod and Seed Diseases . . . . . . . . . . . . . . . . . . . . . . 380
Forage Diseases . . . . . . . . . . . . . . . . . . . . . . . . . . . . . . . . . 383Seedling Diseases . . . . . . . . . . . . . . . . . . . . . . . . . . . . 383Leaf Diseases . . . . . . . . . . . . . . . . . . . . . . . . . . . . . . . . 386
Cereal Diseases . . . . . . . . . . . . . . . . . . . . . . . . . . . . . . . . . 387Fusarium Seedling Blight — Crown Rot . . . . . . . 388Leaf and Stem Diseases . . . . . . . . . . . . . . . . . . . . . . 389Head and Grain Diseases . . . . . . . . . . . . . . . . . . . . . 394Barley Diseases . . . . . . . . . . . . . . . . . . . . . . . . . . . . . . . 398Oat Diseases . . . . . . . . . . . . . . . . . . . . . . . . . . . . . . . . . 399
Edible Bean Diseases . . . . . . . . . . . . . . . . . . . . . . . . . . . . 400Bacterial Blights . . . . . . . . . . . . . . . . . . . . . . . . . . . . . . 401
Canola Diseases . . . . . . . . . . . . . . . . . . . . . . . . . . . . . . . . . 404
AppendicesAppendix A . Insect-Monitoring Equipment
Supply Companies . . . . . . . . . . . . . . . . . . 409Appendix B . Corn Nitrogen Rate Worksheet
(Imperial) With Detailed Explanation . . . . . . . . . . . . . . . . . . . . . . . . . 410
Appendix C . Accredited Soil-Testing Laboratories in Ontario . . . . . . . . . . . . . . . . . . . . . . . . . . . 412
Appendix D . Feed-, Mould- and Mycotoxin-Testing Laboratories . . . . . . . . . . . . . . . . . . . . . . . . 413
Appendix E . Soybean Cyst Nematode-Testing Laboratories . . . . . . . . . . . . . . . . . . . . . . . . 413
Appendix F . Ontario Laboratories Offering Custom Seed Germination Testing . . . . . . . . . . . . . . . . . . . . . . . . . . . . . . 414
Appendix G . Neonicotinoid Regulations in Ontario . . . . . . . . . . . . . . . . . . . . . . . . . . . 415
Appendix H . European Corn Borer Economic Threshold Calculations . . . . . . . . . . . . . 417
Appendix I . Other Contacts . . . . . . . . . . . . . . . . . . . . . 418Appendix J . Row Length for a Partial Acre . . . . . . . 419Appendix K . Hula Hoop Method for Determining
Plant and Pest Populations . . . . . . . . . 419Appendix L . Commercial Grain Seeding
Rates, Test Weights and Moisture Contents . . . . . . . . . . . . . . . . . . 420
Appendix M . The Metric System . . . . . . . . . . . . . . . . . 421Appendix N . Field Scouting Report . . . . . . . . . . . . . . 423Appendix O . Diagnostic Services . . . . . . . . . . . . . . . . 425
Index
xviii
Agronomy guide for field Crops
Tables
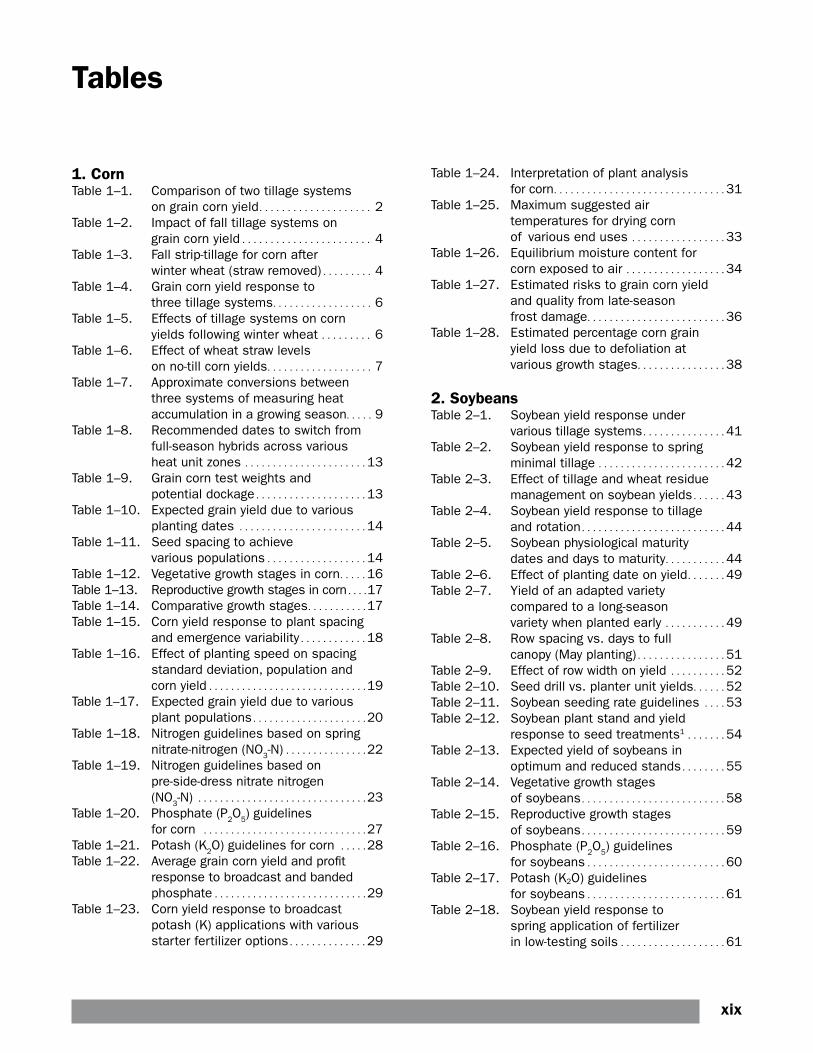
1. CornTable 1–1 . Comparison of two tillage systems
on grain corn yield . . . . . . . . . . . . . . . . . . . . 2Table 1–2 . Impact of fall tillage systems on
grain corn yield . . . . . . . . . . . . . . . . . . . . . . . 4Table 1–3 . Fall strip-tillage for corn after
winter wheat (straw removed) . . . . . . . . . 4Table 1–4 . Grain corn yield response to
three tillage systems . . . . . . . . . . . . . . . . . . 6Table 1–5 . Effects of tillage systems on corn
yields following winter wheat . . . . . . . . . 6Table 1–6 . Effect of wheat straw levels
on no-till corn yields . . . . . . . . . . . . . . . . . . . 7Table 1–7 . Approximate conversions between
three systems of measuring heat accumulation in a growing season . . . . . 9
Table 1–8 . Recommended dates to switch from full-season hybrids across various heat unit zones . . . . . . . . . . . . . . . . . . . . . . 13
Table 1–9 . Grain corn test weights and potential dockage . . . . . . . . . . . . . . . . . . . . 13
Table 1–10 . Expected grain yield due to various planting dates . . . . . . . . . . . . . . . . . . . . . . . 14
Table 1–11 . Seed spacing to achieve various populations . . . . . . . . . . . . . . . . . . 14
Table 1–12 . Vegetative growth stages in corn . . . . . 16Table 1–13 . Reproductive growth stages in corn . . . .17Table 1–14 . Comparative growth stages . . . . . . . . . . .17Table 1–15 . Corn yield response to plant spacing
and emergence variability . . . . . . . . . . . . 18Table 1–16 . Effect of planting speed on spacing
standard deviation, population and corn yield . . . . . . . . . . . . . . . . . . . . . . . . . . . . .19
Table 1–17 . Expected grain yield due to various plant populations . . . . . . . . . . . . . . . . . . . . .20
Table 1–18 . Nitrogen guidelines based on spring nitrate-nitrogen (NO3-N) . . . . . . . . . . . . . . .22
Table 1–19 . Nitrogen guidelines based on pre-side-dress nitrate nitrogen (NO3-N) . . . . . . . . . . . . . . . . . . . . . . . . . . . . . . .23
Table 1–20 . Phosphate (P2O5) guidelines for corn . . . . . . . . . . . . . . . . . . . . . . . . . . . . . .27
Table 1–21 . Potash (K2O) guidelines for corn . . . . .28Table 1–22 . Average grain corn yield and profit
response to broadcast and banded phosphate . . . . . . . . . . . . . . . . . . . . . . . . . . . .29
Table 1–23 . Corn yield response to broadcast potash (K) applications with various starter fertilizer options . . . . . . . . . . . . . . 29
Table 1–24 . Interpretation of plant analysis for corn . . . . . . . . . . . . . . . . . . . . . . . . . . . . . . . 31
Table 1–25 . Maximum suggested air temperatures for drying corn of various end uses . . . . . . . . . . . . . . . . . 33
Table 1–26 . Equilibrium moisture content for corn exposed to air . . . . . . . . . . . . . . . . . . 34
Table 1–27 . Estimated risks to grain corn yield and quality from late-season frost damage . . . . . . . . . . . . . . . . . . . . . . . . . 36
Table 1–28 . Estimated percentage corn grain yield loss due to defoliation at various growth stages . . . . . . . . . . . . . . . . 38
2. SoybeansTable 2–1 . Soybean yield response under
various tillage systems . . . . . . . . . . . . . . . 41Table 2–2 . Soybean yield response to spring
minimal tillage . . . . . . . . . . . . . . . . . . . . . . . 42Table 2–3 . Effect of tillage and wheat residue
management on soybean yields . . . . . . 43Table 2–4 . Soybean yield response to tillage
and rotation . . . . . . . . . . . . . . . . . . . . . . . . . . 44Table 2–5 . Soybean physiological maturity
dates and days to maturity . . . . . . . . . . . 44Table 2–6 . Effect of planting date on yield . . . . . . . 49Table 2–7 . Yield of an adapted variety
compared to a long-season variety when planted early . . . . . . . . . . . 49
Table 2–8 . Row spacing vs . days to full canopy (May planting) . . . . . . . . . . . . . . . . 51
Table 2–9 . Effect of row width on yield . . . . . . . . . . 52Table 2–10 . Seed drill vs . planter unit yields . . . . . . 52Table 2–11 . Soybean seeding rate guidelines . . . . 53Table 2–12 . Soybean plant stand and yield
response to seed treatments1 . . . . . . . 54Table 2–13 . Expected yield of soybeans in
optimum and reduced stands . . . . . . . . 55Table 2–14 . Vegetative growth stages
of soybeans . . . . . . . . . . . . . . . . . . . . . . . . . . 58Table 2–15 . Reproductive growth stages
of soybeans . . . . . . . . . . . . . . . . . . . . . . . . . . 59Table 2–16 . Phosphate (P2O5) guidelines
for soybeans . . . . . . . . . . . . . . . . . . . . . . . . . 60Table 2–17 . Potash (K2O) guidelines
for soybeans . . . . . . . . . . . . . . . . . . . . . . . . . 61Table 2–18 . Soybean yield response to
spring application of fertilizer in low-testing soils . . . . . . . . . . . . . . . . . . . 61
xix
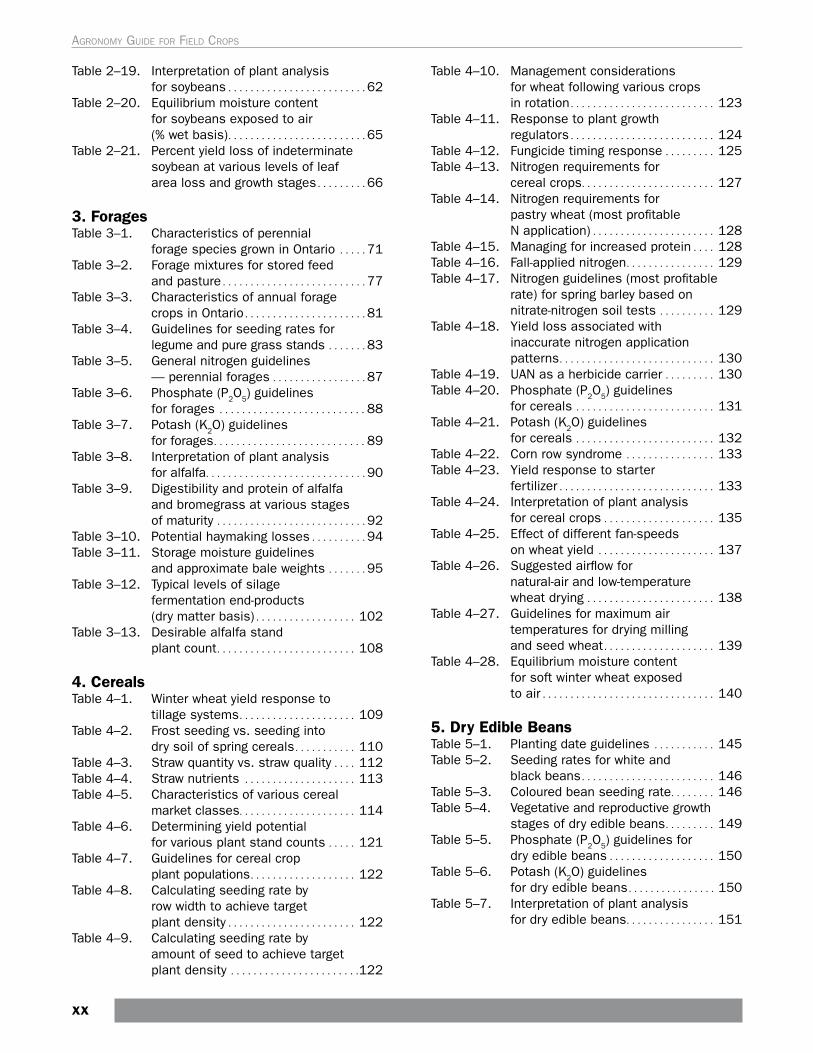
Table 2–19 . Interpretation of plant analysis for soybeans . . . . . . . . . . . . . . . . . . . . . . . . . 62
Table 2–20 . Equilibrium moisture content for soybeans exposed to air (% wet basis) . . . . . . . . . . . . . . . . . . . . . . . . . 65
Table 2–21 . Percent yield loss of indeterminate soybean at various levels of leaf area loss and growth stages . . . . . . . . . 66
3. ForagesTable 3–1 . Characteristics of perennial
forage species grown in Ontario . . . . . 71Table 3–2 . Forage mixtures for stored feed
and pasture . . . . . . . . . . . . . . . . . . . . . . . . . . 77Table 3–3 . Characteristics of annual forage
crops in Ontario . . . . . . . . . . . . . . . . . . . . . . 81Table 3–4 . Guidelines for seeding rates for
legume and pure grass stands . . . . . . . 83Table 3–5 . General nitrogen guidelines
— perennial forages . . . . . . . . . . . . . . . . . 87Table 3–6 . Phosphate (P2O5) guidelines
for forages . . . . . . . . . . . . . . . . . . . . . . . . . . 88Table 3–7 . Potash (K2O) guidelines
for forages . . . . . . . . . . . . . . . . . . . . . . . . . . . 89Table 3–8 . Interpretation of plant analysis
for alfalfa . . . . . . . . . . . . . . . . . . . . . . . . . . . . . 90Table 3–9 . Digestibility and protein of alfalfa
and bromegrass at various stages of maturity . . . . . . . . . . . . . . . . . . . . . . . . . . . 92
Table 3–10 . Potential haymaking losses . . . . . . . . . . 94Table 3–11 . Storage moisture guidelines
and approximate bale weights . . . . . . . 95Table 3–12 . Typical levels of silage
fermentation end-products (dry matter basis) . . . . . . . . . . . . . . . . . . 102
Table 3–13 . Desirable alfalfa stand plant count . . . . . . . . . . . . . . . . . . . . . . . . . 108
4. CerealsTable 4–1 . Winter wheat yield response to
tillage systems . . . . . . . . . . . . . . . . . . . . . 109Table 4–2 . Frost seeding vs . seeding into
dry soil of spring cereals . . . . . . . . . . . 110Table 4–3 . Straw quantity vs . straw quality . . . . 112Table 4–4 . Straw nutrients . . . . . . . . . . . . . . . . . . . . 113Table 4–5 . Characteristics of various cereal
market classes . . . . . . . . . . . . . . . . . . . . . 114Table 4–6 . Determining yield potential
for various plant stand counts . . . . . 121Table 4–7 . Guidelines for cereal crop
plant populations . . . . . . . . . . . . . . . . . . . 122Table 4–8 . Calculating seeding rate by
row width to achieve target plant density . . . . . . . . . . . . . . . . . . . . . . . 122
Table 4–9 . Calculating seeding rate by amount of seed to achieve target plant density . . . . . . . . . . . . . . . . . . . . . . .122
Table 4–10 . Management considerations for wheat following various crops in rotation . . . . . . . . . . . . . . . . . . . . . . . . . . 123
Table 4–11 . Response to plant growth regulators . . . . . . . . . . . . . . . . . . . . . . . . . . 124
Table 4–12 . Fungicide timing response . . . . . . . . . 125Table 4–13 . Nitrogen requirements for
cereal crops . . . . . . . . . . . . . . . . . . . . . . . . 127Table 4–14 . Nitrogen requirements for
pastry wheat (most profitable N application) . . . . . . . . . . . . . . . . . . . . . . 128
Table 4–15 . Managing for increased protein . . . . 128Table 4–16 . Fall-applied nitrogen . . . . . . . . . . . . . . . . 129Table 4–17 . Nitrogen guidelines (most profitable
rate) for spring barley based on nitrate-nitrogen soil tests . . . . . . . . . . 129
Table 4–18 . Yield loss associated with inaccurate nitrogen application patterns . . . . . . . . . . . . . . . . . . . . . . . . . . . . 130
Table 4–19 . UAN as a herbicide carrier . . . . . . . . . 130Table 4–20 . Phosphate (P2O5) guidelines
for cereals . . . . . . . . . . . . . . . . . . . . . . . . . 131Table 4–21 . Potash (K2O) guidelines
for cereals . . . . . . . . . . . . . . . . . . . . . . . . . 132Table 4–22 . Corn row syndrome . . . . . . . . . . . . . . . . 133Table 4–23 . Yield response to starter
fertilizer . . . . . . . . . . . . . . . . . . . . . . . . . . . . 133Table 4–24 . Interpretation of plant analysis
for cereal crops . . . . . . . . . . . . . . . . . . . . 135Table 4–25 . Effect of different fan-speeds
on wheat yield . . . . . . . . . . . . . . . . . . . . . 137Table 4–26 . Suggested airflow for
natural-air and low-temperature wheat drying . . . . . . . . . . . . . . . . . . . . . . . 138
Table 4–27 . Guidelines for maximum air temperatures for drying milling and seed wheat . . . . . . . . . . . . . . . . . . . . 139
Table 4–28 . Equilibrium moisture content for soft winter wheat exposed to air . . . . . . . . . . . . . . . . . . . . . . . . . . . . . . . 140
5. Dry Edible BeansTable 5–1 . Planting date guidelines . . . . . . . . . . . 145Table 5–2 . Seeding rates for white and
black beans . . . . . . . . . . . . . . . . . . . . . . . . 146Table 5–3 . Coloured bean seeding rate . . . . . . . . 146Table 5–4 . Vegetative and reproductive growth
stages of dry edible beans . . . . . . . . . 149Table 5–5 . Phosphate (P2O5) guidelines for
dry edible beans . . . . . . . . . . . . . . . . . . . 150Table 5–6 . Potash (K2O) guidelines
for dry edible beans . . . . . . . . . . . . . . . . 150Table 5–7 . Interpretation of plant analysis
for dry edible beans . . . . . . . . . . . . . . . . 151
xx
Agronomy guide for field Crops
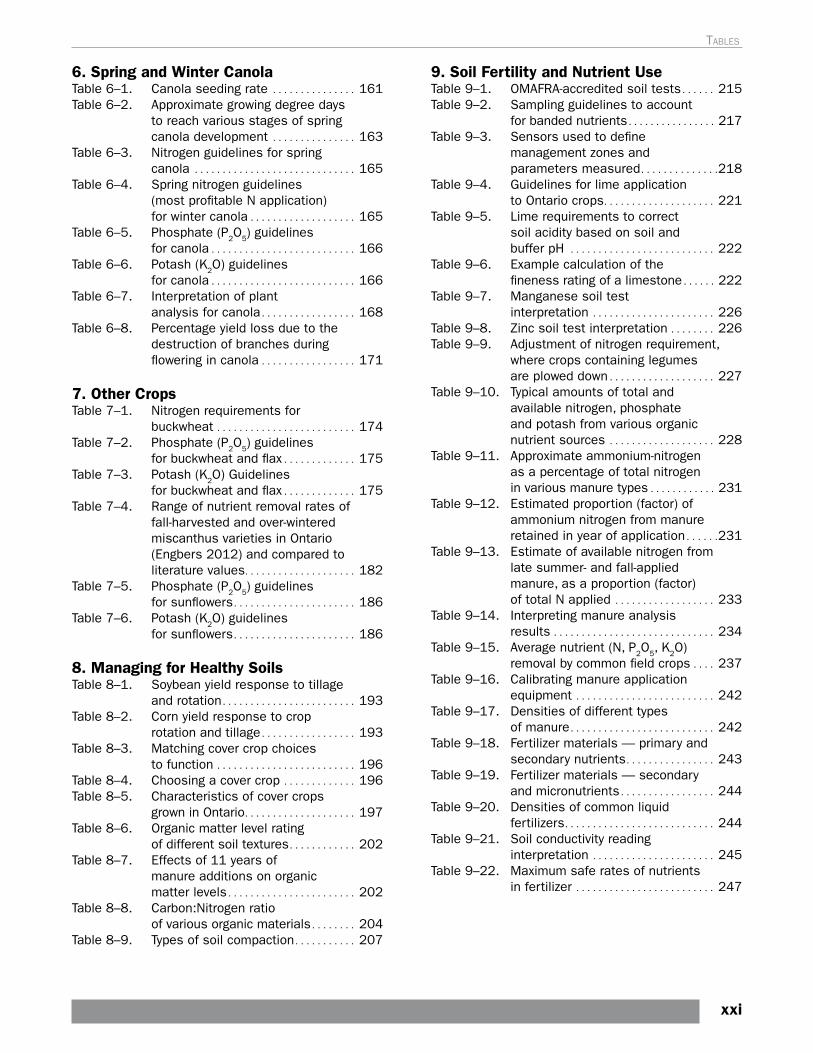
6. Spring and Winter CanolaTable 6–1 . Canola seeding rate . . . . . . . . . . . . . . . 161Table 6–2 . Approximate growing degree days
to reach various stages of spring canola development . . . . . . . . . . . . . . . 163
Table 6–3 . Nitrogen guidelines for spring canola . . . . . . . . . . . . . . . . . . . . . . . . . . . . . 165
Table 6–4 . Spring nitrogen guidelines (most profitable N application) for winter canola . . . . . . . . . . . . . . . . . . . 165
Table 6–5 . Phosphate (P2O5) guidelines for canola . . . . . . . . . . . . . . . . . . . . . . . . . . 166
Table 6–6 . Potash (K2O) guidelines for canola . . . . . . . . . . . . . . . . . . . . . . . . . . 166
Table 6–7 . Interpretation of plant analysis for canola . . . . . . . . . . . . . . . . . 168
Table 6–8 . Percentage yield loss due to the destruction of branches during flowering in canola . . . . . . . . . . . . . . . . . 171
7. Other CropsTable 7–1 . Nitrogen requirements for
buckwheat . . . . . . . . . . . . . . . . . . . . . . . . . 174Table 7–2 . Phosphate (P2O5) guidelines
for buckwheat and flax . . . . . . . . . . . . . 175Table 7–3 . Potash (K2O) Guidelines
for buckwheat and flax . . . . . . . . . . . . . 175Table 7–4 . Range of nutrient removal rates of
fall-harvested and over-wintered miscanthus varieties in Ontario (Engbers 2012) and compared to literature values . . . . . . . . . . . . . . . . . . . . 182
Table 7–5 . Phosphate (P2O5) guidelines for sunflowers . . . . . . . . . . . . . . . . . . . . . . 186
Table 7–6 . Potash (K2O) guidelines for sunflowers . . . . . . . . . . . . . . . . . . . . . . 186
8. Managing for Healthy Soils Table 8–1 . Soybean yield response to tillage
and rotation . . . . . . . . . . . . . . . . . . . . . . . . 193Table 8–2 . Corn yield response to crop
rotation and tillage . . . . . . . . . . . . . . . . . 193Table 8–3 . Matching cover crop choices
to function . . . . . . . . . . . . . . . . . . . . . . . . . 196Table 8–4 . Choosing a cover crop . . . . . . . . . . . . . 196Table 8–5 . Characteristics of cover crops
grown in Ontario . . . . . . . . . . . . . . . . . . . . 197Table 8–6 . Organic matter level rating
of different soil textures . . . . . . . . . . . . 202Table 8–7 . Effects of 11 years of
manure additions on organic matter levels . . . . . . . . . . . . . . . . . . . . . . . 202
Table 8–8 . Carbon:Nitrogen ratio of various organic materials . . . . . . . . 204
Table 8–9 . Types of soil compaction . . . . . . . . . . . 207
9. Soil Fertility and Nutrient UseTable 9–1 . OMAFRA-accredited soil tests . . . . . . 215Table 9–2 . Sampling guidelines to account
for banded nutrients . . . . . . . . . . . . . . . . 217Table 9–3 . Sensors used to define
management zones and parameters measured . . . . . . . . . . . . . .218
Table 9–4 . Guidelines for lime application to Ontario crops . . . . . . . . . . . . . . . . . . . . 221
Table 9–5 . Lime requirements to correct soil acidity based on soil and buffer pH . . . . . . . . . . . . . . . . . . . . . . . . . . 222
Table 9–6 . Example calculation of the fineness rating of a limestone . . . . . . 222
Table 9–7 . Manganese soil test interpretation . . . . . . . . . . . . . . . . . . . . . . 226
Table 9–8 . Zinc soil test interpretation . . . . . . . . 226Table 9–9 . Adjustment of nitrogen requirement,
where crops containing legumes are plowed down . . . . . . . . . . . . . . . . . . . 227
Table 9–10 . Typical amounts of total and available nitrogen, phosphate and potash from various organic nutrient sources . . . . . . . . . . . . . . . . . . . 228
Table 9–11 . Approximate ammonium-nitrogen as a percentage of total nitrogen in various manure types . . . . . . . . . . . . 231
Table 9–12 . Estimated proportion (factor) of ammonium nitrogen from manure retained in year of application . . . . . .231
Table 9–13 . Estimate of available nitrogen from late summer- and fall-applied manure, as a proportion (factor) of total N applied . . . . . . . . . . . . . . . . . . 233
Table 9–14 . Interpreting manure analysis results . . . . . . . . . . . . . . . . . . . . . . . . . . . . . 234
Table 9–15 . Average nutrient (N, P2O5, K2O) removal by common field crops . . . . 237
Table 9–16 . Calibrating manure application equipment . . . . . . . . . . . . . . . . . . . . . . . . . 242
Table 9–17 . Densities of different types of manure . . . . . . . . . . . . . . . . . . . . . . . . . . 242
Table 9–18 . Fertilizer materials — primary and secondary nutrients . . . . . . . . . . . . . . . . 243
Table 9–19 . Fertilizer materials — secondary and micronutrients . . . . . . . . . . . . . . . . . 244
Table 9–20 . Densities of common liquid fertilizers . . . . . . . . . . . . . . . . . . . . . . . . . . . 244
Table 9–21 . Soil conductivity reading interpretation . . . . . . . . . . . . . . . . . . . . . . 245
Table 9–22 . Maximum safe rates of nutrients in fertilizer . . . . . . . . . . . . . . . . . . . . . . . . . 247
xxi
tables
10. Field ScoutingTable 10–1 . Number of suggested sampling
locations based on field size and pest . . . . . . . . . . . . . . . . . . . . . . . . . . . 252
Table 10–2 . Row length for a partial acre . . . . . . . 253Table 10–3 . Hula hoop method for determining
plant and pest populations . . . . . . . . 253Table 10–4 . Daily crop heat unit accumulations
based on maximum and minimum temperatures . . . . . . . . . . . . . . . . . . . . . . 256
12. On-Farm Stored Grain ManagementTable 12–1 . Time required for aeration front
to move through grain . . . . . . . . . . . . . . 266Table 12–2 . Insect management strategies
for farm-stored grain . . . . . . . . . . . . . . . . 269
13. Weed ControlTable 13–1 . Relative ranking of cover
crops and their ability to suppress weeds . . . . . . . . . . . . . . . . . . . 273
Table 13–2 . Weed density in the spring following different summer-seeded cover crops . . . . . . . . . . . . . . . . . . . . . . . . 274
Table 13–3 . Critical weed-free periods for common Ontario field crops . . . . . . . . 277
Table 13–4 . Corn and soybean yield losses from weeds under adequate soil moisture vs . inadequate soil moisture . . . . . . . . . . . . . . . . . . . . . . . 277
Table 13–5 . Top 30 most frequently found weeds in soybean, winter wheat and corn, according to a survey of Ontario Certified Crop Advisors (2014) . . . . . . . . . . . . . . . . . . . . . . . . . . . . . 278
Table 13–6 . Soybean and corn yield losses due to weeds at known populations . . . . . . . . . . . . . . . . . 279
Table 13–7 . Weed populations confirmed resistant to herbicide groups in Ontario (January 2016) . . . . . . . . . . . . . 280
15. Insects and Pests of Field CropsTable 15–1 . Corn insect and pest symptoms
in the field . . . . . . . . . . . . . . . . . . . . . . . . . 311Table 15–2 . Iowa State node injury scale . . . . . . . 321Table 15–3 . Soybean insect and pest symptoms
in the field . . . . . . . . . . . . . . . . . . . . . . . . . . . 326Table 15–4 . Standard damage thresholds
for soybean insect defoliation . . . . . . 333Table 15–5 . Forage insect and pest symptoms
in the field . . . . . . . . . . . . . . . . . . . . . . . . . 336Table 15–6 . Thresholds for potato leafhopper
on alfalfa . . . . . . . . . . . . . . . . . . . . . . . . . . . 342Table 15–7 . Cereal insect and pest symptoms
in the field . . . . . . . . . . . . . . . . . . . . . . . . . 343Table 15–8 . Dry edible bean insect and pest
symptoms in the field . . . . . . . . . . . . . . . 348Table 15–9 . Thresholds for potato leafhopper
on dry edible beans . . . . . . . . . . . . . . . . 349Table 15–10 . Defoliation threshold for
dry beans . . . . . . . . . . . . . . . . . . . . . . . . . . 351Table 15–11 . Canola insect and pest symptoms
in the field . . . . . . . . . . . . . . . . . . . . . . . . . . 354
16. Diseases of Field CropsTable 16–1 . Potential risk of yield loss for various
SCN population levels (based on soil test results) . . . . . . . . . . . . . . . . . . . . . 376
Table 16–2 . Appearance of symptoms for brown stem rot, stem canker and sudden death syndrome on soybeans . . . . . . 378
Table 16–3 . Comparison of common rusts occurring on small grains in Ontario . . . . . . . . . . . . . . . . . . . . . . . . . . . . 392
Table 16–4 . Comparison of cereal viruses (BYDV, SBWMV and WSSMV) . . . . . . . 393
xxii
Agronomy guide for field Crops
Figures
IntroductionFigure Intro–1 . An example of an Ontario scouting
and record keeping smartphone app . . . xii
1. CornFigure 1–1 . Crop heat units (CHU-M1) available
for corn production . . . . . . . . . . . . . . . . . . . 10Figure 1–2 . Nitrogen uptake at various stages
of corn development . . . . . . . . . . . . . . . . . 26Figure 1–3 . Corn scouting calendar . . . . . . . . . . . . . . . 35
2. SoybeansFigure 2–1 . Ontario soybean relative
maturity map . . . . . . . . . . . . . . . . . . . . . . . . . 45Figure 2–2 . The relationship between seed
vigour, viability and deterioration . . . . . 47Figure 2–3 . Soybean yield response to
seeding rates . . . . . . . . . . . . . . . . . . . . . . . . 52Figure 2–4 . Reduced stand in field . . . . . . . . . . . . . . . 57Figure 2–5 . Soybean scouting calendar . . . . . . . . . . . 67
3. ForagesFigure 3–1 . Soil drainage requirements
of forage species . . . . . . . . . . . . . . . . . . . . . 75Figure 3–2 . Estimated hay and haylage
harvest and storage losses . . . . . . . . . . 93Figure 3–3 . Forage scouting calendar . . . . . . . . . . . 104Figure 3–4 . Start of the critical fall harvest
period for alfalfa . . . . . . . . . . . . . . . . . . . 106Figure 3–5 . Alfalfa yield potential at
various stem count densities . . . . . . . 108
4. CerealsFigure 4–1 . Days to emergence at various
seeding depths . . . . . . . . . . . . . . . . . . . . . 117Figure 4–2 . Cereal growth stages . . . . . . . . . . . . . . . 118Figure 4–3 . Provincial winter wheat yield
for 1981–2014 . . . . . . . . . . . . . . . . . . . . 119Figure 4–4 . Optimum date to seed winter
wheat across Ontario . . . . . . . . . . . . . . 120Figure 4–5 . Suggested nozzle orientation of
a forward-and-back double nozzle assembly . . . . . . . . . . . . . . . . . . . . . . . . . . . 125
Figure 4–6 . Nitrogen response with and without fungicides . . . . . . . . . . . . . . . . . . 126
Figure 4–7 . Sulphur response in wheat . . . . . . . . . 134Figure 4–8 . Cereal crops scouting calendar . . . . . 141
5. Dry Edible BeansFigure 5–1 . Dry edible bean scouting
calendar . . . . . . . . . . . . . . . . . . . . . . . . . . . . 155
6. Spring and Winter CanolaFigure 6–1 . Canola scouting calendar . . . . . . . . . . . 170
8. Managing for Healthy Soils Figure 8–1 . Yield benefits of crop rotation
vs . continuous corn in years with above and below average precipitation . . . . . . . . . . . . . . . . . . . . . . . . 194
Figure 8–2 . Impact of long-term crop rotation on soil carbon content . . . . . . . . . . . . . 195
Figure 8–3 . Corn yield response to soil N and soil health . . . . . . . . . . . . . . . . . . . . . 195
Figure 8–4 . The downward spiral of soil degradation . . . . . . . . . . . . . . . . . . . . . . . . 205
Figure 8–5 . Soil organic matter pools . . . . . . . . . . . 210Figure 8–6 . Horizon variability in a soil
profile . . . . . . . . . . . . . . . . . . . . . . . . . . . . . . 214
9. Soil Fertility and Nutrient UseFigure 9–1 . Infra-red image processed
into green difference vegetation index . . . . . . . . . . . . . . . . . . . . . . . . . . . . . . . 218
Figure 9–2 . Topographic map with sampling zones created from elevation data . . . . . . . . . . . . . . . . 219
10. Field ScoutingFigure 10–1 . Scouting patterns . . . . . . . . . . . . . . . . . . 252Figure 10–2 . Example field map using Ontario
Ag Maps (ontario .ca/agmaps) . . . . . . 257
11. Precision AgricultureFigure 11–1 . Real-time Variable Rate Nitrogen
application using optical sensors mounted on a y-drop fertilizer applicator . GreenseekerTM sensors circled in red on the boom for both wheat and corn . . . . . . . . . . . . . . . . . . . . . 261
Figure 11–2 . Screen captures comparing strips to blocks with nitrogen applied using variable rate technology . . . . . . 263
xxiii
12. On-Farm Stored Grain ManagementFigure 12–1 . Home-built manometer . . . . . . . . . . . . . 265
13. Weed ControlFigure 13–1 . Effect of nitrogen fertilizer application
method in four consecutive years on the weed seed bank at the conclusion of the four-year experiment . . . . . . . . . . . . . . . . . . . . . . . . . 274
Figure 13–2 . Typical yield losses of different field crops due to weed competition . . . . . . . . . . . . . . . . . . . . . . . . . . . . 276
15. Insects and Pests of Field CropsFigure 15–1 . Life cycles and feeding periods
for common grubs (European chafer, June beetle, Japanese beetle) . . . . . . . . . . . . . . . . . . . . . . . . . . . . . . 302
Figure 15–2 . Defoliation chart for soybean leaf-feeding insects . . . . . . . . . . . . . . . . 333
Figure 15–3 . Yield loss vs . defoliation of navy beans . . . . . . . . . . . . . . . . . . . . . . . . 350
xxiv
Agronomy guide for field Crops
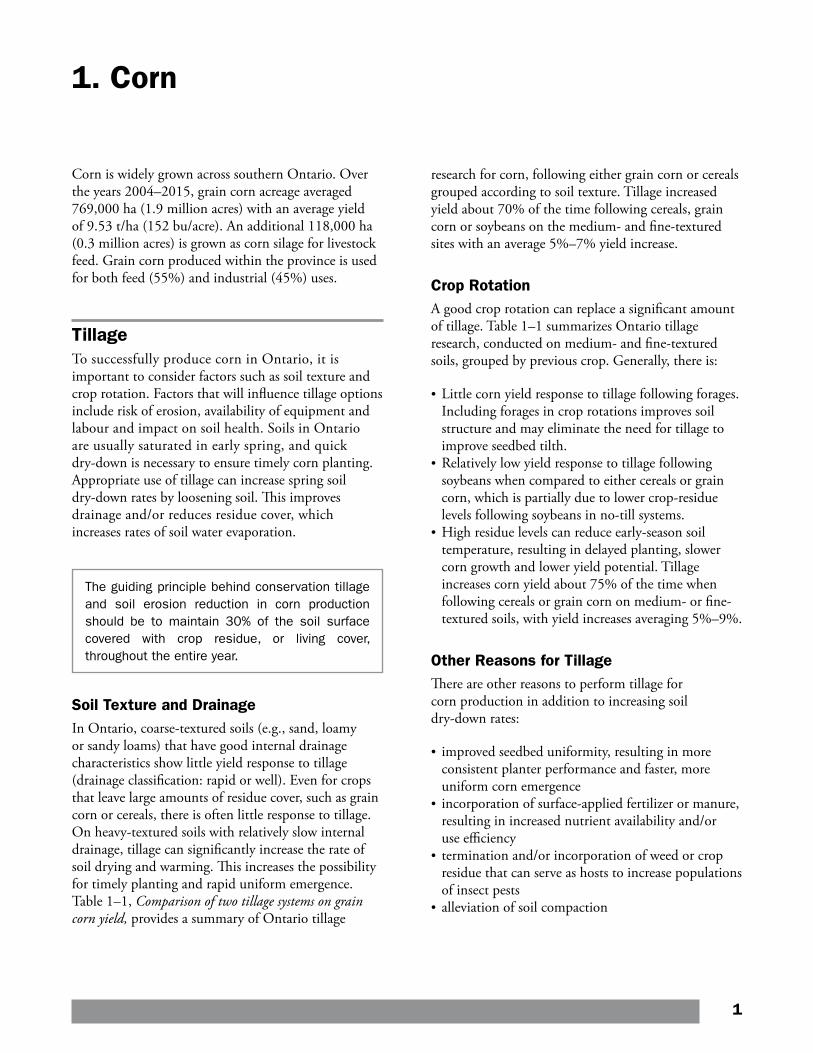
1. Corn
Corn is widely grown across southern Ontario. Over the years 2004–2015, grain corn acreage averaged 769,000 ha (1.9 million acres) with an average yield of 9.53 t/ha (152 bu/acre). An additional 118,000 ha (0.3 million acres) is grown as corn silage for livestock feed. Grain corn produced within the province is used for both feed (55%) and industrial (45%) uses.
Tillage To successfully produce corn in Ontario, it is important to consider factors such as soil texture and crop rotation. Factors that will influence tillage options include risk of erosion, availability of equipment and labour and impact on soil health. Soils in Ontario are usually saturated in early spring, and quick dry-down is necessary to ensure timely corn planting. Appropriate use of tillage can increase spring soil dry-down rates by loosening soil. This improves drainage and/or reduces residue cover, which increases rates of soil water evaporation.
The guiding principle behind conservation tillage and soil erosion reduction in corn production should be to maintain 30% of the soil surface covered with crop residue, or living cover, throughout the entire year.
Soil Texture and DrainageIn Ontario, coarse-textured soils (e.g., sand, loamy or sandy loams) that have good internal drainage characteristics show little yield response to tillage (drainage classification: rapid or well). Even for crops that leave large amounts of residue cover, such as grain corn or cereals, there is often little response to tillage. On heavy-textured soils with relatively slow internal drainage, tillage can significantly increase the rate of soil drying and warming. This increases the possibility for timely planting and rapid uniform emergence. Table 1–1, Comparison of two tillage systems on grain corn yield, provides a summary of Ontario tillage
research for corn, following either grain corn or cereals grouped according to soil texture. Tillage increased yield about 70% of the time following cereals, grain corn or soybeans on the medium- and fine-textured sites with an average 5%–7% yield increase.
Crop RotationA good crop rotation can replace a significant amount of tillage. Table 1–1 summarizes Ontario tillage research, conducted on medium- and fine-textured soils, grouped by previous crop. Generally, there is:
• Little corn yield response to tillage following forages. Including forages in crop rotations improves soil structure and may eliminate the need for tillage to improve seedbed tilth.
• Relatively low yield response to tillage following soybeans when compared to either cereals or grain corn, which is partially due to lower crop-residue levels following soybeans in no-till systems.
• High residue levels can reduce early-season soil temperature, resulting in delayed planting, slower corn growth and lower yield potential. Tillage increases corn yield about 75% of the time when following cereals or grain corn on medium- or fine-textured soils, with yield increases averaging 5%–9%.
Other Reasons for TillageThere are other reasons to perform tillage for corn production in addition to increasing soil dry-down rates:
• improved seedbed uniformity, resulting in more consistent planter performance and faster, more uniform corn emergence
• incorporation of surface-applied fertilizer or manure, resulting in increased nutrient availability and/or use efficiency
• termination and/or incorporation of weed or crop residue that can serve as hosts to increase populations of insect pests
• alleviation of soil compaction
1
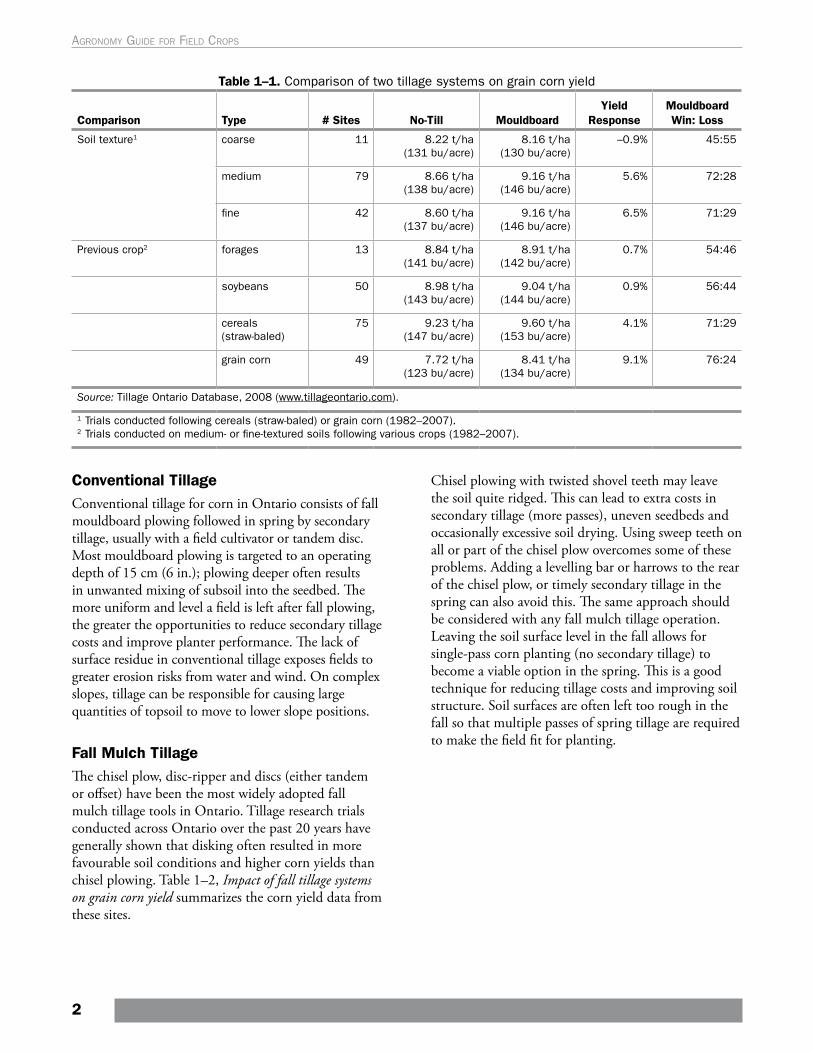
Table 1–1. Comparison of two tillage systems on grain corn yield
Comparison Type # Sites No-Till MouldboardYield
ResponseMouldboard Win: Loss
Soil texture1 coarse 11 8.22 t/ha (131 bu/acre)
8.16 t/ha (130 bu/acre)
–0.9% 45:55
medium 79 8.66 t/ha (138 bu/acre)
9.16 t/ha (146 bu/acre)
5.6% 72:28
fine 42 8.60 t/ha (137 bu/acre)
9.16 t/ha (146 bu/acre)
6.5% 71:29
Previous crop2 forages 13 8.84 t/ha (141 bu/acre)
8.91 t/ha (142 bu/acre)
0.7% 54:46
soybeans 50 8.98 t/ha (143 bu/acre)
9.04 t/ha (144 bu/acre)
0.9% 56:44
cereals (straw-baled)
75 9.23 t/ha (147 bu/acre)
9.60 t/ha(153 bu/acre)
4.1% 71:29
grain corn 49 7.72 t/ha (123 bu/acre)
8.41 t/ha (134 bu/acre)
9.1% 76:24
Source: Tillage Ontario Database, 2008 (www.tillageontario.com).
1 Trials conducted following cereals (straw-baled) or grain corn (1982–2007).2 Trials conducted on medium- or fine-textured soils following various crops (1982–2007).
Conventional TillageConventional tillage for corn in Ontario consists of fall mouldboard plowing followed in spring by secondary tillage, usually with a field cultivator or tandem disc. Most mouldboard plowing is targeted to an operating depth of 15 cm (6 in.); plowing deeper often results in unwanted mixing of subsoil into the seedbed. The more uniform and level a field is left after fall plowing, the greater the opportunities to reduce secondary tillage costs and improve planter performance. The lack of surface residue in conventional tillage exposes fields to greater erosion risks from water and wind. On complex slopes, tillage can be responsible for causing large quantities of topsoil to move to lower slope positions.
Fall Mulch TillageThe chisel plow, disc-ripper and discs (either tandem or offset) have been the most widely adopted fall mulch tillage tools in Ontario. Tillage research trials conducted across Ontario over the past 20 years have generally shown that disking often resulted in more favourable soil conditions and higher corn yields than chisel plowing. Table 1–2, Impact of fall tillage systems on grain corn yield summarizes the corn yield data from these sites.
Chisel plowing with twisted shovel teeth may leave the soil quite ridged. This can lead to extra costs in secondary tillage (more passes), uneven seedbeds and occasionally excessive soil drying. Using sweep teeth on all or part of the chisel plow overcomes some of these problems. Adding a levelling bar or harrows to the rear of the chisel plow, or timely secondary tillage in the spring can also avoid this. The same approach should be considered with any fall mulch tillage operation. Leaving the soil surface level in the fall allows for single-pass corn planting (no secondary tillage) to become a viable option in the spring. This is a good technique for reducing tillage costs and improving soil structure. Soil surfaces are often left too rough in the fall so that multiple passes of spring tillage are required to make the field fit for planting.
2
Agronomy guide for field Crops
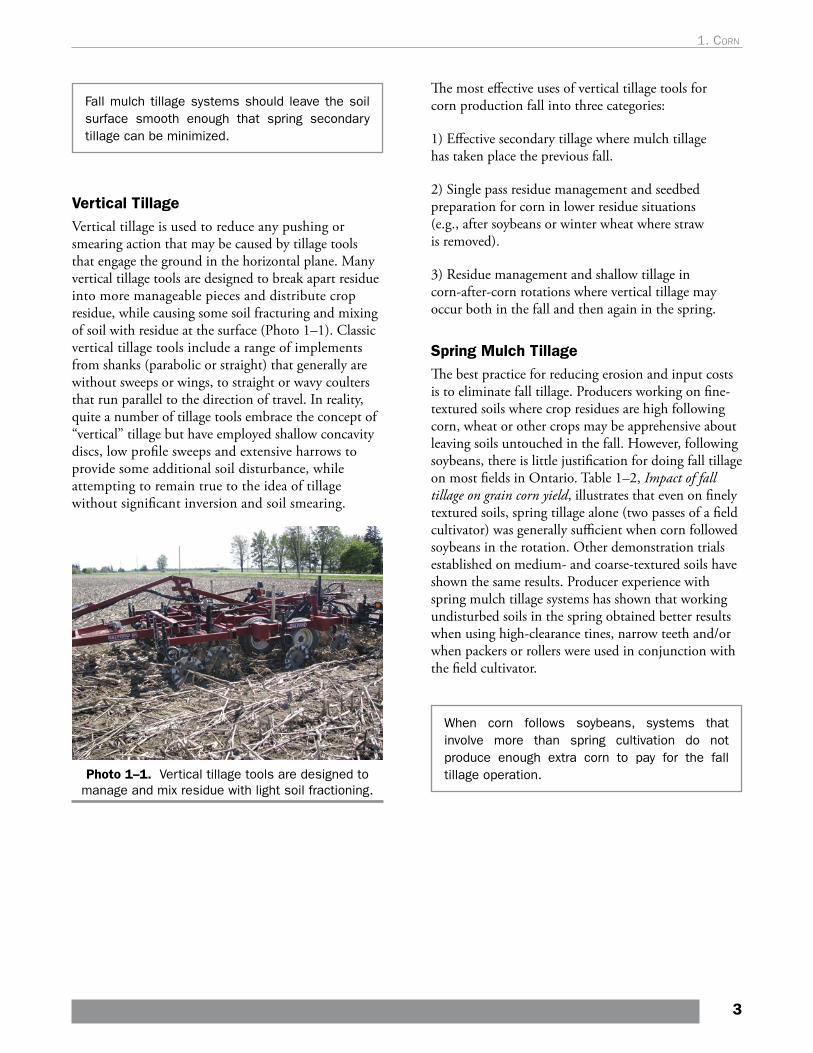
Fall mulch tillage systems should leave the soil surface smooth enough that spring secondary tillage can be minimized.
Vertical TillageVertical tillage is used to reduce any pushing or smearing action that may be caused by tillage tools that engage the ground in the horizontal plane. Many vertical tillage tools are designed to break apart residue into more manageable pieces and distribute crop residue, while causing some soil fracturing and mixing of soil with residue at the surface (Photo 1–1). Classic vertical tillage tools include a range of implements from shanks (parabolic or straight) that generally are without sweeps or wings, to straight or wavy coulters that run parallel to the direction of travel. In reality, quite a number of tillage tools embrace the concept of “vertical” tillage but have employed shallow concavity discs, low profile sweeps and extensive harrows to provide some additional soil disturbance, while attempting to remain true to the idea of tillage without significant inversion and soil smearing.
Photo 1–1. Vertical tillage tools are designed to manage and mix residue with light soil fractioning.
The most effective uses of vertical tillage tools for corn production fall into three categories:
1) Effective secondary tillage where mulch tillage has taken place the previous fall.
2) Single pass residue management and seedbed preparation for corn in lower residue situations (e.g., after soybeans or winter wheat where straw is removed).
3) Residue management and shallow tillage in corn-after-corn rotations where vertical tillage may occur both in the fall and then again in the spring.
Spring Mulch TillageThe best practice for reducing erosion and input costs is to eliminate fall tillage. Producers working on fine-textured soils where crop residues are high following corn, wheat or other crops may be apprehensive about leaving soils untouched in the fall. However, following soybeans, there is little justification for doing fall tillage on most fields in Ontario. Table 1–2, Impact of fall tillage on grain corn yield, illustrates that even on finely textured soils, spring tillage alone (two passes of a field cultivator) was generally sufficient when corn followed soybeans in the rotation. Other demonstration trials established on medium- and coarse-textured soils have shown the same results. Producer experience with spring mulch tillage systems has shown that working undisturbed soils in the spring obtained better results when using high-clearance tines, narrow teeth and/or when packers or rollers were used in conjunction with the field cultivator.
When corn follows soybeans, systems that involve more than spring cultivation do not produce enough extra corn to pay for the fall tillage operation.
3
1. corn
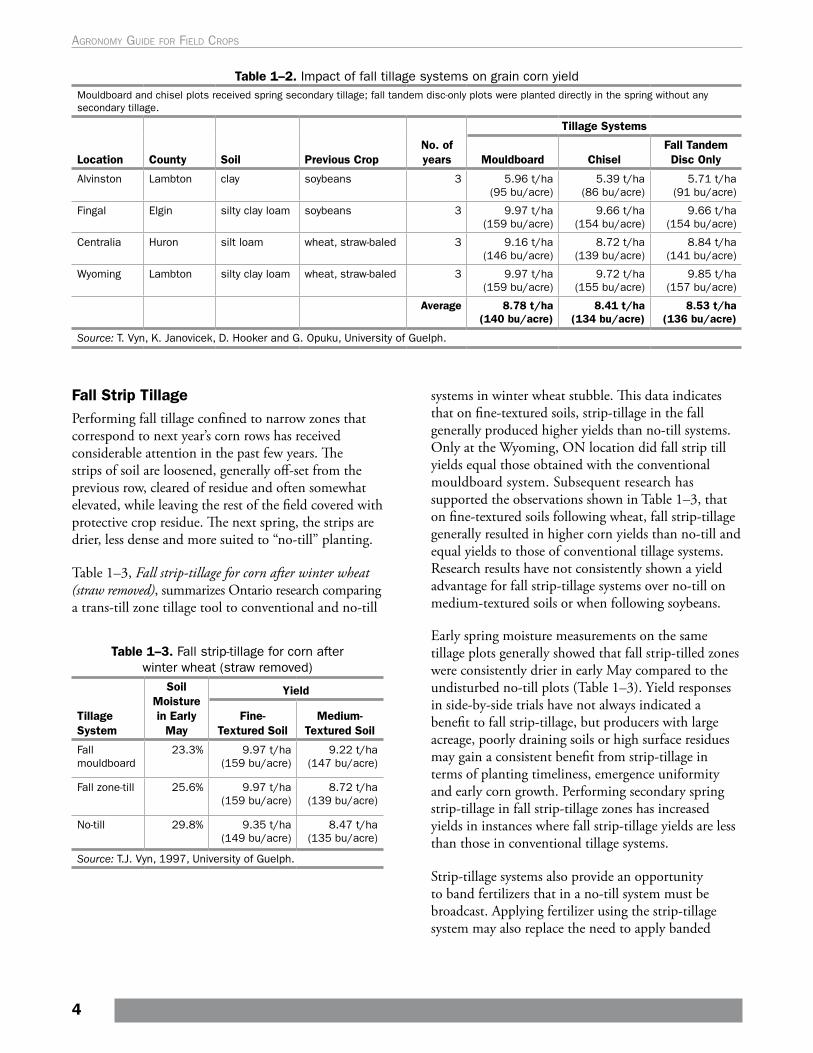
Table 1–2. Impact of fall tillage systems on grain corn yieldMouldboard and chisel plots received spring secondary tillage; fall tandem disc-only plots were planted directly in the spring without any secondary tillage.
Location County Soil Previous CropNo. of years
Tillage Systems
Mouldboard ChiselFall Tandem Disc Only
Alvinston Lambton clay soybeans 3 5.96 t/ha (95 bu/acre)
5.39 t/ha (86 bu/acre)
5.71 t/ha (91 bu/acre)
Fingal Elgin silty clay loam soybeans 3 9.97 t/ha (159 bu/acre)
9.66 t/ha (154 bu/acre)
9.66 t/ha (154 bu/acre)
Centralia Huron silt loam wheat, straw-baled 3 9.16 t/ha (146 bu/acre)
8.72 t/ha (139 bu/acre)
8.84 t/ha (141 bu/acre)
Wyoming Lambton silty clay loam wheat, straw-baled 3 9.97 t/ha (159 bu/acre)
9.72 t/ha (155 bu/acre)
9.85 t/ha (157 bu/acre)
Average 8.78 t/ha (140 bu/acre)
8.41 t/ha (134 bu/acre)
8.53 t/ha (136 bu/acre)
Source: T. Vyn, K. Janovicek, D. Hooker and G. Opuku, University of Guelph.
Fall Strip TillagePerforming fall tillage confined to narrow zones that correspond to next year’s corn rows has received considerable attention in the past few years. The strips of soil are loosened, generally off-set from the previous row, cleared of residue and often somewhat elevated, while leaving the rest of the field covered with protective crop residue. The next spring, the strips are drier, less dense and more suited to “no-till” planting.
Table 1–3, Fall strip-tillage for corn after winter wheat (straw removed), summarizes Ontario research comparing a trans-till zone tillage tool to conventional and no-till
Table 1–3. Fall strip-tillage for corn after winter wheat (straw removed)
Tillage System
Soil Moisture in Early
May
Yield
Fine- Textured Soil
Medium-Textured Soil
Fall mouldboard
23.3% 9.97 t/ha (159 bu/acre)
9.22 t/ha (147 bu/acre)
Fall zone-till 25.6% 9.97 t/ha (159 bu/acre)
8.72 t/ha (139 bu/acre)
No-till 29.8% 9.35 t/ha (149 bu/acre)
8.47 t/ha (135 bu/acre)
Source: T.J. Vyn, 1997, University of Guelph.
systems in winter wheat stubble. This data indicates that on fine-textured soils, strip-tillage in the fall generally produced higher yields than no-till systems. Only at the Wyoming, ON location did fall strip till yields equal those obtained with the conventional mouldboard system. Subsequent research has supported the observations shown in Table 1–3, that on fine-textured soils following wheat, fall strip-tillage generally resulted in higher corn yields than no-till and equal yields to those of conventional tillage systems. Research results have not consistently shown a yield advantage for fall strip-tillage systems over no-till on medium-textured soils or when following soybeans.
Early spring moisture measurements on the same tillage plots generally showed that fall strip-tilled zones were consistently drier in early May compared to the undisturbed no-till plots (Table 1–3). Yield responses in side-by-side trials have not always indicated a benefit to fall strip-tillage, but producers with large acreage, poorly draining soils or high surface residues may gain a consistent benefit from strip-tillage in terms of planting timeliness, emergence uniformity and early corn growth. Performing secondary spring strip-tillage in fall strip-tillage zones has increased yields in instances where fall strip-tillage yields are less than those in conventional tillage systems.
Strip-tillage systems also provide an opportunity to band fertilizers that in a no-till system must be broadcast. Applying fertilizer using the strip-tillage system may also replace the need to apply banded
4
Agronomy guide for field Crops
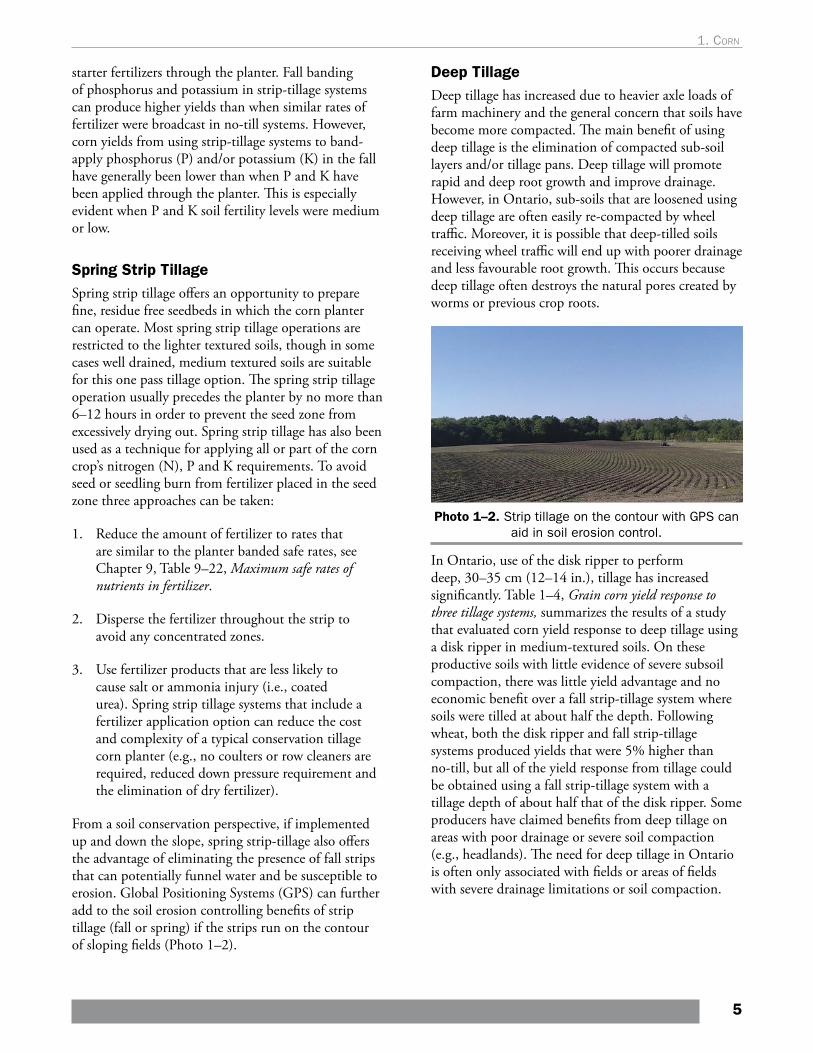
starter fertilizers through the planter. Fall banding of phosphorus and potassium in strip-tillage systems can produce higher yields than when similar rates of fertilizer were broadcast in no-till systems. However, corn yields from using strip-tillage systems to band-apply phosphorus (P) and/or potassium (K) in the fall have generally been lower than when P and K have been applied through the planter. This is especially evident when P and K soil fertility levels were medium or low.
Spring Strip Tillage Spring strip tillage offers an opportunity to prepare fine, residue free seedbeds in which the corn planter can operate. Most spring strip tillage operations are restricted to the lighter textured soils, though in some cases well drained, medium textured soils are suitable for this one pass tillage option. The spring strip tillage operation usually precedes the planter by no more than 6–12 hours in order to prevent the seed zone from excessively drying out. Spring strip tillage has also been used as a technique for applying all or part of the corn crop’s nitrogen (N), P and K requirements. To avoid seed or seedling burn from fertilizer placed in the seed zone three approaches can be taken:
1. Reduce the amount of fertilizer to rates that are similar to the planter banded safe rates, see Chapter 9, Table 9–22, Maximum safe rates of nutrients in fertilizer.
2. Disperse the fertilizer throughout the strip to avoid any concentrated zones.
3. Use fertilizer products that are less likely to cause salt or ammonia injury (i.e., coated urea). Spring strip tillage systems that include a fertilizer application option can reduce the cost and complexity of a typical conservation tillage corn planter (e.g., no coulters or row cleaners are required, reduced down pressure requirement and the elimination of dry fertilizer).
From a soil conservation perspective, if implemented up and down the slope, spring strip-tillage also offers the advantage of eliminating the presence of fall strips that can potentially funnel water and be susceptible to erosion. Global Positioning Systems (GPS) can further add to the soil erosion controlling benefits of strip tillage (fall or spring) if the strips run on the contour of sloping fields (Photo 1–2).
Deep Tillage Deep tillage has increased due to heavier axle loads of farm machinery and the general concern that soils have become more compacted. The main benefit of using deep tillage is the elimination of compacted sub-soil layers and/or tillage pans. Deep tillage will promote rapid and deep root growth and improve drainage. However, in Ontario, sub-soils that are loosened using deep tillage are often easily re-compacted by wheel traffic. Moreover, it is possible that deep-tilled soils receiving wheel traffic will end up with poorer drainage and less favourable root growth. This occurs because deep tillage often destroys the natural pores created by worms or previous crop roots.
Photo 1–2. Strip tillage on the contour with GPS can aid in soil erosion control.
In Ontario, use of the disk ripper to perform deep, 30–35 cm (12–14 in.), tillage has increased significantly. Table 1–4, Grain corn yield response to three tillage systems, summarizes the results of a study that evaluated corn yield response to deep tillage using a disk ripper in medium-textured soils. On these productive soils with little evidence of severe subsoil compaction, there was little yield advantage and no economic benefit over a fall strip-tillage system where soils were tilled at about half the depth. Following wheat, both the disk ripper and fall strip-tillage systems produced yields that were 5% higher than no-till, but all of the yield response from tillage could be obtained using a fall strip-tillage system with a tillage depth of about half that of the disk ripper. Some producers have claimed benefits from deep tillage on areas with poor drainage or severe soil compaction (e.g., headlands). The need for deep tillage in Ontario is often only associated with fields or areas of fields with severe drainage limitations or soil compaction.
5
1. corn
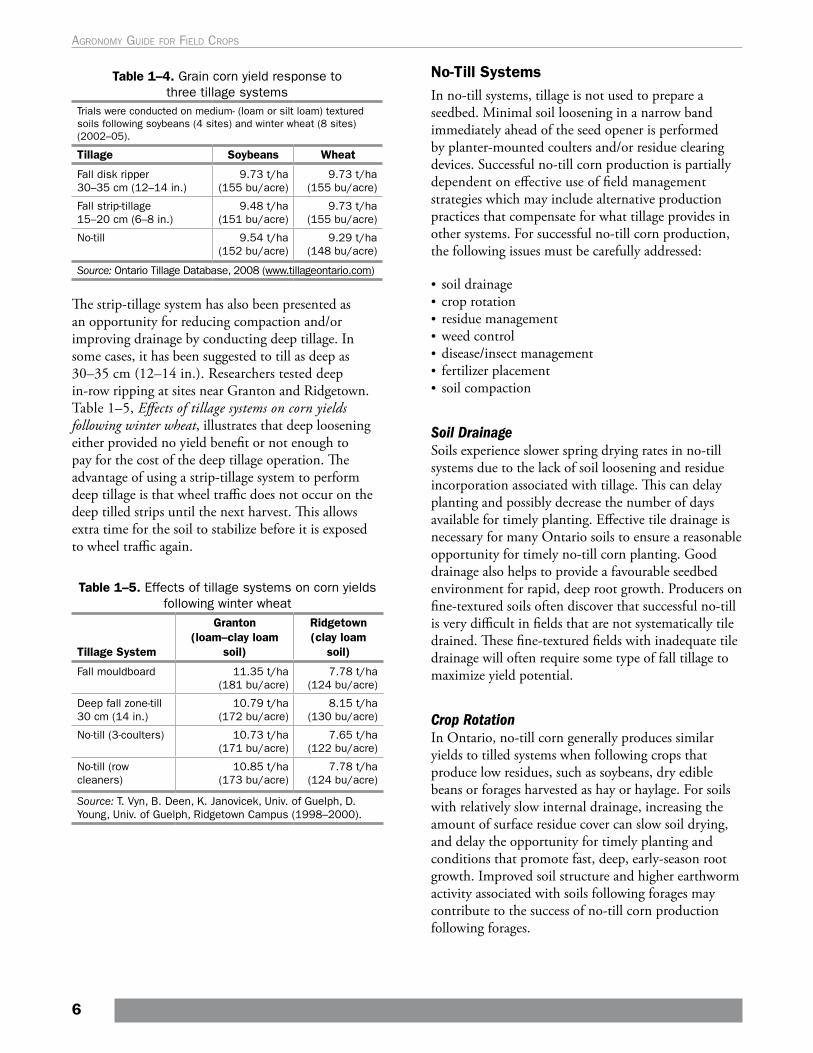
Table 1–4. Grain corn yield response to three tillage systems
Trials were conducted on medium- (loam or silt loam) textured soils following soybeans (4 sites) and winter wheat (8 sites) (2002–05).
Tillage Soybeans Wheat
Fall disk ripper 30–35 cm (12–14 in.)
9.73 t/ha (155 bu/acre)
9.73 t/ha (155 bu/acre)
Fall strip-tillage 15–20 cm (6–8 in.)
9.48 t/ha (151 bu/acre)
9.73 t/ha (155 bu/acre)
No-till 9.54 t/ha (152 bu/acre)
9.29 t/ha (148 bu/acre)
Source: Ontario Tillage Database, 2008 (www.tillageontario.com)
The strip-tillage system has also been presented as an opportunity for reducing compaction and/or improving drainage by conducting deep tillage. In some cases, it has been suggested to till as deep as 30–35 cm (12–14 in.). Researchers tested deep in-row ripping at sites near Granton and Ridgetown. Table 1–5, Effects of tillage systems on corn yields following winter wheat, illustrates that deep loosening either provided no yield benefit or not enough to pay for the cost of the deep tillage operation. The advantage of using a strip-tillage system to perform deep tillage is that wheel traffic does not occur on the deep tilled strips until the next harvest. This allows extra time for the soil to stabilize before it is exposed to wheel traffic again.
Table 1–5. Effects of tillage systems on corn yields following winter wheat
Tillage System
Granton (loam–clay loam
soil)
Ridgetown (clay loam
soil)
Fall mouldboard 11.35 t/ha (181 bu/acre)
7.78 t/ha (124 bu/acre)
Deep fall zone-till 30 cm (14 in.)
10.79 t/ha (172 bu/acre)
8.15 t/ha (130 bu/acre)
No-till (3-coulters) 10.73 t/ha (171 bu/acre)
7.65 t/ha (122 bu/acre)
No-till (row cleaners)
10.85 t/ha (173 bu/acre)
7.78 t/ha (124 bu/acre)
Source: T. Vyn, B. Deen, K. Janovicek, Univ. of Guelph, D. Young, Univ. of Guelph, Ridgetown Campus (1998–2000).
No-Till SystemsIn no-till systems, tillage is not used to prepare a seedbed. Minimal soil loosening in a narrow band immediately ahead of the seed opener is performed by planter-mounted coulters and/or residue clearing devices. Successful no-till corn production is partially dependent on effective use of field management strategies which may include alternative production practices that compensate for what tillage provides in other systems. For successful no-till corn production, the following issues must be carefully addressed:
• soil drainage• crop rotation• residue management• weed control• disease/insect management• fertilizer placement• soil compaction
Soil DrainageSoils experience slower spring drying rates in no-till systems due to the lack of soil loosening and residue incorporation associated with tillage. This can delay planting and possibly decrease the number of days available for timely planting. Effective tile drainage is necessary for many Ontario soils to ensure a reasonable opportunity for timely no-till corn planting. Good drainage also helps to provide a favourable seedbed environment for rapid, deep root growth. Producers on fine-textured soils often discover that successful no-till is very difficult in fields that are not systematically tile drained. These fine-textured fields with inadequate tile drainage will often require some type of fall tillage to maximize yield potential.
Crop RotationIn Ontario, no-till corn generally produces similar yields to tilled systems when following crops that produce low residues, such as soybeans, dry edible beans or forages harvested as hay or haylage. For soils with relatively slow internal drainage, increasing the amount of surface residue cover can slow soil drying, and delay the opportunity for timely planting and conditions that promote fast, deep, early-season root growth. Improved soil structure and higher earthworm activity associated with soils following forages may contribute to the success of no-till corn production following forages.
6
Agronomy guide for field Crops
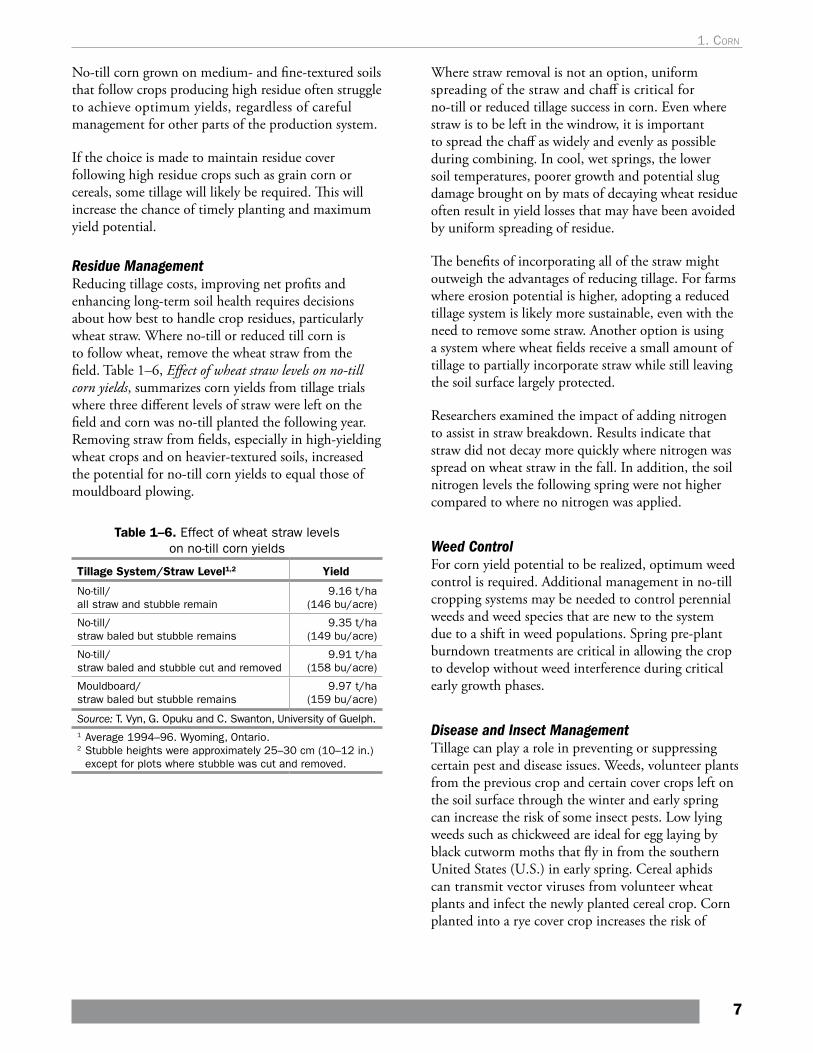
No-till corn grown on medium- and fine-textured soils that follow crops producing high residue often struggle to achieve optimum yields, regardless of careful management for other parts of the production system.
If the choice is made to maintain residue cover following high residue crops such as grain corn or cereals, some tillage will likely be required. This will increase the chance of timely planting and maximum yield potential.
Residue ManagementReducing tillage costs, improving net profits and enhancing long-term soil health requires decisions about how best to handle crop residues, particularly wheat straw. Where no-till or reduced till corn is to follow wheat, remove the wheat straw from the field. Table 1–6, Effect of wheat straw levels on no-till corn yields, summarizes corn yields from tillage trials where three different levels of straw were left on the field and corn was no-till planted the following year. Removing straw from fields, especially in high-yielding wheat crops and on heavier-textured soils, increased the potential for no-till corn yields to equal those of mouldboard plowing.
Table 1–6. Effect of wheat straw levels on no-till corn yields
Tillage System/Straw Level1,2 Yield
No-till/ all straw and stubble remain
9.16 t/ha (146 bu/acre)
No-till/ straw baled but stubble remains
9.35 t/ha (149 bu/acre)
No-till/ straw baled and stubble cut and removed
9.91 t/ha (158 bu/acre)
Mouldboard/ straw baled but stubble remains
9.97 t/ha (159 bu/acre)
Source: T. Vyn, G. Opuku and C. Swanton, University of Guelph.1 Average 1994–96. Wyoming, Ontario. 2 Stubble heights were approximately 25–30 cm (10–12 in.)
except for plots where stubble was cut and removed.
Where straw removal is not an option, uniform spreading of the straw and chaff is critical for no-till or reduced tillage success in corn. Even where straw is to be left in the windrow, it is important to spread the chaff as widely and evenly as possible during combining. In cool, wet springs, the lower soil temperatures, poorer growth and potential slug damage brought on by mats of decaying wheat residue often result in yield losses that may have been avoided by uniform spreading of residue.
The benefits of incorporating all of the straw might outweigh the advantages of reducing tillage. For farms where erosion potential is higher, adopting a reduced tillage system is likely more sustainable, even with the need to remove some straw. Another option is using a system where wheat fields receive a small amount of tillage to partially incorporate straw while still leaving the soil surface largely protected.
Researchers examined the impact of adding nitrogen to assist in straw breakdown. Results indicate that straw did not decay more quickly where nitrogen was spread on wheat straw in the fall. In addition, the soil nitrogen levels the following spring were not higher compared to where no nitrogen was applied.
Weed ControlFor corn yield potential to be realized, optimum weed control is required. Additional management in no-till cropping systems may be needed to control perennial weeds and weed species that are new to the system due to a shift in weed populations. Spring pre-plant burndown treatments are critical in allowing the crop to develop without weed interference during critical early growth phases.
Disease and Insect ManagementTillage can play a role in preventing or suppressing certain pest and disease issues. Weeds, volunteer plants from the previous crop and certain cover crops left on the soil surface through the winter and early spring can increase the risk of some insect pests. Low lying weeds such as chickweed are ideal for egg laying by black cutworm moths that fly in from the southern United States (U.S.) in early spring. Cereal aphids can transmit vector viruses from volunteer wheat plants and infect the newly planted cereal crop. Corn planted into a rye cover crop increases the risk of
7
1. corn
armyworm infestations. Achieving good weed and cover crop management through herbicide applications in the fall and tillage in early spring at least 3 weeks prior to planting can avoid some of these pest risks. Tillage can be used in attempts to reduce populations of wireworms and grubs by bringing them up to the soil surface, exposing them to their natural enemies. However, caution is warranted as several passes are required and may not provide adequate control. Tillage can actually increase the risk of one particular pest, seedcorn maggot, if weeds, manure or cover crops are incorporated into the soil shortly before planting. Incorporation needs to occur at least 3 weeks prior to planting to ensure that the adults are no longer attracted to the decaying vegetation.
Some diseases are more prone to no-till systems as tillage can help in disease management. Tillage helps the soil to warm up and dry quickly, reducing the risk of seedling diseases. Some stalk rot diseases can also be managed through tillage though in some cases, crop rotation and hybrid selection play a larger role in disease management.
More details on insect pests and diseases of corn can be found in Chapter 15, Insects and pests of field crops and Chapter 16, Diseases of field crops.
Fertilizer PlacementNutrient stratification (nutrients concentrated near the soil surface) may occur in long-term, no-till fields. Without the option to incorporate or mix dry fertilizer material in the no-till system, fertilizer placement becomes increasingly important.
Studies done in Ontario and the U.S. cornbelt have shown that applying phosphorus and potassium in starter fertilizer bands resulted in yield response in no-till systems to be similar to fall mouldboard systems. This is especially evident in cases when soil tests indicated low to medium soil fertility levels of K. Planter-banded phosphorus and potassium were utilized more efficiently compared to fall surface broadcast in no-till systems. However, on sites with low fertility, a combination of broadcast and planter banding may be necessary to maximize no-till yields.
Cooler- and less-aerated soils in no-till systems often have a slower rate of nitrogen mineralization compared to conventional tillage systems. This is often overcome by applying 35 kg/ha (30 lb/acre) of nitrogen in the starter fertilizer.
Applying 35 kg/ha (30 lb/acre) of nitrogen in the starter on no-till corn planters has often overcome the slower nitrogen mineralization frequently present in no-till soils, where the balance of the nitrogen is applied in a side-dress application.
Soil CompactionThe best option for preventing soil compaction is to avoid field operations when soils are wet. Soil compaction is often cited as one of the reasons no-till corn may yield less than conventionally tilled corn. An option for enhancing corn yields in reduced tillage systems may include incorporating deep rooted crops into the rotation, and/or extensive loosening of soil deeper into the soil profile. This can be done without disrupting much of the crop residue on the soil surface and can be confined to zones where next year’s corn rows will be planted (e.g., strip-tillage).
Usually the most effective method to minimize the risk of deep compaction, 35–45 cm (15–18 in.) depth is to reduce the number of field operations and/or minimize use of equipment with heavy axles (e.g., grain buggies) wherever possible. Avoiding field traffic when soils are wet will also help minimize compaction.
Tire management can help reduce soil compaction in the root zone (top 20 cm (8 in.). Increasing floatation by minimizing inflation pressures can reduce the impacts of tires, especially in the surface soil layers. This requires three key steps:
1. Know the axle load that each tire is carrying.
2. Know the manufacturer's specifications for that tire.
3. Adjust inflation pressures down to the minimum acceptable pressure for soil conditions (speed, load type, duals, etc.). A good target for tire inflation pressures to reduce soil compaction is 1 Bar (14.5 PSI).
8
Agronomy guide for field Crops
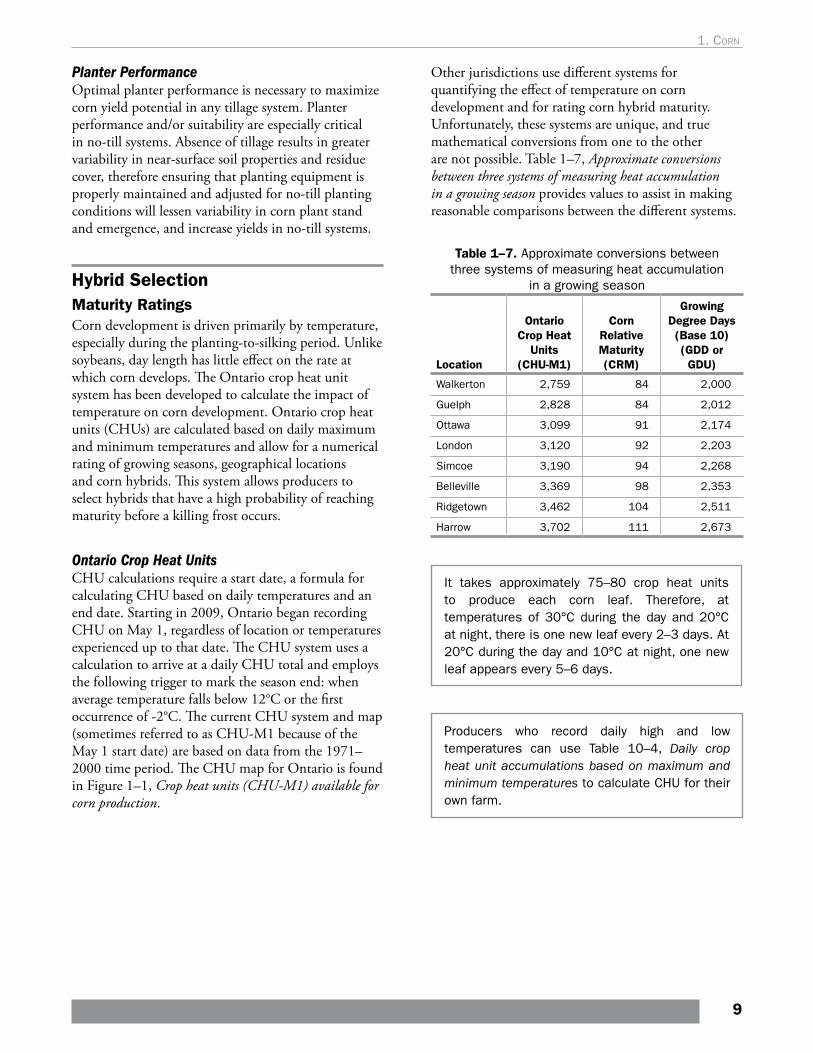
Planter PerformanceOptimal planter performance is necessary to maximize corn yield potential in any tillage system. Planter performance and/or suitability are especially critical in no-till systems. Absence of tillage results in greater variability in near-surface soil properties and residue cover, therefore ensuring that planting equipment is properly maintained and adjusted for no-till planting conditions will lessen variability in corn plant stand and emergence, and increase yields in no-till systems.
Hybrid SelectionMaturity RatingsCorn development is driven primarily by temperature, especially during the planting-to-silking period. Unlike soybeans, day length has little effect on the rate at which corn develops. The Ontario crop heat unit system has been developed to calculate the impact of temperature on corn development. Ontario crop heat units (CHUs) are calculated based on daily maximum and minimum temperatures and allow for a numerical rating of growing seasons, geographical locations and corn hybrids. This system allows producers to select hybrids that have a high probability of reaching maturity before a killing frost occurs.
Ontario Crop Heat Units CHU calculations require a start date, a formula for calculating CHU based on daily temperatures and an end date. Starting in 2009, Ontario began recording CHU on May 1, regardless of location or temperatures experienced up to that date. The CHU system uses a calculation to arrive at a daily CHU total and employs the following trigger to mark the season end: when average temperature falls below 12°C or the first occurrence of -2°C. The current CHU system and map (sometimes referred to as CHU-M1 because of the May 1 start date) are based on data from the 1971–2000 time period. The CHU map for Ontario is found in Figure 1–1, Crop heat units (CHU-M1) available for corn production.
Other jurisdictions use different systems for quantifying the effect of temperature on corn development and for rating corn hybrid maturity. Unfortunately, these systems are unique, and true mathematical conversions from one to the other are not possible. Table 1–7, Approximate conversions between three systems of measuring heat accumulation in a growing season provides values to assist in making reasonable comparisons between the different systems.
Table 1–7. Approximate conversions between three systems of measuring heat accumulation
in a growing season
Location
Ontario Crop Heat
Units (CHU-M1)
Corn Relative Maturity (CRM)
Growing Degree Days (Base 10) (GDD or GDU)
Walkerton 2,759 84 2,000
Guelph 2,828 84 2,012
Ottawa 3,099 91 2,174
London 3,120 92 2,203
Simcoe 3,190 94 2,268
Belleville 3,369 98 2,353
Ridgetown 3,462 104 2,511
Harrow 3,702 111 2,673
It takes approximately 75–80 crop heat units to produce each corn leaf. Therefore, at temperatures of 30°C during the day and 20°C at night, there is one new leaf every 2–3 days. At 20°C during the day and 10°C at night, one new leaf appears every 5–6 days.
Producers who record daily high and low temperatures can use Table 10–4, Daily crop heat unit accumulations based on maximum and minimum temperatures to calculate CHU for their own farm.
9
1. corn
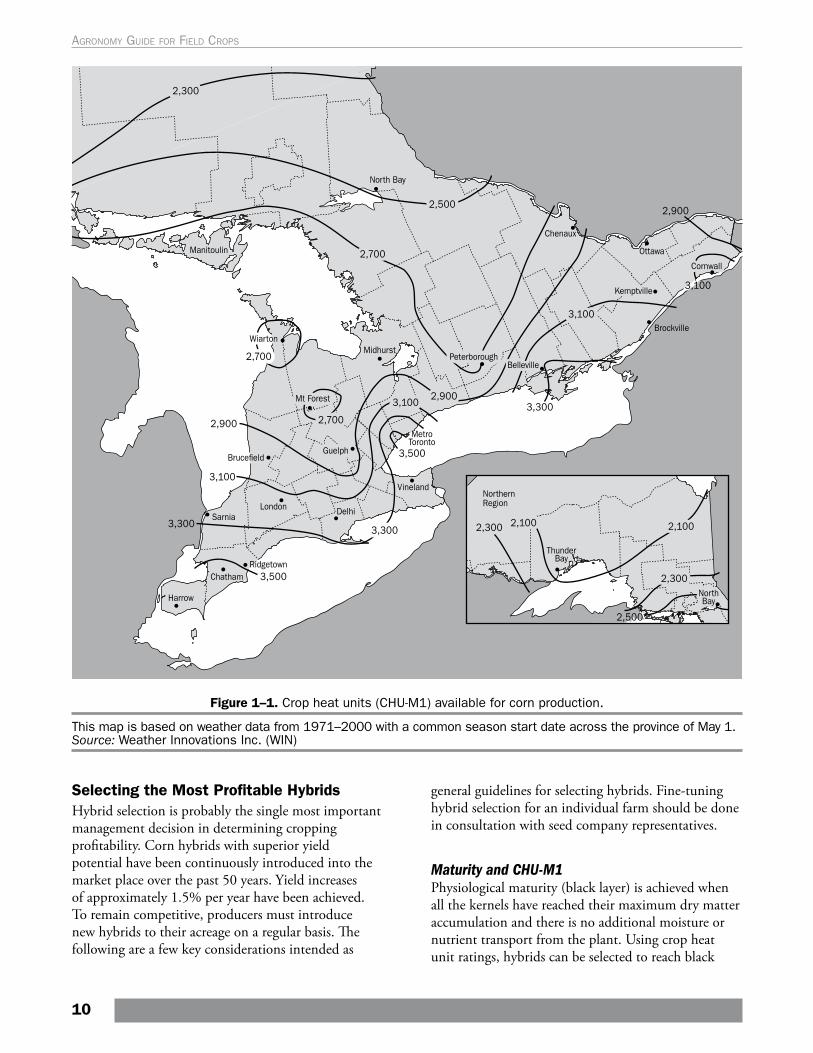
Figure 1–1. Crop heat units (CHU-M1) available for corn production.
This map is based on weather data from 1971–2000 with a common season start date across the province of May 1. Source: Weather Innovations Inc. (WIN)
Selecting the Most Profitable HybridsHybrid selection is probably the single most important management decision in determining cropping profitability. Corn hybrids with superior yield potential have been continuously introduced into the market place over the past 50 years. Yield increases of approximately 1.5% per year have been achieved. To remain competitive, producers must introduce new hybrids to their acreage on a regular basis. The following are a few key considerations intended as
general guidelines for selecting hybrids. Fine-tuning hybrid selection for an individual farm should be done in consultation with seed company representatives.
Maturity and CHU-M1Physiological maturity (black layer) is achieved when all the kernels have reached their maximum dry matter accumulation and there is no additional moisture or nutrient transport from the plant. Using crop heat unit ratings, hybrids can be selected to reach black
10
Agronomy guide for field Crops
layer before traditional season-ending frosts occurs. Figure 1–1, Crop heat units (CHU-M1) available for corn production, or farm records will provide the heat units normally accumulated in a given area.
Highest YieldIn any given hybrid performance trial, there may be a 1.9–2.5 t/ha (30–40 bu/acre) difference in yield between the highest- and lowest-yielding hybrids. This emphasizes the importance of obtaining reliable information on hybrid yield potential and adaptability. Producers must be able to sort through information from several key sources: public performance trial data, strip trial data (seed company or farm organization) and on-farm comparisons.
The Ontario Corn Committee (OCC) conducts corn hybrid performance trials each year across the province. These performance trials include the majority of available hybrids. Generally, these trials are set up so that a given set of hybrids, for a certain heat unit range, are tested at three to four locations. This data is available at www.gocorn.net and can be viewed in several formats to allow for stakeholders to carefully examine the results. These trials give a good indication of yield potential; however, they are limited to a few locations and therefore do not adequately evaluate hybrid adaptability over a wide range of conditions. For this information, producers need to turn to strip trials that are conducted on a larger number of sites across a wide range of environments. Seed companies summarize these strip trial results which are made available through their seed guides.
Many producers find it valuable to have corn hybrid strip trials or comparisons on their own farm. This allows new, high-yield potential hybrids to be tested against those proven performers in the farming practice. However, it is important to remember that reliable hybrid selections require more than one test site, even if that site is on the producer’s own farm. Producers should look for 2-year data that originates from many sites (preferably more than 30) before making decisions about hybrids that will be planted on a significant portion of their acreage.
One way to look at hybrid selection is to define two groups of hybrids for a farm operation. The first group is “New Hybrids” and is comprised of the most promising new hybrids in the market place. This group will represent hybrids that are grown on a
relatively small acreage and that are tracked carefully for their performance on a given farm, in strip trials and in public performance trials. The goal is to quickly identify the top hybrid in this group and move it into the second hybrid group which is called “Tested Hybrids”. The Tested Hybrids group represents hybrids that have proven their performance and are grown on a large percentage of a given operation’s corn acres. Producers who make the most accurate and quickest decisions to move new, higher performing hybrids into their operations will achieve maximum competitive advantage and yield increases.
Producers who make the most accurate and quickest decisions to move new, higher performing hybrids into their operations will achieve maximum competitive advantage.
Hybrid PositioningCorn hybrids have often been classified with various terms such as “workhorses” or “racehorses”, having offensive versus defensive natures. Hybrids that produce above-average yield under good conditions, but perform below average under poor conditions are considered racehorses (offensive). Hybrids that have relatively consistent yields in both low- and high-yielding conditions are considered workhorses (defensive). As site-specific management increases in popularity, many producers will choose racehorse varieties in the most productive areas of their field and workhorse varieties where soil or weather conditions are less favourable. Trends within the seed industry indicate that hybrids will be increasingly defined for their ability to fit into certain management strategies and/or environments. Precision agriculture technologies can better define the potential for hybrids to exploit site specific resources more effectively.
Producers should be aware of the possibility of selecting hybrids that will respond more effectively to higher or lower input strategies. Producers can avoid some of the risk associated with hybrid selection by taking time to investigate a hybrid’s past performance. Select hybrids that complement each other, because they have different weaknesses for specific characteristics. For example, when selecting two long-season hybrids with high yield potential for earliest planting, ensure that they do not both score relatively low for resistance to the leaf diseases.
11
1. corn
StandabilitySelect hybrids that have suitable maturity ratings and outstanding yield potential. Selecting for hybrid standability is also recommended. This trait is particularly important where significant field drying is expected. If drying facilities are available on the farm and harvesting at relatively high moisture levels (>26%) is an option, standability may be less critical. Traits associated with improved hybrid standability include resistance to stalk rot and leaf blights, genetic stalk strength (a thick stalk rind), short plant height, lower ear placement and above average late-season plant health. Plant intactness or late-season plant health ratings also indicate better harvestability ratings.
One of the most significant advancements in improved standability has been the introduction of Bt hybrids that are resistant to a range of corn feeding pests. All producers using Bt hybrids are required to plant a refuge which contains corn plants that are not genetically modified in order to prevent a build-up of resistant pest strains. Producers can now purchase refuge incorporated blends that contain both Bt and non-Bt seed in the same bag, eliminating some of the issues with having to plant separate refuge. For further information on Bt corn refer to Chapter 15, Insects and Pests of Field Crops as well as the Canadian Corn Pest Coalition website at www.cornpest.ca.
Harvest Moistures and Drying CostsHybrid selection may also be influenced by the producer’s target harvest moistures. In situations where corn is stored as high moisture grain (e.g., 28% moisture), producers have an opportunity to maximize returns by growing full-season, high-yielding hybrids. If corn is dried during storage, evaluate the impact that high harvest moistures may have on net returns. For example, any potential gains in net returns from a hybrid that yields 0.31 t/ha (5 bu/acre) greater than another should be balanced against increased drying charges. OCC performance trial data has shown that when corn is planted early, aggressive hybrid selection (i.e., full-season and beyond) often results in yield advantages over hybrids that mature in less days (shorter-season hybrids). The increased yield from full- or long-season hybrids more than compensates for the increased drying costs due to higher harvest moistures. Producers should evaluate net returns for hybrids after dryings costs. Depending on drying costs a 2–3 bushel per acre increase in yield often more than compensates for an additional 1% increase in harvest moistures.
Selecting Hybrids for SilageWhen choosing hybrids specifically for whole-plant silage, a yield advantage can usually be obtained by selecting hybrids rated 100–200 heat units higher than those selected for grain. Select hybrids for high silage yields with improved digestible energy. Silage-only and dual-purpose corn hybrids are available on the market. Dual-purpose hybrids offer grain harvest as an option, providing more flexibility when the silo is full. Without sufficient independent data, it is very difficult to compare and select corn silage hybrids between companies. Choose top hybrids that have strong ratings for silage yield and quality. Various models are used to compare the economic value of corn silage hybrids. The University of Wisconsin has developed “milk per acre” and “milk per ton” calculations using their Milk 2006 model to combine the traits of silage yield, digestibility, fibre, starch, crude protein and intake potential into single measures. Milk per ton measures quality, while milk per acre combines yield and quality.
Switching to Shorter-Season HybridsField conditions may delay planting and necessitate switching to less than full-season hybrids. Factors to consider in this decision include yield potential of shorter-season hybrids, test weight concerns, drying costs and late-season harvesting capabilities.
Grain corn obtains 90% of its total grain weight by the time it reaches one-half milk line, a maturity stage that even late-planted, full-season hybrids reach in most years. Switching to shorter-season hybrids may be a reasonable alternative from a grain yield perspective if earlier maturing hybrids can produce within 10% of the full-season hybrid’s yield. Generally, this is a more favourable proposition in longer-season areas.
Growing full season 3,000 CHU-M1 hybrids allows for switching to hybrids that are 100–150 heat units less without sacrificing excessive yield. If the full-season hybrids are in the 2,800 CHU-M1 range, the odds of dropping to a hybrid 100 heat units less without giving up more than 10% yield are low.
Extensive research across the northern cornbelt defines the optimal date when producers should switch away from full-season hybrids. Some of this data is summarized in Table 1–8, Recommended dates to switch from full-season hybrids across various heat unit zones.
12
Agronomy guide for field Crops
This collection of long-term data took into account yields for hybrids of various maturity ratings as well as deductions for test weight and drying. The switch date indicates the planting date when earlier-maturing hybrids surpass full-season hybrids in terms of net returns (gross returns less drying and test weight deductions).
Table 1–8. Recommended dates to switch from full-season hybrids across various heat unit zonesHeat Unit Zone (CHU-M1) Switch Date
>3,200+ May 30–early June
2,800–3,200 May 20–25
<2,800 May 15–20
Source: Adapted from R. Iragavarapu. Basing Hybrid Maturity Switches on Long-Term Data. Pioneer Hi-Bred Ltd.
Growing hybrids with a range in maturity provides some buffer against stresses at silking time and end-of-season risks. However, making significant adjustments to shorter season hybrids should not be considered until May 30–June 1 for areas in southwest (>3,200 CHU-M1); until May 20–25 for the mid-maturity corn growing areas (2,800–3,200 CHU-M1) and until May 15–20 in the shorter-season areas (<2,800 CHU-M1).
A general rule has been to reduce hybrid maturity by 100 CHU for every week that planting is delayed beyond the cut-off date for full-season hybrids.
Test Weight ConcernsLower test weights often result if end-of-season frosts occur before late-planted corn has reached maturity (black layer). Consider test weight potential when selecting hybrids for planting in a late spring. Potential dockage from delivering lower bushel weight corn to an elevator or end user is shown in Table 1–9, Grain corn test weights and potential dockage.
Table 1–9. Grain corn test weights and potential dockage
Current as of Spring 2016. Potential discounts may vary considerably depending on year and location.
Grade Test Weight Minimum Potential Discount
1 68.0 kg/hL (55.6 lb/bu)
$0.00/tonne
2 66.0 kg/hL (52.8 lb/bu)
$0.00/tonne
3 64.1 kg/hL (51.4 lb/bu)
$2.00/tonne
4 62.0 kg/hL (49.7 lb/bu)
$6.00/tonne
5 58.0 kg/hL (46.5 lb/bu)
$12.00/tonne
Farming operations that handle and feed all of their own corn may be unaffected by test weight concerns and may choose to remain with full-season hybrids longer into the planting season. Experience and research from 1992, 2000 and 2014 indicated there was little or no correlation between test weight and livestock feed value. Producers who deliver all their corn to elevators or processors may want to switch to earlier hybrids to increase the potential for suitable test weights at harvest. Producers in shorter-season areas who fear significant yield losses by switching to earlier-maturing hybrids may consider staying with full-season hybrids but switching to hybrids that have higher test weight scores.
HarvestingRemaining dedicated to high-yielding, later-maturing hybrids may present some logistical harvest issues. Fields planted to potentially delayed hybrids should be well-drained and have good load-bearing capacities to facilitate late-season harvesting in less than ideal conditions. Avoid planting later-maturing hybrids in areas of the province that are more prone to snow in November. The snow adheres to leaves and husks, delaying harvest until the snow melts from the corn plants.
13
1. corn
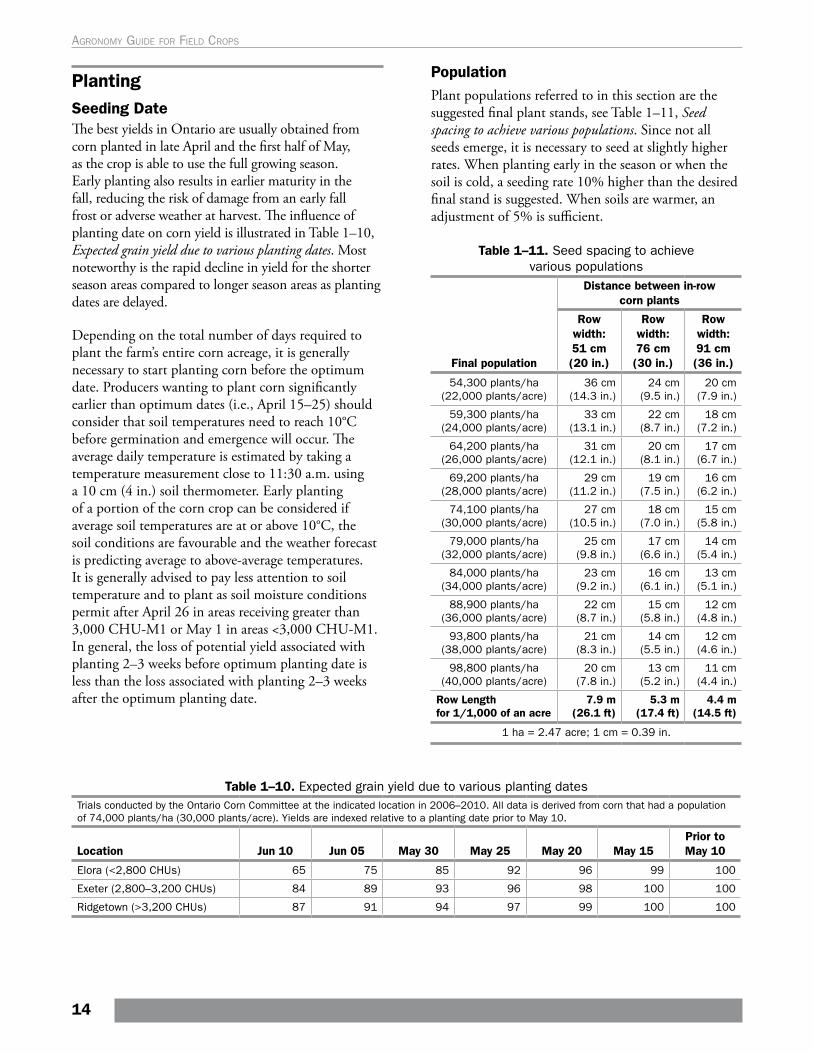
PlantingSeeding DateThe best yields in Ontario are usually obtained from corn planted in late April and the first half of May, as the crop is able to use the full growing season. Early planting also results in earlier maturity in the fall, reducing the risk of damage from an early fall frost or adverse weather at harvest. The influence of planting date on corn yield is illustrated in Table 1–10, Expected grain yield due to various planting dates. Most noteworthy is the rapid decline in yield for the shorter season areas compared to longer season areas as planting dates are delayed.
Depending on the total number of days required to plant the farm’s entire corn acreage, it is generally necessary to start planting corn before the optimum date. Producers wanting to plant corn significantly earlier than optimum dates (i.e., April 15–25) should consider that soil temperatures need to reach 10°C before germination and emergence will occur. The average daily temperature is estimated by taking a temperature measurement close to 11:30 a.m. using a 10 cm (4 in.) soil thermometer. Early planting of a portion of the corn crop can be considered if average soil temperatures are at or above 10°C, the soil conditions are favourable and the weather forecast is predicting average to above-average temperatures. It is generally advised to pay less attention to soil temperature and to plant as soil moisture conditions permit after April 26 in areas receiving greater than 3,000 CHU-M1 or May 1 in areas <3,000 CHU-M1. In general, the loss of potential yield associated with planting 2–3 weeks before optimum planting date is less than the loss associated with planting 2–3 weeks after the optimum planting date.
PopulationPlant populations referred to in this section are the suggested final plant stands, see Table 1–11, Seed spacing to achieve various populations. Since not all seeds emerge, it is necessary to seed at slightly higher rates. When planting early in the season or when the soil is cold, a seeding rate 10% higher than the desired final stand is suggested. When soils are warmer, an adjustment of 5% is sufficient.
Table 1–10. Expected grain yield due to various planting datesTrials conducted by the Ontario Corn Committee at the indicated location in 2006–2010. All data is derived from corn that had a population of 74,000 plants/ha (30,000 plants/acre). Yields are indexed relative to a planting date prior to May 10.
Location Jun 10 Jun 05 May 30 May 25 May 20 May 15Prior to May 10
Elora (<2,800 CHUs) 65 75 85 92 96 99 100
Exeter (2,800–3,200 CHUs) 84 89 93 96 98 100 100
Ridgetown (>3,200 CHUs) 87 91 94 97 99 100 100
Table 1–11. Seed spacing to achieve various populations
Final population
Distance between in-row corn plants
Row width: 51 cm (20 in.)
Row width: 76 cm (30 in.)
Row width: 91 cm (36 in.)
54,300 plants/ha (22,000 plants/acre)
36 cm (14.3 in.)
24 cm (9.5 in.)
20 cm (7.9 in.)
59,300 plants/ha (24,000 plants/acre)
33 cm (13.1 in.)
22 cm (8.7 in.)
18 cm (7.2 in.)
64,200 plants/ha (26,000 plants/acre)
31 cm (12.1 in.)
20 cm (8.1 in.)
17 cm (6.7 in.)
69,200 plants/ha (28,000 plants/acre)
29 cm (11.2 in.)
19 cm (7.5 in.)
16 cm (6.2 in.)
74,100 plants/ha (30,000 plants/acre)
27 cm (10.5 in.)
18 cm (7.0 in.)
15 cm (5.8 in.)
79,000 plants/ha (32,000 plants/acre)
25 cm (9.8 in.)
17 cm (6.6 in.)
14 cm (5.4 in.)
84,000 plants/ha (34,000 plants/acre)
23 cm (9.2 in.)
16 cm (6.1 in.)
13 cm (5.1 in.)
88,900 plants/ha (36,000 plants/acre)
22 cm (8.7 in.)
15 cm (5.8 in.)
12 cm (4.8 in.)
93,800 plants/ha (38,000 plants/acre)
21 cm (8.3 in.)
14 cm (5.5 in.)
12 cm (4.6 in.)
98,800 plants/ha (40,000 plants/acre)
20 cm (7.8 in.)
13 cm (5.2 in.)
11 cm (4.4 in.)
Row Length for 1/1,000 of an acre
7.9 m (26.1 ft)
5.3 m (17.4 ft)
4.4 m (14.5 ft)
1 ha = 2.47 acre; 1 cm = 0.39 in.
14
Agronomy guide for field Crops
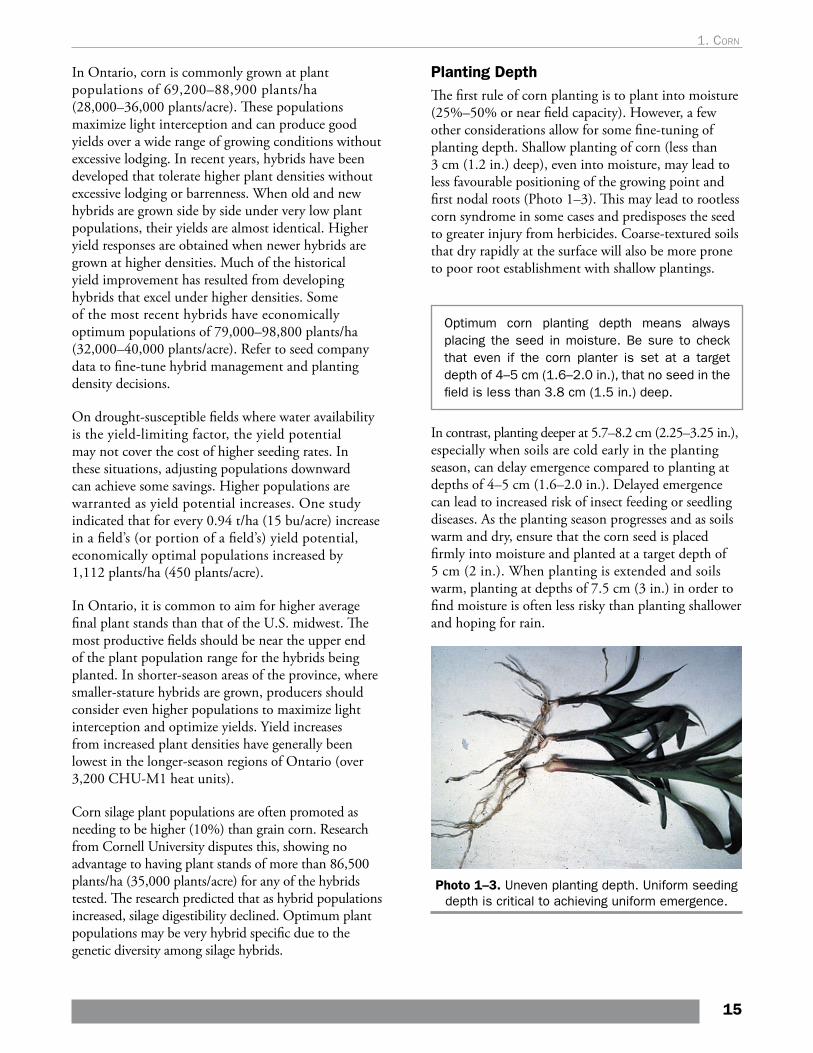
In Ontario, corn is commonly grown at plant populations of 69,200–88,900 plants/ha (28,000–36,000 plants/acre). These populations maximize light interception and can produce good yields over a wide range of growing conditions without excessive lodging. In recent years, hybrids have been developed that tolerate higher plant densities without excessive lodging or barrenness. When old and new hybrids are grown side by side under very low plant populations, their yields are almost identical. Higher yield responses are obtained when newer hybrids are grown at higher densities. Much of the historical yield improvement has resulted from developing hybrids that excel under higher densities. Some of the most recent hybrids have economically optimum populations of 79,000–98,800 plants/ha (32,000–40,000 plants/acre). Refer to seed company data to fine-tune hybrid management and planting density decisions.
On drought-susceptible fields where water availability is the yield-limiting factor, the yield potential may not cover the cost of higher seeding rates. In these situations, adjusting populations downward can achieve some savings. Higher populations are warranted as yield potential increases. One study indicated that for every 0.94 t/ha (15 bu/acre) increase in a field’s (or portion of a field’s) yield potential, economically optimal populations increased by 1,112 plants/ha (450 plants/acre).
In Ontario, it is common to aim for higher average final plant stands than that of the U.S. midwest. The most productive fields should be near the upper end of the plant population range for the hybrids being planted. In shorter-season areas of the province, where smaller-stature hybrids are grown, producers should consider even higher populations to maximize light interception and optimize yields. Yield increases from increased plant densities have generally been lowest in the longer-season regions of Ontario (over 3,200 CHU-M1 heat units).
Corn silage plant populations are often promoted as needing to be higher (10%) than grain corn. Research from Cornell University disputes this, showing no advantage to having plant stands of more than 86,500 plants/ha (35,000 plants/acre) for any of the hybrids tested. The research predicted that as hybrid populations increased, silage digestibility declined. Optimum plant populations may be very hybrid specific due to the genetic diversity among silage hybrids.
Planting DepthThe first rule of corn planting is to plant into moisture (25%–50% or near field capacity). However, a few other considerations allow for some fine-tuning of planting depth. Shallow planting of corn (less than 3 cm (1.2 in.) deep), even into moisture, may lead to less favourable positioning of the growing point and first nodal roots (Photo 1–3). This may lead to rootless corn syndrome in some cases and predisposes the seed to greater injury from herbicides. Coarse-textured soils that dry rapidly at the surface will also be more prone to poor root establishment with shallow plantings.
Optimum corn planting depth means always placing the seed in moisture. Be sure to check that even if the corn planter is set at a target depth of 4–5 cm (1.6–2.0 in.), that no seed in the field is less than 3.8 cm (1.5 in.) deep.
In contrast, planting deeper at 5.7–8.2 cm (2.25–3.25 in.), especially when soils are cold early in the planting season, can delay emergence compared to planting at depths of 4–5 cm (1.6–2.0 in.). Delayed emergence can lead to increased risk of insect feeding or seedling diseases. As the planting season progresses and as soils warm and dry, ensure that the corn seed is placed firmly into moisture and planted at a target depth of 5 cm (2 in.). When planting is extended and soils warm, planting at depths of 7.5 cm (3 in.) in order to find moisture is often less risky than planting shallower and hoping for rain.
Photo 1–3. Uneven planting depth. Uniform seeding depth is critical to achieving uniform emergence.
15
1. corn
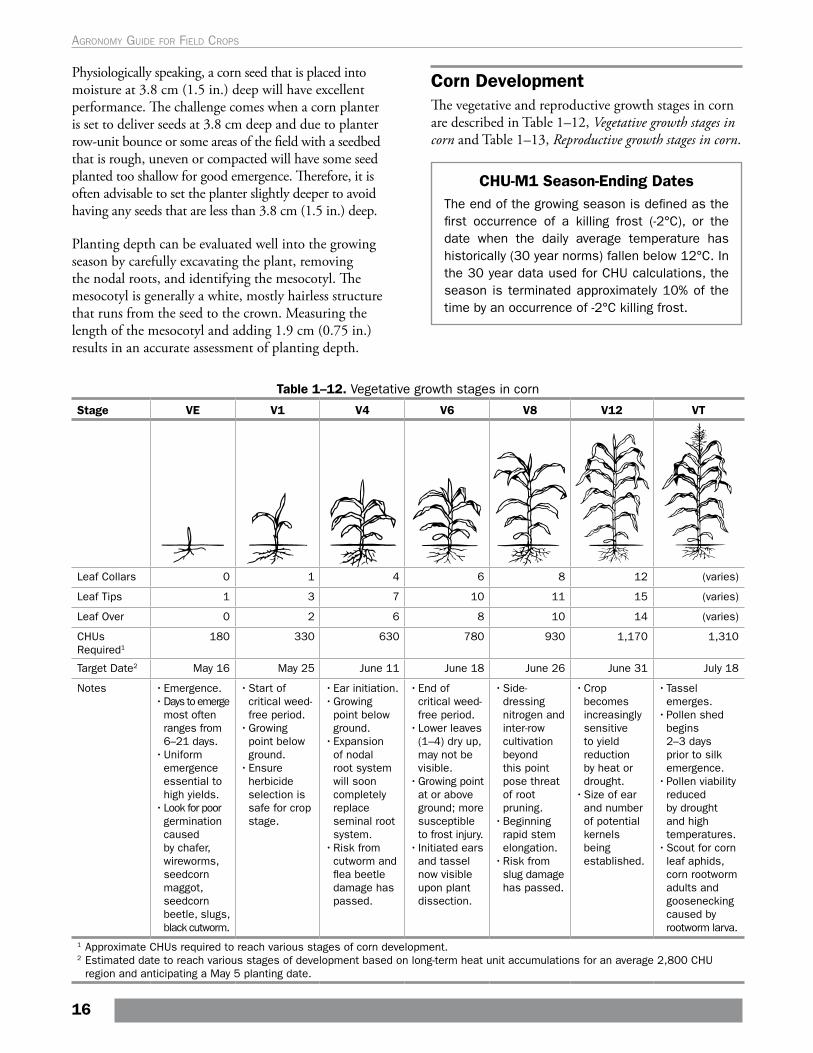
Physiologically speaking, a corn seed that is placed into moisture at 3.8 cm (1.5 in.) deep will have excellent performance. The challenge comes when a corn planter is set to deliver seeds at 3.8 cm deep and due to planter row-unit bounce or some areas of the field with a seedbed that is rough, uneven or compacted will have some seed planted too shallow for good emergence. Therefore, it is often advisable to set the planter slightly deeper to avoid having any seeds that are less than 3.8 cm (1.5 in.) deep.
Planting depth can be evaluated well into the growing season by carefully excavating the plant, removing the nodal roots, and identifying the mesocotyl. The mesocotyl is generally a white, mostly hairless structure that runs from the seed to the crown. Measuring the length of the mesocotyl and adding 1.9 cm (0.75 in.) results in an accurate assessment of planting depth.
Corn DevelopmentThe vegetative and reproductive growth stages in corn are described in Table 1–12, Vegetative growth stages in corn and Table 1–13, Reproductive growth stages in corn.
CHU-M1 Season-Ending DatesThe end of the growing season is defined as the first occurrence of a killing frost (-2°C), or the date when the daily average temperature has historically (30 year norms) fallen below 12°C. In the 30 year data used for CHU calculations, the season is terminated approximately 10% of the time by an occurrence of -2°C killing frost.
Table 1–12. Vegetative growth stages in corn
Stage VE V1 V4 V6 V8 V12 VT
Leaf Collars 0 1 4 6 8 12 (varies)
Leaf Tips 1 3 7 10 11 15 (varies)
Leaf Over 0 2 6 8 10 14 (varies)
CHUs Required1
180 330 630 780 930 1,170 1,310
Target Date2 May 16 May 25 June 11 June 18 June 26 June 31 July 18
Notes • Emergence.• Days to emerge
most often ranges from 6–21 days.
• Uniform emergence essential to high yields.
• Look for poor germination caused by chafer, wireworms, seedcorn maggot, seedcorn beetle, slugs, black cutworm.
• Start of critical weed-free period.
• Growing point below ground.
• Ensure herbicide selection is safe for crop stage.
• Ear initiation.• Growing
point below ground.
• Expansion of nodal root system will soon completely replace seminal root system.
• Risk from cutworm and flea beetle damage has passed.
• End of critical weed-free period.
• Lower leaves (1–4) dry up, may not be visible.
• Growing point at or above ground; more susceptible to frost injury.
• Initiated ears and tassel now visible upon plant dissection.
• Side-dressing nitrogen and inter-row cultivation beyond this point pose threat of root pruning.
• Beginning rapid stem elongation.
• Risk from slug damage has passed.
• Crop becomes increasingly sensitive to yield reduction by heat or drought.
• Size of ear and number of potential kernels being established.
• Tassel emerges.
• Pollen shed begins 2–3 days prior to silk emergence.
• Pollen viability reduced by drought and high temperatures.
• Scout for corn leaf aphids, corn rootworm adults and goosenecking caused by rootworm larva.
1 Approximate CHUs required to reach various stages of corn development.2 Estimated date to reach various stages of development based on long-term heat unit accumulations for an average 2,800 CHU
region and anticipating a May 5 planting date.
16
Agronomy guide for field Crops
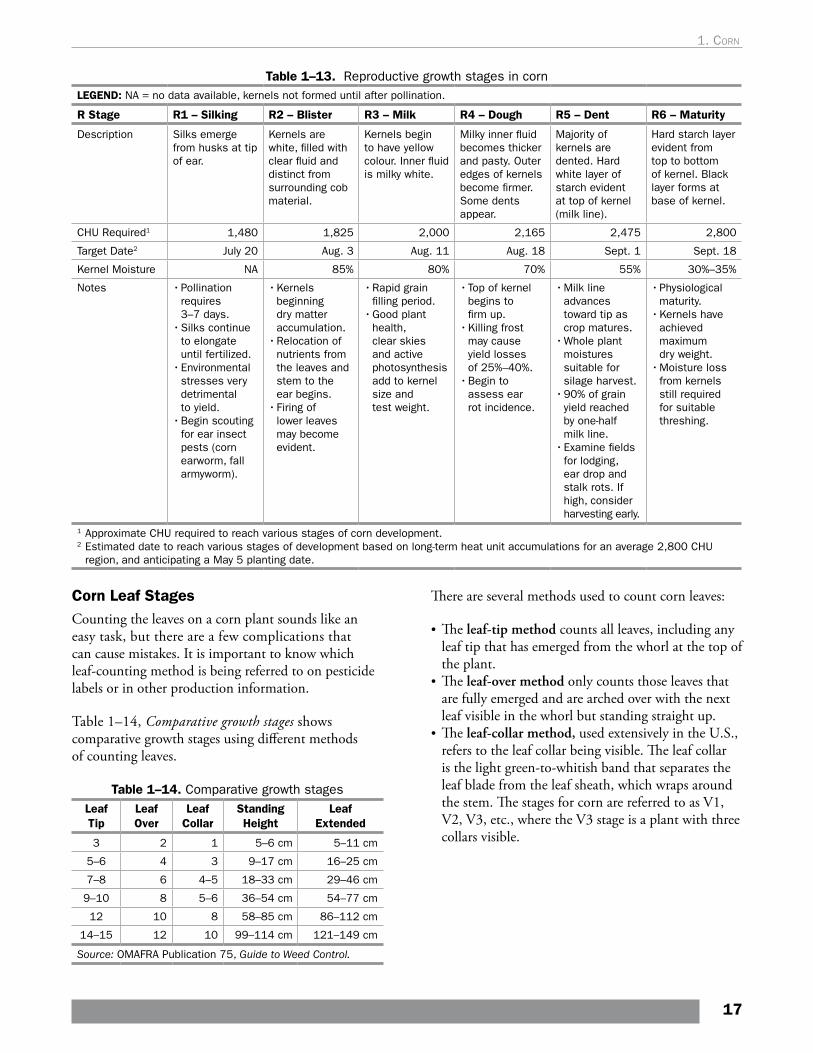
Table 1–13. Reproductive growth stages in cornLEGEND: NA = no data available, kernels not formed until after pollination.
R Stage R1 – Silking R2 – Blister R3 – Milk R4 – Dough R5 – Dent R6 – Maturity
Description Silks emerge from husks at tip of ear.
Kernels are white, filled with clear fluid and distinct from surrounding cob material.
Kernels begin to have yellow colour. Inner fluid is milky white.
Milky inner fluid becomes thicker and pasty. Outer edges of kernels become firmer. Some dents appear.
Majority of kernels are dented. Hard white layer of starch evident at top of kernel (milk line).
Hard starch layer evident from top to bottom of kernel. Black layer forms at base of kernel.
CHU Required1 1,480 1,825 2,000 2,165 2,475 2,800
Target Date2 July 20 Aug. 3 Aug. 11 Aug. 18 Sept. 1 Sept. 18
Kernel Moisture NA 85% 80% 70% 55% 30%–35%
Notes • Pollination requires 3–7 days.
• Silks continue to elongate until fertilized.
• Environmental stresses very detrimental to yield.
• Begin scouting for ear insect pests (corn earworm, fall armyworm).
• Kernels beginning dry matter accumulation.
• Relocation of nutrients from the leaves and stem to the ear begins.
• Firing of lower leaves may become evident.
• Rapid grain filling period.
• Good plant health, clear skies and active photosynthesis add to kernel size and test weight.
• Top of kernel begins to firm up.
• Killing frost may cause yield losses of 25%–40%.
• Begin to assess ear rot incidence.
• Milk line advances toward tip as crop matures.
• Whole plant moistures suitable for silage harvest.
• 90% of grain yield reached by one-half milk line.
• Examine fields for lodging, ear drop and stalk rots. If high, consider harvesting early.
• Physiological maturity.
• Kernels have achieved maximum dry weight.
• Moisture loss from kernels still required for suitable threshing.
1 Approximate CHU required to reach various stages of corn development.2 Estimated date to reach various stages of development based on long-term heat unit accumulations for an average 2,800 CHU
region, and anticipating a May 5 planting date.
Corn Leaf StagesCounting the leaves on a corn plant sounds like an easy task, but there are a few complications that can cause mistakes. It is important to know which leaf-counting method is being referred to on pesticide labels or in other production information.
Table 1–14, Comparative growth stages shows comparative growth stages using different methods of counting leaves.
Table 1–14. Comparative growth stagesLeaf Tip
Leaf Over
Leaf Collar
Standing Height
Leaf Extended
3 2 1 5–6 cm 5–11 cm
5–6 4 3 9–17 cm 16–25 cm
7–8 6 4–5 18–33 cm 29–46 cm
9–10 8 5–6 36–54 cm 54–77 cm
12 10 8 58–85 cm 86–112 cm
14–15 12 10 99–114 cm 121–149 cm
Source: OMAFRA Publication 75, Guide to Weed Control.
There are several methods used to count corn leaves:
• The leaf-tip method counts all leaves, including any leaf tip that has emerged from the whorl at the top of the plant.
• The leaf-over method only counts those leaves that are fully emerged and are arched over with the next leaf visible in the whorl but standing straight up.
• The leaf-collar method, used extensively in the U.S., refers to the leaf collar being visible. The leaf collar is the light green-to-whitish band that separates the leaf blade from the leaf sheath, which wraps around the stem. The stages for corn are referred to as V1, V2, V3, etc., where the V3 stage is a plant with three collars visible.
17
1. corn
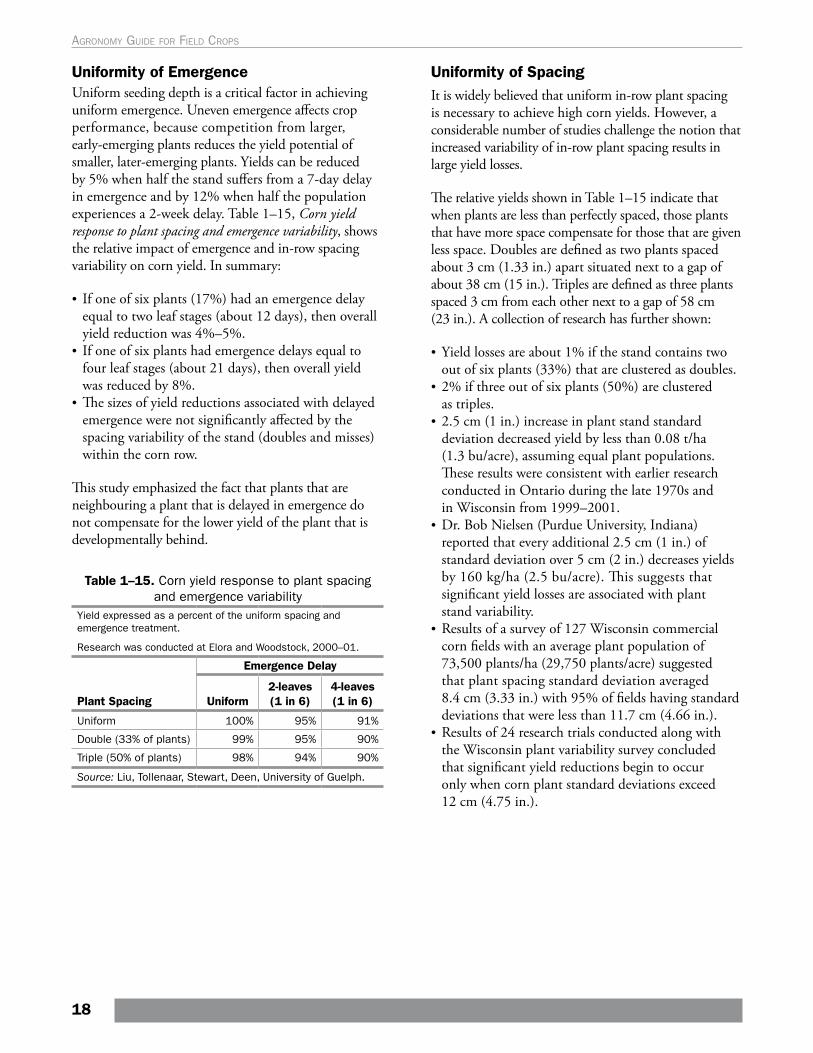
Uniformity of EmergenceUniform seeding depth is a critical factor in achieving uniform emergence. Uneven emergence affects crop performance, because competition from larger, early-emerging plants reduces the yield potential of smaller, later-emerging plants. Yields can be reduced by 5% when half the stand suffers from a 7-day delay in emergence and by 12% when half the population experiences a 2-week delay. Table 1–15, Corn yield response to plant spacing and emergence variability, shows the relative impact of emergence and in-row spacing variability on corn yield. In summary:
• If one of six plants (17%) had an emergence delay equal to two leaf stages (about 12 days), then overall yield reduction was 4%–5%.
• If one of six plants had emergence delays equal to four leaf stages (about 21 days), then overall yield was reduced by 8%.
• The sizes of yield reductions associated with delayed emergence were not significantly affected by the spacing variability of the stand (doubles and misses) within the corn row.
This study emphasized the fact that plants that are neighbouring a plant that is delayed in emergence do not compensate for the lower yield of the plant that is developmentally behind.
Table 1–15. Corn yield response to plant spacing and emergence variability
Yield expressed as a percent of the uniform spacing and emergence treatment.
Research was conducted at Elora and Woodstock, 2000–01.
Plant Spacing
Emergence Delay
Uniform2-leaves (1 in 6)
4-leaves (1 in 6)
Uniform 100% 95% 91%
Double (33% of plants) 99% 95% 90%
Triple (50% of plants) 98% 94% 90%
Source: Liu, Tollenaar, Stewart, Deen, University of Guelph.
Uniformity of SpacingIt is widely believed that uniform in-row plant spacing is necessary to achieve high corn yields. However, a considerable number of studies challenge the notion that increased variability of in-row plant spacing results in large yield losses.
The relative yields shown in Table 1–15 indicate that when plants are less than perfectly spaced, those plants that have more space compensate for those that are given less space. Doubles are defined as two plants spaced about 3 cm (1.33 in.) apart situated next to a gap of about 38 cm (15 in.). Triples are defined as three plants spaced 3 cm from each other next to a gap of 58 cm (23 in.). A collection of research has further shown:
• Yield losses are about 1% if the stand contains two out of six plants (33%) that are clustered as doubles.
• 2% if three out of six plants (50%) are clustered as triples.
• 2.5 cm (1 in.) increase in plant stand standard deviation decreased yield by less than 0.08 t/ha (1.3 bu/acre), assuming equal plant populations. These results were consistent with earlier research conducted in Ontario during the late 1970s and in Wisconsin from 1999–2001.
• Dr. Bob Nielsen (Purdue University, Indiana) reported that every additional 2.5 cm (1 in.) of standard deviation over 5 cm (2 in.) decreases yields by 160 kg/ha (2.5 bu/acre). This suggests that significant yield losses are associated with plant stand variability.
• Results of a survey of 127 Wisconsin commercial corn fields with an average plant population of 73,500 plants/ha (29,750 plants/acre) suggested that plant spacing standard deviation averaged 8.4 cm (3.33 in.) with 95% of fields having standard deviations that were less than 11.7 cm (4.66 in.).
• Results of 24 research trials conducted along with the Wisconsin plant variability survey concluded that significant yield reductions begin to occur only when corn plant standard deviations exceed 12 cm (4.75 in.).
18
Agronomy guide for field Crops
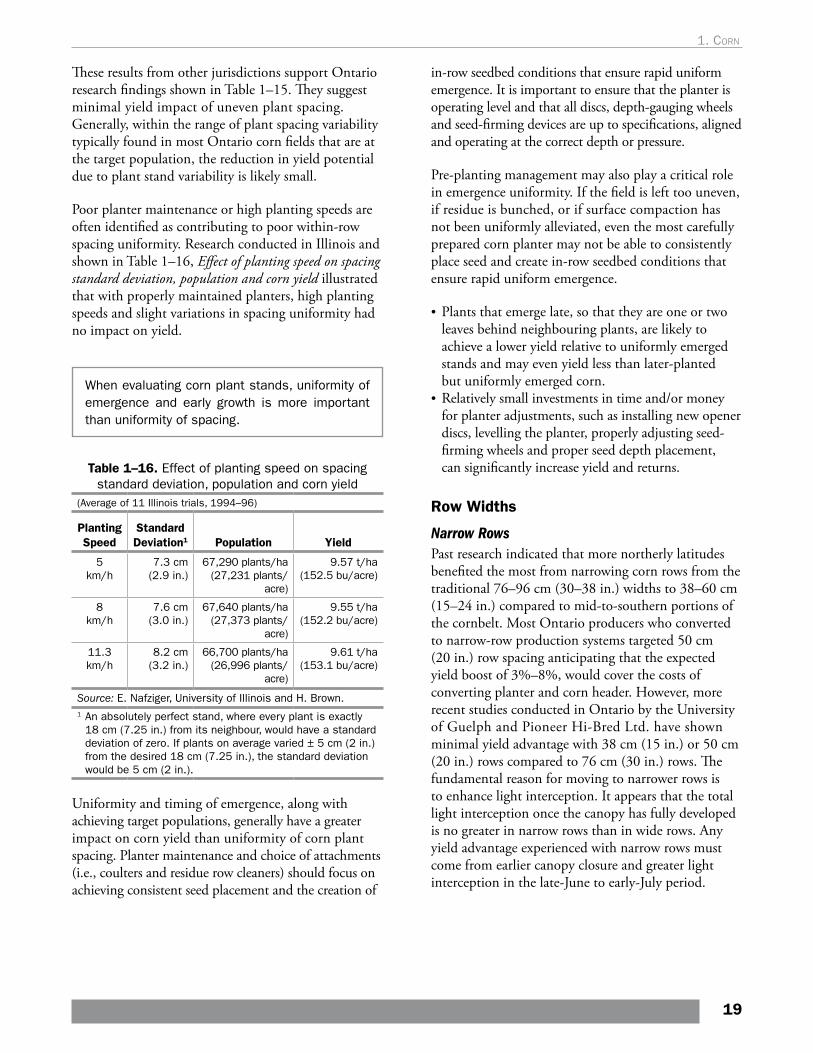
These results from other jurisdictions support Ontario research findings shown in Table 1–15. They suggest minimal yield impact of uneven plant spacing. Generally, within the range of plant spacing variability typically found in most Ontario corn fields that are at the target population, the reduction in yield potential due to plant stand variability is likely small.
Poor planter maintenance or high planting speeds are often identified as contributing to poor within-row spacing uniformity. Research conducted in Illinois and shown in Table 1–16, Effect of planting speed on spacing standard deviation, population and corn yield illustrated that with properly maintained planters, high planting speeds and slight variations in spacing uniformity had no impact on yield.
When evaluating corn plant stands, uniformity of emergence and early growth is more important than uniformity of spacing.
Table 1–16. Effect of planting speed on spacing standard deviation, population and corn yield
(Average of 11 Illinois trials, 1994–96)
Planting Speed
Standard Deviation1 Population Yield
5 km/h
7.3 cm (2.9 in.)
67,290 plants/ha (27,231 plants/
acre)
9.57 t/ha (152.5 bu/acre)
8 km/h
7.6 cm (3.0 in.)
67,640 plants/ha (27,373 plants/
acre)
9.55 t/ha (152.2 bu/acre)
11.3 km/h
8.2 cm (3.2 in.)
66,700 plants/ha (26,996 plants/
acre)
9.61 t/ha (153.1 bu/acre)
Source: E. Nafziger, University of Illinois and H. Brown.1 An absolutely perfect stand, where every plant is exactly
18 cm (7.25 in.) from its neighbour, would have a standard deviation of zero. If plants on average varied ± 5 cm (2 in.) from the desired 18 cm (7.25 in.), the standard deviation would be 5 cm (2 in.).
Uniformity and timing of emergence, along with achieving target populations, generally have a greater impact on corn yield than uniformity of corn plant spacing. Planter maintenance and choice of attachments (i.e., coulters and residue row cleaners) should focus on achieving consistent seed placement and the creation of
in-row seedbed conditions that ensure rapid uniform emergence. It is important to ensure that the planter is operating level and that all discs, depth-gauging wheels and seed-firming devices are up to specifications, aligned and operating at the correct depth or pressure.
Pre-planting management may also play a critical role in emergence uniformity. If the field is left too uneven, if residue is bunched, or if surface compaction has not been uniformly alleviated, even the most carefully prepared corn planter may not be able to consistently place seed and create in-row seedbed conditions that ensure rapid uniform emergence.
• Plants that emerge late, so that they are one or two leaves behind neighbouring plants, are likely to achieve a lower yield relative to uniformly emerged stands and may even yield less than later-planted but uniformly emerged corn.
• Relatively small investments in time and/or money for planter adjustments, such as installing new opener discs, levelling the planter, properly adjusting seed-firming wheels and proper seed depth placement, can significantly increase yield and returns.
Row Widths
Narrow RowsPast research indicated that more northerly latitudes benefited the most from narrowing corn rows from the traditional 76–96 cm (30–38 in.) widths to 38–60 cm (15–24 in.) compared to mid-to-southern portions of the cornbelt. Most Ontario producers who converted to narrow-row production systems targeted 50 cm (20 in.) row spacing anticipating that the expected yield boost of 3%–8%, would cover the costs of converting planter and corn header. However, more recent studies conducted in Ontario by the University of Guelph and Pioneer Hi-Bred Ltd. have shown minimal yield advantage with 38 cm (15 in.) or 50 cm (20 in.) rows compared to 76 cm (30 in.) rows. The fundamental reason for moving to narrower rows is to enhance light interception. It appears that the total light interception once the canopy has fully developed is no greater in narrow rows than in wide rows. Any yield advantage experienced with narrow rows must come from earlier canopy closure and greater light interception in the late-June to early-July period.
19
1. corn
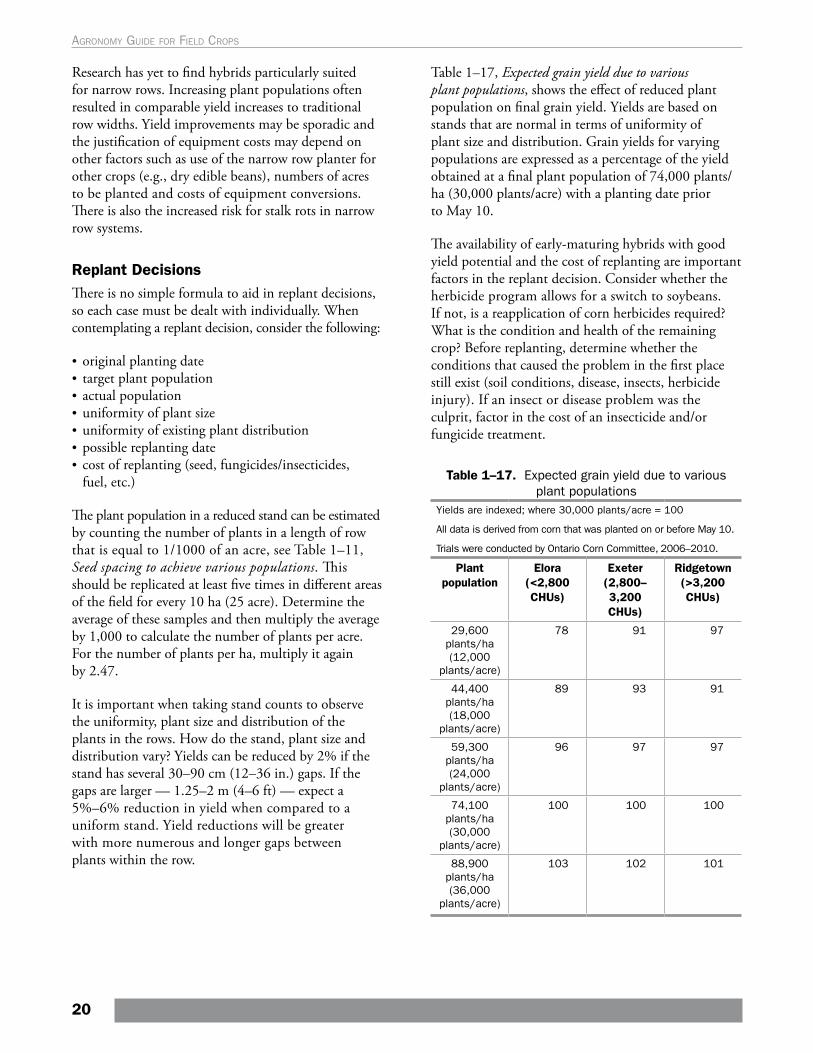
Research has yet to find hybrids particularly suited for narrow rows. Increasing plant populations often resulted in comparable yield increases to traditional row widths. Yield improvements may be sporadic and the justification of equipment costs may depend on other factors such as use of the narrow row planter for other crops (e.g., dry edible beans), numbers of acres to be planted and costs of equipment conversions. There is also the increased risk for stalk rots in narrow row systems.
Replant DecisionsThere is no simple formula to aid in replant decisions, so each case must be dealt with individually. When contemplating a replant decision, consider the following:
• original planting date • target plant population • actual population • uniformity of plant size • uniformity of existing plant distribution • possible replanting date • cost of replanting (seed, fungicides/insecticides,
fuel, etc.)
The plant population in a reduced stand can be estimated by counting the number of plants in a length of row that is equal to 1/1000 of an acre, see Table 1–11, Seed spacing to achieve various populations. This should be replicated at least five times in different areas of the field for every 10 ha (25 acre). Determine the average of these samples and then multiply the average by 1,000 to calculate the number of plants per acre. For the number of plants per ha, multiply it again by 2.47.
It is important when taking stand counts to observe the uniformity, plant size and distribution of the plants in the rows. How do the stand, plant size and distribution vary? Yields can be reduced by 2% if the stand has several 30–90 cm (12–36 in.) gaps. If the gaps are larger — 1.25–2 m (4–6 ft) — expect a 5%–6% reduction in yield when compared to a uniform stand. Yield reductions will be greater with more numerous and longer gaps between plants within the row.
Table 1–17, Expected grain yield due to various plant populations, shows the effect of reduced plant population on final grain yield. Yields are based on stands that are normal in terms of uniformity of plant size and distribution. Grain yields for varying populations are expressed as a percentage of the yield obtained at a final plant population of 74,000 plants/ha (30,000 plants/acre) with a planting date prior to May 10.
The availability of early-maturing hybrids with good yield potential and the cost of replanting are important factors in the replant decision. Consider whether the herbicide program allows for a switch to soybeans. If not, is a reapplication of corn herbicides required? What is the condition and health of the remaining crop? Before replanting, determine whether the conditions that caused the problem in the first place still exist (soil conditions, disease, insects, herbicide injury). If an insect or disease problem was the culprit, factor in the cost of an insecticide and/or fungicide treatment.
Table 1–17. Expected grain yield due to various plant populations
Yields are indexed; where 30,000 plants/acre = 100
All data is derived from corn that was planted on or before May 10.
Trials were conducted by Ontario Corn Committee, 2006–2010.
Plant population
Elora (<2,800 CHUs)
Exeter (2,800–3,200 CHUs)
Ridgetown (>3,200 CHUs)
29,600 plants/ha (12,000
plants/acre)
78 91 97
44,400 plants/ha (18,000
plants/acre)
89 93 91
59,300 plants/ha (24,000
plants/acre)
96 97 97
74,100 plants/ha (30,000
plants/acre)
100 100 100
88,900 plants/ha (36,000
plants/acre)
103 102 101
20
Agronomy guide for field Crops
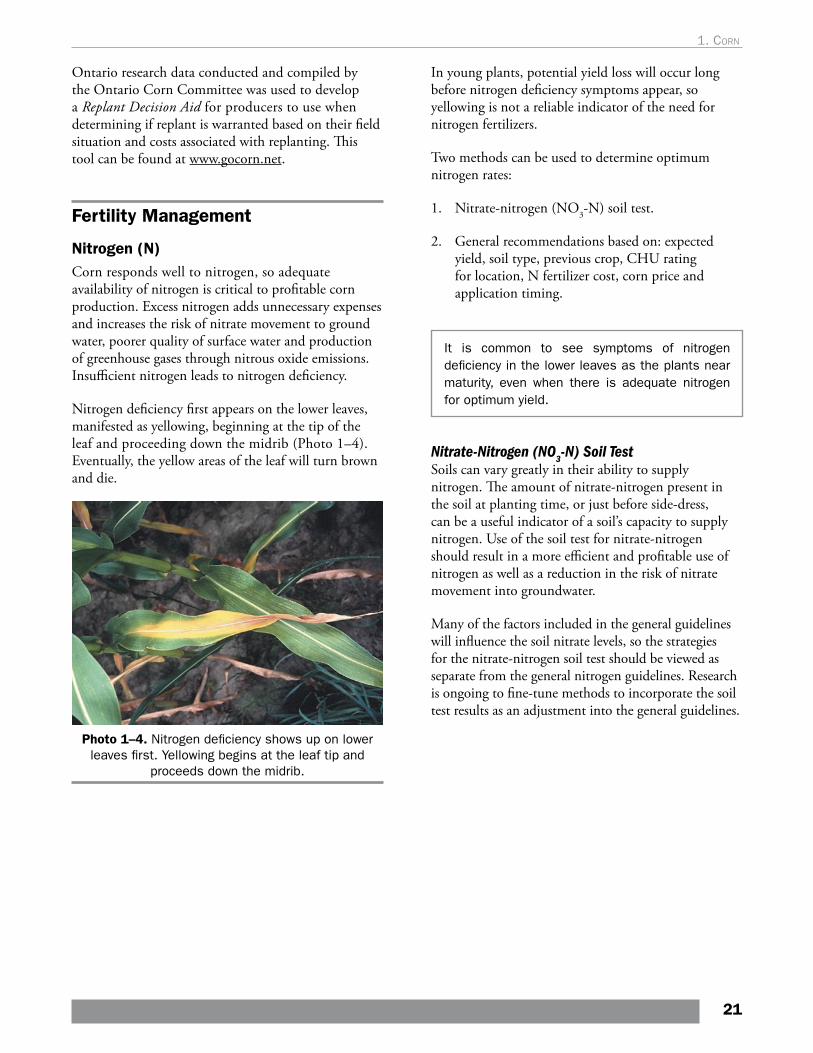
Ontario research data conducted and compiled by the Ontario Corn Committee was used to develop a Replant Decision Aid for producers to use when determining if replant is warranted based on their field situation and costs associated with replanting. This tool can be found at www.gocorn.net.
Fertility Management
Nitrogen (N)Corn responds well to nitrogen, so adequate availability of nitrogen is critical to profitable corn production. Excess nitrogen adds unnecessary expenses and increases the risk of nitrate movement to ground water, poorer quality of surface water and production of greenhouse gases through nitrous oxide emissions. Insufficient nitrogen leads to nitrogen deficiency.
Nitrogen deficiency first appears on the lower leaves, manifested as yellowing, beginning at the tip of the leaf and proceeding down the midrib (Photo 1–4). Eventually, the yellow areas of the leaf will turn brown and die.
Photo 1–4. Nitrogen deficiency shows up on lower leaves first. Yellowing begins at the leaf tip and
proceeds down the midrib.
In young plants, potential yield loss will occur long before nitrogen deficiency symptoms appear, so yellowing is not a reliable indicator of the need for nitrogen fertilizers.
Two methods can be used to determine optimum nitrogen rates:
1. Nitrate-nitrogen (NO3-N) soil test.
2. General recommendations based on: expected yield, soil type, previous crop, CHU rating for location, N fertilizer cost, corn price and application timing.
It is common to see symptoms of nitrogen deficiency in the lower leaves as the plants near maturity, even when there is adequate nitrogen for optimum yield.
Nitrate-Nitrogen (NO3-N) Soil TestSoils can vary greatly in their ability to supply nitrogen. The amount of nitrate-nitrogen present in the soil at planting time, or just before side-dress, can be a useful indicator of a soil’s capacity to supply nitrogen. Use of the soil test for nitrate-nitrogen should result in a more efficient and profitable use of nitrogen as well as a reduction in the risk of nitrate movement into groundwater.
Many of the factors included in the general guidelines will influence the soil nitrate levels, so the strategies for the nitrate-nitrogen soil test should be viewed as separate from the general nitrogen guidelines. Research is ongoing to fine-tune methods to incorporate the soil test results as an adjustment into the general guidelines.
21
1. corn
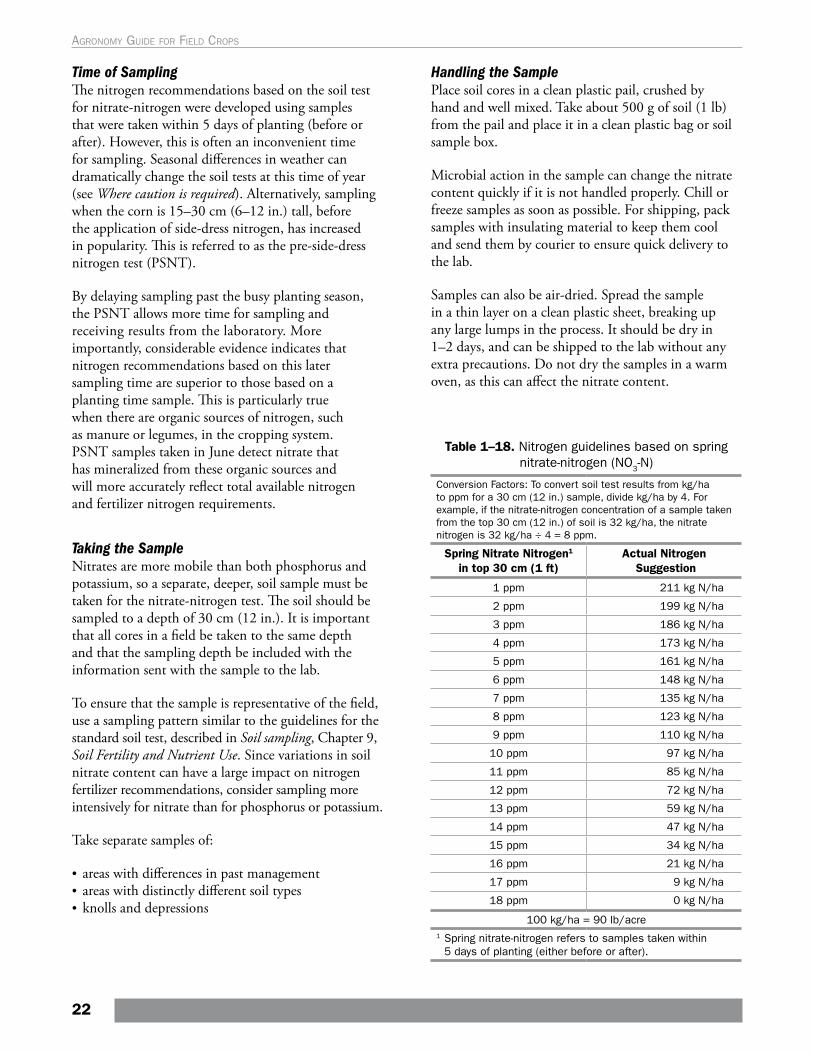
Time of SamplingThe nitrogen recommendations based on the soil test for nitrate-nitrogen were developed using samples that were taken within 5 days of planting (before or after). However, this is often an inconvenient time for sampling. Seasonal differences in weather can dramatically change the soil tests at this time of year (see Where caution is required). Alternatively, sampling when the corn is 15–30 cm (6–12 in.) tall, before the application of side-dress nitrogen, has increased in popularity. This is referred to as the pre-side-dress nitrogen test (PSNT).
By delaying sampling past the busy planting season, the PSNT allows more time for sampling and receiving results from the laboratory. More importantly, considerable evidence indicates that nitrogen recommendations based on this later sampling time are superior to those based on a planting time sample. This is particularly true when there are organic sources of nitrogen, such as manure or legumes, in the cropping system. PSNT samples taken in June detect nitrate that has mineralized from these organic sources and will more accurately reflect total available nitrogen and fertilizer nitrogen requirements.
Taking the SampleNitrates are more mobile than both phosphorus and potassium, so a separate, deeper, soil sample must be taken for the nitrate-nitrogen test. The soil should be sampled to a depth of 30 cm (12 in.). It is important that all cores in a field be taken to the same depth and that the sampling depth be included with the information sent with the sample to the lab.
To ensure that the sample is representative of the field, use a sampling pattern similar to the guidelines for the standard soil test, described in Soil sampling, Chapter 9, Soil Fertility and Nutrient Use. Since variations in soil nitrate content can have a large impact on nitrogen fertilizer recommendations, consider sampling more intensively for nitrate than for phosphorus or potassium.
Take separate samples of:
• areas with differences in past management• areas with distinctly different soil types• knolls and depressions
Handling the SamplePlace soil cores in a clean plastic pail, crushed by hand and well mixed. Take about 500 g of soil (1 lb) from the pail and place it in a clean plastic bag or soil sample box.
Microbial action in the sample can change the nitrate content quickly if it is not handled properly. Chill or freeze samples as soon as possible. For shipping, pack samples with insulating material to keep them cool and send them by courier to ensure quick delivery to the lab.
Samples can also be air-dried. Spread the sample in a thin layer on a clean plastic sheet, breaking up any large lumps in the process. It should be dry in 1–2 days, and can be shipped to the lab without any extra precautions. Do not dry the samples in a warm oven, as this can affect the nitrate content.
Table 1–18. Nitrogen guidelines based on spring nitrate-nitrogen (NO3-N)
Conversion Factors: To convert soil test results from kg/ha to ppm for a 30 cm (12 in.) sample, divide kg/ha by 4. For example, if the nitrate-nitrogen concentration of a sample taken from the top 30 cm (12 in.) of soil is 32 kg/ha, the nitrate nitrogen is 32 kg/ha ÷ 4 = 8 ppm.
Spring Nitrate Nitrogen1 in top 30 cm (1 ft)
Actual Nitrogen Suggestion
1 ppm 211 kg N/ha
2 ppm 199 kg N/ha
3 ppm 186 kg N/ha
4 ppm 173 kg N/ha
5 ppm 161 kg N/ha
6 ppm 148 kg N/ha
7 ppm 135 kg N/ha
8 ppm 123 kg N/ha
9 ppm 110 kg N/ha
10 ppm 97 kg N/ha
11 ppm 85 kg N/ha
12 ppm 72 kg N/ha
13 ppm 59 kg N/ha
14 ppm 47 kg N/ha
15 ppm 34 kg N/ha
16 ppm 21 kg N/ha
17 ppm 9 kg N/ha
18 ppm 0 kg N/ha
100 kg/ha = 90 lb/acre1 Spring nitrate-nitrogen refers to samples taken within
5 days of planting (either before or after).
22
Agronomy guide for field Crops
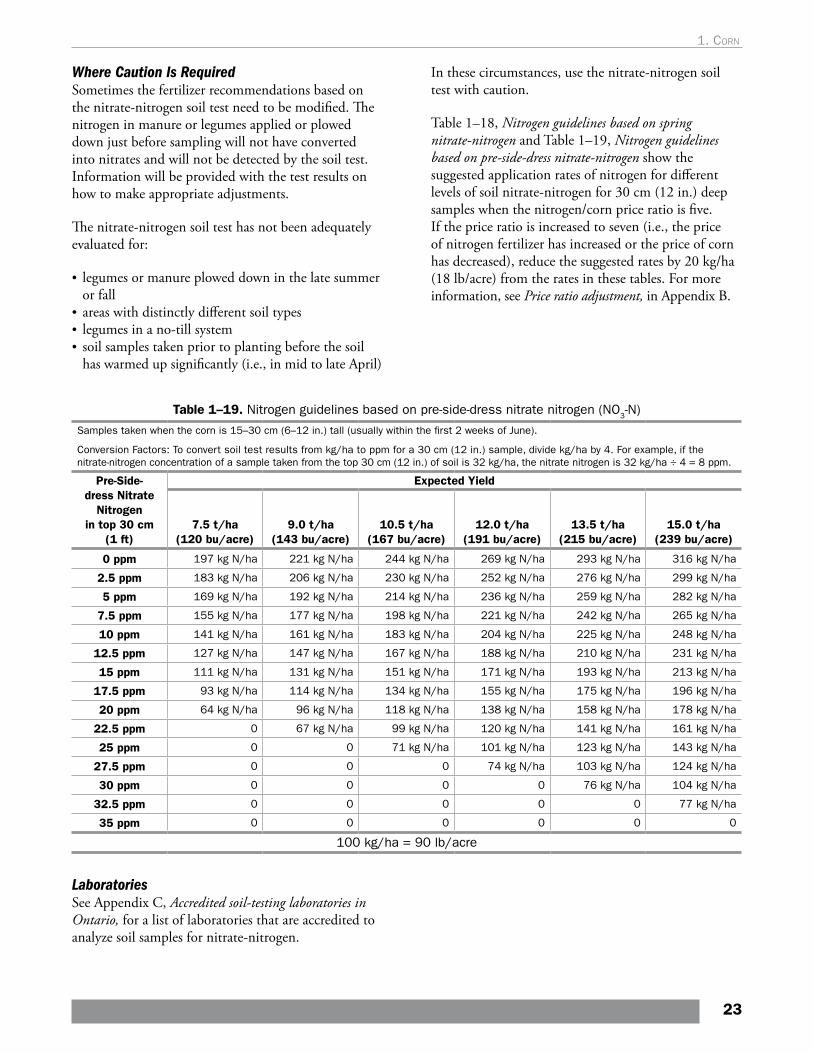
Where Caution Is RequiredSometimes the fertilizer recommendations based on the nitrate-nitrogen soil test need to be modified. The nitrogen in manure or legumes applied or plowed down just before sampling will not have converted into nitrates and will not be detected by the soil test. Information will be provided with the test results on how to make appropriate adjustments.
The nitrate-nitrogen soil test has not been adequately evaluated for:
• legumes or manure plowed down in the late summer or fall
• areas with distinctly different soil types• legumes in a no-till system• soil samples taken prior to planting before the soil
has warmed up significantly (i.e., in mid to late April)
In these circumstances, use the nitrate-nitrogen soil test with caution.
Table 1–18, Nitrogen guidelines based on spring nitrate-nitrogen and Table 1–19, Nitrogen guidelines based on pre-side-dress nitrate-nitrogen show the suggested application rates of nitrogen for different levels of soil nitrate-nitrogen for 30 cm (12 in.) deep samples when the nitrogen/corn price ratio is five. If the price ratio is increased to seven (i.e., the price of nitrogen fertilizer has increased or the price of corn has decreased), reduce the suggested rates by 20 kg/ha (18 lb/acre) from the rates in these tables. For more information, see Price ratio adjustment, in Appendix B.
Table 1–19. Nitrogen guidelines based on pre-side-dress nitrate nitrogen (NO3-N)
Samples taken when the corn is 15–30 cm (6–12 in.) tall (usually within the first 2 weeks of June).
Conversion Factors: To convert soil test results from kg/ha to ppm for a 30 cm (12 in.) sample, divide kg/ha by 4. For example, if the nitrate-nitrogen concentration of a sample taken from the top 30 cm (12 in.) of soil is 32 kg/ha, the nitrate nitrogen is 32 kg/ha ÷ 4 = 8 ppm.
Pre-Side-dress Nitrate
Nitrogen in top 30 cm
(1 ft)
Expected Yield
7.5 t/ha (120 bu/acre)
9.0 t/ha (143 bu/acre)
10.5 t/ha (167 bu/acre)
12.0 t/ha (191 bu/acre)
13.5 t/ha (215 bu/acre)
15.0 t/ha (239 bu/acre)
0 ppm 197 kg N/ha 221 kg N/ha 244 kg N/ha 269 kg N/ha 293 kg N/ha 316 kg N/ha
2.5 ppm 183 kg N/ha 206 kg N/ha 230 kg N/ha 252 kg N/ha 276 kg N/ha 299 kg N/ha
5 ppm 169 kg N/ha 192 kg N/ha 214 kg N/ha 236 kg N/ha 259 kg N/ha 282 kg N/ha
7.5 ppm 155 kg N/ha 177 kg N/ha 198 kg N/ha 221 kg N/ha 242 kg N/ha 265 kg N/ha
10 ppm 141 kg N/ha 161 kg N/ha 183 kg N/ha 204 kg N/ha 225 kg N/ha 248 kg N/ha
12.5 ppm 127 kg N/ha 147 kg N/ha 167 kg N/ha 188 kg N/ha 210 kg N/ha 231 kg N/ha
15 ppm 111 kg N/ha 131 kg N/ha 151 kg N/ha 171 kg N/ha 193 kg N/ha 213 kg N/ha
17.5 ppm 93 kg N/ha 114 kg N/ha 134 kg N/ha 155 kg N/ha 175 kg N/ha 196 kg N/ha
20 ppm 64 kg N/ha 96 kg N/ha 118 kg N/ha 138 kg N/ha 158 kg N/ha 178 kg N/ha
22.5 ppm 0 67 kg N/ha 99 kg N/ha 120 kg N/ha 141 kg N/ha 161 kg N/ha
25 ppm 0 0 71 kg N/ha 101 kg N/ha 123 kg N/ha 143 kg N/ha
27.5 ppm 0 0 0 74 kg N/ha 103 kg N/ha 124 kg N/ha
30 ppm 0 0 0 0 76 kg N/ha 104 kg N/ha
32.5 ppm 0 0 0 0 0 77 kg N/ha
35 ppm 0 0 0 0 0 0
100 kg/ha = 90 lb/acre
LaboratoriesSee Appendix C, Accredited soil-testing laboratories in Ontario, for a list of laboratories that are accredited to analyze soil samples for nitrate-nitrogen.
23
1. corn
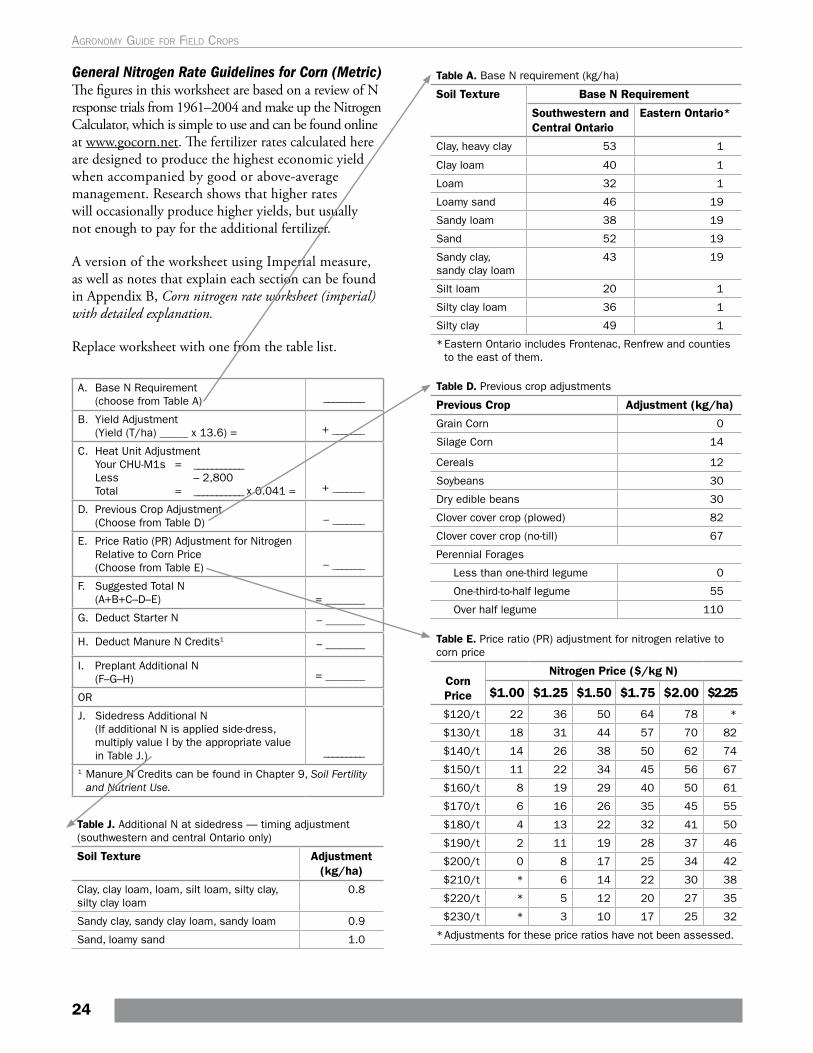
General Nitrogen Rate Guidelines for Corn (Metric)The figures in this worksheet are based on a review of N response trials from 1961–2004 and make up the Nitrogen Calculator, which is simple to use and can be found online at www.gocorn.net. The fertilizer rates calculated here are designed to produce the highest economic yield when accompanied by good or above-average management. Research shows that higher rates will occasionally produce higher yields, but usually not enough to pay for the additional fertilizer.
A version of the worksheet using Imperial measure, as well as notes that explain each section can be found in Appendix B, Corn nitrogen rate worksheet (imperial) with detailed explanation.
Replace worksheet with one from the table list.
_________
+ _______
+ _______
– _______
– _______
= _______
– _______
– _______
= _______
_________
A. Base N Requirement(choose from Table A)
B. Yield Adjustment(Yield (T/ha) _____ x 13.6) =
C. Heat Unit AdjustmentYour CHU-M1s = ___________Less – 2,800Total = ___________ x 0.041 =
D. Previous Crop Adjustment(Choose from Table D)
E. Price Ratio (PR) Adjustment for NitrogenRelative to Corn Price(Choose from Table E)
F. Suggested Total N (A+B+C–D–E)
G. Deduct Starter N
H. Deduct Manure N Credits1
I. Preplant Additional N (F–G–H)
OR
J. Sidedress Additional N(If additional N is applied side-dress, multiply value I by the appropriate value in Table J.)
1 Manure N Credits can be found in Chapter 9, Soil Fertility and Nutrient Use.
Table J. Additional N at sidedress — timing adjustment (southwestern and central Ontario only)
Soil Texture Adjustment (kg/ha)
Clay, clay loam, loam, silt loam, silty clay, silty clay loam
0.8
Sandy clay, sandy clay loam, sandy loam 0.9
Sand, loamy sand 1.0
Table A. Base N requirement (kg/ha)
Soil Texture Base N Requirement
Southwestern and Central Ontario
Eastern Ontario*
Clay, heavy clay 53 1
Clay loam 40 1
Loam 32 1
Loamy sand 46 19
Sandy loam 38 19
Sand 52 19
Sandy clay, sandy clay loam
43 19
Silt loam 20 1
Silty clay loam 36 1
Silty clay 49 1
* Eastern Ontario includes Frontenac, Renfrew and counties to the east of them.
Table D. Previous crop adjustments
Previous Crop Adjustment (kg/ha)
Grain Corn 0
Silage Corn 14
Cereals 12
Soybeans 30
Dry edible beans 30
Clover cover crop (plowed) 82
Clover cover crop (no-till) 67
Perennial Forages
Less than one-third legume 0
One-third-to-half legume 55
Over half legume 110
Table E. Price ratio (PR) adjustment for nitrogen relative to corn price
Corn Price
Nitrogen Price ($/kg N)
$1.00 $1.25 $1.50 $1.75 $2.00 $2.25
$120/t 22 36 50 64 78 *
$130/t 18 31 44 57 70 82
$140/t 14 26 38 50 62 74
$150/t 11 22 34 45 56 67
$160/t 8 19 29 40 50 61
$170/t 6 16 26 35 45 55
$180/t 4 13 22 32 41 50
$190/t 2 11 19 28 37 46
$200/t 0 8 17 25 34 42
$210/t * 6 14 22 30 38
$220/t * 5 12 20 27 35
$230/t * 3 10 17 25 32
* Adjustments for these price ratios have not been assessed.
24
Agronomy guide for field Crops
Nitrogen ApplicationThe major portion of the nitrogen should be applied in the spring as pre-plant, pre-emergence or side-dressed before the corn is 30 cm (12 in.) high. Fall application is not advised due to the potential for high losses (e.g., leaching, volatilization, runoff, nitrous oxide).
A portion of the nitrogen may be applied in a band at planting. Ensure that safe rates of fertilizer near the seed are not exceeded, see Chapter 9, Table 9–22, Maximum safe rates of nutrients in fertilizer. Where it is desirable to apply high rates of nitrogen at planting, it should be placed in a separate band greater than 10 cm (4 in.) from the seed row.
Anhydrous ammonia, applied with conventional equipment, should be placed a minimum of 15 cm (6 in.) deep in the soil. For pre-plant applications, applicator outlets should be no more than 50 cm (20 in.) apart. For wider spacing, a 4 day waiting period before planting is recommended to avoid damage to seedlings.
When appropriate equipment is used, ammonia may be applied with a cultivator or disc, a minimum of 10 cm (4 in.) deep with the ammonia outlets spaced no more than 50 cm (20 in.) apart.
Protecting Nitrogen from LossThere are three key factors that contribute to losses of N when applied as fertilizer:
1. Volatilization from surface applied urea.
2. Early season leaching or denitrification of N when it is in the nitrate (NO3) form.
3. Late season N losses from residual N when supply exceeds crop demand.
To reduce urea volatilization, the most common approach is to incorporate or inject the fertilizer so that soil particles trap the ammonia that might volatilize. Generally, thorough field cultivation or discing (1 pass) is enough to virtually eliminate volatilization from surface applied granular urea. If the urea source is UAN (28% or 32% solutions) the risk of volatilization is less than granular urea and in most cases a shallow tillage practice such as a vertical tillage pass can eliminate most of the volatilization risk.
Additives (e.g., active ingredient NBPT) to urea that block the urease enzyme can also protect urea from volatilization losses for a significant period of time.
Risk from early season leaching or denitrification is generally caused by wet soils; either sandy soils that leach N or saturated conditions that cause denitrification in heavy soils. The key strategy to reduce these two forms of loss is to reduce the size of the nitrate pool in the soil prior to any significant crop uptake. This can be done by delaying application of the N, or by using an N fertilizer product that has a slower release profile, such as coated products that physically delay the release of N or fertilizer additives that slow the conversion to nitrate.
Reducing late season N losses hinges on applying fertilizer N at rates very close to the total crop demand so that post-harvest residual nitrate concentration in the soil is low.
Nitrogen Strategies Successful nitrogen application strategies hinge on applying a rate of fertilizer N that closely matches the net difference between the N supply (soil organic matter, previous crop residues, manure, etc.) and the N demand by the crop. The OMAFRA general guidelines (see Corn nitrogen rate worksheet (imperial) in Appendix B) for N use a significant number of factors to predict, on average, the net N requirement for a given field.
Some other factors that can contribute to an improved understanding of seasonal supply and demand are:
1. total rainfall in the April 10 to June 10 period
2. CHU accumulation
3. yield potential based on plant stand and early growth
4. crop imagery (i.e., Normalized Difference Vegetative Index (NDVI) which attempts to define the colour and size of the crop and potential N status)
25
1. corn
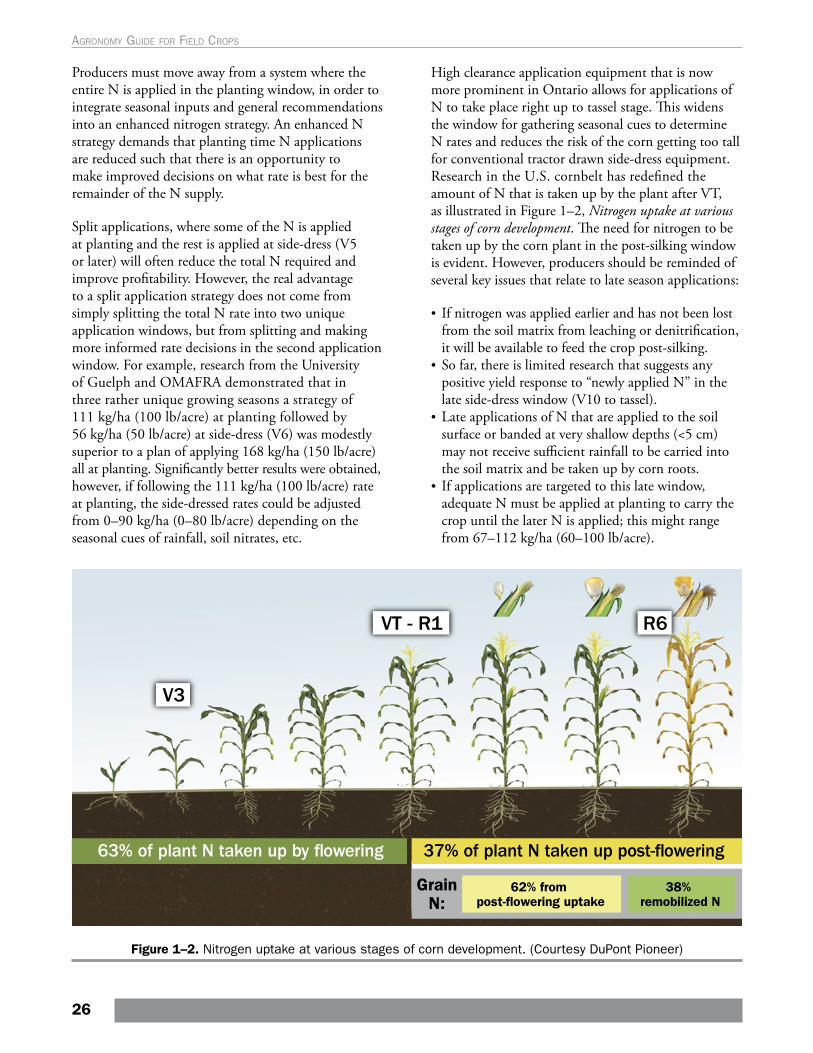
Producers must move away from a system where the entire N is applied in the planting window, in order to integrate seasonal inputs and general recommendations into an enhanced nitrogen strategy. An enhanced N strategy demands that planting time N applications are reduced such that there is an opportunity to make improved decisions on what rate is best for the remainder of the N supply.
Split applications, where some of the N is applied at planting and the rest is applied at side-dress (V5 or later) will often reduce the total N required and improve profitability. However, the real advantage to a split application strategy does not come from simply splitting the total N rate into two unique application windows, but from splitting and making more informed rate decisions in the second application window. For example, research from the University of Guelph and OMAFRA demonstrated that in three rather unique growing seasons a strategy of 111 kg/ha (100 lb/acre) at planting followed by 56 kg/ha (50 lb/acre) at side-dress (V6) was modestly superior to a plan of applying 168 kg/ha (150 lb/acre) all at planting. Significantly better results were obtained, however, if following the 111 kg/ha (100 lb/acre) rate at planting, the side-dressed rates could be adjusted from 0–90 kg/ha (0–80 lb/acre) depending on the seasonal cues of rainfall, soil nitrates, etc.
High clearance application equipment that is now more prominent in Ontario allows for applications of N to take place right up to tassel stage. This widens the window for gathering seasonal cues to determine N rates and reduces the risk of the corn getting too tall for conventional tractor drawn side-dress equipment. Research in the U.S. cornbelt has redefined the amount of N that is taken up by the plant after VT, as illustrated in Figure 1–2, Nitrogen uptake at various stages of corn development. The need for nitrogen to be taken up by the corn plant in the post-silking window is evident. However, producers should be reminded of several key issues that relate to late season applications:
• If nitrogen was applied earlier and has not been lost from the soil matrix from leaching or denitrification, it will be available to feed the crop post-silking.
• So far, there is limited research that suggests any positive yield response to “newly applied N” in the late side-dress window (V10 to tassel).
• Late applications of N that are applied to the soil surface or banded at very shallow depths (<5 cm) may not receive sufficient rainfall to be carried into the soil matrix and be taken up by corn roots.
• If applications are targeted to this late window, adequate N must be applied at planting to carry the crop until the later N is applied; this might range from 67–112 kg/ha (60–100 lb/acre).
Figure 1–2. Nitrogen uptake at various stages of corn development. (Courtesy DuPont Pioneer)
26
Agronomy guide for field Crops
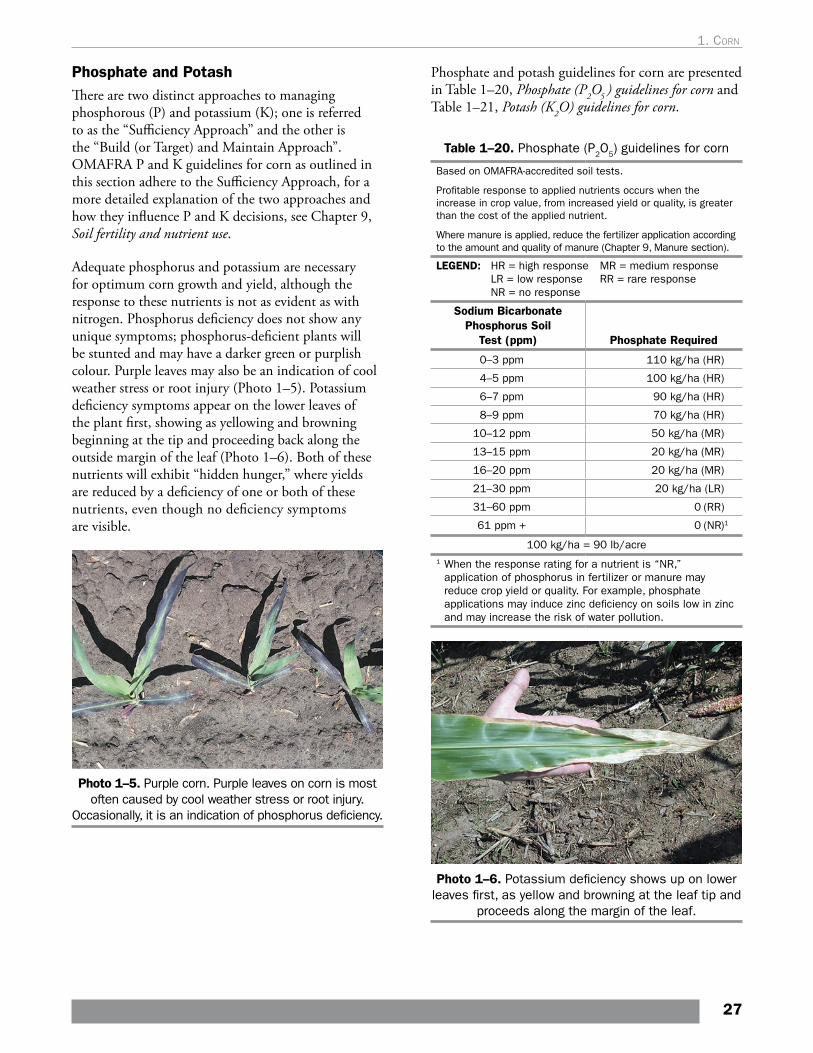
Phosphate and PotashThere are two distinct approaches to managing phosphorous (P) and potassium (K); one is referred to as the “Sufficiency Approach” and the other is the “Build (or Target) and Maintain Approach”. OMAFRA P and K guidelines for corn as outlined in this section adhere to the Sufficiency Approach, for a more detailed explanation of the two approaches and how they influence P and K decisions, see Chapter 9, Soil fertility and nutrient use.
Adequate phosphorus and potassium are necessary for optimum corn growth and yield, although the response to these nutrients is not as evident as with nitrogen. Phosphorus deficiency does not show any unique symptoms; phosphorus-deficient plants will be stunted and may have a darker green or purplish colour. Purple leaves may also be an indication of cool weather stress or root injury (Photo 1–5). Potassium deficiency symptoms appear on the lower leaves of the plant first, showing as yellowing and browning beginning at the tip and proceeding back along the outside margin of the leaf (Photo 1–6). Both of these nutrients will exhibit “hidden hunger,” where yields are reduced by a deficiency of one or both of these nutrients, even though no deficiency symptoms are visible.
Photo 1–5. Purple corn. Purple leaves on corn is most often caused by cool weather stress or root injury.
Occasionally, it is an indication of phosphorus deficiency.
Phosphate and potash guidelines for corn are presented in Table 1–20, Phosphate (P2O5 ) guidelines for corn and Table 1–21, Potash (K2O) guidelines for corn.
Table 1–20. Phosphate (P2O5) guidelines for corn
Based on OMAFRA-accredited soil tests.
Profitable response to applied nutrients occurs when the increase in crop value, from increased yield or quality, is greater than the cost of the applied nutrient.
Where manure is applied, reduce the fertilizer application according to the amount and quality of manure (Chapter 9, Manure section).
LEGEND: HR = high response MR = medium response LR = low response RR = rare response NR = no response
Sodium Bicarbonate Phosphorus Soil
Test (ppm) Phosphate Required
0–3 ppm 110 kg/ha (HR)
4–5 ppm 100 kg/ha (HR)
6–7 ppm 90 kg/ha (HR)
8–9 ppm 70 kg/ha (HR)
10–12 ppm 50 kg/ha (MR)
13–15 ppm 20 kg/ha (MR)
16–20 ppm 20 kg/ha (MR)
21–30 ppm 20 kg/ha (LR)
31–60 ppm 0 (RR)
61 ppm + 0 (NR)1
100 kg/ha = 90 lb/acre1 When the response rating for a nutrient is “NR,”
application of phosphorus in fertilizer or manure may reduce crop yield or quality. For example, phosphate applications may induce zinc deficiency on soils low in zinc and may increase the risk of water pollution.
Photo 1–6. Potassium deficiency shows up on lower leaves first, as yellow and browning at the leaf tip and
proceeds along the margin of the leaf.
27
1. corn
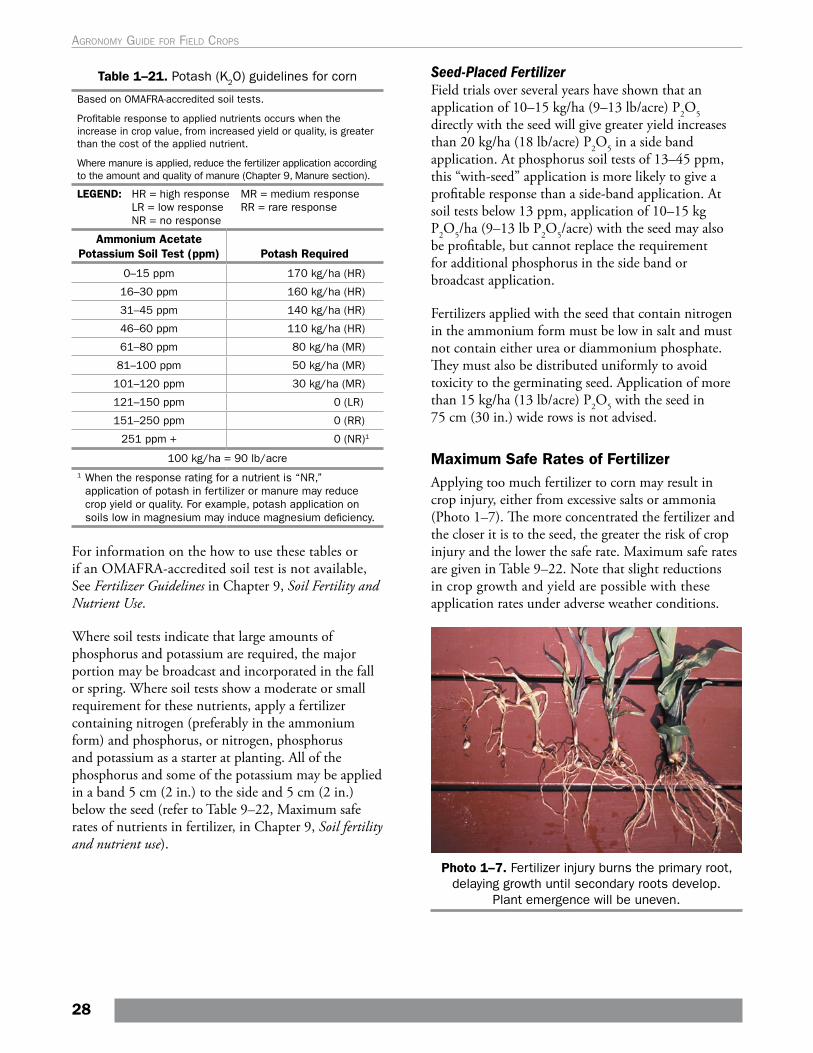
Table 1–21. Potash (K2O) guidelines for corn
Based on OMAFRA-accredited soil tests.
Profitable response to applied nutrients occurs when the increase in crop value, from increased yield or quality, is greater than the cost of the applied nutrient.
Where manure is applied, reduce the fertilizer application according to the amount and quality of manure (Chapter 9, Manure section).
LEGEND: HR = high response MR = medium response LR = low response RR = rare response NR = no response
Ammonium Acetate Potassium Soil Test (ppm) Potash Required
0–15 ppm 170 kg/ha (HR)
16–30 ppm 160 kg/ha (HR)
31–45 ppm 140 kg/ha (HR)
46–60 ppm 110 kg/ha (HR)
61–80 ppm 80 kg/ha (MR)
81–100 ppm 50 kg/ha (MR)
101–120 ppm 30 kg/ha (MR)
121–150 ppm 0 (LR)
151–250 ppm 0 (RR)
251 ppm + 0 (NR)1
100 kg/ha = 90 lb/acre1 When the response rating for a nutrient is “NR,”
application of potash in fertilizer or manure may reduce crop yield or quality. For example, potash application on soils low in magnesium may induce magnesium deficiency.
For information on the how to use these tables or if an OMAFRA-accredited soil test is not available, See Fertilizer Guidelines in Chapter 9, Soil Fertility and Nutrient Use.
Where soil tests indicate that large amounts of phosphorus and potassium are required, the major portion may be broadcast and incorporated in the fall or spring. Where soil tests show a moderate or small requirement for these nutrients, apply a fertilizer containing nitrogen (preferably in the ammonium form) and phosphorus, or nitrogen, phosphorus and potassium as a starter at planting. All of the phosphorus and some of the potassium may be applied in a band 5 cm (2 in.) to the side and 5 cm (2 in.) below the seed (refer to Table 9–22, Maximum safe rates of nutrients in fertilizer, in Chapter 9, Soil fertility and nutrient use).
Seed-Placed FertilizerField trials over several years have shown that an application of 10–15 kg/ha (9–13 lb/acre) P2O5 directly with the seed will give greater yield increases than 20 kg/ha (18 lb/acre) P2O5 in a side band application. At phosphorus soil tests of 13–45 ppm, this “with-seed” application is more likely to give a profitable response than a side-band application. At soil tests below 13 ppm, application of 10–15 kg P2O5/ha (9–13 lb P2O5/acre) with the seed may also be profitable, but cannot replace the requirement for additional phosphorus in the side band or broadcast application.
Fertilizers applied with the seed that contain nitrogen in the ammonium form must be low in salt and must not contain either urea or diammonium phosphate. They must also be distributed uniformly to avoid toxicity to the germinating seed. Application of more than 15 kg/ha (13 lb/acre) P2O5 with the seed in 75 cm (30 in.) wide rows is not advised.
Maximum Safe Rates of FertilizerApplying too much fertilizer to corn may result in crop injury, either from excessive salts or ammonia (Photo 1–7). The more concentrated the fertilizer and the closer it is to the seed, the greater the risk of crop injury and the lower the safe rate. Maximum safe rates are given in Table 9–22. Note that slight reductions in crop growth and yield are possible with these application rates under adverse weather conditions.
Photo 1–7. Fertilizer injury burns the primary root, delaying growth until secondary roots develop.
Plant emergence will be uneven.
28
Agronomy guide for field Crops
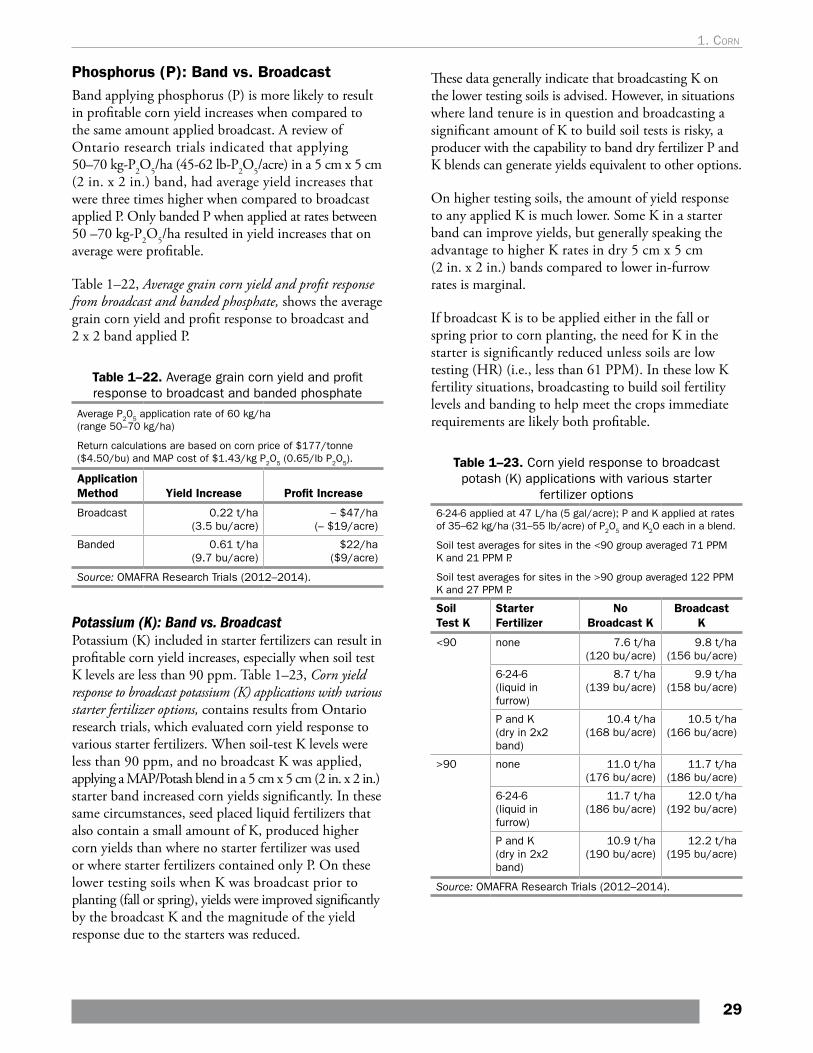
Phosphorus (P): Band vs. BroadcastBand applying phosphorus (P) is more likely to result in profitable corn yield increases when compared to the same amount applied broadcast. A review of Ontario research trials indicated that applying 50–70 kg-P2O5/ha (45-62 lb-P2O5/acre) in a 5 cm x 5 cm (2 in. x 2 in.) band, had average yield increases that were three times higher when compared to broadcast applied P. Only banded P when applied at rates between 50 –70 kg-P2O5/ha resulted in yield increases that on average were profitable.
Table 1–22, Average grain corn yield and profit response from broadcast and banded phosphate, shows the average grain corn yield and profit response to broadcast and 2 x 2 band applied P.
Table 1–22. Average grain corn yield and profit response to broadcast and banded phosphate
Average P205 application rate of 60 kg/ha (range 50–70 kg/ha)
Return calculations are based on corn price of $177/tonne ($4.50/bu) and MAP cost of $1.43/kg P2O5 (0.65/lb P2O5).
Application Method Yield Increase Profit Increase
Broadcast 0.22 t/ha (3.5 bu/acre)
– $47/ha (– $19/acre)
Banded 0.61 t/ha (9.7 bu/acre)
$22/ha ($9/acre)
Source: OMAFRA Research Trials (2012–2014).
Potassium (K): Band vs. BroadcastPotassium (K) included in starter fertilizers can result in profitable corn yield increases, especially when soil test K levels are less than 90 ppm. Table 1–23, Corn yield response to broadcast potassium (K) applications with various starter fertilizer options, contains results from Ontario research trials, which evaluated corn yield response to various starter fertilizers. When soil-test K levels were less than 90 ppm, and no broadcast K was applied, applying a MAP/Potash blend in a 5 cm x 5 cm (2 in. x 2 in.) starter band increased corn yields significantly. In these same circumstances, seed placed liquid fertilizers that also contain a small amount of K, produced higher corn yields than where no starter fertilizer was used or where starter fertilizers contained only P. On these lower testing soils when K was broadcast prior to planting (fall or spring), yields were improved significantly by the broadcast K and the magnitude of the yield response due to the starters was reduced.
These data generally indicate that broadcasting K on the lower testing soils is advised. However, in situations where land tenure is in question and broadcasting a significant amount of K to build soil tests is risky, a producer with the capability to band dry fertilizer P and K blends can generate yields equivalent to other options.
On higher testing soils, the amount of yield response to any applied K is much lower. Some K in a starter band can improve yields, but generally speaking the advantage to higher K rates in dry 5 cm x 5 cm (2 in. x 2 in.) bands compared to lower in-furrow rates is marginal.
If broadcast K is to be applied either in the fall or spring prior to corn planting, the need for K in the starter is significantly reduced unless soils are low testing (HR) (i.e., less than 61 PPM). In these low K fertility situations, broadcasting to build soil fertility levels and banding to help meet the crops immediate requirements are likely both profitable.
Table 1–23. Corn yield response to broadcast potash (K) applications with various starter
fertilizer options6-24-6 applied at 47 L/ha (5 gal/acre); P and K applied at rates of 35–62 kg/ha (31–55 lb/acre) of P2O5 and K2O each in a blend.
Soil test averages for sites in the <90 group averaged 71 PPM K and 21 PPM P.
Soil test averages for sites in the >90 group averaged 122 PPM K and 27 PPM P.
Soil Test K
Starter Fertilizer
No Broadcast K
Broadcast K
<90 none 7.6 t/ha (120 bu/acre)
9.8 t/ha (156 bu/acre)
6-24-6 (liquid in furrow)
8.7 t/ha (139 bu/acre)
9.9 t/ha (158 bu/acre)
P and K (dry in 2x2 band)
10.4 t/ha (168 bu/acre)
10.5 t/ha (166 bu/acre)
>90 none 11.0 t/ha (176 bu/acre)
11.7 t/ha (186 bu/acre)
6-24-6 (liquid in furrow)
11.7 t/ha (186 bu/acre)
12.0 t/ha (192 bu/acre)
P and K (dry in 2x2 band)
10.9 t/ha (190 bu/acre)
12.2 t/ha (195 bu/acre)
Source: OMAFRA Research Trials (2012–2014).
29
1. corn
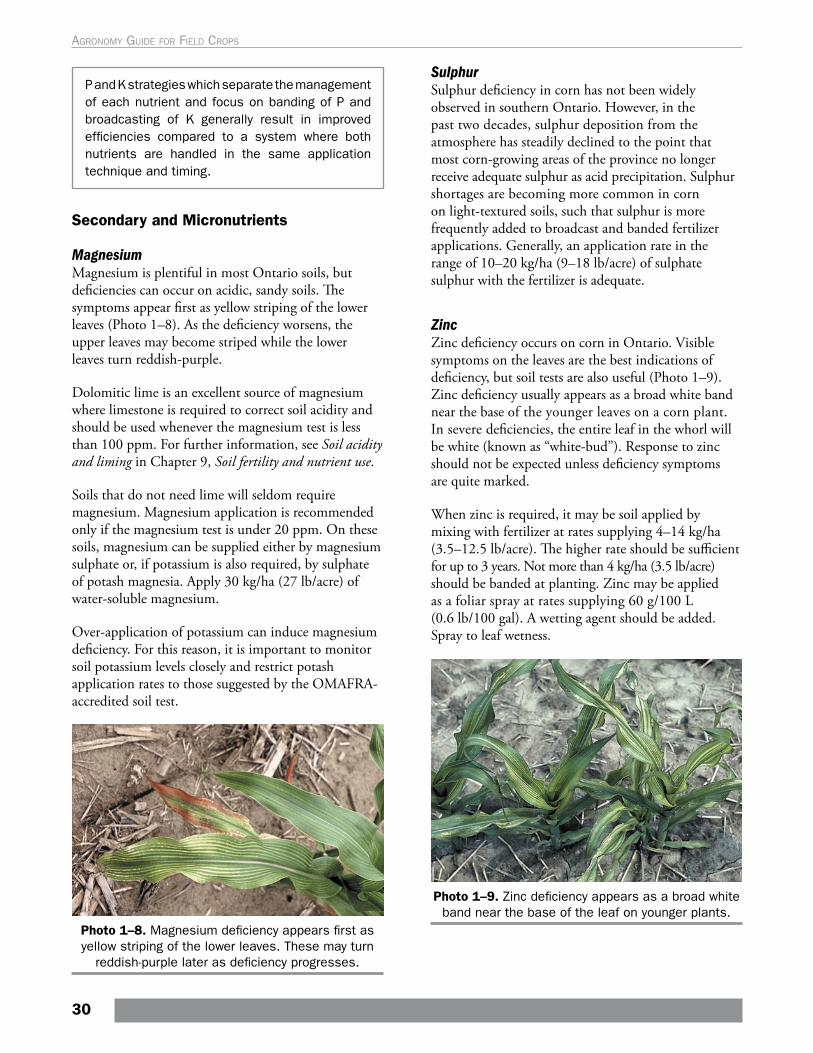
P and K strategies which separate the management of each nutrient and focus on banding of P and broadcasting of K generally result in improved efficiencies compared to a system where both nutrients are handled in the same application technique and timing.
Secondary and Micronutrients
MagnesiumMagnesium is plentiful in most Ontario soils, but deficiencies can occur on acidic, sandy soils. The symptoms appear first as yellow striping of the lower leaves (Photo 1–8). As the deficiency worsens, the upper leaves may become striped while the lower leaves turn reddish-purple.
Dolomitic lime is an excellent source of magnesium where limestone is required to correct soil acidity and should be used whenever the magnesium test is less than 100 ppm. For further information, see Soil acidity and liming in Chapter 9, Soil fertility and nutrient use.
Soils that do not need lime will seldom require magnesium. Magnesium application is recommended only if the magnesium test is under 20 ppm. On these soils, magnesium can be supplied either by magnesium sulphate or, if potassium is also required, by sulphate of potash magnesia. Apply 30 kg/ha (27 lb/acre) of water-soluble magnesium.
Over-application of potassium can induce magnesium deficiency. For this reason, it is important to monitor soil potassium levels closely and restrict potash application rates to those suggested by the OMAFRA-accredited soil test.
Photo 1–8. Magnesium deficiency appears first as yellow striping of the lower leaves. These may turn
reddish-purple later as deficiency progresses.
SulphurSulphur deficiency in corn has not been widely observed in southern Ontario. However, in the past two decades, sulphur deposition from the atmosphere has steadily declined to the point that most corn-growing areas of the province no longer receive adequate sulphur as acid precipitation. Sulphur shortages are becoming more common in corn on light-textured soils, such that sulphur is more frequently added to broadcast and banded fertilizer applications. Generally, an application rate in the range of 10–20 kg/ha (9–18 lb/acre) of sulphate sulphur with the fertilizer is adequate.
ZincZinc deficiency occurs on corn in Ontario. Visible symptoms on the leaves are the best indications of deficiency, but soil tests are also useful (Photo 1–9). Zinc deficiency usually appears as a broad white band near the base of the younger leaves on a corn plant. In severe deficiencies, the entire leaf in the whorl will be white (known as “white-bud”). Response to zinc should not be expected unless deficiency symptoms are quite marked.
When zinc is required, it may be soil applied by mixing with fertilizer at rates supplying 4–14 kg/ha (3.5–12.5 lb/acre). The higher rate should be sufficient for up to 3 years. Not more than 4 kg/ha (3.5 lb/acre) should be banded at planting. Zinc may be applied as a foliar spray at rates supplying 60 g/100 L (0.6 lb/100 gal). A wetting agent should be added. Spray to leaf wetness.
Photo 1–9. Zinc deficiency appears as a broad white band near the base of the leaf on younger plants.
30
Agronomy guide for field Crops
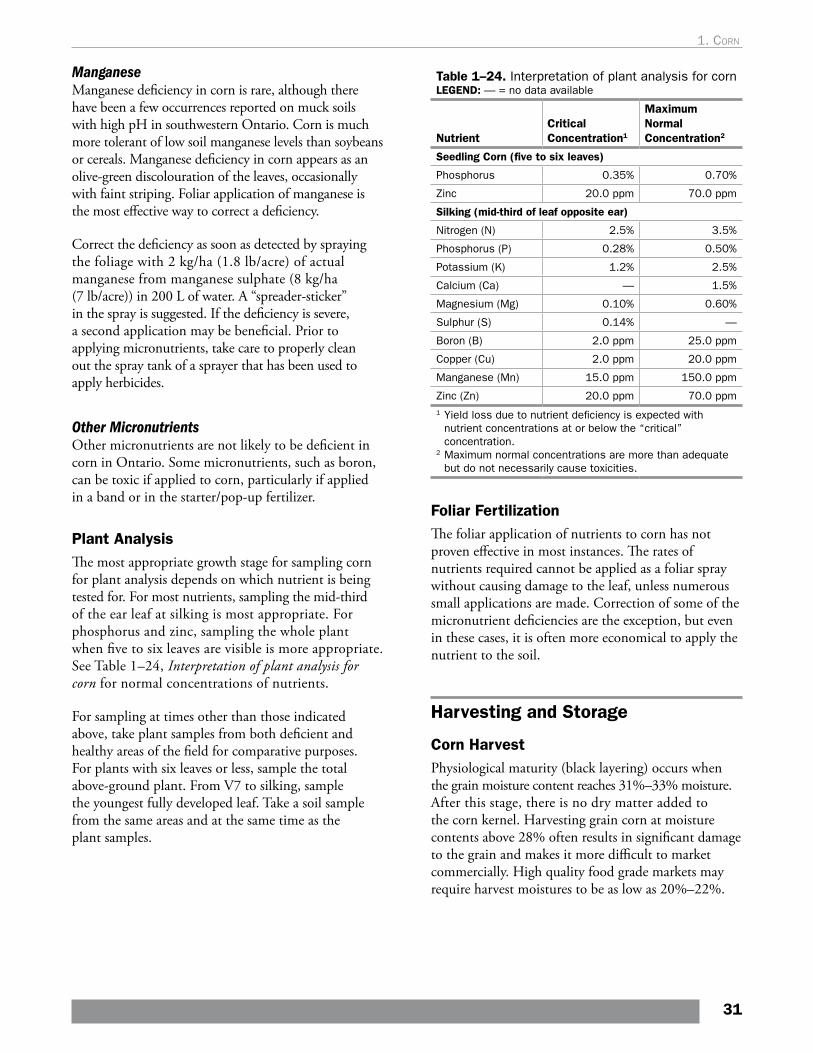
ManganeseManganese deficiency in corn is rare, although there have been a few occurrences reported on muck soils with high pH in southwestern Ontario. Corn is much more tolerant of low soil manganese levels than soybeans or cereals. Manganese deficiency in corn appears as an olive-green discolouration of the leaves, occasionally with faint striping. Foliar application of manganese is the most effective way to correct a deficiency.
Correct the deficiency as soon as detected by spraying the foliage with 2 kg/ha (1.8 lb/acre) of actual manganese from manganese sulphate (8 kg/ha (7 lb/acre)) in 200 L of water. A “spreader-sticker” in the spray is suggested. If the deficiency is severe, a second application may be beneficial. Prior to applying micronutrients, take care to properly clean out the spray tank of a sprayer that has been used to apply herbicides.
Other MicronutrientsOther micronutrients are not likely to be deficient in corn in Ontario. Some micronutrients, such as boron, can be toxic if applied to corn, particularly if applied in a band or in the starter/pop-up fertilizer.
Plant AnalysisThe most appropriate growth stage for sampling corn for plant analysis depends on which nutrient is being tested for. For most nutrients, sampling the mid-third of the ear leaf at silking is most appropriate. For phosphorus and zinc, sampling the whole plant when five to six leaves are visible is more appropriate. See Table 1–24, Interpretation of plant analysis for corn for normal concentrations of nutrients.
For sampling at times other than those indicated above, take plant samples from both deficient and healthy areas of the field for comparative purposes. For plants with six leaves or less, sample the total above-ground plant. From V7 to silking, sample the youngest fully developed leaf. Take a soil sample from the same areas and at the same time as the plant samples.
Table 1–24. Interpretation of plant analysis for cornLEGEND: — = no data available
NutrientCritical Concentration1
Maximum Normal Concentration2
Seedling Corn (five to six leaves)
Phosphorus 0.35% 0.70%
Zinc 20.0 ppm 70.0 ppm
Silking (mid-third of leaf opposite ear)
Nitrogen (N) 2.5% 3.5%
Phosphorus (P) 0.28% 0.50%
Potassium (K) 1.2% 2.5%
Calcium (Ca) — 1.5%
Magnesium (Mg) 0.10% 0.60%
Sulphur (S) 0.14% —
Boron (B) 2.0 ppm 25.0 ppm
Copper (Cu) 2.0 ppm 20.0 ppm
Manganese (Mn) 15.0 ppm 150.0 ppm
Zinc (Zn) 20.0 ppm 70.0 ppm1 Yield loss due to nutrient deficiency is expected with
nutrient concentrations at or below the “critical” concentration.
2 Maximum normal concentrations are more than adequate but do not necessarily cause toxicities.
Foliar FertilizationThe foliar application of nutrients to corn has not proven effective in most instances. The rates of nutrients required cannot be applied as a foliar spray without causing damage to the leaf, unless numerous small applications are made. Correction of some of the micronutrient deficiencies are the exception, but even in these cases, it is often more economical to apply the nutrient to the soil.
Harvesting and Storage
Corn HarvestPhysiological maturity (black layering) occurs when the grain moisture content reaches 31%–33% moisture. After this stage, there is no dry matter added to the corn kernel. Harvesting grain corn at moisture contents above 28% often results in significant damage to the grain and makes it more difficult to market commercially. High quality food grade markets may require harvest moistures to be as low as 20%–22%.
31
1. corn
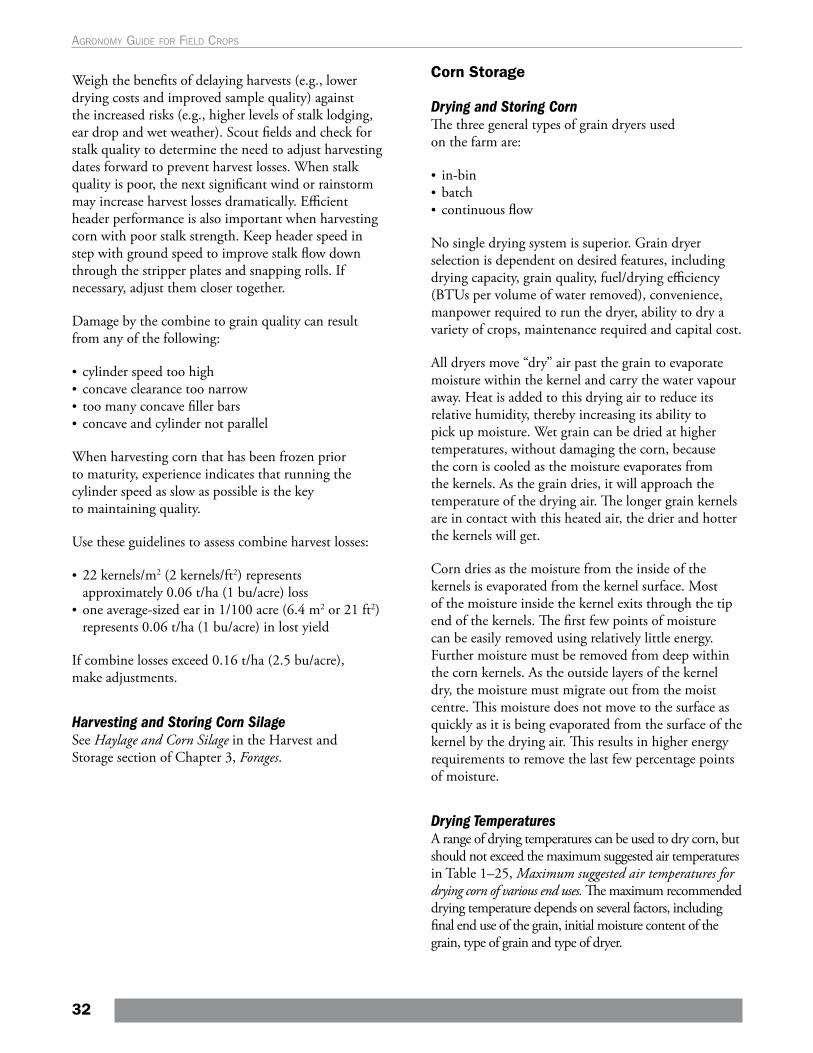
Weigh the benefits of delaying harvests (e.g., lower drying costs and improved sample quality) against the increased risks (e.g., higher levels of stalk lodging, ear drop and wet weather). Scout fields and check for stalk quality to determine the need to adjust harvesting dates forward to prevent harvest losses. When stalk quality is poor, the next significant wind or rainstorm may increase harvest losses dramatically. Efficient header performance is also important when harvesting corn with poor stalk strength. Keep header speed in step with ground speed to improve stalk flow down through the stripper plates and snapping rolls. If necessary, adjust them closer together.
Damage by the combine to grain quality can result from any of the following:
• cylinder speed too high• concave clearance too narrow• too many concave filler bars• concave and cylinder not parallel
When harvesting corn that has been frozen prior to maturity, experience indicates that running the cylinder speed as slow as possible is the key to maintaining quality.
Use these guidelines to assess combine harvest losses:
• 22 kernels/m2 (2 kernels/ft2) represents approximately 0.06 t/ha (1 bu/acre) loss
• one average-sized ear in 1/100 acre (6.4 m2 or 21 ft2) represents 0.06 t/ha (1 bu/acre) in lost yield
If combine losses exceed 0.16 t/ha (2.5 bu/acre), make adjustments.
Harvesting and Storing Corn Silage See Haylage and Corn Silage in the Harvest and Storage section of Chapter 3, Forages.
Corn Storage
Drying and Storing Corn The three general types of grain dryers used on the farm are:
• in-bin• batch • continuous flow
No single drying system is superior. Grain dryer selection is dependent on desired features, including drying capacity, grain quality, fuel/drying efficiency (BTUs per volume of water removed), convenience, manpower required to run the dryer, ability to dry a variety of crops, maintenance required and capital cost.
All dryers move “dry” air past the grain to evaporate moisture within the kernel and carry the water vapour away. Heat is added to this drying air to reduce its relative humidity, thereby increasing its ability to pick up moisture. Wet grain can be dried at higher temperatures, without damaging the corn, because the corn is cooled as the moisture evaporates from the kernels. As the grain dries, it will approach the temperature of the drying air. The longer grain kernels are in contact with this heated air, the drier and hotter the kernels will get.
Corn dries as the moisture from the inside of the kernels is evaporated from the kernel surface. Most of the moisture inside the kernel exits through the tip end of the kernels. The first few points of moisture can be easily removed using relatively little energy. Further moisture must be removed from deep within the corn kernels. As the outside layers of the kernel dry, the moisture must migrate out from the moist centre. This moisture does not move to the surface as quickly as it is being evaporated from the surface of the kernel by the drying air. This results in higher energy requirements to remove the last few percentage points of moisture.
Drying TemperaturesA range of drying temperatures can be used to dry corn, but should not exceed the maximum suggested air temperatures in Table 1–25, Maximum suggested air temperatures for drying corn of various end uses. The maximum recommended drying temperature depends on several factors, including final end use of the grain, initial moisture content of the grain, type of grain and type of dryer.
32
Agronomy guide for field Crops
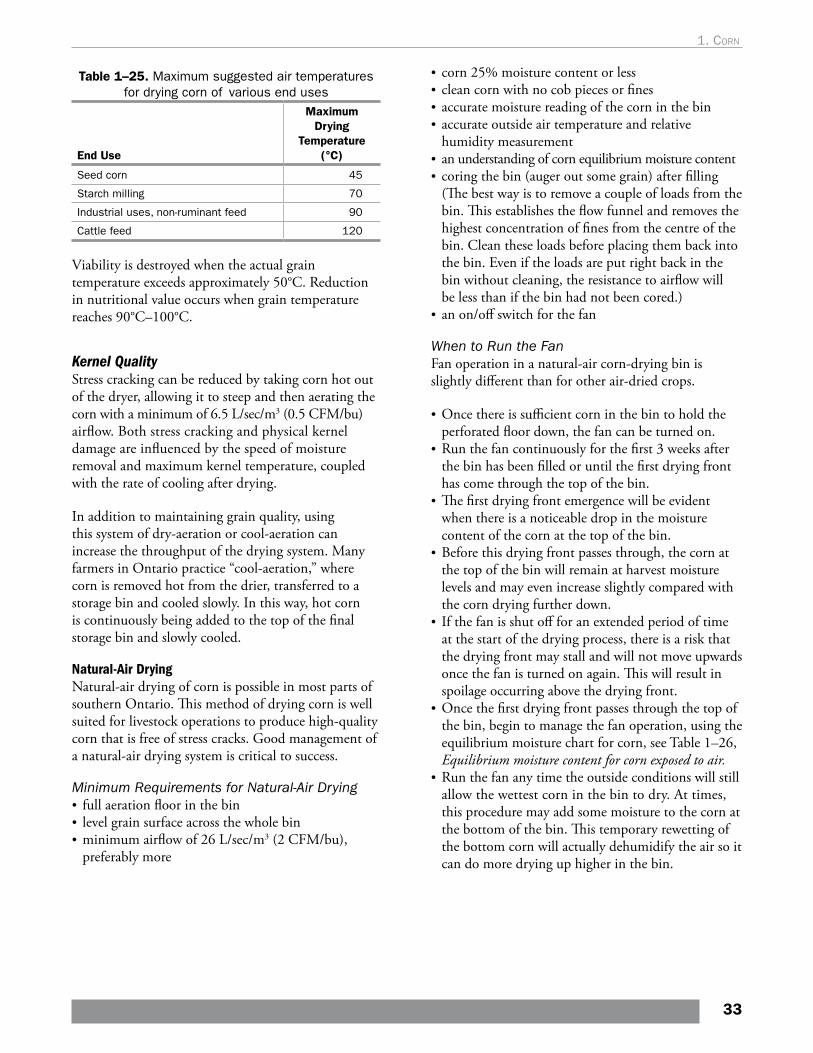
Table 1–25. Maximum suggested air temperatures for drying corn of various end uses
End Use
Maximum Drying
Temperature (°C)
Seed corn 45
Starch milling 70
Industrial uses, non-ruminant feed 90
Cattle feed 120
Viability is destroyed when the actual grain temperature exceeds approximately 50°C. Reduction in nutritional value occurs when grain temperature reaches 90°C–100°C.
Kernel QualityStress cracking can be reduced by taking corn hot out of the dryer, allowing it to steep and then aerating the corn with a minimum of 6.5 L/sec/m3 (0.5 CFM/bu) airflow. Both stress cracking and physical kernel damage are influenced by the speed of moisture removal and maximum kernel temperature, coupled with the rate of cooling after drying.
In addition to maintaining grain quality, using this system of dry-aeration or cool-aeration can increase the throughput of the drying system. Many farmers in Ontario practice “cool-aeration,” where corn is removed hot from the drier, transferred to a storage bin and cooled slowly. In this way, hot corn is continuously being added to the top of the final storage bin and slowly cooled.
Natural-Air DryingNatural-air drying of corn is possible in most parts of southern Ontario. This method of drying corn is well suited for livestock operations to produce high-quality corn that is free of stress cracks. Good management of a natural-air drying system is critical to success.
Minimum Requirements for Natural-Air Drying • full aeration floor in the bin• level grain surface across the whole bin • minimum airflow of 26 L/sec/m3 (2 CFM/bu),
preferably more
• corn 25% moisture content or less• clean corn with no cob pieces or fines • accurate moisture reading of the corn in the bin• accurate outside air temperature and relative
humidity measurement• an understanding of corn equilibrium moisture content• coring the bin (auger out some grain) after filling
(The best way is to remove a couple of loads from the bin. This establishes the flow funnel and removes the highest concentration of fines from the centre of the bin. Clean these loads before placing them back into the bin. Even if the loads are put right back in the bin without cleaning, the resistance to airflow will be less than if the bin had not been cored.)
• an on/off switch for the fan
When to Run the FanFan operation in a natural-air corn-drying bin is slightly different than for other air-dried crops.
• Once there is sufficient corn in the bin to hold the perforated floor down, the fan can be turned on.
• Run the fan continuously for the first 3 weeks after the bin has been filled or until the first drying front has come through the top of the bin.
• The first drying front emergence will be evident when there is a noticeable drop in the moisture content of the corn at the top of the bin.
• Before this drying front passes through, the corn at the top of the bin will remain at harvest moisture levels and may even increase slightly compared with the corn drying further down.
• If the fan is shut off for an extended period of time at the start of the drying process, there is a risk that the drying front may stall and will not move upwards once the fan is turned on again. This will result in spoilage occurring above the drying front.
• Once the first drying front passes through the top of the bin, begin to manage the fan operation, using the equilibrium moisture chart for corn, see Table 1–26, Equilibrium moisture content for corn exposed to air.
• Run the fan any time the outside conditions will still allow the wettest corn in the bin to dry. At times, this procedure may add some moisture to the corn at the bottom of the bin. This temporary rewetting of the bottom corn will actually dehumidify the air so it can do more drying up higher in the bin.
33
1. corn
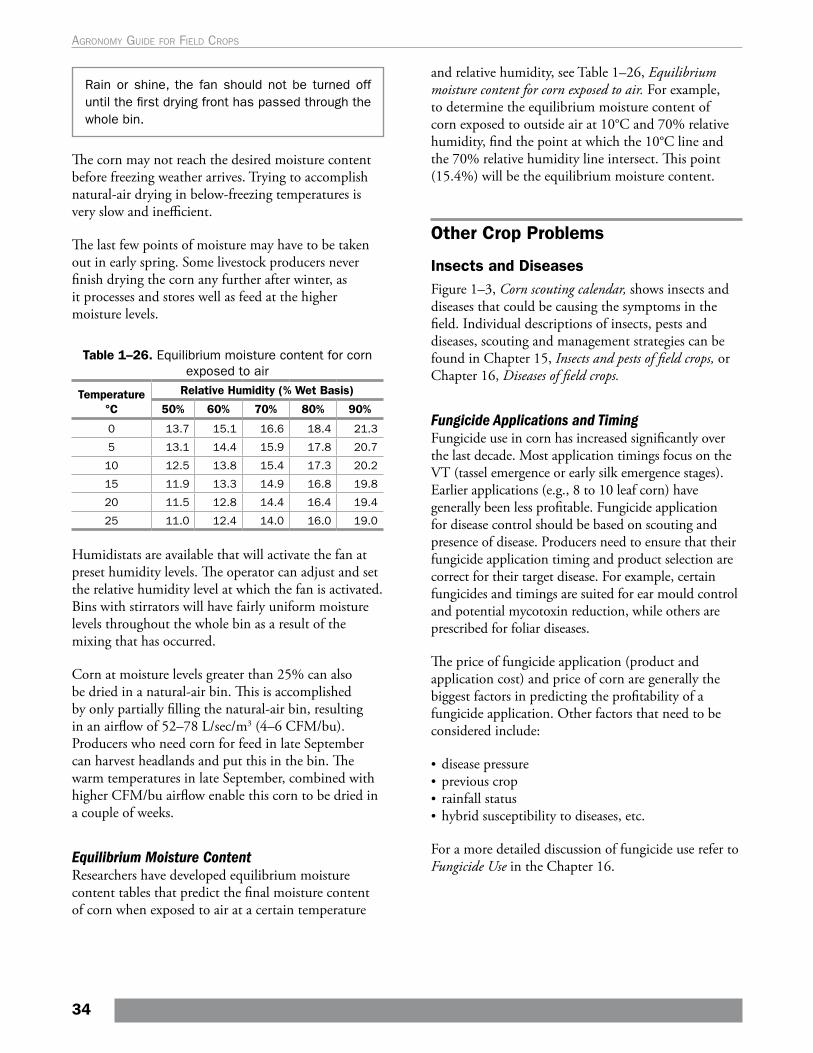
Rain or shine, the fan should not be turned off until the first drying front has passed through the whole bin.
The corn may not reach the desired moisture content before freezing weather arrives. Trying to accomplish natural-air drying in below-freezing temperatures is very slow and inefficient.
The last few points of moisture may have to be taken out in early spring. Some livestock producers never finish drying the corn any further after winter, as it processes and stores well as feed at the higher moisture levels.
Table 1–26. Equilibrium moisture content for corn exposed to air
Temperature °C
Relative Humidity (% Wet Basis)
50% 60% 70% 80% 90%
0 13.7 15.1 16.6 18.4 21.3
5 13.1 14.4 15.9 17.8 20.7
10 12.5 13.8 15.4 17.3 20.2
15 11.9 13.3 14.9 16.8 19.8
20 11.5 12.8 14.4 16.4 19.4
25 11.0 12.4 14.0 16.0 19.0
Humidistats are available that will activate the fan at preset humidity levels. The operator can adjust and set the relative humidity level at which the fan is activated. Bins with stirrators will have fairly uniform moisture levels throughout the whole bin as a result of the mixing that has occurred.
Corn at moisture levels greater than 25% can also be dried in a natural-air bin. This is accomplished by only partially filling the natural-air bin, resulting in an airflow of 52–78 L/sec/m3 (4–6 CFM/bu). Producers who need corn for feed in late September can harvest headlands and put this in the bin. The warm temperatures in late September, combined with higher CFM/bu airflow enable this corn to be dried in a couple of weeks.
Equilibrium Moisture ContentResearchers have developed equilibrium moisture content tables that predict the final moisture content of corn when exposed to air at a certain temperature
and relative humidity, see Table 1–26, Equilibrium moisture content for corn exposed to air. For example, to determine the equilibrium moisture content of corn exposed to outside air at 10°C and 70% relative humidity, find the point at which the 10°C line and the 70% relative humidity line intersect. This point (15.4%) will be the equilibrium moisture content.
Other Crop Problems
Insects and DiseasesFigure 1–3, Corn scouting calendar, shows insects and diseases that could be causing the symptoms in the field. Individual descriptions of insects, pests and diseases, scouting and management strategies can be found in Chapter 15, Insects and pests of field crops, or Chapter 16, Diseases of field crops.
Fungicide Applications and TimingFungicide use in corn has increased significantly over the last decade. Most application timings focus on the VT (tassel emergence or early silk emergence stages). Earlier applications (e.g., 8 to 10 leaf corn) have generally been less profitable. Fungicide application for disease control should be based on scouting and presence of disease. Producers need to ensure that their fungicide application timing and product selection are correct for their target disease. For example, certain fungicides and timings are suited for ear mould control and potential mycotoxin reduction, while others are prescribed for foliar diseases.
The price of fungicide application (product and application cost) and price of corn are generally the biggest factors in predicting the profitability of a fungicide application. Other factors that need to be considered include:
• disease pressure• previous crop • rainfall status• hybrid susceptibility to diseases, etc.
For a more detailed discussion of fungicide use refer to Fungicide Use in the Chapter 16.
34
Agronomy guide for field Crops
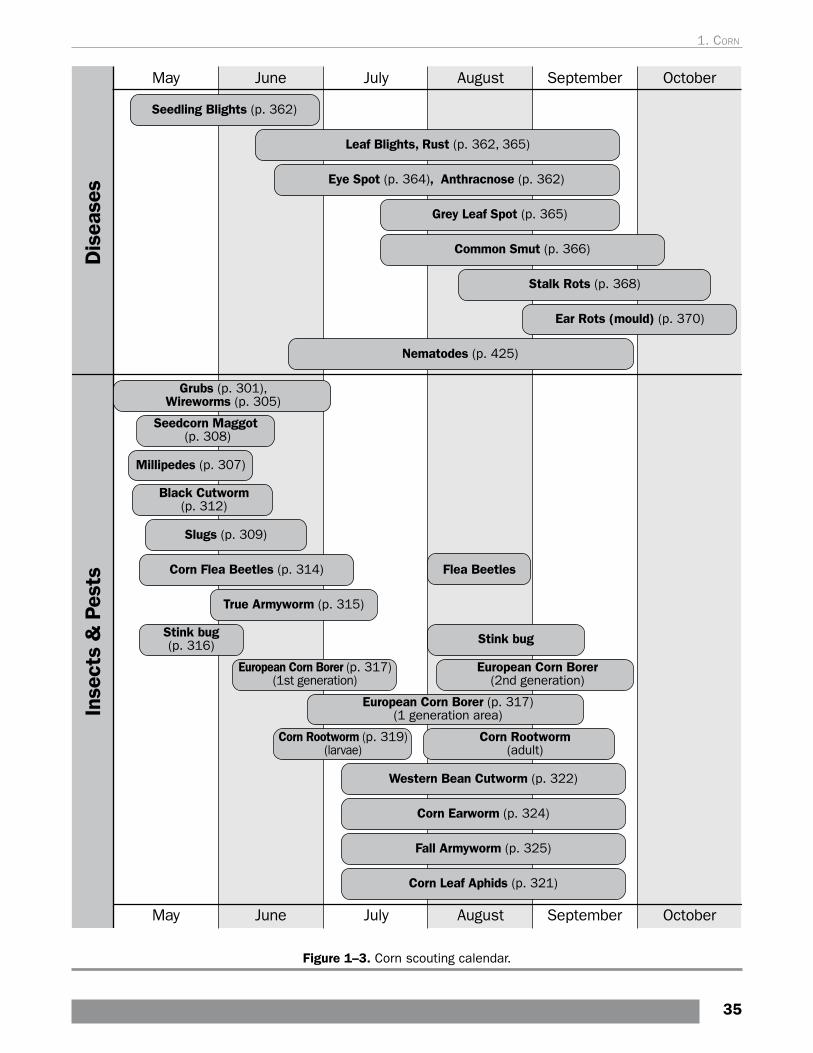
Figure 1–3. Corn scouting calendar.
35
1. corn
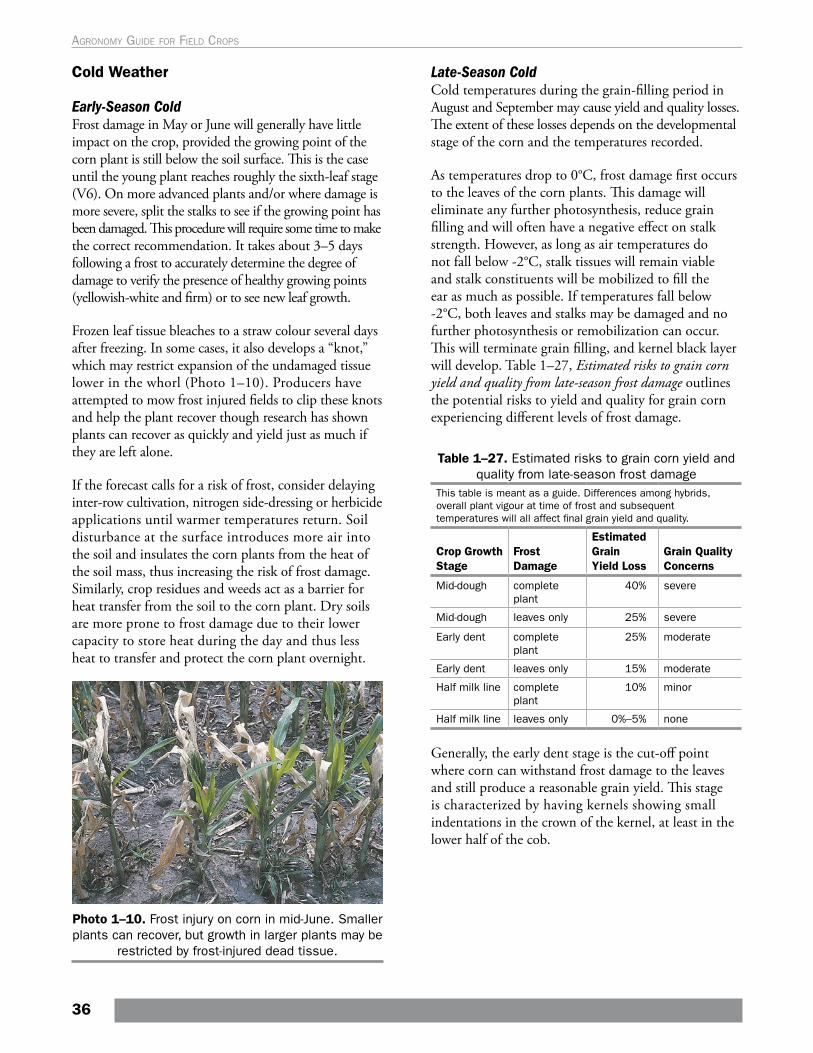
Cold Weather
Early-Season ColdFrost damage in May or June will generally have little impact on the crop, provided the growing point of the corn plant is still below the soil surface. This is the case until the young plant reaches roughly the sixth-leaf stage (V6). On more advanced plants and/or where damage is more severe, split the stalks to see if the growing point has been damaged. This procedure will require some time to make the correct recommendation. It takes about 3–5 days following a frost to accurately determine the degree of damage to verify the presence of healthy growing points (yellowish-white and firm) or to see new leaf growth.
Frozen leaf tissue bleaches to a straw colour several days after freezing. In some cases, it also develops a “knot,” which may restrict expansion of the undamaged tissue lower in the whorl (Photo 1–10). Producers have attempted to mow frost injured fields to clip these knots and help the plant recover though research has shown plants can recover as quickly and yield just as much if they are left alone.
If the forecast calls for a risk of frost, consider delaying inter-row cultivation, nitrogen side-dressing or herbicide applications until warmer temperatures return. Soil disturbance at the surface introduces more air into the soil and insulates the corn plants from the heat of the soil mass, thus increasing the risk of frost damage. Similarly, crop residues and weeds act as a barrier for heat transfer from the soil to the corn plant. Dry soils are more prone to frost damage due to their lower capacity to store heat during the day and thus less heat to transfer and protect the corn plant overnight.
Photo 1–10. Frost injury on corn in mid-June. Smaller plants can recover, but growth in larger plants may be
restricted by frost-injured dead tissue.
Late-Season ColdCold temperatures during the grain-filling period in August and September may cause yield and quality losses. The extent of these losses depends on the developmental stage of the corn and the temperatures recorded.
As temperatures drop to 0°C, frost damage first occurs to the leaves of the corn plants. This damage will eliminate any further photosynthesis, reduce grain filling and will often have a negative effect on stalk strength. However, as long as air temperatures do not fall below -2°C, stalk tissues will remain viable and stalk constituents will be mobilized to fill the ear as much as possible. If temperatures fall below -2°C, both leaves and stalks may be damaged and no further photosynthesis or remobilization can occur. This will terminate grain filling, and kernel black layer will develop. Table 1–27, Estimated risks to grain corn yield and quality from late-season frost damage outlines the potential risks to yield and quality for grain corn experiencing different levels of frost damage.
Table 1–27. Estimated risks to grain corn yield and quality from late-season frost damage
This table is meant as a guide. Differences among hybrids, overall plant vigour at time of frost and subsequent temperatures will all affect final grain yield and quality.
Crop Growth Stage
Frost Damage
Estimated Grain Yield Loss
Grain Quality Concerns
Mid-dough complete plant
40% severe
Mid-dough leaves only 25% severe
Early dent complete plant
25% moderate
Early dent leaves only 15% moderate
Half milk line complete plant
10% minor
Half milk line leaves only 0%–5% none
Generally, the early dent stage is the cut-off point where corn can withstand frost damage to the leaves and still produce a reasonable grain yield. This stage is characterized by having kernels showing small indentations in the crown of the kernel, at least in the lower half of the cob.
36
Agronomy guide for field Crops
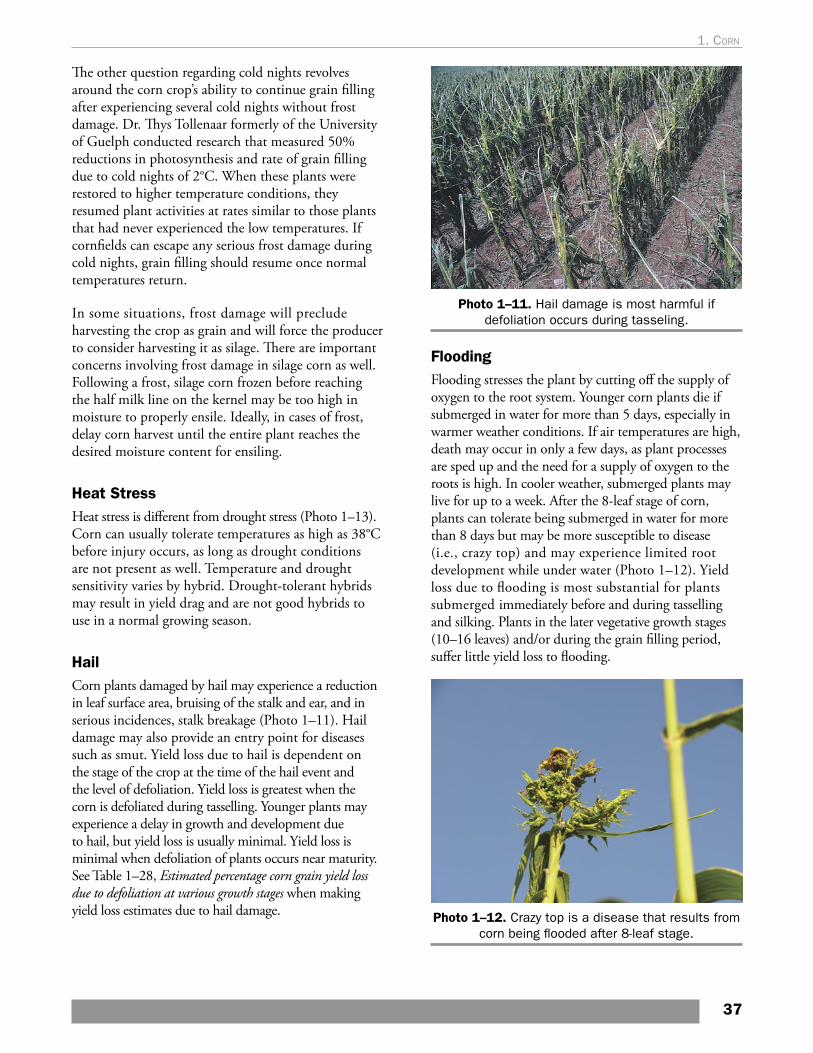
The other question regarding cold nights revolves around the corn crop’s ability to continue grain filling after experiencing several cold nights without frost damage. Dr. Thys Tollenaar formerly of the University of Guelph conducted research that measured 50% reductions in photosynthesis and rate of grain filling due to cold nights of 2°C. When these plants were restored to higher temperature conditions, they resumed plant activities at rates similar to those plants that had never experienced the low temperatures. If cornfields can escape any serious frost damage during cold nights, grain filling should resume once normal temperatures return.
In some situations, frost damage will preclude harvesting the crop as grain and will force the producer to consider harvesting it as silage. There are important concerns involving frost damage in silage corn as well. Following a frost, silage corn frozen before reaching the half milk line on the kernel may be too high in moisture to properly ensile. Ideally, in cases of frost, delay corn harvest until the entire plant reaches the desired moisture content for ensiling.
Heat StressHeat stress is different from drought stress (Photo 1–13). Corn can usually tolerate temperatures as high as 38°C before injury occurs, as long as drought conditions are not present as well. Temperature and drought sensitivity varies by hybrid. Drought-tolerant hybrids may result in yield drag and are not good hybrids to use in a normal growing season.
HailCorn plants damaged by hail may experience a reduction in leaf surface area, bruising of the stalk and ear, and in serious incidences, stalk breakage (Photo 1–11). Hail damage may also provide an entry point for diseases such as smut. Yield loss due to hail is dependent on the stage of the crop at the time of the hail event and the level of defoliation. Yield loss is greatest when the corn is defoliated during tasselling. Younger plants may experience a delay in growth and development due to hail, but yield loss is usually minimal. Yield loss is minimal when defoliation of plants occurs near maturity. See Table 1–28, Estimated percentage corn grain yield loss due to defoliation at various growth stages when making yield loss estimates due to hail damage.
Photo 1–11. Hail damage is most harmful if defoliation occurs during tasseling.
FloodingFlooding stresses the plant by cutting off the supply of oxygen to the root system. Younger corn plants die if submerged in water for more than 5 days, especially in warmer weather conditions. If air temperatures are high, death may occur in only a few days, as plant processes are sped up and the need for a supply of oxygen to the roots is high. In cooler weather, submerged plants may live for up to a week. After the 8-leaf stage of corn, plants can tolerate being submerged in water for more than 8 days but may be more susceptible to disease (i.e., crazy top) and may experience limited root development while under water (Photo 1–12). Yield loss due to flooding is most substantial for plants submerged immediately before and during tasselling and silking. Plants in the later vegetative growth stages (10–16 leaves) and/or during the grain filling period, suffer little yield loss to flooding.
Photo 1–12. Crazy top is a disease that results from corn being flooded after 8-leaf stage.
37
1. corn
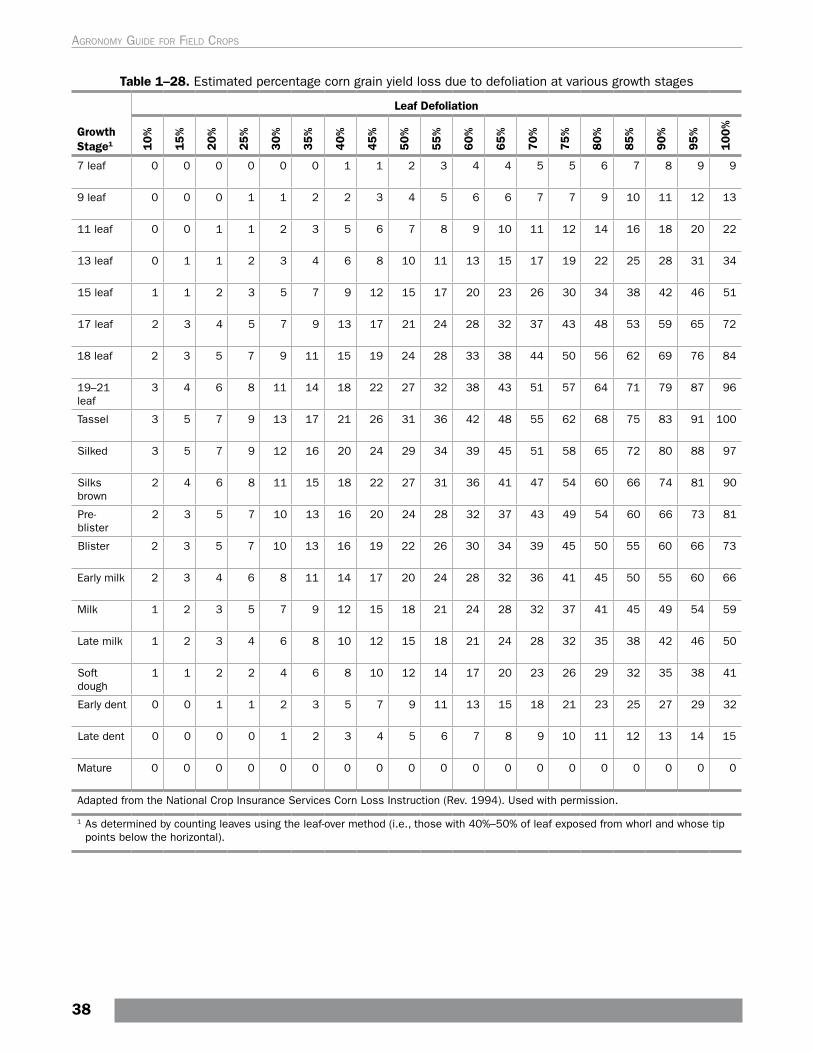
Growth Stage1 1
0%
15%
20%
25%
30%
35%
40%
45%
50%
55%
60%
65%
70%
75%
80%
85%
90%
95%
100
%
Table 1–28. Estimated percentage corn grain yield loss due to defoliation at various growth stages
Leaf Defoliation
7 leaf 0 0 0 0 0 0 1 1 2 3 4 4 5 5 6 7 8 9 9
9 leaf 0 0 0 1 1 2 2 3 4 5 6 6 7 7 9 10 11 12 13
11 leaf 0 0 1 1 2 3 5 6 7 8 9 10 11 12 14 16 18 20 22
13 leaf 0 1 1 2 3 4 6 8 10 11 13 15 17 19 22 25 28 31 34
15 leaf 1 1 2 3 5 7 9 12 15 17 20 23 26 30 34 38 42 46 51
17 leaf 2 3 4 5 7 9 13 17 21 24 28 32 37 43 48 53 59 65 72
18 leaf 2 3 5 7 9 11 15 19 24 28 33 38 44 50 56 62 69 76 84
19–21 leaf
3 4 6 8 11 14 18 22 27 32 38 43 51 57 64 71 79 87 96
Tassel 3 5 7 9 13 17 21 26 31 36 42 48 55 62 68 75 83 91 100
Silked 3 5 7 9 12 16 20 24 29 34 39 45 51 58 65 72 80 88 97
Silks brown
2 4 6 8 11 15 18 22 27 31 36 41 47 54 60 66 74 81 90
Pre-blister
2 3 5 7 10 13 16 20 24 28 32 37 43 49 54 60 66 73 81
Blister 2 3 5 7 10 13 16 19 22 26 30 34 39 45 50 55 60 66 73
Early milk 2 3 4 6 8 11 14 17 20 24 28 32 36 41 45 50 55 60 66
Milk 1 2 3 5 7 9 12 15 18 21 24 28 32 37 41 45 49 54 59
Late milk 1 2 3 4 6 8 10 12 15 18 21 24 28 32 35 38 42 46 50
Soft dough
1 1 2 2 4 6 8 10 12 14 17 20 23 26 29 32 35 38 41
Early dent 0 0 1 1 2 3 5 7 9 11 13 15 18 21 23 25 27 29 32
Late dent 0 0 0 0 1 2 3 4 5 6 7 8 9 10 11 12 13 14 15
Mature 0 0 0 0 0 0 0 0 0 0 0 0 0 0 0 0 0 0 0
Adapted from the National Crop Insurance Services Corn Loss Instruction (Rev. 1994). Used with permission.
1 As determined by counting leaves using the leaf-over method (i.e., those with 40%–50% of leaf exposed from whorl and whose tip points below the horizontal).
38
Agronomy guide for field Crops
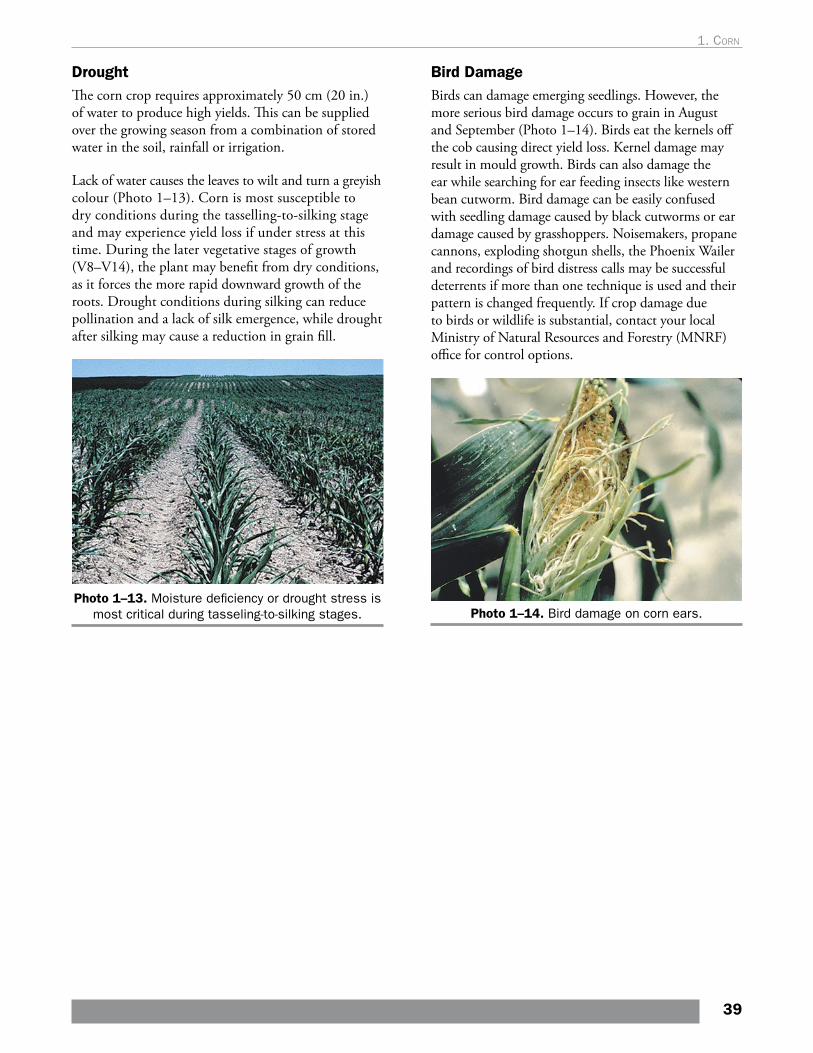
DroughtThe corn crop requires approximately 50 cm (20 in.) of water to produce high yields. This can be supplied over the growing season from a combination of stored water in the soil, rainfall or irrigation.
Lack of water causes the leaves to wilt and turn a greyish colour (Photo 1–13). Corn is most susceptible to dry conditions during the tasselling-to-silking stage and may experience yield loss if under stress at this time. During the later vegetative stages of growth (V8–V14), the plant may benefit from dry conditions, as it forces the more rapid downward growth of the roots. Drought conditions during silking can reduce pollination and a lack of silk emergence, while drought after silking may cause a reduction in grain fill.
Photo 1–13. Moisture deficiency or drought stress is most critical during tasseling-to-silking stages.
Bird DamageBirds can damage emerging seedlings. However, the more serious bird damage occurs to grain in August and September (Photo 1–14). Birds eat the kernels off the cob causing direct yield loss. Kernel damage may result in mould growth. Birds can also damage the ear while searching for ear feeding insects like western bean cutworm. Bird damage can be easily confused with seedling damage caused by black cutworms or ear damage caused by grasshoppers. Noisemakers, propane cannons, exploding shotgun shells, the Phoenix Wailer and recordings of bird distress calls may be successful deterrents if more than one technique is used and their pattern is changed frequently. If crop damage due to birds or wildlife is substantial, contact your local Ministry of Natural Resources and Forestry (MNRF) office for control options.
Photo 1–14. Bird damage on corn ears.
39
1. corn

Page intentionally left blank
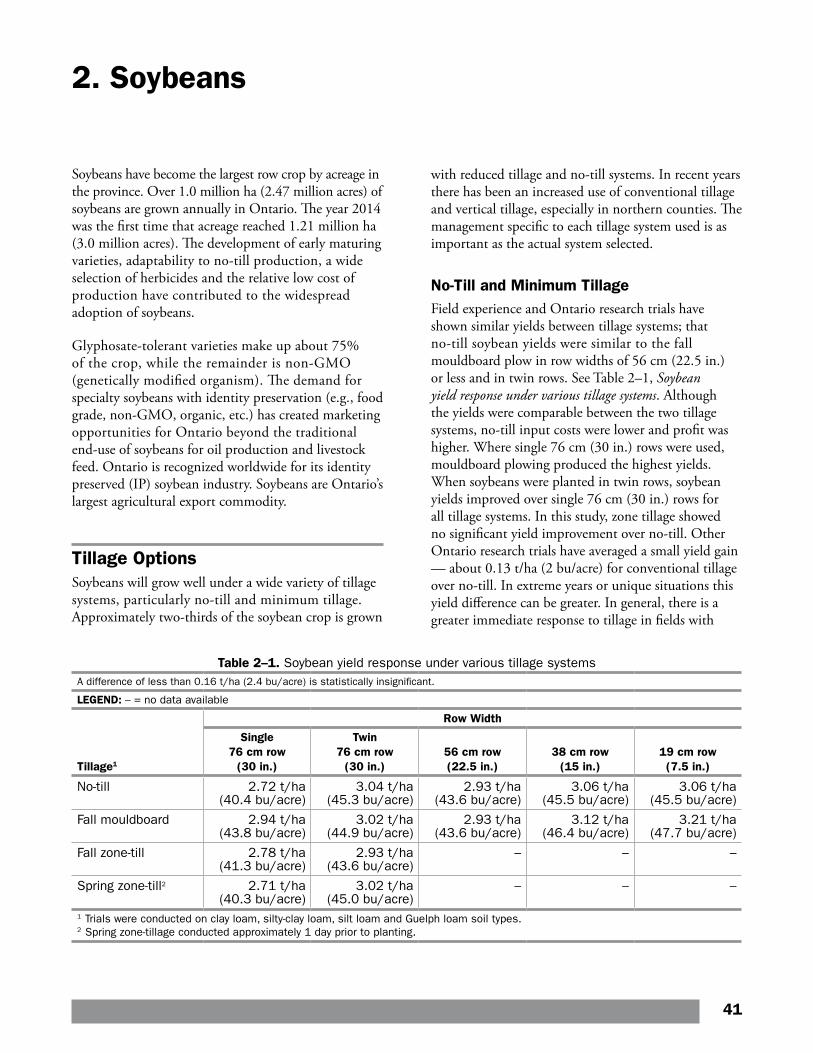
2. Soybeans
Soybeans have become the largest row crop by acreage in the province. Over 1.0 million ha (2.47 million acres) of soybeans are grown annually in Ontario. The year 2014 was the first time that acreage reached 1.21 million ha (3.0 million acres). The development of early maturing varieties, adaptability to no-till production, a wide selection of herbicides and the relative low cost of production have contributed to the widespread adoption of soybeans.
Glyphosate-tolerant varieties make up about 75% of the crop, while the remainder is non-GMO (genetically modified organism). The demand for specialty soybeans with identity preservation (e.g., food grade, non-GMO, organic, etc.) has created marketing opportunities for Ontario beyond the traditional end-use of soybeans for oil production and livestock feed. Ontario is recognized worldwide for its identity preserved (IP) soybean industry. Soybeans are Ontario’s largest agricultural export commodity.
Tillage OptionsSoybeans will grow well under a wide variety of tillage systems, particularly no-till and minimum tillage. Approximately two-thirds of the soybean crop is grown
with reduced tillage and no-till systems. In recent years there has been an increased use of conventional tillage and vertical tillage, especially in northern counties. The management specific to each tillage system used is as important as the actual system selected.
No-Till and Minimum TillageField experience and Ontario research trials have shown similar yields between tillage systems; that no-till soybean yields were similar to the fall mouldboard plow in row widths of 56 cm (22.5 in.) or less and in twin rows. See Table 2–1, Soybean yield response under various tillage systems. Although the yields were comparable between the two tillage systems, no-till input costs were lower and profit was higher. Where single 76 cm (30 in.) rows were used, mouldboard plowing produced the highest yields. When soybeans were planted in twin rows, soybean yields improved over single 76 cm (30 in.) rows for all tillage systems. In this study, zone tillage showed no significant yield improvement over no-till. Other Ontario research trials have averaged a small yield gain — about 0.13 t/ha (2 bu/acre) for conventional tillage over no-till. In extreme years or unique situations this yield difference can be greater. In general, there is a greater immediate response to tillage in fields with
Table 2–1. Soybean yield response under various tillage systemsA difference of less than 0.16 t/ha (2.4 bu/acre) is statistically insignificant.
LEGEND: – = no data available
Tillage1
Row Width
Single 76 cm row
(30 in.)
Twin 76 cm row
(30 in.)56 cm row (22.5 in.)
38 cm row (15 in.)
19 cm row (7.5 in.)
No-till 2.72 t/ha (40.4 bu/acre)
3.04 t/ha (45.3 bu/acre)
2.93 t/ha (43.6 bu/acre)
3.06 t/ha (45.5 bu/acre)
3.06 t/ha (45.5 bu/acre)
Fall mouldboard 2.94 t/ha (43.8 bu/acre)
3.02 t/ha (44.9 bu/acre)
2.93 t/ha (43.6 bu/acre)
3.12 t/ha (46.4 bu/acre)
3.21 t/ha (47.7 bu/acre)
Fall zone-till 2.78 t/ha (41.3 bu/acre)
2.93 t/ha (43.6 bu/acre)
– – –
Spring zone-till2 2.71 t/ha (40.3 bu/acre)
3.02 t/ha (45.0 bu/acre)
– – –
1 Trials were conducted on clay loam, silty-clay loam, silt loam and Guelph loam soil types. 2 Spring zone-tillage conducted approximately 1 day prior to planting.
41
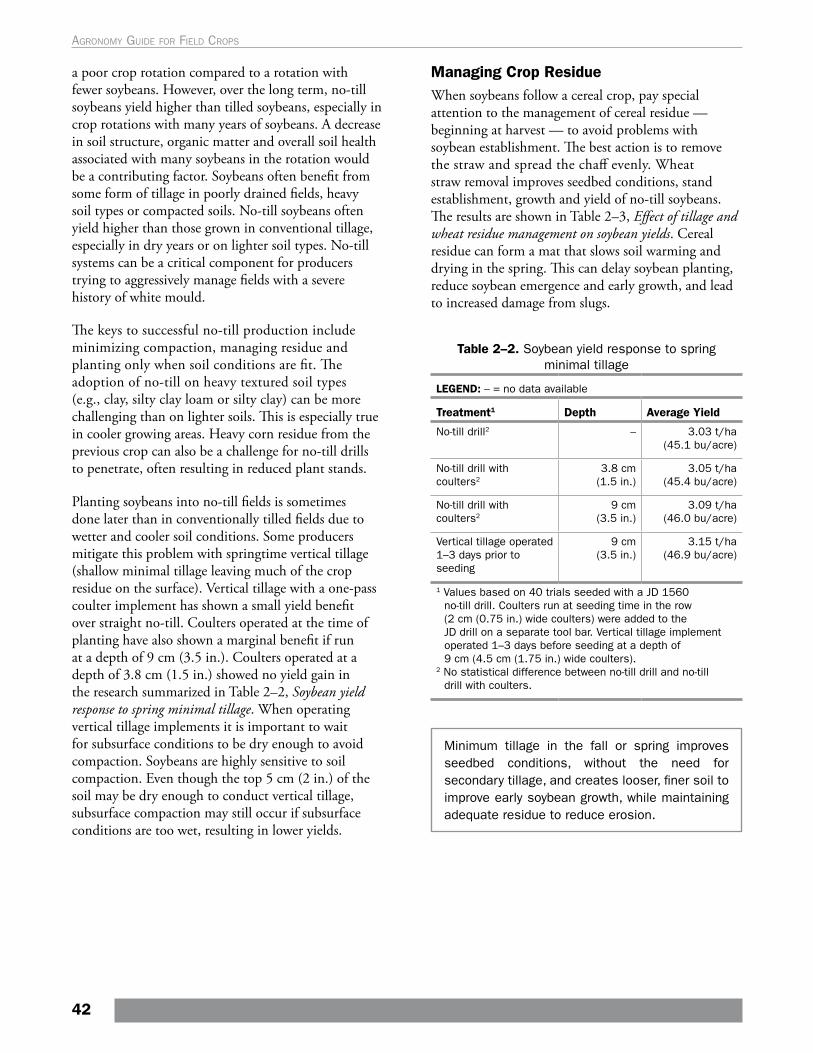
a poor crop rotation compared to a rotation with fewer soybeans. However, over the long term, no-till soybeans yield higher than tilled soybeans, especially in crop rotations with many years of soybeans. A decrease in soil structure, organic matter and overall soil health associated with many soybeans in the rotation would be a contributing factor. Soybeans often benefit from some form of tillage in poorly drained fields, heavy soil types or compacted soils. No-till soybeans often yield higher than those grown in conventional tillage, especially in dry years or on lighter soil types. No-till systems can be a critical component for producers trying to aggressively manage fields with a severe history of white mould.
Managing Crop ResidueWhen soybeans follow a cereal crop, pay special attention to the management of cereal residue — beginning at harvest — to avoid problems with soybean establishment. The best action is to remove the straw and spread the chaff evenly. Wheat straw removal improves seedbed conditions, stand establishment, growth and yield of no-till soybeans. The results are shown in Table 2–3, Effect of tillage and wheat residue management on soybean yields. Cereal residue can form a mat that slows soil warming and drying in the spring. This can delay soybean planting, reduce soybean emergence and early growth, and lead to increased damage from slugs.
Table 2–2. Soybean yield response to spring minimal tillage
LEGEND: – = no data available
Treatment1 Depth Average Yield
No-till drill2 – 3.03 t/ha (45.1 bu/acre)
No-till drill with coulters2
3.8 cm (1.5 in.)
3.05 t/ha (45.4 bu/acre)
No-till drill with coulters2
9 cm (3.5 in.)
3.09 t/ha (46.0 bu/acre)
Vertical tillage operated 1–3 days prior to seeding
9 cm (3.5 in.)
3.15 t/ha (46.9 bu/acre)
1 Values based on 40 trials seeded with a JD 1560 no-till drill. Coulters run at seeding time in the row (2 cm (0.75 in.) wide coulters) were added to the JD drill on a separate tool bar. Vertical tillage implement operated 1–3 days before seeding at a depth of 9 cm (4.5 cm (1.75 in.) wide coulters).
2 No statistical difference between no-till drill and no-till drill with coulters.
Minimum tillage in the fall or spring improves seedbed conditions, without the need for secondary tillage, and creates looser, finer soil to improve early soybean growth, while maintaining adequate residue to reduce erosion.
The keys to successful no-till production include minimizing compaction, managing residue and planting only when soil conditions are fit. The adoption of no-till on heavy textured soil types (e.g., clay, silty clay loam or silty clay) can be more challenging than on lighter soils. This is especially true in cooler growing areas. Heavy corn residue from the previous crop can also be a challenge for no-till drills to penetrate, often resulting in reduced plant stands.
Planting soybeans into no-till fields is sometimes done later than in conventionally tilled fields due to wetter and cooler soil conditions. Some producers mitigate this problem with springtime vertical tillage (shallow minimal tillage leaving much of the crop residue on the surface). Vertical tillage with a one-pass coulter implement has shown a small yield benefit over straight no-till. Coulters operated at the time of planting have also shown a marginal benefit if run at a depth of 9 cm (3.5 in.). Coulters operated at a depth of 3.8 cm (1.5 in.) showed no yield gain in the research summarized in Table 2–2, Soybean yield response to spring minimal tillage. When operating vertical tillage implements it is important to wait for subsurface conditions to be dry enough to avoid compaction. Soybeans are highly sensitive to soil compaction. Even though the top 5 cm (2 in.) of the soil may be dry enough to conduct vertical tillage, subsurface compaction may still occur if subsurface conditions are too wet, resulting in lower yields.
42
Agronomy guide for field Crops
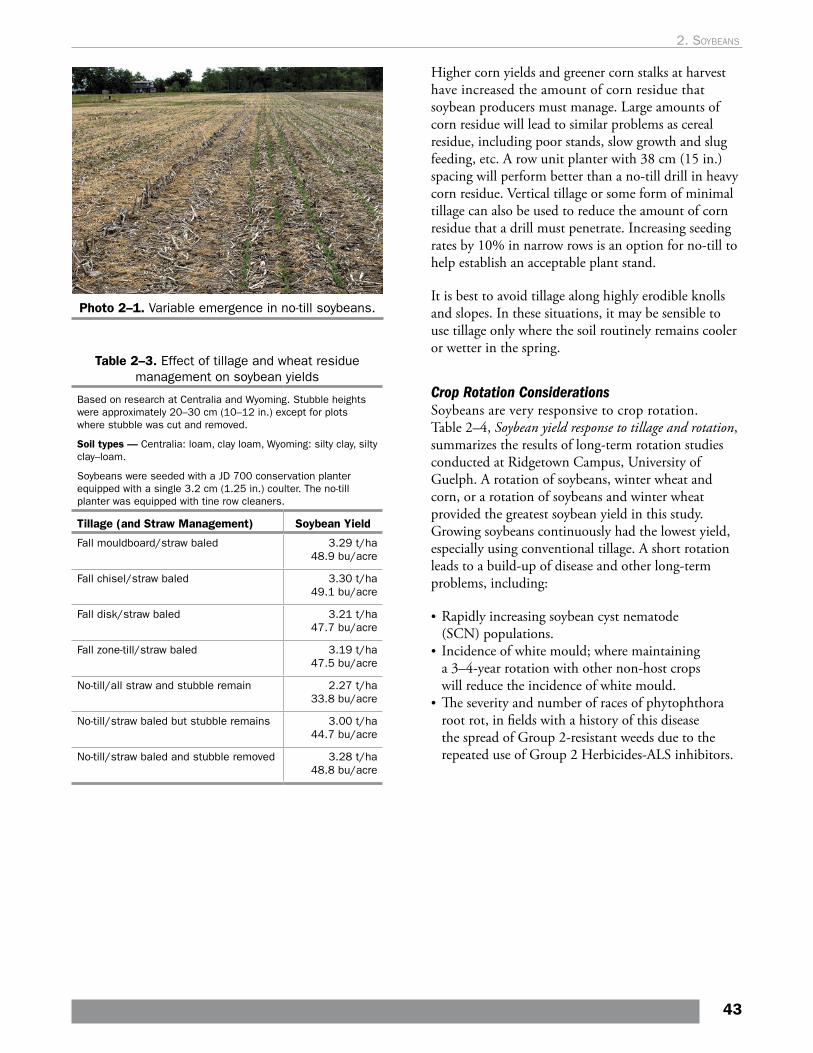
Photo 2–1. Variable emergence in no-till soybeans.
Table 2–3. Effect of tillage and wheat residue management on soybean yields
Based on research at Centralia and Wyoming. Stubble heights were approximately 20–30 cm (10–12 in.) except for plots where stubble was cut and removed.
Soil types — Centralia: loam, clay loam, Wyoming: silty clay, silty clay–loam.
Soybeans were seeded with a JD 700 conservation planter equipped with a single 3.2 cm (1.25 in.) coulter. The no-till planter was equipped with tine row cleaners.
Tillage (and Straw Management) Soybean Yield
Fall mouldboard/straw baled 3.29 t/ha 48.9 bu/acre
Fall chisel/straw baled 3.30 t/ha 49.1 bu/acre
Fall disk/straw baled 3.21 t/ha 47.7 bu/acre
Fall zone-till/straw baled 3.19 t/ha 47.5 bu/acre
No-till/all straw and stubble remain 2.27 t/ha 33.8 bu/acre
No-till/straw baled but stubble remains 3.00 t/ha 44.7 bu/acre
No-till/straw baled and stubble removed 3.28 t/ha 48.8 bu/acre
Higher corn yields and greener corn stalks at harvest have increased the amount of corn residue that soybean producers must manage. Large amounts of corn residue will lead to similar problems as cereal residue, including poor stands, slow growth and slug feeding, etc. A row unit planter with 38 cm (15 in.) spacing will perform better than a no-till drill in heavy corn residue. Vertical tillage or some form of minimal tillage can also be used to reduce the amount of corn residue that a drill must penetrate. Increasing seeding rates by 10% in narrow rows is an option for no-till to help establish an acceptable plant stand.
It is best to avoid tillage along highly erodible knolls and slopes. In these situations, it may be sensible to use tillage only where the soil routinely remains cooler or wetter in the spring.
Crop Rotation ConsiderationsSoybeans are very responsive to crop rotation. Table 2–4, Soybean yield response to tillage and rotation, summarizes the results of long-term rotation studies conducted at Ridgetown Campus, University of Guelph. A rotation of soybeans, winter wheat and corn, or a rotation of soybeans and winter wheat provided the greatest soybean yield in this study. Growing soybeans continuously had the lowest yield, especially using conventional tillage. A short rotation leads to a build-up of disease and other long-term problems, including:
• Rapidly increasing soybean cyst nematode (SCN) populations.
• Incidence of white mould; where maintaining a 3–4-year rotation with other non-host crops will reduce the incidence of white mould.
• The severity and number of races of phytophthora root rot, in fields with a history of this disease the spread of Group 2-resistant weeds due to the repeated use of Group 2 Herbicides-ALS inhibitors.
43
2. soybeans
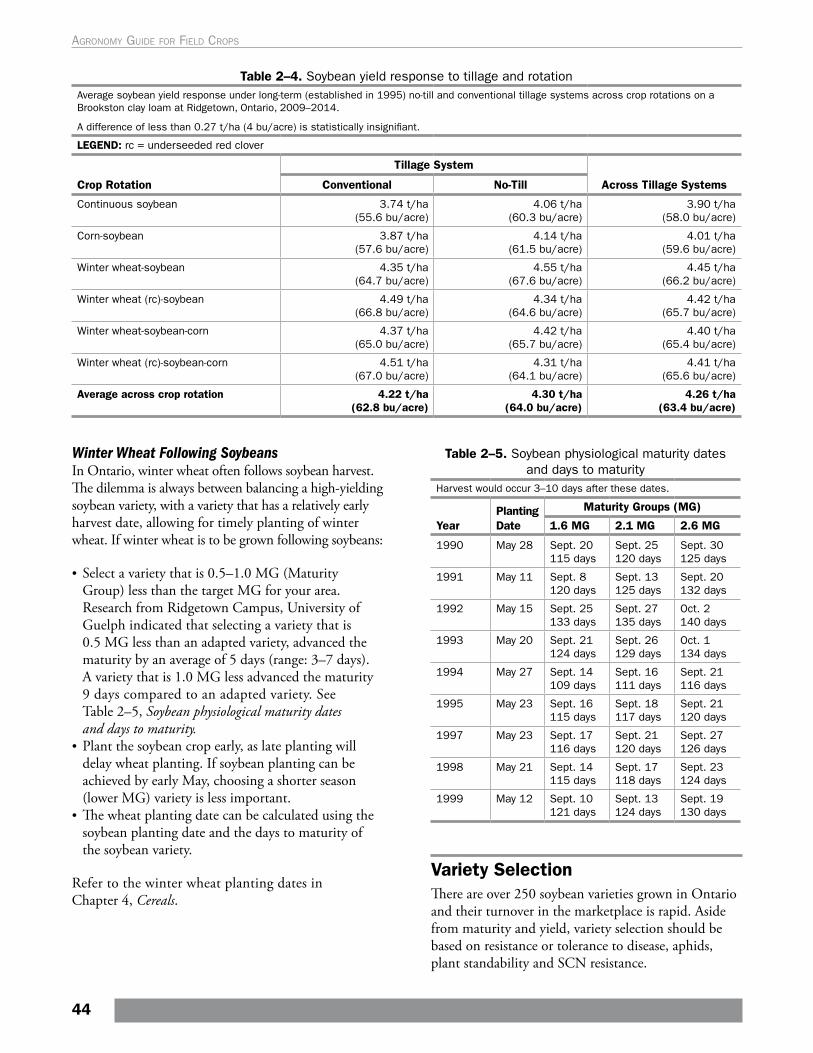
Table 2–5. Soybean physiological maturity dates and days to maturity
Harvest would occur 3–10 days after these dates.
YearPlanting Date
Maturity Groups (MG)
1.6 MG 2.1 MG 2.6 MG
1990 May 28 Sept. 20115 days
Sept. 25120 days
Sept. 30125 days
1991 May 11 Sept. 8120 days
Sept. 13125 days
Sept. 20132 days
1992 May 15 Sept. 25133 days
Sept. 27135 days
Oct. 2140 days
1993 May 20 Sept. 21124 days
Sept. 26129 days
Oct. 1134 days
1994 May 27 Sept. 14109 days
Sept. 16111 days
Sept. 21116 days
1995 May 23 Sept. 16115 days
Sept. 18117 days
Sept. 21120 days
1997 May 23 Sept. 17116 days
Sept. 21120 days
Sept. 27126 days
1998 May 21 Sept. 14115 days
Sept. 17118 days
Sept. 23124 days
1999 May 12 Sept. 10121 days
Sept. 13124 days
Sept. 19130 days
Variety SelectionThere are over 250 soybean varieties grown in Ontario and their turnover in the marketplace is rapid. Aside from maturity and yield, variety selection should be based on resistance or tolerance to disease, aphids, plant standability and SCN resistance.
Table 2–4. Soybean yield response to tillage and rotationAverage soybean yield response under long-term (established in 1995) no-till and conventional tillage systems across crop rotations on a Brookston clay loam at Ridgetown, Ontario, 2009–2014.
A difference of less than 0.27 t/ha (4 bu/acre) is statistically insignifiant.
LEGEND: rc = underseeded red clover
Crop Rotation
Tillage System
Across Tillage SystemsConventional No-Till
Continuous soybean 3.74 t/ha (55.6 bu/acre)
4.06 t/ha (60.3 bu/acre)
3.90 t/ha (58.0 bu/acre)
Corn-soybean 3.87 t/ha (57.6 bu/acre)
4.14 t/ha (61.5 bu/acre)
4.01 t/ha (59.6 bu/acre)
Winter wheat-soybean 4.35 t/ha (64.7 bu/acre)
4.55 t/ha (67.6 bu/acre)
4.45 t/ha (66.2 bu/acre)
Winter wheat (rc)-soybean 4.49 t/ha (66.8 bu/acre)
4.34 t/ha (64.6 bu/acre)
4.42 t/ha (65.7 bu/acre)
Winter wheat-soybean-corn 4.37 t/ha (65.0 bu/acre)
4.42 t/ha (65.7 bu/acre)
4.40 t/ha (65.4 bu/acre)
Winter wheat (rc)-soybean-corn 4.51 t/ha (67.0 bu/acre)
4.31 t/ha (64.1 bu/acre)
4.41 t/ha (65.6 bu/acre)
Average across crop rotation 4.22 t/ha (62.8 bu/acre)
4.30 t/ha (64.0 bu/acre)
4.26 t/ha (63.4 bu/acre)
Winter Wheat Following SoybeansIn Ontario, winter wheat often follows soybean harvest. The dilemma is always between balancing a high-yielding soybean variety, with a variety that has a relatively early harvest date, allowing for timely planting of winter wheat. If winter wheat is to be grown following soybeans:
• Select a variety that is 0.5–1.0 MG (Maturity Group) less than the target MG for your area.Research from Ridgetown Campus, University of Guelph indicated that selecting a variety that is 0.5 MG less than an adapted variety, advanced the maturity by an average of 5 days (range: 3–7 days). A variety that is 1.0 MG less advanced the maturity 9 days compared to an adapted variety. See Table 2–5, Soybean physiological maturity dates and days to maturity.
• Plant the soybean crop early, as late planting will delay wheat planting. If soybean planting can be achieved by early May, choosing a shorter season (lower MG) variety is less important.
• The wheat planting date can be calculated using the soybean planting date and the days to maturity of the soybean variety.
Refer to the winter wheat planting dates in Chapter 4, Cereals.
44
Agronomy guide for field Crops
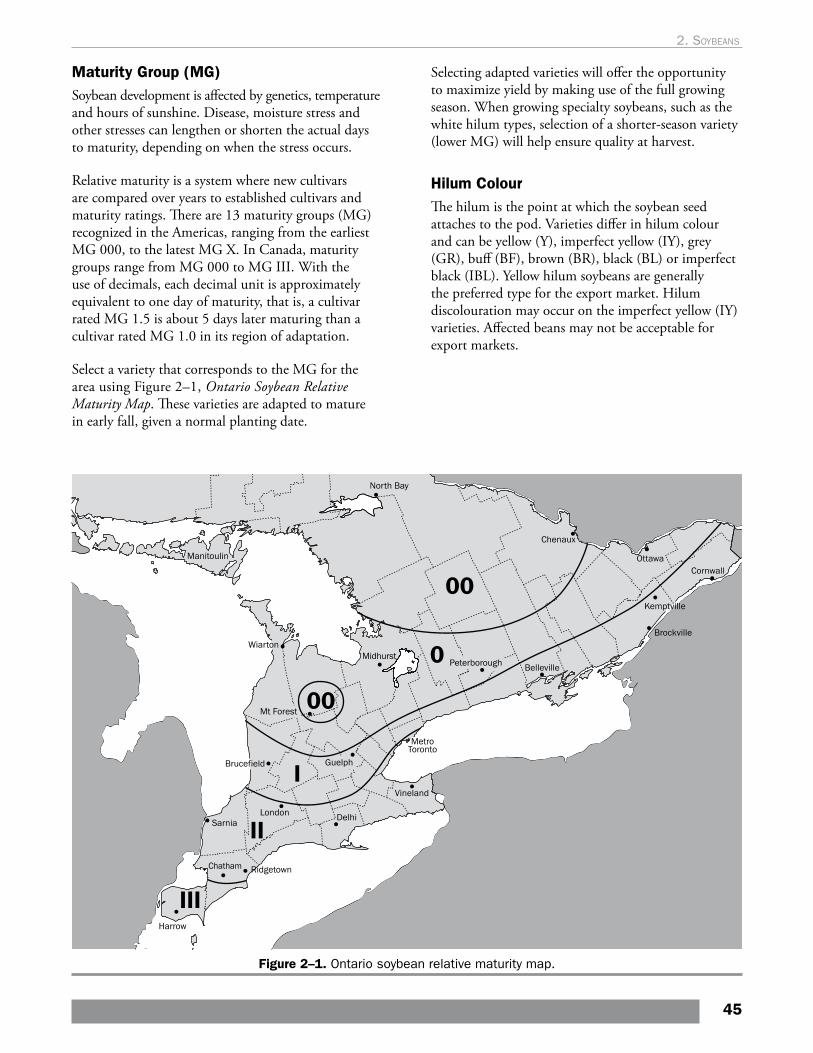
Maturity Group (MG) Soybean development is affected by genetics, temperature and hours of sunshine. Disease, moisture stress and other stresses can lengthen or shorten the actual days to maturity, depending on when the stress occurs.
Relative maturity is a system where new cultivars are compared over years to established cultivars and maturity ratings. There are 13 maturity groups (MG) recognized in the Americas, ranging from the earliest MG 000, to the latest MG X. In Canada, maturity groups range from MG 000 to MG III. With the use of decimals, each decimal unit is approximately equivalent to one day of maturity, that is, a cultivar rated MG 1.5 is about 5 days later maturing than a cultivar rated MG 1.0 in its region of adaptation.
Select a variety that corresponds to the MG for the area using Figure 2–1, Ontario Soybean Relative Maturity Map. These varieties are adapted to mature in early fall, given a normal planting date.
Figure 2–1. Ontario soybean relative maturity map.
Selecting adapted varieties will offer the opportunity to maximize yield by making use of the full growing season. When growing specialty soybeans, such as the white hilum types, selection of a shorter-season variety (lower MG) will help ensure quality at harvest.
Hilum ColourThe hilum is the point at which the soybean seed attaches to the pod. Varieties differ in hilum colour and can be yellow (Y), imperfect yellow (IY), grey (GR), buff (BF), brown (BR), black (BL) or imperfect black (IBL). Yellow hilum soybeans are generally the preferred type for the export market. Hilum discolouration may occur on the imperfect yellow (IY) varieties. Affected beans may not be acceptable for export markets.
45
2. soybeans
Choosing Superior VarietiesIn addition to maturity rating, other important factors for choosing varieties are:
• yield potential • herbicide resistance traits• standability• insect and disease resistance
In selecting superior varieties, three main sources of information exist:
• performance trial data• on-farm strip trial data• company information on variety characteristics
The Ontario Soybean and Canola Committee co-ordinates annual performance trials at various locations across the province. Results are published each fall in the brochure Ontario Soybean Variety Trials. This brochure is available on the internet at www.gosoy.ca and is valuable for comparing the yield potential of varieties. It also provides ratings for maturity, plant height, lodging and other characteristics, such as resistance to phytopthora root rot at locations with heavy textured soils, or resistance to SCN.
Seed companies will provide detailed information on a number of growth characteristics of varieties to aid in selection. When evaluating variety performance, take into account that variety trials conducted under conventional tillage have also proven to be a reliable indicator of a variety’s performance under no-till conditions.
If the soybeans are intended for on-farm livestock feed, choose a variety with a high protein index.
Plant lodging can be a significant yield-reducing problem in Ontario. Varieties with good standability ratings or lodging scores should be chosen for production on medium-to-light-textured soils, fields that have regular manure application, fields with high residual nitrogen levels and fields with a history of lodging. Lowering seeding rates will also reduce lodging.
Soybean variety selection is one of the most important management decisions for improving yields on any farm. A minimum of three different varieties should be grown each year to evaluate the performance of newer higher-yielding varieties.
Individual varieties may perform differently depending on growing conditions. Growing more than one variety will help reduce the risk of crop failure. Plant the majority of the acreage to proven varieties while testing new varieties on a smaller scale.
Identity-Preserved (IP) VarietiesIdentity preservation is the segregation of a variety from planting through to delivery to an end user. It is not a new concept, but IP varieties have existed in a number of markets, including seed production and the production of food-grade soybeans. The introduction of GMO crop varieties has resulted in consumer demand for identity-preserved, non-GMO soybeans. The market offers various levels of premiums and contracts to the producer to grow IP soybeans.
The premiums offered for producing IP varieties must be weighed against their yield potential, increased costs, time and management. Acreage planted should be limited to a size that can be harvested in a timely fashion. Performance information for some specialty-trait varieties may not be available or may only be available from the company selling the seed and/or agreeing to take delivery of the crop after harvest. The agronomic qualities of an IP variety, such as yield, disease resistance and maturity should be evaluated to determine whether or not the premium offered upon sale is adequate. Performance trials of many food-grade soybeans are conducted by the Ontario Soybean and Canola Committee (OSACC). This information is available on the OSACC website at www.gosoy.ca. For crop insurance purposes, Agricorp provides a yield adjustment factor for a number of specialty types since specific varieties may yield less.
BiotechnologyVarieties carrying special traits, such as resistance to certain herbicides, are available in Ontario. Over 75% of soybean varieties have GMO-resistance to herbicides such as glyphosate. These may have value for producers trying to address specific or difficult to control weed issues. They can also be useful in certain tillage systems where burndown treatments or herbicide applications can be applied without killing the GMO resistant soybean variety. These varieties or the pesticides used on them may not be accepted in all soybean markets.
46
Agronomy guide for field Crops
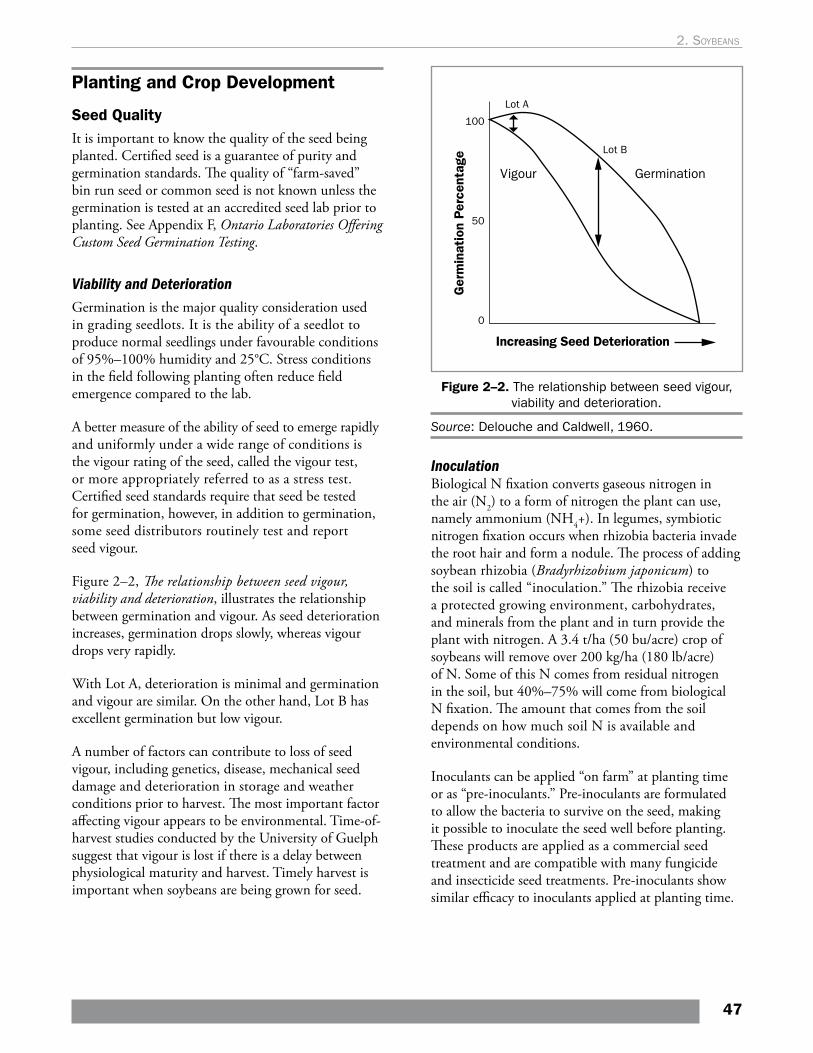
Planting and Crop Development
Seed QualityIt is important to know the quality of the seed being planted. Certified seed is a guarantee of purity and germination standards. The quality of “farm-saved” bin run seed or common seed is not known unless the germination is tested at an accredited seed lab prior to planting. See Appendix F, Ontario Laboratories Offering Custom Seed Germination Testing.
Viability and DeteriorationGermination is the major quality consideration used in grading seedlots. It is the ability of a seedlot to produce normal seedlings under favourable conditions of 95%–100% humidity and 25°C. Stress conditions in the field following planting often reduce field emergence compared to the lab.
A better measure of the ability of seed to emerge rapidly and uniformly under a wide range of conditions is the vigour rating of the seed, called the vigour test, or more appropriately referred to as a stress test. Certified seed standards require that seed be tested for germination, however, in addition to germination, some seed distributors routinely test and report seed vigour.
Figure 2–2, The relationship between seed vigour, viability and deterioration, illustrates the relationship between germination and vigour. As seed deterioration increases, germination drops slowly, whereas vigour drops very rapidly.
With Lot A, deterioration is minimal and germination and vigour are similar. On the other hand, Lot B has excellent germination but low vigour.
A number of factors can contribute to loss of seed vigour, including genetics, disease, mechanical seed damage and deterioration in storage and weather conditions prior to harvest. The most important factor affecting vigour appears to be environmental. Time-of-harvest studies conducted by the University of Guelph suggest that vigour is lost if there is a delay between physiological maturity and harvest. Timely harvest is important when soybeans are being grown for seed.
Figure 2–2. The relationship between seed vigour, viability and deterioration.
Source: Delouche and Caldwell, 1960.
InoculationBiological N fixation converts gaseous nitrogen in the air (N2) to a form of nitrogen the plant can use, namely ammonium (NH4+). In legumes, symbiotic nitrogen fixation occurs when rhizobia bacteria invade the root hair and form a nodule. The process of adding soybean rhizobia (Bradyrhizobium japonicum) to the soil is called “inoculation.” The rhizobia receive a protected growing environment, carbohydrates, and minerals from the plant and in turn provide the plant with nitrogen. A 3.4 t/ha (50 bu/acre) crop of soybeans will remove over 200 kg/ha (180 lb/acre) of N. Some of this N comes from residual nitrogen in the soil, but 40%–75% will come from biological N fixation. The amount that comes from the soil depends on how much soil N is available and environmental conditions.
Inoculants can be applied “on farm” at planting time or as “pre-inoculants.” Pre-inoculants are formulated to allow the bacteria to survive on the seed, making it possible to inoculate the seed well before planting. These products are applied as a commercial seed treatment and are compatible with many fungicide and insecticide seed treatments. Pre-inoculants show similar efficacy to inoculants applied at planting time.
47
2. soybeans
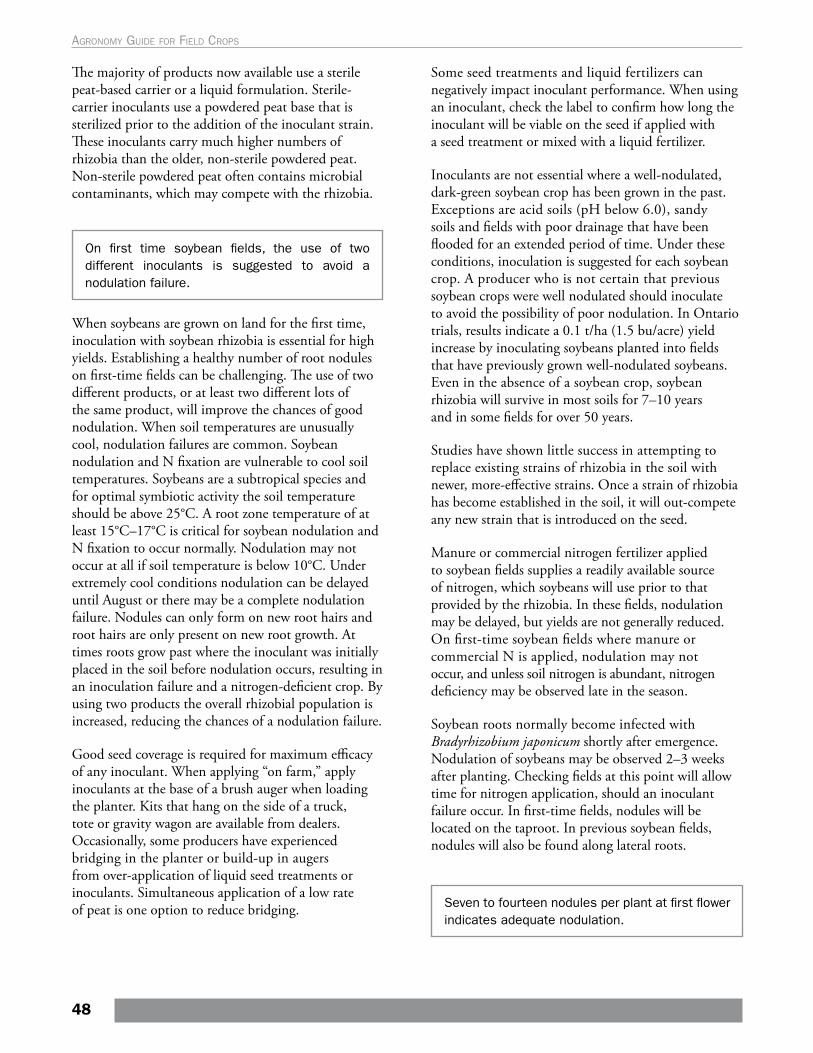
The majority of products now available use a sterile peat-based carrier or a liquid formulation. Sterile-carrier inoculants use a powdered peat base that is sterilized prior to the addition of the inoculant strain. These inoculants carry much higher numbers of rhizobia than the older, non-sterile powdered peat. Non-sterile powdered peat often contains microbial contaminants, which may compete with the rhizobia.
On first time soybean fields, the use of two different inoculants is suggested to avoid a nodulation failure.
When soybeans are grown on land for the first time, inoculation with soybean rhizobia is essential for high yields. Establishing a healthy number of root nodules on first-time fields can be challenging. The use of two different products, or at least two different lots of the same product, will improve the chances of good nodulation. When soil temperatures are unusually cool, nodulation failures are common. Soybean nodulation and N fixation are vulnerable to cool soil temperatures. Soybeans are a subtropical species and for optimal symbiotic activity the soil temperature should be above 25°C. A root zone temperature of at least 15°C–17°C is critical for soybean nodulation and N fixation to occur normally. Nodulation may not occur at all if soil temperature is below 10°C. Under extremely cool conditions nodulation can be delayed until August or there may be a complete nodulation failure. Nodules can only form on new root hairs and root hairs are only present on new root growth. At times roots grow past where the inoculant was initially placed in the soil before nodulation occurs, resulting in an inoculation failure and a nitrogen-deficient crop. By using two products the overall rhizobial population is increased, reducing the chances of a nodulation failure.
Good seed coverage is required for maximum efficacy of any inoculant. When applying “on farm,” apply inoculants at the base of a brush auger when loading the planter. Kits that hang on the side of a truck, tote or gravity wagon are available from dealers. Occasionally, some producers have experienced bridging in the planter or build-up in augers from over-application of liquid seed treatments or inoculants. Simultaneous application of a low rate of peat is one option to reduce bridging.
Some seed treatments and liquid fertilizers can negatively impact inoculant performance. When using an inoculant, check the label to confirm how long the inoculant will be viable on the seed if applied with a seed treatment or mixed with a liquid fertilizer.
Inoculants are not essential where a well-nodulated, dark-green soybean crop has been grown in the past. Exceptions are acid soils (pH below 6.0), sandy soils and fields with poor drainage that have been flooded for an extended period of time. Under these conditions, inoculation is suggested for each soybean crop. A producer who is not certain that previous soybean crops were well nodulated should inoculate to avoid the possibility of poor nodulation. In Ontario trials, results indicate a 0.1 t/ha (1.5 bu/acre) yield increase by inoculating soybeans planted into fields that have previously grown well-nodulated soybeans. Even in the absence of a soybean crop, soybean rhizobia will survive in most soils for 7–10 years and in some fields for over 50 years.
Studies have shown little success in attempting to replace existing strains of rhizobia in the soil with newer, more-effective strains. Once a strain of rhizobia has become established in the soil, it will out-compete any new strain that is introduced on the seed.
Manure or commercial nitrogen fertilizer applied to soybean fields supplies a readily available source of nitrogen, which soybeans will use prior to that provided by the rhizobia. In these fields, nodulation may be delayed, but yields are not generally reduced. On first-time soybean fields where manure or commercial N is applied, nodulation may not occur, and unless soil nitrogen is abundant, nitrogen deficiency may be observed late in the season.
Soybean roots normally become infected with Bradyrhizobium japonicum shortly after emergence. Nodulation of soybeans may be observed 2–3 weeks after planting. Checking fields at this point will allow time for nitrogen application, should an inoculant failure occur. In first-time fields, nodules will be located on the taproot. In previous soybean fields, nodules will also be found along lateral roots.
Seven to fourteen nodules per plant at first flower indicates adequate nodulation.
48
Agronomy guide for field Crops
Soybeans often go through a period when leaves are light green or even pale yellow. This is the period just before the nodules start to supply adequate nitrogen to the leaves and is an important phase in the development of a healthy crop. Usually by the third trifoliate stage, the nodules have established and start providing nitrogen, the leaves will turn a dark-green colour. With proper nodulation, sufficient nutrients and adequate moisture, soybeans will remain yellow for only 7–10 days.
Planting DatePlanting date is an important management tool to maximize yield potential. Soybean planting should be initiated based on calendar date, seedbed conditions, and the weather forecast for 48 hours after planting. It is critical to have a good seedbed. If significant rainfall is forecast, wait until conditions improve before planting. A cold rain immediately after seeding can impact emergence. Yield response to planting date will vary depending on the growing season and the MG of the variety. On average the highest yields are obtained from early plantings, generally before the middle of May. If springtime conditions are favourable, planting in late April or early May can result in a yield advantage over planting in the middle of May. Later plantings are likely to incur significant yield reductions yield 0.34 t/ha (5 bu/acre), as shown in Table 2–6, Effect of planting date on yield. When planting early, select a variety that is adapted or longer season (0.5 MG) for a given area for maximum yields. A three-year study, which compared planting long-season varieties to varieties adapted for a given area, showed a 0.28 t/ha (4 bu/acre) advantage to planting long-season varieties when seeding early. This is shown in Table 2-7, Yield of an adapted variety compared to a long-season variety when planted early.
Table 2–6. Effect of planting date on yield
Planting Date Yield
Percent of Full Yield
(%)
April 15–May 5 4.29 t/ha (63.8 bu/acre)
100%
May 6–20 4.26 t/ha (63.3 bu/acre)
99%
May 21–June 5 3.93 t/ha (58.5 bu/acre)
92%
The data in this table represents the average of 22 trials across Ontario from 2010–2012.
There is concern that planting later-maturing soybean varieties will delay winter wheat seeding after soybean harvest. However, if a long-season variety is seeded before the middle of May, the delay in harvest will be minimal (1–3 days) compared to seeding an adapted variety in late May.
Photo 2–2. Planting date differences. Plot on left planted in May. Plot on right planted in June.
Table 2–7. Yield of an adapted variety compared to a long-season variety when planted early
Average of 22 trials across Ontario from 2010–2012
Planting Date Variety Yield
Mid-May (May 6–May 20)
Adapted for the area based on relative maturity map
4.17 t/ha (62.1 bu/acre)
Early planting (April 15–May 5)
Adapted for the area based on relative maturity map
4.23 t/ha (62.9 bu/acre)
Early planting (April 15–May 5)
Long-season variety (0.5–0.8 MG) for the area based on relative maturity map
4.45 t/ha (66.2 bu/acre)
Field studies have shown that planting a short season (low MG) variety early can reduce yields if August conditions are dry. The short season variety will mature too rapidly and will not be able to take advantage of late season rains.
Soybeans are more sensitive to soil temperature than corn. However, if soil temperature and moisture conditions are suitable for planting corn, they are generally also suitable for soybeans. Soybean seed emergence can be negatively impacted by a cold hard rain immediately after planting if crusting occurs.
49
2. soybeans
A hard spring frost can kill early-planted soybeans, since the growing point of the emerged seedling is above the soil surface. However, soybean plants can withstand temperatures as low as -2.8°C for a short period of time, while corn experiences tissue damage at -2°C.
Delayed PlantingWhen planting is delayed, fewer days are required for the plant to reach maturity. A one-month delay in planting results in a 9-day delay of maturity. Delayed planting will reduce the vegetative growth period. This results in shorter plants with significantly fewer nodes and pods set lower on the plant. Late planting also reduces the number of pods per plant because of the shorter flowering period. Planting date also has an effect on the duration of the pod-filling period.
A 3-day delay in planting date generally results in a 1-day delay of maturity.
Planting after July 1st, most years, has been unprofitable in Ontario and is not covered by crop insurance. If planting must be delayed beyond July 1st:
• On heavy textured soils, select an adapted variety. Planting a short-day variety late in the season will result in extremely short plants with few pods. An early frost may cause dark hilums to “bleed” into the soybean. Select a light hilum variety if this is a concern.
• On medium or light textured soils choosing a variety that is 0.5–1.0 MG less than adapted will aid in reaching maturity before a killing frost.
• Improve vegetative growth of late plantings by selecting taller varieties and planting in narrow rows. Using wide rows when planting late will lead to reduced yield potential. Increase seeding rates by at least 10%. This will increase the height of the low-set pods as well as the number of pods per acre.
Double Cropping SoybeansIn a warm year, some producers in the southernmost regions of Ontario will attempt to grow soybeans immediately following the harvest of their winter cereal or pea crop. Double cropping soybeans in Ontario can be successful if they are seeded early enough; if there is
adequate soil moisture for germination and if the fall season is long with a late killing frost. In southwestern Ontario it is possible to achieve a 2 t/ha (30 bu/acre) crop if planting on or before July 1st and if the weather cooperates. However, the 2 t/ha (30 bu/acre) yield potential drops approximately 67 kg/ha/day (1 bu/acre/day) after July 1st. The chances of success drop dramatically if seeding after July 10th. Areas with more than 3000 CHU have a greater likelihood of success. There is no crop insurance for double cropped soybeans in Ontario.
Producers who have made double cropping work consistently often harvest wheat early, even if some drying is necessary. When it comes to double cropping, every day counts. The following management tips will increase the chances of a successful double crop:
• Do not take out a good red clover stand to double crop. The benefits from the clover stand will outweigh the risk involved in a double crop venture.
• Do not attempt double cropping if soybean cyst nematode is a problem in the field. The soybean crop will reduce the benefits of the non-host (winter cereal) crop and increase cyst populations.
• Wheat stubble may contain many weed seeds. Glyphosate tolerant varieties are generally more suited to double cropping due to more weed control options with limited soil moisture. Volunteer wheat must be controlled.
• Plant immediately after a timely cereal or pea harvest. Double cropping after July 10th is not successful.
• Plant no-till to retain moisture and reduce costs. At harvest, leave approximately 20 cm (8 in.) of cereal stubble to promote soybean stem elongation and higher pod set.
• Plant 1 cm (0.5 in.) into moisture, but do not plant deeper than 7.5 cm (3 in.). If conditions are extremely dry, do not attempt to double crop. Many double crop failures can be attributed to seed being planted into dry conditions.
• Choose tall, small seeded varieties that are 1.0 MG lower than suggested for normal planting dates. Choosing very short day maturities (00 MG) is not a good option. Short season soybeans planted very late will not yield well because the plants will not grow tall enough.
• Plant in narrow rows using high seeding rates. (618,000 seeds/ha or 250,000 seeds/acre).
50
Agronomy guide for field Crops
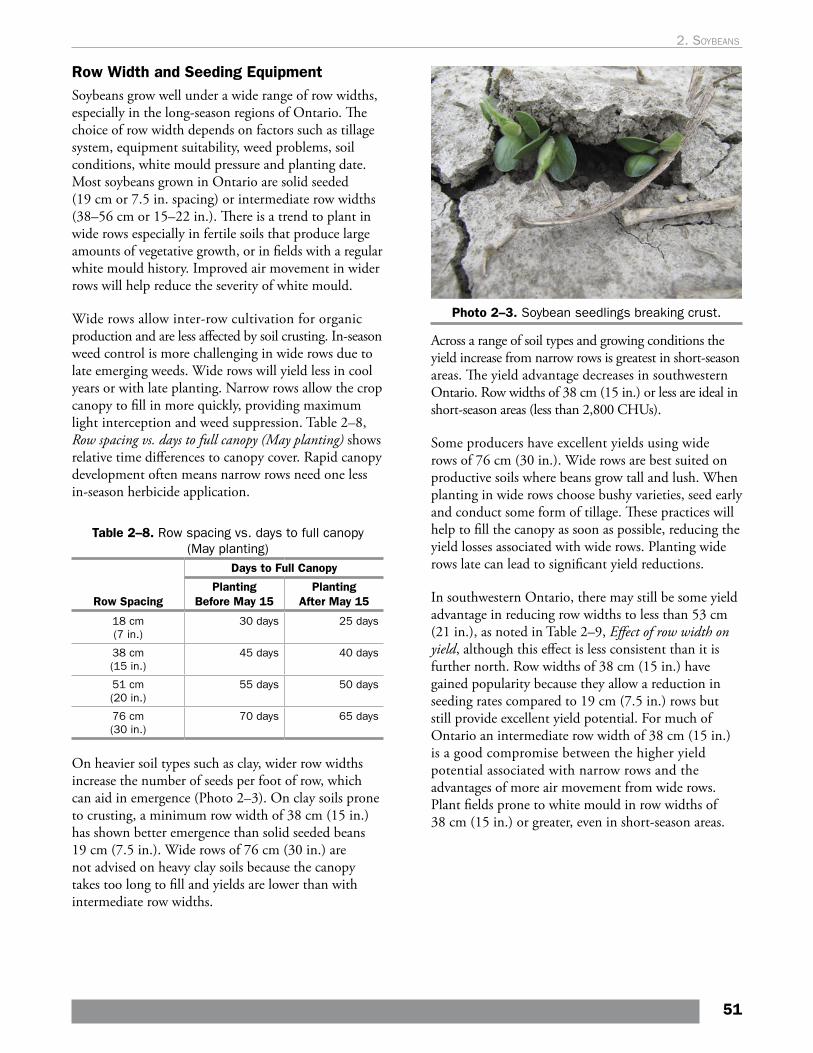
Row Width and Seeding EquipmentSoybeans grow well under a wide range of row widths, especially in the long-season regions of Ontario. The choice of row width depends on factors such as tillage system, equipment suitability, weed problems, soil conditions, white mould pressure and planting date. Most soybeans grown in Ontario are solid seeded (19 cm or 7.5 in. spacing) or intermediate row widths (38–56 cm or 15–22 in.). There is a trend to plant in wide rows especially in fertile soils that produce large amounts of vegetative growth, or in fields with a regular white mould history. Improved air movement in wider rows will help reduce the severity of white mould.
Wide rows allow inter-row cultivation for organic production and are less affected by soil crusting. In-season weed control is more challenging in wide rows due to late emerging weeds. Wide rows will yield less in cool years or with late planting. Narrow rows allow the crop canopy to fill in more quickly, providing maximum light interception and weed suppression. Table 2–8, Row spacing vs. days to full canopy (May planting) shows relative time differences to canopy cover. Rapid canopy development often means narrow rows need one less in-season herbicide application.
Table 2–8. Row spacing vs. days to full canopy (May planting)
Row Spacing
Days to Full Canopy
Planting Before May 15
Planting After May 15
18 cm (7 in.)
30 days 25 days
38 cm (15 in.)
45 days 40 days
51 cm (20 in.)
55 days 50 days
76 cm (30 in.)
70 days 65 days
On heavier soil types such as clay, wider row widths increase the number of seeds per foot of row, which can aid in emergence (Photo 2–3). On clay soils prone to crusting, a minimum row width of 38 cm (15 in.) has shown better emergence than solid seeded beans 19 cm (7.5 in.). Wide rows of 76 cm (30 in.) are not advised on heavy clay soils because the canopy takes too long to fill and yields are lower than with intermediate row widths.
Photo 2–3. Soybean seedlings breaking crust.
Across a range of soil types and growing conditions the yield increase from narrow rows is greatest in short-season areas. The yield advantage decreases in southwestern Ontario. Row widths of 38 cm (15 in.) or less are ideal in short-season areas (less than 2,800 CHUs).
Some producers have excellent yields using wide rows of 76 cm (30 in.). Wide rows are best suited on productive soils where beans grow tall and lush. When planting in wide rows choose bushy varieties, seed early and conduct some form of tillage. These practices will help to fill the canopy as soon as possible, reducing the yield losses associated with wide rows. Planting wide rows late can lead to significant yield reductions.
In southwestern Ontario, there may still be some yield advantage in reducing row widths to less than 53 cm (21 in.), as noted in Table 2–9, Effect of row width on yield, although this effect is less consistent than it is further north. Row widths of 38 cm (15 in.) have gained popularity because they allow a reduction in seeding rates compared to 19 cm (7.5 in.) rows but still provide excellent yield potential. For much of Ontario an intermediate row width of 38 cm (15 in.) is a good compromise between the higher yield potential associated with narrow rows and the advantages of more air movement from wide rows. Plant fields prone to white mould in row widths of 38 cm (15 in.) or greater, even in short-season areas.
51
2. soybeans
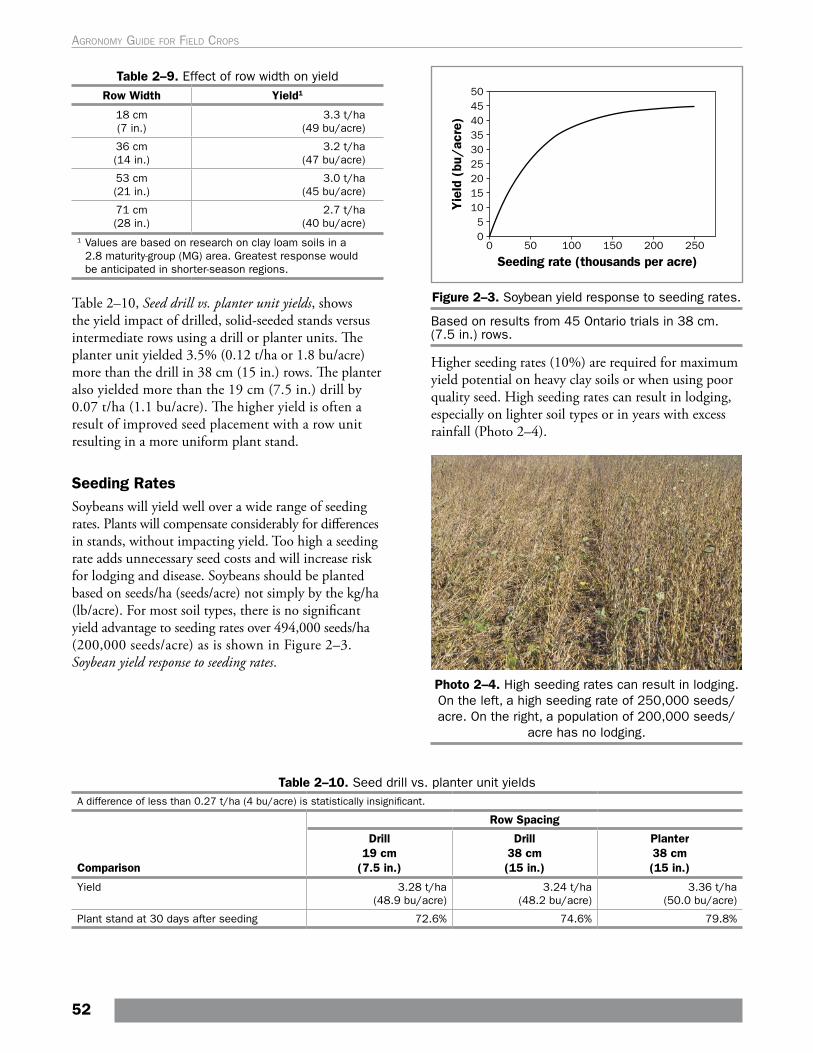
Table 2–9. Effect of row width on yield Row Width Yield1
18 cm (7 in.)
3.3 t/ha (49 bu/acre)
36 cm (14 in.)
3.2 t/ha (47 bu/acre)
53 cm (21 in.)
3.0 t/ha (45 bu/acre)
71 cm (28 in.)
2.7 t/ha (40 bu/acre)
1 Values are based on research on clay loam soils in a 2.8 maturity-group (MG) area. Greatest response would be anticipated in shorter-season regions.
Table 2–10, Seed drill vs. planter unit yields, shows the yield impact of drilled, solid-seeded stands versus intermediate rows using a drill or planter units. The planter unit yielded 3.5% (0.12 t/ha or 1.8 bu/acre) more than the drill in 38 cm (15 in.) rows. The planter also yielded more than the 19 cm (7.5 in.) drill by 0.07 t/ha (1.1 bu/acre). The higher yield is often a result of improved seed placement with a row unit resulting in a more uniform plant stand.
Seeding Rates Soybeans will yield well over a wide range of seeding rates. Plants will compensate considerably for differences in stands, without impacting yield. Too high a seeding rate adds unnecessary seed costs and will increase risk for lodging and disease. Soybeans should be planted based on seeds/ha (seeds/acre) not simply by the kg/ha (lb/acre). For most soil types, there is no significant yield advantage to seeding rates over 494,000 seeds/ha (200,000 seeds/acre) as is shown in Figure 2–3. Soybean yield response to seeding rates.
Figure 2–3. Soybean yield response to seeding rates.
Based on results from 45 Ontario trials in 38 cm. (7.5 in.) rows.
Higher seeding rates (10%) are required for maximum yield potential on heavy clay soils or when using poor quality seed. High seeding rates can result in lodging, especially on lighter soil types or in years with excess rainfall (Photo 2–4).
Photo 2–4. High seeding rates can result in lodging. On the left, a high seeding rate of 250,000 seeds/acre. On the right, a population of 200,000 seeds/
acre has no lodging.
Table 2–10. Seed drill vs. planter unit yieldsA difference of less than 0.27 t/ha (4 bu/acre) is statistically insignificant.
Comparison
Row Spacing
Drill 19 cm
(7.5 in.)
Drill 38 cm (15 in.)
Planter 38 cm (15 in.)
Yield 3.28 t/ha (48.9 bu/acre)
3.24 t/ha (48.2 bu/acre)
3.36 t/ha (50.0 bu/acre)
Plant stand at 30 days after seeding 72.6% 74.6% 79.8%
52
Agronomy guide for field Crops
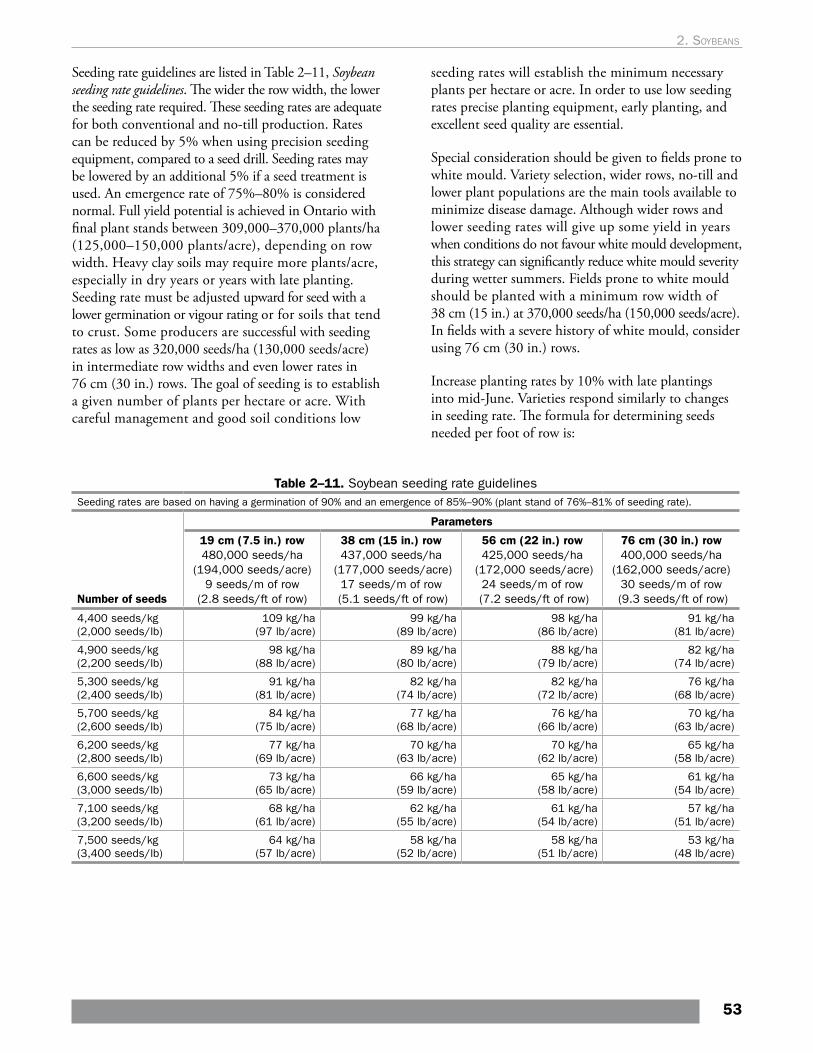
Seeding rate guidelines are listed in Table 2–11, Soybean seeding rate guidelines. The wider the row width, the lower the seeding rate required. These seeding rates are adequate for both conventional and no-till production. Rates can be reduced by 5% when using precision seeding equipment, compared to a seed drill. Seeding rates may be lowered by an additional 5% if a seed treatment is used. An emergence rate of 75%–80% is considered normal. Full yield potential is achieved in Ontario with final plant stands between 309,000–370,000 plants/ha (125,000–150,000 plants/acre), depending on row width. Heavy clay soils may require more plants/acre, especially in dry years or years with late planting. Seeding rate must be adjusted upward for seed with a lower germination or vigour rating or for soils that tend to crust. Some producers are successful with seeding rates as low as 320,000 seeds/ha (130,000 seeds/acre) in intermediate row widths and even lower rates in 76 cm (30 in.) rows. The goal of seeding is to establish a given number of plants per hectare or acre. With careful management and good soil conditions low
seeding rates will establish the minimum necessary plants per hectare or acre. In order to use low seeding rates precise planting equipment, early planting, and excellent seed quality are essential.
Special consideration should be given to fields prone to white mould. Variety selection, wider rows, no-till and lower plant populations are the main tools available to minimize disease damage. Although wider rows and lower seeding rates will give up some yield in years when conditions do not favour white mould development, this strategy can significantly reduce white mould severity during wetter summers. Fields prone to white mould should be planted with a minimum row width of 38 cm (15 in.) at 370,000 seeds/ha (150,000 seeds/acre). In fields with a severe history of white mould, consider using 76 cm (30 in.) rows.
Increase planting rates by 10% with late plantings into mid-June. Varieties respond similarly to changes in seeding rate. The formula for determining seeds needed per foot of row is:
Table 2–11. Soybean seeding rate guidelines Seeding rates are based on having a germination of 90% and an emergence of 85%–90% (plant stand of 76%–81% of seeding rate).
Number of seeds
Parameters
19 cm (7.5 in.) row480,000 seeds/ha
(194,000 seeds/acre)9 seeds/m of row
(2.8 seeds/ft of row)
38 cm (15 in.) row437,000 seeds/ha
(177,000 seeds/acre)17 seeds/m of row
(5.1 seeds/ft of row)
56 cm (22 in.) row425,000 seeds/ha
(172,000 seeds/acre)24 seeds/m of row
(7.2 seeds/ft of row)
76 cm (30 in.) row400,000 seeds/ha
(162,000 seeds/acre)30 seeds/m of row
(9.3 seeds/ft of row)
4,400 seeds/kg (2,000 seeds/lb)
109 kg/ha (97 lb/acre)
99 kg/ha (89 lb/acre)
98 kg/ha (86 lb/acre)
91 kg/ha (81 lb/acre)
4,900 seeds/kg (2,200 seeds/lb)
98 kg/ha (88 lb/acre)
89 kg/ha (80 lb/acre)
88 kg/ha (79 lb/acre)
82 kg/ha (74 lb/acre)
5,300 seeds/kg (2,400 seeds/lb)
91 kg/ha (81 lb/acre)
82 kg/ha (74 lb/acre)
82 kg/ha (72 lb/acre)
76 kg/ha (68 lb/acre)
5,700 seeds/kg (2,600 seeds/lb)
84 kg/ha (75 lb/acre)
77 kg/ha (68 lb/acre)
76 kg/ha (66 lb/acre)
70 kg/ha (63 lb/acre)
6,200 seeds/kg (2,800 seeds/lb)
77 kg/ha (69 lb/acre)
70 kg/ha (63 lb/acre)
70 kg/ha (62 lb/acre)
65 kg/ha (58 lb/acre)
6,600 seeds/kg (3,000 seeds/lb)
73 kg/ha (65 lb/acre)
66 kg/ha (59 lb/acre)
65 kg/ha (58 lb/acre)
61 kg/ha (54 lb/acre)
7,100 seeds/kg (3,200 seeds/lb)
68 kg/ha (61 lb/acre)
62 kg/ha (55 lb/acre)
61 kg/ha (54 lb/acre)
57 kg/ha (51 lb/acre)
7,500 seeds/kg (3,400 seeds/lb)
64 kg/ha (57 lb/acre)
58 kg/ha (52 lb/acre)
58 kg/ha (51 lb/acre)
53 kg/ha (48 lb/acre)
53
2. soybeans
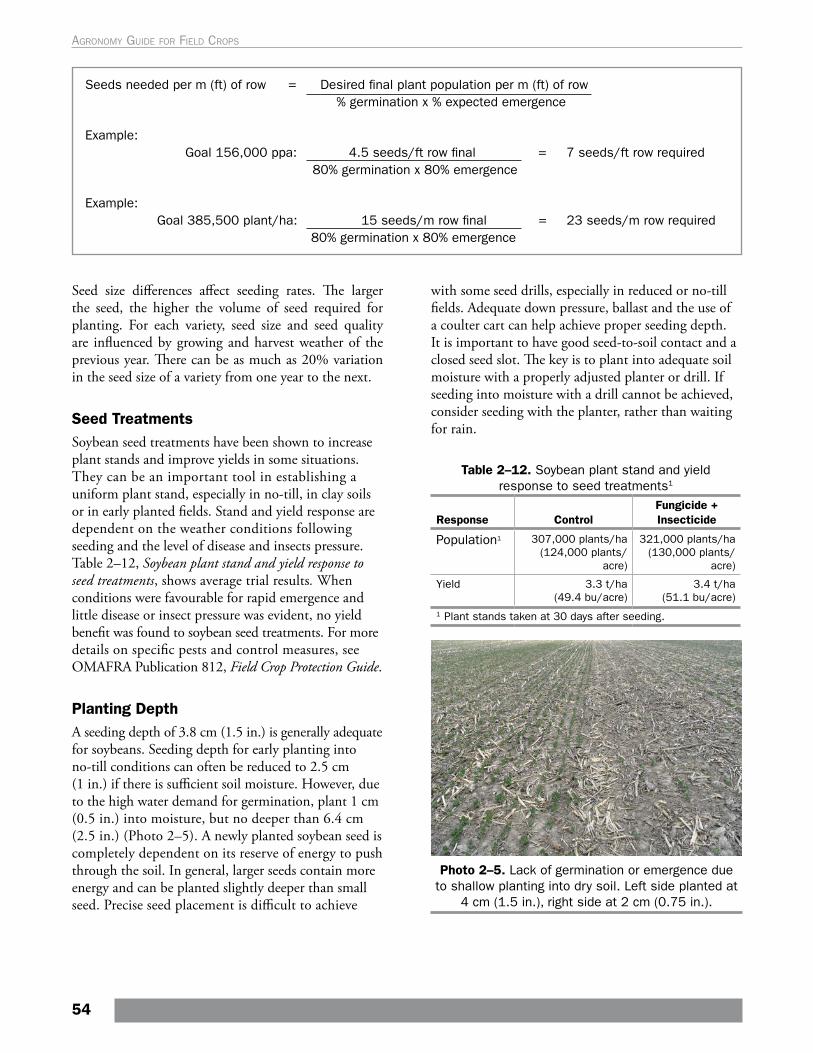
Seed size differences affect seeding rates. The larger the seed, the higher the volume of seed required for planting. For each variety, seed size and seed quality are influenced by growing and harvest weather of the previous year. There can be as much as 20% variation in the seed size of a variety from one year to the next.
Seed TreatmentsSoybean seed treatments have been shown to increase plant stands and improve yields in some situations. They can be an important tool in establishing a uniform plant stand, especially in no-till, in clay soils or in early planted fields. Stand and yield response are dependent on the weather conditions following seeding and the level of disease and insects pressure. Table 2–12, Soybean plant stand and yield response to seed treatments, shows average trial results. When conditions were favourable for rapid emergence and little disease or insect pressure was evident, no yield benefit was found to soybean seed treatments. For more details on specific pests and control measures, see OMAFRA Publication 812, Field Crop Protection Guide.
Planting DepthA seeding depth of 3.8 cm (1.5 in.) is generally adequate for soybeans. Seeding depth for early planting into no-till conditions can often be reduced to 2.5 cm (1 in.) if there is sufficient soil moisture. However, due to the high water demand for germination, plant 1 cm (0.5 in.) into moisture, but no deeper than 6.4 cm (2.5 in.) (Photo 2–5). A newly planted soybean seed is completely dependent on its reserve of energy to push through the soil. In general, larger seeds contain more energy and can be planted slightly deeper than small seed. Precise seed placement is difficult to achieve
with some seed drills, especially in reduced or no-till fields. Adequate down pressure, ballast and the use of a coulter cart can help achieve proper seeding depth. It is important to have good seed-to-soil contact and a closed seed slot. The key is to plant into adequate soil moisture with a properly adjusted planter or drill. If seeding into moisture with a drill cannot be achieved, consider seeding with the planter, rather than waiting for rain.
Table 2–12. Soybean plant stand and yield response to seed treatments1
Response ControlFungicide + Insecticide
Population1 307,000 plants/ha (124,000 plants/
acre)
321,000 plants/ha (130,000 plants/
acre)
Yield 3.3 t/ha (49.4 bu/acre)
3.4 t/ha (51.1 bu/acre)
1 Plant stands taken at 30 days after seeding.
Photo 2–5. Lack of germination or emergence due to shallow planting into dry soil. Left side planted at
4 cm (1.5 in.), right side at 2 cm (0.75 in.).
Seeds needed per m (ft) of row = Desired final plant population per m (ft) of row% germination x % expected emergence
Example: Goal 156,000 ppa: 4.5 seeds/ft row final
80% germination x 80% emergence= 7 seeds/ft row required
Example: Goal 385,500 plant/ha: 15 seeds/m row final
80% germination x 80% emergence = 23 seeds/m row required
54
Agronomy guide for field Crops
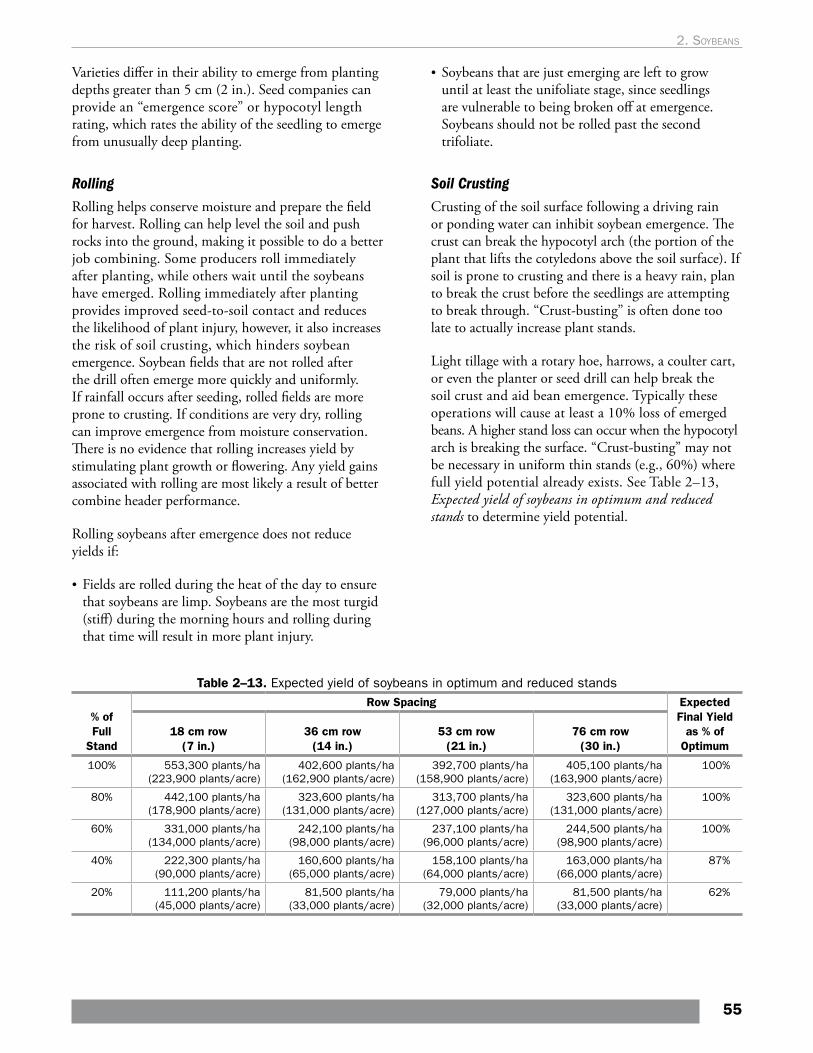
Varieties differ in their ability to emerge from planting depths greater than 5 cm (2 in.). Seed companies can provide an “emergence score” or hypocotyl length rating, which rates the ability of the seedling to emerge from unusually deep planting.
RollingRolling helps conserve moisture and prepare the field for harvest. Rolling can help level the soil and push rocks into the ground, making it possible to do a better job combining. Some producers roll immediately after planting, while others wait until the soybeans have emerged. Rolling immediately after planting provides improved seed-to-soil contact and reduces the likelihood of plant injury, however, it also increases the risk of soil crusting, which hinders soybean emergence. Soybean fields that are not rolled after the drill often emerge more quickly and uniformly. If rainfall occurs after seeding, rolled fields are more prone to crusting. If conditions are very dry, rolling can improve emergence from moisture conservation. There is no evidence that rolling increases yield by stimulating plant growth or flowering. Any yield gains associated with rolling are most likely a result of better combine header performance.
Rolling soybeans after emergence does not reduce yields if:
• Fields are rolled during the heat of the day to ensure that soybeans are limp. Soybeans are the most turgid (stiff) during the morning hours and rolling during that time will result in more plant injury.
• Soybeans that are just emerging are left to grow until at least the unifoliate stage, since seedlings are vulnerable to being broken off at emergence. Soybeans should not be rolled past the second trifoliate.
Soil Crusting Crusting of the soil surface following a driving rain or ponding water can inhibit soybean emergence. The crust can break the hypocotyl arch (the portion of the plant that lifts the cotyledons above the soil surface). If soil is prone to crusting and there is a heavy rain, plan to break the crust before the seedlings are attempting to break through. “Crust-busting” is often done too late to actually increase plant stands.
Light tillage with a rotary hoe, harrows, a coulter cart, or even the planter or seed drill can help break the soil crust and aid bean emergence. Typically these operations will cause at least a 10% loss of emerged beans. A higher stand loss can occur when the hypocotyl arch is breaking the surface. “Crust-busting” may not be necessary in uniform thin stands (e.g., 60%) where full yield potential already exists. See Table 2–13, Expected yield of soybeans in optimum and reduced stands to determine yield potential.
Table 2–13. Expected yield of soybeans in optimum and reduced stands
% of Full
Stand
Row Spacing Expected Final Yield
as % of Optimum
18 cm row (7 in.)
36 cm row (14 in.)
53 cm row (21 in.)
76 cm row (30 in.)
100% 553,300 plants/ha (223,900 plants/acre)
402,600 plants/ha (162,900 plants/acre)
392,700 plants/ha (158,900 plants/acre)
405,100 plants/ha (163,900 plants/acre)
100%
80% 442,100 plants/ha (178,900 plants/acre)
323,600 plants/ha (131,000 plants/acre)
313,700 plants/ha (127,000 plants/acre)
323,600 plants/ha (131,000 plants/acre)
100%
60% 331,000 plants/ha (134,000 plants/acre)
242,100 plants/ha (98,000 plants/acre)
237,100 plants/ha (96,000 plants/acre)
244,500 plants/ha (98,900 plants/acre)
100%
40% 222,300 plants/ha (90,000 plants/acre)
160,600 plants/ha (65,000 plants/acre)
158,100 plants/ha (64,000 plants/acre)
163,000 plants/ha (66,000 plants/acre)
87%
20% 111,200 plants/ha (45,000 plants/acre)
81,500 plants/ha (33,000 plants/acre)
79,000 plants/ha (32,000 plants/acre)
81,500 plants/ha (33,000 plants/acre)
62%
55
2. soybeans
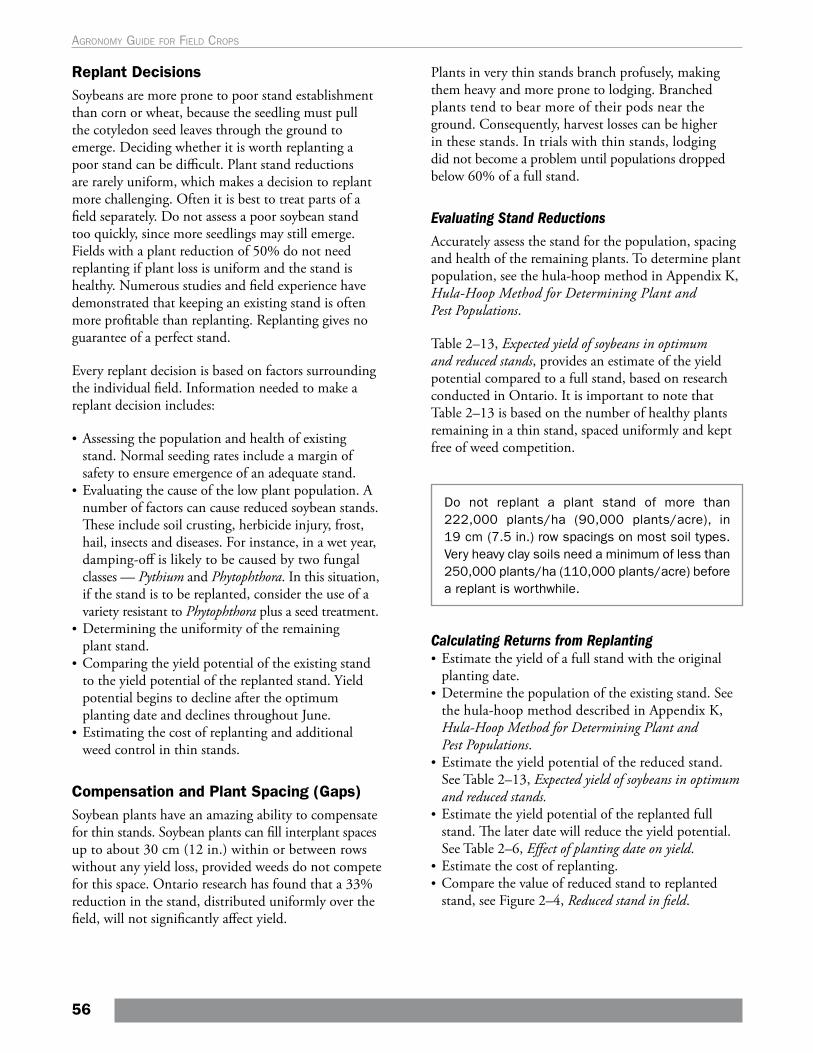
Replant DecisionsSoybeans are more prone to poor stand establishment than corn or wheat, because the seedling must pull the cotyledon seed leaves through the ground to emerge. Deciding whether it is worth replanting a poor stand can be difficult. Plant stand reductions are rarely uniform, which makes a decision to replant more challenging. Often it is best to treat parts of a field separately. Do not assess a poor soybean stand too quickly, since more seedlings may still emerge. Fields with a plant reduction of 50% do not need replanting if plant loss is uniform and the stand is healthy. Numerous studies and field experience have demonstrated that keeping an existing stand is often more profitable than replanting. Replanting gives no guarantee of a perfect stand.
Every replant decision is based on factors surrounding the individual field. Information needed to make a replant decision includes:
• Assessing the population and health of existing stand. Normal seeding rates include a margin of safety to ensure emergence of an adequate stand.
• Evaluating the cause of the low plant population. A number of factors can cause reduced soybean stands. These include soil crusting, herbicide injury, frost, hail, insects and diseases. For instance, in a wet year, damping-off is likely to be caused by two fungal classes — Pythium and Phytophthora. In this situation, if the stand is to be replanted, consider the use of a variety resistant to Phytophthora plus a seed treatment.
• Determining the uniformity of the remaining plant stand.
• Comparing the yield potential of the existing stand to the yield potential of the replanted stand. Yield potential begins to decline after the optimum planting date and declines throughout June.
• Estimating the cost of replanting and additional weed control in thin stands.
Compensation and Plant Spacing (Gaps)Soybean plants have an amazing ability to compensate for thin stands. Soybean plants can fill interplant spaces up to about 30 cm (12 in.) within or between rows without any yield loss, provided weeds do not compete for this space. Ontario research has found that a 33% reduction in the stand, distributed uniformly over the field, will not significantly affect yield.
Plants in very thin stands branch profusely, making them heavy and more prone to lodging. Branched plants tend to bear more of their pods near the ground. Consequently, harvest losses can be higher in these stands. In trials with thin stands, lodging did not become a problem until populations dropped below 60% of a full stand.
Evaluating Stand ReductionsAccurately assess the stand for the population, spacing and health of the remaining plants. To determine plant population, see the hula-hoop method in Appendix K, Hula-Hoop Method for Determining Plant and Pest Populations.
Table 2–13, Expected yield of soybeans in optimum and reduced stands, provides an estimate of the yield potential compared to a full stand, based on research conducted in Ontario. It is important to note that Table 2–13 is based on the number of healthy plants remaining in a thin stand, spaced uniformly and kept free of weed competition.
Do not replant a plant stand of more than 222,000 plants/ha (90,000 plants/acre), in 19 cm (7.5 in.) row spacings on most soil types. Very heavy clay soils need a minimum of less than 250,000 plants/ha (110,000 plants/acre) before a replant is worthwhile.
Calculating Returns from Replanting• Estimate the yield of a full stand with the original
planting date.• Determine the population of the existing stand. See
the hula-hoop method described in Appendix K, Hula-Hoop Method for Determining Plant and Pest Populations.
• Estimate the yield potential of the reduced stand. See Table 2–13, Expected yield of soybeans in optimum and reduced stands.
• Estimate the yield potential of the replanted full stand. The later date will reduce the yield potential. See Table 2–6, Effect of planting date on yield.
• Estimate the cost of replanting.• Compare the value of reduced stand to replanted
stand, see Figure 2–4, Reduced stand in field.
56
Agronomy guide for field Crops
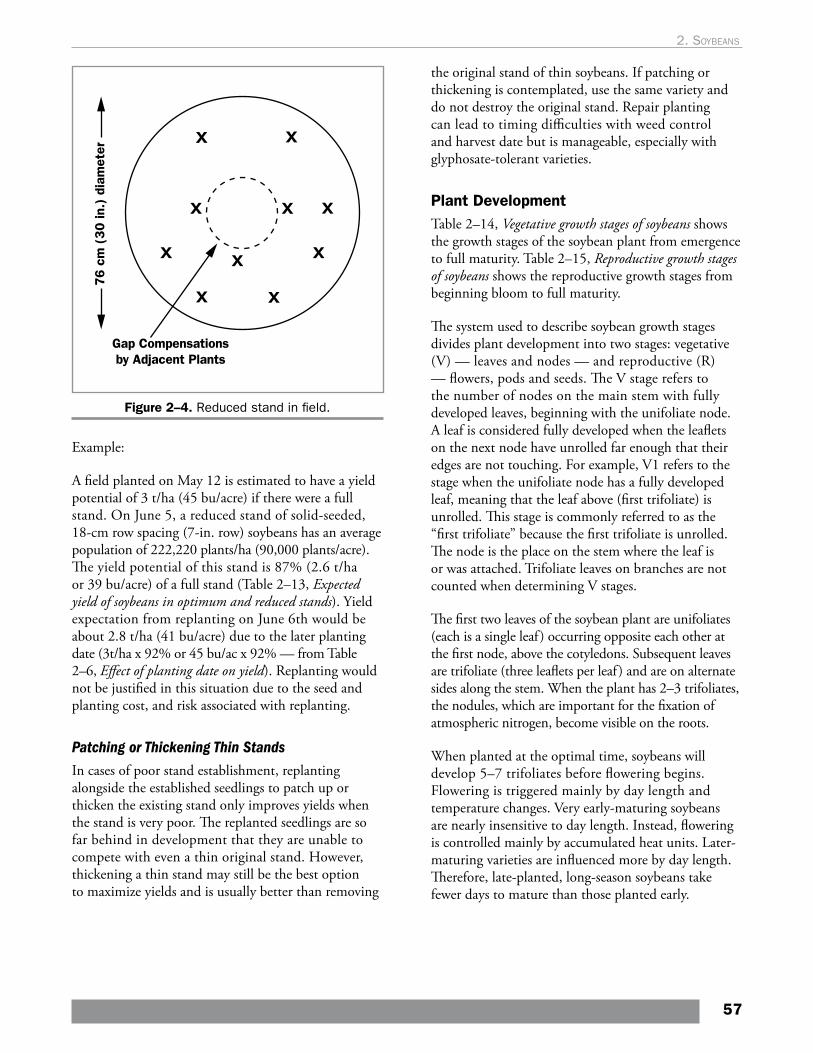
Figure 2–4. Reduced stand in field.
Example:
A field planted on May 12 is estimated to have a yield potential of 3 t/ha (45 bu/acre) if there were a full stand. On June 5, a reduced stand of solid-seeded, 18-cm row spacing (7-in. row) soybeans has an average population of 222,220 plants/ha (90,000 plants/acre). The yield potential of this stand is 87% (2.6 t/ha or 39 bu/acre) of a full stand (Table 2–13, Expected yield of soybeans in optimum and reduced stands). Yield expectation from replanting on June 6th would be about 2.8 t/ha (41 bu/acre) due to the later planting date (3t/ha x 92% or 45 bu/ac x 92% — from Table 2–6, Effect of planting date on yield). Replanting would not be justified in this situation due to the seed and planting cost, and risk associated with replanting.
Patching or Thickening Thin StandsIn cases of poor stand establishment, replanting alongside the established seedlings to patch up or thicken the existing stand only improves yields when the stand is very poor. The replanted seedlings are so far behind in development that they are unable to compete with even a thin original stand. However, thickening a thin stand may still be the best option to maximize yields and is usually better than removing
the original stand of thin soybeans. If patching or thickening is contemplated, use the same variety and do not destroy the original stand. Repair planting can lead to timing difficulties with weed control and harvest date but is manageable, especially with glyphosate-tolerant varieties.
Plant Development Table 2–14, Vegetative growth stages of soybeans shows the growth stages of the soybean plant from emergence to full maturity. Table 2–15, Reproductive growth stages of soybeans shows the reproductive growth stages from beginning bloom to full maturity.
The system used to describe soybean growth stages divides plant development into two stages: vegetative (V) — leaves and nodes — and reproductive (R) — flowers, pods and seeds. The V stage refers to the number of nodes on the main stem with fully developed leaves, beginning with the unifoliate node. A leaf is considered fully developed when the leaflets on the next node have unrolled far enough that their edges are not touching. For example, V1 refers to the stage when the unifoliate node has a fully developed leaf, meaning that the leaf above (first trifoliate) is unrolled. This stage is commonly referred to as the “first trifoliate” because the first trifoliate is unrolled. The node is the place on the stem where the leaf is or was attached. Trifoliate leaves on branches are not counted when determining V stages.
The first two leaves of the soybean plant are unifoliates (each is a single leaf ) occurring opposite each other at the first node, above the cotyledons. Subsequent leaves are trifoliate (three leaflets per leaf ) and are on alternate sides along the stem. When the plant has 2–3 trifoliates, the nodules, which are important for the fixation of atmospheric nitrogen, become visible on the roots.
When planted at the optimal time, soybeans will develop 5–7 trifoliates before flowering begins. Flowering is triggered mainly by day length and temperature changes. Very early-maturing soybeans are nearly insensitive to day length. Instead, flowering is controlled mainly by accumulated heat units. Later-maturing varieties are influenced more by day length. Therefore, late-planted, long-season soybeans take fewer days to mature than those planted early.
57
2. soybeans
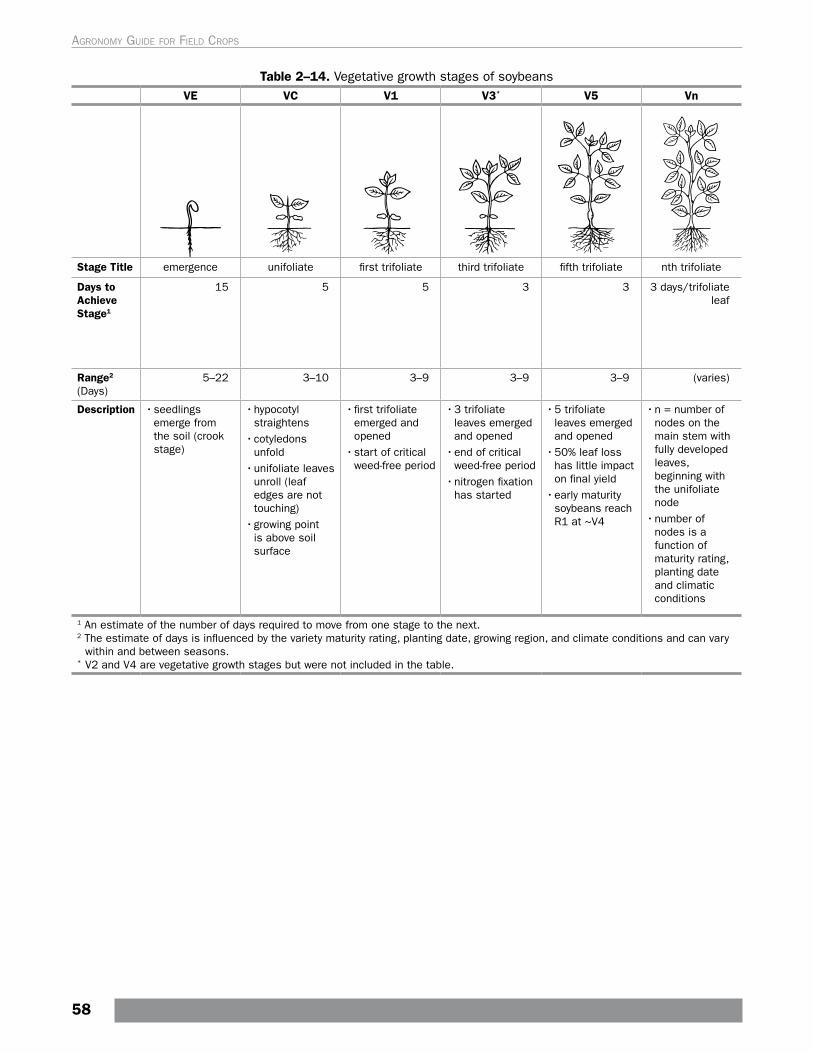
Table 2–14. Vegetative growth stages of soybeansVE VC V1 V3* V5 Vn
Stage Title emergence unifoliate first trifoliate third trifoliate fifth trifoliate nth trifoliate
Days to Achieve Stage1
15 5 5 3 3 3 days/trifoliate leaf
Range2 (Days)
5–22 3–10 3–9 3–9 3–9 (varies)
Description • seedlings emerge from the soil (crook stage)
• hypocotyl straightens
• cotyledons unfold
• unifoliate leaves unroll (leaf edges are not touching)
• growing point is above soil surface
• first trifoliate emerged and opened
• start of critical weed-free period
• 3 trifoliate leaves emerged and opened
• end of critical weed-free period
• nitrogen fixation has started
• 5 trifoliate leaves emerged and opened
• 50% leaf loss has little impact on final yield
• early maturity soybeans reach R1 at ~V4
• n = number of nodes on the main stem with fully developed leaves, beginning with the unifoliate node
• number of nodes is a function of maturity rating, planting date and climatic conditions
1 An estimate of the number of days required to move from one stage to the next.2 The estimate of days is influenced by the variety maturity rating, planting date, growing region, and climate conditions and can vary
within and between seasons.* V2 and V4 are vegetative growth stages but were not included in the table.
58
Agronomy guide for field Crops
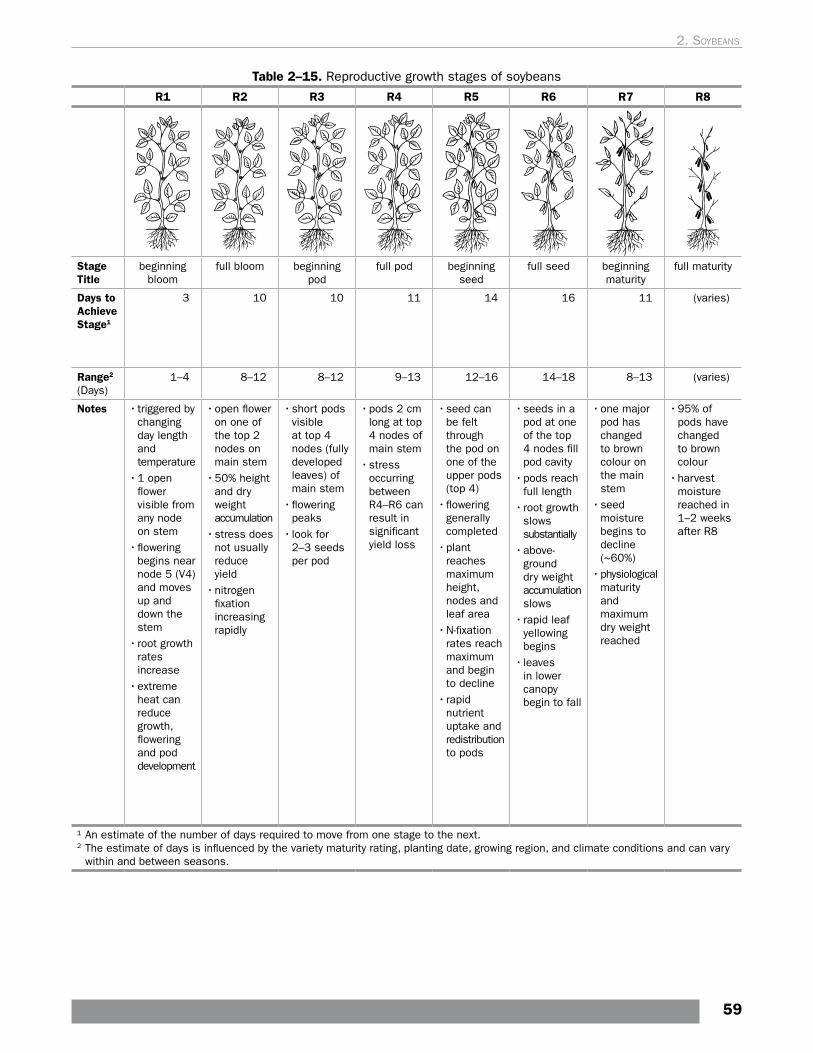
Table 2–15. Reproductive growth stages of soybeans
R1 R2 R3 R4 R5 R6 R7 R8
Stage Title
beginning bloom
full bloom beginning pod
full pod beginning seed
full seed beginning maturity
full maturity
Days to Achieve Stage1
3 10 10 11 14 16 11 (varies)
Range2
(Days)1–4 8–12 8–12 9–13 12–16 14–18 8–13 (varies)
Notes • triggered by changing day length and temperature
• 1 open flower visible from any node on stem
• flowering begins near node 5 (V4) and moves up and down the stem
• root growth rates increase
• extreme heat can reduce growth, flowering and pod development
• open flower on one of the top 2 nodes on main stem
• 50% height and dry weight accumulation
• stress does not usually reduce yield
• nitrogen fixation increasing rapidly
• short pods visible at top 4 nodes (fully developed leaves) of main stem
• flowering peaks
• look for 2–3 seeds per pod
• pods 2 cm long at top 4 nodes of main stem
• stress occurring between R4–R6 can result in significant yield loss
• seed can be felt through the pod on one of the upper pods (top 4)
• flowering generally completed
• plant reaches maximum height, nodes and leaf area
• N-fixation rates reach maximum and begin to decline
• rapid nutrient uptake and redistribution to pods
• seeds in a pod at one of the top 4 nodes fill pod cavity
• pods reach full length
• root growth slows substantially
• above-ground dry weight accumulation slows
• rapid leaf yellowing begins
• leaves in lower canopy begin to fall
• one major pod has changed to brown colour on the main stem
• seed moisture begins to decline (~60%)
• physiological maturity and maximum dry weight reached
• 95% of pods have changed to brown colour
• harvest moisture reached in 1–2 weeks after R8
¹ An estimate of the number of days required to move from one stage to the next.2 The estimate of days is influenced by the variety maturity rating, planting date, growing region, and climate conditions and can vary
within and between seasons.
59
2. soybeans
Germination and EmergenceGermination begins with the seed absorbing soil moisture until it reaches a moisture content of about 50%. The first external sign of germination is the emergence of the radicle (primary root), which grows downward and anchors itself in the soil. Shortly after, the hypocotyl (the section of the stem above the radicle) starts growing upwards, pulling the cotyledons (seed leaves) with it. Once emerged, the hook-shaped hypocotyl straightens out, the cotyledons fold down and the growing point is exposed to sunlight. Emergence normally occurs about 5–21 days after planting, depending on soil moisture, soil temperature and planting depth.
Commercial soybean varieties in Ontario are indeterminate, which continue to grow taller and produce new leaves after flowering has commenced. Tall-determinate varieties grow to their full height before flowering begins. The flowering process occurs over a shorter period of time. Tall-determinate varieties characteristically have their lowest pods higher off the ground than indeterminate varieties.
Fertility Management
Nitrogen and SulphurNitrogen fertilizers are not usually required for soybeans, see earlier Chapter 2 section Inoculation. Research studying nitrogen fertilizer applied at planting has shown that excess nitrogen can delay nodule formation and N fixation, and promote excessive vegetative growth that increases risk of lodging. Ontario research has not shown a significant yield gain to applying nitrogen fertilizer to a well-nodulated field of soybeans. There is also no evidence that soybeans respond to sulphur application in Ontario.
If nodulation does not occur, and the soybeans are pale green and N-deficient, the suggested remedial measure is to apply 50 kg/ha (45 lb/acre) of N at first flower — as urea or calcium ammonium nitrate — when the foliage is dry.
Phosphate and PotashPhosphate and potash guidelines for soybeans are given in Tables 2–16 and 2–17, Phosphate and Potash Guidelines for Soybeans. These guidelines are based on OMAFRA-accredited soil tests using the sufficiency approach, which applies the most economic rate of nutrients for a given crop year.
Profitable response to applied nutrients occurs when the increase in crop value, from increased yield or quality, is greater than the cost of the applied nutrient.
Where manure is applied, reduce the fertilizer application according to the amount and quality of manure. See Chapter 9, Table 9-10 Typical amounts of total and available nitrogen, phosphate and potash from various organic nutrient sources and average concentrations.
Table 2–16. Phosphate (P2O5) guidelines for soybeans
Based on OMAFRA-accredited soil tests.
Profitable response to applied nutrients occurs when the increase in crop value, from increased yield or quality, is greater than the cost of the applied nutrient.
Where manure is applied, reduce the fertilizer application according to the amount and quality of manure (Chapter 9, Manure section).
LEGEND: HR = high response MR = medium responseLR = low response RR = rare responseNR = no response
Sodium Bicarbonate Phosphorus Soil Test Phosphate Required
0–3 ppm 80 kg/ha (HR)
4–5 ppm 60 kg/ha (HR)
6–7 ppm 50 kg/ha (HR)
8–9 ppm 40 kg/ha (HR)
10–12 ppm 30 kg/ha (MR)
13–15 ppm 20 kg/ha (MR)
16–30 ppm 0 (LR)
31–60 ppm 0 (RR)
61 ppm + 0 (NR)1
100 kg/ha = 90 lb/acre1 When the response rating for a nutrient is “NR,”
application of phosphorus in fertilizer or manure may reduce crop yield or quality. For example, phosphate applications may induce zinc deficiency on soils low in zinc and may increase the risk of water pollution.
60
Agronomy guide for field Crops
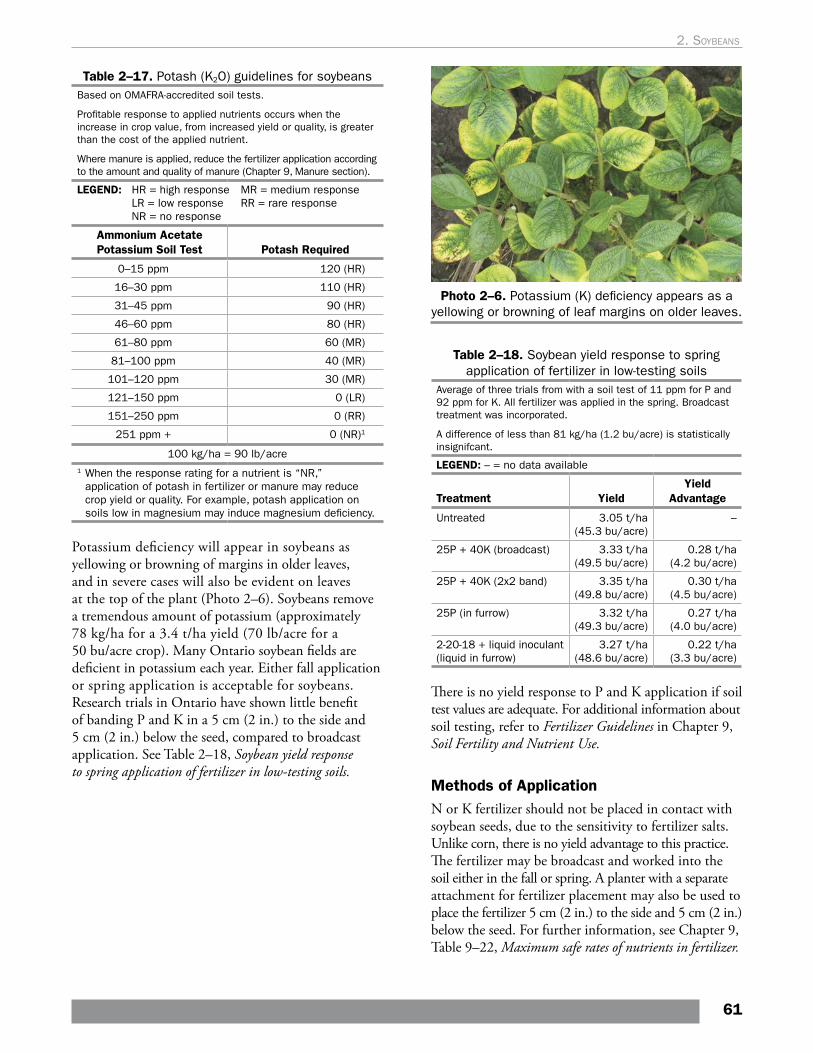
Table 2–17. Potash (K2O) guidelines for soybeansBased on OMAFRA-accredited soil tests.
Profitable response to applied nutrients occurs when the increase in crop value, from increased yield or quality, is greater than the cost of the applied nutrient.
Where manure is applied, reduce the fertilizer application according to the amount and quality of manure (Chapter 9, Manure section).
LEGEND: HR = high response MR = medium response LR = low response RR = rare response NR = no response
Ammonium Acetate Potassium Soil Test Potash Required
0–15 ppm 120 (HR)
16–30 ppm 110 (HR)
31–45 ppm 90 (HR)
46–60 ppm 80 (HR)
61–80 ppm 60 (MR)
81–100 ppm 40 (MR)
101–120 ppm 30 (MR)
121–150 ppm 0 (LR)
151–250 ppm 0 (RR)
251 ppm + 0 (NR)1
100 kg/ha = 90 lb/acre1 When the response rating for a nutrient is “NR,”
application of potash in fertilizer or manure may reduce crop yield or quality. For example, potash application on soils low in magnesium may induce magnesium deficiency.
Potassium deficiency will appear in soybeans as yellowing or browning of margins in older leaves, and in severe cases will also be evident on leaves at the top of the plant (Photo 2–6). Soybeans remove a tremendous amount of potassium (approximately 78 kg/ha for a 3.4 t/ha yield (70 lb/acre for a 50 bu/acre crop). Many Ontario soybean fields are deficient in potassium each year. Either fall application or spring application is acceptable for soybeans. Research trials in Ontario have shown little benefit of banding P and K in a 5 cm (2 in.) to the side and 5 cm (2 in.) below the seed, compared to broadcast application. See Table 2–18, Soybean yield response to spring application of fertilizer in low-testing soils.
Photo 2–6. Potassium (K) deficiency appears as a yellowing or browning of leaf margins on older leaves.
Table 2–18. Soybean yield response to spring application of fertilizer in low-testing soils
Average of three trials from with a soil test of 11 ppm for P and 92 ppm for K. All fertilizer was applied in the spring. Broadcast treatment was incorporated.
A difference of less than 81 kg/ha (1.2 bu/acre) is statistically insignifcant.
LEGEND: – = no data available
Treatment YieldYield
Advantage
Untreated 3.05 t/ha (45.3 bu/acre)
–
25P + 40K (broadcast) 3.33 t/ha (49.5 bu/acre)
0.28 t/ha (4.2 bu/acre)
25P + 40K (2x2 band) 3.35 t/ha (49.8 bu/acre)
0.30 t/ha (4.5 bu/acre)
25P (in furrow) 3.32 t/ha (49.3 bu/acre)
0.27 t/ha (4.0 bu/acre)
2-20-18 + liquid inoculant (liquid in furrow)
3.27 t/ha (48.6 bu/acre)
0.22 t/ha (3.3 bu/acre)
There is no yield response to P and K application if soil test values are adequate. For additional information about soil testing, refer to Fertilizer Guidelines in Chapter 9, Soil Fertility and Nutrient Use.
Methods of Application N or K fertilizer should not be placed in contact with soybean seeds, due to the sensitivity to fertilizer salts. Unlike corn, there is no yield advantage to this practice. The fertilizer may be broadcast and worked into the soil either in the fall or spring. A planter with a separate attachment for fertilizer placement may also be used to place the fertilizer 5 cm (2 in.) to the side and 5 cm (2 in.) below the seed. For further information, see Chapter 9, Table 9–22, Maximum safe rates of nutrients in fertilizer.
61
2. soybeans
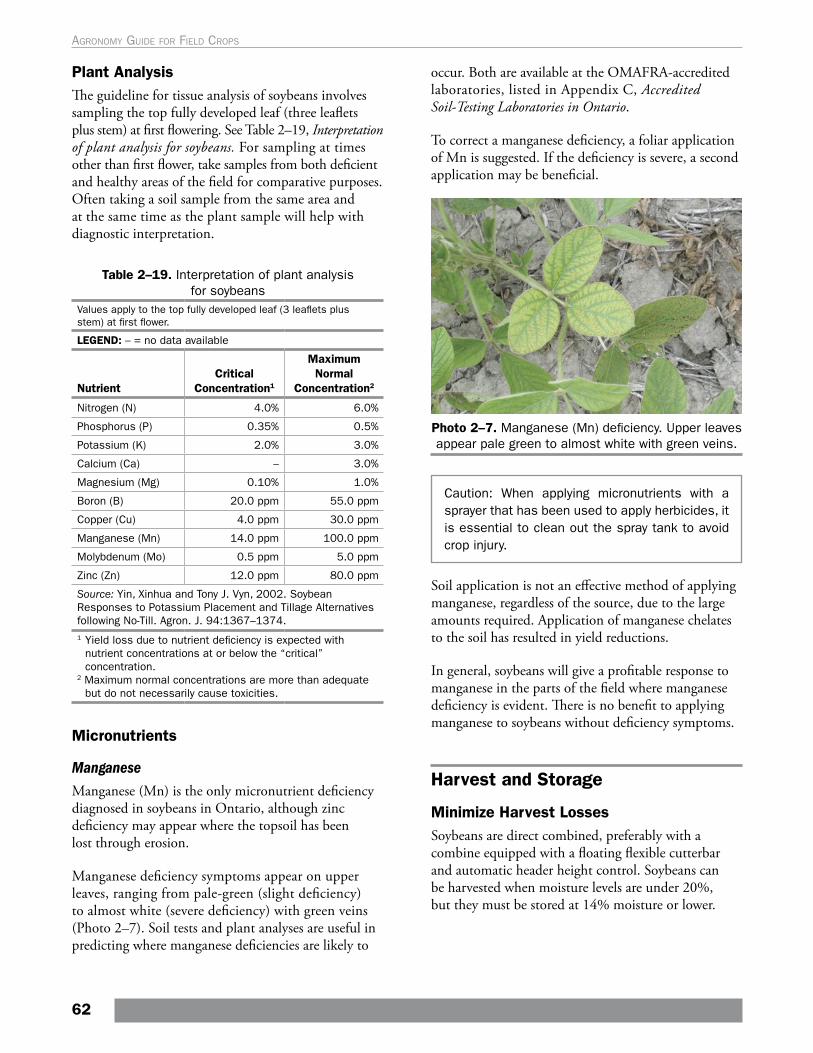
Plant AnalysisThe guideline for tissue analysis of soybeans involves sampling the top fully developed leaf (three leaflets plus stem) at first flowering. See Table 2–19, Interpretation of plant analysis for soybeans. For sampling at times other than first flower, take samples from both deficient and healthy areas of the field for comparative purposes. Often taking a soil sample from the same area and at the same time as the plant sample will help with diagnostic interpretation.
Table 2–19. Interpretation of plant analysis for soybeans
Values apply to the top fully developed leaf (3 leaflets plus stem) at first flower.
LEGEND: – = no data available
NutrientCritical
Concentration1
Maximum Normal
Concentration2
Nitrogen (N) 4.0% 6.0%
Phosphorus (P) 0.35% 0.5%
Potassium (K) 2.0% 3.0%
Calcium (Ca) – 3.0%
Magnesium (Mg) 0.10% 1.0%
Boron (B) 20.0 ppm 55.0 ppm
Copper (Cu) 4.0 ppm 30.0 ppm
Manganese (Mn) 14.0 ppm 100.0 ppm
Molybdenum (Mo) 0.5 ppm 5.0 ppm
Zinc (Zn) 12.0 ppm 80.0 ppm
Source: Yin, Xinhua and Tony J. Vyn, 2002. Soybean Responses to Potassium Placement and Tillage Alternatives following No-Till. Agron. J. 94:1367–1374.1 Yield loss due to nutrient deficiency is expected with
nutrient concentrations at or below the “critical” concentration.
2 Maximum normal concentrations are more than adequate but do not necessarily cause toxicities.
Micronutrients
ManganeseManganese (Mn) is the only micronutrient deficiency diagnosed in soybeans in Ontario, although zinc deficiency may appear where the topsoil has been lost through erosion.
Manganese deficiency symptoms appear on upper leaves, ranging from pale-green (slight deficiency) to almost white (severe deficiency) with green veins (Photo 2–7). Soil tests and plant analyses are useful in predicting where manganese deficiencies are likely to
occur. Both are available at the OMAFRA-accredited laboratories, listed in Appendix C, Accredited Soil-Testing Laboratories in Ontario.
To correct a manganese deficiency, a foliar application of Mn is suggested. If the deficiency is severe, a second application may be beneficial.
Photo 2–7. Manganese (Mn) deficiency. Upper leaves appear pale green to almost white with green veins.
Caution: When applying micronutrients with a sprayer that has been used to apply herbicides, it is essential to clean out the spray tank to avoid crop injury.
Soil application is not an effective method of applying manganese, regardless of the source, due to the large amounts required. Application of manganese chelates to the soil has resulted in yield reductions.
In general, soybeans will give a profitable response to manganese in the parts of the field where manganese deficiency is evident. There is no benefit to applying manganese to soybeans without deficiency symptoms.
Harvest and Storage
Minimize Harvest LossesSoybeans are direct combined, preferably with a combine equipped with a floating flexible cutterbar and automatic header height control. Soybeans can be harvested when moisture levels are under 20%, but they must be stored at 14% moisture or lower.
62
Agronomy guide for field Crops
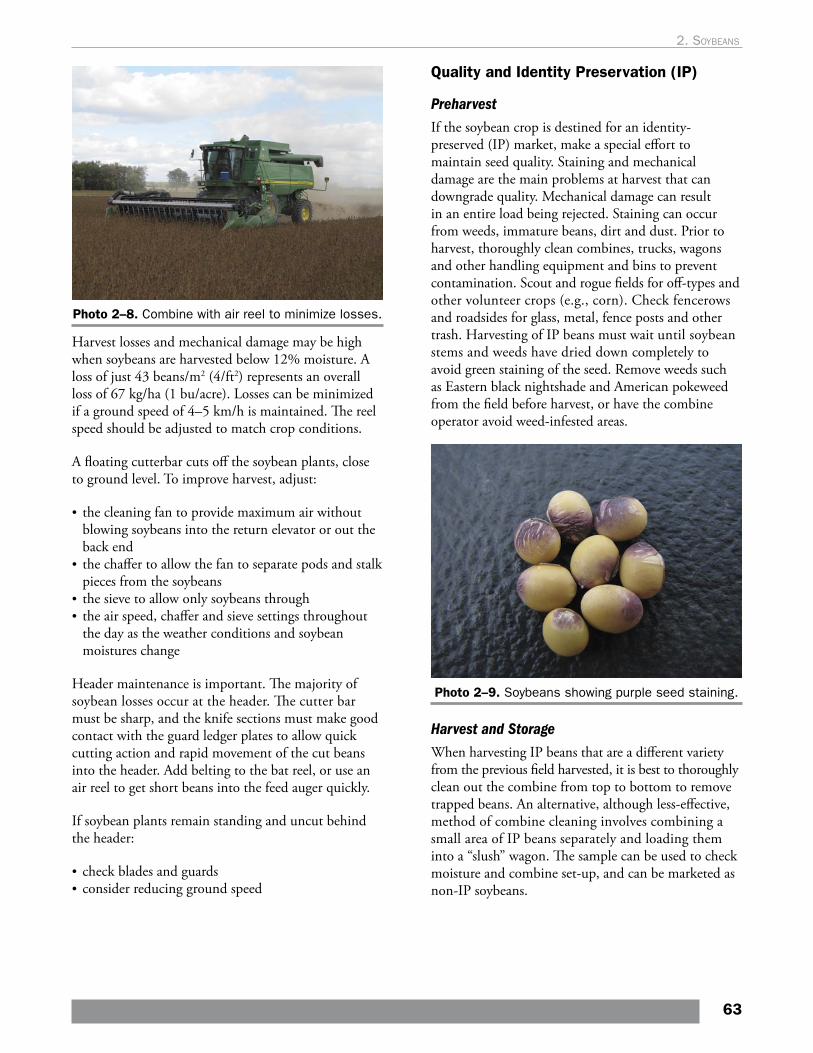
Photo 2–8. Combine with air reel to minimize losses.
Harvest losses and mechanical damage may be high when soybeans are harvested below 12% moisture. A loss of just 43 beans/m2 (4/ft2) represents an overall loss of 67 kg/ha (1 bu/acre). Losses can be minimized if a ground speed of 4–5 km/h is maintained. The reel speed should be adjusted to match crop conditions.
A floating cutterbar cuts off the soybean plants, close to ground level. To improve harvest, adjust:
• the cleaning fan to provide maximum air without blowing soybeans into the return elevator or out the back end
• the chaffer to allow the fan to separate pods and stalk pieces from the soybeans
• the sieve to allow only soybeans through • the air speed, chaffer and sieve settings throughout
the day as the weather conditions and soybean moistures change
Header maintenance is important. The majority of soybean losses occur at the header. The cutter bar must be sharp, and the knife sections must make good contact with the guard ledger plates to allow quick cutting action and rapid movement of the cut beans into the header. Add belting to the bat reel, or use an air reel to get short beans into the feed auger quickly.
If soybean plants remain standing and uncut behind the header:
• check blades and guards• consider reducing ground speed
Quality and Identity Preservation (IP)
PreharvestIf the soybean crop is destined for an identity-preserved (IP) market, make a special effort to maintain seed quality. Staining and mechanical damage are the main problems at harvest that can downgrade quality. Mechanical damage can result in an entire load being rejected. Staining can occur from weeds, immature beans, dirt and dust. Prior to harvest, thoroughly clean combines, trucks, wagons and other handling equipment and bins to prevent contamination. Scout and rogue fields for off-types and other volunteer crops (e.g., corn). Check fencerows and roadsides for glass, metal, fence posts and other trash. Harvesting of IP beans must wait until soybean stems and weeds have dried down completely to avoid green staining of the seed. Remove weeds such as Eastern black nightshade and American pokeweed from the field before harvest, or have the combine operator avoid weed-infested areas.
Photo 2–9. Soybeans showing purple seed staining.
Harvest and StorageWhen harvesting IP beans that are a different variety from the previous field harvested, it is best to thoroughly clean out the combine from top to bottom to remove trapped beans. An alternative, although less-effective, method of combine cleaning involves combining a small area of IP beans separately and loading them into a “slush” wagon. The sample can be used to check moisture and combine set-up, and can be marketed as non-IP soybeans.
63
2. soybeans
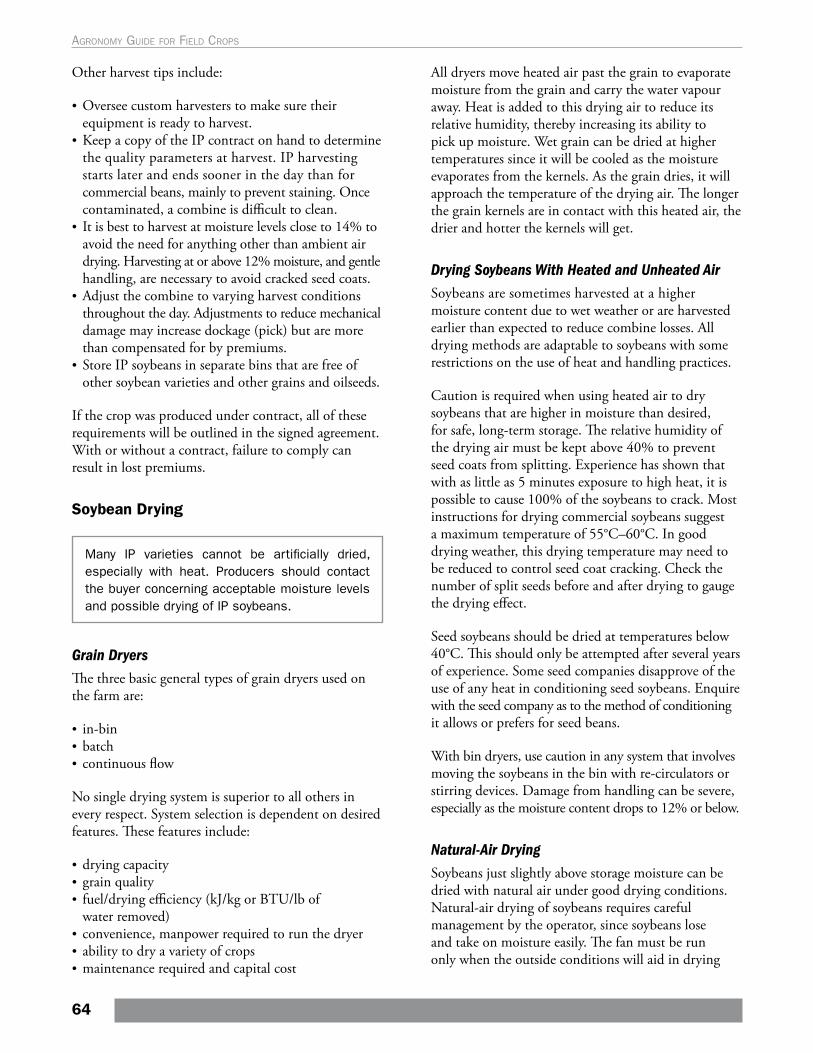
Other harvest tips include:
• Oversee custom harvesters to make sure their equipment is ready to harvest.
• Keep a copy of the IP contract on hand to determine the quality parameters at harvest. IP harvesting starts later and ends sooner in the day than for commercial beans, mainly to prevent staining. Once contaminated, a combine is difficult to clean.
• It is best to harvest at moisture levels close to 14% to avoid the need for anything other than ambient air drying. Harvesting at or above 12% moisture, and gentle handling, are necessary to avoid cracked seed coats.
• Adjust the combine to varying harvest conditions throughout the day. Adjustments to reduce mechanical damage may increase dockage (pick) but are more than compensated for by premiums.
• Store IP soybeans in separate bins that are free of other soybean varieties and other grains and oilseeds.
If the crop was produced under contract, all of these requirements will be outlined in the signed agreement. With or without a contract, failure to comply can result in lost premiums.
Soybean Drying
Many IP varieties cannot be artificially dried, especially with heat. Producers should contact the buyer concerning acceptable moisture levels and possible drying of IP soybeans.
Grain Dryers The three basic general types of grain dryers used on the farm are:
• in-bin• batch • continuous flow
No single drying system is superior to all others in every respect. System selection is dependent on desired features. These features include:
• drying capacity• grain quality• fuel/drying efficiency (kJ/kg or BTU/lb of
water removed)• convenience, manpower required to run the dryer• ability to dry a variety of crops• maintenance required and capital cost
All dryers move heated air past the grain to evaporate moisture from the grain and carry the water vapour away. Heat is added to this drying air to reduce its relative humidity, thereby increasing its ability to pick up moisture. Wet grain can be dried at higher temperatures since it will be cooled as the moisture evaporates from the kernels. As the grain dries, it will approach the temperature of the drying air. The longer the grain kernels are in contact with this heated air, the drier and hotter the kernels will get.
Drying Soybeans With Heated and Unheated AirSoybeans are sometimes harvested at a higher moisture content due to wet weather or are harvested earlier than expected to reduce combine losses. All drying methods are adaptable to soybeans with some restrictions on the use of heat and handling practices.
Caution is required when using heated air to dry soybeans that are higher in moisture than desired, for safe, long-term storage. The relative humidity of the drying air must be kept above 40% to prevent seed coats from splitting. Experience has shown that with as little as 5 minutes exposure to high heat, it is possible to cause 100% of the soybeans to crack. Most instructions for drying commercial soybeans suggest a maximum temperature of 55°C–60°C. In good drying weather, this drying temperature may need to be reduced to control seed coat cracking. Check the number of split seeds before and after drying to gauge the drying effect.
Seed soybeans should be dried at temperatures below 40°C. This should only be attempted after several years of experience. Some seed companies disapprove of the use of any heat in conditioning seed soybeans. Enquire with the seed company as to the method of conditioning it allows or prefers for seed beans.
With bin dryers, use caution in any system that involves moving the soybeans in the bin with re-circulators or stirring devices. Damage from handling can be severe, especially as the moisture content drops to 12% or below.
Natural-Air DryingSoybeans just slightly above storage moisture can be dried with natural air under good drying conditions. Natural-air drying of soybeans requires careful management by the operator, since soybeans lose and take on moisture easily. The fan must be run only when the outside conditions will aid in drying
64
Agronomy guide for field Crops
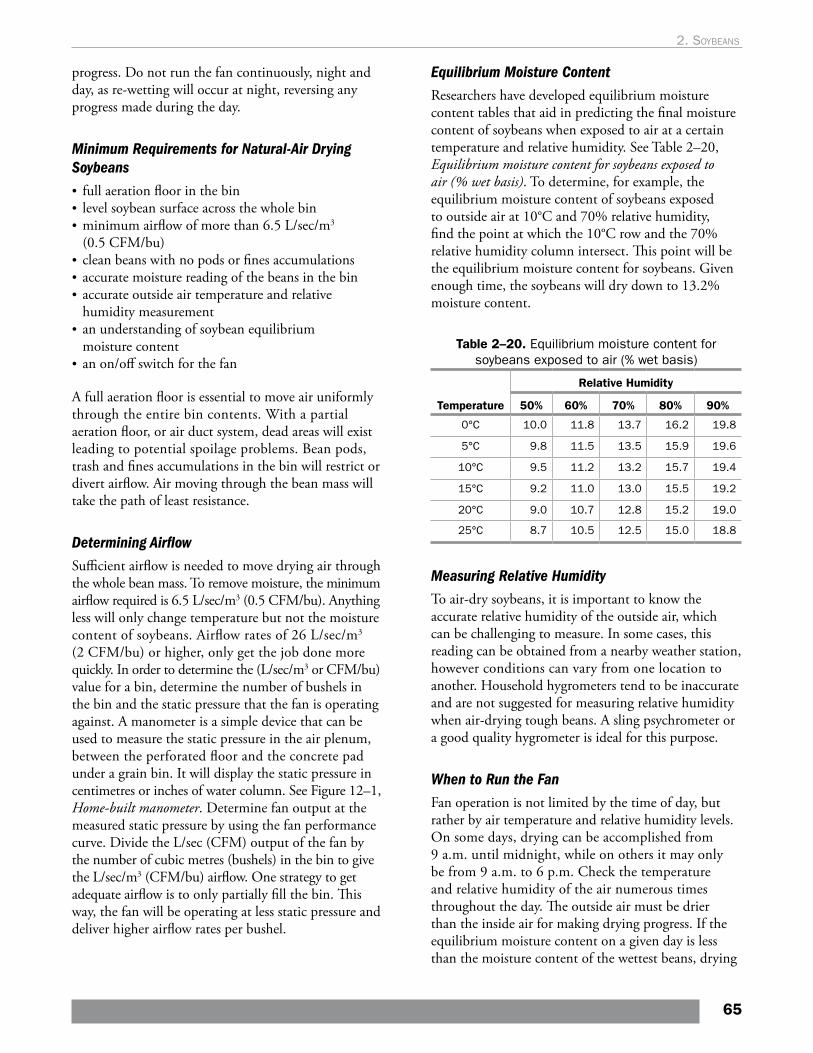
progress. Do not run the fan continuously, night and day, as re-wetting will occur at night, reversing any progress made during the day.
Minimum Requirements for Natural-Air Drying Soybeans• full aeration floor in the bin• level soybean surface across the whole bin • minimum airflow of more than 6.5 L/sec/m3
(0.5 CFM/bu) • clean beans with no pods or fines accumulations• accurate moisture reading of the beans in the bin• accurate outside air temperature and relative
humidity measurement• an understanding of soybean equilibrium
moisture content• an on/off switch for the fan
A full aeration floor is essential to move air uniformly through the entire bin contents. With a partial aeration floor, or air duct system, dead areas will exist leading to potential spoilage problems. Bean pods, trash and fines accumulations in the bin will restrict or divert airflow. Air moving through the bean mass will take the path of least resistance.
Determining AirflowSufficient airflow is needed to move drying air through the whole bean mass. To remove moisture, the minimum airflow required is 6.5 L/sec/m3 (0.5 CFM/bu). Anything less will only change temperature but not the moisture content of soybeans. Airflow rates of 26 L/sec/m3 (2 CFM/bu) or higher, only get the job done more quickly. In order to determine the (L/sec/m3 or CFM/bu) value for a bin, determine the number of bushels in the bin and the static pressure that the fan is operating against. A manometer is a simple device that can be used to measure the static pressure in the air plenum, between the perforated floor and the concrete pad under a grain bin. It will display the static pressure in centimetres or inches of water column. See Figure 12–1, Home-built manometer. Determine fan output at the measured static pressure by using the fan performance curve. Divide the L/sec (CFM) output of the fan by the number of cubic metres (bushels) in the bin to give the L/sec/m3 (CFM/bu) airflow. One strategy to get adequate airflow is to only partially fill the bin. This way, the fan will be operating at less static pressure and deliver higher airflow rates per bushel.
Equilibrium Moisture ContentResearchers have developed equilibrium moisture content tables that aid in predicting the final moisture content of soybeans when exposed to air at a certain temperature and relative humidity. See Table 2–20, Equilibrium moisture content for soybeans exposed to air (% wet basis). To determine, for example, the equilibrium moisture content of soybeans exposed to outside air at 10°C and 70% relative humidity, find the point at which the 10°C row and the 70% relative humidity column intersect. This point will be the equilibrium moisture content for soybeans. Given enough time, the soybeans will dry down to 13.2% moisture content.
Table 2–20. Equilibrium moisture content for soybeans exposed to air (% wet basis)
Temperature
Relative Humidity
50% 60% 70% 80% 90%
0°C 10.0 11.8 13.7 16.2 19.8
5°C 9.8 11.5 13.5 15.9 19.6
10°C 9.5 11.2 13.2 15.7 19.4
15°C 9.2 11.0 13.0 15.5 19.2
20°C 9.0 10.7 12.8 15.2 19.0
25°C 8.7 10.5 12.5 15.0 18.8
Measuring Relative HumidityTo air-dry soybeans, it is important to know the accurate relative humidity of the outside air, which can be challenging to measure. In some cases, this reading can be obtained from a nearby weather station, however conditions can vary from one location to another. Household hygrometers tend to be inaccurate and are not suggested for measuring relative humidity when air-drying tough beans. A sling psychrometer or a good quality hygrometer is ideal for this purpose.
When to Run the FanFan operation is not limited by the time of day, but rather by air temperature and relative humidity levels. On some days, drying can be accomplished from 9 a.m. until midnight, while on others it may only be from 9 a.m. to 6 p.m. Check the temperature and relative humidity of the air numerous times throughout the day. The outside air must be drier than the inside air for making drying progress. If the equilibrium moisture content on a given day is less than the moisture content of the wettest beans, drying
65
2. soybeans
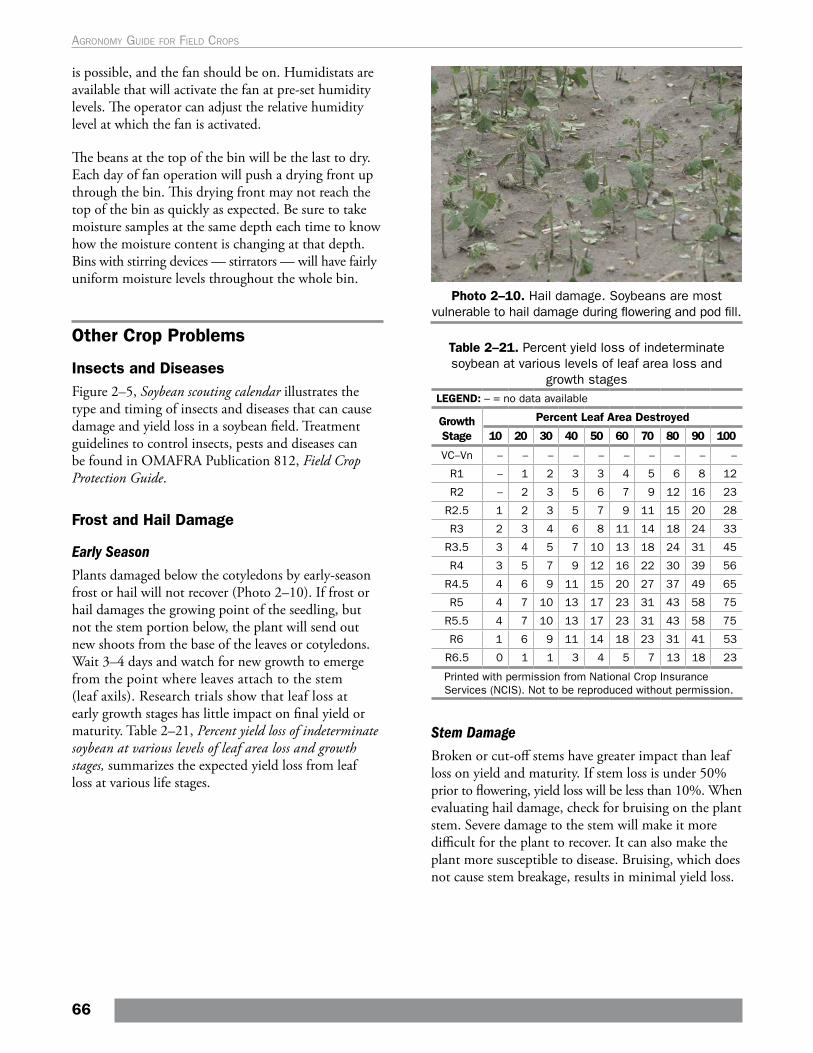
is possible, and the fan should be on. Humidistats are available that will activate the fan at pre-set humidity levels. The operator can adjust the relative humidity level at which the fan is activated.
The beans at the top of the bin will be the last to dry. Each day of fan operation will push a drying front up through the bin. This drying front may not reach the top of the bin as quickly as expected. Be sure to take moisture samples at the same depth each time to know how the moisture content is changing at that depth. Bins with stirring devices — stirrators — will have fairly uniform moisture levels throughout the whole bin.
Other Crop Problems
Insects and Diseases Figure 2–5, Soybean scouting calendar illustrates the type and timing of insects and diseases that can cause damage and yield loss in a soybean field. Treatment guidelines to control insects, pests and diseases can be found in OMAFRA Publication 812, Field Crop Protection Guide.
Frost and Hail Damage
Early Season Plants damaged below the cotyledons by early-season frost or hail will not recover (Photo 2–10). If frost or hail damages the growing point of the seedling, but not the stem portion below, the plant will send out new shoots from the base of the leaves or cotyledons. Wait 3–4 days and watch for new growth to emerge from the point where leaves attach to the stem (leaf axils). Research trials show that leaf loss at early growth stages has little impact on final yield or maturity. Table 2–21, Percent yield loss of indeterminate soybean at various levels of leaf area loss and growth stages, summarizes the expected yield loss from leaf loss at various life stages.
Photo 2–10. Hail damage. Soybeans are most vulnerable to hail damage during flowering and pod fill.
Table 2–21. Percent yield loss of indeterminate soybean at various levels of leaf area loss and
growth stagesLEGEND: – = no data available
Growth Stage
Percent Leaf Area Destroyed
10 20 30 40 50 60 70 80 90 100
VC–Vn – – – – – – – – – –
R1 – 1 2 3 3 4 5 6 8 12
R2 – 2 3 5 6 7 9 12 16 23
R2.5 1 2 3 5 7 9 11 15 20 28
R3 2 3 4 6 8 11 14 18 24 33
R3.5 3 4 5 7 10 13 18 24 31 45
R4 3 5 7 9 12 16 22 30 39 56
R4.5 4 6 9 11 15 20 27 37 49 65
R5 4 7 10 13 17 23 31 43 58 75
R5.5 4 7 10 13 17 23 31 43 58 75
R6 1 6 9 11 14 18 23 31 41 53
R6.5 0 1 1 3 4 5 7 13 18 23
Printed with permission from National Crop Insurance Services (NCIS). Not to be reproduced without permission.
Stem Damage Broken or cut-off stems have greater impact than leaf loss on yield and maturity. If stem loss is under 50% prior to flowering, yield loss will be less than 10%. When evaluating hail damage, check for bruising on the plant stem. Severe damage to the stem will make it more difficult for the plant to recover. It can also make the plant more susceptible to disease. Bruising, which does not cause stem breakage, results in minimal yield loss.
66
Agronomy guide for field Crops
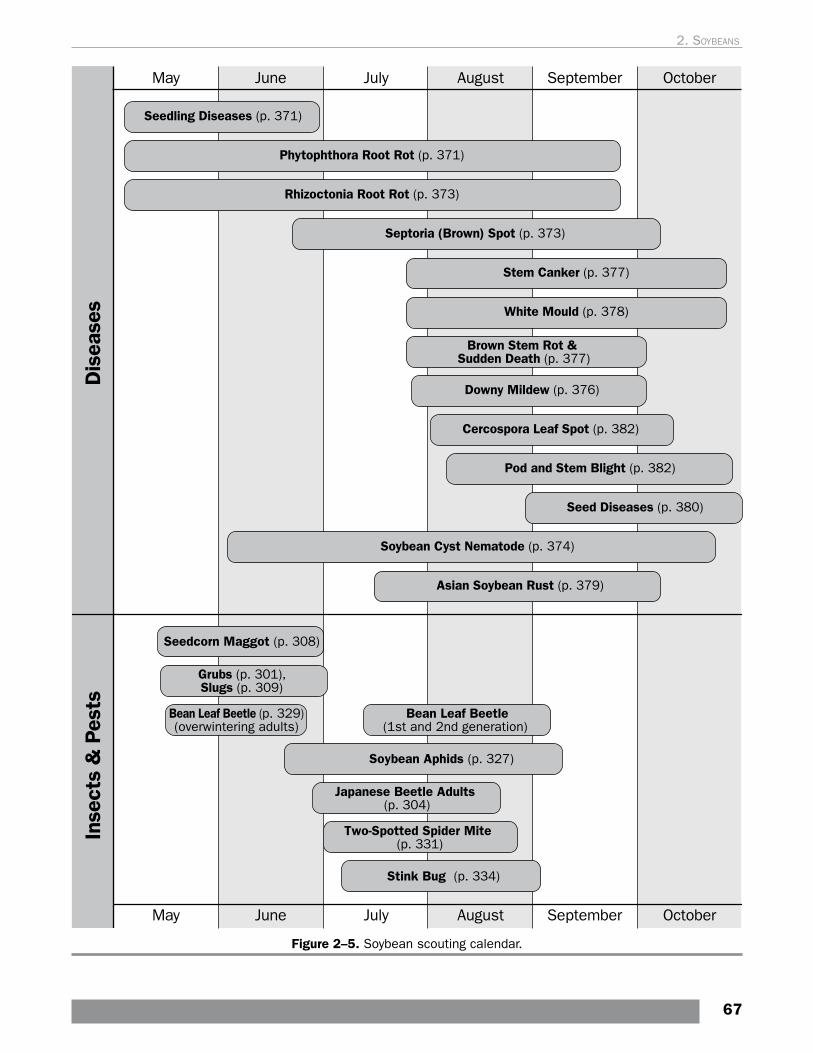
Figure 2–5. Soybean scouting calendar.
67
2. soybeans
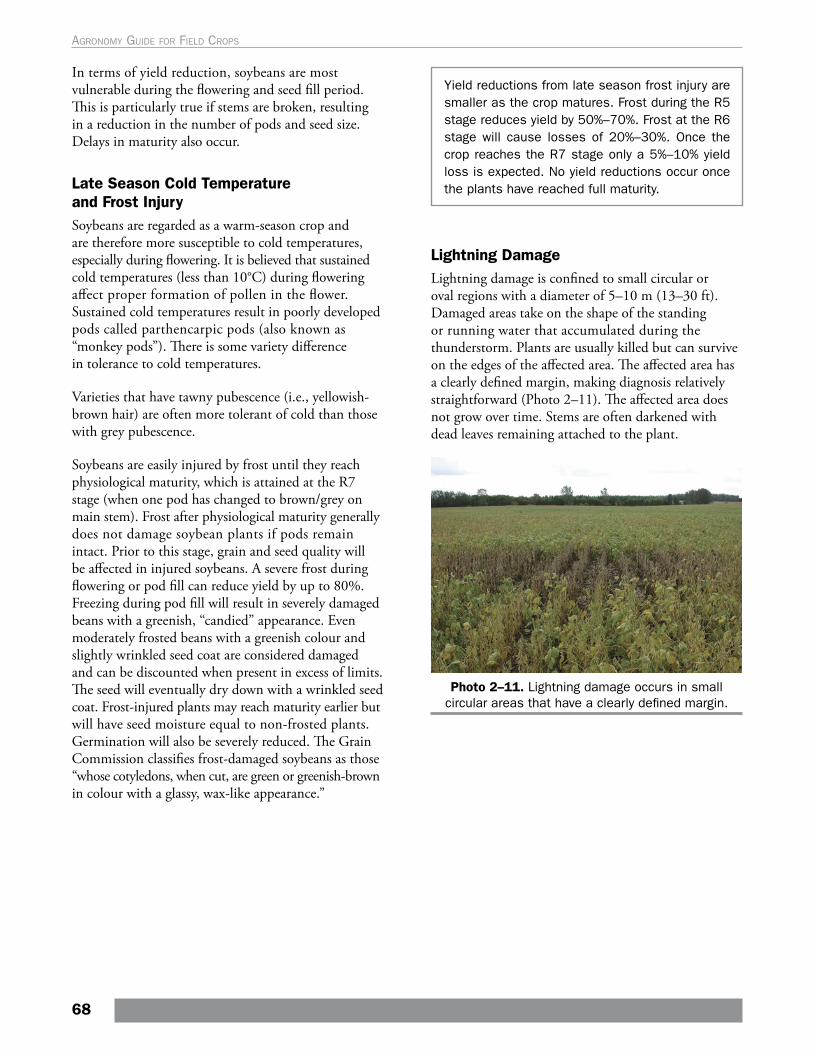
In terms of yield reduction, soybeans are most vulnerable during the flowering and seed fill period. This is particularly true if stems are broken, resulting in a reduction in the number of pods and seed size. Delays in maturity also occur.
Late Season Cold Temperature and Frost InjurySoybeans are regarded as a warm-season crop and are therefore more susceptible to cold temperatures, especially during flowering. It is believed that sustained cold temperatures (less than 10°C) during flowering affect proper formation of pollen in the flower. Sustained cold temperatures result in poorly developed pods called parthencarpic pods (also known as “monkey pods”). There is some variety difference in tolerance to cold temperatures.
Varieties that have tawny pubescence (i.e., yellowish-brown hair) are often more tolerant of cold than those with grey pubescence.
Soybeans are easily injured by frost until they reach physiological maturity, which is attained at the R7 stage (when one pod has changed to brown/grey on main stem). Frost after physiological maturity generally does not damage soybean plants if pods remain intact. Prior to this stage, grain and seed quality will be affected in injured soybeans. A severe frost during flowering or pod fill can reduce yield by up to 80%. Freezing during pod fill will result in severely damaged beans with a greenish, “candied” appearance. Even moderately frosted beans with a greenish colour and slightly wrinkled seed coat are considered damaged and can be discounted when present in excess of limits. The seed will eventually dry down with a wrinkled seed coat. Frost-injured plants may reach maturity earlier but will have seed moisture equal to non-frosted plants. Germination will also be severely reduced. The Grain Commission classifies frost-damaged soybeans as those “whose cotyledons, when cut, are green or greenish-brown in colour with a glassy, wax-like appearance.”
Yield reductions from late season frost injury are smaller as the crop matures. Frost during the R5 stage reduces yield by 50%–70%. Frost at the R6 stage will cause losses of 20%–30%. Once the crop reaches the R7 stage only a 5%–10% yield loss is expected. No yield reductions occur once the plants have reached full maturity.
Lightning DamageLightning damage is confined to small circular or oval regions with a diameter of 5–10 m (13–30 ft). Damaged areas take on the shape of the standing or running water that accumulated during the thunderstorm. Plants are usually killed but can survive on the edges of the affected area. The affected area has a clearly defined margin, making diagnosis relatively straightforward (Photo 2–11). The affected area does not grow over time. Stems are often darkened with dead leaves remaining attached to the plant.
Photo 2–11. Lightning damage occurs in small circular areas that have a clearly defined margin.
68
Agronomy guide for field Crops
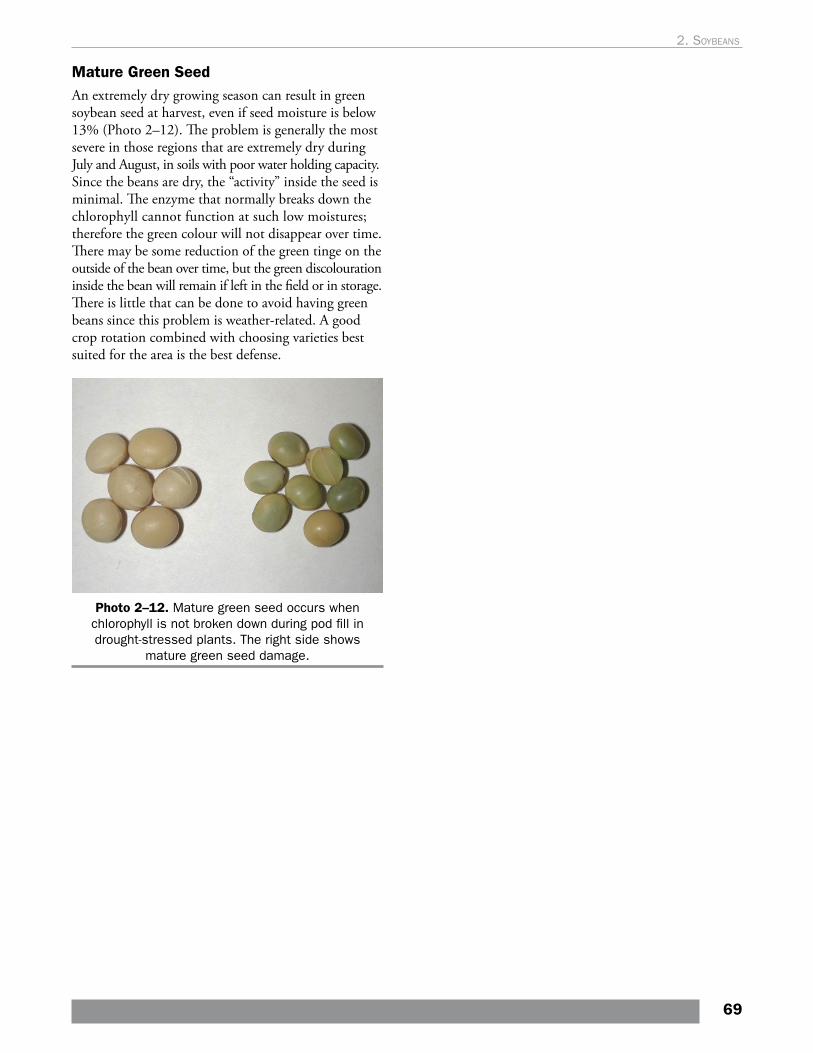
Mature Green SeedAn extremely dry growing season can result in green soybean seed at harvest, even if seed moisture is below 13% (Photo 2–12). The problem is generally the most severe in those regions that are extremely dry during July and August, in soils with poor water holding capacity. Since the beans are dry, the “activity” inside the seed is minimal. The enzyme that normally breaks down the chlorophyll cannot function at such low moistures; therefore the green colour will not disappear over time. There may be some reduction of the green tinge on the outside of the bean over time, but the green discolouration inside the bean will remain if left in the field or in storage. There is little that can be done to avoid having green beans since this problem is weather-related. A good crop rotation combined with choosing varieties best suited for the area is the best defense.
Photo 2–12. Mature green seed occurs when chlorophyll is not broken down during pod fill in drought-stressed plants. The right side shows
mature green seed damage.
69
2. soybeans

Page intentionally left blank
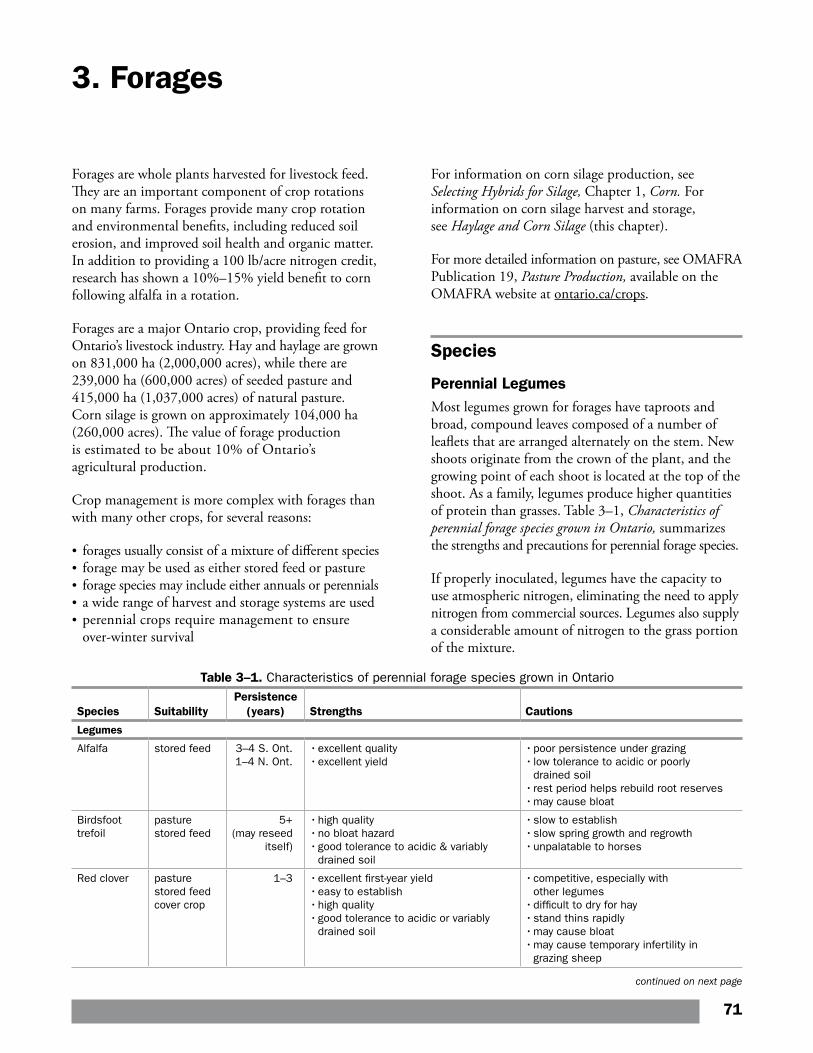
3. Forages
Forages are whole plants harvested for livestock feed. They are an important component of crop rotations on many farms. Forages provide many crop rotation and environmental benefits, including reduced soil erosion, and improved soil health and organic matter. In addition to providing a 100 lb/acre nitrogen credit, research has shown a 10%–15% yield benefit to corn following alfalfa in a rotation.
Forages are a major Ontario crop, providing feed for Ontario’s livestock industry. Hay and haylage are grown on 831,000 ha (2,000,000 acres), while there are 239,000 ha (600,000 acres) of seeded pasture and 415,000 ha (1,037,000 acres) of natural pasture. Corn silage is grown on approximately 104,000 ha (260,000 acres). The value of forage production is estimated to be about 10% of Ontario’s agricultural production.
Crop management is more complex with forages than with many other crops, for several reasons:
• forages usually consist of a mixture of different species• forage may be used as either stored feed or pasture• forage species may include either annuals or perennials• a wide range of harvest and storage systems are used• perennial crops require management to ensure
over-winter survival
For information on corn silage production, see Selecting Hybrids for Silage, Chapter 1, Corn. For information on corn silage harvest and storage, see Haylage and Corn Silage (this chapter).
For more detailed information on pasture, see OMAFRA Publication 19, Pasture Production, available on the OMAFRA website at ontario.ca/crops.
Species
Perennial LegumesMost legumes grown for forages have taproots and broad, compound leaves composed of a number of leaflets that are arranged alternately on the stem. New shoots originate from the crown of the plant, and the growing point of each shoot is located at the top of the shoot. As a family, legumes produce higher quantities of protein than grasses. Table 3–1, Characteristics of perennial forage species grown in Ontario, summarizes the strengths and precautions for perennial forage species.
If properly inoculated, legumes have the capacity to use atmospheric nitrogen, eliminating the need to apply nitrogen from commercial sources. Legumes also supply a considerable amount of nitrogen to the grass portion of the mixture.
Table 3–1. Characteristics of perennial forage species grown in Ontario
Species SuitabilityPersistence
(years) Strengths Cautions
Legumes
Alfalfa stored feed 3–4 S. Ont.1–4 N. Ont.
• excellent quality• excellent yield
• poor persistence under grazing• low tolerance to acidic or poorly
drained soil• rest period helps rebuild root reserves• may cause bloat
Birdsfoot trefoil
pasturestored feed
5+(may reseed
itself)
• high quality• no bloat hazard• good tolerance to acidic & variably
drained soil
• slow to establish• slow spring growth and regrowth• unpalatable to horses
Red clover pasturestored feedcover crop
1–3 • excellent first-year yield• easy to establish• high quality• good tolerance to acidic or variably
drained soil
• competitive, especially with other legumes
• difficult to dry for hay• stand thins rapidly• may cause bloat• may cause temporary infertility in
grazing sheep
continued on next page
71
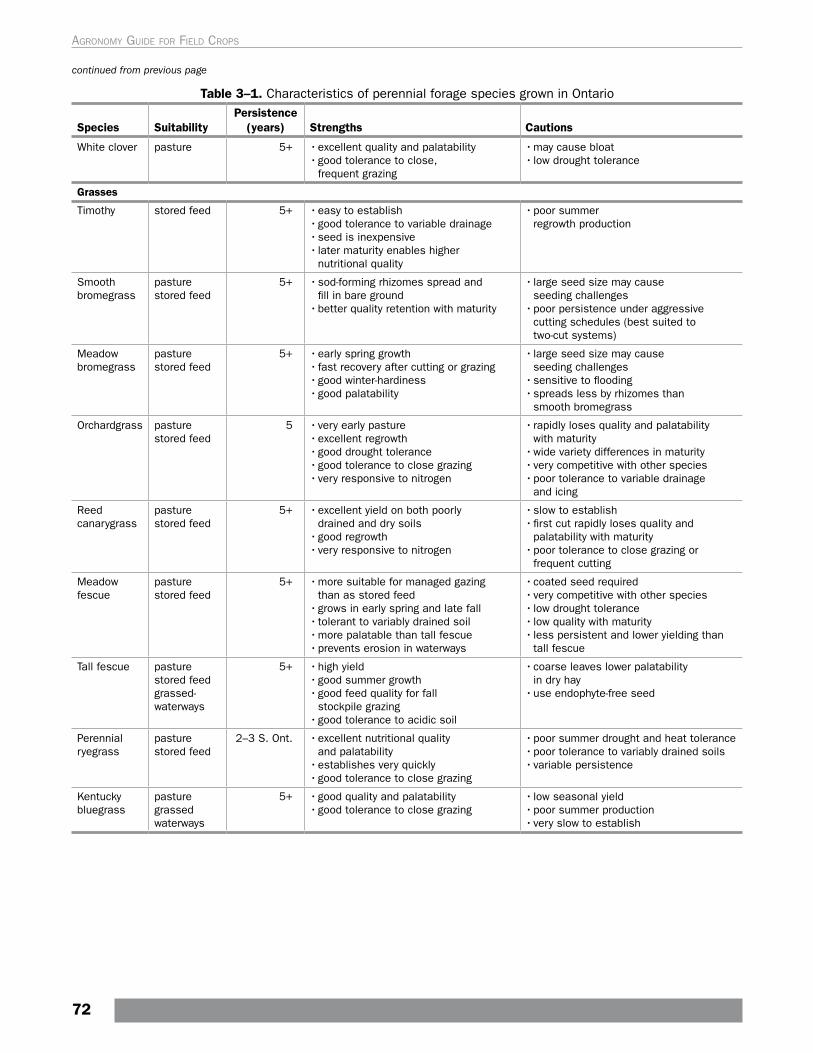
Table 3–1. Characteristics of perennial forage species grown in Ontario
Species SuitabilityPersistence
(years) Strengths Cautions
White clover pasture 5+ • excellent quality and palatability• good tolerance to close,
frequent grazing
• may cause bloat• low drought tolerance
Grasses
Timothy stored feed 5+ • easy to establish• good tolerance to variable drainage• seed is inexpensive• later maturity enables higher
nutritional quality
• poor summer regrowth production
Smooth bromegrass
pasturestored feed
5+ • sod-forming rhizomes spread and fill in bare ground
• better quality retention with maturity
• large seed size may cause seeding challenges
• poor persistence under aggressive cutting schedules (best suited to two-cut systems)
Meadow bromegrass
pasturestored feed
5+ • early spring growth• fast recovery after cutting or grazing• good winter-hardiness• good palatability
• large seed size may cause seeding challenges
• sensitive to flooding• spreads less by rhizomes than
smooth bromegrass
Orchardgrass pasturestored feed
5 • very early pasture• excellent regrowth• good drought tolerance• good tolerance to close grazing• very responsive to nitrogen
• rapidly loses quality and palatability with maturity
• wide variety differences in maturity• very competitive with other species• poor tolerance to variable drainage
and icing
Reed canarygrass
pasturestored feed
5+ • excellent yield on both poorly drained and dry soils
• good regrowth• very responsive to nitrogen
• slow to establish• first cut rapidly loses quality and
palatability with maturity• poor tolerance to close grazing or
frequent cutting
Meadow fescue
pasture stored feed
5+ • more suitable for managed gazing than as stored feed
• grows in early spring and late fall• tolerant to variably drained soil• more palatable than tall fescue• prevents erosion in waterways
• coated seed required• very competitive with other species• low drought tolerance• low quality with maturity• less persistent and lower yielding than
tall fescue
Tall fescue pasturestored feedgrassed- waterways
5+ • high yield• good summer growth• good feed quality for fall
stockpile grazing• good tolerance to acidic soil
• coarse leaves lower palatability in dry hay
• use endophyte-free seed
Perennial ryegrass
pasturestored feed
2–3 S. Ont. • excellent nutritional quality and palatability
• establishes very quickly• good tolerance to close grazing
• poor summer drought and heat tolerance• poor tolerance to variably drained soils• variable persistence
Kentucky bluegrass
pasturegrassed waterways
5+ • good quality and palatability• good tolerance to close grazing
• low seasonal yield• poor summer production• very slow to establish
continued from previous page
72
Agronomy guide for field Crops
AlfalfaAlfalfa is the highest-yielding perennial forage crop grown in Ontario and the most frequently grown forage legume. It is higher yielding and produces more protein per unit area than other forage legumes. Alfalfa can be grown alone, but is often grown in mixed stands with various grass species. For high yields and persistence, alfalfa requires well-drained soil, a pH above 6.1, adequate fertility and proper harvest management. Well-managed alfalfa normally persists for 3 or more years. The energy and protein levels of alfalfa-based forage are determined by stage of growth at the time of cutting. Alfalfa winterkill management risk factors include fall harvest, aggressive cutting schedules, poor fertility, poor drainage and older stands.
Birdsfoot TrefoilBirdsfoot trefoil is a non-bloating legume best suited for permanent pasture. It will reseed itself, making it an excellent choice for steep or stony land not suited to cultivation. Although individual plants live for only a few years, stands of birdsfoot trefoil have remained productive for many years when allowed to go to seed. It is well adapted to soils with marginal drainage. Birdsfoot trefoil has a lower yield potential and is more difficult to dry than alfalfa, so it is recommended for hay production only in areas where alfalfa will not grow well. Since birdsfoot trefoil seedlings are slow to establish, at least a year is required to get a satisfactory stand.
Red CloverRed clover is a short-lived perennial. Yields are good the year after establishment but are often quite low the following year, especially in southern Ontario. It can be grown in fields that are too wet or acidic for alfalfa, and establishes well. It can make excellent quality feed. Red clover is most often stored as haylage or baleage since it is difficult to dry, and often results in dusty or mouldy hay.
There are two general types of red clover grown in Ontario: double-cut or “medium” red clover and single-cut or “mammoth” red clover. Double-cut will flower in the seeding year, with vigorous regrowth after cutting. Single-cut is slower growing and matures about two weeks later than double-cut. Single-cut does not flower in the seeding year or after the first-cut in succeeding years.
Use of red clover as a cover crop has become an important practice on many farms. Refer to Chapter 8, Managing for Healthy Soils, for information on the use of red clover as a cover crop.
White CloverWhite clover is used mainly in pastures. It is a short-lived perennial that can reseed itself. There are three general types of white clover: ladino, white dutch and small wild white. They are similar in appearance but differ in size, with wild white being the smallest and ladino the largest. White clover has stolons, which are stems that creep on the ground, with branches that are erect or upward slanting. Roots are shallow and fibrous and develop from nodes of the creeping stolons. White clover grows poorly in dry weather, but is relatively tolerant to frequent grazing and has good palatability. White clover can be frost seeded or no-tilled into existing grass pastures to improve forage quality and yield.
Sweet CloverSweet clover is a slow-growing biennial, occasionally grown as forage and sometimes used to alleviate compaction. Sweet clover does not flower in the year of establishment. In the spring of the second year, it grows quickly to become a tall, coarse-stemmed plant. The presence of coumarin in sweet clover makes it less palatable to livestock. There are two types of sweet clover: white-flowered and yellow-flowered. White sweet clover is deeper rooted, taller and coarser, which makes it more suitable for plowdown than for forage. The yellow-flowered is more palatable to livestock and more attractive to bees, which makes it more suitable for forage. Mouldy sweet clover hay may contain dicoumarol, which can prevent normal blood clotting and result in the death of livestock from bleeding.
Alsike CloverAlsike clover is a perennial although it is sometimes treated as a biennial. It can grow on soils that are acidic and poorly drained. Alsike produces only one cut of hay per year and is not normally a preferred forage legume. Alsike clover can cause photosensitivity and liver damage in horses, so it should not be included in horse hay or pasture mixtures.
Perennial GrassesGrasses have many long, slender leaves that are borne on a stem. They have very fibrous roots that help bind the soil together, thereby reducing erosion. “Sod-forming” grasses have rhizomes or underground stems that produce new shoots at each node. These grasses are capable of spreading and thickening up a stand. “Bunch-type” grasses do not have the ability to spread by rhizomes, but do produce tillers from crown buds at the base of the plant.
73
3. Forages
in a mixture. Orchardgrass will grow much more vigorously in the warm, dry conditions of midsummer than timothy or bromegrass, resulting in more yield and a greater proportion of grass in the second and third cutting of alfalfa-grass mixtures. Orchardgrass is not as winter-hardy as most other forage grass species and will not persist in wet soils. Its aggressive seedlings make orchardgrass easy to establish. Orchardgrass is a preferred species to use in intensively managed pastures, where early maturing varieties work well.
Reed CanarygrassReed canarygrass is known for its ability to tolerate poorly drained soils, but can also provide high yields on well-drained soils. It will produce higher yields than other grass species during dry conditions. Reed canarygrass spreads by rhizomes. After heading, it develops coarse stems and leaves, and quickly loses palatability and digestibility. Regrowth is vegetative and does not form a seed head, so second and third cuts can be very high quality. Reed canarygrass is slow to establish, usually contributing little yield for the first two years, so is more suitable in longer rotations.
In the past, livestock have performed poorly on older varieties of reed canarygrass because of alkaloids it contained that resulted in reduce palatability, lower intake, and poor animal performance. Currently recommended reed canarygrass varieties are free of tryptomine and carboline alkaloids. Some varieties are also lower in the gramine alkaloids.
Tall FescueTall fescue is a coarser, leafy, bunch-type grass that is used in pastures, alfalfa haylage mixtures and erosion control. It is not as commonly used in dry hay mixtures. It is adapted to most soil types; tolerates imperfect drainage and withstands animal traffic well. Its ability to maintain good feed quality into late fall makes it useful in fall-saved “stockpile grazing”. Endophytes are seed-borne systemic fungi that are linked to poor animal health and performance on some tall fescue pastures. Pregnant broodmares are particularly affected. Once introduced by infected seed, the fungus cannot be controlled in an established stand of tall fescue. To avoid these endophytes in livestock diets, plant endophyte-free varieties.
Creeping Red FescueCreeping red fescue is a dense, sod-forming grass that establishes and spreads vigorously on most soil types, including well-fertilized subsoils. Its solid root system
Grass species differ in their competitiveness with legumes. This will influence the grass-to-legume ratio of an established stand. Grasses such as orchardgrass and the ryegrasses tend to be more competitive with alfalfa than timothy or bromegrass. Grasses are lower in protein than legumes when cut at a similar stage of development. Grasses tend to be higher in fibre and fibre digestibility.
TimothyTimothy is the most widely sown forage grass in Ontario and is commonly grown in mixtures with alfalfa. It is slower to mature than other grass species, making harvest management easier. Timothy seed mixes well with alfalfa seed and flows through the small seed box. It is a bunchgrass with limited tillering ability, which makes it non-aggressive when sown with other species. It is easy to establish in early spring or late summer and is adapted to heavier soils and variable drainage. Timothy is palatable and high yielding in first-cut. Although some varieties have been developed for improved regrowth, regrowth after first-cut and mid-season production is limited, especially in hot and dry seasons. Timothy has poor drought tolerance. For the commercial horse hay market, timothy is the preferred grass species.
Smooth BromegrassSmooth bromegrass spreads by rhizomes and the stand can thicken over time. It is slightly earlier in maturity than Timothy. It does not have good persistence under aggressive cutting schedules, but is well suited to two-cut systems. Smooth bromegrass is palatable and tends to retain its nutritional value with increasing maturity better than most grasses. Its large fluffy seed prevents it from flowing through the small seed box of drills. It does not establish well if it is either surface seeded or seeded deeper than 5 cm (2 in.).
Meadow BromegrassMeadow bromegrass is similar to smooth bromegrass, but is more useful as a pasture species because of its early spring growth and faster recovery rate after grazing.
OrchardgrassMost orchardgrass varieties are the earliest maturing of the forage grasses. Orchardgrass quickly loses palatability and digestibility after heading. Newer, later maturing varieties have been developed that match more closely the maturity of other species
74
Agronomy guide for field Crops
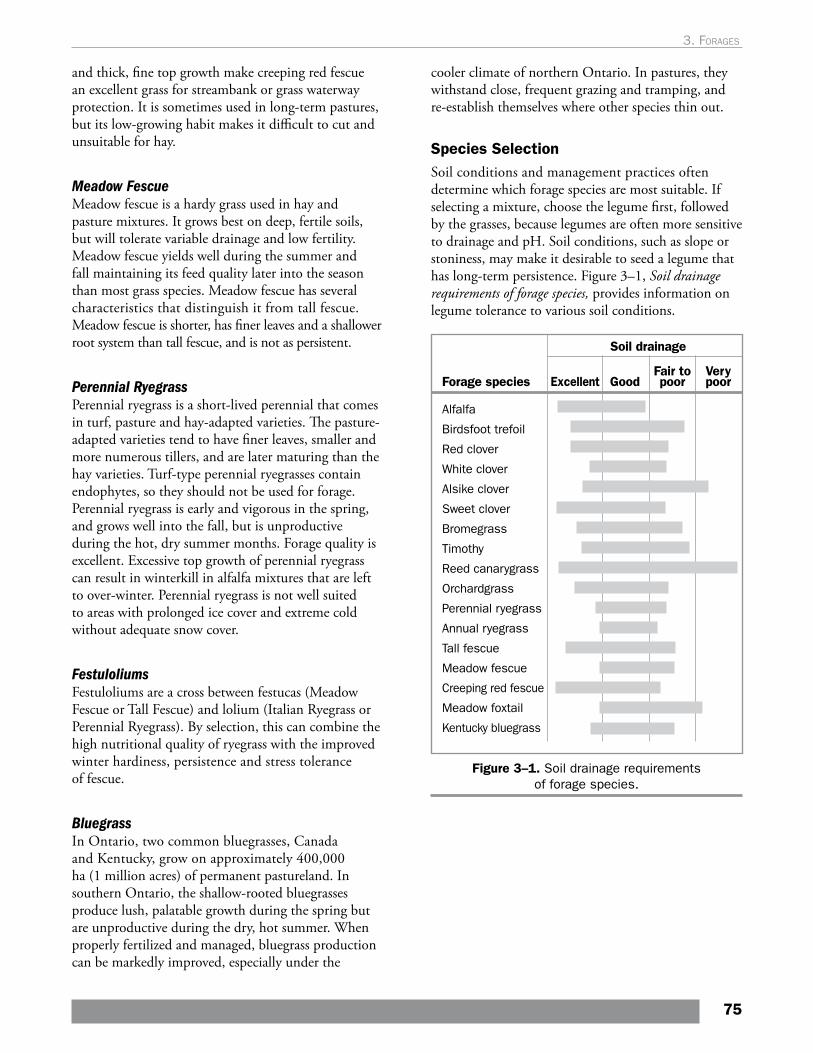
and thick, fine top growth make creeping red fescue an excellent grass for streambank or grass waterway protection. It is sometimes used in long-term pastures, but its low-growing habit makes it difficult to cut and unsuitable for hay.
Meadow FescueMeadow fescue is a hardy grass used in hay and pasture mixtures. It grows best on deep, fertile soils, but will tolerate variable drainage and low fertility. Meadow fescue yields well during the summer and fall maintaining its feed quality later into the season than most grass species. Meadow fescue has several characteristics that distinguish it from tall fescue. Meadow fescue is shorter, has finer leaves and a shallower root system than tall fescue, and is not as persistent.
Perennial RyegrassPerennial ryegrass is a short-lived perennial that comes in turf, pasture and hay-adapted varieties. The pasture-adapted varieties tend to have finer leaves, smaller and more numerous tillers, and are later maturing than the hay varieties. Turf-type perennial ryegrasses contain endophytes, so they should not be used for forage. Perennial ryegrass is early and vigorous in the spring, and grows well into the fall, but is unproductive during the hot, dry summer months. Forage quality is excellent. Excessive top growth of perennial ryegrass can result in winterkill in alfalfa mixtures that are left to over-winter. Perennial ryegrass is not well suited to areas with prolonged ice cover and extreme cold without adequate snow cover.
FestuloliumsFestuloliums are a cross between festucas (Meadow Fescue or Tall Fescue) and lolium (Italian Ryegrass or Perennial Ryegrass). By selection, this can combine the high nutritional quality of ryegrass with the improved winter hardiness, persistence and stress tolerance of fescue.
BluegrassIn Ontario, two common bluegrasses, Canada and Kentucky, grow on approximately 400,000 ha (1 million acres) of permanent pastureland. In southern Ontario, the shallow-rooted bluegrasses produce lush, palatable growth during the spring but are unproductive during the dry, hot summer. When properly fertilized and managed, bluegrass production can be markedly improved, especially under the
cooler climate of northern Ontario. In pastures, they withstand close, frequent grazing and tramping, and re-establish themselves where other species thin out.
Species SelectionSoil conditions and management practices often determine which forage species are most suitable. If selecting a mixture, choose the legume first, followed by the grasses, because legumes are often more sensitive to drainage and pH. Soil conditions, such as slope or stoniness, may make it desirable to seed a legume that has long-term persistence. Figure 3–1, Soil drainage requirements of forage species, provides information on legume tolerance to various soil conditions.
Forage species
Alfalfa
Birdsfoot trefoil
Red clover
White clover
Alsike clover
Sweet clover
Bromegrass
Timothy
Reed canarygrass
Orchardgrass
Perennial ryegrass
Annual ryegrass
Tall fescue
Meadow fescue
Creeping red fescue
Meadow foxtail
Kentucky bluegrass
Fair topoor
Verypoor
Soil drainage
GoodExcellent
Figure 3–1. Soil drainage requirements of forage species.
75
3. Forages
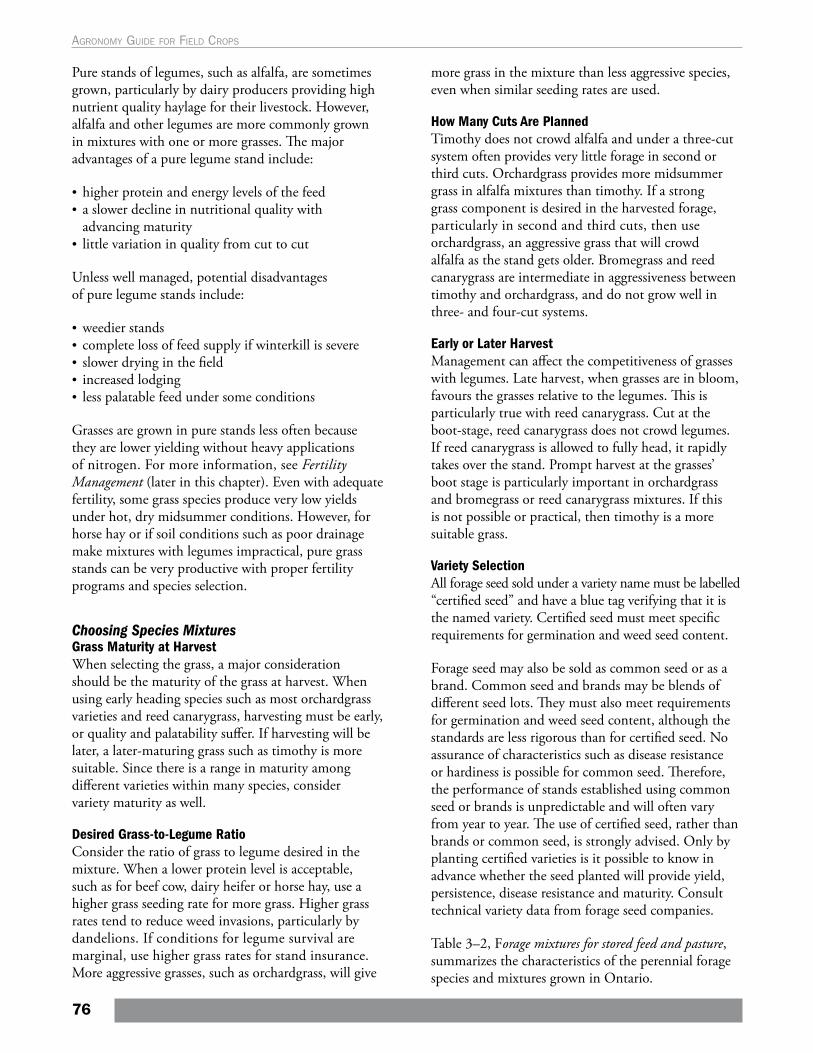
Pure stands of legumes, such as alfalfa, are sometimes grown, particularly by dairy producers providing high nutrient quality haylage for their livestock. However, alfalfa and other legumes are more commonly grown in mixtures with one or more grasses. The major advantages of a pure legume stand include:
• higher protein and energy levels of the feed • a slower decline in nutritional quality with
advancing maturity• little variation in quality from cut to cut
Unless well managed, potential disadvantages of pure legume stands include:
• weedier stands• complete loss of feed supply if winterkill is severe • slower drying in the field • increased lodging • less palatable feed under some conditions
Grasses are grown in pure stands less often because they are lower yielding without heavy applications of nitrogen. For more information, see Fertility Management (later in this chapter). Even with adequate fertility, some grass species produce very low yields under hot, dry midsummer conditions. However, for horse hay or if soil conditions such as poor drainage make mixtures with legumes impractical, pure grass stands can be very productive with proper fertility programs and species selection.
Choosing Species MixturesGrass Maturity at HarvestWhen selecting the grass, a major consideration should be the maturity of the grass at harvest. When using early heading species such as most orchardgrass varieties and reed canarygrass, harvesting must be early, or quality and palatability suffer. If harvesting will be later, a later-maturing grass such as timothy is more suitable. Since there is a range in maturity among different varieties within many species, consider variety maturity as well.
Desired Grass-to-Legume RatioConsider the ratio of grass to legume desired in the mixture. When a lower protein level is acceptable, such as for beef cow, dairy heifer or horse hay, use a higher grass seeding rate for more grass. Higher grass rates tend to reduce weed invasions, particularly by dandelions. If conditions for legume survival are marginal, use higher grass rates for stand insurance. More aggressive grasses, such as orchardgrass, will give
more grass in the mixture than less aggressive species, even when similar seeding rates are used.
How Many Cuts Are PlannedTimothy does not crowd alfalfa and under a three-cut system often provides very little forage in second or third cuts. Orchardgrass provides more midsummer grass in alfalfa mixtures than timothy. If a strong grass component is desired in the harvested forage, particularly in second and third cuts, then use orchardgrass, an aggressive grass that will crowd alfalfa as the stand gets older. Bromegrass and reed canarygrass are intermediate in aggressiveness between timothy and orchardgrass, and do not grow well in three- and four-cut systems.
Early or Later HarvestManagement can affect the competitiveness of grasses with legumes. Late harvest, when grasses are in bloom, favours the grasses relative to the legumes. This is particularly true with reed canarygrass. Cut at the boot-stage, reed canarygrass does not crowd legumes. If reed canarygrass is allowed to fully head, it rapidly takes over the stand. Prompt harvest at the grasses’ boot stage is particularly important in orchardgrass and bromegrass or reed canarygrass mixtures. If this is not possible or practical, then timothy is a more suitable grass.
Variety SelectionAll forage seed sold under a variety name must be labelled “certified seed” and have a blue tag verifying that it is the named variety. Certified seed must meet specific requirements for germination and weed seed content.
Forage seed may also be sold as common seed or as a brand. Common seed and brands may be blends of different seed lots. They must also meet requirements for germination and weed seed content, although the standards are less rigorous than for certified seed. No assurance of characteristics such as disease resistance or hardiness is possible for common seed. Therefore, the performance of stands established using common seed or brands is unpredictable and will often vary from year to year. The use of certified seed, rather than brands or common seed, is strongly advised. Only by planting certified varieties is it possible to know in advance whether the seed planted will provide yield, persistence, disease resistance and maturity. Consult technical variety data from forage seed companies.
Table 3–2, Forage mixtures for stored feed and pasture, summarizes the characteristics of the perennial forage species and mixtures grown in Ontario.
76
Agronomy guide for field Crops
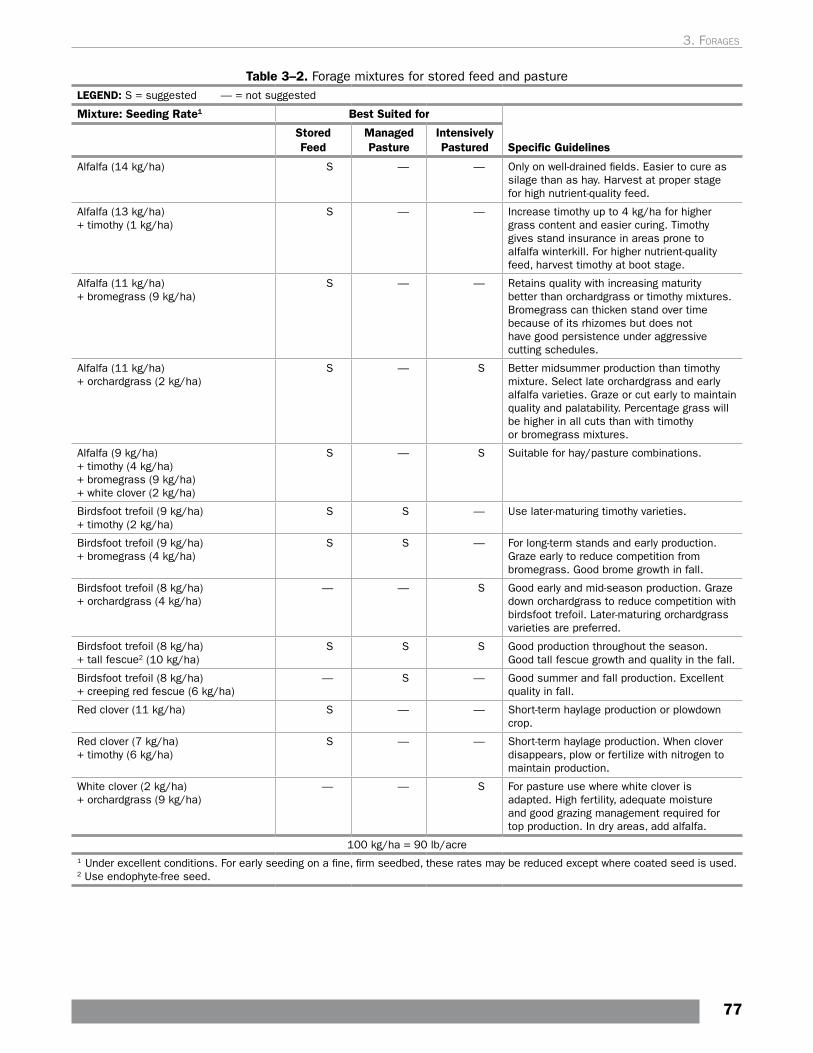
Table 3–2. Forage mixtures for stored feed and pastureLEGEND: S = suggested — = not suggested
Mixture: Seeding Rate1 Best Suited for
Specific GuidelinesStored Feed
Managed Pasture
Intensively Pastured
Alfalfa (14 kg/ha) S — — Only on well-drained fields. Easier to cure as silage than as hay. Harvest at proper stage for high nutrient-quality feed.
Alfalfa (13 kg/ha) + timothy (1 kg/ha)
S — — Increase timothy up to 4 kg/ha for higher grass content and easier curing. Timothy gives stand insurance in areas prone to alfalfa winterkill. For higher nutrient-quality feed, harvest timothy at boot stage.
Alfalfa (11 kg/ha) + bromegrass (9 kg/ha)
S — — Retains quality with increasing maturity better than orchardgrass or timothy mixtures. Bromegrass can thicken stand over time because of its rhizomes but does not have good persistence under aggressive cutting schedules.
Alfalfa (11 kg/ha) + orchardgrass (2 kg/ha)
S — S Better midsummer production than timothy mixture. Select late orchardgrass and early alfalfa varieties. Graze or cut early to maintain quality and palatability. Percentage grass will be higher in all cuts than with timothy or bromegrass mixtures.
Alfalfa (9 kg/ha) + timothy (4 kg/ha) + bromegrass (9 kg/ha) + white clover (2 kg/ha)
S — S Suitable for hay/pasture combinations.
Birdsfoot trefoil (9 kg/ha) + timothy (2 kg/ha)
S S — Use later-maturing timothy varieties.
Birdsfoot trefoil (9 kg/ha) + bromegrass (4 kg/ha)
S S — For long-term stands and early production. Graze early to reduce competition from bromegrass. Good brome growth in fall.
Birdsfoot trefoil (8 kg/ha) + orchardgrass (4 kg/ha)
— — S Good early and mid-season production. Graze down orchardgrass to reduce competition with birdsfoot trefoil. Later-maturing orchardgrass varieties are preferred.
Birdsfoot trefoil (8 kg/ha) + tall fescue2 (10 kg/ha)
S S S Good production throughout the season. Good tall fescue growth and quality in the fall.
Birdsfoot trefoil (8 kg/ha) + creeping red fescue (6 kg/ha)
— S — Good summer and fall production. Excellent quality in fall.
Red clover (11 kg/ha) S — — Short-term haylage production or plowdown crop.
Red clover (7 kg/ha) + timothy (6 kg/ha)
S — — Short-term haylage production. When clover disappears, plow or fertilize with nitrogen to maintain production.
White clover (2 kg/ha) + orchardgrass (9 kg/ha)
— — S For pasture use where white clover is adapted. High fertility, adequate moisture and good grazing management required for top production. In dry areas, add alfalfa.
100 kg/ha = 90 lb/acre1 Under excellent conditions. For early seeding on a fine, firm seedbed, these rates may be reduced except where coated seed is used.2 Use endophyte-free seed.
77
3. Forages
Annual ForagesThere are many options for annual forage crops. They can be part of a planned cropping program or an emergency remedy to provide feed when perennial forage crops are winterkilled or in short supply. Annual forages are a valuable source of hay, pasture or silage. The largest annual crop used to provide forage in Ontario is corn, which is harvested as corn silage. For more information refer to the Haylage and Corn Silage Harvest sections of this chapter.
Winter Cereals (Rye, Triticale)Fall rye and winter triticale can provide a “double crop” forage option by planting after the harvest of many crops, including corn silage. Seeded in late summer or fall, they can provide haylage harvested in mid to late May, or can provide fall and early spring grazing. After the cereals are completely killed with glyphosate or tillage, they can be followed by late-planted crops, such as soybeans or sorghum-sudangrass. Nutritional quality, palatability and intake drop very quickly at the heading stage, so the harvest window is very narrow. Target harvest at the flag-leaf or early-boot stage for high nutrient quality. Rye will mature about 7–10 days earlier than triticale, which enables earlier seeding of the following crop. Apply nitrogen in the spring at green-up to increase yield and crude protein.
Spring Cereals (Oats, Barley, Triticale, Wheat)Spring cereals are very adaptable for forage production as haylage, baleage or pasture. They are difficult to dry for hay in Ontario. Oats, barley and spring wheat are used extensively as companion crops for perennial forage seedings. They should be harvested as forage to improve the establishment of the perennial forage seeding by removing them as competition. As a double-crop option, spring cereals are sometimes seeded in August following winter wheat or a spring cereal for an early October harvest as silage or baleage.
Many find that an oat forage is the most palatable of the cereals. Early spring planting promotes maximum yields. Nitrogen fertilizer enhances vegetative growth, yield and crude protein, and therefore 55 kg/ha (50 lb/acre) of nitrogen is suggested. Oats normally require about 60 days of growth following germination to reach the boot-stage. Forage quality drops quickly after heading, so harvesting at the boot- to early-heading stage will optimize feed value. Yield will increase as plants mature, but feed quality drops dramatically.
At the boot-stage, cereals are typically about 16% crude protein (CP) and 54% neutral detergent fibre NDF with very good fibre digestibility. More information about forage production from spring cereals can be found at fieldcropnews.com.
Cereal-Pea MixturesField peas seeded in mixtures with cereals (oats, spring triticale) will enhance feed nutrient quality. Pea mixtures can increase protein levels and improve forage digestibility assuming the peas make up at least 50% (by weight) of the seed mixture. Adding peas will increase seed costs. Forage pea varieties are preferred. Cereal-pea mixtures may be used as a companion crop for seeding alfalfa but should be harvested for silage. Mixtures of triticale and peas usually have more peas in the harvested forage than mixtures of oats and peas. This tends to increase quality but makes wilting slower and increases the length of time the crop must cure before ensiling. Cut as the cereal is heading out, as the peas will just be starting to pod. If seeded in late April, this growth stage will typically occur around the last week of June. Cereal-pea mixtures can be difficult to wilt and heavy stands can lodge. When used as a companion crop, timely cutting, wilting and removal from the field is important for successful alfalfa establishment.
Westerwold and Italian Ryegrasses (Annual Ryegrass) Ryegrasses are rapidly growing bunchgrasses that are best adapted to cool, moist conditions, and perform poorly in hot, dry weather. They are higher in nutrient quality than other cool-season grasses at the same maturity. Although sometimes lumped together as “annual ryegrass”, Westerwold ryegrass and Italian ryegrass are quite different.
1. Westerwold ryegrass is a true annual that will produce stems and seed heads the year of seeding, and will be winter-killed. Westerwold seed is cheaper and is more commonly used as a cover crop. The Westerwold varieties grow taller, produce stems, and as a result, are easier to harvest for dry hay. They should be cut before or just at the heading stage, since feed quality decreases rapidly after heading.
2. Italian ryegrass is actually a biennial that has a vernalization requirement (exposure to cold temperatures similar to winter wheat) for flowering. The year it is seeded it remains vegetative without a seed-head, producing a lush,
78
Agronomy guide for field Crops
leafy growth with exceptionally high forage quality. When over wintered, it will form a seed-head the following year, therefore harvest timing will be important for forage quality. It can either be spring seeded, or seeded in August. Although there is some risk of winterkill, August seeded Italian ryegrass can provide a late fall harvest and some early season forage the following spring. A single cut can be taken in May, after which the field is replanted to corn silage, soybeans, edible beans or sorghum-sudangrass. An alternative is to keep taking multiple cuts every 4 weeks until the stand becomes unproductive. Harvested correctly, fibre digestibility (NDFd), palatability and intake are exceptionally high, enabling higher forage diets be fed to high producing dairy cows.
Warm-Season Annual GrassesMembers of the sorghum, sudangrass and millet families are semi-arid, tropical, warm-season annual grasses. They are very sensitive to frost in both spring and fall and easily killed. Warm-season annual grasses are sometimes considered in emergency forage situations where alfalfa has winterkilled or when planting has been delayed. They offer advantages over corn silage in that they can be produced with conventional forage seeding and harvesting equipment. They can be used in Ontario for silage (chopped or baleage), green chop or pasture. Sorghums and sudangrass are not recommended as dry hay because they are difficult to cure. Millet is usually harvested as haylage, but with good drying conditions can be made into hay. Millets are preferred over sorghums in some pasture and green chop situations because they do not contain prussic acid. Millets and sorghums can be easily damaged by grazing and therefore should be strip grazed.
MilletsThe name “millet” has been given to numerous grass species with small edible seeds. Most millet types, including Japanese, proso, foxtail, barnyard, Koda, finger and Teff, have short (0.3–1.2 m or 1–4 ft), slim stalks. Pearl millet has thicker stalks that are over twice as long (1.5–3 m or 5–10 ft). The millets commonly used for forage in Ontario are pearl millet and Japanese millet. With proper management, millets can produce forage with very good quality. Millets have a smaller stem than sorghums and slightly higher total digestible nutrients (TDN) and protein levels.
Pearl MilletPearl millet grows with a mass of very fine fibrous secondary roots and tillers. It exhibits drought tolerance and prefers a lighter sand or sandy loam. Pearl millet can be planted when there is no risk of frost and when soil temperatures are 12°C or warmer. While the last week of May or early June is typically the best time to seed, planting can be delayed until the first of July. The suggested seeding rate is 8–10 kg/ha (7–9 lb/acre) at a 0.5–1 cm (0.25–0.5 in.) planting depth. Growth habits are similar to sorghum-sudan hybrids.
Quality and quantity of forage produced will be determined by the stage of maturity when harvested. For high feed quality, first-cut is usually ready about 55–60 days after planting, when it is still vegetative. Second-cut is ready about 30–35 days later. Leaving at least 10 cm (4 in.) of stubble will result in faster regrowth, however, when grazing, about 15–20 cm (6–8 in.) of stubble should be left for faster regrowth.
The general nitrogen guideline is similar to sorghum-sudan hybrids, split half at planting and half following first-cut if a second-cut is to be harvested. This split application of nitrogen will optimize yield and quality. There are limited weed control options for pearl millet. Refer to OMAFRA Publication 75, Guide to Weed Control.
Sorghum Family Members of the sorghum family used for forage include forage sorghums, sudangrass and various hybrids. There is considerable variability in agronomic and nutritional quality traits among species, hybrids and varieties.
Sorghum and Sorghum-SudangrassForage sorghum and sorghum-sudangrass grow tall and have the potential for high yields. Older forage sorghum varieties were adapted to a high-yield, lower forage-quality, single-cut harvest. Grain sorghums, also called milo, are not suggested for forage production due to low yields.
Newer forage sorghums have been developed to be grown as short season, multiple-cut, high-quality forage. Forage sorghums have fine fibrous secondary roots and tillers, giving them good drought tolerance. Forage sorghums will tolerate heavier soils better than pearl millet. Optimum growth of these plants occurs under hot, moist conditions.
79
3. Forages
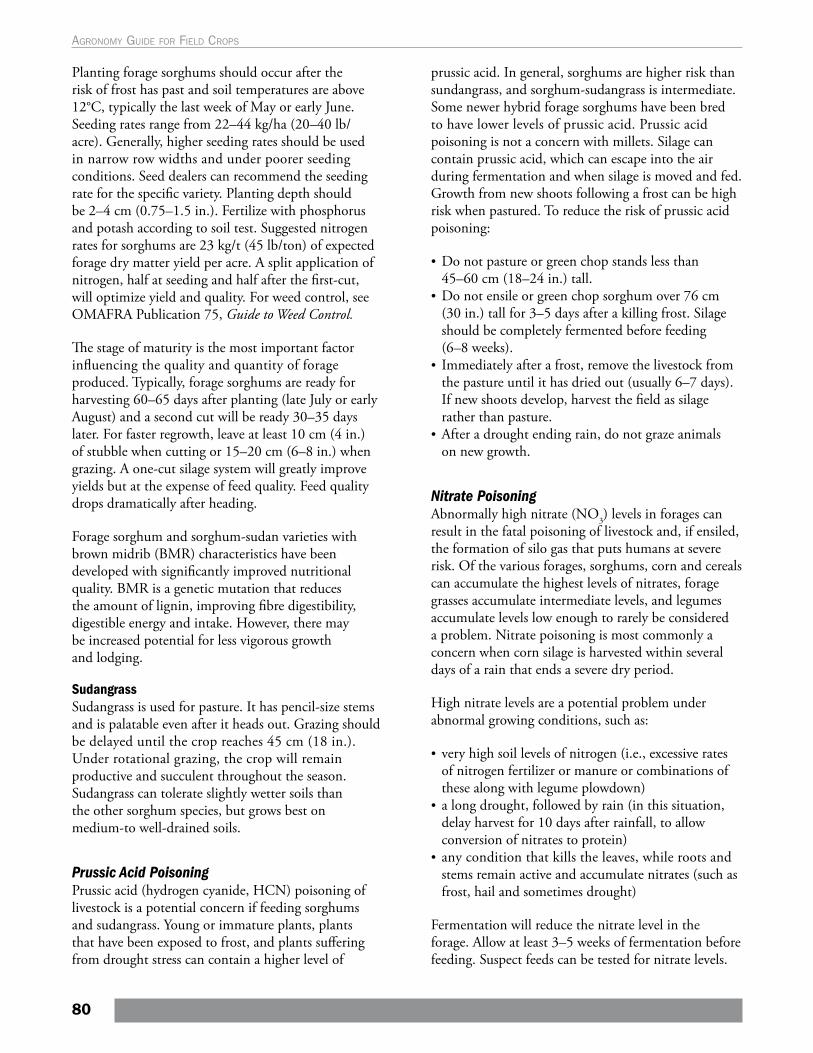
Planting forage sorghums should occur after the risk of frost has past and soil temperatures are above 12°C, typically the last week of May or early June. Seeding rates range from 22–44 kg/ha (20–40 lb/acre). Generally, higher seeding rates should be used in narrow row widths and under poorer seeding conditions. Seed dealers can recommend the seeding rate for the specific variety. Planting depth should be 2–4 cm (0.75–1.5 in.). Fertilize with phosphorus and potash according to soil test. Suggested nitrogen rates for sorghums are 23 kg/t (45 lb/ton) of expected forage dry matter yield per acre. A split application of nitrogen, half at seeding and half after the first-cut, will optimize yield and quality. For weed control, see OMAFRA Publication 75, Guide to Weed Control.
The stage of maturity is the most important factor influencing the quality and quantity of forage produced. Typically, forage sorghums are ready for harvesting 60–65 days after planting (late July or early August) and a second cut will be ready 30–35 days later. For faster regrowth, leave at least 10 cm (4 in.) of stubble when cutting or 15–20 cm (6–8 in.) when grazing. A one-cut silage system will greatly improve yields but at the expense of feed quality. Feed quality drops dramatically after heading.
Forage sorghum and sorghum-sudan varieties with brown midrib (BMR) characteristics have been developed with significantly improved nutritional quality. BMR is a genetic mutation that reduces the amount of lignin, improving fibre digestibility, digestible energy and intake. However, there may be increased potential for less vigorous growth and lodging.
SudangrassSudangrass is used for pasture. It has pencil-size stems and is palatable even after it heads out. Grazing should be delayed until the crop reaches 45 cm (18 in.). Under rotational grazing, the crop will remain productive and succulent throughout the season. Sudangrass can tolerate slightly wetter soils than the other sorghum species, but grows best on medium-to well-drained soils.
Prussic Acid PoisoningPrussic acid (hydrogen cyanide, HCN) poisoning of livestock is a potential concern if feeding sorghums and sudangrass. Young or immature plants, plants that have been exposed to frost, and plants suffering from drought stress can contain a higher level of
prussic acid. In general, sorghums are higher risk than sundangrass, and sorghum-sudangrass is intermediate. Some newer hybrid forage sorghums have been bred to have lower levels of prussic acid. Prussic acid poisoning is not a concern with millets. Silage can contain prussic acid, which can escape into the air during fermentation and when silage is moved and fed. Growth from new shoots following a frost can be high risk when pastured. To reduce the risk of prussic acid poisoning:
• Do not pasture or green chop stands less than 45–60 cm (18–24 in.) tall.
• Do not ensile or green chop sorghum over 76 cm (30 in.) tall for 3–5 days after a killing frost. Silage should be completely fermented before feeding (6–8 weeks).
• Immediately after a frost, remove the livestock from the pasture until it has dried out (usually 6–7 days). If new shoots develop, harvest the field as silage rather than pasture.
• After a drought ending rain, do not graze animals on new growth.
Nitrate PoisoningAbnormally high nitrate (NO3) levels in forages can result in the fatal poisoning of livestock and, if ensiled, the formation of silo gas that puts humans at severe risk. Of the various forages, sorghums, corn and cereals can accumulate the highest levels of nitrates, forage grasses accumulate intermediate levels, and legumes accumulate levels low enough to rarely be considered a problem. Nitrate poisoning is most commonly a concern when corn silage is harvested within several days of a rain that ends a severe dry period.
High nitrate levels are a potential problem under abnormal growing conditions, such as:
• very high soil levels of nitrogen (i.e., excessive rates of nitrogen fertilizer or manure or combinations of these along with legume plowdown)
• a long drought, followed by rain (in this situation, delay harvest for 10 days after rainfall, to allow conversion of nitrates to protein)
• any condition that kills the leaves, while roots and stems remain active and accumulate nitrates (such as frost, hail and sometimes drought)
Fermentation will reduce the nitrate level in the forage. Allow at least 3–5 weeks of fermentation before feeding. Suspect feeds can be tested for nitrate levels.
80
Agronomy guide for field Crops
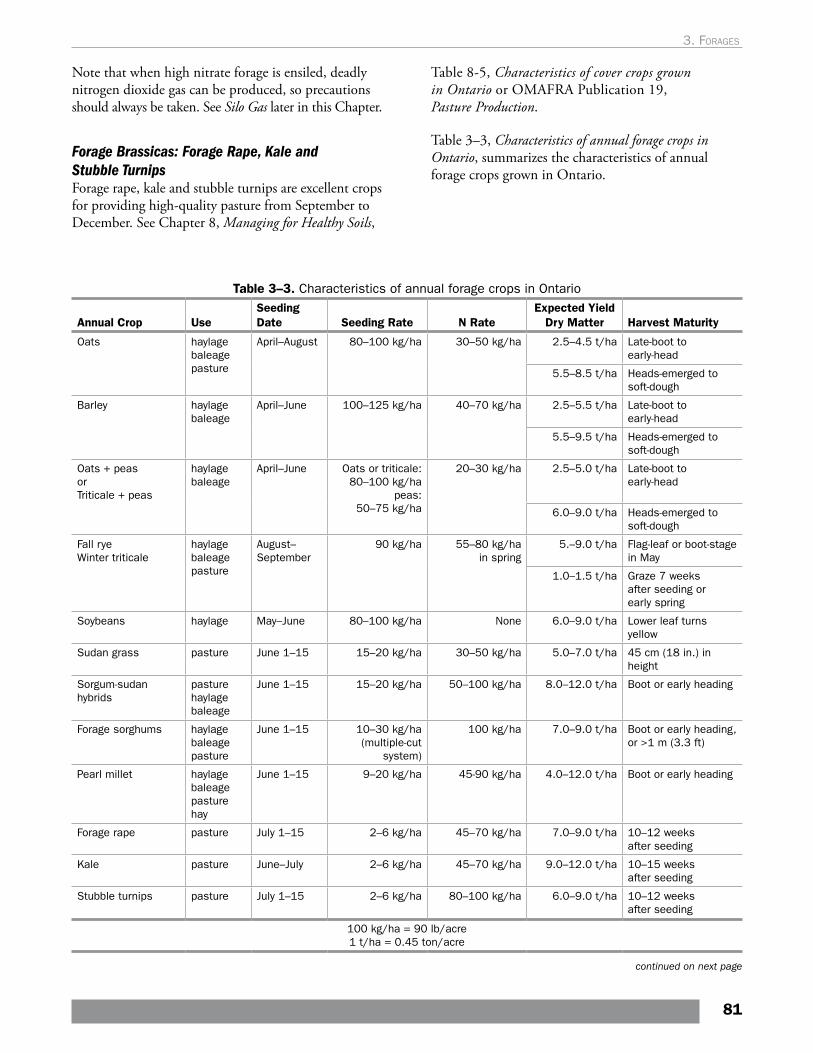
Note that when high nitrate forage is ensiled, deadly nitrogen dioxide gas can be produced, so precautions should always be taken. See Silo Gas later in this Chapter.
Forage Brassicas: Forage Rape, Kale and Stubble Turnips Forage rape, kale and stubble turnips are excellent crops for providing high-quality pasture from September to December. See Chapter 8, Managing for Healthy Soils,
Table 3–3. Characteristics of annual forage crops in Ontario
Annual Crop UseSeeding Date Seeding Rate N Rate
Expected Yield Dry Matter Harvest Maturity
Oats haylagebaleagepasture
April–August 80–100 kg/ha 30–50 kg/ha 2.5–4.5 t/ha Late-boot to early-head
5.5–8.5 t/ha Heads-emerged to soft-dough
Barley haylagebaleage
April–June 100–125 kg/ha 40–70 kg/ha 2.5–5.5 t/ha Late-boot to early-head
5.5–9.5 t/ha Heads-emerged to soft-dough
Oats + peas orTriticale + peas
haylagebaleage
April–June Oats or triticale: 80–100 kg/ha
peas: 50–75 kg/ha
20–30 kg/ha 2.5–5.0 t/ha Late-boot to early-head
6.0–9.0 t/ha Heads-emerged to soft-dough
Fall rye Winter triticale
haylagebaleagepasture
August–September
90 kg/ha 55–80 kg/ha in spring
5.–9.0 t/ha Flag-leaf or boot-stage in May
1.0–1.5 t/ha Graze 7 weeks after seeding or early spring
Soybeans haylage May–June 80–100 kg/ha None 6.0–9.0 t/ha Lower leaf turns yellow
Sudan grass pasture June 1–15 15–20 kg/ha 30–50 kg/ha 5.0–7.0 t/ha 45 cm (18 in.) in height
Sorgum-sudan hybrids
pasturehaylagebaleage
June 1–15 15–20 kg/ha 50–100 kg/ha 8.0–12.0 t/ha Boot or early heading
Forage sorghums haylagebaleagepasture
June 1–15 10–30 kg/ha (multiple-cut
system)
100 kg/ha 7.0–9.0 t/ha Boot or early heading, or >1 m (3.3 ft)
Pearl millet haylagebaleagepasturehay
June 1–15 9–20 kg/ha 45-90 kg/ha 4.0–12.0 t/ha Boot or early heading
Forage rape pasture July 1–15 2–6 kg/ha 45–70 kg/ha 7.0–9.0 t/ha 10–12 weeks after seeding
Kale pasture June–July 2–6 kg/ha 45–70 kg/ha 9.0–12.0 t/ha 10–15 weeks after seeding
Stubble turnips pasture July 1–15 2–6 kg/ha 80–100 kg/ha 6.0–9.0 t/ha 10–12 weeks after seeding
100 kg/ha = 90 lb/acre1 t/ha = 0.45 ton/acre
Table 8-5, Characteristics of cover crops grown in Ontario or OMAFRA Publication 19, Pasture Production.
Table 3–3, Characteristics of annual forage crops in Ontario, summarizes the characteristics of annual forage crops grown in Ontario.
continued on next page
81
3. Forages
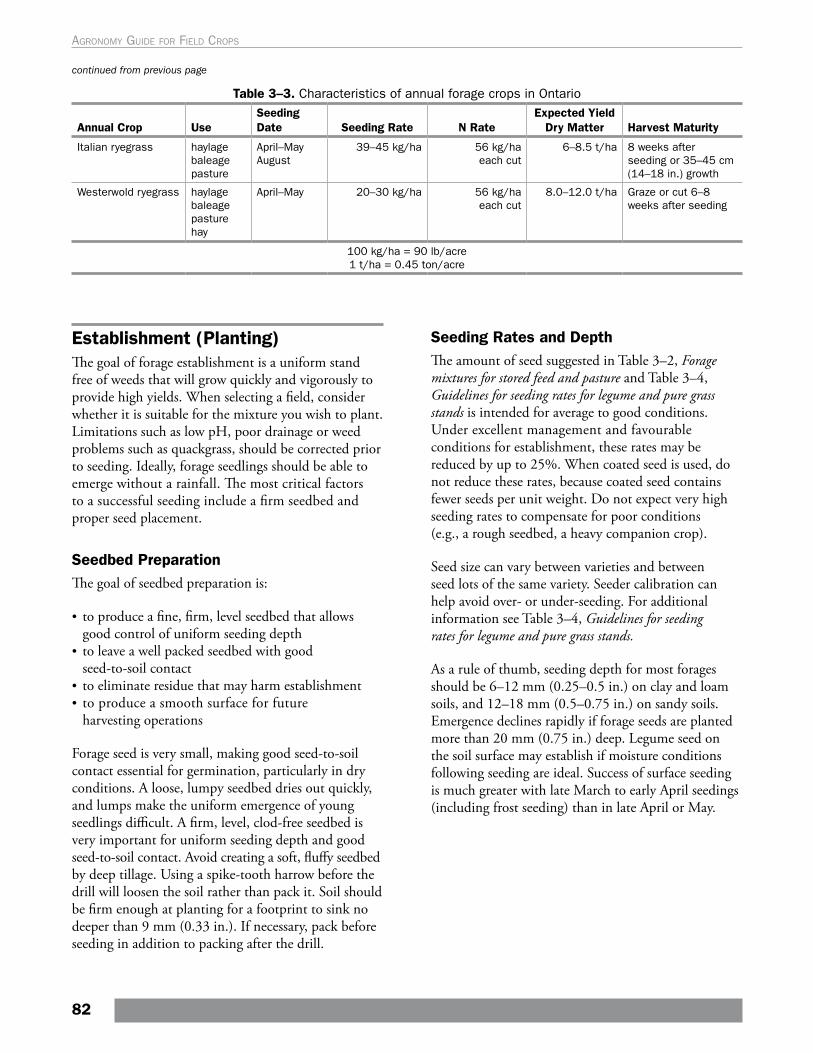
Table 3–3. Characteristics of annual forage crops in Ontario
Annual Crop UseSeeding Date Seeding Rate N Rate
Expected Yield Dry Matter Harvest Maturity
Italian ryegrass haylagebaleagepasture
April–MayAugust
39–45 kg/ha 56 kg/ha each cut
6–8.5 t/ha 8 weeks after seeding or 35–45 cm (14–18 in.) growth
Westerwold ryegrass haylagebaleagepasturehay
April–May 20–30 kg/ha 56 kg/ha each cut
8.0–12.0 t/ha Graze or cut 6–8 weeks after seeding
100 kg/ha = 90 lb/acre1 t/ha = 0.45 ton/acre
Establishment (Planting)The goal of forage establishment is a uniform stand free of weeds that will grow quickly and vigorously to provide high yields. When selecting a field, consider whether it is suitable for the mixture you wish to plant. Limitations such as low pH, poor drainage or weed problems such as quackgrass, should be corrected prior to seeding. Ideally, forage seedlings should be able to emerge without a rainfall. The most critical factors to a successful seeding include a firm seedbed and proper seed placement.
Seedbed Preparation The goal of seedbed preparation is:
• to produce a fine, firm, level seedbed that allows good control of uniform seeding depth
• to leave a well packed seedbed with good seed-to-soil contact
• to eliminate residue that may harm establishment• to produce a smooth surface for future
harvesting operations
Forage seed is very small, making good seed-to-soil contact essential for germination, particularly in dry conditions. A loose, lumpy seedbed dries out quickly, and lumps make the uniform emergence of young seedlings difficult. A firm, level, clod-free seedbed is very important for uniform seeding depth and good seed-to-soil contact. Avoid creating a soft, fluffy seedbed by deep tillage. Using a spike-tooth harrow before the drill will loosen the soil rather than pack it. Soil should be firm enough at planting for a footprint to sink no deeper than 9 mm (0.33 in.). If necessary, pack before seeding in addition to packing after the drill.
Seeding Rates and DepthThe amount of seed suggested in Table 3–2, Forage mixtures for stored feed and pasture and Table 3–4, Guidelines for seeding rates for legume and pure grass stands is intended for average to good conditions. Under excellent management and favourable conditions for establishment, these rates may be reduced by up to 25%. When coated seed is used, do not reduce these rates, because coated seed contains fewer seeds per unit weight. Do not expect very high seeding rates to compensate for poor conditions (e.g., a rough seedbed, a heavy companion crop).
Seed size can vary between varieties and between seed lots of the same variety. Seeder calibration can help avoid over- or under-seeding. For additional information see Table 3–4, Guidelines for seeding rates for legume and pure grass stands.
As a rule of thumb, seeding depth for most forages should be 6–12 mm (0.25–0.5 in.) on clay and loam soils, and 12–18 mm (0.5–0.75 in.) on sandy soils. Emergence declines rapidly if forage seeds are planted more than 20 mm (0.75 in.) deep. Legume seed on the soil surface may establish if moisture conditions following seeding are ideal. Success of surface seeding is much greater with late March to early April seedings (including frost seeding) than in late April or May.
continued from previous page
82
Agronomy guide for field Crops
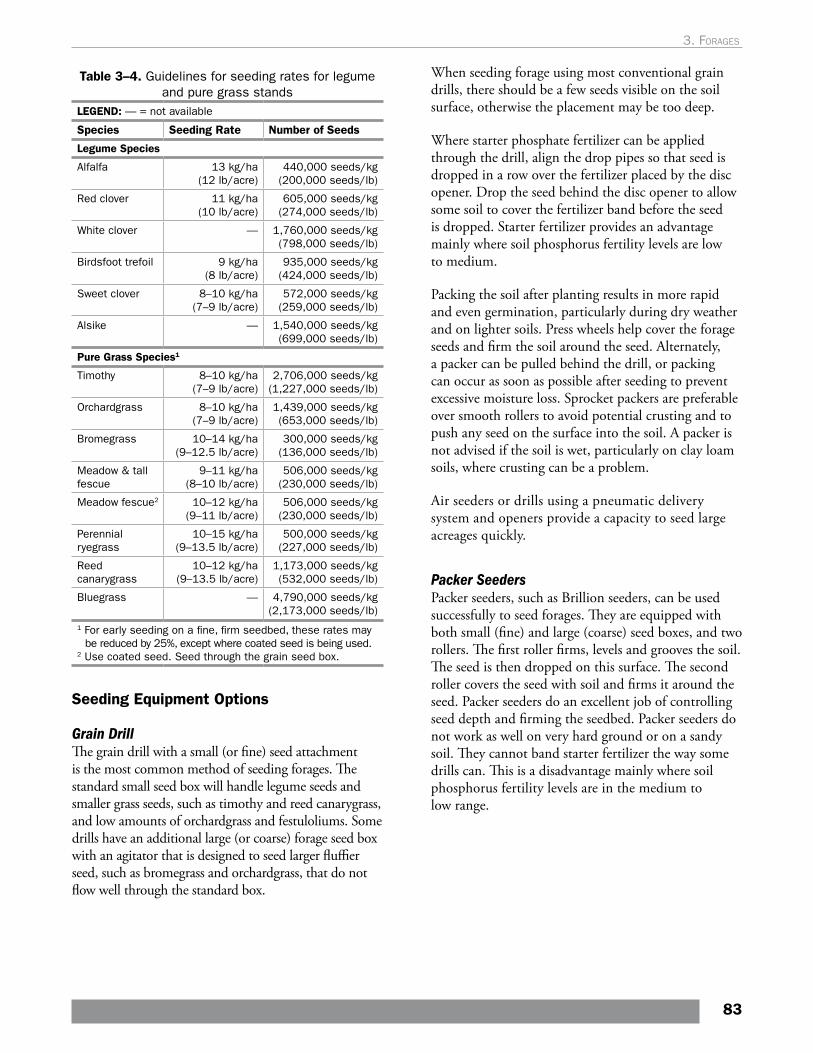
Table 3–4. Guidelines for seeding rates for legume and pure grass stands
LEGEND: — = not available
Species Seeding Rate Number of Seeds
Legume Species
Alfalfa 13 kg/ha (12 lb/acre)
440,000 seeds/kg (200,000 seeds/lb)
Red clover 11 kg/ha (10 lb/acre)
605,000 seeds/kg (274,000 seeds/lb)
White clover — 1,760,000 seeds/kg (798,000 seeds/lb)
Birdsfoot trefoil 9 kg/ha (8 lb/acre)
935,000 seeds/kg (424,000 seeds/lb)
Sweet clover 8–10 kg/ha (7–9 lb/acre)
572,000 seeds/kg (259,000 seeds/lb)
Alsike — 1,540,000 seeds/kg (699,000 seeds/lb)
Pure Grass Species1
Timothy 8–10 kg/ha (7–9 lb/acre)
2,706,000 seeds/kg (1,227,000 seeds/lb)
Orchardgrass 8–10 kg/ha (7–9 lb/acre)
1,439,000 seeds/kg (653,000 seeds/lb)
Bromegrass 10–14 kg/ha (9–12.5 lb/acre)
300,000 seeds/kg (136,000 seeds/lb)
Meadow & tall fescue
9–11 kg/ha (8–10 lb/acre)
506,000 seeds/kg (230,000 seeds/lb)
Meadow fescue2 10–12 kg/ha (9–11 lb/acre)
506,000 seeds/kg (230,000 seeds/lb)
Perennial ryegrass
10–15 kg/ha (9–13.5 lb/acre)
500,000 seeds/kg (227,000 seeds/lb)
Reed canarygrass
10–12 kg/ha (9–13.5 lb/acre)
1,173,000 seeds/kg (532,000 seeds/lb)
Bluegrass — 4,790,000 seeds/kg (2,173,000 seeds/lb)
1 For early seeding on a fine, firm seedbed, these rates may be reduced by 25%, except where coated seed is being used.
2 Use coated seed. Seed through the grain seed box.
Seeding Equipment Options
Grain DrillThe grain drill with a small (or fine) seed attachment is the most common method of seeding forages. The standard small seed box will handle legume seeds and smaller grass seeds, such as timothy and reed canarygrass, and low amounts of orchardgrass and festuloliums. Some drills have an additional large (or coarse) forage seed box with an agitator that is designed to seed larger fluffier seed, such as bromegrass and orchardgrass, that do not flow well through the standard box.
When seeding forage using most conventional grain drills, there should be a few seeds visible on the soil surface, otherwise the placement may be too deep.
Where starter phosphate fertilizer can be applied through the drill, align the drop pipes so that seed is dropped in a row over the fertilizer placed by the disc opener. Drop the seed behind the disc opener to allow some soil to cover the fertilizer band before the seed is dropped. Starter fertilizer provides an advantage mainly where soil phosphorus fertility levels are low to medium.
Packing the soil after planting results in more rapid and even germination, particularly during dry weather and on lighter soils. Press wheels help cover the forage seeds and firm the soil around the seed. Alternately, a packer can be pulled behind the drill, or packing can occur as soon as possible after seeding to prevent excessive moisture loss. Sprocket packers are preferable over smooth rollers to avoid potential crusting and to push any seed on the surface into the soil. A packer is not advised if the soil is wet, particularly on clay loam soils, where crusting can be a problem.
Air seeders or drills using a pneumatic delivery system and openers provide a capacity to seed large acreages quickly.
Packer SeedersPacker seeders, such as Brillion seeders, can be used successfully to seed forages. They are equipped with both small (fine) and large (coarse) seed boxes, and two rollers. The first roller firms, levels and grooves the soil. The seed is then dropped on this surface. The second roller covers the seed with soil and firms it around the seed. Packer seeders do an excellent job of controlling seed depth and firming the seedbed. Packer seeders do not work as well on very hard ground or on a sandy soil. They cannot band starter fertilizer the way some drills can. This is a disadvantage mainly where soil phosphorus fertility levels are in the medium to low range.
83
3. Forages
Broadcast SeedersBroadcast seeders main advantage is increasing the speed and capacity of seeding. Control of seeding depth is a potential problem and packing is necessary to cover the seed. Sprocket packers are preferred over smooth rollers to press surface seed into the soil.
There are two types of broadcast seeders:
1. Seeders that use spinners can give uneven distribution, particularly under windy conditions or with seed mixtures containing light and heavy seeds. This seeding method usually results in inferior stands.
2. Air-flow boom seeders overcome the problems of wind, seed segregation and spread pattern, while still permitting very rapid seeding. An alternate method mixes the forage seed with Monoammonium Phosphate (MAP) for immediate application using an air-flow fertilizer spreader.
No-Till DrillsNo-till seeding of forages has been quite successful where the soil conditions following the previous crop were smooth and level. Weed control, proper seed placement utilizing depth control and use of packing wheels are all important. Where surface residue is heavy, slug damage to forage seedlings is a risk. Land susceptible to erosion will benefit from increased surface residue. However, seeding equipment must be able to handle the increased residue left by reduced tillage systems, without compromising seed placement and adequate seed-to-soil contact. When the soil is too wet, the no-till seed furrow may not close properly, resulting in poor seed-to-soil contact.
Consider these guidelines when planting into no-till or high residue conditions:
• Eliminate perennial weeds, including dandelions, quackgrass, and winter annuals before seeding. Control broadleaf annual weeds in new seedings with a herbicide application.
• Ensure residue from the previous crop is evenly distributed. Manage any excessive residue from the previous crop to improve seed placement and to prevent slug damage. No-till spring seedings into soybean, cereal and corn silage stubble provide the most reliable results.
• Seeding depth should be 6–12 mm (0.25–0.5 in.) on clay and loam soils, and 12–18 mm (0.5–0.75 in.) on sandy soils. Check that openers are placing seed into the soil, rather than into surface residue.
Direct Seeding or Seeding With a Companion CropCompanion crops are sometimes also referred to as “nurse crops”. Forage seeding under a companion cereal crop (oats, triticale, barley) can suppress annual grass weeds and provide rapid protection from erosion on rolling land. The disadvantage of a companion crop is that it competes with the forages for moisture, light and fertility. If any of these items are deficient, the forage seeding will suffer before the grain crop does.
Seeding forages without a companion crop removes this potential threat to establishment. Direct-seeded forage stands are often thicker and more uniform, particularly with alfalfa birdsfoot trefoil and reed canarygrass, which do not tolerate heavy shading. Since a cereal forage crop is not competing for soil moisture, direct seedings are less affected by June or July dry periods.
Early spring direct seedings can be expected to provide 1–2 cuts of forage in the seeding year, yielding 50%–65% of an established stand. Under ideal conditions, first-cut can be harvested 60–70 days after seeding.
Direct seedings are more common in Ontario, where:
• fields have a lower risk of soil erosion• good drainage allows early spring seeding• rotational weed control is good• uniformly high nutrient quality haylage is
required such as dairy farms
Direct seedings are not successful on all farms. Weed competition can be a greater problem with direct seeding than with underseeding a companion crop. A cereal companion crop can provide some early protection to fields that have a greater risk of water erosion during the initial establishment period, including lighter soils types with slope. Direct seedings on heavier clay loam soils can require more skillful seedbed preparation and seeding, where they, are more vulnerable to crusting and seedling emergence problems if heavy rains follow seeding.
84
Agronomy guide for field Crops
Harvesting the Companion Crop as SilageHarvesting the companion cereal crop by combining it as grain is not a preferred practice because it reduces the establishment of the forage crop for the life of the stand. Harvesting the cereal crop at the boot-stage as haylage or baleage reduces the competition, enabling better forage establishment while still providing weed suppression and erosion control, and providing additional forage. The companion crop is removed before it lodges or competes excessively for light and moisture. If the cereal crop is cut and lays in the swath for an extended period while wilting, it has the potential to damage the new forage seeding.
Although some producers use a full cereal seeding rate and apply nitrogen to maximize forage yield, the heavier growth can increase the risk of a less successful forage establishment. Seeding at reduced rates (50%) and avoiding N application usually improves the forage establishment.
Oats are typically the preferred forage cereal. Although rust is a potential concern, forage oats tend to out-yield barley (especially in poorer conditions and later seedings), with less cereal regrowth and heading in the second-cut, and without the awns. Peas are sometimes added to the cereals to improve forage nutrient quality. This eliminates having the option of herbicide weed control and can increase the risk of extended wilting that may damage the forage seeding.
Match the stage of cereal at cutting to the livestock nutritional requirements. For high feed quality, cereals should be harvested at the boot stage. Delaying harvest to the fully headed stage will increase yield but reduce forage quality. Cereals can reach the boot stage in as little as 60 days, so if seeded before the first week of May they could be harvested in late June or early July. With reasonable soil moisture following harvest, it is quite possible to obtain another cut of forage during August in areas with 2,800 crop heat units or more.
More information about forage production from spring cereals can be found at fieldcropnews.com.
Harvesting the Companion Crop as GrainHarvesting cereal grain that has been underseeded to forage increases the risk of a less successful forage stand. Although it provides a grain crop and straw while the forage crop is being established, competition from the cereal reduces forage establishment and subsequent yields. Lodging of the cereal crop or
delayed baling of straw are also significant risks. The primary purpose of the seeding is to establish the forage, while grain and straw production are of secondary importance. Where grain is harvested from a companion crop, the following considerations will help to reduce the potential damage to the new forage seeding:
• Spring wheat and spring triticale generally provide less competition to the forage seeding than oats or barley. Six-row barley is preferable to two-row barley.
• As a general rule, select the strongest-strawed, shortest and earliest grain variety in any species for the least competition.
• Reduce the spring grain seeding rate to 60–70 kg/ha (54–62 lb/acre).
• Reduce the nitrogen fertilizer (<15 kg N/ha or 13 lb/acre) or manure rate to minimize the risk of a dense grain crop and of lodging.
Seeding Time
Spring SeedingThe most reliable time to seed forages is early spring, regardless of whether the crop is direct-seeded or seeded with a companion crop. With a spring seeding, moisture is usually adequate, and the plants are well established for winter survival. Plant as early as a favourable seedbed can be prepared to increase the chances of adequate moisture during the critical germination and early growth period.
Summer SeedingSummer seeding can be a viable alternative to spring seeding. It has the advantage of providing a full yield the following year. A summer seeding can typically follow winter or spring cereal harvest. Companion crops are not recommended in summer seedings because they compete too strongly for available soil moisture.
Seeding DateSeeding too early in the summer increases the risk of hot, dry conditions, affecting germination and seedling development. Seeding too late increases the chance of receiving a killing frost before legume seedlings are adequately established to accumulate enough root reserves to survive the winter. Legumes seeded after early September rarely survive the winter, since small legume plants are more susceptible to heaving. Even if these plants survive, they will be slower starting and
85
3. Forages
lower yielding. Alfalfa requires approximately 6 weeks of growth after germination to survive the winter, and will generally survive if the crown develops before a killing frost.
Summer-seed alfalfa mixtures before the following dates:
• more than 3,100 CHUs — August 10–20• 2,700 to 3,100 CHUs — August 1–10• less than 2,700 CHUs — July 20–30
Birdsfoot trefoil has slow seedling development, so summer seedings are usually unsuccessful. Grasses can tolerate later seedings. September seeding of straight grasses may be successful, with the exception of reed canarygrass, which is slow to establish.
Seedbed PreparationSeed-to-soil contact is particularly important in dry summer conditions. A loose, lumpy seedbed dries out quickly. Packing can help preserve moisture. A fine seedbed can be more difficult to prepare in August on clay loam soils, compared to loams, sandy loams and silt loams. Avoid summer seeding on heavier soils that have a history of alfalfa heaving.
Weed Control and Volunteer GrainWinter annual weeds can be a common problem in summer seedings, and herbicide application may be required. Refer to OMAFRA Publication 75, Guide to Weed Control. Be cautious not to delay growth due to a herbicide effect.
Volunteer grain can be a serious problem in summer seedings following cereals, especially winter wheat, because it may be thick and competitive. Oats or barley will winterkill in November, but winter wheat will be present until the first cut the following year. Tillage and glyphosate can be used to reduce the problem of volunteer cereals, but delay seeding.
No-TillNo-till summer seeding can be successful if proper attention is paid to residue management, seed placement and weed control. However, using no-till to reseed an existing alfalfa field in August is not recommended due to alfalfa autotoxicity, slugs and disease that may exist in the old sod.
Alfalfa AutotoxicitySeeding alfalfa after alfalfa is high risk because old stands of alfalfa release a toxin that reduces germination, root development and growth of new alfalfa seedlings. This is called autotoxicity. Roots are swollen, curled, discoloured and lack root hairs. The negative effects on root growth can significantly impact yields for the life of the stand.
Reseeding alfalfa within 2–3 weeks of killing an old alfalfa stand will result in reduced germination and thin stands. A longer delay will allow full stand establishment, but because the toxins are present for up to 6 months, the plants can permanently suffer damage below ground that will limit yields for the life of the stand. For maximum yields, if the alfalfa is 2 or more years old, an intervening year of an alternate crop is required before reseeding to alfalfa.
The toxins from established alfalfa are not present the first year in new seedings, so seeding failures or new plants that were winterkilled can be reseeded without an autotoxicity effect. This would include a summer seeding into an unsuccessful spring seeding, or a seeding in the spring following an unsuccessful summer seeding or previous spring seeding.
It is not recommended that interseeding be done to thicken an established alfalfa stand, as this is rarely successful. New seedlings often germinate, look acceptable early and then die out over the summer. In emergency situations, thin spots can be interseeded with red clover instead.
Frost Seeding PasturesBroadcast-seeding legumes (clovers and trefoil) into established pastures in late winter or early spring can be an effective way of increasing the legume content in a pasture stand. Broadcast the seed when the ground is still frozen. The freeze thaw action of early spring will help the seeds establish good soil contact. Pastures should be aggressively grazed the previous fall to reduce the competition from the established perennial species in the pasture. Alfalfa and most grass species generally have low to very low success rates when frost seeded.
InoculationFor normal growth, all legumes must have nitrogen-producing nodules on their root systems. These nodules are produced by rhizobium bacteria.
86
Agronomy guide for field Crops
Legume species (alfalfa, clover, birdsfoot trefoil) require their own specific strain of rhizobia Rhizobium for proper nodulation. If a legume is being planted for the first time in a field, the seed must be inoculated with the proper strain of rhizobium bacteria before planting. Pre-inoculated seed is satisfactory, provided that the inoculant is applied in the current season. Since the inoculant must be alive, note the expiry date and handling precautions on the packet to ensure effective nitrogen fixation. When a forage legume species has routinely been grown in a field as part of the rotation, these bacteria are usually present in the soil and should result in good nodulation. The cost of the rhizobia is low in comparison to the cost of seed. If there is any doubt about the presence of rhizobia in the soil, the seed should be inoculated.
Fertility Management
NitrogenForage stands that are less than 50% legume have a yield response to nitrogen (N) fertilizers. For nitrogen guidelines, see Table 3–5, General nitrogen guidelines — perennial forages.
Grass stands containing less than one-third legumes require nitrogen to optimize yield. Where conditions permit, it is generally more economical to grow mixtures containing legumes. It can be profitable to fertilize grass stands consisting of productive forage grass species. Improved grass stands that are well managed will respond well to additional nitrogen. Suggested nitrogen rates for grass stands (less than one-third legume) are 23 kg/t (45 lb/ton) of expected forage dry matter yield.
The use of nitrogen also increases the protein level in the grass. Make the first application for hay or pasture as early as possible in the spring at green-up, followed by a second application after the first cut and a third application after the second cut. To avoid the danger of nitrate toxicity, apply no more than 170 kg/ha (150 lb/acre) of nitrogen at any one time.
Nitrogen deficiency in forages shows up as a general yellowing and stunting of the plants. It may appear in the lower parts of the plants first. In legumes, a nitrogen deficiency usually indicates poor nodulation and/or low soil pH.
Table 3–5. General nitrogen guidelines — perennial forages
Crops Suggested Nitrogen
Legume or legume-grass at seeding
without a nurse crop 0 kg/ha
with a nurse crop 15 kg/ha
unimproved pasture 50 kg/ha
grass for seed 90 kg/ha
Hay or pasture
half or more legumes 0
one-third to one-half legumes 60 kg/ha
grass (less than one-third legumes)
23 kg/t (45 lb/ton) of expected
dry matter yield
100 kg/ha = 90 lb/acre
Phosphate and PotashPhosphate (P2O5) and potash (K2O) guidelines are given in Table 3–6, Phosphate (P2O5) guidelines for forages and Table 3–7, Potash (K2O) guidelines for forages. These guidelines are based on OMAFRA-accredited soil tests using the sufficiency approach which applies the most economic rate of nutrients for a given crop year. For information on the use of these tables or if an OMAFRA-accredited soil test is unavailable, see Chapter 9, Soil Fertility and Nutrient Use, Fertilizer Guidelines.
When direct-seeding on soils that require phosphate fertilizer, establishment may be improved by the placement of a high phosphate fertilizer 5 cm (2 in.) directly below the seed. Using a grain drill with fertilizer and grass seed attachments, this placement may be accomplished by drilling the fertilizer through the furrow opener and dropping the forage seed on a firm soil surface directly behind the furrow opener. Usually it is advisable to firm the soil surface immediately after seeding.
Potash may be more effective in promoting persistence if it is applied within the 6 weeks before the start of the fall rest period. Potash deficiency is visible in alfalfa with symptoms of small, light dots on the leaflets. These dots can be on any part of the leaflet but are usually concentrated near the margins (Photo 3–1). Potash deficiency symptoms in grasses and clovers are less distinctive, but result in overall slow growth and poor yield. However, high soil-potassium levels can result in luxury consumption of potassium by alfalfa and subsequent nutritional problems when fed to dairy cows prior to calving. Potassium applications on soils testing over 150 ppm will not significantly increase winter hardiness and are not recommended.
87
3. Forages
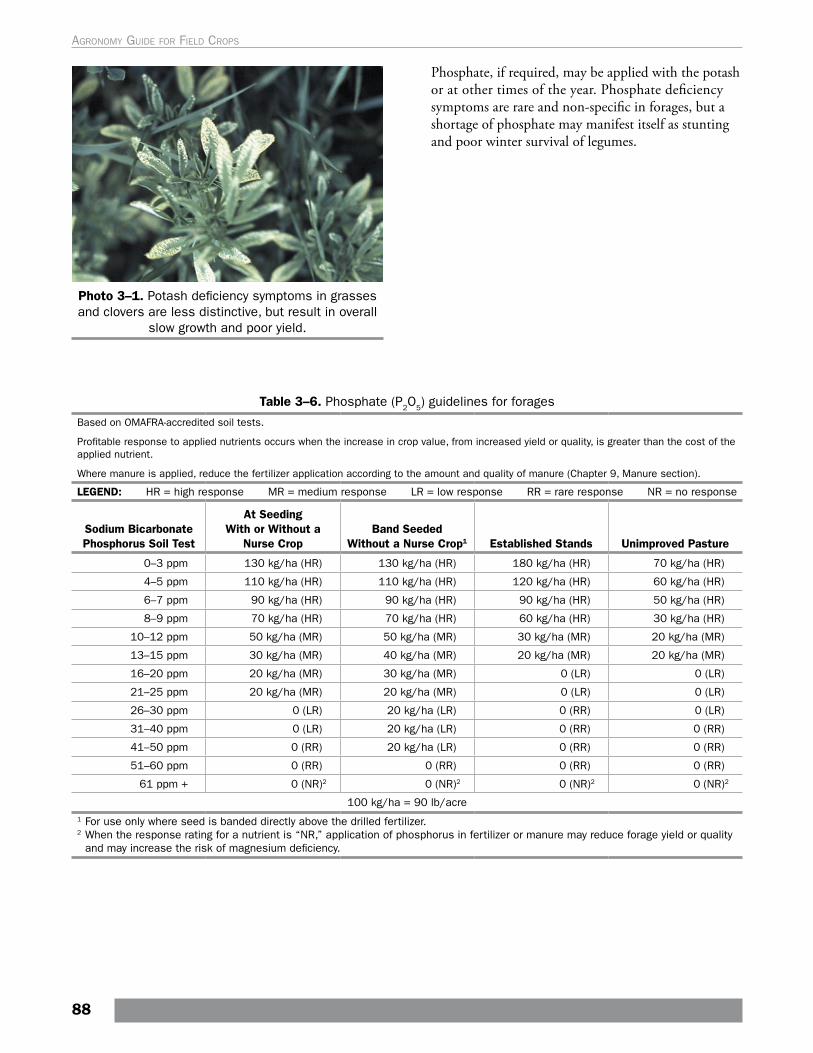
Photo 3–1. Potash deficiency symptoms in grasses and clovers are less distinctive, but result in overall
slow growth and poor yield.
Phosphate, if required, may be applied with the potash or at other times of the year. Phosphate deficiency symptoms are rare and non-specific in forages, but a shortage of phosphate may manifest itself as stunting and poor winter survival of legumes.
Table 3–6. Phosphate (P2O5) guidelines for forages
Based on OMAFRA-accredited soil tests.
Profitable response to applied nutrients occurs when the increase in crop value, from increased yield or quality, is greater than the cost of the applied nutrient.
Where manure is applied, reduce the fertilizer application according to the amount and quality of manure (Chapter 9, Manure section).
LEGEND: HR = high response MR = medium response LR = low response RR = rare response NR = no response
Sodium Bicarbonate Phosphorus Soil Test
At Seeding With or Without a
Nurse CropBand Seeded
Without a Nurse Crop1 Established Stands Unimproved Pasture
0–3 ppm 130 kg/ha (HR) 130 kg/ha (HR) 180 kg/ha (HR) 70 kg/ha (HR)
4–5 ppm 110 kg/ha (HR) 110 kg/ha (HR) 120 kg/ha (HR) 60 kg/ha (HR)
6–7 ppm 90 kg/ha (HR) 90 kg/ha (HR) 90 kg/ha (HR) 50 kg/ha (HR)
8–9 ppm 70 kg/ha (HR) 70 kg/ha (HR) 60 kg/ha (HR) 30 kg/ha (HR)
10–12 ppm 50 kg/ha (MR) 50 kg/ha (MR) 30 kg/ha (MR) 20 kg/ha (MR)
13–15 ppm 30 kg/ha (MR) 40 kg/ha (MR) 20 kg/ha (MR) 20 kg/ha (MR)
16–20 ppm 20 kg/ha (MR) 30 kg/ha (MR) 0 (LR) 0 (LR)
21–25 ppm 20 kg/ha (MR) 20 kg/ha (MR) 0 (LR) 0 (LR)
26–30 ppm 0 (LR) 20 kg/ha (LR) 0 (RR) 0 (LR)
31–40 ppm 0 (LR) 20 kg/ha (LR) 0 (RR) 0 (RR)
41–50 ppm 0 (RR) 20 kg/ha (LR) 0 (RR) 0 (RR)
51–60 ppm 0 (RR) 0 (RR) 0 (RR) 0 (RR)
61 ppm + 0 (NR)2 0 (NR)2 0 (NR)2 0 (NR)2
100 kg/ha = 90 lb/acre1 For use only where seed is banded directly above the drilled fertilizer. 2 When the response rating for a nutrient is “NR,” application of phosphorus in fertilizer or manure may reduce forage yield or quality
and may increase the risk of magnesium deficiency.
88
Agronomy guide for field Crops
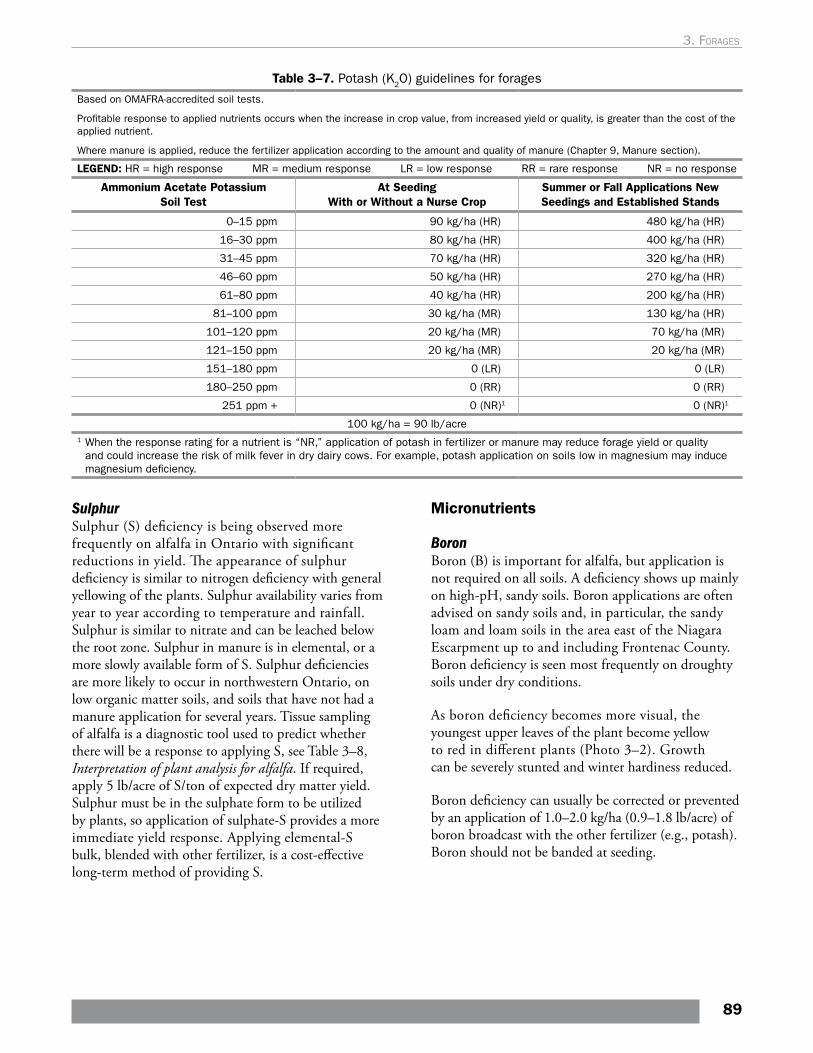
Table 3–7. Potash (K2O) guidelines for forages
Based on OMAFRA-accredited soil tests.
Profitable response to applied nutrients occurs when the increase in crop value, from increased yield or quality, is greater than the cost of the applied nutrient.
Where manure is applied, reduce the fertilizer application according to the amount and quality of manure (Chapter 9, Manure section).
LEGEND: HR = high response MR = medium response LR = low response RR = rare response NR = no response
Ammonium Acetate Potassium Soil Test
At Seeding With or Without a Nurse Crop
Summer or Fall Applications New Seedings and Established Stands
0–15 ppm 90 kg/ha (HR) 480 kg/ha (HR)
16–30 ppm 80 kg/ha (HR) 400 kg/ha (HR)
31–45 ppm 70 kg/ha (HR) 320 kg/ha (HR)
46–60 ppm 50 kg/ha (HR) 270 kg/ha (HR)
61–80 ppm 40 kg/ha (HR) 200 kg/ha (HR)
81–100 ppm 30 kg/ha (MR) 130 kg/ha (HR)
101–120 ppm 20 kg/ha (MR) 70 kg/ha (MR)
121–150 ppm 20 kg/ha (MR) 20 kg/ha (MR)
151–180 ppm 0 (LR) 0 (LR)
180–250 ppm 0 (RR) 0 (RR)
251 ppm + 0 (NR)1 0 (NR)1
100 kg/ha = 90 lb/acre1 When the response rating for a nutrient is “NR,” application of potash in fertilizer or manure may reduce forage yield or quality
and could increase the risk of milk fever in dry dairy cows. For example, potash application on soils low in magnesium may induce magnesium deficiency.
Micronutrients
Boron Boron (B) is important for alfalfa, but application is not required on all soils. A deficiency shows up mainly on high-pH, sandy soils. Boron applications are often advised on sandy soils and, in particular, the sandy loam and loam soils in the area east of the Niagara Escarpment up to and including Frontenac County. Boron deficiency is seen most frequently on droughty soils under dry conditions.
As boron deficiency becomes more visual, the youngest upper leaves of the plant become yellow to red in different plants (Photo 3–2). Growth can be severely stunted and winter hardiness reduced.
Boron deficiency can usually be corrected or prevented by an application of 1.0–2.0 kg/ha (0.9–1.8 lb/acre) of boron broadcast with the other fertilizer (e.g., potash). Boron should not be banded at seeding.
SulphurSulphur (S) deficiency is being observed more frequently on alfalfa in Ontario with significant reductions in yield. The appearance of sulphur deficiency is similar to nitrogen deficiency with general yellowing of the plants. Sulphur availability varies from year to year according to temperature and rainfall. Sulphur is similar to nitrate and can be leached below the root zone. Sulphur in manure is in elemental, or a more slowly available form of S. Sulphur deficiencies are more likely to occur in northwestern Ontario, on low organic matter soils, and soils that have not had a manure application for several years. Tissue sampling of alfalfa is a diagnostic tool used to predict whether there will be a response to applying S, see Table 3–8, Interpretation of plant analysis for alfalfa. If required, apply 5 lb/acre of S/ton of expected dry matter yield. Sulphur must be in the sulphate form to be utilized by plants, so application of sulphate-S provides a more immediate yield response. Applying elemental-S bulk, blended with other fertilizer, is a cost-effective long-term method of providing S.
89
3. Forages
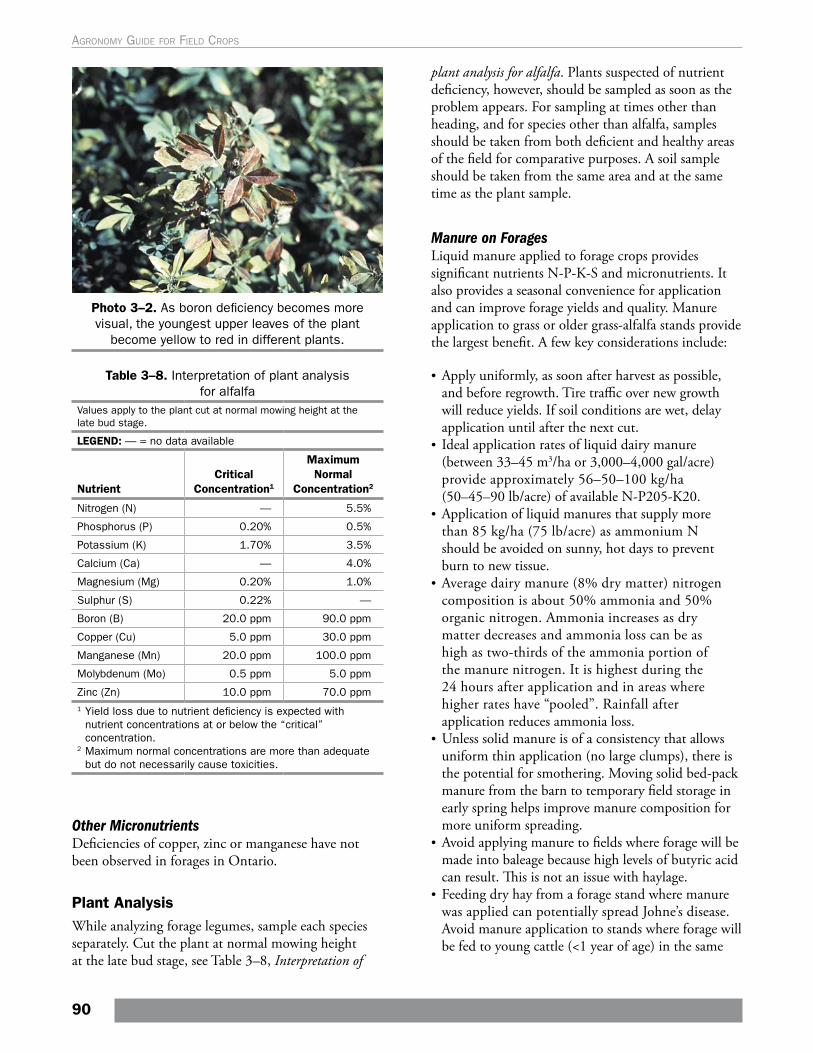
Photo 3–2. As boron deficiency becomes more visual, the youngest upper leaves of the plant
become yellow to red in different plants.
Table 3–8. Interpretation of plant analysis for alfalfa
Values apply to the plant cut at normal mowing height at the late bud stage.
LEGEND: — = no data available
Nutrient Critical
Concentration1
Maximum Normal
Concentration2
Nitrogen (N) — 5.5%
Phosphorus (P) 0.20% 0.5%
Potassium (K) 1.70% 3.5%
Calcium (Ca) — 4.0%
Magnesium (Mg) 0.20% 1.0%
Sulphur (S) 0.22% —
Boron (B) 20.0 ppm 90.0 ppm
Copper (Cu) 5.0 ppm 30.0 ppm
Manganese (Mn) 20.0 ppm 100.0 ppm
Molybdenum (Mo) 0.5 ppm 5.0 ppm
Zinc (Zn) 10.0 ppm 70.0 ppm1 Yield loss due to nutrient deficiency is expected with
nutrient concentrations at or below the “critical” concentration.
2 Maximum normal concentrations are more than adequate but do not necessarily cause toxicities.
Other MicronutrientsDeficiencies of copper, zinc or manganese have not been observed in forages in Ontario.
Plant AnalysisWhile analyzing forage legumes, sample each species separately. Cut the plant at normal mowing height at the late bud stage, see Table 3–8, Interpretation of
plant analysis for alfalfa. Plants suspected of nutrient deficiency, however, should be sampled as soon as the problem appears. For sampling at times other than heading, and for species other than alfalfa, samples should be taken from both deficient and healthy areas of the field for comparative purposes. A soil sample should be taken from the same area and at the same time as the plant sample.
Manure on ForagesLiquid manure applied to forage crops provides significant nutrients N-P-K-S and micronutrients. It also provides a seasonal convenience for application and can improve forage yields and quality. Manure application to grass or older grass-alfalfa stands provide the largest benefit. A few key considerations include:
• Apply uniformly, as soon after harvest as possible, and before regrowth. Tire traffic over new growth will reduce yields. If soil conditions are wet, delay application until after the next cut.
• Ideal application rates of liquid dairy manure (between 33–45 m3/ha or 3,000–4,000 gal/acre) provide approximately 56–50–100 kg/ha (50–45–90 lb/acre) of available N-P205-K20.
• Application of liquid manures that supply more than 85 kg/ha (75 lb/acre) as ammonium N should be avoided on sunny, hot days to prevent burn to new tissue.
• Average dairy manure (8% dry matter) nitrogen composition is about 50% ammonia and 50% organic nitrogen. Ammonia increases as dry matter decreases and ammonia loss can be as high as two-thirds of the ammonia portion of the manure nitrogen. It is highest during the 24 hours after application and in areas where higher rates have “pooled”. Rainfall after application reduces ammonia loss.
• Unless solid manure is of a consistency that allows uniform thin application (no large clumps), there is the potential for smothering. Moving solid bed-pack manure from the barn to temporary field storage in early spring helps improve manure composition for more uniform spreading.
• Avoid applying manure to fields where forage will be made into baleage because high levels of butyric acid can result. This is not an issue with haylage.
• Feeding dry hay from a forage stand where manure was applied can potentially spread Johne’s disease. Avoid manure application to stands where forage will be fed to young cattle (<1 year of age) in the same
90
Agronomy guide for field Crops
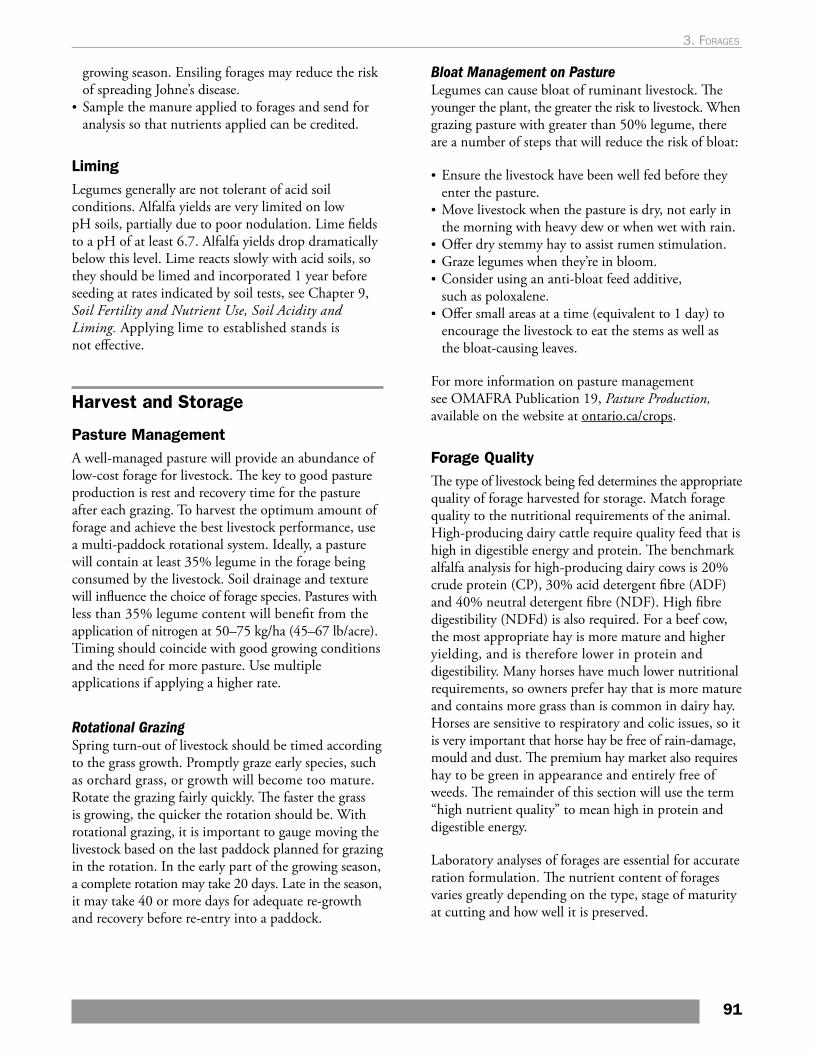
growing season. Ensiling forages may reduce the risk of spreading Johne’s disease.
• Sample the manure applied to forages and send for analysis so that nutrients applied can be credited.
LimingLegumes generally are not tolerant of acid soil conditions. Alfalfa yields are very limited on low pH soils, partially due to poor nodulation. Lime fields to a pH of at least 6.7. Alfalfa yields drop dramatically below this level. Lime reacts slowly with acid soils, so they should be limed and incorporated 1 year before seeding at rates indicated by soil tests, see Chapter 9, Soil Fertility and Nutrient Use, Soil Acidity and Liming. Applying lime to established stands is not effective.
Harvest and Storage
Pasture ManagementA well-managed pasture will provide an abundance of low-cost forage for livestock. The key to good pasture production is rest and recovery time for the pasture after each grazing. To harvest the optimum amount of forage and achieve the best livestock performance, use a multi-paddock rotational system. Ideally, a pasture will contain at least 35% legume in the forage being consumed by the livestock. Soil drainage and texture will influence the choice of forage species. Pastures with less than 35% legume content will benefit from the application of nitrogen at 50–75 kg/ha (45–67 lb/acre). Timing should coincide with good growing conditions and the need for more pasture. Use multiple applications if applying a higher rate.
Rotational GrazingSpring turn-out of livestock should be timed according to the grass growth. Promptly graze early species, such as orchard grass, or growth will become too mature. Rotate the grazing fairly quickly. The faster the grass is growing, the quicker the rotation should be. With rotational grazing, it is important to gauge moving the livestock based on the last paddock planned for grazing in the rotation. In the early part of the growing season, a complete rotation may take 20 days. Late in the season, it may take 40 or more days for adequate re-growth and recovery before re-entry into a paddock.
Bloat Management on PastureLegumes can cause bloat of ruminant livestock. The younger the plant, the greater the risk to livestock. When grazing pasture with greater than 50% legume, there are a number of steps that will reduce the risk of bloat:
• Ensure the livestock have been well fed before they enter the pasture.
• Move livestock when the pasture is dry, not early in the morning with heavy dew or when wet with rain.
• Offer dry stemmy hay to assist rumen stimulation.• Graze legumes when they’re in bloom.• Consider using an anti-bloat feed additive,
such as poloxalene.• Offer small areas at a time (equivalent to 1 day) to
encourage the livestock to eat the stems as well as the bloat-causing leaves.
For more information on pasture management see OMAFRA Publication 19, Pasture Production, available on the website at ontario.ca/crops.
Forage QualityThe type of livestock being fed determines the appropriate quality of forage harvested for storage. Match forage quality to the nutritional requirements of the animal. High-producing dairy cattle require quality feed that is high in digestible energy and protein. The benchmark alfalfa analysis for high-producing dairy cows is 20% crude protein (CP), 30% acid detergent fibre (ADF) and 40% neutral detergent fibre (NDF). High fibre digestibility (NDFd) is also required. For a beef cow, the most appropriate hay is more mature and higher yielding, and is therefore lower in protein and digestibility. Many horses have much lower nutritional requirements, so owners prefer hay that is more mature and contains more grass than is common in dairy hay. Horses are sensitive to respiratory and colic issues, so it is very important that horse hay be free of rain-damage, mould and dust. The premium hay market also requires hay to be green in appearance and entirely free of weeds. The remainder of this section will use the term “high nutrient quality” to mean high in protein and digestible energy.
Laboratory analyses of forages are essential for accurate ration formulation. The nutrient content of forages varies greatly depending on the type, stage of maturity at cutting and how well it is preserved.
91
3. Forages
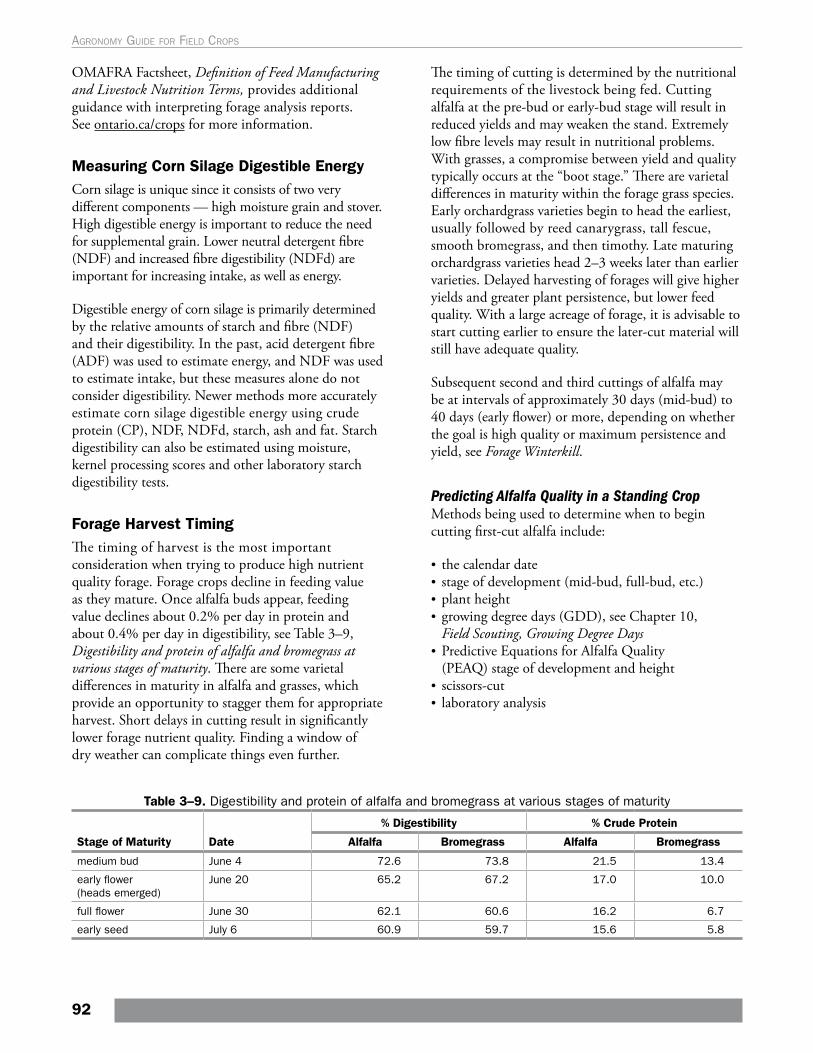
OMAFRA Factsheet, Definition of Feed Manufacturing and Livestock Nutrition Terms, provides additional guidance with interpreting forage analysis reports. See ontario.ca/crops for more information.
Measuring Corn Silage Digestible EnergyCorn silage is unique since it consists of two very different components — high moisture grain and stover. High digestible energy is important to reduce the need for supplemental grain. Lower neutral detergent fibre (NDF) and increased fibre digestibility (NDFd) are important for increasing intake, as well as energy.
Digestible energy of corn silage is primarily determined by the relative amounts of starch and fibre (NDF) and their digestibility. In the past, acid detergent fibre (ADF) was used to estimate energy, and NDF was used to estimate intake, but these measures alone do not consider digestibility. Newer methods more accurately estimate corn silage digestible energy using crude protein (CP), NDF, NDFd, starch, ash and fat. Starch digestibility can also be estimated using moisture, kernel processing scores and other laboratory starch digestibility tests.
Forage Harvest TimingThe timing of harvest is the most important consideration when trying to produce high nutrient quality forage. Forage crops decline in feeding value as they mature. Once alfalfa buds appear, feeding value declines about 0.2% per day in protein and about 0.4% per day in digestibility, see Table 3–9, Digestibility and protein of alfalfa and bromegrass at various stages of maturity. There are some varietal differences in maturity in alfalfa and grasses, which provide an opportunity to stagger them for appropriate harvest. Short delays in cutting result in significantly lower forage nutrient quality. Finding a window of dry weather can complicate things even further.
Table 3–9. Digestibility and protein of alfalfa and bromegrass at various stages of maturity
Stage of Maturity Date
% Digestibility % Crude Protein
Alfalfa Bromegrass Alfalfa Bromegrass
medium bud June 4 72.6 73.8 21.5 13.4
early flower (heads emerged)
June 20 65.2 67.2 17.0 10.0
full flower June 30 62.1 60.6 16.2 6.7
early seed July 6 60.9 59.7 15.6 5.8
The timing of cutting is determined by the nutritional requirements of the livestock being fed. Cutting alfalfa at the pre-bud or early-bud stage will result in reduced yields and may weaken the stand. Extremely low fibre levels may result in nutritional problems. With grasses, a compromise between yield and quality typically occurs at the “boot stage.” There are varietal differences in maturity within the forage grass species. Early orchardgrass varieties begin to head the earliest, usually followed by reed canarygrass, tall fescue, smooth bromegrass, and then timothy. Late maturing orchardgrass varieties head 2–3 weeks later than earlier varieties. Delayed harvesting of forages will give higher yields and greater plant persistence, but lower feed quality. With a large acreage of forage, it is advisable to start cutting earlier to ensure the later-cut material will still have adequate quality.
Subsequent second and third cuttings of alfalfa may be at intervals of approximately 30 days (mid-bud) to 40 days (early flower) or more, depending on whether the goal is high quality or maximum persistence and yield, see Forage Winterkill.
Predicting Alfalfa Quality in a Standing CropMethods being used to determine when to begin cutting first-cut alfalfa include:
• the calendar date• stage of development (mid-bud, full-bud, etc.)• plant height• growing degree days (GDD), see Chapter 10,
Field Scouting, Growing Degree Days• Predictive Equations for Alfalfa Quality
(PEAQ) stage of development and height • scissors-cut • laboratory analysis
92
Agronomy guide for field Crops
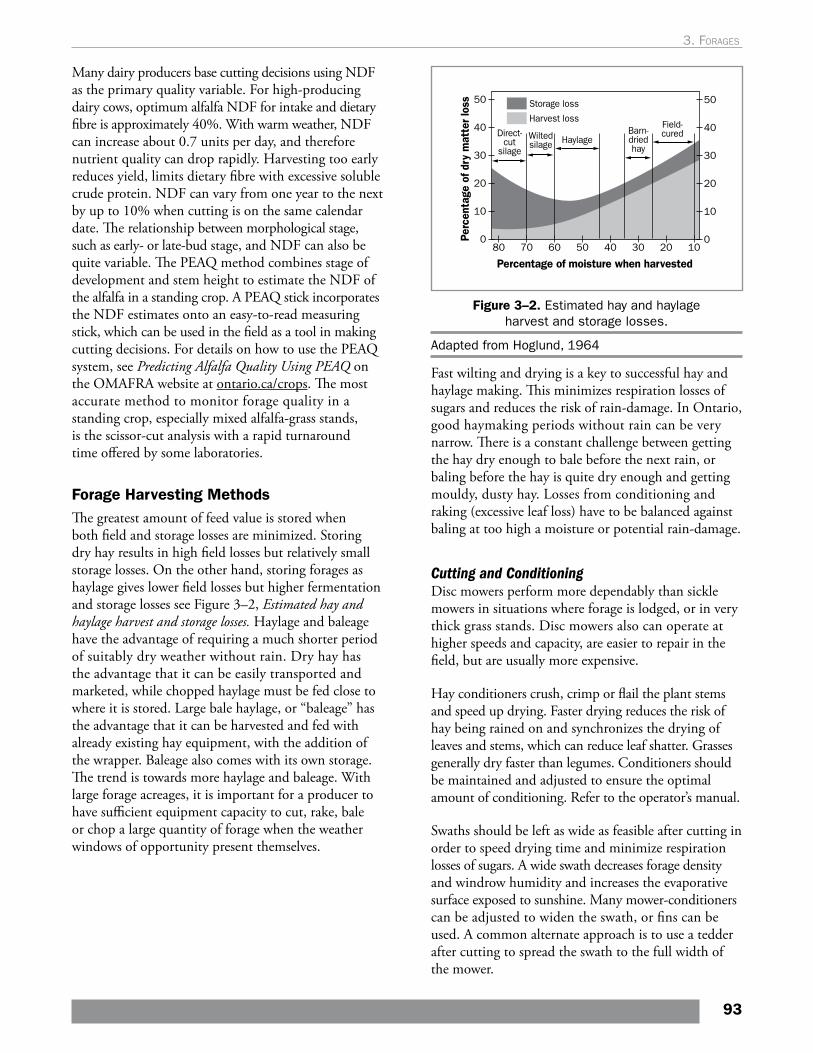
Many dairy producers base cutting decisions using NDF as the primary quality variable. For high-producing dairy cows, optimum alfalfa NDF for intake and dietary fibre is approximately 40%. With warm weather, NDF can increase about 0.7 units per day, and therefore nutrient quality can drop rapidly. Harvesting too early reduces yield, limits dietary fibre with excessive soluble crude protein. NDF can vary from one year to the next by up to 10% when cutting is on the same calendar date. The relationship between morphological stage, such as early- or late-bud stage, and NDF can also be quite variable. The PEAQ method combines stage of development and stem height to estimate the NDF of the alfalfa in a standing crop. A PEAQ stick incorporates the NDF estimates onto an easy-to-read measuring stick, which can be used in the field as a tool in making cutting decisions. For details on how to use the PEAQ system, see Predicting Alfalfa Quality Using PEAQ on the OMAFRA website at ontario.ca/crops. The most accurate method to monitor forage quality in a standing crop, especially mixed alfalfa-grass stands, is the scissor-cut analysis with a rapid turnaround time offered by some laboratories.
Forage Harvesting Methods The greatest amount of feed value is stored when both field and storage losses are minimized. Storing dry hay results in high field losses but relatively small storage losses. On the other hand, storing forages as haylage gives lower field losses but higher fermentation and storage losses see Figure 3–2, Estimated hay and haylage harvest and storage losses. Haylage and baleage have the advantage of requiring a much shorter period of suitably dry weather without rain. Dry hay has the advantage that it can be easily transported and marketed, while chopped haylage must be fed close to where it is stored. Large bale haylage, or “baleage” has the advantage that it can be harvested and fed with already existing hay equipment, with the addition of the wrapper. Baleage also comes with its own storage. The trend is towards more haylage and baleage. With large forage acreages, it is important for a producer to have sufficient equipment capacity to cut, rake, bale or chop a large quantity of forage when the weather windows of opportunity present themselves.
Figure 3–2. Estimated hay and haylage harvest and storage losses.
Adapted from Hoglund, 1964
Fast wilting and drying is a key to successful hay and haylage making. This minimizes respiration losses of sugars and reduces the risk of rain-damage. In Ontario, good haymaking periods without rain can be very narrow. There is a constant challenge between getting the hay dry enough to bale before the next rain, or baling before the hay is quite dry enough and getting mouldy, dusty hay. Losses from conditioning and raking (excessive leaf loss) have to be balanced against baling at too high a moisture or potential rain-damage.
Cutting and ConditioningDisc mowers perform more dependably than sickle mowers in situations where forage is lodged, or in very thick grass stands. Disc mowers also can operate at higher speeds and capacity, are easier to repair in the field, but are usually more expensive.
Hay conditioners crush, crimp or flail the plant stems and speed up drying. Faster drying reduces the risk of hay being rained on and synchronizes the drying of leaves and stems, which can reduce leaf shatter. Grasses generally dry faster than legumes. Conditioners should be maintained and adjusted to ensure the optimal amount of conditioning. Refer to the operator’s manual.
Swaths should be left as wide as feasible after cutting in order to speed drying time and minimize respiration losses of sugars. A wide swath decreases forage density and windrow humidity and increases the evaporative surface exposed to sunshine. Many mower-conditioners can be adjusted to widen the swath, or fins can be used. A common alternate approach is to use a tedder after cutting to spread the swath to the full width of the mower.
93
3. Forages
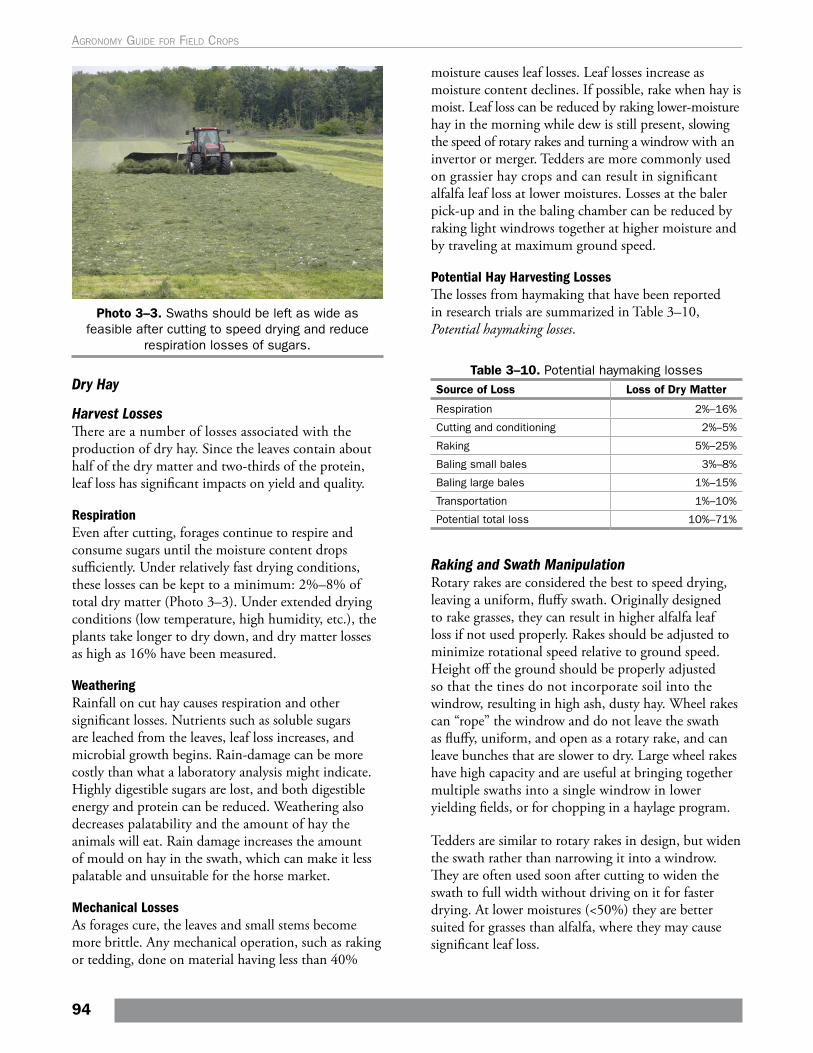
Photo 3–3. Swaths should be left as wide as feasible after cutting to speed drying and reduce
respiration losses of sugars.
Dry Hay
Harvest LossesThere are a number of losses associated with the production of dry hay. Since the leaves contain about half of the dry matter and two-thirds of the protein, leaf loss has significant impacts on yield and quality.
RespirationEven after cutting, forages continue to respire and consume sugars until the moisture content drops sufficiently. Under relatively fast drying conditions, these losses can be kept to a minimum: 2%–8% of total dry matter (Photo 3–3). Under extended drying conditions (low temperature, high humidity, etc.), the plants take longer to dry down, and dry matter losses as high as 16% have been measured.
WeatheringRainfall on cut hay causes respiration and other significant losses. Nutrients such as soluble sugars are leached from the leaves, leaf loss increases, and microbial growth begins. Rain-damage can be more costly than what a laboratory analysis might indicate. Highly digestible sugars are lost, and both digestible energy and protein can be reduced. Weathering also decreases palatability and the amount of hay the animals will eat. Rain damage increases the amount of mould on hay in the swath, which can make it less palatable and unsuitable for the horse market.
Mechanical LossesAs forages cure, the leaves and small stems become more brittle. Any mechanical operation, such as raking or tedding, done on material having less than 40%
moisture causes leaf losses. Leaf losses increase as moisture content declines. If possible, rake when hay is moist. Leaf loss can be reduced by raking lower-moisture hay in the morning while dew is still present, slowing the speed of rotary rakes and turning a windrow with an invertor or merger. Tedders are more commonly used on grassier hay crops and can result in significant alfalfa leaf loss at lower moistures. Losses at the baler pick-up and in the baling chamber can be reduced by raking light windrows together at higher moisture and by traveling at maximum ground speed.
Potential Hay Harvesting LossesThe losses from haymaking that have been reported in research trials are summarized in Table 3–10, Potential haymaking losses.
Table 3–10. Potential haymaking lossesSource of Loss Loss of Dry Matter
Respiration 2%–16%
Cutting and conditioning 2%–5%
Raking 5%–25%
Baling small bales 3%–8%
Baling large bales 1%–15%
Transportation 1%–10%
Potential total loss 10%–71%
Raking and Swath ManipulationRotary rakes are considered the best to speed drying, leaving a uniform, fluffy swath. Originally designed to rake grasses, they can result in higher alfalfa leaf loss if not used properly. Rakes should be adjusted to minimize rotational speed relative to ground speed. Height off the ground should be properly adjusted so that the tines do not incorporate soil into the windrow, resulting in high ash, dusty hay. Wheel rakes can “rope” the windrow and do not leave the swath as fluffy, uniform, and open as a rotary rake, and can leave bunches that are slower to dry. Large wheel rakes have high capacity and are useful at bringing together multiple swaths into a single windrow in lower yielding fields, or for chopping in a haylage program.
Tedders are similar to rotary rakes in design, but widen the swath rather than narrowing it into a windrow. They are often used soon after cutting to widen the swath to full width without driving on it for faster drying. At lower moistures (<50%) they are better suited for grasses than alfalfa, where they may cause significant leaf loss.
94
Agronomy guide for field Crops
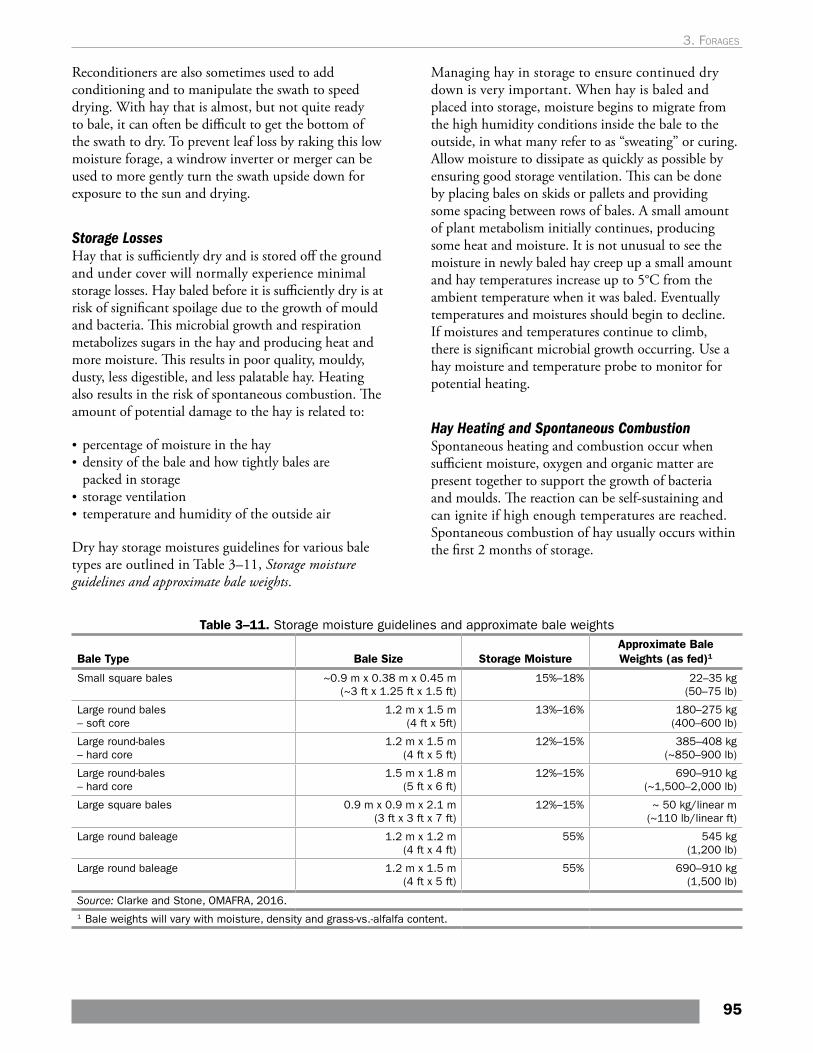
Reconditioners are also sometimes used to add conditioning and to manipulate the swath to speed drying. With hay that is almost, but not quite ready to bale, it can often be difficult to get the bottom of the swath to dry. To prevent leaf loss by raking this low moisture forage, a windrow inverter or merger can be used to more gently turn the swath upside down for exposure to the sun and drying.
Storage LossesHay that is sufficiently dry and is stored off the ground and under cover will normally experience minimal storage losses. Hay baled before it is sufficiently dry is at risk of significant spoilage due to the growth of mould and bacteria. This microbial growth and respiration metabolizes sugars in the hay and producing heat and more moisture. This results in poor quality, mouldy, dusty, less digestible, and less palatable hay. Heating also results in the risk of spontaneous combustion. The amount of potential damage to the hay is related to:
• percentage of moisture in the hay• density of the bale and how tightly bales are
packed in storage• storage ventilation• temperature and humidity of the outside air
Dry hay storage moistures guidelines for various bale types are outlined in Table 3–11, Storage moisture guidelines and approximate bale weights.
Managing hay in storage to ensure continued dry down is very important. When hay is baled and placed into storage, moisture begins to migrate from the high humidity conditions inside the bale to the outside, in what many refer to as “sweating” or curing. Allow moisture to dissipate as quickly as possible by ensuring good storage ventilation. This can be done by placing bales on skids or pallets and providing some spacing between rows of bales. A small amount of plant metabolism initially continues, producing some heat and moisture. It is not unusual to see the moisture in newly baled hay creep up a small amount and hay temperatures increase up to 5°C from the ambient temperature when it was baled. Eventually temperatures and moistures should begin to decline. If moistures and temperatures continue to climb, there is significant microbial growth occurring. Use a hay moisture and temperature probe to monitor for potential heating.
Hay Heating and Spontaneous CombustionSpontaneous heating and combustion occur when sufficient moisture, oxygen and organic matter are present together to support the growth of bacteria and moulds. The reaction can be self-sustaining and can ignite if high enough temperatures are reached. Spontaneous combustion of hay usually occurs within the first 2 months of storage.
Table 3–11. Storage moisture guidelines and approximate bale weights
Bale Type Bale Size Storage MoistureApproximate Bale Weights (as fed)1
Small square bales ~0.9 m x 0.38 m x 0.45 m (~3 ft x 1.25 ft x 1.5 ft)
15%–18% 22–35 kg (50–75 lb)
Large round bales – soft core
1.2 m x 1.5 m (4 ft x 5ft)
13%–16% 180–275 kg (400–600 lb)
Large round-bales – hard core
1.2 m x 1.5 m (4 ft x 5 ft)
12%–15% 385–408 kg (~850–900 lb)
Large round-bales – hard core
1.5 m x 1.8 m (5 ft x 6 ft)
12%–15% 690–910 kg (~1,500–2,000 lb)
Large square bales 0.9 m x 0.9 m x 2.1 m (3 ft x 3 ft x 7 ft)
12%–15% ~ 50 kg/linear m (~110 lb/linear ft)
Large round baleage 1.2 m x 1.2 m (4 ft x 4 ft)
55% 545 kg (1,200 lb)
Large round baleage 1.2 m x 1.5 m (4 ft x 5 ft)
55% 690–910 kg (1,500 lb)
Source: Clarke and Stone, OMAFRA, 2016.1 Bale weights will vary with moisture, density and grass-vs.-alfalfa content.
95
3. Forages
Usually, the first indication that the hay may be hot is the release of an odour similar to pipe tobacco and possibly steam rising from the mow. Hay temperatures can be monitored by using an electronic temperature/moisture probe. The following temperature guidelines can be used for monitoring hay mows:
• 65°C — Entering the danger zone. Take temperatures daily.
• 70°C — Danger! Inspect every 4 hours to see if the temperature is rising.
• 80°C — Fire pockets may form. Call the fire department.
• 100°C — Critical! In the presence of oxygen, ignition will take place.
See the OMAFRA Publication 837 Reducing the Risk of Fires on Your Farm at ontario.ca/crops for more information.
Propionate Hay PreservativesIn order to manage the risks of rain-damage or mouldy hay resulting from hay that is baled before it is sufficiently dry, many hay producers are using commercially available buffered propionate (propionic acid) products. Getting that last increment of drying required is often difficult. Preservatives are particularly useful with higher density bales, such as large squares, that need to be drier at baling to avoid mould growth.
Propionate inhibits aerobic mould growth and subsequent heating while the bales “sweat’ and “cure” down to safe moisture levels by dissipation and evaporation. Propionate hay preservatives should not be confused with enzyme, bacterial inoculant or nutritive additive products, which differ in modes of action and effectiveness. Hay preservative products are registered by the Canadian Food Inspection Agency (CFIA). Be sure to read the label, and follow application rates and directions. Propionate hay preservative products are now buffered to a pH of approximately 6.0, making them safer to use than the original unbuffered products. Products may also include acetic or citric acids. Treated hay is safe to feed to livestock. Propionate and acetate are organic acids that are also produced by microbes in the rumen (and the cecum and colon of horses) and then used by the animal as part of the digestion process.
Propionate preservative is sprayed onto hay as it enters the baler. Basic application systems include a tank, pump and nozzles. Adequate application rates according to moisture and bale type, and uniform coverage are
important. The moisture content at baling determines the amount of preservative required, so it is important that moisture content be measured accurately. There can be large moisture differences within a swath. This variation can lead to pockets of wet material that will be inadequately treated. In manual systems, hand-held moisture probes may not be accurate enough to fine tune the moisture variability and amount of preservative needed, so adjust the rate to maximum rather than average moisture content. Automated computerized application systems are available that include in-chamber moisture sensors that automatically adjust application rates. These systems are common on newer large square balers. Proper indoor storage (off the ground on pallets or a layer of old hay with adequate ventilation) is critical to allow moisture to quickly dissipate out of propionate treated bales while in storage.
Hay StorageAs land value and production costs of haymaking go up and the price of hay increases, it is becoming increasingly important to preserve the hay value by using proper hay storage. Spoilage losses of hay stored outside on the ground are staggering. If the capital cost of a hay storage structure is amortized over 15–20 years, the added cost of production is typically much less than the potential losses from improper storage. Even when hay bales are placed inside, directly on concrete or gravel floors, they will spoil as moisture condenses on the bottom. Bales should be stored off the ground, by placing them on pallets, old hay, etc.
Tarping large round bales outside that are off the ground will reduce spoilage losses compared to having no protection at all. In a 1.5 m (5 ft) round bale, 19% of the hay is in the outside 8 cm (3 in.) and 36% in the outside 15 cm (6 in.). Bales placed directly on the ground will absorb moisture and spoil significantly. Bales should be kept off the ground by placing them on pallets, crushed rock, etc. Situate outside storage on a well-drained site. Bale tarps can be notoriously difficult to keep in place in stormy weather. In addition, after baling, insufficient ventilation under the tarp prevents humidity from escaping and can slow and impair curing. To prevent spoilage, large and small square bales should be stored inside a structure.
Remove bales from fields quickly to prevent damage from rainfall, absorbing moisture from the ground, and to minimize traffic damage to forage regrowth from machinery. To preserve quality, large square bales should be moved from the field the same day they are made.
96
Agronomy guide for field Crops
Feeding LossesFeeding losses of dry hay can be quite significant, with losses greater than 50% when hay is fed to cattle on the ground without a feeder. Cone and ring feeders have less waste than trailer or cradle feeders. Balers with pre-chamber cutting knives reduce feeding waste as less hay is pulled out of the feeder and trampled. As hay production costs increase, properly designed hay feeders that reduce waste can easily pay for themselves.
Horse HayThe quality parameters for horse hay are quite different than for hay produced for cattle and sheep. Many horse owners determine the quality of hay primarily by a green colour that indicates the hay dried quickly and is free of mould, dust and weeds. Hay that is not adequately dry at baling will mould, which results in dusty hay that can cause significant respiratory problems in horses, as well as a risk of colic. Quality horse hay should not have been rained upon. Most horses do not require hay with high protein content, and many recreational horses have low energy requirements. A timothy-alfalfa mix is common. Horse hay can often be harvested later in the haying season when the plants are more mature, giving some flexibility in haying with less chance of being rained upon.
There is good market for horse hay in small square bales, as many horse owners do not have the equipment to handle large bales. There is also a quickly growing market for horse hay in large square bales for both domestic and export markets. Making quality horse hay in large square bales requires skills to ensure it is baled and stored dry enough to avoid mould and retain a green colour, but provides the advantage in increased capacity to produce much more volume of hay when the weather is suitable. More information on horse hay is available on the OMAFRA website at ontario.ca/crops.
Baleage (Large-Bale Haylage)Large-bale haylage, or “baleage,” produces a long-stem haylage by baling at higher moistures and wrapping the bales in plastic to make them anaerobic. While extra care is required to avoid mouldy feed, it is a flexible option for storing excellent-quality forage. Made correctly, baleage can be a very high nutrient quality, and palatable feed. By making baleage, a forage producer can be more aggressive and consistent in cutting schedules because it reduces the risk of
rain-damage within shorter harvest windows. Many producers use baleage as their main storage system, but it can also be a flexible second system when the weather doesn’t permit adequate drying or when the silos are full. Baleage makes use of existing hay equipment, such as large round and large square balers, and bale feeders. Heavier equipment and four-wheel-drive tractors may be required when handling the heavier bales.
The cost and disposal of the plastic are necessary considerations. The cost can usually be justified by the higher energy and protein value of the stored forage, reduced harvest losses, and the value of not requiring additional storage. Many municipalities offer bale wrap recycling programs. See the OMAFRA Factsheet Recycling Farm Plastic Films at ontario.ca/crops.
With baleage, there is less or incomplete fermentation relative to chopped haylage, and it does not have as low of a pH (a less acid environment). To prevent mould and spoilage, baleage relies on more of the forage being kept anaerobic (no oxygen) and requires covering it with adequate plastic. This results in less stable silage than conventional haylage. Storage time and length of time the bales are exposed to oxygen before feed-out should be adjusted to conditions.
Successful use of baleage involves the following management practices:
• Make firm, dense, uniform bales. Large squares are usually denser than rounds. Balers equipped with pre-chamber cutting knives produce bales that are denser.
• Bale at 40%–55% moisture. Too dry is preferable to too wet. Lower moisture baleage (25%–35% moisture) can work, particularly with large square bales, but are at a greater potential risk of spoilage. It is essential that bales are covered with additional plastic and kept “air tight”.
• Use enough plastic! Bales should be wrapped air-tight with a least 6 mils of plastic film. To ensure against tears, 8 mils or more is preferable, particularly with drier baleage.
• Wrap round bales within 2 hours of baling on hot days and within 4–12 hours at cooler temperatures. Large square bales are more forgiving of later wrapping.
• Avoid using hay that was rained on.• Do not incorporate soil into the windrow by
raking in contact with the ground. This can contaminate the forage with Clostridia bacteria
97
3. Forages
that will negatively affect fermentation. Avoid fields where manure has been applied since the previous cut.
• Avoid mature hay with low sugar content.• Early-cut grass is typically easier to make into
baleage than alfalfa.• Be sure to monitor and repair all tears and holes
in the plastic.
Haylage and Corn SilageStoring forage as hay-crop silage or “haylage,” has advantages over storing it as hay. These advantages include:
• lower harvest losses• greater capacity for a faster harvest of more acres• less dependence on good drying conditions, which
allows the crop to be cut at the desired maturity
Corn silage is a popular forage crop due to yield, palatability, high-energy density and single harvest convenience.
Silage Crop Storage Types The most common types of silage storage are:
• vertical (tower) silos: conventional, oxygen limiting (sealed)
• horizontal silos: bunker, piles, silage bags• large bale haylage (baleage)
When to Harvest Corn SilageHarvesting corn silage at the correct moisture is critical for feed quality. The best livestock performance and corn silage fermentation usually occur when whole plant moisture is 65%–70%. This corresponds well to horizontal and bag silos, but silage may have to be somewhat drier in tower silos to prevent seepage, see Maintain Correct Moisture Content.
Kernel Milk LineThe kernel “milk line” has been used in the past to determine when to harvest corn silage, but this method has limitations. The technique involves breaking a cob in half and looking at the kernels. After denting (0% milk line), a whitish line can be seen on the kernels. This line is where the solid and liquid parts of the kernel are separated while maturing and drying. This line will progress from the outer edge of the kernel to the cob. When this milk line reaches the cob (100% milk line), a black layer is visible. The traditional
standard has been to harvest between one-half to two-thirds milk line.
Corn plants severely stressed by dry weather without cobs do not have kernel milk lines to use as estimates, but are typically much higher moisture than they appear. Similarly, it can be difficult to accurately estimate whole-plant moisture from kernel milk lines in frost-damaged corn. Hybrid differences also affect the accuracy of using kernel milk line to estimate moisture level. Corn hybrids have varying degrees of “stay-green” characteristic. More stay-green means there is faster grain dry-down relative to stover dry-down. This is desired in a grain hybrid, because, as the grain dries, the stalk stays green and healthy, and is less likely to have broken stalks and lodge in late season. Some hybrids are designed only for use in silage and have less stay-green, so that the grain will have higher moisture relative to the whole plant. In other words, hybrids with higher stay-green ratings will have milk lines that are more advanced relative to whole plant moistures. Silage-only hybrids that have less stay-green characteristic will likely be ready to harvest at a less advanced milk line. Check with your seed company representative for historic milk line recommendations for estimating moisture levels in a given hybrid.
Measuring Percent MoistureThe most accurate method of determining when to harvest silage corn is to directly measure the moisture content.
1. Sample at least 10 plants from the field, avoiding the headlands. Watch for moisture variability within fields.
2. Chop a sample using a harvester or yard chipper. The finer the sample is chopped, the easier it will be to dry and the more accurate the result.
3. Use a commercial forage moisture tester, microwave or laboratory to determine the percentage of dry matter. Moisture testers and microwaves may not remove all the residual moisture in the sample and may underestimate the moisture level by about 2%–3%. The most accurate option is to send a sample overnight delivery to a forage laboratory for oven drying.
Shortly after denting, when the milk line is about 20%, whole plant moisture can be determined. In a typical year, corn silage at this stage dries approximately 0.5% per day. Therefore, if the
98
Agronomy guide for field Crops
sample was 70% moisture, and 65% moisture is the target, harvest should be done about 10 days after the corn was sampled. In dry years, the drying rate will be more rapid; in wetter years, the drying rate will be slower. Moistures can be checked again closer to harvest if necessary.
Calculating approximate days to reach target moisture: 70% current moisture – 65% target moisture = 5% ÷ 0.5% drying/day = 10 days
Silage Fermentation When forage is first put into a silo, conditions are aerobic (oxygen is present in the silage). Plant respiration and aerobic bacteria convert carbohydrates into carbon dioxide, water and heat, and use up the oxygen present. This phase should be as short as possible.
The silage then becomes anaerobic (without oxygen). The growth of anaerobic bacteria ferments sugars to organic acids (primarily lactic and acetic acid) and other products, including carbon dioxide, heat and water. This biological conversion from fresh plant material to fermented silage also results in the “shrink” or fermentation losses of dry matter and energy. A fast, efficient fermentation that is dominated by lactic acid bacteria (LAB) producing primarily lactic acid, reduces these losses to a minimum. In 2–4 weeks, the silage reaches a stable pH of 3.8–4.5, and all bacterial and enzymatic activity stops. Once this stable pH has been reached, further breakdown of nutrients and spoilage is prevented, and the silage will keep for extended periods of time, provided air (specifically oxygen) is excluded.
Silage Storage LossesRespiration LossesWhen plants are harvested and ensiled, the plant cell respiration continues, resulting in a breakdown of sugars and other carbohydrates. Faster wilting and silo filling minimizes these losses.
Fermentation LossesGood silage management is aimed at minimizing this potentially significant loss in dry matter and energy, commonly known as “shrink”. This reduces both yield and nutrient quality. A poor or extended fermentation results from the following factors and will increase losses:
• slow filling • poor packing • poor covering • improper harvest moisture, or • lack of a suitable LAB inoculant
Seepage LossesWhen excessively wet material is put into a silo, moisture can “squeeze” from the silage. The seepage carries sugars and other nutrients out of the silo. In addition, seepage can lead to excessive corrosion of the silo walls and result in the possible collapse of the silo. Silo seepage can also lead to fish kills if it enters a watercourse, see the OMAFRA Factsheet, How to Handle Seepage From Farm Silos at ontario.ca/crops.
HeatingHeating causes plant sugars and proteins to combine and form indigestible compounds. This results in a “toasting” or browning of the silage and reduced protein digestibility. In extreme cases, because the silage is too dry or a continuous supply of air is getting into the silage, spontaneous combustion can lead to a silo fire. Such fires can happen at any time of the year and are almost impossible to extinguish.
Surface SpoilageCovering and sealing horizontal silos quickly is essential to avoid spoilage and dry matter loss from both oxygen exposure (the growth of yeast, moulds and aerobic bacteria) and rainfall that washes organic acids and soluble nutrients from the silage. Dry matter losses can be 30% or more with an uncovered silo.
Feed-Out LossesWhen a silo is opened to remove feed, there can be significant further losses of dry matter and feed nutrient value, as well as spoiled feed. These losses are caused by moulds and yeast that become active in the silage when it is again exposed to oxygen. Secondary losses can occur at the silo surface and in the bunk while being fed. Minimizing the time exposed to oxygen by proper face management and feed-out rates is important.
Recommended Silage Management PracticesMaintain Correct Moisture Content • conventional upright silos: 60%–65%• horizontal silos: 60%–70% • oxygen-limiting silos: 50%–60%• bag silos: 60%–70%• wrapped large bale haylage: 40%–55%
99
3. Forages
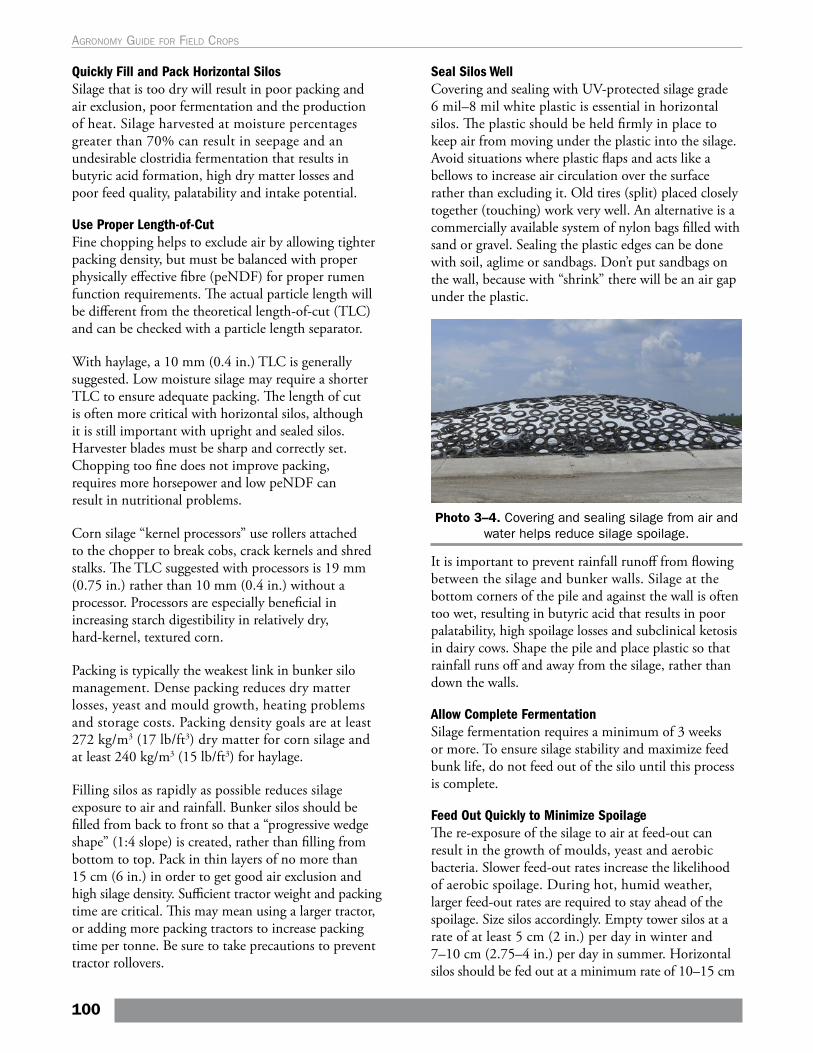
Quickly Fill and Pack Horizontal SilosSilage that is too dry will result in poor packing and air exclusion, poor fermentation and the production of heat. Silage harvested at moisture percentages greater than 70% can result in seepage and an undesirable clostridia fermentation that results in butyric acid formation, high dry matter losses and poor feed quality, palatability and intake potential.
Use Proper Length-of-Cut Fine chopping helps to exclude air by allowing tighter packing density, but must be balanced with proper physically effective fibre (peNDF) for proper rumen function requirements. The actual particle length will be different from the theoretical length-of-cut (TLC) and can be checked with a particle length separator.
With haylage, a 10 mm (0.4 in.) TLC is generally suggested. Low moisture silage may require a shorter TLC to ensure adequate packing. The length of cut is often more critical with horizontal silos, although it is still important with upright and sealed silos. Harvester blades must be sharp and correctly set. Chopping too fine does not improve packing, requires more horsepower and low peNDF can result in nutritional problems.
Corn silage “kernel processors” use rollers attached to the chopper to break cobs, crack kernels and shred stalks. The TLC suggested with processors is 19 mm (0.75 in.) rather than 10 mm (0.4 in.) without a processor. Processors are especially beneficial in increasing starch digestibility in relatively dry, hard-kernel, textured corn.
Packing is typically the weakest link in bunker silo management. Dense packing reduces dry matter losses, yeast and mould growth, heating problems and storage costs. Packing density goals are at least 272 kg/m3 (17 lb/ft3) dry matter for corn silage and at least 240 kg/m3 (15 lb/ft3) for haylage.
Filling silos as rapidly as possible reduces silage exposure to air and rainfall. Bunker silos should be filled from back to front so that a “progressive wedge shape” (1:4 slope) is created, rather than filling from bottom to top. Pack in thin layers of no more than 15 cm (6 in.) in order to get good air exclusion and high silage density. Sufficient tractor weight and packing time are critical. This may mean using a larger tractor, or adding more packing tractors to increase packing time per tonne. Be sure to take precautions to prevent tractor rollovers.
Seal Silos Well Covering and sealing with UV-protected silage grade 6 mil–8 mil white plastic is essential in horizontal silos. The plastic should be held firmly in place to keep air from moving under the plastic into the silage. Avoid situations where plastic flaps and acts like a bellows to increase air circulation over the surface rather than excluding it. Old tires (split) placed closely together (touching) work very well. An alternative is a commercially available system of nylon bags filled with sand or gravel. Sealing the plastic edges can be done with soil, aglime or sandbags. Don’t put sandbags on the wall, because with “shrink” there will be an air gap under the plastic.
Photo 3–4. Covering and sealing silage from air and water helps reduce silage spoilage.
It is important to prevent rainfall runoff from flowing between the silage and bunker walls. Silage at the bottom corners of the pile and against the wall is often too wet, resulting in butyric acid that results in poor palatability, high spoilage losses and subclinical ketosis in dairy cows. Shape the pile and place plastic so that rainfall runs off and away from the silage, rather than down the walls.
Allow Complete FermentationSilage fermentation requires a minimum of 3 weeks or more. To ensure silage stability and maximize feed bunk life, do not feed out of the silo until this process is complete.
Feed Out Quickly to Minimize SpoilageThe re-exposure of the silage to air at feed-out can result in the growth of moulds, yeast and aerobic bacteria. Slower feed-out rates increase the likelihood of aerobic spoilage. During hot, humid weather, larger feed-out rates are required to stay ahead of the spoilage. Size silos accordingly. Empty tower silos at a rate of at least 5 cm (2 in.) per day in winter and 7–10 cm (2.75–4 in.) per day in summer. Horizontal silos should be fed out at a minimum rate of 10–15 cm
100
Agronomy guide for field Crops
(4–6 in.) per day, depending on the season. Feed-out rates may have to be twice that in hot summer weather to avoid significant spoilage. Feeding mouldy silage is not recommended because it reduces intake and can cause nutritional problems.
Manage Silage Face to Minimize SpoilageThe silage face should remain tight and smooth to limit the penetration of air. Block cutters or shear buckets are excellent options. Avoid fracturing the silo face by running at it with a front-end loader and using a lifting action. Minimize fracturing by scraping down the face with the front-end loader and allowing the silage to fall to the floor. Uncover and loosen only as much silage as is required.
Silage InoculantsSilage inoculants are used to manipulate and enhance fermentation in haylage (alfalfa, grass, cereals), corn silage and high moisture corn. These inoculants contain “homofermentative” lactic acid producing bacteria (LAB) and other bacteria, such as Lactobacillus buchneri. The goals are faster, more efficient fermentation with reduced fermentation losses, improved forage quality and palatability, longer bunk life, and improvements in animal performance.
Species and specific strains of bacteria in commercial inoculants have been selected to grow rapidly and efficiently, increasing the fermentation rate with a more rapid decline in pH. Reduced fermentation losses are the result of a more efficient fermentation to lactic acid, with less acetic acid and ethanol, and less carbon dioxide produced that is lost to the environment. Assuming that if fermentation dry matter losses are reduced by a modest 3%, an inoculant could easily pay for itself by reduced shrink alone, before potential improvement in animal performance and bunk life are even considered.
LAB inoculants are typically more successful in alfalfa and grass silage, than in corn silage. Corn silage has a higher sugar content and lower buffering capacity, allowing an easier fermentation. While most corn plants at harvest time are covered in naturally occurring LAB, corn silage harvested after a killing frost should benefit from using an inoculant.
Corn silage inoculants containing both LAB and Lactobacillus buchneri are “heterofermentative.” These produce lactic acid earlier in the fermentation to reduce fermentation losses, and then acetic acid later in the
fermentation to improve aerobic stability by staying fresher longer at feedout. The acetic acid reduces the growth of yeasts and makes the silage more resistant to spoilage and heating at feed out. In situations where spoilage at feedout is an issue, the use of Lactobacillus buchneri inoculant on corn silage may result in less mould and mycotoxins, improved palatability and intake, and reduced total dry matter losses.
Enzyme additives are sometimes included in some inoculant products, including cellulases, hemicellulases and amylases to help break down cellulose, hemicellulose and starch. Research results are mixed and inclusion rates need to be sufficient for desired results. Some newer inoculants contain bacteria that have been selected to produce their own enzymes to improve fibre digestibility and subsequent digestible energy and intake.
Forage additives, including silage inoculants, must be registered with the Canadian Food Inspection Agency (CFIA) to be sold in Canada. Ask company representatives to provide independent research that substantiates the claims for the product, and for product quality control assurances. It is important that the product is labelled for the crop being ensiled, and that directions for storage and use are followed. The application of a silage inoculant will not overcome the effects of poor silage management or poor weather conditions.
Common Silage Problems, Causes & DiagnosisCommon Silage Problems• Rancid, Fishy Odour A rancid, fishy odour is butyric acid resulting from
clostridia contamination from soil. Clostridia silage can result from cutting or raking too close to the ground, soil from packing tractor tires, “splash” from rain, or manure applied too late after the previous cutting. Butyric acid also commonly results from silage that is too wet (>70% moisture). As well as its foul odour, this silage sometimes has a slimy, sticky texture that clump into “butryic balls”. Fermentation losses are high, so ADF levels are high and protein is degraded. Palatability, intake, and digestible energy are low, and livestock performance is poor.
• Mouldy With A Musty Odour Mouldy silage results in high dry matter losses, as
well as poor palatability and livestock performance. This spoilage is the result of aerobic (oxygen) conditions from poor packing, slow filling, low moistures, poor sealing, slow feedout, or poor face management. If the silage is still hot, microbial activity and spoilage is still underway.
101
3. Forages
• Vinegar Odour A vinegar odour indicates acetic acid. Too much
acetic acid relative to lactic acid means the fermentation was less than optimally efficient, and possibly could have benefited from a commercial lactic acid bacteria (LAB) inoculant.
• Sweet Odour A sweet smell is likely high concentrations of ethanol
produced by spoilage yeasts, mixed with acetic acid. Fermentation losses were likely high and this silage will be prone to heating and spoiling in the bunk. Desirable lactic acid has little smell.
• Ammonia Odour An ammonia odour indicates excessive protein
breakdown to ammonia and amines, which could be due to a clostridia fermentation or high pH.
• Caramelized Odour The caramelized odour indicates heat damaged
haylage which is dark in colour with a tobacco-like odour. In severe cases it can smell burnt. It is the result of forage that is too dry. Protein becomes bound and is less digestible. ADF-N (unavailable nitrogen) can be measured in a laboratory.
Fermentation AnalysisA newer technology used in silage problem-solving is fermentation analysis. It objectively quantifies what people subjectively see and smell. This can be especially useful when poor livestock performance cannot be explained by nutrient analysis. Typical fermentation end product concentrations are listed in Table 3–12, Typical levels of silage fermentation end-products (dry matter basis).
Fermentation end-product concentration varies in different types of silage and includes:
1. High pHA high pH indicates a poor or restricted fermentation that will be less stable and result
in poor bunk life and more spoilage at feeding. Legume haylage has a higher buffering capacity than grass haylage and corn silage, and usually has a higher pH.
2. Low Lactic AcidLactic acid should be greater than 65%–70% of the total silage acids, with a lactic/acetic acid ratio of at least 3:1. Lactic acid is the most effective in lowering pH.
3. High Acetic AcidAcetic acid levels greater than 3%–4% can result from poor fermentations, especially if lactic acid levels are significantly low. Buchneri inoculants are sometimes added to corn silage and high moisture corn to produce acetic acid late in the fermentation to improve bunk life. This should not be mistaken for poor fermentation.
4. High EthanolHigh ethanol indicates yeast that reduces dry matter recovery and makes the silage more prone to mould and feedout spoilage.
5. High Ammonia-NThis indicates excessive protein breakdown and possibly excess ruminally degraded protein. Levels greater than 12%–15% can be a problem.
6. Butyric AcidButyric acid in forages reduces quality. If butyric acid is accompanied by high percent moisture and/or high ash content, then this will determine what management issues need to be corrected. In the silo, butyric acid results in high losses of dry matter and digestible energy. In the ruminant it results in poor intakes and metabolic problems. If possible, silage high in butyric acid should be discarded. Dr. Gary Oetzel, University of Wisconsin, suggests
Table 3–12. Typical levels of silage fermentation end-products (dry matter basis)
Fermentation End Products Corn Silage Legume Haylage >65% moisture
Legume Haylage <55% moisture Grass Haylage
pH 3.7–4.2 4.3–4.5 4.7–5.0 4.3–4.7
lactic acid % 4–7 7–8 2–4 6–10
acetic acid % 1–3 2–3 0.5–2.0 1–3
propionic acid % <0.1 <0.5 <0.1 <0.1
butyric acid % 0 <0.5 0 0.5–1.0
ethanol % 1–3 0.5–1.0 0.5 0.5–1.0
ammonia-N (% of CP) 5–7 10–15 <12 8–12
Source: Dr Limin Kung, University of Delaware.
102
Agronomy guide for field Crops
the following butyric acid daily limits to prevent off-feed and ketosis in dairy cows:
• fresh cows – <50 grams• early lactation – <150 grams• all other lactating cows – <250 grams
• Also ventilate the silo room and chute. • Post appropriate warning signs.• Keep people and animals away.
For more information on preventing injury or death from silo gas, refer to:
Silo Safety — Workplace Safety and Prevention Services at www.wsps.ca.
See the OMAFRA Factsheet, Hazardous Gases on Agricultural Operations at ontario.ca/crops.
Other Crop ProblemsInsects and DiseaseSevere infestations of disease and insects that result in reduced stand vigour, reduced root reserves and slow regrowth will increase the risk of winterkill. Potato leafhopper control can be important in reducing winterkill, particularly in the seeding year. See Chapter 15, Insects and Pests of Field Crops, Potato Leafhopper.
Figure 3–3, Forage scouting calendar, shows insects and diseases that could be causing the symptoms in the field. Individual descriptions of insects and diseases, scouting and management strategies can be found in Chapter 15, Insects and Pests of Field Crops, and Chapter 16, Diseases of Field Crops.
Silo GasProducers exposed to silo gas (nitrogen dioxide or NO2) are at risk of severe respiratory distress, permanent damage to lungs, and even sudden death. It is difficult to predict when silo gas will be produced, so always take precautions following harvest. Weather conditions and agronomic practices affect the amount of nitrates in plant material, which sets the stage for the production of NO2 in the silo. For example, a dry period during the growing season followed by abundant rainfall will encourage a corn crop to take up high levels of dissolved nitrates. If the corn is harvested before the nitrates can be converted to proteins, nitrogen dioxide is produced.
Silo gas is produced almost immediately after filling a silo. The greatest risk is the first 12–60 hours after filling the silo, and then risk declines for approximately 4–6 weeks until silage fermentation is complete. Silo gas has a bleach-like odour and may be visible as a reddish-brown haze. However, it is not always visible. Nitrogen dioxide is heavier than air; therefore, it tends to be located just above the silage surface. It may flow down tower silo chutes and into feed rooms. Tower silos are at greater risk because the silo gas is contained at the silage surface level, and operators often enter the silo after filling to level silage and set up the unloader.
When inhaled, nitrogen dioxide mixes with body moisture to form nitric acid, which causes severe burning of the lungs and the rest of the respiratory system. Pulmonary edema often occurs resulting in victims collapsing. Other people can also be overcome when they attempt a rescue. Producers exposed to silo gas should get immediate medical attention.
When entering a silo:
• Do not enter a silo during the risk period without wearing an appropriate self-contained breathing apparatus.
• Before entering the silo, ventilate it by running the forage blower for 30 minutes and leave it running while inside.
103
3. Forages
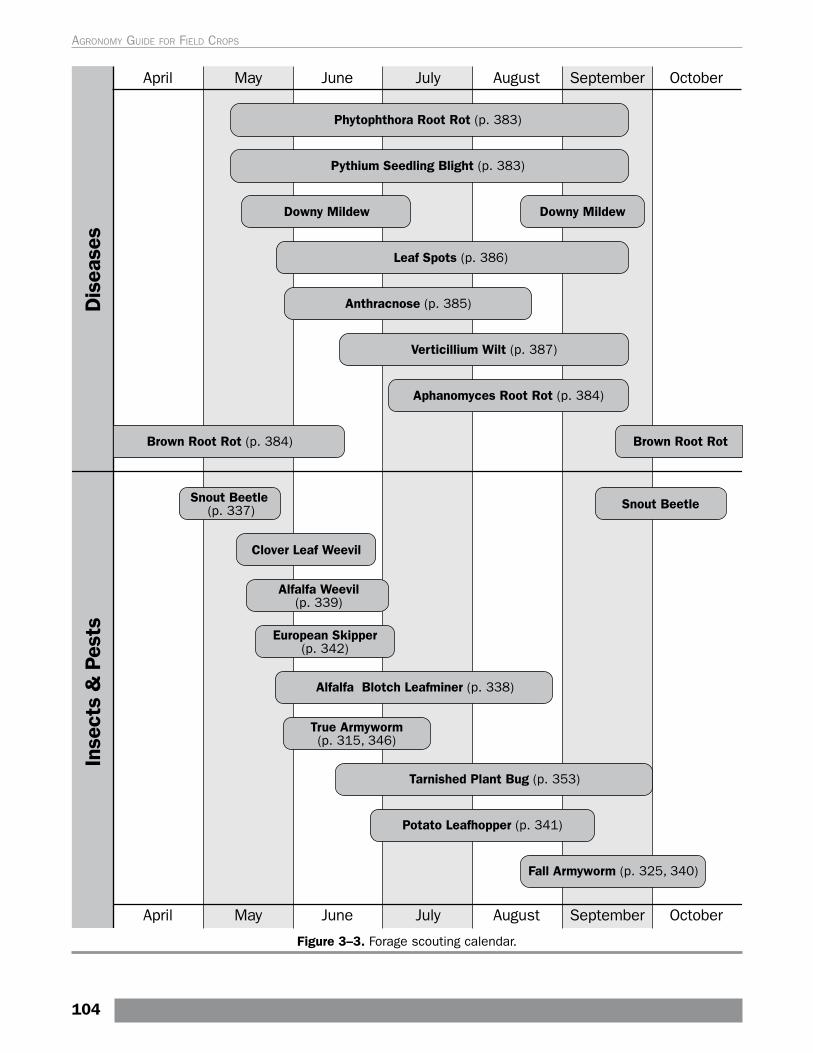
Figure 3–3. Forage scouting calendar.
104
Agronomy guide for field Crops
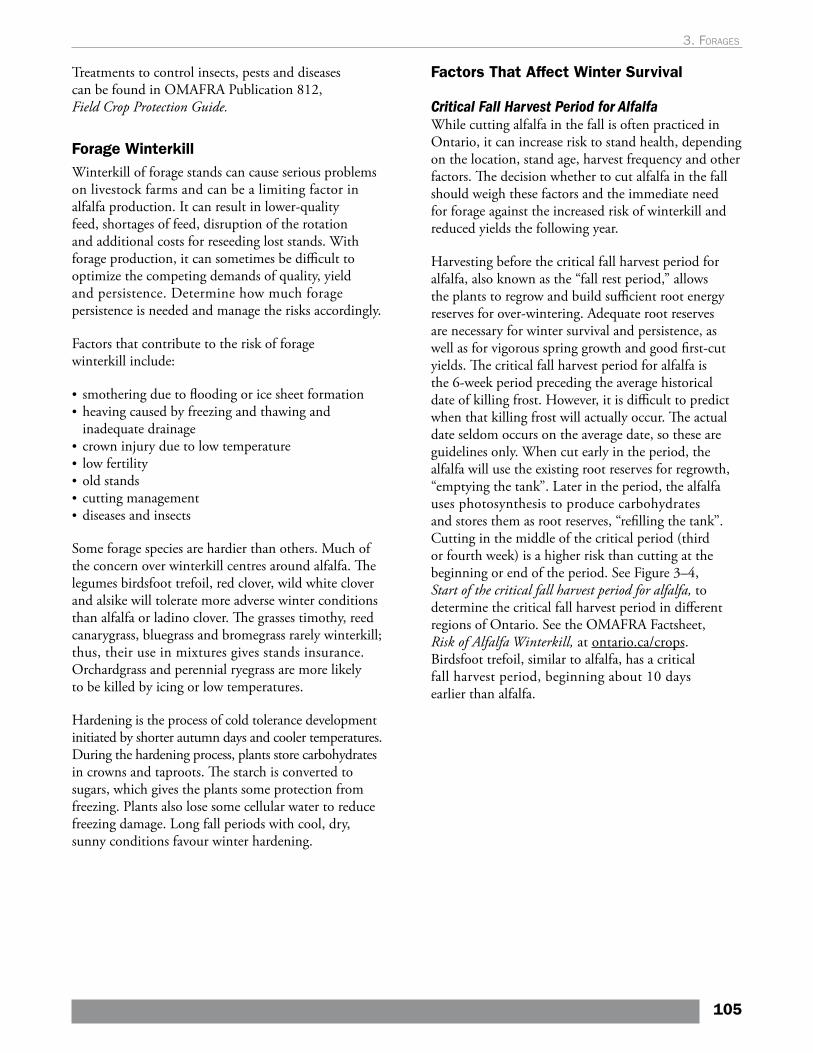
Treatments to control insects, pests and diseases can be found in OMAFRA Publication 812, Field Crop Protection Guide.
Forage WinterkillWinterkill of forage stands can cause serious problems on livestock farms and can be a limiting factor in alfalfa production. It can result in lower-quality feed, shortages of feed, disruption of the rotation and additional costs for reseeding lost stands. With forage production, it can sometimes be difficult to optimize the competing demands of quality, yield and persistence. Determine how much forage persistence is needed and manage the risks accordingly.
Factors that contribute to the risk of forage winterkill include:
• smothering due to flooding or ice sheet formation• heaving caused by freezing and thawing and
inadequate drainage• crown injury due to low temperature• low fertility• old stands• cutting management• diseases and insects
Some forage species are hardier than others. Much of the concern over winterkill centres around alfalfa. The legumes birdsfoot trefoil, red clover, wild white clover and alsike will tolerate more adverse winter conditions than alfalfa or ladino clover. The grasses timothy, reed canarygrass, bluegrass and bromegrass rarely winterkill; thus, their use in mixtures gives stands insurance. Orchardgrass and perennial ryegrass are more likely to be killed by icing or low temperatures.
Hardening is the process of cold tolerance development initiated by shorter autumn days and cooler temperatures. During the hardening process, plants store carbohydrates in crowns and taproots. The starch is converted to sugars, which gives the plants some protection from freezing. Plants also lose some cellular water to reduce freezing damage. Long fall periods with cool, dry, sunny conditions favour winter hardening.
Factors That Affect Winter Survival
Critical Fall Harvest Period for AlfalfaWhile cutting alfalfa in the fall is often practiced in Ontario, it can increase risk to stand health, depending on the location, stand age, harvest frequency and other factors. The decision whether to cut alfalfa in the fall should weigh these factors and the immediate need for forage against the increased risk of winterkill and reduced yields the following year.
Harvesting before the critical fall harvest period for alfalfa, also known as the “fall rest period,” allows the plants to regrow and build sufficient root energy reserves for over-wintering. Adequate root reserves are necessary for winter survival and persistence, as well as for vigorous spring growth and good first-cut yields. The critical fall harvest period for alfalfa is the 6-week period preceding the average historical date of killing frost. However, it is difficult to predict when that killing frost will actually occur. The actual date seldom occurs on the average date, so these are guidelines only. When cut early in the period, the alfalfa will use the existing root reserves for regrowth, “emptying the tank”. Later in the period, the alfalfa uses photosynthesis to produce carbohydrates and stores them as root reserves, “refilling the tank”. Cutting in the middle of the critical period (third or fourth week) is a higher risk than cutting at the beginning or end of the period. See Figure 3–4, Start of the critical fall harvest period for alfalfa, to determine the critical fall harvest period in different regions of Ontario. See the OMAFRA Factsheet, Risk of Alfalfa Winterkill, at ontario.ca/crops. Birdsfoot trefoil, similar to alfalfa, has a critical fall harvest period, beginning about 10 days earlier than alfalfa.
105
3. Forages
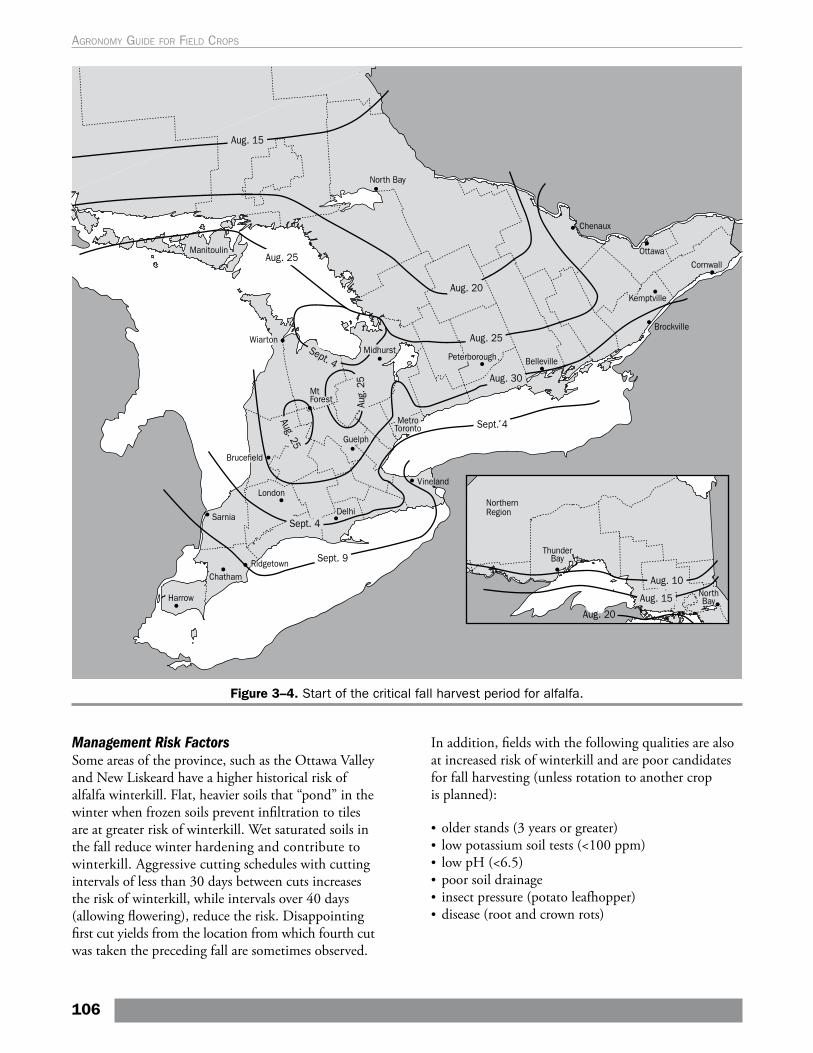
Figure 3–4. Start of the critical fall harvest period for alfalfa.
Management Risk FactorsSome areas of the province, such as the Ottawa Valley and New Liskeard have a higher historical risk of alfalfa winterkill. Flat, heavier soils that “pond” in the winter when frozen soils prevent infiltration to tiles are at greater risk of winterkill. Wet saturated soils in the fall reduce winter hardening and contribute to winterkill. Aggressive cutting schedules with cutting intervals of less than 30 days between cuts increases the risk of winterkill, while intervals over 40 days (allowing flowering), reduce the risk. Disappointing first cut yields from the location from which fourth cut was taken the preceding fall are sometimes observed.
In addition, fields with the following qualities are also at increased risk of winterkill and are poor candidates for fall harvesting (unless rotation to another crop is planned):
• older stands (3 years or greater)• low potassium soil tests (<100 ppm)• low pH (<6.5)• poor soil drainage• insect pressure (potato leafhopper)• disease (root and crown rots)
106
Agronomy guide for field Crops
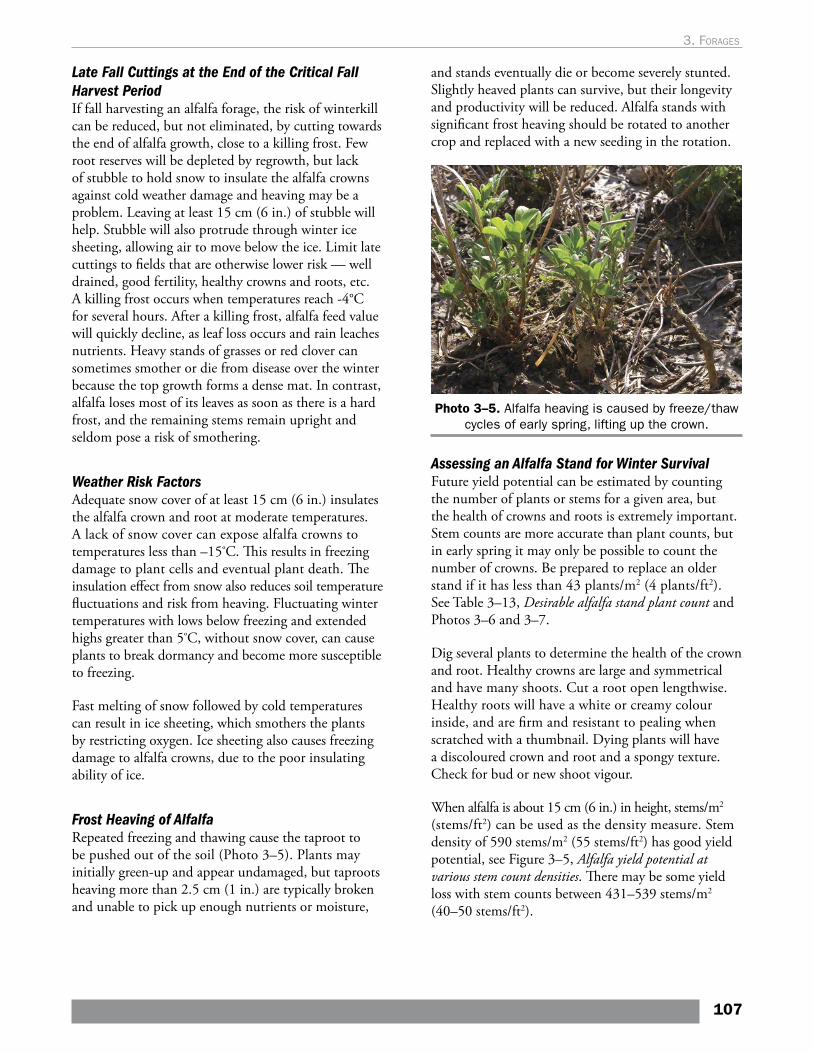
Late Fall Cuttings at the End of the Critical Fall Harvest PeriodIf fall harvesting an alfalfa forage, the risk of winterkill can be reduced, but not eliminated, by cutting towards the end of alfalfa growth, close to a killing frost. Few root reserves will be depleted by regrowth, but lack of stubble to hold snow to insulate the alfalfa crowns against cold weather damage and heaving may be a problem. Leaving at least 15 cm (6 in.) of stubble will help. Stubble will also protrude through winter ice sheeting, allowing air to move below the ice. Limit late cuttings to fields that are otherwise lower risk — well drained, good fertility, healthy crowns and roots, etc. A killing frost occurs when temperatures reach -4°C for several hours. After a killing frost, alfalfa feed value will quickly decline, as leaf loss occurs and rain leaches nutrients. Heavy stands of grasses or red clover can sometimes smother or die from disease over the winter because the top growth forms a dense mat. In contrast, alfalfa loses most of its leaves as soon as there is a hard frost, and the remaining stems remain upright and seldom pose a risk of smothering.
Weather Risk FactorsAdequate snow cover of at least 15 cm (6 in.) insulates the alfalfa crown and root at moderate temperatures. A lack of snow cover can expose alfalfa crowns to temperatures less than –15ºC. This results in freezing damage to plant cells and eventual plant death. The insulation effect from snow also reduces soil temperature fluctuations and risk from heaving. Fluctuating winter temperatures with lows below freezing and extended highs greater than 5ºC, without snow cover, can cause plants to break dormancy and become more susceptible to freezing.
Fast melting of snow followed by cold temperatures can result in ice sheeting, which smothers the plants by restricting oxygen. Ice sheeting also causes freezing damage to alfalfa crowns, due to the poor insulating ability of ice.
Frost Heaving of AlfalfaRepeated freezing and thawing cause the taproot to be pushed out of the soil (Photo 3–5). Plants may initially green-up and appear undamaged, but taproots heaving more than 2.5 cm (1 in.) are typically broken and unable to pick up enough nutrients or moisture,
and stands eventually die or become severely stunted. Slightly heaved plants can survive, but their longevity and productivity will be reduced. Alfalfa stands with significant frost heaving should be rotated to another crop and replaced with a new seeding in the rotation.
Photo 3–5. Alfalfa heaving is caused by freeze/thaw cycles of early spring, lifting up the crown.
Assessing an Alfalfa Stand for Winter SurvivalFuture yield potential can be estimated by counting the number of plants or stems for a given area, but the health of crowns and roots is extremely important. Stem counts are more accurate than plant counts, but in early spring it may only be possible to count the number of crowns. Be prepared to replace an older stand if it has less than 43 plants/m2 (4 plants/ft2). See Table 3–13, Desirable alfalfa stand plant count and Photos 3–6 and 3–7.
Dig several plants to determine the health of the crown and root. Healthy crowns are large and symmetrical and have many shoots. Cut a root open lengthwise. Healthy roots will have a white or creamy colour inside, and are firm and resistant to pealing when scratched with a thumbnail. Dying plants will have a discoloured crown and root and a spongy texture. Check for bud or new shoot vigour.
When alfalfa is about 15 cm (6 in.) in height, stems/m2 (stems/ft2) can be used as the density measure. Stem density of 590 stems/m2 (55 stems/ft2) has good yield potential, see Figure 3–5, Alfalfa yield potential at various stem count densities. There may be some yield loss with stem counts between 431–539 stems/m2 (40–50 stems/ft2).
107
3. Forages
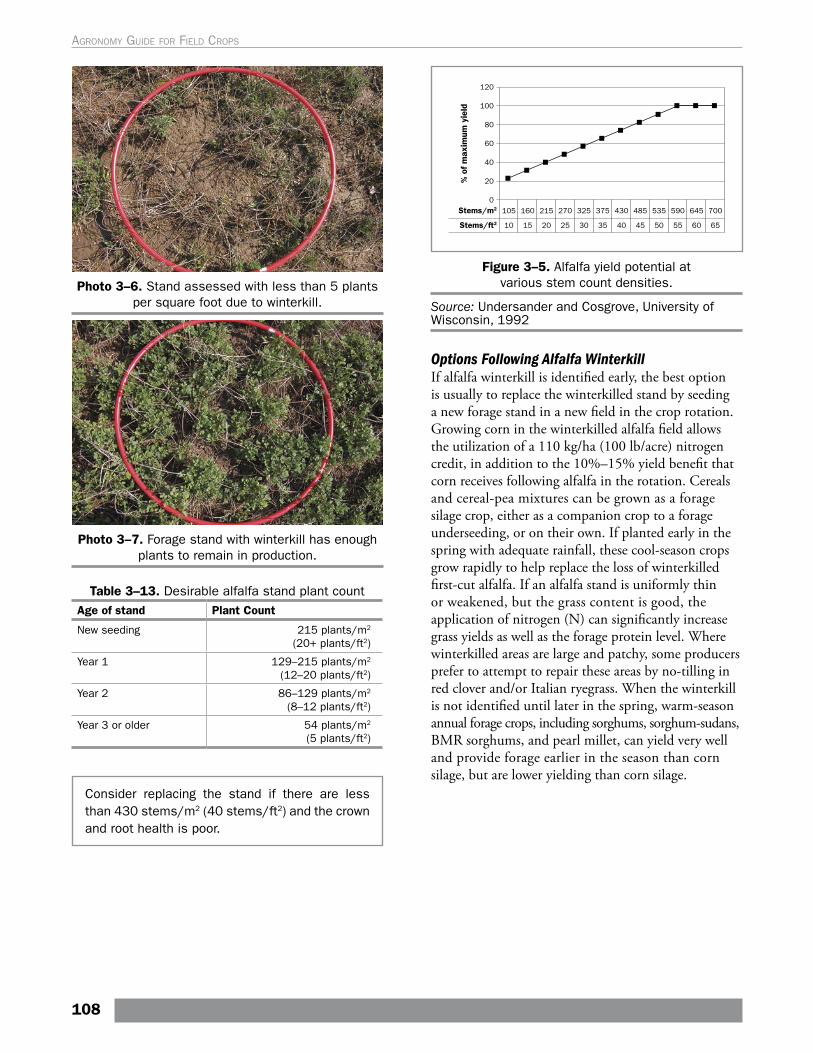
Photo 3–6. Stand assessed with less than 5 plants per square foot due to winterkill.
Photo 3–7. Forage stand with winterkill has enough plants to remain in production.
Table 3–13. Desirable alfalfa stand plant countAge of stand Plant Count
New seeding 215 plants/m2 (20+ plants/ft2)
Year 1 129–215 plants/m2 (12–20 plants/ft2)
Year 2 86–129 plants/m2 (8–12 plants/ft2)
Year 3 or older 54 plants/m2 (5 plants/ft2)
Consider replacing the stand if there are less than 430 stems/m2 (40 stems/ft2) and the crown and root health is poor.
Figure 3–5. Alfalfa yield potential at various stem count densities.
Source: Undersander and Cosgrove, University of Wisconsin, 1992
Options Following Alfalfa WinterkillIf alfalfa winterkill is identified early, the best option is usually to replace the winterkilled stand by seeding a new forage stand in a new field in the crop rotation. Growing corn in the winterkilled alfalfa field allows the utilization of a 110 kg/ha (100 lb/acre) nitrogen credit, in addition to the 10%–15% yield benefit that corn receives following alfalfa in the rotation. Cereals and cereal-pea mixtures can be grown as a forage silage crop, either as a companion crop to a forage underseeding, or on their own. If planted early in the spring with adequate rainfall, these cool-season crops grow rapidly to help replace the loss of winterkilled first-cut alfalfa. If an alfalfa stand is uniformly thin or weakened, but the grass content is good, the application of nitrogen (N) can significantly increase grass yields as well as the forage protein level. Where winterkilled areas are large and patchy, some producers prefer to attempt to repair these areas by no-tilling in red clover and/or Italian ryegrass. When the winterkill is not identified until later in the spring, warm-season annual forage crops, including sorghums, sorghum-sudans, BMR sorghums, and pearl millet, can yield very well and provide forage earlier in the season than corn silage, but are lower yielding than corn silage.
108
Agronomy guide for field Crops
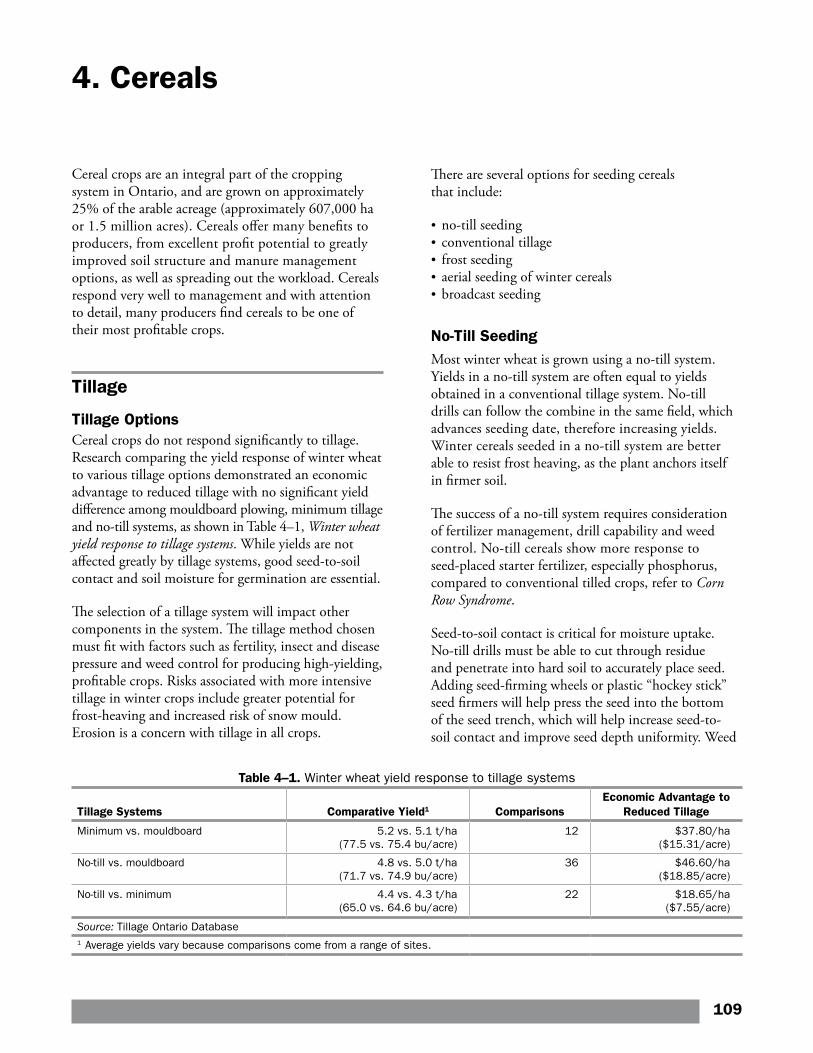
4. Cereals
Cereal crops are an integral part of the cropping system in Ontario, and are grown on approximately 25% of the arable acreage (approximately 607,000 ha or 1.5 million acres). Cereals offer many benefits to producers, from excellent profit potential to greatly improved soil structure and manure management options, as well as spreading out the workload. Cereals respond very well to management and with attention to detail, many producers find cereals to be one of their most profitable crops.
Tillage
Tillage OptionsCereal crops do not respond significantly to tillage. Research comparing the yield response of winter wheat to various tillage options demonstrated an economic advantage to reduced tillage with no significant yield difference among mouldboard plowing, minimum tillage and no-till systems, as shown in Table 4–1, Winter wheat yield response to tillage systems. While yields are not affected greatly by tillage systems, good seed-to-soil contact and soil moisture for germination are essential.
The selection of a tillage system will impact other components in the system. The tillage method chosen must fit with factors such as fertility, insect and disease pressure and weed control for producing high-yielding, profitable crops. Risks associated with more intensive tillage in winter crops include greater potential for frost-heaving and increased risk of snow mould. Erosion is a concern with tillage in all crops.
There are several options for seeding cereals that include:
• no-till seeding• conventional tillage• frost seeding• aerial seeding of winter cereals• broadcast seeding
No-Till SeedingMost winter wheat is grown using a no-till system. Yields in a no-till system are often equal to yields obtained in a conventional tillage system. No-till drills can follow the combine in the same field, which advances seeding date, therefore increasing yields. Winter cereals seeded in a no-till system are better able to resist frost heaving, as the plant anchors itself in firmer soil.
The success of a no-till system requires consideration of fertilizer management, drill capability and weed control. No-till cereals show more response to seed-placed starter fertilizer, especially phosphorus, compared to conventional tilled crops, refer to Corn Row Syndrome.
Seed-to-soil contact is critical for moisture uptake. No-till drills must be able to cut through residue and penetrate into hard soil to accurately place seed. Adding seed-firming wheels or plastic “hockey stick” seed firmers will help press the seed into the bottom of the seed trench, which will help increase seed-to-soil contact and improve seed depth uniformity. Weed
Table 4–1. Winter wheat yield response to tillage systems
Tillage Systems Comparative Yield1 ComparisonsEconomic Advantage to
Reduced Tillage
Minimum vs. mouldboard 5.2 vs. 5.1 t/ha (77.5 vs. 75.4 bu/acre)
12 $37.80/ha ($15.31/acre)
No-till vs. mouldboard 4.8 vs. 5.0 t/ha (71.7 vs. 74.9 bu/acre)
36 $46.60/ha ($18.85/acre)
No-till vs. minimum 4.4 vs. 4.3 t/ha (65.0 vs. 64.6 bu/acre)
22 $18.65/ha ($7.55/acre)
Source: Tillage Ontario Database1 Average yields vary because comparisons come from a range of sites.
109
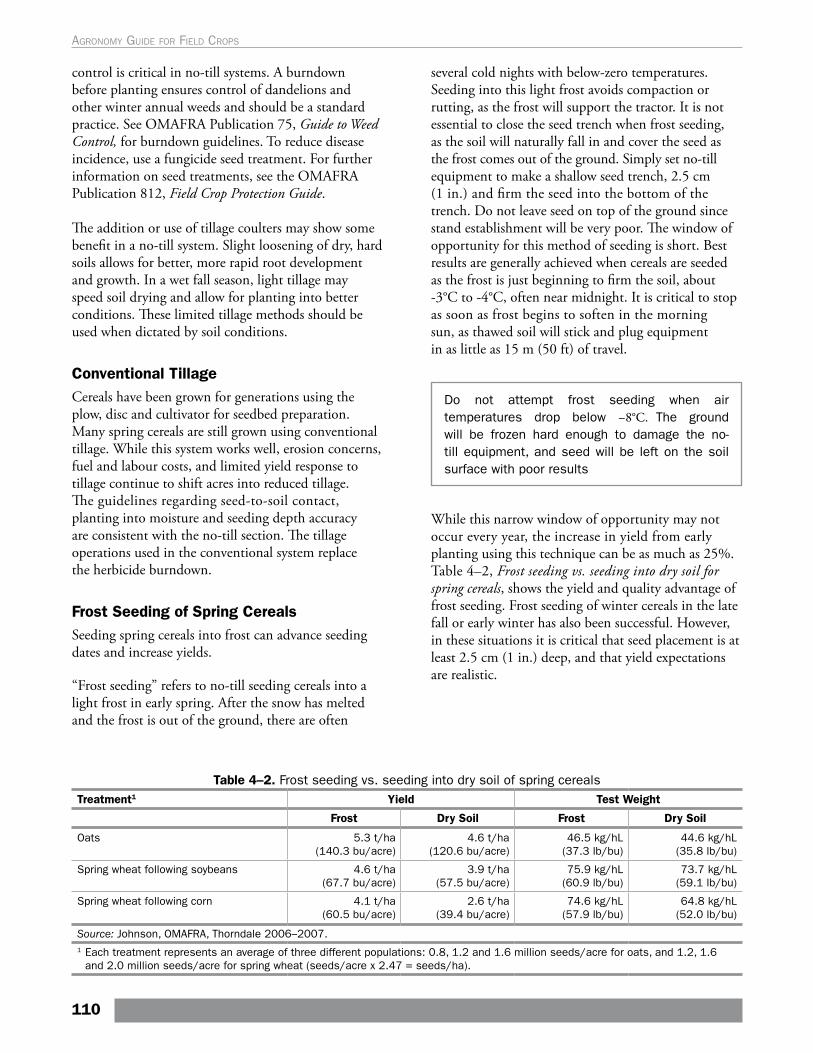
control is critical in no-till systems. A burndown before planting ensures control of dandelions and other winter annual weeds and should be a standard practice. See OMAFRA Publication 75, Guide to Weed Control, for burndown guidelines. To reduce disease incidence, use a fungicide seed treatment. For further information on seed treatments, see the OMAFRA Publication 812, Field Crop Protection Guide.
The addition or use of tillage coulters may show some benefit in a no-till system. Slight loosening of dry, hard soils allows for better, more rapid root development and growth. In a wet fall season, light tillage may speed soil drying and allow for planting into better conditions. These limited tillage methods should be used when dictated by soil conditions.
Conventional TillageCereals have been grown for generations using the plow, disc and cultivator for seedbed preparation. Many spring cereals are still grown using conventional tillage. While this system works well, erosion concerns, fuel and labour costs, and limited yield response to tillage continue to shift acres into reduced tillage. The guidelines regarding seed-to-soil contact, planting into moisture and seeding depth accuracy are consistent with the no-till section. The tillage operations used in the conventional system replace the herbicide burndown.
Frost Seeding of Spring CerealsSeeding spring cereals into frost can advance seeding dates and increase yields.
“Frost seeding” refers to no-till seeding cereals into a light frost in early spring. After the snow has melted and the frost is out of the ground, there are often
several cold nights with below-zero temperatures. Seeding into this light frost avoids compaction or rutting, as the frost will support the tractor. It is not essential to close the seed trench when frost seeding, as the soil will naturally fall in and cover the seed as the frost comes out of the ground. Simply set no-till equipment to make a shallow seed trench, 2.5 cm (1 in.) and firm the seed into the bottom of the trench. Do not leave seed on top of the ground since stand establishment will be very poor. The window of opportunity for this method of seeding is short. Best results are generally achieved when cereals are seeded as the frost is just beginning to firm the soil, about -3°C to -4°C, often near midnight. It is critical to stop as soon as frost begins to soften in the morning sun, as thawed soil will stick and plug equipment in as little as 15 m (50 ft) of travel.
Do not attempt frost seeding when air temperatures drop below –8°C. The ground will be frozen hard enough to damage the no-till equipment, and seed will be left on the soil surface with poor results
While this narrow window of opportunity may not occur every year, the increase in yield from early planting using this technique can be as much as 25%. Table 4–2, Frost seeding vs. seeding into dry soil for spring cereals, shows the yield and quality advantage of frost seeding. Frost seeding of winter cereals in the late fall or early winter has also been successful. However, in these situations it is critical that seed placement is at least 2.5 cm (1 in.) deep, and that yield expectations are realistic.
Table 4–2. Frost seeding vs. seeding into dry soil of spring cerealsTreatment1 Yield Test Weight
Frost Dry Soil Frost Dry Soil
Oats 5.3 t/ha (140.3 bu/acre)
4.6 t/ha (120.6 bu/acre)
46.5 kg/hL (37.3 lb/bu)
44.6 kg/hL (35.8 lb/bu)
Spring wheat following soybeans 4.6 t/ha (67.7 bu/acre)
3.9 t/ha (57.5 bu/acre)
75.9 kg/hL (60.9 lb/bu)
73.7 kg/hL (59.1 lb/bu)
Spring wheat following corn 4.1 t/ha (60.5 bu/acre)
2.6 t/ha (39.4 bu/acre)
74.6 kg/hL (57.9 lb/bu)
64.8 kg/hL (52.0 lb/bu)
Source: Johnson, OMAFRA, Thorndale 2006–2007.1 Each treatment represents an average of three different populations: 0.8, 1.2 and 1.6 million seeds/acre for oats, and 1.2, 1.6
and 2.0 million seeds/acre for spring wheat (seeds/acre x 2.47 = seeds/ha).
110
Agronomy guide for field Crops
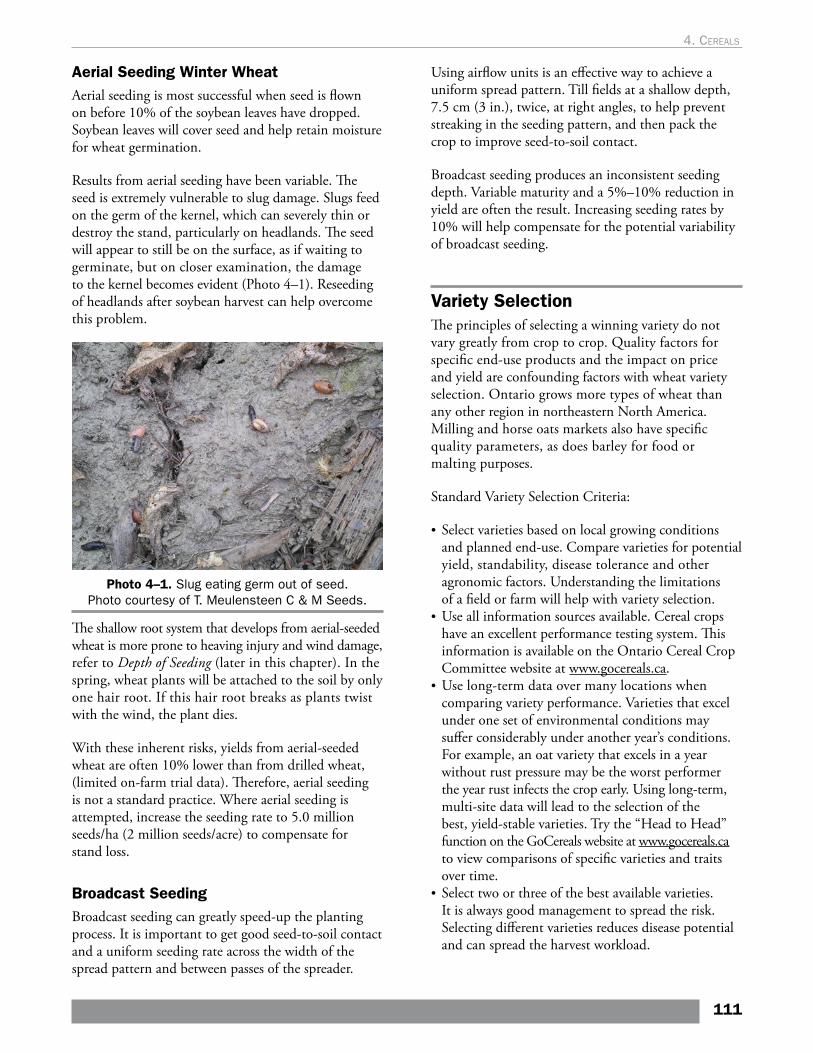
Aerial Seeding Winter WheatAerial seeding is most successful when seed is flown on before 10% of the soybean leaves have dropped. Soybean leaves will cover seed and help retain moisture for wheat germination.
Results from aerial seeding have been variable. The seed is extremely vulnerable to slug damage. Slugs feed on the germ of the kernel, which can severely thin or destroy the stand, particularly on headlands. The seed will appear to still be on the surface, as if waiting to germinate, but on closer examination, the damage to the kernel becomes evident (Photo 4–1). Reseeding of headlands after soybean harvest can help overcome this problem.
Photo 4–1. Slug eating germ out of seed. Photo courtesy of T. Meulensteen C & M Seeds.
The shallow root system that develops from aerial-seeded wheat is more prone to heaving injury and wind damage, refer to Depth of Seeding (later in this chapter). In the spring, wheat plants will be attached to the soil by only one hair root. If this hair root breaks as plants twist with the wind, the plant dies.
With these inherent risks, yields from aerial-seeded wheat are often 10% lower than from drilled wheat, (limited on-farm trial data). Therefore, aerial seeding is not a standard practice. Where aerial seeding is attempted, increase the seeding rate to 5.0 million seeds/ha (2 million seeds/acre) to compensate for stand loss.
Broadcast SeedingBroadcast seeding can greatly speed-up the planting process. It is important to get good seed-to-soil contact and a uniform seeding rate across the width of the spread pattern and between passes of the spreader.
Using airflow units is an effective way to achieve a uniform spread pattern. Till fields at a shallow depth, 7.5 cm (3 in.), twice, at right angles, to help prevent streaking in the seeding pattern, and then pack the crop to improve seed-to-soil contact.
Broadcast seeding produces an inconsistent seeding depth. Variable maturity and a 5%–10% reduction in yield are often the result. Increasing seeding rates by 10% will help compensate for the potential variability of broadcast seeding.
Variety SelectionThe principles of selecting a winning variety do not vary greatly from crop to crop. Quality factors for specific end-use products and the impact on price and yield are confounding factors with wheat variety selection. Ontario grows more types of wheat than any other region in northeastern North America. Milling and horse oats markets also have specific quality parameters, as does barley for food or malting purposes.
Standard Variety Selection Criteria:
• Select varieties based on local growing conditions and planned end-use. Compare varieties for potential yield, standability, disease tolerance and other agronomic factors. Understanding the limitations of a field or farm will help with variety selection.
• Use all information sources available. Cereal crops have an excellent performance testing system. This information is available on the Ontario Cereal Crop Committee website at www.gocereals.ca.
• Use long-term data over many locations when comparing variety performance. Varieties that excel under one set of environmental conditions may suffer considerably under another year’s conditions. For example, an oat variety that excels in a year without rust pressure may be the worst performer the year rust infects the crop early. Using long-term, multi-site data will lead to the selection of the best, yield-stable varieties. Try the “Head to Head” function on the GoCereals website at www.gocereals.ca to view comparisons of specific varieties and traits over time.
• Select two or three of the best available varieties. It is always good management to spread the risk. Selecting different varieties reduces disease potential and can spread the harvest workload.
111
4. cereals
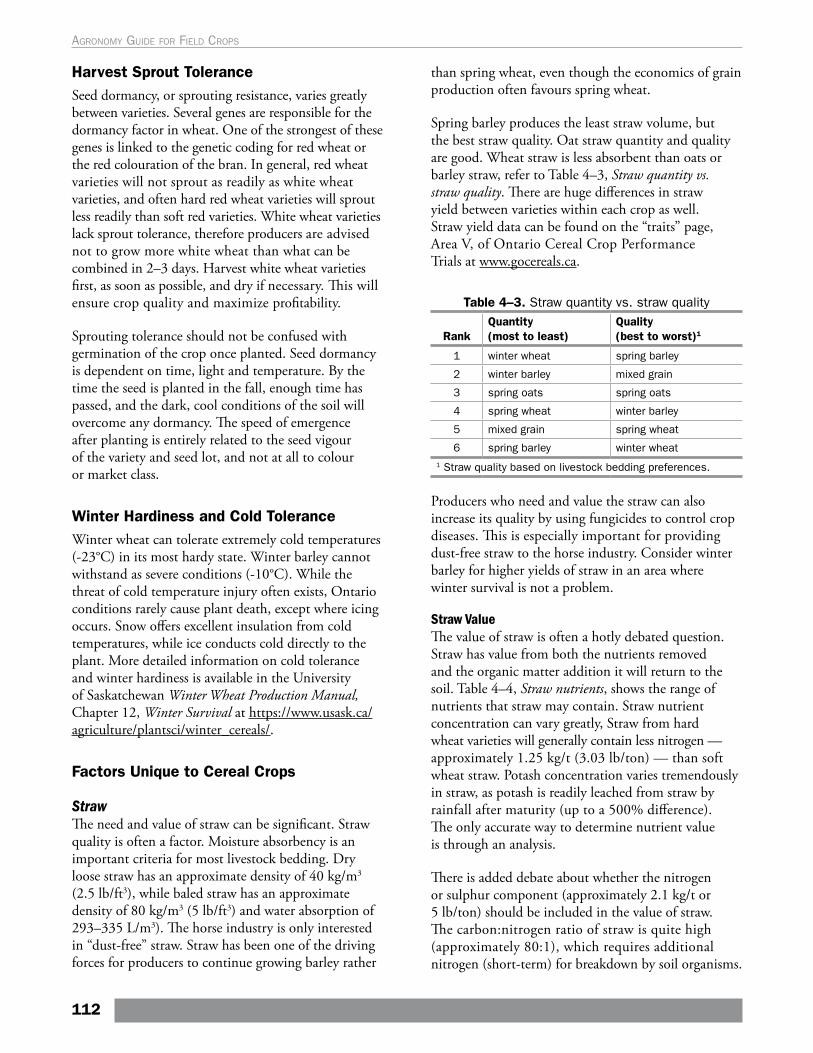
Harvest Sprout ToleranceSeed dormancy, or sprouting resistance, varies greatly between varieties. Several genes are responsible for the dormancy factor in wheat. One of the strongest of these genes is linked to the genetic coding for red wheat or the red colouration of the bran. In general, red wheat varieties will not sprout as readily as white wheat varieties, and often hard red wheat varieties will sprout less readily than soft red varieties. White wheat varieties lack sprout tolerance, therefore producers are advised not to grow more white wheat than what can be combined in 2–3 days. Harvest white wheat varieties first, as soon as possible, and dry if necessary. This will ensure crop quality and maximize profitability.
Sprouting tolerance should not be confused with germination of the crop once planted. Seed dormancy is dependent on time, light and temperature. By the time the seed is planted in the fall, enough time has passed, and the dark, cool conditions of the soil will overcome any dormancy. The speed of emergence after planting is entirely related to the seed vigour of the variety and seed lot, and not at all to colour or market class.
Winter Hardiness and Cold Tolerance Winter wheat can tolerate extremely cold temperatures (-23°C) in its most hardy state. Winter barley cannot withstand as severe conditions (-10°C). While the threat of cold temperature injury often exists, Ontario conditions rarely cause plant death, except where icing occurs. Snow offers excellent insulation from cold temperatures, while ice conducts cold directly to the plant. More detailed information on cold tolerance and winter hardiness is available in the University of Saskatchewan Winter Wheat Production Manual, Chapter 12, Winter Survival at https://www.usask.ca/agriculture/plantsci/winter_cereals/.
Factors Unique to Cereal Crops
StrawThe need and value of straw can be significant. Straw quality is often a factor. Moisture absorbency is an important criteria for most livestock bedding. Dry loose straw has an approximate density of 40 kg/m3 (2.5 lb/ft3), while baled straw has an approximate density of 80 kg/m3 (5 lb/ft3) and water absorption of 293–335 L/m3). The horse industry is only interested in “dust-free” straw. Straw has been one of the driving forces for producers to continue growing barley rather
than spring wheat, even though the economics of grain production often favours spring wheat.
Spring barley produces the least straw volume, but the best straw quality. Oat straw quantity and quality are good. Wheat straw is less absorbent than oats or barley straw, refer to Table 4–3, Straw quantity vs. straw quality. There are huge differences in straw yield between varieties within each crop as well. Straw yield data can be found on the “traits” page, Area V, of Ontario Cereal Crop Performance Trials at www.gocereals.ca.
Table 4–3. Straw quantity vs. straw quality
RankQuantity (most to least)
Quality (best to worst)1
1 winter wheat spring barley
2 winter barley mixed grain
3 spring oats spring oats
4 spring wheat winter barley
5 mixed grain spring wheat
6 spring barley winter wheat1 Straw quality based on livestock bedding preferences.
Producers who need and value the straw can also increase its quality by using fungicides to control crop diseases. This is especially important for providing dust-free straw to the horse industry. Consider winter barley for higher yields of straw in an area where winter survival is not a problem.
Straw ValueThe value of straw is often a hotly debated question. Straw has value from both the nutrients removed and the organic matter addition it will return to the soil. Table 4–4, Straw nutrients, shows the range of nutrients that straw may contain. Straw nutrient concentration can vary greatly, Straw from hard wheat varieties will generally contain less nitrogen — approximately 1.25 kg/t (3.03 lb/ton) — than soft wheat straw. Potash concentration varies tremendously in straw, as potash is readily leached from straw by rainfall after maturity (up to a 500% difference). The only accurate way to determine nutrient value is through an analysis.
There is added debate about whether the nitrogen or sulphur component (approximately 2.1 kg/t or 5 lb/ton) should be included in the value of straw. The carbon:nitrogen ratio of straw is quite high (approximately 80:1), which requires additional nitrogen (short-term) for breakdown by soil organisms.
112
Agronomy guide for field Crops
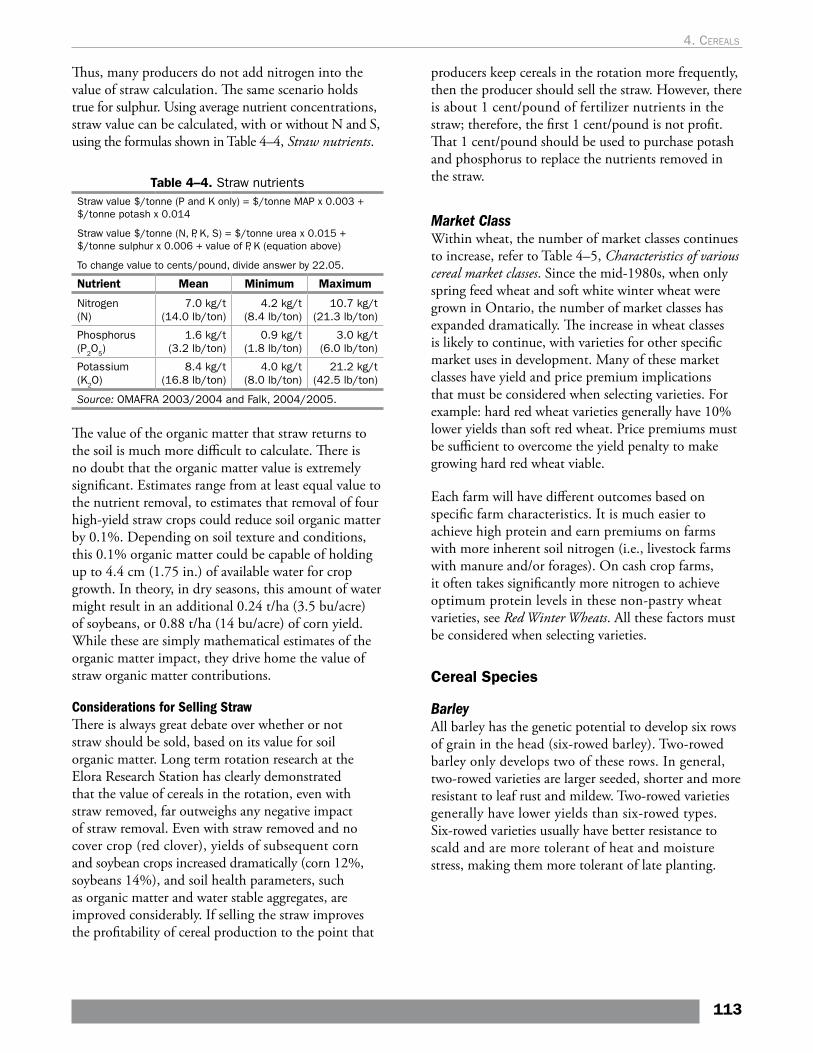
Thus, many producers do not add nitrogen into the value of straw calculation. The same scenario holds true for sulphur. Using average nutrient concentrations, straw value can be calculated, with or without N and S, using the formulas shown in Table 4–4, Straw nutrients.
Table 4–4. Straw nutrients Straw value $/tonne (P and K only) = $/tonne MAP x 0.003 + $/tonne potash x 0.014
Straw value $/tonne (N, P, K, S) = $/tonne urea x 0.015 + $/tonne sulphur x 0.006 + value of P, K (equation above)
To change value to cents/pound, divide answer by 22.05.
Nutrient Mean Minimum Maximum
Nitrogen (N)
7.0 kg/t (14.0 lb/ton)
4.2 kg/t (8.4 lb/ton)
10.7 kg/t (21.3 lb/ton)
Phosphorus (P2O5)
1.6 kg/t (3.2 lb/ton)
0.9 kg/t (1.8 lb/ton)
3.0 kg/t (6.0 lb/ton)
Potassium (K2O)
8.4 kg/t (16.8 lb/ton)
4.0 kg/t (8.0 lb/ton)
21.2 kg/t (42.5 lb/ton)
Source: OMAFRA 2003/2004 and Falk, 2004/2005.
The value of the organic matter that straw returns to the soil is much more difficult to calculate. There is no doubt that the organic matter value is extremely significant. Estimates range from at least equal value to the nutrient removal, to estimates that removal of four high-yield straw crops could reduce soil organic matter by 0.1%. Depending on soil texture and conditions, this 0.1% organic matter could be capable of holding up to 4.4 cm (1.75 in.) of available water for crop growth. In theory, in dry seasons, this amount of water might result in an additional 0.24 t/ha (3.5 bu/acre) of soybeans, or 0.88 t/ha (14 bu/acre) of corn yield. While these are simply mathematical estimates of the organic matter impact, they drive home the value of straw organic matter contributions.
Considerations for Selling StrawThere is always great debate over whether or not straw should be sold, based on its value for soil organic matter. Long term rotation research at the Elora Research Station has clearly demonstrated that the value of cereals in the rotation, even with straw removed, far outweighs any negative impact of straw removal. Even with straw removed and no cover crop (red clover), yields of subsequent corn and soybean crops increased dramatically (corn 12%, soybeans 14%), and soil health parameters, such as organic matter and water stable aggregates, are improved considerably. If selling the straw improves the profitability of cereal production to the point that
producers keep cereals in the rotation more frequently, then the producer should sell the straw. However, there is about 1 cent/pound of fertilizer nutrients in the straw; therefore, the first 1 cent/pound is not profit. That 1 cent/pound should be used to purchase potash and phosphorus to replace the nutrients removed in the straw.
Market ClassWithin wheat, the number of market classes continues to increase, refer to Table 4–5, Characteristics of various cereal market classes. Since the mid-1980s, when only spring feed wheat and soft white winter wheat were grown in Ontario, the number of market classes has expanded dramatically. The increase in wheat classes is likely to continue, with varieties for other specific market uses in development. Many of these market classes have yield and price premium implications that must be considered when selecting varieties. For example: hard red wheat varieties generally have 10% lower yields than soft red wheat. Price premiums must be sufficient to overcome the yield penalty to make growing hard red wheat viable.
Each farm will have different outcomes based on specific farm characteristics. It is much easier to achieve high protein and earn premiums on farms with more inherent soil nitrogen (i.e., livestock farms with manure and/or forages). On cash crop farms, it often takes significantly more nitrogen to achieve optimum protein levels in these non-pastry wheat varieties, see Red Winter Wheats. All these factors must be considered when selecting varieties.
Cereal Species
BarleyAll barley has the genetic potential to develop six rows of grain in the head (six-rowed barley). Two-rowed barley only develops two of these rows. In general, two-rowed varieties are larger seeded, shorter and more resistant to leaf rust and mildew. Two-rowed varieties generally have lower yields than six-rowed types. Six-rowed varieties usually have better resistance to scald and are more tolerant of heat and moisture stress, making them more tolerant of late planting.
113
4. cereals
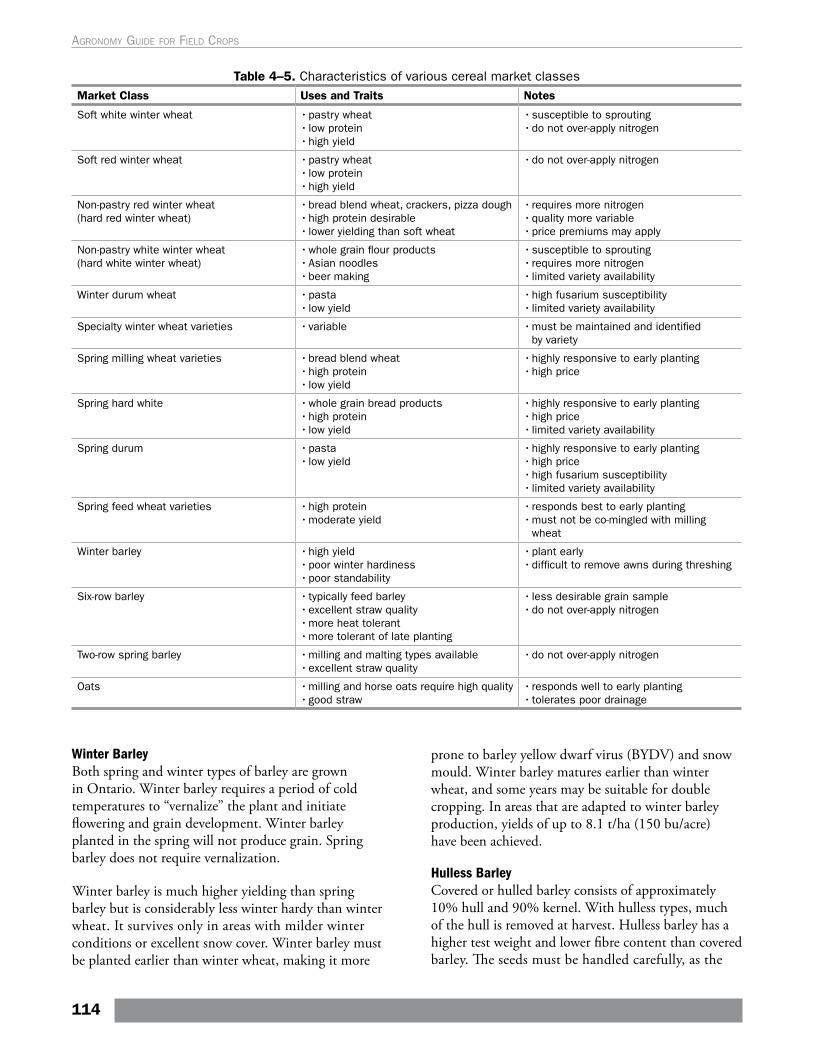
Table 4–5. Characteristics of various cereal market classesMarket Class Uses and Traits Notes
Soft white winter wheat • pastry wheat• low protein• high yield
• susceptible to sprouting• do not over-apply nitrogen
Soft red winter wheat • pastry wheat• low protein• high yield
• do not over-apply nitrogen
Non-pastry red winter wheat (hard red winter wheat)
• bread blend wheat, crackers, pizza dough• high protein desirable• lower yielding than soft wheat
• requires more nitrogen• quality more variable• price premiums may apply
Non-pastry white winter wheat (hard white winter wheat)
• whole grain flour products• Asian noodles• beer making
• susceptible to sprouting• requires more nitrogen• limited variety availability
Winter durum wheat • pasta• low yield
• high fusarium susceptibility• limited variety availability
Specialty winter wheat varieties • variable • must be maintained and identified by variety
Spring milling wheat varieties • bread blend wheat• high protein• low yield
• highly responsive to early planting• high price
Spring hard white • whole grain bread products• high protein• low yield
• highly responsive to early planting• high price• limited variety availability
Spring durum • pasta• low yield
• highly responsive to early planting• high price• high fusarium susceptibility• limited variety availability
Spring feed wheat varieties • high protein• moderate yield
• responds best to early planting• must not be co-mingled with milling
wheat
Winter barley • high yield• poor winter hardiness• poor standability
• plant early • difficult to remove awns during threshing
Six-row barley • typically feed barley• excellent straw quality• more heat tolerant• more tolerant of late planting
• less desirable grain sample• do not over-apply nitrogen
Two-row spring barley • milling and malting types available• excellent straw quality
• do not over-apply nitrogen
Oats • milling and horse oats require high quality • good straw
• responds well to early planting • tolerates poor drainage
Winter BarleyBoth spring and winter types of barley are grown in Ontario. Winter barley requires a period of cold temperatures to “vernalize” the plant and initiate flowering and grain development. Winter barley planted in the spring will not produce grain. Spring barley does not require vernalization.
Winter barley is much higher yielding than spring barley but is considerably less winter hardy than winter wheat. It survives only in areas with milder winter conditions or excellent snow cover. Winter barley must be planted earlier than winter wheat, making it more
prone to barley yellow dwarf virus (BYDV) and snow mould. Winter barley matures earlier than winter wheat, and some years may be suitable for double cropping. In areas that are adapted to winter barley production, yields of up to 8.1 t/ha (150 bu/acre) have been achieved.
Hulless BarleyCovered or hulled barley consists of approximately 10% hull and 90% kernel. With hulless types, much of the hull is removed at harvest. Hulless barley has a higher test weight and lower fibre content than covered barley. The seeds must be handled carefully, as the
114
Agronomy guide for field Crops
embryo (germ) is susceptible to damage. The amount of hull removed from the grain is somewhat dependent on weather conditions at harvest. Hulless barley will yield less than regular varieties, because the weight of the hulls is left in the field, but the concentration of energy and protein will be greater.
OatsOats is a traditional feed crop in Ontario, particularly for horses. Oats has better balanced protein and higher fibre content than barley. Leaf rust-resistant varieties are preferred. Buckthorn acts as the alternate host for leaf rust in oats. Remove buckthorn from field margins whenever possible.
Genetic resistance to crown rust was overcome by a new rust “race” in 2006. Until varieties with resistance to this new variant are available, oats must be sprayed with a fungicide just prior to heading, or yields and quality can be severely impacted (75% yield loss, 50% test weight loss). The exception to this rule is northern Ontario, which does not yet have a rust problem.
Milling OatsMilling oats is used for human consumption and therefore must meet special quality requirements, including plump kernels, high test weight and groats (grain) that are free of discolouration and foreign material (insects, weeds or other crop seeds). Requirements for milling oats can be found at www.grainscanada.gc.ca then click on “Grain Quality,” to find the Official Grain Grading Guide, under “Guides and Manuals.”
Hulless OatsHulless oats may be of interest to pig and poultry producers because the grain (groat) has approximately the same metabolizable energy as corn. Hulless oats has good quality protein and high protein content (14%–20%). Diets can be formulated with hulless oats as a major energy source and only small amounts of soybean meal, canola meal or the amino acid lysine need to be added to obtain performance comparable to a standard corn-soybean meal diet.
Hulless oats becomes groats when they are threshed. The thin hulls are left in the field as chaff, resulting in a kernel weight loss of 25%–30% compared to regular varieties where the hull is retained. Current varieties have a coating of fine hair on the groat that prevents the oats from flowing freely. These hairs cause itching,
making the oats unpleasant to handle. New varieties have greatly improved on these issues.
Take special care at planting, harvesting, handling and storage of hulless oats. Since the hull does not protect the seed, the germ is easily damaged. Take care during the planting process. Embryo damage can occur during harvest and handling. The high oil content at the surface of the seed makes the seed more attractive to storage insects. Moistures should be below 10% to ensure the grain does not lose quality in storage.
Mixed GrainsMixed grains occupy a significant acreage in the province. Most mixed grains are a combination of oats and barley, but mixtures may include spring wheat or field peas. Mixed grains are only grown for feed.
No specific guidelines regarding the best mixtures can be made. Generally, the highest yielding varieties of oats and barley in pure stands also perform best in mixtures, but maturity ratings of the components of a mixture must be matched. The addition of wheat or peas to the mix will increase the energy or protein of the grain, but yields will be reduced.
Leaf and head diseases are usually much less severe with mixed grains than where oats or barley is grown alone. Mixtures of oats and barley are more tolerant of variable drainage conditions, with the barley component becoming predominant in drier areas of the field and the oats component producing more in poorly drained areas.
Winter Wheat Winter wheat is grown on the largest acreage of any of the cereal crops and is grown across the province. Like winter barley and winter rye, winter wheat requires vernalization, a period of cold temperature (below 5°C), that induces the crop to shift from a vegetative to a reproductive state. While wheat vernalizes most effectively at the five-leaf stage, the vernalization process can be completed once germination begins. Therefore winter wheat can be planted at any time in the fall, right until freeze-up, and still head out normally the following year. Winter wheat planted in the spring will not enter the reproductive stage, as it has not been vernalized. In some cases, winter wheat has been spring planted to give the appearance of a lawn that almost never needs cutting.
115
4. cereals
Spring WheatFeed WheatFeed wheat is a more concentrated source of protein and energy for livestock than barley or oats. In non-ruminant diets, take care to limit the amount of feed wheat in the ration to avoid digestive problems. The general guideline is to include no more than 25% of the total ration as wheat. Be sure to consult a nutritionist for further information.
Some feed wheat varieties can produce yields that are competitive with oats and barley as feed grain. At times, these varieties may achieve quality that allows them to be included in the milling wheat market. Check the website www.gocereals.ca to determine if a variety is milling or feed quality. When feed wheat varieties make milling quality, consider it a bonus and not something to depend upon.
Milling WheatTo ensure market acceptance, take care to grow a quality product. This includes factors such as selecting the proper variety, early planting and good weed control. Spring wheat varieties generally have a very open canopy, making weed control more critical, especially for annual grass control. This open canopy makes them ideal as a nurse crop for underseeded alfalfa or hay crops.
RyeBoth spring and winter types of rye are available in Ontario, but winter rye is more commonly grown. Typically, winter rye is grown on the light sandy soils of tobacco and vegetable farms to control wind erosion and build up organic matter. Spring rye is occasionally grown as an annual forage crop. Unlike the other cereal crops, rye is quite susceptible to ergot, which is detrimental to its use as either feed or food.
Winter rye is the most winter hardy of all the winter cereals. It is early maturing — well ahead of either winter wheat or winter barley. Rye is hard to thresh, and despite the early maturity is often not harvested until after wheat and barley crops. This allows the straw to degrade and facilitates the threshing of the grain from the head.
Some livestock producers looking for extra forage plant winter rye after corn silage harvest. This rye will begin to head about mid-May the following spring, when it
is cut for baleage or haylage. Soybeans or dry edible beans are then planted with almost no yield loss due to delayed planting. Concerns from this practice include potential allelopathic effects (the toxic effects of rye residue breakdown during new crop growth) from the rye residue and the possibility of volunteer rye in wheat crops in succeeding years.
Triticale and SpeltBoth triticale (a cross between wheat and rye) and spelt are grown in Ontario on a limited basis. Both winter and spring triticale are available. Winter triticale is used as a forage as with rye (above), while spring triticale is only grown as emergency forage when hay crops winterkill, mostly in combination with peas, see Warm-Season Annual Grasses in Chapter 3, Forages. Spelt, an earlier version of modern day wheat, is mostly grown for the organic market. There is almost no genetic difference between spelt and wheat, only the genetic coding for the “chaff” to either adhere to the grain or be easily removed. In wheat, the chaff comes away easily, while in spelt it does not.
Biotechnology and Cereal CropsMost crop plants are diploids, meaning that they have one pair of each chromosome. Both barley and oats are diploids. Durum wheat is a tetraploid: having two pairs of chromosomes (aabb genome). All other wheats grown in Ontario are hexaploid, with three pairs of chromosomes (aabbdd genome). This makes gene transfer in wheat somewhat more difficult. The profit margin in cereals for seed production and breeding is much less than in many other crops. Additionally, the acceptance of genetically modified wheat plants by consumers has been very low, resulting in less investment in biotechnology in wheat. Thus, cereal crops have been at a standstill in the development of varieties having special traits using gene transfer technology.
This situation appears ready to change. How the industry and consumer will respond to these changes has yet to be determined. Producers should be aware of these developments and the criteria for identity preservation and separation that may go along with any new developments.
116
Agronomy guide for field Crops
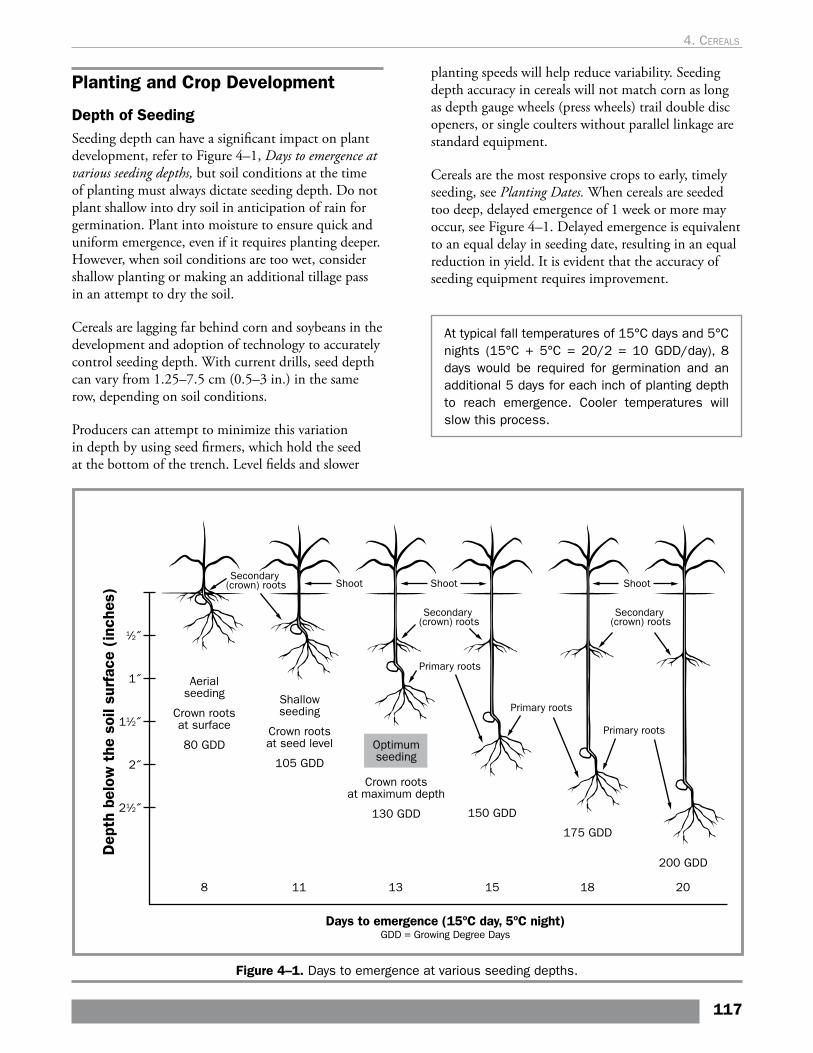
Planting and Crop Development
Depth of SeedingSeeding depth can have a significant impact on plant development, refer to Figure 4–1, Days to emergence at various seeding depths, but soil conditions at the time of planting must always dictate seeding depth. Do not plant shallow into dry soil in anticipation of rain for germination. Plant into moisture to ensure quick and uniform emergence, even if it requires planting deeper. However, when soil conditions are too wet, consider shallow planting or making an additional tillage pass in an attempt to dry the soil.
Cereals are lagging far behind corn and soybeans in the development and adoption of technology to accurately control seeding depth. With current drills, seed depth can vary from 1.25–7.5 cm (0.5–3 in.) in the same row, depending on soil conditions.
Producers can attempt to minimize this variation in depth by using seed firmers, which hold the seed at the bottom of the trench. Level fields and slower
planting speeds will help reduce variability. Seeding depth accuracy in cereals will not match corn as long as depth gauge wheels (press wheels) trail double disc openers, or single coulters without parallel linkage are standard equipment.
Cereals are the most responsive crops to early, timely seeding, see Planting Dates. When cereals are seeded too deep, delayed emergence of 1 week or more may occur, see Figure 4–1. Delayed emergence is equivalent to an equal delay in seeding date, resulting in an equal reduction in yield. It is evident that the accuracy of seeding equipment requires improvement.
At typical fall temperatures of 15°C days and 5°C nights (15°C + 5°C = 20/2 = 10 GDD/day), 8 days would be required for germination and an additional 5 days for each inch of planting depth to reach emergence. Cooler temperatures will slow this process.
Figure 4–1. Days to emergence at various seeding depths.
117
4. cereals
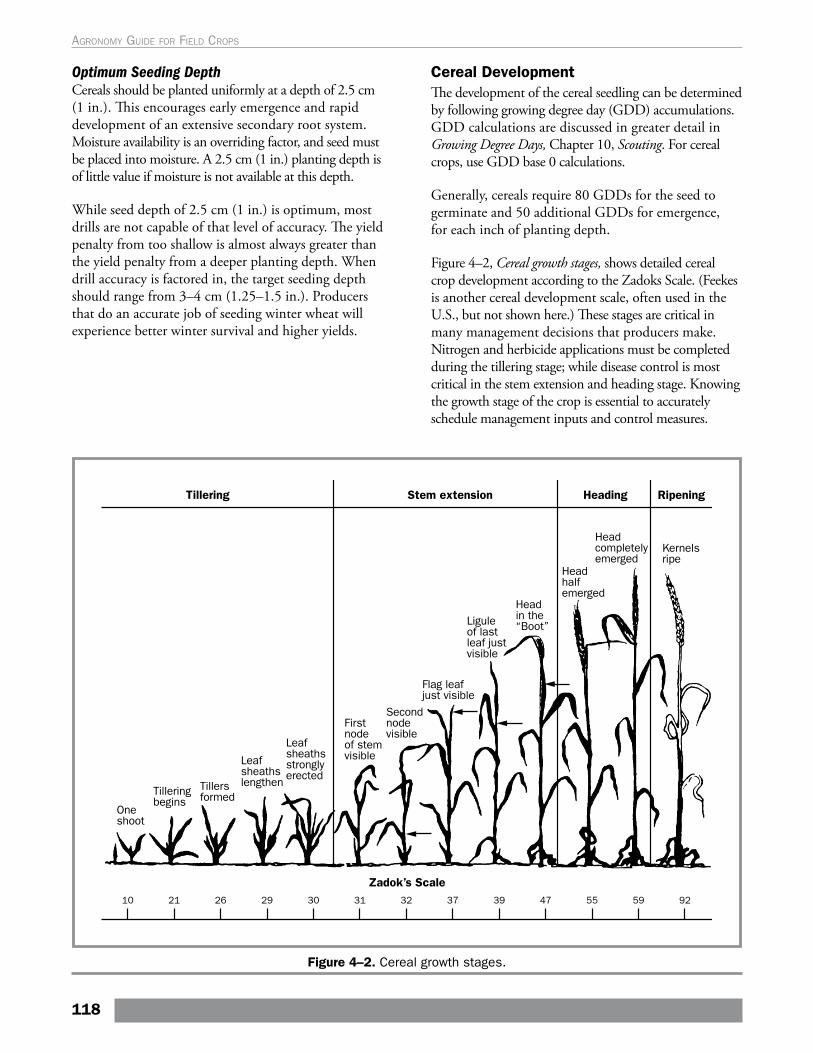
Optimum Seeding DepthCereals should be planted uniformly at a depth of 2.5 cm (1 in.). This encourages early emergence and rapid development of an extensive secondary root system. Moisture availability is an overriding factor, and seed must be placed into moisture. A 2.5 cm (1 in.) planting depth is of little value if moisture is not available at this depth.
While seed depth of 2.5 cm (1 in.) is optimum, most drills are not capable of that level of accuracy. The yield penalty from too shallow is almost always greater than the yield penalty from a deeper planting depth. When drill accuracy is factored in, the target seeding depth should range from 3–4 cm (1.25–1.5 in.). Producers that do an accurate job of seeding winter wheat will experience better winter survival and higher yields.
Cereal DevelopmentThe development of the cereal seedling can be determined by following growing degree day (GDD) accumulations. GDD calculations are discussed in greater detail in Growing Degree Days, Chapter 10, Scouting. For cereal crops, use GDD base 0 calculations.
Generally, cereals require 80 GDDs for the seed to germinate and 50 additional GDDs for emergence, for each inch of planting depth.
Figure 4–2, Cereal growth stages, shows detailed cereal crop development according to the Zadoks Scale. (Feekes is another cereal development scale, often used in the U.S., but not shown here.) These stages are critical in many management decisions that producers make. Nitrogen and herbicide applications must be completed during the tillering stage; while disease control is most critical in the stem extension and heading stage. Knowing the growth stage of the crop is essential to accurately schedule management inputs and control measures.
Figure 4–2. Cereal growth stages.
118
Agronomy guide for field Crops
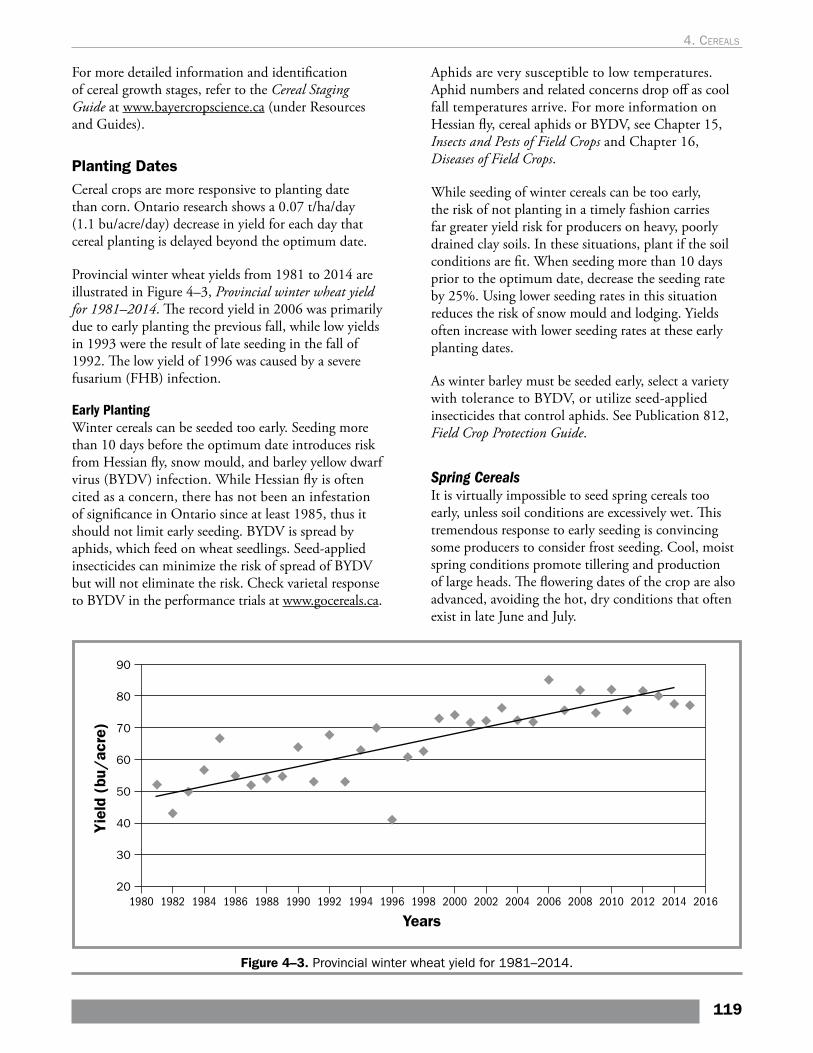
For more detailed information and identification of cereal growth stages, refer to the Cereal Staging Guide at www.bayercropscience.ca (under Resources and Guides).
Planting DatesCereal crops are more responsive to planting date than corn. Ontario research shows a 0.07 t/ha/day (1.1 bu/acre/day) decrease in yield for each day that cereal planting is delayed beyond the optimum date.
Provincial winter wheat yields from 1981 to 2014 are illustrated in Figure 4–3, Provincial winter wheat yield for 1981–2014. The record yield in 2006 was primarily due to early planting the previous fall, while low yields in 1993 were the result of late seeding in the fall of 1992. The low yield of 1996 was caused by a severe fusarium (FHB) infection.
Early PlantingWinter cereals can be seeded too early. Seeding more than 10 days before the optimum date introduces risk from Hessian fly, snow mould, and barley yellow dwarf virus (BYDV) infection. While Hessian fly is often cited as a concern, there has not been an infestation of significance in Ontario since at least 1985, thus it should not limit early seeding. BYDV is spread by aphids, which feed on wheat seedlings. Seed-applied insecticides can minimize the risk of spread of BYDV but will not eliminate the risk. Check varietal response to BYDV in the performance trials at www.gocereals.ca.
Aphids are very susceptible to low temperatures. Aphid numbers and related concerns drop off as cool fall temperatures arrive. For more information on Hessian fly, cereal aphids or BYDV, see Chapter 15, Insects and Pests of Field Crops and Chapter 16, Diseases of Field Crops.
While seeding of winter cereals can be too early, the risk of not planting in a timely fashion carries far greater yield risk for producers on heavy, poorly drained clay soils. In these situations, plant if the soil conditions are fit. When seeding more than 10 days prior to the optimum date, decrease the seeding rate by 25%. Using lower seeding rates in this situation reduces the risk of snow mould and lodging. Yields often increase with lower seeding rates at these early planting dates.
As winter barley must be seeded early, select a variety with tolerance to BYDV, or utilize seed-applied insecticides that control aphids. See Publication 812, Field Crop Protection Guide.
Spring CerealsIt is virtually impossible to seed spring cereals too early, unless soil conditions are excessively wet. This tremendous response to early seeding is convincing some producers to consider frost seeding. Cool, moist spring conditions promote tillering and production of large heads. The flowering dates of the crop are also advanced, avoiding the hot, dry conditions that often exist in late June and July.
Figure 4–3. Provincial winter wheat yield for 1981–2014.
119
4. cereals
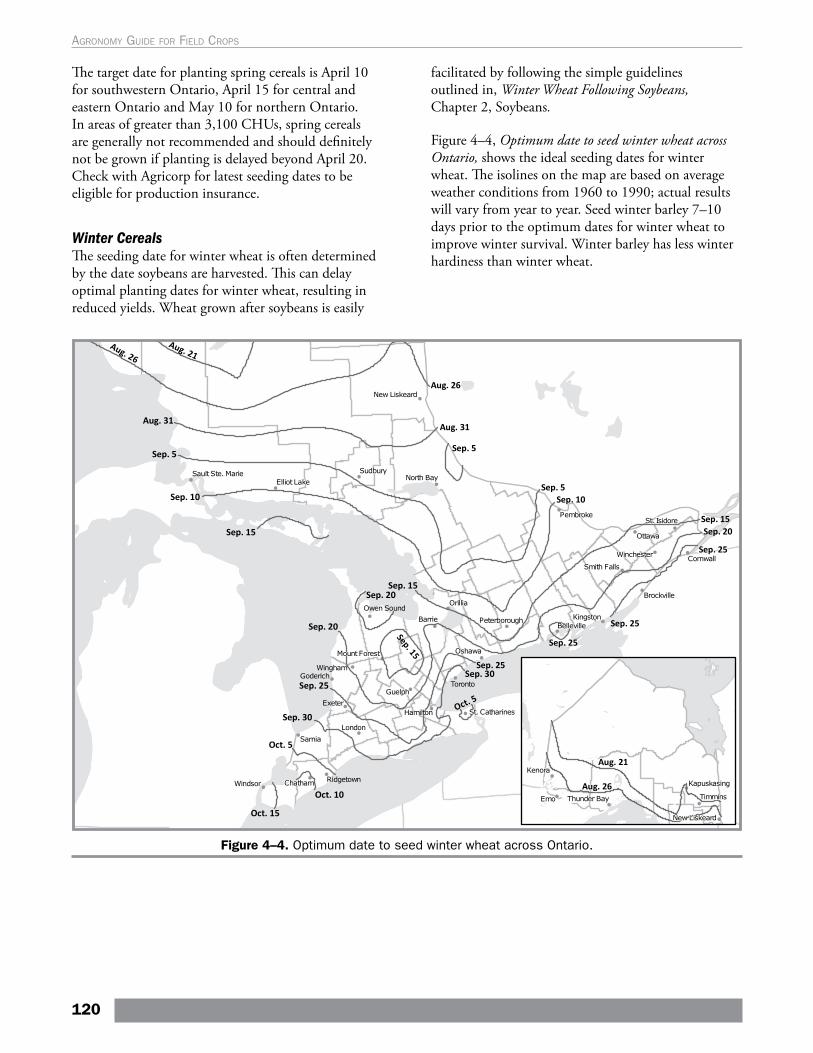
The target date for planting spring cereals is April 10 for southwestern Ontario, April 15 for central and eastern Ontario and May 10 for northern Ontario. In areas of greater than 3,100 CHUs, spring cereals are generally not recommended and should definitely not be grown if planting is delayed beyond April 20. Check with Agricorp for latest seeding dates to be eligible for production insurance.
Winter CerealsThe seeding date for winter wheat is often determined
y in
by the date soybeans are harvested. This can delaoptimal planting dates for winter wheat, resultingreduced yields. Wheat grown after soybeans is easily
facilitated by following the simple guidelines outlined in, Winter Wheat Following Soybeans, Chapter 2, Soybeans.
Figure 4–4, Optimum date to seed winter wheat across Ontario, shows the ideal seeding dates for winter wheat. The isolines on the map are based on average weather conditions from 1960 to 1990; actual results will vary from year to year. Seed winter barley 7–10 days prior to the optimum dates for winter wheat to improve winter survival. Winter barley has less winter hardiness than winter wheat.
Figure 4–4. Optimum date to seed winter wheat across Ontario.
120
Agronomy guide for field Crops
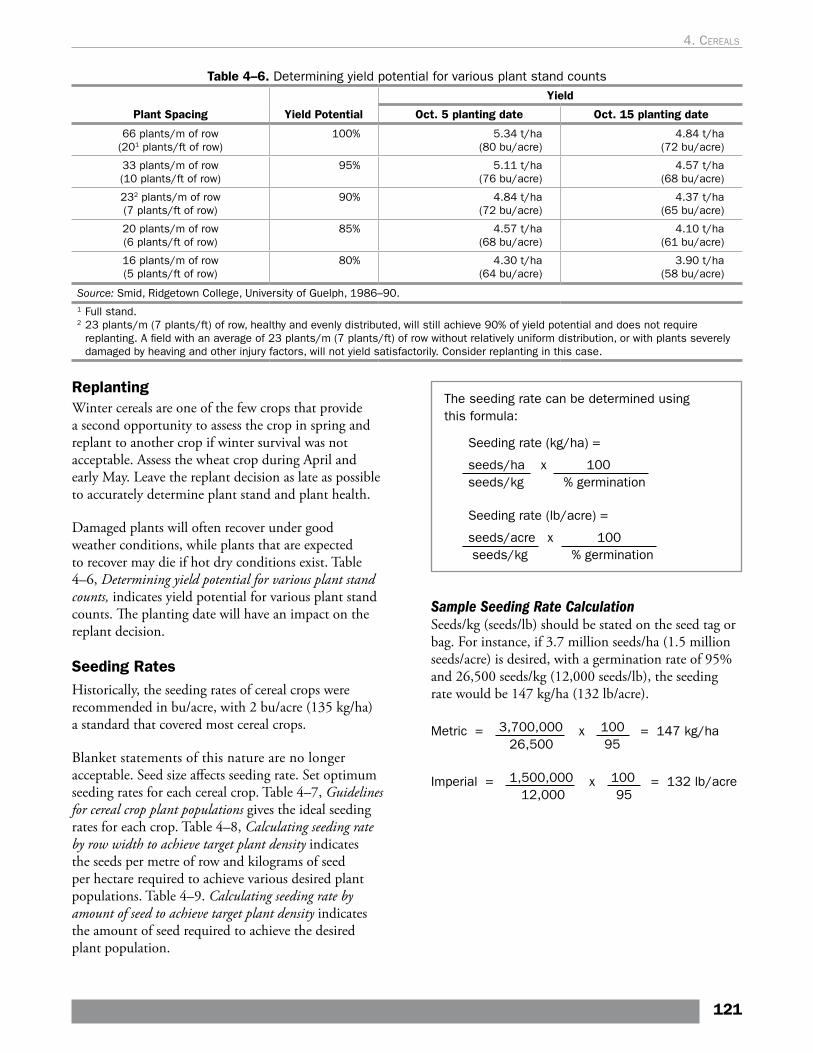
ReplantingWinter cereals are one of the few crops that provide a second opportunity to assess the crop in spring and replant to another crop if winter survival was not acceptable. Assess the wheat crop during April and early May. Leave the replant decision as late as possible to accurately determine plant stand and plant health.
Damaged plants will often recover under good weather conditions, while plants that are expected to recover may die if hot dry conditions exist. Table 4–6, Determining yield potential for various plant stand counts, indicates yield potential for various plant stand counts. The planting date will have an impact on the replant decision.
Table 4–6. Determining yield potential for various plant stand counts
Plant Spacing Yield Potential
Yield
Oct. 5 planting date Oct. 15 planting date
66 plants/m of row (201 plants/ft of row)
100% 5.34 t/ha (80 bu/acre)
4.84 t/ha (72 bu/acre)
33 plants/m of row (10 plants/ft of row)
95% 5.11 t/ha (76 bu/acre)
4.57 t/ha (68 bu/acre)
232 plants/m of row (7 plants/ft of row)
90% 4.84 t/ha (72 bu/acre)
4.37 t/ha (65 bu/acre)
20 plants/m of row (6 plants/ft of row)
85% 4.57 t/ha (68 bu/acre)
4.10 t/ha (61 bu/acre)
16 plants/m of row (5 plants/ft of row)
80% 4.30 t/ha (64 bu/acre)
3.90 t/ha (58 bu/acre)
Source: Smid, Ridgetown College, University of Guelph, 1986–90.1 Full stand.2 23 plants/m (7 plants/ft) of row, healthy and evenly distributed, will still achieve 90% of yield potential and does not require
replanting. A field with an average of 23 plants/m (7 plants/ft) of row without relatively uniform distribution, or with plants severely damaged by heaving and other injury factors, will not yield satisfactorily. Consider replanting in this case.
Seeding RatesHistorically, the seeding rates of cereal crops were recommended in bu/acre, with 2 bu/acre (135 kg/ha) a standard that covered most cereal crops.
Blanket statements of this nature are no longer acceptable. Seed size affects seeding rate. Set optimum seeding rates for each cereal crop. Table 4–7, Guidelines for cereal crop plant populations gives the ideal seeding rates for each crop. Table 4–8, Calculating seeding rate by row width to achieve target plant density indicates the seeds per metre of row and kilograms of seed per hectare required to achieve various desired plant populations. Table 4–9. Calculating seeding rate by amount of seed to achieve target plant density indicates the amount of seed required to achieve the desired plant population.
The seeding rate can be determined using this formula:
Seeding rate (kg/ha) =
seeds/ha x 100 seeds/kg % germination
Seeding rate (lb/acre) =
seeds/acre x 100 seeds/kg % germination
Sample Seeding Rate CalculationSeeds/kg (seeds/lb) should be stated on the seed tag or bag. For instance, if 3.7 million seeds/ha (1.5 million seeds/acre) is desired, with a germination rate of 95% and 26,500 seeds/kg (12,000 seeds/lb), the seeding rate would be 147 kg/ha (132 lb/acre).
Metric = 3,700,000 26,500
x 100 95
= 147 kg/ha
Imperial = 1,500,000 12,000
x 100 95
= 132 lb/acre
121
4. cereals
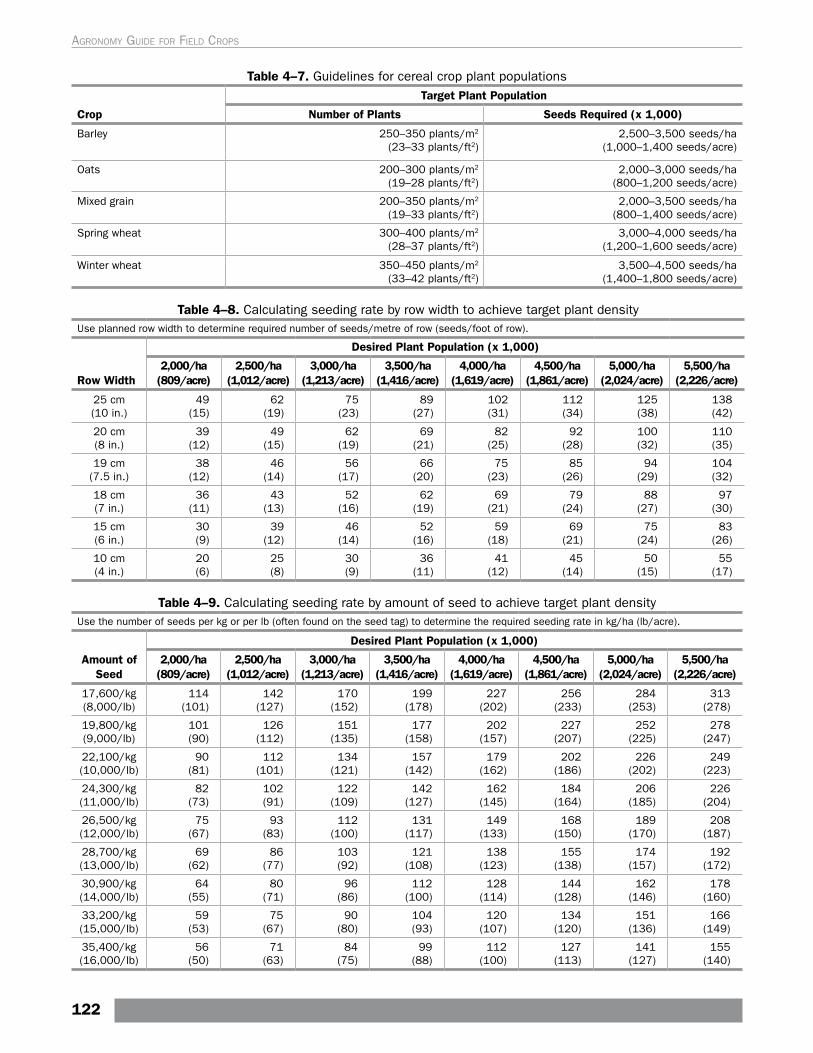
Table 4–7. Guidelines for cereal crop plant populations
Crop
Target Plant Population
Number of Plants Seeds Required (x 1,000)
Barley 250–350 plants/m2 (23–33 plants/ft2)
2,500–3,500 seeds/ha (1,000–1,400 seeds/acre)
Oats 200–300 plants/m2 (19–28 plants/ft2)
2,000–3,000 seeds/ha (800–1,200 seeds/acre)
Mixed grain 200–350 plants/m2 (19–33 plants/ft2)
2,000–3,500 seeds/ha (800–1,400 seeds/acre)
Spring wheat 300–400 plants/m2 (28–37 plants/ft2)
3,000–4,000 seeds/ha (1,200–1,600 seeds/acre)
Winter wheat 350–450 plants/m2 (33–42 plants/ft2)
3,500–4,500 seeds/ha (1,400–1,800 seeds/acre)
Table 4–8. Calculating seeding rate by row width to achieve target plant densityUse planned row width to determine required number of seeds/metre of row (seeds/foot of row).
Row Width
Desired Plant Population (x 1,000)
2,000/ha (809/acre)
2,500/ha (1,012/acre)
3,000/ha (1,213/acre)
3,500/ha (1,416/acre)
4,000/ha (1,619/acre)
4,500/ha (1,861/acre)
5,000/ha (2,024/acre)
5,500/ha (2,226/acre)
25 cm (10 in.)
49 (15)
62 (19)
75 (23)
89 (27)
102 (31)
112 (34)
125 (38)
138 (42)
20 cm (8 in.)
39 (12)
49 (15)
62 (19)
69 (21)
82 (25)
92 (28)
100 (32)
110 (35)
19 cm (7.5 in.)
38 (12)
46 (14)
56 (17)
66 (20)
75 (23)
85 (26)
94 (29)
104 (32)
18 cm (7 in.)
36 (11)
43 (13)
52 (16)
62 (19)
69 (21)
79 (24)
88 (27)
97 (30)
15 cm (6 in.)
30 (9)
39 (12)
46 (14)
52 (16)
59 (18)
69 (21)
75 (24)
83 (26)
10 cm (4 in.)
20 (6)
25 (8)
30 (9)
36 (11)
41 (12)
45 (14)
50 (15)
55 (17)
Table 4–9. Calculating seeding rate by amount of seed to achieve target plant densityUse the number of seeds per kg or per lb (often found on the seed tag) to determine the required seeding rate in kg/ha (lb/acre).
Amount of Seed
Desired Plant Population (x 1,000)
2,000/ha (809/acre)
2,500/ha (1,012/acre)
3,000/ha (1,213/acre)
3,500/ha (1,416/acre)
4,000/ha (1,619/acre)
4,500/ha (1,861/acre)
5,000/ha (2,024/acre)
5,500/ha (2,226/acre)
17,600/kg (8,000/lb)
114 (101)
142 (127)
170 (152)
199 (178)
227 (202)
256 (233)
284 (253)
313 (278)
19,800/kg (9,000/lb)
101 (90)
126 (112)
151 (135)
177 (158)
202 (157)
227 (207)
252 (225)
278 (247)
22,100/kg (10,000/lb)
90 (81)
112 (101)
134 (121)
157 (142)
179 (162)
202 (186)
226 (202)
249 (223)
24,300/kg (11,000/lb)
82 (73)
102 (91)
122 (109)
142 (127)
162 (145)
184 (164)
206 (185)
226 (204)
26,500/kg (12,000/lb)
75 (67)
93 (83)
112 (100)
131 (117)
149 (133)
168 (150)
189 (170)
208 (187)
28,700/kg (13,000/lb)
69 (62)
86 (77)
103 (92)
121 (108)
138 (123)
155 (138)
174 (157)
192 (172)
30,900/kg (14,000/lb)
64 (55)
80 (71)
96 (86)
112 (100)
128 (114)
144 (128)
162 (146)
178 (160)
33,200/kg (15,000/lb)
59 (53)
75 (67)
90 (80)
104 (93)
120 (107)
134 (120)
151 (136)
166 (149)
35,400/kg (16,000/lb)
56 (50)
71 (63)
84 (75)
99 (88)
112 (100)
127 (113)
141 (127)
155 (140)
122
Agronomy guide for field Crops
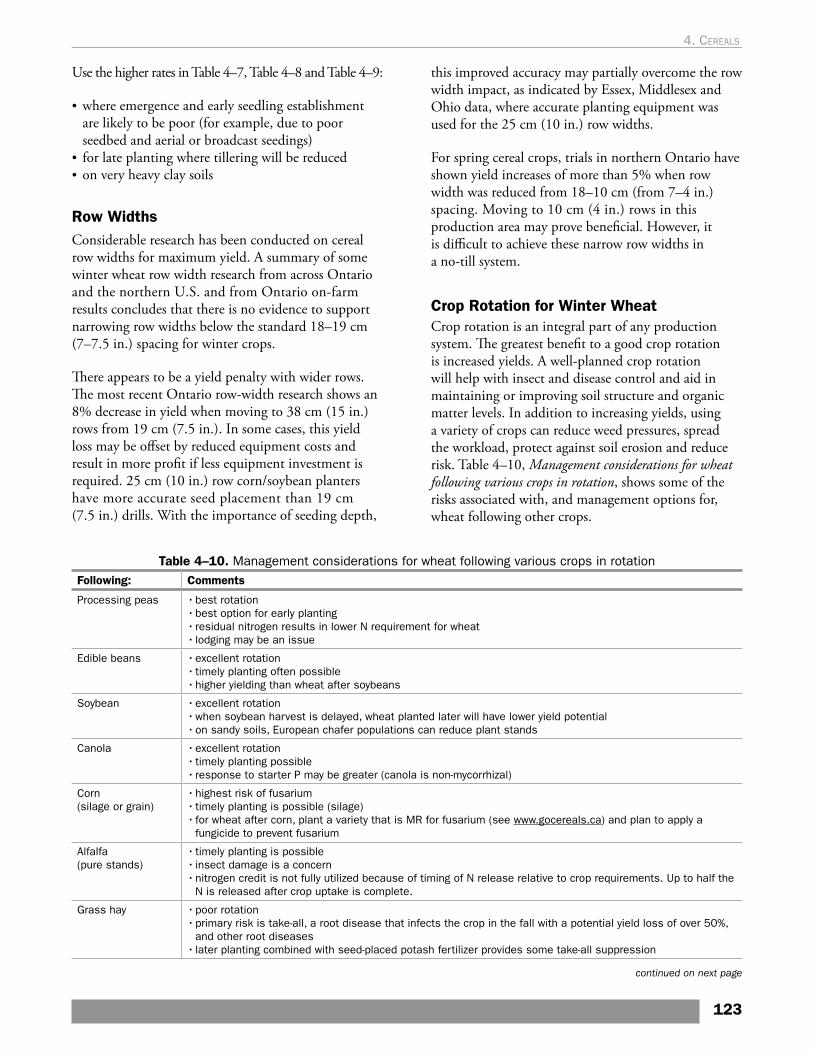
Use the higher rates in Table 4–7, Table 4–8 and Table 4–9:
• where emergence and early seedling establishment are likely to be poor (for example, due to poor seedbed and aerial or broadcast seedings)
• for late planting where tillering will be reduced• on very heavy clay soils
Row WidthsConsiderable research has been conducted on cereal row widths for maximum yield. A summary of some winter wheat row width research from across Ontario and the northern U.S. and from Ontario on-farm results concludes that there is no evidence to support narrowing row widths below the standard 18–19 cm (7–7.5 in.) spacing for winter crops.
There appears to be a yield penalty with wider rows. The most recent Ontario row-width research shows an 8% decrease in yield when moving to 38 cm (15 in.) rows from 19 cm (7.5 in.). In some cases, this yield loss may be offset by reduced equipment costs and result in more profit if less equipment investment is required. 25 cm (10 in.) row corn/soybean planters have more accurate seed placement than 19 cm (7.5 in.) drills. With the importance of seeding depth,
Table 4–10. Management considerations for wheat following various crops in rotation Following: Comments
Processing peas • best rotation• best option for early planting• residual nitrogen results in lower N requirement for wheat• lodging may be an issue
Edible beans • excellent rotation• timely planting often possible• higher yielding than wheat after soybeans
Soybean • excellent rotation• when soybean harvest is delayed, wheat planted later will have lower yield potential• on sandy soils, European chafer populations can reduce plant stands
Canola • excellent rotation • timely planting possible• response to starter P may be greater (canola is non-mycorrhizal)
Corn (silage or grain)
• highest risk of fusarium• timely planting is possible (silage)• for wheat after corn, plant a variety that is MR for fusarium (see www.gocereals.ca) and plan to apply a
fungicide to prevent fusarium
Alfalfa (pure stands)
• timely planting is possible• insect damage is a concern• nitrogen credit is not fully utilized because of timing of N release relative to crop requirements. Up to half the
N is released after crop uptake is complete.
Grass hay • poor rotation• primary risk is take-all, a root disease that infects the crop in the fall with a potential yield loss of over 50%,
and other root diseases• later planting combined with seed-placed potash fertilizer provides some take-all suppression
this improved accuracy may partially overcome the row width impact, as indicated by Essex, Middlesex and Ohio data, where accurate planting equipment was used for the 25 cm (10 in.) row widths.
For spring cereal crops, trials in northern Ontario have shown yield increases of more than 5% when row width was reduced from 18–10 cm (from 7–4 in.) spacing. Moving to 10 cm (4 in.) rows in this production area may prove beneficial. However, it is difficult to achieve these narrow row widths in a no-till system.
Crop Rotation for Winter Wheat Crop rotation is an integral part of any production system. The greatest benefit to a good crop rotation is increased yields. A well-planned crop rotation will help with insect and disease control and aid in maintaining or improving soil structure and organic matter levels. In addition to increasing yields, using a variety of crops can reduce weed pressures, spread the workload, protect against soil erosion and reduce risk. Table 4–10, Management considerations for wheat following various crops in rotation, shows some of the risks associated with, and management options for, wheat following other crops.
continued on next page
123
4. cereals
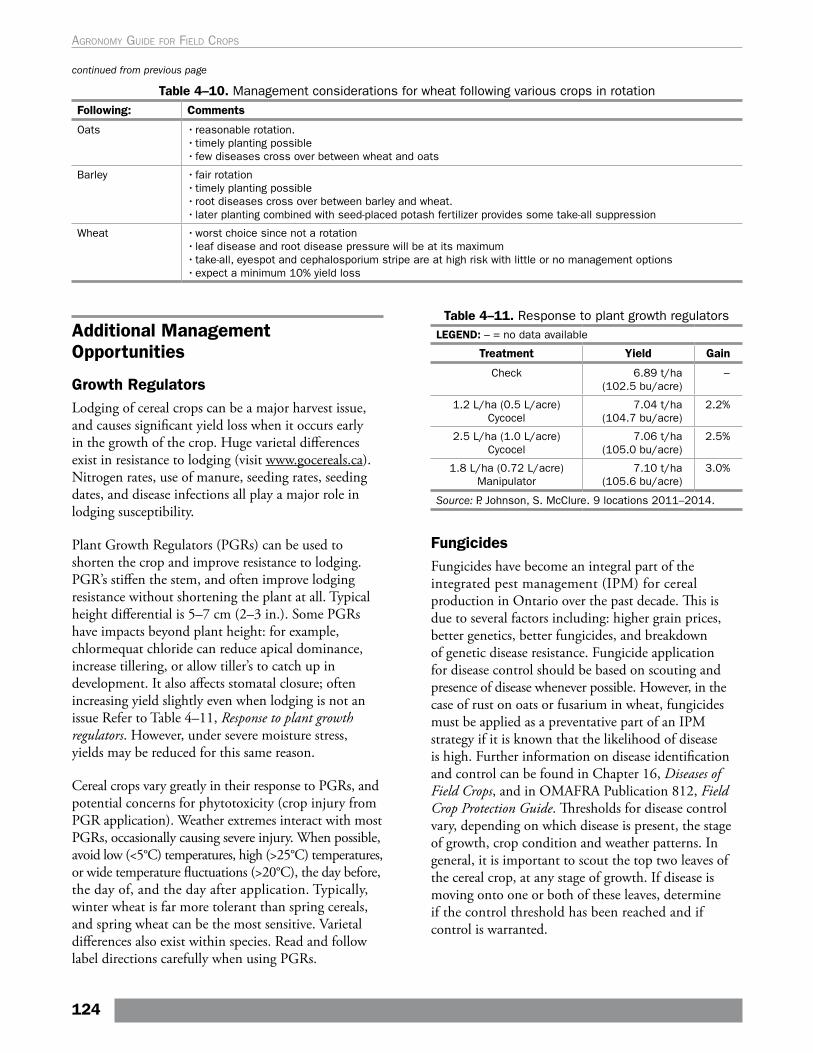
Table 4–10. Management considerations for wheat following various crops in rotation Following: Comments
Oats • reasonable rotation. • timely planting possible• few diseases cross over between wheat and oats
Barley • fair rotation• timely planting possible• root diseases cross over between barley and wheat. • later planting combined with seed-placed potash fertilizer provides some take-all suppression
Wheat • worst choice since not a rotation• leaf disease and root disease pressure will be at its maximum• take-all, eyespot and cephalosporium stripe are at high risk with little or no management options• expect a minimum 10% yield loss
Additional Management Opportunities
Growth RegulatorsLodging of cereal crops can be a major harvest issue, and causes significant yield loss when it occurs early in the growth of the crop. Huge varietal differences exist in resistance to lodging (visit www.gocereals.ca). Nitrogen rates, use of manure, seeding rates, seeding dates, and disease infections all play a major role in lodging susceptibility.
Plant Growth Regulators (PGRs) can be used to shorten the crop and improve resistance to lodging. PGR’s stiffen the stem, and often improve lodging resistance without shortening the plant at all. Typical height differential is 5–7 cm (2–3 in.). Some PGRs have impacts beyond plant height: for example, chlormequat chloride can reduce apical dominance, increase tillering, or allow tiller’s to catch up in development. It also affects stomatal closure; often increasing yield slightly even when lodging is not an issue Refer to Table 4–11, Response to plant growth regulators. However, under severe moisture stress, yields may be reduced for this same reason.
Cereal crops vary greatly in their response to PGRs, and potential concerns for phytotoxicity (crop injury from PGR application). Weather extremes interact with most PGRs, occasionally causing severe injury. When possible, avoid low (<5°C) temperatures, high (>25°C) temperatures, or wide temperature fluctuations (>20°C), the day before, the day of, and the day after application. Typically, winter wheat is far more tolerant than spring cereals, and spring wheat can be the most sensitive. Varietal differences also exist within species. Read and follow label directions carefully when using PGRs.
Table 4–11. Response to plant growth regulatorsLEGEND: – = no data available
Treatment Yield Gain
Check 6.89 t/ha (102.5 bu/acre)
−
1.2 L/ha (0.5 L/acre) Cycocel
7.04 t/ha (104.7 bu/acre)
2.2%
2.5 L/ha (1.0 L/acre) Cycocel
7.06 t/ha (105.0 bu/acre)
2.5%
1.8 L/ha (0.72 L/acre) Manipulator
7.10 t/ha (105.6 bu/acre)
3.0%
Source: P. Johnson, S. McClure. 9 locations 2011–2014.
FungicidesFungicides have become an integral part of the integrated pest management (IPM) for cereal production in Ontario over the past decade. This is due to several factors including: higher grain prices, better genetics, better fungicides, and breakdown of genetic disease resistance. Fungicide application for disease control should be based on scouting and presence of disease whenever possible. However, in the case of rust on oats or fusarium in wheat, fungicides must be applied as a preventative part of an IPM strategy if it is known that the likelihood of disease is high. Further information on disease identification and control can be found in Chapter 16, Diseases of Field Crops, and in OMAFRA Publication 812, Field Crop Protection Guide. Thresholds for disease control vary, depending on which disease is present, the stage of growth, crop condition and weather patterns. In general, it is important to scout the top two leaves of the cereal crop, at any stage of growth. If disease is moving onto one or both of these leaves, determine if the control threshold has been reached and if control is warranted.
continued from previous page
124
Agronomy guide for field Crops
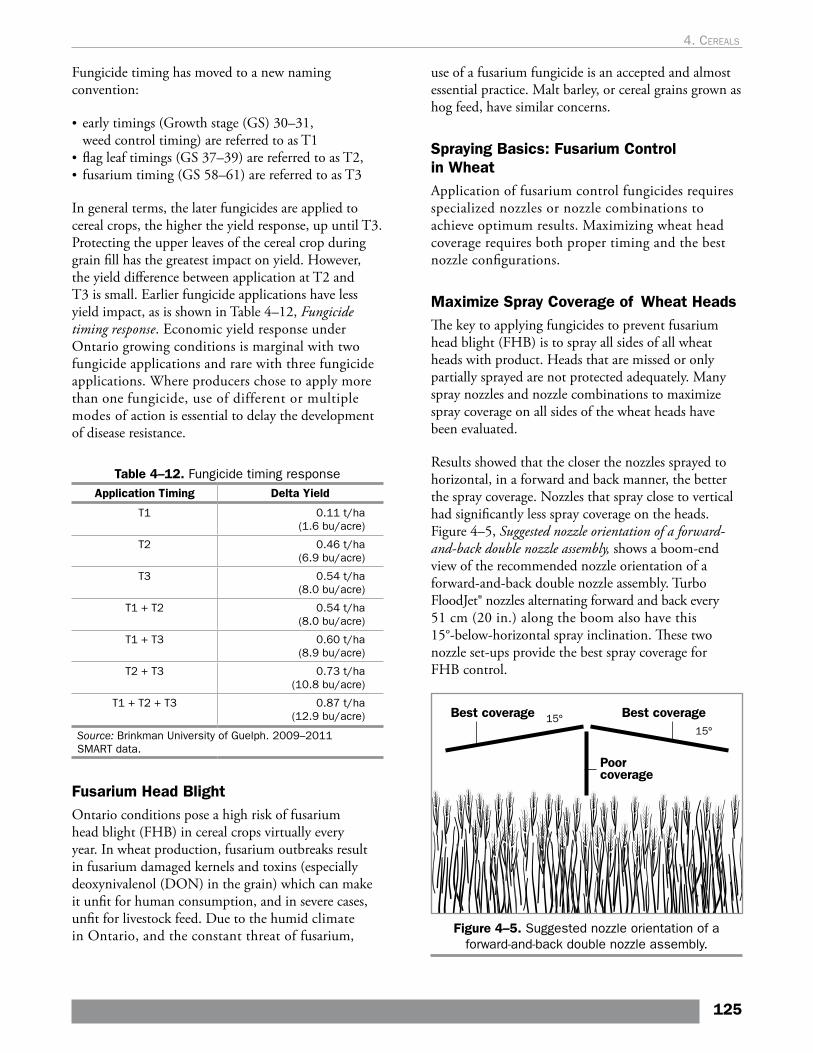
Fungicide timing has moved to a new naming convention:
• early timings (Growth stage (GS) 30–31, weed control timing) are referred to as T1
• flag leaf timings (GS 37–39) are referred to as T2, • fusarium timing (GS 58–61) are referred to as T3
In general terms, the later fungicides are applied to cereal crops, the higher the yield response, up until T3. Protecting the upper leaves of the cereal crop during grain fill has the greatest impact on yield. However, the yield difference between application at T2 and T3 is small. Earlier fungicide applications have less yield impact, as is shown in Table 4–12, Fungicide timing response. Economic yield response under Ontario growing conditions is marginal with two fungicide applications and rare with three fungicide applications. Where producers chose to apply more than one fungicide, use of different or multiple modes of action is essential to delay the development of disease resistance.
Table 4–12. Fungicide timing responseApplication Timing Delta Yield
T1 0.11 t/ha (1.6 bu/acre)
T2 0.46 t/ha (6.9 bu/acre)
T3 0.54 t/ha (8.0 bu/acre)
T1 + T2 0.54 t/ha (8.0 bu/acre)
T1 + T3 0.60 t/ha (8.9 bu/acre)
T2 + T3 0.73 t/ha (10.8 bu/acre)
T1 + T2 + T3 0.87 t/ha (12.9 bu/acre)
Source: Brinkman University of Guelph. 2009–2011 SMART data.
Fusarium Head BlightOntario conditions pose a high risk of fusarium head blight (FHB) in cereal crops virtually every year. In wheat production, fusarium outbreaks result in fusarium damaged kernels and toxins (especially deoxynivalenol (DON) in the grain) which can make it unfit for human consumption, and in severe cases, unfit for livestock feed. Due to the humid climate in Ontario, and the constant threat of fusarium,
use of a fusarium fungicide is an accepted and almost essential practice. Malt barley, or cereal grains grown as hog feed, have similar concerns.
Spraying Basics: Fusarium Control in WheatApplication of fusarium control fungicides requires specialized nozzles or nozzle combinations to achieve optimum results. Maximizing wheat head coverage requires both proper timing and the best nozzle configurations.
Maximize Spray Coverage of Wheat HeadsThe key to applying fungicides to prevent fusarium head blight (FHB) is to spray all sides of all wheat heads with product. Heads that are missed or only partially sprayed are not protected adequately. Many spray nozzles and nozzle combinations to maximize spray coverage on all sides of the wheat heads have been evaluated.
Results showed that the closer the nozzles sprayed to horizontal, in a forward and back manner, the better the spray coverage. Nozzles that spray close to vertical had significantly less spray coverage on the heads. Figure 4–5, Suggested nozzle orientation of a forward-and-back double nozzle assembly, shows a boom-end view of the recommended nozzle orientation of a forward-and-back double nozzle assembly. Turbo FloodJet® nozzles alternating forward and back every 51 cm (20 in.) along the boom also have this 15°-below-horizontal spray inclination. These two nozzle set-ups provide the best spray coverage for FHB control.
Figure 4–5. Suggested nozzle orientation of a forward-and-back double nozzle assembly.
125
4. cereals
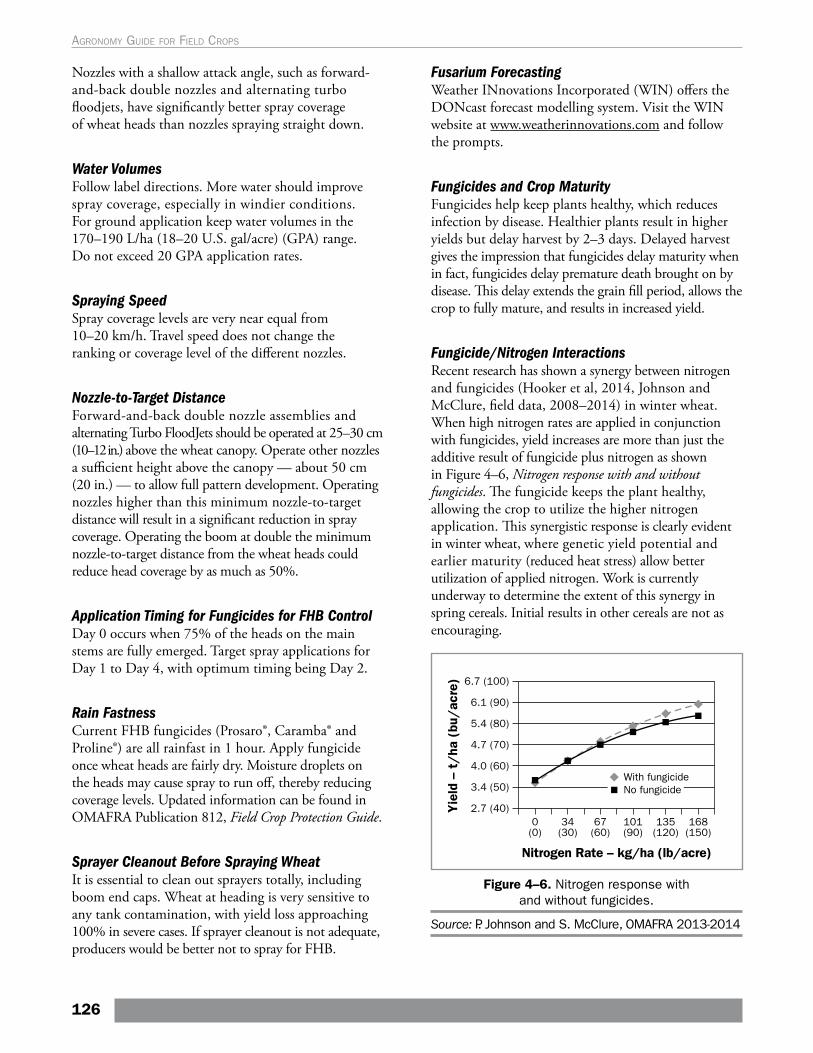
Fusarium ForecastingWeather INnovations Incorporated (WIN) offers the DONcast forecast modelling system. Visit the WIN website at www.weatherinnovations.com and follow the prompts.
Fungicides and Crop MaturityFungicides help keep plants healthy, which reduces infection by disease. Healthier plants result in higher yields but delay harvest by 2–3 days. Delayed harvest gives the impression that fungicides delay maturity when in fact, fungicides delay premature death brought on by disease. This delay extends the grain fill period, allows the crop to fully mature, and results in increased yield.
Fungicide/Nitrogen InteractionsRecent research has shown a synergy between nitrogen and fungicides (Hooker et al, 2014, Johnson and McClure, field data, 2008–2014) in winter wheat. When high nitrogen rates are applied in conjunction with fungicides, yield increases are more than just the additive result of fungicide plus nitrogen as shown in Figure 4–6, Nitrogen response with and without fungicides. The fungicide keeps the plant healthy, allowing the crop to utilize the higher nitrogen application. This synergistic response is clearly evident in winter wheat, where genetic yield potential and earlier maturity (reduced heat stress) allow better utilization of applied nitrogen. Work is currently underway to determine the extent of this synergy in spring cereals. Initial results in other cereals are not as encouraging.
Figure 4–6. Nitrogen response with and without fungicides.
Source: P. Johnson and S. McClure, OMAFRA 2013-2014
Nozzles with a shallow attack angle, such as forward-and-back double nozzles and alternating turbo floodjets, have significantly better spray coverage of wheat heads than nozzles spraying straight down.
Water VolumesFollow label directions. More water should improve spray coverage, especially in windier conditions. For ground application keep water volumes in the 170–190 L/ha (18–20 U.S. gal/acre) (GPA) range. Do not exceed 20 GPA application rates.
Spraying SpeedSpray coverage levels are very near equal from 10–20 km/h. Travel speed does not change the ranking or coverage level of the different nozzles.
Nozzle-to-Target DistanceForward-and-back double nozzle assemblies and alternating Turbo FloodJets should be operated at 25–30 cm (10–12 in.) above the wheat canopy. Operate other nozzles a sufficient height above the canopy — about 50 cm (20 in.) — to allow full pattern development. Operating nozzles higher than this minimum nozzle-to-target distance will result in a significant reduction in spray coverage. Operating the boom at double the minimum nozzle-to-target distance from the wheat heads could reduce head coverage by as much as 50%.
Application Timing for Fungicides for FHB ControlDay 0 occurs when 75% of the heads on the main stems are fully emerged. Target spray applications for Day 1 to Day 4, with optimum timing being Day 2.
Rain FastnessCurrent FHB fungicides (Prosaro®, Caramba® and Proline®) are all rainfast in 1 hour. Apply fungicide once wheat heads are fairly dry. Moisture droplets on the heads may cause spray to run off, thereby reducing coverage levels. Updated information can be found in OMAFRA Publication 812, Field Crop Protection Guide.
Sprayer Cleanout Before Spraying WheatIt is essential to clean out sprayers totally, including boom end caps. Wheat at heading is very sensitive to any tank contamination, with yield loss approaching 100% in severe cases. If sprayer cleanout is not adequate, producers would be better not to spray for FHB.
126
Agronomy guide for field Crops
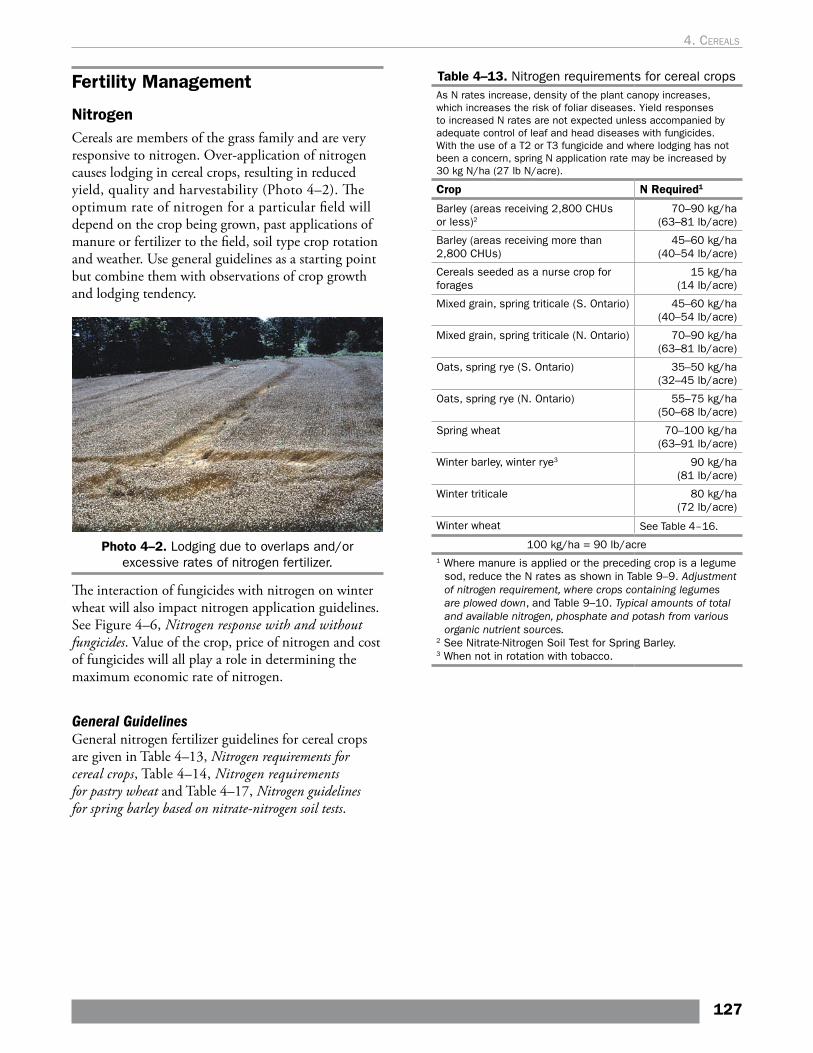
Fertility Management
NitrogenCereals are members of the grass family and are very responsive to nitrogen. Over-application of nitrogen causes lodging in cereal crops, resulting in reduced yield, quality and harvestability (Photo 4–2). The optimum rate of nitrogen for a particular field will depend on the crop being grown, past applications of manure or fertilizer to the field, soil type crop rotation and weather. Use general guidelines as a starting point but combine them with observations of crop growth and lodging tendency.
Photo 4–2. Lodging due to overlaps and/or excessive rates of nitrogen fertilizer.
The interaction of fungicides with nitrogen on winter wheat will also impact nitrogen application guidelines. See Figure 4–6, Nitrogen response with and without fungicides. Value of the crop, price of nitrogen and cost of fungicides will all play a role in determining the maximum economic rate of nitrogen.
General GuidelinesGeneral nitrogen fertilizer guidelines for cereal crops are given in Table 4–13, Nitrogen requirements for cereal crops, Table 4–14, Nitrogen requirements for pastry wheat and Table 4–17, Nitrogen guidelines for spring barley based on nitrate-nitrogen soil tests.
Table 4–13. Nitrogen requirements for cereal cropsAs N rates increase, density of the plant canopy increases, which increases the risk of foliar diseases. Yield responses to increased N rates are not expected unless accompanied by adequate control of leaf and head diseases with fungicides. With the use of a T2 or T3 fungicide and where lodging has not been a concern, spring N application rate may be increased by 30 kg N/ha (27 lb N/acre).
Crop N Required1
Barley (areas receiving 2,800 CHUs or less)2
70–90 kg/ha (63–81 lb/acre)
Barley (areas receiving more than 2,800 CHUs)
45–60 kg/ha (40–54 lb/acre)
Cereals seeded as a nurse crop for forages
15 kg/ha (14 lb/acre)
Mixed grain, spring triticale (S. Ontario) 45–60 kg/ha (40–54 lb/acre)
Mixed grain, spring triticale (N. Ontario) 70–90 kg/ha (63–81 lb/acre)
Oats, spring rye (S. Ontario) 35–50 kg/ha (32–45 lb/acre)
Oats, spring rye (N. Ontario) 55–75 kg/ha (50–68 lb/acre)
Spring wheat 70–100 kg/ha (63–91 lb/acre)
Winter barley, winter rye3 90 kg/ha (81 lb/acre)
Winter triticale 80 kg/ha (72 lb/acre)
Winter wheat See Table 4–16.
100 kg/ha = 90 lb/acre1 Where manure is applied or the preceding crop is a legume
sod, reduce the N rates as shown in Table 9–9. Adjustment of nitrogen requirement, where crops containing legumes are plowed down, and Table 9–10. Typical amounts of total and available nitrogen, phosphate and potash from various organic nutrient sources.
2 See Nitrate-Nitrogen Soil Test for Spring Barley.3 When not in rotation with tobacco.
127
4. cereals
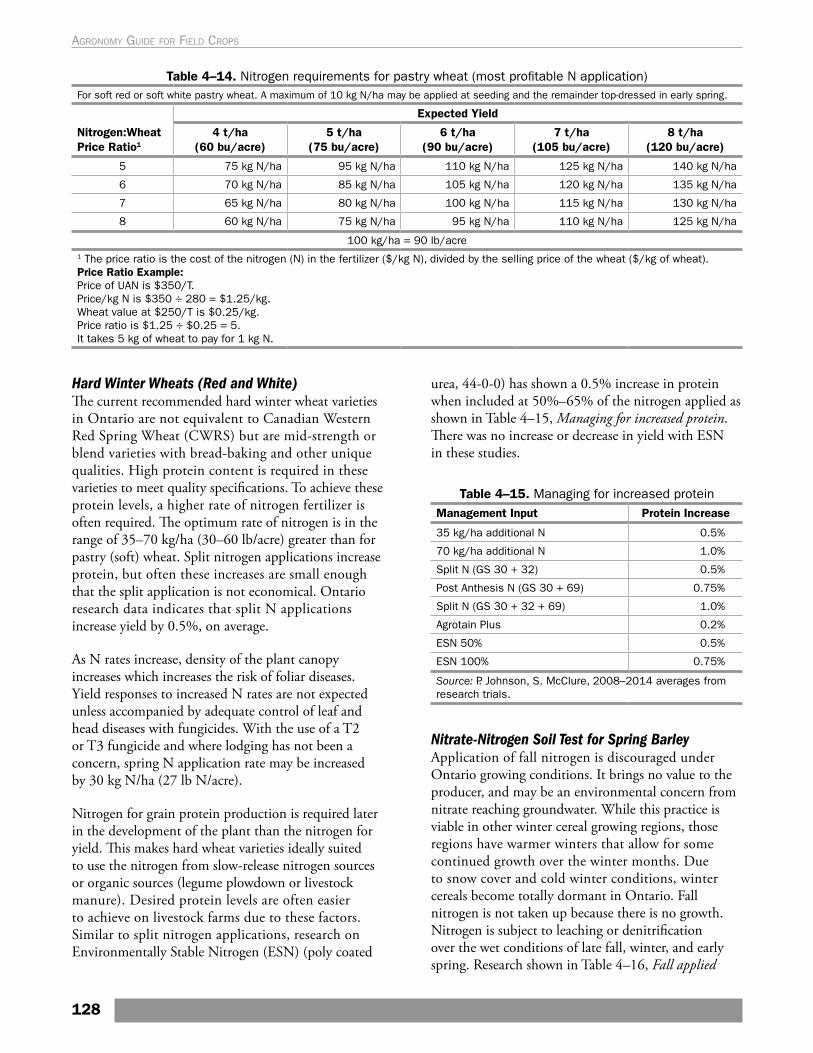
Table 4–14. Nitrogen requirements for pastry wheat (most profitable N application)For soft red or soft white pastry wheat. A maximum of 10 kg N/ha may be applied at seeding and the remainder top-dressed in early spring.
Nitrogen:Wheat Price Ratio1
Expected Yield
4 t/ha (60 bu/acre)
5 t/ha (75 bu/acre)
6 t/ha (90 bu/acre)
7 t/ha (105 bu/acre)
8 t/ha (120 bu/acre)
5 75 kg N/ha 95 kg N/ha 110 kg N/ha 125 kg N/ha 140 kg N/ha
6 70 kg N/ha 85 kg N/ha 105 kg N/ha 120 kg N/ha 135 kg N/ha
7 65 kg N/ha 80 kg N/ha 100 kg N/ha 115 kg N/ha 130 kg N/ha
8 60 kg N/ha 75 kg N/ha 95 kg N/ha 110 kg N/ha 125 kg N/ha
100 kg/ha = 90 lb/acre1 The price ratio is the cost of the nitrogen (N) in the fertilizer ($/kg N), divided by the selling price of the wheat ($/kg of wheat). Price Ratio Example: Price of UAN is $350/T. Price/kg N is $350 ÷ 280 = $1.25/kg. Wheat value at $250/T is $0.25/kg. Price ratio is $1.25 ÷ $0.25 = 5. It takes 5 kg of wheat to pay for 1 kg N.
Hard Winter Wheats (Red and White)The current recommended hard winter wheat varieties in Ontario are not equivalent to Canadian Western Red Spring Wheat (CWRS) but are mid-strength or blend varieties with bread-baking and other unique qualities. High protein content is required in these varieties to meet quality specifications. To achieve these protein levels, a higher rate of nitrogen fertilizer is often required. The optimum rate of nitrogen is in the range of 35–70 kg/ha (30–60 lb/acre) greater than for pastry (soft) wheat. Split nitrogen applications increase protein, but often these increases are small enough that the split application is not economical. Ontario research data indicates that split N applications increase yield by 0.5%, on average.
As N rates increase, density of the plant canopy increases which increases the risk of foliar diseases. Yield responses to increased N rates are not expected unless accompanied by adequate control of leaf and head diseases with fungicides. With the use of a T2 or T3 fungicide and where lodging has not been a concern, spring N application rate may be increased by 30 kg N/ha (27 lb N/acre).
Nitrogen for grain protein production is required later in the development of the plant than the nitrogen for yield. This makes hard wheat varieties ideally suited to use the nitrogen from slow-release nitrogen sources or organic sources (legume plowdown or livestock manure). Desired protein levels are often easier to achieve on livestock farms due to these factors. Similar to split nitrogen applications, research on Environmentally Stable Nitrogen (ESN) (poly coated
urea, 44-0-0) has shown a 0.5% increase in protein when included at 50%–65% of the nitrogen applied as shown in Table 4–15, Managing for increased protein. There was no increase or decrease in yield with ESN in these studies.
Table 4–15. Managing for increased proteinManagement Input Protein Increase
35 kg/ha additional N 0.5%
70 kg/ha additional N 1.0%
Split N (GS 30 + 32) 0.5%
Post Anthesis N (GS 30 + 69) 0.75%
Split N (GS 30 + 32 + 69) 1.0%
Agrotain Plus 0.2%
ESN 50% 0.5%
ESN 100% 0.75%
Source: P. Johnson, S. McClure, 2008–2014 averages from research trials.
Nitrate-Nitrogen Soil Test for Spring BarleyApplication of fall nitrogen is discouraged under Ontario growing conditions. It brings no value to the producer, and may be an environmental concern from nitrate reaching groundwater. While this practice is viable in other winter cereal growing regions, those regions have warmer winters that allow for some continued growth over the winter months. Due to snow cover and cold winter conditions, winter cereals become totally dormant in Ontario. Fall nitrogen is not taken up because there is no growth. Nitrogen is subject to leaching or denitrification over the wet conditions of late fall, winter, and early spring. Research shown in Table 4–16, Fall applied
128
Agronomy guide for field Crops
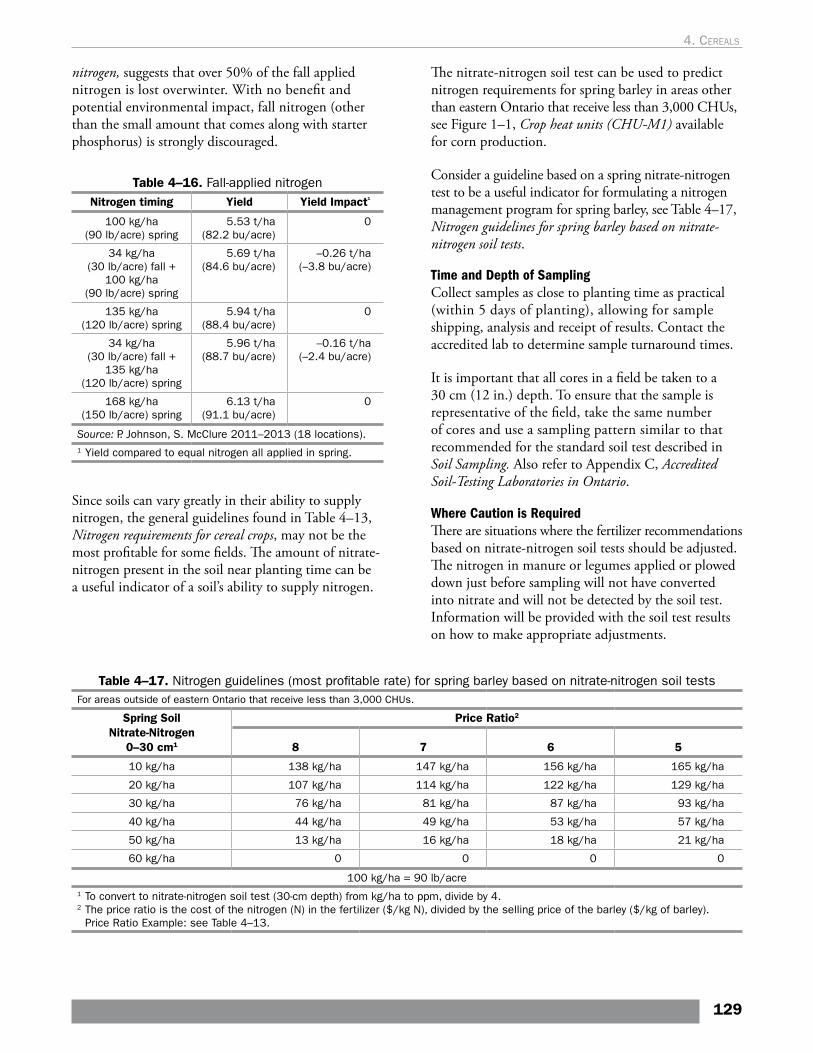
nitrogen, suggests that over 50% of the fall applied nitrogen is lost overwinter. With no benefit and potential environmental impact, fall nitrogen (other than the small amount that comes along with starter phosphorus) is strongly discouraged.
Table 4–16. Fall-applied nitrogenNitrogen timing Yield Yield Impact¹
100 kg/ha (90 lb/acre) spring
5.53 t/ha (82.2 bu/acre)
0
34 kg/ha (30 lb/acre) fall +
100 kg/ha (90 lb/acre) spring
5.69 t/ha (84.6 bu/acre)
–0.26 t/ha (–3.8 bu/acre)
135 kg/ha (120 lb/acre) spring
5.94 t/ha (88.4 bu/acre)
0
34 kg/ha (30 lb/acre) fall +
135 kg/ha (120 lb/acre) spring
5.96 t/ha (88.7 bu/acre)
–0.16 t/ha (–2.4 bu/acre)
168 kg/ha (150 lb/acre) spring
6.13 t/ha (91.1 bu/acre)
0
Source: P. Johnson, S. McClure 2011–2013 (18 locations).1 Yield compared to equal nitrogen all applied in spring.
Table 4–17. Nitrogen guidelines (most profitable rate) for spring barley based on nitrate-nitrogen soil testsFor areas outside of eastern Ontario that receive less than 3,000 CHUs.
Spring Soil Nitrate-Nitrogen
0–30 cm1
Price Ratio2
8 7 6 5
10 kg/ha 138 kg/ha 147 kg/ha 156 kg/ha 165 kg/ha
20 kg/ha 107 kg/ha 114 kg/ha 122 kg/ha 129 kg/ha
30 kg/ha 76 kg/ha 81 kg/ha 87 kg/ha 93 kg/ha
40 kg/ha 44 kg/ha 49 kg/ha 53 kg/ha 57 kg/ha
50 kg/ha 13 kg/ha 16 kg/ha 18 kg/ha 21 kg/ha
60 kg/ha 0 0 0 0
100 kg/ha = 90 lb/acre1 To convert to nitrate-nitrogen soil test (30-cm depth) from kg/ha to ppm, divide by 4.2 The price ratio is the cost of the nitrogen (N) in the fertilizer ($/kg N), divided by the selling price of the barley ($/kg of barley).
Price Ratio Example: see Table 4–13.
Time and Depth of SamplingCollect samples as close to planting time as practical (within 5 days of planting), allowing for sample shipping, analysis and receipt of results. Contact the accredited lab to determine sample turnaround times.
It is important that all cores in a field be taken to a 30 cm (12 in.) depth. To ensure that the sample is representative of the field, take the same number of cores and use a sampling pattern similar to that recommended for the standard soil test described in Soil Sampling. Also refer to Appendix C, Accredited Soil-Testing Laboratories in Ontario.
Where Caution is RequiredThere are situations where the fertilizer recommendations based on nitrate-nitrogen soil tests should be adjusted. The nitrogen in manure or legumes applied or plowed down just before sampling will not have converted into nitrate and will not be detected by the soil test. Information will be provided with the soil test results on how to make appropriate adjustments.
The nitrate-nitrogen soil test can be used to predict nitrogen requirements for spring barley in areas other than eastern Ontario that receive less than 3,000 CHUs, see Figure 1–1, Crop heat units (CHU-M1) available for corn production.
Consider a guideline based on a spring nitrate-nitrogen test to be a useful indicator for formulating a nitrogen management program for spring barley, see Table 4–17, Nitrogen guidelines for spring barley based on nitrate-nitrogen soil tests.
Since soils can vary greatly in their ability to supply nitrogen, the general guidelines found in Table 4–13, Nitrogen requirements for cereal crops, may not be the most profitable for some fields. The amount of nitrate-nitrogen present in the soil near planting time can be a useful indicator of a soil’s ability to supply nitrogen.
129
4. cereals
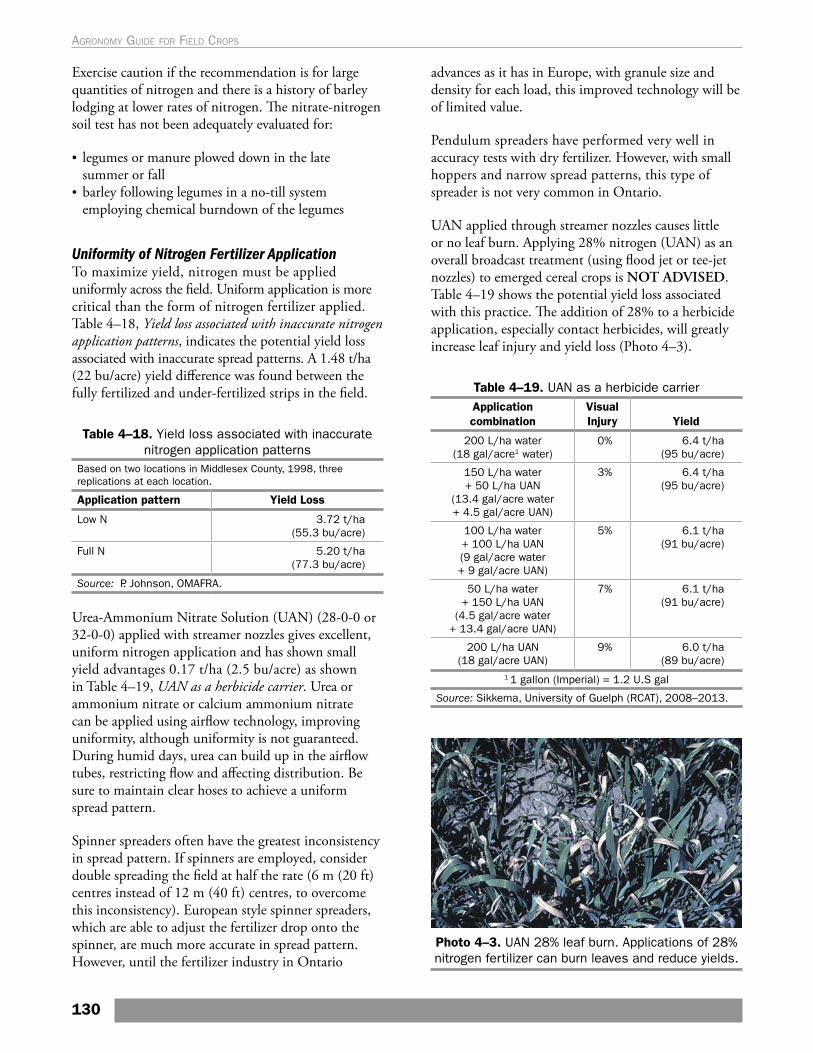
Exercise caution if the recommendation is for large quantities of nitrogen and there is a history of barley lodging at lower rates of nitrogen. The nitrate-nitrogen soil test has not been adequately evaluated for:
• legumes or manure plowed down in the late summer or fall
• barley following legumes in a no-till system employing chemical burndown of the legumes
Uniformity of Nitrogen Fertilizer ApplicationTo maximize yield, nitrogen must be applied uniformly across the field. Uniform application is more critical than the form of nitrogen fertilizer applied. Table 4–18, Yield loss associated with inaccurate nitrogen application patterns, indicates the potential yield loss associated with inaccurate spread patterns. A 1.48 t/ha (22 bu/acre) yield difference was found between the fully fertilized and under-fertilized strips in the field.
Table 4–18. Yield loss associated with inaccurate nitrogen application patterns
Based on two locations in Middlesex County, 1998, three replications at each location.
Application pattern Yield Loss
Low N 3.72 t/ha (55.3 bu/acre)
Full N 5.20 t/ha (77.3 bu/acre)
Source: P. Johnson, OMAFRA.
Urea-Ammonium Nitrate Solution (UAN) (28-0-0 or 32-0-0) applied with streamer nozzles gives excellent, uniform nitrogen application and has shown small yield advantages 0.17 t/ha (2.5 bu/acre) as shown in Table 4–19, UAN as a herbicide carrier. Urea or ammonium nitrate or calcium ammonium nitrate can be applied using airflow technology, improving uniformity, although uniformity is not guaranteed. During humid days, urea can build up in the airflow tubes, restricting flow and affecting distribution. Be sure to maintain clear hoses to achieve a uniform spread pattern.
Spinner spreaders often have the greatest inconsistency in spread pattern. If spinners are employed, consider double spreading the field at half the rate (6 m (20 ft) centres instead of 12 m (40 ft) centres, to overcome this inconsistency). European style spinner spreaders, which are able to adjust the fertilizer drop onto the spinner, are much more accurate in spread pattern. However, until the fertilizer industry in Ontario
advances as it has in Europe, with granule size and density for each load, this improved technology will be of limited value.
Pendulum spreaders have performed very well in accuracy tests with dry fertilizer. However, with small hoppers and narrow spread patterns, this type of spreader is not very common in Ontario.
UAN applied through streamer nozzles causes little or no leaf burn. Applying 28% nitrogen (UAN) as an overall broadcast treatment (using flood jet or tee-jet nozzles) to emerged cereal crops is NOT ADVISED. Table 4–19 shows the potential yield loss associated with this practice. The addition of 28% to a herbicide application, especially contact herbicides, will greatly increase leaf injury and yield loss (Photo 4–3).
Table 4–19. UAN as a herbicide carrierApplication combination
Visual Injury Yield
200 L/ha water (18 gal/acre1 water)
0% 6.4 t/ha (95 bu/acre)
150 L/ha water + 50 L/ha UAN
(13.4 gal/acre water + 4.5 gal/acre UAN)
3% 6.4 t/ha (95 bu/acre)
100 L/ha water + 100 L/ha UAN (9 gal/acre water + 9 gal/acre UAN)
5% 6.1 t/ha (91 bu/acre)
50 L/ha water + 150 L/ha UAN
(4.5 gal/acre water + 13.4 gal/acre UAN)
7% 6.1 t/ha (91 bu/acre)
200 L/ha UAN (18 gal/acre UAN)
9% 6.0 t/ha (89 bu/acre)
1 1 gallon (Imperial) = 1.2 U.S gal
Source: Sikkema, University of Guelph (RCAT), 2008–2013.
Photo 4–3. UAN 28% leaf burn. Applications of 28% nitrogen fertilizer can burn leaves and reduce yields.
130
Agronomy guide for field Crops
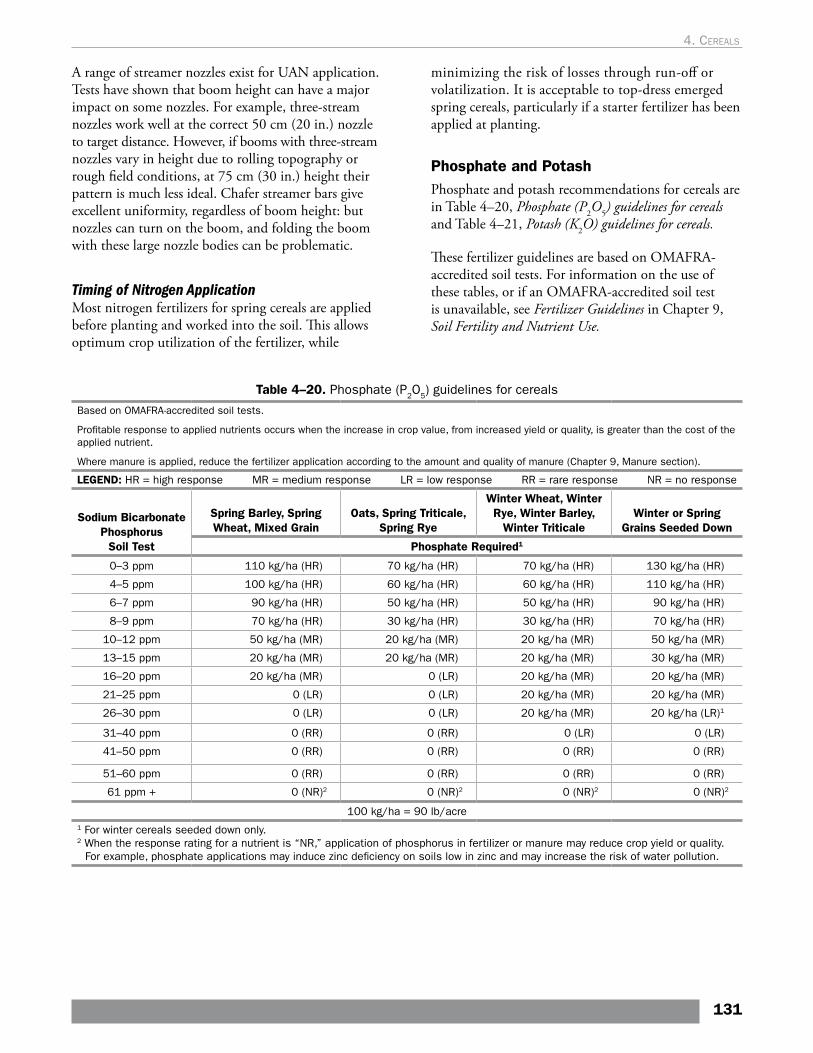
A range of streamer nozzles exist for UAN application. Tests have shown that boom height can have a major impact on some nozzles. For example, three-stream nozzles work well at the correct 50 cm (20 in.) nozzle to target distance. However, if booms with three-stream nozzles vary in height due to rolling topography or rough field conditions, at 75 cm (30 in.) height their pattern is much less ideal. Chafer streamer bars give excellent uniformity, regardless of boom height: but nozzles can turn on the boom, and folding the boom with these large nozzle bodies can be problematic.
Timing of Nitrogen ApplicationMost nitrogen fertilizers for spring cereals are applied before planting and worked into the soil. This allows optimum crop utilization of the fertilizer, while
Table 4–20. Phosphate (P2O5) guidelines for cereals
Based on OMAFRA-accredited soil tests.
Profitable response to applied nutrients occurs when the increase in crop value, from increased yield or quality, is greater than the cost of the applied nutrient.
Where manure is applied, reduce the fertilizer application according to the amount and quality of manure (Chapter 9, Manure section).
LEGEND: HR = high response MR = medium response LR = low response RR = rare response NR = no response
Sodium Bicarbonate Phosphorus
Soil Test
Spring Barley, Spring Wheat, Mixed Grain
Oats, Spring Triticale, Spring Rye
Winter Wheat, Winter Rye, Winter Barley,
Winter TriticaleWinter or Spring
Grains Seeded Down
Phosphate Required1
0–3 ppm 110 kg/ha (HR) 70 kg/ha (HR) 70 kg/ha (HR) 130 kg/ha (HR)
4–5 ppm 100 kg/ha (HR) 60 kg/ha (HR) 60 kg/ha (HR) 110 kg/ha (HR)
6–7 ppm 90 kg/ha (HR) 50 kg/ha (HR) 50 kg/ha (HR) 90 kg/ha (HR)
8–9 ppm 70 kg/ha (HR) 30 kg/ha (HR) 30 kg/ha (HR) 70 kg/ha (HR)
10–12 ppm 50 kg/ha (MR) 20 kg/ha (MR) 20 kg/ha (MR) 50 kg/ha (MR)
13–15 ppm 20 kg/ha (MR) 20 kg/ha (MR) 20 kg/ha (MR) 30 kg/ha (MR)
16–20 ppm 20 kg/ha (MR) 0 (LR) 20 kg/ha (MR) 20 kg/ha (MR)
21–25 ppm 0 (LR) 0 (LR) 20 kg/ha (MR) 20 kg/ha (MR)
26–30 ppm 0 (LR) 0 (LR) 20 kg/ha (MR) 20 kg/ha (LR)1
31–40 ppm 0 (RR) 0 (RR) 0 (LR) 0 (LR)
41–50 ppm 0 (RR) 0 (RR) 0 (RR) 0 (RR)
51–60 ppm 0 (RR) 0 (RR) 0 (RR) 0 (RR)
61 ppm + 0 (NR)2 0 (NR)2 0 (NR)2 0 (NR)2
100 kg/ha = 90 lb/acre1 For winter cereals seeded down only. 2 When the response rating for a nutrient is “NR,” application of phosphorus in fertilizer or manure may reduce crop yield or quality.
For example, phosphate applications may induce zinc deficiency on soils low in zinc and may increase the risk of water pollution.
minimizing the risk of losses through run-off or volatilization. It is acceptable to top-dress emerged spring cereals, particularly if a starter fertilizer has been applied at planting.
Phosphate and PotashPhosphate and potash recommendations for cereals are in Table 4–20, Phosphate (P2O5) guidelines for cereals and Table 4–21, Potash (K2O) guidelines for cereals.
These fertilizer guidelines are based on OMAFRA-accredited soil tests. For information on the use of these tables, or if an OMAFRA-accredited soil test is unavailable, see Fertilizer Guidelines in Chapter 9, Soil Fertility and Nutrient Use.
131
4. cereals
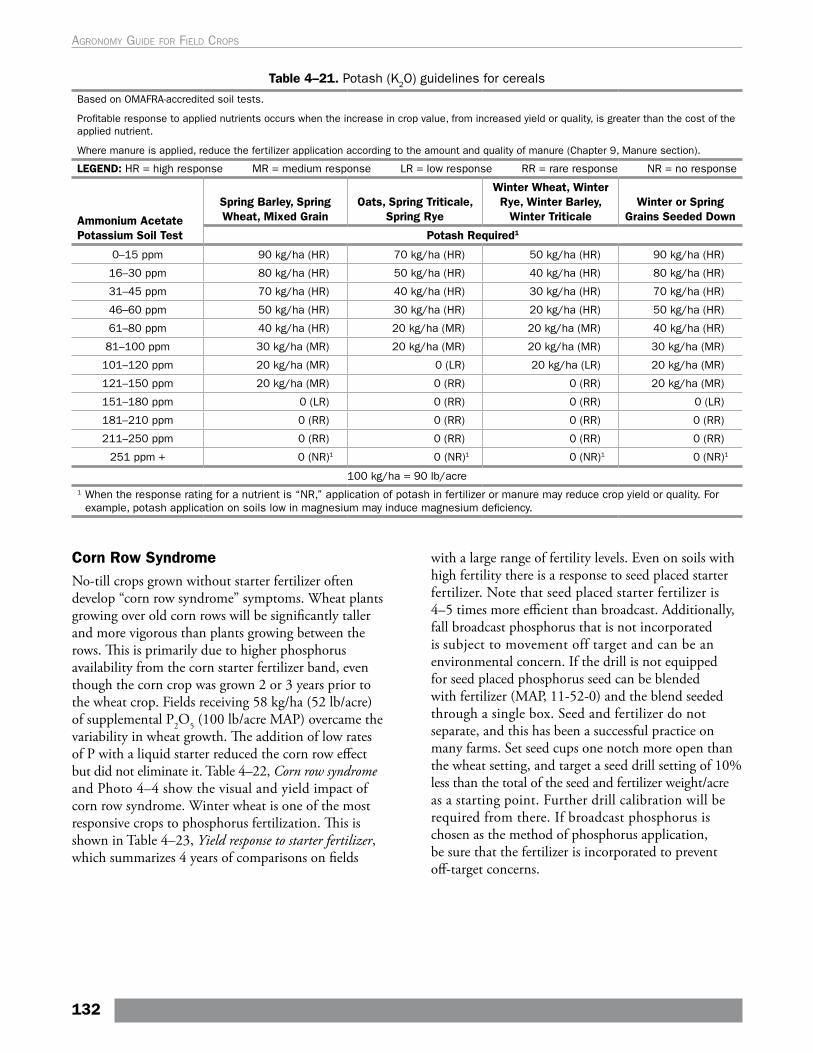
Table 4–21. Potash (K2O) guidelines for cereals
Based on OMAFRA-accredited soil tests.
Profitable response to applied nutrients occurs when the increase in crop value, from increased yield or quality, is greater than the cost of the applied nutrient.
Where manure is applied, reduce the fertilizer application according to the amount and quality of manure (Chapter 9, Manure section).
LEGEND: HR = high response MR = medium response LR = low response RR = rare response NR = no response
Ammonium Acetate Potassium Soil Test
Spring Barley, Spring Wheat, Mixed Grain
Oats, Spring Triticale, Spring Rye
Winter Wheat, Winter Rye, Winter Barley,
Winter TriticaleWinter or Spring
Grains Seeded Down
Potash Required1
0–15 ppm 90 kg/ha (HR) 70 kg/ha (HR) 50 kg/ha (HR) 90 kg/ha (HR)
16–30 ppm 80 kg/ha (HR) 50 kg/ha (HR) 40 kg/ha (HR) 80 kg/ha (HR)
31–45 ppm 70 kg/ha (HR) 40 kg/ha (HR) 30 kg/ha (HR) 70 kg/ha (HR)
46–60 ppm 50 kg/ha (HR) 30 kg/ha (HR) 20 kg/ha (HR) 50 kg/ha (HR)
61–80 ppm 40 kg/ha (HR) 20 kg/ha (MR) 20 kg/ha (MR) 40 kg/ha (HR)
81–100 ppm 30 kg/ha (MR) 20 kg/ha (MR) 20 kg/ha (MR) 30 kg/ha (MR)
101–120 ppm 20 kg/ha (MR) 0 (LR) 20 kg/ha (LR) 20 kg/ha (MR)
121–150 ppm 20 kg/ha (MR) 0 (RR) 0 (RR) 20 kg/ha (MR)
151–180 ppm 0 (LR) 0 (RR) 0 (RR) 0 (LR)
181–210 ppm 0 (RR) 0 (RR) 0 (RR) 0 (RR)
211–250 ppm 0 (RR) 0 (RR) 0 (RR) 0 (RR)
251 ppm + 0 (NR)1 0 (NR)1 0 (NR)1 0 (NR)1
100 kg/ha = 90 lb/acre1 When the response rating for a nutrient is “NR,” application of potash in fertilizer or manure may reduce crop yield or quality. For
example, potash application on soils low in magnesium may induce magnesium deficiency.
Corn Row SyndromeNo-till crops grown without starter fertilizer often develop “corn row syndrome” symptoms. Wheat plants growing over old corn rows will be significantly taller and more vigorous than plants growing between the rows. This is primarily due to higher phosphorus availability from the corn starter fertilizer band, even though the corn crop was grown 2 or 3 years prior to the wheat crop. Fields receiving 58 kg/ha (52 lb/acre) of supplemental P2O5 (100 lb/acre MAP) overcame the variability in wheat growth. The addition of low rates of P with a liquid starter reduced the corn row effect but did not eliminate it. Table 4–22, Corn row syndrome and Photo 4–4 show the visual and yield impact of corn row syndrome. Winter wheat is one of the most responsive crops to phosphorus fertilization. This is shown in Table 4–23, Yield response to starter fertilizer, which summarizes 4 years of comparisons on fields
with a large range of fertility levels. Even on soils with high fertility there is a response to seed placed starter fertilizer. Note that seed placed starter fertilizer is 4–5 times more efficient than broadcast. Additionally, fall broadcast phosphorus that is not incorporated is subject to movement off target and can be an environmental concern. If the drill is not equipped for seed placed phosphorus seed can be blended with fertilizer (MAP, 11-52-0) and the blend seeded through a single box. Seed and fertilizer do not separate, and this has been a successful practice on many farms. Set seed cups one notch more open than the wheat setting, and target a seed drill setting of 10% less than the total of the seed and fertilizer weight/acre as a starting point. Further drill calibration will be required from there. If broadcast phosphorus is chosen as the method of phosphorus application, be sure that the fertilizer is incorporated to prevent off-target concerns.
132
Agronomy guide for field Crops
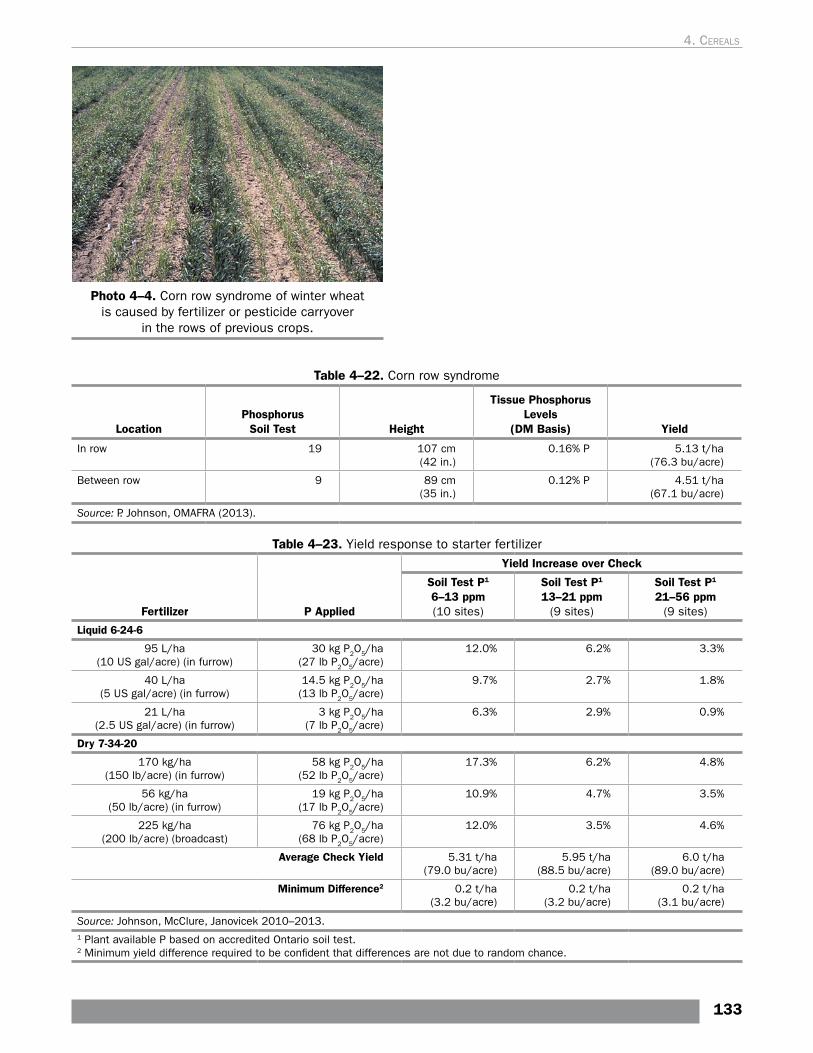
Photo 4–4. Corn row syndrome of winter wheat is caused by fertilizer or pesticide carryover
in the rows of previous crops.
Table 4–22. Corn row syndrome
LocationPhosphorus
Soil Test Height
Tissue Phosphorus Levels
(DM Basis) Yield
In row 19 107 cm (42 in.)
0.16% P 5.13 t/ha (76.3 bu/acre)
Between row 9 89 cm (35 in.)
0.12% P 4.51 t/ha (67.1 bu/acre)
Source: P. Johnson, OMAFRA (2013).
Table 4–23. Yield response to starter fertilizer
Fertilizer P Applied
Yield Increase over Check
Soil Test P1 6–13 ppm(10 sites)
Soil Test P1 13–21 ppm
(9 sites)
Soil Test P1 21–56 ppm
(9 sites)
Liquid 6-24-6
95 L/ha (10 US gal/acre) (in furrow)
30 kg P2O5/ha (27 lb P2O5/acre)
12.0% 6.2% 3.3%
40 L/ha (5 US gal/acre) (in furrow)
14.5 kg P2O5/ha (13 lb P2O5/acre)
9.7% 2.7% 1.8%
21 L/ha (2.5 US gal/acre) (in furrow)
3 kg P2O5/ha (7 lb P2O5/acre)
6.3% 2.9% 0.9%
Dry 7-34-20
170 kg/ha (150 lb/acre) (in furrow)
58 kg P2O5/ha (52 lb P2O5/acre)
17.3% 6.2% 4.8%
56 kg/ha (50 lb/acre) (in furrow)
19 kg P2O5/ha (17 lb P2O5/acre)
10.9% 4.7% 3.5%
225 kg/ha (200 lb/acre) (broadcast)
76 kg P2O5/ha (68 lb P2O5/acre)
12.0% 3.5% 4.6%
Average Check Yield 5.31 t/ha (79.0 bu/acre)
5.95 t/ha (88.5 bu/acre)
6.0 t/ha (89.0 bu/acre)
Minimum Difference2 0.2 t/ha (3.2 bu/acre)
0.2 t/ha (3.2 bu/acre)
0.2 t/ha (3.1 bu/acre)
Source: Johnson, McClure, Janovicek 2010–2013.1 Plant available P based on accredited Ontario soil test.2 Minimum yield difference required to be confident that differences are not due to random chance.
133
4. cereals
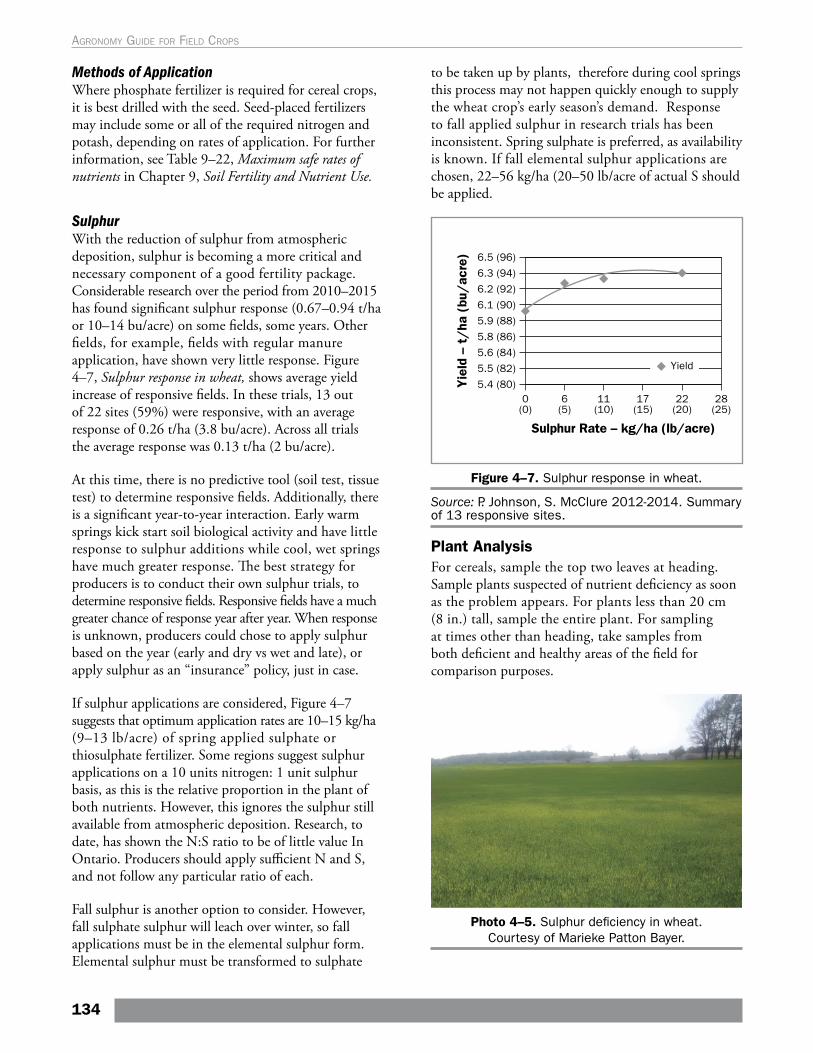
Methods of ApplicationWhere phosphate fertilizer is required for cereal crops, it is best drilled with the seed. Seed-placed fertilizers may include some or all of the required nitrogen and potash, depending on rates of application. For further information, see Table 9–22, Maximum safe rates of nutrients in Chapter 9, Soil Fertility and Nutrient Use.
SulphurWith the reduction of sulphur from atmospheric deposition, sulphur is becoming a more critical and necessary component of a good fertility package. Considerable research over the period from 2010–2015 has found significant sulphur response (0.67–0.94 t/ha or 10–14 bu/acre) on some fields, some years. Other fields, for example, fields with regular manure application, have shown very little response. Figure 4–7, Sulphur response in wheat, shows average yield increase of responsive fields. In these trials, 13 out of 22 sites (59%) were responsive, with an average response of 0.26 t/ha (3.8 bu/acre). Across all trials the average response was 0.13 t/ha (2 bu/acre).
At this time, there is no predictive tool (soil test, tissue test) to determine responsive fields. Additionally, there is a significant year-to-year interaction. Early warm springs kick start soil biological activity and have little response to sulphur additions while cool, wet springs have much greater response. The best strategy for producers is to conduct their own sulphur trials, to determine responsive fields. Responsive fields have a much greater chance of response year after year. When response is unknown, producers could chose to apply sulphur based on the year (early and dry vs wet and late), or apply sulphur as an “insurance” policy, just in case.
If sulphur applications are considered, Figure 4–7 suggests that optimum application rates are 10–15 kg/ha (9–13 lb/acre) of spring applied sulphate or thiosulphate fertilizer. Some regions suggest sulphur applications on a 10 units nitrogen: 1 unit sulphur basis, as this is the relative proportion in the plant of both nutrients. However, this ignores the sulphur still available from atmospheric deposition. Research, to date, has shown the N:S ratio to be of little value In Ontario. Producers should apply sufficient N and S, and not follow any particular ratio of each.
Fall sulphur is another option to consider. However, fall sulphate sulphur will leach over winter, so fall applications must be in the elemental sulphur form. Elemental sulphur must be transformed to sulphate
to be taken up by plants, therefore during cool springs this process may not happen quickly enough to supply the wheat crop’s early season’s demand. Response to fall applied sulphur in research trials has been inconsistent. Spring sulphate is preferred, as availability is known. If fall elemental sulphur applications are chosen, 22–56 kg/ha (20–50 lb/acre of actual S should be applied.
Figure 4–7. Sulphur response in wheat.
Source: P. Johnson, S. McClure 2012-2014. Summary of 13 responsive sites.
Plant AnalysisFor cereals, sample the top two leaves at heading. Sample plants suspected of nutrient deficiency as soon as the problem appears. For plants less than 20 cm (8 in.) tall, sample the entire plant. For sampling at times other than heading, take samples from both deficient and healthy areas of the field for comparison purposes.
Photo 4–5. Sulphur deficiency in wheat. Courtesy of Marieke Patton Bayer.
134
Agronomy guide for field Crops
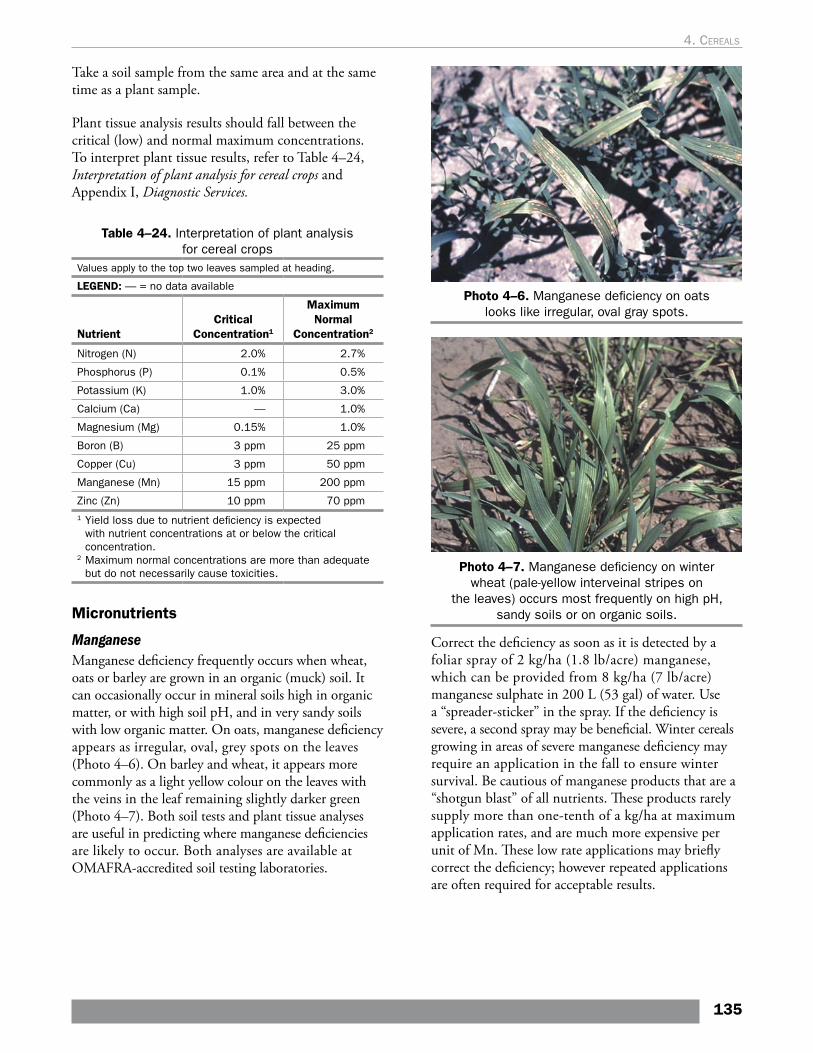
Take a soil sample from the same area and at the same time as a plant sample.
Plant tissue analysis results should fall between the critical (low) and normal maximum concentrations. To interpret plant tissue results, refer to Table 4–24, Interpretation of plant analysis for cereal crops and Appendix I, Diagnostic Services.
Table 4–24. Interpretation of plant analysis for cereal crops
Values apply to the top two leaves sampled at heading.
LEGEND: — = no data available
NutrientCritical
Concentration1
Maximum Normal
Concentration2
Nitrogen (N) 2.0% 2.7%
Phosphorus (P) 0.1% 0.5%
Potassium (K) 1.0% 3.0%
Calcium (Ca) — 1.0%
Magnesium (Mg) 0.15% 1.0%
Boron (B) 3 ppm 25 ppm
Copper (Cu) 3 ppm 50 ppm
Manganese (Mn) 15 ppm 200 ppm
Zinc (Zn) 10 ppm 70 ppm1 Yield loss due to nutrient deficiency is expected
with nutrient concentrations at or below the critical concentration.
2 Maximum normal concentrations are more than adequate but do not necessarily cause toxicities.
Micronutrients
Manganese Manganese deficiency frequently occurs when wheat, oats or barley are grown in an organic (muck) soil. It can occasionally occur in mineral soils high in organic matter, or with high soil pH, and in very sandy soils with low organic matter. On oats, manganese deficiency appears as irregular, oval, grey spots on the leaves (Photo 4–6). On barley and wheat, it appears more commonly as a light yellow colour on the leaves with the veins in the leaf remaining slightly darker green (Photo 4–7). Both soil tests and plant tissue analyses are useful in predicting where manganese deficiencies are likely to occur. Both analyses are available at OMAFRA-accredited soil testing laboratories.
Photo 4–6. Manganese deficiency on oats looks like irregular, oval gray spots.
Photo 4–7. Manganese deficiency on winter wheat (pale-yellow interveinal stripes on
the leaves) occurs most frequently on high pH, sandy soils or on organic soils.
Correct the deficiency as soon as it is detected by a foliar spray of 2 kg/ha (1.8 lb/acre) manganese, which can be provided from 8 kg/ha (7 lb/acre) manganese sulphate in 200 L (53 gal) of water. Use a “spreader-sticker” in the spray. If the deficiency is severe, a second spray may be beneficial. Winter cereals growing in areas of severe manganese deficiency may require an application in the fall to ensure winter survival. Be cautious of manganese products that are a “shotgun blast” of all nutrients. These products rarely supply more than one-tenth of a kg/ha at maximum application rates, and are much more expensive per unit of Mn. These low rate applications may briefly correct the deficiency; however repeated applications are often required for acceptable results.
135
4. cereals
Soil application is not recommended, regardless of source, due to the large amounts of manganese that would be required. In most cases, plant deficiencies are caused by a low availability of manganese from the soil rather than a lack of manganese. Adding more manganese to the soil will not often correct this. However, when small areas of the field are continually deficient, while the balance of the field is fine, soil applications can be attempted in the problem zones to avoid foliar applications on the entire field year after year. Apply from 22 kg/ha (20 lb/acre) Mn from manganese sulphate (MnSO4) to the deficient zone. Repeated applications may be necessary.
Copper Copper deficiency may occur in organic (muck) soils and could be suspected on rare occasions in very sandy soils. Response to copper has never been established on sandy soils. The most common deficiency symptom is dieback from the tip of the leaf, often accompanied by twisting of the upper leaves. For information on correcting copper deficiencies, see Micronutrient Fertilizers, Chapter 9, Soil Fertility and Nutrient Use. Many claims have been associated with copper applications, especially in regards to disease control. Ontario studies have not been able to substantiate any disease control benefit from copper applications.
Boron Boron deficiency has not been diagnosed in cereals. Boron applications can be toxic, causing a bleaching of leaf tissue in seedlings. Many tissue samples come back indicating boron deficiency: however, when boron is applied in these situations, no response occurs. Critical values for boron in wheat leaf tissue needs to be reassessed.
Zinc Zinc deficiency in cereals does not appear to be a problem. Trials on cereals using Micro-Essentials Sulphur Zinc (MESZ) 10-40-0-10-2 have found no benefit from the zinc in this product.
Do not apply mixtures of herbicides and foliar fertilizers to crop foliage unless recommended by reliable agronomists. Always consult the herbicide label.
Harvest and StorageOptimizing Combine AdjustmentsOperator manuals contain the best starting point for setting up a small grain harvester. Occasionally, conditions arise that require further adjustments. Harvest of Fusarium-damaged grain, lodged crops or crops infected with dwarf or common bunt requires special attention. The easiest and best way to improve the grain sample in these situations is with proper combine adjustment. Often the difference between a marketable crop and sample grade wheat is in the combine set-up. Don’t be afraid to experiment.
Storage of the crop allows the opportunity to upgrade the grain before delivery to an elevator or mill. This is particularly important for wheat infested with any of the bunt diseases. Many producers have experimented with re-cleaning the grain through screen cleaners, seed cleaners and fanning mills to upgrade the crop to a better sample. Elevator operators can also do this, for a fee. This can have tremendous economic benefit, where grain can be moved from salvage grade to milling grade. Upgrading the grain makes it much easier for the elevator to handle the crop and find a purchaser for the grain.
Fusarium-Damaged GrainCombines use air blast to separate grain from the chaff in a normal harvest operation. Many of the Fusarium-infected kernels are small, shrunken and lighter than sound kernels. It is often possible to blow a large proportion of these Fusarium-damaged kernels out the back of the combine by increasing the air blast above normal ranges. In 1996, many producers operated combines at the maximum windblast to increase grade. Research conducted by Dr. A Schaafsma (University of Guelph, Ridgetown Campus) in 1996 found a tenfold decrease in Fusarium-damaged kernels in the grain when fan speeds were operated at maximum blast (up to 300 rpm above book settings). Operating cleaning fans at these levels causes an additional loss of good kernels, up to 0.13 t/ha (2 bu/acre) Refer to Table 4–25, Effect of different fan-speeds on wheat yield. This small yield reduction is insignificant if the crop can be made marketable, rather than being downgraded to feed, sample or salvage.
136
Agronomy guide for field Crops
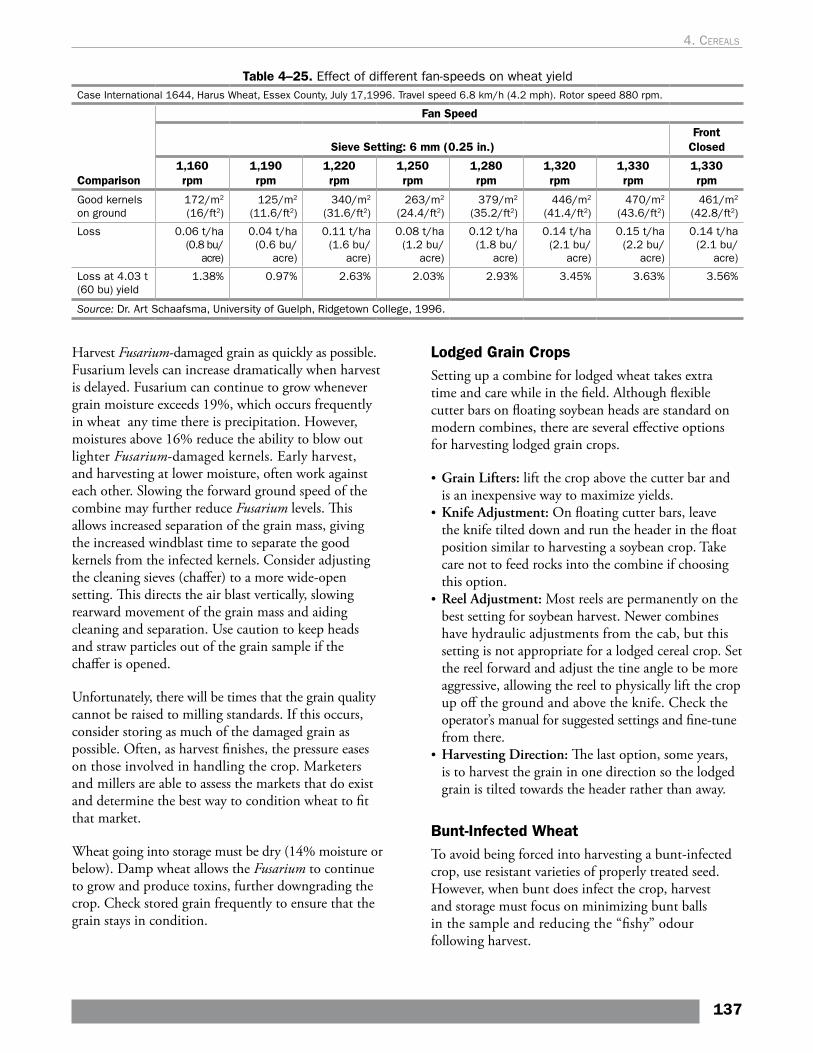
Table 4–25. Effect of different fan-speeds on wheat yieldCase International 1644, Harus Wheat, Essex County, July 17,1996. Travel speed 6.8 km/h (4.2 mph). Rotor speed 880 rpm.
Comparison
Fan Speed
Sieve Setting: 6 mm (0.25 in.)Front
Closed
1,160 rpm
1,190 rpm
1,220 rpm
1,250 rpm
1,280 rpm
1,320 rpm
1,330 rpm
1,330 rpm
Good kernels on ground
172/m2 (16/ft2)
125/m2 (11.6/ft2)
340/m2 (31.6/ft2)
263/m2 (24.4/ft2)
379/m2 (35.2/ft2)
446/m2 (41.4/ft2)
470/m2 (43.6/ft2)
461/m2 (42.8/ft2)
Loss 0.06 t/ha (0.8 bu/
acre)
0.04 t/ha (0.6 bu/
acre)
0.11 t/ha (1.6 bu/
acre)
0.08 t/ha (1.2 bu/
acre)
0.12 t/ha (1.8 bu/
acre)
0.14 t/ha (2.1 bu/
acre)
0.15 t/ha (2.2 bu/
acre)
0.14 t/ha (2.1 bu/
acre)
Loss at 4.03 t (60 bu) yield
1.38% 0.97% 2.63% 2.03% 2.93% 3.45% 3.63% 3.56%
Source: Dr. Art Schaafsma, University of Guelph, Ridgetown College, 1996.
Harvest Fusarium-damaged grain as quickly as possible. Fusarium levels can increase dramatically when harvest is delayed. Fusarium can continue to grow whenever grain moisture exceeds 19%, which occurs frequently in wheat any time there is precipitation. However, moistures above 16% reduce the ability to blow out lighter Fusarium-damaged kernels. Early harvest, and harvesting at lower moisture, often work against each other. Slowing the forward ground speed of the combine may further reduce Fusarium levels. This allows increased separation of the grain mass, giving the increased windblast time to separate the good kernels from the infected kernels. Consider adjusting the cleaning sieves (chaffer) to a more wide-open setting. This directs the air blast vertically, slowing rearward movement of the grain mass and aiding cleaning and separation. Use caution to keep heads and straw particles out of the grain sample if the chaffer is opened.
Unfortunately, there will be times that the grain quality cannot be raised to milling standards. If this occurs, consider storing as much of the damaged grain as possible. Often, as harvest finishes, the pressure eases on those involved in handling the crop. Marketers and millers are able to assess the markets that do exist and determine the best way to condition wheat to fit that market.
Wheat going into storage must be dry (14% moisture or below). Damp wheat allows the Fusarium to continue to grow and produce toxins, further downgrading the crop. Check stored grain frequently to ensure that the grain stays in condition.
Lodged Grain CropsSetting up a combine for lodged wheat takes extra time and care while in the field. Although flexible cutter bars on floating soybean heads are standard on modern combines, there are several effective options for harvesting lodged grain crops.
• Grain Lifters: lift the crop above the cutter bar and is an inexpensive way to maximize yields.
• Knife Adjustment: On floating cutter bars, leave the knife tilted down and run the header in the float position similar to harvesting a soybean crop. Take care not to feed rocks into the combine if choosing this option.
• Reel Adjustment: Most reels are permanently on the best setting for soybean harvest. Newer combines have hydraulic adjustments from the cab, but this setting is not appropriate for a lodged cereal crop. Set the reel forward and adjust the tine angle to be more aggressive, allowing the reel to physically lift the crop up off the ground and above the knife. Check the operator’s manual for suggested settings and fine-tune from there.
• Harvesting Direction: The last option, some years, is to harvest the grain in one direction so the lodged grain is tilted towards the header rather than away.
Bunt-Infected WheatTo avoid being forced into harvesting a bunt-infected crop, use resistant varieties of properly treated seed. However, when bunt does infect the crop, harvest and storage must focus on minimizing bunt balls in the sample and reducing the “fishy” odour following harvest.
137
4. cereals
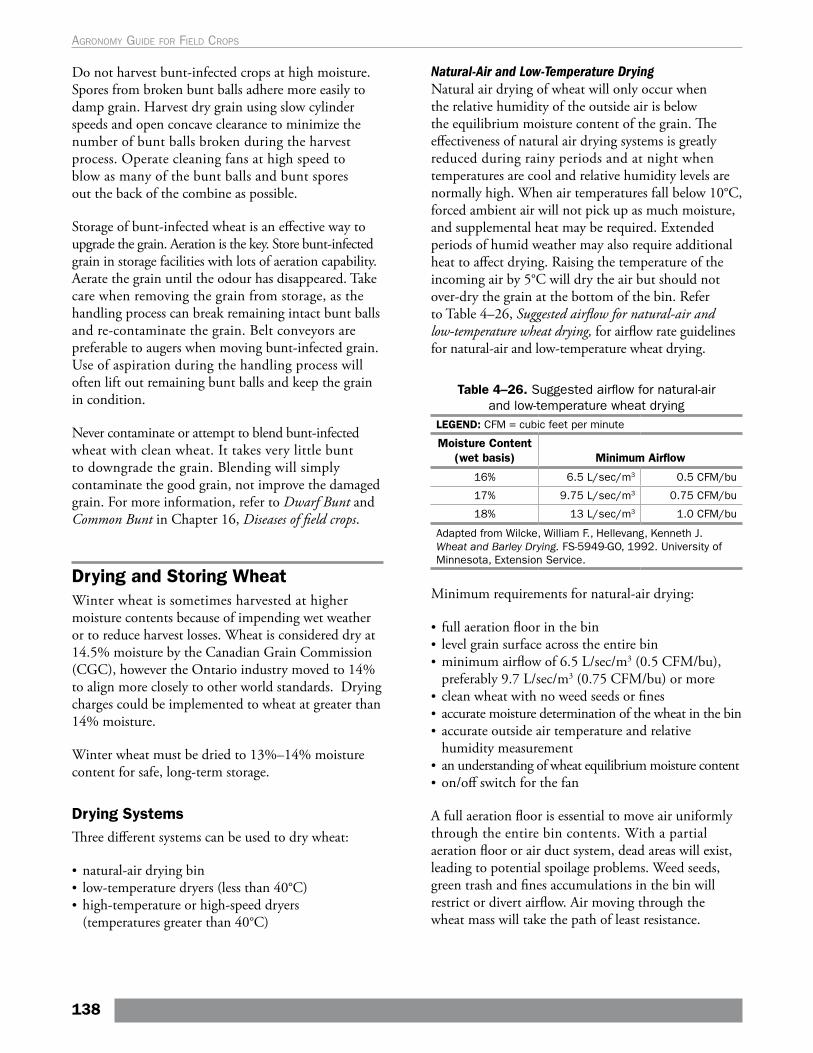
Do not harvest bunt-infected crops at high moisture. Spores from broken bunt balls adhere more easily to damp grain. Harvest dry grain using slow cylinder speeds and open concave clearance to minimize the number of bunt balls broken during the harvest process. Operate cleaning fans at high speed to blow as many of the bunt balls and bunt spores out the back of the combine as possible.
Storage of bunt-infected wheat is an effective way to upgrade the grain. Aeration is the key. Store bunt-infected grain in storage facilities with lots of aeration capability. Aerate the grain until the odour has disappeared. Take care when removing the grain from storage, as the handling process can break remaining intact bunt balls and re-contaminate the grain. Belt conveyors are preferable to augers when moving bunt-infected grain. Use of aspiration during the handling process will often lift out remaining bunt balls and keep the grain in condition.
Never contaminate or attempt to blend bunt-infected wheat with clean wheat. It takes very little bunt to downgrade the grain. Blending will simply contaminate the good grain, not improve the damaged grain. For more information, refer to Dwarf Bunt and Common Bunt in Chapter 16, Diseases of field crops.
Drying and Storing WheatWinter wheat is sometimes harvested at higher moisture contents because of impending wet weather or to reduce harvest losses. Wheat is considered dry at 14.5% moisture by the Canadian Grain Commission (CGC), however the Ontario industry moved to 14% to align more closely to other world standards. Drying charges could be implemented to wheat at greater than 14% moisture.
Winter wheat must be dried to 13%–14% moisture content for safe, long-term storage.
Drying SystemsThree different systems can be used to dry wheat:
• natural-air drying bin• low-temperature dryers (less than 40°C)• high-temperature or high-speed dryers
(temperatures greater than 40°C)
Natural-Air and Low-Temperature DryingNatural air drying of wheat will only occur when the relative humidity of the outside air is below the equilibrium moisture content of the grain. The effectiveness of natural air drying systems is greatly reduced during rainy periods and at night when temperatures are cool and relative humidity levels are normally high. When air temperatures fall below 10°C, forced ambient air will not pick up as much moisture, and supplemental heat may be required. Extended periods of humid weather may also require additional heat to affect drying. Raising the temperature of the incoming air by 5°C will dry the air but should not over-dry the grain at the bottom of the bin. Refer to Table 4–26, Suggested airflow for natural-air and low-temperature wheat drying, for airflow rate guidelines for natural-air and low-temperature wheat drying.
Table 4–26. Suggested airflow for natural-air and low-temperature wheat drying
LEGEND: CFM = cubic feet per minute
Moisture Content (wet basis) Minimum Airflow
16% 6.5 L/sec/m3 0.5 CFM/bu
17% 9.75 L/sec/m3 0.75 CFM/bu
18% 13 L/sec/m3 1.0 CFM/bu
Adapted from Wilcke, William F., Hellevang, Kenneth J. Wheat and Barley Drying. FS-5949-GO, 1992. University of Minnesota, Extension Service.
Minimum requirements for natural-air drying:
• full aeration floor in the bin• level grain surface across the entire bin • minimum airflow of 6.5 L/sec/m3 (0.5 CFM/bu),
preferably 9.7 L/sec/m3 (0.75 CFM/bu) or more• clean wheat with no weed seeds or fines • accurate moisture determination of the wheat in the bin• accurate outside air temperature and relative
humidity measurement• an understanding of wheat equilibrium moisture content• on/off switch for the fan
A full aeration floor is essential to move air uniformly through the entire bin contents. With a partial aeration floor or air duct system, dead areas will exist, leading to potential spoilage problems. Weed seeds, green trash and fines accumulations in the bin will restrict or divert airflow. Air moving through the wheat mass will take the path of least resistance.
138
Agronomy guide for field Crops
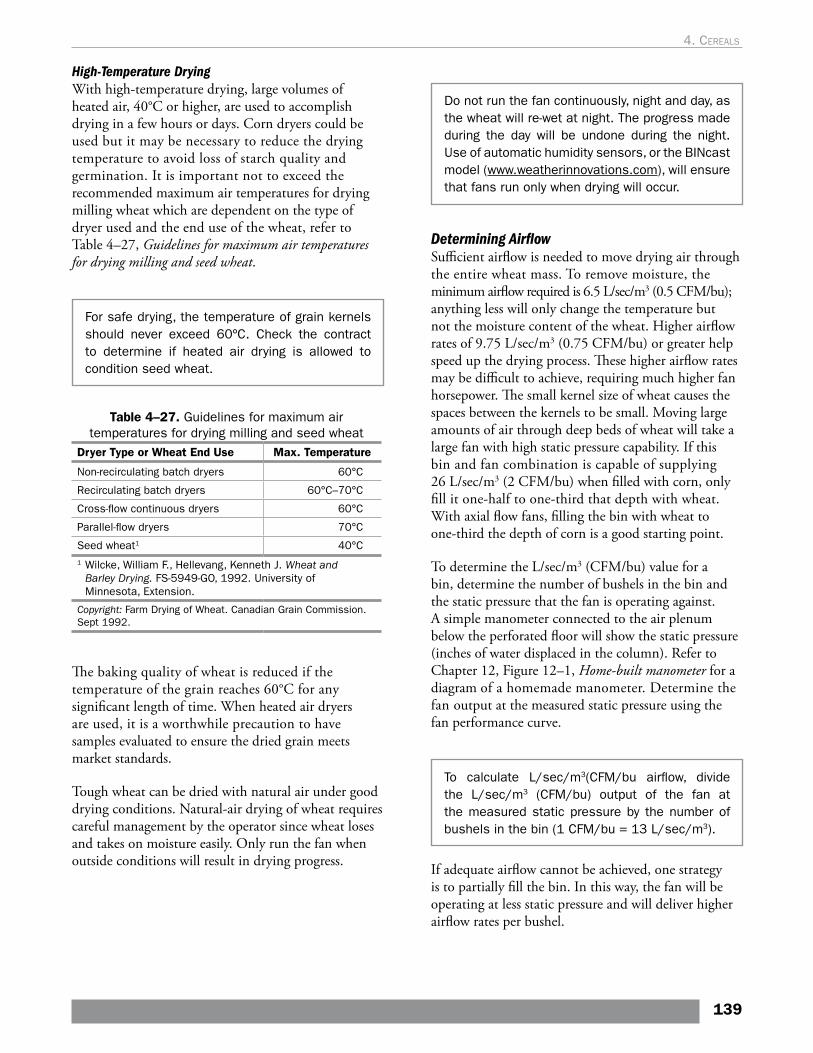
High-Temperature DryingWith high-temperature drying, large volumes of heated air, 40°C or higher, are used to accomplish drying in a few hours or days. Corn dryers could be used but it may be necessary to reduce the drying temperature to avoid loss of starch quality and germination. It is important not to exceed the recommended maximum air temperatures for drying milling wheat which are dependent on the type of dryer used and the end use of the wheat, refer to Table 4–27, Guidelines for maximum air temperatures for drying milling and seed wheat.
For safe drying, the temperature of grain kernels should never exceed 60ºC. Check the contract to determine if heated air drying is allowed to condition seed wheat.
Table 4–27. Guidelines for maximum air temperatures for drying milling and seed wheat
Dryer Type or Wheat End Use Max. Temperature
Non-recirculating batch dryers 60°C
Recirculating batch dryers 60°C–70°C
Cross-flow continuous dryers 60°C
Parallel-flow dryers 70°C
Seed wheat1 40°C1 Wilcke, William F., Hellevang, Kenneth J. Wheat and
Barley Drying. FS-5949-GO, 1992. University of Minnesota, Extension.
Copyright: Farm Drying of Wheat. Canadian Grain Commission. Sept 1992.
The baking quality of wheat is reduced if the temperature of the grain reaches 60°C for any significant length of time. When heated air dryers are used, it is a worthwhile precaution to have samples evaluated to ensure the dried grain meets market standards.
Tough wheat can be dried with natural air under good drying conditions. Natural-air drying of wheat requires careful management by the operator since wheat loses and takes on moisture easily. Only run the fan when outside conditions will result in drying progress.
Do not run the fan continuously, night and day, as the wheat will re-wet at night. The progress made during the day will be undone during the night. Use of automatic humidity sensors, or the BINcast model (www.weatherinnovations.com), will ensure that fans run only when drying will occur.
Determining AirflowSufficient airflow is needed to move drying air through the entire wheat mass. To remove moisture, the minimum airflow required is 6.5 L/sec/m3 (0.5 CFM/bu); anything less will only change the temperature but not the moisture content of the wheat. Higher airflow rates of 9.75 L/sec/m3 (0.75 CFM/bu) or greater help speed up the drying process. These higher airflow rates may be difficult to achieve, requiring much higher fan horsepower. The small kernel size of wheat causes the spaces between the kernels to be small. Moving large amounts of air through deep beds of wheat will take a large fan with high static pressure capability. If this bin and fan combination is capable of supplying 26 L/sec/m3 (2 CFM/bu) when filled with corn, only fill it one-half to one-third that depth with wheat. With axial flow fans, filling the bin with wheat to one-third the depth of corn is a good starting point.
To determine the L/sec/m3 (CFM/bu) value for a bin, determine the number of bushels in the bin and the static pressure that the fan is operating against. A simple manometer connected to the air plenum below the perforated floor will show the static pressure (inches of water displaced in the column). Refer to Chapter 12, Figure 12–1, Home-built manometer for a diagram of a homemade manometer. Determine the fan output at the measured static pressure using the fan performance curve.
To calculate L/sec/m3(CFM/bu airflow, divide the L/sec/m3 (CFM/bu) output of the fan at the measured static pressure by the number of bushels in the bin (1 CFM/bu = 13 L/sec/m3).
If adequate airflow cannot be achieved, one strategy is to partially fill the bin. In this way, the fan will be operating at less static pressure and will deliver higher airflow rates per bushel.
139
4. cereals
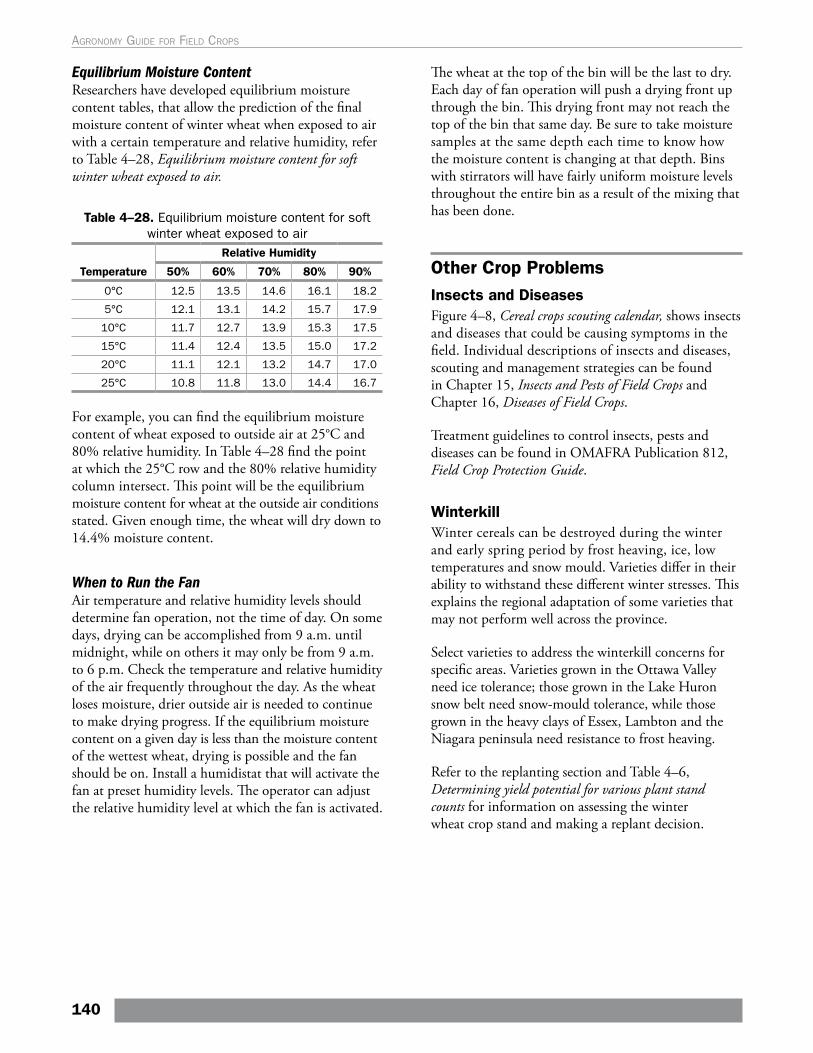
The wheat at the top of the bin will be the last to dry. Each day of fan operation will push a drying front up through the bin. This drying front may not reach the top of the bin that same day. Be sure to take moisture samples at the same depth each time to know how the moisture content is changing at that depth. Bins with stirrators will have fairly uniform moisture levels throughout the entire bin as a result of the mixing that has been done.
Other Crop ProblemsInsects and Diseases Figure 4–8, Cereal crops scouting calendar, shows insects and diseases that could be causing symptoms in the field. Individual descriptions of insects and diseases, scouting and management strategies can be found in Chapter 15, Insects and Pests of Field Crops and Chapter 16, Diseases of Field Crops.
Treatment guidelines to control insects, pests and diseases can be found in OMAFRA Publication 812, Field Crop Protection Guide.
WinterkillWinter cereals can be destroyed during the winter and early spring period by frost heaving, ice, low temperatures and snow mould. Varieties differ in their ability to withstand these different winter stresses. This explains the regional adaptation of some varieties that may not perform well across the province.
Select varieties to address the winterkill concerns for specific areas. Varieties grown in the Ottawa Valley need ice tolerance; those grown in the Lake Huron snow belt need snow-mould tolerance, while those grown in the heavy clays of Essex, Lambton and the Niagara peninsula need resistance to frost heaving.
Refer to the replanting section and Table 4–6, Determining yield potential for various plant stand counts for information on assessing the winter wheat crop stand and making a replant decision.
Equilibrium Moisture ContentResearchers have developed equilibrium moisture content tables, that allow the prediction of the final moisture content of winter wheat when exposed to air with a certain temperature and relative humidity, refer to Table 4–28, Equilibrium moisture content for soft winter wheat exposed to air.
Table 4–28. Equilibrium moisture content for soft winter wheat exposed to air
Temperature
Relative Humidity
50% 60% 70% 80% 90%
0°C 12.5 13.5 14.6 16.1 18.2
5°C 12.1 13.1 14.2 15.7 17.9
10°C 11.7 12.7 13.9 15.3 17.5
15°C 11.4 12.4 13.5 15.0 17.2
20°C 11.1 12.1 13.2 14.7 17.0
25°C 10.8 11.8 13.0 14.4 16.7
For example, you can find the equilibrium moisture content of wheat exposed to outside air at 25°C and 80% relative humidity. In Table 4–28 find the point at which the 25°C row and the 80% relative humidity column intersect. This point will be the equilibrium moisture content for wheat at the outside air conditions stated. Given enough time, the wheat will dry down to 14.4% moisture content.
When to Run the FanAir temperature and relative humidity levels should determine fan operation, not the time of day. On some days, drying can be accomplished from 9 a.m. until midnight, while on others it may only be from 9 a.m. to 6 p.m. Check the temperature and relative humidity of the air frequently throughout the day. As the wheat loses moisture, drier outside air is needed to continue to make drying progress. If the equilibrium moisture content on a given day is less than the moisture content of the wettest wheat, drying is possible and the fan should be on. Install a humidistat that will activate the fan at preset humidity levels. The operator can adjust the relative humidity level at which the fan is activated.
140
Agronomy guide for field Crops
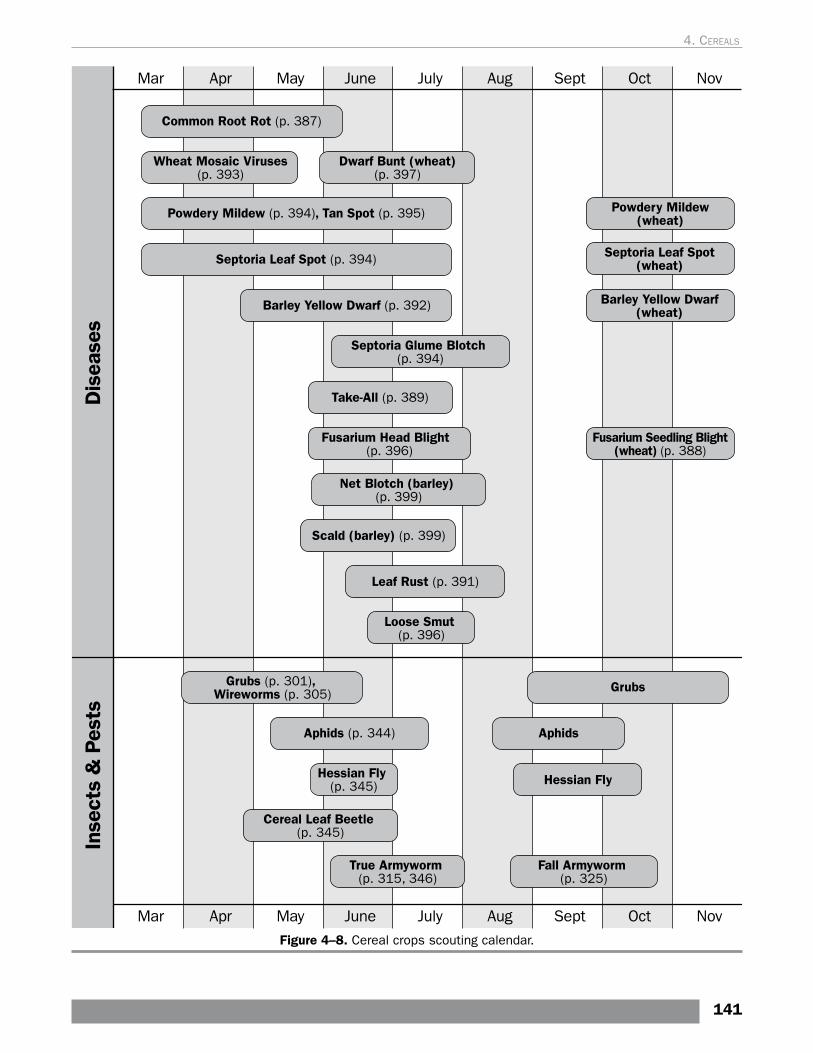
Figure 4–8. Cereal crops scouting calendar.
141
4. cereals
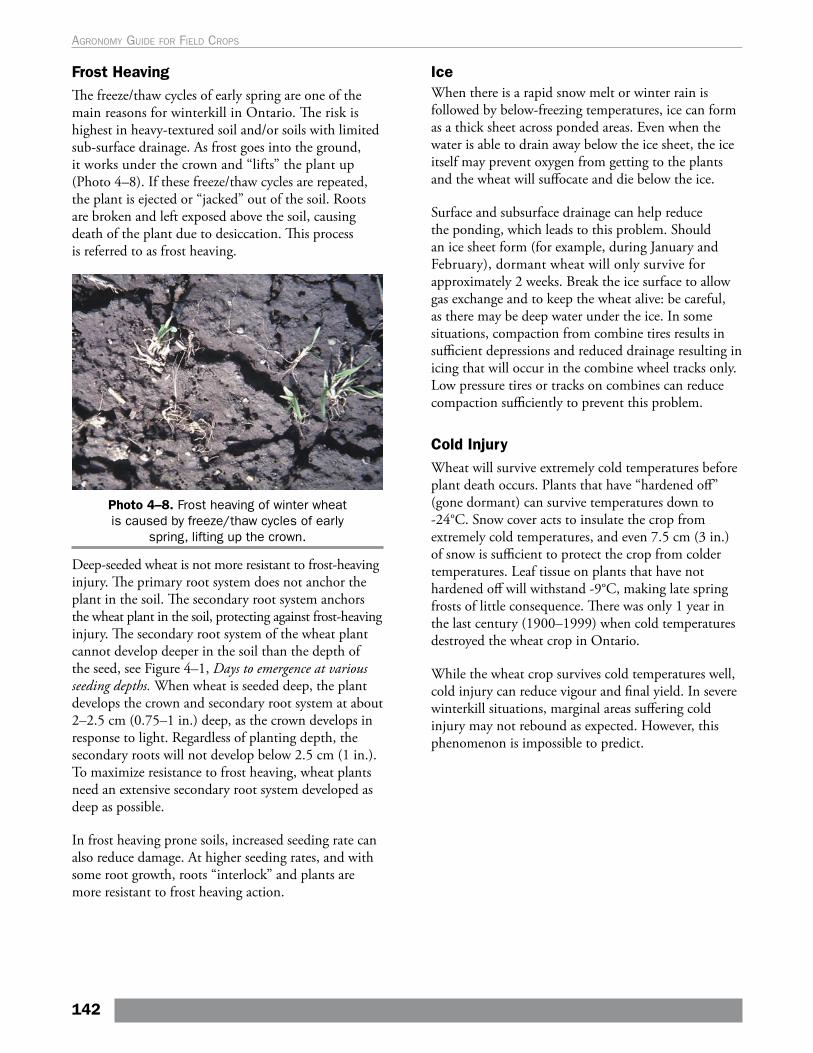
Frost HeavingThe freeze/thaw cycles of early spring are one of the main reasons for winterkill in Ontario. The risk is highest in heavy-textured soil and/or soils with limited sub-surface drainage. As frost goes into the ground, it works under the crown and “lifts” the plant up (Photo 4–8). If these freeze/thaw cycles are repeated, the plant is ejected or “jacked” out of the soil. Roots are broken and left exposed above the soil, causing death of the plant due to desiccation. This process is referred to as frost heaving.
Photo 4–8. Frost heaving of winter wheat is caused by freeze/thaw cycles of early
spring, lifting up the crown.
Deep-seeded wheat is not more resistant to frost-heaving injury. The primary root system does not anchor the plant in the soil. The secondary root system anchors the wheat plant in the soil, protecting against frost-heaving injury. The secondary root system of the wheat plant cannot develop deeper in the soil than the depth of the seed, see Figure 4–1, Days to emergence at various seeding depths. When wheat is seeded deep, the plant develops the crown and secondary root system at about 2–2.5 cm (0.75–1 in.) deep, as the crown develops in response to light. Regardless of planting depth, the secondary roots will not develop below 2.5 cm (1 in.). To maximize resistance to frost heaving, wheat plants need an extensive secondary root system developed as deep as possible.
In frost heaving prone soils, increased seeding rate can also reduce damage. At higher seeding rates, and with some root growth, roots “interlock” and plants are more resistant to frost heaving action.
IceWhen there is a rapid snow melt or winter rain is followed by below-freezing temperatures, ice can form as a thick sheet across ponded areas. Even when the water is able to drain away below the ice sheet, the ice itself may prevent oxygen from getting to the plants and the wheat will suffocate and die below the ice.
Surface and subsurface drainage can help reduce the ponding, which leads to this problem. Should an ice sheet form (for example, during January and February), dormant wheat will only survive for approximately 2 weeks. Break the ice surface to allow gas exchange and to keep the wheat alive: be careful, as there may be deep water under the ice. In some situations, compaction from combine tires results in sufficient depressions and reduced drainage resulting in icing that will occur in the combine wheel tracks only. Low pressure tires or tracks on combines can reduce compaction sufficiently to prevent this problem.
Cold InjuryWheat will survive extremely cold temperatures before plant death occurs. Plants that have “hardened off” (gone dormant) can survive temperatures down to -24°C. Snow cover acts to insulate the crop from extremely cold temperatures, and even 7.5 cm (3 in.) of snow is sufficient to protect the crop from colder temperatures. Leaf tissue on plants that have not hardened off will withstand -9°C, making late spring frosts of little consequence. There was only 1 year in the last century (1900–1999) when cold temperatures destroyed the wheat crop in Ontario.
While the wheat crop survives cold temperatures well, cold injury can reduce vigour and final yield. In severe winterkill situations, marginal areas suffering cold injury may not rebound as expected. However, this phenomenon is impossible to predict.
142
Agronomy guide for field Crops
5. Dry Edible Beans
Dry edible beans (Phaseolus vulgaris) belong to a class of legumes (Fabaceae family). Production of dry edible beans occurs primarily in western Ontario, and the crop is typically grown under contract. Over 80% of production is exported. The main types of beans grown in Ontario include white (navy), kidney, cranberry, black, otebo, and adzuki (or azuki) beans. Adzuki beans (Vigna angularis) are only distantly related and are unique in their growth habit, production and susceptibility to diseases and insects. Dry edible beans require special cultural management practices for optimum quality and profitability.
Tillage OptionsDry edible beans grow best in soils with excellent soil structure and good drainage. The seedbed requirements are similar to those for soybeans, including a firm seedbed to enhance a uniform planting depth and good seed-to-soil contact to promote rapid and uniform emergence. The best, highest-yielding stands come from beans that emerge within a week of planting and remain stress free for the first 3 weeks. This is accomplished with:
• uniform soil moisture• good soil-to-seed contact • secondary tillage limited to the minimum required
for seedbed preparation• surface conditions that minimize risk for soil crusting
The choice of tillage system must consider the harvest method. White and black beans are direct harvested and can be successfully grown using conventional, strip, reduced or no-till systems. Large seeded bean types, including kidney and cranberry, are typically harvested by pulling and windrowing prior to combining. Some producers have had success with direct harvest when done at the ideal bean moisture content. Conventional tillage is the traditional and most common method of preparing seedbeds for larger-seeded bean types that are pulled at harvest, but an increasing number of producers are successfully employing other tillage systems. Large-seeded coloured beans are more prone to damage by crusting because of their large cotyledons.
In no-till systems, dry edible beans respond to some form of tillage in the seed zone at planting. This is largely because of their inherently small and poorly developed root system. Tillage coulters on the planting unit will provide the necessary seed-zone tillage to optimize emergence, stand establishment, early growth and plant height. Beans are shorter when grown in a no-till system and are therefore better suited to narrow row production.
Packing following planting is usually necessary where direct harvesting is planned and for dry edible beans planted no-till into corn stubble. Packing will level the field for clipping beans close to ground and reduce stones, cornstalks and contamination from dirt when combining.
Site Selection and Crop RotationThe most important factors in field selection include:
• disease history • previous crop • weed control and potential herbicide carry-over • soil structure, slope and drainage
Soil Type and StructureFields planted to dry edible beans are susceptible to soil erosion due to late planting, slow growth and the relatively poor root systems of the crop. The crop canopy and crop residue only protect the soil for a relatively short period of the season. For beans in wide rows, the crop canopy may only fully cover the soil in August.
Dry edible beans are one of the most responsive crops to good soil structure and grow best on loamy, uncompacted soils. Heavy soils that are poorly drained, prone to crusting or hard to till risk uneven emergence and poor stands. Soil that remains saturated for 24 hours will cause severe seedling damage. Beans have relatively inefficient and poorly developed root systems that are susceptible to stress. Uneven emergence results in uneven ripening, delayed harvest and immature beans that increase the “pick” and result in lower grade and price when marketed.
143
Avoid growing dry edible beans in fields where compaction is a concern. Soil compaction is a serious dry bean production issue that restricts root growth, promotes root disease and increases risk of herbicide injury. Yield reductions from compaction and poor soil structure can be as high as 30%–50%. Compaction takes time to overcome and cannot be alleviated with tillage alone.
Disease HistoryA rotation where beans are grown only once in 3 years (or longer) is essential to avoid the build-up of diseases. The most common diseases encouraged by short rotations are root rots and white mould (Sclerotinia). Soybean, canola, potato and sunflower are poor rotation choices with beans since they are all susceptible to white mould. Root rots are challenging to control through rotation, because they have a wide crop-host range. The organisms that cause root rots are often invasive, infecting plants that are under stress. Soil compaction, poor drainage, frequent cropping to beans, and other factors cause plant stress that favours root rot. Dry edible beans are also hosts for soybean cyst nematode (SCN). Adzuki beans are particularly susceptible to SCN. For additional information about SCN and other dry edible bean diseases, see Chapter 16, Diseases of Field Crops.
Bean dealers and buyers may stipulate the crop protection products that are permitted to be used, based on the maximum residue limit (MRL) approval of importing countries. Producers need to check their production contract or guidelines and speak with their dealer for a list of approved products.
Weed ControlOptions for controlling annual broadleaf and perennial weeds with herbicides are limited in dry edible beans, so weeds must be controlled in the previous crop. Weeds present at harvest may also create quality problems (i.e., seed staining) and reduce harvest efficiency. Nightshade and perennial pokeweed cause severe staining of beans at harvest. Corn is often favoured as a previous crop due to the number of options for controlling problem weeds. Cultivation between the rows can be used to control weeds. Refer to Chapter 7 of Publication 75, Guide to Weed Control, for more information on cultural and chemical control
options in dry edible beans. Note that not all dry edible bean classes are tested in herbicide-tolerance evaluations, and the classes may vary in their tolerance to certain herbicides.
Dry edible beans are very sensitive to certain herbicides that may be in the soil. To reduce carry-over injury from previous crops, select herbicides carefully the year prior to bean production. Refer to Table 4–4, Herbicide Crop Rotations, and pH Restrictions–Field Crops in OMAFRA Publication 75, Guide to Weed Control.
Considering all the factors, the ultimate rotation crops for dry edible beans include corn, forages and cereals. A previous crop of corn or cereals provides a good opportunity to control weeds, and an effective break in edible bean diseases. The earlier harvest date of dry edible beans allows for timely planting of winter wheat. A cereal crop in which weed control was good would be preferred over a corn field where compaction following a wet harvest might be an issue. Forages promote the best soil structure, but soil insects and weed pressure can be an issue. For more information on appropriate crop rotations for dry edible beans and precautions under different tillage systems, see Table Intro–1. Management considerations for various crop rotations, found in the Introduction.
Variety Selection Before deciding on a market class, carefully consider the unique production requirements and risks for each class. There are differing seed sizes and plant architectures that may dictate the required equipment and harvest method, and for some classes there are distinct challenges in meeting quality standards. Most dry edible beans in Ontario are grown under contract; consider the various marketing opportunities and contract options.
In choosing a dry edible bean variety, consider:
• growth habit (e.g., upright or vining) • days to maturity• yield potential• suitability for intended harvest method• disease resistance/tolerance (e.g., anthracnose,
bean common mosaic virus (BCMV), common bacterial blight (CBB))
144
Agronomy guide for field Crops
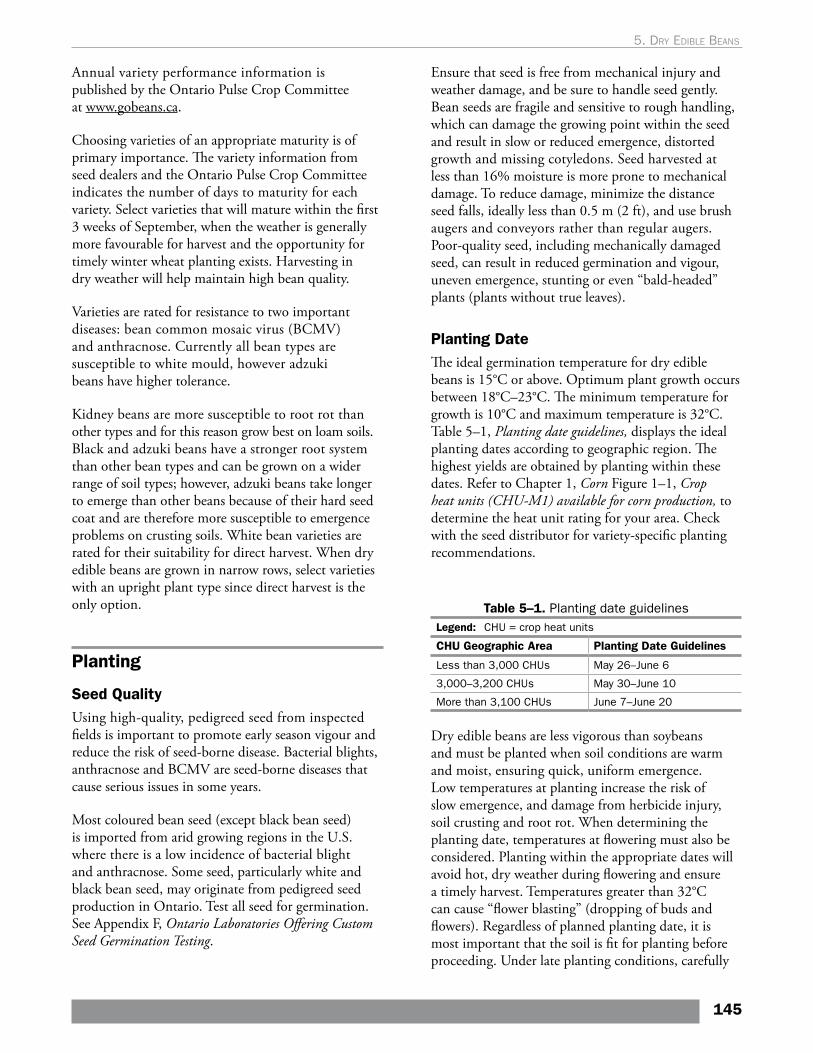
Annual variety performance information is published by the Ontario Pulse Crop Committee at www.gobeans.ca.
Choosing varieties of an appropriate maturity is of primary importance. The variety information from seed dealers and the Ontario Pulse Crop Committee indicates the number of days to maturity for each variety. Select varieties that will mature within the first 3 weeks of September, when the weather is generally more favourable for harvest and the opportunity for timely winter wheat planting exists. Harvesting in dry weather will help maintain high bean quality.
Varieties are rated for resistance to two important diseases: bean common mosaic virus (BCMV) and anthracnose. Currently all bean types are susceptible to white mould, however adzuki beans have higher tolerance.
Kidney beans are more susceptible to root rot than other types and for this reason grow best on loam soils. Black and adzuki beans have a stronger root system than other bean types and can be grown on a wider range of soil types; however, adzuki beans take longer to emerge than other beans because of their hard seed coat and are therefore more susceptible to emergence problems on crusting soils. White bean varieties are rated for their suitability for direct harvest. When dry edible beans are grown in narrow rows, select varieties with an upright plant type since direct harvest is the only option.
Planting
Seed QualityUsing high-quality, pedigreed seed from inspected fields is important to promote early season vigour and reduce the risk of seed-borne disease. Bacterial blights, anthracnose and BCMV are seed-borne diseases that cause serious issues in some years.
Most coloured bean seed (except black bean seed) is imported from arid growing regions in the U.S. where there is a low incidence of bacterial blight and anthracnose. Some seed, particularly white and black bean seed, may originate from pedigreed seed production in Ontario. Test all seed for germination. See Appendix F, Ontario Laboratories Offering Custom Seed Germination Testing.
Ensure that seed is free from mechanical injury and weather damage, and be sure to handle seed gently. Bean seeds are fragile and sensitive to rough handling, which can damage the growing point within the seed and result in slow or reduced emergence, distorted growth and missing cotyledons. Seed harvested at less than 16% moisture is more prone to mechanical damage. To reduce damage, minimize the distance seed falls, ideally less than 0.5 m (2 ft), and use brush augers and conveyors rather than regular augers. Poor-quality seed, including mechanically damaged seed, can result in reduced germination and vigour, uneven emergence, stunting or even “bald-headed” plants (plants without true leaves).
Planting DateThe ideal germination temperature for dry edible beans is 15°C or above. Optimum plant growth occurs between 18°C–23°C. The minimum temperature for growth is 10°C and maximum temperature is 32°C. Table 5–1, Planting date guidelines, displays the ideal planting dates according to geographic region. The highest yields are obtained by planting within these dates. Refer to Chapter 1, Corn Figure 1–1, Crop heat units (CHU-M1) available for corn production, to determine the heat unit rating for your area. Check with the seed distributor for variety-specific planting recommendations.
Table 5–1. Planting date guidelinesLegend: CHU = crop heat units
CHU Geographic Area Planting Date Guidelines
Less than 3,000 CHUs May 26–June 6
3,000–3,200 CHUs May 30–June 10
More than 3,100 CHUs June 7–June 20
Dry edible beans are less vigorous than soybeans and must be planted when soil conditions are warm and moist, ensuring quick, uniform emergence. Low temperatures at planting increase the risk of slow emergence, and damage from herbicide injury, soil crusting and root rot. When determining the planting date, temperatures at flowering must also be considered. Planting within the appropriate dates will avoid hot, dry weather during flowering and ensure a timely harvest. Temperatures greater than 32°C can cause “flower blasting” (dropping of buds and flowers). Regardless of planned planting date, it is most important that the soil is fit for planting before proceeding. Under late planting conditions, carefully
145
5. dry edIble beans
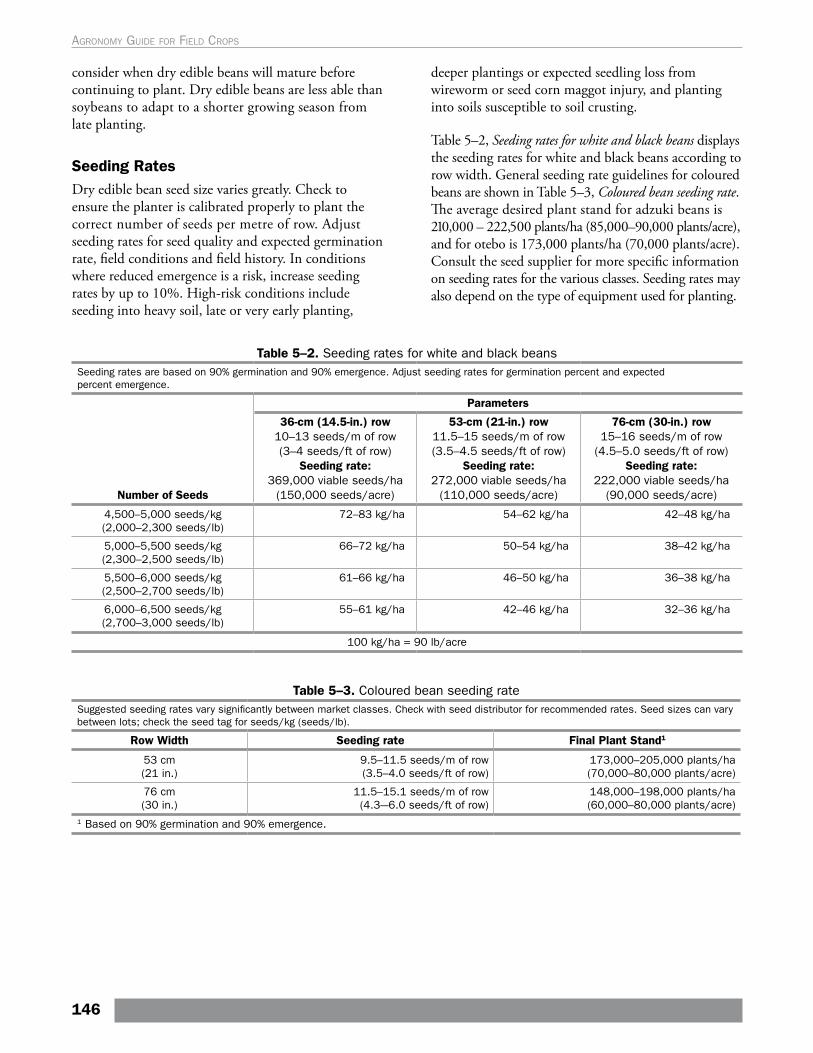
consider when dry edible beans will mature before continuing to plant. Dry edible beans are less able than soybeans to adapt to a shorter growing season from late planting.
Seeding Rates Dry edible bean seed size varies greatly. Check to ensure the planter is calibrated properly to plant the correct number of seeds per metre of row. Adjust seeding rates for seed quality and expected germination rate, field conditions and field history. In conditions where reduced emergence is a risk, increase seeding rates by up to 10%. High-risk conditions include seeding into heavy soil, late or very early planting,
deeper plantings or expected seedling loss from wireworm or seed corn maggot injury, and planting into soils susceptible to soil crusting.
Table 5–2, Seeding rates for white and black beans displays the seeding rates for white and black beans according to row width. General seeding rate guidelines for coloured beans are shown in Table 5–3, Coloured bean seeding rate. The average desired plant stand for adzuki beans is 210,000 – 222,500 plants/ha (85,000–90,000 plants/acre), and for otebo is 173,000 plants/ha (70,000 plants/acre). Consult the seed supplier for more specific information on seeding rates for the various classes. Seeding rates may also depend on the type of equipment used for planting.
Table 5–2. Seeding rates for white and black beansSeeding rates are based on 90% germination and 90% emergence. Adjust seeding rates for germination percent and expected percent emergence.
Number of Seeds
Parameters
36-cm (14.5-in.) row10–13 seeds/m of row (3–4 seeds/ft of row)
Seeding rate: 369,000 viable seeds/ha
(150,000 seeds/acre)
53-cm (21-in.) row11.5–15 seeds/m of row (3.5–4.5 seeds/ft of row)
Seeding rate: 272,000 viable seeds/ha
(110,000 seeds/acre)
76-cm (30-in.) row15–16 seeds/m of row
(4.5–5.0 seeds/ft of row)Seeding rate:
222,000 viable seeds/ha (90,000 seeds/acre)
4,500–5,000 seeds/kg (2,000–2,300 seeds/lb)
72–83 kg/ha 54–62 kg/ha 42–48 kg/ha
5,000–5,500 seeds/kg (2,300–2,500 seeds/lb)
66–72 kg/ha 50–54 kg/ha 38–42 kg/ha
5,500–6,000 seeds/kg (2,500–2,700 seeds/lb)
61–66 kg/ha 46–50 kg/ha 36–38 kg/ha
6,000–6,500 seeds/kg (2,700–3,000 seeds/lb)
55–61 kg/ha 42–46 kg/ha 32–36 kg/ha
100 kg/ha = 90 lb/acre
Table 5–3. Coloured bean seeding rateSuggested seeding rates vary significantly between market classes. Check with seed distributor for recommended rates. Seed sizes can vary between lots; check the seed tag for seeds/kg (seeds/lb).
Row Width Seeding rate Final Plant Stand1
53 cm (21 in.)
9.5–11.5 seeds/m of row (3.5–4.0 seeds/ft of row)
173,000–205,000 plants/ha (70,000–80,000 plants/acre)
76 cm (30 in.)
11.5–15.1 seeds/m of row (4.3-–6.0 seeds/ft of row)
148,000–198,000 plants/ha (60,000–80,000 plants/acre)
1 Based on 90% germination and 90% emergence.
146
Agronomy guide for field Crops
Seeding rate can be calculated using seeds/kg found on seed tag with the following formula:
Seeding rate (kg/ha or lb/acre) = desired final plant population ÷ seedling survival rate ÷ seeds/kg (seeds/lb)
Example: Cranberry beans 148,000 plants/ha desired population 85% seedling survival 1760 seeds/kg
Seeding rate = 148,000 ÷ 0.85 ÷ 1760 = 99 kg/ha
Seeding Depth The seeding depth for dry edible beans is critical for uniform emergence. Frequently, poor stands are the result of not planting into moisture. Planting depth should be at least 1.2 cm (0.5 in.) into soil moisture. Uneven emergence results in uneven maturity. A seeding depth of 4–6 cm (1.5–2.5 in.) is normal, but deeper plantings of up to 9 cm (3.5 in.) may be necessary to seed into moisture. Beans planted deeper are more susceptible to poor emergence and crusting. Some older drills cannot provide accurate depth control. In these situations, a planter may be a better option. Seed drills should have gentle seed distribution devices, depth bands — or depth gauge wheels — and press wheels to ensure uniform seed placement and coverage. High quality, accurate and calibrated seeding equipment is critical to dry edible bean production success. Rolling or packing a field prior to planting helps firm the seedbed and conserve moisture, and can help control planting depth when seeding with a drill. Packing after planting helps level out ridges, pushes down small stones and conserves moisture, but it also makes the soil more susceptible to crusting.
Row WidthRow widths of 70–75 cm (28–30 in.) are standard for both white and coloured beans when the crop will be pulled and windrowed. In fields with a high risk of white mould, wide row widths are preferred to allow more air circulation in the canopy. Narrow row widths of 36–56 cm (14–22 in.) are most suitable if the bean crop will be direct harvested. Ontario row width trials with no-till white beans produced yields 14% higher in narrow row widths, i.e., less than 56 cm (22 in.),
compared to wide rows. White and black bean row width trials, done in Michigan (2011–12), compared 15 in. and 20 in. row widths to 30 in. rows. Yields were improved between 4.5%–14% with narrower row width, and with no increase in plant height. In narrow rows, it is important to select white bean varieties with an upright plant type and good tolerance to white mould.
Emergence may be better in wide rows seeded with a conventional corn planter than narrow rows seeded with a grain drill or air seeder. Consider that:
• Drills and air seeders can damage fragile seed.• Planters are designed to provide more uniform
and accurate seed depth placement and better seed coverage.
• Wide rows have more seeds per linear measure to push up through surface crust. For example, 16 seeds/m (5 seeds/ft) of row in wide rows, compared to 10 seeds/m (3 seeds/ft) of 36 cm (14 in.) rows.
• Planting seeds into tire tracks can result in emergence problems.
In narrow rows, emergence can be a problem for beans planted into tractor tire tracks. Some producers adapt equipment to harrow or cultivate between the tractor tires and the planter. The advent of rod pullers has enabled beans planted in 50–56 cm (20–22 in.) rows to be pulled and windrowed.
InoculationThe species of rhizobia for dry edible beans is Rhizobium leguminosarum biovar phaseoli. Dry edible beans are less efficient at fixing nitrogen through rhizobia than soybeans or other legumes. Inoculation trials and routine use of an inoculant have not shown an economic advantage in Ontario, even though other regions do suggest inoculant use for virgin dry edible bean fields.
Dealing with Soil CrustingPounding rains from thunderstorms can result in severe crusting on heavy soil types, or soils with poor aggregate stability, and can inhibit bean emergence, particularly if hot, dry conditions bake the soil surface. Soil loosening and aeration may be required. There is no advantage to waiting once a crust has been identified. Waiting may increase the lack of uniformity of the stand. It may be better to have a lower, more uniform stand, than an uneven stand with a higher
147
5. dry edIble beans
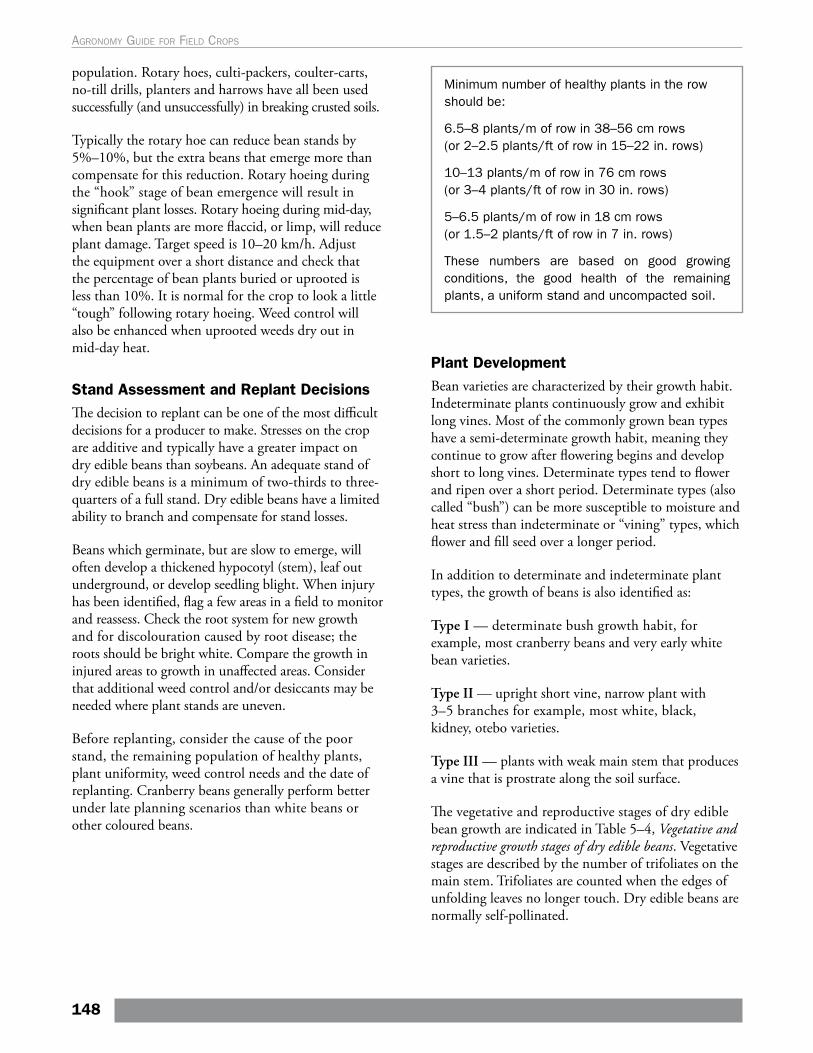
population. Rotary hoes, culti-packers, coulter-carts, no-till drills, planters and harrows have all been used successfully (and unsuccessfully) in breaking crusted soils.
Typically the rotary hoe can reduce bean stands by 5%–10%, but the extra beans that emerge more than compensate for this reduction. Rotary hoeing during the “hook” stage of bean emergence will result in significant plant losses. Rotary hoeing during mid-day, when bean plants are more flaccid, or limp, will reduce plant damage. Target speed is 10–20 km/h. Adjust the equipment over a short distance and check that the percentage of bean plants buried or uprooted is less than 10%. It is normal for the crop to look a little “tough” following rotary hoeing. Weed control will also be enhanced when uprooted weeds dry out in mid-day heat.
Stand Assessment and Replant DecisionsThe decision to replant can be one of the most difficult decisions for a producer to make. Stresses on the crop are additive and typically have a greater impact on dry edible beans than soybeans. An adequate stand of dry edible beans is a minimum of two-thirds to three-quarters of a full stand. Dry edible beans have a limited ability to branch and compensate for stand losses.
Beans which germinate, but are slow to emerge, will often develop a thickened hypocotyl (stem), leaf out underground, or develop seedling blight. When injury has been identified, flag a few areas in a field to monitor and reassess. Check the root system for new growth and for discolouration caused by root disease; the roots should be bright white. Compare the growth in injured areas to growth in unaffected areas. Consider that additional weed control and/or desiccants may be needed where plant stands are uneven.
Before replanting, consider the cause of the poor stand, the remaining population of healthy plants, plant uniformity, weed control needs and the date of replanting. Cranberry beans generally perform better under late planning scenarios than white beans or other coloured beans.
Minimum number of healthy plants in the row should be:
6.5–8 plants/m of row in 38–56 cm rows (or 2–2.5 plants/ft of row in 15–22 in. rows)
10–13 plants/m of row in 76 cm rows (or 3–4 plants/ft of row in 30 in. rows)
5–6.5 plants/m of row in 18 cm rows (or 1.5–2 plants/ft of row in 7 in. rows)
These numbers are based on good growing conditions, the good health of the remaining plants, a uniform stand and uncompacted soil.
Plant DevelopmentBean varieties are characterized by their growth habit. Indeterminate plants continuously grow and exhibit long vines. Most of the commonly grown bean types have a semi-determinate growth habit, meaning they continue to grow after flowering begins and develop short to long vines. Determinate types tend to flower and ripen over a short period. Determinate types (also called “bush”) can be more susceptible to moisture and heat stress than indeterminate or “vining” types, which flower and fill seed over a longer period.
In addition to determinate and indeterminate plant types, the growth of beans is also identified as:
Type I — determinate bush growth habit, for example, most cranberry beans and very early white bean varieties.
Type II — upright short vine, narrow plant with 3–5 branches for example, most white, black, kidney, otebo varieties.
Type III — plants with weak main stem that produces a vine that is prostrate along the soil surface.
The vegetative and reproductive stages of dry edible bean growth are indicated in Table 5–4, Vegetative and reproductive growth stages of dry edible beans. Vegetative stages are described by the number of trifoliates on the main stem. Trifoliates are counted when the edges of unfolding leaves no longer touch. Dry edible beans are normally self-pollinated.
148
Agronomy guide for field Crops
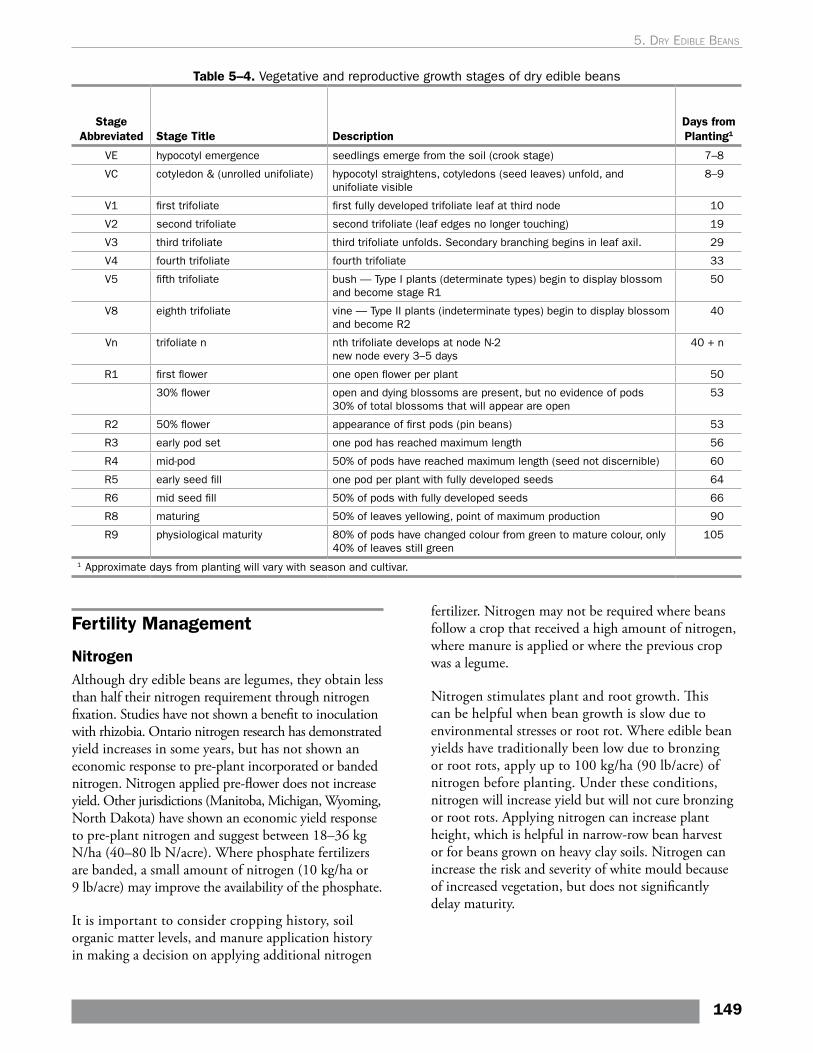
Table 5–4. Vegetative and reproductive growth stages of dry edible beans
Stage Abbreviated Stage Title Description
Days from Planting1
VE hypocotyl emergence seedlings emerge from the soil (crook stage) 7–8
VC cotyledon & (unrolled unifoliate) hypocotyl straightens, cotyledons (seed leaves) unfold, and unifoliate visible
8–9
V1 first trifoliate first fully developed trifoliate leaf at third node 10
V2 second trifoliate second trifoliate (leaf edges no longer touching) 19
V3 third trifoliate third trifoliate unfolds. Secondary branching begins in leaf axil. 29
V4 fourth trifoliate fourth trifoliate 33
V5 fifth trifoliate bush — Type I plants (determinate types) begin to display blossom and become stage R1
50
V8 eighth trifoliate vine — Type II plants (indeterminate types) begin to display blossom and become R2
40
Vn trifoliate n nth trifoliate develops at node N-2new node every 3–5 days
40 + n
R1 first flower one open flower per plant 50
30% flower open and dying blossoms are present, but no evidence of pods30% of total blossoms that will appear are open
53
R2 50% flower appearance of first pods (pin beans) 53
R3 early pod set one pod has reached maximum length 56
R4 mid-pod 50% of pods have reached maximum length (seed not discernible) 60
R5 early seed fill one pod per plant with fully developed seeds 64
R6 mid seed fill 50% of pods with fully developed seeds 66
R8 maturing 50% of leaves yellowing, point of maximum production 90
R9 physiological maturity 80% of pods have changed colour from green to mature colour, only 40% of leaves still green
105
1 Approximate days from planting will vary with season and cultivar.
Fertility Management
NitrogenAlthough dry edible beans are legumes, they obtain less than half their nitrogen requirement through nitrogen fixation. Studies have not shown a benefit to inoculation with rhizobia. Ontario nitrogen research has demonstrated yield increases in some years, but has not shown an economic response to pre-plant incorporated or banded nitrogen. Nitrogen applied pre-flower does not increase yield. Other jurisdictions (Manitoba, Michigan, Wyoming, North Dakota) have shown an economic yield response to pre-plant nitrogen and suggest between 18–36 kg N/ha (40–80 lb N/acre). Where phosphate fertilizers are banded, a small amount of nitrogen (10 kg/ha or 9 lb/acre) may improve the availability of the phosphate.
It is important to consider cropping history, soil organic matter levels, and manure application history in making a decision on applying additional nitrogen
fertilizer. Nitrogen may not be required where beans follow a crop that received a high amount of nitrogen, where manure is applied or where the previous crop was a legume.
Nitrogen stimulates plant and root growth. This can be helpful when bean growth is slow due to environmental stresses or root rot. Where edible bean yields have traditionally been low due to bronzing or root rots, apply up to 100 kg/ha (90 lb/acre) of nitrogen before planting. Under these conditions, nitrogen will increase yield but will not cure bronzing or root rots. Applying nitrogen can increase plant height, which is helpful in narrow-row bean harvest or for beans grown on heavy clay soils. Nitrogen can increase the risk and severity of white mould because of increased vegetation, but does not significantly delay maturity.
149
5. dry edIble beans
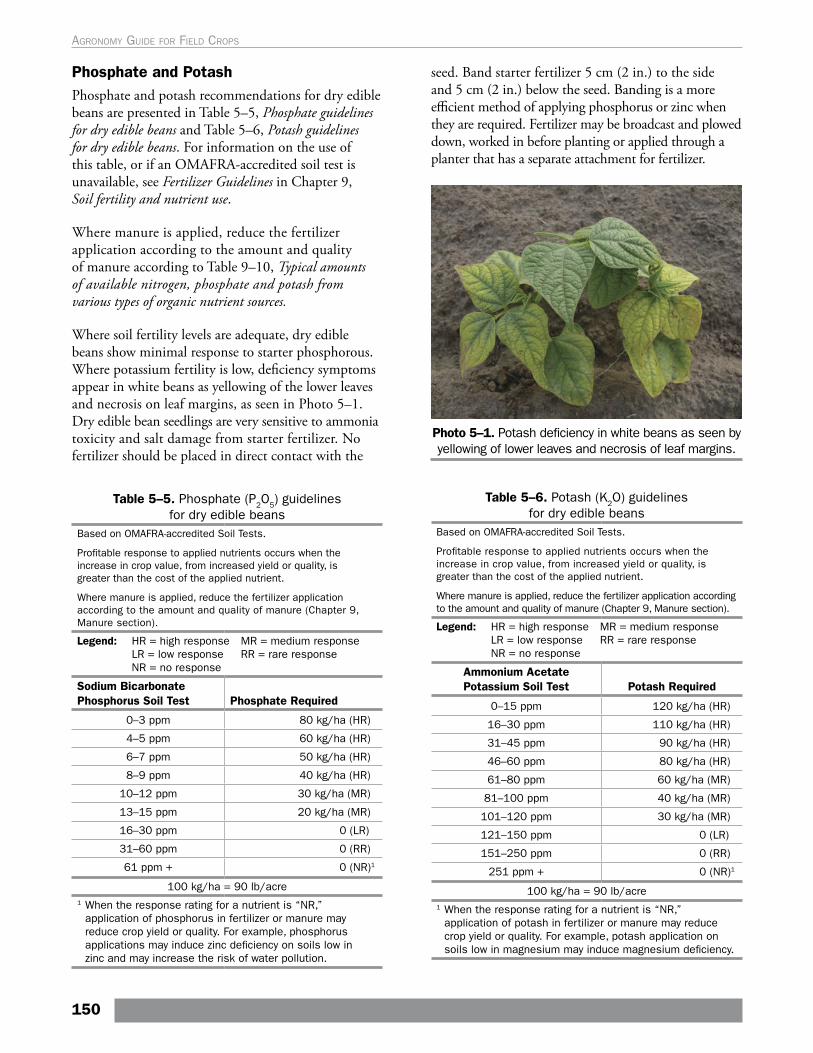
Phosphate and Potash Phosphate and potash recommendations for dry edible beans are presented in Table 5–5, Phosphate guidelines for dry edible beans and Table 5–6, Potash guidelines for dry edible beans. For information on the use of this table, or if an OMAFRA-accredited soil test is unavailable, see Fertilizer Guidelines in Chapter 9, Soil fertility and nutrient use.
Where manure is applied, reduce the fertilizer application according to the amount and quality of manure according to Table 9–10, Typical amounts of available nitrogen, phosphate and potash from various types of organic nutrient sources.
Where soil fertility levels are adequate, dry edible beans show minimal response to starter phosphorous. Where potassium fertility is low, deficiency symptoms appear in white beans as yellowing of the lower leaves and necrosis on leaf margins, as seen in Photo 5–1. Dry edible bean seedlings are very sensitive to ammonia toxicity and salt damage from starter fertilizer. No fertilizer should be placed in direct contact with the
Photo 5–1. Potash deficiency in white beans as seen by yellowing of lower leaves and necrosis of leaf margins.
Table 5–5. Phosphate (P2O5) guidelines for dry edible beans
Based on OMAFRA-accredited Soil Tests.
Profitable response to applied nutrients occurs when the increase in crop value, from increased yield or quality, is greater than the cost of the applied nutrient.
Where manure is applied, reduce the fertilizer application according to the amount and quality of manure (Chapter 9, Manure section).
Legend: HR = high response MR = medium response LR = low response RR = rare response NR = no response
Sodium Bicarbonate Phosphorus Soil Test Phosphate Required
0–3 ppm 80 kg/ha (HR)
4–5 ppm 60 kg/ha (HR)
6–7 ppm 50 kg/ha (HR)
8–9 ppm 40 kg/ha (HR)
10–12 ppm 30 kg/ha (MR)
13–15 ppm 20 kg/ha (MR)
16–30 ppm 0 (LR)
31–60 ppm 0 (RR)
61 ppm + 0 (NR)1
100 kg/ha = 90 lb/acre1 When the response rating for a nutrient is “NR,”
application of phosphorus in fertilizer or manure may reduce crop yield or quality. For example, phosphorus applications may induce zinc deficiency on soils low in zinc and may increase the risk of water pollution.
seed. Band starter fertilizer 5 cm (2 in.) to the side and 5 cm (2 in.) below the seed. Banding is a more efficient method of applying phosphorus or zinc when they are required. Fertilizer may be broadcast and plowed down, worked in before planting or applied through a planter that has a separate attachment for fertilizer.
Table 5–6. Potash (K2O) guidelines for dry edible beans
Based on OMAFRA-accredited Soil Tests.
Profitable response to applied nutrients occurs when the increase in crop value, from increased yield or quality, is greater than the cost of the applied nutrient.
Where manure is applied, reduce the fertilizer application according to the amount and quality of manure (Chapter 9, Manure section).
Legend: HR = high response MR = medium response LR = low response RR = rare response NR = no response
Ammonium Acetate Potassium Soil Test Potash Required
0–15 ppm 120 kg/ha (HR)
16–30 ppm 110 kg/ha (HR)
31–45 ppm 90 kg/ha (HR)
46–60 ppm 80 kg/ha (HR)
61–80 ppm 60 kg/ha (MR)
81–100 ppm 40 kg/ha (MR)
101–120 ppm 30 kg/ha (MR)
121–150 ppm 0 (LR)
151–250 ppm 0 (RR)
251 ppm + 0 (NR)1
100 kg/ha = 90 lb/acre1 When the response rating for a nutrient is “NR,”
application of potash in fertilizer or manure may reduce crop yield or quality. For example, potash application on soils low in magnesium may induce magnesium deficiency.
150
Agronomy guide for field Crops
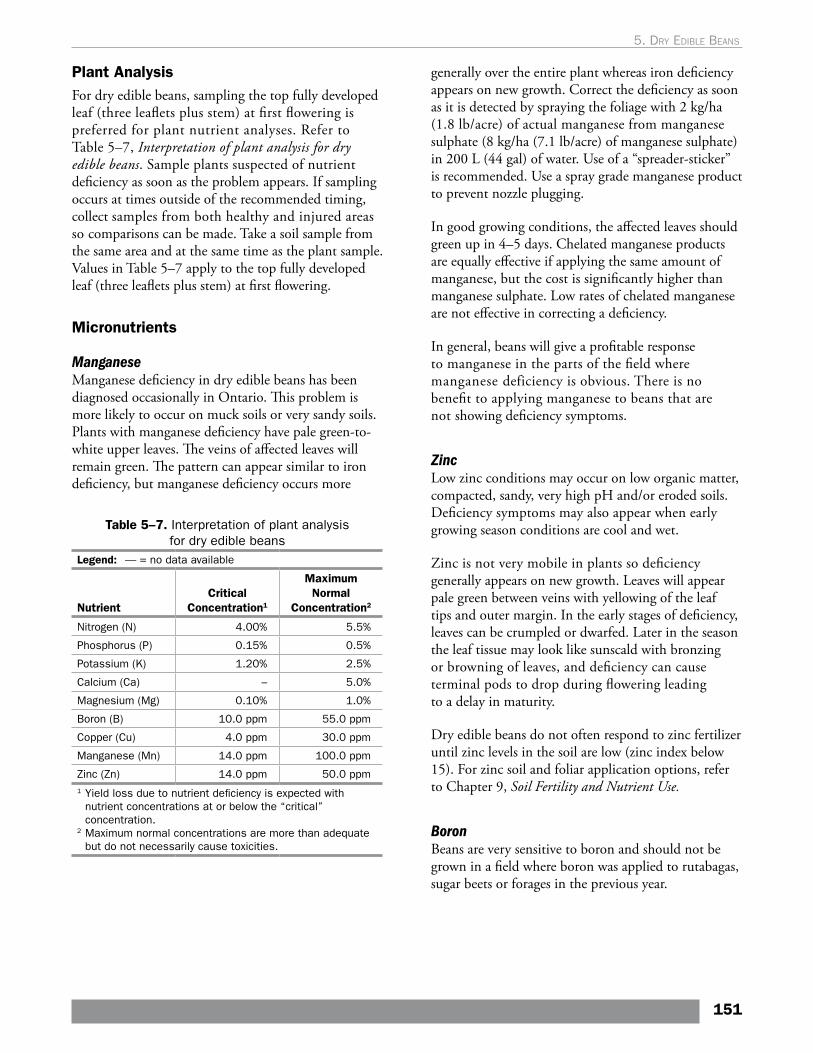
Plant AnalysisFor dry edible beans, sampling the top fully developed leaf (three leaflets plus stem) at first flowering is preferred for plant nutrient analyses. Refer to Table 5–7, Interpretation of plant analysis for dry edible beans. Sample plants suspected of nutrient deficiency as soon as the problem appears. If sampling occurs at times outside of the recommended timing, collect samples from both healthy and injured areas so comparisons can be made. Take a soil sample from the same area and at the same time as the plant sample. Values in Table 5–7 apply to the top fully developed leaf (three leaflets plus stem) at first flowering.
Micronutrients
Manganese Manganese deficiency in dry edible beans has been diagnosed occasionally in Ontario. This problem is more likely to occur on muck soils or very sandy soils. Plants with manganese deficiency have pale green-to-white upper leaves. The veins of affected leaves will remain green. The pattern can appear similar to iron deficiency, but manganese deficiency occurs more
Table 5–7. Interpretation of plant analysis for dry edible beans
Legend: — = no data available
NutrientCritical
Concentration1
Maximum Normal
Concentration2
Nitrogen (N) 4.00% 5.5%
Phosphorus (P) 0.15% 0.5%
Potassium (K) 1.20% 2.5%
Calcium (Ca) – 5.0%
Magnesium (Mg) 0.10% 1.0%
Boron (B) 10.0 ppm 55.0 ppm
Copper (Cu) 4.0 ppm 30.0 ppm
Manganese (Mn) 14.0 ppm 100.0 ppm
Zinc (Zn) 14.0 ppm 50.0 ppm1 Yield loss due to nutrient deficiency is expected with
nutrient concentrations at or below the “critical” concentration.
2 Maximum normal concentrations are more than adequate but do not necessarily cause toxicities.
generally over the entire plant whereas iron deficiency appears on new growth. Correct the deficiency as soon as it is detected by spraying the foliage with 2 kg/ha (1.8 lb/acre) of actual manganese from manganese sulphate (8 kg/ha (7.1 lb/acre) of manganese sulphate) in 200 L (44 gal) of water. Use of a “spreader-sticker” is recommended. Use a spray grade manganese product to prevent nozzle plugging.
In good growing conditions, the affected leaves should green up in 4–5 days. Chelated manganese products are equally effective if applying the same amount of manganese, but the cost is significantly higher than manganese sulphate. Low rates of chelated manganese are not effective in correcting a deficiency.
In general, beans will give a profitable response to manganese in the parts of the field where manganese deficiency is obvious. There is no benefit to applying manganese to beans that are not showing deficiency symptoms.
Zinc Low zinc conditions may occur on low organic matter, compacted, sandy, very high pH and/or eroded soils. Deficiency symptoms may also appear when early growing season conditions are cool and wet.
Zinc is not very mobile in plants so deficiency generally appears on new growth. Leaves will appear pale green between veins with yellowing of the leaf tips and outer margin. In the early stages of deficiency, leaves can be crumpled or dwarfed. Later in the season the leaf tissue may look like sunscald with bronzing or browning of leaves, and deficiency can cause terminal pods to drop during flowering leading to a delay in maturity.
Dry edible beans do not often respond to zinc fertilizer until zinc levels in the soil are low (zinc index below 15). For zinc soil and foliar application options, refer to Chapter 9, Soil Fertility and Nutrient Use.
Boron Beans are very sensitive to boron and should not be grown in a field where boron was applied to rutabagas, sugar beets or forages in the previous year.
151
5. dry edIble beans
Harvest and StorageDry edible beans are sensitive to damage at harvest. Beans are sold based on eye appeal so seed coat quality and colour are important. Producing beans that are clean, bright and whole is the ultimate goal and timely harvest is paramount to maintaining quality. Know the quality standards for the crop’s market class. The ideal moisture range for harvest is 16%–20%. Harvesting outside this range will reduce quality. Low moisture content at harvest will increase the amount of split seeds and cracked seed coats.
Weather conditions in the fall can cause some bean types to deteriorate in quality much more quickly than others. Some differences in classes are as follows:
• Kidney, Dutch brown and black beans tend to withstand more adverse weather at maturity than the white navy, cranberry, otebo and white kidney types.
• Cranberry beans are susceptible to darkening of seed coat following maturity, lowering their value, so prompt harvest is important.
• Larger seeded coloured beans tend to absorb more moisture after a rain, requiring more time to dry down.
• Adzuki beans are strongly upright, quite resistant to weathering and their hard seed coat resists absorption of moisture after maturity.
Each bean type has unique quality standards that buyers look for. It is important to know these prior to harvest. White beans must be clean and free of dirt tag (smearing) and staining. Seed size and colour are important in cranberry and adzuki beans, while a low level of cracked seed coats in kidney beans is an important quality factor.
Dockage and PickDockage is anything foreign that is removed from the beans through a screening process. Some items can only be partly removed through screening, such as weed seed, corn, soybeans or other crop types. Severe bean staining from weeds or green material can cause a load to be refused, and quality will be reduced if there is dirt on the beans. Other items that can cause a load to be rejected include metal and glass. It is critical that bean deliveries are free of soybeans, corn or other bean classes. Soybeans or corn in a sample can result in the
rejection of a load because it will be assumed they are genetically modified, which is not tolerated by some importing countries. Allergens such as wheat and soybean can also be a concern, and processing may not be able to remove all contaminants. Before harvesting, clean the combine of any residual seed from previously harvested crops.
Pick refers to the percentage by weight of defective beans, including cracked seed coats and discoloured and misshapen beans that remain after dockage is removed. The dollar charge for pick is double; equal to the weight loss from picked beans plus the cost of removal.
There are two common methods of harvesting dry edible beans: pulling followed by windrowing and direct-combining.
Pulling, Windrowing, CombiningLarger-seeded beans and beans planted in wide rows are usually pulled and placed in windrows at harvest. Pulling refers to cutting the plants 3-5 cm (1.2-2.0 in.) below the soil surface and merging several of the planted rows into a single swath or windrow. Beans are pulled when 90% of pods have matured and turned “buckskin brown.” To prevent pod drop and shattering losses, pull beans early in the morning when the plants are tough and damp with dew. Beans are harvested later the same day with an edible bean or conventional combine equipped with a windrow pick-up attachment. Since prolonged exposure of the mature crop to moisture will result in reduced quality, harvest the crop as soon as possible after pulling. This specialized harvesting is required to meet quality standards set by the market for larger-seeded bean types. Under good conditions, seed losses of 3%–5% are normal during harvest (e.g., 1% loss pulling and windrowing, 1% at combine pick-up, and 1%–2% cleaning and threshing).
Direct CombiningBean types most suited to direct harvest include white beans with upright plant type, adzuki beans, black beans and pinto beans. Some larger-seeded types can be successfully direct harvested when grown in narrow row widths and harvested at appropriate seed moisture to reduce seed damage.
152
Agronomy guide for field Crops
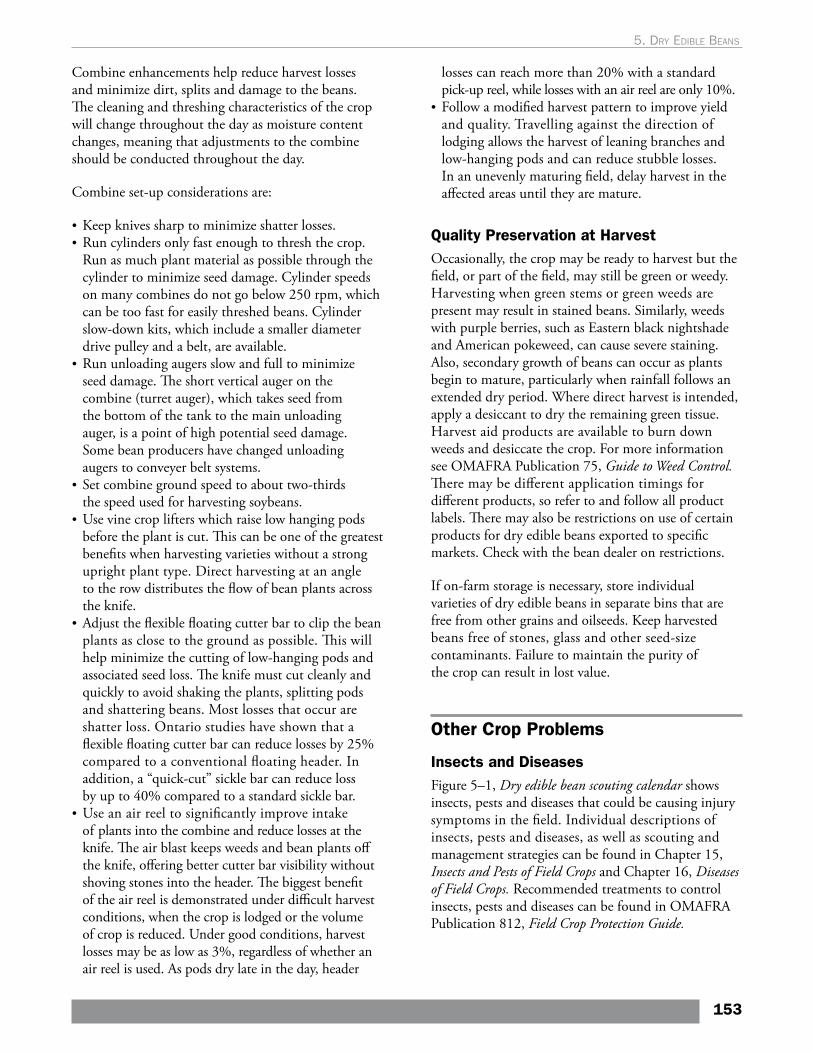
Combine enhancements help reduce harvest losses and minimize dirt, splits and damage to the beans. The cleaning and threshing characteristics of the crop will change throughout the day as moisture content changes, meaning that adjustments to the combine should be conducted throughout the day.
Combine set-up considerations are:
• Keep knives sharp to minimize shatter losses.• Run cylinders only fast enough to thresh the crop.
Run as much plant material as possible through the cylinder to minimize seed damage. Cylinder speeds on many combines do not go below 250 rpm, which can be too fast for easily threshed beans. Cylinder slow-down kits, which include a smaller diameter drive pulley and a belt, are available.
• Run unloading augers slow and full to minimize seed damage. The short vertical auger on the combine (turret auger), which takes seed from the bottom of the tank to the main unloading auger, is a point of high potential seed damage. Some bean producers have changed unloading augers to conveyer belt systems.
• Set combine ground speed to about two-thirds the speed used for harvesting soybeans.
• Use vine crop lifters which raise low hanging pods before the plant is cut. This can be one of the greatest benefits when harvesting varieties without a strong upright plant type. Direct harvesting at an angle to the row distributes the flow of bean plants across the knife.
• Adjust the flexible floating cutter bar to clip the bean plants as close to the ground as possible. This will help minimize the cutting of low-hanging pods and associated seed loss. The knife must cut cleanly and quickly to avoid shaking the plants, splitting pods and shattering beans. Most losses that occur are shatter loss. Ontario studies have shown that a flexible floating cutter bar can reduce losses by 25% compared to a conventional floating header. In addition, a “quick-cut” sickle bar can reduce loss by up to 40% compared to a standard sickle bar.
• Use an air reel to significantly improve intake of plants into the combine and reduce losses at the knife. The air blast keeps weeds and bean plants off the knife, offering better cutter bar visibility without shoving stones into the header. The biggest benefit of the air reel is demonstrated under difficult harvest conditions, when the crop is lodged or the volume of crop is reduced. Under good conditions, harvest losses may be as low as 3%, regardless of whether an air reel is used. As pods dry late in the day, header
losses can reach more than 20% with a standard pick-up reel, while losses with an air reel are only 10%.
• Follow a modified harvest pattern to improve yield and quality. Travelling against the direction of lodging allows the harvest of leaning branches and low-hanging pods and can reduce stubble losses. In an unevenly maturing field, delay harvest in the affected areas until they are mature.
Quality Preservation at HarvestOccasionally, the crop may be ready to harvest but the field, or part of the field, may still be green or weedy. Harvesting when green stems or green weeds are present may result in stained beans. Similarly, weeds with purple berries, such as Eastern black nightshade and American pokeweed, can cause severe staining. Also, secondary growth of beans can occur as plants begin to mature, particularly when rainfall follows an extended dry period. Where direct harvest is intended, apply a desiccant to dry the remaining green tissue. Harvest aid products are available to burn down weeds and desiccate the crop. For more information see OMAFRA Publication 75, Guide to Weed Control. There may be different application timings for different products, so refer to and follow all product labels. There may also be restrictions on use of certain products for dry edible beans exported to specific markets. Check with the bean dealer on restrictions.
If on-farm storage is necessary, store individual varieties of dry edible beans in separate bins that are free from other grains and oilseeds. Keep harvested beans free of stones, glass and other seed-size contaminants. Failure to maintain the purity of the crop can result in lost value.
Other Crop Problems
Insects and DiseasesFigure 5–1, Dry edible bean scouting calendar shows insects, pests and diseases that could be causing injury symptoms in the field. Individual descriptions of insects, pests and diseases, as well as scouting and management strategies can be found in Chapter 15, Insects and Pests of Field Crops and Chapter 16, Diseases of Field Crops. Recommended treatments to control insects, pests and diseases can be found in OMAFRA Publication 812, Field Crop Protection Guide.
153
5. dry edIble beans
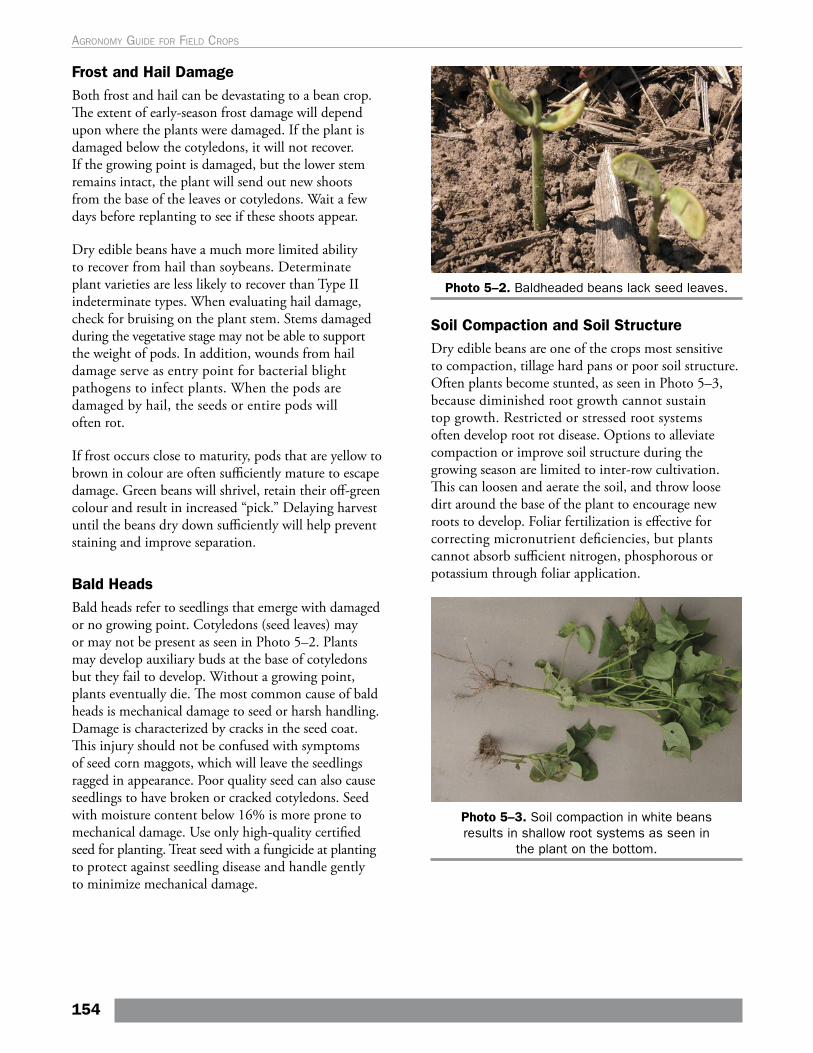
Frost and Hail DamageBoth frost and hail can be devastating to a bean crop. The extent of early-season frost damage will depend upon where the plants were damaged. If the plant is damaged below the cotyledons, it will not recover. If the growing point is damaged, but the lower stem remains intact, the plant will send out new shoots from the base of the leaves or cotyledons. Wait a few days before replanting to see if these shoots appear.
Dry edible beans have a much more limited ability to recover from hail than soybeans. Determinate plant varieties are less likely to recover than Type II indeterminate types. When evaluating hail damage, check for bruising on the plant stem. Stems damaged during the vegetative stage may not be able to support the weight of pods. In addition, wounds from hail damage serve as entry point for bacterial blight pathogens to infect plants. When the pods are damaged by hail, the seeds or entire pods will often rot.
If frost occurs close to maturity, pods that are yellow to brown in colour are often sufficiently mature to escape damage. Green beans will shrivel, retain their off-green colour and result in increased “pick.” Delaying harvest until the beans dry down sufficiently will help prevent staining and improve separation.
Bald HeadsBald heads refer to seedlings that emerge with damaged or no growing point. Cotyledons (seed leaves) may or may not be present as seen in Photo 5–2. Plants may develop auxiliary buds at the base of cotyledons but they fail to develop. Without a growing point, plants eventually die. The most common cause of bald heads is mechanical damage to seed or harsh handling. Damage is characterized by cracks in the seed coat. This injury should not be confused with symptoms of seed corn maggots, which will leave the seedlings ragged in appearance. Poor quality seed can also cause seedlings to have broken or cracked cotyledons. Seed with moisture content below 16% is more prone to mechanical damage. Use only high-quality certified seed for planting. Treat seed with a fungicide at planting to protect against seedling disease and handle gently to minimize mechanical damage.
Photo 5–2. Baldheaded beans lack seed leaves.
Soil Compaction and Soil StructureDry edible beans are one of the crops most sensitive to compaction, tillage hard pans or poor soil structure. Often plants become stunted, as seen in Photo 5–3, because diminished root growth cannot sustain top growth. Restricted or stressed root systems often develop root rot disease. Options to alleviate compaction or improve soil structure during the growing season are limited to inter-row cultivation. This can loosen and aerate the soil, and throw loose dirt around the base of the plant to encourage new roots to develop. Foliar fertilization is effective for correcting micronutrient deficiencies, but plants cannot absorb sufficient nitrogen, phosphorous or potassium through foliar application.
Photo 5–3. Soil compaction in white beans results in shallow root systems as seen in
the plant on the bottom.
154
Agronomy guide for field Crops
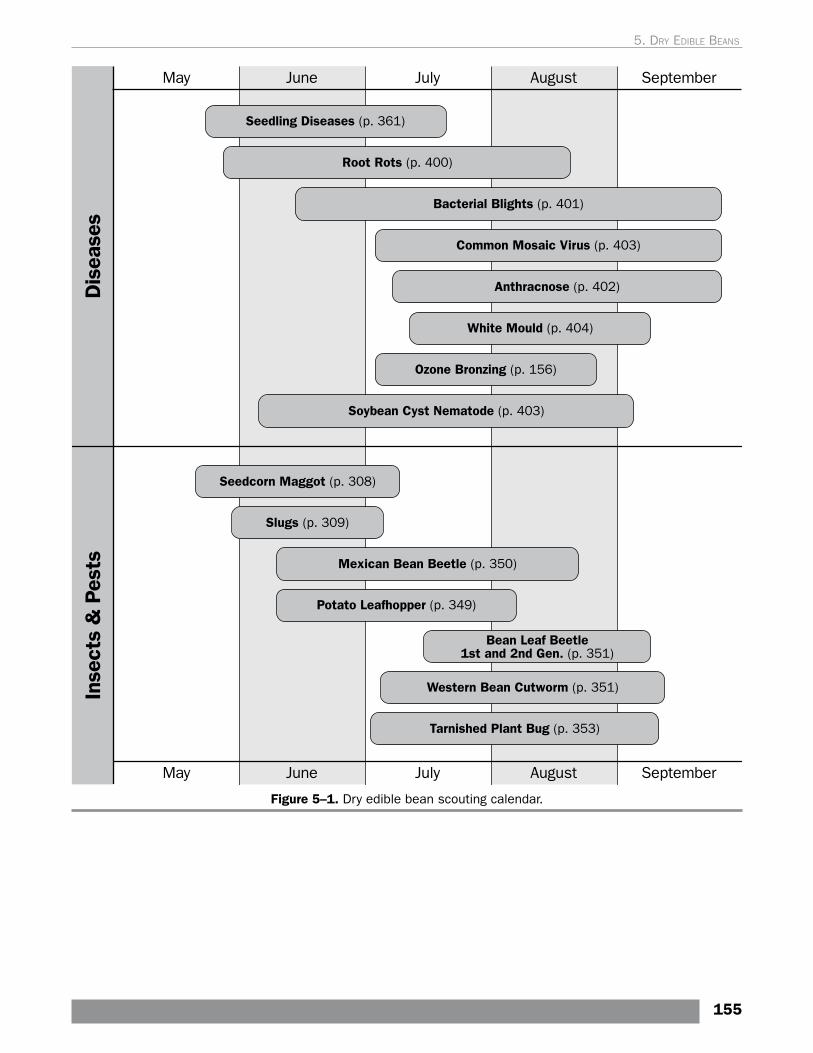
Figure 5–1. Dry edible bean scouting calendar.
155
5. dry edIble beans
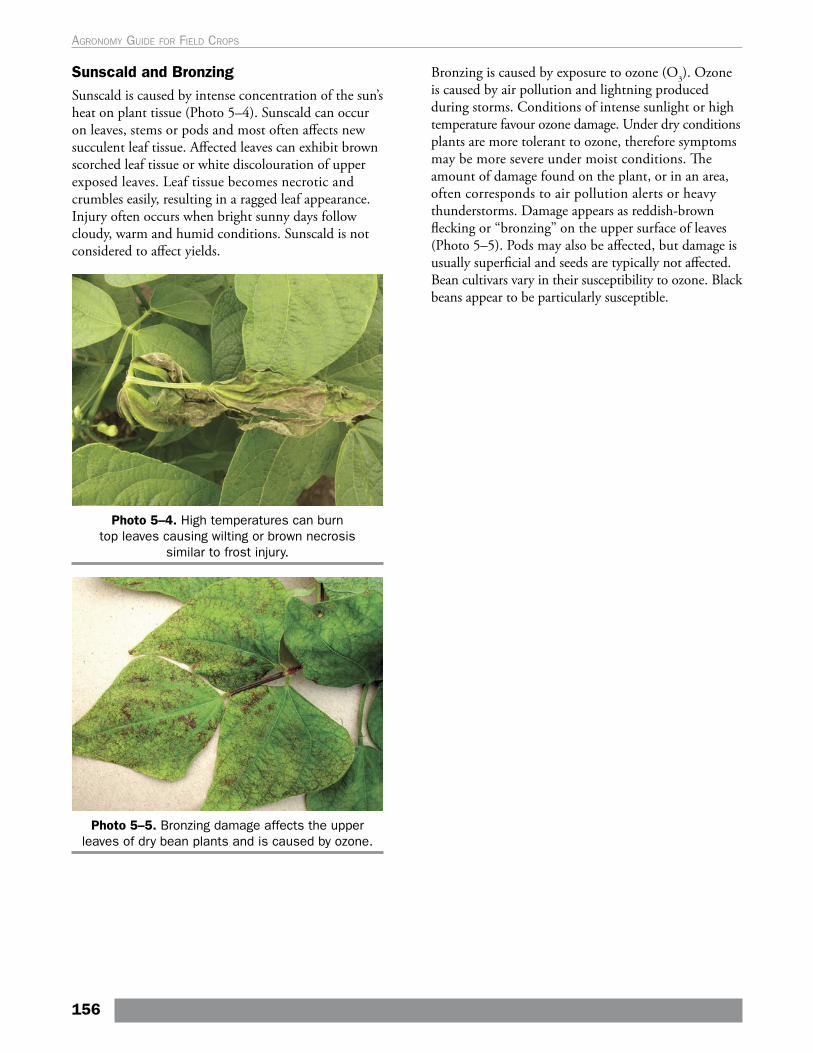
Sunscald and Bronzing Sunscald is caused by intense concentration of the sun’s heat on plant tissue (Photo 5–4). Sunscald can occur on leaves, stems or pods and most often affects new succulent leaf tissue. Affected leaves can exhibit brown scorched leaf tissue or white discolouration of upper exposed leaves. Leaf tissue becomes necrotic and crumbles easily, resulting in a ragged leaf appearance. Injury often occurs when bright sunny days follow cloudy, warm and humid conditions. Sunscald is not considered to affect yields.
Photo 5–4. High temperatures can burn top leaves causing wilting or brown necrosis
similar to frost injury.
Photo 5–5. Bronzing damage affects the upper leaves of dry bean plants and is caused by ozone.
Bronzing is caused by exposure to ozone (O3). Ozone is caused by air pollution and lightning produced during storms. Conditions of intense sunlight or high temperature favour ozone damage. Under dry conditions plants are more tolerant to ozone, therefore symptoms may be more severe under moist conditions. The amount of damage found on the plant, or in an area, often corresponds to air pollution alerts or heavy thunderstorms. Damage appears as reddish-brown flecking or “bronzing” on the upper surface of leaves (Photo 5–5). Pods may also be affected, but damage is usually superficial and seeds are typically not affected. Bean cultivars vary in their susceptibility to ozone. Black beans appear to be particularly susceptible.
156
Agronomy guide for field Crops
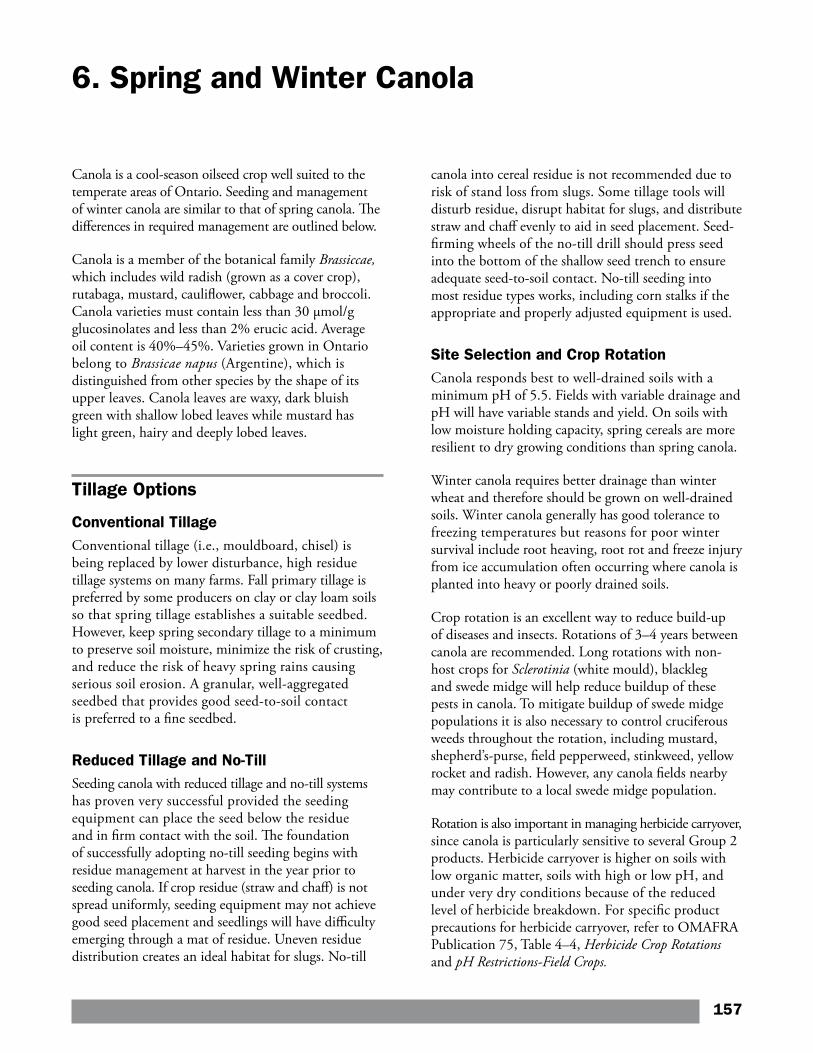
6. Spring and Winter Canola
canola into cereal residue is not recommended due to risk of stand loss from slugs. Some tillage tools will disturb residue, disrupt habitat for slugs, and distribute straw and chaff evenly to aid in seed placement. Seed-firming wheels of the no-till drill should press seed into the bottom of the shallow seed trench to ensure adequate seed-to-soil contact. No-till seeding into most residue types works, including corn stalks if the appropriate and properly adjusted equipment is used.
Site Selection and Crop RotationCanola responds best to well-drained soils with a minimum pH of 5.5. Fields with variable drainage and pH will have variable stands and yield. On soils with low moisture holding capacity, spring cereals are more resilient to dry growing conditions than spring canola.
Winter canola requires better drainage than winter wheat and therefore should be grown on well-drained soils. Winter canola generally has good tolerance to freezing temperatures but reasons for poor winter survival include root heaving, root rot and freeze injury from ice accumulation often occurring where canola is planted into heavy or poorly drained soils.
Crop rotation is an excellent way to reduce build-up of diseases and insects. Rotations of 3–4 years between canola are recommended. Long rotations with non-host crops for Sclerotinia (white mould), blackleg and swede midge will help reduce buildup of these pests in canola. To mitigate buildup of swede midge populations it is also necessary to control cruciferous weeds throughout the rotation, including mustard, shepherd’s-purse, field pepperweed, stinkweed, yellow rocket and radish. However, any canola fields nearby may contribute to a local swede midge population.
Rotation is also important in managing herbicide carryover, since canola is particularly sensitive to several Group 2 products. Herbicide carryover is higher on soils with low organic matter, soils with high or low pH, and under very dry conditions because of the reduced level of herbicide breakdown. For specific product precautions for herbicide carryover, refer to OMAFRA Publication 75, Table 4–4, Herbicide Crop Rotations and pH Restrictions-Field Crops.
Canola is a cool-season oilseed crop well suited to the temperate areas of Ontario. Seeding and management of winter canola are similar to that of spring canola. The differences in required management are outlined below.
Canola is a member of the botanical family Brassiccae, which includes wild radish (grown as a cover crop), rutabaga, mustard, cauliflower, cabbage and broccoli. Canola varieties must contain less than 30 µmol/g glucosinolates and less than 2% erucic acid. Average oil content is 40%–45%. Varieties grown in Ontario belong to Brassicae napus (Argentine), which is distinguished from other species by the shape of its upper leaves. Canola leaves are waxy, dark bluish green with shallow lobed leaves while mustard has light green, hairy and deeply lobed leaves.
Tillage Options
Conventional TillageConventional tillage (i.e., mouldboard, chisel) is being replaced by lower disturbance, high residue tillage systems on many farms. Fall primary tillage is preferred by some producers on clay or clay loam soils so that spring tillage establishes a suitable seedbed. However, keep spring secondary tillage to a minimum to preserve soil moisture, minimize the risk of crusting, and reduce the risk of heavy spring rains causing serious soil erosion. A granular, well-aggregated seedbed that provides good seed-to-soil contact is preferred to a fine seedbed.
Reduced Tillage and No-Till Seeding canola with reduced tillage and no-till systems has proven very successful provided the seeding equipment can place the seed below the residue and in firm contact with the soil. The foundation of successfully adopting no-till seeding begins with residue management at harvest in the year prior to seeding canola. If crop residue (straw and chaff) is not spread uniformly, seeding equipment may not achieve good seed placement and seedlings will have difficulty emerging through a mat of residue. Uneven residue distribution creates an ideal habitat for slugs. No-till
157
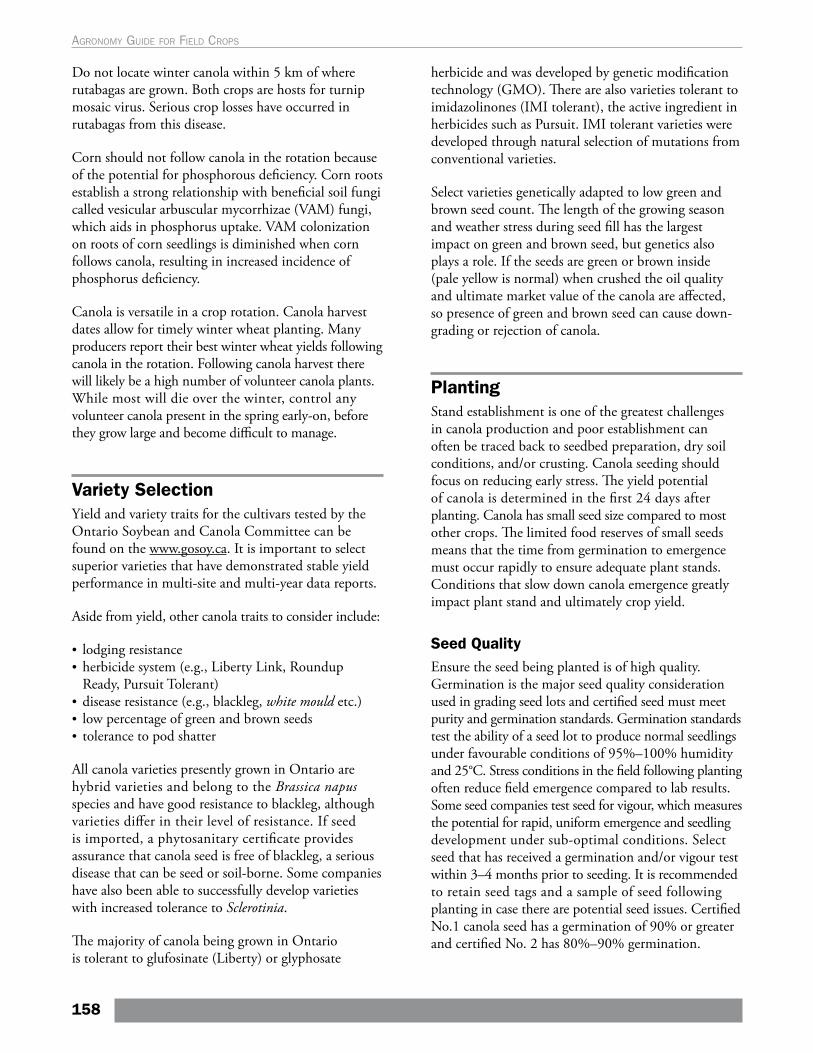
Do not locate winter canola within 5 km of where rutabagas are grown. Both crops are hosts for turnip mosaic virus. Serious crop losses have occurred in rutabagas from this disease.
Corn should not follow canola in the rotation because of the potential for phosphorous deficiency. Corn roots establish a strong relationship with beneficial soil fungi called vesicular arbuscular mycorrhizae (VAM) fungi, which aids in phosphorus uptake. VAM colonization on roots of corn seedlings is diminished when corn follows canola, resulting in increased incidence of phosphorus deficiency.
Canola is versatile in a crop rotation. Canola harvest dates allow for timely winter wheat planting. Many producers report their best winter wheat yields following canola in the rotation. Following canola harvest there will likely be a high number of volunteer canola plants. While most will die over the winter, control any volunteer canola present in the spring early-on, before they grow large and become difficult to manage.
Variety SelectionYield and variety traits for the cultivars tested by the Ontario Soybean and Canola Committee can be found on the www.gosoy.ca. It is important to select superior varieties that have demonstrated stable yield performance in multi-site and multi-year data reports.
Aside from yield, other canola traits to consider include:
• lodging resistance• herbicide system (e.g., Liberty Link, Roundup
Ready, Pursuit Tolerant)• disease resistance (e.g., blackleg, white mould etc.)• low percentage of green and brown seeds• tolerance to pod shatter
All canola varieties presently grown in Ontario are hybrid varieties and belong to the Brassica napus species and have good resistance to blackleg, although varieties differ in their level of resistance. If seed is imported, a phytosanitary certificate provides assurance that canola seed is free of blackleg, a serious disease that can be seed or soil-borne. Some companies have also been able to successfully develop varieties with increased tolerance to Sclerotinia.
The majority of canola being grown in Ontario is tolerant to glufosinate (Liberty) or glyphosate
herbicide and was developed by genetic modification technology (GMO). There are also varieties tolerant to imidazolinones (IMI tolerant), the active ingredient in herbicides such as Pursuit. IMI tolerant varieties were developed through natural selection of mutations from conventional varieties.
Select varieties genetically adapted to low green and brown seed count. The length of the growing season and weather stress during seed fill has the largest impact on green and brown seed, but genetics also plays a role. If the seeds are green or brown inside (pale yellow is normal) when crushed the oil quality and ultimate market value of the canola are affected, so presence of green and brown seed can cause down-grading or rejection of canola.
Planting Stand establishment is one of the greatest challenges in canola production and poor establishment can often be traced back to seedbed preparation, dry soil conditions, and/or crusting. Canola seeding should focus on reducing early stress. The yield potential of canola is determined in the first 24 days after planting. Canola has small seed size compared to most other crops. The limited food reserves of small seeds means that the time from germination to emergence must occur rapidly to ensure adequate plant stands. Conditions that slow down canola emergence greatly impact plant stand and ultimately crop yield.
Seed QualityEnsure the seed being planted is of high quality. Germination is the major seed quality consideration used in grading seed lots and certified seed must meet purity and germination standards. Germination standards test the ability of a seed lot to produce normal seedlings under favourable conditions of 95%–100% humidity and 25°C. Stress conditions in the field following planting often reduce field emergence compared to lab results. Some seed companies test seed for vigour, which measures the potential for rapid, uniform emergence and seedling development under sub-optimal conditions. Select seed that has received a germination and/or vigour test within 3–4 months prior to seeding. It is recommended to retain seed tags and a sample of seed following planting in case there are potential seed issues. Certified No.1 canola seed has a germination of 90% or greater and certified No. 2 has 80%–90% germination.
158
Agronomy guide for field Crops
Seed TreatmentsCertified seed is treated with fungicide and insecticide. The fungicide controls seed-borne and early-season soil-borne diseases, including blackleg, seed decay, damping-off and seedling blight. Insecticide seed treatments are required to provide control of low to moderate populations of flea beetles that feed on young seedlings. Control may not be adequate if flea beetle populations are high or canola is slow to develop. Scouting to monitor flea beetle control is critical to staying ahead of this pest. Refer to Chapter 15, Insects and Pests of Field Crops for additional information on flea beetle. Insecticide seed treatments that control cutworms are recommended in growing regions where cutworm is a common pest.
Winter Canola SeedingSeed winter canola so that canola develops 4–6 leaves and an adequate root system (1.25 cm (0.5 in.) diameter) before winter. Adequate fall growth will reduce risk of frost heaving and spring desiccation. Seed winter canola between August 15 and August 30, or in southwestern Ontario between August 20 and September 10. Delays beyond these dates greatly increase the risk of winterkill. If canola is planted too early and bolts in the fall it will not survive through winter. Heavy competition from weeds or volunteer cereals in the fall can force rapid canola growth and increase the chances of winterkill.
Dry weather following planting can be an issue when seeding in August, resulting in delayed emergence. Prepare the seedbed with a minimum of tillage to conserve moisture and pack following planting to ensure good seed to soil contact.
Where winter canola follows cereals, some tillage of the residue prior to seeding is suggested to reduce the risk of slugs, which can be a problem some years. Attention at cereal harvest to reduce large clumps of straw, and improve uniformity of chaff and straw spreading is important in successfully seeding canola. Tillage coulters and disc openers must cut cleanly through residue to ensure good seed placement and seed to soil contact.
Spring Canola Seeding Seed as early as soil conditions permit. Canola will germinate and grow at soil temperatures of 2°C, but 10°C is ideal for rapid emergence. Sustained low soil temperatures have a detrimental effect on the seed embryo. Soil conditions and weather forecasts should
be the ultimate guide, however 5°C or higher is a reasonable target for planting. At 6°C, emergence reaches 100% within 8 days. When seedlings emerge the growing point is exposed between the cotyledon leaves (seed leaves). Canola seedlings can withstand a considerable frost of -5°C to -8°C if plants have become acclimatized following a few days of cold temperatures. However, canola seedlings growing under warm conditions will be tender, and can be killed by even a few degrees frost. Increasing seeding rates by 5%–10% when canola is planted very early will help to compensate for slower emergence and increased seedling mortality.
Early April seeded canola has higher risk of mortality from seedling disease, soil crusting, and flea beetles. Early planted canola also has a higher risk of infestation by cabbage seedpod weevil during the flowering/early pod stage. Be prepared to control flea beetles if canola is slow to develop beyond the susceptible stage (i.e., up to 4 true leaves). Seed canola by early May to reduce the risk of damage by swede midge. Refer to Chapter 15, Insects and Pests of Field Crops for additional information on swede midge. Photo 6–1 shows the stunted and malformed canola plant resulting from swede midge infestation.
Photo 6–1. Swede midge in canola at bolting results in stunted and malformed plants.
If seeding is delayed, it is critical to conserve soil moisture and to plant into moisture for rapid, uniform emergence. Shallow planted, small canola seedlings die easily when they run out of soil moisture. Late seeded canola carries significant risk of swede midge damage in areas with this pest.
159
6. sprIng and WInter canola
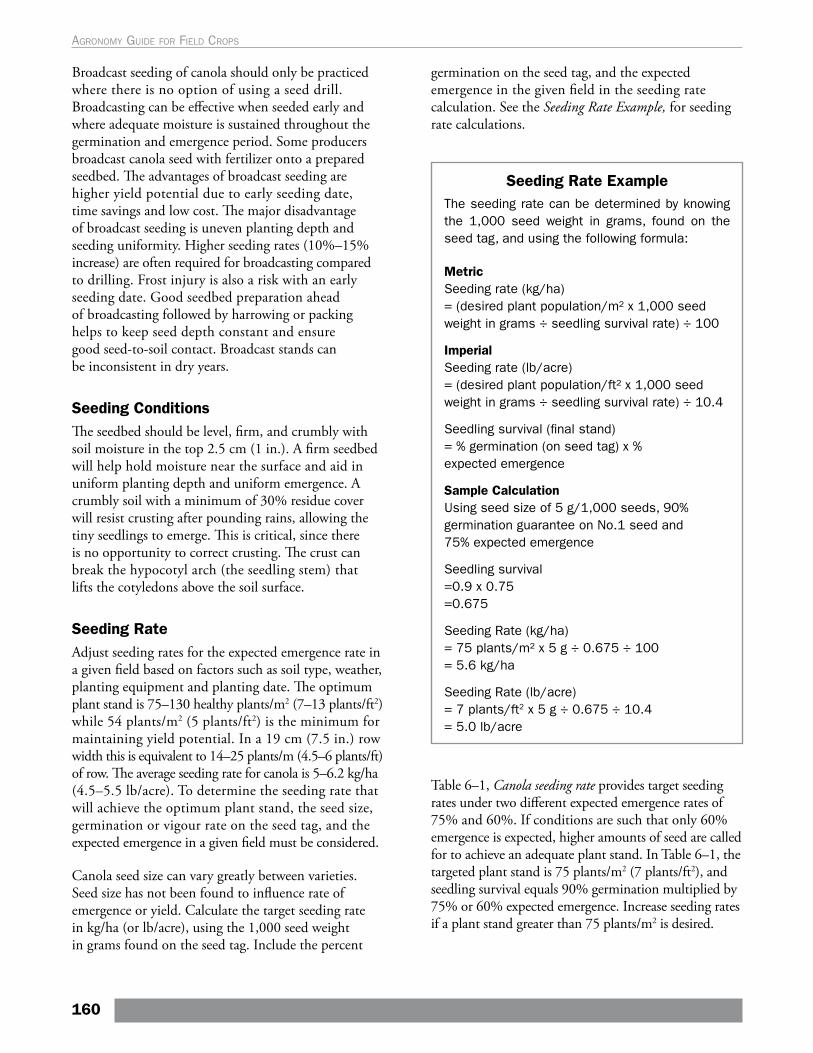
Broadcast seeding of canola should only be practiced where there is no option of using a seed drill. Broadcasting can be effective when seeded early and where adequate moisture is sustained throughout the germination and emergence period. Some producers broadcast canola seed with fertilizer onto a prepared seedbed. The advantages of broadcast seeding are higher yield potential due to early seeding date, time savings and low cost. The major disadvantage of broadcast seeding is uneven planting depth and seeding uniformity. Higher seeding rates (10%–15% increase) are often required for broadcasting compared to drilling. Frost injury is also a risk with an early seeding date. Good seedbed preparation ahead of broadcasting followed by harrowing or packing helps to keep seed depth constant and ensure good seed-to-soil contact. Broadcast stands can be inconsistent in dry years.
Seeding ConditionsThe seedbed should be level, firm, and crumbly with soil moisture in the top 2.5 cm (1 in.). A firm seedbed will help hold moisture near the surface and aid in uniform planting depth and uniform emergence. A crumbly soil with a minimum of 30% residue cover will resist crusting after pounding rains, allowing the tiny seedlings to emerge. This is critical, since there is no opportunity to correct crusting. The crust can break the hypocotyl arch (the seedling stem) that lifts the cotyledons above the soil surface.
Seeding RateAdjust seeding rates for the expected emergence rate in a given field based on factors such as soil type, weather, planting equipment and planting date. The optimum plant stand is 75–130 healthy plants/m2 (7–13 plants/ft2) while 54 plants/m2 (5 plants/ft2) is the minimum for maintaining yield potential. In a 19 cm (7.5 in.) row width this is equivalent to 14–25 plants/m (4.5–6 plants/ft) of row. The average seeding rate for canola is 5–6.2 kg/ha (4.5–5.5 lb/acre). To determine the seeding rate that will achieve the optimum plant stand, the seed size, germination or vigour rate on the seed tag, and the expected emergence in a given field must be considered.
Canola seed size can vary greatly between varieties. Seed size has not been found to influence rate of emergence or yield. Calculate the target seeding rate in kg/ha (or lb/acre), using the 1,000 seed weight in grams found on the seed tag. Include the percent
germination on the seed tag, and the expected emergence in the given field in the seeding rate calculation. See the Seeding Rate Example, for seeding rate calculations.
Seeding Rate ExampleThe seeding rate can be determined by knowing the 1,000 seed weight in grams, found on the seed tag, and using the following formula:
Metric Seeding rate (kg/ha) = (desired plant population/m² x 1,000 seed weight in grams ÷ seedling survival rate) ÷ 100
Imperial Seeding rate (lb/acre) = (desired plant population/ft² x 1,000 seed weight in grams ÷ seedling survival rate) ÷ 10.4
Seedling survival (final stand) = % germination (on seed tag) x % expected emergence
Sample Calculation Using seed size of 5 g/1,000 seeds, 90% germination guarantee on No.1 seed and 75% expected emergence
Seedling survival =0.9 x 0.75 =0.675
Seeding Rate (kg/ha) = 75 plants/m² x 5 g ÷ 0.675 ÷ 100 = 5.6 kg/ha
Seeding Rate (lb/acre) = 7 plants/ft2 x 5 g ÷ 0.675 ÷ 10.4 = 5.0 lb/acre
Table 6–1, Canola seeding rate provides target seeding rates under two different expected emergence rates of 75% and 60%. If conditions are such that only 60% emergence is expected, higher amounts of seed are called for to achieve an adequate plant stand. In Table 6–1, the targeted plant stand is 75 plants/m2 (7 plants/ft2), and seedling survival equals 90% germination multiplied by 75% or 60% expected emergence. Increase seeding rates if a plant stand greater than 75 plants/m2 is desired.
160
Agronomy guide for field Crops
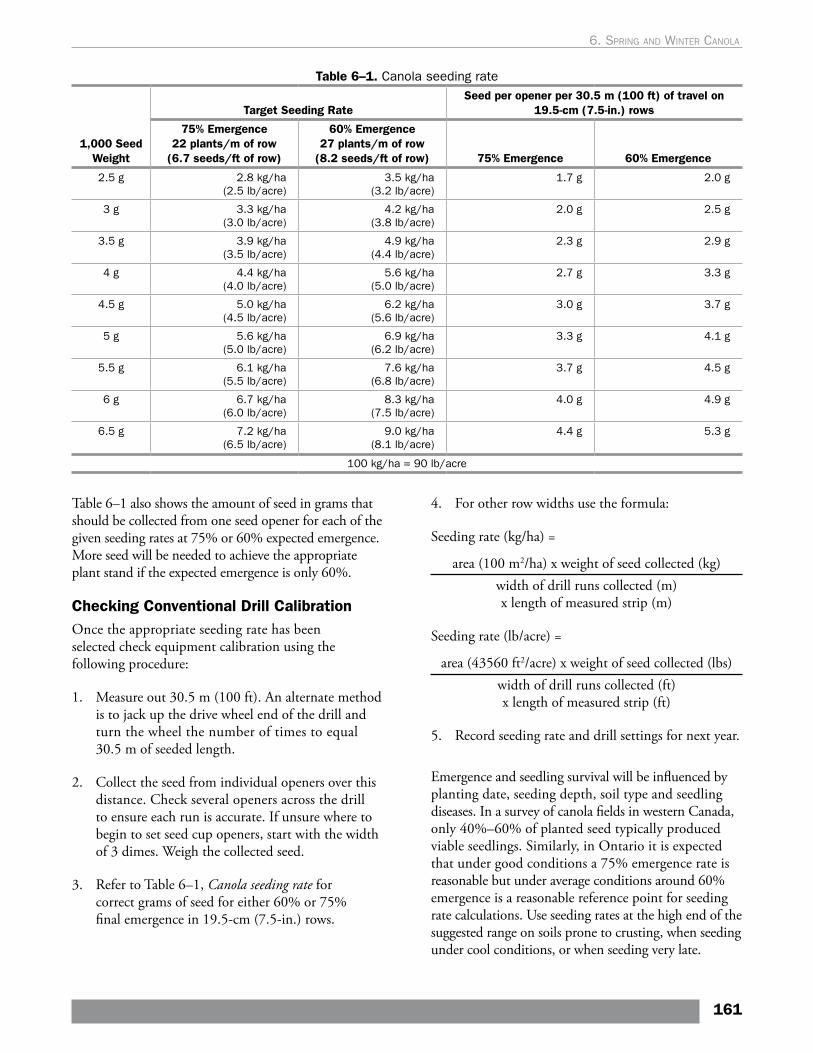
Table 6–1. Canola seeding rate
1,000 Seed Weight
Target Seeding RateSeed per opener per 30.5 m (100 ft) of travel on
19.5-cm (7.5-in.) rows
75% Emergence 22 plants/m of row
(6.7 seeds/ft of row)
60% Emergence 27 plants/m of row
(8.2 seeds/ft of row) 75% Emergence 60% Emergence
2.5 g 2.8 kg/ha (2.5 lb/acre)
3.5 kg/ha (3.2 lb/acre)
1.7 g 2.0 g
3 g 3.3 kg/ha (3.0 lb/acre)
4.2 kg/ha (3.8 lb/acre)
2.0 g 2.5 g
3.5 g 3.9 kg/ha (3.5 lb/acre)
4.9 kg/ha (4.4 lb/acre)
2.3 g 2.9 g
4 g 4.4 kg/ha (4.0 lb/acre)
5.6 kg/ha (5.0 lb/acre)
2.7 g 3.3 g
4.5 g 5.0 kg/ha (4.5 lb/acre)
6.2 kg/ha (5.6 lb/acre)
3.0 g 3.7 g
5 g 5.6 kg/ha (5.0 lb/acre)
6.9 kg/ha (6.2 lb/acre)
3.3 g 4.1 g
5.5 g 6.1 kg/ha (5.5 lb/acre)
7.6 kg/ha (6.8 lb/acre)
3.7 g 4.5 g
6 g 6.7 kg/ha (6.0 lb/acre)
8.3 kg/ha (7.5 lb/acre)
4.0 g 4.9 g
6.5 g 7.2 kg/ha (6.5 lb/acre)
9.0 kg/ha (8.1 lb/acre)
4.4 g 5.3 g
100 kg/ha = 90 lb/acre
Checking Conventional Drill CalibrationOnce the appropriate seeding rate has been selected check equipment calibration using the following procedure:
1. Measure out 30.5 m (100 ft). An alternate method is to jack up the drive wheel end of the drill and turn the wheel the number of times to equal 30.5 m of seeded length.
2. Collect the seed from individual openers over this distance. Check several openers across the drill to ensure each run is accurate. If unsure where to begin to set seed cup openers, start with the width of 3 dimes. Weigh the collected seed.
3. Refer to Table 6–1, Canola seeding rate for correct grams of seed for either 60% or 75% final emergence in 19.5-cm (7.5-in.) rows.
4. For other row widths use the formula:
Seeding rate (kg/ha) =
area (100 m2/ha) x weight of seed collected (kg)width of drill runs collected (m) x length of measured strip (m)
Seeding rate (lb/acre) =
area (43560 ft2/acre) x weight of seed collected (lbs)width of drill runs collected (ft) x length of measured strip (ft)
5. Record seeding rate and drill settings for next year.
Emergence and seedling survival will be influenced by planting date, seeding depth, soil type and seedling diseases. In a survey of canola fields in western Canada, only 40%–60% of planted seed typically produced viable seedlings. Similarly, in Ontario it is expected that under good conditions a 75% emergence rate is reasonable but under average conditions around 60% emergence is a reasonable reference point for seeding rate calculations. Use seeding rates at the high end of the suggested range on soils prone to crusting, when seeding under cool conditions, or when seeding very late.
Table 6–1 also shows the amount of seed in grams that should be collected from one seed opener for each of the given seeding rates at 75% or 60% expected emergence. More seed will be needed to achieve the appropriate plant stand if the expected emergence is only 60%.
161
6. sprIng and WInter canola
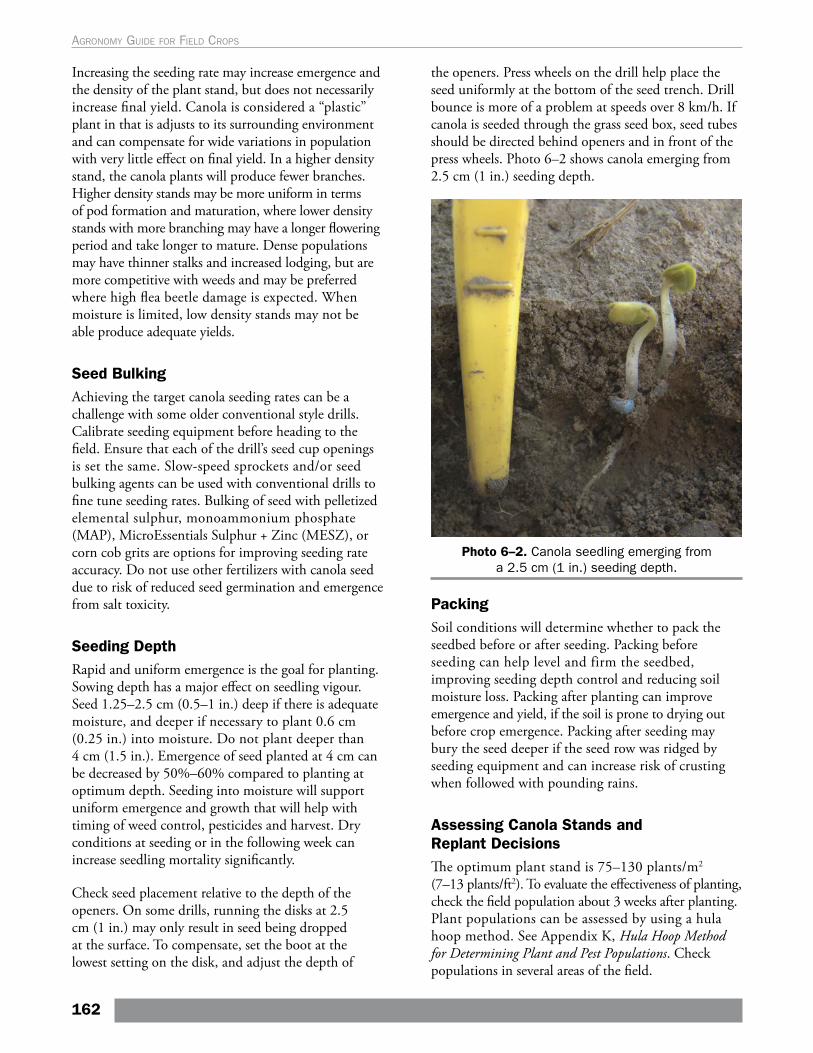
Increasing the seeding rate may increase emergence and the density of the plant stand, but does not necessarily increase final yield. Canola is considered a “plastic” plant in that is adjusts to its surrounding environment and can compensate for wide variations in population with very little effect on final yield. In a higher density stand, the canola plants will produce fewer branches. Higher density stands may be more uniform in terms of pod formation and maturation, where lower density stands with more branching may have a longer flowering period and take longer to mature. Dense populations may have thinner stalks and increased lodging, but are more competitive with weeds and may be preferred where high flea beetle damage is expected. When moisture is limited, low density stands may not be able produce adequate yields.
Seed BulkingAchieving the target canola seeding rates can be a challenge with some older conventional style drills. Calibrate seeding equipment before heading to the field. Ensure that each of the drill’s seed cup openings is set the same. Slow-speed sprockets and/or seed bulking agents can be used with conventional drills to fine tune seeding rates. Bulking of seed with pelletized elemental sulphur, monoammonium phosphate (MAP), MicroEssentials Sulphur + Zinc (MESZ), or corn cob grits are options for improving seeding rate accuracy. Do not use other fertilizers with canola seed due to risk of reduced seed germination and emergence from salt toxicity.
Seeding DepthRapid and uniform emergence is the goal for planting. Sowing depth has a major effect on seedling vigour. Seed 1.25–2.5 cm (0.5–1 in.) deep if there is adequate moisture, and deeper if necessary to plant 0.6 cm (0.25 in.) into moisture. Do not plant deeper than 4 cm (1.5 in.). Emergence of seed planted at 4 cm can be decreased by 50%–60% compared to planting at optimum depth. Seeding into moisture will support uniform emergence and growth that will help with timing of weed control, pesticides and harvest. Dry conditions at seeding or in the following week can increase seedling mortality significantly.
Check seed placement relative to the depth of the openers. On some drills, running the disks at 2.5 cm (1 in.) may only result in seed being dropped at the surface. To compensate, set the boot at the lowest setting on the disk, and adjust the depth of
the openers. Press wheels on the drill help place the seed uniformly at the bottom of the seed trench. Drill bounce is more of a problem at speeds over 8 km/h. If canola is seeded through the grass seed box, seed tubes should be directed behind openers and in front of the press wheels. Photo 6–2 shows canola emerging from 2.5 cm (1 in.) seeding depth.
Photo 6–2. Canola seedling emerging from a 2.5 cm (1 in.) seeding depth.
PackingSoil conditions will determine whether to pack the seedbed before or after seeding. Packing before seeding can help level and firm the seedbed, improving seeding depth control and reducing soil moisture loss. Packing after planting can improve emergence and yield, if the soil is prone to drying out before crop emergence. Packing after seeding may bury the seed deeper if the seed row was ridged by seeding equipment and can increase risk of crusting when followed with pounding rains.
Assessing Canola Stands and Replant DecisionsThe optimum plant stand is 75–130 plants/m2 (7–13 plants/ft2). To evaluate the effectiveness of planting, check the field population about 3 weeks after planting. Plant populations can be assessed by using a hula hoop method. See Appendix K, Hula Hoop Method for Determining Plant and Pest Populations. Check populations in several areas of the field.
162
Agronomy guide for field Crops
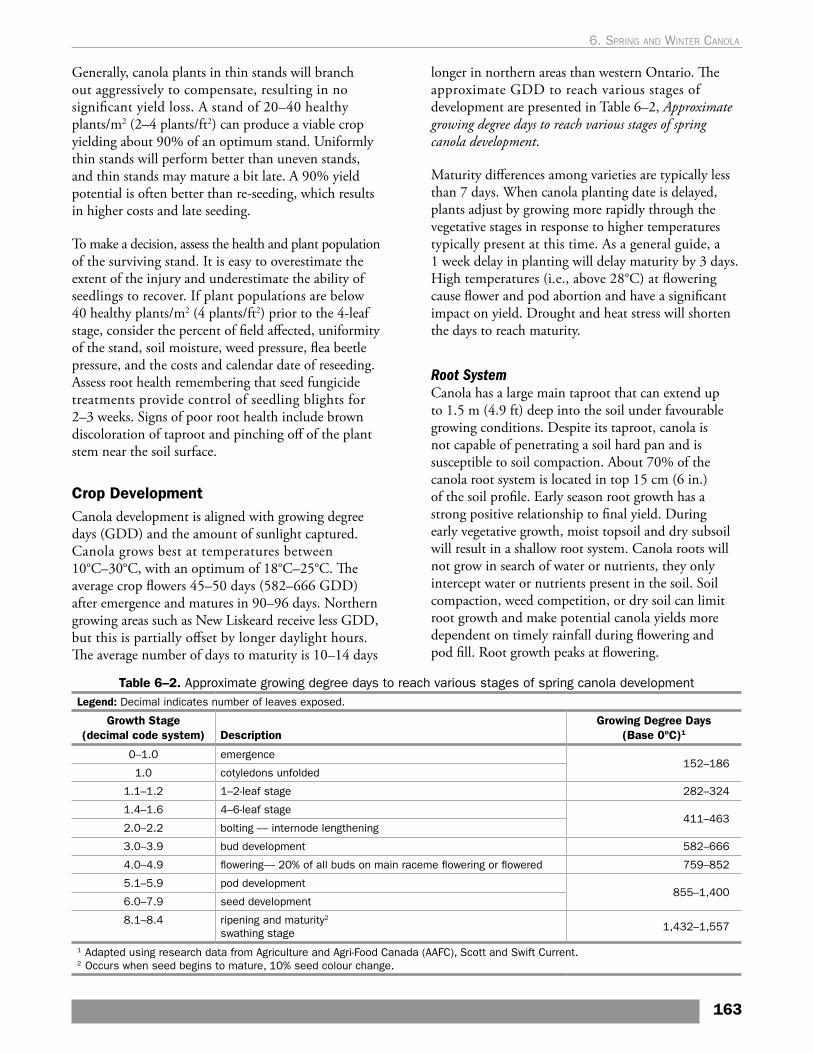
Generally, canola plants in thin stands will branch out aggressively to compensate, resulting in no significant yield loss. A stand of 20–40 healthy plants/m2 (2–4 plants/ft2) can produce a viable crop yielding about 90% of an optimum stand. Uniformly thin stands will perform better than uneven stands, and thin stands may mature a bit late. A 90% yield potential is often better than re-seeding, which results in higher costs and late seeding.
To make a decision, assess the health and plant population of the surviving stand. It is easy to overestimate the extent of the injury and underestimate the ability of seedlings to recover. If plant populations are below 40 healthy plants/m2 (4 plants/ft2) prior to the 4-leaf stage, consider the percent of field affected, uniformity of the stand, soil moisture, weed pressure, flea beetle pressure, and the costs and calendar date of reseeding. Assess root health remembering that seed fungicide treatments provide control of seedling blights for 2–3 weeks. Signs of poor root health include brown discoloration of taproot and pinching off of the plant stem near the soil surface.
Crop DevelopmentCanola development is aligned with growing degree days (GDD) and the amount of sunlight captured. Canola grows best at temperatures between 10°C–30°C, with an optimum of 18°C–25°C. The average crop flowers 45–50 days (582–666 GDD) after emergence and matures in 90–96 days. Northern growing areas such as New Liskeard receive less GDD, but this is partially offset by longer daylight hours. The average number of days to maturity is 10–14 days
Table 6–2. Approximate growing degree days to reach various stages of spring canola developmentLegend: Decimal indicates number of leaves exposed.
Growth Stage (decimal code system) Description
Growing Degree Days (Base 0ºC)1
0–1.0 emergence152–186
1.0 cotyledons unfolded
1.1–1.2 1–2-leaf stage 282–324
1.4–1.6 4–6-leaf stage411–463
2.0–2.2 bolting — internode lengthening
3.0–3.9 bud development 582–666
4.0–4.9 flowering— 20% of all buds on main raceme flowering or flowered 759–852
5.1–5.9 pod development855–1,400
6.0–7.9 seed development
8.1–8.4 ripening and maturity2
swathing stage1,432–1,557
1 Adapted using research data from Agriculture and Agri-Food Canada (AAFC), Scott and Swift Current.2 Occurs when seed begins to mature, 10% seed colour change.
longer in northern areas than western Ontario. The approximate GDD to reach various stages of development are presented in Table 6–2, Approximate growing degree days to reach various stages of spring canola development.
Maturity differences among varieties are typically less than 7 days. When canola planting date is delayed, plants adjust by growing more rapidly through the vegetative stages in response to higher temperatures typically present at this time. As a general guide, a 1 week delay in planting will delay maturity by 3 days. High temperatures (i.e., above 28°C) at flowering cause flower and pod abortion and have a significant impact on yield. Drought and heat stress will shorten the days to reach maturity.
Root SystemCanola has a large main taproot that can extend up to 1.5 m (4.9 ft) deep into the soil under favourable growing conditions. Despite its taproot, canola is not capable of penetrating a soil hard pan and is susceptible to soil compaction. About 70% of the canola root system is located in top 15 cm (6 in.) of the soil profile. Early season root growth has a strong positive relationship to final yield. During early vegetative growth, moist topsoil and dry subsoil will result in a shallow root system. Canola roots will not grow in search of water or nutrients, they only intercept water or nutrients present in the soil. Soil compaction, weed competition, or dry soil can limit root growth and make potential canola yields more dependent on timely rainfall during flowering and pod fill. Root growth peaks at flowering.
163
6. sprIng and WInter canola
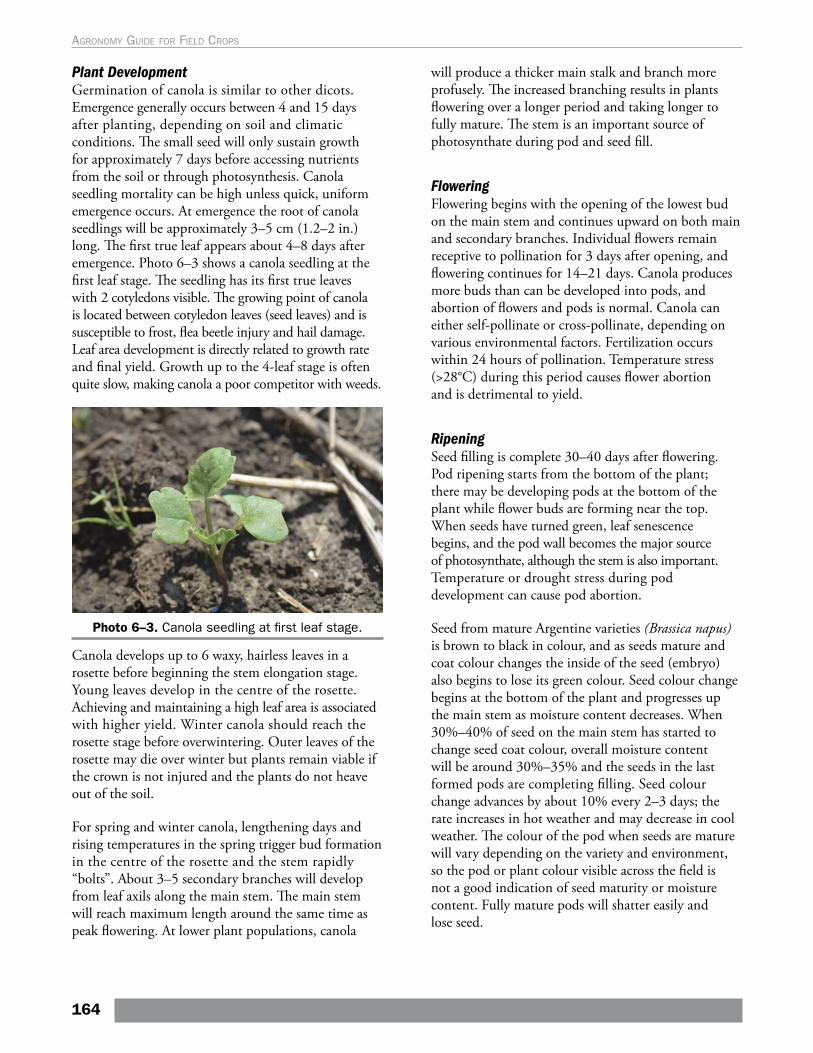
Plant DevelopmentGermination of canola is similar to other dicots. Emergence generally occurs between 4 and 15 days after planting, depending on soil and climatic conditions. The small seed will only sustain growth for approximately 7 days before accessing nutrients from the soil or through photosynthesis. Canola seedling mortality can be high unless quick, uniform emergence occurs. At emergence the root of canola seedlings will be approximately 3–5 cm (1.2–2 in.) long. The first true leaf appears about 4–8 days after emergence. Photo 6–3 shows a canola seedling at the first leaf stage. The seedling has its first true leaves with 2 cotyledons visible. The growing point of canola is located between cotyledon leaves (seed leaves) and is susceptible to frost, flea beetle injury and hail damage. Leaf area development is directly related to growth rate and final yield. Growth up to the 4-leaf stage is often quite slow, making canola a poor competitor with weeds.
Photo 6–3. Canola seedling at first leaf stage.
Canola develops up to 6 waxy, hairless leaves in a rosette before beginning the stem elongation stage. Young leaves develop in the centre of the rosette. Achieving and maintaining a high leaf area is associated with higher yield. Winter canola should reach the rosette stage before overwintering. Outer leaves of the rosette may die over winter but plants remain viable if the crown is not injured and the plants do not heave out of the soil.
For spring and winter canola, lengthening days and rising temperatures in the spring trigger bud formation in the centre of the rosette and the stem rapidly “bolts”. About 3–5 secondary branches will develop from leaf axils along the main stem. The main stem will reach maximum length around the same time as peak flowering. At lower plant populations, canola
will produce a thicker main stalk and branch more profusely. The increased branching results in plants flowering over a longer period and taking longer to fully mature. The stem is an important source of photosynthate during pod and seed fill.
FloweringFlowering begins with the opening of the lowest bud on the main stem and continues upward on both main and secondary branches. Individual flowers remain receptive to pollination for 3 days after opening, and flowering continues for 14–21 days. Canola produces more buds than can be developed into pods, and abortion of flowers and pods is normal. Canola can either self-pollinate or cross-pollinate, depending on various environmental factors. Fertilization occurs within 24 hours of pollination. Temperature stress (>28°C) during this period causes flower abortion and is detrimental to yield.
RipeningSeed filling is complete 30–40 days after flowering. Pod ripening starts from the bottom of the plant; there may be developing pods at the bottom of the plant while flower buds are forming near the top. When seeds have turned green, leaf senescence begins, and the pod wall becomes the major source of photosynthate, although the stem is also important. Temperature or drought stress during pod development can cause pod abortion.
Seed from mature Argentine varieties (Brassica napus) is brown to black in colour, and as seeds mature and coat colour changes the inside of the seed (embryo) also begins to lose its green colour. Seed colour change begins at the bottom of the plant and progresses up the main stem as moisture content decreases. When 30%–40% of seed on the main stem has started to change seed coat colour, overall moisture content will be around 30%–35% and the seeds in the last formed pods are completing filling. Seed colour change advances by about 10% every 2–3 days; the rate increases in hot weather and may decrease in cool weather. The colour of the pod when seeds are mature will vary depending on the variety and environment, so the pod or plant colour visible across the field is not a good indication of seed maturity or moisture content. Fully mature pods will shatter easily and lose seed.
164
Agronomy guide for field Crops
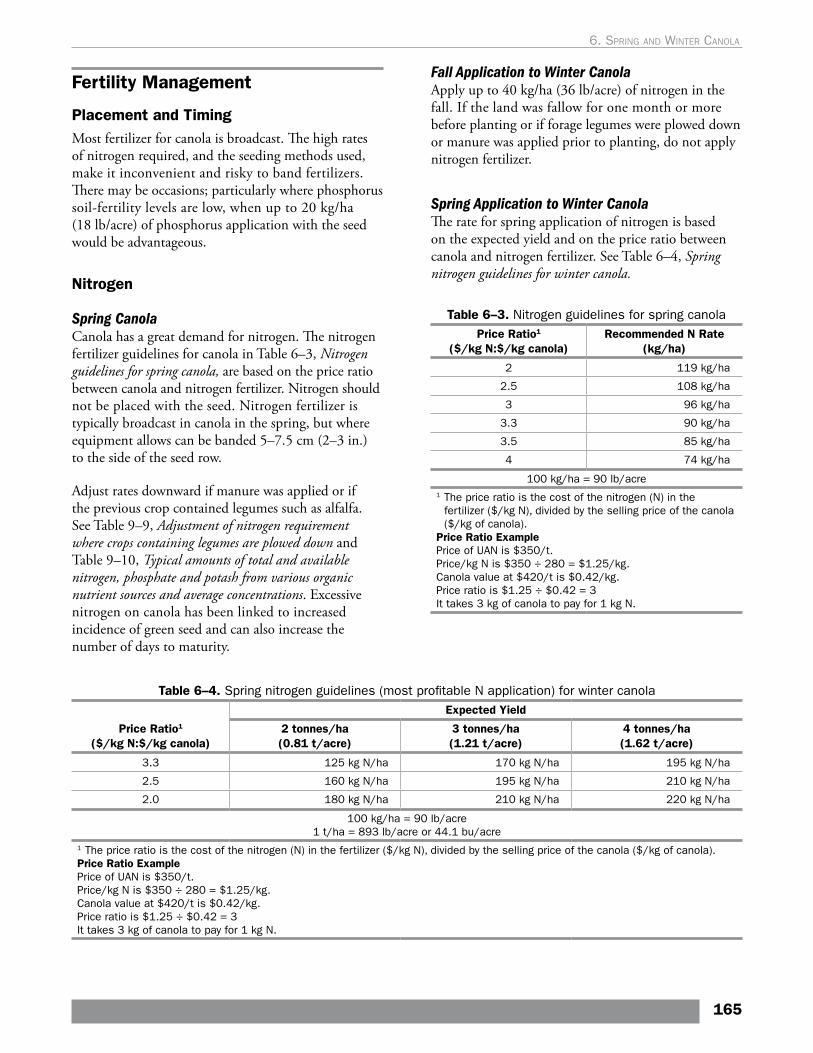
Fertility Management
Placement and TimingMost fertilizer for canola is broadcast. The high rates of nitrogen required, and the seeding methods used, make it inconvenient and risky to band fertilizers. There may be occasions; particularly where phosphorus soil-fertility levels are low, when up to 20 kg/ha (18 lb/acre) of phosphorus application with the seed would be advantageous.
Nitrogen
Spring CanolaCanola has a great demand for nitrogen. The nitrogen fertilizer guidelines for canola in Table 6–3, Nitrogen guidelines for spring canola, are based on the price ratio between canola and nitrogen fertilizer. Nitrogen should not be placed with the seed. Nitrogen fertilizer is typically broadcast in canola in the spring, but where equipment allows can be banded 5–7.5 cm (2–3 in.) to the side of the seed row.
Adjust rates downward if manure was applied or if the previous crop contained legumes such as alfalfa. See Table 9–9, Adjustment of nitrogen requirement where crops containing legumes are plowed down and Table 9–10, Typical amounts of total and available nitrogen, phosphate and potash from various organic nutrient sources and average concentrations. Excessive nitrogen on canola has been linked to increased incidence of green seed and can also increase the number of days to maturity.
Fall Application to Winter CanolaApply up to 40 kg/ha (36 lb/acre) of nitrogen in the fall. If the land was fallow for one month or more before planting or if forage legumes were plowed down or manure was applied prior to planting, do not apply nitrogen fertilizer.
Spring Application to Winter CanolaThe rate for spring application of nitrogen is based on the expected yield and on the price ratio between canola and nitrogen fertilizer. See Table 6–4, Spring nitrogen guidelines for winter canola.
Table 6–3. Nitrogen guidelines for spring canolaPrice Ratio1
($/kg N:$/kg canola)Recommended N Rate
(kg/ha)
2 119 kg/ha
2.5 108 kg/ha
3 96 kg/ha
3.3 90 kg/ha
3.5 85 kg/ha
4 74 kg/ha
100 kg/ha = 90 lb/acre1 The price ratio is the cost of the nitrogen (N) in the
fertilizer ($/kg N), divided by the selling price of the canola ($/kg of canola).
Price Ratio ExamplePrice of UAN is $350/t.Price/kg N is $350 ÷ 280 = $1.25/kg.Canola value at $420/t is $0.42/kg.Price ratio is $1.25 ÷ $0.42 = 3It takes 3 kg of canola to pay for 1 kg N.
Table 6–4. Spring nitrogen guidelines (most profitable N application) for winter canola
Price Ratio1 ($/kg N:$/kg canola)
Expected Yield
2 tonnes/ha (0.81 t/acre)
3 tonnes/ha (1.21 t/acre)
4 tonnes/ha (1.62 t/acre)
3.3 125 kg N/ha 170 kg N/ha 195 kg N/ha
2.5 160 kg N/ha 195 kg N/ha 210 kg N/ha
2.0 180 kg N/ha 210 kg N/ha 220 kg N/ha
100 kg/ha = 90 lb/acre1 t/ha = 893 lb/acre or 44.1 bu/acre
1 The price ratio is the cost of the nitrogen (N) in the fertilizer ($/kg N), divided by the selling price of the canola ($/kg of canola).Price Ratio ExamplePrice of UAN is $350/t.Price/kg N is $350 ÷ 280 = $1.25/kg.Canola value at $420/t is $0.42/kg.Price ratio is $1.25 ÷ $0.42 = 3It takes 3 kg of canola to pay for 1 kg N.
165
6. sprIng and WInter canola
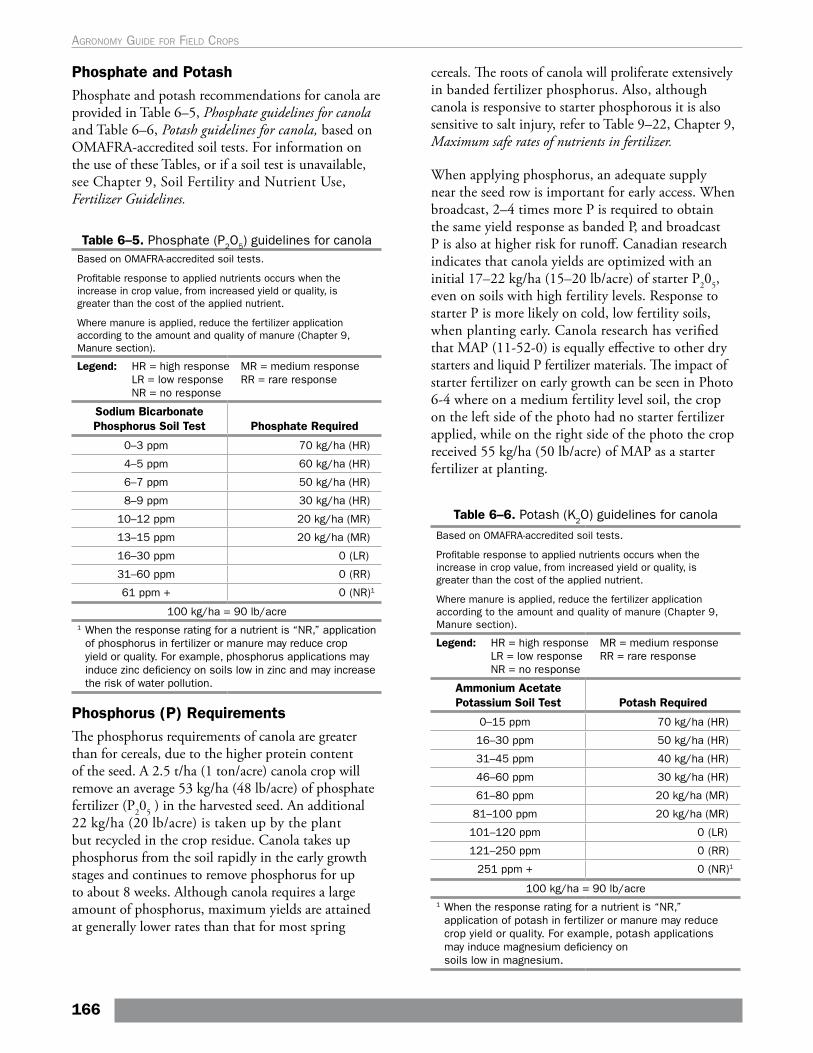
Phosphate and PotashPhosphate and potash recommendations for canola are provided in Table 6–5, Phosphate guidelines for canola and Table 6–6, Potash guidelines for canola, based on OMAFRA-accredited soil tests. For information on the use of these Tables, or if a soil test is unavailable, see Chapter 9, Soil Fertility and Nutrient Use, Fertilizer Guidelines.
Table 6–5. Phosphate (P2O5) guidelines for canola Based on OMAFRA-accredited soil tests.
Profitable response to applied nutrients occurs when the increase in crop value, from increased yield or quality, is greater than the cost of the applied nutrient.
Where manure is applied, reduce the fertilizer application according to the amount and quality of manure (Chapter 9, Manure section).
Legend: HR = high response MR = medium response LR = low response RR = rare response NR = no response
Sodium Bicarbonate Phosphorus Soil Test Phosphate Required
0–3 ppm 70 kg/ha (HR)
4–5 ppm 60 kg/ha (HR)
6–7 ppm 50 kg/ha (HR)
8–9 ppm 30 kg/ha (HR)
10–12 ppm 20 kg/ha (MR)
13–15 ppm 20 kg/ha (MR)
16–30 ppm 0 (LR)
31–60 ppm 0 (RR)
61 ppm + 0 (NR)1
100 kg/ha = 90 lb/acre1 When the response rating for a nutrient is “NR,” application
of phosphorus in fertilizer or manure may reduce crop yield or quality. For example, phosphorus applications may induce zinc deficiency on soils low in zinc and may increase the risk of water pollution.
Table 6–6. Potash (K2O) guidelines for canola
Based on OMAFRA-accredited soil tests.
Profitable response to applied nutrients occurs when the increase in crop value, from increased yield or quality, is greater than the cost of the applied nutrient.
Where manure is applied, reduce the fertilizer application according to the amount and quality of manure (Chapter 9, Manure section).
Legend: HR = high response MR = medium response LR = low response RR = rare response NR = no response
Ammonium Acetate Potassium Soil Test Potash Required
0–15 ppm 70 kg/ha (HR)
16–30 ppm 50 kg/ha (HR)
31–45 ppm 40 kg/ha (HR)
46–60 ppm 30 kg/ha (HR)
61–80 ppm 20 kg/ha (MR)
81–100 ppm 20 kg/ha (MR)
101–120 ppm 0 (LR)
121–250 ppm 0 (RR)
251 ppm + 0 (NR)1
100 kg/ha = 90 lb/acre1 When the response rating for a nutrient is “NR,”
application of potash in fertilizer or manure may reduce crop yield or quality. For example, potash applications may induce magnesium deficiency on soils low in magnesium.
Phosphorus (P) RequirementsThe phosphorus requirements of canola are greater than for cereals, due to the higher protein content of the seed. A 2.5 t/ha (1 ton/acre) canola crop will remove an average 53 kg/ha (48 lb/acre) of phosphate fertilizer (P205 ) in the harvested seed. An additional 22 kg/ha (20 lb/acre) is taken up by the plant but recycled in the crop residue. Canola takes up phosphorus from the soil rapidly in the early growth stages and continues to remove phosphorus for up to about 8 weeks. Although canola requires a large amount of phosphorus, maximum yields are attained at generally lower rates than that for most spring
cereals. The roots of canola will proliferate extensively in banded fertilizer phosphorus. Also, although canola is responsive to starter phosphorous it is also sensitive to salt injury, refer to Table 9–22, Chapter 9, Maximum safe rates of nutrients in fertilizer.
When applying phosphorus, an adequate supply near the seed row is important for early access. When broadcast, 2–4 times more P is required to obtain the same yield response as banded P, and broadcast P is also at higher risk for runoff. Canadian research indicates that canola yields are optimized with an initial 17–22 kg/ha (15–20 lb/acre) of starter P205, even on soils with high fertility levels. Response to starter P is more likely on cold, low fertility soils, when planting early. Canola research has verified that MAP (11-52-0) is equally effective to other dry starters and liquid P fertilizer materials. The impact of starter fertilizer on early growth can be seen in Photo 6-4 where on a medium fertility level soil, the crop on the left side of the photo had no starter fertilizer applied, while on the right side of the photo the crop received 55 kg/ha (50 lb/acre) of MAP as a starter fertilizer at planting.
166
Agronomy guide for field Crops
Photo 6–4. The impact of early canola growth is evident for this medium fertility field, where the crop
on the left side had no starter fertilizer applied while the crop on the right side the crop received
55 kg/ha (50 lbs/acre) of MAP at planting.
Maximum Safe Rates of Seed-Placed Nutrients for CanolaUp to 28 kg/ha (25 lb/acre) of phosphate (P205) may be seed-placed as ammoniated phosphate,or as superphosphate or MAP. Ensure the rate of nitrogen placed with the seed does not exceed 11 kg/ha (10 lb/acre).
The rate of nitrogen, potash (K2O) and sulphur placed with the seed must not exceed 11–33 kg/ha (10–30 lb/acre) depending on soil type. The lower rate on sandy loam soils.
Ammonium sulphate has a high salt index and rates above 22 kg S/ha (20 lb S/acre) can reduce emergence, especially in dry conditions.
Sulphur Sulphur is linked to soil organic matter and is mobile, similar to nitrogen. Therefore deficiency is more likely to occur on sandy or open bottom soils with low organic matter. Canola has a much higher requirement for sulphur than most other field crops and sulphur deficiencies are becoming increasingly prevalent in canola due to higher crop yields and decreasing amounts received through acid rain deposition. A deficiency, shown in Photo 6–5 at the rosette stage, can occur at any crop stage and can reduce yields.
The current guideline is to apply up to 20 lb/acre of sulphur as an “insurance factor” against sulphur deficiency in canola. Applying 45 kg/ha (100 lb/acre) of ammonium sulphate (21-0-0-24) will supply the crop’s sulphur needs and replace 23 kg/ha (50 lb/acre) of urea.
Photo 6–5. Sulphur deficiency, as seen in the canola plant on top, results in mottling of the leaf
surface, purple underside of leaves and small, pale yellow flowers.
It is possible to apply sulphur to correct an observed deficiency with a broadcast application. Ideally all the required sulphur should be applied by the 6-leaf stage of the crop, when demands begin to increase rapidly, however applications up to the early flowering stage may provide a yield benefit where deficiencies exist. Effective absorption of sulphur occurs when foliar applications are made during the evening or early morning when temperatures are moderate, and under high humidity conditions.
Boron Boron deficiencies are rare in canola. Ontario field trials with foliar boron 0.34 kg/ha (0.3 lb/acre) applied at early flower did not show a consistent economic yield response. Although rarely seen, when it occurs it can reduce yields significantly. Symptoms can include:
• stunted appearance• brown areas in pith of the stem or cracked stems• brown to reddish coloured new leaves and yellow
to brown spots in between the leaf veins• cupping of leaves• prolonged flowering and poor pollination
Boron deficiency can be corrected with either foliar or soil applications of soluble boron fertilizers.
Plant AnalysisTissue testing for diagnosing deficiencies is not well developed. Plant nutrient concentration is complicated by the plant age, plant part and level of crop stress. When canola is under stress, it may not be growing
167
6. sprIng and WInter canola
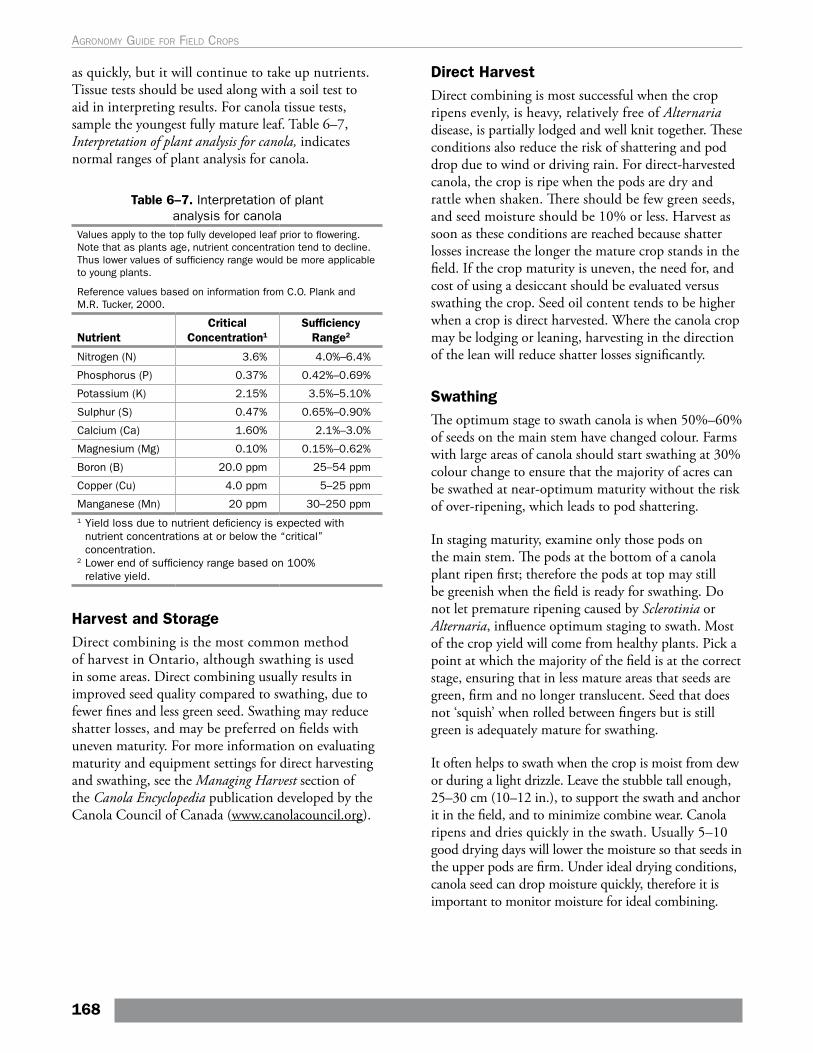
as quickly, but it will continue to take up nutrients. Tissue tests should be used along with a soil test to aid in interpreting results. For canola tissue tests, sample the youngest fully mature leaf. Table 6–7, Interpretation of plant analysis for canola, indicates normal ranges of plant analysis for canola.
Table 6–7. Interpretation of plant analysis for canola
Values apply to the top fully developed leaf prior to flowering. Note that as plants age, nutrient concentration tend to decline. Thus lower values of sufficiency range would be more applicable to young plants.
Reference values based on information from C.O. Plank and M.R. Tucker, 2000.
NutrientCritical
Concentration1
Sufficiency Range2
Nitrogen (N) 3.6% 4.0%–6.4%
Phosphorus (P) 0.37% 0.42%–0.69%
Potassium (K) 2.15% 3.5%–5.10%
Sulphur (S) 0.47% 0.65%–0.90%
Calcium (Ca) 1.60% 2.1%–3.0%
Magnesium (Mg) 0.10% 0.15%–0.62%
Boron (B) 20.0 ppm 25–54 ppm
Copper (Cu) 4.0 ppm 5–25 ppm
Manganese (Mn) 20 ppm 30–250 ppm1 Yield loss due to nutrient deficiency is expected with
nutrient concentrations at or below the “critical” concentration.
2 Lower end of sufficiency range based on 100% relative yield.
Harvest and StorageDirect combining is the most common method of harvest in Ontario, although swathing is used in some areas. Direct combining usually results in improved seed quality compared to swathing, due to fewer fines and less green seed. Swathing may reduce shatter losses, and may be preferred on fields with uneven maturity. For more information on evaluating maturity and equipment settings for direct harvesting and swathing, see the Managing Harvest section of the Canola Encyclopedia publication developed by the Canola Council of Canada (www.canolacouncil.org).
Direct HarvestDirect combining is most successful when the crop ripens evenly, is heavy, relatively free of Alternaria disease, is partially lodged and well knit together. These conditions also reduce the risk of shattering and pod drop due to wind or driving rain. For direct-harvested canola, the crop is ripe when the pods are dry and rattle when shaken. There should be few green seeds, and seed moisture should be 10% or less. Harvest as soon as these conditions are reached because shatter losses increase the longer the mature crop stands in the field. If the crop maturity is uneven, the need for, and cost of using a desiccant should be evaluated versus swathing the crop. Seed oil content tends to be higher when a crop is direct harvested. Where the canola crop may be lodging or leaning, harvesting in the direction of the lean will reduce shatter losses significantly.
SwathingThe optimum stage to swath canola is when 50%–60% of seeds on the main stem have changed colour. Farms with large areas of canola should start swathing at 30% colour change to ensure that the majority of acres can be swathed at near-optimum maturity without the risk of over-ripening, which leads to pod shattering.
In staging maturity, examine only those pods on the main stem. The pods at the bottom of a canola plant ripen first; therefore the pods at top may still be greenish when the field is ready for swathing. Do not let premature ripening caused by Sclerotinia or Alternaria, influence optimum staging to swath. Most of the crop yield will come from healthy plants. Pick a point at which the majority of the field is at the correct stage, ensuring that in less mature areas that seeds are green, firm and no longer translucent. Seed that does not ‘squish’ when rolled between fingers but is still green is adequately mature for swathing.
It often helps to swath when the crop is moist from dew or during a light drizzle. Leave the stubble tall enough, 25–30 cm (10–12 in.), to support the swath and anchor it in the field, and to minimize combine wear. Canola ripens and dries quickly in the swath. Usually 5–10 good drying days will lower the moisture so that seeds in the upper pods are firm. Under ideal drying conditions, canola seed can drop moisture quickly, therefore it is important to monitor moisture for ideal combining.
168
Agronomy guide for field Crops
Pre-Harvest Herbicides to Assist Canola HarvestA pre-harvest herbicide application can facilitate direct harvest by speeding dry-down of canola plants. Use of the herbicide does not hasten maturity. Application can be helpful if the crop is uneven, reducing the risk of shattering in mature plants while waiting for immature areas to dry down. Harvest the field as soon as the crop is ready, as further dry-down increases risk of shattering loss.
Herbicides may also be used before harvest for weed control. Killing weeds can make harvest easier and reduce dockage. Glyphosate applied to Roundup-Ready canola will assist with dry-down of weeds but it will not help to dry down the crop. If winter wheat is planned and perennial weed pressure is high, a pre-harvest burn-down in canola may be the best option for weed control, since there isn’t enough weed top growth for effective control after harvesting the canola.
Combining CanolaThe optimum time to harvest canola, directly or in swaths, is when there are few green seeds and seed moisture content is less than 10%. Depending on weather conditions, seeds rapidly lose moisture at 1%–3% or more per day. Do not delay harvest as seed losses from pod shattering increase dramatically about 10 days after optimum harvest timing. Shattering losses can be reduced by combining at higher seed moisture content and drying the crop, harvesting when there is dew or harvesting at night. Many operators start combining when the seed is slightly above 10% moisture.
Green seed issues occur when chlorophyll is not degraded or cleared from within the seed. Check harvested samples by crushing seeds on a strip of paper and determining the percent of distinctly green seeds. No. 1 and No. 2 Canada canola grades may contain a maximum of 2.0% and 6.0% of green seeds, respectively. Hot or windy weather can result in seed moisture content that indicates it is harvest ready, before there has been sufficient time for green chlorophyll to disappear. Several dews or a light rain can help to clear the green colour from seed.
When harvesting canola swaths, adjust the pick-up speed and height so the pick-up runs just under the swath and it is gently lifted. Also, slowing down the combine travel speed can dramatically reduce harvest losses. Monitor and make adjustments throughout the day to minimize harvest losses. 54 seeds/m2 (5 seeds/ft2) on the ground equates to a loss of 1 kg/ha (0.9 lb/acre). Average harvest losses range from 10–50 kg/ha (9–45 lb/acre).
Storage of CanolaCanola is dry at 10% moisture but for long-term storage, seed moisture should be 8%–9%. The small seed size and high oil content results in rapid heating of stored canola. Heating in storage causes ‘heat damage seed’ that has higher free fatty acids and rancidity problems. High free fatty acid levels in canola are a problem for crushers, and heated seed can cause load rejection.
Before storing canola, check for openings in bins to prevent leaks as canola will flow freely. Aerate canola immediately following harvest to reduce risk of heating and mould development. Freshly harvested canola has a high respiration rate for up to 6 weeks following harvest before becoming dormant and safe for storage. Aeration fans designed to condition cereals and other grains may not be adequate for canola because of its small seed size. It takes more than twice as long to move a cooling front through canola compared to wheat. Green material (dockage) in canola is typically 3%–4% higher in moisture and can cause hot spots in storage. Seed that is over 10% moisture must be dried within 1–2 weeks of harvest to avoid spoilage. The rate at which canola deteriorates in storage depends on storage temperature, relative humidity, seed moisture content, the storage time and initial seed quality (green seed, dockage, etc.). Monitor stored canola weekly.
For further information on drying, handling, and storage of canola refer to the info sheet ‘Storage of Canola’ on the Alberta Agriculture website (www.agric.gov.ab.ca).
169
6. sprIng and WInter canola
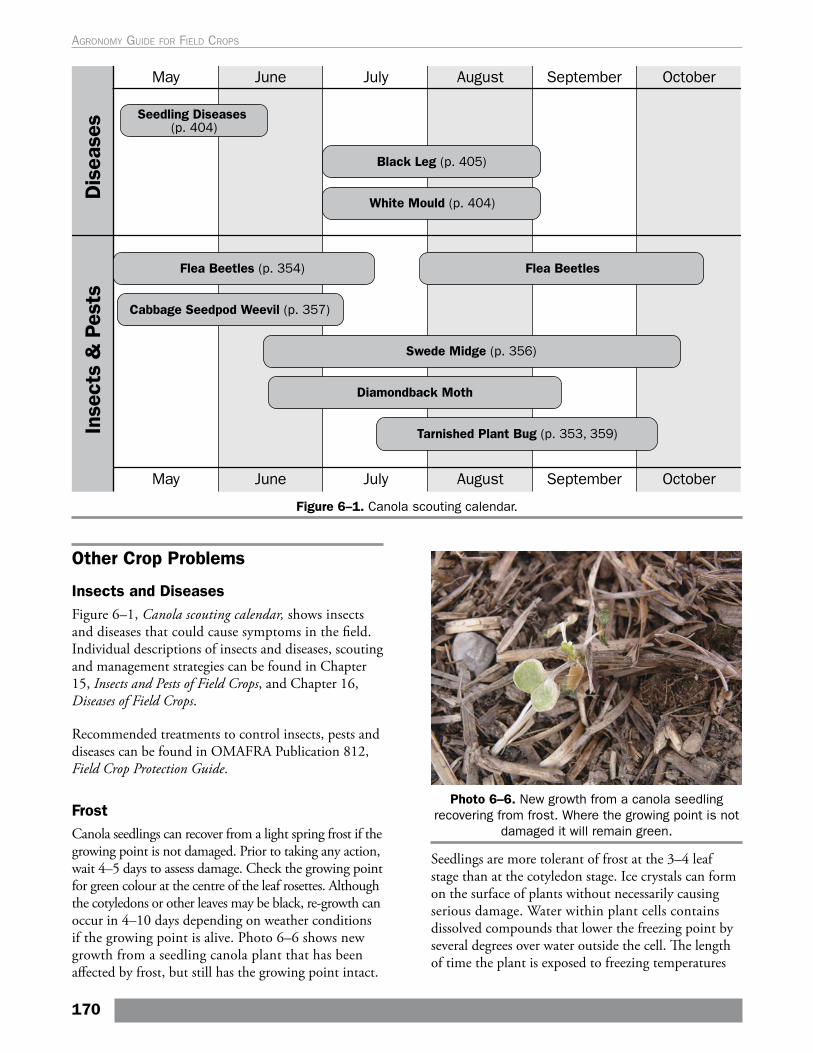
Figure 6–1. Canola scouting calendar.
Other Crop Problems
Insects and DiseasesFigure 6–1, Canola scouting calendar, shows insects and diseases that could cause symptoms in the field. Individual descriptions of insects and diseases, scouting and management strategies can be found in Chapter 15, Insects and Pests of Field Crops, and Chapter 16, Diseases of Field Crops.
Recommended treatments to control insects, pests and diseases can be found in OMAFRA Publication 812, Field Crop Protection Guide.
Frost Canola seedlings can recover from a light spring frost if the growing point is not damaged. Prior to taking any action, wait 4–5 days to assess damage. Check the growing point for green colour at the centre of the leaf rosettes. Although the cotyledons or other leaves may be black, re-growth can occur in 4–10 days depending on weather conditions if the growing point is alive. Photo 6–6 shows new growth from a seedling canola plant that has been affected by frost, but still has the growing point intact.
Photo 6–6. New growth from a canola seedling recovering from frost. Where the growing point is not
damaged it will remain green.
Seedlings are more tolerant of frost at the 3–4 leaf stage than at the cotyledon stage. Ice crystals can form on the surface of plants without necessarily causing serious damage. Water within plant cells contains dissolved compounds that lower the freezing point by several degrees over water outside the cell. The length of time the plant is exposed to freezing temperatures
170
Agronomy guide for field Crops
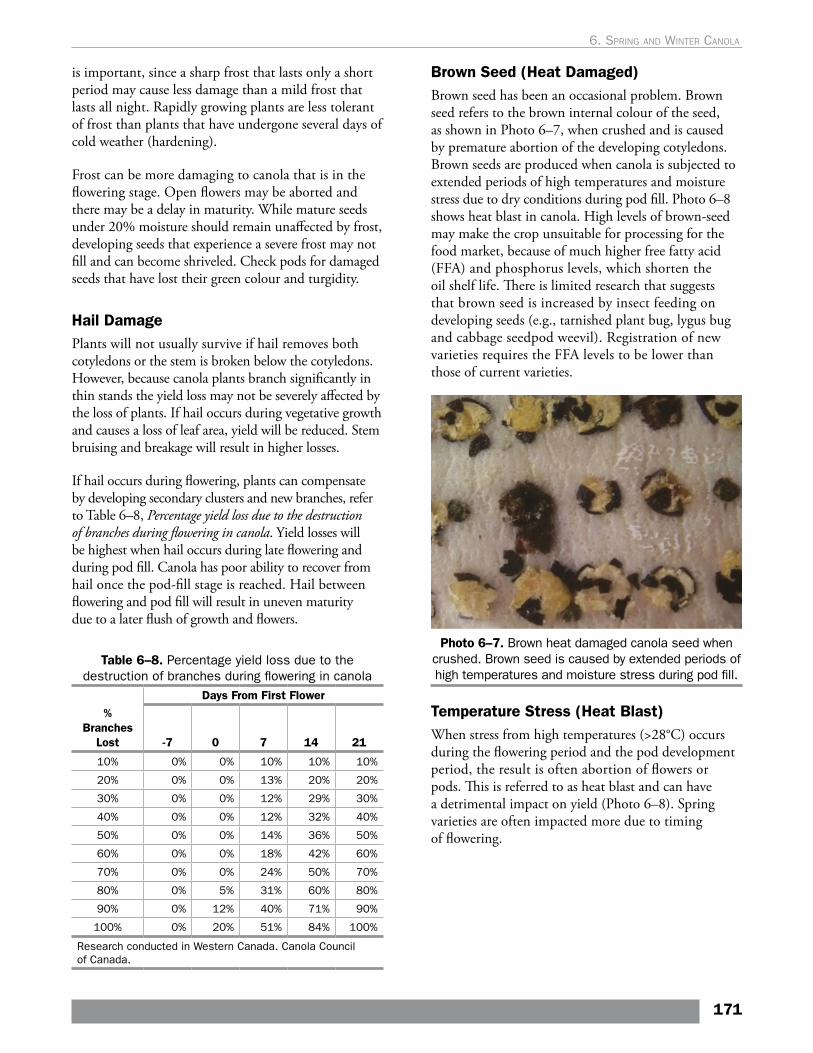
is important, since a sharp frost that lasts only a short period may cause less damage than a mild frost that lasts all night. Rapidly growing plants are less tolerant of frost than plants that have undergone several days of cold weather (hardening).
Frost can be more damaging to canola that is in the flowering stage. Open flowers may be aborted and there may be a delay in maturity. While mature seeds under 20% moisture should remain unaffected by frost, developing seeds that experience a severe frost may not fill and can become shriveled. Check pods for damaged seeds that have lost their green colour and turgidity.
Hail DamagePlants will not usually survive if hail removes both cotyledons or the stem is broken below the cotyledons. However, because canola plants branch significantly in thin stands the yield loss may not be severely affected by the loss of plants. If hail occurs during vegetative growth and causes a loss of leaf area, yield will be reduced. Stem bruising and breakage will result in higher losses.
If hail occurs during flowering, plants can compensate by developing secondary clusters and new branches, refer to Table 6–8, Percentage yield loss due to the destruction of branches during flowering in canola. Yield losses will be highest when hail occurs during late flowering and during pod fill. Canola has poor ability to recover from hail once the pod-fill stage is reached. Hail between flowering and pod fill will result in uneven maturity due to a later flush of growth and flowers.
Table 6–8. Percentage yield loss due to the destruction of branches during flowering in canola
% Branches
Lost
Days From First Flower
-7 0 7 14 21
10% 0% 0% 10% 10% 10%
20% 0% 0% 13% 20% 20%
30% 0% 0% 12% 29% 30%
40% 0% 0% 12% 32% 40%
50% 0% 0% 14% 36% 50%
60% 0% 0% 18% 42% 60%
70% 0% 0% 24% 50% 70%
80% 0% 5% 31% 60% 80%
90% 0% 12% 40% 71% 90%
100% 0% 20% 51% 84% 100%
Research conducted in Western Canada. Canola Council of Canada.
Brown Seed (Heat Damaged) Brown seed has been an occasional problem. Brown seed refers to the brown internal colour of the seed, as shown in Photo 6–7, when crushed and is caused by premature abortion of the developing cotyledons. Brown seeds are produced when canola is subjected to extended periods of high temperatures and moisture stress due to dry conditions during pod fill. Photo 6–8 shows heat blast in canola. High levels of brown-seed may make the crop unsuitable for processing for the food market, because of much higher free fatty acid (FFA) and phosphorus levels, which shorten the oil shelf life. There is limited research that suggests that brown seed is increased by insect feeding on developing seeds (e.g., tarnished plant bug, lygus bug and cabbage seedpod weevil). Registration of new varieties requires the FFA levels to be lower than those of current varieties.
Photo 6–7. Brown heat damaged canola seed when crushed. Brown seed is caused by extended periods of high temperatures and moisture stress during pod fill.
Temperature Stress (Heat Blast) When stress from high temperatures (>28°C) occurs during the flowering period and the pod development period, the result is often abortion of flowers or pods. This is referred to as heat blast and can have a detrimental impact on yield (Photo 6–8). Spring varieties are often impacted more due to timing of flowering.
171
6. sprIng and WInter canola
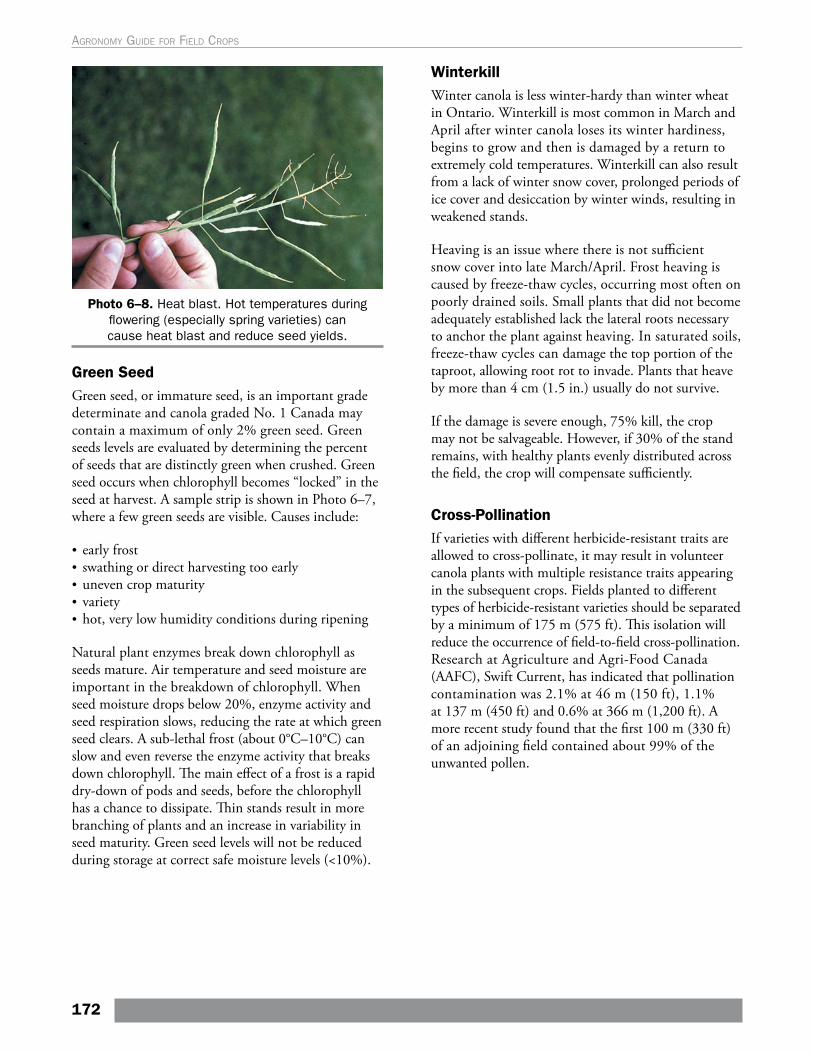
Photo 6–8. Heat blast. Hot temperatures during flowering (especially spring varieties) can cause heat blast and reduce seed yields.
Green Seed Green seed, or immature seed, is an important grade determinate and canola graded No. 1 Canada may contain a maximum of only 2% green seed. Green seeds levels are evaluated by determining the percent of seeds that are distinctly green when crushed. Green seed occurs when chlorophyll becomes “locked” in the seed at harvest. A sample strip is shown in Photo 6–7, where a few green seeds are visible. Causes include:
• early frost• swathing or direct harvesting too early• uneven crop maturity• variety• hot, very low humidity conditions during ripening
Natural plant enzymes break down chlorophyll as seeds mature. Air temperature and seed moisture are important in the breakdown of chlorophyll. When seed moisture drops below 20%, enzyme activity and seed respiration slows, reducing the rate at which green seed clears. A sub-lethal frost (about 0°C–10°C) can slow and even reverse the enzyme activity that breaks down chlorophyll. The main effect of a frost is a rapid dry-down of pods and seeds, before the chlorophyll has a chance to dissipate. Thin stands result in more branching of plants and an increase in variability in seed maturity. Green seed levels will not be reduced during storage at correct safe moisture levels (<10%).
WinterkillWinter canola is less winter-hardy than winter wheat in Ontario. Winterkill is most common in March and April after winter canola loses its winter hardiness, begins to grow and then is damaged by a return to extremely cold temperatures. Winterkill can also result from a lack of winter snow cover, prolonged periods of ice cover and desiccation by winter winds, resulting in weakened stands.
Heaving is an issue where there is not sufficient snow cover into late March/April. Frost heaving is caused by freeze-thaw cycles, occurring most often on poorly drained soils. Small plants that did not become adequately established lack the lateral roots necessary to anchor the plant against heaving. In saturated soils, freeze-thaw cycles can damage the top portion of the taproot, allowing root rot to invade. Plants that heave by more than 4 cm (1.5 in.) usually do not survive.
If the damage is severe enough, 75% kill, the crop may not be salvageable. However, if 30% of the stand remains, with healthy plants evenly distributed across the field, the crop will compensate sufficiently.
Cross-PollinationIf varieties with different herbicide-resistant traits are allowed to cross-pollinate, it may result in volunteer canola plants with multiple resistance traits appearing in the subsequent crops. Fields planted to different types of herbicide-resistant varieties should be separated by a minimum of 175 m (575 ft). This isolation will reduce the occurrence of field-to-field cross-pollination. Research at Agriculture and Agri-Food Canada (AAFC), Swift Current, has indicated that pollination contamination was 2.1% at 46 m (150 ft), 1.1% at 137 m (450 ft) and 0.6% at 366 m (1,200 ft). A more recent study found that the first 100 m (330 ft) of an adjoining field contained about 99% of the unwanted pollen.
172
Agronomy guide for field Crops
7. Other Crops
BUCKWHEAT
Production RequirementsSoil Types: Prefers light to medium textured soils, but will grow in all soil types
Soil pH: 5.4–7.0
Preferred Rotational Crops: Corn, cereal crops
Should Not Rotate With: Soybeans, edible beans, canola or sunflowers
Minimum Soil Temperature: 7°C
Optimum Air Temperature: 12°C–25°C
Earliest Planting Date: After the risk of frost has past
Required Growing Season: 70–90 days from planting to maturity
Buckwheat is a fast-growing summer annual with broad, heart-shaped leaves and white flowers. It takes approximately 5–6 weeks from planting to first flower and 10–12 weeks from planting to harvest. Buckwheat is frost sensitive and is usually planted later than other field crops.
Buckwheat is used for human consumption, as an ingredient in livestock feeds and as a source for buckwheat honey. It is also commonly used as a cover crop for weed suppression and green manure, refer to Chapter 8, Managing for Healthy Soils. The grain of buckwheat has an amino acid composition that includes lysine, and thus provides a more complete protein compared to other cereals.
The most lucrative market is the export of quality, large-seeded buckwheat to the Pacific Rim countries, particularly Japan.
Tillage Options and Seedbed PreparationBuckwheat is often planted in organic rotations and in unseeded acreage conditions where planting of corn or soybeans has been delayed beyond expectations of reaching maturity in remaining growing season. Buckwheat is also commonly used in abandoned fields and old pastures, to rejuvenate the fields prior to planting other crops. When preparing the seedbed, aim for effective weed control, moisture conservation and a firm seedbed. Weed control options in buckwheat are limited, so it is important to address weed control as much as possible before the crop is planted. Field preparation, in either fall or spring, could include an application of glyphosate prior to tillage to improve perennial weed control, or alternatively, spring secondary tillage could remove remaining perennials and stimulate annual weed growth. Repeating shallow tillage approximately every 7–14 days until seeding time will help minimize new weeds and conserve moisture.
Field SelectionBuckwheat is well adapted to the wide range of Ontario weather conditions. It is susceptible to late-spring and early-fall frosts. Buckwheat is sensitive to high temperatures and hot, dry winds, especially if these conditions occur during flowering seed-set. Buckwheat will grow on a wide range of soil types and is likely to produce a better crop on poor soil than any other grain crop. However, buckwheat prefers well-drained soils and is intolerant of severely dry, saturated or compacted soils.
Avoid fields that contain very high residual nitrogen, as this can increase crop lodging. The lush growth associated with these fields has often led to a higher incidence of white mould. White mould is a problem in soybeans, dry edible beans, canola, sunflowers and buckwheat. If possible, avoid fields where white mould has been a problem and plan the rotation to avoid a sequence of these crops.
173
In order to reduce volunteer grain when growing buckwheat for seed, avoid planting in fields where other grains were previously grown. This problem can be overcome by tilling in the fall and planting a winter cover crop that is incorporated in the spring before planting the buckwheat.
Variety Selection If the crop is being grown for export markets, variety selection becomes important. The Japanese, North American and European markets demand large-seeded varieties for milling and de-hulling purposes.
New varieties tend to have larger seed size, along with increased bushel weight. These large-seeded varieties have larger leaves and, as a result, do not require higher seeding rates compared to the smaller-seeded types.
For seed sources, see Cover Crop Seed Suppliers on the OMAFRA website at ontario.ca/crops.
Planting Buckwheat will germinate at temperatures from 7°C–40.5°C and will flower 5–6 weeks after planting. Buckwheat has an indeterminate growth habit, so the crop does not mature uniformly. Yields are highest if buckwheat is planted immediately after the risk of frost has passed. Early planting into conditions that are favourable for crop emergence helps minimize volunteer problems the following year. Traditionally, buckwheat was planted in mid-summer and often harvested after frost. Although this method avoided flowering during hot weather, immature seeds would drop and reduce yields, and potentially pose a severe volunteer problem for following crops.
Planting with a drill will produce a more uniform stand, but satisfactory results can also be obtained with broadcast seeding. Plant seeds at a depth of 4–6 cm (1.5–2.5 in.) into moisture to obtain rapid and uniform emergence. Seedlings should emerge in 2–5 days.
Recommended seeding rates for grain production are 50–65 kg/ha (45–60 lb/acre). This will achieve the ideal plant stand of 140–183 plants/m2 (13–17 plants/ft2).
When planting buckwheat as a green manure or cover crop, the optimum seeding rate ranges from 50–60 kg/ha (45–54 lb/acre). Higher seeding rates result in higher plant populations, producing a smothering effect to aid weed control. However, even if the stand is thin, the plant’s ability to branch out will often compensate for thinner stands and will still result in good weed control.
As a Green ManureBuckwheat has the ability to take up phosphate unavailable to other crops, thereby increasing the amount of phosphorus available to subsequent crops. To take advantage of its large biomass, incorporate or chemically control buckwheat between 4–7 weeks after planting, before the first seeds have set. If the field is left until full bloom, there is more likelihood of volunteer buckwheat problems the following year.
Fertility ManagementFertility requirements for buckwheat are similar to oats. Table 7–1, Nitrogen requirements for buckwheat, Table 7–2, Phosphate guidelines for buckwheat and flax and Table 7–3, Potash guidelines for buckwheat and flax display the suggested rates of nitrogen, phosphate and potash based on OMAFRA-accredited soil tests.
Table 7–1. Nitrogen requirements for buckwheat
Growing RegionMaximum Rate of Nitrogen
for Buckwheat
Southern Ontario 35 kg/ha (30 lbs/acre)
Northern Ontario 55 kg/ha (50 lbs/acre)
Profitable response to applied nutrients occurs when the increase in crop value, from increased yield or quality, is greater than the cost of the applied nutrient.
Where manure is applied, reduce the fertilizer application according to the amount and quality of manure. See Chapter 9, Soil Fertility and Nutrient Use, Table 9–10, Typical amounts of total and available nitrogen, phosphate and potash from various organic nutrient sources.
174
Agronomy guide for field Crops
Table 7–2. Phosphate (P2O5) guidelines for buckwheat and flax
Based on OMAFRA-accredited soil tests.
Profitable response to applied nutrients occurs when the increase in crop value, from increased yield or quality, is greater than the cost of the applied nutrient.
Where manure is applied, reduce the fertilizer application according to the amount and quality of manure (Chapter 9, Manure section).
Legend: HR = high response MR = medium response LR = low response RR = rare response NR = no response
Sodium Bicarbonate Phosphorus Soil Test Phosphate Required
0–3 ppm 70 kg/ha (HR)
4–5 ppm 60 kg/ha (HR)
6–7 ppm 50 kg/ha (HR)
8–9 ppm 30 kg/ha (HR)
10–12 ppm 20 kg/ha (MR)
13–15 ppm 20 kg/ha (MR)
16–30 ppm 0 (LR)
31–60 ppm 0 (RR)
61 ppm + 0 (NR)1
100 kg/ha = 90 lb/acre1 When the response rating for a nutrient is “NR,”
application of phosphorus in fertilizer or manure may reduce crop yield or quality. For example, phosphate applications may induce zinc deficiency on soils low in zinc and may increase the risk of water pollution.
Table 7–3. Potash (K2O) Guidelines for buckwheat and flax
Based on OMAFRA-accredited soil tests.
Profitable response to applied nutrients occurs when the increase in crop value, from increased yield or quality, is greater than the cost of the applied nutrient.
Where manure is applied, reduce the fertilizer application according to the amount and quality of manure (Chapter 9, Manure section).
Legend: HR = high response MR = medium response LR = low response RR = rare response NR = no response
Ammonium Acetate Potassium Soil Test Potash Required
0–15 ppm 70 kg/ha (HR)
16–30 ppm 50 kg/ha (HR)
31–45 ppm 40 kg/ha (HR)
46–60 ppm 30 kg/ha (HR)
61–80 ppm 20 kg/ha (MR)
81–100 ppm 20 kg/ha (MR)
101–120 ppm 0 kg/ha (LR)
121–250 ppm 0 kg/ha (RR)
251 ppm + 0 kg/ha (NR)1
100 kg/ha = 90 lb/acre1 When the response rating for a nutrient is “NR,”
application of potash in fertilizer or manure may reduce crop yield or quality. For example, potash application on soils low in magnesium may induce magnesium deficiency.
Harvest and Storage
Harvest Buckwheat is an indeterminate plant. Flowers, green seed and mature seed are present on the plant at the same time. Flowering begins 5–6 weeks after sowing and continues for at least 1 month. Insects, honeybees and leafcutter bees are the main pollinating agents and are essential for good seed set. An arrangement with an apiarist will be of mutual benefit. Harvest must occur prior to the development of overripe seed. This will be approximately 10 weeks after planting, when the crop is still growing and flowering. At this stage, 70%–75% of the seeds should be brown, mature and not yet dropping from the bottom of the bloom spike. If harvest is delayed until the seeds nearest the ground begin to fall, yields will be decreased due to seed drop, and the volunteer population will cause problems for the next crop.
Yields will vary depending on pollination and weather conditions. Yields of 2.2 t/ha (40 bu/acre) are possible, but 1.1–1.6 t/ha (20–30 bu/acre) are more commonly reported.
SwathingSwath the buckwheat ahead of harvest, if the crop has not been killed by frost. Do not desiccate buckwheat as desiccation weakens the stem and increases lodging. To minimize seed shatter, swath early in the morning when dew is present or in damp weather. Cut the buckwheat high, leaving stubble to facilitate drying.
Combining can occur when seed moisture reaches 16%. When combining, reduce the pick-up speed to match the ground speed to minimize shattering. The draper-type of pick-up causes less shattering than the drum-type. To minimize breakage, reduce the cylinder speed to one-third (600–800 rpm) of that used for cereal grains and set the concaves to approximately 13–16 cm (5.25–6.5 in.) in the front and 9 mm (0.38 in.) in the rear. The upper sieve is set at 16 mm (0.63 in.) and the lower sieve at 8 mm (0.3 in.). If seed is dehulling, increase the concave size or lower the cylinder speed. The lower sieve can then be opened gradually, to the setting that does not allow excess foreign material to pass through. Check that the wind blast is strong enough to remove the maximum amount of trash without blowing out clean grain.
175
7. other crops
Direct CombiningDirect combining is an option for late summer seeded crops that have been killed by frost. Wait 7–10 days after frost, keep ground speed low and cut stubble high to prevent overloading of the combine. To reduce breakage, pay attention to the amount of coarse material that is allowed to pass through so that only a minimum of seed enters the return.
StorageBuckwheat can be safely stored at moisture levels under 16%. The longer buckwheat seed is stored the more oxidation that occurs resulting in the light green layer under the hull gradually changing to a reddish-brown colour. Oxidized seed is easily detected, and becomes significant for markets that prefer freshly harvested buckwheat (i.e., Japanese market). Do not store or mix seed from previous stored crops.
Livestock FeedBuckwheat grain can be used as a livestock feed in a limited inclusion basis in the ration. Buckwheat grain can be up to one-third of the grain concentrate portion for a beef or dairy ration. Swine feeding research, with newer varieties of buckwheat, found that the overall performance of growing-finishing pigs fed buckwheat in the ration was comparable to pigs fed cereal grains.
Feeding PrecautionFeeding buckwheat fodder, whether fresh or dried, can have toxic effects. The primary effect is a photosensitization in animals with light-coloured skin (this includes cattle, goats, sheep, swine and turkey) exposed to the sun. Jaundice is a secondary toxic effect.
Weed ControlWeed control in buckwheat can be difficult and requires planning, as there are few herbicides available, particularly for broadleaf weed control. Buckwheat is sensitive to residual herbicides (e.g., triazine, sulfonylurea and trifluralin). Since buckwheat is often sown late, there is ample opportunity to control problem weeds with herbicides or cultivation before seeding.
Insects and DiseasesBuckwheat seldom has insect or disease concerns other than white mould.
CAMELINA
Production RequirementsSoil Types: Well-drained soils, light to medium textured soils
Soil pH: Acidic to alkaline soils
Preferred Rotational Crops: Cereals
Should Not Rotate With: Canola, dry edible beans, soybeans, sunflowers or buckwheat
Minimum Soil Temperature: Has been broadcast onto frozen ground in early December under no-till conditions
Optimum Air Temperature: 20°C–25°C
Earliest Planting Date: Frost tolerant, heat tolerant
Required Growing Season: 80–100 days (11–14 weeks)
Camelina is an excellent source of omega-3 and omega-6 essential fatty acids. The oil has been used in the formulation of cosmetics, skin creams and lotions. It is also used for biodiesel production and lubricants.
PlantingCamelina can be sown in late fall as a winter annual, or in spring. Fall seeding using no-till methods seems to work better than conventional tillage and seeding. Seed at 4–6 kg/ha (9–13 lb/acre) to achieve a stand of 400–600 plants/m2 (37–56 plants/ft2). Seed at a depth of 6.5 mm (0.25 in.). Seed size varies considerably between varieties. Adjust the planting rate according to both seed size and percent germination.
Fertility ManagementLimited Ontario fertility guidelines exist. Suggested fertilizer rates would be similar to that for canola as camelina is a close relative. Phosphorus and potassium fertility should be at target soil test levels (12–18 ppm P and 100–130 ppm K). If soil phosphorous and potassium levels are below target ranges, incorporate these nutrients into the soil ahead of planting at rates to meet the crop removal plus an amount that will build up the soil test over time. See Fertilizer Guidelines in Chapter 9, Soil Fertility and Nutrient Use.
176
Agronomy guide for field Crops
Harvest and Storage
HarvestCombine 80–100 days after planting when pods are brown. The seed is extremely small; about quarter to half the size of canola seed. (1,000 seed weight = 1 to 2 g, or approximately 666,000 seeds/kg or 300,000 seeds/lb).
Standard canola harvesting practices can be followed, although producers will need to fit combines with properly sized screens.
StorageStore seed in dry areas (under 8% moisture) and at low relative humidity.
Insects and DiseasesCamelina seed can act as a vector for the transmission of Turnip Yellow Mosaic virus. Camelina shows resistance to blackleg (Leptosphaeria maculans), and to Alternaria Brassicae. To date the most significant pest in Ontario has been flea beetles. Pests of canola and other oilseeds in Ontario may affect camelina. For registered pesticides on this crop, always refer to product labels, and follow specified directions. For more information, go to ontario.ca/crops, search on Industrial Miscellaneous, then oil crops.
FLAX
Production RequirementsSoil Types: Well-drained loam, silt loam or clay loam soils are preferred
Soil pH: >5.6
Preferred Rotational Crops: Corn, cereal crops
Minimum Soil Temperature: 3°C
Optimum Air Temperature: 10°C–27°C
Earliest Planting Date: Early to late April
Required Growing Season: 90–115 days
Flax is a versatile crop that has been an ingredient in oil-based paints, protective coatings, linoleum, printer’s ink, soaps, industrial lubricants and as a salt-resistant coating for concrete. Fibre flax and the health benefits of flaxseed oil in a variety of foods have diversified the market. Flax seed contains 35%–40% linseed oil. After oil extraction, the remaining linseed meal is used as a livestock protein supplement, which averages approximately 35% protein content.
The guidelines provided in this section refer to oilseed-type flax. Production requirements for fibre flax may be different. More information on fibre flax in Canada is available from the Flax Council of Canada website at www.flaxcouncil.ca.
Tillage and Seedbed PreparationA firm, level seedbed for good seed-to-soil contact is best for rapid, uniform emergence. Packing the soil before and/or after planting is suggested. Crop success has been better where there is minimal crop residue. Use rotations similar to those for cereals or legume forages.
Variety SelectionVariety selection will be different for oilseed and fibre purposes. Until now, oilseed varieties have been the only commercially produced flax grown in Canada. Oilseed varieties are grown specifically for the oil extracted from the seed.
PlantingFlax is planted using similar equipment to cereals, in narrow rows 15–20 cm (6–8 in.) apart. Using a grain drill results in a more uniform seeding depth and plant emergence than broadcast seeding. Seed to a maximum depth of 2.5 cm (1 in.), as there is likely to be adequate soil moisture to stimulate germination in the spring. Deep seeding can significantly delay emergence, particularly during cool, wet springs. Optimum seeding rates are 35–50 kg/ha (31–45 lb/acre). Seeding rates higher than 50 kg/ha along with high nitrogen rates can lead to excessive lodging, making harvest difficult.
Early planting results in higher yields and easier harvest. Seedlings can withstand moderate frost. Well-drained loam, silt loam or clay loam soils are preferred. Flax plants have a relatively short taproot which makes plants susceptible to moisture stress on light textured soils.
177
7. other crops
Crop DevelopmentFlax is an annual plant with a short taproot from which fibrous roots grow to depths of approximately 1.2 m (4 ft) in light soil. The height of the crop varies from 45–91 cm (1.5–3 ft), depending on growing conditions. In thick stands, only a main stem develops but in thin stands four or more tillers can be produced. Flowers may be white, blue, pink or violet, depending on variety. Flowers open late in the morning and drop by early afternoon. Flax flowers for 3 weeks with sufficient fertility. Flax flowers can self-pollinate, but insects can cross-pollinate between varieties. A seed capsule produces up to 10 seeds. Flax seed produces a gel around the seed once they are exposed to water. This gel gives the seed a sticky texture when wet which could make handling more difficult.
Fertility ManagementFlax nitrogen needs are the same as for mixed grain (45 kg/ha or 40 lb/acre in southern Ontario and 70 kg/ha or 62 lb/acre in northern Ontario). Excessive nitrogen will make the crop lodge. A soil test is the best method of determining phosphorus and potassium requirements. See Table 7–2, Phosphate guidelines for buckwheat and flax and 7–3, Potash guidelines for buckwheat and flax. Flaxseed is susceptible to fertilizer burn; therefore, broadcast all fertilizer.
Harvest and Storage
HarvestFlax typically yields 1,200–2,000 kg/ha (1,100–1,800 lb/acre). Flax can be harvested by either direct combining or by swathing prior to combining.
Direct CombiningSince flax will continue to produce new vegetation throughout the season, a pre-harvest dessicant will be required if the crop is being direct combined. When direct combining, use batt reels to prevent wrapping of flax plants with pick-up reels. Consult the product label for specific directions on pre-harvest applications.
SwathingSwathing, then combining, results in drier seed than with direct combining. Swath when approximately 90% of leaves have fallen and the seeds have turned dark brown. Flax does not shatter as easily as other grains. Swath weedy crops to allow weeds and straw
to dry out before harvest. Leave 15 cm (6 in.) of straw stubble to keep windrows off the ground. Under good drying conditions, the crop can be combined 3–4 days after swathing.
Keep combine and swather cutter bars and guards sharp to reduce the accumulation of immature flax straw on the knife. Combine flax when the straw is dry and seeds rattle in the boll. Early-sown flax is easier to thresh than late-sown flax because it matures under the dryer conditions of late summer.
Adjust the combine to narrow the clearance between the cylinders and concave to about half that of cereal grains and slow down the cylinder. Set fan speeds fairly low since seed is easily blown out the back of the combine. A clean-looking sample in the bin is an indication that too much seed is being blown out. It is not unusual to have dockage levels of 5%–10%. Be sure to plug any holes in the grain tank, augers and elevators, because flax seed is extremely slippery and will flow through small holes.
StorageFor storage, flax should be less than 10.5% moisture. Higher moisture percentages will incur a drying and shrinkage charge. Flax spoils quickly; therefore, proper storage is critical. Drying and cleaning prior to storage can help reduce the amount of dockage.
Straw RemovalOilseed varieties of flax straw are not suitable for linen production due to the short fibres in the stem. Flax straw is slow to rot in the soil and is usually a problem for tillage operations following harvest or in the following crop season. Make every effort to find a use for the straw so that it can be taken off the field. Flax straw is sometimes used in feedlots as bedding. The straw has also been used as a fuel source for burning in large furnaces.
Weed ControlFlax is a poor competitor with weeds. It does not form a dense canopy to shade the ground, so weeds have the opportunity to establish. Perennial and difficult to control weeds are especially problematic since herbicide options are limited. Plant flax in relatively weed-free fields, whenever possible.
For herbicide options, see OMAFRA Publication 75, Guide to Weed Control.
178
Agronomy guide for field Crops
Insects and DiseasesInsects and diseases are typically not a concern in flax production.
HEMP
Production RequirementsSoil Types: Prefers well drained soils. Reduced yields on extremely heavy or light textured soil types
Soil pH: 6.0–7.5
Recommended Rotational Crops: 4-year rotation with cereals or corn
Should not plant after: canola, edible beans, soybeans, buckwheat or sunflowers
Minimum Soil Temperature: 4°C–6°C (seedlings are sensitive to frost)
Optimum Air Temperature: 25°C–28°C
Earliest Planting Date: Early to late May
Required Growing Season: 70–90 days for fibre crops and 100–200 days for grain crops
Hemp (Cannabis sativa) is an annual crop grown for specialty grains, oils and personal care products. It can also be grown as industrial fibre for textiles, paper and biofuels markets. Currently grain is the main market for hemp in Ontario.
Industrial hemp is a controlled substance and may only be grown under license from Health Canada. Health Canada controls the importation, production, processing, possession, sale, transportation, delivery and offering for sale of industrial hemp. Only varieties named in the “List of Approved Cultivars” published by Health Canada are approved for planting. All industrial hemp grown, processed, and sold in Canada must contain 0.3% tetrahydrocannabinol (THC) or less in the leaves and flowering parts. In addition a maximum level of 10 parts per million (ppm) for THC residues in products derived from hemp grain, such as flour and oil has been set under the regulation. Information about varieties, licenses and regulations may be obtained by contacting Health Canada’s Office of Controlled Substances or [email protected].
DescriptionDifferent cultivars are grown for fibre and seed. When grown as a fibre crop, hemp grows to a height of 1.5–3 m (5–10 ft) without branching. In dense plantings, the bottom leaves atrophy due to the exclusion of sunlight. The stem has an outer bark which contains the long, tough bast fibres for which hemp is renowned. The centre core contains the hurds, or short fibres, that are useful in many other applications such as animal bedding.
Soil Conditions Hemp responds to a well-drained, sandy loam soil with a pH range of 6.0–7.5.
The higher the clay content of the soil, the lower the tonnage of fibre that will be produced. Clay soils are easily compacted, and hemp is very sensitive to soil compaction. In well-structured and well-drained soils, the tap root may penetrate 15–30 cm (6–12 in.) deep. In compacted soils the tap root remains short and the plant produces more lateral fibrous roots.
Tillage and Seedbed Preparation Hemp seed requires good seed-to-soil contact. The seedbed should be firm, level and relatively fine, similar to that prepared for direct-seeded forages. The soil can be worked and planted as soon as the ground is dry enough to avoid compaction.
Planting Plant seed in 15–18 cm (6–7 in.) row spacing at a depth of 3 cm (1.25 in.). The optimum soil temperature for rapid germination is 8°C–10°C, although hemp seed will germinate at 4°C–6°C. Early planting produces taller plants with higher fibre yields. The optimum final population for fibre production is about 200–250 plants/m2 (19–23 plants/ft2 or 810,000–1,000,000 plants/acre). For seed or grain production, the optimum final plant population is around 100–150 plants/m2 (9–14 plants/ft2 or (400,000–610,000 plants/acre).
Hemp is a heavy user of moisture; therefore, it is important to make use of early soil moisture and to obtain a good ground cover early to reduce surface evaporation. For grain production, about half of this moisture is required during flowering and seed set.
179
7. other crops
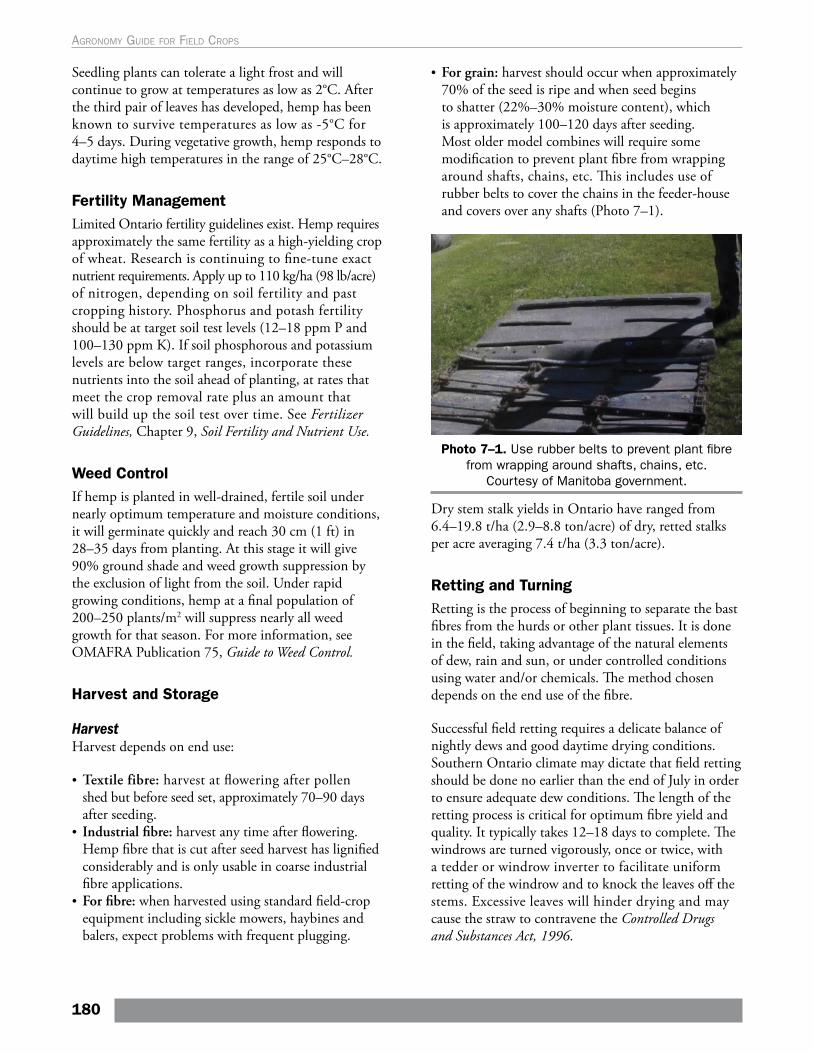
Seedling plants can tolerate a light frost and will continue to grow at temperatures as low as 2°C. After the third pair of leaves has developed, hemp has been known to survive temperatures as low as -5°C for 4–5 days. During vegetative growth, hemp responds to daytime high temperatures in the range of 25°C–28°C.
Fertility Management Limited Ontario fertility guidelines exist. Hemp requires approximately the same fertility as a high-yielding crop of wheat. Research is continuing to fine-tune exact nutrient requirements. Apply up to 110 kg/ha (98 lb/acre) of nitrogen, depending on soil fertility and past cropping history. Phosphorus and potash fertility should be at target soil test levels (12–18 ppm P and 100–130 ppm K). If soil phosphorous and potassium levels are below target ranges, incorporate these nutrients into the soil ahead of planting, at rates that meet the crop removal rate plus an amount that will build up the soil test over time. See Fertilizer Guidelines, Chapter 9, Soil Fertility and Nutrient Use.
Weed ControlIf hemp is planted in well-drained, fertile soil under nearly optimum temperature and moisture conditions, it will germinate quickly and reach 30 cm (1 ft) in 28–35 days from planting. At this stage it will give 90% ground shade and weed growth suppression by the exclusion of light from the soil. Under rapid growing conditions, hemp at a final population of 200–250 plants/m2 will suppress nearly all weed growth for that season. For more information, see OMAFRA Publication 75, Guide to Weed Control.
Harvest and Storage
HarvestHarvest depends on end use:
• Textile fibre: harvest at flowering after pollen shed but before seed set, approximately 70–90 days after seeding.
• Industrial fibre: harvest any time after flowering. Hemp fibre that is cut after seed harvest has lignified considerably and is only usable in coarse industrial fibre applications.
• For fibre: when harvested using standard field-crop equipment including sickle mowers, haybines and balers, expect problems with frequent plugging.
• For grain: harvest should occur when approximately 70% of the seed is ripe and when seed begins to shatter (22%–30% moisture content), which is approximately 100–120 days after seeding. Most older model combines will require some modification to prevent plant fibre from wrapping around shafts, chains, etc. This includes use of rubber belts to cover the chains in the feeder-house and covers over any shafts (Photo 7–1).
Photo 7–1. Use rubber belts to prevent plant fibre from wrapping around shafts, chains, etc.
Courtesy of Manitoba government.
Dry stem stalk yields in Ontario have ranged from 6.4–19.8 t/ha (2.9–8.8 ton/acre) of dry, retted stalks per acre averaging 7.4 t/ha (3.3 ton/acre).
Retting and TurningRetting is the process of beginning to separate the bast fibres from the hurds or other plant tissues. It is done in the field, taking advantage of the natural elements of dew, rain and sun, or under controlled conditions using water and/or chemicals. The method chosen depends on the end use of the fibre.
Successful field retting requires a delicate balance of nightly dews and good daytime drying conditions. Southern Ontario climate may dictate that field retting should be done no earlier than the end of July in order to ensure adequate dew conditions. The length of the retting process is critical for optimum fibre yield and quality. It typically takes 12–18 days to complete. The windrows are turned vigorously, once or twice, with a tedder or windrow inverter to facilitate uniform retting of the windrow and to knock the leaves off the stems. Excessive leaves will hinder drying and may cause the straw to contravene the Controlled Drugs and Substances Act, 1996.
180
Agronomy guide for field Crops
Baling and StoringFor fibre-hemp, stalk moisture should be less than 15% at time of baling, and should continue to dry to about 10%. Baling can be done with any kind of baler. Large round, soft-core balers may be most satisfactory to allow bales to dry more quickly in storage. Bales must be stored indoors under dry conditions to stop the retting process before the fibres become rotted. Bales stored under plastic, based on experiments with hay storage, would indicate that moisture would be wicked up from the ground and some spoilage would take place. Bales placed on pallets will have less spoilage.
Dry grain hemp to 12% moisture for storage. Store in a cool, dry environment.
Insects and DiseasesMore than 50 different viruses, bacteria, fungi and insect pests are known to affect hemp. However, hemp’s rapid growth rate and vigorous nature allow it to overcome the attack of most diseases and pests.
As the concentration of the hemp crop and alternative disease hosts increase in a given area the number of, and population of organisms will tend to increase. A number of pests have been noted in hemp fields in Ontario including common moulds of hemp, Botrytis cinerea (gray mold) and Sclerotinia sclerotiorum (white mould). Sclerotinia also affects soybeans, edible beans, canola, buckwheat and sunflowers. The effect of these diseases on hemp (and hemp as an alternate host) may not be known until hemp is grown more intensively in bean and canola growing areas. Fusarium lesions have been noted on the roots of hemp plants. European corn borer has affected some stands in southern Ontario
A limited number of pesticides are registered for hemp in Ontario. Crop rotation would appear to be the best cultural practice to avoid disease build-up until more is known about hemp’s susceptibility to disease organisms. A 4-year rotation is recommended. Hemp should not follow soybeans, dry edible beans, canola or sunflowers.
Wind and hail damage can be significant in the hemp crop. Tall plants with lots of high leaves can be bent over quite easily by mid-to late-summer storms. Broken plants will partially recover if not broken too low on the stalk.
For further production information go to ontario.ca/crops (search for Specialty Cropportunities, then go to Industrial and Miscellaneous Crops, then Fibre).
MISCANTHUS
Production RequirementsSoil Types: Miscanthus is suited to most soil types. Yields are lower on extremely heavy or light soils
Soil pH: 5.4–6.8
Recommended Rotational Crops: Miscanthus is a long-term perennial and crop rotations do not apply. Wheat or other cereals may act as a nurse crop during establishment
Minimum Soil Temperature: 4°C for planting rhizomes and 10˚C for planting plants or plugs
Optimum Air Temperature: 24°C–29°C
Earliest Planting Date: Early to late May
Required Growing Season: Perennial crop 10+ years
Miscanthus is a relatively new perennial crop for Ontario that has industrial and agricultural uses for fibre, biocomposites, paper, bioenergy (liquid and solid), livestock and poultry bedding and ginseng bedding.
Variety SelectionMiscanthus is a perennial C4 rhizomatous grass originating from Asia. Varieties range in their frost tolerance and winter hardiness, so proper variety selection for particular growing regions is important. Breeding for new varieties is limited. The Biomass Producers’ Co-op website (www.ontariobiomass.com) lists varieties and other variety specific information.
As a result of its perennial nature, miscanthus tends to be more drought tolerant than annual crop types. The crop goes into a conservation mode during dry periods but is able to continue growth quickly when the drought period passes. Yield declines due to dry conditions tend to be much less than experienced with annual crops.
181
7. other crops
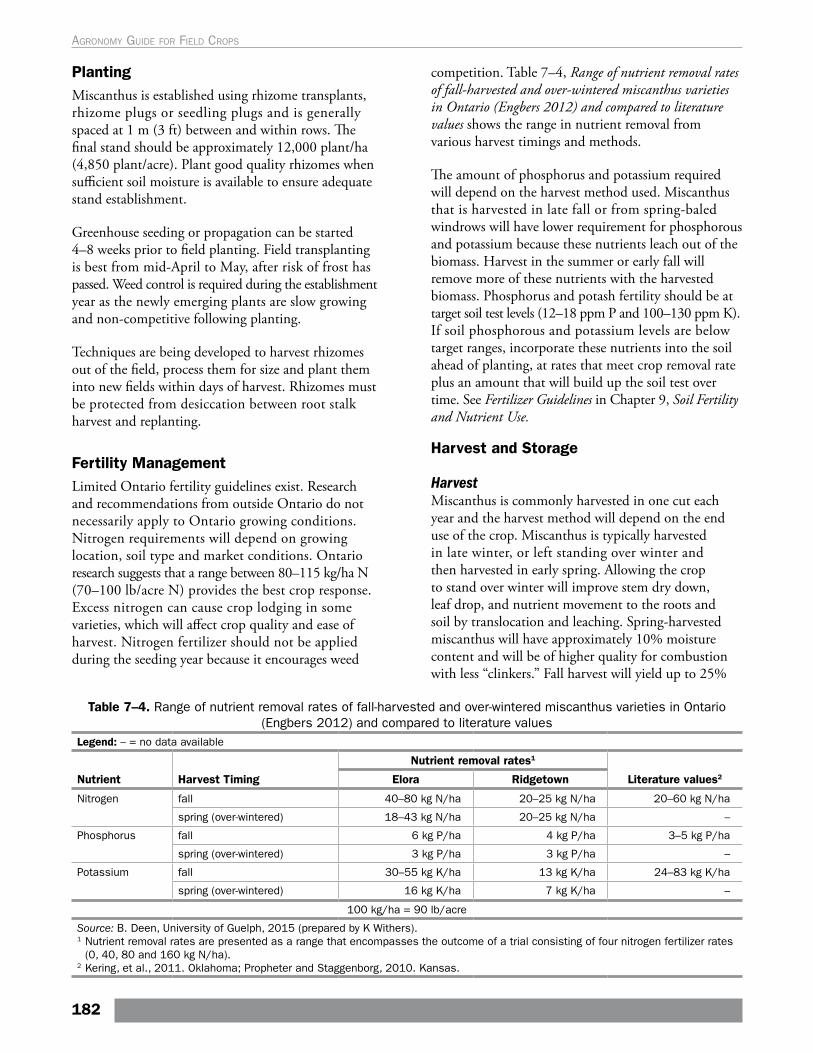
PlantingMiscanthus is established using rhizome transplants, rhizome plugs or seedling plugs and is generally spaced at 1 m (3 ft) between and within rows. The final stand should be approximately 12,000 plant/ha (4,850 plant/acre). Plant good quality rhizomes when sufficient soil moisture is available to ensure adequate stand establishment.
Greenhouse seeding or propagation can be started 4–8 weeks prior to field planting. Field transplanting is best from mid-April to May, after risk of frost has passed. Weed control is required during the establishment year as the newly emerging plants are slow growing and non-competitive following planting.
Techniques are being developed to harvest rhizomes out of the field, process them for size and plant them into new fields within days of harvest. Rhizomes must be protected from desiccation between root stalk harvest and replanting.
Fertility ManagementLimited Ontario fertility guidelines exist. Research and recommendations from outside Ontario do not necessarily apply to Ontario growing conditions. Nitrogen requirements will depend on growing location, soil type and market conditions. Ontario research suggests that a range between 80–115 kg/ha N (70–100 lb/acre N) provides the best crop response. Excess nitrogen can cause crop lodging in some varieties, which will affect crop quality and ease of harvest. Nitrogen fertilizer should not be applied during the seeding year because it encourages weed
competition. Table 7–4, Range of nutrient removal rates of fall-harvested and over-wintered miscanthus varieties in Ontario (Engbers 2012) and compared to literature values shows the range in nutrient removal from various harvest timings and methods.
The amount of phosphorus and potassium required will depend on the harvest method used. Miscanthus that is harvested in late fall or from spring-baled windrows will have lower requirement for phosphorous and potassium because these nutrients leach out of the biomass. Harvest in the summer or early fall will remove more of these nutrients with the harvested biomass. Phosphorus and potash fertility should be at target soil test levels (12–18 ppm P and 100–130 ppm K). If soil phosphorous and potassium levels are below target ranges, incorporate these nutrients into the soil ahead of planting, at rates that meet crop removal rate plus an amount that will build up the soil test over time. See Fertilizer Guidelines in Chapter 9, Soil Fertility and Nutrient Use.
Table 7–4. Range of nutrient removal rates of fall-harvested and over-wintered miscanthus varieties in Ontario (Engbers 2012) and compared to literature values
Legend: – = no data available
Nutrient Harvest Timing
Nutrient removal rates1
Literature values2Elora Ridgetown
Nitrogen fall 40–80 kg N/ha 20–25 kg N/ha 20–60 kg N/ha
spring (over-wintered) 18–43 kg N/ha 20–25 kg N/ha –
Phosphorus fall 6 kg P/ha 4 kg P/ha 3–5 kg P/ha
spring (over-wintered) 3 kg P/ha 3 kg P/ha –
Potassium fall 30–55 kg K/ha 13 kg K/ha 24–83 kg K/ha
spring (over-wintered) 16 kg K/ha 7 kg K/ha –
100 kg/ha = 90 lb/acre
Source: B. Deen, University of Guelph, 2015 (prepared by K Withers).1 Nutrient removal rates are presented as a range that encompasses the outcome of a trial consisting of four nitrogen fertilizer rates
(0, 40, 80 and 160 kg N/ha).2 Kering, et al., 2011. Oklahoma; Propheter and Staggenborg, 2010. Kansas.
Harvest and Storage
HarvestMiscanthus is commonly harvested in one cut each year and the harvest method will depend on the end use of the crop. Miscanthus is typically harvested in late winter, or left standing over winter and then harvested in early spring. Allowing the crop to stand over winter will improve stem dry down, leaf drop, and nutrient movement to the roots and soil by translocation and leaching. Spring-harvested miscanthus will have approximately 10% moisture content and will be of higher quality for combustion with less “clinkers.” Fall harvest will yield up to 25%
182
Agronomy guide for field Crops
more, but is higher in moisture at cutting. Summer or early fall harvest (prior to natural senescence) could reduce winter hardiness and stand longevity. Standard field-crop equipment including sickle/disc mowers, haybines, round/large square balers and forage harvesters are able to handle this voluminous crop. Currently there are no established grades. Quality specifications are determined by the market.
StorageStorage will depend on end use. Miscanthus has been stored in ag-bags; under cover in a building, as well as outside — with and without tarps. Miscanthus straw deteriorates less rapidly than cereal straw. Further processing may be required, such as chopping, pelleting and other treatments that will increase the density and improve storability of the crop.
Weed ControlWeed control options are limited, so select field sites with low weed pressure. A herbicide burn-down using a non-selective herbicide, such as glyphosate, in the previous fall can aid in reducing pressure from winter annuals and biennial weeds. The stale seedbed technique prior to planting is useful when there are few options to control weeds once a miscanthus crop has been planted and is emerged. The stale seedbed technique involves working the soil well before planting; where weeds are allowed to emerge for several weeks followed by the application of a non-selective herbicide, like glyphosate, to kill emerged weeds. Seeding or planting directly into the killed weeds, with minimal soil disturbance will allow the crop to establish before the next flush of weed emergence. In general, control of grassy weeds is more difficult because herbicides that are effective against grasses cause unacceptable injury to miscanthus. The extent of crop injury caused by herbicides depends on the propagule type (e.g., seed, plug/transplant, rhizome) and also on variety or genotype.
Insects and DiseasesIn Ontario, there are no known insect or disease pests that cause economic losses to miscanthus at this time. Nematodes and rabbits have caused some issues. In other regions, European corn borer and western bean cutworm have been identified as insect pests. Few pest control products are registered on this crop.
For further production information, go to ontario.ca/crops.
QUINOA
Production RequirementsSoil Types: Sandy and loam soils. Soils prone to crusting may drastically reduce germination
Soil pH: 4.8–8.5
Recommended Rotational Crops: Corn, cereal crops
Minimum Soil Temperature: 5°C–10°C
Optimum Air Temperature: Prefers a temperate to semi-arid climate. Temperatures above 35°C may cause plant dormancy or pollen sterility
Earliest Planting Date: Plant early, similar to spring cereals
Required Growing Season: 90–120 days
Quinoa is typically used as a cooked whole grain, traditionally in South American cuisine, and is also less commonly used as a milled grain for flour.
PlantingQuinoa is an annual crop. It is generally direct-seeded at a depth of 1.5–2.5 cm (0.5–1 in.), in rows 38–76 cm (15–30 in.) wide. The target seeding rate is 325,000 seeds/ha (131,500 seeds/acre). Seed availability of commonly grown cultivars can be limited. Close attention to planting rate is required to account for large variations in seed size and percent germination.
Fertility ManagementLimited Ontario fertility guidelines exist. Experience from other jurisdictions suggests a range of 100–120 kg/ha (90–105 lb/acre) of nitrogen is sufficient for plant growth and optimal yield. Phosphorus and potassium fertility should be at target soil test levels (12–18 ppm P and 100–130 ppm K). If soil phosphorous and potassium levels are below target ranges, incorporate these nutrients into the soil ahead of planting, at rates that meet crop removal rate plus an amount that will build up the soil test over time. See Fertilizer Guidelines in Chapter 9, Soil Fertility and Nutrient Use.
183
7. other crops
Harvest and Storage
HarvestHarvest occurs approximately 90–120 days after planting depending on the cultivar. Quinoa can be harvested using a combine with a standard header or sorghum header. The seed is disc shaped and is approximately 1.5–2 mm in diameter, so appropriate-sized screens/concaves are required. High humidity or frequent rain may cause mould or sprouting on seed heads. Quinoa can tolerate light frosts. Plants dry quickly resulting in potential grain loss. Yields in Ontario field trials range from 134–240 kg/ha (120–215 lb/acre).
StorageLimited post-harvest storage research has been conducted on quinoa. Oil and protein contents of quinoa seed are similar to that of sunflower seed; therefore, sunflower storage conditions can serve as a general guide for quinoa.
Pest ManagementThere are limited or no pesticides registered for this crop in Ontario. For information on possible minor use registered products, a summary of all active, historical and registered minor use products is available from the OMAFRA Minor Use Coordinator.
WeedsQuinoa is closely related to the common weed species lamb’s-quarters. During vegetative stages the two species look very similar. Early season weed management is required. Weed control options are limited, so use field sites with low weed pressure. A herbicide burn-down in the previous fall, using a non-selective herbicide, such as glyphosate, can aid in reducing pressure from winter annuals and biennial weeds.
Insects and DiseasesTarnished plant bug, stem borer (unknown species), flea beetles, aphids (including sugarbeet root aphid, Pemphigus populivenae), leafhoppers and beet armyworm are known pests of quinoa.
Stalk rot (Phoma spp.), fungal leaf spots, damping off, downy mildew (Peronospora farinose), leaf spot (Ascochyta hyalospora), gray mold (Botrytis cinerea), and bacterial blight (Pseudomonas spp.) are known diseases of quinoa.
To date, tarnished plant bug and phoma stalk rot have been the most significant pests in quinoa in Ontario. Large numbers of tarnished plant bugs have been observed feeding on quinoa in Ontario field trials; however, the impact of damage on yield is not known. Birds are also known to feed on quinoa.
CommentsFor further production information, go to ontario.ca/crops and search for Cropportunities.
SUNFLOWER
Production RequirementsSoil Types: Sunflowers are suited to most soil types. Yields are lower on poorly drained or very light soils
Soil pH: 6.0–7.5
Recommended Rotational Crops: Corn, cereal crops
Should Not Rotate With: Soybeans, dry edible beans, canola, camelina and buckwheat
Minimum Soil Temperature: 6°C
Optimum Air Temperature: 25°C–28°C
Earliest Planting Date: Early May
Required Growing Season: 100–120 days
Sunflower is a tall, broad-leaved, usually single-stemmed plant, with one head per plant. Plants are heliotropic, which means that the heads follow the day’s sun. They have a deep taproot, which allows them to access deep water and nutrient supplies that are generally unavailable for many other annual crops. As a result, sunflowers can handle dry soil conditions better than most crops.
Sunflowers have been grown in Ontario for several decades. The main markets for Ontario sunflowers have been for birdseed and confectionery uses. Both black seeded and striped sunflower seeds are sold into the birdseed markets. Currently there are no sunflower oilseed crushing markets in Ontario. Acreage in Ontario has ranged between 500–1,000 ha (1,250–2,500 acres) over the past decade.
184
Agronomy guide for field Crops
Variety SelectionSunflowers can be classified as either oil or confectionery. Oil-type sunflowers have black hulls and can be conventional hybrids, dwarf hybrids, mid-oleic or open pollinated varieties. Dwarf hybrids mature 6–13 days earlier than conventional hybrids. Open pollinated sunflower (Sunola) varieties are shorter stature 60–90 cm (2–3 ft), have high oil content and require less heat to mature than normal sunflowers, but they do not have good disease resistance.
Confectionery sunflowers have striped hulls and are grown for the human food market. Of the confection sunflowers, only the varieties producing the largest seed are used for human consumption, but these varieties are susceptible to bird and insect damage.
Hybrids have many advantages over open-pollinated varieties. Advantages include:
• approximately 20% greater yield• better disease resistance (e.g., downy mildew,
rust verticillium wilt)• high degree of self-compatibility, which reduces
the need for pollinators• more uniform height and moisture content at harvest
Variety testing is conducted through the National Sunflower Association of Canada, with information available (www.canadasunflower.com).
RotationSunflowers should not be planted in the same field more than once every 4–5 years, due to disease build-up. Canola, dry edible beans, soybeans, buckwheat and hemp are all hosts of white mould (Sclerotinia). Closely monitor rotations with these crops or avoid them altogether.
Volunteer sunflowers can also be a problem in some crop rotations. Sunflowers are susceptible to herbicide carryover from herbicides such as atrazine and sulphonylurea (ALS) herbicides.
Tillage and Seedbed PreparationSunflowers require a firm, moist and weed-free seedbed. Conventional tillage is usually preferred over no-till, mainly for weed control.
The best crop performance is on well-drained, medium-textured soils. Sunflowers can also grow well on sandy soils, but yield will be reduced under
moisture stress during dry conditions. Poorly drained soils will delay planting, delay growth and increase disease pressure.
Planting Sunflowers are planted in early May, similar to corn, and usually bloom in late July. They require approximately 100–120 days to mature. Seedlings are relatively tolerant to frost, up to the 4-leaf stage. A delay in planting beyond May 15 could increase the risk of frost damage prior to maturity in the fall. When delays in planting are unavoidable, use early-season hybrids/varieties.
Optimum planting depth is 3–5 cm (1.25–2 in.), and not more than 8 cm (3.25 in.), into moisture. Sunflowers are prone to lodging in heavier soils or where there is heavy rain and wind.
Ideal row width is 60–90 cm (24–36 in.). Use a corn planter with appropriate seed adjustments or a grain drill with some of the runs blocked-off. Row crop unit planters are preferred since grain drills typically result in poorer emergence. The recommended seeding rate is 40,000–60,000 plants/ha (16,000–24,000 plants/acre). Confection sunflowers should have a final stand target no greater than 45,000 plant/ha (18,000 plants/acre), to help encourage large seed size. Narrow row spacing, 18–25 cm (7–10 in.), increases the risk of white mould. Planting east/west can decrease lodging as sunflower heads face to the east and cause plants to bend in that direction.
Fertility Management The recommended amount of nitrogen for sunflowers is 90 kg/ha (80 lb/acre). Nitrogen fertilizer use is most efficient when it is applied as a side-dress before the plants are 30 cm (12 in.) tall. Phosphorus and potassium fertility should be at target soil test levels (12–18 ppm P and 100–130 ppm K). If soil phosphorous and potassium levels are below target ranges, incorporate these nutrients into the soil ahead of planting, at rates that meet crop removal rate plus an amount that will build up the soil test over time. See Tables 7–5, Phosphate guidelines for sunflowers and 7–6, Potash guidelines for sunflowers.
Where manure is applied, reduce the fertilizer application according to the amount and quality of manure, Chapter 9, Table 9–10, Typical amounts of total and available nitrogen, phosphate and potash from various organic nutrient sources.
185
7. other crops
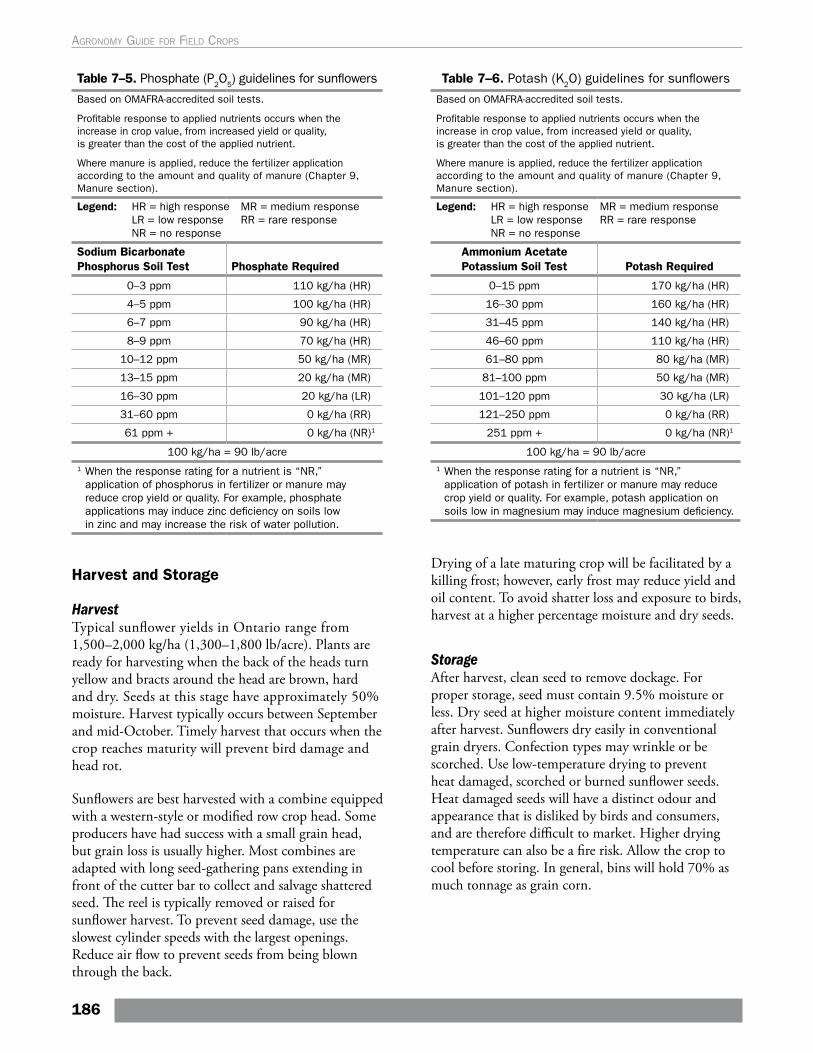
Table 7–5. Phosphate (P2O5) guidelines for sunflowers
Based on OMAFRA-accredited soil tests.
Profitable response to applied nutrients occurs when the increase in crop value, from increased yield or quality, is greater than the cost of the applied nutrient.
Where manure is applied, reduce the fertilizer application according to the amount and quality of manure (Chapter 9, Manure section).
Legend: HR = high response MR = medium response LR = low response RR = rare response NR = no response
Sodium Bicarbonate Phosphorus Soil Test Phosphate Required
0–3 ppm 110 kg/ha (HR)
4–5 ppm 100 kg/ha (HR)
6–7 ppm 90 kg/ha (HR)
8–9 ppm 70 kg/ha (HR)
10–12 ppm 50 kg/ha (MR)
13–15 ppm 20 kg/ha (MR)
16–30 ppm 20 kg/ha (LR)
31–60 ppm 0 kg/ha (RR)
61 ppm + 0 kg/ha (NR)1
100 kg/ha = 90 lb/acre1 When the response rating for a nutrient is “NR,”
application of phosphorus in fertilizer or manure may reduce crop yield or quality. For example, phosphate applications may induce zinc deficiency on soils low in zinc and may increase the risk of water pollution.
Table 7–6. Potash (K2O) guidelines for sunflowers
Based on OMAFRA-accredited soil tests.
Profitable response to applied nutrients occurs when the increase in crop value, from increased yield or quality, is greater than the cost of the applied nutrient.
Where manure is applied, reduce the fertilizer application according to the amount and quality of manure (Chapter 9, Manure section).
Legend: HR = high response MR = medium response LR = low response RR = rare response NR = no response
Ammonium Acetate Potassium Soil Test Potash Required
0–15 ppm 170 kg/ha (HR)
16–30 ppm 160 kg/ha (HR)
31–45 ppm 140 kg/ha (HR)
46–60 ppm 110 kg/ha (HR)
61–80 ppm 80 kg/ha (MR)
81–100 ppm 50 kg/ha (MR)
101–120 ppm 30 kg/ha (LR)
121–250 ppm 0 kg/ha (RR)
251 ppm + 0 kg/ha (NR)1
100 kg/ha = 90 lb/acre1 When the response rating for a nutrient is “NR,”
application of potash in fertilizer or manure may reduce crop yield or quality. For example, potash application on soils low in magnesium may induce magnesium deficiency.
Harvest and Storage
HarvestTypical sunflower yields in Ontario range from 1,500–2,000 kg/ha (1,300–1,800 lb/acre). Plants are ready for harvesting when the back of the heads turn yellow and bracts around the head are brown, hard and dry. Seeds at this stage have approximately 50% moisture. Harvest typically occurs between September and mid-October. Timely harvest that occurs when the crop reaches maturity will prevent bird damage and head rot.
Sunflowers are best harvested with a combine equipped with a western-style or modified row crop head. Some producers have had success with a small grain head, but grain loss is usually higher. Most combines are adapted with long seed-gathering pans extending in front of the cutter bar to collect and salvage shattered seed. The reel is typically removed or raised for sunflower harvest. To prevent seed damage, use the slowest cylinder speeds with the largest openings. Reduce air flow to prevent seeds from being blown through the back.
Drying of a late maturing crop will be facilitated by a killing frost; however, early frost may reduce yield and oil content. To avoid shatter loss and exposure to birds, harvest at a higher percentage moisture and dry seeds.
StorageAfter harvest, clean seed to remove dockage. For proper storage, seed must contain 9.5% moisture or less. Dry seed at higher moisture content immediately after harvest. Sunflowers dry easily in conventional grain dryers. Confection types may wrinkle or be scorched. Use low-temperature drying to prevent heat damaged, scorched or burned sunflower seeds. Heat damaged seeds will have a distinct odour and appearance that is disliked by birds and consumers, and are therefore difficult to market. Higher drying temperature can also be a fire risk. Allow the crop to cool before storing. In general, bins will hold 70% as much tonnage as grain corn.
186
Agronomy guide for field Crops
CautionDry sunflower seeds at a low temperature, because fine hairs and fibres from the seed coat could ignite when put through the drying fan.
Weed ControlSunflower seedlings suffer from weed competition. Early season weed control is important for maximum crop performance. As sunflowers mature, they become better able to compete with weeds.
The crop can be harrowed before seedling emergence to remove emerging weeds before they become established. A light spring-tooth harrowing can remove late-emerging weeds when sunflower seedlings are between the 4- and 6-leaf stage. Harrowing is best done under hot, dry conditions to reduce crop damage. Inter-row cultivation is also recommended.
For herbicide options refer to OMAFRA Publication 75, Guide to Weed Control. Herbicide tolerant sunflower varieties allow for an effective chemical weed control. Refer to seed suppliers for more information.
Insects and DiseasesInsects are typically not a problem in sunflowers when first introduced in a region. After several years, pest populations will build. Scouting and control measures will have to adapt to maintain productivity.
Banded sunflower moth has been a major pest, feeding on sunflower florets and seeds. The moth is small, straw-colored, about 7 mm (0.3 in.) long with a brown triangular area in the middle portion of the front wings. Larvae emerge 1.5 mm (0.6 in.) long, light-coloured with a dark brown head and they darken to reddish-purple and finally green colour at maturity. Full grown larvae are about 10 mm (0.4 in.).
Seed will pass normally through the combine with damage from mild infestations; however, severe infestations can inhibit harvest due to uneven maturing of heads combined with secondary disease infection.
Harvested seed from infected fields can also be a source of banded sunflower moth. Keep the sunflowers cool and dry. If stored for long periods, the larva will hatch and consume stored grain. Any escaping moths are difficult to control and can contaminate grain storage bins, warehouses and retail areas.
Sclerotina or white mould is the most important disease in sunflower crops. Descriptions of insects, pests and diseases, scouting and management strategies can be found in Chapter 15, Insects and Pests of Field Crops and Chapter 16, Diseases of Field Crops.
Suggested treatments to control insects, pests and diseases can be found in OMAFRA Publication 812, Field Crop Protection Guide.
For more detailed sunflower production information, see the Sunflower Production Guide of the National Sunflower Association of Canada at www.canadasunflower.com.
SWITCHGRASS
Production RequirementsSoil Types: Switchgrass is suited to most soil types. Yields are lower on extremely heavy or light soils
Soil pH: 6.0–6.8
Recommended Rotational Crops: Switchgrass is a long-term perennial crop and rotation crops do not apply. Cereal crops may serve as nurse crops during establishment
Minimum Soil Temperature: 10°C
Optimum Air Temperature: 24°C–29°C
Earliest Planting Date: Late April to May
Required Growing Season: Perennial crop 10+ years
Switchgrass is a relatively new perennial crop for Ontario that has industrial and agricultural uses for fibre, biocomposites, paper, bioenergy (liquid and solid), livestock and poultry bedding, and ginseng bedding. It is also know by other names such as tall panic grass, tall prairiegrass and thatchgrass.
RotationSwitchgrass is a long-term perennial crop used for fibre, biocomposites, paper, bioenergy, animal feed and bedding. It has an extensive root system that gives the crop relatively good drought tolerance. Once established it is not rotated to other crops for many years. Switchgrass production is highest on fertile soils but is also well suited to marginal lands where other annual crops are less productive.
187
7. other crops
Tillage and Seedbed PreparationSwitchgrass seed is very small, and therefore requires a seedbed that ensures good seed to soil contact. Establishment has been most successful on well-drained, medium-textured soils that warm quickly and where weed competition is low. A light packing prior to planting will improve uniform seeding depth and again following seeding will improve the seed to soil contact.
Seeding switchgrass following soybeans in the rotation has provided a low-residue, firm seed-bed well adapted for no-till seeding.
PlantingPlanting generally occurs mid-spring, but can also occur in the fall. The optimum seeding rate is 9 kg/ha (8 lb/acre) or less of pure live seed with a seed weight of 570,000 seeds/kg (260,000 seeds/lb). Switchgrass seed has strong dormancy. Pure live seed is a measure of the amount of live seed in a bulk seed lot. The seed is very small which requires a good seedbed to ensure good seed to soil contact. Seed is typically planted in 18 cm (7–7.5 in.) row widths at a depth of 1–1.5 cm (0.25–0.5 in.). Soil moisture is required for good emergence. Weed control is absolutely critical to establishment and production success, therefore, a nurse crop of spring wheat may promote better stand establishment, reduce weed pressure and provide income during the first year. Spring wheat is preferred over oats or barley as spring wheat tillers less, and causes less shading of the switchgrass seedlings. Seed spring wheat at full seeding rates. A nurse crop can aid in establishment success, but may limit chemical weed control options.
Fertility ManagementLimited fertility guidelines exist for switchgrass. Current Ontario research indicates economical yield response to nitrogen rates of 50–80 kg/ha (45–70 lb/acre) depending on price of switchgrass and the expected yield potential. Nitrogen fertilizer should not be applied during the seeding year because it encourages weed competition.
In most cases, the only operation required following harvest is the application of nitrogen (N) fertilizer. For a spring harvest regime, 60–70 kg of N/ha (50–60 lb/acre) is sufficient to sustain production for an 8–10 t/ha yield target. A general rule of thumb is to apply 6 kg N/t (12 lb/ton) of biomass removed from the field.
Over-fertilization with nitrogen usually results in crop lodging, yield reductions and harvesting difficulties. Fertilization is commonly done in mid-to-late May, when the crop is about 15–25 cm (6 - 10 in.) high and when switchgrass has resumed its growth. This timing helps to minimize N losses where urea is used. Earlier N applications tend to help support grass weed growth, especially annual grass weeds and quackgrass. Switchgrass tends to have its peak N demand in year three. This is because considerable N is required to fully develop the large root system of the plant.
The amount of phosphorus and potassium required will depend on the harvest method used. Switchgrass harvested in late fall or from spring baled windrows will have lower requirement for phosphorous and potassium due to leaching of these nutrients out of the biomass and the loss of leaves that often hold a high amount of the nutrients. Harvest in the summer or early fall will remove more of these nutrients with the harvested biomass.
Most producers in Ontario mow the crop in late fall, allow it to winter in the fields in a swath and bale early the following spring. Producers in Ontario have found there is little decomposition of switchgrass over winter when using this system. The grass stays largely in a frozen state and rests on the 10 cm (4 in.) high stubble, keeping the swath separated from contact with the soil. By adopting a spring biomass harvesting regime, phosphorus and potassium fertilizers are usually not required on soils with medium-to-high fertility. Approximately 90%–95% of the potassium in switchgrass is leached back into the soil when the crop is left in the field over-winter. The annual potassium demand is very low when managed as an over-wintered crop since dry switchgrass contains only about 0.1% potassium. A 10 t/ha (4 ton/acre) switchgrass biomass crop will only remove 10 kg/ha (9 lbs/acre) of potassium from the field. Producers can soil sample for P and K periodically to monitor their levels.
Phosphorus and potassium fertility should be at target soil test levels (12–18 P and 100–130 K). If soil phosphorous and potassium levels are below target ranges, incorporate these nutrients into the soil ahead of planting, at rates that meet crop removal rate plus an amount that will build up the soil test over time. See Fertilizer Guidelines, Chapter 9, Soil Fertility and Nutrient Use.
188
Agronomy guide for field Crops
Harvest and Storage
HarvestHarvest management depends on intended end-use. Harvesting switchgrass twice in the same year, or before natural senescence has occurred, could lead to stand degradation. Switchgrass can be harvested in the summer if market conditions warrant, but this should not occur in the first year of growth, or on a yearly basis.
Standard field-crop equipment including sickle/disc mowers, haybines, and round or large square balers and forage harvesters can be used.
If switchgrass is being used for livestock bedding, pasture or roughage in the diet it can be grazed during the growing season or cut for hay in July or August with the possibility of two harvests. If used for cellulosic ethanol, switchgrass is often fall harvested since yield is highest, but moisture levels may be too high for long-term storage. If used as a biofuel for combustion, one-cut with windrowing in late fall and harvest in the spring provides the highest quality product for this market. Spring harvest will result in 15%–25% lower yields, but the grass will be of higher quality for combustion.
Switchgrass is usually left unharvested in the establishment year until the following spring to improve winter hardiness. Expected yield in the establishment year is about one-third of full stand potential and the year after establish is about two-thirds of full production potential. Once established and properly maintained, a switchgrass stand will remain productive for an indefinite period and can produce 8–12 t/ha of dry fall harvest material.
StorageMarket demands will determine what type of storage is required. Switchgrass has been tested for storage in Ag-bags or under cover as well as outside, with and without tarps. Results have been mixed but it is important to note that this crop stands up to the elements better than cereal straw.
The crop may need to be ground and densified or pelleted for ease of transport and/or end use. Research is ongoing to examine other methods of treatment (e.g., torrefaction) that will increase the density and storability of the crop.
Insects and DiseasesSpecific pests observed on this crop in Ontario are based on limited experience. To date rust (Puccinia spp.), has been the most significant issue in Ontario. Other diseases and insect pests of switchgrass include: head smut (Tilletia maclagani), viruses (barley yellow dwarf virus, panicum mosaic virus), grasshoppers, leafhoppers, aphids, stem borers and wireworms.
Weed ControlWeed control prior to establishment and during the first 1–2 years is critical for achieving an adequate stand, since weeds will compete with establishing plants. There are no registered herbicides for switchgrass which makes weed identification, pre-plant herbicide and tillage options for control more important.
For further production information, refer to:
• Ontario Biomass Producers’ Association at www.ontariobiomass.com
• Switchgrass Production in Ontario at www.reap-canada.com
• ontario.ca/crops
Other Biomass CropsOther potential biomass crops in Ontario include perennial grasses (big bluestem, prairie cordgrass, indian grass) and annual grasses (pearl millet, sorghum, sudangrass). Refer to Annual Forages in Chapter 3, Forages.
189
7. other crops

Page intentionally left blank

Soil management is a key component of the crop production system. The best crop production practices applied to a field will not consistently produce a good crop if there has been a history of poor soil management. Managing for a healthy soil is the only way to ensure fields will have the potential for sustained maximum economic yields, especially in years with weather stress. Similar to equipment purchases that require regular maintenance, soil must be protected from erosion and must have organic matter returned to it to support soil life and nutrient cycling.
This chapter will outline how to:
• build and maintain a healthy soil • prevent soil degradation• assess the components of a healthy soil
Ontario soils will provide the backdrop for concepts and examples that improve understanding of soil health, measure current soil health status and illustrate the fundamentals in maintaining economic crop productivity.
Healthy Soils are Productive Soils Soil health is often described as the soil’s capacity to support crop growth, without becoming degraded or otherwise harming the environment. Physical, chemical and biological indicators are measured to determine a soil’s health. Physical indicators include aggregate stability, soil structure and compaction and available water-holding capacity. Soil nutrient and pH levels are chemical indicators. Biological indicators include soil organic matter, microbial respiration and soil life populations. In simple terms, a healthy soil will:
• have good soil structure, resist crusting and have minimal compaction
• have good drainage, water movement and water-holding capacity
• have nutrient levels, pH and organic matter in the optimal range
• be resistant to wind, water or tillage erosion• have an abundance of earthworms
• have a fresh, earthy odour• readily decompose residue• encourage seedling emergence and root growth• produce uniform crop growth and colour
Most of the characteristics of a healthy soil have a direct or indirect link to soil organic matter.
Good Soil ManagementThe key to maintaining healthy and productive soil varies by farm, as do crop combinations and soil types. Some farmers have reduced tillage, many have good rotations and others use manure and other organic materials to improve their soil. Their soil is fertile and free from soil compaction. It is well-structured so it doesn’t crust, allows air to enter the soil and enables water to move into and through the soil. Their economic bottom line is better because yields are consistently higher and inputs are reduced.
Putting it all Together This fifth generation farm family strives to leave the land in excellent condition for the next generation.
The Strategy:• Seven-crop rotations (field crops, horticulture crops and cover crops such as red clover).
• Manure and compost applications to land to increase organic matter levels.
• Reduced tillage to incorporate manure and manage high residue crops.
The Result:• Careful attention to all aspects of soil management has resulted in productive soils where 12 T/ha (190 bu/acre) corn yields have been harvested with no commercial nitrogen.
8. Managing for Healthy Soils
191
Keeping Wheel Traffic Away from the Root Zone
This corn yield challenge winner credits his soil management system for the victory.
The strategy:•A no-till system combined with controlled traffic.
–All wheel traffic is kept off the rows controlling soil compaction.
–No-till on the sandy loam soil minimizes soil disturbance and loss of soil moisture.
–High amount of crop residue feeds earthworms and soil life.
–Mycorrhizae fungi proliferation in undisturbed soil profile improve phosphorus and water uptake.
The result:•Improved nutrient cycling, water holding capacity and an unrestricted root zone lead to high yields with reduced inputs.
Animals Provide a Soil Health Advantage
This dairy farm excels at diversity.
The strategy:•Dairy cattle manure provides both a nutrient and organic matter benefit.
•The length and diversity of the rotation is increased by including forages.
•Forages help to maintain or improve organic matter levels.
•No-till is used for all crops to maintain soil health and diversity of soil life.
The Result:•Soil management practices pay off in an improved bottom line and resilience under poor weather conditions.
Building a Healthy SoilThe key to success in building a healthy soil is effective management of the soil organic matter (SOM). The organic matter (OM) is made up of three parts: active, moderately stable and very stable. Refer to the section The Importance of Organic Matter. The active portion is the segment on which management can have the most influence. The organic matter pool continually experiences gains and losses. If the addition of organic material to the soil exceeds the losses, organic matter levels increase; if the losses exceed the gains, organic matter levels will decrease.
Soil and its management are part of the overall crop production system. Soil is also a central part of the agricultural ecosystem. Changes made in the crop production system over the years, have far-reaching effects on all other systems. When taking steps to improve soil quality, consider the changes being made and how they may affect other components of the crop production system.
Crop Rotation Crop rotation is an integral part of the crop production system. The greatest benefit to a good crop rotation is increased yields. A well-planned crop rotation will:
• aid in maintaining or improving soil structure and organic matter levels
• protect against soil erosion • improve soil resilience against weather extremes• provide residual nitrogen from legumes in
the rotation • help to control insect and disease cycles• reduce weed pressure• spread workload
The basic rule of crop rotation is that a crop should never follow itself. Continuous cropping of any crop will result in the build-up of diseases and insects specific to that crop, and cause a reduction in crop yields. The more often the same crop has been grown in the same field, the greater this impact will be. For example, the practice of growing two or more years of soybeans is becoming increasingly common. Perhaps the greatest impact of back-to-back years of soybeans has been the accelerated spread of soybean cyst nematode (SCN). For more information and potential yield reductions, see Chapter 16, Diseases, Soybean Cyst Nematode. The increased years of soybeans in the rotation is also increasing the susceptibility of Ontario’s soils to erosion. Table 8–1, Soybean yield response to tillage and rotation, describes the average soybean yield respond under long-term no-till and conventional tillage systems. Table 8–2, Corn yield response to crop rotation and tillage, describes the average corn yield response under long-term (established in 1995) no-till and conventional tillage systems.
Soil structure in corn-soybean rotations can actually be poorer than the structure of soils in continuous corn production. For example, the soil erosion that follows an intense June rainstorm in first-year corn following 2 years of soybeans is often twice as high as that
192
Agronomy guide for field Crops
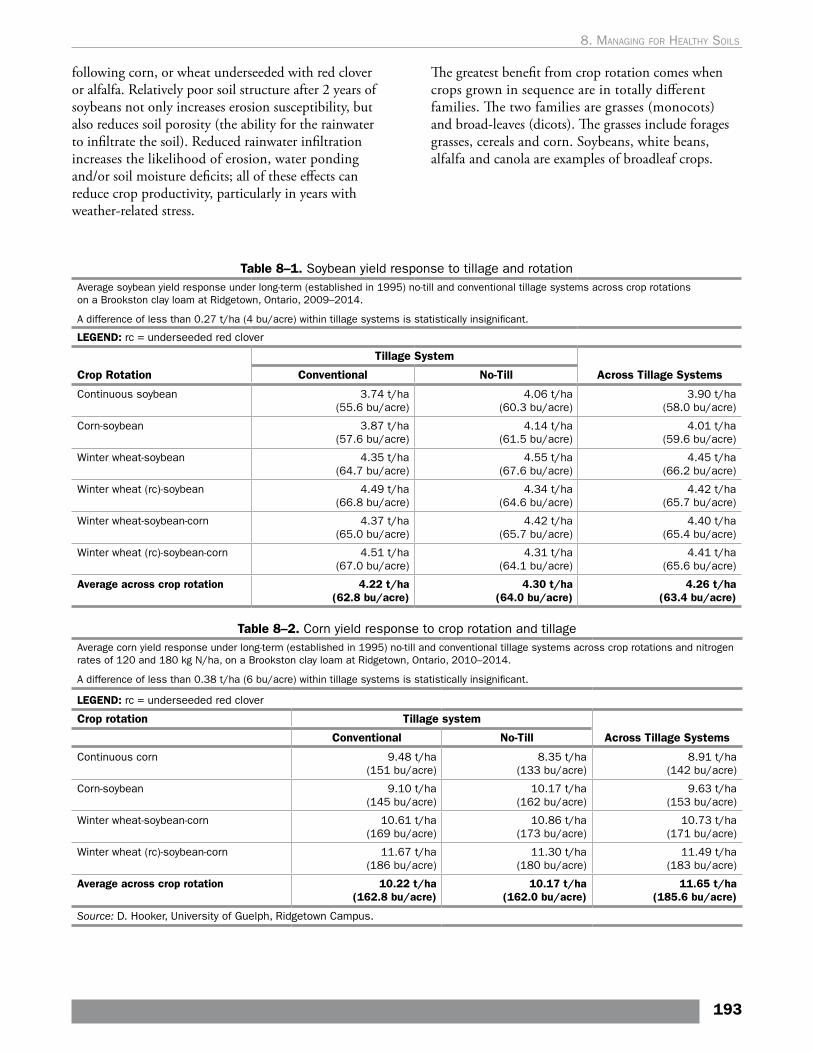
following corn, or wheat underseeded with red clover or alfalfa. Relatively poor soil structure after 2 years of soybeans not only increases erosion susceptibility, but also reduces soil porosity (the ability for the rainwater to infiltrate the soil). Reduced rainwater infiltration increases the likelihood of erosion, water ponding and/or soil moisture deficits; all of these effects can reduce crop productivity, particularly in years with weather-related stress.
The greatest benefit from crop rotation comes when crops grown in sequence are in totally different families. The two families are grasses (monocots) and broad-leaves (dicots). The grasses include forages grasses, cereals and corn. Soybeans, white beans, alfalfa and canola are examples of broadleaf crops.
Table 8–1. Soybean yield response to tillage and rotationAverage soybean yield response under long-term (established in 1995) no-till and conventional tillage systems across crop rotations on a Brookston clay loam at Ridgetown, Ontario, 2009–2014.
A difference of less than 0.27 t/ha (4 bu/acre) within tillage systems is statistically insignificant.
LEGEND: rc = underseeded red clover
Crop Rotation
Tillage System
Across Tillage SystemsConventional No-Till
Continuous soybean 3.74 t/ha (55.6 bu/acre)
4.06 t/ha (60.3 bu/acre)
3.90 t/ha (58.0 bu/acre)
Corn-soybean 3.87 t/ha (57.6 bu/acre)
4.14 t/ha (61.5 bu/acre)
4.01 t/ha (59.6 bu/acre)
Winter wheat-soybean 4.35 t/ha (64.7 bu/acre)
4.55 t/ha (67.6 bu/acre)
4.45 t/ha (66.2 bu/acre)
Winter wheat (rc)-soybean 4.49 t/ha (66.8 bu/acre)
4.34 t/ha (64.6 bu/acre)
4.42 t/ha (65.7 bu/acre)
Winter wheat-soybean-corn 4.37 t/ha (65.0 bu/acre)
4.42 t/ha (65.7 bu/acre)
4.40 t/ha (65.4 bu/acre)
Winter wheat (rc)-soybean-corn 4.51 t/ha (67.0 bu/acre)
4.31 t/ha (64.1 bu/acre)
4.41 t/ha (65.6 bu/acre)
Average across crop rotation 4.22 t/ha (62.8 bu/acre)
4.30 t/ha (64.0 bu/acre)
4.26 t/ha (63.4 bu/acre)
Table 8–2. Corn yield response to crop rotation and tillageAverage corn yield response under long-term (established in 1995) no-till and conventional tillage systems across crop rotations and nitrogen rates of 120 and 180 kg N/ha, on a Brookston clay loam at Ridgetown, Ontario, 2010–2014.
A difference of less than 0.38 t/ha (6 bu/acre) within tillage systems is statistically insignificant.
LEGEND: rc = underseeded red clover
Crop rotation Tillage system
Across Tillage SystemsConventional No-Till
Continuous corn 9.48 t/ha (151 bu/acre)
8.35 t/ha (133 bu/acre)
8.91 t/ha (142 bu/acre)
Corn-soybean 9.10 t/ha (145 bu/acre)
10.17 t/ha (162 bu/acre)
9.63 t/ha (153 bu/acre)
Winter wheat-soybean-corn 10.61 t/ha (169 bu/acre)
10.86 t/ha (173 bu/acre)
10.73 t/ha (171 bu/acre)
Winter wheat (rc)-soybean-corn 11.67 t/ha (186 bu/acre)
11.30 t/ha (180 bu/acre)
11.49 t/ha (183 bu/acre)
Average across crop rotation 10.22 t/ha (162.8 bu/acre)
10.17 t/ha (162.0 bu/acre)
11.65 t/ha (185.6 bu/acre)
Source: D. Hooker, University of Guelph, Ridgetown Campus.
193
8. ManagIng For healthy soIls
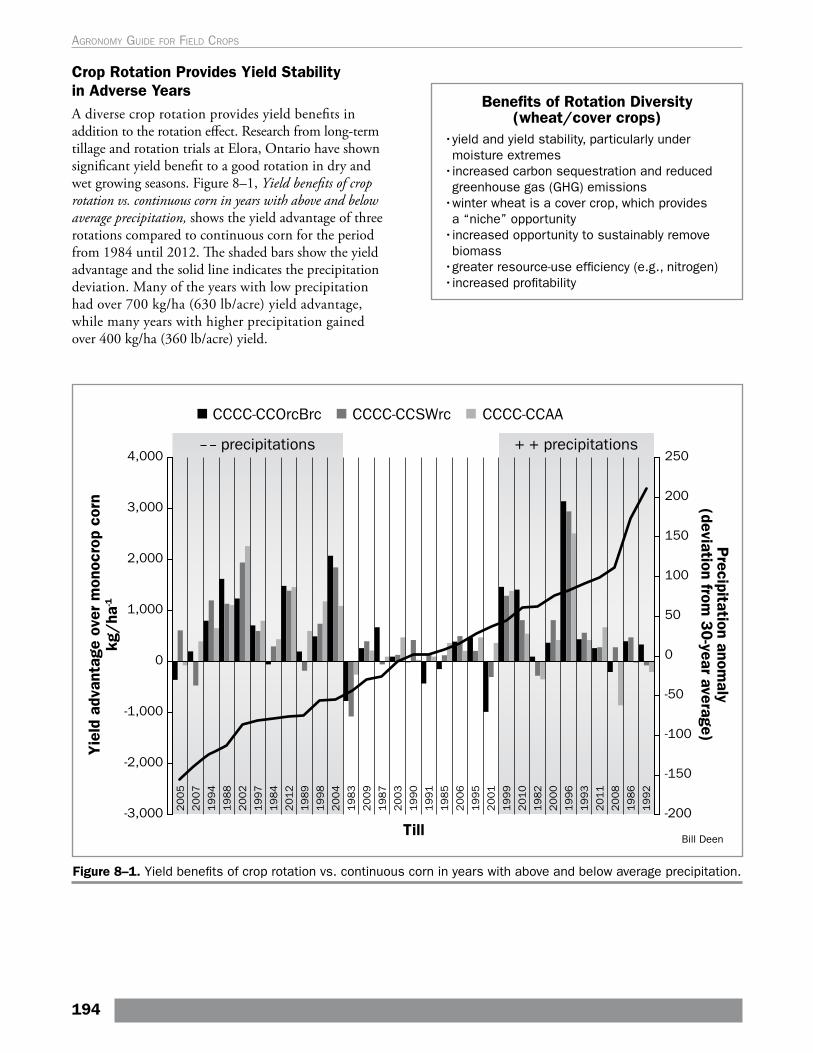
Crop Rotation Provides Yield Stability in Adverse YearsA diverse crop rotation provides yield benefits in addition to the rotation effect. Research from long-term tillage and rotation trials at Elora, Ontario have shown significant yield benefit to a good rotation in dry and wet growing seasons. Figure 8–1, Yield benefits of crop rotation vs. continuous corn in years with above and below average precipitation, shows the yield advantage of three rotations compared to continuous corn for the period from 1984 until 2012. The shaded bars show the yield advantage and the solid line indicates the precipitation deviation. Many of the years with low precipitation had over 700 kg/ha (630 lb/acre) yield advantage, while many years with higher precipitation gained over 400 kg/ha (360 lb/acre) yield.
Yie
ld a
dvan
tage
ove
r m
onoc
rop
corn
kg/
ha-1
Till
– – precipitations + + precipitations
Precipitation anom
aly(deviation from
30-year average)
4,000
Bill Deen
3,000
2,000
1,000
0
-1,000
-2,000
-3,000
250
200
150
100
50
0
-50
-100
-150
-200
CCCC-CCOrcBrc CCCC-CCSWrc CCCC-CCAA
20
05
20
07
19
94
19
88
20
02
19
97
19
84
20
12
19
89
19
98
20
04
19
83
20
09
19
87
20
03
19
90
19
91
19
85
20
06
19
95
20
01
19
99
20
10
19
82
20
00
19
96
19
93
20
11
20
08
19
86
19
92
Figure 8–1. Yield benefits of crop rotation vs. continuous corn in years with above and below average precipitation.
Benefits of Rotation Diversity (wheat/cover crops)
•yield and yield stability, particularly under moisture extremes
•increased carbon sequestration and reduced greenhouse gas (GHG) emissions
•winter wheat is a cover crop, which provides a “niche” opportunity
•increased opportunity to sustainably remove biomass
•greater resource-use efficiency (e.g., nitrogen) •increased profitability
194
Agronomy guide for field Crops
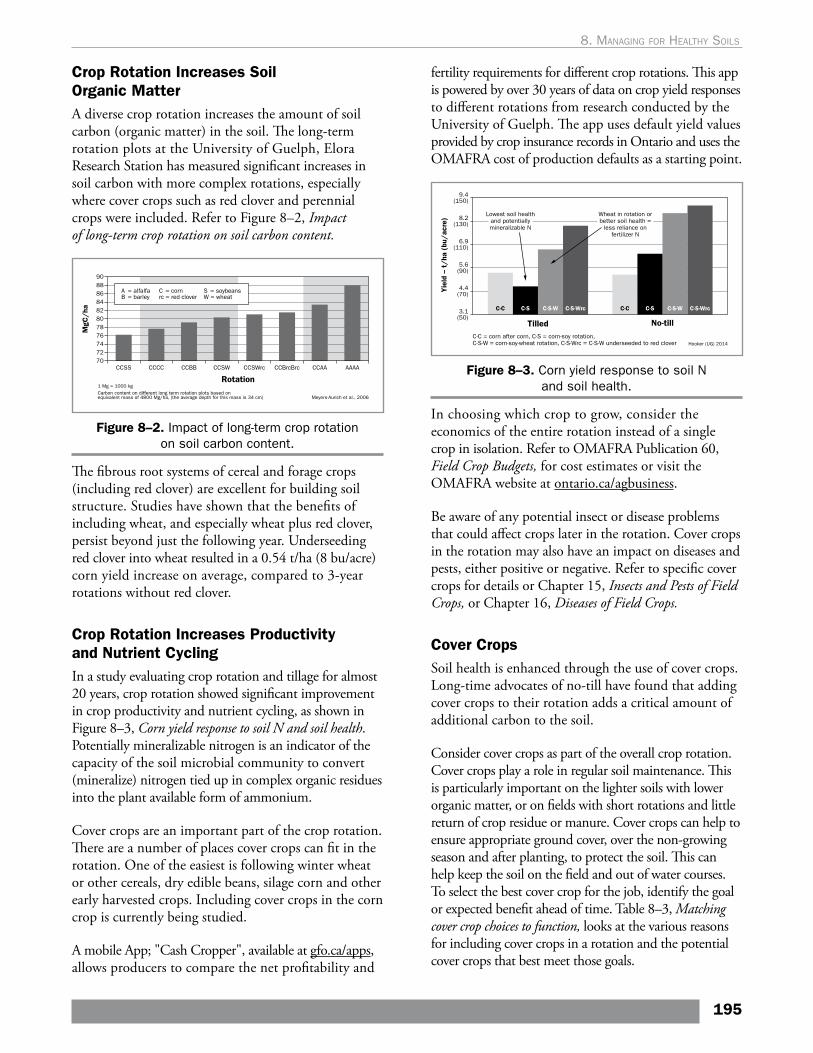
Crop Rotation Increases Soil Organic MatterA diverse crop rotation increases the amount of soil carbon (organic matter) in the soil. The long-term rotation plots at the University of Guelph, Elora Research Station has measured significant increases in soil carbon with more complex rotations, especially where cover crops such as red clover and perennial crops were included. Refer to Figure 8–2, Impact of long-term crop rotation on soil carbon content.
Figure 8–2. Impact of long-term crop rotation on soil carbon content.
The fibrous root systems of cereal and forage crops (including red clover) are excellent for building soil structure. Studies have shown that the benefits of including wheat, and especially wheat plus red clover, persist beyond just the following year. Underseeding red clover into wheat resulted in a 0.54 t/ha (8 bu/acre) corn yield increase on average, compared to 3-year rotations without red clover.
Crop Rotation Increases Productivity and Nutrient CyclingIn a study evaluating crop rotation and tillage for almost 20 years, crop rotation showed significant improvement in crop productivity and nutrient cycling, as shown in Figure 8–3, Corn yield response to soil N and soil health. Potentially mineralizable nitrogen is an indicator of the capacity of the soil microbial community to convert (mineralize) nitrogen tied up in complex organic residues into the plant available form of ammonium.
Cover crops are an important part of the crop rotation. There are a number of places cover crops can fit in the rotation. One of the easiest is following winter wheat or other cereals, dry edible beans, silage corn and other early harvested crops. Including cover crops in the corn crop is currently being studied.
A mobile App; "Cash Cropper", available at gfo.ca/apps, allows producers to compare the net profitability and
fertility requirements for different crop rotations. This app is powered by over 30 years of data on crop yield responses to different rotations from research conducted by the University of Guelph. The app uses default yield values provided by crop insurance records in Ontario and uses the OMAFRA cost of production defaults as a starting point.
Figure 8–3. Corn yield response to soil N and soil health.
In choosing which crop to grow, consider the economics of the entire rotation instead of a single crop in isolation. Refer to OMAFRA Publication 60, Field Crop Budgets, for cost estimates or visit the OMAFRA website at ontario.ca/agbusiness.
Be aware of any potential insect or disease problems that could affect crops later in the rotation. Cover crops in the rotation may also have an impact on diseases and pests, either positive or negative. Refer to specific cover crops for details or Chapter 15, Insects and Pests of Field Crops, or Chapter 16, Diseases of Field Crops.
Cover Crops Soil health is enhanced through the use of cover crops. Long-time advocates of no-till have found that adding cover crops to their rotation adds a critical amount of additional carbon to the soil.
Consider cover crops as part of the overall crop rotation. Cover crops play a role in regular soil maintenance. This is particularly important on the lighter soils with lower organic matter, or on fields with short rotations and little return of crop residue or manure. Cover crops can help to ensure appropriate ground cover, over the non-growing season and after planting, to protect the soil. This can help keep the soil on the field and out of water courses. To select the best cover crop for the job, identify the goal or expected benefit ahead of time. Table 8–3, Matching cover crop choices to function, looks at the various reasons for including cover crops in a rotation and the potential cover crops that best meet those goals.
195
8. ManagIng For healthy soIls
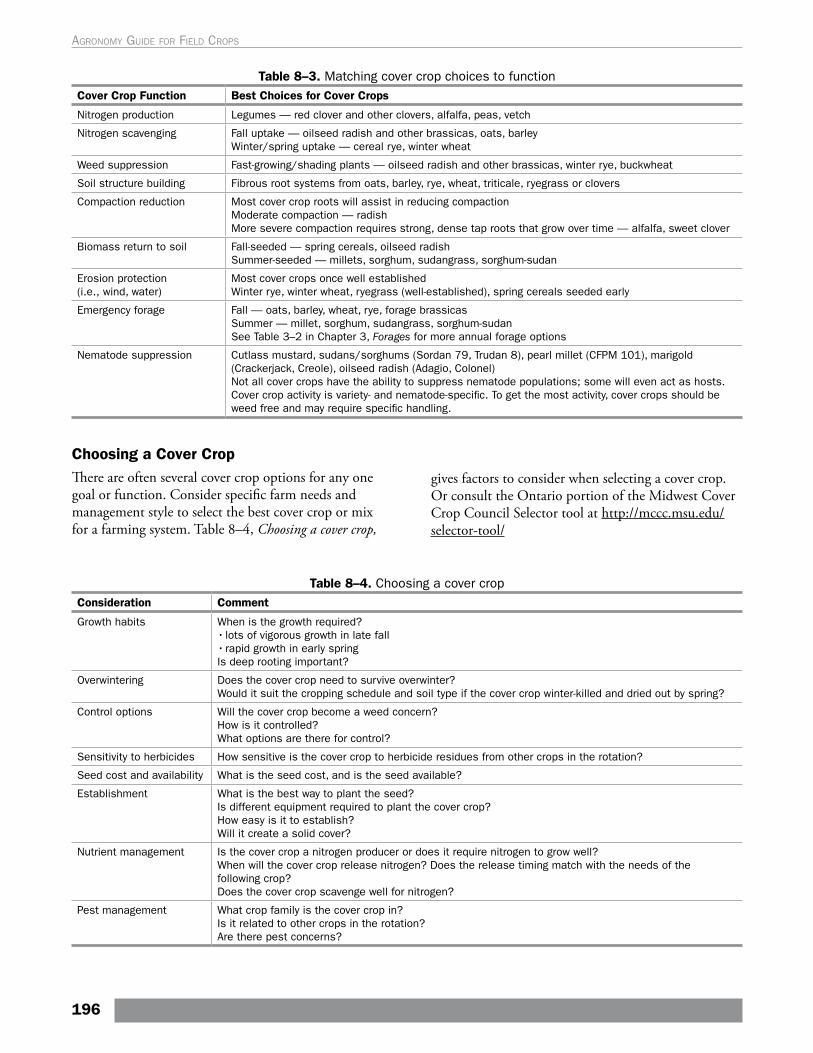
Table 8–3. Matching cover crop choices to function Cover Crop Function Best Choices for Cover Crops
Nitrogen production Legumes — red clover and other clovers, alfalfa, peas, vetch
Nitrogen scavenging Fall uptake — oilseed radish and other brassicas, oats, barleyWinter/spring uptake — cereal rye, winter wheat
Weed suppression Fast-growing/shading plants — oilseed radish and other brassicas, winter rye, buckwheat
Soil structure building Fibrous root systems from oats, barley, rye, wheat, triticale, ryegrass or clovers
Compaction reduction Most cover crop roots will assist in reducing compactionModerate compaction — radishMore severe compaction requires strong, dense tap roots that grow over time — alfalfa, sweet clover
Biomass return to soil Fall-seeded — spring cereals, oilseed radishSummer-seeded — millets, sorghum, sudangrass, sorghum-sudan
Erosion protection (i.e., wind, water)
Most cover crops once well established Winter rye, winter wheat, ryegrass (well-established), spring cereals seeded early
Emergency forage Fall — oats, barley, wheat, rye, forage brassicasSummer — millet, sorghum, sudangrass, sorghum-sudanSee Table 3–2 in Chapter 3, Forages for more annual forage options
Nematode suppression Cutlass mustard, sudans/sorghums (Sordan 79, Trudan 8), pearl millet (CFPM 101), marigold (Crackerjack, Creole), oilseed radish (Adagio, Colonel)Not all cover crops have the ability to suppress nematode populations; some will even act as hosts. Cover crop activity is variety- and nematode-specific. To get the most activity, cover crops should be weed free and may require specific handling.
Choosing a Cover CropThere are often several cover crop options for any one goal or function. Consider specific farm needs and management style to select the best cover crop or mix for a farming system. Table 8–4, Choosing a cover crop,
gives factors to consider when selecting a cover crop. Or consult the Ontario portion of the Midwest Cover Crop Council Selector tool at http://mccc.msu.edu/selector-tool/
Table 8–4. Choosing a cover cropConsideration Comment
Growth habits When is the growth required?• lots of vigorous growth in late fall• rapid growth in early springIs deep rooting important?
Overwintering Does the cover crop need to survive overwinter?Would it suit the cropping schedule and soil type if the cover crop winter-killed and dried out by spring?
Control options Will the cover crop become a weed concern? How is it controlled? What options are there for control?
Sensitivity to herbicides How sensitive is the cover crop to herbicide residues from other crops in the rotation?
Seed cost and availability What is the seed cost, and is the seed available?
Establishment What is the best way to plant the seed?Is different equipment required to plant the cover crop?How easy is it to establish? Will it create a solid cover?
Nutrient management Is the cover crop a nitrogen producer or does it require nitrogen to grow well?When will the cover crop release nitrogen? Does the release timing match with the needs of the following crop?Does the cover crop scavenge well for nitrogen?
Pest management What crop family is the cover crop in? Is it related to other crops in the rotation? Are there pest concerns?
196
Agronomy guide for field Crops
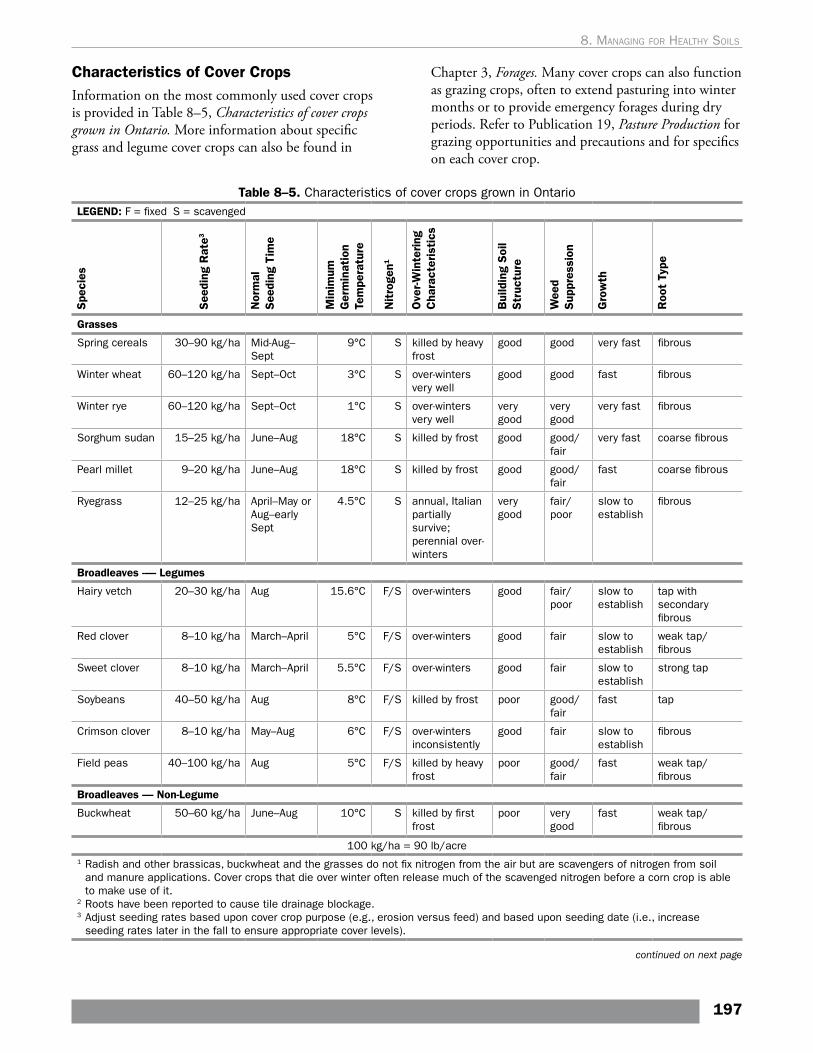
Spe
cies
See
ding
Rat
e3
Nor
mal
S
eedi
ng T
ime
Min
imum
G
erm
inat
ion
Tem
pera
ture
Nit
roge
n1
Ove
r-Win
teri
ng
Cha
ract
eris
tics
Bui
ldin
g S
oil
Str
uctu
re
Wee
d S
uppr
essi
on
Gro
wth
Roo
t Ty
pe
Characteristics of Cover CropsInformation on the most commonly used cover crops is provided in Table 8–5, Characteristics of cover crops grown in Ontario. More information about specific grass and legume cover crops can also be found in
Chapter 3, Forages. Many cover crops can also function as grazing crops, often to extend pasturing into winter months or to provide emergency forages during dry periods. Refer to Publication 19, Pasture Production for grazing opportunities and precautions and for specifics on each cover crop.
Table 8–5. Characteristics of cover crops grown in OntarioLEGEND: F = fixed S = scavenged
Grasses
Spring cereals 30–90 kg/ha Mid-Aug– Sept
9°C S killed by heavy frost
good good very fast fibrous
Winter wheat 60–120 kg/ha Sept–Oct 3°C S over-winters very well
good good fast fibrous
Winter rye 60–120 kg/ha Sept–Oct 1°C S over-winters very well
very good
very good
very fast fibrous
Sorghum sudan 15–25 kg/ha June–Aug 18°C S killed by frost good good/fair
very fast coarse fibrous
Pearl millet 9–20 kg/ha June–Aug 18°C S killed by frost good good/fair
fast coarse fibrous
Ryegrass 12–25 kg/ha April–May or Aug–early Sept
4.5°C S annual, Italian partially survive; perennial over-winters
very good
fair/poor
slow to establish
fibrous
Broadleaves -— Legumes
Hairy vetch 20–30 kg/ha Aug 15.6°C F/S over-winters good fair/poor
slow to establish
tap with secondary fibrous
Red clover 8–10 kg/ha March–April 5°C F/S over-winters good fair slow to establish
weak tap/ fibrous
Sweet clover 8–10 kg/ha March–April 5.5°C F/S over-winters good fair slow to establish
strong tap
Soybeans 40–50 kg/ha Aug 8°C F/S killed by frost poor good/fair
fast tap
Crimson clover 8–10 kg/ha May–Aug 6°C F/S over-winters inconsistently
good fair slow to establish
fibrous
Field peas 40–100 kg/ha Aug 5°C F/S killed by heavy frost
poor good/fair
fast weak tap/fibrous
Broadleaves — Non-Legume
Buckwheat 50–60 kg/ha June–Aug 10°C S killed by first frost
poor very good
fast weak tap/fibrous
100 kg/ha = 90 lb/acre1 Radish and other brassicas, buckwheat and the grasses do not fix nitrogen from the air but are scavengers of nitrogen from soil
and manure applications. Cover crops that die over winter often release much of the scavenged nitrogen before a corn crop is able to make use of it.
2 Roots have been reported to cause tile drainage blockage.3 Adjust seeding rates based upon cover crop purpose (e.g., erosion versus feed) and based upon seeding date (i.e., increase
seeding rates later in the fall to ensure appropriate cover levels).
continued on next page
197
8. ManagIng For healthy soIls
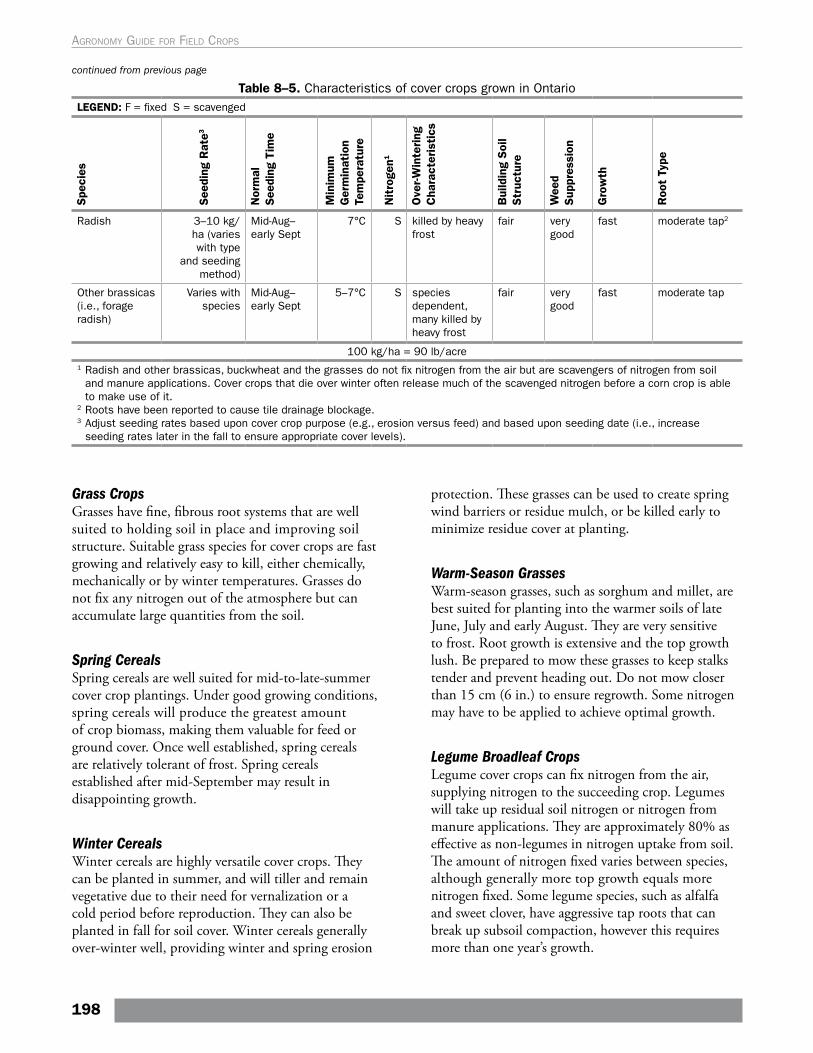
Table 8–5. Characteristics of cover crops grown in OntarioLEGEND: F = fixed S = scavenged
Spe
cies
See
ding
Rat
e3
Nor
mal
See
ding
Tim
e
Min
imum
G
erm
inat
ion
Tem
pera
ture
Nit
roge
n1
Ove
r-Win
tering
C
hara
cter
isti
cs
Bui
ldin
g Soi
l Str
uctu
re
Wee
d Sup
pres
sion
Gro
wth
Roo
t Ty
pe
Radish 3–10 kg/ha (varies with type
and seeding method)
Mid-Aug–early Sept
7°C S killed by heavy frost
fair very good
fast moderate tap2
Other brassicas (i.e., forage radish)
Varies with species
Mid-Aug–early Sept
5–7°C S species dependent, many killed by heavy frost
fair very good
fast moderate tap
100 kg/ha = 90 lb/acre1 Radish and other brassicas, buckwheat and the grasses do not fix nitrogen from the air but are scavengers of nitrogen from soil
and manure applications. Cover crops that die over winter often release much of the scavenged nitrogen before a corn crop is able to make use of it.
2 Roots have been reported to cause tile drainage blockage.3 Adjust seeding rates based upon cover crop purpose (e.g., erosion versus feed) and based upon seeding date (i.e., increase
seeding rates later in the fall to ensure appropriate cover levels).
continued from previous page
Grass CropsGrasses have fine, fibrous root systems that are well suited to holding soil in place and improving soil structure. Suitable grass species for cover crops are fast growing and relatively easy to kill, either chemically, mechanically or by winter temperatures. Grasses do not fix any nitrogen out of the atmosphere but can accumulate large quantities from the soil.
Spring Cereals Spring cereals are well suited for mid-to-late-summer cover crop plantings. Under good growing conditions, spring cereals will produce the greatest amount of crop biomass, making them valuable for feed or ground cover. Once well established, spring cereals are relatively tolerant of frost. Spring cereals established after mid-September may result in disappointing growth.
Winter Cereals Winter cereals are highly versatile cover crops. They can be planted in summer, and will tiller and remain vegetative due to their need for vernalization or a cold period before reproduction. They can also be planted in fall for soil cover. Winter cereals generally over-winter well, providing winter and spring erosion
protection. These grasses can be used to create spring wind barriers or residue mulch, or be killed early to minimize residue cover at planting.
Warm-Season GrassesWarm-season grasses, such as sorghum and millet, are best suited for planting into the warmer soils of late June, July and early August. They are very sensitive to frost. Root growth is extensive and the top growth lush. Be prepared to mow these grasses to keep stalks tender and prevent heading out. Do not mow closer than 15 cm (6 in.) to ensure regrowth. Some nitrogen may have to be applied to achieve optimal growth.
Legume Broadleaf CropsLegume cover crops can fix nitrogen from the air, supplying nitrogen to the succeeding crop. Legumes will take up residual soil nitrogen or nitrogen from manure applications. They are approximately 80% as effective as non-legumes in nitrogen uptake from soil. The amount of nitrogen fixed varies between species, although generally more top growth equals more nitrogen fixed. Some legume species, such as alfalfa and sweet clover, have aggressive tap roots that can break up subsoil compaction, however this requires more than one year’s growth.
198
Agronomy guide for field Crops
Red Clover is an example of a low-cost cover crop with multiple functions:•provides up to 82 kg/ha (75 lb/acre) nitrogen credit for subsequent corn crop
•75% of the fibrous root mass are located in the plough depth of the soil
•root volume increases 4–6 times when plowdown is delayed from September 1 until October 15
Non-Legume Broadleaf CropsThese broadleaf crops cannot fix nitrogen out of the air but may absorb large quantities from the soil. Most are not winter-hardy, so additional control measures are not normally required. They should not be allowed to go to seed, as the volunteer seed can become a significant weed problem.
Cover Crop MixesMixtures of cover crop species are growing in popularity. Mixes offer an opportunity to increase diversity in growth habit and rooting, and increase the chance that some cover crop will grow everywhere across a field. While there are commercial mixtures available, cover crop mixes can easily be created on farm. Consider:
• cover crops’ growth habits and speed of establishment and development (e.g., buckwheat may not be a good choice in a mix that will be allowed to grow for more than 5–6 weeks, due to flower and seed set)
• start with simple mixes of 2, 3 or 6 species• the proportions of various species in a mixture
(To determine the seeding rate for a single cover crop, divide the seeding rate for that one species by the number of species in the mix. Then, make adjustments based on the competitiveness of the species (e.g., radish and oats are more competitive, so rates of 2.2–3.4 kg/ha (2–3 lb/acre) for radish and 22–45 kg/ha (20–40 lb/acre) for oats work better in mixtures.)
• range of seed size for flow-through seeding equipment and the chance of seed segregation
• seed cost, which can increase rapidly with diverse cover crop mixtures
• herbicide carryover from previous crop, and control required for the planned cover crop
New and Emerging Cover CropsEvery year new species are tested as cover crops. Often these species are from different parts of the globe and may not be well adapted to Ontario growing conditions. For more information on new and common cover crop species, see the OMAFRA website at ontario.ca/crops or the Midwest Cover Crop Council at www.mccc.msu.edu.
Seeding RatesThere are many recommendations for seeding rates. Consider the following when choosing seeding rates:
• cover crop seeding rates are specific to soil texture and crop management system
• often less can be more• use higher seeding rates for feed and for erosion
protection and when seeding after mid-October• fine-tuning seeding rates based on experience
from previous years
See Table 8–5, Characteristics of cover crops grown in Ontario, which includes seeding rates of many common cover crop species.
Seeding Cover CropsCover crops can be seeded in a wide variety of ways, however, attention to seed placement, timing and soil conditions can help ensure success. Biomass, especially root growth, is an important goal with cover crops. Early harvested crops like wheat, dry edible beans and vegetables offer an excellent opportunity to plant cover crops. Often soil conditions are dry at that time of year, however early planting will allow for the maximum potential for cover crop growth. Planting with a drill or planter will ensure good seed placement and soil contact, supporting earlier emergence and growth. Broadcasting seed will also work but is more weather-dependent. Experimentation with interseeding some cover crops into corn and soybeans is occurring, but weather plays a significant role in establishment and growth.
Herbicides and Cover CropsSome cover crops are sensitive to herbicide residues and growth may be reduced. Check for herbicide carryover concerns before planting, particularly if planning to interseed into a standing crop such as corn.
Management and TerminationHaving a plan in place for cover crop termination is just as important as selecting the correct type of cover crop. Many of the common cover crops, such as oats
199
8. ManagIng For healthy soIls
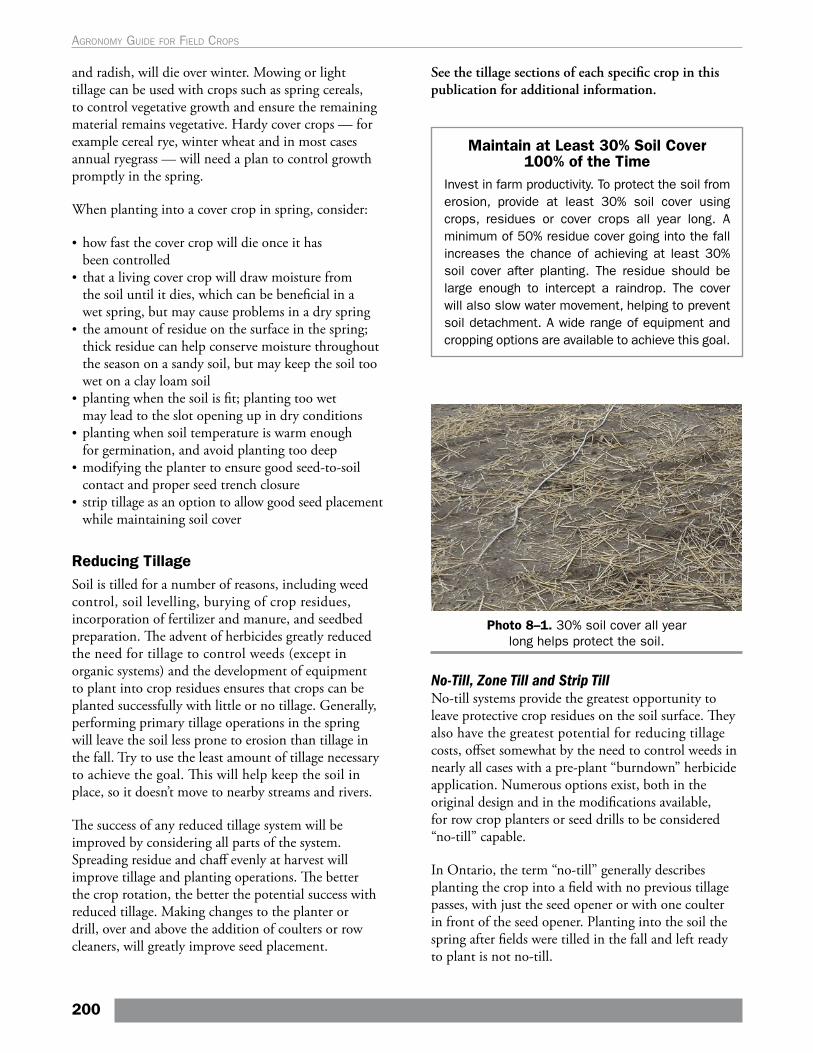
and radish, will die over winter. Mowing or light tillage can be used with crops such as spring cereals, to control vegetative growth and ensure the remaining material remains vegetative. Hardy cover crops — for example cereal rye, winter wheat and in most cases annual ryegrass — will need a plan to control growth promptly in the spring.
When planting into a cover crop in spring, consider:
• how fast the cover crop will die once it has been controlled
• that a living cover crop will draw moisture from the soil until it dies, which can be beneficial in a wet spring, but may cause problems in a dry spring
• the amount of residue on the surface in the spring; thick residue can help conserve moisture throughout the season on a sandy soil, but may keep the soil too wet on a clay loam soil
• planting when the soil is fit; planting too wet may lead to the slot opening up in dry conditions
• planting when soil temperature is warm enough for germination, and avoid planting too deep
• modifying the planter to ensure good seed-to-soil contact and proper seed trench closure
• strip tillage as an option to allow good seed placement while maintaining soil cover
Reducing Tillage Soil is tilled for a number of reasons, including weed control, soil levelling, burying of crop residues, incorporation of fertilizer and manure, and seedbed preparation. The advent of herbicides greatly reduced the need for tillage to control weeds (except in organic systems) and the development of equipment to plant into crop residues ensures that crops can be planted successfully with little or no tillage. Generally, performing primary tillage operations in the spring will leave the soil less prone to erosion than tillage in the fall. Try to use the least amount of tillage necessary to achieve the goal. This will help keep the soil in place, so it doesn’t move to nearby streams and rivers.
The success of any reduced tillage system will be improved by considering all parts of the system. Spreading residue and chaff evenly at harvest will improve tillage and planting operations. The better the crop rotation, the better the potential success with reduced tillage. Making changes to the planter or drill, over and above the addition of coulters or row cleaners, will greatly improve seed placement.
See the tillage sections of each specific crop in this publication for additional information.
Maintain at Least 30% Soil Cover 100% of the Time
Invest in farm productivity. To protect the soil from erosion, provide at least 30% soil cover using crops, residues or cover crops all year long. A minimum of 50% residue cover going into the fall increases the chance of achieving at least 30% soil cover after planting. The residue should be large enough to intercept a raindrop. The cover will also slow water movement, helping to prevent soil detachment. A wide range of equipment and cropping options are available to achieve this goal.
Photo 8–1. 30% soil cover all year long helps protect the soil.
No-Till, Zone Till and Strip Till No-till systems provide the greatest opportunity to leave protective crop residues on the soil surface. They also have the greatest potential for reducing tillage costs, offset somewhat by the need to control weeds in nearly all cases with a pre-plant “burndown” herbicide application. Numerous options exist, both in the original design and in the modifications available, for row crop planters or seed drills to be considered “no-till” capable.
In Ontario, the term “no-till” generally describes planting the crop into a field with no previous tillage passes, with just the seed opener or with one coulter in front of the seed opener. Planting into the soil the spring after fields were tilled in the fall and left ready to plant is not no-till.
200
Agronomy guide for field Crops
Zone tillage systems usually have two or three coulters in front of the seed and fertilizer openers and may also include trash wheels.
Strip tillage uses a toolbar with coulters in front, followed by a combination of shanks and/or coulters or disks. It may be used in the fall, spring or both to prepare a seedbed. Most strip tillers operate at a 10–15 cm (4–6 in.) depth. The strip till system is another way to manage crop residues, allowing soils to warm up faster in the spring while still providing the benefits of residue cover between the rows. Fertilizer can be applied in the same operation.
The success of no-till systems is often dependent on a range of factors other than the equipment design. Two of these — soil drainage and crop rotation — have a significant influence on the performance of all no-till systems. Reduced tillage systems present the greatest challenge for planting corn. Tillage systems are described in more detail in Chapter 1, Corn. More information on these systems can be found in the OMAFRA publication Best Management Practices: No-Till: Making it Work.
Vertical TillageVertical tillage uses a series of coulters of different shapes and configurations to perform shallow tillage. The operation is performed in the fall or spring or both to chop and size residue and perform some light incorporation to encourage residue breakdown. This can reduce the amount of residue into which a producer must plant, and can help soils warm more quickly in spring. Ideally, the number of passes will be limited to ensure greater than 30% residue cover after planting.
Disc The disc, like the chisel plow, will leave more residue on the soil surface than the mouldboard plow. Using this tool when the soil is too wet can cause soil compaction. Too many passes will break down soil aggregates and increase the loss of soil organic matter and the risk of crusting. A planter that is properly set up to handle some residue and a rougher seedbed can help reduce the number of secondary tillage passes in any tillage system.
Chisel Plow The chisel plow will leave more residue on the surface than the mouldboard plow. This will be influenced by chisel plow set-up, the amount of crop residue to be handled and the amount of secondary tillage performed. Chisel plowing with twisted shovel teeth will leave the soil ridged, which is good for soil erosion control, but can require extra tillage passes in the spring and lead to uneven soil moisture in the seedbed. This can be overcome by:
• using sweep teeth on all or part of the chisel plow• adding a levelling bar or harrows to the rear of the
chisel plow• timely secondary tillage in the spring
The chisel plow can also be an effective tool for incorporating manure with uniform distribution through the soil profile.
The chisel plow can cause as much tillage erosion (the movement of soil down a slope) as the mouldboard plow on sloping land.
Mouldboard Plow From a soil health perspective, the mouldboard plow is the least desirable tillage method, because it leaves little residue on the soil surface, requires multiple passes of secondary tillage, is energy intensive and requires significantly more labour than no-till and many reduced tillage systems. Plowing and secondary tillage pulverize aggregates, making the soil more prone to crusting and erosion. The plow moves a significant amount of soil, contributing to tillage erosion and the loss of topsoil on sloping land. If mouldboard plowing is used, set the plow to stand the furrows on edge and try to leave some residue on the surface. Also, minimize the number of secondary tillage passes to reduce the breakdown of soil aggregates.
Fertility ManagementA healthy soil will have nutrient levels in an adequate range for the crops grown. The pH will also be in the correct range for the specific crops that are to be grown. Refer to Chapter 9, Soil Fertility and Nutrient Use, for information on soil and tissue sampling and how to correct deficiencies.
201
8. ManagIng For healthy soIls
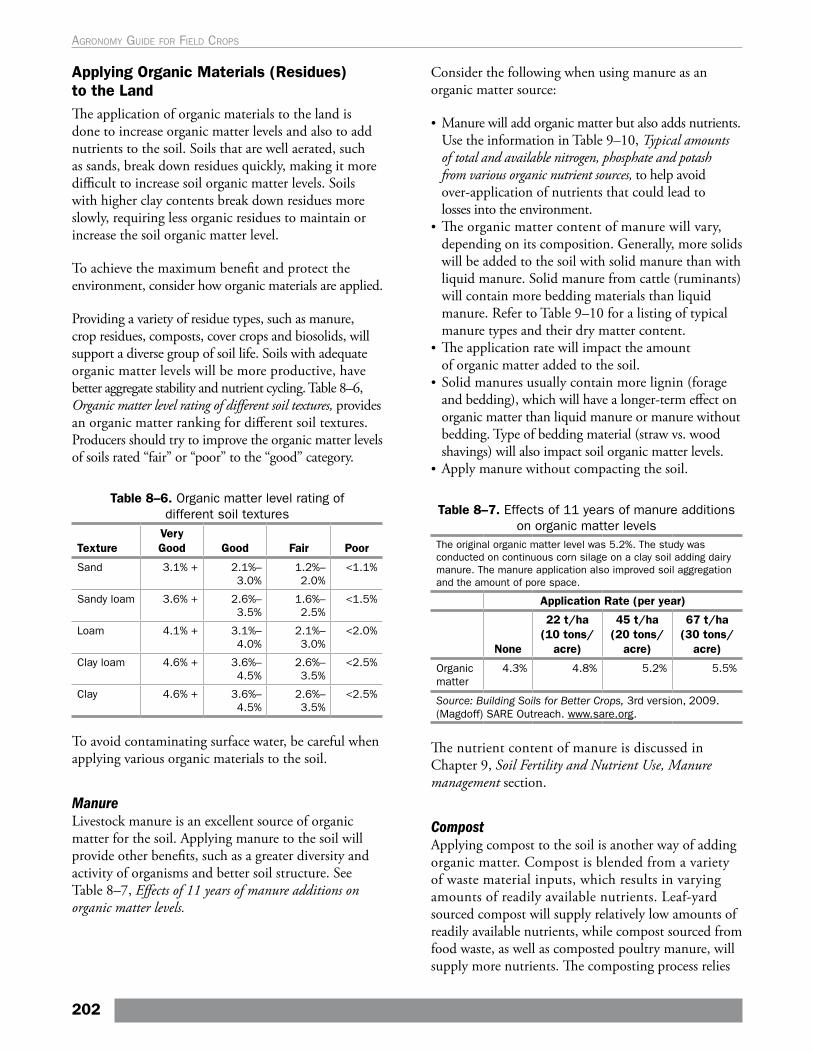
Applying Organic Materials (Residues) to the Land The application of organic materials to the land is done to increase organic matter levels and also to add nutrients to the soil. Soils that are well aerated, such as sands, break down residues quickly, making it more difficult to increase soil organic matter levels. Soils with higher clay contents break down residues more slowly, requiring less organic residues to maintain or increase the soil organic matter level.
To achieve the maximum benefit and protect the environment, consider how organic materials are applied.
Providing a variety of residue types, such as manure, crop residues, composts, cover crops and biosolids, will support a diverse group of soil life. Soils with adequate organic matter levels will be more productive, have better aggregate stability and nutrient cycling. Table 8–6, Organic matter level rating of different soil textures, provides an organic matter ranking for different soil textures. Producers should try to improve the organic matter levels of soils rated “fair” or “poor” to the “good” category.
Table 8–6. Organic matter level rating of different soil textures
TextureVery Good Good Fair Poor
Sand 3.1% + 2.1%–3.0%
1.2%–2.0%
<1.1%
Sandy loam 3.6% + 2.6%–3.5%
1.6%–2.5%
<1.5%
Loam 4.1% + 3.1%–4.0%
2.1%–3.0%
<2.0%
Clay loam 4.6% + 3.6%–4.5%
2.6%–3.5%
<2.5%
Clay 4.6% + 3.6%–4.5%
2.6%–3.5%
<2.5%
To avoid contaminating surface water, be careful when applying various organic materials to the soil.
Manure Livestock manure is an excellent source of organic matter for the soil. Applying manure to the soil will provide other benefits, such as a greater diversity and activity of organisms and better soil structure. See Table 8–7, Effects of 11 years of manure additions on organic matter levels.
Consider the following when using manure as an organic matter source:
• Manure will add organic matter but also adds nutrients. Use the information in Table 9–10, Typical amounts of total and available nitrogen, phosphate and potash from various organic nutrient sources, to help avoid over-application of nutrients that could lead to losses into the environment.
• The organic matter content of manure will vary, depending on its composition. Generally, more solids will be added to the soil with solid manure than with liquid manure. Solid manure from cattle (ruminants) will contain more bedding materials than liquid manure. Refer to Table 9–10 for a listing of typical manure types and their dry matter content.
• The application rate will impact the amount of organic matter added to the soil.
• Solid manures usually contain more lignin (forage and bedding), which will have a longer-term effect on organic matter than liquid manure or manure without bedding. Type of bedding material (straw vs. wood shavings) will also impact soil organic matter levels.
• Apply manure without compacting the soil.
Table 8–7. Effects of 11 years of manure additions on organic matter levels
The original organic matter level was 5.2%. The study was conducted on continuous corn silage on a clay soil adding dairy manure. The manure application also improved soil aggregation and the amount of pore space.
Application Rate (per year)
None
22 t/ha (10 tons/
acre)
45 t/ha (20 tons/
acre)
67 t/ha (30 tons/
acre)
Organic matter
4.3% 4.8% 5.2% 5.5%
Source: Building Soils for Better Crops, 3rd version, 2009. (Magdoff) SARE Outreach. www.sare.org.
The nutrient content of manure is discussed in Chapter 9, Soil Fertility and Nutrient Use, Manure management section.
CompostApplying compost to the soil is another way of adding organic matter. Compost is blended from a variety of waste material inputs, which results in varying amounts of readily available nutrients. Leaf-yard sourced compost will supply relatively low amounts of readily available nutrients, while compost sourced from food waste, as well as composted poultry manure, will supply more nutrients. The composting process relies
202
Agronomy guide for field Crops
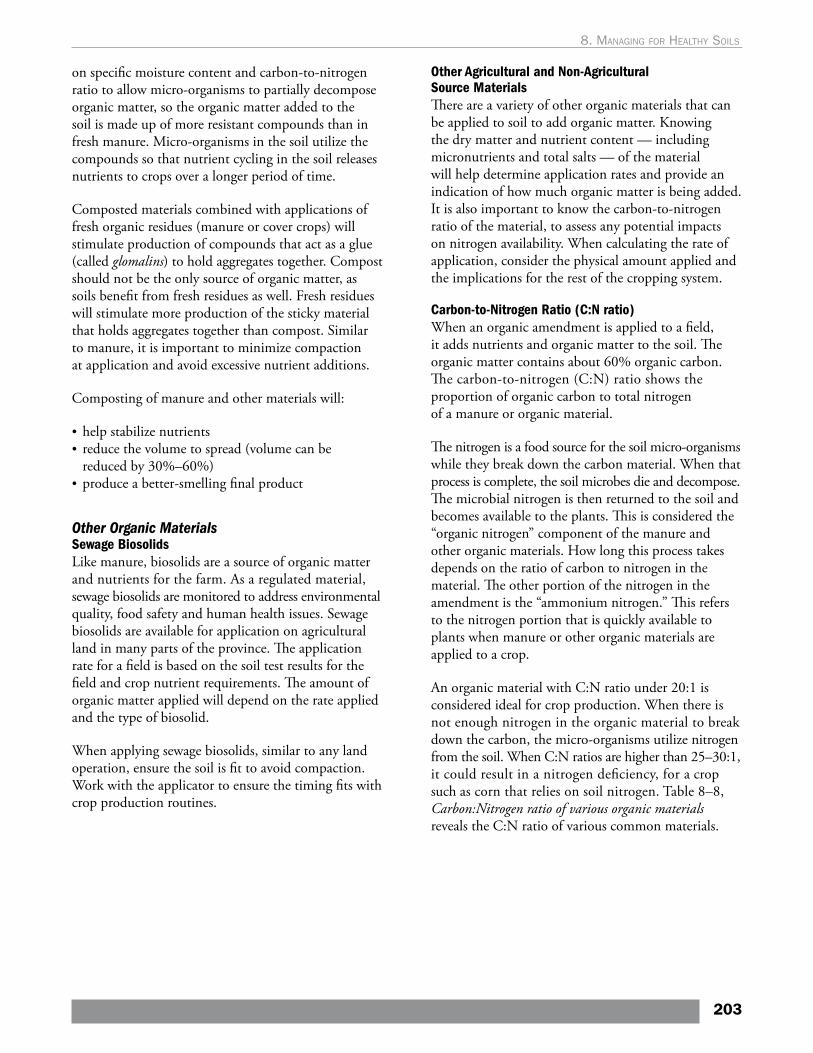
on specific moisture content and carbon-to-nitrogen ratio to allow micro-organisms to partially decompose organic matter, so the organic matter added to the soil is made up of more resistant compounds than in fresh manure. Micro-organisms in the soil utilize the compounds so that nutrient cycling in the soil releases nutrients to crops over a longer period of time.
Composted materials combined with applications of fresh organic residues (manure or cover crops) will stimulate production of compounds that act as a glue (called glomalins) to hold aggregates together. Compost should not be the only source of organic matter, as soils benefit from fresh residues as well. Fresh residues will stimulate more production of the sticky material that holds aggregates together than compost. Similar to manure, it is important to minimize compaction at application and avoid excessive nutrient additions.
Composting of manure and other materials will:
• help stabilize nutrients• reduce the volume to spread (volume can be
reduced by 30%–60%)• produce a better-smelling final product
Other Organic Materials Sewage Biosolids Like manure, biosolids are a source of organic matter and nutrients for the farm. As a regulated material, sewage biosolids are monitored to address environmental quality, food safety and human health issues. Sewage biosolids are available for application on agricultural land in many parts of the province. The application rate for a field is based on the soil test results for the field and crop nutrient requirements. The amount of organic matter applied will depend on the rate applied and the type of biosolid.
When applying sewage biosolids, similar to any land operation, ensure the soil is fit to avoid compaction. Work with the applicator to ensure the timing fits with crop production routines.
Other Agricultural and Non-Agricultural Source MaterialsThere are a variety of other organic materials that can be applied to soil to add organic matter. Knowing the dry matter and nutrient content — including micronutrients and total salts — of the material will help determine application rates and provide an indication of how much organic matter is being added. It is also important to know the carbon-to-nitrogen ratio of the material, to assess any potential impacts on nitrogen availability. When calculating the rate of application, consider the physical amount applied and the implications for the rest of the cropping system.
Carbon-to-Nitrogen Ratio (C:N ratio)When an organic amendment is applied to a field, it adds nutrients and organic matter to the soil. The organic matter contains about 60% organic carbon. The carbon-to-nitrogen (C:N) ratio shows the proportion of organic carbon to total nitrogen of a manure or organic material.
The nitrogen is a food source for the soil micro-organisms while they break down the carbon material. When that process is complete, the soil microbes die and decompose. The microbial nitrogen is then returned to the soil and becomes available to the plants. This is considered the “organic nitrogen” component of the manure and other organic materials. How long this process takes depends on the ratio of carbon to nitrogen in the material. The other portion of the nitrogen in the amendment is the “ammonium nitrogen.” This refers to the nitrogen portion that is quickly available to plants when manure or other organic materials are applied to a crop.
An organic material with C:N ratio under 20:1 is considered ideal for crop production. When there is not enough nitrogen in the organic material to break down the carbon, the micro-organisms utilize nitrogen from the soil. When C:N ratios are higher than 25–30:1, it could result in a nitrogen deficiency, for a crop such as corn that relies on soil nitrogen. Table 8–8, Carbon:Nitrogen ratio of various organic materials reveals the C:N ratio of various common materials.
203
8. ManagIng For healthy soIls
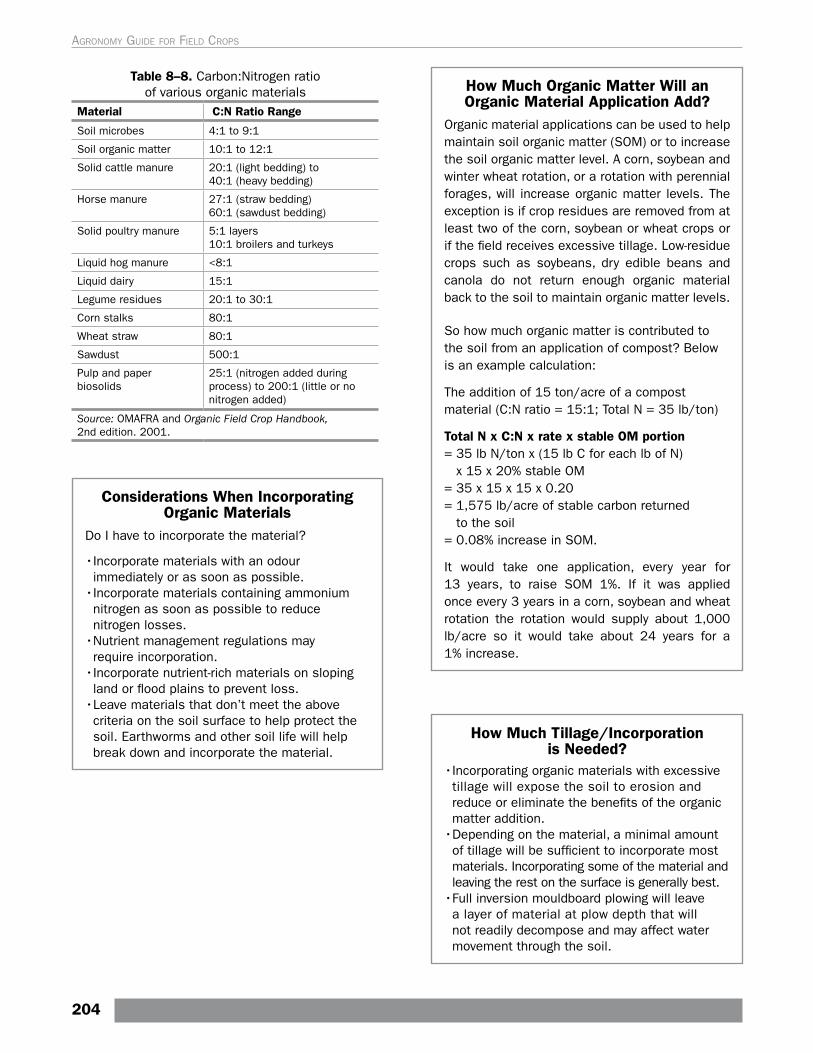
Table 8–8. Carbon:Nitrogen ratio of various organic materials
Material C:N Ratio Range
Soil microbes 4:1 to 9:1
Soil organic matter 10:1 to 12:1
Solid cattle manure 20:1 (light bedding) to 40:1 (heavy bedding)
Horse manure 27:1 (straw bedding) 60:1 (sawdust bedding)
Solid poultry manure 5:1 layers 10:1 broilers and turkeys
Liquid hog manure <8:1
Liquid dairy 15:1
Legume residues 20:1 to 30:1
Corn stalks 80:1
Wheat straw 80:1
Sawdust 500:1
Pulp and paper biosolids
25:1 (nitrogen added during process) to 200:1 (little or no nitrogen added)
Source: OMAFRA and Organic Field Crop Handbook, 2nd edition. 2001.
Considerations When Incorporating Organic Materials
Do I have to incorporate the material?
•Incorporate materials with an odour immediately or as soon as possible.
•Incorporate materials containing ammonium nitrogen as soon as possible to reduce nitrogen losses.
•Nutrient management regulations may require incorporation.
•Incorporate nutrient-rich materials on sloping land or flood plains to prevent loss.
•Leave materials that don’t meet the above criteria on the soil surface to help protect the soil. Earthworms and other soil life will help break down and incorporate the material.
How Much Organic Matter Will an Organic Material Application Add?
Organic material applications can be used to help maintain soil organic matter (SOM) or to increase the soil organic matter level. A corn, soybean and winter wheat rotation, or a rotation with perennial forages, will increase organic matter levels. The exception is if crop residues are removed from at least two of the corn, soybean or wheat crops or if the field receives excessive tillage. Low-residue crops such as soybeans, dry edible beans and canola do not return enough organic material back to the soil to maintain organic matter levels.
So how much organic matter is contributed to the soil from an application of compost? Below is an example calculation:
The addition of 15 ton/acre of a compost material (C:N ratio = 15:1; Total N = 35 lb/ton)
Total N x C:N x rate x stable OM portion= 35 lb N/ton x (15 lb C for each lb of N)
x 15 x 20% stable OM= 35 x 15 x 15 x 0.20= 1,575 lb/acre of stable carbon returned
to the soil= 0.08% increase in SOM.
It would take one application, every year for 13 years, to raise SOM 1%. If it was applied once every 3 years in a corn, soybean and wheat rotation the rotation would supply about 1,000 lb/acre so it would take about 24 years for a 1% increase.
How Much Tillage/Incorporation is Needed?
•Incorporating organic materials with excessive tillage will expose the soil to erosion and reduce or eliminate the benefits of the organic matter addition.
•Depending on the material, a minimal amount of tillage will be sufficient to incorporate most materials. Incorporating some of the material and leaving the rest on the surface is generally best.
•Full inversion mouldboard plowing will leave a layer of material at plow depth that will not readily decompose and may affect water movement through the soil.
204
Agronomy guide for field Crops
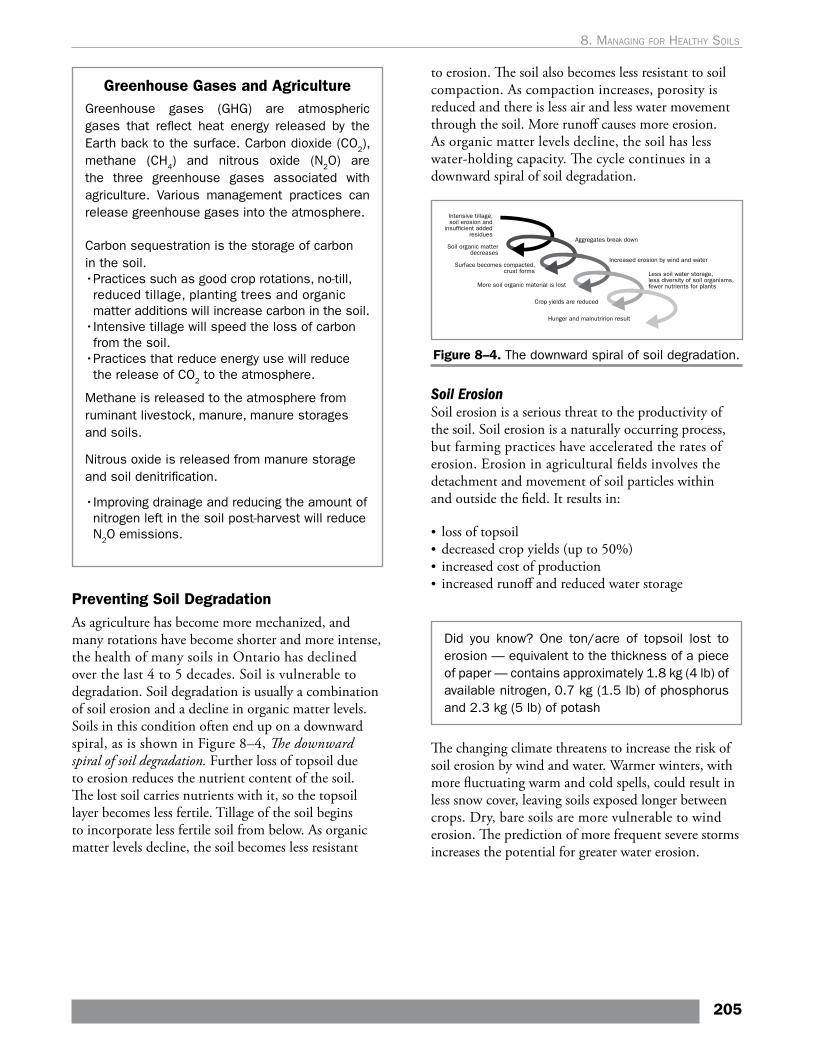
Greenhouse Gases and AgricultureGreenhouse gases (GHG) are atmospheric gases that reflect heat energy released by the Earth back to the surface. Carbon dioxide (CO2), methane (CH4) and nitrous oxide (N2O) are the three greenhouse gases associated with agriculture. Various management practices can release greenhouse gases into the atmosphere.
Carbon sequestration is the storage of carbon in the soil.•Practices such as good crop rotations, no-till, reduced tillage, planting trees and organic matter additions will increase carbon in the soil.
•Intensive tillage will speed the loss of carbon from the soil.
•Practices that reduce energy use will reduce the release of CO2 to the atmosphere.
Methane is released to the atmosphere from ruminant livestock, manure, manure storages and soils.
Nitrous oxide is released from manure storage and soil denitrification.
•Improving drainage and reducing the amount of nitrogen left in the soil post-harvest will reduce N2O emissions.
Preventing Soil DegradationAs agriculture has become more mechanized, and many rotations have become shorter and more intense, the health of many soils in Ontario has declined over the last 4 to 5 decades. Soil is vulnerable to degradation. Soil degradation is usually a combination of soil erosion and a decline in organic matter levels. Soils in this condition often end up on a downward spiral, as is shown in Figure 8–4, The downward spiral of soil degradation. Further loss of topsoil due to erosion reduces the nutrient content of the soil. The lost soil carries nutrients with it, so the topsoil layer becomes less fertile. Tillage of the soil begins to incorporate less fertile soil from below. As organic matter levels decline, the soil becomes less resistant
to erosion. The soil also becomes less resistant to soil compaction. As compaction increases, porosity is reduced and there is less air and less water movement through the soil. More runoff causes more erosion. As organic matter levels decline, the soil has less water-holding capacity. The cycle continues in a downward spiral of soil degradation.
Figure 8–4. The downward spiral of soil degradation.
Soil Erosion Soil erosion is a serious threat to the productivity of the soil. Soil erosion is a naturally occurring process, but farming practices have accelerated the rates of erosion. Erosion in agricultural fields involves the detachment and movement of soil particles within and outside the field. It results in:
• loss of topsoil• decreased crop yields (up to 50%)• increased cost of production• increased runoff and reduced water storage
Did you know? One ton/acre of topsoil lost to erosion — equivalent to the thickness of a piece of paper — contains approximately 1.8 kg (4 lb) of available nitrogen, 0.7 kg (1.5 lb) of phosphorus and 2.3 kg (5 lb) of potash
The changing climate threatens to increase the risk of soil erosion by wind and water. Warmer winters, with more fluctuating warm and cold spells, could result in less snow cover, leaving soils exposed longer between crops. Dry, bare soils are more vulnerable to wind erosion. The prediction of more frequent severe storms increases the potential for greater water erosion.
205
8. ManagIng For healthy soIls
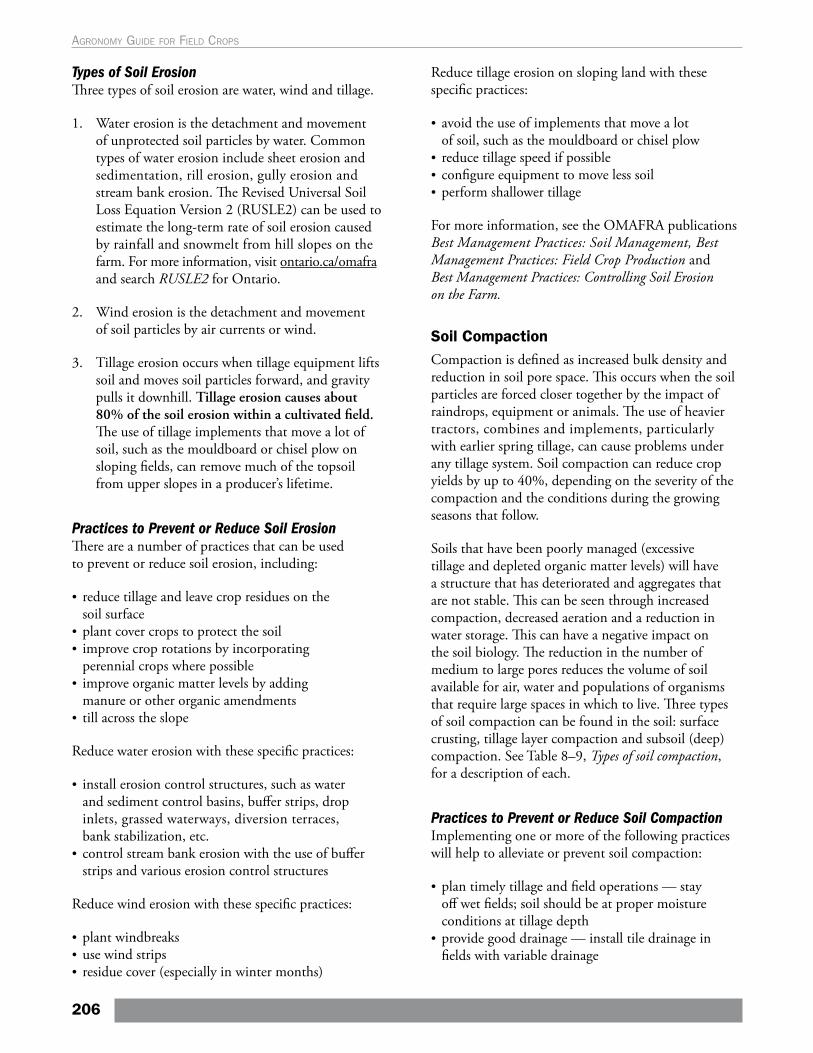
Types of Soil Erosion Three types of soil erosion are water, wind and tillage.
1. Water erosion is the detachment and movement of unprotected soil particles by water. Common types of water erosion include sheet erosion and sedimentation, rill erosion, gully erosion and stream bank erosion. The Revised Universal Soil Loss Equation Version 2 (RUSLE2) can be used to estimate the long-term rate of soil erosion caused by rainfall and snowmelt from hill slopes on the farm. For more information, visit ontario.ca/omafra and search RUSLE2 for Ontario.
2. Wind erosion is the detachment and movement of soil particles by air currents or wind.
3. Tillage erosion occurs when tillage equipment lifts soil and moves soil particles forward, and gravity pulls it downhill. Tillage erosion causes about 80% of the soil erosion within a cultivated field. The use of tillage implements that move a lot of soil, such as the mouldboard or chisel plow on sloping fields, can remove much of the topsoil from upper slopes in a producer’s lifetime.
Practices to Prevent or Reduce Soil ErosionThere are a number of practices that can be used to prevent or reduce soil erosion, including:
• reduce tillage and leave crop residues on the soil surface
• plant cover crops to protect the soil• improve crop rotations by incorporating
perennial crops where possible• improve organic matter levels by adding
manure or other organic amendments• till across the slope
Reduce water erosion with these specific practices:
• install erosion control structures, such as water and sediment control basins, buffer strips, drop inlets, grassed waterways, diversion terraces, bank stabilization, etc.
• control stream bank erosion with the use of buffer strips and various erosion control structures
Reduce wind erosion with these specific practices:
• plant windbreaks• use wind strips• residue cover (especially in winter months)
Reduce tillage erosion on sloping land with these specific practices:
• avoid the use of implements that move a lot of soil, such as the mouldboard or chisel plow
• reduce tillage speed if possible• configure equipment to move less soil• perform shallower tillage
For more information, see the OMAFRA publications Best Management Practices: Soil Management, Best Management Practices: Field Crop Production and Best Management Practices: Controlling Soil Erosion on the Farm.
Soil Compaction Compaction is defined as increased bulk density and reduction in soil pore space. This occurs when the soil particles are forced closer together by the impact of raindrops, equipment or animals. The use of heavier tractors, combines and implements, particularly with earlier spring tillage, can cause problems under any tillage system. Soil compaction can reduce crop yields by up to 40%, depending on the severity of the compaction and the conditions during the growing seasons that follow.
Soils that have been poorly managed (excessive tillage and depleted organic matter levels) will have a structure that has deteriorated and aggregates that are not stable. This can be seen through increased compaction, decreased aeration and a reduction in water storage. This can have a negative impact on the soil biology. The reduction in the number of medium to large pores reduces the volume of soil available for air, water and populations of organisms that require large spaces in which to live. Three types of soil compaction can be found in the soil: surface crusting, tillage layer compaction and subsoil (deep) compaction. See Table 8–9, Types of soil compaction, for a description of each.
Practices to Prevent or Reduce Soil CompactionImplementing one or more of the following practices will help to alleviate or prevent soil compaction:
• plan timely tillage and field operations — stay off wet fields; soil should be at proper moisture conditions at tillage depth
• provide good drainage — install tile drainage in fields with variable drainage
206
Agronomy guide for field Crops
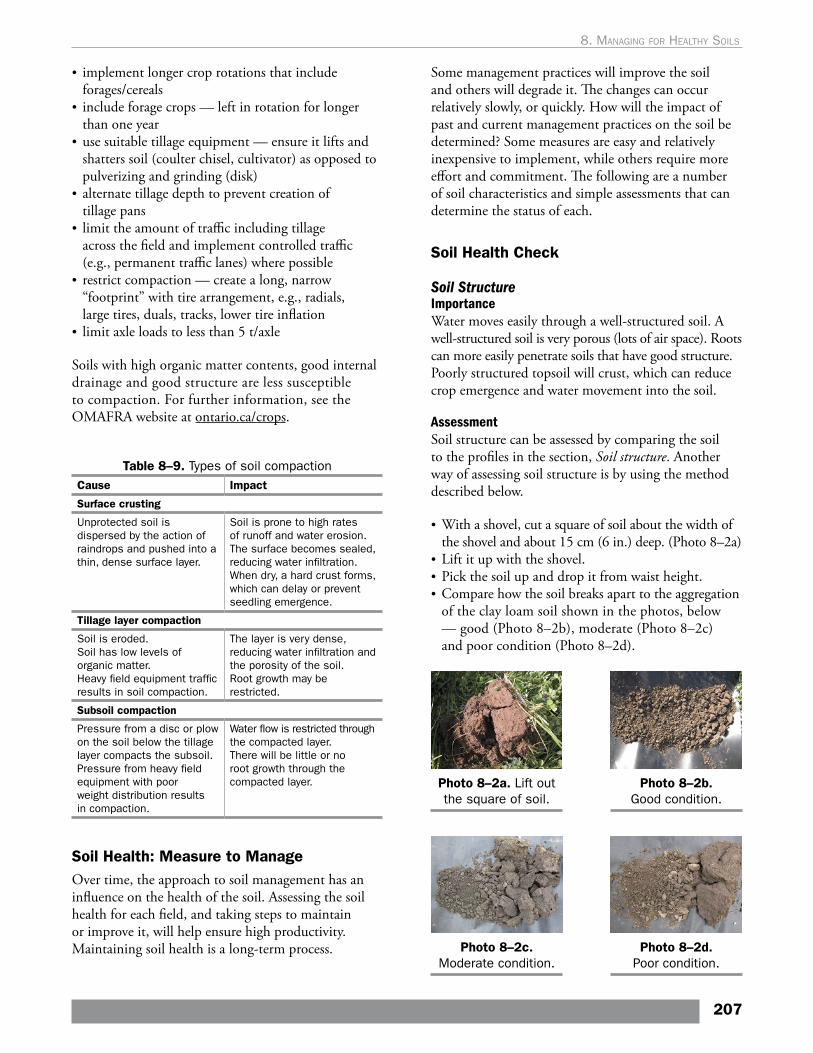
• implement longer crop rotations that include forages/cereals
• include forage crops — left in rotation for longer than one year
• use suitable tillage equipment — ensure it lifts and shatters soil (coulter chisel, cultivator) as opposed to pulverizing and grinding (disk)
• alternate tillage depth to prevent creation of tillage pans
• limit the amount of traffic including tillage across the field and implement controlled traffic (e.g., permanent traffic lanes) where possible
• restrict compaction — create a long, narrow “footprint” with tire arrangement, e.g., radials, large tires, duals, tracks, lower tire inflation
• limit axle loads to less than 5 t/axle
Soils with high organic matter contents, good internal drainage and good structure are less susceptible to compaction. For further information, see the OMAFRA website at ontario.ca/crops.
Table 8–9. Types of soil compaction Cause Impact
Surface crusting
Unprotected soil is dispersed by the action of raindrops and pushed into a thin, dense surface layer.
Soil is prone to high rates of runoff and water erosion.The surface becomes sealed, reducing water infiltration.When dry, a hard crust forms, which can delay or prevent seedling emergence.
Tillage layer compaction
Soil is eroded.Soil has low levels of organic matter.Heavy field equipment traffic results in soil compaction.
The layer is very dense, reducing water infiltration and the porosity of the soil.Root growth may be restricted.
Subsoil compaction
Pressure from a disc or plow on the soil below the tillage layer compacts the subsoil.Pressure from heavy field equipment with poor weight distribution results in compaction.
Water flow is restricted through the compacted layer.There will be little or no root growth through the compacted layer.
Soil Health: Measure to ManageOver time, the approach to soil management has an influence on the health of the soil. Assessing the soil health for each field, and taking steps to maintain or improve it, will help ensure high productivity. Maintaining soil health is a long-term process.
Some management practices will improve the soil and others will degrade it. The changes can occur relatively slowly, or quickly. How will the impact of past and current management practices on the soil be determined? Some measures are easy and relatively inexpensive to implement, while others require more effort and commitment. The following are a number of soil characteristics and simple assessments that can determine the status of each.
Soil Health Check
Soil StructureImportanceWater moves easily through a well-structured soil. A well-structured soil is very porous (lots of air space). Roots can more easily penetrate soils that have good structure. Poorly structured topsoil will crust, which can reduce crop emergence and water movement into the soil.
AssessmentSoil structure can be assessed by comparing the soil to the profiles in the section, Soil structure. Another way of assessing soil structure is by using the method described below.
• With a shovel, cut a square of soil about the width of the shovel and about 15 cm (6 in.) deep. (Photo 8–2a)
• Lift it up with the shovel. • Pick the soil up and drop it from waist height.• Compare how the soil breaks apart to the aggregation
of the clay loam soil shown in the photos, below — good (Photo 8–2b), moderate (Photo 8–2c) and poor condition (Photo 8–2d).
Photo 8–2a. Lift out the square of soil.
Photo 8–2b. Good condition.
Photo 8–2d. Poor condition.
Photo 8–2c. Moderate condition.
207
8. ManagIng For healthy soIls
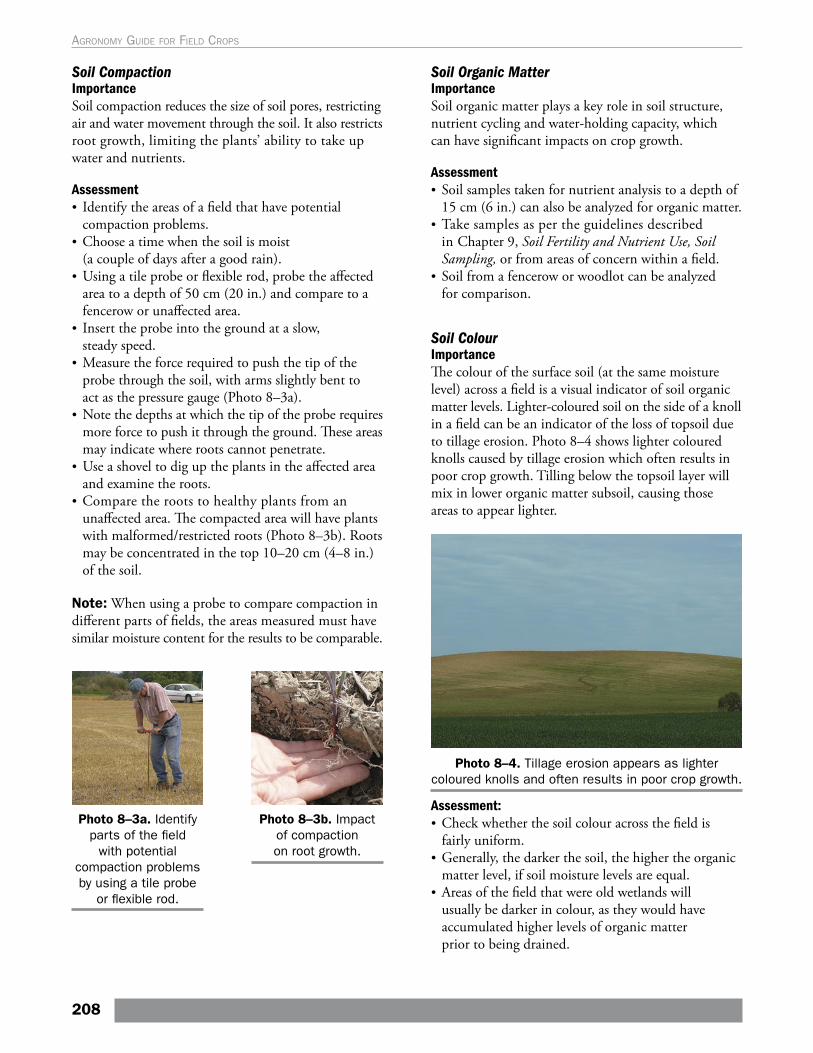
Soil CompactionImportanceSoil compaction reduces the size of soil pores, restricting air and water movement through the soil. It also restricts root growth, limiting the plants’ ability to take up water and nutrients.
Assessment• Identify the areas of a field that have potential
compaction problems. • Choose a time when the soil is moist
(a couple of days after a good rain). • Using a tile probe or flexible rod, probe the affected
area to a depth of 50 cm (20 in.) and compare to a fencerow or unaffected area.
• Insert the probe into the ground at a slow, steady speed.
• Measure the force required to push the tip of the probe through the soil, with arms slightly bent to act as the pressure gauge (Photo 8–3a).
• Note the depths at which the tip of the probe requires more force to push it through the ground. These areas may indicate where roots cannot penetrate.
• Use a shovel to dig up the plants in the affected area and examine the roots.
• Compare the roots to healthy plants from an unaffected area. The compacted area will have plants with malformed/restricted roots (Photo 8–3b). Roots may be concentrated in the top 10–20 cm (4–8 in.) of the soil.
Note: When using a probe to compare compaction in different parts of fields, the areas measured must have similar moisture content for the results to be comparable.
Soil Organic MatterImportanceSoil organic matter plays a key role in soil structure, nutrient cycling and water-holding capacity, which can have significant impacts on crop growth.
Assessment• Soil samples taken for nutrient analysis to a depth of
15 cm (6 in.) can also be analyzed for organic matter. • Take samples as per the guidelines described
in Chapter 9, Soil Fertility and Nutrient Use, Soil Sampling, or from areas of concern within a field.
• Soil from a fencerow or woodlot can be analyzed for comparison.
Soil ColourImportanceThe colour of the surface soil (at the same moisture level) across a field is a visual indicator of soil organic matter levels. Lighter-coloured soil on the side of a knoll in a field can be an indicator of the loss of topsoil due to tillage erosion. Photo 8–4 shows lighter coloured knolls caused by tillage erosion which often results in poor crop growth. Tilling below the topsoil layer will mix in lower organic matter subsoil, causing those areas to appear lighter.
Photo 8–4. Tillage erosion appears as lighter coloured knolls and often results in poor crop growth.
Assessment:• Check whether the soil colour across the field is
fairly uniform.• Generally, the darker the soil, the higher the organic
matter level, if soil moisture levels are equal. • Areas of the field that were old wetlands will
usually be darker in colour, as they would have accumulated higher levels of organic matter prior to being drained.
Photo 8–3a. Identify parts of the field
with potential compaction problems by using a tile probe
or flexible rod.
Photo 8–3b. Impact of compaction on root growth.
208
Agronomy guide for field Crops
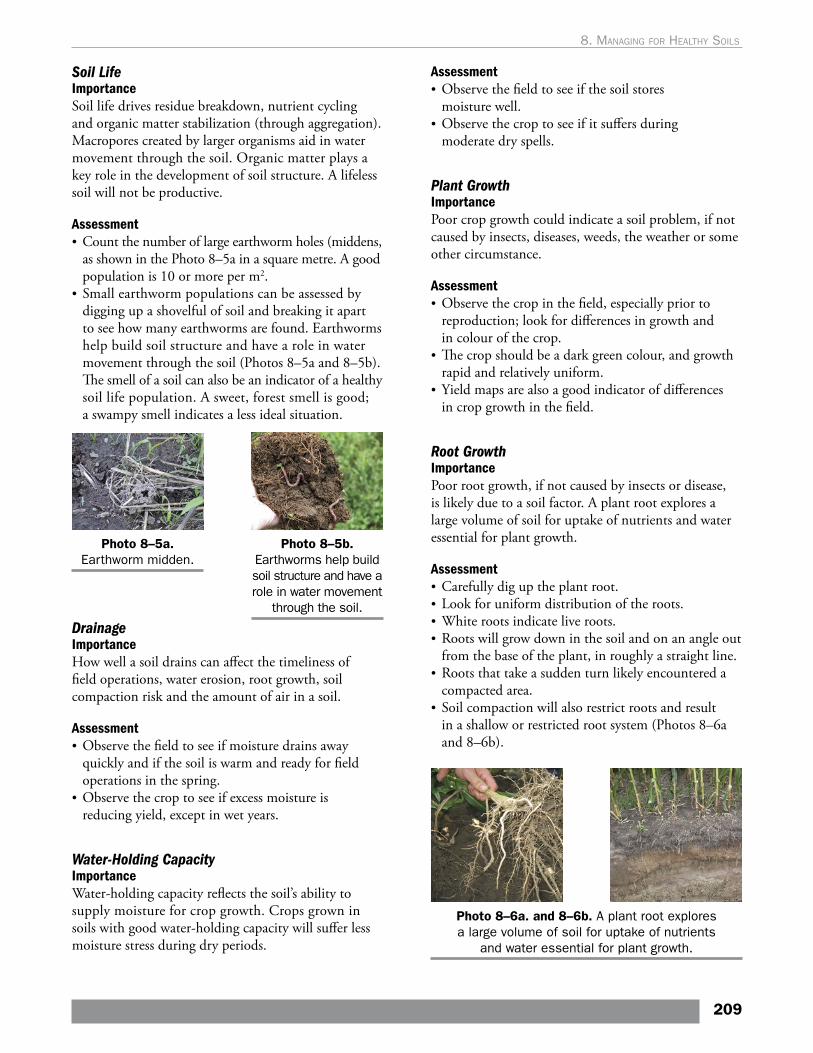
Soil LifeImportanceSoil life drives residue breakdown, nutrient cycling and organic matter stabilization (through aggregation). Macropores created by larger organisms aid in water movement through the soil. Organic matter plays a key role in the development of soil structure. A lifeless soil will not be productive.
Assessment• Count the number of large earthworm holes (middens,
as shown in the Photo 8–5a in a square metre. A good population is 10 or more per m2.
• Small earthworm populations can be assessed by digging up a shovelful of soil and breaking it apart to see how many earthworms are found. Earthworms help build soil structure and have a role in water movement through the soil (Photos 8–5a and 8–5b). The smell of a soil can also be an indicator of a healthy soil life population. A sweet, forest smell is good; a swampy smell indicates a less ideal situation.
Assessment• Observe the field to see if the soil stores
moisture well. • Observe the crop to see if it suffers during
moderate dry spells.
Plant GrowthImportancePoor crop growth could indicate a soil problem, if not caused by insects, diseases, weeds, the weather or some other circumstance.
Assessment• Observe the crop in the field, especially prior to
reproduction; look for differences in growth and in colour of the crop.
• The crop should be a dark green colour, and growth rapid and relatively uniform.
• Yield maps are also a good indicator of differences in crop growth in the field.
Root GrowthImportancePoor root growth, if not caused by insects or disease, is likely due to a soil factor. A plant root explores a large volume of soil for uptake of nutrients and water essential for plant growth.
Assessment• Carefully dig up the plant root. • Look for uniform distribution of the roots.• White roots indicate live roots. • Roots will grow down in the soil and on an angle out
from the base of the plant, in roughly a straight line. • Roots that take a sudden turn likely encountered a
compacted area.• Soil compaction will also restrict roots and result
in a shallow or restricted root system (Photos 8–6a and 8–6b).
Photo 8–5a. Earthworm midden.
Photo 8–5b. Earthworms help build soil structure and have a role in water movement
through the soil.
DrainageImportanceHow well a soil drains can affect the timeliness of field operations, water erosion, root growth, soil compaction risk and the amount of air in a soil.
Assessment• Observe the field to see if moisture drains away
quickly and if the soil is warm and ready for field operations in the spring.
• Observe the crop to see if excess moisture is reducing yield, except in wet years.
Water-Holding CapacityImportanceWater-holding capacity reflects the soil’s ability to supply moisture for crop growth. Crops grown in soils with good water-holding capacity will suffer less moisture stress during dry periods.
Photo 8–6a. and 8–6b. A plant root explores a large volume of soil for uptake of nutrients
and water essential for plant growth.
209
8. ManagIng For healthy soIls
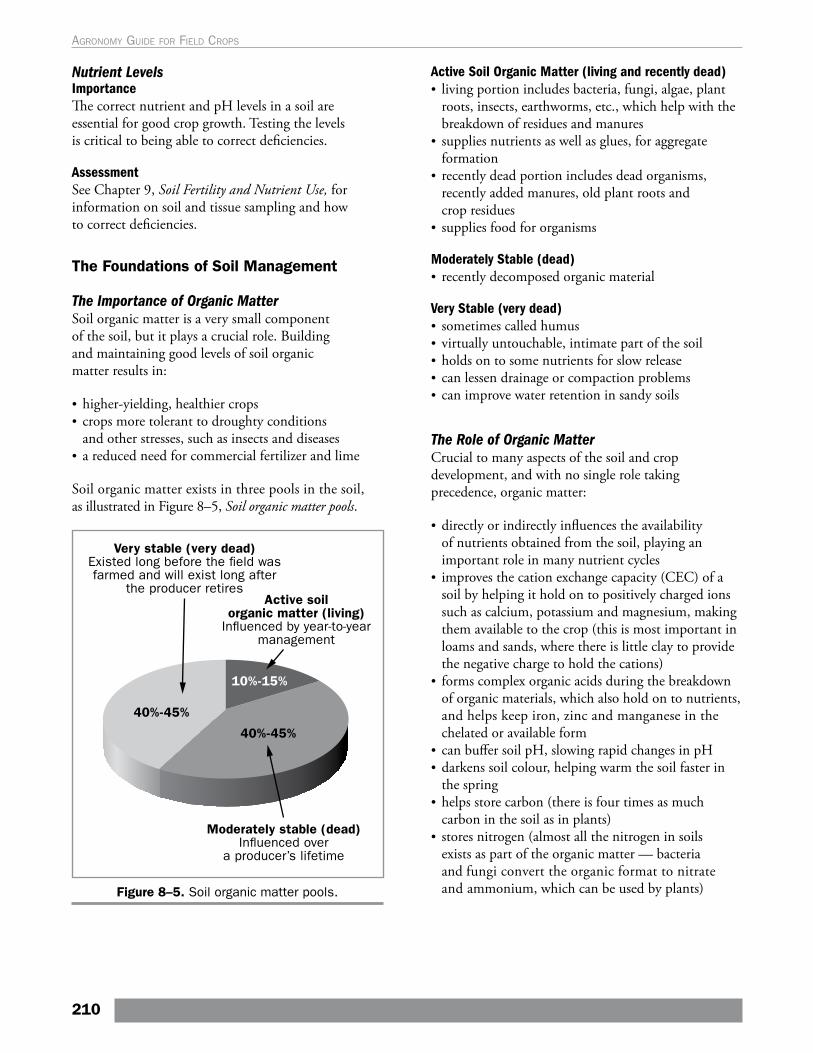
Nutrient LevelsImportanceThe correct nutrient and pH levels in a soil are essential for good crop growth. Testing the levels is critical to being able to correct deficiencies.
AssessmentSee Chapter 9, Soil Fertility and Nutrient Use, for information on soil and tissue sampling and how to correct deficiencies.
The Foundations of Soil Management
The Importance of Organic Matter Soil organic matter is a very small component of the soil, but it plays a crucial role. Building and maintaining good levels of soil organic matter results in:
• higher-yielding, healthier crops• crops more tolerant to droughty conditions
and other stresses, such as insects and diseases• a reduced need for commercial fertilizer and lime
Soil organic matter exists in three pools in the soil, as illustrated in Figure 8–5, Soil organic matter pools.
Figure 8–5. Soil organic matter pools.
Active Soil Organic Matter (living and recently dead)• living portion includes bacteria, fungi, algae, plant
roots, insects, earthworms, etc., which help with the breakdown of residues and manures
• supplies nutrients as well as glues, for aggregate formation
• recently dead portion includes dead organisms, recently added manures, old plant roots and crop residues
• supplies food for organisms
Moderately Stable (dead)• recently decomposed organic material
Very Stable (very dead)• sometimes called humus• virtually untouchable, intimate part of the soil• holds on to some nutrients for slow release• can lessen drainage or compaction problems• can improve water retention in sandy soils
The Role of Organic MatterCrucial to many aspects of the soil and crop development, and with no single role taking precedence, organic matter:
• directly or indirectly influences the availability of nutrients obtained from the soil, playing an important role in many nutrient cycles
• improves the cation exchange capacity (CEC) of a soil by helping it hold on to positively charged ions such as calcium, potassium and magnesium, making them available to the crop (this is most important in loams and sands, where there is little clay to provide the negative charge to hold the cations)
• forms complex organic acids during the breakdown of organic materials, which also hold on to nutrients, and helps keep iron, zinc and manganese in the chelated or available form
• can buffer soil pH, slowing rapid changes in pH• darkens soil colour, helping warm the soil faster in
the spring• helps store carbon (there is four times as much
carbon in the soil as in plants)• stores nitrogen (almost all the nitrogen in soils
exists as part of the organic matter — bacteria and fungi convert the organic format to nitrate and ammonium, which can be used by plants)
210
Agronomy guide for field Crops
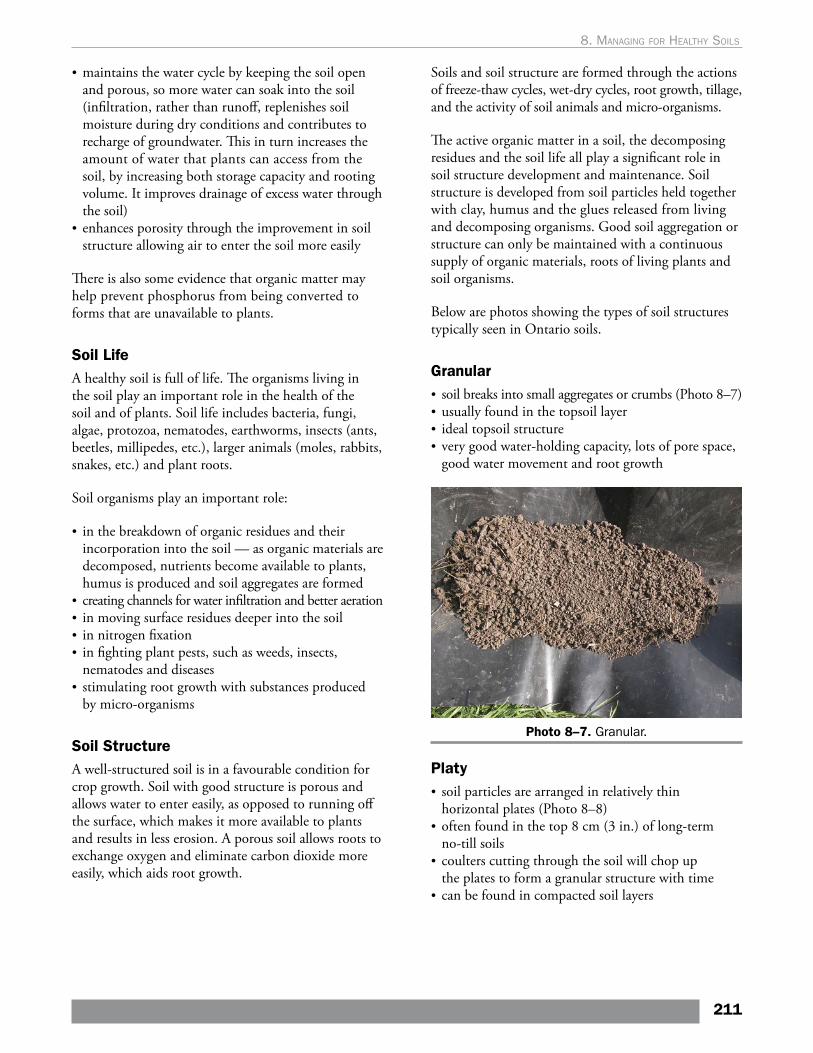
• maintains the water cycle by keeping the soil open and porous, so more water can soak into the soil (infiltration, rather than runoff, replenishes soil moisture during dry conditions and contributes to recharge of groundwater. This in turn increases the amount of water that plants can access from the soil, by increasing both storage capacity and rooting volume. It improves drainage of excess water through the soil)
• enhances porosity through the improvement in soil structure allowing air to enter the soil more easily
There is also some evidence that organic matter may help prevent phosphorus from being converted to forms that are unavailable to plants.
Soil Life A healthy soil is full of life. The organisms living in the soil play an important role in the health of the soil and of plants. Soil life includes bacteria, fungi, algae, protozoa, nematodes, earthworms, insects (ants, beetles, millipedes, etc.), larger animals (moles, rabbits, snakes, etc.) and plant roots.
Soil organisms play an important role:
• in the breakdown of organic residues and their incorporation into the soil — as organic materials are decomposed, nutrients become available to plants, humus is produced and soil aggregates are formed
• creating channels for water infiltration and better aeration• in moving surface residues deeper into the soil • in nitrogen fixation• in fighting plant pests, such as weeds, insects,
nematodes and diseases• stimulating root growth with substances produced
by micro-organisms
Soil StructureA well-structured soil is in a favourable condition for crop growth. Soil with good structure is porous and allows water to enter easily, as opposed to running off the surface, which makes it more available to plants and results in less erosion. A porous soil allows roots to exchange oxygen and eliminate carbon dioxide more easily, which aids root growth.
Soils and soil structure are formed through the actions of freeze-thaw cycles, wet-dry cycles, root growth, tillage, and the activity of soil animals and micro-organisms.
The active organic matter in a soil, the decomposing residues and the soil life all play a significant role in soil structure development and maintenance. Soil structure is developed from soil particles held together with clay, humus and the glues released from living and decomposing organisms. Good soil aggregation or structure can only be maintained with a continuous supply of organic materials, roots of living plants and soil organisms.
Below are photos showing the types of soil structures typically seen in Ontario soils.
Granular• soil breaks into small aggregates or crumbs (Photo 8–7)• usually found in the topsoil layer• ideal topsoil structure• very good water-holding capacity, lots of pore space,
good water movement and root growth
Photo 8–7. Granular.
Platy• soil particles are arranged in relatively thin
horizontal plates (Photo 8–8)• often found in the top 8 cm (3 in.) of long-term
no-till soils• coulters cutting through the soil will chop up
the plates to form a granular structure with time• can be found in compacted soil layers
211
8. ManagIng For healthy soIls
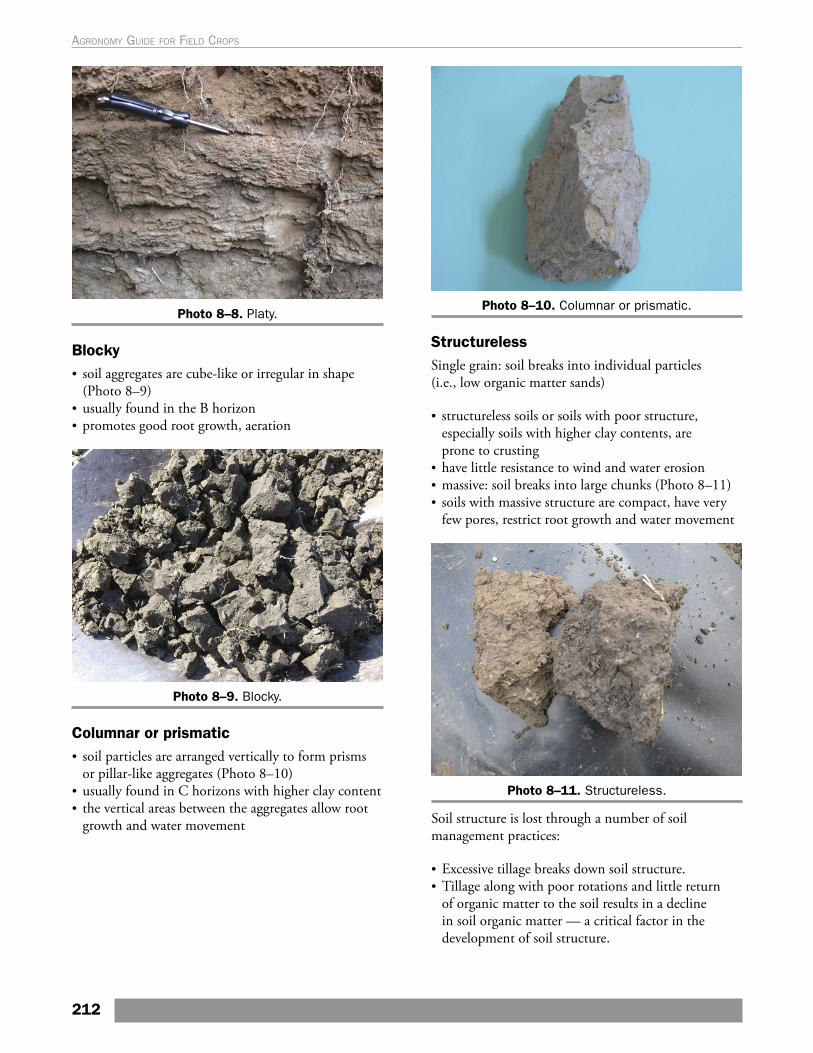
Photo 8–8. Platy.
Blocky• soil aggregates are cube-like or irregular in shape
(Photo 8–9)• usually found in the B horizon• promotes good root growth, aeration
Photo 8–9. Blocky.
Columnar or prismatic• soil particles are arranged vertically to form prisms
or pillar-like aggregates (Photo 8–10)• usually found in C horizons with higher clay content• the vertical areas between the aggregates allow root
growth and water movement
Photo 8–10. Columnar or prismatic.
StructurelessSingle grain: soil breaks into individual particles (i.e., low organic matter sands)
• structureless soils or soils with poor structure, especially soils with higher clay contents, are prone to crusting
• have little resistance to wind and water erosion• massive: soil breaks into large chunks (Photo 8–11)• soils with massive structure are compact, have very
few pores, restrict root growth and water movement
Photo 8–11. Structureless.
Soil structure is lost through a number of soil management practices:
• Excessive tillage breaks down soil structure. • Tillage along with poor rotations and little return
of organic matter to the soil results in a decline in soil organic matter — a critical factor in the development of soil structure.
212
Agronomy guide for field Crops
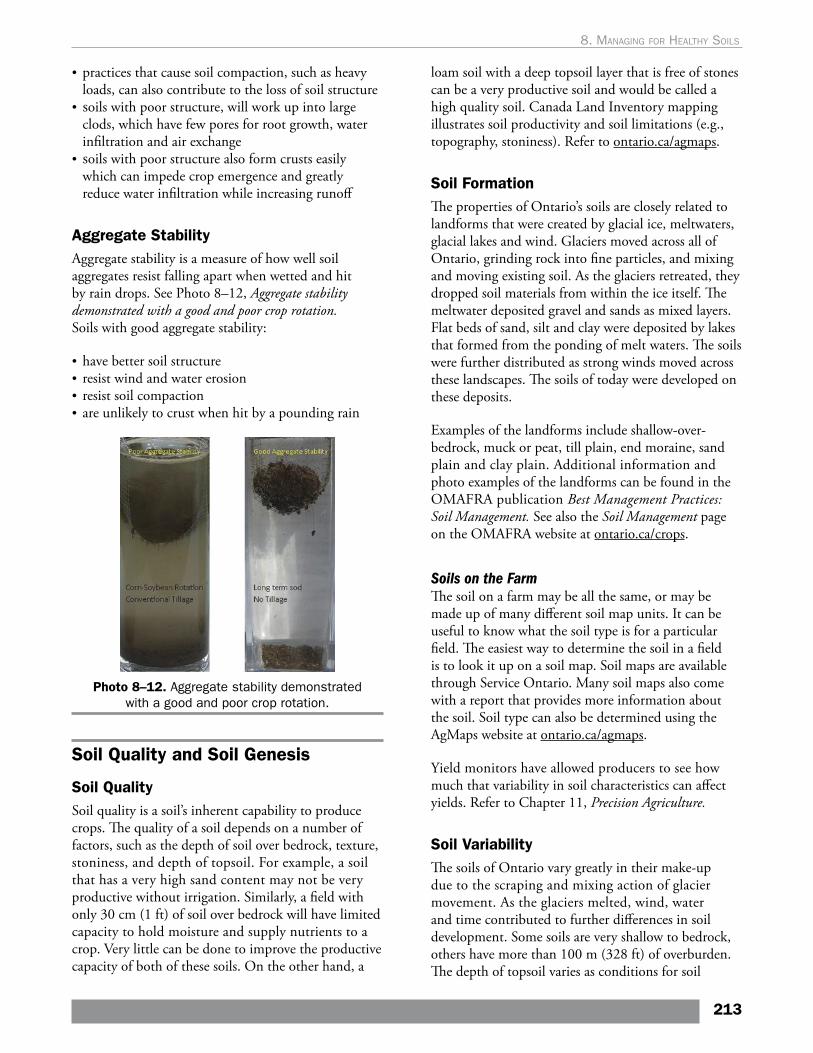
• practices that cause soil compaction, such as heavy loads, can also contribute to the loss of soil structure
• Soils with poor structure, will work up into large clods, which have few pores for root growth, water infiltration and air exchange
• Soils with poor structure also form crusts easily which can impede crop emergence and greatly reduce water infiltration while increasing runoff
Aggregate StabilityAggregate stability is a measure of how well soil aggregates resist falling apart when wetted and hit by rain drops. See Photo 8–12, Aggregate stability demonstrated with a good and poor crop rotation. Soils with good aggregate stability:
• have better soil structure • resist wind and water erosion • resist soil compaction • are unlikely to crust when hit by a pounding rain
Photo 8–12. Aggregate stability demonstrated with a good and poor crop rotation.
Soil Quality and Soil Genesis
Soil QualitySoil quality is a soil’s inherent capability to produce crops. The quality of a soil depends on a number of factors, such as the depth of soil over bedrock, texture, stoniness, and depth of topsoil. For example, a soil that has a very high sand content may not be very productive without irrigation. Similarly, a field with only 30 cm (1 ft) of soil over bedrock will have limited capacity to hold moisture and supply nutrients to a crop. Very little can be done to improve the productive capacity of both of these soils. On the other hand, a
loam soil with a deep topsoil layer that is free of stones can be a very productive soil and would be called a high quality soil. Canada Land Inventory mapping illustrates soil productivity and soil limitations (e.g., topography, stoniness). Refer to ontario.ca/agmaps.
Soil Formation The properties of Ontario’s soils are closely related to landforms that were created by glacial ice, meltwaters, glacial lakes and wind. Glaciers moved across all of Ontario, grinding rock into fine particles, and mixing and moving existing soil. As the glaciers retreated, they dropped soil materials from within the ice itself. The meltwater deposited gravel and sands as mixed layers. Flat beds of sand, silt and clay were deposited by lakes that formed from the ponding of melt waters. The soils were further distributed as strong winds moved across these landscapes. The soils of today were developed on these deposits.
Examples of the landforms include shallow-over-bedrock, muck or peat, till plain, end moraine, sand plain and clay plain. Additional information and photo examples of the landforms can be found in the OMAFRA publication Best Management Practices: Soil Management. See also the Soil Management page on the OMAFRA website at ontario.ca/crops.
Soils on the FarmThe soil on a farm may be all the same, or may be made up of many different soil map units. It can be useful to know what the soil type is for a particular field. The easiest way to determine the soil in a field is to look it up on a soil map. Soil maps are available through Service Ontario. Many soil maps also come with a report that provides more information about the soil. Soil type can also be determined using the AgMaps website at ontario.ca/agmaps.
Yield monitors have allowed producers to see how much that variability in soil characteristics can affect yields. Refer to Chapter 11, Precision Agriculture.
Soil Variability The soils of Ontario vary greatly in their make-up due to the scraping and mixing action of glacier movement. As the glaciers melted, wind, water and time contributed to further differences in soil development. Some soils are very shallow to bedrock, others have more than 100 m (328 ft) of overburden. The depth of topsoil varies as conditions for soil
213
8. ManagIng For healthy soIls
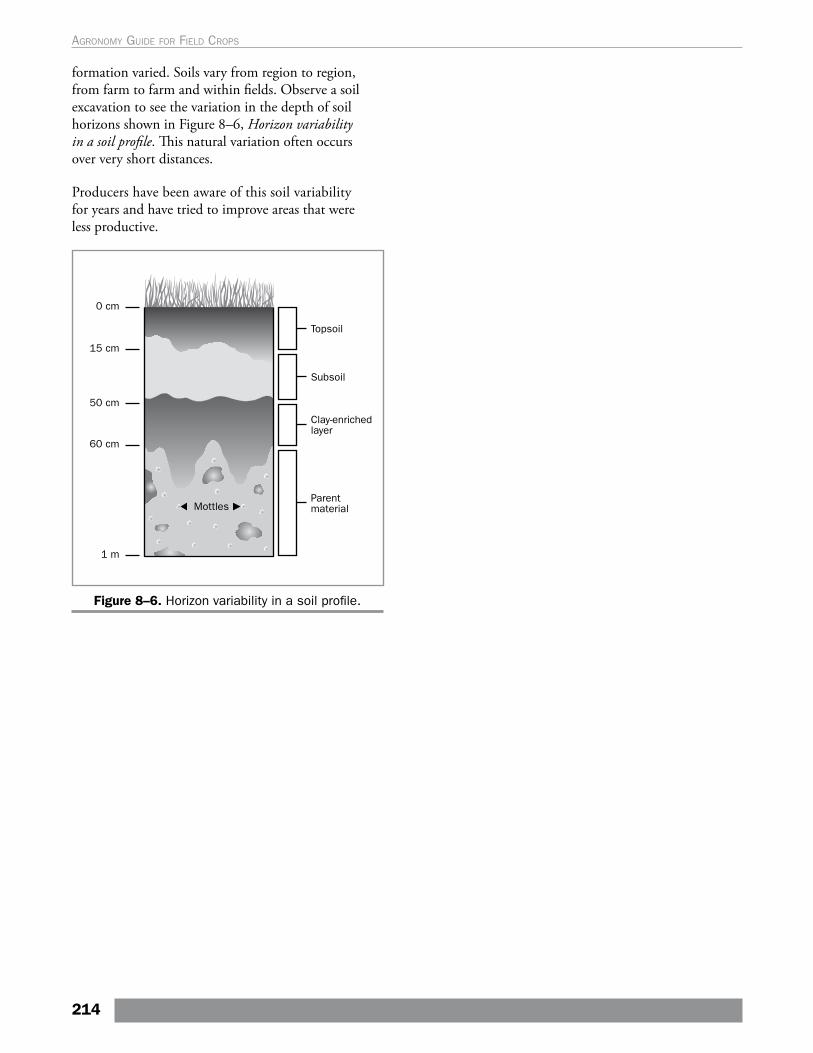
formation varied. Soils vary from region to region, from farm to farm and within fields. Observe a soil excavation to see the variation in the depth of soil horizons shown in Figure 8–6, Horizon variability in a soil profile. This natural variation often occurs over very short distances.
Producers have been aware of this soil variability for years and have tried to improve areas that were less productive.
Figure 8–6. Horizon variability in a soil profile.
214
Agronomy guide for field Crops
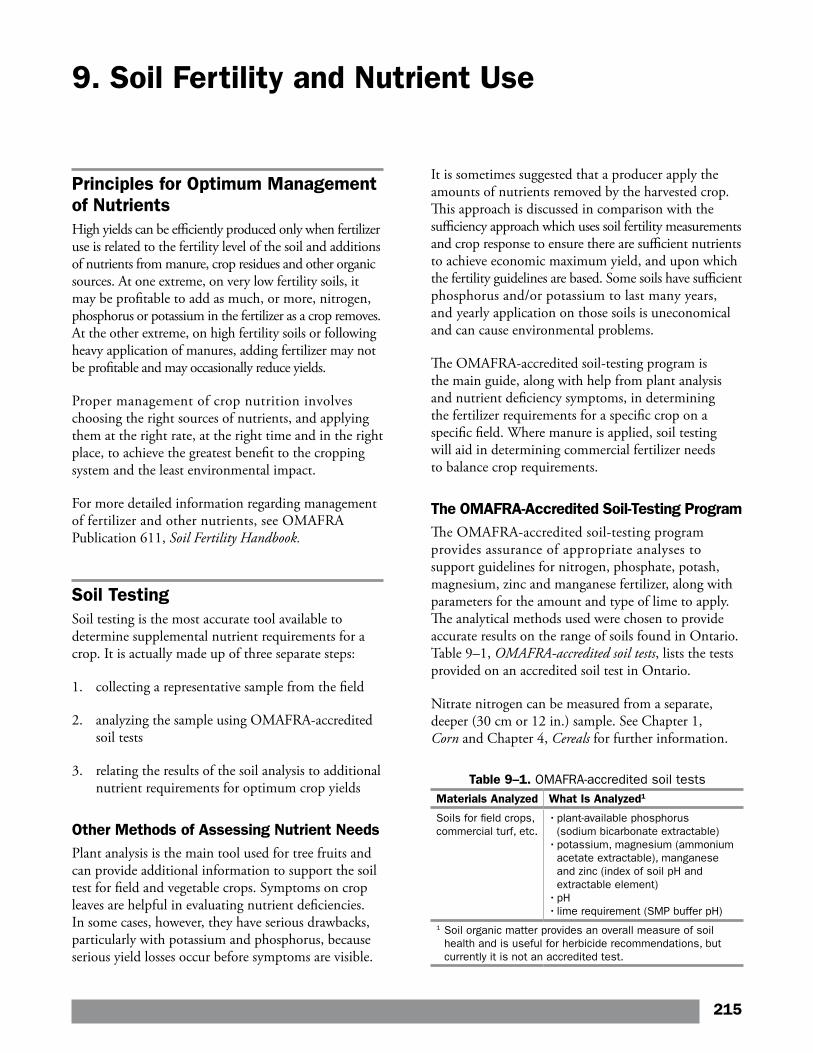
9. Soil Fertility and Nutrient Use
It is sometimes suggested that a producer apply the amounts of nutrients removed by the harvested crop. This approach is discussed in comparison with the sufficiency approach which uses soil fertility measurements and crop response to ensure there are sufficient nutrients to achieve economic maximum yield, and upon which the fertility guidelines are based. Some soils have sufficient phosphorus and/or potassium to last many years, and yearly application on those soils is uneconomical and can cause environmental problems.
The OMAFRA-accredited soil-testing program is the main guide, along with help from plant analysis and nutrient deficiency symptoms, in determining the fertilizer requirements for a specific crop on a specific field. Where manure is applied, soil testing will aid in determining commercial fertilizer needs to balance crop requirements.
The OMAFRA-Accredited Soil-Testing Program The OMAFRA-accredited soil-testing program provides assurance of appropriate analyses to support guidelines for nitrogen, phosphate, potash, magnesium, zinc and manganese fertilizer, along with parameters for the amount and type of lime to apply. The analytical methods used were chosen to provide accurate results on the range of soils found in Ontario. Table 9–1, OMAFRA-accredited soil tests, lists the tests provided on an accredited soil test in Ontario.
Nitrate nitrogen can be measured from a separate, deeper (30 cm or 12 in.) sample. See Chapter 1, Corn and Chapter 4, Cereals for further information.
Table 9–1. OMAFRA-accredited soil testsMaterials Analyzed What Is Analyzed1
Soils for field crops, commercial turf, etc.
• plant-available phosphorus (sodium bicarbonate extractable)
• potassium, magnesium (ammonium acetate extractable), manganese and zinc (index of soil pH and extractable element)
• pH• lime requirement (SMP buffer pH)
1 Soil organic matter provides an overall measure of soil health and is useful for herbicide recommendations, but currently it is not an accredited test.
Principles for Optimum Management of NutrientsHigh yields can be efficiently produced only when fertilizer use is related to the fertility level of the soil and additions of nutrients from manure, crop residues and other organic sources. At one extreme, on very low fertility soils, it may be profitable to add as much, or more, nitrogen, phosphorus or potassium in the fertilizer as a crop removes. At the other extreme, on high fertility soils or following heavy application of manures, adding fertilizer may not be profitable and may occasionally reduce yields.
Proper management of crop nutrition involves choosing the right sources of nutrients, and applying them at the right rate, at the right time and in the right place, to achieve the greatest benefit to the cropping system and the least environmental impact.
For more detailed information regarding management of fertilizer and other nutrients, see OMAFRA Publication 611, Soil Fertility Handbook.
Soil TestingSoil testing is the most accurate tool available to determine supplemental nutrient requirements for a crop. It is actually made up of three separate steps:
1. collecting a representative sample from the field
2. analyzing the sample using OMAFRA-accredited soil tests
3. relating the results of the soil analysis to additional nutrient requirements for optimum crop yields
Other Methods of Assessing Nutrient NeedsPlant analysis is the main tool used for tree fruits and can provide additional information to support the soil test for field and vegetable crops. Symptoms on crop leaves are helpful in evaluating nutrient deficiencies. In some cases, however, they have serious drawbacks, particularly with potassium and phosphorus, because serious yield losses occur before symptoms are visible.
215
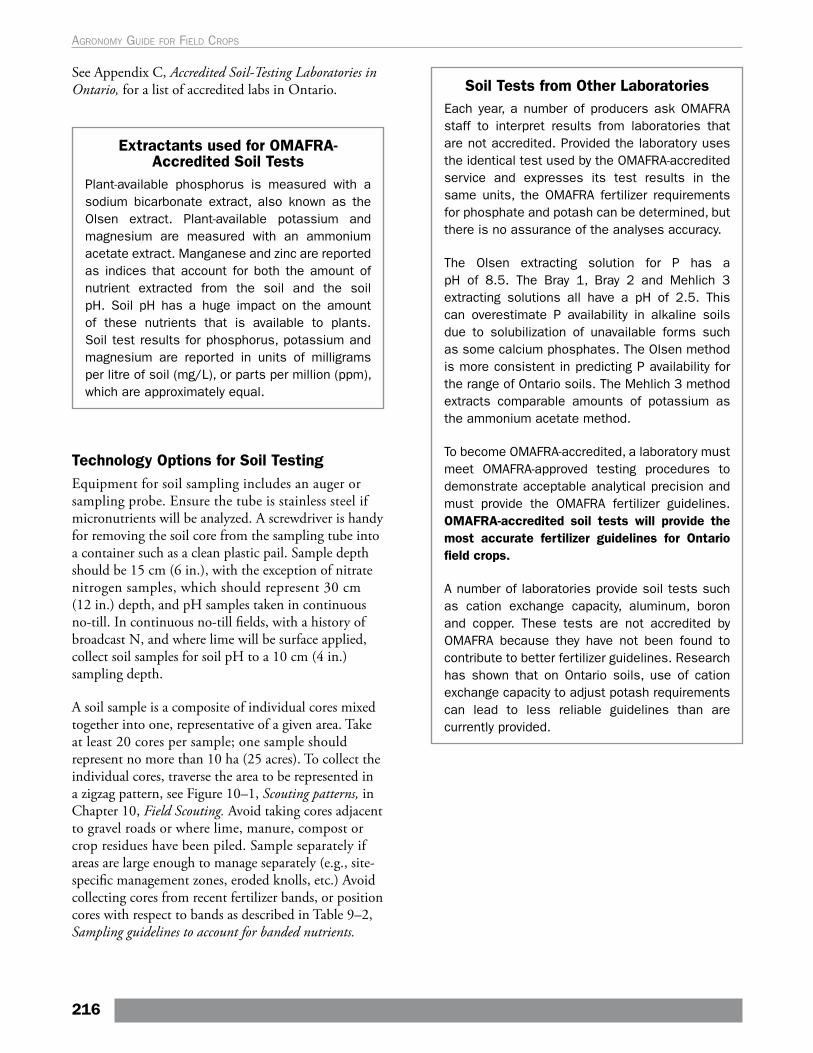
See Appendix C, Accredited Soil-Testing Laboratories in Ontario, for a list of accredited labs in Ontario.
Extractants used for OMAFRA-Accredited Soil Tests
Plant-available phosphorus is measured with a sodium bicarbonate extract, also known as the Olsen extract. Plant-available potassium and magnesium are measured with an ammonium acetate extract. Manganese and zinc are reported as indices that account for both the amount of nutrient extracted from the soil and the soil pH. Soil pH has a huge impact on the amount of these nutrients that is available to plants. Soil test results for phosphorus, potassium and magnesium are reported in units of milligrams per litre of soil (mg/L), or parts per million (ppm), which are approximately equal.
Soil Tests from Other LaboratoriesEach year, a number of producers ask OMAFRA staff to interpret results from laboratories that are not accredited. Provided the laboratory uses the identical test used by the OMAFRA-accredited service and expresses its test results in the same units, the OMAFRA fertilizer requirements for phosphate and potash can be determined, but there is no assurance of the analyses accuracy.
The Olsen extracting solution for P has a pH of 8.5. The Bray 1, Bray 2 and Mehlich 3 extracting solutions all have a pH of 2.5. This can overestimate P availability in alkaline soils due to solubilization of unavailable forms such as some calcium phosphates. The Olsen method is more consistent in predicting P availability for the range of Ontario soils. The Mehlich 3 method extracts comparable amounts of potassium as the ammonium acetate method.
To become OMAFRA-accredited, a laboratory must meet OMAFRA-approved testing procedures to demonstrate acceptable analytical precision and must provide the OMAFRA fertilizer guidelines. OMAFRA-accredited soil tests will provide the most accurate fertilizer guidelines for Ontario field crops.
A number of laboratories provide soil tests such as cation exchange capacity, aluminum, boron and copper. These tests are not accredited by OMAFRA because they have not been found to contribute to better fertilizer guidelines. Research has shown that on Ontario soils, use of cation exchange capacity to adjust potash requirements can lead to less reliable guidelines than are currently provided.
Technology Options for Soil Testing Equipment for soil sampling includes an auger or sampling probe. Ensure the tube is stainless steel if micronutrients will be analyzed. A screwdriver is handy for removing the soil core from the sampling tube into a container such as a clean plastic pail. Sample depth should be 15 cm (6 in.), with the exception of nitrate nitrogen samples, which should represent 30 cm (12 in.) depth, and pH samples taken in continuous no-till. In continuous no-till fields, with a history of broadcast N, and where lime will be surface applied, collect soil samples for soil pH to a 10 cm (4 in.) sampling depth.
A soil sample is a composite of individual cores mixed together into one, representative of a given area. Take at least 20 cores per sample; one sample should represent no more than 10 ha (25 acres). To collect the individual cores, traverse the area to be represented in a zigzag pattern, see Figure 10–1, Scouting patterns, in Chapter 10, Field Scouting. Avoid taking cores adjacent to gravel roads or where lime, manure, compost or crop residues have been piled. Sample separately if areas are large enough to manage separately (e.g., site-specific management zones, eroded knolls, etc.) Avoid collecting cores from recent fertilizer bands, or position cores with respect to bands as described in Table 9–2, Sampling guidelines to account for banded nutrients.
216
Agronomy guide for field Crops
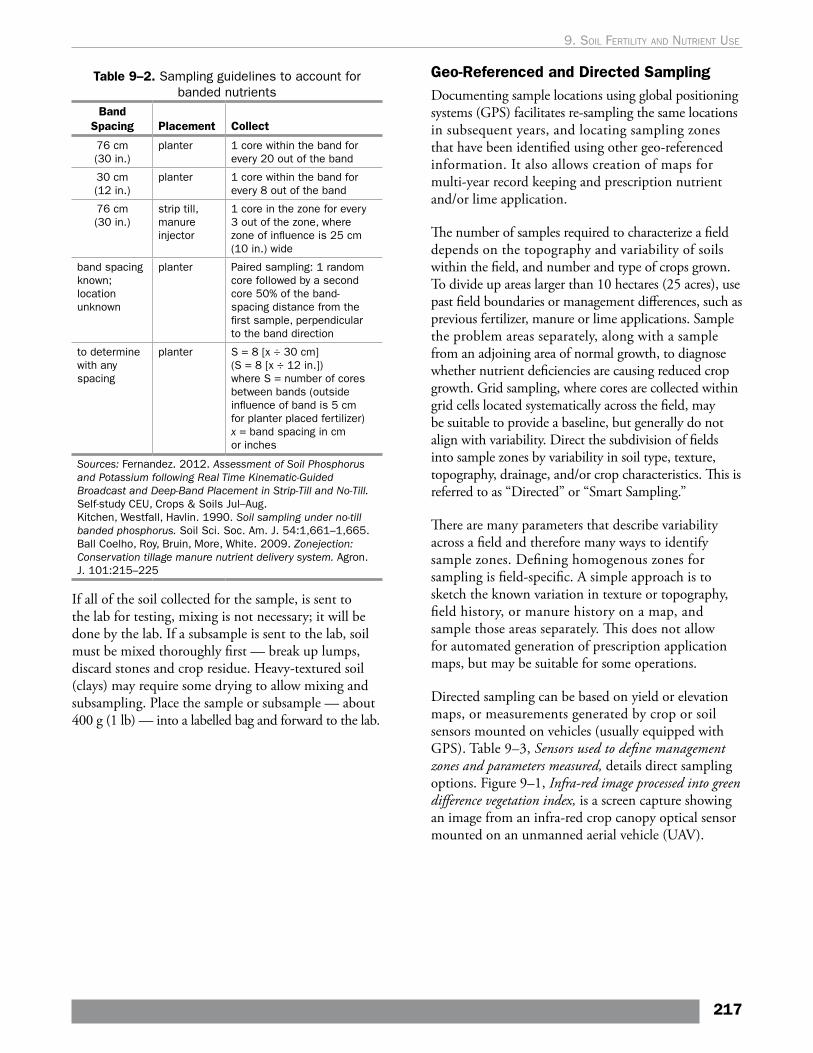
Table 9–2. Sampling guidelines to account for banded nutrients
Band Spacing Placement Collect
76 cm (30 in.)
planter 1 core within the band for every 20 out of the band
30 cm (12 in.)
planter 1 core within the band for every 8 out of the band
76 cm (30 in.)
strip till, manure injector
1 core in the zone for every 3 out of the zone, where zone of influence is 25 cm (10 in.) wide
band spacing known; location unknown
planter Paired sampling: 1 random core followed by a second core 50% of the band-spacing distance from the first sample, perpendicular to the band direction
to determine with any spacing
planter S = 8 [x ÷ 30 cm] (S = 8 [x ÷ 12 in.]) where S = number of cores between bands (outside influence of band is 5 cm for planter placed fertilizer) x = band spacing in cm or inches
Sources: Fernandez. 2012. Assessment of Soil Phosphorus and Potassium following Real Time Kinematic-Guided Broadcast and Deep-Band Placement in Strip-Till and No-Till. Self-study CEU, Crops & Soils Jul–Aug. Kitchen, Westfall, Havlin. 1990. Soil sampling under no-till banded phosphorus. Soil Sci. Soc. Am. J. 54:1,661–1,665. Ball Coelho, Roy, Bruin, More, White. 2009. Zonejection: Conservation tillage manure nutrient delivery system. Agron. J. 101:215–225
Geo-Referenced and Directed Sampling Documenting sample locations using global positioning systems (GPS) facilitates re-sampling the same locations in subsequent years, and locating sampling zones that have been identified using other geo-referenced information. It also allows creation of maps for multi-year record keeping and prescription nutrient and/or lime application.
The number of samples required to characterize a field depends on the topography and variability of soils within the field, and number and type of crops grown. To divide up areas larger than 10 hectares (25 acres), use past field boundaries or management differences, such as previous fertilizer, manure or lime applications. Sample the problem areas separately, along with a sample from an adjoining area of normal growth, to diagnose whether nutrient deficiencies are causing reduced crop growth. Grid sampling, where cores are collected within grid cells located systematically across the field, may be suitable to provide a baseline, but generally do not align with variability. Direct the subdivision of fields into sample zones by variability in soil type, texture, topography, drainage, and/or crop characteristics. This is referred to as “Directed” or “Smart Sampling.”
There are many parameters that describe variability across a field and therefore many ways to identify sample zones. Defining homogenous zones for sampling is field-specific. A simple approach is to sketch the known variation in texture or topography, field history, or manure history on a map, and sample those areas separately. This does not allow for automated generation of prescription application maps, but may be suitable for some operations.
Directed sampling can be based on yield or elevation maps, or measurements generated by crop or soil sensors mounted on vehicles (usually equipped with GPS). Table 9–3, Sensors used to define management zones and parameters measured, details direct sampling options. Figure 9–1, Infra-red image processed into green difference vegetation index, is a screen capture showing an image from an infra-red crop canopy optical sensor mounted on an unmanned aerial vehicle (UAV).
If all of the soil collected for the sample, is sent to the lab for testing, mixing is not necessary; it will be done by the lab. If a subsample is sent to the lab, soil must be mixed thoroughly first — break up lumps, discard stones and crop residue. Heavy-textured soil (clays) may require some drying to allow mixing and subsampling. Place the sample or subsample — about 400 g (1 lb) — into a labelled bag and forward to the lab.
217
9. soIl FertIlIty and nutrIent use
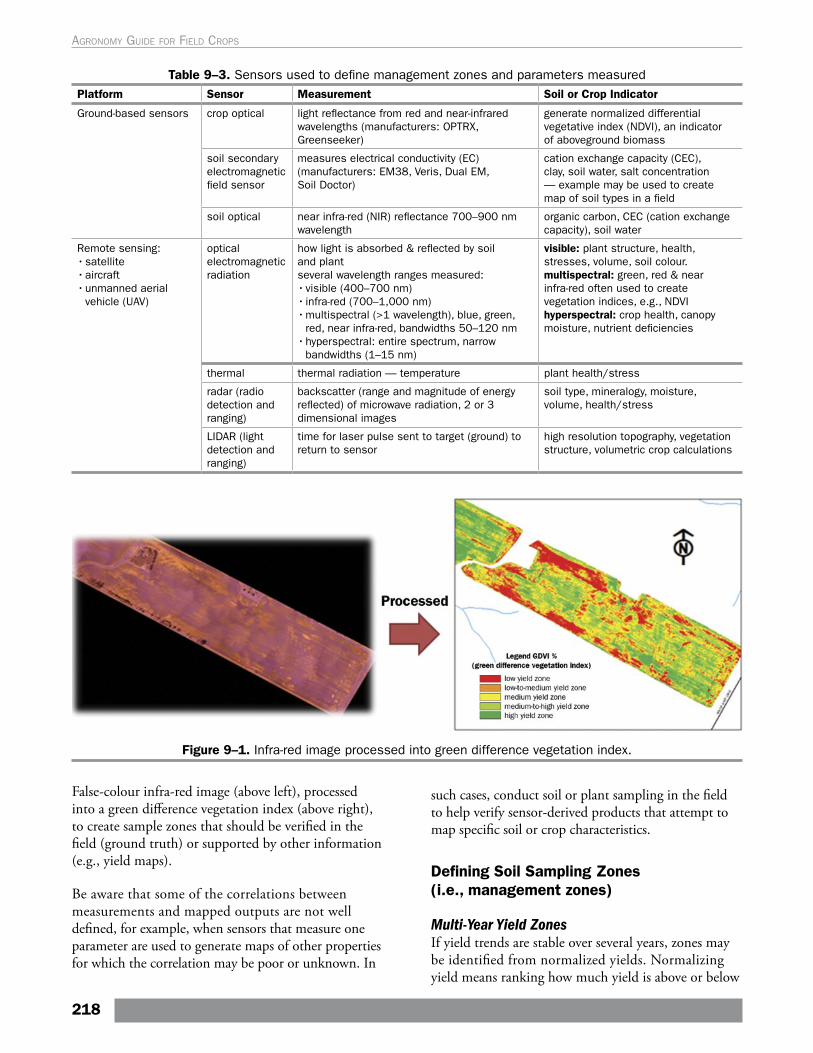
Table 9–3. Sensors used to define management zones and parameters measured Platform Sensor Measurement Soil or Crop Indicator
Ground-based sensors crop optical light reflectance from red and near-infrared wavelengths (manufacturers: OPTRX, Greenseeker)
generate normalized differential vegetative index (NDVI), an indicator of aboveground biomass
soil secondary electromagnetic field sensor
measures electrical conductivity (EC) (manufacturers: EM38, Veris, Dual EM, Soil Doctor)
cation exchange capacity (CEC), clay, soil water, salt concentration — example may be used to create map of soil types in a field
soil optical near infra-red (NIR) reflectance 700–900 nm wavelength
organic carbon, CEC (cation exchange capacity), soil water
Remote sensing:• satellite• aircraft• unmanned aerial
vehicle (UAV)
optical electromagnetic radiation
how light is absorbed & reflected by soil and plantseveral wavelength ranges measured: • visible (400–700 nm)• infra-red (700–1,000 nm)• multispectral (>1 wavelength), blue, green,
red, near infra-red, bandwidths 50–120 nm• hyperspectral: entire spectrum, narrow
bandwidths (1–15 nm)
visible: plant structure, health, stresses, volume, soil colour. multispectral: green, red & near infra-red often used to create vegetation indices, e.g., NDVI hyperspectral: crop health, canopy moisture, nutrient deficiencies
thermal thermal radiation — temperature plant health/stress
radar (radio detection and ranging)
backscatter (range and magnitude of energy reflected) of microwave radiation, 2 or 3 dimensional images
soil type, mineralogy, moisture, volume, health/stress
LIDAR (light detection and ranging)
time for laser pulse sent to target (ground) to return to sensor
high resolution topography, vegetation structure, volumetric crop calculations
Figure 9–1. Infra-red image processed into green difference vegetation index.
False-colour infra-red image (above left), processed into a green difference vegetation index (above right), to create sample zones that should be verified in the field (ground truth) or supported by other information (e.g., yield maps).
Be aware that some of the correlations between measurements and mapped outputs are not well defined, for example, when sensors that measure one parameter are used to generate maps of other properties for which the correlation may be poor or unknown. In
such cases, conduct soil or plant sampling in the field to help verify sensor-derived products that attempt to map specific soil or crop characteristics.
Defining Soil Sampling Zones (i.e., management zones)
Multi-Year Yield ZonesIf yield trends are stable over several years, zones may be identified from normalized yields. Normalizing yield means ranking how much yield is above or below
218
Agronomy guide for field Crops
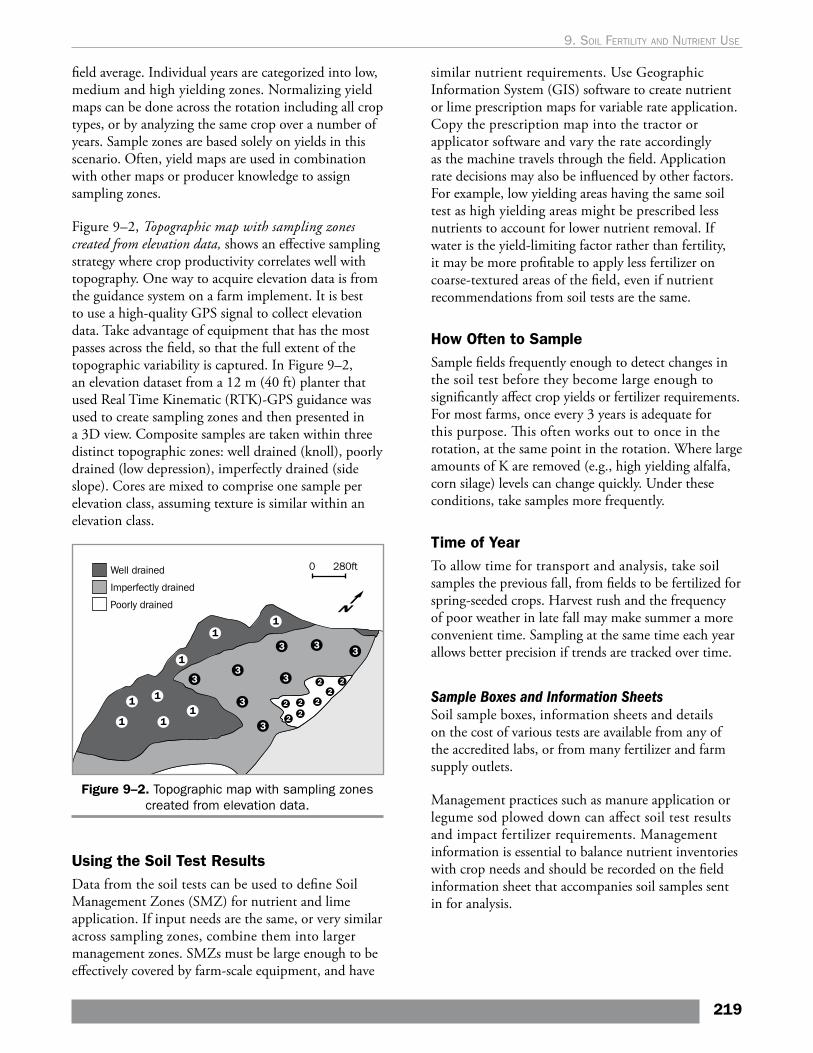
field average. Individual years are categorized into low, medium and high yielding zones. Normalizing yield maps can be done across the rotation including all crop types, or by analyzing the same crop over a number of years. Sample zones are based solely on yields in this scenario. Often, yield maps are used in combination with other maps or producer knowledge to assign sampling zones.
Figure 9–2, Topographic map with sampling zones created from elevation data, shows an effective sampling strategy where crop productivity correlates well with topography. One way to acquire elevation data is from the guidance system on a farm implement. It is best to use a high-quality GPS signal to collect elevation data. Take advantage of equipment that has the most passes across the field, so that the full extent of the topographic variability is captured. In Figure 9–2, an elevation dataset from a 12 m (40 ft) planter that used Real Time Kinematic (RTK)-GPS guidance was used to create sampling zones and then presented in a 3D view. Composite samples are taken within three distinct topographic zones: well drained (knoll), poorly drained (low depression), imperfectly drained (side slope). Cores are mixed to comprise one sample per elevation class, assuming texture is similar within an elevation class.
Figure 9–2. Topographic map with sampling zones created from elevation data.
Using the Soil Test ResultsData from the soil tests can be used to define Soil Management Zones (SMZ) for nutrient and lime application. If input needs are the same, or very similar across sampling zones, combine them into larger management zones. SMZs must be large enough to be effectively covered by farm-scale equipment, and have
similar nutrient requirements. Use Geographic Information System (GIS) software to create nutrient or lime prescription maps for variable rate application. Copy the prescription map into the tractor or applicator software and vary the rate accordingly as the machine travels through the field. Application rate decisions may also be influenced by other factors. For example, low yielding areas having the same soil test as high yielding areas might be prescribed less nutrients to account for lower nutrient removal. If water is the yield-limiting factor rather than fertility, it may be more profitable to apply less fertilizer on coarse-textured areas of the field, even if nutrient recommendations from soil tests are the same.
How Often to SampleSample fields frequently enough to detect changes in the soil test before they become large enough to significantly affect crop yields or fertilizer requirements. For most farms, once every 3 years is adequate for this purpose. This often works out to once in the rotation, at the same point in the rotation. Where large amounts of K are removed (e.g., high yielding alfalfa, corn silage) levels can change quickly. Under these conditions, take samples more frequently.
Time of YearTo allow time for transport and analysis, take soil samples the previous fall, from fields to be fertilized for spring-seeded crops. Harvest rush and the frequency of poor weather in late fall may make summer a more convenient time. Sampling at the same time each year allows better precision if trends are tracked over time.
Sample Boxes and Information SheetsSoil sample boxes, information sheets and details on the cost of various tests are available from any of the accredited labs, or from many fertilizer and farm supply outlets.
Management practices such as manure application or legume sod plowed down can affect soil test results and impact fertilizer requirements. Management information is essential to balance nutrient inventories with crop needs and should be recorded on the field information sheet that accompanies soil samples sent in for analysis.
219
9. soIl FertIlIty and nutrIent use
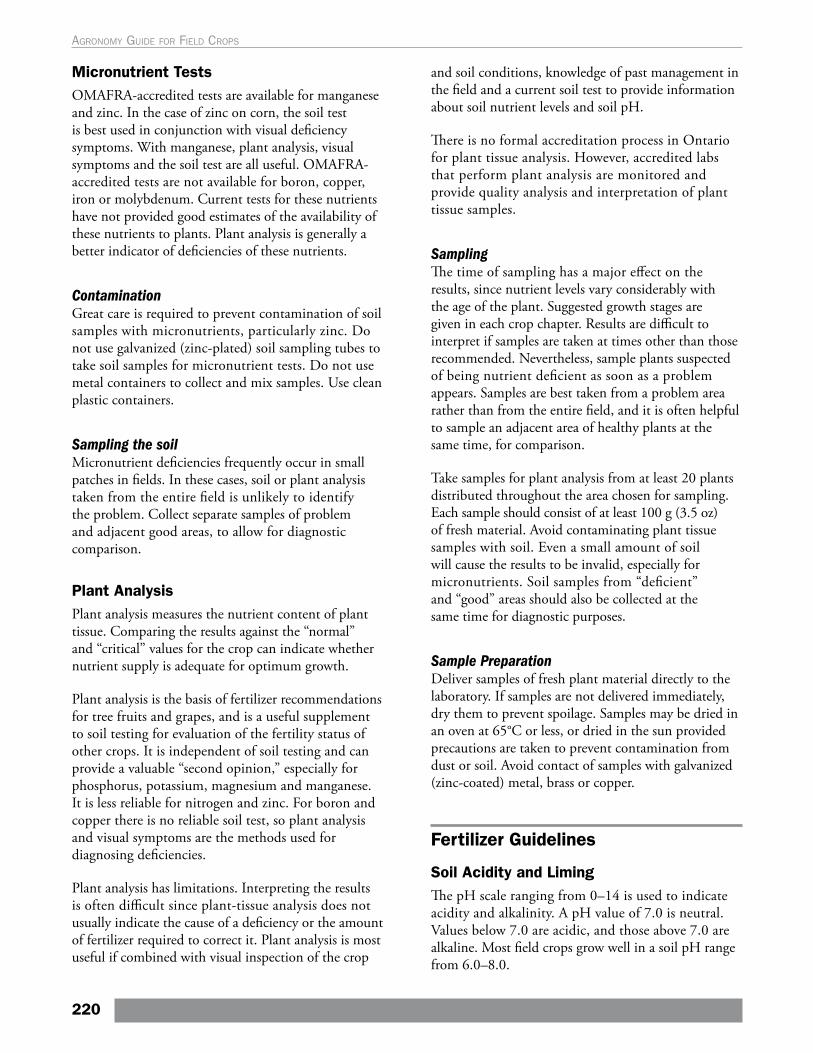
Micronutrient TestsOMAFRA-accredited tests are available for manganese and zinc. In the case of zinc on corn, the soil test is best used in conjunction with visual deficiency symptoms. With manganese, plant analysis, visual symptoms and the soil test are all useful. OMAFRA-accredited tests are not available for boron, copper, iron or molybdenum. Current tests for these nutrients have not provided good estimates of the availability of these nutrients to plants. Plant analysis is generally a better indicator of deficiencies of these nutrients.
Contamination Great care is required to prevent contamination of soil samples with micronutrients, particularly zinc. Do not use galvanized (zinc-plated) soil sampling tubes to take soil samples for micronutrient tests. Do not use metal containers to collect and mix samples. Use clean plastic containers.
Sampling the soil Micronutrient deficiencies frequently occur in small patches in fields. In these cases, soil or plant analysis taken from the entire field is unlikely to identify the problem. Collect separate samples of problem and adjacent good areas, to allow for diagnostic comparison.
Plant AnalysisPlant analysis measures the nutrient content of plant tissue. Comparing the results against the “normal” and “critical” values for the crop can indicate whether nutrient supply is adequate for optimum growth.
Plant analysis is the basis of fertilizer recommendations for tree fruits and grapes, and is a useful supplement to soil testing for evaluation of the fertility status of other crops. It is independent of soil testing and can provide a valuable “second opinion,” especially for phosphorus, potassium, magnesium and manganese. It is less reliable for nitrogen and zinc. For boron and copper there is no reliable soil test, so plant analysis and visual symptoms are the methods used for diagnosing deficiencies.
Plant analysis has limitations. Interpreting the results is often difficult since plant-tissue analysis does not usually indicate the cause of a deficiency or the amount of fertilizer required to correct it. Plant analysis is most useful if combined with visual inspection of the crop
and soil conditions, knowledge of past management in the field and a current soil test to provide information about soil nutrient levels and soil pH.
There is no formal accreditation process in Ontario for plant tissue analysis. However, accredited labs that perform plant analysis are monitored and provide quality analysis and interpretation of plant tissue samples.
SamplingThe time of sampling has a major effect on the results, since nutrient levels vary considerably with the age of the plant. Suggested growth stages are given in each crop chapter. Results are difficult to interpret if samples are taken at times other than those recommended. Nevertheless, sample plants suspected of being nutrient deficient as soon as a problem appears. Samples are best taken from a problem area rather than from the entire field, and it is often helpful to sample an adjacent area of healthy plants at the same time, for comparison.
Take samples for plant analysis from at least 20 plants distributed throughout the area chosen for sampling. Each sample should consist of at least 100 g (3.5 oz) of fresh material. Avoid contaminating plant tissue samples with soil. Even a small amount of soil will cause the results to be invalid, especially for micronutrients. Soil samples from “deficient” and “good” areas should also be collected at the same time for diagnostic purposes.
Sample PreparationDeliver samples of fresh plant material directly to the laboratory. If samples are not delivered immediately, dry them to prevent spoilage. Samples may be dried in an oven at 65°C or less, or dried in the sun provided precautions are taken to prevent contamination from dust or soil. Avoid contact of samples with galvanized (zinc-coated) metal, brass or copper.
Fertilizer Guidelines
Soil Acidity and LimingThe pH scale ranging from 0–14 is used to indicate acidity and alkalinity. A pH value of 7.0 is neutral. Values below 7.0 are acidic, and those above 7.0 are alkaline. Most field crops grow well in a soil pH range from 6.0–8.0.
220
Agronomy guide for field Crops
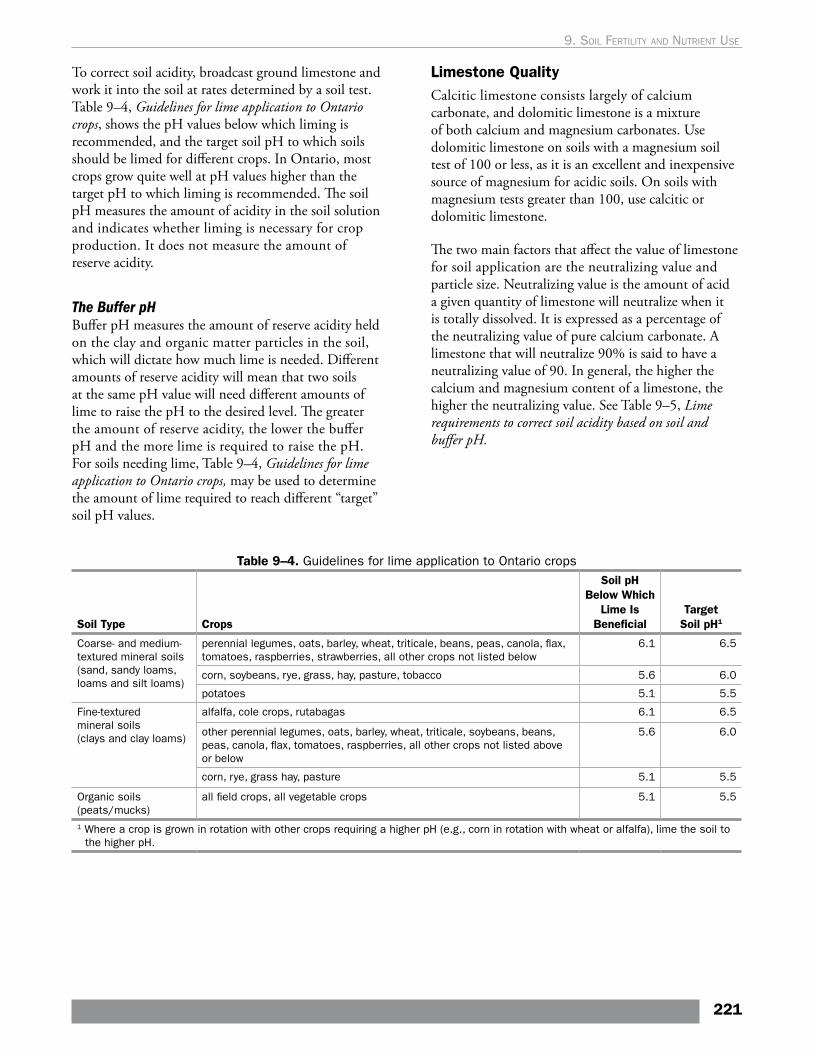
To correct soil acidity, broadcast ground limestone and work it into the soil at rates determined by a soil test. Table 9–4, Guidelines for lime application to Ontario crops, shows the pH values below which liming is recommended, and the target soil pH to which soils should be limed for different crops. In Ontario, most crops grow quite well at pH values higher than the target pH to which liming is recommended. The soil pH measures the amount of acidity in the soil solution and indicates whether liming is necessary for crop production. It does not measure the amount of reserve acidity.
The Buffer pH Buffer pH measures the amount of reserve acidity held on the clay and organic matter particles in the soil, which will dictate how much lime is needed. Different amounts of reserve acidity will mean that two soils at the same pH value will need different amounts of lime to raise the pH to the desired level. The greater the amount of reserve acidity, the lower the buffer pH and the more lime is required to raise the pH. For soils needing lime, Table 9–4, Guidelines for lime application to Ontario crops, may be used to determine the amount of lime required to reach different “target” soil pH values.
Limestone Quality Calcitic limestone consists largely of calcium carbonate, and dolomitic limestone is a mixture of both calcium and magnesium carbonates. Use dolomitic limestone on soils with a magnesium soil test of 100 or less, as it is an excellent and inexpensive source of magnesium for acidic soils. On soils with magnesium tests greater than 100, use calcitic or dolomitic limestone.
The two main factors that affect the value of limestone for soil application are the neutralizing value and particle size. Neutralizing value is the amount of acid a given quantity of limestone will neutralize when it is totally dissolved. It is expressed as a percentage of the neutralizing value of pure calcium carbonate. A limestone that will neutralize 90% is said to have a neutralizing value of 90. In general, the higher the calcium and magnesium content of a limestone, the higher the neutralizing value. See Table 9–5, Lime requirements to correct soil acidity based on soil and buffer pH.
Table 9–4. Guidelines for lime application to Ontario crops
Soil Type Crops
Soil pH Below Which
Lime Is Beneficial
Target Soil pH1
Coarse- and medium-textured mineral soils (sand, sandy loams, loams and silt loams)
perennial legumes, oats, barley, wheat, triticale, beans, peas, canola, flax, tomatoes, raspberries, strawberries, all other crops not listed below
6.1 6.5
corn, soybeans, rye, grass, hay, pasture, tobacco 5.6 6.0
potatoes 5.1 5.5
Fine-textured mineral soils (clays and clay loams)
alfalfa, cole crops, rutabagas 6.1 6.5
other perennial legumes, oats, barley, wheat, triticale, soybeans, beans, peas, canola, flax, tomatoes, raspberries, all other crops not listed above or below
5.6 6.0
corn, rye, grass hay, pasture 5.1 5.5
Organic soils (peats/mucks)
all field crops, all vegetable crops 5.1 5.5
1 Where a crop is grown in rotation with other crops requiring a higher pH (e.g., corn in rotation with wheat or alfalfa), lime the soil to the higher pH.
221
9. soIl FertIlIty and nutrIent use
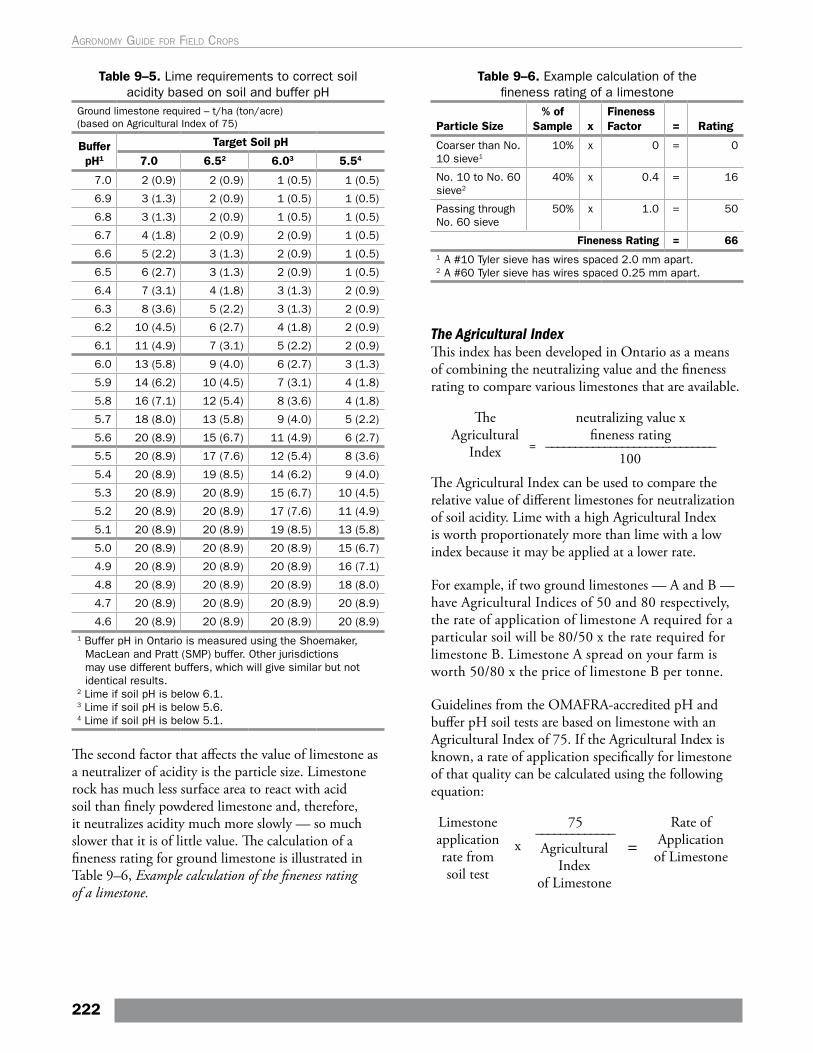
Table 9–5. Lime requirements to correct soil acidity based on soil and buffer pH
Ground limestone required – t/ha (ton/acre) (based on Agricultural Index of 75)
Buffer pH1
Target Soil pH
7.0 6.52 6.03 5.54
7.0 2 (0.9) 2 (0.9) 1 (0.5) 1 (0.5)
6.9 3 (1.3) 2 (0.9) 1 (0.5) 1 (0.5)
6.8 3 (1.3) 2 (0.9) 1 (0.5) 1 (0.5)
6.7 4 (1.8) 2 (0.9) 2 (0.9) 1 (0.5)
6.6 5 (2.2) 3 (1.3) 2 (0.9) 1 (0.5)
6.5 6 (2.7) 3 (1.3) 2 (0.9) 1 (0.5)
6.4 7 (3.1) 4 (1.8) 3 (1.3) 2 (0.9)
6.3 8 (3.6) 5 (2.2) 3 (1.3) 2 (0.9)
6.2 10 (4.5) 6 (2.7) 4 (1.8) 2 (0.9)
6.1 11 (4.9) 7 (3.1) 5 (2.2) 2 (0.9)
6.0 13 (5.8) 9 (4.0) 6 (2.7) 3 (1.3)
5.9 14 (6.2) 10 (4.5) 7 (3.1) 4 (1.8)
5.8 16 (7.1) 12 (5.4) 8 (3.6) 4 (1.8)
5.7 18 (8.0) 13 (5.8) 9 (4.0) 5 (2.2)
5.6 20 (8.9) 15 (6.7) 11 (4.9) 6 (2.7)
5.5 20 (8.9) 17 (7.6) 12 (5.4) 8 (3.6)
5.4 20 (8.9) 19 (8.5) 14 (6.2) 9 (4.0)
5.3 20 (8.9) 20 (8.9) 15 (6.7) 10 (4.5)
5.2 20 (8.9) 20 (8.9) 17 (7.6) 11 (4.9)
5.1 20 (8.9) 20 (8.9) 19 (8.5) 13 (5.8)
5.0 20 (8.9) 20 (8.9) 20 (8.9) 15 (6.7)
4.9 20 (8.9) 20 (8.9) 20 (8.9) 16 (7.1)
4.8 20 (8.9) 20 (8.9) 20 (8.9) 18 (8.0)
4.7 20 (8.9) 20 (8.9) 20 (8.9) 20 (8.9)
4.6 20 (8.9) 20 (8.9) 20 (8.9) 20 (8.9)1 Buffer pH in Ontario is measured using the Shoemaker,
MacLean and Pratt (SMP) buffer. Other jurisdictions may use different buffers, which will give similar but not identical results.
2 Lime if soil pH is below 6.1.3 Lime if soil pH is below 5.6.4 Lime if soil pH is below 5.1.
The second factor that affects the value of limestone as a neutralizer of acidity is the particle size. Limestone rock has much less surface area to react with acid soil than finely powdered limestone and, therefore, it neutralizes acidity much more slowly — so much slower that it is of little value. The calculation of a fineness rating for ground limestone is illustrated in Table 9–6, Example calculation of the fineness rating of a limestone.
Table 9–6. Example calculation of the fineness rating of a limestone
Particle Size% of
Sample xFineness Factor = Rating
Coarser than No. 10 sieve1
10% x 0 = 0
No. 10 to No. 60 sieve2
40% x 0.4 = 16
Passing through No. 60 sieve
50% x 1.0 = 50
Fineness Rating = 661 A #10 Tyler sieve has wires spaced 2.0 mm apart.2 A #60 Tyler sieve has wires spaced 0.25 mm apart.
The Agricultural Index This index has been developed in Ontario as a means of combining the neutralizing value and the fineness rating to compare various limestones that are available.
The Agricultural
Index =100
_____________________________
neutralizing value x fineness rating
The Agricultural Index can be used to compare the relative value of different limestones for neutralization of soil acidity. Lime with a high Agricultural Index is worth proportionately more than lime with a low index because it may be applied at a lower rate.
For example, if two ground limestones — A and B — have Agricultural Indices of 50 and 80 respectively, the rate of application of limestone A required for a particular soil will be 80/50 x the rate required for limestone B. Limestone A spread on your farm is worth 50/80 x the price of limestone B per tonne.
Guidelines from the OMAFRA-accredited pH and buffer pH soil tests are based on limestone with an Agricultural Index of 75. If the Agricultural Index is known, a rate of application specifically for limestone of that quality can be calculated using the following equation:
Limestone application rate from soil test
x
75_____________Agricultural
Index of Limestone
=Rate of
Application of Limestone
222
Agronomy guide for field Crops
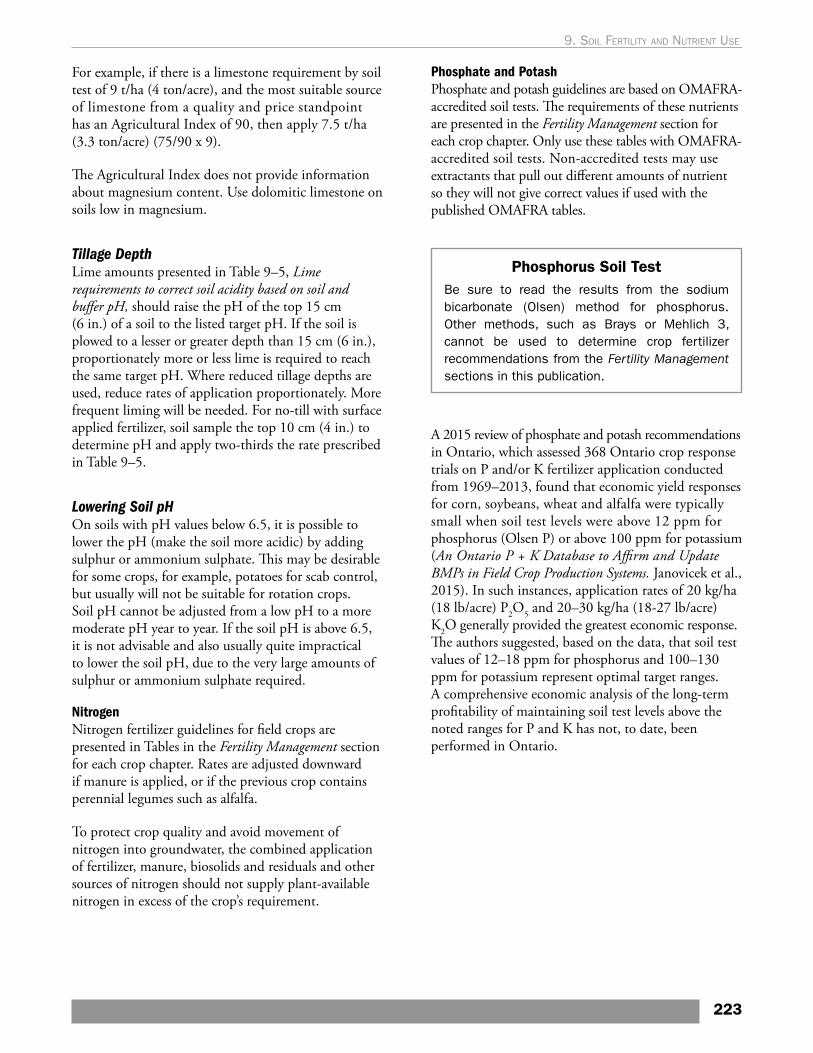
For example, if there is a limestone requirement by soil test of 9 t/ha (4 ton/acre), and the most suitable source of limestone from a quality and price standpoint has an Agricultural Index of 90, then apply 7.5 t/ha (3.3 ton/acre) (75/90 x 9).
The Agricultural Index does not provide information about magnesium content. Use dolomitic limestone on soils low in magnesium.
Tillage Depth Lime amounts presented in Table 9–5, Lime requirements to correct soil acidity based on soil and buffer pH, should raise the pH of the top 15 cm (6 in.) of a soil to the listed target pH. If the soil is plowed to a lesser or greater depth than 15 cm (6 in.), proportionately more or less lime is required to reach the same target pH. Where reduced tillage depths are used, reduce rates of application proportionately. More frequent liming will be needed. For no-till with surface applied fertilizer, soil sample the top 10 cm (4 in.) to determine pH and apply two-thirds the rate prescribed in Table 9–5.
Lowering Soil pH On soils with pH values below 6.5, it is possible to lower the pH (make the soil more acidic) by adding sulphur or ammonium sulphate. This may be desirable for some crops, for example, potatoes for scab control, but usually will not be suitable for rotation crops. Soil pH cannot be adjusted from a low pH to a more moderate pH year to year. If the soil pH is above 6.5, it is not advisable and also usually quite impractical to lower the soil pH, due to the very large amounts of sulphur or ammonium sulphate required.
NitrogenNitrogen fertilizer guidelines for field crops are presented in Tables in the Fertility Management section for each crop chapter. Rates are adjusted downward if manure is applied, or if the previous crop contains perennial legumes such as alfalfa.
To protect crop quality and avoid movement of nitrogen into groundwater, the combined application of fertilizer, manure, biosolids and residuals and other sources of nitrogen should not supply plant-available nitrogen in excess of the crop’s requirement.
Phosphate and PotashPhosphate and potash guidelines are based on OMAFRA-accredited soil tests. The requirements of these nutrients are presented in the Fertility Management section for each crop chapter. Only use these tables with OMAFRA-accredited soil tests. Non-accredited tests may use extractants that pull out different amounts of nutrient so they will not give correct values if used with the published OMAFRA tables.
Phosphorus Soil TestBe sure to read the results from the sodium bicarbonate (Olsen) method for phosphorus. Other methods, such as Brays or Mehlich 3, cannot be used to determine crop fertilizer recommendations from the Fertility Management sections in this publication.
A 2015 review of phosphate and potash recommendations in Ontario, which assessed 368 Ontario crop response trials on P and/or K fertilizer application conducted from 1969–2013, found that economic yield responses for corn, soybeans, wheat and alfalfa were typically small when soil test levels were above 12 ppm for phosphorus (Olsen P) or above 100 ppm for potassium (An Ontario P + K Database to Affirm and Update BMPs in Field Crop Production Systems. Janovicek et al., 2015). In such instances, application rates of 20 kg/ha (18 lb/acre) P2O5 and 20–30 kg/ha (18-27 lb/acre) K2O generally provided the greatest economic response. The authors suggested, based on the data, that soil test values of 12–18 ppm for phosphorus and 100–130 ppm for potassium represent optimal target ranges. A comprehensive economic analysis of the long-term profitability of maintaining soil test levels above the noted ranges for P and K has not, to date, been performed in Ontario.
223
9. soIl FertIlIty and nutrIent use
Phosphorus Pools in SoilPhosphorus in soil exists in three main “pools”:
Solution P pool: the phosphorus found in soil water. It represents a very small portion of total soil P — usually less than 1.12 kg/ha (1 lb/acre).
Active P pool: the solid phase phosphorus that replenishes solution P. It is the main source of available P for crops and comes from minerals (e.g., calcium phosphate), inorganic P attached to soil, and P mineralized from organic matter.
Fixed P pool: inorganic phosphate that is unavailable and organic phosphorus that is resistant to mineralization. It can remain in soil for years without becoming available to plants.
Source: The Nature of Phosphorus in Soils. Busman et al., 2009. www.extension.umn.edu
Regular monitoring through soil testing and ensuring that soil test levels remain within a reasonable range is an important part of managing risk on your farm. It is also important to note that a soil test result is an estimate of nutrient availability. In the case of both phosphorus and potassium, the value reported on a soil test report reflects the portion of that soil nutrient that is available for crop uptake; it represents a small percentage of the total amount of nutrient in the soil. For example, for phosphorus, the soil test value represents the amount of phosphate that is immediately and moderately available for plant uptake — it is the phosphorus present in the “solution P pool” and some of the “active P pool” (see side bar). Applied phosphate fertilizers are highly soluble and initially enter the solution pool; however, a portion of applied fertilizer phosphate will react in soil and become part of the unavailable, or fixed, P pool. Due to the reactive and immobile nature of phosphate, it is most efficiently applied in a band close to crop roots for maximum uptake benefit in the application year.
Good soil structure is a critical component of soil fertility. An extensive root system allows a crop to access nutrients from a greater volume of soil, which is particularly important for immobile nutrients such as phosphate. A healthy, well-structured soil will also have improved nutrient cycling, which can result in an
enhanced supply of nutrients such as phosphorus and potassium from the breakdown of residue, soil organic matter, and soil minerals.
Where a soil test is not available, a rough estimate of requirements can be obtained from the phosphate and potash guidelines tables using the following guidelines:
• Where the field has been fertilized regularly for a number of years, or heavily in recent years, use one of the rates of phosphate and potash recommended for the moderately responsive (MR) soil test rating.
• If the field has received little fertilizer in the past, use one of the rates recommended for a highly responsive (HR) soil test rating.
• When the soil test response rating for phosphorus is NR (no profitable response), the soil contains much more plant-available phosphorus than is required by most crops. Application of phosphorus in fertilizer, manure or biosolids may reduce crop yield or quality and is not advised. For example, phosphate applications may induce zinc deficiency on soils low in zinc and may increase the risk of water pollution.
The risk of surface water contamination by phosphorus may be increased at higher soil test phosphorus levels. Since phosphorus binds tightly to soil particles, the movement of soil off the field through erosion is a major factor in determining the risk of surface water contamination. It is for this reason that the risk of surface water contamination by phosphorus cannot be based solely on a soil test phosphorus level. Wherever soil tests show a very low or no probability of response to added phosphorus, application of any source of phosphorus should be guided by a phosphorus index. See the OMAFRA nutrient management planning (NMAN) software, or the OMAFRA Factsheet, Determining the Phosphorus Index for a Field, available at ontario.ca/omafra. A phosphorus index ranks the relative risk of surface water contamination for applications made to a particular area of land. It will also determine maximum application rates, if manure is applied, and suggested setbacks from watercourses.
MagnesiumMagnesium is a nutrient that is naturally plentiful in many Ontario soils. Although rare, when magnesium soil tests are below 20 ppm, according to an OMAFRA soil test, magnesium application will be required for production of most crops. If the soil pH is below 6.0
224
Agronomy guide for field Crops
and magnesium is below 100 ppm, the most effective and inexpensive means of supplying magnesium is by application of dolomitic lime. On soils with a higher magnesium test, use either dolomitic or calcitic lime to correct soil pH. If the pH is above 6.0 and the soil test is 20 ppm or less, supply magnesium by either magnesium sulfate or sulfate of potash magnesia (a mixture of sulfate of potash and magnesium sulfate). Apply 30 kg/ha (27 lb/acre) of actual soluble magnesium. These latter sources of magnesium are usually more expensive compared to supplying magnesium from dolomitic limestone.
Potassium competes with magnesium for uptake by crops, and potash applications can therefore induce or increase magnesium deficiency. For this reason, it is important to monitor soil potassium levels and carefully control potash fertilizer applications on low magnesium soils.
Crops grown on a number of Ontario soils are low in magnesium to the extent that livestock health is affected, although the crops themselves do not suffer from magnesium deficiency. In these situations, it is usually much more economical to add magnesium to the animal’s diet than to add it to the soil. Closely monitor soil potassium and restrict potash applications to requirements as measured by soil test.
Calcium Calcium deficiency has not been a problem in Ontario soils with soil pH adequate for field crop growth.
SulphurSulphur is often provided in adequate amounts for crop growth in acid precipitation, livestock manure and organic matter breakdown. Sulphur deficiencies are increasing due to less atmospheric deposition. Deposition from rainfall has decreased by over 5 kg S/ha over the past 20 years. There has been increasing response to sulphur application in numerous trials, especially in canola, alfalfa forages and wheat crops. Where sulphur is required, apply it as ammonium sulphate, calcium sulphate (gypsum), ammonium thiosulphate, potassium sulphate or elemental sulphur. Elemental sulphur must be oxidized to the sulphate form before the plants can absorb it. Apply elemental sulphur a few months before a crop requiring sulphur is planted, or in fall for established alfalfa.
Micronutrient Fertilizers Apply micronutrient elements only on competent advice or where experience has proven their application to be necessary. Generally, it is best to make soil applications during soil preparation and foliar applications during the growing season. Include a spreader sticker in micronutrient sprays applied directly to crop foliage.
Do not combine micronutrient elements with insecticide or fungicide sprays unless the manufacturer’s directions indicate that this may be done.
Manganese
Preventing and Correcting Manganese Deficiency The general symptom of manganese deficiency is interveinal chlorosis of leaves, which begins on the younger foliage. Later, the whole plant may be affected. Cereals show manganese deficiency as a general yellowing and stunting, occasionally with grey specks on the leaves. The crops most susceptible to manganese deficiency are soybeans, dry edible beans and cereals.
Manganese is less available at high soil pH, so it is important not to add more lime than is needed to correct soil acidity. The oxidized form of Mn is less available than the reduced form, which is why sometimes symptoms appear in areas with greater aeration and less compaction. For materials and rates to correct a deficiency, consult the individual crop chapters under Micronutrients. Interpretation of the manganese soil test is found in Table 9–7, Manganese soil test interpretation.
225
9. soIl FertIlIty and nutrIent use
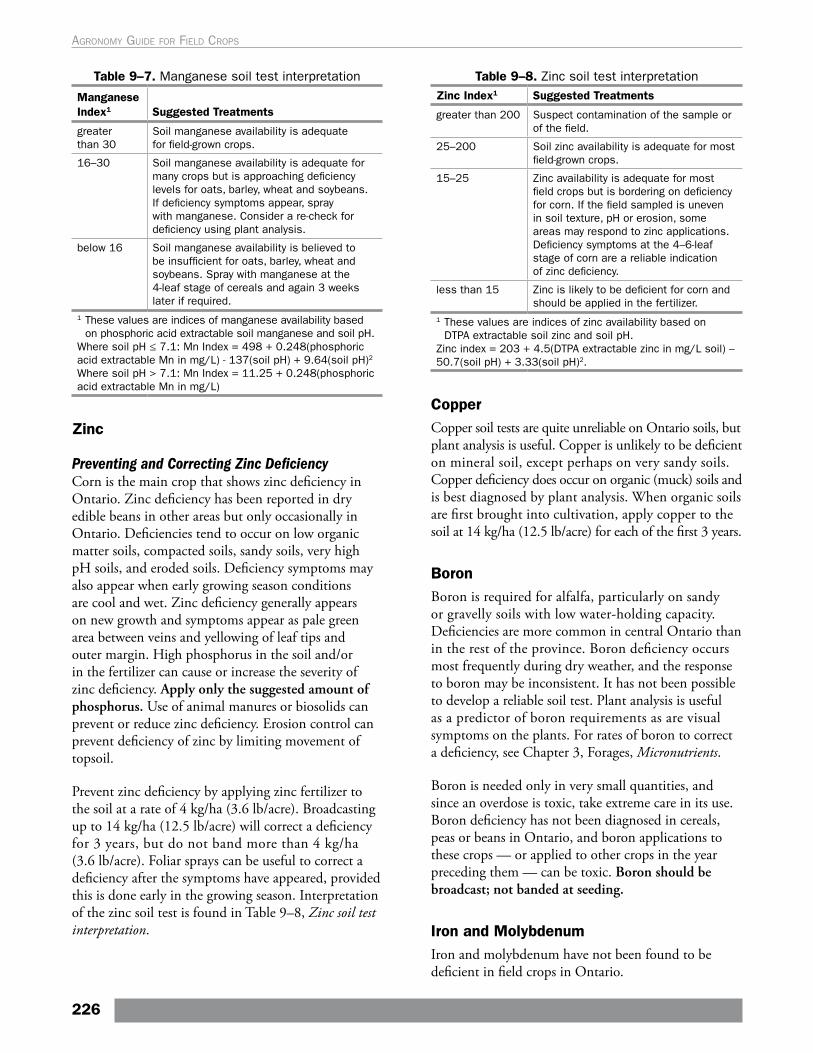
Table 9–7. Manganese soil test interpretation
Manganese Index1 Suggested Treatments
greater than 30
Soil manganese availability is adequate for field-grown crops.
16–30 Soil manganese availability is adequate for many crops but is approaching deficiency levels for oats, barley, wheat and soybeans. If deficiency symptoms appear, spray with manganese. Consider a re-check for deficiency using plant analysis.
below 16 Soil manganese availability is believed to be insufficient for oats, barley, wheat and soybeans. Spray with manganese at the 4-leaf stage of cereals and again 3 weeks later if required.
1 These values are indices of manganese availability based on phosphoric acid extractable soil manganese and soil pH.
Where soil pH ≤ 7.1: Mn Index = 498 + 0.248(phosphoric acid extractable Mn in mg/L) - 137(soil pH) + 9.64(soil pH)2
Where soil pH > 7.1: Mn Index = 11.25 + 0.248(phosphoric acid extractable Mn in mg/L)
Zinc
Preventing and Correcting Zinc Deficiency Corn is the main crop that shows zinc deficiency in Ontario. Zinc deficiency has been reported in dry edible beans in other areas but only occasionally in Ontario. Deficiencies tend to occur on low organic matter soils, compacted soils, sandy soils, very high pH soils, and eroded soils. Deficiency symptoms may also appear when early growing season conditions are cool and wet. Zinc deficiency generally appears on new growth and symptoms appear as pale green area between veins and yellowing of leaf tips and outer margin. High phosphorus in the soil and/or in the fertilizer can cause or increase the severity of zinc deficiency. Apply only the suggested amount of phosphorus. Use of animal manures or biosolids can prevent or reduce zinc deficiency. Erosion control can prevent deficiency of zinc by limiting movement of topsoil.
Prevent zinc deficiency by applying zinc fertilizer to the soil at a rate of 4 kg/ha (3.6 lb/acre). Broadcasting up to 14 kg/ha (12.5 lb/acre) will correct a deficiency for 3 years, but do not band more than 4 kg/ha (3.6 lb/acre). Foliar sprays can be useful to correct a deficiency after the symptoms have appeared, provided this is done early in the growing season. Interpretation of the zinc soil test is found in Table 9–8, Zinc soil test interpretation.
Table 9–8. Zinc soil test interpretationZinc Index1 Suggested Treatments
greater than 200 Suspect contamination of the sample or of the field.
25–200 Soil zinc availability is adequate for most field-grown crops.
15–25 Zinc availability is adequate for most field crops but is bordering on deficiency for corn. If the field sampled is uneven in soil texture, pH or erosion, some areas may respond to zinc applications. Deficiency symptoms at the 4–6-leaf stage of corn are a reliable indication of zinc deficiency.
less than 15 Zinc is likely to be deficient for corn and should be applied in the fertilizer.
1 These values are indices of zinc availability based on DTPA extractable soil zinc and soil pH.
Zinc index = 203 + 4.5(DTPA extractable zinc in mg/L soil) – 50.7(soil pH) + 3.33(soil pH)2.
Copper Copper soil tests are quite unreliable on Ontario soils, but plant analysis is useful. Copper is unlikely to be deficient on mineral soil, except perhaps on very sandy soils. Copper deficiency does occur on organic (muck) soils and is best diagnosed by plant analysis. When organic soils are first brought into cultivation, apply copper to the soil at 14 kg/ha (12.5 lb/acre) for each of the first 3 years.
Boron Boron is required for alfalfa, particularly on sandy or gravelly soils with low water-holding capacity. Deficiencies are more common in central Ontario than in the rest of the province. Boron deficiency occurs most frequently during dry weather, and the response to boron may be inconsistent. It has not been possible to develop a reliable soil test. Plant analysis is useful as a predictor of boron requirements as are visual symptoms on the plants. For rates of boron to correct a deficiency, see Chapter 3, Forages, Micronutrients.
Boron is needed only in very small quantities, and since an overdose is toxic, take extreme care in its use. Boron deficiency has not been diagnosed in cereals, peas or beans in Ontario, and boron applications to these crops — or applied to other crops in the year preceding them — can be toxic. Boron should be broadcast; not banded at seeding.
Iron and MolybdenumIron and molybdenum have not been found to be deficient in field crops in Ontario.
226
Agronomy guide for field Crops
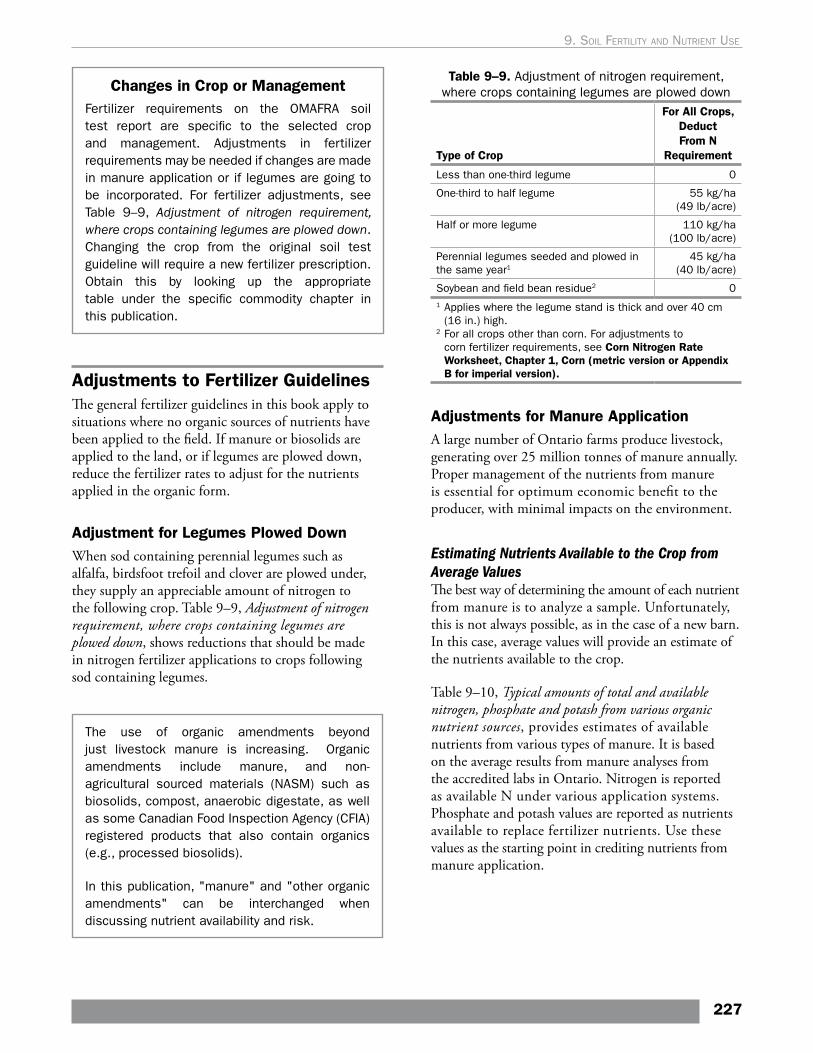
Changes in Crop or ManagementFertilizer requirements on the OMAFRA soil test report are specific to the selected crop and management. Adjustments in fertilizer requirements may be needed if changes are made in manure application or if legumes are going to be incorporated. For fertilizer adjustments, see Table 9–9, Adjustment of nitrogen requirement, where crops containing legumes are plowed down. Changing the crop from the original soil test guideline will require a new fertilizer prescription. Obtain this by looking up the appropriate table under the specific commodity chapter in this publication.
Adjustments to Fertilizer GuidelinesThe general fertilizer guidelines in this book apply to situations where no organic sources of nutrients have been applied to the field. If manure or biosolids are applied to the land, or if legumes are plowed down, reduce the fertilizer rates to adjust for the nutrients applied in the organic form.
Adjustment for Legumes Plowed DownWhen sod containing perennial legumes such as alfalfa, birdsfoot trefoil and clover are plowed under, they supply an appreciable amount of nitrogen to the following crop. Table 9–9, Adjustment of nitrogen requirement, where crops containing legumes are plowed down, shows reductions that should be made in nitrogen fertilizer applications to crops following sod containing legumes.
The use of organic amendments beyond just livestock manure is increasing. Organic amendments include manure, and non-agricultural sourced materials (NASM) such as biosolids, compost, anaerobic digestate, as well as some Canadian Food Inspection Agency (CFIA) registered products that also contain organics (e.g., processed biosolids).
In this publication, "manure" and "other organic amendments" can be interchanged when discussing nutrient availability and risk.
Table 9–9. Adjustment of nitrogen requirement, where crops containing legumes are plowed down
Type of Crop
For All Crops, Deduct From N
Requirement
Less than one-third legume 0
One-third to half legume 55 kg/ha (49 lb/acre)
Half or more legume 110 kg/ha (100 lb/acre)
Perennial legumes seeded and plowed in the same year1
45 kg/ha (40 lb/acre)
Soybean and field bean residue2 01 Applies where the legume stand is thick and over 40 cm
(16 in.) high.2 For all crops other than corn. For adjustments to
corn fertilizer requirements, see Corn Nitrogen Rate Worksheet, Chapter 1, Corn (metric version or Appendix B for imperial version).
Adjustments for Manure ApplicationA large number of Ontario farms produce livestock, generating over 25 million tonnes of manure annually. Proper management of the nutrients from manure is essential for optimum economic benefit to the producer, with minimal impacts on the environment.
Estimating Nutrients Available to the Crop from Average ValuesThe best way of determining the amount of each nutrient from manure is to analyze a sample. Unfortunately, this is not always possible, as in the case of a new barn. In this case, average values will provide an estimate of the nutrients available to the crop.
Table 9–10, Typical amounts of total and available nitrogen, phosphate and potash from various organic nutrient sources, provides estimates of available nutrients from various types of manure. It is based on the average results from manure analyses from the accredited labs in Ontario. Nitrogen is reported as available N under various application systems. Phosphate and potash values are reported as nutrients available to replace fertilizer nutrients. Use these values as the starting point in crediting nutrients from manure application.
227
9. soIl FertIlIty and nutrIent use
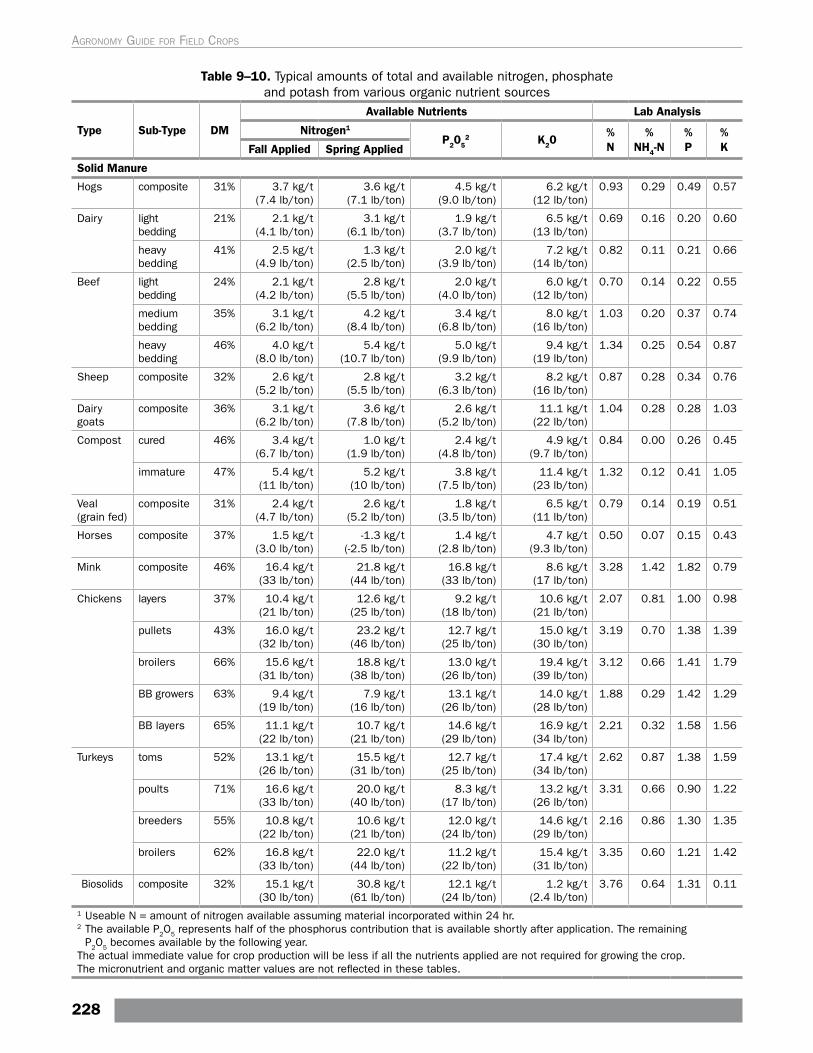
Table 9–10. Typical amounts of total and available nitrogen, phosphate and potash from various organic nutrient sources
Type Sub-Type DM
Available Nutrients Lab Analysis
Nitrogen1
P2052 K20
% N
% NH4-N
% P
% KFall Applied Spring Applied
Solid Manure
Hogs composite 31% 3.7 kg/t (7.4 lb/ton)
3.6 kg/t (7.1 lb/ton)
4.5 kg/t (9.0 lb/ton)
6.2 kg/t (12 lb/ton)
0.93 0.29 0.49 0.57
Dairy light bedding
21% 2.1 kg/t (4.1 lb/ton)
3.1 kg/t (6.1 lb/ton)
1.9 kg/t (3.7 lb/ton)
6.5 kg/t (13 lb/ton)
0.69 0.16 0.20 0.60
heavy bedding
41% 2.5 kg/t (4.9 lb/ton)
1.3 kg/t (2.5 lb/ton)
2.0 kg/t (3.9 lb/ton)
7.2 kg/t (14 lb/ton)
0.82 0.11 0.21 0.66
Beef light bedding
24% 2.1 kg/t (4.2 lb/ton)
2.8 kg/t (5.5 lb/ton)
2.0 kg/t (4.0 lb/ton)
6.0 kg/t (12 lb/ton)
0.70 0.14 0.22 0.55
medium bedding
35% 3.1 kg/t (6.2 lb/ton)
4.2 kg/t (8.4 lb/ton)
3.4 kg/t (6.8 lb/ton)
8.0 kg/t (16 lb/ton)
1.03 0.20 0.37 0.74
heavy bedding
46% 4.0 kg/t (8.0 lb/ton)
5.4 kg/t (10.7 lb/ton)
5.0 kg/t (9.9 lb/ton)
9.4 kg/t (19 lb/ton)
1.34 0.25 0.54 0.87
Sheep composite 32% 2.6 kg/t (5.2 lb/ton)
2.8 kg/t (5.5 lb/ton)
3.2 kg/t (6.3 lb/ton)
8.2 kg/t (16 lb/ton)
0.87 0.28 0.34 0.76
Dairy goats
composite 36% 3.1 kg/t (6.2 lb/ton)
3.6 kg/t (7.8 lb/ton)
2.6 kg/t (5.2 lb/ton)
11.1 kg/t (22 lb/ton)
1.04 0.28 0.28 1.03
Compost cured 46% 3.4 kg/t (6.7 lb/ton)
1.0 kg/t (1.9 lb/ton)
2.4 kg/t (4.8 lb/ton)
4.9 kg/t (9.7 lb/ton)
0.84 0.00 0.26 0.45
immature 47% 5.4 kg/t (11 lb/ton)
5.2 kg/t (10 lb/ton)
3.8 kg/t (7.5 lb/ton)
11.4 kg/t (23 lb/ton)
1.32 0.12 0.41 1.05
Veal (grain fed)
composite 31% 2.4 kg/t (4.7 lb/ton)
2.6 kg/t (5.2 lb/ton)
1.8 kg/t (3.5 lb/ton)
6.5 kg/t (11 lb/ton)
0.79 0.14 0.19 0.51
Horses composite 37% 1.5 kg/t (3.0 lb/ton)
-1.3 kg/t (-2.5 lb/ton)
1.4 kg/t (2.8 lb/ton)
4.7 kg/t (9.3 lb/ton)
0.50 0.07 0.15 0.43
Mink composite 46% 16.4 kg/t (33 lb/ton)
21.8 kg/t (44 lb/ton)
16.8 kg/t (33 lb/ton)
8.6 kg/t (17 lb/ton)
3.28 1.42 1.82 0.79
Chickens layers 37% 10.4 kg/t (21 lb/ton)
12.6 kg/t (25 lb/ton)
9.2 kg/t (18 lb/ton)
10.6 kg/t (21 lb/ton)
2.07 0.81 1.00 0.98
pullets 43% 16.0 kg/t (32 lb/ton)
23.2 kg/t (46 lb/ton)
12.7 kg/t (25 lb/ton)
15.0 kg/t (30 lb/ton)
3.19 0.70 1.38 1.39
broilers 66% 15.6 kg/t (31 lb/ton)
18.8 kg/t (38 lb/ton)
13.0 kg/t (26 lb/ton)
19.4 kg/t (39 lb/ton)
3.12 0.66 1.41 1.79
BB growers 63% 9.4 kg/t (19 lb/ton)
7.9 kg/t (16 lb/ton)
13.1 kg/t (26 lb/ton)
14.0 kg/t (28 lb/ton)
1.88 0.29 1.42 1.29
BB layers 65% 11.1 kg/t (22 lb/ton)
10.7 kg/t (21 lb/ton)
14.6 kg/t (29 lb/ton)
16.9 kg/t (34 lb/ton)
2.21 0.32 1.58 1.56
Turkeys toms 52% 13.1 kg/t (26 lb/ton)
15.5 kg/t (31 lb/ton)
12.7 kg/t (25 lb/ton)
17.4 kg/t (34 lb/ton)
2.62 0.87 1.38 1.59
poults 71% 16.6 kg/t (33 lb/ton)
20.0 kg/t (40 lb/ton)
8.3 kg/t (17 lb/ton)
13.2 kg/t (26 lb/ton)
3.31 0.66 0.90 1.22
breeders 55% 10.8 kg/t (22 lb/ton)
10.6 kg/t (21 lb/ton)
12.0 kg/t (24 lb/ton)
14.6 kg/t (29 lb/ton)
2.16 0.86 1.30 1.35
broilers 62% 16.8 kg/t (33 lb/ton)
22.0 kg/t (44 lb/ton)
11.2 kg/t (22 lb/ton)
15.4 kg/t (31 lb/ton)
3.35 0.60 1.21 1.42
Biosolids composite 32% 15.1 kg/t (30 lb/ton)
30.8 kg/t (61 lb/ton)
12.1 kg/t (24 lb/ton)
1.2 kg/t (2.4 lb/ton)
3.76 0.64 1.31 0.11
1 Useable N = amount of nitrogen available assuming material incorporated within 24 hr. 2 The available P2O5 represents half of the phosphorus contribution that is available shortly after application. The remaining
P2O5 becomes available by the following year.The actual immediate value for crop production will be less if all the nutrients applied are not required for growing the crop.The micronutrient and organic matter values are not reflected in these tables.
228
Agronomy guide for field Crops
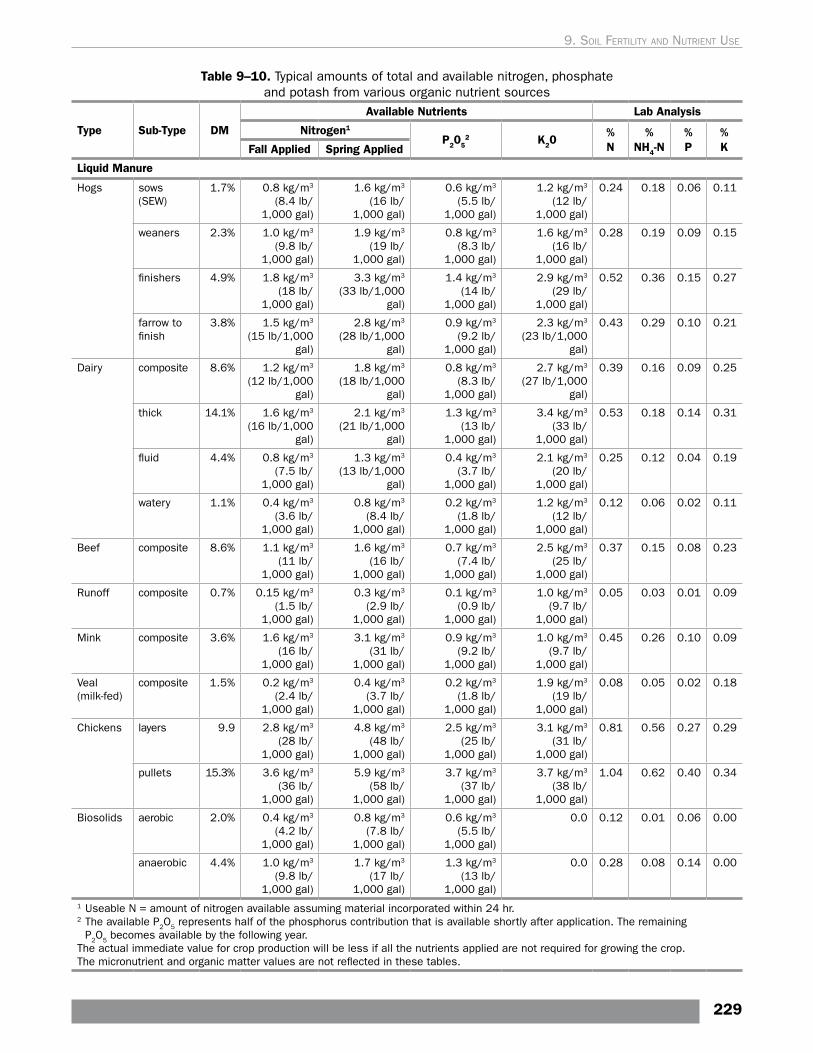
Table 9–10. Typical amounts of total and available nitrogen, phosphate and potash from various organic nutrient sources
Type Sub-Type DM
Available Nutrients Lab Analysis
Nitrogen1
P2052 K20
% N
% NH4-N
% P
% KFall Applied Spring Applied
Liquid Manure
Hogs sows (SEW)
1.7% 0.8 kg/m3 (8.4 lb/
1,000 gal)
1.6 kg/m3 (16 lb/
1,000 gal)
0.6 kg/m3 (5.5 lb/
1,000 gal)
1.2 kg/m3 (12 lb/
1,000 gal)
0.24 0.18 0.06 0.11
weaners 2.3% 1.0 kg/m3 (9.8 lb/
1,000 gal)
1.9 kg/m3 (19 lb/
1,000 gal)
0.8 kg/m3 (8.3 lb/
1,000 gal)
1.6 kg/m3 (16 lb/
1,000 gal)
0.28 0.19 0.09 0.15
finishers 4.9% 1.8 kg/m3 (18 lb/
1,000 gal)
3.3 kg/m3 (33 lb/1,000
gal)
1.4 kg/m3 (14 lb/
1,000 gal)
2.9 kg/m3 (29 lb/
1,000 gal)
0.52 0.36 0.15 0.27
farrow to finish
3.8% 1.5 kg/m3 (15 lb/1,000
gal)
2.8 kg/m3 (28 lb/1,000
gal)
0.9 kg/m3 (9.2 lb/
1,000 gal)
2.3 kg/m3 (23 lb/1,000
gal)
0.43 0.29 0.10 0.21
Dairy composite 8.6% 1.2 kg/m3 (12 lb/1,000
gal)
1.8 kg/m3 (18 lb/1,000
gal)
0.8 kg/m3 (8.3 lb/
1,000 gal)
2.7 kg/m3 (27 lb/1,000
gal)
0.39 0.16 0.09 0.25
thick 14.1% 1.6 kg/m3 (16 lb/1,000
gal)
2.1 kg/m3 (21 lb/1,000
gal)
1.3 kg/m3 (13 lb/
1,000 gal)
3.4 kg/m3 (33 lb/
1,000 gal)
0.53 0.18 0.14 0.31
fluid 4.4% 0.8 kg/m3 (7.5 lb/
1,000 gal)
1.3 kg/m3 (13 lb/1,000
gal)
0.4 kg/m3 (3.7 lb/
1,000 gal)
2.1 kg/m3 (20 lb/
1,000 gal)
0.25 0.12 0.04 0.19
watery 1.1% 0.4 kg/m3 (3.6 lb/
1,000 gal)
0.8 kg/m3 (8.4 lb/
1,000 gal)
0.2 kg/m3 (1.8 lb/
1,000 gal)
1.2 kg/m3 (12 lb/
1,000 gal)
0.12 0.06 0.02 0.11
Beef composite 8.6% 1.1 kg/m3 (11 lb/
1,000 gal)
1.6 kg/m3 (16 lb/
1,000 gal)
0.7 kg/m3 (7.4 lb/
1,000 gal)
2.5 kg/m3 (25 lb/
1,000 gal)
0.37 0.15 0.08 0.23
Runoff composite 0.7% 0.15 kg/m3 (1.5 lb/
1,000 gal)
0.3 kg/m3 (2.9 lb/
1,000 gal)
0.1 kg/m3 (0.9 lb/
1,000 gal)
1.0 kg/m3 (9.7 lb/
1,000 gal)
0.05 0.03 0.01 0.09
Mink composite 3.6% 1.6 kg/m3 (16 lb/
1,000 gal)
3.1 kg/m3 (31 lb/
1,000 gal)
0.9 kg/m3 (9.2 lb/
1,000 gal)
1.0 kg/m3 (9.7 lb/
1,000 gal)
0.45 0.26 0.10 0.09
Veal (milk-fed)
composite 1.5% 0.2 kg/m3 (2.4 lb/
1,000 gal)
0.4 kg/m3 (3.7 lb/
1,000 gal)
0.2 kg/m3 (1.8 lb/
1,000 gal)
1.9 kg/m3 (19 lb/
1,000 gal)
0.08 0.05 0.02 0.18
Chickens layers 9.9 2.8 kg/m3 (28 lb/
1,000 gal)
4.8 kg/m3 (48 lb/
1,000 gal)
2.5 kg/m3 (25 lb/
1,000 gal)
3.1 kg/m3 (31 lb/
1,000 gal)
0.81 0.56 0.27 0.29
pullets 15.3% 3.6 kg/m3 (36 lb/
1,000 gal)
5.9 kg/m3 (58 lb/
1,000 gal)
3.7 kg/m3 (37 lb/
1,000 gal)
3.7 kg/m3 (38 lb/
1,000 gal)
1.04 0.62 0.40 0.34
Biosolids aerobic 2.0% 0.4 kg/m3 (4.2 lb/
1,000 gal)
0.8 kg/m3 (7.8 lb/
1,000 gal)
0.6 kg/m3 (5.5 lb/
1,000 gal)
0.0 0.12 0.01 0.06 0.00
anaerobic 4.4% 1.0 kg/m3 (9.8 lb/
1,000 gal)
1.7 kg/m3 (17 lb/
1,000 gal)
1.3 kg/m3 (13 lb/
1,000 gal)
0.0 0.28 0.08 0.14 0.00
1 Useable N = amount of nitrogen available assuming material incorporated within 24 hr. 2 The available P2O5 represents half of the phosphorus contribution that is available shortly after application. The remaining
P2O5 becomes available by the following year.The actual immediate value for crop production will be less if all the nutrients applied are not required for growing the crop.The micronutrient and organic matter values are not reflected in these tables.
229
9. soIl FertIlIty and nutrIent use
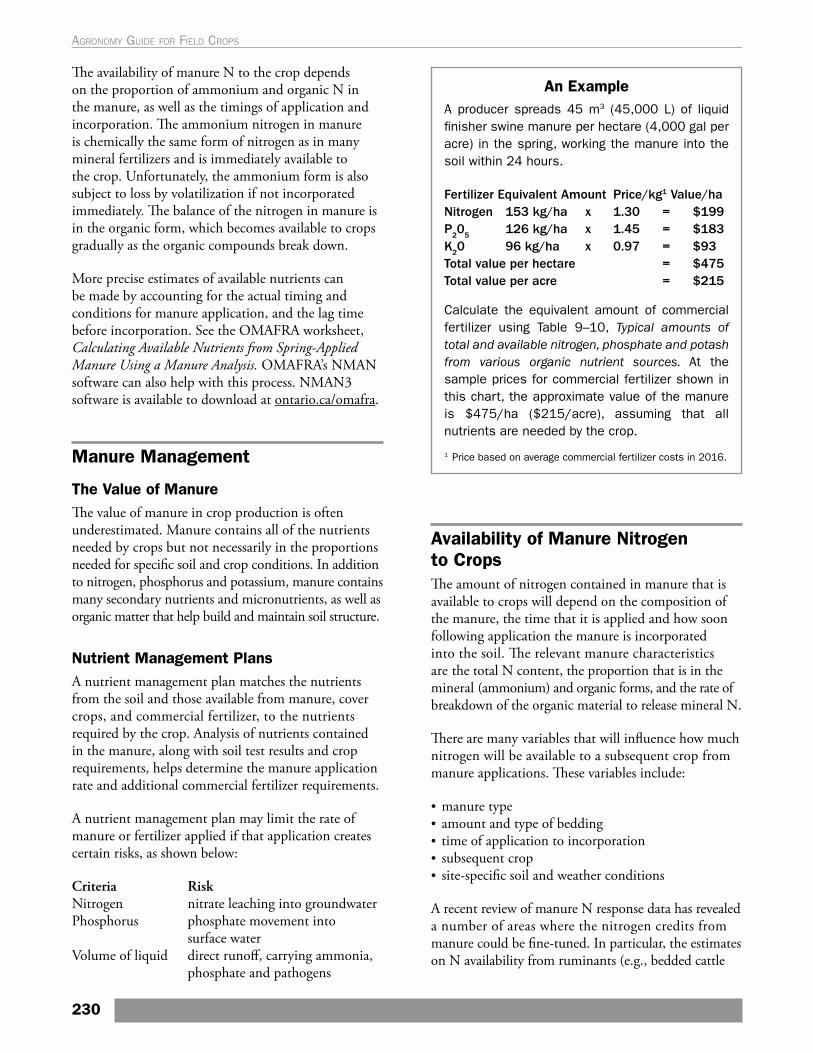
The availability of manure N to the crop depends on the proportion of ammonium and organic N in the manure, as well as the timings of application and incorporation. The ammonium nitrogen in manure is chemically the same form of nitrogen as in many mineral fertilizers and is immediately available to the crop. Unfortunately, the ammonium form is also subject to loss by volatilization if not incorporated immediately. The balance of the nitrogen in manure is in the organic form, which becomes available to crops gradually as the organic compounds break down.
More precise estimates of available nutrients can be made by accounting for the actual timing and conditions for manure application, and the lag time before incorporation. See the OMAFRA worksheet, Calculating Available Nutrients from Spring-Applied Manure Using a Manure Analysis. OMAFRA’s NMAN software can also help with this process. NMAN3 software is available to download at ontario.ca/omafra.
Manure Management
The Value of ManureThe value of manure in crop production is often underestimated. Manure contains all of the nutrients needed by crops but not necessarily in the proportions needed for specific soil and crop conditions. In addition to nitrogen, phosphorus and potassium, manure contains many secondary nutrients and micronutrients, as well as organic matter that help build and maintain soil structure.
Nutrient Management PlansA nutrient management plan matches the nutrients from the soil and those available from manure, cover crops, and commercial fertilizer, to the nutrients required by the crop. Analysis of nutrients contained in the manure, along with soil test results and crop requirements, helps determine the manure application rate and additional commercial fertilizer requirements.
A nutrient management plan may limit the rate of manure or fertilizer applied if that application creates certain risks, as shown below:
Criteria RiskNitrogen nitrate leaching into groundwaterPhosphorus phosphate movement into
surface waterVolume of liquid direct runoff, carrying ammonia,
phosphate and pathogens
An ExampleA producer spreads 45 m3 (45,000 L) of liquid finisher swine manure per hectare (4,000 gal per acre) in the spring, working the manure into the soil within 24 hours.
Fertilizer Equivalent Amount Price/kg1 Value/haNitrogen 153 kg/ha 1.30 $199 P
20
5126 kg/ha 1.45 $183
K20 96 kg/ha 0.97 $93
Total value per hectare $475 Total value per acre $215
Calculate the equivalent amount of commercial fertilizer using Table 9–10, Typical amounts of total and available nitrogen, phosphate and potash from various organic nutrient sources. At the sample prices for commercial fertilizer shown in this chart, the approximate value of the manure is $475/ha ($215/acre), assuming that all nutrients are needed by the crop.
x =x =x =
==
1 Price based on average commercial fertilizer costs in 2016.
Availability of Manure Nitrogen to CropsThe amount of nitrogen contained in manure that is available to crops will depend on the composition of the manure, the time that it is applied and how soon following application the manure is incorporated into the soil. The relevant manure characteristics are the total N content, the proportion that is in the mineral (ammonium) and organic forms, and the rate of breakdown of the organic material to release mineral N.
There are many variables that will influence how much nitrogen will be available to a subsequent crop from manure applications. These variables include:
• manure type • amount and type of bedding• time of application to incorporation• subsequent crop• site-specific soil and weather conditions
A recent review of manure N response data has revealed a number of areas where the nitrogen credits from manure could be fine-tuned. In particular, the estimates on N availability from ruminants (e.g., bedded cattle
230
Agronomy guide for field Crops
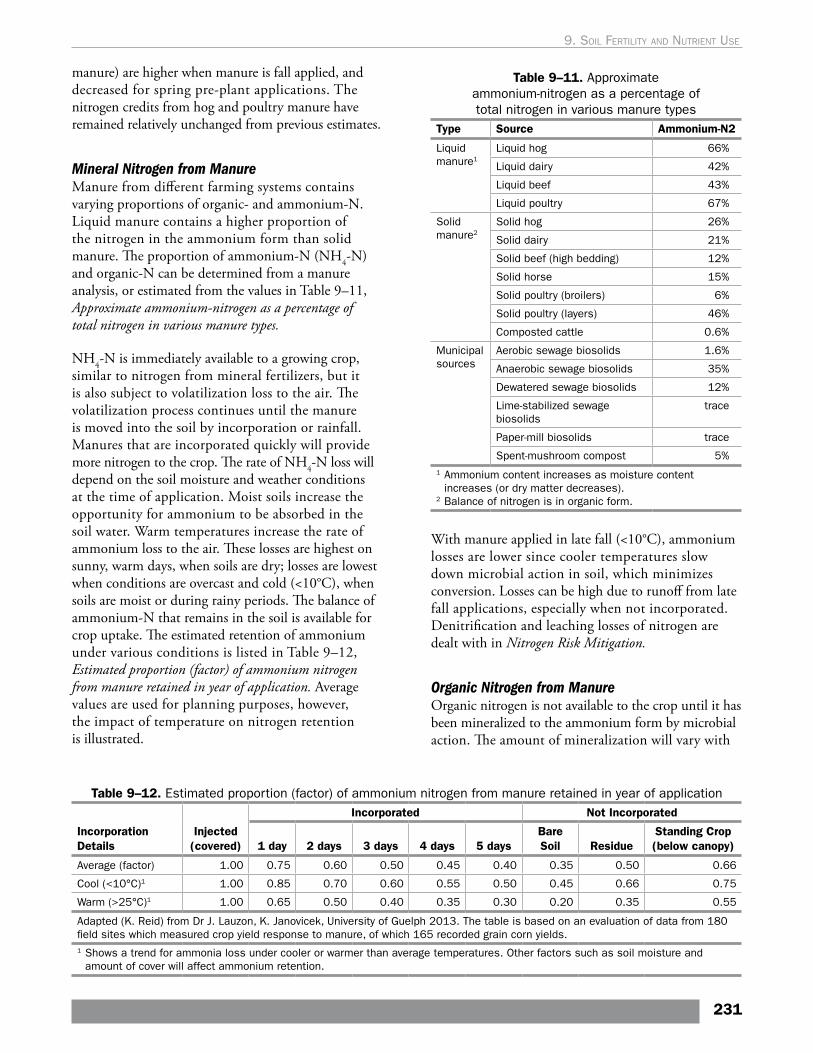
manure) are higher when manure is fall applied, and decreased for spring pre-plant applications. The nitrogen credits from hog and poultry manure have remained relatively unchanged from previous estimates.
Mineral Nitrogen from ManureManure from different farming systems contains varying proportions of organic- and ammonium-N. Liquid manure contains a higher proportion of the nitrogen in the ammonium form than solid manure. The proportion of ammonium-N (NH4-N) and organic-N can be determined from a manure analysis, or estimated from the values in Table 9–11, Approximate ammonium-nitrogen as a percentage of total nitrogen in various manure types.
NH4-N is immediately available to a growing crop, similar to nitrogen from mineral fertilizers, but it is also subject to volatilization loss to the air. The volatilization process continues until the manure is moved into the soil by incorporation or rainfall. Manures that are incorporated quickly will provide more nitrogen to the crop. The rate of NH4-N loss will depend on the soil moisture and weather conditions at the time of application. Moist soils increase the opportunity for ammonium to be absorbed in the soil water. Warm temperatures increase the rate of ammonium loss to the air. These losses are highest on sunny, warm days, when soils are dry; losses are lowest when conditions are overcast and cold (<10°C), when soils are moist or during rainy periods. The balance of ammonium-N that remains in the soil is available for crop uptake. The estimated retention of ammonium under various conditions is listed in Table 9–12, Estimated proportion (factor) of ammonium nitrogen from manure retained in year of application. Average values are used for planning purposes, however, the impact of temperature on nitrogen retention is illustrated.
Table 9–11. Approximate ammonium-nitrogen as a percentage of total nitrogen in various manure types
Type Source Ammonium-N2
Liquid manure1
Liquid hog 66%
Liquid dairy 42%
Liquid beef 43%
Liquid poultry 67%
Solid manure2
Solid hog 26%
Solid dairy 21%
Solid beef (high bedding) 12%
Solid horse 15%
Solid poultry (broilers) 6%
Solid poultry (layers) 46%
Composted cattle 0.6%
Municipal sources
Aerobic sewage biosolids 1.6%
Anaerobic sewage biosolids 35%
Dewatered sewage biosolids 12%
Lime-stabilized sewage biosolids
trace
Paper-mill biosolids trace
Spent-mushroom compost 5%1 Ammonium content increases as moisture content
increases (or dry matter decreases).2 Balance of nitrogen is in organic form.
Table 9–12. Estimated proportion (factor) of ammonium nitrogen from manure retained in year of application
Incorporation Details
Injected (covered)
Incorporated Not Incorporated
1 day 2 days 3 days 4 days 5 daysBare Soil Residue
Standing Crop (below canopy)
Average (factor) 1.00 0.75 0.60 0.50 0.45 0.40 0.35 0.50 0.66
Cool (<10°C)1 1.00 0.85 0.70 0.60 0.55 0.50 0.45 0.66 0.75
Warm (>25°C)1 1.00 0.65 0.50 0.40 0.35 0.30 0.20 0.35 0.55
Adapted (K. Reid) from Dr J. Lauzon, K. Janovicek, University of Guelph 2013. The table is based on an evaluation of data from 180 field sites which measured crop yield response to manure, of which 165 recorded grain corn yields.1 Shows a trend for ammonia loss under cooler or warmer than average temperatures. Other factors such as soil moisture and
amount of cover will affect ammonium retention.
With manure applied in late fall (<10°C), ammonium losses are lower since cooler temperatures slow down microbial action in soil, which minimizes conversion. Losses can be high due to runoff from late fall applications, especially when not incorporated. Denitrification and leaching losses of nitrogen are dealt with in Nitrogen Risk Mitigation.
Organic Nitrogen from ManureOrganic nitrogen is not available to the crop until it has been mineralized to the ammonium form by microbial action. The amount of mineralization will vary with
231
9. soIl FertIlIty and nutrIent use
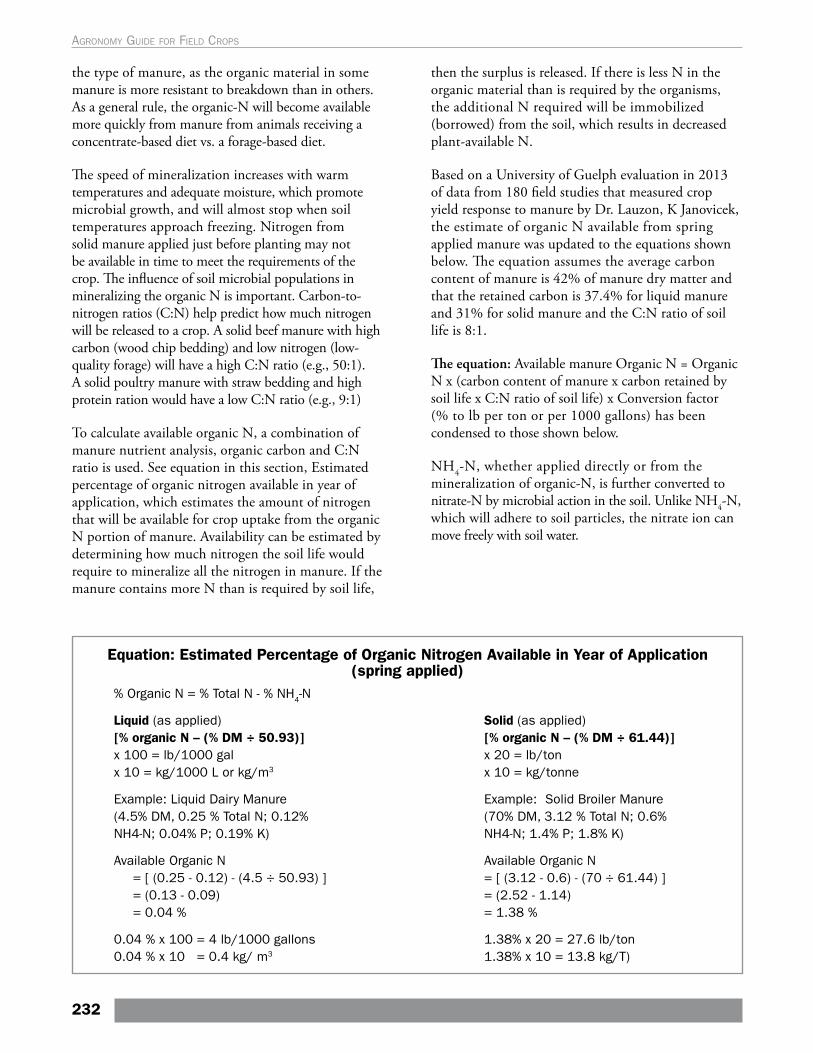
the type of manure, as the organic material in some manure is more resistant to breakdown than in others. As a general rule, the organic-N will become available more quickly from manure from animals receiving a concentrate-based diet vs. a forage-based diet.
The speed of mineralization increases with warm temperatures and adequate moisture, which promote microbial growth, and will almost stop when soil temperatures approach freezing. Nitrogen from solid manure applied just before planting may not be available in time to meet the requirements of the crop. The influence of soil microbial populations in mineralizing the organic N is important. Carbon-to-nitrogen ratios (C:N) help predict how much nitrogen will be released to a crop. A solid beef manure with high carbon (wood chip bedding) and low nitrogen (low-quality forage) will have a high C:N ratio (e.g., 50:1). A solid poultry manure with straw bedding and high protein ration would have a low C:N ratio (e.g., 9:1)
To calculate available organic N, a combination of manure nutrient analysis, organic carbon and C:N ratio is used. See equation in this section, Estimated percentage of organic nitrogen available in year of application, which estimates the amount of nitrogen that will be available for crop uptake from the organic N portion of manure. Availability can be estimated by determining how much nitrogen the soil life would require to mineralize all the nitrogen in manure. If the manure contains more N than is required by soil life,
Equation: Estimated Percentage of Organic Nitrogen Available in Year of Application (spring applied)
% Organic N = % Total N - % NH4-N
Liquid (as applied)[% organic N – (% DM ÷ 50.93)] x 100 = lb/1000 galx 10 = kg/1000 L or kg/m3
Example: Liquid Dairy Manure(4.5% DM, 0.25 % Total N; 0.12% NH4-N; 0.04% P; 0.19% K)
Available Organic N = [ (0.25 - 0.12) - (4.5 ÷ 50.93) ]= (0.13 - 0.09) = 0.04 %
0.04 % x 100 = 4 lb/1000 gallons0.04 % x 10 = 0.4 kg/ m3
Solid (as applied)[% organic N – (% DM ÷ 61.44)]x 20 = lb/tonx 10 = kg/tonne
Example: Solid Broiler Manure(70% DM, 3.12 % Total N; 0.6%NH4-N; 1.4% P; 1.8% K)
Available Organic N= [ (3.12 - 0.6) - (70 ÷ 61.44) ]= (2.52 - 1.14)= 1.38 %
1.38% x 20 = 27.6 lb/ton 1.38% x 10 = 13.8 kg/T)
then the surplus is released. If there is less N in the organic material than is required by the organisms, the additional N required will be immobilized (borrowed) from the soil, which results in decreased plant-available N.
Based on a University of Guelph evaluation in 2013 of data from 180 field studies that measured crop yield response to manure by Dr. Lauzon, K Janovicek, the estimate of organic N available from spring applied manure was updated to the equations shown below. The equation assumes the average carbon content of manure is 42% of manure dry matter and that the retained carbon is 37.4% for liquid manure and 31% for solid manure and the C:N ratio of soil life is 8:1.
The equation: Available manure Organic N = Organic N x (carbon content of manure x carbon retained by soil life x C:N ratio of soil life) x Conversion factor (% to lb per ton or per 1000 gallons) has been condensed to those shown below.
NH4-N, whether applied directly or from the mineralization of organic-N, is further converted to nitrate-N by microbial action in the soil. Unlike NH4-N, which will adhere to soil particles, the nitrate ion can move freely with soil water.
232
Agronomy guide for field Crops
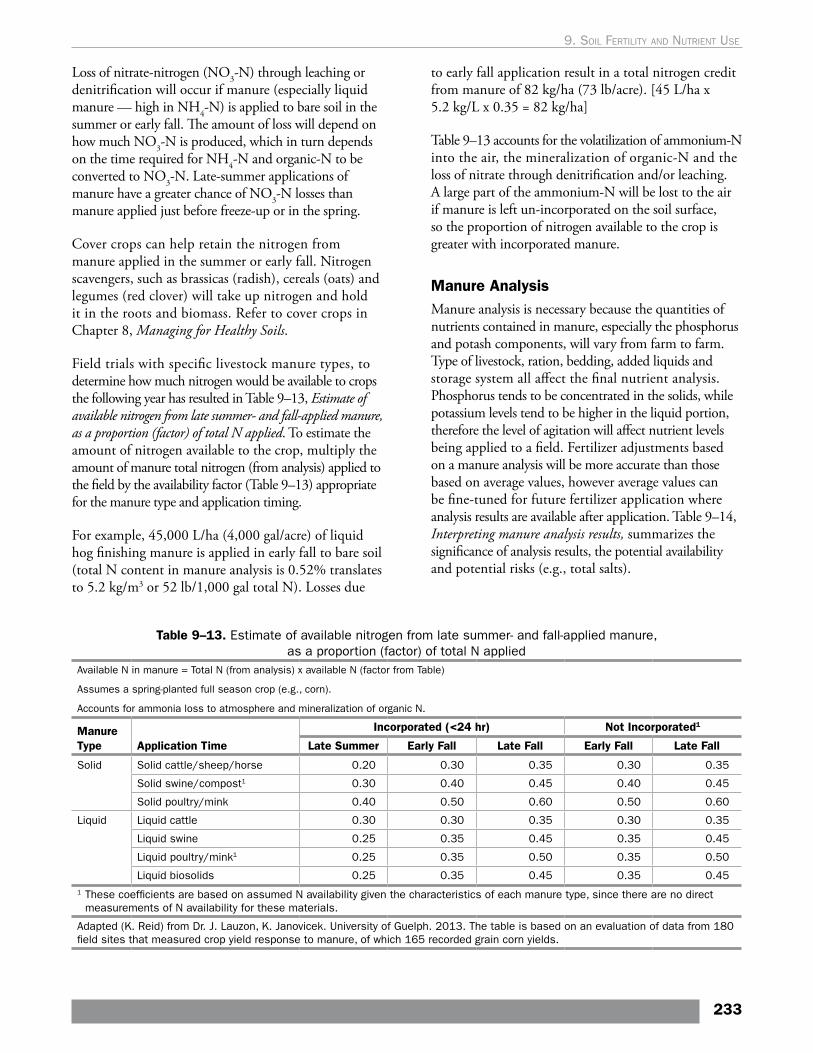
Loss of nitrate-nitrogen (NO3-N) through leaching or denitrification will occur if manure (especially liquid manure — high in NH4-N) is applied to bare soil in the summer or early fall. The amount of loss will depend on how much NO3-N is produced, which in turn depends on the time required for NH4-N and organic-N to be converted to NO3-N. Late-summer applications of manure have a greater chance of NO3-N losses than manure applied just before freeze-up or in the spring.
Cover crops can help retain the nitrogen from manure applied in the summer or early fall. Nitrogen scavengers, such as brassicas (radish), cereals (oats) and legumes (red clover) will take up nitrogen and hold it in the roots and biomass. Refer to cover crops in Chapter 8, Managing for Healthy Soils.
Field trials with specific livestock manure types, to determine how much nitrogen would be available to crops the following year has resulted in Table 9–13, Estimate of available nitrogen from late summer- and fall-applied manure, as a proportion (factor) of total N applied. To estimate the amount of nitrogen available to the crop, multiply the amount of manure total nitrogen (from analysis) applied to the field by the availability factor (Table 9–13) appropriate for the manure type and application timing.
For example, 45,000 L/ha (4,000 gal/acre) of liquid hog finishing manure is applied in early fall to bare soil (total N content in manure analysis is 0.52% translates to 5.2 kg/m3 or 52 lb/1,000 gal total N). Losses due
to early fall application result in a total nitrogen credit from manure of 82 kg/ha (73 lb/acre). [45 L/ha x 5.2 kg/L x 0.35 = 82 kg/ha]
Table 9–13 accounts for the volatilization of ammonium-N into the air, the mineralization of organic-N and the loss of nitrate through denitrification and/or leaching. A large part of the ammonium-N will be lost to the air if manure is left un-incorporated on the soil surface, so the proportion of nitrogen available to the crop is greater with incorporated manure.
Manure AnalysisManure analysis is necessary because the quantities of nutrients contained in manure, especially the phosphorus and potash components, will vary from farm to farm. Type of livestock, ration, bedding, added liquids and storage system all affect the final nutrient analysis. Phosphorus tends to be concentrated in the solids, while potassium levels tend to be higher in the liquid portion, therefore the level of agitation will affect nutrient levels being applied to a field. Fertilizer adjustments based on a manure analysis will be more accurate than those based on average values, however average values can be fine-tuned for future fertilizer application where analysis results are available after application. Table 9–14, Interpreting manure analysis results, summarizes the significance of analysis results, the potential availability and potential risks (e.g., total salts).
Table 9–13. Estimate of available nitrogen from late summer- and fall-applied manure, as a proportion (factor) of total N applied
Available N in manure = Total N (from analysis) x available N (factor from Table)
Assumes a spring-planted full season crop (e.g., corn).
Accounts for ammonia loss to atmosphere and mineralization of organic N.
Manure Type Application Time
Incorporated (<24 hr) Not Incorporated1
Late Summer Early Fall Late Fall Early Fall Late Fall
Solid Solid cattle/sheep/horse 0.20 0.30 0.35 0.30 0.35
Solid swine/compost1 0.30 0.40 0.45 0.40 0.45
Solid poultry/mink 0.40 0.50 0.60 0.50 0.60
Liquid Liquid cattle 0.30 0.30 0.35 0.30 0.35
Liquid swine 0.25 0.35 0.45 0.35 0.45
Liquid poultry/mink1 0.25 0.35 0.50 0.35 0.50
Liquid biosolids 0.25 0.35 0.45 0.35 0.451 These coefficients are based on assumed N availability given the characteristics of each manure type, since there are no direct
measurements of N availability for these materials.
Adapted (K. Reid) from Dr. J. Lauzon, K. Janovicek. University of Guelph. 2013. The table is based on an evaluation of data from 180 field sites that measured crop yield response to manure, of which 165 recorded grain corn yields.
233
9. soIl FertIlIty and nutrIent use
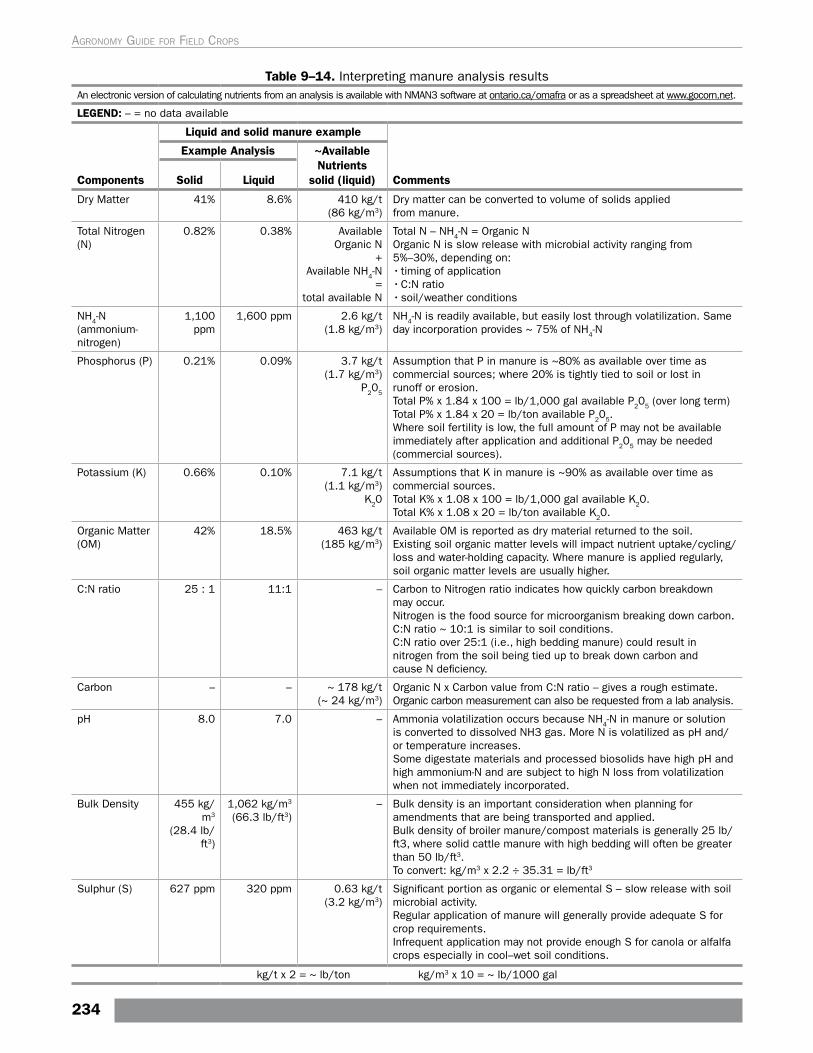
Table 9–14. Interpreting manure analysis resultsAn electronic version of calculating nutrients from an analysis is available with NMAN3 software at ontario.ca/omafra or as a spreadsheet at www.gocorn.net.
LEGEND: – = no data available
Components
Liquid and solid manure example
Comments
Example Analysis ~Available Nutrients
solid (liquid)Solid Liquid
Dry Matter 41% 8.6% 410 kg/t (86 kg/m3)
Dry matter can be converted to volume of solids applied from manure.
Total Nitrogen (N)
0.82% 0.38% Available Organic N
+ Available NH4-N
= total available N
Total N – NH4-N = Organic NOrganic N is slow release with microbial activity ranging from 5%–30%, depending on:• timing of application• C:N ratio • soil/weather conditions
NH4-N (ammonium- nitrogen)
1,100 ppm
1,600 ppm 2.6 kg/t (1.8 kg/m3)
NH4-N is readily available, but easily lost through volatilization. Same day incorporation provides ~ 75% of NH4-N
Phosphorus (P) 0.21% 0.09% 3.7 kg/t (1.7 kg/m3)
P205
Assumption that P in manure is ~80% as available over time as commercial sources; where 20% is tightly tied to soil or lost in runoff or erosion.Total P% x 1.84 x 100 = lb/1,000 gal available P205 (over long term)Total P% x 1.84 x 20 = lb/ton available P205. Where soil fertility is low, the full amount of P may not be available immediately after application and additional P205 may be needed (commercial sources).
Potassium (K) 0.66% 0.10% 7.1 kg/t (1.1 kg/m3)
K20
Assumptions that K in manure is ~90% as available over time as commercial sources.Total K% x 1.08 x 100 = lb/1,000 gal available K20.Total K% x 1.08 x 20 = lb/ton available K20.
Organic Matter (OM)
42% 18.5% 463 kg/t (185 kg/m3)
Available OM is reported as dry material returned to the soil.Existing soil organic matter levels will impact nutrient uptake/cycling/loss and water-holding capacity. Where manure is applied regularly, soil organic matter levels are usually higher.
C:N ratio 25 : 1 11:1 – Carbon to Nitrogen ratio indicates how quickly carbon breakdown may occur. Nitrogen is the food source for microorganism breaking down carbon. C:N ratio ~ 10:1 is similar to soil conditions.C:N ratio over 25:1 (i.e., high bedding manure) could result in nitrogen from the soil being tied up to break down carbon and cause N deficiency.
Carbon – – ~ 178 kg/t (~ 24 kg/m3)
Organic N x Carbon value from C:N ratio – gives a rough estimate. Organic carbon measurement can also be requested from a lab analysis.
pH 8.0 7.0 – Ammonia volatilization occurs because NH4-N in manure or solution is converted to dissolved NH3 gas. More N is volatilized as pH and/or temperature increases.Some digestate materials and processed biosolids have high pH and high ammonium-N and are subject to high N loss from volatilization when not immediately incorporated.
Bulk Density 455 kg/m3
(28.4 lb/ft3)
1,062 kg/m3 (66.3 lb/ft3)
– Bulk density is an important consideration when planning for amendments that are being transported and applied. Bulk density of broiler manure/compost materials is generally 25 lb/ft3, where solid cattle manure with high bedding will often be greater than 50 lb/ft3.To convert: kg/m3 x 2.2 ÷ 35.31 = lb/ft3
Sulphur (S) 627 ppm 320 ppm 0.63 kg/t (3.2 kg/m3)
Significant portion as organic or elemental S – slow release with soil microbial activity.Regular application of manure will generally provide adequate S for crop requirements. Infrequent application may not provide enough S for canola or alfalfa crops especially in cool–wet soil conditions.
kg/t x 2 = ~ lb/ton kg/m3 x 10 = ~ lb/1000 gal
234
Agronomy guide for field Crops
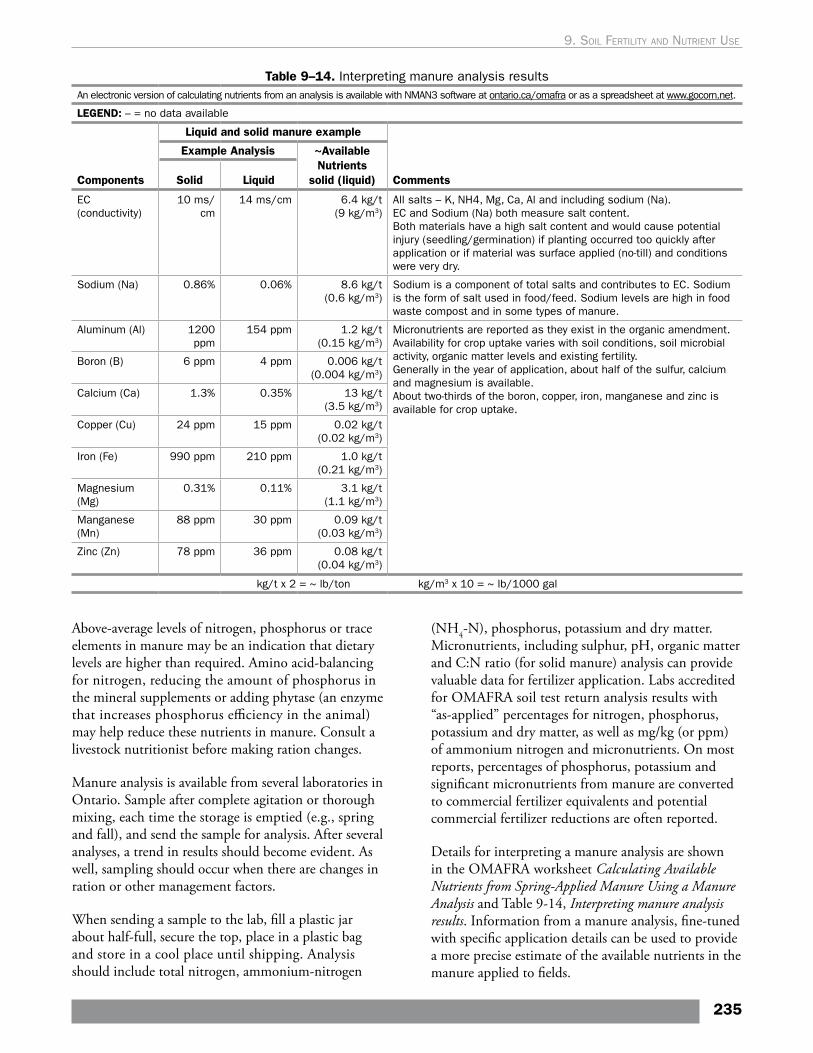
Table 9–14. Interpreting manure analysis resultsAn electronic version of calculating nutrients from an analysis is available with NMAN3 software at ontario.ca/omafra or as a spreadsheet at www.gocorn.net.
LEGEND: – = no data available
Components
Liquid and solid manure example
Comments
Example Analysis ~Available Nutrients
solid (liquid)Solid Liquid
EC (conductivity)
10 ms/cm
14 ms/cm 6.4 kg/t (9 kg/m3)
All salts – K, NH4, Mg, Ca, Al and including sodium (Na).EC and Sodium (Na) both measure salt content. Both materials have a high salt content and would cause potential injury (seedling/germination) if planting occurred too quickly after application or if material was surface applied (no-till) and conditions were very dry.
Sodium (Na) 0.86% 0.06% 8.6 kg/t (0.6 kg/m3)
Sodium is a component of total salts and contributes to EC. Sodium is the form of salt used in food/feed. Sodium levels are high in food waste compost and in some types of manure.
Aluminum (Al) 1200 ppm
154 ppm 1.2 kg/t (0.15 kg/m3)
Micronutrients are reported as they exist in the organic amendment. Availability for crop uptake varies with soil conditions, soil microbial activity, organic matter levels and existing fertility. Generally in the year of application, about half of the sulfur, calcium and magnesium is available.About two-thirds of the boron, copper, iron, manganese and zinc is available for crop uptake.
Boron (B) 6 ppm 4 ppm 0.006 kg/t (0.004 kg/m3)
Calcium (Ca) 1.3% 0.35% 13 kg/t (3.5 kg/m3)
Copper (Cu) 24 ppm 15 ppm 0.02 kg/t (0.02 kg/m3)
Iron (Fe) 990 ppm 210 ppm 1.0 kg/t (0.21 kg/m3)
Magnesium (Mg)
0.31% 0.11% 3.1 kg/t (1.1 kg/m3)
Manganese (Mn)
88 ppm 30 ppm 0.09 kg/t (0.03 kg/m3)
Zinc (Zn) 78 ppm 36 ppm 0.08 kg/t (0.04 kg/m3)
kg/t x 2 = ~ lb/ton kg/m3 x 10 = ~ lb/1000 gal
Above-average levels of nitrogen, phosphorus or trace elements in manure may be an indication that dietary levels are higher than required. Amino acid-balancing for nitrogen, reducing the amount of phosphorus in the mineral supplements or adding phytase (an enzyme that increases phosphorus efficiency in the animal) may help reduce these nutrients in manure. Consult a livestock nutritionist before making ration changes.
Manure analysis is available from several laboratories in Ontario. Sample after complete agitation or thorough mixing, each time the storage is emptied (e.g., spring and fall), and send the sample for analysis. After several analyses, a trend in results should become evident. As well, sampling should occur when there are changes in ration or other management factors.
When sending a sample to the lab, fill a plastic jar about half-full, secure the top, place in a plastic bag and store in a cool place until shipping. Analysis should include total nitrogen, ammonium-nitrogen
(NH4-N), phosphorus, potassium and dry matter. Micronutrients, including sulphur, pH, organic matter and C:N ratio (for solid manure) analysis can provide valuable data for fertilizer application. Labs accredited for OMAFRA soil test return analysis results with “as-applied” percentages for nitrogen, phosphorus, potassium and dry matter, as well as mg/kg (or ppm) of ammonium nitrogen and micronutrients. On most reports, percentages of phosphorus, potassium and significant micronutrients from manure are converted to commercial fertilizer equivalents and potential commercial fertilizer reductions are often reported.
Details for interpreting a manure analysis are shown in the OMAFRA worksheet Calculating Available Nutrients from Spring-Applied Manure Using a Manure Analysis and Table 9-14, Interpreting manure analysis results. Information from a manure analysis, fine-tuned with specific application details can be used to provide a more precise estimate of the available nutrients in the manure applied to fields.
235
9. soIl FertIlIty and nutrIent use
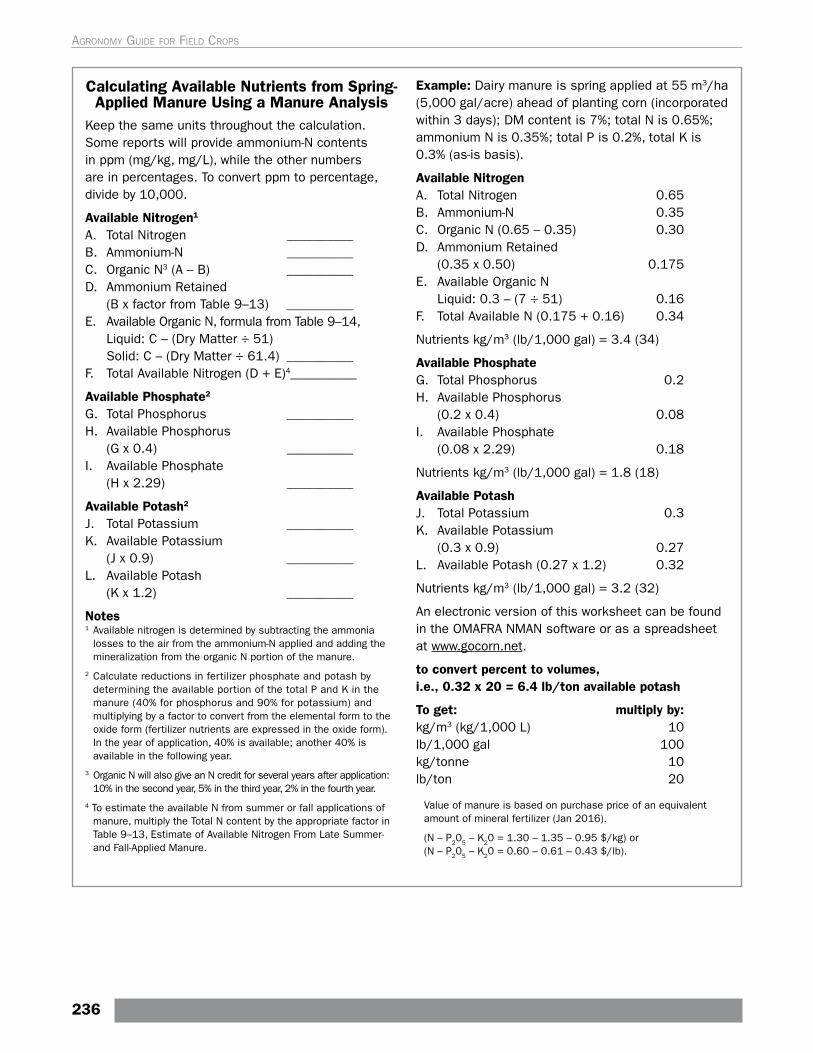
______________________________
__________
____________________
__________
__________
__________
__________
__________
__________
Calculating Available Nutrients from Spring-Applied Manure Using a Manure Analysis
Keep the same units throughout the calculation. Some reports will provide ammonium-N contents in ppm (mg/kg, mg/L), while the other numbers are in percentages. To convert ppm to percentage, divide by 10,000.
Available Nitrogen1
A. Total NitrogenB. Ammonium-NC. Organic N3 (A – B)D. Ammonium Retained
(B x factor from Table 9–13)E. Available Organic N, formula from Table 9–14,
Liquid: C – (Dry Matter ÷ 51) Solid: C – (Dry Matter ÷ 61.4)
F. Total Available Nitrogen (D + E)4
Available Phosphate2
G. Total PhosphorusH. Available Phosphorus
(G x 0.4)I. Available Phosphate
(H x 2.29)
Available Potash2
J. Total PotassiumK. Available Potassium
(J x 0.9)L. Available Potash
(K x 1.2)
Notes1 Available nitrogen is determined by subtracting the ammonia
losses to the air from the ammonium-N applied and adding the mineralization from the organic N portion of the manure.
2 Calculate reductions in fertilizer phosphate and potash by determining the available portion of the total P and K in the manure (40% for phosphorus and 90% for potassium) and multiplying by a factor to convert from the elemental form to the oxide form (fertilizer nutrients are expressed in the oxide form). In the year of application, 40% is available; another 40% is available in the following year.
3 Organic N will also give an N credit for several years after application: 10% in the second year, 5% in the third year, 2% in the fourth year.
4 To estimate the available N from summer or fall applications of manure, multiply the Total N content by the appropriate factor in Table 9–13, Estimate of Available Nitrogen From Late Summer- and Fall-Applied Manure.
Example: Dairy manure is spring applied at 55 m3/ha (5,000 gal/acre) ahead of planting corn (incorporated within 3 days); DM content is 7%; total N is 0.65%; ammonium N is 0.35%; total P is 0.2%, total K is 0.3% (as-is basis).
Available NitrogenA. Total Nitrogen 0.65B. Ammonium-N 0.35C. Organic N (0.65 – 0.35) 0.30D. Ammonium Retained
(0.35 x 0.50) 0.175E. Available Organic N
Liquid: 0.3 – (7 ÷ 51) 0.16F. Total Available N (0.175 + 0.16) 0.34
Nutrients kg/m3 (lb/1,000 gal) = 3.4 (34)
Available PhosphateG. Total Phosphorus 0.2H. Available Phosphorus
(0.2 x 0.4) 0.08I. Available Phosphate
(0.08 x 2.29) 0.18
Nutrients kg/m3 (lb/1,000 gal) = 1.8 (18)
Available PotashJ. Total Potassium 0.3K. Available Potassium
(0.3 x 0.9) 0.27L. Available Potash (0.27 x 1.2) 0.32
Nutrients kg/m3 (lb/1,000 gal) = 3.2 (32)
An electronic version of this worksheet can be found in the OMAFRA NMAN software or as a spreadsheet at www.gocorn.net.
to convert percent to volumes, i.e., 0.32 x 20 = 6.4 lb/ton available potash
To get: multiply by:kg/m3 (kg/1,000 L) 10lb/1,000 gal 100kg/tonne 10lb/ton 20
Value of manure is based on purchase price of an equivalent amount of mineral fertilizer (Jan 2016).
(N – P205 – K20 = 1.30 – 1.35 – 0.95 $/kg) or (N – P205 – K20 = 0.60 – 0.61 – 0.43 $/lb).
236
Agronomy guide for field Crops
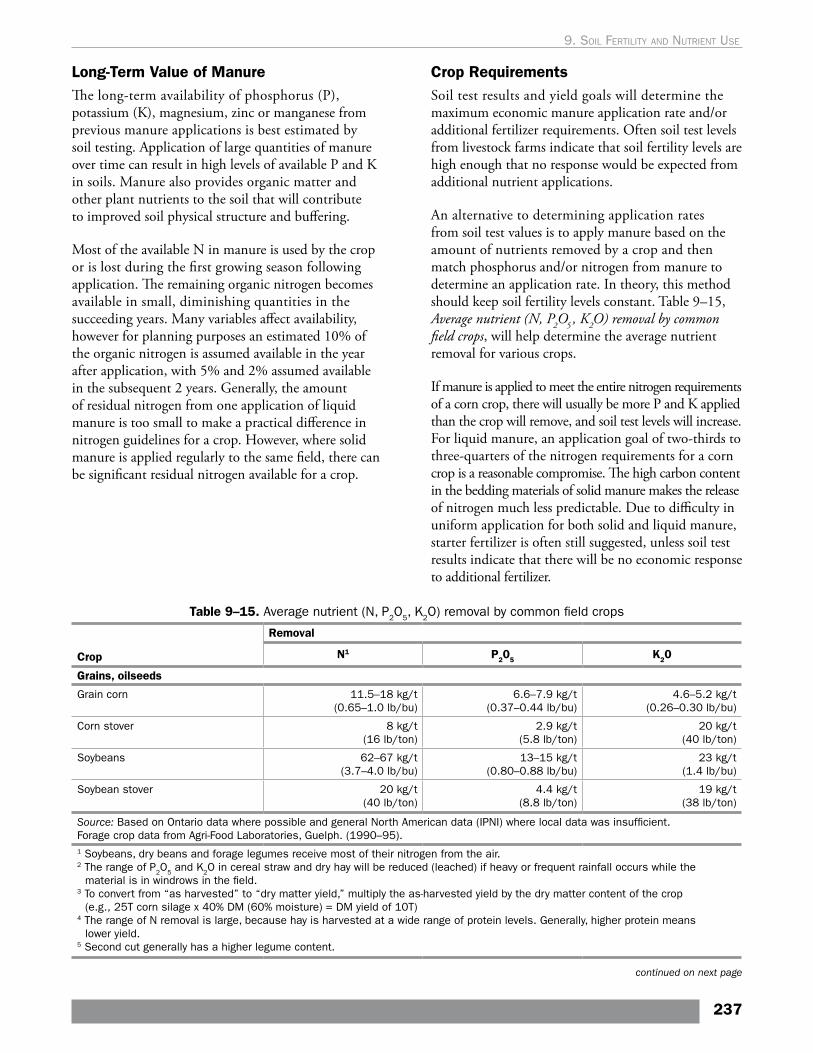
Long-Term Value of ManureThe long-term availability of phosphorus (P), potassium (K), magnesium, zinc or manganese from previous manure applications is best estimated by soil testing. Application of large quantities of manure over time can result in high levels of available P and K in soils. Manure also provides organic matter and other plant nutrients to the soil that will contribute to improved soil physical structure and buffering.
Most of the available N in manure is used by the crop or is lost during the first growing season following application. The remaining organic nitrogen becomes available in small, diminishing quantities in the succeeding years. Many variables affect availability, however for planning purposes an estimated 10% of the organic nitrogen is assumed available in the year after application, with 5% and 2% assumed available in the subsequent 2 years. Generally, the amount of residual nitrogen from one application of liquid manure is too small to make a practical difference in nitrogen guidelines for a crop. However, where solid manure is applied regularly to the same field, there can be significant residual nitrogen available for a crop.
Crop RequirementsSoil test results and yield goals will determine the maximum economic manure application rate and/or additional fertilizer requirements. Often soil test levels from livestock farms indicate that soil fertility levels are high enough that no response would be expected from additional nutrient applications.
An alternative to determining application rates from soil test values is to apply manure based on the amount of nutrients removed by a crop and then match phosphorus and/or nitrogen from manure to determine an application rate. In theory, this method should keep soil fertility levels constant. Table 9–15, Average nutrient (N, P2O5 , K2O) removal by common field crops, will help determine the average nutrient removal for various crops.
If manure is applied to meet the entire nitrogen requirements of a corn crop, there will usually be more P and K applied than the crop will remove, and soil test levels will increase. For liquid manure, an application goal of two-thirds to three-quarters of the nitrogen requirements for a corn crop is a reasonable compromise. The high carbon content in the bedding materials of solid manure makes the release of nitrogen much less predictable. Due to difficulty in uniform application for both solid and liquid manure, starter fertilizer is often still suggested, unless soil test results indicate that there will be no economic response to additional fertilizer.
Table 9–15. Average nutrient (N, P2O5, K2O) removal by common field crops
Crop
Removal
N1 P205 K20
Grains, oilseeds
Grain corn 11.5–18 kg/t (0.65–1.0 lb/bu)
6.6–7.9 kg/t (0.37–0.44 lb/bu)
4.6–5.2 kg/t (0.26–0.30 lb/bu)
Corn stover 8 kg/t (16 lb/ton)
2.9 kg/t (5.8 lb/ton)
20 kg/t (40 lb/ton)
Soybeans 62–67 kg/t (3.7–4.0 lb/bu)
13–15 kg/t (0.80–0.88 lb/bu)
23 kg/t (1.4 lb/bu)
Soybean stover 20 kg/t (40 lb/ton)
4.4 kg/t (8.8 lb/ton)
19 kg/t (38 lb/ton)
Source: Based on Ontario data where possible and general North American data (IPNI) where local data was insufficient.Forage crop data from Agri-Food Laboratories, Guelph. (1990–95).1 Soybeans, dry beans and forage legumes receive most of their nitrogen from the air.2 The range of P2O5 and K2O in cereal straw and dry hay will be reduced (leached) if heavy or frequent rainfall occurs while the
material is in windrows in the field.3 To convert from “as harvested” to “dry matter yield,” multiply the as-harvested yield by the dry matter content of the crop
(e.g., 25T corn silage x 40% DM (60% moisture) = DM yield of 10T) 4 The range of N removal is large, because hay is harvested at a wide range of protein levels. Generally, higher protein means
lower yield. 5 Second cut generally has a higher legume content.
continued on next page
237
9. soIl FertIlIty and nutrIent use
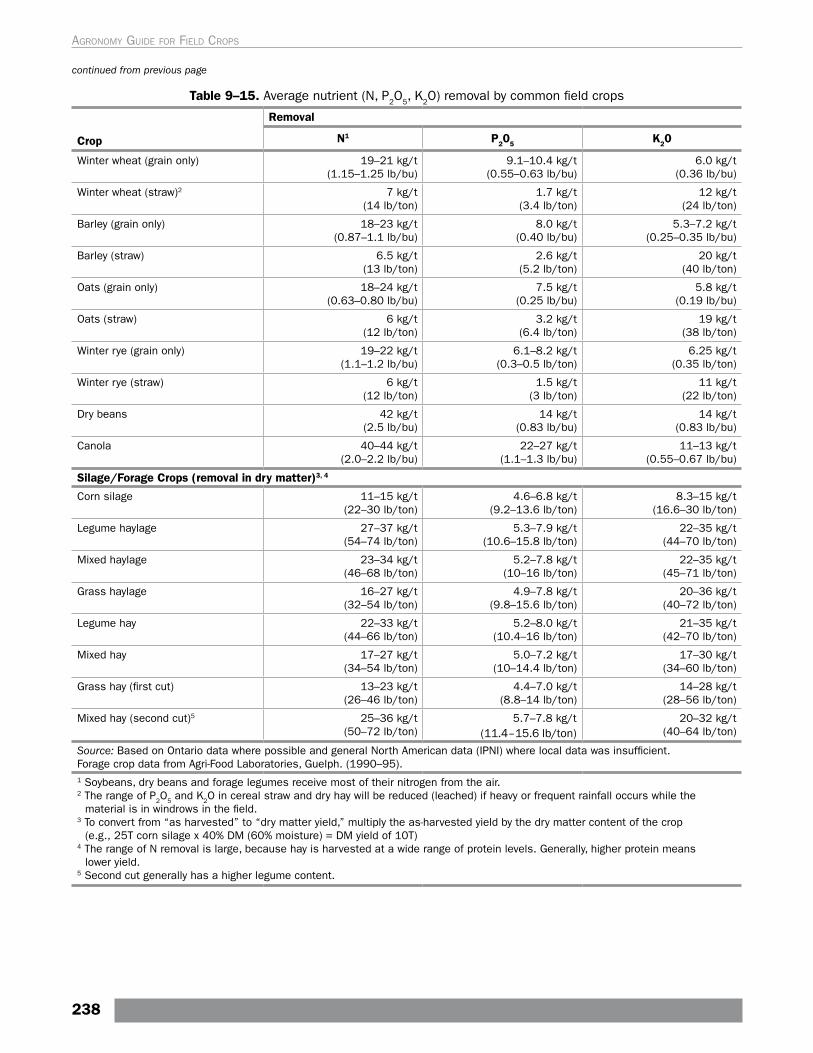
Table 9–15. Average nutrient (N, P2O5, K2O) removal by common field crops
Crop
Removal
N1 P205 K20
Winter wheat (grain only) 19–21 kg/t (1.15–1.25 lb/bu)
9.1–10.4 kg/t (0.55–0.63 lb/bu)
6.0 kg/t (0.36 lb/bu)
Winter wheat (straw)2 7 kg/t (14 lb/ton)
1.7 kg/t (3.4 lb/ton)
12 kg/t (24 lb/ton)
Barley (grain only) 18–23 kg/t (0.87–1.1 lb/bu)
8.0 kg/t (0.40 lb/bu)
5.3–7.2 kg/t (0.25–0.35 lb/bu)
Barley (straw) 6.5 kg/t (13 lb/ton)
2.6 kg/t (5.2 lb/ton)
20 kg/t (40 lb/ton)
Oats (grain only) 18–24 kg/t (0.63–0.80 lb/bu)
7.5 kg/t (0.25 lb/bu)
5.8 kg/t (0.19 lb/bu)
Oats (straw) 6 kg/t (12 lb/ton)
3.2 kg/t (6.4 lb/ton)
19 kg/t (38 lb/ton)
Winter rye (grain only) 19–22 kg/t (1.1–1.2 lb/bu)
6.1–8.2 kg/t (0.3–0.5 lb/ton)
6.25 kg/t (0.35 lb/ton)
Winter rye (straw) 6 kg/t (12 lb/ton)
1.5 kg/t (3 lb/ton)
11 kg/t (22 lb/ton)
Dry beans 42 kg/t (2.5 lb/bu)
14 kg/t (0.83 lb/bu)
14 kg/t (0.83 lb/bu)
Canola 40–44 kg/t (2.0–2.2 lb/bu)
22–27 kg/t (1.1–1.3 lb/bu)
11–13 kg/t (0.55–0.67 lb/bu)
Silage/Forage Crops (removal in dry matter)3, 4
Corn silage 11–15 kg/t (22–30 lb/ton)
4.6–6.8 kg/t (9.2–13.6 lb/ton)
8.3–15 kg/t (16.6–30 lb/ton)
Legume haylage 27–37 kg/t (54–74 lb/ton)
5.3–7.9 kg/t (10.6–15.8 lb/ton)
22–35 kg/t (44–70 lb/ton)
Mixed haylage 23–34 kg/t (46–68 lb/ton)
5.2–7.8 kg/t (10–16 lb/ton)
22–35 kg/t (45–71 lb/ton)
Grass haylage 16–27 kg/t (32–54 lb/ton)
4.9–7.8 kg/t (9.8–15.6 lb/ton)
20–36 kg/t (40–72 lb/ton)
Legume hay 22–33 kg/t (44–66 lb/ton)
5.2–8.0 kg/t (10.4–16 lb/ton)
21–35 kg/t (42–70 lb/ton)
Mixed hay 17–27 kg/t (34–54 lb/ton)
5.0–7.2 kg/t (10–14.4 lb/ton)
17–30 kg/t (34–60 lb/ton)
Grass hay (first cut) 13–23 kg/t (26–46 lb/ton)
4.4–7.0 kg/t (8.8–14 lb/ton)
14–28 kg/t (28–56 lb/ton)
Mixed hay (second cut)5 25–36 kg/t (50–72 lb/ton)
5.7–7.8 kg/t (11.4–15.6 lb/ton)
20–32 kg/t (40–64 lb/ton)
Source: Based on Ontario data where possible and general North American data (IPNI) where local data was insufficient.Forage crop data from Agri-Food Laboratories, Guelph. (1990–95).1 Soybeans, dry beans and forage legumes receive most of their nitrogen from the air.2 The range of P2O5 and K2O in cereal straw and dry hay will be reduced (leached) if heavy or frequent rainfall occurs while the
material is in windrows in the field.3 To convert from “as harvested” to “dry matter yield,” multiply the as-harvested yield by the dry matter content of the crop
(e.g., 25T corn silage x 40% DM (60% moisture) = DM yield of 10T) 4 The range of N removal is large, because hay is harvested at a wide range of protein levels. Generally, higher protein means
lower yield. 5 Second cut generally has a higher legume content.
continued from previous page
238
Agronomy guide for field Crops
Take into account residual nitrogen from legume crops when determining additional nitrogen needs from manure or fertilizer. See Table 9–9, Adjustment of nitrogen requirement, where crops containing legumes are plowed down. Apply manure to cereal crops, soybeans or canola with caution, since too high a rate will increase the potential for lodging.
Equipment technology is increasing the opportunities for manure application into growing crops such as corn, forages, and cover crops planted after wheat harvest. For summer application to established forages, keep rates below 45m3/ha (4,000 gal/acre) or 55–65 kg/ha (50–60 lb/acre) NH4-N. Complete application to forages as soon as possible after harvest to avoid wheel track damage to new growth and potential nitrogen burn to new leaf tissue. Do not apply concentrated manures with high ammonium-nitrogen levels (e.g., liquid layer poultry or concentrated finisher hog manure) onto leaf tissue of standing crops. Older forage stands with higher grass content will benefit most from the manure nitrogen.
Soil compaction is a problem for many producers and is a main reason that application into growing crops, late summer or early fall manure application is popular. Compaction leads to poor drainage and decreased aeration. The best way to reduce or avoid soil compaction from manure application is to spread manure when the soil is dry. Drag-hose systems can help reduce compaction, as do radial tires and on-the-go-tire inflation options on manure application equipment. Loads should stay below 4.5 tonnes (5 tons) per axle. Spring spreading is often carried out on fields where soils are too wet, and it is not unusual for strips of stunted crops to reveal the location of wheel traffic from application equipment.
Environmental Concerns With ManureTo minimize environmental concerns with manure, the 4-R approach commonly used for fertilizer can also apply to manure application:
• right product • right place • right time • right rate
Manure has unique aspects that are different from fertilizer — its blend of nutrients (i.e., N-P-K ratios) are not adjustable therefore commercial fertilizer may be used along with manure to meet nutrient requirements. Conversely, some nutrients may be
applied over requirements, but within the ability of the crop (or a rotation of crops) to uptake the nutrients over a period of time. A nutrient management plan will address this.
The timing of application may be driven by the production of the manure and the available manure storage. Application timing should avoid nutrients (especially inorganic nitrogen) being on the soil for long periods of time before utilization by a crop. The use of cover crops may be considered if manure is to be applied in late summer or early fall.
Application to fields with steep slopes or impermeable soils can cause manure runoff when application rates are too high. For some soil types, several applications at lower rates may be necessary. Spreading manure in the winter and early spring creates the potential for runoff to surface water and nutrient accumulations in water-ponded areas. Never apply manure on snow-covered or frozen soil due to risk of nutrient movement. The soil has no capacity for infiltration, which results in phosphorus movement with melt-water and soil. Although winter application should not be part of a nutrient management plan, there are some mild spells where field application accompanied by immediate incorporation is possible. When winter spreading is essential (i.e., part of contingency plan), take care to select fields with the lowest risk of runoff to surface water.
Contamination of the environment is prohibited under the Environmental Protection Act, 1990, the Ontario Water Resources Act, 1990 and the federal Fisheries Act , 1985. In addition, there are specific requirements for manure application under the Nutrient Management Act, 2002 and Regulation 267/03. Refer to the most recent updates of the regulation and protocols at ontario.ca/laws.
Rain can cause organic nitrogen to wash into streams if manure has been applied to unprotected cropland. Phosphorus attached to soil particles can be carried to streams by soil erosion. Conservation practices can reduce the chances of nutrients polluting waterways.
A vegetated buffer along watercourses protects against contamination from manure applied in adjacent fields and protects the watercourse from streambank erosion. Runoff potential is influenced by field slope and soil texture. Flow in tile drains can become contaminated,
239
9. soIl FertIlIty and nutrIent use
if manure enters a catchbasin or travels through soil cracks or earthworm/root channels to the tiles. To minimize the risk of contaminated tile flow, apply at low rates when the tiles are not running, or lightly till the field before manure application to break any macropores.
Application of nutrients contained in manure or fertilizer in excess of crop requirements can result in contamination of groundwater, particularly on shallow soils over bedrock, soils with a water table close to the surface or very sandy soils where leaching is a concern. Groundwater contamination can occur by mass flow through cracks and holes to groundwater or through leaching of nitrates through the soil. Contamination can also occur if manure seeps directly into inadequately protected water wells. Manure should not be applied within 15 m (50 ft) of drilled wells, 30 m (100 ft) of dug wells or 100 m (330 ft) of a municipal well. See the Nutrient Management Act, 2002 and Regulation 267/03, section 43.
Large livestock operations on small land bases pose special challenges. To avoid over-application of nutrients, complete a nutrient management plan. It may be necessary to sign agreements with neighbouring farms to ensure the availability of fields for proper manure spreading.
Detailed information about maximum application rates and setbacks from surface water or water wells can be found in the NMAN3 software at ontario.ca/omafra.
Nitrogen Risk MitigationThe nitrogen cycle, with its many forms of nitrogen, is a complicated process that is influenced by many factors, including weather, soil, physical, chemical and biological processes. Use the optimum amount of nitrogen required for crop production, keeping in perspective that any nitrogen not used by the crop has the potential to leach below the root zone, volatilize into the atmosphere or denitrify (potentially to nitrous oxide).
Nitrate that could potentially leach out of the rooting zone includes nitrogen that is applied in excess of crop removal and nitrogen from manure or biosolids applied during the non-growing season (late summer or fall). In Ontario, most of the drainage to groundwater occurs during the late fall to early spring period, when
precipitation exceeds evaporation. On sandy, well-drained soils, much of the nitrate present in the fall could be leached into groundwater when drainage occurs. On heavier soils, more of the loss will be through denitrification. Minimizing the amount of soil nitrate present in the fall will reduce both types of loss.
Management practices to reduce the risk of nitrate losses include:
• growing cover crops whenever manure is applied in late summer or early fall
• timing nitrogen applications close to crop nitrogen uptake (right time)
• matching total nitrogen applications to crop requirements (right rate)
Phosphorus Risk AssessmentThe risk of surface water contamination by phosphorus may be increased at higher soil test phosphorus levels. However, since phosphorus binds tightly to soil particles, the movement of soil from a field by erosion is also a major factor in determining the risk of surface-water contamination. Because of this, the risk of surface-water contamination by phosphorus cannot be based on a soil-test phosphorus level alone.
The risk of phosphorus contamination to surface water increases when soil test results indicate that no additional phosphorus is required to achieve maximum economic yield, but manure nutrients are still applied. Phosphorus in surface-water sources increases eutrophication or aquatic plant growth (algae blooms), which leads to oxygen fluctuations and decreased ability for the water source to support aquatic life. To address the environmental risk of additional phosphorus application when soil test levels are adequate, a phosphorus index has been developed. The phosphorus index results in lower phosphorus application rates and wider phosphorus-free buffers adjacent to water courses when there is a significant risk of nutrient/soil runoff and when phosphorus fertility levels are high.
The phosphorus index considers:
• soil erosion potential• water runoff potential• phosphorus soil fertility levels• fertilizer and manure application method
(right place) and rate (right rate)
240
Agronomy guide for field Crops
OMAFRA is developing an updated phosphorus index, which will also consider the impact of tile drainage, as well as the solubility of various types of manure and risk of loss in the non-growing season. For more information on phosphorus risk assessment, see the OMAFRA factsheet, Determining the Phosphorus Index for a Field or visit the website at ontario.ca/crops.
Manure and No-TillThe goal with no-till is to minimize disturbance of the soil and seedbed. The goal with manure application in a no-till system is a combination of nutrients to feed crops and soil microorganisms as well as to provide organic matter contributions that help improve soil health. Manure application is most effective when nutrients are incorporated. When manure is utilized in a no-till system, there has to be a compromise. Some tillage will be required or some loss of nutrients will occur. Advances in application technology and in-crop application opportunities (including dribble bar application of manure under a crop canopy or slurry-seeding cover crops after cereal harvest) allow manure application to occur in no-till systems with minimal nutrient loss.
A few points to consider when applying manure in a no-till system:
• Plan manure application to consider crop rotation and in-crop applications, especially in a true no-till system where nutrients are not incorporated through tillage.
• Manure applied after wheat or spring cereal harvest is the best option. Shallow tillage using vertical tillage or discing when soils are dry will help incorporate cereal straw and manure and could also incorporate cover crop seed. During warm, dry conditions earthworms reside deep in the soil where minimal tillage will not destroy their channels, and nitrogen will help with straw breakdown.
• Apply manure to corn when soils are dry to avoid rutting and compaction. Consider side-dress applications to standing corn. If nutrients, especially nitrogen, are the important feature, decide which is more important: limited pre-planned tillage or some nitrogen loss. Manure type will influence how much nitrogen is potentially lost. Solid manure has a smaller portion as ammonium-N, therefore less total nitrogen will be lost. The higher the organic-N component is the less available N is but it results in the release of nitrogen over a longer period of
time. Where manure is surface applied to bare soil, a majority of the ammonium portion of the manure will be lost. Rain (10–15 mm (~1/2 in.) gentle, infiltrating) shortly after application will incorporate some of the ammonium.
• Although white mould is less problematic in no-till systems, manure applied ahead of soybean planting often results in a denser canopy where risk of white mould is higher. Choose a variety with some resistance to white mould.
• Liquid manure applied to forages is a good option. Apply manure as soon as possible after harvest, before re-growth. Application to older grass-alfalfa stands will give the largest nutrient benefit.
• Surface applied phosphorus from manure in no-till scenarios will increase risk of movement (runoff) to water courses, especially when application occurs outside the growing season. Increased residue cover or cover crops will limit movement, however where manure is applied on sloping land, it is best to have a buffer (vegetated or separation distance) from a water courses or in-field area of concentrated flow.
• Never plan to apply manure to frozen or snow covered land since nutrient (especially phosphorus) runoff is a high risk. Avoid applying liquid manure to snow-covered perennial forages, since ice can form under the manure, resulting in increased winterkill and runoff.
• A nutrient analysis is important, regardless of which crop the manure is applied to, so that commercial fertilizer application can be balanced with what was provided in the manure.
• High volumes of surface applied manure can lead to slower soil warm-up in spring or sealing of soil. Calibrate application equipment to ensure an accurate rate.
Calibrating Application EquipmentCalibrating manure application equipment is essential. Several methods can be used to measure spreading rates. Weighing a load of manure and measuring the area that load covers is one method of estimating the rate of application. Another method is to weigh solid manure by placing plastic sheets on the ground and liquid manure by using straight-walled pails for measuring depth of application. Consider overlap, especially in irrigation systems. Table 9–16, Calibrating manure application equipment, gives an estimate of application rates, while Table 9–17, Densities of different types of manure, distinguishes between the densities of different types of manure. For further details, visit the OMAFRA website at ontario.ca/crops.
241
9. soIl FertIlIty and nutrIent use
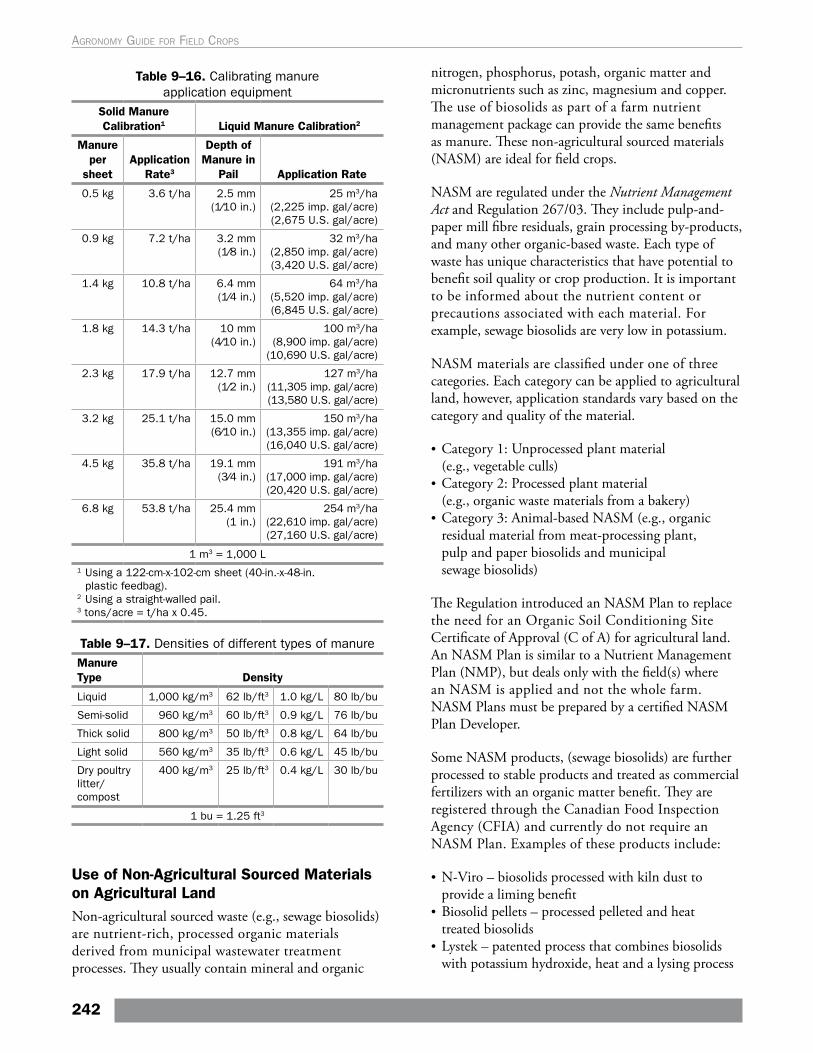
Table 9–16. Calibrating manure application equipment
Solid Manure Calibration1 Liquid Manure Calibration2
Manure per
sheetApplication
Rate3
Depth of Manure in
Pail Application Rate
0.5 kg 3.6 t/ha 2.5 mm (1⁄10 in.)
25 m3/ha (2,225 imp. gal/acre) (2,675 U.S. gal/acre)
0.9 kg 7.2 t/ha 3.2 mm (1⁄8 in.)
32 m3/ha (2,850 imp. gal/acre) (3,420 U.S. gal/acre)
1.4 kg 10.8 t/ha 6.4 mm (1⁄4 in.)
64 m3/ha (5,520 imp. gal/acre) (6,845 U.S. gal/acre)
1.8 kg 14.3 t/ha 10 mm (4⁄10 in.)
100 m3/ha (8,900 imp. gal/acre)
(10,690 U.S. gal/acre)
2.3 kg 17.9 t/ha 12.7 mm (1⁄2 in.)
127 m3/ha (11,305 imp. gal/acre) (13,580 U.S. gal/acre)
3.2 kg 25.1 t/ha 15.0 mm (6⁄10 in.)
150 m3/ha (13,355 imp. gal/acre) (16,040 U.S. gal/acre)
4.5 kg 35.8 t/ha 19.1 mm (3⁄4 in.)
191 m3/ha (17,000 imp. gal/acre) (20,420 U.S. gal/acre)
6.8 kg 53.8 t/ha 25.4 mm (1 in.)
254 m3/ha (22,610 imp. gal/acre) (27,160 U.S. gal/acre)
1 m3 = 1,000 L1 Using a 122-cm-x-102-cm sheet (40-in.-x-48-in.
plastic feedbag).2 Using a straight-walled pail.3 tons/acre = t/ha x 0.45.
Table 9–17. Densities of different types of manureManure Type Density
Liquid 1,000 kg/m3 62 lb/ft3 1.0 kg/L 80 lb/bu
Semi-solid 960 kg/m3 60 lb/ft3 0.9 kg/L 76 lb/bu
Thick solid 800 kg/m3 50 lb/ft3 0.8 kg/L 64 lb/bu
Light solid 560 kg/m3 35 lb/ft3 0.6 kg/L 45 lb/bu
Dry poultry litter/compost
400 kg/m3 25 lb/ft3 0.4 kg/L 30 lb/bu
1 bu = 1.25 ft3
Use of Non-Agricultural Sourced Materials on Agricultural LandNon-agricultural sourced waste (e.g., sewage biosolids) are nutrient-rich, processed organic materials derived from municipal wastewater treatment processes. They usually contain mineral and organic
nitrogen, phosphorus, potash, organic matter and micronutrients such as zinc, magnesium and copper. The use of biosolids as part of a farm nutrient management package can provide the same benefits as manure. These non-agricultural sourced materials (NASM) are ideal for field crops.
NASM are regulated under the Nutrient Management Act and Regulation 267/03. They include pulp-and-paper mill fibre residuals, grain processing by-products, and many other organic-based waste. Each type of waste has unique characteristics that have potential to benefit soil quality or crop production. It is important to be informed about the nutrient content or precautions associated with each material. For example, sewage biosolids are very low in potassium.
NASM materials are classified under one of three categories. Each category can be applied to agricultural land, however, application standards vary based on the category and quality of the material.
• Category 1: Unprocessed plant material (e.g., vegetable culls)
• Category 2: Processed plant material (e.g., organic waste materials from a bakery)
• Category 3: Animal-based NASM (e.g., organic residual material from meat-processing plant, pulp and paper biosolids and municipal sewage biosolids)
The Regulation introduced an NASM Plan to replace the need for an Organic Soil Conditioning Site Certificate of Approval (C of A) for agricultural land. An NASM Plan is similar to a Nutrient Management Plan (NMP), but deals only with the field(s) where an NASM is applied and not the whole farm. NASM Plans must be prepared by a certified NASM Plan Developer.
Some NASM products, (sewage biosolids) are further processed to stable products and treated as commercial fertilizers with an organic matter benefit. They are registered through the Canadian Food Inspection Agency (CFIA) and currently do not require an NASM Plan. Examples of these products include:
• N-Viro – biosolids processed with kiln dust to provide a liming benefit
• Biosolid pellets – processed pelleted and heat treated biosolids
• Lystek – patented process that combines biosolids with potassium hydroxide, heat and a lysing process
242
Agronomy guide for field Crops
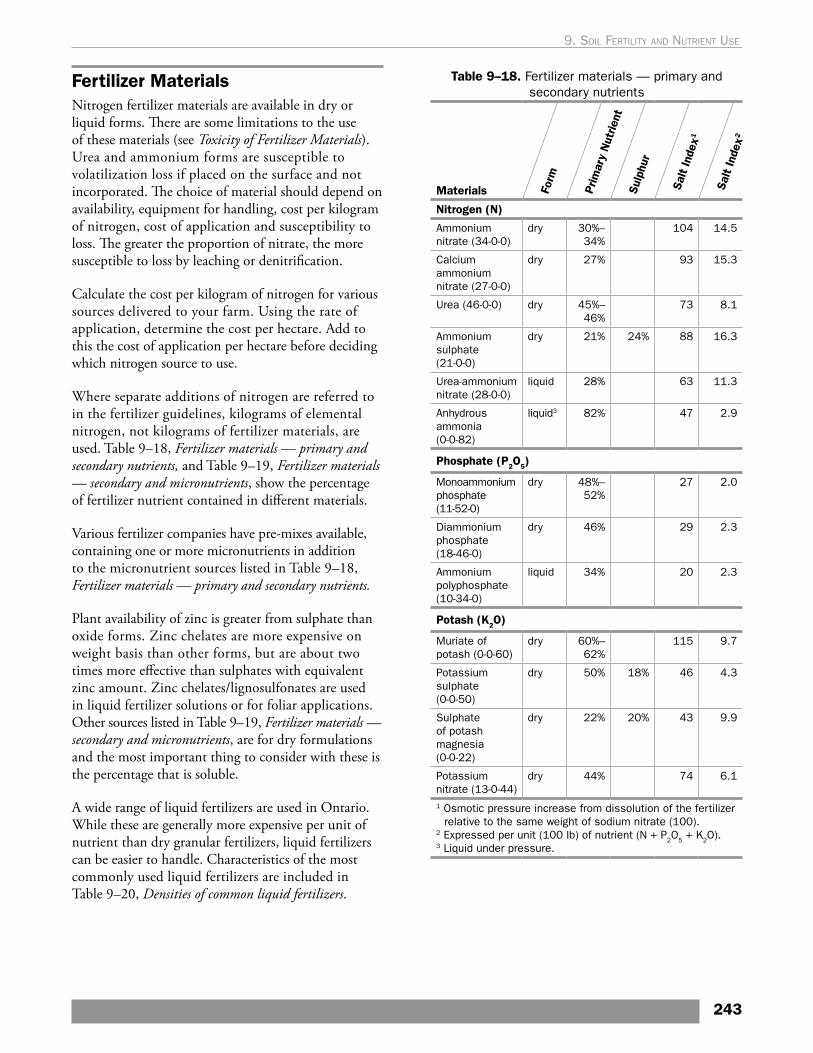
Fertilizer MaterialsNitrogen fertilizer materials are available in dry or liquid forms. There are some limitations to the use of these materials (see Toxicity of Fertilizer Materials). Urea and ammonium forms are susceptible to volatilization loss if placed on the surface and not incorporated. The choice of material should depend on availability, equipment for handling, cost per kilogram of nitrogen, cost of application and susceptibility to loss. The greater the proportion of nitrate, the more susceptible to loss by leaching or denitrification.
Calculate the cost per kilogram of nitrogen for various sources delivered to your farm. Using the rate of application, determine the cost per hectare. Add to this the cost of application per hectare before deciding which nitrogen source to use.
Where separate additions of nitrogen are referred to in the fertilizer guidelines, kilograms of elemental nitrogen, not kilograms of fertilizer materials, are used. Table 9–18, Fertilizer materials — primary and secondary nutrients, and Table 9–19, Fertilizer materials — secondary and micronutrients, show the percentage of fertilizer nutrient contained in different materials.
Various fertilizer companies have pre-mixes available, containing one or more micronutrients in addition to the micronutrient sources listed in Table 9–18, Fertilizer materials — primary and secondary nutrients.
Plant availability of zinc is greater from sulphate than oxide forms. Zinc chelates are more expensive on weight basis than other forms, but are about two times more effective than sulphates with equivalent zinc amount. Zinc chelates/lignosulfonates are used in liquid fertilizer solutions or for foliar applications. Other sources listed in Table 9–19, Fertilizer materials — secondary and micronutrients, are for dry formulations and the most important thing to consider with these is the percentage that is soluble.
A wide range of liquid fertilizers are used in Ontario. While these are generally more expensive per unit of nutrient than dry granular fertilizers, liquid fertilizers can be easier to handle. Characteristics of the most commonly used liquid fertilizers are included in Table 9–20, Densities of common liquid fertilizers.
Table 9–18. Fertilizer materials — primary and secondary nutrients
Materials Form
Prim
ary
Nut
rient
Sulp
hur
Salt
Inde
x1
Salt
Inde
x2
Nitrogen (N)
Ammonium nitrate (34-0-0)
dry 30%–34%
104 14.5
Calcium ammonium nitrate (27-0-0)
dry 27% 93 15.3
Urea (46-0-0) dry 45%–46%
73 8.1
Ammonium sulphate (21-0-0)
dry 21% 24% 88 16.3
Urea-ammonium nitrate (28-0-0)
liquid 28% 63 11.3
Anhydrous ammonia (0-0-82)
liquid3 82% 47 2.9
Phosphate (P2O5)
Monoammonium phosphate (11-52-0)
dry 48%–52%
27 2.0
Diammonium phosphate (18-46-0)
dry 46% 29 2.3
Ammonium polyphosphate (10-34-0)
liquid 34% 20 2.3
Potash (K2O)
Muriate of potash (0-0-60)
dry 60%–62%
115 9.7
Potassium sulphate (0-0-50)
dry 50% 18% 46 4.3
Sulphate of potash magnesia (0-0-22)
dry 22% 20% 43 9.9
Potassium nitrate (13-0-44)
dry 44% 74 6.1
1 Osmotic pressure increase from dissolution of the fertilizer relative to the same weight of sodium nitrate (100).
2 Expressed per unit (100 lb) of nutrient (N + P2O5 + K2O).3 Liquid under pressure.
243
9. soIl FertIlIty and nutrIent use
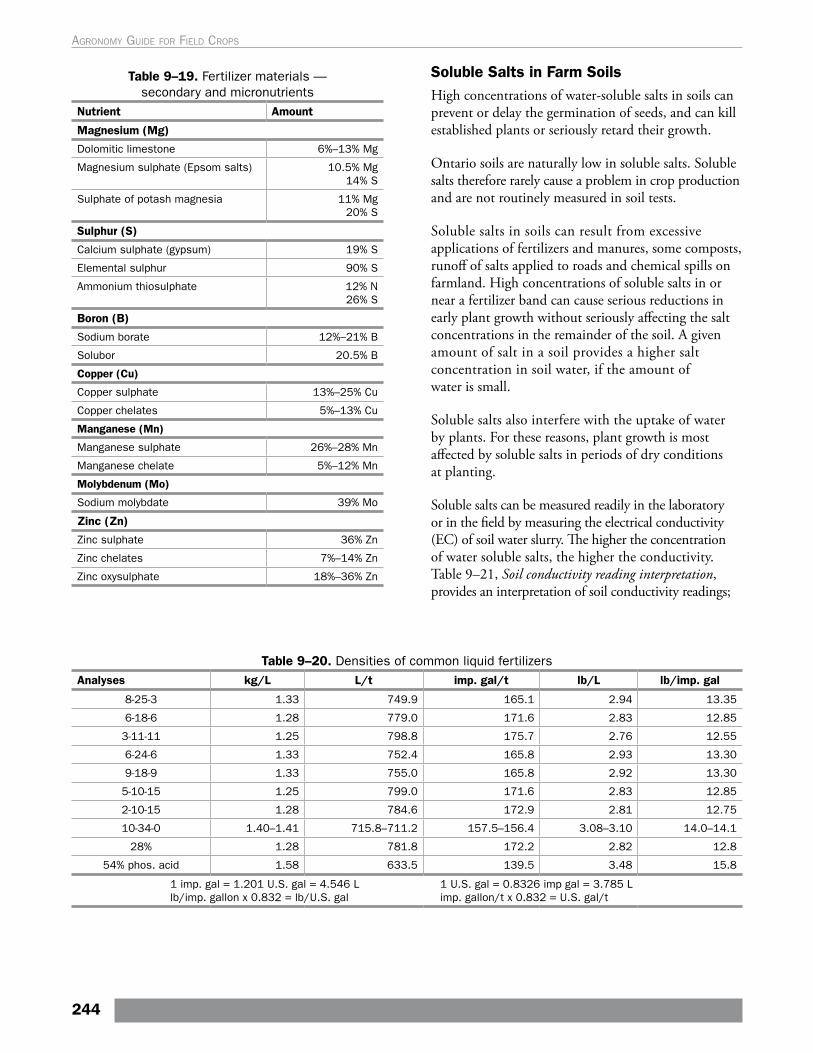
Table 9–19. Fertilizer materials — secondary and micronutrients
Nutrient Amount
Magnesium (Mg)
Dolomitic limestone 6%–13% Mg
Magnesium sulphate (Epsom salts) 10.5% Mg 14% S
Sulphate of potash magnesia 11% Mg 20% S
Sulphur (S)
Calcium sulphate (gypsum) 19% S
Elemental sulphur 90% S
Ammonium thiosulphate 12% N 26% S
Boron (B)
Sodium borate 12%–21% B
Solubor 20.5% B
Copper (Cu)
Copper sulphate 13%–25% Cu
Copper chelates 5%–13% Cu
Manganese (Mn)
Manganese sulphate 26%–28% Mn
Manganese chelate 5%–12% Mn
Molybdenum (Mo)
Sodium molybdate 39% Mo
Zinc (Zn)
Zinc sulphate 36% Zn
Zinc chelates 7%–14% Zn
Zinc oxysulphate 18%–36% Zn
Soluble Salts in Farm SoilsHigh concentrations of water-soluble salts in soils can prevent or delay the germination of seeds, and can kill established plants or seriously retard their growth.
Ontario soils are naturally low in soluble salts. Soluble salts therefore rarely cause a problem in crop production and are not routinely measured in soil tests.
Soluble salts in soils can result from excessive applications of fertilizers and manures, some composts, runoff of salts applied to roads and chemical spills on farmland. High concentrations of soluble salts in or near a fertilizer band can cause serious reductions in early plant growth without seriously affecting the salt concentrations in the remainder of the soil. A given amount of salt in a soil provides a higher salt concentration in soil water, if the amount of water is small.
Soluble salts also interfere with the uptake of water by plants. For these reasons, plant growth is most affected by soluble salts in periods of dry conditions at planting.
Soluble salts can be measured readily in the laboratory or in the field by measuring the electrical conductivity (EC) of soil water slurry. The higher the concentration of water soluble salts, the higher the conductivity. Table 9–21, Soil conductivity reading interpretation, provides an interpretation of soil conductivity readings;
Table 9–20. Densities of common liquid fertilizersAnalyses kg/L L/t imp. gal/t lb/L lb/imp. gal
8-25-3 1.33 749.9 165.1 2.94 13.35
6-18-6 1.28 779.0 171.6 2.83 12.85
3-11-11 1.25 798.8 175.7 2.76 12.55
6-24-6 1.33 752.4 165.8 2.93 13.30
9-18-9 1.33 755.0 165.8 2.92 13.30
5-10-15 1.25 799.0 171.6 2.83 12.85
2-10-15 1.28 784.6 172.9 2.81 12.75
10-34-0 1.40–1.41 715.8–711.2 157.5–156.4 3.08–3.10 14.0–14.1
28% 1.28 781.8 172.2 2.82 12.8
54% phos. acid 1.58 633.5 139.5 3.48 15.8
1 imp. gal = 1.201 U.S. gal = 4.546 Llb/imp. gallon x 0.832 = lb/U.S. gal
1 U.S. gal = 0.8326 imp gal = 3.785 L imp. gallon/t x 0.832 = U.S. gal/t
244
Agronomy guide for field Crops
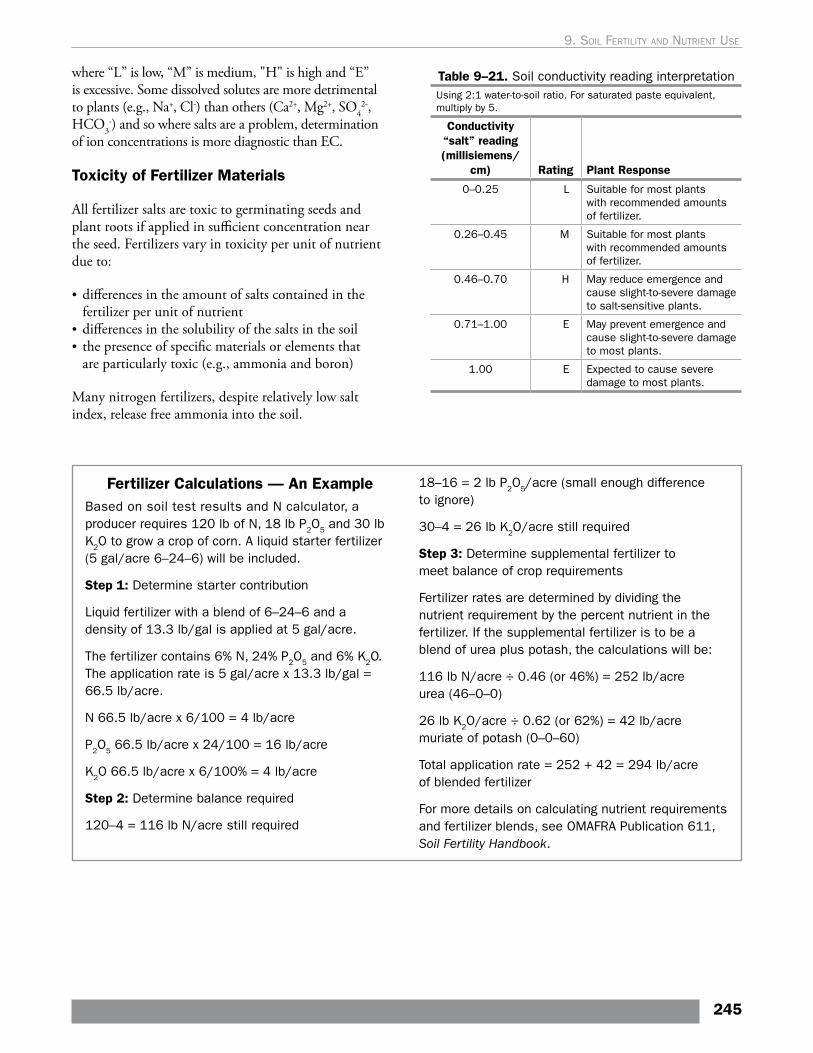
where “L” is low, “M” is medium, "H" is high and “E” is excessive. Some dissolved solutes are more detrimental to plants (e.g., Na+, Cl-) than others (Ca2+, Mg2+, SO4
2-, HCO3
-) and so where salts are a problem, determination of ion concentrations is more diagnostic than EC.
Toxicity of Fertilizer Materials
All fertilizer salts are toxic to germinating seeds and plant roots if applied in sufficient concentration near the seed. Fertilizers vary in toxicity per unit of nutrient due to:
• differences in the amount of salts contained in the fertilizer per unit of nutrient
• differences in the solubility of the salts in the soil• the presence of specific materials or elements that
are particularly toxic (e.g., ammonia and boron)
Many nitrogen fertilizers, despite relatively low salt index, release free ammonia into the soil.
Fertilizer Calculations — An ExampleBased on soil test results and N calculator, a producer requires 120 lb of N, 18 lb P2O5 and 30 lb K2O to grow a crop of corn. A liquid starter fertilizer (5 gal/acre 6–24–6) will be included.
Step 1: Determine starter contribution
Liquid fertilizer with a blend of 6–24–6 and a density of 13.3 lb/gal is applied at 5 gal/acre.
The fertilizer contains 6% N, 24% P2O5 and 6% K2O. The application rate is 5 gal/acre x 13.3 lb/gal = 66.5 lb/acre.
N 66.5 lb/acre x 6/100 = 4 lb/acre
P2O5 66.5 lb/acre x 24/100 = 16 lb/acre
K2O 66.5 lb/acre x 6/100% = 4 lb/acre
Step 2: Determine balance required
120–4 = 116 lb N/acre still required
18–16 = 2 lb P2O5/acre (small enough difference to ignore)
30–4 = 26 lb K2O/acre still required
Step 3: Determine supplemental fertilizer to meet balance of crop requirements
Fertilizer rates are determined by dividing the nutrient requirement by the percent nutrient in the fertilizer. If the supplemental fertilizer is to be a blend of urea plus potash, the calculations will be:
116 lb N/acre ÷ 0.46 (or 46%) = 252 lb/acre urea (46–0–0)
26 lb K2O/acre ÷ 0.62 (or 62%) = 42 lb/acre muriate of potash (0–0–60)
Total application rate = 252 + 42 = 294 lb/acre of blended fertilizer
For more details on calculating nutrient requirements and fertilizer blends, see OMAFRA Publication 611, Soil Fertility Handbook.
Table 9–21. Soil conductivity reading interpretation Using 2:1 water-to-soil ratio. For saturated paste equivalent, multiply by 5.
Conductivity “salt” reading (millisiemens/
cm) Rating Plant Response
0–0.25 L Suitable for most plants with recommended amounts of fertilizer.
0.26–0.45 M Suitable for most plants with recommended amounts of fertilizer.
0.46–0.70 H May reduce emergence and cause slight-to-severe damage to salt-sensitive plants.
0.71–1.00 E May prevent emergence and cause slight-to-severe damage to most plants.
1.00 E Expected to cause severe damage to most plants.
245
9. soIl FertIlIty and nutrIent use
Nitrogen FertilizersAmmonium nitrate, monoammonium phosphate and ammonium sulphate are similar in toxicity and much safer than anhydrous ammonia, aqua ammonia or urea. Diammonium phosphate is more toxic than monoammonium phosphate but less toxic than urea. Use lower rates of urea, or increase the distance between the seed and fertilizer band, particularly with sensitive seeds such as beans or peas, and on coarse-textured soil (sand and sandy loam).
Because anhydrous ammonia and aqua ammonia release free ammonia, they should not be placed near seeds. It is preferable to make pre-plant applications crossways to the direction in which the crop will be planted. Stand reductions may still occur over the band, in very dry soils or if planting takes place too soon after application.
Urea is toxic when banded with or near the seed, but is safe when broadcast at rates normally used. Blends containing more than half as much nitrogen as phosphate frequently contain urea.
Phosphate FertilizersPhosphate fertilizers are usually low in toxicity due to a large portion of the phosphate being precipitated in the soil before it can reach the plant roots. The concentration of phosphorus in soil solution at any one time is very low. No limit is normally set for the safe rate at which phosphates may be applied with, or near, the seed of field-grown crops.
Diammonium phosphate is more injurious than other phosphate fertilizers. See Nitrogen Fertilizers.
Potash FertilizersMuriate of potash (KCl) is the most common source of potassium in fertilizers and is less injurious per unit of plant nutrients than most nitrogen fertilizers.
Sulphate of potash (K2SO4) has a lower salt index than muriate of potash. Sulphate of potash-magnesia has approximately the same toxicity per unit of potassium as muriate of potash. Potassium nitrate is one of the safer sources of potassium.
Table 9–22, Maximum safe rates of nutrients in fertilizer, provides the maximum safe rates of nutrients for various crop scenarios. The safe rates listed in this table are for single applications. If two or more fertilizer applications are combined, the additive effect may cause damage to the crop even though the individual applications are below the threshold for injury.
Guidelines for Safe Rates of Nutrients Applied at SeedingFertilizer toxicity varies widely, depending on the amount of soil moisture. Injury will occur most frequently on course-textured (sandy or gravelly) soils low in organic matter and with dry weather. To ensure completely safe rates of banded fertilizer for all seeding conditions they would require extremely low rates of application. The maximum safe rates suggested here will most likely reduce or delay germination, or retard growth in up to 10% of the cases where they are used. It is generally advisable to use lower rates of fertilizer at seeding than those listed in Table 9–22, Maximum safe rates of nutrients in fertilizer.
Excess fertilizer can harm seedlings because of effects from ammonia and salt. These effects are related to fertilizer N and K content. It is generally advisable to use lower rates of fertilizer at seeding than those listed.
If fertilizer requirements are high, it may be better to broadcast most of the fertilizer required and to band only a small portion at seeding. Fertilizers containing the micronutrients boron, copper, iron, manganese and zinc are more injurious than the same grades without micronutrients, and the safe rates recommended will be lower than those shown in this table. Boron is particularly toxic and should not be banded.
Some producers use much higher rates of banded fertilizer than are listed here, with no apparent problem. Crops are able to tolerate much higher rates of fertilizer with adequate moisture, but it is impossible to predict before planting when adverse conditions for germination will occur. Keeping below the maximum safe rates is the surest way to ensure a good start for the crop.
246
Agronomy guide for field Crops
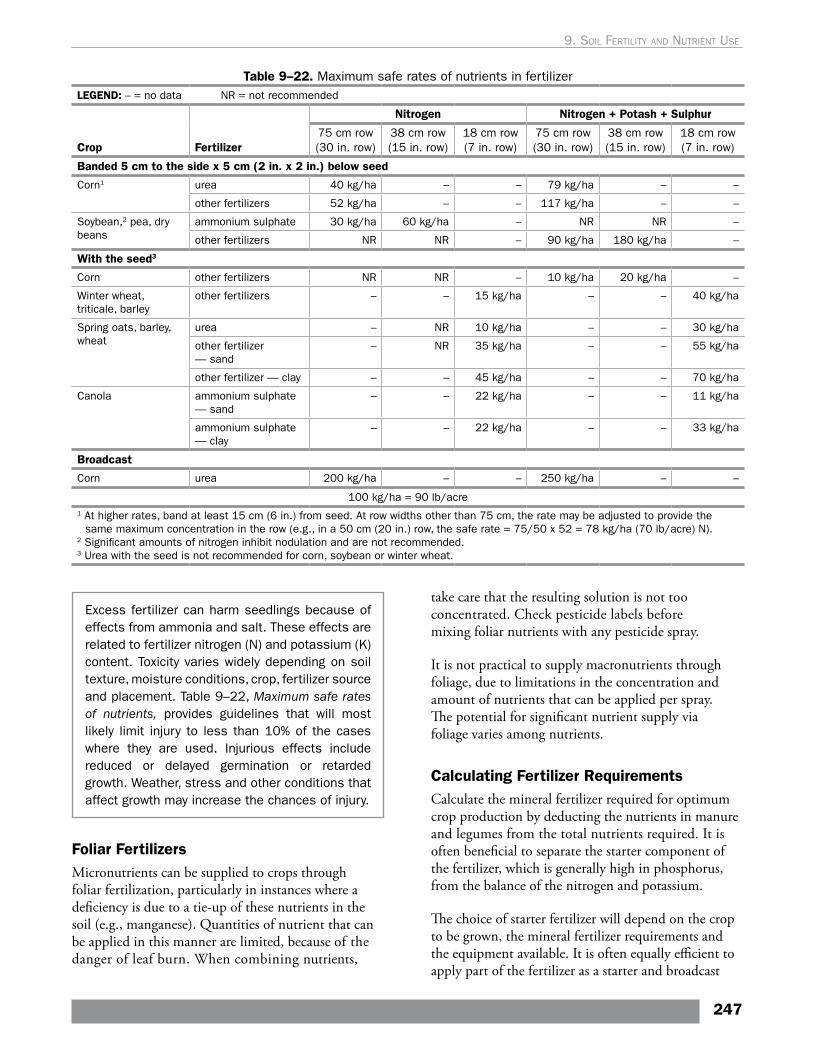
Table 9–22. Maximum safe rates of nutrients in fertilizerLEGEND: – = no data NR = not recommended
Crop Fertilizer
Nitrogen Nitrogen + Potash + Sulphur
75 cm row (30 in. row)
38 cm row (15 in. row)
18 cm row (7 in. row)
75 cm row (30 in. row)
38 cm row (15 in. row)
18 cm row (7 in. row)
Banded 5 cm to the side x 5 cm (2 in. x 2 in.) below seed
Corn1 urea 40 kg/ha – – 79 kg/ha – –
other fertilizers 52 kg/ha – – 117 kg/ha – –
Soybean,2 pea, dry beans
ammonium sulphate 30 kg/ha 60 kg/ha – NR NR –
other fertilizers NR NR – 90 kg/ha 180 kg/ha –
With the seed3
Corn other fertilizers NR NR – 10 kg/ha 20 kg/ha –
Winter wheat, triticale, barley
other fertilizers – – 15 kg/ha – – 40 kg/ha
Spring oats, barley, wheat
urea – NR 10 kg/ha – – 30 kg/ha
other fertilizer — sand
– NR 35 kg/ha – – 55 kg/ha
other fertilizer — clay – – 45 kg/ha – – 70 kg/ha
Canola ammonium sulphate — sand
– – 22 kg/ha – – 11 kg/ha
ammonium sulphate — clay
– – 22 kg/ha – – 33 kg/ha
Broadcast
Corn urea 200 kg/ha – – 250 kg/ha – –
100 kg/ha = 90 lb/acre1 At higher rates, band at least 15 cm (6 in.) from seed. At row widths other than 75 cm, the rate may be adjusted to provide the
same maximum concentration in the row (e.g., in a 50 cm (20 in.) row, the safe rate = 75/50 x 52 = 78 kg/ha (70 lb/acre) N). 2 Significant amounts of nitrogen inhibit nodulation and are not recommended.3 Urea with the seed is not recommended for corn, soybean or winter wheat.
Excess fertilizer can harm seedlings because of effects from ammonia and salt. These effects are related to fertilizer nitrogen (N) and potassium (K) content. Toxicity varies widely depending on soil texture, moisture conditions, crop, fertilizer source and placement. Table 9–22, Maximum safe rates of nutrients, provides guidelines that will most likely limit injury to less than 10% of the cases where they are used. Injurious effects include reduced or delayed germination or retarded growth. Weather, stress and other conditions that affect growth may increase the chances of injury.
Foliar FertilizersMicronutrients can be supplied to crops through foliar fertilization, particularly in instances where a deficiency is due to a tie-up of these nutrients in the soil (e.g., manganese). Quantities of nutrient that can be applied in this manner are limited, because of the danger of leaf burn. When combining nutrients,
take care that the resulting solution is not too concentrated. Check pesticide labels before mixing foliar nutrients with any pesticide spray.
It is not practical to supply macronutrients through foliage, due to limitations in the concentration and amount of nutrients that can be applied per spray. The potential for significant nutrient supply via foliage varies among nutrients.
Calculating Fertilizer RequirementsCalculate the mineral fertilizer required for optimum crop production by deducting the nutrients in manure and legumes from the total nutrients required. It is often beneficial to separate the starter component of the fertilizer, which is generally high in phosphorus, from the balance of the nitrogen and potassium.
The choice of starter fertilizer will depend on the crop to be grown, the mineral fertilizer requirements and the equipment available. It is often equally efficient to apply part of the fertilizer as a starter and broadcast
247
9. soIl FertIlIty and nutrIent use
the rest, as it is to apply all the fertilizer through the planter or drill. The advantage to this program is savings in time and labour, and less risk of fertilizer injury to the seedling. Broadcasting phosphate fertilizers on the soil surface without incorporation, however, increases risks of harming water quality. Consider alternatives wherever possible.
Deduct applications of starter fertilizer and side-dressed fertilizer from the total mineral fertilizer requirement. Broadcast any balance remaining. If only very small numbers remain, consider adjusting the rates of one of the other nutrient sources, ignoring the small residuals or planning a fertilizer application that will meet multi-year requirements (P and K only).
CitationsTable 9–3. Sensors used to define management zones and parameters measured.
Adapted from:Sensors - Precision Farming and Variable Rate Technology: A Resource Guide. 2010. Agricultural Research and Extension Council of Alberta.
Table 9–15. Average nutrient (N, P205 , K20) removal by common field crops
Adapted from:Murrell, T.S., 2005. Average nutrient removal rates for crops in the northcentral region. Available at www.ipni.net/article/IPNI-3258
Table 9–18. Fertilizer materials - primary and secondary nutrients
Adapted from:Follett, R.H., Murphy L.S., Donahue, R.L., 1981. Fertilizers and soil amendments. (Fertilizer materials: salt index) Prentice-Hall, Inc., Englewood Cliffs, N.J.
Joseph Jez (ed.), 2008. Sulfur: A Missing Link between Soils, Crops, and Nutrition, Agronomy Monographs 50. Chapter: Sulfur forms and cycling processes in soil and their relationship to sulfur fertility. pg 1-10. Schoenau, J., Malhi S.S., ASA, ISBN: 978-0-89118-186-6
248
Agronomy guide for field Crops
10. Field Scouting
Field ScoutingField scouting is an important part of cropping system and farm management. Ongoing monitoring of fields and crops throughout the growing season and beyond, allows a producer to identify issues and apply remediation in a timely manner to minimize negative economic impact, while improving field operation efficiencies. Some problems cannot be addressed when observed, but the information can still be recorded for future use.
Traditionally, field scouting has been considered a part of integrated pest management (IPM) and thus solely associated with monitoring and managing pests. Field scouting also has many other benefits, including:
• pre-planting field walks to identify drainage issues• post-planting field walks to look at equipment
performance (e.g., planters delivering desired population, depth, placement across the entire unit)
• nutrient management (identifying specific areas with nutrient deficiency symptoms)
• crop variety selection (evaluating in-field comparisons of variety performance)
• observing field conditions (e.g., erosion, drainage) outside the cropping window when performing tasks such as soil sampling
Field scouting involves recording information attained from all field observations. This is important so that necessary action can be taken, immediately or incorporated into future planning. Scouting records are an important part of an overall farm record-keeping system.
Traditional Field ScoutingField scouting involves walking through a field, and stopping at a number of either random or specific locations to make and record observations. Regular field examinations help to accurately identify yield-limiting problems during the growing season, at a time when they can often be corrected to preserve maximum economic yield potential. When scouting events occur beyond the point at which corrective action can be taken, records of the observations help
plan for the next season to avoid the same problem(s). Begin every cropping season by reviewing previous scouting records and recording current year vital field information (soil fertility and crop inputs) on a field record form (either paper or electronic). Refer to Appendix N for a paper version of a field record form. This information, combined with regular field visits, accurate identification and diagnosis of problems, and a record of those observations, builds a successful crop monitoring program. In addition to dealing with immediate issues, scouting records are essential for planning purposes. For example, a pest such as soybean cyst nematode (SCN) will impact both crop rotation and variety selection in future years.
A standardized farm and field naming and numbering system is the first step in organizing farm information to obtain the most from scouting records.
Timing of Field Scouting OperationsEarly recognition and action on identified problems will minimize their economic impact on a crop. Under each commodity Chapter within this publication, crop scouting calendars illustrate the timing associated with the common crop pests found in Ontario. Monitor fields regularly, since conditions can change rapidly throughout the season. As optimum plant populations are critical for achieving maximum economic yields, perform crop stand evaluations within 1–2 weeks of plant emergence, and continue on a weekly basis. When approaching a control threshold, such as the application of a post-emergent herbicide or an insecticide, fields may require daily scouting to correctly time the intervention. Later in the season, bi-weekly scouting is normally sufficient. Some insects and diseases occur later in the season and may approach control thresholds in a matter of days. Examples of such pests include armyworm and soybean aphids. If field and weather conditions favour these later-season pests, scout weekly. Pre-harvest notes are often useful to estimate yield and to start the planning process for the next cropping year. Where weed escapes have obviously survived herbicide
249
treatment, and where application and product issues have been ruled out, collect weed seed samples for herbicide-resistance testing before harvest. Samples can be submitted to the Weeds Lab, Crop Science Building, University of Guelph, 50 Stone Rd. E., Guelph, ON N1G 2W1.
Scouting Tools and TechniquesTools used to monitor crop development and pests vary with the crop and the pest. Basic field scouting equipment includes:
• a clipboard with field scouting forms or field pocket guide to record observations (paper or electronic format)
• field maps• a shovel• a pocketknife• plastic and paper bags for collecting specimens• a 10X hand lens and a sampling frame
(e.g., hula hoop)• a ruler
Professional scouts often carry other tools that could include:
• aerial field images• a camera (smart phone)• labels for identification• reference guides• a sweep net• drop cloth• vials and isopropyl alcohol• sticky cards or traps to detect insect pests• a global positioning systems (GPS) unit and/or
flagging material to mark specific locations, etc.
When scouting, proper clothing is important for protection from the sun and from other unknown risks such as poisonous plants, ticks and mosquitoes. Be aware of recent pesticide treatments applied to the field and comply with re-entry intervals indicated on product labels.
New Tools for Field ScoutingNew tools are available to increase the value of scouting and to assist in record keeping. With the adoption of smartphones and tablets, a large number of apps are available to assist with scouting. Chosen apps should address all the information parameters of interest and
integrate with other software/hardware systems on the farm. An app that isolates data on a phone or tablet offers little value. Many of the crop and whole farm management systems have developed field apps that integrate with their main programs. Many of these also take advantage of GPS capabilities, to better identify the location where problems/issues are discovered.
Another advantage of electronic devices is that, as part of the platform, they have the capability of quick access to resource materials such as field guides, measurement tools etc. This eliminates the inconvenience of carrying paper copies of field guides. Some of these tools also offer the opportunity to share observations with others. For example, insect observations can be shared so others can benefit from the mapping of occurrences, densities and spread pattern of infestations across the province. These collaborations can act as early warning systems and help target scouting activities throughout the season.
A new Ontario specific smartphone app has been developed to assist in field scouting of common pests. Pest Manager is available at the following website for all common platforms. (www.pestmanager.ca)
The function of the scouting software and/or application is to do more site-specific record keeping, as well as quantifying the extent of the issues identified in the field. In some cases, scouting software or applications may help diagnose an issue and allow someone to take management actions remotely from the field. Most electronic devices have GPS locational services that can provide the capacity to navigate back to trouble spots in the field (e.g., geotag photos).
The following is a short list of the basic functions that are found in typical field scouting software or mobile mapping apps:
• base maps and satellite imagery provided in the software or on the application for finding field locations (e.g., roads, waterways)
• map and/or mark a point, line or polygon to identify the trouble area
• calculate distance (i.e., length or width) or calculate the area affected (e.g., by weed or pest)
• geotagging photographs of trouble areas• connect to lists and databases for crop diagnostics
(e.g., weeds, disease, nutrient deficiency symptoms and photo libraries)
250
Agronomy guide for field Crops
• order other agronomic services to diagnose or remedy the scouted issue (i.e., order soil sampling to a specific locations, place a work order for other custom application services)
• import and view (online or offline) other data, in-field device information (e.g., plant sensors) and maps (e.g., yield, previous scouting events and reports)
• semi- or fully-automated export and upload of all crop scouting data and records from the field via an internet connection (or as soon as the scout returns back to the office)
• several administrative levels for the same application, where certain tools or editing options can be turned on or off, offering large organizations the flexibility to customize services for different users (i.e., crop scout vs. manager)
Scouting for InsectsWhen scouting for insects that move too quickly in the canopy to be spotted or counted, or insects which are difficult to detect, it may be beneficial to use a drop cloth, insect traps or a sweep net to collect and count them.
Using a Drop ClothSpread a white drop cloth on the ground between two rows of crop. Pull the crop over the cloth and shake vigorously so that any insects on the plant are dislodged and dropped onto the cloth. The insects can then be identified and counted.
Using an Insect TrapInsect traps can be useful for specific pests, such as swede midge and western bean cutworm. Many types of traps are available, often specific to the pest of interest. Insect pheromone traps are useful to monitor these pests over time. The use of pheromone traps allows for the collection, identification and counting of insects, in addition to comparing the population to known thresholds at specific crop development stages. Trapping networks provide useful information to help determine the particular pest populations in an area. Western bean cutworm in corn is an example of regional pests monitored by trapping networks.
Insect traps are available from a number of sources. Refer to Appendix A, Insect-Monitoring Equipment Supply Companies. For some pests, insect infestation thresholds that trigger application of control measures are calibrated to observations from the traps.
Using Sweep NetsA sweep net is the preferred scouting method when evaluating insects in a solid stand crop such as cereals, alfalfa, canola or solid seeded soybeans. Standard 37 cm (15 in.) diameter sweep nets are available commercially through the various companies listed in Appendix A. While walking through the canopy, swing the net from side to side in a pendulum-like motion, across the top of the canopy so the top of the net is sweeping the top 37 cm (15 in.) of the canopy. Avoid collecting soil in the net during the sweeping procedure.
Pest management thresholds are established using one of two methods:
1. Single sweep — two 180° arcs: Some researchers set thresholds based on the definition that one sweep consists of two 180° arcs, bringing the net across from one side of the body to the other, and back to home, while walking slowly forward
2. Single sweep — one 180° arc: Other researchers set thresholds based on the definition that one sweep consists of only one 180° arc bringing the sweep net from one side of the body to the other only once
In order to avoid over- or underestimating the average number of insects per sweep, first determine which definition of a sweep was used to establish the specific threshold. In this publication, the definition of a sweep (i.e., either one 180° arc or two 180° arcs) is listed for each insect pest threshold, if it is known.
After completing the indicated number of sweeps, quickly close the top of the net by grasping it just below the ring. Slowly open the net, remove any plant debris collected, identify and count the insects captured. Though sweep nets will not give an absolute number, they will provide a relative estimate of insect pressures, allowing for a quick assessment of the presence of a particular insect.
Number of Sampling LocationsThe number of sampling locations in a field depends on factors, including field size, crop, pest type and stage of development, level of infestation, timing, topography, and soil type changes across the field. The general number of sampling locations for a
251
10. FIeld scoutIng
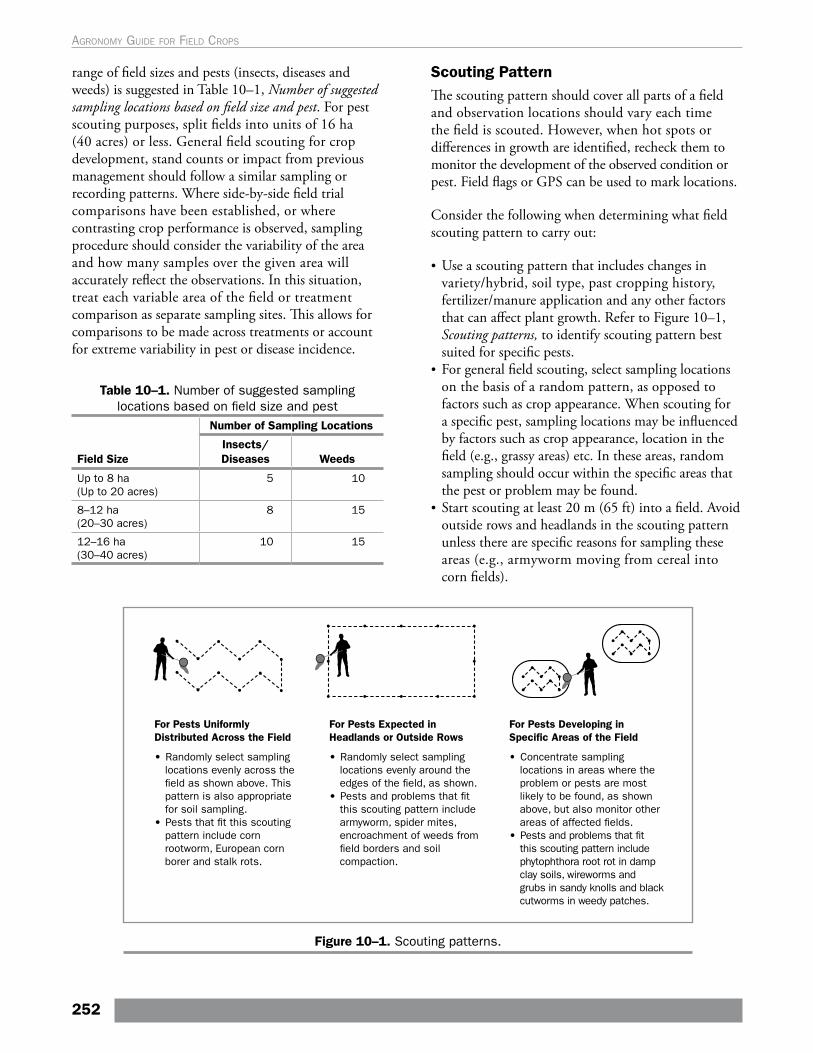
range of field sizes and pests (insects, diseases and weeds) is suggested in Table 10–1, Number of suggested sampling locations based on field size and pest. For pest scouting purposes, split fields into units of 16 ha (40 acres) or less. General field scouting for crop development, stand counts or impact from previous management should follow a similar sampling or recording patterns. Where side-by-side field trial comparisons have been established, or where contrasting crop performance is observed, sampling procedure should consider the variability of the area and how many samples over the given area will accurately reflect the observations. In this situation, treat each variable area of the field or treatment comparison as separate sampling sites. This allows for comparisons to be made across treatments or account for extreme variability in pest or disease incidence.
Table 10–1. Number of suggested sampling locations based on field size and pest
Field Size
Number of Sampling Locations
Insects/Diseases Weeds
Up to 8 ha (Up to 20 acres)
5 10
8–12 ha (20–30 acres)
8 15
12–16 ha (30–40 acres)
10 15
Scouting PatternThe scouting pattern should cover all parts of a field and observation locations should vary each time the field is scouted. However, when hot spots or differences in growth are identified, recheck them to monitor the development of the observed condition or pest. Field flags or GPS can be used to mark locations.
Consider the following when determining what field scouting pattern to carry out:
• Use a scouting pattern that includes changes in variety/hybrid, soil type, past cropping history, fertilizer/manure application and any other factors that can affect plant growth. Refer to Figure 10–1, Scouting patterns, to identify scouting pattern best suited for specific pests.
• For general field scouting, select sampling locations on the basis of a random pattern, as opposed to factors such as crop appearance. When scouting for a specific pest, sampling locations may be influenced by factors such as crop appearance, location in the field (e.g., grassy areas) etc. In these areas, random sampling should occur within the specific areas that the pest or problem may be found.
• Start scouting at least 20 m (65 ft) into a field. Avoid outside rows and headlands in the scouting pattern unless there are specific reasons for sampling these areas (e.g., armyworm moving from cereal into corn fields).
Figure 10–1. Scouting patterns.
252
Agronomy guide for field Crops
Plant Population and Pest Infestation LevelsPlant population and some pest infestation levels are determined by making counts in areas of a given size and then multiplying that number by a factor to obtain the population per hectare or acre.
For row crops with easily defined rows, plant population can be calculated by counting the number of plants in a row that represents 1/1,000 of a hectare (or acre), then multiplying the count by 1,000 to obtain the number of plants/ha (plants/acre). See Table 10–2, Row length for a partial acre. A standardized length rope or chain based on Table 10–2 is useful when doing population counts. Late emerging plants need to be noted and excluded from the count. Check non-emerged seeds to determine the cause.
Table 10–2. Row length for a partial acre
Row WidthRow Length for 1⁄1,000 acre1,2
18 cm (7 in.)
22.8 m (74 ft 8 in.)
38 cm (15 in.)
10.6 m (34 ft 10 in.)
51 cm (20 in.)
8.0 m (26 ft 2 in.)
56 cm (22 in.)
7.2 m (23 ft 9 in.)
71 cm (28 in.)
5.7 m (18 ft 8 in.)
76 cm (30 in.)
5.3 m (17 ft 5 in.)
91 cm (36 in.)
4.4 m (14 ft 6 in.)
1 To obtain the number of plants per one-thousandth hectare, multiply the number of plants in the length of row for the specific row width by a factor of 2.47.
2 Multiply the number of plants counted in the length of row above by 1,000 to determine the number of plants/acre.
To determine plant population in narrow-row crops or weed/insect infestation levels, a sampling frame with a known area can be used. Place sampling frames carefully into the canopy so as not to be destructive to the crop or dislodge the pests to be counted. Count all plants, pests or weeds within the area of the frame. This can be accomplished using a square frame (e.g., 1 m x 1 m = 1 m2 = 1/10,000 hectare (25 in. x 25 in. = 4.36 ft2 = 1/10,000 acre)) or a
circular frame (e.g., a hula hoop). The square frame and hula-hoop methods are presented in Table 10–3, Hula-hoop method for determining plant and pest populations.
Many insect action thresholds are expressed as the average number of insects per plant, per sweep, per unit of area or per length of row. Some may also be based on a percentage of defoliation or damage. Regardless of the method used, take sufficient random counts in each field to determine average populations. Refer to Table 10-1, Number of suggested sampling locations based on field size and pest, for the recommended number of sampling locations based on field size and pest. Record each count. Take the average of all counts as the estimate of the field pest population. Within a field, spots with higher pest pressure may be identified. These “hot” spots may be isolated for targeted treatment, while leaving the remainder of the field untreated. To stay on top of the pest, monitor the entire field in subsequent scouting events.
Table 10–3. Hula hoop method for determining plant and pest populations
Count the number of plants found within the hoop or square and multiply that number by the pre-determined factor listed to determine plant population per hectare or acre.
Inside Dimensions Area
Factor by Which to Multiply the Number of Plants
Within the Hoop to Equal:
Plants per Hectare
Plants per Acre
Inside diameter of hoop
91 cm (36 in.)
0.66 m2 (7.1 ft2)
15,228 6,162
84 cm (33 in.)
0.55 m2 (5.9 ft2)
18,122 7,334
76 cm (30 in.)
0.46 m2 (4.9 ft2)
21,928 8,874
71.8 cm (28.25 in.)
0.37 m2 (4.36 ft2)
24,711 10,000
61 cm (24 in.)
0.29 m2 (3.1 ft2)
34,263 13,866
Inside dimensions of square frame
63.6 x 63.6 cm
(25 x 25 in.)
0.405 m2 (4.36 ft2)
24,712 10,000
100 x 100 cm
(40 x 40 in.)
1.00 m2 (11.1 ft2)
10,000 3,920
253
10. FIeld scoutIng
Recording Field ObservationsField scouting records are an essential tool for making current and future management decisions. Using a field scouting form or smartphone/tablet application will help standardize the recording of field observations. Once recorded, add the scouting data to the field record files (paper, electronic or both). Computer software is also available to record and manipulate data from field observations.
Recorded information during scouting events includes:
Whole Field Standard Data• field name/code, physical location, GPS coordinates
and scouting date• hybrid/variety planted, including traits (e.g., Bt, RR)• weather conditions
Site Specific Data Collected at Each Sampling Location Within the Field• soil conditions• flowering, tasselling, heading dates• weeds, insects and diseases present (identify
growth stages and populations of each weed/pest species separately)
• crop damage• results of scouting procedures performed,
along with actions required
Sample Handling and SubmissionIt can be difficult to identify a pest or field problem. Seek diagnosis and assistance from other resources, including smartphones/tablets linked to internet tools, experts and/or diagnostic laboratories. The cameras on smartphones/tablets are important tools for the collection of data on unknown pests or conditions. Although cameras are a great tool, take pictures carefully and include additional information with any pictures sent for identification. Always take pictures (or samples) of both the affected and normal condition. Most smartphone/tablet platforms have apps available to enhance picture-taking and associated data recording. When taking samples from the field, following proper sample handling procedures is critical to ensuring accurate diagnosis and/or analysis. In general, samples should be collected and submitted quickly. Samples should be taken using proper equipment (e.g., clean plastic buckets for soil samples or paper bags for plant tissue samples) and should be kept cool to ensure accurate results. For more information on how to take proper samples, where to
obtain sample submission forms and diagnostic service fees, see Appendix O, Diagnostic Services.
Using Growing Degree Days and Crop Heat Units
Growing Degree DaysGrowing degree days (GDD), an estimate of accumulated heat, are used to predict the growth and development of plants, insects and diseases during the growing season. Insect, disease and plant development are very dependent on temperature and the daily accumulation of heat. The amount of heat required to advance a plant or pest to the next development stage remains constant from year to year, however, the actual amount of time (days) can vary considerably because of weather conditions.
Each crop, insect and disease species has a minimum base temperature or threshold below which development does not occur. These base temperatures have been determined experimentally and are different for each organism. GDD information can be very useful for predicting plant, insect and disease development. Some Ontario crops still use the GDD system while others have moved to the Ontario Crop Heat Unit (CHU) system described in the next section. Field crops that use the GDD system are cereals which have a Base: 0 (plant development occurs at 0°C or higher), and alfalfa and canola which have a Base: 5 (plant development occurs at 5°C or higher). To calculate GDD, first determine the mean temperature for the day. This is usually done by taking the maximum and minimum temperatures for the day, adding them together and dividing by two. The base temperature is then subtracted from the mean temperature to give a daily GDD. If the daily GDD calculates to a negative number it is recorded as zero. Each daily GDD is then added up (accumulated) over the growing season.
GDD are sometimes referred to as “degree days” or the “degree days averaging method.” Some jurisdictions also use the term “heat units” interchangeably with “degree days.” In Ontario, the terms “growing degree days” (GDD) and “crop heat units” (CHU) are used independently since they represent two very different, temperature-dependent, development models.
254
Agronomy guide for field Crops
Growing Degree Day Equation: The GDD equation used by OMAFRA is calculated as follows:Daily GDD = ((T max + T min) ÷ 2) – T baseT max = the daily maximum air temperatureT min = the daily minimum air temperatureT base = the GDD base temperature for the organism being monitored
Example:Maximum Temperature: 28°CMinimum Temperature: 15°CPest: European corn borer (ECB) Base Temperature for ECB: 10°C
Calculation:Daily GDD = ((28 + 15) ÷ 2) - 10 = 11.5Therefore: 11.5 GDDs were accumulated for that day for the European corn borer GDD model.
There are four factors to consider when comparing GDD accumulations from various sources or regions.
1. Are the base temperatures used in the equations the same?
Different organisms have different base temperatures used to calculate GDD: 150 GDD at Base 10 does not equal 150 GDD at Base 0.
2. Are the start dates for the accumulations the same?
Generally, GDD accumulations start on April 1 each year, but some insect GDD models start at the emergence of a specific life stage. This is referred to as a biofix.
3. Are the equations used to calculate the daily GDD the same?
Many modifications to the simple GDD calculation have been developed over the years and may be referred to generally as degree days.
4. Are the temperatures used in degrees Celsius or Fahrenheit?
GDD accumulations will vary significantly, depending on whether they are being tracked in Celsius or Fahrenheit. GDD models have been designed specifically for use in one or the other and cannot be interchanged without making conversions. The ECB GDD model was based on measurements in Celsius.
Crop Heat Units (CHU)Crop Heat Units (CHU) are based on a principle similar to GDD. CHU accumulations are calculated on a daily basis, using the maximum and minimum temperatures, however, the equation that is used is quite different. The CHU model uses separate calculations for maximum and minimum temperatures. The maximum or daytime relationship uses 10°C as the base temperature and 30°C as the ceiling, because warm-season crops do not develop at all when daytime temperatures fall below 10°C and develop fastest at about 30°C. The minimum or nighttime relationship uses 4.4°C as the base temperature and does not specify an optimum temperature, because nighttime minimum temperatures very seldom exceed 25°C in Ontario. The nighttime relationship is considered a linear relationship, while the daytime relationship is considered non-linear because crop development peaks at 30°C and begins to decline at higher temperatures. Daily CHU are calculated by using the average of the two daily values from the equations below or can be read from the matrix in Table 10–4, Daily crop heat unit accumulations based on maximum and minimum temperatures. Figure 1–1, Crop heat units (CHU-M1) available for corn production, in Chapter 1 gives a map view of typical season total CHU-M1 accumulations for Ontario.
Producers who record high and low temperatures can use Table 10–4, Daily crop heat unit accumulations based on maximum and minimum temperatures, to calculate CHU accumulations for their own farm. CHU accumulations are recorded from May 1st at all locations and end with the first occurrence of -2°C in the fall. Corn development is driven primarily by temperature, and this is especially true during the planting-to-silking period. Unlike soybeans, day length has little effect on the rate at which corn develops. The Ontario CHU system has been developed to calculate the impact of temperature on corn development.
CHU accumulation affects soybeans differently than corn. Soybeans, a warm-season crop, are more susceptible to cold temperatures, especially during flowering. It is believed that sustained cold temperatures (less than 10°C) during flowering affect proper formation of pollen in the flower. Sustained cold temperatures result in poorly developed pods called parthenocarpic pods (also called “monkey pods”). There is some variety difference in tolerance to cold temperatures.
255
10. FIeld scoutIng
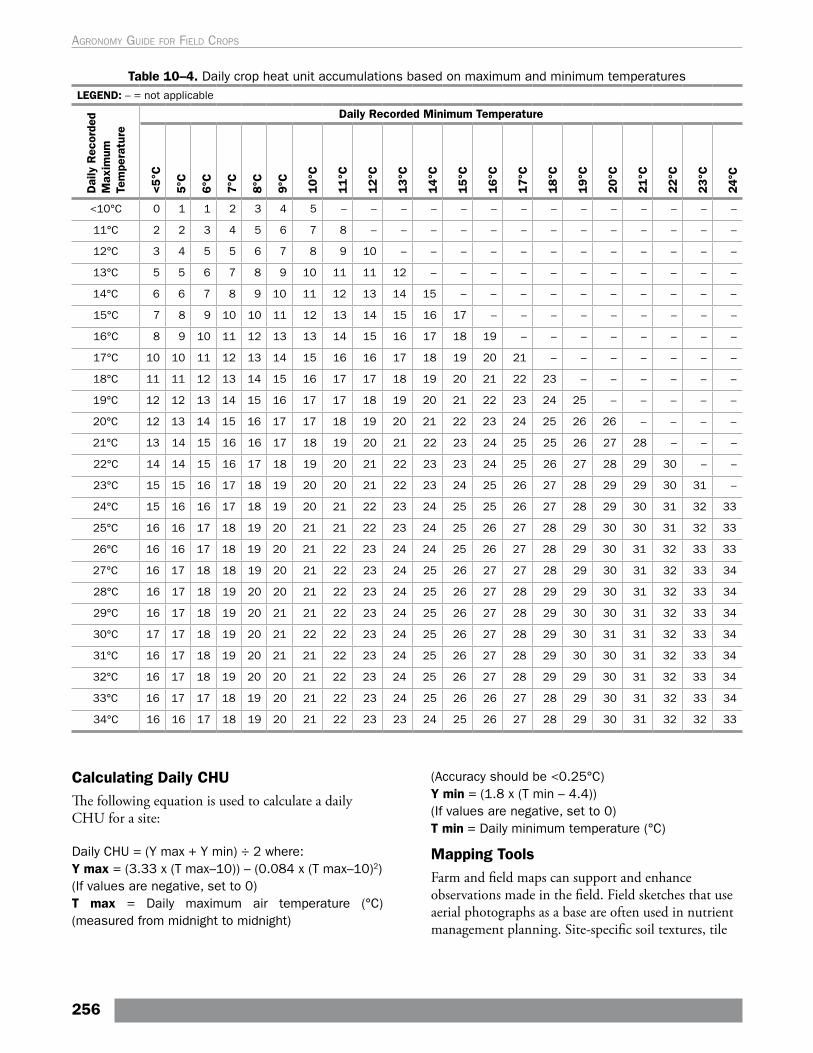
Table 10–4. Daily crop heat unit accumulations based on maximum and minimum temperaturesLEGEND: – = not applicable
Dai
ly R
ecor
ded
Max
imum
Te
mpe
ratu
reDaily Recorded Minimum Temperature
<5°C
5°C
6°C
7°C
8°C
9°C
10°C
11°C
12°C
13°C
14°C
15°C
16°C
17°C
18°C
19°C
20°C
21°C
22°C
23°C
24°C
<10°C 0 1 1 2 3 4 5 – – – – – – – – – – – – – –
11°C 2 2 3 4 5 6 7 8 – – – – – – – – – – – – –
12°C 3 4 5 5 6 7 8 9 10 – – – – – – – – – – – –
13°C 5 5 6 7 8 9 10 11 11 12 – – – – – – – – – – –
14°C 6 6 7 8 9 10 11 12 13 14 15 – – – – – – – – – –
15°C 7 8 9 10 10 11 12 13 14 15 16 17 – – – – – – – – –
16°C 8 9 10 11 12 13 13 14 15 16 17 18 19 – – – – – – – –
17°C 10 10 11 12 13 14 15 16 16 17 18 19 20 21 – – – – – – –
18°C 11 11 12 13 14 15 16 17 17 18 19 20 21 22 23 – – – – – –
19°C 12 12 13 14 15 16 17 17 18 19 20 21 22 23 24 25 – – – – –
20°C 12 13 14 15 16 17 17 18 19 20 21 22 23 24 25 26 26 – – – –
21°C 13 14 15 16 16 17 18 19 20 21 22 23 24 25 25 26 27 28 – – –
22°C 14 14 15 16 17 18 19 20 21 22 23 23 24 25 26 27 28 29 30 – –
23°C 15 15 16 17 18 19 20 20 21 22 23 24 25 26 27 28 29 29 30 31 –
24°C 15 16 16 17 18 19 20 21 22 23 24 25 25 26 27 28 29 30 31 32 33
25°C 16 16 17 18 19 20 21 21 22 23 24 25 26 27 28 29 30 30 31 32 33
26°C 16 16 17 18 19 20 21 22 23 24 24 25 26 27 28 29 30 31 32 33 33
27°C 16 17 18 18 19 20 21 22 23 24 25 26 27 27 28 29 30 31 32 33 34
28°C 16 17 18 19 20 20 21 22 23 24 25 26 27 28 29 29 30 31 32 33 34
29°C 16 17 18 19 20 21 21 22 23 24 25 26 27 28 29 30 30 31 32 33 34
30°C 17 17 18 19 20 21 22 22 23 24 25 26 27 28 29 30 31 31 32 33 34
31°C 16 17 18 19 20 21 21 22 23 24 25 26 27 28 29 30 30 31 32 33 34
32°C 16 17 18 19 20 20 21 22 23 24 25 26 27 28 29 29 30 31 32 33 34
33°C 16 17 17 18 19 20 21 22 23 24 25 26 26 27 28 29 30 31 32 33 34
34°C 16 16 17 18 19 20 21 22 23 23 24 25 26 27 28 29 30 31 32 32 33
Calculating Daily CHUThe following equation is used to calculate a daily CHU for a site:
Daily CHU = (Y max + Y min) ÷ 2 where:Y max = (3.33 x (T max–10)) – (0.084 x (T max–10)2)(If values are negative, set to 0)T max = Daily maximum air temperature (°C) (measured from midnight to midnight)
(Accuracy should be <0.25°C)Y min = (1.8 x (T min – 4.4))(If values are negative, set to 0)T min = Daily minimum temperature (°C)
Mapping ToolsFarm and field maps can support and enhance observations made in the field. Field sketches that use aerial photographs as a base are often used in nutrient management planning. Site-specific soil textures, tile
256
Agronomy guide for field Crops
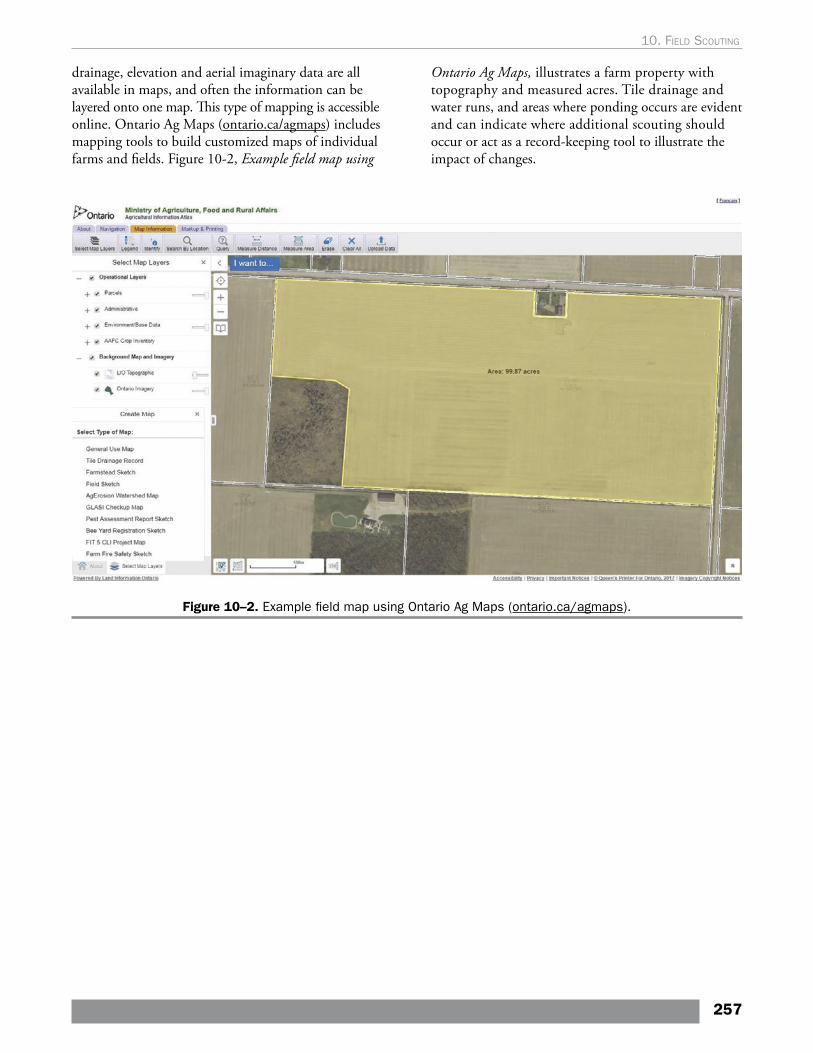
drainage, elevation and aerial imaginary data are all available in maps, and often the information can be layered onto one map. This type of mapping is accessible online. Ontario Ag Maps (ontario.ca/agmaps) includes mapping tools to build customized maps of individual farms and fields. Figure 10-2, Example field map using
Ontario Ag Maps, illustrates a farm property with topography and measured acres. Tile drainage and water runs, and areas where ponding occurs are evident and can indicate where additional scouting should occur or act as a record-keeping tool to illustrate the impact of changes.
Figure 10–2. Example field map using Ontario Ag Maps (ontario.ca/agmaps).
257
10. FIeld scoutIng

Page intentionally left blank
Precision agriculture for crop production can be defined as a management system that:
• is information- and technology-based• is site-specific • uses one or more of the following sources of data for
optimum profitability, sustainability and protection of the environment:
– soils (texture, pH) – crop (inputs, health and growth) – nutrients – elevation/topography – pests – moisture – yield
(Source: U.S. Department of Agriculture, Natural Resources Conservation Service (NRCS), Precision Agriculture Technical Note, 2007).
This chapter outlines some of the basic concepts of precision agriculture as it pertains to field crop production, and is not intended to be a comprehensive overview. Precision agriculture also includes technologies being deployed in other agricultural areas, such as livestock and horticulture that will not be discussed. It is highly recommended that readers frequently check local sources of current information. Refer to Chapter 9, Soil Fertility and Nutrient Use, and Chapter 10, Field Scouting, for specific precision agriculture strategies.
Precision Tools
Real Time Kinematic (RTK) and Global Positioning Systems (GPS)The advances made in precision agriculture started with the adoption of Real Time Kinematic (RTK) guidance and accurate elevation mapping made possible with geospatial technology that includes global positioning systems (GPS). This capability is enabling the deployment of increasingly sophisticated technology that allows fields to be managed at a spatial level never before possible. An onboard computer knows exactly where a piece of farm equipment is
in space and time, and can adjust inputs (e.g., lime, fertilizer, seed population, planter depth, planter down pressure, variety, pesticide rates, tillage depth or aggressiveness) based on a prescription that is loaded into the controllers on the equipment. Precision agriculture brings together the disciplines of agronomy, engineering and geospatial analysis. Continued efforts to bridge the gap between these disciplines for producers, advisors and extension personnel will increase the ability to use these technologies more efficiently and productively.
GPS guidance systems have allowed farm equipment to be driven with automated navigation. Several key benefits are realized from this technology. One benefit is that operators are less stressed and tired from long hours in their tractor cabs. Many studies have shown significant increases in operator efficiency, comfort and improved accuracy when autopilot technology is used. The second benefit of the auto-guidance systems is efficiency in equipment operation. Larger equipment can be operated with centimetre accuracy in pass-to-pass navigation, which insures efficient use of time, fuel and inputs. Auto-steer systems allow the tractor to operate the equipment, while the operator monitors the systems and field conditions to make on-the-go adjustments without concern about where the equipment is heading.
Applications for Precision Agriculture1. One of the first, but still vitally important,
applications of precision agriculture is the yield mapping capability of harvest equipment (mainly grain combines). While yield monitors were used before the deployment of GPS technology, the amalgamation of yield monitors and GPS technology has enhanced the value of yield monitor output. Yield monitors, when calibrated, are extremely good at revealing the variability of crop yield across a field. This variability is accurately recorded so the producer can navigate to those areas to determine what factors are impacting the significant yield differences at those precise locations.
Yield monitors gather tremendous amounts of data, and allow the preparation of visual yield maps that quickly demonstrate where, and how
11. Precision Agriculture
259
much, the variability in the field is affecting the overall field productivity. While yield monitors have been around for several decades, only recently has the accuracy, connectivity to GPS and software tools that process the data been available to start maximizing the use of this technology.
2. Another advancement in precision agriculture is the use of planter row, plus dry and liquid application equipment differential shutoff systems. Since the equipment tracks where it is and where it has been, it can be programmed to stop the application of inputs on areas where it has already placed inputs. This application reduces over applying inputs of seed, fertilizer, pesticides, etc. The benefit is reduced overlap, resulting in economic savings and diminished environmental risk. The savings in inputs, and potential environmental stewardship associated with use of these technologies makes purchase of planting or application equipment with VRA options a “must-have” technology with an excellent return on investment potential.
3. Down pressure technology on planting equipment is another precision agriculture tool that is not directly linked to the use of GPS. In theory, down pressure technology should adjust planter contact with the soil to ensure continuous optimum seed placement. There are two options for this:
– air and hydraulic systems that control the whole planter
– similar systems that control individual row units across the planter
Continuous monitoring of planting equipment performance, seeding depth, quality of the seed trench, etc., is difficult to accomplish for most producers, but can be done by down pressure technology. Producers have reported mixed results based on their expectation of what the system should deliver. Some feel it is enough that the system take into account the general field conditions and adjust down pressure at a field level. Others have expectations that the system should react quickly to the range of topography and variable soil conditions experienced in the field, and quickly adjust down pressure to optimize continuous planting performance. The use of this technology does not exclude the operator from occasionally checking on the performance of the planter, by digging up planted seed in all rows to ensure depth, compaction, spacing and population accuracy.
4. Equipment manufacturers are collecting machinery data in near real time and are compiling and analyzing data on larger scales (e.g., farm, regional, provincial, national) to allow an evaluation of equipment performance and how this relates to crop management decisions. Partnerships between equipment, seed and agricultural input companies are forming so that data is shared and ”mined” to answer agronomic questions.
Variable Rate Application Currently, there is an increased interest in using all the data being collected by equipment to manage fields at a sub-field level. This requires the creation of management zones across a field. Zone management is defined as areas within a field that perform similarly and consistently over time (e.g., zones with similar soil texture, topography, drainage and crop yield). Since different parts of a field often perform differently, the expectation is that by defining zones of similar performance potential, the application of varying inputs across these zones should optimize productivity. Once zones are defined, apply separate input prescriptions to each management zone for a multitude of crop inputs (e.g., fertilizer, pesticide, tillage, seed, etc.). Inputs are applied differentially across the field based on the rates allocated to each zone by the equipment controllers. This is also known as variable rate application (VRA).
The goal of VRA at the field level is to optimize crop inputs with economic yield potential. Achieving this goal often requires the application of inputs to vary significantly across a field. Compared to current practices, some portion of fields will receive fewer inputs, while other portions will receive more. The end result should optimize crop input use efficiency. The amount of crop inputs may be smaller or greater than they are now, but the geospatial application of those inputs will ensure the most efficient use. Overall, it is expected that there will be less crop inputs left in the environment than with current practices.
The delineation of management zones within the field requires input of data such as yield, soil chemistry and topography. Once zones are defined, the assignment of input prescriptions requires agronomic knowledge, to determine the rates of input that would best respond to the characteristics of the specific zones. Refer to Defining Soil Sampling Zones, Chapter 9 for an example of soil sampling zones created with elevation data.
260
Agronomy guide for field Crops
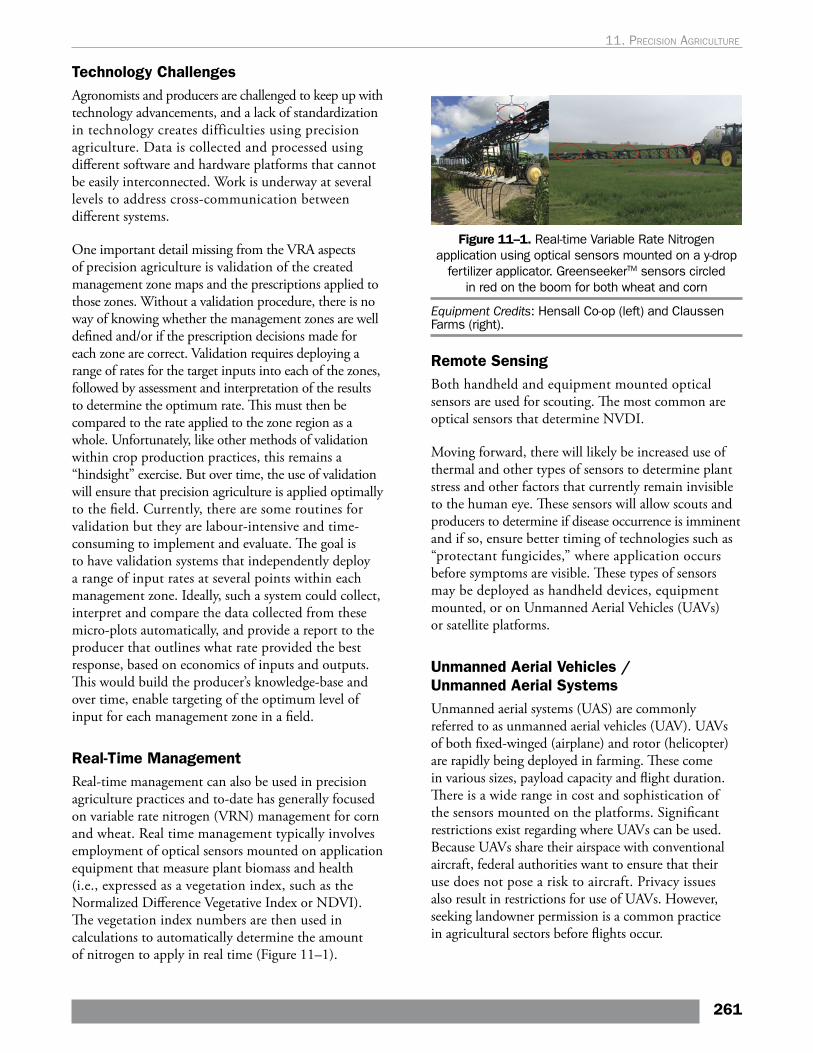
Technology ChallengesAgronomists and producers are challenged to keep up with technology advancements, and a lack of standardization in technology creates difficulties using precision agriculture. Data is collected and processed using different software and hardware platforms that cannot be easily interconnected. Work is underway at several levels to address cross-communication between different systems.
One important detail missing from the VRA aspects of precision agriculture is validation of the created management zone maps and the prescriptions applied to those zones. Without a validation procedure, there is no way of knowing whether the management zones are well defined and/or if the prescription decisions made for each zone are correct. Validation requires deploying a range of rates for the target inputs into each of the zones, followed by assessment and interpretation of the results to determine the optimum rate. This must then be compared to the rate applied to the zone region as a whole. Unfortunately, like other methods of validation within crop production practices, this remains a “hindsight” exercise. But over time, the use of validation will ensure that precision agriculture is applied optimally to the field. Currently, there are some routines for validation but they are labour-intensive and time-consuming to implement and evaluate. The goal is to have validation systems that independently deploy a range of input rates at several points within each management zone. Ideally, such a system could collect, interpret and compare the data collected from these micro-plots automatically, and provide a report to the producer that outlines what rate provided the best response, based on economics of inputs and outputs. This would build the producer’s knowledge-base and over time, enable targeting of the optimum level of input for each management zone in a field.
Real-Time ManagementReal-time management can also be used in precision agriculture practices and to-date has generally focused on variable rate nitrogen (VRN) management for corn and wheat. Real time management typically involves employment of optical sensors mounted on application equipment that measure plant biomass and health (i.e., expressed as a vegetation index, such as the Normalized Difference Vegetative Index or NDVI). The vegetation index numbers are then used in calculations to automatically determine the amount of nitrogen to apply in real time (Figure 11–1).
Figure 11–1. Real-time Variable Rate Nitrogen application using optical sensors mounted on a y-drop
fertilizer applicator. GreenseekerTM sensors circled in red on the boom for both wheat and corn
Equipment Credits: Hensall Co-op (left) and Claussen Farms (right).
Remote Sensing Both handheld and equipment mounted optical sensors are used for scouting. The most common are optical sensors that determine NVDI.
Moving forward, there will likely be increased use of thermal and other types of sensors to determine plant stress and other factors that currently remain invisible to the human eye. These sensors will allow scouts and producers to determine if disease occurrence is imminent and if so, ensure better timing of technologies such as “protectant fungicides,” where application occurs before symptoms are visible. These types of sensors may be deployed as handheld devices, equipment mounted, or on Unmanned Aerial Vehicles (UAVs) or satellite platforms.
Unmanned Aerial Vehicles / Unmanned Aerial Systems Unmanned aerial systems (UAS) are commonly referred to as unmanned aerial vehicles (UAV). UAVs of both fixed-winged (airplane) and rotor (helicopter) are rapidly being deployed in farming. These come in various sizes, payload capacity and flight duration. There is a wide range in cost and sophistication of the sensors mounted on the platforms. Significant restrictions exist regarding where UAVs can be used. Because UAVs share their airspace with conventional aircraft, federal authorities want to ensure that their use does not pose a risk to aircraft. Privacy issues also result in restrictions for use of UAVs. However, seeking landowner permission is a common practice in agricultural sectors before flights occur.
261
11. precIsIon agrIculture
The various payloads available for these vehicles can collect a variety of images during a scouting operation. These include high resolution digital photography and video, modelled 3D elevation, infrared, NDVI, thermal and other sensors. This data can be made available to producers and advisors to assist in monitoring the crop within a field or whole field, or on a local, regional or national level. This technology appeals to many diverse groups interested in the status and progress of crops throughout the growing season.
While these are very valuable tools that ideally could collect, interpret and compare data; to date the technology simply identifies where field differences are occurring. From there it can direct attention to exact locations in the field to determine what is happening. On-site human interpretation of differences identified by the technology is required to establish economical management options that can address the detected differences.
Advances with remote sensing and UAV technology will likely result in ground truthing the differences identified (i.e., patterns, crop, weed or soil colours, etc.), to build the capability to detect, identify and determine the cause of differences and enable automatic management decisions. It is expected that this technology may advance to the point where management decisions can be made without having to visit the field to calibrate observations made by the sensors.
Sensors in future will detect disease, insects, drought, weeds, flooding etc. There are satellite companies currently exploring their role in agriculture and the timeliness of observations needed to benefit crop management.
Many of these new technologies will enhance the options available in precision agriculture to improve economic and environmental aspects of crop production.
Trust vs. TestCurrently, many precision agriculture software and cloud-based computing services are offered. In many cases the expectation is that the producer will upload their field data into the system for analysis (e.g., soil chemistry and yield data, etc.). A prescription map can then be downloaded from the system for variable rate application in the field. Some of these solutions are modeled results and are not always based on site-specific climate and soils information. “Test not trust” prescription maps, and implement validation strategies. For example, in Figure 11–2, Comparing strips to blocks with nitrogen applied using variable rate technology, entire passes or small blocks within management zones reflect the conventional uniform practices and rates that would have typically been used by the producer. Post-harvest analysis would compare the precision agriculture approach versus the results of the normal practice for that particular growing season’s conditions. The goal is to determine areas of the field that were optimized, while identifying zones in the field where the prescription may require further adjustment in the years to follow.
262
Agronomy guide for field Crops
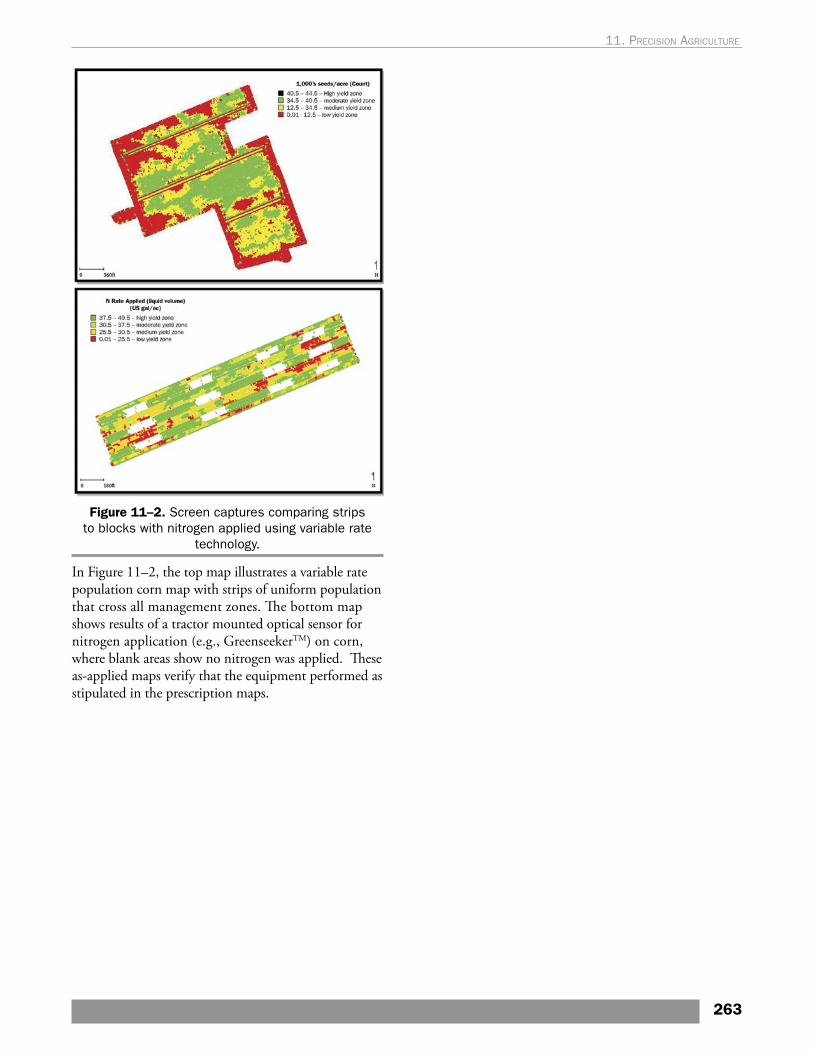
Figure 11–2. Screen captures comparing strips to blocks with nitrogen applied using variable rate
technology.
In Figure 11–2, the top map illustrates a variable rate population corn map with strips of uniform population that cross all management zones. The bottom map shows results of a tractor mounted optical sensor for nitrogen application (e.g., GreenseekerTM) on corn, where blank areas show no nitrogen was applied. These as-applied maps verify that the equipment performed as stipulated in the prescription maps.
263
11. precIsIon agrIculture

Page intentionally left blank
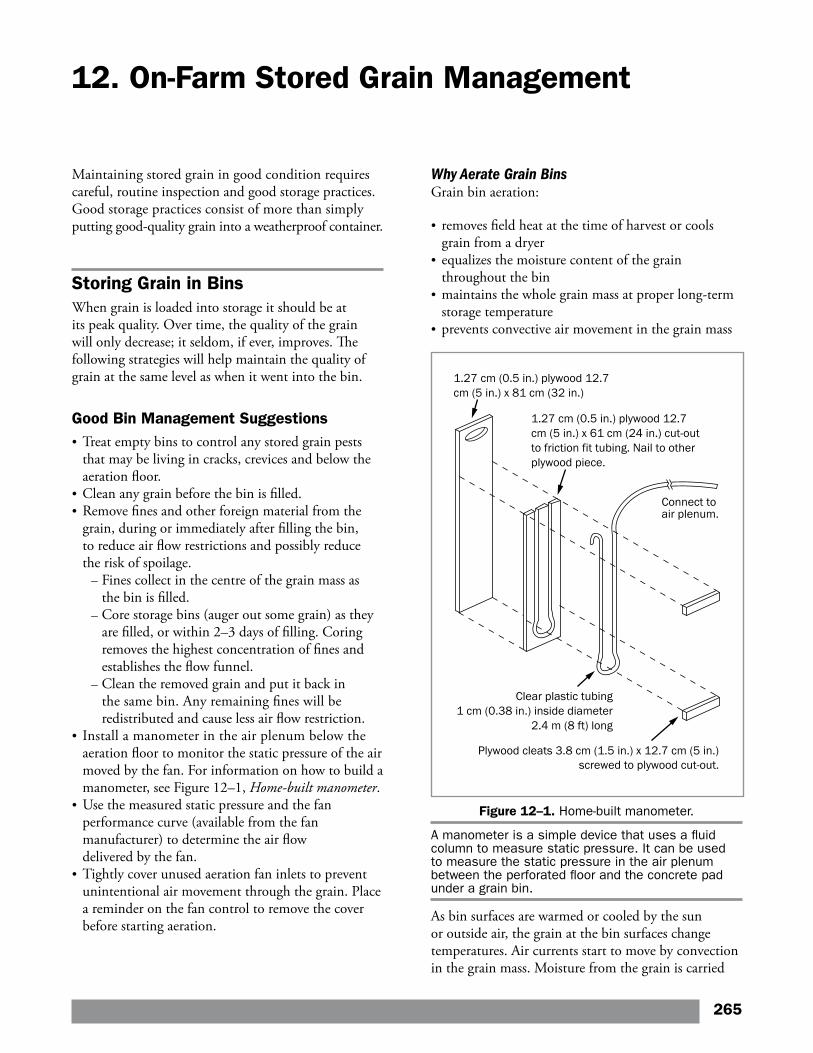
12. On-Farm Stored Grain Management
Maintaining stored grain in good condition requires careful, routine inspection and good storage practices. Good storage practices consist of more than simply putting good-quality grain into a weatherproof container.
Storing Grain in BinsWhen grain is loaded into storage it should be at its peak quality. Over time, the quality of the grain will only decrease; it seldom, if ever, improves. The following strategies will help maintain the quality of grain at the same level as when it went into the bin.
Good Bin Management Suggestions• Treat empty bins to control any stored grain pests
that may be living in cracks, crevices and below theaeration floor.
• Clean any grain before the bin is filled.• Remove fines and other foreign material from the
grain, during or immediately after filling the bin,to reduce air flow restrictions and possibly reducethe risk of spoilage.
– Fines collect in the centre of the grain mass as the bin is filled.
– Core storage bins (auger out some grain) as they are filled, or within 2–3 days of filling. Coring removes the highest concentration of fines and establishes the flow funnel.
– Clean the removed grain and put it back in the same bin. Any remaining fines will be redistributed and cause less air flow restriction.
• Install a manometer in the air plenum below theaeration floor to monitor the static pressure of the airmoved by the fan. For information on how to build amanometer, see Figure 12–1, Home-built manometer.
• Use the measured static pressure and the fanperformance curve (available from the fanmanufacturer) to determine the air flowdelivered by the fan.
• Tightly cover unused aeration fan inlets to preventunintentional air movement through the grain. Placea reminder on the fan control to remove the coverbefore starting aeration.
Why Aerate Grain BinsGrain bin aeration:
• removes field heat at the time of harvest or coolsgrain from a dryer
• equalizes the moisture content of the grainthroughout the bin
• maintains the whole grain mass at proper long-termstorage temperature
• prevents convective air movement in the grain mass
1.27 cm (0.5 in.) plywood 12.7 cm (5 in.) x 81 cm (32 in.)
1.27 cm (0.5 in.) plywood 12.7 cm (5 in.) x 61 cm (24 in.) cut-out to friction fit tubing. Nail to other plywood piece.
Clear plastic tubing1 cm (0.38 in.) inside diameter
2.4 m (8 ft) long
Plywood cleats 3.8 cm (1.5 in.) x 12.7 cm (5 in.) screwed to plywood cut-out.
Connect toair plenum.
Figure 12–1. Home-built manometer.
A manometer is a simple device that uses a fluid column to measure static pressure. It can be used to measure the static pressure in the air plenum between the perforated floor and the concrete pad under a grain bin.
As bin surfaces are warmed or cooled by the sun or outside air, the grain at the bin surfaces change temperatures. Air currents start to move by convection in the grain mass. Moisture from the grain is carried
265
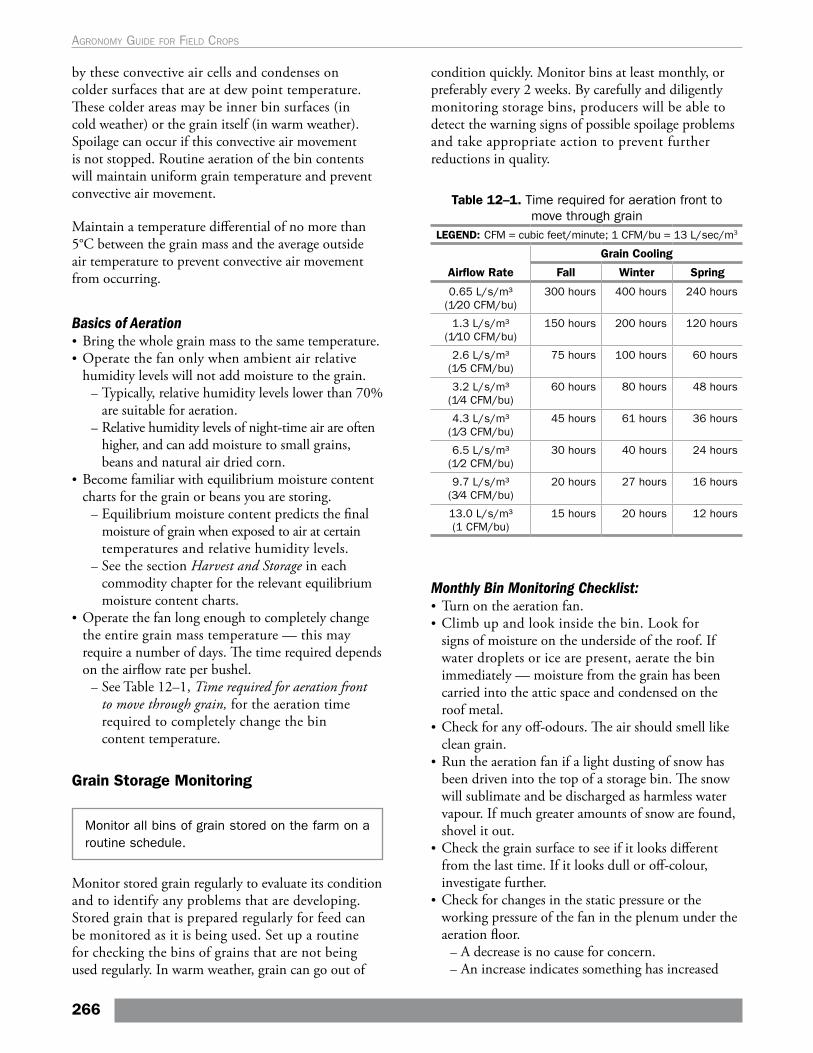
by these convective air cells and condenses on colder surfaces that are at dew point temperature. These colder areas may be inner bin surfaces (in cold weather) or the grain itself (in warm weather). Spoilage can occur if this convective air movement is not stopped. Routine aeration of the bin contents will maintain uniform grain temperature and prevent convective air movement.
Maintain a temperature differential of no more than 5°C between the grain mass and the average outside air temperature to prevent convective air movement from occurring.
Basics of Aeration• Bring the whole grain mass to the same temperature.• Operate the fan only when ambient air relative
humidity levels will not add moisture to the grain. – Typically, relative humidity levels lower than 70% are suitable for aeration.
– Relative humidity levels of night-time air are often higher, and can add moisture to small grains, beans and natural air dried corn.
• Become familiar with equilibrium moisture content charts for the grain or beans you are storing.
– Equilibrium moisture content predicts the final moisture of grain when exposed to air at certain temperatures and relative humidity levels.
– See the section Harvest and Storage in each commodity chapter for the relevant equilibrium moisture content charts.
• Operate the fan long enough to completely change the entire grain mass temperature — this may require a number of days. The time required depends on the airflow rate per bushel.
– See Table 12–1, Time required for aeration front to move through grain, for the aeration time required to completely change the bin content temperature.
Grain Storage Monitoring
Monitor all bins of grain stored on the farm on a routine schedule.
Monitor stored grain regularly to evaluate its condition and to identify any problems that are developing. Stored grain that is prepared regularly for feed can be monitored as it is being used. Set up a routine for checking the bins of grains that are not being used regularly. In warm weather, grain can go out of
condition quickly. Monitor bins at least monthly, or preferably every 2 weeks. By carefully and diligently monitoring storage bins, producers will be able to detect the warning signs of possible spoilage problems and take appropriate action to prevent further reductions in quality.
Table 12–1. Time required for aeration front to move through grain
LEGEND: CFM = cubic feet/minute; 1 CFM/bu = 13 L/sec/m3
Airflow Rate
Grain Cooling
Fall Winter Spring
0.65 L/s/m³ (1⁄20 CFM/bu)
300 hours 400 hours 240 hours
1.3 L/s/m³ (1⁄10 CFM/bu)
150 hours 200 hours 120 hours
2.6 L/s/m³ (1⁄5 CFM/bu)
75 hours 100 hours 60 hours
3.2 L/s/m³ (1⁄4 CFM/bu)
60 hours 80 hours 48 hours
4.3 L/s/m³ (1⁄3 CFM/bu)
45 hours 61 hours 36 hours
6.5 L/s/m³ (1⁄2 CFM/bu)
30 hours 40 hours 24 hours
9.7 L/s/m³ (3⁄4 CFM/bu)
20 hours 27 hours 16 hours
13.0 L/s/m³ (1 CFM/bu)
15 hours 20 hours 12 hours
Monthly Bin Monitoring Checklist:• Turn on the aeration fan.• Climb up and look inside the bin. Look for
signs of moisture on the underside of the roof. If water droplets or ice are present, aerate the bin immediately — moisture from the grain has been carried into the attic space and condensed on the roof metal.
• Check for any off-odours. The air should smell like clean grain.
• Run the aeration fan if a light dusting of snow has been driven into the top of a storage bin. The snow will sublimate and be discharged as harmless water vapour. If much greater amounts of snow are found, shovel it out.
• Check the grain surface to see if it looks different from the last time. If it looks dull or off-colour, investigate further.
• Check for changes in the static pressure or the working pressure of the fan in the plenum under the aeration floor.
– A decrease is no cause for concern. – An increase indicates something has increased
266
Agronomy guide for field Crops
the resistance of the air as it moves through the grain mass. Investigate deeper into the grain mass.
• Watch for any signs of insect activity.• Record your notes in a monitoring logbook for
comparison with the next month’s readings.
Insect Management for Farm-Stored Grain
The key to controlling insects in stored grain is good sanitation and storage practices.
The following strategies are essential for preventing infestations and reducing the need for rescue fumigation treatments.
Keep a Clean FacilityThe most important strategy to keeping facilities insect-free is cleaning bins and equipment before storing any new grain. Grain residues from previous crops are the main source of stored pest infestations. At least 2 weeks before filling, clean bins thoroughly, using a good vacuum cleaner, to remove all grain residue or caked material. Ensure old grain has been removed from cracks and crevices, behind partitions, between double walls, outside and under bins, in grain-handling equipment, inside aeration piping and under perforated floors. Harvesting and grain-handling equipment containing old crop residues are another source of new infestations. Fully perforated floors present a problem because they cannot be easily lifted for cleaning, and grain dust will accumulate and may become infested with grain storage pests.
Clean up all spills of grain and feed around handling and storage facilities. Burn all grain that is collected, deposit it in a sanitary landfill or grind it up for feed. Leave space between feed rooms and storage facilities to prevent pest movement from one to the other. Once established, storage pests can quickly spread to nearby storage facilities.
Do not store grain in buildings that shelter animals or hay. Mangers, feed boxes and troughs are often infested with insects. These shelters are also warmer and provide an excellent wintering site for insects.
Maintain Sound Storage FacilitiesAfter clean-up, repair facilities so they are pest-proof. Seal cracks and crevices that may allow insects and other pests to enter.
Store Clean, Dry GrainNever store new grain with old grain, because insects in the old grain will migrate to the new. Ensure grain being placed in the storage facility is pest-free.
Moulds, as well as insects, are much more troublesome in moist grain. If stored grain is more than 15% moisture content, check it regularly. Dry wheat and other grains down to 12% moisture, if the plan is to store them for longer than a month through the warm summer season. Dry corn to 14% moisture for safe long-term storage.
Monitor Storage Temperature and Sample for InsectsWheat is the crop most susceptible to infestations, because it is harvested during the summer when the air temperature is warmest, and insects are most active inside and outside the storage facilities. Once in the bin, the grain is still warm and can provide an excellent habitat for stored-grain insects. In Ontario, corn storage usually follows wheat storage, and infestations can easily be carried from the wheat to the corn. Monitor the temperature of the grain using temperature sensors or cables placed throughout the grain pile. Warm areas in the pile often indicate insect and/or spoilage problems.
Use aeration to cool down grain in the fall, to reduce insect infestation and slow reproduction. Insects do not develop in grain when temperatures are below 10°C and can be killed if temperatures are kept below -10°C for extended periods of time (depending on the insect species).
Rusty grain beetle and Indian meal moth can be monitored using plastic probe traps (Photo 12–1). These probe traps are very sensitive and will show an infestation well before it reaches the economic threshold. If rusty grain beetle or Indian meal moths are found, fumigate the grain. Fumigants are restricted-use products that can only treat grain warmer than 5°C.
267
12. on-FarM stored graIn ManageMent
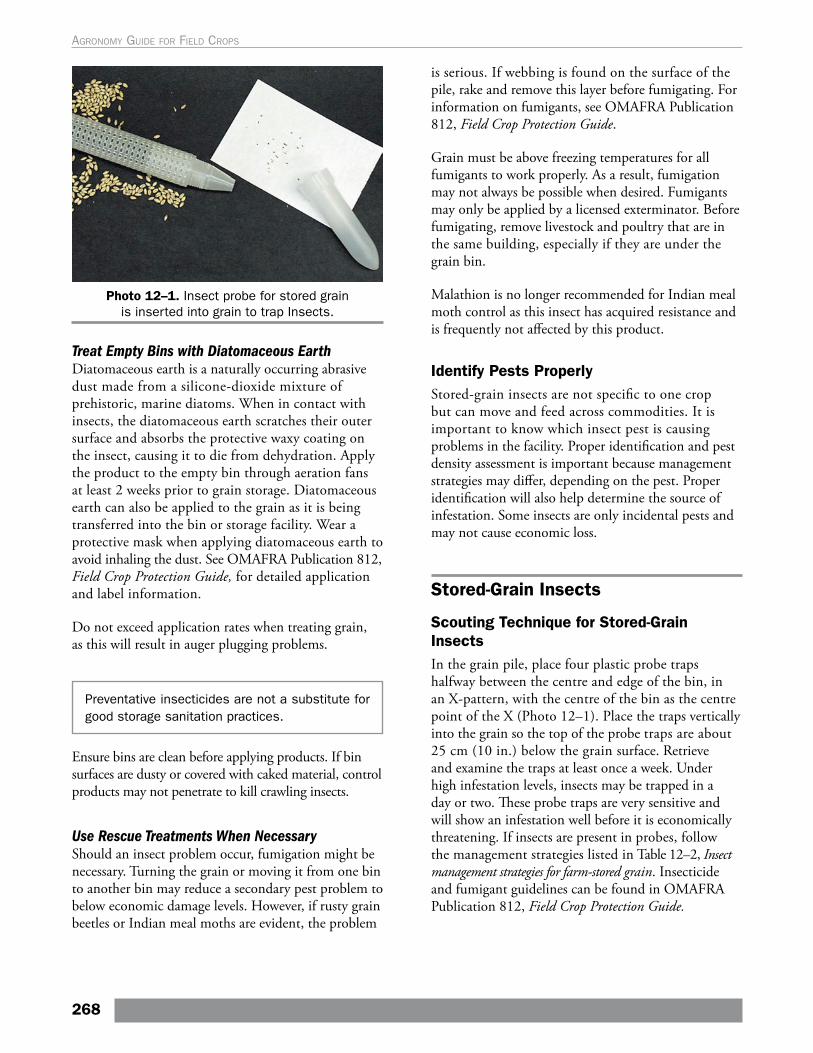
Photo 12–1. Insect probe for stored grain is inserted into grain to trap Insects.
Treat Empty Bins with Diatomaceous EarthDiatomaceous earth is a naturally occurring abrasive dust made from a silicone-dioxide mixture of prehistoric, marine diatoms. When in contact with insects, the diatomaceous earth scratches their outer surface and absorbs the protective waxy coating on the insect, causing it to die from dehydration. Apply the product to the empty bin through aeration fans at least 2 weeks prior to grain storage. Diatomaceous earth can also be applied to the grain as it is being transferred into the bin or storage facility. Wear a protective mask when applying diatomaceous earth to avoid inhaling the dust. See OMAFRA Publication 812, Field Crop Protection Guide, for detailed application and label information.
Do not exceed application rates when treating grain, as this will result in auger plugging problems.
Preventative insecticides are not a substitute for good storage sanitation practices.
Ensure bins are clean before applying products. If bin surfaces are dusty or covered with caked material, control products may not penetrate to kill crawling insects.
Use Rescue Treatments When NecessaryShould an insect problem occur, fumigation might be necessary. Turning the grain or moving it from one bin to another bin may reduce a secondary pest problem to below economic damage levels. However, if rusty grain beetles or Indian meal moths are evident, the problem
is serious. If webbing is found on the surface of the pile, rake and remove this layer before fumigating. For information on fumigants, see OMAFRA Publication 812, Field Crop Protection Guide.
Grain must be above freezing temperatures for all fumigants to work properly. As a result, fumigation may not always be possible when desired. Fumigants may only be applied by a licensed exterminator. Before fumigating, remove livestock and poultry that are in the same building, especially if they are under the grain bin.
Malathion is no longer recommended for Indian meal moth control as this insect has acquired resistance and is frequently not affected by this product.
Identify Pests ProperlyStored-grain insects are not specific to one crop but can move and feed across commodities. It is important to know which insect pest is causing problems in the facility. Proper identification and pest density assessment is important because management strategies may differ, depending on the pest. Proper identification will also help determine the source of infestation. Some insects are only incidental pests and may not cause economic loss.
Stored-Grain Insects
Scouting Technique for Stored-Grain InsectsIn the grain pile, place four plastic probe traps halfway between the centre and edge of the bin, in an X-pattern, with the centre of the bin as the centre point of the X (Photo 12–1). Place the traps vertically into the grain so the top of the probe traps are about 25 cm (10 in.) below the grain surface. Retrieve and examine the traps at least once a week. Under high infestation levels, insects may be trapped in a day or two. These probe traps are very sensitive and will show an infestation well before it is economically threatening. If insects are present in probes, follow the management strategies listed in Table 12–2, Insect management strategies for farm-stored grain. Insecticide and fumigant guidelines can be found in OMAFRA Publication 812, Field Crop Protection Guide.
268
Agronomy guide for field Crops
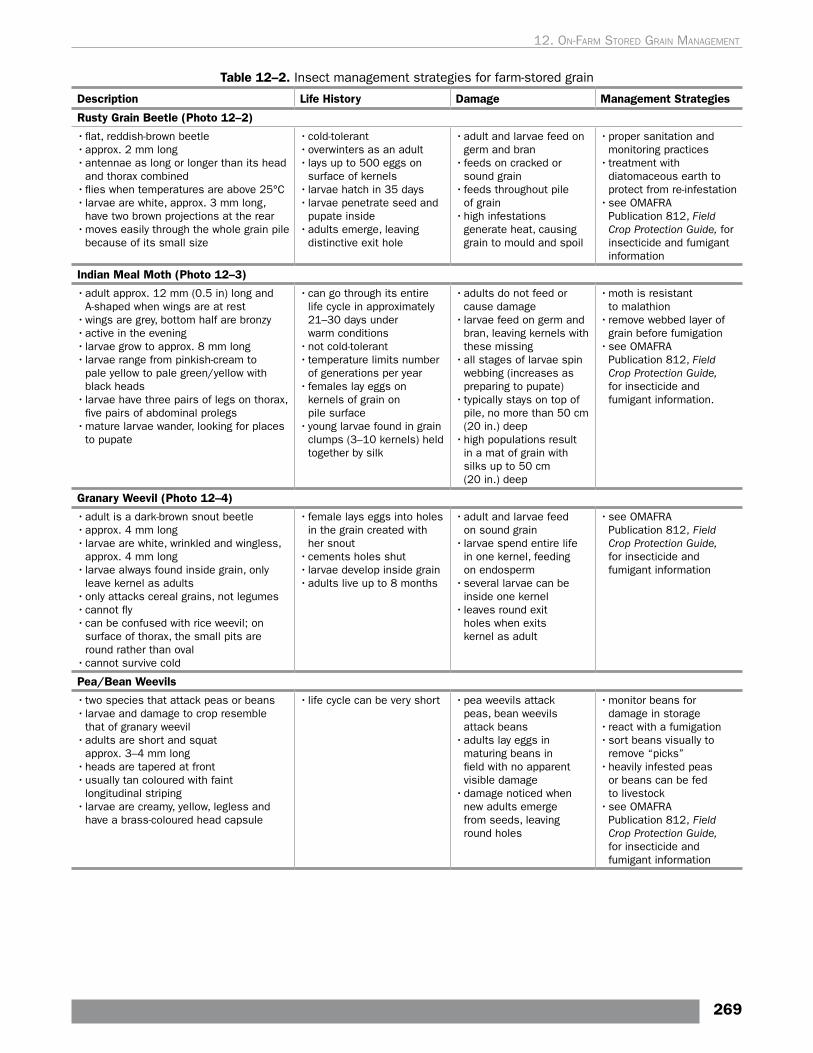
Table 12–2. Insect management strategies for farm-stored grain
Description Life History Damage Management Strategies
Rusty Grain Beetle (Photo 12–2)
• flat, reddish-brown beetle• approx. 2 mm long• antennae as long or longer than its head
and thorax combined• flies when temperatures are above 25°C • larvae are white, approx. 3 mm long,
have two brown projections at the rear• moves easily through the whole grain pile
because of its small size
• cold-tolerant• overwinters as an adult• lays up to 500 eggs on
surface of kernels• larvae hatch in 35 days• larvae penetrate seed and
pupate inside• adults emerge, leaving
distinctive exit hole
• adult and larvae feed on germ and bran
• feeds on cracked or sound grain
• feeds throughout pile of grain
• high infestations generate heat, causing grain to mould and spoil
• proper sanitation and monitoring practices
• treatment with diatomaceous earth to protect from re-infestation
• see OMAFRA Publication 812, Field Crop Protection Guide, for insecticide and fumigant information
Indian Meal Moth (Photo 12–3)
• adult approx. 12 mm (0.5 in) long and A-shaped when wings are at rest
• wings are grey, bottom half are bronzy• active in the evening• larvae grow to approx. 8 mm long• larvae range from pinkish-cream to
pale yellow to pale green/yellow with black heads
• larvae have three pairs of legs on thorax, five pairs of abdominal prolegs
• mature larvae wander, looking for places to pupate
• can go through its entire life cycle in approximately 21–30 days under warm conditions
• not cold-tolerant• temperature limits number
of generations per year• females lay eggs on
kernels of grain on pile surface
• young larvae found in grain clumps (3–10 kernels) held together by silk
• adults do not feed or cause damage
• larvae feed on germ and bran, leaving kernels with these missing
• all stages of larvae spin webbing (increases as preparing to pupate)
• typically stays on top of pile, no more than 50 cm (20 in.) deep
• high populations result in a mat of grain with silks up to 50 cm (20 in.) deep
• moth is resistant to malathion
• remove webbed layer of grain before fumigation
• see OMAFRA Publication 812, Field Crop Protection Guide, for insecticide and fumigant information.
Granary Weevil (Photo 12–4)
• adult is a dark-brown snout beetle• approx. 4 mm long• larvae are white, wrinkled and wingless,
approx. 4 mm long• larvae always found inside grain, only
leave kernel as adults• only attacks cereal grains, not legumes• cannot fly• can be confused with rice weevil; on
surface of thorax, the small pits are round rather than oval
• cannot survive cold
• female lays eggs into holes in the grain created with her snout
• cements holes shut• larvae develop inside grain • adults live up to 8 months
• adult and larvae feed on sound grain
• larvae spend entire life in one kernel, feeding on endosperm
• several larvae can be inside one kernel
• leaves round exit holes when exits kernel as adult
• see OMAFRA Publication 812, Field Crop Protection Guide, for insecticide and fumigant information
Pea/Bean Weevils
• two species that attack peas or beans• larvae and damage to crop resemble
that of granary weevil• adults are short and squat
approx. 3–4 mm long• heads are tapered at front• usually tan coloured with faint
longitudinal striping• larvae are creamy, yellow, legless and
have a brass-coloured head capsule
• life cycle can be very short • pea weevils attack peas, bean weevils attack beans
• adults lay eggs in maturing beans in field with no apparent visible damage
• damage noticed when new adults emerge from seeds, leaving round holes
• monitor beans for damage in storage
• react with a fumigation• sort beans visually to
remove “picks”• heavily infested peas
or beans can be fed to livestock
• see OMAFRA Publication 812, Field Crop Protection Guide, for insecticide and fumigant information
269
12. on-FarM stored graIn ManageMent
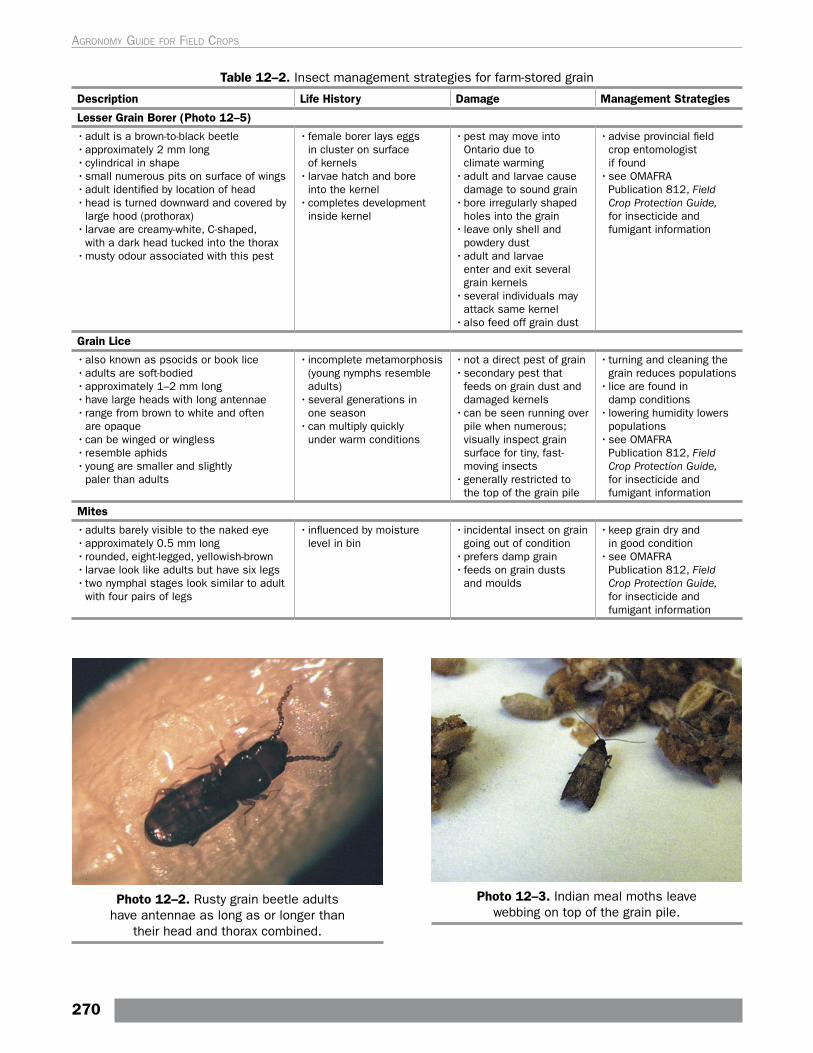
Table 12–2. Insect management strategies for farm-stored grain
Description Life History Damage Management Strategies
Lesser Grain Borer (Photo 12–5)
• adult is a brown-to-black beetle• approximately 2 mm long• cylindrical in shape• small numerous pits on surface of wings• adult identified by location of head• head is turned downward and covered by
large hood (prothorax)• larvae are creamy-white, C-shaped,
with a dark head tucked into the thorax• musty odour associated with this pest
• female borer lays eggs in cluster on surface of kernels
• larvae hatch and bore into the kernel
• completes development inside kernel
• pest may move into Ontario due to climate warming
• adult and larvae cause damage to sound grain
• bore irregularly shaped holes into the grain
• leave only shell and powdery dust
• adult and larvae enter and exit several grain kernels
• several individuals may attack same kernel
• also feed off grain dust
• advise provincial field crop entomologist if found
• see OMAFRA Publication 812, Field Crop Protection Guide, for insecticide and fumigant information
Grain Lice
• also known as psocids or book lice• adults are soft-bodied• approximately 1–2 mm long• have large heads with long antennae• range from brown to white and often
are opaque• can be winged or wingless• resemble aphids• young are smaller and slightly
paler than adults
• incomplete metamorphosis (young nymphs resemble adults)
• several generations in one season
• can multiply quickly under warm conditions
• not a direct pest of grain• secondary pest that
feeds on grain dust and damaged kernels
• can be seen running over pile when numerous; visually inspect grain surface for tiny, fast-moving insects
• generally restricted to the top of the grain pile
• turning and cleaning the grain reduces populations
• lice are found in damp conditions
• lowering humidity lowers populations
• see OMAFRA Publication 812, Field Crop Protection Guide, for insecticide and fumigant information
Mites
• adults barely visible to the naked eye• approximately 0.5 mm long• rounded, eight-legged, yellowish-brown • larvae look like adults but have six legs• two nymphal stages look similar to adult
with four pairs of legs
• influenced by moisture level in bin
• incidental insect on grain going out of condition
• prefers damp grain• feeds on grain dusts
and moulds
• keep grain dry and in good condition
• see OMAFRA Publication 812, Field Crop Protection Guide, for insecticide and fumigant information
Photo 12–2. Rusty grain beetle adults have antennae as long as or longer than
their head and thorax combined.
Photo 12–3. Indian meal moths leave webbing on top of the grain pile.
270
Agronomy guide for field Crops
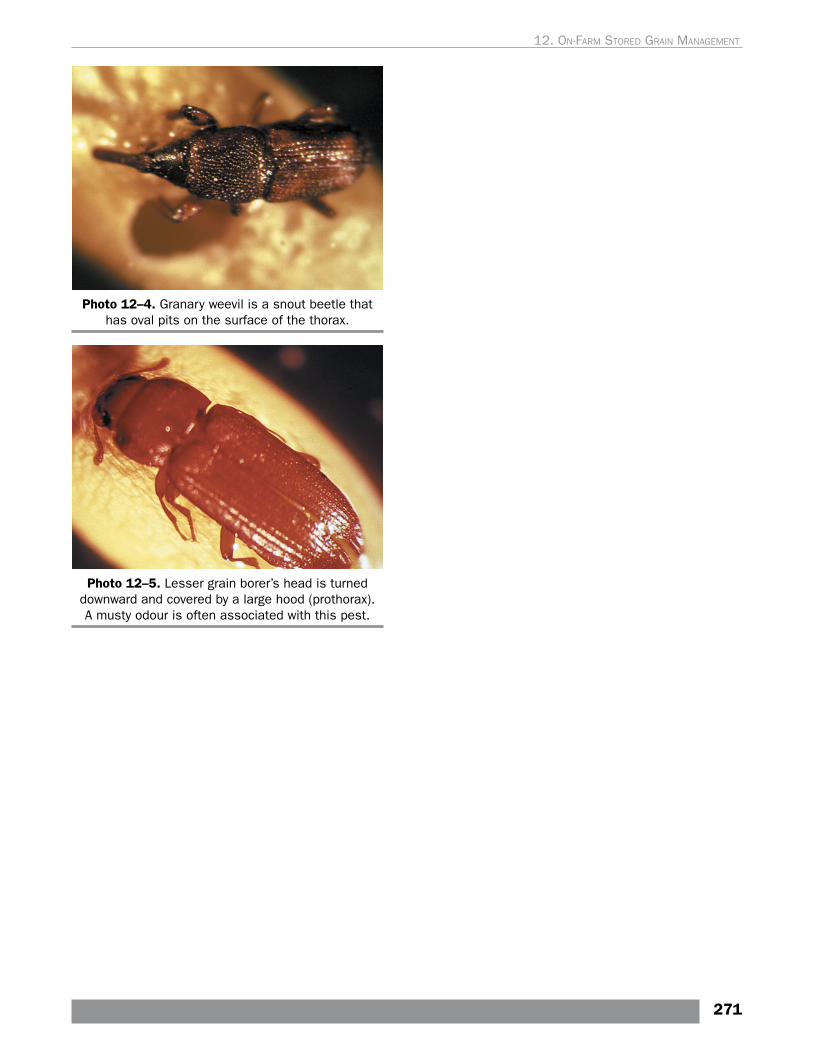
Photo 12–4. Granary weevil is a snout beetle that has oval pits on the surface of the thorax.
Photo 12–5. Lesser grain borer’s head is turned downward and covered by a large hood (prothorax). A musty odour is often associated with this pest.
271
12. on-FarM stored graIn ManageMent

Page intentionally left blank
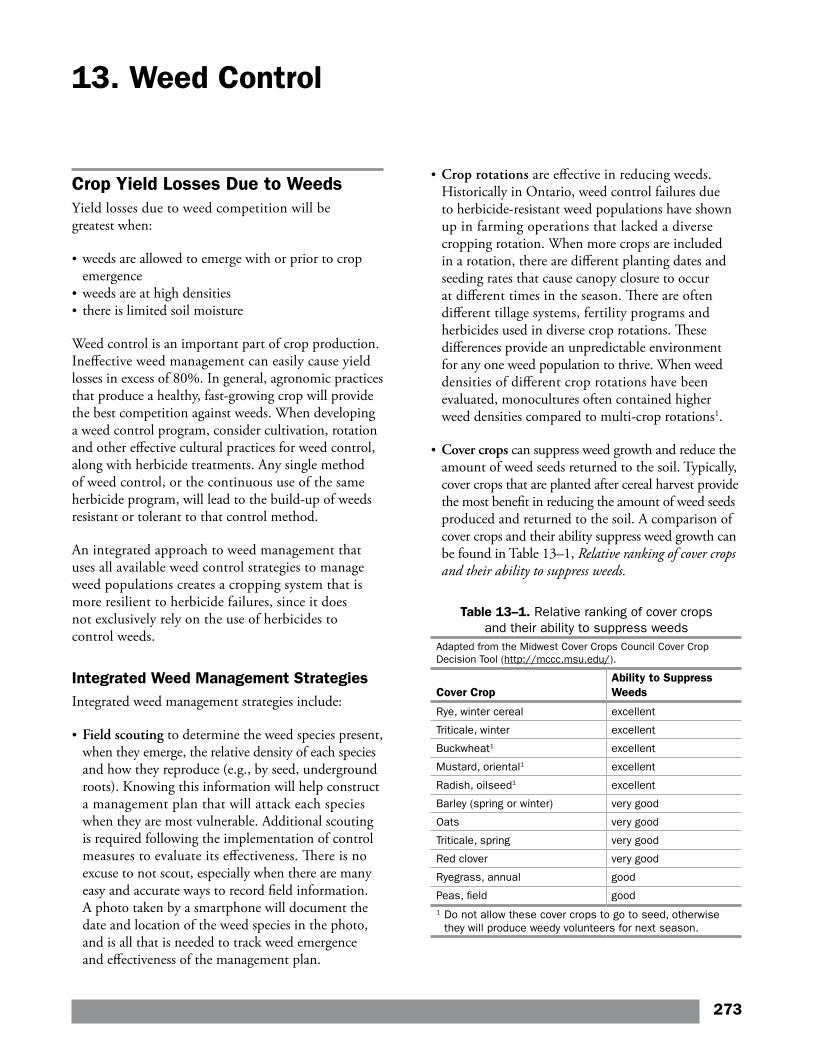
13. Weed Control
Crop Yield Losses Due to WeedsYield losses due to weed competition will be greatest when:
• weeds are allowed to emerge with or prior to crop emergence
• weeds are at high densities• there is limited soil moisture
Weed control is an important part of crop production. Ineffective weed management can easily cause yield losses in excess of 80%. In general, agronomic practices that produce a healthy, fast-growing crop will provide the best competition against weeds. When developing a weed control program, consider cultivation, rotation and other effective cultural practices for weed control, along with herbicide treatments. Any single method of weed control, or the continuous use of the same herbicide program, will lead to the build-up of weeds resistant or tolerant to that control method.
An integrated approach to weed management that uses all available weed control strategies to manage weed populations creates a cropping system that is more resilient to herbicide failures, since it does not exclusively rely on the use of herbicides to control weeds.
Integrated Weed Management StrategiesIntegrated weed management strategies include:
• Field scouting to determine the weed species present, when they emerge, the relative density of each species and how they reproduce (e.g., by seed, underground roots). Knowing this information will help construct a management plan that will attack each species when they are most vulnerable. Additional scouting is required following the implementation of control measures to evaluate its effectiveness. There is no excuse to not scout, especially when there are many easy and accurate ways to record field information. A photo taken by a smartphone will document the date and location of the weed species in the photo, and is all that is needed to track weed emergence and effectiveness of the management plan.
• Crop rotations are effective in reducing weeds. Historically in Ontario, weed control failures due to herbicide-resistant weed populations have shown up in farming operations that lacked a diverse cropping rotation. When more crops are included in a rotation, there are different planting dates and seeding rates that cause canopy closure to occur at different times in the season. There are often different tillage systems, fertility programs and herbicides used in diverse crop rotations. These differences provide an unpredictable environment for any one weed population to thrive. When weed densities of different crop rotations have been evaluated, monocultures often contained higher weed densities compared to multi-crop rotations1.
• Cover crops can suppress weed growth and reduce the amount of weed seeds returned to the soil. Typically, cover crops that are planted after cereal harvest provide the most benefit in reducing the amount of weed seeds produced and returned to the soil. A comparison of cover crops and their ability suppress weed growth can be found in Table 13–1, Relative ranking of cover crops and their ability to suppress weeds.
Table 13–1. Relative ranking of cover crops and their ability to suppress weeds
Adapted from the Midwest Cover Crops Council Cover Crop Decision Tool (http://mccc.msu.edu/).
Cover CropAbility to Suppress Weeds
Rye, winter cereal excellent
Triticale, winter excellent
Buckwheat1 excellent
Mustard, oriental1 excellent
Radish, oilseed1 excellent
Barley (spring or winter) very good
Oats very good
Triticale, spring very good
Red clover very good
Ryegrass, annual good
Peas, field good1 Do not allow these cover crops to go to seed, otherwise
they will produce weedy volunteers for next season.
273
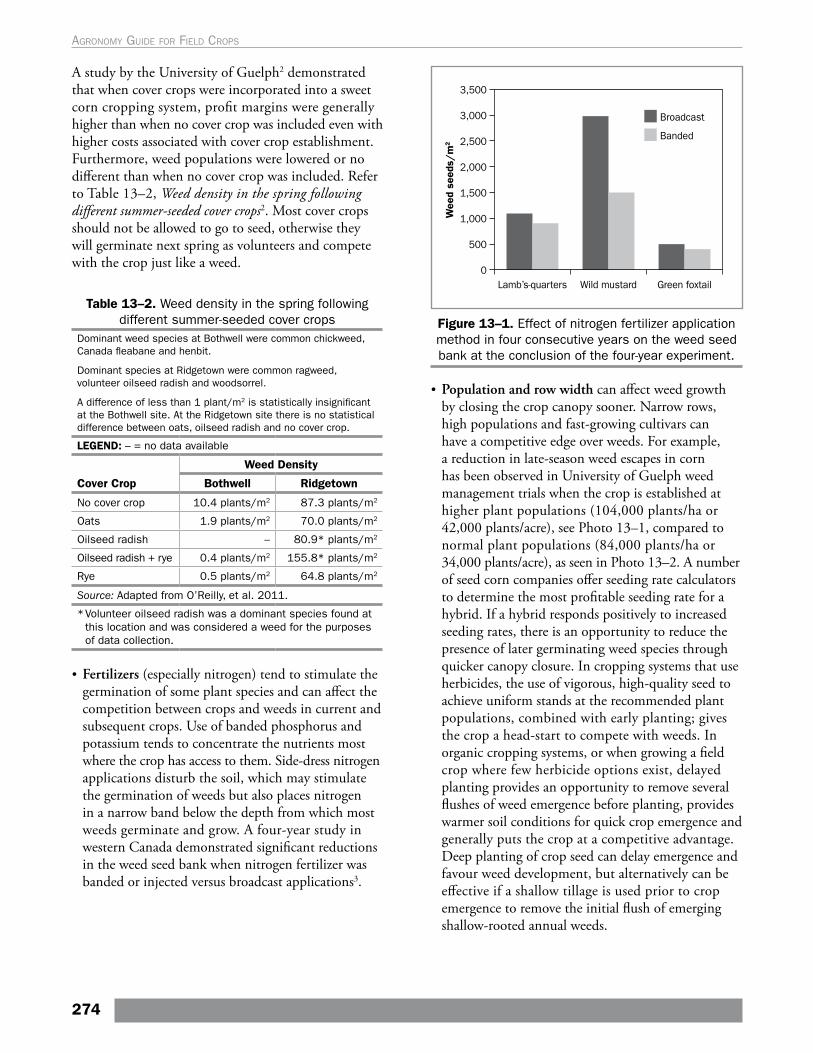
A study by the University of Guelph2 demonstrated that when cover crops were incorporated into a sweet corn cropping system, profit margins were generally higher than when no cover crop was included even with higher costs associated with cover crop establishment. Furthermore, weed populations were lowered or no different than when no cover crop was included. Refer to Table 13–2, Weed density in the spring following different summer-seeded cover crops2. Most cover crops should not be allowed to go to seed, otherwise they will germinate next spring as volunteers and compete with the crop just like a weed.
Table 13–2. Weed density in the spring following different summer-seeded cover crops
Dominant weed species at Bothwell were common chickweed, Canada fleabane and henbit.
Dominant species at Ridgetown were common ragweed, volunteer oilseed radish and woodsorrel.
A difference of less than 1 plant/m2 is statistically insignificant at the Bothwell site. At the Ridgetown site there is no statistical difference between oats, oilseed radish and no cover crop.
LEGEND: – = no data available
Cover Crop
Weed Density
Bothwell Ridgetown
No cover crop 10.4 plants/m2 87.3 plants/m2
Oats 1.9 plants/m2 70.0 plants/m2
Oilseed radish – 80.9* plants/m2
Oilseed radish + rye 0.4 plants/m2 155.8* plants/m2
Rye 0.5 plants/m2 64.8 plants/m2
Source: Adapted from O’Reilly, et al. 2011.
* Volunteer oilseed radish was a dominant species found at this location and was considered a weed for the purposes of data collection.
• Fertilizers (especially nitrogen) tend to stimulate the germination of some plant species and can affect the competition between crops and weeds in current and subsequent crops. Use of banded phosphorus and potassium tends to concentrate the nutrients most where the crop has access to them. Side-dress nitrogen applications disturb the soil, which may stimulate the germination of weeds but also places nitrogen in a narrow band below the depth from which most weeds germinate and grow. A four-year study in western Canada demonstrated significant reductions in the weed seed bank when nitrogen fertilizer was banded or injected versus broadcast applications3.
Figure 13–1. Effect of nitrogen fertilizer application method in four consecutive years on the weed seed bank at the conclusion of the four-year experiment.
• Population and row width can affect weed growth by closing the crop canopy sooner. Narrow rows, high populations and fast-growing cultivars can have a competitive edge over weeds. For example, a reduction in late-season weed escapes in corn has been observed in University of Guelph weed management trials when the crop is established at higher plant populations (104,000 plants/ha or 42,000 plants/acre), see Photo 13–1, compared to normal plant populations (84,000 plants/ha or 34,000 plants/acre), as seen in Photo 13–2. A number of seed corn companies offer seeding rate calculators to determine the most profitable seeding rate for a hybrid. If a hybrid responds positively to increased seeding rates, there is an opportunity to reduce the presence of later germinating weed species through quicker canopy closure. In cropping systems that use herbicides, the use of vigorous, high-quality seed to achieve uniform stands at the recommended plant populations, combined with early planting; gives the crop a head-start to compete with weeds. In organic cropping systems, or when growing a field crop where few herbicide options exist, delayed planting provides an opportunity to remove several flushes of weed emergence before planting, provides warmer soil conditions for quick crop emergence and generally puts the crop at a competitive advantage. Deep planting of crop seed can delay emergence and favour weed development, but alternatively can be effective if a shallow tillage is used prior to crop emergence to remove the initial flush of emerging shallow-rooted annual weeds.
274
Agronomy guide for field Crops
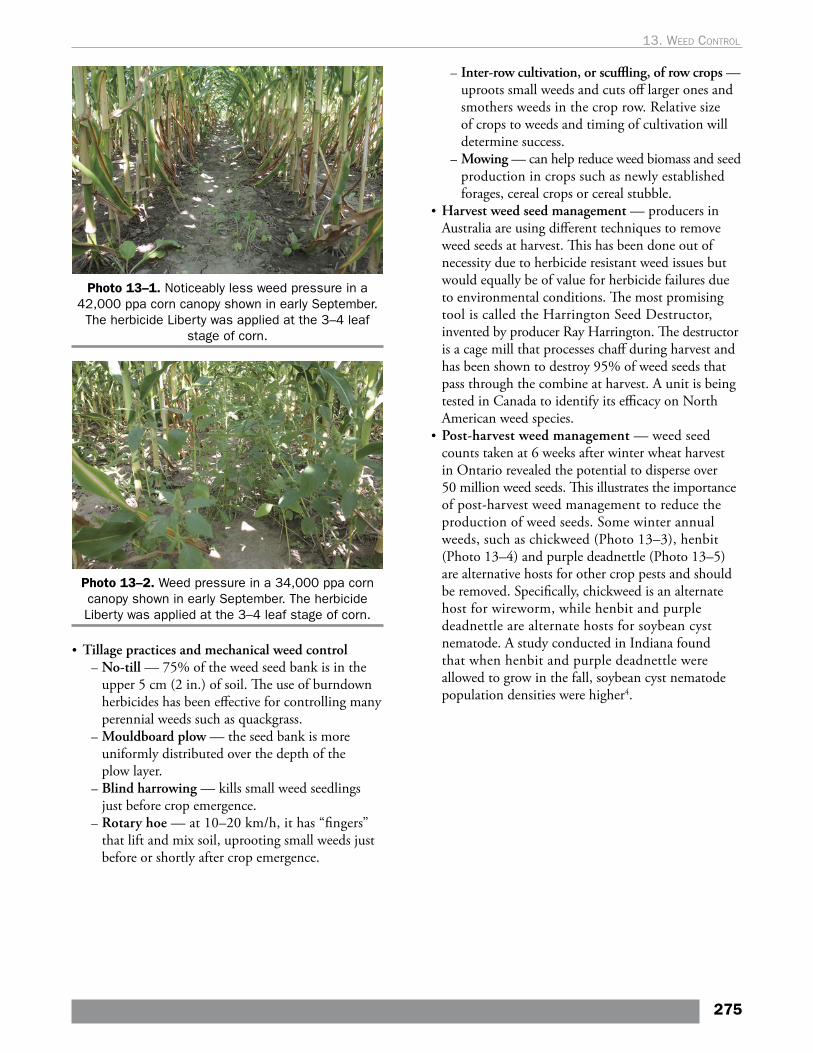
Photo 13–1. Noticeably less weed pressure in a 42,000 ppa corn canopy shown in early September.
The herbicide Liberty was applied at the 3–4 leaf stage of corn.
Photo 13–2. Weed pressure in a 34,000 ppa corn canopy shown in early September. The herbicide Liberty was applied at the 3–4 leaf stage of corn.
• Tillage practices and mechanical weed control – No-till — 75% of the weed seed bank is in the upper 5 cm (2 in.) of soil. The use of burndown herbicides has been effective for controlling many perennial weeds such as quackgrass.
– Mouldboard plow — the seed bank is more uniformly distributed over the depth of the plow layer.
– Blind harrowing — kills small weed seedlings just before crop emergence.
– Rotary hoe — at 10–20 km/h, it has “fingers” that lift and mix soil, uprooting small weeds just before or shortly after crop emergence.
– Inter-row cultivation, or scuffling, of row crops — uproots small weeds and cuts off larger ones and smothers weeds in the crop row. Relative size of crops to weeds and timing of cultivation will determine success.
– Mowing — can help reduce weed biomass and seed production in crops such as newly established forages, cereal crops or cereal stubble.
• Harvest weed seed management — producers in Australia are using different techniques to remove weed seeds at harvest. This has been done out of necessity due to herbicide resistant weed issues but would equally be of value for herbicide failures due to environmental conditions. The most promising tool is called the Harrington Seed Destructor, invented by producer Ray Harrington. The destructor is a cage mill that processes chaff during harvest and has been shown to destroy 95% of weed seeds that pass through the combine at harvest. A unit is being tested in Canada to identify its efficacy on North American weed species.
• Post-harvest weed management — weed seed counts taken at 6 weeks after winter wheat harvest in Ontario revealed the potential to disperse over 50 million weed seeds. This illustrates the importance of post-harvest weed management to reduce the production of weed seeds. Some winter annual weeds, such as chickweed (Photo 13–3), henbit (Photo 13–4) and purple deadnettle (Photo 13–5) are alternative hosts for other crop pests and should be removed. Specifically, chickweed is an alternate host for wireworm, while henbit and purple deadnettle are alternate hosts for soybean cyst nematode. A study conducted in Indiana found that when henbit and purple deadnettle were allowed to grow in the fall, soybean cyst nematode population densities were higher4.
275
13. Weed control
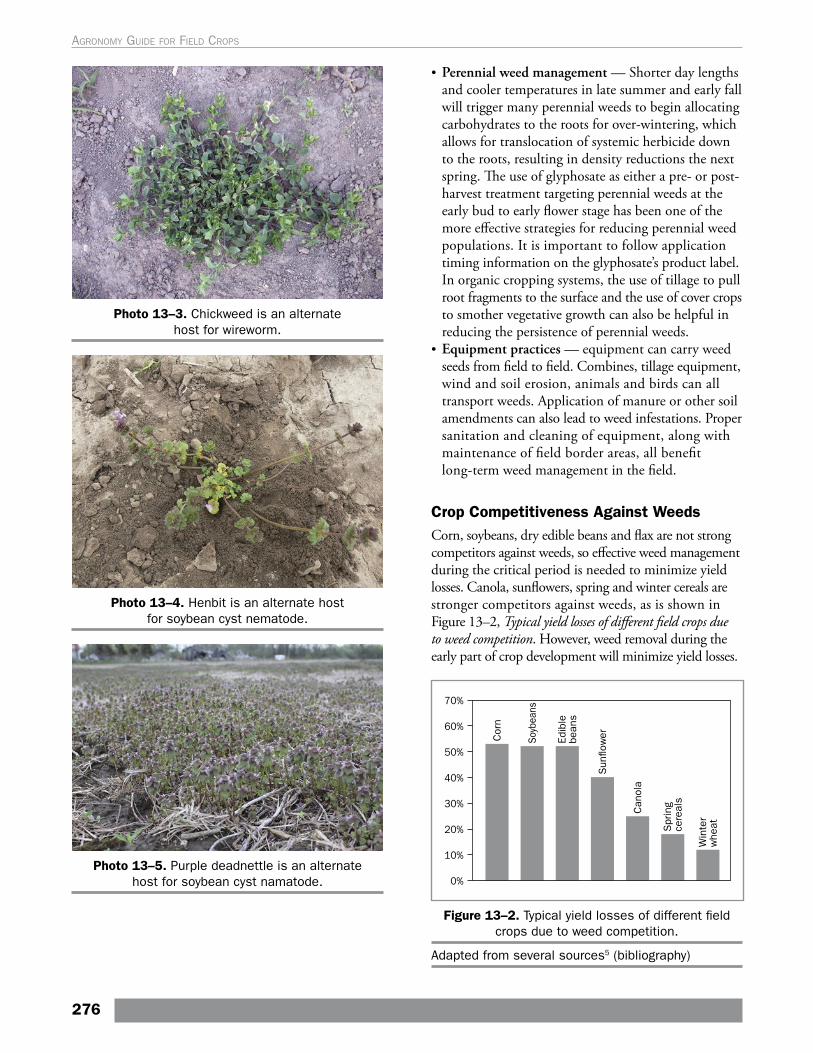
Photo 13–3. Chickweed is an alternate host for wireworm.
Photo 13–4. Henbit is an alternate host for soybean cyst nematode.
Photo 13–5. Purple deadnettle is an alternate host for soybean cyst namatode.
• Perennial weed management — Shorter day lengths and cooler temperatures in late summer and early fall will trigger many perennial weeds to begin allocating carbohydrates to the roots for over-wintering, which allows for translocation of systemic herbicide down to the roots, resulting in density reductions the next spring. The use of glyphosate as either a pre- or post-harvest treatment targeting perennial weeds at the early bud to early flower stage has been one of the more effective strategies for reducing perennial weed populations. It is important to follow application timing information on the glyphosate’s product label. In organic cropping systems, the use of tillage to pull root fragments to the surface and the use of cover crops to smother vegetative growth can also be helpful in reducing the persistence of perennial weeds.
• Equipment practices — equipment can carry weed seeds from field to field. Combines, tillage equipment, wind and soil erosion, animals and birds can all transport weeds. Application of manure or other soil amendments can also lead to weed infestations. Proper sanitation and cleaning of equipment, along with maintenance of field border areas, all benefit long-term weed management in the field.
Crop Competitiveness Against WeedsCorn, soybeans, dry edible beans and flax are not strong competitors against weeds, so effective weed management during the critical period is needed to minimize yield losses. Canola, sunflowers, spring and winter cereals are stronger competitors against weeds, as is shown in Figure 13–2, Typical yield losses of different field crops due to weed competition. However, weed removal during the early part of crop development will minimize yield losses.
Figure 13–2. Typical yield losses of different field crops due to weed competition.
Adapted from several sources5 (bibliography)
276
Agronomy guide for field Crops
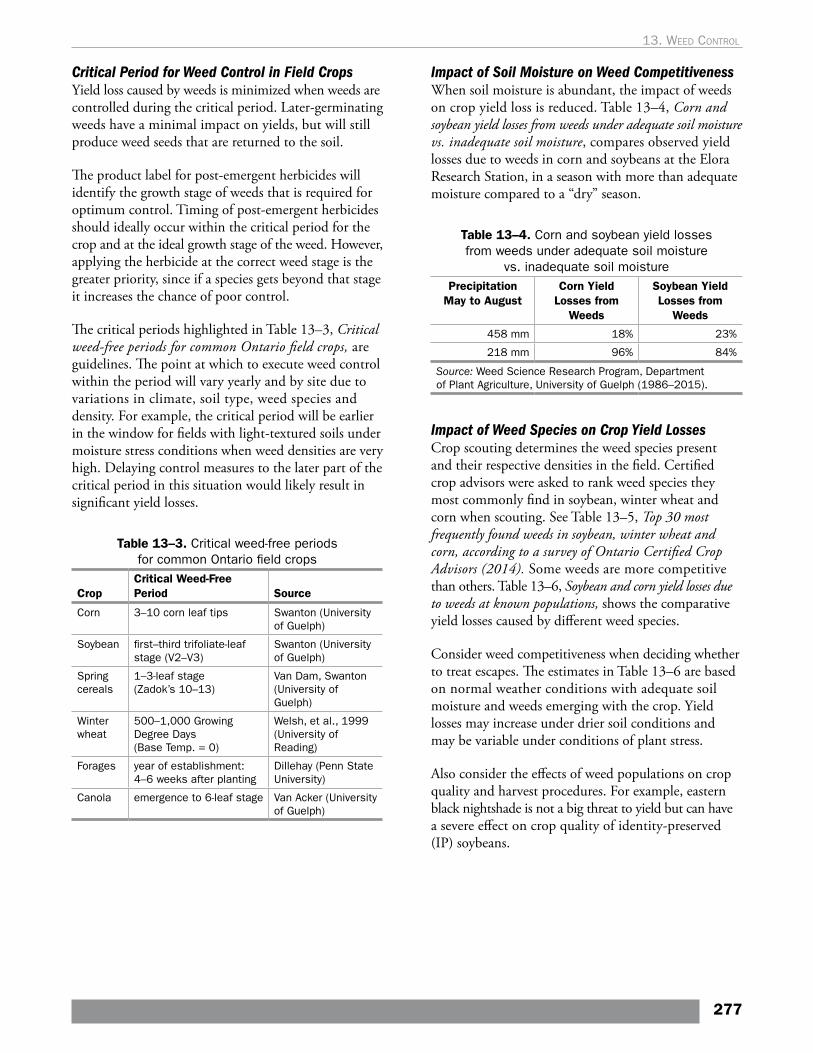
Critical Period for Weed Control in Field Crops Yield loss caused by weeds is minimized when weeds are controlled during the critical period. Later-germinating weeds have a minimal impact on yields, but will still produce weed seeds that are returned to the soil.
The product label for post-emergent herbicides will identify the growth stage of weeds that is required for optimum control. Timing of post-emergent herbicides should ideally occur within the critical period for the crop and at the ideal growth stage of the weed. However, applying the herbicide at the correct weed stage is the greater priority, since if a species gets beyond that stage it increases the chance of poor control.
The critical periods highlighted in Table 13–3, Critical weed-free periods for common Ontario field crops, are guidelines. The point at which to execute weed control within the period will vary yearly and by site due to variations in climate, soil type, weed species and density. For example, the critical period will be earlier in the window for fields with light-textured soils under moisture stress conditions when weed densities are very high. Delaying control measures to the later part of the critical period in this situation would likely result in significant yield losses.
Table 13–3. Critical weed-free periods for common Ontario field crops
Crop Critical Weed-Free Period Source
Corn 3–10 corn leaf tips Swanton (University of Guelph)
Soybean first–third trifoliate-leaf stage (V2–V3)
Swanton (University of Guelph)
Spring cereals
1–3-leaf stage (Zadok’s 10–13)
Van Dam, Swanton (University of Guelph)
Winter wheat
500–1,000 Growing Degree Days (Base Temp. = 0)
Welsh, et al., 1999 (University of Reading)
Forages year of establishment: 4–6 weeks after planting
Dillehay (Penn State University)
Canola emergence to 6-leaf stage Van Acker (University of Guelph)
Impact of Soil Moisture on Weed Competitiveness When soil moisture is abundant, the impact of weeds on crop yield loss is reduced. Table 13–4, Corn and soybean yield losses from weeds under adequate soil moisture vs. inadequate soil moisture, compares observed yield losses due to weeds in corn and soybeans at the Elora Research Station, in a season with more than adequate moisture compared to a “dry” season.
Table 13–4. Corn and soybean yield losses from weeds under adequate soil moisture
vs. inadequate soil moisturePrecipitation
May to AugustCorn Yield
Losses from Weeds
Soybean Yield Losses from
Weeds
458 mm 18% 23%
218 mm 96% 84%
Source: Weed Science Research Program, Department of Plant Agriculture, University of Guelph (1986–2015).
Impact of Weed Species on Crop Yield LossesCrop scouting determines the weed species present and their respective densities in the field. Certified crop advisors were asked to rank weed species they most commonly find in soybean, winter wheat and corn when scouting. See Table 13–5, Top 30 most frequently found weeds in soybean, winter wheat and corn, according to a survey of Ontario Certified Crop Advisors (2014). Some weeds are more competitive than others. Table 13–6, Soybean and corn yield losses due to weeds at known populations, shows the comparative yield losses caused by different weed species.
Consider weed competitiveness when deciding whether to treat escapes. The estimates in Table 13–6 are based on normal weather conditions with adequate soil moisture and weeds emerging with the crop. Yield losses may increase under drier soil conditions and may be variable under conditions of plant stress.
Also consider the effects of weed populations on crop quality and harvest procedures. For example, eastern black nightshade is not a big threat to yield but can have a severe effect on crop quality of identity-preserved (IP) soybeans.
277
13. Weed control
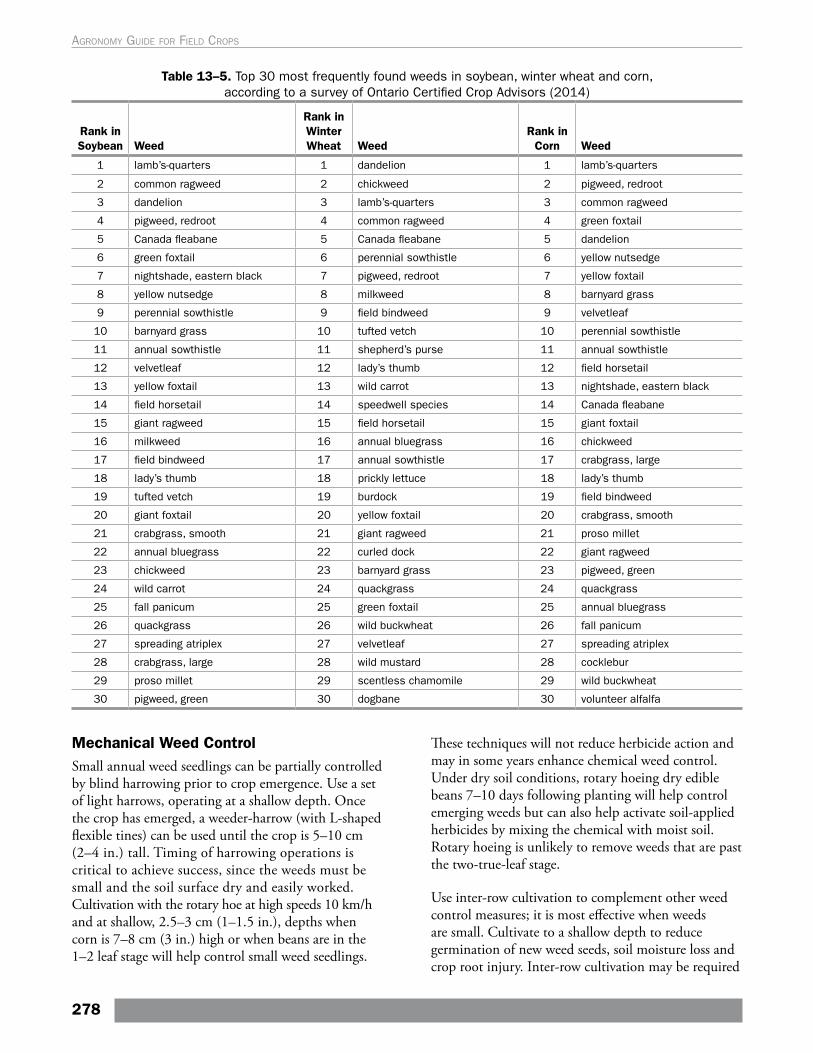
Table 13–5. Top 30 most frequently found weeds in soybean, winter wheat and corn, according to a survey of Ontario Certified Crop Advisors (2014)
Rank in Soybean Weed
Rank in Winter Wheat Weed
Rank in Corn Weed
1 lamb’s-quarters 1 dandelion 1 lamb’s-quarters
2 common ragweed 2 chickweed 2 pigweed, redroot
3 dandelion 3 lamb’s-quarters 3 common ragweed
4 pigweed, redroot 4 common ragweed 4 green foxtail
5 Canada fleabane 5 Canada fleabane 5 dandelion
6 green foxtail 6 perennial sowthistle 6 yellow nutsedge
7 nightshade, eastern black 7 pigweed, redroot 7 yellow foxtail
8 yellow nutsedge 8 milkweed 8 barnyard grass
9 perennial sowthistle 9 field bindweed 9 velvetleaf
10 barnyard grass 10 tufted vetch 10 perennial sowthistle
11 annual sowthistle 11 shepherd’s purse 11 annual sowthistle
12 velvetleaf 12 lady’s thumb 12 field horsetail
13 yellow foxtail 13 wild carrot 13 nightshade, eastern black
14 field horsetail 14 speedwell species 14 Canada fleabane
15 giant ragweed 15 field horsetail 15 giant foxtail
16 milkweed 16 annual bluegrass 16 chickweed
17 field bindweed 17 annual sowthistle 17 crabgrass, large
18 lady’s thumb 18 prickly lettuce 18 lady’s thumb
19 tufted vetch 19 burdock 19 field bindweed
20 giant foxtail 20 yellow foxtail 20 crabgrass, smooth
21 crabgrass, smooth 21 giant ragweed 21 proso millet
22 annual bluegrass 22 curled dock 22 giant ragweed
23 chickweed 23 barnyard grass 23 pigweed, green
24 wild carrot 24 quackgrass 24 quackgrass
25 fall panicum 25 green foxtail 25 annual bluegrass
26 quackgrass 26 wild buckwheat 26 fall panicum
27 spreading atriplex 27 velvetleaf 27 spreading atriplex
28 crabgrass, large 28 wild mustard 28 cocklebur
29 proso millet 29 scentless chamomile 29 wild buckwheat
30 pigweed, green 30 dogbane 30 volunteer alfalfa
Mechanical Weed ControlSmall annual weed seedlings can be partially controlled by blind harrowing prior to crop emergence. Use a set of light harrows, operating at a shallow depth. Once the crop has emerged, a weeder-harrow (with L-shaped flexible tines) can be used until the crop is 5–10 cm (2–4 in.) tall. Timing of harrowing operations is critical to achieve success, since the weeds must be small and the soil surface dry and easily worked. Cultivation with the rotary hoe at high speeds 10 km/h and at shallow, 2.5–3 cm (1–1.5 in.), depths when corn is 7–8 cm (3 in.) high or when beans are in the 1–2 leaf stage will help control small weed seedlings.
These techniques will not reduce herbicide action and may in some years enhance chemical weed control. Under dry soil conditions, rotary hoeing dry edible beans 7–10 days following planting will help control emerging weeds but can also help activate soil-applied herbicides by mixing the chemical with moist soil. Rotary hoeing is unlikely to remove weeds that are past the two-true-leaf stage.
Use inter-row cultivation to complement other weed control measures; it is most effective when weeds are small. Cultivate to a shallow depth to reduce germination of new weed seeds, soil moisture loss and crop root injury. Inter-row cultivation may be required
278
Agronomy guide for field Crops
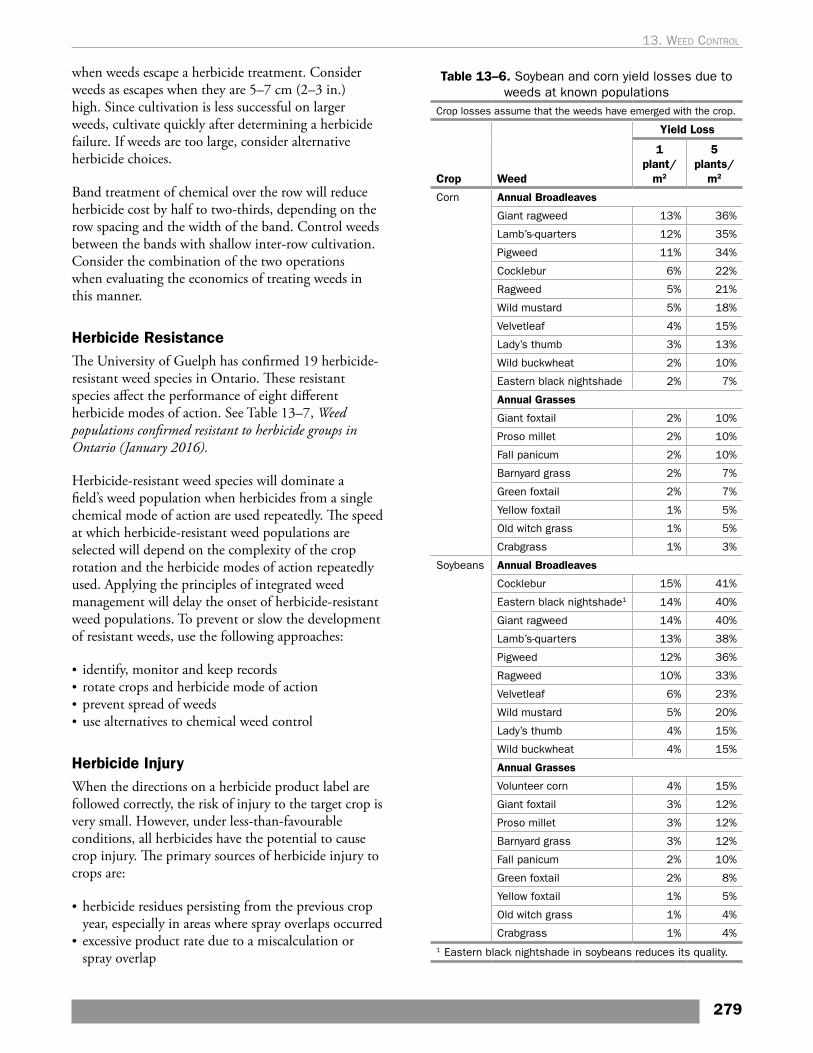
when weeds escape a herbicide treatment. Consider weeds as escapes when they are 5–7 cm (2–3 in.) high. Since cultivation is less successful on larger weeds, cultivate quickly after determining a herbicide failure. If weeds are too large, consider alternative herbicide choices.
Band treatment of chemical over the row will reduce herbicide cost by half to two-thirds, depending on the row spacing and the width of the band. Control weeds between the bands with shallow inter-row cultivation. Consider the combination of the two operations when evaluating the economics of treating weeds in this manner.
Herbicide ResistanceThe University of Guelph has confirmed 19 herbicide-resistant weed species in Ontario. These resistant species affect the performance of eight different herbicide modes of action. See Table 13–7, Weed populations confirmed resistant to herbicide groups in Ontario (January 2016).
Herbicide-resistant weed species will dominate a field’s weed population when herbicides from a single chemical mode of action are used repeatedly. The speed at which herbicide-resistant weed populations are selected will depend on the complexity of the crop rotation and the herbicide modes of action repeatedly used. Applying the principles of integrated weed management will delay the onset of herbicide-resistant weed populations. To prevent or slow the development of resistant weeds, use the following approaches:
• identify, monitor and keep records• rotate crops and herbicide mode of action• prevent spread of weeds• use alternatives to chemical weed control
Herbicide Injury When the directions on a herbicide product label are followed correctly, the risk of injury to the target crop is very small. However, under less-than-favourable conditions, all herbicides have the potential to cause crop injury. The primary sources of herbicide injury to crops are:
• herbicide residues persisting from the previous crop year, especially in areas where spray overlaps occurred
• excessive product rate due to a miscalculation or spray overlap
Table 13–6. Soybean and corn yield losses due to weeds at known populations
Crop losses assume that the weeds have emerged with the crop.
Crop Weed
Yield Loss
1 plant/
m2
5 plants/
m2
Corn Annual Broadleaves
Giant ragweed 13% 36%
Lamb’s-quarters 12% 35%
Pigweed 11% 34%
Cocklebur 6% 22%
Ragweed 5% 21%
Wild mustard 5% 18%
Velvetleaf 4% 15%
Lady’s thumb 3% 13%
Wild buckwheat 2% 10%
Eastern black nightshade 2% 7%
Annual Grasses
Giant foxtail 2% 10%
Proso millet 2% 10%
Fall panicum 2% 10%
Barnyard grass 2% 7%
Green foxtail 2% 7%
Yellow foxtail 1% 5%
Old witch grass 1% 5%
Crabgrass 1% 3%
Soybeans Annual Broadleaves
Cocklebur 15% 41%
Eastern black nightshade1 14% 40%
Giant ragweed 14% 40%
Lamb’s-quarters 13% 38%
Pigweed 12% 36%
Ragweed 10% 33%
Velvetleaf 6% 23%
Wild mustard 5% 20%
Lady’s thumb 4% 15%
Wild buckwheat 4% 15%
Annual Grasses
Volunteer corn 4% 15%
Giant foxtail 3% 12%
Proso millet 3% 12%
Barnyard grass 3% 12%
Fall panicum 2% 10%
Green foxtail 2% 8%
Yellow foxtail 1% 5%
Old witch grass 1% 4%
Crabgrass 1% 4%1 Eastern black nightshade in soybeans reduces its quality.
279
13. Weed control
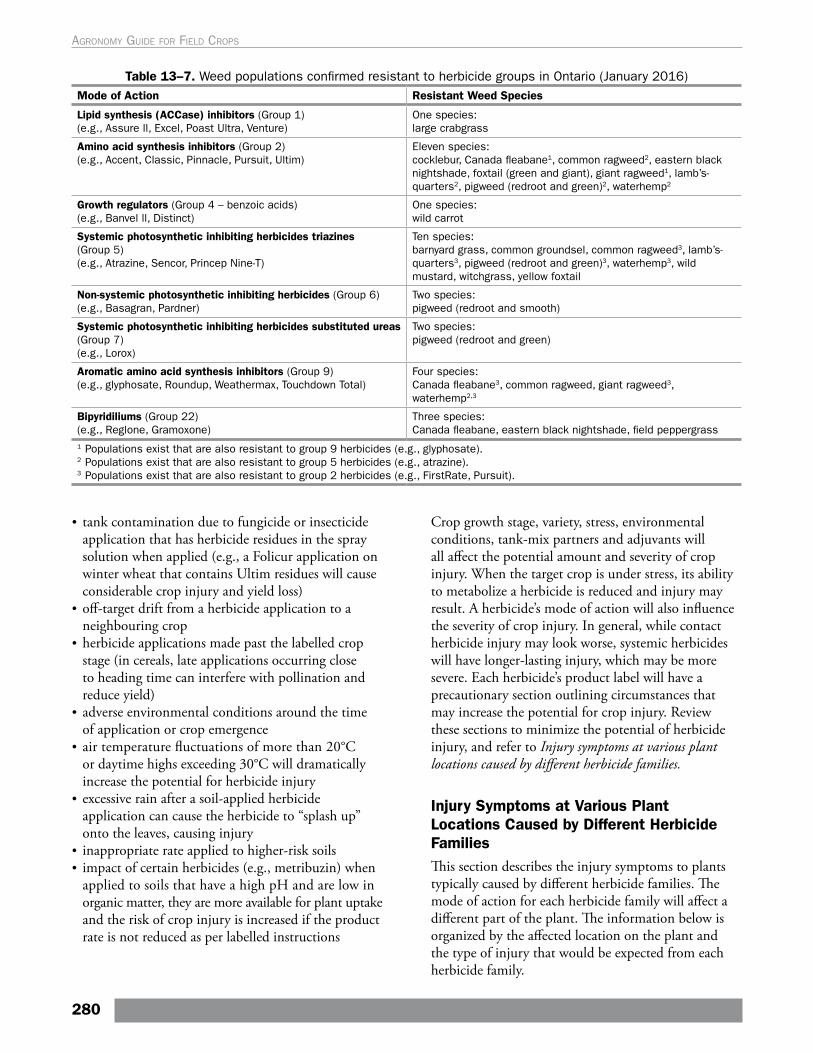
Table 13–7. Weed populations confirmed resistant to herbicide groups in Ontario (January 2016)Mode of Action Resistant Weed Species
Lipid synthesis (ACCase) inhibitors (Group 1) (e.g., Assure ll, Excel, Poast Ultra, Venture)
One species: large crabgrass
Amino acid synthesis inhibitors (Group 2) (e.g., Accent, Classic, Pinnacle, Pursuit, Ultim)
Eleven species: cocklebur, Canada fleabane1, common ragweed2, eastern black nightshade, foxtail (green and giant), giant ragweed1, lamb’s-quarters2, pigweed (redroot and green)2, waterhemp2
Growth regulators (Group 4 – benzoic acids) (e.g., Banvel ll, Distinct)
One species: wild carrot
Systemic photosynthetic inhibiting herbicides triazines (Group 5) (e.g., Atrazine, Sencor, Princep Nine-T)
Ten species: barnyard grass, common groundsel, common ragweed3, lamb’s-quarters3, pigweed (redroot and green)3, waterhemp3, wild mustard, witchgrass, yellow foxtail
Non-systemic photosynthetic inhibiting herbicides (Group 6) (e.g., Basagran, Pardner)
Two species: pigweed (redroot and smooth)
Systemic photosynthetic inhibiting herbicides substituted ureas (Group 7) (e.g., Lorox)
Two species: pigweed (redroot and green)
Aromatic amino acid synthesis inhibitors (Group 9) (e.g., glyphosate, Roundup, Weathermax, Touchdown Total)
Four species: Canada fleabane3, common ragweed, giant ragweed3, waterhemp2,3
Bipyridiliums (Group 22) (e.g., Reglone, Gramoxone)
Three species: Canada fleabane, eastern black nightshade, field peppergrass
1 Populations exist that are also resistant to group 9 herbicides (e.g., glyphosate).2 Populations exist that are also resistant to group 5 herbicides (e.g., atrazine).3 Populations exist that are also resistant to group 2 herbicides (e.g., FirstRate, Pursuit).
• tank contamination due to fungicide or insecticide application that has herbicide residues in the spray solution when applied (e.g., a Folicur application on winter wheat that contains Ultim residues will cause considerable crop injury and yield loss)
• off-target drift from a herbicide application to a neighbouring crop
• herbicide applications made past the labelled crop stage (in cereals, late applications occurring close to heading time can interfere with pollination and reduce yield)
• adverse environmental conditions around the time of application or crop emergence
• air temperature fluctuations of more than 20°C or daytime highs exceeding 30°C will dramatically increase the potential for herbicide injury
• excessive rain after a soil-applied herbicide application can cause the herbicide to “splash up” onto the leaves, causing injury
• inappropriate rate applied to higher-risk soils• impact of certain herbicides (e.g., metribuzin) when
applied to soils that have a high pH and are low in organic matter, they are more available for plant uptake and the risk of crop injury is increased if the product rate is not reduced as per labelled instructions
Crop growth stage, variety, stress, environmental conditions, tank-mix partners and adjuvants will all affect the potential amount and severity of crop injury. When the target crop is under stress, its ability to metabolize a herbicide is reduced and injury may result. A herbicide’s mode of action will also influence the severity of crop injury. In general, while contact herbicide injury may look worse, systemic herbicides will have longer-lasting injury, which may be more severe. Each herbicide’s product label will have a precautionary section outlining circumstances that may increase the potential for crop injury. Review these sections to minimize the potential of herbicide injury, and refer to Injury symptoms at various plant locations caused by different herbicide families.
Injury Symptoms at Various Plant Locations Caused by Different Herbicide Families This section describes the injury symptoms to plants typically caused by different herbicide families. The mode of action for each herbicide family will affect a different part of the plant. The information below is organized by the affected location on the plant and the type of injury that would be expected from each herbicide family.
280
Agronomy guide for field Crops
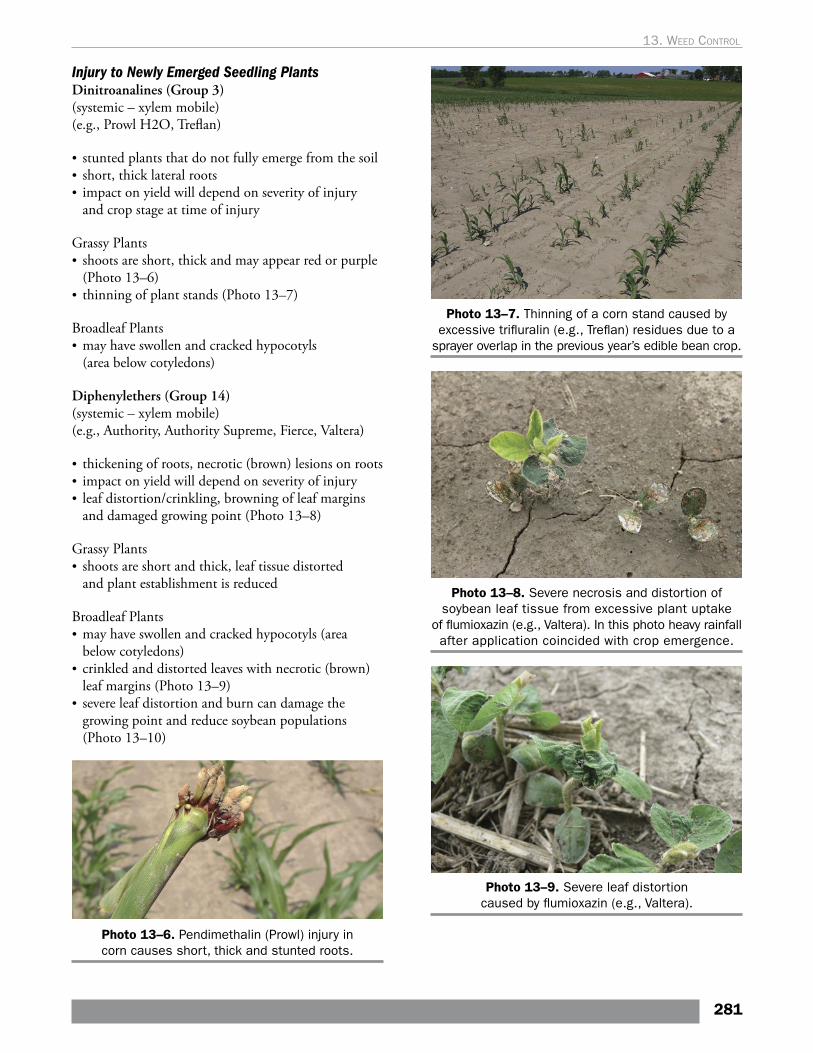
Injury to Newly Emerged Seedling PlantsDinitroanalines (Group 3)(systemic – xylem mobile) (e.g., Prowl H2O, Treflan)
• stunted plants that do not fully emerge from the soil• short, thick lateral roots• impact on yield will depend on severity of injury
and crop stage at time of injury
Grassy Plants• shoots are short, thick and may appear red or purple
(Photo 13–6) • thinning of plant stands (Photo 13–7)
Broadleaf Plants• may have swollen and cracked hypocotyls
(area below cotyledons)
Diphenylethers (Group 14) (systemic – xylem mobile) (e.g., Authority, Authority Supreme, Fierce, Valtera)
• thickening of roots, necrotic (brown) lesions on roots• impact on yield will depend on severity of injury • leaf distortion/crinkling, browning of leaf margins
and damaged growing point (Photo 13–8)
Grassy Plants• shoots are short and thick, leaf tissue distorted
and plant establishment is reduced
Broadleaf Plants• may have swollen and cracked hypocotyls (area
below cotyledons) • crinkled and distorted leaves with necrotic (brown)
leaf margins (Photo 13–9)• severe leaf distortion and burn can damage the
growing point and reduce soybean populations (Photo 13–10)
Photo 13–6. Pendimethalin (Prowl) injury in corn causes short, thick and stunted roots.
Photo 13–7. Thinning of a corn stand caused by excessive trifluralin (e.g., Treflan) residues due to a
sprayer overlap in the previous year’s edible bean crop.
Photo 13–8. Severe necrosis and distortion of soybean leaf tissue from excessive plant uptake
of flumioxazin (e.g., Valtera). In this photo heavy rainfall after application coincided with crop emergence.
Photo 13–9. Severe leaf distortion caused by flumioxazin (e.g., Valtera).
281
13. Weed control
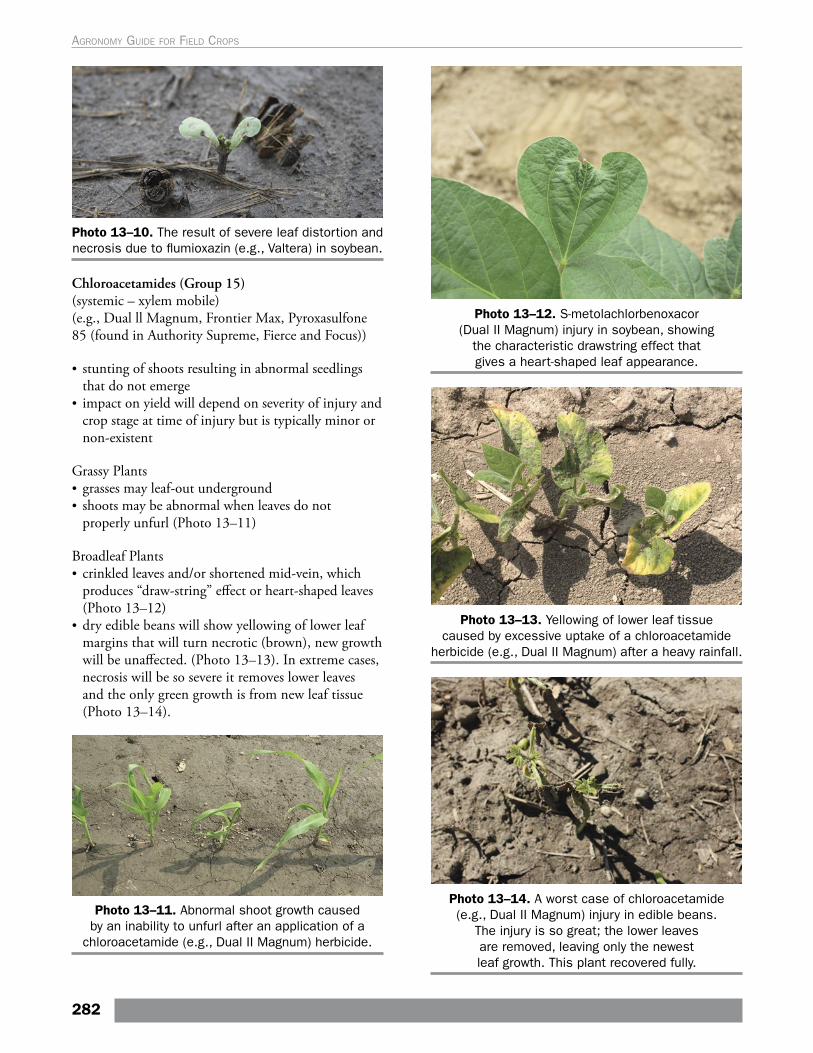
Photo 13–10. The result of severe leaf distortion and necrosis due to flumioxazin (e.g., Valtera) in soybean.
Chloroacetamides (Group 15) (systemic – xylem mobile) (e.g., Dual ll Magnum, Frontier Max, Pyroxasulfone 85 (found in Authority Supreme, Fierce and Focus))
• stunting of shoots resulting in abnormal seedlings that do not emerge
• impact on yield will depend on severity of injury and crop stage at time of injury but is typically minor or non-existent
Grassy Plants• grasses may leaf-out underground• shoots may be abnormal when leaves do not
properly unfurl (Photo 13–11)
Broadleaf Plants• crinkled leaves and/or shortened mid-vein, which
produces “draw-string” effect or heart-shaped leaves (Photo 13–12)
• dry edible beans will show yellowing of lower leaf margins that will turn necrotic (brown), new growth will be unaffected. (Photo 13–13). In extreme cases, necrosis will be so severe it removes lower leaves and the only green growth is from new leaf tissue (Photo 13–14).
Photo 13–11. Abnormal shoot growth caused by an inability to unfurl after an application of a
chloroacetamide (e.g., Dual II Magnum) herbicide.
Photo 13–12. S-metolachlorbenoxacor (Dual II Magnum) injury in soybean, showing
the characteristic drawstring effect that gives a heart-shaped leaf appearance.
Photo 13–13. Yellowing of lower leaf tissue caused by excessive uptake of a chloroacetamide
herbicide (e.g., Dual II Magnum) after a heavy rainfall.
Photo 13–14. A worst case of chloroacetamide (e.g., Dual II Magnum) injury in edible beans.
The injury is so great; the lower leaves are removed, leaving only the newest leaf growth. This plant recovered fully.
282
Agronomy guide for field Crops
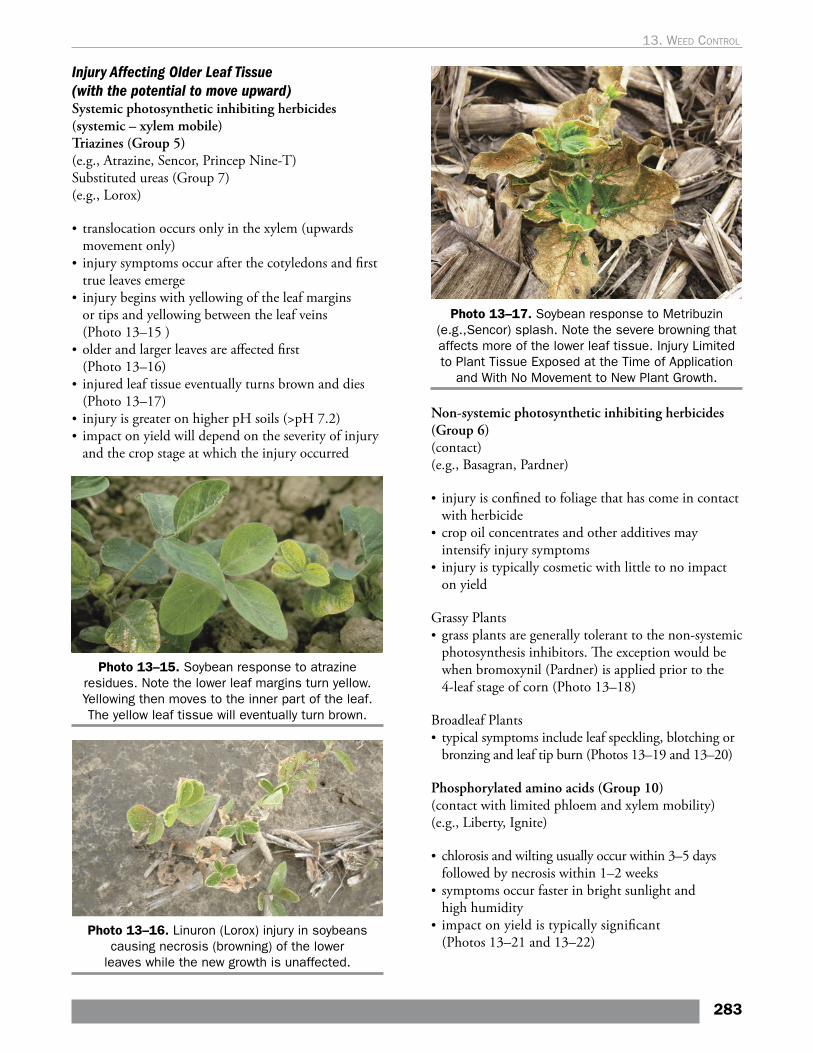
Injury Affecting Older Leaf Tissue (with the potential to move upward)Systemic photosynthetic inhibiting herbicides(systemic – xylem mobile) Triazines (Group 5)(e.g., Atrazine, Sencor, Princep Nine-T) Substituted ureas (Group 7)(e.g., Lorox)
• translocation occurs only in the xylem (upwards movement only)
• injury symptoms occur after the cotyledons and first true leaves emerge
• injury begins with yellowing of the leaf margins or tips and yellowing between the leaf veins (Photo 13–15 )
• older and larger leaves are affected first (Photo 13–16)
• injured leaf tissue eventually turns brown and dies (Photo 13–17)
• injury is greater on higher pH soils (>pH 7.2)• impact on yield will depend on the severity of injury
and the crop stage at which the injury occurred
Photo 13–15. Soybean response to atrazine residues. Note the lower leaf margins turn yellow. Yellowing then moves to the inner part of the leaf. The yellow leaf tissue will eventually turn brown.
Photo 13–16. Linuron (Lorox) injury in soybeans causing necrosis (browning) of the lower
leaves while the new growth is unaffected.
Photo 13–17. Soybean response to Metribuzin (e.g.,Sencor) splash. Note the severe browning that affects more of the lower leaf tissue. Injury Limited to Plant Tissue Exposed at the Time of Application
and With No Movement to New Plant Growth.
Non-systemic photosynthetic inhibiting herbicides (Group 6)(contact) (e.g., Basagran, Pardner)
• injury is confined to foliage that has come in contact with herbicide
• crop oil concentrates and other additives may intensify injury symptoms
• injury is typically cosmetic with little to no impact on yield
Grassy Plants• grass plants are generally tolerant to the non-systemic
photosynthesis inhibitors. The exception would be when bromoxynil (Pardner) is applied prior to the 4-leaf stage of corn (Photo 13–18)
Broadleaf Plants• typical symptoms include leaf speckling, blotching or
bronzing and leaf tip burn (Photos 13–19 and 13–20)
Phosphorylated amino acids (Group 10) (contact with limited phloem and xylem mobility) (e.g., Liberty, Ignite)
• chlorosis and wilting usually occur within 3–5 days followed by necrosis within 1–2 weeks
• symptoms occur faster in bright sunlight and high humidity
• impact on yield is typically significant (Photos 13–21 and 13–22)
283
13. Weed control
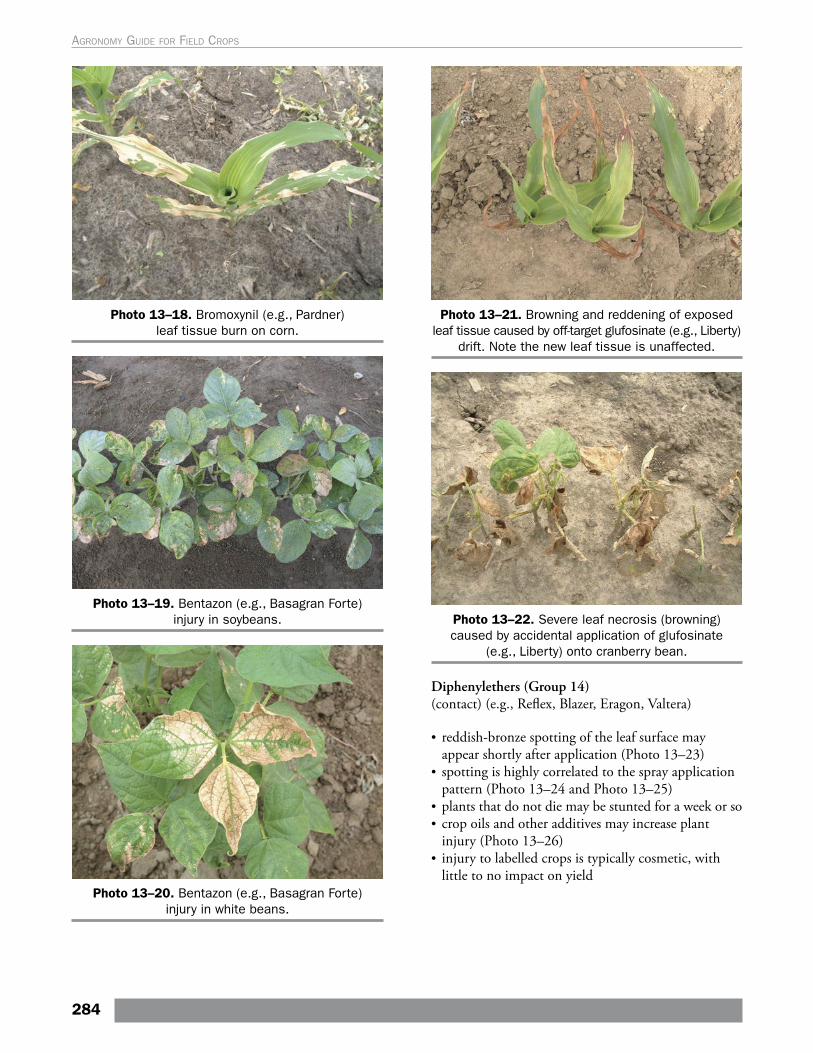
Photo 13–18. Bromoxynil (e.g., Pardner) leaf tissue burn on corn.
Photo 13–19. Bentazon (e.g., Basagran Forte) injury in soybeans.
Photo 13–20. Bentazon (e.g., Basagran Forte) injury in white beans.
Photo 13–21. Browning and reddening of exposed leaf tissue caused by off-target glufosinate (e.g., Liberty)
drift. Note the new leaf tissue is unaffected.
Photo 13–22. Severe leaf necrosis (browning) caused by accidental application of glufosinate
(e.g., Liberty) onto cranberry bean.
Diphenylethers (Group 14) (contact) (e.g., Reflex, Blazer, Eragon, Valtera)
• reddish-bronze spotting of the leaf surface may appear shortly after application (Photo 13–23)
• spotting is highly correlated to the spray application pattern (Photo 13–24 and Photo 13–25)
• plants that do not die may be stunted for a week or so• crop oils and other additives may increase plant
injury (Photo 13–26)• injury to labelled crops is typically cosmetic, with
little to no impact on yield
284
Agronomy guide for field Crops
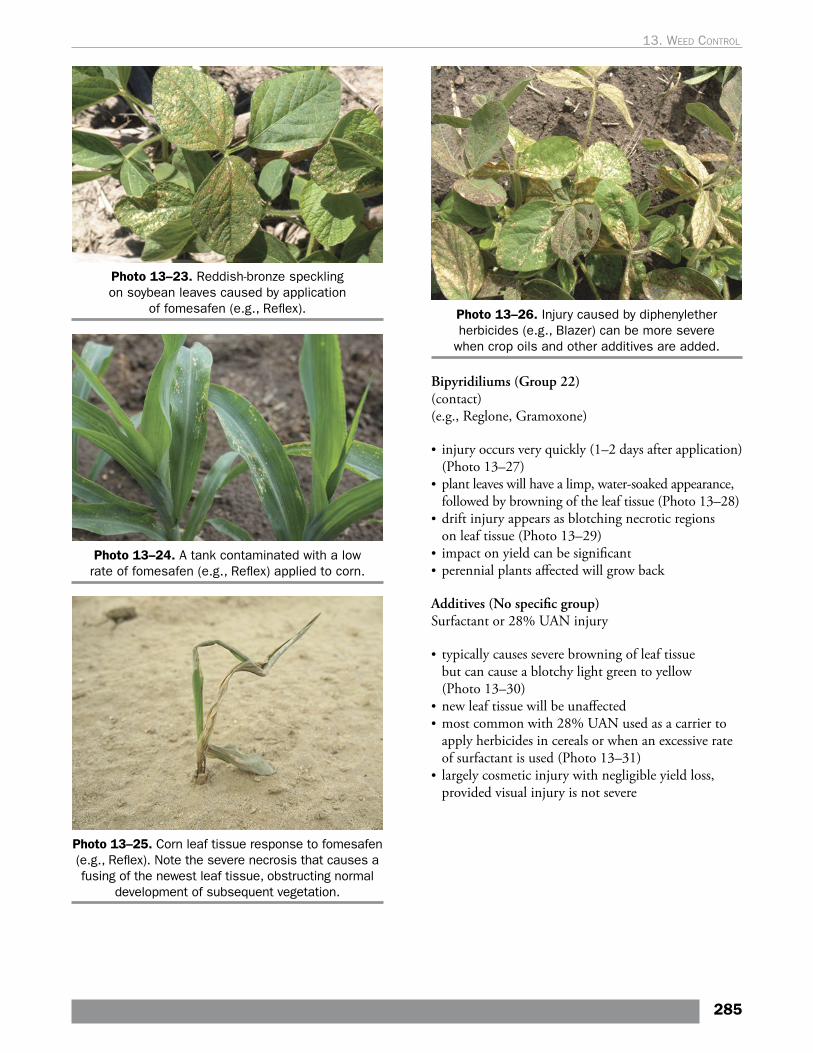
Photo 13–23. Reddish-bronze speckling on soybean leaves caused by application
of fomesafen (e.g., Reflex).
Photo 13–24. A tank contaminated with a low rate of fomesafen (e.g., Reflex) applied to corn.
Photo 13–25. Corn leaf tissue response to fomesafen (e.g., Reflex). Note the severe necrosis that causes a fusing of the newest leaf tissue, obstructing normal
development of subsequent vegetation.
Photo 13–26. Injury caused by diphenylether herbicides (e.g., Blazer) can be more severe
when crop oils and other additives are added.
Bipyridiliums (Group 22) (contact) (e.g., Reglone, Gramoxone)
• injury occurs very quickly (1–2 days after application) (Photo 13–27)
• plant leaves will have a limp, water-soaked appearance, followed by browning of the leaf tissue (Photo 13–28)
• drift injury appears as blotching necrotic regions on leaf tissue (Photo 13–29)
• impact on yield can be significant• perennial plants affected will grow back
Additives (No specific group) Surfactant or 28% UAN injury
• typically causes severe browning of leaf tissue but can cause a blotchy light green to yellow (Photo 13–30)
• new leaf tissue will be unaffected• most common with 28% UAN used as a carrier to
apply herbicides in cereals or when an excessive rate of surfactant is used (Photo 13–31)
• largely cosmetic injury with negligible yield loss, provided visual injury is not severe
285
13. Weed control
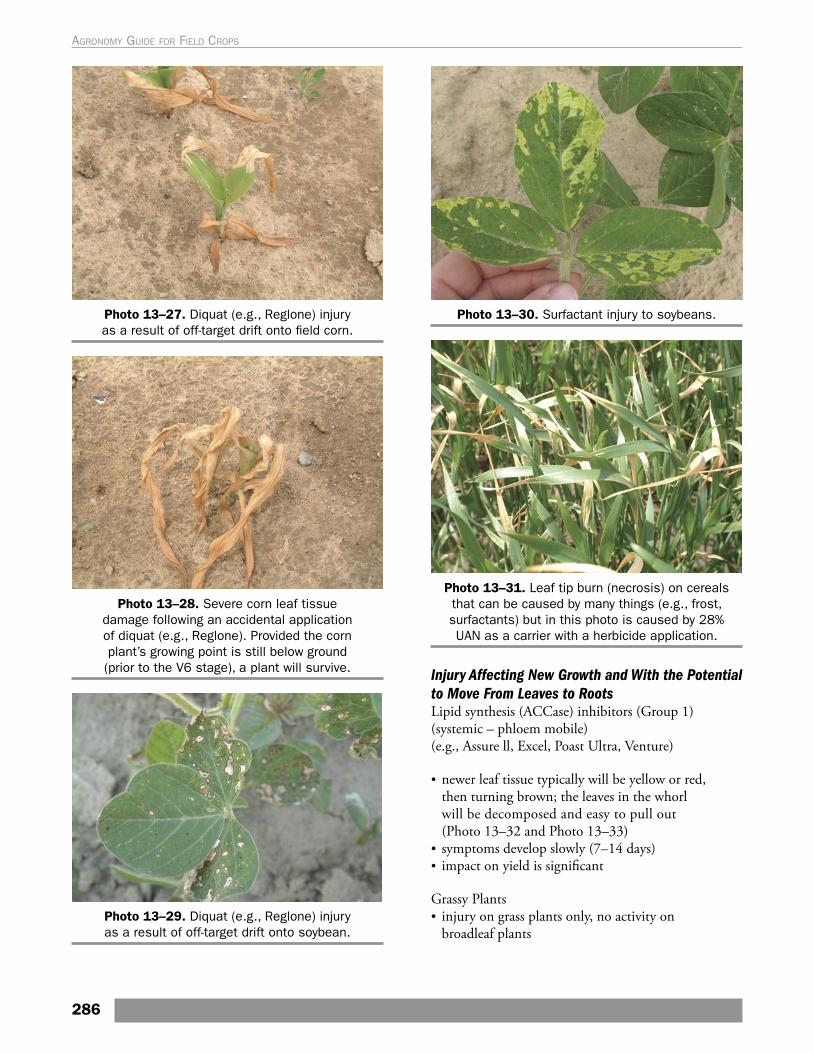
Photo 13–27. Diquat (e.g., Reglone) injury as a result of off-target drift onto field corn.
Photo 13–28. Severe corn leaf tissue damage following an accidental application of diquat (e.g., Reglone). Provided the corn plant’s growing point is still below ground (prior to the V6 stage), a plant will survive.
Photo 13–29. Diquat (e.g., Reglone) injury as a result of off-target drift onto soybean.
Photo 13–30. Surfactant injury to soybeans.
Photo 13–31. Leaf tip burn (necrosis) on cereals that can be caused by many things (e.g., frost, surfactants) but in this photo is caused by 28% UAN as a carrier with a herbicide application.
Injury Affecting New Growth and With the Potential to Move From Leaves to Roots Lipid synthesis (ACCase) inhibitors (Group 1)(systemic – phloem mobile) (e.g., Assure ll, Excel, Poast Ultra, Venture)
• newer leaf tissue typically will be yellow or red, then turning brown; the leaves in the whorl will be decomposed and easy to pull out (Photo 13–32 and Photo 13–33)
• symptoms develop slowly (7–14 days)• impact on yield is significant
Grassy Plants• injury on grass plants only, no activity on
broadleaf plants
286
Agronomy guide for field Crops
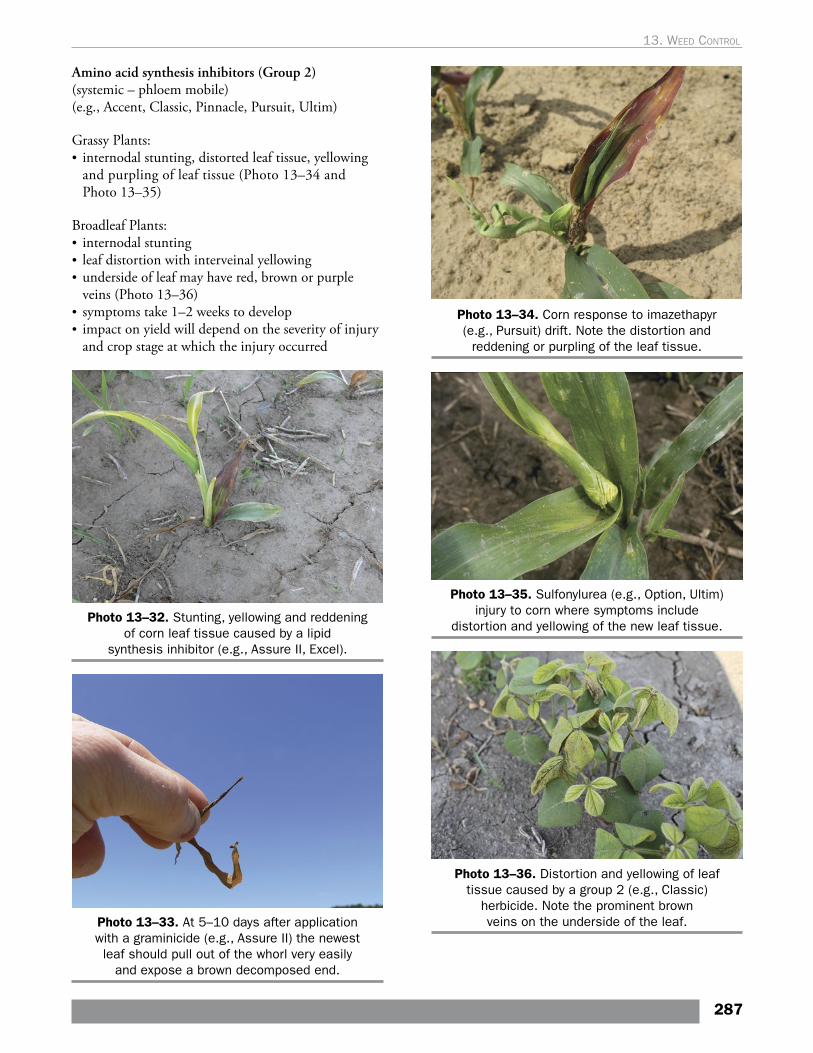
Amino acid synthesis inhibitors (Group 2) (systemic – phloem mobile) (e.g., Accent, Classic, Pinnacle, Pursuit, Ultim)
Grassy Plants:• internodal stunting, distorted leaf tissue, yellowing
and purpling of leaf tissue (Photo 13–34 and Photo 13–35)
Broadleaf Plants:• internodal stunting• leaf distortion with interveinal yellowing• underside of leaf may have red, brown or purple
veins (Photo 13–36)• symptoms take 1–2 weeks to develop• impact on yield will depend on the severity of injury
and crop stage at which the injury occurred
Photo 13–32. Stunting, yellowing and reddening of corn leaf tissue caused by a lipid
synthesis inhibitor (e.g., Assure II, Excel).
Photo 13–33. At 5–10 days after application with a graminicide (e.g., Assure II) the newest leaf should pull out of the whorl very easily
and expose a brown decomposed end.
Photo 13–34. Corn response to imazethapyr (e.g., Pursuit) drift. Note the distortion and
reddening or purpling of the leaf tissue.
Photo 13–35. Sulfonylurea (e.g., Option, Ultim) injury to corn where symptoms include
distortion and yellowing of the new leaf tissue.
Photo 13–36. Distortion and yellowing of leaf tissue caused by a group 2 (e.g., Classic)
herbicide. Note the prominent brown veins on the underside of the leaf.
287
13. Weed control
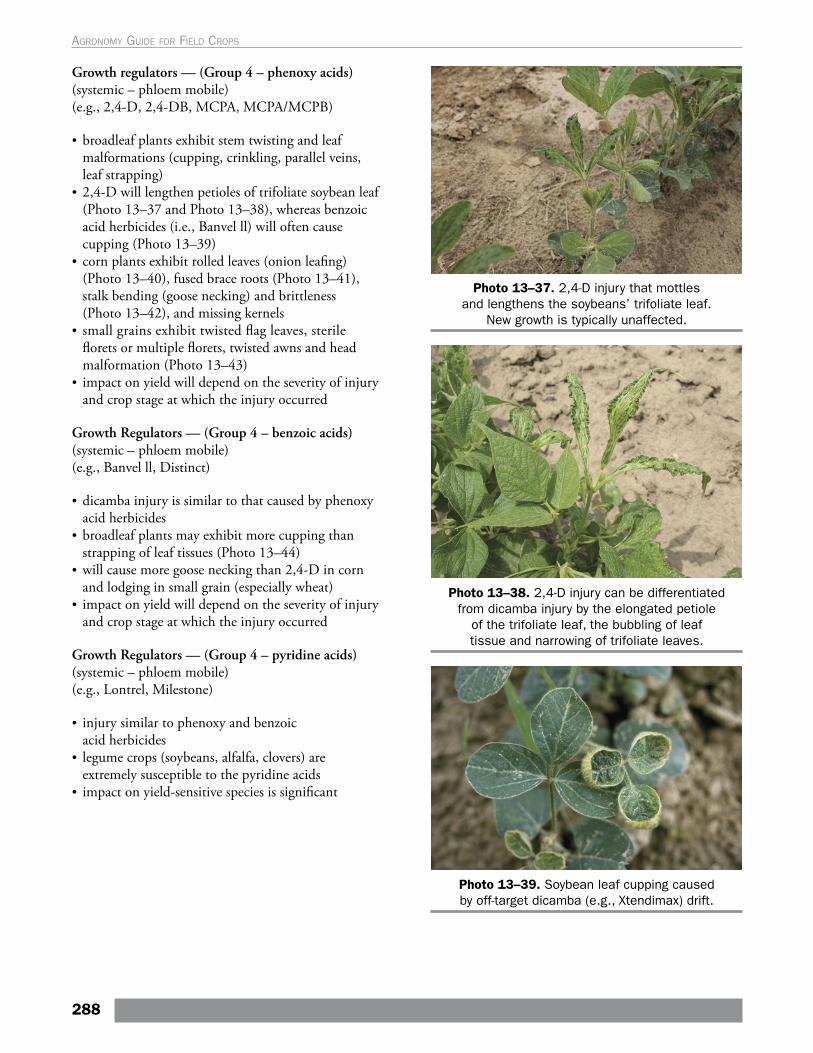
Growth regulators — (Group 4 – phenoxy acids)(systemic – phloem mobile) (e.g., 2,4-D, 2,4-DB, MCPA, MCPA/MCPB)
• broadleaf plants exhibit stem twisting and leaf malformations (cupping, crinkling, parallel veins, leaf strapping)
• 2,4-D will lengthen petioles of trifoliate soybean leaf (Photo 13–37 and Photo 13–38), whereas benzoic acid herbicides (i.e., Banvel ll) will often cause cupping (Photo 13–39)
• corn plants exhibit rolled leaves (onion leafing) (Photo 13–40), fused brace roots (Photo 13–41), stalk bending (goose necking) and brittleness (Photo 13–42), and missing kernels
• small grains exhibit twisted flag leaves, sterile florets or multiple florets, twisted awns and head malformation (Photo 13–43)
• impact on yield will depend on the severity of injury and crop stage at which the injury occurred
Growth Regulators — (Group 4 – benzoic acids)(systemic – phloem mobile) (e.g., Banvel ll, Distinct)
• dicamba injury is similar to that caused by phenoxy acid herbicides
• broadleaf plants may exhibit more cupping than strapping of leaf tissues (Photo 13–44)
• will cause more goose necking than 2,4-D in corn and lodging in small grain (especially wheat)
• impact on yield will depend on the severity of injury and crop stage at which the injury occurred
Growth Regulators — (Group 4 – pyridine acids) (systemic – phloem mobile) (e.g., Lontrel, Milestone)
• injury similar to phenoxy and benzoic acid herbicides
• legume crops (soybeans, alfalfa, clovers) are extremely susceptible to the pyridine acids
• impact on yield-sensitive species is significant
Photo 13–37. 2,4-D injury that mottles and lengthens the soybeans’ trifoliate leaf.
New growth is typically unaffected.
Photo 13–38. 2,4-D injury can be differentiated from dicamba injury by the elongated petiole
of the trifoliate leaf, the bubbling of leaf tissue and narrowing of trifoliate leaves.
Photo 13–39. Soybean leaf cupping caused by off-target dicamba (e.g., Xtendimax) drift.
288
Agronomy guide for field Crops
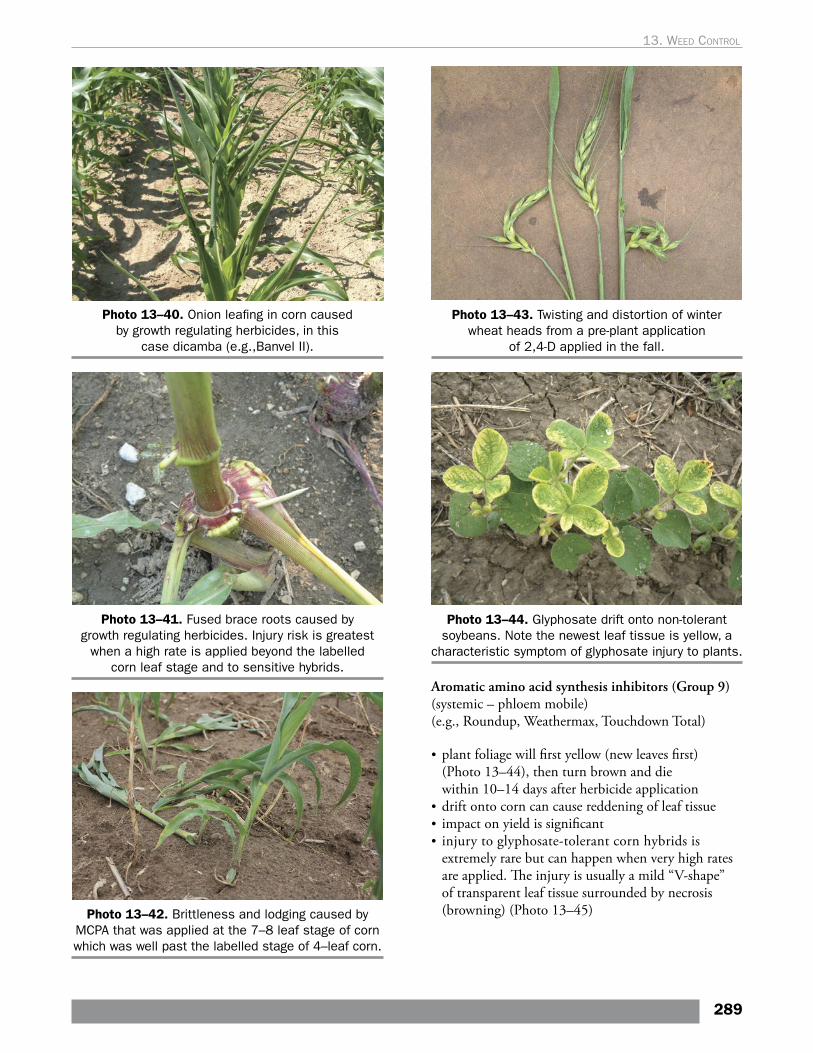
Photo 13–40. Onion leafing in corn caused by growth regulating herbicides, in this
case dicamba (e.g.,Banvel II).
Photo 13–41. Fused brace roots caused by growth regulating herbicides. Injury risk is greatest
when a high rate is applied beyond the labelled corn leaf stage and to sensitive hybrids.
Photo 13–42. Brittleness and lodging caused by MCPA that was applied at the 7–8 leaf stage of corn which was well past the labelled stage of 4–leaf corn.
Photo 13–43. Twisting and distortion of winter wheat heads from a pre-plant application
of 2,4-D applied in the fall.
Photo 13–44. Glyphosate drift onto non-tolerant soybeans. Note the newest leaf tissue is yellow, a
characteristic symptom of glyphosate injury to plants.
Aromatic amino acid synthesis inhibitors (Group 9) (systemic – phloem mobile) (e.g., Roundup, Weathermax, Touchdown Total)
• plant foliage will first yellow (new leaves first) (Photo 13–44), then turn brown and die within 10–14 days after herbicide application
• drift onto corn can cause reddening of leaf tissue• impact on yield is significant• injury to glyphosate-tolerant corn hybrids is
extremely rare but can happen when very high rates are applied. The injury is usually a mild “V-shape” of transparent leaf tissue surrounded by necrosis (browning) (Photo 13–45)
289
13. Weed control
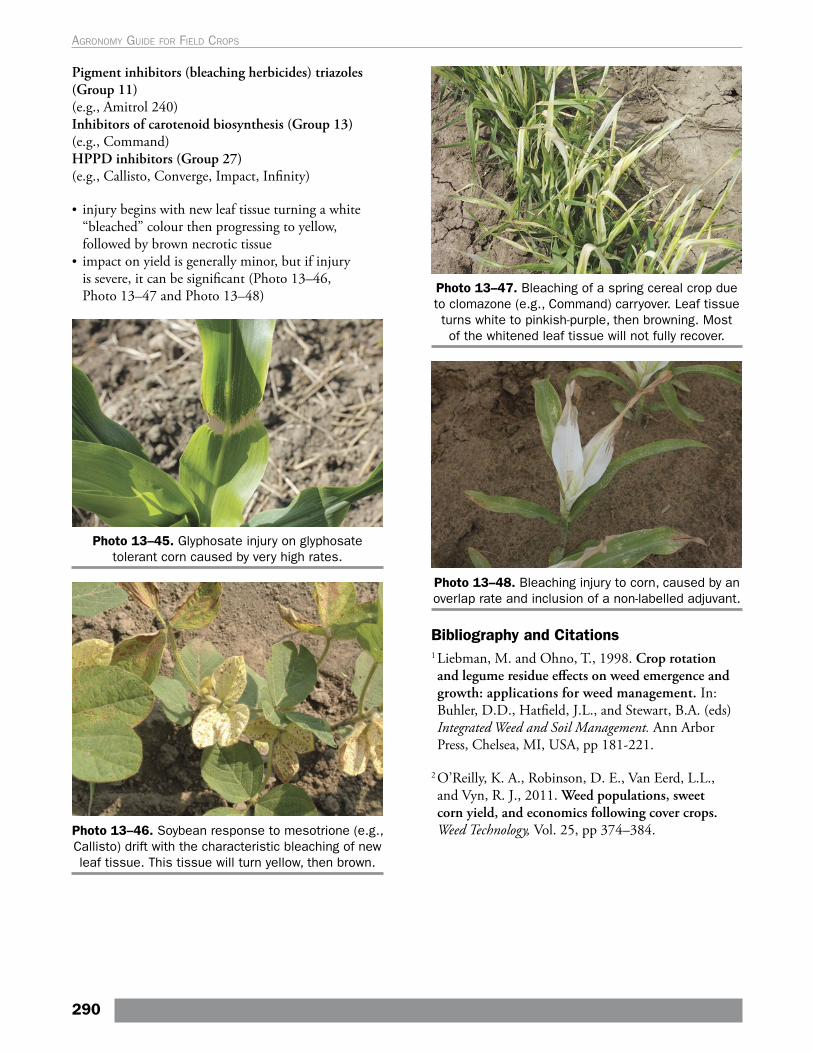
Pigment inhibitors (bleaching herbicides) triazoles (Group 11) (e.g., Amitrol 240)Inhibitors of carotenoid biosynthesis (Group 13)(e.g., Command)HPPD inhibitors (Group 27) (e.g., Callisto, Converge, Impact, Infinity)
• injury begins with new leaf tissue turning a white “bleached” colour then progressing to yellow, followed by brown necrotic tissue
• impact on yield is generally minor, but if injury is severe, it can be significant (Photo 13–46, Photo 13–47 and Photo 13–48)
Photo 13–45. Glyphosate injury on glyphosate tolerant corn caused by very high rates.
Photo 13–46. Soybean response to mesotrione (e.g., Callisto) drift with the characteristic bleaching of new leaf tissue. This tissue will turn yellow, then brown.
Photo 13–47. Bleaching of a spring cereal crop due to clomazone (e.g., Command) carryover. Leaf tissue turns white to pinkish-purple, then browning. Most of the whitened leaf tissue will not fully recover.
Photo 13–48. Bleaching injury to corn, caused by an overlap rate and inclusion of a non-labelled adjuvant.
Bibliography and Citations1 Liebman, M. and Ohno, T., 1998. Crop rotation and legume residue effects on weed emergence and growth: applications for weed management. In: Buhler, D.D., Hatfield, J.L., and Stewart, B.A. (eds) Integrated Weed and Soil Management. Ann Arbor Press, Chelsea, MI, USA, pp 181-221.
2 O’Reilly, K. A., Robinson, D. E., Van Eerd, L.L., and Vyn, R. J., 2011. Weed populations, sweet corn yield, and economics following cover crops. Weed Technology, Vol. 25, pp 374–384.
290
Agronomy guide for field Crops
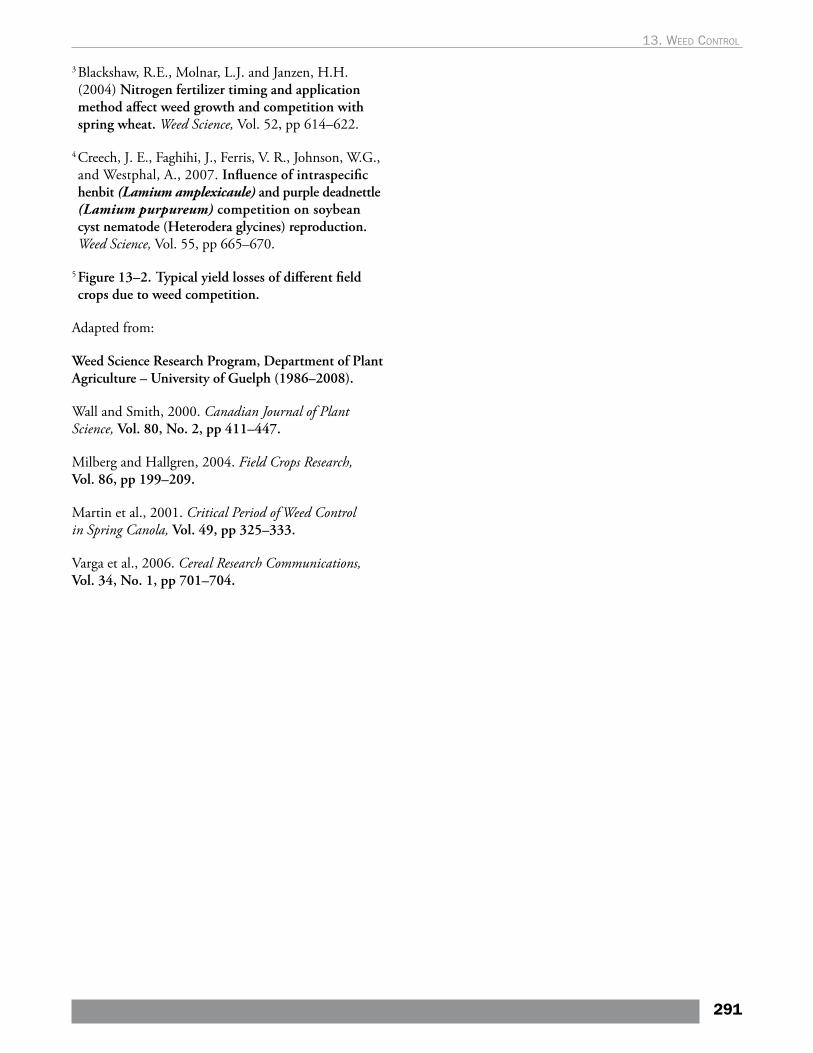
3 Blackshaw, R.E., Molnar, L.J. and Janzen, H.H. (2004) Nitrogen fertilizer timing and application method affect weed growth and competition with spring wheat. Weed Science, Vol. 52, pp 614–622.
4 Creech, J. E., Faghihi, J., Ferris, V. R., Johnson, W.G., and Westphal, A., 2007. Influence of intraspecific henbit (Lamium amplexicaule) and purple deadnettle (Lamium purpureum) competition on soybean cyst nematode (Heterodera glycines) reproduction. Weed Science, Vol. 55, pp 665–670.
5 Figure 13–2. Typical yield losses of different field crops due to weed competition.
Adapted from:
Weed Science Research Program, Department of Plant Agriculture – University of Guelph (1986–2008).
Wall and Smith, 2000. Canadian Journal of Plant Science, Vol. 80, No. 2, pp 411–447.
Milberg and Hallgren, 2004. Field Crops Research, Vol. 86, pp 199–209.
Martin et al., 2001. Critical Period of Weed Control in Spring Canola, Vol. 49, pp 325–333.
Varga et al., 2006. Cereal Research Communications, Vol. 34, No. 1, pp 701–704.
291
13. Weed control

Page intentionally left blank
14. Integrated Pest Management and Protecting Natural Enemies and Pollinators
Integrated Pest ManagementIntegrated pest management (IPM) is an approach to pest management that integrates all available practices and technologies to keep pest populations below economic thresholds while minimizing the impact to the environment. In this approach, chemical control is applied only when thresholds are reached and when other available approaches have not effectively managed the pest. Some of the first steps to IPM are to better understand each pest, its life cycle and its impact on the crop, so that scouting and preventative and cultural measures can be timed appropriately. Often producers are implementing cultural components of IPM under typical farming practices without always realizing they are considered part of IPM. Examples include crop rotation, variety selection, tillage and early harvest to reduce disease and quality concerns.
The principles of IPM include:
1. Knowledge and proper identification of pests, diseases and weeds
• knowing the key pests for each crop grown, and how to properly identify them and the damage they cause
• understanding the different crop stages and which are most at-risk from each pest
• knowing what weather conditions allow the pest to thrive
• understanding the impact each pest can have on the crop
• understanding that the presence of a pest does not necessarily result in economic damage
• being aware of the pest’s life cycle and which stages do damage
• recognizing each pest’s natural enemies and being aware of the presence of natural enemies
2. Preventative measures (also known as cultural control)
• rotating crops to ensure susceptible crops are not planted in the same field each year, helping to break some pest life cycles
• preparing the field to reduce risk (e.g., good weed management prior to planting and tillage practices to remove crop residue for certain disease management)
• planting certified seed and keeping field equipment free of soil and plant debris
• cleaning bins before storage• selecting varieties proven to tolerate disease and
that yield well under stress• adjusting planting times to avoid damage from pests• planting into good growing conditions to ensure
good crop establishment• managing nutrients to maintain good soil and
plant health without increasing the risk to the environment or promoting certain pests
• encouraging biodiversity through natural habitat establishment for natural enemies (e.g., cover crops and buffer strips)
3. Assessing fields for pest populations
• understanding and using prediction models that indicate level of risk
• timely and regular scouting to determine presence of pests and natural enemies
• setting up traps and using appropriate monitoring tools where needed (e.g., sweep nets, hand lens, scouting guides and identification books)
• understanding economic injury levels versus thresholds and knowing when management is required
• being aware of secondary pests that may become a problem once chemical control is applied and natural enemies become absent
• seeking help with proper diagnosis/identification when needed
4. Managing pests using the least destructive methods
• cultural control — removing weed escapes, maintaining good soil health, planting Bt hybrid corn and refuge, timely harvest and other preventative measures
• biological control — helping to encourage predators, parasitoids and pathogens that control pests and giving them a chance to control the pest
293
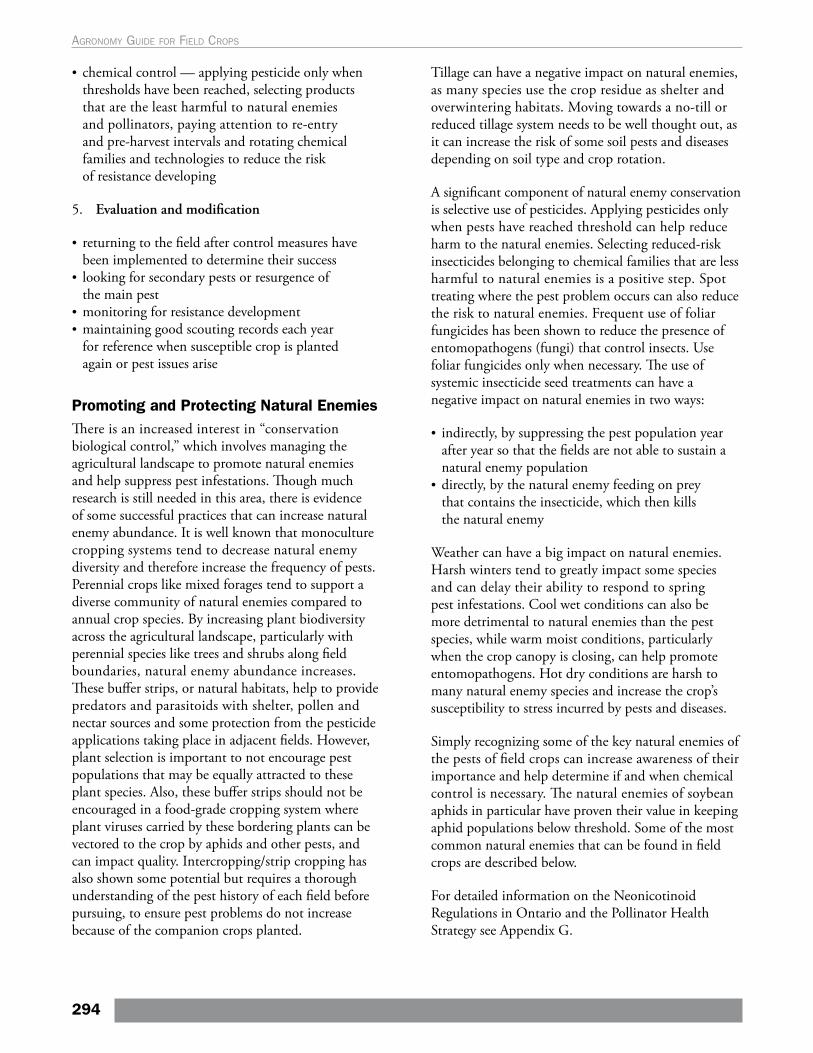
• chemical control — applying pesticide only when thresholds have been reached, selecting products that are the least harmful to natural enemies and pollinators, paying attention to re-entry and pre-harvest intervals and rotating chemical families and technologies to reduce the risk of resistance developing
5. Evaluation and modification
• returning to the field after control measures have been implemented to determine their success
• looking for secondary pests or resurgence of the main pest
• monitoring for resistance development• maintaining good scouting records each year
for reference when susceptible crop is planted again or pest issues arise
Promoting and Protecting Natural EnemiesThere is an increased interest in “conservation biological control,” which involves managing the agricultural landscape to promote natural enemies and help suppress pest infestations. Though much research is still needed in this area, there is evidence of some successful practices that can increase natural enemy abundance. It is well known that monoculture cropping systems tend to decrease natural enemy diversity and therefore increase the frequency of pests. Perennial crops like mixed forages tend to support a diverse community of natural enemies compared to annual crop species. By increasing plant biodiversity across the agricultural landscape, particularly with perennial species like trees and shrubs along field boundaries, natural enemy abundance increases. These buffer strips, or natural habitats, help to provide predators and parasitoids with shelter, pollen and nectar sources and some protection from the pesticide applications taking place in adjacent fields. However, plant selection is important to not encourage pest populations that may be equally attracted to these plant species. Also, these buffer strips should not be encouraged in a food-grade cropping system where plant viruses carried by these bordering plants can be vectored to the crop by aphids and other pests, and can impact quality. Intercropping/strip cropping has also shown some potential but requires a thorough understanding of the pest history of each field before pursuing, to ensure pest problems do not increase because of the companion crops planted.
Tillage can have a negative impact on natural enemies, as many species use the crop residue as shelter and overwintering habitats. Moving towards a no-till or reduced tillage system needs to be well thought out, as it can increase the risk of some soil pests and diseases depending on soil type and crop rotation.
A significant component of natural enemy conservation is selective use of pesticides. Applying pesticides only when pests have reached threshold can help reduce harm to the natural enemies. Selecting reduced-risk insecticides belonging to chemical families that are less harmful to natural enemies is a positive step. Spot treating where the pest problem occurs can also reduce the risk to natural enemies. Frequent use of foliar fungicides has been shown to reduce the presence of entomopathogens (fungi) that control insects. Use foliar fungicides only when necessary. The use of systemic insecticide seed treatments can have a negative impact on natural enemies in two ways:
• indirectly, by suppressing the pest population year after year so that the fields are not able to sustain a natural enemy population
• directly, by the natural enemy feeding on prey that contains the insecticide, which then kills the natural enemy
Weather can have a big impact on natural enemies. Harsh winters tend to greatly impact some species and can delay their ability to respond to spring pest infestations. Cool wet conditions can also be more detrimental to natural enemies than the pest species, while warm moist conditions, particularly when the crop canopy is closing, can help promote entomopathogens. Hot dry conditions are harsh to many natural enemy species and increase the crop’s susceptibility to stress incurred by pests and diseases.
Simply recognizing some of the key natural enemies of the pests of field crops can increase awareness of their importance and help determine if and when chemical control is necessary. The natural enemies of soybean aphids in particular have proven their value in keeping aphid populations below threshold. Some of the most common natural enemies that can be found in field crops are described below.
For detailed information on the Neonicotinoid Regulations in Ontario and the Pollinator Health Strategy see Appendix G.
294
Agronomy guide for field Crops
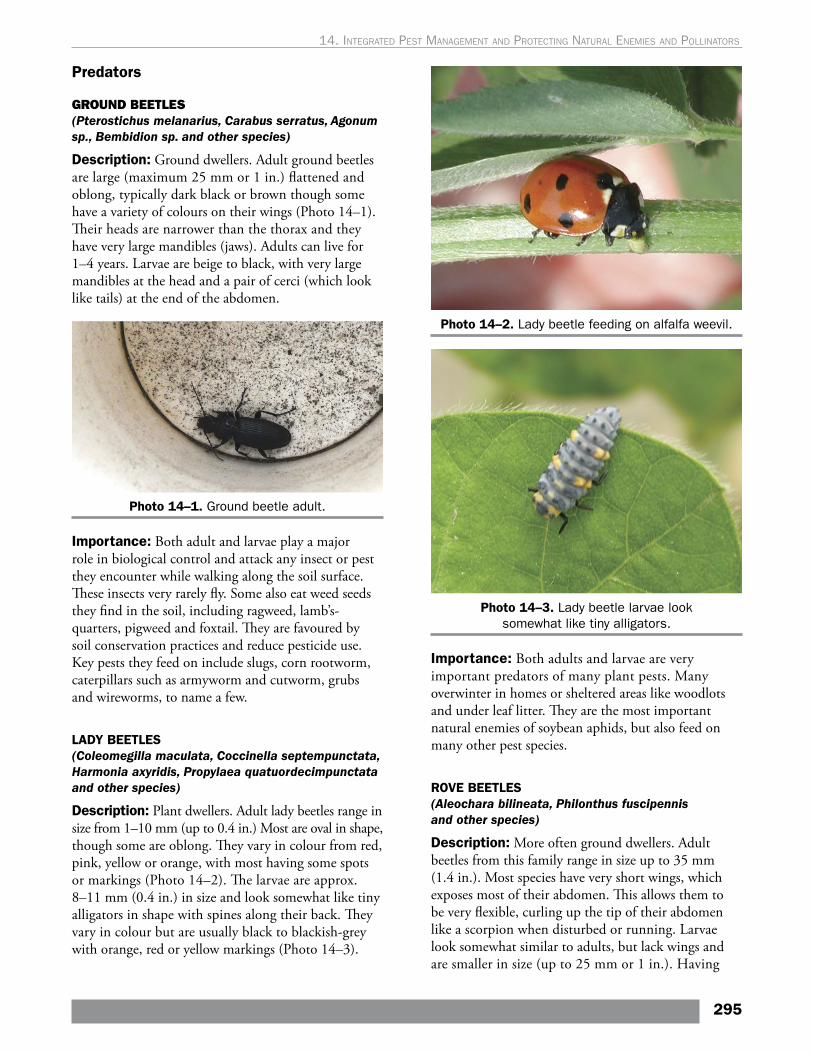
Predators
GROUND BEETLES (Pterostichus melanarius, Carabus serratus, Agonum sp., Bembidion sp. and other species)
Description: Ground dwellers. Adult ground beetles are large (maximum 25 mm or 1 in.) flattened and oblong, typically dark black or brown though some have a variety of colours on their wings (Photo 14–1). Their heads are narrower than the thorax and they have very large mandibles (jaws). Adults can live for 1–4 years. Larvae are beige to black, with very large mandibles at the head and a pair of cerci (which look like tails) at the end of the abdomen.
Photo 14–1. Ground beetle adult.
Importance: Both adult and larvae play a major role in biological control and attack any insect or pest they encounter while walking along the soil surface. These insects very rarely fly. Some also eat weed seeds they find in the soil, including ragweed, lamb’s-quarters, pigweed and foxtail. They are favoured by soil conservation practices and reduce pesticide use. Key pests they feed on include slugs, corn rootworm, caterpillars such as armyworm and cutworm, grubs and wireworms, to name a few.
LADY BEETLES(Coleomegilla maculata, Coccinella septempunctata, Harmonia axyridis, Propylaea quatuordecimpunctata and other species)
Description: Plant dwellers. Adult lady beetles range in size from 1–10 mm (up to 0.4 in.) Most are oval in shape, though some are oblong. They vary in colour from red, pink, yellow or orange, with most having some spots or markings (Photo 14–2). The larvae are approx. 8–11 mm (0.4 in.) in size and look somewhat like tiny alligators in shape with spines along their back. They vary in colour but are usually black to blackish-grey with orange, red or yellow markings (Photo 14–3).
Photo 14–2. Lady beetle feeding on alfalfa weevil.
Photo 14–3. Lady beetle larvae look somewhat like tiny alligators.
Importance: Both adults and larvae are very important predators of many plant pests. Many overwinter in homes or sheltered areas like woodlots and under leaf litter. They are the most important natural enemies of soybean aphids, but also feed on many other pest species.
ROVE BEETLES(Aleochara bilineata, Philonthus fuscipennis and other species)
Description: More often ground dwellers. Adult beetles from this family range in size up to 35 mm (1.4 in.). Most species have very short wings, which exposes most of their abdomen. This allows them to be very flexible, curling up the tip of their abdomen like a scorpion when disturbed or running. Larvae look somewhat similar to adults, but lack wings and are smaller in size (up to 25 mm or 1 in.). Having
295
14. Integrated pest ManageMent and protectIng natural eneMIes and pollInators
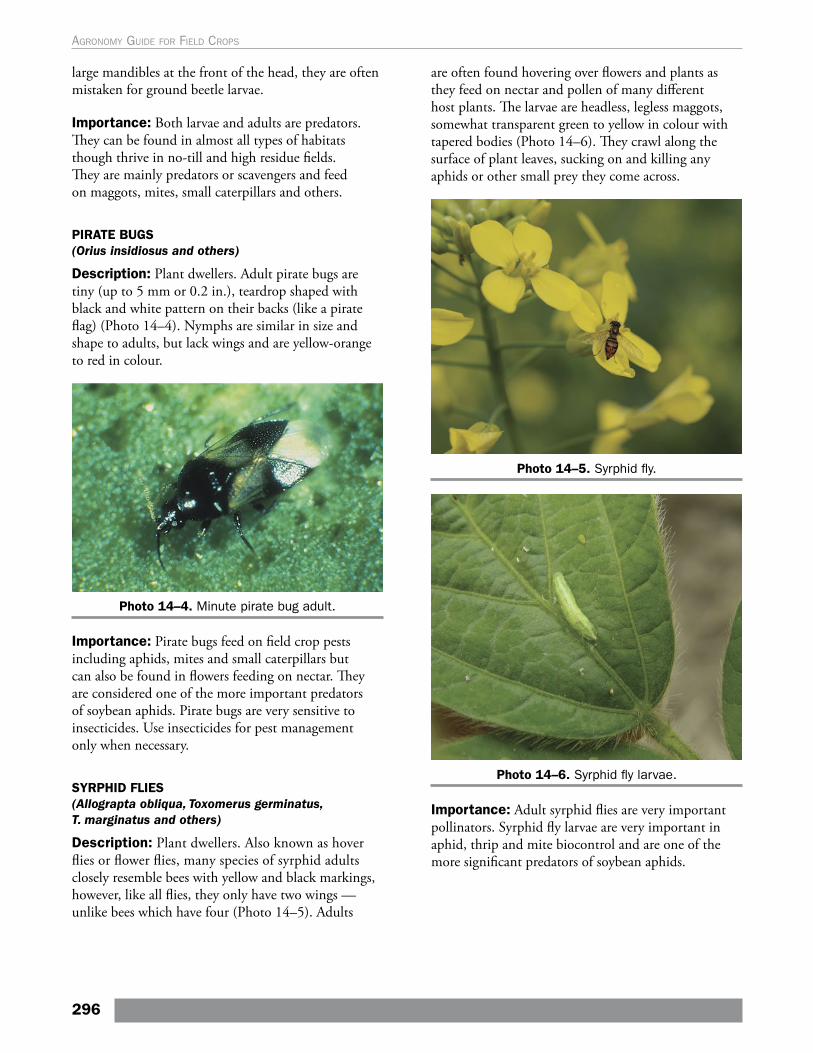
large mandibles at the front of the head, they are often mistaken for ground beetle larvae.
Importance: Both larvae and adults are predators. They can be found in almost all types of habitats though thrive in no-till and high residue fields. They are mainly predators or scavengers and feed on maggots, mites, small caterpillars and others.
PIRATE BUGS(Orius insidiosus and others)
Description: Plant dwellers. Adult pirate bugs are tiny (up to 5 mm or 0.2 in.), teardrop shaped with black and white pattern on their backs (like a pirate flag) (Photo 14–4). Nymphs are similar in size and shape to adults, but lack wings and are yellow-orange to red in colour.
Photo 14–4. Minute pirate bug adult.
Importance: Pirate bugs feed on field crop pests including aphids, mites and small caterpillars but can also be found in flowers feeding on nectar. They are considered one of the more important predators of soybean aphids. Pirate bugs are very sensitive to insecticides. Use insecticides for pest management only when necessary.
SYRPHID FLIES(Allograpta obliqua, Toxomerus germinatus, T. marginatus and others)
Description: Plant dwellers. Also known as hover flies or flower flies, many species of syrphid adults closely resemble bees with yellow and black markings, however, like all flies, they only have two wings — unlike bees which have four (Photo 14–5). Adults
are often found hovering over flowers and plants as they feed on nectar and pollen of many different host plants. The larvae are headless, legless maggots, somewhat transparent green to yellow in colour with tapered bodies (Photo 14–6). They crawl along the surface of plant leaves, sucking on and killing any aphids or other small prey they come across.
Photo 14–5. Syrphid fly.
Photo 14–6. Syrphid fly larvae.
Importance: Adult syrphid flies are very important pollinators. Syrphid fly larvae are very important in aphid, thrip and mite biocontrol and are one of the more significant predators of soybean aphids.
296
Agronomy guide for field Crops
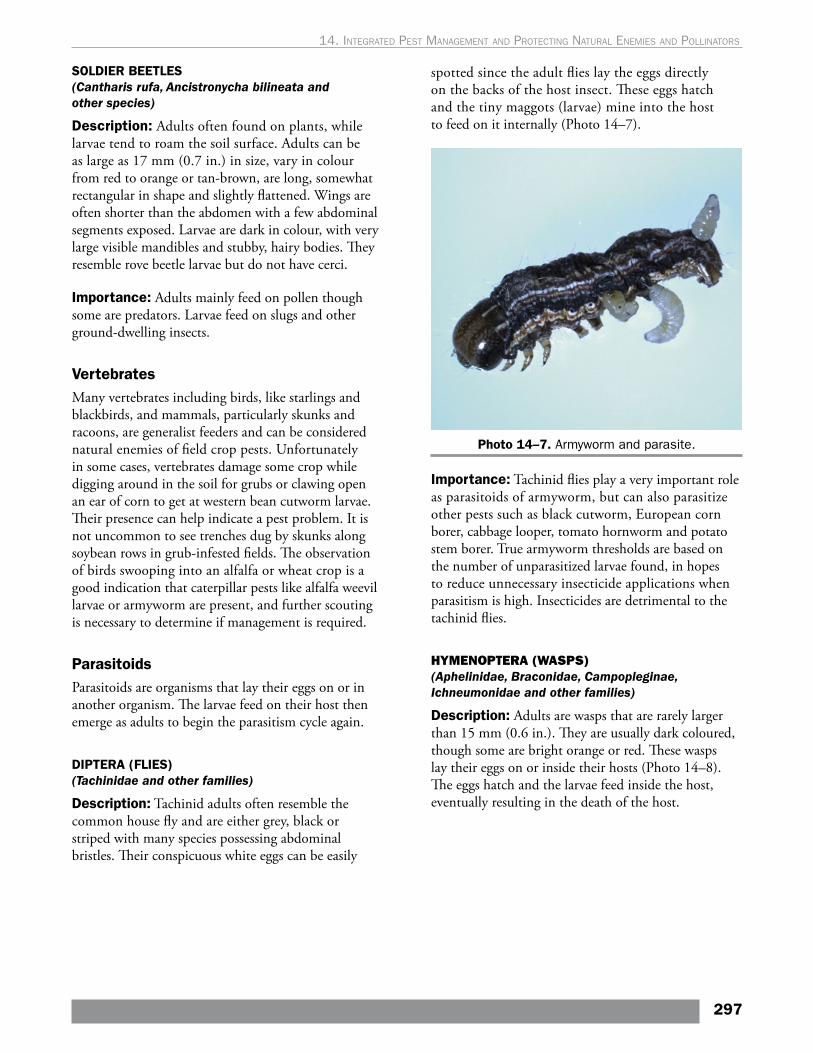
SOLDIER BEETLES(Cantharis rufa, Ancistronycha bilineata and other species)
Description: Adults often found on plants, while larvae tend to roam the soil surface. Adults can be as large as 17 mm (0.7 in.) in size, vary in colour from red to orange or tan-brown, are long, somewhat rectangular in shape and slightly flattened. Wings are often shorter than the abdomen with a few abdominal segments exposed. Larvae are dark in colour, with very large visible mandibles and stubby, hairy bodies. They resemble rove beetle larvae but do not have cerci.
Importance: Adults mainly feed on pollen though some are predators. Larvae feed on slugs and other ground-dwelling insects.
VertebratesMany vertebrates including birds, like starlings and blackbirds, and mammals, particularly skunks and racoons, are generalist feeders and can be considered natural enemies of field crop pests. Unfortunately in some cases, vertebrates damage some crop while digging around in the soil for grubs or clawing open an ear of corn to get at western bean cutworm larvae. Their presence can help indicate a pest problem. It is not uncommon to see trenches dug by skunks along soybean rows in grub-infested fields. The observation of birds swooping into an alfalfa or wheat crop is a good indication that caterpillar pests like alfalfa weevil larvae or armyworm are present, and further scouting is necessary to determine if management is required.
ParasitoidsParasitoids are organisms that lay their eggs on or in another organism. The larvae feed on their host then emerge as adults to begin the parasitism cycle again.
DIPTERA (FLIES)(Tachinidae and other families)
Description: Tachinid adults often resemble the common house fly and are either grey, black or striped with many species possessing abdominal bristles. Their conspicuous white eggs can be easily
spotted since the adult flies lay the eggs directly on the backs of the host insect. These eggs hatch and the tiny maggots (larvae) mine into the host to feed on it internally (Photo 14–7).
Photo 14–7. Armyworm and parasite.
Importance: Tachinid flies play a very important role as parasitoids of armyworm, but can also parasitize other pests such as black cutworm, European corn borer, cabbage looper, tomato hornworm and potato stem borer. True armyworm thresholds are based on the number of unparasitized larvae found, in hopes to reduce unnecessary insecticide applications when parasitism is high. Insecticides are detrimental to the tachinid flies.
HYMENOPTERA (WASPS) (Aphelinidae, Braconidae, Campopleginae, Ichneumonidae and other families)
Description: Adults are wasps that are rarely larger than 15 mm (0.6 in.). They are usually dark coloured, though some are bright orange or red. These wasps lay their eggs on or inside their hosts (Photo 14–8). The eggs hatch and the larvae feed inside the host, eventually resulting in the death of the host.
297
14. Integrated pest ManageMent and protectIng natural eneMIes and pollInators
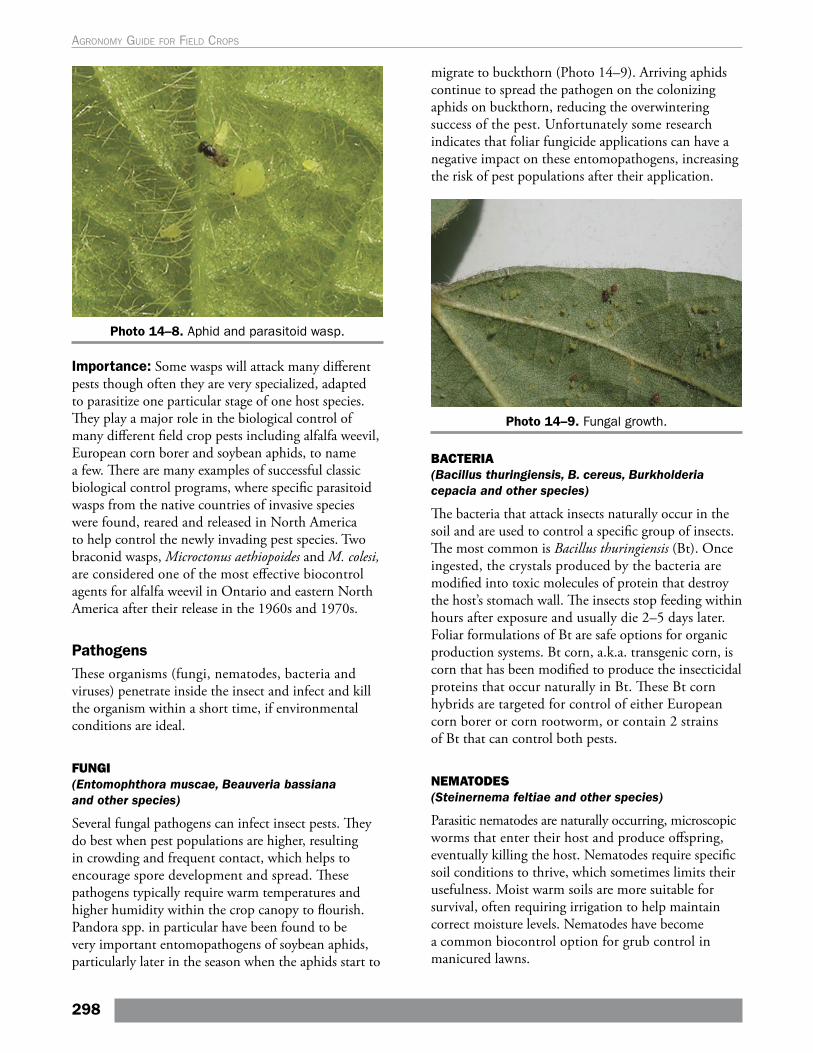
Photo 14–8. Aphid and parasitoid wasp.
Importance: Some wasps will attack many different pests though often they are very specialized, adapted to parasitize one particular stage of one host species. They play a major role in the biological control of many different field crop pests including alfalfa weevil, European corn borer and soybean aphids, to name a few. There are many examples of successful classic biological control programs, where specific parasitoid wasps from the native countries of invasive species were found, reared and released in North America to help control the newly invading pest species. Two braconid wasps, Microctonus aethiopoides and M. colesi, are considered one of the most effective biocontrol agents for alfalfa weevil in Ontario and eastern North America after their release in the 1960s and 1970s.
PathogensThese organisms (fungi, nematodes, bacteria and viruses) penetrate inside the insect and infect and kill the organism within a short time, if environmental conditions are ideal.
FUNGI(Entomophthora muscae, Beauveria bassiana and other species)
Several fungal pathogens can infect insect pests. They do best when pest populations are higher, resulting in crowding and frequent contact, which helps to encourage spore development and spread. These pathogens typically require warm temperatures and higher humidity within the crop canopy to flourish. Pandora spp. in particular have been found to be very important entomopathogens of soybean aphids, particularly later in the season when the aphids start to
migrate to buckthorn (Photo 14–9). Arriving aphids continue to spread the pathogen on the colonizing aphids on buckthorn, reducing the overwintering success of the pest. Unfortunately some research indicates that foliar fungicide applications can have a negative impact on these entomopathogens, increasing the risk of pest populations after their application.
Photo 14–9. Fungal growth.
BACTERIA(Bacillus thuringiensis, B. cereus, Burkholderia cepacia and other species)
The bacteria that attack insects naturally occur in the soil and are used to control a specific group of insects. The most common is Bacillus thuringiensis (Bt). Once ingested, the crystals produced by the bacteria are modified into toxic molecules of protein that destroy the host’s stomach wall. The insects stop feeding within hours after exposure and usually die 2–5 days later. Foliar formulations of Bt are safe options for organic production systems. Bt corn, a.k.a. transgenic corn, is corn that has been modified to produce the insecticidal proteins that occur naturally in Bt. These Bt corn hybrids are targeted for control of either European corn borer or corn rootworm, or contain 2 strains of Bt that can control both pests.
NEMATODES(Steinernema feltiae and other species)
Parasitic nematodes are naturally occurring, microscopic worms that enter their host and produce offspring, eventually killing the host. Nematodes require specific soil conditions to thrive, which sometimes limits their usefulness. Moist warm soils are more suitable for survival, often requiring irrigation to help maintain correct moisture levels. Nematodes have become a common biocontrol option for grub control in manicured lawns.
298
Agronomy guide for field Crops
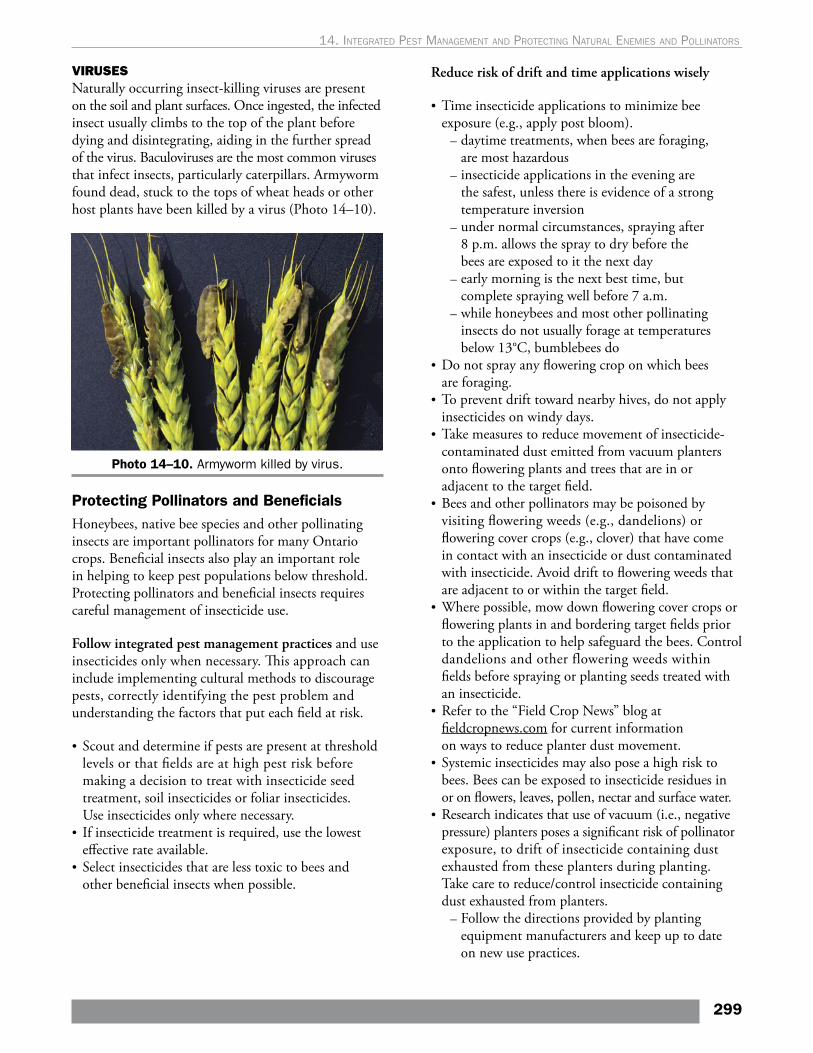
VIRUSESNaturally occurring insect-killing viruses are present on the soil and plant surfaces. Once ingested, the infected insect usually climbs to the top of the plant before dying and disintegrating, aiding in the further spread of the virus. Baculoviruses are the most common viruses that infect insects, particularly caterpillars. Armyworm found dead, stuck to the tops of wheat heads or other host plants have been killed by a virus (Photo 14–10).
Photo 14–10. Armyworm killed by virus.
Protecting Pollinators and BeneficialsHoneybees, native bee species and other pollinating insects are important pollinators for many Ontario crops. Beneficial insects also play an important role in helping to keep pest populations below threshold. Protecting pollinators and beneficial insects requires careful management of insecticide use.
Follow integrated pest management practices and use insecticides only when necessary. This approach can include implementing cultural methods to discourage pests, correctly identifying the pest problem and understanding the factors that put each field at risk.
• Scout and determine if pests are present at threshold levels or that fields are at high pest risk before making a decision to treat with insecticide seed treatment, soil insecticides or foliar insecticides. Use insecticides only where necessary.
• If insecticide treatment is required, use the lowest effective rate available.
• Select insecticides that are less toxic to bees and other beneficial insects when possible.
Reduce risk of drift and time applications wisely
• Time insecticide applications to minimize bee exposure (e.g., apply post bloom).
– daytime treatments, when bees are foraging, are most hazardous
– insecticide applications in the evening are the safest, unless there is evidence of a strong temperature inversion
– under normal circumstances, spraying after 8 p.m. allows the spray to dry before the bees are exposed to it the next day
– early morning is the next best time, but complete spraying well before 7 a.m.
– while honeybees and most other pollinating insects do not usually forage at temperatures below 13°C, bumblebees do
• Do not spray any flowering crop on which bees are foraging.
• To prevent drift toward nearby hives, do not apply insecticides on windy days.
• Take measures to reduce movement of insecticide-contaminated dust emitted from vacuum planters onto flowering plants and trees that are in or adjacent to the target field.
• Bees and other pollinators may be poisoned by visiting flowering weeds (e.g., dandelions) or flowering cover crops (e.g., clover) that have come in contact with an insecticide or dust contaminated with insecticide. Avoid drift to flowering weeds that are adjacent to or within the target field.
• Where possible, mow down flowering cover crops or flowering plants in and bordering target fields prior to the application to help safeguard the bees. Control dandelions and other flowering weeds within fields before spraying or planting seeds treated with an insecticide.
• Refer to the “Field Crop News” blog at fieldcropnews.com for current information on ways to reduce planter dust movement.
• Systemic insecticides may also pose a high risk to bees. Bees can be exposed to insecticide residues in or on flowers, leaves, pollen, nectar and surface water.
• Research indicates that use of vacuum (i.e., negative pressure) planters poses a significant risk of pollinator exposure, to drift of insecticide containing dust exhausted from these planters during planting. Take care to reduce/control insecticide containing dust exhausted from planters.
– Follow the directions provided by planting equipment manufacturers and keep up to date on new use practices.
299
14. Integrated pest ManageMent and protectIng natural eneMIes and pollInators
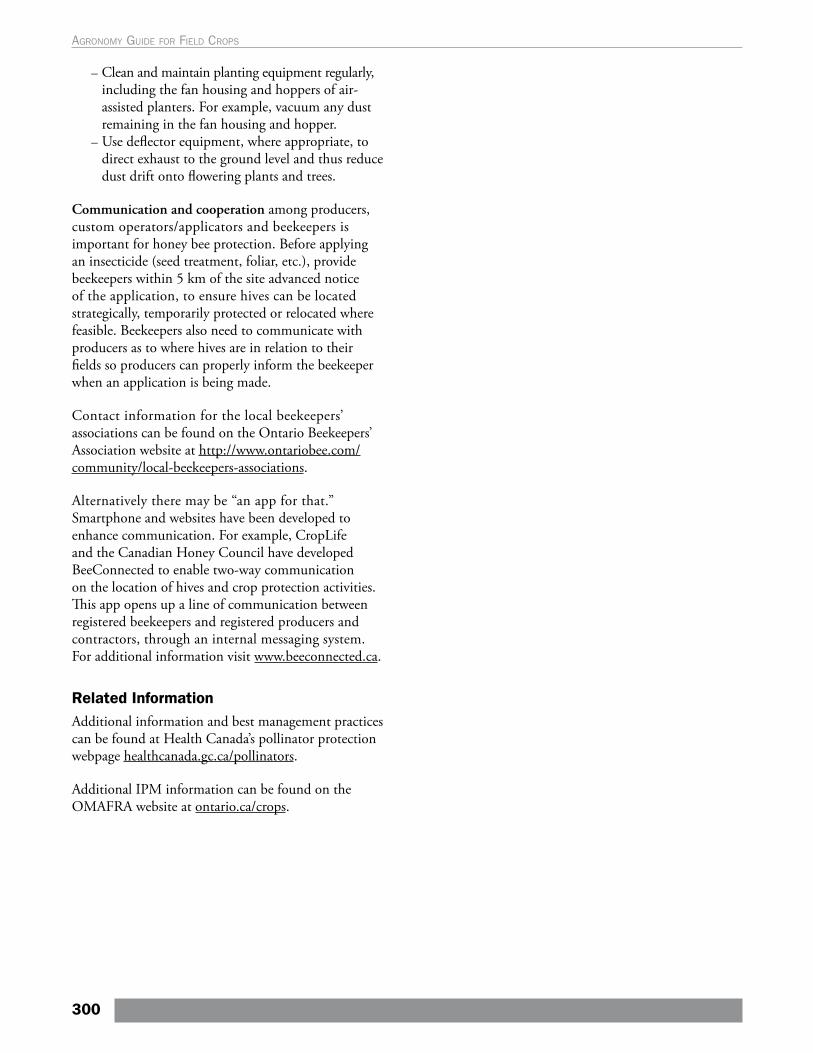
– Clean and maintain planting equipment regularly, including the fan housing and hoppers of air-assisted planters. For example, vacuum any dust remaining in the fan housing and hopper.
– Use deflector equipment, where appropriate, to direct exhaust to the ground level and thus reduce dust drift onto flowering plants and trees.
Communication and cooperation among producers, custom operators/applicators and beekeepers is important for honey bee protection. Before applying an insecticide (seed treatment, foliar, etc.), provide beekeepers within 5 km of the site advanced notice of the application, to ensure hives can be located strategically, temporarily protected or relocated where feasible. Beekeepers also need to communicate with producers as to where hives are in relation to their fields so producers can properly inform the beekeeper when an application is being made.
Contact information for the local beekeepers’ associations can be found on the Ontario Beekeepers’ Association website at http://www.ontariobee.com/community/local-beekeepers-associations.
Alternatively there may be “an app for that.” Smartphone and websites have been developed to enhance communication. For example, CropLife and the Canadian Honey Council have developed BeeConnected to enable two-way communication on the location of hives and crop protection activities. This app opens up a line of communication between registered beekeepers and registered producers and contractors, through an internal messaging system. For additional information visit www.beeconnected.ca.
Related InformationAdditional information and best management practices can be found at Health Canada’s pollinator protection webpage healthcanada.gc.ca/pollinators.
Additional IPM information can be found on the OMAFRA website at ontario.ca/crops.
300
Agronomy guide for field Crops
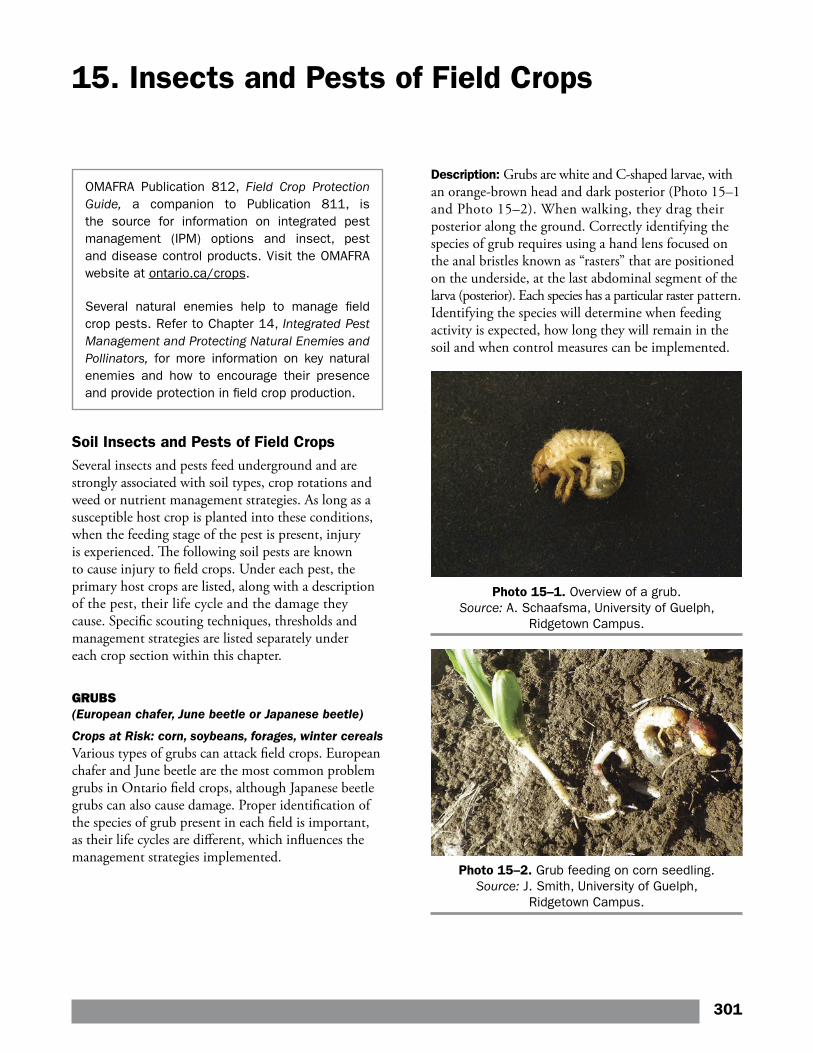
15. Insects and Pests of Field Crops
OMAFRA Publication 812, Field Crop Protection Guide, a companion to Publication 811, is the source for information on integrated pest management (IPM) options and insect, pest and disease control products. Visit the OMAFRA website at ontario.ca/crops.
Several natural enemies help to manage field crop pests. Refer to Chapter 14, Integrated Pest Management and Protecting Natural Enemies and Pollinators, for more information on key natural enemies and how to encourage their presence and provide protection in field crop production.
Soil Insects and Pests of Field CropsSeveral insects and pests feed underground and are strongly associated with soil types, crop rotations and weed or nutrient management strategies. As long as a susceptible host crop is planted into these conditions, when the feeding stage of the pest is present, injury is experienced. The following soil pests are known to cause injury to field crops. Under each pest, the primary host crops are listed, along with a description of the pest, their life cycle and the damage they cause. Specific scouting techniques, thresholds and management strategies are listed separately under each crop section within this chapter.
GRUBS (European chafer, June beetle or Japanese beetle)
Crops at Risk: corn, soybeans, forages, winter cerealsVarious types of grubs can attack field crops. European chafer and June beetle are the most common problem grubs in Ontario field crops, although Japanese beetle grubs can also cause damage. Proper identification of the species of grub present in each field is important, as their life cycles are different, which influences the management strategies implemented.
Description: Grubs are white and C-shaped larvae, with an orange-brown head and dark posterior (Photo 15–1 and Photo 15–2). When walking, they drag their posterior along the ground. Correctly identifying the species of grub requires using a hand lens focused on the anal bristles known as “rasters” that are positioned on the underside, at the last abdominal segment of the larva (posterior). Each species has a particular raster pattern. Identifying the species will determine when feeding activity is expected, how long they will remain in the soil and when control measures can be implemented.
Photo 15–1. Overview of a grub. Source: A. Schaafsma, University of Guelph,
Ridgetown Campus.
Photo 15–2. Grub feeding on corn seedling. Source: J. Smith, University of Guelph,
Ridgetown Campus.
301
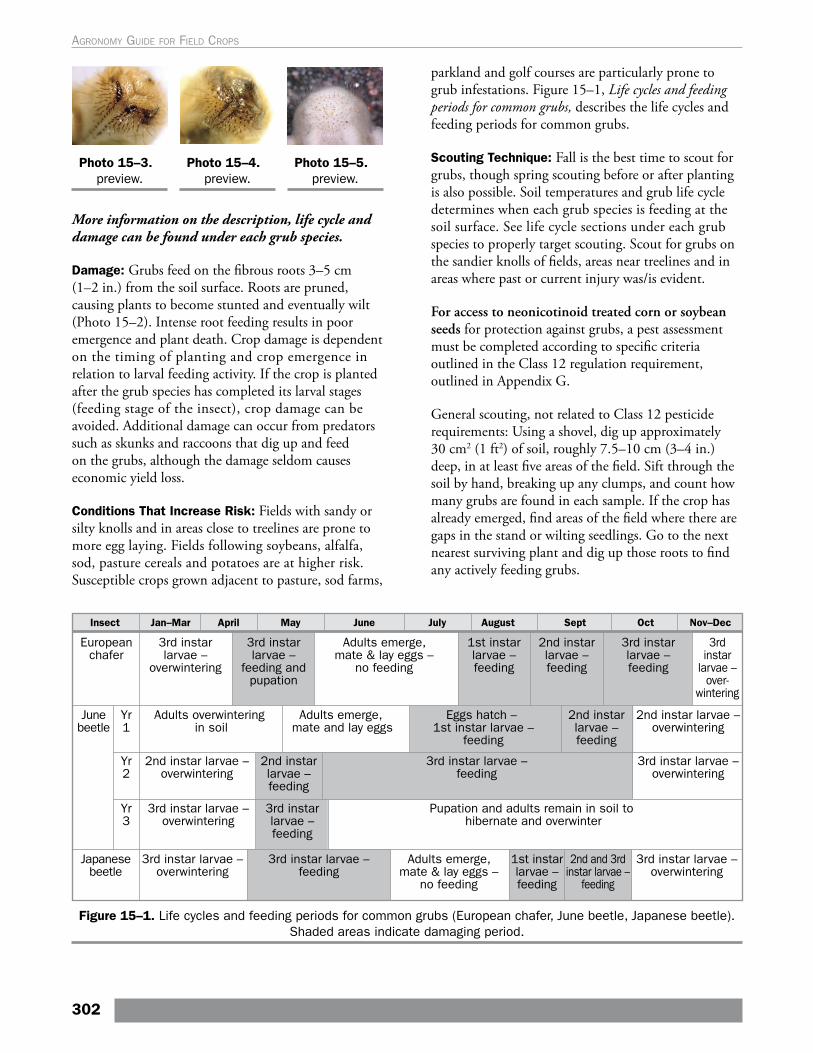
More information on the description, life cycle and damage can be found under each grub species.
Damage: Grubs feed on the fibrous roots 3–5 cm (1–2 in.) from the soil surface. Roots are pruned, causing plants to become stunted and eventually wilt (Photo 15–2). Intense root feeding results in poor emergence and plant death. Crop damage is dependent on the timing of planting and crop emergence in relation to larval feeding activity. If the crop is planted after the grub species has completed its larval stages (feeding stage of the insect), crop damage can be avoided. Additional damage can occur from predators such as skunks and raccoons that dig up and feed on the grubs, although the damage seldom causes economic yield loss.
Conditions That Increase Risk: Fields with sandy or silty knolls and in areas close to treelines are prone to more egg laying. Fields following soybeans, alfalfa, sod, pasture cereals and potatoes are at higher risk. Susceptible crops grown adjacent to pasture, sod farms,
parkland and golf courses are particularly prone to grub infestations. Figure 15–1, Life cycles and feeding periods for common grubs, describes the life cycles and feeding periods for common grubs.
Scouting Technique: Fall is the best time to scout for grubs, though spring scouting before or after planting is also possible. Soil temperatures and grub life cycle determines when each grub species is feeding at the soil surface. See life cycle sections under each grub species to properly target scouting. Scout for grubs on the sandier knolls of fields, areas near treelines and in areas where past or current injury was/is evident.
For access to neonicotinoid treated corn or soybean seeds for protection against grubs, a pest assessment must be completed according to specific criteria outlined in the Class 12 regulation requirement, outlined in Appendix G.
General scouting, not related to Class 12 pesticide requirements: Using a shovel, dig up approximately 30 cm2 (1 ft2) of soil, roughly 7.5–10 cm (3–4 in.) deep, in at least five areas of the field. Sift through the soil by hand, breaking up any clumps, and count how many grubs are found in each sample. If the crop has already emerged, find areas of the field where there are gaps in the stand or wilting seedlings. Go to the next nearest surviving plant and dig up those roots to find any actively feeding grubs.
Photo 15–3. preview.
Photo 15–4. preview.
Photo 15–5. preview.
Figure 15–1. Life cycles and feeding periods for common grubs (European chafer, June beetle, Japanese beetle). Shaded areas indicate damaging period.
302
Agronomy guide for field Crops
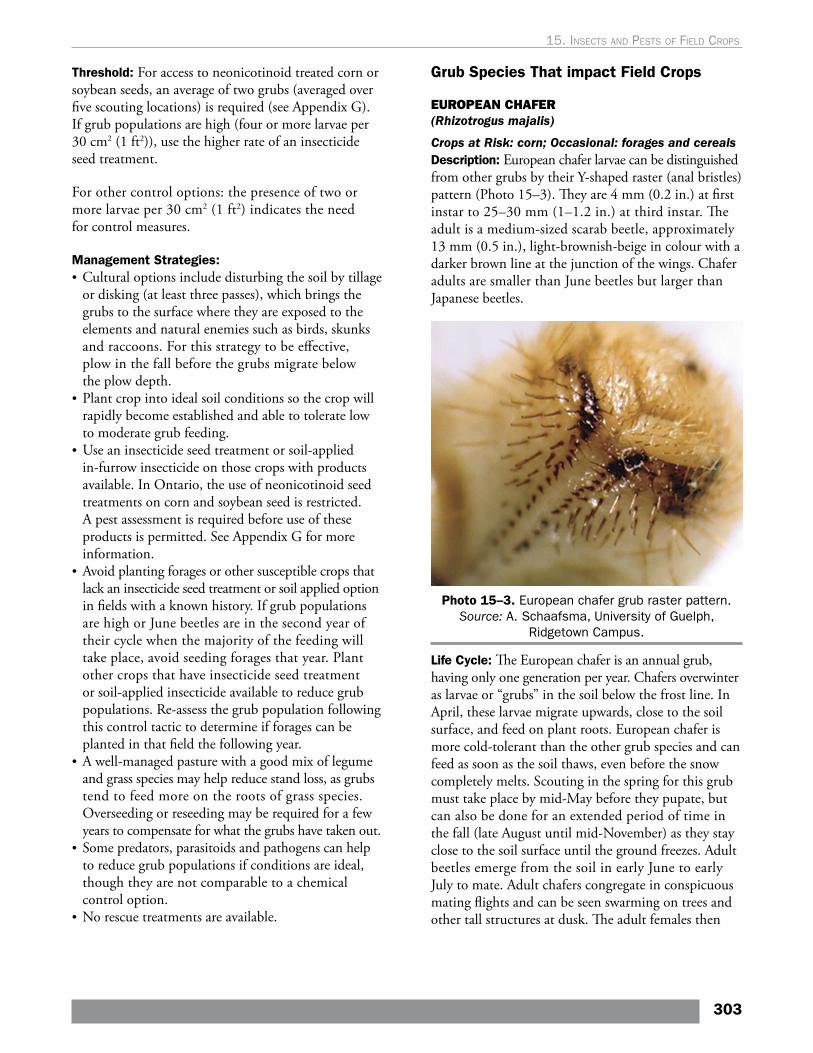
Threshold: For access to neonicotinoid treated corn or soybean seeds, an average of two grubs (averaged over five scouting locations) is required (see Appendix G). If grub populations are high (four or more larvae per 30 cm2 (1 ft2)), use the higher rate of an insecticide seed treatment.
For other control options: the presence of two or more larvae per 30 cm2 (1 ft2) indicates the need for control measures.
Management Strategies:• Cultural options include disturbing the soil by tillage
or disking (at least three passes), which brings the grubs to the surface where they are exposed to the elements and natural enemies such as birds, skunks and raccoons. For this strategy to be effective, plow in the fall before the grubs migrate below the plow depth.
• Plant crop into ideal soil conditions so the crop will rapidly become established and able to tolerate low to moderate grub feeding.
• Use an insecticide seed treatment or soil-applied in-furrow insecticide on those crops with products available. In Ontario, the use of neonicotinoid seed treatments on corn and soybean seed is restricted. A pest assessment is required before use of these products is permitted. See Appendix G for more information.
• Avoid planting forages or other susceptible crops that lack an insecticide seed treatment or soil applied option in fields with a known history. If grub populations are high or June beetles are in the second year of their cycle when the majority of the feeding will take place, avoid seeding forages that year. Plant other crops that have insecticide seed treatment or soil-applied insecticide available to reduce grub populations. Re-assess the grub population following this control tactic to determine if forages can be planted in that field the following year.
• A well-managed pasture with a good mix of legume and grass species may help reduce stand loss, as grubs tend to feed more on the roots of grass species. Overseeding or reseeding may be required for a few years to compensate for what the grubs have taken out.
• Some predators, parasitoids and pathogens can help to reduce grub populations if conditions are ideal, though they are not comparable to a chemical control option.
• No rescue treatments are available.
Grub Species That impact Field Crops
EUROPEAN CHAFER (Rhizotrogus majalis)
Crops at Risk: corn; Occasional: forages and cereals Description: European chafer larvae can be distinguished from other grubs by their Y-shaped raster (anal bristles) pattern (Photo 15–3). They are 4 mm (0.2 in.) at first instar to 25–30 mm (1–1.2 in.) at third instar. The adult is a medium-sized scarab beetle, approximately 13 mm (0.5 in.), light-brownish-beige in colour with a darker brown line at the junction of the wings. Chafer adults are smaller than June beetles but larger than Japanese beetles.
Photo 15–3. European chafer grub raster pattern. Source: A. Schaafsma, University of Guelph,
Ridgetown Campus.
Life Cycle: The European chafer is an annual grub, having only one generation per year. Chafers overwinter as larvae or “grubs” in the soil below the frost line. In April, these larvae migrate upwards, close to the soil surface, and feed on plant roots. European chafer is more cold-tolerant than the other grub species and can feed as soon as the soil thaws, even before the snow completely melts. Scouting in the spring for this grub must take place by mid-May before they pupate, but can also be done for an extended period of time in the fall (late August until mid-November) as they stay close to the soil surface until the ground freezes. Adult beetles emerge from the soil in early June to early July to mate. Adult chafers congregate in conspicuous mating flights and can be seen swarming on trees and other tall structures at dusk. The adult females then
303
15. Insects and pests oF FIeld crops
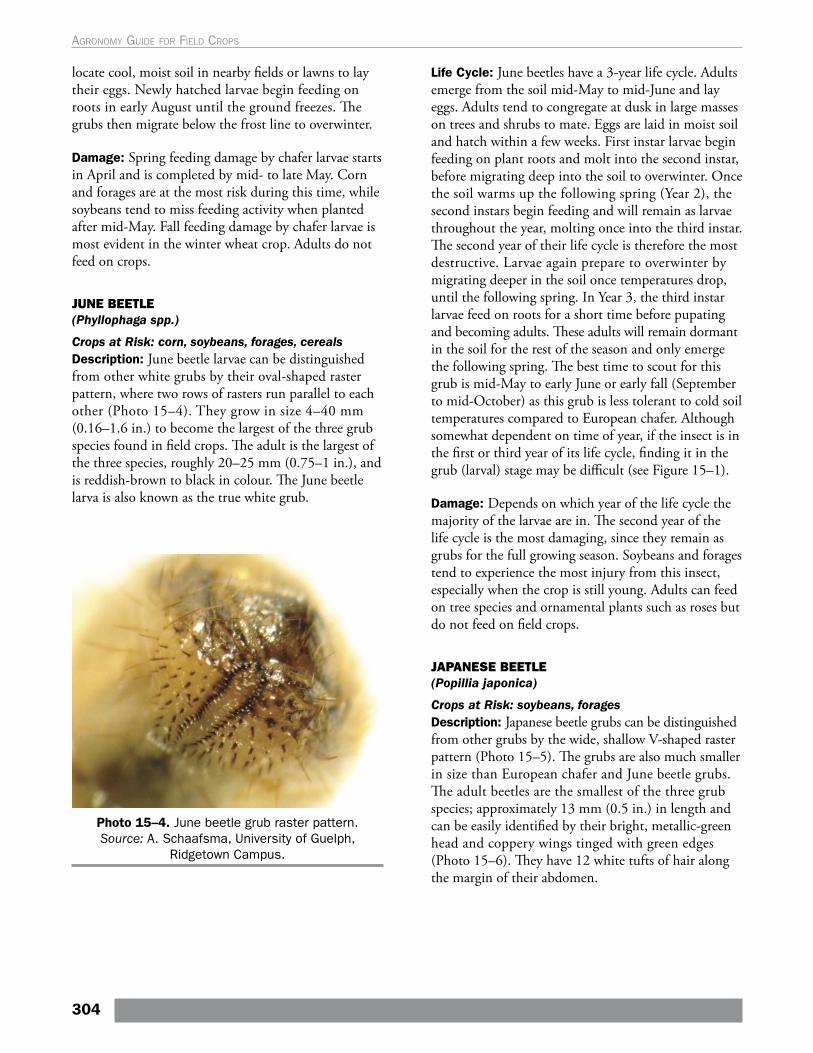
locate cool, moist soil in nearby fields or lawns to lay their eggs. Newly hatched larvae begin feeding on roots in early August until the ground freezes. The grubs then migrate below the frost line to overwinter.
Damage: Spring feeding damage by chafer larvae starts in April and is completed by mid- to late May. Corn and forages are at the most risk during this time, while soybeans tend to miss feeding activity when planted after mid-May. Fall feeding damage by chafer larvae is most evident in the winter wheat crop. Adults do not feed on crops.
JUNE BEETLE (Phyllophaga spp.)
Crops at Risk: corn, soybeans, forages, cerealsDescription: June beetle larvae can be distinguished from other white grubs by their oval-shaped raster pattern, where two rows of rasters run parallel to each other (Photo 15–4). They grow in size 4–40 mm (0.16–1.6 in.) to become the largest of the three grub species found in field crops. The adult is the largest of the three species, roughly 20–25 mm (0.75–1 in.), and is reddish-brown to black in colour. The June beetle larva is also known as the true white grub.
Photo 15–4. June beetle grub raster pattern. Source: A. Schaafsma, University of Guelph,
Ridgetown Campus.
Life Cycle: June beetles have a 3-year life cycle. Adults emerge from the soil mid-May to mid-June and lay eggs. Adults tend to congregate at dusk in large masses on trees and shrubs to mate. Eggs are laid in moist soil and hatch within a few weeks. First instar larvae begin feeding on plant roots and molt into the second instar, before migrating deep into the soil to overwinter. Once the soil warms up the following spring (Year 2), the second instars begin feeding and will remain as larvae throughout the year, molting once into the third instar. The second year of their life cycle is therefore the most destructive. Larvae again prepare to overwinter by migrating deeper in the soil once temperatures drop, until the following spring. In Year 3, the third instar larvae feed on roots for a short time before pupating and becoming adults. These adults will remain dormant in the soil for the rest of the season and only emerge the following spring. The best time to scout for this grub is mid-May to early June or early fall (September to mid-October) as this grub is less tolerant to cold soil temperatures compared to European chafer. Although somewhat dependent on time of year, if the insect is in the first or third year of its life cycle, finding it in the grub (larval) stage may be difficult (see Figure 15–1).
Damage: Depends on which year of the life cycle the majority of the larvae are in. The second year of the life cycle is the most damaging, since they remain as grubs for the full growing season. Soybeans and forages tend to experience the most injury from this insect, especially when the crop is still young. Adults can feed on tree species and ornamental plants such as roses but do not feed on field crops.
JAPANESE BEETLE(Popillia japonica)
Crops at Risk: soybeans, foragesDescription: Japanese beetle grubs can be distinguished from other grubs by the wide, shallow V-shaped raster pattern (Photo 15–5). The grubs are also much smaller in size than European chafer and June beetle grubs. The adult beetles are the smallest of the three grub species; approximately 13 mm (0.5 in.) in length and can be easily identified by their bright, metallic-green head and coppery wings tinged with green edges (Photo 15–6). They have 12 white tufts of hair along the margin of their abdomen.
304
Agronomy guide for field Crops
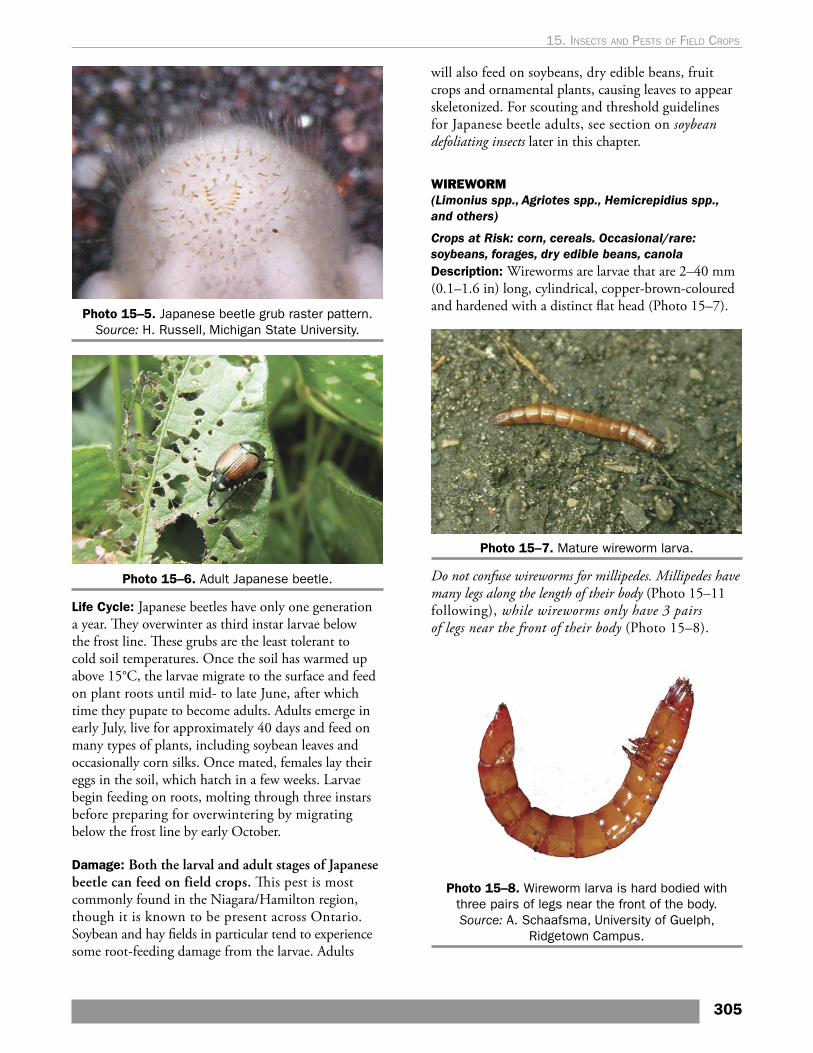
Photo 15–5. Japanese beetle grub raster pattern. Source: H. Russell, Michigan State University.
Photo 15–6. Adult Japanese beetle.
Life Cycle: Japanese beetles have only one generation a year. They overwinter as third instar larvae below the frost line. These grubs are the least tolerant to cold soil temperatures. Once the soil has warmed up above 15°C, the larvae migrate to the surface and feed on plant roots until mid- to late June, after which time they pupate to become adults. Adults emerge in early July, live for approximately 40 days and feed on many types of plants, including soybean leaves and occasionally corn silks. Once mated, females lay their eggs in the soil, which hatch in a few weeks. Larvae begin feeding on roots, molting through three instars before preparing for overwintering by migrating below the frost line by early October.
Damage: Both the larval and adult stages of Japanese beetle can feed on field crops. This pest is most commonly found in the Niagara/Hamilton region, though it is known to be present across Ontario. Soybean and hay fields in particular tend to experience some root-feeding damage from the larvae. Adults
will also feed on soybeans, dry edible beans, fruit crops and ornamental plants, causing leaves to appear skeletonized. For scouting and threshold guidelines for Japanese beetle adults, see section on soybean defoliating insects later in this chapter.
WIREWORM (Limonius spp., Agriotes spp., Hemicrepidius spp., and others)
Crops at Risk: corn, cereals. Occasional/rare: soybeans, forages, dry edible beans, canola Description: Wireworms are larvae that are 2–40 mm (0.1–1.6 in) long, cylindrical, copper-brown-coloured and hardened with a distinct flat head (Photo 15–7).
Photo 15–7. Mature wireworm larva.
Do not confuse wireworms for millipedes. Millipedes have many legs along the length of their body (Photo 15–11 following), while wireworms only have 3 pairs of legs near the front of their body (Photo 15–8).
Photo 15–8. Wireworm larva is hard bodied with three pairs of legs near the front of the body. Source: A. Schaafsma, University of Guelph,
Ridgetown Campus.
305
15. Insects and pests oF FIeld crops
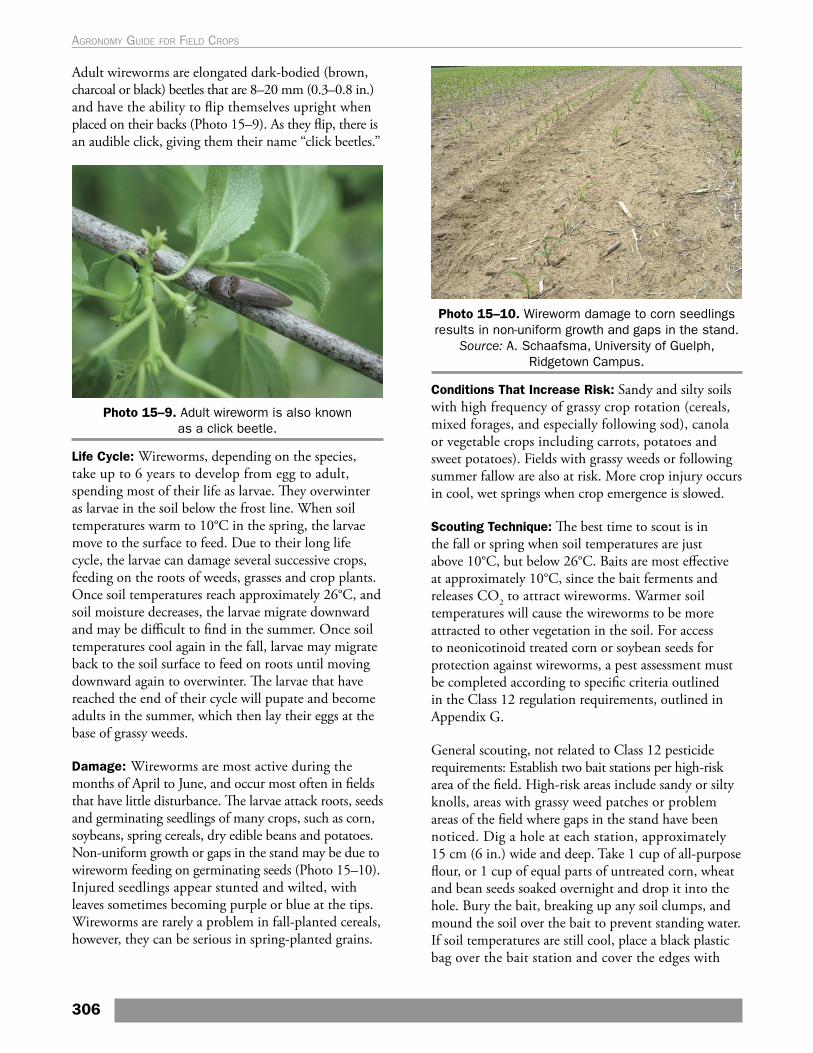
Adult wireworms are elongated dark-bodied (brown, charcoal or black) beetles that are 8–20 mm (0.3–0.8 in.) and have the ability to flip themselves upright when placed on their backs (Photo 15–9). As they flip, there is an audible click, giving them their name “click beetles.”
Photo 15–9. Adult wireworm is also known as a click beetle.
Life Cycle: Wireworms, depending on the species, take up to 6 years to develop from egg to adult, spending most of their life as larvae. They overwinter as larvae in the soil below the frost line. When soil temperatures warm to 10°C in the spring, the larvae move to the surface to feed. Due to their long life cycle, the larvae can damage several successive crops, feeding on the roots of weeds, grasses and crop plants. Once soil temperatures reach approximately 26°C, and soil moisture decreases, the larvae migrate downward and may be difficult to find in the summer. Once soil temperatures cool again in the fall, larvae may migrate back to the soil surface to feed on roots until moving downward again to overwinter. The larvae that have reached the end of their cycle will pupate and become adults in the summer, which then lay their eggs at the base of grassy weeds.
Damage: Wireworms are most active during the months of April to June, and occur most often in fields that have little disturbance. The larvae attack roots, seeds and germinating seedlings of many crops, such as corn, soybeans, spring cereals, dry edible beans and potatoes. Non-uniform growth or gaps in the stand may be due to wireworm feeding on germinating seeds (Photo 15–10). Injured seedlings appear stunted and wilted, with leaves sometimes becoming purple or blue at the tips. Wireworms are rarely a problem in fall-planted cereals, however, they can be serious in spring-planted grains.
Photo 15–10. Wireworm damage to corn seedlings results in non-uniform growth and gaps in the stand.
Source: A. Schaafsma, University of Guelph, Ridgetown Campus.
Conditions That Increase Risk: Sandy and silty soils with high frequency of grassy crop rotation (cereals, mixed forages, and especially following sod), canola or vegetable crops including carrots, potatoes and sweet potatoes). Fields with grassy weeds or following summer fallow are also at risk. More crop injury occurs in cool, wet springs when crop emergence is slowed.
Scouting Technique: The best time to scout is in the fall or spring when soil temperatures are just above 10°C, but below 26°C. Baits are most effective at approximately 10°C, since the bait ferments and releases CO2 to attract wireworms. Warmer soil temperatures will cause the wireworms to be more attracted to other vegetation in the soil. For access to neonicotinoid treated corn or soybean seeds for protection against wireworms, a pest assessment must be completed according to specific criteria outlined in the Class 12 regulation requirements, outlined in Appendix G.
General scouting, not related to Class 12 pesticide requirements: Establish two bait stations per high-risk area of the field. High-risk areas include sandy or silty knolls, areas with grassy weed patches or problem areas of the field where gaps in the stand have been noticed. Dig a hole at each station, approximately 15 cm (6 in.) wide and deep. Take 1 cup of all-purpose flour, or 1 cup of equal parts of untreated corn, wheat and bean seeds soaked overnight and drop it into the hole. Bury the bait, breaking up any soil clumps, and mound the soil over the bait to prevent standing water. If soil temperatures are still cool, place a black plastic bag over the bait station and cover the edges with
306
Agronomy guide for field Crops
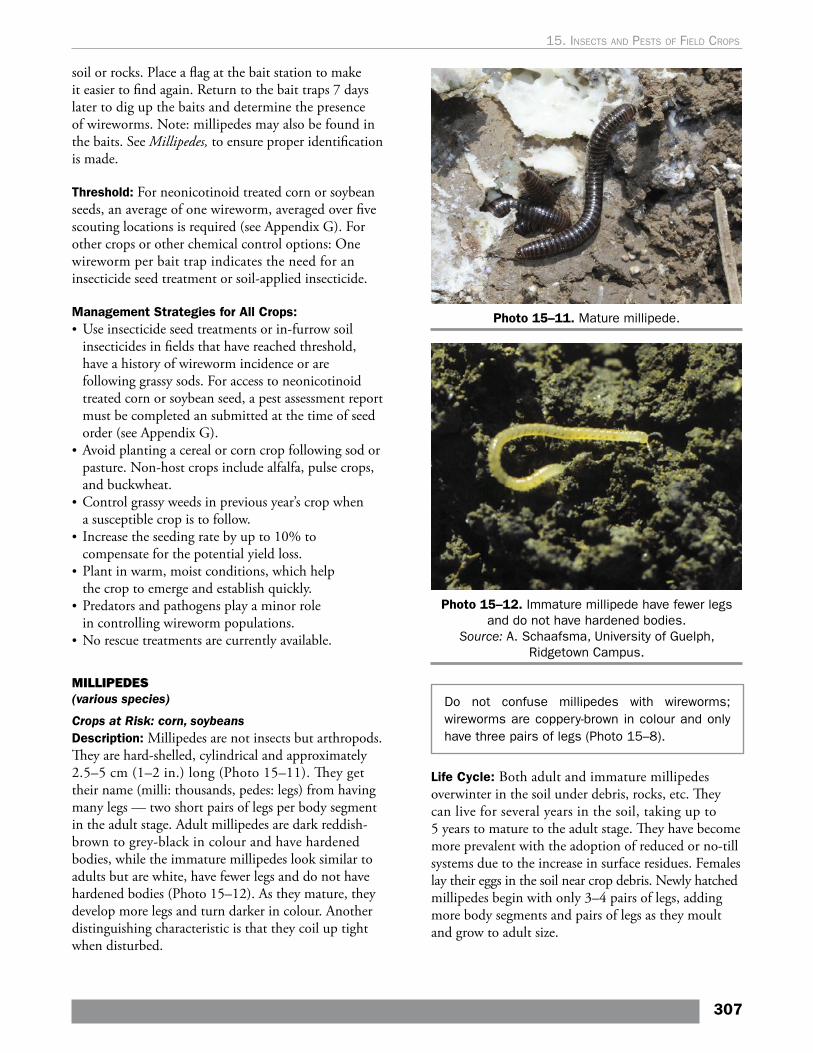
soil or rocks. Place a flag at the bait station to make it easier to find again. Return to the bait traps 7 days later to dig up the baits and determine the presence of wireworms. Note: millipedes may also be found in the baits. See Millipedes, to ensure proper identification is made.
Threshold: For neonicotinoid treated corn or soybean seeds, an average of one wireworm, averaged over five scouting locations is required (see Appendix G). For other crops or other chemical control options: One wireworm per bait trap indicates the need for an insecticide seed treatment or soil-applied insecticide.
Management Strategies for All Crops: • Use insecticide seed treatments or in-furrow soil
insecticides in fields that have reached threshold, have a history of wireworm incidence or are following grassy sods. For access to neonicotinoid treated corn or soybean seed, a pest assessment report must be completed an submitted at the time of seed order (see Appendix G).
• Avoid planting a cereal or corn crop following sod or pasture. Non-host crops include alfalfa, pulse crops, and buckwheat.
• Control grassy weeds in previous year’s crop when a susceptible crop is to follow.
• Increase the seeding rate by up to 10% to compensate for the potential yield loss.
• Plant in warm, moist conditions, which help the crop to emerge and establish quickly.
• Predators and pathogens play a minor role in controlling wireworm populations.
• No rescue treatments are currently available.
MILLIPEDES(various species)
Crops at Risk: corn, soybeansDescription: Millipedes are not insects but arthropods. They are hard-shelled, cylindrical and approximately 2.5–5 cm (1–2 in.) long (Photo 15–11). They get their name (milli: thousands, pedes: legs) from having many legs — two short pairs of legs per body segment in the adult stage. Adult millipedes are dark reddish-brown to grey-black in colour and have hardened bodies, while the immature millipedes look similar to adults but are white, have fewer legs and do not have hardened bodies (Photo 15–12). As they mature, they develop more legs and turn darker in colour. Another distinguishing characteristic is that they coil up tight when disturbed.
Photo 15–11. Mature millipede.
Photo 15–12. Immature millipede have fewer legs and do not have hardened bodies.
Source: A. Schaafsma, University of Guelph, Ridgetown Campus.
Do not confuse millipedes with wireworms; wireworms are coppery-brown in colour and only have three pairs of legs (Photo 15–8).
Life Cycle: Both adult and immature millipedes overwinter in the soil under debris, rocks, etc. They can live for several years in the soil, taking up to 5 years to mature to the adult stage. They have become more prevalent with the adoption of reduced or no-till systems due to the increase in surface residues. Females lay their eggs in the soil near crop debris. Newly hatched millipedes begin with only 3–4 pairs of legs, adding more body segments and pairs of legs as they moult and grow to adult size.
307
15. Insects and pests oF FIeld crops
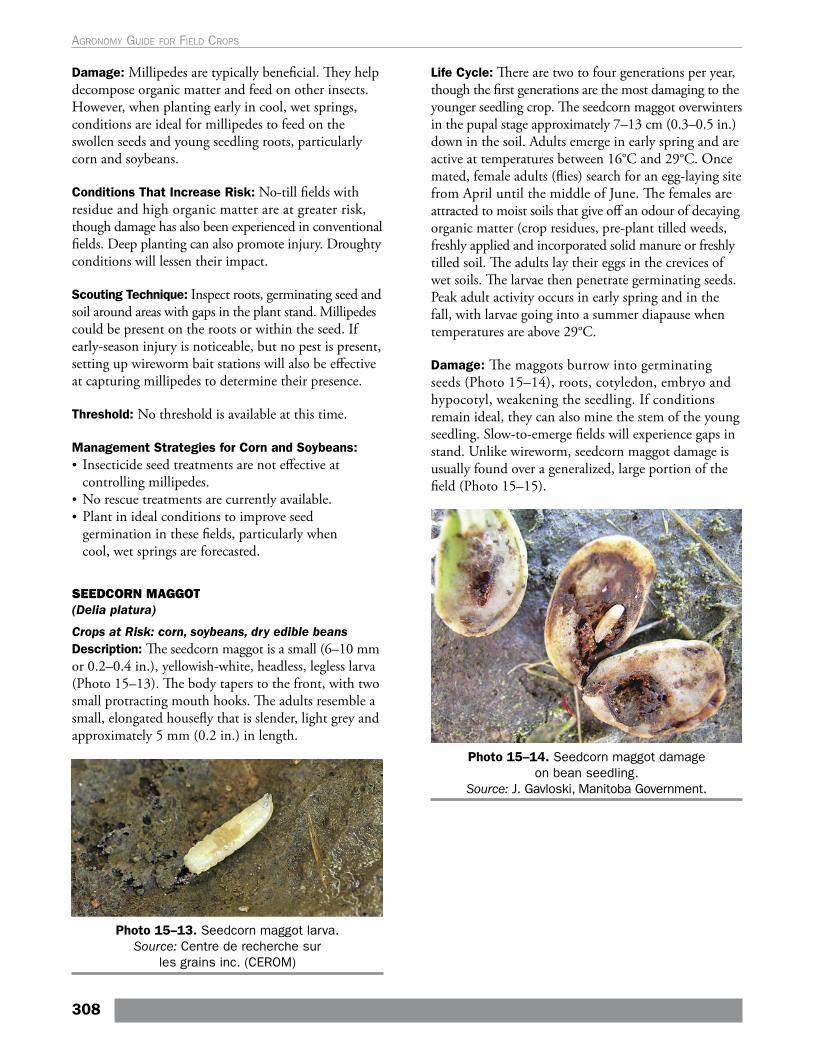
Damage: Millipedes are typically beneficial. They help decompose organic matter and feed on other insects. However, when planting early in cool, wet springs, conditions are ideal for millipedes to feed on the swollen seeds and young seedling roots, particularly corn and soybeans.
Conditions That Increase Risk: No-till fields with residue and high organic matter are at greater risk, though damage has also been experienced in conventional fields. Deep planting can also promote injury. Droughty conditions will lessen their impact.
Scouting Technique: Inspect roots, germinating seed and soil around areas with gaps in the plant stand. Millipedes could be present on the roots or within the seed. If early-season injury is noticeable, but no pest is present, setting up wireworm bait stations will also be effective at capturing millipedes to determine their presence.
Threshold: No threshold is available at this time.
Management Strategies for Corn and Soybeans: • Insecticide seed treatments are not effective at
controlling millipedes. • No rescue treatments are currently available.• Plant in ideal conditions to improve seed
germination in these fields, particularly when cool, wet springs are forecasted.
SEEDCORN MAGGOT (Delia platura)
Crops at Risk: corn, soybeans, dry edible beansDescription: The seedcorn maggot is a small (6–10 mm or 0.2–0.4 in.), yellowish-white, headless, legless larva (Photo 15–13). The body tapers to the front, with two small protracting mouth hooks. The adults resemble a small, elongated housefly that is slender, light grey and approximately 5 mm (0.2 in.) in length.
Photo 15–13. Seedcorn maggot larva. Source: Centre de recherche sur
les grains inc. (CEROM)
Life Cycle: There are two to four generations per year, though the first generations are the most damaging to the younger seedling crop. The seedcorn maggot overwinters in the pupal stage approximately 7–13 cm (0.3–0.5 in.) down in the soil. Adults emerge in early spring and are active at temperatures between 16°C and 29°C. Once mated, female adults (flies) search for an egg-laying site from April until the middle of June. The females are attracted to moist soils that give off an odour of decaying organic matter (crop residues, pre-plant tilled weeds, freshly applied and incorporated solid manure or freshly tilled soil. The adults lay their eggs in the crevices of wet soils. The larvae then penetrate germinating seeds. Peak adult activity occurs in early spring and in the fall, with larvae going into a summer diapause when temperatures are above 29°C.
Damage: The maggots burrow into germinating seeds (Photo 15–14), roots, cotyledon, embryo and hypocotyl, weakening the seedling. If conditions remain ideal, they can also mine the stem of the young seedling. Slow-to-emerge fields will experience gaps in stand. Unlike wireworm, seedcorn maggot damage is usually found over a generalized, large portion of the field (Photo 15–15).
Photo 15–14. Seedcorn maggot damage on bean seedling.
Source: J. Gavloski, Manitoba Government.
308
Agronomy guide for field Crops
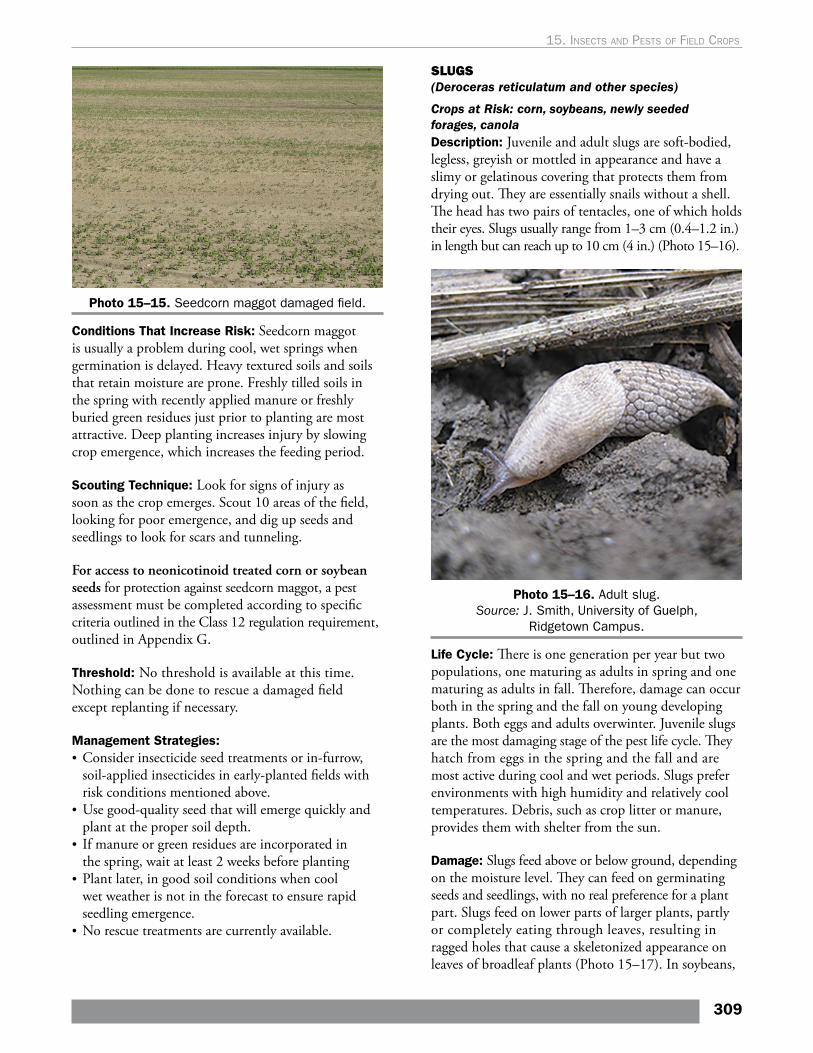
Photo 15–15. Seedcorn maggot damaged field.
Conditions That Increase Risk: Seedcorn maggot is usually a problem during cool, wet springs when germination is delayed. Heavy textured soils and soils that retain moisture are prone. Freshly tilled soils in the spring with recently applied manure or freshly buried green residues just prior to planting are most attractive. Deep planting increases injury by slowing crop emergence, which increases the feeding period.
Scouting Technique: Look for signs of injury as soon as the crop emerges. Scout 10 areas of the field, looking for poor emergence, and dig up seeds and seedlings to look for scars and tunneling.
For access to neonicotinoid treated corn or soybean seeds for protection against seedcorn maggot, a pest assessment must be completed according to specific criteria outlined in the Class 12 regulation requirement, outlined in Appendix G.
Threshold: No threshold is available at this time. Nothing can be done to rescue a damaged field except replanting if necessary.
Management Strategies: • Consider insecticide seed treatments or in-furrow,
soil-applied insecticides in early-planted fields with risk conditions mentioned above.
• Use good-quality seed that will emerge quickly and plant at the proper soil depth.
• If manure or green residues are incorporated in the spring, wait at least 2 weeks before planting
• Plant later, in good soil conditions when cool wet weather is not in the forecast to ensure rapid seedling emergence.
• No rescue treatments are currently available.
SLUGS (Deroceras reticulatum and other species)
Crops at Risk: corn, soybeans, newly seeded forages, canolaDescription: Juvenile and adult slugs are soft-bodied, legless, greyish or mottled in appearance and have a slimy or gelatinous covering that protects them from drying out. They are essentially snails without a shell. The head has two pairs of tentacles, one of which holds their eyes. Slugs usually range from 1–3 cm (0.4–1.2 in.) in length but can reach up to 10 cm (4 in.) (Photo 15–16).
Photo 15–16. Adult slug. Source: J. Smith, University of Guelph,
Ridgetown Campus.
Life Cycle: There is one generation per year but two populations, one maturing as adults in spring and one maturing as adults in fall. Therefore, damage can occur both in the spring and the fall on young developing plants. Both eggs and adults overwinter. Juvenile slugs are the most damaging stage of the pest life cycle. They hatch from eggs in the spring and the fall and are most active during cool and wet periods. Slugs prefer environments with high humidity and relatively cool temperatures. Debris, such as crop litter or manure, provides them with shelter from the sun.
Damage: Slugs feed above or below ground, depending on the moisture level. They can feed on germinating seeds and seedlings, with no real preference for a plant part. Slugs feed on lower parts of larger plants, partly or completely eating through leaves, resulting in ragged holes that cause a skeletonized appearance on leaves of broadleaf plants (Photo 15–17). In soybeans,
309
15. Insects and pests oF FIeld crops
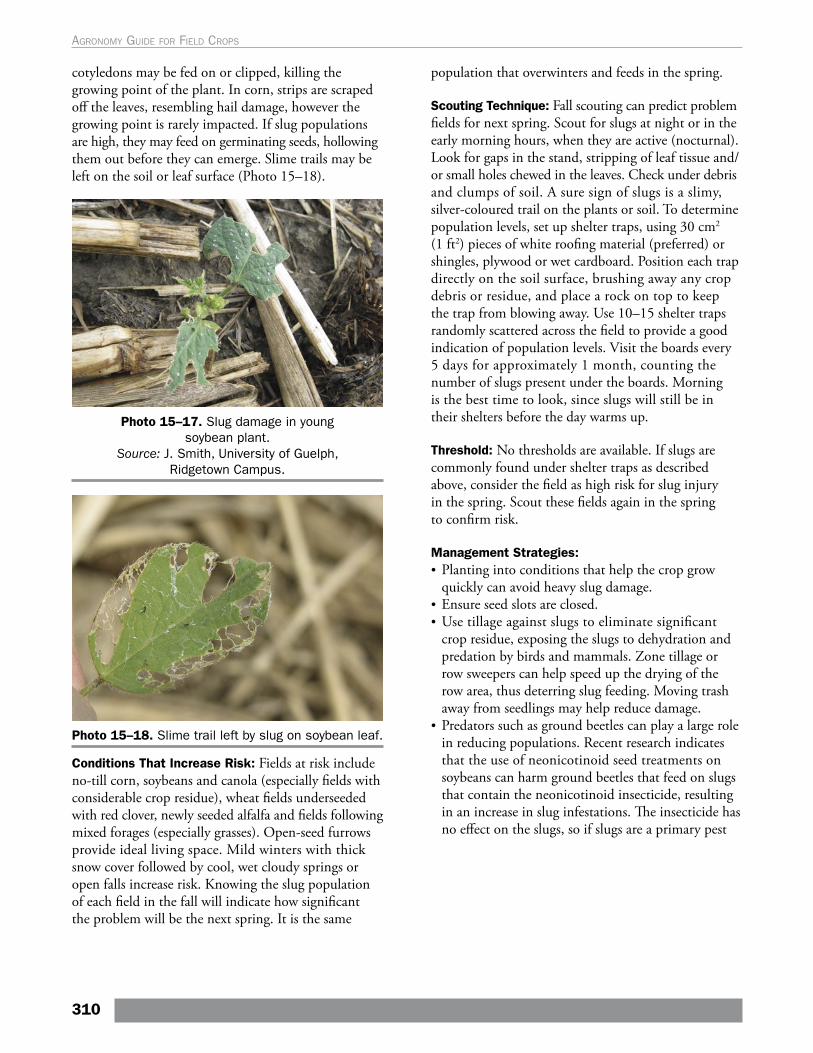
cotyledons may be fed on or clipped, killing the growing point of the plant. In corn, strips are scraped off the leaves, resembling hail damage, however the growing point is rarely impacted. If slug populations are high, they may feed on germinating seeds, hollowing them out before they can emerge. Slime trails may be left on the soil or leaf surface (Photo 15–18).
Photo 15–17. Slug damage in young soybean plant.
Source: J. Smith, University of Guelph, Ridgetown Campus.
Photo 15–18. Slime trail left by slug on soybean leaf.
Conditions That Increase Risk: Fields at risk include no-till corn, soybeans and canola (especially fields with considerable crop residue), wheat fields underseeded with red clover, newly seeded alfalfa and fields following mixed forages (especially grasses). Open-seed furrows provide ideal living space. Mild winters with thick snow cover followed by cool, wet cloudy springs or open falls increase risk. Knowing the slug population of each field in the fall will indicate how significant the problem will be the next spring. It is the same
population that overwinters and feeds in the spring.
Scouting Technique: Fall scouting can predict problem fields for next spring. Scout for slugs at night or in the early morning hours, when they are active (nocturnal). Look for gaps in the stand, stripping of leaf tissue and/or small holes chewed in the leaves. Check under debris and clumps of soil. A sure sign of slugs is a slimy, silver-coloured trail on the plants or soil. To determine population levels, set up shelter traps, using 30 cm2 (1 ft2) pieces of white roofing material (preferred) or shingles, plywood or wet cardboard. Position each trap directly on the soil surface, brushing away any crop debris or residue, and place a rock on top to keep the trap from blowing away. Use 10–15 shelter traps randomly scattered across the field to provide a good indication of population levels. Visit the boards every 5 days for approximately 1 month, counting the number of slugs present under the boards. Morning is the best time to look, since slugs will still be in their shelters before the day warms up.
Threshold: No thresholds are available. If slugs are commonly found under shelter traps as described above, consider the field as high risk for slug injury in the spring. Scout these fields again in the spring to confirm risk.
Management Strategies: • Planting into conditions that help the crop grow
quickly can avoid heavy slug damage. • Ensure seed slots are closed.• Use tillage against slugs to eliminate significant
crop residue, exposing the slugs to dehydration and predation by birds and mammals. Zone tillage or row sweepers can help speed up the drying of the row area, thus deterring slug feeding. Moving trash away from seedlings may help reduce damage.
• Predators such as ground beetles can play a large role in reducing populations. Recent research indicates that the use of neonicotinoid seed treatments on soybeans can harm ground beetles that feed on slugs that contain the neonicotinoid insecticide, resulting in an increase in slug infestations. The insecticide has no effect on the slugs, so if slugs are a primary pest
310
Agronomy guide for field Crops
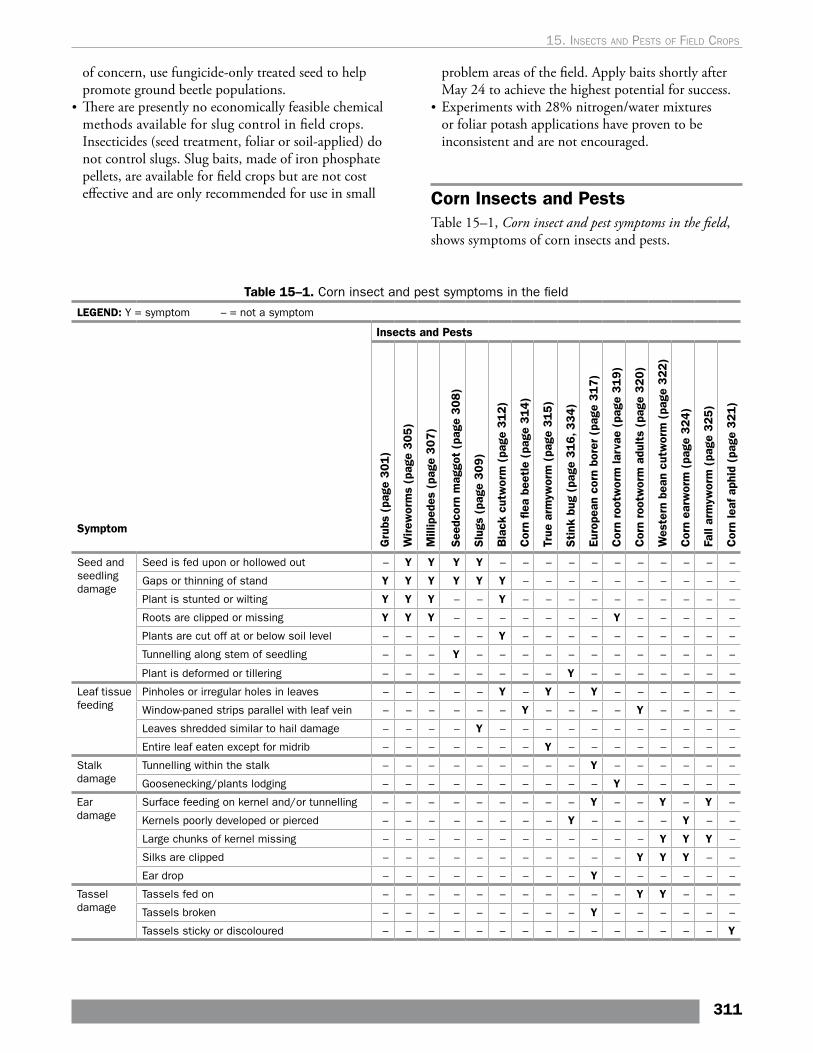
of concern, use fungicide-only treated seed to help promote ground beetle populations.
• There are presently no economically feasible chemical methods available for slug control in field crops. Insecticides (seed treatment, foliar or soil-applied) do not control slugs. Slug baits, made of iron phosphate pellets, are available for field crops but are not cost effective and are only recommended for use in small
problem areas of the field. Apply baits shortly after May 24 to achieve the highest potential for success.
• Experiments with 28% nitrogen/water mixtures or foliar potash applications have proven to be inconsistent and are not encouraged.
Corn Insects and PestsTable 15–1, Corn insect and pest symptoms in the field, shows symptoms of corn insects and pests.
Table 15–1. Corn insect and pest symptoms in the field
LEGEND: Y = symptom – = not a symptom
Symptom
Insects and Pests
Gru
bs (
page
301)
Wirew
orm
s (p
age
305)
Mill
iped
es (
page
30
7)
See
dcor
n m
aggo
t (p
age
308)
Slu
gs (
page
309)
Bla
ck c
utw
orm
(pa
ge 3
12)
Cor
n fle
a be
etle
(pa
ge 3
14)
True
arm
ywor
m (
page
315
)
Sti
nk b
ug (
page
316, 3
34)
Euro
pean
cor
n bo
rer
(pag
e 3
17)
Cor
n ro
otw
orm
larv
ae (
page
319)
Cor
n ro
otw
orm
adu
lts
(pag
e 320
)
Wes
tern
bea
n cu
twor
m (
page
322)
Cor
n ea
rwor
m (
page
32
4)
Fall
arm
ywor
m (
page
32
5)
Cor
n le
af a
phid
(pa
ge 3
21)
Seed and seedling damage
Seed is fed upon or hollowed out – Y Y Y Y – – – – – – – – – – –
Gaps or thinning of stand Y Y Y Y Y Y – – – – – – – – – –
Plant is stunted or wilting Y Y Y – – Y – – – – – – – – – –
Roots are clipped or missing Y Y Y – – – – – – – Y – – – – –
Plants are cut off at or below soil level – – – – – Y – – – – – – – – – –
Tunnelling along stem of seedling – – – Y – – – – – – – – – – – –
Plant is deformed or tillering – – – – – – – – Y – – – – – – –
Leaf tissue feeding
Pinholes or irregular holes in leaves – – – – – Y – Y – Y – – – – – –
Window-paned strips parallel with leaf vein – – – – – – Y – – – – Y – – – –
Leaves shredded similar to hail damage – – – – Y – – – – – – – – – – –
Entire leaf eaten except for midrib – – – – – – – Y – – – – – – – –
Stalk damage
Tunnelling within the stalk – – – – – – – – – Y – – – – – –
Goosenecking/plants lodging – – – – – – – – – – Y – – – – –
Ear damage
Surface feeding on kernel and/or tunnelling – – – – – – – – – Y – – Y – Y –
Kernels poorly developed or pierced – – – – – – – – Y – – – – Y – –
Large chunks of kernel missing – – – – – – – – – – – – Y Y Y –
Silks are clipped – – – – – – – – – – – Y Y Y – –
Ear drop – – – – – – – – – Y – – – – – –
Tassel damage
Tassels fed on – – – – – – – – – – – Y Y – – –
Tassels broken – – – – – – – – – Y – – – – – –
Tassels sticky or discoloured – – – – – – – – – – – – – – – Y
311
15. Insects and pests oF FIeld crops
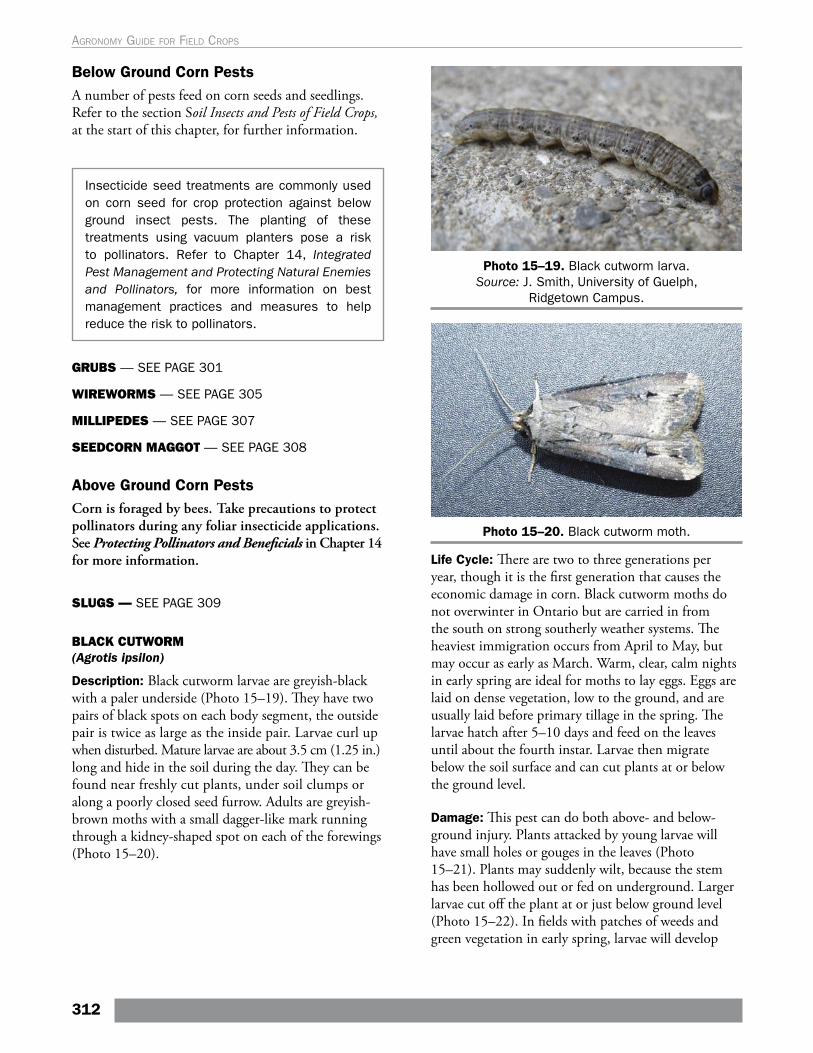
Below Ground Corn PestsA number of pests feed on corn seeds and seedlings. Refer to the section Soil Insects and Pests of Field Crops, at the start of this chapter, for further information.
Insecticide seed treatments are commonly used on corn seed for crop protection against below ground insect pests. The planting of these treatments using vacuum planters pose a risk to pollinators. Refer to Chapter 14, Integrated Pest Management and Protecting Natural Enemies and Pollinators, for more information on best management practices and measures to help reduce the risk to pollinators.
GRUBS — SEE PAGE 301
WIREWORMS — SEE PAGE 305
MILLIPEDES — SEE PAGE 307
SEEDCORN MAGGOT — SEE PAGE 308
Above Ground Corn PestsCorn is foraged by bees. Take precautions to protect pollinators during any foliar insecticide applications. See Protecting Pollinators and Beneficials in Chapter 14 for more information.
SLUGS — SEE PAGE 309
BLACK CUTWORM(Agrotis ipsilon)
Description: Black cutworm larvae are greyish-black with a paler underside (Photo 15–19). They have two pairs of black spots on each body segment, the outside pair is twice as large as the inside pair. Larvae curl up when disturbed. Mature larvae are about 3.5 cm (1.25 in.) long and hide in the soil during the day. They can be found near freshly cut plants, under soil clumps or along a poorly closed seed furrow. Adults are greyish-brown moths with a small dagger-like mark running through a kidney-shaped spot on each of the forewings (Photo 15–20).
Photo 15–19. Black cutworm larva. Source: J. Smith, University of Guelph,
Ridgetown Campus.
Photo 15–20. Black cutworm moth.
Life Cycle: There are two to three generations per year, though it is the first generation that causes the economic damage in corn. Black cutworm moths do not overwinter in Ontario but are carried in from the south on strong southerly weather systems. The heaviest immigration occurs from April to May, but may occur as early as March. Warm, clear, calm nights in early spring are ideal for moths to lay eggs. Eggs are laid on dense vegetation, low to the ground, and are usually laid before primary tillage in the spring. The larvae hatch after 5–10 days and feed on the leaves until about the fourth instar. Larvae then migrate below the soil surface and can cut plants at or below the ground level.
Damage: This pest can do both above- and below- ground injury. Plants attacked by young larvae will have small holes or gouges in the leaves (Photo 15–21). Plants may suddenly wilt, because the stem has been hollowed out or fed on underground. Larger larvae cut off the plant at or just below ground level (Photo 15–22). In fields with patches of weeds and green vegetation in early spring, larvae will develop
312
Agronomy guide for field Crops
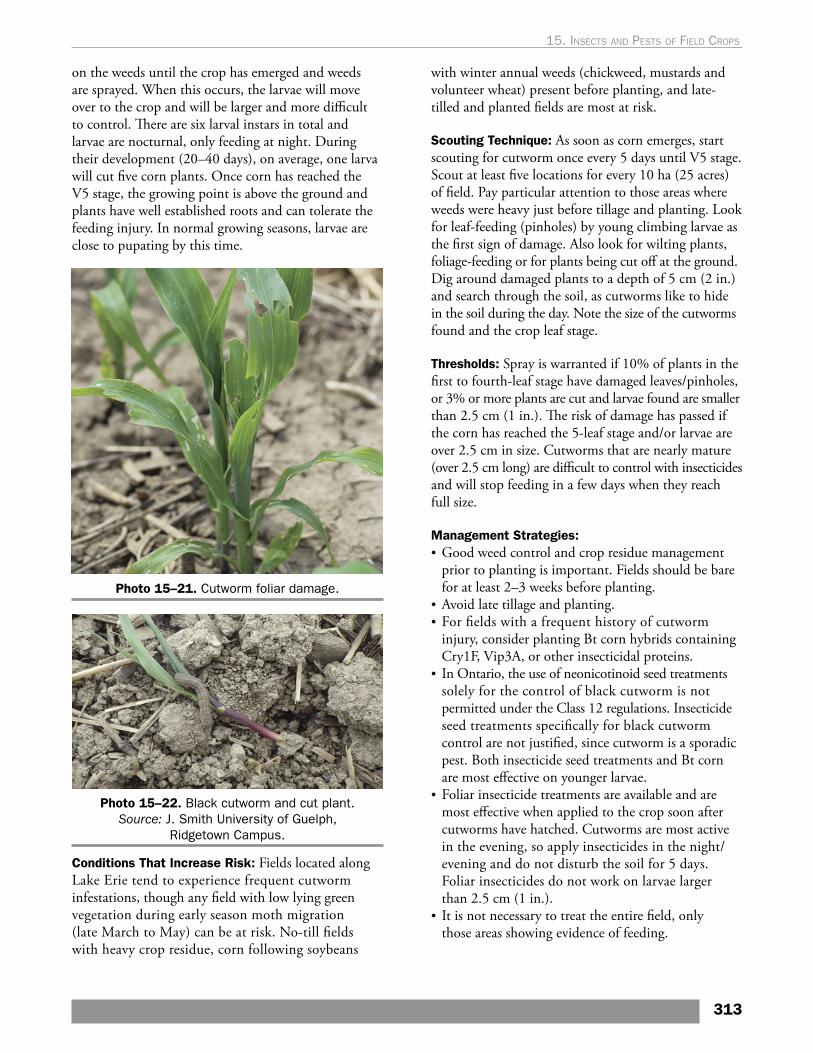
on the weeds until the crop has emerged and weeds are sprayed. When this occurs, the larvae will move over to the crop and will be larger and more difficult to control. There are six larval instars in total and larvae are nocturnal, only feeding at night. During their development (20–40 days), on average, one larva will cut five corn plants. Once corn has reached the V5 stage, the growing point is above the ground and plants have well established roots and can tolerate the feeding injury. In normal growing seasons, larvae are close to pupating by this time.
Photo 15–21. Cutworm foliar damage.
Photo 15–22. Black cutworm and cut plant. Source: J. Smith University of Guelph,
Ridgetown Campus.
Conditions That Increase Risk: Fields located along Lake Erie tend to experience frequent cutworm infestations, though any field with low lying green vegetation during early season moth migration (late March to May) can be at risk. No-till fields with heavy crop residue, corn following soybeans
with winter annual weeds (chickweed, mustards and volunteer wheat) present before planting, and late-tilled and planted fields are most at risk.
Scouting Technique: As soon as corn emerges, start scouting for cutworm once every 5 days until V5 stage. Scout at least five locations for every 10 ha (25 acres) of field. Pay particular attention to those areas where weeds were heavy just before tillage and planting. Look for leaf-feeding (pinholes) by young climbing larvae as the first sign of damage. Also look for wilting plants, foliage-feeding or for plants being cut off at the ground. Dig around damaged plants to a depth of 5 cm (2 in.) and search through the soil, as cutworms like to hide in the soil during the day. Note the size of the cutworms found and the crop leaf stage.
Thresholds: Spray is warranted if 10% of plants in the first to fourth-leaf stage have damaged leaves/pinholes, or 3% or more plants are cut and larvae found are smaller than 2.5 cm (1 in.). The risk of damage has passed if the corn has reached the 5-leaf stage and/or larvae are over 2.5 cm in size. Cutworms that are nearly mature (over 2.5 cm long) are difficult to control with insecticides and will stop feeding in a few days when they reach full size.
Management Strategies: • Good weed control and crop residue management
prior to planting is important. Fields should be bare for at least 2–3 weeks before planting.
• Avoid late tillage and planting.• For fields with a frequent history of cutworm
injury, consider planting Bt corn hybrids containing Cry1F, Vip3A, or other insecticidal proteins.
• In Ontario, the use of neonicotinoid seed treatments solely for the control of black cutworm is not permitted under the Class 12 regulations. Insecticide seed treatments specifically for black cutworm control are not justified, since cutworm is a sporadic pest. Both insecticide seed treatments and Bt corn are most effective on younger larvae.
• Foliar insecticide treatments are available and are most effective when applied to the crop soon after cutworms have hatched. Cutworms are most active in the evening, so apply insecticides in the night/evening and do not disturb the soil for 5 days. Foliar insecticides do not work on larvae larger than 2.5 cm (1 in.).
• It is not necessary to treat the entire field, only those areas showing evidence of feeding.
313
15. Insects and pests oF FIeld crops
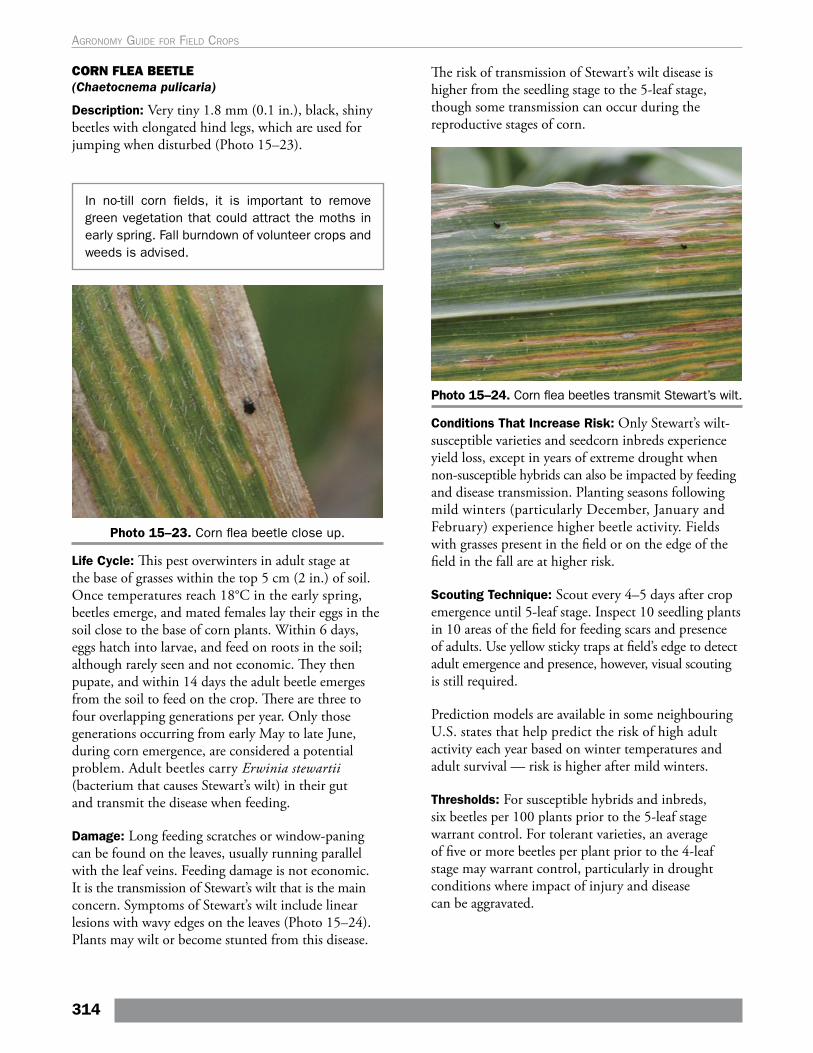
CORN FLEA BEETLE (Chaetocnema pulicaria)
Description: Very tiny 1.8 mm (0.1 in.), black, shiny beetles with elongated hind legs, which are used for jumping when disturbed (Photo 15–23).
In no-till corn fields, it is important to remove green vegetation that could attract the moths in early spring. Fall burndown of volunteer crops and weeds is advised.
Photo 15–23. Corn flea beetle close up.
Life Cycle: This pest overwinters in adult stage at the base of grasses within the top 5 cm (2 in.) of soil. Once temperatures reach 18°C in the early spring, beetles emerge, and mated females lay their eggs in the soil close to the base of corn plants. Within 6 days, eggs hatch into larvae, and feed on roots in the soil; although rarely seen and not economic. They then pupate, and within 14 days the adult beetle emerges from the soil to feed on the crop. There are three to four overlapping generations per year. Only those generations occurring from early May to late June, during corn emergence, are considered a potential problem. Adult beetles carry Erwinia stewartii (bacterium that causes Stewart’s wilt) in their gut and transmit the disease when feeding.
Damage: Long feeding scratches or window-paning can be found on the leaves, usually running parallel with the leaf veins. Feeding damage is not economic. It is the transmission of Stewart’s wilt that is the main concern. Symptoms of Stewart’s wilt include linear lesions with wavy edges on the leaves (Photo 15–24). Plants may wilt or become stunted from this disease.
The risk of transmission of Stewart’s wilt disease is higher from the seedling stage to the 5-leaf stage, though some transmission can occur during the reproductive stages of corn.
Photo 15–24. Corn flea beetles transmit Stewart’s wilt.
Conditions That Increase Risk: Only Stewart’s wilt-susceptible varieties and seedcorn inbreds experience yield loss, except in years of extreme drought when non-susceptible hybrids can also be impacted by feeding and disease transmission. Planting seasons following mild winters (particularly December, January and February) experience higher beetle activity. Fields with grasses present in the field or on the edge of the field in the fall are at higher risk.
Scouting Technique: Scout every 4–5 days after crop emergence until 5-leaf stage. Inspect 10 seedling plants in 10 areas of the field for feeding scars and presence of adults. Use yellow sticky traps at field’s edge to detect adult emergence and presence, however, visual scouting is still required.
Prediction models are available in some neighbouring U.S. states that help predict the risk of high adult activity each year based on winter temperatures and adult survival — risk is higher after mild winters.
Thresholds: For susceptible hybrids and inbreds, six beetles per 100 plants prior to the 5-leaf stage warrant control. For tolerant varieties, an average of five or more beetles per plant prior to the 4-leaf stage may warrant control, particularly in drought conditions where impact of injury and disease can be aggravated.
314
Agronomy guide for field Crops
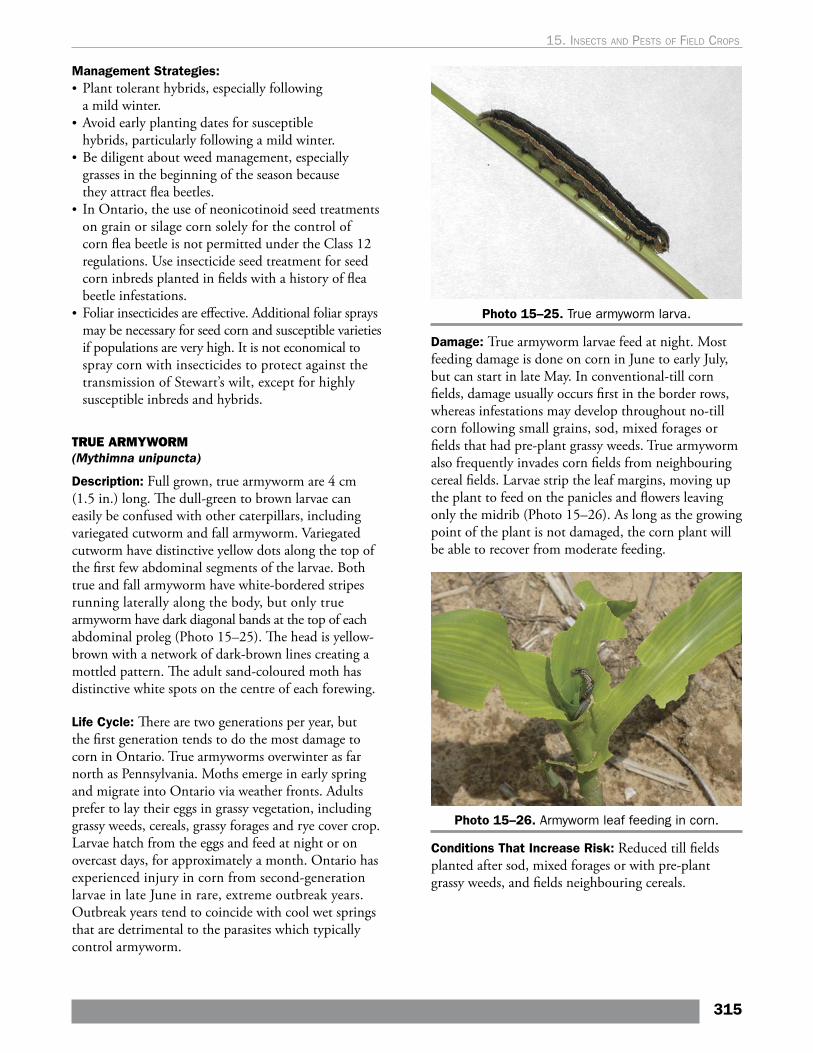
Management Strategies: • Plant tolerant hybrids, especially following
a mild winter.• Avoid early planting dates for susceptible
hybrids, particularly following a mild winter.• Be diligent about weed management, especially
grasses in the beginning of the season because they attract flea beetles.
• In Ontario, the use of neonicotinoid seed treatments on grain or silage corn solely for the control of corn flea beetle is not permitted under the Class 12 regulations. Use insecticide seed treatment for seed corn inbreds planted in fields with a history of flea beetle infestations.
• Foliar insecticides are effective. Additional foliar sprays may be necessary for seed corn and susceptible varieties if populations are very high. It is not economical to spray corn with insecticides to protect against the transmission of Stewart’s wilt, except for highly susceptible inbreds and hybrids.
TRUE ARMYWORM(Mythimna unipuncta)
Description: Full grown, true armyworm are 4 cm (1.5 in.) long. The dull-green to brown larvae can easily be confused with other caterpillars, including variegated cutworm and fall armyworm. Variegated cutworm have distinctive yellow dots along the top of the first few abdominal segments of the larvae. Both true and fall armyworm have white-bordered stripes running laterally along the body, but only true armyworm have dark diagonal bands at the top of each abdominal proleg (Photo 15–25). The head is yellow-brown with a network of dark-brown lines creating a mottled pattern. The adult sand-coloured moth has distinctive white spots on the centre of each forewing.
Life Cycle: There are two generations per year, but the first generation tends to do the most damage to corn in Ontario. True armyworms overwinter as far north as Pennsylvania. Moths emerge in early spring and migrate into Ontario via weather fronts. Adults prefer to lay their eggs in grassy vegetation, including grassy weeds, cereals, grassy forages and rye cover crop. Larvae hatch from the eggs and feed at night or on overcast days, for approximately a month. Ontario has experienced injury in corn from second-generation larvae in late June in rare, extreme outbreak years. Outbreak years tend to coincide with cool wet springs that are detrimental to the parasites which typically control armyworm.
Photo 15–25. True armyworm larva.
Damage: True armyworm larvae feed at night. Most feeding damage is done on corn in June to early July, but can start in late May. In conventional-till corn fields, damage usually occurs first in the border rows, whereas infestations may develop throughout no-till corn following small grains, sod, mixed forages or fields that had pre-plant grassy weeds. True armyworm also frequently invades corn fields from neighbouring cereal fields. Larvae strip the leaf margins, moving up the plant to feed on the panicles and flowers leaving only the midrib (Photo 15–26). As long as the growing point of the plant is not damaged, the corn plant will be able to recover from moderate feeding.
Photo 15–26. Armyworm leaf feeding in corn.
Conditions That Increase Risk: Reduced till fields planted after sod, mixed forages or with pre-plant grassy weeds, and fields neighbouring cereals.
315
15. Insects and pests oF FIeld crops
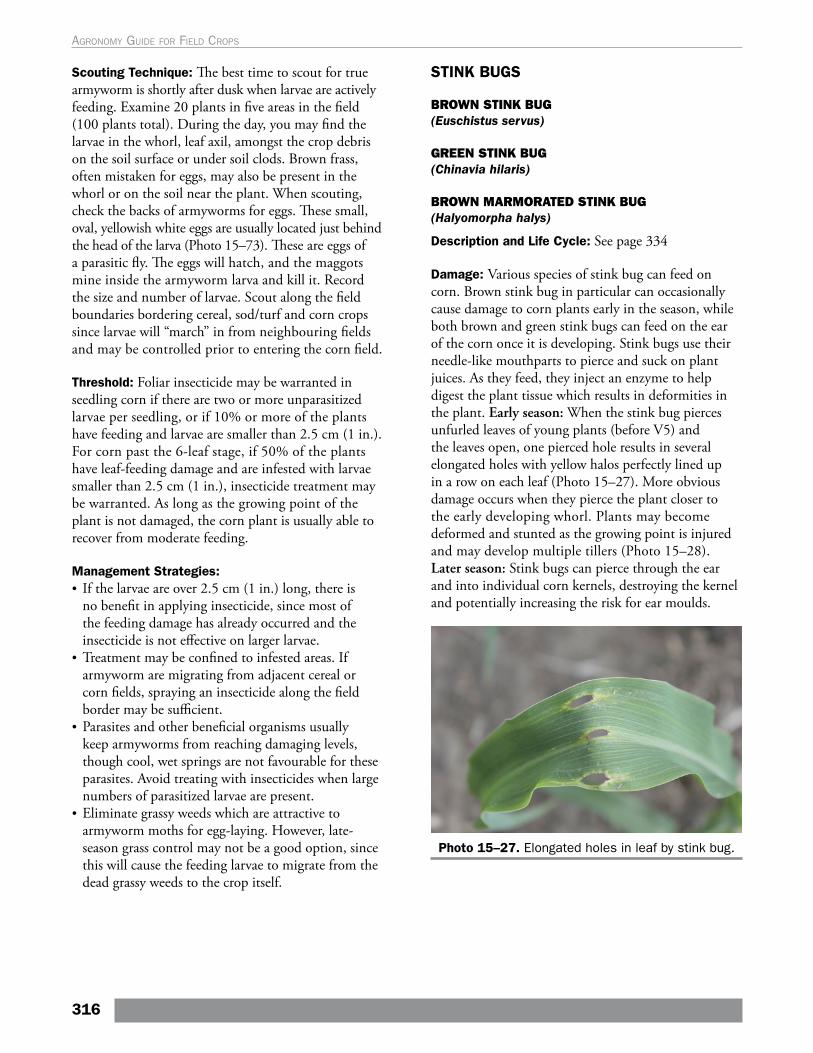
Scouting Technique: The best time to scout for true armyworm is shortly after dusk when larvae are actively feeding. Examine 20 plants in five areas in the field (100 plants total). During the day, you may find the larvae in the whorl, leaf axil, amongst the crop debris on the soil surface or under soil clods. Brown frass, often mistaken for eggs, may also be present in the whorl or on the soil near the plant. When scouting, check the backs of armyworms for eggs. These small, oval, yellowish white eggs are usually located just behind the head of the larva (Photo 15–73). These are eggs of a parasitic fly. The eggs will hatch, and the maggots mine inside the armyworm larva and kill it. Record the size and number of larvae. Scout along the field boundaries bordering cereal, sod/turf and corn crops since larvae will “march” in from neighbouring fields and may be controlled prior to entering the corn field.
Threshold: Foliar insecticide may be warranted in seedling corn if there are two or more unparasitized larvae per seedling, or if 10% or more of the plants have feeding and larvae are smaller than 2.5 cm (1 in.). For corn past the 6-leaf stage, if 50% of the plants have leaf-feeding damage and are infested with larvae smaller than 2.5 cm (1 in.), insecticide treatment may be warranted. As long as the growing point of the plant is not damaged, the corn plant is usually able to recover from moderate feeding.
Management Strategies: • If the larvae are over 2.5 cm (1 in.) long, there is
no benefit in applying insecticide, since most of the feeding damage has already occurred and the insecticide is not effective on larger larvae.
• Treatment may be confined to infested areas. If armyworm are migrating from adjacent cereal or corn fields, spraying an insecticide along the field border may be sufficient.
• Parasites and other beneficial organisms usually keep armyworms from reaching damaging levels, though cool, wet springs are not favourable for these parasites. Avoid treating with insecticides when large numbers of parasitized larvae are present.
• Eliminate grassy weeds which are attractive to armyworm moths for egg-laying. However, late-season grass control may not be a good option, since this will cause the feeding larvae to migrate from the dead grassy weeds to the crop itself.
STINK BUGS
BROWN STINK BUG(Euschistus servus)
GREEN STINK BUG(Chinavia hilaris)
BROWN MARMORATED STINK BUG(Halyomorpha halys)
Description and Life Cycle: See page 334
Damage: Various species of stink bug can feed on corn. Brown stink bug in particular can occasionally cause damage to corn plants early in the season, while both brown and green stink bugs can feed on the ear of the corn once it is developing. Stink bugs use their needle-like mouthparts to pierce and suck on plant juices. As they feed, they inject an enzyme to help digest the plant tissue which results in deformities in the plant. Early season: When the stink bug pierces unfurled leaves of young plants (before V5) and the leaves open, one pierced hole results in several elongated holes with yellow halos perfectly lined up in a row on each leaf (Photo 15–27). More obvious damage occurs when they pierce the plant closer to the early developing whorl. Plants may become deformed and stunted as the growing point is injured and may develop multiple tillers (Photo 15–28). Later season: Stink bugs can pierce through the ear and into individual corn kernels, destroying the kernel and potentially increasing the risk for ear moulds.
Photo 15–27. Elongated holes in leaf by stink bug.
316
Agronomy guide for field Crops
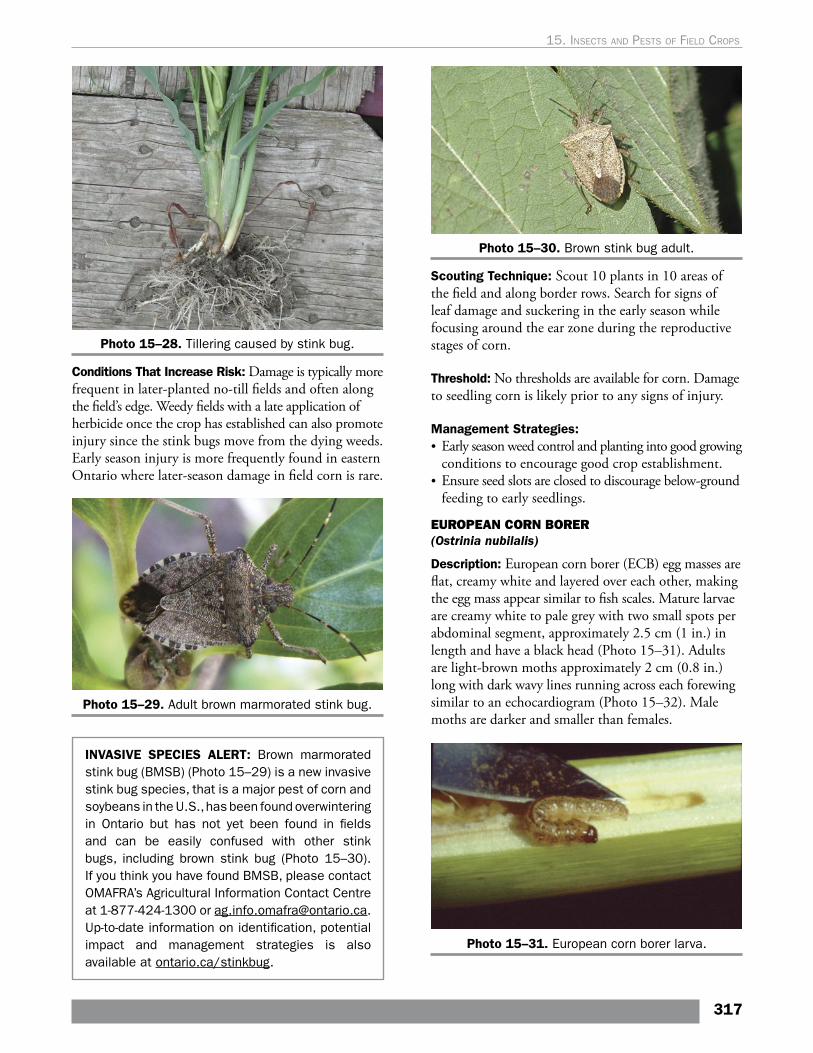
Photo 15–28. Tillering caused by stink bug.
Conditions That Increase Risk: Damage is typically more frequent in later-planted no-till fields and often along the field’s edge. Weedy fields with a late application of herbicide once the crop has established can also promote injury since the stink bugs move from the dying weeds. Early season injury is more frequently found in eastern Ontario where later-season damage in field corn is rare.
Photo 15–29. Adult brown marmorated stink bug.
INVASIVE SPECIES ALERT: Brown marmorated stink bug (BMSB) (Photo 15–29) is a new invasive stink bug species, that is a major pest of corn and soybeans in the U.S., has been found overwintering in Ontario but has not yet been found in fields and can be easily confused with other stink bugs, including brown stink bug (Photo 15–30). If you think you have found BMSB, please contact OMAFRA’s Agricultural Information Contact Centre at 1-877-424-1300 or [email protected]. Up-to-date information on identification, potential impact and management strategies is also available at ontario.ca/stinkbug.
Photo 15–30. Brown stink bug adult.
Scouting Technique: Scout 10 plants in 10 areas of the field and along border rows. Search for signs of leaf damage and suckering in the early season while focusing around the ear zone during the reproductive stages of corn.
Threshold: No thresholds are available for corn. Damage to seedling corn is likely prior to any signs of injury.
Management Strategies: • Early season weed control and planting into good growing
conditions to encourage good crop establishment.• Ensure seed slots are closed to discourage below-ground
feeding to early seedlings.
EUROPEAN CORN BORER (Ostrinia nubilalis)
Description: European corn borer (ECB) egg masses are flat, creamy white and layered over each other, making the egg mass appear similar to fish scales. Mature larvae are creamy white to pale grey with two small spots per abdominal segment, approximately 2.5 cm (1 in.) in length and have a black head (Photo 15–31). Adults are light-brown moths approximately 2 cm (0.8 in.) long with dark wavy lines running across each forewing similar to an echocardiogram (Photo 15–32). Male moths are darker and smaller than females.
Photo 15–31. European corn borer larva.
317
15. Insects and pests oF FIeld crops
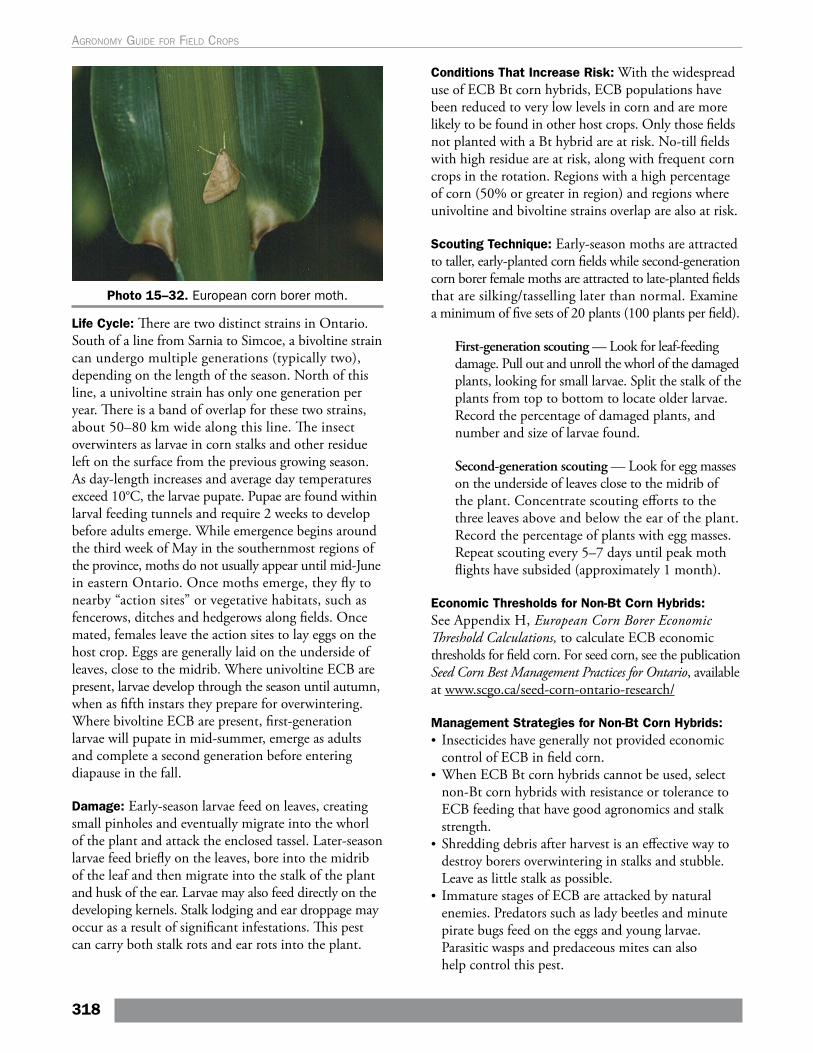
Photo 15–32. European corn borer moth.
Life Cycle: There are two distinct strains in Ontario. South of a line from Sarnia to Simcoe, a bivoltine strain can undergo multiple generations (typically two), depending on the length of the season. North of this line, a univoltine strain has only one generation per year. There is a band of overlap for these two strains, about 50–80 km wide along this line. The insect overwinters as larvae in corn stalks and other residue left on the surface from the previous growing season. As day-length increases and average day temperatures exceed 10°C, the larvae pupate. Pupae are found within larval feeding tunnels and require 2 weeks to develop before adults emerge. While emergence begins around the third week of May in the southernmost regions of the province, moths do not usually appear until mid-June in eastern Ontario. Once moths emerge, they fly to nearby “action sites” or vegetative habitats, such as fencerows, ditches and hedgerows along fields. Once mated, females leave the action sites to lay eggs on the host crop. Eggs are generally laid on the underside of leaves, close to the midrib. Where univoltine ECB are present, larvae develop through the season until autumn, when as fifth instars they prepare for overwintering. Where bivoltine ECB are present, first-generation larvae will pupate in mid-summer, emerge as adults and complete a second generation before entering diapause in the fall.
Damage: Early-season larvae feed on leaves, creating small pinholes and eventually migrate into the whorl of the plant and attack the enclosed tassel. Later-season larvae feed briefly on the leaves, bore into the midrib of the leaf and then migrate into the stalk of the plant and husk of the ear. Larvae may also feed directly on the developing kernels. Stalk lodging and ear droppage may occur as a result of significant infestations. This pest can carry both stalk rots and ear rots into the plant.
Conditions That Increase Risk: With the widespread use of ECB Bt corn hybrids, ECB populations have been reduced to very low levels in corn and are more likely to be found in other host crops. Only those fields not planted with a Bt hybrid are at risk. No-till fields with high residue are at risk, along with frequent corn crops in the rotation. Regions with a high percentage of corn (50% or greater in region) and regions where univoltine and bivoltine strains overlap are also at risk.
Scouting Technique: Early-season moths are attracted to taller, early-planted corn fields while second-generation corn borer female moths are attracted to late-planted fields that are silking/tasselling later than normal. Examine a minimum of five sets of 20 plants (100 plants per field).
First-generation scouting — Look for leaf-feeding damage. Pull out and unroll the whorl of the damaged plants, looking for small larvae. Split the stalk of the plants from top to bottom to locate older larvae. Record the percentage of damaged plants, and number and size of larvae found.
Second-generation scouting — Look for egg masses on the underside of leaves close to the midrib of the plant. Concentrate scouting efforts to the three leaves above and below the ear of the plant. Record the percentage of plants with egg masses. Repeat scouting every 5–7 days until peak moth flights have subsided (approximately 1 month).
Economic Thresholds for Non-Bt Corn Hybrids: See Appendix H, European Corn Borer Economic Threshold Calculations, to calculate ECB economic thresholds for field corn. For seed corn, see the publication Seed Corn Best Management Practices for Ontario, available at www.scgo.ca/seed-corn-ontario-research/
Management Strategies for Non-Bt Corn Hybrids: • Insecticides have generally not provided economic
control of ECB in field corn. • When ECB Bt corn hybrids cannot be used, select
non-Bt corn hybrids with resistance or tolerance to ECB feeding that have good agronomics and stalk strength.
• Shredding debris after harvest is an effective way to destroy borers overwintering in stalks and stubble. Leave as little stalk as possible.
• Immature stages of ECB are attacked by natural enemies. Predators such as lady beetles and minute pirate bugs feed on the eggs and young larvae. Parasitic wasps and predaceous mites can also help control this pest.
318
Agronomy guide for field Crops
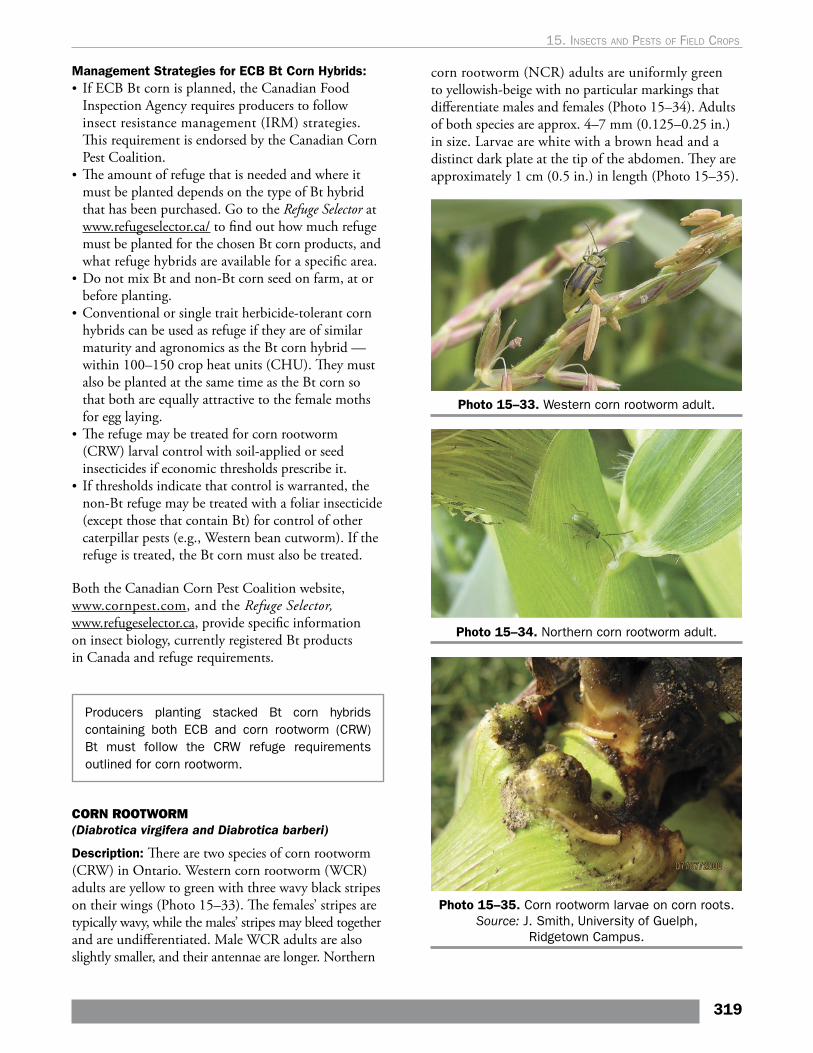
Management Strategies for ECB Bt Corn Hybrids:• If ECB Bt corn is planned, the Canadian Food
Inspection Agency requires producers to follow insect resistance management (IRM) strategies. This requirement is endorsed by the Canadian Corn Pest Coalition.
• The amount of refuge that is needed and where it must be planted depends on the type of Bt hybrid that has been purchased. Go to the Refuge Selector at www.refugeselector.ca/ to find out how much refuge must be planted for the chosen Bt corn products, and what refuge hybrids are available for a specific area.
• Do not mix Bt and non-Bt corn seed on farm, at or before planting.
• Conventional or single trait herbicide-tolerant corn hybrids can be used as refuge if they are of similar maturity and agronomics as the Bt corn hybrid — within 100–150 crop heat units (CHU). They must also be planted at the same time as the Bt corn so that both are equally attractive to the female moths for egg laying.
• The refuge may be treated for corn rootworm (CRW) larval control with soil-applied or seed insecticides if economic thresholds prescribe it.
• If thresholds indicate that control is warranted, the non-Bt refuge may be treated with a foliar insecticide (except those that contain Bt) for control of other caterpillar pests (e.g., Western bean cutworm). If the refuge is treated, the Bt corn must also be treated.
Both the Canadian Corn Pest Coalition website, www.cornpest.com, and the Refuge Selector, www.refugeselector.ca, provide specific information on insect biology, currently registered Bt products in Canada and refuge requirements.
Producers planting stacked Bt corn hybrids containing both ECB and corn rootworm (CRW) Bt must follow the CRW refuge requirements outlined for corn rootworm.
CORN ROOTWORM (Diabrotica virgifera and Diabrotica barberi)
Description: There are two species of corn rootworm (CRW) in Ontario. Western corn rootworm (WCR) adults are yellow to green with three wavy black stripes on their wings (Photo 15–33). The females’ stripes are typically wavy, while the males’ stripes may bleed together and are undifferentiated. Male WCR adults are also slightly smaller, and their antennae are longer. Northern
corn rootworm (NCR) adults are uniformly green to yellowish-beige with no particular markings that differentiate males and females (Photo 15–34). Adults of both species are approx. 4–7 mm (0.125–0.25 in.) in size. Larvae are white with a brown head and a distinct dark plate at the tip of the abdomen. They are approximately 1 cm (0.5 in.) in length (Photo 15–35).
Photo 15–33. Western corn rootworm adult.
Photo 15–34. Northern corn rootworm adult.
Photo 15–35. Corn rootworm larvae on corn roots. Source: J. Smith, University of Guelph,
Ridgetown Campus.
319
15. Insects and pests oF FIeld crops
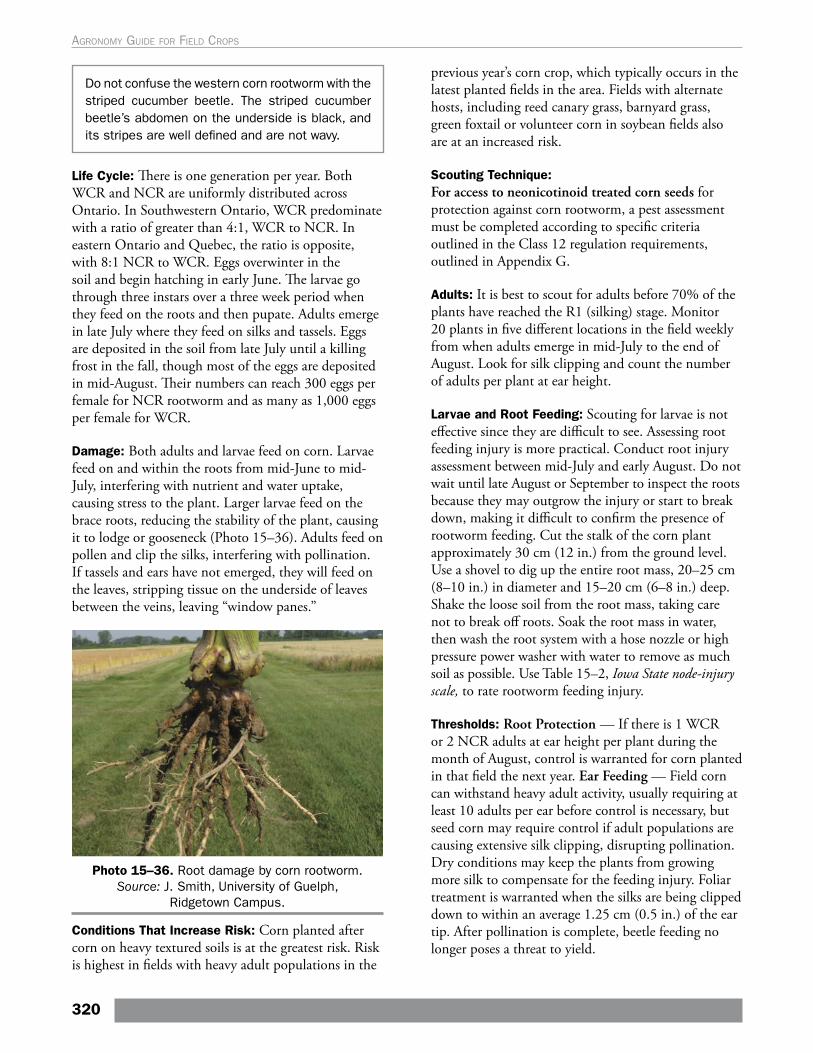
Do not confuse the western corn rootworm with the striped cucumber beetle. The striped cucumber beetle’s abdomen on the underside is black, and its stripes are well defined and are not wavy.
Life Cycle: There is one generation per year. Both WCR and NCR are uniformly distributed across Ontario. In Southwestern Ontario, WCR predominate with a ratio of greater than 4:1, WCR to NCR. In eastern Ontario and Quebec, the ratio is opposite, with 8:1 NCR to WCR. Eggs overwinter in the soil and begin hatching in early June. The larvae go through three instars over a three week period when they feed on the roots and then pupate. Adults emerge in late July where they feed on silks and tassels. Eggs are deposited in the soil from late July until a killing frost in the fall, though most of the eggs are deposited in mid-August. Their numbers can reach 300 eggs per female for NCR rootworm and as many as 1,000 eggs per female for WCR.
Damage: Both adults and larvae feed on corn. Larvae feed on and within the roots from mid-June to mid-July, interfering with nutrient and water uptake, causing stress to the plant. Larger larvae feed on the brace roots, reducing the stability of the plant, causing it to lodge or gooseneck (Photo 15–36). Adults feed on pollen and clip the silks, interfering with pollination. If tassels and ears have not emerged, they will feed on the leaves, stripping tissue on the underside of leaves between the veins, leaving “window panes.”
Photo 15–36. Root damage by corn rootworm. Source: J. Smith, University of Guelph,
Ridgetown Campus.
Conditions That Increase Risk: Corn planted after corn on heavy textured soils is at the greatest risk. Risk is highest in fields with heavy adult populations in the
previous year’s corn crop, which typically occurs in the latest planted fields in the area. Fields with alternate hosts, including reed canary grass, barnyard grass, green foxtail or volunteer corn in soybean fields also are at an increased risk.
Scouting Technique: For access to neonicotinoid treated corn seeds for protection against corn rootworm, a pest assessment must be completed according to specific criteria outlined in the Class 12 regulation requirements, outlined in Appendix G.
Adults: It is best to scout for adults before 70% of the plants have reached the R1 (silking) stage. Monitor 20 plants in five different locations in the field weekly from when adults emerge in mid-July to the end of August. Look for silk clipping and count the number of adults per plant at ear height.
Larvae and Root Feeding: Scouting for larvae is not effective since they are difficult to see. Assessing root feeding injury is more practical. Conduct root injury assessment between mid-July and early August. Do not wait until late August or September to inspect the roots because they may outgrow the injury or start to break down, making it difficult to confirm the presence of rootworm feeding. Cut the stalk of the corn plant approximately 30 cm (12 in.) from the ground level. Use a shovel to dig up the entire root mass, 20–25 cm (8–10 in.) in diameter and 15–20 cm (6–8 in.) deep. Shake the loose soil from the root mass, taking care not to break off roots. Soak the root mass in water, then wash the root system with a hose nozzle or high pressure power washer with water to remove as much soil as possible. Use Table 15–2, Iowa State node-injury scale, to rate rootworm feeding injury.
Thresholds: Root Protection — If there is 1 WCR or 2 NCR adults at ear height per plant during the month of August, control is warranted for corn planted in that field the next year. Ear Feeding — Field corn can withstand heavy adult activity, usually requiring at least 10 adults per ear before control is necessary, but seed corn may require control if adult populations are causing extensive silk clipping, disrupting pollination. Dry conditions may keep the plants from growing more silk to compensate for the feeding injury. Foliar treatment is warranted when the silks are being clipped down to within an average 1.25 cm (0.5 in.) of the ear tip. After pollination is complete, beetle feeding no longer poses a threat to yield.
320
Agronomy guide for field Crops
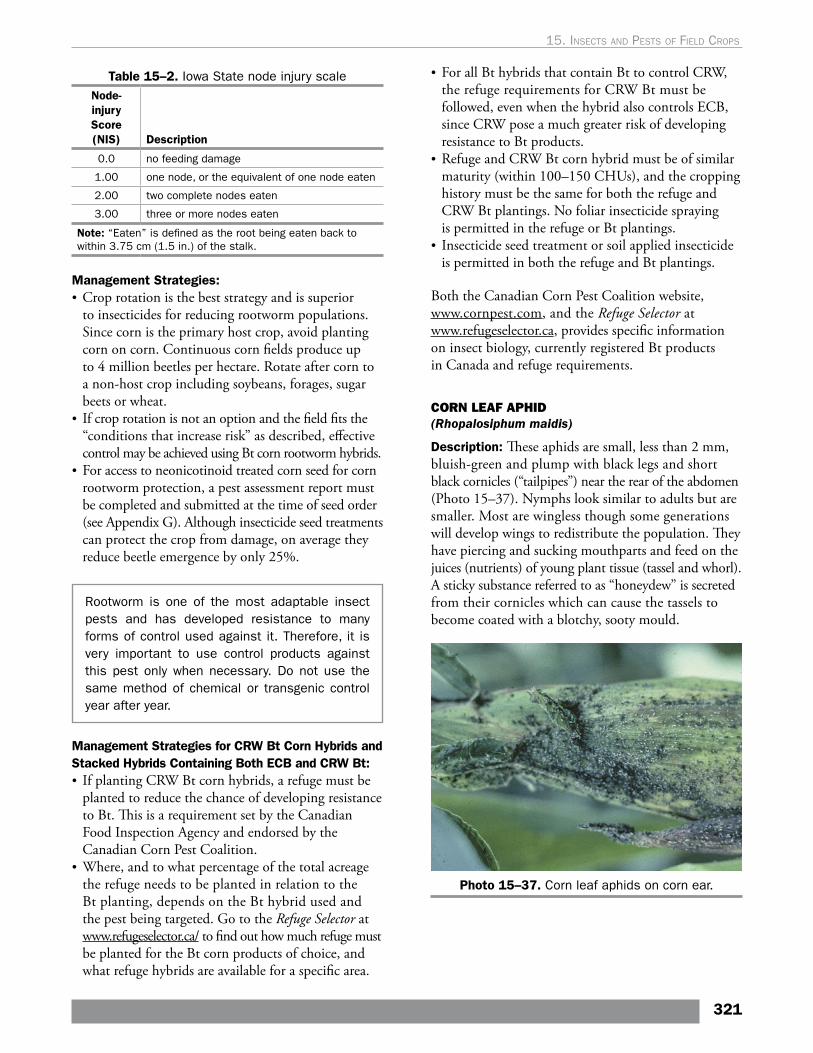
Table 15–2. Iowa State node injury scaleNode-injury Score (NIS) Description
0.0 no feeding damage
1.00 one node, or the equivalent of one node eaten
2.00 two complete nodes eaten
3.00 three or more nodes eaten
Note: “Eaten” is defined as the root being eaten back to within 3.75 cm (1.5 in.) of the stalk.
Management Strategies: • Crop rotation is the best strategy and is superior
to insecticides for reducing rootworm populations. Since corn is the primary host crop, avoid planting corn on corn. Continuous corn fields produce up to 4 million beetles per hectare. Rotate after corn to a non-host crop including soybeans, forages, sugar beets or wheat.
• If crop rotation is not an option and the field fits the “conditions that increase risk” as described, effective control may be achieved using Bt corn rootworm hybrids.
• For access to neonicotinoid treated corn seed for corn rootworm protection, a pest assessment report must be completed and submitted at the time of seed order (see Appendix G). Although insecticide seed treatments can protect the crop from damage, on average they reduce beetle emergence by only 25%.
Rootworm is one of the most adaptable insect pests and has developed resistance to many forms of control used against it. Therefore, it is very important to use control products against this pest only when necessary. Do not use the same method of chemical or transgenic control year after year.
Management Strategies for CRW Bt Corn Hybrids and Stacked Hybrids Containing Both ECB and CRW Bt:• If planting CRW Bt corn hybrids, a refuge must be
planted to reduce the chance of developing resistance to Bt. This is a requirement set by the Canadian Food Inspection Agency and endorsed by the Canadian Corn Pest Coalition.
• Where, and to what percentage of the total acreage the refuge needs to be planted in relation to the Bt planting, depends on the Bt hybrid used and the pest being targeted. Go to the Refuge Selector at www.refugeselector.ca/ to find out how much refuge must be planted for the Bt corn products of choice, and what refuge hybrids are available for a specific area.
• For all Bt hybrids that contain Bt to control CRW, the refuge requirements for CRW Bt must be followed, even when the hybrid also controls ECB, since CRW pose a much greater risk of developing resistance to Bt products.
• Refuge and CRW Bt corn hybrid must be of similar maturity (within 100–150 CHUs), and the cropping history must be the same for both the refuge and CRW Bt plantings. No foliar insecticide spraying is permitted in the refuge or Bt plantings.
• Insecticide seed treatment or soil applied insecticide is permitted in both the refuge and Bt plantings.
Both the Canadian Corn Pest Coalition website, www.cornpest.com, and the Refuge Selector at www.refugeselector.ca, provides specific information on insect biology, currently registered Bt products in Canada and refuge requirements.
CORN LEAF APHID (Rhopalosiphum maidis)
Description: These aphids are small, less than 2 mm, bluish-green and plump with black legs and short black cornicles (“tailpipes”) near the rear of the abdomen (Photo 15–37). Nymphs look similar to adults but are smaller. Most are wingless though some generations will develop wings to redistribute the population. They have piercing and sucking mouthparts and feed on the juices (nutrients) of young plant tissue (tassel and whorl). A sticky substance referred to as “honeydew” is secreted from their cornicles which can cause the tassels to become coated with a blotchy, sooty mould.
Photo 15–37. Corn leaf aphids on corn ear.
321
15. Insects and pests oF FIeld crops
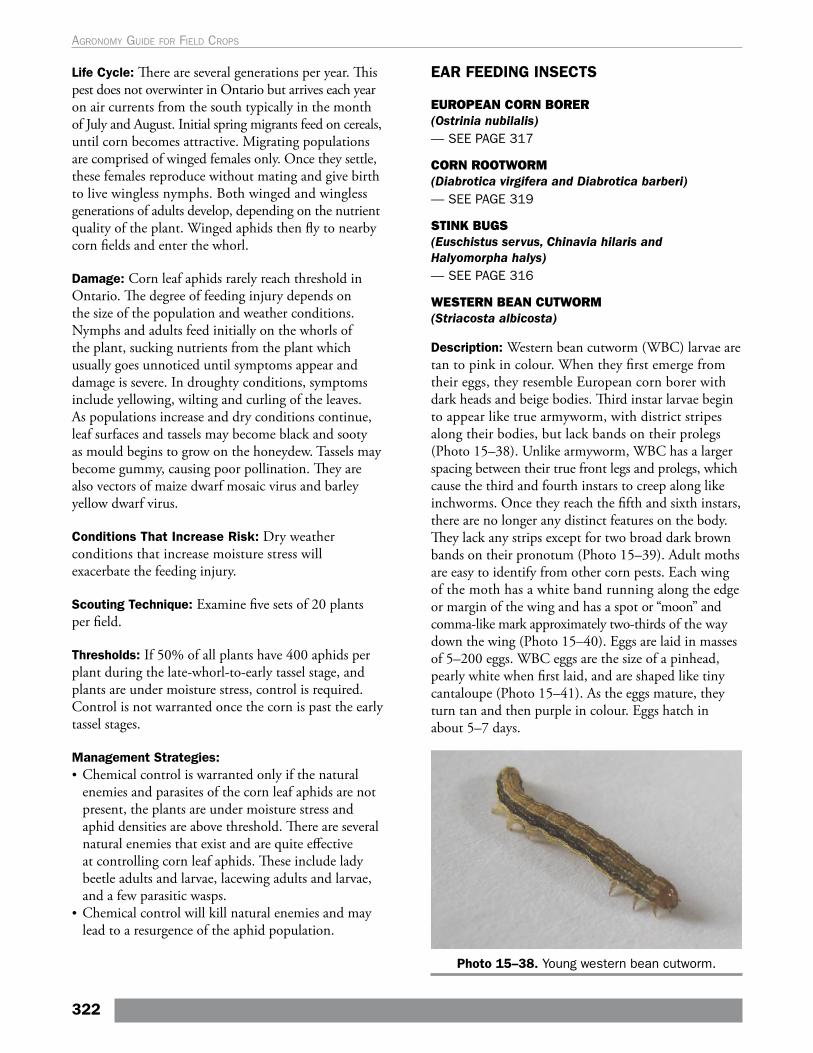
Life Cycle: There are several generations per year. This pest does not overwinter in Ontario but arrives each year on air currents from the south typically in the month of July and August. Initial spring migrants feed on cereals, until corn becomes attractive. Migrating populations are comprised of winged females only. Once they settle, these females reproduce without mating and give birth to live wingless nymphs. Both winged and wingless generations of adults develop, depending on the nutrient quality of the plant. Winged aphids then fly to nearby corn fields and enter the whorl.
Damage: Corn leaf aphids rarely reach threshold in Ontario. The degree of feeding injury depends on the size of the population and weather conditions. Nymphs and adults feed initially on the whorls of the plant, sucking nutrients from the plant which usually goes unnoticed until symptoms appear and damage is severe. In droughty conditions, symptoms include yellowing, wilting and curling of the leaves. As populations increase and dry conditions continue, leaf surfaces and tassels may become black and sooty as mould begins to grow on the honeydew. Tassels may become gummy, causing poor pollination. They are also vectors of maize dwarf mosaic virus and barley yellow dwarf virus.
Conditions That Increase Risk: Dry weather conditions that increase moisture stress will exacerbate the feeding injury.
Scouting Technique: Examine five sets of 20 plants per field.
Thresholds: If 50% of all plants have 400 aphids per plant during the late-whorl-to-early tassel stage, and plants are under moisture stress, control is required. Control is not warranted once the corn is past the early tassel stages.
Management Strategies: • Chemical control is warranted only if the natural
enemies and parasites of the corn leaf aphids are not present, the plants are under moisture stress and aphid densities are above threshold. There are several natural enemies that exist and are quite effective at controlling corn leaf aphids. These include lady beetle adults and larvae, lacewing adults and larvae, and a few parasitic wasps.
• Chemical control will kill natural enemies and may lead to a resurgence of the aphid population.
EAR FEEDING INSECTS
EUROPEAN CORN BORER (Ostrinia nubilalis) — SEE PAGE 317
CORN ROOTWORM (Diabrotica virgifera and Diabrotica barberi) — SEE PAGE 319
STINK BUGS (Euschistus servus, Chinavia hilaris and Halyomorpha halys)— SEE PAGE 316
WESTERN BEAN CUTWORM(Striacosta albicosta)
Description: Western bean cutworm (WBC) larvae are tan to pink in colour. When they first emerge from their eggs, they resemble European corn borer with dark heads and beige bodies. Third instar larvae begin to appear like true armyworm, with district stripes along their bodies, but lack bands on their prolegs (Photo 15–38). Unlike armyworm, WBC has a larger spacing between their true front legs and prolegs, which cause the third and fourth instars to creep along like inchworms. Once they reach the fifth and sixth instars, there are no longer any distinct features on the body. They lack any strips except for two broad dark brown bands on their pronotum (Photo 15–39). Adult moths are easy to identify from other corn pests. Each wing of the moth has a white band running along the edge or margin of the wing and has a spot or “moon” and comma-like mark approximately two-thirds of the way down the wing (Photo 15–40). Eggs are laid in masses of 5–200 eggs. WBC eggs are the size of a pinhead, pearly white when first laid, and are shaped like tiny cantaloupe (Photo 15–41). As the eggs mature, they turn tan and then purple in colour. Eggs hatch in about 5–7 days.
Photo 15–38. Young western bean cutworm.
322
Agronomy guide for field Crops
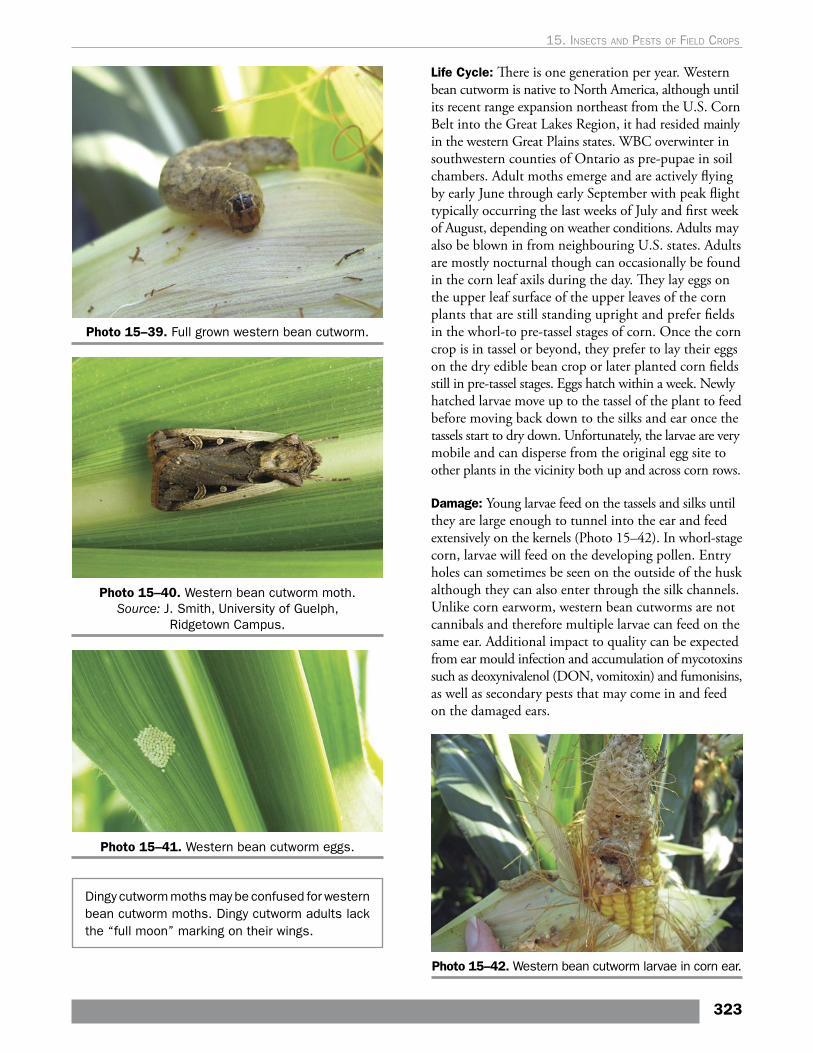
Photo 15–39. Full grown western bean cutworm.
Photo 15–40. Western bean cutworm moth. Source: J. Smith, University of Guelph,
Ridgetown Campus.
Photo 15–41. Western bean cutworm eggs.
Dingy cutworm moths may be confused for western bean cutworm moths. Dingy cutworm adults lack the “full moon” marking on their wings.
Life Cycle: There is one generation per year. Western bean cutworm is native to North America, although until its recent range expansion northeast from the U.S. Corn Belt into the Great Lakes Region, it had resided mainly in the western Great Plains states. WBC overwinter in southwestern counties of Ontario as pre-pupae in soil chambers. Adult moths emerge and are actively flying by early June through early September with peak flight typically occurring the last weeks of July and first week of August, depending on weather conditions. Adults may also be blown in from neighbouring U.S. states. Adults are mostly nocturnal though can occasionally be found in the corn leaf axils during the day. They lay eggs on the upper leaf surface of the upper leaves of the corn plants that are still standing upright and prefer fields in the whorl-to pre-tassel stages of corn. Once the corn crop is in tassel or beyond, they prefer to lay their eggs on the dry edible bean crop or later planted corn fields still in pre-tassel stages. Eggs hatch within a week. Newly hatched larvae move up to the tassel of the plant to feed before moving back down to the silks and ear once the tassels start to dry down. Unfortunately, the larvae are very mobile and can disperse from the original egg site to other plants in the vicinity both up and across corn rows.
Damage: Young larvae feed on the tassels and silks until they are large enough to tunnel into the ear and feed extensively on the kernels (Photo 15–42). In whorl-stage corn, larvae will feed on the developing pollen. Entry holes can sometimes be seen on the outside of the husk although they can also enter through the silk channels. Unlike corn earworm, western bean cutworms are not cannibals and therefore multiple larvae can feed on the same ear. Additional impact to quality can be expected from ear mould infection and accumulation of mycotoxins such as deoxynivalenol (DON, vomitoxin) and fumonisins, as well as secondary pests that may come in and feed on the damaged ears.
Photo 15–42. Western bean cutworm larvae in corn ear.
323
15. Insects and pests oF FIeld crops
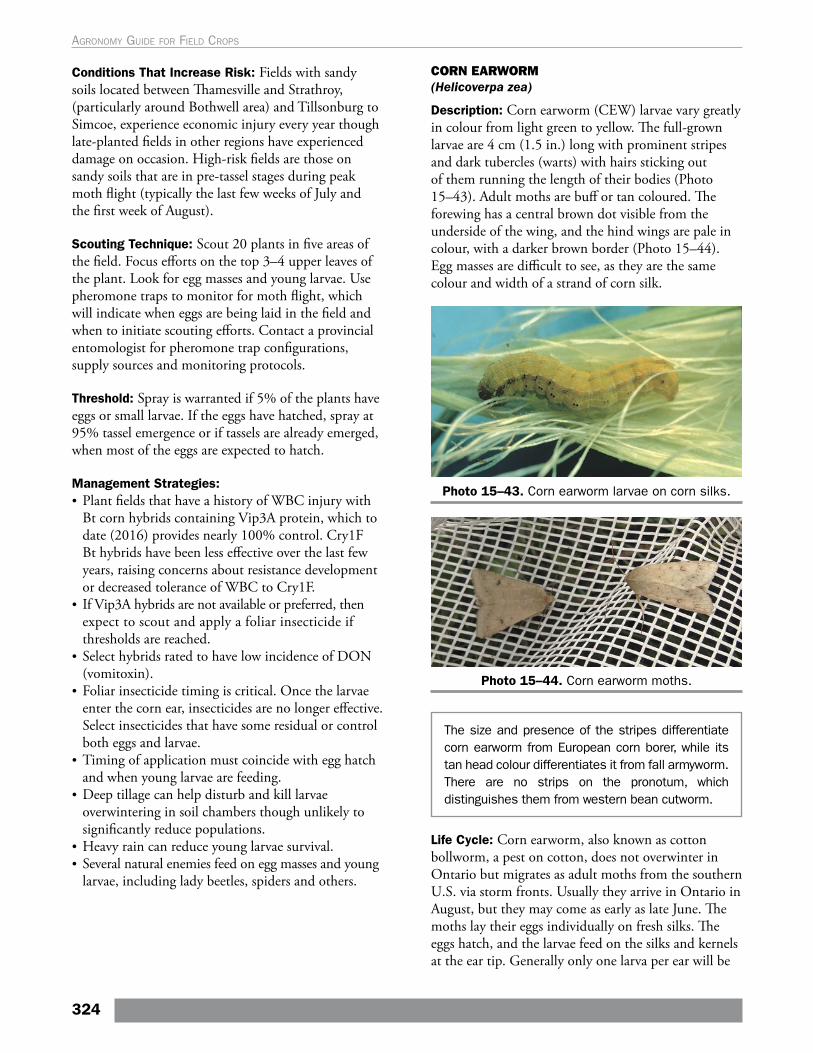
Conditions That Increase Risk: Fields with sandy soils located between Thamesville and Strathroy, (particularly around Bothwell area) and Tillsonburg to Simcoe, experience economic injury every year though late-planted fields in other regions have experienced damage on occasion. High-risk fields are those on sandy soils that are in pre-tassel stages during peak moth flight (typically the last few weeks of July and the first week of August).
Scouting Technique: Scout 20 plants in five areas of the field. Focus efforts on the top 3–4 upper leaves of the plant. Look for egg masses and young larvae. Use pheromone traps to monitor for moth flight, which will indicate when eggs are being laid in the field and when to initiate scouting efforts. Contact a provincial entomologist for pheromone trap configurations, supply sources and monitoring protocols.
Threshold: Spray is warranted if 5% of the plants have eggs or small larvae. If the eggs have hatched, spray at 95% tassel emergence or if tassels are already emerged, when most of the eggs are expected to hatch.
Management Strategies: • Plant fields that have a history of WBC injury with
Bt corn hybrids containing Vip3A protein, which to date (2016) provides nearly 100% control. Cry1F Bt hybrids have been less effective over the last few years, raising concerns about resistance development or decreased tolerance of WBC to Cry1F.
• If Vip3A hybrids are not available or preferred, then expect to scout and apply a foliar insecticide if thresholds are reached.
• Select hybrids rated to have low incidence of DON (vomitoxin).
• Foliar insecticide timing is critical. Once the larvae enter the corn ear, insecticides are no longer effective. Select insecticides that have some residual or control both eggs and larvae.
• Timing of application must coincide with egg hatch and when young larvae are feeding.
• Deep tillage can help disturb and kill larvae overwintering in soil chambers though unlikely to significantly reduce populations.
• Heavy rain can reduce young larvae survival. • Several natural enemies feed on egg masses and young
larvae, including lady beetles, spiders and others.
CORN EARWORM (Helicoverpa zea)
Description: Corn earworm (CEW) larvae vary greatly in colour from light green to yellow. The full-grown larvae are 4 cm (1.5 in.) long with prominent stripes and dark tubercles (warts) with hairs sticking out of them running the length of their bodies (Photo 15–43). Adult moths are buff or tan coloured. The forewing has a central brown dot visible from the underside of the wing, and the hind wings are pale in colour, with a darker brown border (Photo 15–44). Egg masses are difficult to see, as they are the same colour and width of a strand of corn silk.
Photo 15–43. Corn earworm larvae on corn silks.
Photo 15–44. Corn earworm moths.
The size and presence of the stripes differentiate corn earworm from European corn borer, while its tan head colour differentiates it from fall armyworm. There are no strips on the pronotum, which distinguishes them from western bean cutworm.
Life Cycle: Corn earworm, also known as cotton bollworm, a pest on cotton, does not overwinter in Ontario but migrates as adult moths from the southern U.S. via storm fronts. Usually they arrive in Ontario in August, but they may come as early as late June. The moths lay their eggs individually on fresh silks. The eggs hatch, and the larvae feed on the silks and kernels at the ear tip. Generally only one larva per ear will be
324
Agronomy guide for field Crops
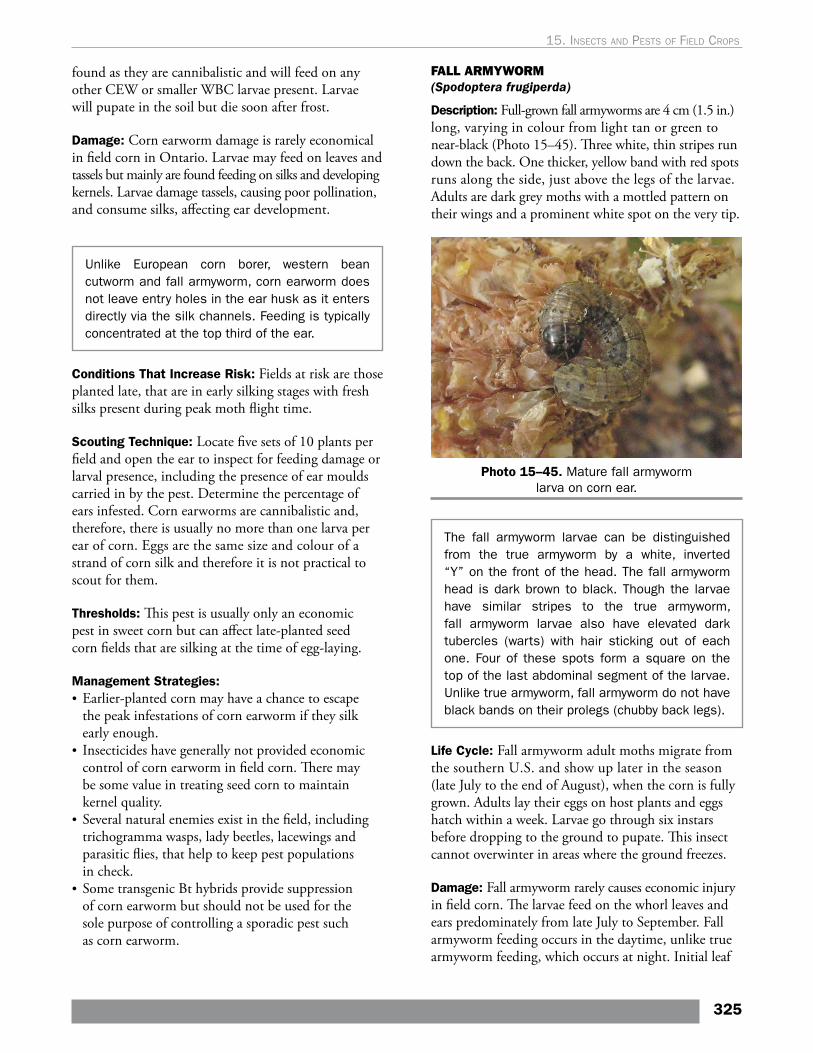
found as they are cannibalistic and will feed on any other CEW or smaller WBC larvae present. Larvae will pupate in the soil but die soon after frost.
Damage: Corn earworm damage is rarely economical in field corn in Ontario. Larvae may feed on leaves and tassels but mainly are found feeding on silks and developing kernels. Larvae damage tassels, causing poor pollination, and consume silks, affecting ear development.
Unlike European corn borer, western bean cutworm and fall armyworm, corn earworm does not leave entry holes in the ear husk as it enters directly via the silk channels. Feeding is typically concentrated at the top third of the ear.
Conditions That Increase Risk: Fields at risk are those planted late, that are in early silking stages with fresh silks present during peak moth flight time.
Scouting Technique: Locate five sets of 10 plants per field and open the ear to inspect for feeding damage or larval presence, including the presence of ear moulds carried in by the pest. Determine the percentage of ears infested. Corn earworms are cannibalistic and, therefore, there is usually no more than one larva per ear of corn. Eggs are the same size and colour of a strand of corn silk and therefore it is not practical to scout for them.
Thresholds: This pest is usually only an economic pest in sweet corn but can affect late-planted seed corn fields that are silking at the time of egg-laying.
Management Strategies: • Earlier-planted corn may have a chance to escape
the peak infestations of corn earworm if they silk early enough.
• Insecticides have generally not provided economic control of corn earworm in field corn. There may be some value in treating seed corn to maintain kernel quality.
• Several natural enemies exist in the field, including trichogramma wasps, lady beetles, lacewings and parasitic flies, that help to keep pest populations in check.
• Some transgenic Bt hybrids provide suppression of corn earworm but should not be used for the sole purpose of controlling a sporadic pest such as corn earworm.
FALL ARMYWORM (Spodoptera frugiperda)
Description: Full-grown fall armyworms are 4 cm (1.5 in.) long, varying in colour from light tan or green to near-black (Photo 15–45). Three white, thin stripes run down the back. One thicker, yellow band with red spots runs along the side, just above the legs of the larvae. Adults are dark grey moths with a mottled pattern on their wings and a prominent white spot on the very tip.
Photo 15–45. Mature fall armyworm larva on corn ear.
The fall armyworm larvae can be distinguished from the true armyworm by a white, inverted “Y” on the front of the head. The fall armyworm head is dark brown to black. Though the larvae have similar stripes to the true armyworm, fall armyworm larvae also have elevated dark tubercles (warts) with hair sticking out of each one. Four of these spots form a square on the top of the last abdominal segment of the larvae. Unlike true armyworm, fall armyworm do not have black bands on their prolegs (chubby back legs).
Life Cycle: Fall armyworm adult moths migrate from the southern U.S. and show up later in the season (late July to the end of August), when the corn is fully grown. Adults lay their eggs on host plants and eggs hatch within a week. Larvae go through six instars before dropping to the ground to pupate. This insect cannot overwinter in areas where the ground freezes.
Damage: Fall armyworm rarely causes economic injury in field corn. The larvae feed on the whorl leaves and ears predominately from late July to September. Fall armyworm feeding occurs in the daytime, unlike true armyworm feeding, which occurs at night. Initial leaf
325
15. Insects and pests oF FIeld crops
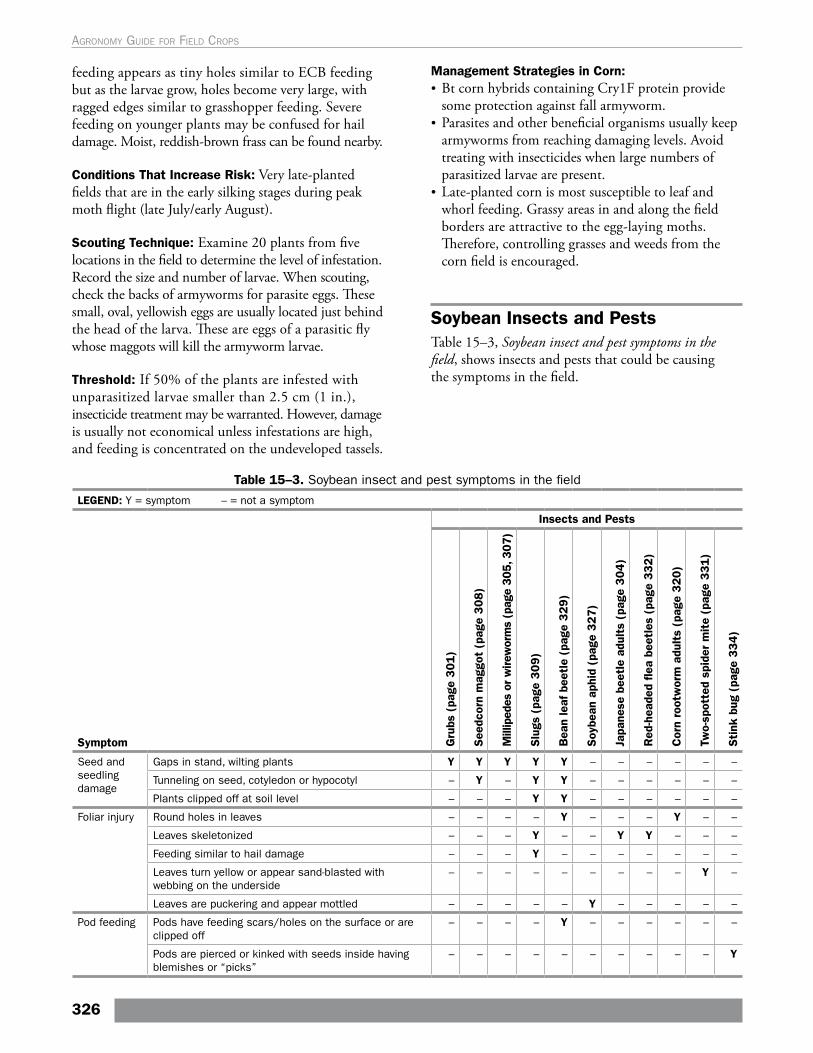
feeding appears as tiny holes similar to ECB feeding but as the larvae grow, holes become very large, with ragged edges similar to grasshopper feeding. Severe feeding on younger plants may be confused for hail damage. Moist, reddish-brown frass can be found nearby.
Conditions That Increase Risk: Very late-planted fields that are in the early silking stages during peak moth flight (late July/early August).
Scouting Technique: Examine 20 plants from five locations in the field to determine the level of infestation. Record the size and number of larvae. When scouting, check the backs of armyworms for parasite eggs. These small, oval, yellowish eggs are usually located just behind the head of the larva. These are eggs of a parasitic fly whose maggots will kill the armyworm larvae.
Threshold: If 50% of the plants are infested with unparasitized larvae smaller than 2.5 cm (1 in.), insecticide treatment may be warranted. However, damage is usually not economical unless infestations are high, and feeding is concentrated on the undeveloped tassels.
Management Strategies in Corn: • Bt corn hybrids containing Cry1F protein provide
some protection against fall armyworm. • Parasites and other beneficial organisms usually keep
armyworms from reaching damaging levels. Avoid treating with insecticides when large numbers of parasitized larvae are present.
• Late-planted corn is most susceptible to leaf and whorl feeding. Grassy areas in and along the field borders are attractive to the egg-laying moths. Therefore, controlling grasses and weeds from the corn field is encouraged.
Soybean Insects and PestsTable 15–3, Soybean insect and pest symptoms in the field, shows insects and pests that could be causing the symptoms in the field.
Table 15–3. Soybean insect and pest symptoms in the field
LEGEND: Y = symptom – = not a symptom
Symptom
Insects and Pests
Gru
bs (
page
301
)
See
dcor
n m
aggo
t (p
age
30
8)
Mill
iped
es o
r w
irew
orm
s (p
age
305,
307
)
Slu
gs (
page
309
)
Bea
n le
af b
eetl
e (p
age
329)
Soy
bean
aph
id (
page
327)
Japa
nese
bee
tle
adul
ts (
page
304)
Red
-hea
ded
flea
beet
les
(pag
e 33
2)
Cor
n ro
otw
orm
adu
lts
(pag
e 3
20)
Two-
spot
ted
spid
er m
ite
(pag
e 331)
Sti
nk b
ug (
page
334
)
Seed and seedling damage
Gaps in stand, wilting plants Y Y Y Y Y – – – – – –
Tunneling on seed, cotyledon or hypocotyl – Y – Y Y – – – – – –
Plants clipped off at soil level – – – Y Y – – – – – –
Foliar injury Round holes in leaves – – – – Y – – – Y – –
Leaves skeletonized – – – Y – – Y Y – – –
Feeding similar to hail damage – – – Y – – – – – – –
Leaves turn yellow or appear sand-blasted with webbing on the underside
– – – – – – – – – Y –
Leaves are puckering and appear mottled – – – – – Y – – – – –
Pod feeding Pods have feeding scars/holes on the surface or are clipped off
– – – – Y – – – – – –
Pods are pierced or kinked with seeds inside having blemishes or “picks”
– – – – – – – – – – Y
326
Agronomy guide for field Crops
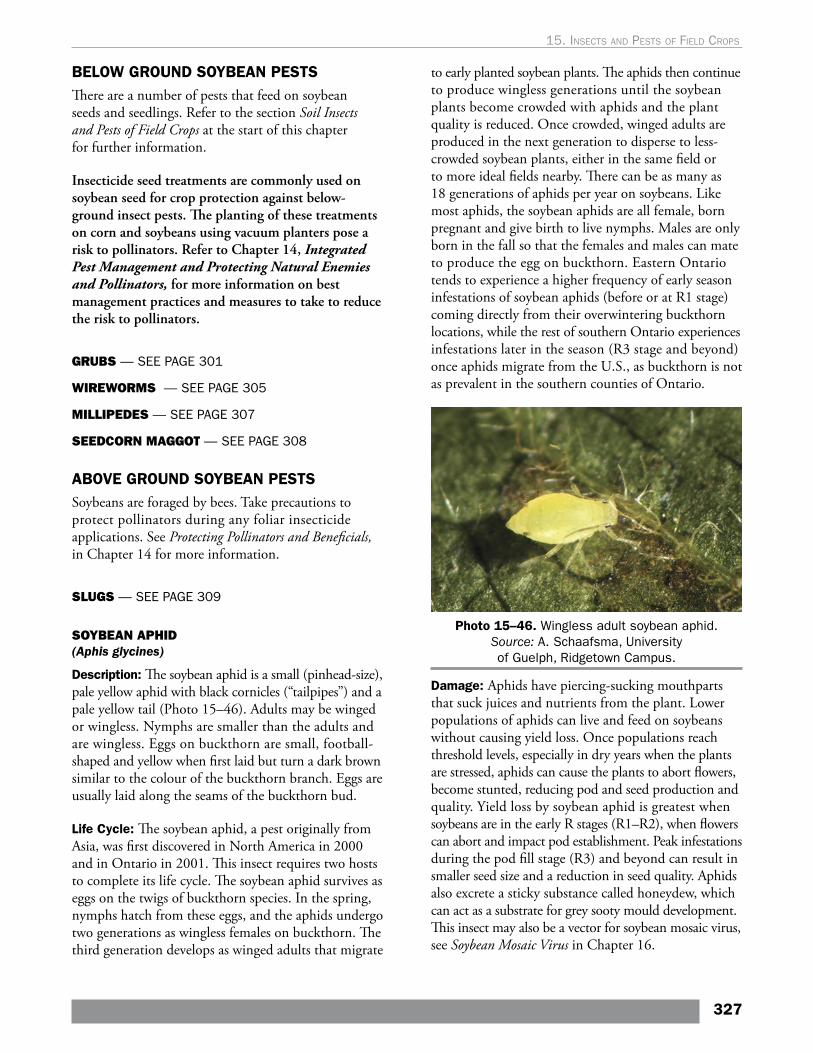
BELOW GROUND SOYBEAN PESTSThere are a number of pests that feed on soybean seeds and seedlings. Refer to the section Soil Insects and Pests of Field Crops at the start of this chapter for further information.
Insecticide seed treatments are commonly used on soybean seed for crop protection against below-ground insect pests. The planting of these treatments on corn and soybeans using vacuum planters pose a risk to pollinators. Refer to Chapter 14, Integrated Pest Management and Protecting Natural Enemies and Pollinators, for more information on best management practices and measures to take to reduce the risk to pollinators.
GRUBS — SEE PAGE 301
WIREWORMS — SEE PAGE 305
MILLIPEDES — SEE PAGE 307
SEEDCORN MAGGOT — SEE PAGE 308
ABOVE GROUND SOYBEAN PESTSSoybeans are foraged by bees. Take precautions to protect pollinators during any foliar insecticide applications. See Protecting Pollinators and Beneficials, in Chapter 14 for more information.
SLUGS — SEE PAGE 309
SOYBEAN APHID(Aphis glycines)
Description: The soybean aphid is a small (pinhead-size), pale yellow aphid with black cornicles (“tailpipes”) and a pale yellow tail (Photo 15–46). Adults may be winged or wingless. Nymphs are smaller than the adults and are wingless. Eggs on buckthorn are small, football-shaped and yellow when first laid but turn a dark brown similar to the colour of the buckthorn branch. Eggs are usually laid along the seams of the buckthorn bud.
Life Cycle: The soybean aphid, a pest originally from Asia, was first discovered in North America in 2000 and in Ontario in 2001. This insect requires two hosts to complete its life cycle. The soybean aphid survives as eggs on the twigs of buckthorn species. In the spring, nymphs hatch from these eggs, and the aphids undergo two generations as wingless females on buckthorn. The third generation develops as winged adults that migrate
to early planted soybean plants. The aphids then continue to produce wingless generations until the soybean plants become crowded with aphids and the plant quality is reduced. Once crowded, winged adults are produced in the next generation to disperse to less-crowded soybean plants, either in the same field or to more ideal fields nearby. There can be as many as 18 generations of aphids per year on soybeans. Like most aphids, the soybean aphids are all female, born pregnant and give birth to live nymphs. Males are only born in the fall so that the females and males can mate to produce the egg on buckthorn. Eastern Ontario tends to experience a higher frequency of early season infestations of soybean aphids (before or at R1 stage) coming directly from their overwintering buckthorn locations, while the rest of southern Ontario experiences infestations later in the season (R3 stage and beyond) once aphids migrate from the U.S., as buckthorn is not as prevalent in the southern counties of Ontario.
Photo 15–46. Wingless adult soybean aphid. Source: A. Schaafsma, University of Guelph, Ridgetown Campus.
Damage: Aphids have piercing-sucking mouthparts that suck juices and nutrients from the plant. Lower populations of aphids can live and feed on soybeans without causing yield loss. Once populations reach threshold levels, especially in dry years when the plants are stressed, aphids can cause the plants to abort flowers, become stunted, reducing pod and seed production and quality. Yield loss by soybean aphid is greatest when soybeans are in the early R stages (R1–R2), when flowers can abort and impact pod establishment. Peak infestations during the pod fill stage (R3) and beyond can result in smaller seed size and a reduction in seed quality. Aphids also excrete a sticky substance called honeydew, which can act as a substrate for grey sooty mould development. This insect may also be a vector for soybean mosaic virus, see Soybean Mosaic Virus in Chapter 16.
327
15. Insects and pests oF FIeld crops
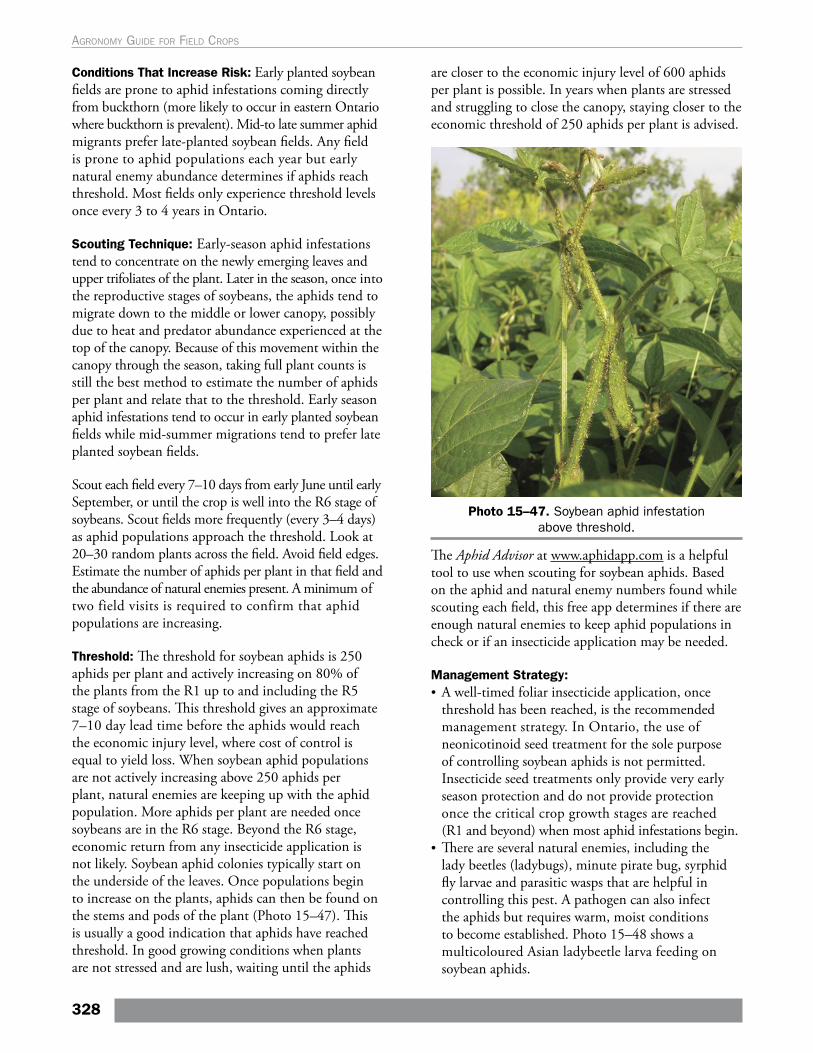
Conditions That Increase Risk: Early planted soybean fields are prone to aphid infestations coming directly from buckthorn (more likely to occur in eastern Ontario where buckthorn is prevalent). Mid-to late summer aphid migrants prefer late-planted soybean fields. Any field is prone to aphid populations each year but early natural enemy abundance determines if aphids reach threshold. Most fields only experience threshold levels once every 3 to 4 years in Ontario.
Scouting Technique: Early-season aphid infestations tend to concentrate on the newly emerging leaves and upper trifoliates of the plant. Later in the season, once into the reproductive stages of soybeans, the aphids tend to migrate down to the middle or lower canopy, possibly due to heat and predator abundance experienced at the top of the canopy. Because of this movement within the canopy through the season, taking full plant counts is still the best method to estimate the number of aphids per plant and relate that to the threshold. Early season aphid infestations tend to occur in early planted soybean fields while mid-summer migrations tend to prefer late planted soybean fields.
Scout each field every 7–10 days from early June until early September, or until the crop is well into the R6 stage of soybeans. Scout fields more frequently (every 3–4 days) as aphid populations approach the threshold. Look at 20–30 random plants across the field. Avoid field edges. Estimate the number of aphids per plant in that field and the abundance of natural enemies present. A minimum of two field visits is required to confirm that aphid populations are increasing.
Threshold: The threshold for soybean aphids is 250 aphids per plant and actively increasing on 80% of the plants from the R1 up to and including the R5 stage of soybeans. This threshold gives an approximate 7–10 day lead time before the aphids would reach the economic injury level, where cost of control is equal to yield loss. When soybean aphid populations are not actively increasing above 250 aphids per plant, natural enemies are keeping up with the aphid population. More aphids per plant are needed once soybeans are in the R6 stage. Beyond the R6 stage, economic return from any insecticide application is not likely. Soybean aphid colonies typically start on the underside of the leaves. Once populations begin to increase on the plants, aphids can then be found on the stems and pods of the plant (Photo 15–47). This is usually a good indication that aphids have reached threshold. In good growing conditions when plants are not stressed and are lush, waiting until the aphids
are closer to the economic injury level of 600 aphids per plant is possible. In years when plants are stressed and struggling to close the canopy, staying closer to the economic threshold of 250 aphids per plant is advised.
Photo 15–47. Soybean aphid infestation above threshold.
The Aphid Advisor at www.aphidapp.com is a helpful tool to use when scouting for soybean aphids. Based on the aphid and natural enemy numbers found while scouting each field, this free app determines if there are enough natural enemies to keep aphid populations in check or if an insecticide application may be needed.
Management Strategy:• A well-timed foliar insecticide application, once
threshold has been reached, is the recommended management strategy. In Ontario, the use of neonicotinoid seed treatment for the sole purpose of controlling soybean aphids is not permitted. Insecticide seed treatments only provide very early season protection and do not provide protection once the critical crop growth stages are reached (R1 and beyond) when most aphid infestations begin.
• There are several natural enemies, including the lady beetles (ladybugs), minute pirate bug, syrphid fly larvae and parasitic wasps that are helpful in controlling this pest. A pathogen can also infect the aphids but requires warm, moist conditions to become established. Photo 15–48 shows a multicoloured Asian ladybeetle larva feeding on soybean aphids.
328
Agronomy guide for field Crops
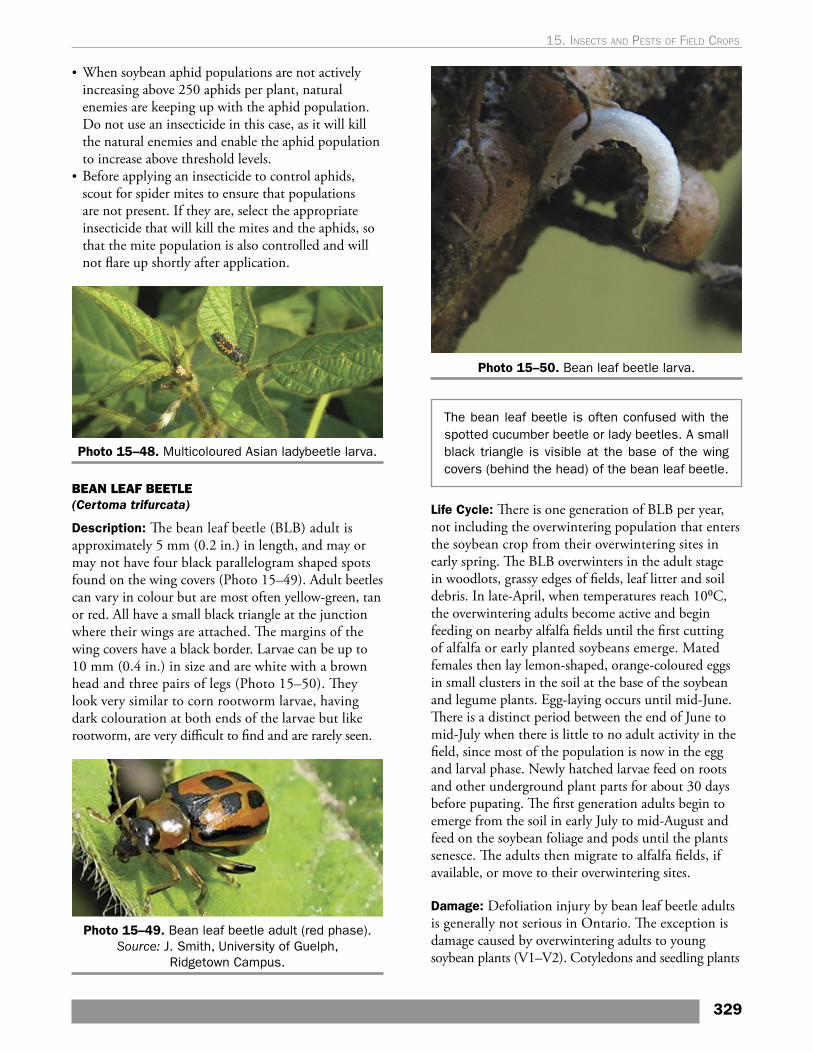
• When soybean aphid populations are not actively increasing above 250 aphids per plant, natural enemies are keeping up with the aphid population. Do not use an insecticide in this case, as it will kill the natural enemies and enable the aphid population to increase above threshold levels.
• Before applying an insecticide to control aphids, scout for spider mites to ensure that populations are not present. If they are, select the appropriate insecticide that will kill the mites and the aphids, so that the mite population is also controlled and will not flare up shortly after application.
Photo 15–48. Multicoloured Asian ladybeetle larva.
BEAN LEAF BEETLE (Certoma trifurcata)
Description: The bean leaf beetle (BLB) adult is approximately 5 mm (0.2 in.) in length, and may or may not have four black parallelogram shaped spots found on the wing covers (Photo 15–49). Adult beetles can vary in colour but are most often yellow-green, tan or red. All have a small black triangle at the junction where their wings are attached. The margins of the wing covers have a black border. Larvae can be up to 10 mm (0.4 in.) in size and are white with a brown head and three pairs of legs (Photo 15–50). They look very similar to corn rootworm larvae, having dark colouration at both ends of the larvae but like rootworm, are very difficult to find and are rarely seen.
Photo 15–49. Bean leaf beetle adult (red phase). Source: J. Smith, University of Guelph,
Ridgetown Campus.
Photo 15–50. Bean leaf beetle larva.
The bean leaf beetle is often confused with the spotted cucumber beetle or lady beetles. A small black triangle is visible at the base of the wing covers (behind the head) of the bean leaf beetle.
Life Cycle: There is one generation of BLB per year, not including the overwintering population that enters the soybean crop from their overwintering sites in early spring. The BLB overwinters in the adult stage in woodlots, grassy edges of fields, leaf litter and soil debris. In late-April, when temperatures reach 10⁰C, the overwintering adults become active and begin feeding on nearby alfalfa fields until the first cutting of alfalfa or early planted soybeans emerge. Mated females then lay lemon-shaped, orange-coloured eggs in small clusters in the soil at the base of the soybean and legume plants. Egg-laying occurs until mid-June. There is a distinct period between the end of June to mid-July when there is little to no adult activity in the field, since most of the population is now in the egg and larval phase. Newly hatched larvae feed on roots and other underground plant parts for about 30 days before pupating. The first generation adults begin to emerge from the soil in early July to mid-August and feed on the soybean foliage and pods until the plants senesce. The adults then migrate to alfalfa fields, if available, or move to their overwintering sites.
Damage: Defoliation injury by bean leaf beetle adults is generally not serious in Ontario. The exception is damage caused by overwintering adults to young soybean plants (V1–V2). Cotyledons and seedling plants
329
15. Insects and pests oF FIeld crops
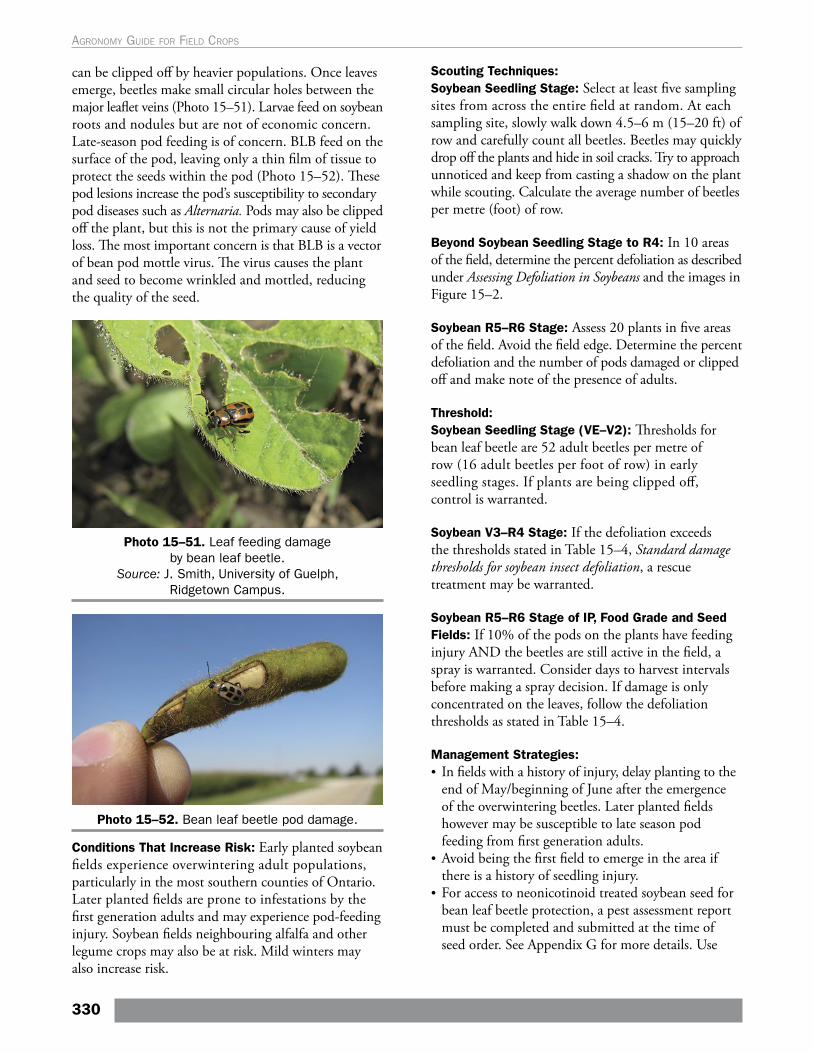
can be clipped off by heavier populations. Once leaves emerge, beetles make small circular holes between the major leaflet veins (Photo 15–51). Larvae feed on soybean roots and nodules but are not of economic concern. Late-season pod feeding is of concern. BLB feed on the surface of the pod, leaving only a thin film of tissue to protect the seeds within the pod (Photo 15–52). These pod lesions increase the pod’s susceptibility to secondary pod diseases such as Alternaria. Pods may also be clipped off the plant, but this is not the primary cause of yield loss. The most important concern is that BLB is a vector of bean pod mottle virus. The virus causes the plant and seed to become wrinkled and mottled, reducing the quality of the seed.
Photo 15–51. Leaf feeding damage by bean leaf beetle.
Source: J. Smith, University of Guelph, Ridgetown Campus.
Photo 15–52. Bean leaf beetle pod damage.
Conditions That Increase Risk: Early planted soybean fields experience overwintering adult populations, particularly in the most southern counties of Ontario. Later planted fields are prone to infestations by the first generation adults and may experience pod-feeding injury. Soybean fields neighbouring alfalfa and other legume crops may also be at risk. Mild winters may also increase risk.
Scouting Techniques:Soybean Seedling Stage: Select at least five sampling sites from across the entire field at random. At each sampling site, slowly walk down 4.5–6 m (15–20 ft) of row and carefully count all beetles. Beetles may quickly drop off the plants and hide in soil cracks. Try to approach unnoticed and keep from casting a shadow on the plant while scouting. Calculate the average number of beetles per metre (foot) of row.
Beyond Soybean Seedling Stage to R4: In 10 areas of the field, determine the percent defoliation as described under Assessing Defoliation in Soybeans and the images in Figure 15–2.
Soybean R5–R6 Stage: Assess 20 plants in five areas of the field. Avoid the field edge. Determine the percent defoliation and the number of pods damaged or clipped off and make note of the presence of adults.
Threshold:Soybean Seedling Stage (VE–V2): Thresholds for bean leaf beetle are 52 adult beetles per metre of row (16 adult beetles per foot of row) in early seedling stages. If plants are being clipped off, control is warranted.
Soybean V3–R4 Stage: If the defoliation exceeds the thresholds stated in Table 15–4, Standard damage thresholds for soybean insect defoliation, a rescue treatment may be warranted.
Soybean R5–R6 Stage of IP, Food Grade and Seed Fields: If 10% of the pods on the plants have feeding injury AND the beetles are still active in the field, a spray is warranted. Consider days to harvest intervals before making a spray decision. If damage is only concentrated on the leaves, follow the defoliation thresholds as stated in Table 15–4.
Management Strategies: • In fields with a history of injury, delay planting to the
end of May/beginning of June after the emergence of the overwintering beetles. Later planted fields however may be susceptible to late season pod feeding from first generation adults.
• Avoid being the first field to emerge in the area if there is a history of seedling injury.
• For access to neonicotinoid treated soybean seed for bean leaf beetle protection, a pest assessment report must be completed and submitted at the time of seed order. See Appendix G for more details. Use
330
Agronomy guide for field Crops
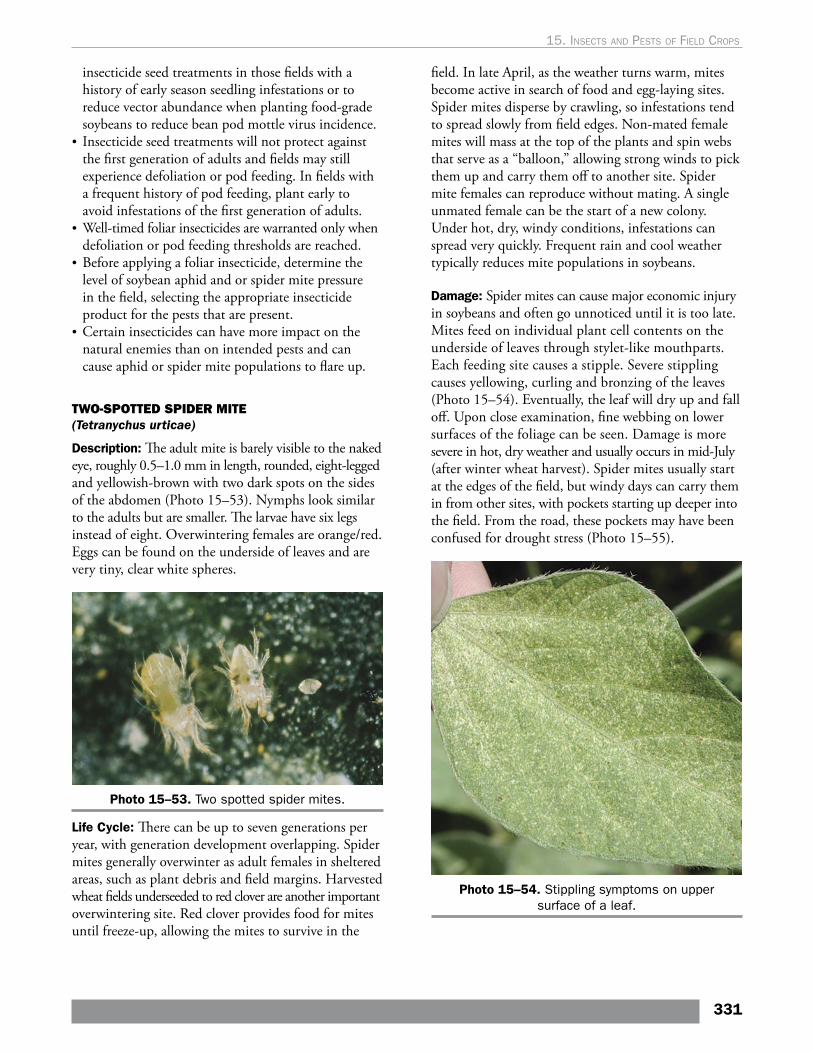
insecticide seed treatments in those fields with a history of early season seedling infestations or to reduce vector abundance when planting food-grade soybeans to reduce bean pod mottle virus incidence.
• Insecticide seed treatments will not protect against the first generation of adults and fields may still experience defoliation or pod feeding. In fields with a frequent history of pod feeding, plant early to avoid infestations of the first generation of adults.
• Well-timed foliar insecticides are warranted only when defoliation or pod feeding thresholds are reached.
• Before applying a foliar insecticide, determine the level of soybean aphid and or spider mite pressure in the field, selecting the appropriate insecticide product for the pests that are present.
• Certain insecticides can have more impact on the natural enemies than on intended pests and can cause aphid or spider mite populations to flare up.
TWO-SPOTTED SPIDER MITE (Tetranychus urticae)
Description: The adult mite is barely visible to the naked eye, roughly 0.5–1.0 mm in length, rounded, eight-legged and yellowish-brown with two dark spots on the sides of the abdomen (Photo 15–53). Nymphs look similar to the adults but are smaller. The larvae have six legs instead of eight. Overwintering females are orange/red. Eggs can be found on the underside of leaves and are very tiny, clear white spheres.
Photo 15–53. Two spotted spider mites.
Life Cycle: There can be up to seven generations per year, with generation development overlapping. Spider mites generally overwinter as adult females in sheltered areas, such as plant debris and field margins. Harvested wheat fields underseeded to red clover are another important overwintering site. Red clover provides food for mites until freeze-up, allowing the mites to survive in the
field. In late April, as the weather turns warm, mites become active in search of food and egg-laying sites. Spider mites disperse by crawling, so infestations tend to spread slowly from field edges. Non-mated female mites will mass at the top of the plants and spin webs that serve as a “balloon,” allowing strong winds to pick them up and carry them off to another site. Spider mite females can reproduce without mating. A single unmated female can be the start of a new colony. Under hot, dry, windy conditions, infestations can spread very quickly. Frequent rain and cool weather typically reduces mite populations in soybeans.
Damage: Spider mites can cause major economic injury in soybeans and often go unnoticed until it is too late. Mites feed on individual plant cell contents on the underside of leaves through stylet-like mouthparts. Each feeding site causes a stipple. Severe stippling causes yellowing, curling and bronzing of the leaves (Photo 15–54). Eventually, the leaf will dry up and fall off. Upon close examination, fine webbing on lower surfaces of the foliage can be seen. Damage is more severe in hot, dry weather and usually occurs in mid-July (after winter wheat harvest). Spider mites usually start at the edges of the field, but windy days can carry them in from other sites, with pockets starting up deeper into the field. From the road, these pockets may have been confused for drought stress (Photo 15–55).
Photo 15–54. Stippling symptoms on upper surface of a leaf.
331
15. Insects and pests oF FIeld crops
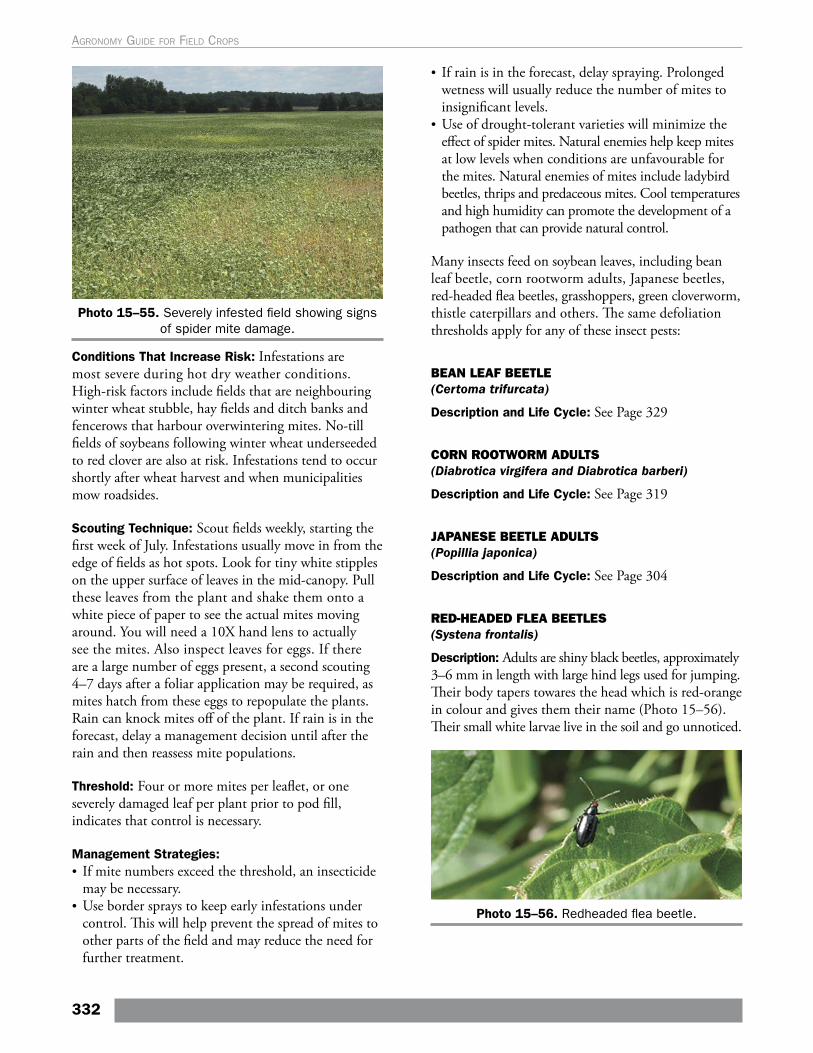
Photo 15–55. Severely infested field showing signs of spider mite damage.
Conditions That Increase Risk: Infestations are most severe during hot dry weather conditions. High-risk factors include fields that are neighbouring winter wheat stubble, hay fields and ditch banks and fencerows that harbour overwintering mites. No-till fields of soybeans following winter wheat underseeded to red clover are also at risk. Infestations tend to occur shortly after wheat harvest and when municipalities mow roadsides.
Scouting Technique: Scout fields weekly, starting the first week of July. Infestations usually move in from the edge of fields as hot spots. Look for tiny white stipples on the upper surface of leaves in the mid-canopy. Pull these leaves from the plant and shake them onto a white piece of paper to see the actual mites moving around. You will need a 10X hand lens to actually see the mites. Also inspect leaves for eggs. If there are a large number of eggs present, a second scouting 4–7 days after a foliar application may be required, as mites hatch from these eggs to repopulate the plants. Rain can knock mites off of the plant. If rain is in the forecast, delay a management decision until after the rain and then reassess mite populations.
Threshold: Four or more mites per leaflet, or one severely damaged leaf per plant prior to pod fill, indicates that control is necessary.
Management Strategies: • If mite numbers exceed the threshold, an insecticide
may be necessary. • Use border sprays to keep early infestations under
control. This will help prevent the spread of mites to other parts of the field and may reduce the need for further treatment.
• If rain is in the forecast, delay spraying. Prolonged wetness will usually reduce the number of mites to insignificant levels.
• Use of drought-tolerant varieties will minimize the effect of spider mites. Natural enemies help keep mites at low levels when conditions are unfavourable for the mites. Natural enemies of mites include ladybird beetles, thrips and predaceous mites. Cool temperatures and high humidity can promote the development of a pathogen that can provide natural control.
Many insects feed on soybean leaves, including bean leaf beetle, corn rootworm adults, Japanese beetles, red-headed flea beetles, grasshoppers, green cloverworm, thistle caterpillars and others. The same defoliation thresholds apply for any of these insect pests:
BEAN LEAF BEETLE(Certoma trifurcata)
Description and Life Cycle: See Page 329
CORN ROOTWORM ADULTS(Diabrotica virgifera and Diabrotica barberi)
Description and Life Cycle: See Page 319
JAPANESE BEETLE ADULTS(Popillia japonica)
Description and Life Cycle: See Page 304
RED-HEADED FLEA BEETLES(Systena frontalis)
Description: Adults are shiny black beetles, approximately 3–6 mm in length with large hind legs used for jumping. Their body tapers towares the head which is red-orange in colour and gives them their name (Photo 15–56). Their small white larvae live in the soil and go unnoticed.
Photo 15–56. Redheaded flea beetle.
332
Agronomy guide for field Crops
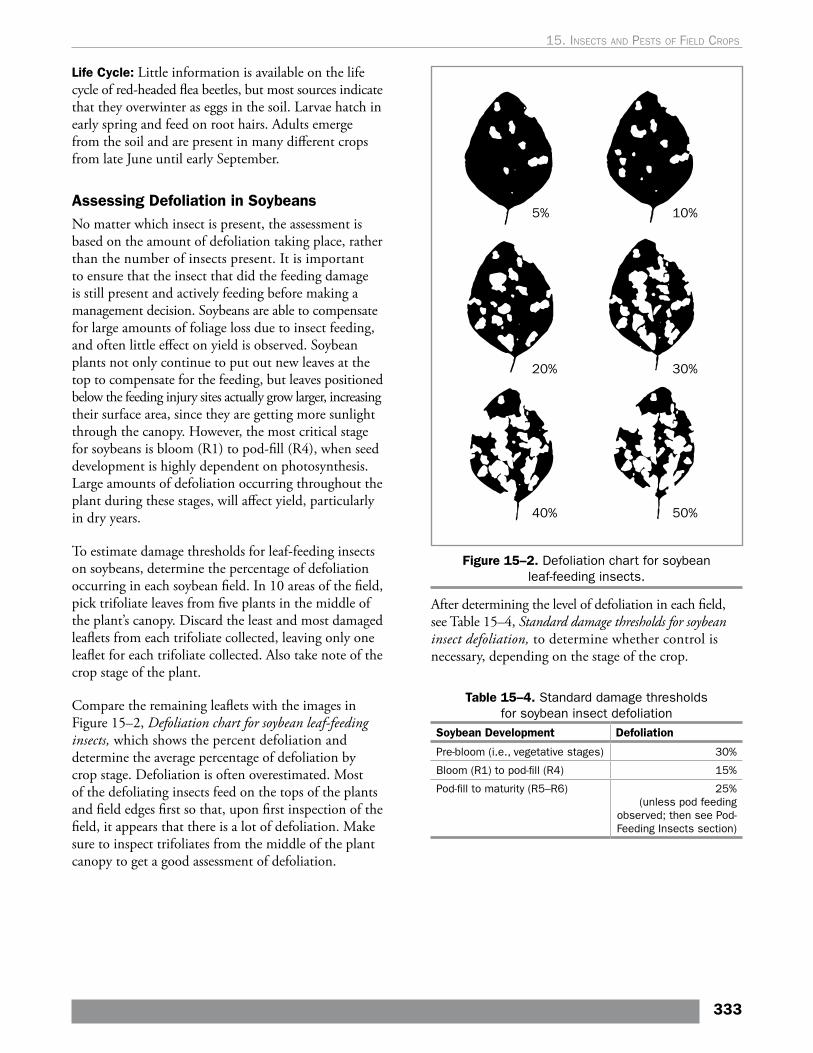
Life Cycle: Little information is available on the life cycle of red-headed flea beetles, but most sources indicate that they overwinter as eggs in the soil. Larvae hatch in early spring and feed on root hairs. Adults emerge from the soil and are present in many different crops from late June until early September.
Assessing Defoliation in SoybeansNo matter which insect is present, the assessment is based on the amount of defoliation taking place, rather than the number of insects present. It is important to ensure that the insect that did the feeding damage is still present and actively feeding before making a management decision. Soybeans are able to compensate for large amounts of foliage loss due to insect feeding, and often little effect on yield is observed. Soybean plants not only continue to put out new leaves at the top to compensate for the feeding, but leaves positioned below the feeding injury sites actually grow larger, increasing their surface area, since they are getting more sunlight through the canopy. However, the most critical stage for soybeans is bloom (R1) to pod-fill (R4), when seed development is highly dependent on photosynthesis. Large amounts of defoliation occurring throughout the plant during these stages, will affect yield, particularly in dry years.
To estimate damage thresholds for leaf-feeding insects on soybeans, determine the percentage of defoliation occurring in each soybean field. In 10 areas of the field, pick trifoliate leaves from five plants in the middle of the plant’s canopy. Discard the least and most damaged leaflets from each trifoliate collected, leaving only one leaflet for each trifoliate collected. Also take note of the crop stage of the plant.
Compare the remaining leaflets with the images in Figure 15–2, Defoliation chart for soybean leaf-feeding insects, which shows the percent defoliation and determine the average percentage of defoliation by crop stage. Defoliation is often overestimated. Most of the defoliating insects feed on the tops of the plants and field edges first so that, upon first inspection of the field, it appears that there is a lot of defoliation. Make sure to inspect trifoliates from the middle of the plant canopy to get a good assessment of defoliation.
Figure 15–2. Defoliation chart for soybean leaf-feeding insects.
After determining the level of defoliation in each field, see Table 15–4, Standard damage thresholds for soybean insect defoliation, to determine whether control is necessary, depending on the stage of the crop.
Table 15–4. Standard damage thresholds for soybean insect defoliation
Soybean Development Defoliation
Pre-bloom (i.e., vegetative stages) 30%
Bloom (R1) to pod-fill (R4) 15%
Pod-fill to maturity (R5–R6) 25% (unless pod feeding
observed; then see Pod-Feeding Insects section)
333
15. Insects and pests oF FIeld crops
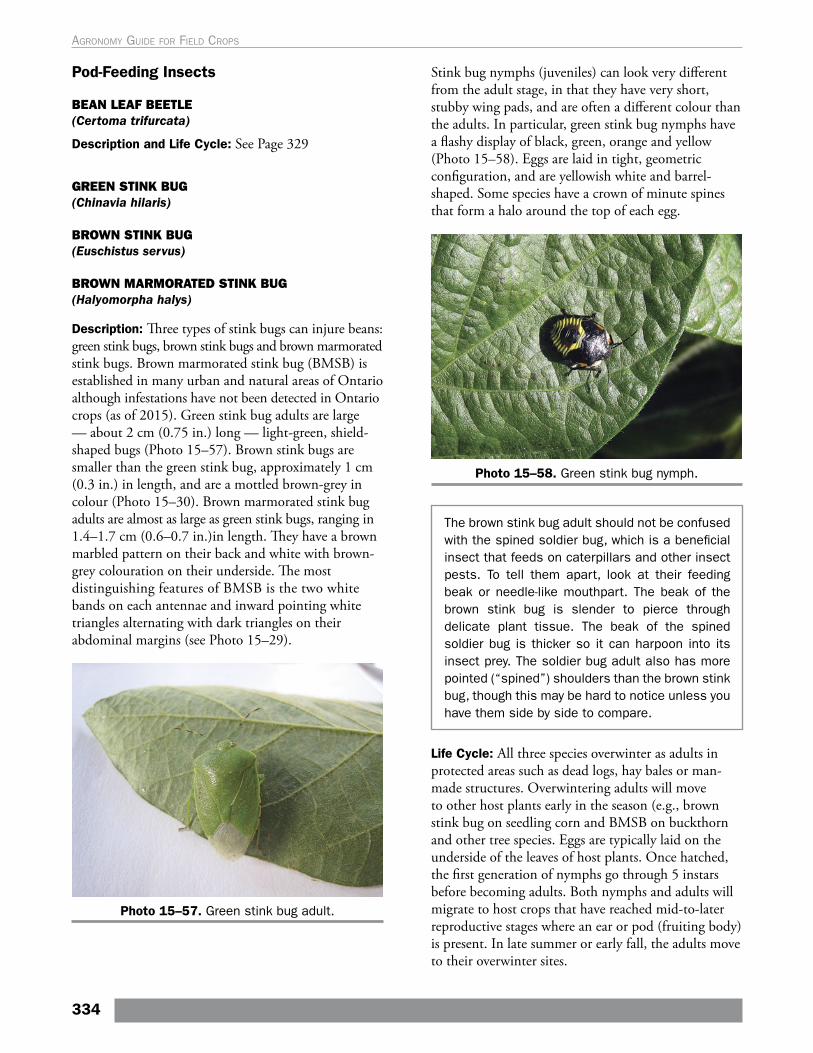
Pod-Feeding Insects
BEAN LEAF BEETLE(Certoma trifurcata)
Description and Life Cycle: See Page 329
GREEN STINK BUG(Chinavia hilaris)
BROWN STINK BUG(Euschistus servus)
BROWN MARMORATED STINK BUG(Halyomorpha halys)
Description: Three types of stink bugs can injure beans: green stink bugs, brown stink bugs and brown marmorated stink bugs. Brown marmorated stink bug (BMSB) is established in many urban and natural areas of Ontario although infestations have not been detected in Ontario crops (as of 2015). Green stink bug adults are large — about 2 cm (0.75 in.) long — light-green, shield-shaped bugs (Photo 15–57). Brown stink bugs are smaller than the green stink bug, approximately 1 cm (0.3 in.) in length, and are a mottled brown-grey in colour (Photo 15–30). Brown marmorated stink bug adults are almost as large as green stink bugs, ranging in 1.4–1.7 cm (0.6–0.7 in.)in length. They have a brown marbled pattern on their back and white with brown-grey colouration on their underside. The most distinguishing features of BMSB is the two white bands on each antennae and inward pointing white triangles alternating with dark triangles on their abdominal margins (see Photo 15–29).
Photo 15–57. Green stink bug adult.
Stink bug nymphs (juveniles) can look very different from the adult stage, in that they have very short, stubby wing pads, and are often a different colour than the adults. In particular, green stink bug nymphs have a flashy display of black, green, orange and yellow (Photo 15–58). Eggs are laid in tight, geometric configuration, and are yellowish white and barrel-shaped. Some species have a crown of minute spines that form a halo around the top of each egg.
Photo 15–58. Green stink bug nymph.
The brown stink bug adult should not be confused with the spined soldier bug, which is a beneficial insect that feeds on caterpillars and other insect pests. To tell them apart, look at their feeding beak or needle-like mouthpart. The beak of the brown stink bug is slender to pierce through delicate plant tissue. The beak of the spined soldier bug is thicker so it can harpoon into its insect prey. The soldier bug adult also has more pointed (“spined”) shoulders than the brown stink bug, though this may be hard to notice unless you have them side by side to compare.
Life Cycle: All three species overwinter as adults in protected areas such as dead logs, hay bales or man-made structures. Overwintering adults will move to other host plants early in the season (e.g., brown stink bug on seedling corn and BMSB on buckthorn and other tree species. Eggs are typically laid on the underside of the leaves of host plants. Once hatched, the first generation of nymphs go through 5 instars before becoming adults. Both nymphs and adults will migrate to host crops that have reached mid-to-later reproductive stages where an ear or pod (fruiting body) is present. In late summer or early fall, the adults move to their overwinter sites.
334
Agronomy guide for field Crops
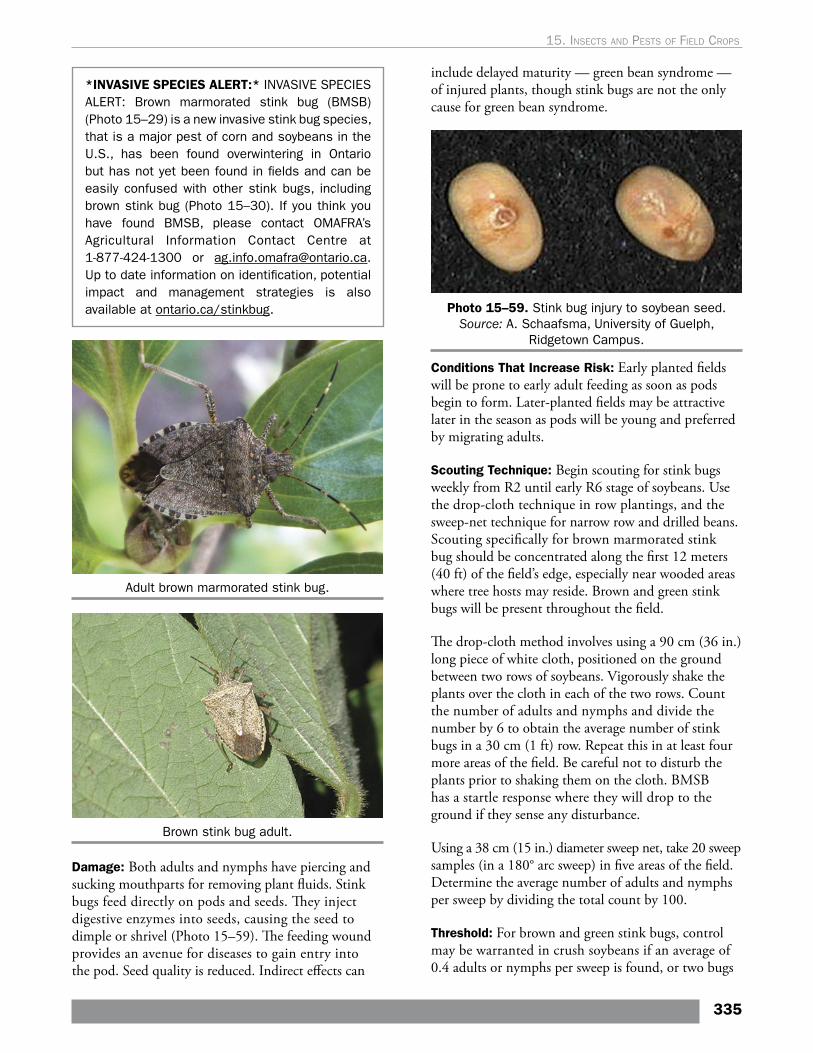
*INVASIVE SPECIES ALERT:* INVASIVE SPECIES ALERT: Brown marmorated stink bug (BMSB) (Photo 15–29) is a new invasive stink bug species, that is a major pest of corn and soybeans in the U.S., has been found overwintering in Ontario but has not yet been found in fields and can be easily confused with other stink bugs, including brown stink bug (Photo 15–30). If you think you have found BMSB, please contact OMAFRA’s Agricultural Information Contact Centre at 1-877-424-1300 or [email protected]. Up to date information on identification, potential impact and management strategies is also available at ontario.ca/stinkbug.
Adult brown marmorated stink bug.
Brown stink bug adult.
Damage: Both adults and nymphs have piercing and sucking mouthparts for removing plant fluids. Stink bugs feed directly on pods and seeds. They inject digestive enzymes into seeds, causing the seed to dimple or shrivel (Photo 15–59). The feeding wound provides an avenue for diseases to gain entry into the pod. Seed quality is reduced. Indirect effects can
include delayed maturity — green bean syndrome — of injured plants, though stink bugs are not the only cause for green bean syndrome.
Photo 15–59. Stink bug injury to soybean seed. Source: A. Schaafsma, University of Guelph,
Ridgetown Campus.
Conditions That Increase Risk: Early planted fields will be prone to early adult feeding as soon as pods begin to form. Later-planted fields may be attractive later in the season as pods will be young and preferred by migrating adults.
Scouting Technique: Begin scouting for stink bugs weekly from R2 until early R6 stage of soybeans. Use the drop-cloth technique in row plantings, and the sweep-net technique for narrow row and drilled beans. Scouting specifically for brown marmorated stink bug should be concentrated along the first 12 meters (40 ft) of the field’s edge, especially near wooded areas where tree hosts may reside. Brown and green stink bugs will be present throughout the field.
The drop-cloth method involves using a 90 cm (36 in.) long piece of white cloth, positioned on the ground between two rows of soybeans. Vigorously shake the plants over the cloth in each of the two rows. Count the number of adults and nymphs and divide the number by 6 to obtain the average number of stink bugs in a 30 cm (1 ft) row. Repeat this in at least four more areas of the field. Be careful not to disturb the plants prior to shaking them on the cloth. BMSB has a startle response where they will drop to the ground if they sense any disturbance.
Using a 38 cm (15 in.) diameter sweep net, take 20 sweep samples (in a 180° arc sweep) in five areas of the field. Determine the average number of adults and nymphs per sweep by dividing the total count by 100.
Threshold: For brown and green stink bugs, control may be warranted in crush soybeans if an average of 0.4 adults or nymphs per sweep is found, or two bugs
335
15. Insects and pests oF FIeld crops
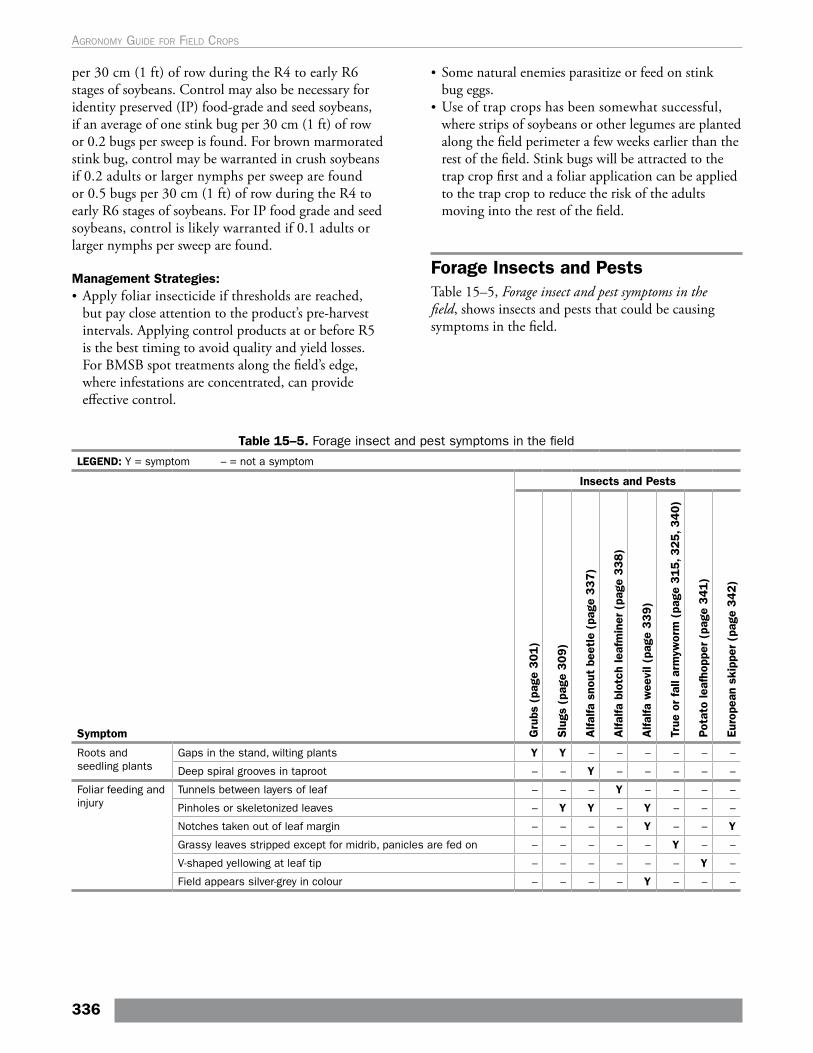
per 30 cm (1 ft) of row during the R4 to early R6 stages of soybeans. Control may also be necessary for identity preserved (IP) food-grade and seed soybeans, if an average of one stink bug per 30 cm (1 ft) of row or 0.2 bugs per sweep is found. For brown marmorated stink bug, control may be warranted in crush soybeans if 0.2 adults or larger nymphs per sweep are found or 0.5 bugs per 30 cm (1 ft) of row during the R4 to early R6 stages of soybeans. For IP food grade and seed soybeans, control is likely warranted if 0.1 adults or larger nymphs per sweep are found.
Management Strategies: • Apply foliar insecticide if thresholds are reached,
but pay close attention to the product’s pre-harvest intervals. Applying control products at or before R5 is the best timing to avoid quality and yield losses. For BMSB spot treatments along the field’s edge, where infestations are concentrated, can provide effective control.
• Some natural enemies parasitize or feed on stink bug eggs.
• Use of trap crops has been somewhat successful, where strips of soybeans or other legumes are planted along the field perimeter a few weeks earlier than the rest of the field. Stink bugs will be attracted to the trap crop first and a foliar application can be applied to the trap crop to reduce the risk of the adults moving into the rest of the field.
Forage Insects and PestsTable 15–5, Forage insect and pest symptoms in the field, shows insects and pests that could be causing symptoms in the field.
Table 15–5. Forage insect and pest symptoms in the field
LEGEND: Y = symptom – = not a symptom
Symptom
Insects and Pests
Gru
bs (
page
301)
Slu
gs (
page
309)
Alfa
lfa s
nout
bee
tle
(pag
e 337)
Alfa
lfa b
lotc
h le
afm
iner
(pa
ge 3
38)
Alfa
lfa w
eevi
l (pa
ge 3
39
)
True
or
fall
arm
ywor
m (
page
315, 3
25, 3
40)
Pot
ato
leaf
hopp
er (
page
341
)
Euro
pean
ski
pper
(pa
ge 3
42
)
Roots and seedling plants
Gaps in the stand, wilting plants Y Y – – – – – –
Deep spiral grooves in taproot – – Y – – – – –
Foliar feeding and injury
Tunnels between layers of leaf – – – Y – – – –
Pinholes or skeletonized leaves – Y Y – Y – – –
Notches taken out of leaf margin – – – – Y – – Y
Grassy leaves stripped except for midrib, panicles are fed on – – – – – Y – –
V-shaped yellowing at leaf tip – – – – – – Y –
Field appears silver-grey in colour – – – – Y – – –
336
Agronomy guide for field Crops
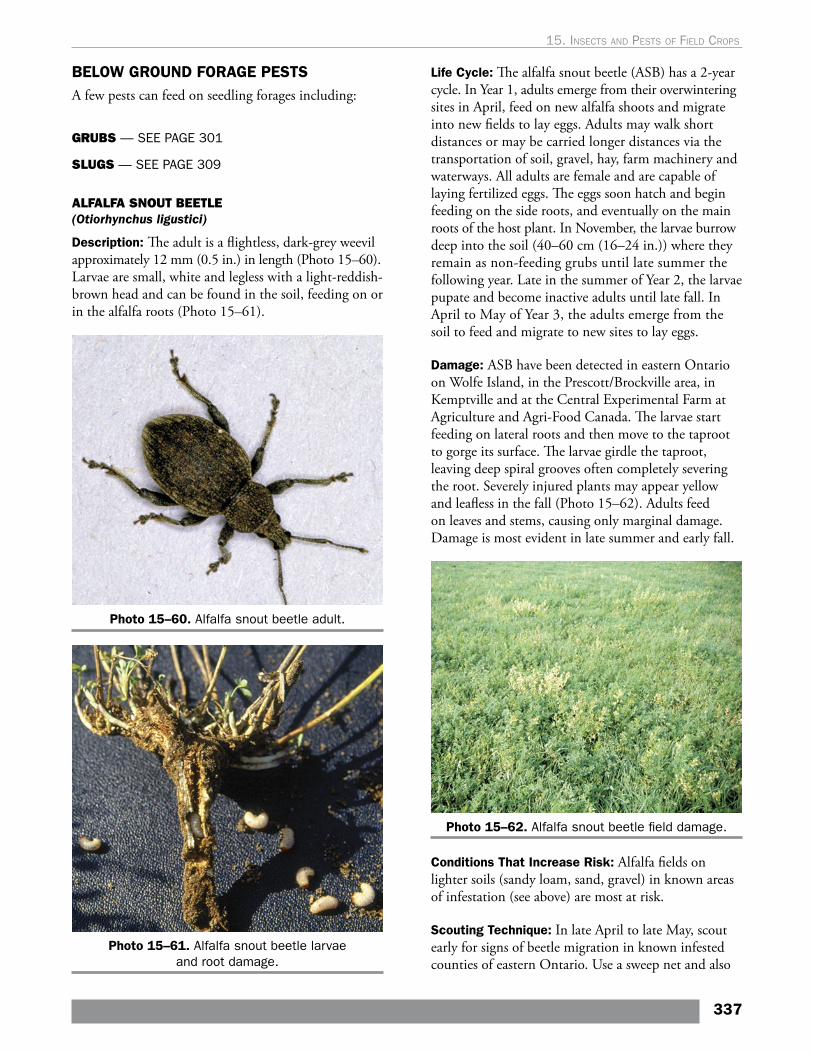
BELOW GROUND FORAGE PESTSA few pests can feed on seedling forages including:
GRUBS — SEE PAGE 301
SLUGS — SEE PAGE 309
ALFALFA SNOUT BEETLE(Otiorhynchus ligustici)
Description: The adult is a flightless, dark-grey weevil approximately 12 mm (0.5 in.) in length (Photo 15–60). Larvae are small, white and legless with a light-reddish-brown head and can be found in the soil, feeding on or in the alfalfa roots (Photo 15–61).
Photo 15–60. Alfalfa snout beetle adult.
Photo 15–61. Alfalfa snout beetle larvae and root damage.
Life Cycle: The alfalfa snout beetle (ASB) has a 2-year cycle. In Year 1, adults emerge from their overwintering sites in April, feed on new alfalfa shoots and migrate into new fields to lay eggs. Adults may walk short distances or may be carried longer distances via the transportation of soil, gravel, hay, farm machinery and waterways. All adults are female and are capable of laying fertilized eggs. The eggs soon hatch and begin feeding on the side roots, and eventually on the main roots of the host plant. In November, the larvae burrow deep into the soil (40–60 cm (16–24 in.)) where they remain as non-feeding grubs until late summer the following year. Late in the summer of Year 2, the larvae pupate and become inactive adults until late fall. In April to May of Year 3, the adults emerge from the soil to feed and migrate to new sites to lay eggs.
Damage: ASB have been detected in eastern Ontario on Wolfe Island, in the Prescott/Brockville area, in Kemptville and at the Central Experimental Farm at Agriculture and Agri-Food Canada. The larvae start feeding on lateral roots and then move to the taproot to gorge its surface. The larvae girdle the taproot, leaving deep spiral grooves often completely severing the root. Severely injured plants may appear yellow and leafless in the fall (Photo 15–62). Adults feed on leaves and stems, causing only marginal damage. Damage is most evident in late summer and early fall.
Photo 15–62. Alfalfa snout beetle field damage.
Conditions That Increase Risk: Alfalfa fields on lighter soils (sandy loam, sand, gravel) in known areas of infestation (see above) are most at risk.
Scouting Technique: In late April to late May, scout early for signs of beetle migration in known infested counties of eastern Ontario. Use a sweep net and also
337
15. Insects and pests oF FIeld crops
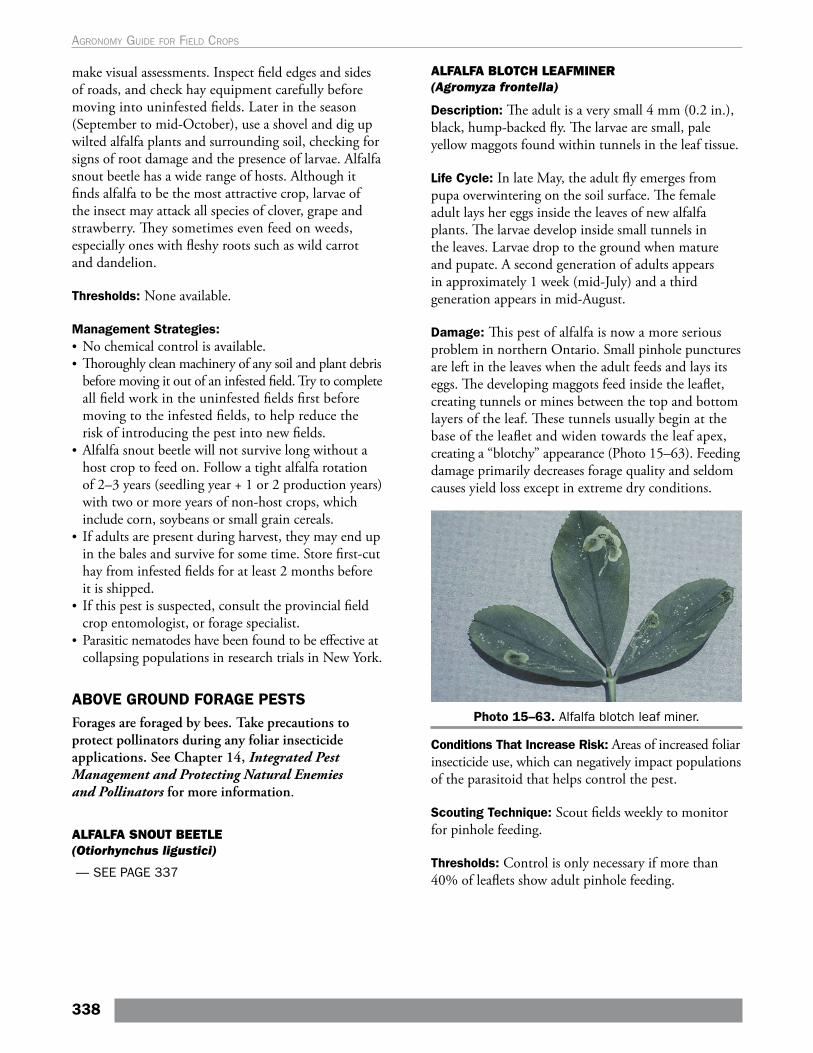
make visual assessments. Inspect field edges and sides of roads, and check hay equipment carefully before moving into uninfested fields. Later in the season (September to mid-October), use a shovel and dig up wilted alfalfa plants and surrounding soil, checking for signs of root damage and the presence of larvae. Alfalfa snout beetle has a wide range of hosts. Although it finds alfalfa to be the most attractive crop, larvae of the insect may attack all species of clover, grape and strawberry. They sometimes even feed on weeds, especially ones with fleshy roots such as wild carrot and dandelion.
Thresholds: None available.
Management Strategies:• No chemical control is available. • Thoroughly clean machinery of any soil and plant debris
before moving it out of an infested field. Try to complete all field work in the uninfested fields first before moving to the infested fields, to help reduce the risk of introducing the pest into new fields.
• Alfalfa snout beetle will not survive long without a host crop to feed on. Follow a tight alfalfa rotation of 2–3 years (seedling year + 1 or 2 production years) with two or more years of non-host crops, which include corn, soybeans or small grain cereals.
• If adults are present during harvest, they may end up in the bales and survive for some time. Store first-cut hay from infested fields for at least 2 months before it is shipped.
• If this pest is suspected, consult the provincial field crop entomologist, or forage specialist.
• Parasitic nematodes have been found to be effective at collapsing populations in research trials in New York.
ABOVE GROUND FORAGE PESTSForages are foraged by bees. Take precautions to protect pollinators during any foliar insecticide applications. See Chapter 14, Integrated Pest Management and Protecting Natural Enemies and Pollinators for more information.
ALFALFA SNOUT BEETLE(Otiorhynchus ligustici)
— SEE PAGE 337
ALFALFA BLOTCH LEAFMINER(Agromyza frontella)
Description: The adult is a very small 4 mm (0.2 in.), black, hump-backed fly. The larvae are small, pale yellow maggots found within tunnels in the leaf tissue.
Life Cycle: In late May, the adult fly emerges from pupa overwintering on the soil surface. The female adult lays her eggs inside the leaves of new alfalfa plants. The larvae develop inside small tunnels in the leaves. Larvae drop to the ground when mature and pupate. A second generation of adults appears in approximately 1 week (mid-July) and a third generation appears in mid-August.
Damage: This pest of alfalfa is now a more serious problem in northern Ontario. Small pinhole punctures are left in the leaves when the adult feeds and lays its eggs. The developing maggots feed inside the leaflet, creating tunnels or mines between the top and bottom layers of the leaf. These tunnels usually begin at the base of the leaflet and widen towards the leaf apex, creating a “blotchy” appearance (Photo 15–63). Feeding damage primarily decreases forage quality and seldom causes yield loss except in extreme dry conditions.
Photo 15–63. Alfalfa blotch leaf miner.
Conditions That Increase Risk: Areas of increased foliar insecticide use, which can negatively impact populations of the parasitoid that helps control the pest.
Scouting Technique: Scout fields weekly to monitor for pinhole feeding.
Thresholds: Control is only necessary if more than 40% of leaflets show adult pinhole feeding.
338
Agronomy guide for field Crops
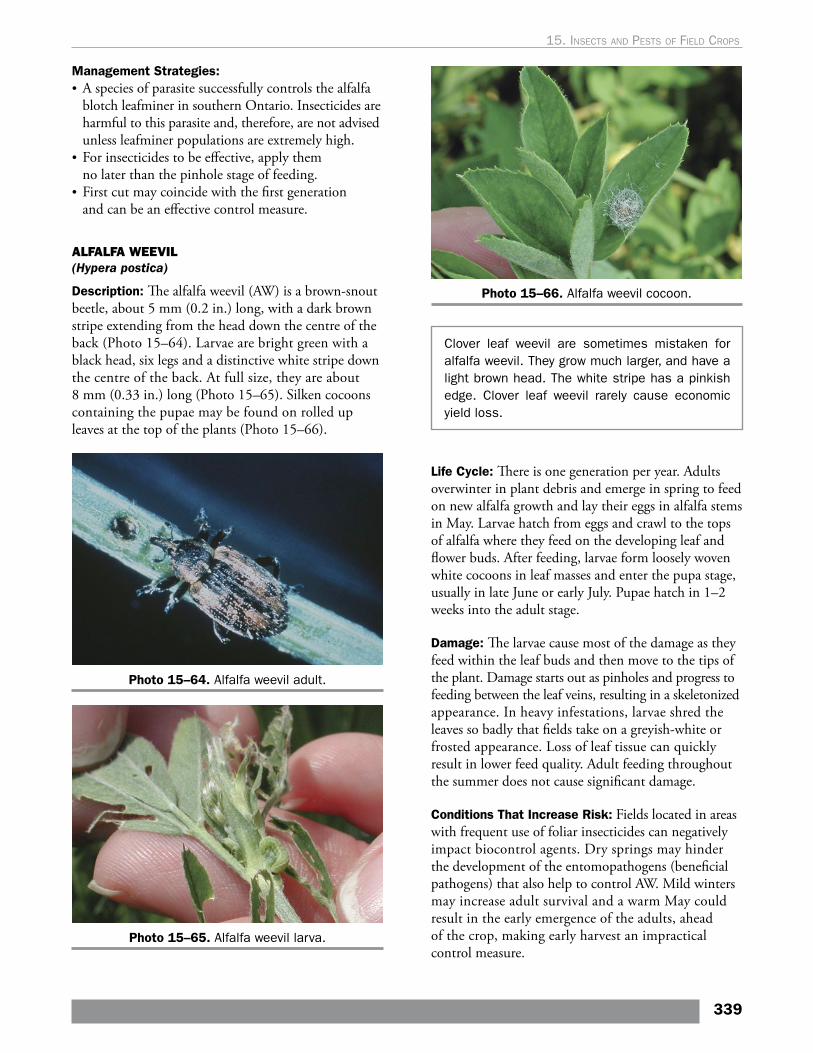
Management Strategies:• A species of parasite successfully controls the alfalfa
blotch leafminer in southern Ontario. Insecticides are harmful to this parasite and, therefore, are not advised unless leafminer populations are extremely high.
• For insecticides to be effective, apply them no later than the pinhole stage of feeding.
• First cut may coincide with the first generation and can be an effective control measure.
ALFALFA WEEVIL(Hypera postica)
Description: The alfalfa weevil (AW) is a brown-snout beetle, about 5 mm (0.2 in.) long, with a dark brown stripe extending from the head down the centre of the back (Photo 15–64). Larvae are bright green with a black head, six legs and a distinctive white stripe down the centre of the back. At full size, they are about 8 mm (0.33 in.) long (Photo 15–65). Silken cocoons containing the pupae may be found on rolled up leaves at the top of the plants (Photo 15–66).
Photo 15–64. Alfalfa weevil adult.
Photo 15–65. Alfalfa weevil larva.
Photo 15–66. Alfalfa weevil cocoon.
Clover leaf weevil are sometimes mistaken for alfalfa weevil. They grow much larger, and have a light brown head. The white stripe has a pinkish edge. Clover leaf weevil rarely cause economic yield loss.
Life Cycle: There is one generation per year. Adults overwinter in plant debris and emerge in spring to feed on new alfalfa growth and lay their eggs in alfalfa stems in May. Larvae hatch from eggs and crawl to the tops of alfalfa where they feed on the developing leaf and flower buds. After feeding, larvae form loosely woven white cocoons in leaf masses and enter the pupa stage, usually in late June or early July. Pupae hatch in 1–2 weeks into the adult stage.
Damage: The larvae cause most of the damage as they feed within the leaf buds and then move to the tips of the plant. Damage starts out as pinholes and progress to feeding between the leaf veins, resulting in a skeletonized appearance. In heavy infestations, larvae shred the leaves so badly that fields take on a greyish-white or frosted appearance. Loss of leaf tissue can quickly result in lower feed quality. Adult feeding throughout the summer does not cause significant damage.
Conditions That Increase Risk: Fields located in areas with frequent use of foliar insecticides can negatively impact biocontrol agents. Dry springs may hinder the development of the entomopathogens (beneficial pathogens) that also help to control AW. Mild winters may increase adult survival and a warm May could result in the early emergence of the adults, ahead of the crop, making early harvest an impractical control measure.
339
15. Insects and pests oF FIeld crops
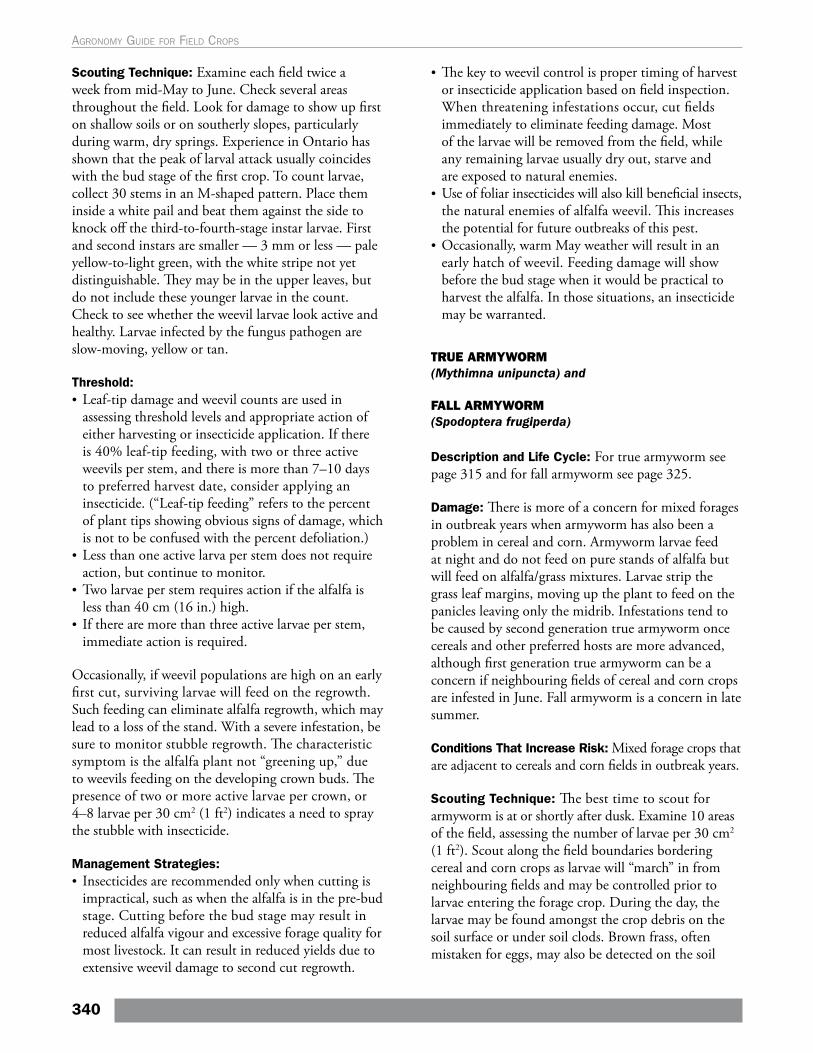
Scouting Technique: Examine each field twice a week from mid-May to June. Check several areas throughout the field. Look for damage to show up first on shallow soils or on southerly slopes, particularly during warm, dry springs. Experience in Ontario has shown that the peak of larval attack usually coincides with the bud stage of the first crop. To count larvae, collect 30 stems in an M-shaped pattern. Place them inside a white pail and beat them against the side to knock off the third-to-fourth-stage instar larvae. First and second instars are smaller — 3 mm or less — pale yellow-to-light green, with the white stripe not yet distinguishable. They may be in the upper leaves, but do not include these younger larvae in the count. Check to see whether the weevil larvae look active and healthy. Larvae infected by the fungus pathogen are slow-moving, yellow or tan.
Threshold:• Leaf-tip damage and weevil counts are used in
assessing threshold levels and appropriate action of either harvesting or insecticide application. If there is 40% leaf-tip feeding, with two or three active weevils per stem, and there is more than 7–10 days to preferred harvest date, consider applying an insecticide. (“Leaf-tip feeding” refers to the percent of plant tips showing obvious signs of damage, which is not to be confused with the percent defoliation.)
• Less than one active larva per stem does not require action, but continue to monitor.
• Two larvae per stem requires action if the alfalfa is less than 40 cm (16 in.) high.
• If there are more than three active larvae per stem, immediate action is required.
Occasionally, if weevil populations are high on an early first cut, surviving larvae will feed on the regrowth. Such feeding can eliminate alfalfa regrowth, which may lead to a loss of the stand. With a severe infestation, be sure to monitor stubble regrowth. The characteristic symptom is the alfalfa plant not “greening up,” due to weevils feeding on the developing crown buds. The presence of two or more active larvae per crown, or 4–8 larvae per 30 cm2 (1 ft2) indicates a need to spray the stubble with insecticide.
Management Strategies:• Insecticides are recommended only when cutting is
impractical, such as when the alfalfa is in the pre-bud stage. Cutting before the bud stage may result in reduced alfalfa vigour and excessive forage quality for most livestock. It can result in reduced yields due to extensive weevil damage to second cut regrowth.
• The key to weevil control is proper timing of harvest or insecticide application based on field inspection. When threatening infestations occur, cut fields immediately to eliminate feeding damage. Most of the larvae will be removed from the field, while any remaining larvae usually dry out, starve and are exposed to natural enemies.
• Use of foliar insecticides will also kill beneficial insects, the natural enemies of alfalfa weevil. This increases the potential for future outbreaks of this pest.
• Occasionally, warm May weather will result in an early hatch of weevil. Feeding damage will show before the bud stage when it would be practical to harvest the alfalfa. In those situations, an insecticide may be warranted.
TRUE ARMYWORM (Mythimna unipuncta) and
FALL ARMYWORM (Spodoptera frugiperda)
Description and Life Cycle: For true armyworm see page 315 and for fall armyworm see page 325.
Damage: There is more of a concern for mixed forages in outbreak years when armyworm has also been a problem in cereal and corn. Armyworm larvae feed at night and do not feed on pure stands of alfalfa but will feed on alfalfa/grass mixtures. Larvae strip the grass leaf margins, moving up the plant to feed on the panicles leaving only the midrib. Infestations tend to be caused by second generation true armyworm once cereals and other preferred hosts are more advanced, although first generation true armyworm can be a concern if neighbouring fields of cereal and corn crops are infested in June. Fall armyworm is a concern in late summer.
Conditions That Increase Risk: Mixed forage crops that are adjacent to cereals and corn fields in outbreak years.
Scouting Technique: The best time to scout for armyworm is at or shortly after dusk. Examine 10 areas of the field, assessing the number of larvae per 30 cm2 (1 ft2). Scout along the field boundaries bordering cereal and corn crops as larvae will “march” in from neighbouring fields and may be controlled prior to larvae entering the forage crop. During the day, the larvae may be found amongst the crop debris on the soil surface or under soil clods. Brown frass, often mistaken for eggs, may also be detected on the soil
340
Agronomy guide for field Crops
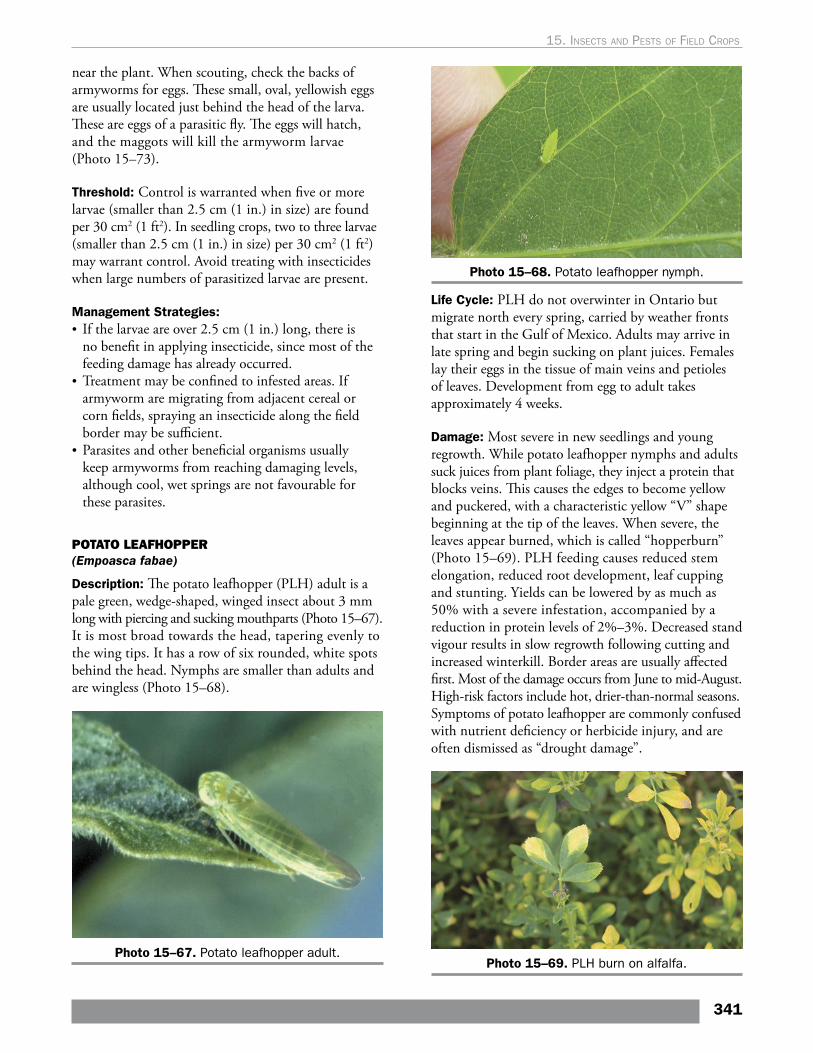
near the plant. When scouting, check the backs of armyworms for eggs. These small, oval, yellowish eggs are usually located just behind the head of the larva. These are eggs of a parasitic fly. The eggs will hatch, and the maggots will kill the armyworm larvae (Photo 15–73).
Threshold: Control is warranted when five or more larvae (smaller than 2.5 cm (1 in.) in size) are found per 30 cm2 (1 ft2). In seedling crops, two to three larvae (smaller than 2.5 cm (1 in.) in size) per 30 cm2 (1 ft2) may warrant control. Avoid treating with insecticides when large numbers of parasitized larvae are present.
Management Strategies: • If the larvae are over 2.5 cm (1 in.) long, there is
no benefit in applying insecticide, since most of the feeding damage has already occurred.
• Treatment may be confined to infested areas. If armyworm are migrating from adjacent cereal or corn fields, spraying an insecticide along the field border may be sufficient.
• Parasites and other beneficial organisms usually keep armyworms from reaching damaging levels, although cool, wet springs are not favourable for these parasites.
POTATO LEAFHOPPER(Empoasca fabae)
Description: The potato leafhopper (PLH) adult is a pale green, wedge-shaped, winged insect about 3 mm long with piercing and sucking mouthparts (Photo 15–67). It is most broad towards the head, tapering evenly to the wing tips. It has a row of six rounded, white spots behind the head. Nymphs are smaller than adults and are wingless (Photo 15–68).
Photo 15–67. Potato leafhopper adult.
Photo 15–68. Potato leafhopper nymph.
Life Cycle: PLH do not overwinter in Ontario but migrate north every spring, carried by weather fronts that start in the Gulf of Mexico. Adults may arrive in late spring and begin sucking on plant juices. Females lay their eggs in the tissue of main veins and petioles of leaves. Development from egg to adult takes approximately 4 weeks.
Damage: Most severe in new seedlings and young regrowth. While potato leafhopper nymphs and adults suck juices from plant foliage, they inject a protein that blocks veins. This causes the edges to become yellow and puckered, with a characteristic yellow “V” shape beginning at the tip of the leaves. When severe, the leaves appear burned, which is called “hopperburn” (Photo 15–69). PLH feeding causes reduced stem elongation, reduced root development, leaf cupping and stunting. Yields can be lowered by as much as 50% with a severe infestation, accompanied by a reduction in protein levels of 2%–3%. Decreased stand vigour results in slow regrowth following cutting and increased winterkill. Border areas are usually affected first. Most of the damage occurs from June to mid-August. High-risk factors include hot, drier-than-normal seasons. Symptoms of potato leafhopper are commonly confused with nutrient deficiency or herbicide injury, and are often dismissed as “drought damage”.
Photo 15–69. PLH burn on alfalfa.
341
15. Insects and pests oF FIeld crops
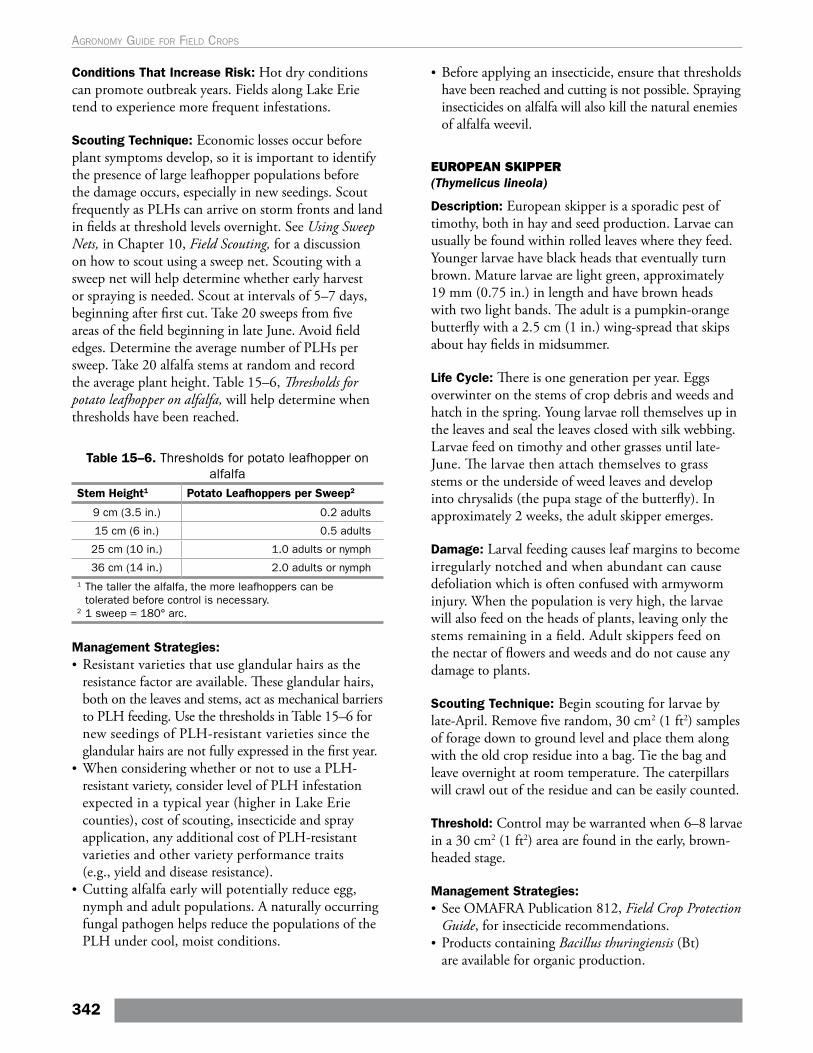
Conditions That Increase Risk: Hot dry conditions can promote outbreak years. Fields along Lake Erie tend to experience more frequent infestations.
Scouting Technique: Economic losses occur before plant symptoms develop, so it is important to identify the presence of large leafhopper populations before the damage occurs, especially in new seedings. Scout frequently as PLHs can arrive on storm fronts and land in fields at threshold levels overnight. See Using Sweep Nets, in Chapter 10, Field Scouting, for a discussion on how to scout using a sweep net. Scouting with a sweep net will help determine whether early harvest or spraying is needed. Scout at intervals of 5–7 days, beginning after first cut. Take 20 sweeps from five areas of the field beginning in late June. Avoid field edges. Determine the average number of PLHs per sweep. Take 20 alfalfa stems at random and record the average plant height. Table 15–6, Thresholds for potato leafhopper on alfalfa, will help determine when thresholds have been reached.
Table 15–6. Thresholds for potato leafhopper on alfalfa
Stem Height1 Potato Leafhoppers per Sweep2
9 cm (3.5 in.) 0.2 adults
15 cm (6 in.) 0.5 adults
25 cm (10 in.) 1.0 adults or nymph
36 cm (14 in.) 2.0 adults or nymph1 The taller the alfalfa, the more leafhoppers can be
tolerated before control is necessary.2 1 sweep = 180° arc.
Management Strategies:• Resistant varieties that use glandular hairs as the
resistance factor are available. These glandular hairs, both on the leaves and stems, act as mechanical barriers to PLH feeding. Use the thresholds in Table 15–6 for new seedings of PLH-resistant varieties since the glandular hairs are not fully expressed in the first year.
• When considering whether or not to use a PLH-resistant variety, consider level of PLH infestation expected in a typical year (higher in Lake Erie counties), cost of scouting, insecticide and spray application, any additional cost of PLH-resistant varieties and other variety performance traits (e.g., yield and disease resistance).
• Cutting alfalfa early will potentially reduce egg, nymph and adult populations. A naturally occurring fungal pathogen helps reduce the populations of the PLH under cool, moist conditions.
• Before applying an insecticide, ensure that thresholds have been reached and cutting is not possible. Spraying insecticides on alfalfa will also kill the natural enemies of alfalfa weevil.
EUROPEAN SKIPPER (Thymelicus lineola)
Description: European skipper is a sporadic pest of timothy, both in hay and seed production. Larvae can usually be found within rolled leaves where they feed. Younger larvae have black heads that eventually turn brown. Mature larvae are light green, approximately 19 mm (0.75 in.) in length and have brown heads with two light bands. The adult is a pumpkin-orange butterfly with a 2.5 cm (1 in.) wing-spread that skips about hay fields in midsummer.
Life Cycle: There is one generation per year. Eggs overwinter on the stems of crop debris and weeds and hatch in the spring. Young larvae roll themselves up in the leaves and seal the leaves closed with silk webbing. Larvae feed on timothy and other grasses until late-June. The larvae then attach themselves to grass stems or the underside of weed leaves and develop into chrysalids (the pupa stage of the butterfly). In approximately 2 weeks, the adult skipper emerges.
Damage: Larval feeding causes leaf margins to become irregularly notched and when abundant can cause defoliation which is often confused with armyworm injury. When the population is very high, the larvae will also feed on the heads of plants, leaving only the stems remaining in a field. Adult skippers feed on the nectar of flowers and weeds and do not cause any damage to plants.
Scouting Technique: Begin scouting for larvae by late-April. Remove five random, 30 cm2 (1 ft2) samples of forage down to ground level and place them along with the old crop residue into a bag. Tie the bag and leave overnight at room temperature. The caterpillars will crawl out of the residue and can be easily counted.
Threshold: Control may be warranted when 6–8 larvae in a 30 cm2 (1 ft2) area are found in the early, brown-headed stage.
Management Strategies: • See OMAFRA Publication 812, Field Crop Protection
Guide, for insecticide recommendations. • Products containing Bacillus thuringiensis (Bt)
are available for organic production.
342
Agronomy guide for field Crops
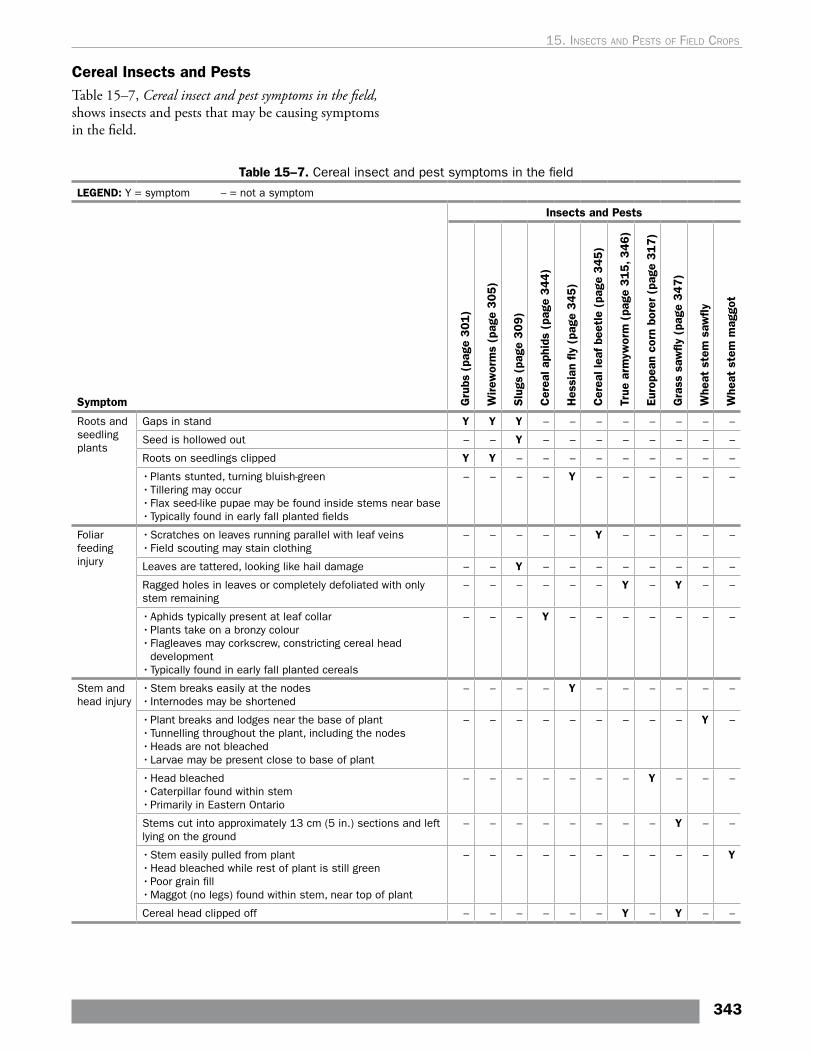
Cereal Insects and PestsTable 15–7, Cereal insect and pest symptoms in the field, shows insects and pests that may be causing symptoms in the field.
Table 15–7. Cereal insect and pest symptoms in the field
LEGEND: Y = symptom – = not a symptom
Symptom
Insects and Pests
Gru
bs (
page
30
1)
Wirew
orm
s (p
age
305
)
Slu
gs (
page
30
9)
Cer
eal a
phid
s (p
age
34
4)
Hes
sian
fly
(pag
e 3
45)
Cer
eal l
eaf
beet
le (
page
34
5)
True
arm
ywor
m (
page
315
, 34
6)
Euro
pean
cor
n bo
rer
(pag
e 3
17
)
Gra
ss s
awfly
(pa
ge 3
47)
Whe
at s
tem
saw
fly
Whe
at s
tem
mag
got
Roots and seedling plants
Gaps in stand Y Y Y – – – – – – – –
Seed is hollowed out – – Y – – – – – – – –
Roots on seedlings clipped Y Y – – – – – – – – –
• Plants stunted, turning bluish-green• Tillering may occur• Flax seed-like pupae may be found inside stems near base• Typically found in early fall planted fields
– – – – Y – – – – – –
Foliar feeding injury
• Scratches on leaves running parallel with leaf veins• Field scouting may stain clothing
– – – – – Y – – – – –
Leaves are tattered, looking like hail damage – – Y – – – – – – – –
Ragged holes in leaves or completely defoliated with only stem remaining
– – – – – – Y – Y – –
• Aphids typically present at leaf collar• Plants take on a bronzy colour• Flagleaves may corkscrew, constricting cereal head
development• Typically found in early fall planted cereals
– – – Y – – – – – – –
Stem and head injury
• Stem breaks easily at the nodes• Internodes may be shortened
– – – – Y – – – – – –
• Plant breaks and lodges near the base of plant• Tunnelling throughout the plant, including the nodes• Heads are not bleached• Larvae may be present close to base of plant
– – – – – – – – – Y –
• Head bleached • Caterpillar found within stem• Primarily in Eastern Ontario
– – – – – – – Y – – –
Stems cut into approximately 13 cm (5 in.) sections and left lying on the ground
– – – – – – – – Y – –
• Stem easily pulled from plant• Head bleached while rest of plant is still green• Poor grain fill• Maggot (no legs) found within stem, near top of plant
– – – – – – – – – – Y
Cereal head clipped off – – – – – – Y – Y – –
343
15. Insects and pests oF FIeld crops
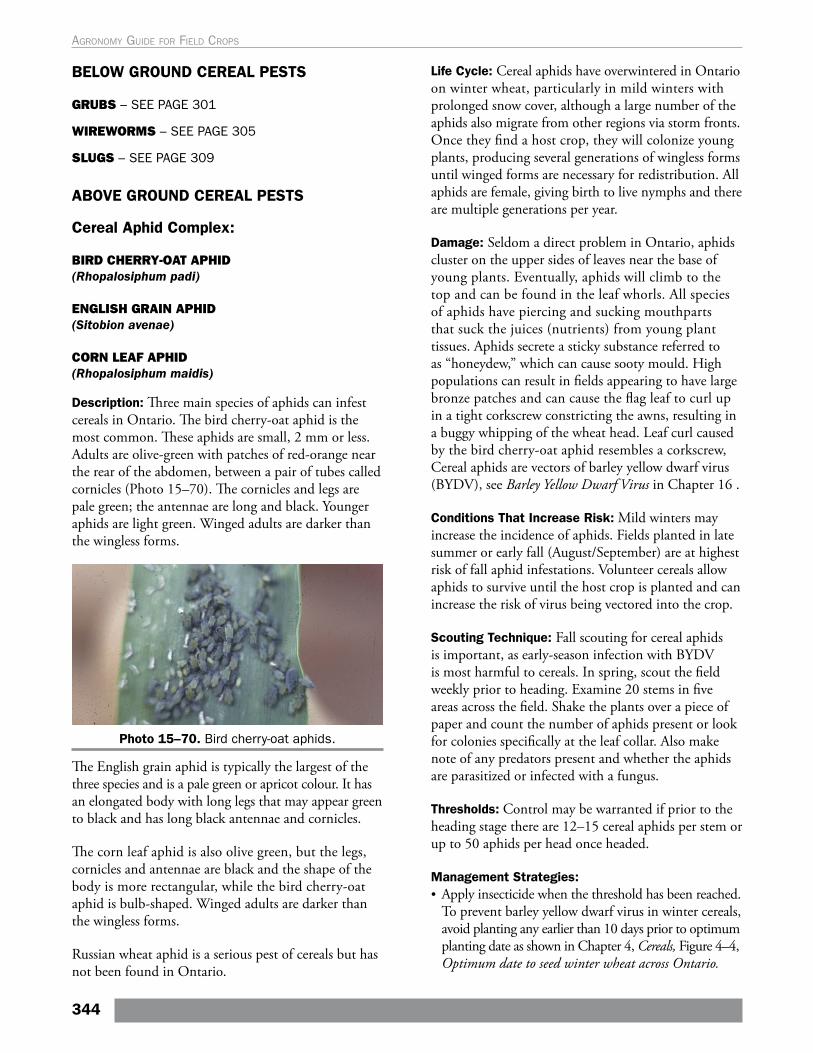
BELOW GROUND CEREAL PESTS
GRUBS – SEE PAGE 301
WIREWORMS – SEE PAGE 305
SLUGS – SEE PAGE 309
ABOVE GROUND CEREAL PESTS
Cereal Aphid Complex:
BIRD CHERRY-OAT APHID (Rhopalosiphum padi)
ENGLISH GRAIN APHID (Sitobion avenae)
CORN LEAF APHID (Rhopalosiphum maidis)
Description: Three main species of aphids can infest cereals in Ontario. The bird cherry-oat aphid is the most common. These aphids are small, 2 mm or less. Adults are olive-green with patches of red-orange near the rear of the abdomen, between a pair of tubes called cornicles (Photo 15–70). The cornicles and legs are pale green; the antennae are long and black. Younger aphids are light green. Winged adults are darker than the wingless forms.
Photo 15–70. Bird cherry-oat aphids.
The English grain aphid is typically the largest of the three species and is a pale green or apricot colour. It has an elongated body with long legs that may appear green to black and has long black antennae and cornicles.
The corn leaf aphid is also olive green, but the legs, cornicles and antennae are black and the shape of the body is more rectangular, while the bird cherry-oat aphid is bulb-shaped. Winged adults are darker than the wingless forms.
Russian wheat aphid is a serious pest of cereals but has not been found in Ontario.
Life Cycle: Cereal aphids have overwintered in Ontario on winter wheat, particularly in mild winters with prolonged snow cover, although a large number of the aphids also migrate from other regions via storm fronts. Once they find a host crop, they will colonize young plants, producing several generations of wingless forms until winged forms are necessary for redistribution. All aphids are female, giving birth to live nymphs and there are multiple generations per year.
Damage: Seldom a direct problem in Ontario, aphids cluster on the upper sides of leaves near the base of young plants. Eventually, aphids will climb to the top and can be found in the leaf whorls. All species of aphids have piercing and sucking mouthparts that suck the juices (nutrients) from young plant tissues. Aphids secrete a sticky substance referred to as “honeydew,” which can cause sooty mould. High populations can result in fields appearing to have large bronze patches and can cause the flag leaf to curl up in a tight corkscrew constricting the awns, resulting in a buggy whipping of the wheat head. Leaf curl caused by the bird cherry-oat aphid resembles a corkscrew, Cereal aphids are vectors of barley yellow dwarf virus (BYDV), see Barley Yellow Dwarf Virus in Chapter 16 .
Conditions That Increase Risk: Mild winters may increase the incidence of aphids. Fields planted in late summer or early fall (August/September) are at highest risk of fall aphid infestations. Volunteer cereals allow aphids to survive until the host crop is planted and can increase the risk of virus being vectored into the crop.
Scouting Technique: Fall scouting for cereal aphids is important, as early-season infection with BYDV is most harmful to cereals. In spring, scout the field weekly prior to heading. Examine 20 stems in five areas across the field. Shake the plants over a piece of paper and count the number of aphids present or look for colonies specifically at the leaf collar. Also make note of any predators present and whether the aphids are parasitized or infected with a fungus.
Thresholds: Control may be warranted if prior to the heading stage there are 12–15 cereal aphids per stem or up to 50 aphids per head once headed.
Management Strategies:• Apply insecticide when the threshold has been reached.
To prevent barley yellow dwarf virus in winter cereals, avoid planting any earlier than 10 days prior to optimum planting date as shown in Chapter 4, Cereals, Figure 4–4, Optimum date to seed winter wheat across Ontario.
344
Agronomy guide for field Crops
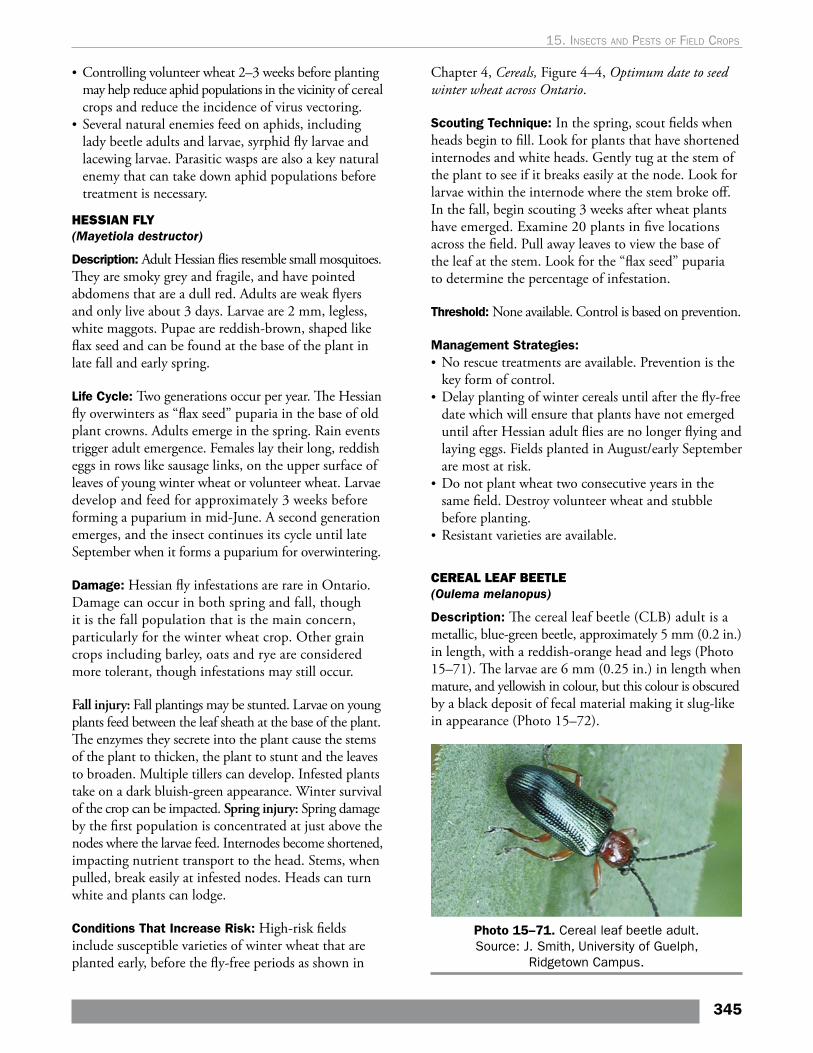
• Controlling volunteer wheat 2–3 weeks before planting may help reduce aphid populations in the vicinity of cereal crops and reduce the incidence of virus vectoring.
• Several natural enemies feed on aphids, including lady beetle adults and larvae, syrphid fly larvae and lacewing larvae. Parasitic wasps are also a key natural enemy that can take down aphid populations before treatment is necessary.
HESSIAN FLY (Mayetiola destructor)
Description: Adult Hessian flies resemble small mosquitoes. They are smoky grey and fragile, and have pointed abdomens that are a dull red. Adults are weak flyers and only live about 3 days. Larvae are 2 mm, legless, white maggots. Pupae are reddish-brown, shaped like flax seed and can be found at the base of the plant in late fall and early spring.
Life Cycle: Two generations occur per year. The Hessian fly overwinters as “flax seed” puparia in the base of old plant crowns. Adults emerge in the spring. Rain events trigger adult emergence. Females lay their long, reddish eggs in rows like sausage links, on the upper surface of leaves of young winter wheat or volunteer wheat. Larvae develop and feed for approximately 3 weeks before forming a puparium in mid-June. A second generation emerges, and the insect continues its cycle until late September when it forms a puparium for overwintering.
Damage: Hessian fly infestations are rare in Ontario. Damage can occur in both spring and fall, though it is the fall population that is the main concern, particularly for the winter wheat crop. Other grain crops including barley, oats and rye are considered more tolerant, though infestations may still occur.
Fall injury: Fall plantings may be stunted. Larvae on young plants feed between the leaf sheath at the base of the plant. The enzymes they secrete into the plant cause the stems of the plant to thicken, the plant to stunt and the leaves to broaden. Multiple tillers can develop. Infested plants take on a dark bluish-green appearance. Winter survival of the crop can be impacted. Spring injury: Spring damage by the first population is concentrated at just above the nodes where the larvae feed. Internodes become shortened, impacting nutrient transport to the head. Stems, when pulled, break easily at infested nodes. Heads can turn white and plants can lodge.
Conditions That Increase Risk: High-risk fields include susceptible varieties of winter wheat that are planted early, before the fly-free periods as shown in
Chapter 4, Cereals, Figure 4–4, Optimum date to seed winter wheat across Ontario.
Scouting Technique: In the spring, scout fields when heads begin to fill. Look for plants that have shortened internodes and white heads. Gently tug at the stem of the plant to see if it breaks easily at the node. Look for larvae within the internode where the stem broke off. In the fall, begin scouting 3 weeks after wheat plants have emerged. Examine 20 plants in five locations across the field. Pull away leaves to view the base of the leaf at the stem. Look for the “flax seed” puparia to determine the percentage of infestation.
Threshold: None available. Control is based on prevention.
Management Strategies:• No rescue treatments are available. Prevention is the
key form of control. • Delay planting of winter cereals until after the fly-free
date which will ensure that plants have not emerged until after Hessian adult flies are no longer flying and laying eggs. Fields planted in August/early September are most at risk.
• Do not plant wheat two consecutive years in the same field. Destroy volunteer wheat and stubble before planting.
• Resistant varieties are available.
CEREAL LEAF BEETLE (Oulema melanopus)
Description: The cereal leaf beetle (CLB) adult is a metallic, blue-green beetle, approximately 5 mm (0.2 in.) in length, with a reddish-orange head and legs (Photo 15–71). The larvae are 6 mm (0.25 in.) in length when mature, and yellowish in colour, but this colour is obscured by a black deposit of fecal material making it slug-like in appearance (Photo 15–72).
Photo 15–71. Cereal leaf beetle adult. Source: J. Smith, University of Guelph,
Ridgetown Campus.
345
15. Insects and pests oF FIeld crops
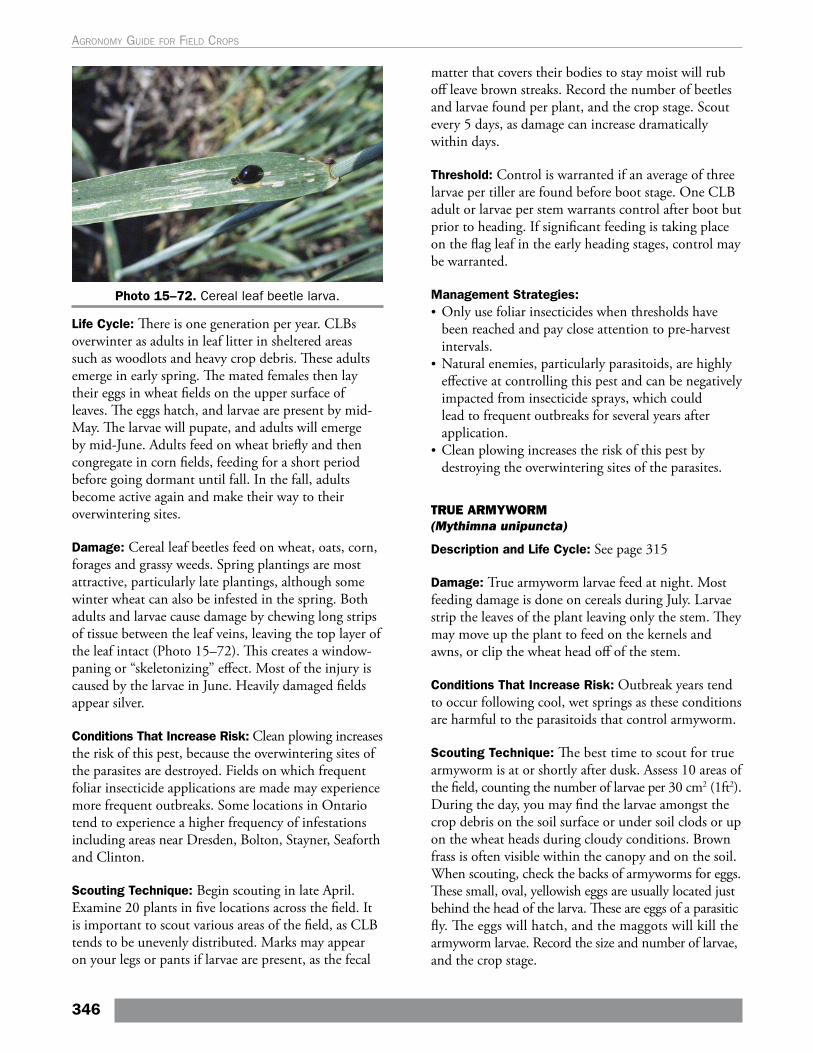
Photo 15–72. Cereal leaf beetle larva.
Life Cycle: There is one generation per year. CLBs overwinter as adults in leaf litter in sheltered areas such as woodlots and heavy crop debris. These adults emerge in early spring. The mated females then lay their eggs in wheat fields on the upper surface of leaves. The eggs hatch, and larvae are present by mid-May. The larvae will pupate, and adults will emerge by mid-June. Adults feed on wheat briefly and then congregate in corn fields, feeding for a short period before going dormant until fall. In the fall, adults become active again and make their way to their overwintering sites.
Damage: Cereal leaf beetles feed on wheat, oats, corn, forages and grassy weeds. Spring plantings are most attractive, particularly late plantings, although some winter wheat can also be infested in the spring. Both adults and larvae cause damage by chewing long strips of tissue between the leaf veins, leaving the top layer of the leaf intact (Photo 15–72). This creates a window-paning or “skeletonizing” effect. Most of the injury is caused by the larvae in June. Heavily damaged fields appear silver.
Conditions That Increase Risk: Clean plowing increases the risk of this pest, because the overwintering sites of the parasites are destroyed. Fields on which frequent foliar insecticide applications are made may experience more frequent outbreaks. Some locations in Ontario tend to experience a higher frequency of infestations including areas near Dresden, Bolton, Stayner, Seaforth and Clinton.
Scouting Technique: Begin scouting in late April. Examine 20 plants in five locations across the field. It is important to scout various areas of the field, as CLB tends to be unevenly distributed. Marks may appear on your legs or pants if larvae are present, as the fecal
matter that covers their bodies to stay moist will rub off leave brown streaks. Record the number of beetles and larvae found per plant, and the crop stage. Scout every 5 days, as damage can increase dramatically within days.
Threshold: Control is warranted if an average of three larvae per tiller are found before boot stage. One CLB adult or larvae per stem warrants control after boot but prior to heading. If significant feeding is taking place on the flag leaf in the early heading stages, control may be warranted.
Management Strategies:• Only use foliar insecticides when thresholds have
been reached and pay close attention to pre-harvest intervals.
• Natural enemies, particularly parasitoids, are highly effective at controlling this pest and can be negatively impacted from insecticide sprays, which could lead to frequent outbreaks for several years after application.
• Clean plowing increases the risk of this pest by destroying the overwintering sites of the parasites.
TRUE ARMYWORM (Mythimna unipuncta)
Description and Life Cycle: See page 315
Damage: True armyworm larvae feed at night. Most feeding damage is done on cereals during July. Larvae strip the leaves of the plant leaving only the stem. They may move up the plant to feed on the kernels and awns, or clip the wheat head off of the stem.
Conditions That Increase Risk: Outbreak years tend to occur following cool, wet springs as these conditions are harmful to the parasitoids that control armyworm.
Scouting Technique: The best time to scout for true armyworm is at or shortly after dusk. Assess 10 areas of the field, counting the number of larvae per 30 cm2 (1ft2). During the day, you may find the larvae amongst the crop debris on the soil surface or under soil clods or up on the wheat heads during cloudy conditions. Brown frass is often visible within the canopy and on the soil. When scouting, check the backs of armyworms for eggs. These small, oval, yellowish eggs are usually located just behind the head of the larva. These are eggs of a parasitic fly. The eggs will hatch, and the maggots will kill the armyworm larvae. Record the size and number of larvae, and the crop stage.
346
Agronomy guide for field Crops
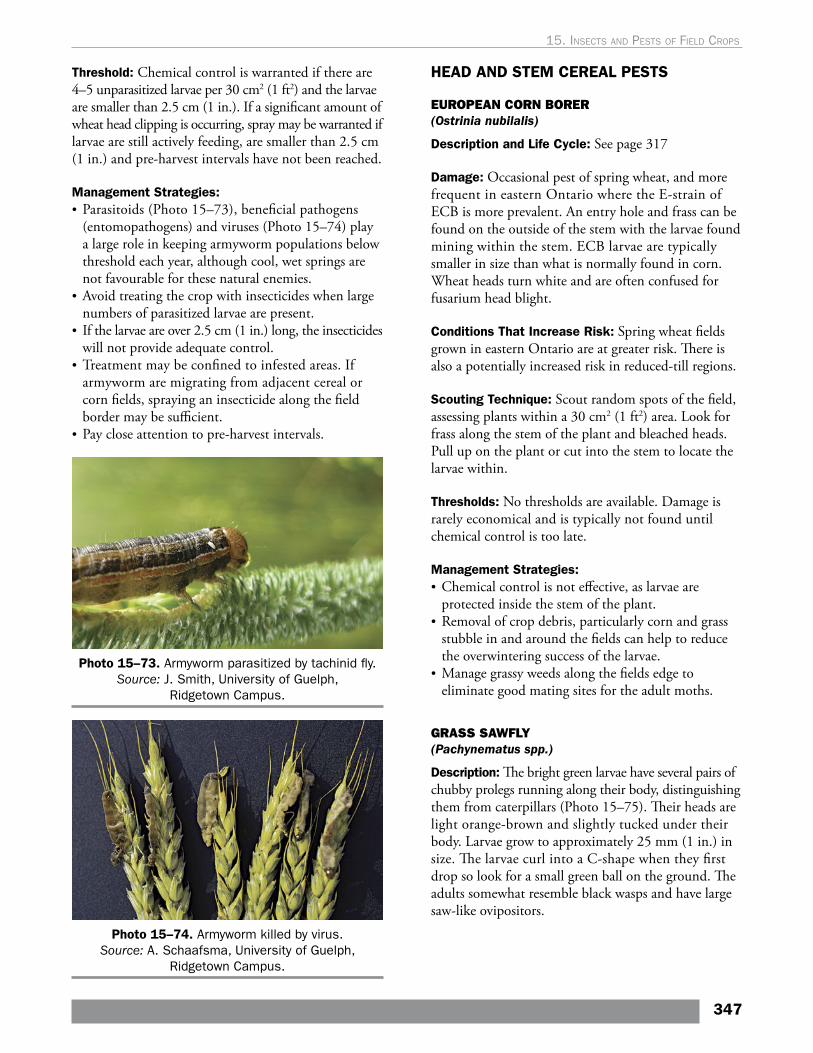
Threshold: Chemical control is warranted if there are 4–5 unparasitized larvae per 30 cm2 (1 ft2) and the larvae are smaller than 2.5 cm (1 in.). If a significant amount of wheat head clipping is occurring, spray may be warranted if larvae are still actively feeding, are smaller than 2.5 cm (1 in.) and pre-harvest intervals have not been reached.
Management Strategies: • Parasitoids (Photo 15–73), beneficial pathogens
(entomopathogens) and viruses (Photo 15–74) play a large role in keeping armyworm populations below threshold each year, although cool, wet springs are not favourable for these natural enemies.
• Avoid treating the crop with insecticides when large numbers of parasitized larvae are present.
• If the larvae are over 2.5 cm (1 in.) long, the insecticides will not provide adequate control.
• Treatment may be confined to infested areas. If armyworm are migrating from adjacent cereal or corn fields, spraying an insecticide along the field border may be sufficient.
• Pay close attention to pre-harvest intervals.
Photo 15–73. Armyworm parasitized by tachinid fly. Source: J. Smith, University of Guelph,
Ridgetown Campus.
Photo 15–74. Armyworm killed by virus. Source: A. Schaafsma, University of Guelph,
Ridgetown Campus.
HEAD AND STEM CEREAL PESTS
EUROPEAN CORN BORER (Ostrinia nubilalis)
Description and Life Cycle: See page 317
Damage: Occasional pest of spring wheat, and more frequent in eastern Ontario where the E-strain of ECB is more prevalent. An entry hole and frass can be found on the outside of the stem with the larvae found mining within the stem. ECB larvae are typically smaller in size than what is normally found in corn. Wheat heads turn white and are often confused for fusarium head blight.
Conditions That Increase Risk: Spring wheat fields grown in eastern Ontario are at greater risk. There is also a potentially increased risk in reduced-till regions.
Scouting Technique: Scout random spots of the field, assessing plants within a 30 cm2 (1 ft2) area. Look for frass along the stem of the plant and bleached heads. Pull up on the plant or cut into the stem to locate the larvae within.
Thresholds: No thresholds are available. Damage is rarely economical and is typically not found until chemical control is too late.
Management Strategies:• Chemical control is not effective, as larvae are
protected inside the stem of the plant.• Removal of crop debris, particularly corn and grass
stubble in and around the fields can help to reduce the overwintering success of the larvae.
• Manage grassy weeds along the fields edge to eliminate good mating sites for the adult moths.
GRASS SAWFLY(Pachynematus spp.)
Description: The bright green larvae have several pairs of chubby prolegs running along their body, distinguishing them from caterpillars (Photo 15–75). Their heads are light orange-brown and slightly tucked under their body. Larvae grow to approximately 25 mm (1 in.) in size. The larvae curl into a C-shape when they first drop so look for a small green ball on the ground. The adults somewhat resemble black wasps and have large saw-like ovipositors.
347
15. Insects and pests oF FIeld crops
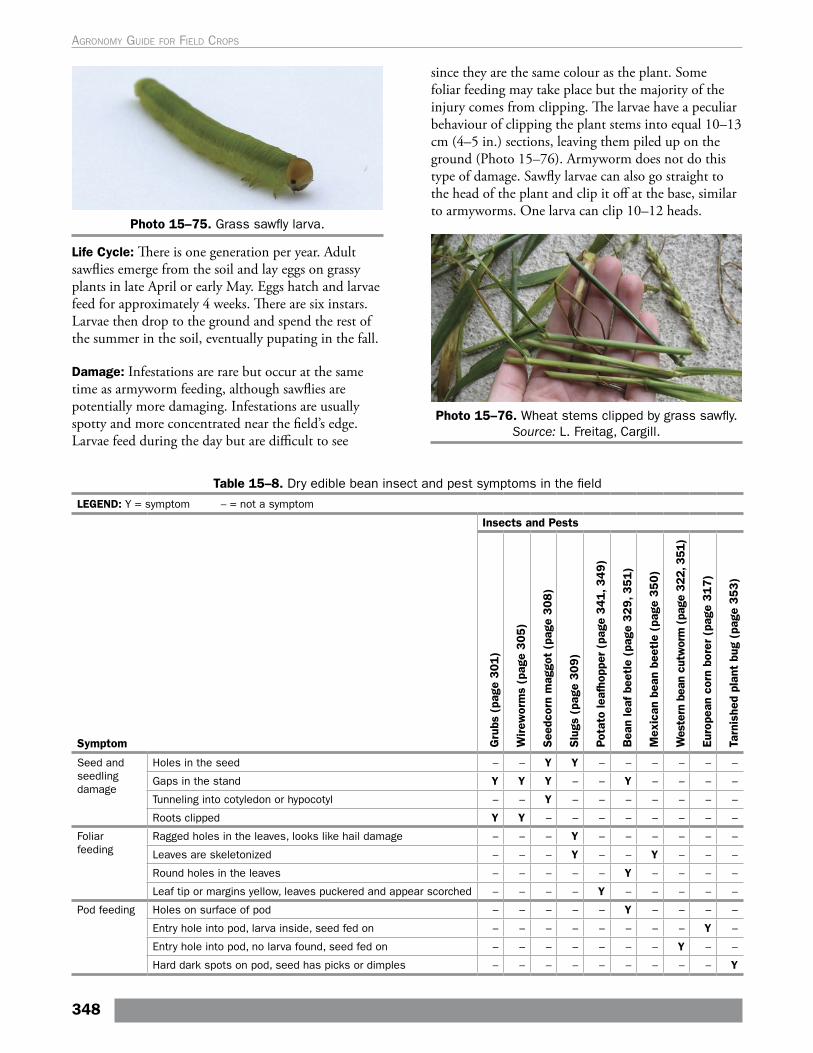
Photo 15–75. Grass sawfly larva.
Life Cycle: There is one generation per year. Adult sawflies emerge from the soil and lay eggs on grassy plants in late April or early May. Eggs hatch and larvae feed for approximately 4 weeks. There are six instars. Larvae then drop to the ground and spend the rest of the summer in the soil, eventually pupating in the fall.
Damage: Infestations are rare but occur at the same time as armyworm feeding, although sawflies are potentially more damaging. Infestations are usually spotty and more concentrated near the field’s edge. Larvae feed during the day but are difficult to see
since they are the same colour as the plant. Some foliar feeding may take place but the majority of the injury comes from clipping. The larvae have a peculiar behaviour of clipping the plant stems into equal 10–13 cm (4–5 in.) sections, leaving them piled up on the ground (Photo 15–76). Armyworm does not do this type of damage. Sawfly larvae can also go straight to the head of the plant and clip it off at the base, similar to armyworms. One larva can clip 10–12 heads.
Photo 15–76. Wheat stems clipped by grass sawfly. Source: L. Freitag, Cargill.
Table 15–8. Dry edible bean insect and pest symptoms in the field
LEGEND: Y = symptom – = not a symptom
Symptom
Insects and Pests
Gru
bs (
page
301)
Wirew
orm
s (p
age
30
5)
See
dcor
n m
aggo
t (p
age
308
)
Slu
gs (
page
309)
Pot
ato
leaf
hopp
er (
page
341
, 349)
Bea
n le
af b
eetl
e (p
age
329, 3
51)
Mex
ican
bea
n be
etle
(pa
ge 3
50)
Wes
tern
bea
n cu
twor
m (
page
322
, 351
)
Euro
pean
cor
n bo
rer
(pag
e 31
7)
Tarn
ishe
d pl
ant
bug
(pag
e 353
)
Seed and seedling damage
Holes in the seed – – Y Y – – – – – –
Gaps in the stand Y Y Y – – Y – – – –
Tunneling into cotyledon or hypocotyl – – Y – – – – – – –
Roots clipped Y Y – – – – – – – –
Foliar feeding
Ragged holes in the leaves, looks like hail damage – – – Y – – – – – –
Leaves are skeletonized – – – Y – – Y – – –
Round holes in the leaves – – – – – Y – – – –
Leaf tip or margins yellow, leaves puckered and appear scorched – – – – Y – – – – –
Pod feeding Holes on surface of pod – – – – – Y – – – –
Entry hole into pod, larva inside, seed fed on – – – – – – – – Y –
Entry hole into pod, no larva found, seed fed on – – – – – – – Y – –
Hard dark spots on pod, seed has picks or dimples – – – – – – – – – Y
348
Agronomy guide for field Crops
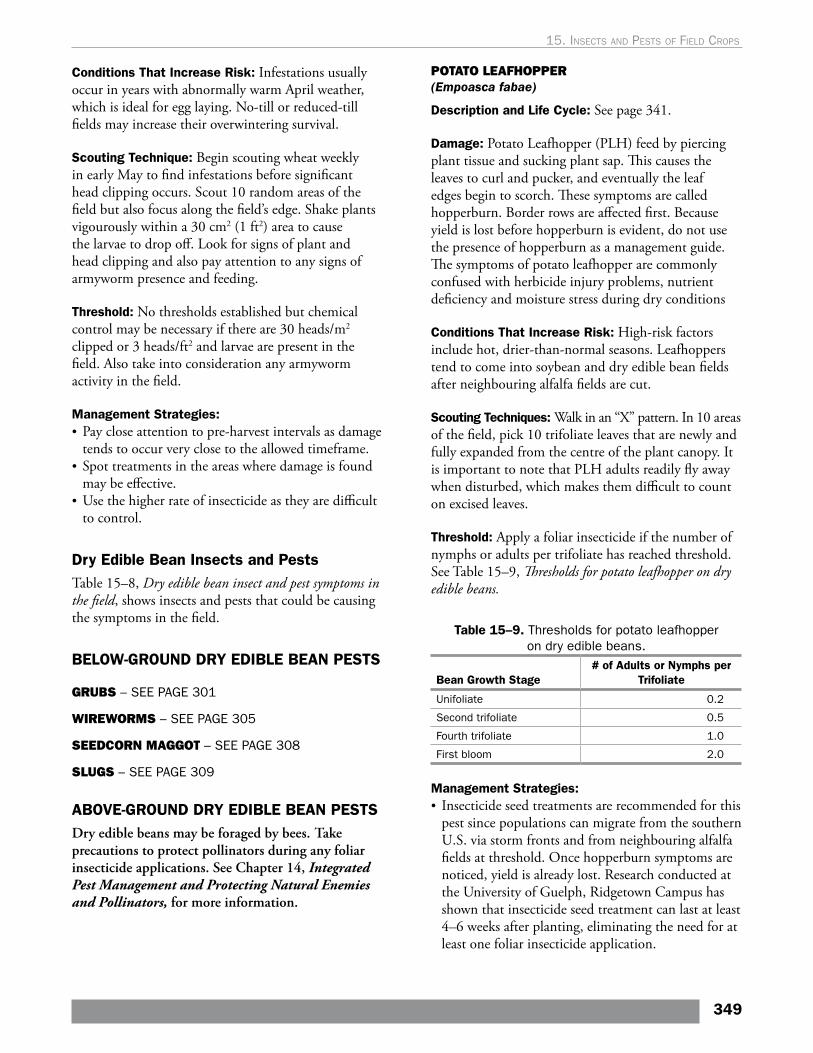
Conditions That Increase Risk: Infestations usually occur in years with abnormally warm April weather, which is ideal for egg laying. No-till or reduced-till fields may increase their overwintering survival.
Scouting Technique: Begin scouting wheat weekly in early May to find infestations before significant head clipping occurs. Scout 10 random areas of the field but also focus along the field’s edge. Shake plants vigourously within a 30 cm2 (1 ft2) area to cause the larvae to drop off. Look for signs of plant and head clipping and also pay attention to any signs of armyworm presence and feeding.
Threshold: No thresholds established but chemical control may be necessary if there are 30 heads/m2 clipped or 3 heads/ft2 and larvae are present in the field. Also take into consideration any armyworm activity in the field.
Management Strategies:• Pay close attention to pre-harvest intervals as damage
tends to occur very close to the allowed timeframe.• Spot treatments in the areas where damage is found
may be effective.• Use the higher rate of insecticide as they are difficult
to control.
Dry Edible Bean Insects and PestsTable 15–8, Dry edible bean insect and pest symptoms in the field, shows insects and pests that could be causing the symptoms in the field.
BELOW-GROUND DRY EDIBLE BEAN PESTS
GRUBS – SEE PAGE 301
WIREWORMS – SEE PAGE 305
SEEDCORN MAGGOT – SEE PAGE 308
SLUGS – SEE PAGE 309
ABOVE-GROUND DRY EDIBLE BEAN PESTSDry edible beans may be foraged by bees. Take precautions to protect pollinators during any foliar insecticide applications. See Chapter 14, Integrated Pest Management and Protecting Natural Enemies and Pollinators, for more information.
POTATO LEAFHOPPER(Empoasca fabae)
Description and Life Cycle: See page 341.
Damage: Potato Leafhopper (PLH) feed by piercing plant tissue and sucking plant sap. This causes the leaves to curl and pucker, and eventually the leaf edges begin to scorch. These symptoms are called hopperburn. Border rows are affected first. Because yield is lost before hopperburn is evident, do not use the presence of hopperburn as a management guide. The symptoms of potato leafhopper are commonly confused with herbicide injury problems, nutrient deficiency and moisture stress during dry conditions
Conditions That Increase Risk: High-risk factors include hot, drier-than-normal seasons. Leafhoppers tend to come into soybean and dry edible bean fields after neighbouring alfalfa fields are cut.
Scouting Techniques: Walk in an “X” pattern. In 10 areas of the field, pick 10 trifoliate leaves that are newly and fully expanded from the centre of the plant canopy. It is important to note that PLH adults readily fly away when disturbed, which makes them difficult to count on excised leaves.
Threshold: Apply a foliar insecticide if the number of nymphs or adults per trifoliate has reached threshold. See Table 15–9, Thresholds for potato leafhopper on dry edible beans.
Table 15–9. Thresholds for potato leafhopper on dry edible beans.
Bean Growth Stage# of Adults or Nymphs per
Trifoliate
Unifoliate 0.2
Second trifoliate 0.5
Fourth trifoliate 1.0
First bloom 2.0
Management Strategies:• Insecticide seed treatments are recommended for this
pest since populations can migrate from the southern U.S. via storm fronts and from neighbouring alfalfa fields at threshold. Once hopperburn symptoms are noticed, yield is already lost. Research conducted at the University of Guelph, Ridgetown Campus has shown that insecticide seed treatment can last at least 4–6 weeks after planting, eliminating the need for at least one foliar insecticide application.
349
15. Insects and pests oF FIeld crops
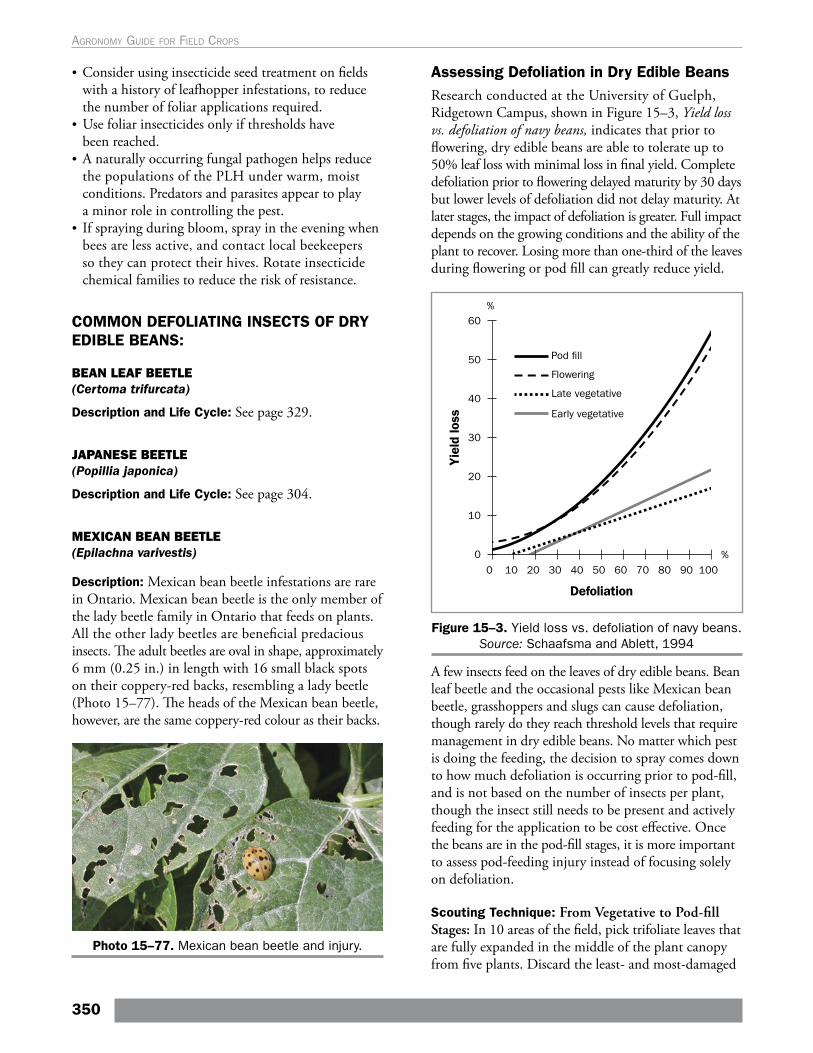
• Consider using insecticide seed treatment on fields with a history of leafhopper infestations, to reduce the number of foliar applications required.
• Use foliar insecticides only if thresholds have been reached.
• A naturally occurring fungal pathogen helps reduce the populations of the PLH under warm, moist conditions. Predators and parasites appear to play a minor role in controlling the pest.
• If spraying during bloom, spray in the evening when bees are less active, and contact local beekeepers so they can protect their hives. Rotate insecticide chemical families to reduce the risk of resistance.
COMMON DEFOLIATING INSECTS OF DRY EDIBLE BEANS:
BEAN LEAF BEETLE(Certoma trifurcata)
Description and Life Cycle: See page 329.
JAPANESE BEETLE(Popillia japonica)
Description and Life Cycle: See page 304.
MEXICAN BEAN BEETLE(Epilachna varivestis)
Description: Mexican bean beetle infestations are rare in Ontario. Mexican bean beetle is the only member of the lady beetle family in Ontario that feeds on plants. All the other lady beetles are beneficial predacious insects. The adult beetles are oval in shape, approximately 6 mm (0.25 in.) in length with 16 small black spots on their coppery-red backs, resembling a lady beetle (Photo 15–77). The heads of the Mexican bean beetle, however, are the same coppery-red colour as their backs.
Photo 15–77. Mexican bean beetle and injury.
Assessing Defoliation in Dry Edible BeansResearch conducted at the University of Guelph, Ridgetown Campus, shown in Figure 15–3, Yield loss vs. defoliation of navy beans, indicates that prior to flowering, dry edible beans are able to tolerate up to 50% leaf loss with minimal loss in final yield. Complete defoliation prior to flowering delayed maturity by 30 days but lower levels of defoliation did not delay maturity. At later stages, the impact of defoliation is greater. Full impact depends on the growing conditions and the ability of the plant to recover. Losing more than one-third of the leaves during flowering or pod fill can greatly reduce yield.
Figure 15–3. Yield loss vs. defoliation of navy beans. Source: Schaafsma and Ablett, 1994
A few insects feed on the leaves of dry edible beans. Bean leaf beetle and the occasional pests like Mexican bean beetle, grasshoppers and slugs can cause defoliation, though rarely do they reach threshold levels that require management in dry edible beans. No matter which pest is doing the feeding, the decision to spray comes down to how much defoliation is occurring prior to pod-fill, and is not based on the number of insects per plant, though the insect still needs to be present and actively feeding for the application to be cost effective. Once the beans are in the pod-fill stages, it is more important to assess pod-feeding injury instead of focusing solely on defoliation.
Scouting Technique: From Vegetative to Pod-fill Stages: In 10 areas of the field, pick trifoliate leaves that are fully expanded in the middle of the plant canopy from five plants. Discard the least- and most-damaged
350
Agronomy guide for field Crops
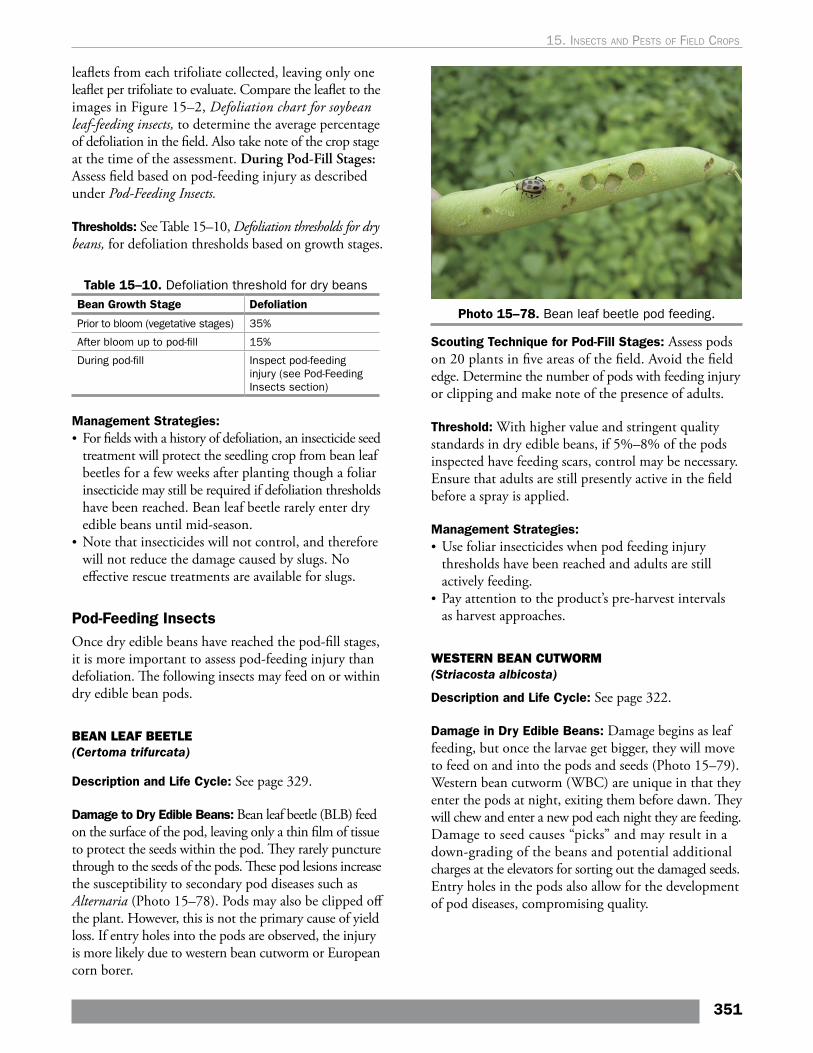
leaflets from each trifoliate collected, leaving only one leaflet per trifoliate to evaluate. Compare the leaflet to the images in Figure 15–2, Defoliation chart for soybean leaf-feeding insects, to determine the average percentage of defoliation in the field. Also take note of the crop stage at the time of the assessment. During Pod-Fill Stages: Assess field based on pod-feeding injury as described under Pod-Feeding Insects.
Thresholds: See Table 15–10, Defoliation thresholds for dry beans, for defoliation thresholds based on growth stages.
Table 15–10. Defoliation threshold for dry beansBean Growth Stage Defoliation
Prior to bloom (vegetative stages) 35%
After bloom up to pod-fill 15%
During pod-fill Inspect pod-feeding injury (see Pod-Feeding Insects section)
Management Strategies: • For fields with a history of defoliation, an insecticide seed
treatment will protect the seedling crop from bean leaf beetles for a few weeks after planting though a foliar insecticide may still be required if defoliation thresholds have been reached. Bean leaf beetle rarely enter dry edible beans until mid-season.
• Note that insecticides will not control, and therefore will not reduce the damage caused by slugs. No effective rescue treatments are available for slugs.
Pod-Feeding Insects Once dry edible beans have reached the pod-fill stages, it is more important to assess pod-feeding injury than defoliation. The following insects may feed on or within dry edible bean pods.
BEAN LEAF BEETLE(Certoma trifurcata)
Description and Life Cycle: See page 329.
Damage to Dry Edible Beans: Bean leaf beetle (BLB) feed on the surface of the pod, leaving only a thin film of tissue to protect the seeds within the pod. They rarely puncture through to the seeds of the pods. These pod lesions increase the susceptibility to secondary pod diseases such as Alternaria (Photo 15–78). Pods may also be clipped off the plant. However, this is not the primary cause of yield loss. If entry holes into the pods are observed, the injury is more likely due to western bean cutworm or European corn borer.
Photo 15–78. Bean leaf beetle pod feeding.
Scouting Technique for Pod-Fill Stages: Assess pods on 20 plants in five areas of the field. Avoid the field edge. Determine the number of pods with feeding injury or clipping and make note of the presence of adults.
Threshold: With higher value and stringent quality standards in dry edible beans, if 5%–8% of the pods inspected have feeding scars, control may be necessary. Ensure that adults are still presently active in the field before a spray is applied.
Management Strategies:• Use foliar insecticides when pod feeding injury
thresholds have been reached and adults are still actively feeding.
• Pay attention to the product’s pre-harvest intervals as harvest approaches.
WESTERN BEAN CUTWORM(Striacosta albicosta)
Description and Life Cycle: See page 322.
Damage in Dry Edible Beans: Damage begins as leaf feeding, but once the larvae get bigger, they will move to feed on and into the pods and seeds (Photo 15–79). Western bean cutworm (WBC) are unique in that they enter the pods at night, exiting them before dawn. They will chew and enter a new pod each night they are feeding. Damage to seed causes “picks” and may result in a down-grading of the beans and potential additional charges at the elevators for sorting out the damaged seeds. Entry holes in the pods also allow for the development of pod diseases, compromising quality.
351
15. Insects and pests oF FIeld crops
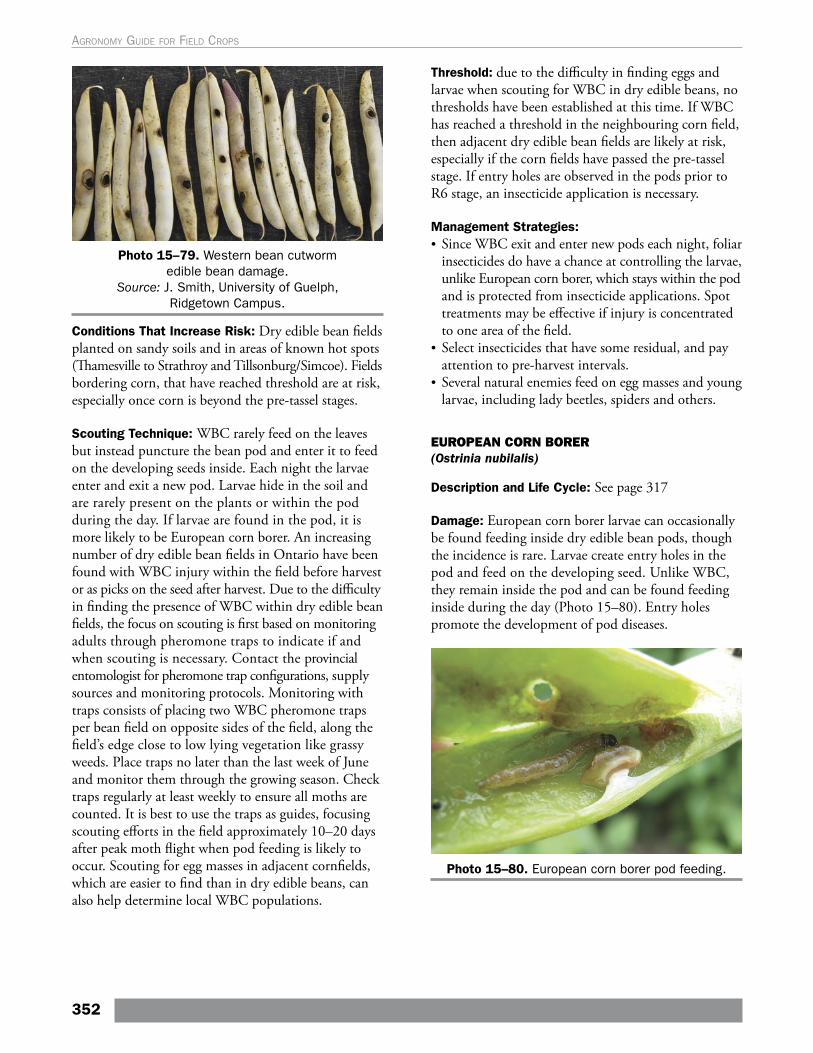
Photo 15–79. Western bean cutworm edible bean damage.
Source: J. Smith, University of Guelph, Ridgetown Campus.
Conditions That Increase Risk: Dry edible bean fields planted on sandy soils and in areas of known hot spots (Thamesville to Strathroy and Tillsonburg/Simcoe). Fields bordering corn, that have reached threshold are at risk, especially once corn is beyond the pre-tassel stages.
Scouting Technique: WBC rarely feed on the leaves but instead puncture the bean pod and enter it to feed on the developing seeds inside. Each night the larvae enter and exit a new pod. Larvae hide in the soil and are rarely present on the plants or within the pod during the day. If larvae are found in the pod, it is more likely to be European corn borer. An increasing number of dry edible bean fields in Ontario have been found with WBC injury within the field before harvest or as picks on the seed after harvest. Due to the difficulty in finding the presence of WBC within dry edible bean fields, the focus on scouting is first based on monitoring adults through pheromone traps to indicate if and when scouting is necessary. Contact the provincial entomologist for pheromone trap configurations, supply sources and monitoring protocols. Monitoring with traps consists of placing two WBC pheromone traps per bean field on opposite sides of the field, along the field’s edge close to low lying vegetation like grassy weeds. Place traps no later than the last week of June and monitor them through the growing season. Check traps regularly at least weekly to ensure all moths are counted. It is best to use the traps as guides, focusing scouting efforts in the field approximately 10–20 days after peak moth flight when pod feeding is likely to occur. Scouting for egg masses in adjacent cornfields, which are easier to find than in dry edible beans, can also help determine local WBC populations.
Threshold: due to the difficulty in finding eggs and larvae when scouting for WBC in dry edible beans, no thresholds have been established at this time. If WBC has reached a threshold in the neighbouring corn field, then adjacent dry edible bean fields are likely at risk, especially if the corn fields have passed the pre-tassel stage. If entry holes are observed in the pods prior to R6 stage, an insecticide application is necessary.
Management Strategies: • Since WBC exit and enter new pods each night, foliar
insecticides do have a chance at controlling the larvae, unlike European corn borer, which stays within the pod and is protected from insecticide applications. Spot treatments may be effective if injury is concentrated to one area of the field.
• Select insecticides that have some residual, and pay attention to pre-harvest intervals.
• Several natural enemies feed on egg masses and young larvae, including lady beetles, spiders and others.
EUROPEAN CORN BORER (Ostrinia nubilalis)
Description and Life Cycle: See page 317
Damage: European corn borer larvae can occasionally be found feeding inside dry edible bean pods, though the incidence is rare. Larvae create entry holes in the pod and feed on the developing seed. Unlike WBC, they remain inside the pod and can be found feeding inside during the day (Photo 15–80). Entry holes promote the development of pod diseases.
Photo 15–80. European corn borer pod feeding.
352
Agronomy guide for field Crops
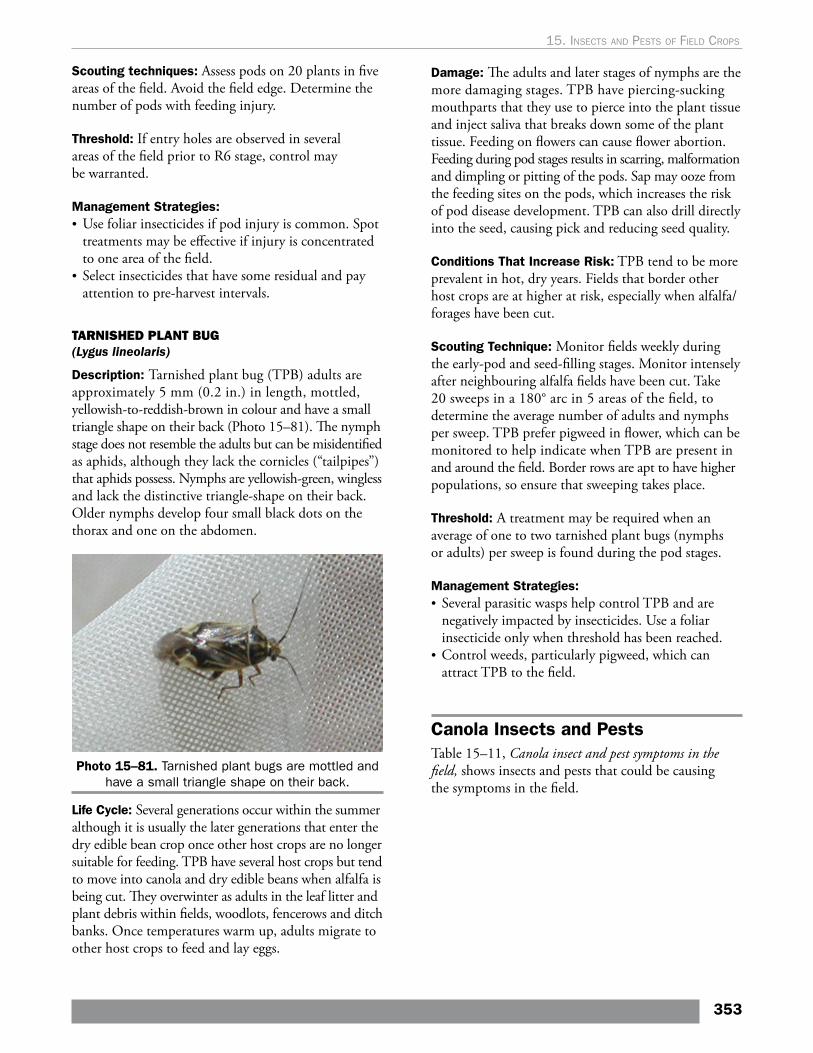
Scouting techniques: Assess pods on 20 plants in five areas of the field. Avoid the field edge. Determine the number of pods with feeding injury.
Threshold: If entry holes are observed in several areas of the field prior to R6 stage, control may be warranted.
Management Strategies: • Use foliar insecticides if pod injury is common. Spot
treatments may be effective if injury is concentrated to one area of the field.
• Select insecticides that have some residual and pay attention to pre-harvest intervals.
TARNISHED PLANT BUG(Lygus lineolaris)
Description: Tarnished plant bug (TPB) adults are approximately 5 mm (0.2 in.) in length, mottled, yellowish-to-reddish-brown in colour and have a small triangle shape on their back (Photo 15–81). The nymph stage does not resemble the adults but can be misidentified as aphids, although they lack the cornicles (“tailpipes”) that aphids possess. Nymphs are yellowish-green, wingless and lack the distinctive triangle-shape on their back. Older nymphs develop four small black dots on the thorax and one on the abdomen.
Photo 15–81. Tarnished plant bugs are mottled and have a small triangle shape on their back.
Life Cycle: Several generations occur within the summer although it is usually the later generations that enter the dry edible bean crop once other host crops are no longer suitable for feeding. TPB have several host crops but tend to move into canola and dry edible beans when alfalfa is being cut. They overwinter as adults in the leaf litter and plant debris within fields, woodlots, fencerows and ditch banks. Once temperatures warm up, adults migrate to other host crops to feed and lay eggs.
Damage: The adults and later stages of nymphs are the more damaging stages. TPB have piercing-sucking mouthparts that they use to pierce into the plant tissue and inject saliva that breaks down some of the plant tissue. Feeding on flowers can cause flower abortion. Feeding during pod stages results in scarring, malformation and dimpling or pitting of the pods. Sap may ooze from the feeding sites on the pods, which increases the risk of pod disease development. TPB can also drill directly into the seed, causing pick and reducing seed quality.
Conditions That Increase Risk: TPB tend to be more prevalent in hot, dry years. Fields that border other host crops are at higher at risk, especially when alfalfa/forages have been cut.
Scouting Technique: Monitor fields weekly during the early-pod and seed-filling stages. Monitor intensely after neighbouring alfalfa fields have been cut. Take 20 sweeps in a 180° arc in 5 areas of the field, to determine the average number of adults and nymphs per sweep. TPB prefer pigweed in flower, which can be monitored to help indicate when TPB are present in and around the field. Border rows are apt to have higher populations, so ensure that sweeping takes place.
Threshold: A treatment may be required when an average of one to two tarnished plant bugs (nymphs or adults) per sweep is found during the pod stages.
Management Strategies: • Several parasitic wasps help control TPB and are
negatively impacted by insecticides. Use a foliar insecticide only when threshold has been reached.
• Control weeds, particularly pigweed, which can attract TPB to the field.
Canola Insects and PestsTable 15–11, Canola insect and pest symptoms in the field, shows insects and pests that could be causing the symptoms in the field.
353
15. Insects and pests oF FIeld crops
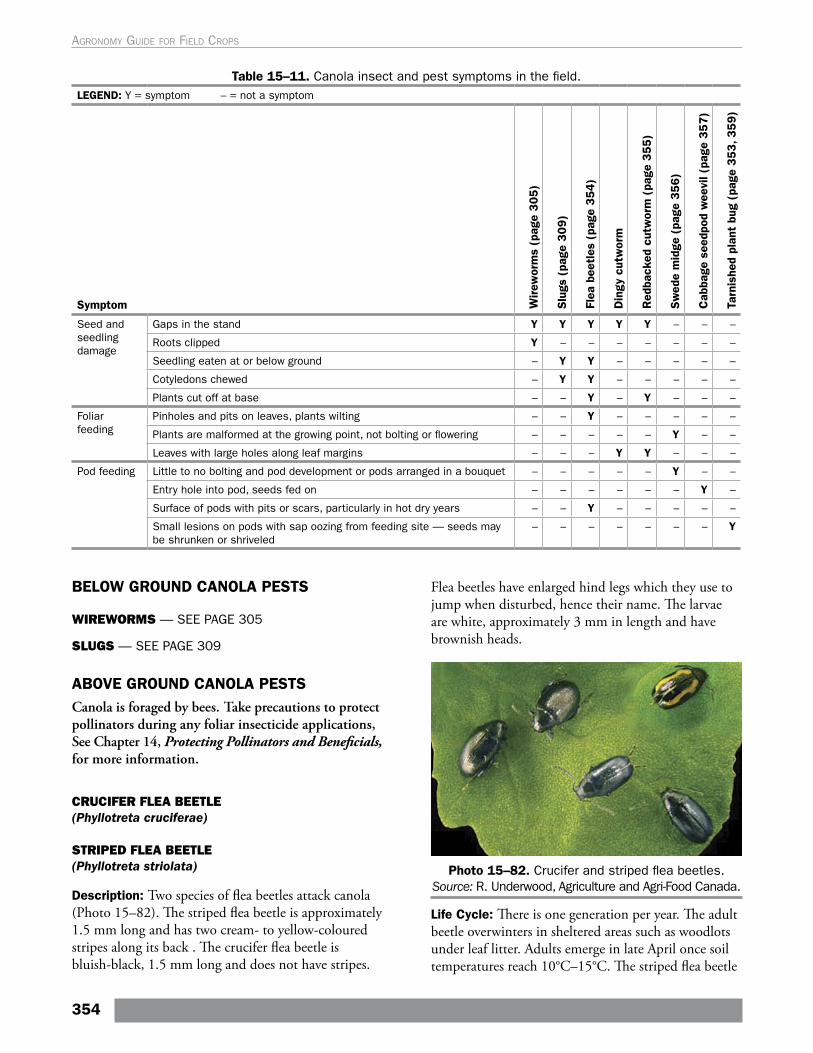
Table 15–11. Canola insect and pest symptoms in the field.LEGEND: Y = symptom – = not a symptom
Symptom Wir
ewor
ms
(pag
e 3
05
)
Slu
gs (
page
30
9)
Flea
bee
tles
(pa
ge 3
54
)
Din
gy c
utw
orm
Red
back
ed c
utw
orm
(pa
ge 3
55
)
Sw
ede
mid
ge (
page
35
6)
Cab
bage
see
dpod
wee
vil (
page
35
7)
Tarn
ishe
d pl
ant
bug
(pag
e 3
53, 3
59)
Seed and seedling damage
Gaps in the stand Y Y Y Y Y – – –
Roots clipped Y – – – – – – –
Seedling eaten at or below ground – Y Y – – – – –
Cotyledons chewed – Y Y – – – – –
Plants cut off at base – – Y – Y – – –
Foliar feeding
Pinholes and pits on leaves, plants wilting – – Y – – – – –
Plants are malformed at the growing point, not bolting or flowering – – – – – Y – –
Leaves with large holes along leaf margins – – – Y Y – – –
Pod feeding Little to no bolting and pod development or pods arranged in a bouquet – – – – – Y – –
Entry hole into pod, seeds fed on – – – – – – Y –
Surface of pods with pits or scars, particularly in hot dry years – – Y – – – – –
Small lesions on pods with sap oozing from feeding site — seeds may be shrunken or shriveled
– – – – – – – Y
BELOW GROUND CANOLA PESTS
WIREWORMS — SEE PAGE 305
SLUGS — SEE PAGE 309
ABOVE GROUND CANOLA PESTSCanola is foraged by bees. Take precautions to protect pollinators during any foliar insecticide applications, See Chapter 14, Protecting Pollinators and Beneficials, for more information.
CRUCIFER FLEA BEETLE(Phyllotreta cruciferae)
STRIPED FLEA BEETLE(Phyllotreta striolata)
Description: Two species of flea beetles attack canola (Photo 15–82). The striped flea beetle is approximately 1.5 mm long and has two cream- to yellow-coloured stripes along its back . The crucifer flea beetle is bluish-black, 1.5 mm long and does not have stripes.
Flea beetles have enlarged hind legs which they use to jump when disturbed, hence their name. The larvae are white, approximately 3 mm in length and have brownish heads.
Photo 15–82. Crucifer and striped flea beetles. Source: R. Underwood, Agriculture and Agri-Food Canada.
Life Cycle: There is one generation per year. The adult beetle overwinters in sheltered areas such as woodlots under leaf litter. Adults emerge in late April once soil temperatures reach 10°C–15°C. The striped flea beetle
354
Agronomy guide for field Crops
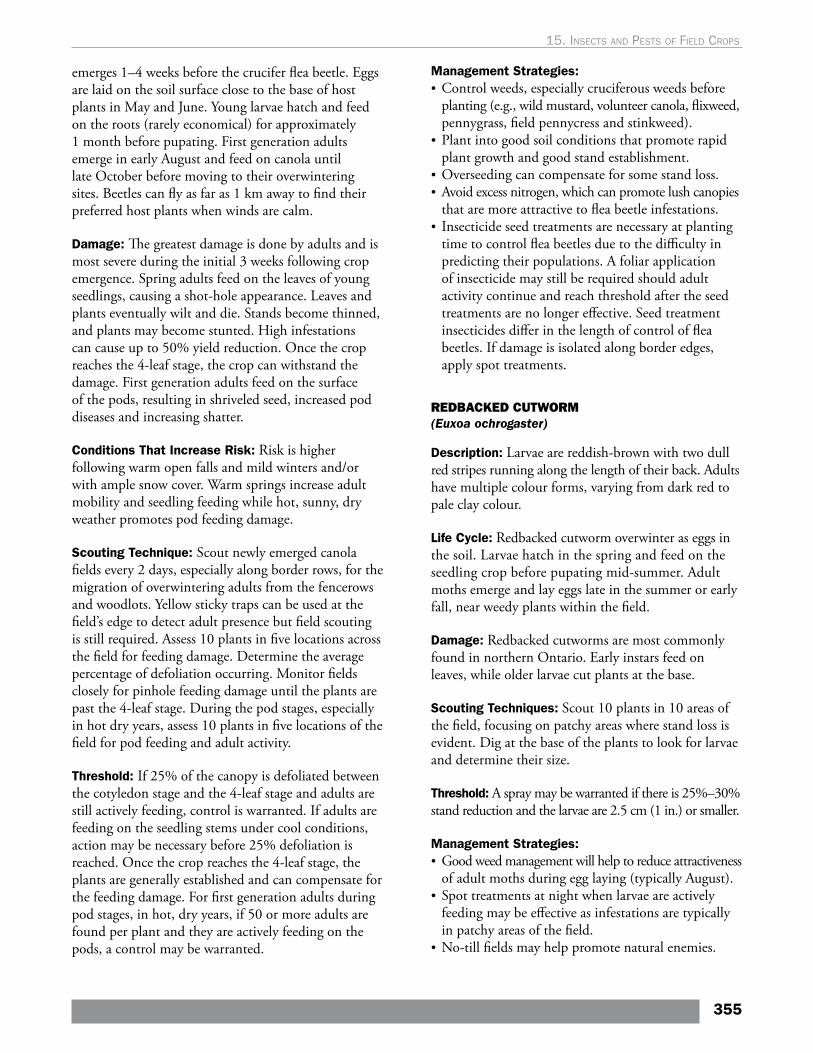
emerges 1–4 weeks before the crucifer flea beetle. Eggs are laid on the soil surface close to the base of host plants in May and June. Young larvae hatch and feed on the roots (rarely economical) for approximately 1 month before pupating. First generation adults emerge in early August and feed on canola until late October before moving to their overwintering sites. Beetles can fly as far as 1 km away to find their preferred host plants when winds are calm.
Damage: The greatest damage is done by adults and is most severe during the initial 3 weeks following crop emergence. Spring adults feed on the leaves of young seedlings, causing a shot-hole appearance. Leaves and plants eventually wilt and die. Stands become thinned, and plants may become stunted. High infestations can cause up to 50% yield reduction. Once the crop reaches the 4-leaf stage, the crop can withstand the damage. First generation adults feed on the surface of the pods, resulting in shriveled seed, increased pod diseases and increasing shatter.
Conditions That Increase Risk: Risk is higher following warm open falls and mild winters and/or with ample snow cover. Warm springs increase adult mobility and seedling feeding while hot, sunny, dry weather promotes pod feeding damage.
Scouting Technique: Scout newly emerged canola fields every 2 days, especially along border rows, for the migration of overwintering adults from the fencerows and woodlots. Yellow sticky traps can be used at the field’s edge to detect adult presence but field scouting is still required. Assess 10 plants in five locations across the field for feeding damage. Determine the average percentage of defoliation occurring. Monitor fields closely for pinhole feeding damage until the plants are past the 4-leaf stage. During the pod stages, especially in hot dry years, assess 10 plants in five locations of the field for pod feeding and adult activity.
Threshold: If 25% of the canopy is defoliated between the cotyledon stage and the 4-leaf stage and adults are still actively feeding, control is warranted. If adults are feeding on the seedling stems under cool conditions, action may be necessary before 25% defoliation is reached. Once the crop reaches the 4-leaf stage, the plants are generally established and can compensate for the feeding damage. For first generation adults during pod stages, in hot, dry years, if 50 or more adults are found per plant and they are actively feeding on the pods, a control may be warranted.
Management Strategies: • Control weeds, especially cruciferous weeds before
planting (e.g., wild mustard, volunteer canola, flixweed, pennygrass, field pennycress and stinkweed).
• Plant into good soil conditions that promote rapid plant growth and good stand establishment.
• Overseeding can compensate for some stand loss.• Avoid excess nitrogen, which can promote lush canopies
that are more attractive to flea beetle infestations.• Insecticide seed treatments are necessary at planting
time to control flea beetles due to the difficulty in predicting their populations. A foliar application of insecticide may still be required should adult activity continue and reach threshold after the seed treatments are no longer effective. Seed treatment insecticides differ in the length of control of flea beetles. If damage is isolated along border edges, apply spot treatments.
REDBACKED CUTWORM(Euxoa ochrogaster)
Description: Larvae are reddish-brown with two dull red stripes running along the length of their back. Adults have multiple colour forms, varying from dark red to pale clay colour.
Life Cycle: Redbacked cutworm overwinter as eggs in the soil. Larvae hatch in the spring and feed on the seedling crop before pupating mid-summer. Adult moths emerge and lay eggs late in the summer or early fall, near weedy plants within the field.
Damage: Redbacked cutworms are most commonly found in northern Ontario. Early instars feed on leaves, while older larvae cut plants at the base.
Scouting Techniques: Scout 10 plants in 10 areas of the field, focusing on patchy areas where stand loss is evident. Dig at the base of the plants to look for larvae and determine their size.
Threshold: A spray may be warranted if there is 25%–30% stand reduction and the larvae are 2.5 cm (1 in.) or smaller.
Management Strategies: • Good weed management will help to reduce attractiveness
of adult moths during egg laying (typically August).• Spot treatments at night when larvae are actively
feeding may be effective as infestations are typically in patchy areas of the field.
• No-till fields may help promote natural enemies.
355
15. Insects and pests oF FIeld crops
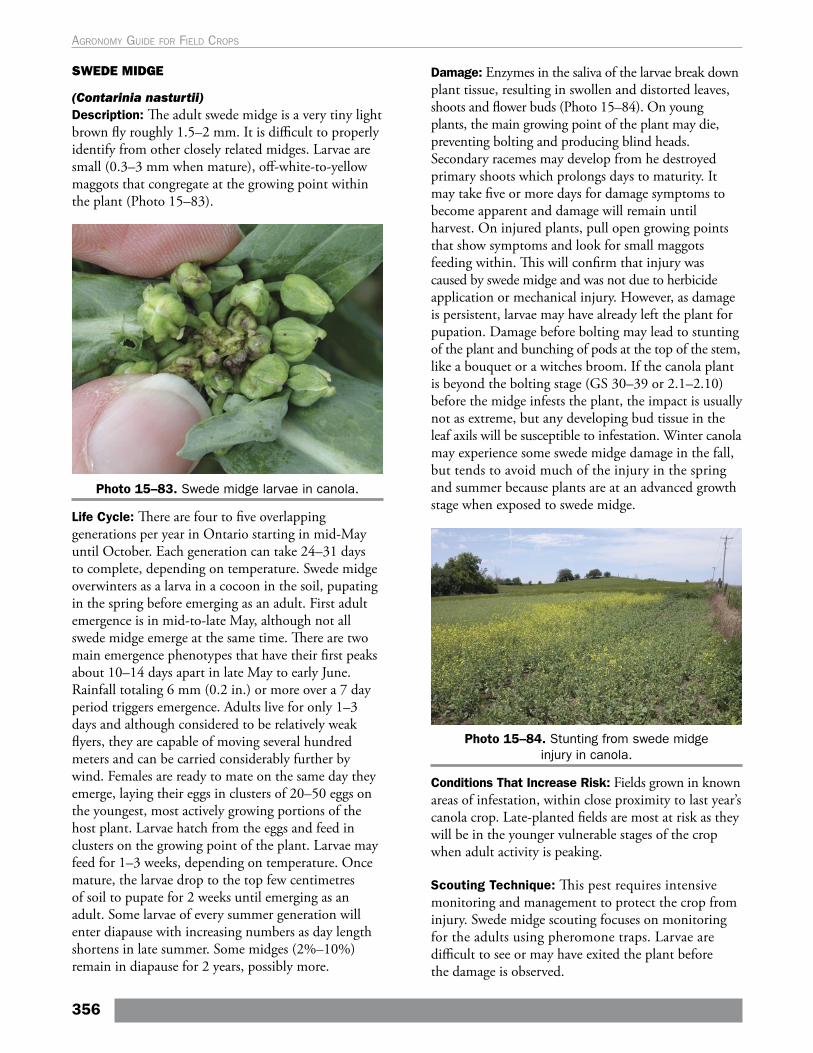
SWEDE MIDGE
(Contarinia nasturtii)Description: The adult swede midge is a very tiny light brown fly roughly 1.5–2 mm. It is difficult to properly identify from other closely related midges. Larvae are small (0.3–3 mm when mature), off-white-to-yellow maggots that congregate at the growing point within the plant (Photo 15–83).
Photo 15–83. Swede midge larvae in canola.
Life Cycle: There are four to five overlapping generations per year in Ontario starting in mid-May until October. Each generation can take 24–31 days to complete, depending on temperature. Swede midge overwinters as a larva in a cocoon in the soil, pupating in the spring before emerging as an adult. First adult emergence is in mid-to-late May, although not all swede midge emerge at the same time. There are two main emergence phenotypes that have their first peaks about 10–14 days apart in late May to early June. Rainfall totaling 6 mm (0.2 in.) or more over a 7 day period triggers emergence. Adults live for only 1–3 days and although considered to be relatively weak flyers, they are capable of moving several hundred meters and can be carried considerably further by wind. Females are ready to mate on the same day they emerge, laying their eggs in clusters of 20–50 eggs on the youngest, most actively growing portions of the host plant. Larvae hatch from the eggs and feed in clusters on the growing point of the plant. Larvae may feed for 1–3 weeks, depending on temperature. Once mature, the larvae drop to the top few centimetres of soil to pupate for 2 weeks until emerging as an adult. Some larvae of every summer generation will enter diapause with increasing numbers as day length shortens in late summer. Some midges (2%–10%) remain in diapause for 2 years, possibly more.
Damage: Enzymes in the saliva of the larvae break down plant tissue, resulting in swollen and distorted leaves, shoots and flower buds (Photo 15–84). On young plants, the main growing point of the plant may die, preventing bolting and producing blind heads. Secondary racemes may develop from he destroyed primary shoots which prolongs days to maturity. It may take five or more days for damage symptoms to become apparent and damage will remain until harvest. On injured plants, pull open growing points that show symptoms and look for small maggots feeding within. This will confirm that injury was caused by swede midge and was not due to herbicide application or mechanical injury. However, as damage is persistent, larvae may have already left the plant for pupation. Damage before bolting may lead to stunting of the plant and bunching of pods at the top of the stem, like a bouquet or a witches broom. If the canola plant is beyond the bolting stage (GS 30–39 or 2.1–2.10) before the midge infests the plant, the impact is usually not as extreme, but any developing bud tissue in the leaf axils will be susceptible to infestation. Winter canola may experience some swede midge damage in the fall, but tends to avoid much of the injury in the spring and summer because plants are at an advanced growth stage when exposed to swede midge.
Photo 15–84. Stunting from swede midge injury in canola.
Conditions That Increase Risk: Fields grown in known areas of infestation, within close proximity to last year’s canola crop. Late-planted fields are most at risk as they will be in the younger vulnerable stages of the crop when adult activity is peaking.
Scouting Technique: This pest requires intensive monitoring and management to protect the crop from injury. Swede midge scouting focuses on monitoring for the adults using pheromone traps. Larvae are difficult to see or may have exited the plant before the damage is observed.
356
Agronomy guide for field Crops
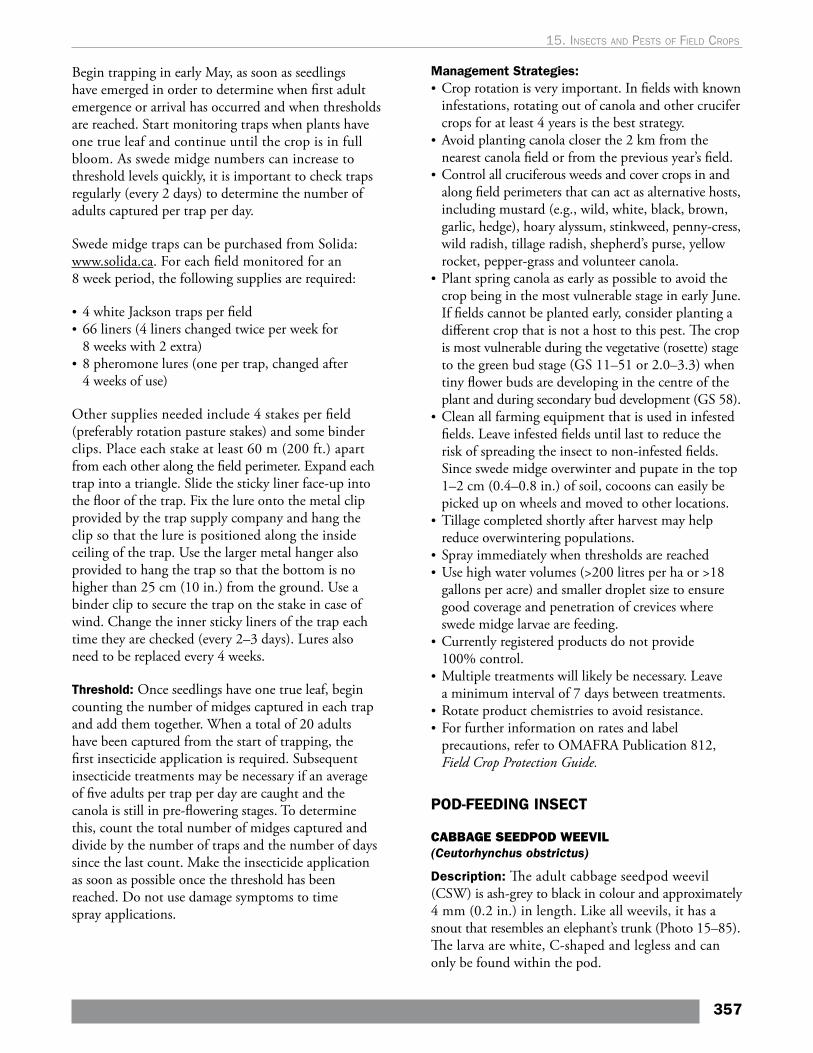
Begin trapping in early May, as soon as seedlings have emerged in order to determine when first adult emergence or arrival has occurred and when thresholds are reached. Start monitoring traps when plants have one true leaf and continue until the crop is in full bloom. As swede midge numbers can increase to threshold levels quickly, it is important to check traps regularly (every 2 days) to determine the number of adults captured per trap per day.
Swede midge traps can be purchased from Solida: www.solida.ca. For each field monitored for an 8 week period, the following supplies are required:
• 4 white Jackson traps per field• 66 liners (4 liners changed twice per week for
8 weeks with 2 extra)• 8 pheromone lures (one per trap, changed after
4 weeks of use)
Other supplies needed include 4 stakes per field (preferably rotation pasture stakes) and some binder clips. Place each stake at least 60 m (200 ft.) apart from each other along the field perimeter. Expand each trap into a triangle. Slide the sticky liner face-up into the floor of the trap. Fix the lure onto the metal clip provided by the trap supply company and hang the clip so that the lure is positioned along the inside ceiling of the trap. Use the larger metal hanger also provided to hang the trap so that the bottom is no higher than 25 cm (10 in.) from the ground. Use a binder clip to secure the trap on the stake in case of wind. Change the inner sticky liners of the trap each time they are checked (every 2–3 days). Lures also need to be replaced every 4 weeks.
Threshold: Once seedlings have one true leaf, begin counting the number of midges captured in each trap and add them together. When a total of 20 adults have been captured from the start of trapping, the first insecticide application is required. Subsequent insecticide treatments may be necessary if an average of five adults per trap per day are caught and the canola is still in pre-flowering stages. To determine this, count the total number of midges captured and divide by the number of traps and the number of days since the last count. Make the insecticide application as soon as possible once the threshold has been reached. Do not use damage symptoms to time spray applications.
Management Strategies: • Crop rotation is very important. In fields with known
infestations, rotating out of canola and other crucifer crops for at least 4 years is the best strategy.
• Avoid planting canola closer the 2 km from the nearest canola field or from the previous year’s field.
• Control all cruciferous weeds and cover crops in and along field perimeters that can act as alternative hosts, including mustard (e.g., wild, white, black, brown, garlic, hedge), hoary alyssum, stinkweed, penny-cress, wild radish, tillage radish, shepherd’s purse, yellow rocket, pepper-grass and volunteer canola.
• Plant spring canola as early as possible to avoid the crop being in the most vulnerable stage in early June. If fields cannot be planted early, consider planting a different crop that is not a host to this pest. The crop is most vulnerable during the vegetative (rosette) stage to the green bud stage (GS 11–51 or 2.0–3.3) when tiny flower buds are developing in the centre of the plant and during secondary bud development (GS 58).
• Clean all farming equipment that is used in infested fields. Leave infested fields until last to reduce the risk of spreading the insect to non-infested fields. Since swede midge overwinter and pupate in the top 1–2 cm (0.4–0.8 in.) of soil, cocoons can easily be picked up on wheels and moved to other locations.
• Tillage completed shortly after harvest may help reduce overwintering populations.
• Spray immediately when thresholds are reached• Use high water volumes (>200 litres per ha or >18
gallons per acre) and smaller droplet size to ensure good coverage and penetration of crevices where swede midge larvae are feeding.
• Currently registered products do not provide 100% control.
• Multiple treatments will likely be necessary. Leave a minimum interval of 7 days between treatments.
• Rotate product chemistries to avoid resistance.• For further information on rates and label
precautions, refer to OMAFRA Publication 812, Field Crop Protection Guide.
POD-FEEDING INSECT
CABBAGE SEEDPOD WEEVIL (Ceutorhynchus obstrictus)
Description: The adult cabbage seedpod weevil (CSW) is ash-grey to black in colour and approximately 4 mm (0.2 in.) in length. Like all weevils, it has a snout that resembles an elephant’s trunk (Photo 15–85). The larva are white, C-shaped and legless and can only be found within the pod.
357
15. Insects and pests oF FIeld crops
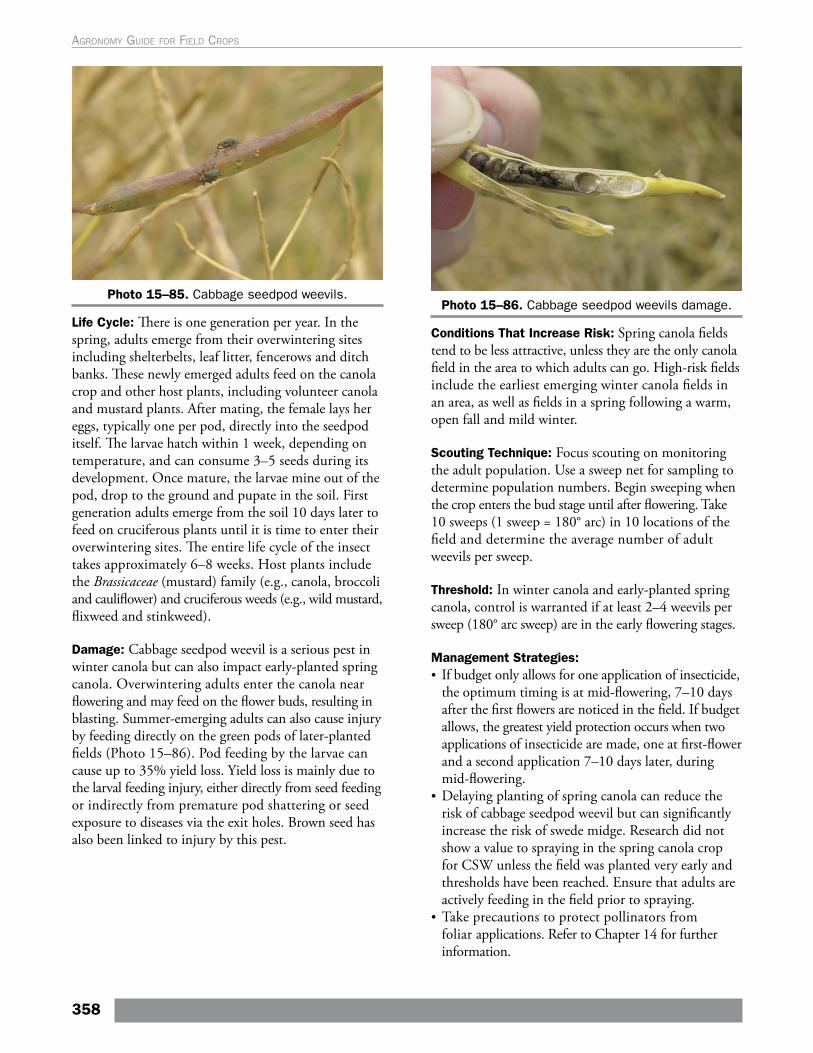
Photo 15–85. Cabbage seedpod weevils.
Life Cycle: There is one generation per year. In the spring, adults emerge from their overwintering sites including shelterbelts, leaf litter, fencerows and ditch banks. These newly emerged adults feed on the canola crop and other host plants, including volunteer canola and mustard plants. After mating, the female lays her eggs, typically one per pod, directly into the seedpod itself. The larvae hatch within 1 week, depending on temperature, and can consume 3–5 seeds during its development. Once mature, the larvae mine out of the pod, drop to the ground and pupate in the soil. First generation adults emerge from the soil 10 days later to feed on cruciferous plants until it is time to enter their overwintering sites. The entire life cycle of the insect takes approximately 6–8 weeks. Host plants include the Brassicaceae (mustard) family (e.g., canola, broccoli and cauliflower) and cruciferous weeds (e.g., wild mustard, flixweed and stinkweed).
Damage: Cabbage seedpod weevil is a serious pest in winter canola but can also impact early-planted spring canola. Overwintering adults enter the canola near flowering and may feed on the flower buds, resulting in blasting. Summer-emerging adults can also cause injury by feeding directly on the green pods of later-planted fields (Photo 15–86). Pod feeding by the larvae can cause up to 35% yield loss. Yield loss is mainly due to the larval feeding injury, either directly from seed feeding or indirectly from premature pod shattering or seed exposure to diseases via the exit holes. Brown seed has also been linked to injury by this pest.
Photo 15–86. Cabbage seedpod weevils damage.
Conditions That Increase Risk: Spring canola fields tend to be less attractive, unless they are the only canola field in the area to which adults can go. High-risk fields include the earliest emerging winter canola fields in an area, as well as fields in a spring following a warm, open fall and mild winter.
Scouting Technique: Focus scouting on monitoring the adult population. Use a sweep net for sampling to determine population numbers. Begin sweeping when the crop enters the bud stage until after flowering. Take 10 sweeps (1 sweep = 180° arc) in 10 locations of the field and determine the average number of adult weevils per sweep.
Threshold: In winter canola and early-planted spring canola, control is warranted if at least 2–4 weevils per sweep (180° arc sweep) are in the early flowering stages.
Management Strategies: • If budget only allows for one application of insecticide,
the optimum timing is at mid-flowering, 7–10 days after the first flowers are noticed in the field. If budget allows, the greatest yield protection occurs when two applications of insecticide are made, one at first-flower and a second application 7–10 days later, during mid-flowering.
• Delaying planting of spring canola can reduce the risk of cabbage seedpod weevil but can significantly increase the risk of swede midge. Research did not show a value to spraying in the spring canola crop for CSW unless the field was planted very early and thresholds have been reached. Ensure that adults are actively feeding in the field prior to spraying.
• Take precautions to protect pollinators from foliar applications. Refer to Chapter 14 for further information.
358
Agronomy guide for field Crops
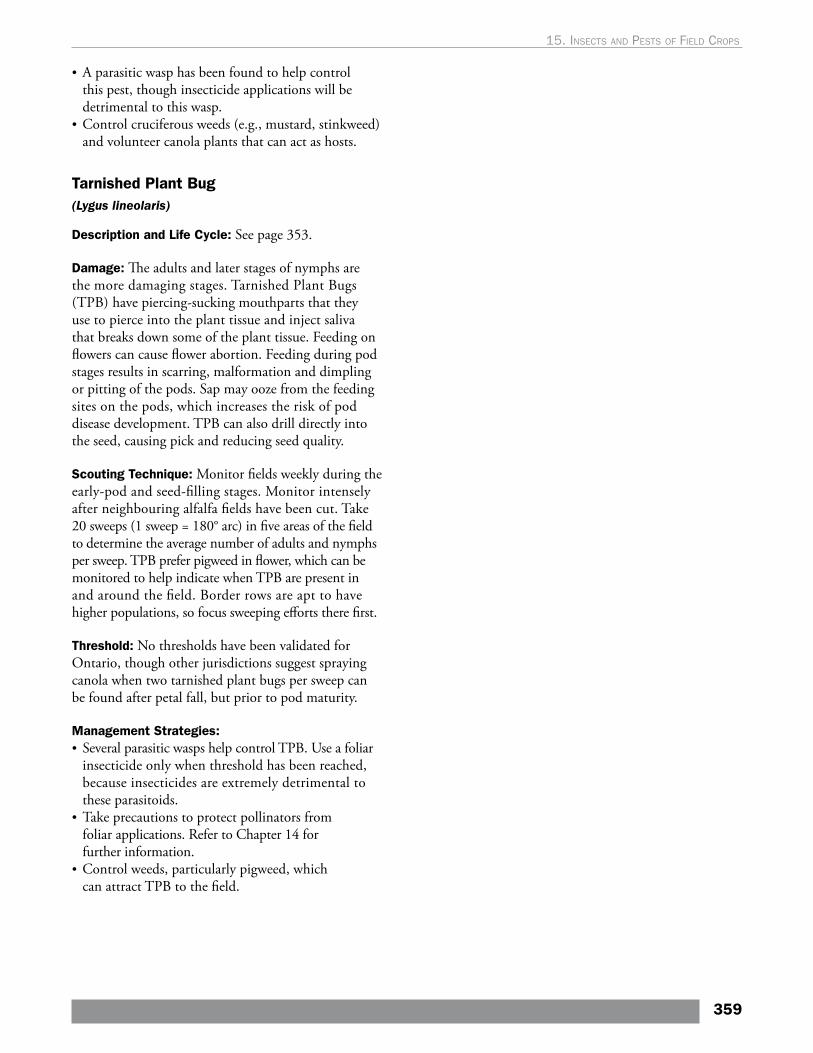
• A parasitic wasp has been found to help control this pest, though insecticide applications will be detrimental to this wasp.
• Control cruciferous weeds (e.g., mustard, stinkweed) and volunteer canola plants that can act as hosts.
Tarnished Plant Bug(Lygus lineolaris)
Description and Life Cycle: See page 353.
Damage: The adults and later stages of nymphs are the more damaging stages. Tarnished Plant Bugs (TPB) have piercing-sucking mouthparts that they use to pierce into the plant tissue and inject saliva that breaks down some of the plant tissue. Feeding on flowers can cause flower abortion. Feeding during pod stages results in scarring, malformation and dimpling or pitting of the pods. Sap may ooze from the feeding sites on the pods, which increases the risk of pod disease development. TPB can also drill directly into the seed, causing pick and reducing seed quality.
Scouting Technique: Monitor fields weekly during the early-pod and seed-filling stages. Monitor intensely after neighbouring alfalfa fields have been cut. Take 20 sweeps (1 sweep = 180° arc) in five areas of the field to determine the average number of adults and nymphs per sweep. TPB prefer pigweed in flower, which can be monitored to help indicate when TPB are present in and around the field. Border rows are apt to have higher populations, so focus sweeping efforts there first.
Threshold: No thresholds have been validated for Ontario, though other jurisdictions suggest spraying canola when two tarnished plant bugs per sweep can be found after petal fall, but prior to pod maturity.
Management Strategies: • Several parasitic wasps help control TPB. Use a foliar
insecticide only when threshold has been reached, because insecticides are extremely detrimental to these parasitoids.
• Take precautions to protect pollinators from foliar applications. Refer to Chapter 14 for further information.
• Control weeds, particularly pigweed, which can attract TPB to the field.
359
15. Insects and pests oF FIeld crops

Page intentionally left blank
16. Diseases of Field Crops
Many different pathogens are responsible for Ontario’s common field crop diseases. Their management is an important component in any field crop production system. Scouting and proper disease identification is critical in order to initiate the corrective management practices. The following descriptions will help to identify the various field crop diseases and aid in their management.
General Seed Rots and Seedling Blights in Field CropsIncidence: Cool or wet conditions that delay seed germination or seedling development can lead to early-season seed rots, seedling blights and/or root rots. Poor stand establishment, non-uniform emergence, “gaps” or missing plants are obvious signs of seed or seedling infection. Many different fungal pathogens are responsible for these diseases. Some, such as Fusarium solani and Rhizoctonia solani can infect many different
field crops, whereas others are more specific, such as Phytophthora sojae, which infects soybeans.
What makes these pathogens difficult to control is their ability to survive in many soil types. Depending on the year and field conditions, their impact ranges from minor to severe (replant). Low-lying or poorly drained areas of the field are often the first to show disease problems. Seed rots and seedling blights can be more severe in no-till or reduced tillage fields since heavy residue keeps the soil cooler and wetter than in conventionally tilled fields. Damping-off occurs when the crop is planted early into conditions that favour disease development, or when environmental conditions cause the seed to sit in the ground for a prolonged period of time. Other factors that delay germination and emergence such as compaction, crusting or deep planting can also cause poor stand establishment. It is important to distinguish between seedling diseases and other potential problems such as insects, herbicide injury and soil compaction, etc.
Fungicide UseResearch from the University of Guelph and OMAFRA has shown a positive return on investment to producers where fungicides are used appropriately. Risk factors for determining potential use include:
• disease pressure and identifying which diseases are present (e.g., fungal versus bacterial)
• hybrid/variety susceptibility (e.g., the more susceptible to a disease, the more potential for losses)
• previous crops (especially same crop) • disease history • environmental conditions• plant populations • fertility • tillage (the more residue in the field, the greater the potential for disease development under favourable weather conditions)
Basically, the more of these risk factors present in a crop, the greater likelihood of a positive return from using fungicides, however, there are no guarantees, so consider the following when making a fungicide decision.
Identification. Correct identification is the first step to effective disease management and is critical, especially since many bacterial disease symptoms are similar to fungal diseases and fungicides have no control activity on bacteria. Refer to OMAFRA Publication 812, Field Crop Production Guide for specific diseases and their control.
1. Timing. Fungicide application timing and coverage are important, since many diseases require application of a fungicide before there is significant disease development. However, early growth stage applications where, fungicides are combined with a herbicide spray, are not beneficial, in most cases, since disease levels are low and many require a second fungicide application later when disease develops.
2. Fungicide resistance. Fungicide resistance in field crops has been confirmed in the U.S. and although there are currently no known cases in Ontario, the misuse of products may result in the development of resistant populations and jeopardize their usefulness. Resistance development can occur in a pathogen population after repeated use of products with the same modes of action, especially if they have a single-site mode of action.
361
Appearance: It can be difficult to distinguish between pathogens since symptoms are not always clearly distinguishable. Seed rots are diseases that affect seeds prior to or shortly after germination. With seed rots, the seed rots and dies. Seeds that have been damaged or have poor seedling vigour are the most susceptible to seed rots. High-risk conditions include cool (10°C–13°C) and wet soil conditions for an extended period of time after planting. Seedlings that take a long time to emerge are most susceptible to fungal infection.
Seedling blights or “damping-off” are characterized into two groups, namely pre-emergence and post-emergence seedling blights. Pre-emergence seedling blights affect young seedlings prior to emergence. Affected seedlings may die or grow slower than healthy unaffected seedlings, resulting in “gaps” or stand problems. Seedlings that do emerge can also be diseased. Post-emergence seedling blights (damping-off) affect the roots or lower stems of young seedlings from emergence to the second- or third-leaf stage. Symptoms include delayed growth, wilting, dieback and/or death. In most cases, infected seedlings will have a “pinching” or “girdling” of the stem near the soil line.
Root rot-causing organisms infect the seedlings’ root system, including lateral roots and root hairs. Affected plants may be stunted, off-colour or lack vigour. Infection can result in seedling death when disease infection is severe, and infected plants may be more susceptible to stalk rots later in the season.
Disease Cycle: Refer to the specific crop sections for further details.
Management Strategies: Planting seed with good germination and seed vigour will substantially reduce the risk of seed rots and seedling blights. Seeds cracked or damaged during harvest or handling are most prone to infection and should be removed. Management practices that favour quick germination, such as minimizing soil compaction, removal of excess soil moisture through improved drainage and removal of excessive crop residues, can also help reduce the severity of rots and seedling blights.
Fungicidal seed treatments will provide some protection to vulnerable seedlings. All seed should be treated with a fungicide seed treatment to minimize early season pre-emergence and post-emergence disease problems. The average fungicide seed treatment provides up to 2 weeks of protection. There is no replacement
for timely planting into a good seedbed. For seed treatment guidelines, refer to OMAFRA Publication 812, Field Crop Protection Guide.
Corn Diseases
Corn Seedling Diseases
SEED ROT, SEEDLING BLIGHT, ROOT ROT Refer to the general seedling disease section at the beginning of the chapter.
Disease Cycle: In corn, the most common diseases are caused by Pythium, Fusarium, Gibberella, Trichoderma and Penicillium, but other fungi such as Diplodia and Rhizoctonia can also be involved. Seed, seedling and roots infected by Pythium are most often soft (wet) and dark coloured, as opposed to roots infected with Fusarium, Gibberella, Diplodia and Rhizoctonia, which are firm or leathery. The colour of the roots most often provides a good indication of which organism(s) are present: greyish-white indicates Diplodia, tan to pink indicates Fusarium or Gibberella, reddish to brown indicates Rhizoctonia and blue-green indicates Penicillium or Trichoderma.
Pythium, Fusarium, Gibberella, Diplodia, Rhizoctonia, Penicillium and Trichoderma all live and thrive in the soil. In most cases, they can affect other crops beside corn. Except for Pythium, all of these organisms also have the ability to live on or in corn seed.
Corn Leaf Diseases
ANTHRACNOSE LEAF BLIGHT (Colletotrichum graminicola)
Incidence: Anthracnose may become severe in warm, wet years and is often the first corn leaf disease that is noticed. It begins on the lower leaves, working its way up the plant. Symptoms often disappear as the corn plant begins its rapid growth phase. The fungus that causes anthracnose leaf blight is also responsible for anthracnose stalk rot (refer to corn stalk rot section for more details). Producers should record where anthracnose leaf blight symptoms developed early in the season and return to those areas to scout for stalk rots a few weeks before harvest. Tillage systems that leave considerable amounts of anthracnose-infected debris on the soil surface may lead to greater severity and an increased presence of the disease.
362
Agronomy guide for field Crops
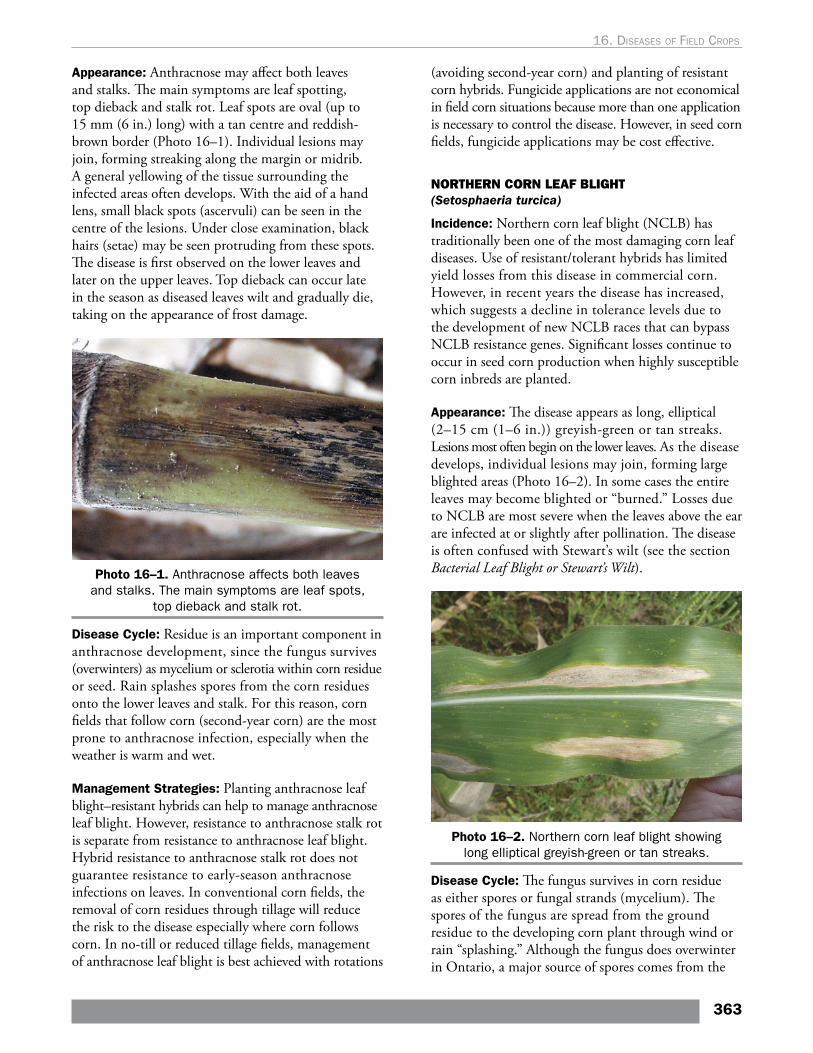
Appearance: Anthracnose may affect both leaves and stalks. The main symptoms are leaf spotting, top dieback and stalk rot. Leaf spots are oval (up to 15 mm (6 in.) long) with a tan centre and reddish-brown border (Photo 16–1). Individual lesions may join, forming streaking along the margin or midrib. A general yellowing of the tissue surrounding the infected areas often develops. With the aid of a hand lens, small black spots (ascervuli) can be seen in the centre of the lesions. Under close examination, black hairs (setae) may be seen protruding from these spots. The disease is first observed on the lower leaves and later on the upper leaves. Top dieback can occur late in the season as diseased leaves wilt and gradually die, taking on the appearance of frost damage.
Photo 16–1. Anthracnose affects both leaves and stalks. The main symptoms are leaf spots,
top dieback and stalk rot.
Disease Cycle: Residue is an important component in anthracnose development, since the fungus survives (overwinters) as mycelium or sclerotia within corn residue or seed. Rain splashes spores from the corn residues onto the lower leaves and stalk. For this reason, corn fields that follow corn (second-year corn) are the most prone to anthracnose infection, especially when the weather is warm and wet.
Management Strategies: Planting anthracnose leaf blight–resistant hybrids can help to manage anthracnose leaf blight. However, resistance to anthracnose stalk rot is separate from resistance to anthracnose leaf blight. Hybrid resistance to anthracnose stalk rot does not guarantee resistance to early-season anthracnose infections on leaves. In conventional corn fields, the removal of corn residues through tillage will reduce the risk to the disease especially where corn follows corn. In no-till or reduced tillage fields, management of anthracnose leaf blight is best achieved with rotations
(avoiding second-year corn) and planting of resistant corn hybrids. Fungicide applications are not economical in field corn situations because more than one application is necessary to control the disease. However, in seed corn fields, fungicide applications may be cost effective.
NORTHERN CORN LEAF BLIGHT (Setosphaeria turcica)
Incidence: Northern corn leaf blight (NCLB) has traditionally been one of the most damaging corn leaf diseases. Use of resistant/tolerant hybrids has limited yield losses from this disease in commercial corn. However, in recent years the disease has increased, which suggests a decline in tolerance levels due to the development of new NCLB races that can bypass NCLB resistance genes. Significant losses continue to occur in seed corn production when highly susceptible corn inbreds are planted.
Appearance: The disease appears as long, elliptical (2–15 cm (1–6 in.)) greyish-green or tan streaks. Lesions most often begin on the lower leaves. As the disease develops, individual lesions may join, forming large blighted areas (Photo 16–2). In some cases the entire leaves may become blighted or “burned.” Losses due to NCLB are most severe when the leaves above the ear are infected at or slightly after pollination. The disease is often confused with Stewart’s wilt (see the section Bacterial Leaf Blight or Stewart’s Wilt).
Photo 16–2. Northern corn leaf blight showing long elliptical greyish-green or tan streaks.
Disease Cycle: The fungus survives in corn residue as either spores or fungal strands (mycelium). The spores of the fungus are spread from the ground residue to the developing corn plant through wind or rain “splashing.” Although the fungus does overwinter in Ontario, a major source of spores comes from the
363
16. dIseases oF FIeld crops
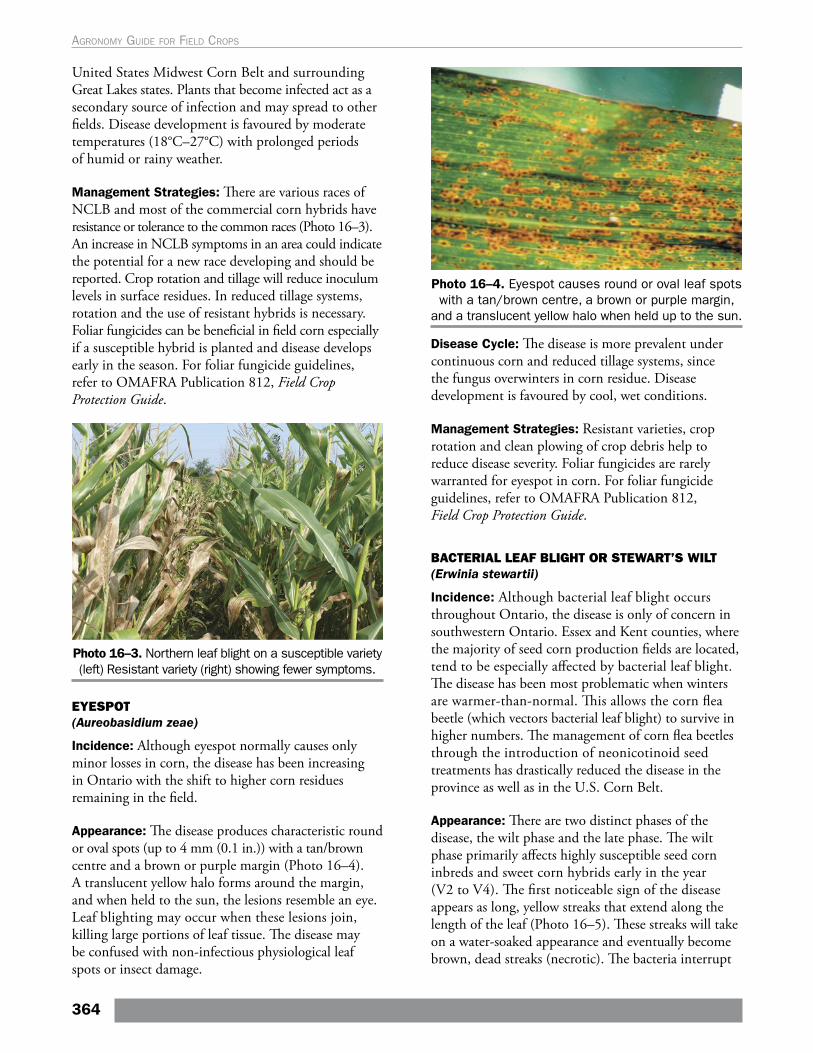
United States Midwest Corn Belt and surrounding Great Lakes states. Plants that become infected act as a secondary source of infection and may spread to other fields. Disease development is favoured by moderate temperatures (18°C–27°C) with prolonged periods of humid or rainy weather.
Management Strategies: There are various races of NCLB and most of the commercial corn hybrids have resistance or tolerance to the common races (Photo 16–3). An increase in NCLB symptoms in an area could indicate the potential for a new race developing and should be reported. Crop rotation and tillage will reduce inoculum levels in surface residues. In reduced tillage systems, rotation and the use of resistant hybrids is necessary. Foliar fungicides can be beneficial in field corn especially if a susceptible hybrid is planted and disease develops early in the season. For foliar fungicide guidelines, refer to OMAFRA Publication 812, Field Crop Protection Guide.
Photo 16–3. Northern leaf blight on a susceptible variety (left) Resistant variety (right) showing fewer symptoms.
EYESPOT(Aureobasidium zeae)
Incidence: Although eyespot normally causes only minor losses in corn, the disease has been increasing in Ontario with the shift to higher corn residues remaining in the field.
Appearance: The disease produces characteristic round or oval spots (up to 4 mm (0.1 in.)) with a tan/brown centre and a brown or purple margin (Photo 16–4). A translucent yellow halo forms around the margin, and when held to the sun, the lesions resemble an eye. Leaf blighting may occur when these lesions join, killing large portions of leaf tissue. The disease may be confused with non-infectious physiological leaf spots or insect damage.
Photo 16–4. Eyespot causes round or oval leaf spots with a tan/brown centre, a brown or purple margin,
and a translucent yellow halo when held up to the sun.
Disease Cycle: The disease is more prevalent under continuous corn and reduced tillage systems, since the fungus overwinters in corn residue. Disease development is favoured by cool, wet conditions.
Management Strategies: Resistant varieties, crop rotation and clean plowing of crop debris help to reduce disease severity. Foliar fungicides are rarely warranted for eyespot in corn. For foliar fungicide guidelines, refer to OMAFRA Publication 812, Field Crop Protection Guide.
BACTERIAL LEAF BLIGHT OR STEWART’S WILT (Erwinia stewartii)
Incidence: Although bacterial leaf blight occurs throughout Ontario, the disease is only of concern in southwestern Ontario. Essex and Kent counties, where the majority of seed corn production fields are located, tend to be especially affected by bacterial leaf blight. The disease has been most problematic when winters are warmer-than-normal. This allows the corn flea beetle (which vectors bacterial leaf blight) to survive in higher numbers. The management of corn flea beetles through the introduction of neonicotinoid seed treatments has drastically reduced the disease in the province as well as in the U.S. Corn Belt.
Appearance: There are two distinct phases of the disease, the wilt phase and the late phase. The wilt phase primarily affects highly susceptible seed corn inbreds and sweet corn hybrids early in the year (V2 to V4). The first noticeable sign of the disease appears as long, yellow streaks that extend along the length of the leaf (Photo 16–5). These streaks will take on a water-soaked appearance and eventually become brown, dead streaks (necrotic). The bacteria interrupt
364
Agronomy guide for field Crops
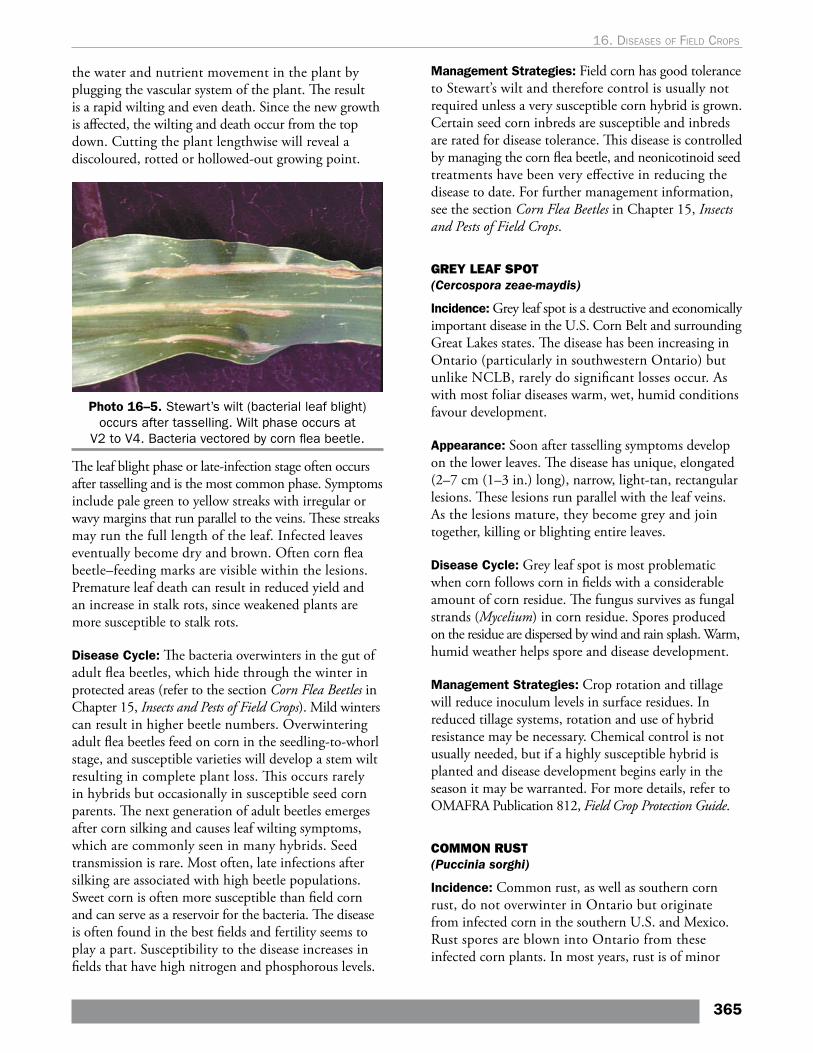
the water and nutrient movement in the plant by plugging the vascular system of the plant. The result is a rapid wilting and even death. Since the new growth is affected, the wilting and death occur from the top down. Cutting the plant lengthwise will reveal a discoloured, rotted or hollowed-out growing point.
Photo 16–5. Stewart’s wilt (bacterial leaf blight) occurs after tasselling. Wilt phase occurs at
V2 to V4. Bacteria vectored by corn flea beetle.
The leaf blight phase or late-infection stage often occurs after tasselling and is the most common phase. Symptoms include pale green to yellow streaks with irregular or wavy margins that run parallel to the veins. These streaks may run the full length of the leaf. Infected leaves eventually become dry and brown. Often corn flea beetle–feeding marks are visible within the lesions. Premature leaf death can result in reduced yield and an increase in stalk rots, since weakened plants are more susceptible to stalk rots.
Disease Cycle: The bacteria overwinters in the gut of adult flea beetles, which hide through the winter in protected areas (refer to the section Corn Flea Beetles in Chapter 15, Insects and Pests of Field Crops). Mild winters can result in higher beetle numbers. Overwintering adult flea beetles feed on corn in the seedling-to-whorl stage, and susceptible varieties will develop a stem wilt resulting in complete plant loss. This occurs rarely in hybrids but occasionally in susceptible seed corn parents. The next generation of adult beetles emerges after corn silking and causes leaf wilting symptoms, which are commonly seen in many hybrids. Seed transmission is rare. Most often, late infections after silking are associated with high beetle populations. Sweet corn is often more susceptible than field corn and can serve as a reservoir for the bacteria. The disease is often found in the best fields and fertility seems to play a part. Susceptibility to the disease increases in fields that have high nitrogen and phosphorous levels.
Management Strategies: Field corn has good tolerance to Stewart’s wilt and therefore control is usually not required unless a very susceptible corn hybrid is grown. Certain seed corn inbreds are susceptible and inbreds are rated for disease tolerance. This disease is controlled by managing the corn flea beetle, and neonicotinoid seed treatments have been very effective in reducing the disease to date. For further management information, see the section Corn Flea Beetles in Chapter 15, Insects and Pests of Field Crops.
GREY LEAF SPOT(Cercospora zeae-maydis)
Incidence: Grey leaf spot is a destructive and economically important disease in the U.S. Corn Belt and surrounding Great Lakes states. The disease has been increasing in Ontario (particularly in southwestern Ontario) but unlike NCLB, rarely do significant losses occur. As with most foliar diseases warm, wet, humid conditions favour development.
Appearance: Soon after tasselling symptoms develop on the lower leaves. The disease has unique, elongated (2–7 cm (1–3 in.) long), narrow, light-tan, rectangular lesions. These lesions run parallel with the leaf veins. As the lesions mature, they become grey and join together, killing or blighting entire leaves.
Disease Cycle: Grey leaf spot is most problematic when corn follows corn in fields with a considerable amount of corn residue. The fungus survives as fungal strands (Mycelium) in corn residue. Spores produced on the residue are dispersed by wind and rain splash. Warm, humid weather helps spore and disease development.
Management Strategies: Crop rotation and tillage will reduce inoculum levels in surface residues. In reduced tillage systems, rotation and use of hybrid resistance may be necessary. Chemical control is not usually needed, but if a highly susceptible hybrid is planted and disease development begins early in the season it may be warranted. For more details, refer to OMAFRA Publication 812, Field Crop Protection Guide.
COMMON RUST(Puccinia sorghi)
Incidence: Common rust, as well as southern corn rust, do not overwinter in Ontario but originate from infected corn in the southern U.S. and Mexico. Rust spores are blown into Ontario from these infected corn plants. In most years, rust is of minor
365
16. dIseases oF FIeld crops
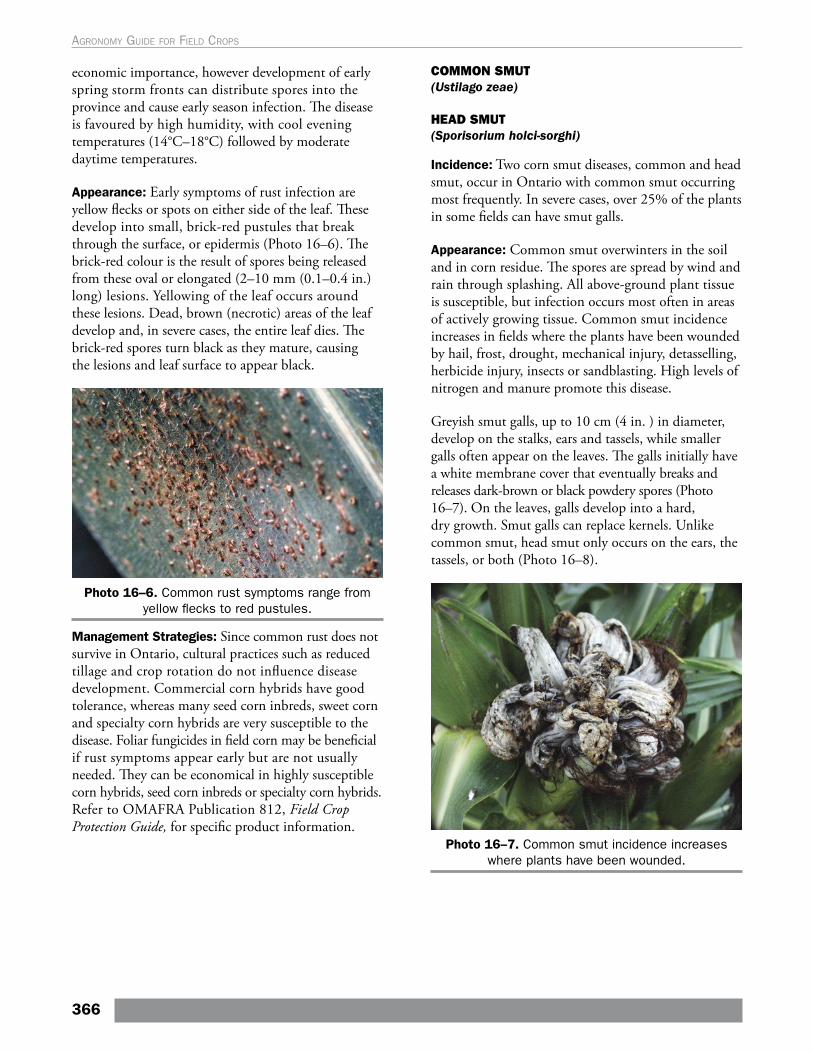
economic importance, however development of early spring storm fronts can distribute spores into the province and cause early season infection. The disease is favoured by high humidity, with cool evening temperatures (14°C–18°C) followed by moderate daytime temperatures.
Appearance: Early symptoms of rust infection are yellow flecks or spots on either side of the leaf. These develop into small, brick-red pustules that break through the surface, or epidermis (Photo 16–6). The brick-red colour is the result of spores being released from these oval or elongated (2–10 mm (0.1–0.4 in.) long) lesions. Yellowing of the leaf occurs around these lesions. Dead, brown (necrotic) areas of the leaf develop and, in severe cases, the entire leaf dies. The brick-red spores turn black as they mature, causing the lesions and leaf surface to appear black.
Photo 16–6. Common rust symptoms range from yellow flecks to red pustules.
Management Strategies: Since common rust does not survive in Ontario, cultural practices such as reduced tillage and crop rotation do not influence disease development. Commercial corn hybrids have good tolerance, whereas many seed corn inbreds, sweet corn and specialty corn hybrids are very susceptible to the disease. Foliar fungicides in field corn may be beneficial if rust symptoms appear early but are not usually needed. They can be economical in highly susceptible corn hybrids, seed corn inbreds or specialty corn hybrids. Refer to OMAFRA Publication 812, Field Crop Protection Guide, for specific product information.
COMMON SMUT (Ustilago zeae)
HEAD SMUT (Sporisorium holci-sorghi)
Incidence: Two corn smut diseases, common and head smut, occur in Ontario with common smut occurring most frequently. In severe cases, over 25% of the plants in some fields can have smut galls.
Appearance: Common smut overwinters in the soil and in corn residue. The spores are spread by wind and rain through splashing. All above-ground plant tissue is susceptible, but infection occurs most often in areas of actively growing tissue. Common smut incidence increases in fields where the plants have been wounded by hail, frost, drought, mechanical injury, detasselling, herbicide injury, insects or sandblasting. High levels of nitrogen and manure promote this disease.
Greyish smut galls, up to 10 cm (4 in. ) in diameter, develop on the stalks, ears and tassels, while smaller galls often appear on the leaves. The galls initially have a white membrane cover that eventually breaks and releases dark-brown or black powdery spores (Photo 16–7). On the leaves, galls develop into a hard, dry growth. Smut galls can replace kernels. Unlike common smut, head smut only occurs on the ears, the tassels, or both (Photo 16–8).
Photo 16–7. Common smut incidence increases where plants have been wounded.
366
Agronomy guide for field Crops
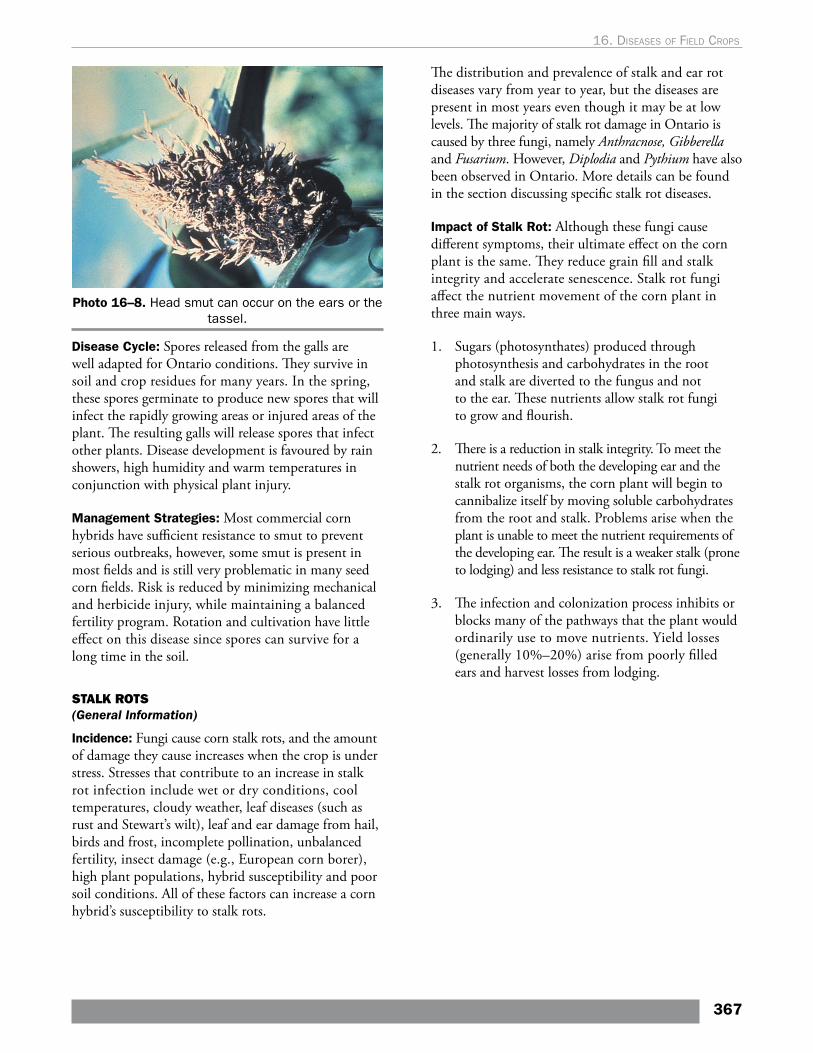
Photo 16–8. Head smut can occur on the ears or the tassel.
Disease Cycle: Spores released from the galls are well adapted for Ontario conditions. They survive in soil and crop residues for many years. In the spring, these spores germinate to produce new spores that will infect the rapidly growing areas or injured areas of the plant. The resulting galls will release spores that infect other plants. Disease development is favoured by rain showers, high humidity and warm temperatures in conjunction with physical plant injury.
Management Strategies: Most commercial corn hybrids have sufficient resistance to smut to prevent serious outbreaks, however, some smut is present in most fields and is still very problematic in many seed corn fields. Risk is reduced by minimizing mechanical and herbicide injury, while maintaining a balanced fertility program. Rotation and cultivation have little effect on this disease since spores can survive for a long time in the soil.
STALK ROTS (General Information)
Incidence: Fungi cause corn stalk rots, and the amount of damage they cause increases when the crop is under stress. Stresses that contribute to an increase in stalk rot infection include wet or dry conditions, cool temperatures, cloudy weather, leaf diseases (such as rust and Stewart’s wilt), leaf and ear damage from hail, birds and frost, incomplete pollination, unbalanced fertility, insect damage (e.g., European corn borer), high plant populations, hybrid susceptibility and poor soil conditions. All of these factors can increase a corn hybrid’s susceptibility to stalk rots.
The distribution and prevalence of stalk and ear rot diseases vary from year to year, but the diseases are present in most years even though it may be at low levels. The majority of stalk rot damage in Ontario is caused by three fungi, namely Anthracnose, Gibberella and Fusarium. However, Diplodia and Pythium have also been observed in Ontario. More details can be found in the section discussing specific stalk rot diseases.
Impact of Stalk Rot: Although these fungi cause different symptoms, their ultimate effect on the corn plant is the same. They reduce grain fill and stalk integrity and accelerate senescence. Stalk rot fungi affect the nutrient movement of the corn plant in three main ways.
1. Sugars (photosynthates) produced through photosynthesis and carbohydrates in the root and stalk are diverted to the fungus and not to the ear. These nutrients allow stalk rot fungi to grow and flourish.
2. There is a reduction in stalk integrity. To meet the nutrient needs of both the developing ear and the stalk rot organisms, the corn plant will begin to cannibalize itself by moving soluble carbohydrates from the root and stalk. Problems arise when the plant is unable to meet the nutrient requirements of the developing ear. The result is a weaker stalk (prone to lodging) and less resistance to stalk rot fungi.
3. The infection and colonization process inhibits or blocks many of the pathways that the plant would ordinarily use to move nutrients. Yield losses (generally 10%–20%) arise from poorly filled ears and harvest losses from lodging.
367
16. dIseases oF FIeld crops
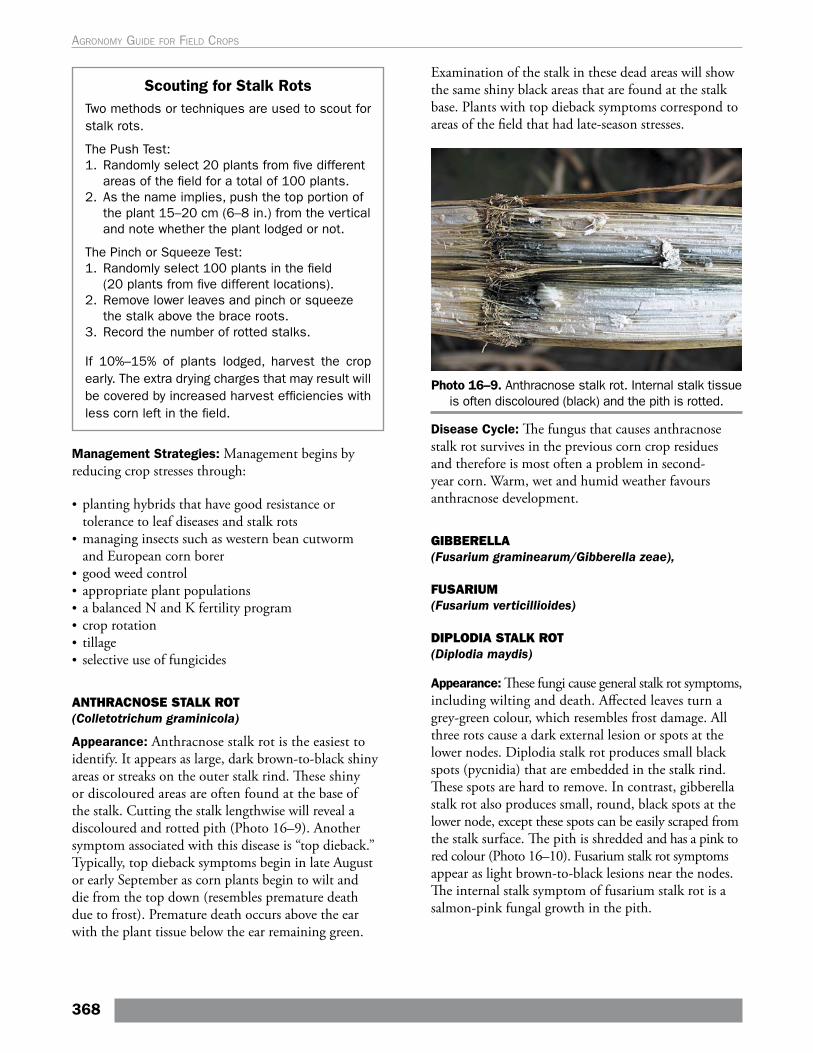
Scouting for Stalk RotsTwo methods or techniques are used to scout for stalk rots.
The Push Test:1. Randomly select 20 plants from five different
areas of the field for a total of 100 plants. 2. As the name implies, push the top portion of
the plant 15–20 cm (6–8 in.) from the vertical and note whether the plant lodged or not.
The Pinch or Squeeze Test:1. Randomly select 100 plants in the field
(20 plants from five different locations). 2. Remove lower leaves and pinch or squeeze
the stalk above the brace roots. 3. Record the number of rotted stalks.
If 10%–15% of plants lodged, harvest the crop early. The extra drying charges that may result will be covered by increased harvest efficiencies with less corn left in the field.
Management Strategies: Management begins by reducing crop stresses through:
• planting hybrids that have good resistance or tolerance to leaf diseases and stalk rots
• managing insects such as western bean cutworm and European corn borer
• good weed control• appropriate plant populations • a balanced N and K fertility program • crop rotation• tillage • selective use of fungicides
ANTHRACNOSE STALK ROT (Colletotrichum graminicola)
Appearance: Anthracnose stalk rot is the easiest to identify. It appears as large, dark brown-to-black shiny areas or streaks on the outer stalk rind. These shiny or discoloured areas are often found at the base of the stalk. Cutting the stalk lengthwise will reveal a discoloured and rotted pith (Photo 16–9). Another symptom associated with this disease is “top dieback.” Typically, top dieback symptoms begin in late August or early September as corn plants begin to wilt and die from the top down (resembles premature death due to frost). Premature death occurs above the ear with the plant tissue below the ear remaining green.
Examination of the stalk in these dead areas will show the same shiny black areas that are found at the stalk base. Plants with top dieback symptoms correspond to areas of the field that had late-season stresses.
Photo 16–9. Anthracnose stalk rot. Internal stalk tissue is often discoloured (black) and the pith is rotted.
Disease Cycle: The fungus that causes anthracnose stalk rot survives in the previous corn crop residues and therefore is most often a problem in second-year corn. Warm, wet and humid weather favours anthracnose development.
GIBBERELLA (Fusarium graminearum/Gibberella zeae),
FUSARIUM (Fusarium verticillioides)
DIPLODIA STALK ROT (Diplodia maydis)
Appearance: These fungi cause general stalk rot symptoms, including wilting and death. Affected leaves turn a grey-green colour, which resembles frost damage. All three rots cause a dark external lesion or spots at the lower nodes. Diplodia stalk rot produces small black spots (pycnidia) that are embedded in the stalk rind. These spots are hard to remove. In contrast, gibberella stalk rot also produces small, round, black spots at the lower node, except these spots can be easily scraped from the stalk surface. The pith is shredded and has a pink to red colour (Photo 16–10). Fusarium stalk rot symptoms appear as light brown-to-black lesions near the nodes. The internal stalk symptom of fusarium stalk rot is a salmon-pink fungal growth in the pith.
368
Agronomy guide for field Crops
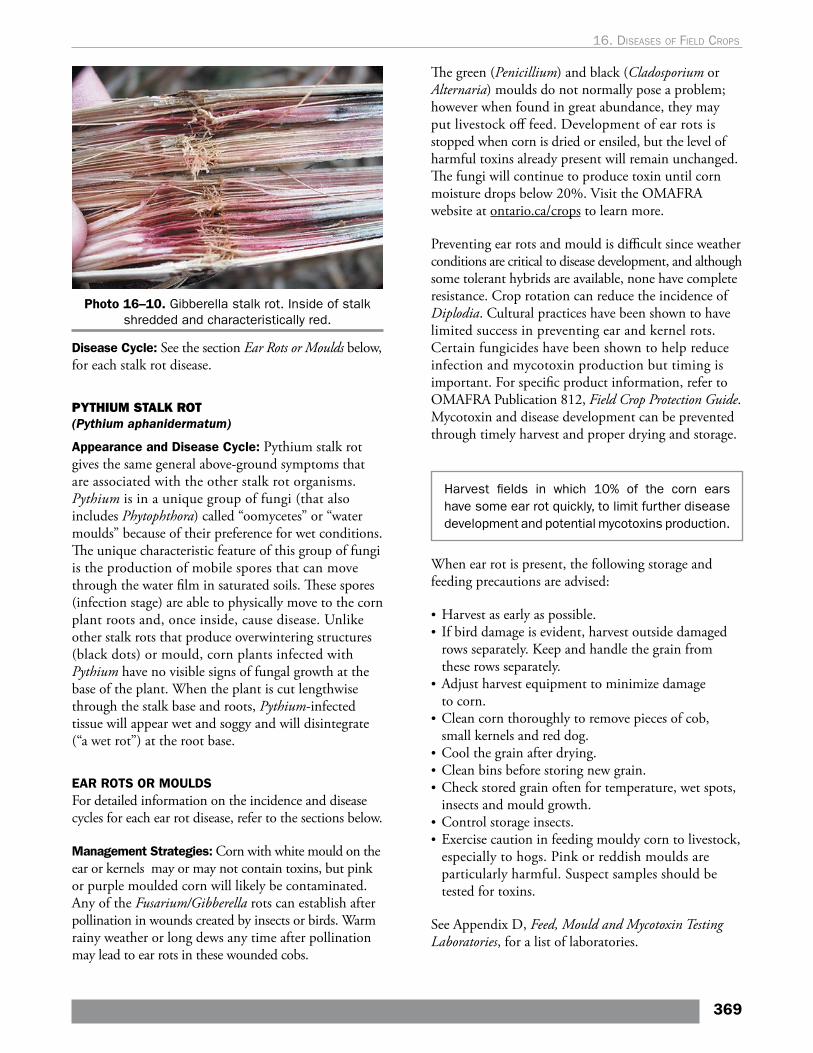
Photo 16–10. Gibberella stalk rot. Inside of stalk shredded and characteristically red.
Disease Cycle: See the section Ear Rots or Moulds below, for each stalk rot disease.
PYTHIUM STALK ROT (Pythium aphanidermatum)
Appearance and Disease Cycle: Pythium stalk rot gives the same general above-ground symptoms that are associated with the other stalk rot organisms. Pythium is in a unique group of fungi (that also includes Phytophthora) called “oomycetes” or “water moulds” because of their preference for wet conditions. The unique characteristic feature of this group of fungi is the production of mobile spores that can move through the water film in saturated soils. These spores (infection stage) are able to physically move to the corn plant roots and, once inside, cause disease. Unlike other stalk rots that produce overwintering structures (black dots) or mould, corn plants infected with Pythium have no visible signs of fungal growth at the base of the plant. When the plant is cut lengthwise through the stalk base and roots, Pythium-infected tissue will appear wet and soggy and will disintegrate (“a wet rot”) at the root base.
EAR ROTS OR MOULDS For detailed information on the incidence and disease cycles for each ear rot disease, refer to the sections below.
Management Strategies: Corn with white mould on the ear or kernels may or may not contain toxins, but pink or purple moulded corn will likely be contaminated. Any of the Fusarium/Gibberella rots can establish after pollination in wounds created by insects or birds. Warm rainy weather or long dews any time after pollination may lead to ear rots in these wounded cobs.
The green (Penicillium) and black (Cladosporium or Alternaria) moulds do not normally pose a problem; however when found in great abundance, they may put livestock off feed. Development of ear rots is stopped when corn is dried or ensiled, but the level of harmful toxins already present will remain unchanged. The fungi will continue to produce toxin until corn moisture drops below 20%. Visit the OMAFRA website at ontario.ca/crops to learn more.
Preventing ear rots and mould is difficult since weather conditions are critical to disease development, and although some tolerant hybrids are available, none have complete resistance. Crop rotation can reduce the incidence of Diplodia. Cultural practices have been shown to have limited success in preventing ear and kernel rots. Certain fungicides have been shown to help reduce infection and mycotoxin production but timing is important. For specific product information, refer to OMAFRA Publication 812, Field Crop Protection Guide. Mycotoxin and disease development can be prevented through timely harvest and proper drying and storage.
Harvest fields in which 10% of the corn ears have some ear rot quickly, to limit further disease development and potential mycotoxins production.
When ear rot is present, the following storage and feeding precautions are advised:
• Harvest as early as possible. • If bird damage is evident, harvest outside damaged
rows separately. Keep and handle the grain from these rows separately.
• Adjust harvest equipment to minimize damage to corn.
• Clean corn thoroughly to remove pieces of cob, small kernels and red dog.
• Cool the grain after drying. • Clean bins before storing new grain. • Check stored grain often for temperature, wet spots,
insects and mould growth. • Control storage insects. • Exercise caution in feeding mouldy corn to livestock,
especially to hogs. Pink or reddish moulds are particularly harmful. Suspect samples should be tested for toxins.
See Appendix D, Feed, Mould and Mycotoxin Testing Laboratories, for a list of laboratories.
369
16. dIseases oF FIeld crops
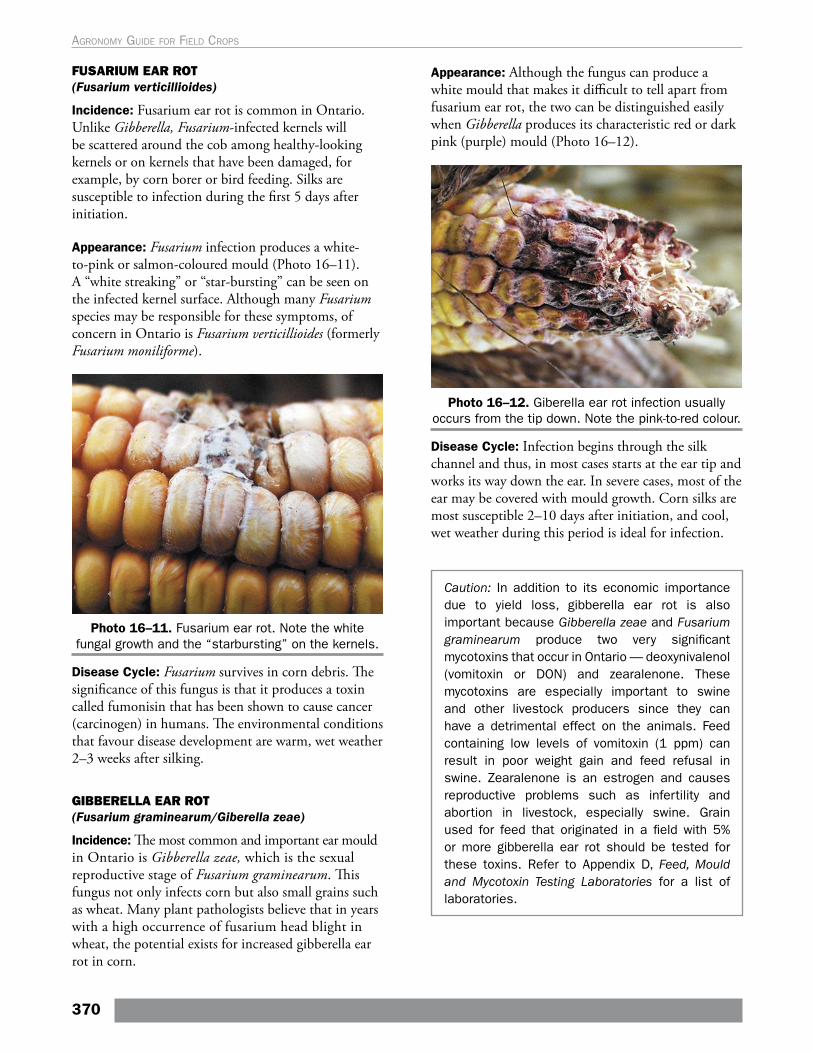
FUSARIUM EAR ROT (Fusarium verticillioides)
Incidence: Fusarium ear rot is common in Ontario. Unlike Gibberella, Fusarium-infected kernels will be scattered around the cob among healthy-looking kernels or on kernels that have been damaged, for example, by corn borer or bird feeding. Silks are susceptible to infection during the first 5 days after initiation.
Appearance: Fusarium infection produces a white-to-pink or salmon-coloured mould (Photo 16–11). A “white streaking” or “star-bursting” can be seen on the infected kernel surface. Although many Fusarium species may be responsible for these symptoms, of concern in Ontario is Fusarium verticillioides (formerly Fusarium moniliforme).
Photo 16–11. Fusarium ear rot. Note the white fungal growth and the “starbursting” on the kernels.
Disease Cycle: Fusarium survives in corn debris. The significance of this fungus is that it produces a toxin called fumonisin that has been shown to cause cancer (carcinogen) in humans. The environmental conditions that favour disease development are warm, wet weather 2–3 weeks after silking.
GIBBERELLA EAR ROT (Fusarium graminearum/Giberella zeae)
Incidence: The most common and important ear mould in Ontario is Gibberella zeae, which is the sexual reproductive stage of Fusarium graminearum. This fungus not only infects corn but also small grains such as wheat. Many plant pathologists believe that in years with a high occurrence of fusarium head blight in wheat, the potential exists for increased gibberella ear rot in corn.
Appearance: Although the fungus can produce a white mould that makes it difficult to tell apart from fusarium ear rot, the two can be distinguished easily when Gibberella produces its characteristic red or dark pink (purple) mould (Photo 16–12).
Photo 16–12. Giberella ear rot infection usually occurs from the tip down. Note the pink-to-red colour.
Disease Cycle: Infection begins through the silk channel and thus, in most cases starts at the ear tip and works its way down the ear. In severe cases, most of the ear may be covered with mould growth. Corn silks are most susceptible 2–10 days after initiation, and cool, wet weather during this period is ideal for infection.
Caution: In addition to its economic importance due to yield loss, gibberella ear rot is also important because Gibberella zeae and Fusarium graminearum produce two very significant mycotoxins that occur in Ontario — deoxynivalenol (vomitoxin or DON) and zearalenone. These mycotoxins are especially important to swine and other livestock producers since they can have a detrimental effect on the animals. Feed containing low levels of vomitoxin (1 ppm) can result in poor weight gain and feed refusal in swine. Zearalenone is an estrogen and causes reproductive problems such as infertility and abortion in livestock, especially swine. Grain used for feed that originated in a field with 5% or more gibberella ear rot should be tested for these toxins. Refer to Appendix D, Feed, Mould and Mycotoxin Testing Laboratories for a list of laboratories.
370
Agronomy guide for field Crops
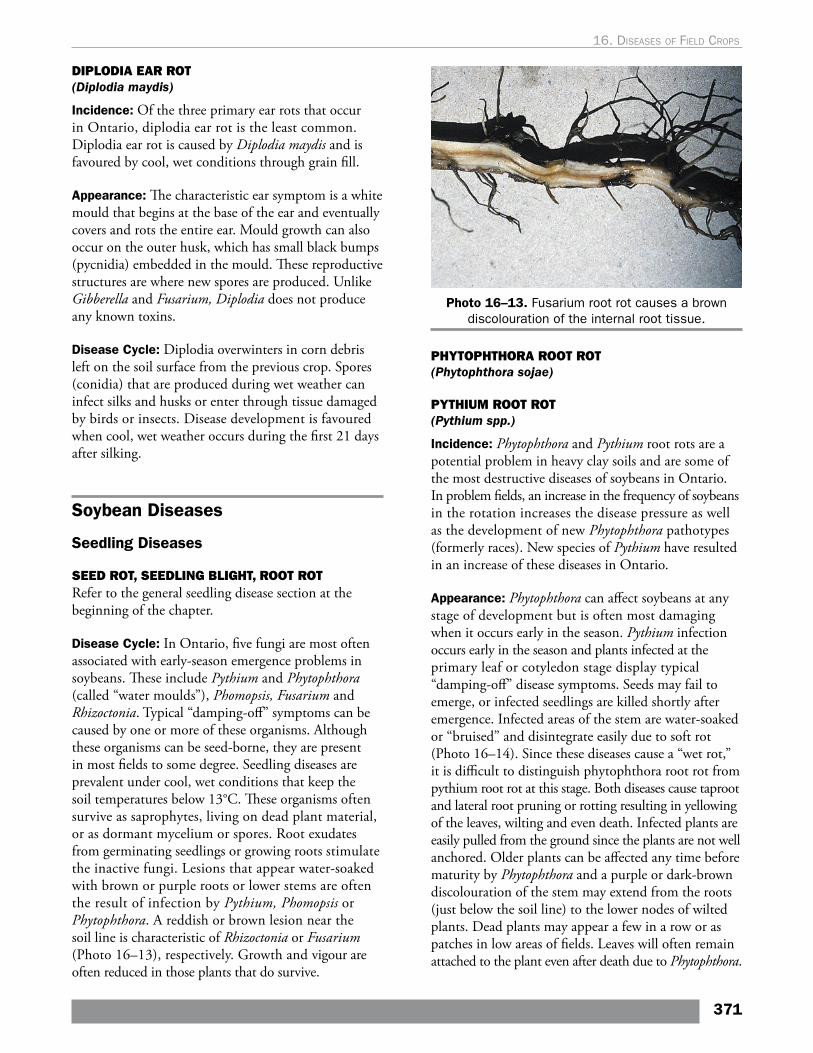
DIPLODIA EAR ROT (Diplodia maydis)
Incidence: Of the three primary ear rots that occur in Ontario, diplodia ear rot is the least common. Diplodia ear rot is caused by Diplodia maydis and is favoured by cool, wet conditions through grain fill.
Appearance: The characteristic ear symptom is a white mould that begins at the base of the ear and eventually covers and rots the entire ear. Mould growth can also occur on the outer husk, which has small black bumps (pycnidia) embedded in the mould. These reproductive structures are where new spores are produced. Unlike Gibberella and Fusarium, Diplodia does not produce any known toxins.
Disease Cycle: Diplodia overwinters in corn debris left on the soil surface from the previous crop. Spores (conidia) that are produced during wet weather can infect silks and husks or enter through tissue damaged by birds or insects. Disease development is favoured when cool, wet weather occurs during the first 21 days after silking.
Soybean Diseases
Seedling Diseases
SEED ROT, SEEDLING BLIGHT, ROOT ROT Refer to the general seedling disease section at the beginning of the chapter.
Disease Cycle: In Ontario, five fungi are most often associated with early-season emergence problems in soybeans. These include Pythium and Phytophthora (called “water moulds”), Phomopsis, Fusarium and Rhizoctonia. Typical “damping-off” symptoms can be caused by one or more of these organisms. Although these organisms can be seed-borne, they are present in most fields to some degree. Seedling diseases are prevalent under cool, wet conditions that keep the soil temperatures below 13°C. These organisms often survive as saprophytes, living on dead plant material, or as dormant mycelium or spores. Root exudates from germinating seedlings or growing roots stimulate the inactive fungi. Lesions that appear water-soaked with brown or purple roots or lower stems are often the result of infection by Pythium, Phomopsis or Phytophthora. A reddish or brown lesion near the soil line is characteristic of Rhizoctonia or Fusarium (Photo 16–13), respectively. Growth and vigour are often reduced in those plants that do survive.
Photo 16–13. Fusarium root rot causes a brown discolouration of the internal root tissue.
PHYTOPHTHORA ROOT ROT (Phytophthora sojae)
PYTHIUM ROOT ROT (Pythium spp.)
Incidence: Phytophthora and Pythium root rots are a potential problem in heavy clay soils and are some of the most destructive diseases of soybeans in Ontario. In problem fields, an increase in the frequency of soybeans in the rotation increases the disease pressure as well as the development of new Phytophthora pathotypes (formerly races). New species of Pythium have resulted in an increase of these diseases in Ontario.
Appearance: Phytophthora can affect soybeans at any stage of development but is often most damaging when it occurs early in the season. Pythium infection occurs early in the season and plants infected at the primary leaf or cotyledon stage display typical “damping-off” disease symptoms. Seeds may fail to emerge, or infected seedlings are killed shortly after emergence. Infected areas of the stem are water-soaked or “bruised” and disintegrate easily due to soft rot (Photo 16–14). Since these diseases cause a “wet rot,” it is difficult to distinguish phytophthora root rot from pythium root rot at this stage. Both diseases cause taproot and lateral root pruning or rotting resulting in yellowing of the leaves, wilting and even death. Infected plants are easily pulled from the ground since the plants are not well anchored. Older plants can be affected any time before maturity by Phytophthora and a purple or dark-brown discolouration of the stem may extend from the roots (just below the soil line) to the lower nodes of wilted plants. Dead plants may appear a few in a row or as patches in low areas of fields. Leaves will often remain attached to the plant even after death due to Phytophthora.
371
16. dIseases oF FIeld crops
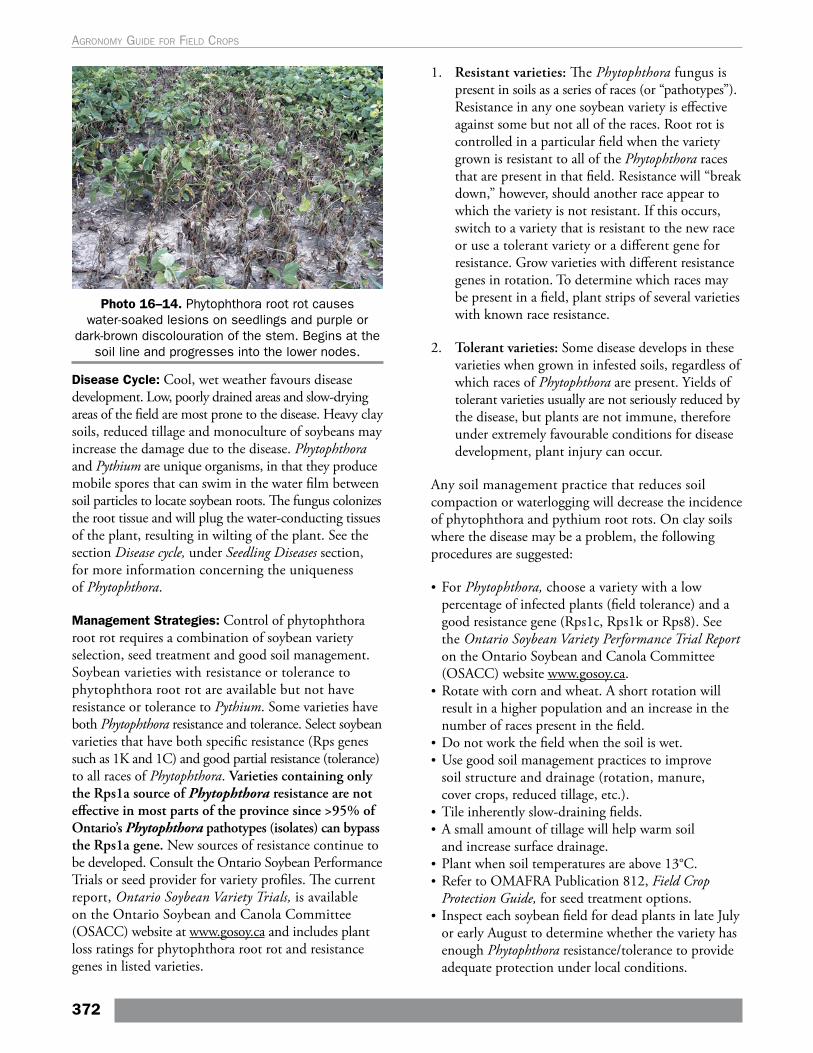
Photo 16–14. Phytophthora root rot causes water-soaked lesions on seedlings and purple or
dark-brown discolouration of the stem. Begins at the soil line and progresses into the lower nodes.
Disease Cycle: Cool, wet weather favours disease development. Low, poorly drained areas and slow-drying areas of the field are most prone to the disease. Heavy clay soils, reduced tillage and monoculture of soybeans may increase the damage due to the disease. Phytophthora and Pythium are unique organisms, in that they produce mobile spores that can swim in the water film between soil particles to locate soybean roots. The fungus colonizes the root tissue and will plug the water-conducting tissues of the plant, resulting in wilting of the plant. See the section Disease cycle, under Seedling Diseases section, for more information concerning the uniqueness of Phytophthora.
Management Strategies: Control of phytophthora root rot requires a combination of soybean variety selection, seed treatment and good soil management. Soybean varieties with resistance or tolerance to phytophthora root rot are available but not have resistance or tolerance to Pythium. Some varieties have both Phytophthora resistance and tolerance. Select soybean varieties that have both specific resistance (Rps genes such as 1K and 1C) and good partial resistance (tolerance) to all races of Phytophthora. Varieties containing only the Rps1a source of Phytophthora resistance are not effective in most parts of the province since >95% of Ontario’s Phytophthora pathotypes (isolates) can bypass the Rps1a gene. New sources of resistance continue to be developed. Consult the Ontario Soybean Performance Trials or seed provider for variety profiles. The current report, Ontario Soybean Variety Trials, is available on the Ontario Soybean and Canola Committee (OSACC) website at www.gosoy.ca and includes plant loss ratings for phytophthora root rot and resistance genes in listed varieties.
1. Resistant varieties: The Phytophthora fungus is present in soils as a series of races (or “pathotypes”). Resistance in any one soybean variety is effective against some but not all of the races. Root rot is controlled in a particular field when the variety grown is resistant to all of the Phytophthora races that are present in that field. Resistance will “break down,” however, should another race appear to which the variety is not resistant. If this occurs, switch to a variety that is resistant to the new race or use a tolerant variety or a different gene for resistance. Grow varieties with different resistance genes in rotation. To determine which races may be present in a field, plant strips of several varieties with known race resistance.
2. Tolerant varieties: Some disease develops in these varieties when grown in infested soils, regardless of which races of Phytophthora are present. Yields of tolerant varieties usually are not seriously reduced by the disease, but plants are not immune, therefore under extremely favourable conditions for disease development, plant injury can occur.
Any soil management practice that reduces soil compaction or waterlogging will decrease the incidence of phytophthora and pythium root rots. On clay soils where the disease may be a problem, the following procedures are suggested:
• For Phytophthora, choose a variety with a low percentage of infected plants (field tolerance) and a good resistance gene (Rps1c, Rps1k or Rps8). See the Ontario Soybean Variety Performance Trial Report on the Ontario Soybean and Canola Committee (OSACC) website www.gosoy.ca.
• Rotate with corn and wheat. A short rotation will result in a higher population and an increase in the number of races present in the field.
• Do not work the field when the soil is wet. • Use good soil management practices to improve
soil structure and drainage (rotation, manure, cover crops, reduced tillage, etc.).
• Tile inherently slow-draining fields. • A small amount of tillage will help warm soil
and increase surface drainage. • Plant when soil temperatures are above 13°C. • Refer to OMAFRA Publication 812, Field Crop
Protection Guide, for seed treatment options. • Inspect each soybean field for dead plants in late July
or early August to determine whether the variety has enough Phytophthora resistance/tolerance to provide adequate protection under local conditions.
372
Agronomy guide for field Crops
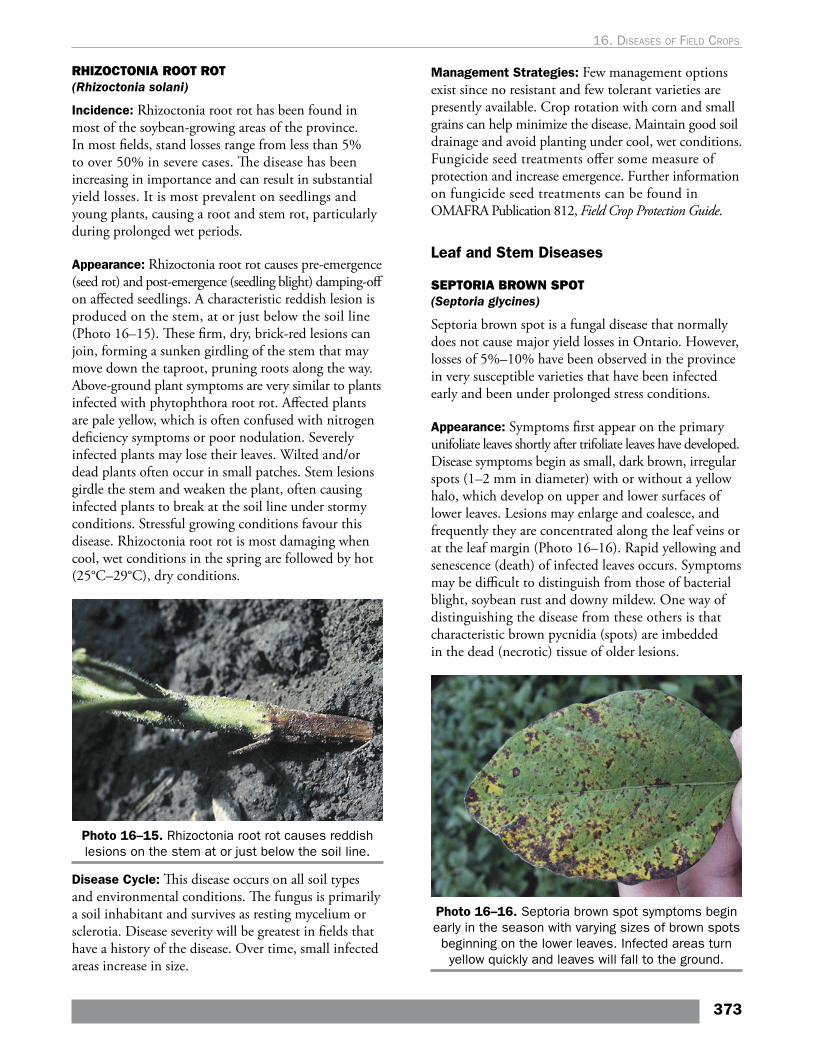
RHIZOCTONIA ROOT ROT (Rhizoctonia solani)
Incidence: Rhizoctonia root rot has been found in most of the soybean-growing areas of the province. In most fields, stand losses range from less than 5% to over 50% in severe cases. The disease has been increasing in importance and can result in substantial yield losses. It is most prevalent on seedlings and young plants, causing a root and stem rot, particularly during prolonged wet periods.
Appearance: Rhizoctonia root rot causes pre-emergence (seed rot) and post-emergence (seedling blight) damping-off on affected seedlings. A characteristic reddish lesion is produced on the stem, at or just below the soil line (Photo 16–15). These firm, dry, brick-red lesions can join, forming a sunken girdling of the stem that may move down the taproot, pruning roots along the way. Above-ground plant symptoms are very similar to plants infected with phytophthora root rot. Affected plants are pale yellow, which is often confused with nitrogen deficiency symptoms or poor nodulation. Severely infected plants may lose their leaves. Wilted and/or dead plants often occur in small patches. Stem lesions girdle the stem and weaken the plant, often causing infected plants to break at the soil line under stormy conditions. Stressful growing conditions favour this disease. Rhizoctonia root rot is most damaging when cool, wet conditions in the spring are followed by hot (25°C–29°C), dry conditions.
Photo 16–15. Rhizoctonia root rot causes reddish lesions on the stem at or just below the soil line.
Disease Cycle: This disease occurs on all soil types and environmental conditions. The fungus is primarily a soil inhabitant and survives as resting mycelium or sclerotia. Disease severity will be greatest in fields that have a history of the disease. Over time, small infected areas increase in size.
Management Strategies: Few management options exist since no resistant and few tolerant varieties are presently available. Crop rotation with corn and small grains can help minimize the disease. Maintain good soil drainage and avoid planting under cool, wet conditions. Fungicide seed treatments offer some measure of protection and increase emergence. Further information on fungicide seed treatments can be found in OMAFRA Publication 812, Field Crop Protection Guide.
Leaf and Stem Diseases
SEPTORIA BROWN SPOT (Septoria glycines)
Septoria brown spot is a fungal disease that normally does not cause major yield losses in Ontario. However, losses of 5%–10% have been observed in the province in very susceptible varieties that have been infected early and been under prolonged stress conditions.
Appearance: Symptoms first appear on the primary unifoliate leaves shortly after trifoliate leaves have developed. Disease symptoms begin as small, dark brown, irregular spots (1–2 mm in diameter) with or without a yellow halo, which develop on upper and lower surfaces of lower leaves. Lesions may enlarge and coalesce, and frequently they are concentrated along the leaf veins or at the leaf margin (Photo 16–16). Rapid yellowing and senescence (death) of infected leaves occurs. Symptoms may be difficult to distinguish from those of bacterial blight, soybean rust and downy mildew. One way of distinguishing the disease from these others is that characteristic brown pycnidia (spots) are imbedded in the dead (necrotic) tissue of older lesions.
Photo 16–16. Septoria brown spot symptoms begin early in the season with varying sizes of brown spots
beginning on the lower leaves. Infected areas turn yellow quickly and leaves will fall to the ground.
373
16. dIseases oF FIeld crops
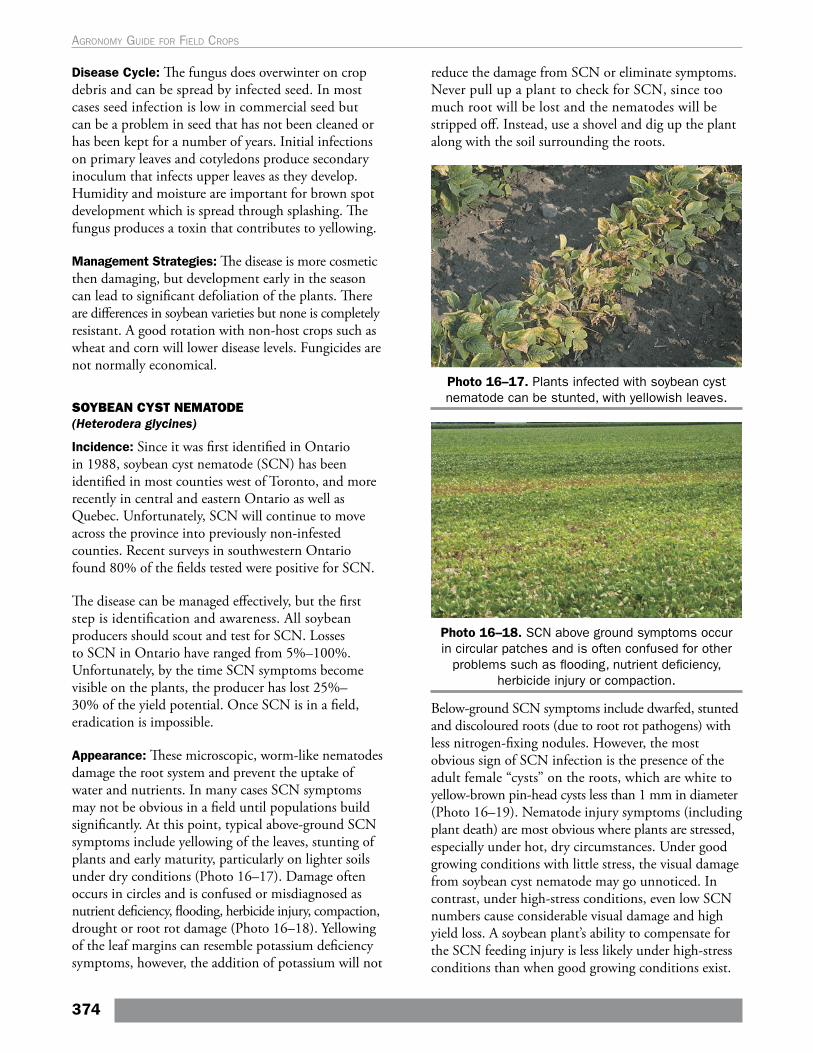
Disease Cycle: The fungus does overwinter on crop debris and can be spread by infected seed. In most cases seed infection is low in commercial seed but can be a problem in seed that has not been cleaned or has been kept for a number of years. Initial infections on primary leaves and cotyledons produce secondary inoculum that infects upper leaves as they develop. Humidity and moisture are important for brown spot development which is spread through splashing. The fungus produces a toxin that contributes to yellowing.
Management Strategies: The disease is more cosmetic then damaging, but development early in the season can lead to significant defoliation of the plants. There are differences in soybean varieties but none is completely resistant. A good rotation with non-host crops such as wheat and corn will lower disease levels. Fungicides are not normally economical.
SOYBEAN CYST NEMATODE (Heterodera glycines)
Incidence: Since it was first identified in Ontario in 1988, soybean cyst nematode (SCN) has been identified in most counties west of Toronto, and more recently in central and eastern Ontario as well as Quebec. Unfortunately, SCN will continue to move across the province into previously non-infested counties. Recent surveys in southwestern Ontario found 80% of the fields tested were positive for SCN.
The disease can be managed effectively, but the first step is identification and awareness. All soybean producers should scout and test for SCN. Losses to SCN in Ontario have ranged from 5%–100%. Unfortunately, by the time SCN symptoms become visible on the plants, the producer has lost 25%–30% of the yield potential. Once SCN is in a field, eradication is impossible.
Appearance: These microscopic, worm-like nematodes damage the root system and prevent the uptake of water and nutrients. In many cases SCN symptoms may not be obvious in a field until populations build significantly. At this point, typical above-ground SCN symptoms include yellowing of the leaves, stunting of plants and early maturity, particularly on lighter soils under dry conditions (Photo 16–17). Damage often occurs in circles and is confused or misdiagnosed as nutrient deficiency, flooding, herbicide injury, compaction, drought or root rot damage (Photo 16–18). Yellowing of the leaf margins can resemble potassium deficiency symptoms, however, the addition of potassium will not
reduce the damage from SCN or eliminate symptoms. Never pull up a plant to check for SCN, since too much root will be lost and the nematodes will be stripped off. Instead, use a shovel and dig up the plant along with the soil surrounding the roots.
Photo 16–17. Plants infected with soybean cyst nematode can be stunted, with yellowish leaves.
Photo 16–18. SCN above ground symptoms occur in circular patches and is often confused for other
problems such as flooding, nutrient deficiency, herbicide injury or compaction.
Below-ground SCN symptoms include dwarfed, stunted and discoloured roots (due to root rot pathogens) with less nitrogen-fixing nodules. However, the most obvious sign of SCN infection is the presence of the adult female “cysts” on the roots, which are white to yellow-brown pin-head cysts less than 1 mm in diameter (Photo 16–19). Nematode injury symptoms (including plant death) are most obvious where plants are stressed, especially under hot, dry circumstances. Under good growing conditions with little stress, the visual damage from soybean cyst nematode may go unnoticed. In contrast, under high-stress conditions, even low SCN numbers cause considerable visual damage and high yield loss. A soybean plant’s ability to compensate for the SCN feeding injury is less likely under high-stress conditions than when good growing conditions exist.
374
Agronomy guide for field Crops
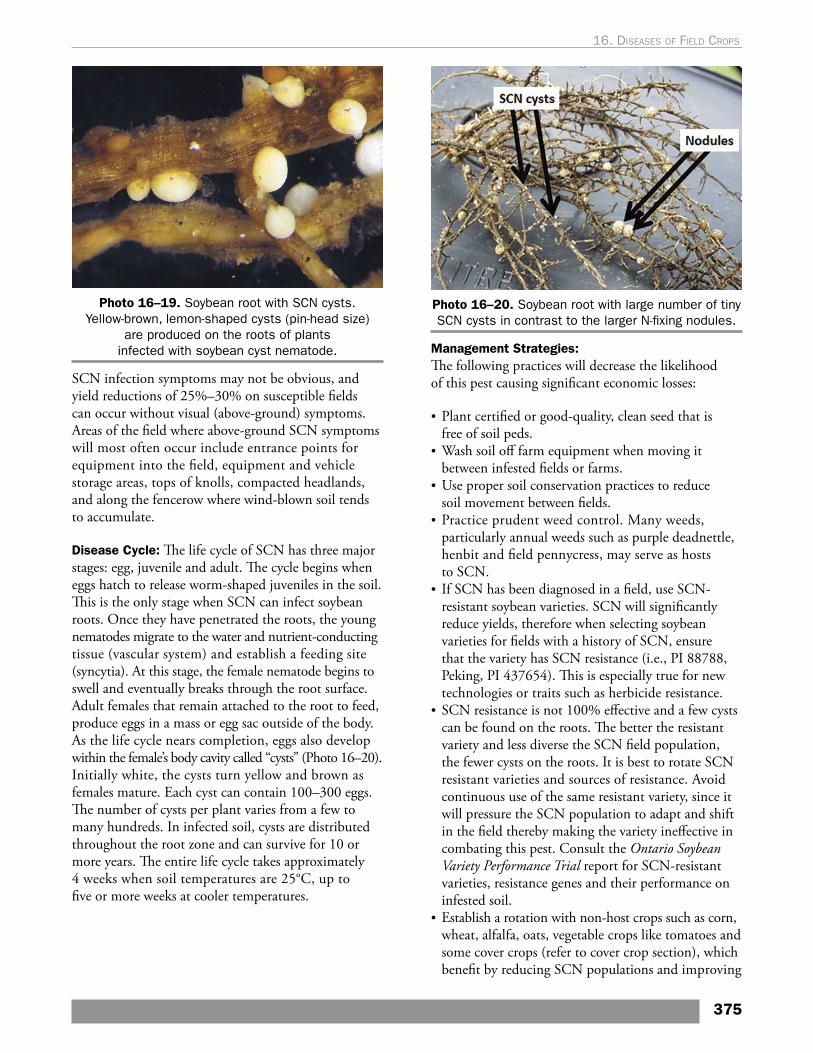
Photo 16–19. Soybean root with SCN cysts. Yellow-brown, lemon-shaped cysts (pin-head size)
are produced on the roots of plants infected with soybean cyst nematode.
SCN infection symptoms may not be obvious, and yield reductions of 25%–30% on susceptible fields can occur without visual (above-ground) symptoms. Areas of the field where above-ground SCN symptoms will most often occur include entrance points for equipment into the field, equipment and vehicle storage areas, tops of knolls, compacted headlands, and along the fencerow where wind-blown soil tends to accumulate.
Disease Cycle: The life cycle of SCN has three major stages: egg, juvenile and adult. The cycle begins when eggs hatch to release worm-shaped juveniles in the soil. This is the only stage when SCN can infect soybean roots. Once they have penetrated the roots, the young nematodes migrate to the water and nutrient-conducting tissue (vascular system) and establish a feeding site (syncytia). At this stage, the female nematode begins to swell and eventually breaks through the root surface. Adult females that remain attached to the root to feed, produce eggs in a mass or egg sac outside of the body. As the life cycle nears completion, eggs also develop within the female’s body cavity called “cysts” (Photo 16–20). Initially white, the cysts turn yellow and brown as females mature. Each cyst can contain 100–300 eggs. The number of cysts per plant varies from a few to many hundreds. In infected soil, cysts are distributed throughout the root zone and can survive for 10 or more years. The entire life cycle takes approximately 4 weeks when soil temperatures are 25°C, up to five or more weeks at cooler temperatures.
Photo 16–20. Soybean root with large number of tiny SCN cysts in contrast to the larger N-fixing nodules.
Management Strategies:The following practices will decrease the likelihood of this pest causing significant economic losses:
• Plant certified or good-quality, clean seed that is free of soil peds.
• Wash soil off farm equipment when moving it between infested fields or farms.
• Use proper soil conservation practices to reduce soil movement between fields.
• Practice prudent weed control. Many weeds, particularly annual weeds such as purple deadnettle, henbit and field pennycress, may serve as hosts to SCN.
• If SCN has been diagnosed in a field, use SCN-resistant soybean varieties. SCN will significantly reduce yields, therefore when selecting soybean varieties for fields with a history of SCN, ensure that the variety has SCN resistance (i.e., PI 88788, Peking, PI 437654). This is especially true for new technologies or traits such as herbicide resistance.
• SCN resistance is not 100% effective and a few cysts can be found on the roots. The better the resistant variety and less diverse the SCN field population, the fewer cysts on the roots. It is best to rotate SCN resistant varieties and sources of resistance. Avoid continuous use of the same resistant variety, since it will pressure the SCN population to adapt and shift in the field thereby making the variety ineffective in combating this pest. Consult the Ontario Soybean Variety Performance Trial report for SCN-resistant varieties, resistance genes and their performance on infested soil.
• Establish a rotation with non-host crops such as corn, wheat, alfalfa, oats, vegetable crops like tomatoes and some cover crops (refer to cover crop section), which benefit by reducing SCN populations and improving
375
16. dIseases oF FIeld crops
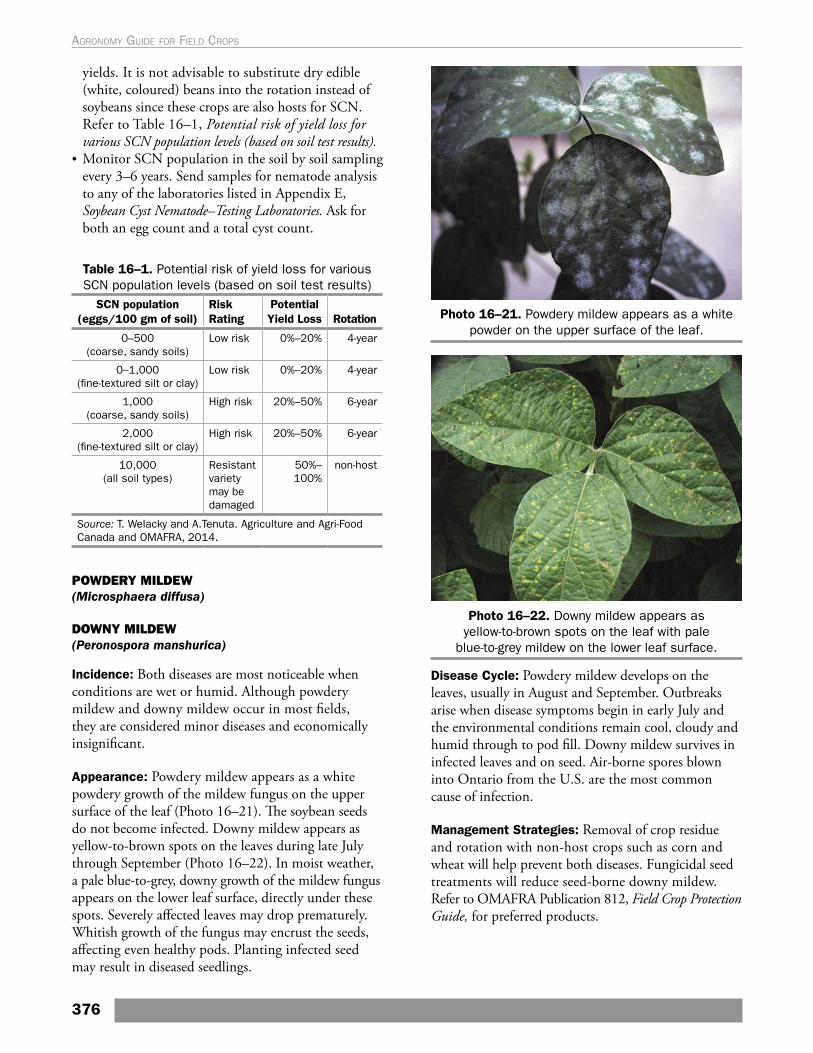
yields. It is not advisable to substitute dry edible (white, coloured) beans into the rotation instead of soybeans since these crops are also hosts for SCN. Refer to Table 16–1, Potential risk of yield loss for various SCN population levels (based on soil test results).
• Monitor SCN population in the soil by soil sampling every 3–6 years. Send samples for nematode analysis to any of the laboratories listed in Appendix E, Soybean Cyst Nematode–Testing Laboratories. Ask for both an egg count and a total cyst count.
Table 16–1. Potential risk of yield loss for various SCN population levels (based on soil test results)
SCN population (eggs/100 gm of soil)
Risk Rating
Potential Yield Loss Rotation
0–500 (coarse, sandy soils)
Low risk 0%–20% 4-year
0–1,000 (fine-textured silt or clay)
Low risk 0%–20% 4-year
1,000 (coarse, sandy soils)
High risk 20%–50% 6-year
2,000 (fine-textured silt or clay)
High risk 20%–50% 6-year
10,000 (all soil types)
Resistant variety may be damaged
50%–100%
non-host
Source: T. Welacky and A.Tenuta. Agriculture and Agri-Food Canada and OMAFRA, 2014.
POWDERY MILDEW (Microsphaera diffusa)
DOWNY MILDEW (Peronospora manshurica)
Incidence: Both diseases are most noticeable when conditions are wet or humid. Although powdery mildew and downy mildew occur in most fields, they are considered minor diseases and economically insignificant.
Appearance: Powdery mildew appears as a white powdery growth of the mildew fungus on the upper surface of the leaf (Photo 16–21). The soybean seeds do not become infected. Downy mildew appears as yellow-to-brown spots on the leaves during late July through September (Photo 16–22). In moist weather, a pale blue-to-grey, downy growth of the mildew fungus appears on the lower leaf surface, directly under these spots. Severely affected leaves may drop prematurely. Whitish growth of the fungus may encrust the seeds, affecting even healthy pods. Planting infected seed may result in diseased seedlings.
Photo 16–21. Powdery mildew appears as a white powder on the upper surface of the leaf.
Photo 16–22. Downy mildew appears as yellow-to-brown spots on the leaf with pale
blue-to-grey mildew on the lower leaf surface.
Disease Cycle: Powdery mildew develops on the leaves, usually in August and September. Outbreaks arise when disease symptoms begin in early July and the environmental conditions remain cool, cloudy and humid through to pod fill. Downy mildew survives in infected leaves and on seed. Air-borne spores blown into Ontario from the U.S. are the most common cause of infection.
Management Strategies: Removal of crop residue and rotation with non-host crops such as corn and wheat will help prevent both diseases. Fungicidal seed treatments will reduce seed-borne downy mildew. Refer to OMAFRA Publication 812, Field Crop Protection Guide, for preferred products.
376
Agronomy guide for field Crops
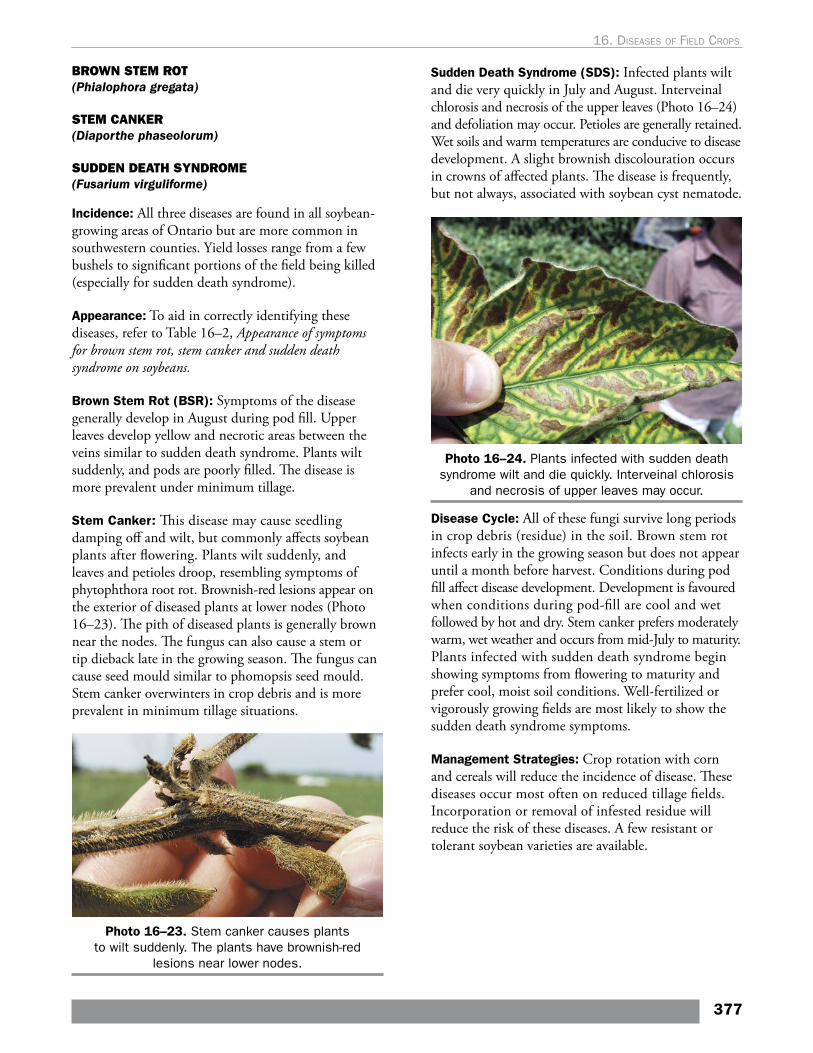
BROWN STEM ROT (Phialophora gregata)
STEM CANKER (Diaporthe phaseolorum)
SUDDEN DEATH SYNDROME (Fusarium virguliforme)
Incidence: All three diseases are found in all soybean-growing areas of Ontario but are more common in southwestern counties. Yield losses range from a few bushels to significant portions of the field being killed (especially for sudden death syndrome).
Appearance: To aid in correctly identifying these diseases, refer to Table 16–2, Appearance of symptoms for brown stem rot, stem canker and sudden death syndrome on soybeans.
Brown Stem Rot (BSR): Symptoms of the disease generally develop in August during pod fill. Upper leaves develop yellow and necrotic areas between the veins similar to sudden death syndrome. Plants wilt suddenly, and pods are poorly filled. The disease is more prevalent under minimum tillage.
Stem Canker: This disease may cause seedling damping off and wilt, but commonly affects soybean plants after flowering. Plants wilt suddenly, and leaves and petioles droop, resembling symptoms of phytophthora root rot. Brownish-red lesions appear on the exterior of diseased plants at lower nodes (Photo 16–23). The pith of diseased plants is generally brown near the nodes. The fungus can also cause a stem or tip dieback late in the growing season. The fungus can cause seed mould similar to phomopsis seed mould. Stem canker overwinters in crop debris and is more prevalent in minimum tillage situations.
Photo 16–23. Stem canker causes plants to wilt suddenly. The plants have brownish-red
lesions near lower nodes.
Sudden Death Syndrome (SDS): Infected plants wilt and die very quickly in July and August. Interveinal chlorosis and necrosis of the upper leaves (Photo 16–24) and defoliation may occur. Petioles are generally retained. Wet soils and warm temperatures are conducive to disease development. A slight brownish discolouration occurs in crowns of affected plants. The disease is frequently, but not always, associated with soybean cyst nematode.
Photo 16–24. Plants infected with sudden death syndrome wilt and die quickly. Interveinal chlorosis
and necrosis of upper leaves may occur.
Disease Cycle: All of these fungi survive long periods in crop debris (residue) in the soil. Brown stem rot infects early in the growing season but does not appear until a month before harvest. Conditions during pod fill affect disease development. Development is favoured when conditions during pod-fill are cool and wet followed by hot and dry. Stem canker prefers moderately warm, wet weather and occurs from mid-July to maturity. Plants infected with sudden death syndrome begin showing symptoms from flowering to maturity and prefer cool, moist soil conditions. Well-fertilized or vigorously growing fields are most likely to show the sudden death syndrome symptoms.
Management Strategies: Crop rotation with corn and cereals will reduce the incidence of disease. These diseases occur most often on reduced tillage fields. Incorporation or removal of infested residue will reduce the risk of these diseases. A few resistant or tolerant soybean varieties are available.
377
16. dIseases oF FIeld crops
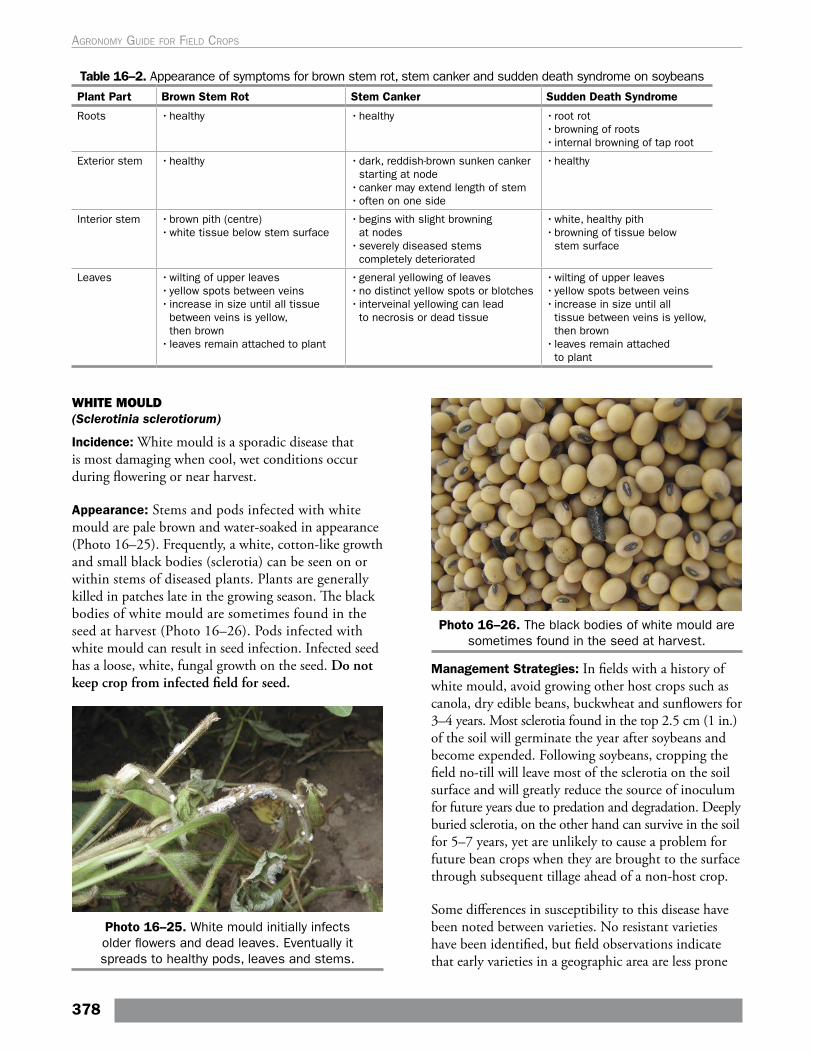
Table 16–2. Appearance of symptoms for brown stem rot, stem canker and sudden death syndrome on soybeans
Plant Part Brown Stem Rot Stem Canker Sudden Death Syndrome
Roots • healthy • healthy • root rot • browning of roots • internal browning of tap root
Exterior stem • healthy • dark, reddish-brown sunken canker starting at node
• canker may extend length of stem• often on one side
• healthy
Interior stem • brown pith (centre)• white tissue below stem surface
• begins with slight browning at nodes
• severely diseased stems completely deteriorated
• white, healthy pith• browning of tissue below
stem surface
Leaves • wilting of upper leaves • yellow spots between veins • increase in size until all tissue
between veins is yellow, then brown
• leaves remain attached to plant
• general yellowing of leaves • no distinct yellow spots or blotches • interveinal yellowing can lead
to necrosis or dead tissue
• wilting of upper leaves • yellow spots between veins • increase in size until all
tissue between veins is yellow, then brown
• leaves remain attached to plant
WHITE MOULD (Sclerotinia sclerotiorum)
Incidence: White mould is a sporadic disease that is most damaging when cool, wet conditions occur during flowering or near harvest.
Appearance: Stems and pods infected with white mould are pale brown and water-soaked in appearance (Photo 16–25). Frequently, a white, cotton-like growth and small black bodies (sclerotia) can be seen on or within stems of diseased plants. Plants are generally killed in patches late in the growing season. The black bodies of white mould are sometimes found in the seed at harvest (Photo 16–26). Pods infected with white mould can result in seed infection. Infected seed has a loose, white, fungal growth on the seed. Do not keep crop from infected field for seed.
Photo 16–25. White mould initially infects older flowers and dead leaves. Eventually it spreads to healthy pods, leaves and stems.
Photo 16–26. The black bodies of white mould are sometimes found in the seed at harvest.
Management Strategies: In fields with a history of white mould, avoid growing other host crops such as canola, dry edible beans, buckwheat and sunflowers for 3–4 years. Most sclerotia found in the top 2.5 cm (1 in.) of the soil will germinate the year after soybeans and become expended. Following soybeans, cropping the field no-till will leave most of the sclerotia on the soil surface and will greatly reduce the source of inoculum for future years due to predation and degradation. Deeply buried sclerotia, on the other hand can survive in the soil for 5–7 years, yet are unlikely to cause a problem for future bean crops when they are brought to the surface through subsequent tillage ahead of a non-host crop.
Some differences in susceptibility to this disease have been noted between varieties. No resistant varieties have been identified, but field observations indicate that early varieties in a geographic area are less prone
378
Agronomy guide for field Crops
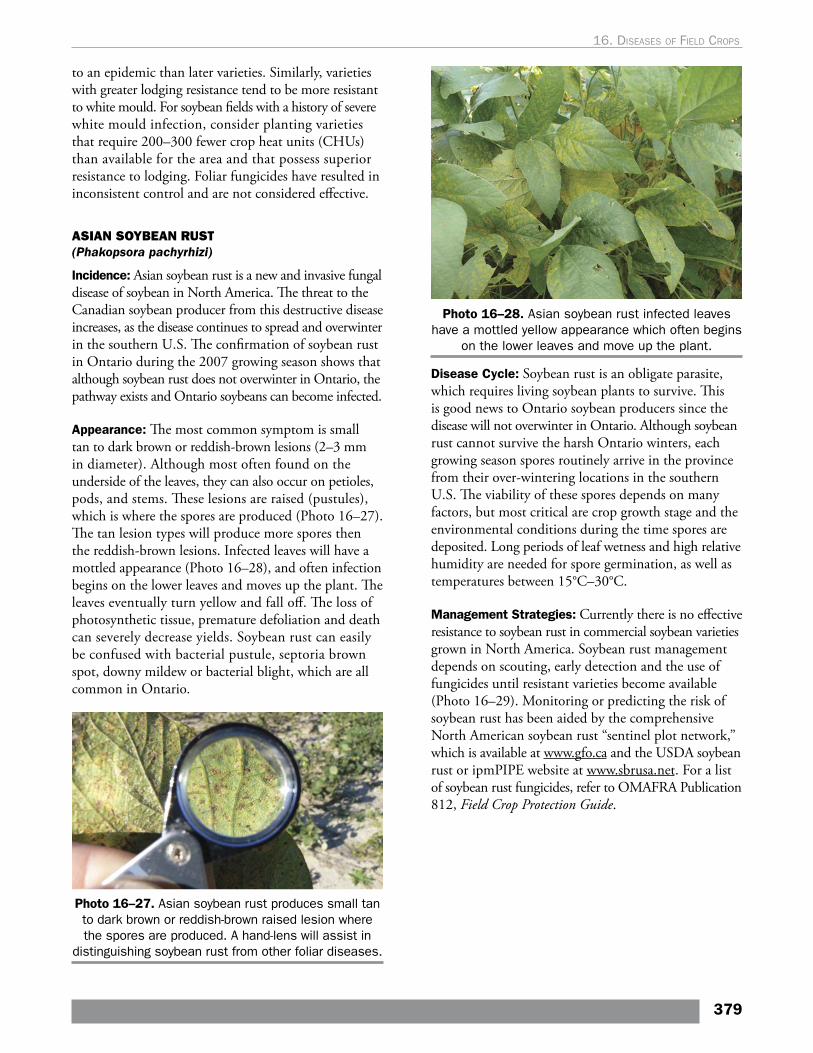
to an epidemic than later varieties. Similarly, varieties with greater lodging resistance tend to be more resistant to white mould. For soybean fields with a history of severe white mould infection, consider planting varieties that require 200–300 fewer crop heat units (CHUs) than available for the area and that possess superior resistance to lodging. Foliar fungicides have resulted in inconsistent control and are not considered effective.
ASIAN SOYBEAN RUST (Phakopsora pachyrhizi)
Incidence: Asian soybean rust is a new and invasive fungal disease of soybean in North America. The threat to the Canadian soybean producer from this destructive disease increases, as the disease continues to spread and overwinter in the southern U.S. The confirmation of soybean rust in Ontario during the 2007 growing season shows that although soybean rust does not overwinter in Ontario, the pathway exists and Ontario soybeans can become infected.
Appearance: The most common symptom is small tan to dark brown or reddish-brown lesions (2–3 mm in diameter). Although most often found on the underside of the leaves, they can also occur on petioles, pods, and stems. These lesions are raised (pustules), which is where the spores are produced (Photo 16–27). The tan lesion types will produce more spores then the reddish-brown lesions. Infected leaves will have a mottled appearance (Photo 16–28), and often infection begins on the lower leaves and moves up the plant. The leaves eventually turn yellow and fall off. The loss of photosynthetic tissue, premature defoliation and death can severely decrease yields. Soybean rust can easily be confused with bacterial pustule, septoria brown spot, downy mildew or bacterial blight, which are all common in Ontario.
Photo 16–27. Asian soybean rust produces small tan to dark brown or reddish-brown raised lesion where the spores are produced. A hand-lens will assist in
distinguishing soybean rust from other foliar diseases.
Photo 16–28. Asian soybean rust infected leaves have a mottled yellow appearance which often begins
on the lower leaves and move up the plant.
Disease Cycle: Soybean rust is an obligate parasite, which requires living soybean plants to survive. This is good news to Ontario soybean producers since the disease will not overwinter in Ontario. Although soybean rust cannot survive the harsh Ontario winters, each growing season spores routinely arrive in the province from their over-wintering locations in the southern U.S. The viability of these spores depends on many factors, but most critical are crop growth stage and the environmental conditions during the time spores are deposited. Long periods of leaf wetness and high relative humidity are needed for spore germination, as well as temperatures between 15°C–30°C.
Management Strategies: Currently there is no effective resistance to soybean rust in commercial soybean varieties grown in North America. Soybean rust management depends on scouting, early detection and the use of fungicides until resistant varieties become available (Photo 16–29). Monitoring or predicting the risk of soybean rust has been aided by the comprehensive North American soybean rust “sentinel plot network,” which is available at www.gfo.ca and the USDA soybean rust or ipmPIPE website at www.sbrusa.net. For a list of soybean rust fungicides, refer to OMAFRA Publication 812, Field Crop Protection Guide.
379
16. dIseases oF FIeld crops
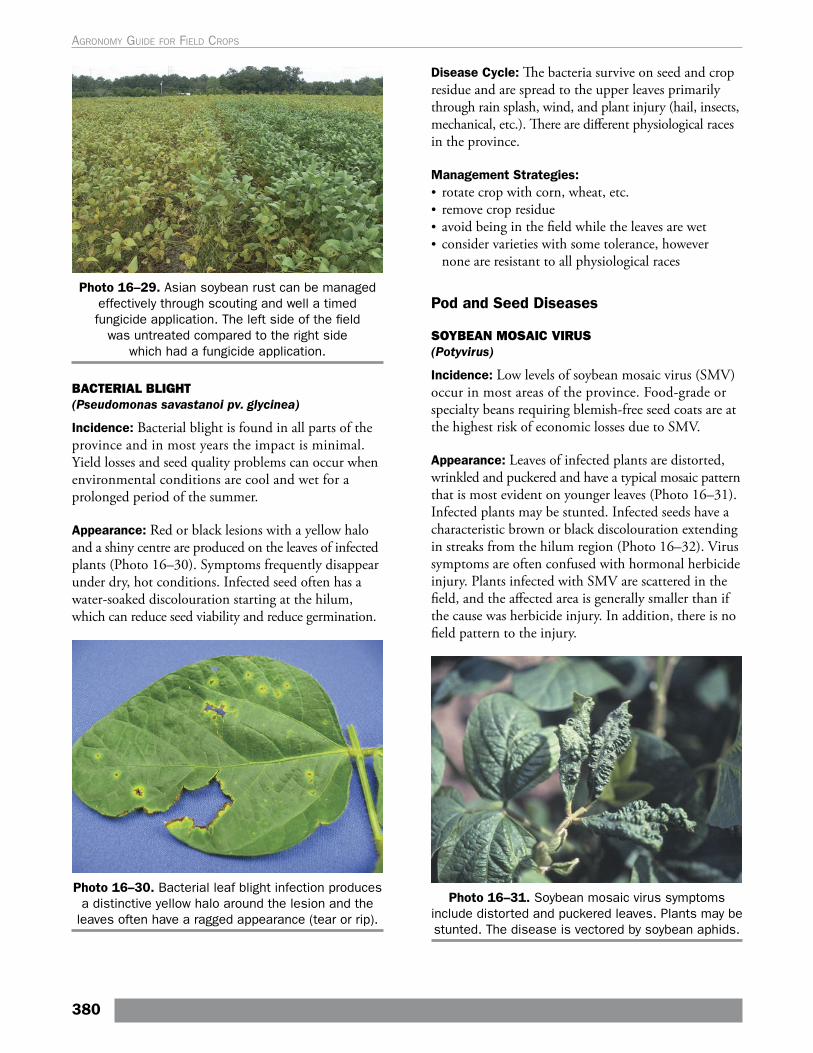
Photo 16–29. Asian soybean rust can be managed effectively through scouting and well a timed fungicide application. The left side of the field
was untreated compared to the right side which had a fungicide application.
BACTERIAL BLIGHT (Pseudomonas savastanoi pv. glycinea)
Incidence: Bacterial blight is found in all parts of the province and in most years the impact is minimal. Yield losses and seed quality problems can occur when environmental conditions are cool and wet for a prolonged period of the summer.
Appearance: Red or black lesions with a yellow halo and a shiny centre are produced on the leaves of infected plants (Photo 16–30). Symptoms frequently disappear under dry, hot conditions. Infected seed often has a water-soaked discolouration starting at the hilum, which can reduce seed viability and reduce germination.
Photo 16–30. Bacterial leaf blight infection produces a distinctive yellow halo around the lesion and the
leaves often have a ragged appearance (tear or rip).
Disease Cycle: The bacteria survive on seed and crop residue and are spread to the upper leaves primarily through rain splash, wind, and plant injury (hail, insects, mechanical, etc.). There are different physiological races in the province.
Management Strategies:• rotate crop with corn, wheat, etc.• remove crop residue• avoid being in the field while the leaves are wet• consider varieties with some tolerance, however
none are resistant to all physiological races
Pod and Seed Diseases
SOYBEAN MOSAIC VIRUS (Potyvirus)
Incidence: Low levels of soybean mosaic virus (SMV) occur in most areas of the province. Food-grade or specialty beans requiring blemish-free seed coats are at the highest risk of economic losses due to SMV.
Appearance: Leaves of infected plants are distorted, wrinkled and puckered and have a typical mosaic pattern that is most evident on younger leaves (Photo 16–31). Infected plants may be stunted. Infected seeds have a characteristic brown or black discolouration extending in streaks from the hilum region (Photo 16–32). Virus symptoms are often confused with hormonal herbicide injury. Plants infected with SMV are scattered in the field, and the affected area is generally smaller than if the cause was herbicide injury. In addition, there is no field pattern to the injury.
Photo 16–31. Soybean mosaic virus symptoms include distorted and puckered leaves. Plants may be stunted. The disease is vectored by soybean aphids.
380
Agronomy guide for field Crops
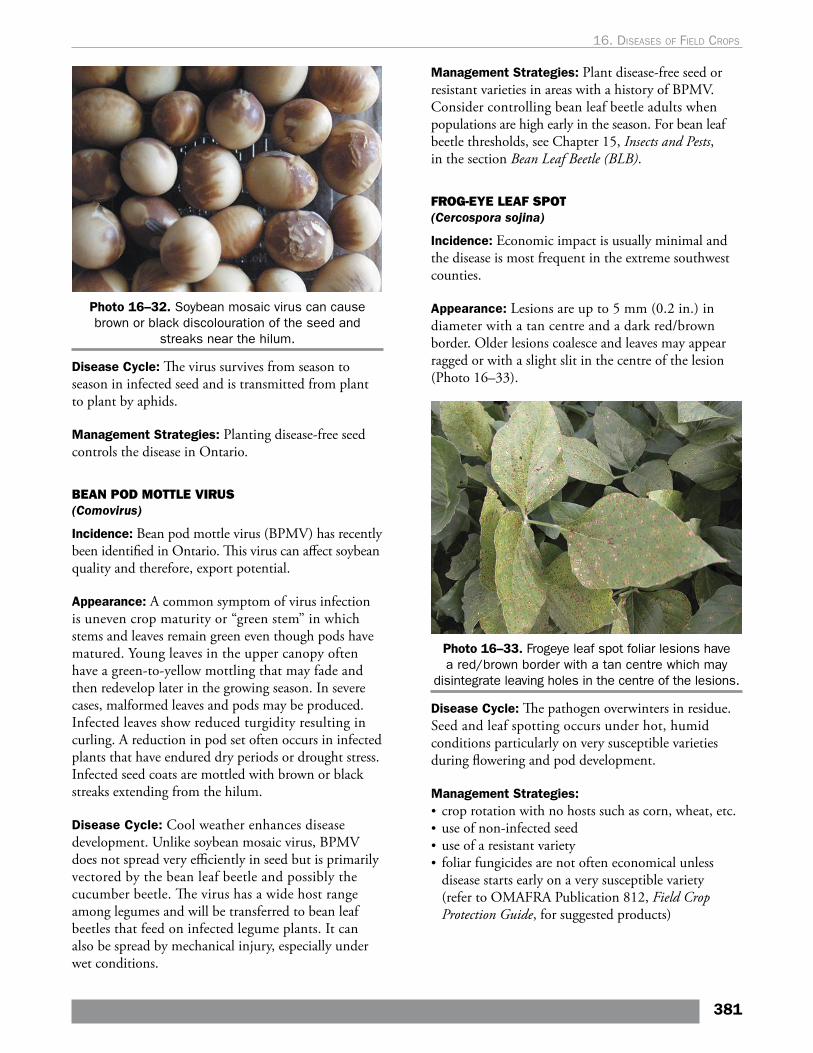
Photo 16–32. Soybean mosaic virus can cause brown or black discolouration of the seed and
streaks near the hilum.
Disease Cycle: The virus survives from season to season in infected seed and is transmitted from plant to plant by aphids.
Management Strategies: Planting disease-free seed controls the disease in Ontario.
BEAN POD MOTTLE VIRUS (Comovirus)
Incidence: Bean pod mottle virus (BPMV) has recently been identified in Ontario. This virus can affect soybean quality and therefore, export potential.
Appearance: A common symptom of virus infection is uneven crop maturity or “green stem” in which stems and leaves remain green even though pods have matured. Young leaves in the upper canopy often have a green-to-yellow mottling that may fade and then redevelop later in the growing season. In severe cases, malformed leaves and pods may be produced. Infected leaves show reduced turgidity resulting in curling. A reduction in pod set often occurs in infected plants that have endured dry periods or drought stress. Infected seed coats are mottled with brown or black streaks extending from the hilum.
Disease Cycle: Cool weather enhances disease development. Unlike soybean mosaic virus, BPMV does not spread very efficiently in seed but is primarily vectored by the bean leaf beetle and possibly the cucumber beetle. The virus has a wide host range among legumes and will be transferred to bean leaf beetles that feed on infected legume plants. It can also be spread by mechanical injury, especially under wet conditions.
Management Strategies: Plant disease-free seed or resistant varieties in areas with a history of BPMV. Consider controlling bean leaf beetle adults when populations are high early in the season. For bean leaf beetle thresholds, see Chapter 15, Insects and Pests, in the section Bean Leaf Beetle (BLB).
FROG-EYE LEAF SPOT (Cercospora sojina)
Incidence: Economic impact is usually minimal and the disease is most frequent in the extreme southwest counties.
Appearance: Lesions are up to 5 mm (0.2 in.) in diameter with a tan centre and a dark red/brown border. Older lesions coalesce and leaves may appear ragged or with a slight slit in the centre of the lesion (Photo 16–33).
Photo 16–33. Frogeye leaf spot foliar lesions have a red/brown border with a tan centre which may
disintegrate leaving holes in the centre of the lesions.
Disease Cycle: The pathogen overwinters in residue. Seed and leaf spotting occurs under hot, humid conditions particularly on very susceptible varieties during flowering and pod development.
Management Strategies: • crop rotation with no hosts such as corn, wheat, etc.• use of non-infected seed• use of a resistant variety• foliar fungicides are not often economical unless
disease starts early on a very susceptible variety (refer to OMAFRA Publication 812, Field Crop Protection Guide, for suggested products)
381
16. dIseases oF FIeld crops
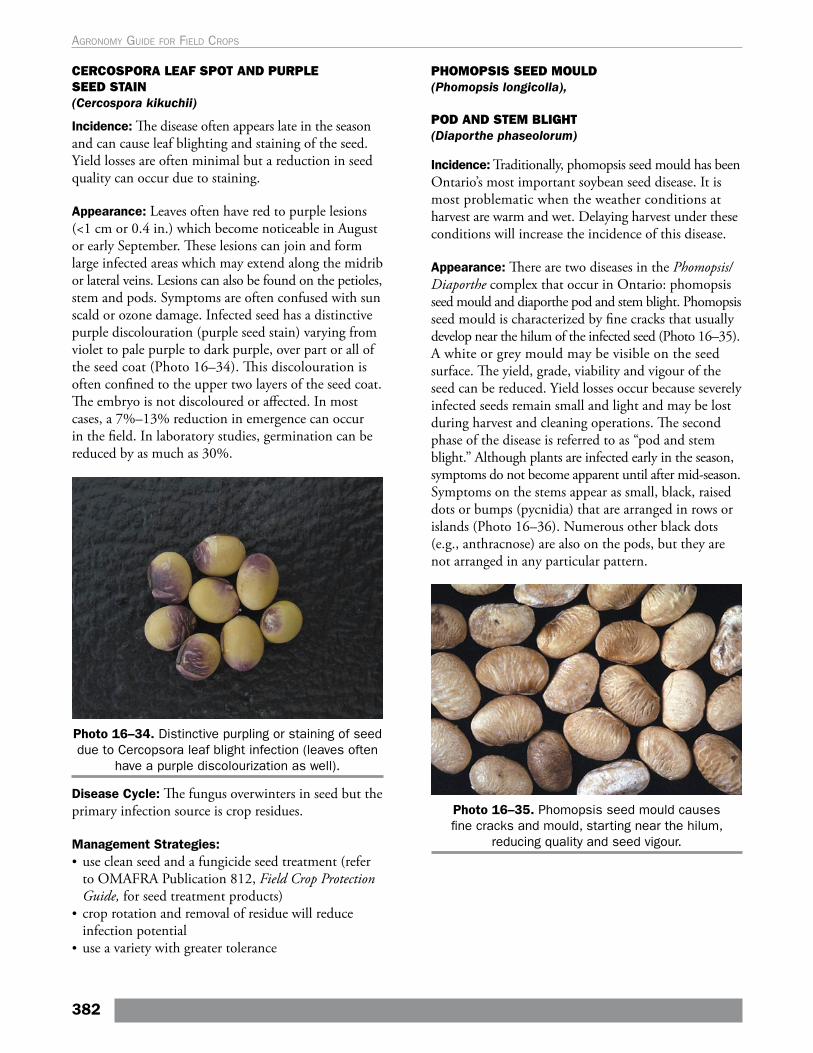
CERCOSPORA LEAF SPOT AND PURPLE SEED STAIN (Cercospora kikuchii)
Incidence: The disease often appears late in the season and can cause leaf blighting and staining of the seed. Yield losses are often minimal but a reduction in seed quality can occur due to staining.
Appearance: Leaves often have red to purple lesions (<1 cm or 0.4 in.) which become noticeable in August or early September. These lesions can join and form large infected areas which may extend along the midrib or lateral veins. Lesions can also be found on the petioles, stem and pods. Symptoms are often confused with sun scald or ozone damage. Infected seed has a distinctive purple discolouration (purple seed stain) varying from violet to pale purple to dark purple, over part or all of the seed coat (Photo 16–34). This discolouration is often confined to the upper two layers of the seed coat. The embryo is not discoloured or affected. In most cases, a 7%–13% reduction in emergence can occur in the field. In laboratory studies, germination can be reduced by as much as 30%.
Photo 16–34. Distinctive purpling or staining of seed due to Cercopsora leaf blight infection (leaves often
have a purple discolourization as well).
Disease Cycle: The fungus overwinters in seed but the primary infection source is crop residues.
Management Strategies: • use clean seed and a fungicide seed treatment (refer
to OMAFRA Publication 812, Field Crop Protection Guide, for seed treatment products)
• crop rotation and removal of residue will reduce infection potential
• use a variety with greater tolerance
PHOMOPSIS SEED MOULD (Phomopsis longicolla),
POD AND STEM BLIGHT (Diaporthe phaseolorum)
Incidence: Traditionally, phomopsis seed mould has been Ontario’s most important soybean seed disease. It is most problematic when the weather conditions at harvest are warm and wet. Delaying harvest under these conditions will increase the incidence of this disease.
Appearance: There are two diseases in the Phomopsis/Diaporthe complex that occur in Ontario: phomopsis seed mould and diaporthe pod and stem blight. Phomopsis seed mould is characterized by fine cracks that usually develop near the hilum of the infected seed (Photo 16–35). A white or grey mould may be visible on the seed surface. The yield, grade, viability and vigour of the seed can be reduced. Yield losses occur because severely infected seeds remain small and light and may be lost during harvest and cleaning operations. The second phase of the disease is referred to as “pod and stem blight.” Although plants are infected early in the season, symptoms do not become apparent until after mid-season. Symptoms on the stems appear as small, black, raised dots or bumps (pycnidia) that are arranged in rows or islands (Photo 16–36). Numerous other black dots (e.g., anthracnose) are also on the pods, but they are not arranged in any particular pattern.
Photo 16–35. Phomopsis seed mould causes fine cracks and mould, starting near the hilum,
reducing quality and seed vigour.
382
Agronomy guide for field Crops
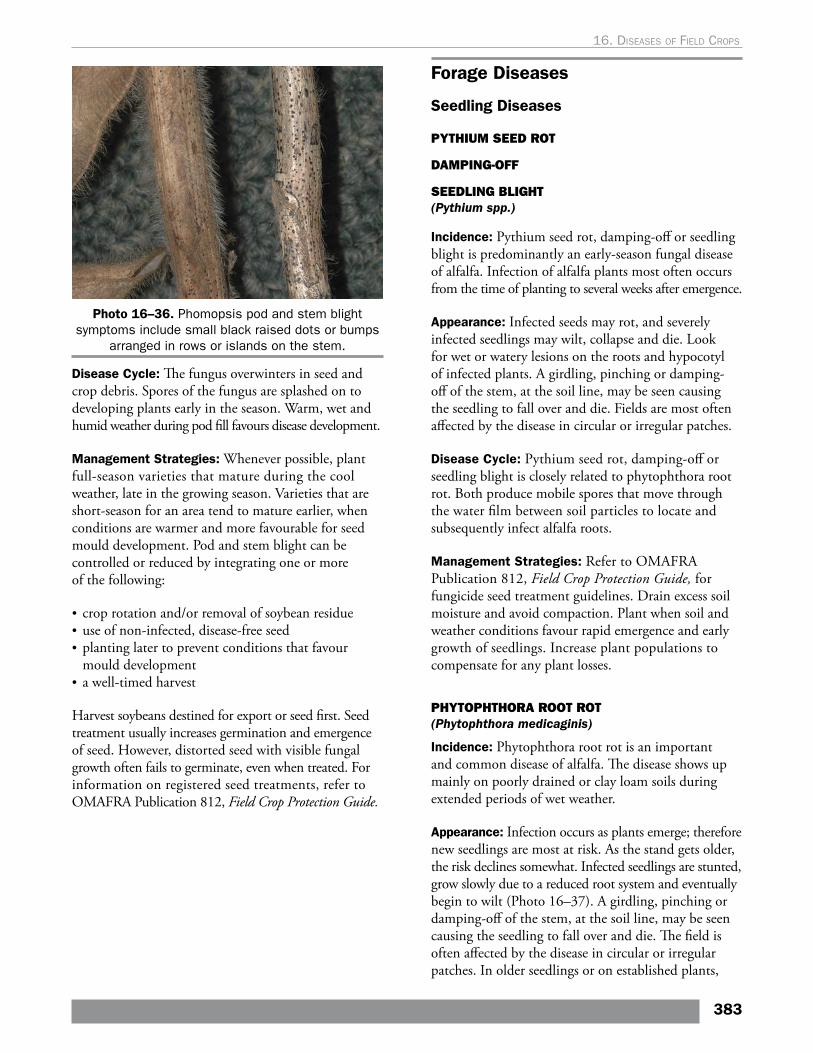
Photo 16–36. Phomopsis pod and stem blight symptoms include small black raised dots or bumps
arranged in rows or islands on the stem.
Disease Cycle: The fungus overwinters in seed and crop debris. Spores of the fungus are splashed on to developing plants early in the season. Warm, wet and humid weather during pod fill favours disease development.
Management Strategies: Whenever possible, plant full-season varieties that mature during the cool weather, late in the growing season. Varieties that are short-season for an area tend to mature earlier, when conditions are warmer and more favourable for seed mould development. Pod and stem blight can be controlled or reduced by integrating one or more of the following:
• crop rotation and/or removal of soybean residue• use of non-infected, disease-free seed• planting later to prevent conditions that favour
mould development • a well-timed harvest
Harvest soybeans destined for export or seed first. Seed treatment usually increases germination and emergence of seed. However, distorted seed with visible fungal growth often fails to germinate, even when treated. For information on registered seed treatments, refer to OMAFRA Publication 812, Field Crop Protection Guide.
Forage Diseases
Seedling Diseases
PYTHIUM SEED ROT
DAMPING-OFF
SEEDLING BLIGHT (Pythium spp.)
Incidence: Pythium seed rot, damping-off or seedling blight is predominantly an early-season fungal disease of alfalfa. Infection of alfalfa plants most often occurs from the time of planting to several weeks after emergence.
Appearance: Infected seeds may rot, and severely infected seedlings may wilt, collapse and die. Look for wet or watery lesions on the roots and hypocotyl of infected plants. A girdling, pinching or damping-off of the stem, at the soil line, may be seen causing the seedling to fall over and die. Fields are most often affected by the disease in circular or irregular patches.
Disease Cycle: Pythium seed rot, damping-off or seedling blight is closely related to phytophthora root rot. Both produce mobile spores that move through the water film between soil particles to locate and subsequently infect alfalfa roots.
Management Strategies: Refer to OMAFRA Publication 812, Field Crop Protection Guide, for fungicide seed treatment guidelines. Drain excess soil moisture and avoid compaction. Plant when soil and weather conditions favour rapid emergence and early growth of seedlings. Increase plant populations to compensate for any plant losses.
PHYTOPHTHORA ROOT ROT (Phytophthora medicaginis)
Incidence: Phytophthora root rot is an important and common disease of alfalfa. The disease shows up mainly on poorly drained or clay loam soils during extended periods of wet weather.
Appearance: Infection occurs as plants emerge; therefore new seedlings are most at risk. As the stand gets older, the risk declines somewhat. Infected seedlings are stunted, grow slowly due to a reduced root system and eventually begin to wilt (Photo 16–37). A girdling, pinching or damping-off of the stem, at the soil line, may be seen causing the seedling to fall over and die. The field is often affected by the disease in circular or irregular patches. In older seedlings or on established plants,
383
16. dIseases oF FIeld crops
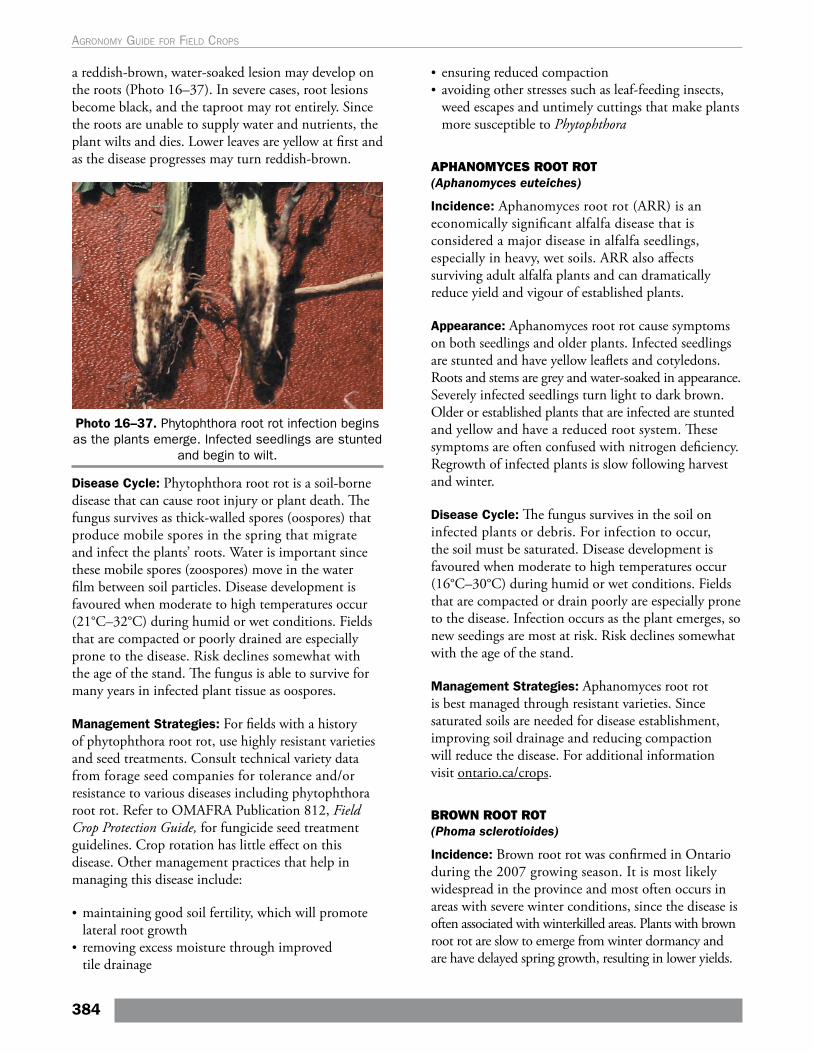
a reddish-brown, water-soaked lesion may develop on the roots (Photo 16–37). In severe cases, root lesions become black, and the taproot may rot entirely. Since the roots are unable to supply water and nutrients, the plant wilts and dies. Lower leaves are yellow at first and as the disease progresses may turn reddish-brown.
Photo 16–37. Phytophthora root rot infection begins as the plants emerge. Infected seedlings are stunted
and begin to wilt.
Disease Cycle: Phytophthora root rot is a soil-borne disease that can cause root injury or plant death. The fungus survives as thick-walled spores (oospores) that produce mobile spores in the spring that migrate and infect the plants’ roots. Water is important since these mobile spores (zoospores) move in the water film between soil particles. Disease development is favoured when moderate to high temperatures occur (21°C–32°C) during humid or wet conditions. Fields that are compacted or poorly drained are especially prone to the disease. Risk declines somewhat with the age of the stand. The fungus is able to survive for many years in infected plant tissue as oospores.
Management Strategies: For fields with a history of phytophthora root rot, use highly resistant varieties and seed treatments. Consult technical variety data from forage seed companies for tolerance and/or resistance to various diseases including phytophthora root rot. Refer to OMAFRA Publication 812, Field Crop Protection Guide, for fungicide seed treatment guidelines. Crop rotation has little effect on this disease. Other management practices that help in managing this disease include:
• maintaining good soil fertility, which will promote lateral root growth
• removing excess moisture through improved tile drainage
• ensuring reduced compaction• avoiding other stresses such as leaf-feeding insects,
weed escapes and untimely cuttings that make plants more susceptible to Phytophthora
APHANOMYCES ROOT ROT (Aphanomyces euteiches)
Incidence: Aphanomyces root rot (ARR) is an economically significant alfalfa disease that is considered a major disease in alfalfa seedlings, especially in heavy, wet soils. ARR also affects surviving adult alfalfa plants and can dramatically reduce yield and vigour of established plants.
Appearance: Aphanomyces root rot cause symptoms on both seedlings and older plants. Infected seedlings are stunted and have yellow leaflets and cotyledons. Roots and stems are grey and water-soaked in appearance. Severely infected seedlings turn light to dark brown. Older or established plants that are infected are stunted and yellow and have a reduced root system. These symptoms are often confused with nitrogen deficiency. Regrowth of infected plants is slow following harvest and winter.
Disease Cycle: The fungus survives in the soil on infected plants or debris. For infection to occur, the soil must be saturated. Disease development is favoured when moderate to high temperatures occur (16°C–30°C) during humid or wet conditions. Fields that are compacted or drain poorly are especially prone to the disease. Infection occurs as the plant emerges, so new seedings are most at risk. Risk declines somewhat with the age of the stand.
Management Strategies: Aphanomyces root rot is best managed through resistant varieties. Since saturated soils are needed for disease establishment, improving soil drainage and reducing compaction will reduce the disease. For additional information visit ontario.ca/crops.
BROWN ROOT ROT (Phoma sclerotioides)
Incidence: Brown root rot was confirmed in Ontario during the 2007 growing season. It is most likely widespread in the province and most often occurs in areas with severe winter conditions, since the disease is often associated with winterkilled areas. Plants with brown root rot are slow to emerge from winter dormancy and are have delayed spring growth, resulting in lower yields.
384
Agronomy guide for field Crops
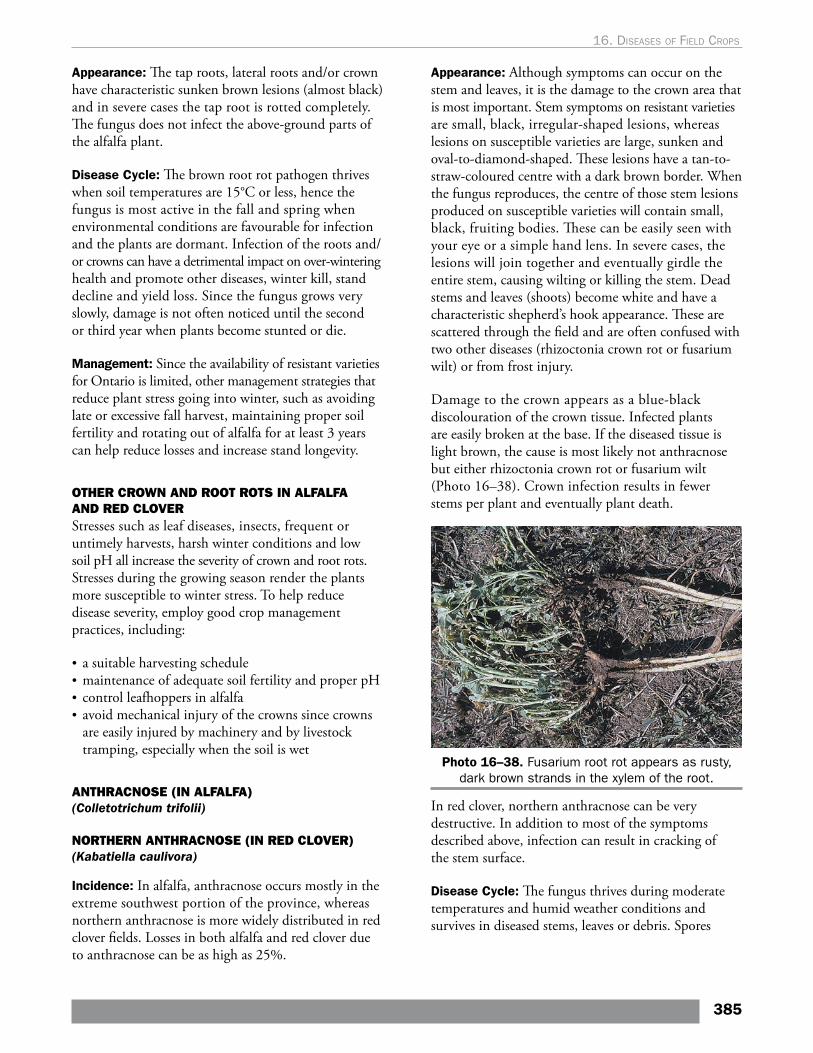
Appearance: The tap roots, lateral roots and/or crown have characteristic sunken brown lesions (almost black) and in severe cases the tap root is rotted completely. The fungus does not infect the above-ground parts of the alfalfa plant.
Disease Cycle: The brown root rot pathogen thrives when soil temperatures are 15°C or less, hence the fungus is most active in the fall and spring when environmental conditions are favourable for infection and the plants are dormant. Infection of the roots and/or crowns can have a detrimental impact on over-wintering health and promote other diseases, winter kill, stand decline and yield loss. Since the fungus grows very slowly, damage is not often noticed until the second or third year when plants become stunted or die.
Management: Since the availability of resistant varieties for Ontario is limited, other management strategies that reduce plant stress going into winter, such as avoiding late or excessive fall harvest, maintaining proper soil fertility and rotating out of alfalfa for at least 3 years can help reduce losses and increase stand longevity.
OTHER CROWN AND ROOT ROTS IN ALFALFA AND RED CLOVERStresses such as leaf diseases, insects, frequent or untimely harvests, harsh winter conditions and low soil pH all increase the severity of crown and root rots. Stresses during the growing season render the plants more susceptible to winter stress. To help reduce disease severity, employ good crop management practices, including:
• a suitable harvesting schedule • maintenance of adequate soil fertility and proper pH • control leafhoppers in alfalfa • avoid mechanical injury of the crowns since crowns
are easily injured by machinery and by livestock tramping, especially when the soil is wet
ANTHRACNOSE (IN ALFALFA) (Colletotrichum trifolii)
NORTHERN ANTHRACNOSE (IN RED CLOVER) (Kabatiella caulivora)
Incidence: In alfalfa, anthracnose occurs mostly in the extreme southwest portion of the province, whereas northern anthracnose is more widely distributed in red clover fields. Losses in both alfalfa and red clover due to anthracnose can be as high as 25%.
Appearance: Although symptoms can occur on the stem and leaves, it is the damage to the crown area that is most important. Stem symptoms on resistant varieties are small, black, irregular-shaped lesions, whereas lesions on susceptible varieties are large, sunken and oval-to-diamond-shaped. These lesions have a tan-to-straw-coloured centre with a dark brown border. When the fungus reproduces, the centre of those stem lesions produced on susceptible varieties will contain small, black, fruiting bodies. These can be easily seen with your eye or a simple hand lens. In severe cases, the lesions will join together and eventually girdle the entire stem, causing wilting or killing the stem. Dead stems and leaves (shoots) become white and have a characteristic shepherd’s hook appearance. These are scattered through the field and are often confused with two other diseases (rhizoctonia crown rot or fusarium wilt) or from frost injury.
Damage to the crown appears as a blue-black discolouration of the crown tissue. Infected plants are easily broken at the base. If the diseased tissue is light brown, the cause is most likely not anthracnose but either rhizoctonia crown rot or fusarium wilt (Photo 16–38). Crown infection results in fewer stems per plant and eventually plant death.
Photo 16–38. Fusarium root rot appears as rusty, dark brown strands in the xylem of the root.
In red clover, northern anthracnose can be very destructive. In addition to most of the symptoms described above, infection can result in cracking of the stem surface.
Disease Cycle: The fungus thrives during moderate temperatures and humid weather conditions and survives in diseased stems, leaves or debris. Spores
385
16. dIseases oF FIeld crops
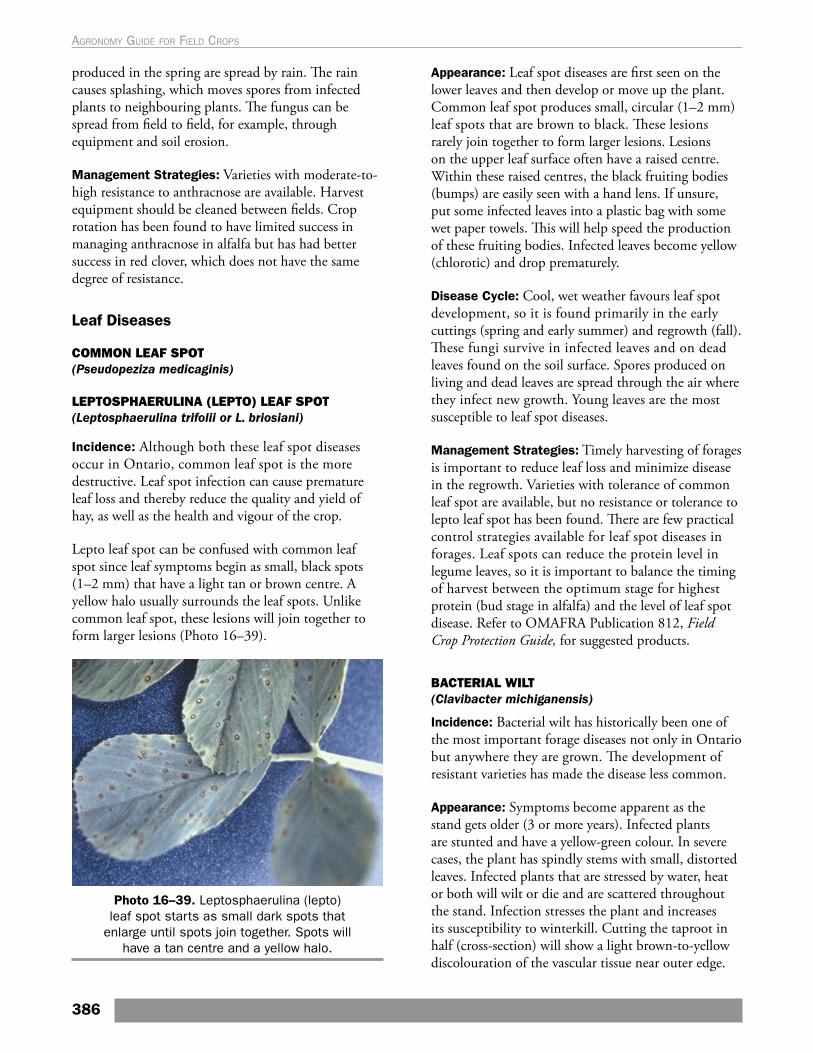
produced in the spring are spread by rain. The rain causes splashing, which moves spores from infected plants to neighbouring plants. The fungus can be spread from field to field, for example, through equipment and soil erosion.
Management Strategies: Varieties with moderate-to-high resistance to anthracnose are available. Harvest equipment should be cleaned between fields. Crop rotation has been found to have limited success in managing anthracnose in alfalfa but has had better success in red clover, which does not have the same degree of resistance.
Leaf Diseases
COMMON LEAF SPOT (Pseudopeziza medicaginis)
LEPTOSPHAERULINA (LEPTO) LEAF SPOT (Leptosphaerulina trifolii or L. briosiani)
Incidence: Although both these leaf spot diseases occur in Ontario, common leaf spot is the more destructive. Leaf spot infection can cause premature leaf loss and thereby reduce the quality and yield of hay, as well as the health and vigour of the crop.
Lepto leaf spot can be confused with common leaf spot since leaf symptoms begin as small, black spots (1–2 mm) that have a light tan or brown centre. A yellow halo usually surrounds the leaf spots. Unlike common leaf spot, these lesions will join together to form larger lesions (Photo 16–39).
Photo 16–39. Leptosphaerulina (lepto) leaf spot starts as small dark spots that
enlarge until spots join together. Spots will have a tan centre and a yellow halo.
Appearance: Leaf spot diseases are first seen on the lower leaves and then develop or move up the plant. Common leaf spot produces small, circular (1–2 mm) leaf spots that are brown to black. These lesions rarely join together to form larger lesions. Lesions on the upper leaf surface often have a raised centre. Within these raised centres, the black fruiting bodies (bumps) are easily seen with a hand lens. If unsure, put some infected leaves into a plastic bag with some wet paper towels. This will help speed the production of these fruiting bodies. Infected leaves become yellow (chlorotic) and drop prematurely.
Disease Cycle: Cool, wet weather favours leaf spot development, so it is found primarily in the early cuttings (spring and early summer) and regrowth (fall). These fungi survive in infected leaves and on dead leaves found on the soil surface. Spores produced on living and dead leaves are spread through the air where they infect new growth. Young leaves are the most susceptible to leaf spot diseases.
Management Strategies: Timely harvesting of forages is important to reduce leaf loss and minimize disease in the regrowth. Varieties with tolerance of common leaf spot are available, but no resistance or tolerance to lepto leaf spot has been found. There are few practical control strategies available for leaf spot diseases in forages. Leaf spots can reduce the protein level in legume leaves, so it is important to balance the timing of harvest between the optimum stage for highest protein (bud stage in alfalfa) and the level of leaf spot disease. Refer to OMAFRA Publication 812, Field Crop Protection Guide, for suggested products.
BACTERIAL WILT (Clavibacter michiganensis)
Incidence: Bacterial wilt has historically been one of the most important forage diseases not only in Ontario but anywhere they are grown. The development of resistant varieties has made the disease less common.
Appearance: Symptoms become apparent as the stand gets older (3 or more years). Infected plants are stunted and have a yellow-green colour. In severe cases, the plant has spindly stems with small, distorted leaves. Infected plants that are stressed by water, heat or both will wilt or die and are scattered throughout the stand. Infection stresses the plant and increases its susceptibility to winterkill. Cutting the taproot in half (cross-section) will show a light brown-to-yellow discolouration of the vascular tissue near outer edge.
386
Agronomy guide for field Crops
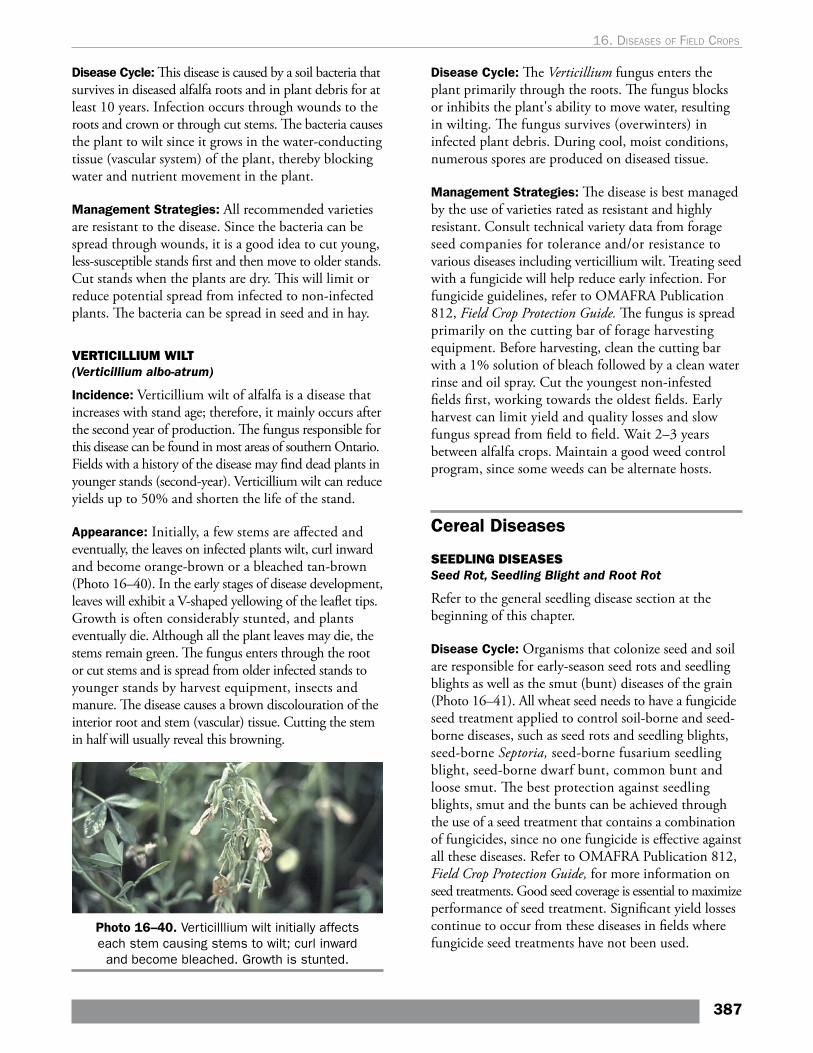
Disease Cycle: This disease is caused by a soil bacteria that survives in diseased alfalfa roots and in plant debris for at least 10 years. Infection occurs through wounds to the roots and crown or through cut stems. The bacteria causes the plant to wilt since it grows in the water-conducting tissue (vascular system) of the plant, thereby blocking water and nutrient movement in the plant.
Management Strategies: All recommended varieties are resistant to the disease. Since the bacteria can be spread through wounds, it is a good idea to cut young, less-susceptible stands first and then move to older stands. Cut stands when the plants are dry. This will limit or reduce potential spread from infected to non-infected plants. The bacteria can be spread in seed and in hay.
VERTICILLIUM WILT (Verticillium albo-atrum)
Incidence: Verticillium wilt of alfalfa is a disease that increases with stand age; therefore, it mainly occurs after the second year of production. The fungus responsible for this disease can be found in most areas of southern Ontario. Fields with a history of the disease may find dead plants in younger stands (second-year). Verticillium wilt can reduce yields up to 50% and shorten the life of the stand.
Appearance: Initially, a few stems are affected and eventually, the leaves on infected plants wilt, curl inward and become orange-brown or a bleached tan-brown (Photo 16–40). In the early stages of disease development, leaves will exhibit a V-shaped yellowing of the leaflet tips. Growth is often considerably stunted, and plants eventually die. Although all the plant leaves may die, the stems remain green. The fungus enters through the root or cut stems and is spread from older infected stands to younger stands by harvest equipment, insects and manure. The disease causes a brown discolouration of the interior root and stem (vascular) tissue. Cutting the stem in half will usually reveal this browning.
Photo 16–40. Verticilllium wilt initially affects each stem causing stems to wilt; curl inward
and become bleached. Growth is stunted.
Disease Cycle: The Verticillium fungus enters the plant primarily through the roots. The fungus blocks or inhibits the plant's ability to move water, resulting in wilting. The fungus survives (overwinters) in infected plant debris. During cool, moist conditions, numerous spores are produced on diseased tissue.
Management Strategies: The disease is best managed by the use of varieties rated as resistant and highly resistant. Consult technical variety data from forage seed companies for tolerance and/or resistance to various diseases including verticillium wilt. Treating seed with a fungicide will help reduce early infection. For fungicide guidelines, refer to OMAFRA Publication 812, Field Crop Protection Guide. The fungus is spread primarily on the cutting bar of forage harvesting equipment. Before harvesting, clean the cutting bar with a 1% solution of bleach followed by a clean water rinse and oil spray. Cut the youngest non-infested fields first, working towards the oldest fields. Early harvest can limit yield and quality losses and slow fungus spread from field to field. Wait 2–3 years between alfalfa crops. Maintain a good weed control program, since some weeds can be alternate hosts.
Cereal Diseases
SEEDLING DISEASES Seed Rot, Seedling Blight and Root Rot
Refer to the general seedling disease section at the beginning of this chapter.
Disease Cycle: Organisms that colonize seed and soil are responsible for early-season seed rots and seedling blights as well as the smut (bunt) diseases of the grain (Photo 16–41). All wheat seed needs to have a fungicide seed treatment applied to control soil-borne and seed-borne diseases, such as seed rots and seedling blights, seed-borne Septoria, seed-borne fusarium seedling blight, seed-borne dwarf bunt, common bunt and loose smut. The best protection against seedling blights, smut and the bunts can be achieved through the use of a seed treatment that contains a combination of fungicides, since no one fungicide is effective against all these diseases. Refer to OMAFRA Publication 812, Field Crop Protection Guide, for more information on seed treatments. Good seed coverage is essential to maximize performance of seed treatment. Significant yield losses continue to occur from these diseases in fields where fungicide seed treatments have not been used.
387
16. dIseases oF FIeld crops
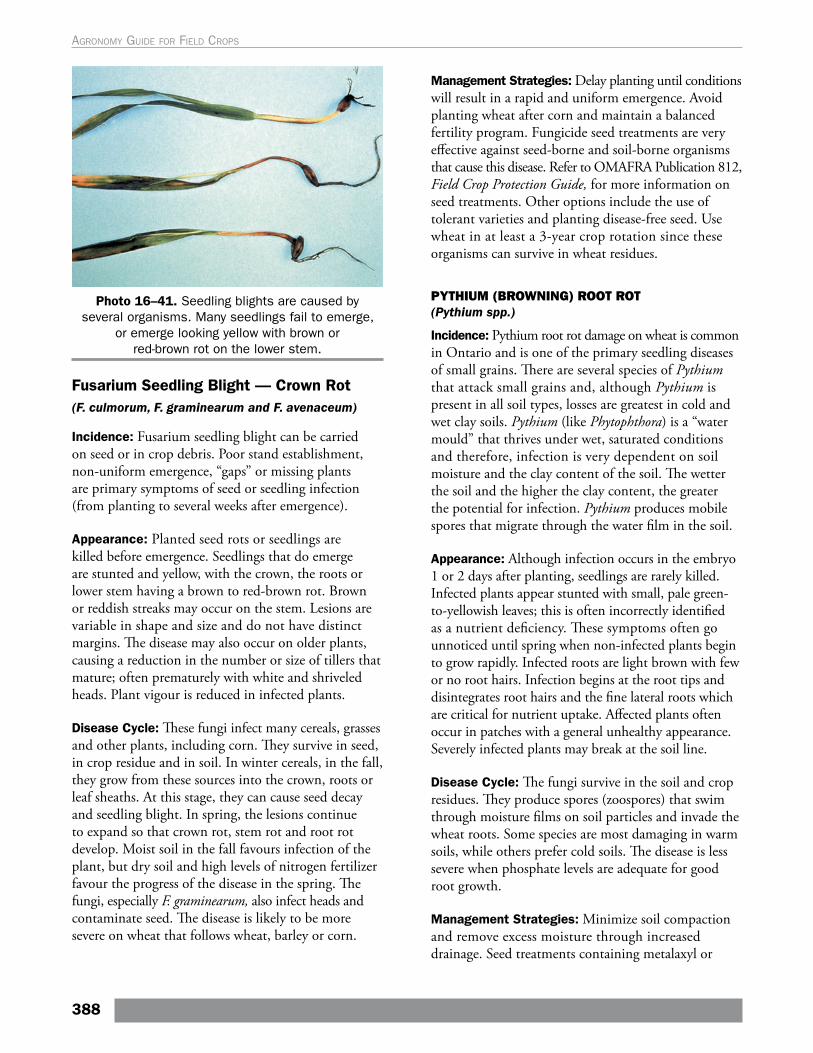
Photo 16–41. Seedling blights are caused by several organisms. Many seedlings fail to emerge,
or emerge looking yellow with brown or red-brown rot on the lower stem.
Fusarium Seedling Blight — Crown Rot (F. culmorum, F. graminearum and F. avenaceum)
Incidence: Fusarium seedling blight can be carried on seed or in crop debris. Poor stand establishment, non-uniform emergence, “gaps” or missing plants are primary symptoms of seed or seedling infection (from planting to several weeks after emergence).
Appearance: Planted seed rots or seedlings are killed before emergence. Seedlings that do emerge are stunted and yellow, with the crown, the roots or lower stem having a brown to red-brown rot. Brown or reddish streaks may occur on the stem. Lesions are variable in shape and size and do not have distinct margins. The disease may also occur on older plants, causing a reduction in the number or size of tillers that mature; often prematurely with white and shriveled heads. Plant vigour is reduced in infected plants.
Disease Cycle: These fungi infect many cereals, grasses and other plants, including corn. They survive in seed, in crop residue and in soil. In winter cereals, in the fall, they grow from these sources into the crown, roots or leaf sheaths. At this stage, they can cause seed decay and seedling blight. In spring, the lesions continue to expand so that crown rot, stem rot and root rot develop. Moist soil in the fall favours infection of the plant, but dry soil and high levels of nitrogen fertilizer favour the progress of the disease in the spring. The fungi, especially F. graminearum, also infect heads and contaminate seed. The disease is likely to be more severe on wheat that follows wheat, barley or corn.
Management Strategies: Delay planting until conditions will result in a rapid and uniform emergence. Avoid planting wheat after corn and maintain a balanced fertility program. Fungicide seed treatments are very effective against seed-borne and soil-borne organisms that cause this disease. Refer to OMAFRA Publication 812, Field Crop Protection Guide, for more information on seed treatments. Other options include the use of tolerant varieties and planting disease-free seed. Use wheat in at least a 3-year crop rotation since these organisms can survive in wheat residues.
PYTHIUM (BROWNING) ROOT ROT (Pythium spp.)
Incidence: Pythium root rot damage on wheat is common in Ontario and is one of the primary seedling diseases of small grains. There are several species of Pythium that attack small grains and, although Pythium is present in all soil types, losses are greatest in cold and wet clay soils. Pythium (like Phytophthora) is a “water mould” that thrives under wet, saturated conditions and therefore, infection is very dependent on soil moisture and the clay content of the soil. The wetter the soil and the higher the clay content, the greater the potential for infection. Pythium produces mobile spores that migrate through the water film in the soil.
Appearance: Although infection occurs in the embryo 1 or 2 days after planting, seedlings are rarely killed. Infected plants appear stunted with small, pale green-to-yellowish leaves; this is often incorrectly identified as a nutrient deficiency. These symptoms often go unnoticed until spring when non-infected plants begin to grow rapidly. Infected roots are light brown with few or no root hairs. Infection begins at the root tips and disintegrates root hairs and the fine lateral roots which are critical for nutrient uptake. Affected plants often occur in patches with a general unhealthy appearance. Severely infected plants may break at the soil line.
Disease Cycle: The fungi survive in the soil and crop residues. They produce spores (zoospores) that swim through moisture films on soil particles and invade the wheat roots. Some species are most damaging in warm soils, while others prefer cold soils. The disease is less severe when phosphate levels are adequate for good root growth.
Management Strategies: Minimize soil compaction and remove excess moisture through increased drainage. Seed treatments containing metalaxyl or
388
Agronomy guide for field Crops
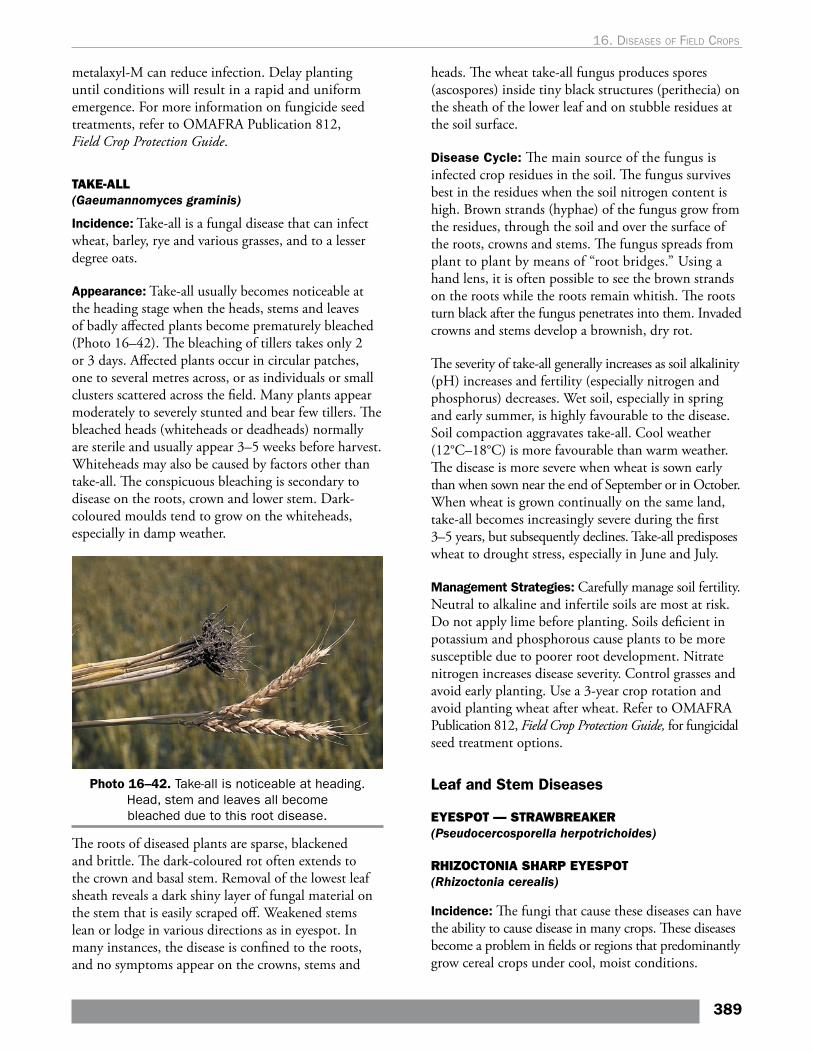
metalaxyl-M can reduce infection. Delay planting until conditions will result in a rapid and uniform emergence. For more information on fungicide seed treatments, refer to OMAFRA Publication 812, Field Crop Protection Guide.
TAKE-ALL (Gaeumannomyces graminis)
Incidence: Take-all is a fungal disease that can infect wheat, barley, rye and various grasses, and to a lesser degree oats.
Appearance: Take-all usually becomes noticeable at the heading stage when the heads, stems and leaves of badly affected plants become prematurely bleached (Photo 16–42). The bleaching of tillers takes only 2 or 3 days. Affected plants occur in circular patches, one to several metres across, or as individuals or small clusters scattered across the field. Many plants appear moderately to severely stunted and bear few tillers. The bleached heads (whiteheads or deadheads) normally are sterile and usually appear 3–5 weeks before harvest. Whiteheads may also be caused by factors other than take-all. The conspicuous bleaching is secondary to disease on the roots, crown and lower stem. Dark-coloured moulds tend to grow on the whiteheads, especially in damp weather.
Photo 16–42. Take-all is noticeable at heading. Head, stem and leaves all become bleached due to this root disease.
The roots of diseased plants are sparse, blackened and brittle. The dark-coloured rot often extends to the crown and basal stem. Removal of the lowest leaf sheath reveals a dark shiny layer of fungal material on the stem that is easily scraped off. Weakened stems lean or lodge in various directions as in eyespot. In many instances, the disease is confined to the roots, and no symptoms appear on the crowns, stems and
heads. The wheat take-all fungus produces spores (ascospores) inside tiny black structures (perithecia) on the sheath of the lower leaf and on stubble residues at the soil surface.
Disease Cycle: The main source of the fungus is infected crop residues in the soil. The fungus survives best in the residues when the soil nitrogen content is high. Brown strands (hyphae) of the fungus grow from the residues, through the soil and over the surface of the roots, crowns and stems. The fungus spreads from plant to plant by means of “root bridges.” Using a hand lens, it is often possible to see the brown strands on the roots while the roots remain whitish. The roots turn black after the fungus penetrates into them. Invaded crowns and stems develop a brownish, dry rot.
The severity of take-all generally increases as soil alkalinity (pH) increases and fertility (especially nitrogen and phosphorus) decreases. Wet soil, especially in spring and early summer, is highly favourable to the disease. Soil compaction aggravates take-all. Cool weather (12°C–18°C) is more favourable than warm weather. The disease is more severe when wheat is sown early than when sown near the end of September or in October. When wheat is grown continually on the same land, take-all becomes increasingly severe during the first 3–5 years, but subsequently declines. Take-all predisposes wheat to drought stress, especially in June and July.
Management Strategies: Carefully manage soil fertility. Neutral to alkaline and infertile soils are most at risk. Do not apply lime before planting. Soils deficient in potassium and phosphorous cause plants to be more susceptible due to poorer root development. Nitrate nitrogen increases disease severity. Control grasses and avoid early planting. Use a 3-year crop rotation and avoid planting wheat after wheat. Refer to OMAFRA Publication 812, Field Crop Protection Guide, for fungicidal seed treatment options.
Leaf and Stem Diseases
EYESPOT — STRAWBREAKER (Pseudocercosporella herpotrichoides)
RHIZOCTONIA SHARP EYESPOT (Rhizoctonia cerealis)
Incidence: The fungi that cause these diseases can have the ability to cause disease in many crops. These diseases become a problem in fields or regions that predominantly grow cereal crops under cool, moist conditions.
389
16. dIseases oF FIeld crops
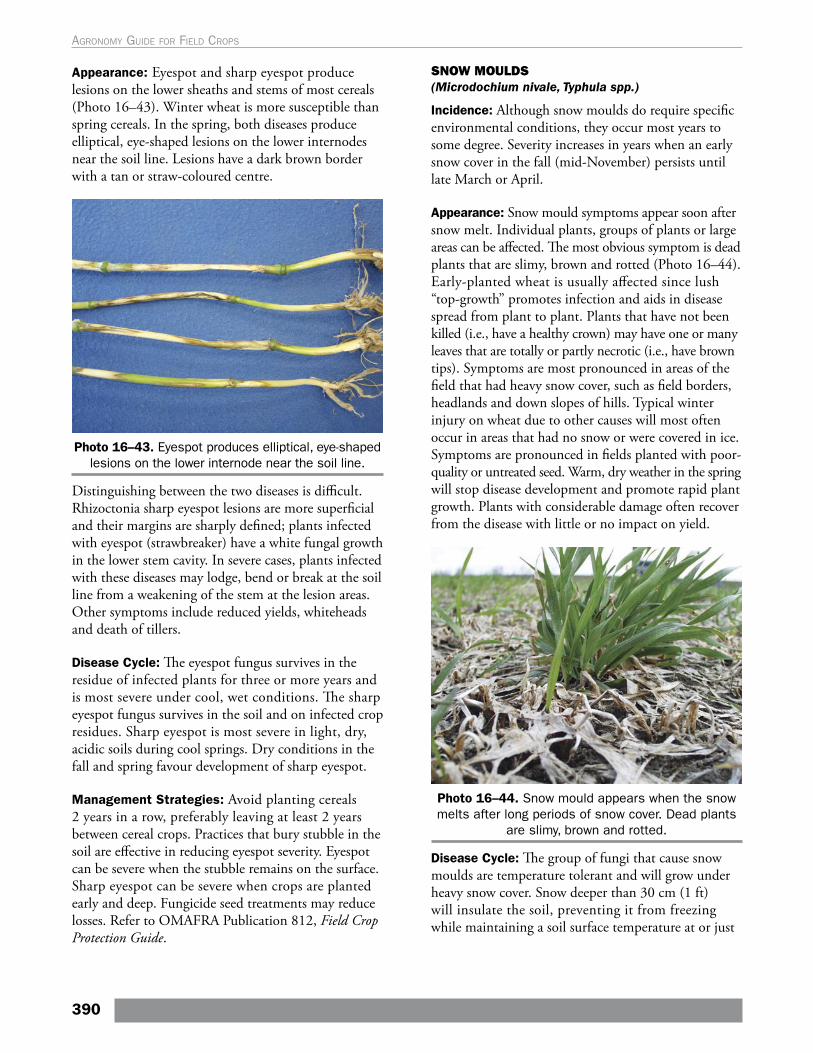
Appearance: Eyespot and sharp eyespot produce lesions on the lower sheaths and stems of most cereals (Photo 16–43). Winter wheat is more susceptible than spring cereals. In the spring, both diseases produce elliptical, eye-shaped lesions on the lower internodes near the soil line. Lesions have a dark brown border with a tan or straw-coloured centre.
Photo 16–43. Eyespot produces elliptical, eye-shaped lesions on the lower internode near the soil line.
Distinguishing between the two diseases is difficult. Rhizoctonia sharp eyespot lesions are more superficial and their margins are sharply defined; plants infected with eyespot (strawbreaker) have a white fungal growth in the lower stem cavity. In severe cases, plants infected with these diseases may lodge, bend or break at the soil line from a weakening of the stem at the lesion areas. Other symptoms include reduced yields, whiteheads and death of tillers.
Disease Cycle: The eyespot fungus survives in the residue of infected plants for three or more years and is most severe under cool, wet conditions. The sharp eyespot fungus survives in the soil and on infected crop residues. Sharp eyespot is most severe in light, dry, acidic soils during cool springs. Dry conditions in the fall and spring favour development of sharp eyespot.
Management Strategies: Avoid planting cereals 2 years in a row, preferably leaving at least 2 years between cereal crops. Practices that bury stubble in the soil are effective in reducing eyespot severity. Eyespot can be severe when the stubble remains on the surface. Sharp eyespot can be severe when crops are planted early and deep. Fungicide seed treatments may reduce losses. Refer to OMAFRA Publication 812, Field Crop Protection Guide.
SNOW MOULDS (Microdochium nivale, Typhula spp.)
Incidence: Although snow moulds do require specific environmental conditions, they occur most years to some degree. Severity increases in years when an early snow cover in the fall (mid-November) persists until late March or April.
Appearance: Snow mould symptoms appear soon after snow melt. Individual plants, groups of plants or large areas can be affected. The most obvious symptom is dead plants that are slimy, brown and rotted (Photo 16–44). Early-planted wheat is usually affected since lush “top-growth” promotes infection and aids in disease spread from plant to plant. Plants that have not been killed (i.e., have a healthy crown) may have one or many leaves that are totally or partly necrotic (i.e., have brown tips). Symptoms are most pronounced in areas of the field that had heavy snow cover, such as field borders, headlands and down slopes of hills. Typical winter injury on wheat due to other causes will most often occur in areas that had no snow or were covered in ice. Symptoms are pronounced in fields planted with poor-quality or untreated seed. Warm, dry weather in the spring will stop disease development and promote rapid plant growth. Plants with considerable damage often recover from the disease with little or no impact on yield.
Photo 16–44. Snow mould appears when the snow melts after long periods of snow cover. Dead plants
are slimy, brown and rotted.
Disease Cycle: The group of fungi that cause snow moulds are temperature tolerant and will grow under heavy snow cover. Snow deeper than 30 cm (1 ft) will insulate the soil, preventing it from freezing while maintaining a soil surface temperature at or just
390
Agronomy guide for field Crops
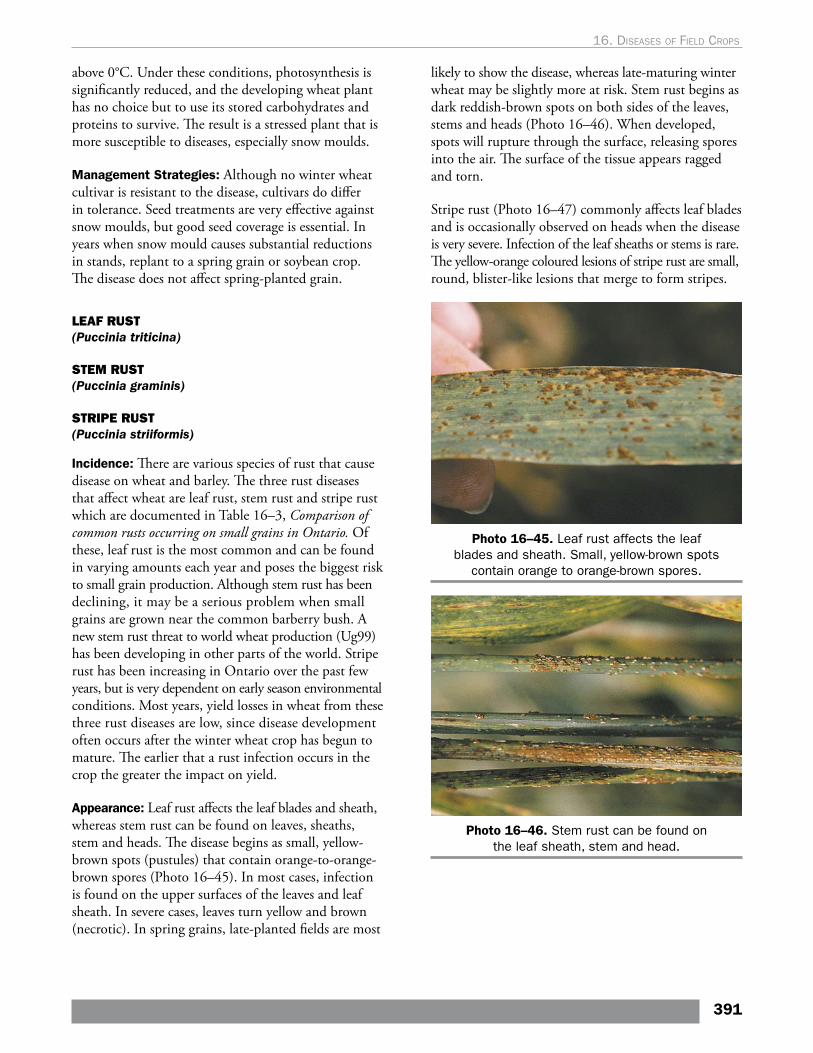
above 0°C. Under these conditions, photosynthesis is significantly reduced, and the developing wheat plant has no choice but to use its stored carbohydrates and proteins to survive. The result is a stressed plant that is more susceptible to diseases, especially snow moulds.
Management Strategies: Although no winter wheat cultivar is resistant to the disease, cultivars do differ in tolerance. Seed treatments are very effective against snow moulds, but good seed coverage is essential. In years when snow mould causes substantial reductions in stands, replant to a spring grain or soybean crop. The disease does not affect spring-planted grain.
LEAF RUST (Puccinia triticina)
STEM RUST (Puccinia graminis)
STRIPE RUST (Puccinia striiformis)
Incidence: There are various species of rust that cause disease on wheat and barley. The three rust diseases that affect wheat are leaf rust, stem rust and stripe rust which are documented in Table 16–3, Comparison of common rusts occurring on small grains in Ontario. Of these, leaf rust is the most common and can be found in varying amounts each year and poses the biggest risk to small grain production. Although stem rust has been declining, it may be a serious problem when small grains are grown near the common barberry bush. A new stem rust threat to world wheat production (Ug99) has been developing in other parts of the world. Stripe rust has been increasing in Ontario over the past few years, but is very dependent on early season environmental conditions. Most years, yield losses in wheat from these three rust diseases are low, since disease development often occurs after the winter wheat crop has begun to mature. The earlier that a rust infection occurs in the crop the greater the impact on yield.
Appearance: Leaf rust affects the leaf blades and sheath, whereas stem rust can be found on leaves, sheaths, stem and heads. The disease begins as small, yellow-brown spots (pustules) that contain orange-to-orange-brown spores (Photo 16–45). In most cases, infection is found on the upper surfaces of the leaves and leaf sheath. In severe cases, leaves turn yellow and brown (necrotic). In spring grains, late-planted fields are most
likely to show the disease, whereas late-maturing winter wheat may be slightly more at risk. Stem rust begins as dark reddish-brown spots on both sides of the leaves, stems and heads (Photo 16–46). When developed, spots will rupture through the surface, releasing spores into the air. The surface of the tissue appears ragged and torn.
Stripe rust (Photo 16–47) commonly affects leaf blades and is occasionally observed on heads when the disease is very severe. Infection of the leaf sheaths or stems is rare. The yellow-orange coloured lesions of stripe rust are small, round, blister-like lesions that merge to form stripes.
Photo 16–45. Leaf rust affects the leaf blades and sheath. Small, yellow-brown spots
contain orange to orange-brown spores.
Photo 16–46. Stem rust can be found on the leaf sheath, stem and head.
391
16. dIseases oF FIeld crops
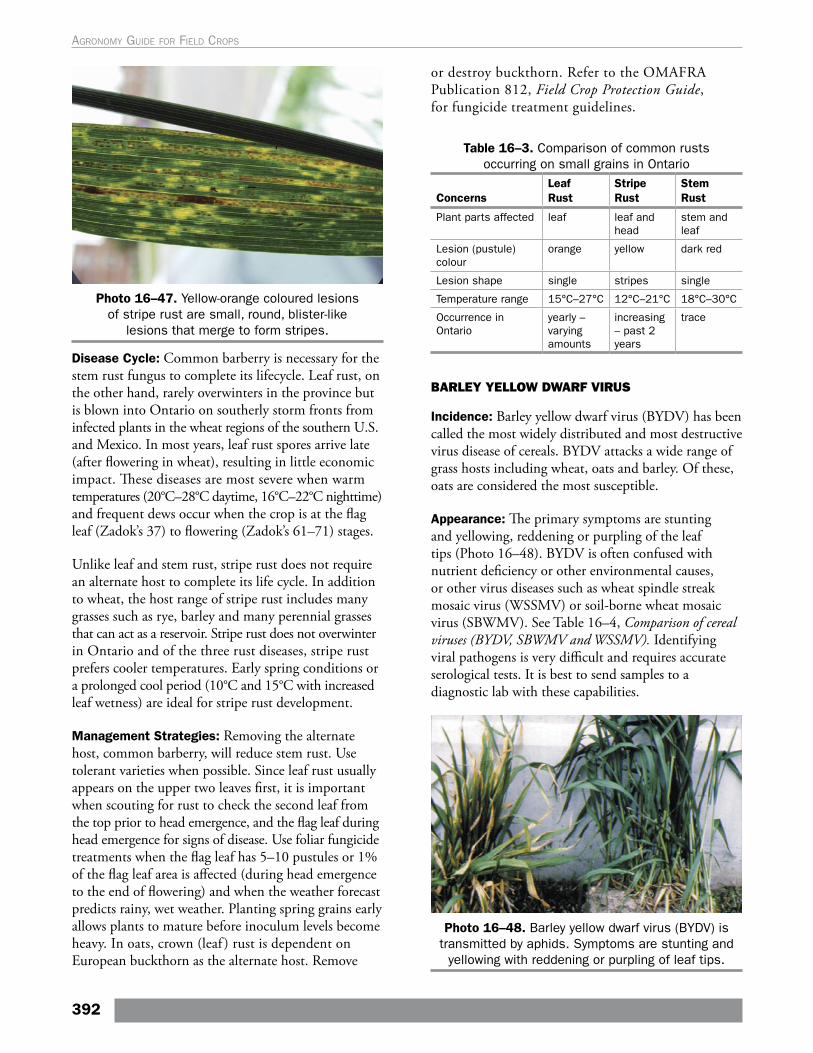
Photo 16–47. Yellow-orange coloured lesions of stripe rust are small, round, blister-like
lesions that merge to form stripes.
Disease Cycle: Common barberry is necessary for the stem rust fungus to complete its lifecycle. Leaf rust, on the other hand, rarely overwinters in the province but is blown into Ontario on southerly storm fronts from infected plants in the wheat regions of the southern U.S. and Mexico. In most years, leaf rust spores arrive late (after flowering in wheat), resulting in little economic impact. These diseases are most severe when warm temperatures (20°C–28°C daytime, 16°C–22°C nighttime) and frequent dews occur when the crop is at the flag leaf (Zadok’s 37) to flowering (Zadok’s 61–71) stages.
Unlike leaf and stem rust, stripe rust does not require an alternate host to complete its life cycle. In addition to wheat, the host range of stripe rust includes many grasses such as rye, barley and many perennial grasses that can act as a reservoir. Stripe rust does not overwinter in Ontario and of the three rust diseases, stripe rust prefers cooler temperatures. Early spring conditions or a prolonged cool period (10°C and 15°C with increased leaf wetness) are ideal for stripe rust development.
Management Strategies: Removing the alternate host, common barberry, will reduce stem rust. Use tolerant varieties when possible. Since leaf rust usually appears on the upper two leaves first, it is important when scouting for rust to check the second leaf from the top prior to head emergence, and the flag leaf during head emergence for signs of disease. Use foliar fungicide treatments when the flag leaf has 5–10 pustules or 1% of the flag leaf area is affected (during head emergence to the end of flowering) and when the weather forecast predicts rainy, wet weather. Planting spring grains early allows plants to mature before inoculum levels become heavy. In oats, crown (leaf ) rust is dependent on European buckthorn as the alternate host. Remove
or destroy buckthorn. Refer to the OMAFRA Publication 812, Field Crop Protection Guide, for fungicide treatment guidelines.
Table 16–3. Comparison of common rusts occurring on small grains in Ontario
ConcernsLeaf Rust
Stripe Rust
Stem Rust
Plant parts affected leaf leaf and head
stem and leaf
Lesion (pustule) colour
orange yellow dark red
Lesion shape single stripes single
Temperature range 15°C–27°C 12°C–21°C 18°C–30°C
Occurrence in Ontario
yearly – varying amounts
increasing – past 2 years
trace
BARLEY YELLOW DWARF VIRUS
Incidence: Barley yellow dwarf virus (BYDV) has been called the most widely distributed and most destructive virus disease of cereals. BYDV attacks a wide range of grass hosts including wheat, oats and barley. Of these, oats are considered the most susceptible.
Appearance: The primary symptoms are stunting and yellowing, reddening or purpling of the leaf tips (Photo 16–48). BYDV is often confused with nutrient deficiency or other environmental causes, or other virus diseases such as wheat spindle streak mosaic virus (WSSMV) or soil-borne wheat mosaic virus (SBWMV). See Table 16–4, Comparison of cereal viruses (BYDV, SBWMV and WSSMV). Identifying viral pathogens is very difficult and requires accurate serological tests. It is best to send samples to a diagnostic lab with these capabilities.
Photo 16–48. Barley yellow dwarf virus (BYDV) is transmitted by aphids. Symptoms are stunting and
yellowing with reddening or purpling of leaf tips.
392
Agronomy guide for field Crops
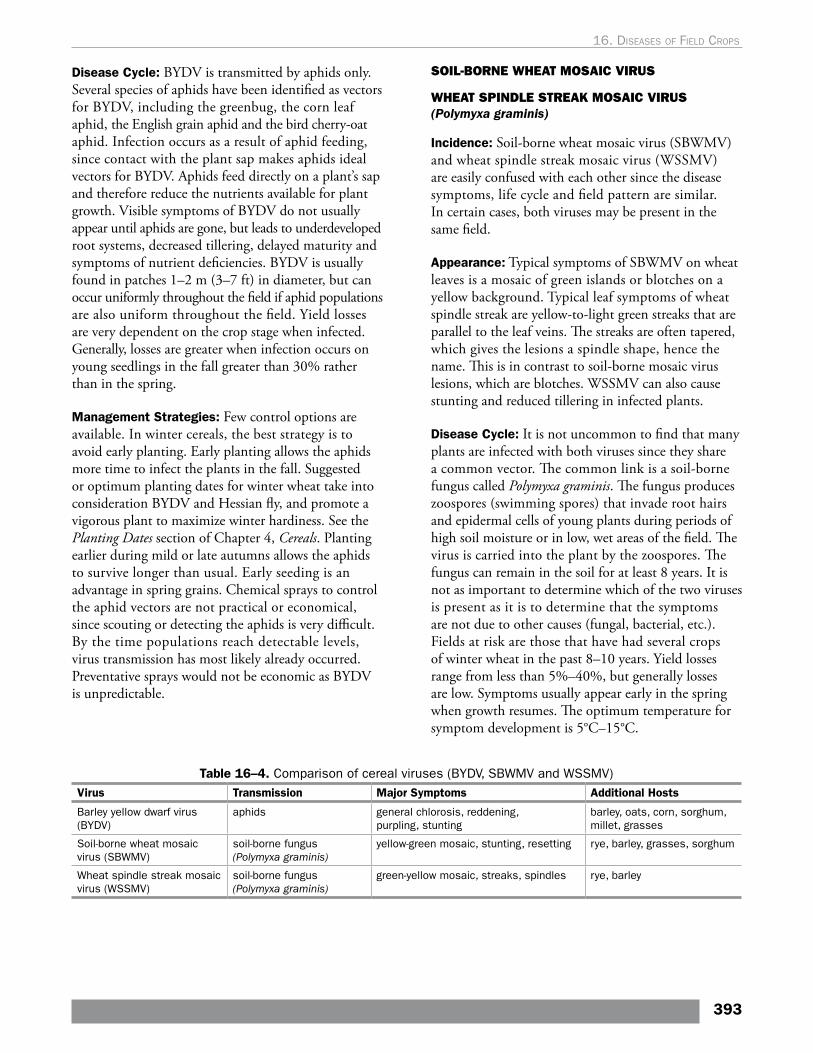
Disease Cycle: BYDV is transmitted by aphids only. Several species of aphids have been identified as vectors for BYDV, including the greenbug, the corn leaf aphid, the English grain aphid and the bird cherry-oat aphid. Infection occurs as a result of aphid feeding, since contact with the plant sap makes aphids ideal vectors for BYDV. Aphids feed directly on a plant’s sap and therefore reduce the nutrients available for plant growth. Visible symptoms of BYDV do not usually appear until aphids are gone, but leads to underdeveloped root systems, decreased tillering, delayed maturity and symptoms of nutrient deficiencies. BYDV is usually found in patches 1–2 m (3–7 ft) in diameter, but can occur uniformly throughout the field if aphid populations are also uniform throughout the field. Yield losses are very dependent on the crop stage when infected. Generally, losses are greater when infection occurs on young seedlings in the fall greater than 30% rather than in the spring.
Management Strategies: Few control options are available. In winter cereals, the best strategy is to avoid early planting. Early planting allows the aphids more time to infect the plants in the fall. Suggested or optimum planting dates for winter wheat take into consideration BYDV and Hessian fly, and promote a vigorous plant to maximize winter hardiness. See the Planting Dates section of Chapter 4, Cereals. Planting earlier during mild or late autumns allows the aphids to survive longer than usual. Early seeding is an advantage in spring grains. Chemical sprays to control the aphid vectors are not practical or economical, since scouting or detecting the aphids is very difficult. By the time populations reach detectable levels, virus transmission has most likely already occurred. Preventative sprays would not be economic as BYDV is unpredictable.
SOIL-BORNE WHEAT MOSAIC VIRUS
WHEAT SPINDLE STREAK MOSAIC VIRUS (Polymyxa graminis)
Incidence: Soil-borne wheat mosaic virus (SBWMV) and wheat spindle streak mosaic virus (WSSMV) are easily confused with each other since the disease symptoms, life cycle and field pattern are similar. In certain cases, both viruses may be present in the same field.
Appearance: Typical symptoms of SBWMV on wheat leaves is a mosaic of green islands or blotches on a yellow background. Typical leaf symptoms of wheat spindle streak are yellow-to-light green streaks that are parallel to the leaf veins. The streaks are often tapered, which gives the lesions a spindle shape, hence the name. This is in contrast to soil-borne mosaic virus lesions, which are blotches. WSSMV can also cause stunting and reduced tillering in infected plants.
Disease Cycle: It is not uncommon to find that many plants are infected with both viruses since they share a common vector. The common link is a soil-borne fungus called Polymyxa graminis. The fungus produces zoospores (swimming spores) that invade root hairs and epidermal cells of young plants during periods of high soil moisture or in low, wet areas of the field. The virus is carried into the plant by the zoospores. The fungus can remain in the soil for at least 8 years. It is not as important to determine which of the two viruses is present as it is to determine that the symptoms are not due to other causes (fungal, bacterial, etc.). Fields at risk are those that have had several crops of winter wheat in the past 8–10 years. Yield losses range from less than 5%–40%, but generally losses are low. Symptoms usually appear early in the spring when growth resumes. The optimum temperature for symptom development is 5°C–15°C.
Table 16–4. Comparison of cereal viruses (BYDV, SBWMV and WSSMV)Virus Transmission Major Symptoms Additional Hosts
Barley yellow dwarf virus (BYDV)
aphids general chlorosis, reddening, purpling, stunting
barley, oats, corn, sorghum, millet, grasses
Soil-borne wheat mosaic virus (SBWMV)
soil-borne fungus (Polymyxa graminis)
yellow-green mosaic, stunting, resetting rye, barley, grasses, sorghum
Wheat spindle streak mosaic virus (WSSMV)
soil-borne fungus (Polymyxa graminis)
green-yellow mosaic, streaks, spindles rye, barley
393
16. dIseases oF FIeld crops
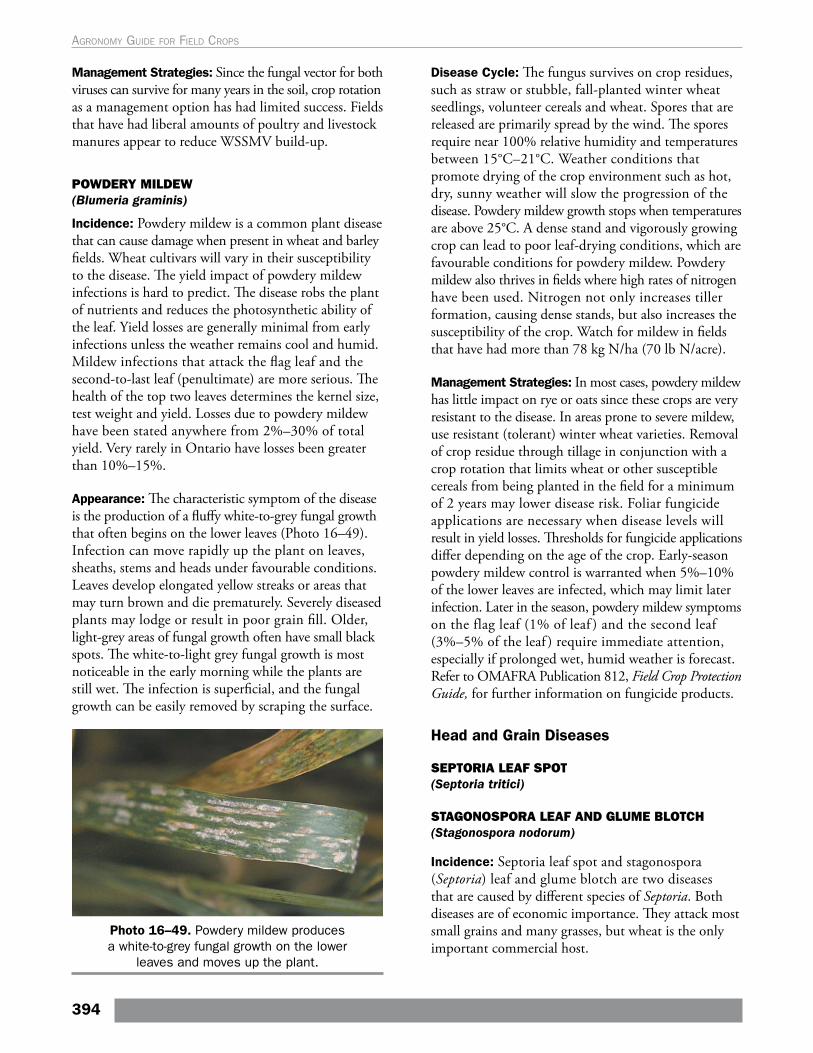
Management Strategies: Since the fungal vector for both viruses can survive for many years in the soil, crop rotation as a management option has had limited success. Fields that have had liberal amounts of poultry and livestock manures appear to reduce WSSMV build-up.
POWDERY MILDEW (Blumeria graminis)
Incidence: Powdery mildew is a common plant disease that can cause damage when present in wheat and barley fields. Wheat cultivars will vary in their susceptibility to the disease. The yield impact of powdery mildew infections is hard to predict. The disease robs the plant of nutrients and reduces the photosynthetic ability of the leaf. Yield losses are generally minimal from early infections unless the weather remains cool and humid. Mildew infections that attack the flag leaf and the second-to-last leaf (penultimate) are more serious. The health of the top two leaves determines the kernel size, test weight and yield. Losses due to powdery mildew have been stated anywhere from 2%–30% of total yield. Very rarely in Ontario have losses been greater than 10%–15%.
Appearance: The characteristic symptom of the disease is the production of a fluffy white-to-grey fungal growth that often begins on the lower leaves (Photo 16–49). Infection can move rapidly up the plant on leaves, sheaths, stems and heads under favourable conditions. Leaves develop elongated yellow streaks or areas that may turn brown and die prematurely. Severely diseased plants may lodge or result in poor grain fill. Older, light-grey areas of fungal growth often have small black spots. The white-to-light grey fungal growth is most noticeable in the early morning while the plants are still wet. The infection is superficial, and the fungal growth can be easily removed by scraping the surface.
Photo 16–49. Powdery mildew produces a white-to-grey fungal growth on the lower
leaves and moves up the plant.
Disease Cycle: The fungus survives on crop residues, such as straw or stubble, fall-planted winter wheat seedlings, volunteer cereals and wheat. Spores that are released are primarily spread by the wind. The spores require near 100% relative humidity and temperatures between 15°C–21°C. Weather conditions that promote drying of the crop environment such as hot, dry, sunny weather will slow the progression of the disease. Powdery mildew growth stops when temperatures are above 25°C. A dense stand and vigorously growing crop can lead to poor leaf-drying conditions, which are favourable conditions for powdery mildew. Powdery mildew also thrives in fields where high rates of nitrogen have been used. Nitrogen not only increases tiller formation, causing dense stands, but also increases the susceptibility of the crop. Watch for mildew in fields that have had more than 78 kg N/ha (70 lb N/acre).
Management Strategies: In most cases, powdery mildew has little impact on rye or oats since these crops are very resistant to the disease. In areas prone to severe mildew, use resistant (tolerant) winter wheat varieties. Removal of crop residue through tillage in conjunction with a crop rotation that limits wheat or other susceptible cereals from being planted in the field for a minimum of 2 years may lower disease risk. Foliar fungicide applications are necessary when disease levels will result in yield losses. Thresholds for fungicide applications differ depending on the age of the crop. Early-season powdery mildew control is warranted when 5%–10% of the lower leaves are infected, which may limit later infection. Later in the season, powdery mildew symptoms on the flag leaf (1% of leaf ) and the second leaf (3%–5% of the leaf ) require immediate attention, especially if prolonged wet, humid weather is forecast. Refer to OMAFRA Publication 812, Field Crop Protection Guide, for further information on fungicide products.
Head and Grain Diseases
SEPTORIA LEAF SPOT (Septoria tritici)
STAGONOSPORA LEAF AND GLUME BLOTCH (Stagonospora nodorum)
Incidence: Septoria leaf spot and stagonospora (Septoria) leaf and glume blotch are two diseases that are caused by different species of Septoria. Both diseases are of economic importance. They attack most small grains and many grasses, but wheat is the only important commercial host.
394
Agronomy guide for field Crops
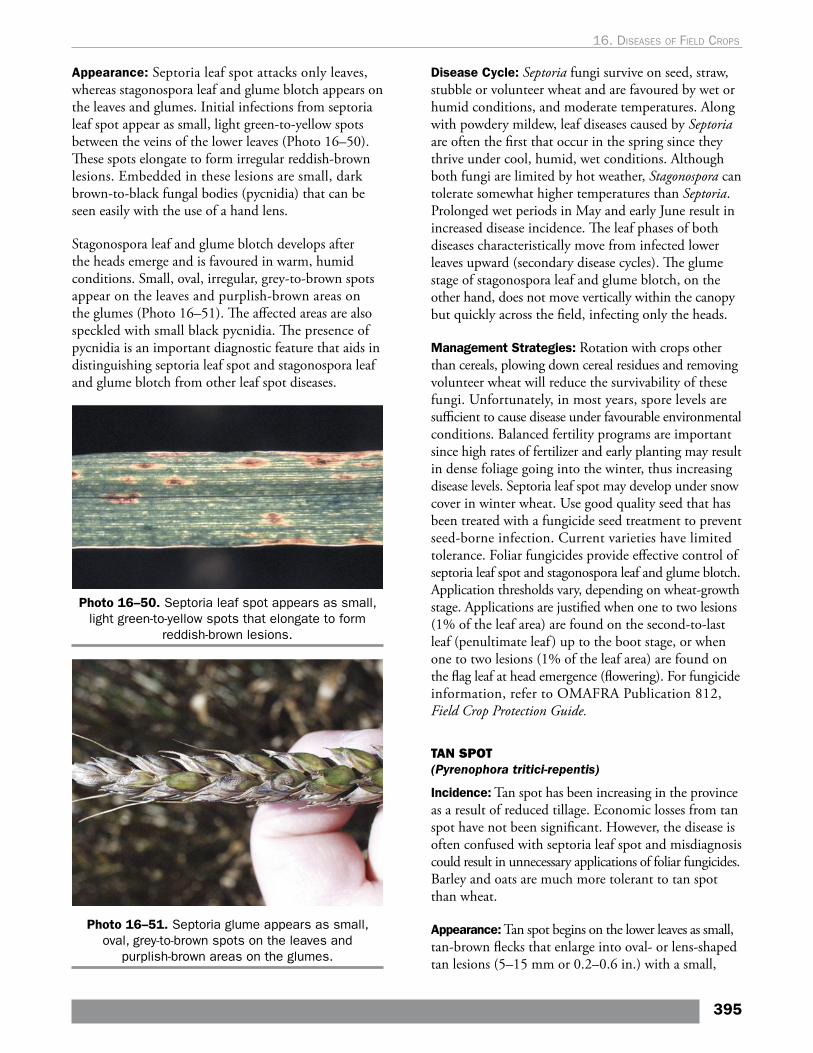
Appearance: Septoria leaf spot attacks only leaves, whereas stagonospora leaf and glume blotch appears on the leaves and glumes. Initial infections from septoria leaf spot appear as small, light green-to-yellow spots between the veins of the lower leaves (Photo 16–50). These spots elongate to form irregular reddish-brown lesions. Embedded in these lesions are small, dark brown-to-black fungal bodies (pycnidia) that can be seen easily with the use of a hand lens.
Stagonospora leaf and glume blotch develops after the heads emerge and is favoured in warm, humid conditions. Small, oval, irregular, grey-to-brown spots appear on the leaves and purplish-brown areas on the glumes (Photo 16–51). The affected areas are also speckled with small black pycnidia. The presence of pycnidia is an important diagnostic feature that aids in distinguishing septoria leaf spot and stagonospora leaf and glume blotch from other leaf spot diseases.
Photo 16–50. Septoria leaf spot appears as small, light green-to-yellow spots that elongate to form
reddish-brown lesions.
Photo 16–51. Septoria glume appears as small, oval, grey-to-brown spots on the leaves and
purplish-brown areas on the glumes.
Disease Cycle: Septoria fungi survive on seed, straw, stubble or volunteer wheat and are favoured by wet or humid conditions, and moderate temperatures. Along with powdery mildew, leaf diseases caused by Septoria are often the first that occur in the spring since they thrive under cool, humid, wet conditions. Although both fungi are limited by hot weather, Stagonospora can tolerate somewhat higher temperatures than Septoria. Prolonged wet periods in May and early June result in increased disease incidence. The leaf phases of both diseases characteristically move from infected lower leaves upward (secondary disease cycles). The glume stage of stagonospora leaf and glume blotch, on the other hand, does not move vertically within the canopy but quickly across the field, infecting only the heads.
Management Strategies: Rotation with crops other than cereals, plowing down cereal residues and removing volunteer wheat will reduce the survivability of these fungi. Unfortunately, in most years, spore levels are sufficient to cause disease under favourable environmental conditions. Balanced fertility programs are important since high rates of fertilizer and early planting may result in dense foliage going into the winter, thus increasing disease levels. Septoria leaf spot may develop under snow cover in winter wheat. Use good quality seed that has been treated with a fungicide seed treatment to prevent seed-borne infection. Current varieties have limited tolerance. Foliar fungicides provide effective control of septoria leaf spot and stagonospora leaf and glume blotch. Application thresholds vary, depending on wheat-growth stage. Applications are justified when one to two lesions (1% of the leaf area) are found on the second-to-last leaf (penultimate leaf ) up to the boot stage, or when one to two lesions (1% of the leaf area) are found on the flag leaf at head emergence (flowering). For fungicide information, refer to OMAFRA Publication 812, Field Crop Protection Guide.
TAN SPOT (Pyrenophora tritici-repentis)
Incidence: Tan spot has been increasing in the province as a result of reduced tillage. Economic losses from tan spot have not been significant. However, the disease is often confused with septoria leaf spot and misdiagnosis could result in unnecessary applications of foliar fungicides. Barley and oats are much more tolerant to tan spot than wheat.
Appearance: Tan spot begins on the lower leaves as small, tan-brown flecks that enlarge into oval- or lens-shaped tan lesions (5–15 mm or 0.2–0.6 in.) with a small,
395
16. dIseases oF FIeld crops
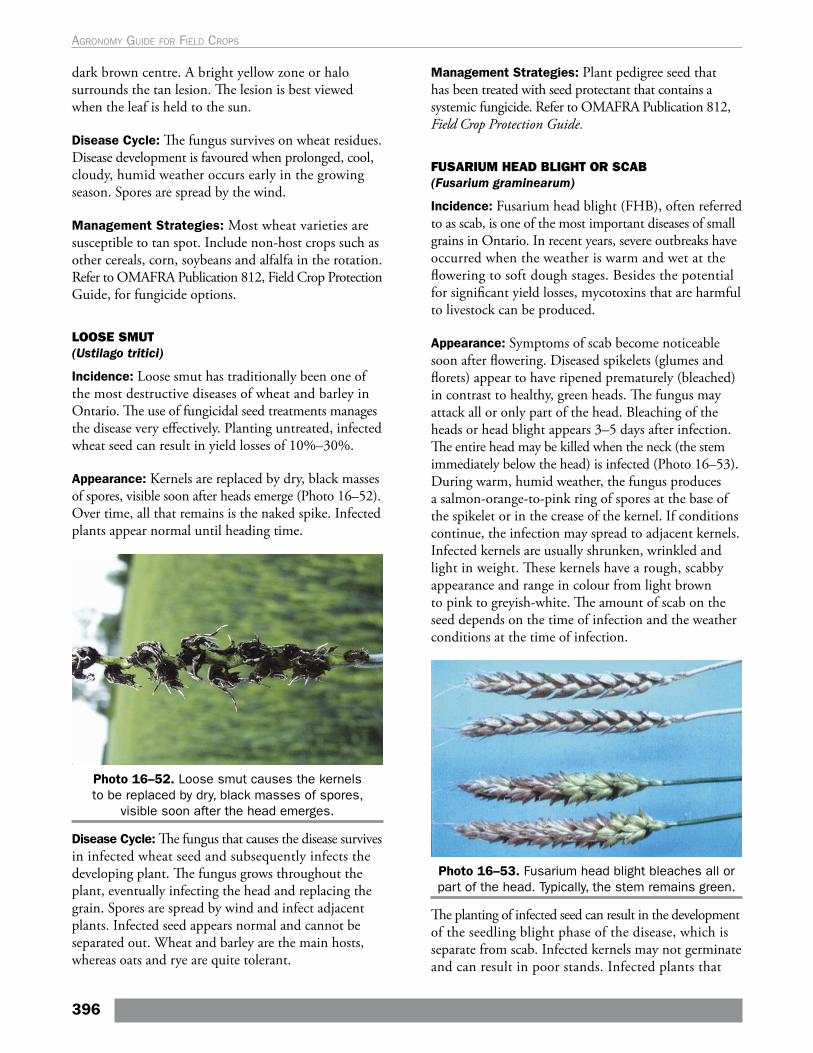
dark brown centre. A bright yellow zone or halo surrounds the tan lesion. The lesion is best viewed when the leaf is held to the sun.
Disease Cycle: The fungus survives on wheat residues. Disease development is favoured when prolonged, cool, cloudy, humid weather occurs early in the growing season. Spores are spread by the wind.
Management Strategies: Most wheat varieties are susceptible to tan spot. Include non-host crops such as other cereals, corn, soybeans and alfalfa in the rotation. Refer to OMAFRA Publication 812, Field Crop Protection Guide, for fungicide options.
LOOSE SMUT (Ustilago tritici)
Incidence: Loose smut has traditionally been one of the most destructive diseases of wheat and barley in Ontario. The use of fungicidal seed treatments manages the disease very effectively. Planting untreated, infected wheat seed can result in yield losses of 10%–30%.
Appearance: Kernels are replaced by dry, black masses of spores, visible soon after heads emerge (Photo 16–52). Over time, all that remains is the naked spike. Infected plants appear normal until heading time.
Photo 16–52. Loose smut causes the kernels to be replaced by dry, black masses of spores,
visible soon after the head emerges.
Disease Cycle: The fungus that causes the disease survives in infected wheat seed and subsequently infects the developing plant. The fungus grows throughout the plant, eventually infecting the head and replacing the grain. Spores are spread by wind and infect adjacent plants. Infected seed appears normal and cannot be separated out. Wheat and barley are the main hosts, whereas oats and rye are quite tolerant.
Management Strategies: Plant pedigree seed that has been treated with seed protectant that contains a systemic fungicide. Refer to OMAFRA Publication 812, Field Crop Protection Guide.
FUSARIUM HEAD BLIGHT OR SCAB (Fusarium graminearum)
Incidence: Fusarium head blight (FHB), often referred to as scab, is one of the most important diseases of small grains in Ontario. In recent years, severe outbreaks have occurred when the weather is warm and wet at the flowering to soft dough stages. Besides the potential for significant yield losses, mycotoxins that are harmful to livestock can be produced.
Appearance: Symptoms of scab become noticeable soon after flowering. Diseased spikelets (glumes and florets) appear to have ripened prematurely (bleached) in contrast to healthy, green heads. The fungus may attack all or only part of the head. Bleaching of the heads or head blight appears 3–5 days after infection. The entire head may be killed when the neck (the stem immediately below the head) is infected (Photo 16–53). During warm, humid weather, the fungus produces a salmon-orange-to-pink ring of spores at the base of the spikelet or in the crease of the kernel. If conditions continue, the infection may spread to adjacent kernels. Infected kernels are usually shrunken, wrinkled and light in weight. These kernels have a rough, scabby appearance and range in colour from light brown to pink to greyish-white. The amount of scab on the seed depends on the time of infection and the weather conditions at the time of infection.
Photo 16–53. Fusarium head blight bleaches all or part of the head. Typically, the stem remains green.
The planting of infected seed can result in the development of the seedling blight phase of the disease, which is separate from scab. Infected kernels may not germinate and can result in poor stands. Infected plants that
396
Agronomy guide for field Crops
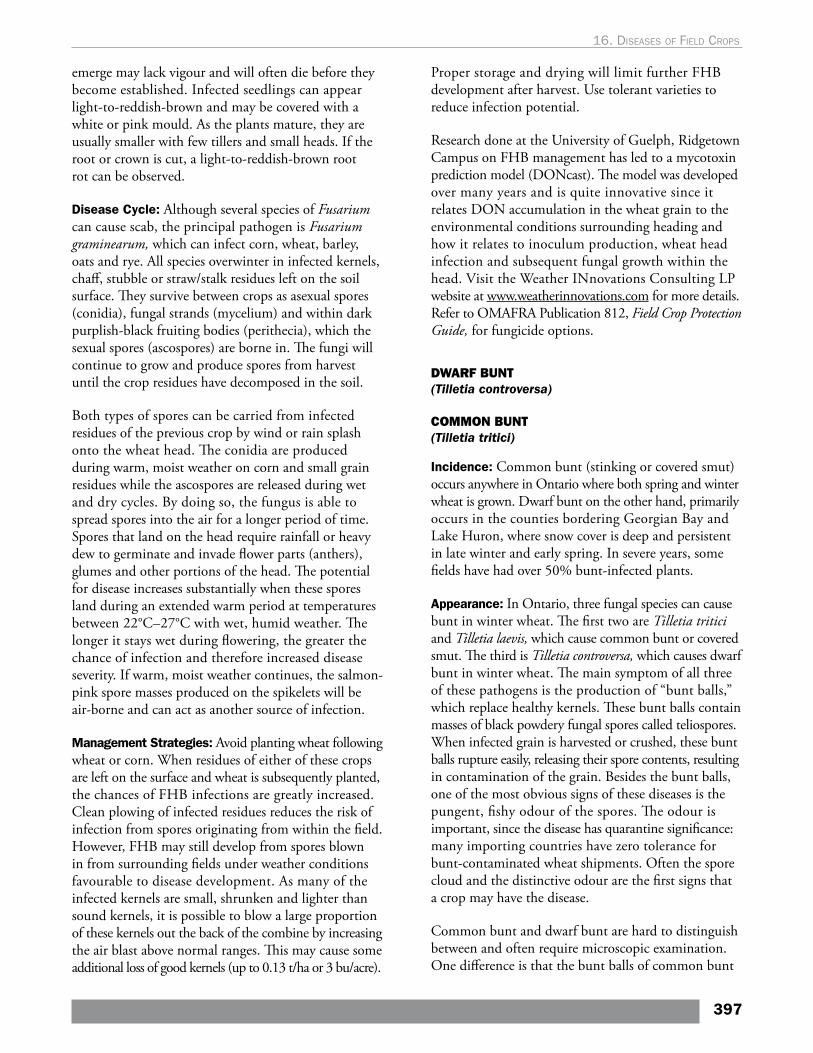
emerge may lack vigour and will often die before they become established. Infected seedlings can appear light-to-reddish-brown and may be covered with a white or pink mould. As the plants mature, they are usually smaller with few tillers and small heads. If the root or crown is cut, a light-to-reddish-brown root rot can be observed.
Disease Cycle: Although several species of Fusarium can cause scab, the principal pathogen is Fusarium graminearum, which can infect corn, wheat, barley, oats and rye. All species overwinter in infected kernels, chaff, stubble or straw/stalk residues left on the soil surface. They survive between crops as asexual spores (conidia), fungal strands (mycelium) and within dark purplish-black fruiting bodies (perithecia), which the sexual spores (ascospores) are borne in. The fungi will continue to grow and produce spores from harvest until the crop residues have decomposed in the soil.
Both types of spores can be carried from infected residues of the previous crop by wind or rain splash onto the wheat head. The conidia are produced during warm, moist weather on corn and small grain residues while the ascospores are released during wet and dry cycles. By doing so, the fungus is able to spread spores into the air for a longer period of time. Spores that land on the head require rainfall or heavy dew to germinate and invade flower parts (anthers), glumes and other portions of the head. The potential for disease increases substantially when these spores land during an extended warm period at temperatures between 22°C–27°C with wet, humid weather. The longer it stays wet during flowering, the greater the chance of infection and therefore increased disease severity. If warm, moist weather continues, the salmon-pink spore masses produced on the spikelets will be air-borne and can act as another source of infection.
Management Strategies: Avoid planting wheat following wheat or corn. When residues of either of these crops are left on the surface and wheat is subsequently planted, the chances of FHB infections are greatly increased. Clean plowing of infected residues reduces the risk of infection from spores originating from within the field. However, FHB may still develop from spores blown in from surrounding fields under weather conditions favourable to disease development. As many of the infected kernels are small, shrunken and lighter than sound kernels, it is possible to blow a large proportion of these kernels out the back of the combine by increasing the air blast above normal ranges. This may cause some additional loss of good kernels (up to 0.13 t/ha or 3 bu/acre).
Proper storage and drying will limit further FHB development after harvest. Use tolerant varieties to reduce infection potential.
Research done at the University of Guelph, Ridgetown Campus on FHB management has led to a mycotoxin prediction model (DONcast). The model was developed over many years and is quite innovative since it relates DON accumulation in the wheat grain to the environmental conditions surrounding heading and how it relates to inoculum production, wheat head infection and subsequent fungal growth within the head. Visit the Weather INnovations Consulting LP website at www.weatherinnovations.com for more details. Refer to OMAFRA Publication 812, Field Crop Protection Guide, for fungicide options.
DWARF BUNT (Tilletia controversa)
COMMON BUNT (Tilletia tritici)
Incidence: Common bunt (stinking or covered smut) occurs anywhere in Ontario where both spring and winter wheat is grown. Dwarf bunt on the other hand, primarily occurs in the counties bordering Georgian Bay and Lake Huron, where snow cover is deep and persistent in late winter and early spring. In severe years, some fields have had over 50% bunt-infected plants.
Appearance: In Ontario, three fungal species can cause bunt in winter wheat. The first two are Tilletia tritici and Tilletia laevis, which cause common bunt or covered smut. The third is Tilletia controversa, which causes dwarf bunt in winter wheat. The main symptom of all three of these pathogens is the production of “bunt balls,” which replace healthy kernels. These bunt balls contain masses of black powdery fungal spores called teliospores. When infected grain is harvested or crushed, these bunt balls rupture easily, releasing their spore contents, resulting in contamination of the grain. Besides the bunt balls, one of the most obvious signs of these diseases is the pungent, fishy odour of the spores. The odour is important, since the disease has quarantine significance: many importing countries have zero tolerance for bunt-contaminated wheat shipments. Often the spore cloud and the distinctive odour are the first signs that a crop may have the disease.
Common bunt and dwarf bunt are hard to distinguish between and often require microscopic examination. One difference is that the bunt balls of common bunt
397
16. dIseases oF FIeld crops
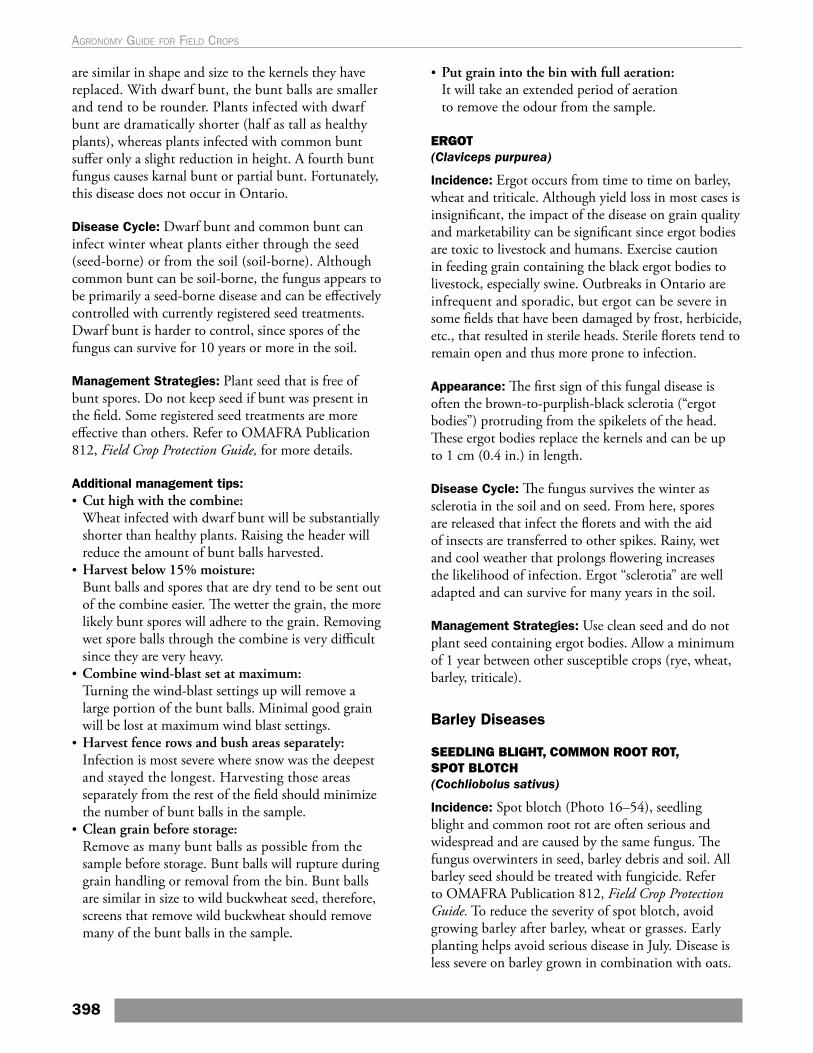
are similar in shape and size to the kernels they have replaced. With dwarf bunt, the bunt balls are smaller and tend to be rounder. Plants infected with dwarf bunt are dramatically shorter (half as tall as healthy plants), whereas plants infected with common bunt suffer only a slight reduction in height. A fourth bunt fungus causes karnal bunt or partial bunt. Fortunately, this disease does not occur in Ontario.
Disease Cycle: Dwarf bunt and common bunt can infect winter wheat plants either through the seed (seed-borne) or from the soil (soil-borne). Although common bunt can be soil-borne, the fungus appears to be primarily a seed-borne disease and can be effectively controlled with currently registered seed treatments. Dwarf bunt is harder to control, since spores of the fungus can survive for 10 years or more in the soil.
Management Strategies: Plant seed that is free of bunt spores. Do not keep seed if bunt was present in the field. Some registered seed treatments are more effective than others. Refer to OMAFRA Publication 812, Field Crop Protection Guide, for more details.
Additional management tips: • Cut high with the combine: Wheat infected with dwarf bunt will be substantially
shorter than healthy plants. Raising the header will reduce the amount of bunt balls harvested.
• Harvest below 15% moisture: Bunt balls and spores that are dry tend to be sent out
of the combine easier. The wetter the grain, the more likely bunt spores will adhere to the grain. Removing wet spore balls through the combine is very difficult since they are very heavy.
• Combine wind-blast set at maximum: Turning the wind-blast settings up will remove a
large portion of the bunt balls. Minimal good grain will be lost at maximum wind blast settings.
• Harvest fence rows and bush areas separately: Infection is most severe where snow was the deepest
and stayed the longest. Harvesting those areas separately from the rest of the field should minimize the number of bunt balls in the sample.
• Clean grain before storage: Remove as many bunt balls as possible from the
sample before storage. Bunt balls will rupture during grain handling or removal from the bin. Bunt balls are similar in size to wild buckwheat seed, therefore, screens that remove wild buckwheat should remove many of the bunt balls in the sample.
• Put grain into the bin with full aeration: It will take an extended period of aeration
to remove the odour from the sample.
ERGOT (Claviceps purpurea)
Incidence: Ergot occurs from time to time on barley, wheat and triticale. Although yield loss in most cases is insignificant, the impact of the disease on grain quality and marketability can be significant since ergot bodies are toxic to livestock and humans. Exercise caution in feeding grain containing the black ergot bodies to livestock, especially swine. Outbreaks in Ontario are infrequent and sporadic, but ergot can be severe in some fields that have been damaged by frost, herbicide, etc., that resulted in sterile heads. Sterile florets tend to remain open and thus more prone to infection.
Appearance: The first sign of this fungal disease is often the brown-to-purplish-black sclerotia (“ergot bodies”) protruding from the spikelets of the head. These ergot bodies replace the kernels and can be up to 1 cm (0.4 in.) in length.
Disease Cycle: The fungus survives the winter as sclerotia in the soil and on seed. From here, spores are released that infect the florets and with the aid of insects are transferred to other spikes. Rainy, wet and cool weather that prolongs flowering increases the likelihood of infection. Ergot “sclerotia” are well adapted and can survive for many years in the soil.
Management Strategies: Use clean seed and do not plant seed containing ergot bodies. Allow a minimum of 1 year between other susceptible crops (rye, wheat, barley, triticale).
Barley Diseases
SEEDLING BLIGHT, COMMON ROOT ROT, SPOT BLOTCH (Cochliobolus sativus)
Incidence: Spot blotch (Photo 16–54), seedling blight and common root rot are often serious and widespread and are caused by the same fungus. The fungus overwinters in seed, barley debris and soil. All barley seed should be treated with fungicide. Refer to OMAFRA Publication 812, Field Crop Protection Guide. To reduce the severity of spot blotch, avoid growing barley after barley, wheat or grasses. Early planting helps avoid serious disease in July. Disease is less severe on barley grown in combination with oats.
398
Agronomy guide for field Crops
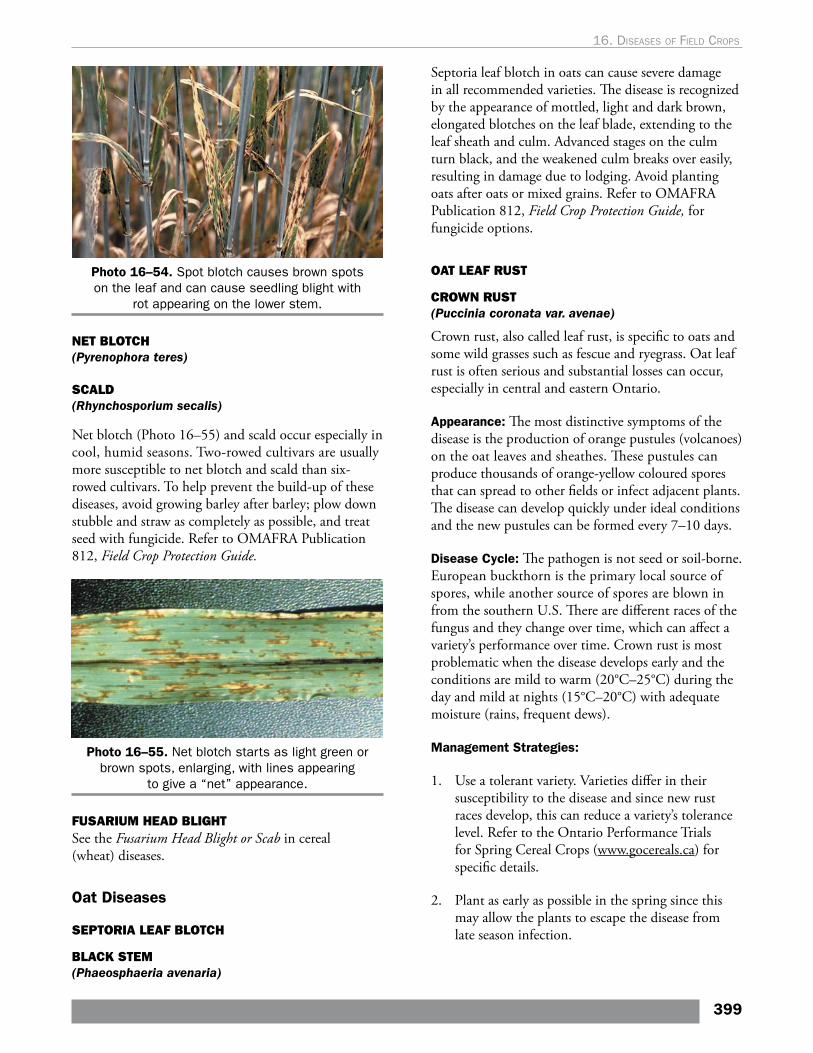
Photo 16–54. Spot blotch causes brown spots on the leaf and can cause seedling blight with
rot appearing on the lower stem.
NET BLOTCH (Pyrenophora teres)
SCALD (Rhynchosporium secalis)
Net blotch (Photo 16–55) and scald occur especially in cool, humid seasons. Two-rowed cultivars are usually more susceptible to net blotch and scald than six-rowed cultivars. To help prevent the build-up of these diseases, avoid growing barley after barley; plow down stubble and straw as completely as possible, and treat seed with fungicide. Refer to OMAFRA Publication 812, Field Crop Protection Guide.
Photo 16–55. Net blotch starts as light green or brown spots, enlarging, with lines appearing
to give a “net” appearance.
FUSARIUM HEAD BLIGHTSee the Fusarium Head Blight or Scab in cereal (wheat) diseases.
Oat Diseases
SEPTORIA LEAF BLOTCH
BLACK STEM (Phaeosphaeria avenaria)
Septoria leaf blotch in oats can cause severe damage in all recommended varieties. The disease is recognized by the appearance of mottled, light and dark brown, elongated blotches on the leaf blade, extending to the leaf sheath and culm. Advanced stages on the culm turn black, and the weakened culm breaks over easily, resulting in damage due to lodging. Avoid planting oats after oats or mixed grains. Refer to OMAFRA Publication 812, Field Crop Protection Guide, for fungicide options.
OAT LEAF RUST
CROWN RUST (Puccinia coronata var. avenae)
Crown rust, also called leaf rust, is specific to oats and some wild grasses such as fescue and ryegrass. Oat leaf rust is often serious and substantial losses can occur, especially in central and eastern Ontario.
Appearance: The most distinctive symptoms of the disease is the production of orange pustules (volcanoes) on the oat leaves and sheathes. These pustules can produce thousands of orange-yellow coloured spores that can spread to other fields or infect adjacent plants. The disease can develop quickly under ideal conditions and the new pustules can be formed every 7–10 days.
Disease Cycle: The pathogen is not seed or soil-borne. European buckthorn is the primary local source of spores, while another source of spores are blown in from the southern U.S. There are different races of the fungus and they change over time, which can affect a variety’s performance over time. Crown rust is most problematic when the disease develops early and the conditions are mild to warm (20°C–25°C) during the day and mild at nights (15°C–20°C) with adequate moisture (rains, frequent dews).
Management Strategies:
1. Use a tolerant variety. Varieties differ in their susceptibility to the disease and since new rust races develop, this can reduce a variety’s tolerance level. Refer to the Ontario Performance Trials for Spring Cereal Crops (www.gocereals.ca) for specific details.
2. Plant as early as possible in the spring since this may allow the plants to escape the disease from late season infection.
399
16. dIseases oF FIeld crops
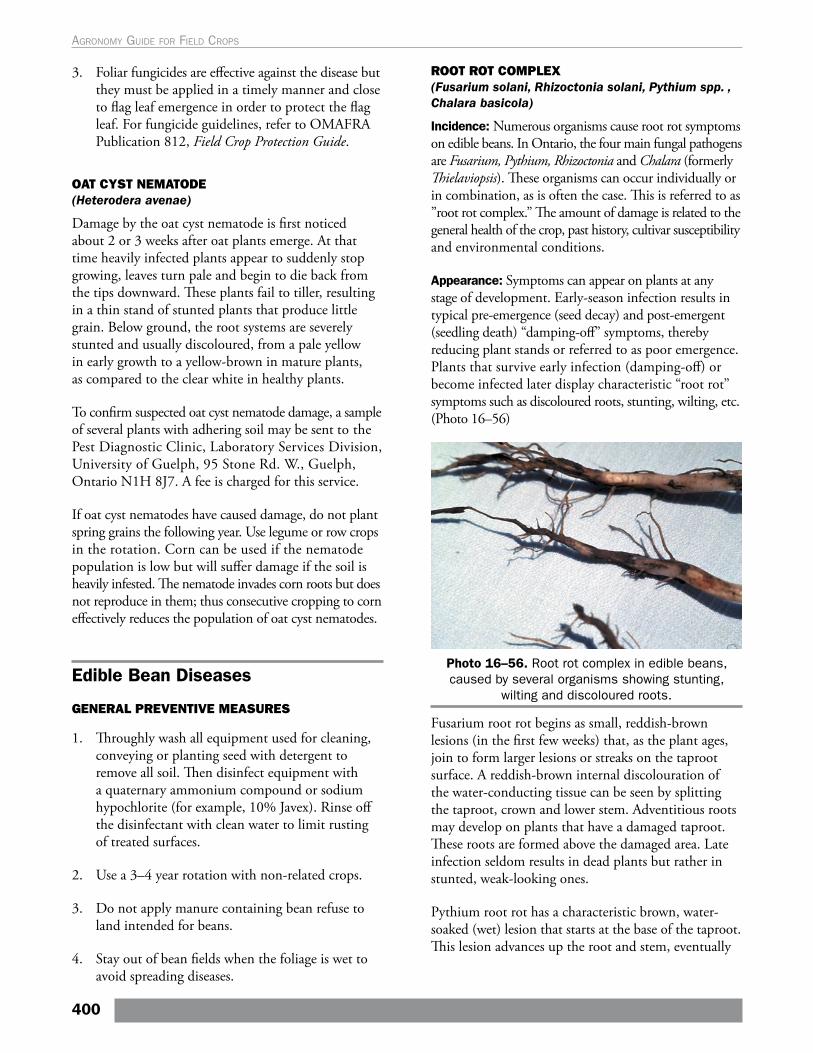
3. Foliar fungicides are effective against the disease but they must be applied in a timely manner and close to flag leaf emergence in order to protect the flag leaf. For fungicide guidelines, refer to OMAFRA Publication 812, Field Crop Protection Guide.
OAT CYST NEMATODE (Heterodera avenae)
Damage by the oat cyst nematode is first noticed about 2 or 3 weeks after oat plants emerge. At that time heavily infected plants appear to suddenly stop growing, leaves turn pale and begin to die back from the tips downward. These plants fail to tiller, resulting in a thin stand of stunted plants that produce little grain. Below ground, the root systems are severely stunted and usually discoloured, from a pale yellow in early growth to a yellow-brown in mature plants, as compared to the clear white in healthy plants.
To confirm suspected oat cyst nematode damage, a sample of several plants with adhering soil may be sent to the Pest Diagnostic Clinic, Laboratory Services Division, University of Guelph, 95 Stone Rd. W., Guelph, Ontario N1H 8J7. A fee is charged for this service.
If oat cyst nematodes have caused damage, do not plant spring grains the following year. Use legume or row crops in the rotation. Corn can be used if the nematode population is low but will suffer damage if the soil is heavily infested. The nematode invades corn roots but does not reproduce in them; thus consecutive cropping to corn effectively reduces the population of oat cyst nematodes.
Edible Bean Diseases
GENERAL PREVENTIVE MEASURES
1. Throughly wash all equipment used for cleaning, conveying or planting seed with detergent to remove all soil. Then disinfect equipment with a quaternary ammonium compound or sodium hypochlorite (for example, 10% Javex). Rinse off the disinfectant with clean water to limit rusting of treated surfaces.
2. Use a 3–4 year rotation with non-related crops.
3. Do not apply manure containing bean refuse to land intended for beans.
4. Stay out of bean fields when the foliage is wet to avoid spreading diseases.
ROOT ROT COMPLEX (Fusarium solani, Rhizoctonia solani, Pythium spp. , Chalara basicola)
Incidence: Numerous organisms cause root rot symptoms on edible beans. In Ontario, the four main fungal pathogens are Fusarium, Pythium, Rhizoctonia and Chalara (formerly Thielaviopsis). These organisms can occur individually or in combination, as is often the case. This is referred to as ”root rot complex.” The amount of damage is related to the general health of the crop, past history, cultivar susceptibility and environmental conditions.
Appearance: Symptoms can appear on plants at any stage of development. Early-season infection results in typical pre-emergence (seed decay) and post-emergent (seedling death) “damping-off” symptoms, thereby reducing plant stands or referred to as poor emergence. Plants that survive early infection (damping-off) or become infected later display characteristic “root rot” symptoms such as discoloured roots, stunting, wilting, etc. (Photo 16–56)
Photo 16–56. Root rot complex in edible beans, caused by several organisms showing stunting,
wilting and discoloured roots.
Fusarium root rot begins as small, reddish-brown lesions (in the first few weeks) that, as the plant ages, join to form larger lesions or streaks on the taproot surface. A reddish-brown internal discolouration of the water-conducting tissue can be seen by splitting the taproot, crown and lower stem. Adventitious roots may develop on plants that have a damaged taproot. These roots are formed above the damaged area. Late infection seldom results in dead plants but rather in stunted, weak-looking ones.
Pythium root rot has a characteristic brown, water-soaked (wet) lesion that starts at the base of the taproot. This lesion advances up the root and stem, eventually
400
Agronomy guide for field Crops
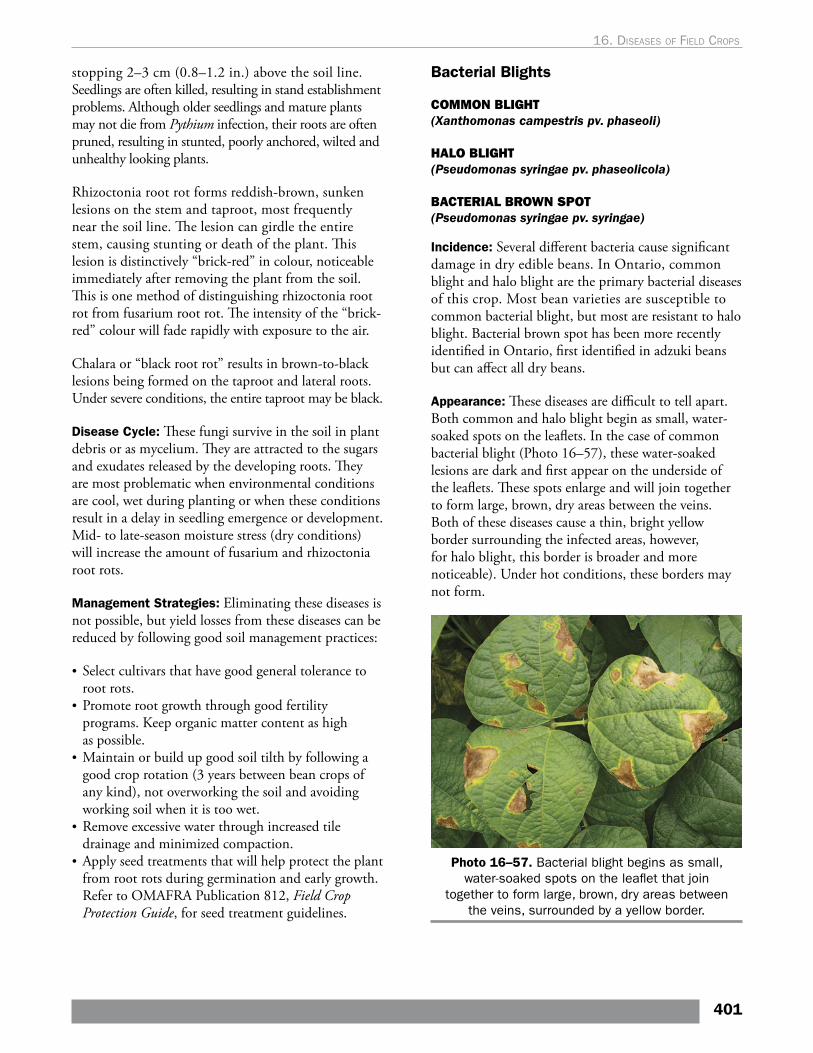
stopping 2–3 cm (0.8–1.2 in.) above the soil line. Seedlings are often killed, resulting in stand establishment problems. Although older seedlings and mature plants may not die from Pythium infection, their roots are often pruned, resulting in stunted, poorly anchored, wilted and unhealthy looking plants.
Rhizoctonia root rot forms reddish-brown, sunken lesions on the stem and taproot, most frequently near the soil line. The lesion can girdle the entire stem, causing stunting or death of the plant. This lesion is distinctively “brick-red” in colour, noticeable immediately after removing the plant from the soil. This is one method of distinguishing rhizoctonia root rot from fusarium root rot. The intensity of the “brick-red” colour will fade rapidly with exposure to the air.
Chalara or “black root rot” results in brown-to-black lesions being formed on the taproot and lateral roots. Under severe conditions, the entire taproot may be black.
Disease Cycle: These fungi survive in the soil in plant debris or as mycelium. They are attracted to the sugars and exudates released by the developing roots. They are most problematic when environmental conditions are cool, wet during planting or when these conditions result in a delay in seedling emergence or development. Mid- to late-season moisture stress (dry conditions) will increase the amount of fusarium and rhizoctonia root rots.
Management Strategies: Eliminating these diseases is not possible, but yield losses from these diseases can be reduced by following good soil management practices:
• Select cultivars that have good general tolerance to root rots.
• Promote root growth through good fertility programs. Keep organic matter content as high as possible.
• Maintain or build up good soil tilth by following a good crop rotation (3 years between bean crops of any kind), not overworking the soil and avoiding working soil when it is too wet.
• Remove excessive water through increased tile drainage and minimized compaction.
• Apply seed treatments that will help protect the plant from root rots during germination and early growth. Refer to OMAFRA Publication 812, Field Crop Protection Guide, for seed treatment guidelines.
Bacterial Blights
COMMON BLIGHT (Xanthomonas campestris pv. phaseoli)
HALO BLIGHT (Pseudomonas syringae pv. phaseolicola)
BACTERIAL BROWN SPOT (Pseudomonas syringae pv. syringae)
Incidence: Several different bacteria cause significant damage in dry edible beans. In Ontario, common blight and halo blight are the primary bacterial diseases of this crop. Most bean varieties are susceptible to common bacterial blight, but most are resistant to halo blight. Bacterial brown spot has been more recently identified in Ontario, first identified in adzuki beans but can affect all dry beans.
Appearance: These diseases are difficult to tell apart. Both common and halo blight begin as small, water-soaked spots on the leaflets. In the case of common bacterial blight (Photo 16–57), these water-soaked lesions are dark and first appear on the underside of the leaflets. These spots enlarge and will join together to form large, brown, dry areas between the veins. Both of these diseases cause a thin, bright yellow border surrounding the infected areas, however, for halo blight, this border is broader and more noticeable). Under hot conditions, these borders may not form.
Photo 16–57. Bacterial blight begins as small, water-soaked spots on the leaflet that join
together to form large, brown, dry areas between the veins, surrounded by a yellow border.
401
16. dIseases oF FIeld crops
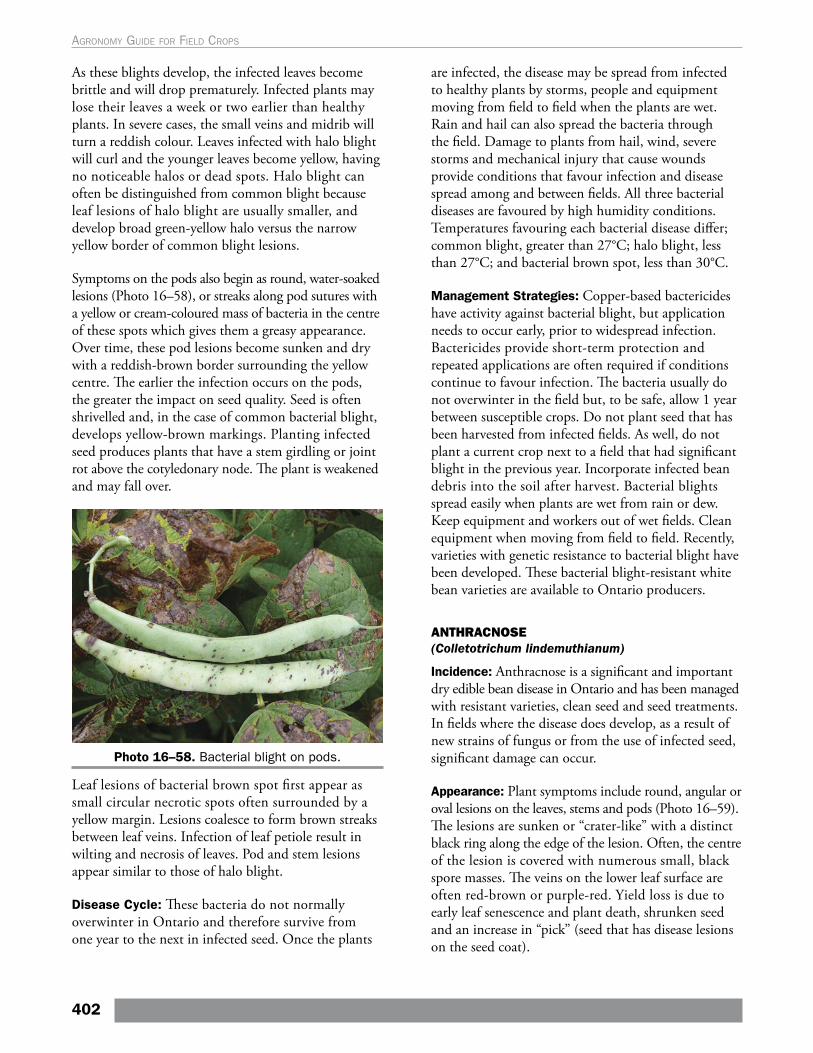
As these blights develop, the infected leaves become brittle and will drop prematurely. Infected plants may lose their leaves a week or two earlier than healthy plants. In severe cases, the small veins and midrib will turn a reddish colour. Leaves infected with halo blight will curl and the younger leaves become yellow, having no noticeable halos or dead spots. Halo blight can often be distinguished from common blight because leaf lesions of halo blight are usually smaller, and develop broad green-yellow halo versus the narrow yellow border of common blight lesions.
Symptoms on the pods also begin as round, water-soaked lesions (Photo 16–58), or streaks along pod sutures with a yellow or cream-coloured mass of bacteria in the centre of these spots which gives them a greasy appearance. Over time, these pod lesions become sunken and dry with a reddish-brown border surrounding the yellow centre. The earlier the infection occurs on the pods, the greater the impact on seed quality. Seed is often shrivelled and, in the case of common bacterial blight, develops yellow-brown markings. Planting infected seed produces plants that have a stem girdling or joint rot above the cotyledonary node. The plant is weakened and may fall over.
Photo 16–58. Bacterial blight on pods.
Leaf lesions of bacterial brown spot first appear as small circular necrotic spots often surrounded by a yellow margin. Lesions coalesce to form brown streaks between leaf veins. Infection of leaf petiole result in wilting and necrosis of leaves. Pod and stem lesions appear similar to those of halo blight.
Disease Cycle: These bacteria do not normally overwinter in Ontario and therefore survive from one year to the next in infected seed. Once the plants
are infected, the disease may be spread from infected to healthy plants by storms, people and equipment moving from field to field when the plants are wet. Rain and hail can also spread the bacteria through the field. Damage to plants from hail, wind, severe storms and mechanical injury that cause wounds provide conditions that favour infection and disease spread among and between fields. All three bacterial diseases are favoured by high humidity conditions. Temperatures favouring each bacterial disease differ; common blight, greater than 27°C; halo blight, less than 27°C; and bacterial brown spot, less than 30°C.
Management Strategies: Copper-based bactericides have activity against bacterial blight, but application needs to occur early, prior to widespread infection. Bactericides provide short-term protection and repeated applications are often required if conditions continue to favour infection. The bacteria usually do not overwinter in the field but, to be safe, allow 1 year between susceptible crops. Do not plant seed that has been harvested from infected fields. As well, do not plant a current crop next to a field that had significant blight in the previous year. Incorporate infected bean debris into the soil after harvest. Bacterial blights spread easily when plants are wet from rain or dew. Keep equipment and workers out of wet fields. Clean equipment when moving from field to field. Recently, varieties with genetic resistance to bacterial blight have been developed. These bacterial blight-resistant white bean varieties are available to Ontario producers.
ANTHRACNOSE (Colletotrichum lindemuthianum)
Incidence: Anthracnose is a significant and important dry edible bean disease in Ontario and has been managed with resistant varieties, clean seed and seed treatments. In fields where the disease does develop, as a result of new strains of fungus or from the use of infected seed, significant damage can occur.
Appearance: Plant symptoms include round, angular or oval lesions on the leaves, stems and pods (Photo 16–59). The lesions are sunken or “crater-like” with a distinct black ring along the edge of the lesion. Often, the centre of the lesion is covered with numerous small, black spore masses. The veins on the lower leaf surface are often red-brown or purple-red. Yield loss is due to early leaf senescence and plant death, shrunken seed and an increase in “pick” (seed that has disease lesions on the seed coat).
402
Agronomy guide for field Crops
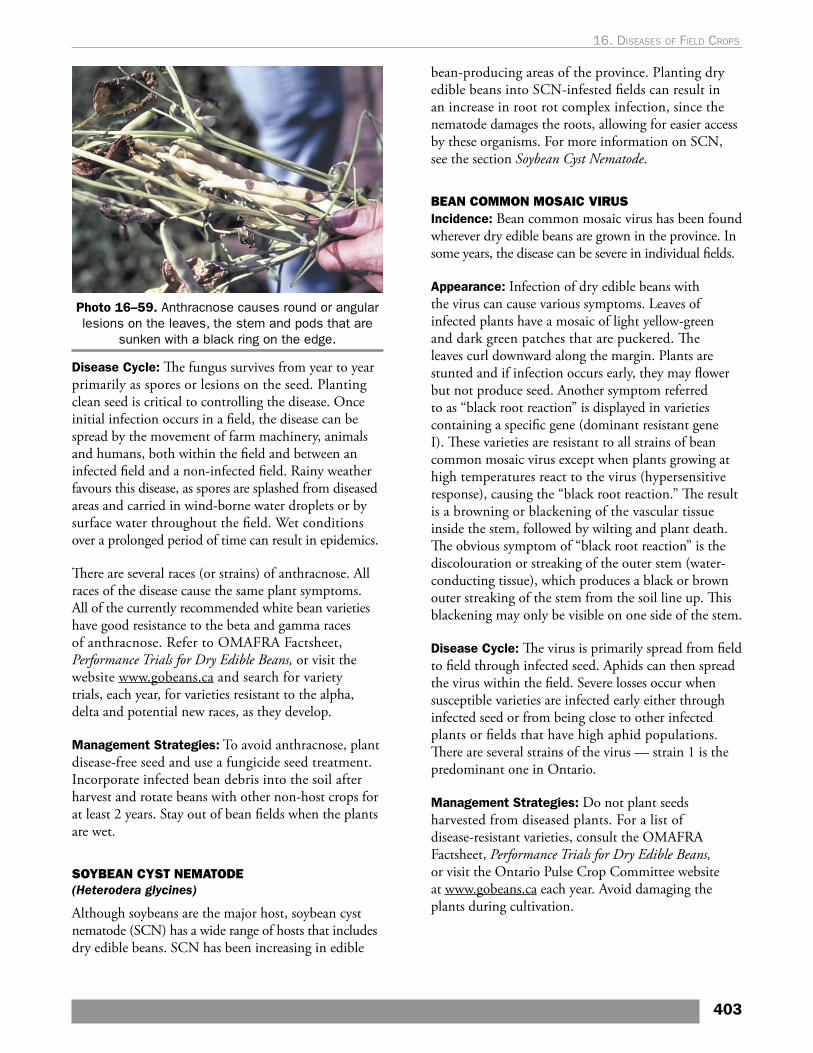
Photo 16–59. Anthracnose causes round or angular lesions on the leaves, the stem and pods that are
sunken with a black ring on the edge.
Disease Cycle: The fungus survives from year to year primarily as spores or lesions on the seed. Planting clean seed is critical to controlling the disease. Once initial infection occurs in a field, the disease can be spread by the movement of farm machinery, animals and humans, both within the field and between an infected field and a non-infected field. Rainy weather favours this disease, as spores are splashed from diseased areas and carried in wind-borne water droplets or by surface water throughout the field. Wet conditions over a prolonged period of time can result in epidemics.
There are several races (or strains) of anthracnose. All races of the disease cause the same plant symptoms. All of the currently recommended white bean varieties have good resistance to the beta and gamma races of anthracnose. Refer to OMAFRA Factsheet, Performance Trials for Dry Edible Beans, or visit the website www.gobeans.ca and search for variety trials, each year, for varieties resistant to the alpha, delta and potential new races, as they develop.
Management Strategies: To avoid anthracnose, plant disease-free seed and use a fungicide seed treatment. Incorporate infected bean debris into the soil after harvest and rotate beans with other non-host crops for at least 2 years. Stay out of bean fields when the plants are wet.
SOYBEAN CYST NEMATODE (Heterodera glycines)
Although soybeans are the major host, soybean cyst nematode (SCN) has a wide range of hosts that includes dry edible beans. SCN has been increasing in edible
bean-producing areas of the province. Planting dry edible beans into SCN-infested fields can result in an increase in root rot complex infection, since the nematode damages the roots, allowing for easier access by these organisms. For more information on SCN, see the section Soybean Cyst Nematode.
BEAN COMMON MOSAIC VIRUS Incidence: Bean common mosaic virus has been found wherever dry edible beans are grown in the province. In some years, the disease can be severe in individual fields.
Appearance: Infection of dry edible beans with the virus can cause various symptoms. Leaves of infected plants have a mosaic of light yellow-green and dark green patches that are puckered. The leaves curl downward along the margin. Plants are stunted and if infection occurs early, they may flower but not produce seed. Another symptom referred to as “black root reaction” is displayed in varieties containing a specific gene (dominant resistant gene I). These varieties are resistant to all strains of bean common mosaic virus except when plants growing at high temperatures react to the virus (hypersensitive response), causing the “black root reaction.” The result is a browning or blackening of the vascular tissue inside the stem, followed by wilting and plant death. The obvious symptom of “black root reaction” is the discolouration or streaking of the outer stem (water-conducting tissue), which produces a black or brown outer streaking of the stem from the soil line up. This blackening may only be visible on one side of the stem.
Disease Cycle: The virus is primarily spread from field to field through infected seed. Aphids can then spread the virus within the field. Severe losses occur when susceptible varieties are infected early either through infected seed or from being close to other infected plants or fields that have high aphid populations. There are several strains of the virus — strain 1 is the predominant one in Ontario.
Management Strategies: Do not plant seeds harvested from diseased plants. For a list of disease-resistant varieties, consult the OMAFRA Factsheet, Performance Trials for Dry Edible Beans, or visit the Ontario Pulse Crop Committee website at www.gobeans.ca each year. Avoid damaging the plants during cultivation.
403
16. dIseases oF FIeld crops
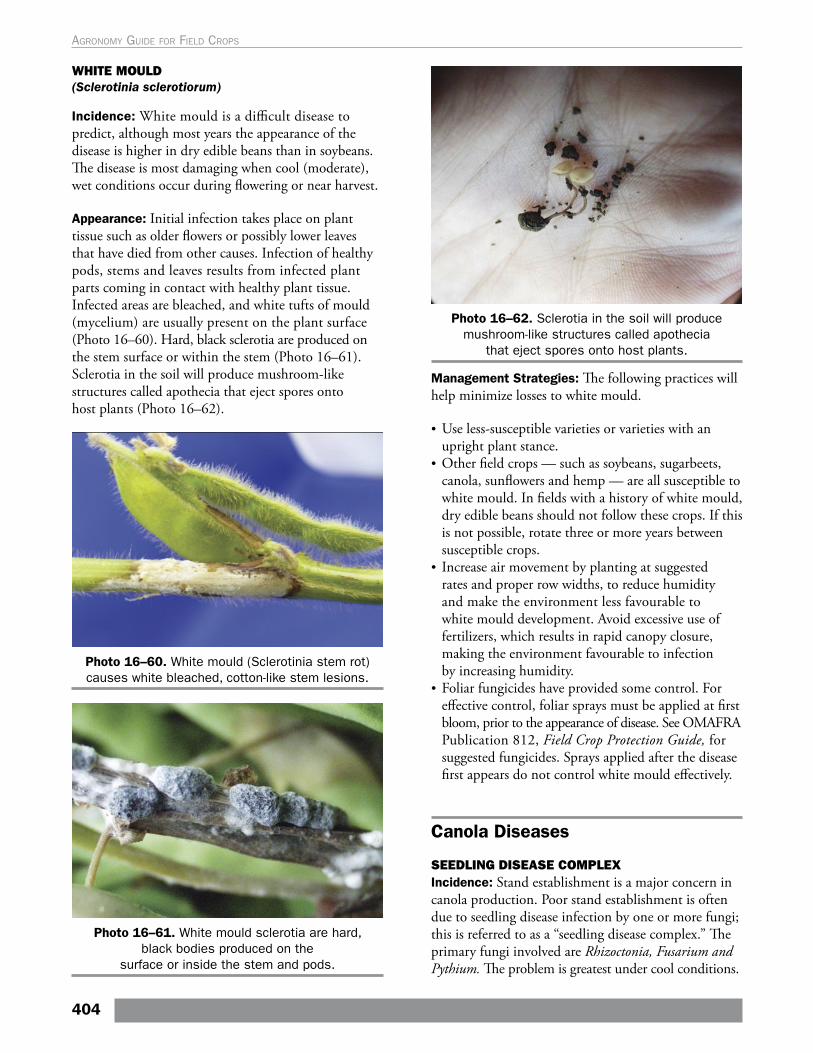
WHITE MOULD (Sclerotinia sclerotiorum)
Incidence: White mould is a difficult disease to predict, although most years the appearance of the disease is higher in dry edible beans than in soybeans. The disease is most damaging when cool (moderate), wet conditions occur during flowering or near harvest.
Appearance: Initial infection takes place on plant tissue such as older flowers or possibly lower leaves that have died from other causes. Infection of healthy pods, stems and leaves results from infected plant parts coming in contact with healthy plant tissue. Infected areas are bleached, and white tufts of mould (mycelium) are usually present on the plant surface (Photo 16–60). Hard, black sclerotia are produced on the stem surface or within the stem (Photo 16–61). Sclerotia in the soil will produce mushroom-like structures called apothecia that eject spores onto host plants (Photo 16–62).
Photo 16–60. White mould (Sclerotinia stem rot) causes white bleached, cotton-like stem lesions.
Photo 16–61. White mould sclerotia are hard, black bodies produced on the
surface or inside the stem and pods.
Photo 16–62. Sclerotia in the soil will produce mushroom-like structures called apothecia
that eject spores onto host plants.
Management Strategies: The following practices will help minimize losses to white mould.
• Use less-susceptible varieties or varieties with an upright plant stance.
• Other field crops — such as soybeans, sugarbeets, canola, sunflowers and hemp — are all susceptible to white mould. In fields with a history of white mould, dry edible beans should not follow these crops. If this is not possible, rotate three or more years between susceptible crops.
• Increase air movement by planting at suggested rates and proper row widths, to reduce humidity and make the environment less favourable to white mould development. Avoid excessive use of fertilizers, which results in rapid canopy closure, making the environment favourable to infection by increasing humidity.
• Foliar fungicides have provided some control. For effective control, foliar sprays must be applied at first bloom, prior to the appearance of disease. See OMAFRA Publication 812, Field Crop Protection Guide, for suggested fungicides. Sprays applied after the disease first appears do not control white mould effectively.
Canola Diseases
SEEDLING DISEASE COMPLEX Incidence: Stand establishment is a major concern in canola production. Poor stand establishment is often due to seedling disease infection by one or more fungi; this is referred to as a “seedling disease complex.” The primary fungi involved are Rhizoctonia, Fusarium and Pythium. The problem is greatest under cool conditions.
404
Agronomy guide for field Crops
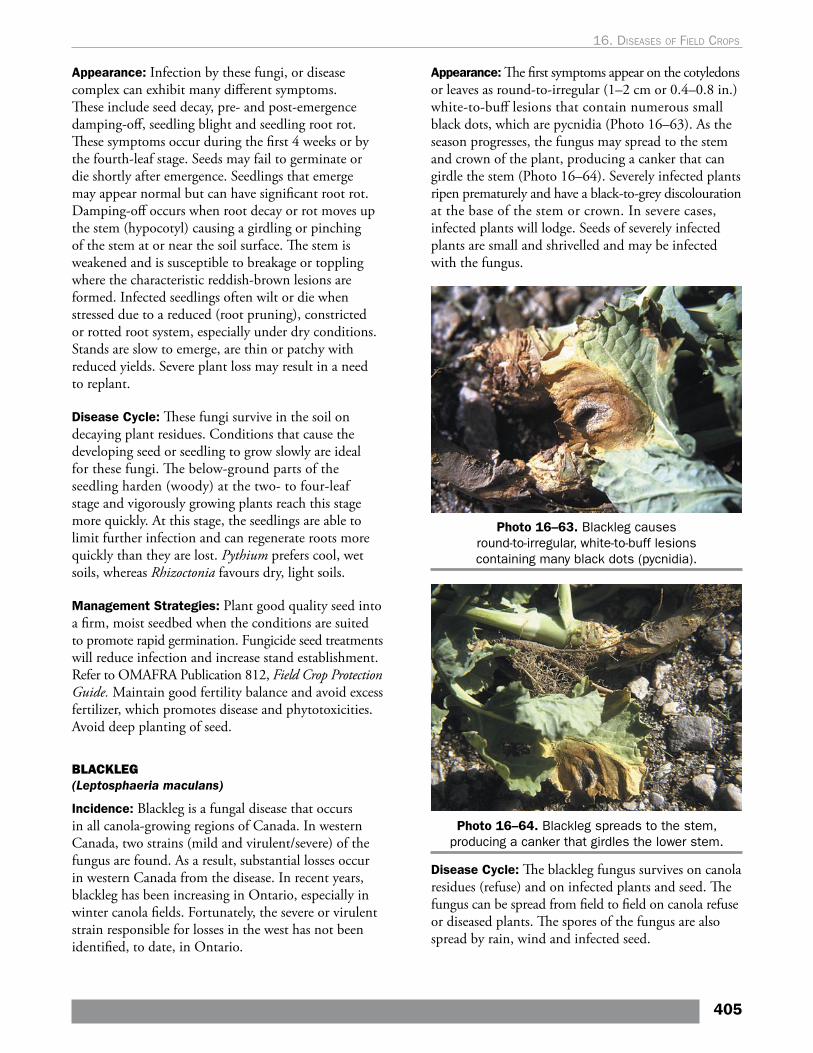
Appearance: Infection by these fungi, or disease complex can exhibit many different symptoms. These include seed decay, pre- and post-emergence damping-off, seedling blight and seedling root rot. These symptoms occur during the first 4 weeks or by the fourth-leaf stage. Seeds may fail to germinate or die shortly after emergence. Seedlings that emerge may appear normal but can have significant root rot. Damping-off occurs when root decay or rot moves up the stem (hypocotyl) causing a girdling or pinching of the stem at or near the soil surface. The stem is weakened and is susceptible to breakage or toppling where the characteristic reddish-brown lesions are formed. Infected seedlings often wilt or die when stressed due to a reduced (root pruning), constricted or rotted root system, especially under dry conditions. Stands are slow to emerge, are thin or patchy with reduced yields. Severe plant loss may result in a need to replant.
Disease Cycle: These fungi survive in the soil on decaying plant residues. Conditions that cause the developing seed or seedling to grow slowly are ideal for these fungi. The below-ground parts of the seedling harden (woody) at the two- to four-leaf stage and vigorously growing plants reach this stage more quickly. At this stage, the seedlings are able to limit further infection and can regenerate roots more quickly than they are lost. Pythium prefers cool, wet soils, whereas Rhizoctonia favours dry, light soils.
Management Strategies: Plant good quality seed into a firm, moist seedbed when the conditions are suited to promote rapid germination. Fungicide seed treatments will reduce infection and increase stand establishment. Refer to OMAFRA Publication 812, Field Crop Protection Guide. Maintain good fertility balance and avoid excess fertilizer, which promotes disease and phytotoxicities. Avoid deep planting of seed.
BLACKLEG (Leptosphaeria maculans)
Incidence: Blackleg is a fungal disease that occurs in all canola-growing regions of Canada. In western Canada, two strains (mild and virulent/severe) of the fungus are found. As a result, substantial losses occur in western Canada from the disease. In recent years, blackleg has been increasing in Ontario, especially in winter canola fields. Fortunately, the severe or virulent strain responsible for losses in the west has not been identified, to date, in Ontario.
Appearance: The first symptoms appear on the cotyledons or leaves as round-to-irregular (1–2 cm or 0.4–0.8 in.) white-to-buff lesions that contain numerous small black dots, which are pycnidia (Photo 16–63). As the season progresses, the fungus may spread to the stem and crown of the plant, producing a canker that can girdle the stem (Photo 16–64). Severely infected plants ripen prematurely and have a black-to-grey discolouration at the base of the stem or crown. In severe cases, infected plants will lodge. Seeds of severely infected plants are small and shrivelled and may be infected with the fungus.
Photo 16–63. Blackleg causes round-to-irregular, white-to-buff lesions containing many black dots (pycnidia).
Photo 16–64. Blackleg spreads to the stem, producing a canker that girdles the lower stem.
Disease Cycle: The blackleg fungus survives on canola residues (refuse) and on infected plants and seed. The fungus can be spread from field to field on canola refuse or diseased plants. The spores of the fungus are also spread by rain, wind and infected seed.
405
16. dIseases oF FIeld crops
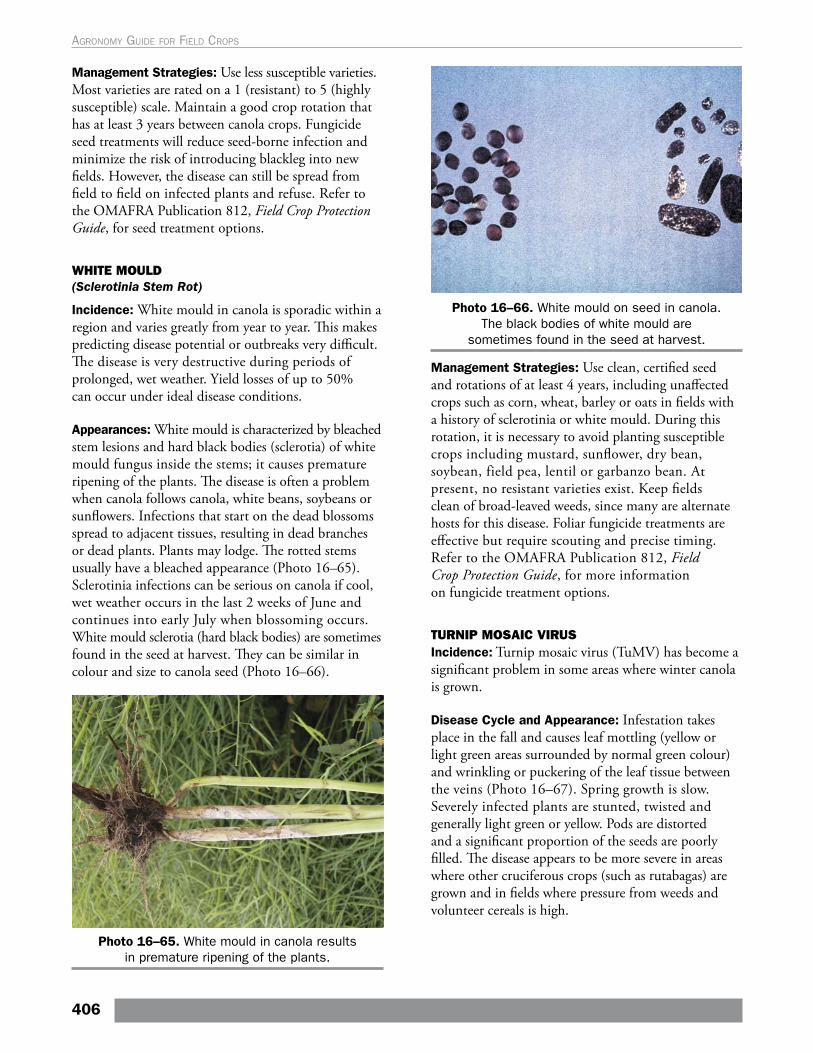
Management Strategies: Use less susceptible varieties. Most varieties are rated on a 1 (resistant) to 5 (highly susceptible) scale. Maintain a good crop rotation that has at least 3 years between canola crops. Fungicide seed treatments will reduce seed-borne infection and minimize the risk of introducing blackleg into new fields. However, the disease can still be spread from field to field on infected plants and refuse. Refer to the OMAFRA Publication 812, Field Crop Protection Guide, for seed treatment options.
WHITE MOULD (Sclerotinia Stem Rot)
Incidence: White mould in canola is sporadic within a region and varies greatly from year to year. This makes predicting disease potential or outbreaks very difficult. The disease is very destructive during periods of prolonged, wet weather. Yield losses of up to 50% can occur under ideal disease conditions.
Appearances: White mould is characterized by bleached stem lesions and hard black bodies (sclerotia) of white mould fungus inside the stems; it causes premature ripening of the plants. The disease is often a problem when canola follows canola, white beans, soybeans or sunflowers. Infections that start on the dead blossoms spread to adjacent tissues, resulting in dead branches or dead plants. Plants may lodge. The rotted stems usually have a bleached appearance (Photo 16–65). Sclerotinia infections can be serious on canola if cool, wet weather occurs in the last 2 weeks of June and continues into early July when blossoming occurs. White mould sclerotia (hard black bodies) are sometimes found in the seed at harvest. They can be similar in colour and size to canola seed (Photo 16–66).
Photo 16–65. White mould in canola results in premature ripening of the plants.
Photo 16–66. White mould on seed in canola. The black bodies of white mould are
sometimes found in the seed at harvest.
Management Strategies: Use clean, certified seed and rotations of at least 4 years, including unaffected crops such as corn, wheat, barley or oats in fields with a history of sclerotinia or white mould. During this rotation, it is necessary to avoid planting susceptible crops including mustard, sunflower, dry bean, soybean, field pea, lentil or garbanzo bean. At present, no resistant varieties exist. Keep fields clean of broad-leaved weeds, since many are alternate hosts for this disease. Foliar fungicide treatments are effective but require scouting and precise timing. Refer to the OMAFRA Publication 812, Field Crop Protection Guide, for more information on fungicide treatment options.
TURNIP MOSAIC VIRUSIncidence: Turnip mosaic virus (TuMV) has become a significant problem in some areas where winter canola is grown.
Disease Cycle and Appearance: Infestation takes place in the fall and causes leaf mottling (yellow or light green areas surrounded by normal green colour) and wrinkling or puckering of the leaf tissue between the veins (Photo 16–67). Spring growth is slow. Severely infected plants are stunted, twisted and generally light green or yellow. Pods are distorted and a significant proportion of the seeds are poorly filled. The disease appears to be more severe in areas where other cruciferous crops (such as rutabagas) are grown and in fields where pressure from weeds and volunteer cereals is high.
406
Agronomy guide for field Crops
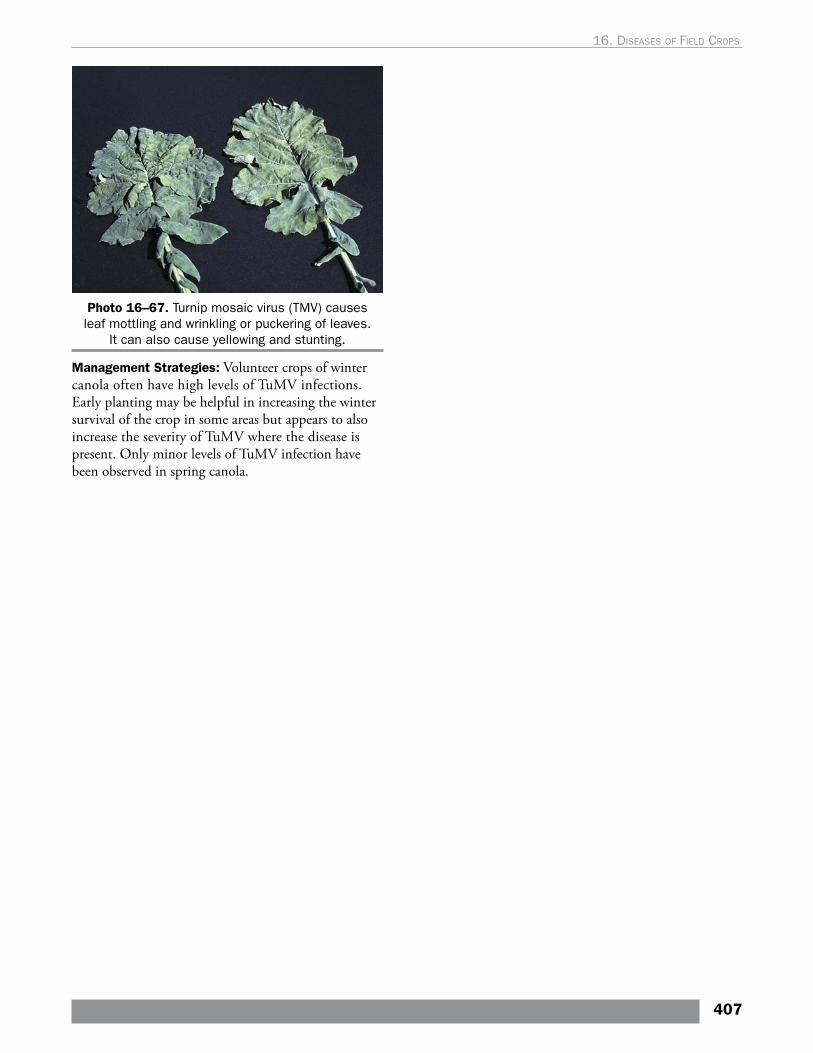
Photo 16–67. Turnip mosaic virus (TMV) causes leaf mottling and wrinkling or puckering of leaves.
It can also cause yellowing and stunting.
Management Strategies: Volunteer crops of winter canola often have high levels of TuMV infections. Early planting may be helpful in increasing the winter survival of the crop in some areas but appears to also increase the severity of TuMV where the disease is present. Only minor levels of TuMV infection have been observed in spring canola.
407
16. dIseases oF FIeld crops

Page intentionally left blank
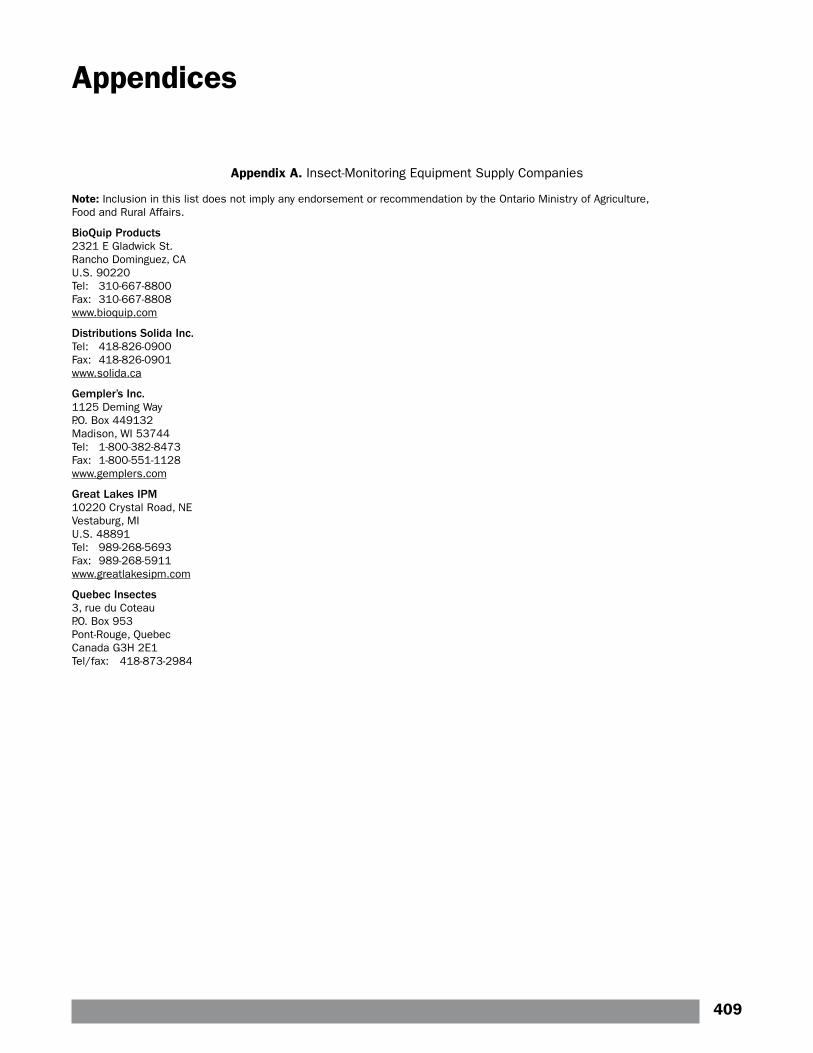
Appendices
Appendix A. Insect-Monitoring Equipment Supply Companies
Note: Inclusion in this list does not imply any endorsement or recommendation by the Ontario Ministry of Agriculture, Food and Rural Affairs.
BioQuip Products2321 E Gladwick St.Rancho Dominguez, CA U.S. 90220Tel: 310-667-8800Fax: 310-667-8808www.bioquip.com
Distributions Solida Inc.Tel: 418-826-0900Fax: 418-826-0901www.solida.ca
Gempler’s Inc.1125 Deming WayP.O. Box 449132 Madison, WI 53744Tel: 1-800-382-8473Fax: 1-800-551-1128www.gemplers.com
Great Lakes IPM10220 Crystal Road, NEVestaburg, MI U.S. 48891Tel: 989-268-5693Fax: 989-268-5911www.greatlakesipm.com
Quebec Insectes3, rue du Coteau P.O. Box 953Pont-Rouge, QuebecCanada G3H 2E1 Tel/fax: 418-873-2984
409
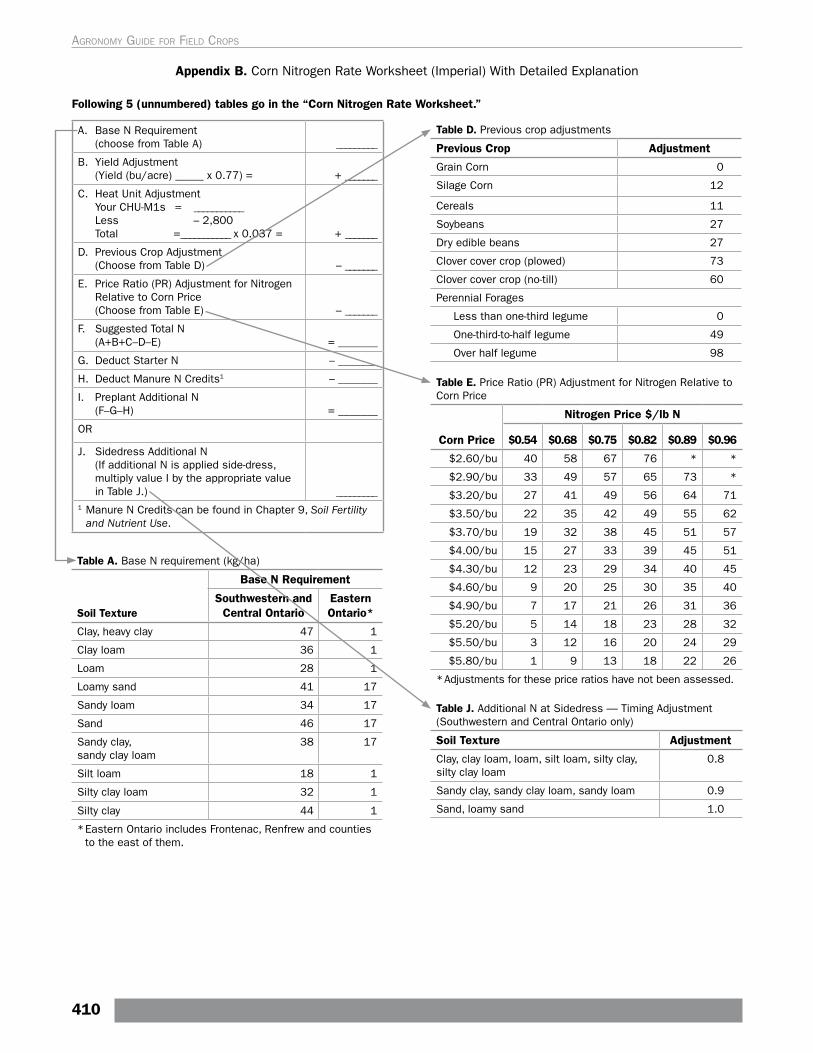
A. Base N Requirement (choose from Table A) _________
B. Yield Adjustment (Yield (bu/acre) _____ x 0.77) = + _______
C. Heat Unit Adjustment Your CHU-M1s = ___________ Less – 2,800 Total =___________ x 0.037 = + _______
D. Previous Crop Adjustment (Choose from Table D) – _______
E. Price Ratio (PR) Adjustment for Nitrogen Relative to Corn Price (Choose from Table E) – _______
F. Suggested Total N (A+B+C–D–E) = _______
G. Deduct Starter N – _______
H. Deduct Manure N Credits1 – _______
I. Preplant Additional N (F–G–H) = _______
OR
J. Sidedress Additional N (If additional N is applied side-dress,
multiply value I by the appropriate value in Table J.) _________
1 Manure N Credits can be found in Chapter 9, Soil Fertility and Nutrient Use.
Table A. Base N requirement (kg/ha)
Soil Texture
Base N Requirement
Southwestern and Central Ontario
Eastern Ontario*
Clay, heavy clay 47 1
Clay loam 36 1
Loam 28 1
Loamy sand 41 17
Sandy loam 34 17
Sand 46 17
Sandy clay, sandy clay loam
38 17
Silt loam 18 1
Silty clay loam 32 1
Silty clay 44 1
* Eastern Ontario includes Frontenac, Renfrew and counties to the east of them.
Table D. Previous crop adjustments
Previous Crop Adjustment
Grain Corn 0
Silage Corn 12
Cereals 11
Soybeans 27
Dry edible beans 27
Clover cover crop (plowed) 73
Clover cover crop (no-till) 60
Perennial Forages
Less than one-third legume 0
One-third-to-half legume 49
Over half legume 98
Table E. Price Ratio (PR) Adjustment for Nitrogen Relative to Corn Price
Corn Price
Nitrogen Price $/lb N
$0.54 $0.68 $0.75 $0.82 $0.89 $0.96
$2.60/bu 40 58 67 76 * *
$2.90/bu 33 49 57 65 73 *
$3.20/bu 27 41 49 56 64 71
$3.50/bu 22 35 42 49 55 62
$3.70/bu 19 32 38 45 51 57
$4.00/bu 15 27 33 39 45 51
$4.30/bu 12 23 29 34 40 45
$4.60/bu 9 20 25 30 35 40
$4.90/bu 7 17 21 26 31 36
$5.20/bu 5 14 18 23 28 32
$5.50/bu 3 12 16 20 24 29
$5.80/bu 1 9 13 18 22 26
* Adjustments for these price ratios have not been assessed.
Table J. Additional N at Sidedress — Timing Adjustment (Southwestern and Central Ontario only)
Soil Texture Adjustment
Clay, clay loam, loam, silt loam, silty clay, silty clay loam
0.8
Sandy clay, sandy clay loam, sandy loam 0.9
Sand, loamy sand 1.0
Appendix B. Corn Nitrogen Rate Worksheet (Imperial) With Detailed Explanation
Following 5 (unnumbered) tables go in the “Corn Nitrogen Rate Worksheet.”
410
Agronomy guide for field Crops

Explanation of Factors in Worksheet
A. Base N RequirementIn most of the province, the medium-textured soils (silt loams and loams) provided the greatest amount of nitrogen to the corn crop, as indicated by the lower “Base N Requirement” (Table A). In both coarser and finer textured soils, the nitrogen requirements are higher.
The data showed a significantly lower requirement for nitrogen in the Ottawa Valley than in the rest of the province, although the reasons for this are not completely clear. This appears to apply in all of the counties east of the Frontenac Axis.
Since these values are derived from the average responses on a wide range of sites, they will represent the expected requirements for soils with “average” characteristics. Any soil that varies from the average (e.g., higher or lower organic matter (OM) content) may differ in the optimum N rates.
B. Yield AdjustmentThere is a weak but consistent relationship between fields with higher yields at optimum N rates and higher nitrogen requirements. The yield factor derived from the N response data (0.77 lb N per bushel of yield) is almost exactly equal to the N removal from the field in the grain portion of the crop.
Use average yields for the previous 5 years to estimate the productive capacity of the field. Entering an inflated yield goal into this adjustment will not increase the productivity of the field, will cost money for wasted N and may result in environmental harm. To convert silage yield to an estimate of grain yield, divide the silage yield by 5 for grain yield in tonnes/hectare or tons/acre, or multiply tons per acre by 7 to estimate bushels per acre.
C. Heat Unit AdjustmentResearch shows that corn in the long-season areas of the province requires more nitrogen. This may be due to greater moisture stress on the crop in areas with higher average temperatures, which would decrease N use efficiency, or it could be related to differences in soil OM content.
D. Previous Crop AdjustmentThe crop that was grown immediately prior to planting corn has a significant impact on the nitrogen requirements. Crops such as grain corn immobilize a significant quantity of mineral N from the soil as the high carbon residue decomposes, and this is reflected in higher N requirements. Forage legume crops fix nitrogen out of the air, which is released to the corn crop as the residue breaks down, resulting in reduced N requirements.
E. Price Ratio AdjustmentThe optimum N rate is the point where the yield increase from the last pound of added nitrogen just pays for the extra N. As the cost of nitrogen fertilizer goes up or the value of the corn crop goes down, the amount of yield required to pay for a pound of nitrogen increases. This means that the nitrogen rate that provides the maximum return to added fertilizer is reduced. The amount of reduction in N rates for various combinations of corn and nitrogen price is found in Table E.For prices outside of the ranges provided, calculate the adjustment to fertilizer rates by following these steps:• Determine the price of a kilogram of nitrogen. Divide the
price per tonne of fertilizer by the number of kilograms of nitrogen in each tonne (the %N multiplied by 10). Calculate the price per pound by multiplying the price per kilogram by 0.45. For example, urea (46% N) at $865 per tonne will have an N price per kilogram of $865/460 kg = $1.88/kg N, or $0.85/lb N.
• Estimate the value of a kilogram (or pound) of corn for the year following harvest (unless the corn has been pre-sold at a fixed price), including all stabilization payments, minus costs for drying, trucking and elevation. Price the value of corn to be fed on-farm at the replacement cost for the corn if it had to be purchased from off farm. The price for a kilogram of corn is the expected price per tonne, divided by 1,000. The price for a pound of corn is the expected net price per bushel divided by 56.
• Calculate the N:corn price ratio, by dividing the price of a kilogram (or pound) of nitrogen into the value of a kilogram (or pound) of corn.
• Subtract 5 from the price ratio, because the N recommendations were developed for a price ratio of 5.
• Multiply the resulting figure by 6.7 (6 for Imperial calculations), and enter this figure into the price ratio adjustment.
F. Total N RecommendationThis figure, calculated by adding values A through E, represents the total N requirements for the crop. This is normally supplied by a combination of starter fertilizer, broadcast or side-dressed fertilizer, and manure.
G. Deduct Starter NInclude any N that is supplied at planting here.
H. Deduct Manure N CreditsInclude available nitrogen from manure (or biosolids) on this line. Available N from manure, based on accurate application rates and manure analysis will give more reliable N credits. For estimates of available nitrogen from manure, see Table 9–10, Typical amounts of available nitrogen, phosphate and potash from different types of organic nutrient sources.
I. Preplant Additional NThe difference between the Total N recommendation, and the credits for starter and manure N, is the amount of nitrogen to be included in a pre-plant application.
OR
J. Sidedress Additional NNitrogen that is applied just before the crop needs it is utilized more efficiently than N applied preplant (less opportunity for loss through denitrification or leaching). This difference is most pronounced in the heavier-textured soils. Sandy soils do not normally show a benefit to side-dress N applications. NOTE: This adjustment does not apply in Eastern Ontario, where the N recommendations are already relatively low.
411
appendIces
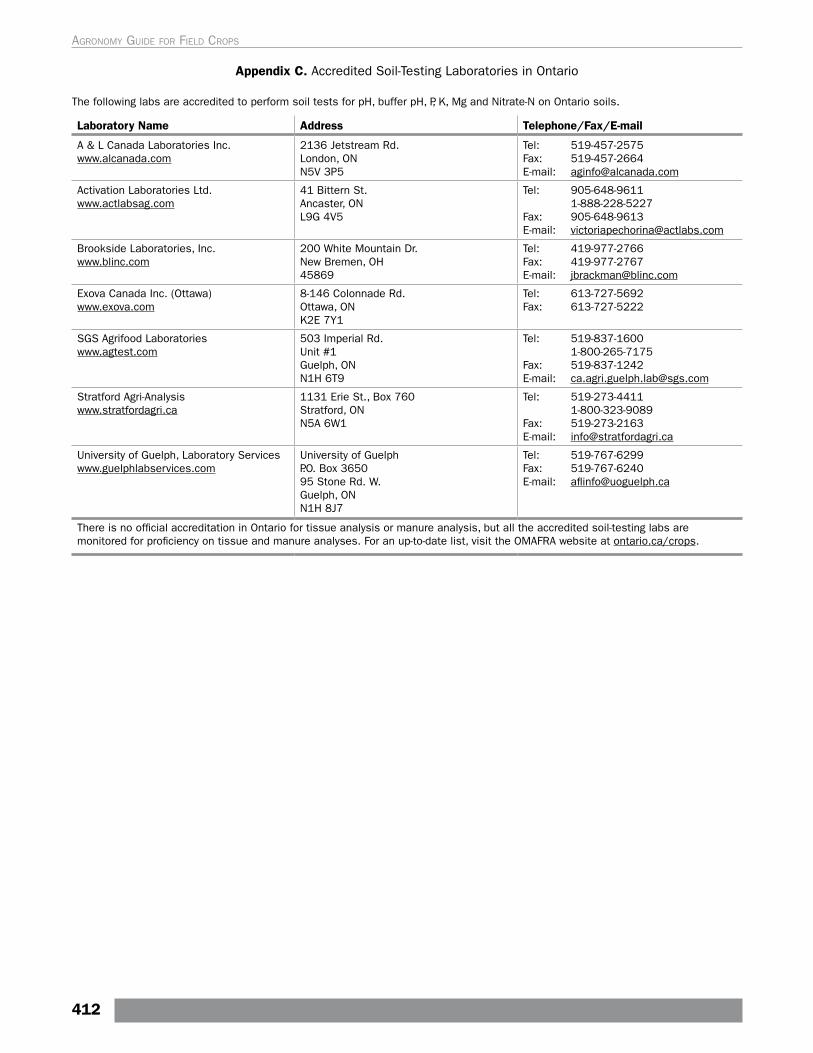
Appendix C. Accredited Soil-Testing Laboratories in Ontario
The following labs are accredited to perform soil tests for pH, buffer pH, P, K, Mg and Nitrate-N on Ontario soils.
Laboratory Name Address Telephone/Fax/E-mail
A & L Canada Laboratories Inc. www.alcanada.com
2136 Jetstream Rd. London, ON N5V 3P5
Tel: 519-457-2575 Fax: 519-457-2664 E-mail: [email protected]
Activation Laboratories Ltd.www.actlabsag.com
41 Bittern St. Ancaster, ON L9G 4V5
Tel: 905-648-9611 1-888-228-5227Fax: 905-648-9613E-mail: [email protected]
Brookside Laboratories, Inc.www.blinc.com
200 White Mountain Dr. New Bremen, OH45869
Tel: 419-977-2766Fax: 419-977-2767E-mail: [email protected]
Exova Canada Inc. (Ottawa)www.exova.com
8-146 Colonnade Rd.Ottawa, ONK2E 7Y1
Tel: 613-727-5692Fax: 613-727-5222
SGS Agrifood Laboratorieswww.agtest.com
503 Imperial Rd.Unit #1Guelph, ONN1H 6T9
Tel: 519-837-1600 1-800-265-7175Fax: 519-837-1242E-mail: [email protected]
Stratford Agri-Analysiswww.stratfordagri.ca
1131 Erie St., Box 760 Stratford, ONN5A 6W1
Tel: 519-273-4411 1-800-323-9089Fax: 519-273-2163E-mail: [email protected]
University of Guelph, Laboratory Serviceswww.guelphlabservices.com
University of GuelphP.O. Box 365095 Stone Rd. W.Guelph, ONN1H 8J7
Tel: 519-767-6299Fax: 519-767-6240E-mail: [email protected]
There is no official accreditation in Ontario for tissue analysis or manure analysis, but all the accredited soil-testing labs are monitored for proficiency on tissue and manure analyses. For an up-to-date list, visit the OMAFRA website at ontario.ca/crops.
412
Agronomy guide for field Crops
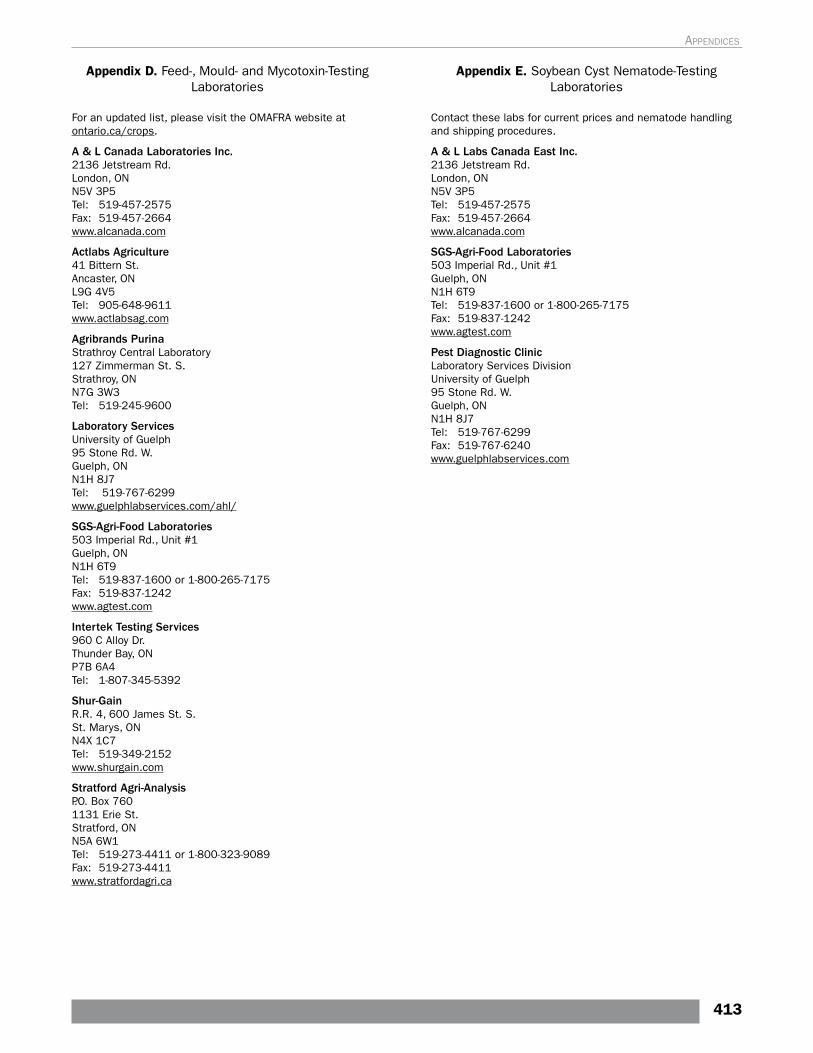
Appendix D. Feed-, Mould- and Mycotoxin-Testing Laboratories
For an updated list, please visit the OMAFRA website at ontario.ca/crops.
A & L Canada Laboratories Inc.2136 Jetstream Rd.London, ONN5V 3P5Tel: 519-457-2575Fax: 519-457-2664www.alcanada.com
Actlabs Agriculture41 Bittern St.Ancaster, ON L9G 4V5 Tel: 905-648-9611www.actlabsag.com
Agribrands PurinaStrathroy Central Laboratory127 Zimmerman St. S.Strathroy, ONN7G 3W3Tel: 519-245-9600
Laboratory Services University of Guelph95 Stone Rd. W.Guelph, ONN1H 8J7Tel: 519-767-6299www.guelphlabservices.com/ahl/
SGS-Agri-Food Laboratories503 Imperial Rd., Unit #1Guelph, ONN1H 6T9Tel: 519-837-1600 or 1-800-265-7175Fax: 519-837-1242www.agtest.com
Intertek Testing Services960 C Alloy Dr.Thunder Bay, ONP7B 6A4Tel: 1-807-345-5392
Shur-GainR.R. 4, 600 James St. S.St. Marys, ONN4X 1C7Tel: 519-349-2152www.shurgain.com
Stratford Agri-AnalysisP.O. Box 7601131 Erie St.Stratford, ONN5A 6W1Tel: 519-273-4411 or 1-800-323-9089Fax: 519-273-4411www.stratfordagri.ca
Appendix E. Soybean Cyst Nematode-Testing Laboratories
Contact these labs for current prices and nematode handling and shipping procedures.
A & L Labs Canada East Inc.2136 Jetstream Rd.London, ONN5V 3P5Tel: 519-457-2575Fax: 519-457-2664www.alcanada.com
SGS-Agri-Food Laboratories503 Imperial Rd., Unit #1Guelph, ONN1H 6T9Tel: 519-837-1600 or 1-800-265-7175Fax: 519-837-1242www.agtest.com
Pest Diagnostic ClinicLaboratory Services DivisionUniversity of Guelph95 Stone Rd. W.Guelph, ONN1H 8J7Tel: 519-767-6299Fax: 519-767-6240www.guelphlabservices.com
413
appendIces
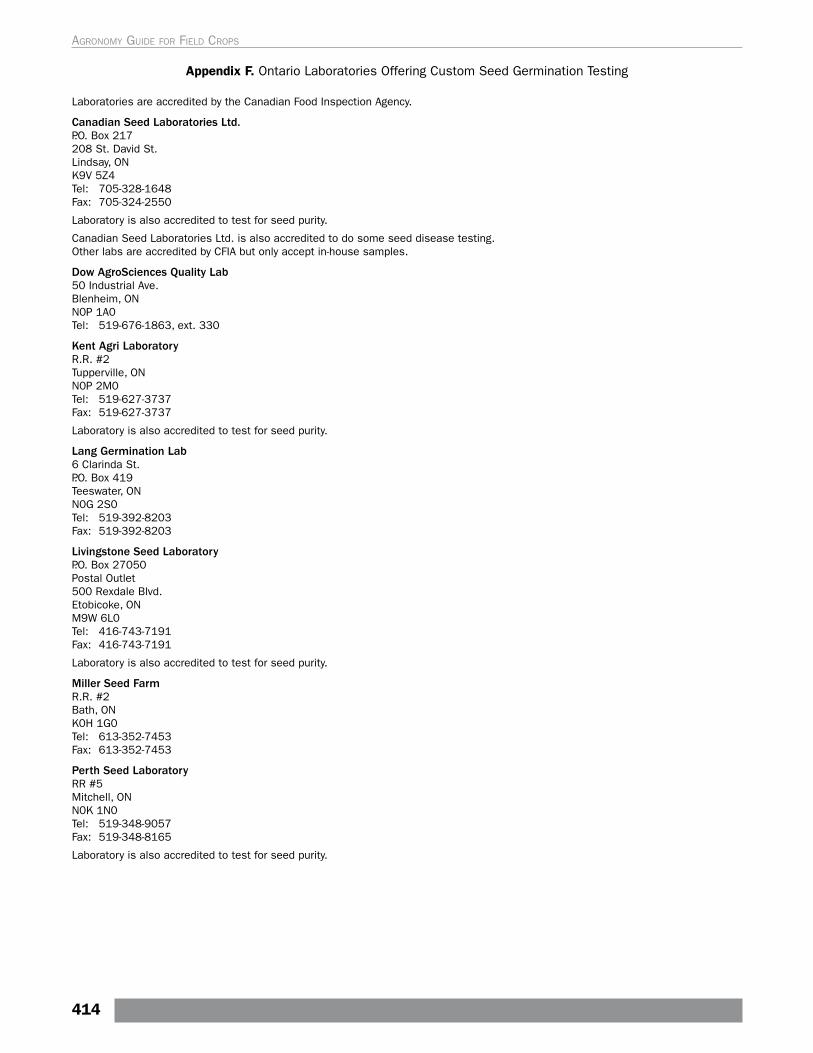
Appendix F. Ontario Laboratories Offering Custom Seed Germination Testing
Laboratories are accredited by the Canadian Food Inspection Agency.
Canadian Seed Laboratories Ltd.P.O. Box 217208 St. David St.Lindsay, ONK9V 5Z4Tel: 705-328-1648Fax: 705-324-2550
Laboratory is also accredited to test for seed purity.
Canadian Seed Laboratories Ltd. is also accredited to do some seed disease testing. Other labs are accredited by CFIA but only accept in-house samples.
Dow AgroSciences Quality Lab50 Industrial Ave.Blenheim, ONN0P 1A0Tel: 519-676-1863, ext. 330
Kent Agri LaboratoryR.R. #2Tupperville, ONN0P 2M0Tel: 519-627-3737Fax: 519-627-3737
Laboratory is also accredited to test for seed purity.
Lang Germination Lab6 Clarinda St.P.O. Box 419Teeswater, ONN0G 2S0Tel: 519-392-8203Fax: 519-392-8203
Livingstone Seed LaboratoryP.O. Box 27050Postal Outlet500 Rexdale Blvd.Etobicoke, ONM9W 6L0Tel: 416-743-7191Fax: 416-743-7191
Laboratory is also accredited to test for seed purity.
Miller Seed FarmR.R. #2Bath, ONK0H 1G0Tel: 613-352-7453Fax: 613-352-7453
Perth Seed LaboratoryRR #5Mitchell, ONN0K 1N0Tel: 519-348-9057Fax: 519-348-8165
Laboratory is also accredited to test for seed purity.
414
Agronomy guide for field Crops
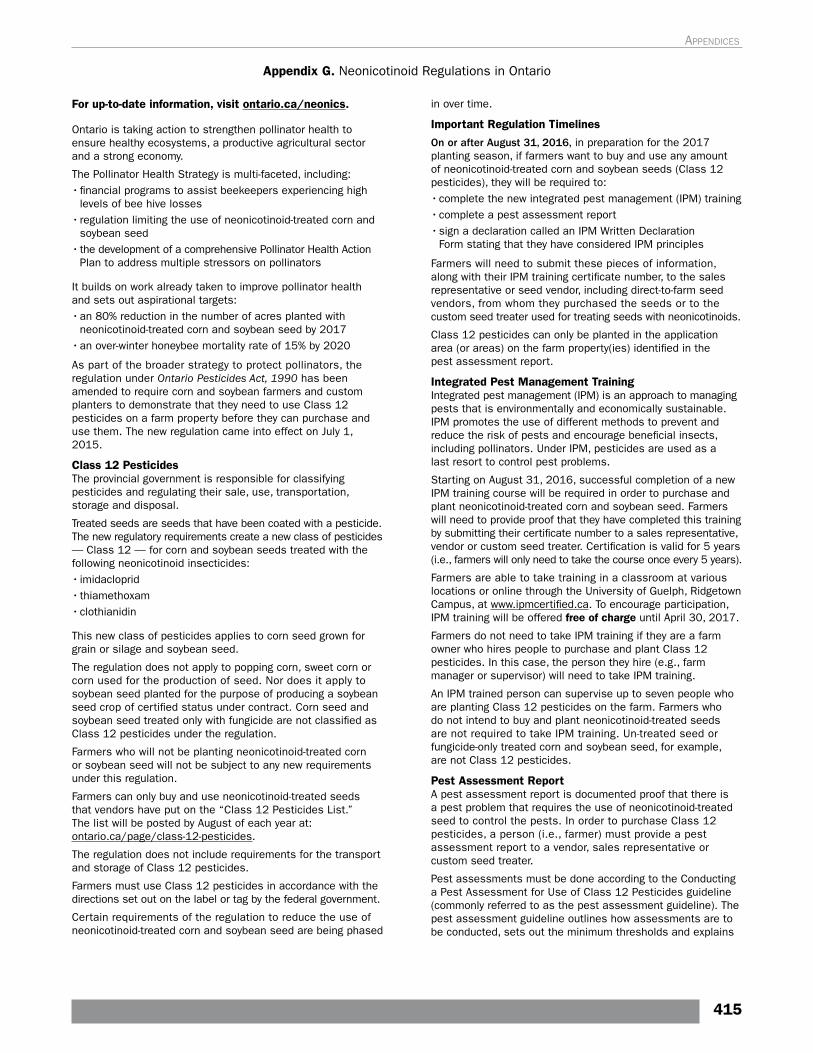
For up-to-date information, visit ontario.ca/neonics.
Ontario is taking action to strengthen pollinator health to ensure healthy ecosystems, a productive agricultural sector and a strong economy.
The Pollinator Health Strategy is multi-faceted, including:• financial programs to assist beekeepers experiencing high
levels of bee hive losses• regulation limiting the use of neonicotinoid-treated corn and
soybean seed• the development of a comprehensive Pollinator Health Action
Plan to address multiple stressors on pollinators
It builds on work already taken to improve pollinator health and sets out aspirational targets:• an 80% reduction in the number of acres planted with
neonicotinoid-treated corn and soybean seed by 2017• an over-winter honeybee mortality rate of 15% by 2020
As part of the broader strategy to protect pollinators, the regulation under Ontario Pesticides Act, 1990 has been amended to require corn and soybean farmers and custom planters to demonstrate that they need to use Class 12 pesticides on a farm property before they can purchase and use them. The new regulation came into effect on July 1, 2015.
Class 12 PesticidesThe provincial government is responsible for classifying pesticides and regulating their sale, use, transportation, storage and disposal.
Treated seeds are seeds that have been coated with a pesticide. The new regulatory requirements create a new class of pesticides — Class 12 — for corn and soybean seeds treated with the following neonicotinoid insecticides:• imidacloprid• thiamethoxam• clothianidin
This new class of pesticides applies to corn seed grown for grain or silage and soybean seed.
The regulation does not apply to popping corn, sweet corn or corn used for the production of seed. Nor does it apply to soybean seed planted for the purpose of producing a soybean seed crop of certified status under contract. Corn seed and soybean seed treated only with fungicide are not classified as Class 12 pesticides under the regulation.
Farmers who will not be planting neonicotinoid-treated corn or soybean seed will not be subject to any new requirements under this regulation.
Farmers can only buy and use neonicotinoid-treated seeds that vendors have put on the “Class 12 Pesticides List.” The list will be posted by August of each year at: ontario.ca/page/class-12-pesticides.
The regulation does not include requirements for the transport and storage of Class 12 pesticides.
Farmers must use Class 12 pesticides in accordance with the directions set out on the label or tag by the federal government.
Certain requirements of the regulation to reduce the use of neonicotinoid-treated corn and soybean seed are being phased
Appendix G. Neonicotinoid Regulations in Ontario
in over time.
Important Regulation Timelines
On or after August 31, 2016, in preparation for the 2017 planting season, if farmers want to buy and use any amount of neonicotinoid-treated corn and soybean seeds (Class 12 pesticides), they will be required to:• complete the new integrated pest management (IPM) training• complete a pest assessment report• sign a declaration called an IPM Written Declaration
Form stating that they have considered IPM principles
Farmers will need to submit these pieces of information, along with their IPM training certificate number, to the sales representative or seed vendor, including direct-to-farm seed vendors, from whom they purchased the seeds or to the custom seed treater used for treating seeds with neonicotinoids.
Class 12 pesticides can only be planted in the application area (or areas) on the farm property(ies) identified in the pest assessment report.
Integrated Pest Management TrainingIntegrated pest management (IPM) is an approach to managing pests that is environmentally and economically sustainable. IPM promotes the use of different methods to prevent and reduce the risk of pests and encourage beneficial insects, including pollinators. Under IPM, pesticides are used as a last resort to control pest problems.
Starting on August 31, 2016, successful completion of a new IPM training course will be required in order to purchase and plant neonicotinoid-treated corn and soybean seed. Farmers will need to provide proof that they have completed this training by submitting their certificate number to a sales representative, vendor or custom seed treater. Certification is valid for 5 years (i.e., farmers will only need to take the course once every 5 years).
Farmers are able to take training in a classroom at various locations or online through the University of Guelph, Ridgetown Campus, at www.ipmcertified.ca. To encourage participation, IPM training will be offered free of charge until April 30, 2017.
Farmers do not need to take IPM training if they are a farm owner who hires people to purchase and plant Class 12 pesticides. In this case, the person they hire (e.g., farm manager or supervisor) will need to take IPM training.
An IPM trained person can supervise up to seven people who are planting Class 12 pesticides on the farm. Farmers who do not intend to buy and plant neonicotinoid-treated seeds are not required to take IPM training. Un-treated seed or fungicide-only treated corn and soybean seed, for example, are not Class 12 pesticides.
Pest Assessment ReportA pest assessment report is documented proof that there is a pest problem that requires the use of neonicotinoid-treated seed to control the pests. In order to purchase Class 12 pesticides, a person (i.e., farmer) must provide a pest assessment report to a vendor, sales representative or custom seed treater.
Pest assessments must be done according to the Conducting a Pest Assessment for Use of Class 12 Pesticides guideline (commonly referred to as the pest assessment guideline). The pest assessment guideline outlines how assessments are to be conducted, sets out the minimum thresholds and explains
415
appendIces
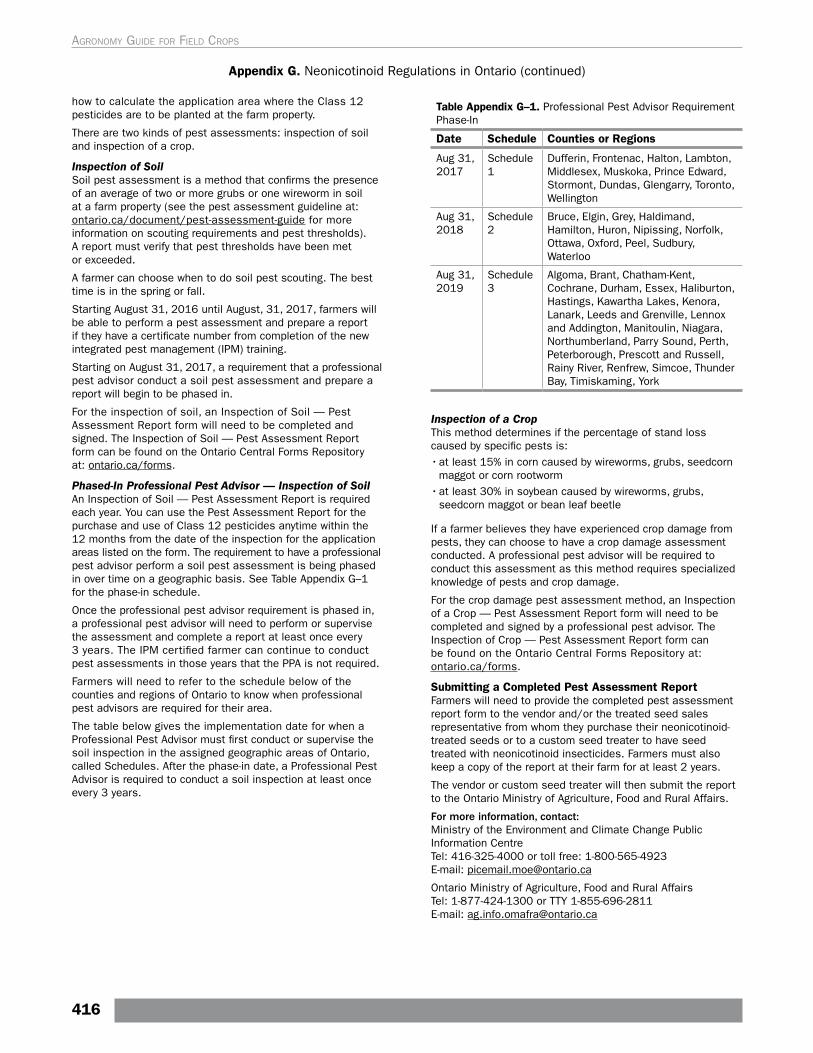
how to calculate the application area where the Class 12 pesticides are to be planted at the farm property.
There are two kinds of pest assessments: inspection of soil and inspection of a crop.
Inspection of SoilSoil pest assessment is a method that confirms the presence of an average of two or more grubs or one wireworm in soil at a farm property (see the pest assessment guideline at: ontario.ca/document/pest-assessment-guide for more information on scouting requirements and pest thresholds). A report must verify that pest thresholds have been met or exceeded.
A farmer can choose when to do soil pest scouting. The best time is in the spring or fall.
Starting August 31, 2016 until August, 31, 2017, farmers will be able to perform a pest assessment and prepare a report if they have a certificate number from completion of the new integrated pest management (IPM) training.
Starting on August 31, 2017, a requirement that a professional pest advisor conduct a soil pest assessment and prepare a report will begin to be phased in.
For the inspection of soil, an Inspection of Soil — Pest Assessment Report form will need to be completed and signed. The Inspection of Soil — Pest Assessment Report form can be found on the Ontario Central Forms Repository at: ontario.ca/forms.
Phased-In Professional Pest Advisor — Inspection of SoilAn Inspection of Soil — Pest Assessment Report is required each year. You can use the Pest Assessment Report for the purchase and use of Class 12 pesticides anytime within the 12 months from the date of the inspection for the application areas listed on the form. The requirement to have a professional pest advisor perform a soil pest assessment is being phased in over time on a geographic basis. See Table Appendix G–1 for the phase-in schedule.
Once the professional pest advisor requirement is phased in, a professional pest advisor will need to perform or supervise the assessment and complete a report at least once every 3 years. The IPM certified farmer can continue to conduct pest assessments in those years that the PPA is not required.
Farmers will need to refer to the schedule below of the counties and regions of Ontario to know when professional pest advisors are required for their area.
The table below gives the implementation date for when a Professional Pest Advisor must first conduct or supervise the soil inspection in the assigned geographic areas of Ontario, called Schedules. After the phase-in date, a Professional Pest Advisor is required to conduct a soil inspection at least once every 3 years.
Table Appendix G–1. Professional Pest Advisor Requirement Phase-In
Date Schedule Counties or Regions
Aug 31, 2017
Schedule 1
Dufferin, Frontenac, Halton, Lambton, Middlesex, Muskoka, Prince Edward, Stormont, Dundas, Glengarry, Toronto, Wellington
Aug 31, 2018
Schedule 2
Bruce, Elgin, Grey, Haldimand, Hamilton, Huron, Nipissing, Norfolk, Ottawa, Oxford, Peel, Sudbury, Waterloo
Aug 31, 2019
Schedule 3
Algoma, Brant, Chatham-Kent, Cochrane, Durham, Essex, Haliburton, Hastings, Kawartha Lakes, Kenora, Lanark, Leeds and Grenville, Lennox and Addington, Manitoulin, Niagara, Northumberland, Parry Sound, Perth, Peterborough, Prescott and Russell, Rainy River, Renfrew, Simcoe, Thunder Bay, Timiskaming, York
Inspection of a CropThis method determines if the percentage of stand loss caused by specific pests is:• at least 15% in corn caused by wireworms, grubs, seedcorn
maggot or corn rootworm• at least 30% in soybean caused by wireworms, grubs,
seedcorn maggot or bean leaf beetle
If a farmer believes they have experienced crop damage from pests, they can choose to have a crop damage assessment conducted. A professional pest advisor will be required to conduct this assessment as this method requires specialized knowledge of pests and crop damage.
For the crop damage pest assessment method, an Inspection of a Crop — Pest Assessment Report form will need to be completed and signed by a professional pest advisor. The Inspection of Crop — Pest Assessment Report form can be found on the Ontario Central Forms Repository at: ontario.ca/forms.
Submitting a Completed Pest Assessment ReportFarmers will need to provide the completed pest assessment report form to the vendor and/or the treated seed sales representative from whom they purchase their neonicotinoid-treated seeds or to a custom seed treater to have seed treated with neonicotinoid insecticides. Farmers must also keep a copy of the report at their farm for at least 2 years.
The vendor or custom seed treater will then submit the report to the Ontario Ministry of Agriculture, Food and Rural Affairs.
For more information, contact:Ministry of the Environment and Climate Change Public Information CentreTel: 416-325-4000 or toll free: 1-800-565-4923E-mail: [email protected]
Ontario Ministry of Agriculture, Food and Rural AffairsTel: 1-877-424-1300 or TTY 1-855-696-2811E-mail: [email protected]
Appendix G. Neonicotinoid Regulations in Ontario (continued)
416
Agronomy guide for field Crops

Univoltine Strain (for areas where there is one generation of ECB per year)A. % shot-holed plants _____ = plants with shot-holes ÷ total plants checked
Unfurl one of the shot-holed plants from each location and look for larvae.
B. Larvae per plant _____ = number of live larvae per unfurled plant x (A)% shot-holed plants ÷ 100
Example: 25 shot-holed plants and 1.5 larvae per unfurled plant.
larvae per plant is 0.38 = 1.5 x 25 ÷ 100
A yield loss of 5% per live larvae is estimated.1 Therefore:
C. Potential % yield loss _____ = (B) x 5 ÷ 100
D. Potential $ loss _____ = (C) potential % yield loss x expected yield t/ha (bu/acre) x value $/t ($/bu)
A 75% effectiveness of a pesticide treatment is estimated.1 Therefore:
E. $ preventable loss _____ = (D) potential $ loss x % effectiveness of pesticide treatment
F. Treatment cost _____ = pesticide cost + application cost
G. Gain (+) or loss (–) if treatment is applied _____ = (E) – (F)1 Use another estimated value if desired.
Bivoltine Strain (for areas where there are two generations of ECB per year)A. Larvae per plant (cumulative counts taken 7 days apart) _____ = number of egg masses/plant x 2 borer/egg mass (Assumes a survival rate of 2 larvae per egg mass. This may vary with weather and egg mass size.)
B. % yield loss _____ = (A) larvae/plant x 4% yield loss per larvae/plant (Use a 3% loss per borer per plant if infestation occurs after silks are brown. The economic benefit of treatment declines rapidly if
infestations occur after the blister stage.)
C. Yield loss t/ha (bu/acre) _____ = % yield loss x expected yield t/ha (bu/acre)
D. $ loss/ha (acre) _____ = (C) yield loss t/ha (or bu/acre) x expected value $/t ($/bu)
E. Preventable loss per ha (acre) _____ = (D) $ loss per ha (or acre) x 75% control (75% is an average. Use another estimated value if desired. )
F. Treatment Cost _____ = pesticide cost + application cost
G. Gain (+) or loss (–) if treatment is applied _____ = (E) – (F)
Appendix H. European Corn Borer Economic Threshold Calculations
Use these calculations to estimate if it is economical to treat a non-Bt field with an insecticide. See European corn borer.
417
appendIces
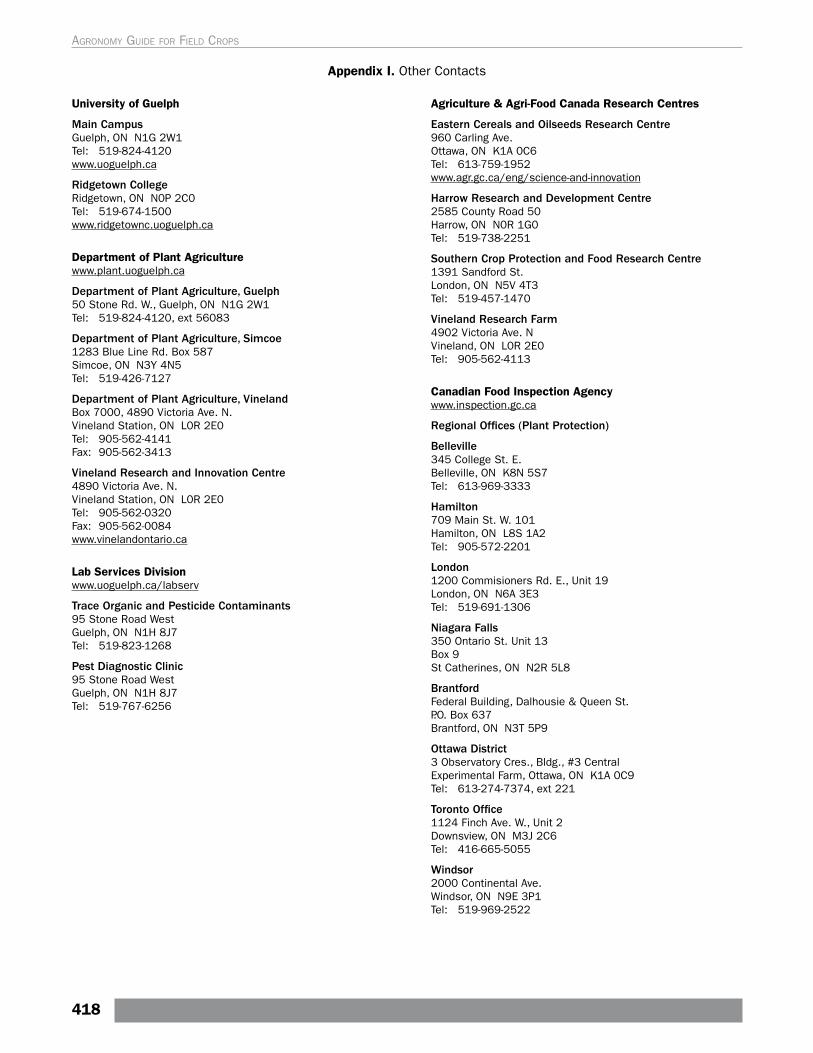
University of Guelph
Main CampusGuelph, ON N1G 2W1 Tel: 519-824-4120www.uoguelph.ca
Ridgetown CollegeRidgetown, ON N0P 2C0Tel: 519-674-1500www.ridgetownc.uoguelph.ca
Department of Plant Agriculturewww.plant.uoguelph.ca
Department of Plant Agriculture, Guelph50 Stone Rd. W., Guelph, ON N1G 2W1Tel: 519-824-4120, ext 56083
Department of Plant Agriculture, Simcoe1283 Blue Line Rd. Box 587Simcoe, ON N3Y 4N5Tel: 519-426-7127
Department of Plant Agriculture, VinelandBox 7000, 4890 Victoria Ave. N.Vineland Station, ON L0R 2E0Tel: 905-562-4141 Fax: 905-562-3413
Vineland Research and Innovation Centre4890 Victoria Ave. N.Vineland Station, ON L0R 2E0Tel: 905-562-0320Fax: 905-562-0084www.vinelandontario.ca
Lab Services Divisionwww.uoguelph.ca/labserv
Trace Organic and Pesticide Contaminants95 Stone Road WestGuelph, ON N1H 8J7Tel: 519-823-1268
Pest Diagnostic Clinic 95 Stone Road WestGuelph, ON N1H 8J7Tel: 519-767-6256
Agriculture & Agri-Food Canada Research Centres
Eastern Cereals and Oilseeds Research Centre960 Carling Ave.Ottawa, ON K1A 0C6 Tel: 613-759-1952www.agr.gc.ca/eng/science-and-innovation
Harrow Research and Development Centre2585 County Road 50Harrow, ON N0R 1G0Tel: 519-738-2251
Southern Crop Protection and Food Research Centre1391 Sandford St.London, ON N5V 4T3Tel: 519-457-1470
Vineland Research Farm4902 Victoria Ave. NVineland, ON L0R 2E0 Tel: 905-562-4113
Canadian Food Inspection Agencywww.inspection.gc.ca
Regional Offices (Plant Protection)
Belleville 345 College St. E. Belleville, ON K8N 5S7Tel: 613-969-3333
Hamilton 709 Main St. W. 101Hamilton, ON L8S 1A2Tel: 905-572-2201
London1200 Commisioners Rd. E., Unit 19 London, ON N6A 3E3Tel: 519-691-1306
Niagara Falls350 Ontario St. Unit 13 Box 9St Catherines, ON N2R 5L8
BrantfordFederal Building, Dalhousie & Queen St. P.O. Box 637Brantford, ON N3T 5P9
Ottawa District3 Observatory Cres., Bldg., #3 CentralExperimental Farm, Ottawa, ON K1A 0C9Tel: 613-274-7374, ext 221
Toronto Office1124 Finch Ave. W., Unit 2Downsview, ON M3J 2C6Tel: 416-665-5055
Windsor 2000 Continental Ave.Windsor, ON N9E 3P1Tel: 519-969-2522
Appendix I. Other Contacts
418
Agronomy guide for field Crops
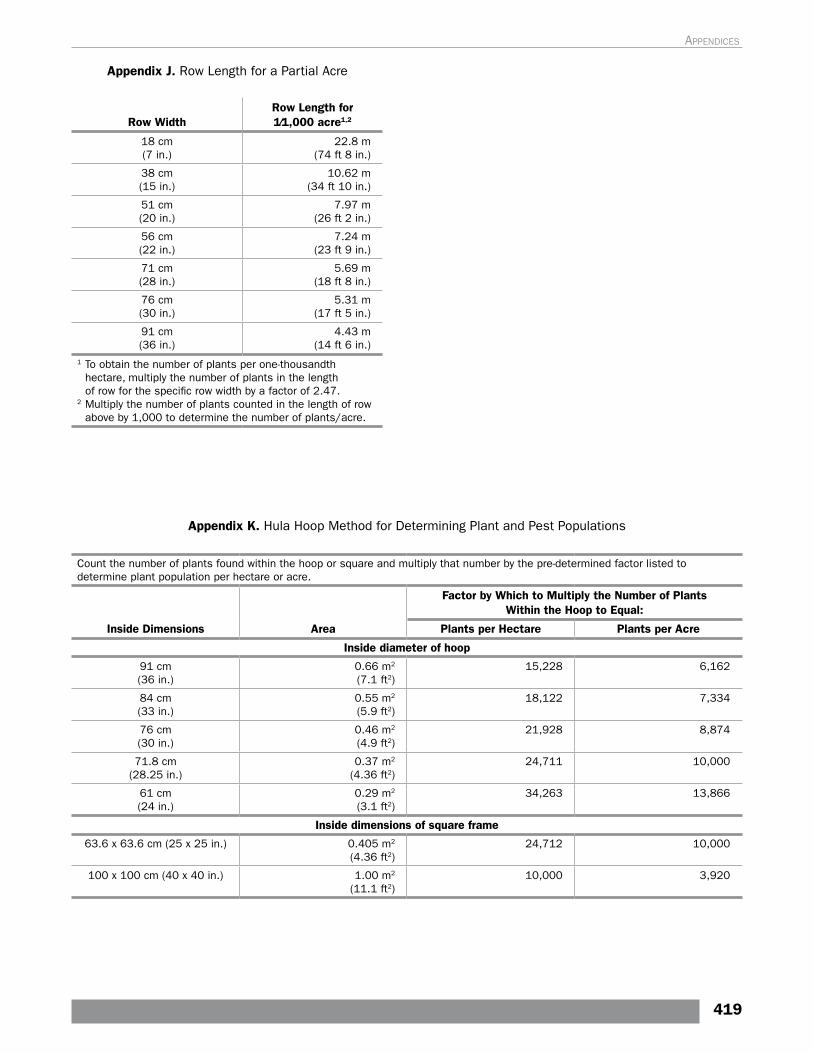
Appendix J. Row Length for a Partial Acre
Row WidthRow Length for 1⁄1,000 acre1,2
18 cm (7 in.)
22.8 m (74 ft 8 in.)
38 cm (15 in.)
10.62 m (34 ft 10 in.)
51 cm (20 in.)
7.97 m (26 ft 2 in.)
56 cm (22 in.)
7.24 m (23 ft 9 in.)
71 cm (28 in.)
5.69 m (18 ft 8 in.)
76 cm (30 in.)
5.31 m (17 ft 5 in.)
91 cm (36 in.)
4.43 m (14 ft 6 in.)
1 To obtain the number of plants per one-thousandth hectare, multiply the number of plants in the length of row for the specific row width by a factor of 2.47.
2 Multiply the number of plants counted in the length of row above by 1,000 to determine the number of plants/acre.
Appendix K. Hula Hoop Method for Determining Plant and Pest Populations
Count the number of plants found within the hoop or square and multiply that number by the pre-determined factor listed to determine plant population per hectare or acre.
Inside Dimensions Area
Factor by Which to Multiply the Number of Plants Within the Hoop to Equal:
Plants per Hectare Plants per Acre
Inside diameter of hoop
91 cm (36 in.)
0.66 m2 (7.1 ft2)
15,228 6,162
84 cm (33 in.)
0.55 m2 (5.9 ft2)
18,122 7,334
76 cm (30 in.)
0.46 m2 (4.9 ft2)
21,928 8,874
71.8 cm (28.25 in.)
0.37 m2 (4.36 ft2)
24,711 10,000
61 cm (24 in.)
0.29 m2 (3.1 ft2)
34,263 13,866
Inside dimensions of square frame
63.6 x 63.6 cm (25 x 25 in.) 0.405 m2 (4.36 ft2)
24,712 10,000
100 x 100 cm (40 x 40 in.) 1.00 m2 (11.1 ft2)
10,000 3,920
419
appendIces
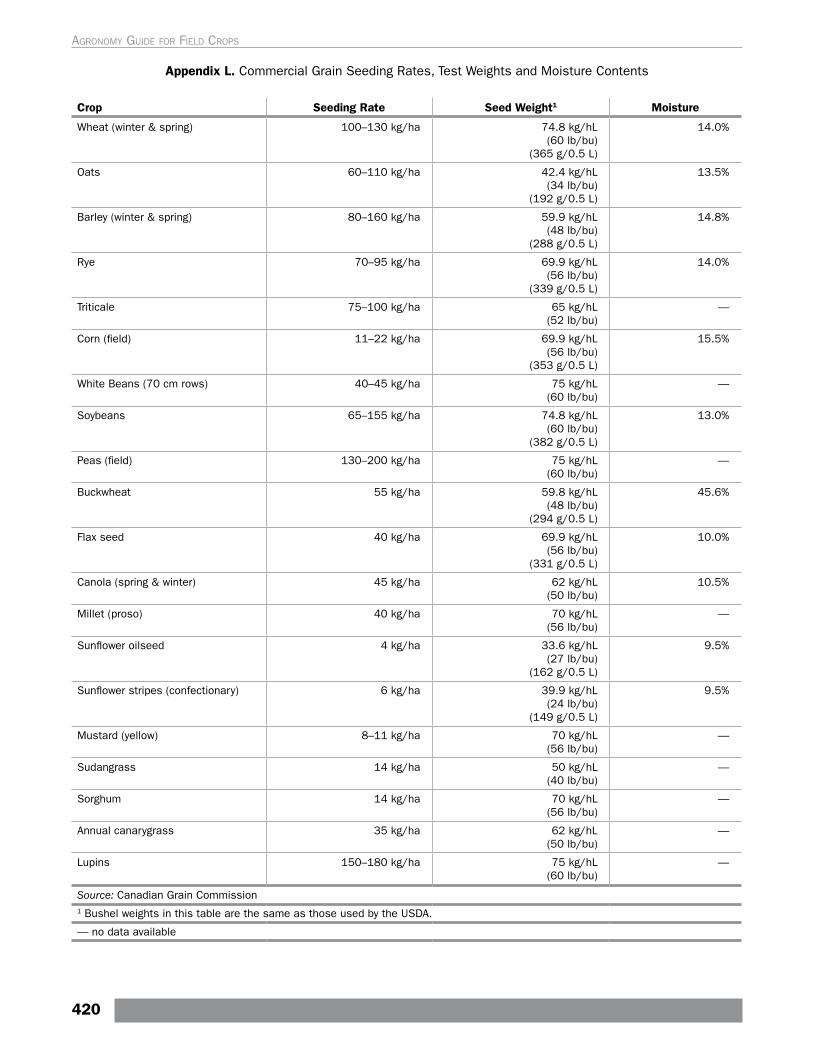
Appendix L. Commercial Grain Seeding Rates, Test Weights and Moisture Contents
Crop Seeding Rate Seed Weight1 Moisture
Wheat (winter & spring) 100–130 kg/ha 74.8 kg/hL (60 lb/bu)
(365 g/0.5 L)
14.0%
Oats 60–110 kg/ha 42.4 kg/hL (34 lb/bu)
(192 g/0.5 L)
13.5%
Barley (winter & spring) 80–160 kg/ha 59.9 kg/hL (48 lb/bu)
(288 g/0.5 L)
14.8%
Rye 70–95 kg/ha 69.9 kg/hL (56 lb/bu)
(339 g/0.5 L)
14.0%
Triticale 75–100 kg/ha 65 kg/hL (52 lb/bu)
—
Corn (field) 11–22 kg/ha 69.9 kg/hL (56 lb/bu)
(353 g/0.5 L)
15.5%
White Beans (70 cm rows) 40–45 kg/ha 75 kg/hL (60 lb/bu)
—
Soybeans 65–155 kg/ha 74.8 kg/hL (60 lb/bu)
(382 g/0.5 L)
13.0%
Peas (field) 130–200 kg/ha 75 kg/hL (60 lb/bu)
—
Buckwheat 55 kg/ha 59.8 kg/hL (48 lb/bu)
(294 g/0.5 L)
45.6%
Flax seed 40 kg/ha 69.9 kg/hL (56 lb/bu)
(331 g/0.5 L)
10.0%
Canola (spring & winter) 45 kg/ha 62 kg/hL (50 lb/bu)
10.5%
Millet (proso) 40 kg/ha 70 kg/hL (56 lb/bu)
—
Sunflower oilseed 4 kg/ha 33.6 kg/hL (27 lb/bu)
(162 g/0.5 L)
9.5%
Sunflower stripes (confectionary) 6 kg/ha 39.9 kg/hL (24 lb/bu)
(149 g/0.5 L)
9.5%
Mustard (yellow) 8–11 kg/ha 70 kg/hL (56 lb/bu)
—
Sudangrass 14 kg/ha 50 kg/hL (40 lb/bu)
—
Sorghum 14 kg/ha 70 kg/hL (56 lb/bu)
—
Annual canarygrass 35 kg/ha 62 kg/hL (50 lb/bu)
—
Lupins 150–180 kg/ha 75 kg/hL (60 lb/bu)
—
Source: Canadian Grain Commission1 Bushel weights in this table are the same as those used by the USDA.
— no data available
420
Agronomy guide for field Crops
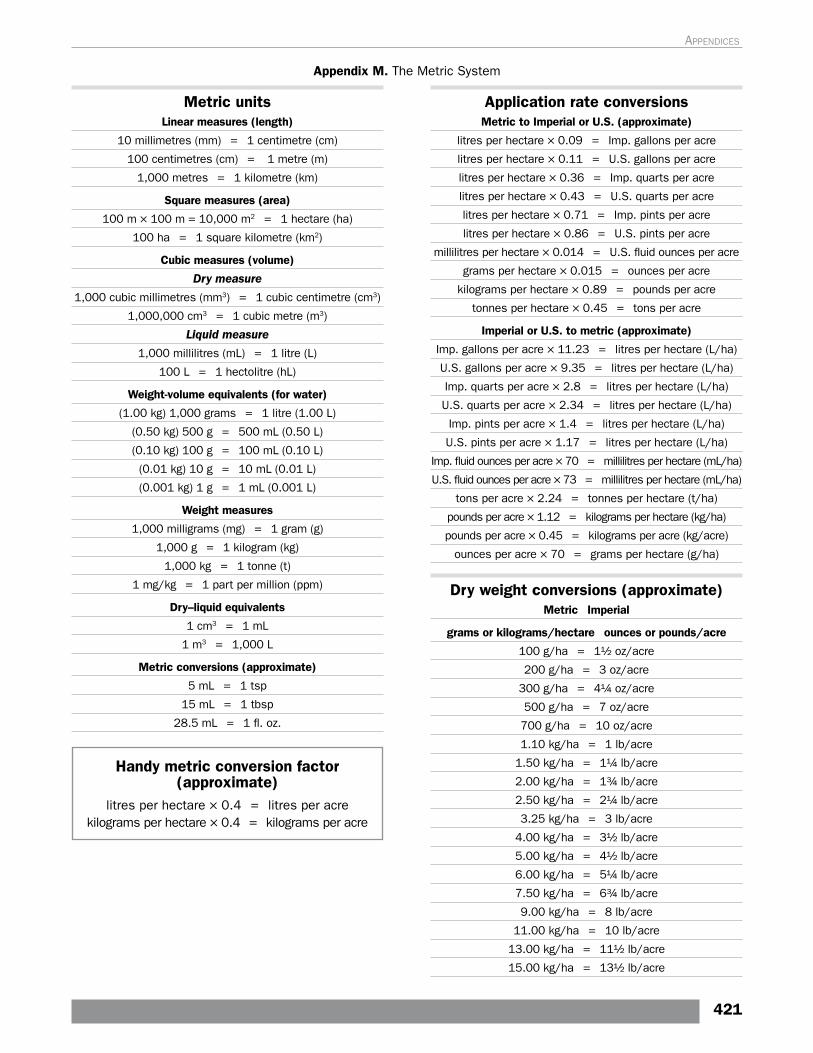
Metric unitsLinear measures (length)
10 millimetres (mm) = 1 centimetre (cm)
100 centimetres (cm) = 1 metre (m)
1,000 metres = 1 kilometre (km)
Square measures (area)
100 m × 100 m = 10,000 m2 = 1 hectare (ha)
100 ha = 1 square kilometre (km2)
Cubic measures (volume)
Dry measure
1,000 cubic millimetres (mm3) = 1 cubic centimetre (cm3)
1,000,000 cm3 = 1 cubic metre (m3)
Liquid measure
1,000 millilitres (mL) = 1 litre (L)
100 L = 1 hectolitre (hL)
Weight-volume equivalents (for water)
(1.00 kg) 1,000 grams = 1 litre (1.00 L)
(0.50 kg) 500 g = 500 mL (0.50 L)
(0.10 kg) 100 g = 100 mL (0.10 L)
(0.01 kg) 10 g = 10 mL (0.01 L)
(0.001 kg) 1 g = 1 mL (0.001 L)
Weight measures
1,000 milligrams (mg) = 1 gram (g)
1,000 g = 1 kilogram (kg)
1,000 kg = 1 tonne (t)
1 mg/kg = 1 part per million (ppm)
Dry–liquid equivalents
1 cm3 = 1 mL
1 m3 = 1,000 L
Metric conversions (approximate)
5 mL = 1 tsp
15 mL = 1 tbsp
28.5 mL = 1 fl. oz.
Handy metric conversion factor (approximate)
litres per hectare × 0.4 = litres per acre kilograms per hectare × 0.4 = kilograms per acre
Appendix M. The Metric System
Application rate conversionsMetric to Imperial or U.S. (approximate)
litres per hectare × 0.09 = Imp. gallons per acre
litres per hectare × 0.11 = U.S. gallons per acre
litres per hectare × 0.36 = Imp. quarts per acre
litres per hectare × 0.43 = U.S. quarts per acre
litres per hectare × 0.71 = Imp. pints per acre
litres per hectare × 0.86 = U.S. pints per acre
millilitres per hectare × 0.014 = U.S. fluid ounces per acre
grams per hectare × 0.015 = ounces per acre
kilograms per hectare × 0.89 = pounds per acre
tonnes per hectare × 0.45 = tons per acre
Imperial or U.S. to metric (approximate)
Imp. gallons per acre × 11.23 = litres per hectare (L/ha)
U.S. gallons per acre × 9.35 = litres per hectare (L/ha)
Imp. quarts per acre × 2.8 = litres per hectare (L/ha)
U.S. quarts per acre × 2.34 = litres per hectare (L/ha)
Imp. pints per acre × 1.4 = litres per hectare (L/ha)
U.S. pints per acre × 1.17 = litres per hectare (L/ha)
Imp. fluid ounces per acre × 70 = millilitres per hectare (mL/ha)
U.S. fluid ounces per acre × 73 = millilitres per hectare (mL/ha)
tons per acre × 2.24 = tonnes per hectare (t/ha)
pounds per acre × 1.12 = kilograms per hectare (kg/ha)
pounds per acre × 0.45 = kilograms per acre (kg/acre)
ounces per acre × 70 = grams per hectare (g/ha)
Dry weight conversions (approximate)Metric Imperial
grams or kilograms/hectare ounces or pounds/acre
100 g/ha = 1½ oz/acre
200 g/ha = 3 oz/acre
300 g/ha = 4¼ oz/acre
500 g/ha = 7 oz/acre
700 g/ha = 10 oz/acre
1.10 kg/ha = 1 lb/acre
1.50 kg/ha = 1¼ lb/acre
2.00 kg/ha = 1¾ lb/acre
2.50 kg/ha = 2¼ lb/acre
3.25 kg/ha = 3 lb/acre
4.00 kg/ha = 3½ lb/acre
5.00 kg/ha = 4½ lb/acre
6.00 kg/ha = 5¼ lb/acre
7.50 kg/ha = 6¾ lb/acre
9.00 kg/ha = 8 lb/acre
11.00 kg/ha = 10 lb/acre
13.00 kg/ha = 11½ lb/acre
15.00 kg/ha = 13½ lb/acre
421
appendIces
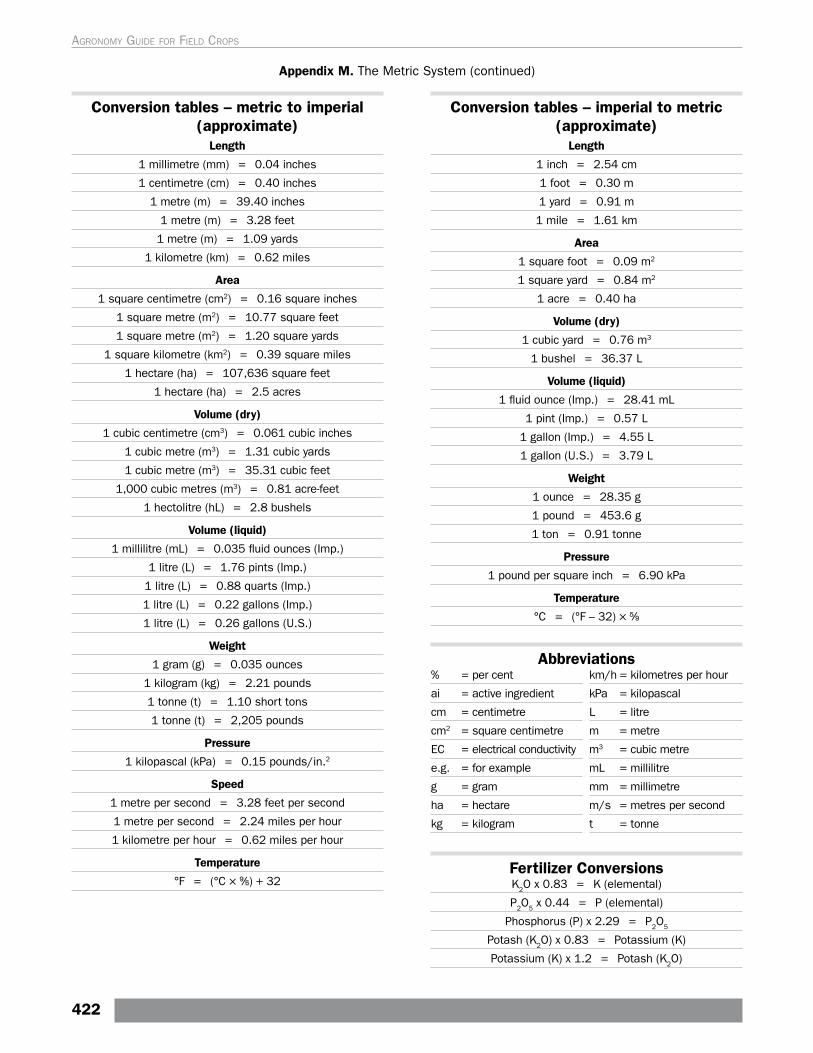
Conversion tables – metric to imperial (approximate)
Length
1 millimetre (mm) = 0.04 inches
1 centimetre (cm) = 0.40 inches
1 metre (m) = 39.40 inches
1 metre (m) = 3.28 feet
1 metre (m) = 1.09 yards
1 kilometre (km) = 0.62 miles
Area
1 square centimetre (cm2) = 0.16 square inches
1 square metre (m2) = 10.77 square feet
1 square metre (m2) = 1.20 square yards
1 square kilometre (km2) = 0.39 square miles
1 hectare (ha) = 107,636 square feet
1 hectare (ha) = 2.5 acres
Volume (dry)
1 cubic centimetre (cm3) = 0.061 cubic inches
1 cubic metre (m3) = 1.31 cubic yards
1 cubic metre (m3) = 35.31 cubic feet
1,000 cubic metres (m3) = 0.81 acre-feet
1 hectolitre (hL) = 2.8 bushels
Volume (liquid)
1 millilitre (mL) = 0.035 fluid ounces (Imp.)
1 litre (L) = 1.76 pints (Imp.)
1 litre (L) = 0.88 quarts (Imp.)
1 litre (L) = 0.22 gallons (Imp.)
1 litre (L) = 0.26 gallons (U.S.)
Weight
1 gram (g) = 0.035 ounces
1 kilogram (kg) = 2.21 pounds
1 tonne (t) = 1.10 short tons
1 tonne (t) = 2,205 pounds
Pressure
1 kilopascal (kPa) = 0.15 pounds/in.2
Speed
1 metre per second = 3.28 feet per second
1 metre per second = 2.24 miles per hour
1 kilometre per hour = 0.62 miles per hour
Temperature
°F = (°C × 9⁄5) + 32
Conversion tables – imperial to metric (approximate)
Length
1 inch = 2.54 cm
1 foot = 0.30 m
1 yard = 0.91 m
1 mile = 1.61 km
Area
1 square foot = 0.09 m2
1 square yard = 0.84 m2
1 acre = 0.40 ha
Volume (dry)
1 cubic yard = 0.76 m3
1 bushel = 36.37 L
Volume (liquid)
1 fluid ounce (Imp.) = 28.41 mL
1 pint (Imp.) = 0.57 L
1 gallon (Imp.) = 4.55 L
1 gallon (U.S.) = 3.79 L
Weight
1 ounce = 28.35 g
1 pound = 453.6 g
1 ton = 0.91 tonne
Pressure
1 pound per square inch = 6.90 kPa
Temperature
°C = (°F – 32) × 5⁄9
Abbreviations% = per cent
ai = active ingredient
cm = centimetre
cm2 = square centimetre
EC = electrical conductivity
e.g. = for example
g = gram
ha = hectare
kg = kilogram
km/h = kilometres per hour
kPa = kilopascal
L = litre
m = metre
m3 = cubic metre
mL = millilitre
mm = millimetre
m/s = metres per second
t = tonne
Fertilizer ConversionsK2O x 0.83 = K (elemental)
P2O5 x 0.44 = P (elemental)
Phosphorus (P) x 2.29 = P2O5
Potash (K2O) x 0.83 = Potassium (K)
Potassium (K) x 1.2 = Potash (K2O)
Appendix M. The Metric System (continued)
422
Agronomy guide for field Crops

Appendix N. Field Scouting Report
Farm: ________________________ Scout: _____________________ Date:______________________ Time: ______________________
Field: ________________________ Acreage: ___________________ Crop: ______________________ Plant Population: ____________
Crop Growth Stage, Height and Condition: _________________________________________________________________________________
______________________________________________________________________________________________________________________
______________________________________________________________________________________________________________________
______________________________________________________________________________________________________________________
Soil Condition: _________________________________________________________________________________________________________
Weeds Growth Stage Pressure/Density
Insects Stage Pressure/Density
Diseases Stage Pressure/Density
423
appendIces

Field Map: Use the blank area below to sketch in the location of weeds, insects, disease patches, crop condition, including GPS coordinates.
Field Scout’s Comments: ________________________________________________________________________________________________
______________________________________________________________________________________________________________________
______________________________________________________________________________________________________________________
______________________________________________________________________________________________________________________
______________________________________________________________________________________________________________________
______________________________________________________________________________________________________________________
______________________________________________________________________________________________________________________
______________________________________________________________________________________________________________________
Action Recommended: __________________________________________________________________________________________________
______________________________________________________________________________________________________________________
______________________________________________________________________________________________________________________
______________________________________________________________________________________________________________________
______________________________________________________________________________________________________________________
______________________________________________________________________________________________________________________
______________________________________________________________________________________________________________________
______________________________________________________________________________________________________________________
Appendix N. Field Scouting Report (continued)
424
Agronomy guide for field Crops
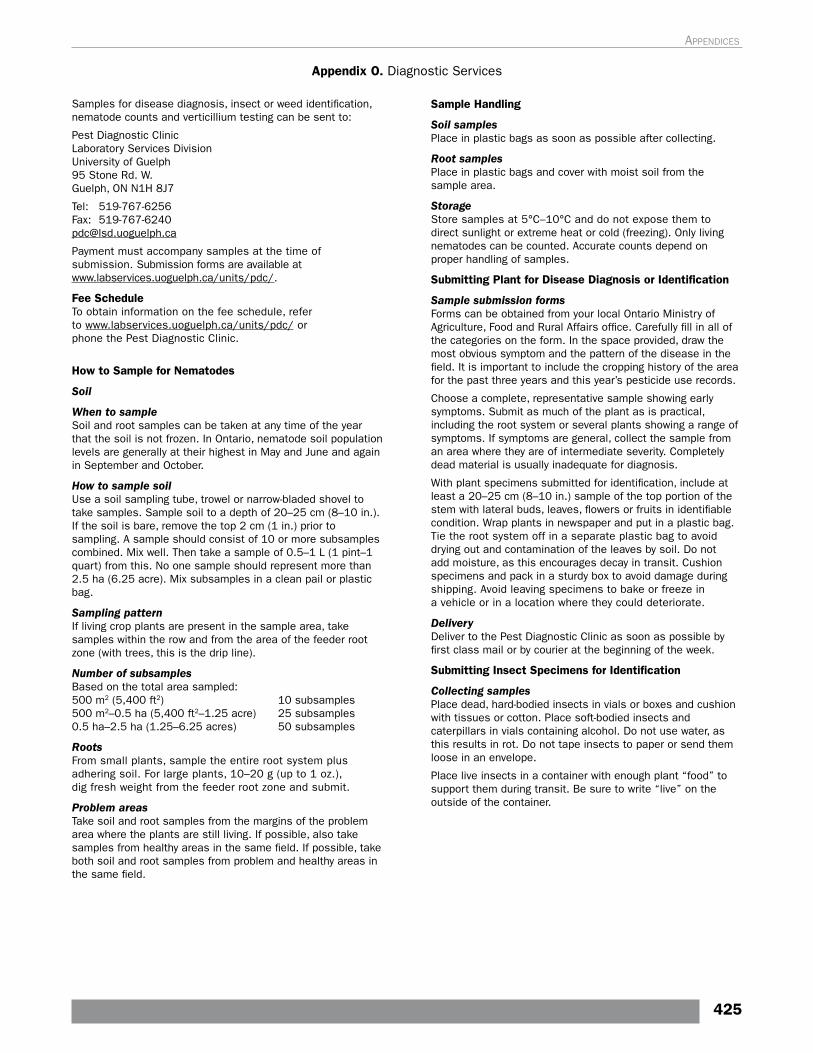
Samples for disease diagnosis, insect or weed identification, nematode counts and verticillium testing can be sent to:
Pest Diagnostic ClinicLaboratory Services DivisionUniversity of Guelph95 Stone Rd. W.Guelph, ON N1H 8J7
Tel: 519-767-6256 Fax: [email protected]
Payment must accompany samples at the time of submission. Submission forms are available at www.labservices.uoguelph.ca/units/pdc/.
Fee ScheduleTo obtain information on the fee schedule, refer to www.labservices.uoguelph.ca/units/pdc/ or phone the Pest Diagnostic Clinic.
How to Sample for Nematodes
Soil
When to sampleSoil and root samples can be taken at any time of the year that the soil is not frozen. In Ontario, nematode soil population levels are generally at their highest in May and June and again in September and October.
How to sample soilUse a soil sampling tube, trowel or narrow-bladed shovel to take samples. Sample soil to a depth of 20–25 cm (8–10 in.). If the soil is bare, remove the top 2 cm (1 in.) prior to sampling. A sample should consist of 10 or more subsamples combined. Mix well. Then take a sample of 0.5–1 L (1 pint–1 quart) from this. No one sample should represent more than 2.5 ha (6.25 acre). Mix subsamples in a clean pail or plastic bag.
Sampling patternIf living crop plants are present in the sample area, take samples within the row and from the area of the feeder root zone (with trees, this is the drip line).
Number of subsamplesBased on the total area sampled:500 m2 (5,400 ft2) 10 subsamples500 m2–0.5 ha (5,400 ft2–1.25 acre) 25 subsamples0.5 ha–2.5 ha (1.25–6.25 acres) 50 subsamples
RootsFrom small plants, sample the entire root system plus adhering soil. For large plants, 10–20 g (up to 1 oz.), dig fresh weight from the feeder root zone and submit.
Problem areasTake soil and root samples from the margins of the problem area where the plants are still living. If possible, also take samples from healthy areas in the same field. If possible, take both soil and root samples from problem and healthy areas in the same field.
Sample Handling
Soil samplesPlace in plastic bags as soon as possible after collecting.
Root samplesPlace in plastic bags and cover with moist soil from the sample area.
Storage Store samples at 5°C–10°C and do not expose them to direct sunlight or extreme heat or cold (freezing). Only living nematodes can be counted. Accurate counts depend on proper handling of samples.
Submitting Plant for Disease Diagnosis or Identification
Sample submission formsForms can be obtained from your local Ontario Ministry of Agriculture, Food and Rural Affairs office. Carefully fill in all of the categories on the form. In the space provided, draw the most obvious symptom and the pattern of the disease in the field. It is important to include the cropping history of the area for the past three years and this year’s pesticide use records.
Choose a complete, representative sample showing early symptoms. Submit as much of the plant as is practical, including the root system or several plants showing a range of symptoms. If symptoms are general, collect the sample from an area where they are of intermediate severity. Completely dead material is usually inadequate for diagnosis.
With plant specimens submitted for identification, include at least a 20–25 cm (8–10 in.) sample of the top portion of the stem with lateral buds, leaves, flowers or fruits in identifiable condition. Wrap plants in newspaper and put in a plastic bag. Tie the root system off in a separate plastic bag to avoid drying out and contamination of the leaves by soil. Do not add moisture, as this encourages decay in transit. Cushion specimens and pack in a sturdy box to avoid damage during shipping. Avoid leaving specimens to bake or freeze in a vehicle or in a location where they could deteriorate.
DeliveryDeliver to the Pest Diagnostic Clinic as soon as possible by first class mail or by courier at the beginning of the week.
Submitting Insect Specimens for Identification
Collecting samplesPlace dead, hard-bodied insects in vials or boxes and cushion with tissues or cotton. Place soft-bodied insects and caterpillars in vials containing alcohol. Do not use water, as this results in rot. Do not tape insects to paper or send them loose in an envelope.
Place live insects in a container with enough plant “food” to support them during transit. Be sure to write “live” on the outside of the container.
Appendix O. Diagnostic Services
425
appendIces

Page intentionally left blank
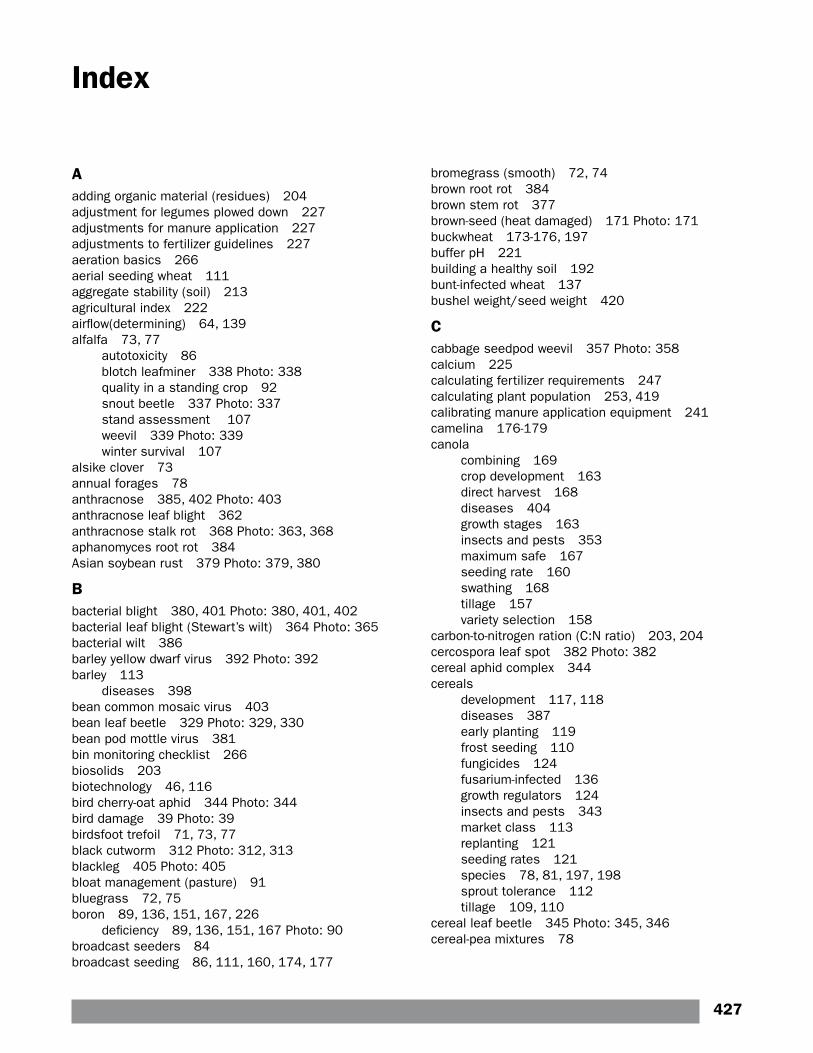
Index
bromegrass (smooth) 72, 74brown root rot 384brown stem rot 377brown-seed (heat damaged) 171 Photo: 171buckwheat 173-176, 197buffer pH 221building a healthy soil 192bunt-infected wheat 137bushel weight/seed weight 420
Ccabbage seedpod weevil 357 Photo: 358calcium 225calculating fertilizer requirements 247calculating plant population 253, 419calibrating manure application equipment 241camelina 176-179canola
combining 169crop development 163direct harvest 168diseases 404growth stages 163insects and pests 353 maximum safe 167seeding rate 160swathing 168tillage 157variety selection 158
carbon-to-nitrogen ration (C:N ratio) 203, 204cercospora leaf spot 382 Photo: 382cereal aphid complex 344cereals
development 117, 118diseases 387early planting 119frost seeding 110 fungicides 124fusarium-infected 136growth regulators 124insects and pests 343market class 113replanting 121seeding rates 121species 78, 81, 197, 198sprout tolerance 112tillage 109, 110
cereal leaf beetle 345 Photo: 345, 346cereal-pea mixtures 78
Aadding organic material (residues) 204adjustment for legumes plowed down 227adjustments for manure application 227adjustments to fertilizer guidelines 227aeration basics 266aerial seeding wheat 111aggregate stability (soil) 213agricultural index 222airflow(determining) 64, 139alfalfa 73, 77
autotoxicity 86blotch leafminer 338 Photo: 338quality in a standing crop 92snout beetle 337 Photo: 337stand assessment 107weevil 339 Photo: 339winter survival 107
alsike clover 73annual forages 78anthracnose 385, 402 Photo: 403anthracnose leaf blight 362anthracnose stalk rot 368 Photo: 363, 368aphanomyces root rot 384Asian soybean rust 379 Photo: 379, 380
Bbacterial blight 380, 401 Photo: 380, 401, 402bacterial leaf blight (Stewart’s wilt) 364 Photo: 365bacterial wilt 386barley yellow dwarf virus 392 Photo: 392barley 113
diseases 398bean common mosaic virus 403bean leaf beetle 329 Photo: 329, 330bean pod mottle virus 381bin monitoring checklist 266biosolids 203biotechnology 46, 116bird cherry-oat aphid 344 Photo: 344bird damage 39 Photo: 39birdsfoot trefoil 71, 73, 77black cutworm 312 Photo: 312, 313blackleg 405 Photo: 405bloat management (pasture) 91bluegrass 72, 75boron 89, 136, 151, 167, 226
deficiency 89, 136, 151, 167 Photo: 90broadcast seeders 84broadcast seeding 86, 111, 160, 174, 177
427
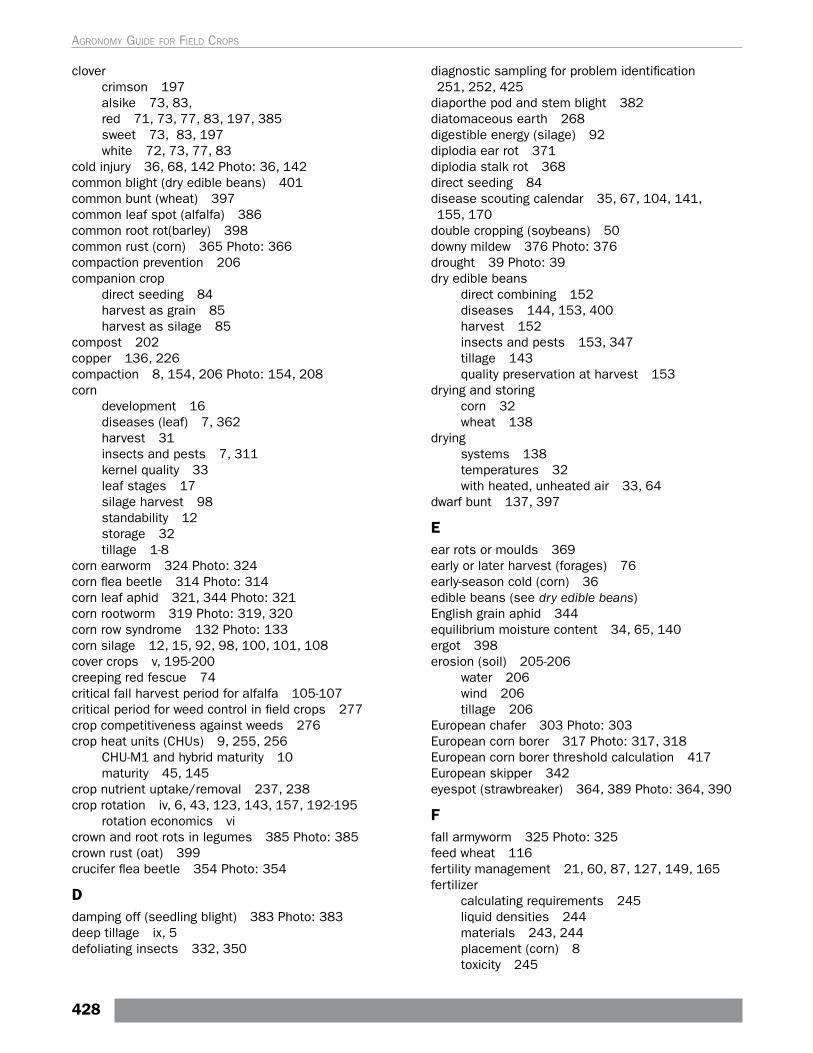
clovercrimson 197alsike 73, 83,red 71, 73, 77, 83, 197, 385sweet 73, 83, 197white 72, 73, 77, 83
cold injury 36, 68, 142 Photo: 36, 142common blight (dry edible beans) 401common bunt (wheat) 397common leaf spot (alfalfa) 386common root rot(barley) 398common rust (corn) 365 Photo: 366compaction prevention 206companion crop
direct seeding 84harvest as grain 85harvest as silage 85
compost 202copper 136, 226compaction 8, 154, 206 Photo: 154, 208corn
development 16diseases (leaf) 7, 362harvest 31insects and pests 7, 311kernel quality 33leaf stages 17silage harvest 98standability 12storage 32tillage 1-8
corn earworm 324 Photo: 324corn flea beetle 314 Photo: 314corn leaf aphid 321, 344 Photo: 321corn rootworm 319 Photo: 319, 320corn row syndrome 132 Photo: 133corn silage 12, 15, 92, 98, 100, 101, 108cover crops v, 195-200creeping red fescue 74critical fall harvest period for alfalfa 105-107critical period for weed control in field crops 277crop competitiveness against weeds 276crop heat units (CHUs) 9, 255, 256
CHU-M1 and hybrid maturity 10 maturity 45, 145
crop nutrient uptake/removal 237, 238crop rotation iv, 6, 43, 123, 143, 157, 192-195
rotation economics vicrown and root rots in legumes 385 Photo: 385crown rust (oat) 399crucifer flea beetle 354 Photo: 354
Ddamping off (seedling blight) 383 Photo: 383deep tillage ix, 5defoliating insects 332, 350
diagnostic sampling for problem identification 251, 252, 425
diaporthe pod and stem blight 382diatomaceous earth 268digestible energy (silage) 92diplodia ear rot 371diplodia stalk rot 368direct seeding 84disease scouting calendar 35, 67, 104, 141, 155, 170
double cropping (soybeans) 50 downy mildew 376 Photo: 376drought 39 Photo: 39dry edible beans
direct combining 152diseases 144, 153, 400harvest 152insects and pests 153, 347tillage 143quality preservation at harvest 153
drying and storing corn 32wheat 138
drying systems 138temperatures 32with heated, unheated air 33, 64
dwarf bunt 137, 397
Eear rots or moulds 369early or later harvest (forages) 76early-season cold (corn) 36edible beans (see dry edible beans)English grain aphid 344equilibrium moisture content 34, 65, 140ergot 398erosion (soil) 205-206
water 206wind 206tillage 206
European chafer 303 Photo: 303European corn borer 317 Photo: 317, 318European corn borer threshold calculation 417European skipper 342eyespot (strawbreaker) 364, 389 Photo: 364, 390
Ffall armyworm 325 Photo: 325feed wheat 116fertility management 21, 60, 87, 127, 149, 165fertilizer
calculating requirements 245liquid densities 244materials 243, 244placement (corn) 8toxicity 245
428
Agronomy guide for field Crops
fertilizer guidelines 220fermentation analysis (silage) 102festuloliums 75field management zones 218flax 177, 178flooding 37 Photo: 37foliar fertilization 31, 62, 135, 151foliar fertilizers 247forage brassicas: rape, kale, turnips 81, 198, 199forage
bale weights 95critical harvest 105, 106cutting and conditioning 93establishment 82feeding losses 97grass-to-legume ratio 76harvest losses 94harvest timing 92insects and pests 103, 336nitrate poisoning 80quality 91, 92, 102rotational grazing 91seeding rates 81-83species mixtures 76, 77species selection 75spoilage 97-102storage loses 95, 96winterkill 105, 108 Photo: 108
forage soybeans 81frog-eye leaf spot 381 Photo: 381frost heaving/injury (also see cold injury) 36,68,107,142,154,170 Photo: 142,170
fungicides and growth regulators (cereals) 124fungicide timing and application 34, 125, 126, 294, 361
fusarium control (cereals) 125fusarium crown rot 388fusarium ear rot 370 Photo: 370fusarium forecasting 126fusarium head blight (scab) 125, 396 Photo: 396fusarium seedling blight 387, 388fusarium root rot 371, 400 Photo: 371, 400fusarium stalk rot 368fusarium-damaged grain 136
Ggeneral insects and pests 301general seed rots and seedling blights 361geo reference (and direct sampling) 217gibberella ear rot 370 Photo: 370gibberella stalk rot 368 Photo: 369GMO (genetically modified organism) 41, 46, 158grain bin aeration 266grain bin management 266grain drill 52, 83, 161grain dryers 32, 64, 138, 139grain storage monitoring 266
granary weevil 269 Photo: 271grass crops 73-75, 79, 80, 198grass maturity at harvest 76grass-to-legume ratio 76greenhouse gases 194, 205green manure 173, 174green seed 69, 172grey leaf spot 365growing degree days (GDD) 117, 118, 254growing degree days and crop heat units 254grubs 301-305 Photo: 301, 303, 304, 305
Hhail damage 37, 66, 154, 171, 181 Photo: 37, 66halo blight 401 Photo: 401harvest and storage 31,62,91,136,152,168, 175,177,178,180,182,184,186,189,266
harvest moistures 12, 31, 59, 99hay
barn dryers 94bale size and weights 95feeding losses 97for horses 97harvest losses 94heating 95preservatives 96respiration 94storage 96storage losses 95weathering 94
haylage and silage 81, 85, 93, 97-102heat/temperature stress 37, 164, 171hemp 179-181herbicide injury 279-290 Photo: 281-290herbicide resistance 279
cross-pollination (canola) 172Hessian fly 119, 345high-temperature drying (cereals) 139hilum colour 45hulless barley/oat 114, 115hybrid selection 9
and harvesting 13and test weight 13for highest yield 11for silage 12for standibilty 12 switching to shorter-season 12workhorse vs. racehorse 11
Iice 105, 107, 112, 140, 142, 171, 172identity preservation (IP) 46, 63indeterminate type (vine) 148indian meal moth 269 Photo: 270inoculation 47, 48, 60, 86, 147insect management for farm-stored grain 267insect probe 267 Photo: 268
429
Index
insect scouting calendar 35, 67, 104, 141, 155, 170insect monitoring supplies 409integrated cropping systems iii integrated pest management ix, 124, 249, 293, 301, 415
integrated weed management ix, 273, 279iron and molybdenum 226Italian ryegrasses 78
JJapanese beetle 304 Photo: 305June beetle 304 Photo: 304
Kkernel milk line 98kernel quality 33
Llaboratories
diagnostic 425mycotoxin (feed and mould) 413nematode 413soil testing 412
ladybird beetle 295, 328 Photo: 295, 328large-bale haylage (baleage) 95, 97leaf rust 365, 391 Photo: 366, 391, 392legume broadleaf crops 71, 198length of row for one-thousandth of an acre 253, 419
length-of-cut for forage harvest 100leptosphaerulina (lepto) leaf spot 386 Photo: 386lesser grain borer 270 Photo: 271lightning damage 68 Photo: 68limestone quality 221liming 91, 220-223lodged grain crops 137, 366 Photo: 52, 127low temperature drying 138lowering soil pH 223
Mmanagement zones (field) 218 Photo: 218magnesium 30, 224, 244
deficiency 30, 224 Photo: 30manganese 31, 62, 90, 135, 151, 216, 220, 225, 226
deficiency 62, 135, 151, 225 Photo: 62, 135manure 227-242
analysis 229, 233-235and no-till 241 calculating available nutrients 236environmental concerns 239equipment calibration 241management 230nitrogen, mineral and organic 231-233on forages 90value 230, 237
mature green seed 69 Photo: 69maturity group (soybeans) 45maximum safe rates of fertilizer 28, 246-247 Photo: 28
meadow bromegrass 72, 74meadow fescue 72, 75, 83measuring moisture content (silage) 98measuring relative humidity 65mechanical losses from forage harvest 94mechanical weed control 278metric conversions 421,422Mexican bean beetle 350 Photo: 350micronutrients 30, 31,62, 89, 135, 151, 225
fertilizers 225sampling 220tests 220
milk line, silage corn 98milling oat 115milling wheat 89millipedes 307 Photo: 307miscanthus 181-183mixed grains 115moisture contents at harvest (grains) 420
NNASM 203, 242natural-air drying 33, 64, 138natural enemies (beneficials) 294
bacteria 298fungi 298 Photo: 298nematodes 298parasitoids 297 Photo: 297, 298pathogens 298predators 295-297 Photo: 295, 296vertebrates 297viruses 299 Photo: 299
net blotch 399 Photo: 399nitrate poisoning 80nitrate-nitrogen soil test 21-23, 128-129
application precautions 23, 129nitrogen 21-26, 60, 87, 127-131, 149, 165
deficiency 21 Photo: 21fertilizers 243, 246, 247worksheet for corn (Imperial) 410-411worksheet for corn (metric) 24risk mitigation 240
non-agricultural source materials 203, 242non-legume broadleaf crops 81, 199northern anthracnose, red clover 385northern leaf blight 363 Photo: 363nutrients
assessing needs 215nutrient management plans 230
430
Agronomy guide for field Crops
Ooat 115
cyst nematode 400diseases 399leaf rust 399
OMAFRA-accredited soil-testing program 215orchardgrass 72, 74, 77organic materials application 202-204, 230-239organic matter (OM) 208, 210
additions 204and crop rotation 195role 210
ozone injury 156 Photo: 156
Ppacker seeders 83packing (canola) 162parasitic wasps (beneficial insects) 318, 322, 328, 345, 353, 359
pasture management 91patching or thickening thin stands 57PEAQ stick 92pearl millet 79, 81perennial grasses 73perennial legumes 71perennial ryegrass 72, 75phomopsis
seed mould 382 Photo: 382 pod and stem blight 380 Photo: 381
phosphate and potash 27, 60, 87, 131, 150, 166, 223
phosphate fertilizers 246phosphorus deficiency 27 Photo: 27phosphorus risk assessment 240phytophthora root rot 371, 383 Photo: 372, 384plant analysis 31, 62, 90, 134, 151, 167plant development 57, 148, 164 Photo: 164plant population (corn) 14plant spacing (gaps) 18, 56planter performance 9planting (also see seeding) 14, 47, 82, 109-111, 145, 158
date 14, 49, 85, 119, 145delayed 50depth (also see seeding depth) 15, 54, 82
Photo: 54equipment and maintenance 9, 42, 51, 83-84speed 19
pod and seed diseases 380pod-piercing insects 334pollinators (protecting) 299potash fertilizers 246potassium deficiency 27, 61, 88 Photo: 27, 61, 88potato leafhopper 341, 349 Photo: 341powdery mildew 376, 394 Photo: 376, 394precision tools
RTK Real time kinematic 259GPS global positioning systems 259
predators (beneficial)ground beetles 295 Photo: 295lady beetles 295 Photo: 295rove beetles 295pirate bugs 296 Photo: 296syrphid flies 296 Photo: 296soldier beetles 297
pre-harvest herbicides for canola harvest 169principles for management of nutrients 215propionate hay preservatives 96prussic acid poisoning 80purple seed stain 382 Photo: 382pythium (browning) root rot 362, 371, 388, 400 Photo: 400
pythium seedling blight, damping off 362, 371, 372, 383, 404
pythium stalk rot 367, 369
Qquinoa 183-184
Rrain fastness 126real-time management 261 Photo: 261recording field observations 254, 423-424redbacked cutworm 355red clover 70, 73, 77, 197red-headed flea beetles 332 Photo: 332red (hard) winter wheats 128reducing soil erosion 206reed canarygrass 72, 74remote sensing 261replant decisions 20, 56, 121, 148, 162rescue fumigation treatments 268residue management v, 7, 42, 86, 157respiration losses in forages 94 Photo: 94rhizoctonia root rot 373, 373rhizoctonia sharp eyespot 389 Photo: 390root rot 362, 371, 388, 400root rot complex 400, 404 Photo: 400rotational grazing 91row width 19, 51, 123, 147,
narrow rows 19, rusty grain beetle 269 Photo: 270rye 116, 197, 198
Ssafe fertilizer rates 246sampling locations (management zones) 218, 251sampling (plant tissue) 220scald (barley) 399scouting pattern 252scouting techniques (stored grain) 268scouting tools 250sealing silos 100 Photo: 100
431
Index
seed bulking 162seed quality 47, 145, 154, 158seed rot 361, 362, 371, 383, 387seed treatments 47, 54, 159, 387seedbed preparation 82, 86, 173, 177, 179, 185, 188
seedcorn maggot 308 Photo: 308, 309seeding
conditions 121date 14, 49, 85, 119, 154, depth 15, 54, 82 Photo: 54equipment 9, 42, 51, 83-84rates 20, 52-54, 77, 81-83, 121, 122,
146, 160-161with a companion crop 84
seedling blight 362, 371, 372, 383, 404seedling disease complex 400, 404 Photo: 400seedling diseases 361, 362, 371, 383, 387, 400, 404
seed-placed fertilizer 28seepage losses 99septoria black stem 399septoria brown spot 373 Photo: 373septoria glume blotch 394 Photo: 395septoria leaf blotch 399septoria leaf spot 394 Photo: 394silage
bacterial inoculants 101crop storage types 98fermentation 99fermentation analysis 102harvest management 98heating 99inoculants 101problems and causes 101silo type 100storage losses 99spoilage losses(minimizing) 100
silo gas 103slugs 309 Photo: 309, 310smooth bromegrass 72, 74smut 366, 396, 397 Photo: 366, 367, 396snow mould 390 Photo: 390soil
acidity and liming 220aggregate stability 213 Photo: 213compaction 8, 154, 206 Photo: 154, 208conductivity 245crusting iv, 55, 83, 84, 143, 147, 160, 162,
206, 207, 212 Photo: 51drainage 1, 5, 75, 105, 106, 142, 206, 209erosion 205fertility and pH 91formation 213life 209, 211organic matter 195, 204, 208, 210
quality 213sampling 216-220sample boxes and information sheets 219sampling zones 218soluble salts 244structure 211-212 Photo: 211-212testing 215texture and drainage 1type and structure 143variability 213
soil health check 207-210soil-borne wheat mosaic virus 393soluble salts 244sorghum and sorghum-sudangrass 79, 80, 81, 197, 198
soybeanaphid 327-329 Photo: 327, 328cyst nematode 374, 375, 377, 403, 413
Photo: 375diseases 370double cropping 50drying 64 germination and emergence 60 Photo: 54harvest losses 62 insects and pests 326rust 379 Photo: 379, 380seed viability and deterioration 47stand reductions (evaluation) 56stem damage 66tillage 41-43variety selection 44
soybean mosaic virus 380 Photo: 380, 381spider mites, two spotted 331-332 Photo: 331, 332
spot blotch 398 Photo: 399sprayer cleanout 126spring canola 159, 165 spring cereals 78, 81, 113-116, 119, 122, 128, 131, 134
spring seeding forages 85spring wheat 116, 122, 127stagonospora leaf and glume blotch 395 Photo: 395
stalk rots 367, 368stem canker 377 Photo: 377stem rust 391 Photo: 391Stewart’s wilt 364, 365 Photo: 365stink bug 316, 334
brown 316, 334 Photo: 335brown marmorated 317, 335 Photo: 335green 316, 334 Photo: 334
stored graininsect identification 268stored-grain insects 268-270 Photo: 270, 271
storing clean, dry grain 267storing grain in bins 265
432
Agronomy guide for field Crops
strawremoval (flax) 178quality and quantity 112, 113value 112
stripe rust 391, 392 Photo: 392striped flea beetle 354 Photo: 354sudangrass 80, 81sudden death syndrome 377 Photo: 377sulphur 30, 60, 89, 134, 167 Photo: 134, 167
summer seeding (forages) 85sunscald 156 Photo: 156sunflower 184-187swede midge 356-357 Photo: 356sustainable production iii switch grass 187-189sweep nets 253
Ttake-all 389 Photo: 389tall fescue 72, 74tan spot 395tarnished plant bug 353, 359 Photo: 353test weight 13, 420tillage
depth for liming 223options 41, 109, 143, 157, 173, 275 rationale vii, 1, 275reducing 157, 200
tillage systems vii-ix, 1-9, 41-43, 84, 109-111, 143, 157 200-201, 275
chisel plow (mulch) 2, 3, 201conventional viii, 2, 110, 157 deep (subsoiling) ix, 5, disc 201mouldboard plow 201mulch 2, 3mulch and no-till 41,no-till ix, 6-9, 84, 109, 157strip viii, 4, 5, 200vertical 3, 201zone 200
timing of field scouting 249timing of nitrogen application (cereals) 131timing PSNT nitrate sampling 22, 129timothy 74, 77toxicity of fertilizer materials 245triticale and spelt 116true armyworm 315, 346 Photo: 315, 347turnip mosaic virus 406 Photo: 407two-spotted spider mites 331 Photo: 331, 332
UUAV unmanned aerial vehicles/systems 261, 262uniform nitrogen application 130uniformity of emergence 18 Photo: 43uniformity spacing (corn) 18
Vvariable rate application 260 Photo: 263variety selection iii, 44, 76, 111, 144, 158, 174, 177, 181, 185
verticillium wilt 387 Photo: 387volunteer grain 86
Wwarm-season grasses 79, 198weeds
competitiveness 276control 7, 86, 144, 176, 178, 180, 183,
184, 187, 189cover crops 273critical control period 277crop rotation 273impact on crop yield losses 276species, impact on crop yield 279
western bean cutworm 322-324 Photo: 322, 323westerwold ryegrasses 78wheat spindle streak mosaic virus 393white mould 378, 404, 406 Photo: 378, 404, 406wind erosion 206winter barley 114winter canola
seeding 159fall nitrogen 165spring nitrogen 165
winter cereals 78, 115, 198 winter hardiness and cold tolerance (cereals) 112winterkill 105, 140, 172 Photo: 108wireworms 305 Photo: 305, 306
Zzinc 30, 136, 151, 226
deficiency 30, 151, 226 Photo: 30Zadok’s scale 118
433
Index
Related Documents