NATURAL GAS MARKET SUMMER OUTLOOK 2018 MAY 2018 Prepared for: NATURAL GAS SUPPLY ASSOCIATION Prepared by: ENERGY VENTURES ANALYSIS ENERGY VENTURES ANALYSIS SUMMER 2018 1901 N. Moore Street 703-276-8900 Suite 1200 www.evainc.com Arlington, VA 22209-1706 © 2018 Energy Ventures Analysis

Welcome message from author
This document is posted to help you gain knowledge. Please leave a comment to let me know what you think about it! Share it to your friends and learn new things together.
Transcript
NATURAL GAS MARKET SUMMER OUTLOOK 2018 MAY 2018
Prepared for:
NATURAL GAS SUPPLY ASSOCIATION
Prepared by:
ENERGY VENTURES ANALYSIS
ENER
GY
VEN
TUR
ES A
NA
LYSI
S SU
MM
ER 2
01
8
1901 N. Moore Street 703-276-8900 Suite 1200 www.evainc.com Arlington, VA 22209-1706 © 2018 Energy Ventures Analysis
SUMMER OUTLOOK SUMMER 2018
© 2018 ENERGY VENTURES ANALYSIS 2
Table of Contents I. OVERVIEW ...................................................................................................................................................................... 3
II. OUTLOOK FOR DEMAND ................................................................................................................................................. 4
Power .................................................................................................................................................................................. 4
Industrial demand ............................................................................................................................................................... 7
Residential and Commercial ............................................................................................................................................... 9
Exports .............................................................................................................................................................................. 10
III. OUTLOOK FOR SUPPLY .................................................................................................................................................. 13
Production ........................................................................................................................................................................ 13
Imports from Canada ........................................................................................................................................................ 14
IV. STORAGE INJECTION ..................................................................................................................................................... 15
V. APPENDICES .................................................................................................................................................................. 16
1. The Impacts of Hurricanes on Supply and Demand of Natural Gas ......................................................................... 16
2. Aliso Canyon and SoCalGas System – Status Update and Summer Assessment ..................................................... 17
3. EIA’s Short-Term Forecast Versus NYMEX ............................................................................................................... 18
4. Summer Imports and Exports of Natural Gas .......................................................................................................... 18
5. Total 2017 Primary Natural Gas Demand by EIA Natural Gas Region and Time of Year ......................................... 19
6. Total 2017 Primary Natural Gas Demand by Sector and Time of Year .................................................................... 20
7. 2017 Power Natural Gas Demand by Natural Gas Region and Time of Year ........................................................... 21
8. Weather ................................................................................................................................................................... 22
9. GDP Index ................................................................................................................................................................ 22
10. U.S. Lower 48 Gas Consumption (Summer Season April to October, BCFD) ........................................................... 23
11. Performance Characteristics of Natural Gas Combined Cycle Units by Region ....................................................... 23

SUMMER OUTLOOK SUMMER 2018
© 2018 ENERGY VENTURES ANALYSIS 3
I. OVERVIEW Summer 20181 began with a low March-end natural gas storage inventory level, 339 BCF lower than the five-
year average. For the first three weeks of April, high demand caused by cold weather continued to pull natural
gas out of the ground beyond the winter. Subsequent weather patterns through the second week of May, when
this report was prepared, has alleviated this trend, with storage recovered to 75% of five-year average at this
time of the year.
Given the low storage inventory, growth in production is required this summer to fill storage as well as to meet
growing demand, both domestically and for exports. Dry natural gas production is expected to grow by 7.8
BCFD summer over summer, a record since 2005.
On the demand side, power burn and exports are the big growth sectors. Natural gas capacity added to the
generation fleet since last summer coupled with low prices and low hydro will boost power burn by 2.7 BCFD
summer over summer. Exports growth can be counted on as new LNG trains have been added and pipelines in
Mexico are being completed (see summer fundamentals in the summary table below). Total natural gas
demand including exports is expected to grow by 6.2 BCFD summer over summer.
Storage inventory is forecast to reach 3.5 TCF by October 2018. Injections will have to be almost 2 BCFD higher
than last summer to get storage to this five-year minimum season-end level.
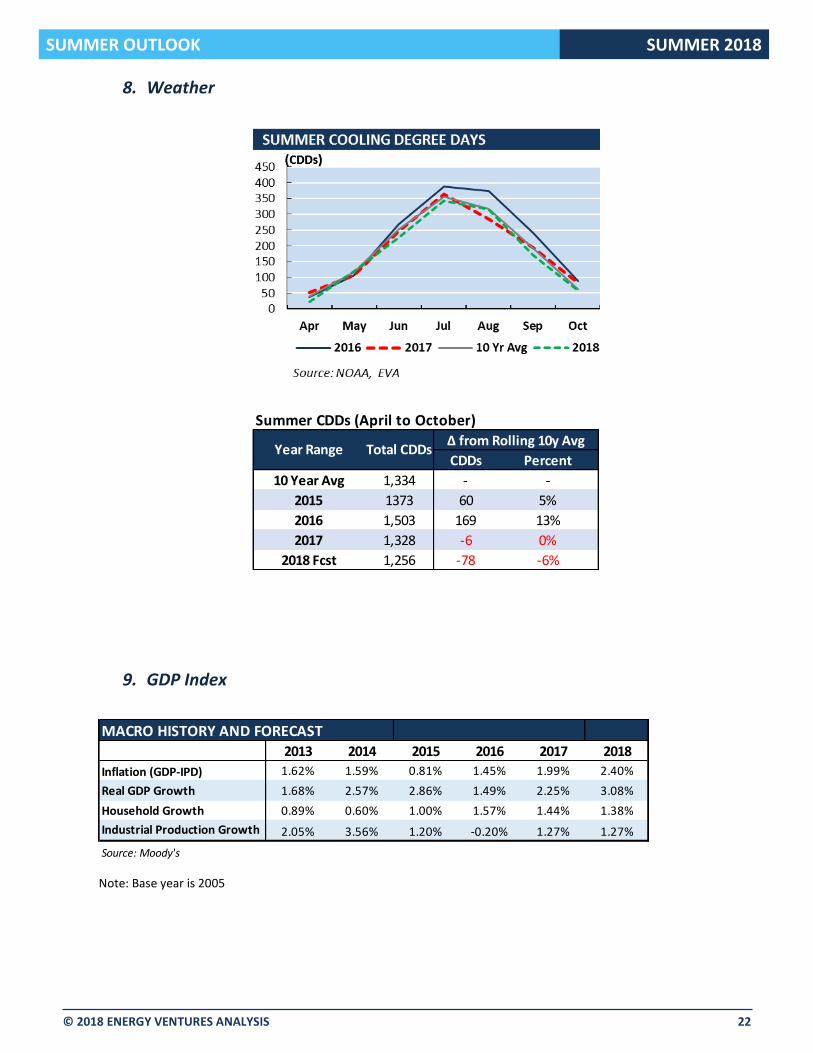
Summer 2018’s cooling degree days (CDDs) are expected to total 1,256 according to National Weather Service,
which is 6% lower than 10-year average and 5% lower than summer 2017. This cooler than normal forecast
could offset some structural growth in natural gas demand, leading to more natural gas in the storage than the
base case.
SUMMER OUTLOOK FUNDAMENTALS SUMMARY TABLE
BCFD Summer
2018 Summer
2017 Summer-over-
Summer Changes
Dry Production 80.4 72.5 7.8
Net Canadian Imports 5.4 5.2 0.2
LNG Imports Sendout 0.2 0.2 0.0
Total Supply 86.0 77.9 8.1
Power Burn 30.0 27.3 2.7
Industrial 21.0 20.5 0.5
Residential and Commercial 11.5 10.7 0.9
Pipeline Loss and Other 5.0 5.0 0.0
Mexico Exports 4.7 4.2 0.5
LNG Exports Feedgas Demand 3.7 2.1 1.6
Total Demand 75.9 69.7 6.2
Injections 10.0 8.1 1.9
CDDs 1,256 1,328 -72 Source: EVA
1For the purpose of this report, summer refers to April through October which is, in general, the gas injection season.
SUMMER OUTLOOK SUMMER 2018
© 2018 ENERGY VENTURES ANALYSIS 4
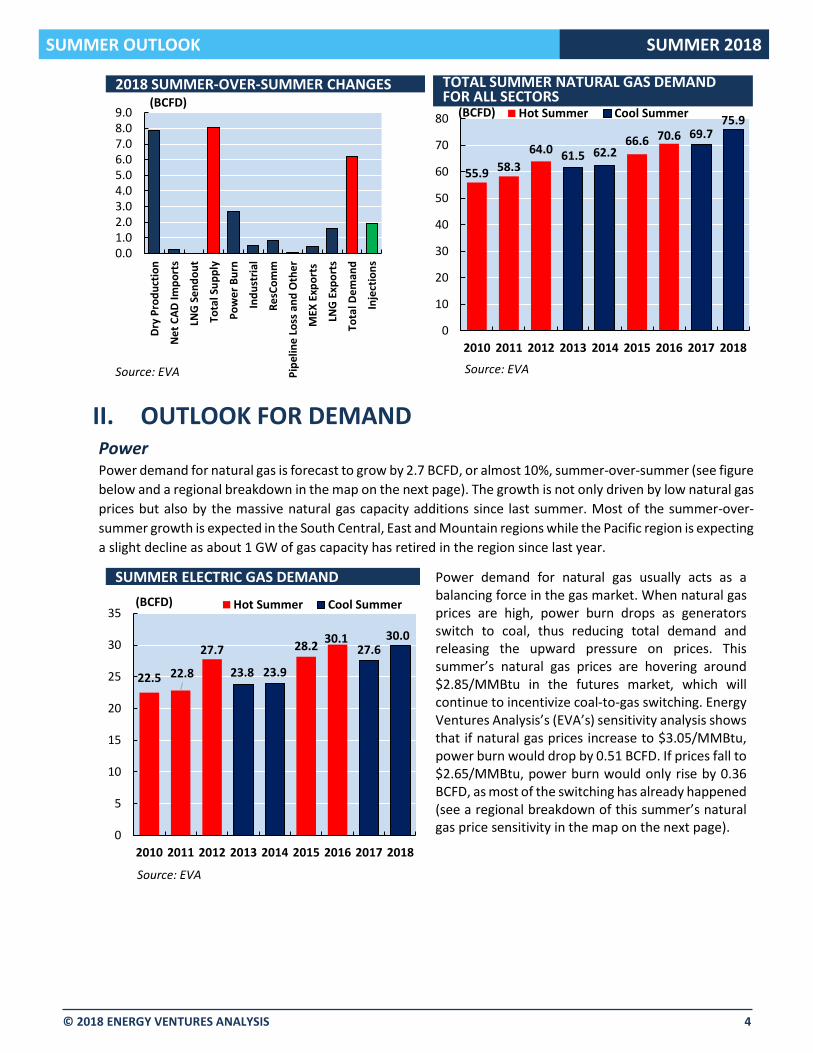
II. OUTLOOK FOR DEMAND Power Power demand for natural gas is forecast to grow by 2.7 BCFD, or almost 10%, summer-over-summer (see figure
below and a regional breakdown in the map on the next page). The growth is not only driven by low natural gas
prices but also by the massive natural gas capacity additions since last summer. Most of the summer-over-
summer growth is expected in the South Central, East and Mountain regions while the Pacific region is expecting
a slight decline as about 1 GW of gas capacity has retired in the region since last year.
Power demand for natural gas usually acts as a balancing force in the gas market. When natural gas prices are high, power burn drops as generators switch to coal, thus reducing total demand and releasing the upward pressure on prices. This summer’s natural gas prices are hovering around $2.85/MMBtu in the futures market, which will continue to incentivize coal-to-gas switching. Energy Ventures Analysis’s (EVA’s) sensitivity analysis shows that if natural gas prices increase to $3.05/MMBtu, power burn would drop by 0.51 BCFD. If prices fall to $2.65/MMBtu, power burn would only rise by 0.36 BCFD, as most of the switching has already happened (see a regional breakdown of this summer’s natural gas price sensitivity in the map on the next page).
0.01.02.03.04.05.06.07.08.09.0
Dry
Pro
du
ctio
n
Ne
t C
AD
Imp
ort
s
LNG
Se
nd
ou
t
Tota
l Su
pp
ly
Po
we
r B
urn
Ind
ust
rial
Re
sCo
mm
Pip
elin
e L
oss
an
d O
the
r
MEX
Exp
ort
s
LNG
Exp
ort
s
Tota
l De
man
d
Inje
ctio
ns
2018 SUMMER-OVER-SUMMER CHANGES(BCFD)
Source: EVA
55.9 58.3
64.066.6 70.6
61.5 62.2
69.775.9
0
10
20
30
40
50
60
70
80
2010 2011 2012 2013 2014 2015 2016 2017 2018
Hot Summer Cool Summer
TOTAL SUMMER NATURAL GAS DEMAND FOR ALL SECTORS
(BCFD)
Source: EVA
22.5 22.8
27.7 28.230.1
23.8 23.9
27.630.0
0
5
10
15
20
25
30
35
2010 2011 2012 2013 2014 2015 2016 2017 2018
Hot Summer Cool Summer
SUMMER ELECTRIC GAS DEMAND
(BCFD)
Source: EVA
SUMMER OUTLOOK SUMMER 2018
© 2018 ENERGY VENTURES ANALYSIS 5
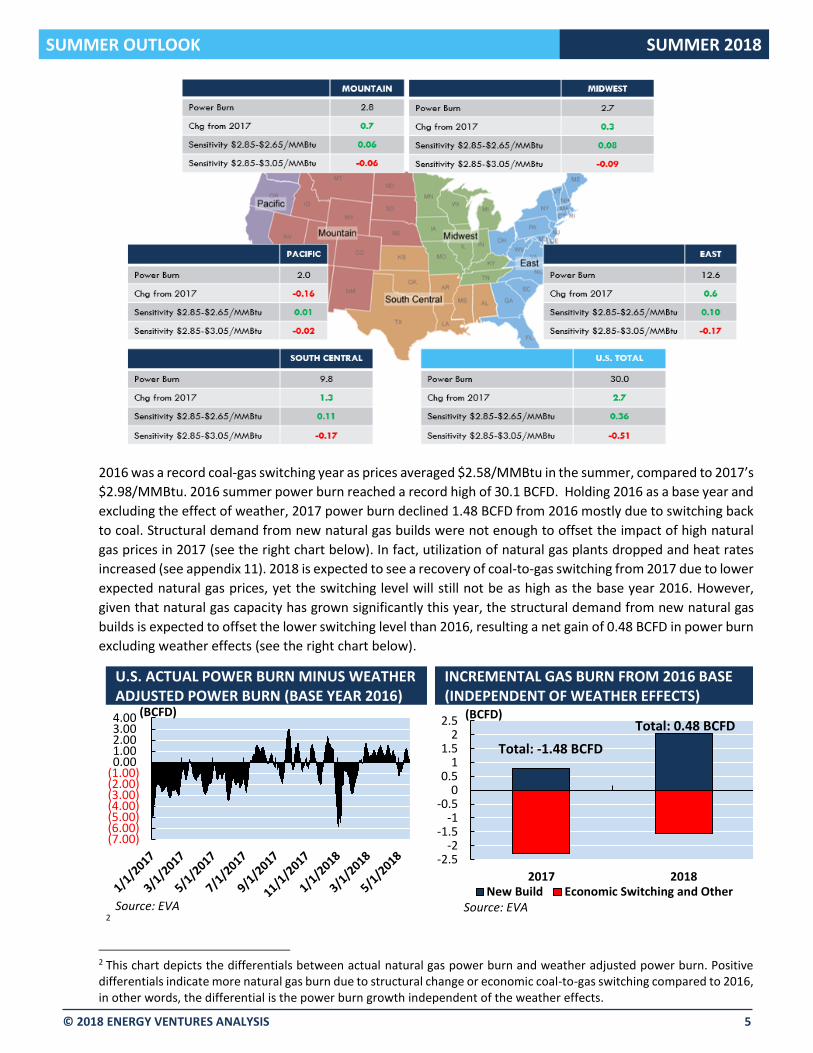
2016 was a record coal-gas switching year as prices averaged $2.58/MMBtu in the summer, compared to 2017’s
$2.98/MMBtu. 2016 summer power burn reached a record high of 30.1 BCFD. Holding 2016 as a base year and
excluding the effect of weather, 2017 power burn declined 1.48 BCFD from 2016 mostly due to switching back
to coal. Structural demand from new natural gas builds were not enough to offset the impact of high natural
gas prices in 2017 (see the right chart below). In fact, utilization of natural gas plants dropped and heat rates
increased (see appendix 11). 2018 is expected to see a recovery of coal-to-gas switching from 2017 due to lower
expected natural gas prices, yet the switching level will still not be as high as the base year 2016. However,
given that natural gas capacity has grown significantly this year, the structural demand from new natural gas
builds is expected to offset the lower switching level than 2016, resulting a net gain of 0.48 BCFD in power burn
excluding weather effects (see the right chart below).
2
2 This chart depicts the differentials between actual natural gas power burn and weather adjusted power burn. Positive differentials indicate more natural gas burn due to structural change or economic coal-to-gas switching compared to 2016, in other words, the differential is the power burn growth independent of the weather effects.
(7.00)(6.00)(5.00)(4.00)(3.00)(2.00)(1.00)0.001.002.003.004.00
U.S. ACTUAL POWER BURN MINUS WEATHER ADJUSTED POWER BURN (BASE YEAR 2016)
(BCFD)
Source: EVA
-2.5-2
-1.5-1
-0.50
0.51
1.52
2.5
2017 2018New Build Economic Switching and Other
INCREMENTAL GAS BURN FROM 2016 BASE (INDEPENDENT OF WEATHER EFFECTS)
(BCFD)
Source: EVA
Total: -1.48 BCFD
Total: 0.48 BCFD

SUMMER OUTLOOK SUMMER 2018
© 2018 ENERGY VENTURES ANALYSIS 6
The structural change in the power sector is expected to be significant this year. Since last summer, the U.S.
has added a net 10.6 GW of natural gas capacity (equivalent to about 2 BCFD of gas burn growth) and retired
7.3 GW of coal capacity (see chart below). Note that the East region added 6.7 GW of gas capacity but only
retired 2.8 GW of coal capacity, indicating that gas-on-gas competition can be present in that region. EVA’s
model run shows that the average utilization of combined cycle gas turbines (CCGT) capacity in the East that is
more than 30-years old fell from 20% in 2016 to 10% in 2018. Going forward, EVA tracks 21 GW of natural gas
capacity net additions and 8.4 GW of coal retirements from May 2018 to Dec 2019.
Besides gas-on-gas competition, gas-renewable competition has become more evident. Since 2016, renewable
generation from utility solar and wind has been growing by roughly 1 BCFD per year in gas-equivalent terms,
putting pressure on natural gas generation growth, especially in the Pacific region. However, this year’s hydro
generation in the Pacific region is expected to be below normal, which will boost power burn by about 0.4 BCFD
compared to the normal hydro case (see text box on the next page).
YEARLY NET CAPACITY ADDITIONS AND RETIREMENTS (GW)
Coal CCGT Gas
Turbine Steam –
Gas & Oil Nuclear Hydro Peaker & Other Wind Solar
2016 (7.79) 4.45 0.76 0.89 0.70 0.27 0.64 8.68 7.99
2017 (8.86) 7.71 (1.09) (5.75) 0.00 (0.12) 0.31 6.26 4.59
2018 (15.50) 17.38 1.48 (1.72) (0.61) 0.04 0.17 7.03 5.49
2019 (4.77) 4.99 0.82 (0.56) (1.48) 0.03 (0.01) 7.56 6.50
2020 (2.98) 6.02 0.43 (2.30) 1.58 0.00 (0.01) 4.24 3.73
-4
-2
0
2
4
6
8
Net Gas Additions/Retirements Coal Retirements
GENERATION CAPACITY SUMMER OVER SUMMER CHANGES
(GW)
Source: EVA, Changes since Apr 2017
-
20
40
60
80
100
120
140
160
20
10
20
11
20
12
20
13
20
14
20
15
20
16
20
17
20
18
20
19
Tho
usa
nd
s
Wind Solar Other
RENEWABLES CAPACITY
(GW)
Source: EVA*Other includes biomass, geothermal, municipal solid waste and landfill gas
U.S.: 10.6 GW natural gas additions; 7.3 GW coal retirements.
SUMMER OUTLOOK SUMMER 2018
© 2018 ENERGY VENTURES ANALYSIS 7
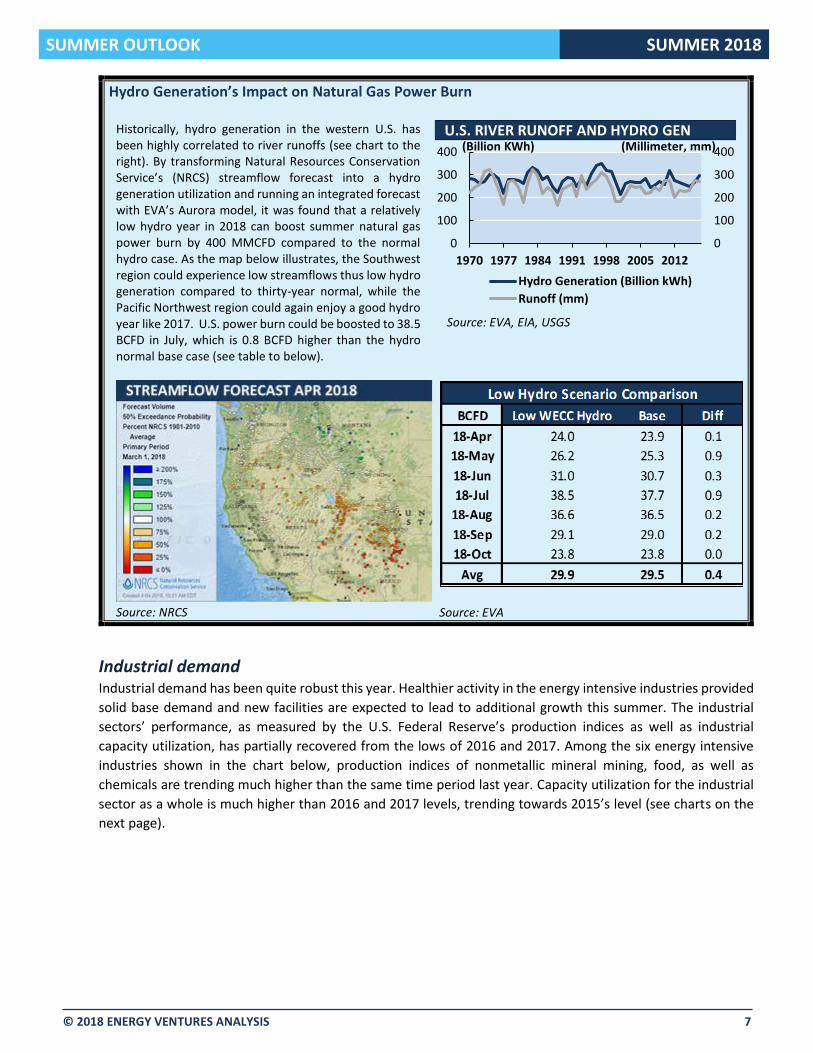
Hydro Generation’s Impact on Natural Gas Power Burn
Historically, hydro generation in the western U.S. has been highly correlated to river runoffs (see chart to the right). By transforming Natural Resources Conservation Service’s (NRCS) streamflow forecast into a hydro generation utilization and running an integrated forecast with EVA’s Aurora model, it was found that a relatively low hydro year in 2018 can boost summer natural gas power burn by 400 MMCFD compared to the normal hydro case. As the map below illustrates, the Southwest region could experience low streamflows thus low hydro generation compared to thirty-year normal, while the Pacific Northwest region could again enjoy a good hydro year like 2017. U.S. power burn could be boosted to 38.5 BCFD in July, which is 0.8 BCFD higher than the hydro normal base case (see table to below).
Source: NRCS
Source: EVA
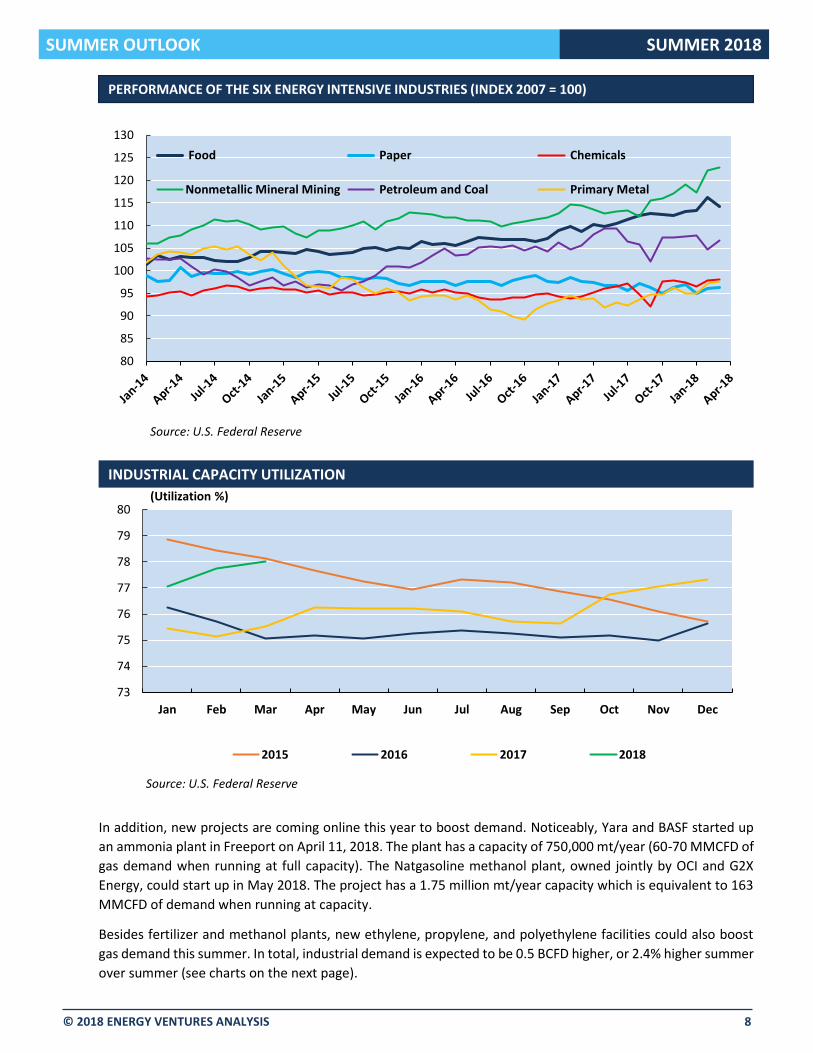
Industrial demand Industrial demand has been quite robust this year. Healthier activity in the energy intensive industries provided
solid base demand and new facilities are expected to lead to additional growth this summer. The industrial
sectors’ performance, as measured by the U.S. Federal Reserve’s production indices as well as industrial
capacity utilization, has partially recovered from the lows of 2016 and 2017. Among the six energy intensive
industries shown in the chart below, production indices of nonmetallic mineral mining, food, as well as
chemicals are trending much higher than the same time period last year. Capacity utilization for the industrial
sector as a whole is much higher than 2016 and 2017 levels, trending towards 2015’s level (see charts on the
next page).
0
100
200
300
400
0
100
200
300
400
1970 1977 1984 1991 1998 2005 2012
Hydro Generation (Billion kWh)
Runoff (mm)
(Billion KWh)U.S. RIVER RUNOFF AND HYDRO GEN
Source: EVA, EIA, USGS
(Millimeter, mm)
SUMMER OUTLOOK SUMMER 2018
© 2018 ENERGY VENTURES ANALYSIS 8
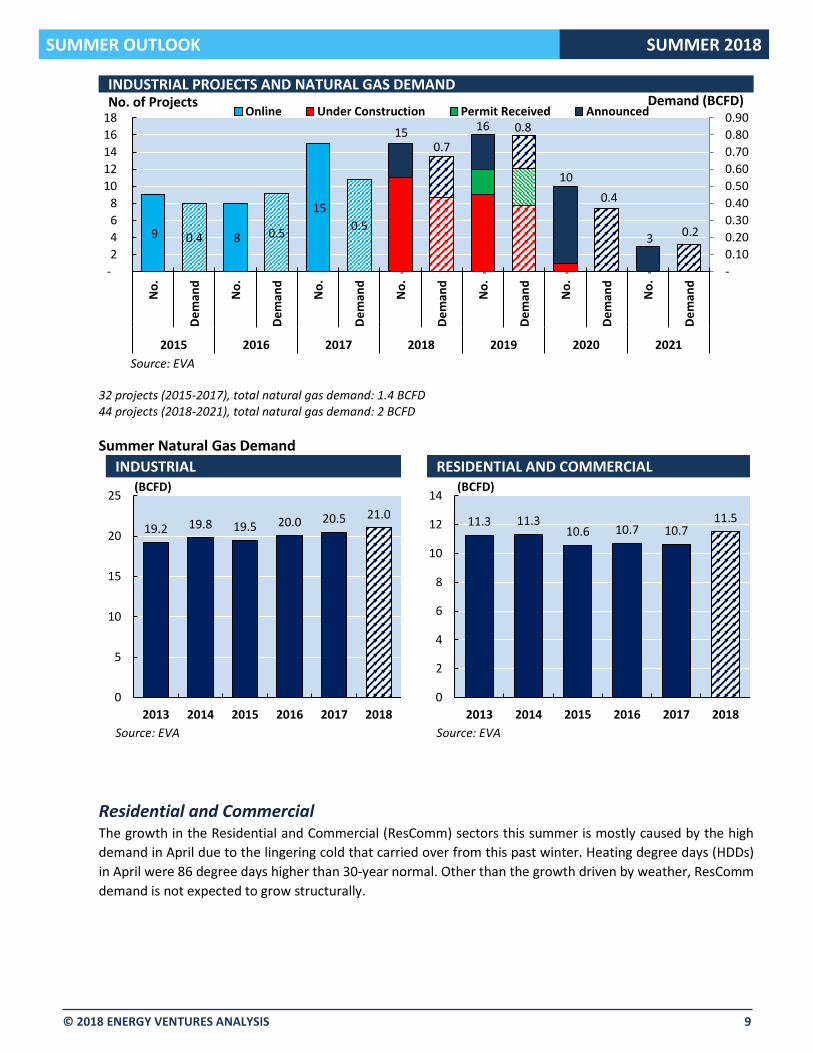
In addition, new projects are coming online this year to boost demand. Noticeably, Yara and BASF started up
an ammonia plant in Freeport on April 11, 2018. The plant has a capacity of 750,000 mt/year (60-70 MMCFD of
gas demand when running at full capacity). The Natgasoline methanol plant, owned jointly by OCI and G2X
Energy, could start up in May 2018. The project has a 1.75 million mt/year capacity which is equivalent to 163
MMCFD of demand when running at capacity.
Besides fertilizer and methanol plants, new ethylene, propylene, and polyethylene facilities could also boost
gas demand this summer. In total, industrial demand is expected to be 0.5 BCFD higher, or 2.4% higher summer
over summer (see charts on the next page).
80
85
90
95
100
105
110
115
120
125
130
Food Paper Chemicals
Nonmetallic Mineral Mining Petroleum and Coal Primary Metal
PERFORMANCE OF THE SIX ENERGY INTENSIVE INDUSTRIES (INDEX 2007 = 100)PERFORMANCE OF THE SIX ENERGY INTENSIVE INDUSTRIES (INDEX 2007 = 100)
Source: U.S. Federal Reserve
73
74
75
76
77
78
79
80
Jan Feb Mar Apr May Jun Jul Aug Sep Oct Nov Dec
2015 2016 2017 2018
INDUSTRIAL CAPACITY UTILIZATION
(Utilization %)
Source: U.S. Federal Reserve
SUMMER OUTLOOK SUMMER 2018
© 2018 ENERGY VENTURES ANALYSIS 9
32 projects (2015-2017), total natural gas demand: 1.4 BCFD 44 projects (2018-2021), total natural gas demand: 2 BCFD
Summer Natural Gas Demand
Residential and Commercial The growth in the Residential and Commercial (ResComm) sectors this summer is mostly caused by the high
demand in April due to the lingering cold that carried over from this past winter. Heating degree days (HDDs)
in April were 86 degree days higher than 30-year normal. Other than the growth driven by weather, ResComm
demand is not expected to grow structurally.
9 8
15
- - - -
0.4 0.50.5
-
0.10
0.20
0.30
0.40
0.50
0.60
0.70
0.80
0.90
-
2
4
6
8
10
12
14
16
18
No
.
De
man
d
No
.
De
man
d
No
.
De
man
d
No
.
De
man
d
No
.
De
man
d
No
.
De
man
d
No
.
De
man
d
2015 2016 2017 2018 2019 2020 2021
Online Under Construction Permit Received AnnouncedDemand (BCFD)No. of Projects
INDUSTRIAL PROJECTS AND NATURAL GAS DEMAND
Source: EVA
16
10
3
0.7
0.8
0.4
0.2
19.2 19.8 19.5 20.0 20.5 21.0
0
5
10
15
20
25
2013 2014 2015 2016 2017 2018
INDUSTRIAL(BCFD)
Source: EVA
11.3 11.310.6 10.7 10.7
11.5
0
2
4
6
8
10
12
14
2013 2014 2015 2016 2017 2018
RESIDENTIAL AND COMMERCIAL(BCFD)
Source: EVA
15
SUMMER OUTLOOK SUMMER 2018
© 2018 ENERGY VENTURES ANALYSIS 10
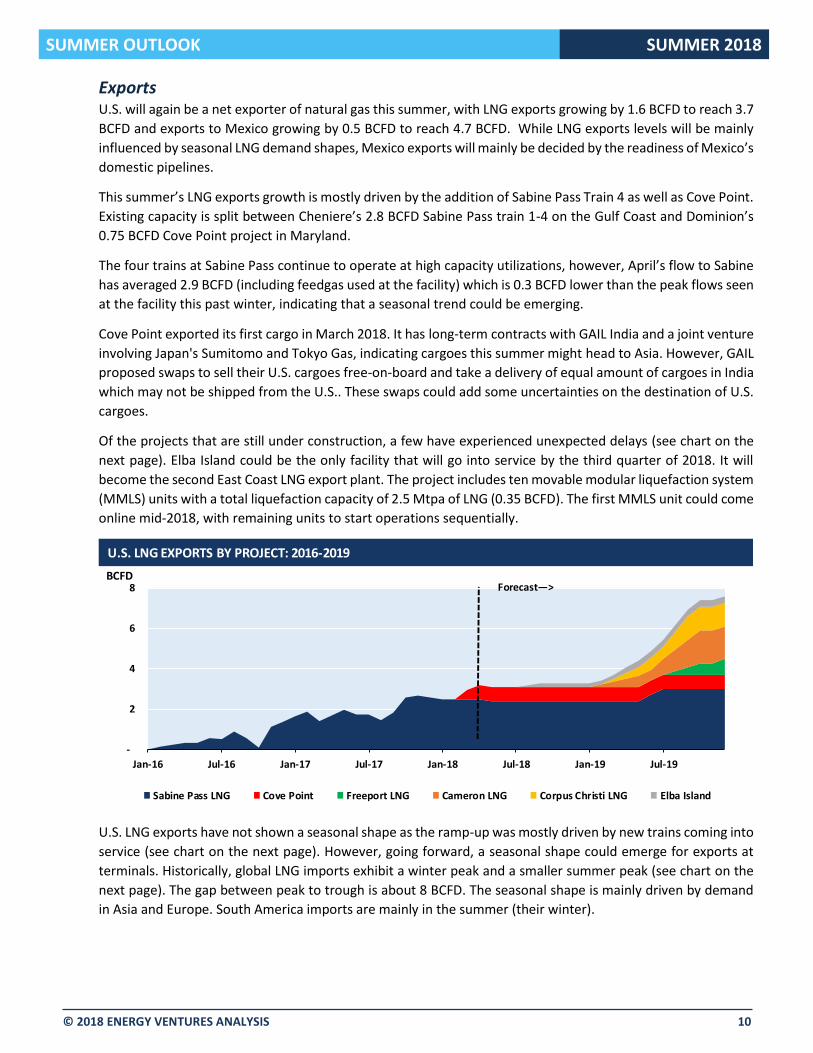
Exports
U.S. will again be a net exporter of natural gas this summer, with LNG exports growing by 1.6 BCFD to reach 3.7
BCFD and exports to Mexico growing by 0.5 BCFD to reach 4.7 BCFD. While LNG exports levels will be mainly
influenced by seasonal LNG demand shapes, Mexico exports will mainly be decided by the readiness of Mexico’s
domestic pipelines.
This summer’s LNG exports growth is mostly driven by the addition of Sabine Pass Train 4 as well as Cove Point.
Existing capacity is split between Cheniere’s 2.8 BCFD Sabine Pass train 1-4 on the Gulf Coast and Dominion’s
0.75 BCFD Cove Point project in Maryland.
The four trains at Sabine Pass continue to operate at high capacity utilizations, however, April’s flow to Sabine
has averaged 2.9 BCFD (including feedgas used at the facility) which is 0.3 BCFD lower than the peak flows seen
at the facility this past winter, indicating that a seasonal trend could be emerging.
Cove Point exported its first cargo in March 2018. It has long-term contracts with GAIL India and a joint venture
involving Japan's Sumitomo and Tokyo Gas, indicating cargoes this summer might head to Asia. However, GAIL
proposed swaps to sell their U.S. cargoes free-on-board and take a delivery of equal amount of cargoes in India
which may not be shipped from the U.S.. These swaps could add some uncertainties on the destination of U.S.
cargoes.
Of the projects that are still under construction, a few have experienced unexpected delays (see chart on the
next page). Elba Island could be the only facility that will go into service by the third quarter of 2018. It will
become the second East Coast LNG export plant. The project includes ten movable modular liquefaction system
(MMLS) units with a total liquefaction capacity of 2.5 Mtpa of LNG (0.35 BCFD). The first MMLS unit could come
online mid-2018, with remaining units to start operations sequentially.
-
2
4
6
8
Jan-16 Jul-16 Jan-17 Jul-17 Jan-18 Jul-18 Jan-19 Jul-19
BCFD
Sabine Pass LNG Cove Point Freeport LNG Cameron LNG Corpus Christi LNG Elba Island
U.S. LNG EXPORTS BY PROJECT: 2016-2019
Forecast—>
U.S. LNG exports have not shown a seasonal shape as the ramp-up was mostly driven by new trains coming into
service (see chart on the next page). However, going forward, a seasonal shape could emerge for exports at
terminals. Historically, global LNG imports exhibit a winter peak and a smaller summer peak (see chart on the
next page). The gap between peak to trough is about 8 BCFD. The seasonal shape is mainly driven by demand
in Asia and Europe. South America imports are mainly in the summer (their winter).

SUMMER OUTLOOK SUMMER 2018
© 2018 ENERGY VENTURES ANALYSIS 11
Last summer, South America and Mexico took a large share of total exports by destination. While in winter
2017-2018, most cargoes went to Asia which could be a result of Korea Gas Corporation’s (KOGAS) contract
with Sabine Pass Train 3 coming into effect (see charts below).
Contracts with U.S. terminals that are operating this summer are mainly with Asian players as well as Shell and
Gas Natural Fenosa. Last summer, Cheniere’s marketing company also sold spot cargoes themselves. Given the
shape in global LNG seasonal demand, it’s likely that buyers that have contracts at the terminals will allocate
more of their contracted volumes to the winter and take fewer cargoes in the summer. Furthermore, there is
certainly less demand for spot cargoes globally in the summer season. Therefore, this summer Sabine Pass
would likely be running less hard than they did this past winter.
The growth of exports to Mexico is currently hindered by the pipeline delays in Mexico. The average delay time
for the announced pipelines is more than a year. The pipelines shown in the figure on the next page are slated
to come online this summer; however, delays could slow down growth in pipeline exports.
0
0.5
1
1.5
2
2.5
3
3.5
4
U.S. LNG EXPORTS
(BCFD)
Source: EVA
-
5.00
10.00
15.00
20.00
25.00
Jan
-14
May
-14
Sep
-14
Jan
-15
May
-15
Sep
-15
Jan
-16
May
-16
Sep
-16
Jan
-17
May
-17
Sep
-17
Jan
-18
Asia MENA
Europe South America
North America
GLOBAL LNG IMPORTS SEASONALITY
(MMTons)
Source: EVA
Asia39%
Mexico22%
South America
14%
MENA12%
Europe13%
SABINE PASS CARGOES BY REGION (SUMMER 2017)
Source: EVA
Asia59%
Mexico15%
South America
4%
MENA9%
Europe13%
SABINE PASS CARGOES BY REGION (WINTER 2017-2018)
Source: EVA
SUMMER OUTLOOK SUMMER 2018
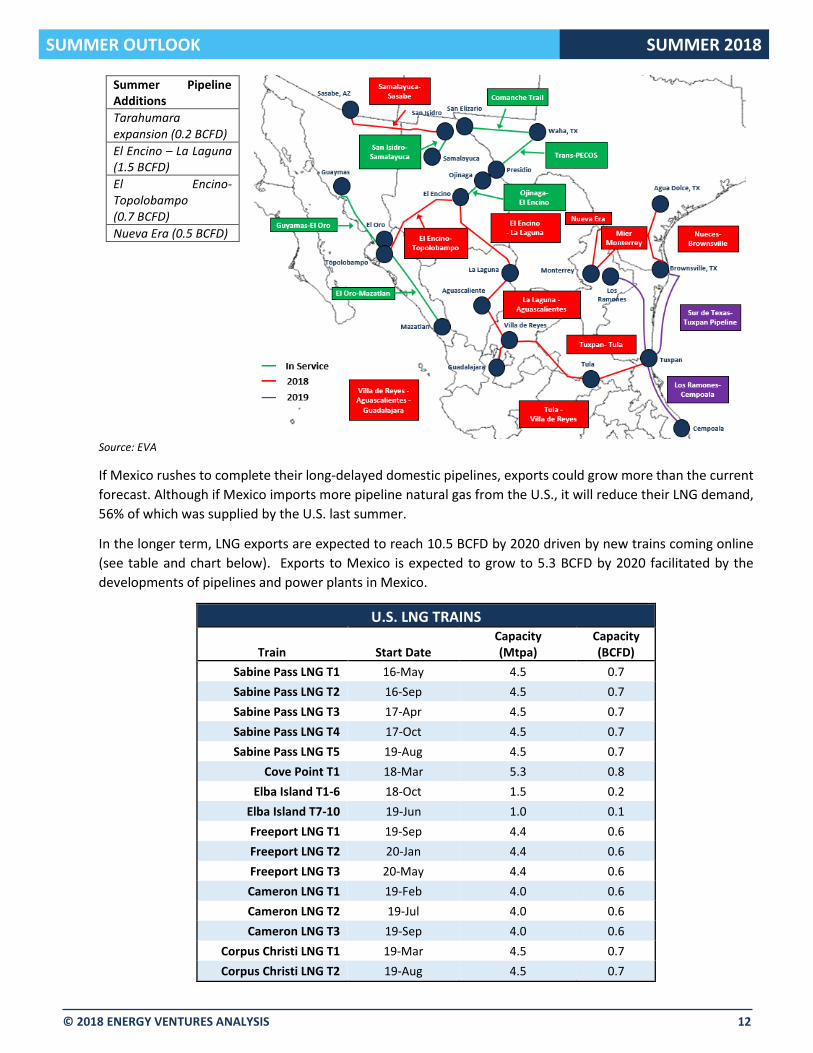
© 2018 ENERGY VENTURES ANALYSIS 12
Summer Pipeline Additions
Tarahumara expansion (0.2 BCFD)
El Encino – La Laguna (1.5 BCFD)
El Encino-Topolobampo (0.7 BCFD)
Nueva Era (0.5 BCFD)
Source: EVA
If Mexico rushes to complete their long-delayed domestic pipelines, exports could grow more than the current
forecast. Although if Mexico imports more pipeline natural gas from the U.S., it will reduce their LNG demand,
56% of which was supplied by the U.S. last summer.
In the longer term, LNG exports are expected to reach 10.5 BCFD by 2020 driven by new trains coming online
(see table and chart below). Exports to Mexico is expected to grow to 5.3 BCFD by 2020 facilitated by the
developments of pipelines and power plants in Mexico.
U.S. LNG TRAINS
Train Start Date Capacity (Mtpa)
Capacity (BCFD)
Sabine Pass LNG T1 16-May 4.5 0.7
Sabine Pass LNG T2 16-Sep 4.5 0.7
Sabine Pass LNG T3 17-Apr 4.5 0.7
Sabine Pass LNG T4 17-Oct 4.5 0.7
Sabine Pass LNG T5 19-Aug 4.5 0.7
Cove Point T1 18-Mar 5.3 0.8
Elba Island T1-6 18-Oct 1.5 0.2
Elba Island T7-10 19-Jun 1.0 0.1
Freeport LNG T1 19-Sep 4.4 0.6
Freeport LNG T2 20-Jan 4.4 0.6
Freeport LNG T3 20-May 4.4 0.6
Cameron LNG T1 19-Feb 4.0 0.6
Cameron LNG T2 19-Jul 4.0 0.6
Cameron LNG T3 19-Sep 4.0 0.6
Corpus Christi LNG T1 19-Mar 4.5 0.7
Corpus Christi LNG T2 19-Aug 4.5 0.7
SUMMER OUTLOOK SUMMER 2018
© 2018 ENERGY VENTURES ANALYSIS 13
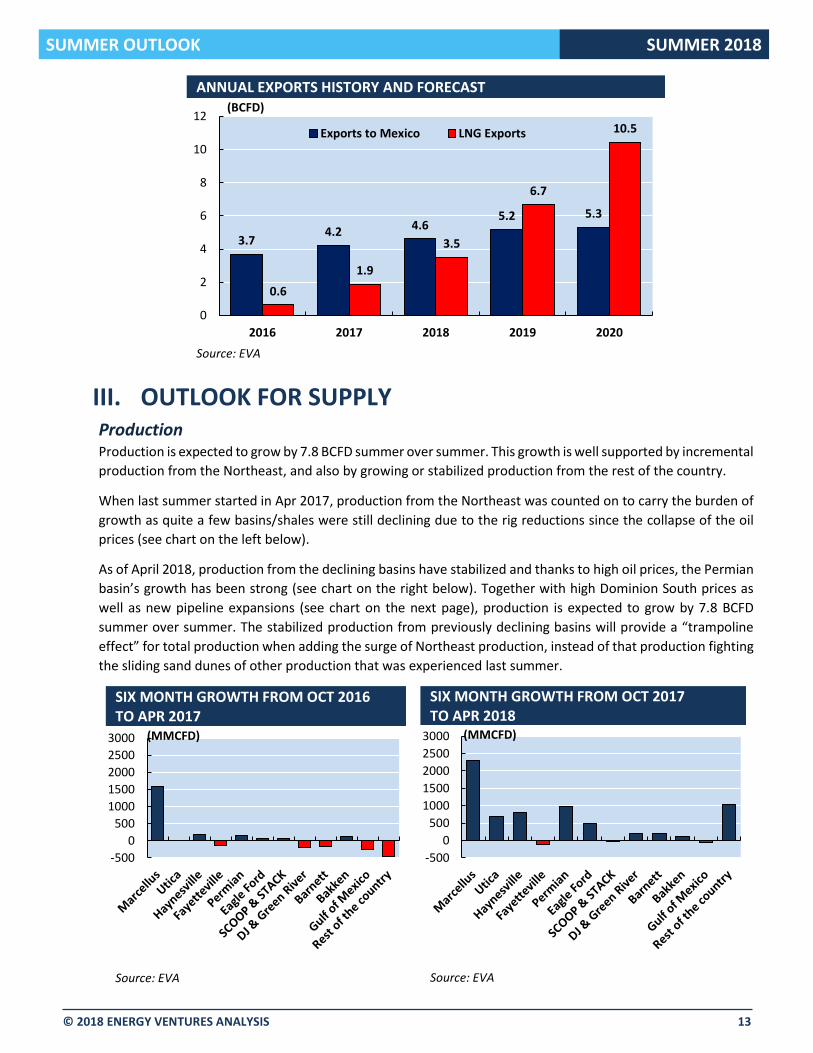
III. OUTLOOK FOR SUPPLY Production Production is expected to grow by 7.8 BCFD summer over summer. This growth is well supported by incremental
production from the Northeast, and also by growing or stabilized production from the rest of the country.
When last summer started in Apr 2017, production from the Northeast was counted on to carry the burden of
growth as quite a few basins/shales were still declining due to the rig reductions since the collapse of the oil
prices (see chart on the left below).
As of April 2018, production from the declining basins have stabilized and thanks to high oil prices, the Permian
basin’s growth has been strong (see chart on the right below). Together with high Dominion South prices as
well as new pipeline expansions (see chart on the next page), production is expected to grow by 7.8 BCFD
summer over summer. The stabilized production from previously declining basins will provide a “trampoline
effect” for total production when adding the surge of Northeast production, instead of that production fighting
the sliding sand dunes of other production that was experienced last summer.
3.74.2 4.6
5.2 5.3
0.6
1.9
3.5
6.7
10.5
0
2
4
6
8
10
12
2016 2017 2018 2019 2020
Exports to Mexico LNG Exports
ANNUAL EXPORTS HISTORY AND FORECAST(BCFD)
Source: EVA
-500
0
500
1000
1500
2000
2500
3000
SIX MONTH GROWTH FROM OCT 2016 TO APR 2017
(MMCFD)
Source: EVA
-500
0
500
1000
1500
2000
2500
3000
SIX MONTH GROWTH FROM OCT 2017 TO APR 2018
(MMCFD)
Source: EVA
SUMMER OUTLOOK SUMMER 2018
© 2018 ENERGY VENTURES ANALYSIS 14
Imports from Canada Imports from Canada is forecast to slightly grow this summer compared to last summer thanks to TransCanada’s
NGTL expansion projects3 and the low-cost production in West Canada. These new takeaway projects from
West Canada could result in more exports to the Pacific region of the U.S. However, risks exist to the growth of
net imports as Rover has sought approval from FERC to bring online the market segment of the pipeline, which
could send natural gas to Dawn via the Vector pipeline (see map below). This natural gas from the Northeast
could displace flows from Alliance to Vector, which is mostly West Canadian gas. Exports from the Midwest to
East Canada will likely offset gains of imports from West Canada to the Pacific region.
ROVER’S MARKET SEGMENT TO SEND GAS TO DAWN VIA VECTOR
3 TransCanada brought online the Northwest Mainline Loop-Boundary Lake pipeline and the Sundre Crossover project in April.
0.0
2.0
4.0
6.0
8.0
10.0
12.0
14.0
16.0(BCFD)
Rover Phase 1 Access South and Adair Southwest
Atlantic Sunrise Orion
Leach/Rayne Xpress Rover Phase 2
Broad Run Expansion Equitrans Expansion Project
Mountaineer/Gulf Xpress WB Xpress
Nexus Mountain Valley
NORTHEAST PRODUCTION TAKEAWAY PROJECTS (THROUGH THE END OF 2018)
SUMMER OUTLOOK SUMMER 2018
© 2018 ENERGY VENTURES ANALYSIS 15
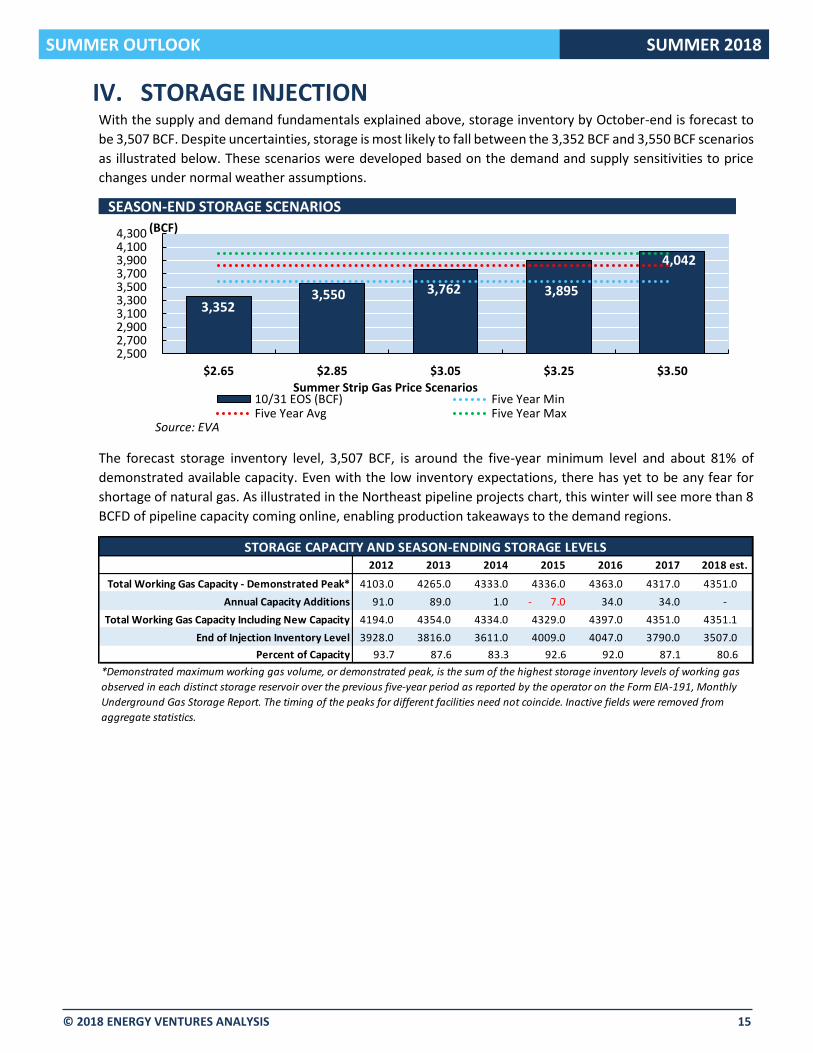
IV. STORAGE INJECTION With the supply and demand fundamentals explained above, storage inventory by October-end is forecast to
be 3,507 BCF. Despite uncertainties, storage is most likely to fall between the 3,352 BCF and 3,550 BCF scenarios
as illustrated below. These scenarios were developed based on the demand and supply sensitivities to price
changes under normal weather assumptions.
The forecast storage inventory level, 3,507 BCF, is around the five-year minimum level and about 81% of
demonstrated available capacity. Even with the low inventory expectations, there has yet to be any fear for
shortage of natural gas. As illustrated in the Northeast pipeline projects chart, this winter will see more than 8
BCFD of pipeline capacity coming online, enabling production takeaways to the demand regions.
2,5002,7002,9003,1003,3003,5003,7003,9004,1004,300
$2.65 $2.85 $3.05 $3.25 $3.50
Summer Strip Gas Price Scenarios10/31 EOS (BCF) Five Year MinFive Year Avg Five Year Max
SEASON-END STORAGE SCENARIOS
(BCF)
Source: EVA
3,5503,352
3,762 3,895
4,042
2012 2013 2014 2015 2016 2017 2018 est.
Total Working Gas Capacity - Demonstrated Peak* 4103.0 4265.0 4333.0 4336.0 4363.0 4317.0 4351.0
Annual Capacity Additions 91.0 89.0 1.0 - 7.0 34.0 34.0 -
Total Working Gas Capacity Including New Capacity 4194.0 4354.0 4334.0 4329.0 4397.0 4351.0 4351.1
End of Injection Inventory Level 3928.0 3816.0 3611.0 4009.0 4047.0 3790.0 3507.0
Percent of Capacity 93.7 87.6 83.3 92.6 92.0 87.1 80.6
STORAGE CAPACITY AND SEASON-ENDING STORAGE LEVELS
*Demonstrated maximum working gas volume, or demonstrated peak, is the sum of the highest storage inventory levels of working gas
observed in each distinct storage reservoir over the previous five-year period as reported by the operator on the Form EIA-191, Monthly
Underground Gas Storage Report. The timing of the peaks for different facilities need not coincide. Inactive fields were removed from
aggregate statistics.
SUMMER OUTLOOK SUMMER 2018
© 2018 ENERGY VENTURES ANALYSIS 16
V. APPENDICES 1. The Impacts of Hurricanes on Supply and Demand of Natural Gas
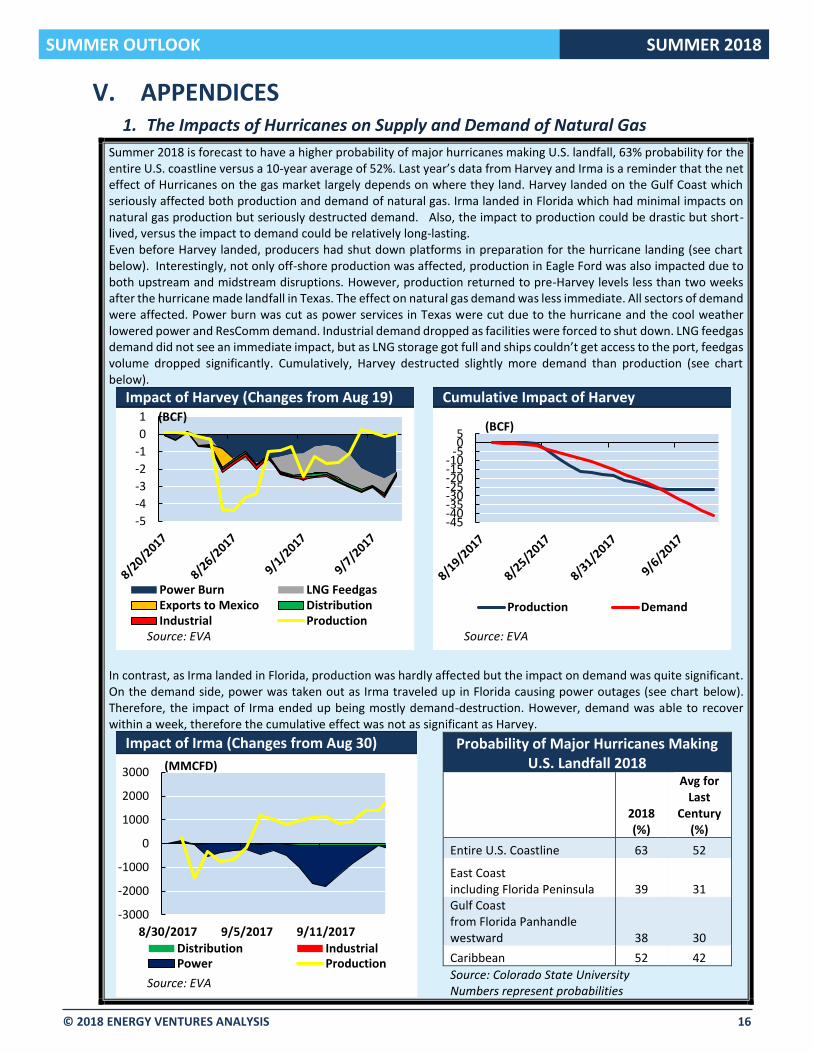
Summer 2018 is forecast to have a higher probability of major hurricanes making U.S. landfall, 63% probability for the entire U.S. coastline versus a 10-year average of 52%. Last year’s data from Harvey and Irma is a reminder that the net effect of Hurricanes on the gas market largely depends on where they land. Harvey landed on the Gulf Coast which seriously affected both production and demand of natural gas. Irma landed in Florida which had minimal impacts on natural gas production but seriously destructed demand. Also, the impact to production could be drastic but short-lived, versus the impact to demand could be relatively long-lasting. Even before Harvey landed, producers had shut down platforms in preparation for the hurricane landing (see chart below). Interestingly, not only off-shore production was affected, production in Eagle Ford was also impacted due to both upstream and midstream disruptions. However, production returned to pre-Harvey levels less than two weeks after the hurricane made landfall in Texas. The effect on natural gas demand was less immediate. All sectors of demand were affected. Power burn was cut as power services in Texas were cut due to the hurricane and the cool weather lowered power and ResComm demand. Industrial demand dropped as facilities were forced to shut down. LNG feedgas demand did not see an immediate impact, but as LNG storage got full and ships couldn’t get access to the port, feedgas volume dropped significantly. Cumulatively, Harvey destructed slightly more demand than production (see chart below).
In contrast, as Irma landed in Florida, production was hardly affected but the impact on demand was quite significant. On the demand side, power was taken out as Irma traveled up in Florida causing power outages (see chart below). Therefore, the impact of Irma ended up being mostly demand-destruction. However, demand was able to recover within a week, therefore the cumulative effect was not as significant as Harvey.
Probability of Major Hurricanes Making U.S. Landfall 2018
2018 (%)
Avg for Last
Century (%)
Entire U.S. Coastline 63 52
East Coast including Florida Peninsula 39 31 Gulf Coast from Florida Panhandle westward 38 30
Caribbean 52 42
Source: Colorado State University Numbers represent probabilities
-5
-4
-3
-2
-1
0
1
Power Burn LNG FeedgasExports to Mexico DistributionIndustrial Production
MARCELLUS(BCF)
MARCELLUSImpact of Harvey (Changes from Aug 19)
Source: EVA
-45-40-35-30-25-20-15-10
-505
Production Demand
MARCELLUS
(BCF)
MARCELLUSCumulative Impact of Harvey
Source: EVA
-3000
-2000
-1000
0
1000
2000
3000
8/30/2017 9/5/2017 9/11/2017Distribution IndustrialPower Production
MARCELLUS
(MMCFD)
MARCELLUSImpact of Irma (Changes from Aug 30)
Source: EVA
SUMMER OUTLOOK SUMMER 2018
© 2018 ENERGY VENTURES ANALYSIS 17
2. Aliso Canyon and SoCalGas System – Status Update and Summer Assessment
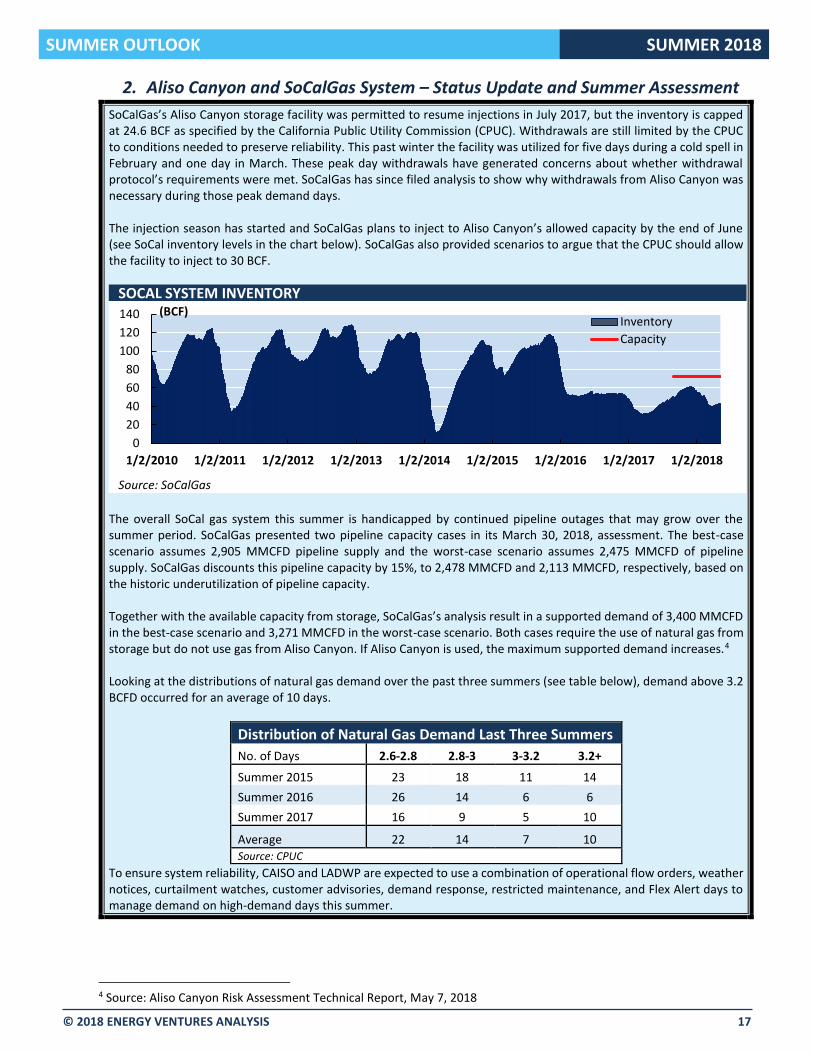
SoCalGas’s Aliso Canyon storage facility was permitted to resume injections in July 2017, but the inventory is capped at 24.6 BCF as specified by the California Public Utility Commission (CPUC). Withdrawals are still limited by the CPUC to conditions needed to preserve reliability. This past winter the facility was utilized for five days during a cold spell in February and one day in March. These peak day withdrawals have generated concerns about whether withdrawal protocol’s requirements were met. SoCalGas has since filed analysis to show why withdrawals from Aliso Canyon was necessary during those peak demand days. The injection season has started and SoCalGas plans to inject to Aliso Canyon’s allowed capacity by the end of June (see SoCal inventory levels in the chart below). SoCalGas also provided scenarios to argue that the CPUC should allow the facility to inject to 30 BCF.
The overall SoCal gas system this summer is handicapped by continued pipeline outages that may grow over the summer period. SoCalGas presented two pipeline capacity cases in its March 30, 2018, assessment. The best-case scenario assumes 2,905 MMCFD pipeline supply and the worst-case scenario assumes 2,475 MMCFD of pipeline supply. SoCalGas discounts this pipeline capacity by 15%, to 2,478 MMCFD and 2,113 MMCFD, respectively, based on the historic underutilization of pipeline capacity. Together with the available capacity from storage, SoCalGas’s analysis result in a supported demand of 3,400 MMCFD in the best-case scenario and 3,271 MMCFD in the worst-case scenario. Both cases require the use of natural gas from storage but do not use gas from Aliso Canyon. If Aliso Canyon is used, the maximum supported demand increases.4 Looking at the distributions of natural gas demand over the past three summers (see table below), demand above 3.2 BCFD occurred for an average of 10 days.
Distribution of Natural Gas Demand Last Three Summers
No. of Days 2.6-2.8 2.8-3 3-3.2 3.2+
Summer 2015 23 18 11 14
Summer 2016 26 14 6 6
Summer 2017 16 9 5 10
Average 22 14 7 10 Source: CPUC
To ensure system reliability, CAISO and LADWP are expected to use a combination of operational flow orders, weather notices, curtailment watches, customer advisories, demand response, restricted maintenance, and Flex Alert days to manage demand on high-demand days this summer.
4 Source: Aliso Canyon Risk Assessment Technical Report, May 7, 2018
0
20
40
60
80
100
120
140
1/2/2010 1/2/2011 1/2/2012 1/2/2013 1/2/2014 1/2/2015 1/2/2016 1/2/2017 1/2/2018
Inventory
Capacity
SOCAL SYSTEM INVENTORY(BCF)
Source: SoCalGas
SUMMER OUTLOOK SUMMER 2018
© 2018 ENERGY VENTURES ANALYSIS 18
3. EIA’s Short-Term Forecast Versus NYMEX
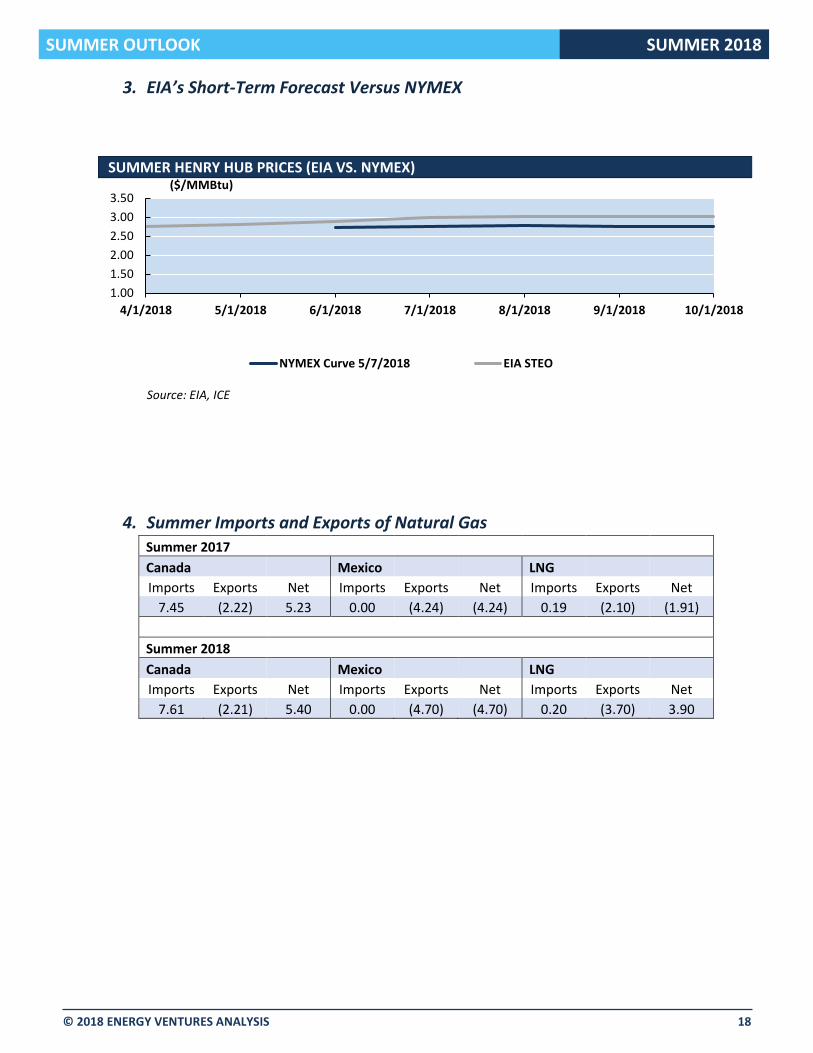
4. Summer Imports and Exports of Natural Gas Summer 2017
Canada Mexico LNG
Imports Exports Net Imports Exports Net Imports Exports Net
7.45 (2.22) 5.23 0.00 (4.24) (4.24) 0.19 (2.10) (1.91)
Summer 2018
Canada Mexico LNG
Imports Exports Net Imports Exports Net Imports Exports Net
7.61 (2.21) 5.40 0.00 (4.70) (4.70) 0.20 (3.70) 3.90
1.00
1.50
2.00
2.50
3.00
3.50
4/1/2018 5/1/2018 6/1/2018 7/1/2018 8/1/2018 9/1/2018 10/1/2018
NYMEX Curve 5/7/2018 EIA STEO
($/MMBtu)
SUMMER HENRY HUB PRICES (EIA VS. NYMEX)
Source: EIA, ICE
SUMMER OUTLOOK SUMMER 2018
© 2018 ENERGY VENTURES ANALYSIS 19
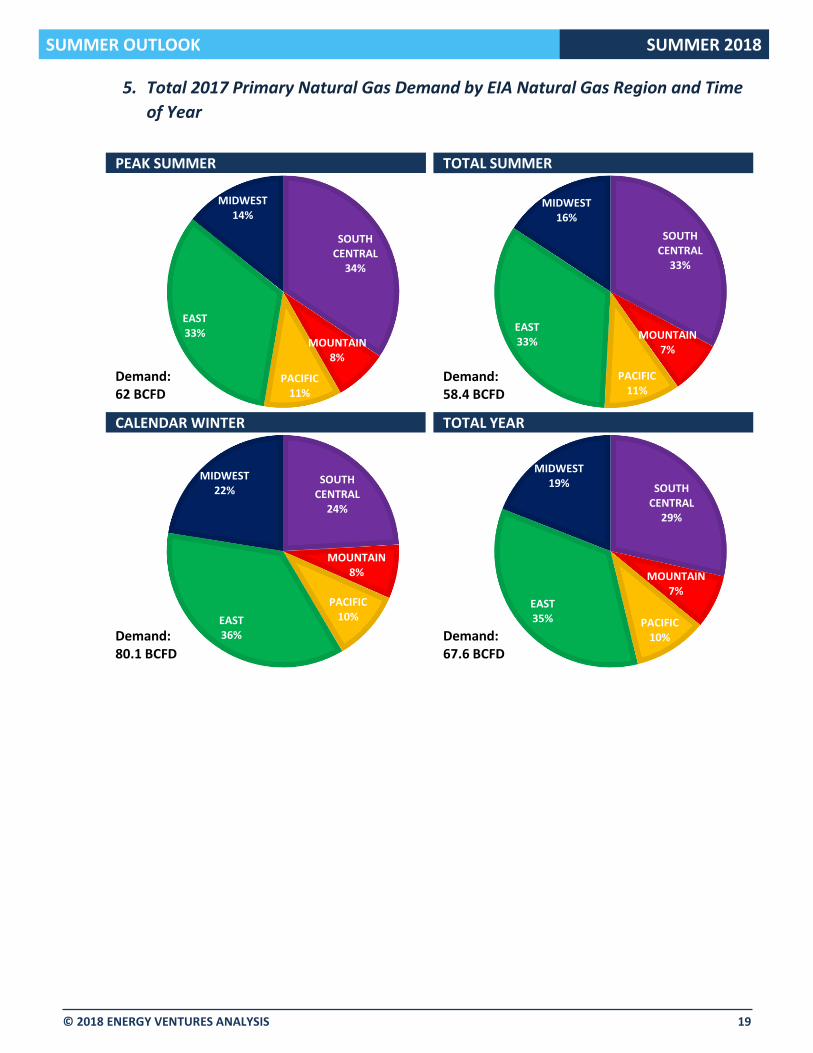
5. Total 2017 Primary Natural Gas Demand by EIA Natural Gas Region and Time
of Year
SOUTHCENTRAL
34%
MOUNTAIN8%
PACIFIC11%
EAST33%
MIDWEST14%
PEAK SUMMER
Demand: 62 BCFD
SOUTH CENTRAL
33%
MOUNTAIN7%
PACIFIC11%
EAST33%
MIDWEST16%
TOTAL SUMMER
Demand: 58.4 BCFD
SOUTH CENTRAL
24%
MOUNTAIN8%
PACIFIC10%EAST
36%
MIDWEST22%
CALENDAR WINTER
Demand: 80.1 BCFD
SOUTH CENTRAL
29%
MOUNTAIN7%
PACIFIC10%
EAST35%
MIDWEST19%
TOTAL YEAR
Demand: 67.6 BCFD
SUMMER OUTLOOK SUMMER 2018
© 2018 ENERGY VENTURES ANALYSIS 20
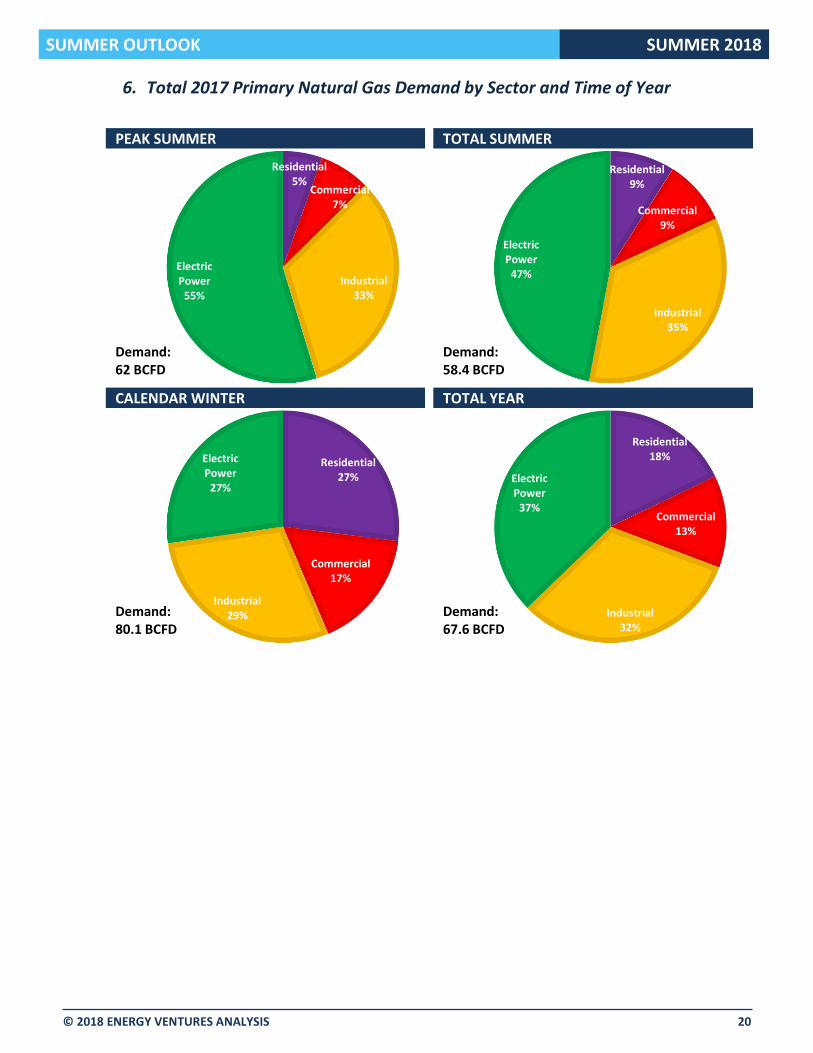
6. Total 2017 Primary Natural Gas Demand by Sector and Time of Year
Residential5%
Commercial7%
Industrial33%
Electric Power
55%
PEAK SUMMER
Demand: 62 BCFD
Residential9%
Commercial9%
Industrial35%
Electric Power
47%
TOTAL SUMMER
Demand: 58.4 BCFD
Residential27%
Commercial17%
Industrial29%
Electric Power
27%
CALENDAR WINTER
Demand: 80.1 BCFD
Residential18%
Commercial13%
Industrial32%
Electric Power
37%
TOTAL YEAR
Demand: 67.6 BCFD
SUMMER OUTLOOK SUMMER 2018
© 2018 ENERGY VENTURES ANALYSIS 21
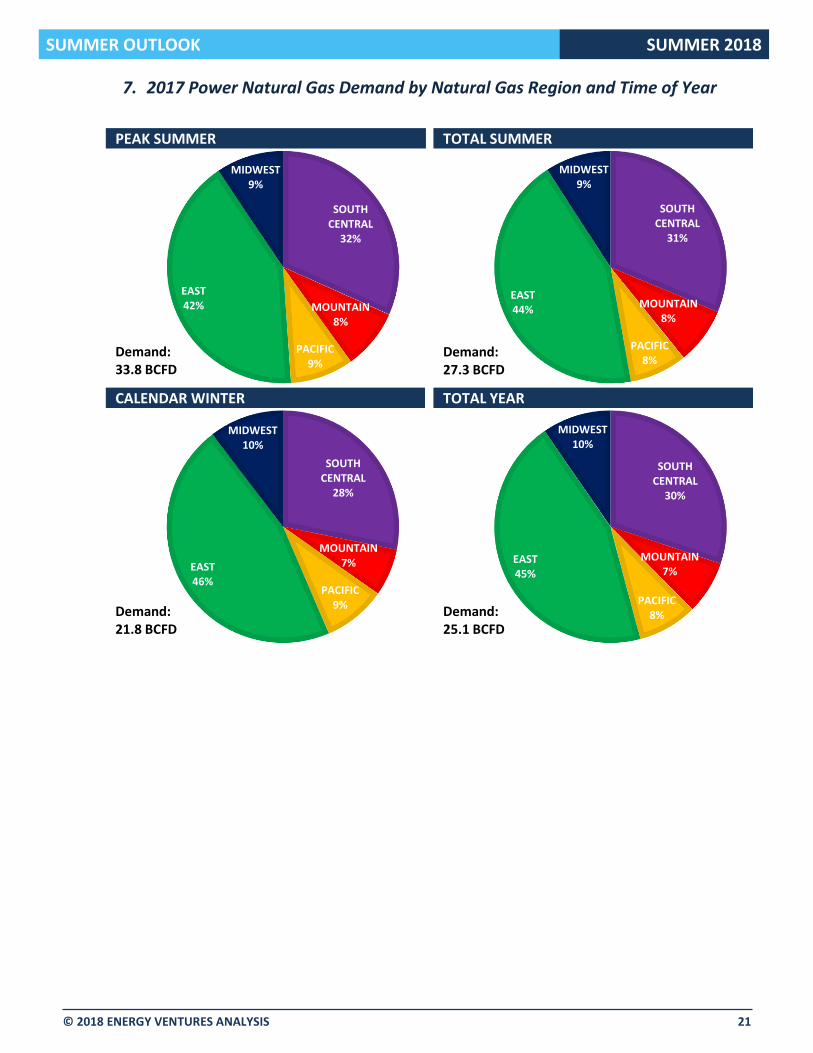
7. 2017 Power Natural Gas Demand by Natural Gas Region and Time of Year
SOUTH CENTRAL
32%
MOUNTAIN8%
PACIFIC9%
EAST42%
MIDWEST9%
PEAK SUMMER
Demand: 33.8 BCFD
SOUTH CENTRAL
31%
MOUNTAIN8%
PACIFIC8%
EAST44%
MIDWEST9%
TOTAL SUMMER
Demand: 27.3 BCFD
SOUTH CENTRAL
28%
MOUNTAIN7%
PACIFIC9%
EAST46%
MIDWEST10%
CALENDAR WINTER
Demand: 21.8 BCFD
SOUTH CENTRAL
30%
MOUNTAIN7%
PACIFIC8%
EAST45%
MIDWEST10%
TOTAL YEAR
Demand: 25.1 BCFD
SUMMER OUTLOOK SUMMER 2018
© 2018 ENERGY VENTURES ANALYSIS 22
8. Weather
9. GDP Index
Note: Base year is 2005
Summer CDDs (April to October)
CDDs Percent
10 Year Avg 1,334 - -
2015 1373 60 5%
2016 1,503 169 13%
2017 1,328 -6 0%
2018 Fcst 1,256 -78 -6%
Δ from Rolling 10y AvgYear Range Total CDDs
2013 2014 2015 2016 2017 2018
Inflation (GDP-IPD) 1.62% 1.59% 0.81% 1.45% 1.99% 2.40%
Real GDP Growth 1.68% 2.57% 2.86% 1.49% 2.25% 3.08%
Household Growth 0.89% 0.60% 1.00% 1.57% 1.44% 1.38%
Industrial Production Growth 2.05% 3.56% 1.20% -0.20% 1.27% 1.27%
Source: Moody's
MACRO HISTORY AND FORECAST
SUMMER OUTLOOK SUMMER 2018
© 2018 ENERGY VENTURES ANALYSIS 23
10. U.S. Lower 48 Gas Consumption (Summer Season April to October, BCFD)
ResComm Industrial Electric Other Vehicles Total
2013 11.3 19.2 23.8 5.6 0.1 60.0
2014 11.3 19.8 23.9 5.4 0.1 60.4
2015 10.6 19.5 28.2 5.5 0.1 63.8
2016 10.7 20.0 30.1 5.5 0.1 66.4
2017 10.7 20.5 27.3 4.8 0.1 63.4
2018 11.5 21.0 30.0 4.9 0.1 67.5
11. Performance Characteristics of Natural Gas Combined Cycle Units by Region
Census Region 2008 2009 2010 2011 2012 2013 2014 2015 2016 2017
New England 47% 47% 53% 58% 55% 45% 43% 49% 48% 44%
Middle Atlantic 34% 43% 46% 51% 58% 54% 56% 61% 60% 50%
East North Central 15% 17% 23% 31% 48% 34% 35% 54% 59% 51%
West North Central 20% 13% 18% 15% 26% 21% 17% 26% 32% 24%
South Atlantic w/o Florida 22% 34% 43% 52% 61% 58% 56% 66% 67% 67%
South Atlantic 41% 45% 53% 58% 62% 59% 57% 64% 64% 62%
East South Central 27% 37% 45% 49% 60% 49% 52% 64% 68% 58%
West South Central w/o ERCOT 38% 41% 36% 38% 47% 37% 39% 49% 49% 43%
ERCOT 48% 46% 43% 46% 51% 49% 49% 57% 52% 44%
West South Central 44% 44% 41% 43% 49% 44% 45% 54% 51% 44%
Mountain 47% 46% 41% 35% 40% 43% 40% 44% 44% 39%
Pacific Contiguous w/o CA 54% 56% 51% 26% 33% 51% 47% 56% 49% 40%
California 62% 53% 54% 40% 57% 55% 54% 53% 43% 39%
Total U.S. 40% 42% 44% 45% 53% 48% 48% 56% 55% 49%
Source: EIA and EVA
Capacity Factor
Census Region 2008 2009 2010 2011 2012 2013 2014 2015 2016 2017
New England 7,500 7,493 7,522 7,470 7,492 7,531 7,548 7,592 7,533 8,048
Middle Atlantic 8,204 7,970 7,764 7,746 7,431 7,423 7,453 7,650 7,519 7,821
East North Central 9,400 9,096 8,718 8,275 7,437 7,561 7,517 7,838 7,690 7,699
West North Central 7,739 7,892 7,795 7,819 7,433 7,584 7,621 7,391 7,437 8,683
South Atlantic w/o Florida 7,709 7,482 7,486 7,433 7,311 7,215 7,270 7,279 7,236 7,249
South Atlantic 7,549 7,533 7,489 7,416 7,313 7,274 7,299 7,287 7,270 7,308
East South Central 7,643 7,437 7,409 7,375 7,296 7,327 7,345 7,306 7,238 7,404
West South Central w/o ERCOT 8,292 8,106 7,885 7,957 7,302 7,419 7,362 7,517 7,479 7,534
ERCOT 8,459 8,304 8,364 8,320 7,324 7,294 7,333 8,012 7,872 8,116
West South Central 8,404 8,234 8,197 8,195 7,316 7,336 7,343 7,839 7,726 7,902
Mountain 7,528 7,600 7,596 7,706 7,492 7,495 7,534 7,543 7,533 7,621
Pacific Contiguous w/o CA 7,484 7,445 7,550 7,781 7,182 7,282 7,305 7,427 7,538 8,233
California 7,458 7,490 7,441 7,595 7,308 7,276 7,346 7,518 7,486 7,569
Total U.S. 7,880 7,800 7,734 7,730 7,359 7,362 7,383 7,555 7,485 7,641
Source: EIA and EVA
Heat Rate (BTU/kWh)
Related Documents