1 8 Ethernet Passive Optical Network (EPON) Glen Kramer, University of California, Davis Biswanath Mukherjee, University of California, Davis Ariel Maislos, Passave Networks, Israel 8.1 Introduction In recent years the telecommunications backbone has experienced substantial growth; however, little has changed in the access network. The tremendous growth of Internet traffic has accentuated the aggravating lag of access network capacity. The “last mile” still remains the bottleneck between high-capacity Local Area Networks (LANs) and the backbone network. The most widely deployed “broadband” solutions today are Digital Subscriber Line (DSL) and cable modem (CM) networks. Although they are an improvement compared to 56 Kbps dial-up lines, they are unable to provide enough bandwidth for emerging services such as Video-On-Demand (VoD), interactive gaming or two-way video conferencing. A new technology is required; one that is inexpensive, simple, scalable, and capable of delivering bundled voice, data and video services to an end-user over a single network. Ethernet Passive Optical Networks (EPONs), which represent the convergence of low-cost Ethernet equipment and low-cost fiber infrastructure, appear to be the best candidate for the next-generation access network. 8.1.1 Traffic Growth Data traffic is increasing at an unprecedented rate. Sustainable data traffic growth rate of over 100% per year has been observed since 1990. There were periods when a combination of economic and technological factors resulted in even larger growth rates, e.g., 1000% increase per year in 1995 and 1996 [1]. This trend is likely to continue in the future. Simply put, more and

Welcome message from author
This document is posted to help you gain knowledge. Please leave a comment to let me know what you think about it! Share it to your friends and learn new things together.
Transcript
1
8 Ethernet Passive Optical Network (EPON)
Glen Kramer, University of California, Davis
Biswanath Mukherjee, University of California, Davis
Ariel Maislos, Passave Networks, Israel
8.1 Introduction
In recent years the telecommunications backbone has experienced substantial growth;
however, little has changed in the access network. The tremendous growth of Internet traffic has
accentuated the aggravating lag of access network capacity. The “last mile” still remains the
bottleneck between high-capacity Local Area Networks (LANs) and the backbone network. The
most widely deployed “broadband” solutions today are Digital Subscriber Line (DSL) and cable
modem (CM) networks. Although they are an improvement compared to 56 Kbps dial-up lines,
they are unable to provide enough bandwidth for emerging services such as Video-On-Demand
(VoD), interactive gaming or two-way video conferencing. A new technology is required; one that
is inexpensive, simple, scalable, and capable of delivering bundled voice, data and video services
to an end-user over a single network. Ethernet Passive Optical Networks (EPONs), which represent
the convergence of low-cost Ethernet equipment and low-cost fiber infrastructure, appear to be the
best candidate for the next-generation access network.
8.1.1 Traffic Growth
Data traffic is increasing at an unprecedented rate. Sustainable data traffic growth rate of
over 100% per year has been observed since 1990. There were periods when a combination of
economic and technological factors resulted in even larger growth rates, e.g., 1000% increase per
year in 1995 and 1996 [1]. This trend is likely to continue in the future. Simply put, more and

2
more users are getting online, and those who are already online are spending more time online and
are using more bandwidth-intensive applications. Market research shows that, after upgrading to a
broadband connection, users spend about 35% more time online than before [2]. Voice traffic is
also growing, but at a much slower rate of 8% annually. According to most analysts, data traffic
has already surpassed the voice traffic. More and more subscribers telecommute, and require the
same network performance as they see on corporate LANs. More services and new applications
will become available as bandwidth per user increases.
Neither DSL nor cable modems can keep up with such demand. Both technologies are
built on top of existing communication infrastructure not optimized for data traffic. In cable
modem networks, only a few RF channels are dedicated for data, while the majority of bandwidth
is tied up servicing legacy analog video. DSL copper networks do not allow sufficient data rates at
required distances due to signal distortion and crosstalk. Most network operators have come to the
realization that a new, data-centric solution is necessary. Such a technology would be optimized
for Internet Protocol (IP) data traffic. The remaining services, such a voice or video, will converge
into a digital format and a true full-service network will emerge.
8.1.2 Evolution of the “First Mile”
The first mile? Once called the last mile, the networking community has renamed this
network segment to the first mile, to symbolize its priority and importance*. The first mile
connects the service provider central offices to business and residential subscribers. Also referred
to as the subscriber access network, or the local loop, it is the network infrastructure at the
neighborhood level. Residential subscribers demand first-mile access solutions that are broadband,
offer Internet media-rich services, and are comparable in price with existing networks.
Incumbent telephone companies responded to Internet access demand by deploying Digital
Subscriber Line (DSL) technology. DSL uses the same twisted pair as telephone lines and requires
a DSL modem at the customer premises and Digital Subscriber Line Access Multiplexer (DSLAM)
in the central office (CO). The data rate provided by DSL is typically offered in a range from 128
Kbps to 1.5 Mbps. While this is significantly faster than an analog modem, it is well shy of being
considered “broadband,” in that it cannot support emerging voice, data, and video applications. In
addition, the physical area that one central office can cover with DSL is limited to distances less
than 18000 ft (5.5 km), which covers approximately 60% of potential subscribers. And even
though, to increase DSL coverage remote DSLAMs (R-DSLAMs) may be deployed closer to
* Ethernet in the First Mile Alliance was formed in December 2001 by Alloptic, Cisco Systems, Elastic Networks, Ericsson, Extreme Networks, Finisar, Intel, NTT, and World Wide Packets. For more information, visit www.efmalliance.org
3
subscribers, network operators, in general, do not provide DSL services to subscribers located more
than a 12000 ft from CO due to increased costs [3].
Cable television companies responded to Internet service demand by integrating data
services over their coaxial cable networks, which were originally designed for analog video
broadcast. Typically, these hybrid fiber coax (HFC) networks have fiber running between a video
head-end or a hub to a curbside optical node, with the final drop to the subscriber being coaxial
cable, repeaters, and tap couplers. The drawback of this architecture is that each shared optical
node has less than 36 Mbps effective data throughput, which is typically divided between 2000
homes, resulting in frustrating slow speed during peak hours. To alleviate bandwidth bottlenecks,
optical fibers, and thus optical nodes, are penetrating deeper into the first mile.
The next wave of local access deployment promises to bring fiber to the building (FTTB)
and fiber to the home (FTTH). Unlike previous architectures, where fiber is used as a feeder to
shorten the lengths of copper and coaxial networks, these new deployments use optical fiber
throughout the access network. New optical fiber network architectures are emerging that are
capable of supporting gigabit per second speeds, at costs comparable to those of DSL and HFC
networks.
8.1.3 Next-Generation Access Network
Optical fiber is capable of delivering bandwidth-intensive, integrated, voice, data and video
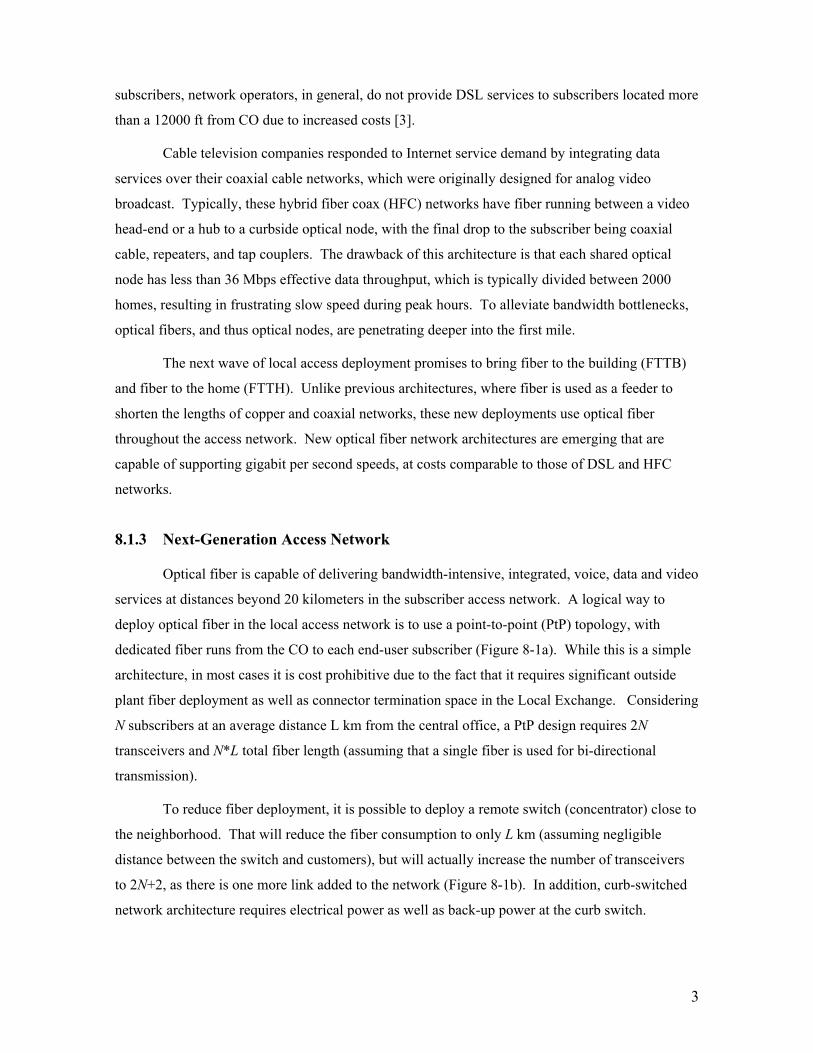
services at distances beyond 20 kilometers in the subscriber access network. A logical way to
deploy optical fiber in the local access network is to use a point-to-point (PtP) topology, with
dedicated fiber runs from the CO to each end-user subscriber (Figure 8-1a). While this is a simple
architecture, in most cases it is cost prohibitive due to the fact that it requires significant outside
plant fiber deployment as well as connector termination space in the Local Exchange. Considering
N subscribers at an average distance L km from the central office, a PtP design requires 2N
transceivers and N*L total fiber length (assuming that a single fiber is used for bi-directional
transmission).
To reduce fiber deployment, it is possible to deploy a remote switch (concentrator) close to
the neighborhood. That will reduce the fiber consumption to only L km (assuming negligible
distance between the switch and customers), but will actually increase the number of transceivers
to 2N+2, as there is one more link added to the network (Figure 8-1b). In addition, curb-switched
network architecture requires electrical power as well as back-up power at the curb switch.
4
Currently, one of the highest costs for Local Exchange Carriers (LECs) is providing and
maintaining electrical power in the local loop.
Curb switch
CO
CO
CO
(a) Point-to-point network N fibers 2N transceivers
(b) Curb-switched network 1 fiber 2N+2 transceivers
(c) Passive optical network 1 fiber N transceivers
N subscribers
L km
L km
L km
Passiveopticalsplitter
N subscribers
N subscribers
Figure 8-1. Fiber to the home (FTTH) deployment scenarios.
Therefore, it is logical to replace the hardened (environmentally protected) active curb-side
switch with an inexpensive passive optical splitter. Passive Optical Network (PON) is a
technology viewed by many as an attractive solution to the first mile problem [4, 5]; a PON
minimizes the number of optical transceivers, central office terminations and fiber deployment. A
PON is a point-to-multipoint (PtMP) optical network with no active elements in the signals’ path
from source to destination. The only interior elements used in PON are passive optical
components, such as optical fiber, splices and splitters. An access network based on a single-fiber
PON only require N + 1 transceivers and L km of fiber (Figure 8-1c).

5
8.2 Overview of PON technologies
8.2.1 Optical Splitters/Combiners
A passive optical network employs a passive (not requiring any power) device to split
optical signal (power) from one fiber into several fibers and reciprocally, to combine optical signals
from multiple fibers into one. This device is an optical coupler. In its simplest form, an optical
coupler consists of two fibers fused together. Signal power received on any input port is split
between both output ports. The splitting ratio of a splitter can be controlled by the length of the
fused region and therefore is a constant parameter.
NN × couplers are manufactured by staggering multiple 2x2 couplers (Figure 8-2) or by
using planar waveguide technology.
(a) 4-stage 8x8 coupler (b) 3-stage 8x8 coupler
Figure 8-2. 8x8 couplers created from multiple 2x2 couplers.
Couplers are characterized by the following parameters:
Splitting Loss – Power level at the coupler’s output vs. power level at its input, measured in
dB. For an ideal 2x2 coupler, this value is 3 dB. Figure 8-2 illustrates two topologies for 8x8
couplers based on 2x2 couplers. In a 4-stage topology (Figure 8-2.a), only 1/16 of the input power
is delivered to each output. Figure 8-2.b shows a more efficient design called multistage
interconnection network [6]. In this arrangement, each output receives 1/8 of the input power.
Insertion Loss – Power loss resulting from imperfections of the manufacturing process.
Typically, this value ranges from 0.1 dB to 1 dB.
Directivity – Amount of input power leaked from one input port to another input port.
Couplers are highly directional devices with the directivity parameter reaching 40 – 50 dB.
6
Very often, couplers are manufactured to have only one input or one output. A coupler
with only one input is referred to as a splitter. A coupler with only one output is called a combiner.
Sometimes, 2x2 couplers are made highly asymmetric (with splitting ratios 5/95 or 10/90). This
kind of couplers is used to branch off a small portion of signal power, for example, for monitoring
purposes. Such devices are called tap couplers.
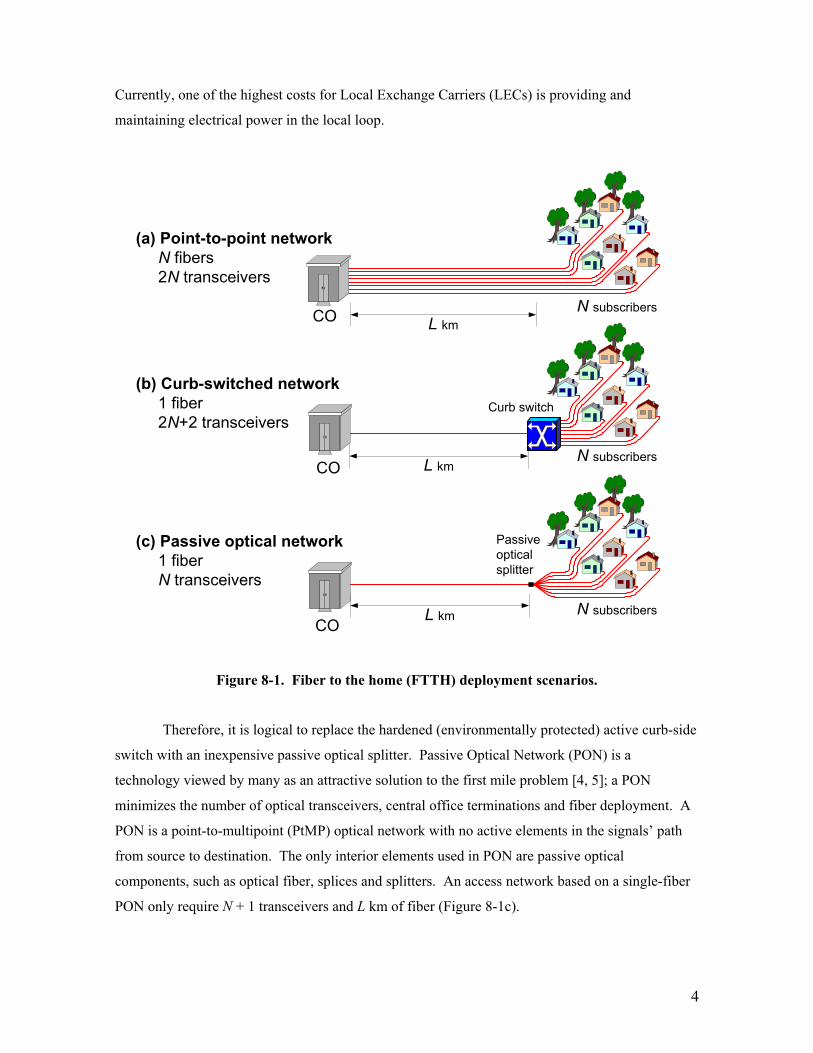
8.2.2 PON Topologies
Logically, the first mile is a PtMP network, with a CO servicing multiple subscribers.
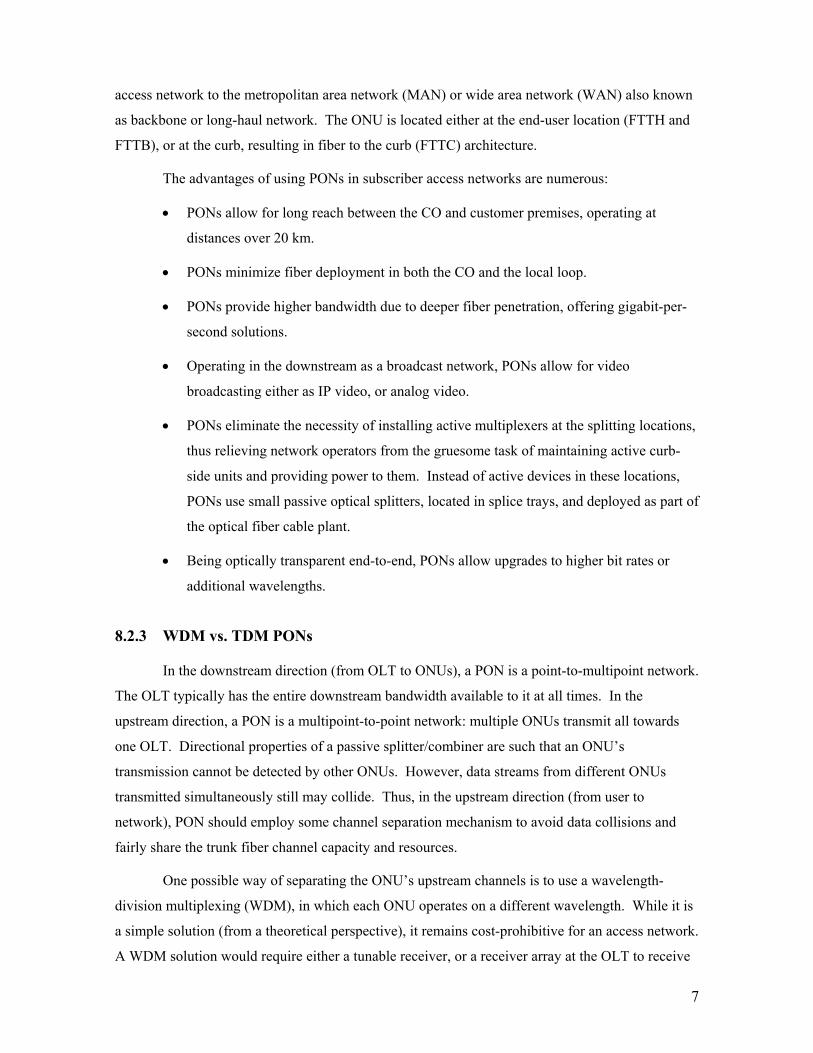
There are several multipoint topologies suitable for the access network, including tree, tree-and-
branch, ring, or bus (Figure 8-3). Using 1:2 optical tap couplers and 1:N optical splitters, PONs
can be flexibly deployed in any of these topologies. In addition, PONs can be deployed in
redundant configurations such as double rings or double trees; or redundancy may be added to only
a part of the PON, say the trunk of the tree (Figure 8-3d) (also refer to [7] for more redundant
topologies).
(a) Tree topology (using 1:N splitter)
OLT
ONU1ONU2
ONU3
ONU4
ONU5
(b) Bus topology (using 1:2 tap couplers)
OLT
ONU1 ONU2
ONU3 ONU4ONU5
(c) Ring topology (using 2x2 tap couplers)
OLT
ONU1ONU2
ONU3
ONU4
ONU5
(d) Tree with redundant trunk (using 2:N splitter)
ONU1
OLT ONU3
ONU5
ONU2
ONU4
Figure 8-3. PON topologies.
All transmissions in a PON are performed between an Optical Line Terminal (OLT) and
Optical Network Units (ONUs) (Figure 8-3). The OLT resides in the CO and connects the optical
7
access network to the metropolitan area network (MAN) or wide area network (WAN) also known
as backbone or long-haul network. The ONU is located either at the end-user location (FTTH and
FTTB), or at the curb, resulting in fiber to the curb (FTTC) architecture.
The advantages of using PONs in subscriber access networks are numerous:
• PONs allow for long reach between the CO and customer premises, operating at
distances over 20 km.
• PONs minimize fiber deployment in both the CO and the local loop.
• PONs provide higher bandwidth due to deeper fiber penetration, offering gigabit-per-
second solutions.
• Operating in the downstream as a broadcast network, PONs allow for video
broadcasting either as IP video, or analog video.
• PONs eliminate the necessity of installing active multiplexers at the splitting locations,
thus relieving network operators from the gruesome task of maintaining active curb-
side units and providing power to them. Instead of active devices in these locations,
PONs use small passive optical splitters, located in splice trays, and deployed as part of
the optical fiber cable plant.
• Being optically transparent end-to-end, PONs allow upgrades to higher bit rates or
additional wavelengths.
8.2.3 WDM vs. TDM PONs
In the downstream direction (from OLT to ONUs), a PON is a point-to-multipoint network.
The OLT typically has the entire downstream bandwidth available to it at all times. In the
upstream direction, a PON is a multipoint-to-point network: multiple ONUs transmit all towards
one OLT. Directional properties of a passive splitter/combiner are such that an ONU’s
transmission cannot be detected by other ONUs. However, data streams from different ONUs
transmitted simultaneously still may collide. Thus, in the upstream direction (from user to
network), PON should employ some channel separation mechanism to avoid data collisions and
fairly share the trunk fiber channel capacity and resources.
One possible way of separating the ONU’s upstream channels is to use a wavelength-
division multiplexing (WDM), in which each ONU operates on a different wavelength. While it is
a simple solution (from a theoretical perspective), it remains cost-prohibitive for an access network.
A WDM solution would require either a tunable receiver, or a receiver array at the OLT to receive
8
multiple channels. An even more serious problem for network operators would be wavelength-
specific ONU inventory: instead of having just one type of ONU, there would be multiple types of
ONUs based on their laser wavelength. Each ONU will have to use a laser with narrow and
controlled spectral width, and thus will become more expensive. It would also be more
problematic for an unqualified user to replace a defective ONU because a unit with wrong
wavelength may interfere with some other ONU in the PON. Using tunable lasers in ONUs may
solve the inventory problem, but is too expensive at the current state of technology. For these
reasons, a WDM PON network is not an attractive solution in today’s environment.
Several alternative solutions based on WDM have been proposed, namely wavelength-
routed PON (WRPON). A WRPON uses an arrayed waveguide grating (AWG) instead of
wavelength-independent optical splitter/combiner. We refer the reader to [8] for a detailed
overview of these approaches.
In one variation, ONUs use external modulators to modulate the signal received from the
OLT and send it back upstream. This solution, however, is not cheap either; it requires additional
amplifiers at or close to the ONUs to compensate for signal attenuation after the round-trip
propagation, and it requires more expensive optics to limit the reflections, since both downstream
and upstream channels used the same wavelength. Also to allow independent (non-arbitrated)
transmission from each of N ONUs, the OLT must have N receivers – one for each ONU.
In another variation, ONUs contain cheap laser-emitting diodes (LEDs) whose wide
spectral band was sliced by the AWG on the upstream path. This approach still requires multiple
receivers at the OLT. If, however, a single tunable receiver is used at the OLT, then a data stream
from only one ONU can be received at a time, which in effect makes it a time-division multiplexed
(TDM) PON.
In a TDM PON, simultaneous transmissions from several ONUs will collide when
reaching the combiner. In order to prevent data collisions, each ONU must transmit in its own
transmission window (timeslot). One of the major advantages of a TDM PON is that all ONUs can
operate on the same wavelength and be absolutely identical component-wise. The OLT will also
need a single receiver. A transceiver in an ONU must operate at the full line rate, even though the
bandwidth available to the ONU is lower. However, this property also allows the TDM PON to
efficiently change the bandwidth allocated to each ONU by changing the assigned timeslot size, or
even employ statistical multiplexing to fully utilize the bandwidth available in the PON.
In a subscriber access network, most of the traffic flows downstream (from network to
users) and upstream (from users to the network), but not peer-to-peer (user to user). Thus, it seems

9
reasonable to separate the downstream and the upstream channels. A simple channel separation
can be based on space division multiplexing (SDM) where separate PONs provided for
downstream and for upstream transmissions. To save optical fiber and reduce cost of repair and
maintenance, a single fiber may be used for bi-directional transmission. In this case, two
wavelengths are used: typically 1310 nm (λ1) for the upstream transmission and 1550 nm (λ2) for
the downstream transmission (Figure 8-4). The channel capacity on each wavelength can be
flexibly divided between the ONUs.
Figure 8-4. PON using a single fiber.
Time-sharing appears to be the preferred method today for optical channel sharing in an
access network as it allows for a single upstream wavelength, such as 1310 nm, and a single
transceiver in the OLT, resulting in a cost-effective solution.
8.2.4 Burst-Mode Transceivers
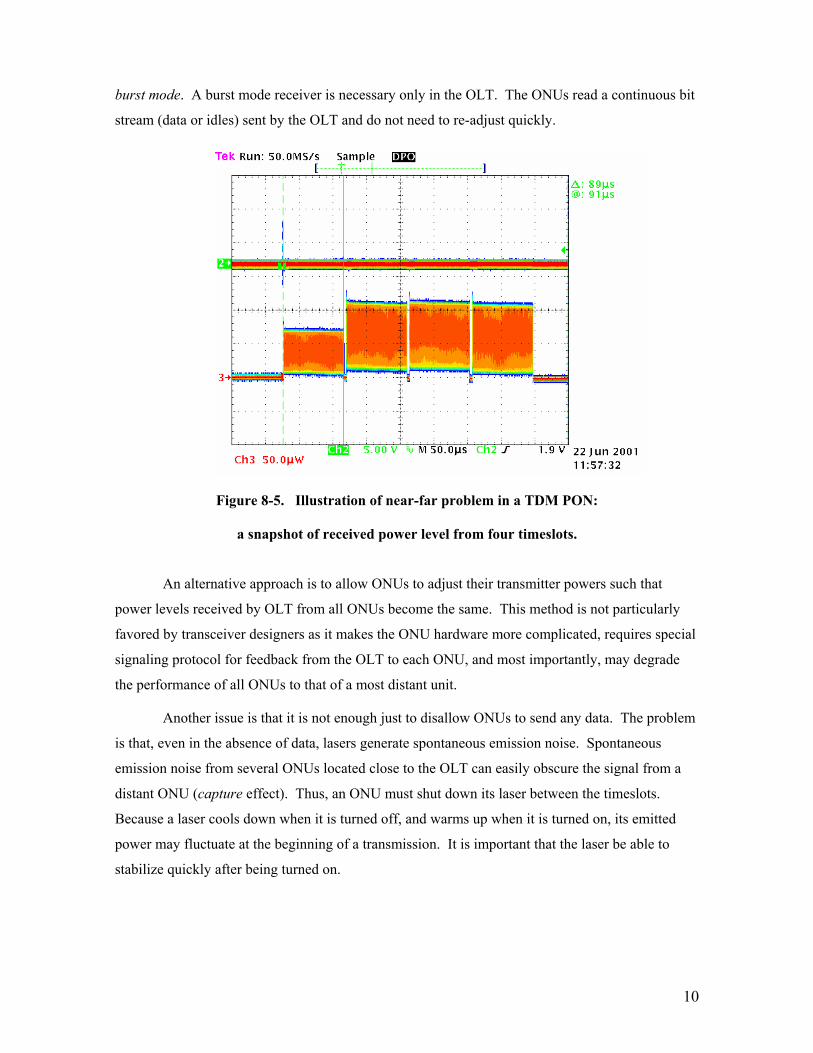
Due to unequal distances between CO and ONUs, optical signal attenuation in the PON is
not the same for each ONU. The power level received at the OLT will be different for each
timeslot (called the near-far problem). Figure 8-5 depicts power levels of four timeslots received
by the OLT from four different ONUs in a TDM PON. As shown, one ONU’s signal strength is
lower at the OLT most likely due to its longer distance. If the receiver in OLT is adjusted to
properly receive high-power signal from a close ONU, it may mistakenly read ones as zeros when
receiving weak signal from a distant ONU. In the opposite case, if the receiver is trained on a weak
signal, it may read zeros as ones when receiving a strong signal.
To properly detect the incoming bit stream, the OLT receiver must be able to quickly
adjust its zero-one threshold at the beginning of each received timeslot, i.e., it should operate in
10
burst mode. A burst mode receiver is necessary only in the OLT. The ONUs read a continuous bit
stream (data or idles) sent by the OLT and do not need to re-adjust quickly.
Figure 8-5. Illustration of near-far problem in a TDM PON:
a snapshot of received power level from four timeslots.
An alternative approach is to allow ONUs to adjust their transmitter powers such that
power levels received by OLT from all ONUs become the same. This method is not particularly
favored by transceiver designers as it makes the ONU hardware more complicated, requires special
signaling protocol for feedback from the OLT to each ONU, and most importantly, may degrade
the performance of all ONUs to that of a most distant unit.
Another issue is that it is not enough just to disallow ONUs to send any data. The problem
is that, even in the absence of data, lasers generate spontaneous emission noise. Spontaneous
emission noise from several ONUs located close to the OLT can easily obscure the signal from a
distant ONU (capture effect). Thus, an ONU must shut down its laser between the timeslots.
Because a laser cools down when it is turned off, and warms up when it is turned on, its emitted
power may fluctuate at the beginning of a transmission. It is important that the laser be able to
stabilize quickly after being turned on.

11
8.3 Ethernet PON (EPON) Access Network
Ethernet PON (EPON) is a PON-based network that carries data traffic encapsulated in
Ethernet frames (defined in the IEEE 802.3 standard). It uses a standard 8b/10b line coding (8 user
bits encoded as 10 line bits) and operates at standard Ethernet speed.
8.3.1 Why Ethernet?
Passive optical networking has been considered for the access network for quite some time,
even well before the Internet spurred bandwidth demand. The Full Service Access Network
(FSAN) recommendation (ITU G.983) defines a PON-based optical access network that uses ATM
as its layer 2 protocol. In 1995, when the FSAN initiative was started, ATM had high hopes of
becoming the prevalent technology in the LAN, MAN and backbone. However, since that time,
Ethernet technology has leapfrogged ATM. Ethernet has become a universally accepted standard,
with over 320 million port deployments worldwide, offering staggering economies of scale [9].
High-speed Gigabit Ethernet deployment is widely accelerating and 10 Gigabit Ethernet products
are becoming available. Ethernet, which is easy to scale and manage, is winning new grounds in
MAN and WAN. Considering the fact that 95% of LANs use Ethernet, it becomes clear that ATM
PON may not be the best choice to interconnect two Ethernet networks.
One of ATM’s shortcomings is the fact that a dropped or corrupted ATM cell will
invalidate the entire IP datagram. However, the remaining cells carrying the portions of the same
IP datagram will propagate further, thus consuming network resources unnecessarily. Also, ATM
imposes a cell tax on variable-length IP packets. For example, for the tri-modal packet-size
distribution reported in [10], the cell tax is approximately 13%, i.e., to send the same amount of
user’s data an ATM network must transmit 13% more bytes than an Ethernet network (counting
64-bit preamble and 96-bit minimum inter-frame gap (IFG) in Ethernet and 12 bytes of overhead
associated with ATM adaptation layer 5 (AAL-5)). And finally, perhaps most importantly, ATM
did not live up to its promise of becoming an inexpensive technology – vendors are in decline and
manufacturing volumes are relatively low. ATM switches and network cards are significantly
(roughly 8x) more expensive than Ethernet switches and network cards [9].
On the other hand, Ethernet looks like a logical choice for an IP data-optimized access
network. Newly-adopted quality-of-service (QoS) techniques have made Ethernet networks
capable of supporting voice, data and video. These techniques include full duplex transmission
mode, prioritization (P802.1p), and virtual LAN (VLAN) tagging (P802.1Q). Ethernet is an

12
inexpensive technology, which is ubiquitous and interoperable with a variety of legacy equipment.
The rest of this article will focus on EPONs.
8.3.2 Principle of Operation
The IEEE 802.3 standard defines two basic configurations for an Ethernet network. In one
configuration it can be deployed over a shared medium using the Carrier Sense Multiple Access
with Collision Detection (CSMA/CD) protocol. In another configuration, stations may be
connected through a switch using full-duplex point-to-point links. Properties of EPON are such
that it cannot be considered either a shared medium or a point-to-point network; rather, it is a
combination of both.
In the downstream direction, Ethernet frames transmitted by the OLT pass through a 1:N
passive splitter and reach each ONU. N is typically between 4 and 64. This behavior is similar to a
shared-medium network. Because Ethernet is broadcast by nature, in the downstream direction
(from network to user), it fits perfectly with the Ethernet PON architecture: packets are broadcast
by the OLT and extracted by their destination ONU based on the media-access control (MAC)
address (Figure 8-6).
OLT ONU 2 USER 2
ONU 1
USER 3ONU 3
USER 1
1 3 1 2 1 3 1 2
13
12
13
12
1 1
2
3header Payload FCS
802.3 frame
Figure 8-6. Downstream traffic in EPON.
In the upstream direction, due to the directional properties of a passive optical combiner,
data frames from any ONU will only reach the OLT, and not other ONUs. In that sense, in the
upstream direction, the behavior of EPON is similar to that of a point-to-point architecture.
However, unlike in a true point-to-point network, in EPON data frames from different ONUs
transmitted simultaneously still may collide. Thus, in the upstream direction (from users to

13
network) the ONUs need to employ some arbitration mechanism to avoid data collisions and fairly
share the fiber-channel capacity.
A contention-based media access mechanism (something similar to CSMA/CD) is difficult
to implement because ONUs cannot detect a collision at the OLT (due to directional properties of
optical splitter/combiner). An OLT could detect a collision and inform ONUs by sending a jam
signal; however, propagation delays in PON, which can exceed 20 km in length, can greatly reduce
the efficiency of such a scheme. Contention-based schemes also have a drawback of providing a
non-deterministic service, i.e., node throughput and channel utilization may be described as
statistical averages. There is no guarantee of a node getting access to the media in any small
interval of time. It is not a problem for CSMA/CD-based enterprise networks where links are
short, typically over-provisioned, and traffic predominantly consists of data. Subscriber access
networks, however, in addition to data, must support voice and video services, and thus must
provide some guarantees on timely delivery of these traffic types.
To introduce determinism in the frame delivery, different non-contention schemes have
been proposed. Figure 8-7 illustrates an upstream time-shared data flow in an EPON.
OLT ONU 2 USER 2
ONU 1
USER 3ONU 3
USER 1
2
33 3
1 1
33
3
2
11
1 1 2 3 3 3
header Payload FCS
802.3 frame
time slot
Figure 8-7. Upstream traffic in EPON.
All ONUs are synchronized to a common time reference and each ONU is allocated a
timeslot. Each timeslot is capable of carrying several Ethernet frames. An ONU should buffer
frames received from a subscriber until its timeslot arrives. When its timeslot arrives, the ONU
would “burst” all stored frames at full channel speed which must correspond to one of standard
Ethernet rates (10/100/1000/10000 Mbps). If there are no frames in the buffer to fill the entire
14
timeslot, idles 10-bit characters are transmitted. The possible timeslot allocation schemes could
range from a static allocation (fixed time-division multiple access (TDMA)) to a dynamically
adapting scheme based on instantaneous queue size in every ONU (statistical multiplexing
scheme). There are more allocation schemes possible, including schemes utilizing notions of
traffic priority, Quality of Service (QoS), Service-Level Agreements (SLAs), over-subscription
ratios, etc.
Decentralized approaches to implement a dynamic slot assignment scheme are also
possible, in which ONUs decide when to send data and for how long. These schemes are somewhat
similar to a token-passing approach, except that in this case it is a passive ring. In such a scheme,
every ONU, before sending its data, will send a special message announcing how many bytes it is
about to send. The ONU that is scheduled next (say, in round-robin fashion) will monitor the
transmission of the previous ONU and will time its transmission such that it arrives to the OLT
right after the transmission from the previous ONU. Thus, there will be no collision and no
bandwidth will be wasted. This scheme is similar to hub polling [11]. However, this scheme has a
major limitation: it requires connectivity (communicability) between ONUs. That imposes some
constraints on PON topology; namely, the network should be deployed as a ring or as a
broadcasting star. This requirement is not desirable as (a) it may require more fiber to be deployed,
or (b) fiber plant with different topology might be already pre-deployed. In general, a preferred
algorithm shall support any point-to-multipoint PON topology.
In an optical access network, we can count only on connectivity from the OLT to every
ONU (downstream traffic) and every ONU to the OLT (upstream traffic). That is true for all PON
topologies. Therefore, the OLT remains the only device that can arbitrate time-division access to
the shared channel.
The challenge of implementing an OLT-based dynamic arbitration scheme is in the fact
that the OLT does not know how many bytes of data each ONU has buffered. The burstiness of
data traffic precludes a queue occupancy prediction with any reasonable accuracy. If the OLT is to
make an accurate timeslot assignment, it should know the state of a given ONU exactly. One
solution may be to use a polling scheme based on Grant and Request messages. Requests are sent
from an ONU to report changes in an ONU’s state, e.g., the amount of buffered data. The OLT
processes all Requests and allocates different transmission windows (timeslots) to ONUs. Slot-
assignment information is delivered to ONUs using Grant messages.
The advantage of having centralized intelligence for the slot-allocation algorithm is that the
OLT knows the state of the entire network and can switch to another allocation scheme based on

15
that information; the ONUs don’t need to monitor the network state or negotiate and acknowledge
new parameters. That will make ONUs simpler and cheaper and the entire network more robust.
8.3.3 Multi-Point Control Protocol (MPCP)
To support a timeslot allocation by the OLT, the multi-point control protocol (MPCP) is
being developed by the IEEE 802.3ah task force. This protocol relies on two Ethernet messages:
GATE and REPORT. GATE message is sent from OLT to an ONU and used to assign a
transmission timeslot. REPORT message is used by an ONU to convey its local conditions (such
as buffer occupancy, etc.) to the OLT to help it make intelligent allocation decision. Both GATE
and REPORT messages are MAC control frames (type 88-08) and are processed by the MAC
control sub-layer.
There are two modes of operation of MPCP: auto-discovery (initialization) and normal
operation. Auto-discovery mode is used to detect newly connected ONUs and learn the round-trip
delay and MAC address of that ONU, plus maybe some additional parameters yet to be defined.
Normal mode is used to assign transmission opportunities to all initialized ONUs.
Since more than one ONU can require initialization at one time, auto-discovery is a
contention-based procedure. At a high level, it works as follows:
1. OLT allocates an initialization slot, an interval of time when no previously initialized
ONUs are allowed to transmit. The length of this initialization slot must be at least
<transmission size> + < maximum round-trip time> - <minimum round-trip time>,
where <transmission size> is the length of the transmission window which an un-
initialized ONU can use.
2. OLT sends an initialization GATE message advertising the start time of the
initialization slot and its length. While relaying this message from a higher layer to the
MAC layer, MPCP will timestamp it with its local time.
3. Only un-initialized ONUs will respond to the initialization GATE message. Upon
receiving the initialization GATE message, an ONU will set its local time to the
arriving timestamp in the initialization GATE message.
4. When the local clock located in the ONU reaches the start time of the initialization slot
(also delivered in the GATE message), the ONU will transmit its own message
(initialization REPORT). The REPORT message will contain the ONU’s source
16
address and a timestamp representing local ONU’s time when the REPORT message
was sent.
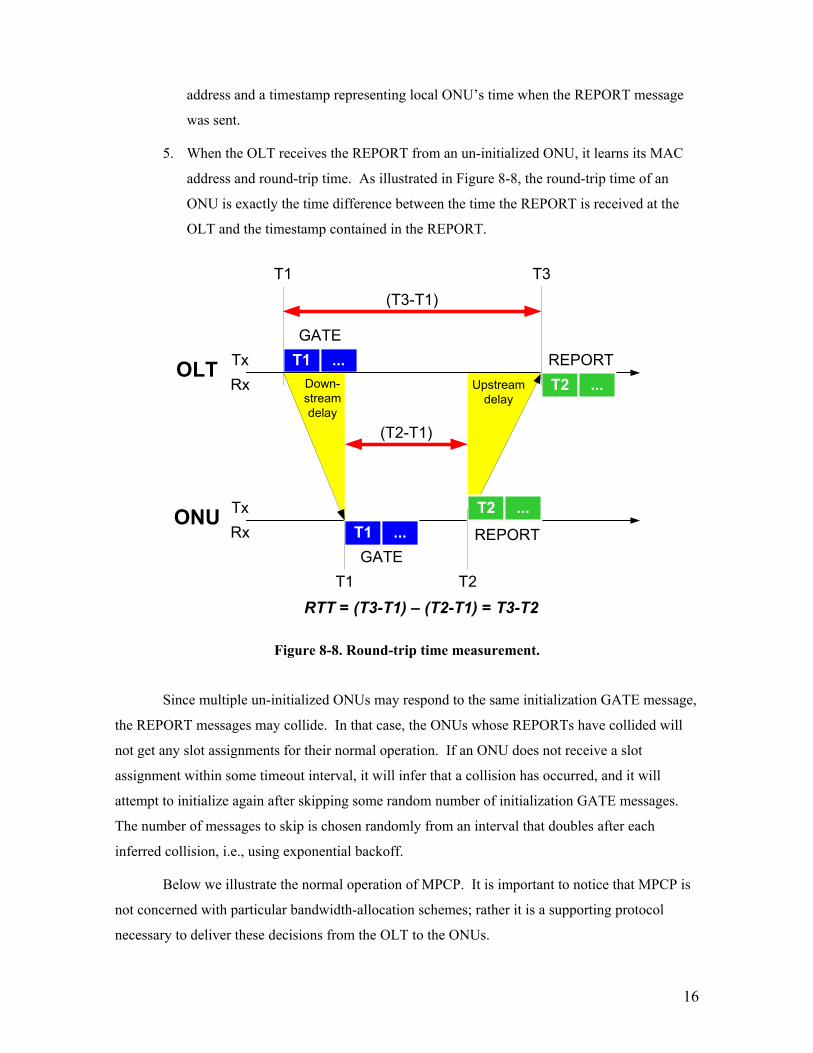
5. When the OLT receives the REPORT from an un-initialized ONU, it learns its MAC
address and round-trip time. As illustrated in Figure 8-8, the round-trip time of an
ONU is exactly the time difference between the time the REPORT is received at the
OLT and the timestamp contained in the REPORT.
T1 ...GATE
T2 ...
REPORTGATE
T1 ...
REPORTT2 ...
OLTRxTx
ONURxTx
T1
T1
T2
T3
(T2-T1)
(T3-T1)
Down-streamdelay
Upstreamdelay
Figure 8-8. Round-trip time measurement.
Since multiple un-initialized ONUs may respond to the same initialization GATE message,
the REPORT messages may collide. In that case, the ONUs whose REPORTs have collided will
not get any slot assignments for their normal operation. If an ONU does not receive a slot
assignment within some timeout interval, it will infer that a collision has occurred, and it will
attempt to initialize again after skipping some random number of initialization GATE messages.
The number of messages to skip is chosen randomly from an interval that doubles after each
inferred collision, i.e., using exponential backoff.
Below we illustrate the normal operation of MPCP. It is important to notice that MPCP is
not concerned with particular bandwidth-allocation schemes; rather it is a supporting protocol
necessary to deliver these decisions from the OLT to the ONUs.
RTT = (T3-T1) – (T2-T1) = T3-T2

17
1. From its higher layer (MAC control client), MPCP gets a request to transmit a GATE
message to a particular ONU with the following information: time when that ONU
should start transmission and length of the transmission (Figure 8-9).
2. MPCP layer (in OLT and each ONU) maintains a clock. Upon passing a GATE
message from its higher layer to MAC, MPCP timestamps it with its local time.
3. Upon receiving a GATE message matching that ONU’s MAC address (GATE
messages are unicast), the ONU will program its local registers with transmission start
and transmission length times. The ONU will also verify that time when the GATE
message arrived is close to the timestamp value contained within the message. If the
difference in values exceeds some pre-defined threshold, the ONU will assume that it
has lost its synchronization and will switch itself into un-initialized mode. In that
mode, the ONU is not allowed to transmit. It will monitor its incoming traffic waiting
for the next initialization GATE message to perform initialization.
4. If the time the GATE message is received is close to the timestamp value in the GATE
message, the ONU will update its local clock to that of timestamp. When the local
time reaches the ‘start transmission’ value, the ONU will start transmitting. That
transmission may include multiple Ethernet frames. The ONU will ensure that no
frames are fragmented. If the next frame does not fit in the remainder of the timeslot,
it will be deferred till the next timeslot.
MAC Control Client
MAC Control
MAC
PHY
Clock register
Slot Start register
Slot Stop register
MAC Control Client
MAC Control
MAC
PHY
Generate GATEmessage
TimestampGATE message
Write registers
OLT ONU
Ups
tream
Dat
a Pa
thStartStop
StartStop
TSStartStop
TS
Laser ON/OFF
Clock register
MA_CONTROL.request(GATE) MA_CONTROL.indication(GATE) MA_DATA.request( … )
IN
S
CO
PE
Figure 8-9. Multi-Point Control Protocol – GATE operation.
18
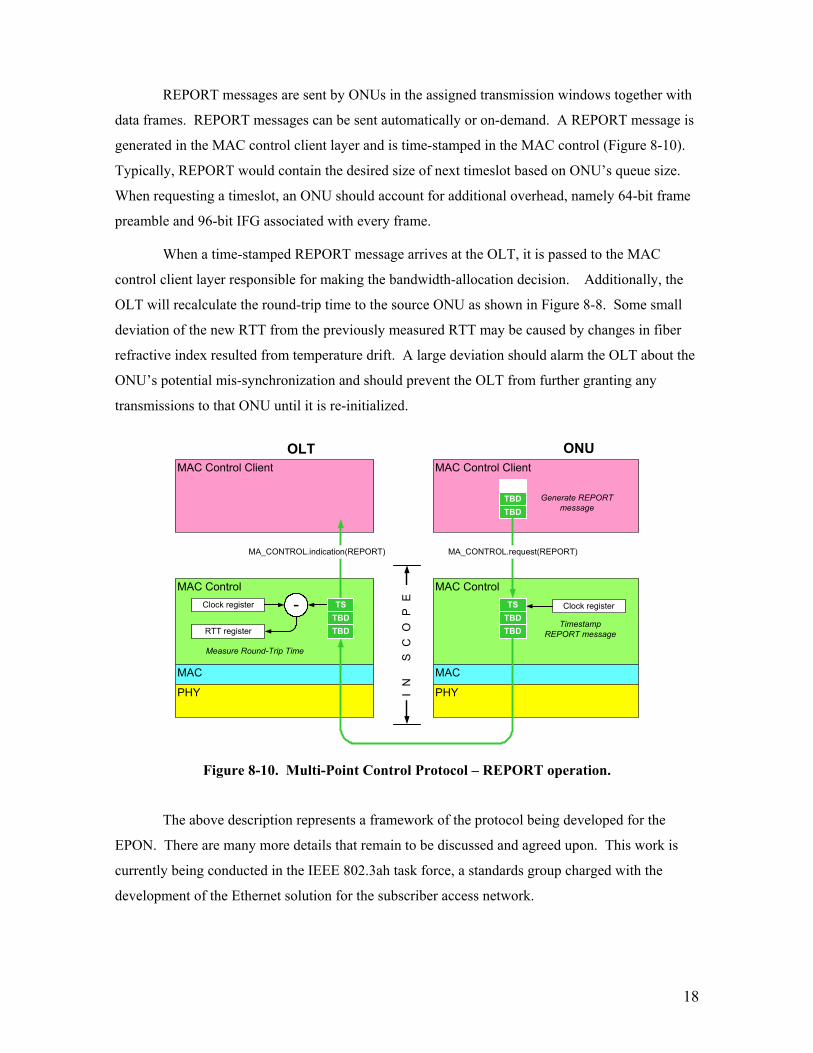
REPORT messages are sent by ONUs in the assigned transmission windows together with
data frames. REPORT messages can be sent automatically or on-demand. A REPORT message is
generated in the MAC control client layer and is time-stamped in the MAC control (Figure 8-10).
Typically, REPORT would contain the desired size of next timeslot based on ONU’s queue size.
When requesting a timeslot, an ONU should account for additional overhead, namely 64-bit frame
preamble and 96-bit IFG associated with every frame.
When a time-stamped REPORT message arrives at the OLT, it is passed to the MAC
control client layer responsible for making the bandwidth-allocation decision. Additionally, the
OLT will recalculate the round-trip time to the source ONU as shown in Figure 8-8. Some small
deviation of the new RTT from the previously measured RTT may be caused by changes in fiber
refractive index resulted from temperature drift. A large deviation should alarm the OLT about the
ONU’s potential mis-synchronization and should prevent the OLT from further granting any
transmissions to that ONU until it is re-initialized.
MAC Control Client
MAC Control
MAC
PHY
Clock register
MAC Control Client
MAC Control
MAC
PHY
Generate REPORTmessage
Measure Round-Trip Time
OLT ONU
TBDTBD
TBDTBD
TSClock register
MA_CONTROL.request(REPORT)MA_CONTROL.indication(REPORT)
IN
S
CO
PE
TimestampREPORT message
TBDTBD
TS-RTT register
Figure 8-10. Multi-Point Control Protocol – REPORT operation.
The above description represents a framework of the protocol being developed for the
EPON. There are many more details that remain to be discussed and agreed upon. This work is
currently being conducted in the IEEE 802.3ah task force, a standards group charged with the
development of the Ethernet solution for the subscriber access network.
19
8.3.4 EPON Compliance with 802 Architecture
The IEEE 802 architecture defines two types of media: shared medium and full duplex. In
a shared medium, all stations are connected to a single access domain where at most one station
can transmit at a time and all stations can receive all the time. The full-duplex segment is a point-
to-point link connecting two stations (or a station and a bridge) such that both stations can transmit
and receive simultaneously. Relying on the above definitions, bridges never forward a frame back
to its ingress port. In other words, it is assumed that all the stations connected to the same port on
the bridge can communicate with one another without the bridge’s help. This bridge behavior has
led to an interesting problem: users connected to a different ONUs on the same PON are unable to
communicate with one another without data being processed at layer 3 (network layer) or above.
This raises a question of compliance with IEEE 802 architecture, particularly with P802.1D
bridging.
To resolve this issue and to ensure seamless integration with other Ethernet networks,
devices attached to the EPON medium will have an additional sub-layer that, based on its
configuration, will emulate either a shared medium or a point-to-point medium. This sub-layer is
referred to as Shared-Medium Emulation (SME) or Point-to-Point Emulation (PtPE) sub-layer.
This sub-layer must reside below the MAC layer to preserve the existing Ethernet MAC operation
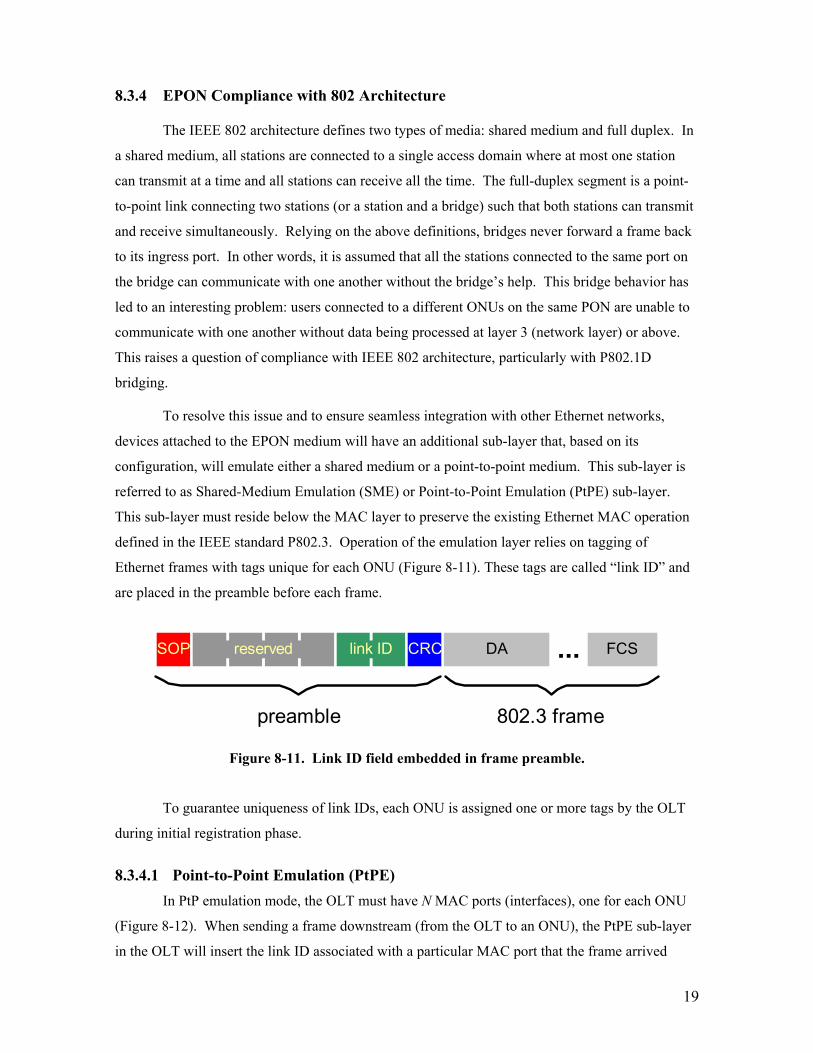
defined in the IEEE standard P802.3. Operation of the emulation layer relies on tagging of
Ethernet frames with tags unique for each ONU (Figure 8-11). These tags are called “link ID” and
are placed in the preamble before each frame.
DASOP reserved link ID CRC FCS...
802.3 framepreamble
Figure 8-11. Link ID field embedded in frame preamble.
To guarantee uniqueness of link IDs, each ONU is assigned one or more tags by the OLT
during initial registration phase.
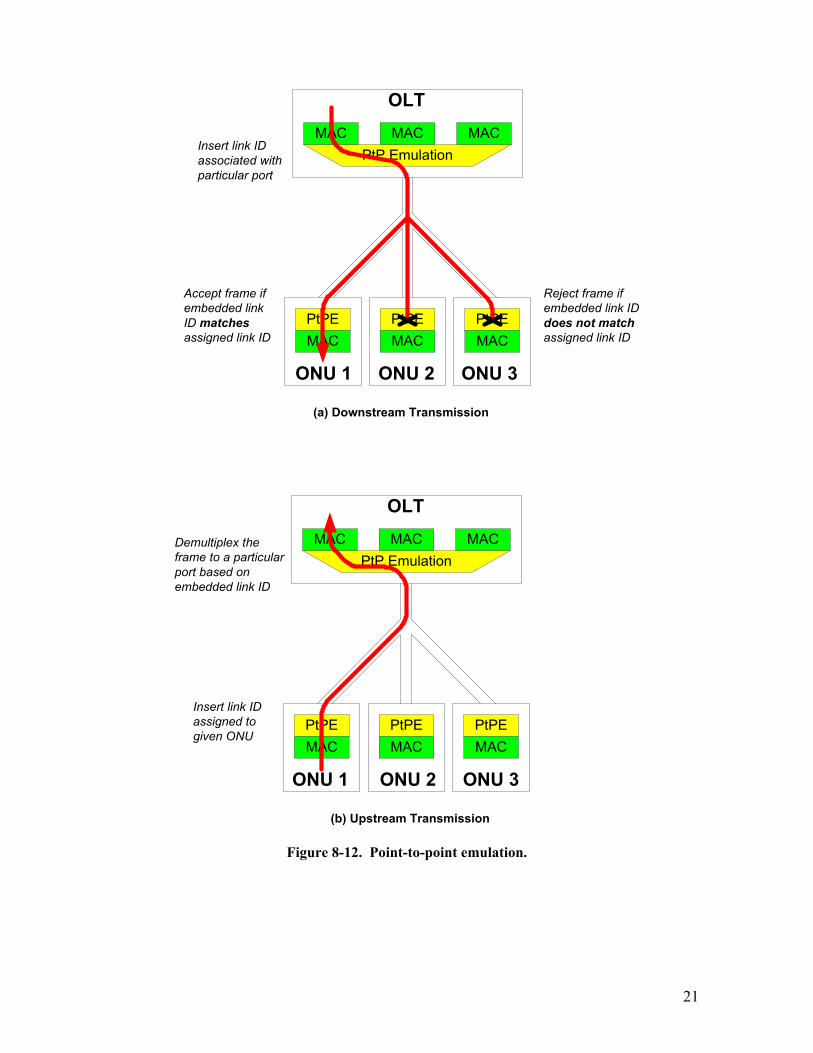
8.3.4.1 Point-to-Point Emulation (PtPE) In PtP emulation mode, the OLT must have N MAC ports (interfaces), one for each ONU
(Figure 8-12). When sending a frame downstream (from the OLT to an ONU), the PtPE sub-layer
in the OLT will insert the link ID associated with a particular MAC port that the frame arrived

20
from (Figure 8-12.a). Even though the frame will be delivered to each ONU, only one PtPE sub-
layer will match that frame’s link ID with the value assigned to the ONU and will accept the frame
and pass it to its MAC layer for further verification. MAC layers in all other ONUs will never see
that frame. In this sense, it appears as if the frame was sent on a point-to-point link to only one
ONU.
In the upstream direction, the ONU will insert its assigned link ID in the preamble of each
transmitted frame. The PtPE sub-layer in the OLT will de-multiplex the frame to the proper MAC
port based on the unique link ID (Figure 8-12.b).
21
(a) Downstream Transmission
(b) Upstream Transmission
PtPEMAC
PtPEMAC
PtPEMAC
PtP EmulationMAC MAC MAC
OLT
ONU 1 ONU 2 ONU 3
Demultiplex theframe to a particularport based onembedded link ID
Insert link IDassigned togiven ONU
OLT
ONU 1 ONU 2 ONU 3
PtPEMAC
PtPEMAC
PtPEMAC
PtP EmulationMAC MACMAC
Insert link IDassociated withparticular port
Accept frame ifembedded linkID matchesassigned link ID
Reject frame ifembedded link IDdoes not matchassigned link ID
Figure 8-12. Point-to-point emulation.

22
The PtPE configuration is clearly compatible with bridging as each ONU is connected to
an independent bridge port. The bridge placed in the OLT (Figure 8-13) will relay inter-ONU
traffic between its ports.
MAC
PtPE
MAC
PtPE
MAC
PtP Emulation
MAC
OLT
ONU 1 ONU 2 ONU 3
Bridge
Figure 8-13. Bridging between ONUs with point-to-point emulation.
8.3.4.2 Shared-Medium Emulation (SME) In shared-medium emulation, frames transmitted by any node (OLT or any ONU) should
be received by every node (OLT and every ONU). In the downstream direction, the OLT will
insert a “broadcast” link ID which will be accepted by every ONU (Figure 8-14.a). To ensure
shared-medium operation for upstream data (frames sent by ONUs), the SME sub-layer in OLT
must mirror all frames back downstream to be received by all other ONUs (Figure 8-14.b). To
avoid frame duplication when an ONU receives its own frame, the SME sub-layer in an ONU
accepts a frame only if the frame’s link ID is different from the link ID assigned to that ONU.

23
(a) Downstream Transmission
SME
MAC
SME
MAC
SME
MAC
MAC
OLT
ONU 1 ONU 2 ONU 3
SMEInsert broadcastlink ID
Accept frames with alllink IDs except own
(b) Upstream Transmission
SME
MAC
SME
MAC
SME
MAC
MAC
OLT
ONU 1 ONU 2 ONU 3
SME
When transmittingframe, insert assignedlink ID
Accept all frames andreflect them downstream
When receiving frame,reject if embedded linkID matches own link ID
Figure 8-14. Shared-medium emulation.
The shared-medium emulation requires only one MAC port in the OLT. Physical-layer
functionality (SME sub-layer) provides the ONU-to-ONU communicability, eliminating the need
for a bridge.
24
8.3.4.3 Combined PtPE and SME Mode While both PtPE and SME options provide solutions for P802.1 standards compliance
issues, both of them also have drawbacks, specifically when considered for an application in a
subscriber access networks. The PtPE mode precludes the possibility to have a single-copy
multicast/broadcast when the OLT sends one frame received by several ONUs. This feature is very
important for services such as video broadcast or any real-time broadcast services. To support such
services, the OLT operating in the PtPE mode must duplicate broadcast packets, each time with a
different link ID.
Shared-medium emulation, on the other hand, provides multicast/broadcast capabilities.
However, because every upstream frame is reflected downstream, it wastes a lot of downstream
bandwidth.
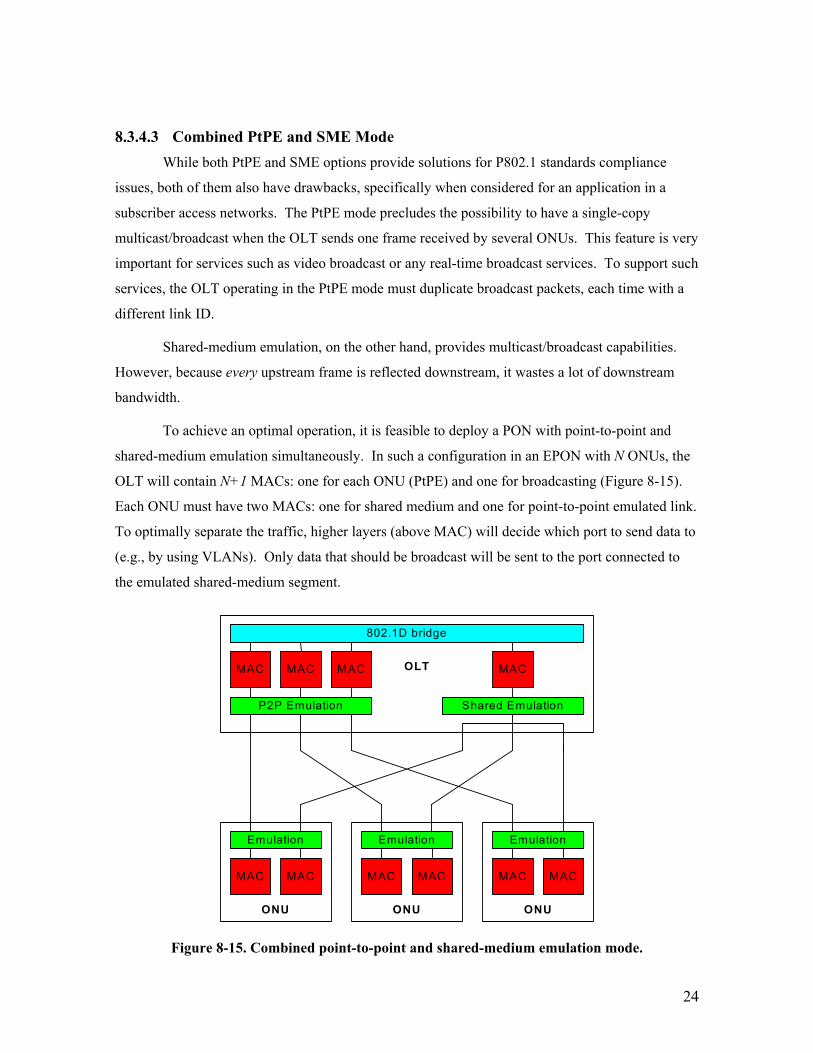
To achieve an optimal operation, it is feasible to deploy a PON with point-to-point and
shared-medium emulation simultaneously. In such a configuration in an EPON with N ONUs, the
OLT will contain N+1 MACs: one for each ONU (PtPE) and one for broadcasting (Figure 8-15).
Each ONU must have two MACs: one for shared medium and one for point-to-point emulated link.
To optimally separate the traffic, higher layers (above MAC) will decide which port to send data to
(e.g., by using VLANs). Only data that should be broadcast will be sent to the port connected to
the emulated shared-medium segment.
802.1D bridge
MAC
P2P Emulation
MAC MAC MAC
Shared Emulation
Emulation
MAC MAC
ONU
Emulation
MAC MAC
ONU
Emulation
MAC MAC
ONU
OLT
Figure 8-15. Combined point-to-point and shared-medium emulation mode.
25
8.3.4.4 Open Issues The work on emulation sub-layer design is still in progress. A serious challenge that needs
to be solved is that the emulation sub-layer must be able to multiplex several data flows into one
flow. In PtPE mode, the emulation layer may receive data frames from multiple MAC ports
simultaneously. In SME mode this happens when an ONU-to-ONU data frame competes with a
network-to-ONU data frame for the downstream channel. The apparent drawback of this
competition is that, now, some frames may have to be discarded below the MAC sub-layer, which
may make the BER dependent on the traffic load. To drop frames intelligently, the emulation sub-
layer should be aware of the sender’s or the recipient’s SLA and frame priority. All these features
are strictly out-of-scope of the IEEE 802 standard and do not belong in PHY layer. Additionally,
even if frames are not dropped in the emulation sub-layer, MAC-to-MAC delay may not be
constant due to head-of-line blocking, which may have a detrimental effect on QoS.
An alternative proposal suggests putting the emulation sub-layer in the MAC control layer.
In this case, the link ID information should transparently propagate through the MAC and this will
require MAC modifications. Another, more subtle problem is that, since frame filtering is now
performed above the MAC layer, in PtPE mode, every MAC will see all frames before they are
filtered out based on link ID. This means that a corrupted and invalid frame will increment error
counters in all MACs as opposed to only one MAC at the other end of its virtual PtP link. This, of
course, will invalidate layer-management facilities provisioned by the standard.
Finding solutions for the above-mentioned issues, as well as converging on a best place for
the emulation sub-layer, remains on the list of open issues for the IEEE 802.3ah task force.
8.4 Performance of EPON
The performance of an EPON depends on the particular bandwidth-allocation scheme.
Choosing the best allocation scheme, however, is not a trivial task. If all users belong to the same
administrative domain (say a corporate or campus network), full statistical multiplexing would
make sense – network administrators would like to get most out of the available bandwidth.
However, subscriber access networks are not private LANs and the objective is to ensure Service-
Level Agreement (SLA) compliance for each individual user. Using statistical multiplexing
mechanisms to give each user best effort-bandwidth may complicate billing and may potentially
offset the user’s drive to upgrade to a higher bandwidth. Also, subscribers may get used to and
expect the performance that they get during low-activity hours when lots of best-effort bandwidth

26
is available. Then, at peak hours, the same users would perceive the service as unsatisfactory, even
though they get what is guaranteed by their SLA. An optimized bandwidth-allocation algorithm
will ultimately depend on the future SLA and billing model used by the service provider.
This notion has led to a “fixed pipe” model for an access network. Fixed pipe assumes that
each user will agree to and pay for a fixed bandwidth regardless of the network conditions or
applications using it. Because the contracted bandwidth must be available at any time, this model
does not support over-subscription. Correspondingly, network operators are not eager to give users
an additional best-effort bandwidth. It is not easy to charge for and users are not willing to pay for
what is hard to measure. In a sense, this model operates like a fixed circuit given to each customer.
Recently, however, there has been a shift to a new paradigm. Since bandwidth is getting
cheaper, the revenues the service providers get from data traffic are decreasing. Correspondingly,
many carriers complain that, to accommodate the increased traffic on their networks, they have to
upgrade their networks often, and thus their capital expenses increase, but the revenue remains flat
or even decreases. In recent years, it has become apparent that raw bandwidth cannot generate
enough revenue. The new thinking among telecommunication operators calls for service-based
billing in which users pay for the services they get, and not for the guaranteed bandwidth they are
provisioned. In this model, the network operators are willing to employ statistical multiplexing to
be able to support more services over the network.
Below we will compare the EPON performance operated in fixed TDMA (“fixed pipe”)
and statistical multiplexed modes.
8.4.1 Model Description
In this study, we consider an access network consisting of an OLT and N ONUs connected
using a passive optical network (Figure 8-16). Every ONU is assigned a downstream propagation
delay (from the OLT to the ONU) and an upstream propagation delay (from the ONU to the OLT.)
While with a tree topology both downstream and upstream delays are the same, with a ring
topology delays will be different. To keep the model general we assume independent delays and
select them randomly (uniformly) over the interval [50 µs, 100 µs]. These values correspond to
distances between the OLT and ONUs ranging from 10 to 20 km.

27
OLT
ONU 2RU Mbps
...1 2 N ...1 2 N
...1 2 N ...1 2 N
...1 2 N ...1 2 N
...1 2 N ...1 2 N
ONU 1RU Mbps
ONU NRU Mbps
cycle
cycle
cycle
cycle
RN Mbps
RN Mbps
RN Mbps
RN Mbps
Figure 8-16. Simulation model of an EPON access network.
From the access side, traffic may arrive at an ONU from a single user or from a gateway of
a LAN, i.e., traffic may be aggregated from a number of users. Ethernet frames should be buffered
in the ONU until the ONU is allowed to transmit the packets. The transmission speed of the PON
and the user access link may not necessarily be the same. In our model, we consider RU Mbps to be
the user data rate (rate of access link from a user to an ONU), and RN Mbps to be the network data
rate (upstream slotted link from an ONU to the OLT) (see Figure 8-16). We should mention here
that, if UN RNR ×≥ , then the bandwidth utilization problem does not exist, as the system
throughput is higher than the peak aggregated load from all ONUs. In this study, we consider a
system with N=16 and RU and RN being 100 Mbps and 1000 Mbps, respectively.
A set of N timeslots together with their associated guard intervals is called a cycle. In other
words, a cycle is a time interval between two successive timeslots assigned to one ONU (Figure 8-
16). We denote cycle time by T. Making T too large will result in increased delay for all the
packets, including high-priority (real-time) packets. Making T too small will result in more
bandwidth being wasted by guard intervals.
To obtain an accurate and realistic performance analysis, it is important to simulate the
system behavior with appropriate traffic injected into the system. There is an extensive study
showing that most network traffic flows (i.e., generated by http, ftp, variable-bit-rate (VBR) video
applications, etc.) can be characterized by self-similarity and long-range dependence (LRD) (see
[12] for an extensive reference list). To generate self-similar traffic, we used the method described
28
in [13], where the resulting traffic is an aggregation of multiple streams, each consisting of
alternating Pareto-distributed ON/OFF periods.
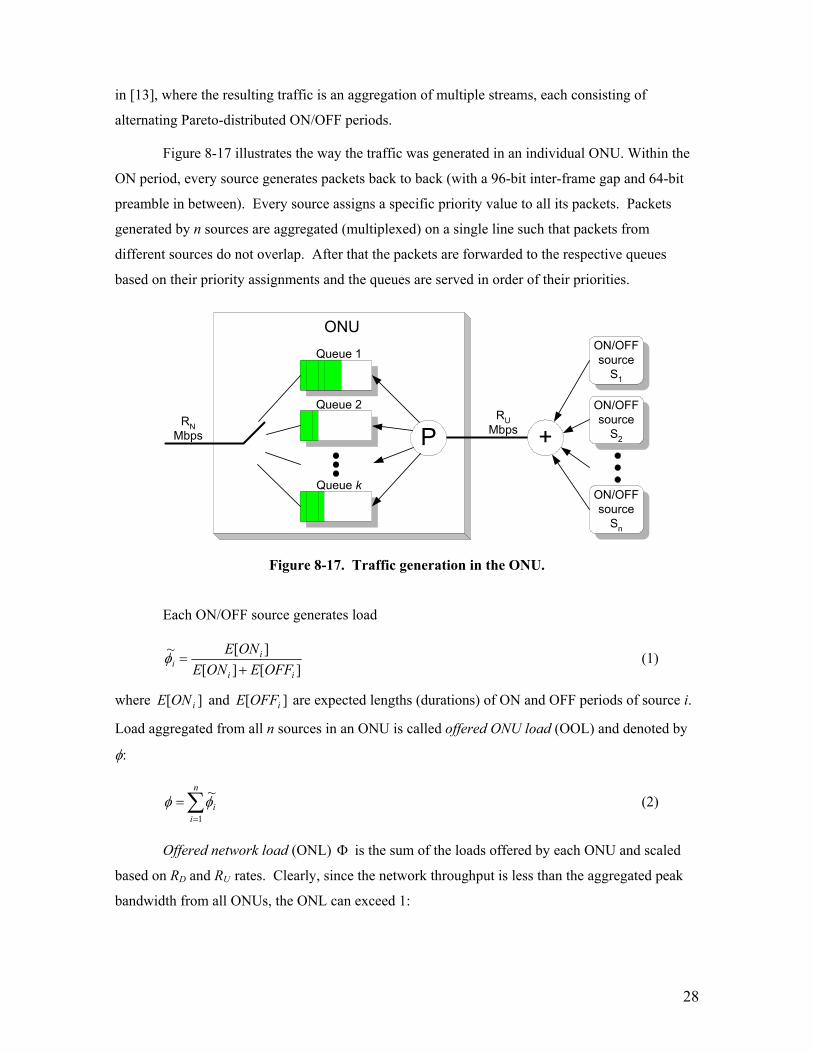
Figure 8-17 illustrates the way the traffic was generated in an individual ONU. Within the
ON period, every source generates packets back to back (with a 96-bit inter-frame gap and 64-bit
preamble in between). Every source assigns a specific priority value to all its packets. Packets
generated by n sources are aggregated (multiplexed) on a single line such that packets from
different sources do not overlap. After that the packets are forwarded to the respective queues
based on their priority assignments and the queues are served in order of their priorities.
Queue 1
Queue 2
Queue k
RUMbps
RNMbps
ONU
P
ON/OFFsource
S1
ON/OFFsource
S2
ON/OFFsource
Sn
+
Figure 8-17. Traffic generation in the ONU.
Each ON/OFF source generates load
][][][~
ii
ii OFFEONE
ONE+
=φ (1)
where ][ iONE and ][ iOFFE are expected lengths (durations) of ON and OFF periods of source i.
Load aggregated from all n sources in an ONU is called offered ONU load (OOL) and denoted by
φ:
∑=
=n
ii
1
~φφ (2)
Offered network load (ONL) Φ is the sum of the loads offered by each ONU and scaled
based on RD and RU rates. Clearly, since the network throughput is less than the aggregated peak
bandwidth from all ONUs, the ONL can exceed 1:
29
∑=
=ΦN
j
j
N
U
RR
1
][φ (3)
It is important to differentiate between offered load and effective load. The effective ONU
load (EOL) is denoted ϖ and results from the data (packets) that have been sent out by the ONUs.
Thus, the EOL is equal to the OOL only if the packet loss rate is zero. In general, φϖ ≤ .
The EOL generated by the ONU j is denoted ϖ[j]. Effective network load (ENL) Ω is just
a sum of the EOLs generated by all ONUs with a corresponding scaling coefficient based on the
PON and user link bit rates:
∑=
=ΩN
j
j
N
U
RR
1
][ϖ (4)
Every ONU may have k queues which are served in order of their priority (priority queuing
is discussed in Section 8.5.3.1). Every ONU has a finite buffer of size Q. The memory is allocated
to different queues based on demand and priority, i.e., if the entire buffer is occupied and a frame
with a higher priority arrives, the lowest-priority non-empty queue will drop one or more frames,
so that the higher-priority queue can store the new packet. In our simulations, buffer size Q was set
to 10 Mbytes.
8.4.2 Bandwidth-Allocation Schemes
The essence of the MPCP protocol is in assigning a variable-sized slot (transmission
window) to each ONU based on decisions made by some bandwidth-allocation scheme. To
prevent the upstream channel being monopolized by one ONU with high data volume, there should
be a maximum transmission window size limit assigned to every ONU. We denote an ONU-
specific maximum transmission window size by ][iMAXW (in bytes). The choice of specific values of
][iMAXW determines the maximum granting cycle time TMAX under heavy load conditions:
∑=
×+=
N
i
iMAX
MAX RW
GT1
][8 (5)
where ][iMAXW - maximum window size for ith ONU (in bytes), G – guard interval (seconds), N –
number of ONUs, and R – line rate (bps).
The guard intervals provide protection for fluctuations of round-trip time of different
ONUs. Additionally, the OLT receiver needs some time to readjust its sensitivity due to the fact
that signals from different ONUs may have different power levels (near-far problem).

30
Making TMAX too large will result in increased delay for all Ethernet frames, including
those carrying high-priority (real-time) IP packets. Making TMAX too small will result in more
bandwidth being wasted by guard intervals.
It is the ONU’s responsibility to ensure that the frame it is about to send fits in the
remainder of the timeslot. If the frame does not fit, it should be deferred till the next timeslot,
leaving the current timeslot underutilized (not filled completely with Ethernet frames). Section
8.5.1 investigates the timeslot utilization issues in more details.
In addition to the maximum cycle time, the ][iMAXW value also determines the guaranteed
bandwidth available to ONU i. Let ][iMINΛ denote the (minimum) guaranteed bandwidth of ONU i
(in bps). Obviously,
MAX
iMAXi
MIN TW ][
][ 8×=Λ (6)
i.e., the ONU is guaranteed to be able to send at least ][iMAXW bytes (or ][8 i
MAXW× bits) in at most
TMAX time. Of course, an ONUs bandwidth will be limited to its guaranteed bandwidth only if all
other ONUs in the system also use all of their available bandwidth. If at least one ONU has less
data, it will be granted a shorter transmission window, thus making the granting cycle time shorter,
and therefore the available bandwidth to all other ONUs will increase proportionally to their ][i
MAXW . This is the mechanism behind dynamic bandwidth distribution described in [15]: by
adapting the cycle time to the instantaneous network load (i.e., queue occupancy), the bandwidth is
automatically distributed to ONUs based on their loads. In the extreme case, when only one ONU
has data to send, the bandwidth available to that ONU will be:
RWGN
Wi
MAX
iMAXi
MAX ][
][][
88
×+×
×=Λ (7)
In our simulations, we assume that all ONUs have the same guaranteed bandwidth, i.e.,
iWW MAXi
MAX ∀= ,][ . This results in
×
+=RWGNT MAX
MAX8
(8)
We believe TMAX = 2 ms and G = 5 µs are reasonable choices. They make WMAX = 15,000
bytes. With these choices of parameters, every ONU will get a guaranteed bandwidth of 60 Mbps,
and maximum (best-effort) bandwidth of 600 Mbps (see Equations 6 and 7).

31
The following algorithm was considered in our simulation study.
RTT[i] – table containing round-trip times for each ONU. This table is originally populated during auto-discovery phase. It is updated constantly during normal operation.
V – size of transmission window (in bytes) requested by ONU
W – size of transmission window (in bytes) granted to ONU
ch_avail – time when channel becomes available for next transmission
local_time - read-only register containing OLT’s local clock values
guard - guard interval (constant)
delta - time interval to process GATE message in the ONU (minimum time between GATE arrival and beginning of timeslot)
ch_avail = 0; repeat forever FOR i from 1 to N /* wait for REPORT from ONU i */ until(REPORT from ONU i arrived)
/* do nothing */;
/* get round-trip time */ RTT[i] = local_time – REPORT.timestamp /*get requested slot size */ V = REPORT.slot_size /* update channel availability time
to make sure we don’t schedule slot for the past time */ if(ch_avail < local_time + delta + RTT[i]) ch_avail = local_time + delta + RTT[i]
/* make timeslot allocation decision
(specific allocation schemes are considered below)*/
W = f(V) /* create GATE message */

32
GATE.slot_start = ch_avail – RTT[i] GATE.slot_size = W /* update channel availability time for next ONU*/ ch_avail = ch_avail + guard + time(W) /* send GATE message to ONU i */ send(i, GATE)
The remaining question is how the OLT should determine the granted window size if the
requested window size is less than the predefined maximum ( MAXi WW <][ )? Table 8-1 defines a
few approaches (services) the OLT may take in making its decision.
Service Formula Description
Fixed MAXi WW =][
This scheduling discipline ignores the requested
window size and always grants the maximum
window. As a result, it has a constant cycle time
TMAX. Essentially, this is a “fixed pipe” model and
corresponds to the fixed TDMA PON system
described in [14].
Limited
=MAX
ii
WV
MINW][
][
][iV = requested window size
This discipline grants the requested number of
bytes, but no more than WMAX. It is the most
conservative scheme and has the shortest cycle of
all the schemes.

33
Gated ][][ ii VW =
This service discipline does not impose the WMAX
limit on the granted window size, i.e., it will
always authorize an ONU to send as much data as
it has requested. Of course, without any limiting
parameter, the cycle time may increase
unboundedly if the offered load exceeds the
network throughput. In this discipline, such a
limiting factor is the buffer size Q, i.e., an ONU
cannot store more than Q bytes, and thus, it will
never request more than Q bytes.
Constant
Credit +
=MAX
ii
WConstVMINW
][][
This scheme adds a constant credit to the requested
window size. The idea behind adding the credit is
the following: assume x bytes arrived between the
time when an ONU sent a REPORT message and
the beginning of the timeslot assigned to the ONU
as the result of processing the REPORT. If the
granted window size equals requested window + x
(i.e., it has a credit of size x), then these x bytes
will experience smaller delay, and thus the average
delay will reduce.
Linear
Credit ×
=MAX
ii
WConstVMINW
][][
This scheme uses a similar approach as the
Constant Credit scheme. However, the size of the
credit is proportional to the requested window.
The reasoning here is the following: LRD traffic
possesses a certain degree of predictability (see
[16]), viz., if we observe a long burst of data, then
this burst is likely to continue for some time into
the future. Correspondingly, the arrival of more
data during the last cycle time may signal that we
are observing a burst of packets.

34
Elastic
−=
∑−
−=
1][
][
][ i
Nij
jMAX
i
i
WNW
VMINW
Elastic service is an attempt to get rid of a fixed
maximum window limit. The only limiting factor
is the maximum cycle time TMAX. The maximum
window is granted in such a way that the
accumulated size of last N grants (including the
one being granted) does not exceed NWMAX bytes
(N = number of ONUs). Thus, if only one ONU
has data to send, it may get a Grant of size up to
NWMAX.
Table 8-1. Grant scheduling services used in simulation.
8.4.3 Simulation results
First, let us take a look at the components of the packet delay (Figure 8-18).
timeslot
packetarrival
packetdeparture
dcycle dqueuedpoll
REPORT
Figure 8-18. Components of packet delay.
The packet delay d is equal to:
queuecyclepoll dddd ++= (8)
where
polld = time between packet arrival and next REPORT sent by that ONU. On average this
delay equals half of the cycle time.
cycled = time interval from ONU’s request for a transmission window till the beginning of
the timeslot in which this frame it to be transmitted. This delay may span multiple

35
cycles (i.e., a frame may have to skip several timeslots before it reaches the head of
the queue), depending on how many frames there were in the queue at the time of
the new arrival.
queued = delay from the beginning of the timeslot till the beginning of frame transmission.
In average, this delay is equal to half of slot time and is insignificant comparing to
the previous two.
Figure 8-19 illustrates the mean packet delay for different timeslot allocation services as a
function of an ONU’s offered load φ. In this simulation, all ONUs have identical load; therefore,
the offered network load Φ is equal Nφ.
1.0E-04
1.0E-03
1.0E-02
1.0E-01
1.0E+00
1.0E+01
0.0 0.1 0.2 0.3 0.4 0.5 0.6 0.7 0.8 0.9 1.0
Offered Load
Del
ay (s
)
Fixed serviceLimited serviceGated serviceConstant creditLinear creditElastic service
Figure 8-19. Mean packet delay.
As can be seen in the figure, all granting services except fixed and gated have almost
coinciding plots. We will discuss fixed and gated service results below. As for the rest of the
schemes, no other method gives a detectable improvement in packet delay. The explanation to this
lies in the fact that all these methods are trying to send more data by way of increasing the granted
window size. While that may result in a decrease or elimination of the dcycle delay component for
some packets, it will increase the cycle time, and thus result in an increase of the dpoll component
for all the packets.

36
The fixed service plot is interesting as an illustration of the LRD traffic. Even at the very
light load of 5%, the average packet delay is already quite high (~15ms). This is because most
packets arrive in very large packet trains. In fact, the packet trains were so large that the 10-Mbyte
buffers overflowed and about 0.14% of packets were dropped. Why do we observe this anomalous
behavior only with fixed service? The reason is that the other services have a much shorter cycle
time; there is just not enough time in a cycle to receive more bytes than WMAX, thus the queue never
builds up. In fixed service, on the other hand, the cycle is large (fixed) regardless of the network
load and several bursts that arrived close to each other can easily overflow the buffer.
Before we continue with our discussion of gated service, we would like to present the
simulation results for the average queue size (Figure 8-20). This picture is similar to the mean
delay plot: fixed service has a larger queue due to larger cycle time.
1.0E+02
1.0E+03
1.0E+04
1.0E+05
1.0E+06
1.0E+07
1.0E+08
0.0 0.1 0.2 0.3 0.4 0.5 0.6 0.7 0.8 0.9 1.0
Offered Load
Byt
es
Fixed serviceLimited serviceGated serviceConstant creditLinear creditElastic service
Figure 8-20. Average queue size.
Let us now turn our attention to the delay and queue size plots for gated service. It can be
noticed that gated service provides a considerable improvement in the mid-range load between
45% and 65%. At 60% load, for example, the delay and average queue size are approximately 40
times less than with other services. This happens because gated service has higher channel
utilization due to the fact that the cycle time is much larger, and, as a result, fewer guard intervals

37
are used per unit of time. For the same reason, its saturation delay is a little bit lower than in other
services (refer to Figure 8-19) – the entire buffer contents are being transferred in one jumbo
transmission rather then in batches of WMAX bytes with a guard time in front of each batch.
Next, we will show that, even though gated service has lower delay and average queue
size, it is not a suitable service for an access network under consideration. The problem lies in the
much longer cycle time (see Figure 8-21). As a result, the dpoll delay will be much larger, and
therefore, the packet latency will be much higher. Clearly, large dcycle and dqueue delay components
can be avoided for high-priority packets by using priority queuing. But dpoll is a fundamental delay,
which cannot be avoided in general. This makes gated service not feasible for access network.
1.0E-04
1.0E-03
1.0E-02
1.0E-01
1.0E+00
0.0 0.1 0.2 0.3 0.4 0.5 0.6 0.7 0.8 0.9 1.0
Offered Load
Cyc
le T
ime
(s)
Fixed serviceLimited serviceGated serviceConstant creditLinear creditElastic service
Figure 8-21. Mean cycle times for various service disciplines.
Thus, we conclude that neither of the discussed service disciplines is better than limited
service, which is most conservative of all. As such, for the remainder of this study, we will focus
our attention on the limited service discipline. In the next section, we will analyze the fairness and
QoS characteristics of limited service.

38
8.4.4 Performance of Limited Service
In this section, we analyze the performance of one ONU (called tagged ONU) while
varying its offered load (φi) independently of its ambient load (effective load Ω generated by the
rest of the ONUs). In Figure 8-22, we present the average packet delay. All system parameters
remained the same as in the previous simulation.
0.10.3
0.50.7
0.9
0.1
0.3
0.5
0.70.9
1.0E-04
1.0E-03
1.0E-02
1.0E-01
1.0E+00
1.0E+01
Del
ay (s
)
Effective network Load
Tagged ONU offered load
Figure 8-22. Average packet delay as a function of effective network load and ONU offered
load.
When the effective network load is low, all packets in a tagged source experience very
little delay, no matter what the ONU’s offered load is. This is a manifestation of dynamic
bandwidth allocation – when the network load is low, the tagged source gets more bandwidth.
The opposite situation – low offered load at the ONU and high effective network load –
results in a higher delay. The only reason to this is the burstiness (i.e., long-range dependence) of
the traffic. This is the same phenomenon observed with fixed service: high network load results in
increased cycle time. This cycle time is large enough to receive more than WMAX bytes of data
39
during a burst. Hence, the dcycle delay for some packets will increase beyond one cycle time. We
will discuss a way to combat this phenomenon by using priority queuing in Section 8.5.3.
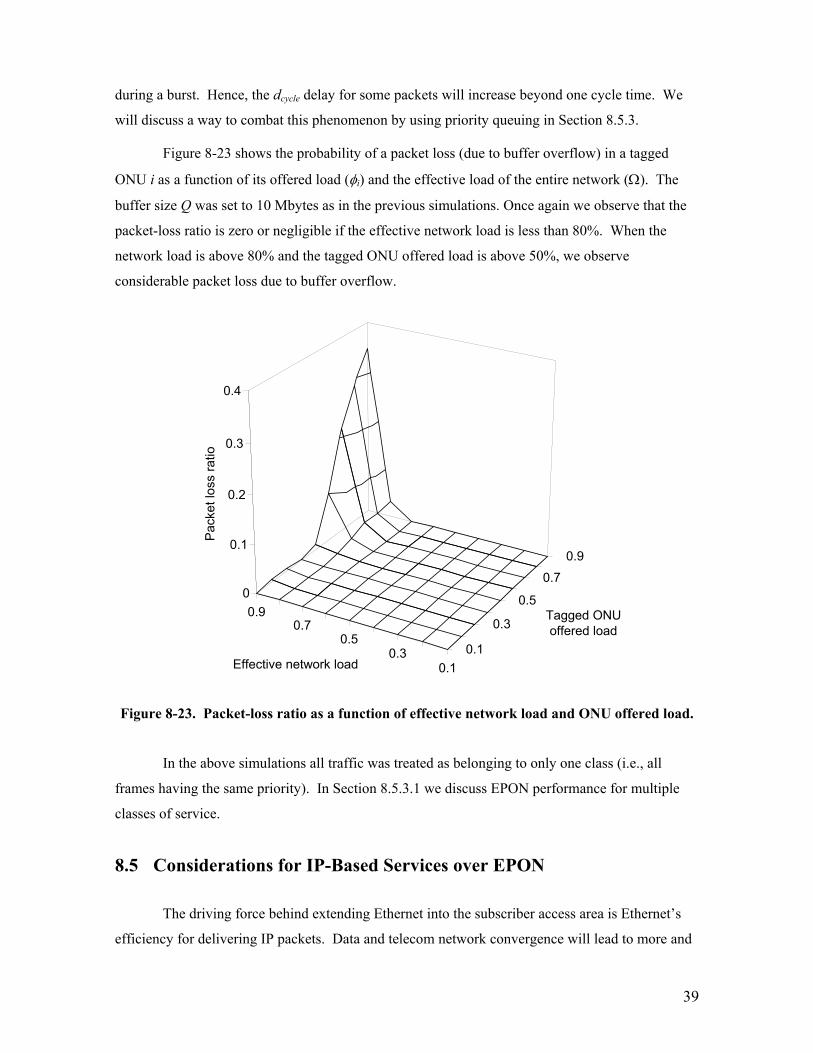
Figure 8-23 shows the probability of a packet loss (due to buffer overflow) in a tagged
ONU i as a function of its offered load (φi) and the effective load of the entire network (Ω). The
buffer size Q was set to 10 Mbytes as in the previous simulations. Once again we observe that the
packet-loss ratio is zero or negligible if the effective network load is less than 80%. When the
network load is above 80% and the tagged ONU offered load is above 50%, we observe
considerable packet loss due to buffer overflow.
0.10.3
0.50.7
0.9
0.1
0.3
0.5
0.7
0.9
0
0.1
0.2
0.3
0.4
Pac
ket l
oss
ratio
Effective network load
Tagged ONU offered load
Figure 8-23. Packet-loss ratio as a function of effective network load and ONU offered load.
In the above simulations all traffic was treated as belonging to only one class (i.e., all
frames having the same priority). In Section 8.5.3.1 we discuss EPON performance for multiple
classes of service.
8.5 Considerations for IP-Based Services over EPON
The driving force behind extending Ethernet into the subscriber access area is Ethernet’s
efficiency for delivering IP packets. Data and telecom network convergence will lead to more and

40
more telecommunication services migrating to a variable-length packet-based data networks. To
ensure successful convergence, this migration should be accompanied by implementation of
specific mechanisms traditionally available in telecom networks only.
Being designed with IP layer in mind, EPON is expected to seamlessly operate with IP-
based traffic flows, similarly to any switched Ethernet network. One distinction with the typical
switched architecture is that in an EPON, the user’s throughput is slotted (gated), i.e., packets
cannot be transmitted by an ONU at any time. This feature results in two issues unique to EPONs:
(a) slot utilization by variable-length packets and (b) slot scheduling to support real-time and
controlled-load traffic classes.
8.5.1 Slot Utilization Problem
The slot utilization problem is related to the fact that Ethernet frames cannot be fragmented
and as a result variable-length packets don’t fill the given slot completely. This problem manifests
itself in a fixed service when slots of constant size are given to an ONU regardless of its queue
occupancy. Slots may not be filled to capacity also in the case when the OLT grants to an ONU a
slot smaller than the ONU requested based on its queue size. The fact that there is an unused
remainder at the end of the slot means that the user’s throughput is less than the bandwidth given to
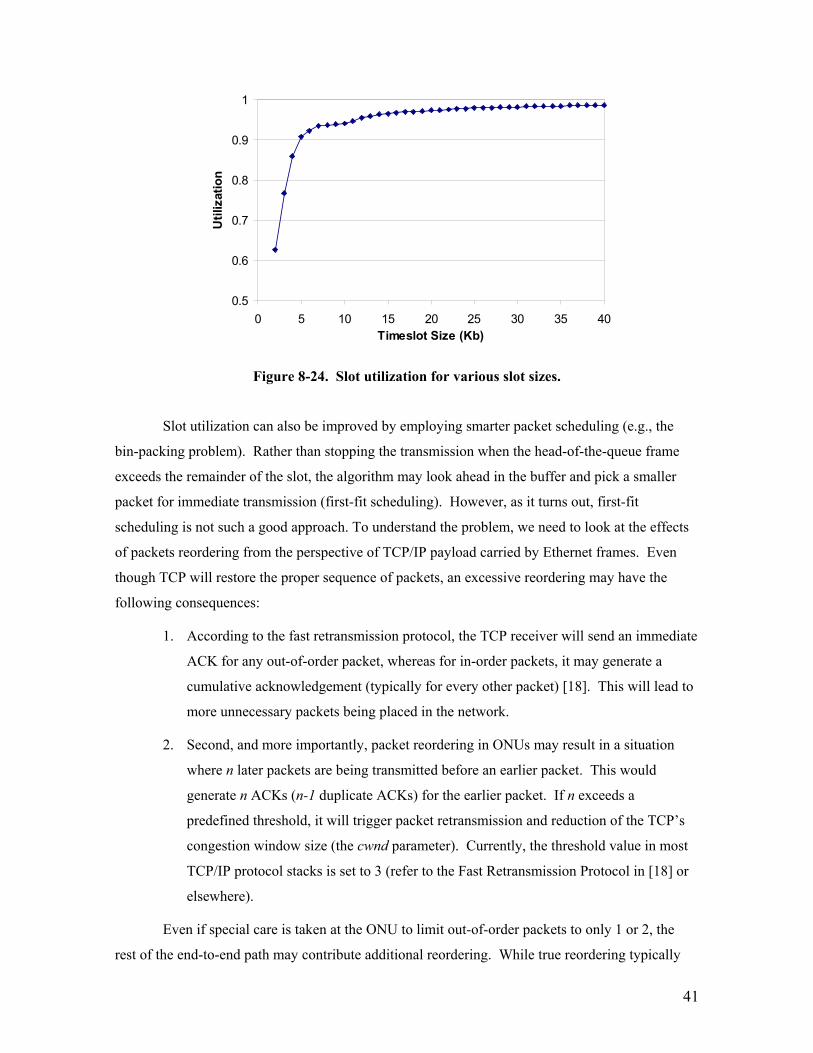
the user by a network operator in accordance with a particular SLA. Figure 8-24 presents slot
utilization for packet traces obtained on an Ethernet LAN in Bellcore [17]. Increasing the slot size
improves the utilization, i.e., the user’s throughput approaches the bandwidth assigned by the
operator; however it has detrimental effects on the data latency as larger slots increase the overall
cycle time.
41
0.5
0.6
0.7
0.8
0.9
1
0 5 10 15 20 25 30 35 40Timeslot Size (Kb)
Util
izat
ion
Figure 8-24. Slot utilization for various slot sizes.
Slot utilization can also be improved by employing smarter packet scheduling (e.g., the
bin-packing problem). Rather than stopping the transmission when the head-of-the-queue frame
exceeds the remainder of the slot, the algorithm may look ahead in the buffer and pick a smaller
packet for immediate transmission (first-fit scheduling). However, as it turns out, first-fit
scheduling is not such a good approach. To understand the problem, we need to look at the effects
of packets reordering from the perspective of TCP/IP payload carried by Ethernet frames. Even
though TCP will restore the proper sequence of packets, an excessive reordering may have the
following consequences:
1. According to the fast retransmission protocol, the TCP receiver will send an immediate
ACK for any out-of-order packet, whereas for in-order packets, it may generate a
cumulative acknowledgement (typically for every other packet) [18]. This will lead to
more unnecessary packets being placed in the network.
2. Second, and more importantly, packet reordering in ONUs may result in a situation
where n later packets are being transmitted before an earlier packet. This would
generate n ACKs (n-1 duplicate ACKs) for the earlier packet. If n exceeds a
predefined threshold, it will trigger packet retransmission and reduction of the TCP’s
congestion window size (the cwnd parameter). Currently, the threshold value in most
TCP/IP protocol stacks is set to 3 (refer to the Fast Retransmission Protocol in [18] or
elsewhere).
Even if special care is taken at the ONU to limit out-of-order packets to only 1 or 2, the
rest of the end-to-end path may contribute additional reordering. While true reordering typically
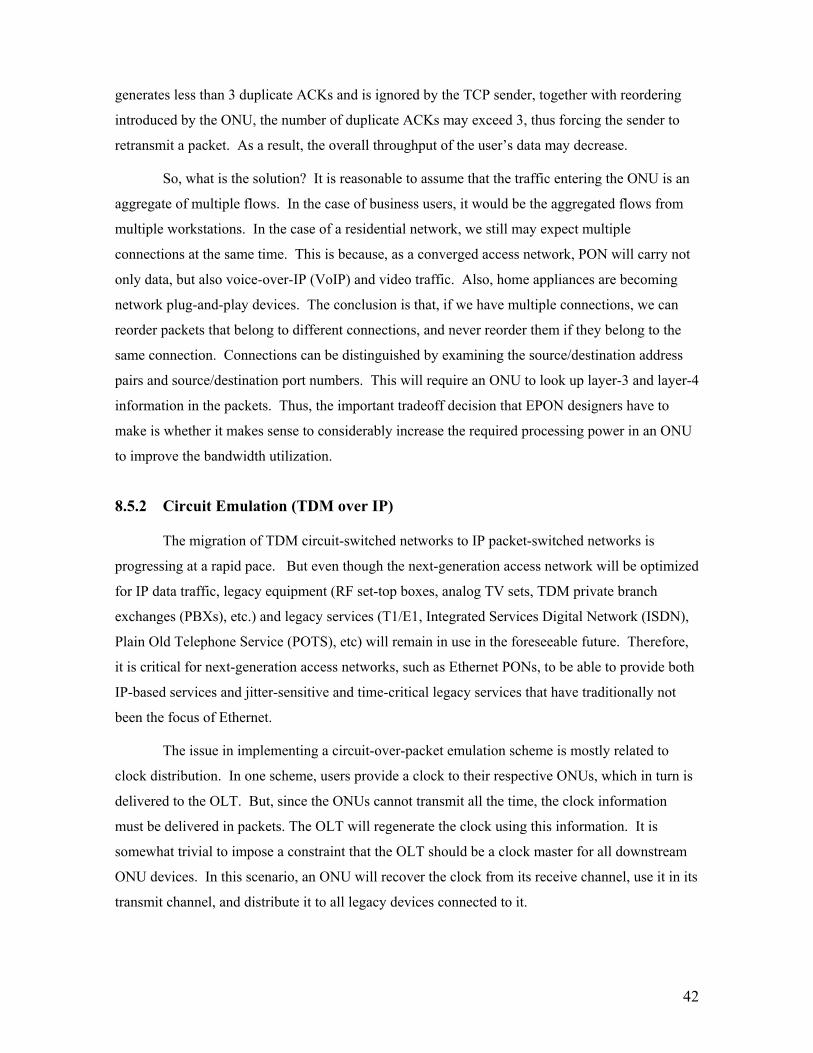
42
generates less than 3 duplicate ACKs and is ignored by the TCP sender, together with reordering
introduced by the ONU, the number of duplicate ACKs may exceed 3, thus forcing the sender to
retransmit a packet. As a result, the overall throughput of the user’s data may decrease.
So, what is the solution? It is reasonable to assume that the traffic entering the ONU is an
aggregate of multiple flows. In the case of business users, it would be the aggregated flows from
multiple workstations. In the case of a residential network, we still may expect multiple
connections at the same time. This is because, as a converged access network, PON will carry not
only data, but also voice-over-IP (VoIP) and video traffic. Also, home appliances are becoming
network plug-and-play devices. The conclusion is that, if we have multiple connections, we can
reorder packets that belong to different connections, and never reorder them if they belong to the
same connection. Connections can be distinguished by examining the source/destination address
pairs and source/destination port numbers. This will require an ONU to look up layer-3 and layer-4
information in the packets. Thus, the important tradeoff decision that EPON designers have to
make is whether it makes sense to considerably increase the required processing power in an ONU
to improve the bandwidth utilization.
8.5.2 Circuit Emulation (TDM over IP)
The migration of TDM circuit-switched networks to IP packet-switched networks is
progressing at a rapid pace. But even though the next-generation access network will be optimized
for IP data traffic, legacy equipment (RF set-top boxes, analog TV sets, TDM private branch
exchanges (PBXs), etc.) and legacy services (T1/E1, Integrated Services Digital Network (ISDN),
Plain Old Telephone Service (POTS), etc) will remain in use in the foreseeable future. Therefore,
it is critical for next-generation access networks, such as Ethernet PONs, to be able to provide both
IP-based services and jitter-sensitive and time-critical legacy services that have traditionally not
been the focus of Ethernet.
The issue in implementing a circuit-over-packet emulation scheme is mostly related to
clock distribution. In one scheme, users provide a clock to their respective ONUs, which in turn is
delivered to the OLT. But, since the ONUs cannot transmit all the time, the clock information
must be delivered in packets. The OLT will regenerate the clock using this information. It is
somewhat trivial to impose a constraint that the OLT should be a clock master for all downstream
ONU devices. In this scenario, an ONU will recover the clock from its receive channel, use it in its
transmit channel, and distribute it to all legacy devices connected to it.

43
8.5.3 Real-Time Video and Voice Over IP
Performance of a packet-based network can be conveniently characterized by several
parameters: bandwidth, packet delay (latency) and delay variation (jitter), and packet-loss ratio.
Quality of Service (QoS) refers to a network’s ability to provide bounds on some or all of these
parameters. It is useful to further differentiate statistical QoS from guaranteed QoS. Statistical
QoS refers to a case when parameters can exceed the specified bounds with some small probability.
Correspondingly, guaranteed QoS refers to a network architecture where parameters are guaranteed
to stay within the specified bounds for the entire duration of a connection. A network is required to
provide QoS (i.e., bounds on performance parameters) to ensure proper operation of real-time
services such as video-over-packets (digital video conferencing, VoD), voice-over-IP (VoIP), real-
time transactions, etc. To be able to guarantee QoS for higher-layer services, QoS must be
maintained in all traversed network segments, including the access network portion of the end-to-
end path. This section only focuses on QoS in the EPON access network.
The original Ethernet standard based on the CSMA/CD MAC protocol was never
concerned with QoS. All connections (traffic flows) were treated equally and were given best-
effort service from the network. The first major step in allowing QoS in the Ethernet was an
introduction of the full-duplex mode. Full duplex MAC (otherwise called null-MAC) can transmit
data frames at any time; this eliminated non-deterministic delay in accessing the medium. In a full
duplex link (segment), once a packet is given to a transmitting MAC layer, its delay, jitter, and loss
probability are known or predictable all the way to the receiving MAC layer. Delay and jitter may
be affected by head of line blocking when the MAC port is busy transmitting the previous frame at
the time when the next one becomes available. However, with 1-Gbps channel, this delay variation
becomes negligible since the maximum-sized Ethernet frame is transmitted in only about 12 µs. It
is important to note that the full-duplex MAC does not make the Ethernet a QoS-capable network:
switches located in junction points still may provide non-deterministic, best-effort services.
The next step in enabling QoS in Ethernet was brought by introduction of two new
standards extensions: P802.1p “Supplement to MAC Bridges: Traffic Class Expediting and
Dynamic Multicast Filtering” (later merged with P802.1D) and P802.1Q “Virtual Bridged Local
Area Networks”. P802.1Q defines a frame format extension allowing Ethernet frames to carry
priority information. P802.1p specifies the default bridge (switch) behavior for different priority
classes; specifically, it allows a queue in a bridge to be serviced only when all higher-priority
queues are empty. The standard distinguishes the following traffic classes:

44
1. Network Control—characterized by a “must get there” requirement to maintain and
support the network infrastructure.
2. “Voice”—characterized by less than 10 ms delay, and hence maximum jitter (one
way transmission through the LAN infrastructure of a single campus).
3. “Video”—characterized by less than 100 ms delay.
4. Controlled Load—important business applications subject to some form of
“admission control,” be that pre-planning of the network requirement at one
extreme to bandwidth reservation per flow at the time the flow is started at the
other.
5. Excellent Effort—or “CEO’s best effort,” the best-effort type services that an
information services organization would deliver to its most important customers.
6. Best Effort—LAN traffic as we know it today.
7. Background—bulk transfers and other activities that are permitted on the network
but that should not impact the use of the network by other users and applications.
If a bridge or a switch has less than 7 queues, some of the traffic classes are grouped
together. Table 8-2 illustrates the standards-recommended grouping of traffic classes.

45
Number of queues
Groups of traffic types
1 Network Control, Voice, Video, Controlled Load, Excellent Effort, Best Effort, Background Network Control, Voice, Video, Controlled Load 2 Excellent Effort. Best Effort, Background Network Control, Voice Video, Controlled Load 3 Excellent Effort, Best Effort, Background Network Control, Voice Video, Controlled Load Excellent Effort, Best Effort
4
Background Network Control, Voice Video Controlled Load Excellent Effort, Best Effort
5
Background Network Control, Voice Video Controlled Load Excellent Effort Best Effort Background
6
Best Effort Network Control Voice Video Controlled Load Excellent Effort Best Effort
7
Background
Table 8-2: Mapping of traffic classes into priority queues (P802.1p).
Both full duplex and P802.1p/P802.1Q standards extensions are important but not
sufficient QoS enablers. The remaining part is admission control. Without it, each priority class
may intermittently degrade to best-effort performance. Here, EPON can provide a simple and
robust method for performing admission control. In Section 8.3.3, we mentioned that multi-point
control protocol (MPCP) relies on GATE messages sent from the OLT to ONUs to allocate the
transmission window. A very simple protocol modification may allow a single GATE message to
grant multiple windows, one for each priority class. REPORT message is also to be extended to
report queue states for each priority class. Alternatively, admission control can be left to higher-
layer intelligence in ONUs. In this case, the higher layer will know when the next transmission

46
window will arrive and how large it will be, and will schedule packets for transmission
accordingly.
8.5.3.1 Performance of COS-Aware EPON In this section, we will investigate how priority queuing will allow us to provide a delay
bound for some services. Below we describe a simulation setup in which data arriving from the
user is classified in three priority classes and directed to different queues in the ONU. The queues
then are serviced in order of their priority; a lower-priority queue is serviced only when all higher-
priority queues are empty. In this experiment, the tagged ONU has a constant load. We investigate
the performance of each class as the ambient network load varies.
Best Effort (BE) class has the lowest priority. This priority level is used for non-real time
data transfer. There is no delivery or delay guarantees in this service. The BE queue in the ONU is
served only if higher priority queues are empty. Since all queues in our system share the same
buffer, the packets arriving at higher priority queues may displace the BE packets that are already
in the BE queue. In our experiment, the tagged source has the BE traffic with an average load of
0.4 (40 Mbps).
Assured Forwarding (AF) class has higher priority than the BE class. The AF queue is
served before the BE queue. In our experiment, the AF traffic consisted of a VBR stream with
average bit rate of 16 Mbps. This corresponds to three simultaneous MPEG-2-coded video streams
[19]. Since the AF traffic is also highly bursty (LRD), it is possible that some packets in long
bursts will be lost. This will happen if the entire buffer is occupied by AF or higher priority
packets.
Guaranteed Forwarding (GF) priority class was used to emulate a T1 line in the packet-
based access network. The GF class has the highest priority and can displace the BE and AF data
from their queues if there is not enough buffer space to store the GF packet. A new GF packet will
be lost only if the entire buffer is occupied by GF packets. The GF queue is served before the AF
and BE queues. The T1 data arriving from the user is packetized in the ONU by placing 24 bytes
of data in a packet. Including Ethernet and UDP/IP headers results in a 70-byte frame generated
every 125 µs. Hence, the T1 data consumed the bandwidth equal to 4.48 Mbps. Of course, we
could put 48 bytes of T1 data in one packet and send one 94-byte packet every 250 µs. This would
consume only 3.008 Mbps, but will increase the packetization delay.
Figures 8-25 and 8-26 show the average and the maximum packet delay for each type of
traffic. The average load of the tagged ONU was set to 40 Mbps of BE data, 16 Mbps of AF data,
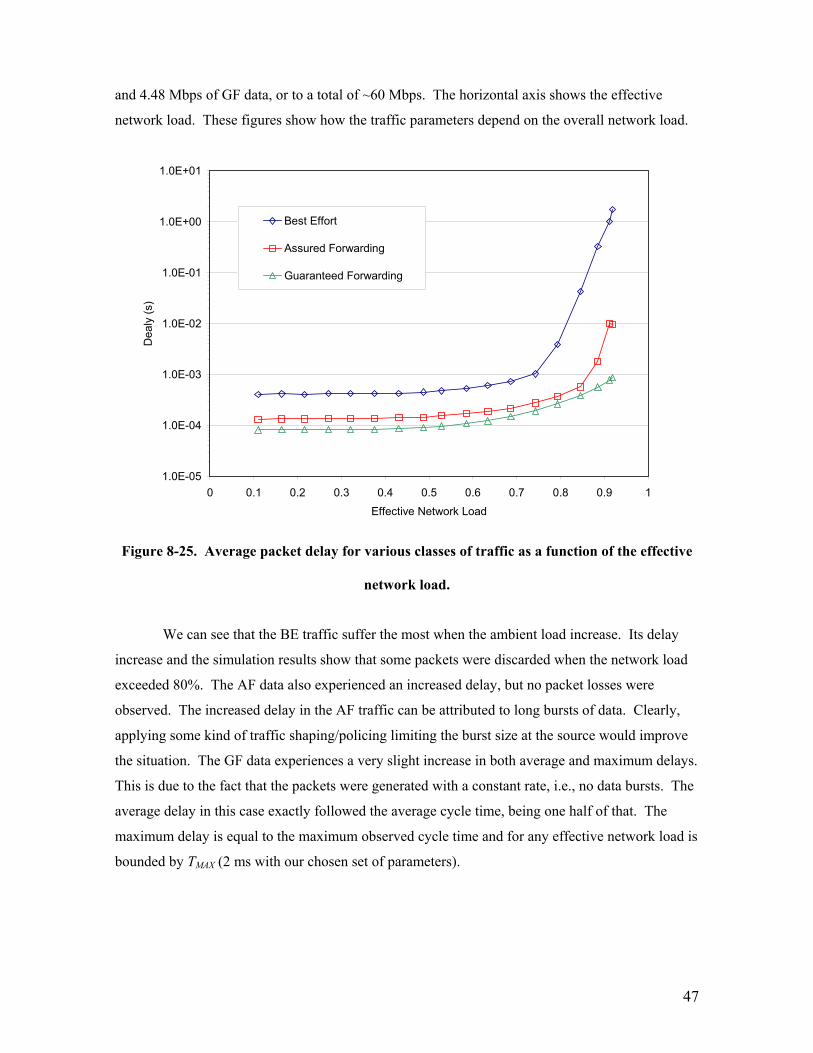
47
and 4.48 Mbps of GF data, or to a total of ~60 Mbps. The horizontal axis shows the effective
network load. These figures show how the traffic parameters depend on the overall network load.
1.0E-05
1.0E-04
1.0E-03
1.0E-02
1.0E-01
1.0E+00
1.0E+01
0 0.1 0.2 0.3 0.4 0.5 0.6 0.7 0.8 0.9 1
Effective Network Load
Dea
ly (s
)
Best Effort
Assured Forwarding
Guaranteed Forwarding
Figure 8-25. Average packet delay for various classes of traffic as a function of the effective
network load.
We can see that the BE traffic suffer the most when the ambient load increase. Its delay
increase and the simulation results show that some packets were discarded when the network load
exceeded 80%. The AF data also experienced an increased delay, but no packet losses were
observed. The increased delay in the AF traffic can be attributed to long bursts of data. Clearly,
applying some kind of traffic shaping/policing limiting the burst size at the source would improve
the situation. The GF data experiences a very slight increase in both average and maximum delays.
This is due to the fact that the packets were generated with a constant rate, i.e., no data bursts. The
average delay in this case exactly followed the average cycle time, being one half of that. The
maximum delay is equal to the maximum observed cycle time and for any effective network load is
bounded by TMAX (2 ms with our chosen set of parameters).
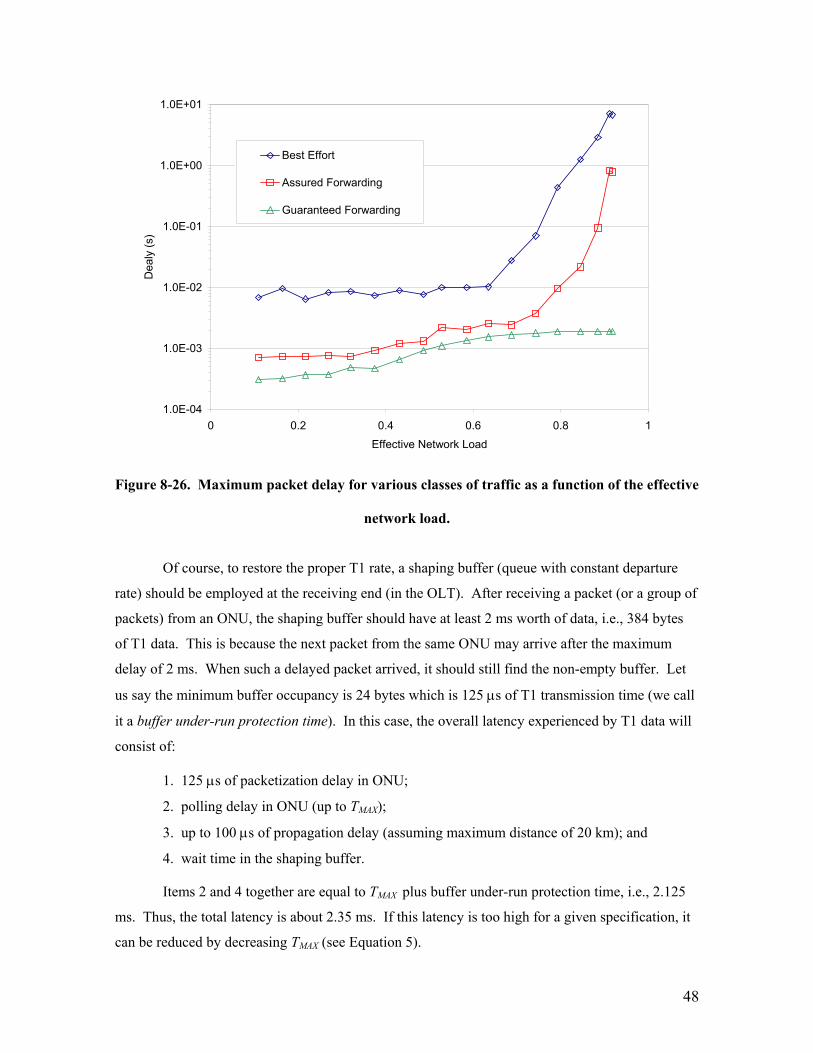
48
1.0E-04
1.0E-03
1.0E-02
1.0E-01
1.0E+00
1.0E+01
0 0.2 0.4 0.6 0.8 1
Effective Network Load
Dea
ly (s
)Best Effort
Assured Forwarding
Guaranteed Forwarding
Figure 8-26. Maximum packet delay for various classes of traffic as a function of the effective
network load.
Of course, to restore the proper T1 rate, a shaping buffer (queue with constant departure
rate) should be employed at the receiving end (in the OLT). After receiving a packet (or a group of
packets) from an ONU, the shaping buffer should have at least 2 ms worth of data, i.e., 384 bytes
of T1 data. This is because the next packet from the same ONU may arrive after the maximum
delay of 2 ms. When such a delayed packet arrived, it should still find the non-empty buffer. Let
us say the minimum buffer occupancy is 24 bytes which is 125 µs of T1 transmission time (we call
it a buffer under-run protection time). In this case, the overall latency experienced by T1 data will
consist of:
1. 125 µs of packetization delay in ONU;
2. polling delay in ONU (up to TMAX);
3. up to 100 µs of propagation delay (assuming maximum distance of 20 km); and
4. wait time in the shaping buffer.
Items 2 and 4 together are equal to TMAX plus buffer under-run protection time, i.e., 2.125
ms. Thus, the total latency is about 2.35 ms. If this latency is too high for a given specification, it
can be reduced by decreasing TMAX (see Equation 5).

49
8.6 Security issues
Security has never been a strong part of Ethernet networks. In point-to-point full-duplex
Ethernet, security is not a critical issue because there are only two communicating stations, using a
private channel. In shared half-duplex Ethernet, security concerns are minimized because users
belong to a single administrative domain and are subject to same set of policies.
EPON, however, has a different set of requirements, mostly due to its intended use in
subscriber access environment. EPON serves non-cooperative, private users, but on the other hand,
has a broadcasting downstream channel, potentially available to any interested party capable of
operating an end station in promiscuous mode. In general, to ensure EPON security, network
operators must be able to guarantee subscriber privacy, and must be provided mechanisms to
control subscriber’s access to the infrastructure.
In a residential access environment, individual users expect their data to remain private.
For the business access application, this requirement is fundamental. The two main problems
associated with lack of privacy are subscriber’s susceptibility to eavesdropping by neighbors (a
subscriber issue), and susceptibility to theft-of-service (a service provider issue). Let us explore
these two problems:
8.6.1 Eavesdropping
In EPON, eavesdropping is possible by operating an ONU is promiscuous mode: being
exposed to all downstream traffic, such an ONU can listen to traffic intended to other ONUs.
Point-to-point emulation adds link IDs (see Section 8.3.4) that allow an ONU to recognize
frames intended for it, and filter out the rest. However, this mechanism does not offer the required
security, as an ONU might disable this filtering, and monitor all traffic.
The upstream transmission in an EPON is relatively more secure. All upstream traffic is
multiplexed, and is visible only to the OLT (due to directivity of a passive combiner). Although
reflections might occur in the passive combiner, sending some upstream signal downstream again,
the downstream transmission is in a different wavelength than the upstream transmissions. Thus,
the ONU is “blind” to reflected traffic which is not processed in the receive circuitry.
The upstream can also be intercepted at the PON splitter/combiner, as splitters and
combiners are most often manufactures as symmetrical devices, i.e., even though only one coupler
port is connected to the trunk fiber, more ports are available. A special device sensitive to the
50
upstream wavelength can be connected facing downstream to one such unused port. This device
will be able to intercept all upstream communications.
8.6.2 Theft-of-service
Theft of service occurs when a subscriber impersonates his neighbor, and transmits frames
that are not billed under impersonator’s account. OLT obtains the identity of the subscriber
through link ID inserted by each ONU in the frame preambles. This link ID can be faked by the
malicious ONU when transmitting in the upstream direction. Of course, to be able to transmit in
the hijacked timeslot, the impersonating ONU should also be able to eavesdrop to receive GATE
messages addressed to a victim.
8.6.3 Solving the Problem using Encryption
Encryption of downstream transmission prevents eavesdropping when the encryption key
is not shared. Thus, a point-to-point tunnel is created that allows private communication between
the OLT and the different ONUs.
Encryption of the upstream transmission prevents interception of the upstream traffic when
a tap is added at the PON splitter. Upstream encryption also prevents ONU impersonation: data
arriving from an ONU must be encrypted with a key available to that ONU only. There exist
secure methods of key distribution, but they are outside the scope of this book.
Encryption and decryption may be implemented at the physical layer, data link layer, or in
higher layers. Implementing encryption above the MAC sub-layer will encrypt the MAC frame
payload only, and leave headers in plain text. In that scenario, the transmitting MAC will calculate
Frame Check Sequence (FCS) for the encrypted payload, and the receiving MAC will verify the
received frame integrity before passing the payload to a higher sub-layer for decryption. This
scheme prevents malicious ONUs from reading the payload, but they may still learn other ONUs
MAC addresses.
Alternatively, encryption can be implemented below the MAC. In that scheme, the
encryption engine will encrypt the entire bit stream, including the frame headers and FCS. At the
receiving end, decryptor will decrypt the data before passing it to MAC for verification. Since
encryption keys are different for different ONUs, frames not destined to a given ONU will not
decrypt into a properly formed frame and will be rejected. In this scheme no information may be
learned by a malicious ONU. Implementing an encryption layer below MAC appears to be more
secure and reliable method.
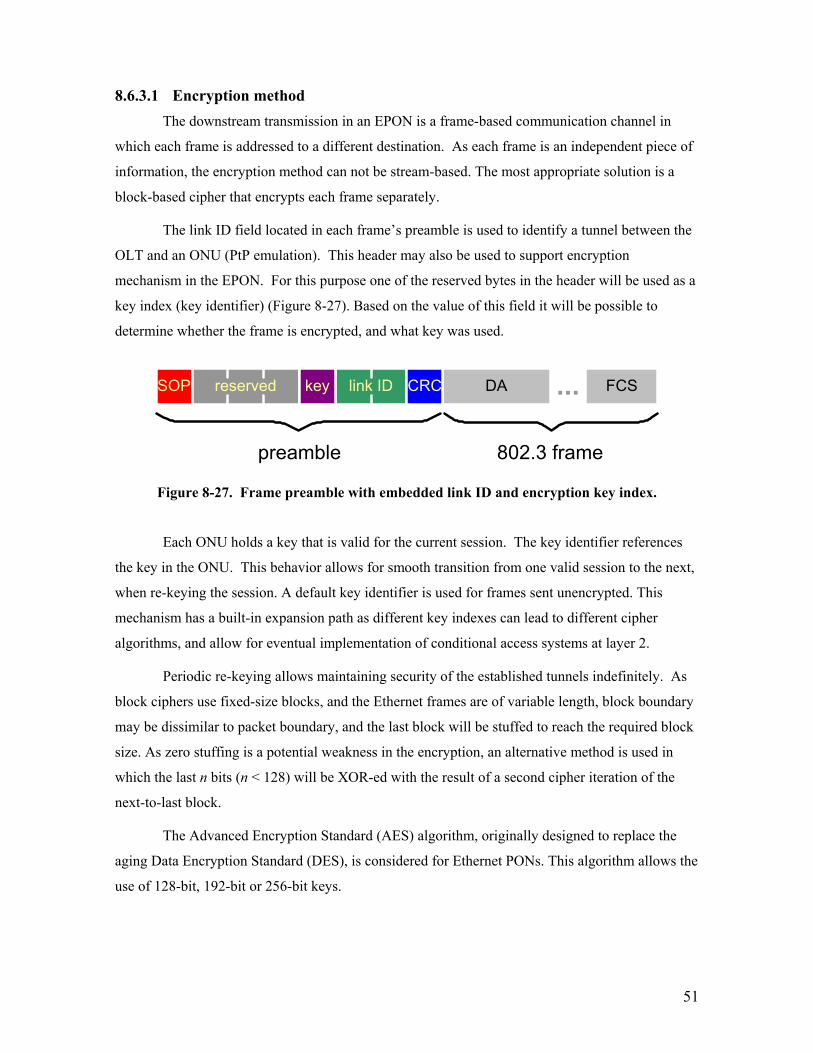
51
8.6.3.1 Encryption method The downstream transmission in an EPON is a frame-based communication channel in
which each frame is addressed to a different destination. As each frame is an independent piece of
information, the encryption method can not be stream-based. The most appropriate solution is a
block-based cipher that encrypts each frame separately.
The link ID field located in each frame’s preamble is used to identify a tunnel between the
OLT and an ONU (PtP emulation). This header may also be used to support encryption
mechanism in the EPON. For this purpose one of the reserved bytes in the header will be used as a
key index (key identifier) (Figure 8-27). Based on the value of this field it will be possible to
determine whether the frame is encrypted, and what key was used.
DASOP reserved link ID CRC FCS...
802.3 framepreamble
key
Figure 8-27. Frame preamble with embedded link ID and encryption key index.
Each ONU holds a key that is valid for the current session. The key identifier references
the key in the ONU. This behavior allows for smooth transition from one valid session to the next,
when re-keying the session. A default key identifier is used for frames sent unencrypted. This
mechanism has a built-in expansion path as different key indexes can lead to different cipher
algorithms, and allow for eventual implementation of conditional access systems at layer 2.
Periodic re-keying allows maintaining security of the established tunnels indefinitely. As
block ciphers use fixed-size blocks, and the Ethernet frames are of variable length, block boundary
may be dissimilar to packet boundary, and the last block will be stuffed to reach the required block
size. As zero stuffing is a potential weakness in the encryption, an alternative method is used in
which the last n bits (n < 128) will be XOR-ed with the result of a second cipher iteration of the
next-to-last block.
The Advanced Encryption Standard (AES) algorithm, originally designed to replace the
aging Data Encryption Standard (DES), is considered for Ethernet PONs. This algorithm allows the
use of 128-bit, 192-bit or 256-bit keys.
52
8.7 EPON Upgrade Scenarios
By the amount of bandwidth it makes available to subscribers, EPON is a giant step
forward compared to DSL and cable modem technologies. With a line rate of 1 Gbps (current
target for IEEE 802.3ah efforts) and 16 to 64 subscribers per EPON, each user will get between 15
and 60 Mbps bandwidth. Still, unavoidably, as more bandwidth-intensive services become
available to users, this capacity will get exhausted. It is therefore, crucial for the success of EPON
technology to provide a smooth path for future upgrades. It is hard to envision what upgrade
scenario will be most favorable at the time when the EPON capacity will become a limiting factor.
The best scenario will not require a lift-fork upgrade (i.e., will allow incremental expenses) and
will capitalize on the most matured technology. In this section we consider three possible
directions: wavelength upgrade, rate upgrade, and spatial upgrade.
8.7.1 Wavelength Upgrade
If WDM technology matured enough to provide high-volume, low-cost components it may
become economically feasible to migrate EPON to a multi-wavelength configuration. In this
scheme, some of the EPON ONUs will migrate to new wavelengths for both upstream and
downstream traffic. While the data rate on each wavelength will remain the same, there will be
fewer ONUs to share that bandwidth capacity. This procedure can be repeated again in the future
and eventually will lead to a WDM PON system where each subscriber is allocated its individual
wavelengths. The major cost factor of such an upgrade is the necessity of tunable transmitters and
receivers in ONUs. Also, the OLT must have multiple transceivers (tunable or fixed) – one for
each wavelength. To allow incremental upgrade, a new spectral region should be allocated for
premium ONUs. This will allow non-premium ONUs to continue using cheap 1310 nm lasers with
high spectral width. Only the premium ONUs will have to be replaced by new ones operating at
different wavelength or having tunable transceivers.
8.7.2 Rate Upgrade
With the finalizing of the 10 Gbps Ethernet standard by the IEEE, rate upgrade appears as
an attractive solution. To allow incremental upgrade cost, only a subset of ONUs may be upgraded
to operate at higher rates. Thus, the rate-upgrade scenario will call for a mixed-rate EPON where
some ONUs operate at 1 Gbps, and some at 10 Gbps. This upgrade would require high-speed
electronics in the OLT which is able to operate at both rates. The main challenge with this kind of
53
upgrade is that dispersion penalties become much more severe. The narrow margin of available
power budget may not allow the desired distances or concentration ratios.
8.7.3 Spatial Upgrade
It is reasonable to expect the fiber prices to reduce enough to consider a spatial-upgrade
scenario in which a subset of users is migrated to a separate EPON. In this scenario, a new trunk
fiber is deployed from the central office to the splitter and some branches are re-attached to a new
trunk fiber (and a new splitter). To avoid the cost of additional fiber deployment, this upgrade fiber
can be pre-deployed at the time of the original deployment. Alternatively, some network operators
consider EPON deployment with a splitter located in the central office. This EPON configuration
will require as much fiber to be deployed as in the point-to-point configuration, but it will still
require only one transceiver in the OLT. This will allow having much higher-density equipment,
which is very important in a limited CO space available to competitive local exchange carriers
(CLECs) who have to rent CO space from incumbent LECs (ILECs). In a scenario where a splitter
is located in the central office, to upgrade to higher bandwidth, some users will be reconnected to
another EPON in the patch panel located in the same central office. Given the current state of the
technology, this seems to be the most cost-efficient type of upgrade. Eventually, spatial upgrade
may lead to a point-to-point architecture with an independent fiber running to each subscriber.
8.8 IEEE P802.3ah Status
The standards work for Ethernet in the local subscriber access network is being done in the
IEEE P802.3ah Ethernet in the First Mile Task Force. This group received approval to operate as a
Task Force from the IEEE Standards Association (IEEE-SA) Standards Board in September 2001.
The P802.3ah Ethernet in the First Mile Task Force is bringing Ethernet to the local
subscriber loop, focusing on both residential and business access networks. While, at first glance,
this appears to be a simple task, in reality the requirements of local exchange carriers are vastly
different from those of enterprise managers for which Ethernet has been designed. In order to
“evolve” Ethernet for local subscriber networks, P802.3ah is focused on four primary standards
definitions:
1. Ethernet over copper,
2. Ethernet over point-to-point (PtP) fiber,
3. Ethernet over point-to-multipoint (PtMP) fiber, and
4. Operation, Administration and Maintenance (OAM).

54
Thus, the Ethernet in the First Mile (EFM) Task Force is focused both on copper and fiber
standards, optimized for the first mile, and glued together by a common operation, administration
and maintenance system. This is a particularly strong vision, as it allows a local network operator a
choice of Ethernet flavors using a common hardware and management platform. In each of these
subject areas, new physical layer specifications are being discussed to both meet the requirements
of service providers, while preserving the integrity of Ethernet. Standards for Ethernet in the First
Mile are anticipated by September 2003, with baseline proposals emerging as early as March 2002.
The Ethernet over Point-to-Multipoint (PtMP) track is focusing on the lower layers of an
EPON network. This involves a Physical (PHY) layer specification, with possibly minimal
modifications to the 802.3 MAC. The standards work for P2MP fiber-based Ethernet is in progress,
while the multi-point control protocol framework is emerging. This emerging protocol uses MAC
control messaging (similar to the Ethernet PAUSE message) to coordinate multipoint-to-point
upstream Ethernet frame traffic. Materials concerning the P802.3ah standards effort can be found
at [20] and presentations materials at [21].
8.9 Conclusion
Unlike the backbone network, which received an abundance of investment in long-haul
fiber routes during the Internet boom, optical technology has not been widely deployed in the
access network. It is possible that EPONs and point-to-point optical Ethernet offer the best
possibility for a turnaround in the telecom sector. As service providers invest in optical access
technologies, this will enable new applications, stimulating revenue growth and driving more
traffic onto backbone routes. The large increase in access network bandwidth provided by EPONs
and point-to-point optical Ethernet will eventually stimulate renewed investment in metro and
long-haul fiber routes.
The subscriber access network is constrained by equipment and infrastructure not
originally designed for high-bandwidth IP data. Whether riding on shorter copper drops or optical
fiber, Ethernet is emerging as the future broadband protocol of choice, offering plug-and-play
simplicity, IP efficiency, and low cost. Of particular interest are Ethernet Passive Optical
Networks, which combine low-cost point-to-multipoint optical infrastructure with low-cost, high-
bandwidth Ethernet. The future broadband access network is likely to be a combination of point-to-
point and point-to-multipoint Ethernet, optimized for transporting IP data, as well as time-critical
voice and video.
55
References [1] K. G. Coffman and A. M. Odlyzko, “Internet growth: Is there a "Moore's Law" for data
traffic?” Handbook of Massive Data Sets, J. Abello, P. M. Pardalos, and M. G. C. Resende,
eds., Kluwer, 2001
[2] “Broadband 2001. A Comprehensive Analysis of Demand, Supply, Economics, and Industry
Dynamics in the U.S. Broadband Market”, JP Morgan Securities, Inc., New York, April
2001.
[3] “Access Network Systems: North America – Optical Access. DLC and PON Technology and
Market Report”, Report RHK-RPT-0548, RHK Telecommunication Industry Analysis, San
Francisco, June 2001.
[4] G. Pesavento and M. Kelsey, “PONs for the broadband local loop,” Lightwave, PennWell,
vol. 16, no. 10, pp. 68 – 74, September 1999.
[5] B. Lung, “PON architecture ‘futureproofs’ FTTH,” Lightwave, PennWell, vol. 16, no. 10,
pp. 104 – 107, September 1999.
[6] B. Mukherjee, Optical Communication Networks, McGraw-Hill, New York, 1997.
[7] F.J. Effenberger, H. Ichibangase, and H. Yamashita, “Advances in Broadband Passive
Optical Networking Technologies”, IEEE Communications, vol. 39, no. 12, pp. 118 – 124,
December, 2001.
[8] R. Ramaswami and K. N. Sivarajan, Optical Networks, A Practical Perspective, Morgan
Kaufmann, San Francisco, 1998.
[9] S. Clavenna, “Metro Optical Ethernet,” Lightreading (www.lightreading.com), November
2000.
[10] K. Claffy, G. Miller, and K. Thompson, “The nature of the beast: Recent traffic
measurements from an internet backbone,” in Proceedings INET '98, (Geneva, Switzerland),
July 1998. Available at http://www.isoc.org/inet98/proceedings/6g/6g_3.htm.
[11] J. L. Hammond and P. J. P. O'Reilly. Performance Analysis of Local Computer Networks,
Addison Wesley, 1987.
[12] W. Willinger, M. S. Taqqu, and A. Erramilli, “A bibliographical guide to self-similar traffic
and performance modeling for modern high-speed networks,” in Stochastic Networks, F. P.
Kelly, S. Zachary, and I. Ziedins (eds.), Oxford University Press, Oxford, pp. 339-366, 1996.

56
[13] W. Willinger, M. Taqqu, R. Sherman, and D. Wilson. “Self-similarity through high-
variability: statistical analysis of Ethernet LAN traffic at the source level,” In Proc. ACM
SIGCOMM '95, pp. 100-113, Cambridge, MA, August 1995.
[14] G.Kramer, B. Mukherjee, and G.Pesavento, “Ethernet PON (ePON): Design and Analysis of
an Optical Access Network,” Photonic Network Communications, vol. 3, no. 3, pp. 307-319,
July 2001.
[15] G. Kramer, B. Mukherjee, and G. Pesavento, “Interleaved Polling with Adaptive Cycle Time
(IPACT): A Dynamic Bandwidth Distribution Scheme in an Optical Access Network,”
Photonic Network Communications, vol. 4, no. 1 pp. 89-107, January 2002.
[16] K. Park and W. Willinger, Self-similar network traffic: An overview, In K. Park and W.
Willinger, editors, Self-Similar Network Traffic and Performance Evaluation. Wiley
Interscience, 2000.
[17] W. Leland, M. Taqqu, W. Willinger, and D. Wilson, “On the Self-Similar Nature of Ethernet
Traffic (Extended Version),” IEEE/ACM Transactions on Networking, 2(1), pp. 1-15,
February 1994.
[18] W. R. Stevens, TCP/IP Illustrated, Volume 1, Addison-Wesley Publishing Co., Reading,
MA, 1994.
[19] M. W. Garrett and W. Willinger, “Analysis, Modeling and Generation of Self-Similar VBR
Video Traffic,” Proc. ACM Sigcomm’94, London, pp. 269-280, September 1994.
[20] IEEE P802.3ah task force home page: http://www.ieee802.org/3/efm
[21] IEEE P802.3ah presentation materials: http://www.ieee802.org/3/efm/public
Related Documents