2013 Douglas A. Dawson President 5/7/2013 TACOMA POWER – C LICK! 10-YEAR BUSINESS P LA N AND PROFITABILITY ANA L YSIS “DRAFT” “confidential – Do not disclose outside of Click! Network”

Welcome message from author
This document is posted to help you gain knowledge. Please leave a comment to let me know what you think about it! Share it to your friends and learn new things together.
Transcript

7/21/2019 8. Draft Report 051013
http://slidepdf.com/reader/full/8-draft-report-051013 1/58
2013
Douglas A. Dawson
President
5/7/2013
TACOMA POWER – CLICK! 10-YEAR BUSINESS PLAN AND PROFITABILITY ANALYSIS
“DRAFT” “confidential – Do not
disclose outside of Click! Networ

7/21/2019 8. Draft Report 051013
http://slidepdf.com/reader/full/8-draft-report-051013 2/58
CCG Consulting LLC
10-Year Strategic Business Plan for Click!
Page | 1
“DRAFT” “confidential – do not disclose outside of Click! Network”
Table of Contents
Page
Executive Summary .......................................................................................................................2
Overview of the Project .................................................................................................................6
Strategic Considerations ...............................................................................................................8A. Issues Affecting the Cable TV Business ........................................................................8B. Issues Affecting the ISP Data Business .......................................................................13C. Other Considerations ....................................................................................................16
Business Plan ................................................................................................................................21A. The Analysis ................................................................................................................22B. Projecting Expenses .....................................................................................................28C. Projecting Capital .........................................................................................................30D. Business Plan Results ..................................................................................................30E. Comparing Scenarios....................................................................................................34F. Why Click!? ..................................................................................................................43E. Future Concerns............................................................................................................45
Profitability Analysis ...................................................................................................................48A. Allocating Revenue .......................................................................................................48B. Allocating Expenses ......................................................................................................48C. Profitability Results .......................................................................................................51
Next Steps .....................................................................................................................................57

7/21/2019 8. Draft Report 051013
http://slidepdf.com/reader/full/8-draft-report-051013 3/58
CCG Consulting LLC
10-Year Strategic Business Plan for Click!
Page | 2
“DRAFT” “confidential – do not disclose outside of Click! Network”
Executive Summary
Click! (“Company”) hired CCG Consulting, LLC (“CCG”) to create a 10-year strategic planand also to look at the profitability of each major product line. This report describes CCG’s theanalysis undertaken by CCG as well as our findings and recommendations. Following is a short
description of the primary findings of the report. All of these topics are discussed in greaterdetail in the report following this executive summary.
Findings
1. The cable TV business at Click! is losing customers each month and probably willcontinue to do so. There are a lot of factors affecting the cable industry as a whole thatare affecting cable subscribers for every cable provider. Unless something drasticchanges in the industry the business will slowly decline and may even die.
2. Due to rate increases Click! has cut operating losses significantly. But in doing so the
business has lost the price advantage it had compared to surrounding communities. AsClick! reaches market rates its ability to increase cable rates is going to depend uponComcast and the market to define future rates.
3. Click! is losing the competitive battle with Comcast. The lack of a bundle is stillhurting both Click! and the ISPs. Comcast customers get a bundling discount that savesthem money by buying multiple products. But they lose that discount when they try tokeep some Comcast products but buy cable TV from Click! or data from the ISPs.
4. I studied three different, yet representative 10-year business forecast scenarios labeledas Status Quo, Optimistic and Pessimistic. All three scenarios were able to cover the
operating costs and capital for operating the business. But the Pessimistic scenarios didnot cover the full cost of the internal debt.
5. However, all of the scenarios are very sensitive to some variables and there is a chancethat the business could do far worse than predicted by these scenarios. The variablewith the biggest possible downside is the assumption that the business can keep raisingcable TV rates. If that is not possible due to Comcast not raising rates, or not raisingthem fast enough, then the business could do far worse than projected. Higher inflationcould also negatively impact the business.
6. The business can get healthier if the ISPs are able to sell to more data customers. You
currently have an agreement with the ISPs referred to as Plan B which gives themincentive to add 6,000 new ISP customers to the network over a few years. Butincreased ISP sales will need to continue after the end of Plan B if Click! is to remainhealthy.

7/21/2019 8. Draft Report 051013
http://slidepdf.com/reader/full/8-draft-report-051013 4/58
CCG Consulting LLC
10-Year Strategic Business Plan for Click!
Page | 3
“DRAFT” “confidential – do not disclose outside of Click! Network”
7. There is the possibility that something could happen in Tacoma that would drasticallychange the profitability of the company. Probably the biggest threat is that somebodymight build fiber in the City. Google is now building fiber in several cities and it seemsthat companies are now seeing fiber networks as potentially profitable investmentsagain. The business could not withstand an additional competitor in the Tacoma cable
or ISP market.
8. It is also possible that the cable industry as a whole could undergo drastic changesduring the next ten years that would negatively affect all cable companies. One possiblechange is that Congress or some other factor could lead to the introduction of a la cartecable pricing. This would disrupt the industry completely. It is also possible thatdisruptive technologies like Aereo could be the first wave of new providers that disruptthe industry enough to contribute to significant drops in traditional cable subscribers.It’s also possible that a combination of factors could make the web more attractive as a programming alternative for the average household.
9. Programming expenses continue to be a huge drag on the business. If programmingcosts keep rising, leading to higher rates it is likely that the whole industry is going tosee rate fatigue, where a lot of the public decides that they can’t afford the traditionalcable product.
10. The cable TV business at Click! is losing money today and none of the scenarios Istudied results in bringing cable to profitability. The cable business is being subsidized by the ISP data business and the broadband business.
11. I think all of the large cable providers understand that cable as a product has started todecline. Nobody has a good enough crystal ball at this point to know how fast it willdecline and if and when it might someday not be viable, but I think everybody in theindustry believes it will decline. This report discusses numerous reasons for thisdecline.
12. Knowing that cable will be declining as a product line, I believe that cable companieswill transform themselves over time into become primarily data providers. I think thatthey will begin raising data prices over time so that by the time that cable has declinedsignificantly they will be making all of their needed profits from data. Unfortunately,this same transition is not possible for Click! since you are not in the retail data business.
13. Click! wages and benefits are very high and it is vital that as you lose cable customersthat you eliminate a pro rate share of employees that support the cable operation.Failure to do so would result in performance that is significantly worse than what I have projected. The Optimistic scenario only cuts three net employees over 10 years. The
7/21/2019 8. Draft Report 051013
http://slidepdf.com/reader/full/8-draft-report-051013 5/58

7/21/2019 8. Draft Report 051013
http://slidepdf.com/reader/full/8-draft-report-051013 6/58
CCG Consulting LLC
10-Year Strategic Business Plan for Click!
Page | 5
“DRAFT” “confidential – do not disclose outside of Click! Network”
The company needs to decide if it makes sense to continue to operate a business line
that is losing money and will likely always lose money. I think this decision would
benefit by some additional analysis that would look at some of the alternatives to
continuing to operate at the status quo. Some alternatives that could be considered:
• Sell or even give the cable customers to the ISPs and then sell wholesale access
to them to deliver cable.
• Sell the customers to somebody like Comcast who would take them off of your
network.
• Keep the cable business operating but do it in such a way as to minimize losses.
For example, this might mean having an immediate 10% staff reduction or
taking other measures that would reduce the losses due to cable.
• Keep operating as is. It looks like the business will be viable for the next decade
as long as no major external factor upsets the market. However, there are so
many forces affecting programming content at the national level that it is hard to
envision a decade without some kind of major change. And on a local level theappearance of a new competitor, even if it is somebody small like Aereo could
have a devastating impact on the business.
One thing that I still don’t know is if Click! can survive with only the wholesale data
business. Since the cable business is in decline and could either slowly fade away or
could be pushed over the cliff sooner by external factors, I think the company needs to
understand if the business can survive without cable. Or, asked a different way, you
should answer the question of what factors are needed if you only operated the
wholesale data business to make a viable business (such as have 30,000 customers, or
higher rates, etc.).

7/21/2019 8. Draft Report 051013
http://slidepdf.com/reader/full/8-draft-report-051013 7/58
CCG Consulting LLC
10-Year Strategic Business Plan for Click!
Page | 6
“DRAFT” “confidential – do not disclose outside of Click! Network”
Overview of the Project
CCG Consulting, LLC was hired in response to a proposal submitted to the City to do thefollowing:
Future Business Plan Projection. Prepare a forward looking business plan for a ten year period based upon the current business model. That is a very different model than we looked at
a few years back. This model would start with the current state of the company and would
project forward the current trends affecting the company. This would include such things as the
growth rate of ISP data customers and the rate of losses for the cable customers. We will look
at three businesses cases: one of the most expected direction for the company, and a version
that shows what would happen if you do better and worse than your normal expectation. Such
framing of business models is standard practice and really helps you to understand what factors
have the biggest impact on the bottom line.
Deliverable: CCG will prepare a ten-year forward-looking business plan in Excel. The base for
this plan would start with the 2013 portion of the current two-year budget and extend until
2022.
The purpose of this plan is to look at the variables that are going to affect the business over that
time frame. For example, it will reflect all of the changes you have recently made in your
business. It will then also look at several important variables such as future potential rate
increases, increases in programming costs, loss of cable customers, growth of ISP data
customers, and normal operating expenses. The model will be constructed in such a way that it
will be easy to change any of these assumptions so that we can understand how variations inthe major assumptions affect the business. This means that the projection will not produce one
result, but rather a range of results depending upon the assumptions made for each major
variable.
Cable TV Profitability. CCG will also look at the profitability of cable TV as a standalone
business compared to your other business lines. It is vital for Click! to understand if the cable
business is making money today. The cable business is probably right now at the peak of where
it will ever be in terms of profitability due to the rate increases. But as you lose customers into
the future, profitability is going to erode.
You should look at profitability for one simple reason. If it turns out that the cable business is
already losing money today, and we know it will get worse, you need to have the discussion
about whether Click! still belongs in the cable business. When you only have two lines of

7/21/2019 8. Draft Report 051013
http://slidepdf.com/reader/full/8-draft-report-051013 8/58
CCG Consulting LLC
10-Year Strategic Business Plan for Click!
Page | 7
“DRAFT” “confidential – do not disclose outside of Click! Network”
business – retail cable and wholesale data, you really can’t last if one of those products is going
to perpetually lose money.
Deliverable: The deliverable will be an analysis of your current budget in Excel and that will
assign all expenses and revenues between the major business lines at the company. This same
analysis will be built into the future-looking projection so that we can see how profitability will
change over time for the two product lines.
Report for the First Two Tasks. CCG will prepare a report that discusses the findings of the
two tasks above – the forward-looking forecast and the cable TV profitability. This report will
describe the methodology used to obtain the results of the study. More importantly, it will
discuss the study results as well as some recommendations of next steps the company might
want to consider.
Deliverable: This is that report.
7/21/2019 8. Draft Report 051013
http://slidepdf.com/reader/full/8-draft-report-051013 9/58
CCG Consulting LLC
10-Year Strategic Business Plan for Click!
Page | 8
“DRAFT” “confidential – do not disclose outside of Click! Network”
Strategic Considerations
This section looks at ways to grow revenues. Additional ideas for revenue growth areaddressed in the Operational section of the report under the discussion of Sales and Marketing.
A. Issues Affecting the Cable TV Business
There are a number of changes that are affecting the cable ind ustry, and many of the changesare negative.
1. Factors Affecting Subscribers
Over-the-top Service (OTT). There is a very rapidly growing trend of customers watchingor buying programming over the Internet rather than through from the traditional cable TVcompany. This group is now being referred to as the cord-avoiders. There is a huge varietyof programming on the Internet from many sources:
• NetFlix. NetFlix is now the biggest single user of bandwidth on the Internet. For$7.99 per month NetFlix offers a huge library of movies, TV programming (mostlylast year or older) and even some unique content that they have created only for theweb. Netflix has dreams of becoming a cable network, but they would still probablycontinue with the very lucrative web business. Their business has been growingrapidly and it was just reported this week that NetFlix now has more subscribersnationwide than HBO. NetFlix can be watched on computers or mobile devices.
• Hulu Plus. Hulu (free content) and Hulu Plus are owned by a consortium of cablecompanies and networks and it provides net versions of cable TV shows. A $7.99monthly subscription gives access to a wider set of TV series than NetFlix. Can bewatched on computers or mobile devices.
• iTunes. iTunes offers just about everything that is on TV on a per episode basis atabout $2 per episode. iTunes works on computers and IOS capable devices.
• Google Play. Pretty much the same content and pricing as iTunes, but Google Playalso works on Android devices.
• Amazon Instant Video. Similar to iTunes. But if you buy Amazon Prime at $79 peryear or $7.99 per month you get the ability to watch the streaming content as well asfree shipping on some items.
• Others. There are a number of other companies trying to be NetFlix that includeVeoh, Clicker, Xfinity, AOL, Babelgum and Joost. Each has a nuance, but all arevery similar to the NetFlix model.
• Free Network Programming. Many network series (ABC, NBC, CBS and Fox) showsare free on the Internet a few hours after they air live. These shows come withcommercials just like the live broadcasts.
• Free Movies. There is a mountain of free older movies on the Internet. I wasinterested in watching some film noir and found a site listing over 500 free old film

7/21/2019 8. Draft Report 051013
http://slidepdf.com/reader/full/8-draft-report-051013 10/58
CCG Consulting LLC
10-Year Strategic Business Plan for Click!
Page | 9
“DRAFT” “confidential – do not disclose outside of Click! Network”
noir movies on the web, include academy award winners. It generally takes somesearching to find the best free content.
• Programmers moving to the Internet. Many networks now offer some of their contenton the web. Comedy Central is a good example and they offer some full episodes oftheir most popular shows as well as mountains of clips.
There are also a host of devices that make it easy for consumers to get anything that is ontheir computer onto the TV. This can be done using Roku, Wii, Apple TV, Xbox,Playstation, Tivo or the Logitech Revue.
Cord-cutters. Cord cutters are households who report they have given up watching all TV, be that traditional or over the Internet. The number of people who are completely droppingcable is growing and the speed of that drop is accelerating. I have seen several differentrecent estimates of the number of zero-TV homes. Nielson reported the number as 5million households at the end of 2012. They said that 36% of those homes didn’t have TVdue to the cost while the rest reported lack of interest as the reason they don’t have TV. I
have seen one estimate that this group is growing rapidly and that an additional 1 millionhouseholds will not have any television service by the end of 2013.
Never-ending Rate Increases and Rate Fatigue. The large cable companies have increasedrates around 7% per year for many years. The cable companies have usually blamed thesize of the increases on increased programming costs, but until the recent increases in localnetwork programming the increases were generally about twice what was needed to cover programming cost increases. If the rate increases continue at the 7% annual level, then a$70 package today will cost $129 in ten years. Prices are already at a point that is forcingsome households off the network.
The industry jargon for this is rate fatigue and many households cannot afford to buy the packages that they want and either drop service or cut back on the packages they buy.Almost all of my cable clients are also reporting higher rates of uncollectibles for cableservice, showing that many households are having trouble paying their cable bill. Onewould expect this problem to get worst every year since cable rates are climbing muchfaster than wages and inflation. The industry is slowly pricing itself out of reach of manyhouseholds, and each year the number of households who feel they cannot afford cable isincreasing.
Cable Downgrades. Only the cable providers know how many households have cut back onthe size of the package they buy rather than drop service totally. I anecdotally know many people, myself included, who have gone from the big cable packages to something less – inmy case I now have only the basic package of about 20 channels.
Demographics – The Cord-Nevers. One very dire trend for the industry is that young people are not as interested in traditional cable in the same frequency as earlier generations,

7/21/2019 8. Draft Report 051013
http://slidepdf.com/reader/full/8-draft-report-051013 11/58
CCG Consulting LLC
10-Year Strategic Business Plan for Click!
Page | 10
“DRAFT” “confidential – do not disclose outside of Click! Network”
and as they age the percentage of households wanting cable is going to drop faster andfaster. This demographic is now being referred to as the cord-nevers because they maynever have traditional cable service. I haven’t seen a US statistic for this, but in Europe areport by Credit Suisse said that there was 1.8 million new households formed in 2011 andonly 16.9% of those households signed up for traditional cable service. And we know the
same thing is happening in the US. Kids growing up in the digital age are learning a totallydifferent model for being entertained. They get most of their entertainment from theirsmartphones or tablets and most kids aren’t using traditional computers or sitting in front ofthe TV any longer. Kids today multitask and thus they are almost always doing somethingelse at the same time they are watching programming.
One issue with the younger demographic is that they expect to be able to watch things forfree. They seem to be just as happy to watch YouTube or the wide variety of free programming that is on the web. And they seem happy with snippets of shows rather thanwatching the whole thing, an example being the huge number of people who watchsnippets of John Stewart and Bill Mahrer on YouTube. The younger generation also seems
to have no compunction against using passwords from friends or family to watch pre-paid programming, but are not willing themselves to pay for TV. In the long-run this might bethe trend that will sink the industry, as each year there are more and more households whoare just not willing to pay for traditional cable TV.
New Disruptive Factors. There are several new disruptive factors in the industry that mayaccelerate the move away from traditional cable TV.
Aereo is a company that has an interesting business model. They are taking advantage of anuance of the cable TV rules at the FCC that says that if a company retransmits local programming that they need to then pay the local networks (ABC, NBC, CBS and Fox) aretransmission fee for selling their signal to somebody. But Aereo has found a way to avoidthe retransmission fees. They have installed equipment at a central hub that has anindividual antenna that transmits the TV signal to each customer. By doing this they havenot created a cable TV system under the FCC rules but rather a big pile of individualtransmissions, which are allowed. Aereo is then transmitting local programming so thatcustomers can watch it on any device. The main customer appeal of Aereo is the ability towatch TV everywhere, which is how the younger generation wants to watch TV. Aereo isonly in a few markets now and will probably see some additional court challenges, but they plan to be in most large cities within a few years and if they come to Seattle they might alsocome to Tacoma.
Another new disruptive factor is that there is a lot of new programming being made that isonly for the Internet. For example, NetFlix is producing several new series that will beavailable only on the Internet. There is also a new trend whereby cancelled TV series are being continued for an Internet audience. As more content is available on-line there isgoing to be less incentive to stick with traditional cable TV.

7/21/2019 8. Draft Report 051013
http://slidepdf.com/reader/full/8-draft-report-051013 12/58
CCG Consulting LLC
10-Year Strategic Business Plan for Click!
Page | 11
“DRAFT” “confidential – do not disclose outside of Click! Network”
2. Other Factors
Ever-Increasing Programming Expense. Programming costs have been rising steadily forthe last decade and until the last few years were climbing between 6% and 7% per year.
Costs have climbed even faster in the most recent years due to retransmission costincreases. There are several trends that are driving the two different trends that are affectingthe increase in programming cost:
• Retransmission Costs. Local network programming (ABC, NBC, CBS and Fox)was free for cable companies until a few years ago, but now they are paying asmuch as $1 per month per customer for each major network channel. The right torebroadcast local networks is called retransmission and is governed by FCC rules.There have been a number of disputes and challenges of the rules between cable providers and network affiliates in recent years that have affirmed the right ofnetwork affiliates to charge a cable company that uses their signal.
• Competition for Eyeballs. Networks are competing against each other for eyeballs
(and for rates they charge to cable companies). The rates charge by networks varywidely and some networks are only a few cents per cable subscriber per month,while the most expensive like ESPN are as much more than $5 per subscriber permonth. And so cable companies are in a battle to produce better original programming so that they can charge more for their network. So you find networkslike American Movie Classics producing shows like Mad Men to increase the valueof their network. This race to increase profits and raise rates is one of the drivers behind increasing programming costs. Networks produce popular content that thenallows them to charge more for their network and then roll some of the new revenue back into producing even more original content. Anecdotally, it is this race tocharge more than has totally transformed many networks. This is why, for example,
there is very little history on the History Channel, but rather reality TV. It’s allabout eyeballs.
• Bundling of channels. While there are hundreds of cable channels there are nothundreds of networks that own the channels. Rather, most of the channels we arefamiliar with are owned by companies that own many channels. As an example,MTV doesn’t just own the numerous MTV stations. They also own Nickelodeon,Spike TV, Comedy Central, Noggin, TV Land and others. Some of the otherchannel owners include Disney (who also owns ESPN), Turner, Comcast,Discovery, Rainbow, Fox, etc. One of the trends in the industry is that thesenetwork owners often either start new networks or buy networks from somebodyelse and then try to force cable systems into carrying their new channels. The large
cable companies like Comcast and Time Warner are able to often negotiate out ofthese requirements, but it is nearly impossible for small providers like Click! tohave any power in a negotiation with a programmer.
7/21/2019 8. Draft Report 051013
http://slidepdf.com/reader/full/8-draft-report-051013 13/58
CCG Consulting LLC
10-Year Strategic Business Plan for Click!
Page | 12
“DRAFT” “confidential – do not disclose outside of Click! Network”
Winnowing of Cable Networks. Above I discussed earlier there is competition betweennetworks for eyeballs and rates. As the industry loses subscribers and as people downgradefrom larger packages to smaller ones, the demand for some of the networks is going todiminish. One way for cable companies to control costs is going to be to whittle away attheir line-up, and that is not that hard to do with 300+ channels on many cable systems. So
some of the marginal networks are going to either die or have to greatly reduce the feesthey charge if they want to stay in business. This might take a little bit of the pressure offfuture rate increase, but not much since the networks that likely fail will be those thatalready charge the lowest rates.
A la Carte Programming. There is one industry change that might reverse some of thedownward trends in the industry, and that is a la carte programming. There are a lot of barriers to make that happen, but cable companies might get new life if they are able to sellonly those channels that people want to watch. It’s possible that Click! could sell a packageof 20 or 30 channels to a family at an affordable price and make more profit than you dotoday with the large expensive packages. But changing this is going to require a major
change in an industry that is currently controlled by the programmers and not by the cablecompanies. Most industry analysts I have seen think that a la carte programming is notlikely to happen without prompting from Congress or something similar. Although it is possible that it could happen if the industry loses enough total subscribers that the programmers look for a new model to survive. But one counter argument to that last pointis that networks might instead go straight to subscribers on the web and bypass the cablecompanies directly, in which case we might see an implosion of the market and cable TVas a product. There are industry people who believe that cable TV will die a rapid deathmuch like what has happened to the music industry due to iTunes and the on-line musicindustry. I don’t have a good enough crystal ball to understand if or when that mighthappen and so I have not modeled this scenario. But if it happened it would be happeningto the whole industry and to every cable company.
3. The Impact of these Factors on Click!
I have a lot of clients in the cable TV business and I don’t think any of them are losingcustomers as quickly as you are. And I think there are reasons for that. Obviously all of theabove mentioned factors come into play. But there are also unique factors that wouldaccount for why Click! is performing less well than many other similarly-sized cablecompanies:
Loss of Click!’s Pricing Advantage. A few years ago the Click! cable prices weresignificantly below the rates of surrounding communities. When I looked at the company afew years ago your rates were around 35% lower than the rates in Seattle. But as you haveraised rates Click! has lost that advantage. (Note that raising rates was something Irecommended as necessary if the business was ever to be profitable). But one of theconsequences of raising rates is that you will have driven away some customers due to
7/21/2019 8. Draft Report 051013
http://slidepdf.com/reader/full/8-draft-report-051013 14/58
CCG Consulting LLC
10-Year Strategic Business Plan for Click!
Page | 13
“DRAFT” “confidential – do not disclose outside of Click! Network”
price. The fact that your rate increases were larger than any other cable company could alsohave resulted in some rate fatigue. Your rates are now getting very close to the rates insurrounding communities, so there no longer is any gap to close nor is there anyopportunity to raise rates to make Click! profitable. I would strongly recommend againstraising your rates above the rates in surrounding communities. At that point Comcast is
likely to halt their own rate increases to be in parity with Seattle and they would then havethe price advantage.
Comcast’s Bundling Discount. Probably the biggest factor affecting Click! is still theComcast’s bundling discount. There is about a $10 penalty for any Comcast customer whowants to break the bundle and take part of their business to somebody else. For example, ifa Comcast customer wants to keep the Comcast cable modem but bring their cable TV toClick! the price of the cable modem service is going to go up by $10 if the customer breaksa bundle. This is a huge deterrent to customers changing from Comcast to Click!. But the bundling discount also means that customers don’t know what they pay for any service,making it possible for Comcast today to say that their bundled cable service costs less than
Click!.
Because Click! and the ISPs cannot bill, install and repair as one entity, it also means that itis harder for a customer to work with Click! and the ISPs. With Comcast a customer getsone person showing up to install, one repairman coming if maintenance is needed, one callwhen there is trouble to report, and one bill.
The Incumbent Advantage. Everybody who competes against an incumbent provider cansee that the incumbent has a natural advantage when it comes to landing new peoplemoving to town. A company like Click! can advertise and create a brand name forcustomers who have lived in the market for a while, but the incumbent has a massiveadvantage for customers just moving to the market. This advantage means that Comcast isgoing to get a larger share of new customers than one would expect due to their marketshare.
B. Issues Involving the ISP Data Business
Click’s Reliance on the ISPs. Possibly the biggest weakness in Click!’s business plan is thereliance on the performance of your current ISPs. There is currently a negotiated deal betweenthe ISPs and Click! that is being referred to internally as Plan B. This plan has the ISPs addinga net 6,000 new customers to the network by the end of 2016 with the agreement that Click!will not increase the wholesale data price to them.
And this is a laudable goal and it is exactly what the business needs. But let’s face it. Therereally has never been any barrier for the ISPs to sell before and it’s a pretty tall order for them

7/21/2019 8. Draft Report 051013
http://slidepdf.com/reader/full/8-draft-report-051013 15/58
CCG Consulting LLC
10-Year Strategic Business Plan for Click!
Page | 14
“DRAFT” “confidential – do not disclose outside of Click! Network”
to increase customers by 6,000. They face many of the same issues that Click! faces with cableTV, as follows:
• Comcast’s Bundling Discount. The bundling discount discussed above affects them asmuch as it affects Click!. For example, if a Comcast customer wants to keep Comcastcable but bring their data to the ISP then the price of the cable service is going to go up
by $10. When customers figure this out they often decide not to change providers.• Comcast Data Speeds. Just this month Comcast announced nationwide that their 15
Mbps product will automatically be increased to 25 M bps. Of course we know that inmost cases there will probably be no immediate increase in actual speeds. I recall whenComcast announced raising data speeds from 6 Mbps to 12 Mbps. In most marketsthere was no change in speeds right after the announcement. But over time the Comcastspeeds were increased and in most markets came up to the advertised speeds, at least atsome times of the day. Comcast still has issues of having their network bog down someat peak times, which for residential is the evening. But overall they have gotten much better in recent years in delivering data speeds that are reasonably close to theadvertised speeds.
Click! is never going to win the speed battle with Comcast. There will times when youwill have made upgrades where your network will be faster than Comcast’s. But overtime they will increase speeds to match or even beat you. Your network has no inherentadvantages over their network. If you have any one long-term advantage it is that youhave fewer customers on your network, and this less means congestion at the busyhours of the day. But Comcast will match you technology upgrade for technologyupgrade and you are never going to have drastically better speeds than they offer.
The Click! network is more reliable. Comcast has had some very ugly and publicInternet outages, some that lasted a day or more. And because they consolidate services
over a large area, they don’t just lose service in a neighborhood. Their outages are oftenfor huge multi-state areas.
• Churn. The ISPs are seeing churn in the same manner that Click! sees churn in thecable business. They have to add a significant number of new customers every month just to stay even. Overall the ISPs have been adding more customers than they lose,albeit at a fairly slow pace. But this does mean that with concentrated marketing thatthey might be able to get the extra customers needed to achieve Plan B.
• Customer Loyalty to an Email Address. This is a minor issue, but an issue nonetheless.There are still customers who use a Comcast email address and who are hesitant tomove to a new ISP. Savvy customers have all moved email to portable email addressessuch as gmail, but there are a decent percentage of the customers who use the email
address at the service provider and who then are hard to get to move.
Cable Companies Have Very Solid Cable Modem Business. To a large degree the cablecompanies have won the war with DSL. However, they have stiff competition on the east coastfrom Verizon and FiOS on fiber. There is limited competition outside the Verizon footprint,
7/21/2019 8. Draft Report 051013
http://slidepdf.com/reader/full/8-draft-report-051013 16/58
CCG Consulting LLC
10-Year Strategic Business Plan for Click!
Page | 15
“DRAFT” “confidential – do not disclose outside of Click! Network”
but with Google building fiber in Kansas City and having announced Austin and Provo there isgoing to be more competition for the residential business.
It is very likely that almost nobody in the industry other than Comcast is making much profitfrom cable. In in fact, many cable companies might be losing money on cable TV in the same
way that Click! is. But the cable companies have done extremely well with the cable modem business. This is a very high margin business and the margin has been growing as the cost ofconnecting to the Internet has dropped over the last decade. And so other cable providers havea full retail revenue stream from their data business where Click! only has the wholesalerevenue stream. Since other cable companies sell bundles, they might be willing to live withlosses on cable as long as the bundle is profitable. But Click! does not have that luxury.
Cable Providers Become Data Companies. Because the data business is profitable, and becausecable will lose customers over time, the cable companies will become more and more relianton selling data. A really large portion of their bottom line comes from data sales today and that percentage is going to grow in the future.
This is going to lead cable companies to maximize their networks over time for providing bandwidth for data rather than for cable TV. And I predict it also means that they will startraising data prices over time, something that we just started seeing in the last year.
Over the long haul there are many who believe that most network owners become ‘dumb pipe providers’ as discussed below.
It is also possible for cable companies, including Click! to offer faster data in the future.Following are the upgrades for faster data speeds that are available to cable companies. It is myunderstanding that Click! has made the transition through step 6. But over time, if Comcastgoes beyond step 6 or some other faster data provider comes to town Click! will need toupgrade further to get even faster data speeds.
1. Increase System Bandwidth. An example of this kind of upgrade is when a system isupgraded from 750 MHz to 1,000 MHz (or 1 GHz). This upgrade provides more bandwidth by widening the frequencies that are available on the coax.
2. Reducing Node Size. A node in an HFC system is a neighborhood of homes and/or businesses that share the same bandwidth. Typically there is fiber built to a node andthen coax cable from the node to each customer. Making smaller nodes creates smaller pools of shared bandwidth, meaning there is more bandwidth available to customers at peak times.
3. MPEG4 Compression. A lot of cable systems still use a compression technique knownas MPEG2. This technology is used to compress the digital channels on a networktoday so that up to ten digital channels will fit into one 6 MHz analog slot. But withMPEG4 as many as 20 digital channels can fit into the same 6 MHz slot. The biggestissue with this conversion is that older settop boxes won’t recognize MPEG4.
7/21/2019 8. Draft Report 051013
http://slidepdf.com/reader/full/8-draft-report-051013 17/58
CCG Consulting LLC
10-Year Strategic Business Plan for Click!
Page | 16
“DRAFT” “confidential – do not disclose outside of Click! Network”
4. Deploy DOCSIS 3.0. DOCSIS 3.0 is a bandwidth management technology that allows acable modem to use a larger window of RF frequency for data. The way this works isthat a cable system can ‘bond’ multiple channel slots together to that the cable modemscan use more than one 6 MHz channel slow for data.
5. Migrate Analog Channels to Digital. A cable provider can gain some bandwidth space
by migrating analog channels to an existing digital line-up. There are often contractualrequirements with programmers that make this difficult to achieve. However, asmentioned above, as many as 20 digital channels can fit in the same sized slot as ananalog channel. There are always customer issues to also consider since this kind ofconversion will shrink the analog offering and expand the digital tiers.
6. Full Digital Conversion. In a full digital conversion all channels are converted todigital. Once completed, every customer needs a settop box or a Digital TelevisionAdapter (DTA) in order to decode and view channels.
7. Deploy Data QOS. This technique does not increase system bandwidth, but ratherallows the cable provider to sell faster data to some customers. For example, Comcastadvertises 100 Mbps service in most large cities, and they would deliver that kind of
speed by giving the 100 Mbps customer priority over other customers in the node byhaving those customers send their data over a lesser-used frequency on the coax. Ofcourse, as the priority customer gets more bandwidth, everybody else in the node getsdegraded service, and if too many premium services are sold then even the prioritycustomer can’t get the promised bandwidth.
8. Convert to IPTV. This conversion allows a cable system to use more of the RFfrequency on the network for bandwidth. On an IPTV system the programming, voiceand cable modem service are all sent over shared bandwidth. An IPTV conversion doesnot automatically gain a lot of extra bandwidth and any savings come from the fact thatthe company does not have to broadcast all channels to all nodes all of the time, butrather can just those channels that somebody in the node is watching.
9. Higher Spectral Efficiency. This technique involves converting to DOCSIS 3.1 and alsochanging the system modulation techniques. The traditional modulation technique iscalled QAM (Quadrature Amplitude Modulation) and uses a 6 MHz frequencyallocation. The new technique is ODFM (Orthogonal Frequency DivisionMultiplexing) which uses a higher QAM modulation. Whereas Current DOCSIScapabilities achieve approximately 6.3 bits per Hertz, DOCSIS 3.1 can achieve 10 bits per Hertz. New modulation techniques can create much larger bandwidth slots and canat the same time increase the bits to Hz efficiency of the frequency being used.
As cable companies decide to migrate to become data companies we will see them upgradetheir networks in the above manner (plus with whatever technology is available in the future).The common wisdom in the industry is that the cable companies will change electronics andmaximize their coaxial systems rather than abandon those networks and build all-new fibernetworks.
7/21/2019 8. Draft Report 051013
http://slidepdf.com/reader/full/8-draft-report-051013 18/58
CCG Consulting LLC
10-Year Strategic Business Plan for Click!
Page | 17
“DRAFT” “confidential – do not disclose outside of Click! Network”
C. Other Strategic Considerations
There are a few more industry trends to consider:
Dumb Pipe vs. Full Service Provider. Broadband and cable TV companies have been looking
at their long-term strategy and they are going to have to decide if they are going to be what weat CCG call either a dumb pipe provider or a full service provider.
A dumb pipe provider is a broadband company that sells a very fast Internet connection as its primary product and not much of anything else. A perfect example of this is what Google isdoing in Kansas City. Google is selling a 1 Gbps Internet connection there for $70 per month.That is far more speed than is possible from the competition, but it is also more expensive. Theonly other product available from Google is one cable TV package that is bundled with thedata for $120. Google only offers one other data package for low income homes. Googledoesn’t offer different size cable packages. They don’t offer voice. They don’t offer security,or cloud services or any of the panoply of new services that can be provided over fiber.
In my opinion Google has looked into the future and they believe that most of the otherservices that they could be selling will be available to customers over the very fast Internetconnection that Google is selling them. One of the primary advantages to Google of the dumb pipe strategy is that they have a very simple product mix to sell. Fewer products means lessstaff needed to market, sell, provision and support customers.
The downside to the dumb pipe provider is that they will have a much lower average revenue per user (ARPU) than the full service provider. But both types of providers have a very similarcost of the network. And this is at the heart of the discussion that many of my clients arehaving about the long-term trends in the industry.
Most providers in the industry today are full service providers. They support the full residentialtriple-play, have multiple options for cable TV, and have multiple options for voice. They alsosell a wide range of other products and their marketing strategy is aimed at getting the highestARPU from customers they can.
But the full-service providers are worried when they look at some of the trends in the industry.They have already seen a lot of voice customers drop off the network. They are starting to seecable customers leave the network and they look ten years down the road and see a verydifferent cable market. And so full-service providers are faced with figuring out how to gofrom where they are today to where they think they must be in the future.
I am starting to see evidence of the shift in the strategy of full service providers. In the last yearI have seen data prices being increased all over the country for the first time. And this is not because the cost of providing data is growing, because the margins on data have grown steadilyeach year over the last decade and are still growing. I think the service providers have

7/21/2019 8. Draft Report 051013
http://slidepdf.com/reader/full/8-draft-report-051013 19/58
CCG Consulting LLC
10-Year Strategic Business Plan for Click!
Page | 18
“DRAFT” “confidential – do not disclose outside of Click! Network”
embarked on a long-term upward shift in data prices so that they will be getting more revenuefrom the one product that is likely to survive into the future.
The companies with the biggest dilemma are these just entering the market for the first time.Do they make the leap straight to being a dumb pipe provider, like Google, or do they become
a full service provider and enjoy the remaining years of high ARPU before voice and cable TVlosses pull those numbers downward? It is a hard decision and a conversation I am now havingwith every new service provider.
What will Comcast Do? The issues facing Click! for cable TV are the same as for any other provider, and so these same trends are going to affect Comcast as much as they will Click!. Soone thing that will affect Click! is how Comcast reacts to these market pressures. There are anumber of different ways that Comcast can react to these trends, and we need to consider thefollowing when thinking about what they might do in general and also in Tacoma:
• Continued Competition. Click! will continue to see stiff competition from Comcast. Alot of your churn is due to customers who take advantage of the Comcast special deals.
Comcast always somewhat matched the lower prices charged by Click!, but their primary competition comes through offering specials and deals that lure customers tolower prices for a set term like a year. And since Comcast and Click! prices are fairlyclose to each other there is very little incentive for customers to change back to Click!at the end of a Comcast special.
• Rate Increases. Comcast is facing the same future as Click! If they continue to raiserates 7% per year they are going to start pricing their service out of the price of many oftheir customers. As much as we read in the tech media about customers looking to theweb for programming, a lot of that phenomenon is driven by the cable companiesdriving people away with higher prices. To the extent that Comcast figures out a way toslow down rate increases, a cap will be put on what Click! can charge in the
marketplace. Your rates have now caught up to Comcast rates in surroundingcommunities and so you are now bound on the upper end by how the industry sets prices.
• Bundling Discount. Comcast’s bundling discount continues to be a huge competitiveadvantage. For most Comcast bundles there is still about a $10 penalty for a customerto break the bundle to buy either Click! cable TV or data from one of your ISPs. This is possibly their strongest advantage in the market. Click!’s biggest obstacle is that yourcable TV product is nor very different than Comcast’s (nor can it be). And while therewill be times where your network or Comcast’s network might have an advantage fordata speeds, in the long-run the two networks are identical in technology and capabilityand it is unlikely that either one of you will ever possess a substantial differentiation in
terms of your data products.• Comcast Owns Programming. Comcast has one cost advantage of Click! in that they
own a substantial number of cable channels. While I am certain that the Seattlesubsidiary of Comcast probably pays rates for these channels similar to the rates you pay, the fact is that since Comcast owns these networks the true cost is the cost of
7/21/2019 8. Draft Report 051013
http://slidepdf.com/reader/full/8-draft-report-051013 20/58
CCG Consulting LLC
10-Year Strategic Business Plan for Click!
Page | 19
“DRAFT” “confidential – do not disclose outside of Click! Network”
operating the programming networks and not what they bill internally betweensubsidiaries. So for instance, if Comcast has a 50% margin on its own programming, it probably has something like a $3 cost advantage per customer over Click! (or any othercable company). Just FYI, Comcast owns Comcast SportsNet, Bravo, Universal HD,Chiller, CNBC, CNBC World, MSNBC, Syfy, ShopNBC, Telemundo and mun2, Cloo
and the USA Network. Additionally Comcast owns the rights to the Olympics. Theyalso are part owners of the Weather Channel, Canal+ and A&E. As an aside, they alsoown a part of Tivo.
Will Fiber Ever Come to Tacoma? Competition for a cable company is always local. There aremarkets where a cable company gets stiff competition, as with Click! and Comcast. On the eastcoast Verizon has over 9 million subscribers on its fiber FiOS service, and in neighborhoodswhere two companies both provide the triple play, Verizon is still taking customers away fromComcast. And there are other fiber providers, with the best known being Google who iscompeting in Kansas City and who has announced build-outs in Austin and Provo. But thereare still plenty of markets where the cable companies are competing against telco copper.
When looking out ten years it is certainly possible that a new player could show up in Tacoma.If Google or some other fiber provider showed up, then one would expect Comcast and Click!to suffer a significant loss of customers, and quickly. Certainly over that time frame somebodyis probably going to build fiber in Seattle and the question will be if such a buildout moves tosurrounding communities like Tacoma.
Nobody knows Google’s business plan, but you can make an educated guess. Google won’t build to a neighborhood until 15% of the homes there have agreed to purchase service. Andthat is 15% of homes which equates to about 20% of the households that buy broadband orcable TV. And one has to think that Google’s business plan is to ultimately do at least twice theinitial threshold, which means that they would have a goal of capturing 30% of the total marketor 40% of households that buy services. And so competing against somebody like Googlecould kill Click! and the ISPs in a hurry. In the current market, losing 40% of Click’s cable business would mean a loss of 9,000 customers and for the ISPs it would equate to 8,000customers.
The bottom line is that if somebody decides to build fiber in Tacoma then the Click! business probably would not be sustainable.
Effect of Google. One of the possible results of Google building fiber in multiple cities is thatthey are demonstrating that there are profits to be made in building a competitive fibernetwork. This could accelerate the number of other companies who are willing to invest infiber. One could certainly envision a large fiber overbuild that would encompass both Seattleand Tacoma.

7/21/2019 8. Draft Report 051013
http://slidepdf.com/reader/full/8-draft-report-051013 21/58
CCG Consulting LLC
10-Year Strategic Business Plan for Click!
Page | 20
“DRAFT” “confidential – do not disclose outside of Click! Network”
Aging Infrastructure. Another factor to consider is that Click!’s infrastructure is aging. Andthat is particularly relevant when looking out over the next ten years. Click! provided me witha ten year capital budget that shows capital being spent for the same sorts of changes andupgrades as have been done in recent years. But it certainly possible that the company will facea time in the next decade when significant repairs and/or upgrades will be needed over and
above that baseline budget. I look at this as perhaps the softest line item in the 1-year forecastfor this reason. I would note that I have made an inflation adjustment to the budget that was prepared by Click!, which was all in current dollars.
Competing as a Municipality. One of the factors we always have to remember is that Click! iscompeting as a municipality. This means that you will engage in practices that yourcompetitors will not. For example, Click! must go through the municipal bid practices. This is probably not a great hindrance, but commercial companies often will make an alliance withvendors that is not available to Click!. Probably the biggest impact on your business as amunicipal provider is that Click! is unionized, has high salaries and tremendous (but costly) benefits. To the extent that your competitors can employ lower-cost employees or outsource
easier they will have an advantage due to higher margins.

7/21/2019 8. Draft Report 051013
http://slidepdf.com/reader/full/8-draft-report-051013 22/58
CCG Consulting LLC
10-Year Strategic Business Plan for Click!
Page | 21
“DRAFT” “confidential – do not disclose outside of Click! Network”
10-Year Forward Looking Business Plan
The project involved creating a 10-year financial plan and the period studied was the years2013 – 2022. I have chosen to select three different scenarios which will demonstrate therange of possible futures. I have labeled these scenarios as ‘Status Quo’, ‘Optimistic Scenario’
and ‘Pessimistic Scenario’. The three plans are described as below.
Note that I looked at dozens of different scenarios. I don’t have a crystal ball and since thecompany is going in possibly two different directions with the cable and the ISP business Itook an approach that allowed me to look at the two different business lines separately. Ilooked at dozens of different growth (or shrinkage) scenarios for each type of customer. In theend I kept three possible plans for each scenario in the model, for each business line thatdemonstrates the sort of forces that are required to end up with each scenario. Finally, I pickedone of the many scenarios that is representative for the results in the range that could bedescribed as status quo, optimistic or pessimistic.
Status Quo Plan.• Shows cable TV customers dropping over ten years to 10,500 customers. This loses
customers at a slower rate than is budgeted today.
• Grows ISP customers to 27,100 over ten years.
• Assumes 10% cable rate increases in 2013 and 2014 and then increases of 5.5% peryear thereafter.
• Assumes a 5% increase in data rates in 2018, 2020 and 2022.
• Assumes most expenses inflate at 2.5% per year.
• Assumes programming expense will continue to increase 7% per year.
Optimistic Scenario
• Shows cable TV customers dropping over ten years to 14,700 customers. This losescustomers at a significantly slower rate than is budgeted today.
• Grows ISP customers to 30,000 over ten years.
• Assumes 10% cable rate increases in 2013 and 2014 and then increases of 5.5% peryear thereafter.
• Assumes a 5% increase in data rates in 2018, 2020 and 2022.
• Assumes most expenses inflate at 2.5% per year.
• Assumes programming expense will continue to increase 7% per year.
Pessimistic Scenario
•
Shows cable TV customers dropping over ten years to 4,800 customers.• Grows ISP customers to 20,700 within a few years, but then they decrease over ten
years to be the same as today.
• Assumes 10% cable rate increases in 2013 and 2014 and then increases of 5.5% peryear for 2015 and 2016 and then 4% thereafter.
7/21/2019 8. Draft Report 051013
http://slidepdf.com/reader/full/8-draft-report-051013 23/58
CCG Consulting LLC
10-Year Strategic Business Plan for Click!
Page | 22
“DRAFT” “confidential – do not disclose outside of Click! Network”
• Assumes a 10% rate increase in 2016 and then 5% increase every year starting in 2018.
• Assumes most expenses inflate at 2.5% per year.
• Assumes programming expense will continue to increase 7% per year.
A. The Analysis
The process and data used to create my analysis is as follows:
• Base Budget. Click! provided the most current budget for 2013/2014. Click! uses a biennial budget, meaning that the budget gets approved for a two year period at a time.The budget used as the base for these two years assumed several things: 1) That therewould be another cable rate increase of 10% at midyear in both 2013 and 2014; 2) ThatPlan B would be implemented for the ISPs; 3) That the business would lose cable TVcustomers but gain ISP connections. 4) That there would be normal inflation for mostexpenses, with the exception of a few things like programming costs.
For the most part I adopted the assumptions used for 2013 revenues and expenses. Thecompany provided actual performance in terms of customers and financial performancethrough March and I used that data to test the budget assumptions. I did make someminor adjustments to budget, but the adjustments were pretty minor.
• Future Budget Years. For 2014 I used a mix of the biennial budget plus my own projections. For example, I used my own projections in 2014 for any revenue orexpense account that would vary by the number of customers or amount billed tocustomers. This means, for example, that I created my own projection for things likecable TV revenue, ISP revenue, programming expense, and the various taxes that arelevied on those revenues. For other items like salaries and normal operating expenses I
used the projections from the 2014 budget. I did give careful consideration to each itemin the budget to consider if I might get a more accurate estimate for 2014 based uponmy own analysis.
After 2014 I projected everything. The cable TV and ISP revenues are based uponseveral factors. First is rate increases. There are differing amounts of assumed rateincreases that vary by the three scenarios. Second is number of customers. As describedearlier, I made three guesses as to the direction and magnitude of the change incustomers for the status quo, the optimistic and the pessimistic scenario. Finally, Inoticed a phenomenon in Plan B where the ISPs were migrating customers from slowerto faster revenues, and these shifts result in higher wholesale payments to Click!. So I
estimated the impact of customer upgrades in terms of projecting an average revenue per ISP customer each year.
In future years I also projected expenses. I assumed programming expenses wouldcontinue to climb 7% per year. This has been the historic growth rate for most of my

7/21/2019 8. Draft Report 051013
http://slidepdf.com/reader/full/8-draft-report-051013 24/58
CCG Consulting LLC
10-Year Strategic Business Plan for Click!
Page | 23
“DRAFT” “confidential – do not disclose outside of Click! Network”
clients over the last half dozen years. Many of these clients, and also Click! has growthin costs grow even faster than this the last few years as the local networks introducedand then quickly increased the fees for gaining access to the national networks of ABC, NBC, CBS and Fox. However, the feeling around the industry is that those rates arestarting to reach a justifiable market level and the rate increase for the networks will not
continue to rise at a meteoric rate. One can certainly postulate that if rates continue toraise the rates for programming at the historic rates that they will begin to price cableTV out of the price range of many households. However, many programmers signmulti-year contracts for programming and from what I have seen there doesn’t seem toslowing of the rate increases by any of the programmers.
As described above, I varied the projected amount of taxes levied on the business basedupon the projected revenues. I assumed that the tax rates for these taxes would notchange during the 10-year period.
I grew other expenses by the rate of inflation and used a growth rate of 2.5% per year.
Finally, I made adjustments to manpower in the model based upon the change in thenumber of customers, as will be described below in more detail.
• Cable TV Revenues and Rate Increases. The model assumes that future cable TVrevenues are a function of the number of future customers plus the average revenue peruser (ARPU) that increases over time due rate increases.
The current biennial budget assumes that Click! will lose customers each month duringthe biennial budget. And this loss of customers is derived by two separate projections:the number of new customers that are connected each month and the number that are
churned, or who leave the system each month.
Click! has been very successful at selling to new customers for a number of years. Butthe company has now finally gotten to the place where the number of monthlydisconnects exceeds the number of new sales. This is due to a number of factors that arediscussed earlier in this report, as well as the normal reasons that people disconnect,such as moving, dying, losing a job, etc. Click! tracks the reasons why customers leavethe business.
In my projections I used the assumption that in 2013 that Click! would connect 400new cable customers each month (annual total of 4,800). And I assumed that 527customers would disconnect each month (or 6,324 annually). This results in a drop of1,524 customers during 2013. If this same number of customers were added anddisconnected each year, the company would be completely out of the cable TV businessin 14 years.

7/21/2019 8. Draft Report 051013
http://slidepdf.com/reader/full/8-draft-report-051013 25/58
CCG Consulting LLC
10-Year Strategic Business Plan for Click!
Page | 24
“DRAFT” “confidential – do not disclose outside of Click! Network”
However, the factors that drive connections and disconnects are separate and so it isvery unlikely that the business would continue to lose customers at the same volumeinto the future. I believe that to understand the direction the company is going that youhave to look at the two factors separately, and that is what I did in creating the variousscenarios.
The assumptions used for new connections and disconnections for each scenario is asfollows. However, recall that I looked at dozens of different scenarios before pickingthese three to be typical for forecasts that could be considered as status quo, optimisticor pessimistic.
o Status Quo Projection. In this projection I assumed that churn can best belooked at as a percentage of the people who have service. And this, as thenumber of total customers decreases, the number that will churn will alsodecrease. The 2013 projection shows an annual churn rate of 28.2%. In thestatus quo projection I assumed that the amount of churn would increase every
year by 1.5% in total. This means that if the churn was 28.2% in 2013 that I projected the churn to be 29.7% in 2014, with that same increase each futureyear until the churn rate in 2022 is 41.7%.
Why did I increase churn? If you look at my earlier analysis of the cable TVindustry one message that comes clear is that there will be more and more people unhappy with traditional cable TV each year, and in your case possiblyless enamored by your product versus the Comcast bundle. Churn is something Ianalyzed several years ago and the rate of churn has been increasing at Click!over time. And due to the various factors such as the rates getting lessaffordable, customers deciding to opt out for over-the-top programming, orcustomers deciding to change to a Comcast bundle, one should expect a greater percentage of the customers to leave each year.
The other half of the equation is new sales and I assumed with the status quothat sales would get harder and harder to do each year. In the final option Ichose for the status quo scenario I used the assumption that sales would getworse each year by an accumulative 0.5%. This means that the company wouldsell 0.5% fewer customers in 2014 compared to 2013, and then 1% fewercustomers in 2015 compared to 2014, etc. This means the rate of the rate ofsales would slowly decrease every year until by 2022 the company would beselling 4.5% less in 2022 compared to 2021.
Again, I predict that sales will slow due to the factors described earlier in thereport. There are going to be more households each year who are electing to becord-cutters or who are opting out to over-the-top programming. There will benew young households in the market who want to get their programming in
7/21/2019 8. Draft Report 051013
http://slidepdf.com/reader/full/8-draft-report-051013 26/58
CCG Consulting LLC
10-Year Strategic Business Plan for Click!
Page | 25
“DRAFT” “confidential – do not disclose outside of Click! Network”
some nontraditional way. This projection does not predict the collapse of theindustry, but rather a gradual wearing away, much like has happened to thevoice business over the last decade. We just completed a survey in a town inColorado that showed that only 43% of the households there still have alandline, which is down from 98% a decade ago. Every industry expert expects
something similar to happen to cable TV, but I don’t think anybody can pinpoint yet the speed that it will happen.
There certainly are scenarios where the industry could collapse dramatically, asthe traditional music did with CD sales after the introduction of iTunes. Thetraditional industry was basically wiped out within three years. But nobodythinks that is going to happen to this industry due to the fact that is driven by the programmers. As long as they withhold enough valued programming from theweb to make people want traditional cable TV, then it’s unlikely that theindustry will collapse dramatically. But a dramatic implosion is possible and Ihave not looked at a scenario where most of the customers abandon Click! (and
Comcast) in a relatively short period of time.
Over time the combination of increasing churn and slower sales has a prettydramatic impact on the business, and in the Status Quo scenario the customerschange from 22,400 at the beginning of 2013 to 10,500 by the end of 2022.Again, this is slower than assuming that the business will continue to lose 127customers per month in perpetuity, and this is due to the fact that as the numberof customers gets smaller, the number that might churn each month should alsoget smaller. And this is true even as the rate of churn gets higher. Thissomewhat mitigates the rate of decline in the customer base, but the customer base will still shrink forever under this scenario and the customer base nevercomes to an equilibrium where the amount of additions and churn are equal.
Unless something drastic changes to make more people want cable TV, Click!will eventually be out of the cable TV business. The real key is predicting when,which was the whole point of this analysis. I don’t have a crystal ball and Ireally don’t know when this will happen, but I think these various scenariosdemonstrate what happens to the company if the loss of customers is faster orslower than expected.
o Optimistic Projection. In the Optimistic projection I assumed the current annualchurn rate of 28.2% would hold into the future. This means that every year the business would continue to lose that percentage of customers.
For the sales projection I assumed sales would get harder and harder to do eachyear. In the final option I chose for the status quo scenario I used the assumptionthat sales would get worse each year by an accumulative 25 customers. This
7/21/2019 8. Draft Report 051013
http://slidepdf.com/reader/full/8-draft-report-051013 27/58
CCG Consulting LLC
10-Year Strategic Business Plan for Click!
Page | 26
“DRAFT” “confidential – do not disclose outside of Click! Network”
means that the company would sell 25 customers less in 2014 than they did in2013. The year after that would they would sell 50 less in 2015 compared to2014, and so forth. And so the rate of the slowing of sales increases over time. Ihad also looked at scenarios where sales decreased each year by a fixed percentage, and so if one were to assume that new sales drop 0.5% per year that
the results would be very similar to the results I used in the study.
Over time this subtle change in the model has a pretty dramatic impact on the business, and in the Optimistic scenario the customers still drop from 22,400 atthe beginning of 2013 to 14,700 by the end of 2022. This means that even themost optimistic look at the business is going to see a significant decline of cablecustomers, and I don’t think this comes as a shock to anybody. As before, theloss of customers in this scenario is slower than assuming that the business willcontinue to lose the current 127 customers per month in perpetuity due to thefact that as the number of customers gets smaller, the number that might churneach month will probably also get smaller. This somewhat mitigates the rate of
decline in the customer base, but the customer base will still shrink foreverunder this scenario and never comes to an equilibrium where the amount ofadditions and churn are equal.
o Pessimistic Projection. I really struggled with creating a Pessimistic projection.I kept asking myself how bad is bad. I have seen at least a dozen predictions ofthe future of the industry from ‘experts’. A few of these predictions say thatcable subscribers will just slowly bleed away and that none of the trends Idiscussed will be material enough to bring down the industry immediately. Andat the other extreme are those predicting that the cable business will die in afiery heap when programming on the web becomes good enough to supplant it.
So I ended up choosing a Pessimistic scenario that ends up with a result that issomewhat akin to continuing the trend in the 2013 projection of losing 127customers per month. So I ended up looking for scenarios that produce thatresult.
The closest set of assumptions that ended up matching a straight-line scenariowas as follows. I assumed that the amount of churn would increase every year by 2% in total. This means that if the churn was 28.2% in 2013 that I projectedthe churn to be 30.2% in 2014, with that same increase each future year until thechurn rate in 2022 is 46.2%.
One the sales side I assumed that sales would get worse each year by 80 salescumulative. This means that the company would have 80 fewer sales in 2014than 2013 and then 160 fewer sales in 2014 compared to 2014. This means thatsales would drop more year over year.
7/21/2019 8. Draft Report 051013
http://slidepdf.com/reader/full/8-draft-report-051013 28/58
CCG Consulting LLC
10-Year Strategic Business Plan for Click!
Page | 27
“DRAFT” “confidential – do not disclose outside of Click! Network”
One assumption I made in the pessimistic scenario is that after five years youwould only be able to raise cable rates by 4% per year, while in the otherscenarios I have assumed 5.5% per year.
•
ISP Wholesale Revenues and Rate Increases. The model assumes that future ISPrevenues are a function of the number of future ISP customers plus the average revenue per user (ARPU) that increases over time due rate increases. Additionally, there iscurrently a trend where the ISPs are upgrading customers to faster speeds which isresulting in paying higher wholesale charges for those customers. So the forecast alsoincrease ARPU for that trend.
Click! recently made an agreement with the ISPs not to raise ISP wholesale rates if theISPs collectively can get 6,000 net new customers by the end of 2016. This plan is being referred to as Plan B.
The ISPs have been very successful at selling to new customers for a number of years.But in the same manner that Click! is experiencing churn the ISPs have the same issue.However, in 2012 the ISPs sold more customers than they churned and their customer base has been growing.
In the Status Quo and Optimistic Projection I assumed that the ISPs would meet thegrowth goals of Plan B. I assumed that they would not do so well in the Pessimisticscenario. I assumed for all plans that in 2013 there was churn of 366 customers permonth (4,392 annually) and the ISPs would need to sell more than that in order to add6,000 net new customers over four years.
Just like with the cable business, the factors that drive connections and disconnects aredistinct and unrelated, and so it is very unlikely that the business would remain attoday’s growth rate. Rather, I believe the rate of churn is going to get faster or slowerdepending upon whether the total number of customers grows or shrinks.
The assumptions used for new connections and disconnections for each scenario are asfollows. However, recall that I looked at dozens of different scenarios before pickingthese three to be typical for forecasts that could be considered as status quo, optimisticor pessimistic.
o Status Quo Projection. I assumed that the ISPs would meet the goals of Plan Band would add 6,000 new customers. In this projection I assumed that churnwould hold steady at the current rate of 24.2% per year. With this assumption asthe number of customers increases the number that will churn will also increase.
7/21/2019 8. Draft Report 051013
http://slidepdf.com/reader/full/8-draft-report-051013 29/58
CCG Consulting LLC
10-Year Strategic Business Plan for Click!
Page | 28
“DRAFT” “confidential – do not disclose outside of Click! Network”
The other half of the equation is new sales and I assumed that the ISPs wouldmeet Plan B but that ISPs sales would then drop in 2017 to add only 200 netnew customers and that sales would then increase by 200 each year after that.This results in a total number of ISP customers of around 27,100 by the end often years.
o Optimistic Projection. In the Optimistic projection I assumed the current annualchurn rate of 28.2% would hold into the future. This means that every year the business would continue to lose that percentage of customers.
For the sales projection I assumed that the ISPs would be able to growcustomers in 2017 by 400 and then increase sales each year after that by 400.This results in just under 30,000 ISP customers by 2022.
o Pessimistic Projection. I really struggled with creating a Pessimistic projection.I kept asking myself how bad is bad for the ISPs. I started by predicting that the
ISPs would never meet Plan B. That certainly is possible. So I further made theassumptions that ISP sales remained at the 2013 levels, which is 5,580 newsales per year. Then, starting in 2017 I have sales declining slowly by 2% peryear.
This results in 18,700 ISP customers by 2022, which is slightly lower than yourtarget customers for the end of this year. And so the pessimistic assumption isthat the ISPs try to sell but do no better at sales than they do today.
One thing to note in this scenario is that since the ISPs did not meet Plan B thatdata rates were increased by 10% in 2016 and then 5% every other year afterthat.
This is not a totally unrealistic scenario and circumstances could bringsomething like it about. For example, while you are not bundled with the ISP products, the fact that you will be losing cable customers might drag down ISPsales over time. This could certainly be understood if a lot of the people wholeave move the Comcast bundle rather than drop from buying cable. And sothere actually might be a worse scenario than the one I have painted here, whichwould be that the ISPs have trouble holding onto customers as Click! keepslosing cable customers.
B. Projecting Expenses
I made several adjustments to expenses as part of future projections, as follows:

7/21/2019 8. Draft Report 051013
http://slidepdf.com/reader/full/8-draft-report-051013 30/58
CCG Consulting LLC
10-Year Strategic Business Plan for Click!
Page | 29
“DRAFT” “confidential – do not disclose outside of Click! Network”
• Labor Adjustments. As the number of customers and new installations change therewill be changes in the numbers of employee positions that are related to thosefunctions. I looked at the following positions: Installers, Installer Supervisor Assistant,Cable Customer Care, Converter Inventory Technicians, and Wholesale CustomerSupport. The adjustments made for each scenario are as follows:
o
Status Quo Scenario. I made the following adjustments: Installers. The number of installers needed increases by one for 2014,
2015 and 2016. Then all three positions are eliminated for 2017, but oneextra hired for 2018. It’s a net increase over time of one new installeradded. I would imagine that until around 2017 that you would do thiswith temporary workers and not hire several new employees that areonly needed for a few years.
Customer Care Reps. I have shown the company eliminating a customercare rep in seven of the ten years of the projection.
Converter Tech. I show the business eliminating one converter tech in2016.
Wholesale Support Reps. I show a net addition of one new rep in 2016due to adding more ISP customers. In total this is a decrease of six employees over ten years, mostly due to
the drop in cable TV customers. But some of that drop is offset by anincrease in ISP customers.
o Optimistic Scenario. I made the following adjustments: Installers. The number of installers needed increases by one for 2014,
2015 and 2016. Then the company eliminates an installer in 2017 and2021.
Customer Care Reps. I have shown the company eliminating fourcustomer care reps during the forecast period.
Converter Tech. I show the business eliminating one converter tech in2018. Wholesale Support Reps. I show a net addition of one new rep in 2016
due to adding more ISP customers. Overall this is a net decrease in three employees over ten years.
o Pessimistic Scenario. I made the following adjustments: Installers. The number of installers decreases by eight over the ten year
period. Installer Supervisor Assistant. I eliminate one Installer Supervisor
Assistant in 2019. Customer Care Reps. I have shown the company eliminating eleven
customer care reps during the ten year forecast. Converter Tech. I show the business eliminating one converter tech in
2016 and a second one in 2020. Overall this is a net decrease of 22 employees during the ten years.

7/21/2019 8. Draft Report 051013
http://slidepdf.com/reader/full/8-draft-report-051013 31/58
CCG Consulting LLC
10-Year Strategic Business Plan for Click!
Page | 30
“DRAFT” “confidential – do not disclose outside of Click! Network”
• Marketing Costs. Even though the predictions all show sales dropping over time atvarious speeds, I didn’t make any adjustment to marketing expenses. I think the fullcurrent marketing effort will be needed to achieve the sales predicted in the model.
• Taxes. The business pays various taxes based upon the revenues of the business. In
each scenario these taxes were increased and decreased each year in a ratio based uponthe increase or decrease of the appropriate revenues.
• Inflation. Most other expense were increased by a 2.5% annual change in the rate ofinflation. Obviously inflation could be higher or lower than assumed in the model. Ifinflation is much faster than in the model that the Company would counter this byraising some rates to compensate.
C. Projecting Capital
I used the capital budget as proposed by the company. For the most part this budget is modest
and includes the cost of maintenance. It does not include any major upgrades, but someupgrades that will be needed just to keep the system running.
However, in the pessimistic version it is likely that the capital budget would decrease some justdue to losing most cable TV customers. However, it’s going to be hard to pull the plug onkeeping the headend and TV related assets operating until such point that the company woulddecide it’s better to get out of the cable business altogether. So in reality, if the pessimisticscenario materializes these might still be reasonable capital budgets.
D. Business Plan Results
Following is a summary of the results of the business model.
Cable Customers
This is the predicted number of cable customers for each scenario, by year.
Status Optimistic Pessimistic
Quo Scenario Scenario
2013 20,925 20,925 20,925
2014 19,492 19,805 19,332
2015 18,145 18,951 17,673
2016 16,874 18,262 15,9542017 15,672 17,668 14,183
2018 14,532 17,116 12,369
2019 13,447 16,569 10,521
2020 12,412 16,002 8,644

7/21/2019 8. Draft Report 051013
http://slidepdf.com/reader/full/8-draft-report-051013 32/58
CCG Consulting LLC
10-Year Strategic Business Plan for Click!
Page | 31
“DRAFT” “confidential – do not disclose outside of Click! Network”
2021 11,425 15,394 6,746
2022 10,483 14,732 4,831
ISP Customers
This is the predicted number of ISP customers for each scenario, by year.
Status Optimistic Pessimistic
Quo Scenario Scenario
2013 19,357 19,357 19,357
2014 20,894 20,894 20,161
2015 22,535 22,535 20,666
2016 24,256 24,256 20,940
2017 24,446 24,655 20,928
2018 24,791 25,358 20,705
2019 25,252 26,292 20,331
2020 25,802 27,399 19,8512021 26,419 28,639 19,302
2022 27,087 29,979 18,711
Revenues
This is the predicted total of all revenues.
Status Optimistic Pessimistic
Quo Scenario Scenario
2013 26,698,343 26,698,343 26,698,343
2014 27,459,842 27,611,467 27,276,9752015 27,634,118 28,212,747 26,924,463
2016 27,988,185 29,189,187 27,071,378
2017 27,988,013 29,975,596 26,066,315
2018 28,137,809 31,055,864 25,011,214
2019 27,939,955 31,871,966 23,714,800
2020 28,159,970 33,166,541 22,182,508
2021 27,974,576 34,042,620 20,417,458
2022 28,234,496 35,368,881 18,420,235
Total 278,215,306 307,193,211 243,783,688
Cash Expenses
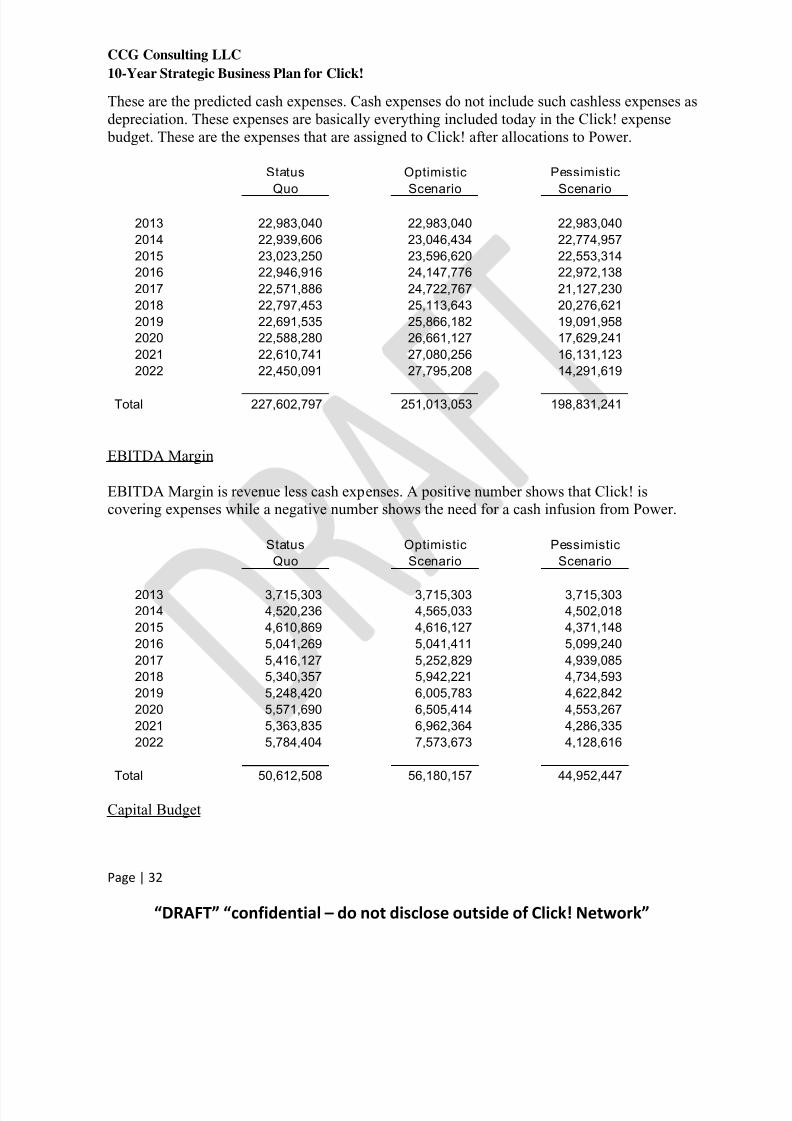
7/21/2019 8. Draft Report 051013
http://slidepdf.com/reader/full/8-draft-report-051013 33/58
CCG Consulting LLC
10-Year Strategic Business Plan for Click!
Page | 32
“DRAFT” “confidential – do not disclose outside of Click! Network”
These are the predicted cash expenses. Cash expenses do not include such cashless expenses asdepreciation. These expenses are basically everything included today in the Click! expense budget. These are the expenses that are assigned to Click! after allocations to Power.
Status Optimistic Pessimistic
Quo Scenario Scenario
2013 22,983,040 22,983,040 22,983,040
2014 22,939,606 23,046,434 22,774,957
2015 23,023,250 23,596,620 22,553,314
2016 22,946,916 24,147,776 22,972,138
2017 22,571,886 24,722,767 21,127,230
2018 22,797,453 25,113,643 20,276,621
2019 22,691,535 25,866,182 19,091,958
2020 22,588,280 26,661,127 17,629,241
2021 22,610,741 27,080,256 16,131,123
2022 22,450,091 27,795,208 14,291,619
Total 227,602,797 251,013,053 198,831,241
EBITDA Margin
EBITDA Margin is revenue less cash expenses. A positive number shows that Click! iscovering expenses while a negative number shows the need for a cash infusion from Power.
Status Optimistic Pessimistic
Quo Scenario Scenario
2013 3,715,303 3,715,303 3,715,303
2014 4,520,236 4,565,033 4,502,018
2015 4,610,869 4,616,127 4,371,148
2016 5,041,269 5,041,411 5,099,240
2017 5,416,127 5,252,829 4,939,085
2018 5,340,357 5,942,221 4,734,593
2019 5,248,420 6,005,783 4,622,842
2020 5,571,690 6,505,414 4,553,267
2021 5,363,835 6,962,364 4,286,335
2022 5,784,404 7,573,673 4,128,616
Total 50,612,508 56,180,157 44,952,447
Capital Budget

7/21/2019 8. Draft Report 051013
http://slidepdf.com/reader/full/8-draft-report-051013 34/58
CCG Consulting LLC
10-Year Strategic Business Plan for Click!
Page | 33
“DRAFT” “confidential – do not disclose outside of Click! Network”
The capital budget is the same for all three scenarios. This is the amount Click! is predicted tospend each year to keep the network operational and to add customers. However, it is likelythat the spending on capital would decrease somewhat if the company was to lose greaternumbers of customers. So, if anything, this forecast is a little high.
Status Optimistic PessimisticQuo Scenario Scenario
2013 2,376,000 2,376,000 2,376,000
2014 2,435,400 2,435,400 2,435,400
2015 2,610,803 2,610,803 2,610,803
2016 2,676,073 2,676,073 2,676,073
2017 3,327,996 3,327,996 3,327,996
2018 3,411,196 3,411,196 3,411,196
2019 2,963,017 2,963,017 2,963,017
2020 3,037,092 3,037,092 3,037,092
2021 3,326,240 3,326,240 3,326,240
2022 3,409,396 3,409,396 3,409,396
Total 29,573,213 29,573,213 29,573,213
Operating Cash Generated
A positive figure means that Click! is covering all expenses and capital and is generatingexcess cash. A negative number implies the need for a cash infusion from Power.
Status Optimistic Pessimistic
Quo Scenario Scenario
2013 1,339,303 1,339,303 1,339,303
2014 2,084,836 2,129,633 2,066,618
2015 2,000,065 2,005,324 1,760,345
2016 2,365,195 2,365,338 2,423,167
2017 2,088,131 1,924,833 1,611,089
2018 1,929,161 2,531,025 1,323,397
2019 2,285,403 3,042,767 1,659,826
2020 2,534,598 3,468,322 1,516,175
2021 2,037,595 3,636,124 960,095
2022 2,375,009 4,164,277 719,220
Total 21,039,296 26,606,945 15,379,235
Internal Debt

7/21/2019 8. Draft Report 051013
http://slidepdf.com/reader/full/8-draft-report-051013 35/58
CCG Consulting LLC
10-Year Strategic Business Plan for Click!
Page | 34
“DRAFT” “confidential – do not disclose outside of Click! Network”
This the internal debt payments currently calculated for Click! to repay the cost to build theoriginal network. To the extent that any of these scenarios show a cash requirement fromPower, then these amounts would go up a little.
Status Optimistic Pessimistic
Quo Scenario Scenario
2013 1,967,787 1,967,787 1,967,787
2014 1,967,787 1,967,787 1,967,787
2015 1,967,787 1,967,787 1,967,787
2016 1,967,787 1,967,787 1,967,787
2017 1,967,787 1,967,787 1,967,787
2018 1,967,787 1,967,787 1,967,787
2019 1,967,787 1,967,787 1,967,787
2020 1,967,787 1,967,787 1,967,787
2021 1,967,787 1,967,787 1,967,787
2022 1,967,787 1,967,787 1,967,787
Total 19,677,870 19,677,870 19,677,870
Net Cash Generated
This is the bottom line cash generated by the business, assuming that Click! makes the internaldebt payments. If there is a negative number that is not quite as high as the debt paymentslisted above, it would mean that Click! was unable to make a debt payment.
Status Optimistic Pessimistic
Quo Scenario Scenario
2013 (628,484) (628,484) (628,484)
2014 117,049 161,846 98,831
2015 32,278 37,537 (207,442)
2016 397,408 397,451 455,380
2017 120,344 (42,954) (356,698)
2018 (38,626) 563,238 (644,390)
2019 317,616 1,074,980 (307,961)
2020 566,811 1,500,535 (451,612)
2021 69,808 1,668,337 (1,007,692)
2022 407,222 2,196,490 (1,248,567)
Total 1,361,426 6,929,075 (4,298,635)
E. Comparing Scenarios

7/21/2019 8. Draft Report 051013
http://slidepdf.com/reader/full/8-draft-report-051013 36/58
CCG Consulting LLC
10-Year Strategic Business Plan for Click!
Page | 35
“DRAFT” “confidential – do not disclose outside of Click! Network”
Overall Observations. Note that some of my observations here include the knowledge I gained by looking at profits by business line, which is discussed in the next section of the report. Myconclusions from this analysis are as follows:
• The cable TV business is already losing money and is dragging down the performance
at Click! and it will eventually pull the company back under water. The real unknownwith Click! is not that you are going to lose cable customers over time, but rather howquickly or slowly that will occur.
• It is possible through really good data sales to keep the company positive, even whilethe cable business continues to lose customers.
• As the company loses cable customers it is going to be really important that you cutdown on the number of employees to match the cut in customers. This is going to be particular important for customer service reps, but there are other positions that are alsosensitive to changes in customer numbers. The cuts in positions are important to keep asolid bottom line.
• A corollary to the first point is that if data sales turn out to be lower than hoped for with
Plan B that the business could go downhill somewhat quickly.• One thing that I have not modeled is if the industry implodes. There are industry
experts that predict that all of the factors hitting the industry could come together in the perfect storm to undo the cable industry in the same way that iTunes undid the musicindustry. But most experts see a gradual falling off of cable that is more like what hashappened to telephone voice lines over the last decade. Nationwide somewhere like halfof all houses still have voice lines even though there are cheaper alternatives on theweb.
• One of the biggest factors driving all of the scenarios is future cable rate increases. Theforecast assume a 10% increase in cable rates in 2014 and then 5.5% per yearthereafter. However, the whole industry is starting to get pushback on cable rates as
being unaffordable, and the generally feeling is that as rates start going up that moreand more households will be pushed into finding an alternative. And this is going toaffect Comcast as much as it does Click! Click! is going to be at parity by 2014 withthe rates in surrounding communities and with Comcast and will no longer have any price advantage. From that point forward it is doubtful that you are ever going to wantto raise rates more than Comcast does, and so whatever they do will become a cap foryour rates. And so if they decide to trim back rate increases in the future, then Click!will have to do the same and will not perform as well as predicted by any of thesemodels. Below I have quantified the effect of changing the annual cable rate increase by 1%.
Following are the results of the three scenarios:• The Status Quo scenario does okay over ten years. It hovers just over and under a
breakeven scenario each year and overall makes $1.4 million over the ten years. Thisscenario assumes that Click! will eliminate a net of six employees during the ten yearsas cable customers drop. I say net employees because the model assumes that the
7/21/2019 8. Draft Report 051013
http://slidepdf.com/reader/full/8-draft-report-051013 37/58
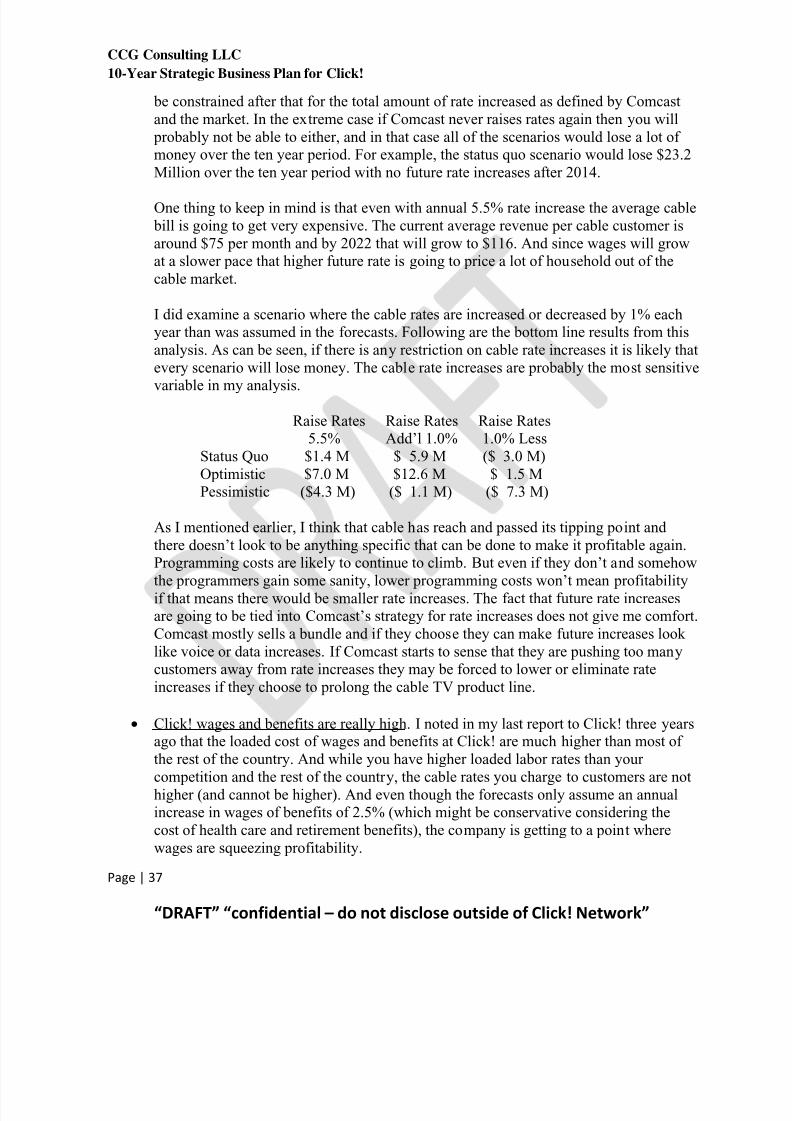
7/21/2019 8. Draft Report 051013
http://slidepdf.com/reader/full/8-draft-report-051013 38/58
CCG Consulting LLC
10-Year Strategic Business Plan for Click!
Page | 37
“DRAFT” “confidential – do not disclose outside of Click! Network”
be constrained after that for the total amount of rate increased as defined by Comcastand the market. In the extreme case if Comcast never raises rates again then you will probably not be able to either, and in that case all of the scenarios would lose a lot ofmoney over the ten year period. For example, the status quo scenario would lose $23.2Million over the ten year period with no future rate increases after 2014.
One thing to keep in mind is that even with annual 5.5% rate increase the average cable bill is going to get very expensive. The current average revenue per cable customer isaround $75 per month and by 2022 that will grow to $116. And since wages will growat a slower pace that higher future rate is going to price a lot of household out of thecable market.
I did examine a scenario where the cable rates are increased or decreased by 1% eachyear than was assumed in the forecasts. Following are the bottom line results from thisanalysis. As can be seen, if there is any restriction on cable rate increases it is likely thatevery scenario will lose money. The cable rate increases are probably the most sensitive
variable in my analysis.
Raise Rates Raise Rates Raise Rates5.5% Add’l 1.0% 1.0% Less
Status Quo $1.4 M $ 5.9 M ($ 3.0 M)Optimistic $7.0 M $12.6 M $ 1.5 MPessimistic ($4.3 M) ($ 1.1 M) ($ 7.3 M)
As I mentioned earlier, I think that cable has reach and passed its tipping point andthere doesn’t look to be anything specific that can be done to make it profitable again.Programming costs are likely to continue to climb. But even if they don’t and somehowthe programmers gain some sanity, lower programming costs won’t mean profitabilityif that means there would be smaller rate increases. The fact that future rate increasesare going to be tied into Comcast’s strategy for rate increases does not give me comfort.Comcast mostly sells a bundle and if they choose they can make future increases looklike voice or data increases. If Comcast starts to sense that they are pushing too manycustomers away from rate increases they may be forced to lower or eliminate rateincreases if they choose to prolong the cable TV product line.
• Click! wages and benefits are really high. I noted in my last report to Click! three yearsago that the loaded cost of wages and benefits at Click! are much higher than most ofthe rest of the country. And while you have higher loaded labor rates than yourcompetition and the rest of the country, the cable rates you charge to customers are nothigher (and cannot be higher). And even though the forecasts only assume an annualincrease in wages of benefits of 2.5% (which might be conservative considering thecost of health care and retirement benefits), the company is getting to a point wherewages are squeezing profitability.

7/21/2019 8. Draft Report 051013
http://slidepdf.com/reader/full/8-draft-report-051013 39/58
CCG Consulting LLC
10-Year Strategic Business Plan for Click!
Page | 38
“DRAFT” “confidential – do not disclose outside of Click! Network”
Because if this it is really important for Click! to eliminate employees as the number ofcable customers drop. The workload of some employees such as customer service repsis very much dependent upon the number of cable customers, and so as your forecastcable drops each year you need to look hard at matching those drops by eliminating
employees. In the Pessimistic scenario I have assumed that the business wouldeliminate 22 employees over the ten years while the status quo model eliminates six positions and the optimistic scenario eliminates only 3.
This does raise the question if Click! could become more viable by cutting people. Theanswer to some degree is always yes, and every organization can find a way to cut backa few people if needed. Following is the impact on the business of cutting $1 M a yearof labor and benefit cost starting in 2014. Depending upon who would be eliminatedthat would mean a cut of five to seven employees. As can be seen, this would result inmaking the Status Quo scenario profitable and even would almost make the Pessimisticscenario profitable. I am not necessarily recommending cutting people, but it has been
my experience that almost any company can absorb a 5% to 10% staff cut and ifmanagement wanted to do this it could be made to work. This is one of the easiest waysto achieve better results. It really is going to be impossible to predict the future abilityto raise rates, but spending is something totally under management control. And to getthe impact shown below the cuts would need to be soon since the benefit decreases thelonger it is delayed.
Base Study Cut WagesStatus Quo $1.4 M $ 6.3 MOptimistic $7.0 M $11.9 MPessimistic ($4.3 M) $ 0.7 M
• Inflation Matters Somewhat. In the models I assumed an average inflation rate for mostexpenses, including wages and salaries at 2.5%. Below shows the impact of varyinginflation upward and downward to 2% and 3%. Obviously inflation is something out ofthe company’s control. Most economists I have read see inflation staying low for thenext three to five years but nobody has a crystal ball. For instance if world politics goinsane inflation could come roaring back. I am old enough to have lived with thedouble digit inflation of the early 70’s and it is always possible that inflation couldreturn. It’s also possible for a stagnant economy to remain and inflation could slowdown or even stop again. That actually would be somewhat harmful to the company because it would increase the pressure to eliminate of hold back on rate increases. Andrate increases have a bigger impact on the business than inflation.
Inflation Inflation InflationAt 2.5% At 2% At 3%
Status Quo $1.5 M $3.5 M ($0.9 M)

7/21/2019 8. Draft Report 051013
http://slidepdf.com/reader/full/8-draft-report-051013 40/58
CCG Consulting LLC
10-Year Strategic Business Plan for Click!
Page | 39
“DRAFT” “confidential – do not disclose outside of Click! Network”
Optimistic $7.0 M $9.2 M $4.6 MPessimistic ($4.3 M) ($2.4 M) ($6.2 M)
Obviously the cable industry as a whole is going to have an issue if inflation ever risesagain to high levels. To some degree the industry faces a perception issue when the
rates reach certain levels. For instance, I would foresee a lot of push back whenExpanded Basic packages reach $100 per month.
But inflation matters because of the trend of ongoing 7% rate increases in the industry.Will cable companies want to raise rates by 7% per year if inflation gets higher orwould they absorb some of the costs rather than drive away customers? That is an issuethat is going to hit the whole industry at about the same time. If a national consensusgrows that cable rates are unaffordable, then people might drop off cable in droves inthe same manner that they have dropped landline telephones.
• ISP Rate Increases. In the forecasts I’ve made the assumption that if the ISPs meet Plan
B, meaning add 6,000 customers that you would not raise rates. But if they don’t meetthat you would raise rates by 10%. But what happens after Plan B? My model hasassumed that there is a 5% rate increase every other year after the end of Plan B. Buthere is the impact if you instead were to raise rates 5% every year after plan B:
5% IncreaseBase Study Each Year
Status Quo $1.4 M $ 6.3 MOptimistic $7.0 M $12.1 MPessimistic ($4.3 M) ($ 2.2 M)
•
Programming Expenses are a Big Drag on the Business. The forecasts all assume that programming expenses will increase by 7% per year, which has been the averageincrease over the past 5 – 7 years. However, a small change in that rate of growth issignificant to the bottom line. Following is the impact on the business if programminginstead grows by 6% or 8 % per year.
Grows GrowsBase At 8% At 6%
Status Quo $1.4 M ($2.8 M) $ 5.4 MOptimistic $7.0 M $1.7 M $11.9 MPessimistic ($4.3 M) ($7.5 M) ($ 1.2 M)
• Combining All of the Variables. Following is the impact if everything breaks the bestfor the company. Here is the combined impact from having a 2% rate of inflation, ofhaving programming costs grow by 6%, the ability to raise cable rates by 1% more per

7/21/2019 8. Draft Report 051013
http://slidepdf.com/reader/full/8-draft-report-051013 41/58
CCG Consulting LLC
10-Year Strategic Business Plan for Click!
Page | 40
“DRAFT” “confidential – do not disclose outside of Click! Network”
year, the ability to raise ISP rates 5% each year after the end of Plan B, and somehowcutting $1M from salaries from Click! in 2014:
Base Model Best FutureStatus Quo $1.5 M $21.9 M
Optimistic $7.0 M $29.9 MPessimistic ($4.3 M) $10.8 M
I am serious doubts that this scenario is possible. In order to raise cable rates by morethan 5.5% per year Comcast is going to have to be ignoring rate fatigue and raisingrates aggressively forever. Click! may not have the stomach for cutting 5 – 7 employeesfrom the cable staff. The programmers would have to get less greedy to agree to slowdown programming rate increase. However, these upward limit numbers do show thatthe results could be better than I have forecast, but probably not anywhere close tothese best possible future numbers.
On the other hand, everything could go worse than I have predicted. Following is the bottom line cash results if things go worse as planned. This would mean that programming costs would increase by 8% per year. Inflation would be at 3%. Comcastwould slow down rate increases and future increases would be at 4.5% per years. AndClick! would elect to not eliminate $1M in salary and benefits in 2014. This scenario,however, does not include the effect of any huge negative event such as somebody building a competing fiber network.
Base Model Worst FutureStatus Quo $1.5 M ($ 9.4 M)Optimistic $7.0 M ($ 6.0 M)Pessimistic ($4.3 M) ($14.6 M)
And so, while the Status Quo model is predicting that the company will come close to acash breakeven over ten years, it is possible for the customers predicted by that scenarioto come true but the results to be considerably higher or lower than predicted by thespecific variables predicted by that forecast. The odds are that the results will be muchcloser to the forecasts than to either of these two extremes, but the whole range of possibilities are possible under the right (or wrong) conditions.
Conclusions
The company has already crossed the tipping point in terms of the cable TV business. That business line is already under water and only a really fortuitous set of market conditions couldmake it positive. I don’t see any scenario where the company can increase cable customers andthe difference between the scenarios is really the speed at which the cable customers will drop.

7/21/2019 8. Draft Report 051013
http://slidepdf.com/reader/full/8-draft-report-051013 42/58
CCG Consulting LLC
10-Year Strategic Business Plan for Click!
Page | 41
“DRAFT” “confidential – do not disclose outside of Click! Network”
The business is very dependent on the ability to raise cable rates each year in the future. Andnow that the business is getting to market rates, the ability of the business to raise rates is goingto depend upon what Comcast does. Comcast has been very aggressively in raising rates
nationwide but there is probably going to come some point in time where they will seeincreased backlash against raising rates too much. And so while these forecasts show thecompany either making money or not losing too much, this one variable could have a hugeimpact on those predicted results. If Comcast slows down rate increases then Click! couldexperience significant losses. And since rates are getting really high for the average family, andsince the cord-cutters are growing, it would not be a bold prediction that sometime in the nextfew years that Comcast would slow down rate increases in order to keep customers and to prolong how long their cable business stays healthy.
It’s also possible that Comcast might decide to set rates below Click! rates. If they do that youwill be hard-pressed to raise rates again at all. As Click! gets rates closer to surrounding market
rates you have given Comcast more options in how to compete with you.
About the only expense reduction that could materially affect profitability would be toarbitrarily cut employees in 2014 or soon thereafter. Above I have calculated the impact on the bottom line of cutting $1 million of wages and benefits which equates to 6 – 8 positions. Thatwould be a drastic manpower reduction, but I believe it is something that you could absorb andstill keep the company performing. I know many other companies that run with leaner staffingthan Click!.
There are scenarios that could quickly make the results worse than my forecast. The two mostimportant variables are cable rate increases and programming expenses. If the business findsitself unable to raise rates as much as predicted because of Comcast, and if programming costsincrease faster than predicted, the business could be much worse off than predicted by the basestudies.
Click! and Utility Management have some choices to make now:1. You are going to have to decide if it is okay that cable TV is already losing money each
year. This means that cable is being subsidized by the ISP and broadband businesses.And before the rate increases of recent times the losses used to be much larger. Manycompanies have products that the use as loss leaders. These are products they sell thatthen tend to pull in sales of related products that are very profitable. But the businesslines at Click! are not closely related. While the ISPs probably have any easier timeselling a data product to somebody who has a Click! cable product, the two productsare not bundled or tethered in any way.
2. If subsidizing cable is not acceptable to management there are a few changes that could be made that would lower future losses somewhat. These include:

7/21/2019 8. Draft Report 051013
http://slidepdf.com/reader/full/8-draft-report-051013 43/58
CCG Consulting LLC
10-Year Strategic Business Plan for Click!
Page | 42
“DRAFT” “confidential – do not disclose outside of Click! Network”
a. Aggressively cutting staff soon. My analysis shows that eliminating $1M ormore annually of wages and associated benefits would significantly improve the profitability of Click!, but also of the cable TV product line.
b. Announce to the ISPs that after the end of Plan B that you are going to raisedata rates every year thereafter by something like 5%. I know that you have
already told them that if they can meet plan B that you won’t raise rates for thenext few years. However, the long term viability of the company is going torequire greater revenues from some source.
c. Find some way to really improve the broadband business. I know of smallerCities than Tacoma who have sold greater amounts of data to CLECS, wirelesscarriers and other wholesalers. Of course, they did not have the sameretail/wholesale structure as Click! and many of them own more fiber thanClick!. But another $1 million or more annually from that business would makea big difference to the 10-year bottom line.
d. Since your success is largely going to depend upon the ISPs you might look atways to help them do better. In the past they have asked for direct marketing
assistance but if I recall that did not result in noticeably better results. Perhapsinstead you could so something like pay for CCG to go provide a privatedetailed analysis for each firm to help them do better. Anyway, there might besome creative ways for Click! to help the ISPs that would bring more bottomline return to Click! than the cost of the effort.
3. In the long run the company is going to lose cable customers. And in fact, I can’t seeany circumstances where those losses don’t come faster and faster over time, and soalmost any scenario I picture eventually results in Click! being out of the cable TV business. And as the Pessimistic scenario shows, as the number of customers get lowyou are going to have bigger and bigger losses. It is not too early to determine yourlong-term and short-term strategy for dealing with this eventuality. There are a numberof different strategies you could employ, and I have proposed some additional modelingfor Phase 2 of my engagement that would quantify some of these scenarios. But someof your tactics you might choose could be as follows:
a. Sell Now. Look at exiting the business and sell it to somebody else. This wouldrequire an updated valuation, but the valuation I did a few years ago showedthat the value is not going to be very close to the investment made in thenetwork.
b. Sell the Cable Business. Somehow get out of the cable business and continue tooffer wholesale data. Perhaps you could somehow sell the cable customers andthe headend to the ISPs and then charge them a wholesale rate for offering cableon the network. In concept this could work but needs more thought andmodeling. The biggest concern I have about the idea is the ability of the ISPs tosomehow pay you much of anything for the cable customers, and so it might benecessary to almost give them away if you want out of the business.

7/21/2019 8. Draft Report 051013
http://slidepdf.com/reader/full/8-draft-report-051013 44/58
CCG Consulting LLC
10-Year Strategic Business Plan for Click!
Page | 43
“DRAFT” “confidential – do not disclose outside of Click! Network”
c. Go Retail. A few years ago I suggested that Click! go into the retail businessand that you jump start the business by buying the data customers from one ormore of the ISPs. I know the Board rejected this idea, but it is still a viableoption. This is not as good of an idea now as it was three years ago, mostly dueto the fact that Click! has lost cable customers each of the past three years. But
going retail would let you more directly compete with Comcast, who is the primary cause for your current customer losses. The major economic value ofgoing retail is that you would pick up all of the profits from selling data tocustomers rather than a little profit that comes from selling wholesale dataconnections. This kind of shift could extend the viability of the network forquite some time into the future. In effect you would be subsidizing the slowdeath of cable TV with higher data revenues. I have never looked at a scenariowhere you eventually end up with only data customers to see if it is viable. Iwould expect that there is a viable business in the long-run of offering only dataservices while it is going to be much harder to make the same case for onlyoffering wholesale data connections.
d. Keep the Cable Business Going as Long as Possible. Try to extend the life ofthe cable business as long as possible. This would mean getting very aggressivenow in terms of reducing staff, and it means staying very aggressive with rateincreases. Doing that is probably going to drive more customers away sooner, but the ones who remain would be paying more. But this scenario still has the potential to lose a lot of money as cable slowly dies. This is pretty much thestatus quo business plan which could be improved some by eliminating staffnow and being more aggressive on rate increases.
e. Push Cable to Die Earlier. Let cable die a natural death and maybe even push italong the way. This would mean eliminating a lot of staff. Certainly before pushing this idea we need to do an analysis to show what the company lookslike without any cable TV offering.
f. Business Tweaks. Look at some business tweaks. For example, is there a lifeline product that could produce a little revenue for both Click! and the ISPs thatwould drive more profit and help extend the life of the business? Eliminate atleast some jobs. Do as many little improvements as you can to extend theviability of the cable business.
F. Why Click!?
It looks like the cable product line is going to die, and the only question is how long it is goingto take to do so. This eventuality should be pushing Utility Management and the Board to askthe question: Why Click?
A few years ago I looked at some of the early years of Click! and looked to see what themotivation for the Utility to start Click!. There were several clear initial goals in mind:
7/21/2019 8. Draft Report 051013
http://slidepdf.com/reader/full/8-draft-report-051013 45/58
CCG Consulting LLC
10-Year Strategic Business Plan for Click!
Page | 44
“DRAFT” “confidential – do not disclose outside of Click! Network”
• Find other uses for the network to reduce the cost to the Utility of operating a network.
• Get into the cable business to promote competition in the City. At the time the cable provider was far less competent than Comcast is today.
• Help solve the digital divide and bring Internet access into more lower-income homes.
• Promote economic development using the advantages of the network.
As an outside observer I think you met the first two goals. I can’t see that much as ever done tomeet the last two goals.
Certainly Click! brought significant savings to customers through lower cable rates andthrough lower data rates through the ISPs. When I first came to the City the rates in Tacomafor everybody, including Comcast were 35% to 40% lower than the rates in surroundingcommunities. And so Click! was able to save a lot of money for customers which then infusesa lot of money back into the local economy. However, the business lost money because of thelow rates. In effect, the Utility was paying for some of the savings passed on to customers.Through rate increases and efficiencies you have largely eliminated the subsidies, but in doing
so you have also effectively eliminated the customer savings.
And so now the utility is operating a business today that may not be meeting any of the originalgoals. It would take a detailed analysis to see if the Utility could meet its transport needs on itsown more cheaply without Click! But it is certainly possible that it could do so. Certainly thereis still some debate to be had about whether the current allocations of expenses between theUtility and Click! are set fairly, and it could be that the Utility is still subsidizing Click!through the allocation process.
And so I think you have reached the point in the business where it is time for management tohave the philosophical discussion of what they are hoping to accomplish with Click!.
Otherwise, I am not certain how you will be able to choose between the alternatives I haveoutlined above.
Every business should have goals and a vision of what constitutes success, and I am not surethat there is such a vision for Click! I know your short term goal was to eliminate the obviouscash subsidies from the Utility and that has largely been accomplished. But my analysis showsthat over time those subsidies are going to be required again, possibly larger than ever by thetime the next decade is over.
There are certainly things that Click! can still do towards solving the digital divide and promoting more economic development in the City. So perhaps meeting those two goals could
be a reason to keep operating Click!. Certainly there are also new goals that Click! couldundertake and the business should not be constrained by the goals that were established backwhen the business began.
7/21/2019 8. Draft Report 051013
http://slidepdf.com/reader/full/8-draft-report-051013 46/58
7/21/2019 8. Draft Report 051013
http://slidepdf.com/reader/full/8-draft-report-051013 47/58
CCG Consulting LLC
10-Year Strategic Business Plan for Click!
Page | 46
“DRAFT” “confidential – do not disclose outside of Click! Network”
disruptive is if some networks see a better business model from going onto theweb live. This industry is comprised of two kinds of networks. There are the behemoths who charge a lot for their programming and who are considered tohave unique and valuable programming such as Disney, ESPN and other sportsnetwork, the major broadcast networks, HBO, etc. But there are also a number
of smaller networks who charge very little to be carried on cable systems. Someor even many of these smaller networks might find it financially beneficial tomake their programming available for a fee to Internet subscribers. There couldcome a tipping point where most households find enough web programming tosatisfy their entertainment needs and who are willing to then drop their $70 -$100 cable plans.
d. Rate Fatigue. The average cable customer at Click! pays $75 per month for your programming. Even with the modest 5.5% rate increases built into the analysisthis will grow to $116 per customer in ten years. At each higher dollar amountthere are households who will drop cable for economic purposes.
e. Web Program Consolidators. Today a consumer has to be somewhat savvy to
know where to find the best free programming. But there are some fee serviceslike NetFlix and Hulu who make it easier for customers to find what they wantto watch. And one would expect in the future that there will be others who finda market in making it easier for
f. A la carte and subscription web programming. Consumers have been trained byiTunes to pay small fees to get what they really want to watch. I expect moreand more quality programming to make it to the web and to be priced per view.People who prefer this model will drop the subscription cable and move to theirown version of a la carte. There are also some major subscription servicesoffering content such as NetFlix, Hulu and the very recently announcedYouTube. Combining modest subscriptions like NetFlix with subscription programming available elsewhere can become a pretty potent combination of programming.
2. Industry Reaches Rate Saturation Point. The whole industry could reach a place in afew years where they find it is detrimental to raise cable rates. Until now, the number ofconsumers who would leave after getting a rate increase has been minor. And so thecable companies have made significant rate increases every year knowing that theywould get a huge amount of new revenue from the increase. But this could change andthe industry could reach an equilibrium where a cable company could lose money aftera rate increase if that drives enough customers to leave.
3. Comcast Raises Data Rates instead of Cable Rates. I believe that all of the large cablecompanies realize that their future is in data. They will continue to try to make moneyfrom cable as long as they can. But I fully expect cable companies to start to raise datarates each year to get prepared for the time when that will be their primary product, oreven their only product. The large cable companies have bundles and they have a lot of
7/21/2019 8. Draft Report 051013
http://slidepdf.com/reader/full/8-draft-report-051013 48/58
CCG Consulting LLC
10-Year Strategic Business Plan for Click!
Page | 47
“DRAFT” “confidential – do not disclose outside of Click! Network”
flexibility in what they say the rates are inside of the bundles. And so if the cablecompanies find that they get too much pushback from increased cable rates they mayinstead say that their rate increases are more for data than cable. This could bedevastating to Click! who competes with a single product since you would then belimited in raising cable rates. My analysis shows that raising cable rates is the most
important single variable in having future profitability. However, having Comcast raisedata rates would be pretty good for the ISPs and there would be some opportunities forClick! to raise wholesale data rates – but not nearly as much as you can raise cablerates.
4. True a la Carte Programming. There is the chance that real a la carte programmingcould become a reality where cable companies would not be locked into offering thehuge channel lineups but could instead offer smaller packages of things customers mostwant to watch. This could come about from legislation (been talk of it in Washington)or it could be the result of a change of heart by some programmers. A la carte programming could be either a blessing or a curse to Click!. It is possible that this could
result in the ability of Click! to offer 30-channel packages that make more profit thanyour large line-ups today. But it is also possible that this would be the big change thatwould move most programming to the web.
5. Cable Companies Refuse to Lose Money. Comcast is a little unusual in that they probably make money at cable today due to owning a lot of networks. But many othercable companies are in the same boat as Click! and I think a lot of them are either at a breakeven or even a loss position with cable. To the extent that a lot of major cablecompanies find themselves underwater on cable, they could be the ones that drive the big changes in the industry. For instance, one way for a cable company to get profitablewould be to cut down on the networks it carries. Cable companies who are losingmoney on cable could be the drivers of a change to a la carte programming or ofmoving programming to the web. No business or industry has any great motivation tocontinue to operate a business that loses money.

7/21/2019 8. Draft Report 051013
http://slidepdf.com/reader/full/8-draft-report-051013 49/58
CCG Consulting LLC
10-Year Strategic Business Plan for Click!
Page | 48
“DRAFT” “confidential – do not disclose outside of Click! Network”
Profitability Analysis
In this section of the report I will look at a profitability analysis by major product line. In my
analysis I separated costs into three categories – cable TV, wholesale data and
broadband/other. In this section I will describe the allocation methods I used and discuss the
results of the analysis.
A. Allocating Revenue
Allocating revenues to product lines was very straightforward since each ledger revenueaccount was directly assignable to one of the categories. The allocations were as follows:
CATV Revenue Cable TVCATV Retail Revenue Cable TVBroadband Revenue BroadbandBroadband Tax Revenue Broadband
Broadband Wholesale Revenue BroadbandBroadband Qual Revenue BroadbandCable Modem Wholesale DataMisc Revenue – Telecom Cable TVInterdepartmental Revenue - Teleco Broadband
B. Allocating Expenses
In allocating expenses I developed a number of allocation factors. The procedures I used are pretty standard in the industry when taking a broad look at allocating expenses to product lines.The alternatives to my approach would be to conduct a series of detailed time studies and other
analysis that would look at some of the operating expenses in order to allocate them moreaccurately. For example, employees who work in departments that benefit multiple productlines could keep very detailed time sheets for the functions they perform so that each of thosefunction could then be assigned to the product lines.
There are a number of issues with using detailed time studies and many companies think that inthe long run they are not much more accurate than using broader allocation factors. Some ofthe problems with relying on time studies are:
• Management tends to think that a result that uses a more detailed study methodologyis somehow more accurate, when it might not be. Click! is very typical of a telecomcompany where most of the employees in the company perform functions that benefit
most or all products. In economic terms this would mean that most of the expenses atClick! are what is referred to as joint costs. And regardless of how detailed of a timestudy one might conduct, it still becomes very arbitrary to assign a joint cost to products. As an example, how do you allocate the time spent by a technicians whovisits a home and repairs a drop wire that was knocked down by a storm. That drop

7/21/2019 8. Draft Report 051013
http://slidepdf.com/reader/full/8-draft-report-051013 50/58
CCG Consulting LLC
10-Year Strategic Business Plan for Click!
Page | 49
“DRAFT” “confidential – do not disclose outside of Click! Network”
wire could have been used for that customer to supply both cable TV service as wellas provide a wholesale data connection to an ISP. Allocating that trip is somewhatarbitrary at best.
• A study done for a short period of time, like a sample month may not represent thelonger term. The functions done within groups often change over time. There may be
seasonal factors or workload factors that change over time which might mean that theanalysis that done for a detailed time study might get out of date. Companies that usedetailed time studies to allocate costs often only update the studies every 3 – 5 years because of the major amount of work required to conduct the studies. During that period of time the actual work being performed might change to be quite differentthan what was seen during the time study sample period.
I have conducted at least 1,000 profitability analyses over the years. My experience is that the basic method I used for the Click! study produces reasonably accurate results. The method Iused was to directly assign those costs to products that are directly assignable and then to comeup with representative allocators to assign remaining costs. I have made some broad
assumptions about which expenses should use which allocators and it is possible that after thecompany assesses my choice of allocators that they could refine the study to be more accurate.And they should review the allocators. Because once the company is satisfied that theallocations are fair, these same allocations could be applied internally against future ledgers orfuture budgets to see how each product line will fare with changing expenditures.
Directly Assigned Expenses
The following expenses were directly assigned to product lines:
552300 Programming Cable TV
552300 Credit Card Fees Cable TV552400 Bandwidth Wholesale ISP552600 Whole Department Broadband553700 Whole Department Cable TV
Allocation Factors
I created the following allocation factors:
Customers (C) – Allocator based upon the customers of all three product lines usingcustomers. I weighted broadband customers with a weighting of four since these tend to be larger customers that require a little more effort than a normal customer. But thenumber of broadband customers is relatively small and this weighting doesn’t havemuch impact on the other product lines.
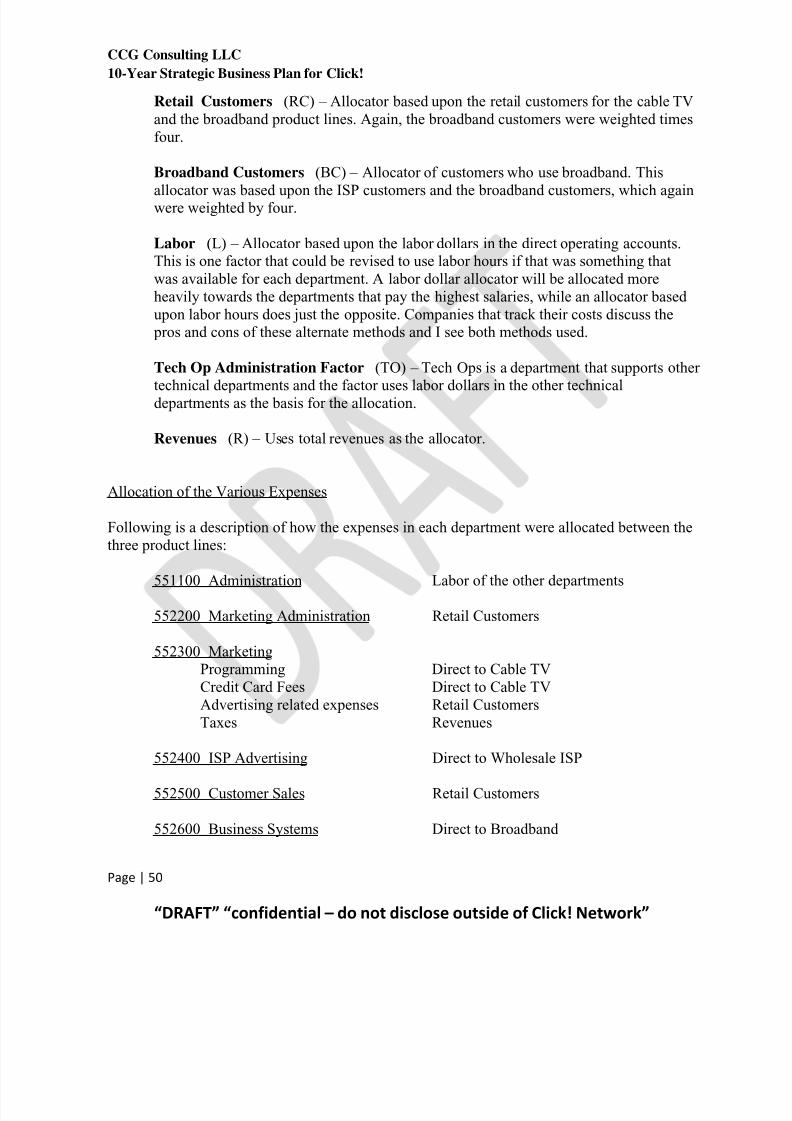
7/21/2019 8. Draft Report 051013
http://slidepdf.com/reader/full/8-draft-report-051013 51/58
CCG Consulting LLC
10-Year Strategic Business Plan for Click!
Page | 50
“DRAFT” “confidential – do not disclose outside of Click! Network”
Retail Customers (RC) – Allocator based upon the retail customers for the cable TVand the broadband product lines. Again, the broadband customers were weighted timesfour.
Broadband Customers (BC) – Allocator of customers who use broadband. This
allocator was based upon the ISP customers and the broadband customers, which againwere weighted by four.
Labor (L) – Allocator based upon the labor dollars in the direct operating accounts.This is one factor that could be revised to use labor hours if that was something thatwas available for each department. A labor dollar allocator will be allocated moreheavily towards the departments that pay the highest salaries, while an allocator basedupon labor hours does just the opposite. Companies that track their costs discuss the pros and cons of these alternate methods and I see both methods used.
Tech Op Administration Factor (TO) – Tech Ops is a department that supports other
technical departments and the factor uses labor dollars in the other technicaldepartments as the basis for the allocation.
Revenues (R) – Uses total revenues as the allocator.
Allocation of the Various Expenses
Following is a description of how the expenses in each department were allocated between thethree product lines:
551100 Administration Labor of the other departments
552200 Marketing Administration Retail Customers
552300 MarketingProgramming Direct to Cable TVCredit Card Fees Direct to Cable TVAdvertising related expenses Retail CustomersTaxes Revenues
552400 ISP Advertising Direct to Wholesale ISP
552500 Customer Sales Retail Customers
552600 Business Systems Direct to Broadband

7/21/2019 8. Draft Report 051013
http://slidepdf.com/reader/full/8-draft-report-051013 52/58
CCG Consulting LLC
10-Year Strategic Business Plan for Click!
Page | 51
“DRAFT” “confidential – do not disclose outside of Click! Network”
553200 Tech Op Admin On salaries of other technical departments
553600 Dispatch Customers
553700 Converter Inventory Direct to Cable TV
555300 Network Operations Customers
555400 Broadband Services Broadband Customers
555500 Network Engineering Customers
555600 Network Service Assurance Customers
Note that I only allocated expenses that were assigned to Click!. Anything allocated to theUtility was not allocated. So for instance, when I show that Network Service Assurance was
allocated on customers, since the cost of the whole department was allocated to the Utility nowdollars from this department were allocated to the three product lines. However, I built themodel to allow for such allocations so that we could see the impact of changing the variousallocations between Click! and the Utility.
C. Profitability Results
Beginning on the next page is a summary of the results of the profitability study. The resultsare shown by product line with the analysis following.
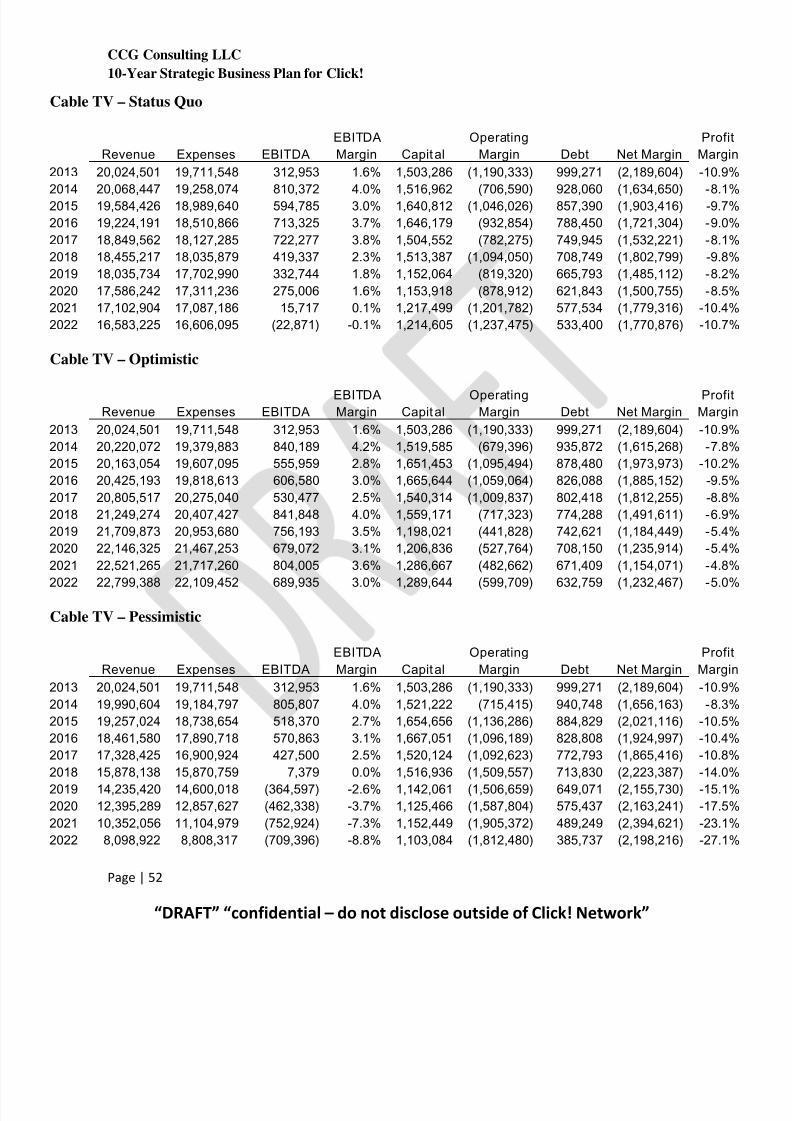
7/21/2019 8. Draft Report 051013
http://slidepdf.com/reader/full/8-draft-report-051013 53/58
CCG Consulting LLC
10-Year Strategic Business Plan for Click!
Page | 52
“DRAFT” “confidential – do not disclose outside of Click! Network”
Cable TV – Status Quo
EBITDA Operating Profit
Revenue Expenses EBITDA Margin Capital Margin Debt Net Margin Margin
2013 20,024,501 19,711,548 312,953 1.6% 1,503,286 (1,190,333) 999,271 (2,189,604) -10.9%
2014 20,068,447 19,258,074 810,372 4.0% 1,516,962 (706,590) 928,060 (1,634,650) -8.1%
2015 19,584,426 18,989,640 594,785 3.0% 1,640,812 (1,046,026) 857,390 (1,903,416) -9.7%
2016 19,224,191 18,510,866 713,325 3.7% 1,646,179 (932,854) 788,450 (1,721,304) -9.0%
2017 18,849,562 18,127,285 722,277 3.8% 1,504,552 (782,275) 749,945 (1,532,221) -8.1%
2018 18,455,217 18,035,879 419,337 2.3% 1,513,387 (1,094,050) 708,749 (1,802,799) -9.8%
2019 18,035,734 17,702,990 332,744 1.8% 1,152,064 (819,320) 665,793 (1,485,112) -8.2%
2020 17,586,242 17,311,236 275,006 1.6% 1,153,918 (878,912) 621,843 (1,500,755) -8.5%
2021 17,102,904 17,087,186 15,717 0.1% 1,217,499 (1,201,782) 577,534 (1,779,316) -10.4%
2022 16,583,225 16,606,095 (22,871) -0.1% 1,214,605 (1,237,475) 533,400 (1,770,876) -10.7%
Cable TV – Optimistic
EBITDA Operating ProfitRevenue Expenses EBITDA Margin Capital Margin Debt Net Margin Margin
2013 20,024,501 19,711,548 312,953 1.6% 1,503,286 (1,190,333) 999,271 (2,189,604) -10.9%
2014 20,220,072 19,379,883 840,189 4.2% 1,519,585 (679,396) 935,872 (1,615,268) -7.8%
2015 20,163,054 19,607,095 555,959 2.8% 1,651,453 (1,095,494) 878,480 (1,973,973) -10.2%
2016 20,425,193 19,818,613 606,580 3.0% 1,665,644 (1,059,064) 826,088 (1,885,152) -9.5%
2017 20,805,517 20,275,040 530,477 2.5% 1,540,314 (1,009,837) 802,418 (1,812,255) -8.8%
2018 21,249,274 20,407,427 841,848 4.0% 1,559,171 (717,323) 774,288 (1,491,611) -6.9%
2019 21,709,873 20,953,680 756,193 3.5% 1,198,021 (441,828) 742,621 (1,184,449) -5.4%
2020 22,146,325 21,467,253 679,072 3.1% 1,206,836 (527,764) 708,150 (1,235,914) -5.4%
2021 22,521,265 21,717,260 804,005 3.6% 1,286,667 (482,662) 671,409 (1,154,071) -4.8%
2022 22,799,388 22,109,452 689,935 3.0% 1,289,644 (599,709) 632,759 (1,232,467) -5.0%
Cable TV – Pessimistic
EBITDA Operating Profit
Revenue Expenses EBITDA Margin Capital Margin Debt Net Margin Margin
2013 20,024,501 19,711,548 312,953 1.6% 1,503,286 (1,190,333) 999,271 (2,189,604) -10.9%
2014 19,990,604 19,184,797 805,807 4.0% 1,521,222 (715,415) 940,748 (1,656,163) -8.3%
2015 19,257,024 18,738,654 518,370 2.7% 1,654,656 (1,136,286) 884,829 (2,021,116) -10.5%
2016 18,461,580 17,890,718 570,863 3.1% 1,667,051 (1,096,189) 828,808 (1,924,997) -10.4%
2017 17,328,425 16,900,924 427,500 2.5% 1,520,124 (1,092,623) 772,793 (1,865,416) -10.8%
2018 15,878,138 15,870,759 7,379 0.0% 1,516,936 (1,509,557) 713,830 (2,223,387) -14.0%
2019 14,235,420 14,600,018 (364,597) -2.6% 1,142,061 (1,506,659) 649,071 (2,155,730) -15.1%
2020 12,395,289 12,857,627 (462,338) -3.7% 1,125,466 (1,587,804) 575,437 (2,163,241) -17.5%
2021 10,352,056 11,104,979 (752,924) -7.3% 1,152,449 (1,905,372) 489,249 (2,394,621) -23.1%
2022 8,098,922 8,808,317 (709,396) -8.8% 1,103,084 (1,812,480) 385,737 (2,198,216) -27.1%
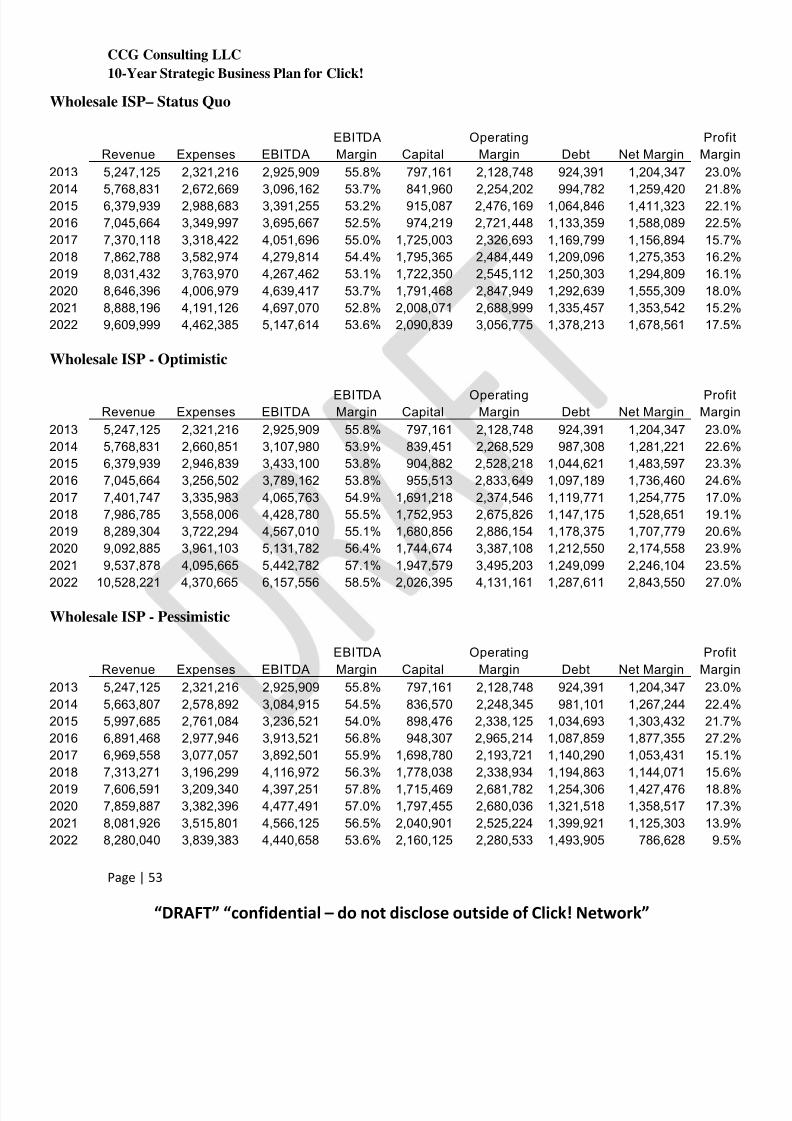
7/21/2019 8. Draft Report 051013
http://slidepdf.com/reader/full/8-draft-report-051013 54/58
CCG Consulting LLC
10-Year Strategic Business Plan for Click!
Page | 53
“DRAFT” “confidential – do not disclose outside of Click! Network”
Wholesale ISP– Status Quo
EBITDA Operating Profit
Revenue Expenses EBITDA Margin Capital Margin Debt Net Margin Margin
2013 5,247,125 2,321,216 2,925,909 55.8% 797,161 2,128,748 924,391 1,204,347 23.0%
2014 5,768,831 2,672,669 3,096,162 53.7% 841,960 2,254,202 994,782 1,259,420 21.8%
2015 6,379,939 2,988,683 3,391,255 53.2% 915,087 2,476,169 1,064,846 1,411,323 22.1%
2016 7,045,664 3,349,997 3,695,667 52.5% 974,219 2,721,448 1,133,359 1,588,089 22.5%
2017 7,370,118 3,318,422 4,051,696 55.0% 1,725,003 2,326,693 1,169,799 1,156,894 15.7%
2018 7,862,788 3,582,974 4,279,814 54.4% 1,795,365 2,484,449 1,209,096 1,275,353 16.2%
2019 8,031,432 3,763,970 4,267,462 53.1% 1,722,350 2,545,112 1,250,303 1,294,809 16.1%
2020 8,646,396 4,006,979 4,639,417 53.7% 1,791,468 2,847,949 1,292,639 1,555,309 18.0%
2021 8,888,196 4,191,126 4,697,070 52.8% 2,008,071 2,688,999 1,335,457 1,353,542 15.2%
2022 9,609,999 4,462,385 5,147,614 53.6% 2,090,839 3,056,775 1,378,213 1,678,561 17.5%
Wholesale ISP - Optimistic
EBITDA Operating ProfitRevenue Expenses EBITDA Margin Capital Margin Debt Net Margin Margin
2013 5,247,125 2,321,216 2,925,909 55.8% 797,161 2,128,748 924,391 1,204,347 23.0%
2014 5,768,831 2,660,851 3,107,980 53.9% 839,451 2,268,529 987,308 1,281,221 22.6%
2015 6,379,939 2,946,839 3,433,100 53.8% 904,882 2,528,218 1,044,621 1,483,597 23.3%
2016 7,045,664 3,256,502 3,789,162 53.8% 955,513 2,833,649 1,097,189 1,736,460 24.6%
2017 7,401,747 3,335,983 4,065,763 54.9% 1,691,218 2,374,546 1,119,771 1,254,775 17.0%
2018 7,986,785 3,558,006 4,428,780 55.5% 1,752,953 2,675,826 1,147,175 1,528,651 19.1%
2019 8,289,304 3,722,294 4,567,010 55.1% 1,680,856 2,886,154 1,178,375 1,707,779 20.6%
2020 9,092,885 3,961,103 5,131,782 56.4% 1,744,674 3,387,108 1,212,550 2,174,558 23.9%
2021 9,537,878 4,095,665 5,442,782 57.1% 1,947,579 3,495,203 1,249,099 2,246,104 23.5%
2022 10,528,221 4,370,665 6,157,556 58.5% 2,026,395 4,131,161 1,287,611 2,843,550 27.0%
Wholesale ISP - Pessimistic
EBITDA Operating Profit
Revenue Expenses EBITDA Margin Capital Margin Debt Net Margin Margin
2013 5,247,125 2,321,216 2,925,909 55.8% 797,161 2,128,748 924,391 1,204,347 23.0%
2014 5,663,807 2,578,892 3,084,915 54.5% 836,570 2,248,345 981,101 1,267,244 22.4%
2015 5,997,685 2,761,084 3,236,521 54.0% 898,476 2,338,125 1,034,693 1,303,432 21.7%
2016 6,891,468 2,977,946 3,913,521 56.8% 948,307 2,965,214 1,087,859 1,877,355 27.2%
2017 6,969,558 3,077,057 3,892,501 55.9% 1,698,780 2,193,721 1,140,290 1,053,431 15.1%
2018 7,313,271 3,196,299 4,116,972 56.3% 1,778,038 2,338,934 1,194,863 1,144,071 15.6%
2019 7,606,591 3,209,340 4,397,251 57.8% 1,715,469 2,681,782 1,254,306 1,427,476 18.8%
2020 7,859,887 3,382,396 4,477,491 57.0% 1,797,455 2,680,036 1,321,518 1,358,517 17.3%
2021 8,081,926 3,515,801 4,566,125 56.5% 2,040,901 2,525,224 1,399,921 1,125,303 13.9%
2022 8,280,040 3,839,383 4,440,658 53.6% 2,160,125 2,280,533 1,493,905 786,628 9.5%

7/21/2019 8. Draft Report 051013
http://slidepdf.com/reader/full/8-draft-report-051013 55/58
CCG Consulting LLC
10-Year Strategic Business Plan for Click!
Page | 54
“DRAFT” “confidential – do not disclose outside of Click! Network”
Other – Status Quo
EBITDA Operating Profit
Revenue Expenses EBITDA Margin Capital Margin Debt Net Margin Margin
2013 1,426,716 950,276 476,440 33.4% 75,552 400,888 44,125 356,763 25.0%
2014 1,622,564 1,008,862 613,702 37.8% 76,478 537,224 44,945 492,279 30.3%
2015 1,669,754 1,044,926 624,828 37.4% 54,905 569,923 45,552 524,371 31.4%
2016 1,718,330 1,086,053 632,277 36.8% 55,675 576,601 45,978 530,624 30.9%
2017 1,768,333 1,126,179 642,154 36.3% 98,440 543,714 48,083 495,671 28.0%
2018 1,819,805 1,178,599 641,205 35.2% 102,444 538,762 49,942 488,820 26.9%
2019 1,872,789 1,224,576 648,214 34.6% 88,602 559,611 51,691 507,920 27.1%
2020 1,927,331 1,270,064 657,267 34.1% 91,705 565,561 53,305 512,257 26.6%
2021 1,983,476 1,332,429 651,047 32.8% 100,670 550,378 54,796 495,582 25.0%
2022 2,041,273 1,381,611 659,661 32.3% 103,952 555,709 56,173 499,536 24.5%
Other – Optimistic
EBITDA Operating Profit
Revenue Expenses EBITDA Margin Capital Margin Debt Net Margin Margin2013 1,426,716 950,276 476,440 33.4% 75,552 400,888 44,125 356,763 25.0%
2014 1,622,564 1,005,700 616,864 38.0% 76,365 540,499 44,607 495,892 30.6%
2015 1,669,754 1,042,686 627,068 37.6% 54,468 572,600 44,686 527,914 31.6%
2016 1,718,330 1,072,661 645,669 37.6% 54,916 590,753 44,510 546,242 31.8%
2017 1,768,333 1,111,744 656,588 37.1% 96,464 560,124 45,599 514,526 29.1%
2018 1,819,805 1,148,211 671,594 36.9% 99,071 572,523 46,324 526,198 28.9%
2019 1,872,789 1,190,208 682,581 36.4% 84,140 598,441 46,792 551,649 29.5%
2020 1,927,331 1,232,771 694,560 36.0% 85,582 608,978 47,087 561,891 29.2%
2021 1,983,476 1,267,900 715,576 36.1% 91,993 623,583 47,279 576,304 29.1%
2022 2,041,273 1,315,091 726,181 35.6% 93,357 632,825 47,417 585,408 28.7%
Other – Pessimistic
EBITDA Operating Profit
Revenue Expenses EBITDA Margin Capital Margin Debt Net Margin Margin
2013 1,426,716 950,276 476,440 33.4% 75,552 400,888 44,125 356,763 25.0%
2014 1,622,564 1,011,268 611,296 37.7% 77,608 533,688 45,938 487,750 30.1%
2015 1,669,754 1,053,576 616,178 36.9% 57,671 558,507 48,265 510,242 30.6%
2016 1,718,330 1,103,474 614,856 35.8% 60,715 554,141 51,119 503,022 29.3%
2017 1,768,333 1,149,249 619,084 35.0% 109,093 509,991 54,704 455,287 25.7%
2018 1,819,805 1,209,563 610,241 33.5% 116,221 494,020 59,094 434,926 23.9%
2019 1,872,789 1,282,601 590,189 31.5% 105,487 484,702 64,410 420,292 22.4%
2020 1,927,331 1,389,217 538,114 27.9% 114,171 423,943 70,831 353,112 18.3%
2021 1,983,476 1,510,342 473,134 23.9% 132,890 340,244 78,618 261,626 13.2%2022 2,041,273 1,643,918 397,354 19.5% 146,187 251,167 88,145 163,022 8.0%
7/21/2019 8. Draft Report 051013
http://slidepdf.com/reader/full/8-draft-report-051013 56/58
CCG Consulting LLC
10-Year Strategic Business Plan for Click!
Page | 55
“DRAFT” “confidential – do not disclose outside of Click! Network”
Following are the highlights of the results of the profitability analysis:
1. Cable is Already Losing Money. On an allocated basis, cable TV is losing moneytoday, and there are no future years under any of the scenarios studied where cable becomes profitable.
This fact alone should make the company look at whether you should be in the cable business. There is no automatic yes or no answer to that question. There are often goodreasons to continue to operate a business that is losing money. But on the other hand,there is often a time when the best choice is to somehow exit a business that is losingmoney.
How does Click! know which of these situations you are in and if it is time to considerleaving the business? I would suggest the following:
a. First, you need more facts. I anticipated this finding when I made the proposalfor this first phase. In the second phase I had proposed to look at alternate proposals for the business, and this finding would lead to an analysis of severaldifferent scenarios for exiting the cable business:
1. One scenario would be to sell (or give) the cable customers to the ISPsand then charge them wholesale access for using the network in thesame manner that you do for data customers. This scenario wouldentail Click! eliminating all of the employees that are needed to provide cable and instead become only a network operator. With asmaller, leaner staff this might be a viable long-term business.
2. Sell the cable customers to somebody else (probably Comcast) whowould not keep them on your network. This would result in a business
at Click! that just provides wholesale data access to the ISPs.
3. Continue to operate the cable business but take steps to make it as profitable as possible. For example, you may consider cutting cable-related staff. There are companies who decide to operate losing portions of their business for strategic purposes. This could be one ofthose cases. In effect, the decision to keep operating the cable businesswould be a decision to stick with the business until it finally dies. Butdeciding to not exit the business does not have to mean that thecompany is willing to accept the losses associated with operating it inthe status quo way. Rather it ought to prompt the company to look atstrategies that would minimize the losses from cable.
b. As mentioned earlier in this report, I think the fact that cable is already losingmoney ought to prompt the company to take a hard look at whether Click! stillhas a purpose. Thus, another scenario to consider is one that somehow gets

7/21/2019 8. Draft Report 051013
http://slidepdf.com/reader/full/8-draft-report-051013 57/58
CCG Consulting LLC
10-Year Strategic Business Plan for Click!
Page | 56
“DRAFT” “confidential – do not disclose outside of Click! Network”
Click! out of the business altogether. This scenario would look to somehow sellthe business. And it would need to consider what staffing would be needed tocontinue to satisfy the network needs of the Utility if Click! no longer existed.
2. Scenarios are not that Different. One thing I see in looking at the results is that there isnot that much difference for the next five years between the best and worst scenarios.Interestingly there looks to be factors that lesson how bad and how good the businesscan be. Probably the biggest of these factors is churn. The business does not churn a‘number’ of customers per month, but rather a percentage of customers. As the businessshrinks due to churn one would expect the volume of churn to get smaller. Assumingthis holds true it means that the business ought to be viable for a longer time than onemight expect if one was to straight-line trend the current rate of customer churn.
3. Not a Crisis. I take this result to mean that Click! has some time to figure things out. Insaying that, though, I would also say just the opposite as well. It seems to me thatClick! has in many ways lost its purpose for being. And this has to affect employees,morale and the public perception of your value. When Click! was offering cable rates
that were significantly below surrounding markets, the customers knew this and youremployees could proudly point to that benefit as a reason to work at Click! But nowthat your rates are getting to market the business will be losing the loyalty of yourcustomers as well as the motivation from your workforce. This is obviously not a goodthing. I think you are wide to be looking at this now and not waiting until the businessdeteriorates to plot your future.

7/21/2019 8. Draft Report 051013
http://slidepdf.com/reader/full/8-draft-report-051013 58/58
CCG Consulting LLC
10-Year Strategic Business Plan for Click!
Next Steps
In this report I have discussed a number of issues. I see the next steps after this report as being:
Determine if any of this Report Should be Public. This report discusses a lot of different future
options for Click! including some that would result in selling off product lines or eliminating asignificant number of employees. It would be my recommendation that this report be kept private as much as possible. Certainly this report does not make specific recommendations onwhere the business should go in the long run, so it is more a report on the possibilities of thefuture rather than a set of concrete recommendations.
Look at Future Options in Detail. When I proposed this analysis I had suggested that it mightmake sense to do a little more analysis, and I think the results would indicate that might be agood idea. As it turns out, cable TV is losing money today and it also looks like it is going tolose customers year after year. This should prompt several things at the company:
•
First, it should prompt an examination of what the business should do about operating acable TV business that is losing money and customers. I think that some of thealternatives of what to do with the cable business can be quantified and might includelooking at scenarios that:
o Sell the cable customers to the ISPso Sell the cable customers to somebody who would take them off your networko Keep the customers but look to minimize the losses.
• This should also prompt the internal discussion at the management and Board level ofwhy to still operate Click!. The business does not look to be fulfilling the original goalsthat prompted the formation of Click! and should prompt a discussion of whether thereare benefits of operating Click! that justify continuing to operate the business.
Doug DawsonPresidentCCG Consulting LLCMay 13, 2013
Related Documents