EXECUTIVE DIRECTOR EUROPEAN UNION AGENCY FOR RAILWAYS Making the railway system To the attention of: work betterfor society. Ms Elisabeth WERNER Director DG MOVE - Directorate Cland” Rue De Mot 28 BE — 1049 Bruxelles Belgium J D-MV-D(2018)1642 Valenciennes, 18 MAI 2018 Subject: The Agency’s 7 Report ERA-REP-114- IMPL-2017-02 — 2nd Half 2017 on TAF TSI Implementation Dear Ms Werner, In the DG MOVE letter of 26/05/2014, you requested the assistance of the Agency for the assessment of the TAF TSI implementation in accordance with Article 5 (1) of R{egulation (EU) 1305/2014. The Agency set up in October 2014 the Implementation Co-operation Group Telematics Applications for Freight to perform the assessment of the TAF TSI Implementation. The Agency hereby provides the 7th report ERA-REP-114 - IMPL-2017-02 — 2nd Half 2017 to inform DG MOVE on the progress of the implementation of TAF TSI regulation. Should you require further clarifications, please do not hesitate to contact me. For detailed questions, you may wish to contact Ms Anna GIGANTINO, the Head of lnteroperability Unit (Tel: +33 32 70 96 548) e-mail: [email protected]. Yours sincerely, /////I / Jf DOP LBAUER Executive Director Enclosure: Report ERA-REP-i 14 - IMPL-2017-01 Copy: K. FITCH, C. DE GRANDIS; B.COLLIGNON (DG MOVE) A. GIGANTINO, F. FERRARI, M. VARGA, K. NAGY BUREAuvERIrAS 120 Rue Marc Lefrancq I BP 20392 I FR-59307 Valenciennes cedex Tel. +33 (0)327 09 65 00 I era.europa.eu 1 / 1

Welcome message from author
This document is posted to help you gain knowledge. Please leave a comment to let me know what you think about it! Share it to your friends and learn new things together.
Transcript
EXECUTIVE DIRECTOR
EUROPEANUNIONAGENCYFOR RAILWAYS
Making the railway system To the attention of:work betterfor society. Ms Elisabeth WERNER
DirectorDG MOVE - Directorate Cland”Rue De Mot 28BE — 1049 BruxellesBelgium
J D-MV-D(2018)1642
Valenciennes, 18 MAI 2018
Subject: The Agency’s 7 Report ERA-REP-114- IMPL-2017-02 — 2nd Half 2017 on TAF TSI Implementation
Dear Ms Werner,
In the DG MOVE letter of 26/05/2014, you requested the assistance of the Agency for the assessment of theTAF TSI implementation in accordance with Article 5 (1) of R{egulation (EU) 1305/2014.
The Agency set up in October 2014 the Implementation Co-operation Group Telematics Applications forFreight to perform the assessment of the TAF TSI Implementation. The Agency hereby provides the 7threport ERA-REP-114 - IMPL-2017-02 — 2nd Half 2017 to inform DG MOVE on the progress of theimplementation of TAF TSI regulation.
Should you require further clarifications, please do not hesitate to contact me.
For detailed questions, you may wish to contact Ms Anna GIGANTINO, the Head of lnteroperability Unit(Tel: +33 32 70 96 548) e-mail: [email protected].
Yours sincerely,
/////I /
Jf DOP LBAUER
Executive Director
Enclosure: Report ERA-REP-i 14 - IMPL-2017-01
Copy: K. FITCH, C. DE GRANDIS; B.COLLIGNON (DG MOVE)A. GIGANTINO, F. FERRARI, M. VARGA, K. NAGY
BUREAuvERIrAS 120 Rue Marc Lefrancq I BP 20392 I FR-59307 Valenciennes cedexTel. +33 (0)327 09 65 00 I era.europa.eu 1 / 1
Report
7 TAF TS Implementation Status Report ERA-REP-114 - IMPL-2017-02
Report7th
TAF TSI IMPLEMENTATION STATUS REPORT OF THE EUROPEAN
UNION AGENCY FOR RAILWAYS — 2’’ HALF 2017
Drafted by Validated by Approved by
Name Mickael Varga Kornel Nagy Anna Gigantino
Position Telematics Coordinator Project Officer Head of Unit
Date 05/03/2018 07/05/2018 07/05/2018
Signature Signed Signed Signed
Document History
Version Date Comments
0.1 05/03/2018 1st draft
- Inclusion of new planning for 8
0.2 30/03/2018 reporting session (chapter 9.2)- Inclusion of GIS maps (chapter 6)
- Inclusion of comments from NCP CH,1.0 07/05/2018 NCP ES, NCP NL and NCP PT
- Inclusion of comments from CER
120 Rue Marc Lefrancq I BP 20392 I FR-59307 Valenciennes Cedex 1 / 55Tel. +33 (0)32709 6500 I era.europa.eu
Contents
Abbreviations 3
Reference documents 5
Reference legislation 5
1. Executive summary 6
2. Introduction 9
3. Context 10
4. Participation in the 7th Reporting Session 14
4.1. Responses to the survey 14
4.2. Participation per company type 16
5. Data Basis for evaluation 18
6. Implementation monitoring of TAFTSI functions 19
6.1. Common Reference Files — Primary Location Codes (IMs) 19
6.2. Common Reference Files - Company Code (all companies) 21
6.3. Common Interface Implementation (all companies) 23
6.4. Train Running Information (IMs and RU5-F) 27
6.5. Train Composition Message (IMs and RU5-F) 30
6.6. Consignment Note Data (RU5-F) 32
6.7. Wagon and Intermodal Unit Operating Database (RUs-F) 34
6.8. Rolling Stock Reference Database (WK5) 36
6.9. Reasons for not starting implementation of TAF/TAP TSI functions 39
6.10. Degree of implementation at European level 40
7. Intentions for implementation 42
7.1. Common sector tools 42
8. Surveycoverage 43
9. Conclusion and Findings 44
10. Regional Workshops 44
10.1 TAF WS 07/08 March 2018— Bucharest, Romania 44
10.2 Proposal for next Workshop 44
11. Proposals to support the Reporting Process 44
11.1 Functions to be reported in the next report 45
11.2 Calendar for reporting 45
Annex 1: Distribution of freight fleet per country in Europe 47
Annex 2: Responses contact list v7 48
Annex 3: Responses contact list v6 54
2
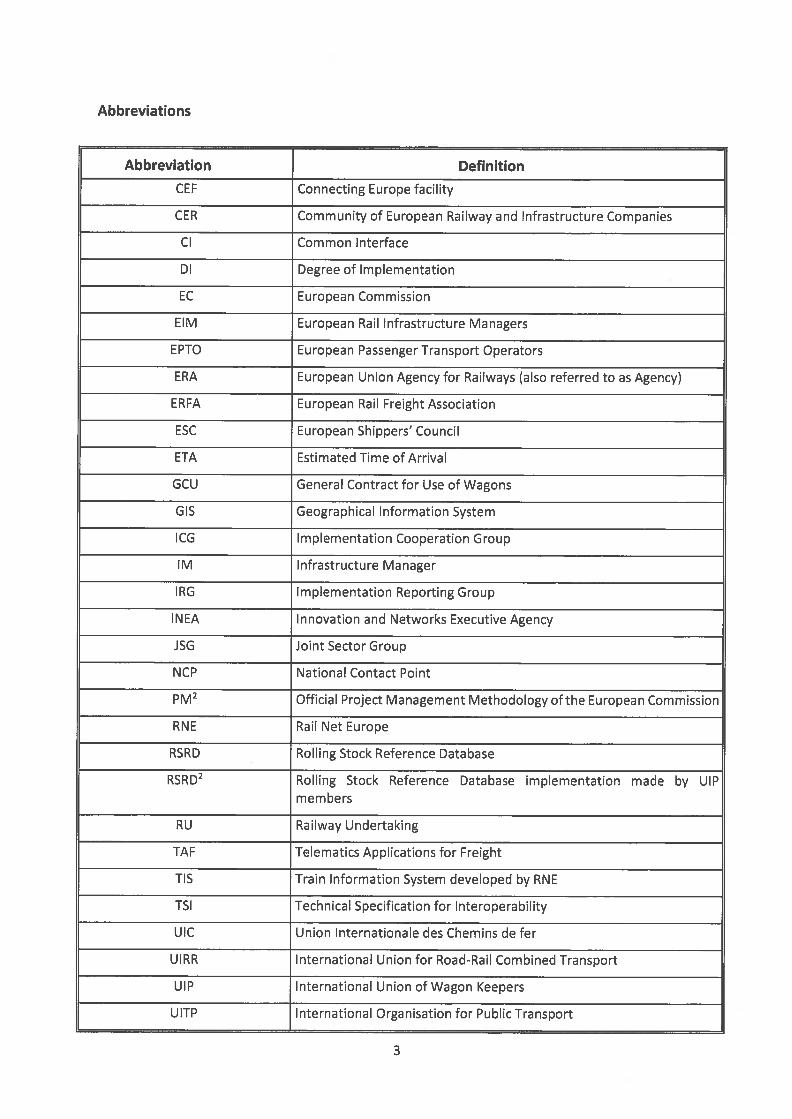
Abbreviations
Abbreviation Definition
CEF Connecting Europe facility
CER Community of European Railway and Infrastructure Companies
CI Common Interface
Dl Degree of Implementation
EC European Commission
ElM European Rail Infrastructure Managers
EPTO European Passenger Transport Operators
ERA European Union Agency for Railways (also referred to as Agency)
ERFA European Rail Freight Association
ESC European Shippers’ Council
ETA Estimated Time of Arrival
GCU General Contract for Use of Wagons
GIS Geographical Information System
ICG Implementation Cooperation Group
IM Infrastructure Manager
IRG Implementation Reporting Group
INEA Innovation and Networks Executive Agency
JSG Joint Sector Group
NCP National Contact Point
PM2 Official Project Management Methodology of the European Commission
RNE Rail Net Europe
RSRD Rolling Stock Reference Database
RSRD2 Rolling Stock Reference Database implementation made by UIPmembers
RU Railway Undertaking
TAF Telematics Applications for Freight
TIS Train Information System developed by RNE
TSI Technical Specification for Interoperability
UIC Union Internationale des Chemins de fer
UIRR International Union for Road-Rail Combined Transport
UIP International Union of Wagon Keepers
UITP International Organisation for Public Transport
3
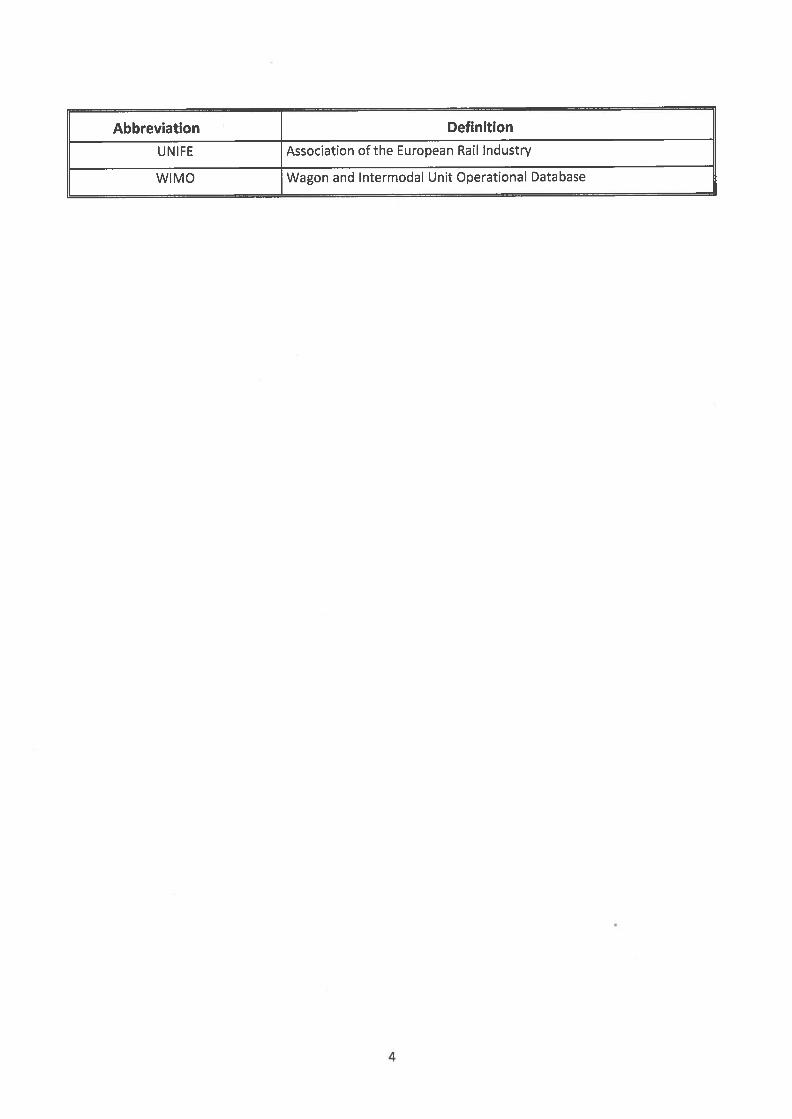
Abbreviation Definition
UNIFE Association of the European Rail Industry
WIMO Wagon and Intermodal Unit Operational Database
4
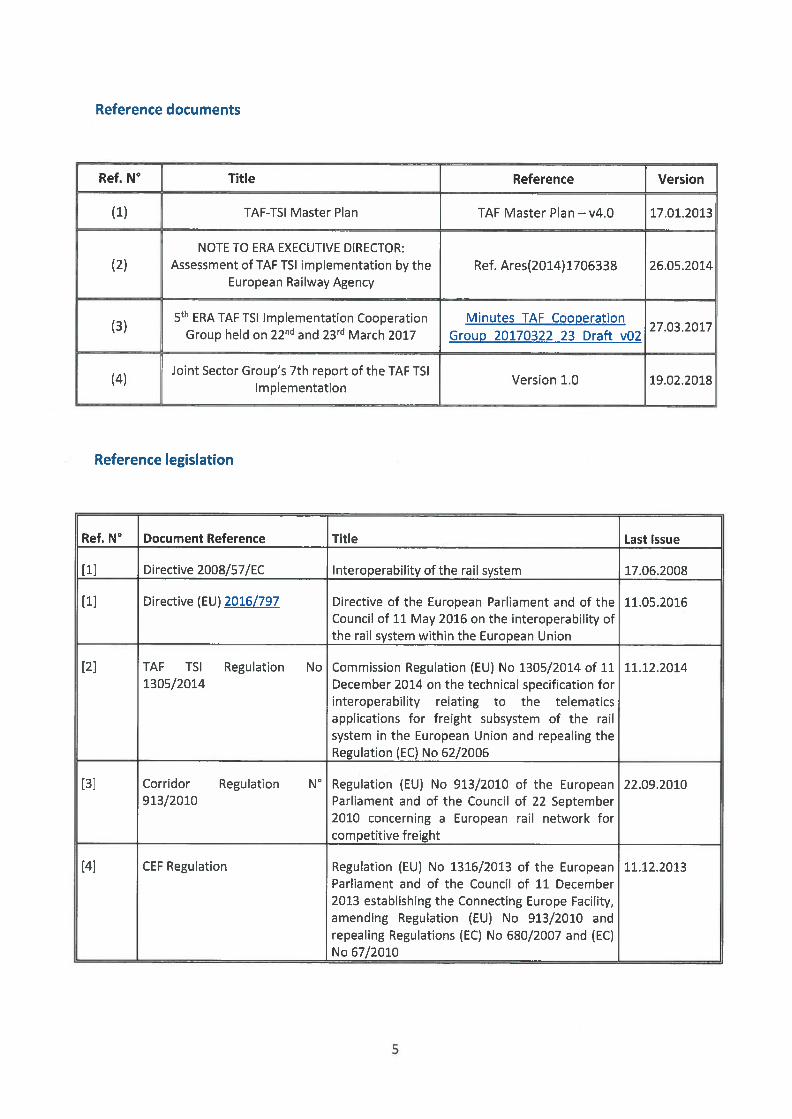
Reference documents
Ref. N° Title Reference Version
(1) TAF-TSI Master Plan TAF Master Plan —v4.0 17.01.2013
NOTE TO ERA EXECUTIVE DIRECTOR:(2) Assessment of TAF TSI implementation by the Ref. Ares(2014)1706338 26.05.2014
European Railway Agency
5th ERA TAF TSI Implementation Cooperation Minutes TAF Cooperation27 03 2017
Group held on 22 and 23rd March 2017 Group 20170322 23 Draft v02
(4)Joint Sector Group’s 7th report of the TAF TSI
Version 1.0 19.02.2018Implementation
Reference legislation
Ref. W Document Reference Title Last Issue
[1] Directive 2008/57/EC Interoperability of the rail system 17.06.2008
[1] Directive (EU) 2016/797 Directive of the European Parliament and of the 11.05.2016Council of 11 May 2016 on the interoperability ofthe rail system within the European Union
[2] TAF TSI Regulation No Commission Regulation (EU) No 1305/2014 of 11 11.12.20141305/2014 December 2014 on the technical specification for
interoperability relating to the telematicsapplications for freight subsystem of the railsystem in the European Union and repealing theRegulation (EC) No 62/2006
[3] Corridor Regulation N Regulation (EU) No 913/2010 of the European 22.09.2010913/2010 Parliament and of the Council of 22 September
2010 concerning a European rail network forcompetitive freight
[4] CEF Regulation Regulation (EU) No 1316/2013 of the European 11.12.2013Parliament and of the Council of 11 December2013 establishing the Connecting Europe Facility,amending Regulation (EU) No 913/2010 andrepealing Regulations (EC) No 680/2007 and (EC)No 67/2010
5
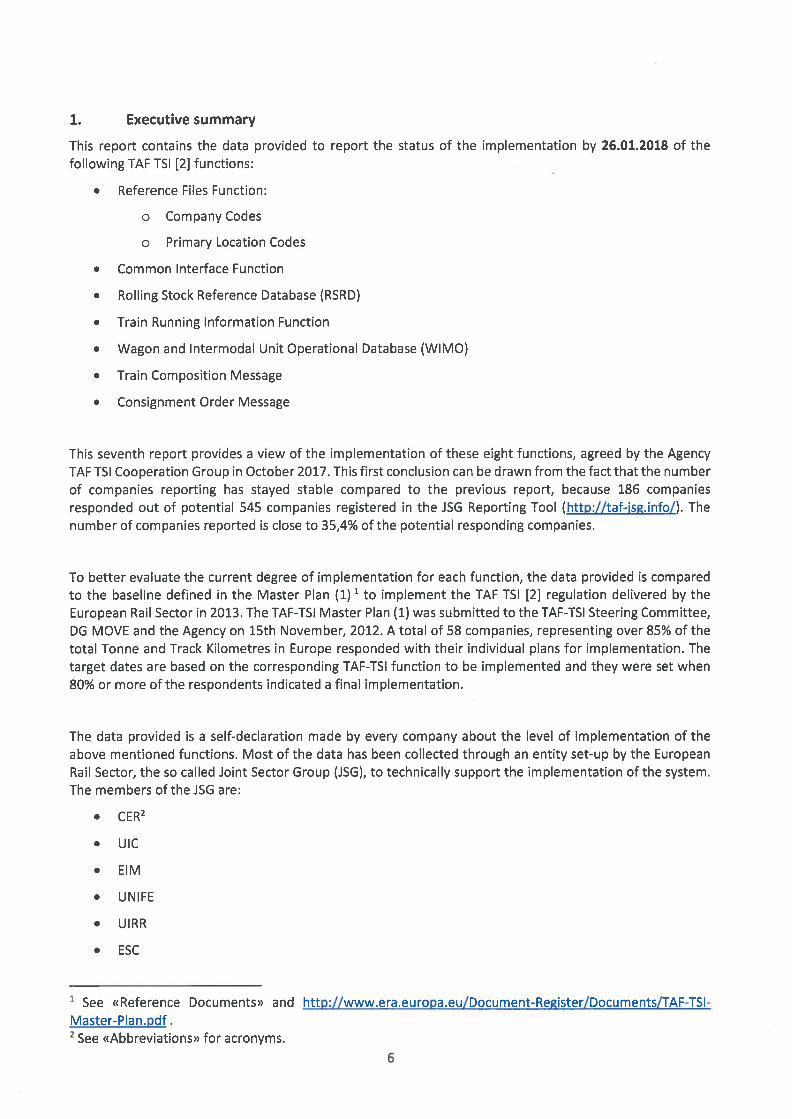
1. Executive summary
This report contains the data provided to report the status of the implementation by 26.01.2018 of thefollowing TAF TSI [2] functions:
• Reference Files Function:
o Company Codes
o Primary Location Codes
• Common Interface Function
• Rolling Stock Reference Database (RSRD)
• Train Running Information Function
• Wagon and Intermodal Unit Operational Database (WIMO)
• Train Composition Message
• Consignment Order Message
This seventh report provides a view of the implementation of these eight functions, agreed by the AgencyTAF TSI Cooperation Group in October 2017. This first conclusion can be drawn from the fact that the numberof companies reporting has stayed stable compared to the previous report, because 186 companiesresponded out of potential 545 companies registered in the JSG Reporting Tool (http:/Itaf-isg.info/). Thenumber of companies reported is close to 35,4% of the potential responding companies.
To better evaluate the current degree of implementation for each function, the data provided is comparedto the baseline defined in the Master Plan (1) 1 to implement the TAF TSl [2] regulation delivered by theEuropean Rail Sector in 2013. The TAF-TSI Master Plan (1) was submitted to the TAF-TSl Steering Committee,DG MOVE and the Agency on 15th November, 2012. A total of 58 companies, representing over 85% of thetotal Tonne and Track Kilometres in Europe responded with their individual plans for implementation. Thetarget dates are based on the corresponding TAF-TSI function to be implemented and they were set when80% or more of the respondents indicated a final implementation.
The data provided is a self-declaration made by every company about the level of implementation of theabove mentioned functions. Most of the data has been collected through an entity set-up by the EuropeanRail Sector, the so called Joint Sector Group (JSG), to technically support the implementation of the system.The members of the JSG are:
• CER2
• UIC
• ElM
• UNIFE
• UIRR
• ESC
1 See <<Reference Documents>> and htt://www.era.europa .eu/Document-Register/Documents/TAF-TSIMaster-Plan.pdf.2 See <<Abbreviations>> for acronyms.
6
• UlP
• RNE
• ERFA
• RAILDATA
• UITP
• EPTO
In addition, the Agency has kept the “Degree of Implementation” for all companies, which have not delivereddata for the current report, but data from preceding deliveries was available (see chapter 5). All thesecompanies were duly consulted before keeping their reporting values.
Regarding the function “Rolling Stock Reference Database”, the implementation data has been collected bythe JSG in close cooperation with the International Union of Wagon Keepers, UIP. They have submitted tothe Agency a file containing the status information of 70 companies across Europe.
The following key findings per TAF function can be highlighted:
• In general terms, whether we consider a reference group of companies reporting in the last threeimplementation reports, we can observe an increase of companies having finished implementationof the earliest TAF TSI functions.
• The majority of IMs has completed the population of the Common Reference Files for locations ontheir network.
• Company codes are already widely used within the sector, by both IMs and RU5. Nevertheless, somedifficulties still remain in the process to get the Company Codes, in particular for newcomers andwagon keepers.
• The majority of RUs is still developing the common interface, while most of the IMs have alreadyfinished the implementation of the common interface.
• The deployment of the Rolling Stock Reference Database has already been launched. Although thenumber of Railway Undertakings reporting about this function has significantly increased, mainly UIPmembers have delivered these data. Regarding the data delivered, these members of UIP havealready completed the implementation of this function. Nevertheless, the accomplishment of thisfunction considering the whole European fleet of wagons is clearly delayed.
• The level of realisation of Train Running Information is progressing mostly in accordance with theimplementation schedule quoted in the TAF TSI Master plan by 2018, in particular for theInfrastructure Managers. Meanwhile the evolution for the Railway Undertakings has significantlyimproved meeting the milestones quoted in the TAF TSI Master Plan (1).
• The level of fulfilment of the Wagon and Intermodal Unit Operational Database is improving incomparison with the realisation milestones committed on the TAF TSI Master Plan (1). Indeed, theactual value is however slightly behind the expected implementation value by 2018, when half ofRailway Undertakings respondents committed to deploy this function by 2016. Nevertheless, thecomplete implementation is expected by 2018.
• As regards the level of implementation of the Train Composition Message, the actual implementationstatus is significantly below the expectations committed by the companies on the TAF TSI MasterPlan (1).
7
Furthermore, the report identifies the TAF TSI functions where the sector shall allocate more resources to
meet the target implementation date quoted in the TAF TSI Master Plan (1), in particular the Rolling Stock
Reference Database, the Wagon and Intermodal Unit Operational Database and the Train Composition
Message. These functions are either already delayed or on the way of not meeting the implementation
deadlines quoted on the TAF TSI Master Plan (1).
In particular, this report shows that the implementation of the Rolling Stock Reference Database (RSRD) by
2017 is on average for the overall European rail sector delayed compared to the declared target
implementation date in the Master Plan, 2015. The implementation data used in this report permits to
conclude that the RUs have already started delivering information about the implementation of the TAF TSI
[2] compliant RSRD database.
8
2. Introduction
This 7th Implementation Status Report is delivered in accordance with the legal frame provided by theCommission Regulation (EU) No 1305/2014 of 11 December 2014 on the Technical Specification forInteroperability relating to the Telematics Applications for Freight subsystem of the rail system in theEuropean Union and repealing the Regulation (EC) No 62/2006 in force, TAF TSI [2] and with the RailInteroperability Directive (EU) 2016/797 [1].
In particular, Article 5 of the Regulation [2] attributes to the European Union Agency for Railways, named theAgency along the report, the task to assess and oversee the implementation of the Regulation to determinewhether the agreed objectives and deadlines have been achieved and to provide an assessment report tothe TAF steering committee. Furthermore, the European Commission (EC) issued a letter on 26.05.2014 (2)describing the tasks expected to be carried out by the Agency for the Assessment of TAF TSI [2]implementation. In addition, since June 2016 the Agency has become a system authority for Telematics. Thisnew role prescribed in article 23 of Regulation (EU) 2016/796 requires the Agency to assist the Commissionin the monitoring of deployment of specifications for telematics applications in accordance with relevantTS Is.
Beyond this, this activity meets the 4th Strategic Priority of the Agency work programmes 2017 and 2018,“Simplified Access for Customers”. On this basis, the Agency launched in October 2014 the Co-operationGroup for the Implementation of Telematics Applications for Freight. The Co-operation Group performs thefollowing tasks:
• To assess the reports from the sector (companies, NCPs and RB5) about the TAF TSI [2]implementation.
• To compare the data received with the content of the TAF TSI Master Plan (1) and assess the progressof implementation to determine whether the objectives pursued and deadlines have been achieved.
• To use Key Performance Indicators (KPIs) previously agreed between the Agency and the Rail Sectorto assess the evolution of the deployment of the system and report twice per year to the EuropeanCommission and to the TAF Steering Committee.
• To help to perform a dissemination campaign to NCPs.
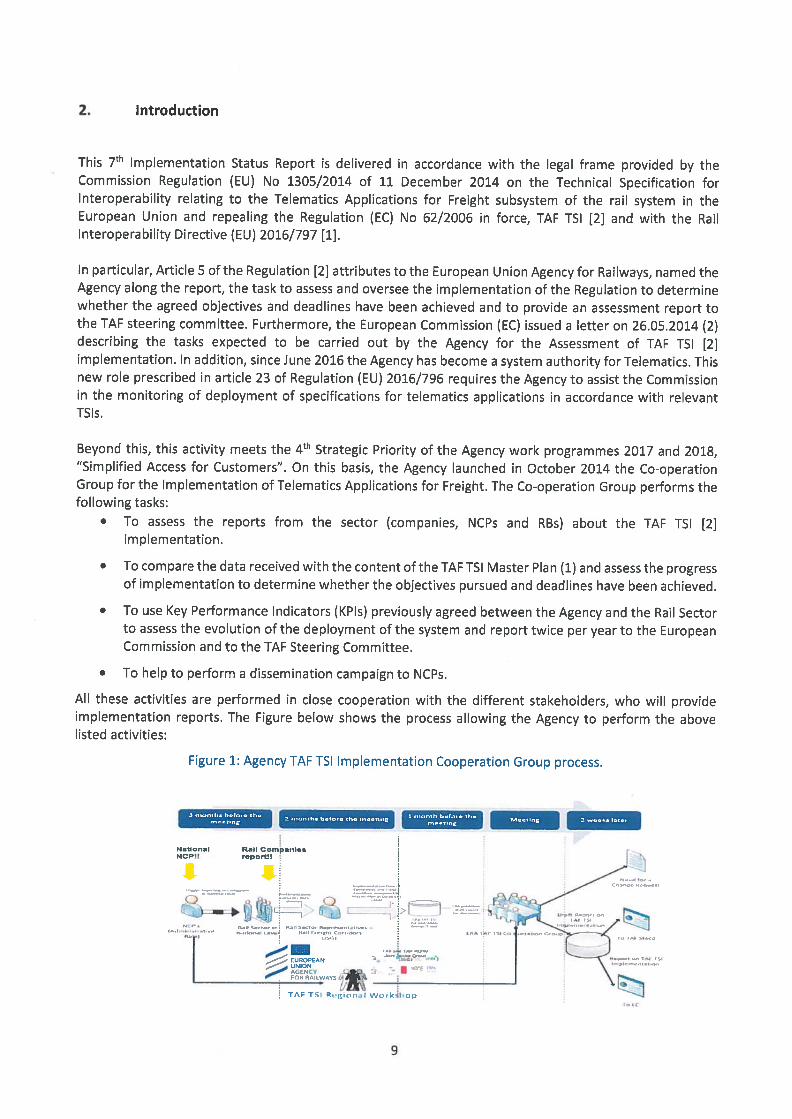
All these activities are performed in close cooperation with the different stakeholders, who will provideimplementation reports. The Figure below shows the process allowing the Agency to perform the abovelisted activities:
Figure 1: Agency TAF TSI Implementation Cooperation Group process.
M..dng 2 w..k. It
CompnI. rNCP’! rport N
LZJH
EUflOPEAN
T,F TS r kthup
2 .,,nd.. bf.,, th. IJ1i
\
9
The Agency has to inform the EC about the results of this monitoring and has to advise the EC about the
possible changes needed. In a multimodal context, the Agency has to guarantee that any of the actions taken
do not create additional obstacles for multimodal environment.
In addition, the effort made by the European rail sector to deploy the TAF TSI [2] system is also supported by
the Connecting Europe Facility (CEF) [4] programme launched by the European Commission and managed by
the INEA Executive Agency.
The CEF3 [4] will better mobilise private and public financing and allow for innovative financial instruments
such as guarantees and project bonds to gain maximum leverage from this EU funding. A financial tool is
available for all the companies implementing TAF TSI [2] regulation.
3. Context
The final version of the TAF-TSI Master Plan (1), establishing the implementation timeline for the Regulation,
was submitted to the TAF-TSI Steering Committee, DG MOVE and the Agency on 15th November 2012.
A total of 58 companies, representing over 85% of the total Tonnes and Track Kilometres in Europe responded
with their individual plans for implementation. Target dates were set when 80% or more of the respondents
indicated a final implementation. The target dates are based on the corresponding TAF-TSI function to be
implemented.
An analysis, based on Corridor Regulation N° 913/2010 [3], was also incorporated into this Master Plan (1).
As the Corridor Regulation specifically addresses Short Term Path Requests and Train Running Information,
these were the only functions included. It should be noted that the TAF-TSI is a supporting tool — and not a
prerequisite —for the implementation of Regulation N° 913/2010. Therefore the later date of implementation
of the TAF-TSI should have no impact on the implementation of 913/2010.
In order to collect the data and to boost the involvement of the higher possible number of companies, the
European Union Agency for Railways has closely worked with the European Rail Sector to set-up the
appropriate mechanism to collect the data concerning the deployment of the above mentioned functions.
Indeed, the European Rail Sector grouped through the entity Joint Sector Group (JSG) and the Agency has
set-up two IT tools to collect and visualize the data submitted by the European rail companies, Infrastructure
Managers, Railway Undertakings and Wagon Keepers. For this purpose the companies submit their
information to the JSG IT tool through a Web service available for all the companies registered. For the time
being the number of registered companies is 545 thanks to the information delivered by the National
Contact Points (NCP5). Once the data is collected, the raw data (together with the JSG report of the TAF TSI
Implementation (4)) is delivered by the JSG to the Agency, who incorporates this information in the Agency
IT tool forTAF TSI [2] monitoring. This IT tool comprises a database to store the data and a GIS tool to visualize
on maps the progress of the implementation. There are three groups of maps:
• Maps to report about common functions. These maps show the degree of implementation of the
Reference Files (Company Codes and Primary Location Codes) and the Common Interface functions
at European level.
3https://ec.eu ropa .eu/inea/en/connecting-europe-facility/2016-cef-synergv-caII10
• Maps to report about RU-IM Communication functions. These maps show the degree ofimplementation at country level of the RU-IM Communication functions and there is an additionalpublication of the data per rail freight corridor in Europe as defined in the Corridor Regulation N913/2010 [3]. The presentation of the progress evolution per corridors underpins theimplementation of Corridor Regulation N 913/2010 [3]. Thereby, the maps used in this reportrepresent the progress of the implementation at country level and at corridor level of the followingfunctions
o Short Term Path Request,
o Train Running Information,
o Train Preparation,
o Service Disruption and
o Unique Train Identifiers.
• Maps to report about Railway Undertaking’s functions. These maps show the degree ofimplementation at country level of the functions to exchange data amongst Railway Undertakingsand Wagon Keepers:
o Consignment Data Function,
o Wagon and Intermodal Unit Operational Database (WIMO) Function,
o Wagon Movement Function,
o Shipment ETA Function and
o Rolling Stock Reference Database
o Train Composition Function.
The scope of the present 7th report is to inform about the deployment of the functions scheduled to beimplemented by 2 half 2017 in the Master Plan (1) delivered by the sector for the implementation of theTAF TSI [2] system. This temporary scope was agreed by the members of the Co-operation Group for theImplementation of Telematics Applications for Freight in the 6th meeting (7) held in October 2017, this reportprovides information about the implementation of the following functions:
• Reference Files Function:
o Company Codes
o Primary Location Codes
• Common Interface Function
• Consignment Data Function
• Rolling Stock Reference Database
• Train Running Information Function
• Wagon and Intermodal Unit Operational Database
• Train Composition Function
To have a common approach for all companies’ contributors submitting implementation information, acommon criterion has been agreed with the representatives of the rail sector at the start of the reportingactivities 2015 to assess the degree of deployment of TAF TSI functions. This criterion is based on the
11
standard division in project phases of IT projects defined in the methodology for project management in use
at the European Commission (PM2). Assuming that project phases are divisions within a project where extra
control is needed to effectively manage the completion of a major deliverable, then it may be ideally
assimilated with each of the 12 TAF TSI functions identified in the TAF TSI Master Plan (1) to an individual IT
reference implementation project.
Within every individual IT reference implementation project, we use percentages of completion as early
indicators to track the progress made each period of one year (n-3, n-2, and n-i, n) over a 4-year time span.
This allows detecting delays in the implementation of a particular function.
Therefore, taking into account the above mentioned assumptions, every function implementation may be
considered as an individual project to be split in the following reference phases:
• Initiating Phase: This phase may comprise those processes performed to define a new project or a
new phase of an existing project by obtaining authorization to start the project or phase. This phase
includes typically the following activities:
o Feasibility Study
o Business Case
o Gathering of Technical and Functional Requirements
These activities may correspond in an “optional” reference implementation to a Degree of Implementation
(DI) between 0% and 25% for a particular function. If the Dl is achieved at the beginning of the timeframe for
the deployment of such a function, ideally deadline minus three years (deadline-3), the implementation of
this function can be deemed on time.
• Planning Phase: this phase includes typically those activities required to establish the scope of the
project, refine the objectives, and define the course of action required to attain the objectives that
the project was undertaken to achieve:
o Resource Planning
o Project Work Planning (Working Break Down Structure)
o Migration Planning
o Outsourcing Plan
o Risk Management Planning
These activities may correspond in an “optional” reference implementation to a Degree of Implementation
(DI) between 25% and 50% for a particular function. If the DI is achieved ideally within the deadline minus
two years (deadline-2) period, the implementation of this function could be deemed to be on time.
• Executing Phase: this phase may comprise those processes performed to complete the work defined
in the project management plan to satisfy the project specifications. This phase includes activities
such as:
o Procurement
o Executing
o Testing (User Acceptance and system Integration)
o Training and Education
12
These activities may correspond in an “optional” reference implementation to a Degree of Implementation(Dl) between 50% and 100% for a particular function. If the Dl is achieved ideally within the deadline minusone year (deadline-i) period, the implementation of this function could be deemed to be on time.
Closing & Production: this phase may comprise those processes performed to finalise all activitiesacross all phases to formally close the project. Therefore, it may include the delivery of theproduct/service, in the context of the TAF TSI [2] deployment, the delivery of the IT systemimplementing a particular TAF TSI [2] function moving to production environment. These activitiescorrespond in an “optional” reference implementation to a Degree of Implementation (Dl) of 100%for a particular function. If the DI is achieved within the deadline minus ideally one year (deadline-i)period, the implementation of this function could be deemed to be on time. This level ofimplementation means that the company is capable to use the system in production or is usingalready the system in production for a particular TAF TSI function.
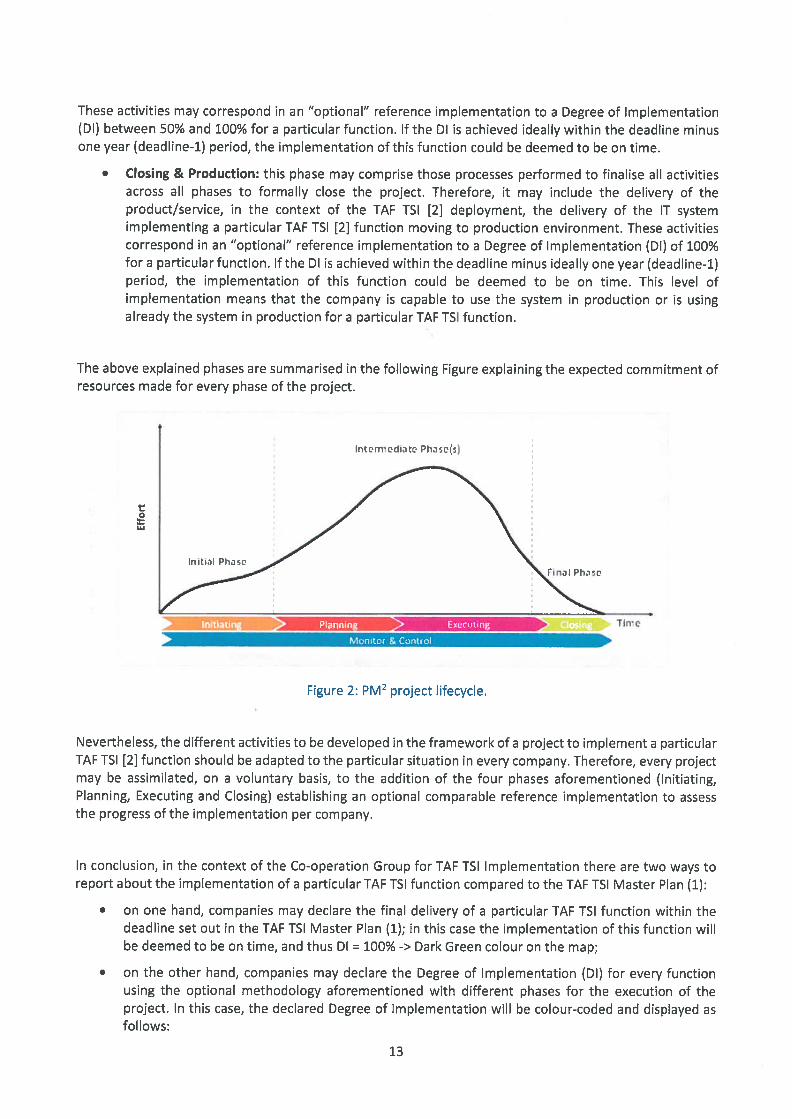
The above explained phases are summarised in the following Figure explaining the expected commitment ofresources made for every phase of the project.
C
LJ
— —aTlive
Nevertheless, the different activities to be developed in the framework of a project to implement a particularTAF TSI [2] function should be adapted to the particular situation in every company. Therefore, every projectmay be assimilated, on a voluntary basis, to the addition of the four phases aforementioned (Initiating,Planning, Executing and Closing) establishing an optional comparable reference implementation to assessthe progress of the implementation per company.
In conclusion, in the context of the Co-operation Group for TAF TSI Implementation there are two ways toreport about the implementation of a particular TAF TSI function compared to the TAF TSI Master Plan (1):
• on one hand, companies may declare the final delivery of a particular TAF TSI function within thedeadline set out in the TAF TSI Master Plan (1); in this case the implementation of this function willbe deemed to be on time, and thus Dl = 100% -> Dark Green colour on the map;
• on the other hand, companies may declare the Degree of Implementation (DI) for every functionusing the optional methodology aforementioned with different phases for the execution of theproject. In this case, the declared Degree of Implementation will be colour-coded and displayed asfollows:
Inrn’iclicc Ph(r)
ni.iI Phac
Figure 2: PM2 project lifecycle.
13
o Project not launched: No data -> White colour on the map.
o Initiating Phase accomplished: 0% =< Dl <25% -> Red colour on the map.
o Planning Phase accomplished: 25% =< Dl < 50% -> Orange colour on the map.
o Executing Phase accomplished: 50% =< Dl <75% -> Green colour on the map.
o Closing & Production accomplished: 75% =< Dl = 100% -> Dark Green colour on the map.
4. Participation in the 7th Reporting Session
4.1. Responses to the survey
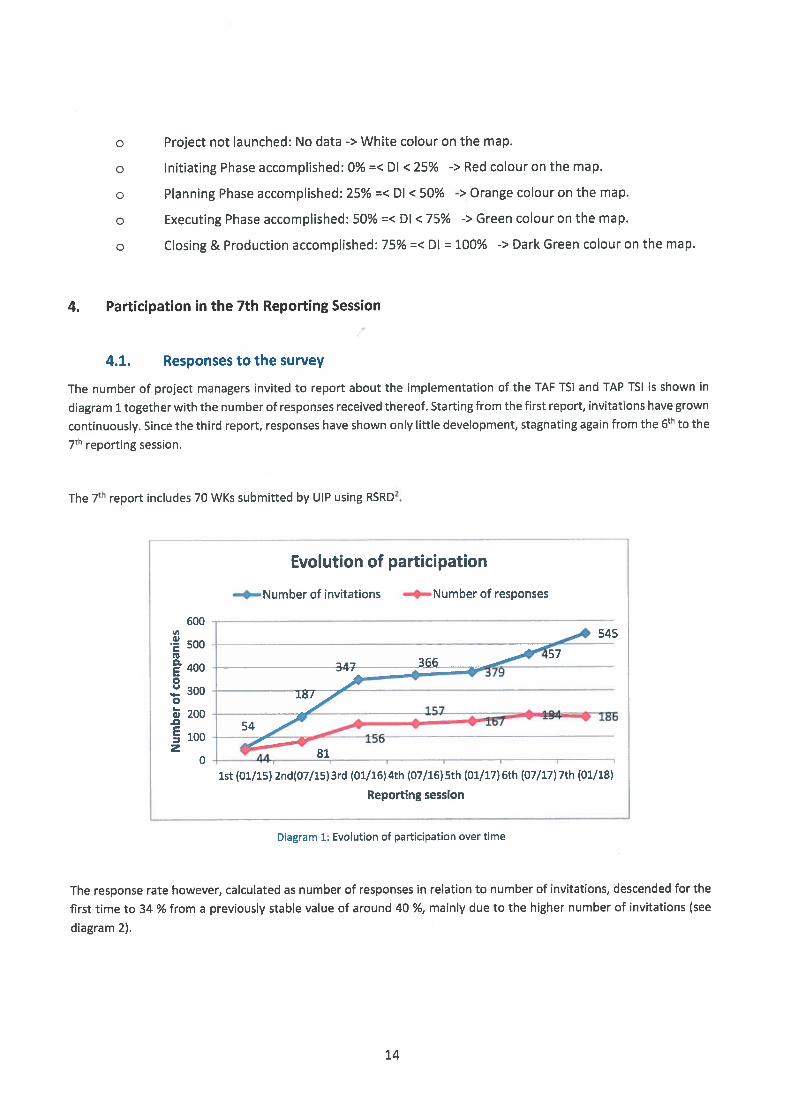
The number of project managers invited to report about the implementation of the TAF TSI and TAP TSI is shown in
diagram 1 together with the number of responses received thereof. Starting from the first report, invitations have grown
continuously. Since the third report, responses have shown only little development, stagnating again from the 6th to the7th reporting session.
The 7th report includes 70 WKs submitted by UIP using RSRD2,
600
500
400
. 30001w 200
1100
Evolution of participation
—4.—Number of invitations —4—Number of responses
Reporting session
Diagram 1: Evolution of participation over time
The response rate however, calculated as number of responses in relation to number of invitations, descended for the
first time to 34 % from a previously stable value of around 40 %, mainly due to the higher number of invitations (see
diagram 2).
1st (01/15) 2nd(07/15) 3rd (01/16)4th (07/16)5th (01/17)6th (07/17)7th (01/18)
14
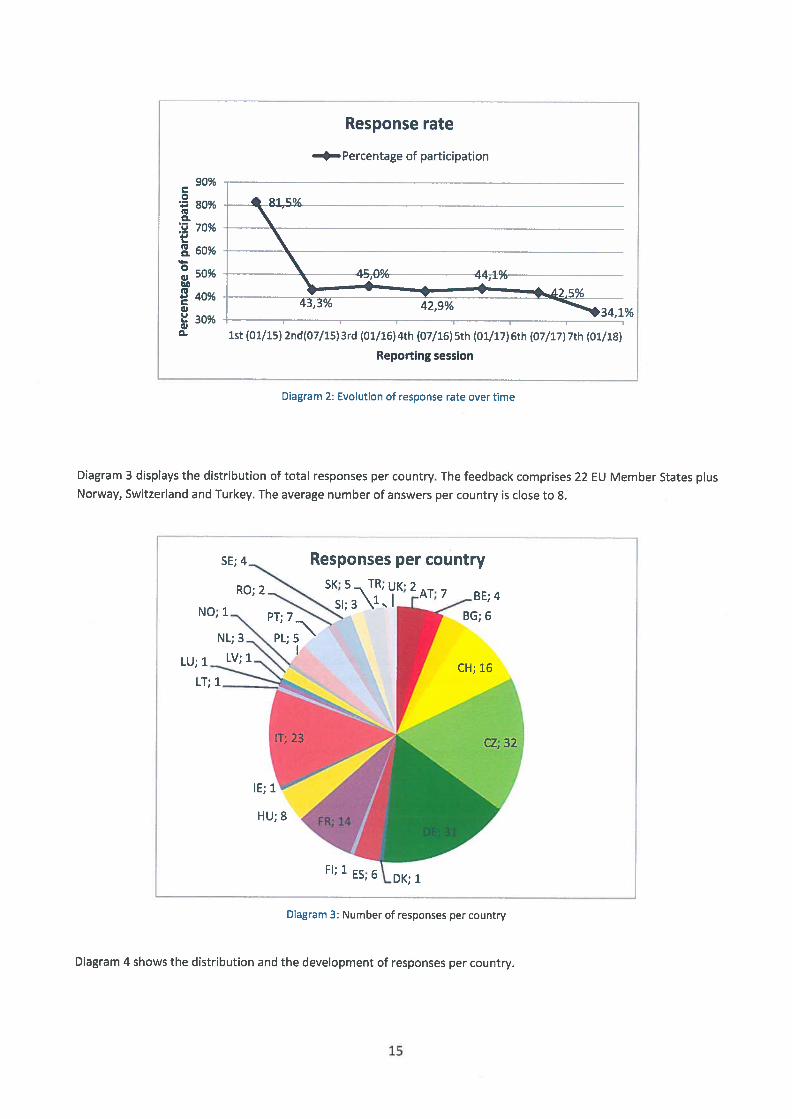
Response rate
Diagram 2: Evolution of response rate over time
Diagram 3 displays the distribution of total responses per country. The feedback comprises 22 EU Member States plusNorway, Switzerland and Turkey. The average number of answers per country is close to 8.
Diagram 3: Number of responses per country
Diagram 4 shows the distribution and the development of responses per country.
—4—-Percentage of participation
90%C0
80% 81,5%a
70%ta 60%
—
50% -.-fl- --- _4q4
________
—-V40%
43,3% 42,9% - -- 34,1%30% —-----—
1st (01/15) 2nd(07/15) 3rd (01/16)4th (07/16)5th (01/17)6th (07/17)7th (01/18)
Reporting session
SE; 4. Responses per country
.BE; 4
LT; 1_
*CZ; 32
IE;
HU;8 FR;14
Fl; 1 ES; 6 \DK; 1
15
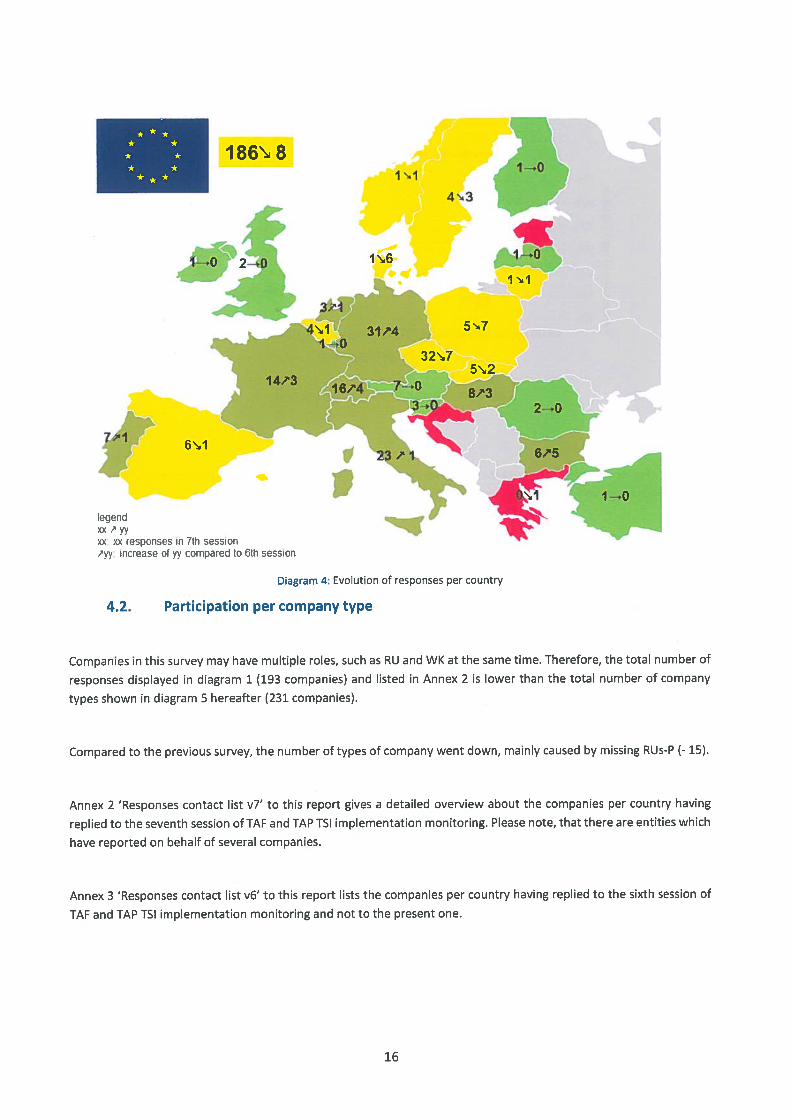
7F1,
legendxx 7 yyxx xx responses in 7th sessioniyy. increase or vv compared to 6th session
Diagram 4: Evolution of responses per country
4.2. Participation per company type
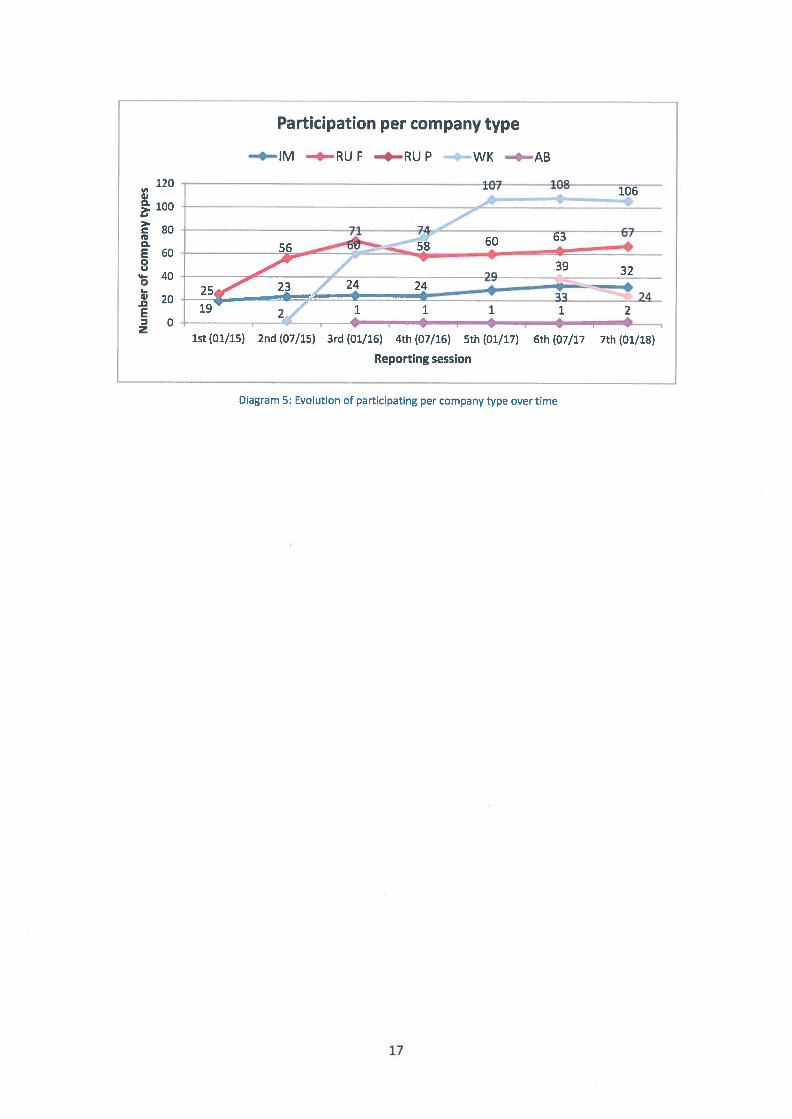
Companies in this survey may have multiple roles, such as RU and WK at the same time. Therefore, the total number of
responses displayed in diagram 1 (193 companies) and listed in Annex 2 is lower than the total number of company
types shown in diagram 5 hereafter (231 companies).
Compared to the previous survey, the number of types of company went down, mainly caused by missing RUs-P (- 15).
Annex 2 ‘Responses contact list v7’ to this report gives a detailed overview about the companies per country having
replied to the seventh session of TAF and TAP TSI implementation monitoring. Please note, that there are entities which
have reported on behalf of several companies.
Annex 3 ‘Responses contact list v6’ to this report lists the companies per country having replied to the sixth session of
TAF and TAP TSI implementation monitoring and not to the present one.
‘F
.bo4
1868I “II
I \6
5 “7
!
V
0
16
Participation
per
company
type
—4—
IM—
4--RU
F—
4—R
UP
,.
WK
+A
B
120—
-—
---
—i0
7—
---—-z
--—
.1
o0
—-—
——
—
___
8071
7L
a60
E60
---—
-----
:: zj2
:-2
ZZiT
-2•9-kZ
.2
4
01st
(01/15)2nd
(07/15)3rd
(01/16)4th
(07/16)5th
(01/17)6th
(07/177th
(01/18)
Rep
ortin
gsessio
n
Diagram
5:E
volutionof
particip
ating
per
com
pan
ytype
overtim
e
17
5. Data Basis for evaluation
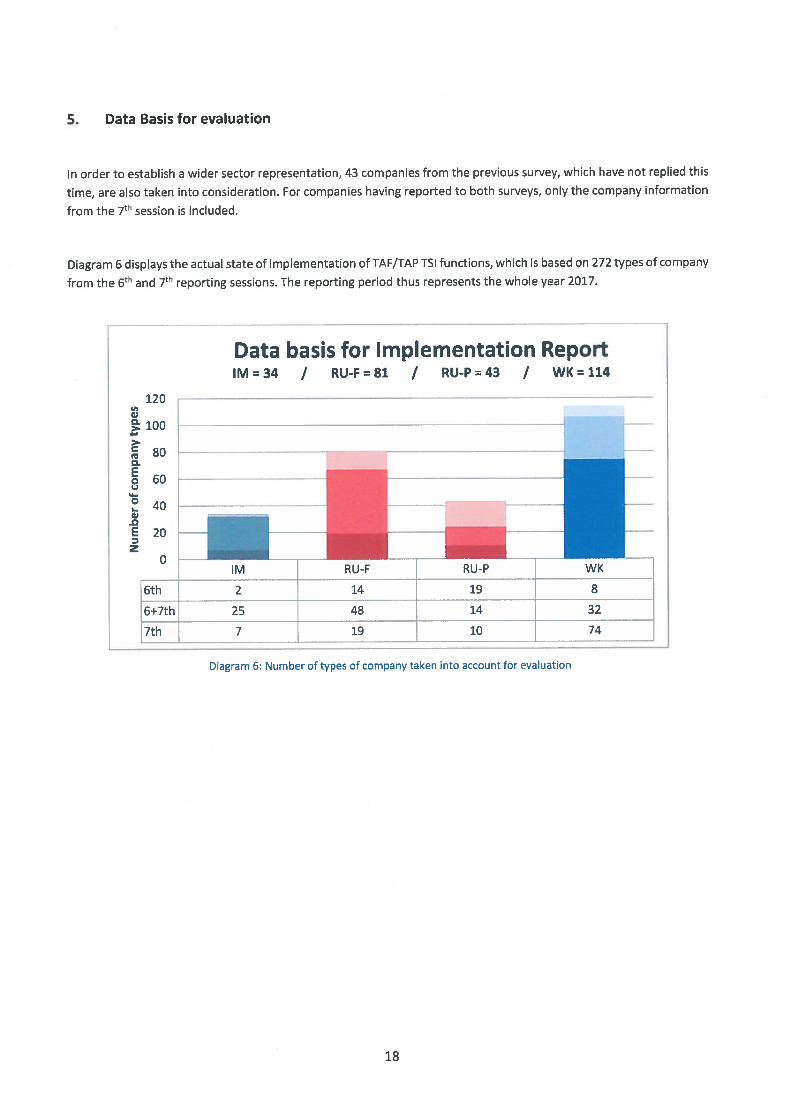
In order to establish a wider sector representation, 43 companies from the previous survey, which have not replied this
time, are also taken into consideration. For companies having reported to both surveys, only the company information
from the 7th session is included.
Diagram 6 displays the actual state of implementation of TAF/TAP TSI functions, which is based on 272 types of company
from the 6th and 7th reporting sessions. The reporting period thus represents the whole year 2017.
Data basis for Implementation ReportIM = 34 / RU-F = 81 / RU-P = 43 / WK = 114
w0.
0.E0U
.4-0I
.0Ez
Diagram 6: Number of types of company taken into account for evaluation
18
6. Implementation monitoring of TAF TSI functions
6.1. Common Reference Files — Primary Location Codes (IMs)
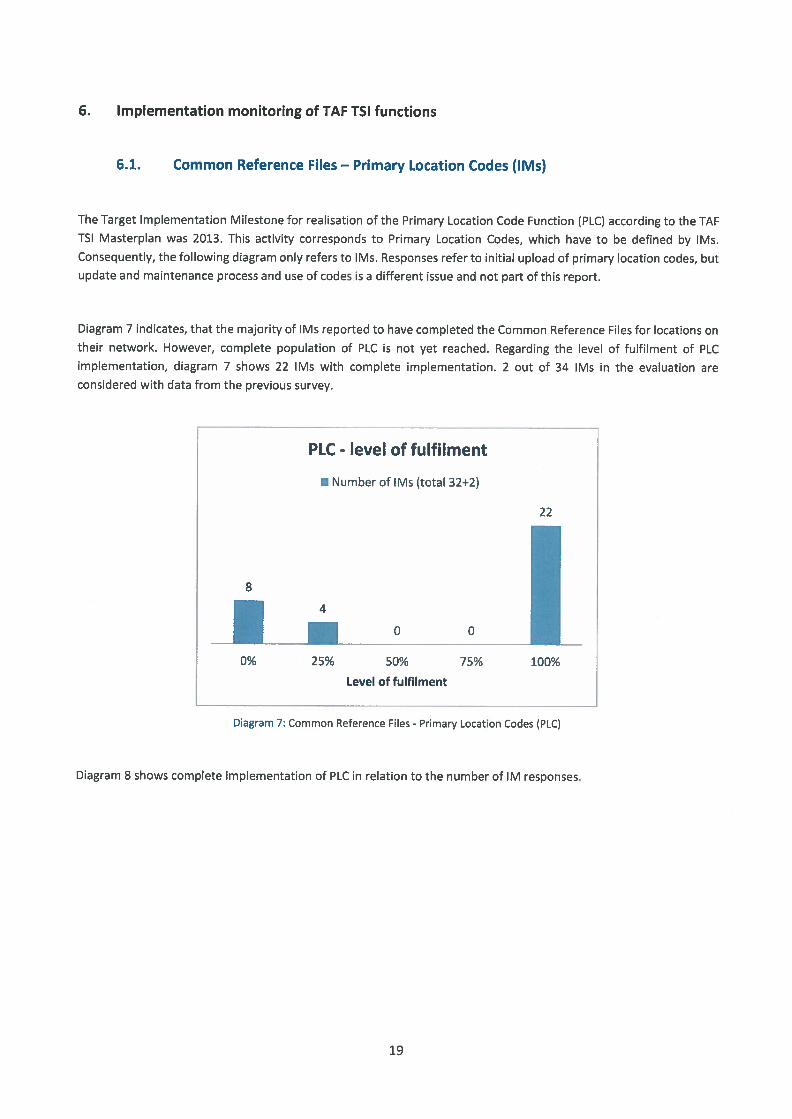
The Target Implementation Milestone for realisation of the Primary Location Code Function (PLC) according to the TAFTSI Masterplan was 2013. This activity corresponds to Primary Location Codes, which have to be defined by IMs.Consequently, the following diagram only refers to IMs. Responses refer to initial upload of primary location codes, butupdate and maintenance process and use of codes is a different issue and not part of this report.
Diagram 7 indicates, that the majority of IMs reported to have completed the Common Reference Files for locations ontheir network. However, complete population of PLC is not yet reached. Regarding the level of fulfilment of PLCimplementation, diagram 7 shows 22 IMs with complete implementation. 2 out of 34 IMs in the evaluation areconsidered with data from the previous survey.
8
0%
PLC - level of fulfilment
• Number of IMs (total 32+2)
4
22
_•_-
-
0
25% 50% 75% 100%
Level of fulfilment
Diagram 7: Common Reference Files - Primary Location Codes (PLC)
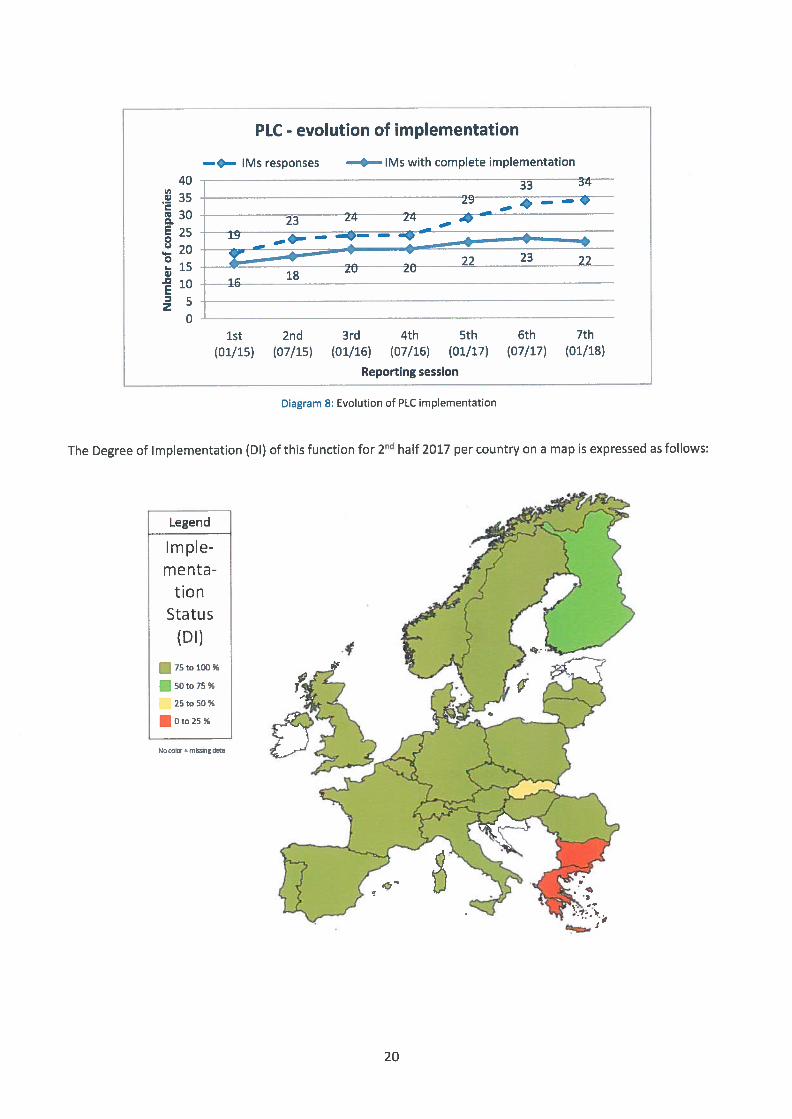
Diagram 8 shows complete implementation of PLC in relation to the number of lM responses.
19
PLC - evolution of implementation
——. Ms responses • IMs with complete implementation
40 - --- —------— --
.35 --—- --------- 29Ca3° - 24 24
I10 16
18
__ ____
1st 2nd 3rd 4th 5th 6th 7th
(01/15) (07/15) (01/16) (07/16) (01/17) (07/17) (01/18)
Reporting session
Diagram 8: Evolution of PLC implementation
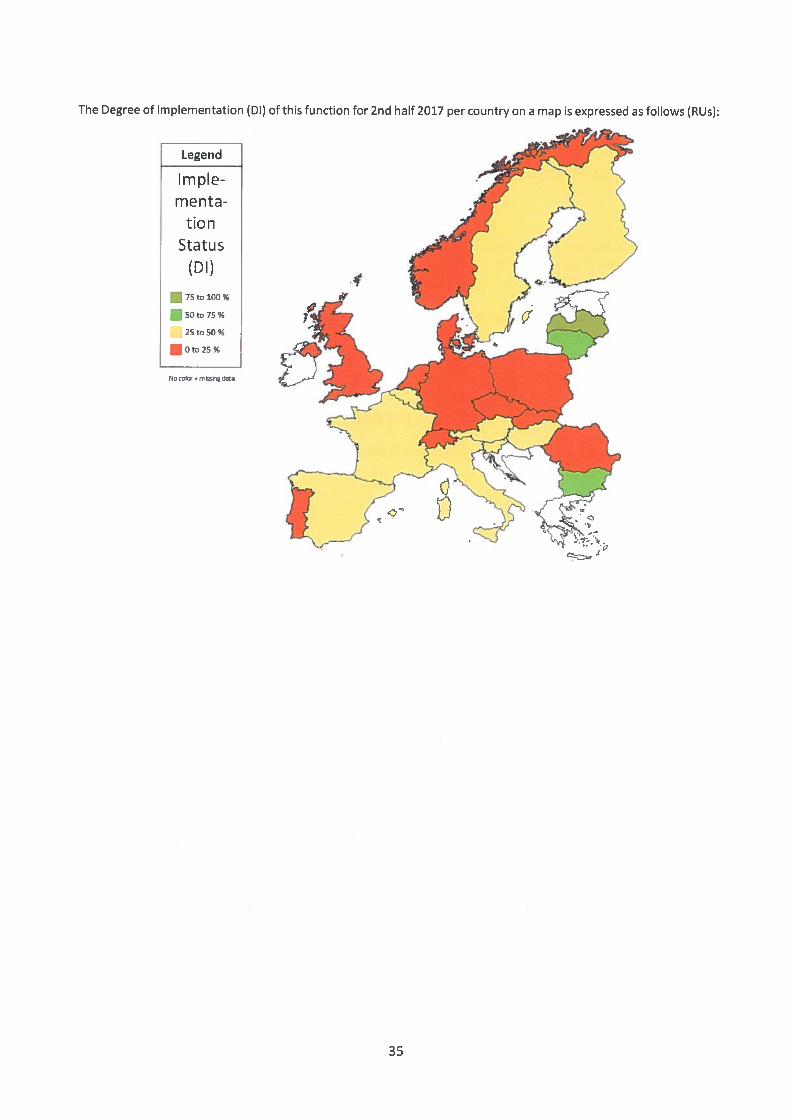
The Degree of Implementation (DI) of this function for 2 half 2017 per country on a map is expressed as follows:
Legend
Impi ementa
tionStatus
(DI)
• 75 to 100
50 to 75%
25 to 50%
• 0 to 25%
Nocom5si1tdo
20
C
0.E0
.4-0
C)-øEz
CC - level of fulfilment
• Number of Ms (total 32+2)
• Number of RUs-F (total 67+14)
• Number of WKs (total 106+8)
6.2. Common Reference Files - Company Code (all companies)
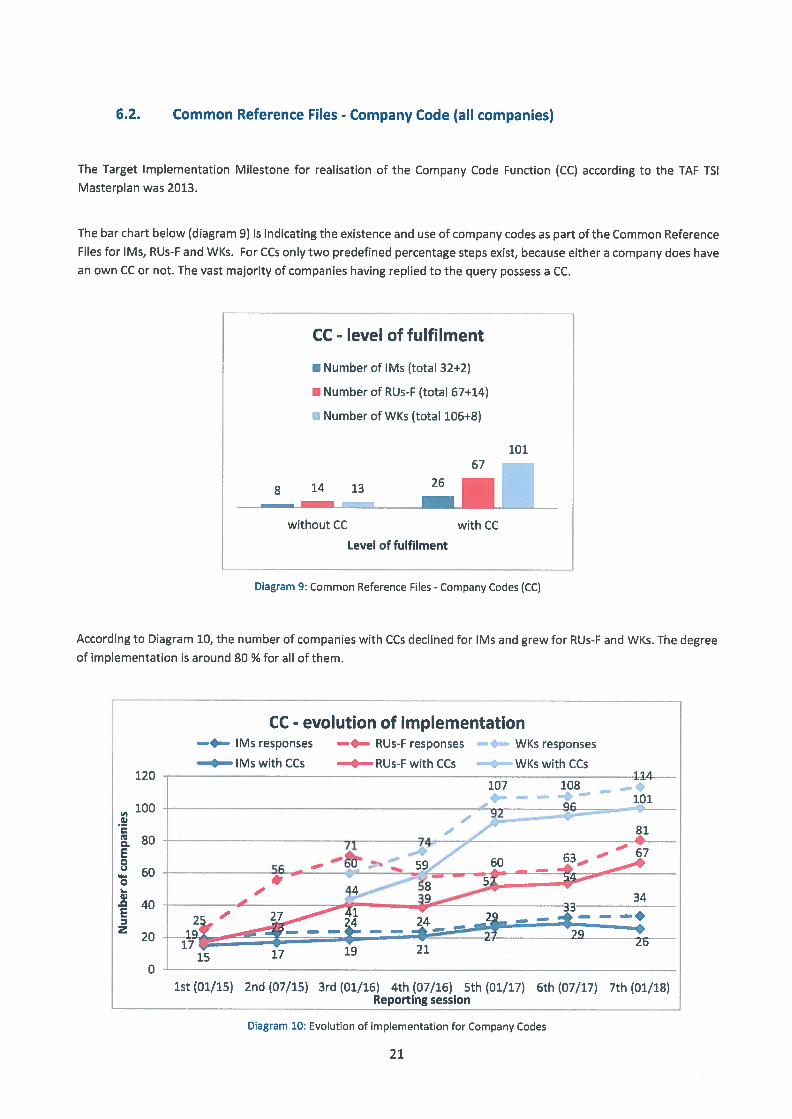
The Target Implementation Milestone for realisation of the Company Code Function (CC) according to the TAF TSIMasterplan was 2013.
The bar chart below (diagram 9) is indicating the existence and use of company codes as part of the Common ReferenceFiles for IMs, RUs-F and WKs. For CCs only two predefined percentage steps exist, because either a company does havean own CC or not. The vast majority of companies having replied to the query possess a CC.
8 14 13 261
without CC with CC
Level of fulfilment
Diagram 9: Common Reference Files Company Codes (CC)
According to Diagram 10, the number of companies with CCs declined for Ms and grew for RUs-F and WKs. The degree
of implementation is around 80 % for all of them.
CC - evolution of implementation—— lMs responses —— RUs-F responses —— WKs responses
• IMs with CCs S RUs-F with CCs S WKs with CCs120
100
80
60
40
20
107 108hA
101
81
0 - —————
1st (01/15) 2nd (07/15) 3rd (01/16) 4th (07/16) 5th (01/17) 6th (07/17) 7th (01/18)
____________ ___________
Reporting session
Diagram 10: Evolution of implementation for Company Codes
21
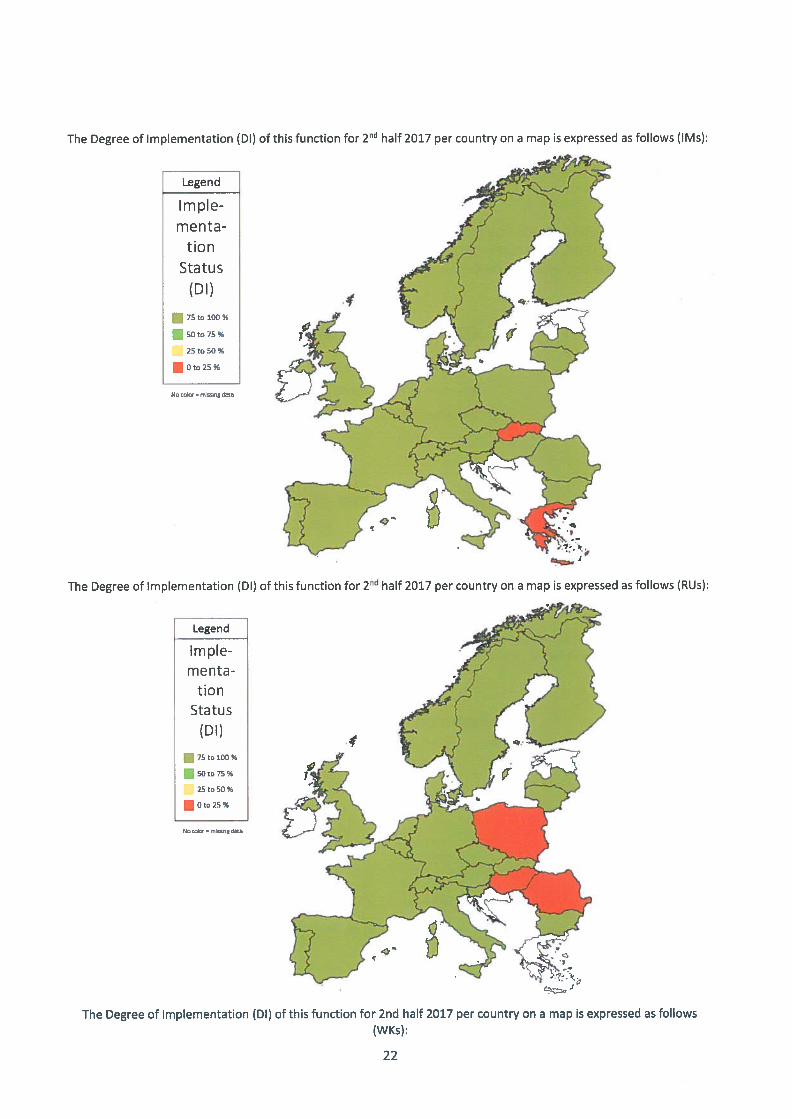
The Degree of Implementation (DI) of this function for 2 half 2017 per country on a map is expressed as follows (IMs):
Legend
Implementa
tionStatus
(DI)
175t0100%
• 50 to 75
25 to 50 %
•Oto2S%
No tolat ntooag data
The Degree of Implementation (DI) of this function for 2 half 2017 per country on a map is expressed as follows (RU5):
Legend
lmpl ementa
tionStatus
(DI)
• 75 to 100%
• 50 to 75%
25 to 50%
• 0 to 25%
Nato
The Degree of Implementation (Dl) of this function for 2nd half 2017 per country on a map is expressed as follows(WKs):
22
Legend
Implementa
tionStatus
(DI)
• 75 to 100
• 50 to 75
25 to 50
•NocosigdI
6.3. Common Interface Implementation (all companies)
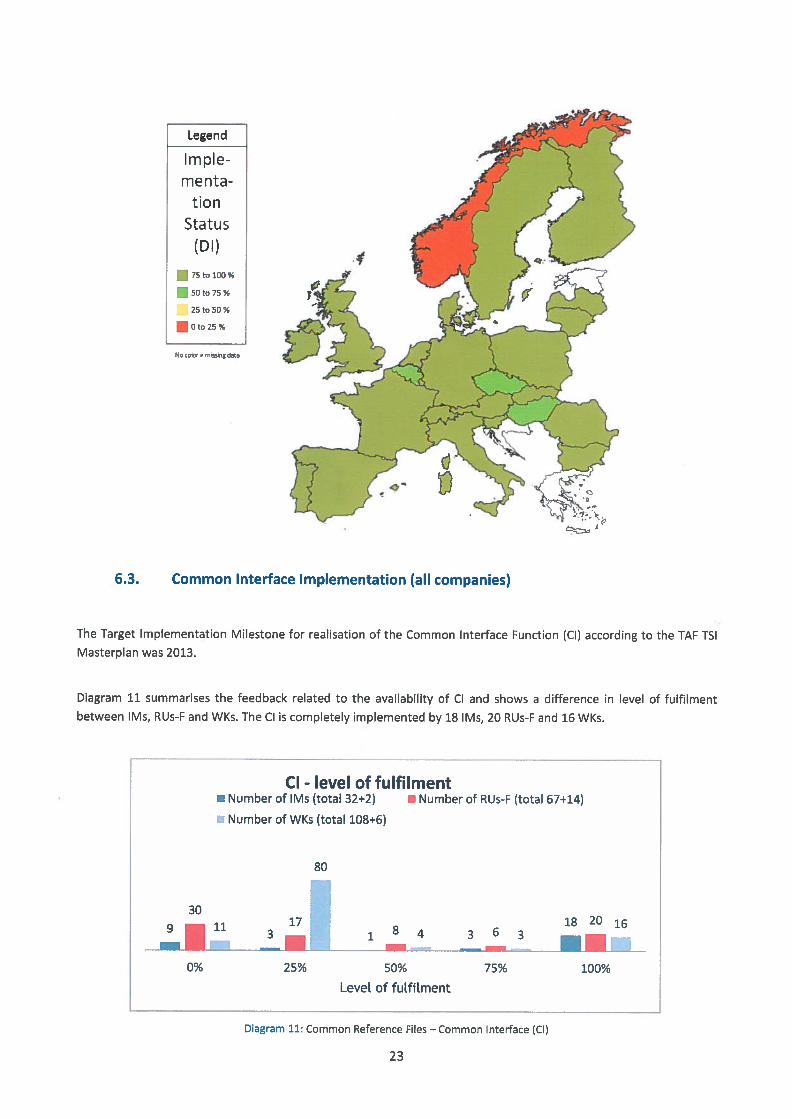
The Target Implementation Milestone for realisation of the Common Interface Function (Cl) according to the TAF TSlMasterplan was 2013.
Diagram 11 summarises the feedback related to the availability of Cl and shows a difference in level of fulfilmentbetween IMs, RUs-F and WKs. The Cl is completely implemented by 18 IMs, 20 RUs-F and 16 WKs.
Cl - level of fulfilment• Number of lMs (total 32+2) • Number of RUs-F (total 67+14)
B Number of WKs (total 108+6)
80
Diagram 11: Common Reference Files — Common Interface (CI)
30911 17
8182016
i 4 6 3
0% 25% 50% 75% 100%
Leve[ of fuLfilment
23
(IMs):
(RU5):
Legend
impiementa
tio nStatus
(DI)
B 75 to 100
50 to 75%
25 to 50
• 0 to 25%
No = mig
Legend
implementa
tion
Status(Di)
75 to 100%
50 to 75
25 to 50%
• 0 to 25%
No oIor = roiosing dota
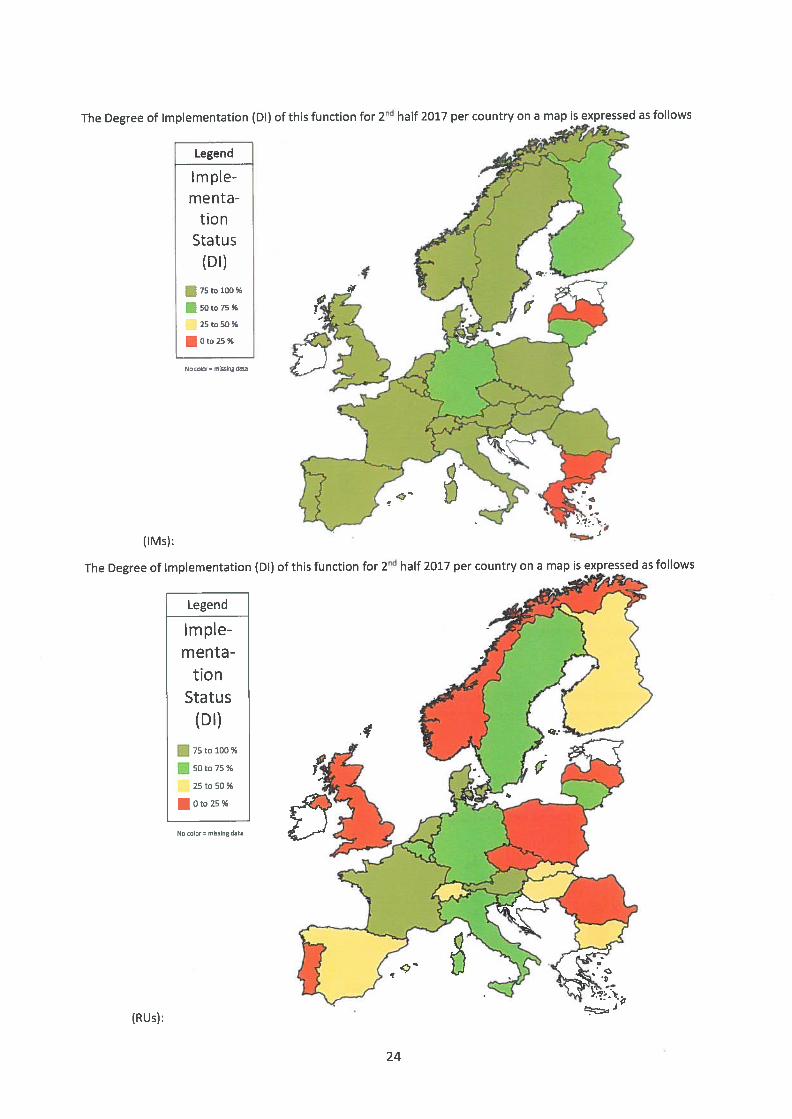
The Degree of Implementation (Dl) of this function for 2 half 2017 per country on a map is expressed as follows
The Degree of Implementation (Dl) of this function for 2 half 2017 per country on a map is expressed as follows
24
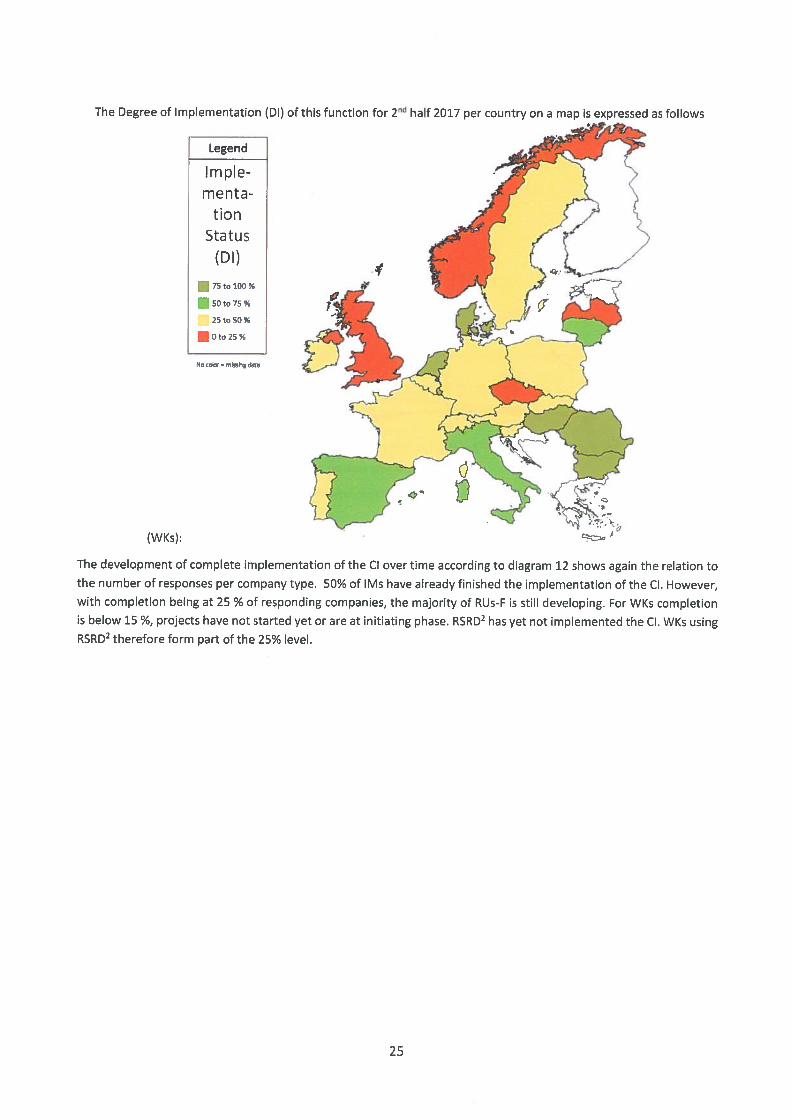
The Degree of Implementation (Dl) of this function for 2° half 2017 per country on a map is expressed as follows
Legend
Implementa
tionStatus
(DI)
ri 75 to 100%
•25 to 50
•No CoI n’n doto
(WKs):
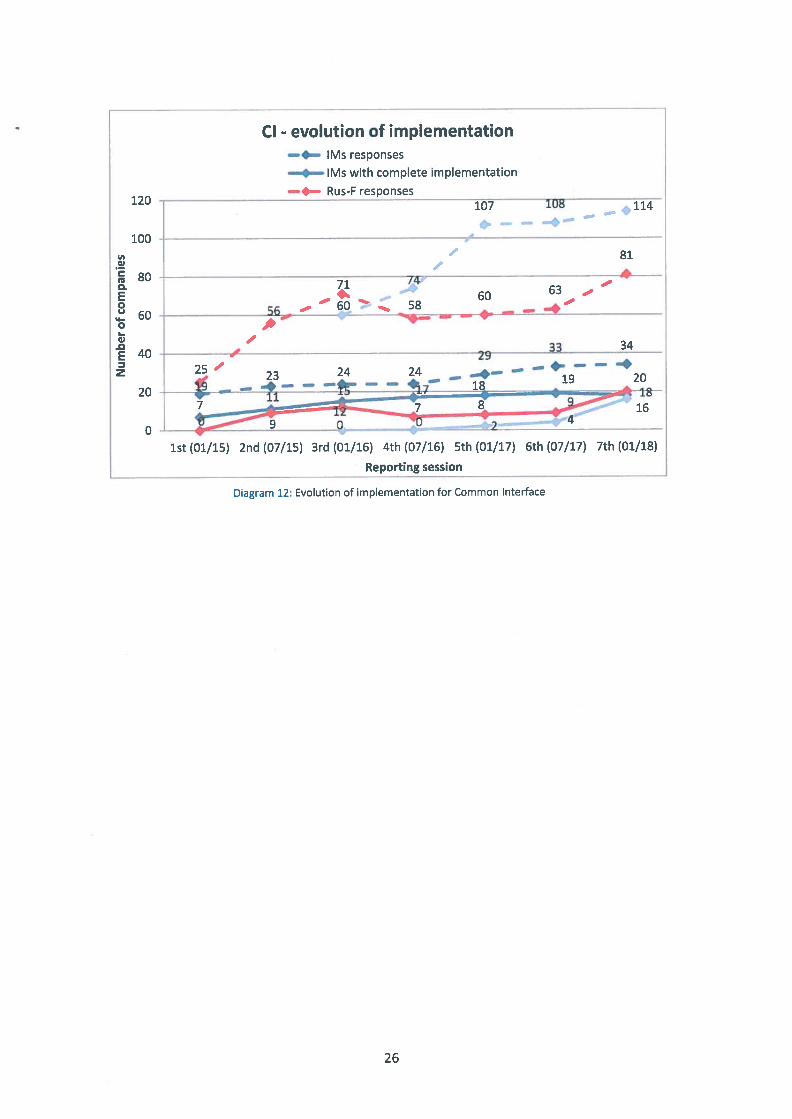
The development of complete implementation of the Cl over time according to diagram 12 shows again the relation tothe number of responses per company type. 50% of Ms have already finished the implementation of the Cl. However,with completion being at 25 % of responding companies, the majority of RUs-F is still developing. For WKs completionis below 15 %, projects have not started yet or are at initiating phase. RSRD2 has yet not implemented the Cl. WKs usingRSRD2 therefore form part of the 25% level.
25
Cl - evolution of implementation— Ms responses
• IMs with complete implementation
120—-— Rus-F resoonses
100
a)
to0.E0U
0I-a).0E 40
z
20
0
16
—
4
1st (01/15) 2nd (07/15) 3rd (01/16) 4th (07/16) 5th (01/17) 6th (07/17) 7th (01/18)
___________
Reporting session
Diagram 12: Evolution of implementation for Common Interface
26
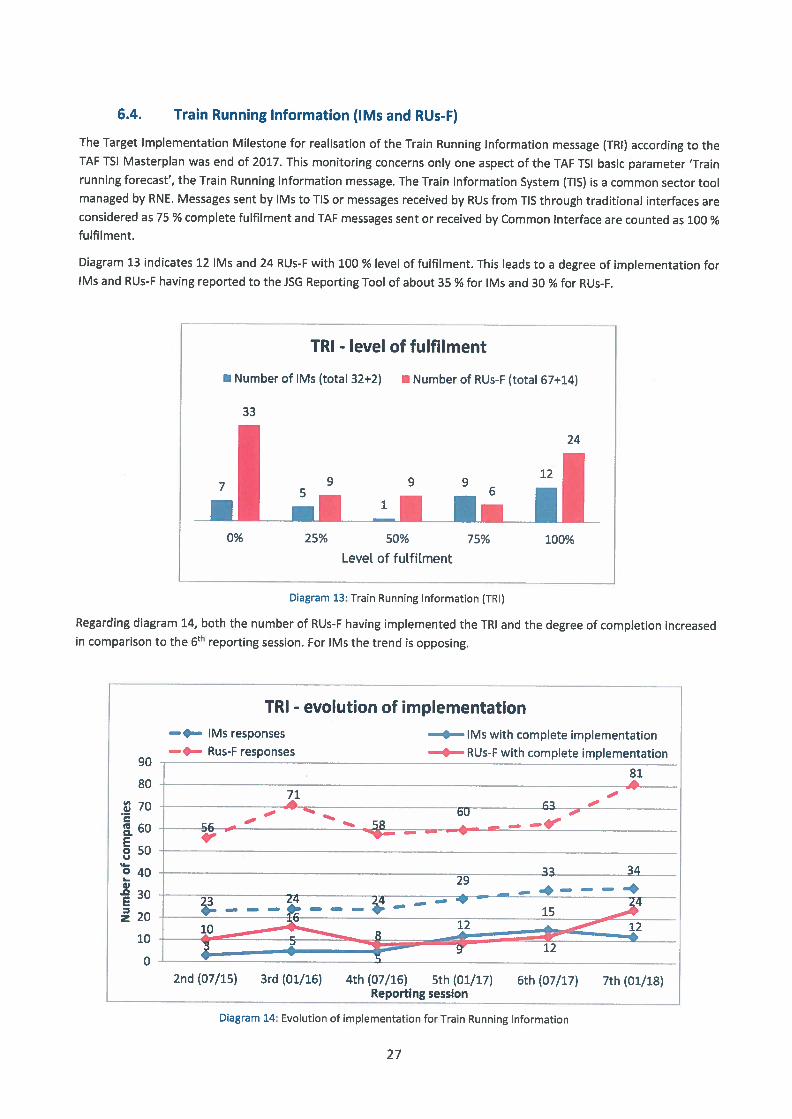
6.4. Train Running Information (IMs and RUs-F)
The Target Implementation Milestone for realisation of the Train Running Information message (TRI) according to theTAF TSI Masterplan was end of 2017. This monitoring concerns only one aspect of the TAF TSI basic parameter ‘Trainrunning forecast’, the Train Running Information message. The Train Information System (TIS) is a common sector toolmanaged by RNE. Messages sent by IMs to TIS or messages received by RUs from TIS through traditional interfaces areconsidered as 75 % complete fulfilment and TAF messages sent or received by Common Interface are counted as 100 %fulfilment.
Diagram 13 indicates 12 Ms and 24 RUs-F with 100 % level of fulfilment. This leads to a degree of implementation forIMs and RUs-F having reported to the JSG Reporting Tool of about 35 % for lMs and 30 % for RUs-F.
TRI - level of fulfilment
I Number of IMs (total 32+2) I Number of RUs-F (total 67+14)
Level of fulfilment
Diagram 13: Train Running Information (TRI)
Regarding diagram 14, both the number of RUs-F having implemented the TRI and the degree of completion increasedin comparison to the 6th reporting session. For IMs the trend is opposing.
C)C
a.
0‘‘I01C).0Ezz
TRI - evolution of implementation
33
71 9
BI.
24
9
I—0% 25% 50% 75% 100%
——— IMs responses
—•— Rus-F responses90
80
70
60
50
40
30
20
10
71p4%b%
56 .
.p —
• IMs with complete implementation
• RUs-F with complete implementation
81
____
—bU
!‘
2934
— — — — —
0-
____
2nd (07/15) 3rd (01/16) 4th (07/16) 5th (01/17) 6th (07/17) 7th (01/18)
________
Reporting session
Diagram 14: Evolution of implementation for Train Running Information
27
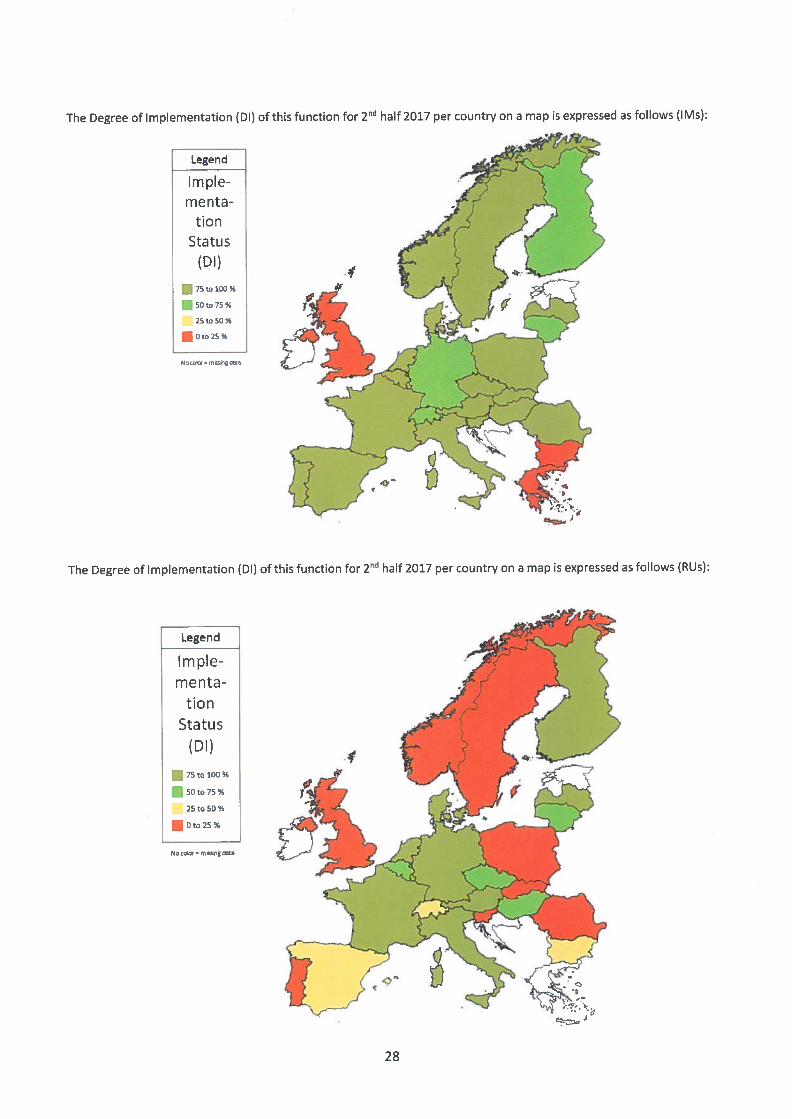
The Degree of Implementation (DI) of this function for 2r,d half 2017 per country on a map is expressed as follows (IMs):
Legend
Implementa
tb nStatus
(Dl)
to 100 %
• 50 to 75%
25 to 50%
•
The Degree of Implementation (DI) of this function for 2 half 2017 per country on a map is expressed as follows (RUs):
Legend
Imple
mentatbon
Status
(DI)
• 75 to 100
•25 to 0%
•Noco o1Ot
-
28
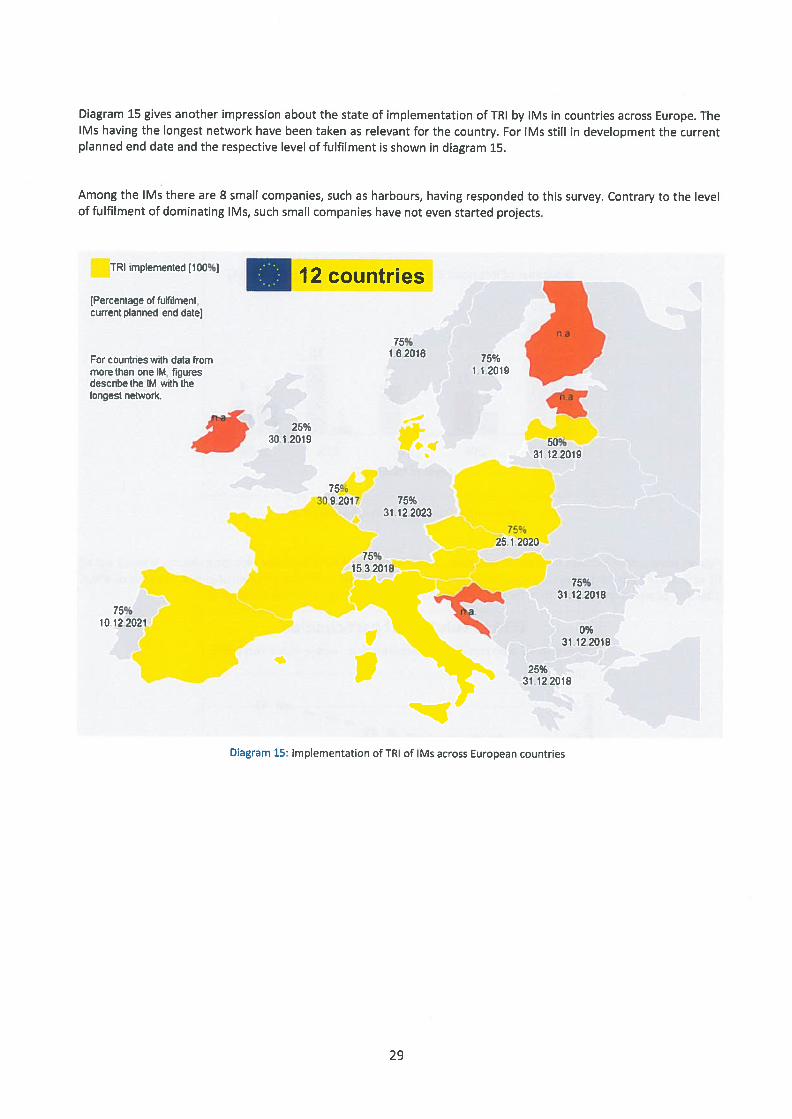
Diagram 15 gives another impression about the state of implementation of TRI by IMs in countries across Europe. TheIMs having the longest network have been taken as relevant for the country. For Ms still in development the currentplanned end date and the respective level of fulfilment is shown in diagram 15.
Among the IMs there are 8 small companies, such as harbours, having responded to this survey. Contrary to the levelof fulfilment of dominating IMs, such small companies have not even started projects.
[Percentage of fulfilment,current planned end date]
For countries wfth data frommore than one l1,. figuresdescribe the IM iith thelongest network
75°o
10122021
75%1,6 2016
75%31122023
50%31122019
TRI implemented [100%] [ 1 2 countries
75%11 2019
25%30.1 2019
75%3092017
75%25.1 2020
75%1532018
75%31122018
0%31122018
25%31 122018
Diagram 15: Implementation of TRI of lMs across European countries
29
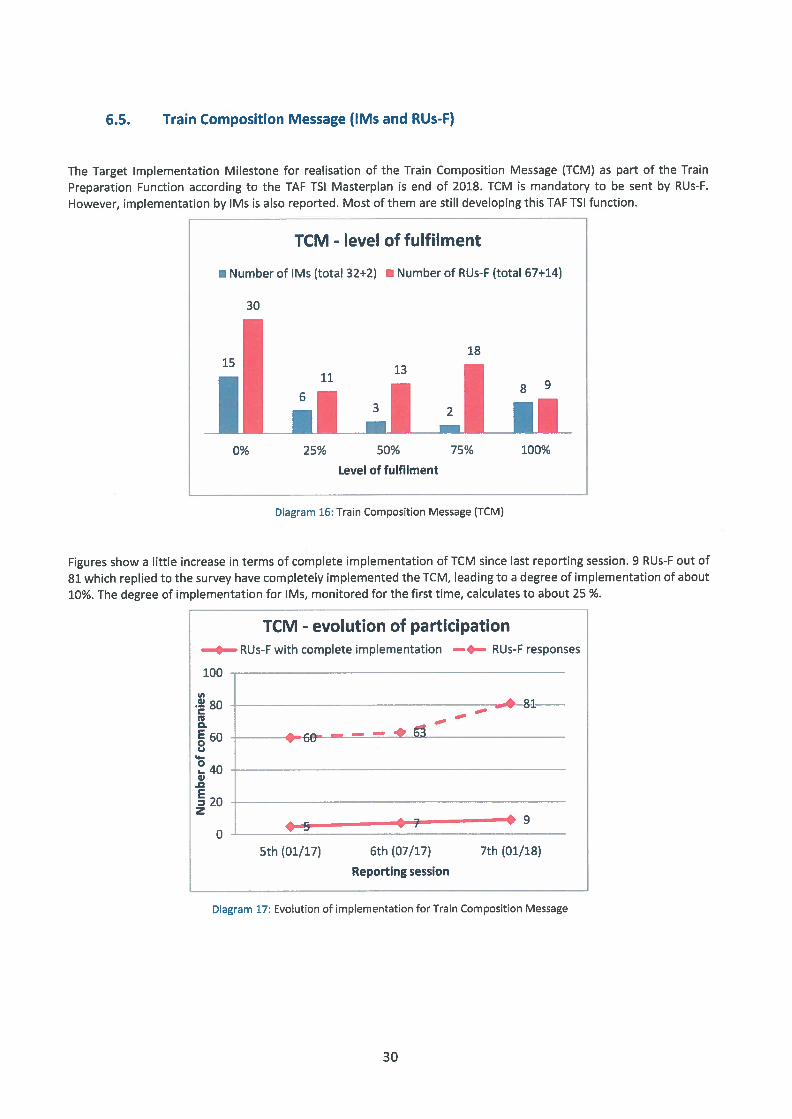
6.5. Train Composition Message (IMs and RUs-F)
The Target Implementation Milestone for realisation of the Train Composition Message (TCM) as part of the Train
Preparation Function according to the TAF TSI Masterplan is end of 2018. TCM is mandatory to be sent by RUs-F.
However, implementation by lMs is also reported. Most of them are still developing this TAF TSI function.
TCM - level of fulfilment
• Number of IMs (total 32+2) • Number of RUs-F (total 67+14)
30
0% 25% 50% 75% 100%
Diagram 16: Train Composition Message (TCM)
Figures show a little increase in terms of complete implementation of TCM since last reporting session. 9 RUs-F out of
81 which replied to the survey have completely implemented the TCM, leading to a degree of implementation of about
10%. The degree of implementation for IMs, monitored for the first time, calculates to about 25 %.
TCM - evolution of participation• RUs-F with complete implementation ——- RUs-F responses
Reporting session
100
1.80
20z
0
Diagram 17: Evolution of implementation for Train Composition Message
18
Level of fulfilment
-———--‘66 — — —
5th (01/17)
.9
6th (07/17) 7th (01/18)
30
The Degree of Implementation (Dl) of this function for 2nd half 2017 per country on a map is expressed as follows (IMs):
Legend
Implementa
tionStatus
(DI)
75 to 100 %
•25 to 50%
•No color m6shg deta
The Degree of Implementation (Dl) of this function for 2nd half 2017 per country on a map is expressed as follows (RUs):
Legend
Implementa
tio nStatus
(DI)
• 75 to 100%
• 50 to 75%
25 to 50
• 0 to 25%
No color. oolog o
n •çc\J
yt 7
r
Qb
31
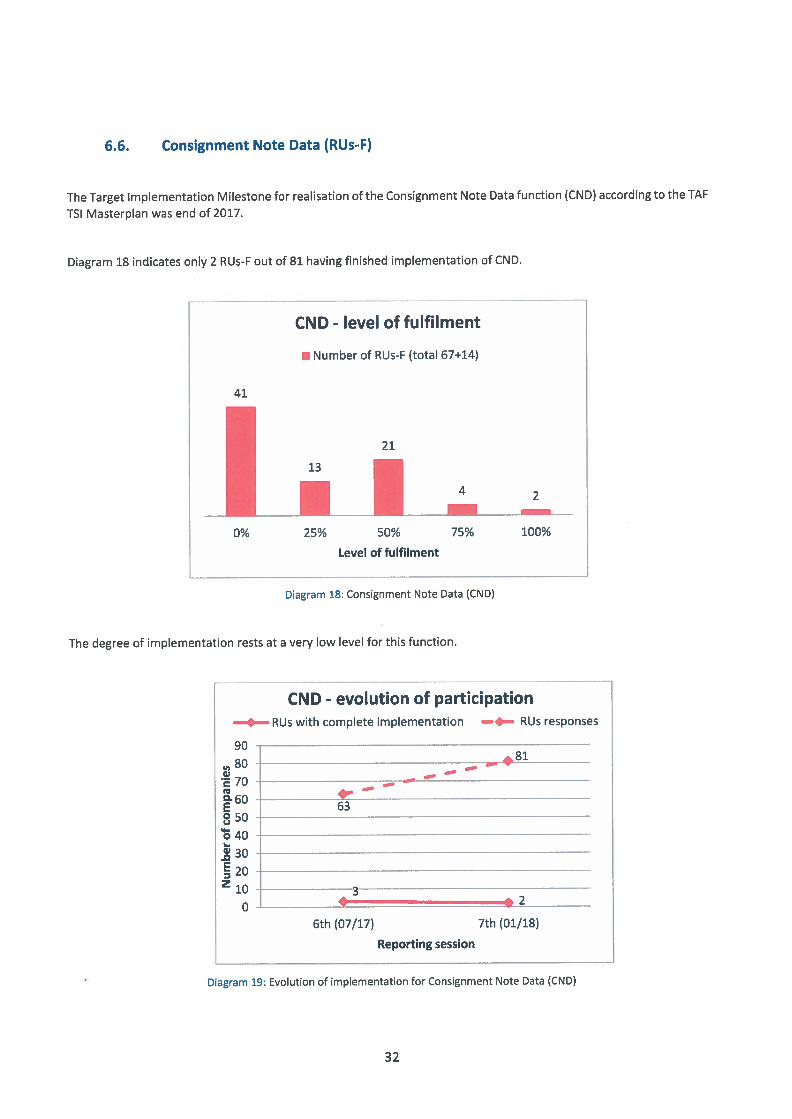
The Target Implementation Milestone for realisation of the Consignment Note Data function (CND) according to the TAF
TSI Masterplan was end of 2017.
Diagram 18 indicates only 2 RUs-F out of 81 having finished implementation of CND.
CND - level of fulfilment
• Number of RUs-F (total 67+14)
Diagram 18: Consignment Note Data (CND)
The degree of implementation rests at a very low level for this function.
90
80
70
60
o 40 -
________________________________
I
30
20Z 10
0-
6.6. Consignment Note Data (RU5-F)
41
21
0% 25%
2—
50% 75%
Level of fulfilment
100%
CND - evolution of participation• RUs with complete implementation ——— RUs responses
-—
—-p.-
—
63
jS.
6th (07/17)
:2
7th (01/18)
Reporting session
Diagram 19: Evolution of implementation for Consignment Note Data (CND)
32
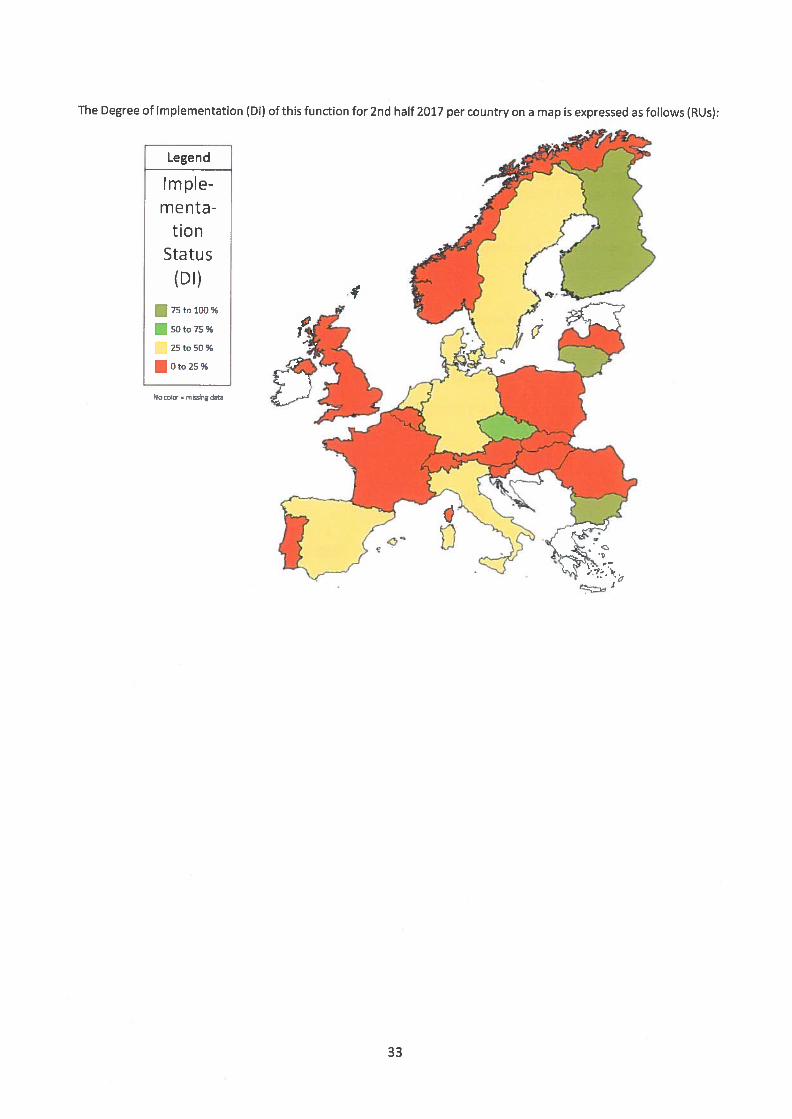
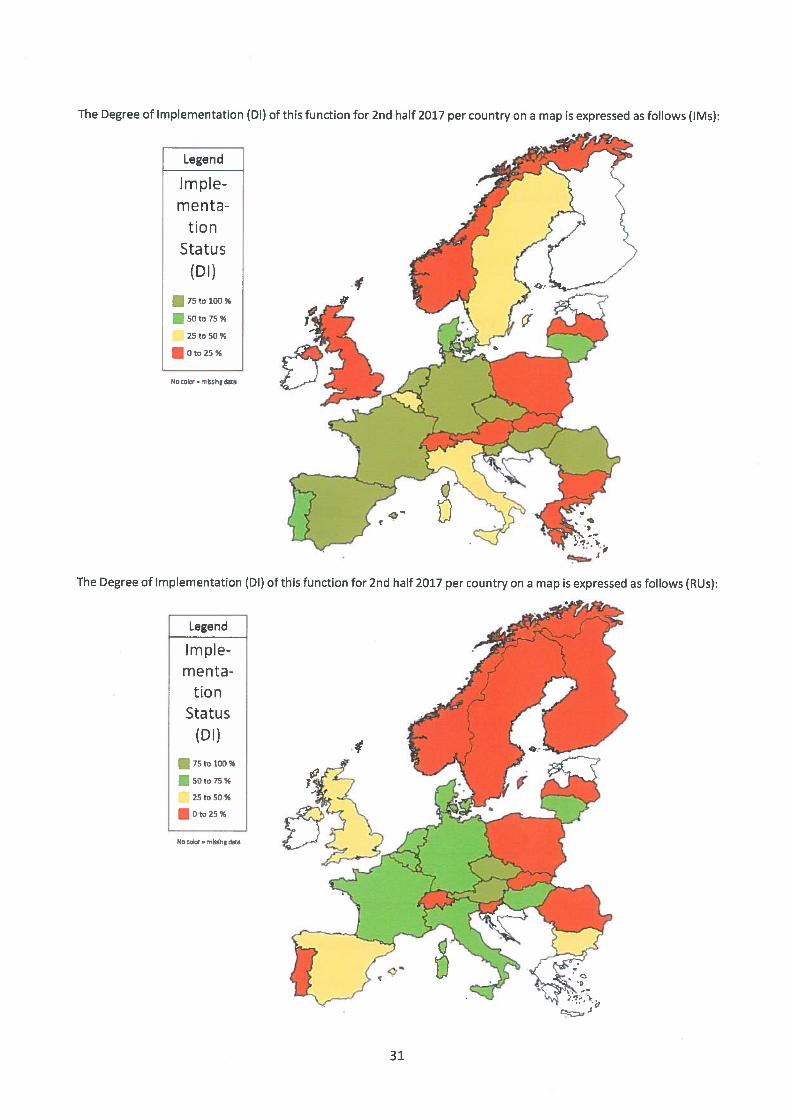
The Degree of Implementation (Dl) of this function for 2nd half 2017 per country on a map is expressed as follows (RUs):
Legend
Implementa
tionStatus
(DI)
• 75 to 100%
• 50 to 75%
25 to 50%
•ND CDIO( mrig dDt
33
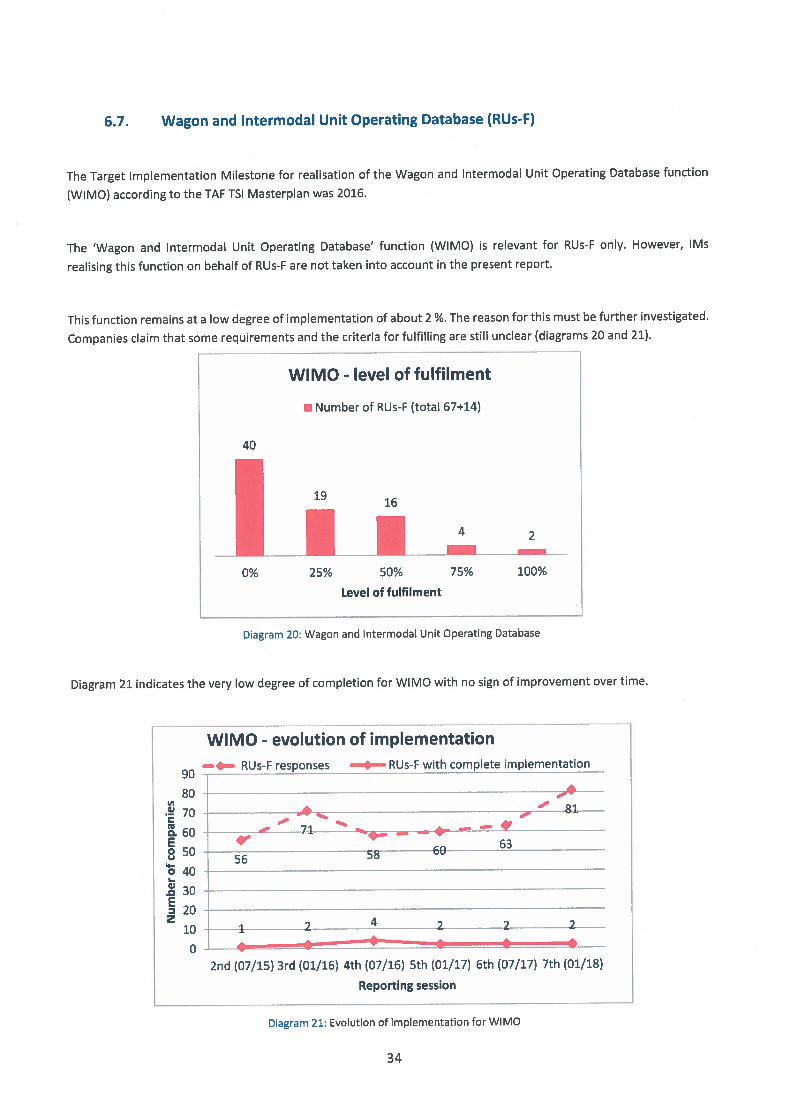
6.7. Wagon and Intermodal Unit Operating Database (RUs-F)
The Target Implementation Milestone for realisation of the Wagon and Intermodal Unit Operating Database function
(WIMO) according to the TAF TSI Masterplan was 2016.
The ‘Wagon and Intermodal Unit Operating Database’ function (WIMO) is relevant for RUs-F only. However, IMs
realising this function on behalf of RUs-F are not taken into account in the present report.
This function remains at a low degree of implementation of about 2 %. The reason for this must be further investigated.
Companies claim that some requirements and the criteria for fulfilling are still unclear (diagrams 20 and 21).
WIMO - level of fulfilment
B Number of RUs-F (total 67+14)
40
16
•—0% 25% 50% 75% 100%
Level of fulfilment
Diagram 20: Wagon and Intermodal Unit Operating Database
Diagram 21 indicates the very low degree of completion for WIMO with no sign of improvement over time.
WIMO - evolution of implementation
90— RIJs-F responses • RUs-F with complete_implementation
80--------————
4’ 81
a60 - 71__.
50 60
o4Qw
________ _________________
.o 30 j -
______________ ______________________________
2O2 .4 2 2
0 -. —
2nd (07/15) 3rd (01/16) 4th (07/16) 5th (01/17) 6th (07/17) 7th (01/18)
Reporting session
Diagram 21: Evolution of implementation for WIMO
34
The Degree of Implementation (Dl) of this function for 2nd half 2017 per country on a map is expressed as follows (RUs):
Legend
Implementa
tionStatus
(DI)
• 75to100%
•25 to 50%
• Oto2S
Noisnt
35
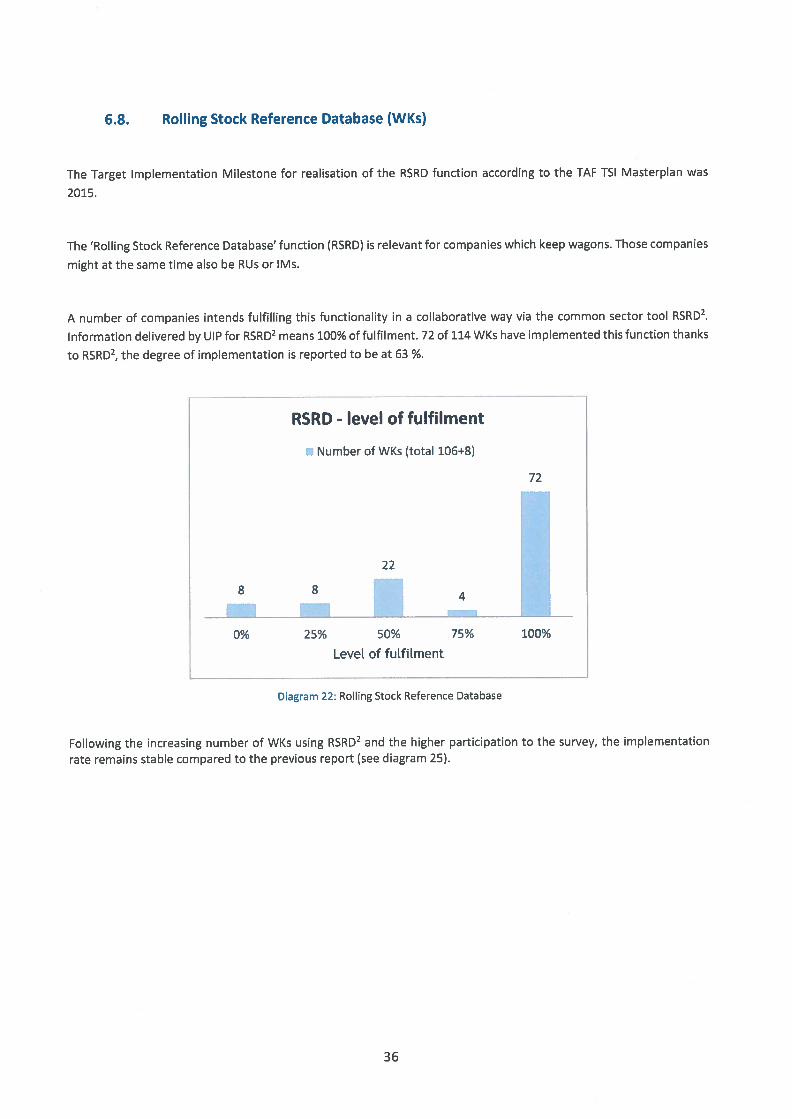
6.8. RoIling Stock Reference Database (WKs)
The Target Implementation Milestone for realisation of the RSRD function according to the TAF TSI Masterplan was
2015.
The Rolling Stock Reference Databas& function (RSRD) is relevant for companies which keep wagons. Those companies
might at the same time also be RUs or IMs.
A number of companies intends fulfilling this functionality in a collaborative way via the common sector tool RSRD2.
Information delivered by UIP for RSRD2means 100% of fulfilment. 72 of 114 WKs have implemented this function thanks
to RSRD2,the degree of implementation is reported to be at 63 %.
RSRD - level of fulfilment
Number of WKs (total 106+8)
0% 25% 50% 75%
Level of fuLfilment
Diagram 22: Rolling Stock Reference Database
Following the increasing number of WKs using RSRD2 and the higher participation to the survey, the implementation
rate remains stable compared to the previous report (see diagram 25).
72
8
22
8 I 41
100%
36
a)
0.E
_______________________ __________________________________
10
.0E
Diagram 23: Evolution of implementation for RSRD
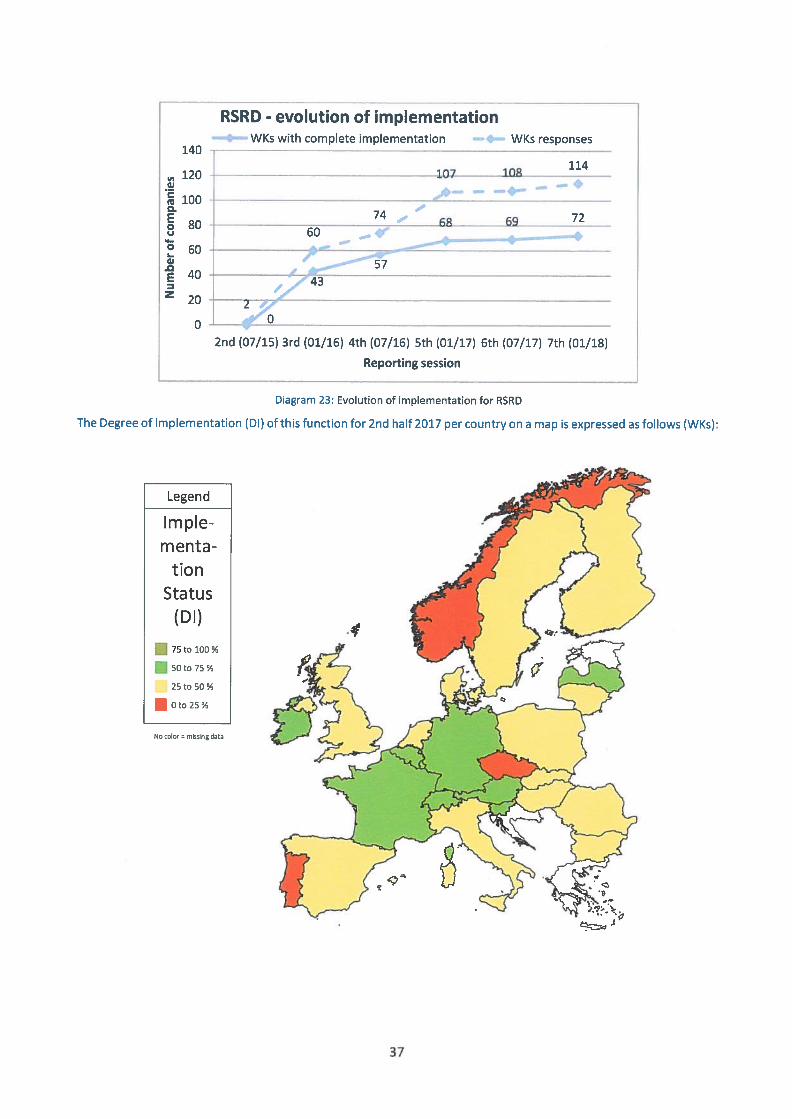
The Degree of Implementation (Dl) of this function for 2nd half 2017 per country on a map is expressed as follows (WK5):
Legend
Implementa
tic nStatus
(DI)
• 75 to 100%
•25 to 50%
• 0 to 25%
N oIo = msing data
RSRD - evolution of implementation• WKs with complete implementation —— WKs responses
140
120
100
80
60
40
20
0
107114
— — - -— A — —• — —
____________ 69 72
0
______
2nd (07/15) 3rd (01/16) 4th (07/16) 5th (01/17) 6th (07/17) 7th (01/18)
Reporting session
37

38
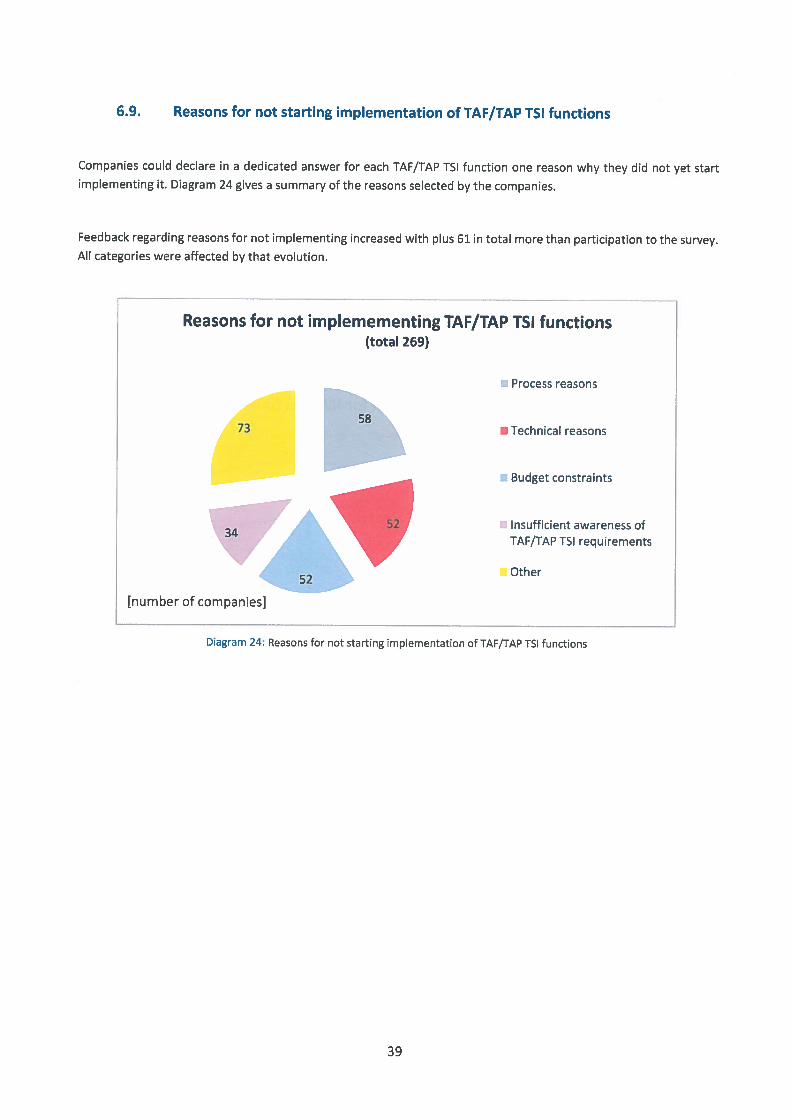
6.9. Reasons for not starting implementation of TAF/TAP TSI functions
Companies could declare in a dedicated answer for each TAF/TAP TSI function one reason why they did not yet startimplementing it. Diagram 24 gives a summary of the reasons selected by the companies.
Feedback regarding reasons for not implementing increased with plus 61 in total more than participation to the survey.All categories were affected by that evolution.
Reasons for not implemementing TAF/TAP TSI functions(total 269)
58
4I
[number of companies]
• Process reasons
• Technical reasons
Otherr
52
Budget constraints
• Insufficient awareness ofTAF/TAP TSI requirements
Diagram 24: Reasons for not starting implementation of TAF/TAP TSI functions
39
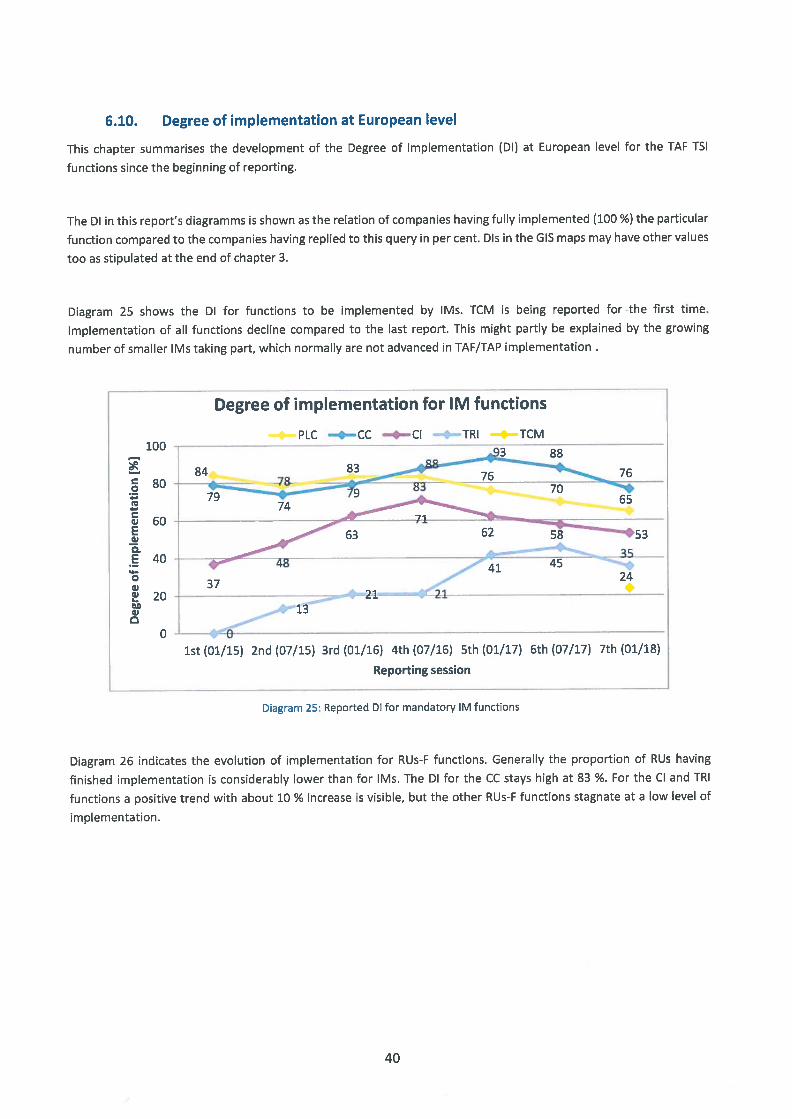
6.10. Degree of implementation at European level
This chapter summarises the development of the Degree of Implementation (Dl) at European level for the TAF TSI
functions since the beginning of reporting.
The DI in this report’s diagramms is shown as the relation of companies having fully implemented (100 %) the particular
function compared to the companies having replied to this query in per cent. Dls in the GIS maps may have other values
too as stipulated at the end of chapter 3.
Diagram 25 shows the Dl for functions to be implemented by IMs. TCM is being reported for the first time.
Implementation of all functions decline compared to the last report. This might partly be explained by the growing
number of smaller Ms taking part, which normally are not advanced in TAF/TAP implementation
Degree of implementation for IM functions
100
80
60
PLC ——CC —4—Cl —4 TRI —.‘.. TCM
0
4-
a)
a)0.E
0a)a)
a)
63
7065
62 53
40 --- _4_5
I 3724
20 -H------ --- 21 -2-1 —-_____
______
0L1st (01/15) 2nd (07/15) 3rd (01/16) 4th (07/16) 5th (01/17) 6th (07/17) 7th (01/18)
Reporting session
Diagram 25: Reported DI for mandatory IM functions
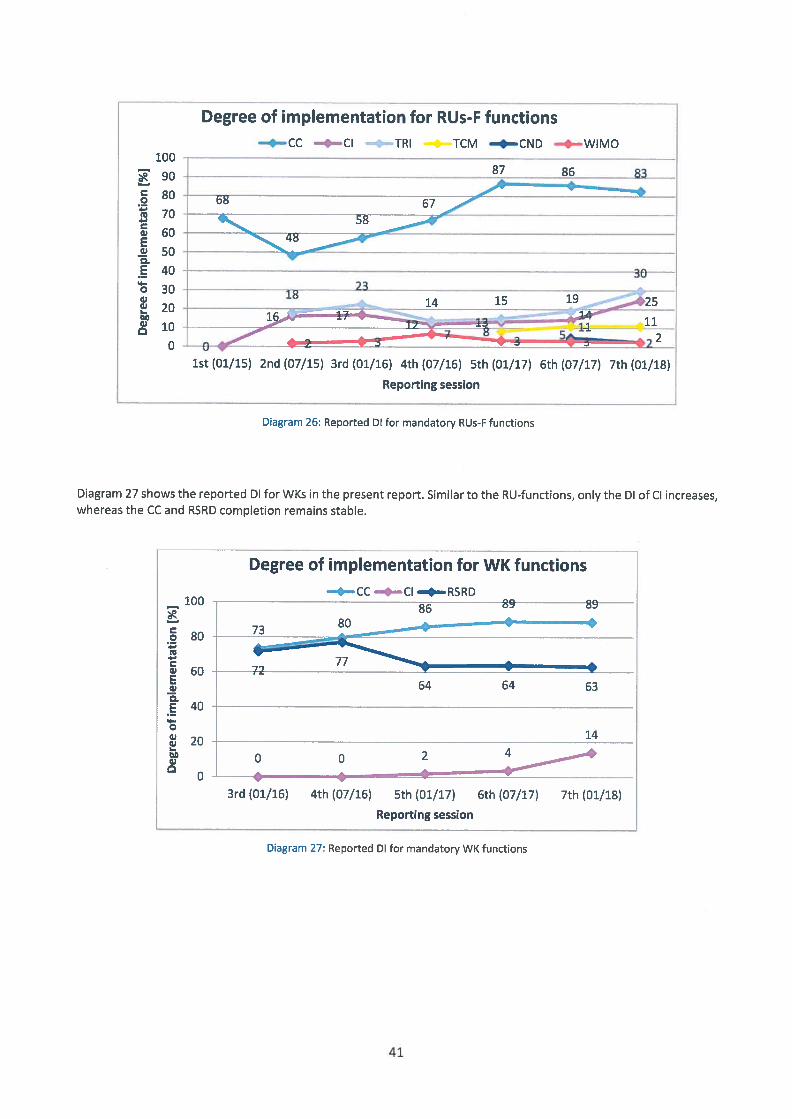
Diagram 26 indicates the evolution of implementation for RUs-F functions. Generally the proportion of RUs having
finished implementation is considerably lower than for IMs. The DI for the CC stays high at 83 %. For the Cl and TRI
functions a positive trend with about 10 % increase is visible, but the other RUs-F functions stagnate at a low level of
implementation.
40
Degree of implementation for RUs-F functions—4--CC —4--Cl —4 TRI —- TCM —.—CND —4--WIMO
E67
_______ _____
—
--
__ ____________
14
_______
15 19
1st (01/15) 2nd (07/15) 3rd (01/16) 4th (07/16) 5th (01/17) 6th (07/17) 7th (01/18)
Reporting session
Diagram 26: Reported DI for mandatory RUs-F functions
Diagram 27 shows the reported DI for WKs in the present report. Similar to the RU-functions, only the Dl of Cl increases,whereas the CC and RSRD completion remains stable.
Degree of implementation for WK functions
—4-—CC —4—Cl .—4—RSRD
73
_________
—,--——____
64 64 63
:-i
100
90
80
m 70.1
w 60
150E 40
.4-o 30a)
20
10
0
C04-
4-Ca)Ea)C.E
.4-
0a)a)
a)
100
80 -
60
40
20
03rd (01/16) 4th (07/16) 5th (01/17) 6th (07/17) 7th (01/18)
Reporting session
Diagram 27: Reported DI for mandatory WK functions
41
7. Intentions for implementation
7.1. Common sector tools
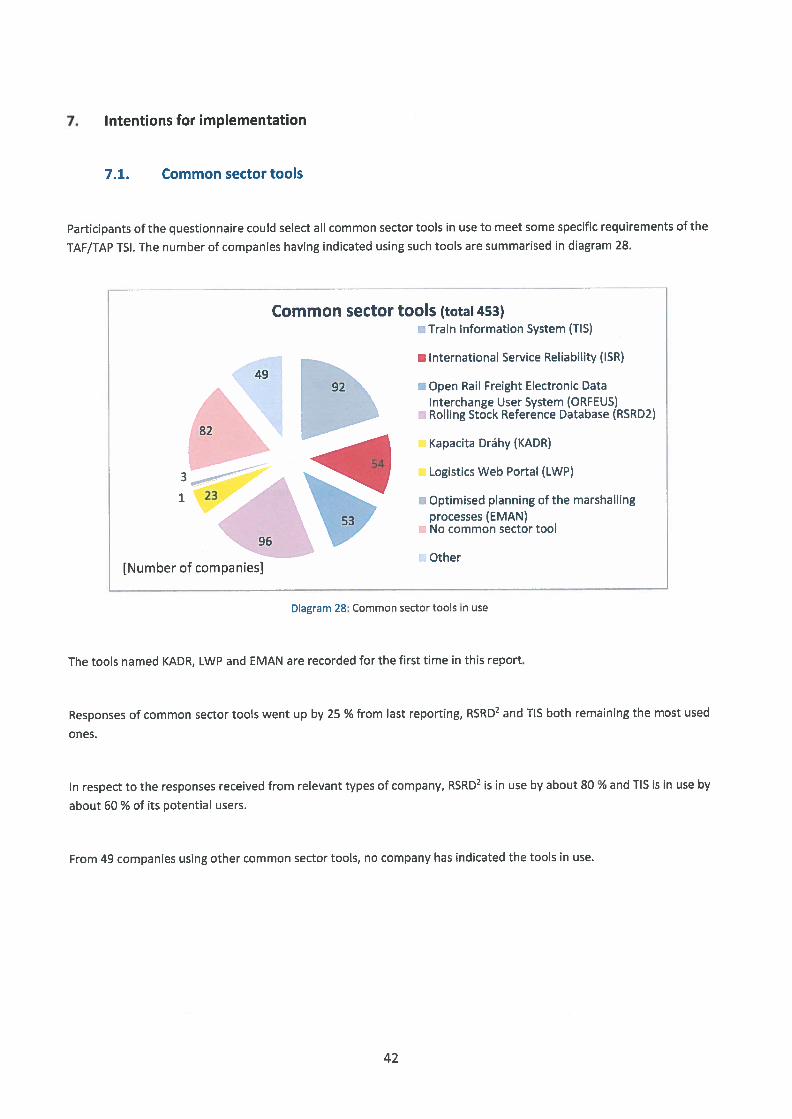
Participants of the questionnaire could select all common sector tools in use to meet some specific requirements of the
TAF/TAP TSI. The number of companies having indicated using such tools are summarised in diagram 28.
Common sector tools (total 453)U Train Information System (TlS)
• International Service Reliability (ISR)
• Open Rail Freight Electronic DataInterchange User System (ORFEUS)Rolling Stock Reference Database (RSRD2)
Kapacita Dráhy (KADR)
Logistics Web Portal (LWP)
1 23 I Optimised planning of the marshalling
53 processes (EMAN)
96sector tool
[Number of companies]
Diagram 28: Common sector tools in use
The tools named KADR, LWP and EMAN are recorded for the first time in this report.
Responses of common sector tools went up by 25 % from last reporting, RSRD2 and TIS both remaining the most used
ones.
In respect to the responses received from relevant types of company, RSRD2 is in use by about 80 % and TIS is in use by
about 60 % of its potential users.
From 49 companies using other common sector tools, no company has indicated the tools in use.
42
8. Survey coverage
The present reporting period contained also few statistical questions, such as line-km, ton-km and passenger-km.
After analysing the partly incomplete data from the companies and the comparison of this data with the availablestatistical data the IRG was unable to draw a clear picture of the actual situation for whole Europe. Also a first checkwith the available ABC-analysis4did not show any reliable results.
Therefore the rail sector’s Implementation Reporting Group (IRG) suggests removing these specific questions from thequestionnaire for the next reporting session.
Since an European-wide picture of the real implementation status would be very helpful, the IRG proposes to put moreeffort in aforementioned analysis with the support of the NCPs.
ABC-analysis means the classification of companies in relation to their market share.
43
9. Conclusion and Findings
The number of companies having responded to the 7th questionnaire is, as always as, significantly lower than the
number of companies having been invited. The response rate descended for the first time to 35 % from a previously
stable value of around 40 %.
Lower absolute numbers of participation result from the fact, that participation of RUs-P has decreased.
For some TAF TSI functions there is a strong need to precisely define the compliance with TAF TSI regulation. For
example for the WIMO function, companies claim that some requirements and the criteria for fulfilling are still unclear.
This task has been initiated from the European rail sector and work is ongoing.
The degree of implementation as set out in diagrams 25 to 27 of this report is calculated from the responses to the
questionnaire. If companies not having responded would be also taken into calculation, the degree of implementation
would drop.
The inclusion of data from the previous reporting session in this report was an effort to have a more complete view of
the company’s feedback and the current level of implementation.
10. Regional Workshops
To provide an appropriate response to the first action requested to EU institutions, the Agency TAF TSI
Implementation Cooperation Group adopted in the 2 meeting held on 29th and 30th September 2015 (3) the
decision to launch a campaign of Regional Workshops across European Member States.
There was one WS held in 2018:
10.1 TAF WS 07/08 March 2018 — Bucharest, Romania
• Attendees: 80 RU5/lMs/WK5/IT providers from Romania, Bulgaria, Greece, Serbia (IPA) and Former
Yugoslav Republic Of Macedonia (IPA)
• Information about TAF regulation and TAF implementation status — incumbent actors: on the right
track
• Information about TAF regulation and TAF implementation status — newcomer actors: room for
improvement
- further communication or WS needed
10.2 Proposal for next Workshop
• Planned date: 2nd half 2018
• Venue: A central place in Europe with easy access
• Attendees: all smaller RU5/WKs/lMs with Dl =< 25% or not reporting at all to JSG IT tool
11. Proposals to support the Reporting Process
44
In order to clarify the scope and content of the TAF TSI Implementation Report and the TAP TSIImplementation Report, it has been agreed (3) that the content of the reports will be discussed in TAF TSI cooperation group for TAP TSI RU-IM basic parameters and in the TAP TSI retail co-operation group for the TAPTSI retail basic parameters.
Therefore, the Agency will deliver in the future two reports, one for TAF TSI and another for TAP TSI (retailand RU-lM-communication).
Beyond this, it has been agreed to put in place the following measures to facilitate the implementation andengagement of the small and medium sized RUs and IMs:
• To deliver newsletters after every Implementation Cooperation Group (ICG) meeting to the NCPswith the main outcomes of every meeting.
• To translate questionnaire at the JSG reporting tool into other languages: this will increase the levelof reposnese.
• The Agency must address the TSI TAF TAP topic to the top management of lMs and RUs byparticipation in appropriate “High Level Rail Events” throughout Europe.
• The Agency should explain together with EC about the additional funding for the TAF TSl functions,and in particular, the implementation of the common interface and the upgrade of the legacysystems.
• Continue with dissemination in form of regional woskshops.
11.1 Functions to be reported in the next report
During the 7’ TAF TSI Implementation Cooperation Group meeting held in March 2018, it was agreed toreport about the following functions for the gth Reporting wave in the frame of the TAF TSI regulation:
• Primary location codes• Company codes• Common interface• Train running information
RSRDWIMO
• Train composition message• Consignment note data• Wagon Movement data (new)
11.2 Calendar for reporting
In the frame of the 7tITAF TSI Implementation Cooperation Group meeting held in March 2018, it was agreedthe following schedule to report about the implementation of TAF TSI functions and RU-IM Communicationfor TAP TSI:
45
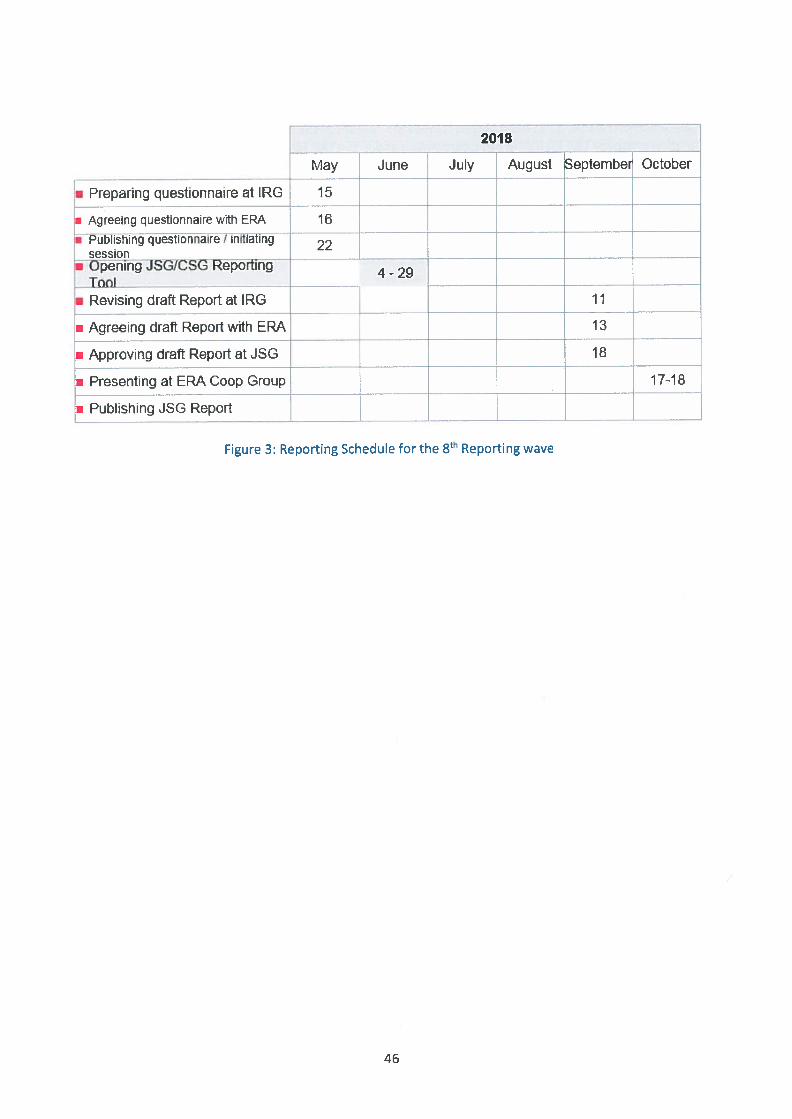
2018
May June July August Jsepternber October
reparing questionnaire at IRG 15
Agreeing questionnaire with ERA 161 Publishing questionnaire i’initiating 2
session LI OèhihJSGTCSGRöft11i -
4-29Tool
_____
. Revising draft Report at IRG 11
. Agreeing draft Report with ERA 13
• Approving draft Report at JSG I 18
• Presenting at ERA Coop Group 17-18
• Publishing JSG Report
Figure 3: Reporting Schedule for the 8th Reporting wave
46
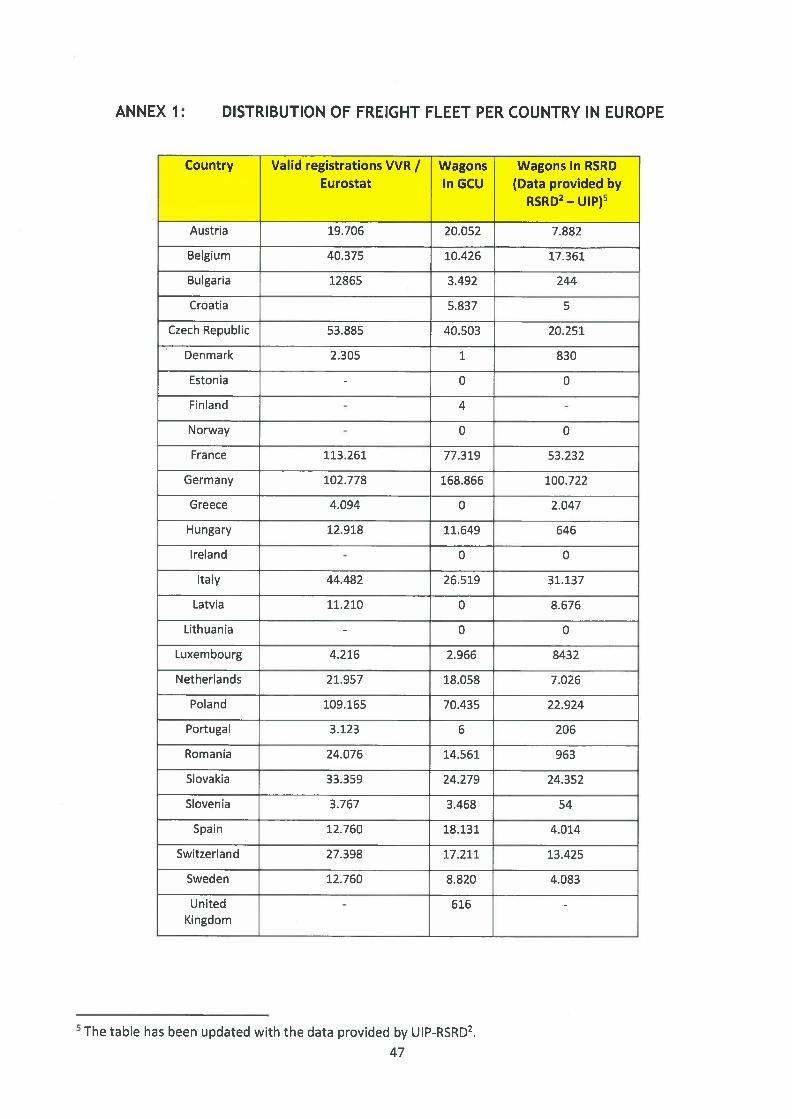
ANNEX 1: DISTRIBUTION OF FREIGHT FLEET PER COUNTRY IN EUROPE
Country Valid registrations VVR / Wagons Wagons In RSRDEurostat In GCU (Data provided by
RSRD2— UIP)5
Austria 19.706 20.052 7.882
Belgium 40.375 10.426 17.361
Bulgaria 12865 3.492 244
Croatia 5.837 5
Czech Republic 53.885 40.503 20.251
Denmark 2.305 1 830
Estonia - 0 0
Finland - 4 -
Norway - 0 0
France 113.261 77.319 53.232
Germany 102.778 168.866 100.722
Greece 4.094 0 2.047
Hungary 12.918 11.649 646
Ireland - 0 0
Italy 44.482 26.519 31.137
Latvia 11.210 0 8.676
Lithuania - 0 0
Luxembourg 4.216 2.966 8432
Netherlands 21.957 18.058 7.026
Poland 109.165 70.435 22.924
Portugal 3.123 6 206
Romania 24.076 14.561 963
Slovakia 33.359 24.279 24.352
Slovenia 3.767 3.468 54
Spain 12.760 18.131 4.014
Switzerland 27.398 17.211 13.425
Sweden 12.760 8.820 4.083
United - 616 -
Kingdom
The table has been updated with the data provided by UIP-RSRD2.
47
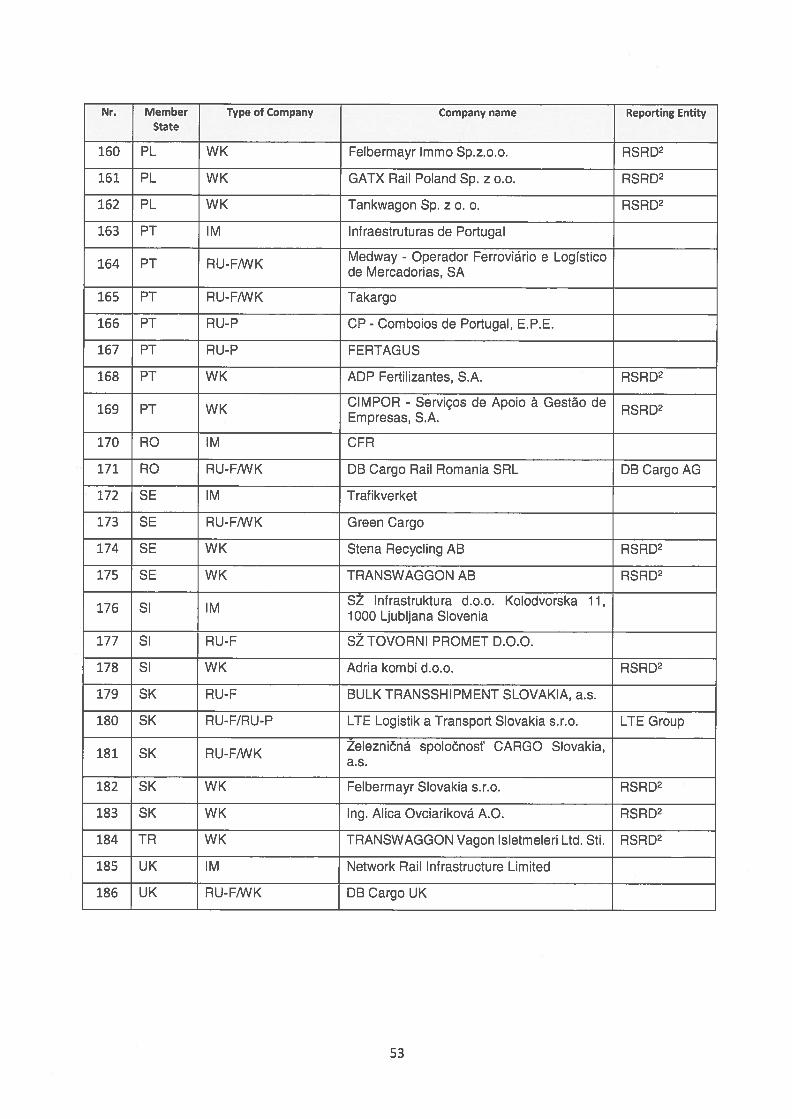
ANNEX 2: RESPONSES CONTACT LIST V7
Nr. Member Type of Company Company name Reporting EntityState
1 AT IM OBBlnfrastrukturAG
2 AT RU-RANK Rail Cargo Austria AG
3 AT WK Bahnbau Wels GmbH RSRD2
4 AT WKFelbermayr Transport- und Hebetechnik RSRD2GmbH & Co KG
5 AT WK GATX Rail Austria GmbH RSRD2
6 AT WK Logistik Service GmbH RSRD2
7 AT WK PropangasAG RSRD2
8 BE lM Infrabel
9 BE WK LINEAS RSRD2
10 BE WK LINEAS GROUP RSRD2
11 BE WK LINEAS Intermodal RSRD2
12 BG IM NRIC
13 BG RU-F BDZ Cargo
14 BG RU-F Bulgarian Railway Company (BRC)
15 BG RU-F EXPRESS SERVICE OOD
16 BG RU-F Rail Cargo Carrier - Bulgaris Ltd.
17 BG RU-F/WK DB Cargo Bulgaria DB Cargo AG
18 CH IM BLS-NetzAG
19 CH IM SBB AG, Division lnfrastruktur
20 CH RU-F BLS Cargo
21 CH RU-F SBB Cargo International
22 CH RU-F WRS Widmer Rail Services AG
23 CH RU-FJWK DB Cargo Switzerland DB Cargo AG
24 CH RU-F/WK SBB CARGO AG
25 CH RU-P SBB AG, Division Personenverkehr
26 CH WK Diversified Investments SA RSRD2
27 CH WK Ermewa SA, Geneva branch RSRD2
28 CH WK HASTAG (Zurich) AG RSRD2
29 CH WK MITRAGAG RSRD2
30 CH WK SBB Cargo AG RSRD2
31 CH WK TRANSWAGGON AG RSRD2
48
Nr. Member Type of Company Company name Reporting EntityState
32 CH WK VTG Schweiz GmbH RSRD2
33 CH WK WASCOSA AG Luzern RSRD2
34 CZ IM PDV RAILWAY a.s.
35 CZ IM Sprãva eIezniãnI dopravnI cesty, státniorgan izace
36 CZ RU-F BF Logistics s.r.o.
37 CZ RU-F DBV-ITL, s.r.o.
38 CZ RU-F LTE Logistik a Transport Czechia s.r.o. LTE Group
39 CZ RU-F MH-spedition s.r.o.
40 CZ RU-F SLEZSKOMORAVSKA DRAHA a.s.
41 CZ RU-F Sokolovská uhelná, prãvnI nástupce, a.s.
42 CZ RU-F TCHAS ZD s.r.o.
43 CZ RU-F VITKOVICE Doprava, a.s.
44 CZ RU-F/RU-P LTE Logistik a Transport Slovakia s.r.o. LTE Group
45 CZ RU-F/RU-P RegioJet
46 CZ RU-F/RU-PIWK Ceske drahy, a.s.
47 CZ RU-F,WK Advanced world transport a.s.
48 CZ RU-FiWK D Cargo.a.s.
49 CZ RU-F1WK LOKO TRANS s.r.o.
50 CZ RU-F,WK UNIPETROL Doprava, s.r.o.
51 CZ WK ArcelorMittal Ostrava a.s. RSRD2
52 CZ WK Oeskã republika -Sprãva státnich hmotnch
53 CZ WK eskomoravsk’ cement, a.s.
54 CZ WK Coal Services a.s.
55 CZ WK Felbermayr Transport- und HebetechnikRSRD2spol.s. r.o.
56 CZ WK KOS Trading, akciovã spoleOnost RSRD2
57 CZ WK Lafarge Cement, a.s. RSRD2
58 CZ WK Lovochemie, a.s. RSRD2
59 CZ WK NH-TRANS, SE
60 CZ WK Railco a.s. RSRD2
61 CZ WK RYKO PLUS spol. s r.o. RSRD2
62 CZ WK V.K.S. Vagon Komerc Speed, spol. S r.o. RSRD2
63 CZ WK Vápenka Oertovy schody a.s.
49
Nr. Member Type of Company Company name Reporting Entity
State
64 CZ WK VAPENKAVITOSOVs.r.o.
65 CZ WK ZX-BENETCZs.r.o.
66 DE IM DBNetzAG
67 DE IM Häfen und Güterverkehr KöIn AG
68 DE IM/RU-F Bayernhafen GmbH & Co KG
69 DE IM/RU-F/RU-P Hafen Krefeld GmbH & Co. KG
70 DE RU-F Captrain CargoWest GmbH
RTB CARGO GMBH and VIAS GMBH71 DE RU-F (freight part)
72 DE RU-F SBB Cargo Deutschland GmbH flatio0
73 DE RU-F/WK DBCargoAG
74 DE RU-FIWK MEG Mitteldeutsche Eisenbahn GmbH DB Cargo AG
75 DE RU-FiWK RBH Logistics GmbH DB Cargo AG
76 DE RU-P DB Regio AG
77 DE WK AlzChem AG RSRD2
78 DE WK Aretz GmbH und Co. KG RSRD2
79 DE WK BASE SE RSRD2
80 DE WK DAHER PROJECTS GmbH RSRD2
81 DE WK Ermewa GmbH RSRD2
82 DE WK ERR European Rail Rent GmbH RSRD2
83 DE WK GATX Rail Germany GmbH RSRD2
84 DE WKKombiverkehr Deutsche Gesellschaft für RSRD2kombinierten Guterverkehr mbH & Co KG
85 DE WK Mosolf Automotive Railway GmbH RSRD2
86 DE WK NACCO GmbH RSRD2
87 DE WKOn Rail - Gesellschaft für RSRD2Eisenbahnausrustung und ZubehOr mbH
88 DE WKOn Rail Gesellschaft für Vermietung und RSRD2Verwaltung von Eisenbahnwaggons mbH
89 DE WK Petrochem Mineralöl-Handels-GmbH RSRD2
90 DE WK TRANSWAGGON GmbH RSRD2
91 DE WK Tyczka Gase GmbH RSRD2
92 DE WK voestalpine Rail Center Konigsborn GmbH RSRD2
93 DE WK Vossloh Logistics GmbH RSRD2
94 DE WK VTG Aktiengesellschaft RSRD2
50
Nr. Member Type of Company Company name Reporting EntityState
95 DE WK VTG Rail Europe GmbH RSRD2
96 DE WK Zürcher Bau GmbH RSRD2
97 DK RU-FIWK DB Cargo Scandinavia A/S DB Cargo AG
98 ES IM ADIF Administrador de InfraestructurasFerroviarias
199 ES RU-F ACCIONA RAIL SERVICES
100 ES RU-F RENFE MERCANCIAS
101 ES RU-F/WK TF Transfesa DB Cargo AG
102 ES WK Sociedad de estudios y explotacion de RSRD2material auxiliar de transportes S.A.
103 ES WK Transportes Ferroviarios Especiales S.A. RSRD2
104 Fl RU-F/RU-P Vr Group
105 FR IM SNCFRéseau
106 FR RU-F SNCF MOBILITES - Fret
107 FR RU-RANK ECR Euro Cargo Rail SA DB Cargo AG
108 FR RU-P SNCF Mobilités Voyageurs
109 FR WK ATIR-RAIL RSRD2
110 FR WKCompagnie Francaise de Produits RSRD2Metallurgiques
111 FR WK Ermewa SA RSRD2
112 FR WK Millet SAS RSRD2
113 FR WK Monfer France SASU RSRD2
114 FR WK NACCO S.A.S. RSRD2
115 FR WK SOCOMAC RSRD2
116 FR WK STVA S.A. RSRD2
117 FR WK VTG Austria Ges.m.b.H. RSRD2
118 FR WK VTG France SAS RSRD2
119 HU AB VPE - Vasüti Pályakapacitãs-elosztó Kft.
120 HU IM GYSEVZrt.
121 HU IM MAy
122 HU RU-F GYSEV CARGO Zrt.
123 HU RU-F MMV ?agyar MagénvasUt Zrt.
124 HU RU-RANK DB Cargo Hungãria Kft. DB Cargo AG
125 HU RU-F,WK Rail Cargo Hungaria Zrt.
126 HU RU-P MAy-START
51
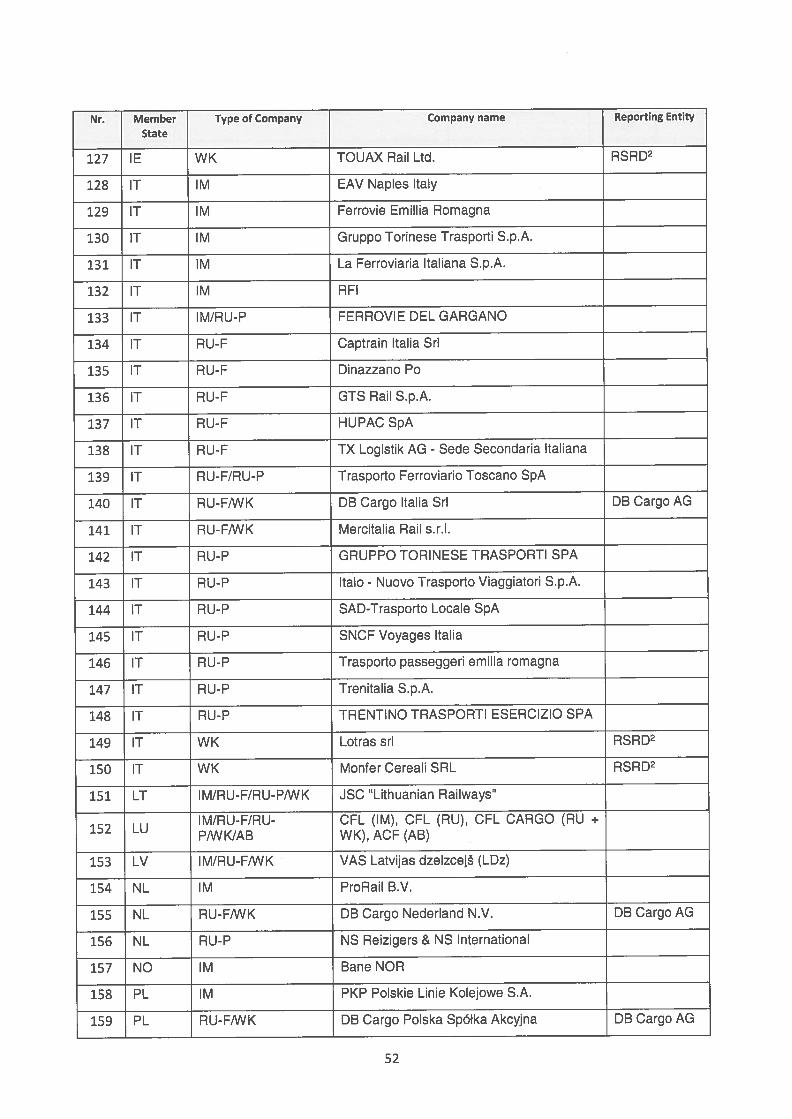
Nr. Member Type of Company Company name Reporting Entity
State
127 IE WK TOUAX Rail Ltd. RSRD2
128 IT IM EAV Naples Italy
129 IT IM Ferrovie Emillia Romagna
130 IT IM Gruppo Torinese Trasporti S.p.A.
131 IT IM La Ferroviaria Italiana S.p.A.
132 IT IM RFI
133 IT IM/RU-P FERROVIE DEL GARGANO
134 IT RU-F Captrain Italia Sri
135 IT RU-F Dinazzano Po
136 IT RU-F GTS Rail S.p.A.
137 IT RU-F HUPAC SpA
138 IT RU-F TX Logistik AG - Sede Secondaria Italiana
139 IT RU-F/RU-P Trasporto Ferroviario Toscano SpA
140 IT RU-FIWK DB Cargo Italia SrI DB Cargo AG
141 IT RU-F,’WK Mercitalia Rail s.r.I.
142 IT RU-P GRUPPO TORINESE TRASPORTI SPA
143 IT RU-P Italo - Nuovo Trasporto Viaggiatori S.p.A.
144 IT RU-P SAD-Trasporto Locale SpA
145 IT RU-P SNCF Voyages Italia
146 IT RU-P Trasporto passeggeri emilia romagna
147 IT RU-P Trenitalia S.p.A.
148 IT RU-P TRENTINO TRASPORTI ESERCIZIO SPA
149 IT WK Lotras sri RSRD2
150 IT WK Monfer Cereali SRL RSRD2
151 LT IM/RU-F/RU-P,WK JSC “Lithuanian Railways”
IM/RU-F/RU- CFL (IM), CFL (RU), CFL CARGO (RU +152 LU P/WK/AB WK), ACF (AB)
153 LV IM/RU-FJWK VAS Latvijas dzeIzce1 (LDz)
154 NL IM ProRail B.V.
155 NL RU-FiWK DB Cargo Nederland N.V. DB Cargo AG
156 NL RU-P NS Reizigers & NS International
157 NO IM Bane NOR
158 PL IM PKP Polskie Linie Kolejowe S.A.
159 PL RU-F,WK DB Cargo Polska Spótka Akcyjna DB Cargo AG
52
Nr. Member Type of Company Company name Reporting EntityState
160 PL WK Felbermayr Immo Sp.z.o.o. RSRD2
161 PL WK GATX Rail Poland Sp. z 0.0. RSRD2
162 PL WK Tankwagon Sp. z o. o. RSRD2
163 PT IM lnfraestruturas de Portugal
164 PT RU-F/WK Medway - Operador Ferroviário e LogIsticode Mercadorias, SA
165 PT RU-F,WK Takargo
166 PT RU-P CP - Comboios de Portugal, E.P.E.
167 PT RU-P FERTAGUS
168 PT WK ADP Fertilizantes, SA. RSRD2
169 PT WKcMPOR- Serviços de Apolo a Gestão de RSRD2
170 RO IM CFR
171 RO RU-F,WK DB Cargo Rail Romania SRL DB Cargo AG
172 SE IM Trafikverket
173 SE RU-F/WK Green Cargo
174 SE WK Stena Recycling AB RSRD2
175 SE WK TRANSWAGGON AB RSRD2
176 SI IM S lnfrastruktura d.o.o. Kolodvorska 11,1000 Ljubljana Slovenia
177 SI RU-F 2 TOVORNI PROMET D.O.O.
178 SI WK Adria kombi d.o.o. RSRD2
179 SK RU-F BULK TRANSSHIPMENT SLOVAKIA, a.s.
180 SK RU-F/RU-P LTE Logistik a Transport Slovakia s.r.o. LTE Group
181 5K RU-F/WK 2ezniOnã spoloOnost’ CARGO Slovakia,
182 SK WK Felbermayr Slovakia s.r.o. RSRD2
183 SK WK Ing. Alica Ovciarikovã A.O. RSRD2
184 TR WK TRANSWAGGON Vagon Isletmeleri Ltd. Sti. RSRD2
185 UK IM Network Rail Infrastructure Limited
186 UK RU-F/WK DB Cargo UK
53
ANNEX 3: RESPONSES CONTACT LIST V6
Nr. Member Type of Company Company name Reporting Entity
State
1 BE RU-F Lineas Group
2 BE RU-P THI factory
3 CZ RU-F EP Cargo
4 CZ RU-F IDS CARGO
5 CZ RU-F TONCUR
6 CZ RU-F/RU-P CityRail
7 CZ RU-F/RU-P Jindrichohradecke mistni drahy
8 CZ RU-F/RU-P KZC Doprava
9 CZ RU-P GW Train Regio
10 CZ WK Cement Hranice
11 CZ WK ORSSHR
12 CZ WK KKB
13 CZ WK KOTOUOTRAMBERK
14 CZ WK koda Auto
15 CZ WK Spolek pro chemickou a hutnI v9robu
16 CZ WK státnI podnik DIAMO
17 DE RU-F RheinCargo
18 DK RU-P DSB
19 EL IM O.S.E.
20 ES RU-F Logitren Ferroviaria
21 ES RU-F/RU-P FERROVIAL RAILWAY
22 IT RU-F/RU-P Società Ferrovie Udine Cividale
23 IT RU-F/RU-P TRENORD
24 IT RU-P ARRIVA Italia Rail
25 PL RU-P Arriva RP
26 PL RU-P Koleje Dolnoslaskie
27 PL RU-P Koleje Matopolskie
28 PL RU-P Koleje Iskie
29 PL RU-P PKP
30 PL RU-P PKP Intercity
54
Nr. Member Type of Company Company name Reporting EntityState
31 PL WK tOdzka Kolej Aglomeracyjna
32 SE RU-F Hector Rail
33 SE RU-F LKAB Malmtrafik
34 SE RU-P sj
35 5K IM Slovak Railways
36 SK RU-P RegioJet
37 SK RU-P 2eiezninã spoloOnost’ Slovensko
55

Related Documents