CORRELATION ANALYSIS OF A REINFORCED-CONCRETE BUILDING UNDER TSUNAMI LOADS AND EFFECT OF MASONRY INFILL WALLS IN TSUNAMI RESISTANCE Anat Ruangrassamee 1 and Piyawat Foytong 2 1 Assistant Professor, Department of Civil Engineering, Chulalongkorn University, Bangkok, Thailand, [email protected] 2 Graduate Student, Department of Civil Engineering, Chulalongkorn University, Bangkok, Thailand, [email protected] ABSTRACT: The December 26th, 2004 Indian Ocean tsunami caused damage to many buildings and killed many people in many Indian Ocean countries and the South of Thailand. Almost reinforced-concrete buildings in Thailand are the gravity load designed buildings and damaged ranging from no damage to collapse from that event. To understand behavior of a reinforced-concrete building, one-story building which is the former office of Thai Meteorological Department located in Phang-Nga province was tested under tsunami load pattern. In this research, the reinforced-concrete building model is constructed by using 3-dimensional non-linear static pushover analysis. In the building model, masonry infill walls are considered and idealized as the diagonal stud by using uniaxial non-linear springs. The results of the building model agree well with the test results on the displacement of each frame and damage on the masonry infill walls. The masonry infill wall in the middle frame can resist the lateral load of the top part load about 60%. This building with masonry infill walls can resist the lateral load 3 times higher than the resisting load of this building without masonry infill walls. To analyze the effect of masonry infill wall of reinforced-concrete building, the patterns of the wall are rearranged. The masonry infill walls with the appropriate arrangement can significantly improve the load resisting capacity of the building. Key Words: tsunami, tsunami load, reinforced concrete, building, nonlinear analysis INTRODUCTION The December 26th, 2004 Indian Ocean tsunami caused damage to several buildings in southern provinces of Thailand. Reinforced-concrete buildings in the area are mainly designed for gravity loads. One-story building which is the former office of Thai Meteorological Department located in Phang-Nga province was tested under tsunami load patterns. This research focuses on correlation analysis that experimental results to evaluate forces distribution in each member, the lateral resistance Proceedings of the International Symposium on Engineering Lessons Learned from the 2011 Great East Japan Earthquake, March 1-4, 2012, Tokyo, Japan 528

Welcome message from author
This document is posted to help you gain knowledge. Please leave a comment to let me know what you think about it! Share it to your friends and learn new things together.
Transcript
CORRELATION ANALYSIS OF A REINFORCED-CONCRETE BUILDING UNDER TSUNAMI LOADS AND EFFECT OF MASONRY
INFILL WALLS IN TSUNAMI RESISTANCE
Anat Ruangrassamee1 and Piyawat Foytong2
1 Assistant Professor, Department of Civil Engineering, Chulalongkorn University, Bangkok, Thailand, [email protected]
2 Graduate Student, Department of Civil Engineering, Chulalongkorn University, Bangkok, Thailand, [email protected]
ABSTRACT: The December 26th, 2004 Indian Ocean tsunami caused damage to many buildings and killed many people in many Indian Ocean countries and the South of Thailand. Almost reinforced-concrete buildings in Thailand are the gravity load designed buildings and damaged ranging from no damage to collapse from that event. To understand behavior of a reinforced-concrete building, one-story building which is the former office of Thai Meteorological Department located in Phang-Nga province was tested under tsunami load pattern. In this research, the reinforced-concrete building model is constructed by using 3-dimensional non-linear static pushover analysis. In the building model, masonry infill walls are considered and idealized as the diagonal stud by using uniaxial non-linear springs. The results of the building model agree well with the test results on the displacement of each frame and damage on the masonry infill walls. The masonry infill wall in the middle frame can resist the lateral load of the top part load about 60%. This building with masonry infill walls can resist the lateral load 3 times higher than the resisting load of this building without masonry infill walls. To analyze the effect of masonry infill wall of reinforced-concrete building, the patterns of the wall are rearranged. The masonry infill walls with the appropriate arrangement can significantly improve the load resisting capacity of the building. Key Words: tsunami, tsunami load, reinforced concrete, building, nonlinear analysis
INTRODUCTION The December 26th, 2004 Indian Ocean tsunami caused damage to several buildings in southern provinces of Thailand. Reinforced-concrete buildings in the area are mainly designed for gravity loads. One-story building which is the former office of Thai Meteorological Department located in Phang-Nga province was tested under tsunami load patterns. This research focuses on correlation analysis that experimental results to evaluate forces distribution in each member, the lateral resistance
Proceedings of the International Symposium on Engineering Lessons Learned from the 2011 Great East Japan Earthquake, March 1-4, 2012, Tokyo, Japan
528
force and the damage of building under tsunami loading. The building model is analyzed by using non-linear static pushover analysis with TDAPIII program. A 3-dimensional fiber analytical model is used to analyze the building model. The masonry infill wall is considered and idealized as the diagonal stud by using uniaxial non-linear springs. To analyze the, effect of masonry infill walls in a tsunami load resisting capacity and to be the design guideline of reinforced-concrete buildings with masonry infill wall, the patterns of the wall are rearranged.
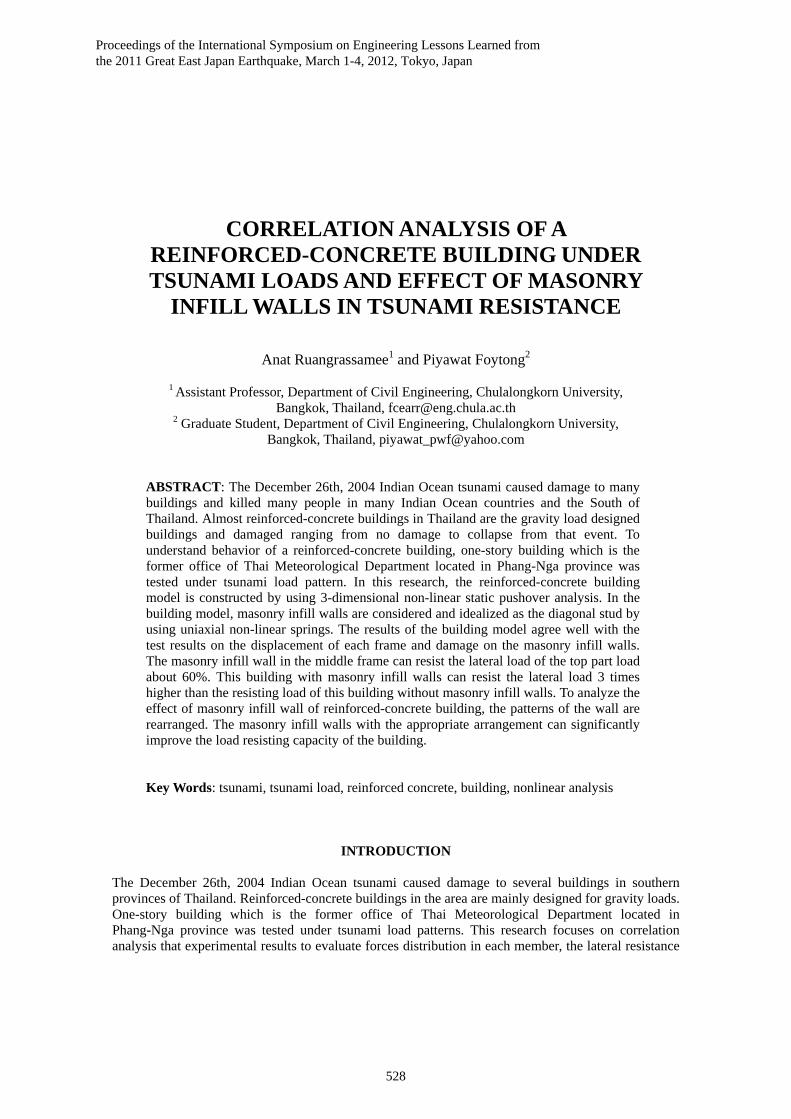
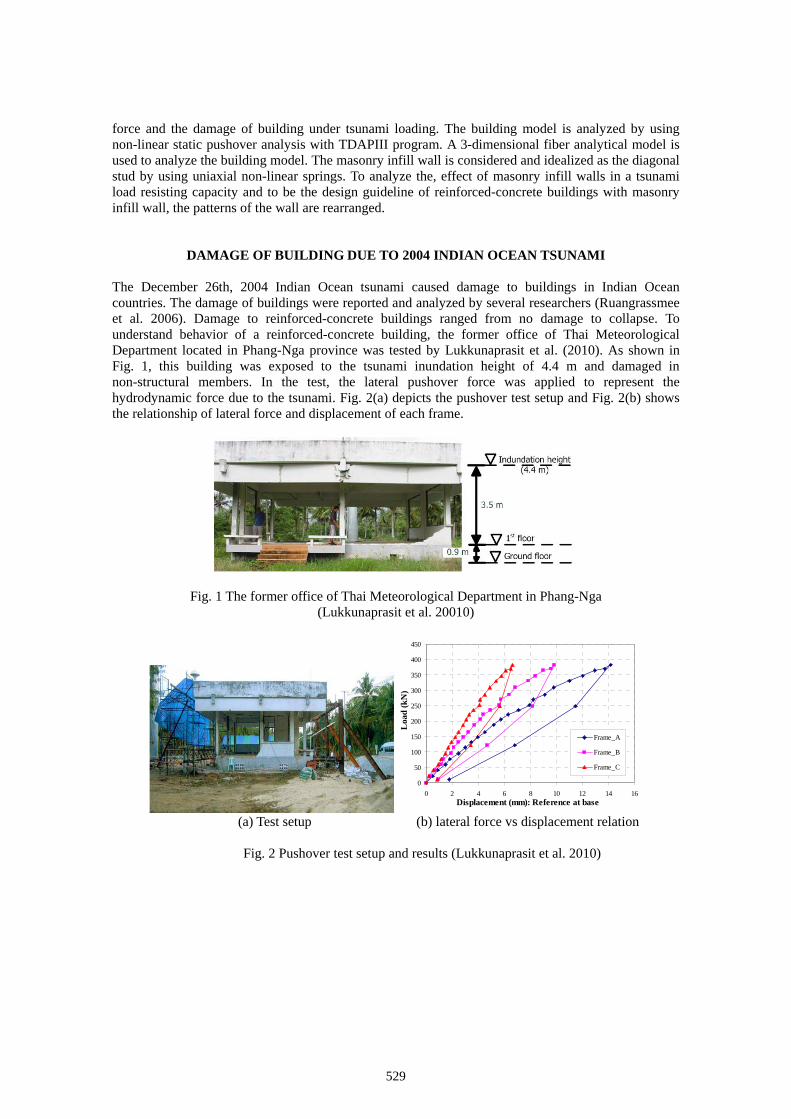
DAMAGE OF BUILDING DUE TO 2004 INDIAN OCEAN TSUNAMI The December 26th, 2004 Indian Ocean tsunami caused damage to buildings in Indian Ocean countries. The damage of buildings were reported and analyzed by several researchers (Ruangrassmee et al. 2006). Damage to reinforced-concrete buildings ranged from no damage to collapse. To understand behavior of a reinforced-concrete building, the former office of Thai Meteorological Department located in Phang-Nga province was tested by Lukkunaprasit et al. (2010). As shown in Fig. 1, this building was exposed to the tsunami inundation height of 4.4 m and damaged in non-structural members. In the test, the lateral pushover force was applied to represent the hydrodynamic force due to the tsunami. Fig. 2(a) depicts the pushover test setup and Fig. 2(b) shows the relationship of lateral force and displacement of each frame.
Fig. 1 The former office of Thai Meteorological Department in Phang-Nga (Lukkunaprasit et al. 20010)
0
50
100
150
200
250
300
350
400
450
0 2 4 6 8 10 12 14 16Displacement (mm): Reference at base
Loa
d (
kN
)
Frame_A
Frame_B
Frame_C
(a) Test setup (b) lateral force vs displacement relation
Fig. 2 Pushover test setup and results (Lukkunaprasit et al. 2010)
529
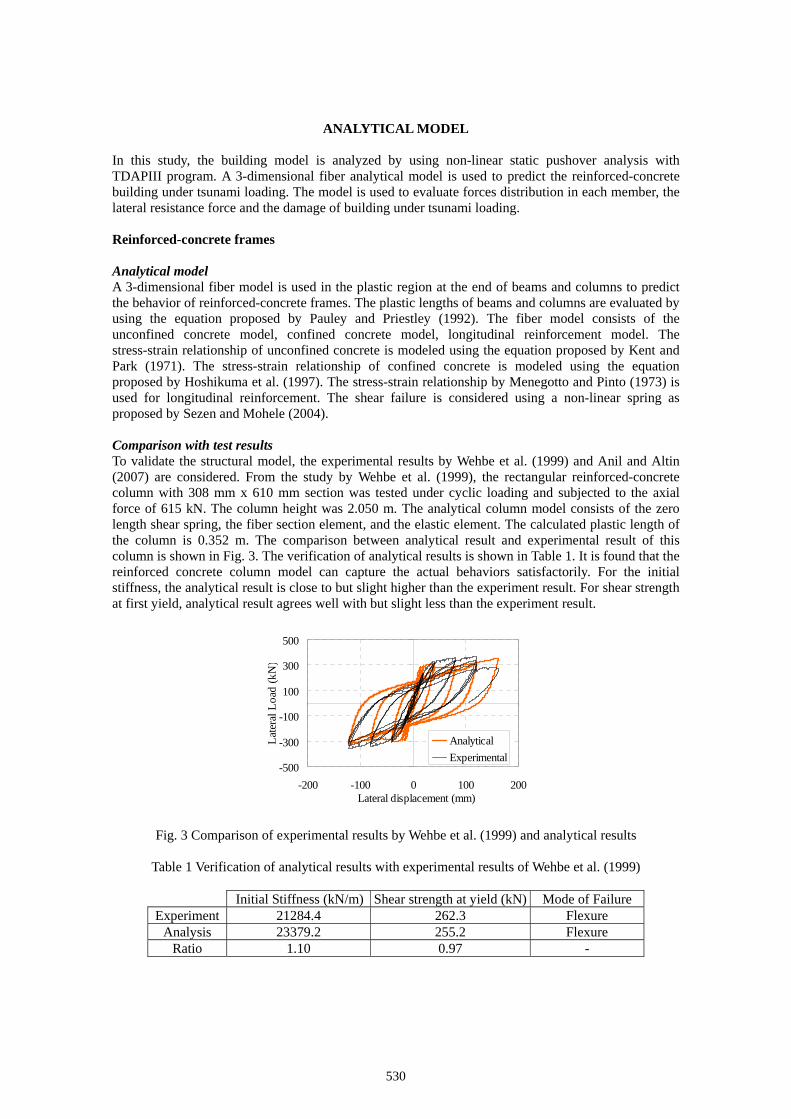
ANALYTICAL MODEL In this study, the building model is analyzed by using non-linear static pushover analysis with TDAPIII program. A 3-dimensional fiber analytical model is used to predict the reinforced-concrete building under tsunami loading. The model is used to evaluate forces distribution in each member, the lateral resistance force and the damage of building under tsunami loading. Reinforced-concrete frames Analytical model A 3-dimensional fiber model is used in the plastic region at the end of beams and columns to predict the behavior of reinforced-concrete frames. The plastic lengths of beams and columns are evaluated by using the equation proposed by Pauley and Priestley (1992). The fiber model consists of the unconfined concrete model, confined concrete model, longitudinal reinforcement model. The stress-strain relationship of unconfined concrete is modeled using the equation proposed by Kent and Park (1971). The stress-strain relationship of confined concrete is modeled using the equation proposed by Hoshikuma et al. (1997). The stress-strain relationship by Menegotto and Pinto (1973) is used for longitudinal reinforcement. The shear failure is considered using a non-linear spring as proposed by Sezen and Mohele (2004). Comparison with test results To validate the structural model, the experimental results by Wehbe et al. (1999) and Anil and Altin (2007) are considered. From the study by Wehbe et al. (1999), the rectangular reinforced-concrete column with 308 mm x 610 mm section was tested under cyclic loading and subjected to the axial force of 615 kN. The column height was 2.050 m. The analytical column model consists of the zero length shear spring, the fiber section element, and the elastic element. The calculated plastic length of the column is 0.352 m. The comparison between analytical result and experimental result of this column is shown in Fig. 3. The verification of analytical results is shown in Table 1. It is found that the reinforced concrete column model can capture the actual behaviors satisfactorily. For the initial stiffness, the analytical result is close to but slight higher than the experiment result. For shear strength at first yield, analytical result agrees well with but slight less than the experiment result.
-500
-300
-100
100
300
500
-200 -100 0 100 200Lateral displacement (mm)
Lat
eral
Loa
d (k
N)
Analytical
Experimental
Fig. 3 Comparison of experimental results by Wehbe et al. (1999) and analytical results
Table 1 Verification of analytical results with experimental results of Wehbe et al. (1999)
Initial Stiffness (kN/m) Shear strength at yield (kN) Mode of Failure Experiment 21284.4 262.3 Flexure
Analysis 23379.2 255.2 Flexure Ratio 1.10 0.97 -
530
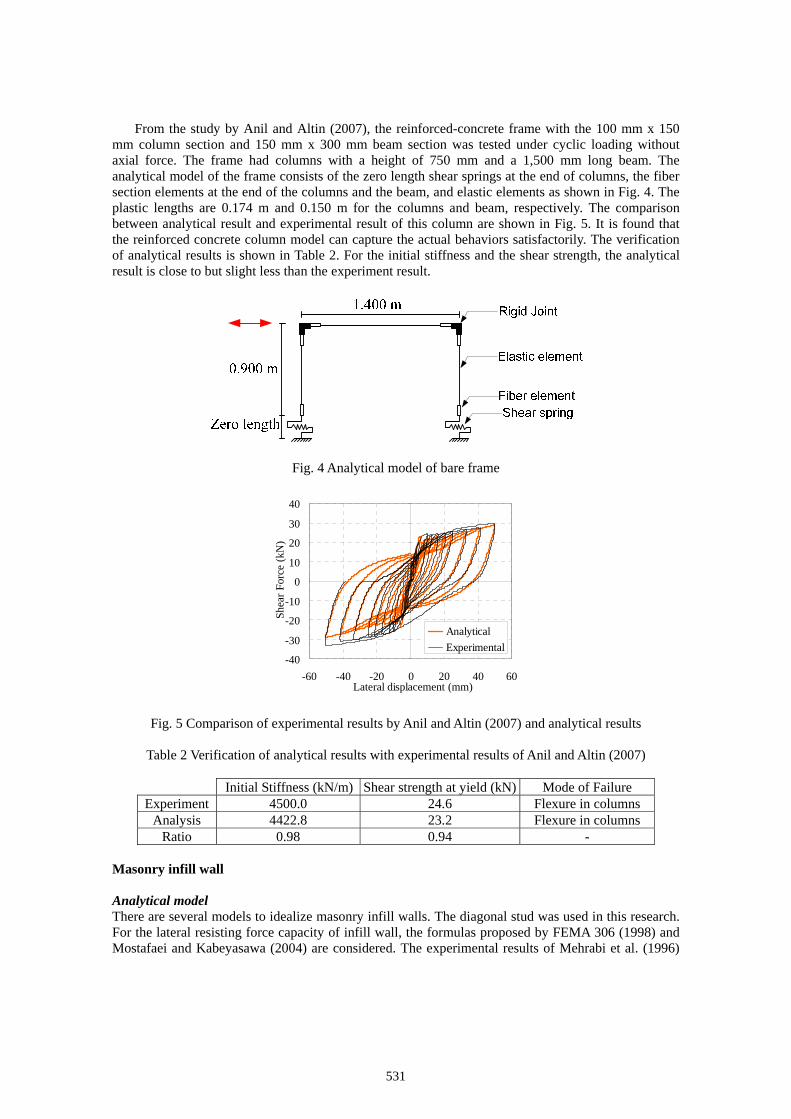
From the study by Anil and Altin (2007), the reinforced-concrete frame with the 100 mm x 150 mm column section and 150 mm x 300 mm beam section was tested under cyclic loading without axial force. The frame had columns with a height of 750 mm and a 1,500 mm long beam. The analytical model of the frame consists of the zero length shear springs at the end of columns, the fiber section elements at the end of the columns and the beam, and elastic elements as shown in Fig. 4. The plastic lengths are 0.174 m and 0.150 m for the columns and beam, respectively. The comparison between analytical result and experimental result of this column are shown in Fig. 5. It is found that the reinforced concrete column model can capture the actual behaviors satisfactorily. The verification of analytical results is shown in Table 2. For the initial stiffness and the shear strength, the analytical result is close to but slight less than the experiment result.
Fig. 4 Analytical model of bare frame
-40
-30
-20
-10
0
10
20
30
40
-60 -40 -20 0 20 40 60Lateral displacement (mm)
Shea
r F
orce
(kN
)
Analytical
Experimental
Fig. 5 Comparison of experimental results by Anil and Altin (2007) and analytical results
Table 2 Verification of analytical results with experimental results of Anil and Altin (2007)
Initial Stiffness (kN/m) Shear strength at yield (kN) Mode of Failure Experiment 4500.0 24.6 Flexure in columns
Analysis 4422.8 23.2 Flexure in columns Ratio 0.98 0.94 -
Masonry infill wall Analytical model There are several models to idealize masonry infill walls. The diagonal stud was used in this research. For the lateral resisting force capacity of infill wall, the formulas proposed by FEMA 306 (1998) and Mostafaei and Kabeyasawa (2004) are considered. The experimental results of Mehrabi et al. (1996)
531
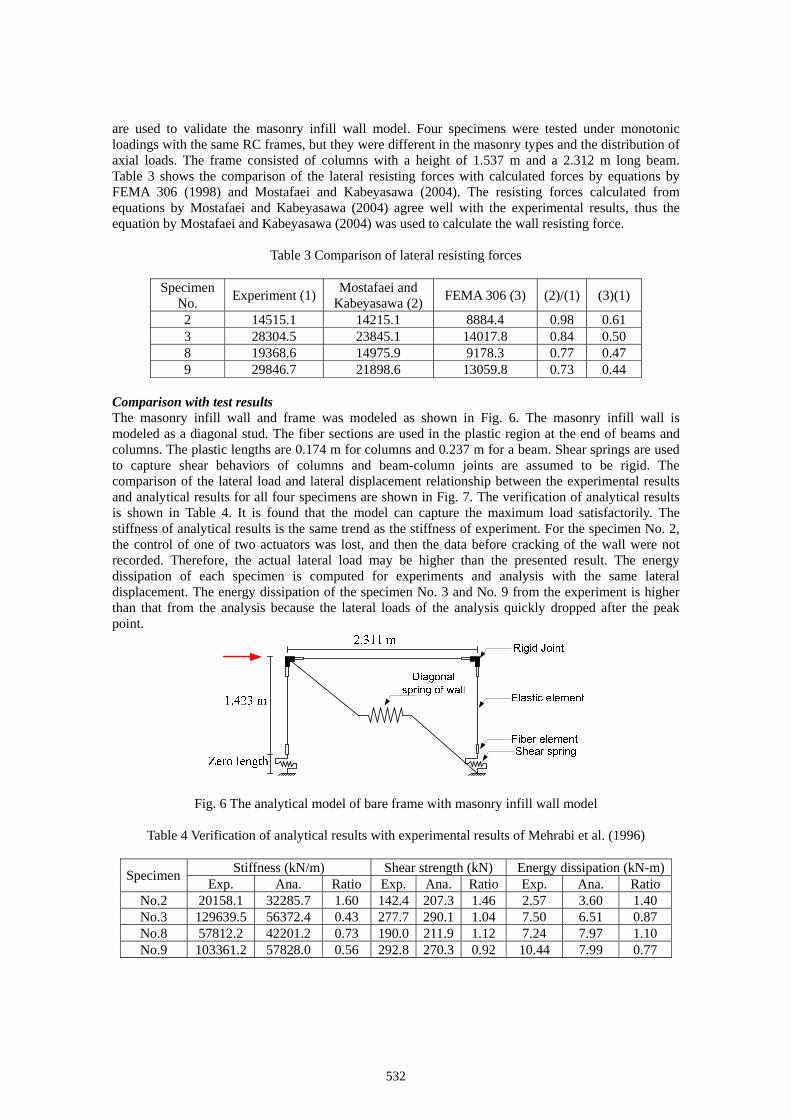
are used to validate the masonry infill wall model. Four specimens were tested under monotonic loadings with the same RC frames, but they were different in the masonry types and the distribution of axial loads. The frame consisted of columns with a height of 1.537 m and a 2.312 m long beam. Table 3 shows the comparison of the lateral resisting forces with calculated forces by equations by FEMA 306 (1998) and Mostafaei and Kabeyasawa (2004). The resisting forces calculated from equations by Mostafaei and Kabeyasawa (2004) agree well with the experimental results, thus the equation by Mostafaei and Kabeyasawa (2004) was used to calculate the wall resisting force.
Table 3 Comparison of lateral resisting forces
Specimen No.
Experiment (1) Mostafaei and
Kabeyasawa (2) FEMA 306 (3) (2)/(1) (3)(1)
2 14515.1 14215.1 8884.4 0.98 0.61 3 28304.5 23845.1 14017.8 0.84 0.50 8 19368.6 14975.9 9178.3 0.77 0.47 9 29846.7 21898.6 13059.8 0.73 0.44
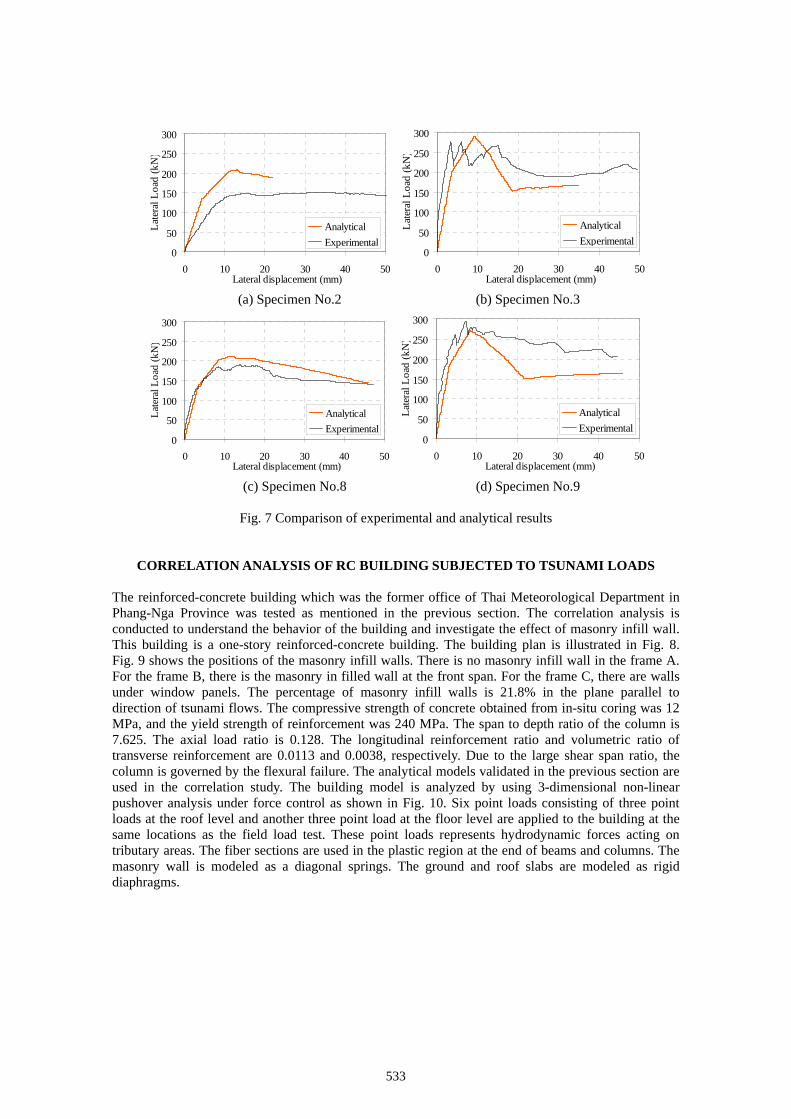
Comparison with test results The masonry infill wall and frame was modeled as shown in Fig. 6. The masonry infill wall is modeled as a diagonal stud. The fiber sections are used in the plastic region at the end of beams and columns. The plastic lengths are 0.174 m for columns and 0.237 m for a beam. Shear springs are used to capture shear behaviors of columns and beam-column joints are assumed to be rigid. The comparison of the lateral load and lateral displacement relationship between the experimental results and analytical results for all four specimens are shown in Fig. 7. The verification of analytical results is shown in Table 4. It is found that the model can capture the maximum load satisfactorily. The stiffness of analytical results is the same trend as the stiffness of experiment. For the specimen No. 2, the control of one of two actuators was lost, and then the data before cracking of the wall were not recorded. Therefore, the actual lateral load may be higher than the presented result. The energy dissipation of each specimen is computed for experiments and analysis with the same lateral displacement. The energy dissipation of the specimen No. 3 and No. 9 from the experiment is higher than that from the analysis because the lateral loads of the analysis quickly dropped after the peak point.
Fig. 6 The analytical model of bare frame with masonry infill wall model
Table 4 Verification of analytical results with experimental results of Mehrabi et al. (1996)
Stiffness (kN/m) Shear strength (kN) Energy dissipation (kN-m)Specimen
Exp. Ana. Ratio Exp. Ana. Ratio Exp. Ana. Ratio No.2 20158.1 32285.7 1.60 142.4 207.3 1.46 2.57 3.60 1.40 No.3 129639.5 56372.4 0.43 277.7 290.1 1.04 7.50 6.51 0.87 No.8 57812.2 42201.2 0.73 190.0 211.9 1.12 7.24 7.97 1.10 No.9 103361.2 57828.0 0.56 292.8 270.3 0.92 10.44 7.99 0.77
532
0
50
100
150
200
250
300
0 10 20 30 40 50Lateral displacement (mm)
Lat
eral
Loa
d (k
N)
Analytical
Experimental0
50
100
150
200
250
300
0 10 20 30 40 50Lateral displacement (mm)
Lat
eral
Loa
d (k
N)
Analytical
Experimental
(a) Specimen No.2 (b) Specimen No.3
0
50
100
150
200
250
300
0 10 20 30 40 50Lateral displacement (mm)
Lat
eral
Loa
d (k
N)
Analytical
Experimental0
50
100
150
200
250
300
0 10 20 30 40 50Lateral displacement (mm)
Lat
eral
Loa
d (k
N)
Analytical
Experimental
(c) Specimen No.8 (d) Specimen No.9
Fig. 7 Comparison of experimental and analytical results
CORRELATION ANALYSIS OF RC BUILDING SUBJECTED TO TSUNAMI LOADS
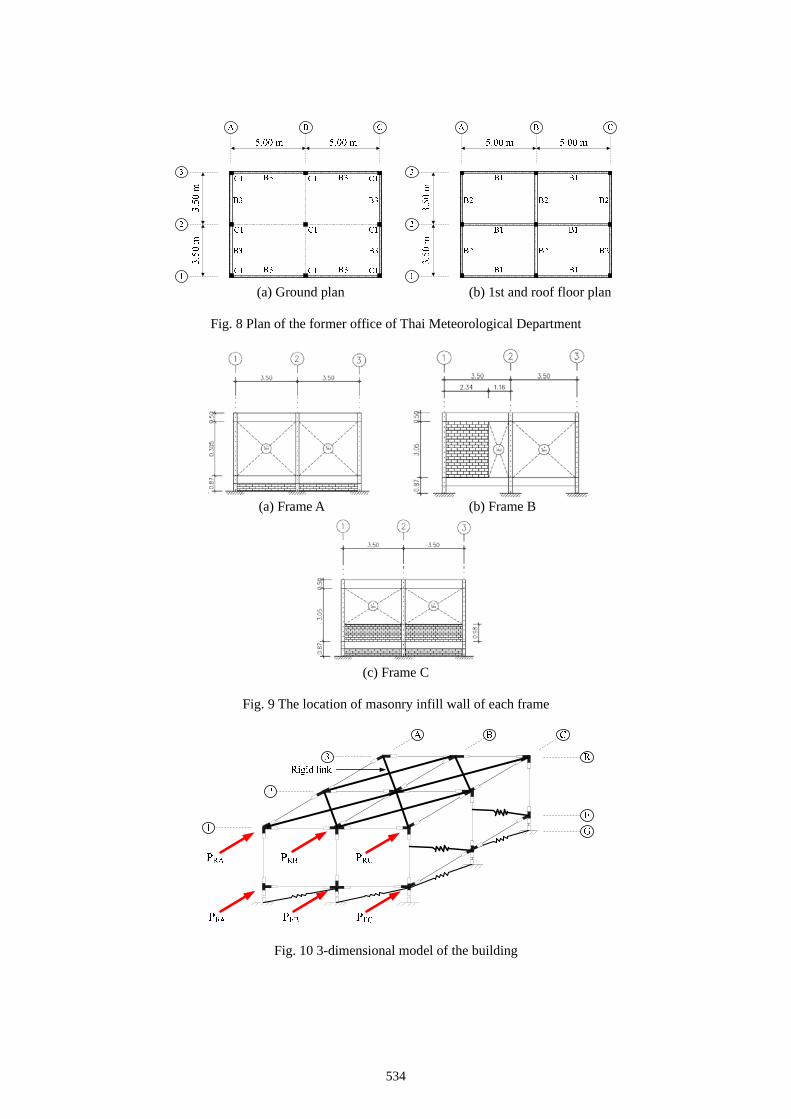
The reinforced-concrete building which was the former office of Thai Meteorological Department in Phang-Nga Province was tested as mentioned in the previous section. The correlation analysis is conducted to understand the behavior of the building and investigate the effect of masonry infill wall. This building is a one-story reinforced-concrete building. The building plan is illustrated in Fig. 8. Fig. 9 shows the positions of the masonry infill walls. There is no masonry infill wall in the frame A. For the frame B, there is the masonry in filled wall at the front span. For the frame C, there are walls under window panels. The percentage of masonry infill walls is 21.8% in the plane parallel to direction of tsunami flows. The compressive strength of concrete obtained from in-situ coring was 12 MPa, and the yield strength of reinforcement was 240 MPa. The span to depth ratio of the column is 7.625. The axial load ratio is 0.128. The longitudinal reinforcement ratio and volumetric ratio of transverse reinforcement are 0.0113 and 0.0038, respectively. Due to the large shear span ratio, the column is governed by the flexural failure. The analytical models validated in the previous section are used in the correlation study. The building model is analyzed by using 3-dimensional non-linear pushover analysis under force control as shown in Fig. 10. Six point loads consisting of three point loads at the roof level and another three point load at the floor level are applied to the building at the same locations as the field load test. These point loads represents hydrodynamic forces acting on tributary areas. The fiber sections are used in the plastic region at the end of beams and columns. The masonry wall is modeled as a diagonal springs. The ground and roof slabs are modeled as rigid diaphragms.
533
(a) Ground plan (b) 1st and roof floor plan
Fig. 8 Plan of the former office of Thai Meteorological Department
(a) Frame A (b) Frame B
(c) Frame C
Fig. 9 The location of masonry infill wall of each frame
Fig. 10 3-dimensional model of the building
534
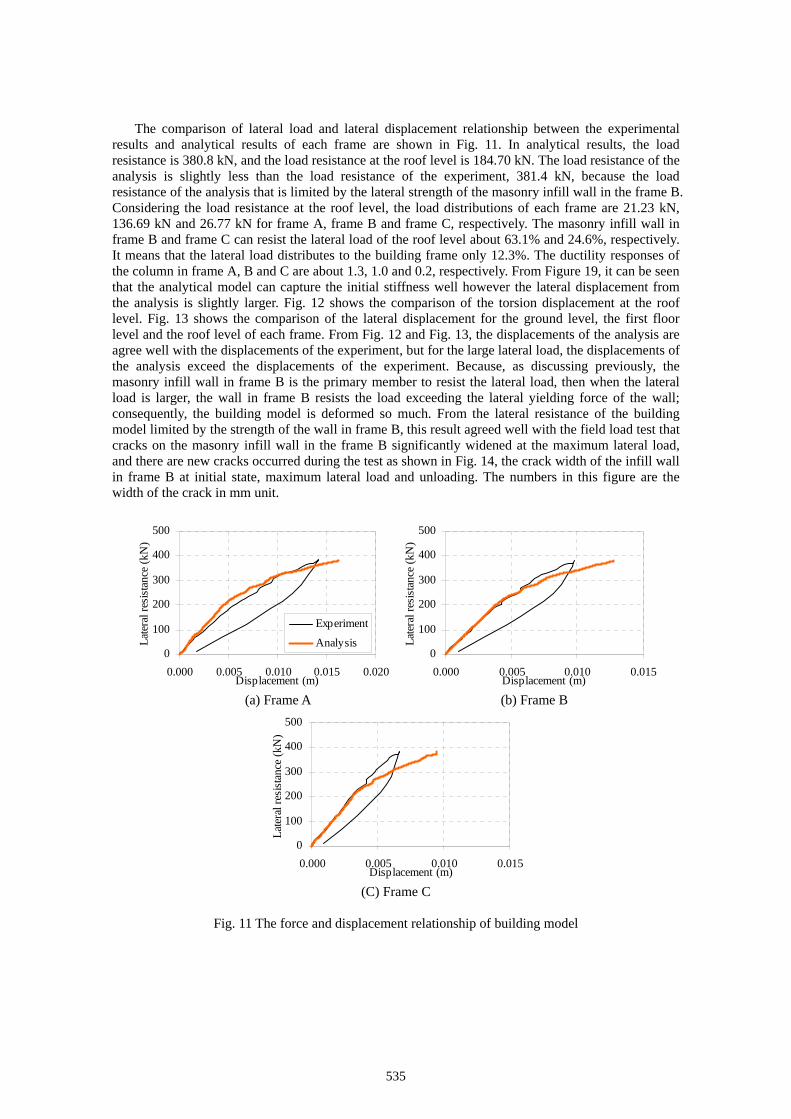
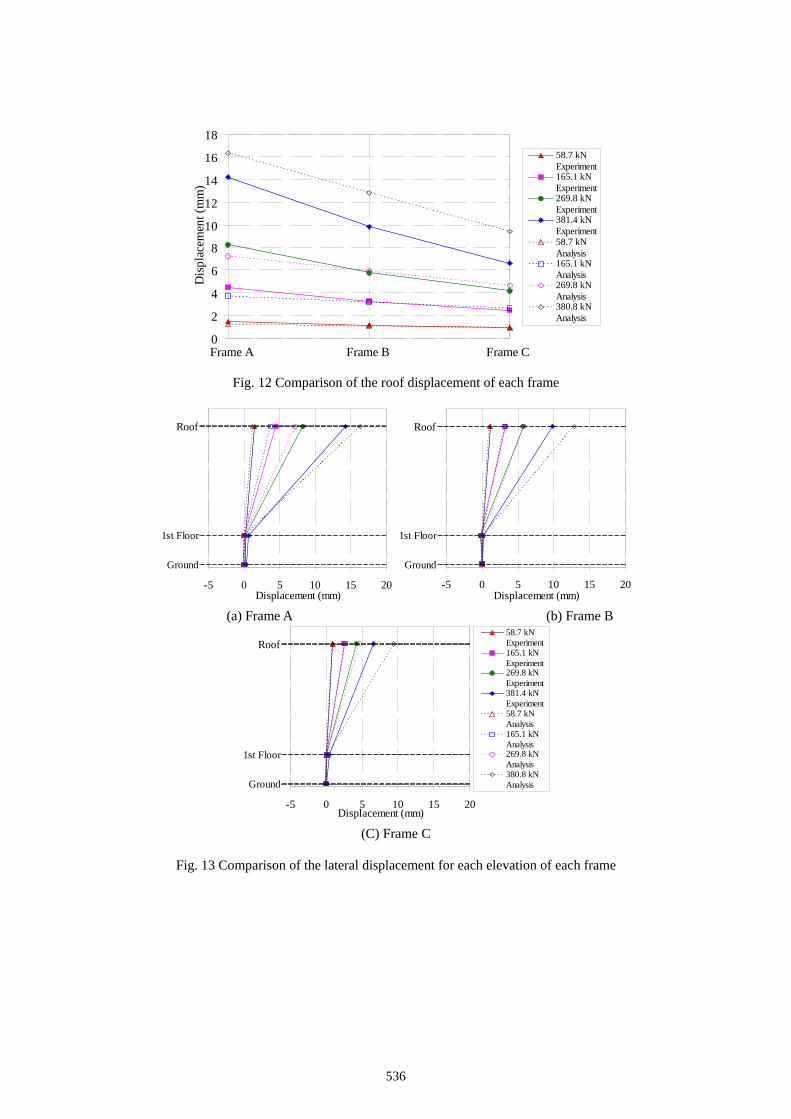
The comparison of lateral load and lateral displacement relationship between the experimental results and analytical results of each frame are shown in Fig. 11. In analytical results, the load resistance is 380.8 kN, and the load resistance at the roof level is 184.70 kN. The load resistance of the analysis is slightly less than the load resistance of the experiment, 381.4 kN, because the load resistance of the analysis that is limited by the lateral strength of the masonry infill wall in the frame B. Considering the load resistance at the roof level, the load distributions of each frame are 21.23 kN, 136.69 kN and 26.77 kN for frame A, frame B and frame C, respectively. The masonry infill wall in frame B and frame C can resist the lateral load of the roof level about 63.1% and 24.6%, respectively. It means that the lateral load distributes to the building frame only 12.3%. The ductility responses of the column in frame A, B and C are about 1.3, 1.0 and 0.2, respectively. From Figure 19, it can be seen that the analytical model can capture the initial stiffness well however the lateral displacement from the analysis is slightly larger. Fig. 12 shows the comparison of the torsion displacement at the roof level. Fig. 13 shows the comparison of the lateral displacement for the ground level, the first floor level and the roof level of each frame. From Fig. 12 and Fig. 13, the displacements of the analysis are agree well with the displacements of the experiment, but for the large lateral load, the displacements of the analysis exceed the displacements of the experiment. Because, as discussing previously, the masonry infill wall in frame B is the primary member to resist the lateral load, then when the lateral load is larger, the wall in frame B resists the load exceeding the lateral yielding force of the wall; consequently, the building model is deformed so much. From the lateral resistance of the building model limited by the strength of the wall in frame B, this result agreed well with the field load test that cracks on the masonry infill wall in the frame B significantly widened at the maximum lateral load, and there are new cracks occurred during the test as shown in Fig. 14, the crack width of the infill wall in frame B at initial state, maximum lateral load and unloading. The numbers in this figure are the width of the crack in mm unit.
0
100
200
300
400
500
0.000 0.005 0.010 0.015 0.020Displacement (m)
Lat
eral
res
ista
nce
(kN
)
Experiment
Analysis0
100
200
300
400
500
0.000 0.005 0.010 0.015Displacement (m)
Lat
eral
res
ista
nce
(kN
)
(a) Frame A (b) Frame B
(C) Frame C
Fig. 11 The force and displacement relationship of building model
0
100
200
300
400
500
0.000 0.005 0.010 0.015Displacement (m)
Lat
eral
res
ista
nce
(kN
)
535
0
2
4
6
8
10
12
14
16
18
Dis
plac
emen
t (m
m)
58.7 kNExperiment165.1 kNExperiment269.8 kNExperiment381.4 kNExperiment58.7 kNAnalysis165.1 kNAnalysis269.8 kNAnalysis380.8 kNAnalysis
Frame A Frame B Frame C
Fig. 12 Comparison of the roof displacement of each frame
-5 0 5 10 15 20Displacement (mm)
Ground
1st Floor
Roof
-5 0 5 10 15 20Displacement (mm)
Ground
Roof
1st Floor
(a) Frame A (b) Frame B
-5 0 5 10 15 20Displacement (mm)
58.7 kNExperiment165.1 kNExperiment269.8 kNExperiment381.4 kNExperiment58.7 kNAnalysis165.1 kNAnalysis269.8 kNAnalysis380.8 kNAnalysisGround
Roof
1st Floor
(C) Frame C
Fig. 13 Comparison of the lateral displacement for each elevation of each frame
536

(a) Initial (b) Maximum load (c) Unloading
Fig. 14 Crack width of the masonry infill wall in frame B
EFFECT OF MASONRY INFILL WALL ON TSUNAMI RESISTING CAPACITY
The effect of masonry infill wall is investigated by arranging patterns of walls. The building model is analyzed with the same load pattern as the field load test. The names of each masonry infill wall are denoted as in Fig. 15. A, B, and C denotes the infill wall in both front and back spans in the frames A, B, and C, respectively.
Fig. 15 Definition of masonry infill walls
Table 5 Results of rearranged masonry infill wall
No Description Percentage of
Infill Wall Max Load (kN) Failure
1 Without wall 0.0 138.8 All Columns 2 A 33.3 162.1 Columns in Frame C 3 B 33.3 694.1 Shear in Short Columns 4 A-C 66.7 704.6 Shear in Short Columns 5 A-B-C 100.0 706.2 Shear in Short Columns 6 A1-B1-C1 50.0 685.4 Shear in Short Columns
537
0
100
200
300
400
500
600
700
800
0 20 40 60 80 100Percentage of Masonry Infilled Wall
Latt
eral
Res
istin
g Fo
rce
(kN
)Eccentric w/o frame B wallEccentric w/ frame B wallConcentricExisting building
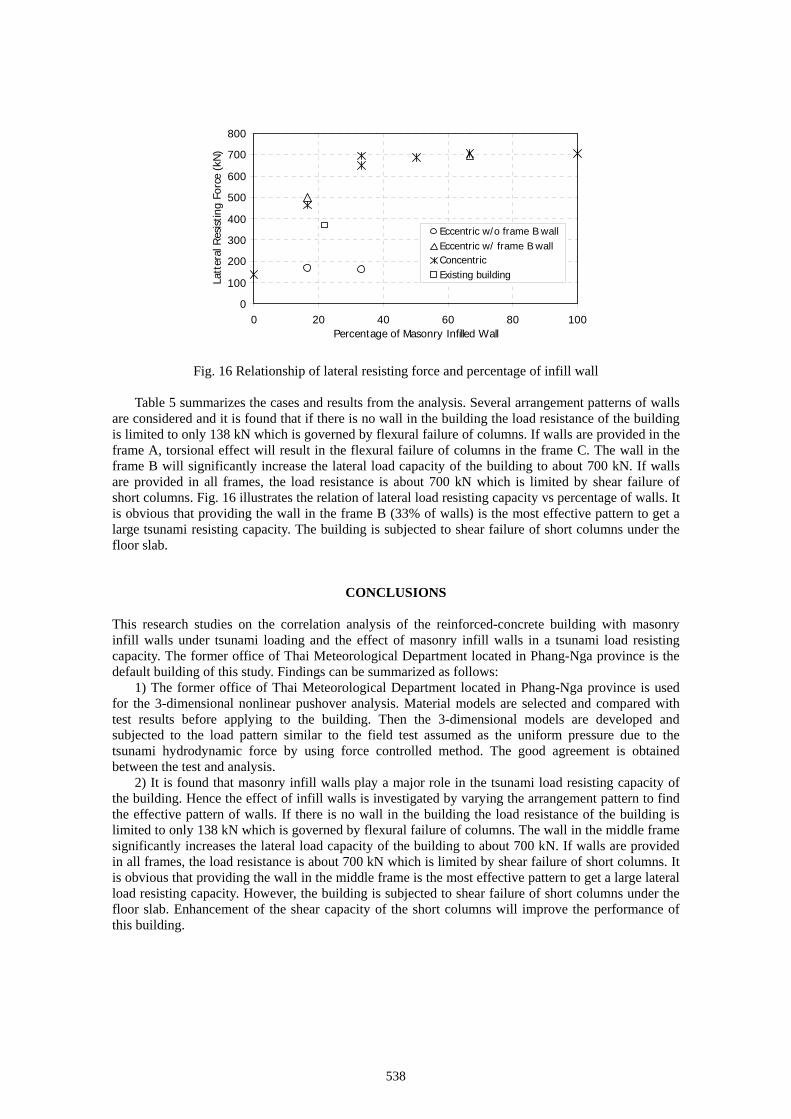
Fig. 16 Relationship of lateral resisting force and percentage of infill wall
Table 5 summarizes the cases and results from the analysis. Several arrangement patterns of walls are considered and it is found that if there is no wall in the building the load resistance of the building is limited to only 138 kN which is governed by flexural failure of columns. If walls are provided in the frame A, torsional effect will result in the flexural failure of columns in the frame C. The wall in the frame B will significantly increase the lateral load capacity of the building to about 700 kN. If walls are provided in all frames, the load resistance is about 700 kN which is limited by shear failure of short columns. Fig. 16 illustrates the relation of lateral load resisting capacity vs percentage of walls. It is obvious that providing the wall in the frame B (33% of walls) is the most effective pattern to get a large tsunami resisting capacity. The building is subjected to shear failure of short columns under the floor slab.
CONCLUSIONS
This research studies on the correlation analysis of the reinforced-concrete building with masonry infill walls under tsunami loading and the effect of masonry infill walls in a tsunami load resisting capacity. The former office of Thai Meteorological Department located in Phang-Nga province is the default building of this study. Findings can be summarized as follows:
1) The former office of Thai Meteorological Department located in Phang-Nga province is used for the 3-dimensional nonlinear pushover analysis. Material models are selected and compared with test results before applying to the building. Then the 3-dimensional models are developed and subjected to the load pattern similar to the field test assumed as the uniform pressure due to the tsunami hydrodynamic force by using force controlled method. The good agreement is obtained between the test and analysis.
2) It is found that masonry infill walls play a major role in the tsunami load resisting capacity of the building. Hence the effect of infill walls is investigated by varying the arrangement pattern to find the effective pattern of walls. If there is no wall in the building the load resistance of the building is limited to only 138 kN which is governed by flexural failure of columns. The wall in the middle frame significantly increases the lateral load capacity of the building to about 700 kN. If walls are provided in all frames, the load resistance is about 700 kN which is limited by shear failure of short columns. It is obvious that providing the wall in the middle frame is the most effective pattern to get a large lateral load resisting capacity. However, the building is subjected to shear failure of short columns under the floor slab. Enhancement of the shear capacity of the short columns will improve the performance of this building.
538
ACKNOWLEDGMENTS Office of the Higher Education Commission, Ministry of Education, Thailand is gratefully acknowledged. The assistance of Dr. Nuttawut Thanasisathit is also acknowledged.
REFERENCES Anil, O. and Altin, S. (2007). “An experimental study on reinforced concrete partially infilled frames.”
Engineering Structures, Vol. 29, 449-460. FEMA 306. (1998). “Evaluation of earthquake damaged concrete and masonry wall buildings - Basic
procedures manual.” Federal Emergency Management Agency, Washington, DC. Hoshikuma, J., Kawashima, K., Nagaya, K. and Taylor, A. W. (1997). “Stress-strain model for
confined reinforced concrete in bridge piers”. Journal of the Structural Engineering, ASCE, Vol. 123, No. 5, 624-633.
Kent, D. C. and Park, R. (1971). “Flexural members with confined concrete.” Journal of Structural Engineering, ASCE, Vol. 97, No. 7, 1969-1990.
Lukkunaprasit, P., Ruanrassamee, A., Stitmannaithum, B., Chintanapakdee, C. and Thanasisathit, N. (2010). “Calibration of tsunami loading on a damaged building.” Journal of Earthquake and Tsunami, Vol. 4, No. 2, 105-114.
Mehrabi, A. B., Shing, P. B., Schuller, M. P. and Noland, J.L. (1996). “Experimental evaluation of masonry-infilled RC frames.” Journal of Structural Engineering, Vol. 122, 228-237.
Menegotto, M. and Pinto, P. (1973). “Method of analysis for cyclically loaded RC plane frames including changes in geometry and non-elastic behavior of elements under combined normal force and bending.” Symp. Resistance and ultimate deformability of structures acted on by well defined repeated loads, IABSE Reports, Vol. 13, Lisbon, Portugal.
Mostafaei, H. and Kabeyasawa, T. (2004). “Effect of infill masonry walls on the seismic response of reinforced concrete buildings subjected to the 2003 Bam Earthquake strong motion: A case study of Bam telephone center.” Bulletin Earthquake Research Institute Univ. Tokyo, Vol. 79, 133-156.
Paulay, T. and Priestley, M. J. N. (1992). “Seismic design of reinforced concrete and masonry structures.” John Wiley and Sons, Inc., New York, USA.
Ruangrassamee, A., Yanagisawa, H., Foytong, P., Lukkunaprasit, P., Koshimura, S. and Imamura, F. (2006). “Investigation of tsunami-induced damage and fragility of buildings in Thailand after the December 2004 Indian Ocean tsunami.” Earthquake Spectra, Vol. 22, S377–S401.
Sezen, H. and Moehle, J. P. (2004). “Shear strength model for lightly reinforced concrete columns.” Journal of Structural Engineering, ASCE, Vol. 130, 1692-1703.
Wehbe, N. I., Saiidi, M. S. and Sanders, D. H. (1999). “Seismic performance of rectangular bridge columns with moderate confinement.” ACI Structural Journal, Vol. 96, No. S27, 248-259.
539
Related Documents