7th Annual Conference of the EBU Information & Statistics Network Marrakech, Morocco, 15– 16 September 2005 EBU Members finance EBU Members finance trends over the last trends over the last few years few years Krzysztof Klimaszewski Polskie Radio S.A.

7th Annual Conference of the EBU Information & Statistics Network Marrakech, Morocco, 15– 16 September 2005 EBU Members finance trends over the last few.
Dec 19, 2015
Welcome message from author
This document is posted to help you gain knowledge. Please leave a comment to let me know what you think about it! Share it to your friends and learn new things together.
Transcript

7th Annual Conference of the EBU Information & Statistics Network Marrakech, Morocco, 15– 16 September 2005
EBU Members financeEBU Members finance trends over the last few trends over the last few
yearsyearsKrzysztof Klimaszewski
Polskie Radio S.A.

OutlineOutline Total income and sources of funding - PSB historical trends – Income
- Breakdown of income
Total expenditure Conclusions for the coming future
Main source of information Analytical tool SIS guides/ EBU guides Presentations from Finance Assembly

PSB Historical Trends - Income
Percentage of evolution of income (1995-2003) Total income (based on local currency nominal value)
0%
10%
20%
30%
40%
50%
60%
70%
80%
90%
YLE
Finland
Radio France
France
FT ARD
Germany
ZDF RAI
Italy
TVP
Poland
BBC
UK
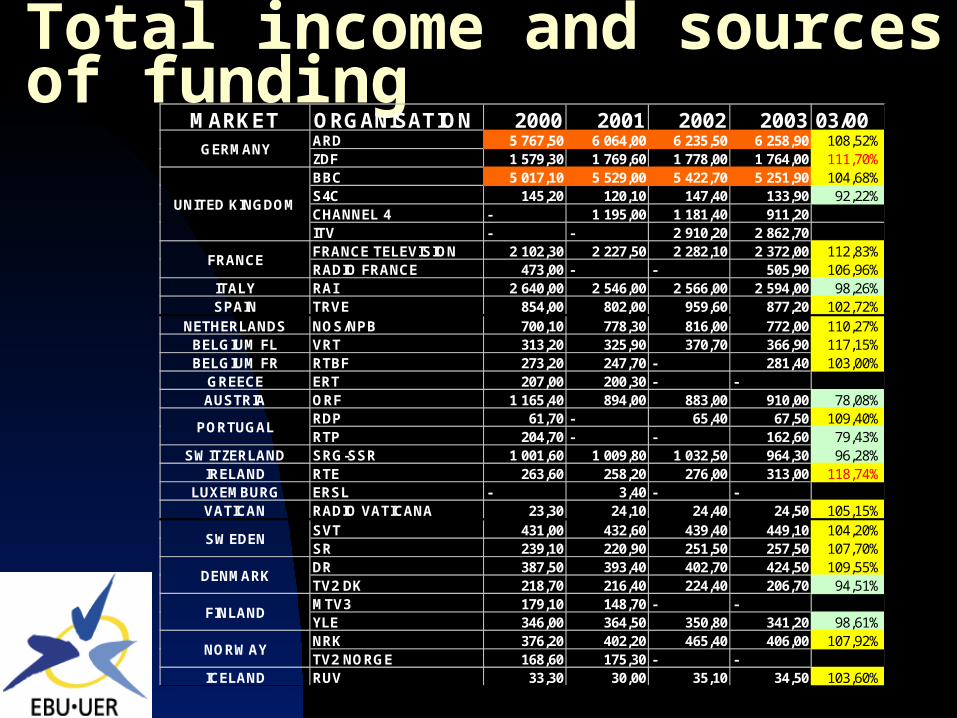
Total income and sources of fundingMARKET ORGANISATION 2000 2001 2002 2003 03/00
ARD 5 767,50 6 064,00 6 235,50 6 258,90 108,52%ZDF 1 579,30 1 769,60 1 778,00 1 764,00 111,70%BBC 5 017,10 5 529,00 5 422,70 5 251,90 104,68%S4C 145,20 120,10 147,40 133,90 92,22%CHANNEL 4 - 1 195,00 1 181,40 911,20ITV - - 2 910,20 2 862,70FRANCE TELEVISION 2 102,30 2 227,50 2 282,10 2 372,00 112,83%RADIO FRANCE 473,00 - - 505,90 106,96%
ITALY RAI 2 640,00 2 546,00 2 566,00 2 594,00 98,26%SPAIN TRVE 854,00 802,00 959,60 877,20 102,72%
NETHERLANDS NOS/NPB 700,10 778,30 816,00 772,00 110,27%BELGIUM FL VRT 313,20 325,90 370,70 366,90 117,15%BELGIUM FR RTBF 273,20 247,70 - 281,40 103,00%
GREECE ERT 207,00 200,30 - -AUSTRIA ORF 1 165,40 894,00 883,00 910,00 78,08%
RDP 61,70 - 65,40 67,50 109,40%RTP 204,70 - - 162,60 79,43%
SWITZERLAND SRG-SSR 1 001,60 1 009,80 1 032,50 964,30 96,28%IRELAND RTE 263,60 258,20 276,00 313,00 118,74%
LUXEMBURG ERSL - 3,40 - -VATICAN RADIO VATICANA 23,30 24,10 24,40 24,50 105,15%
SVT 431,00 432,60 439,40 449,10 104,20%SR 239,10 220,90 251,50 257,50 107,70%DR 387,50 393,40 402,70 424,50 109,55%TV2 DK 218,70 216,40 224,40 206,70 94,51%MTV3 179,10 148,70 - -YLE 346,00 364,50 350,80 341,20 98,61%NRK 376,20 402,20 465,40 406,00 107,92%TV2 NORGE 168,60 175,30 - -
ICELAND RUV 33,30 30,00 35,10 34,50 103,60%
SWEDEN
NORWAY
PORTUGAL
DENMARK
FINLAND
GERMANY
UNITED KINGDOM
FRANCE

PR 60,80 76,90 67,60 59,10 97,20%TVP 417,30 480,30 424,60 353,10 84,62%SRTV 69,50 67,50 73,90 90,90 130,79%ROR - 46,70 48,40 55,30CR 48,30 52,90 49,70 53,10 109,94%CT 192,90 181,00 180,20 154,90 80,30%MR 42,90 50,10 - 52,80 123,08%MTV3 100,70 - - -MTV - 141,90 85,40 82,60BNT 23,60 - - -BNR 13,30 - 17,00 17,10 128,57%
SERBIA RTS-RTNS - 49,00 79,40 72,50LITHUANIA LRT 12,90 15,20 - 15,20 117,83%
STV 36,00 39,10 37,80 -SR 17,10 19,90 21,50 24,30 142,11%
CROATIA HRT 153,00 164,70 175,40 188,90 123,46%LATVIJAS RADIO 5,50 - 6,50 -LTV 13,20 13,10 - -
SLOVENIA RTVSLO 108,30 108,30 - -ERT 5,60 - - 6,90 123,21%ETV 9,80 - 19,60 13,20 134,69%
MACEDONIA/FYROM MKRTV 16,90 15,70 - -UKRAINE NRU - 3,40 - 2,80TURKEY TRT 382,70 312,10 316,40 229,90 60,07%
ENRS 12,80 13,70 - -ENTV 23,40 - - -
ISRAEL IBA 209,20 - - -CYPRUS CYBC 29,30 - - -MALTA PBS 8,50 - - 7,10 83,53%
MOROCCO RTM - 52,00 51,20 48,40LIBYA LJB - 20,60 - -
ALGERIA
CZECH REPUBLIC
HUNGARY
SLOVAKIA
ESTONIA
BULGARIA
LATVIA
ROMANIA
POLAND
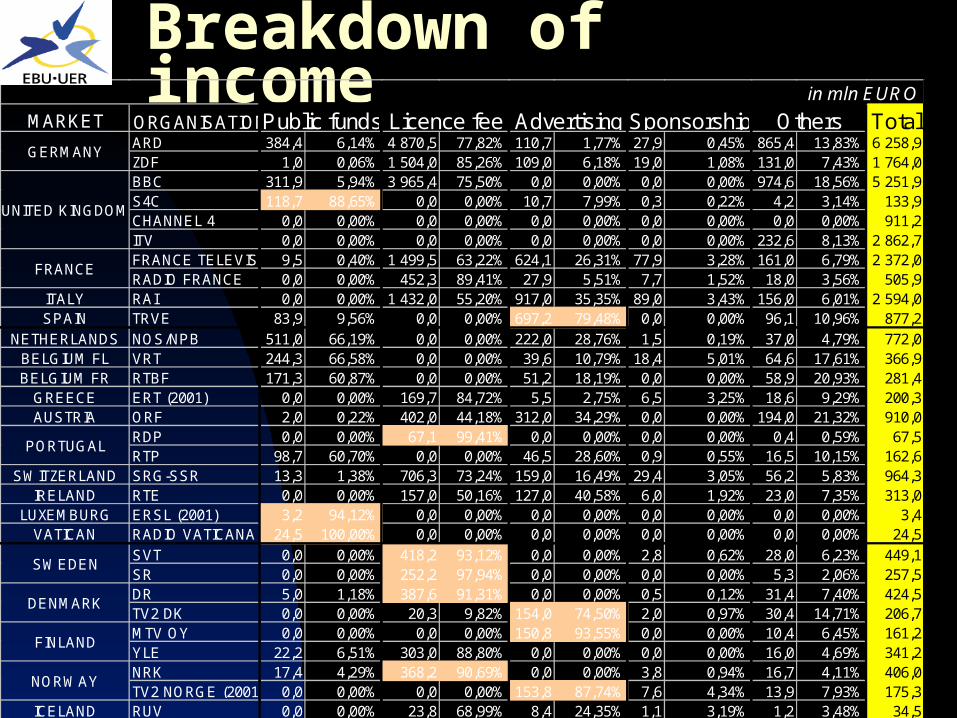
Breakdown of incomeMARKET ORGANISATION Total
ARD 384,4 6,14% 4 870,5 77,82% 110,7 1,77% 27,9 0,45% 865,4 13,83% 6 258,9ZDF 1,0 0,06% 1 504,0 85,26% 109,0 6,18% 19,0 1,08% 131,0 7,43% 1 764,0BBC 311,9 5,94% 3 965,4 75,50% 0,0 0,00% 0,0 0,00% 974,6 18,56% 5 251,9S4C 118,7 88,65% 0,0 0,00% 10,7 7,99% 0,3 0,22% 4,2 3,14% 133,9CHANNEL 4 0,0 0,00% 0,0 0,00% 0,0 0,00% 0,0 0,00% 0,0 0,00% 911,2ITV 0,0 0,00% 0,0 0,00% 0,0 0,00% 0,0 0,00% 232,6 8,13% 2 862,7FRANCE TELEVISION9,5 0,40% 1 499,5 63,22% 624,1 26,31% 77,9 3,28% 161,0 6,79% 2 372,0RADIO FRANCE 0,0 0,00% 452,3 89,41% 27,9 5,51% 7,7 1,52% 18,0 3,56% 505,9
ITALY RAI 0,0 0,00% 1 432,0 55,20% 917,0 35,35% 89,0 3,43% 156,0 6,01% 2 594,0SPAIN TRVE 83,9 9,56% 0,0 0,00% 697,2 79,48% 0,0 0,00% 96,1 10,96% 877,2
NETHERLANDS NOS/NPB 511,0 66,19% 0,0 0,00% 222,0 28,76% 1,5 0,19% 37,0 4,79% 772,0BELGIUM FL VRT 244,3 66,58% 0,0 0,00% 39,6 10,79% 18,4 5,01% 64,6 17,61% 366,9BELGIUM FR RTBF 171,3 60,87% 0,0 0,00% 51,2 18,19% 0,0 0,00% 58,9 20,93% 281,4
GREECE ERT (2001) 0,0 0,00% 169,7 84,72% 5,5 2,75% 6,5 3,25% 18,6 9,29% 200,3AUSTRIA ORF 2,0 0,22% 402,0 44,18% 312,0 34,29% 0,0 0,00% 194,0 21,32% 910,0
RDP 0,0 0,00% 67,1 99,41% 0,0 0,00% 0,0 0,00% 0,4 0,59% 67,5RTP 98,7 60,70% 0,0 0,00% 46,5 28,60% 0,9 0,55% 16,5 10,15% 162,6
SWITZERLAND SRG-SSR 13,3 1,38% 706,3 73,24% 159,0 16,49% 29,4 3,05% 56,2 5,83% 964,3IRELAND RTE 0,0 0,00% 157,0 50,16% 127,0 40,58% 6,0 1,92% 23,0 7,35% 313,0
LUXEMBURG ERSL (2001) 3,2 94,12% 0,0 0,00% 0,0 0,00% 0,0 0,00% 0,0 0,00% 3,4VATICAN RADIO VATICANA 24,5 100,00% 0,0 0,00% 0,0 0,00% 0,0 0,00% 0,0 0,00% 24,5
SVT 0,0 0,00% 418,2 93,12% 0,0 0,00% 2,8 0,62% 28,0 6,23% 449,1SR 0,0 0,00% 252,2 97,94% 0,0 0,00% 0,0 0,00% 5,3 2,06% 257,5DR 5,0 1,18% 387,6 91,31% 0,0 0,00% 0,5 0,12% 31,4 7,40% 424,5TV2 DK 0,0 0,00% 20,3 9,82% 154,0 74,50% 2,0 0,97% 30,4 14,71% 206,7MTV OY 0,0 0,00% 0,0 0,00% 150,8 93,55% 0,0 0,00% 10,4 6,45% 161,2YLE 22,2 6,51% 303,0 88,80% 0,0 0,00% 0,0 0,00% 16,0 4,69% 341,2NRK 17,4 4,29% 368,2 90,69% 0,0 0,00% 3,8 0,94% 16,7 4,11% 406,0TV2 NORGE (2001) 0,0 0,00% 0,0 0,00% 153,8 87,74% 7,6 4,34% 13,9 7,93% 175,3
ICELAND RUV 0,0 0,00% 23,8 68,99% 8,4 24,35% 1,1 3,19% 1,2 3,48% 34,5
in mln EURO
GERMANY
UNITED KINGDOM
FRANCE
Public funds Licence fee Advertising Sponsorship Others
PORTUGAL
DENMARK
FINLAND
SWEDEN
NORWAY

MARKET ORGANISATION Total PR 1,3 2,20% 43,1 72,93% 6,8 11,51% 0,8 1,35% 7,0 11,84% 59,1TVP 1,1 0,31% 114,3 32,37% 186,1 52,70% 12,1 3,43% 39,5 11,19% 353,1SRTV 13,2 14,52% 66,9 73,60% 7,4 8,14% 0,2 0,22% 3,2 3,52% 90,9ROR 15,8 28,57% 37,7 68,17% 0,7 1,27% 0,3 0,54% 0,8 1,45% 55,3CR 1,9 3,58% 41,4 77,97% 1,7 3,20% 2,0 3,77% 6,2 11,68% 53,1CT 0,0 0,00% 89,8 57,97% 26,8 17,30% 5,3 3,42% 33,0 21,30% 154,9MR 18,3 34,66% 21,8 41,29% 3,7 7,01% 0,0 0,00% 9,0 17,05% 52,8MTV 31,1 37,65% 31,2 37,77% 9,2 11,14% 0,8 0,97% 10,3 12,47% 82,6BNT (1999) 11,2 47,66% 0,0 0,00% 10,1 42,98% 1,5 6,38% 0,7 2,98% 23,5BNR 16,2 94,74% 0,0 0,00% 0,7 4,09% 0,1 0,58% 0,1 0,58% 17,1
SERBIA RTS-RTNS 53,4 73,66% 0,0 0,00% 8,5 11,72% 0,0 0,00% 10,6 14,62% 72,5LITHUANIA LNRT 10,6 69,74% 0,0 0,00% 3,3 21,71% 0,1 0,66% 1,1 7,24% 15,2
STV (2002) 5,3 14,02% 24,8 65,61% 4,3 11,38% 1,2 3,17% 2,2 5,82% 37,8SR 7,9 32,51% 12,7 52,26% 2,3 9,47% 0,0 0,00% 1,5 6,17% 24,3
CROATIA HRT 16,0 8,47% 104,6 55,37% 66,4 35,15% 0,0 0,00% 1,9 1,01% 188,9LR (2002) 4,6 70,77% 0,0 0,00% 1,2 18,46% 0,2 3,08% 0,6 9,23% 6,5LT (2001) 6,4 48,85% 0,0 0,00% 4,2 32,06% 0,9 6,87% 1,6 12,21% 13,1
SLOVENIA RTVSLO (2001) 1,5 1,39% 71,6 66,11% 13,0 12,00% 7,8 7,20% 14,4 13,30% 108,3ETV 11,8 89,39% 0,0 0,00% 0,0 0,00% 0,0 0,00% 0,0 0,00% 13,2ER 5,4 78,26% 0,0 0,00% 0,8 11,59% 0,2 2,90% 0,5 7,25% 6,9
MACEDONIA/FYROMMKRTV (2001) 1,8 11,46% 8,3 52,87% 3,1 19,75% 0,1 0,64% 2,4 15,29% 15,7UKRAINE NRU 0,0 0,00% 0,0 0,00% 1,1 39,29% 0,0 0,00% 0,0 0,00% 2,8TURKEY TRT 29,9 13,01% 171,3 74,51% 26,4 11,48% 0,4 0,17% 1,9 0,83% 229,9
ENRS (2001) 7,8 56,93% 4,2 30,66% 1,7 12,41% 0,0 0,00% 0,0 0,00% 13,7ENTV (2000) 17,1 73,39% 5,0 21,46% 0,0 0,00% 0,0 0,00% 1,2 5,15% 23,3
ISRAEL IBA (1999) 44,4 23,29% 107,0 56,14% 29,4 15,42% 0,7 0,37% 9,1 4,77% 190,6CYPRUS CYBC (1999) 3,4 11,60% 17,3 59,04% 0,0 0,00% 0,0 0,00% 1,7 5,80% 29,3MALTA PBS 0,0 0,00% 4,5 63,38% 2,4 33,80% 0,0 0,00% 0,2 2,82% 7,1
MOROCCO RTM 14,7 30,37% 21,2 43,80% 10,1 20,87% 0,0 0,00% 2,3 4,75% 48,4LIBYA LJB (2001) 20,4 99,03% 0,0 0,00% 0,2 0,97% 0,0 0,00% 0,0 0,00% 20,6
in mln EURO
Public funds Licence fee Advertising Sponsorship Others
ALGERIA
BULGARIA
LATVIA
POLAND
ROMANIA
CZECH REPUBLIC
HUNGARY
SLOVAKIA
ESTONIA
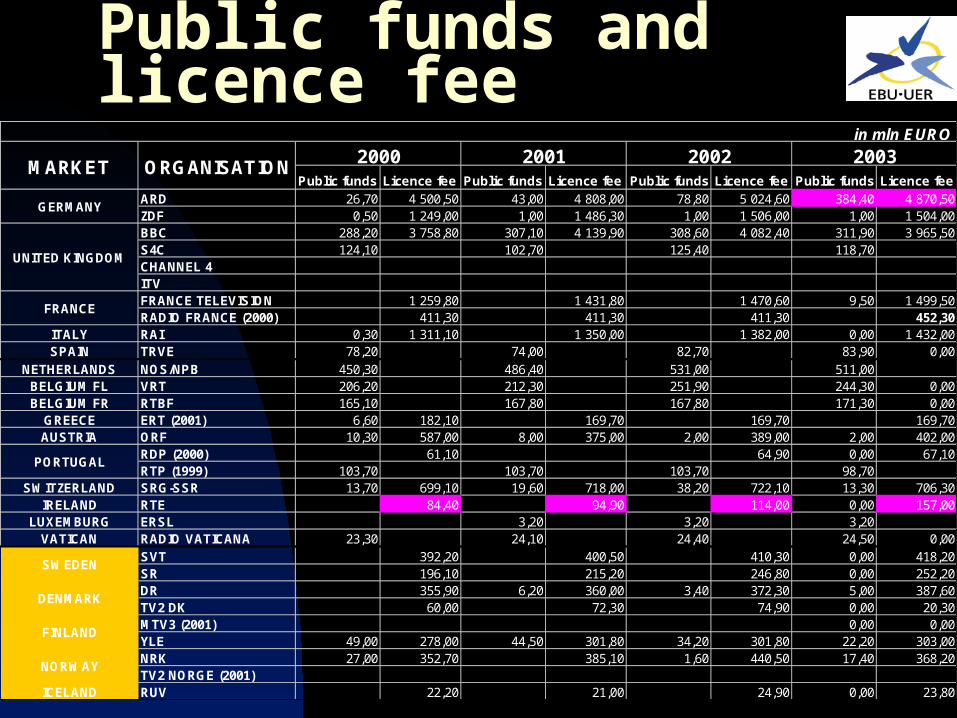
Public funds and licence fee
Public funds Licence fee Public funds Licence fee Public funds Licence fee Public funds Licence feeARD 26,70 4 500,50 43,00 4 808,00 78,80 5 024,60 384,40 4 870,50ZDF 0,50 1 249,00 1,00 1 486,30 1,00 1 506,00 1,00 1 504,00BBC 288,20 3 758,80 307,10 4 139,90 308,60 4 082,40 311,90 3 965,50S4C 124,10 102,70 125,40 118,70CHANNEL 4ITVFRANCE TELEVISION 1 259,80 1 431,80 1 470,60 9,50 1 499,50RADIO FRANCE (2000) 411,30 411,30 411,30 452,30
ITALY RAI 0,30 1 311,10 1 350,00 1 382,00 0,00 1 432,00SPAIN TRVE 78,20 74,00 82,70 83,90 0,00
NETHERLANDS NOS/NPB 450,30 486,40 531,00 511,00BELGIUM FL VRT 206,20 212,30 251,90 244,30 0,00BELGIUM FR RTBF 165,10 167,80 167,80 171,30 0,00
GREECE ERT (2001) 6,60 182,10 169,70 169,70 169,70AUSTRIA ORF 10,30 587,00 8,00 375,00 2,00 389,00 2,00 402,00
RDP (2000) 61,10 64,90 0,00 67,10RTP (1999) 103,70 103,70 103,70 98,70
SWITZERLAND SRG-SSR 13,70 699,10 19,60 718,00 38,20 722,10 13,30 706,30IRELAND RTE 84,40 94,90 114,00 0,00 157,00
LUXEMBURG ERSL 3,20 3,20 3,20VATICAN RADIO VATICANA 23,30 24,10 24,40 24,50 0,00
SVT 392,20 400,50 410,30 0,00 418,20SR 196,10 215,20 246,80 0,00 252,20DR 355,90 6,20 360,00 3,40 372,30 5,00 387,60TV2 DK 60,00 72,30 74,90 0,00 20,30MTV3 (2001) 0,00 0,00YLE 49,00 278,00 44,50 301,80 34,20 301,80 22,20 303,00NRK 27,00 352,70 385,10 1,60 440,50 17,40 368,20TV2 NORGE (2001)
ICELAND RUV 22,20 21,00 24,90 0,00 23,80
GERMANY
UNITED KINGDOM
FRANCE
PORTUGAL
DENMARK
FINLAND
SWEDEN
NORWAY
in mln EURO
2000 2001 2002 2003MARKET ORGANISATION
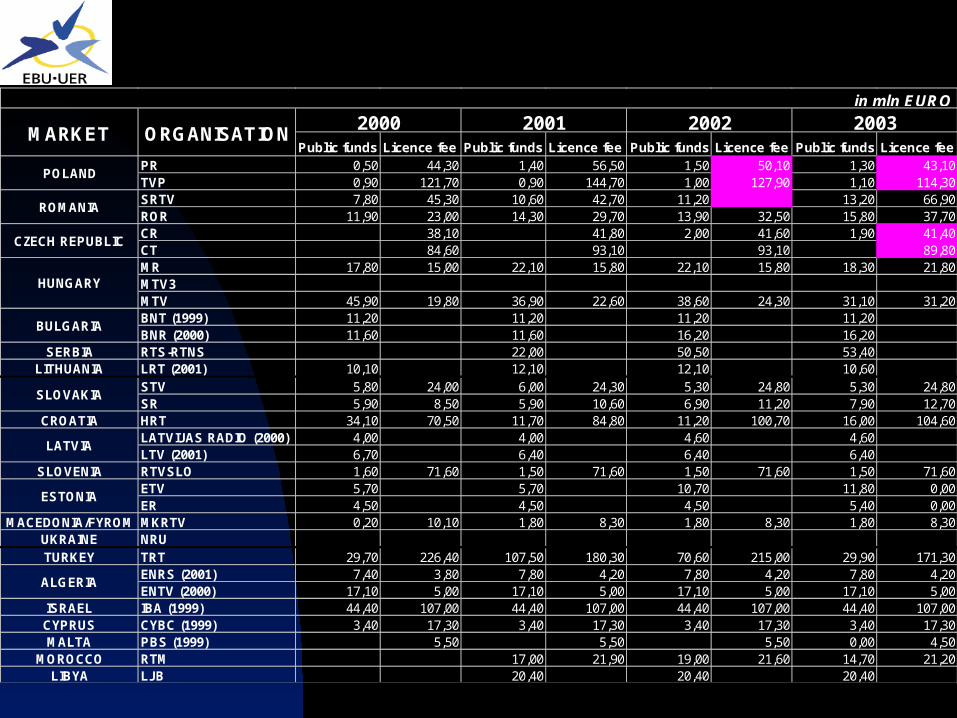
Public funds Licence fee Public funds Licence fee Public funds Licence fee Public funds Licence feePR 0,50 44,30 1,40 56,50 1,50 50,10 1,30 43,10TVP 0,90 121,70 0,90 144,70 1,00 127,90 1,10 114,30SRTV 7,80 45,30 10,60 42,70 11,20 13,20 66,90ROR 11,90 23,00 14,30 29,70 13,90 32,50 15,80 37,70CR 38,10 41,80 2,00 41,60 1,90 41,40CT 84,60 93,10 93,10 89,80MR 17,80 15,00 22,10 15,80 22,10 15,80 18,30 21,80MTV3MTV 45,90 19,80 36,90 22,60 38,60 24,30 31,10 31,20BNT (1999) 11,20 11,20 11,20 11,20BNR (2000) 11,60 11,60 16,20 16,20
SERBIA RTS-RTNS 22,00 50,50 53,40LITHUANIA LRT (2001) 10,10 12,10 12,10 10,60
STV 5,80 24,00 6,00 24,30 5,30 24,80 5,30 24,80SR 5,90 8,50 5,90 10,60 6,90 11,20 7,90 12,70
CROATIA HRT 34,10 70,50 11,70 84,80 11,20 100,70 16,00 104,60LATVIJAS RADIO (2000) 4,00 4,00 4,60 4,60LTV (2001) 6,70 6,40 6,40 6,40
SLOVENIA RTVSLO 1,60 71,60 1,50 71,60 1,50 71,60 1,50 71,60ETV 5,70 5,70 10,70 11,80 0,00ER 4,50 4,50 4,50 5,40 0,00
MACEDONIA/FYROM MKRTV 0,20 10,10 1,80 8,30 1,80 8,30 1,80 8,30UKRAINE NRUTURKEY TRT 29,70 226,40 107,50 180,30 70,60 215,00 29,90 171,30
ENRS (2001) 7,40 3,80 7,80 4,20 7,80 4,20 7,80 4,20ENTV (2000) 17,10 5,00 17,10 5,00 17,10 5,00 17,10 5,00
ISRAEL IBA (1999) 44,40 107,00 44,40 107,00 44,40 107,00 44,40 107,00CYPRUS CYBC (1999) 3,40 17,30 3,40 17,30 3,40 17,30 3,40 17,30MALTA PBS (1999) 5,50 5,50 5,50 0,00 4,50
MOROCCO RTM 17,00 21,90 19,00 21,60 14,70 21,20LIBYA LJB 20,40 20,40 20,40
POLAND
ROMANIA
ALGERIA
CZECH REPUBLIC
HUNGARY
SLOVAKIA
ESTONIA
BULGARIA
LATVIA
in mln EURO
2000 2001 2002 2003MARKET ORGANISATION

...
Change in licence fee + public funding: 2002-2003 % Growth
10.34.5 3.6 3.3 3.0 2.6 1.9 1.5 -0.1 0.5-72.9-10.5-5.3-3.8-3.5-3.1-3.0-2.6-1.0
37.7
-80%
-60%
-40%
-20%
0%
20%
40%
60%R
TE
ET
V
DR
RA
I
OR
F
AR
D
Fra
nce
Tél
évi
sion
s
SV
T
RT
VE
ZD
F
MT
V
BB
C
VR
T
YLE C
T
NP
B
S4C
TV
P
TV
2 D
K*
Agr
ega
te a
vera
ge

PSB Income – Funding Mix
40% of EBU Members get at least 20% funding from advertising.
The evolution of the funding mix has been most closely linked to ad cycles
0%
10%
20%
30%
40%
50%
60%
70%
80%
90%
100%
0% 20% 40% 60% 80% 100%
Adv
ertis
ing
and
spo
nso
rshi
p in
com
e
BBC
MTV OY
RTVE
TV2 DK
TVP
ORF
RTE
RAI
CT
RTBF VRT ER
MR
TRT
BNR Radio Vaticana
HRT
FTVNPB
ARD
Licence fee and public funds

Total Income of the public radio and television organizations in South Eastern Europe for the period (1999-2004) in million Euros
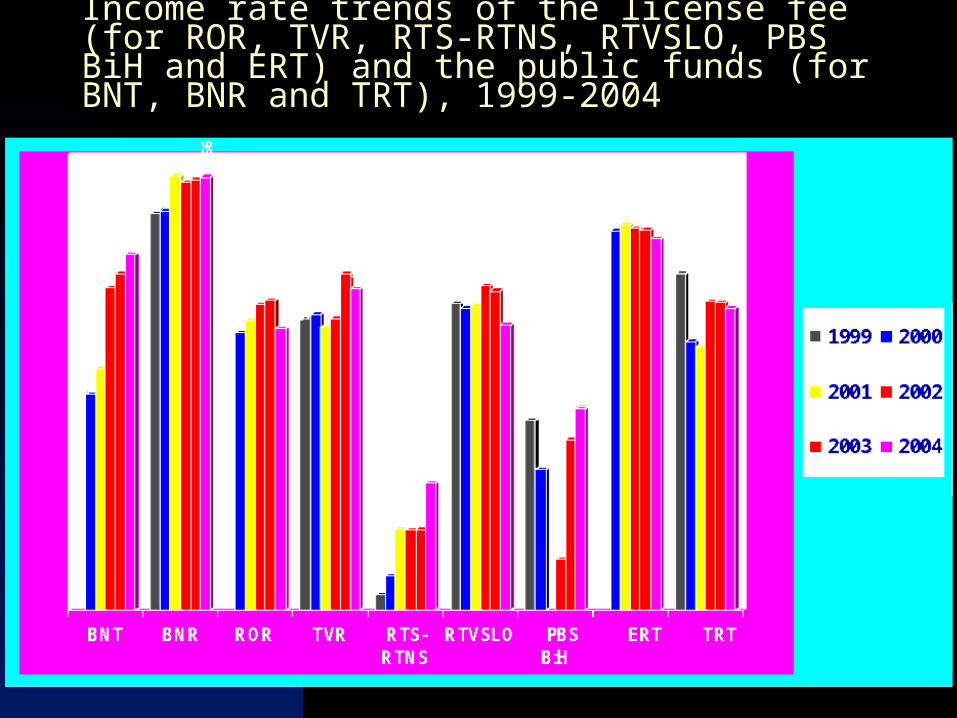
Income rate trends of the license fee (for ROR, TVR, RTS-RTNS, RTVSLO, PBS BiH and ERT) and the public funds (for BNT, BNR and TRT), 1999-2004
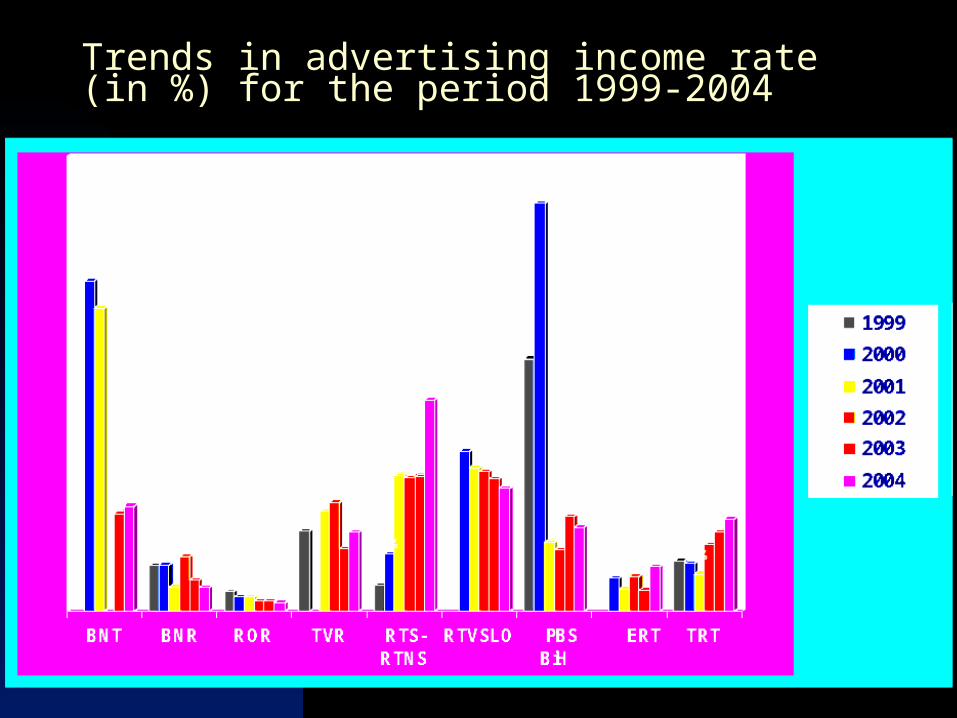
Trends in advertising income rate (in %) for the period 1999-2004

Total expenditureMARKET ORGANISATION 2001 2002 2003
ARD 5 405,00 6 229,10 6 284,80ZDF 1 699,50 1 801,00 1 683,00BBC 5 811,90 6 047,60 5 671,00S4C 158,70 148,80 128,50CHANNEL 4 - 1 048,90 908,40FRANCE TELEVISION 2 190,40 2 289,70 2 363,60RADIO FRANCE - - 531,60
ITALY RAI 2 548,00 2 558,00 1 730,00SPAIN RTVE 1 499,00 1 559,50 1 477,20
NOS/NPB 786,60 817,00 774,00BELGIUM FL VRT 327,40 362,90 348,60BELGIUM FR RTBF 248,70 - -
GREECE ERT 218,50 - -AUSTRIA ORF 892,00 925,00 905,00
RDP - 60,00 39,00RTP - - 236,10
SWITZERLAND SRG-SSR 1 026,10 1 038,20 953,20IRELAND RTE 304,40 298,00 310,00
LUXEMBURG ERSL 3,40 - -VATICAN RADIO VATICANA 24,10 24,40 25,00
SVT 406,90 412,90 422,50SR 212,40 228,00 230,20DR 368,60 387,60 383,60TV2 DK 161,90 173,10 184,80MTV3 169,30 - 157,50YLE 428,00 432,00 412,30NRK 401,90 477,10 407,70TV2 NORGE 157,20 - -
ICELAND RUV 34,70 37,30 36,70
GERMANY
UNITED KINGDOM
FRANCE
in mln EURO
NETHERLANDS
PORTUGAL
SWEDEN
DENMARK
FINLAND
NORWAY
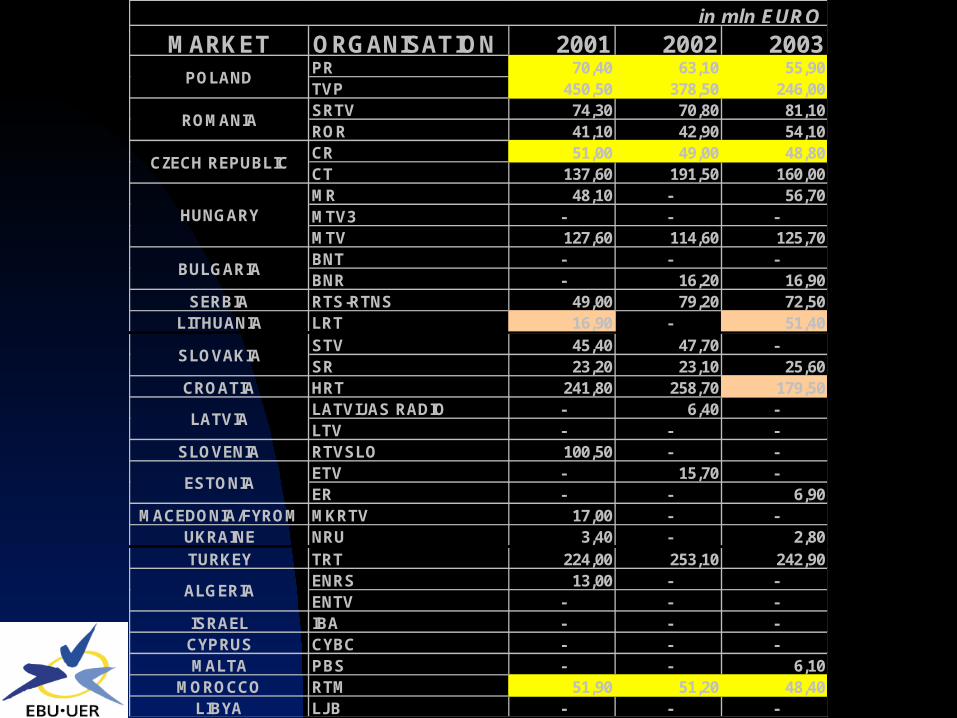
MARKET ORGANISATION 2001 2002 2003PR 70,40 63,10 55,90TVP 450,50 378,50 246,00SRTV 74,30 70,80 81,10ROR 41,10 42,90 54,10CR 51,00 49,00 48,80CT 137,60 191,50 160,00MR 48,10 - 56,70MTV3 - - -MTV 127,60 114,60 125,70BNT - - -BNR - 16,20 16,90
SERBIA RTS-RTNS 49,00 79,20 72,50LITHUANIA LRT 16,90 - 51,40
STV 45,40 47,70 -SR 23,20 23,10 25,60
CROATIA HRT 241,80 258,70 179,50LATVIJAS RADIO - 6,40 -LTV - - -
SLOVENIA RTVSLO 100,50 - -ETV - 15,70 -ER - - 6,90
MACEDONIA/FYROM MKRTV 17,00 - -UKRAINE NRU 3,40 - 2,80TURKEY TRT 224,00 253,10 242,90
ENRS 13,00 - -ENTV - - -
ISRAEL IBA - - -CYPRUS CYBC - - -MALTA PBS - - 6,10
MOROCCO RTM 51,90 51,20 48,40LIBYA LJB - - -
in mln EURO
POLAND
ROMANIA
LATVIA
ESTONIA
ALGERIA
CZECH REPUBLIC
HUNGARY
BULGARIA
SLOVAKIA

What do we finance?
Market Organisation
National Services - Programme Expenditure
National Services - Transmission
Algeria Etablissement Public de Radiodiffusion Sonore 31,09% 0,00%Algeria ETABLISSEMENT PUBLIC DE TELEDIFFUSION ALGERIEN0,00% 88,49%Austria Oesterreichischer Rundfunk 53,31% 3,09%Belgium Fl De Vlaamse Radio- en Televisieomroep 57,99% 2,30%Belgium Fr Radio-Television Belge de la Communaute francaise65,29% 1,04%Bulgaria Balgarska Nationalna Televizia 45,76% 14,21%Bulgaria Balgarsko Natzionalno Radio 24,97% 33,48%Croatia Hrvatska Radiotelevizija 23,02% 10,72%Czech republicCeska Televize 53,09% 14,07%Czech republicCesky Rozhlas 21,74% 18,46%Denmark Danmarks Radio 12,61% 4,73%Denmark TV 2/DANMARK a/s 39,83% 4,99%Estonia Eesti Raadio 37,72% 20,49%Estonia Eesti Televisioon 62,87% 14,97%Finland MTV OY 49,34% 9,59%Finland Yleisradio Oy 67,75% 11,00%France France Televisions 61,14% 7,27%Germany Arbeitsgemeinschaft der oeffentlich- rechtlichen Rundfunkanstalten der Bundesrepublik Deutschland (ARD)43,79% 6,22%Germany Zweites Deutsches Fernsehen 72,17% 5,87%Hungary Magyar Radio RT 61,23% 31,02%Hungary Magyar Televizio Reszvenytarsasag 37,59% 19,78%Iceland Rikisutvarpid 59,39% 5,26%Ireland Radio Telefis Eireann 76,45% 10,97%Israel Rashut HaShidur 75,08% 8,76%Italy RAI-Radiotelevisione Italiana S.p.A. 67,57% 8,73%
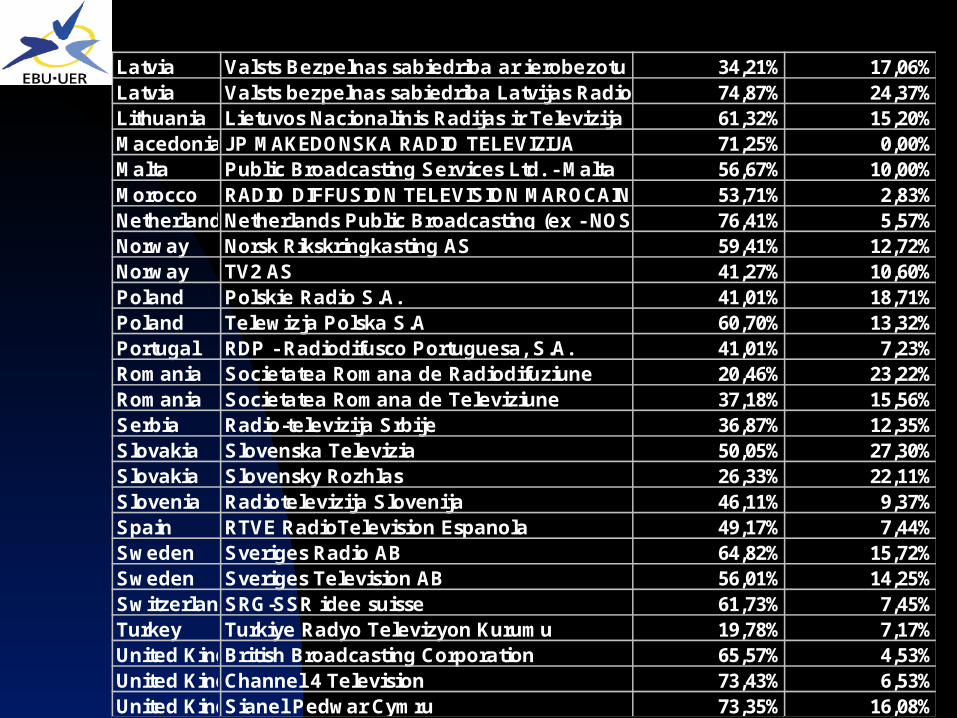
Latvia Valsts Bezpelnas sabiedriba ar ierobezotu atbildibu 34,21% 17,06%Latvia Valsts bezpelnas sabiedriba Latvijas Radio 74,87% 24,37%Lithuania Lietuvos Nacionalinis Radijas ir Televizija 61,32% 15,20%Macedonia JP MAKEDONSKA RADIO TELEVIZIJA 71,25% 0,00%Malta Public Broadcasting Services Ltd. - Malta 56,67% 10,00%Morocco RADIO DIFFUSION TELEVISION MAROCAINE 53,71% 2,83%NetherlandsNetherlands Public Broadcasting (ex - NOS) 76,41% 5,57%Norway Norsk Rikskringkasting AS 59,41% 12,72%Norway TV2 AS 41,27% 10,60%Poland Polskie Radio S.A. 41,01% 18,71%Poland Telewizja Polska S.A 60,70% 13,32%Portugal RDP - Radiodifusco Portuguesa, S.A. 41,01% 7,23%Romania Societatea Romana de Radiodifuziune 20,46% 23,22%Romania Societatea Romana de Televiziune 37,18% 15,56%Serbia Radio-televizija Srbije 36,87% 12,35%Slovakia Slovenska Televizia 50,05% 27,30%Slovakia Slovensky Rozhlas 26,33% 22,11%Slovenia Radiotelevizija Slovenija 46,11% 9,37%Spain RTVE RadioTelevision Espanola 49,17% 7,44%Sweden Sveriges Radio AB 64,82% 15,72%Sweden Sveriges Television AB 56,01% 14,25%SwitzerlandSRG-SSR idee suisse 61,73% 7,45%Turkey Turkiye Radyo Televizyon Kurumu 19,78% 7,17%United KingdomBritish Broadcasting Corporation 65,57% 4,53%United KingdomChannel 4 Television 73,43% 6,53%United KingdomSianel Pedwar Cymru 73,35% 16,08%

Conclusions for the coming future Public Broadcasters will be at a competitive disadvantage (licence fee
difficult to find the socially acceptable level, new investments like new
channels ex. thematics, digitalisation, new active players on the adv market –
mobile operators, Internet providers and outdoor advertisers)
Public channel output is more heavily skewed to genres like education,
factual, arts, news and information –genres that would be explicitly prohibited
from product placement.
Commercial broadcasters are increasing in number and in financial strength
Broadcasters whose schedules are dominated by entertainment and format
shows will have competitive advantage and reap most of the financial
rewards.
Private broadcasters can do product placement (relaxed rules), teleshopping
services, internet etc.
Commercial broadcasters promote and lobby the dual system where they
would have the advertising time market to itself and PSB would only receive
license fee
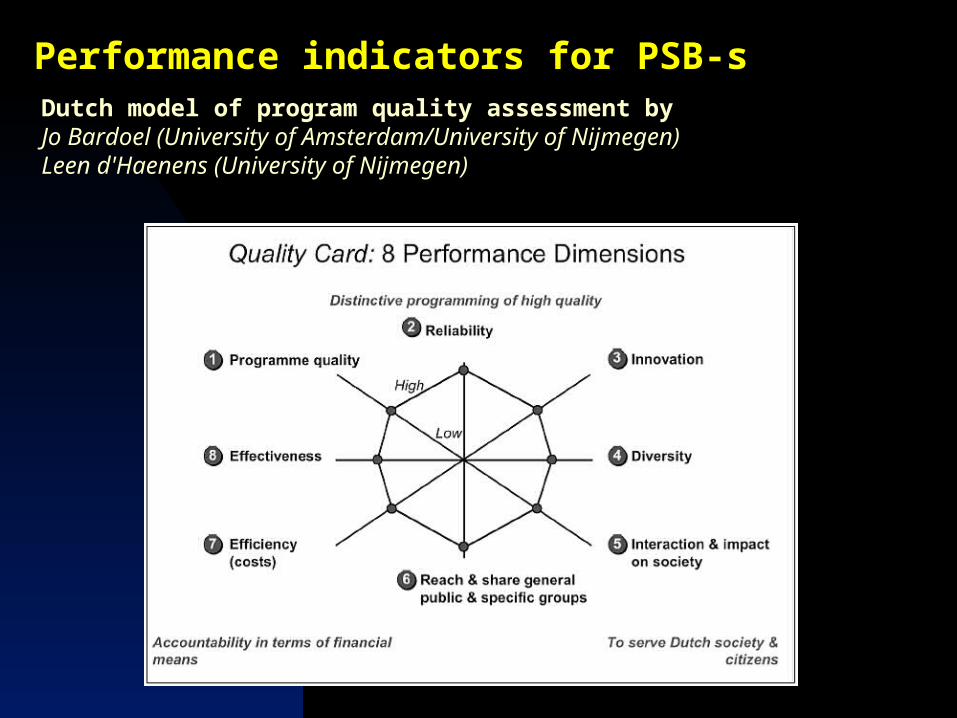
Performance indicators for PSB-sDutch model of program quality assessment byJo Bardoel (University of Amsterdam/University of Nijmegen)Leen d'Haenens (University of Nijmegen)

Performance indicators for PSB-s
Broadcaster’s performance indicators
Audience indicators(by different target groups)
Qua
ntit
ativ
e in
dica
tors
(by
prog
ram
cat
egor
ies) Q
ualitative in
dicators
innovativeness
variety
balance,impartiality
reliability
satisfactionshare
reach
rating
interactivity
cost perlistener/viewer
cost per hour
program volume(hours, quotas)
source data:budget & accounts
source data:audience research
source data:expert evaluation
source data:opinion research
citation frequency
budget volume
cost per citizen
technical quality
in public interest
AIMSMEANS
RESULTS EFFECT
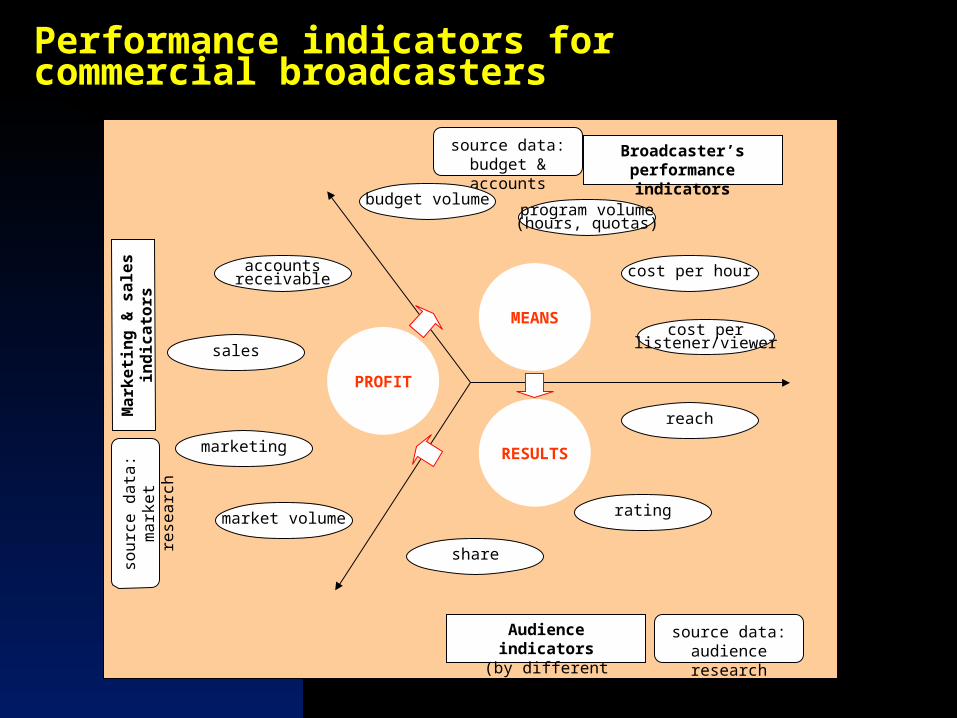
Performance indicators for commercial broadcasters
Audience indicators(by different target groups)
share
reach
rating
source data:audience research
Broadcaster’s performance indicators
cost perlistener/viewer
cost per hour
program volume(hours, quotas)
source data:budget & accounts
budget volume
PROFIT
MEANS
RESULTS
market volume
marketing
sales
accountsreceivable
Mar
ket
ing
& s
ales
in
dic
ator
sso
urce
dat
a:m
arke
t res
earc
h
Related Documents


