ϢʔβͷߦಈཤσʔλΛ༻ ίϯςϯπڵຯਪҠΧςΰϦͷՄࢹԽख๏ Visualization Method of Content Interest Evolution Categories using User’s Activity Data อ ७ Jun Hozumi দඌ ๛ Yutaka Matsuo ౦ژେେӃ ڀݚܥՊ Graduate School of Engineering, the University of Tokyo In this study, we propose a method to visualize categories that show how users’ interests change by using log data in which actions of users are recorded. We define actions those show user’s interest for certain contents as interest-actions and extract time series of user’s interest-actions from log data. We divide them into soft clusters and user interests in each cluster to levels and visualize how the interesting contents changes for users in each cluster. As a result of the verification experiment, our proposed method visualizes the trend of interest trends of consumers in more detail than the previous method. We also confirmed that the visualization by our method is qualitatively effective by questionnaire evaluation to the stakeholders of content industries. 1. Ίʹ ݱͷϚʔέςΟϯάͰɼࢢͷফඅΛෳݸͷά ϧʔϓʹɼͷதΒλʔήοτͱΔάϧʔϓΛબ Δख๏ߦΘΕΔɽΕΒͷख๏ɼ ηάϝϯςʔγϣ ϯ ʢࢢࡉԽʣͱλʔήςΟϯάͱݺΕΔɽηάϝϯςʔ γϣϯɼηάϝϯτʹଐΔݸʑਓͷझຯᅂফඅߦಈ ΕΕҟͰΔͱॏཁͰΔΊɼηάϝϯ ςʔγϣϯͰΔͱʹɼͷझຯᅂͷରΛΧ ςΰϦͱΔͱͰΔɽ·ɼͷΑͳΧςΰ ϦΛಛఆΔͱͰΕɼͷΧςΰϦΛᅂΔফඅ ΛΊΔͱͰɼϚʔέςΟϯά༗ͳηάϝϯτΛ࡞ ΔͱͰΔͱߟΒΕΔɽ ɹΛΧςΰϦʹΔ๏ʹɼফඅߦಈͷ ʹڀݚෳͷछΔͱΒΕΔ [9]ɽͱɼ ϚϯΨͷʮݥϚϯΨʯʮSF ϚϯΨʯͱɼͱ ʹҰఆͷಛΒΊఆΕɼͷఆʹԠίϯ ςϯπΛطఆͷΧςΰϦʹΓৼΔͱͰߏΔతΧ ςΰϦɼʮٽΔϚϯΨʯʮਓʹનΊͳΔϚϯΨʯͱ ɼফඅͷίϯςΫετ *1 ʹΑϘτϜΞοϓʹੜ ·ΕΔΞυϗοΫɾΧςΰϦΔɽΞυϗοΫɾΧςΰϦ ফඅͷҙߦಈʹΑੜ·ΕΔΧςΰϦͰΔΊɼੜ ଆʹͱΔͱࠔͰΔɼΞυϗοΫɾΧ ςΰϦʹணΔͱͰɼͷΧςΰϦͷΛڞ༗ ΔࢢηάϝϯτΛݟͰΔՄΔɽ ɹաߦʹڈΘΕϢʔβͷࡍͷߦಈΒϘτϜΞοϓʹର ͷΧςΰϦΛՄࢹԽΑͱࢼΈͱɼYang Βͷ ڀݚ[8] ڍΒΕΔɽYang ΒɼϢʔβΛߦಈͷมԽͷύ λʔϯʹΑΫϥελϦϯάɼΒʹɼϢʔβʹϨϕϧΛ ༩ΔͱͰɼΫϥελͷϨϕϧʹΔͳञ පؾͷਐߦঢ়گͳͲɼରͷΧςΰϦߏΛϘτϜΞοϓʹ ՄࢹԽɽɼͷख๏ɼՄࢹԽΛߦͰϢʔβΛ ΕΕ୯ҰͷΧςΰϦʹଐΔΊɼίϯςϯπͷΞυ ϗοΫɾΧςΰϦΛՄࢹԽΔΊʹͷख๏Λ༻Δ߹ɼ ϢʔβෳͷΧςΰϦͷझຯᅂΛΔͱΛແ ࿈བྷઌ: อ ७ɼ౦ژେڀݚܥՊɼ [email protected] tokyo.ac.jp *1 ফඅͷஔΕΔঢ়گɼͷഎܠͷͱɽ ਤ 1: ຊڀݚͷఏҊख๏ͷਤ ࢹΔͱʹͳ·ɽ ɹҎͷ՝Λ౿·ɼຊڀݚͰҎͷΛղΧ ςΰϦߏʹݟΑΔηάϝϯςʔγϣϯΛୡΔΊʹɼ Web αʔϏεͳͲͷϢʔβͷߦಈهΕϩάσʔλΛ ༻ɼϢʔβͷڵຯରͲਪҠΔΛදΧςΰϦΛ ϘτϜΞοϓʹՄࢹԽΔख๏ΛఏҊΔɽΔίϯςϯπ ʹରڵຯΛΔڌͱͳΔߦಈΛڵຯߦಈͱఆɼ ϩάσʔλΒϢʔβͷڵຯߦಈͷܥΛநग़ޙɼਤ 1 ʹදΕΔϢʔβͷιϑτΫϥελϦϯάɼΫϥελ ͷϢʔβͷڵຯਪҠঢ়گΛϨϕϧͰදͱͰɼΫϥελ ͱʹڵຯରͲਪҠΔΛՄࢹԽΔɽ ɹຊख๏ͷ৽نͱ༗༻ɼҎԼͷ௨ΓͰΔɽ • ຊख๏ϢʔβಉʹෳͷδϟϯϧʹڵຯΛͱ લఏΛߟιϑτΫϥελϦϯάΛ༻ઃ ܭͱͳΔΊɼདྷख๏ʹൺɼࢢͷঢ়گΛΑ Γਖ਼ʹөՄࢹԽݱͰΔɽ • ຊख๏ʹΑಘΒΕΔՄࢹԽՌɼίϯςϯπఏ ڙଆΒѲΔͱফඅͷࡍͷڵຯಈʹ جϘτϜΞοϓͳΧςΰϦΛՄࢹԽͷͰΔ ΊɼࡍͷϚʔέςΟϯά׆ಈʹ༗ӹͳ ΛΒͷͰΔɽ 1 The 31st Annual Conference of the Japanese Society for Artificial Intelligence, 2017 4I2-1

Welcome message from author
This document is posted to help you gain knowledge. Please leave a comment to let me know what you think about it! Share it to your friends and learn new things together.
Transcript

ユーザの行動履歴データを用いたコンテンツ興味推移カテゴリの可視化手法
Visualization Method of Content Interest Evolution Categories using User’s Activity Data
保住 純Jun Hozumi
松尾 豊Yutaka Matsuo
東京大学大学院 工学系研究科Graduate School of Engineering, the University of Tokyo
In this study, we propose a method to visualize categories that show how users’ interests change by using logdata in which actions of users are recorded. We define actions those show user’s interest for certain contents asinterest-actions and extract time series of user’s interest-actions from log data. We divide them into soft clustersand user interests in each cluster to levels and visualize how the interesting contents changes for users in eachcluster. As a result of the verification experiment, our proposed method visualizes the trend of interest trends ofconsumers in more detail than the previous method. We also confirmed that the visualization by our method isqualitatively effective by questionnaire evaluation to the stakeholders of content industries.
1. はじめに現代のマーケティングでは,市場内の消費者を複数個のグ
ループに分割し,その中からターゲットとするグループを選択する手法が行われている.それらの手法は,セグメンテーション(市場細分化)とターゲティングと呼ばれる.セグメンテーションは,各セグメントに属する個々人の趣味嗜好や消費行動がそれぞれ異質であることが重要であるため,良いセグメンテーションができているときには,その趣味嗜好の対象物をカテゴリとして分類することができる.また,そのようなカテゴリを特定することができれば,そのカテゴリを嗜好する消費者を集めることで,マーケティング上有効なセグメントを作成することができると考えられる. 商品をカテゴリに分類する方法には,消費者行動論の研究において複数の種類があることが知られている [9].たとえば,マンガの「冒険マンガ」や「SFマンガ」といった,商品ごとに一定の特性があらかじめ定義され,その定義に応じて各コンテンツを既定のカテゴリに割り振ることで構成する分類学的カテゴリや,「泣けるマンガ」や「人に薦めたくなるマンガ」といった,消費者のコンテクスト ∗1 によってボトムアップに生まれるアドホック・カテゴリがある.アドホック・カテゴリは消費者の意識や行動によって生まれるカテゴリであるため,生産者側にとって認識することは困難であるが,アドホック・カテゴリに着目することで,そのカテゴリへの認識を共有している市場内セグメントを発見できる可能性がある. 過去に行われたユーザの実際の行動からボトムアップに対象物のカテゴリを可視化しようとした試みとして,Yangらの研究 [8]が挙げられる.Yangらは,ユーザを行動の変化のパターンによってクラスタリングし,さらに,ユーザにレベルを付与することで,各クラスタの各レベルにおける好きな酒類や病気の進行状況など,対象物のカテゴリ構造をボトムアップに可視化した.しかし,この手法は,可視化を行う上でユーザをそれぞれ単一のカテゴリに属させるため,コンテンツのアドホック・カテゴリを可視化するためにこの手法を用いる場合,ユーザが複数のカテゴリへの趣味嗜好を持ちうるという点を無
連絡先:保住純,東京大学工学系研究科,[email protected]
tokyo.ac.jp∗1 消費者の置かれている状況や,その背景のこと.
図 1: 本研究の提案手法の模式図
視することになってしまう. 以上の課題を踏まえて,本研究では以上の問題を解決したカテゴリ構造発見によるセグメンテーションを達成するために,Webサービスなどのユーザの行動が記録されたログデータを用いて,ユーザの興味対象がどう推移するかを表すカテゴリをボトムアップに可視化する手法を提案する.あるコンテンツに対し興味を示している証拠となる行動を興味行動と定義し,ログデータからユーザの興味行動の時系列を抽出した後,図 1
に表されるユーザのソフトクラスタリング,そして各クラスタ内のユーザの興味推移状況をレベルで表すことで,クラスタごとに興味対象がどう推移するかを可視化する. 本手法の新規性と有用性は,以下の通りである.
• 本手法はユーザが同時に複数のジャンルに興味を持つという前提を考慮したソフトクラスタリングを用いた設計となっているため,従来手法に比べて,市場の状況をより正確に反映した可視化が実現できる.
• 本手法によって得られる可視化結果は,コンテンツ提供側から把握することが難しい消費者の実際の興味動向に基づくボトムアップなカテゴリを可視化したものであるため,実際のマーケティング活動においても有益な示唆をもたらすものである.
1
The 31st Annual Conference of the Japanese Society for Artificial Intelligence, 2017
4I2-1
2. 関連研究ユーザのWeb上での行動や興味の対象を詳しく把握するた
めのアプローチの一つに,各ユーザに属性を付与する方法がある.たとえば,Sarwarらはユーザのクラスタリングを行うことで,オンラインショッピングにおける商品の推薦精度を高めた [6].ここで用いられるクラスタリングはハードクラスタリングと呼ばれ,一つの要素を一つのクラスタに属させる手法である.しかし,実際には各ユーザをその性質によって単一のグループのみに属させることは不自然であり,複数のグループに属させることが,より適切である場合も考えられる.そのため,Senらは,各ユーザをそれぞれ一つのクラスタに配属するのではなく,ユーザにその性質に合ったタグを付与する手法を提案した [7].ただし,タグ付けの基準によっては,どのタグも付与されないユーザが発生する可能性があり,そのユーザへの推薦がうまくできなくなる問題がある.これら従来手法の限界を克服するために,Binらは,ユーザとアイテムの双方を最低 1 つ以上のグループに属させるクラスタリング手法であるMulticlass Co-Clustering手法を提案した [2]. もう一つのアプローチとして,ユーザの成熟度という概念を取り入れる手法がある.時間の経過やそのWebサービスの利用によってユーザの成熟度が進展するとみなし,それを連続的に捉え続けるための研究が存在する.たとえば,Lauschkeらは,Twitterユーザの利用期間によるつぶやき内容の変化をを追跡している [4].そして,Mcauleyらは,消費者が高評価をつけるアルコール類が時間経過で変化することを示した上で,各ユーザにレベルという属性を付与し,それを用いることによって各ユーザのアルコール類へのレビュー評価の予測精度を高め,ユーザのレベルごとに嗜好する可能性の高いアルコール類を可視化する手法を提案した [5].さらに,Yang らは,この手法を病気の進行状況など,より幅広い分野の時系列データに適用することができる手法へと改良した [8]. 本論文で提案するユーザ興味推移の可視化手法は,Yangらの手法 [8]をベースとし,それで行われるハードクラスタリングの代わりに,Binらの手法 [2]で用いられるユーザを複数のクラスタに所属させることを認めるソフトクラスタリングを採用している.ソフトクラスタリングを導入する際には,各ユーザが各クラスタへ所属するか否かの判定基準や,各クラスタごとの最適なレベル数を新たに設定する必要があるが,ユーザが複数のクラスタに該当する特徴を持ち,かつそれぞれの特徴ごとに成熟度が異なる場合も,その特徴を失わせることなくYangらの手法を適用できるようになると考えられる.
3. 提案手法3.1 用語の定義本手法では,各ユーザが興味を抱いているコンテンツ集合を
興味ジャンル,各ユーザの興味ジャンルごとの造詣の深さ(成熟度)を興味レベル,各ユーザがあるコンテンツに対し,それに興味を持っていたことで行われた行動を興味行動と定義する.興味行動の例としては,コンテンツの購入や,コンテンツに対する好意的なレビューの投稿などが挙げられる.
3.2 素性の作成はじめに,各ユーザごとに行動ログデータから興味行動を収
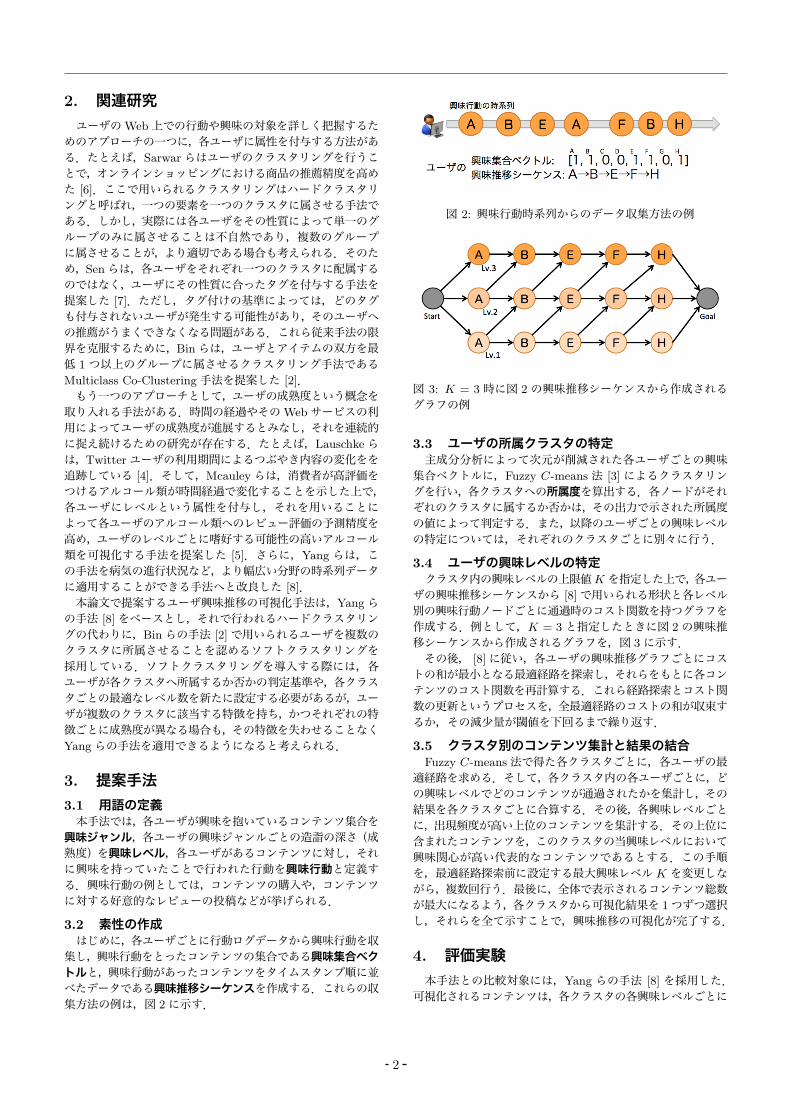
集し,興味行動をとったコンテンツの集合である興味集合ベクトルと,興味行動があったコンテンツをタイムスタンプ順に並べたデータである興味推移シーケンスを作成する.これらの収集方法の例は,図 2に示す.
図 2: 興味行動時系列からのデータ収集方法の例
図 3: K = 3 時に図 2 の興味推移シーケンスから作成されるグラフの例
3.3 ユーザの所属クラスタの特定主成分分析によって次元が削減された各ユーザごとの興味
集合ベクトルに,Fuzzy C-means法 [3]によるクラスタリングを行い,各クラスタへの所属度を算出する.各ノードがそれぞれのクラスタに属するか否かは,その出力で示された所属度の値によって判定する.また,以降のユーザごとの興味レベルの特定については,それぞれのクラスタごとに別々に行う.
3.4 ユーザの興味レベルの特定クラスタ内の興味レベルの上限値Kを指定した上で,各ユー
ザの興味推移シーケンスから [8]で用いられる形状と各レベル別の興味行動ノードごとに通過時のコスト関数を持つグラフを作成する.例として,K = 3と指定したときに図 2の興味推移シーケンスから作成されるグラフを,図 3に示す. その後, [8]に従い,各ユーザの興味推移グラフごとにコストの和が最小となる最適経路を探索し,それらをもとに各コンテンツのコスト関数を再計算する.これら経路探索とコスト関数の更新というプロセスを,全最適経路のコストの和が収束するか,その減少量が閾値を下回るまで繰り返す.
3.5 クラスタ別のコンテンツ集計と結果の結合Fuzzy C-means法で得た各クラスタごとに,各ユーザの最
適経路を求める.そして,各クラスタ内の各ユーザごとに,どの興味レベルでどのコンテンツが通過されたかを集計し,その結果を各クラスタごとに合算する.その後,各興味レベルごとに,出現頻度が高い上位のコンテンツを集計する.その上位に含まれたコンテンツを,このクラスタの当興味レベルにおいて興味関心が高い代表的なコンテンツであるとする.この手順を,最適経路探索前に設定する最大興味レベル K を変更しながら,複数回行う.最後に,全体で表示されるコンテンツ総数が最大になるよう,各クラスタから可視化結果を 1つずつ選択し,それらを全て示すことで,興味推移の可視化が完了する.
4. 評価実験本手法との比較対象には,Yang らの手法 [8] を採用した.
可視化されるコンテンツは,各クラスタの各興味レベルごとに
2

登場頻度が高かった上位 10件とする. 実験用データセットには,MovieLens(1M)データセット ∗2
及びWikipedia日本語版のコンテンツページ編集履歴データを採用した.MovieLens(1M)データセットは,ユーザが映画へ 4 点以上の評価を付けたことを,ユーザのその映画に対する興味行動であると判断した.実験には,ユーザとコンテンツそれぞれ約 20%に相当する,無作為に選出したユーザ 1200人についての,興味行動での登場頻度上位 800 位までの映画のみを対象とした.Wikipedia 日本語版のコンテンツページ編集履歴データは,2014年 12月 11日時点のWikipedia日本語版ダンプデータに含まれる編集履歴データとし,ユーザがコンテンツページを編集することを興味行動であると判断した.可視化対象のコンテンツは,オリコン株式会社の提供する 2013
年 12月におけるコミック月別売上ランキング上位 200件のうち,Wikipedia日本語版ダンプデータにコンテンツページが存在したマンガ 179 種類とした.そして,興味レベル判定を行うユーザは,上記対象コンテンツを 2 つ以上編集したことのあるユーザ計 1871人とした.
4.1 量的評価実験本研究の目的であるコンテンツ興味推移カテゴリの可視化
を量的に評価する場合,各コンテンツのアドホック・カテゴリや興味レベルを表す正解データの入手が困難であることから,[8]で行われたような精度の評価を行うことはできない。そのため,量的な可視化の良さの判定には,以下に説明する実用性指標 U を新たに導入し,それを用いる.
全体コンテンツカバー数 C: その可視化におけるコンテンツの登場総数.この値が大きいほど,可視化におけるもれが少なく,より広く市場の消費者の興味推移が可視化できていることを示す.
クラスタ内コンテンツ重複数 D: 可視化において特定のコンテンツが同一クラスタの複数の興味レベルに登場した回数.この値が大きいほど,可視化結果に重複(だぶり)が多く発生しているため,興味推移における興味レベルの割り当てが正しくなされていないことを示す.
実用性指標 U : U = C −Dとし,U をその可視化の良さを表す点数とする.
ただし,これらの指標も量的な評価に過ぎず,市場の消費者の心理の実態に即して可視化できているかという質的な評価をするものではないので,可視化の質を検証するために,コンテンツ企業関係者へのアンケート調査も実施している. 本実験における提案手法では,ソフトクラスタリングの質を高め,かつ計算量を削減するために,すべてのユーザの興味集合ベクトルに対し,各素性を TFIDF値に変換した後,主成分分析を行い 20 次元に削減した.クラスタへの所属の判定は,クラスタ総数が nのときに,各ユーザはそれぞれ所属度が 1/n
以上であるクラスタに所属するものとした.興味レベル判定については,各ユーザがコストを最小とするグラフ上の経路が変化しなくなったときか,ステップを 50回繰り返したときに処理を終了した.また提案手法は,クラスタ数 C = 2~8と最大興味レベル上限数 K = 2~8における組み合わせ計 49通り,比較対象とする Yang らの手法は C = 1~8 と K = 2~8 における組み合わせ計 56通りを試行した. 実験結果を,映画については表 1に,マンガについては表 2
に記す.実験の結果,提案手法によって Yangらの手法より高い U が得られる可視化が実現されていることが確認できる.
∗2 http://grouplens.org/datasets/movielens/
表 1: 各手法による映画興味推移可視化の量的実験結果
手法 クラスタ数 興味レベル数 D C U
Yang[8] 7 すべて 5 52 228 176
提案手法 8 6,6,8,8,8,8,8,8 53 254 201
表 2: 各手法によるマンガ興味推移可視化の量的実験結果手法 クラスタ数 興味レベル数 D C U
Yang[8] 6 すべて 3 25 92 67
提案手法 6 2, 2, 2, 3, 4, 8 19 89 70
4.2 質的評価実験次に,提案手法による可視化結果が既存手法に比べて質の高
いものになっているかどうかを,実際にコンテンツ企業関係者にアンケートを実施することで,主観評価実験にて用いられる順位法によって検証した.本検証実験では,マンガの可視化結果のみを検証した. 可視化を提示する上で,提案手法と Yangら [8]からは,ともに U が最も高い可視化結果であるクラスタ数 6の可視化結果を採用し,それぞれ「マップ C」,「マップ B」とした.さらにダミーとして,各ユーザを無作為に 6つのクラスタに割り振り,その中からさらに無作為にコンテンツを選出して可視化結果としたものも「マップ A」として選択肢に加えた.そして,それら可視化結果を,それぞれどの手法によるものかを隠した上で回答者に提示した.解答項目として,マップ A, B, Cの三種類すべてに順位付けをすることで評価を行う欄を設けた.実際に提示したマップの例として,マップ Cを図 4に示す. アンケートは経済産業省,pixiv株式会社,および株式会社ヒューマンメディアでの勤務者合計 12名より回答を得た.最も 1 位評価が多かったマップは提案手法によって作成されたマップ Cであり,6名に評価された.Yangの手法によるマップ Bは 4名,ダミー用に作成したマップ Aは 2名であった.
5. 考察第 4 章の結果より,行動ログデータからユーザの興味の推
移動向やその段階ごとに好むコンテンツを可視化することができ,さらに,アンケート評価によって他者の目からその質が担保されていることを確認できた.また,アンケートのコメント記述欄において,Dの大きい可視化マップへ改善の余地を求めるコメントや,C の大きい可視化マップをより高評価するコメントが見られた.これらのコメントから,本研究において可視化の量的評価基準とした U = D−C は,人々の可視化マップへの評価を反映する指標にとして有効であったと考えられる. 本研究で述べた提案手法の限界として,興味の推移を正確に反映した興味推移シーケンスを作成しづらいという問題がある.たとえば,コンテンツの登場がログデータ収集を行う期間の後半で登場した場合には,このユーザの興味レベルが高まったことでこのコンテンツに興味をもったからなのか,そもそもコンテンツが市場に登場したのが後半であったからなのか,その判別ができなくなる.後発のコンテンツについても適切な位置で可視化する手法は,今後さらに詳しい研究が必要であると言える.
3

図 4: 提案手法による可視化結果の例 (マップ C)
6. 結論本研究では,Webサービスなどのユーザの行動が記録され
たログデータを用いて,ユーザの興味対象がどう推移するかを表すカテゴリを可視化する手法を提案した.あるコンテンツに対し興味を示している証拠となる行動を興味行動と定義し,ログデータからユーザの興味行動の時系列を抽出,ユーザをソフトクラスタリング,そして各クラスタ内のユーザの興味推移状況をレベルで表すことで,クラスタごとに興味対象がどう推移するかを可視化した.検証実験の結果,本手法によって消費者の興味推移動向が従来手法よりも詳細に可視化できることを示した.また,コンテンツ企業関係者へのアンケート評価によっても,本手法が質的に有効なものであることを確認した.
謝辞本研究は JSPS 科研費 JP25700032, JP15H05327,
JP16H06562 の助成を受けたものです.また,アンケートにご協力いただきました経済産業省,株式会社ヒューマンメディア,チームラボ株式会社の皆さまに,この場を借りてお礼申し上げます.
参考文献[1] Antin, Judd, Coye Cheshire, and Oded Nov.
”Technology-mediated contributions: editing behav-
iors among new wikipedians.” In Proceedings of the
ACM 2012 Conference on Computer Supported Coop-
erative Work. ACM, 2012.
[2] Xu, Bin, et al. ”An exploration of improving collabo-
rative recommender systems via user-item subgroups.”
In Proceedings of the 21st International Conference on
World Wide Web. ACM, 2012.
[3] Dunn, Joseph C. ”A fuzzy relative of the ISODATA
process and its use in detecting compact well-separated
clusters.” Journal of Cybernetics. Vol.3 (1973): 32-57.
[4] Lauschke, Claudia, and Eirini Ntoutsi. ”Monitoring
user evolution in twitter.” In Proceedings of the 2012
International Conference on Advances in Social Net-
works Analysis and Mining. IEEE Computer Society,
2012.
[5] McAuley, Julian John, and Jure Leskovec. ”From am-
ateurs to connoisseurs: modeling the evolution of user
expertise through online reviews.” In Proceedings of
the 22nd International Conference on World Wide
Web. ACM, 2013.
[6] Sarwar, Badrul M., et al. ”Recommender systems for
large-scale e-commerce: Scalable neighborhood forma-
tion using clustering.” In Proceedings of the 5th In-
ternational Conference on Computer and Information
Technology. 2002.
[7] Sen, Shilad, Jesse Vig, and John Riedl. ”Tagom-
menders: connecting users to items through tags.” In
Proceedings of the 18th International Conference on
World Wide Web. ACM, 2009.
[8] Yang, Jaewon, et al. ”Finding progression stages in
time-evolving event sequences.” In Proceedings of the
23rd International Conference on World Wide Web.
ACM, 2014.
[9] 新倉 貴士. ”消費者の認知世界̶ブランドマーケティング・パースペクティブ.” 千倉書房, 2005.
4
Related Documents


![N µ W % ¡ ; N @ | ü · 2019-04-11 · q ª | ë @ j ; ] H % ù z 9 ] ì  ò q q s H K t s ÷ þ Ô 6 V µ j % ´ C n  p 3 j ; ] H % ù z þ Ô s m  3 @ j Ê Ä ] ² ÷ þ](https://static.cupdf.com/doc/110x72/5f0b038d7e708231d42e6d54/n-w-n-2019-04-11-q-j-h-z-9-q-q.jpg)


![c z 8 J O E P X T w å · ï µ Ý Â æ l o < ^ M { ï » É ¿ Ä t ` o å · ï ... U ] _ M b w p z f w q ] º M h ` b {å · ï µ Ý Â q x å · ï µ Ý Â q x z S M w 8 J O](https://static.cupdf.com/doc/110x72/5aca30d27f8b9a40728e1000/c-z-8-j-o-e-p-x-t-w-l-o-m-t-o-u-m-b-w-p-z-f-w-q-m-h-b-q-x-q.jpg)
![J ¿ , ` á q £ µ W ± N¦...y  [ n 8 s ÷ @ [ æ | ¥ c q q o 6 J L i  z 2 W 6 " ± O ù , 6 ÿ q ³ k A Ì Â L q % k < ] H % ù y d s ø ï  L c 3 ± H T ÷ , ] q þ Â](https://static.cupdf.com/doc/110x72/5ecc1b837fac6307ca567f46/j-q-w-n-y-n-8-s-c-q-q-o-6-j-l-i.jpg)