Journal of Engineering Volume 19 November 2013 Number 11 1382 An Investigation to the Abrasive Wear in Pipes Used for Oil Industry Asst.Prof. Dr.Ahmed Abdul-Hussein Ali Eng. Mohanad kassim Abdul-Razzaq Zalzala University of Baghdad University of Baghdad College of Engineering College of Engineering Mechanical Engineering Department Mechanical Engineering Department [email protected] (M.Sc) [email protected] ABSTRACT The work reported in this study focusing on the abrasive wear behavior for three types of pipes used in oil industries (Carbone steel, Alloy steel and Stainless steel) using a wear apparatus for dry and wet tests, manufactured according to ASTM G65. Silica sand with hardness (1000-1100) HV was used as abrasive material. The abrasive wear of these pipes has been measured experimentally by measuring the wear rate for each case under different sliding speeds, applied loads, and sand conditions (dry or wet). All tests have been conducted using sand of particle size (200-425) μm, ambient temperature of 34.5 °C and humidity 22% (Lab conditions). The results show that the material loss due to abrasive wear increased monotonically with the applied load at constant sliding speed and constant grit size due to increasing depth of penetration in both dry and wet sand which agrees with Archard´s equation. Sliding speed show insignificant effect on the wear loss of metals at constant load and constant grit size in both dry and wet sand. Wet sand results show higher wear losses than dry sand (20-70) % due to micro abrasion – corrosion wear and high slurry concentration. Keywords: Abrasive wear ,Wear loss; Dry abrasion; Wet abrasion; Stainless steel; Carbon steel; Alloy steel;ASTMG65; Wear modeling; Finite element method. ﺩﺭﺍﺳﺔ ﺍﻟﺘﺄﻛﻞ ﺑﺄﻟﺤﻚ ﻋﻠﻰ ﺃﻻﻧﺎﺑﻴﺐ ﺃﻟﻤﺴﺘﺨﺪﻣﻪ ﻓﻲ ﺍﻟﻤﻨﺸﺎﺕ ﺍﻟﻨﻔﻄﻴﻪ اﻟﺨﻼﺼﺔ ﻳﺮﻛﺰ ﺍﻟﻌﻤﻞ ﺍﻟﺬﻱ ﺗﻢ ﺍﻧﺠﺎﺯﻩ ﻓﻲ ﻫﺬﻩ ﺍﻟﺪﺭﺍﺳﻪ ﻋﻠﻰ ﺳﻠﻮﻙ ﺍﻟﺘﺎﻛﻞ ﺍﻭ ﺍﻟﺒﻠﻴﺎﻥ ﺑﺎﻟﺤﻚ ﻟﺜﻼﺛﺔ ﺍﻧﻮﺍﻉ ﻣﻦ ﺍﻻﻧﺎﺑﻴﺐ ﺍﻟﻤﺴﺘﺨﺪﻣﻪ ﻓﻲ ﺍﻟﺼﻨﺎﻋﺎﺕ ﺍﻟﻨﻔﻄﻴﻪ ﺍﻟﻤﺼﻨﻌﻪ ﻣﻦ ﺍﻟﻔﻮﻻﺫ ﺍﻟﻜﺎﺭﺑﻮﻧﻲ ﻭﺍﻟﻔﻮﻻﺫ ﺍﻟﺴﺒﺎﺋﻜﻲ ﻭﺍﻟﻔﻮﻻﺫ ﺍﻟﻤﻘﺎﻭﻡ ﻟ ﻠﺼﺪﺃ ﺑﺎﺳﺘﺨﺪﺍﻡ ﺟﻬﺎﺯ ﻣﻘﻴﺎﺱ ﺍﻟﺘﺎﻛﻞ ﺍﻟﺬﻱ ﺗﻢ ﺗﺼﻨﻴﻌﻪ ﺑﺎﻻﺳﻮﺍﻕ ﺍﻟﻤﺤﻠﻴﻪ ﻁﺒﻘﺎ ﻟﻠﻤﻮﺍﺻﻔﻪ ﺍﻟﻘﻴﺎﺳﻴﻪASTM G65 ﺍﻟﺘﻲ ﺗﺴﺘﺨﺪﻡ ﻟﻘﻴﺎﺱ ﻣﻘﺪﺍ ﺭ ﺗﺎﻛﻞ ﺍﻟﻤﻌﺎﺩﻥ ﻓﻲ ﺍﻟﻈﺮﻭﻑ ﺍﻟﺠﺎﻓﻪ ﻭﺍﻟﺮﻁﺒﻪ . ﺍﻥ ﺍﻟﺮﻣﻞ ﺍﻟﺬﻱ ﺗﻢ ﺍﺳﺘﺨﺪﺍﻣﻪ ﻛﻌﺎﻣﻞ ﻭﺑﺼﻼﺩﻩ ﺣﻮﺍﻟﻲ( ﺳﻴﻠﻴﻜﺎ) ﻣﺴﺒﺐ ﻟﻠﺘﺎﻛﻞ ﻫﻮ ﺭﻣﻞ ﺯﺟﺎﺟﻲ) 1000 - 1100 ( ﻛﻎ) \ ﻣﻢ2 .ﺑﺘﻐـﻴﻴـﺮ ﻛﻞ ﻣﻦ ﺍﻟﺤﻤﻞ ﻭﺍﻟﺴﺮﻋﻪ ﻭﻭﺳﻂ ﺍﻟﺘﺎﻛﻞ ﻣﻦ ﺟﺎﻑ ﺍﻟﻰ ﺭﻁﺐ ﻳﻤﻜﻦ ﻗﻴﺎﺱ ﺍﻟﺘﺎﻛﻞ ﺑﺎﻟﺤﻚ ﻟﻬﺬﻩ ﺍﻻﻧﺎﺑﻴﺐ ﻋﻦ( ﻁﺮﻳﻖ ﻣﻌﺮﻓﺔ ﻣﻘﺪﺍﺭ ﺍﻟﺨﺴﺎﺭﻩ ﺑﺎﻟﺤﺠﻢ ﻟﻜﻞ ﻣﻦ ﻫﺬﻩ ﺍﻻﻧﺎﺑﻴﺐ ﻋﻤﻠﻴﺎ.ﺍﻥ ﺟﻤﻴﻊ ﺍﻻﺧﺘﺒﺎﺭﺍﺕ ﺗﻤﺖ ﺗﺤﺖ ﺣ ﺠﻢ ﺣﺒﻴﺒﺎﺕ) 200 - 425 ( ﻣﺎﻳﻜﺮﻭ ﻣﺘﺮ ﻭﺧﺸﻮﻧﺔ ﺳﻄﺢ ﺛﺎﺑﺘﻪ ﻭﺩﺭﺟﺔ ﺣﺮﺍﺭﻩ ﺣﻮﺍﻟﻲ34.5 ﺩﺭﺟﻪ ﻣﺌﻮﻳﻪ ﻭﻧﺴﺒﺔ ﺭﻁﻮﺑﻪ ﺣﻮﺍﻟﻲ22 % .ﺍﻥ( ﻅﺮﻭﻑ ﺍﻟﻤﺨﺘﺒﺮ)

Welcome message from author
This document is posted to help you gain knowledge. Please leave a comment to let me know what you think about it! Share it to your friends and learn new things together.
Transcript
Journal of Engineering Volume 19 November 2013 Number 11
1382
An Investigation to the Abrasive Wear in Pipes Used for Oil Industry
Asst.Prof. Dr.Ahmed Abdul-Hussein Ali Eng. Mohanad kassim Abdul-Razzaq Zalzala
University of Baghdad University of Baghdad College of Engineering College of Engineering
Mechanical Engineering Department Mechanical Engineering Department [email protected] (M.Sc) [email protected]
ABSTRACT
The work reported in this study focusing on the abrasive wear behavior for three types of pipes used in oil industries (Carbone steel, Alloy steel and Stainless steel) using a wear apparatus for dry and wet tests, manufactured according to ASTM G65. Silica sand with hardness (1000-1100) HV was used as abrasive material. The abrasive wear of these pipes has been measured experimentally by measuring the wear rate for each case under different sliding speeds, applied loads, and sand conditions (dry or wet). All tests have been conducted using sand of particle size (200-425) µm, ambient temperature of 34.5 °C and humidity 22% (Lab conditions).
The results show that the material loss due to abrasive wear increased monotonically with the applied load at constant sliding speed and constant grit size due to increasing depth of penetration in both dry and wet sand which agrees with Archard´s equation. Sliding speed show insignificant effect on the wear loss of metals at constant load and constant grit size in both dry and wet sand. Wet sand results show higher wear losses than dry sand (20-70) % due to micro abrasion – corrosion wear and high slurry concentration.
Keywords: Abrasive wear ,Wear loss; Dry abrasion; Wet abrasion; Stainless steel; Carbon steel; Alloy steel;ASTMG65; Wear modeling; Finite element method.
دراسة التأكل بألحك على أالنابيب ألمستخدمه في المنشات النفطيه
الخالصةسلوك التاكل او البليان بالحك لثالثة انواع من االنابيب المستخدمه في على الدراسهالعمل الذي تم انجازه في هذه يركز
مقياس التاكل الذي جهازباستخدام لصدأل المقاوموالفوالذ والفوالذ السبائكي الفوالذ الكاربوني المصنعه منالصناعات النفطيه ر تاكل المعادن في الظروف التي تستخدم لقياس مقدا ASTM G65تم تصنيعه باالسواق المحليه طبقا للمواصفه القياسيه
)1100-1000(مسبب للتاكل هو رمل زجاجي (سيليكا ) وبصالده حوالي ان الرمل الذي تم استخدامه كعاملالجافه والرطبه .مم\( كغ
2).بتغـييـر كل من الحمل والسرعه ووسط التاكل من جاف الى رطب يمكن قياس التاكل بالحك لهذه االنابيب عن
) 425-200(جم حبيبات طريق معرفة مقدار الخساره بالحجم لكل من هذه االنابيب عمليا.ان جميع االختبارات تمت تحت ح ( ظروف المختبر).ان %22درجه مئويه ونسبة رطوبه حوالي 34.5مايكرو متر وخشونة سطح ثابته ودرجة حراره حوالي
Ahmed Abdul-Hussein Ali An Investigation to the Abrasive Wear in Pipes Mohanad kassim Abdul-Razzaq Zalzala Used for Oil Industry
1383
النتائج اظهرت ان مقدار الخسارة بالحجم لهذه المعادن التي تم استخدامها تزداد طرديا مع زيادة الحمل المسلط عند سرعه ثابته وحجم حبيبات ثابت نتيجة زيادة عمق التأكل او التغلغل في حالتي الرمل الجاف والرطب وهذا يتفق مع
Archard´s equation)(ها لم تظهر تاثيـر مقنع على مقادر الخساره بالحجم لهذه المعادن في ، اما فيما يخص السرعه فاننتيجة للتداخل %)70-20(نتائج الرمل الرطب تظهرخسائربالحجم أعلى من نتائج الرمل الجافحالتي الـرمل الجاف والرطب.
بة الـرمل العاليه في وكذلك نتيجة لنس (micro abrasion – corrosion wear) في اكثر من نوع واحد من التاكل .(slurry concentration)الماء
هالعناصر المحددطريقة ; G65المواصفه ;السبائكي;الكاربوني ;فوالذ عديم الصدأ ;الكلمات الرئيسيه: التاكل بالحك (جاف ورطب)
1. INTRODUCTION
The dry sand/rubber-wheel abrasion test is widely used to evaluate low-stress abrasive wear of materials, particularly for evaluating wear-resistant materials used in the mining, oil sand, oil pipe lines and agricultural machinery industries. During such a test, a specimen is loaded against the rim of a rotating rubber wheel, a sand flow is directed to the gap between the wheel and specimen, abrading the specimen under an applied normal load at a certain sliding speed. Abrasion resistance of a material is evaluated by measuring its volume loss [C. Hilerio, 2004].
Abrasive wear defines by ASTM (American Society for Testing and Materials) as the loss of material due to hard particles or hard protuberances that are forced against and move along a solid surface, [D. Hewitt, 2009]. 50% of all wear problems in industry are due to abrasion, and as such, much laboratory work has examined and sought to rationalize the abrasive wear behavior of a wide range of materials [S. Wirojanupatump, 2000]. Based on the analysis of parameters responsible for the wear of mechanical parts, about 50% (of the parts) works in abrasive wear, 15% - adhesive wear, 8% - erosion, 8% - fretting, 5% - wear is due to corrosion and about 14% is just a combination of abrasive, erosive and corrosive wear[M. Adamiak, 2009].
Abrasive wear in pipes results when solids make up a large percentage of the fluid being transported [D. Hewitt, 2009].
The sand particles interact with each other, the fluid media and the pipe wall. This
can be described by measuring the lost mass of the pipe [D. Hewitt, 2009].
For many industrial applications, the rubber-wheel test is performed often under a fixed load and at a fixed sliding speed to have all tested materials evaluated under the same condition. ASTM G65 has specified such
abrasion test with fixed loads and fixed sliding speeds for ranking materials in different classes. However, ranking materials using this method may not be always accurate and misleading information might be generated [X. Ma, 2000].
Wear resistances of a Be–Cu alloy, 17-4 PH steel and D2 tool steel using a rubber-wheel tester have been studied. Different loads and sliding speeds were chosen for the abrasion test and SiO2 sand was used as the abrasive [X. Ma, 2000].
In this work the abrasive wear behavior of three types of pipes used in oil industries (Carbone steel, Alloy steel and Stainless steel) has been studied using a wear apparatus according to ASTM G65 for dry and wet tests.
Different sliding speeds (1.7954-3.5908) m/s, different applied loads (50-150) N and different test condition (dry and wet) had been set for this work and the abrasive wear behavior were compared with other behaviors obtained by [C. Hilerio, 2004] , [D. Hewitt, 2009],[M.Adamiak, 2009], [S. Wirojanupatump, 2000] and [X. Ma, 2000],etc.
Journal of Engineering Volume 19 November 2013 Number 11
1384
2. EXPERIMENTAL DETAILS The dry and wet sand/rubber wheel
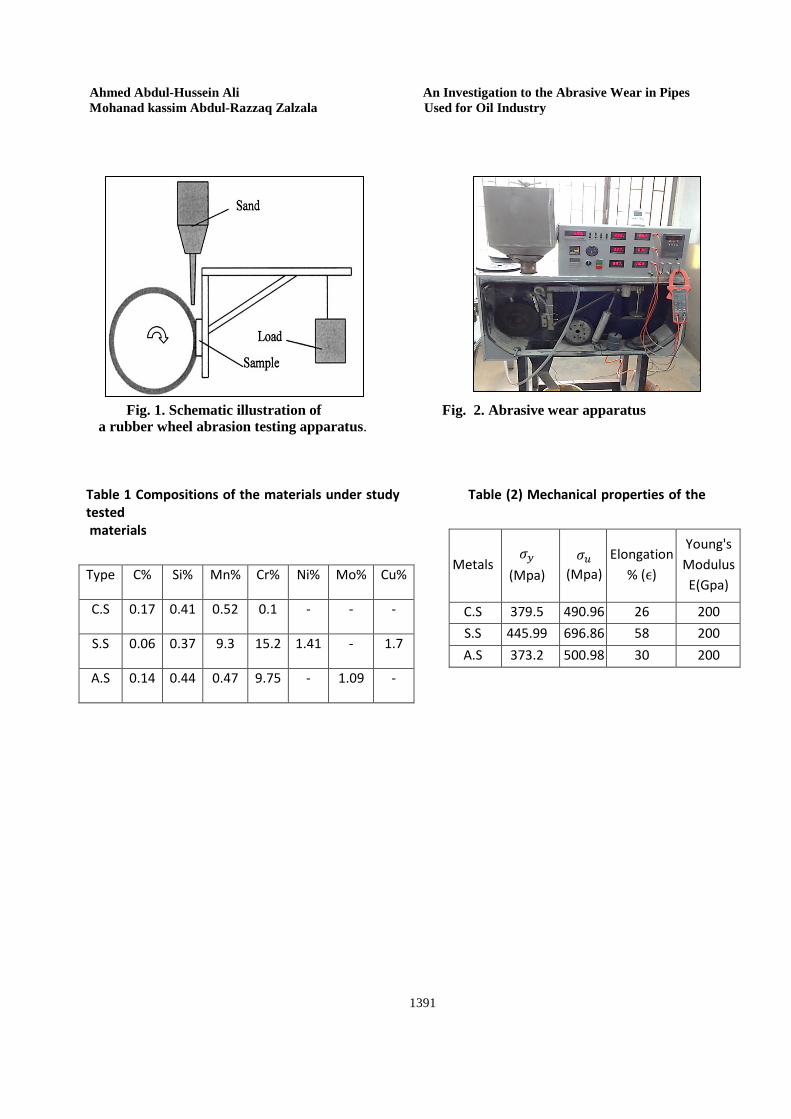
apparatus used in this work is schematically illustrated in Fig. 1. It was built based on ASTM G65 standard [ASTM G65, 2001]. The rubber wheel is in contact with a specimen under an applied load. A flow of sand particles is directed to the gap between a rotating rubber wheel and the specimen. The sand particles scratch the surface of the specimen under the applied load at a sliding speed of Rω, where ω is the angular speed of the rubber wheel and R is its radius.
The rubber wheel was made of chlorabutyl and its hardness was Durometer A-62. In the study, standard silica sand (Sio2) with hardness (1000 -1100) HV, (200-425)µm of rounded silica sand abrasive were obtained by sieving, as recommended by ASTM G65 for the dry and wet sand/rubber wheel abrasion test. Specimens for the wear test had a rectangular shape with dimension of 75mm long, 26 mm wide and 6 mm thickness. Specimens of different material, namely, Carbon steel A106 grade C, Alloy steel A213 grade T9, Stainless steel A312 grade S20400 with hardness of 153 Hv, 174 Hv, and 253 Hv respectively.
Chemical composition of the tested materials can be shown in table (1).
Mechanical properties of these materials were determined by tensile test according to ASTM E8M using a tensile machine (Instron8516). The mechanical properties of the tested materials can be shown in table (2).
Specimens for the wear test were polished
using emery paper of different grit size to obtain surface roughness of Ra less than (0.8) µm (between 0.146-0.236) µm according to ASTM G65. Since the sand flow rate affects the wear rate, a constant sand flow of 320 g/min was used for both dry and wet tests.
Feed water added to enable the apparatus to measure the wear losses in wet conditions according to modified ASTM G65 apparatus.
Wet test used a mixture of 1.5kg of abrasive and 0.940 Kg of water according to modified ASTM G65 for wet test. Wear loss of
a steel specimens was evaluated by measuring the volume losses of the specimens. Volume losses were measured by specimen mass loss using an electronic balance (KERN) with an accuracy of 0.001 g. The volume losses is the mass loss divided by the density of each type of steel.
Specimens were well cleaned before a new tests are carried out.
In industry, a constant force of 130 N is usually used for the abrasion test. Such a load is recommended by ASTM G65 for testing most metallic materials in a wide range of abrasion resistance. In the present study, range of loads from (50 to 150) N were used while the sliding speed was also changed from 1.7954 to 3.5908 m/s. We did not exactly follow the ASTM G 65 standard and, instead, used various loads and speeds to investigate effects of the load and sliding speed on the wear loss. The difference in wear between different materials could vary markedly when the applied load or the sliding speed is changed. Some materials have excellent wear resistance under low loads or speeds but may perform poorly under higher loads or speeds, while the other materials may show opposite behavior. Therefore, using one fixed load and sliding speed to rank industrial materials may not be sufficient to obtain accurate information. The test duration was (5) min according to ASTM G65 procedure E for low and medium abrasion materials resistance with a linear sliding distance between (538.62 -1077.24) m according to the rotational speed (150-300) r.p.m. The specific wear coefficient of the dry and wet tests was determined by the standard Archard´s equation, [T.A. Rodil, 2006], [R.L. Norton, 2011]. KS = Vloss
L.W eq. (1)
Where KS is the specific wear coefficient in units of mm3/N.m, Vloss is the volume removed
Ahmed Abdul-Hussein Ali An Investigation to the Abrasive Wear in Pipes Mohanad kassim Abdul-Razzaq Zalzala Used for Oil Industry
1385
from materials in mm3 , L is per unit sliding distance (m) and W is the applied load (N). All dry tests were done under apparent temperature range between (34-75) °C using the infrared scan temperature model (410), the scan temperature apparatus was calibrated and reported with an error of 8% between the actual and apparent temperature. To determine the actual temperature the following equation could be used. Tact.= Tr × (1 + 0.08
0.92 ) eq. (2)
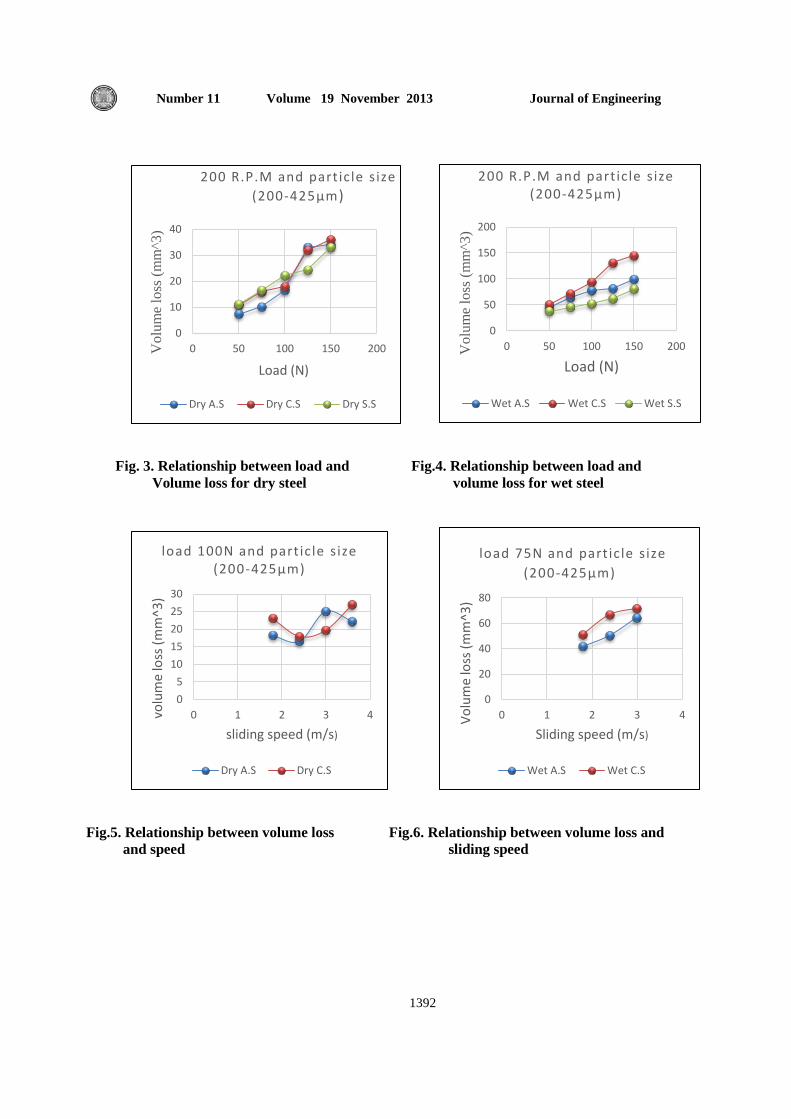
Finally it should be mentioned that for dry tests, an apparatus according to ASTM G65 was used, and for wet tests the same apparatus was used with a feed water added according to modified ASTM G65 as shown in Fig. 2. 3. EXPERIMENTAL RESULTS 3.1. Wear Loss with Respect to the Applied Load Volume losses of the Carbon steel (A106), Alloy steel (A213) and Stainless steel (A312) were measured with respect to the applied load and results of the measurement are illustrated in Fig. 3 for dry tests and Fig.4 for wet tests.
The data was an averaged result of a two measurements with its error range less than 5%.
It was demonstrated that from all experimental and numerical results obtained the wear losses of Carbon steel (A106), Alloy steel (A213) and Stainless steel (A312) increased monotonically with applied load due to increasing depth of penetration in both dry and wet tests which agrees with Archard´s equation.
3.2. Effect of Sliding Speed The sliding speed is another parameter that influences the wear loss of a material. In order to determine the effect of sliding speed on wear loss, four sliding speeds were used for the abrasion test in dry condition and three sliding speeds were used for abrasion test in wet condition. Volume losses of C.S, A.S and S.S specimens at different sliding speeds under different loads were measured.
However, carbon steel and alloy steel showed different response to the sliding speeds. 3.2.1 Effect of sliding speed on the wear rate of carbon steel and alloy steel in dry test.
The volume losses of these metals in dry tests are illustrated in Fig.5.
It seem that the interaction between the wear mechanisms during the dry tests is a reason for this behavior, for carbon steel and alloy steel at sliding speeds less than 2.3938m/s, wear loss decreased rapidly in oxidational wear condition due to the protective layers of oxidized debris. Sliding speeds higher than 2.3938m/s abrasive wear was predominant resulting in the highest wear loss [K. Elalem, 2001] and [N. N .Aung, 2008].
3.2.2 Effect of sliding speed on the wear rate of carbon steel and alloy steel in wet test. The result of abrasive wear behavior of these metals in wet sand are illustrated in Fig. 6.
It was demonstrated that the increasing of sliding speeds increase the volume losses of these metals which agrees with Archard´s equation.
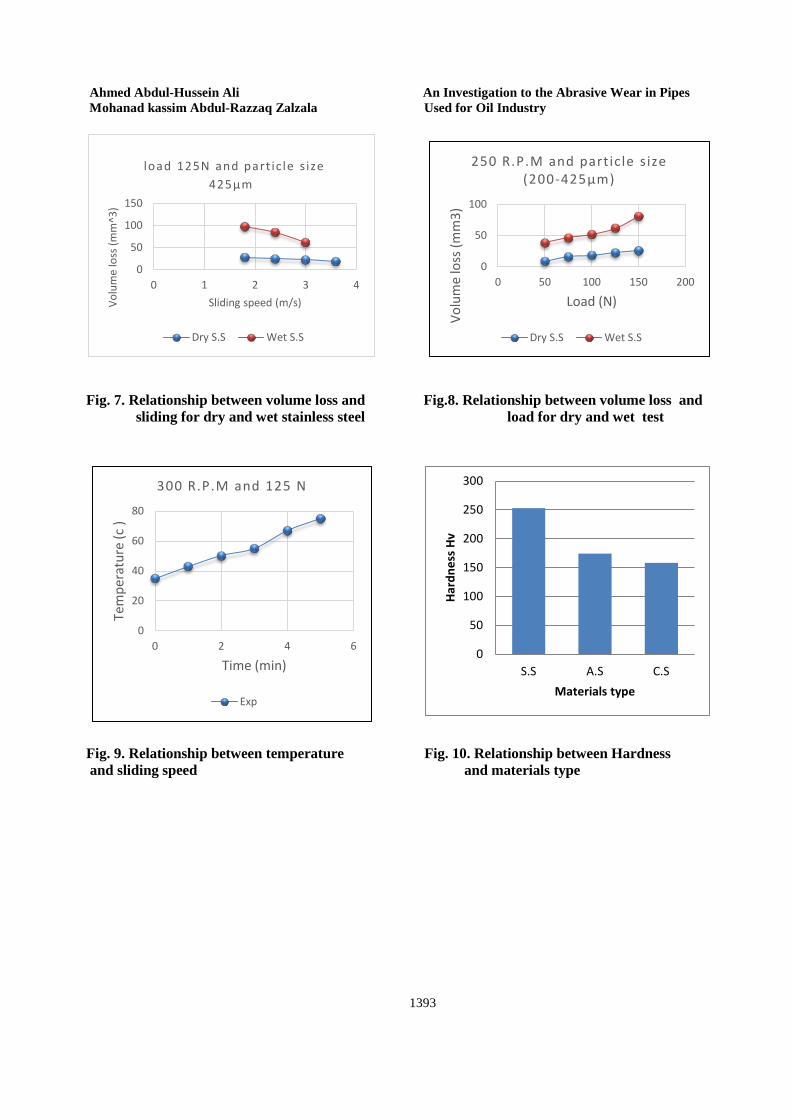
3.2.3 Effect of sliding speed on the wear rate of stainless steel in dry and wet tests.
The result of abrasive wear behavior illustrated in Fig. 7. It was demonstrated that the increase in sliding speeds cause a decrease in the volume loss of stainless steel in both dry and wet conditions, this is can explained by referring to the following: 1. The heat generated due to friction within test duration (300s) is negligible. Therefore it seems the effect of work hardening in dry conditions is predominant factor here, because ASTM A312 grade S20400 has a very high work by increasing the sliding speeds, [A.K Steel, 2007]. 2. The SiO2 sand was not strong enough to significantly damage the surface of stainless steel under loads. Instead, it seems that the surface of SiO2 sand was damaged to a
Journal of Engineering Volume 19 November 2013 Number 11
1386
considerable degree, thus diminishing its role in abrading the tested material, [X. Ma, 2000]. 3.3. Wear Loss with Respect to Dry and Wet Tests It is obvious from all dry and wet results, the volume losses in wet sand conditions is higher than dry sand conditions (20-70)% for all metallic materials used in experiment tests as shown in Fig. 8. This can be attributed to: 1. Wear-corrosion interaction can lead to either increase in the overall mass loss or a decrease in the overall mass loss. The change in the mass loss due to the synergistic effects of coupling wear and corrosion is often referred to as synergy (S). Positive synergy results in accelerated material loss due to the combined action of wear and corrosion and is an undesirable material property,[J.O. Bello, 2007]. On the other hand, negative synergy results in a decrease in the overall loss of material due to improvement in either wear or corrosion resistance and is a desirable material property According to the ASTM G119 standard guide for determining synergism between wear and corrosion, the total wear during the process of abrasive wear-corrosion is defined by the following equations, [J.O. Bello, 2007] Total Wear (AC) = Pure Abrasion (PA) + Pure Corrosion (PC) + Synergy (S) Synergy (S) = ΔPCA + ΔPAC Wear may be accelerating by corrosion, increased removal of the protecting oxide layer from the surface during the friction of the corrosion process. Friction provides continuous removal of the oxide layer.
The transition from mild to severe wear is linked to the level of oxidation of the metal in contact.
During corrosion, the oxide layer decrease due to interaction between water and surface layer of metals and therefore the protective oxide layer removed by wear faster than it is regenerate.
The influence of water on the wear of metals, however, is much more significant than on friction. The greatest effects occur during
wear in the corrosive regime where chemical reactions with the environment lead to either increase the removal of the protecting oxide layer from the surface and then increase the mass losses, [j.k. Lancaster, 1990]. 2. It is obvious that the volume loss exhibited relatively greater dependence on slurry concentration than normal load which increase the severity of wear, in other word, the slurry concentration has more effect than the normal load which was agree with [S.G. Sapate, 2010].
It should be mention that the slurry concentration used in this study is (150%) which considered as a high concentration.
3.4. Temperature Measurement The induced temperature due to applying a certain load and sliding speed have been measured and plotted against time as shown in Fig. 9.
The temperature rises during the test depend on sliding speed more than normal load, in other word the temperature increase with sliding speed more than normal load. 3.5. Correlation between Volume Loss and Hardness of Materials
According to the experimental results of hardness for S.S (253Hv), A.S (174Hv) and C.S (153Hv).
It seem that from mass losses of the three types of metals (C.S A.S, S.S) that the mass losses of stainless steel in both dry and wet conditions have wear losses more than Alloy steel at 150 R.P.M and 200 R.P.M and less than carbon steel. After increasing the sliding speed to 250 R.P.M and 300 R.P.M the wear losses of stainless steel became less than Alloy steel and also less than carbon steel. The reason for that is that the hardness of the material should not always mean that higher hardness means lower wear losses, in fact in some cases higher hardness produce higher wear losses, [J.G.C. Nava, 2010].
Ahmed Abdul-Hussein Ali An Investigation to the Abrasive Wear in Pipes Mohanad kassim Abdul-Razzaq Zalzala Used for Oil Industry
1387
Fig. 10. show the relationship between the hardness and the materials type used in this work and does not represent the volume loss of these materials.
4. FINITE ELEMENT METHOD AND WEAR SIMULATION Predicting wear and scuffing risk in metallic contacts is an important task. Influential factors such as temperature, elastic–plastic deformations, wear, surface topography, material properties and chemical composition all contribute to the complex contact conditions.
Three-dimensional components. Thus, it is very important to identify when and how much material should be removed from the models. The basic approach is to: (1) identify the important parameters affecting the material removal rates, (2) determine appropriate wear rates from specimen-level tests, and (3) perform iterative finite element analyses to progressively remove materials during simulation. In this study, the wear loss that is obtained from the ASTM G65 apparatus is used to perform a series of finite element analyses and to estimate the profile of the worn surface [N.H. Kim, 2005].
For finite element modeling and analysis a commercial program, ANSYS V13, is used to solve the contact problem and wear strain.
The most frequently model used is based on the Archard’s abrasive wear law. It is assumed here that wear can be evaluated by applying modified Archard’s equation to local contact conditions along a differential width of the contact interface.
Solid95 is used to represent the steel specimen with 20 node and plane183 is used to represent the sand particles with 8 node.
The finite element mesh used was map and hexahedral.
Each line of steel specimen and sand was divided into eight equal lines before meshing using the command (esize).
In the present study, it has been observed that maximum number of a bout (6400) iteration is generally sufficient to predict
the solution divergence or failure for the abrasive wear problems.
This maximum number of iterations depends on the type of the problem, extent of nonlinearities, and on the specified tolerance.
Maximum number of elements used is (512) elements and max number of nodes (2673) for steel specimens and same number used for sand at esize equal to (8).
It should be mention that at esize (6) and esize (4) the error between the experimental and numerical results was greater than at esize (8),also using lesize cause divergence during the test and long time running , therefor all results were obtained at esize (8) which could be represent the optimum number for meshing.
4.1 Calculation of Contact Pressure A surface-to-surface contact modeling technique that prevents contact elements (CONTA174) and target elements (TARGE170) from penetrating each other is used. In this contact–target strategy the contact pressure is only calculated for nodes on the contact elements. In order to calculate the contact pressure on steel specimen surface, symmetric contact is used.
To find the contact point locations and pressure augmented lagrange approach was used in conjunction with standard behavior of contact, symmetric stiffness matrix and automatic time increment was used during all tests. Modified Newton Raphson iterations are required to find the converged configuration for each time step. 4.2 Calculation of Wear Strain Some researchers used the modified Archard’s model to determine the wear strain as follow [J.M. Thompson, 2006]: Vloss = KD. 𝑆C2.R eq. (3) Where: KD is the dimension abrasive wear coefficient C2= 1
Journal of Engineering Volume 19 November 2013 Number 11
1388
R is the number of repetition of load If (Vloss) represents the change in
volume of the specimen due to wear, then we can define wear strain as the change in volume divided by the original volume of the specimen and rewrite the wear equation as ,[ J.M. Thompson, 2006]:
𝑒𝑤= C1. 𝑆C2.R eq. (4) Where: 𝑒𝑤 is the wear strain C1 = (KD/V)
Wear strain as proposed here is different from wear as proposed by Archard. The Archard equation is a systems approach where the applied load is assumed to be distributed over the entire loading area. Wear would be expected to occur uniformly over the entire surface. The wear strain proposed here is a function of stress and load repetitions. This implies that where load is applied to the surface, wear will occur and that parts of the surface which are (currently) unloaded will not experience change due to wear. Explicit creep is used since the plan is to calculate the wear strain based upon the final configuration of the surface at the end of the load step. In ANSYS, the explicit creep calculation is performed as in [J.M. Thompson, 2006]. The strain hardening creep equation used is given by [J.M. Thompson, 2006]:
ecr = ddt
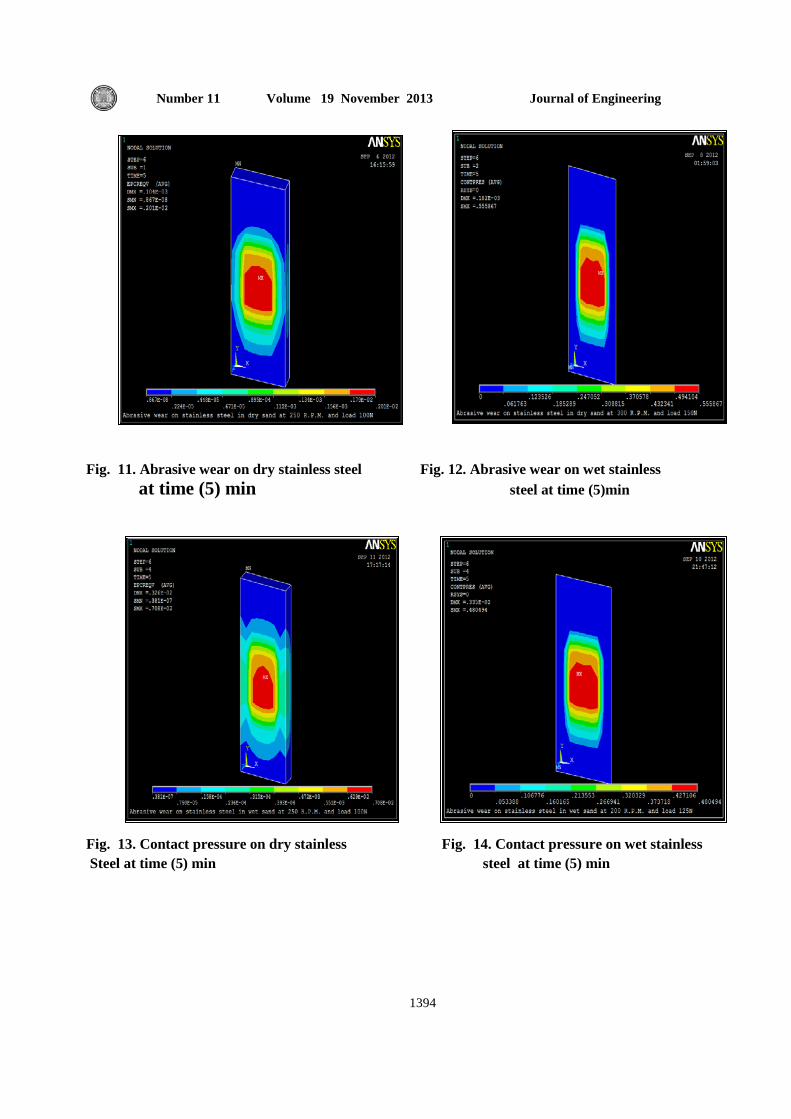
C1.SC2 . ecrC3 . e(−C4 T� ) eq. (5) 4.3 Finite Element Results The volume losses of all materials used in this study are determined through wear strain equation as shown in Fig. 11. and Fig. 12. These figures represent the maximum wear strain at the end of the tests (5) min, it is obvious that the maximum wear strain form a volume at the middle of the specimen which agrees with the experimental results.
From wear strain we calculated the volume loss by multiply the maximum wear strain by the original volume of each specimen at specific load and sliding speed. Wear strain was calculated using eq. (5) and set C3 and C4 to zero. The contact pressure of all materials used in this study are determined through surface to surface contact as shown in Fig. 13. and Fig.14 These figures represent the maximum contact pressure at the end of the tests (5) min, it is obvious that the maximum contact pressure form an area at the middle of the specimen which agrees with the experimental results. The contact pressure was calculated by using the contact wizard. The contact pressure was calculated experimentally be divided the applied load on the apparent contact area of the specimen and these results compared with the contact pressure obtained by ANSYS. 5. DISCUSSION
It was demonstrated that from all experimental and numerical results obtained the wear loss of stainless steel, alloy steel and carbon steel increased monotonically (linearly) with applied load due to increasing depth of penetration which agrees with Archard’s equation.
The Relationship between the load and volume loss may be linearly described in Equation of the following form using linear curve fitting:
Y(x) =𝑎1(x) +𝑎𝑜 eq. (6)
Sliding speed didn’t show significant effect on the volume loss of materials used in this study, many of these relationships may be described linearly, some of these relationship as shown in Fig. 5. Show that linear curve fitting is not appropriate for these relationships and nonlinear curve will be better.
Ahmed Abdul-Hussein Ali An Investigation to the Abrasive Wear in Pipes Mohanad kassim Abdul-Razzaq Zalzala Used for Oil Industry
1389
The present results did not show a defined relationship between materials hardness and volume loss of materials. The specific wear coefficient (KS) show marked dependency on both applied load, sliding speed and test condition (dry or wet). The error percentage between experimental and numerical results was calculated as follows:
Error = �𝐸𝑥𝑝−𝑁𝑢𝑚𝑒𝑟𝑖𝑐𝑎𝑙𝑁𝑢𝑚𝑒𝑟𝑖𝑐𝑎𝑙
� ×100 eq. (7) The error was calculated between the experimental and numerical contact pressure results and between the experimental and numerical volume losses results for each test of the specimens (dry and wet). From dry test five values of load and four values of sliding speed were used which mean that , 20 test for each steel type has been done , and in total 60 test for dry condition. From wet test five values of load and three values of sliding speed were used which mean that , 15 test for each steel type has been done , and in total 45 test for wet condition.
Therefore the results show that the standard deviation (σ) between the experimental and numerical results is:
(12.85034) volume loss for dry condition (60) test and (7.93811) % for wet condition (45) test.
(0.72753)% contact pressure for dry condition (60) test and (0.2160) %for wet condition (60) test.
The standard deviation was calculated for the (60) dry tests and for the (45) wet tests.
6. CONCLUSION 1. The abrasive wear loss of metals increased monotonically with applied load according to Archard´s equation at constant sliding speed and constant grit size. 2. Sliding speed show insignificant effect on the wear loss of metals at constant load and constant grit size for both dry and wet sand. 3. Wet sand results show higher wear losses than dry sand results (20-70)% due to micro abrasion – corrosion wear and slurry concentration.
4. The wear losses of stainless steel decrease with increasing sliding speed in both dry and wet conditions due to work hardening. 5. The temperature of metals increase with increasing both applied load and sliding speed, but it show relative depends on sliding speed than applied load. 6. Results shows that a linear relationship could be used which agrees with Archard´s equation. 7. Some figures show that linear curve fitting is not the best choice and it seems that nonlinear curve will be more appropriate for these figures. 8. It should mention here that in order to study the effect of any other parameters like particle size, surface roughness, temperature and humidity, the effect of these parameters could be included by the specific wear coefficient(KS). 9. Increase the hardness should not always mean that the higher hardness means the lower wear losses.
REFERENCES
• A.K Steel Corporation UNS S20400, West Chester, OH 45069, [2007].
• ASTM G65: Standard Test Method for Measuring Abrasion Using the Dry Sand/Rubber Wheel Apparatus, [2001].
• C. Hilerio, M.A. Barron, A. Altamirano, "Wet and Dry Abrasion Behavior of AISI 8620 Steel Boriding”, University of Metropolitana Unidad Azcapotzalco, Department of Materials, Mexico,D.F,[2004].
• D. Hewitt ,S. Allard , P. Radziszewski , "Pipe Lining Abrasion Testing for Paste Backfill Operations", Minerals Engineering 22,(1088–1090), [2009].
• J.G.C. Nava , A.M. Villafan , F.A. Calderon , J.A. Cabral , M.M. Stack , "Some Remarks on Particle Size Effects on the Abrasion of a Range of Fe Based Alloys”, Science Direct, Tribology International Vol 43, p (1307–1317), [2010].
Journal of Engineering Volume 19 November 2013 Number 11
1390
• J.k. Lancaster, "A Review of the Influence of Environmental Humidity and Water on Friction, Lubrication and Wear", Tribology International, [1990].
• J.M. Thompson, M.K. Thompson, "Proposal for the Calculation of Wear", Mechanical Engineering Dept., MIT, [2006].
• J.O. Bello, R.J.K. Wood, "Synergistic
Effects of Micro-Abrasion–Corrosion of UNS S30403, S31603 and S32760 Stainless Steels”, Wear 263, p (149–159), Science Direct, [2007].
• K. Elalem , D.Y. Li , "Variations in Wear Loss with Respect to Load and Sliding Speed under Dry Sand/Rubber - wheel Abrasion Condition" , Wear 250, (59–65),[2001].
• M. Adamiak, J. Górka, T. Kik, "Comparison of Abrasion Resistance of Selected Constructional Materials", Journal of Achievement in Materials and Manufacturing Engineering, Volume37, Issue2, [2009].
• N.H. Kim, D. Won, D. Burris, P.
Swanson, "Finite Element Analysis and Experiments of Metal/Metal Wear in Oscillatory Contacts", Science Direct, Wear258, (1787-1793), [2005].
• N. N .Aung, W. Zhou, L. E.N. Lim,
“Wear Behavior of AZ91D Alloy at Low Sliding Speeds”, Wear 265, p (780-786), Science Direct, [2008].
• R.L. Norton "Machine Design", Worcester, Massachusetts, Fourth Edition, [2011].
• S.G. Sapate, A. Selokar, N. Garg,
"Experimental Investigation of Hard-faced Martensitic Steel under Slurry Abrasion Conditions", Materials and
Design, Volume31, Pages (4001-4006), Science Direct, [2010].
• S. Wirojanupatump, P.H. Shipway, "Abrasion of Mild Steel in Wet and Dry Conditions with the Rubber and Steel Wheel Abrasion Apparatus", Wear 239, 91–101, [2000].
• T.A. Rodil, "Edge Effect on Abrasive Wear Mechanisms and Wear Resistance in WC-6wt. %Co Hard Metals", Karlstad University, [2006].
• X. Ma , R. Liu , D.Y. Li , "Abrasive
Wear Behavior of D2 Tool Steel with Respect to Load and Sliding Speed under Dry Sand/ Rubber Wheel Abrasion Condition" , Wear 241 , (79–85), [2000].
Ahmed Abdul-Hussein Ali An Investigation to the Abrasive Wear in Pipes Mohanad kassim Abdul-Razzaq Zalzala Used for Oil Industry
1391
Fig. 1. Schematic illustration of Fig. 2. Abrasive wear apparatus a rubber wheel abrasion testing apparatus.
Table 1 Compositions of the materials under study Table (2) Mechanical properties of the tested materials
Metals 𝜎𝑦
(Mpa) 𝜎𝑢
(Mpa) Elongation
% (ϵ)
Young's Modulus E(Gpa)
C.S 379.5 490.96 26 200 S.S 445.99 696.86 58 200 A.S 373.2 500.98 30 200
Type C% Si% Mn% Cr% Ni% Mo% Cu%
C.S 0.17 0.41 0.52 0.1 - - -
S.S 0.06 0.37 9.3 15.2 1.41 - 1.7
A.S 0.14 0.44 0.47 9.75 - 1.09 -
Journal of Engineering Volume 19 November 2013 Number 11
1392
Fig. 3. Relationship between load and Fig.4. Relationship between load and Volume loss for dry steel volume loss for wet steel
Fig.5. Relationship between volume loss Fig.6. Relationship between volume loss and and speed sliding speed
0
10
20
30
40
0 50 100 150 200Vol
ume
loss
(mm
^3)
Load (N)
200 R.P.M and particle size (200-425μm)
Dry A.S Dry C.S Dry S.S
0
50
100
150
200
0 50 100 150 200Vol
ume
loss
(mm
^3)
Load (N)
200 R.P.M and particle size (200-425μm)
Wet A.S Wet C.S Wet S.S
0
20
40
60
80
0 1 2 3 4Volu
me
loss
(mm
^3)
Sliding speed (m/s)
load 75N and particle size (200-425µm)
Wet A.S Wet C.S
05
1015202530
0 1 2 3 4volu
me
loss
(mm
^3)
sliding speed (m/s)
load 100N and particle size (200-425μm)
Dry A.S Dry C.S
Ahmed Abdul-Hussein Ali An Investigation to the Abrasive Wear in Pipes Mohanad kassim Abdul-Razzaq Zalzala Used for Oil Industry
1393
Fig. 7. Relationship between volume loss and Fig.8. Relationship between volume loss and sliding for dry and wet stainless steel load for dry and wet test
Fig. 9. Relationship between temperature Fig. 10. Relationship between Hardness and sliding speed and materials type
0
50
100
0 50 100 150 200
Volu
me
loss
(mm
3)
Load (N)
250 R.P.M and particle size (200-425μm)
Dry S.S Wet S.S
0
20
40
60
80
0 2 4 6
Tem
pera
ture
(c )
Time (min)
300 R.P.M and 125 N
Exp
0
50
100
150
0 1 2 3 4
Volu
me
loss
(mm
^3)
Sliding speed (m/s)
load 125N and part ic le s ize 425µm
Dry S.S Wet S.S
0
50
100
150
200
250
300
S.S A.S C.S
Hard
ness
Hv
Materials type
Journal of Engineering Volume 19 November 2013 Number 11
1394
Fig. 11. Abrasive wear on dry stainless steel Fig. 12. Abrasive wear on wet stainless at time (5) min steel at time (5)min
Fig. 13. Contact pressure on dry stainless Fig. 14. Contact pressure on wet stainless Steel at time (5) min steel at time (5) min
Related Documents