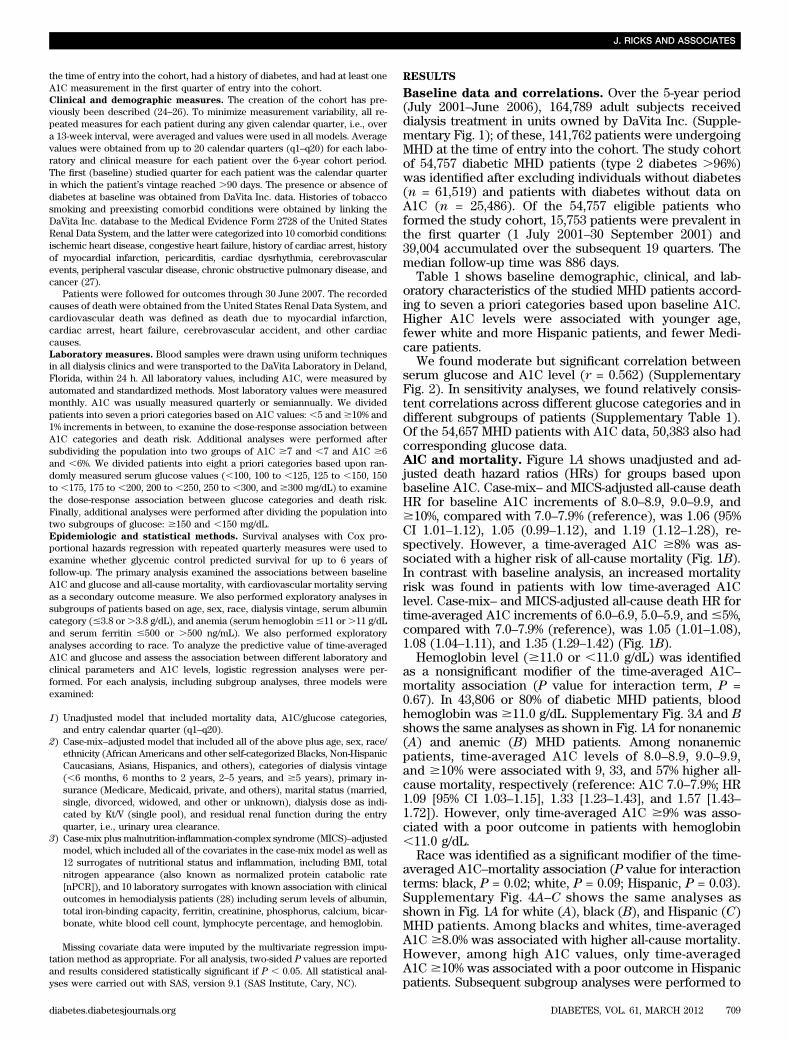
Glycemic Control and Cardiovascular Mortality in Hemodialysis Patients With Diabetes A 6-Year Cohort Study Joni Ricks, 1 Miklos Z. Molnar, 1,2 Csaba P. Kovesdy, 3,4 Anuja Shah, 5 Allen R. Nissenson, 6,7 Mark Williams, 8 and Kamyar Kalantar-Zadeh 1,5,7,9 Previous observational studies using differing methodologies have yielded inconsistent results regarding the association between glycemic control and outcomes in diabetic patients receiving maintenance hemodialysis (MHD). We examined mor- tality predictability of A1C and random serum glucose over time in a contemporary cohort of 54,757 diabetic MHD patients (age 63 6 13 years, 51% men, 30% African Americans, 19% Hispanics). Adjusted all-cause death hazard ratio (HR) for baseline A1C increments of 8.0–8.9, 9.0–9.9, and $10%, compared with 7.0– 7.9% (reference), was 1.06 (95% CI 1.01–1.12), 1.05 (0.99–1.12), and 1.19 (1.12–1.28), respectively, and for time-averaged A1C was 1.11 (1.05–1.16), 1.36 (1.27–1.45), and 1.59 (1.46–1.72). A symmet- ric increase in mortality also occurred with time-averaged A1C levels in the low range (6.0–6.9%, HR 1.05 [95% CI 1.01–1.08]; 5.0– 5.9%, 1.08 [1.04–1.11], and #5%, 1.35 [1.29–1.42]) compared with 7.0–7.9% in fully adjusted models. Adjusted all-cause death HR for time-averaged blood glucose 175–199, 200–249, 250–299, and $300 mg/dL, compared with 150–175 mg/dL (reference), was 1.03 (95% CI 0.99–1.07), 1.14 (1.10–1.19), 1.30 (1.23–1.37), and 1.66 (1.56–1.76), respectively. Hence, poor glycemic control (A1C $8% or serum glucose $200 mg/dL) appears to be associ- ated with high all-cause and cardiovascular death in MHD patients. Very low glycemic levels are also associated with high mortality risk. Diabetes 61:708–715, 2012 D iabetes is a potent cardiovascular risk factor in the general population as well as in people with end-stage renal disease (ESRD) undergoing maintenance dialysis treatment (1–5). Clinical trials have shown that tight glycemic control decreases the risk of developing retinopathy, nephropathy, and neu- ropathy in the general population (6,7). Furthermore, gly- cemic control —as measured by A1C—is a predictor of cardiovascular complications, including myocardial in- farctions and hospitalizations for coronary artery disease (1,8). Some guidelines, such as those of the National Kid- ney Foundation Kidney Disease Outcomes Quality Initia- tive (KDOQI), have recommended that diabetic dialysis patients should follow the American Diabetes Association guidelines; however, there is no consistent evidence to support these recommendations for patients with ESRD (9– 12). This lack of evidence is highlighted by the KDOQI recommendations, last updated in 2007, stating that “target A1C for people with diabetes should be ,7%, irrespective of presence or absence CKD [chronic kidney disease]” (13). There are several issues unique to the dialysis popu- lation that obligate a separate examination of glycemic control on outcomes in this cohort. Insulin and glucose homeostasis are affected by uremia, which may aggravate insulin resistance (14). Moreover, it may be difficult to accurately assess glycemic control in this population be- cause of changes in erythrocyte survival in renal failure and the effects of erythropoiesis-stimulating agents on A1C levels (14,15). Recently, three large randomized trials have indicated that intensive glucose lowering in patients with type 2 di- abetes did not reduce the risks of cardiovascular disease, the most common source of ESRD mortality (16–19). Ad- ditionally, Williams and colleagues (20,21) reported a higher risk of death only in diabetic hemodialysis patients with A1C levels .11%. Shurraw et al. (22) found that higher casual glucose and A1C levels were not associated with mortality in maintenance hemodialysis (MHD) patients with or without diabetes. In contrast, we reported that after adjusting for potential confounders, higher A1C val- ues were incrementally associated with higher death risks in patients on MHD (23). These large observational studies with differing methodologies and recruited patient pop- ulations reached somewhat contrasting conclusions re- garding the association of A1C with survival in diabetic MHD patients. Hence, we undertook this study to further examine the predictive value of glycemic control on all- cause and cardiovascular mortality in a large, contempo- rary cohort of MHD patients. This extended cohort study also adds data on glucose levels, examines the effects of anemia and race, and provides new subset analyses. RESEARCH DESIGN AND METHODS We extracted, refined, and examined data from all individuals with ESRD who underwent MHD treatment from July 2001 through June 2006 in any 1 of the 580 outpatient dialysis facilities of DaVita Inc., a large dialysis organization in the U.S. (before its acquisition of units owned by Gambro). The study was approved by relevant institutional review committees. Patients were included who had been undergoing dialysis for at least 90 days, were being treated with MHD at From the 1 Harold Simmons Center for Chronic Disease Research and Epide- miology, Los Angeles Biomedical Research Institute at Harbor–UCLA Med- ical Center, Torrance, California; the 2 Institute of Pathophysiology, Semmelweis University, Budapest, Hungary; the 3 Division of Nephrology, Salem VA Medical Center, Salem, Virginia; the 4 Division of Nephrology, University of Virginia, Charlottesville, Virginia; the 5 Division of Nephrology and Hypertension, Harbor–UCLA Medical Center, Torrance, California; 6 DaVita Inc., Denver, Colorado; the 7 David Geffen School of Medicine at UCLA, Los Angeles, California; the 8 Renal Unit, Joslin Diabetes Center, Harvard Medical School, Boston, Massachusetts; and the 9 Department of Epidemiology, UCLA School of Public Health, Los Angeles, California. Corresponding author: Kamyar Kalantar-Zadeh, [email protected]. Received 19 July 2011 and accepted 1 December 2011. DOI: 10.2337/db11-1015 This article contains Supplementary Data online at http://diabetes .diabetesjournals.org/lookup/suppl/doi:10.2337/db11-1015/-/DC1. J.R. and M.Z.M. contributed equally to this work. Ó 2012 by the American Diabetes Association. Readers may use this article as long as the work is properly cited, the use is educational and not for profit, and the work is not altered. See http://creativecommons.org/licenses/by -nc-nd/3.0/ for details. 708 DIABETES, VOL. 61, MARCH 2012 diabetes.diabetesjournals.org ORIGINAL ARTICLE

Welcome message from author
This document is posted to help you gain knowledge. Please leave a comment to let me know what you think about it! Share it to your friends and learn new things together.
Transcript
Glycemic Control and Cardiovascular Mortality inHemodialysis Patients With DiabetesA 6-Year Cohort StudyJoni Ricks,
1Miklos Z. Molnar,
1,2Csaba P. Kovesdy,
3,4Anuja Shah,
5Allen R. Nissenson,
6,7
Mark Williams,8and Kamyar Kalantar-Zadeh
1,5,7,9
Previous observational studies using differing methodologieshave yielded inconsistent results regarding the associationbetween glycemic control and outcomes in diabetic patientsreceiving maintenance hemodialysis (MHD). We examined mor-tality predictability of A1C and random serum glucose over timein a contemporary cohort of 54,757 diabetic MHD patients (age63 6 13 years, 51% men, 30% African Americans, 19% Hispanics).Adjusted all-cause death hazard ratio (HR) for baseline A1Cincrements of 8.0–8.9, 9.0–9.9, and $10%, compared with 7.0–7.9% (reference), was 1.06 (95% CI 1.01–1.12), 1.05 (0.99–1.12),and 1.19 (1.12–1.28), respectively, and for time-averaged A1C was1.11 (1.05–1.16), 1.36 (1.27–1.45), and 1.59 (1.46–1.72). A symmet-ric increase in mortality also occurred with time-averaged A1Clevels in the low range (6.0–6.9%, HR 1.05 [95% CI 1.01–1.08]; 5.0–5.9%, 1.08 [1.04–1.11], and #5%, 1.35 [1.29–1.42]) compared with7.0–7.9% in fully adjusted models. Adjusted all-cause death HR fortime-averaged blood glucose 175–199, 200–249, 250–299, and$300 mg/dL, compared with 150–175 mg/dL (reference), was1.03 (95% CI 0.99–1.07), 1.14 (1.10–1.19), 1.30 (1.23–1.37), and1.66 (1.56–1.76), respectively. Hence, poor glycemic control(A1C $8% or serum glucose $200 mg/dL) appears to be associ-ated with high all-cause and cardiovascular death in MHDpatients. Very low glycemic levels are also associated with highmortality risk. Diabetes 61:708–715, 2012
Diabetes is a potent cardiovascular risk factorin the general population as well as in peoplewith end-stage renal disease (ESRD) undergoingmaintenance dialysis treatment (1–5). Clinical
trials have shown that tight glycemic control decreasesthe risk of developing retinopathy, nephropathy, and neu-ropathy in the general population (6,7). Furthermore, gly-cemic control—as measured by A1C—is a predictor of
cardiovascular complications, including myocardial in-farctions and hospitalizations for coronary artery disease(1,8). Some guidelines, such as those of the National Kid-ney Foundation Kidney Disease Outcomes Quality Initia-tive (KDOQI), have recommended that diabetic dialysispatients should follow the American Diabetes Associationguidelines; however, there is no consistent evidence tosupport these recommendations for patients with ESRD (9–12). This lack of evidence is highlighted by the KDOQIrecommendations, last updated in 2007, stating that “targetA1C for people with diabetes should be,7%, irrespective ofpresence or absence CKD [chronic kidney disease]” (13).
There are several issues unique to the dialysis popu-lation that obligate a separate examination of glycemiccontrol on outcomes in this cohort. Insulin and glucosehomeostasis are affected by uremia, which may aggravateinsulin resistance (14). Moreover, it may be difficult toaccurately assess glycemic control in this population be-cause of changes in erythrocyte survival in renal failureand the effects of erythropoiesis-stimulating agents on A1Clevels (14,15).
Recently, three large randomized trials have indicatedthat intensive glucose lowering in patients with type 2 di-abetes did not reduce the risks of cardiovascular disease,the most common source of ESRD mortality (16–19). Ad-ditionally, Williams and colleagues (20,21) reported a higherrisk of death only in diabetic hemodialysis patients withA1C levels .11%. Shurraw et al. (22) found that highercasual glucose and A1C levels were not associated withmortality in maintenance hemodialysis (MHD) patientswith or without diabetes. In contrast, we reported thatafter adjusting for potential confounders, higher A1C val-ues were incrementally associated with higher death risksin patients on MHD (23). These large observational studieswith differing methodologies and recruited patient pop-ulations reached somewhat contrasting conclusions re-garding the association of A1C with survival in diabeticMHD patients. Hence, we undertook this study to furtherexamine the predictive value of glycemic control on all-cause and cardiovascular mortality in a large, contempo-rary cohort of MHD patients. This extended cohort studyalso adds data on glucose levels, examines the effects ofanemia and race, and provides new subset analyses.
RESEARCH DESIGN AND METHODS
We extracted, refined, and examined data from all individuals with ESRD whounderwent MHD treatment from July 2001 through June 2006 in any 1 of the 580outpatient dialysis facilities of DaVita Inc., a large dialysis organization in theU.S. (before its acquisition of units owned byGambro). The study was approvedby relevant institutional review committees. Patients were included who hadbeen undergoing dialysis for at least 90 days, were being treated with MHD at
From the 1Harold Simmons Center for Chronic Disease Research and Epide-miology, Los Angeles Biomedical Research Institute at Harbor–UCLA Med-ical Center, Torrance, California; the 2Institute of Pathophysiology,Semmelweis University, Budapest, Hungary; the 3Division of Nephrology,Salem VA Medical Center, Salem, Virginia; the 4Division of Nephrology,University of Virginia, Charlottesville, Virginia; the 5Division of Nephrologyand Hypertension, Harbor–UCLA Medical Center, Torrance, California;6DaVita Inc., Denver, Colorado; the 7David Geffen School of Medicine atUCLA, Los Angeles, California; the 8Renal Unit, Joslin Diabetes Center,Harvard Medical School, Boston, Massachusetts; and the 9Department ofEpidemiology, UCLA School of Public Health, Los Angeles, California.
Corresponding author: Kamyar Kalantar-Zadeh, [email protected] 19 July 2011 and accepted 1 December 2011.DOI: 10.2337/db11-1015This article contains Supplementary Data online at http://diabetes
.diabetesjournals.org/lookup/suppl/doi:10.2337/db11-1015/-/DC1.J.R. and M.Z.M. contributed equally to this work.� 2012 by the American Diabetes Association. Readers may use this article as
long as the work is properly cited, the use is educational and not for profit,and the work is not altered. See http://creativecommons.org/licenses/by-nc-nd/3.0/ for details.
708 DIABETES, VOL. 61, MARCH 2012 diabetes.diabetesjournals.org
ORIGINAL ARTICLE
the time of entry into the cohort, had a history of diabetes, and had at least oneA1C measurement in the first quarter of entry into the cohort.Clinical and demographic measures. The creation of the cohort has pre-viously been described (24–26). To minimize measurement variability, all re-peated measures for each patient during any given calendar quarter, i.e., overa 13-week interval, were averaged and values were used in all models. Averagevalues were obtained from up to 20 calendar quarters (q1–q20) for each labo-ratory and clinical measure for each patient over the 6-year cohort period.The first (baseline) studied quarter for each patient was the calendar quarterin which the patient’s vintage reached .90 days. The presence or absence ofdiabetes at baseline was obtained from DaVita Inc. data. Histories of tobaccosmoking and preexisting comorbid conditions were obtained by linking theDaVita Inc. database to the Medical Evidence Form 2728 of the United StatesRenal Data System, and the latter were categorized into 10 comorbid conditions:ischemic heart disease, congestive heart failure, history of cardiac arrest, historyof myocardial infarction, pericarditis, cardiac dysrhythmia, cerebrovascularevents, peripheral vascular disease, chronic obstructive pulmonary disease, andcancer (27).
Patients were followed for outcomes through 30 June 2007. The recordedcauses of death were obtained from the United States Renal Data System, andcardiovascular death was defined as death due to myocardial infarction,cardiac arrest, heart failure, cerebrovascular accident, and other cardiaccauses.Laboratory measures. Blood samples were drawn using uniform techniquesin all dialysis clinics and were transported to the DaVita Laboratory in Deland,Florida, within 24 h. All laboratory values, including A1C, were measured byautomated and standardized methods. Most laboratory values were measuredmonthly. A1C was usually measured quarterly or semiannually. We dividedpatients into seven a priori categories based on A1C values: ,5 and $10% and1% increments in between, to examine the dose-response association betweenA1C categories and death risk. Additional analyses were performed aftersubdividing the population into two groups of A1C $7 and ,7 and A1C $6and ,6%. We divided patients into eight a priori categories based upon ran-domly measured serum glucose values (,100, 100 to ,125, 125 to ,150, 150to ,175, 175 to ,200, 200 to ,250, 250 to ,300, and $300 mg/dL) to examinethe dose-response association between glucose categories and death risk.Finally, additional analyses were performed after dividing the population intotwo subgroups of glucose: $150 and ,150 mg/dL.Epidemiologic and statistical methods. Survival analyses with Cox pro-portional hazards regression with repeated quarterly measures were used toexamine whether glycemic control predicted survival for up to 6 years offollow-up. The primary analysis examined the associations between baselineA1C and glucose and all-cause mortality, with cardiovascular mortality servingas a secondary outcome measure. We also performed exploratory analyses insubgroups of patients based on age, sex, race, dialysis vintage, serum albumincategory (#3.8 or.3.8 g/dL), and anemia (serum hemoglobin#11 or.11 g/dLand serum ferritin #500 or .500 ng/mL). We also performed exploratoryanalyses according to race. To analyze the predictive value of time-averagedA1C and glucose and assess the association between different laboratory andclinical parameters and A1C levels, logistic regression analyses were per-formed. For each analysis, including subgroup analyses, three models wereexamined:
1) Unadjusted model that included mortality data, A1C/glucose categories,and entry calendar quarter (q1–q20).
2) Case-mix–adjusted model that included all of the above plus age, sex, race/ethnicity (African Americans and other self-categorized Blacks, Non-HispanicCaucasians, Asians, Hispanics, and others), categories of dialysis vintage(,6 months, 6 months to 2 years, 2–5 years, and $5 years), primary in-surance (Medicare, Medicaid, private, and others), marital status (married,single, divorced, widowed, and other or unknown), dialysis dose as indi-cated by Kt/V (single pool), and residual renal function during the entryquarter, i.e., urinary urea clearance.
3) Case-mix plus malnutrition-inflammation-complex syndrome (MICS)–adjustedmodel, which included all of the covariates in the case-mix model as well as12 surrogates of nutritional status and inflammation, including BMI, totalnitrogen appearance (also known as normalized protein catabolic rate[nPCR]), and 10 laboratory surrogates with known association with clinicaloutcomes in hemodialysis patients (28) including serum levels of albumin,total iron-binding capacity, ferritin, creatinine, phosphorus, calcium, bicar-bonate, white blood cell count, lymphocyte percentage, and hemoglobin.
Missing covariate data were imputed by the multivariate regression impu-tation method as appropriate. For all analysis, two-sided P values are reportedand results considered statistically significant if P , 0.05. All statistical anal-yses were carried out with SAS, version 9.1 (SAS Institute, Cary, NC).
RESULTS
Baseline data and correlations. Over the 5-year period(July 2001–June 2006), 164,789 adult subjects receiveddialysis treatment in units owned by DaVita Inc. (Supple-mentary Fig. 1); of these, 141,762 patients were undergoingMHD at the time of entry into the cohort. The study cohortof 54,757 diabetic MHD patients (type 2 diabetes .96%)was identified after excluding individuals without diabetes(n = 61,519) and patients with diabetes without data onA1C (n = 25,486). Of the 54,757 eligible patients whoformed the study cohort, 15,753 patients were prevalent inthe first quarter (1 July 2001–30 September 2001) and39,004 accumulated over the subsequent 19 quarters. Themedian follow-up time was 886 days.
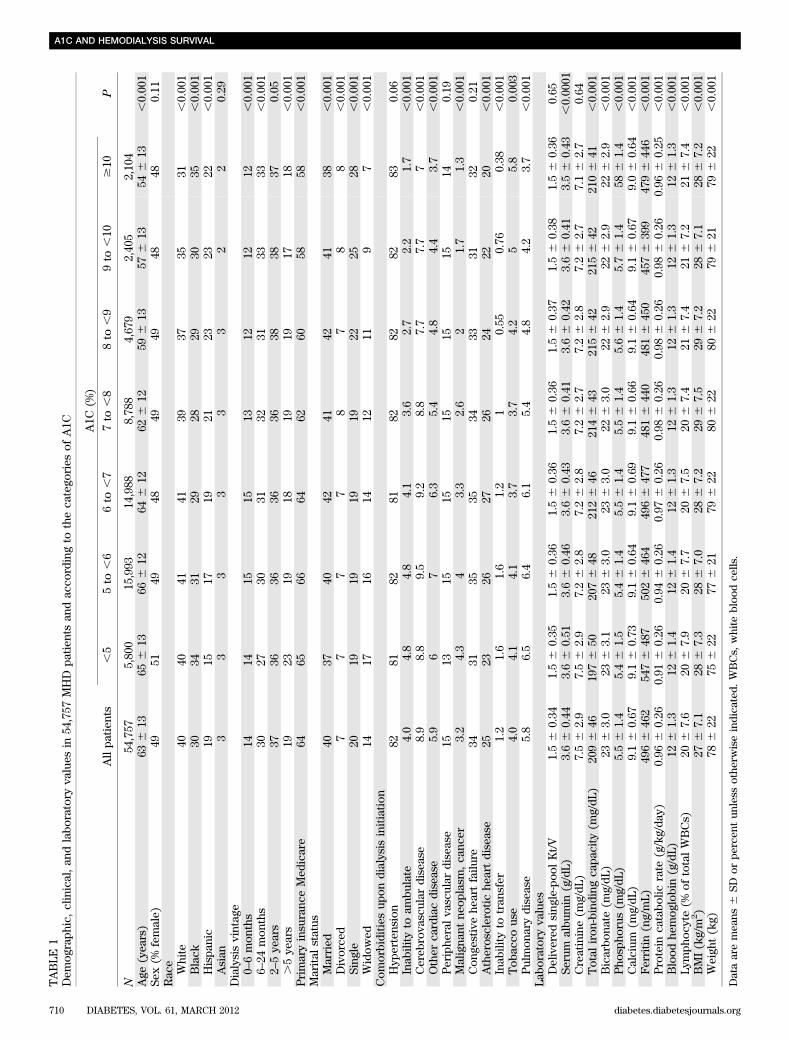
Table 1 shows baseline demographic, clinical, and lab-oratory characteristics of the studied MHD patients accord-ing to seven a priori categories based upon baseline A1C.Higher A1C levels were associated with younger age,fewer white and more Hispanic patients, and fewer Medi-care patients.
We found moderate but significant correlation betweenserum glucose and A1C level (r = 0.562) (SupplementaryFig. 2). In sensitivity analyses, we found relatively consis-tent correlations across different glucose categories and indifferent subgroups of patients (Supplementary Table 1).Of the 54,657 MHD patients with A1C data, 50,383 also hadcorresponding glucose data.AlC and mortality. Figure 1A shows unadjusted and ad-justed death hazard ratios (HRs) for groups based uponbaseline A1C. Case-mix– and MICS-adjusted all-cause deathHR for baseline A1C increments of 8.0–8.9, 9.0–9.9, and$10%, compared with 7.0–7.9% (reference), was 1.06 (95%CI 1.01–1.12), 1.05 (0.99–1.12), and 1.19 (1.12–1.28), re-spectively. However, a time-averaged A1C $8% was as-sociated with a higher risk of all-cause mortality (Fig. 1B).In contrast with baseline analysis, an increased mortalityrisk was found in patients with low time-averaged A1Clevel. Case-mix– and MICS-adjusted all-cause death HR fortime-averaged A1C increments of 6.0–6.9, 5.0–5.9, and #5%,compared with 7.0–7.9% (reference), was 1.05 (1.01–1.08),1.08 (1.04–1.11), and 1.35 (1.29–1.42) (Fig. 1B).
Hemoglobin level ($11.0 or ,11.0 g/dL) was identifiedas a nonsignificant modifier of the time-averaged A1C–mortality association (P value for interaction term, P =0.67). In 43,806 or 80% of diabetic MHD patients, bloodhemoglobin was $11.0 g/dL. Supplementary Fig. 3A and Bshows the same analyses as shown in Fig. 1A for nonanemic(A) and anemic (B) MHD patients. Among nonanemicpatients, time-averaged A1C levels of 8.0–8.9, 9.0–9.9,and $10% were associated with 9, 33, and 57% higher all-cause mortality, respectively (reference: A1C 7.0–7.9%; HR1.09 [95% CI 1.03–1.15], 1.33 [1.23–1.43], and 1.57 [1.43–1.72]). However, only time-averaged A1C $9% was asso-ciated with a poor outcome in patients with hemoglobin,11.0 g/dL.
Race was identified as a significant modifier of the time-averaged A1C–mortality association (P value for interactionterms: black, P = 0.02; white, P = 0.09; Hispanic, P = 0.03).Supplementary Fig. 4A–C shows the same analyses asshown in Fig. 1A for white (A), black (B), and Hispanic (C)MHD patients. Among blacks and whites, time-averagedA1C $8.0% was associated with higher all-cause mortality.However, among high A1C values, only time-averagedA1C $10% was associated with a poor outcome in Hispanicpatients. Subsequent subgroup analyses were performed to
J. RICKS AND ASSOCIATES
diabetes.diabetesjournals.org DIABETES, VOL. 61, MARCH 2012 709
TABLE
1Dem
ograph
ic,clinical,an
dlabo
ratory
values
in54
,757
MHD
patien
tsan
dac
cordingto
theca
tego
ries
ofA1C
Allpa
tien
ts
A1C
(%)
P,5
5to
,6
6to
,7
7to
,8
8to
,9
9to
,10
$10
N54
,757
5,80
015
,993
14,988
8,78
84,67
92,40
52,10
4Age
(yea
rs)
636
1365
613
666
1264
612
626
1259
613
576
1354
613
,0.00
1Se
x(%
female)
4951
4948
4949
4848
0.11
Rac
eWhite
4040
4141
3937
3531
,0.00
1Black
3034
3129
2829
3035
,0.00
1Hispa
nic
1915
1719
2123
2322
,0.00
1Asian
33
33
33
22
0.29
Dialysisvintag
e0–6mon
ths
1414
1515
1312
1212
,0.00
16–24
mon
ths
3027
3031
3231
3333
,0.00
12–5ye
ars
3736
3636
3638
3837
0.05
.5ye
ars
1923
1918
1919
1718
,0.00
1Primaryinsuranc
eMed
icare
6465
6664
6260
5858
,0.00
1Marital
status
Married
4037
4042
4142
4138
,0.00
1Divorce
d7
77
78
78
8,0.00
1Sing
le20
1919
1919
2225
28,0.00
1Widow
ed14
1716
1412
119
7,0.00
1Com
orbidities
upon
dialysis
initiation
Hyp
ertension
8281
8281
8282
8283
0.06
Inab
ility
toam
bulate
4.0
4.8
4.8
4.1
3.6
2.7
2.2
1.7
,0.00
1Cereb
rova
scular
disease
8.9
8.8
9.5
9.2
8.8
7.7
7.7
7,0.00
1Other
cardiacdisease
5.9
67
6.3
5.4
4.8
4.4
3.7
,0.00
1Periphe
ralva
scular
disease
1513
1515
1515
1514
0.19
Maligna
ntne
oplasm
,ca
ncer
3.2
4.3
43.3
2.6
21.7
1.3
,0.00
1Con
gestivehe
artfailu
re34
3135
3534
3331
320.21
Atherosclerotic
heartdisease
2523
2627
2624
2220
,0.00
1Inab
ility
totran
sfer
1.2
1.6
1.6
1.2
10.55
0.76
0.38
,0.00
1Tob
acco
use
4.0
4.1
4.1
3.7
3.7
4.2
55.8
0.00
3Pulmon
arydisease
5.8
6.5
6.4
6.1
5.4
4.8
4.2
3.7
,0.00
1La
boratory
values
Delivered
sing
le-poo
lKt/V
1.56
0.34
1.56
0.35
1.56
0.36
1.56
0.36
1.56
0.36
1.56
0.37
1.56
0.38
1.56
0.36
0.65
Serum
albu
min
(g/dL)
3.66
0.44
3.66
0.51
3.66
0.46
3.66
0.43
3.66
0.41
3.66
0.42
3.66
0.41
3.56
0.43
,0.00
01Creatinine(m
g/dL
)7.56
2.9
7.56
2.9
7.26
2.8
7.26
2.8
7.26
2.7
7.26
2.8
7.26
2.7
7.16
2.7
0.64
Total
iron
-binding
capa
city
(mg/dL
)2096
4619
76
5020
76
4821
26
4621
46
4321
56
4221
56
4221
06
41,0.00
1Bicarbo
nate
(mg/dL
)23
63.0
236
3.1
236
3.0
236
3.0
226
3.0
226
2.9
226
2.9
226
2.9
,0.00
1Pho
spho
rus(m
g/dL
)5.56
1.4
5.46
1.5
5.46
1.4
5.56
1.4
5.56
1.4
5.66
1.4
5.76
1.4
586
1.4
,0.00
1Calcium
(mg/dL
)9.16
0.67
9.16
0.73
9.16
0.64
9.16
0.69
9.16
0.66
9.16
0.64
9.16
0.67
9.06
0.64
,0.00
1Ferritin(ng/mL)
4966
462
5476
487
5026
464
4966
477
4816
440
4816
450
4576
399
4796
446
,0.00
1Protein
catabo
licrate
(g/kg/da
y)0.96
60.26
0.91
60.26
0.94
60.26
0.97
60.26
0.98
60.26
0.98
60.26
0.98
60.26
0.96
60.25
,0.00
1Blood
hemog
lobin(g/dL)
126
1.3
126
1.4
126
1.4
126
1.3
126
1.3
126
1.3
126
1.3
126
1.3
,0.00
1Ly
mph
ocyte(%
oftotalWBCs)
206
7.6
206
7.9
206
7.7
206
7.5
206
7.4
216
7.4
216
7.2
216
7.4
,0.00
1BMI(kg/m
2 )27
67.1
286
7.3
286
7.0
286
7.2
296
7.5
296
7.2
286
7.1
286
7.2
,0.00
1Weigh
t(kg)
786
2275
622
776
2179
622
806
2280
622
796
2179
622
,0.00
1
Dataaremea
ns6
SDor
percen
tun
less
othe
rwiseindica
ted.
WBCs,
white
bloo
dce
lls.
A1C AND HEMODIALYSIS SURVIVAL
710 DIABETES, VOL. 61, MARCH 2012 diabetes.diabetesjournals.org

examine the HRs for all-cause mortality for patients withbaseline A1C $7% among relevant demographic, clinical,and laboratory categories of MHD patients (Fig. 2A). Allunadjusted analyses show that A1C .7% is protectiveagainst all-cause mortality. However, this diminished orreversed after adjustment for case-mix and MICS variablesin all subgroups. In the entire MHD population, the HR forall-cause mortality in patients with baseline A1C $7% was1.06 (95% CI 1.01–1.11) after adjustment for case-mix andMICS variables. A1C $7% was associated with highermortality risk in white male patients, patients aged ,65years, patients with albumin ,3.8 g/dL, and patients withhemoglobin $11.0 g/dL.
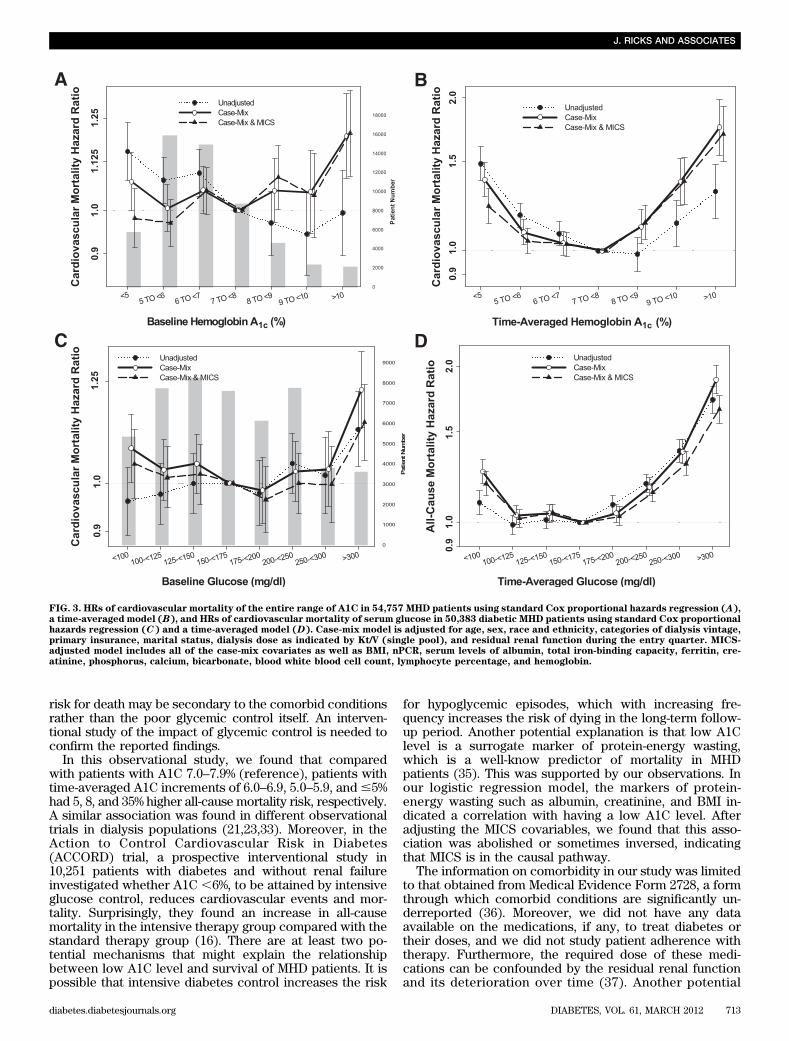
We repeated the analyses using cardiovascular death asthe outcome. Figure 3A and B shows unadjusted and ad-justed HRs according to the baseline and time-averagedA1C values. Similarly to all-cause mortality, increasedcardiovascular mortality risk was associated with baselineA1C $10% and time-averaged A1C $8%.Glucose and mortality. Figure 1C shows unadjusted andadjusted death HRs for groups based upon baseline glu-cose. Case-mix– and MICS-adjusted all-cause death HRfor baseline glucose increments of 200–249, 250–299, and
$300 mg/dL, compared with 150–175 mg/dL (reference),was 1.03 (95% CI 0.99–1.08), 1.04 (0.99–1.09), and 1.16(1.10–1.22), respectively. However, a time-averaged glu-cose $200 mg/dL was associated with a higher risk of all-cause mortality (Fig. 1D).
Hemoglobin level ($11.0 or ,11.0 g/dL) was not iden-tified as a significant modifier of the baseline glucose–mortality association. Supplementary Fig. 5A and B showsthe same analyses as shown in Supplementary Fig. 3 fornonanemic (A) and anemic (B) MHD patients. Amonganemic and nonanemic patients, a baseline glucose $200mg/dL was associated with higher all-cause mortality (ref-erence: glucose 150–175 mg/dL). Supplementary Fig. 6A–Cshows the same analyses as shown in Supplementary Fig. 4for white (A), black (B), and Hispanic (C) MHD patients.
Subsequent subgroup analyses were performed to ex-amine the HRs for all-cause mortality for patients withbaseline glucose $150 mg/dL among relevant demographic,clinical, and laboratory categories of MHD patients includingrace, sex, age, vintage, and selected laboratory measures(Fig. 2B). In the entire MHD population, the HR for all-causemortality in patients with baseline glucose $150 mg/dL was1.04 (95% CI 0.99–1.08) after adjustment for case-mix and
FIG. 1. HRs of all-cause mortality of the entire range of A1C in 54,757 MHD patients using standard Cox proportional hazards regression (A),a time-averaged model (B), and HRs of all-cause mortality of serum glucose in 50,383 diabetic MHD patients using standard Cox proportionalhazards regression (C) and a time-averaged model (D). Case-mix model is adjusted for age, sex, race and ethnicity, categories of dialysis vintage,primary insurance, marital status, dialysis dose as indicated by Kt/V (single pool), and residual renal function during the entry quarter. MICS-adjusted model includes all of the case-mix covariates as well as BMI, nPCR, serum levels of albumin, total iron-binding capacity, ferritin, cre-atinine, phosphorus, calcium, bicarbonate, blood white blood cell count, lymphocyte percentage, and hemoglobin.
J. RICKS AND ASSOCIATES
diabetes.diabetesjournals.org DIABETES, VOL. 61, MARCH 2012 711
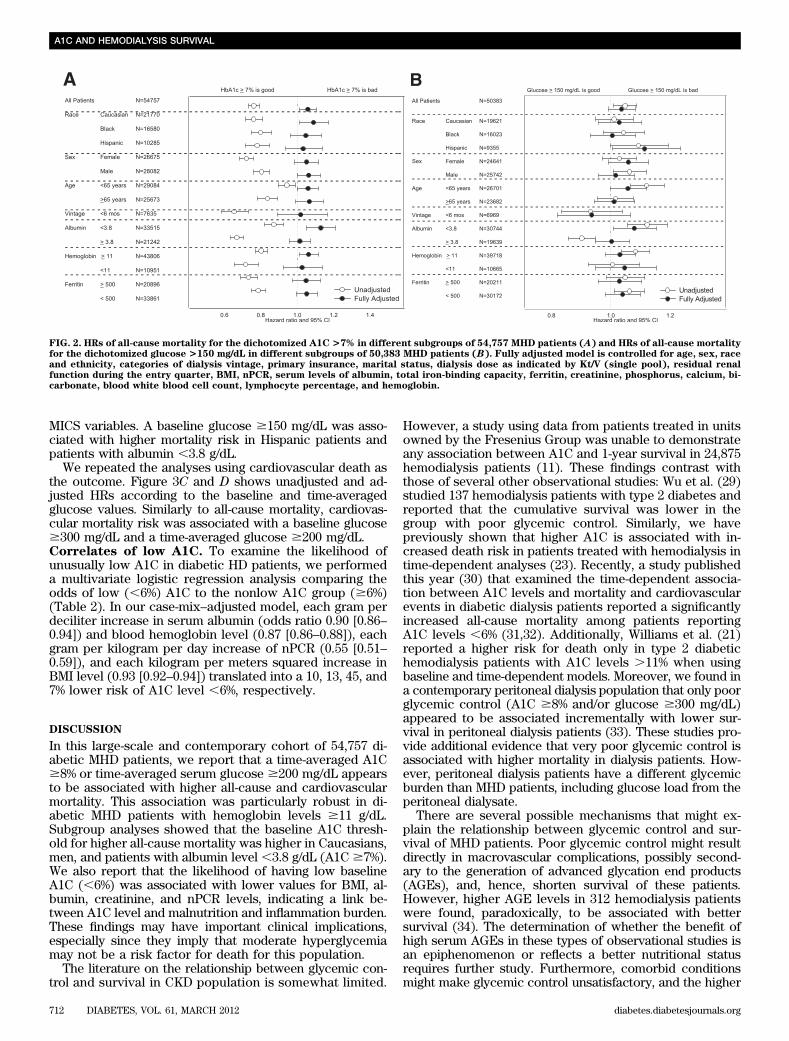
MICS variables. A baseline glucose $150 mg/dL was asso-ciated with higher mortality risk in Hispanic patients andpatients with albumin ,3.8 g/dL.
We repeated the analyses using cardiovascular death asthe outcome. Figure 3C and D shows unadjusted and ad-justed HRs according to the baseline and time-averagedglucose values. Similarly to all-cause mortality, cardiovas-cular mortality risk was associated with a baseline glucose$300 mg/dL and a time-averaged glucose $200 mg/dL.Correlates of low A1C. To examine the likelihood ofunusually low A1C in diabetic HD patients, we performeda multivariate logistic regression analysis comparing theodds of low (,6%) A1C to the nonlow A1C group ($6%)(Table 2). In our case-mix–adjusted model, each gram perdeciliter increase in serum albumin (odds ratio 0.90 [0.86–0.94]) and blood hemoglobin level (0.87 [0.86–0.88]), eachgram per kilogram per day increase of nPCR (0.55 [0.51–0.59]), and each kilogram per meters squared increase inBMI level (0.93 [0.92–0.94]) translated into a 10, 13, 45, and7% lower risk of A1C level ,6%, respectively.
DISCUSSION
In this large-scale and contemporary cohort of 54,757 di-abetic MHD patients, we report that a time-averaged A1C$8% or time-averaged serum glucose $200 mg/dL appearsto be associated with higher all-cause and cardiovascularmortality. This association was particularly robust in di-abetic MHD patients with hemoglobin levels $11 g/dL.Subgroup analyses showed that the baseline A1C thresh-old for higher all-cause mortality was higher in Caucasians,men, and patients with albumin level ,3.8 g/dL (A1C $7%).We also report that the likelihood of having low baselineA1C (,6%) was associated with lower values for BMI, al-bumin, creatinine, and nPCR levels, indicating a link be-tween A1C level and malnutrition and inflammation burden.These findings may have important clinical implications,especially since they imply that moderate hyperglycemiamay not be a risk factor for death for this population.
The literature on the relationship between glycemic con-trol and survival in CKD population is somewhat limited.
However, a study using data from patients treated in unitsowned by the Fresenius Group was unable to demonstrateany association between A1C and 1-year survival in 24,875hemodialysis patients (11). These findings contrast withthose of several other observational studies: Wu et al. (29)studied 137 hemodialysis patients with type 2 diabetes andreported that the cumulative survival was lower in thegroup with poor glycemic control. Similarly, we havepreviously shown that higher A1C is associated with in-creased death risk in patients treated with hemodialysis intime-dependent analyses (23). Recently, a study publishedthis year (30) that examined the time-dependent associa-tion between A1C levels and mortality and cardiovascularevents in diabetic dialysis patients reported a significantlyincreased all-cause mortality among patients reportingA1C levels ,6% (31,32). Additionally, Williams et al. (21)reported a higher risk for death only in type 2 diabetichemodialysis patients with A1C levels .11% when usingbaseline and time-dependent models. Moreover, we found ina contemporary peritoneal dialysis population that only poorglycemic control (A1C $8% and/or glucose $300 mg/dL)appeared to be associated incrementally with lower sur-vival in peritoneal dialysis patients (33). These studies pro-vide additional evidence that very poor glycemic control isassociated with higher mortality in dialysis patients. How-ever, peritoneal dialysis patients have a different glycemicburden than MHD patients, including glucose load from theperitoneal dialysate.
There are several possible mechanisms that might ex-plain the relationship between glycemic control and sur-vival of MHD patients. Poor glycemic control might resultdirectly in macrovascular complications, possibly second-ary to the generation of advanced glycation end products(AGEs), and, hence, shorten survival of these patients.However, higher AGE levels in 312 hemodialysis patientswere found, paradoxically, to be associated with bettersurvival (34). The determination of whether the benefit ofhigh serum AGEs in these types of observational studies isan epiphenomenon or reflects a better nutritional statusrequires further study. Furthermore, comorbid conditionsmight make glycemic control unsatisfactory, and the higher
FIG. 2. HRs of all-cause mortality for the dichotomized A1C>7% in different subgroups of 54,757 MHD patients (A) and HRs of all-cause mortalityfor the dichotomized glucose >150 mg/dL in different subgroups of 50,383 MHD patients (B). Fully adjusted model is controlled for age, sex, raceand ethnicity, categories of dialysis vintage, primary insurance, marital status, dialysis dose as indicated by Kt/V (single pool), residual renalfunction during the entry quarter, BMI, nPCR, serum levels of albumin, total iron-binding capacity, ferritin, creatinine, phosphorus, calcium, bi-carbonate, blood white blood cell count, lymphocyte percentage, and hemoglobin.
A1C AND HEMODIALYSIS SURVIVAL
712 DIABETES, VOL. 61, MARCH 2012 diabetes.diabetesjournals.org
risk for death may be secondary to the comorbid conditionsrather than the poor glycemic control itself. An interven-tional study of the impact of glycemic control is needed toconfirm the reported findings.
In this observational study, we found that comparedwith patients with A1C 7.0–7.9% (reference), patients withtime-averaged A1C increments of 6.0–6.9, 5.0–5.9, and#5%had 5, 8, and 35% higher all-cause mortality risk, respectively.A similar association was found in different observationaltrials in dialysis populations (21,23,33). Moreover, in theAction to Control Cardiovascular Risk in Diabetes(ACCORD) trial, a prospective interventional study in10,251 patients with diabetes and without renal failureinvestigated whether A1C ,6%, to be attained by intensiveglucose control, reduces cardiovascular events and mor-tality. Surprisingly, they found an increase in all-causemortality in the intensive therapy group compared with thestandard therapy group (16). There are at least two po-tential mechanisms that might explain the relationshipbetween low A1C level and survival of MHD patients. It ispossible that intensive diabetes control increases the risk
for hypoglycemic episodes, which with increasing fre-quency increases the risk of dying in the long-term follow-up period. Another potential explanation is that low A1Clevel is a surrogate marker of protein-energy wasting,which is a well-know predictor of mortality in MHDpatients (35). This was supported by our observations. Inour logistic regression model, the markers of protein-energy wasting such as albumin, creatinine, and BMI in-dicated a correlation with having a low A1C level. Afteradjusting the MICS covariables, we found that this asso-ciation was abolished or sometimes inversed, indicatingthat MICS is in the causal pathway.
The information on comorbidity in our study was limitedto that obtained from Medical Evidence Form 2728, a formthrough which comorbid conditions are significantly un-derreported (36). Moreover, we did not have any dataavailable on the medications, if any, to treat diabetes ortheir doses, and we did not study patient adherence withtherapy. Furthermore, the required dose of these medi-cations can be confounded by the residual renal functionand its deterioration over time (37). Another potential
FIG. 3. HRs of cardiovascular mortality of the entire range of A1C in 54,757 MHD patients using standard Cox proportional hazards regression (A),a time-averaged model (B), and HRs of cardiovascular mortality of serum glucose in 50,383 diabetic MHD patients using standard Cox proportionalhazards regression (C) and a time-averaged model (D). Case-mix model is adjusted for age, sex, race and ethnicity, categories of dialysis vintage,primary insurance, marital status, dialysis dose as indicated by Kt/V (single pool), and residual renal function during the entry quarter. MICS-adjusted model includes all of the case-mix covariates as well as BMI, nPCR, serum levels of albumin, total iron-binding capacity, ferritin, cre-atinine, phosphorus, calcium, bicarbonate, blood white blood cell count, lymphocyte percentage, and hemoglobin.
J. RICKS AND ASSOCIATES
diabetes.diabetesjournals.org DIABETES, VOL. 61, MARCH 2012 713

limitation is the use of nonfasting (random) blood draw forA1C and glucose as well as a lack of explicit laboratorymarkers of inflammation such as C-reactive protein. How-ever, we used data on serum albumin, ferritin, total iron-binding capacity, blood white blood cell count, lymphocytepercentage, and hemoglobin, which have significant associ-ations with inflammation in dialysis patients (28). Moreover,it is known that A1C significantly underestimates glycemiccontrol in hemodialysis patients (38). Finally, the use of time-averaged measures in this analysis allowed us to reducevariability observed over time and to examine overall trendsin the association between glycemic control and mortality;however, these methods may mask significant increases ordecreases in laboratory parameters important to survival.
In conclusion, poor glycemic control (A1C $8% or se-rum glucose $200 mg/dL) appears to be associated withdecreased survival in the general population of diabeticMHD patients. Our study suggests that moderate hyper-glycemia increases the risk for all-cause or cardiovascularmortality of diabetic MHD patients, especially in certainsubgroups (Caucasians, men, and those with serum albu-min #3.8 g/dL). Moreover, the presence of protein-energywasting contributes to the higher risk of low (,6%) A1Clevel. Admittedly, mortality is only one measure of thedeleterious impact of poor glycemic control. Other po-tential benefits of glycemic control, including slowing therate of progression of microvascular disease and rate ofloss of residual renal function, are possible and were not
TABLE 2Multivariate logistic regression models showing clinical parameters and their odds ratios (95% CI) for low (,6%) A1C compared withthe nonlow A1C group ($6%) as reference
Unadjusted Case-mix adjusted Case-mix and MICS adjusted
Age (+1 year) 1.02 (1.02–1.03) 1.03 (1.02–1.03) 1.03 (1.03–1.03)Female vs. male sex (reference) 1.04 (1.00–1.07) 0.98 (0.94–1.02) 1.00 (0.96–1.04)RaceWhite Reference Reference ReferenceBlack 1.15 (1.11–1.19) 1.07 (1.02–1.11) 0.91 (0.87–0.96)Hispanic 0.77 (0.74–0.81) 0.79 (0.75–0.83) 0.79 (0.75–0.84)Asian 0.92 (0.83–1.01) 0.82 (0.74–0.91) 0.78 (0.70–0.87)
Dialysis vintage0–6 months Reference Reference Reference6–24 months 0.90 (0.87–0.93) 0.93 (0.88–0.98) 0.95 (0.90–1.01)2–5 years 0.98 (0.95–1.02) 1.02 (0.96–1.08) 0.96 (0.91–1.02).5 years 1.13 (1.08–1.18) 1.16 (1.08–1.23) 0.93 (0.86–1.00)
Primary insuranceMedicare Reference Reference ReferenceMedicaid 0.90 (0.83–0.97) 1.13 (1.04–1.23) 1.12 (1.03–1.22)Private 0.96 (0.91–1.02) 1.02 (0.96–1.08) 1.02 (0.96–1.09)Other 0.77 (0.73–0.81) 0.87 (0.82–0.92) 0.94 (0.89–0.99)
Marital statusMarried Reference Reference ReferenceDivorced 0.90 (0.84–0.96) 0.98 (0.91–1.05) 0.97 (0.90–1.04)Single 0.92 (0.88–0.96) 1.09 (1.04–1.14) 1.08 (1.03–1.13)Widowed 1.33 (1.27–1.40) 1.06 (1.00–1.12) 1.04 (0.99–1.10)
Presence of comorbiditiesHypertension 1.00 (0.95–1.04) 1.01 (0.97–1.06) 1.02 (0.97–1.06)Inability to ambulate 1.40 (1.28–1.52) 1.26 (1.14–1.40) 1.25 (1.13–1.39)Cerebrovascular disease 1.09 (1.03–1.16) 1.00 (0.94–1.07) 1.00 (0.94–1.06)Other cardiac disease 1.21 (1.12–1.30) 1.12 (1.03–1.20) 1.13 (1.04–1.22)Peripheral vascular disease 0.94 (0.90–0.99) 0.90 (0.86–0.95) 0.90 (0.85–0.95)Cancer 1.55 (1.41–1.71) 1.30 (1.18–1.44) 1.24 (1.12–1.37)Congestive heart failure 0.98 (0.94–1.10) 0.90 (0.87–0.94) 0.94 (0.90–0.98)Atherosclerotic heart disease 0.98 (0.94–1.02) 0.88 (0.84–0.92) 0.89 (0.85–0.93)Inability to transfer 1.68 (1.44–1.96) 1.27 (1.06–1.52) 1.25 (1.04–1.50)Tobacco use 1.03 (0.94–1.12) 1.15 (1.05–1.26) 1.12 (1.02–1.23)Pulmonary disease 1.20 (1.12–1.30) 1.09 (1.01–1.18) 1.13 (1.04–1.22)
Laboratory parametersDelivered single-pool Kt/V (+1 increase) 0.98 (0.93–1.02) 0.90 (0.86–0.95) 1.12 (1.05–1.19)Albumin (+1 g/dL increase) 0.90 (0.87–0.94) 0.90 (0.86–0.94) 1.09 (1.03–1.15)Creatinine (+1 mg/dL increase) 1.02 (1.01–1.02) 1.05 (1.04–1.06) 1.08 (1.07–1.09)Total iron-binding capacity (+100 mg/dL increase) 0.68 (0.67–0.69) 0.73 (0.71–0.74) 0.78 (0.76–0.78)Bicarbonate (+1 mg/dL increase) 1.02 (1.01–1.03) 1.00 (0.99–1.01) 0.99 (0.98–1.00)Phosphorus (+1 mg/dL increase) 0.95 (0.94–0.96) 1.00 (0.99–1.01) 1.01 (0.99–1.02)Calcium (+1 mg/dL increase) 1.08 (1.05–1.10) 1.04 (1.01–1.06) 1.09 (1.06–1.12)Protein catabolic rate (+1 g/kg/day increase) 0.54 (0.51–0.58) 0.55 (0.51–0.59) 0.45 (0.41–0.49)Blood hemoglobin (+1 g/dL increase) 0.87 (0.86–0.88) 0.87 (0.86–0.88) 0.87 (0.86–0.88)Lymphocyte (+1% of total WBCs) 1.00 (0.99–1.00) 1.00 (1.00–1.01) 1.00 (1.00–1.00)BMI (+5 kg/m2 increase) 0.92 (0.91–0.92) 0.93 (0.92–0.94) 0.93 (0.92–0.94)
WBCs, white blood cells.
A1C AND HEMODIALYSIS SURVIVAL
714 DIABETES, VOL. 61, MARCH 2012 diabetes.diabetesjournals.org
studied herein. Clinical trials are needed to better definethe target A1C levels in different subgroups of diabeticMHD patients.
ACKNOWLEDGMENTS
This study was partly supported by a research grant fromthe National Institutes of Health (DK077341) to K.K.-Z. K.K.-Z.also receives funding from the National Institute ofDiabetes and Digestive and Kidney Diseases of the NationalInstitutes of Health (R01 DK078106) and a philanthropicgrant from Mr. Harold Simmons. M.Z.M. received grantsfrom the National Developmental Agency (KTIA-OTKA-EU7KP-HUMAN-MB08-A-81231) from the Research and Tech-nological Innovation Fund and was also supported by theHungarian Kidney Foundation.
This study was also supported by a research grant fromDaVita Inc. (to K.K.-Z.). No other potential conflicts ofinterest relevant to this article were reported.
J.R., M.Z.M., C.P.K., and M.W. contributed to analysisand interpretation of data and to writing the manuscript.A.S. contributed to writing the manuscript. A.R.N. con-tributed to analysis and interpretation of data. K.K.-Z.designed, organized, and coordinated the study; manageddata entry; contributed to data analysis and interpretationof data; and wrote the manuscript. K.K.-Z. is the guarantorof this work and, as such, had full access to all the data inthe study and takes responsibility for the integrity of thedata and the accuracy of the data analysis.
Parts of this study were presented in abstract form at the44th Annual Meeting of the American Society of Nephrol-ogy, Philadelphia, Pennsylvania, 8–13 November 2011.
The authors thank DaVita Clinical Research for provid-ing the clinical data, analysis, and review for this researchproject.
REFERENCES
1. Gaede P, Vedel P, Larsen N, Jensen GV, Parving HH, Pedersen O. Multi-factorial intervention and cardiovascular disease in patients with type 2diabetes. N Engl J Med 2003;348:383–393
2. United States Renal Data System. Excerpts from the USRDS 2005 AnnualData Report: Atlas of End-Stage Renal Disease in the United States, Na-tional Institutes of Health, National Institute of Diabetes and Digestive andKidney Diseases. Am J Kid Dis 2006;47(Suppl. 1):1–286
3. Friedman EA. Renal syndromes in diabetes. Endocrinol Metab Clin NorthAm 1996;25:293–324
4. Abbott KC, Bakris GL. Treatment of the diabetic patient: focus on cardio-vascular and renal risk reduction. Prog Brain Res 2002;139:289–298
5. Kimmel PL, Varela MP, Peterson RA, et al. Interdialytic weight gain andsurvival in hemodialysis patients: effects of duration of ESRD and diabetesmellitus. Kidney Int 2000;57:1141–1151
6. Warram JH, Manson JE, Krolewski AS. Glycosylated hemoglobin and therisk of retinopathy in insulin-dependent diabetes mellitus. N Engl J Med1995;332:1305–1306
7. The Diabetes Control and Complications Trial Research Group. The effectof intensive treatment of diabetes on the development and progression oflong-term complications in insulin-dependent diabetes mellitus. N Engl JMed 1993;329:977–986
8. Chaturvedi N, Fuller JH; EURODIAB IDDM Complications Study Group.Glycosylated hemoglobin and the risk of microalbuminuria in insulin-dependent diabetes mellitus. N Engl J Med 1995;333:940–941
9. American Diabetes Association. Standards of medical care in diabetes—2010. Diabetes Care 2010;33(Suppl. 1):S11–S61
10. K/DOQI clinical practice guidelines for cardiovascular disease in dialysispatients. Am J Kidney Dis 2005;45(Suppl. 3):S46–S48
11. Williams ME, Lacson E Jr, Teng M, Ofsthun N, Lazarus JM. Hemodialyzedtype I and type II diabetic patients in the US: characteristics, glycemiccontrol, and survival. Kidney Int 2006;70:1503–1509
12. Feldt-Rasmussen B. Is there a need to optimize glycemic control in he-modialyzed diabetic patients? Kidney Int 2006;70:1392–1394
13. KDOQI Clinical Practice Guidelines and Clinical Practice Recommendationsfor Diabetes and Chronic Kidney Disease. Am J Kidney Dis 2007;49:S12–S154
14. Rubenstein AH, Mako ME, Horwitz DL. Insulin and the kidney. Nephron1975;15:306–326
15. Ly J, Marticorena R, Donnelly S. Red blood cell survival in chronic renalfailure. Am J Kidney Dis 2004;44:715–719
16. Gerstein HC, Miller ME, Byington RP, et al.; Action to Control Cardio-vascular Risk in Diabetes Study Group. Effects of intensive glucose low-ering in type 2 diabetes. N Engl J Med 2008;358:2545–2559
17. Patel A, MacMahon S, Chalmers J, et al.; ADVANCE Collaborative Group.Intensive blood glucose control and vascular outcomes in patients withtype 2 diabetes. N Engl J Med 2008;358:2560–2572
18. Duckworth W, Abraira C, Moritz T, et al.; VADT Investigators. Glucosecontrol and vascular complications in veterans with type 2 diabetes.N Engl J Med 2009;360:129–139
19. Skyler JS, Bergenstal R, Bonow RO, et al.; American Diabetes Association;American College of Cardiology Foundation; American Heart Association.Intensive glycemic control and the prevention of cardiovascular events:implications of the ACCORD, ADVANCE, and VA Diabetes Trials: a posi-tion statement of the American Diabetes Association and a ScientificStatement of the American College of Cardiology Foundation and theAmerican Heart Association. J Am Coll Cardiol 2009;53:298–304
20. Ix JH. Hemoglobin A1C in hemodialysis patients: should one size fit all?Clin J Am Soc Nephrol 2010;5:1539–1541
21. Williams ME, Lacson E Jr, Wang W, Lazarus JM, Hakim R. Glycemiccontrol and extended hemodialysis survival in patients with diabetesmellitus: comparative results of traditional and time-dependent Cox modelanalyses. Clin J Am Soc Nephrol 2010;5:1595–1601
22. Shurraw S, Majumdar SR, Thadhani R, Wiebe N, Tonelli M; Alberta KidneyDisease Network. Glycemic control and the risk of death in 1,484 patientsreceiving maintenance hemodialysis. Am J Kidney Dis 2010;55:875–884
23. Kalantar-Zadeh K, Kopple JD, Regidor DL, et al. A1C and survival inmaintenance hemodialysis patients. Diabetes Care 2007;30:1049–1055
24. Molnar MZ, Streja E, Kovesdy CP, et al. High platelet count as a link be-tween renal cachexia and cardiovascular mortality in end-stage renaldisease patients. Am J Clin Nutr 2011;94:945–954
25. Ricks J, Molnar MZ, Kovesdy CP, et al. Racial and ethnic differences in theassociation of body mass index and survival in maintenance hemodialysispatients. Am J Kidney Dis 2011;58:574–582
26. Streja E, Kovesdy CP, Molnar MZ, et al. Role of nutritional status and in-flammation in higher survival of African American and Hispanic hemodi-alysis patients. Am J Kidney Dis 2011;57:883–893
27. Rattanasompattikul M, Feroze U, Molnar MZ, et al. Charlson comorbidityscore is a strong predictor of mortality in hemodialysis patients. Int UrolNephrol. 30 November 2011 [Epub ahead of print]
28. Kilpatrick RD, McAllister CJ, Kovesdy CP, Derose SF, Kopple JD,Kalantar-Zadeh K. Association between serum lipids and survival in he-modialysis patients and impact of race. J Am Soc Nephrol 2007;18:293–303
29. Wu MS, Yu CC, Yang CW, et al. Poor pre-dialysis glycaemic control isa predictor of mortality in type II diabetic patients on maintenance hae-modialysis. Nephrol Dial Transplant 1997;12:2105–2110
30. Sturm G, Lamina C, Zitt E, et al. Association of HbA1C values with mor-tality and cardiovascular events in diabetic dialysis patients. The INVORstudy and review of the literature. PLoS ONE 2011;6:e20093
31. Kovesdy CP, Park JC, Kalantar-Zadeh K. Glycemic control and burnt-outdiabetes in ESRD. Semin Dial 2010;23:148–156
32. Kalantar-Zadeh K, Derose SF, Nicholas S, Benner D, Sharma K, Kovesdy CP.Burnt-out diabetes: impact of chronic kidney disease progression on thenatural course of diabetes mellitus. J Ren Nutr 2009;19:33–37
33. Duong U, Mehrotra R, Molnar MZ, et al. Glycemic control and survival inperitoneal dialysis patients with diabetes mellitus. Clin J Am Soc Nephrol2011;6:1041–1048
34. Schwedler SB, Metzger T, Schinzel R, Wanner C. Advanced glycation endproducts and mortality in hemodialysis patients. Kidney Int 2002;62:301–310
35. Rambod M, Bross R, Zitterkoph J, et al. Association of Malnutrition-Inflammation Score with quality of life and mortality in hemodialysis pa-tients: a 5-year prospective cohort study. Am J Kidney Dis 2009;53:298–309
36. Longenecker JC, Coresh J, Klag MJ, et al. Validation of comorbid conditionson the end-stage renal disease medical evidence report: the CHOICE study.Choices for Healthy Outcomes in Caring for ESRD. J Am Soc Nephrol 2000;11:520–529
37. McMurray SD, Johnson G, Davis S, McDougall K. Diabetes education andcare management significantly improve patient outcomes in the dialysis unit.Am J Kidney Dis 2002;40:566–575
38. Freedman BI, Shenoy RN, Planer JA, et al. Comparison of glycated albu-min and hemoglobin A1C concentrations in diabetic subjects on peritonealand hemodialysis. Perit Dial Int 2010;30:72–79
J. RICKS AND ASSOCIATES
diabetes.diabetesjournals.org DIABETES, VOL. 61, MARCH 2012 715
Related Documents