Paintsville Utilities, Kentucky SECTION 7 – Forecasts of Flows and Waste Loads Combined Regional Wastewater Facility Plan ____________________________________________________________________________________________________________ 61 7.01 Current Flows and Waste Loads - Paintsville Wastewater Treatment Plant: As discussed in prior chapters of this report, the Paintsville WWTP located within the Paintsville City Limits currently receives and treats all of the wastewater from the City of Paintsville and some areas just outside the city limits. The plant’s design capacity is 0.99 MGD (million gallons per day). From data recorded on the plants 2010 Discharge Monitoring Reports (DMR), the following is the average flows observed at this facility: Average Daily Flow – 2010: 0.92 MGD From data recorded on the plants 2015 DMR’s, the following is the average flows observed at the facility for the first 11 months: Average Daily Flow – 2015: 0.99 MGD The excessive daily flow recorded is mostly due to excessive infiltration and inflow in the downtown collection system. In addition due to the layout of the plant, some plant recirculation flow (RAS from polishing clarifier and supernatant flow from sludge thickener) is measured as influent flow. As shown in Table 7.01, the maximum recorded daily flows are a result of infiltration and inflow and can exceed one million gallons per day during rainfall events. As of the writing of this facility plan, Paintsville Utilities has a project ready to bid to reduce infiltration and inflow in the downtown area by eliminating several known cross connections with the storm water collection system. Upon the completion of this project, the wet weather flow to the plant from I & I should be greatly reduced.

Welcome message from author
This document is posted to help you gain knowledge. Please leave a comment to let me know what you think about it! Share it to your friends and learn new things together.
Transcript
Paintsville Utilities, Kentucky SECTION 7 – Forecasts of Flows and Waste Loads Combined Regional Wastewater Facility Plan ____________________________________________________________________________________________________________
61
7.01 Current Flows and Waste Loads - Paintsville Wastewater Treatment Plant:
As discussed in prior chapters of this report, the Paintsville WWTP located within the
Paintsville City Limits currently receives and treats all of the wastewater from the City of
Paintsville and some areas just outside the city limits. The plant’s design capacity is
0.99 MGD (million gallons per day). From data recorded on the plants 2010 Discharge
Monitoring Reports (DMR), the following is the average flows observed at this facility:
Average Daily Flow – 2010: 0.92 MGD
From data recorded on the plants 2015 DMR’s, the following is the average flows
observed at the facility for the first 11 months:
Average Daily Flow – 2015: 0.99 MGD
The excessive daily flow recorded is mostly due to excessive infiltration and inflow in the
downtown collection system. In addition due to the layout of the plant, some plant
recirculation flow (RAS from polishing clarifier and supernatant flow from sludge
thickener) is measured as influent flow. As shown in Table 7.01, the maximum
recorded daily flows are a result of infiltration and inflow and can exceed one million
gallons per day during rainfall events. As of the writing of this facility plan, Paintsville
Utilities has a project ready to bid to reduce infiltration and inflow in the downtown area
by eliminating several known cross connections with the storm water collection system.
Upon the completion of this project, the wet weather flow to the plant from I & I should
be greatly reduced.
Paintsville Utilities, Kentucky SECTION 7 – Forecasts of Flows and Waste Loads Combined Regional Wastewater Facility Plan ____________________________________________________________________________________________________________
62
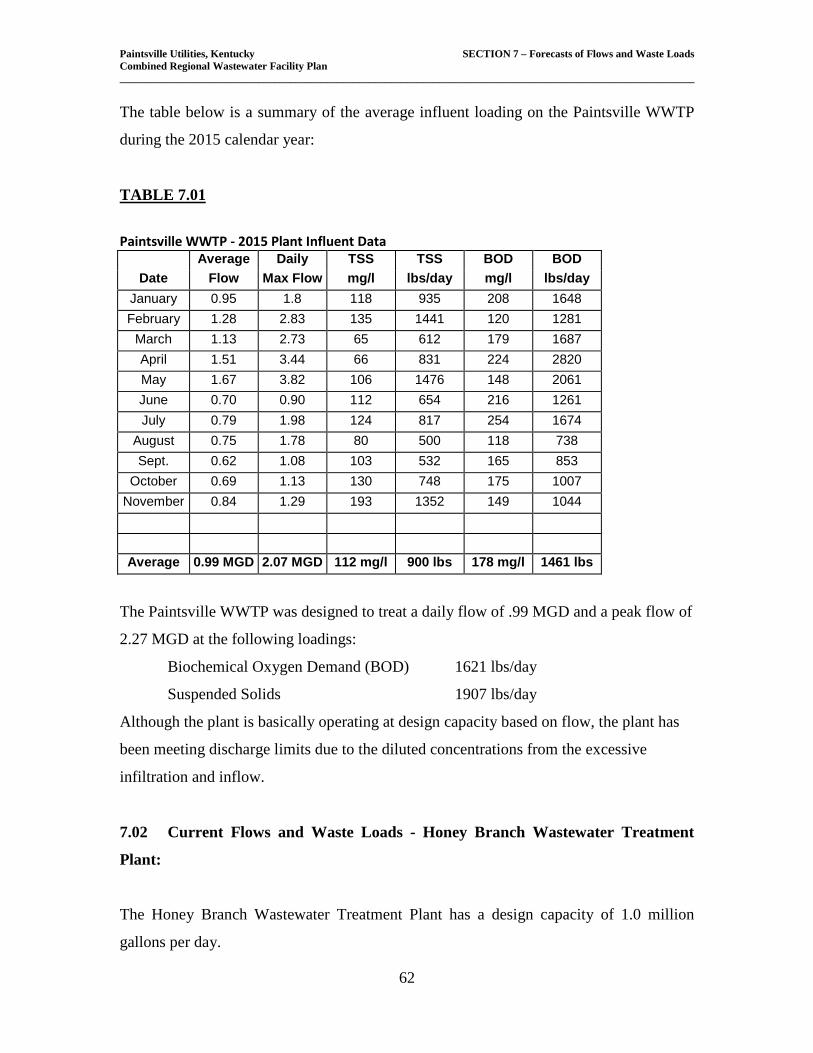
The table below is a summary of the average influent loading on the Paintsville WWTP
during the 2015 calendar year:
TABLE 7.01
Paintsville WWTP - 2015 Plant Influent Data
Average Daily TSS TSS BOD BOD Date Flow Max Flow mg/l lbs/day mg/l lbs/day
January 0.95 1.8 118 935 208 1648 February 1.28 2.83 135 1441 120 1281
March 1.13 2.73 65 612 179 1687 April 1.51 3.44 66 831 224 2820 May 1.67 3.82 106 1476 148 2061 June 0.70 0.90 112 654 216 1261 July 0.79 1.98 124 817 254 1674
August 0.75 1.78 80 500 118 738 Sept. 0.62 1.08 103 532 165 853
October 0.69 1.13 130 748 175 1007 November 0.84 1.29 193 1352 149 1044
Average 0.99 MGD 2.07 MGD 112 mg/l 900 lbs 178 mg/l 1461 lbs
The Paintsville WWTP was designed to treat a daily flow of .99 MGD and a peak flow of
2.27 MGD at the following loadings:
Biochemical Oxygen Demand (BOD) 1621 lbs/day
Suspended Solids 1907 lbs/day
Although the plant is basically operating at design capacity based on flow, the plant has
been meeting discharge limits due to the diluted concentrations from the excessive
infiltration and inflow.
7.02 Current Flows and Waste Loads - Honey Branch Wastewater Treatment
Plant:
The Honey Branch Wastewater Treatment Plant has a design capacity of 1.0 million
gallons per day.
Paintsville Utilities, Kentucky SECTION 7 – Forecasts of Flows and Waste Loads Combined Regional Wastewater Facility Plan ____________________________________________________________________________________________________________
63
The Honey Branch Wastewater Treatment Plant currently receives and treats wastewater
from communities in the planning area that include a Federal Bureau of Prisons facility,
United States Penitentiary (USP) Big Sandy that houses approximately 1,000 high-
security inmates. Communities currently being served by the Honey Branch WWTP
include the unincorporated yet developed areas of West Van Lear, Auxier in Floyd
County, Richmond Hills, and Paradise Valley. Also being currently served by the Honey
Branch WWTP are American Standard Manufacturing Plant, Porter Elem. School, Honey
Branch Industrial Park, Thunder Ridge Race Tract and the Dewey Dam Recreational
Area.
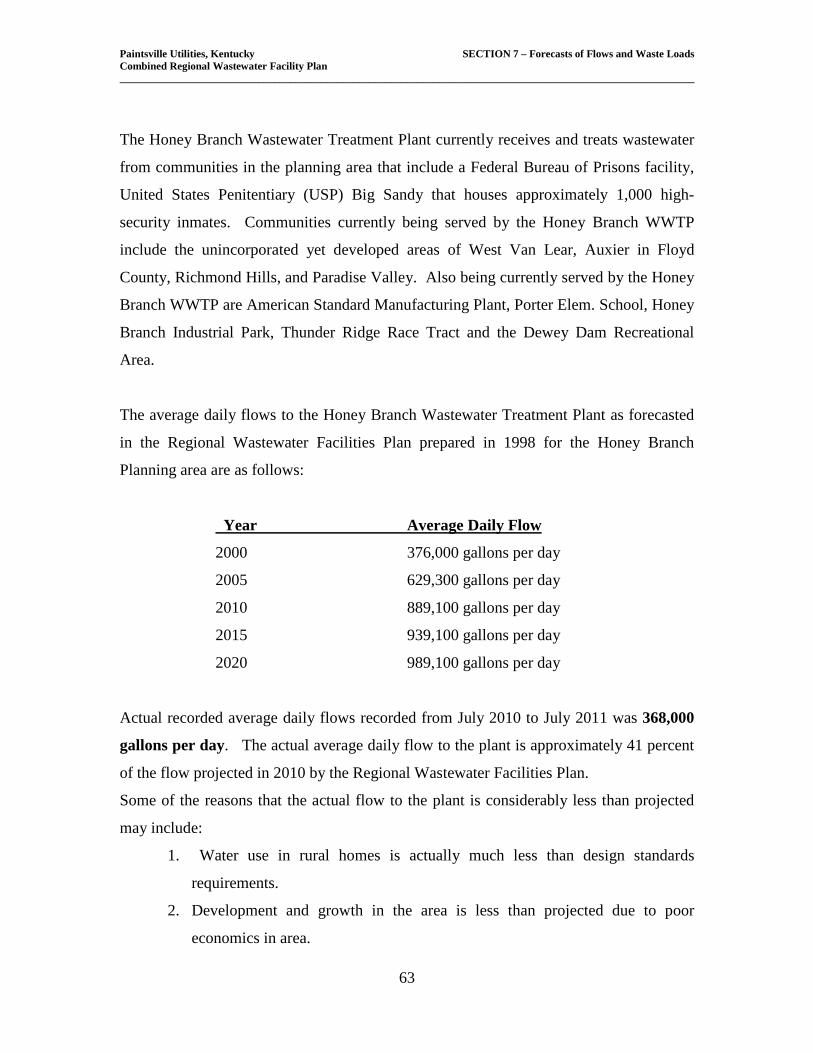
The average daily flows to the Honey Branch Wastewater Treatment Plant as forecasted
in the Regional Wastewater Facilities Plan prepared in 1998 for the Honey Branch
Planning area are as follows:
Year Average Daily Flow
2000 376,000 gallons per day
2005 629,300 gallons per day
2010 889,100 gallons per day
2015 939,100 gallons per day
2020 989,100 gallons per day
Actual recorded average daily flows recorded from July 2010 to July 2011 was 368,000
gallons per day. The actual average daily flow to the plant is approximately 41 percent
of the flow projected in 2010 by the Regional Wastewater Facilities Plan.
Some of the reasons that the actual flow to the plant is considerably less than projected
may include:
1. Water use in rural homes is actually much less than design standards
requirements.
2. Development and growth in the area is less than projected due to poor
economics in area.
Paintsville Utilities, Kentucky SECTION 7 – Forecasts of Flows and Waste Loads Combined Regional Wastewater Facility Plan ____________________________________________________________________________________________________________
64
3. Recorded water usage at the Federal Prison is approximately 100,000 gallons
per day less than predicted in the Regional Facilities Plan.
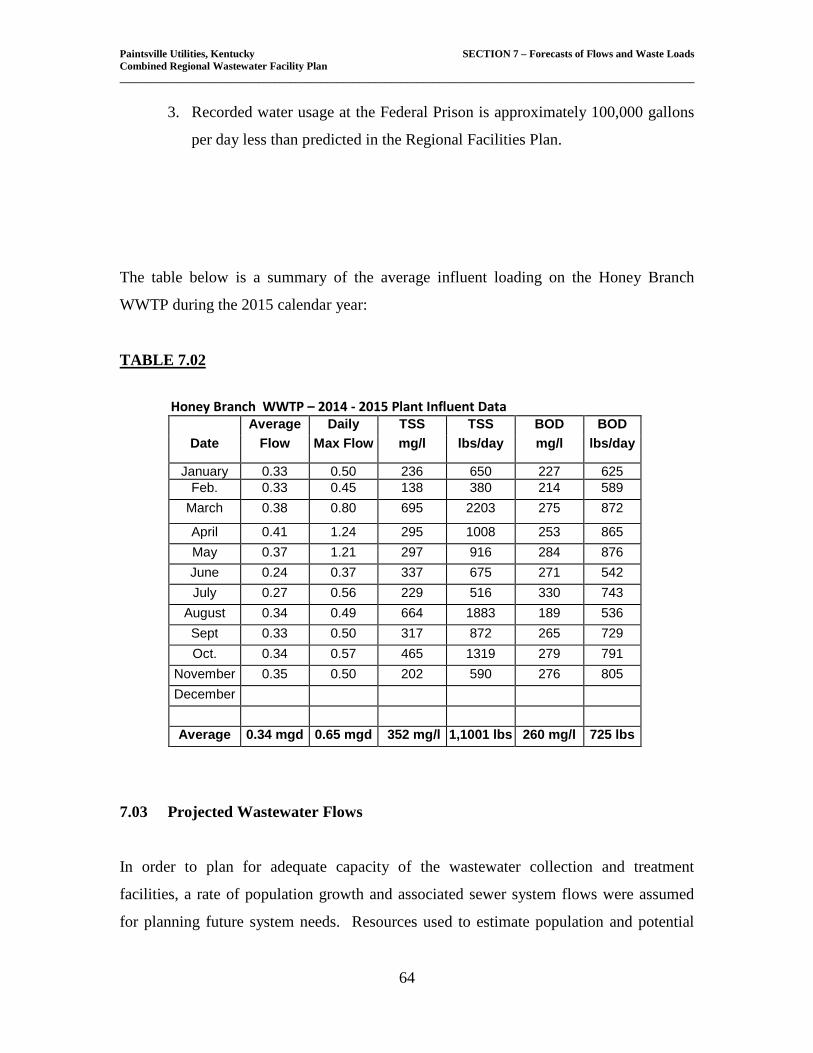
The table below is a summary of the average influent loading on the Honey Branch
WWTP during the 2015 calendar year:
TABLE 7.02
Honey Branch WWTP – 2014 - 2015 Plant Influent Data
Average Daily TSS TSS BOD BOD Date Flow Max Flow mg/l lbs/day mg/l lbs/day
January 0.33 0.50 236 650 227 625 Feb. 0.33 0.45 138 380 214 589
March 0.38 0.80 695 2203 275 872
April 0.41 1.24 295 1008 253 865 May 0.37 1.21 297 916 284 876 June 0.24 0.37 337 675 271 542 July 0.27 0.56 229 516 330 743
August 0.34 0.49 664 1883 189 536 Sept 0.33 0.50 317 872 265 729 Oct. 0.34 0.57 465 1319 279 791
November 0.35 0.50 202 590 276 805 December
Average 0.34 mgd 0.65 mgd 352 mg/l 1,1001 lbs 260 mg/l 725 lbs
7.03 Projected Wastewater Flows
In order to plan for adequate capacity of the wastewater collection and treatment
facilities, a rate of population growth and associated sewer system flows were assumed
for planning future system needs. Resources used to estimate population and potential
Paintsville Utilities, Kentucky SECTION 7 – Forecasts of Flows and Waste Loads Combined Regional Wastewater Facility Plan ____________________________________________________________________________________________________________
65
growth rates in the planning area include publications from the University of Louisville,
KSDC, the U.S. Department of Commerce Bureau of the Census, and Johnson County
representatives. These are detailed in Section 4 of this document.
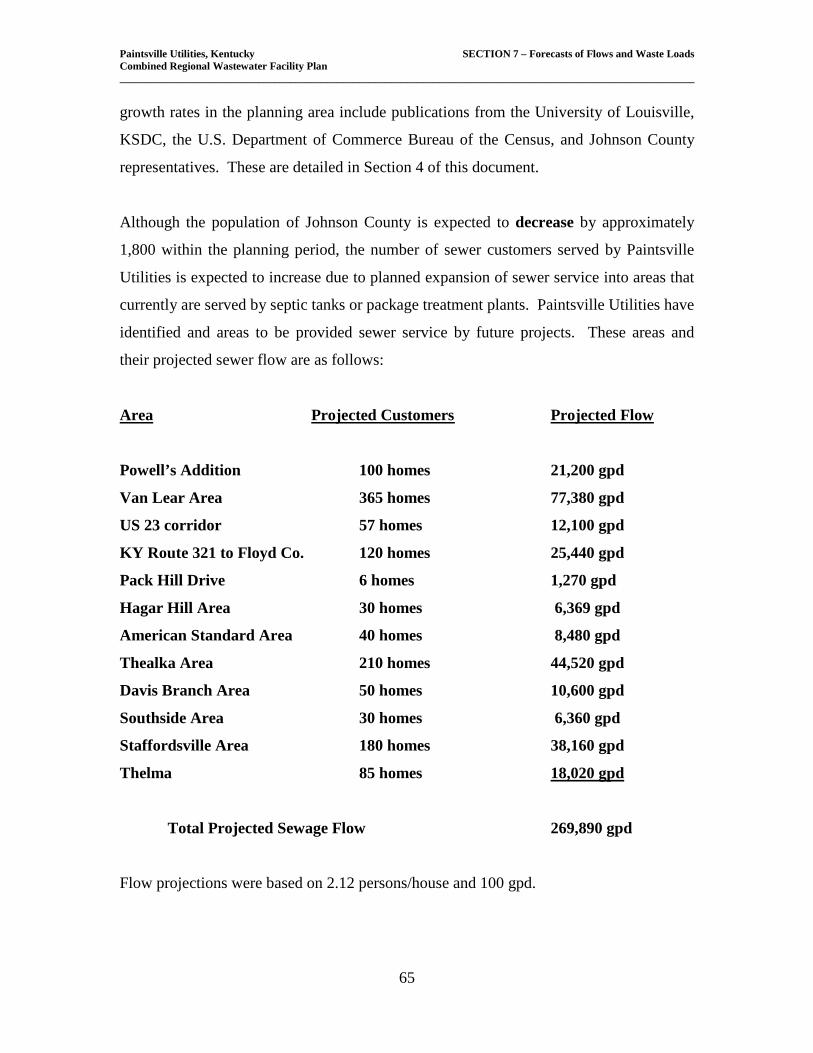
Although the population of Johnson County is expected to decrease by approximately
1,800 within the planning period, the number of sewer customers served by Paintsville
Utilities is expected to increase due to planned expansion of sewer service into areas that
currently are served by septic tanks or package treatment plants. Paintsville Utilities have
identified and areas to be provided sewer service by future projects. These areas and
their projected sewer flow are as follows:
Area Projected Customers Projected Flow
Powell’s Addition 100 homes 21,200 gpd
Van Lear Area 365 homes 77,380 gpd
US 23 corridor 57 homes 12,100 gpd
KY Route 321 to Floyd Co. 120 homes 25,440 gpd
Pack Hill Drive 6 homes 1,270 gpd
Hagar Hill Area 30 homes 6,369 gpd
American Standard Area 40 homes 8,480 gpd
Thealka Area 210 homes 44,520 gpd
Davis Branch Area 50 homes 10,600 gpd
Southside Area 30 homes 6,360 gpd
Staffordsville Area 180 homes 38,160 gpd
Thelma 85 homes 18,020 gpd
Total Projected Sewage Flow 269,890 gpd
Flow projections were based on 2.12 persons/house and 100 gpd.
Paintsville Utilities, Kentucky SECTION 7 – Forecasts of Flows and Waste Loads Combined Regional Wastewater Facility Plan ____________________________________________________________________________________________________________
66
Currently Paintsville Utilities serves approximately 2600 sewer customers. This total
includes approximately 350 commercial users. Over the past 3 years the number of
sewer customers has increased by approximately 126 customers. This increase was
mostly due to the completion of a project that eliminated package treatment plants in the
communities of Preston Estates, Paradise Village, Richmond Hills, Burkshire, and
Woodland Estates.
Paintsville Utilities, Kentucky SECTION 7 – Forecasts of Flows and Waste Loads Combined Regional Wastewater Facility Plan ____________________________________________________________________________________________________________
67
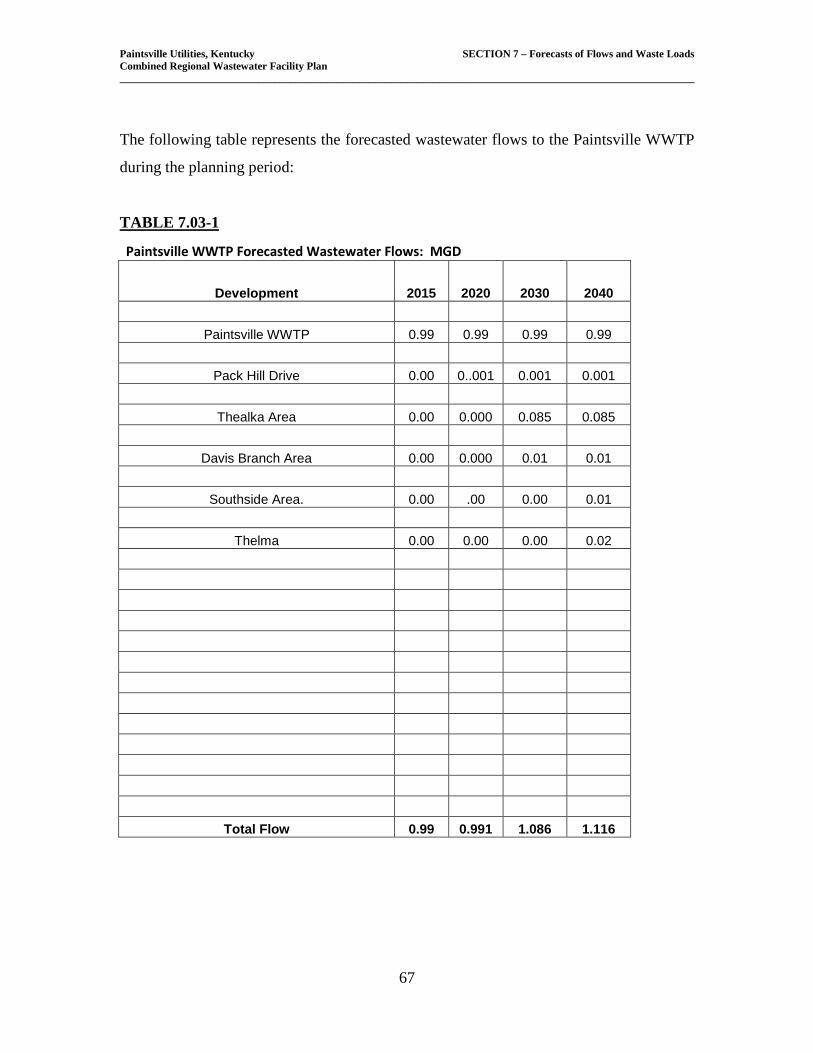
The following table represents the forecasted wastewater flows to the Paintsville WWTP
during the planning period:
TABLE 7.03-1
Paintsville WWTP Forecasted Wastewater Flows: MGD
Development 2015 2020 2030 2040
Paintsville WWTP 0.99 0.99 0.99 0.99
Pack Hill Drive 0.00 0..001 0.001 0.001
Thealka Area 0.00 0.000 0.085 0.085
Davis Branch Area 0.00 0.000 0.01 0.01
Southside Area. 0.00 .00 0.00 0.01
Thelma 0.00 0.00 0.00 0.02
Total Flow 0.99 0.991 1.086 1.116
Paintsville Utilities, Kentucky SECTION 7 – Forecasts of Flows and Waste Loads Combined Regional Wastewater Facility Plan ____________________________________________________________________________________________________________
68
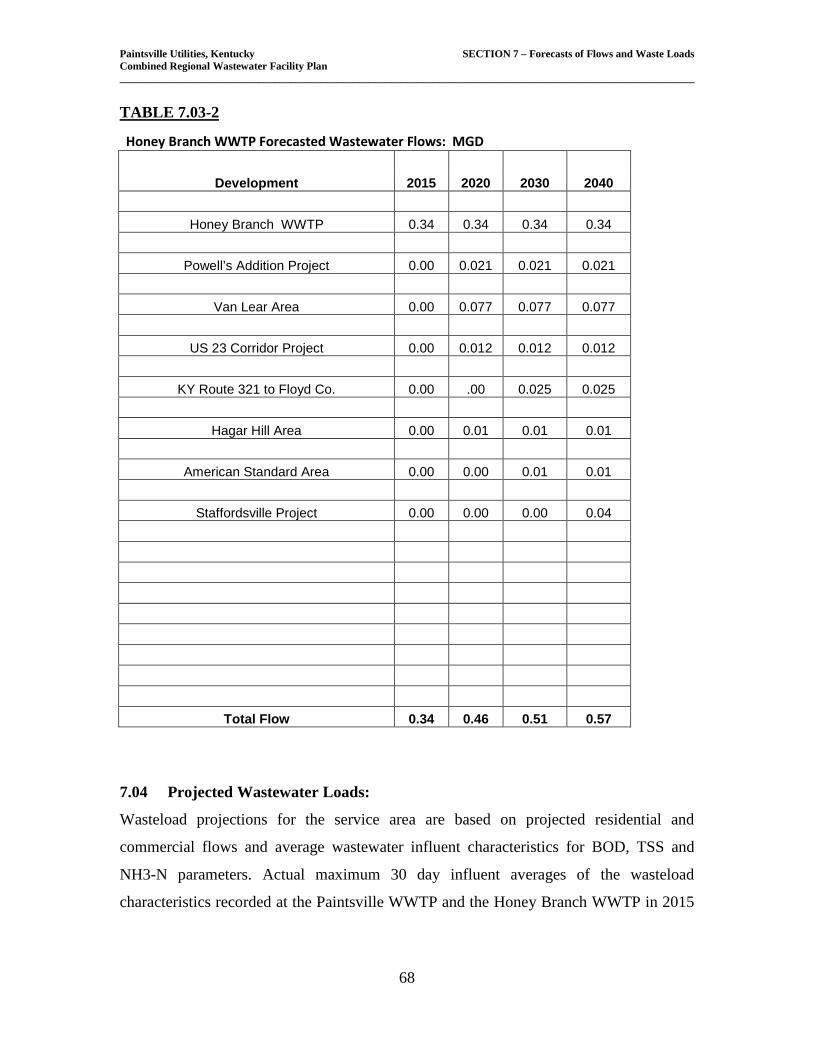
TABLE 7.03-2
Honey Branch WWTP Forecasted Wastewater Flows: MGD
Development 2015 2020 2030 2040
Honey Branch WWTP 0.34 0.34 0.34 0.34
Powell’s Addition Project 0.00 0.021 0.021 0.021
Van Lear Area 0.00 0.077 0.077 0.077
US 23 Corridor Project 0.00 0.012 0.012 0.012
KY Route 321 to Floyd Co. 0.00 .00 0.025 0.025
Hagar Hill Area 0.00 0.01 0.01 0.01
American Standard Area 0.00 0.00 0.01 0.01
Staffordsville Project 0.00 0.00 0.00 0.04
Total Flow 0.34 0.46 0.51 0.57
7.04 Projected Wastewater Loads:
Wasteload projections for the service area are based on projected residential and
commercial flows and average wastewater influent characteristics for BOD, TSS and
NH3-N parameters. Actual maximum 30 day influent averages of the wasteload
characteristics recorded at the Paintsville WWTP and the Honey Branch WWTP in 2015
Paintsville Utilities, Kentucky SECTION 7 – Forecasts of Flows and Waste Loads Combined Regional Wastewater Facility Plan ____________________________________________________________________________________________________________
69
are used as the basis for projections and are shown in the tables in Section 7.01 and
Section 7.02.
The Paintsville WWTP had the following maximum 30-day averages: BOD- 254 mg/l
and TSS – 193 mg/l. The Honey Branch WWTP had the following maximum 30-day
averages: BOD – 330 mg/l and TSS – 695 mg/l. The higher concentrations for the
Honey Branch WWTP are likely a result of discharge at the federal prison. It is well
documented that wastewater from prisons are generally of higher strength in terms of
BOD and TSS than typical domestic wastewater. A higher concentration will be used
for the projected flows from the prison in the load calculations for the proposed upgrade.
The future influent wasteload projections were calculated by multiplying 0.22 pounds per
capita day (ppcd) by population for BOD and 0.25 ppcd by the population for TSS.
Paintsville Utilities, Kentucky SECTION 7 – Forecasts of Flows and Waste Loads Combined Regional Wastewater Facility Plan ____________________________________________________________________________________________________________
70
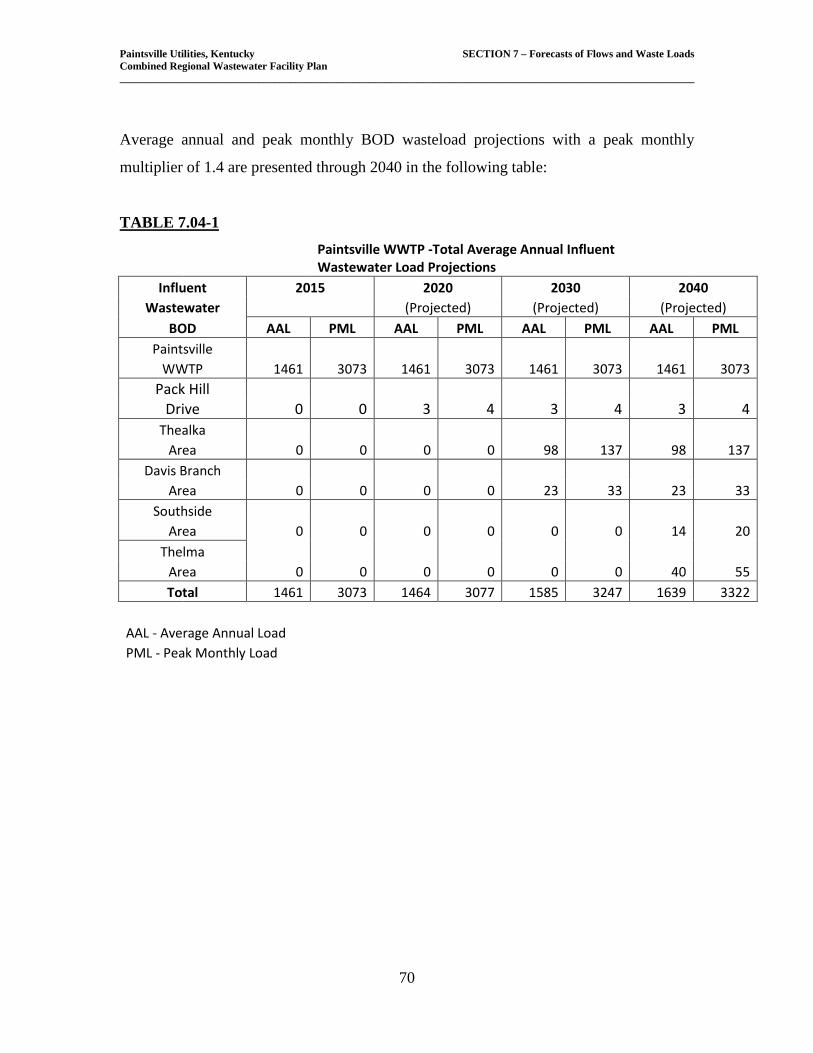
Average annual and peak monthly BOD wasteload projections with a peak monthly
multiplier of 1.4 are presented through 2040 in the following table:
TABLE 7.04-1
Paintsville WWTP -Total Average Annual Influent Wastewater Load Projections
Influent 2015 2020 2030 2040 Wastewater (Projected) (Projected) (Projected)
BOD AAL PML AAL PML AAL PML AAL PML Paintsville
WWTP 1461 3073 1461 3073 1461 3073 1461 3073 Pack Hill
Drive 0 0 3 4 3 4 3 4 Thealka
Area 0 0 0 0 98 137 98 137 Davis Branch
Area 0 0 0 0 23 33 23 33 Southside
Area 0 0 0 0 0 0 14 20 Thelma
Area 0 0 0 0 0 0 40 55 Total 1461 3073 1464 3077 1585 3247 1639 3322
AAL - Average Annual Load PML - Peak Monthly Load
Paintsville Utilities, Kentucky SECTION 7 – Forecasts of Flows and Waste Loads Combined Regional Wastewater Facility Plan ____________________________________________________________________________________________________________
71
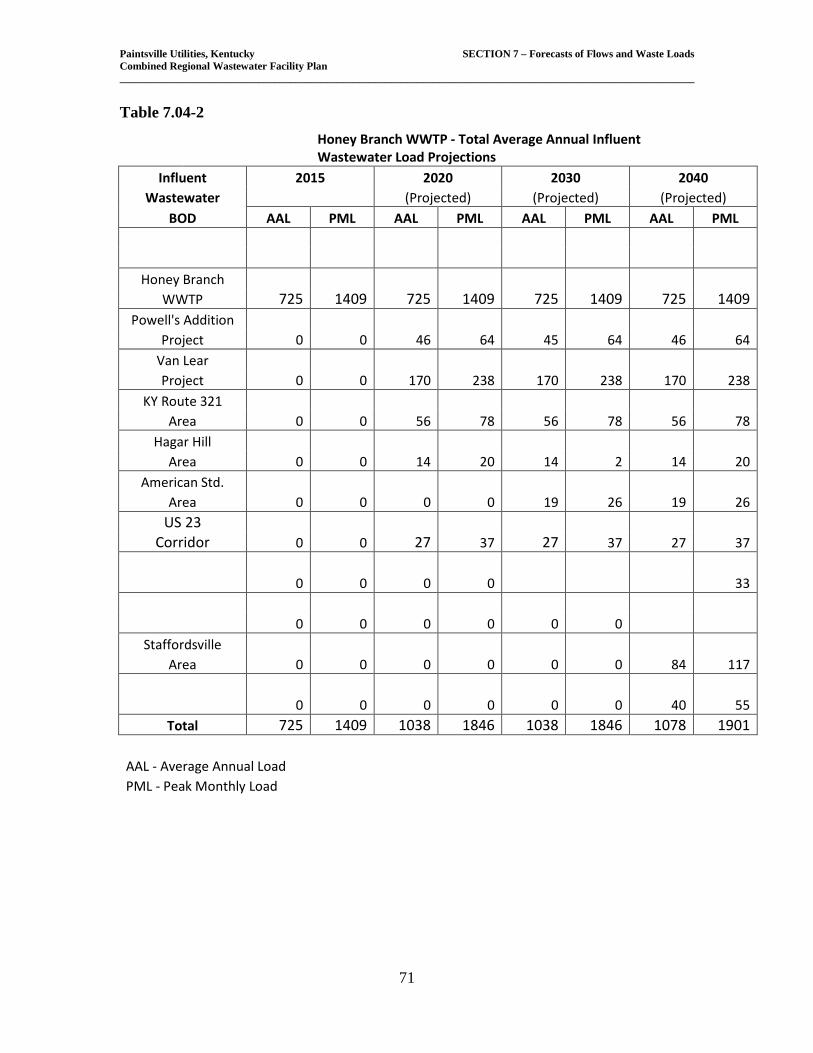
Table 7.04-2
Honey Branch WWTP - Total Average Annual Influent Wastewater Load Projections
Influent 2015 2020 2030 2040 Wastewater (Projected) (Projected) (Projected)
BOD AAL PML AAL PML AAL PML AAL PML
Honey Branch WWTP 725 1409 725 1409 725 1409 725 1409
Powell's Addition Project 0 0 46 64 45 64 46 64
Van Lear Project 0 0 170 238 170 238 170 238
KY Route 321 Area 0 0 56 78 56 78 56 78
Hagar Hill Area 0 0 14 20 14 2 14 20
American Std. Area 0 0 0 0 19 26 19 26
US 23 Corridor 0 0 27 37 27 37 27 37
0 0 0 0
33
0 0 0 0 0 0
Staffordsville Area 0 0 0 0 0 0 84 117
0 0 0 0 0 0 40 55
Total 725 1409 1038 1846 1038 1846 1078 1901
AAL - Average Annual Load PML - Peak Monthly Load
Paintsville Utilities, Kentucky SECTION 7 – Forecasts of Flows and Waste Loads Combined Regional Wastewater Facility Plan ____________________________________________________________________________________________________________
72
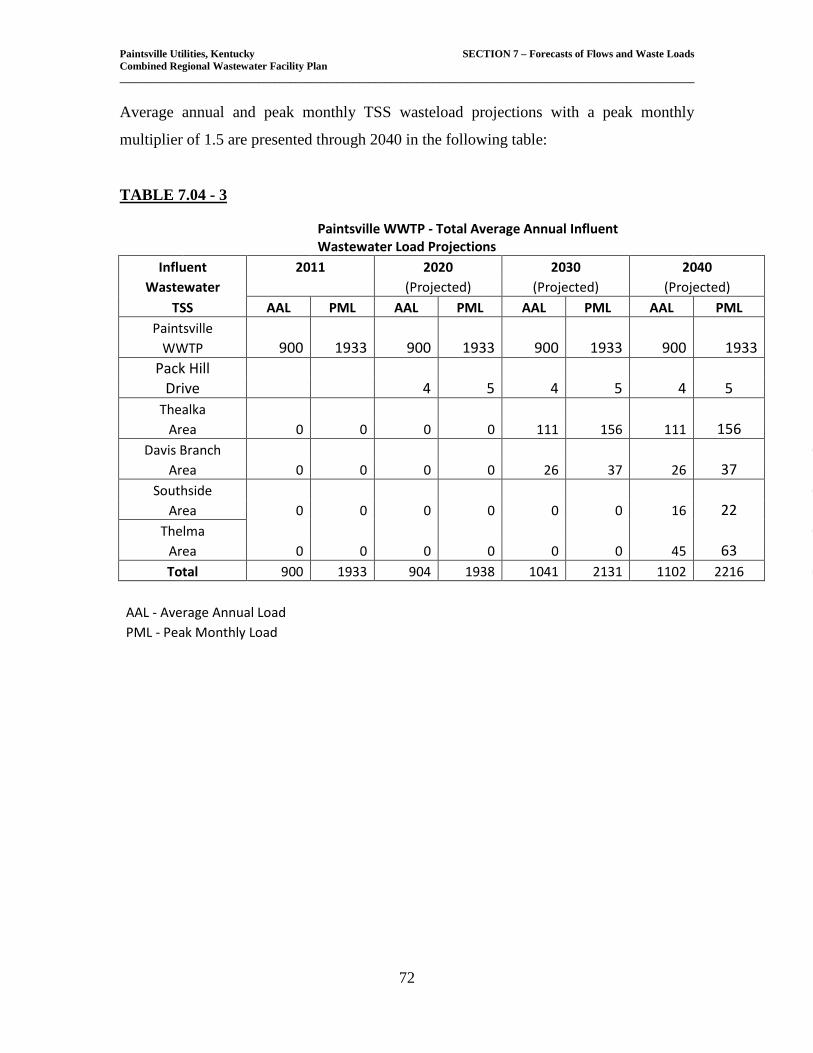
Average annual and peak monthly TSS wasteload projections with a peak monthly
multiplier of 1.5 are presented through 2040 in the following table:
TABLE 7.04 - 3
Paintsville WWTP - Total Average Annual Influent Wastewater Load Projections
Influent 2011 2020 2030 2040 Wastewater (Projected) (Projected) (Projected)
TSS AAL PML AAL PML AAL PML AAL PML Paintsville
WWTP 900 1933 900 1933 900 1933 900 1933 Pack Hill
Drive
4 5 4 5 4 5 Thealka
Area 0 0 0 0 111 156 111 156 Davis Branch
0
Area 0 0 0 0 26 37 26 37 Southside
0
Area 0 0 0 0 0 0 16 22 Thelma
0
Area 0 0 0 0 0 0 45 63 Total 900 1933 904 1938 1041 2131 1102 2216 0
AAL - Average Annual Load PML - Peak Monthly Load
Paintsville Utilities, Kentucky SECTION 7 – Forecasts of Flows and Waste Loads Combined Regional Wastewater Facility Plan ____________________________________________________________________________________________________________
73
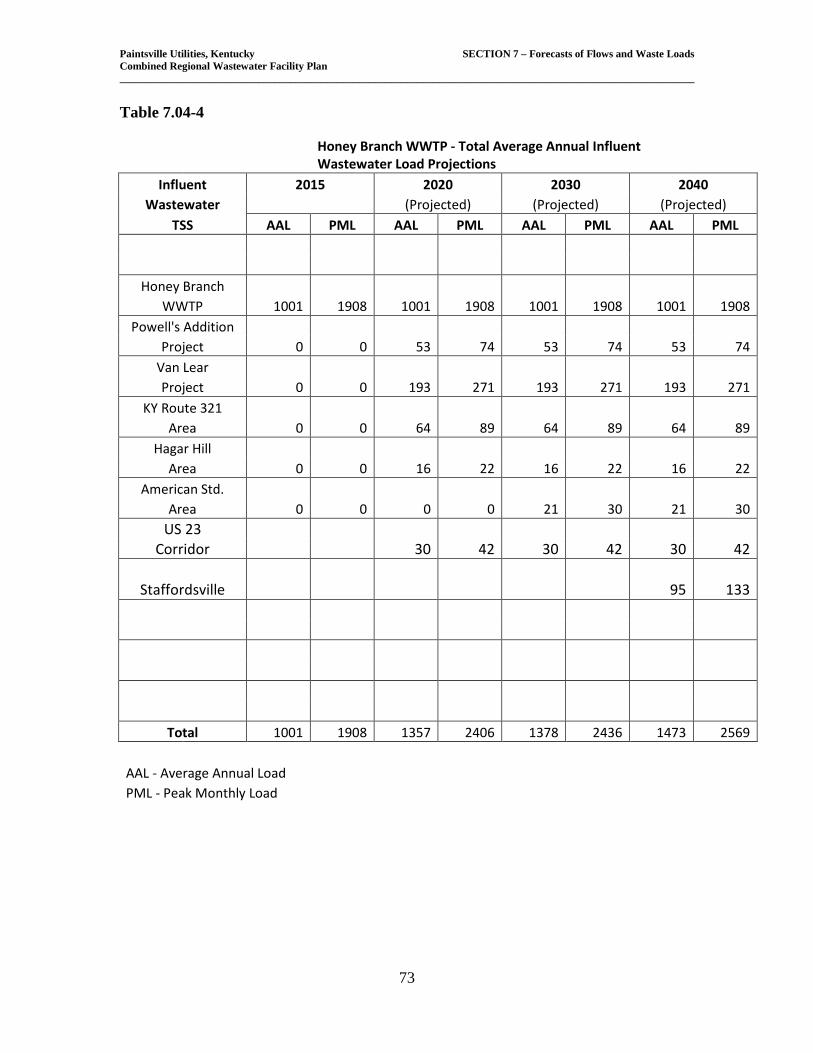
Table 7.04-4
Honey Branch WWTP - Total Average Annual Influent Wastewater Load Projections
Influent 2015 2020 2030 2040 Wastewater (Projected) (Projected) (Projected)
TSS AAL PML AAL PML AAL PML AAL PML
Honey Branch
WWTP 1001 1908 1001 1908 1001 1908 1001 1908 Powell's Addition
Project 0 0 53 74 53 74 53 74 Van Lear Project 0 0 193 271 193 271 193 271
KY Route 321 Area 0 0 64 89 64 89 64 89
Hagar Hill Area 0 0 16 22 16 22 16 22
American Std. Area 0 0 0 0 21 30 21 30
US 23 Corridor
30 42 30 42 30 42
Staffordsville
95 133
Total 1001 1908 1357 2406 1378 2436 1473 2569
AAL - Average Annual Load PML - Peak Monthly Load
Paintsville Utilities, Kentucky SECTION 7 – Forecasts of Flows and Waste Loads Combined Regional Wastewater Facility Plan ____________________________________________________________________________________________________________
74
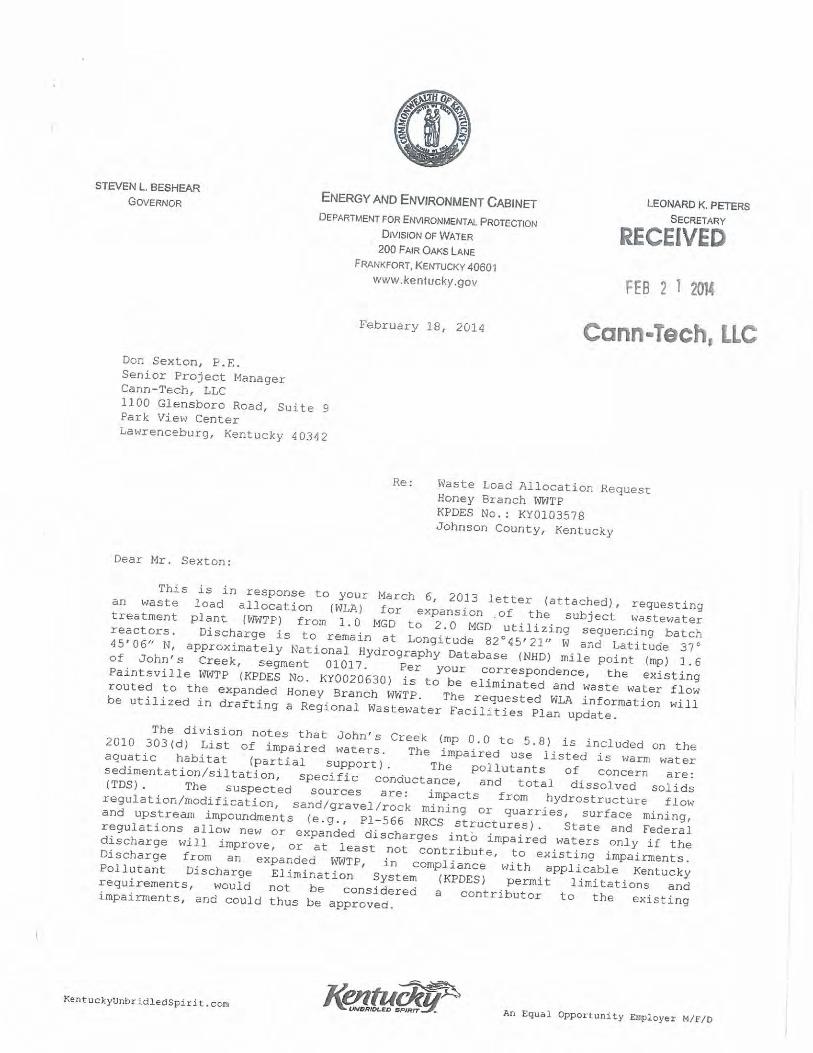
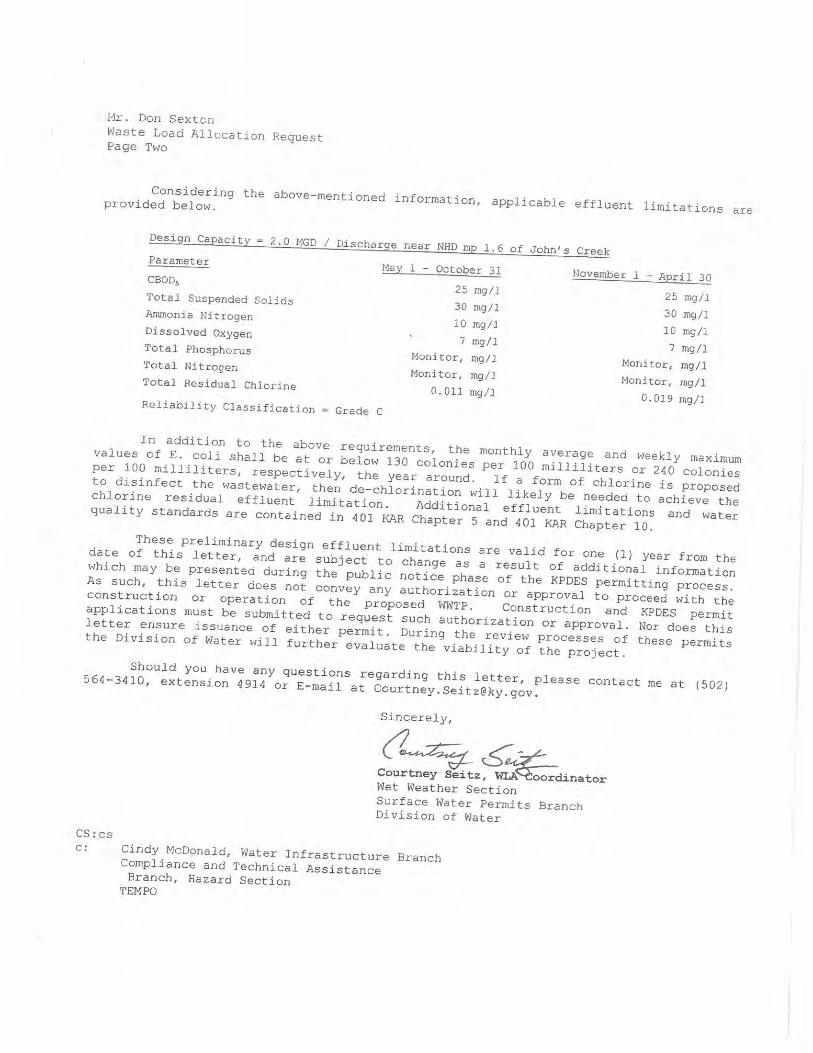
7.05 Projected Permit Limits and Wasteload Allocation
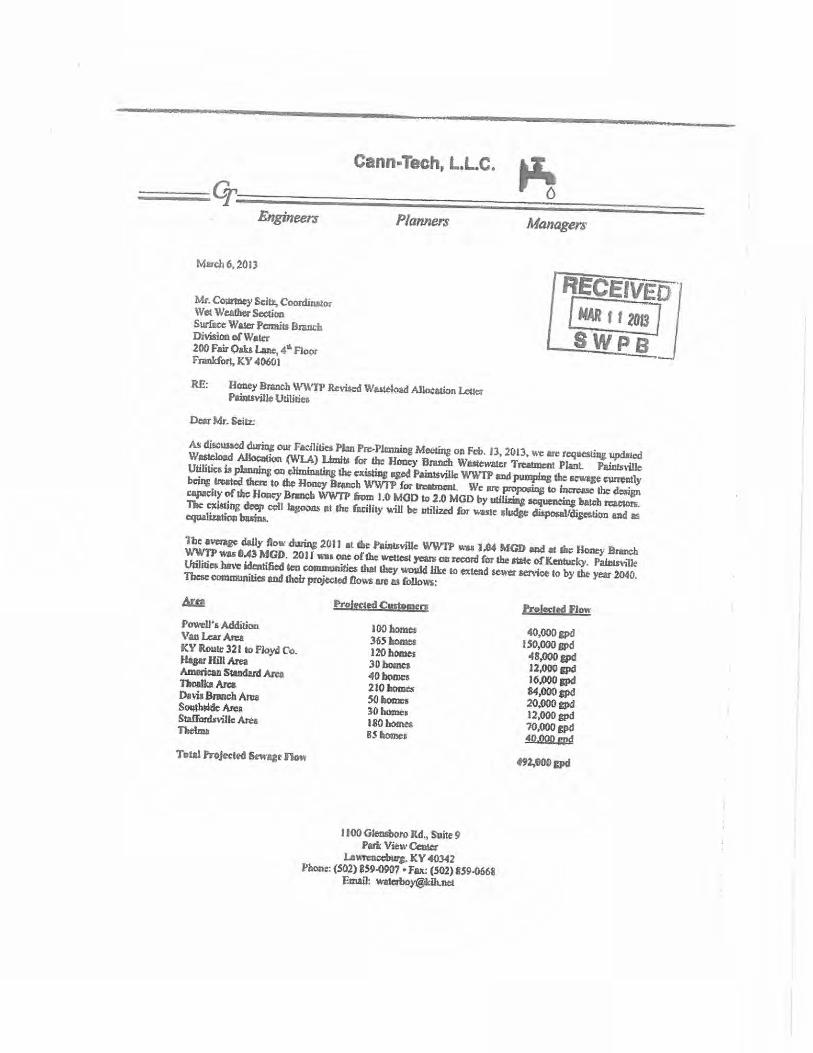
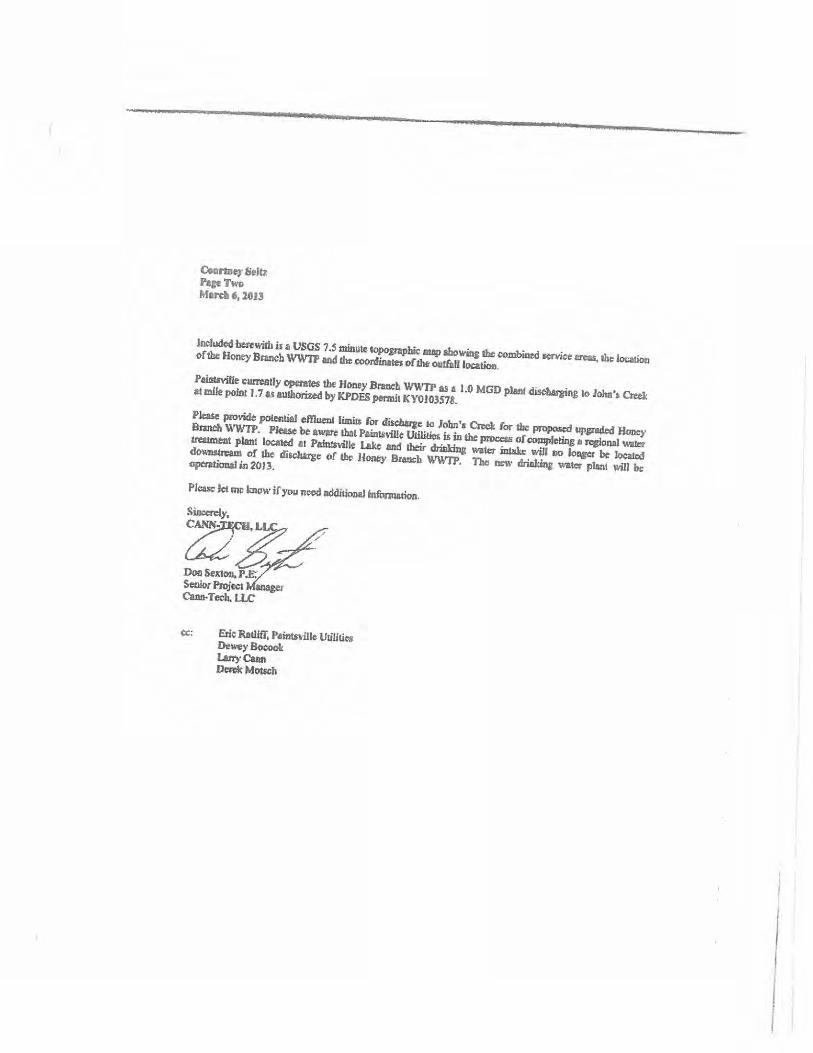
The Kentucky Division of Water was contacted in a letter dated March 6, 2013 regarding
a future discharge from the Honey Branch WWTP at mile point 1.7 into John’s Creek for
a treatment plant having a design capacity of 2.0 mgd. A response from KDOW was
received on Feb. 18, 2014. A copy of these letters is included in this section of this
document.
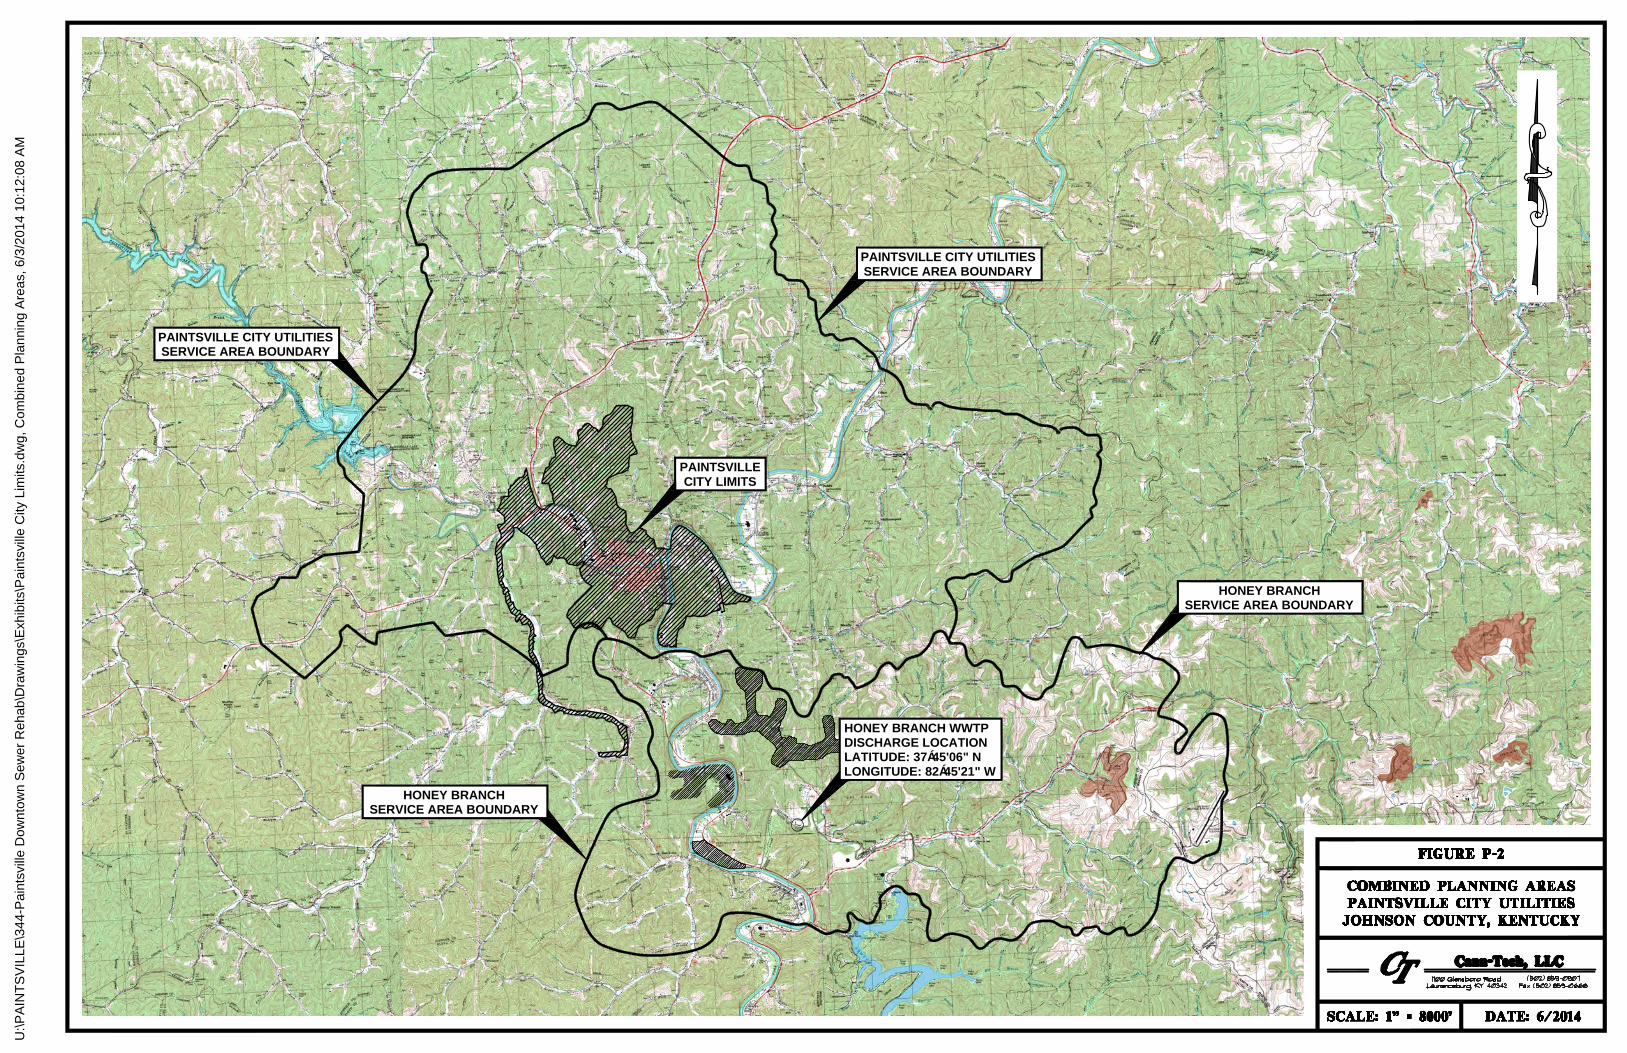
PAINTSVILLE CITY UTILITIESSERVICE AREA BOUNDARY
HONEY BRANCHSERVICE AREA BOUNDARY
PAINTSVILLE CITY UTILITIESSERVICE AREA BOUNDARY
HONEY BRANCHSERVICE AREA BOUNDARY
PAINTSVILLECITY LIMITS
HONEY BRANCH WWTPDISCHARGE LOCATIONLATITUDE: 37Á45'06" NLONGITUDE: 82Á45'21" W
U:\P
AIN
TS
VILLE
\344-P
aintsville D
ow
ntow
n S
ew
er R
ehab\D
raw
ings\E
xhibits\P
aintsville C
ity Lim
its.dw
g, C
om
bined P
lanning A
reas, 6/3/2014 10:12:08 A
M
Paintsville Utilities, Kentucky SECTION 8 – Evaluation of Alternates Combined Regional Wastewater Facilities Plan
81
8.0 General The primary purpose of this Facilities Plan is to determine the most cost-effective and
environmentally sound means of meeting the wastewater needs for the City of Paintsville.
The first step in this evaluation is to consider all applicable alternatives for Paintsville
with its two wastewater treatment plants. The first consideration would be whether to
remain a decentralized system or to combine into a regional facility. Options for these
will be evaluated including doing nothing.
8.10 No Action Alternative Due to Agreed Order set by the KDOW and EPA and the fact that the Paintsville WWTP
is operating near or at its rated capacity, the “No-Action” alternative will not be
considered as a part of this planning document.
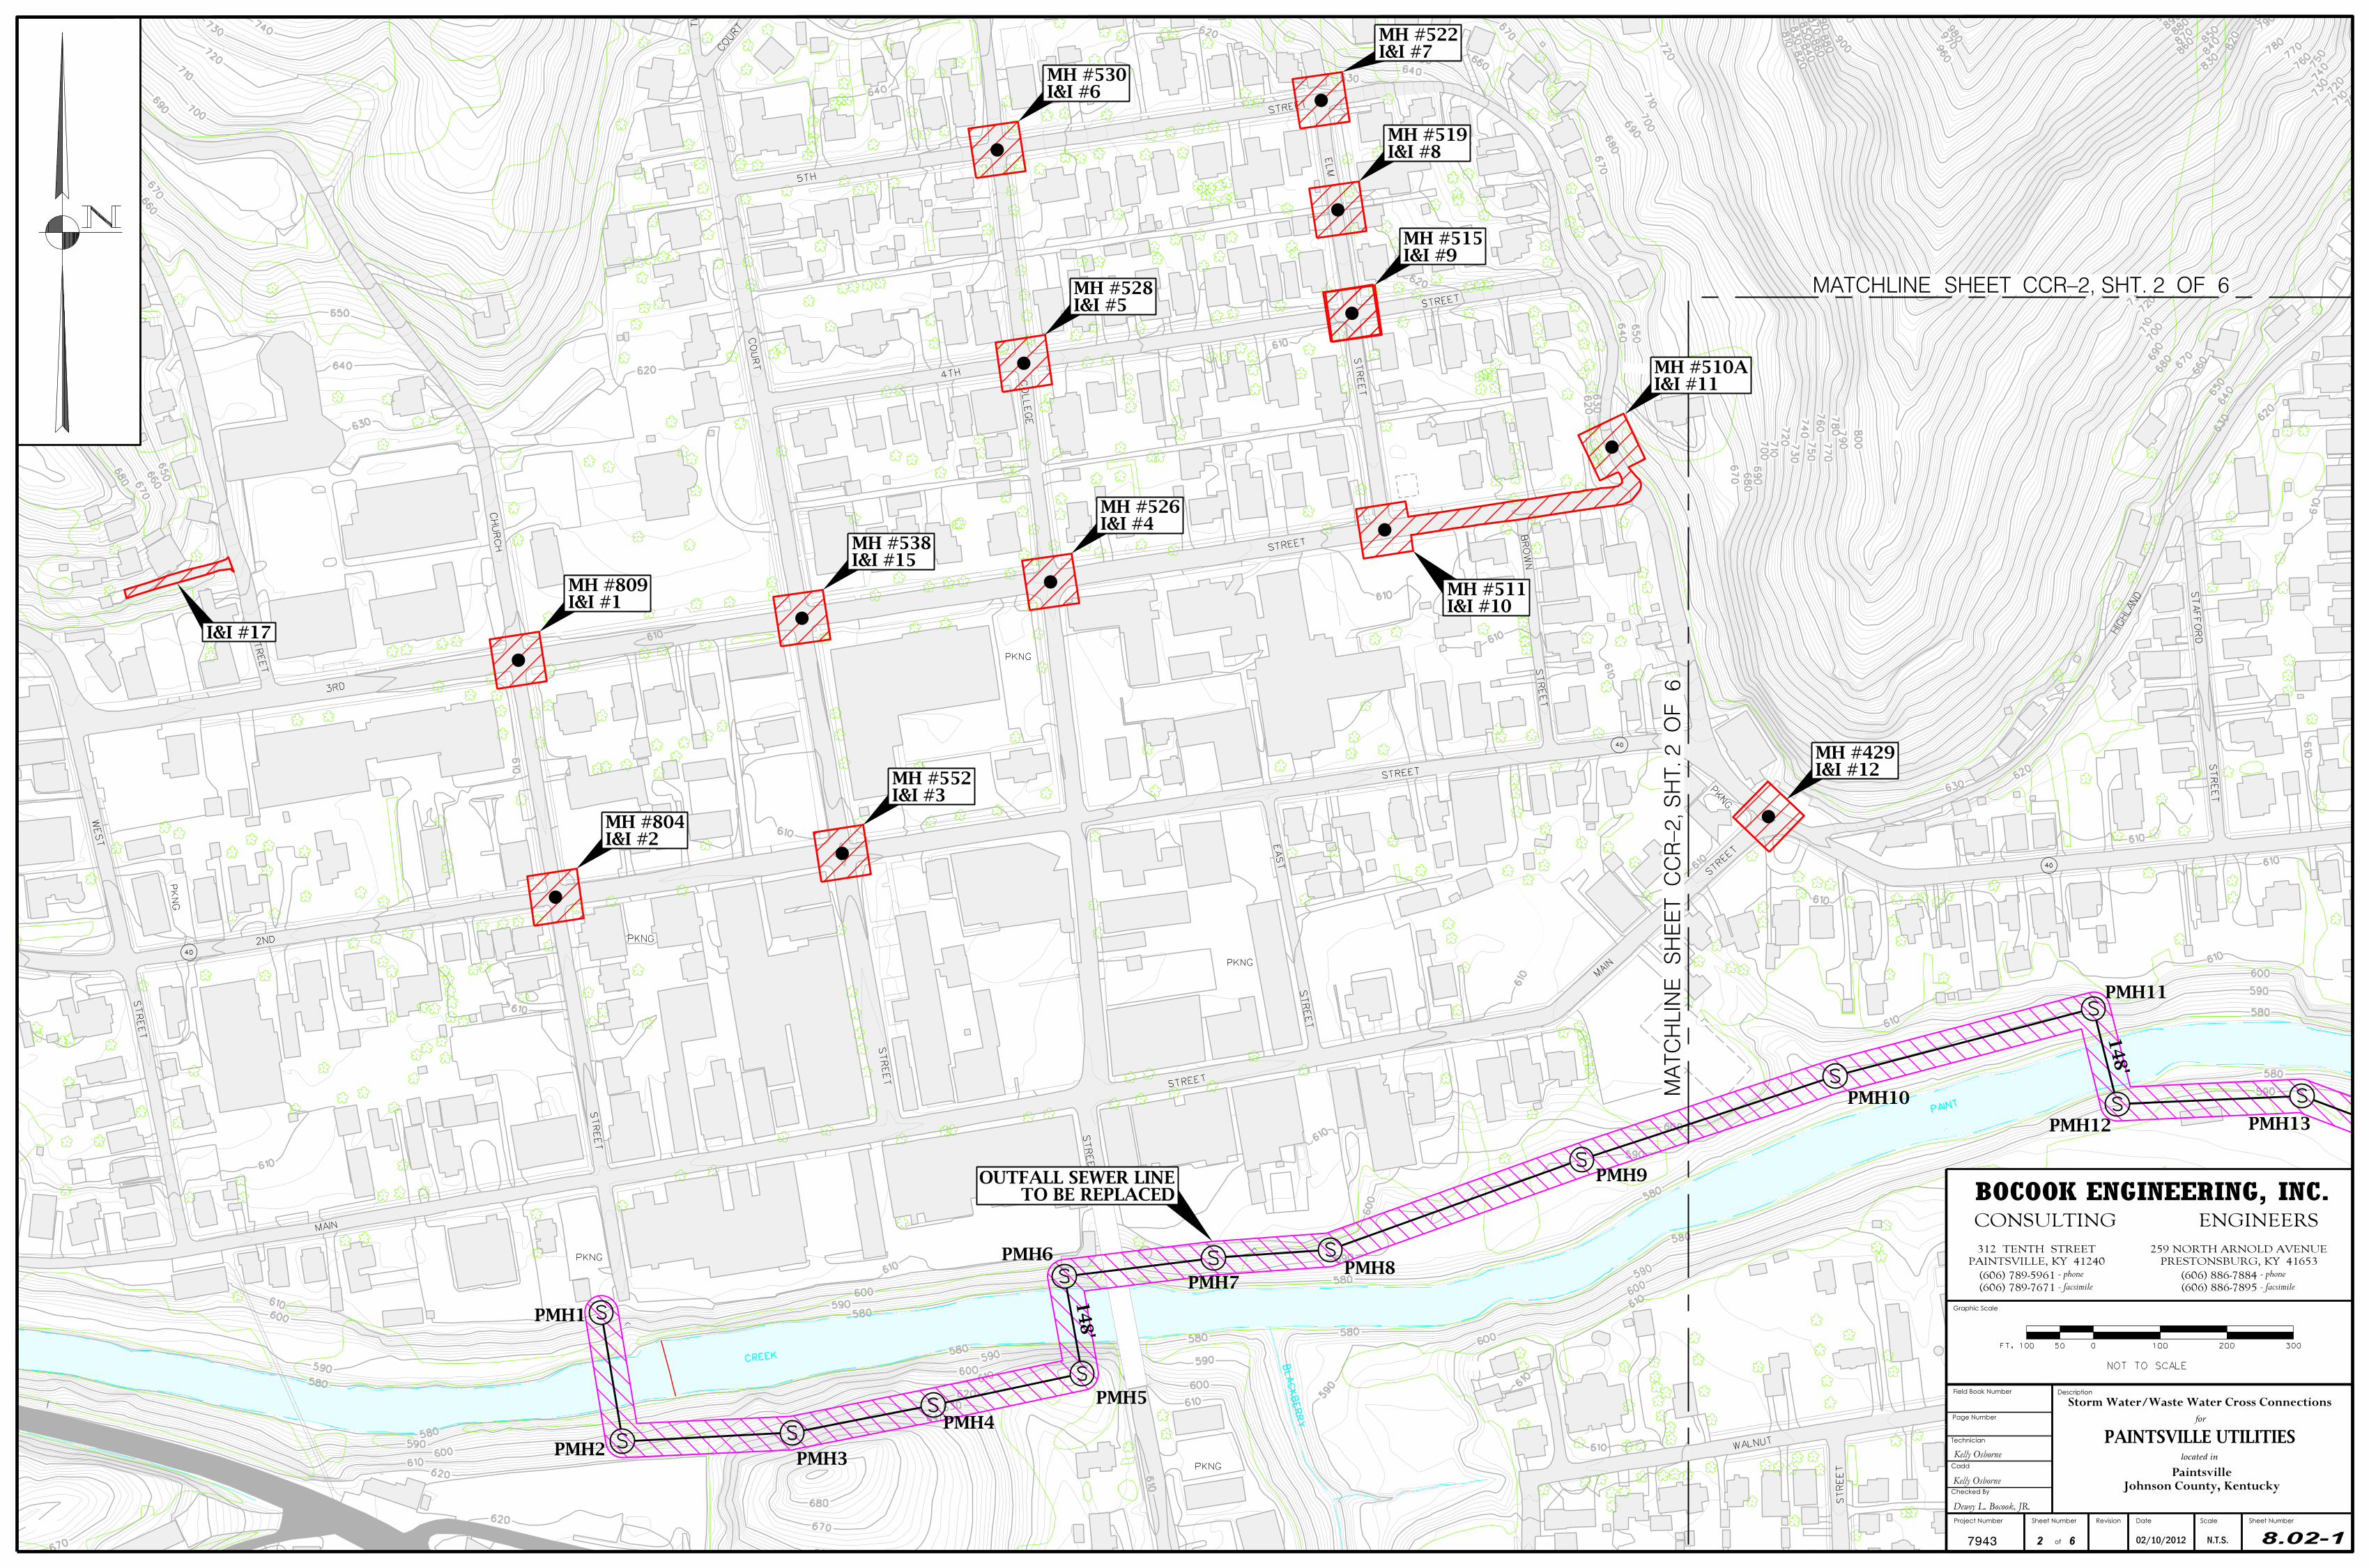
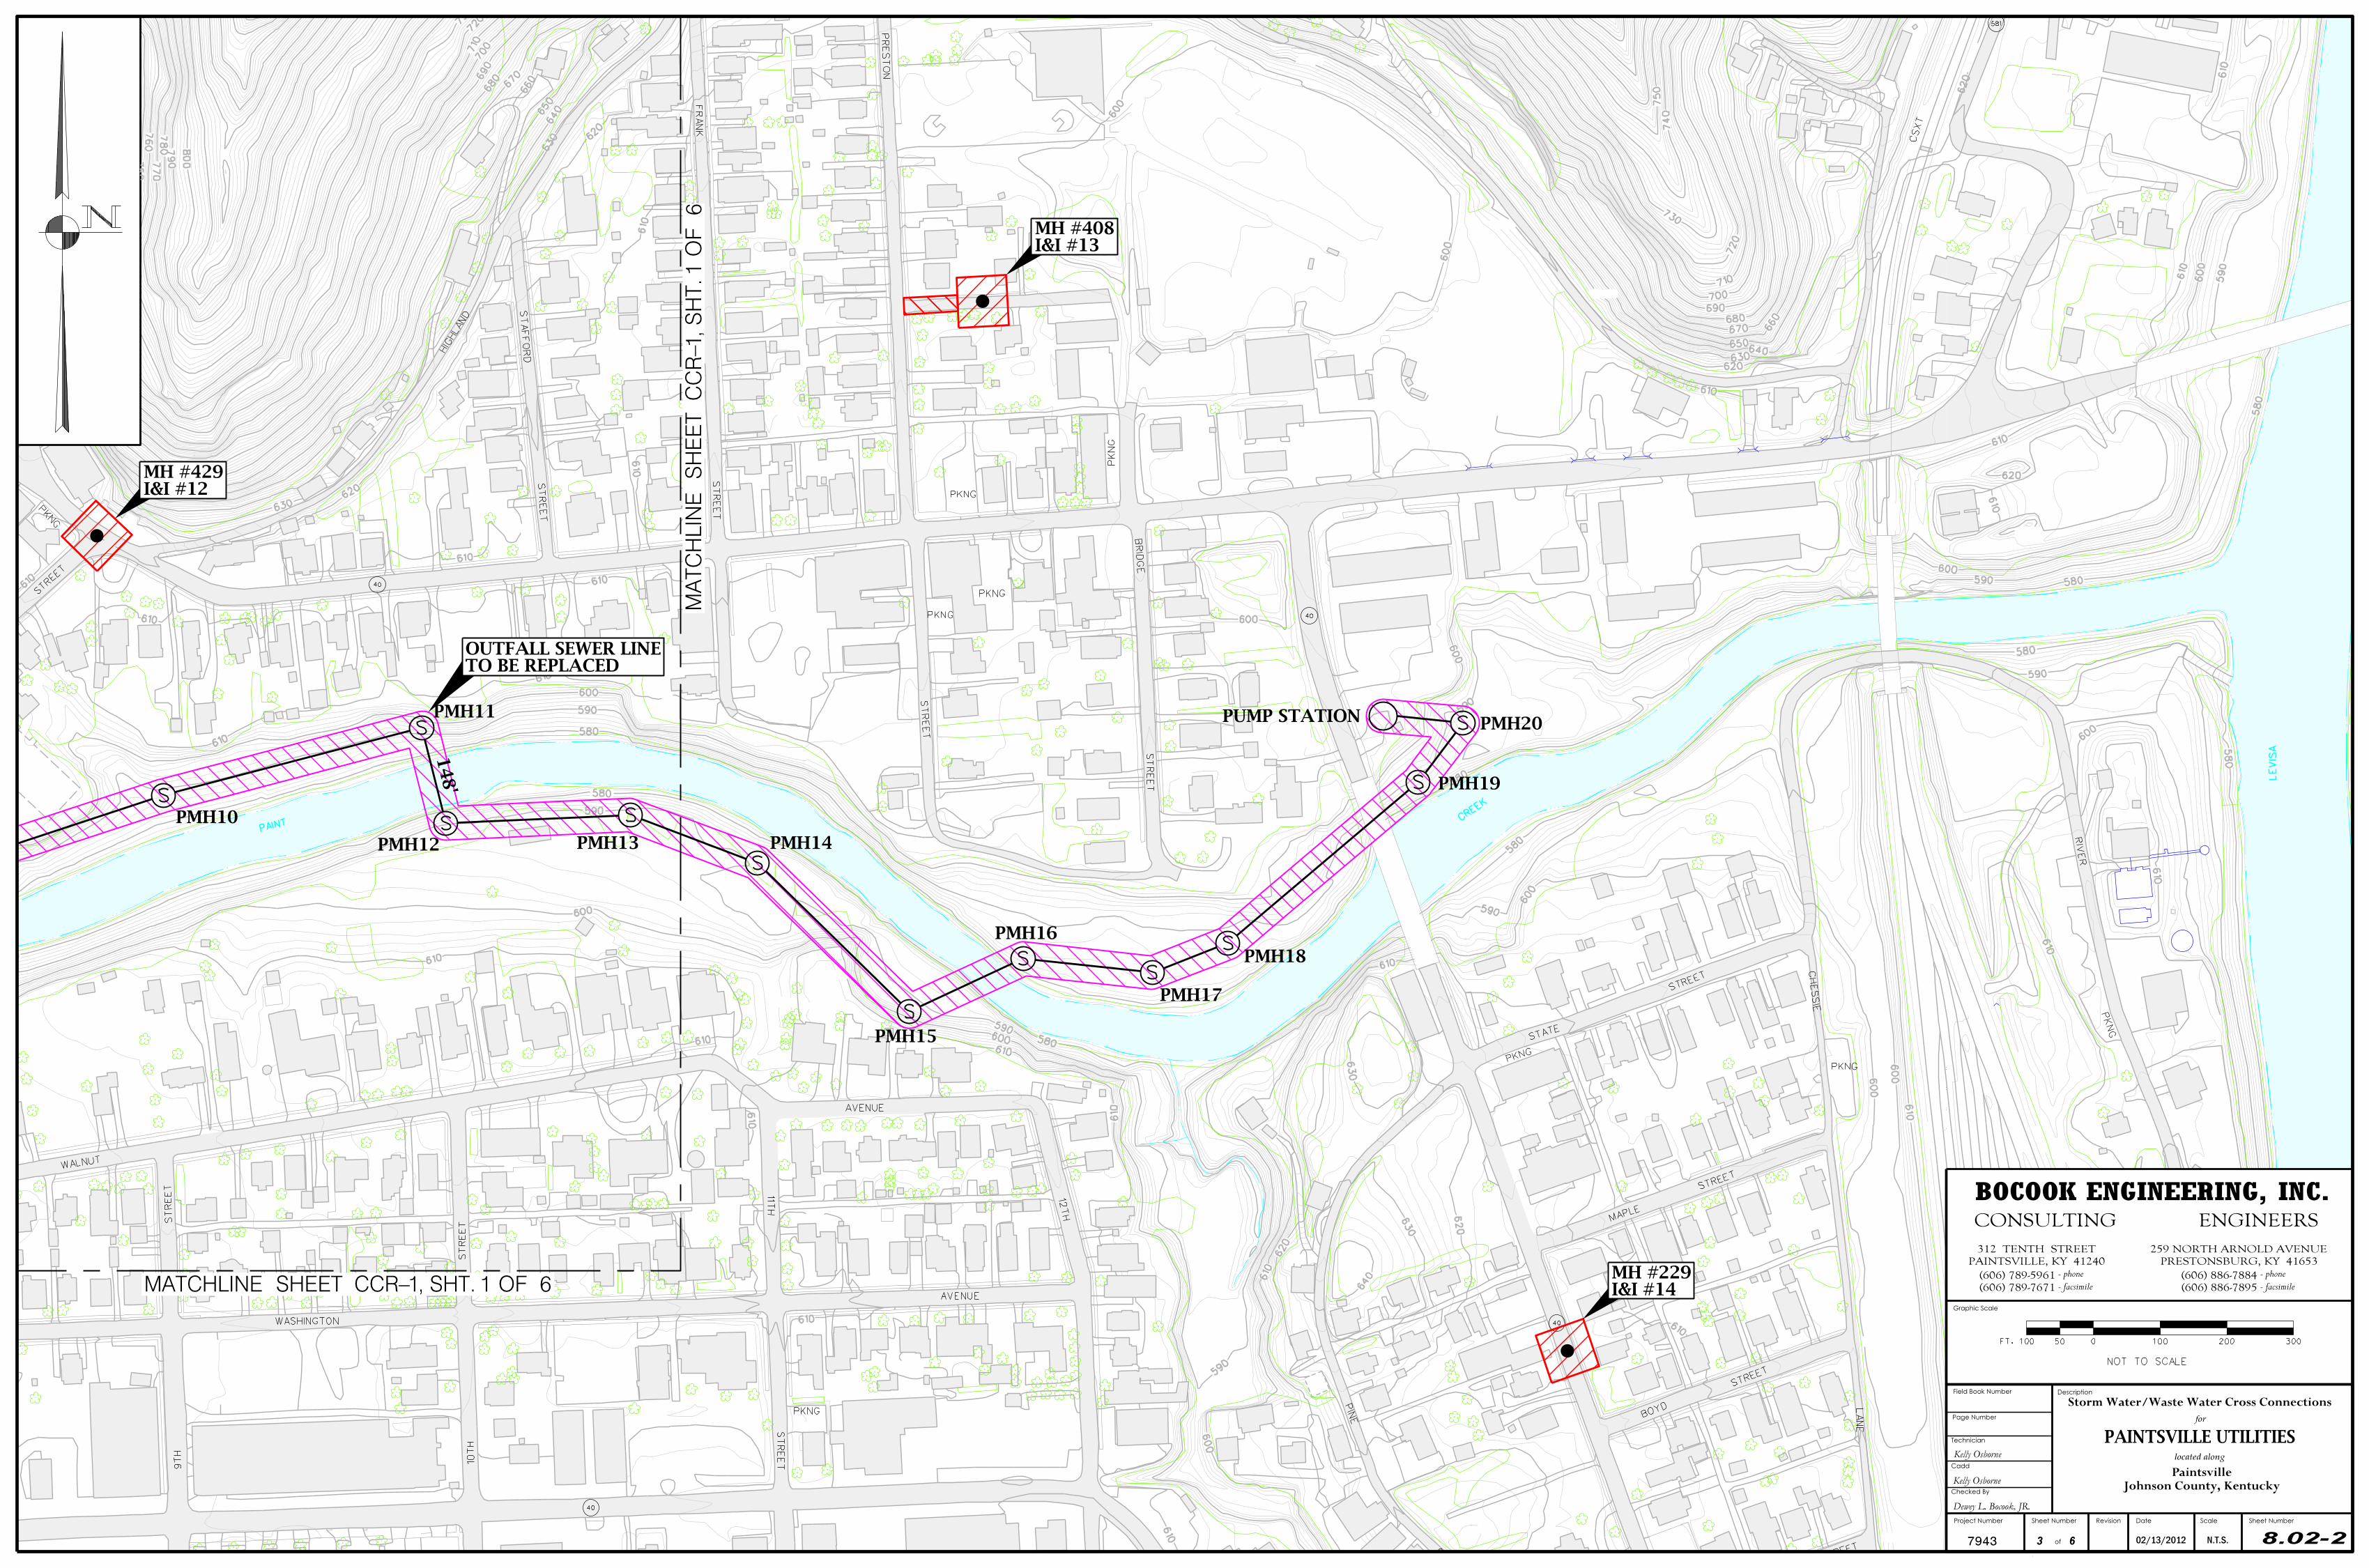
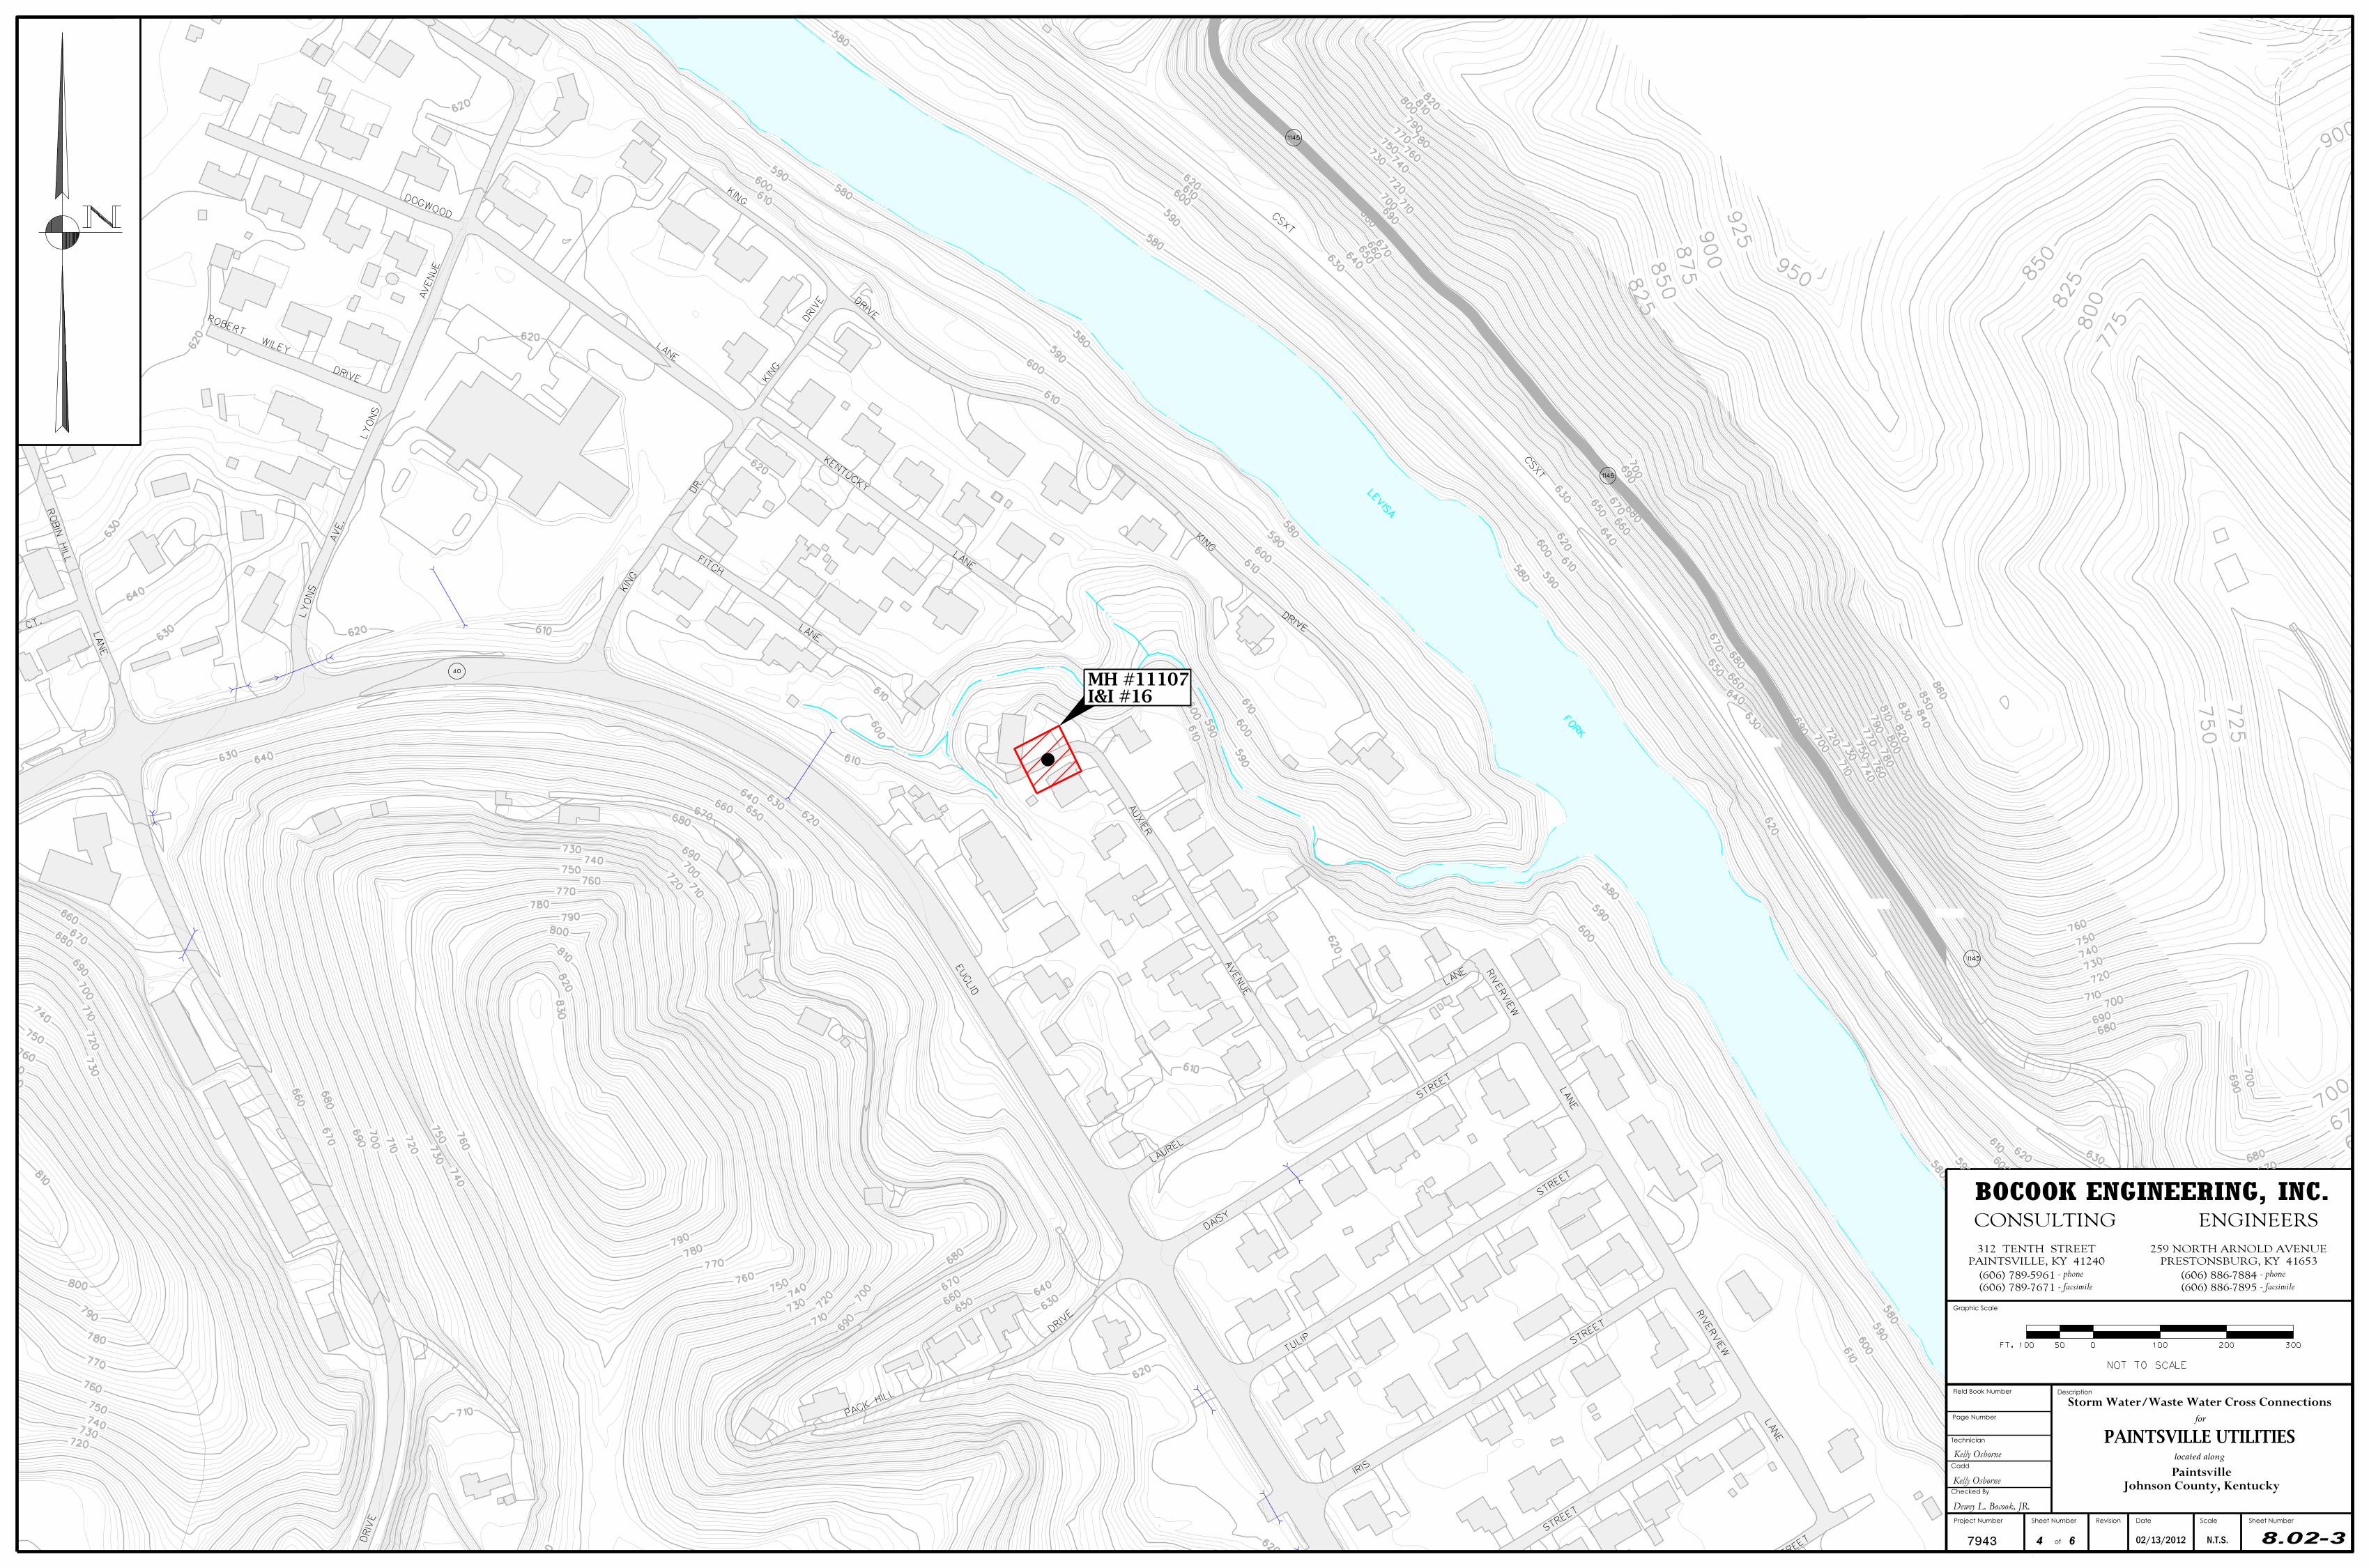
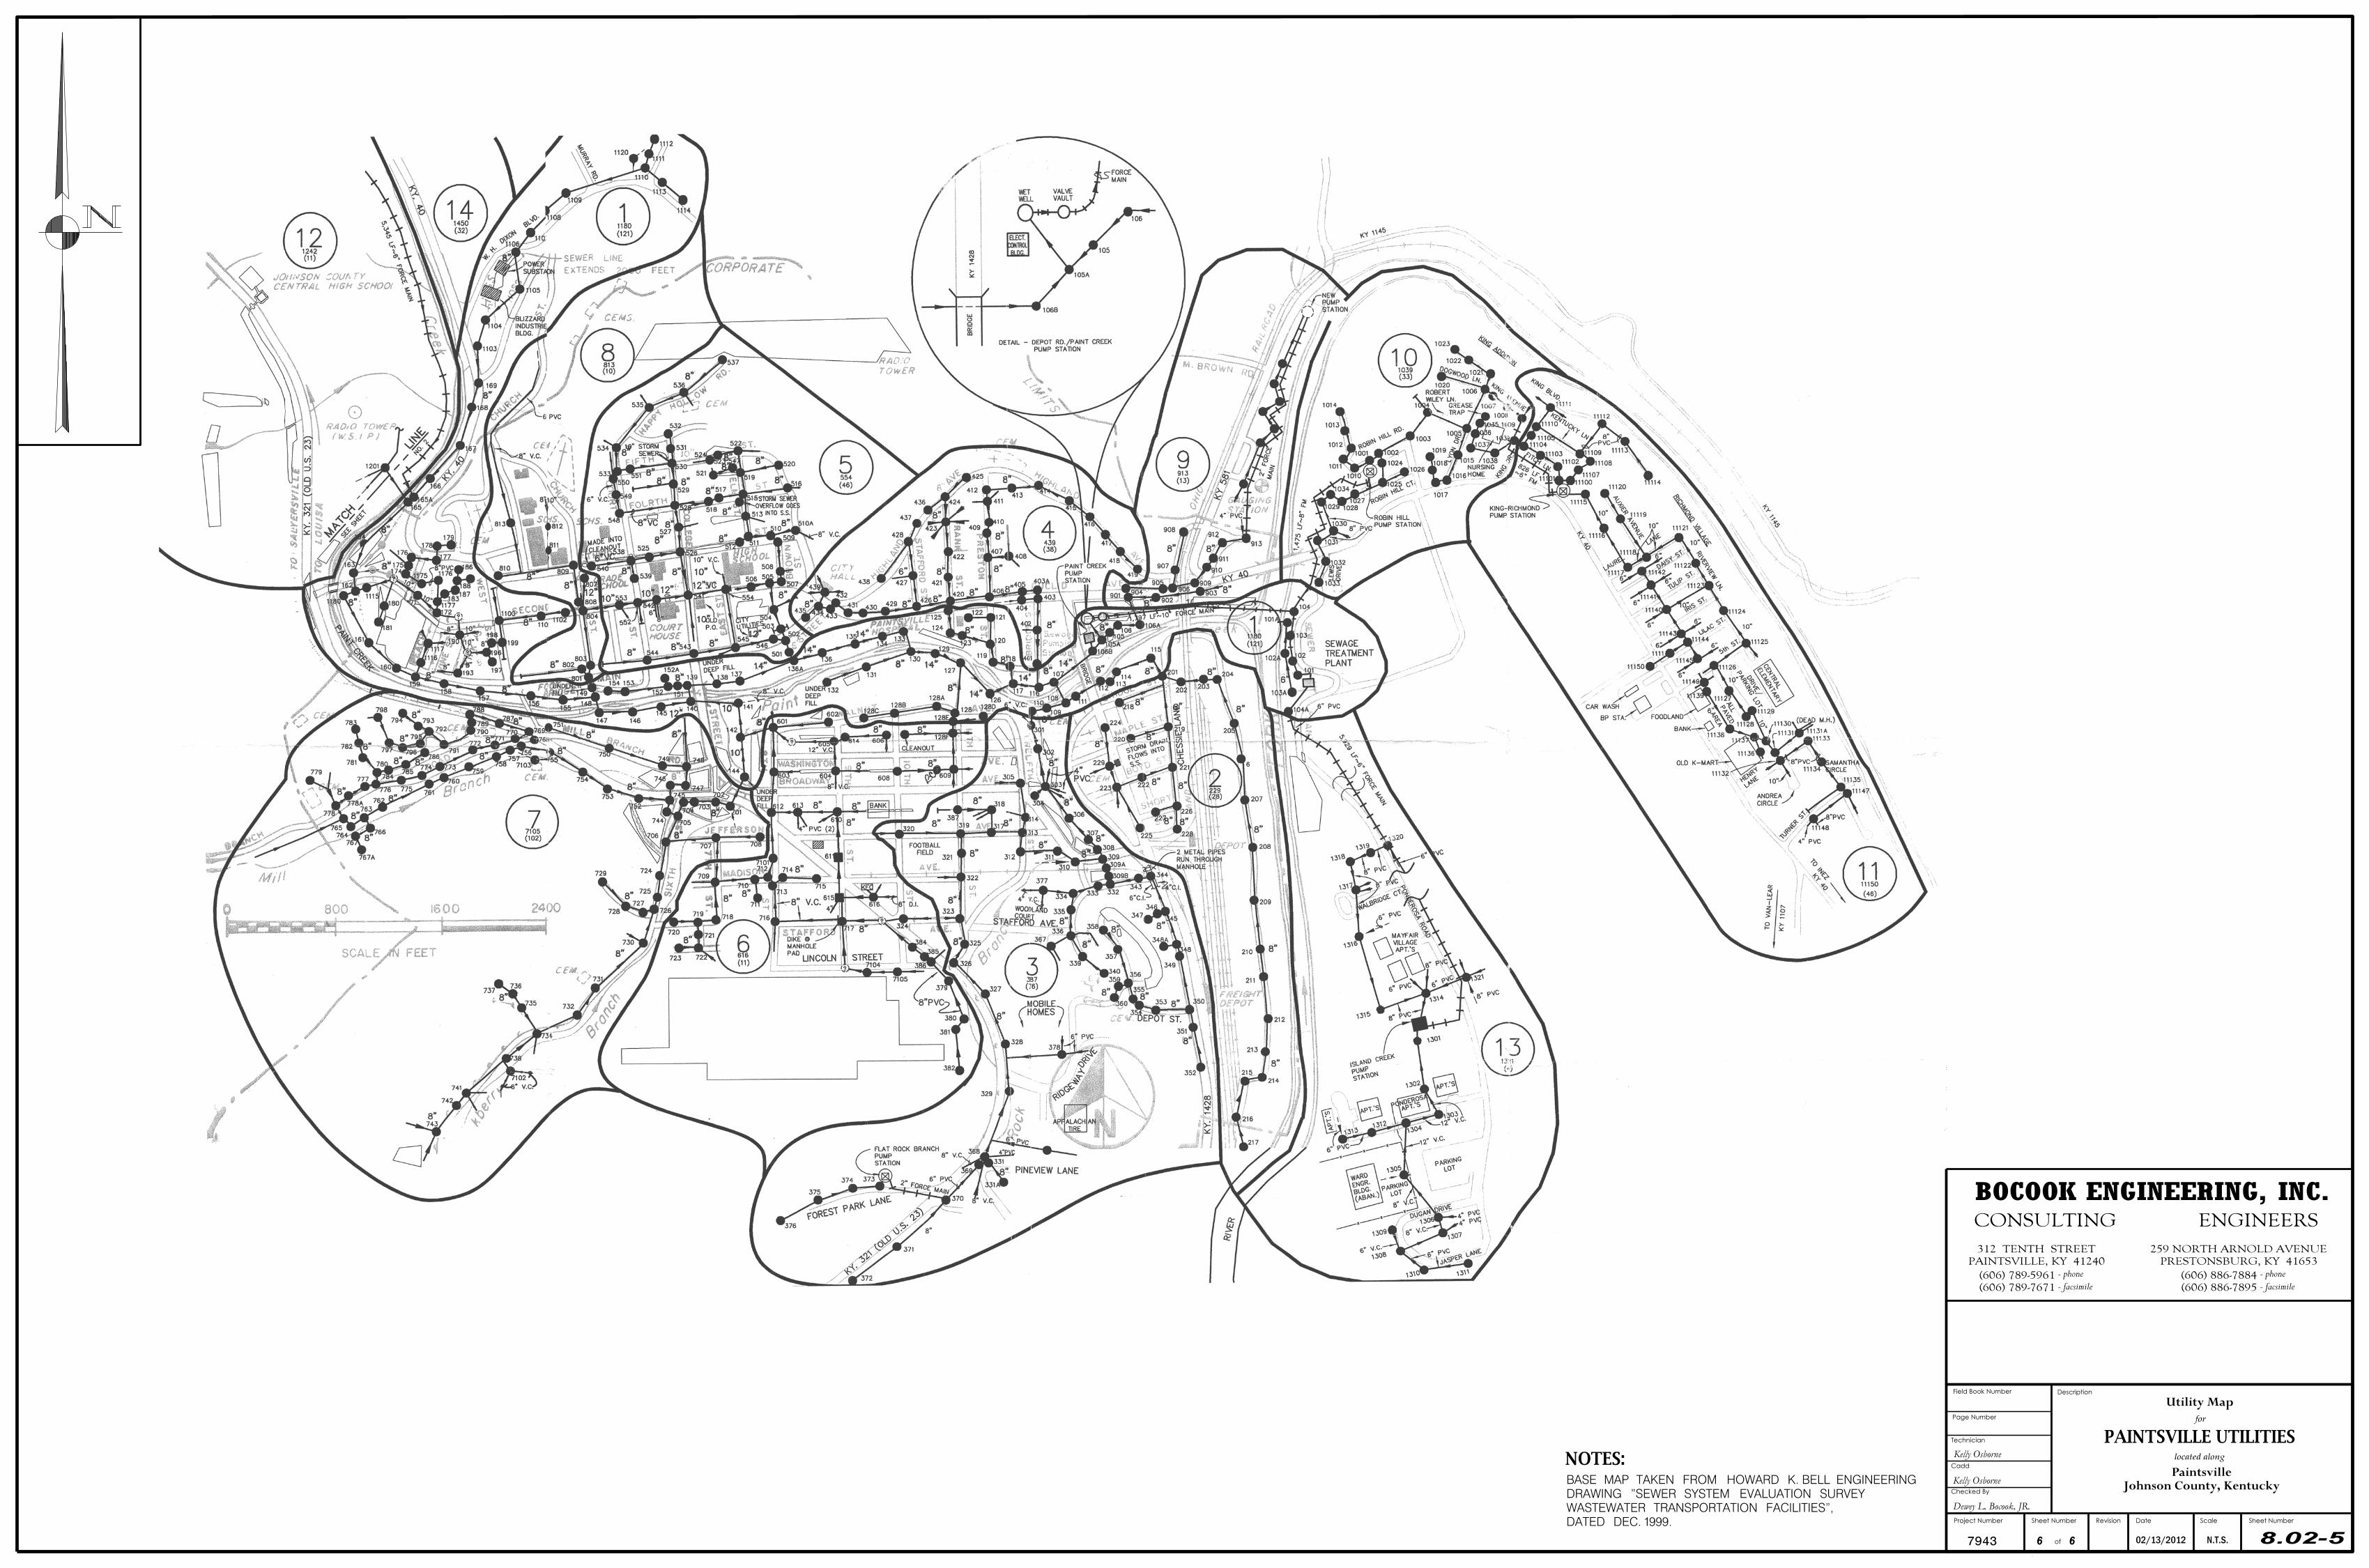
COLLECTION SYSTEM: 8.202 Collection System Improvements
As discussed in Section 6 of this facilities plan, the downtown gravity collection system
currently has excessive inflow and infiltration that has resulted in excessive flows to the
Paintsville WWTP. Prior studies and smoke testing has identified 17 locations where
there are cross connections or know issues with the existing storm water collection
system and the existing sanitary sewer collection system. During heavy rains, these
cross connections cause much of the excessive flow to the wastewater outfall system and
to the existing waste water treatment plant. This excessive inflow results in sanitary
sewage overflows along the outfall sewer and causes operation issues at the wastewater
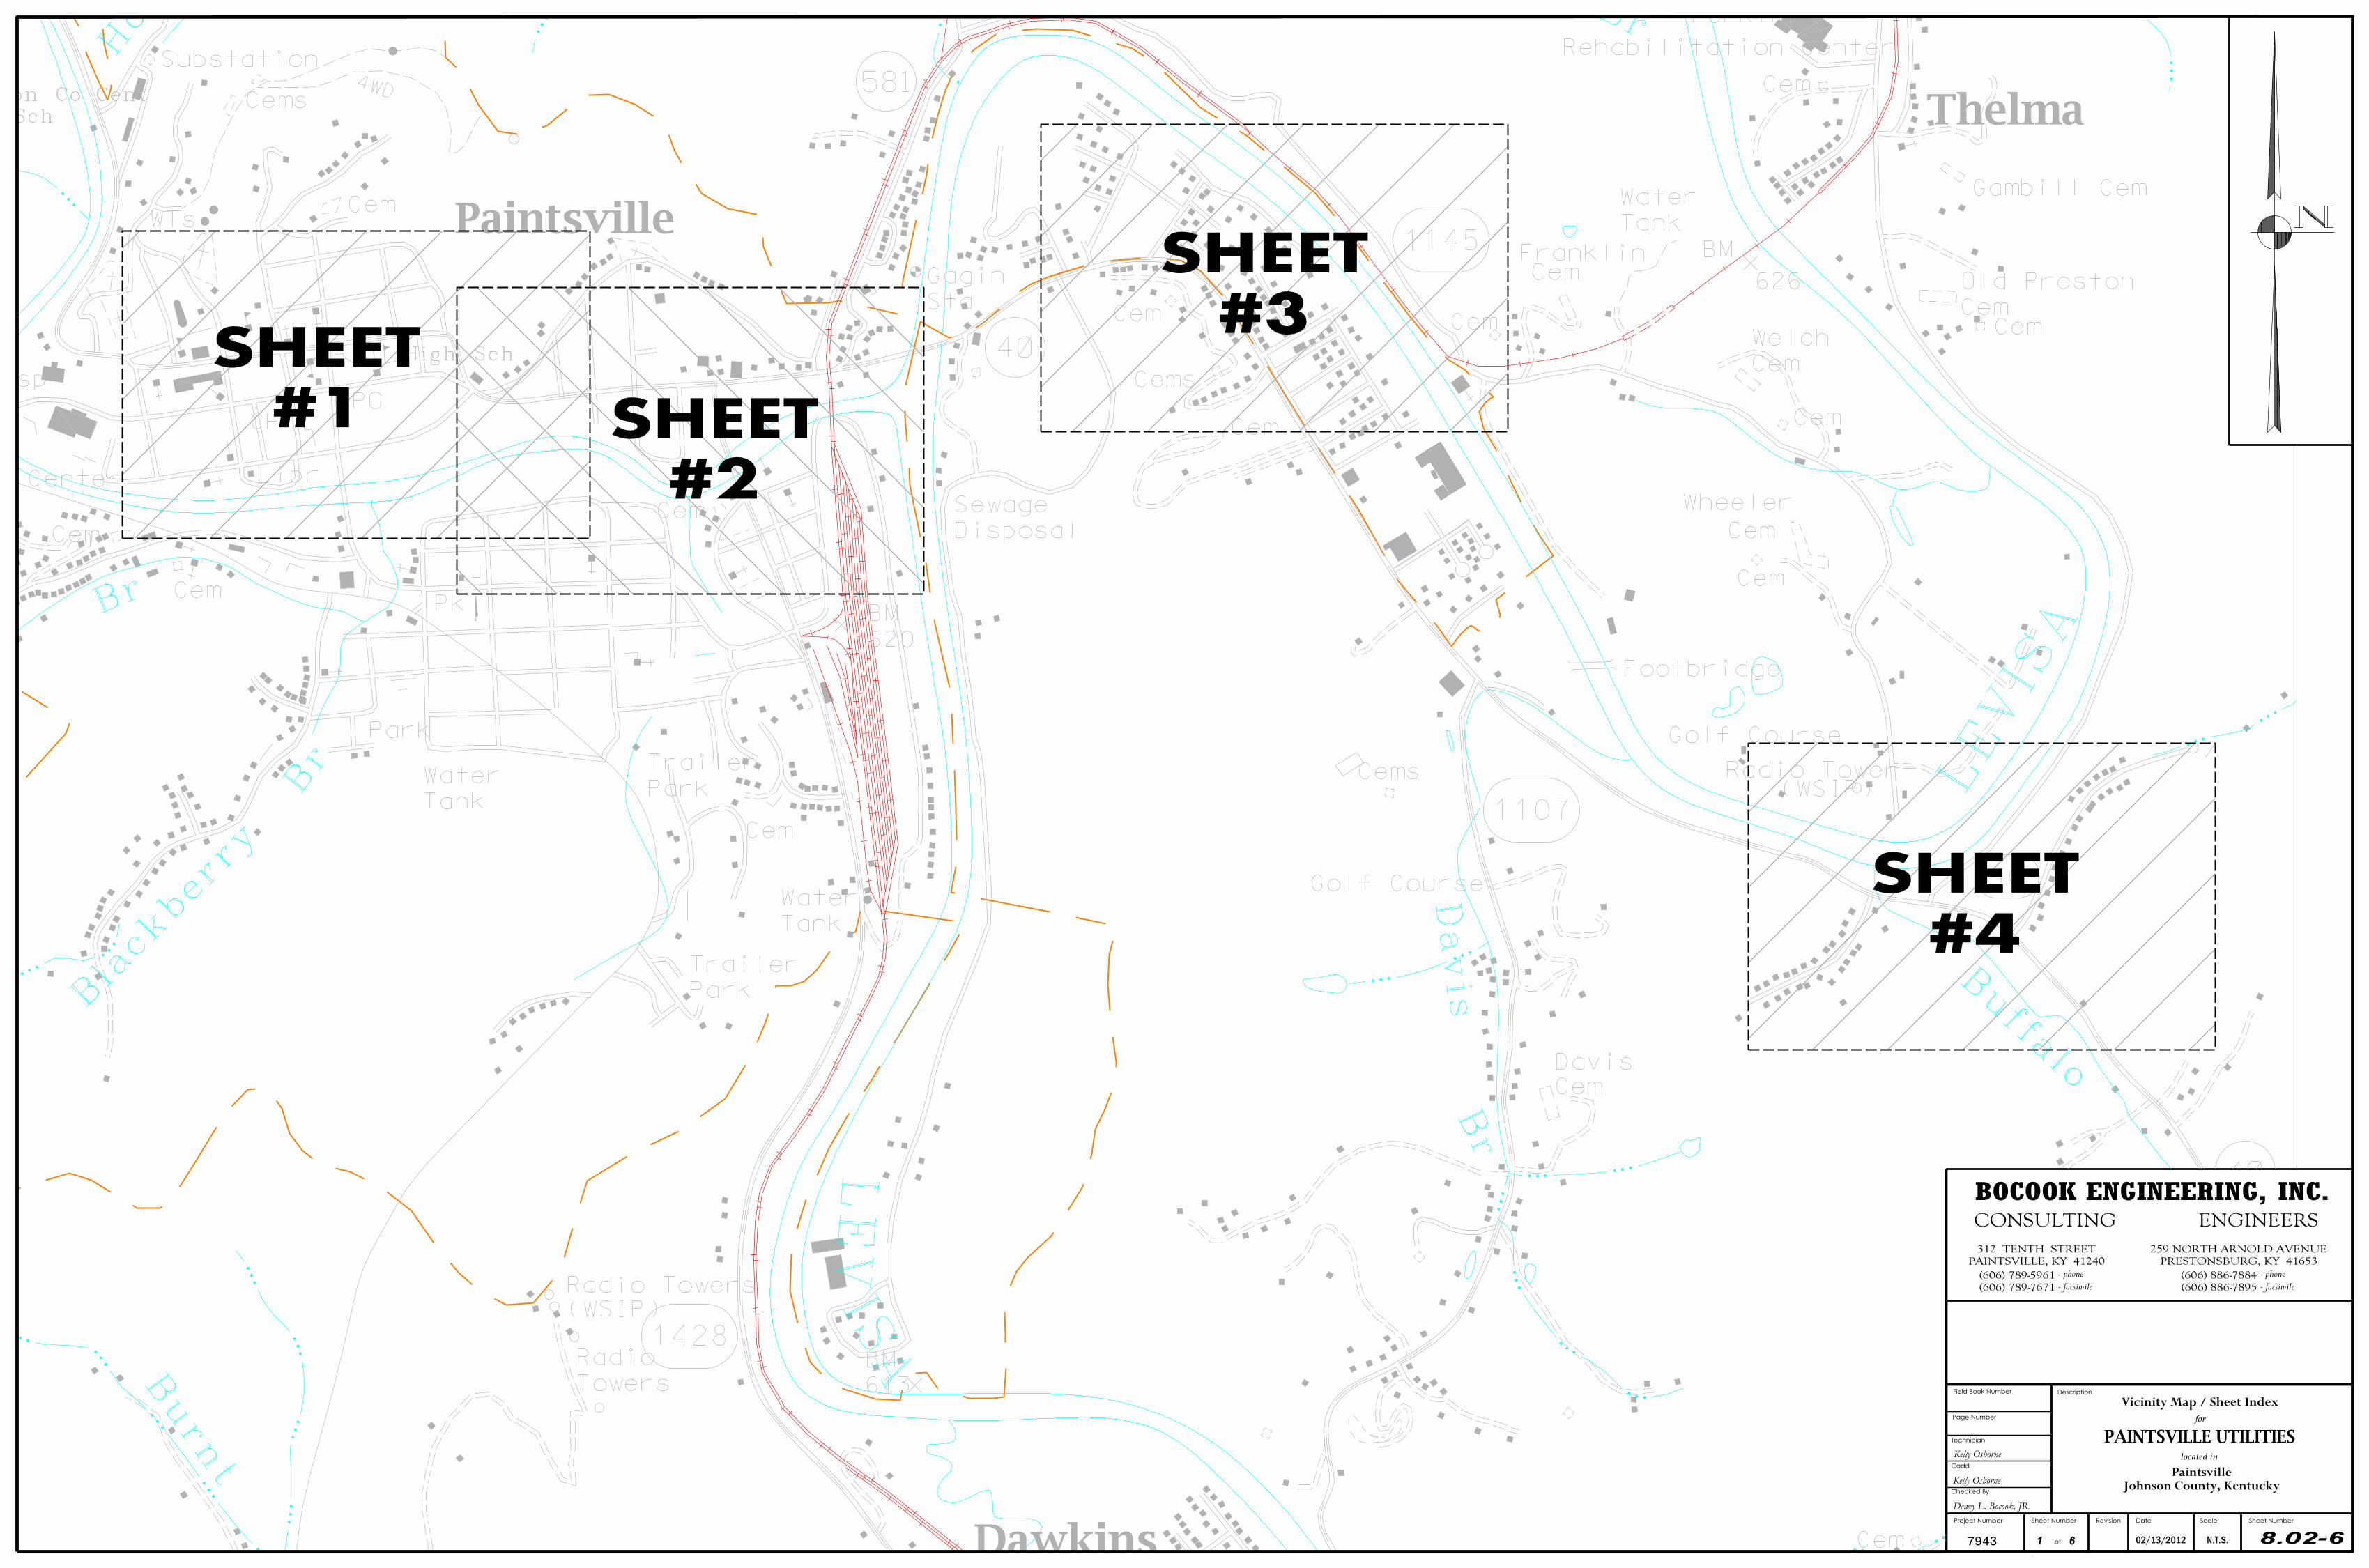
treatment plant. The locations of these cross connections are shown on Figure 8.02-1
through 8.02-3. Figure 8.02-6 is a key map showing general locations of proposed
improvements to the collection system. In order to correct these cross connections it will
be necessary to basically re-construct the sanitary and storm systems at these
intersections. A detailed cost estimate for each location is included in the Appendix of
this report.

Paintsville Utilities, Kentucky SECTION 8 – Evaluation of Alternates Combined Regional Wastewater Facilities Plan
82
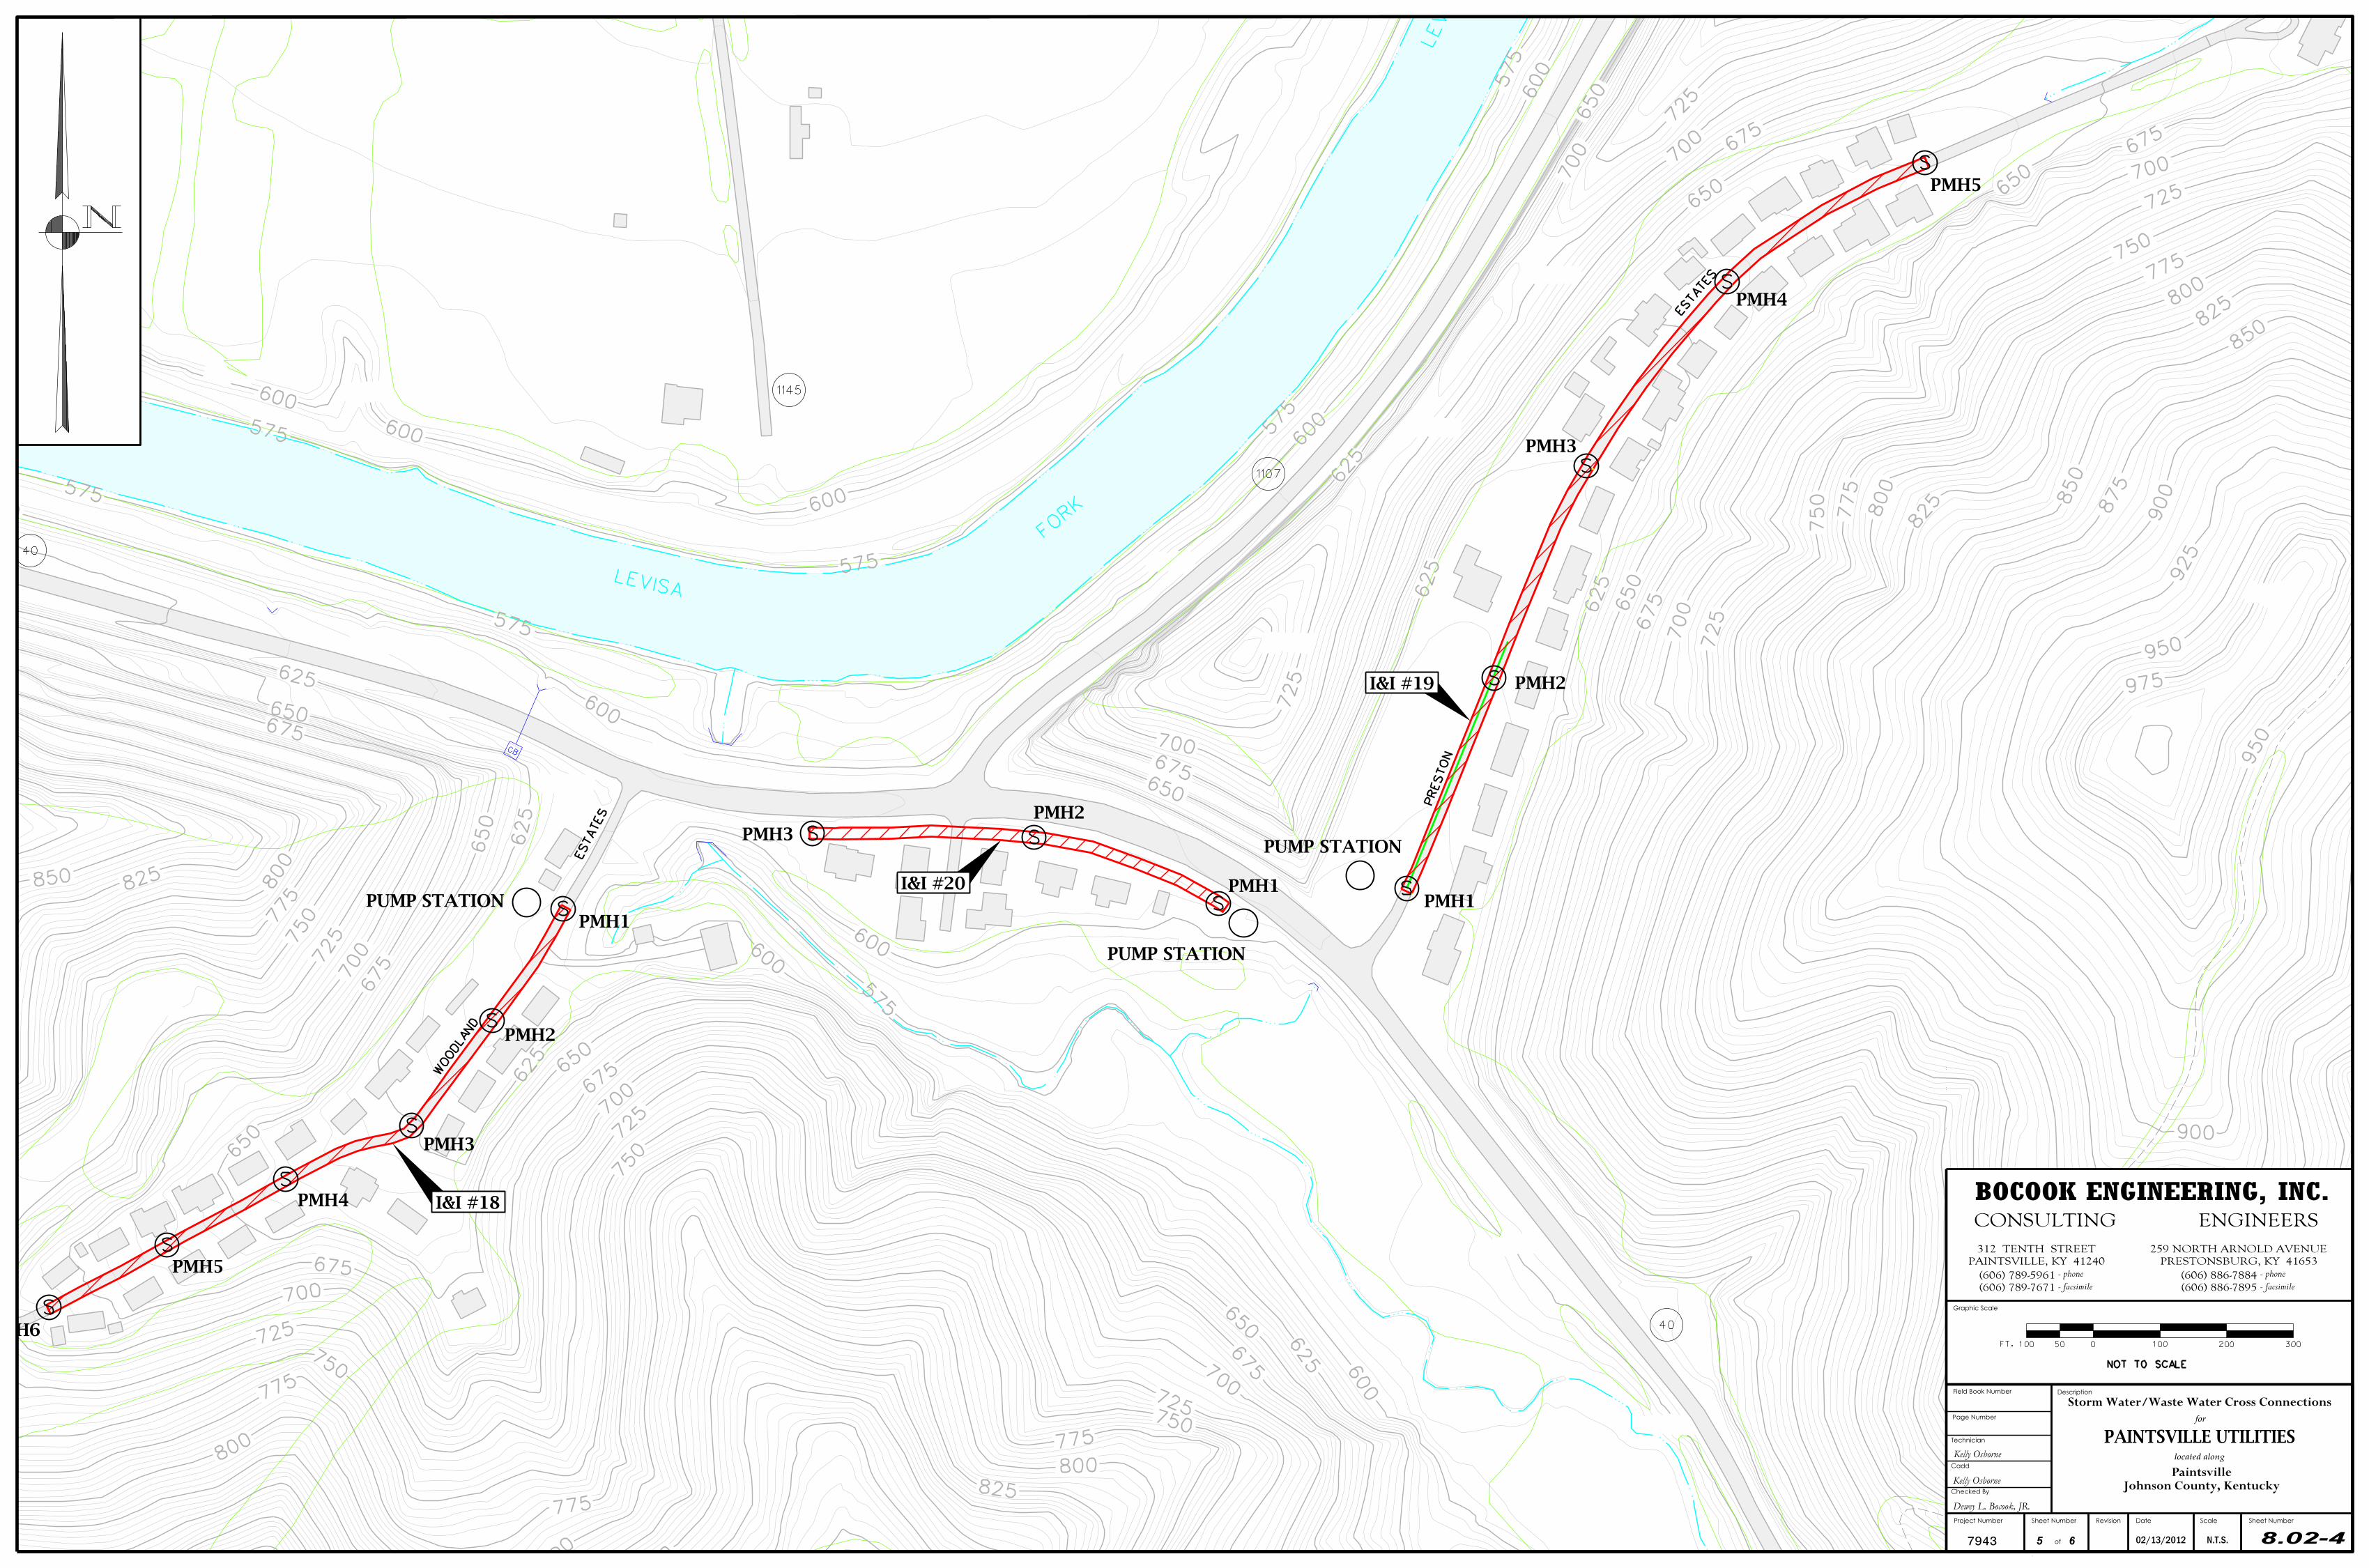
Paintsville Utilities have also determined that they are receiving excessive infiltration and
inflow from newly acquired collection sewers in the areas of Preston Estates and Concord
Development. Included in phase 1 improvements is replacement of the collection
systems for these areas. These areas are shown on Figure 8.02-4.
Paintsville Utilities, Kentucky SECTION 8 – Evaluation of Alternates Combined Regional Wastewater Facilities Plan
83
The other issue that needs to be addressed with the collection system is to replace the
existing outfall sewer with a larger diameter sewer with more capacity. The proposed
new manholes on this outfall sewer system will include locked lids to limit sanitary sewer
overflows. The section of outfall sewer to be replaced is shown on Figure 8.02-1 and
8.02-2.
Because of the known issues and limited construction options, only one alternative was
considered in the corrections to the Paintsville Collection System issues. The following
Is a summary of the projected project costs for Phase 1 correcting I & I issues and
replacing the outfall sewer:

Paintsville Utilities, Kentucky SECTION 8 – Evaluation of Alternates Combined Regional Wastewater Facilities Plan
84
TABLE 8.02-1I & I Cost
Description Cost Location #1 Intersection of 3rd and Church Street $46,745Location #2 Intersection of 2nd and Church Street $65,750Location #3 Intersection of 2nd and Court Street $74,370Location #4 Intersection of 3rd and College Street $48,180Location #5 Intersection of 4th and College Street $57,100Location #6 Intersection of 5th and College Street $54,390Location #7 Intersection of 5th and Elm Street $93,790Location #8 Intersection of Elm and Ally before 5th Street $63,160Location #9 Intersection of 4th and Elm Street $41,850Location #10 intersection of 3rd and Elm Street $37,120Location #11 Intersection of 3rd and Margaret Heights $127,870Location #12 Intersection of Euclid and Main Street $35,055Location #13 Intersection of Preston Street and Salt well Street $48,890Location #14 Between maple Street and Boyd Street on Depo Rd $32,435Location #15 Intersection of 3rd and Court Street $50,180Location #16 Auxier Ave $35,450Location #17 Mill Street $109,750Location #18 Woodland #1 $235,000Location #19 Preston Estates $291,000Location #20 Woodland #2 $86,250
Project Budget Construction Cost $1,634,335
TABLE 8.02-2
Projected Budget Construction Cost $1,634,335Contingency $320,000Engineering $150,000Inspection $75,000Processing Fees $15,000Legal $15,000Land and R/W $20,000Planning $20,000
Total Estimated Project Cost - Contract #1 $2,249,335
Cost Summary - Phase I - Contract #1
Projected Budget Project Cost Phase I- Contract #1
Paintsville Utilities, Kentucky SECTION 8 – Evaluation of Alternates Combined Regional Wastewater Facilities Plan
85
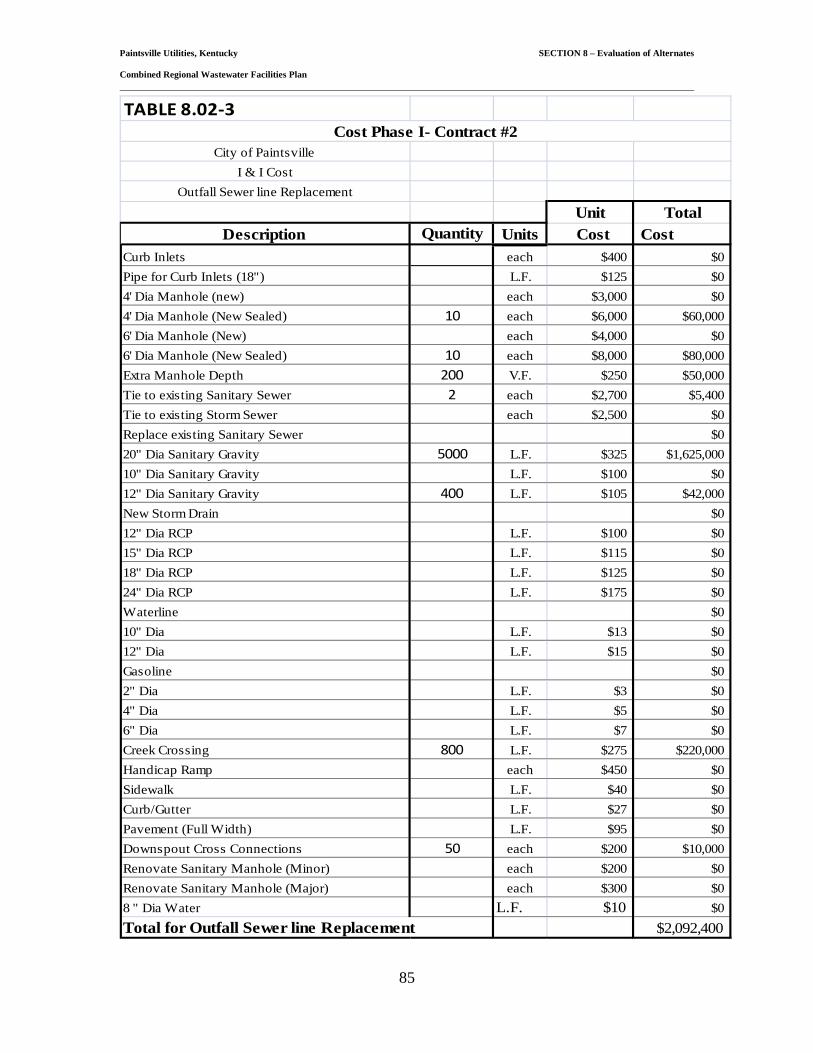
TABLE 8.02-3
City of Paintsville I & I Cost
Outfall Sewer line Replacement
Unit TotalDescription Quantity Units Cost Cost
Curb Inlets each $400 $0Pipe for Curb Inlets (18") L.F. $125 $04' Dia Manhole (new) each $3,000 $04' Dia Manhole (New Sealed) 10 each $6,000 $60,0006' Dia Manhole (New) each $4,000 $06' Dia Manhole (New Sealed) 10 each $8,000 $80,000Extra Manhole Depth 200 V.F. $250 $50,000Tie to existing Sanitary Sewer 2 each $2,700 $5,400Tie to existing Storm Sewer each $2,500 $0Replace existing Sanitary Sewer $020" Dia Sanitary Gravity 5000 L.F. $325 $1,625,00010" Dia Sanitary Gravity L.F. $100 $012" Dia Sanitary Gravity 400 L.F. $105 $42,000New Storm Drain $012" Dia RCP L.F. $100 $015" Dia RCP L.F. $115 $018" Dia RCP L.F. $125 $024" Dia RCP L.F. $175 $0Waterline $010" Dia L.F. $13 $012" Dia L.F. $15 $0Gasoline $02" Dia L.F. $3 $04" Dia L.F. $5 $06" Dia L.F. $7 $0Creek Crossing 800 L.F. $275 $220,000Handicap Ramp each $450 $0Sidewalk L.F. $40 $0Curb/Gutter L.F. $27 $0Pavement (Full Width) L.F. $95 $0Downspout Cross Connections 50 each $200 $10,000Renovate Sanitary Manhole (Minor) each $200 $0Renovate Sanitary Manhole (Major) each $300 $08 " Dia Water L.F. $10 $0Total for Outfall Sewer line Replacement $2,092,400
Cost Phase I- Contract #2
Paintsville Utilities, Kentucky SECTION 8 – Evaluation of Alternates Combined Regional Wastewater Facilities Plan
86
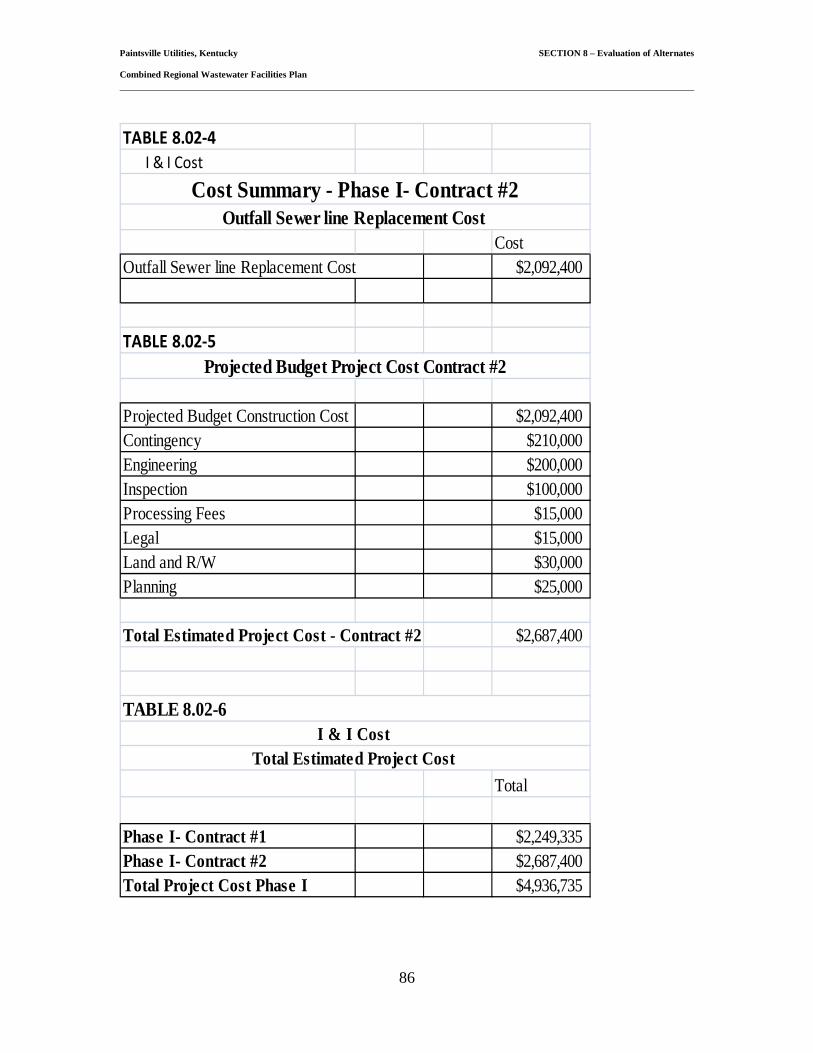
TABLE 8.02-4 I & I Cost
CostOutfall Sewer line Replacement Cost $2,092,400
TABLE 8.02-5
Projected Budget Construction Cost $2,092,400Contingency $210,000Engineering $200,000Inspection $100,000Processing Fees $15,000Legal $15,000Land and R/W $30,000Planning $25,000
Total Estimated Project Cost - Contract #2 $2,687,400
Total
Phase I- Contract #1 $2,249,335Phase I- Contract #2 $2,687,400Total Project Cost Phase I $4,936,735
Total Estimated Project Cost
Cost Summary - Phase I- Contract #2Outfall Sewer line Replacement Cost
Projected Budget Project Cost Contract #2
TABLE 8.02-6I & I Cost
Related Documents


