PMRN User’s Guide Version 11.0 Page Overview of Reports - Overview 7.1 7.0 Overview of Reports Overview After data has been Submitted to the PMRN, reports will become available. Most reports in the PMRN display student assessment data, to include scores from Progress Monitoring and Year- End Outcome Tests. In addition there are reports that display Coach’s Log data, students with missing scores, and key dates in the PMRN. The reports that display student data are useful in many ways, including: • Analyzing student progress • Planning student reading instruction • Communicating student achievement • Planning professional development There are several different types of reports in the PMRN. These reports range from displaying a single student’s performance on a single assessment to the performance of an entire school population. For the purposes of this User’s Guide, student data that is gathered will be discussed as displayed in four levels of reports: school, teacher, class, and student. The following are examples of information that can be found in PMRN reports. Success Zone Reports: Show the percentage of students in each Success Zone for all assessment periods in a school year Status Reports: Show the most immediate individual performance of students by showing the ScoreType details of each student Cumulative Reports: Show the results at the individual student level of all assessments recorded in the PMRN across all years, including scores from other schools Progress Reports: Show the results of all assessments recorded in the PMRN across all assessment periods, including scores from other schools

Welcome message from author
This document is posted to help you gain knowledge. Please leave a comment to let me know what you think about it! Share it to your friends and learn new things together.
Transcript

PMRN User’s Guide Version 11.0 Page
Overview of Reports - Overview
7.1
7.0 Overview of Reports
Overview
After data has been Submitted to the PMRN, reports will become available. Most reports in the PMRN display student assessment data, to include scores from Progress Monitoring and Year-End Outcome Tests. In addition there are reports that display Coach’s Log data, students with missing scores, and key dates in the PMRN.
The reports that display student data are useful in many ways, including: • Analyzing student progress • Planning student reading instruction • Communicating student achievement • Planning professional development
There are several different types of reports in the PMRN. These reports range from displaying a single student’s performance on a single assessment to the performance of an entire school population. For the purposes of this User’s Guide, student data that is gathered will be discussed as displayed in four levels of reports: school, teacher, class, and student.
The following are examples of information that can be found in PMRN reports.
Success Zone Reports: Show the percentage of students in each Success Zone for all assessment periods in a school year
Status Reports: Show the most immediate individual performance of students by showing the ScoreType details of each student
Cumulative Reports: Show the results at the individual student level of all assessments recorded in the PMRN across all years, including scores from other schools
Progress Reports: Show the results of all assessments recorded in the PMRN across all assessment periods, including scores from other schools

PMRN User’s Guide Version 11.0 Page 7.2
Grade Summary Reports: Show the summary of the overall performance on all available tasks for the selected assessment period and selected grade level
TDI Reports: Show performance data for TDI tasks on a per-student and class basis (K-2 only)
TDI Detail Reports: Show performance data for TDI tasks on a task-by-task basis (K-2 only)
Error Analysis Reports: Show the specific errors made by students during task administration
Year-End Outcome Test Reports: Show FCAT data
ECHOS™ Reports: Show ECHOS™ data from the FLKRS for Assessment Period 1
FLKRS Reports: Show FLKRS data from the FAIR portion of the FLKRS for Assessment Period 1
Research Behind the AssessmentsTo view information on the research behind PMRN reports, please refer to the Florida Assessments for Instruction in Reading Technical Manual 2009-2010 Edition.
The FAIR Technical Manual 2009-2010 Edition (Kindergarten - Grade 2) is available at:
http://www.fcrr.org/fair/K-2_Technical_Manual_FINAL.pdf
The FAIR Technical Manual 2009-2010 Edition (Grades 3 - 12) is available at:
http://www.fcrr.org/fair/3-12_Technical_Manual_FINAL.pdf
Overview of Reports - Overview
PMRN User’s Guide Version 11.0 Page 7.3
Overview of Reports - Assessment Types
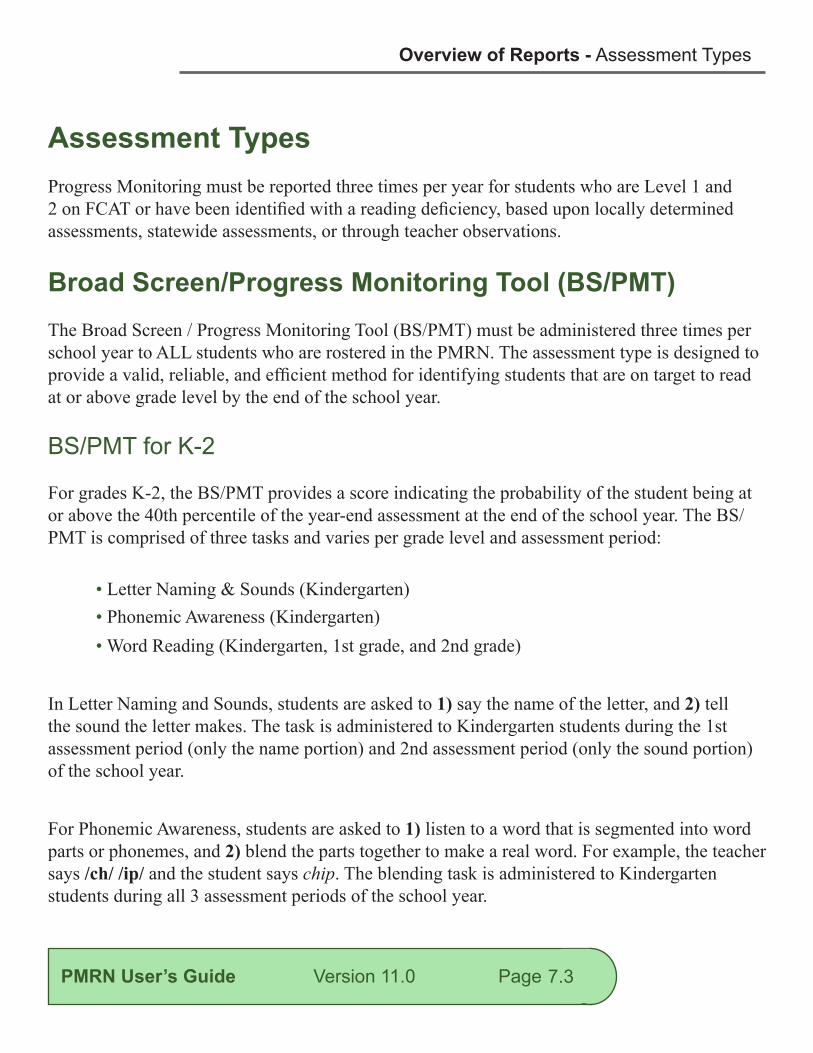
Assessment TypesProgress Monitoring must be reported three times per year for students who are Level 1 and 2 on FCAT or have been identified with a reading deficiency, based upon locally determined assessments, statewide assessments, or through teacher observations.
Broad Screen/Progress Monitoring Tool (BS/PMT)The Broad Screen / Progress Monitoring Tool (BS/PMT) must be administered three times per school year to ALL students who are rostered in the PMRN. The assessment type is designed to provide a valid, reliable, and efficient method for identifying students that are on target to read at or above grade level by the end of the school year.
BS/PMT for K-2
For grades K-2, the BS/PMT provides a score indicating the probability of the student being at or above the 40th percentile of the year-end assessment at the end of the school year. The BS/PMT is comprised of three tasks and varies per grade level and assessment period:
• Letter Naming & Sounds (Kindergarten) • Phonemic Awareness (Kindergarten) • Word Reading (Kindergarten, 1st grade, and 2nd grade)
In Letter Naming and Sounds, students are asked to 1) say the name of the letter, and 2) tell the sound the letter makes. The task is administered to Kindergarten students during the 1st assessment period (only the name portion) and 2nd assessment period (only the sound portion)of the school year.
For Phonemic Awareness, students are asked to 1) listen to a word that is segmented into word parts or phonemes, and 2) blend the parts together to make a real word. For example, the teacher says /ch/ /ip/ and the student says chip. The blending task is administered to Kindergarten students during all 3 assessment periods of the school year.
PMRN User’s Guide Version 11.0 Page
Overview of Reports - Assessment Types
7.4
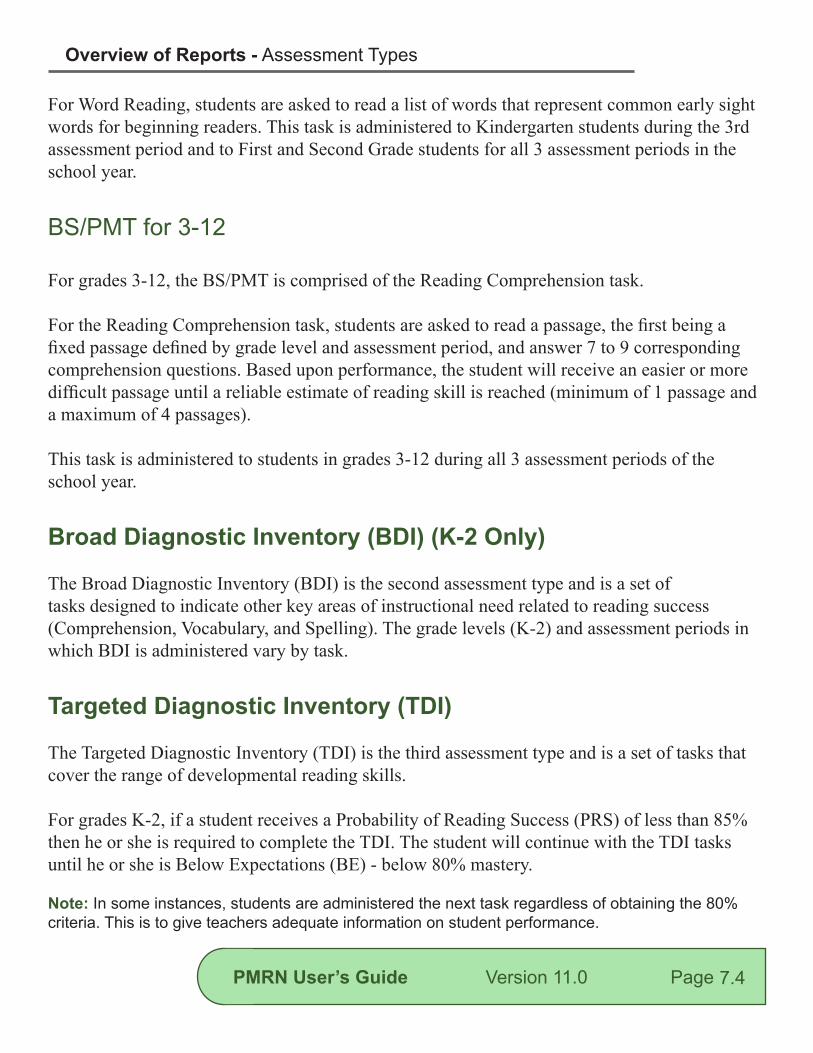
For Word Reading, students are asked to read a list of words that represent common early sight words for beginning readers. This task is administered to Kindergarten students during the 3rd assessment period and to First and Second Grade students for all 3 assessment periods in the school year. BS/PMT for 3-12
For grades 3-12, the BS/PMT is comprised of the Reading Comprehension task.
For the Reading Comprehension task, students are asked to read a passage, the first being a fixed passage defined by grade level and assessment period, and answer 7 to 9 corresponding comprehension questions. Based upon performance, the student will receive an easier or more difficult passage until a reliable estimate of reading skill is reached (minimum of 1 passage and a maximum of 4 passages).
This task is administered to students in grades 3-12 during all 3 assessment periods of the school year.
Broad Diagnostic Inventory (BDI) (K-2 Only)
The Broad Diagnostic Inventory (BDI) is the second assessment type and is a set of tasks designed to indicate other key areas of instructional need related to reading success (Comprehension, Vocabulary, and Spelling). The grade levels (K-2) and assessment periods in which BDI is administered vary by task.
Targeted Diagnostic Inventory (TDI)
The Targeted Diagnostic Inventory (TDI) is the third assessment type and is a set of tasks that cover the range of developmental reading skills.
For grades K-2, if a student receives a Probability of Reading Success (PRS) of less than 85% then he or she is required to complete the TDI. The student will continue with the TDI tasks until he or she is Below Expectations (BE) - below 80% mastery.
Note: In some instances, students are administered the next task regardless of obtaining the 80% criteria. This is to give teachers adequate information on student performance.

PMRN User’s Guide Version 11.0 Page
For grades 3-12, the TDI is optional for all students. The TDI in grades 3-12 consists of two tasks: Maze and Word Analysis.
Success ProbabilitiesAfter a student’s score is Submitted to the PMRN, it is assigned a Success Zone, which corresponds to the Probability Score that is calculated based on student performance on the Broad Screen task for grades K-2 and student performance on the Broad Screen task and the prior year’s FCAT score for grades 3-12.
The following Success Zones and corresponding colors are used in the PMRN:
Overview of Reports - Success Probabilities
7.5
High Success, Green: 85% chance or higher of success on the Year-End Outcome measure
Moderate Success, Yellow: 16% - 84% chance of success on the Year-End Outcome measure
Low Success, Red: 15% chance or less of success on the Year-End Outcome measure
Green
Yellow
Red
If the student’s performance falls in the Green Success Zone, this means that with continued instruction at the current level of intensity, the student should maintain reading growth at the appropriate rate.
If the student’s performance falls in the Yellow Success Zone, the student requires additional instruction at varying levels of intensity in order to improve his or her chance of success on the Year-End Outcome measure.
If the student’s performance falls in the Red Success Zone, this means that the student will require intensive intervention to accelerate reading growth for an end of the year performance that is at least at the 40th percentile for grades K-2 or a Level 3 for grades 3-12.
PMRN User’s Guide Version 11.0 Page
Overview of Reports - Score Types (K-2)
7.6
Score Types for K-2The assessment types for grades Kindergarten through 2nd contain the following score types:
BS/PMT • Probability of Reading Success (PRS)
BDI - Listening Comprehension, Reading Comprehension, Vocabulary, Spelling • Percentile Rank • Fluency Score (WCPM) • Percent Accuracy • Target Passage
TDI • Meets Expectations (ME) • Below Expectations (BE)
Probability of Reading Success (PRS)
A probability is the relative possibility that an event will occur or is likely to occur.
In the FAIR, each child receives a probability score. For K-2, the Probability of Reading Success (PRS) is calculated based on the student’s performance on the Broad Screen/Progress Monitoring Tool (BS/PMT).
The PRS score predicts the percent chance of a student’s success in reading.
The PRS is broken into 3 Success Zones: High Success (Green Zone), Moderate Success (Yellow Zone), and Low Success (Red Zone).
PMRN User’s Guide Version 11.0 Page
Overview of Reports - Score Types (K-2)
7.7
Percentile Ranks
Percentile Ranks are derived scores that are used to rank one student’s performance in relation to a specific group (i.e. students in the same grade level). On the Florida Assessments for Instruction in Reading (FAIR), the specified group is a representative sample of Florida students at the same grade.
Percentile ranks are the scores given on the Vocabulary and Spelling (2nd grade only) tasks.
Note: A percentile rank is NOT a percentage score identifying how many items were answered correctly.
Fluency Score (WCPM)
Words Correct Per Minute (WCPM) is the fluency score that is calculated for the Reading Comprehension task on the BDI.
If using the K-2 Electronic Scoring Tool (EST), fluency is calculated for you, or you can calculate it in your Student Score Booklets (SSB) by using the following formulas: • Words in Story - Errors = Words Correct • Words Correct / Total Seconds X 60 = Fluency (WCPM)
Percent Accuracy Score
The Percent Accuracy score is calculated on the Reading Comprehension task of the BDI. Percent Accuracy takes into account how many word reading errors the student made when considering the total number of words read.
Note: A Percent Accuracy score also may indicate that a student needs additional support in building a sight word vocabulary or phonics instruction.

PMRN User’s Guide Version 11.0 Page
Overview of Reports - Score Types (K-2)
7.8
Note: On the PMRN reports, students who meet the criteria will have a ME for that task. Those students that do not meet the criteria will receive a BE.
Reading with at least 90% accuracy is required in order to complete the Reading Comprehension task. This allows the teachers to assess the student’s comprehension in a passage at his or her instructional reading level.
Target Passage
The Target Passage is a passage on the Reading Comprehension task of the BDI that has been identified as the Target Passage for that assessment period and that grade level. The passage provides teachers with a guideline to determine if a student is meeting developmental reading expectations for each assessment period.
The following passages are identified as Target Passages: • 1st Grade • Assessment Period 1 = Passage 1 • Assessment Period 2 = Passage 3 • Assessment Period 3 = Passage 5 • 2nd Grade • Assessment Period 1 = Passage 2 • Assessment Period 2 = Passage 4 • Assessment Period 3 = Passage 5
Meets Expectations / Below Expectations
Meets Expectations (ME) or Below Expectations (BE) are Criterion Scores that are calculated on the TDI. A Criterion Score is an agreed upon standard used to identify adequate student performance.
For Florida Assessments for Instruction in Reading (FAIR), the agreed upon criteria for students to achieve ME is an 80% level of mastery on the TDI.

PMRN User’s Guide Version 11.0 Page
Overview of Reports - Score Types (3-12)
7.9
Score Types for 3-12The assessment types for grades 3 through 12 contain the following score types:
BS/PMT – Reading Comprehension • FCAT Success Probability (FSP) • Percentile Rank • FCAT Reporting Categories
TDI – Maze • Percentile Rank • Average Adjusted Maze Score
TDI – Word Analysis • Percentile Rank
FCAT Success Probability (FSP)
A probability is the relative possibility that an event will occur or is likely to occur.
In the FAIR system each child receives a probability score. In the 3-12 system, the FCAT Success Probability (FSP) is calculated based on the student’s performance on the Broad Screen/Progress Monitoring Tool (BS/PMT) and the student’s prior year FCAT score if available. For all 3rd grade students (even those repeating 3rd grade), the FSP score is based only on performance on the BS/PMT.
In the 3-12 system, the FSP score predicts the percent chance a student will score at or above Level 3 on the Florida Comprehensive Assessment Test (FCAT) at the end of the year. For example, an FSP score of 70% means that we expect this student to have a 70% chance of scoring at or above Level 3 at the end of the year on the FCAT.
PMRN User’s Guide Version 11.0 Page
Overview of Reports - Score Types (3-12)
7.10
Percentile Ranks
Percentile Ranks are derived scores that are used to rank one student’s performance in relation to a specific group (i.e. students in the same grade level). On the Florida Assessments for Instruction in Reading (FAIR), the specified group is a representative sample of Florida students at the same grade level as the student.
For example, a student who takes a task and scores in the 50th percentile scores equal to or better than 50 of 100 students at the same grade. The student performed in the middle or average when compared to students who also took the task.
Percentile Ranks are a score given on Reading Comprehension, Maze and Word Analysis.
Note: A percentile rank is NOT a percentage score identifying how many items were answered correctly.
FCAT Reporting Categories
Reporting Categories are calculated on the Reading Comprehension (RC) task of the BS/PMT. Previously called Cluster Scores, Reporting Categories measure different areas of the RC task. The four Reporting Categories and the corresponding abbreviations on the Class Status Report and Student Score Detail Report are: • 1 - Vocabulary (VC) • 2 - Reading Application (RA) • 3 - Literary Analysis Fiction / Nonfiction (LA) • 4 - Informational Text Process (IT)
The questions in the Reading Comprehension task and therefore the Reporting Categories are passage specific. The passage difficulty level differs based on student performance so teachers should interpret these scores considering the adaptive nature of the assessment.
PMRN User’s Guide Version 11.0 Page
Overview of Reports - Score Types (3-12)
7.11
The goal should be to help the student achieve sufficiently strong overall reading ability to allow the student to be tested on grade level passages within the adaptive framework.
Passage Text Complexity
Passage Text Complexity ratings are calculated on the Reading Comprehension (RC) task of the BS/PMT. Text Complexity ratings measure the level of complication in the text of the RC task. The three Passage Text Complexity ratings and the corresponding abbreviations on the Student Score Detail Report are:
• 1 - Simple (SI) • 2 - Moderate (MD) • 3 - Complex (CX)
Adjusted Maze Score
The Adjusted Maze Score is calculated on the TDI - Maze task. The score reported is measured in items correct per three minutes. It represents the student’s average performance across the two grade level passages and can be used to compare performance across assessment periods.
Note: This score is not the same thing as a fluency score reported in words correct per minute (WCPM).
Adjusted Maze Scores are adjusted in two ways: • For the amount of time it takes the student to complete the measure • For differences in difficulty of individual passages to allow for comparison across passages

PMRN User’s Guide Version 11.0 Page
Overview of Reports - Report Components
7.12
Report ComponentsData collected from the PMRN is displayed on the reports through various report components, including Success Boxes, pie graphs, column headers, and Student Score Detail Boxes.
Report Legend
Legends are available for each report by clicking on the Show Legend link in the upper right corner of each report.
Legends, specific to each report, identify and provide a description of each component of a report.

PMRN User’s Guide Version 11.0 Page
Success Box
Within PMRN reports, Success Boxes represent the student’s Probability of a Reading Success score (K-2) or FCAT Success Probability (3-12) for the assessment period being displayed.
The boxes are color-coded and represent the Success Zones, which show the student at High Success (Green), Moderate Success (Yellow), or Low Success (Red). For more information on Success Zones, please see Success Probabilities, page 7.5.
7.13
Overview of Reports - Report Components
Success Boxes are displayed in Status and Success Zone Reports.
Pie Graph
Pie Graphs identify the percent of students within each Success Zone. The number directly under the pie graph represents the number of students calculated in the percentages.
The pie chart and list of students includes all students who were in the class at the time of assessment when the assessment was administered during the norming window, even if the student is removed from the class.
Students with an asterisk (*), were not assessed in the class, the scores were copied from another class, and are not calculated in the pie chart.

PMRN User’s Guide Version 11.0 Page
Students with Daggers were assessed outside of the norming window and are not part of the pie chart. If a student is currently enrolled in a class, tested during the assessment, and assigned to another class, the student will still be a part of the population in the pie graph for that assessment period.
Column Header
Column Headers signify the type of data that is displayed in the column below. Some reports (i.e., the Class Status Report) and their data may be sorted in various ways by clicking on the multiple Column Headers. For example, if you wish to view students in a 4th grade class by their Prior Year Matched FCAT Level, click Prior Year Matched FCAT Level on the Class Status Report.
Note: Default sorting for PMRN reports is alphabetical order. The Prior Year FCAT will be displayed for those students who took the FCAT during the previous year’s Spring administration. The Identifier used in the FCAT data file is the same as the one listed in the PMRN.
Overview of Reports - Report Components
7.14
Magnifying Glass
The Magnifying Glass icon is used to indicate that a more detailed and specific look at student data is available on the report being viewed. Once the icon is clicked, a pop-up window will display the Student Score Detail Box.

PMRN User’s Guide Version 11.0 Page
Student Score Detail Box
The Student Score Detail Box (SSDB) displays a more specific view of the data that is shown in the original report. The SSDB includes all specific scores for each task the student completed for the assessment period being reported.
Overview of Reports - Report Components
The SSDB can be printed and placed in the student’s cumulative folder as a point of reference for the student’s performance for the assessment period. To print the individual SSDB, click the Print icon at the bottom of the box.
7.15

PMRN User’s Guide Version 11.0 Page
Dagger
A Dagger icon represents a score that has been achieved by a student outside of the norming window being displayed on the report. The scores are not aggregated.
Overview of Reports - Report Components
7.16
Copied Score
A copied score occurs when a student moves to another school after the student’s score was Submitted from the previous school during the same assessment period.
The User enrolling the student into the new school will be given the option to either copy or not copy the scores from the previous schools.
If the scores are copied, the student’s scores shown in the PMRN reports are displayed with an asterisk. The scores are not aggregated (Asterisks are also displayed for students that have been moved to another class during the same assessment period.).
If the scores are not copied, the student may be re-assessed for the assessment period, and the scores may be Submitted in the PMRN.
A description of the Dagger icon can also be found at the bottom of the report.
PMRN User’s Guide Version 11.0 Page
Duplicate Score
As a result of the high migration rate throughout Florida schools, students may be enrolled in more than one school (up to 2) at the same time in the PMRN. These students are able to have scores Submitted in both schools. These scores are known as duplicate scores.
Duplicate scores appear normally on PMRN reports with the exception of the District and School Data File. Duplicate scores are flagged in these reports.
At regular intervals, the Support Specialists of the PMRN Help Desk work to resolve all duplicate scores and ensure that only one of the scores is permanently kept.
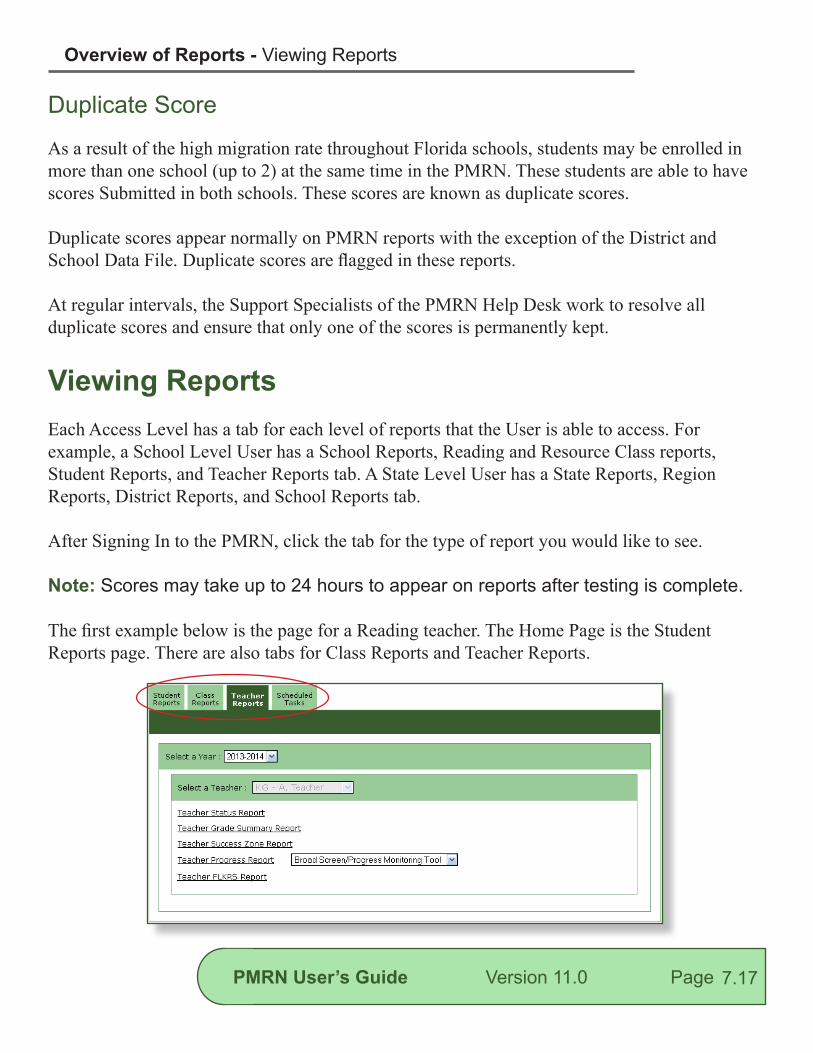
Viewing ReportsEach Access Level has a tab for each level of reports that the User is able to access. For example, a School Level User has a School Reports, Reading and Resource Class reports, Student Reports, and Teacher Reports tab. A State Level User has a State Reports, Region Reports, District Reports, and School Reports tab.
After Signing In to the PMRN, click the tab for the type of report you would like to see.
Note: Scores may take up to 24 hours to appear on reports after testing is complete.
The first example below is the page for a Reading teacher. The Home Page is the Student Reports page. There are also tabs for Class Reports and Teacher Reports.
7.17
Overview of Reports - Viewing Reports

PMRN User’s Guide Version 11.0 Page
The second example below is the page for a School Level User who has selected the Teacher Reports tab. The Home Page is the School Reports page. There are also tabs for Class Reports, Student Reports and Teacher Reports.
Overview of Reports - Viewing Reports
7.18
After the report has been accessed via the corresponding tab, a User is able to navigate to other reports using the Active Header Menu (AHM) as well as links available on the reports. For example, a School Level User viewing the School Status Report can access a Class Status Report for an individual class by selecting the class from the AHM.
More information about specific reports can be found in sections 8.0 - 11.0 of the PMRN User’s Guide.

PMRN User’s Guide Version 11.0 Page
Active Header MenuMost reports in the PMRN have an Active Header Menu (AHM) at the top. The AHM allows easier navigation via drop-down menus and also allows the User to apply various filters to the data that is displayed.
The number of drop-down menus active in the AHM depends on the report and the Access Level of the user that is viewing the report. For example, School Level Users can move between the classes of the different teachers while Reading and Resource Level Users can only view the classes that they teach. Where there is only a single option for navigation, a label is displayed instead of a drop-down menu.
7.19
Overview of Reports - Active Header Menu
Beneath the AHM, a Click Here to Print this Report link is displayed. Clicking this link brings up the browser’s print dialog and allows you to print the current view of the report. In the PMRN, the print button on the browser’s toolbar is disabled and this is the only way to print reports.
Related Documents


![FLORIDA FIELD NATURALIST - University of New Mexico1].pdf · FLORIDA FIELD NATURALIST ... and evaluate reports of crocodiles in the area. Florida Field Naturalist 11: 1-16, 1983.](https://static.cupdf.com/doc/110x72/5b4a627b7f8b9a5c278c2a50/florida-field-naturalist-university-of-new-mexico-1pdf-florida-field-naturalist.jpg)