
Welcome message from author
This document is posted to help you gain knowledge. Please leave a comment to let me know what you think about it! Share it to your friends and learn new things together.
Transcript

7700++ DDVVDD’’ss FFOORR SSAALLEE && EEXXCCHHAANNGGEE
wwwwww..ttrraaddeerrss--ssooffttwwaarree..ccoomm
wwwwww..ffoorreexx--wwaarreezz..ccoomm
wwwwww..ttrraaddiinngg--ssooffttwwaarree--ccoolllleeccttiioonn..ccoomm
wwwwww..ttrraaddeessttaattiioonn--ddoowwnnllooaadd--ffrreeee..ccoomm
CCoonnttaaccttss
aannddrreeyybbbbrrvv@@ggmmaaiill..ccoomm aannddrreeyybbbbrrvv@@yyaannddeexx..rruu
SSkkyyppee:: aannddrreeyybbbbrrvv
Selected material from
Fundamentals of Corporate FinanceThird Edition
Richard A. BrealeyBank of England and London Business School
Stewart C. MyersSloan School of Management
Massachusetts Institute of Technology
Alan J. MarcusWallace E. Carroll School of Management
Boston College
with additional material from
Fundamentals of Corporate Finance, Alternate Fifth Edition
Essentials of Corporate Finance, Second Edition
Stephen A. Ross, Massachusetts Institute of Technology
Randolph W. Westerfield, University of Southern California
Bradford D. Jordan, University of Kentucky
UNIVERSITY OF PHOENIX
Boston Burr Ridge, IL Dubuque, IA Madison, WI New York San Francisco St. LouisBangkok Bogotá Caracas Lisbon London Madrid
Mexico City Milan New Delhi Seoul Singapore Sydney Taipei Toronto
Selected material fromFUNDAMENTALS OF CORPORATE FINANCE, Third Editionwith additional material fromFUNDAMENTALS OF CORPORATE FINANCE, Alternate Fifth EditionESSENTIALS OF CORPORATE FINANCE, Second Edition
Copyright © 2001 by The McGraw-Hill Companies, Inc. All rights reserved. Printed in the United States of America. Ex-cept as permitted under the United States Copyright Act of 1976, no part of this publication may be reproduced or distrib-uted in any form or by any means, or stored in a data base retrieval system, without prior written permission of the pub-lisher.
This book contains select material from:Fundamentals of Corporate Finance, Third Edition by Richard A. Brealey, Stewart C. Myers, and Alan J. Marcus. Copyright© 2001, 1999, 1995, by The McGraw-Hill Companies, Inc.Fundamentals of Corporate Finance, Alternate Fifth Edition by Stephen A. Ross, Randolph W. Westerfield, and Bradford D.Jordan. Copyright © 2000, 1998, 1995, 1993, 1991 by The McGraw-Hill Companies, Inc.Essentials of Corporate Finance, Second Edition by Stephen A. Ross, Randolph W. Westerfield, and Bradford D. Jordan.Copyright © 1999 by The McGraw-Hill Companies, Inc. Previous edition © 1996 by Richard D. Irwin, a Times MirrorHigher Education Group, Inc. company.All reprinted with permission of the publisher.
ISBN 0-07-553109-7
Sponsoring Editor: Christian PerleeProduction Editor: Nina Meyer
iii
ContentsSECTION 1 1
How to Value Perpetuities 50How to Value Annuities 51Annuities Due 54Future Value of an Annuity 57
Inflation and the Time Value of Money 61Real versus Nominal Cash Flows 61Inflation and Interest Rates 63Valuing Real Cash Payments 65Real or Nominal? 67
Effective Annual Interest Rates 67
Summary 69Related Web Links 69Key Terms 70Quiz 70Practice Problems 72Challenge Problems 75Solutions to Self-Test Questions 77Minicase 79
Financial Planning 81What Is Financial Planning? 82Financial Planning Focuses on the Big Picture 83Financial Planning Is Not Just Forecasting 84Three Requirements for Effective Planning 84
Financial Planning Models 86Components of a Financial Planning Model 87An Example of a Planning Model 88An Improved Model 89
Planners Beware 93Pitfalls in Model Design 93The Assumption in Percentage of Sales Models 94The Role of Financial Planning Models 95
External Financing and Growth 96
Summary 100Related Web Links 101Key Terms 101Quiz 101Practice Problems 102Challenge Problems 106Solutions to Self-Test Questions 106
The Firm and the Financial Manager 3
Organizing a Business 4Sole Proprietorships 4Partnerships 5Corporations 5Hybrid Forms of Business Organization 6
The Role of the Financial Manager 7The Capital Budgeting Decision 8The Financing Decision 9
Financial Institutions and Markets 10Financial Institutions 10Financial Markets 11Other Functions of Financial Markets and
Institutions 12
Who Is the Financial Manager? 13Careers in Finance 15
Goals of the Corporation 17Shareholders Want Managers to Maximize
Market Value 17Ethics and Management Objectives 19Do Managers Really Maximize Firm Value? 21Snippets of History 25
Summary 25Related Web Links 28Key Terms 28Quiz 28Practice Problems 29Solutions to Self-Test Questions 31
The Time Value of Money 33Future Values and Compound Interest 34
Present Values 38Finding the Interest Rate 44
Multiple Cash Flows 46Future Value of Multiple Cash Flows 46Present Value of Multiple Cash Flows 49
Level Cash Flows: Perpetuities and Annuities 50
Financial Statement Analysis 133Financial Ratios 134Leverage Ratios 138Liquidity Ratios 139Efficiency Ratios 141Profitability Ratios 143
The Du Pont System 145Other Financial Ratios 146
Using Financial Ratios 147Choosing a Benchmark 147
Measuring Company Performance 150
The Role of Financial Ratios 151
Summary 153Related Web Links 155Key Terms 155Quiz 155Practice Problems 157Challenge Problem 158Solutions to Self-Test Questions 159Minicase 160
IV CONTENTS
Accounting and Finance 111The Balance Sheet 112Book Values and Market Values 115
The Income Statement 117Profits versus Cash Flow 118
The Statement of Cash Flows 119
Accounting for Differences 121
Taxes 123Corporate Tax 123Personal Tax 125
Summary 126Related Web Links 127Key Terms 127Quiz 127Practice Problems 128Challenge Problem 131Solutions to Self-Test Questions 131
APPENDIX A 109
SECTION 2 163
Working Capital Management and Short-Term Planning 165
Working Capital 167The Components of Working Capital 167Working Capital and the Cash Conversion Cycle 168The Working Capital Trade-Off 171
Links between Long-Term and Short-TermFinancing 172
Tracing Changes in Cash and Working Capital 175
Cash Budgeting 177Forecast Sources of Cash 177Forecast Uses of Cash 179The Cash Balance 179
A Short-Term Financing Plan 180Options for Short-Term Financing 180Evaluating the Plan 184
Sources of Short-Term Financing 185
Bank Loans 185Commercial Paper 186Secured Loans 186
The Cost of Bank Loans 187Simple Interest 187Discount Interest 188Interest with Compensating Balances 189
Summary 190Related Web Links 191Key Terms 191Quiz 191Practice Problems 192Challenge Problem 194Solutions to Self-Test Questions 195Minicase 197
Cash and Inventory Management 201Cash Collection, Disbursement, and Float 202Float 203Valuing Float 204
CONTENTS V
Managing Float 205Speeding Up Collections 206Controlling Disbursements 209Electronic Funds Transfer 210
Inventories and Cash Balances 211Managing Inventories 212Managing Inventories of Cash 215Uncertain Cash Flows 216Cash Management in the Largest Corporations 217Investing Idle Cash: The Money Market 218
Summary 219Related Web Links 220Key Terms 220Quiz 220Practice Problems 221Challenge Problem 224Solutions to Self-Test Questions 224
Credit Management and Collection 227Terms of Sale 229
Credit Agreements 231
Credit Analysis 232Financial Ratio Analysis 233Numerical Credit Scoring 233When to Stop Looking for Clues 234
The Credit Decision 236Credit Decisions with Repeat Orders 237Some General Principles 238
Collection Policy 239
Bankruptcy 240Bankruptcy Procedures 241The Choice between Liquidation and
Reorganization 242
Summary 244Related Web Links 245Key Terms 245Quiz 245Practice Problems 246Challenge Problems 248Solutions to Self-Test Questions 249Minicase 250
Valuing Bonds 255Bond Characteristics 256Reading the Financial Pages 257
Bond Prices and Yields 259How Bond Prices Vary with Interest Rates 260Yield to Maturity versus Current Yield 261Rate of Return 265Interest Rate Risk 267The Yield Curve 268Nominal and Real Rates of Interest 268Default Risk 270Valuations in Corporate Bonds 273
Summary 273Related Web Links 274Key Terms 274Quiz 274Practice Problems 275Challenge Problems 277Solutions to Self-Test Questions 277
Valuing Stocks 279Stocks and the Stock Market 280Reading the Stock Market Listings 281
Book Values, Liquidation Values, and MarketValues 283
Valuing Common Stocks 287Today’s Price and Tomorrow’s Price 287The Dividend Discount Model 288
Simplifying the Dividend Discount Model 291The Dividend Discount Model with No Growth 291The Constant-Growth Dividend Discount Model 292Estimating Expected Rates of Return 293Nonconstant Growth 295
Growth Stocks and Income Stocks 296The Price-Earnings Ratio 298What Do Earnings Mean? 298Valuing Entire Businesses 301
Summary 301Related Web Links 302Key Terms 302Quiz 302Practice Problems 303Challenge Problems 306Solutions to Self-Test Questions 307
SECTION 3 253
VI CONTENTS
Introduction to Risk, Return, and theOpportunity Cost of Capital 311
Rates of Return: A Review 312
Seventy-Three Years of Capital Market History 313Market Indexes 314The Historical Record 314Using Historical Evidence to Estimate Today’s Cost of
Capital 317
Measuring Risk 318Variance and Standard Deviation 318A Note on Calculating Variance 322Measuring the Variation in Stock Returns 322
Risk and Diversification 324Diversification 324Asset versus Portfolio Risk 325Market Risk versus Unique Risk 330
Thinking about Risk 331Message 1: Some Risks Look Big and Dangerous but
Really Are Diversifiable 331Message 2: Market Risks Are Macro Risks 332Message 3: Risk Can Be Measured 333
Summary 334Related Web Links 334Key Terms 334Quiz 335Practice Problems 336Solutions to Self-Test Questions 338
SECTION 4 339Net Present Value and Other InvestmentCriteria 341
Net Present Value 343A Comment on Risk and Present Value 344Valuing Long-Lived Projects 345
Other Investment Criteria 349Internal Rate of Return 349A Closer Look at the Rate of Return Rule 350Calculating the Rate of Return for Long-Lived
Projects 351A Word of Caution 352Payback 352Book Rate of Return 355
Investment Criteria When Projects Interact 356Mutually Exclusive Projects 356Investment Timing 357Long- versus Short-Lived Equipment 359Replacing an Old Machine 361Mutually Exclusive Projects and the IRR Rule 361Other Pitfalls of the IRR Rule 363
Capital Rationing 365Soft Rationing 365Hard Rationing 366Pitfalls of the Profitability Index 3667
Summary 367Related Web Links 368Key Terms 368Quiz 368Practice Problems 369
Challenge Problems 373Solutions to Self-Test Questions 373
Using Discounted Cash-Flow Analysis toMake Investment Decisions 377
Discount Cash Flows, Not Profits 379
Discount Incremental Cash Flows 381Include All Indirect Effects 381Forget Sunk Costs 382Include Opportunity Costs 382Recognize the Investment in Working Capital 383Beware of Allocated Overhead Costs 384
Discount Nominal Cash Flows by the Nominal Costof Capital 385
Separate Investment and Financing Decisions 386
Calculating Cash Flow 387Capital Investment 387Investment in Working Capital 387Cash Flow from Operations 388
Example: Blooper Industries 390Calculating Blooper’s Project Cash Flows 391Calculating the NPV of Blooper’s Project 392Further Notes and Wrinkles Arising from Blooper’s
Project 393
Summary 397Related Web Links 398Key Terms 398Quiz 398
CONTENTS VII
Practice Problems 200Challenge Problems 402Solutions to Spreadsheet Model Questions 403Solutions to Self-Test Questions 404Minicase 405
Risk, Return, and Capital Budgeting 407Measuring Market Risk 408Measuring Beta 409Betas for MCI WorldCom and Exxon 411Portfolio Betas 412
Risk and Return 414Why the CAPM Works 416The Security Market Line 417How Well Does the CAPM Work? 419Using the CAPM to Estimate Expected Returns 420
Capital Budgeting and Project Risk 422Company versus Project Risk 422Determinants of Project Risk 423Don’t Add Fudge Factors to Discount Rates 424
Summary 425Related Web Links 426Key Terms 426Quiz 426Practice Problems 427Challenge Problem 432Solutions to Self-Test Questions 432
The Cost of Capital 435Geothermal’s Cost of Capital 436
Calculating the Weighted-Average Cost of Capital 438
Calculating Company Cost of Capital as a WeightedAverage 440
Market versus Book Weights 441Taxes and the Weighted-Average Cost of Capital 442What If There Are Three (or More) Sources of
Financing? 443Wrapping Up Geothermal 444Checking Our Logic 445
Measuring Capital Structure 446
Calculating Required Rates of Return 447The Expected Return on Bonds 448The Expected Return on Common Stock 448The Expected Return on Preferred Stock 449
Big Oil’s Weighted-Average Cost of Capital 450Real Oil Company WACCs 450
Interpreting the Weighted-Average Cost of Capital 451When You Can and Can’t Use WACC 451Some Common Mistakes 452How Changing Capital Structure Affects Expected
Returns 452What Happens When the Corporate Tax Rate Is Not
Zero 453
Flotation Costs and the Cost of Capital 454
Summary 454Related Web Links 455Key Terms 455Quiz 455Practice Problems 456Challenge Problems 458Solutions to Self-Test Questions 458Minicase 459
SECTION 5 463
Project Analysis 465How Firms Organize the Investment Process 466Stage 1: The Capital Budget 467Stage 2: Project Authorizations 467Problems and Some Solutions 468
Some “What-If ” Questions 469Sensitivity Analysis 469Scenario Analysis 472
Break-Even Analysis 473Accounting Break-Even Analysis 474
NPV Break-Even Analysis 475Operating Leverage 478
Flexibility in Capital Budgeting 481Decision Trees 481The Option to Expand 482Abandonment Options 483Flexible Production Facilities 484Investment Timing Options 484
Summary 485Related Web Links 485Key Terms 485
VIII CONTENTS
Quiz 485Practice Problems 486Challenge Problems 489Solutions to Self-Test Questions 489Minicase 491
An Overview of Corporate Financing 493
Common Stock 494Book Value versus Market Value 496Dividends 497Stockholders’ Rights 497Voting Procedures 497Classes of Stock 498Corporate Governance in the United States and
Elsewhere 498
Preferred Stock 499
Corporate Debt 500Debt Comes in Many Forms 501Innovation in the Debt Market 504
Convertible Securities 507
Patterns of Corporate Financing 508Do Firms Rely Too Heavily on Internal Funds? 508External Sources of Capital 510
Summary 511Related Web Links 512Key Terms 512
Quiz 512Practice Problems 513Solutions to Self-Test Questions 514
How Corporations Issue Securities 517Venture Capital 519
The Initial Public Offering 520Arranging a Public Issue 521
The Underwriters 526Who Are the Underwriters? 526
General Cash Offers by Public Companies 528General Cash Offers and Shelf Registration 528Costs of the General Cash Offer 529Market Reaction to Stock Issues 530
The Private Placement 531
Summary 532Related Web Links 533Key Terms 533Quiz 534Practice Problems 534Challenge Problem 536Solutions to Self-Test Questions 537Minicase 537
Appendix: Hotch Pot’s New Issue Prospectus 539
Leasing 547Leasing versus Buying 548
Operating Leases 548
Financial Leases 549
Tax-Oriented Leases 549
Leveraged Leases 550
Sale and Leaseback Agreements 550
Accounting and Leasing 550
Taxes, the IRS, and Leases 552
The Cash Flows from Leasing 553
The Incremental Cash Flows 553
A Note on Taxes 554
Lease or Buy? 555
A Preliminary Analysis 555
Three Potential Pitfalls 555
NPV Analysis 556
A Misconception 556
Leverage and Capital Structure559The Capital Structure Question 560
The Effect of Financial Leverage 560The Impact of Financial Leverage 560
Financial Leverage, EPS, and ROE: An Example 561
EPS versus EBIT 561
APPENDIX B 545
CONTENTS IX
Mergers, Acquisitions, and CorporateControl 56722.1 The Market for Corporate Control 569
Method 1: Proxy Contests 569Method 2: Mergers and Acquisitions 570Method 3: Leveraged Buyouts 571Method 4: Divestitures and Spin-offs 571
22.2 Sensible Motives for Mergers 572Economies of Scale 573Economies of Vertical Integration 573Combining Complementary Resources 574Mergers as a Use for Surplus Funds 574
22.3 Dubious Reasons for Mergers 575Diversification 575The Bootstrap Game 575
22.4 Evaluating Mergers 577Mergers Financed by Cash 577Mergers Financed by Stock 579A Warning 580Another Warning 580
22.5 Merger Tactics 582Who Gets the Gains? 584
22.6 Leveraged Buyouts 585Barbarians at the Gate? 587
22.7 Mergers and the Economy 588Merger Waves 588Do Mergers Generate Net Benefits? 589
22.8 Summary 590
Related Web Links 592Key Terms 592Quiz 592Practice Problems 593Challenge Problems 594Solutions to Self-Test Questions 595Minicase 595
International Financial Management 59723.1 Foreign Exchange Markets 598
23.2 Some Basic Relationships 602Exchange Rates and Inflation 602Inflation and Interest Rates 606Interest Rates and Exchange Rates 608The Forward Rate and the Expected Spot Rate 609Some Implications 610
23.3 Hedging Exchange Rate Risk 612
23.4 International Capital Budgeting 613Net Present Value Analysis 613The Cost of Capital for Foreign Investment 615Avoiding Fudge Factors 616
23.5 Summary 617Related Web Links 618Key Terms 618Quiz 618Practice Problems 619Challenge Problem 621Solutions to Self-Test Questions 621Minicase 623
Glossary 635
SECTION 6 565
APPENDIX C 625

The Firm and the Financial Manager
The Time Value of Money
Financial Statement Analysis
Section 1

3
THE FIRM AND THEFINANCIAL MANAGER
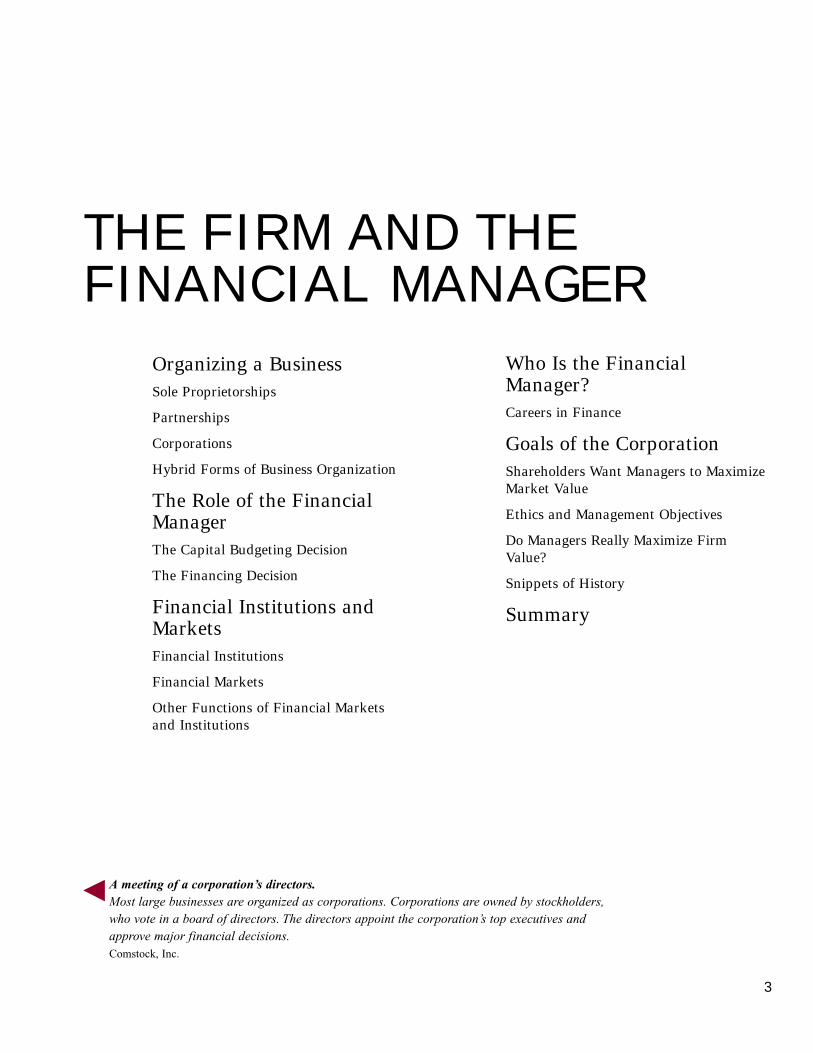
A meeting of a corporation’s directors.Most large businesses are organized as corporations. Corporations are owned by stockholders,who vote in a board of directors. The directors appoint the corporation’s top executives andapprove major financial decisions.Comstock, Inc.
Organizing a BusinessSole Proprietorships
Partnerships
Corporations
Hybrid Forms of Business Organization
The Role of the FinancialManagerThe Capital Budgeting Decision
The Financing Decision
Financial Institutions andMarketsFinancial Institutions
Financial Markets
Other Functions of Financial Marketsand Institutions
Who Is the FinancialManager?Careers in Finance
Goals of the CorporationShareholders Want Managers to MaximizeMarket Value
Ethics and Management Objectives
Do Managers Really Maximize FirmValue?
Snippets of History
Summary
his material is an introduction to corporate finance. We will discuss the
various responsibilities of the corporation’s financial managers and
show you how to tackle many of the problems that these managers are
expected to solve. We begin with a discussion of the corporation, the finan-
cial decisions it needs to make, and why they are important.
To survive and prosper, a company must satisfy its customers. It must also produce
and sell products and services at a profit. In order to produce, it needs many assets—
plant, equipment, offices, computers, technology, and so on. The company has to de-
cide (1) which assets to buy and (2) how to pay for them. The financial manager plays
a key role in both these decisions. The investment decision, that is, the decision to in-
vest in assets like plant, equipment, and know-how, is in large part a responsibility of
the financial manager. So is the financing decision, the choice of how to pay for such
investments.
We start by explaining how businesses are organized. We then provide a brief intro-
duction to the role of the financial manager and show you why corporate managers need
a sophisticated understanding of financial markets. Next we turn to the goals of the firm
and ask what makes for a good financial decision. Is the firm’s aim to maximize prof-
its? To avoid bankruptcy? To be a good citizen? We consider some conflicts of interest
that arise in large organizations and review some mechanisms that align the interests of
the firm’s managers with the interests of its owners. Finally, we provide an overview of
what is to come.
After studying this material you should be able to
� Explain the advantages and disadvantages of the most common forms of business
organization and determine which forms are most suitable to different types of
businesses.
� Cite the major business functions and decisions that the firm’s financial managers
are responsible for and understand some of the possible career choices in finance.
� Explain the role of financial markets and institutions.
� Explain why it makes sense for corporations to maximize their market values.
� Show why conflicts of interest may arise in large organizations and discuss how cor-
porations can provide incentives for everyone to work toward a common end.
4
T
Organizing a BusinessSOLE PROPRIETORSHIPS
In 1901 pharmacist Charles Walgreen bought the drugstore in which he worked on theSouth Side of Chicago. Today Walgreen’s is the largest drugstore chain in the UnitedStates. If, like Charles Walgreen, you start on your own, with no partners or stockhold-ers, you are said to be a sole proprietor. You bear all the costs and keep all the profits
The Firm and the Financial Manager 5
after the Internal Revenue Service has taken its cut. The advantages of a proprietorshipare the ease with which it can be established and the lack of regulations governing it.This makes it well-suited for a small company with an informal business structure.
As a sole proprietor, you are responsible for all the business’s debts and other liabil-ities. If the business borrows from the bank and subsequently cannot repay the loan, thebank has a claim against your personal belongings. It could force you into personalbankruptcy if the business debts are big enough. Thus as sole proprietor you have un-limited liability.
PARTNERSHIPS
Instead of starting on your own, you may wish to pool money and expertise with friendsor business associates. If so, a sole proprietorship is obviously inappropriate. Instead,you can form a partnership. Your partnership agreement will set out how managementdecisions are to be made and the proportion of the profits to which each partner is en-titled. The partners then pay personal income tax on their share of these profits.
Partners, like sole proprietors, have the disadvantage of unlimited liability. If the busi-ness runs into financial difficulties, each partner has unlimited liability for all the busi-ness’s debts, not just his or her share. The moral is clear and simple: “Know thy partner.”
Many professional businesses are organized as partnerships. They include the largeaccounting, legal, and management consulting firms. Most large investment banks suchas Morgan Stanley, Salomon, Smith Barney, Merrill Lynch, and Goldman Sachs startedlife as partnerships. So did many well-known companies, such as Microsoft and AppleComputer. But eventually these companies and their financing requirements grew toolarge for them to continue as partnerships.
CORPORATIONS
As your firm grows, you may decide to incorporate. Unlike a proprietorship or part-nership, a corporation is legally distinct from its owners. It is based on articles of in-corporation that set out the purpose of the business, how many shares can be issued, thenumber of directors to be appointed, and so on. These articles must conform to the lawsof the state in which the business is incorporated. For many legal purposes, the corpo-ration is considered a resident of its state. For example, it can borrow or lend money,and it can sue or be sued. It pays its own taxes (but it cannot vote!).
The corporation is owned by its stockholders and they get to vote on important mat-ters. Unlike proprietorships or partnerships, corporations have limited liability, whichmeans that the stockholders cannot be held personally responsible for the obligations ofthe firm. If, say, IBM were to fail, no one could demand that its shareholders put upmore money to pay off the debts. The most a stockholder can lose is the amount investedin the stock.
While the stockholders of a corporation own the firm, they do not usually manageit. Instead, they elect a board of directors, which in turn appoints the top managers. Theboard is the representative of shareholders and is supposed to ensure that managementis acting in their best interests.
This separation of ownership and management is one distinctive feature of corpora-tions. In other forms of business organization, such as proprietorships and partnerships,the owners are the managers.
The separation between management and ownership gives a corporation more flex-ibility and permanence than a partnership. Even if managers of a corporation quit or are
SOLE PROPRIETORSole owner of a businesswhich has no partners andno shareholders. Theproprietor is personally liablefor all the firm’s obligations.
PARTNERSHIPBusiness owned by two ormore persons who arepersonally responsible for allits liabilities.
CORPORATIONBusiness owned bystockholders who are notpersonally liable for thebusiness’s liabilities.
LIMITED LIABILITYThe owners of thecorporation are notpersonally responsible for itsobligations.
6 SECTION ONE
dismissed and replaced by others, the corporation can survive. Similarly, today’s share-holders may sell all their shares to new investors without affecting the business. In con-trast, ownership of a proprietorship cannot be transferred without selling out to anotherowner-manager.
By organizing as a corporation, a business may be able to attract a wide variety ofinvestors. The shareholders may include individuals who hold only a single share wortha few dollars, receive only a single vote, and are entitled to only a tiny proportion of theprofits. Shareholders may also include giant pension funds and insurance companieswhose investment in the firm may run into the millions of shares and who are entitledto a correspondingly large number of votes and proportion of the profits.
Given these advantages, you might be wondering why all businesses are not organ-ized as corporations. One reason is the time and cost required to manage a corporation’slegal machinery. There is also an important tax drawback to corporations in the UnitedStates. Because the corporation is a separate legal entity, it is taxed separately. So cor-porations pay tax on their profits, and, in addition, shareholders pay tax on any divi-dends that they receive from the company.1 By contrast, income received by partnersand sole proprietors is taxed only once as personal income.
When you first establish a corporation, the shares may all be held by a small group,perhaps the company’s managers and a small number of backers who believe the busi-ness will grow into a profitable investment. Your shares are not publicly traded and yourcompany is closely held. Eventually, when the firm grows and new shares are issued toraise additional capital, the shares will be widely traded. Such corporations are knownas public companies. Most well-known corporations are public companies.2
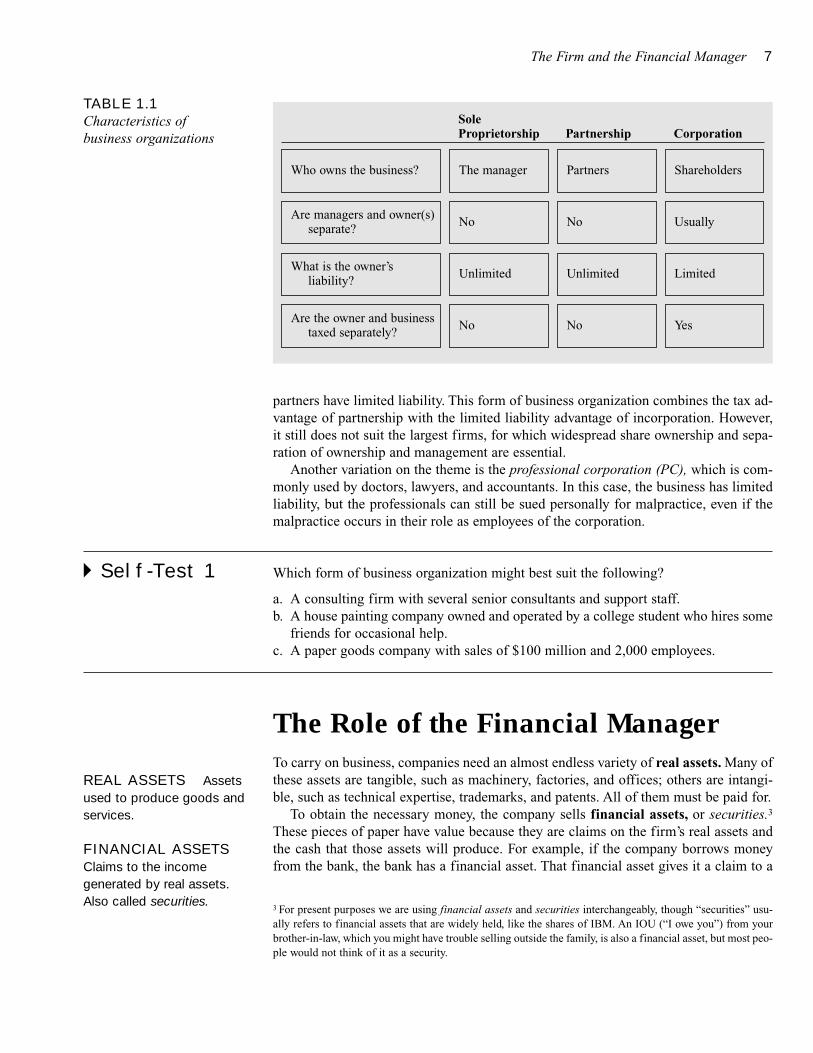
The financial managers of a corporation are responsible, by way of top managementand the board of directors, to the corporation’s shareholders. Financial managers aresupposed to make financial decisions that serve shareholders’ interests. Table 1.1 pre-sents the distinctive features of the major forms of business organization.
HYBRID FORMS OF BUSINESS ORGANIZATION
Businesses do not always fit into these neat categories. Some are hybrids of the threebasic types: proprietorships, partnerships, and corporations.
For example, businesses can be set up as limited partnerships. In this case, partnersare classified as general or limited. General partners manage the business and have un-limited personal liability for the business’s debts. Limited partners, however, are liableonly for the money they contribute to the business. They can lose everything they putin, but not more. Limited partners usually have a restricted role in management.
In many states a firm can also be set up as a limited liability partnership (LLP) or,equivalently, a limited liability company (LLC). These are partnerships in which all
To summarize, the corporation is a distinct, permanent legal entity. Itsadvantages are limited liability and the ease with which ownership andmanagement can be separated. These advantages are especially important forlarge firms. The disadvantage of corporate organization is double taxation.
1 The United States is unusual in its taxation of corporations. To avoid taxing the same income twice, mostother countries give shareholders at least some credit for the taxes that their company has already paid.2 For example, when Microsoft was initially established as a corporation, its shares were closely held by asmall number of employees and backers. Microsoft shares were issued to the public in 1986.
The Firm and the Financial Manager 7
partners have limited liability. This form of business organization combines the tax ad-vantage of partnership with the limited liability advantage of incorporation. However,it still does not suit the largest firms, for which widespread share ownership and sepa-ration of ownership and management are essential.
Another variation on the theme is the professional corporation (PC), which is com-monly used by doctors, lawyers, and accountants. In this case, the business has limitedliability, but the professionals can still be sued personally for malpractice, even if themalpractice occurs in their role as employees of the corporation.
� Self-Test 1 Which form of business organization might best suit the following?
a. A consulting firm with several senior consultants and support staff.b. A house painting company owned and operated by a college student who hires some
friends for occasional help.c. A paper goods company with sales of $100 million and 2,000 employees.
The Role of the Financial ManagerTo carry on business, companies need an almost endless variety of real assets. Many ofthese assets are tangible, such as machinery, factories, and offices; others are intangi-ble, such as technical expertise, trademarks, and patents. All of them must be paid for.
To obtain the necessary money, the company sells financial assets, or securities.3
These pieces of paper have value because they are claims on the firm’s real assets andthe cash that those assets will produce. For example, if the company borrows moneyfrom the bank, the bank has a financial asset. That financial asset gives it a claim to a
SoleProprietorship Partnership Corporation
Who owns the business?
Are managers and owner(s)separate?
What is the owner’sliability?
Are the owner and businesstaxed separately?
TABLE 1.1Characteristics ofbusiness organizations
3 For present purposes we are using financial assets and securities interchangeably, though “securities” usu-ally refers to financial assets that are widely held, like the shares of IBM. An IOU (“I owe you”) from yourbrother-in-law, which you might have trouble selling outside the family, is also a financial asset, but most peo-ple would not think of it as a security.
REAL ASSETS Assetsused to produce goods andservices.
FINANCIAL ASSETSClaims to the incomegenerated by real assets.Also called securities.
The manager Partners Shareholders
No No Usually
Unlimited Unlimited Limited
No No Yes
8 SECTION ONE
stream of interest payments and to repayment of the loan. The company’s real assetsneed to produce enough cash to satisfy these claims.
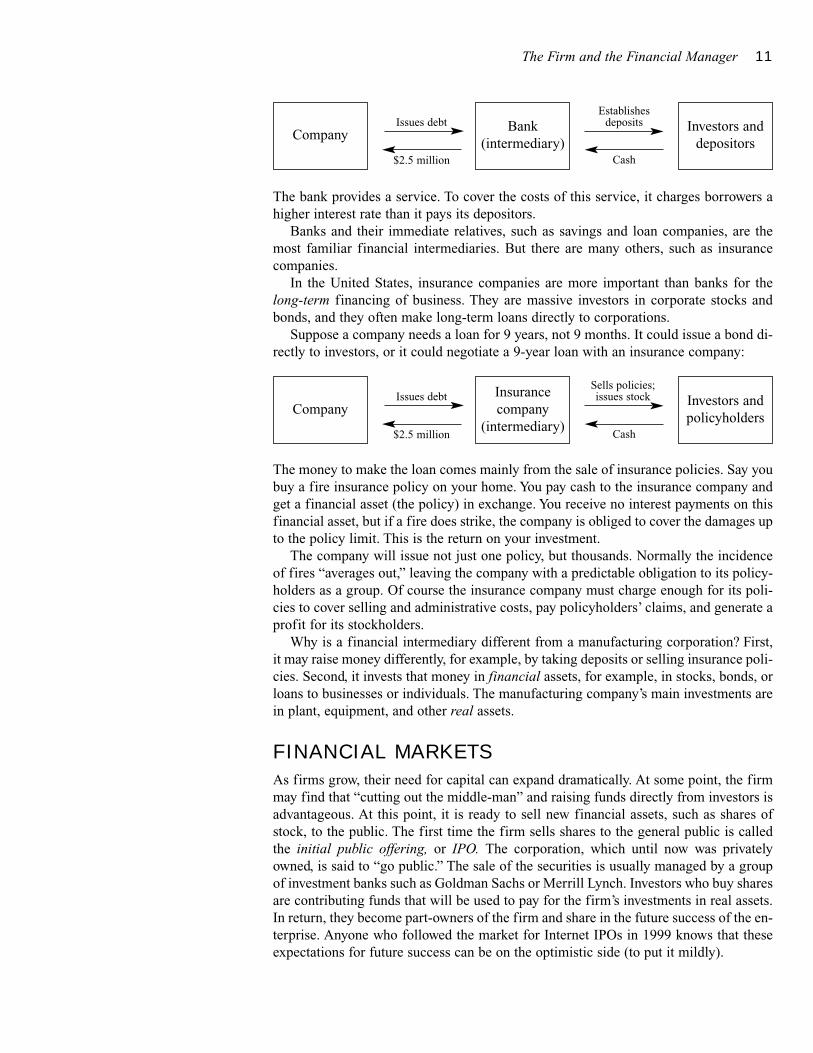
Financial managers stand between the firm’s real assets and the financial marketsin which the firm raises cash. The financial manager’s role is shown in Figure 1.1,which traces how money flows from investors to the firm and back to investors again.The flow starts when financial assets are sold to raise cash (arrow 1 in the figure). Thecash is employed to purchase the real assets used in the firm’s operations (arrow 2).Later, if the firm does well, the real assets generate enough cash inflow to more thanrepay the initial investment (arrow 3). Finally, the cash is either reinvested (arrow 4a)or returned to the investors who contributed the money in the first place (arrow 4b). Ofcourse the choice between arrows 4a and 4b is not a completely free one. For example,if a bank lends the firm money at stage 1, the bank has to be repaid this money plus in-terest at stage 4b.
This flow chart suggests that the financial manager faces two basic problems. First,how much money should the firm invest, and what specific assets should the firm in-vest in? This is the firm’s investment, or capital budgeting, decision. Second, howshould the cash required for an investment be raised? This is the financing decision.
THE CAPITAL BUDGETING DECISION
Capital budgeting decisions are central to the company’s success or failure. For exam-ple, in the late 1980s, the Walt Disney Company committed to construction of a Dis-neyland Paris theme park at a total cost of well over $2 billion. The park, which openedin 1992, turned out to be a financial bust, and Euro Disney had to reorganize in May1994. Instead of providing profits on the investment, accumulated losses on the park bythat date were more than $200 million.
Contrast that with Boeing’s decision to “bet the company” by developing the 757 and767 jets. Boeing’s investment in these planes was $3 billion, more than double the totalvalue of stockholders’ investment as shown in the company’s accounts at the time. By1997, estimated cumulative profits from this investment were approaching $8 billion,and the planes were still selling well.
Disney’s decision to invest in Euro Disney and Boeing’s decision to invest in a newgeneration of airliners are both examples of capital budgeting decisions. The success ofsuch decisions is usually judged in terms of value. Good investment projects are worthmore than they cost. Adopting such projects increases the value of the firm and there-fore the wealth of its shareholders. For example, Boeing’s investment produced a streamof cash flows that were worth much more than its $3 billion outlay.
Not all investments are in physical plant and equipment. For example, Gillette spentaround $300 million to market its new Mach3 razor. This represents an investment in a
(2)
(3)
(1)
(4b)
(4a)Financial manager
Firm’soperations
(a bundleof real assets)
Financialmarkets(investors holdingfinancial assets)
FIGURE 1.1Flow of cash between capitalmarkets and the firm’soperations. Key: (1) Cashraised by selling financialassets to investors; (2) cashinvested in the firm’soperations; (3) cashgenerated by the firm’soperations; (4a) cashreinvested; (4b) cashreturned to investors.
FINANCIAL MARKETSMarkets in which financialassets are traded.
CAPITAL BUDGETINGDECISION Decision asto which real assets the firmshould acquire.
FINANCING DECISIONDecision as to how to raisethe money to pay forinvestments in real assets.
The Firm and the Financial Manager 9
nontangible asset—brand recognition and acceptance. Moreover, traditional manufac-turing firms are not the only ones that make important capital budgeting decisions. Forexample, Intel’s research and development expenditures in 1998 were more than $2.5billion.4 This investment in future products and product improvement will be crucial tothe company’s ability to retain its existing customers and attract new ones.
Today’s investments provide benefits in the future. Thus the financial manager isconcerned not solely with the size of the benefits but also with how long the firm mustwait for them. The sooner the profits come in, the better. In addition, these benefits arerarely certain; a new project may be a great success—but then again it could be a dis-mal failure. The financial manager needs a way to place a value on these uncertain fu-ture benefits.
We will spend considerable time in later material on project evaluation. While no onecan guarantee that you will avoid disasters like Euro Disney or that you will be blessedwith successes like the 757 and 767, a disciplined, analytical approach to project pro-posals will weight the odds in your favor.
THE FINANCING DECISION
The financial manager’s second responsibility is to raise the money to pay for the in-vestment in real assets. This is the financing decision. When a company needs financ-ing, it can invite investors to put up cash in return for a share of profits or it can prom-ise investors a series of fixed payments. In the first case, the investor receives newlyissued shares of stock and becomes a shareholder, a part-owner of the firm. In the sec-ond, the investor becomes a lender who must one day be repaid. The choice of the long-term financing mix is often called the capital structure decision, since capital refersto the firm’s sources of long-term financing, and the markets for long-term financingare called capital markets.5
Within the basic distinction—issuing new shares of stock versus borrowing money—there are endless variations. Suppose the company decides to borrow. Should it go tocapital markets for long-term debt financing or should it borrow from a bank? Shouldit borrow in Paris, receiving and promising to repay euros, or should it borrow dollarsin New York? Should it demand the right to pay off the debt early if future interest ratesfall?
The decision to invest in a new factory or to issue new shares of stock has long-termconsequences. But the financial manager is also involved in some important short-termdecisions. For example, she needs to make sure that the company has enough cash onhand to pay next week’s bills and that any spare cash is put to work to earn interest. Suchshort-term financial decisions involve both investment (how to invest spare cash) andfinancing (how to raise cash to meet a short-term need).
Businesses are inherently risky, but the financial manager needs to ensure that risksare managed. For example, the manager will want to be certain that the firm cannot bewiped out by a sudden rise in oil prices or a fall in the value of the dollar. We will lookat the techniques that managers use to explore the future and some of the ways that thefirm can be protected against nasty surprises.
4 Accountants may treat investments in R&D differently than investments in plant and equipment. But it isclear that both investments are creating real assets, whether those assets are physical capital or know-how;both investments are essential capital budgeting activities.5 Money markets are used for short-term financing.
CAPITAL STRUCTUREFirm’s mix of long-termfinancing.
CAPITAL MARKETSMarkets for long-termfinancing.
10 SECTION ONE
� Self-Test 2 Are the following capital budgeting or financing decisions?
a. Intel decides to spend $500 million to develop a new microprocessor.b. Volkswagen decides to raise 350 million euros through a bank loan.c. Exxon constructs a pipeline to bring natural gas on shore from the Gulf of Mexico.d. Pierre Lapin sells shares to finance expansion of his newly formed securities trading
firm.e. Novartis buys a license to produce and sell a new drug developed by a biotech
company.f. Merck issues new shares to help pay for the purchase of Medco, a pharmaceutical
distribution company.
Financial Institutions and MarketsIf a corporation needs to borrow from the bank or issue new securities, then its finan-cial manager had better understand how financial markets work. Perhaps less obviously,the capital budgeting decision also requires an understanding of financial markets. Wehave said that a successful investment is one that increases firm value. But how do in-vestors value a firm? The answer to this question requires a theory of how the firm’sstock is priced in financial markets.
Of course, theory is not the end of it. The financial manager is in day-by-day—some-times minute-by-minute—contact with financial markets and must understand their in-stitutions, regulations, and operating practices. We can give you a flavor for these issuesby considering briefly some of the ways that firms interact with financial markets andinstitutions.
FINANCIAL INSTITUTIONS
Most firms are too small to raise funds by selling stocks or bonds directly to investors.When these companies need to raise funds to help pay for a capital investment, the onlychoice is to borrow money from a financial intermediary like a bank or insurancecompany. The financial intermediary, in turn, raises funds, often in small amounts, fromindividual households. For example, a bank raises funds when customers deposit moneyinto their bank accounts. The bank can then lend this money to borrowers.
The bank saves borrowers and lenders from finding and negotiating with each otherdirectly. For example, a firm that wishes to borrow $2.5 million could in principle tryto arrange loans from many individuals:
Company Investors
Issues debt (borrows)
$2.5 million
However, it is far more convenient and efficient for a bank, which has ongoing relationswith thousands of depositors, to raise the funds from them, and then lend the money tothe company:
FINANCIALINTERMEDIARY Firmthat raises money from manysmall investors and providesfinancing to businesses orother organizations byinvesting in their securities.
The Firm and the Financial Manager 11
The bank provides a service. To cover the costs of this service, it charges borrowers ahigher interest rate than it pays its depositors.
Banks and their immediate relatives, such as savings and loan companies, are themost familiar financial intermediaries. But there are many others, such as insurancecompanies.
In the United States, insurance companies are more important than banks for thelong-term financing of business. They are massive investors in corporate stocks andbonds, and they often make long-term loans directly to corporations.
Suppose a company needs a loan for 9 years, not 9 months. It could issue a bond di-rectly to investors, or it could negotiate a 9-year loan with an insurance company:
CompanyBank
(intermediary)Investors and
depositors
Issues debt
$2.5 million
Establishesdeposits
Cash
CompanyInsurancecompany
(intermediary)
Investors andpolicyholders
Issues debt
$2.5 million
Sells policies;issues stock
Cash
The money to make the loan comes mainly from the sale of insurance policies. Say youbuy a fire insurance policy on your home. You pay cash to the insurance company andget a financial asset (the policy) in exchange. You receive no interest payments on thisfinancial asset, but if a fire does strike, the company is obliged to cover the damages upto the policy limit. This is the return on your investment.
The company will issue not just one policy, but thousands. Normally the incidenceof fires “averages out,” leaving the company with a predictable obligation to its policy-holders as a group. Of course the insurance company must charge enough for its poli-cies to cover selling and administrative costs, pay policyholders’ claims, and generate aprofit for its stockholders.
Why is a financial intermediary different from a manufacturing corporation? First,it may raise money differently, for example, by taking deposits or selling insurance poli-cies. Second, it invests that money in financial assets, for example, in stocks, bonds, orloans to businesses or individuals. The manufacturing company’s main investments arein plant, equipment, and other real assets.
FINANCIAL MARKETS
As firms grow, their need for capital can expand dramatically. At some point, the firmmay find that “cutting out the middle-man” and raising funds directly from investors isadvantageous. At this point, it is ready to sell new financial assets, such as shares ofstock, to the public. The first time the firm sells shares to the general public is calledthe initial public offering, or IPO. The corporation, which until now was privatelyowned, is said to “go public.” The sale of the securities is usually managed by a groupof investment banks such as Goldman Sachs or Merrill Lynch. Investors who buy sharesare contributing funds that will be used to pay for the firm’s investments in real assets.In return, they become part-owners of the firm and share in the future success of the en-terprise. Anyone who followed the market for Internet IPOs in 1999 knows that theseexpectations for future success can be on the optimistic side (to put it mildly).
12 SECTION ONE
An IPO is not the only occasion on which newly issued stock is sold to the public.Established firms also issue new shares from time to time. For example, suppose Gen-eral Motors needs to raise funds to renovate an auto plant. It might hire an investmentbanking firm to sell $500 million of GM stock to investors. Some of this stock may bebought by individuals; the remainder will be bought by financial institutions such aspension funds and insurance companies. In fact, about a quarter of the shares of U.S.companies are owned by pension funds.
A new issue of securities increases both the amount of cash held by the company andthe amount of stocks or bonds held by the public. Such an issue is known as a primaryissue and it is sold in the primary market. But in addition to helping companies raisenew cash, financial markets also allow investors to trade stocks or bonds between them-selves. For example, Smith might decide to raise some cash by selling her AT&T stockat the same time that Jones invests his spare cash in AT&T. The result is simply a trans-fer of ownership from Smith to Jones, which has no effect on the company itself. Suchpurchases and sales of existing securities are known as secondary transactions and theytake place in the secondary market.
Some financial assets have no secondary market. For example, when a small com-pany borrows money from the bank, it gives the bank an IOU promising to repay themoney with interest. The bank will keep the IOU and will not sell it to another bank.Other financial assets are regularly traded. Thus when a large public company raisescash by selling new shares to investors, it knows that many of these investors will sub-sequently decide to sell their shares to others.
Most trading in the shares of large United States corporations takes place on stockexchanges such as the New York Stock Exchange (NYSE). There is also a thriving over-the-counter (OTC) market in securities. The over-the-counter market is not a centralizedexchange like the NYSE but a network of security dealers who use an electronic sys-tem known as NASDAQ6 to quote prices at which they will buy and sell shares. Whileshares of stock may be traded either on exchanges or over-the-counter, almost all cor-porate debt is traded over-the-counter, if it is traded at all. United States governmentdebt is also traded over-the-counter.
Many other things trade in financial markets, including foreign currencies; claims oncommodities such as corn, crude oil, and silver; and options.
Now may be a good point to stress that the financial manager plays on a global stageand needs to be familiar with markets around the world. For example, the stock of Citi-corp, one of the largest U.S. banks, is listed in New York, London, Amsterdam, Tokyo,Zurich, Toronto, and Frankfurt, as well as on several smaller exchanges. Conversely,British Airways, Deutsche Telecom, Nestlé, Sony, and nearly 200 other overseas firmshave listed their shares on the New York Stock Exchange.
OTHER FUNCTIONS OF FINANCIAL MARKETSAND INSTITUTIONS
Financial markets and institutions provide financing for business. They also contributein many other ways to our individual well-being and the smooth functioning of theeconomy. Here are some examples.7
6 National Association of Security Dealers Automated Quotation system.7 Robert Merton gives an excellent overview of these functions in “A Functional Perspective of Financial In-termediation,” Financial Management 24 (Summer 1995), pp. 23–41.
PRIMARY MARKETMarket for the sale of newsecurities by corporations.
SECONDARY MARKETMarket in which alreadyissued securities are tradedamong investors.
The Firm and the Financial Manager 13
The Payment Mechanism. Think how inconvenient life would be if you had to pay forevery purchase in cash or if General Motors had to ship truckloads of hundred-dollar billsround the country to pay its suppliers. Checking accounts, credit cards, and electronictransfers allow individuals and firms to send and receive payments quickly and safely overlong distances. Banks are the obvious providers of payment services, but they are notalone. For example, if you buy shares in a money-market mutual fund, your money ispooled with that of other investors and used to buy safe, short-term securities. You canthen write checks on this mutual fund investment, just as if you had a bank deposit.
Borrowing and Lending. Financial institutions allow individuals to transfer expen-ditures across time. If you have more money now than you need and you wish to savefor a rainy day, you can (for example) put the money on deposit in a bank. If you wishto anticipate some of your future income to buy a car, you can borrow money from thebank. Both the lender and the borrower are happier than if they were forced to spendcash as it arrived. Of course, individuals are not alone in needing to raise cash from timeto time. Firms with good investment opportunities raise cash by borrowing or sellingnew shares. Many governments run at a deficit.
In principle, individuals or firms with cash surpluses could take out newspaper advertisements or surf the Net looking for counterparts with cash shortages. But it isusually cheaper and more convenient to use financial markets or institutions to link the borrower and the lender. For example, banks are equipped to check the borrower’screditworthiness and to monitor the use of the cash.
Almost all financial institutions are involved in channeling savings toward those whocan best use them.
Pooling Risk. Financial markets and institutions allow individuals and firms to pooltheir risks. Insurance companies are an obvious example. Here is another. Suppose thatyou have only a small sum to invest. You could buy the stock of a single company, but thenyou could be wiped out if that company went belly-up. It’s generally better to buy sharesin a mutual fund that invests in a diversified portfolio of common stocks or other securi-ties. In this case you are exposed only to the risk that security prices as a whole may fall.8
� Self-Test 3 Do you understand the following distinctions? Briefly explain in each case.
a. Real versus financial assets.b. Investment versus financing decisions.c. Capital budgeting versus capital structure decisions.d. Primary versus secondary markets.e. Financial intermediation versus direct financing from financial markets.
Who Is the Financial Manager?We will use the term financial manager to refer to anyone responsible for a significantcorporate investment or financing decision. But except in the smallest firms, no single
8 Mutual funds provide other services. For example, they take care of much of the paperwork of holdingshares. Investors also hope that the fund’s professional managers will be able to outsmart the market and se-cure higher returns.
14 SECTION ONE
person is responsible for all the decisions discussed in this book. Responsibility is dis-persed throughout the firm. Top management is of course constantly involved in finan-cial decisions. But the engineer who designs a new production facility is also involved:the design determines the kind of asset the firm will invest in. Likewise the marketingmanager who undertakes a major advertising campaign is making an investment deci-sion: the campaign is an investment in an intangible asset that will pay off in future salesand earnings.
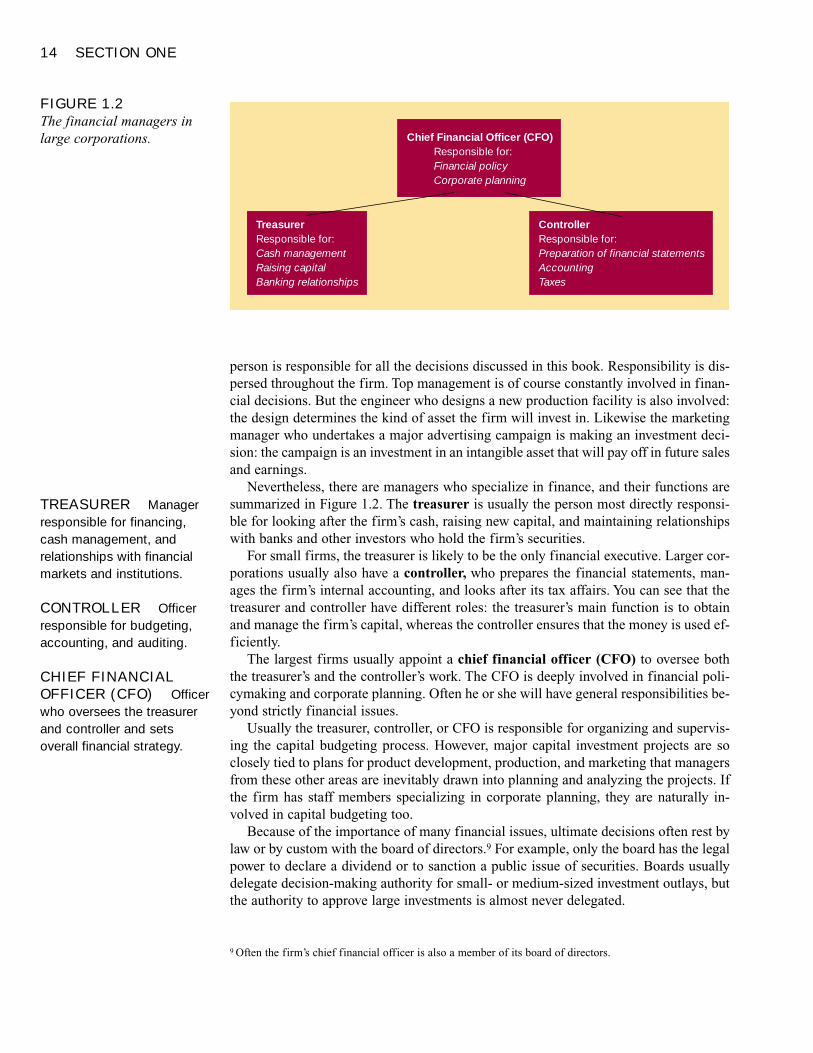
Nevertheless, there are managers who specialize in finance, and their functions aresummarized in Figure 1.2. The treasurer is usually the person most directly responsi-ble for looking after the firm’s cash, raising new capital, and maintaining relationshipswith banks and other investors who hold the firm’s securities.
For small firms, the treasurer is likely to be the only financial executive. Larger cor-porations usually also have a controller, who prepares the financial statements, man-ages the firm’s internal accounting, and looks after its tax affairs. You can see that thetreasurer and controller have different roles: the treasurer’s main function is to obtainand manage the firm’s capital, whereas the controller ensures that the money is used ef-ficiently.
The largest firms usually appoint a chief financial officer (CFO) to oversee boththe treasurer’s and the controller’s work. The CFO is deeply involved in financial poli-cymaking and corporate planning. Often he or she will have general responsibilities be-yond strictly financial issues.
Usually the treasurer, controller, or CFO is responsible for organizing and supervis-ing the capital budgeting process. However, major capital investment projects are soclosely tied to plans for product development, production, and marketing that managersfrom these other areas are inevitably drawn into planning and analyzing the projects. Ifthe firm has staff members specializing in corporate planning, they are naturally in-volved in capital budgeting too.
Because of the importance of many financial issues, ultimate decisions often rest bylaw or by custom with the board of directors.9 For example, only the board has the legalpower to declare a dividend or to sanction a public issue of securities. Boards usuallydelegate decision-making authority for small- or medium-sized investment outlays, butthe authority to approve large investments is almost never delegated.
TreasurerResponsible for:Cash managementRaising capitalBanking relationships
ControllerResponsible for:Preparation of financial statementsAccountingTaxes
Chief Financial Officer (CFO)Responsible for:Financial policyCorporate planning
FIGURE 1.2The financial managers inlarge corporations.
9 Often the firm’s chief financial officer is also a member of its board of directors.
TREASURER Managerresponsible for financing,cash management, andrelationships with financialmarkets and institutions.
CONTROLLER Officerresponsible for budgeting,accounting, and auditing.
CHIEF FINANCIALOFFICER (CFO) Officerwho oversees the treasurerand controller and setsoverall financial strategy.
The Firm and the Financial Manager 15
� Self-Test 4 Sal and Sally went to business school together 10 years ago. They have just been hiredby a midsized corporation that wants to bring in new financial managers. Sal studied fi-nance, with an emphasis on financial markets and institutions. Sally majored in ac-counting and became a CPA 5 years ago. Who is more suited to be treasurer and whocontroller? Briefly explain.
CAREERS IN FINANCE
In the United States well over 1 million people work in financial services, and many oth-ers work in the finance departments of corporations. We can’t tell you what each persondoes all day, but we can give you some idea of the variety of careers in finance. Thenearby box summarizes the experience of a small sample of recent (fictitious) graduates.
We explained earlier that corporations face two principal financial decisions: the in-vestment decision and the financing decision. Therefore, as a newly recruited financialanalyst, you may help to analyze a major new investment project. Or you may insteadhelp to raise the money to pay for it, perhaps by a new issue of debt or by arranging tolease the plant and equipment. Other financial analysts work on short-term financial is-sues, such as collecting and investing the company’s cash or checking whether cus-tomers are likely to pay their bills. Financial analysts are also involved in monitoringand controlling risk. For example, they may help to arrange insurance for the firm’splant and equipment, or they may assist with the purchase and sale of options, futures,and other exotic tools for managing risk.
Instead of working in the finance department of a corporation, you may join a fi-nancial institution. The largest employers are the commercial banks. We noted earlierthat banks collect deposits and relend the cash to corporations and individuals. If youjoin a bank, at some point you may well work in a branch, where individuals and smallbusinesses come to deposit cash or to seek a loan. Alternatively, you may be employedin the head office, helping to analyze a $100 million loan to a large corporation.
Banks do many things in addition to lending money, and they probably provide agreater variety of jobs than other financial institutions. For example, individuals andbusinesses use banks to make payments to each other. So if you work in the cash man-agement department of a large bank, you may help companies electronically transferhuge sums of money as wages, taxes, and payments to suppliers. Banks also buy and sellforeign exchange, so you could find yourself working in front of one of those computerscreens in a foreign exchange dealing room. Another glamorous bank job is in the de-rivatives group, which helps companies to manage their risk by buying and selling op-tions, futures, and so on. This is where the mathematicians and the computer buffs thrive.
Investment banks, such as Merrill Lynch or Goldman Sachs, help companies selltheir securities to investors. They also have large corporate finance departments whichassist firms in major reorganizations such as takeovers. When firms issue securities ortry to take over another firm, frequently a lot of money is at stake and the firms mayneed to move fast. Thus, working for an investment bank can be a high-pressure activ-ity with long hours. It can also be very well paid.
The distinction between commercial banks and investment banks is narrowing. For ex-ample, commercial banks may also be involved in new issues of securities, while invest-ment banks are major traders in options and futures. Investment banks and commercialbanks may even be owned by the same company; for example, Salomon Smith Barney (aninvestment bank) and Citibank (a commercial bank) are both owned by Citigroup.
SEE BOX
FINANCE IN ACTION
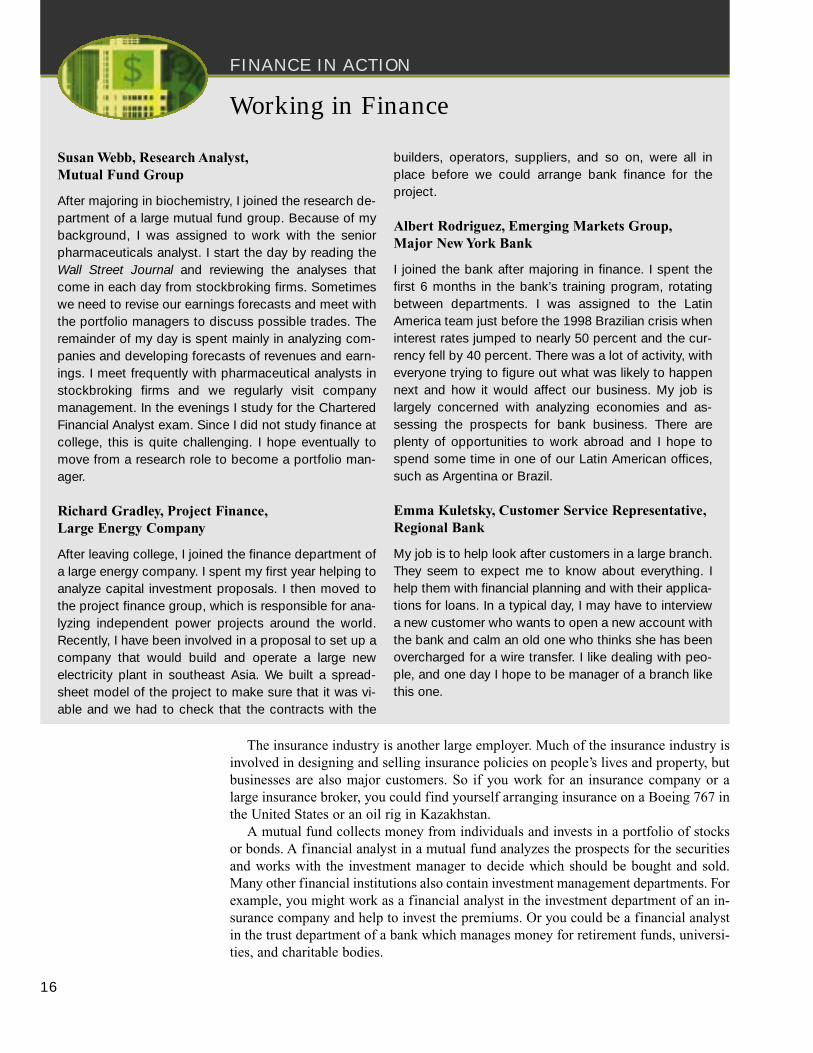
Working in Finance
Susan Webb, Research Analyst,Mutual Fund Group
After majoring in biochemistry, I joined the research de-partment of a large mutual fund group. Because of mybackground, I was assigned to work with the seniorpharmaceuticals analyst. I start the day by reading theWall Street Journal and reviewing the analyses thatcome in each day from stockbroking firms. Sometimeswe need to revise our earnings forecasts and meet withthe portfolio managers to discuss possible trades. Theremainder of my day is spent mainly in analyzing com-panies and developing forecasts of revenues and earn-ings. I meet frequently with pharmaceutical analysts instockbroking firms and we regularly visit companymanagement. In the evenings I study for the CharteredFinancial Analyst exam. Since I did not study finance atcollege, this is quite challenging. I hope eventually tomove from a research role to become a portfolio man-ager.
Richard Gradley, Project Finance,Large Energy Company
After leaving college, I joined the finance department ofa large energy company. I spent my first year helping toanalyze capital investment proposals. I then moved tothe project finance group, which is responsible for ana-lyzing independent power projects around the world.Recently, I have been involved in a proposal to set up acompany that would build and operate a large newelectricity plant in southeast Asia. We built a spread-sheet model of the project to make sure that it was vi-able and we had to check that the contracts with the
builders, operators, suppliers, and so on, were all inplace before we could arrange bank finance for theproject.
Albert Rodriguez, Emerging Markets Group,Major New York Bank
I joined the bank after majoring in finance. I spent thefirst 6 months in the bank’s training program, rotatingbetween departments. I was assigned to the LatinAmerica team just before the 1998 Brazilian crisis wheninterest rates jumped to nearly 50 percent and the cur-rency fell by 40 percent. There was a lot of activity, witheveryone trying to figure out what was likely to happennext and how it would affect our business. My job islargely concerned with analyzing economies and as-sessing the prospects for bank business. There areplenty of opportunities to work abroad and I hope tospend some time in one of our Latin American offices,such as Argentina or Brazil.
Emma Kuletsky, Customer Service Representative,Regional Bank
My job is to help look after customers in a large branch.They seem to expect me to know about everything. Ihelp them with financial planning and with their applica-tions for loans. In a typical day, I may have to interviewa new customer who wants to open a new account withthe bank and calm an old one who thinks she has beenovercharged for a wire transfer. I like dealing with peo-ple, and one day I hope to be manager of a branch likethis one.
16
The insurance industry is another large employer. Much of the insurance industry isinvolved in designing and selling insurance policies on people’s lives and property, butbusinesses are also major customers. So if you work for an insurance company or alarge insurance broker, you could find yourself arranging insurance on a Boeing 767 inthe United States or an oil rig in Kazakhstan.
A mutual fund collects money from individuals and invests in a portfolio of stocksor bonds. A financial analyst in a mutual fund analyzes the prospects for the securitiesand works with the investment manager to decide which should be bought and sold.Many other financial institutions also contain investment management departments. Forexample, you might work as a financial analyst in the investment department of an in-surance company and help to invest the premiums. Or you could be a financial analystin the trust department of a bank which manages money for retirement funds, universi-ties, and charitable bodies.
The Firm and the Financial Manager 17
Stockbroking firms and bond dealers help investment management companies andprivate individuals to invest in securities. They employ sales staff and dealers who makethe trades. They also employ financial analysts to analyze the securities and help cus-tomers to decide which to buy or sell. Many stockbroking firms are owned by invest-ment banks, such as Merrill Lynch.
Investment banks and stockbroking firms are largely headquartered in New York, asare many of the large commercial banks. Insurance companies and investment man-agement companies tend to be more scattered. For example, some of the largest insur-ance companies are headquartered in Hartford, Connecticut, and many investment man-agement companies are located in Boston. Of course, many financial institutions havelarge businesses outside the United States. Finance is a global business. So you mayspend some time working in a branch overseas or making the occasional trip to one ofthe other major financial centers, such as London, Tokyo, Hong Kong, or Singapore.
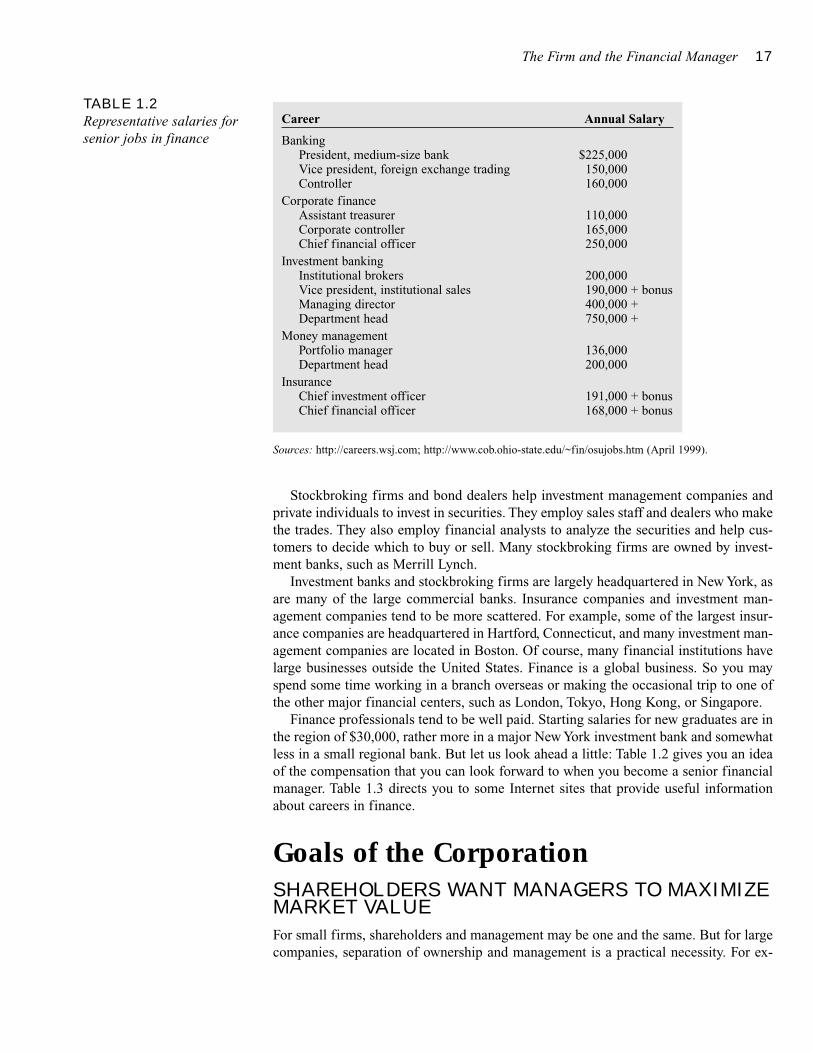
Finance professionals tend to be well paid. Starting salaries for new graduates are inthe region of $30,000, rather more in a major New York investment bank and somewhatless in a small regional bank. But let us look ahead a little: Table 1.2 gives you an ideaof the compensation that you can look forward to when you become a senior financialmanager. Table 1.3 directs you to some Internet sites that provide useful informationabout careers in finance.
Goals of the CorporationSHAREHOLDERS WANT MANAGERS TO MAXIMIZEMARKET VALUE
For small firms, shareholders and management may be one and the same. But for largecompanies, separation of ownership and management is a practical necessity. For ex-
TABLE 1.2Representative salaries forsenior jobs in finance
Career Annual Salary
BankingPresident, medium-size bank $225,000Vice president, foreign exchange trading 150,000Controller 160,000
Corporate financeAssistant treasurer 110,000Corporate controller 165,000Chief financial officer 250,000
Investment bankingInstitutional brokers 200,000Vice president, institutional sales 190,000 + bonusManaging director 400,000 +Department head 750,000 +
Money managementPortfolio manager 136,000Department head 200,000
InsuranceChief investment officer 191,000 + bonusChief financial officer 168,000 + bonus
Sources: http://careers.wsj.com; http://www.cob.ohio-state.edu/~fin/osujobs.htm (April 1999).
18 SECTION ONE
ample, AT&T has over 2 million shareholders. There is no way that these shareholderscan be actively involved in management; it would be like trying to run New York Cityby town meetings. Authority has to be delegated.
How can shareholders decide how to delegate decision making when they all havedifferent tastes, wealth, time horizons, and personal opportunities? Delegation can workonly if the shareholders have a common objective. Fortunately there is a natural finan-cial objective on which almost all shareholders can agree. This is to maximize the cur-rent value of their investment.
A smart and effective financial manager makes decisions which increase the currentvalue of the company’s shares and the wealth of its stockholders. That increased wealthcan then be put to whatever purposes the shareholders want. They can give their moneyto charity or spend it in glitzy night clubs; they can save it or spend it now. Whatevertheir personal tastes or objectives, they can all do more when their shares are worthmore.
Sometimes you hear managers speak as if the corporation has other goals. For ex-ample, they may say that their job is to “maximize profits.” That sounds reasonable.After all, don’t shareholders want their company to be profitable? But taken literally,profit maximization is not a well-defined corporate objective. Here are three reasons:
1. “Maximizing profits” leaves open the question of “which year’s profits?” The com-pany may be able to increase current profits by cutting back on maintenance or stafftraining, but shareholders may not welcome this if profits are damaged in futureyears.
2. A company may be able to increase future profits by cutting this year’s dividend andinvesting the freed-up cash in the firm. That is not in the shareholders’ best interestif the company earns only a very low rate of return on the extra investment.
3. Different accountants may calculate profits in different ways. So you may find thata decision that improves profits using one set of accounting rules may reduce themusing another.
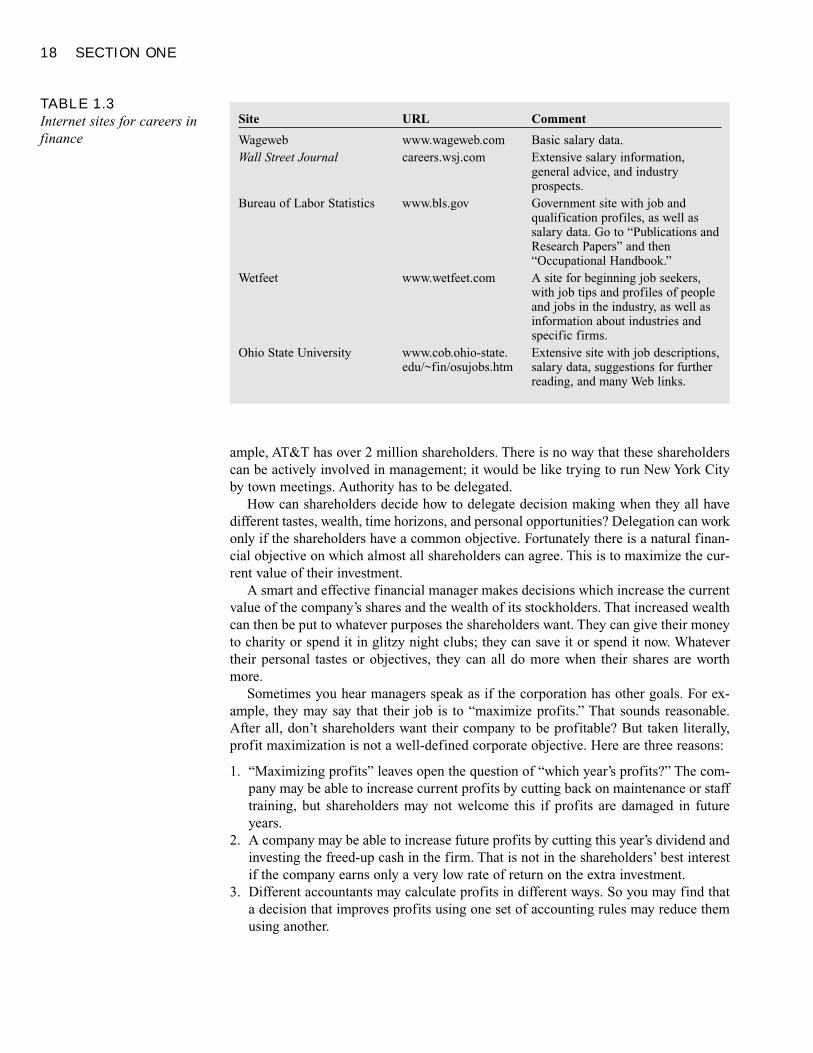
TABLE 1.3Internet sites for careers infinance
Site URL Comment
www.wageweb.comcareers.wsj.com
www.bls.gov
www.wetfeet.com
www.cob.ohio-state.edu/~fin/osujobs.htm
WagewebWall Street Journal
Bureau of Labor Statistics
Wetfeet
Ohio State University
Basic salary data.Extensive salary information,general advice, and industryprospects.Government site with job andqualification profiles, as well assalary data. Go to “Publications andResearch Papers” and then“Occupational Handbook.”A site for beginning job seekers,with job tips and profiles of peopleand jobs in the industry, as well asinformation about industries andspecific firms.Extensive site with job descriptions,salary data, suggestions for furtherreading, and many Web links.
The Firm and the Financial Manager 19
In a free economy a firm is unlikely to survive if it pursues goals that reduce thefirm’s value. Suppose, for example, that a firm’s only goal is to increase its marketshare. It aggressively reduces prices to capture new customers, even when the price dis-counts cause continuing losses. What would happen to such a firm? As losses mount, itwill find it more and more difficult to borrow money, and it may not even have suffi-cient profits to repay existing debts. Sooner or later, however, outside investors wouldsee an opportunity for easy money. They could offer to buy the firm from its currentshareholders and, once they have tossed out existing management, could increase thefirm’s value by changing its policies. They would profit by the difference between theprice paid for the firm and the higher value it would have under new management. Man-agers who pursue goals that destroy value often land in early retirement.
ETHICS AND MANAGEMENT OBJECTIVES
We have suggested that managers should try to maximize market value. But some ide-alists say that managers should not be obliged to act in the selfish interests of theirstockholders. Some realists argue that, regardless of what managers ought to do, theyin fact look after themselves rather than their shareholders.
Let us respond to the idealists first. Does a focus on value mean that managers mustact as greedy mercenaries riding roughshod over the weak and helpless? Most of thisbook is devoted to financial policies that increase firm value. None of these policies re-quire gallops over the weak and helpless. In most instances there is little conflict be-tween doing well (maximizing value) and doing good.
The first step in doing well is doing good by your customers. Here is how AdamSmith put the case in 1776:
It is not from the benevolence of the butcher, the brewer, or the baker, that we expect ourdinner, but from their regard to their own interest. We address ourselves, not to theirhumanity but to their self-love, and never talk to them of our own necessities but of theiradvantages.10
By striving to enrich themselves and their shareholders, businesspeople have to providetheir customers with the products and services they truly desire.
Of course ethical issues do arise in business as in other walks of life. So when wesay that the objective of the firm is to maximize shareholder wealth, we do not meanthat anything goes.
In part, the law deters managers from blatantly illegal action. But when the stakesare high, competition is intense, and a deadline is looming, it’s easy to blunder, and notto inquire as deeply as they should about the legality or morality of their actions.
Written rules and laws can help only so much. In business, as in other day-to-day af-fairs, there are also unwritten rules of behavior. These work because everyone knowsthat such rules are in the general interest. But they are reinforced because good man-
We conclude that managers as a general rule will act to maximize the value ofthe firm to its stockholders. Management teams that deviate too far from thisrule are likely to be replaced.
10 Adam Smith, An Inquiry into the Nature and Causes of the Wealth of Nations (New York: Random House,1937; first published 1776), p. 14.
20 SECTION ONE
agers know that their firm’s reputation is one of its most important assets and thereforeplaying fair and keeping one’s word are simply good business practices. Thus huge fi-nancial deals are regularly completed on a handshake and each side knows that the otherwill not renege later if things turn sour.11
Reputation is particularly important in financial management. If you buy a well-known brand in a store, you can be fairly sure what you are getting. But in financialtransactions the other party often has more information than you and it is less easy tobe sure of the quality of what you are buying. This opens up plenty of opportunities forsharp practice and outright fraud, and, because the activities of rogues are more enter-taining than those of honest people, bookshelves are packed with accounts of financialfraudsters.
The reaction of honest financial firms is to build long-term relationships with theircustomers and establish a name for fair dealing and financial integrity. Major banks andsecurities firms know that their most valuable asset is their reputation and they empha-size their long history and their responsible behavior when seeking new customers.When something happens to undermine that reputation the costs can be enormous.
Consider the case of the Salomon Brothers bidding scandal in 1991.12 A Salomontrader tried to evade rules limiting its participation in auctions of U.S. Treasury bondsby submitting bids in the names of the company’s customers without the customers’knowledge. When this was discovered, Salomon settled the case by paying almost $200million in fines and establishing a $100 million fund for payments of claims from civillawsuits. Yet the value of Salomon Brothers stock fell by far more than $300 million. Infact, the price dropped by about a third, representing a $1.5 billion decline in marketvalue.
Why did the value of the firm drop so dramatically? Largely because investors wereworried that Salomon would lose business from customers that now distrusted the com-pany. The damage to Salomon’s reputation was far greater than the explicit costs of thescandal, and hundreds or thousands of times as costly as the potential gains it couldhave reaped from the illegal trades.
It is not always easy to know what is ethical behavior and there can be many grayareas. For example, should the firm be prepared to do business with a corrupt or re-pressive government? Should it employ child labor in countries where that is the norm?The nearby box presents several simple situations that call for an ethically based deci-sion, along with survey responses to the proper course of action in each circumstance.Compare your decisions with those of the general public.
� Self-Test 5 Without knowing anything about the personal ethics of the owners, which companywould you better trust to keep its word in a business deal?
a. Harry’s Hardware has been in business for 50 years. Harry’s grandchildren, now al-most adults, plan to take over and operate the business. Hardware stores require con-siderable investment in customer relations to become established.
b. Victor’s Videos just opened for business. It rents a storefront in a strip mall and hasfinanced its inventory with a bank loan. Victor has little of his own money investedin the business. Video shops usually command little customer loyalty.
11 For example, the motto of the London Stock Exchange is “My word is my bond.”12 This discussion is based on Clifford W. Smith Jr., “Economics and Ethics: The Case of Salomon Brothers,”Journal of Applied Corporate Finance 5 (Summer 1992), pp. 23–28.
SEE BOX
21
FINANCE IN ACTION
Things Are Not Always Fair in Loveor Economics
What constitutes fair behavior by companies? One sur-vey asked a number of individuals to state whether theyregarded a particular action as acceptable or unfair. Be-fore we tell you how they responded, think how youwould rate each of the following actions:
1a. A small photocopying shop has one employee who hasworked in the shop for 6 months and earns $9 per hour.Business continues to be satisfactory, but a factory in thearea has closed and unemployment has increased. Othersmall shops in the area have now hired reliable workersat $7 an hour to perform jobs similar to those done by thephotocopying shop employee. The owner of the photo-copying shop reduces the employee’s wage to $7.
1b. Now suppose that the shop does not reduce the em-ployee’s wage but he or she leaves. The owner decides topay a replacement $7 an hour.
2. A house painter employs two assistants and pays them $9per hour. The painter decides to quit house painting andgo into the business of providing landscape services,where the going wage is lower. He reduces the workers’wages to $7 per hour for the landscaping work.
3a. A small company employs several workers and has beenpaying them average wages. There is severe unemploy-ment in the area and the company could easily replace itscurrent employees with good workers at a lower wage.The company has been making money. The owners re-duce the current workers’ wages by 5 percent.
3b. Now suppose instead that the company has been losingmoney and the owners reduce wages by 5 percent.
4. A grocery store has several months’ supply of peanut but-ter in stock on shelves in the storeroom. The owner hears
that the wholesale price of peanut butter has increasedand immediately raises the price on the current stock ofpeanut butter.
5. A hardware store has been selling snow shovels for $15.The morning after a large snowstorm, the store raises theprice to $20.
6. A store has been sold out of the popular Beanie Babydolls for a month. A week before Christmas a single dollis discovered in a storeroom. The managers know thatmany customers would like to buy the doll. They an-nounce over the store’s public address system that thedoll will be sold by auction to the customer who offers topay the most.
Now compare your responses with the responses ofa random sample of individuals:
Percent Rating the Action As:
Action Acceptable Unfair
1a 17 831b 73 272 63 373a 23 773b 68 324 21 795 18 826 26 74
Source: Adapted from D. Kahneman, J. L. Knetsch, and R. Thaler,“Fairness as a Constraint on Profit Seeking: Entitlements in the Mar-ket,” American Economic Review 76 (September 1986), pp. 728–741.Reprinted by permission of American Economic Association and theauthors.
DO MANAGERS REALLY MAXIMIZE FIRM VALUE?
Owner-managers have no conflicts of interest in their management of the business.They work for themselves, reaping the rewards of good work and suffering the penal-ties of bad work. Their personal well-being is tied to the value of the firm.
In most large companies the managers are not the owners and they might be temptedto act in ways that are not in the best interests of the owners. For example, they mightbuy luxurious corporate jets for their travel, or overindulge in expense-account dinners.They might shy away from attractive but risky projects because they are worried moreabout the safety of their jobs than the potential for superior profits. They might engagein empire building, adding unnecessary capacity or employees. Such problems can arise
22 SECTION ONE
because the managers of the firm, who are hired as agents of the owners, may have theirown axes to grind. Therefore they are called agency problems.
Think of the company’s net revenue as a pie that is divided among a number ofclaimants. These include the management and the work force as well as the lenders andshareholders who put up the money to establish and maintain the business. The gov-ernment is a claimant, too, since it gets to tax the profits of the enterprise. It is commonto hear these claimants called stakeholders in the firm. Each has a stake in the firm andtheir interests may not coincide.
All these stakeholders are bound together in a complex web of contracts and under-standings. For example, when banks lend money to the firm, they insist on a formalcontract stating the rate of interest and repayment dates, perhaps placing restrictions ondividends or additional borrowing. Similarly, large companies have carefully workedout personnel policies that establish employees’ rights and responsibilities. But youcan’t devise written rules to cover every possible future event. So the written contractsare supplemented by understandings. For example, managers understand that in returnfor a fat salary they are expected to work hard and not spend the firm’s money on un-warranted personal luxuries.
What enforces these understandings? Is it realistic to expect managers always to acton behalf of the shareholders? The shareholders can’t spend their lives watchingthrough binoculars to check that managers are not shirking or dissipating companyfunds on the latest executive jet.
A closer look reveals several arrangements that help to ensure that the shareholdersand managers are working toward common goals.
Compensation Plans. Managers are spurred on by incentive schemes that providebig returns if shareholders gain but are valueless if they do not. For example, whenMichael Eisner was hired as chief executive officer (CEO) by the Walt Disney Com-pany, his compensation package had three main components: a base annual salary of$750,000; an annual bonus of 2 percent of Disney’s net income above a threshold of“normal” profitability; and a 10-year option that allowed him to purchase 2 millionshares of stock for $14 per share, which was about the price of Disney stock at the time.Those options would be worthless if Disney’s shares were selling for below $14 buthighly valuable if the shares were worth more. This gave Eisner a huge personal stakein the success of the firm.
As it turned out, by the end of Eisner’s 6-year contract the value of Disney shares hadincreased by $12 billion, more than sixfold. Eisner’s compensation over the period was$190 million.13 Was he overpaid? We don’t know (and we suspect nobody else knows)how much Disney’s success was due to Michael Eisner or how hard Eisner would haveworked with a different compensation scheme. Our point is that managers often have astrong financial interest in increasing firm value. Table 1.4 lists the top-earning CEOsin 1998. Notice the importance of stock options in the total compensation package.
The Board of Directors. Boards of directors are sometimes portrayed as passive sup-porters of top management. But when company performance starts to slide, and man-agers don’t offer a credible recovery plan, boards do act. In recent years, the chief ex-ecutives of IBM, Eastman Kodak, General Motors, and Apple Computer all were forced
13 This discussion is based on Stephen F. O’Byrne, “What Pay for Performance Looks Like: The Case ofMichael Eisner,” Journal of Applied Corporate Finance 5 (Summer 1992), pp. 135–136.
STAKEHOLDER Anyonewith a financial interest in thefirm.
AGENCY PROBLEMSConflict of interest betweenthe firm’s owners andmanagers.
The Firm and the Financial Manager 23
out. The nearby box points out that boards recently have become more aggressive intheir willingness to replace underperforming managers.
If shareholders believe that the corporation is underperforming and that the board ofdirectors is not sufficiently aggressive in holding the managers to task, they can try toreplace the board in the next election. The dissident shareholders will attempt to con-vince other shareholders to vote for their slate of candidates to the board. If they suc-ceed, a new board will be elected and it can replace the current management team.
Takeovers. Poorly performing companies are also more likely to be taken over by an-other firm. After the takeover, the old management team may find itself out on thestreet.
Specialist Monitoring. Finally, managers are subject to the scrutiny of specialists.Their actions are monitored by the security analysts who advise investors to buy, hold,or sell the company’s shares. They are also reviewed by banks, which keep an eagle eyeon the progress of firms receiving their loans.
We do not want to leave the impression that corporate life is a series of squabblesand endless micromanagement. It isn’t, because practical corporate finance has evolvedto reconcile personal and corporate interests—to keep everyone working together to in-crease the value of the whole pie, not merely the size of each person’s slice.
� Self-Test 6 Corporations are now required to make public the amount and form of compensation(e.g., stock options versus salary versus performance bonuses) received by their top ex-ecutives. Of what use would that information be to a potential investor in the firm?
The agency problem is mitigated in practice through several devices:compensation plans that tie the fortune of the manager to the fortunes of thefirm; monitoring by lenders, stock market analysts, and investors; andultimately the threat that poor performance will result in the removal of themanager.
TABLE 1.4Highest earning CEOs in 1998
Total Earnings Option Component Individual Company (in millions) (in millions)
Michael Eisner Walt Disney $575.6 $569.8Sanford Weill Citigroup 166.9 156.6Steven Case America Online 159.2 158.1John Welch Jr. General Electric 83.6 46.5M. Douglas Ivester Coca-Cola 57.3 37.0Charles Heimbold Jr. Bristol-Myers Squibb 56.3 30.4Philip Purcell Morgan Stanley Dean Witter 53.4 40.1Reuben Mark Colgate-Palmolive 52.7 42.2
Source: Republished with permission of Dow Jones, from the Wall Street Journal, April 8, 1999, p. R1: permission conveyedthrough Copyright Clearance Center, Inc.
SEE BOX

FINANCE IN ACTION
Thank You and Goodbye
When it happens, says a wise old headhunter, it is usu-ally a quick killing. It takes about a week. “Nobody ismore powerful than a chief executive, right up until theend. Then suddenly, at the end, he has no power at all.”
In the past few months, some big names have hadthe treatment: Eckhard Pfeiffer left Compaq, a com-puter company; Derek Wanless has left NatWest, a bigBritish bank that became a takeover target. Others,such as Martin Grass, who left Rite Aid, an Americandrugstore chain, resigned unexpectedly without a job togo to.
It used to be rare for a board to sack the boss. Inmany parts of the world, it still is. But in big Americanand British companies these days, bosses who failseem to be more likely to be sacked than ever before.Rakesh Khurana of the Sloan School of Management atMassachusetts Institute of Technology has recently ex-amined 1,300 occasions when chief executives of For-tune 500 firms left their jobs. He found that, in a third ofcases, the boss was sacked. For a similar level of per-formance, a chief executive appointed after 1985 is
three times as likely to be fired as one appointed beforethat date.
What has changed? In the 1980s, the way to disposeof an unsatisfactory boss was by a hostile takeover.Nowadays, legal barriers make those much harder tomount. Indeed, by the beginning of the 1990s, chief ex-ecutives were probably harder to dislodge than ever be-fore. That started to change when, after a catastrophicfall in the company’s share of the American car market,the board of General Motors screwed up the courage in1992 to replace Robert Stempel.
The result seems to be that incompetent chief exec-utives in large companies are rarer than they were in1990 . . . In Silicon Valley, sacking the boss has becomeso routine that some firms find that they spend longerlooking for a chief executive than the new boss does inthe job.
Source: © 1999 The Economist Newspaper Group, Inc. Reprintedwith permission. www.economist.com.
24
SNIPPETS OF HISTORY
Now let’s lighten up a little. In this material we are going to describe how financial de-cisions are made today. But financial markets also have an interesting history. Look atthe accompanying box, which lays out bits of this history, starting in prehistoric times,when the growth of bacteria anticipated the mathematics of compound interest, andcontinuing nearly to the present.
SummaryWhat are the advantages and disadvantages of the most common forms of businessorganization? Which forms are most suitable to different types of businesses?
Businesses may be organized as proprietorships, partnerships, or corporations. Acorporation is legally distinct from its owners. Therefore, the shareholders who own acorporation enjoy limited liability for its obligations. Ownership and management ofcorporations are usually separate, which means that the firm’s operations need not bedisrupted by changes in ownership. On the other hand, corporations are subject to doubletaxation. Larger companies, for which the separation of ownership and management is moreimportant, tend to be organized as corporations.
The Firm and the Financial Manager 25
What are the major business functions and decisions for which the firm’s financialmanagers are responsible?
The overall task of financial management can be broken down into (1) the investment, orcapital budgeting, decision and (2) the financing decision. In other words, the firm has todecide (1) how much to invest and what assets to invest in and (2) how to raise thenecessary cash. The objective is to increase the value of the shareholders’ stake in the firm.
The financial manager acts as the intermediary between the firm and financial markets,where companies raise funds by issuing securities directly to investors, and where investorscan trade already-issued securities among themselves. The financial manager also may raisefunds by borrowing from financial intermediaries like banks or insurance companies. Thefinancial intermediaries in turn raise funds, often in small amounts, from individualhouseholds.
In small companies there is often only one financial executive. However, the largercorporation usually has both a treasurer and a controller. The treasurer’s job is to obtainand manage the company’s financing. By contrast, the controller’s job is one of inspectingto see that the money is used correctly. Large firms may also appoint a chief financialofficer, or CFO.
Why does it make sense for corporations to maximize their market values?
Value maximization is usually taken to be the goal of the firm. Such a strategy maximizesshareholders’ wealth, thereby enabling shareholders to pursue their personal goals. However,value maximization does not imply a disregard for ethical decision making, in part becausethe firm’s reputation as an employer and business partner depends on its past actions.
Why may conflicts of interest arise in large organizations? How can corporationsprovide incentives for everyone to work toward a common end?
Agency problems imply that managers may have interests that differ from those of the firm.These problems are kept in check by compensation plans that link the well-being ofemployees to that of the firm, by monitoring of management by the board of directors,security holders, and creditors, and by the threat of takeover.
SEE BOX
FINANCE IN ACTION
Finance through the Ages
Date unknown Compound Growth. Bacteria start topropagate by subdividing. They thereby demon-strate the power of compound growth.
c. 1800 B.C. Interest Rates. In Babylonia Ham-murabi’s Code established maximum interest rateson loans. Borrowers often mortgaged their propertyand sometimes their spouses but in these cases thelender was obliged to return the spouse in goodcondition within 3 years.
c. 1000 B.C. Options. One of the earliest recorded options is described by Aristotle. The philosopherThales knew by the stars that there would be a greatolive harvest, so, having a little money, he boughtoptions for the use of olive presses. When the har-vest came Thales was able to rent the presses atgreat profit. Today financial managers need to beable to evaluate options to buy or sell a wide varietyof assets.
15th century International Banking. Modern inter-national banking has its origins in the great Floren-tine banking houses. But the entire European net-work of the Medici empire employed only 57 peoplein eight offices. Today Citicorp has 81,000 employ-ees and 3500 offices in 93 different countries.
1650 Futures. Futures markets allow companies toprotect themselves against fluctuations in commod-ity prices. During the Tokugawa era in Japan feudallords collected rents in the form of rice but often theywished to trade their future rice deliveries. Rice fu-tures therefore came to be traded on what was laterknown as the Dojima Rice Market. Rice futures arestill traded but now companies can also trade in fu-tures on a range of items from pork bellies to stockmarket indexes.
17th century Joint Stock Corporations. Althoughinvestors have for a long time combined together asjoint owners of an enterprise, the modern corpora-tion with a large number of stockholders originateswith the formation in England of the great tradingfirms like the East India Company (est. 1599). An-other early trading firm, Hudson’s Bay (est. 1670),
still survives and is one of Canada’s largest compa-nies.
17th century Money. America has been in the fore-front in the development of new types of money.Early settlers often used a shell known as wampum.For example, Peter Stuyvesant raised a loan inwampum and in Massachusetts it was legal tender.Unfortunately, the enterprising settlers found thatwith a little dye the relatively common whitewampum shells could be converted profitably intothe more valuable black ones, which simply demon-strated Gresham’s law that bad money drives outgood. The first issue of paper money in America (andalmost in the world) was by the Massachusetts BayColony in 1690, and other colonies soon set theirprinting presses to producing money. In 1862 Con-gress agreed to an issue of paper money whichwould be legal tender. These notes, printed in greenink, immediately became known as greenbacks.
1720 New Issue Speculation. From time to time in-vestors have been tempted by speculative new is-sues. During the South Sea Bubble in England onecompany was launched to develop perpetual mo-tion. Another enterprising individual announced acompany “for carrying on an undertaking of greatadvantage but nobody to know what it is.” Within 5hours he had raised £2000; within 6 hours he was onhis way out of the country.
1792 Formation of the New York Stock Exchange.The New York Stock Exchange (NYSE) was foundedin 1792 when a group of brokers met under a but-tonwood tree and arranged to trade shares with oneanother at agreed rates of commission. Today theNYSE is the largest stock exchange in the world,trading on average about a billion shares a day.
1929 Stock Market Crashes. Common stocks arerisky investments. In September 1929 stock prices inthe United States reached an all-time high and theeconomist Irving Fisher forecast that they were at “apermanently high plateau.” Some 3 years later stockprices were almost 90 percent lower and it was to be
26
a quarter of a century before the prices of Septem-ber 1929 were seen again. Contrary to popular im-pression, no Wall Street broker jumped out the win-dow.
1960s Eurodollar Market. In the 1950s the SovietUnion transferred its dollar holdings from the UnitedStates to a Russian-owned bank in Paris. This bankwas best known by its telex address, EUROBANK,and consequently dollars held outside the UnitedStates came to be known as eurodollars. In the1960s U.S. taxes and regulation made it muchcheaper to borrow and lend dollars in Europe ratherthan in the United States and a huge market in eu-rodollars arose.
1972 Financial Futures. Financial futures allow com-panies to protect themselves against fluctuations ininterest rates, exchange rates, and so on. It is saidthat they originated from a remark by the economistMilton Friedman that he was unable to profit from hisview that sterling was overpriced. The Chicago Mer-cantile Exchange founded the first financial futuresmarket. Today futures exchanges in the UnitedStates trade 200 million contracts a year of financialfutures.
1986 Capital Investment Decisions. The largest in-vestment project undertaken by private companieswas the construction of the tunnel under the EnglishChannel. This started in 1986 and was completed in1994 at a total cost of $15 billion.
1988 Mergers. The 1980s saw a wave of takeoversculminating in the $25 billion takeover of RJRNabisco. Over a period of 6 weeks three groups bat-tled for control of the company. As one of the con-testants put it, “We were charging through the ricepaddies, not stopping for anything and taking noprisoners.” The takeover was the largest in historyand generated almost $1 billion in fees for the banksand advisers.
1993 Inflation. Financial managers need to recognizethe effect of inflation on interest rates and on theprofitability of the firm’s investments. In the United
States inflation has been relatively modest, but somecountries have suffered from hyperinflation. In Hun-gary after World War II the government issued bank-notes worth 1000 trillion pengoes. In Yugoslavia inOctober 1993 prices rose by nearly 2000 percentand a dollar bought 105 million dinars.
1780 and 1997 Inflation-Indexed Debt. In 1780,Massachusetts paid Revolutionary War soldiers withinterest-bearing notes rather than its rapidly erodingcurrency. Interest and principal payments on thenotes were tied to the rate of subsequent inflation.After a 217-year hiatus, the United States Treasuryissued 10-year inflation-indexed notes. Many othercountries, including Britain and Israel, had done sopreviously.
1993 Controlling Risk. When a company fails tokeep close tabs on the risks being taken by its em-ployees, it can get into serious trouble. This was thefate of Barings, a 220-year-old British bank thatnumbered the queen among its clients. In 1993 itdiscovered that Nick Leeson, a trader in its Singa-pore office, had hidden losses of $1.3 billion (£869million) from unauthorized bets on the Japanese eq-uity market. The losses wiped out Barings andlanded Leeson in jail, with a 6-year sentence.
1999 The Euro. Large corporations do business inmany currencies. In 1999 a new currency came intoexistence, when 11 European countries adopted theeuro in place of their separate currencies. This wasnot the first time that different countries have agreedon a common currency. In 1865 France, Belgium,Switzerland, and Italy came together in the LatinMonetary Union, and they were joined by Greeceand Romania the following year. Members of the Eu-ropean Monetary Union (EMU) hope that the eurowill be a longer lasting success than earlier experi-ments.
27
28 SECTION ONE
www.financewise.com/ A search engine for finance-related siteswww.forbes.com/ News about financial managementwww.wiso.gwdg.de/ifbg/finance.html Links to all kinds of finance siteswww.edgeonline.com/ Information for the small business financial managerwww.corpmon.com/index.htm The corporate monitoring project dedicated to inducing firms to
make good decisionswww.companylink.com/ News, research, and contacts for more than 100,000 companieshttp://crcse.business.pitt.edu/pages/biblio.html A bibliography of research on motivating man-
agers through effective incentiveshttp://pwl.netcom.com/~jstorres/internalaudit/resources.html Internal control and corporate
governance resources
sole proprietor capital budgeting decision treasurerpartnership financing decision controllercorporation capital structure chief financial officer (CFO)limited liability capital markets agency problemsreal assets financial intermediary stakeholderfinancial assets primary marketfinancial markets secondary market
1. Financial Decisions. Fit each of the following terms into the most appropriate space: fi-nancing, real, stock, investment, executive airplanes, financial, capital budgeting, brandnames.Companies usually buy ___ assets. These include both tangible assets such as ___ and intangible assets such as ___. In order to pay for these assets, they sell ___ assets such as___. The decision regarding which assets to buy is usually termed the ___ or ___ decision.The decision regarding how to raise the money is usually termed the ___ decision.
2. Value Maximization. Give an example of an action that might increase profits but at thesame time reduce stock price.
3. Corporate Organization. You may own shares of IBM, but you still can’t enter corporateheadquarters whenever you feel like it. In what sense then are you an owner of the firm?
4. Corporate Organization. What are the advantages and disadvantages of organizing a firmas a proprietorship, partnership, or corporation? In what sense are LLPs or professional cor-porations hybrid forms of business organization?
5. Corporate Organization. What do we mean when we say that corporate income is subjectto double taxation?
6. Financial Managers. Which of the following statements more accurately describes thetreasurer than the controller?
a. Likely to be the only financial executive in small firmsb. Monitors capital expenditures to make sure that they are not misappropriatedc. Responsible for investing the firm’s spare cashd. Responsible for arranging any issue of common stocke. Responsible for the company’s tax affairs
Related WebLinks
Key Terms
Quiz
The Firm and the Financial Manager 29
7. Real versus Financial Assets. Which of the following are real assets, and which are financial?
a. A share of stockb. A personal IOUc. A trademarkd. A trucke. Undeveloped landf. The balance in the firm’s checking accountg. An experienced and hardworking sales forceh. A bank loan agreement
8. The Financial Manager. Give two examples of capital budgeting decisions and financingdecisions.
9. Financial Markets. What is meant by over-the-counter trading? Is this trading mechanismused for stocks, bonds, or both?
10. Financial Institutions. We gave banks and insurance companies as two examples of finan-cial institutions. What other types of financial institutions can you identify?
11. Financial Markets. In most years new issues of stock are a tiny fraction of total stock mar-ket trading. In other words, secondary market volume is much greater than primary marketvolume. Does the fact that firms only occasionally sell new shares mean that the stock mar-ket is largely irrelevant to the financial manager? Hint: How is the price of the firm’s stockdetermined, and why is it important to the financial manager?
12. Goals of the Firm. You may have heard big business criticized for focusing on short-termperformance at the expense of long-term results. Explain why a firm that strives to maxi-mize stock price should be less subject to an overemphasis on short-term results than onethat maximizes profits.
13. Goals of the Firm. We claim that the goal of the firm is to maximize stock price. Are thefollowing actions necessarily consistent with that goal?
a. The firm donates $3 million to the local art museum.b. The firm reduces its dividend payment, choosing to reinvest more of earnings in the
business.c. The firm buys a corporate jet for its executives.
14. Goals of the Firm. Explain why each of the following may not be appropriate corporategoals:
a. Increase market shareb. Minimize costsc. Underprice any competitorsd. Expand profits
15. Agency Issues. Sometimes lawyers work on a contingency basis. They collect a percentageof their client’s settlement instead of receiving a fixed fee. Why might clients prefer thisarrangement? Would this sort of arrangement be more appropriate for clients that uselawyers regularly or infrequently?
16. Reputation. As you drive down a deserted highway you are overcome with a sudden desirefor a hamburger. Fortunately, just ahead are two hamburger outlets; one is owned by a na-tional brand, the other appears to be owned by “Joe.” Which outlet has the greater incentiveto serve you catmeat? Why?
17. Agency Problems. If agency problems can be mitigated by tying the manager’s compensa-tion to the fortunes of the firm, why don’t firms compensate managers exclusively withshares in the firm?
PracticeProblems
30 SECTION ONE
18. Agency Problems. Many firms have devised defenses that make it much more costly or dif-ficult for other firms to take them over. How might such takeover defenses affect the firm’sagency problems? Are managers of firms with formidable takeover defenses more or lesslikely to act in the firm’s interests rather than their own?
19. Agency Issues. One of the “Finance through the Ages” episodes that we cite on page 27 isthe 1993 collapse of Barings Bank, when one of its traders lost $1.3 billion. Traders are com-pensated in large part according to their trading profits. How might this practice have con-tributed to an agency problem?
20. Agency Issues. Discuss which of the following forms of compensation is most likely toalign the interests of managers and shareholders:
a. A fixed salaryb. A salary linked to company profitsc. A salary that is paid partly in the form of the company’s sharesd. An option to buy the company’s shares at an attractive price
21. Agency Issues. When a company’s stock is widely held, it may not pay an individual share-holder to spend time monitoring the manager’s performance and trying to replace poor man-agement. Explain why. Do you think that a bank that has made a large loan to the companyis in a different position?
22. Ethics. In some countries, such as Japan and Germany, corporations develop close long-term relationships with one bank and rely on that bank for a large part of their financingneeds. In the United States companies are more likely to shop around for the best deal. Doyou think that this practice is more or less likely to encourage ethical behavior on the partof the corporation?
23. Ethics. Is there a conflict between “doing well” and “doing good”? In other words, are poli-cies that increase the value of the firm (doing well) necessarily at odds with socially re-sponsible policies (doing good)? When there are conflicts, how might government regula-tions or laws tilt the firm toward doing good? For example, how do taxes or fees charged onpollutants affect the firm’s decision to pollute? Can you cite other examples of “incentives”used by governments to align private interests with public ones?
24. Ethics. The following report appeared in the Financial Times (October 28,1999, p. 1):“Coca-Cola is testing a vending machine that automatically raises the price of the world’sfavorite soft drink when the temperature increases . . . [T]he new machine, believed to havebeen tested in Japan, may well create controversy by using hot weather to charge extra. Onerival said the idea of charging more when temperatures rose was ‘incredible.’” Discuss.
1 a. The consulting firm is most suited to a partnership. Each senior consultant might be apartner, with partial responsibility for managing the firm and its clients.
b. The college student would set up the business as a sole proprietorship. He or she is theonly manager, and has little need for partners to contribute capital.
c. The large firm would be set up as a corporation. It requires great amounts of capital andwith the budgetary, payroll, and management issues that arise with such a large numberof employees, it probably needs a professional management team.
2 a. The development of a microprocessor is a capital budgeting decision. The investment of$500 million will purchase a real asset, the microprocessor.
b. The bank loan is a financing decision. This is how Volkswagen will raise money for its investment.
c. Capital budgeting.d. Financing.
Solutions toSelf-TestQuestions
The Firm and the Financial Manager 31
e. Capital budgeting. Though intangible, the license is a real asset that is expected to pro-duce future sales and profits.
f. Financing.3 a. Real assets support the operations of the business. They are necessary to produce future
profits and cash inflows. Financial assets or securities are claims on the profits and cashinflows generated by the firm’s real assets and operations.
b. A company invests in real assets to support its operations. It finances the investment byraising money from banks, shareholders, or other investors.
c. Capital budgeting deals with investment decisions. Capital structure is the composition ofthe company’s sources of financing.
d. When a company raises money from investors, it sells financial assets or securities in theprimary market. Later trades among investors occur in the secondary market.
e. A company can raise money by selling securities directly to investors in financial mar-kets, or it can deal with a financial intermediary. The intermediary raises money from in-vestors and reinvests it in the company’s securities. The intermediary invests primarily infinancial assets.
4 Sal would more likely be the treasurer and Sally the controller. The treasurer raises moneyfrom the credit and financial markets and requires background in financial institutions. Thecontroller is more of an overseer who requires background in accounting.
5 Harry’s has a far bigger stake in the reputation of the business than Victor’s. The store hasbeen in business for a long time. The owners have spent years establishing customer loyalty.In contrast, Victor’s has just been established. The owner has little of his own money tied upin the firm, and so has little to lose if the business fails. In addition, the nature of the busi-ness results in little customer loyalty. Harry’s is probably more reliable.
6 An investor would like top management to be compensated according to the fortunes of thefirm. If management is willing to bet its own compensation on the success of the firm, thatis good news, first because it shows management has confidence in the firm, and second be-cause it gives managers greater incentives to work hard to make the firm succeed.
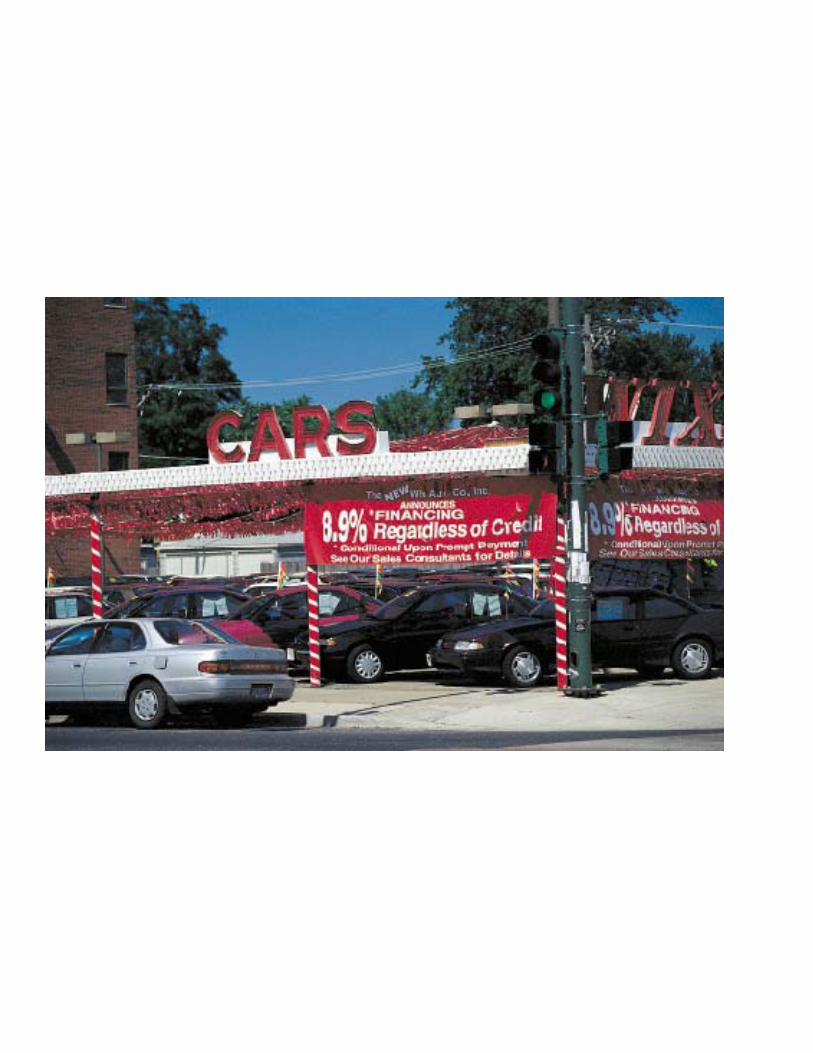
33
THE TIME VALUE OF MONEY
Future Values and Compound Interest
Present ValuesFinding the Interest Rate
Multiple Cash FlowsFuture Value of Multiple Cash Flows
Present Value of Multiple Cash Flows
Level Cash Flows: Perpetuities and AnnuitiesHow to Value Perpetuities
How to Value Annuities
Annuities Due
Future Value of an Annuity
Inflation and the Time Value of MoneyReal versus Nominal Cash Flows
Inflation and Interest Rates
Valuing Real Cash Payments
Real or Nominal?
Effective Annual Interest Rates
Summary
Kangaroo Auto’s view of the time value of money.Do you truly understand what these percentages mean? Do you realize that the dealership isnot quoting effective annual interest rates? If the dealership quotes a monthly payment on afour-year, $10,000 car loan, would you be able to double-check the dealership’s calculations?Cameramann International, LTD.

34
Future Values and Compound InterestYou have $100 invested in a bank account. Suppose banks are currently paying an in-terest rate of 6 percent per year on deposits. So after a year, your account will earn in-terest of $6:
ompanies invest in lots of things. Some are tangible assets—that is, as-
sets you can kick, like factories, machinery, and offices. Others are in-
tangible assets, such as patents or trademarks. In each case the company
lays out some money now in the hope of receiving even more money later.
Individuals also make investments. For example, your college education may cost
you $20,000 per year. That is an investment you hope will pay off in the form of a higher
salary later in life. You are sowing now and expecting to reap later.
Companies pay for their investments by raising money and in the process assuming
liabilities. For example, they may borrow money from a bank and promise to repay it
with interest later. You also may have financed your investment in a college education
by borrowing money which you plan to pay back out of that fat salary.
All these financial decisions require comparisons of cash payments at different dates.
Will your future salary be sufficient to justify the current expenditure on college tuition?
How much will you have to repay the bank if you borrow to finance your education?
In this material we take the first steps toward understanding the relationship between
the value of dollars today and that of dollars in the future. We start by looking at how
funds invested at a specific interest rate will grow over time. We next ask how much you
would need to invest today to produce a specified future sum of money, and we describe
some shortcuts for working out the value of a series of cash payments. Then we con-
sider how inflation affects these financial calculations.
After studying this material you should be able to
� Calculate the future value to which money invested at a given interest rate will grow.
� Calculate the present value of a future payment.
� Calculate present and future values of streams of cash payments.
� Find the interest rate implied by the present or future value.
� Understand the difference between real and nominal cash flows and between real and
nominal interest rates.
� Compare interest rates quoted over different time intervals—for example, monthly
versus annual rates.
There is nothing complicated about these calculations, but if they are to become sec-
ond nature, you should read the material thoroughly, work carefully through the exam-
ples (we have provided plenty), and make sure you tackle the self-test questions. We are
asking you to make an investment now in return for a payoff later.
C
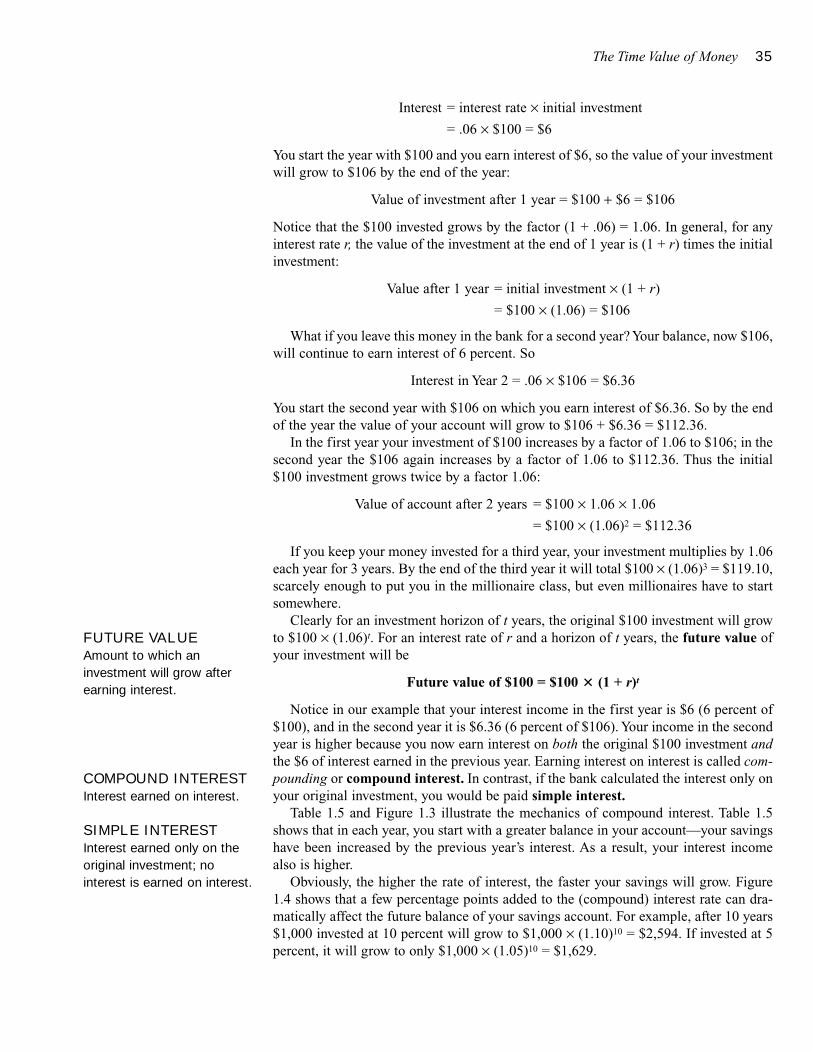
The Time Value of Money 35
Interest = interest rate × initial investment
= .06 × $100 = $6
You start the year with $100 and you earn interest of $6, so the value of your investmentwill grow to $106 by the end of the year:
Value of investment after 1 year = $100 + $6 = $106
Notice that the $100 invested grows by the factor (1 + .06) = 1.06. In general, for anyinterest rate r, the value of the investment at the end of 1 year is (1 + r) times the initialinvestment:
Value after 1 year = initial investment × (1 + r)
= $100 × (1.06) = $106
What if you leave this money in the bank for a second year? Your balance, now $106,will continue to earn interest of 6 percent. So
Interest in Year 2 = .06 × $106 = $6.36
You start the second year with $106 on which you earn interest of $6.36. So by the endof the year the value of your account will grow to $106 + $6.36 = $112.36.
In the first year your investment of $100 increases by a factor of 1.06 to $106; in thesecond year the $106 again increases by a factor of 1.06 to $112.36. Thus the initial$100 investment grows twice by a factor 1.06:
Value of account after 2 years = $100 × 1.06 × 1.06
= $100 × (1.06)2 = $112.36
If you keep your money invested for a third year, your investment multiplies by 1.06each year for 3 years. By the end of the third year it will total $100 × (1.06)3 = $119.10,scarcely enough to put you in the millionaire class, but even millionaires have to startsomewhere.
Clearly for an investment horizon of t years, the original $100 investment will growto $100 × (1.06)t. For an interest rate of r and a horizon of t years, the future value ofyour investment will be
Future value of $100 = $100 � (1 + r)t
Notice in our example that your interest income in the first year is $6 (6 percent of$100), and in the second year it is $6.36 (6 percent of $106). Your income in the secondyear is higher because you now earn interest on both the original $100 investment andthe $6 of interest earned in the previous year. Earning interest on interest is called com-pounding or compound interest. In contrast, if the bank calculated the interest only onyour original investment, you would be paid simple interest.
Table 1.5 and Figure 1.3 illustrate the mechanics of compound interest. Table 1.5shows that in each year, you start with a greater balance in your account—your savingshave been increased by the previous year’s interest. As a result, your interest incomealso is higher.
Obviously, the higher the rate of interest, the faster your savings will grow. Figure1.4 shows that a few percentage points added to the (compound) interest rate can dra-matically affect the future balance of your savings account. For example, after 10 years$1,000 invested at 10 percent will grow to $1,000 × (1.10)10 = $2,594. If invested at 5percent, it will grow to only $1,000 × (1.05)10 = $1,629.
FUTURE VALUEAmount to which aninvestment will grow afterearning interest.
COMPOUND INTERESTInterest earned on interest.
SIMPLE INTERESTInterest earned only on theoriginal investment; nointerest is earned on interest.
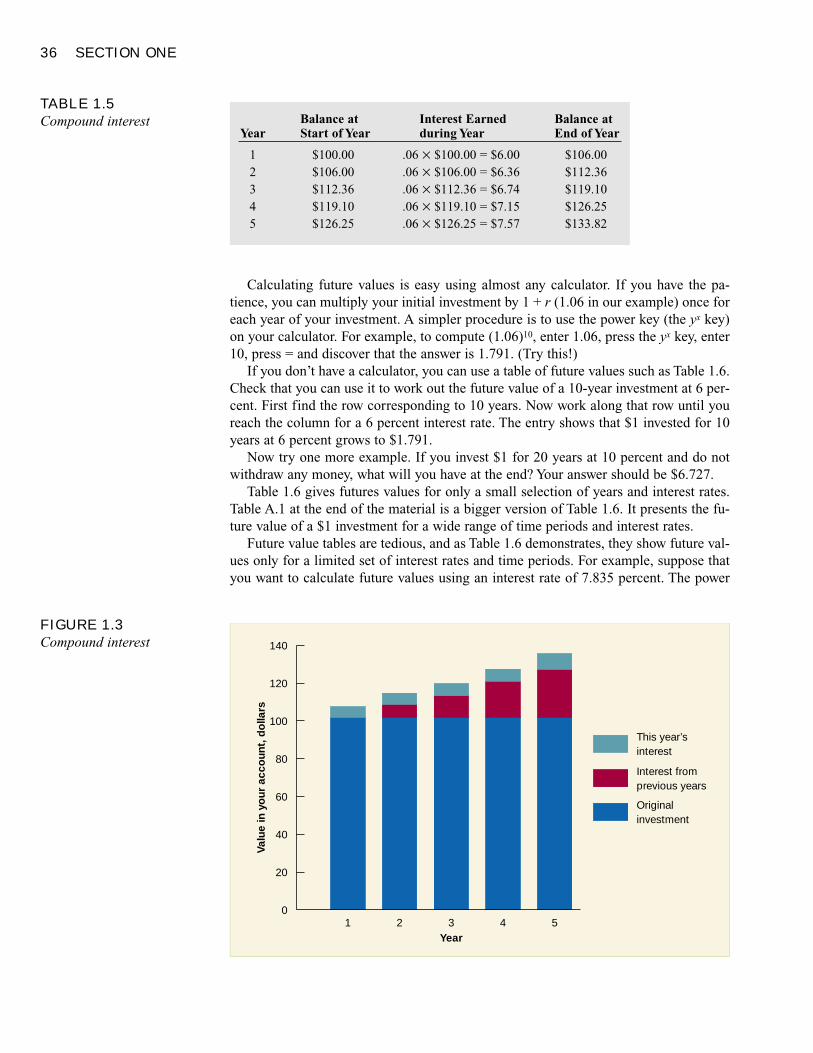
36 SECTION ONE
Calculating future values is easy using almost any calculator. If you have the pa-tience, you can multiply your initial investment by 1 + r (1.06 in our example) once foreach year of your investment. A simpler procedure is to use the power key (the yx key)on your calculator. For example, to compute (1.06)10, enter 1.06, press the yx key, enter10, press = and discover that the answer is 1.791. (Try this!)
If you don’t have a calculator, you can use a table of future values such as Table 1.6.Check that you can use it to work out the future value of a 10-year investment at 6 per-cent. First find the row corresponding to 10 years. Now work along that row until youreach the column for a 6 percent interest rate. The entry shows that $1 invested for 10years at 6 percent grows to $1.791.
Now try one more example. If you invest $1 for 20 years at 10 percent and do notwithdraw any money, what will you have at the end? Your answer should be $6.727.
Table 1.6 gives futures values for only a small selection of years and interest rates.Table A.1 at the end of the material is a bigger version of Table 1.6. It presents the fu-ture value of a $1 investment for a wide range of time periods and interest rates.
Future value tables are tedious, and as Table 1.6 demonstrates, they show future val-ues only for a limited set of interest rates and time periods. For example, suppose thatyou want to calculate future values using an interest rate of 7.835 percent. The power
TABLE 1.5Compound interest Balance at Interest Earned Balance at
Year Start of Year during Year End of Year
1 $100.00 .06 × $100.00 = $6.00 $106.002 $106.00 .06 × $106.00 = $6.36 $112.363 $112.36 .06 × $112.36 = $6.74 $119.104 $119.10 .06 × $119.10 = $7.15 $126.255 $126.25 .06 × $126.25 = $7.57 $133.82
Year
Valu
e in
yo
ur a
cco
unt,
do
llars
140
120
100
80
60
40
20
01 2 3 4 5
This year’sinterest
Interest fromprevious years
Originalinvestment
FIGURE 1.3Compound interest
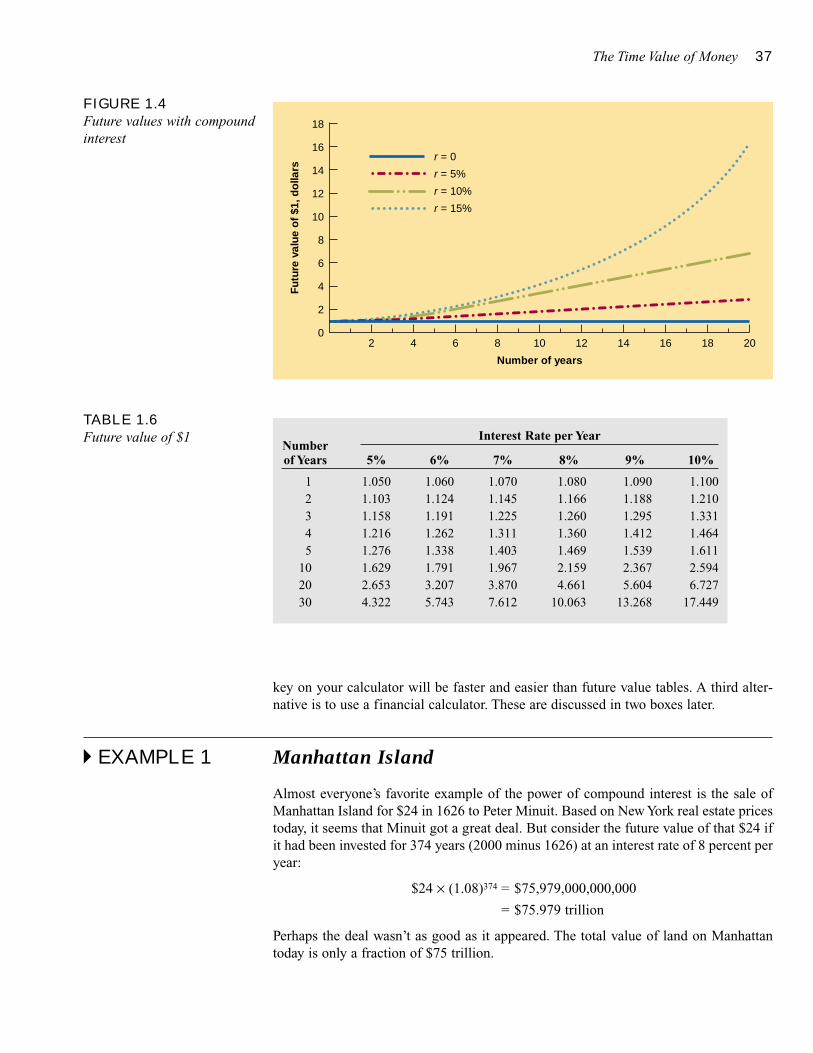
The Time Value of Money 37
key on your calculator will be faster and easier than future value tables. A third alter-native is to use a financial calculator. These are discussed in two boxes later.
� EXAMPLE 1 Manhattan Island
Almost everyone’s favorite example of the power of compound interest is the sale ofManhattan Island for $24 in 1626 to Peter Minuit. Based on New York real estate pricestoday, it seems that Minuit got a great deal. But consider the future value of that $24 ifit had been invested for 374 years (2000 minus 1626) at an interest rate of 8 percent peryear:
$24 × (1.08)374 = $75,979,000,000,000
= $75.979 trillion
Perhaps the deal wasn’t as good as it appeared. The total value of land on Manhattantoday is only a fraction of $75 trillion.
2 4 6 8 10 12 14 16 18 20
Number of years
r = 0
r = 5%
r = 10%
r = 15%
Futu
re v
alue
of
$1, d
olla
rs
18
16
14
12
10
8
6
4
2
0
FIGURE 1.4Future values with compoundinterest
TABLE 1.6Future value of $1 Interest Rate per Year
Numberof Years 5% 6% 7% 8% 9% 10%
1 1.050 1.060 1.070 1.080 1.090 1.1002 1.103 1.124 1.145 1.166 1.188 1.2103 1.158 1.191 1.225 1.260 1.295 1.3314 1.216 1.262 1.311 1.360 1.412 1.4645 1.276 1.338 1.403 1.469 1.539 1.611
10 1.629 1.791 1.967 2.159 2.367 2.59420 2.653 3.207 3.870 4.661 5.604 6.72730 4.322 5.743 7.612 10.063 13.268 17.449

38 SECTION ONE
Though entertaining, this analysis is actually somewhat misleading. First, the 8 per-cent interest rate we’ve used to compute future values is quite high by historical stan-dards. At a 3.5 percent interest rate, more consistent with historical experience, the fu-ture value of the $24 would be dramatically lower, only $24 × (1.035)374 = $9,287,569!Second, we have understated the returns to Mr. Minuit and his successors: we have ig-nored all the rental income that the island’s land has generated over the last three or fourcenturies.
All things considered, if we had been around in 1626, we would have gladly paid $24for the island.
The power of compounding is not restricted to money. Foresters try to forecast thecompound growth rate of trees, demographers the compound growth rate of population.A social commentator once observed that the number of lawyers in the United States isincreasing at a higher compound rate than the population as a whole (3.6 vs. .9 percentin the 1980s) and calculated that in about two centuries there will be more lawyers thanpeople. In all these cases, the principle is the same:
� Self-Test 1 Suppose that Peter Minuit did not become the first New York real estate tycoon, but in-stead had invested his $24 at a 5 percent interest rate in New Amsterdam Savings Bank.What would have been the balance in his account after 5 years? 50 years?
� Self-Test 2 Start-up Enterprises had sales last year of only $.5 million. However, a stock market an-alyst is bullish on the company and predicts that sales will double each year for 4 years.What are projected sales at the end of this period?
Present ValuesMoney can be invested to earn interest. If you are offered the choice between $100,000now and $100,000 at the end of the year, you naturally take the money now to get a year’sinterest. Financial managers make the same point when they say that money in handtoday has a time value or when they quote perhaps the most basic financial principle:
We have seen that $100 invested for 1 year at 6 percent will grow to a future valueof 100 × 1.06 = $106. Let’s turn this around: How much do we need to invest now inorder to produce $106 at the end of the year? Financial managers refer to this as thepresent value (PV) of the $106 payoff.
Future value is calculated by multiplying the present investment by 1 plus the inter-
A dollar today is worth more than a dollar tomorrow.
Compound growth means that value increases each period by the factor (1 +growth rate). The value after t periods will equal the initial value times (1 +growth rate)t. When money is invested at compound interest, the growth rate is the interest rate.
The Time Value of Money 39
est rate, .06, or 1.06. To calculate present value, we simply reverse the process and di-vide the future value by 1.06:
Present value = PV =future value
=$106
= $1001.06 1.06
What is the present value of, say, $112.36 to be received 2 years from now? Againwe ask, “How much would we need to invest now to produce $112.36 after 2 years?”The answer is obviously $100; we’ve already calculated that at 6 percent $100 grows to$112.36:
$100 × (1.06)2 = $112.36
However, if we don’t know, or forgot the answer, we just divide future value by (1.06)2:
Present value = PV =$112.36
= $100(1.06)2
In general, for a future value or payment t periods away, present value is
Present value =future value after t periods
(1 + r)t
In this context the interest rate r is known as the discount rate and the present value isoften called the discounted value of the future payment. To calculate present value, wediscounted the future value at the interest r.
� EXAMPLE 2 Saving to Buy a New Computer
Suppose you need $3,000 next year to buy a new computer. The interest rate is 8 per-cent per year. How much money should you set aside now in order to pay for the pur-chase? Just calculate the present value at an 8 percent interest rate of a $3,000 paymentat the end of one year. This value is
PV =$3,000
= $2,7781.08
Notice that $2,778 invested for 1 year at 8 percent will prove just enough to buy yourcomputer:
Future value = $2,778 × 1.08 = $3,000
The longer the time before you must make a payment, the less you need to investtoday. For example, suppose that you can postpone buying that computer until the endof 2 years. In this case we calculate the present value of the future payment by dividing$3,000 by (1.08)2:
PV =$3,000
= $2,572(1.08)2
Thus you need to invest $2,778 today to provide $3,000 in 1 year but only $2,572 toprovide the same $3,000 in 2 years.
DISCOUNT RATE Interestrate used to compute presentvalues of future cash flows.
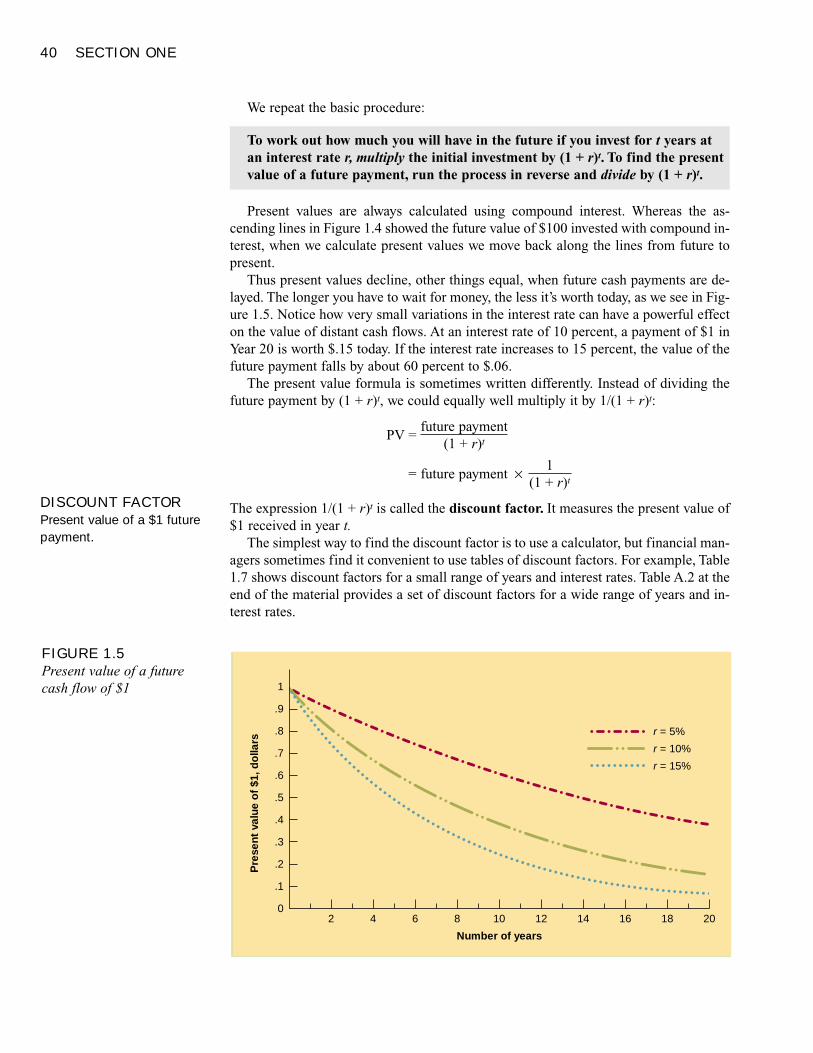
40 SECTION ONE
We repeat the basic procedure:
Present values are always calculated using compound interest. Whereas the as-cending lines in Figure 1.4 showed the future value of $100 invested with compound in-terest, when we calculate present values we move back along the lines from future topresent.
Thus present values decline, other things equal, when future cash payments are de-layed. The longer you have to wait for money, the less it’s worth today, as we see in Fig-ure 1.5. Notice how very small variations in the interest rate can have a powerful effecton the value of distant cash flows. At an interest rate of 10 percent, a payment of $1 inYear 20 is worth $.15 today. If the interest rate increases to 15 percent, the value of thefuture payment falls by about 60 percent to $.06.
The present value formula is sometimes written differently. Instead of dividing thefuture payment by (1 + r)t, we could equally well multiply it by 1/(1 + r)t:
PV =future payment
(1 + r)t
= future payment × 1(1 + r)t
The expression 1/(1 + r)t is called the discount factor. It measures the present value of$1 received in year t.
The simplest way to find the discount factor is to use a calculator, but financial man-agers sometimes find it convenient to use tables of discount factors. For example, Table1.7 shows discount factors for a small range of years and interest rates. Table A.2 at theend of the material provides a set of discount factors for a wide range of years and in-terest rates.
To work out how much you will have in the future if you invest for t years atan interest rate r, multiply the initial investment by (1 + r)t. To find the presentvalue of a future payment, run the process in reverse and divide by (1 + r)t.
2 4 6 8 10 12 14 16 18 20
Number of years
r = 5%
r = 10%
r = 15%
Pre
sent
val
ue o
f $1
, do
llars
1
.8
.9
.7
.6
.5
.4
.3
.2
.1
0
FIGURE 1.5Present value of a futurecash flow of $1
DISCOUNT FACTORPresent value of a $1 futurepayment.
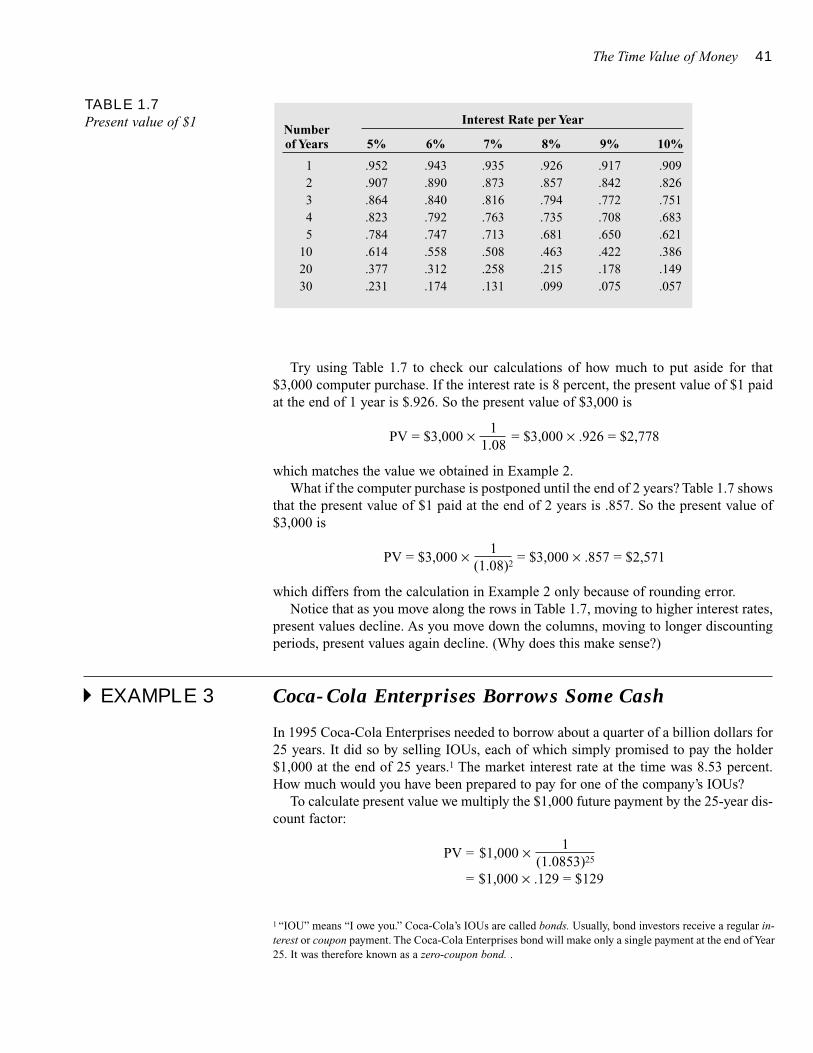
The Time Value of Money 41
Try using Table 1.7 to check our calculations of how much to put aside for that$3,000 computer purchase. If the interest rate is 8 percent, the present value of $1 paidat the end of 1 year is $.926. So the present value of $3,000 is
PV = $3,000 × 1= $3,000 × .926 = $2,778
1.08
which matches the value we obtained in Example 2.What if the computer purchase is postponed until the end of 2 years? Table 1.7 shows
that the present value of $1 paid at the end of 2 years is .857. So the present value of$3,000 is
PV = $3,000 × 1= $3,000 × .857 = $2,571
(1.08)2
which differs from the calculation in Example 2 only because of rounding error.Notice that as you move along the rows in Table 1.7, moving to higher interest rates,
present values decline. As you move down the columns, moving to longer discountingperiods, present values again decline. (Why does this make sense?)
� EXAMPLE 3 Coca-Cola Enterprises Borrows Some Cash
In 1995 Coca-Cola Enterprises needed to borrow about a quarter of a billion dollars for25 years. It did so by selling IOUs, each of which simply promised to pay the holder$1,000 at the end of 25 years.1 The market interest rate at the time was 8.53 percent.How much would you have been prepared to pay for one of the company’s IOUs?
To calculate present value we multiply the $1,000 future payment by the 25-year dis-count factor:
PV = $1,000 × 1(1.0853)25
= $1,000 × .129 = $129
TABLE 1.7Present value of $1 Interest Rate per Year
Numberof Years 5% 6% 7% 8% 9% 10%
1 .952 .943 .935 .926 .917 .9092 .907 .890 .873 .857 .842 .8263 .864 .840 .816 .794 .772 .7514 .823 .792 .763 .735 .708 .6835 .784 .747 .713 .681 .650 .621
10 .614 .558 .508 .463 .422 .38620 .377 .312 .258 .215 .178 .14930 .231 .174 .131 .099 .075 .057
1 “IOU” means “I owe you.” Coca-Cola’s IOUs are called bonds. Usually, bond investors receive a regular in-terest or coupon payment. The Coca-Cola Enterprises bond will make only a single payment at the end of Year25. It was therefore known as a zero-coupon bond. .
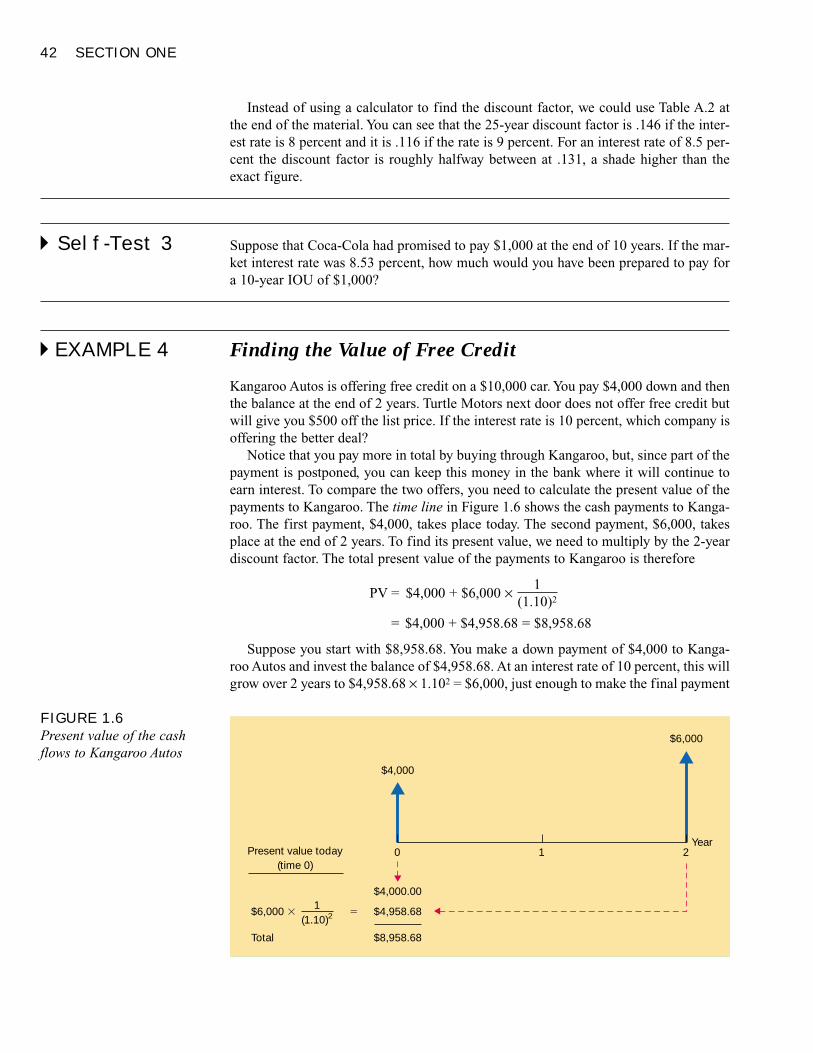
42 SECTION ONE
Instead of using a calculator to find the discount factor, we could use Table A.2 atthe end of the material. You can see that the 25-year discount factor is .146 if the inter-est rate is 8 percent and it is .116 if the rate is 9 percent. For an interest rate of 8.5 per-cent the discount factor is roughly halfway between at .131, a shade higher than theexact figure.
� Self-Test 3 Suppose that Coca-Cola had promised to pay $1,000 at the end of 10 years. If the mar-ket interest rate was 8.53 percent, how much would you have been prepared to pay fora 10-year IOU of $1,000?
� EXAMPLE 4 Finding the Value of Free Credit
Kangaroo Autos is offering free credit on a $10,000 car. You pay $4,000 down and thenthe balance at the end of 2 years. Turtle Motors next door does not offer free credit butwill give you $500 off the list price. If the interest rate is 10 percent, which company isoffering the better deal?
Notice that you pay more in total by buying through Kangaroo, but, since part of thepayment is postponed, you can keep this money in the bank where it will continue toearn interest. To compare the two offers, you need to calculate the present value of thepayments to Kangaroo. The time line in Figure 1.6 shows the cash payments to Kanga-roo. The first payment, $4,000, takes place today. The second payment, $6,000, takesplace at the end of 2 years. To find its present value, we need to multiply by the 2-yeardiscount factor. The total present value of the payments to Kangaroo is therefore
PV = $4,000 + $6,000 × 1(1.10)2
= $4,000 + $4,958.68 = $8,958.68
Suppose you start with $8,958.68. You make a down payment of $4,000 to Kanga-roo Autos and invest the balance of $4,958.68. At an interest rate of 10 percent, this willgrow over 2 years to $4,958.68 × 1.102 = $6,000, just enough to make the final payment
0 1 2
$6,000
$6,000 � $4,958.68
Present value today(time 0)
$8,958.68
$4,000.00
Year
Total
(1.10)21
$4,000
�
FIGURE 1.6Present value of the cashflows to Kangaroo Autos
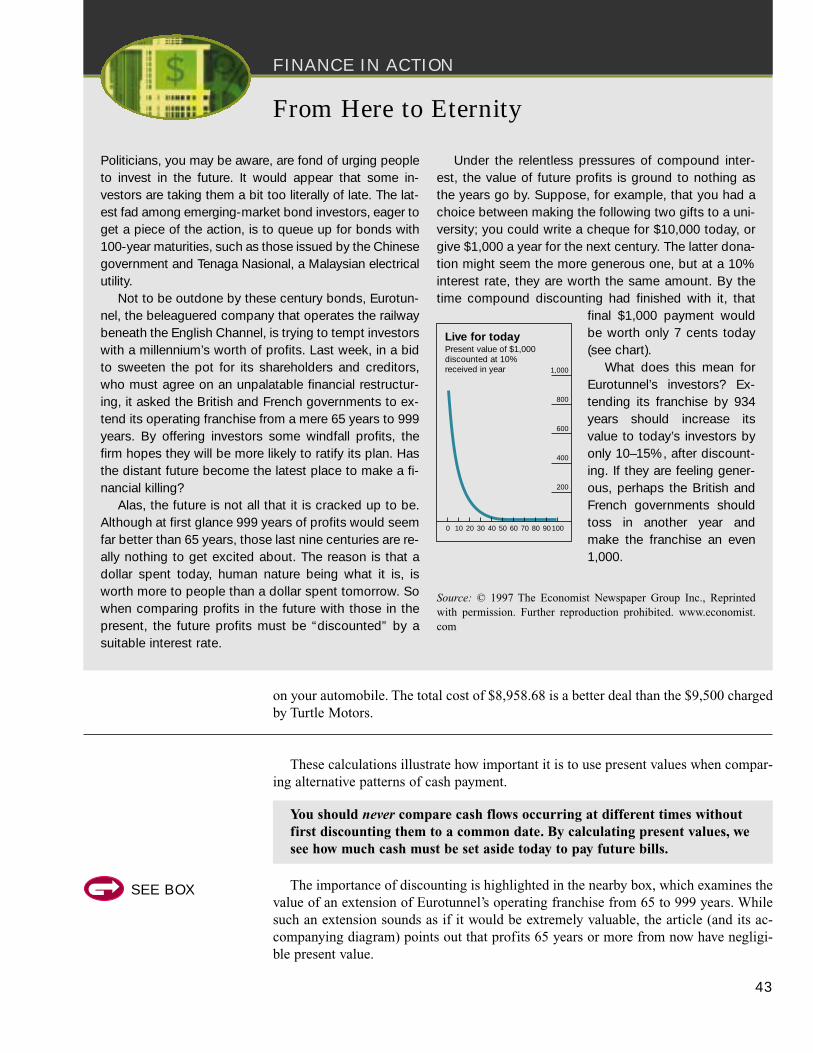
FINANCE IN ACTION
on your automobile. The total cost of $8,958.68 is a better deal than the $9,500 chargedby Turtle Motors.
These calculations illustrate how important it is to use present values when compar-ing alternative patterns of cash payment.
The importance of discounting is highlighted in the nearby box, which examines thevalue of an extension of Eurotunnel’s operating franchise from 65 to 999 years. Whilesuch an extension sounds as if it would be extremely valuable, the article (and its ac-companying diagram) points out that profits 65 years or more from now have negligi-ble present value.
You should never compare cash flows occurring at different times without first discounting them to a common date. By calculating present values, we see how much cash must be set aside today to pay future bills.
43
From Here to Eternity
Politicians, you may be aware, are fond of urging peopleto invest in the future. It would appear that some in-vestors are taking them a bit too literally of late. The lat-est fad among emerging-market bond investors, eager toget a piece of the action, is to queue up for bonds with100-year maturities, such as those issued by the Chinesegovernment and Tenaga Nasional, a Malaysian electricalutility.
Not to be outdone by these century bonds, Eurotun-nel, the beleaguered company that operates the railwaybeneath the English Channel, is trying to tempt investorswith a millennium’s worth of profits. Last week, in a bidto sweeten the pot for its shareholders and creditors,who must agree on an unpalatable financial restructur-ing, it asked the British and French governments to ex-tend its operating franchise from a mere 65 years to 999years. By offering investors some windfall profits, thefirm hopes they will be more likely to ratify its plan. Hasthe distant future become the latest place to make a fi-nancial killing?
Alas, the future is not all that it is cracked up to be.Although at first glance 999 years of profits would seemfar better than 65 years, those last nine centuries are re-ally nothing to get excited about. The reason is that adollar spent today, human nature being what it is, isworth more to people than a dollar spent tomorrow. Sowhen comparing profits in the future with those in thepresent, the future profits must be “discounted” by asuitable interest rate.
Under the relentless pressures of compound inter-est, the value of future profits is ground to nothing asthe years go by. Suppose, for example, that you had achoice between making the following two gifts to a uni-versity; you could write a cheque for $10,000 today, orgive $1,000 a year for the next century. The latter dona-tion might seem the more generous one, but at a 10%interest rate, they are worth the same amount. By thetime compound discounting had finished with it, that
final $1,000 payment wouldbe worth only 7 cents today(see chart).
What does this mean forEurotunnel’s investors? Ex-tending its franchise by 934years should increase itsvalue to today’s investors byonly 10–15%, after discount-ing. If they are feeling gener-ous, perhaps the British andFrench governments shouldtoss in another year andmake the franchise an even1,000.
Source: © 1997 The Economist Newspaper Group Inc., Reprintedwith permission. Further reproduction prohibited. www.economist.com
Live for todayPresent value of $1,000discounted at 10%received in year 1,000
800
600
400
200
0 10 20 30 40 50 60 70 80 90 100
SEE BOX
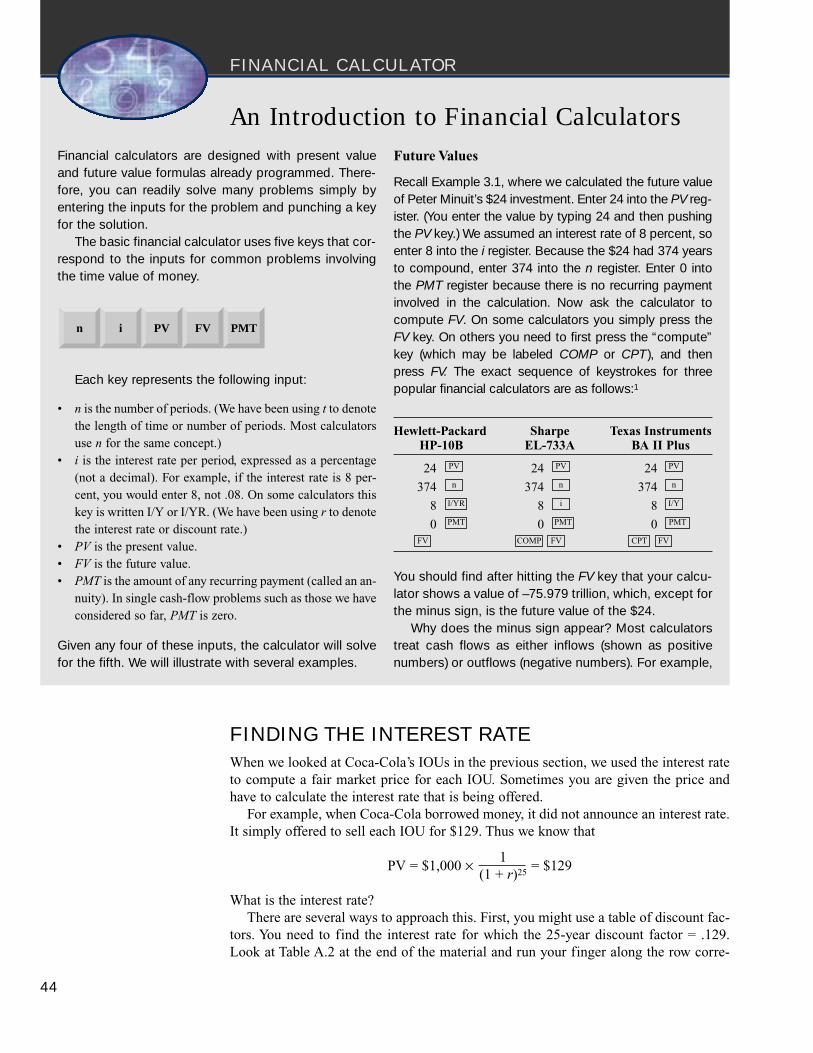
FINANCIAL CALCULATOR
FINDING THE INTEREST RATE
When we looked at Coca-Cola’s IOUs in the previous section, we used the interest rateto compute a fair market price for each IOU. Sometimes you are given the price andhave to calculate the interest rate that is being offered.
For example, when Coca-Cola borrowed money, it did not announce an interest rate.It simply offered to sell each IOU for $129. Thus we know that
PV = $1,000 × 1= $129
(1 + r)25
What is the interest rate?There are several ways to approach this. First, you might use a table of discount fac-
tors. You need to find the interest rate for which the 25-year discount factor = .129.Look at Table A.2 at the end of the material and run your finger along the row corre-
44
An Introduction to Financial CalculatorsFinancial calculators are designed with present valueand future value formulas already programmed. There-fore, you can readily solve many problems simply byentering the inputs for the problem and punching a keyfor the solution.
The basic financial calculator uses five keys that cor-respond to the inputs for common problems involvingthe time value of money.
Each key represents the following input:
• n is the number of periods. (We have been using t to denotethe length of time or number of periods. Most calculatorsuse n for the same concept.)
• i is the interest rate per period, expressed as a percentage(not a decimal). For example, if the interest rate is 8 per-cent, you would enter 8, not .08. On some calculators thiskey is written I/Y or I/YR. (We have been using r to denotethe interest rate or discount rate.)
• PV is the present value.• FV is the future value.• PMT is the amount of any recurring payment (called an an-
nuity). In single cash-flow problems such as those we haveconsidered so far, PMT is zero.
Given any four of these inputs, the calculator will solvefor the fifth. We will illustrate with several examples.
Future Values
Recall Example 3.1, where we calculated the future valueof Peter Minuit’s $24 investment. Enter 24 into the PV reg-ister. (You enter the value by typing 24 and then pushingthe PV key.) We assumed an interest rate of 8 percent, soenter 8 into the i register. Because the $24 had 374 yearsto compound, enter 374 into the n register. Enter 0 intothe PMT register because there is no recurring paymentinvolved in the calculation. Now ask the calculator tocompute FV. On some calculators you simply press theFV key. On others you need to first press the “compute”key (which may be labeled COMP or CPT ), and thenpress FV. The exact sequence of keystrokes for threepopular financial calculators are as follows:1
Hewlett-Packard Sharpe Texas InstrumentsHP-10B EL-733A BA II Plus
24 24 24
374 374 374
8 8 8
0 0 0FVCPTFVCOMPFV
PMTPMTPMT
I/YiI/YR
nnn
PVPVPV
PMTFVPVin
You should find after hitting the FV key that your calcu-lator shows a value of –75.979 trillion, which, except forthe minus sign, is the future value of the $24.
Why does the minus sign appear? Most calculatorstreat cash flows as either inflows (shown as positivenumbers) or outflows (negative numbers). For example,
sponding to 25 years. You can see that an interest rate of 8 percent gives too high a dis-count factor and a rate of 9 percent gives too low a discount factor. The interest rate onthe Coca-Cola loan was about halfway between at 8.5 percent.
Second, you can rearrange the equation and use your calculator.
$129 × (1 + r)25 = $1,000
(1 + r)25 =$1,000
= 7.75$129
(1 + r) = (7.75)1/25 = 1.0853
r = .0853, or 8.53%
In general this is more accurate. You can also use a financial calculator (see the nearbybox).
45
FINANCIAL CALCULATOR
if you borrow $100 today at an interest rate of 12 per-cent, you receive money now (a positive cash flow), butyou will have to pay back $112 in a year, a negativecash flow at that time. Therefore, the calculator displaysFV as a negative number. The following time line of cashflows shows the reasoning employed. The final negativecash flow of $112 has the same present value as the$100 borrowed today.
PV = $100
Year: 0 1v
FV = $112
If, instead of borrowing, you were to invest $100today to reap a future benefit, you would enter PV as anegative number (first press 100, then press the +/– keyto make the value negative, and finally press PV to enterthe value into the PV register). In this case, FV wouldappear as a positive number, indicating that you willreap a cash inflow when your investment comes tofruition.
Present Values
Suppose your savings goal is to accumulate $10,000 bythe end of 30 years. If the interest rate is 8 percent, howmuch would you need to invest today to achieve yourgoal? Again, there is no recurring payment involved, soPMT is zero. We therefore enter the following: n = 30; i= 8; FV = 1,000; PMT = 0. Now compute PV, and you
should get an answer of –993.77. The answer is dis-played as a negative number because you need tomake a cash outflow (an investment) of $993.77 now inorder to enjoy a cash inflow of $10,000 in 30 years.
Finding the Interest Rate
The 25-year Coca-Cola Enterprises IOU in Example 3.3sold at $129 and promised a final payment of $1,000.We may obtain the market interest rate by entering n =25, FV = 1,000, PV = –129, and PMT = 0. Compute i andyou will find that the interest rate is 8.53 percent. This isthe value we computed directly (but with more work) inthe example.
How Long an Investment?
In Example 3.5, we consider how long it would take foran investment to double in value. This sort of problemis easily solved using a calculator. If the investment is todouble, we enter FV = 2 and PV = –1. If the interest rateis 9 percent, enter i = 9 and PMT = 0. Compute n andyou will find that n = 8.04 years. If the interest rate is9.05 percent, the doubling period falls to 8 years, as wefound in the example.
1 The BAII Plus requires a little extra work to initialize the calculator.When you buy the calculator, it is set to automatically interpret eachperiod as a year but to assume that interest compounds monthly. Inour experience, it is best to change the compounding frequency toonce per period. To do so, press {P/Y} 1 , then press 1 , and finally press {QUIT} to return to standard calcu-lator mode. You should need to do this only once, even if the calcula-tor is shut off.
2ndENTER
↓ENTER2nd
v
SEE BOX
46 SECTION ONE
� EXAMPLE 5 Double Your Money
How many times have you heard of an investment adviser who promises to double yourmoney? Is this really an amazing feat? That depends on how long it will take for yourmoney to double. With enough patience, your funds eventually will double even if theyearn only a very modest interest rate. Suppose your investment adviser promises to dou-ble your money in 8 years. What interest rate is implicitly being promised?
The adviser is promising a future value of $2 for every $1 invested today. Therefore,we find the interest rate by solving for r as follows:
Future value = PV × (1 + r)t
$2 = $1 × (1 + r)8
1 + r = 21/8 = 1.0905
r = .0905, or 9.05%
By the way, there is a convenient rule of thumb that one can use to approximate the an-swer to this problem. The Rule of 72 states that the time it will take for an investmentto double in value equals approximately 72/r, where r is expressed as a percentage.Therefore, if the doubling period is 8 years, the Rule of 72 implies an (approximate) in-terest rate of 9 percent (since 72/9 = 8 years). This is quite close to the exact solutionof 9.05 percent.
The nearby box discusses the Rule of 72 as well as other issues of compound inter-est. By now you easily should be able to explain why, as the box suggests, “10 + 10 =21.” In addition, the box considers the impact of inflation on the purchasing power ofyour investments.
� Self-Test 4 The Rule of 72 works best with relatively low interest rates. Suppose the time it willtake for an investment to double in value is 12 years. Find the interest rate. What is theapproximate rate implied by the Rule of 72? Now suppose that the doubling period isonly 2 years. Is the approximation better or worse in this case?
Multiple Cash FlowsSo far, we have considered problems involving only a single cash flow. This is obviouslylimiting. Most real-world investments, after all, will involve many cash flows over time.When there are many payments, you’ll hear businesspeople refer to a stream of cashflows.
FUTURE VALUE OF MULTIPLE CASH FLOWS
Recall the computer you hope to purchase in 2 years (see Example 2). Now suppose thatinstead of putting aside one sum in the bank to finance the purchase, you plan to savesome amount of money each year. You might be able to put $1,200 in the bank now, and
SEE BOX
FINANCE IN ACTION
another $1,400 in 1 year. If you earn an 8 percent rate of interest, how much will yoube able to spend on a computer in 2 years?
The time line in Figure 1.7 shows how your savings grow. There are two cash inflowsinto the savings plan. The first cash flow will have 2 years to earn interest and thereforewill grow to $1,200 × (1.08)2 = $1,399.68 while the second deposit, which comes a yearlater, will be invested for only 1 year and will grow to $1,400 × (1.08) = $1,512. After2 years, then, your total savings will be the sum of these two amounts, or $2,911.68.
� EXAMPLE 6 Even More Savings
Suppose that the computer purchase can be put off for an additional year and that youcan make a third deposit of $1,000 at the end of the second year. How much will beavailable to spend 3 years from now?
47
Confused by Investing? Maybe It’s the New Math
If there’s something about your investment portfoliothat doesn’t seem to add up, maybe you should checkyour math.
Lots of folks are perplexed by the mathematics of in-vesting, so I thought a refresher course might help.Here’s a look at some key concepts:
10 Plus 10 Is 21
Imagine you invest $100, which earns 10% this yearand 10% next. How much have you made? If you an-swered 21%, go to the head of the class.
Here’s how the math works. This year’s 10% gainturns your $100 into $110. Next year, you also earn10%, but you start the year with $110. Result? You earn$11, boosting your wealth to $121.
Thus, your portfolio has earned a cumulative 21%return over two years, but the annualized return is just10%. The fact that 21% is more than double 10% canbe attributed to the effect of investment compounding,the way that you earn money each year not only on youroriginal investment, but also on earnings from prioryears that you’ve reinvested.
The Rule of 72
To get a feel for compounding, try the rule of 72. What’sthat? If you divide a particular annual return into 72,you’ll find out how many years it will take to double yourmoney. Thus, at 10% a year, an investment will doublein value in a tad over seven years.
What Goes Down Comes Back Slowly
In the investment world, winning is nice, but losses canreally sting. Let’s say you invest $100, which loses 10%in the first year, but bounces back 10% the next. Backto even? Not at all. In fact, you’re down to $99.
Here’s why. The initial 10% loss turns your $100 into$90. But the subsequent 10% gain earns you just $9,boosting your account’s value to $99. The bottom line:To recoup any percentage loss, you need an evengreater percentage gain. For instance, if you lose 25%,you need to make 33% to get back to even.
Not All Losses Are Equal
Which is less damaging, inflation of 50% or a 50% dropin your portfolio’s value? If you said inflation, join thatother bloke at the head of the class.
Confused? Consider the following example. If youhave $100 to spend on cappuccino and your favoritecappuccino costs $1, you can buy 100 cups. What ifyour $100 then drops in value to $50? You can only buy50 cups. And if the cappuccino’s price instead rises50% to $1.50? If you divide $100 by $1.50, you’ll findyou can still buy 66 cups, and even leave a tip.
Source: Republished with permission of Dow Jones, from “GettingConfused by Investing: Maybe It’s the New Math,” by JonathanClements, Wall Street Journal, February 20, 1996. Permission con-veyed through Copyright Clearance Center.
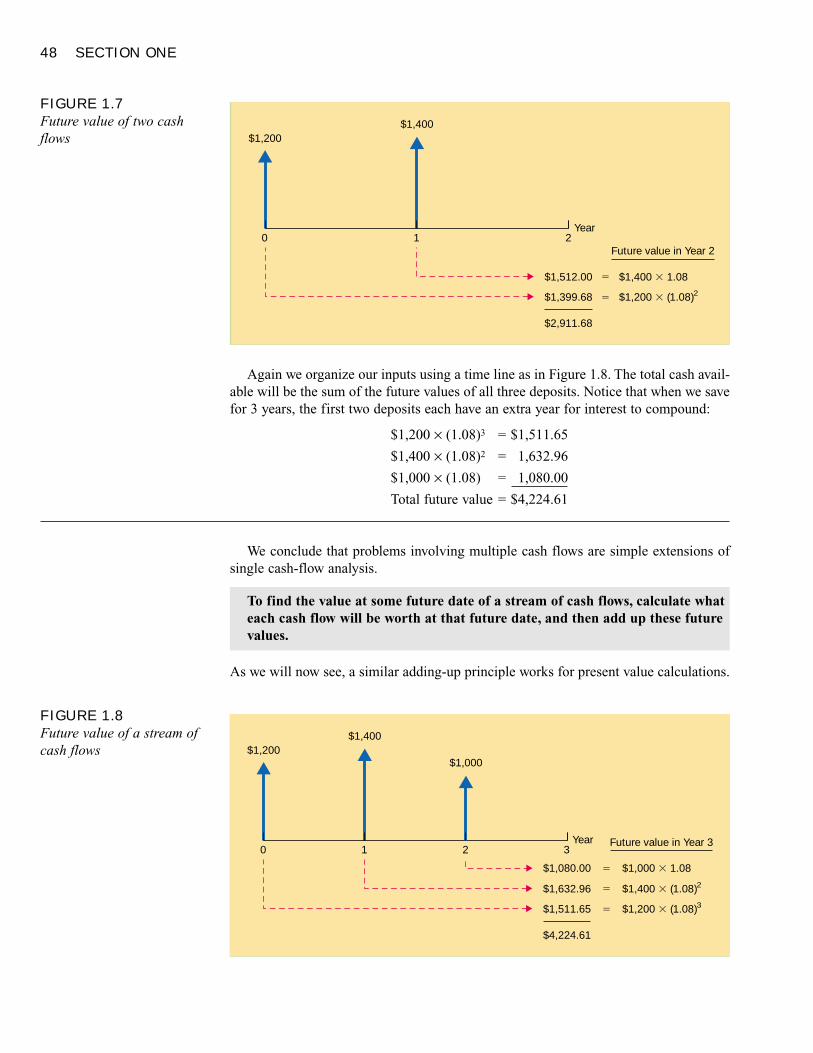
48 SECTION ONE
Again we organize our inputs using a time line as in Figure 1.8. The total cash avail-able will be the sum of the future values of all three deposits. Notice that when we savefor 3 years, the first two deposits each have an extra year for interest to compound:
$1,200 × (1.08)3 = $1,511.65
$1,400 × (1.08)2 = 1,632.96
$1,000 × (1.08) = 1,080.00
Total future value = $4,224.61
We conclude that problems involving multiple cash flows are simple extensions ofsingle cash-flow analysis.
As we will now see, a similar adding-up principle works for present value calculations.
To find the value at some future date of a stream of cash flows, calculate whateach cash flow will be worth at that future date, and then add up these futurevalues.
0 1 2
$1,400
$1,399.68
$2,911.68
$1,512.00
$1,200 � (1.08)2$1,400 � 1.08
Year
Future value in Year 2
$1,200
�
�
FIGURE 1.7Future value of two cashflows
0 1 3
$1,400
$1,511.65
$4,224.61
$1,632.96
$1,200 � (1.08)3$1,400 � (1.08)2
Year Future value in Year 32
$1,200$1,000
�
$1,080.00 $1,000 � 1.08�
�
FIGURE 1.8Future value of a stream ofcash flows
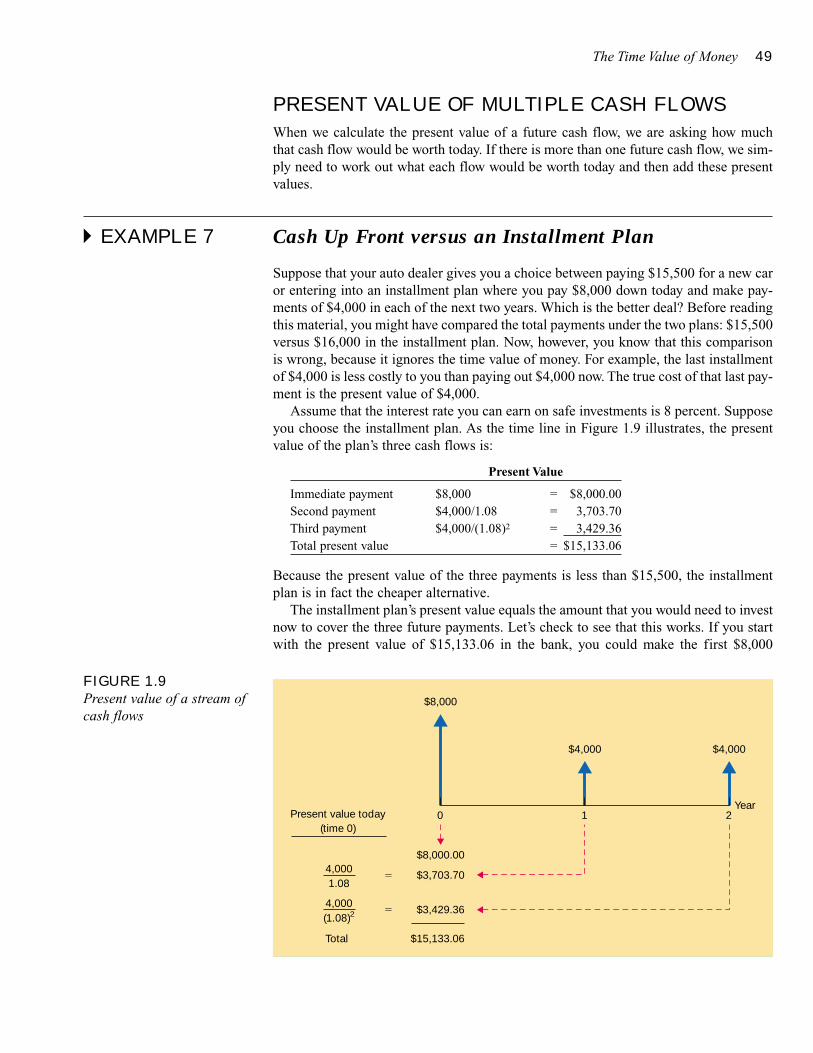
The Time Value of Money 49
PRESENT VALUE OF MULTIPLE CASH FLOWS
When we calculate the present value of a future cash flow, we are asking how much that cash flow would be worth today. If there is more than one future cash flow, we sim-ply need to work out what each flow would be worth today and then add these presentvalues.
� EXAMPLE 7 Cash Up Front versus an Installment Plan
Suppose that your auto dealer gives you a choice between paying $15,500 for a new caror entering into an installment plan where you pay $8,000 down today and make pay-ments of $4,000 in each of the next two years. Which is the better deal? Before readingthis material, you might have compared the total payments under the two plans: $15,500versus $16,000 in the installment plan. Now, however, you know that this comparisonis wrong, because it ignores the time value of money. For example, the last installmentof $4,000 is less costly to you than paying out $4,000 now. The true cost of that last pay-ment is the present value of $4,000.
Assume that the interest rate you can earn on safe investments is 8 percent. Supposeyou choose the installment plan. As the time line in Figure 1.9 illustrates, the presentvalue of the plan’s three cash flows is:
Present Value
Immediate payment $8,000 = $8,000.00Second payment $4,000/1.08 = 3,703.70Third payment $4,000/(1.08)2 = 3,429.36Total present value = $15,133.06
Because the present value of the three payments is less than $15,500, the installmentplan is in fact the cheaper alternative.
The installment plan’s present value equals the amount that you would need to investnow to cover the three future payments. Let’s check to see that this works. If you startwith the present value of $15,133.06 in the bank, you could make the first $8,000
0 1 2
$8,000
Present value today(time 0)
Year
1.084,000
$4,000$4,000
(1.08)24,000
$3,703.70
$15,133.06Total
$8,000.00
$3,429.36
�
�
FIGURE 1.9Present value of a stream ofcash flows
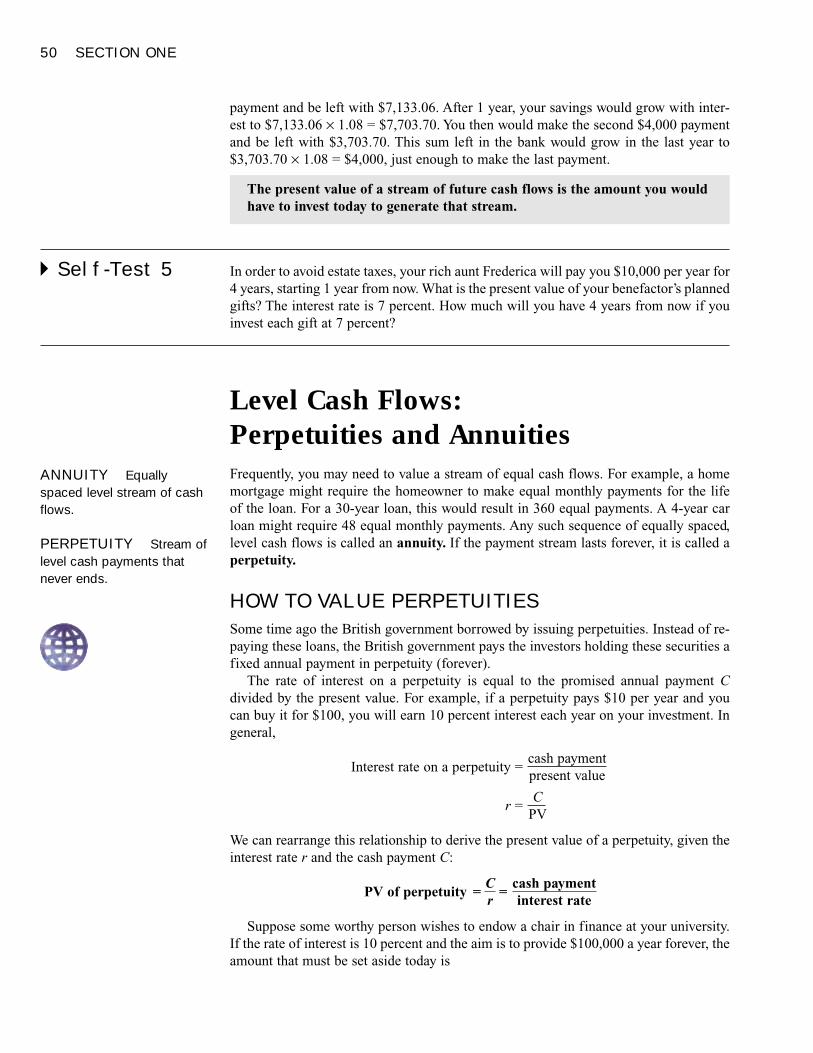
50 SECTION ONE
payment and be left with $7,133.06. After 1 year, your savings would grow with inter-est to $7,133.06 × 1.08 = $7,703.70. You then would make the second $4,000 paymentand be left with $3,703.70. This sum left in the bank would grow in the last year to$3,703.70 × 1.08 = $4,000, just enough to make the last payment.
� Self-Test 5 In order to avoid estate taxes, your rich aunt Frederica will pay you $10,000 per year for4 years, starting 1 year from now. What is the present value of your benefactor’s plannedgifts? The interest rate is 7 percent. How much will you have 4 years from now if youinvest each gift at 7 percent?
Level Cash Flows: Perpetuities and AnnuitiesFrequently, you may need to value a stream of equal cash flows. For example, a homemortgage might require the homeowner to make equal monthly payments for the life of the loan. For a 30-year loan, this would result in 360 equal payments. A 4-year carloan might require 48 equal monthly payments. Any such sequence of equally spaced,level cash flows is called an annuity. If the payment stream lasts forever, it is called aperpetuity.
HOW TO VALUE PERPETUITIES
Some time ago the British government borrowed by issuing perpetuities. Instead of re-paying these loans, the British government pays the investors holding these securities afixed annual payment in perpetuity (forever).
The rate of interest on a perpetuity is equal to the promised annual payment Cdivided by the present value. For example, if a perpetuity pays $10 per year and you can buy it for $100, you will earn 10 percent interest each year on your investment. Ingeneral,
Interest rate on a perpetuity =cash paymentpresent value
r =C
PV
We can rearrange this relationship to derive the present value of a perpetuity, given theinterest rate r and the cash payment C:
PV of perpetuity =C
=cash payment
r interest rate
Suppose some worthy person wishes to endow a chair in finance at your university.If the rate of interest is 10 percent and the aim is to provide $100,000 a year forever, theamount that must be set aside today is
The present value of a stream of future cash flows is the amount you wouldhave to invest today to generate that stream.
ANNUITY Equallyspaced level stream of cashflows.
PERPETUITY Stream oflevel cash payments thatnever ends.
The Time Value of Money 51
Present value of perpetuity =C
=$100,000
= $1,000,000r .10
Two warnings about the perpetuity formula. First, at a quick glance you can easilyconfuse the formula with the present value of a single cash payment. A payment of $1at the end of 1 year has a present value 1/(1 + r). The perpetuity has a value of 1/r. Theseare quite different.
Second, the perpetuity formula tells us the value of a regular stream of paymentsstarting one period from now. Thus our endowment of $1 million would provide the uni-versity with its first payment of $100,000 one year hence. If the worthy donor wants toprovide the university with an additional payment of $100,000 up front, he or she wouldneed to put aside $1,100,000.
Sometimes you may need to calculate the value of a perpetuity that does not start tomake payments for several years. For example, suppose that our philanthropist decidesto provide $100,000 a year with the first payment 4 years from now. We know that inYear 3, this endowment will be an ordinary perpetuity with payments starting at the endof 1 year. So our perpetuity formula tells us that in Year 3 the endowment will be worth$100,000/r. But it is not worth that much now. To find today’s value we need to multi-ply by the 3-year discount factor. Thus, the “delayed” perpetuity is worth
$100,000 × 1 × 1= $1,000,000 × 1
= $751,315r (1 + r)3 (1.10)3
� Self-Test 6 A British government perpetuity pays £4 a year forever and is selling for £48. What isthe interest rate?
HOW TO VALUE ANNUITIES
There are two ways to value an annuity, that is, a limited number of cash flows. Theslow way is to value each cash flow separately and add up the present values. The quickway is to take advantage of the following simplification. Figure 1.10 shows the cashpayments and values of three investments.
Row 1. The investment shown in the first row provides a perpetual stream of $1 pay-ments starting in Year 1. We have already seen that this perpetuity has a present valueof 1/r.
Row 2. Now look at the investment shown in the second row of Figure 1.10. It alsoprovides a perpetual stream of $1 payments, but these payments don’t start until Year 4.This stream of payments is identical to the delayed perpetuity that we just valued. InYear 3, the investment will be an ordinary perpetuity with payments starting in 1 yearand will therefore be worth 1/r in Year 3. To find the value today, we simply multiplythis figure by the 3-year discount factor. Thus
PV =1 × 1
=1
r (1 + r)3 r(1 + r)3
Row 3. Finally, look at the investment shown in the third row of Figure 1.10. This pro-vides a level payment of $1 a year for each of three years. In other words, it is a 3-yearannuity. You can also see that, taken together, the investments in rows 2 and 3 provide
52 SECTION ONE
exactly the same cash payments as the investment in row 1. Thus the value of our an-nuity (row 3) must be equal to the value of the row 1 perpetuity less the value of the de-layed row 2 perpetuity:
Present value of a 3-year $1 annuity =1
–1
r r(1 + r)3
The general formula for the value of an annuity that pays C dollars a year for eachof t years is
Present value of t-year annuity = C [ 1–
1 ]r r(1 + r)t
The expression in square brackets shows the present value of a t-year annuity of $1a year. It is generally known as the t-year annuity factor. Therefore, another way towrite the value of an annuity is
Present value of t-year annuity = payment � annuity factor
Remembering formulas is about as difficult as remembering other people’s birth-days. But as long as you bear in mind that an annuity is equivalent to the difference be-tween an immediate and a delayed perpetuity, you shouldn’t have any difficulty.
� EXAMPLE 8 Back to Kangaroo Autos
Let us return to Kangaroo Autos for (almost) the last time. Most installment plans callfor level streams of payments. So let us suppose that this time Kangaroo offers an “easypayment” scheme of $4,000 a year at the end of each of the next 3 years. First let’s dothe calculations the slow way, to show that if the interest rate is 10%, the present valueof the three payments is $9,947.41. The time line in Figure 1.11 shows these calcula-tions. The present value of each cash flow is calculated and then the three present val-ues are summed. The annuity formula, however, is much quicker:
Present value = $4,000 × [ 1–
1 ].10 .10(1.10)3
= $4,000 × 2.48685 = $9,947.41
You can use a calculator to work out annuity factors or you can use a set of annuitytables. Table 1.8 is an abridged annuity table (an extended version is shown in Table A.3at the end of the material). Check that you can find the 3-year annuity factor for an in-terest rate of 10 percent.
FIGURE 1.10Valuing an annuity Cash Flow
Year: 1 2 3 4 5 6 . . . Present Value
1. Perpetuity A $1 $1 $1 $1 $1 $1 . . .
2. Perpetuity B $1 $1 $1 . . .
3. Three-year annuity $1 $1 $1
1r
1r(1 + r)3
1–
1r r(1 + r)3
ANNUITY FACTORPresent value of a $1 annuity.
The Time Value of Money 53
� Self-Test 7 If the interest rate is 8 percent, what is the 4-year discount factor? What is the 4-yearannuity factor? What is the relationship between these two numbers? Explain.
� EXAMPLE 9 Winning Big at a Slot Machine
In May 1992, a 60-year-old nurse plunked down $12 in a Reno casino and walked awaywith the biggest jackpot to that date—$9.3 million. We suspect she received unsolicitedcongratulations, good wishes, and requests for money from dozens of more or less wor-thy charities, relatives, and newly devoted friends. In response she could fairly point outthat her prize wasn’t really worth $9.3 million. That sum was to be paid in 20 annual in-stallments of $465,000 each. What is the present value of the jackpot? The interest rateat the time was about 8 percent.
The present value of these payments is simply the sum of the present values of eachpayment. But rather than valuing each payment separately, it is much easier to treat thecash payments as a 20-year annuity. To value this annuity we simply multiply $465,000by the 20-year annuity factor:
$3,305.79
$9,947.41
$3,636.36
$3,005.26
Total
(1.10)24,000
1.104,000
(1.10)34,000
0 21 3Present value
Year
$4,000$4,000 $4,000
�
�
�
FIGURE 1.11Time line for Kangaroo Autos
TABLE 1.8Annuity table: present valueof $1 a year for each of tyears
Interest Rate per YearNumberof Years 5% 6% 7% 8% 9% 10%
1 .952 .943 .935 .926 .917 .9092 1.859 1.833 1.808 1.783 1.759 1.7363 2.723 2.673 2.624 2.577 2.531 2.4874 3.546 3.465 3.387 3.312 3.240 3.1705 4.329 4.212 4.100 3.993 3.890 3.79110 7.722 7.360 7.024 6.710 6.418 6.14520 12.462 11.470 10.594 9.818 9.129 8.51430 15.372 13.765 12.409 11.258 10.274 9.427
54 SECTION ONE
PV = $465,000 × 20-year annuity factor
= $465,000 × [ 1–
1 ]r r(1 + r)20
At an interest rate of 8 percent, the annuity factor is
[ 1–
1 ] = 9.818.08 .08(1.08)20
(We also could look up the annuity factor in either Table 1.8 or Table A.3.) The presentvalue of the $465,000 annuity is $465,000 × 9.818 = $4,565,000. That “$9.3 millionprize” has a true value of about $4.6 million.
This present value is the price which investors would be prepared to offer for the se-ries of cash flows. For example, the gambling casino might arrange for an insurancecompany to actually make the payments to the lucky winner. In this case, the companywould charge a bit under $4.6 million to take over the obligation. With this amount inhand today, it could generate enough interest income to make the 20 payments beforerunning its “account” down to zero.
ANNUITIES DUE
The perpetuity and annuity formulas assume that the first payment occurs at the end ofthe period. They tell you the value of a stream of cash payments starting one periodhence.
However, streams of cash payments often start immediately. For example, KangarooAutos in Example 8 might have required three annual payments of $4,000 starting im-mediately. A level stream of payments starting immediately is known as an annuitydue.
If Kangaroo’s loan were paid as an annuity due, you could think of the three pay-ments as equivalent to an immediate payment of $4,000 plus an ordinary annuity of$4,000 for the remaining 2 years. This is made clear in Figure 1.12, which compares thecash-flow stream of the Kangaroo Autos loan treating the three payments as an annuity(panel a) and as an annuity due (panel b).
In general, the present value of an annuity due of t payments of $1 a year is the sameas $1 plus the present value of an ordinary annuity providing the remaining t – 1 pay-ments. The present value of an annuity due of $1 for t years is therefore
PV annuity due = 1 + PV ordinary annuity of t – 1 payments
= 1 + [ 1–
1 ]r r (1 + r)t–1
By comparing the two panels of Figure 1.12, you can see that each of the three cashflows in the annuity due comes one period earlier than the corresponding cash flow ofthe ordinary annuity. Therefore, the present value of an annuity due is (1 + r) times thepresent value of an annuity.2 Figure 1.12 shows that the effect of bringing the Kangarooloan payments forward by 1 year was to increase their value from $9,947.41 (as an an-nuity) to $10,942.15 (as an annuity due). Notice that $10,942.15 = $9,947.41 × 1.10.
ANNUITY DUE Levelstream of cash flows startingimmediately.
2 Your financial calculator is equipped to handle annuities due. You simply need to put the calculator in“begin” mode, and the stream of cash flows will be interpreted as starting immediately. The begin key is la-beled BGN or BEG/END. Each time you press the key, the calculator will toggle between ordinary annuityversus annuity due mode.
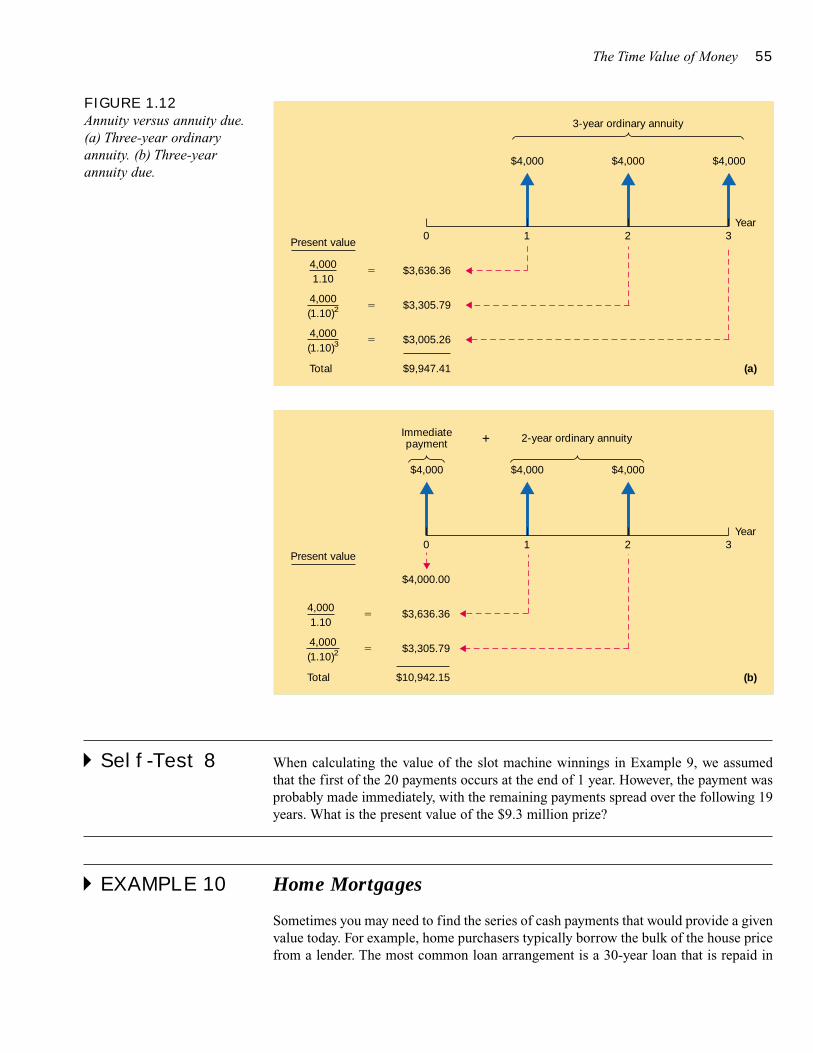
The Time Value of Money 55
� Self-Test 8 When calculating the value of the slot machine winnings in Example 9, we assumedthat the first of the 20 payments occurs at the end of 1 year. However, the payment wasprobably made immediately, with the remaining payments spread over the following 19years. What is the present value of the $9.3 million prize?
� EXAMPLE 10 Home Mortgages
Sometimes you may need to find the series of cash payments that would provide a givenvalue today. For example, home purchasers typically borrow the bulk of the house pricefrom a lender. The most common loan arrangement is a 30-year loan that is repaid in
3-year ordinary annuity
(a)
$3,305.79
$9,947.41
$3,636.36
$3,005.26
Total
(1.10)24,000
1.104,000
(1.10)34,000
0 21 3Present value
Year
$4,000$4,000 $4,000
�
�
�
(b)
0 21 3
2-year ordinary annuity�Immediatepayment
$3,636.36
Present value
$10,942.15
Year
Total
1.104,000
$4,000.00
$4,000 $4,000 $4,000
$3,305.79(1.10)24,000
�
�
FIGURE 1.12Annuity versus annuity due.(a) Three-year ordinaryannuity. (b) Three-yearannuity due.
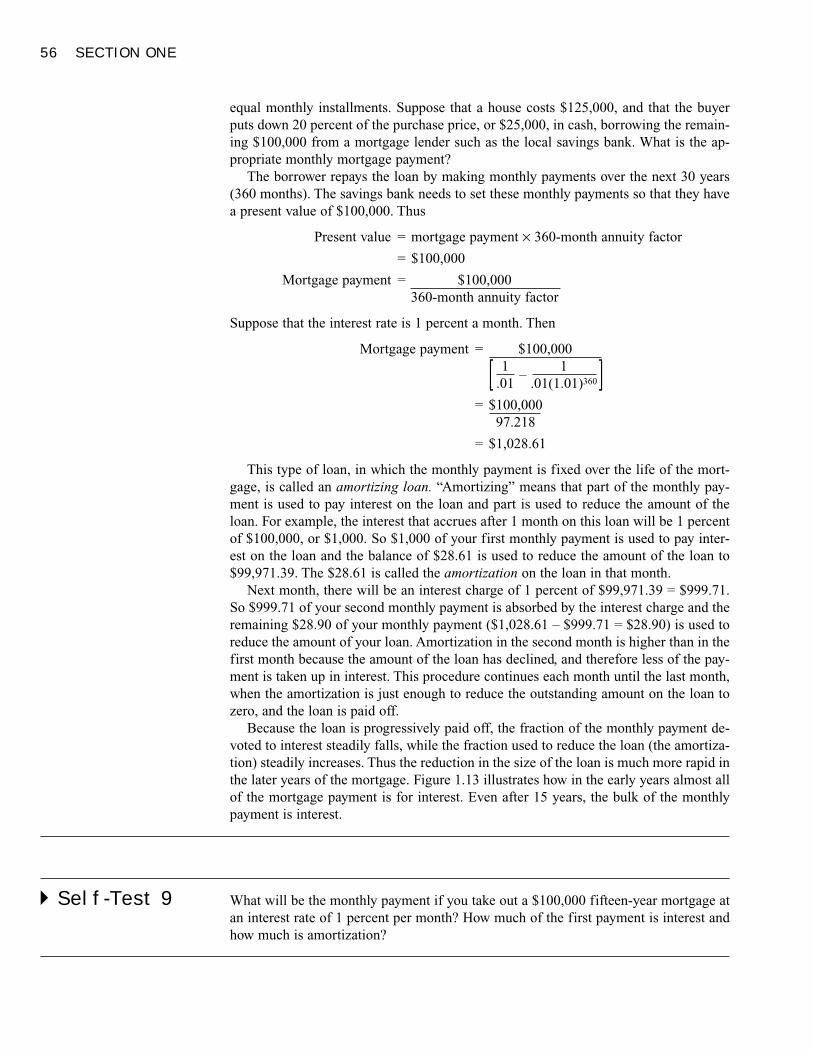
56 SECTION ONE
equal monthly installments. Suppose that a house costs $125,000, and that the buyerputs down 20 percent of the purchase price, or $25,000, in cash, borrowing the remain-ing $100,000 from a mortgage lender such as the local savings bank. What is the ap-propriate monthly mortgage payment?
The borrower repays the loan by making monthly payments over the next 30 years(360 months). The savings bank needs to set these monthly payments so that they havea present value of $100,000. Thus
Present value = mortgage payment × 360-month annuity factor
= $100,000
Mortgage payment = $100,000360-month annuity factor
Suppose that the interest rate is 1 percent a month. Then
Mortgage payment = $100,000
[ 1–
1 ]. .01 .01(1.01)360
= $100,00097.218
= $1,028.61
This type of loan, in which the monthly payment is fixed over the life of the mort-gage, is called an amortizing loan. “Amortizing” means that part of the monthly pay-ment is used to pay interest on the loan and part is used to reduce the amount of theloan. For example, the interest that accrues after 1 month on this loan will be 1 percentof $100,000, or $1,000. So $1,000 of your first monthly payment is used to pay inter-est on the loan and the balance of $28.61 is used to reduce the amount of the loan to$99,971.39. The $28.61 is called the amortization on the loan in that month.
Next month, there will be an interest charge of 1 percent of $99,971.39 = $999.71.So $999.71 of your second monthly payment is absorbed by the interest charge and theremaining $28.90 of your monthly payment ($1,028.61 – $999.71 = $28.90) is used toreduce the amount of your loan. Amortization in the second month is higher than in thefirst month because the amount of the loan has declined, and therefore less of the pay-ment is taken up in interest. This procedure continues each month until the last month,when the amortization is just enough to reduce the outstanding amount on the loan tozero, and the loan is paid off.
Because the loan is progressively paid off, the fraction of the monthly payment de-voted to interest steadily falls, while the fraction used to reduce the loan (the amortiza-tion) steadily increases. Thus the reduction in the size of the loan is much more rapid inthe later years of the mortgage. Figure 1.13 illustrates how in the early years almost allof the mortgage payment is for interest. Even after 15 years, the bulk of the monthlypayment is interest.
� Self-Test 9 What will be the monthly payment if you take out a $100,000 fifteen-year mortgage atan interest rate of 1 percent per month? How much of the first payment is interest andhow much is amortization?
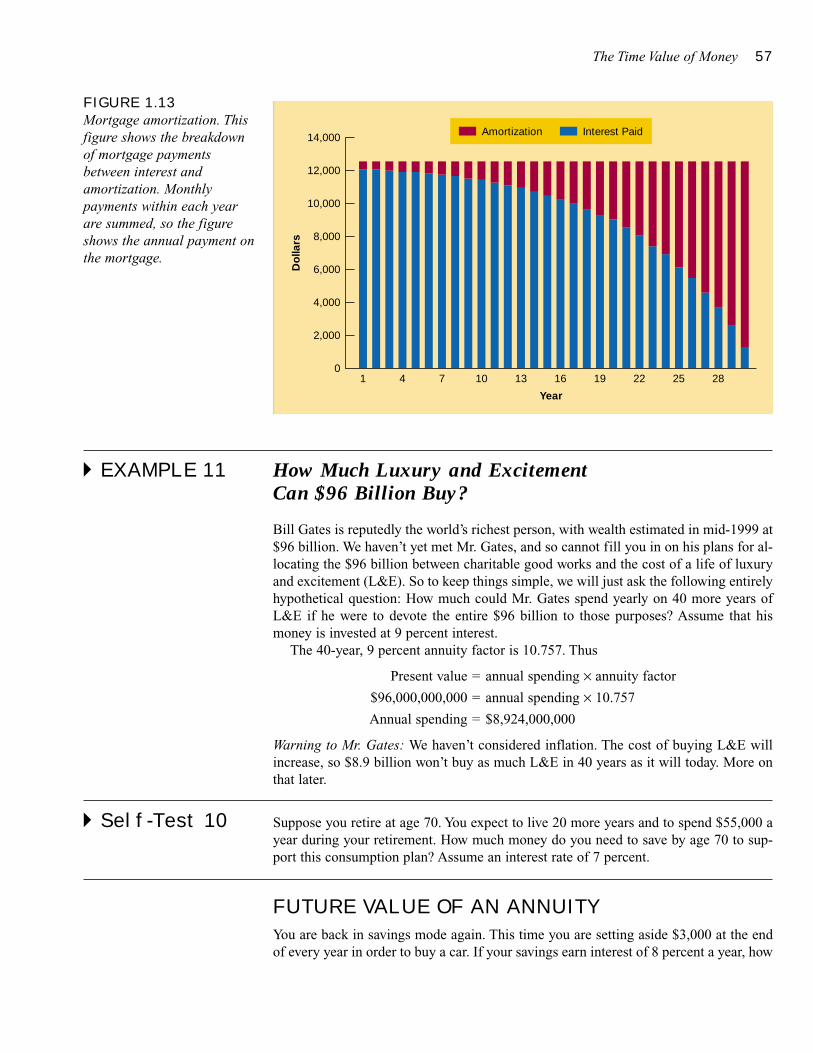
The Time Value of Money 57
� EXAMPLE 11 How Much Luxury and Excitement Can $96 Billion Buy?
Bill Gates is reputedly the world’s richest person, with wealth estimated in mid-1999 at$96 billion. We haven’t yet met Mr. Gates, and so cannot fill you in on his plans for al-locating the $96 billion between charitable good works and the cost of a life of luxuryand excitement (L&E). So to keep things simple, we will just ask the following entirelyhypothetical question: How much could Mr. Gates spend yearly on 40 more years ofL&E if he were to devote the entire $96 billion to those purposes? Assume that hismoney is invested at 9 percent interest.
The 40-year, 9 percent annuity factor is 10.757. Thus
Present value = annual spending × annuity factor
$96,000,000,000 = annual spending × 10.757
Annual spending = $8,924,000,000
Warning to Mr. Gates: We haven’t considered inflation. The cost of buying L&E willincrease, so $8.9 billion won’t buy as much L&E in 40 years as it will today. More onthat later.
� Self-Test 10 Suppose you retire at age 70. You expect to live 20 more years and to spend $55,000 ayear during your retirement. How much money do you need to save by age 70 to sup-port this consumption plan? Assume an interest rate of 7 percent.
FUTURE VALUE OF AN ANNUITY
You are back in savings mode again. This time you are setting aside $3,000 at the endof every year in order to buy a car. If your savings earn interest of 8 percent a year, how
1 4 7 10 13 16 19 22 25 28
Year
Do
llars
14,000
10,000
12,000
8,000
6,000
4,000
2,000
0
Amortization Interest Paid
FIGURE 1.13Mortgage amortization. Thisfigure shows the breakdownof mortgage paymentsbetween interest andamortization. Monthlypayments within each yearare summed, so the figureshows the annual payment onthe mortgage.
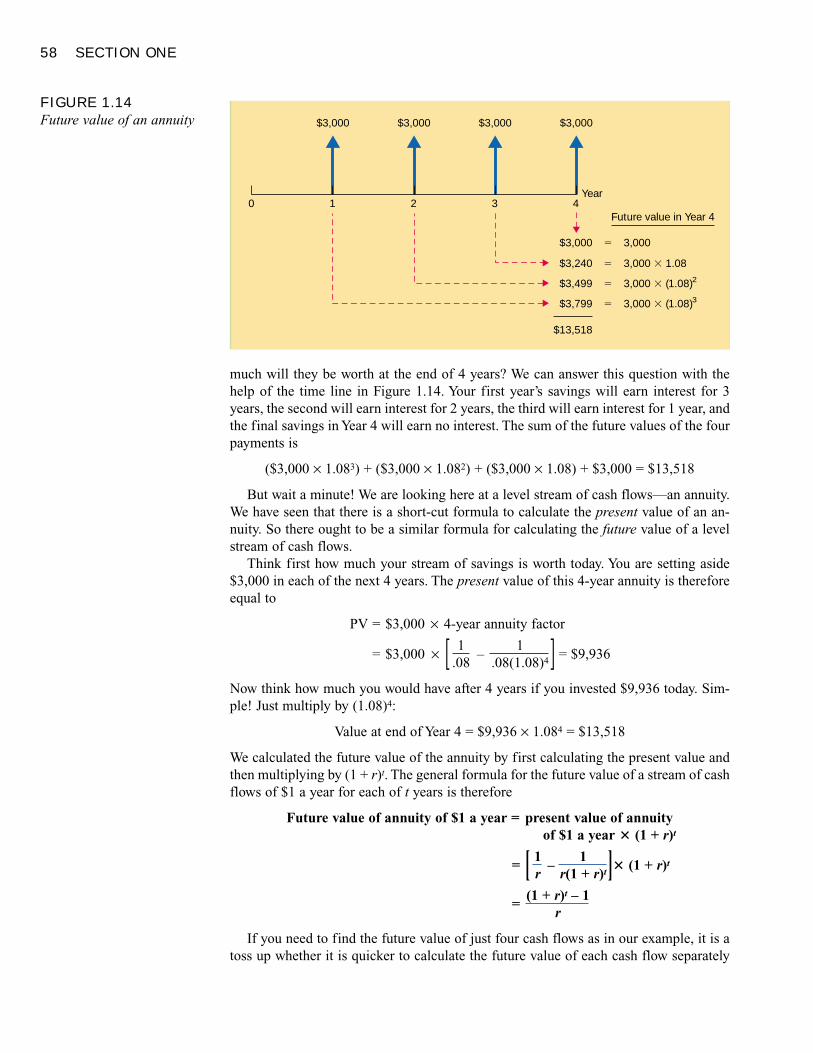
58 SECTION ONE
much will they be worth at the end of 4 years? We can answer this question with thehelp of the time line in Figure 1.14. Your first year’s savings will earn interest for 3years, the second will earn interest for 2 years, the third will earn interest for 1 year, andthe final savings in Year 4 will earn no interest. The sum of the future values of the fourpayments is
($3,000 × 1.083) + ($3,000 × 1.082) + ($3,000 × 1.08) + $3,000 = $13,518
But wait a minute! We are looking here at a level stream of cash flows—an annuity.We have seen that there is a short-cut formula to calculate the present value of an an-nuity. So there ought to be a similar formula for calculating the future value of a levelstream of cash flows.
Think first how much your stream of savings is worth today. You are setting aside$3,000 in each of the next 4 years. The present value of this 4-year annuity is thereforeequal to
PV = $3,000 × 4-year annuity factor
= $3,000 × [ 1–
1 ] = $9,936.08 .08(1.08)4
Now think how much you would have after 4 years if you invested $9,936 today. Sim-ple! Just multiply by (1.08)4:
Value at end of Year 4 = $9,936 × 1.084 = $13,518
We calculated the future value of the annuity by first calculating the present value andthen multiplying by (1 + r)t. The general formula for the future value of a stream of cashflows of $1 a year for each of t years is therefore
Future value of annuity of $1 a year = present value of annuityof $1 a year � (1 + r)t
= [ 1–
1 ]� (1 + r)tr r(1 + r)t
=(1 + r)t – 1
r
If you need to find the future value of just four cash flows as in our example, it is atoss up whether it is quicker to calculate the future value of each cash flow separately
$3,000
$3,499
$13,518
$3,240
3,000 � (1.08)23,000 � 1.08
Year
Future value in Year 4
$3,000 $3,000$3,000
�
$3,799 3,000 � (1.08)3�
$3,000 3,000�
�
0 1 432
FIGURE 1.14Future value of an annuity
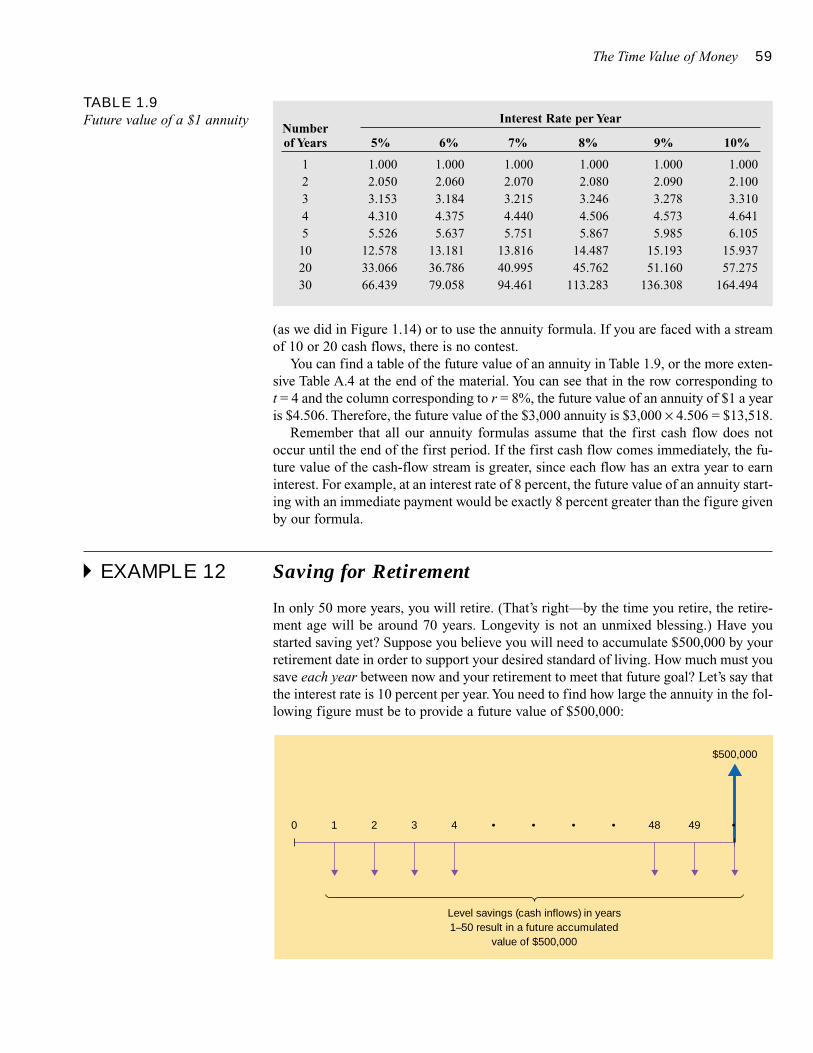
The Time Value of Money 59
(as we did in Figure 1.14) or to use the annuity formula. If you are faced with a streamof 10 or 20 cash flows, there is no contest.
You can find a table of the future value of an annuity in Table 1.9, or the more exten-sive Table A.4 at the end of the material. You can see that in the row corresponding to t = 4 and the column corresponding to r = 8%, the future value of an annuity of $1 a yearis $4.506. Therefore, the future value of the $3,000 annuity is $3,000 × 4.506 = $13,518.
Remember that all our annuity formulas assume that the first cash flow does notoccur until the end of the first period. If the first cash flow comes immediately, the fu-ture value of the cash-flow stream is greater, since each flow has an extra year to earninterest. For example, at an interest rate of 8 percent, the future value of an annuity start-ing with an immediate payment would be exactly 8 percent greater than the figure givenby our formula.
� EXAMPLE 12 Saving for Retirement
In only 50 more years, you will retire. (That’s right—by the time you retire, the retire-ment age will be around 70 years. Longevity is not an unmixed blessing.) Have youstarted saving yet? Suppose you believe you will need to accumulate $500,000 by yourretirement date in order to support your desired standard of living. How much must yousave each year between now and your retirement to meet that future goal? Let’s say thatthe interest rate is 10 percent per year. You need to find how large the annuity in the fol-lowing figure must be to provide a future value of $500,000:
TABLE 1.9Future value of a $1 annuity Interest Rate per Year
Numberof Years 5% 6% 7% 8% 9% 10%
1 1.000 1.000 1.000 1.000 1.000 1.0002 2.050 2.060 2.070 2.080 2.090 2.1003 3.153 3.184 3.215 3.246 3.278 3.3104 4.310 4.375 4.440 4.506 4.573 4.6415 5.526 5.637 5.751 5.867 5.985 6.10510 12.578 13.181 13.816 14.487 15.193 15.93720 33.066 36.786 40.995 45.762 51.160 57.27530 66.439 79.058 94.461 113.283 136.308 164.494
0 4948••••4321 •
$500,000
Level savings (cash inflows) in years1–50 result in a future accumulated
value of $500,000
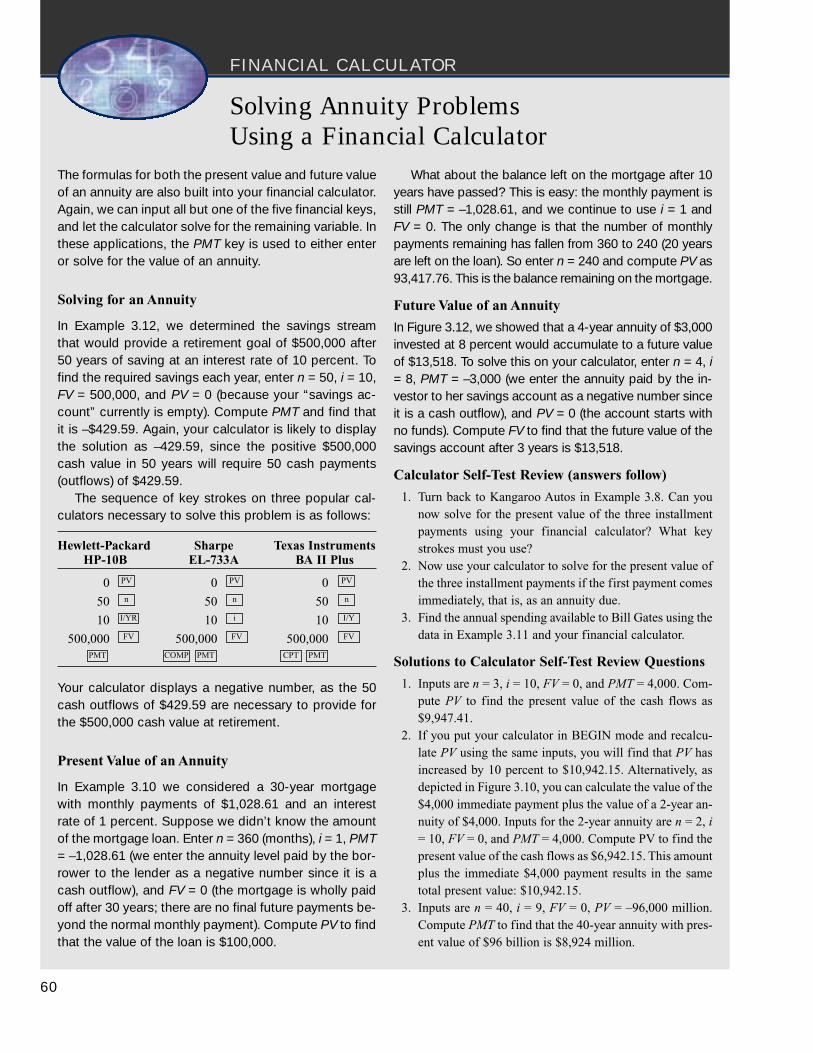
FINANCIAL CALCULATOR
60
Solving Annuity Problems Using a Financial Calculator
The formulas for both the present value and future valueof an annuity are also built into your financial calculator.Again, we can input all but one of the five financial keys,and let the calculator solve for the remaining variable. Inthese applications, the PMT key is used to either enteror solve for the value of an annuity.
Solving for an Annuity
In Example 3.12, we determined the savings streamthat would provide a retirement goal of $500,000 after50 years of saving at an interest rate of 10 percent. Tofind the required savings each year, enter n = 50, i = 10,FV = 500,000, and PV = 0 (because your “savings ac-count” currently is empty). Compute PMT and find thatit is –$429.59. Again, your calculator is likely to displaythe solution as –429.59, since the positive $500,000cash value in 50 years will require 50 cash payments(outflows) of $429.59.
The sequence of key strokes on three popular cal-culators necessary to solve this problem is as follows:
What about the balance left on the mortgage after 10years have passed? This is easy: the monthly payment isstill PMT = –1,028.61, and we continue to use i = 1 andFV = 0. The only change is that the number of monthlypayments remaining has fallen from 360 to 240 (20 yearsare left on the loan). So enter n = 240 and compute PV as93,417.76. This is the balance remaining on the mortgage.
Future Value of an Annuity
In Figure 3.12, we showed that a 4-year annuity of $3,000invested at 8 percent would accumulate to a future valueof $13,518. To solve this on your calculator, enter n = 4, i= 8, PMT = –3,000 (we enter the annuity paid by the in-vestor to her savings account as a negative number sinceit is a cash outflow), and PV = 0 (the account starts withno funds). Compute FV to find that the future value of thesavings account after 3 years is $13,518.
Calculator Self-Test Review (answers follow)
1. Turn back to Kangaroo Autos in Example 3.8. Can younow solve for the present value of the three installmentpayments using your financial calculator? What keystrokes must you use?
2. Now use your calculator to solve for the present value ofthe three installment payments if the first payment comesimmediately, that is, as an annuity due.
3. Find the annual spending available to Bill Gates using thedata in Example 3.11 and your financial calculator.
Solutions to Calculator Self-Test Review Questions
1. Inputs are n = 3, i = 10, FV = 0, and PMT = 4,000. Com-pute PV to find the present value of the cash flows as$9,947.41.
2. If you put your calculator in BEGIN mode and recalcu-late PV using the same inputs, you will find that PV hasincreased by 10 percent to $10,942.15. Alternatively, asdepicted in Figure 3.10, you can calculate the value of the$4,000 immediate payment plus the value of a 2-year an-nuity of $4,000. Inputs for the 2-year annuity are n = 2, i= 10, FV = 0, and PMT = 4,000. Compute PV to find thepresent value of the cash flows as $6,942.15. This amountplus the immediate $4,000 payment results in the sametotal present value: $10,942.15.
3. Inputs are n = 40, i = 9, FV = 0, PV = –96,000 million.Compute PMT to find that the 40-year annuity with pres-ent value of $96 billion is $8,924 million.
Hewlett-Packard Sharpe Texas InstrumentsHP-10B EL-733A BA II Plus
0 0 0
50 50 50
10 10 10
500,000 500,000 500,000PMTCPTPMTCOMPPMT
FVFVFV
I/YiI/YR
nnn
PVPVPV
Your calculator displays a negative number, as the 50cash outflows of $429.59 are necessary to provide forthe $500,000 cash value at retirement.
Present Value of an Annuity
In Example 3.10 we considered a 30-year mortgagewith monthly payments of $1,028.61 and an interestrate of 1 percent. Suppose we didn’t know the amountof the mortgage loan. Enter n = 360 (months), i = 1, PMT= –1,028.61 (we enter the annuity level paid by the bor-rower to the lender as a negative number since it is acash outflow), and FV = 0 (the mortgage is wholly paidoff after 30 years; there are no final future payments be-yond the normal monthly payment). Compute PV to findthat the value of the loan is $100,000.
The Time Value of Money 61
We know that if you were to save $1 each year your funds would accumulate to
Future value of annuity of $1 a year =(1 + r)t – 1
=(1.10)50 – 1
r .10
= $1,163.91
(Rather than compute the future value formula directly, you could look up the futurevalue annuity factor in Table 1.9 or Table A.4. Alternatively, you can use a financialcalculator as we describe in the nearby box.) Therefore, if we save an amount of $C eachyear, we will accumulate $C × 1,163.91.
We need to choose C to ensure that $C × 1,163.91 = $500,000. Thus C =$500,000/1,163.91 = $429.59. This appears to be surprisingly good news. Saving$429.59 a year does not seem to be an extremely demanding savings program. Don’tcelebrate yet, however. The news will get worse when we consider the impact of inflation.
� Self-Test 11 What is the required savings level if the interest rate is only 5 percent? Why has theamount increased?
Inflation and the Time Value of MoneyWhen a bank offers to pay 6 percent on a savings account, it promises to pay interest of$60 for every $1,000 you deposit. The bank fixes the number of dollars that it pays, butit doesn’t provide any assurance of how much those dollars will buy. If the value of yourinvestment increases by 6 percent, while the prices of goods and services increase by10 percent, you actually lose ground in terms of the goods you can buy.
REAL VERSUS NOMINAL CASH FLOWS
Prices of goods and services continually change. Textbooks may become more expen-sive (sorry) while computers become cheaper. An overall general rise in prices is knownas inflation. If the inflation rate is 5 percent per year, then goods that cost $1.00 a yearago typically cost $1.05 this year. The increase in the general level of prices means thatthe purchasing power of money has eroded. If a dollar bill bought one loaf of bread lastyear, the same dollar this year buys only part of a loaf.
Economists track the general level of prices using several different price indexes.The best known of these is the consumer price index, or CPI. This measures the num-ber of dollars that it takes to buy a specified basket of goods and services that is sup-posed to represent the typical family’s purchases.3 Thus the percentage increase in theCPI from one year to the next measures the rate of inflation.
Figure 1.15 graphs the CPI since 1947. We have set the index for the end of 1947 to100, so the graph shows the price level in each year as a percentage of 1947 prices. Forexample, the index in 1948 was 103. This means that on average $103 in 1948 would
SEE BOX
INFLATION Rate atwhich prices as a whole areincreasing.
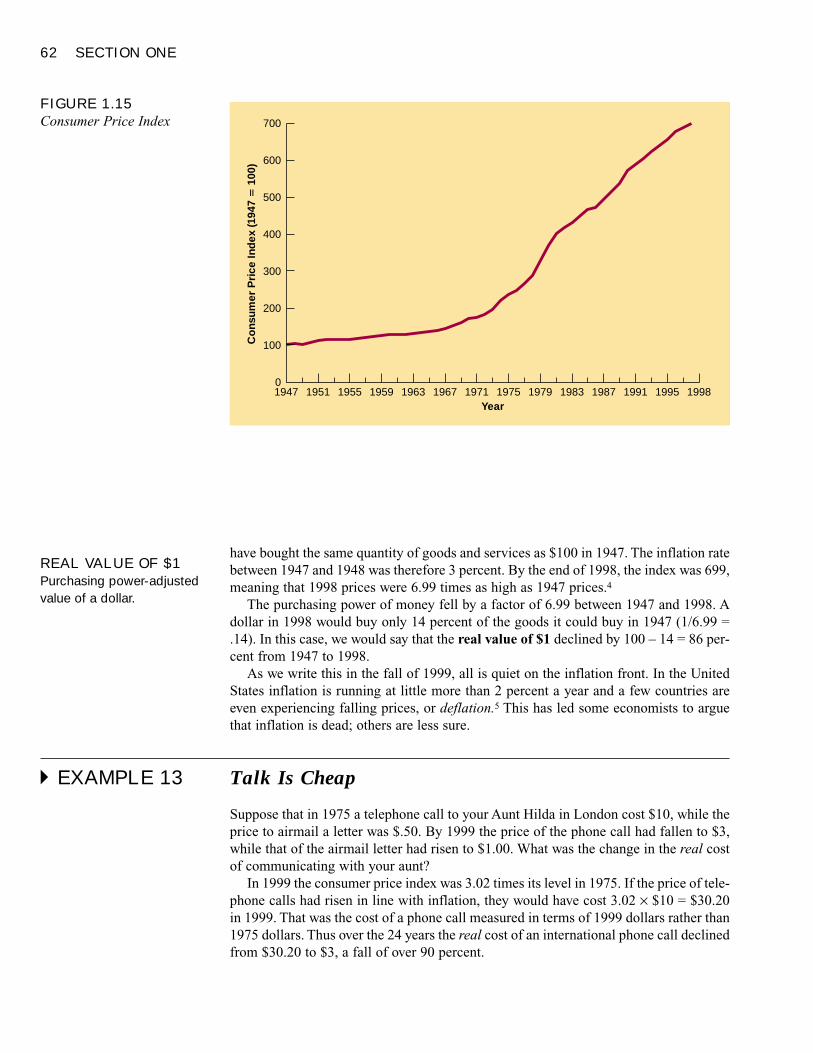
62 SECTION ONE
have bought the same quantity of goods and services as $100 in 1947. The inflation ratebetween 1947 and 1948 was therefore 3 percent. By the end of 1998, the index was 699,meaning that 1998 prices were 6.99 times as high as 1947 prices.4
The purchasing power of money fell by a factor of 6.99 between 1947 and 1998. Adollar in 1998 would buy only 14 percent of the goods it could buy in 1947 (1/6.99 =.14). In this case, we would say that the real value of $1 declined by 100 – 14 = 86 per-cent from 1947 to 1998.
As we write this in the fall of 1999, all is quiet on the inflation front. In the UnitedStates inflation is running at little more than 2 percent a year and a few countries areeven experiencing falling prices, or deflation.5 This has led some economists to arguethat inflation is dead; others are less sure.
� EXAMPLE 13 Talk Is Cheap
Suppose that in 1975 a telephone call to your Aunt Hilda in London cost $10, while theprice to airmail a letter was $.50. By 1999 the price of the phone call had fallen to $3,while that of the airmail letter had risen to $1.00. What was the change in the real costof communicating with your aunt?
In 1999 the consumer price index was 3.02 times its level in 1975. If the price of tele-phone calls had risen in line with inflation, they would have cost 3.02 × $10 = $30.20in 1999. That was the cost of a phone call measured in terms of 1999 dollars rather than1975 dollars. Thus over the 24 years the real cost of an international phone call declinedfrom $30.20 to $3, a fall of over 90 percent.
Year
Co
nsum
er P
rice
Ind
ex (1
947
�10
0)
1947 1951 1955 1959 1963 1967 1971 1975 1979 1983 1987 1991 19981995
700
600
500
400
300
200
100
0
FIGURE 1.15Consumer Price Index
REAL VALUE OF $1Purchasing power-adjustedvalue of a dollar.
The Time Value of Money 63
What about the cost of sending a letter? If the price of an airmail letter had kept pacewith inflation, it would have been 3.02 × $.50 = $1.51 in 1999. The actual price wasonly $1.00. So the real cost of letter writing also has declined.
� Self-Test 12 Consider a telephone call to London that currently would cost $5. If the real price oftelephone calls does not change in the future, how much will it cost you to make a callto London in 50 years if the inflation rate is 5 percent (roughly its average over the past25 years)? What if inflation is 10 percent?
Some expenditures are fixed in nominal terms, and therefore decline in real terms.Suppose you took out a 30-year house mortgage in 1988. The monthly payment was$800. It was still $800 in 1998, even though the CPI increased by a factor of 1.36 overthose years.
What’s the monthly payment for 1998 expressed in real 1988 dollars? The answer is$800/1.36, or $588.24 per month. The real burden of paying the mortgage was muchless in 1998 than in 1988.
� Self-Test 13 The price index in 1980 was 370. If a family spent $250 a week on their typical pur-chases in 1947, how much would those purchases have cost in 1980? If your salary in1980 was $30,000 a year, what would be the real value of that salary in terms of 1947dollars?
INFLATION AND INTEREST RATES
Whenever anyone quotes an interest rate, you can be fairly sure that it is a nominal, nota real rate. It sets the actual number of dollars you will be paid with no offset for futureinflation.
If you deposit $1,000 in the bank at a nominal interest rate of 6 percent, you willhave $1,060 at the end of the year. But this does not mean you are 6 percent better off.Suppose that the inflation rate during the year is also 6 percent. Then the goods that cost$1,000 last year will now cost $1,000 × 1.06 = $1,060, so you’ve gained nothing:
Real future value of investment =$1,000 × (1 + nominal interest rate)
(1 + inflation rate)
=$1,000 × 1.06
= $1,0001.06
In this example, the nominal rate of interest is 6 percent, but the real interest rate is zero.
Economists sometimes talk about current or nominal dollars versus constantor real dollars. Current or nominal dollars refer to the actual number ofdollars of the day; constant or real dollars refer to the amount of purchasingpower.
NOMINAL INTERESTRATE Rate at whichmoney invested grows.
REAL INTEREST RATERate at which the purchasingpower of an investmentincreases.
64 SECTION ONE
The real rate of interest is calculated by
1 + real interest rate =1 + nominal interest rate
1 + inflation rate
In our example both the nominal interest rate and the inflation rate were 6 percent. So
1 + real interest rate =1.06
= 11.06
real interest rate = 0
What if the nominal interest rate is 6 percent but the inflation rate is only 2 percent?In that case the real interest rate is 1.06/1.02 – 1 = .039, or 3.9 percent. Imagine that the price of a loaf of bread is $1, so that $1,000 would buy 1,000 loaves today. If youinvest that $1,000 at a nominal interest rate of 6 percent, you will have $1,060 at the end of the year. However, if the price of loaves has risen in the meantime to $1.02, thenyour money will buy you only 1,060/1.02 = 1,039 loaves. The real rate of interest is 3.9percent.
� Self-Test 14 a. Suppose that you invest your funds at an interest rate of 8 percent. What will be yourreal rate of interest if the inflation rate is zero? What if it is 5 percent?
b. Suppose that you demand a real rate of interest of 3 percent on your investments.What nominal interest rate do you need to earn if the inflation rate is zero? If it is 5percent?
Here is a useful approximation. The real rate approximately equals the difference be-tween the nominal rate and the inflation rate:6
Real interest rate ≈ nominal interest rate – inflation rate
Our example used a nominal interest rate of 6 percent, an inflation rate of 2 percent,and a real rate of 3.9 percent. If we round to 4 percent, the approximation gives the sameanswer:
Real interest rate ≈ nominal interest rate – inflation rate
≈ 6 – 2 = 4%
The approximation works best when both the inflation rate and the real rate are small.7
When they are not small, throw the approximation away and do it right.
� EXAMPLE 14 Real and Nominal Rates
In the United States in 1999, the interest rate on 1-year government borrowing wasabout 5.0 percent. The inflation rate was 2.2 percent. Therefore, the real rate can befound by computing
6 The squiggle (≈) means “approximately equal to.”7 When the interest and inflation rates are expressed as decimals (rather than percentages), the approximationerror equals the product (real interest rate × inflation rate).
The Time Value of Money 65
1 + real interest rate =1 + nominal interest rate
1 + inflation rate
=1.050
= 1.0271.022
real interest rate = .027, or 2.7%
The approximation rule gives a similar value of 5.0 – 2.2 = 2.8 percent. But the ap-proximation would not have worked in the German hyperinflation of 1922–1923, whenthe inflation rate was well over 100 percent per month (at one point you needed 1 mil-lion marks to mail a letter), or in Peru in 1990, when prices increased by nearly 7,500percent.
VALUING REAL CASH PAYMENTS
Think again about how to value future cash payments. Earlier you learned how to valuepayments in current dollars by discounting at the nominal interest rate. For example,suppose that the nominal interest rate is 10 percent. How much do you need to investnow to produce $100 in a year’s time? Easy! Calculate the present value of $100 by dis-counting by 10 percent:
PV =$100
= $90.911.10
You get exactly the same result if you discount the real payment by the real interestrate. For example, assume that you expect inflation of 7 percent over the next year. Thereal value of that $100 is therefore only $100/1.07 = $93.46. In one year’s time your$100 will buy only as much as $93.46 today. Also with a 7 percent inflation rate the realrate of interest is only about 3 percent. We can calculate it exactly from the formula
(1 + real interest rate) =1 + nominal interest rate
1 + inflation rate
=1.10
= 1.0281.07
real interest rate = .028, or 2.8%
If we now discount the $93.46 real payment by the 2.8 percent real interest rate, wehave a present value of $90.91, just as before:
PV =$93.46
= $90.911.028
The two methods should always give the same answer.8
8 If they don’t there must be an error in your calculations. All we have done in the second calculation is to di-vide both the numerator (the cash payment) and the denominator (one plus the nominal interest rate) by thesame number (one plus the inflation rate):
PV =payment in current dollars1 + nominal interest rate
=(payment in current dollars)/(1 + inflation rate)(1 + nominal interest rate)/(1 + inflation rate)
=payment in constant dollars
1 + real interest rate
66 SECTION ONE
Remember:
Mixing up nominal cash flows and real discount rates (or real rates and nominal flows)is an unforgivable sin. It is surprising how many sinners one finds.
� Self-Test 15 You are owed $5,000 by a relative who will pay back in 1 year. The nominal interest rateis 8 percent and the inflation rate is 5 percent. What is the present value of your rela-tive’s IOU? Show that you get the same answer (a) discounting the nominal payment atthe nominal rate and (b) discounting the real payment at the real rate.
� EXAMPLE 15 How Inflation Might Affect Bill Gates
We showed earlier (Example 11) that at an interest rate of 9 percent Bill Gates could, ifhe wished, turn his $96 billion wealth into a 40-year annuity of $8.9 billion per year ofluxury and excitement (L&E). Unfortunately L&E expenses inflate just like gasolineand groceries. Thus Mr. Gates would find the purchasing power of that $8.9 billionsteadily declining. If he wants the same luxuries in 2040 as in 2000, he’ll have to spendless in 2000, and then increase expenditures in line with inflation. How much should hespend in 2000? Assume the long-run inflation rate is 5 percent.
Mr. Gates needs to calculate a 40-year real annuity. The real interest rate is a littleless than 4 percent:
1 + real interest rate =1 + nominal interest rate
1 + inflation rate
=1.09
= 1.0381.05
so the real rate is 3.8 percent. The 40-year annuity factor at 3.8 percent is 20.4. There-fore, annual spending (in 2000 dollars) should be chosen so that
$96,000,000,000 = annual spending × 20.4
annual spending = $4,706,000,000
Mr. Gates could spend that amount on L&E in 2000 and 5 percent more (in line withinflation) in each subsequent year. This is only about half the value we calculated whenwe ignored inflation. Life has many disappointments, even for tycoons.
� Self-Test 16 You have reached age 60 with a modest fortune of $3 million and are considering earlyretirement. How much can you spend each year for the next 30 years? Assume thatspending is stable in real terms. The nominal interest rate is 10 percent and the inflationrate is 5 percent.
Current dollar cash flows must be discounted by the nominal interest rate;real cash flows must be discounted by the real interest rate.
The Time Value of Money 67
REAL OR NOMINAL?
Any present value calculation done in nominal terms can also be done in real terms, andvice versa. Most financial analysts forecast in nominal terms and discount at nominalrates. However, in some cases real cash flows are easier to deal with. In our example ofBill Gates, the real expenditures were fixed. In this case, it was easiest to use real quan-tities. On the other hand, if the cash-flow stream is fixed in nominal terms (for exam-ple, the payments on a loan), it is easiest to use all nominal quantities.
Effective Annual Interest RatesThus far we have used annual interest rates to value a series of annual cash flows. Butinterest rates may be quoted for days, months, years, or any convenient interval. Howshould we compare rates when they are quoted for different periods, such as monthlyversus annually?
Consider your credit card. Suppose you have to pay interest on any unpaid balancesat the rate of 1 percent per month. What is it going to cost you if you neglect to pay offyour unpaid balance for a year?
Don’t be put off because the interest rate is quoted per month rather than per year.The important thing is to maintain consistency between the interest rate and the num-ber of periods. If the interest rate is quoted as a percent per month, then we must definethe number of periods in our future value calculation as the number of months. So ifyou borrow $100 from the credit card company at 1 percent per month for 12 months,you will need to repay $100 × (1.01)12 = $112.68. Thus your debt grows after 1 year to$112.68. Therefore, we can say that the interest rate of 1 percent a month is equivalentto an effective annual interest rate, or annually compounded rate of 12.68 percent.
In general, the effective annual interest rate is defined as the annual growth rate al-lowing for the effect of compounding. Therefore,
(1 + annual rate) = (1 + monthly rate)12
When comparing interest rates, it is best to use effective annual rates. This comparesinterest paid or received over a common period (1 year) and allows for possible com-pounding during the period. Unfortunately, short-term rates are sometimes annualizedby multiplying the rate per period by the number of periods in a year. In fact, truth-in-lending laws in the United States require that rates be annualized in this manner. Suchrates are called annual percentage rates (APRs).9 The interest rate on your credit cardloan was 1 percent per month. Since there are 12 months in a year, the APR on the loanis 12 × 1% = 12%.
If the credit card company quotes an APR of 12 percent, how can you find the ef-fective annual interest rate? The solution is simple:
Step 1. Take the quoted APR and divide by the number of compounding periods in ayear to recover the rate per period actually charged. In our example, the interest wascalculated monthly. So we divide the APR by 12 to obtain the interest rate per month:
Monthly interest rate =APR
=12%
= 1%12 12
9 The truth-in-lending laws apply to credit card loans, auto loans, home improvement loans, and some loansto small businesses. APRs are not commonly used or quoted in the big leagues of finance.
EFFECTIVE ANNUALINTEREST RATEInterest rate that isannualized using compoundinterest.
ANNUAL PERCENTAGERATE (APR) Interestrate that is annualized usingsimple interest.
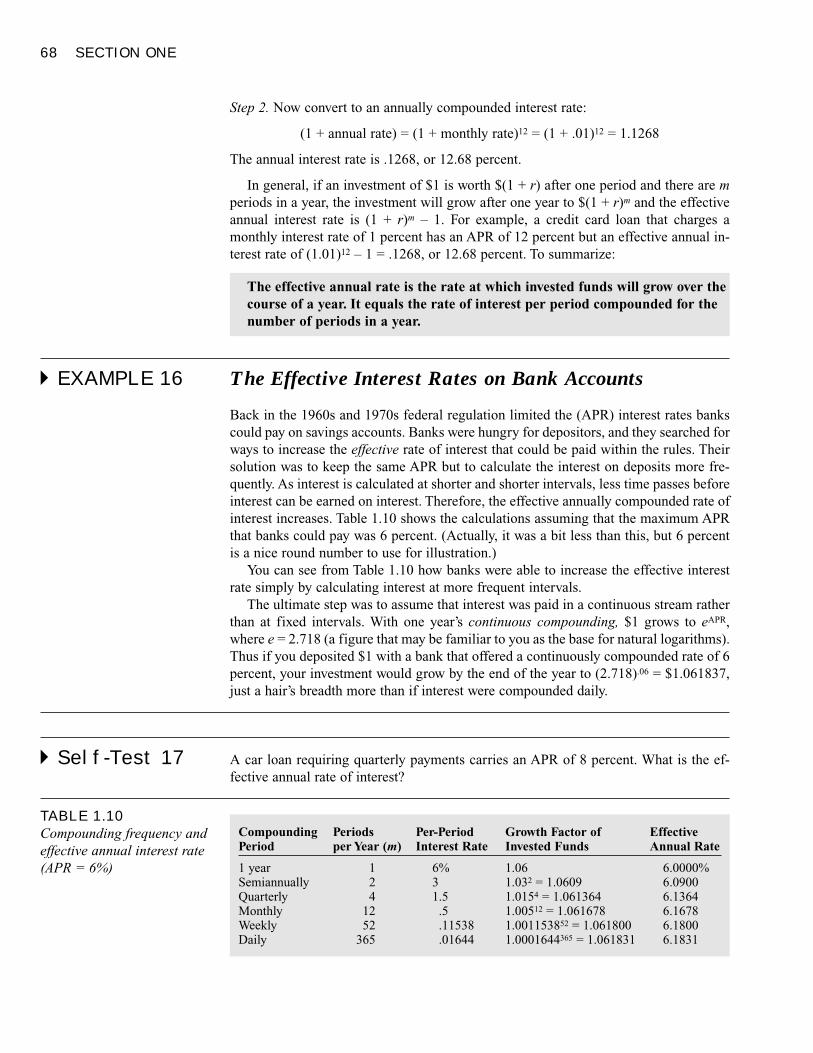
68 SECTION ONE
Step 2. Now convert to an annually compounded interest rate:
(1 + annual rate) = (1 + monthly rate)12 = (1 + .01)12 = 1.1268
The annual interest rate is .1268, or 12.68 percent.
In general, if an investment of $1 is worth $(1 + r) after one period and there are mperiods in a year, the investment will grow after one year to $(1 + r)m and the effectiveannual interest rate is (1 + r)m – 1. For example, a credit card loan that charges amonthly interest rate of 1 percent has an APR of 12 percent but an effective annual in-terest rate of (1.01)12 – 1 = .1268, or 12.68 percent. To summarize:
� EXAMPLE 16 The Effective Interest Rates on Bank Accounts
Back in the 1960s and 1970s federal regulation limited the (APR) interest rates bankscould pay on savings accounts. Banks were hungry for depositors, and they searched forways to increase the effective rate of interest that could be paid within the rules. Theirsolution was to keep the same APR but to calculate the interest on deposits more fre-quently. As interest is calculated at shorter and shorter intervals, less time passes beforeinterest can be earned on interest. Therefore, the effective annually compounded rate ofinterest increases. Table 1.10 shows the calculations assuming that the maximum APRthat banks could pay was 6 percent. (Actually, it was a bit less than this, but 6 percentis a nice round number to use for illustration.)
You can see from Table 1.10 how banks were able to increase the effective interestrate simply by calculating interest at more frequent intervals.
The ultimate step was to assume that interest was paid in a continuous stream ratherthan at fixed intervals. With one year’s continuous compounding, $1 grows to eAPR,where e = 2.718 (a figure that may be familiar to you as the base for natural logarithms).Thus if you deposited $1 with a bank that offered a continuously compounded rate of 6percent, your investment would grow by the end of the year to (2.718).06 = $1.061837,just a hair’s breadth more than if interest were compounded daily.
� Self-Test 17 A car loan requiring quarterly payments carries an APR of 8 percent. What is the ef-fective annual rate of interest?
The effective annual rate is the rate at which invested funds will grow over thecourse of a year. It equals the rate of interest per period compounded for thenumber of periods in a year.
TABLE 1.10Compounding frequency andeffective annual interest rate(APR = 6%)
Compounding Periods Per-Period Growth Factor of EffectivePeriod per Year (m) Interest Rate Invested Funds Annual Rate
1 year 1 6% 1.06 6.0000%Semiannually 2 3 1.032 = 1.0609 6.0900Quarterly 4 1.5 1.0154 = 1.061364 6.1364Monthly 12 .5 1.00512 = 1.061678 6.1678Weekly 52 .11538 1.001153852 = 1.061800 6.1800Daily 365 .01644 1.0001644365 = 1.061831 6.1831
The Time Value of Money 69
Related WebLinks
SummaryTo what future value will money invested at a given interest rate grow after a givenperiod of time?
An investment of $1 earning an interest rate of r will increase in value each period by thefactor (1 + r). After t periods its value will grow to $(1 + r)t. This is the future value of the$1 investment with compound interest.
What is the present value of a cash flow to be received in the future?
The present value of a future cash payment is the amount that you would need to investtoday to match that future payment. To calculate present value we divide the cash paymentby (1 + r)t or, equivalently, multiply by the discount factor 1/(1 + r)t. The discount factormeasures the value today of $1 received in period t.
How can we calculate present and future values of streams of cash payments?
A level stream of cash payments that continues indefinitely is known as a perpetuity; onethat continues for a limited number of years is called an annuity. The present value of astream of cash flows is simply the sum of the present value of each individual cash flow.Similarly, the future value of an annuity is the sum of the future value of each individualcash flow. Shortcut formulas make the calculations for perpetuities and annuities easy.
What is the difference between real and nominal cash flows and between real andnominal interest rates?
A dollar is a dollar but the amount of goods that a dollar can buy is eroded by inflation. Ifprices double, the real value of a dollar halves. Financial managers and economists oftenfind it helpful to reexpress future cash flows in terms of real dollars—that is, dollars ofconstant purchasing power.
Be careful to distinguish the nominal interest rate and the real interest rate—that is,the rate at which the real value of the investment grows. Discount nominal cash flows (thatis, cash flows measured in current dollars) at nominal interest rates. Discount real cashflows (cash flows measured in constant dollars) at real interest rates. Never mix and matchnominal and real.
How should we compare interest rates quoted over different time intervals—for ex-ample, monthly versus annual rates?
Interest rates for short time periods are often quoted as annual rates by multiplying the per-period rate by the number of periods in a year. These annual percentage rates (APRs) donot recognize the effect of compound interest, that is, they annualize assuming simpleinterest. The effective annual rate annualizes using compound interest. It equals the rate ofinterest per period compounded for the number of periods in a year.
http://invest-faq.com/articles/analy-fut-prs-val.html Understanding the concepts of presentand future value
www.bankrate.com/brm/default.asp Different interest rates for a variety of purposes, and somecalculators
www.financenter.com/ Calculators for evaluating financial decisions of all kindshttp://www.financialplayerscenter.com/Overview.html An introduction to time value of
money with several calculatorshttp://ourworld.compuserve.com/homepages More calculators, concepts, and formulas

70 SECTION ONE
1. Present Values. Compute the present value of a $100 cash flow for the following combina-tions of discount rates and times:
a. r = 10 percent. t = 10 yearsb. r = 10 percent. t = 20 yearsc. r = 5 percent. t = 10 yearsd. r = 5 percent. t = 20 years
2. Future Values. Compute the future value of a $100 cash flow for the same combinations ofrates and times as in problem 1.
3. Future Values. In 1880 five aboriginal trackers were each promised the equivalent of 100Australian dollars for helping to capture the notorious outlaw Ned Kelley. In 1993 thegranddaughters of two of the trackers claimed that this reward had not been paid. The Vic-torian prime minister stated that if this was true, the government would be happy to pay the$100. However, the granddaughters also claimed that they were entitled to compound inter-est. How much was each entitled to if the interest rate was 5 percent? What if it was 10 per-cent?
4. Future Values. You deposit $1,000 in your bank account. If the bank pays 4 percent simpleinterest, how much will you accumulate in your account after 10 years? What if the bankpays compound interest? How much of your earnings will be interest on interest?
5. Present Values. You will require $700 in 5 years. If you earn 6 percent interest on yourfunds, how much will you need to invest today in order to reach your savings goal?
6. Calculating Interest Rate. Find the interest rate implied by the following combinations ofpresent and future values:
Present Value Years Future Value
$400 11 $684$183 4 $249$300 7 $300
7. Present Values. Would you rather receive $1,000 a year for 10 years or $800 a year for 15years if
a. the interest rate is 5 percent?b. the interest rate is 20 percent?c. Why do your answers to (a) and (b) differ?
8. Calculating Interest Rate. Find the annual interest rate.
Present Value Future Value Time Period
100 115.76 3 years200 262.16 4 years100 110.41 5 years
9. Present Values. What is the present value of the following cash-flow stream if the interestrate is 5 percent?
Quiz
Key Terms future valuecompound interestsimple interestpresent value (PV)discount ratediscount factor
annuityperpetuityannuity factorannuity dueinflationreal value of $1
nominal interest ratereal interest rateeffective annual interest rateannual percentage rate (APR)
The Time Value of Money 71
Year Cash Flow
1 $2002 $4003 $300
10. Number of Periods. How long will it take for $400 to grow to $1,000 at the interest ratespecified?a. 4 percentb. 8 percentc. 16 percent
11. Calculating Interest Rate. Find the effective annual interest rate for each case:
APR Compounding Period
12% 1 month8% 3 months
10% 6 months
12. Calculating Interest Rate. Find the APR (the stated interest rate) for each case:
Effective Annual Compounding Interest Rate Period
10.00% 1 month6.09% 6 months8.24% 3 months
13. Growth of Funds. If you earn 8 percent per year on your bank account, how long will it takean account with $100 to double to $200?
14. Comparing Interest Rates. Suppose you can borrow money at 8.6 percent per year (APR)compounded semiannually or 8.4 percent per year (APR) compounded monthly. Which isthe better deal?
15. Calculating Interest Rate. Lenny Loanshark charges “one point” per week (that is, 1 per-cent per week) on his loans. What APR must he report to consumers? Assume exactly 52weeks in a year. What is the effective annual rate?
16. Compound Interest. Investments in the stock market have increased at an average com-pound rate of about 10 percent since 1926.
a. If you invested $1,000 in the stock market in 1926, how much would that investment beworth today?
b. If your investment in 1926 has grown to $1 million, how much did you invest in 1926?
17. Compound Interest. Old Time Savings Bank pays 5 percent interest on its savings ac-counts. If you deposit $1,000 in the bank and leave it there, how much interest will you earnin the first year? The second year? The tenth year?
18. Compound Interest. New Savings Bank pays 4 percent interest on its deposits. If you de-posit $1,000 in the bank and leave it there, will it take more or less than 25 years for yourmoney to double? You should be able to answer this without a calculator or interest rate tables.
19. Calculating Interest Rate. A zero-coupon bond which will pay $1,000 in 10 years is sell-ing today for $422.41. What interest rate does the bond offer?
20. Present Values. A famous quarterback just signed a $15 million contract providing $3 mil-lion a year for 5 years. A less famous receiver signed a $14 million 5-year contract provid-ing $4 million now and $2 million a year for 5 years. Who is better paid? The interest rateis 12 percent.
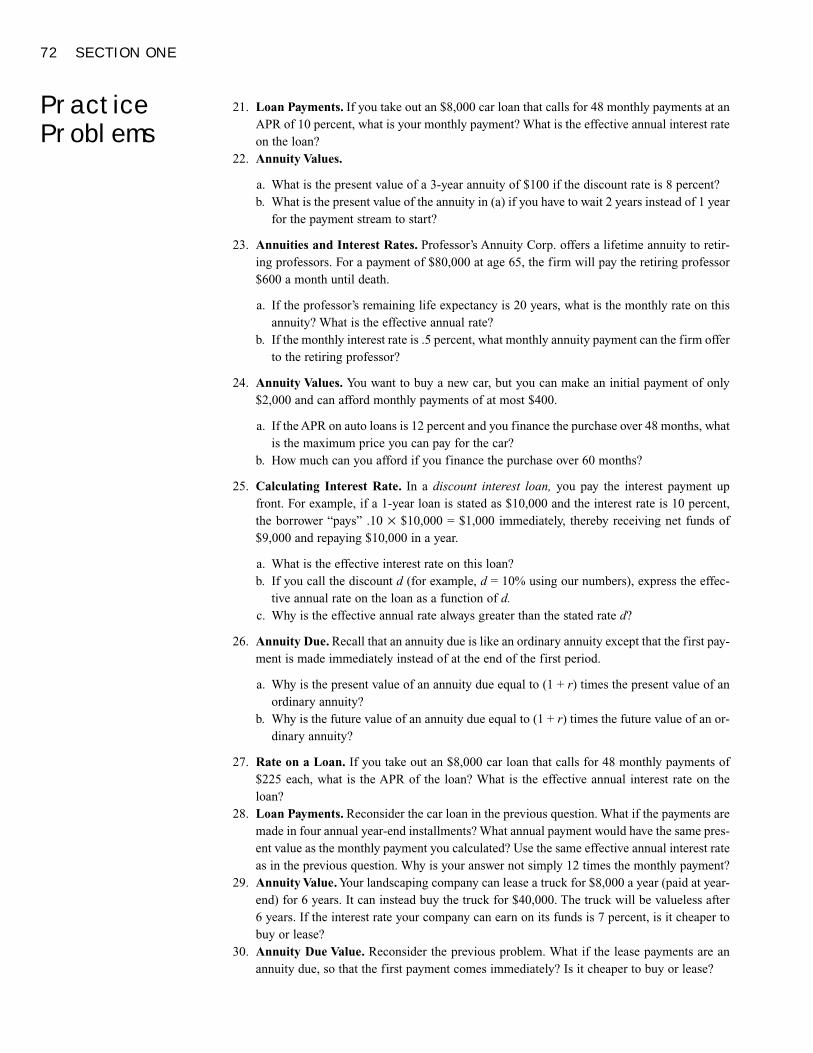
72 SECTION ONE
21. Loan Payments. If you take out an $8,000 car loan that calls for 48 monthly payments at anAPR of 10 percent, what is your monthly payment? What is the effective annual interest rateon the loan?
22. Annuity Values.
a. What is the present value of a 3-year annuity of $100 if the discount rate is 8 percent?b. What is the present value of the annuity in (a) if you have to wait 2 years instead of 1 year
for the payment stream to start?
23. Annuities and Interest Rates. Professor’s Annuity Corp. offers a lifetime annuity to retir-ing professors. For a payment of $80,000 at age 65, the firm will pay the retiring professor$600 a month until death.
a. If the professor’s remaining life expectancy is 20 years, what is the monthly rate on thisannuity? What is the effective annual rate?
b. If the monthly interest rate is .5 percent, what monthly annuity payment can the firm offerto the retiring professor?
24. Annuity Values. You want to buy a new car, but you can make an initial payment of only$2,000 and can afford monthly payments of at most $400.
a. If the APR on auto loans is 12 percent and you finance the purchase over 48 months, whatis the maximum price you can pay for the car?
b. How much can you afford if you finance the purchase over 60 months?
25. Calculating Interest Rate. In a discount interest loan, you pay the interest payment upfront. For example, if a 1-year loan is stated as $10,000 and the interest rate is 10 percent,the borrower “pays” .10 × $10,000 = $1,000 immediately, thereby receiving net funds of$9,000 and repaying $10,000 in a year.
a. What is the effective interest rate on this loan?b. If you call the discount d (for example, d = 10% using our numbers), express the effec-
tive annual rate on the loan as a function of d.c. Why is the effective annual rate always greater than the stated rate d?
26. Annuity Due. Recall that an annuity due is like an ordinary annuity except that the first pay-ment is made immediately instead of at the end of the first period.
a. Why is the present value of an annuity due equal to (1 + r) times the present value of anordinary annuity?
b. Why is the future value of an annuity due equal to (1 + r) times the future value of an or-dinary annuity?
27. Rate on a Loan. If you take out an $8,000 car loan that calls for 48 monthly payments of$225 each, what is the APR of the loan? What is the effective annual interest rate on theloan?
28. Loan Payments. Reconsider the car loan in the previous question. What if the payments aremade in four annual year-end installments? What annual payment would have the same pres-ent value as the monthly payment you calculated? Use the same effective annual interest rateas in the previous question. Why is your answer not simply 12 times the monthly payment?
29. Annuity Value. Your landscaping company can lease a truck for $8,000 a year (paid at year-end) for 6 years. It can instead buy the truck for $40,000. The truck will be valueless after6 years. If the interest rate your company can earn on its funds is 7 percent, is it cheaper tobuy or lease?
30. Annuity Due Value. Reconsider the previous problem. What if the lease payments are anannuity due, so that the first payment comes immediately? Is it cheaper to buy or lease?
PracticeProblems
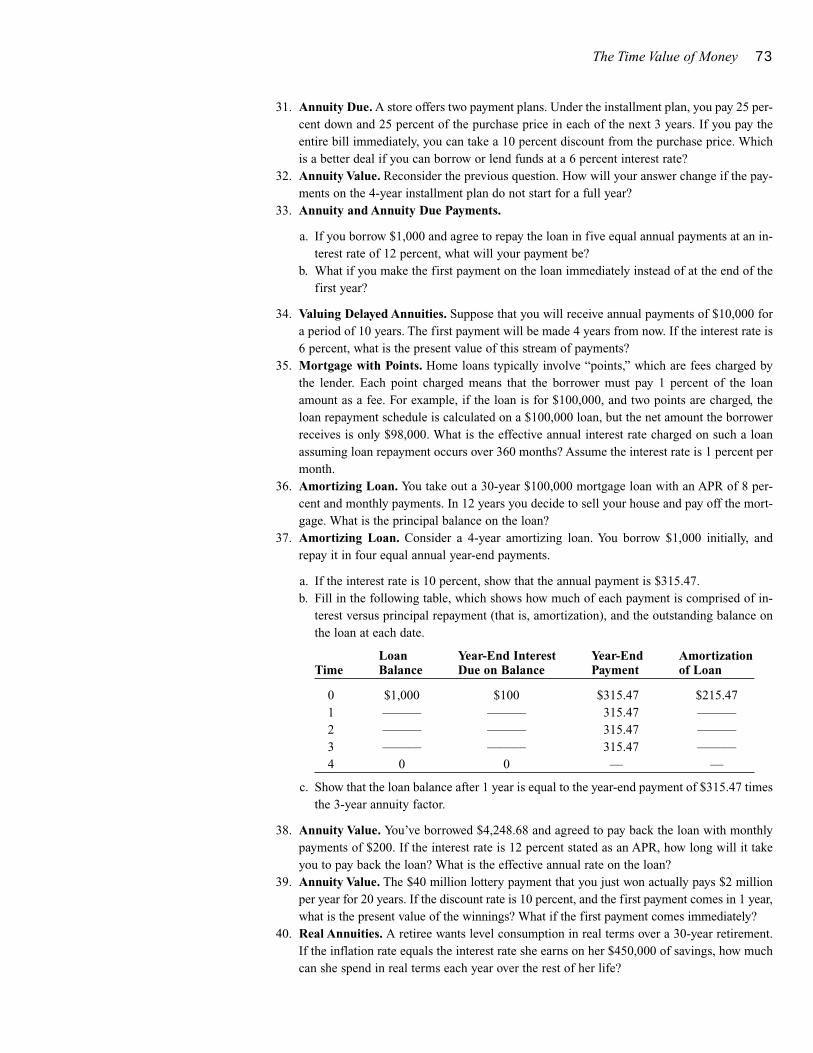
The Time Value of Money 73
31. Annuity Due. A store offers two payment plans. Under the installment plan, you pay 25 per-cent down and 25 percent of the purchase price in each of the next 3 years. If you pay theentire bill immediately, you can take a 10 percent discount from the purchase price. Whichis a better deal if you can borrow or lend funds at a 6 percent interest rate?
32. Annuity Value. Reconsider the previous question. How will your answer change if the pay-ments on the 4-year installment plan do not start for a full year?
33. Annuity and Annuity Due Payments.
a. If you borrow $1,000 and agree to repay the loan in five equal annual payments at an in-terest rate of 12 percent, what will your payment be?
b. What if you make the first payment on the loan immediately instead of at the end of thefirst year?
34. Valuing Delayed Annuities. Suppose that you will receive annual payments of $10,000 fora period of 10 years. The first payment will be made 4 years from now. If the interest rate is6 percent, what is the present value of this stream of payments?
35. Mortgage with Points. Home loans typically involve “points,” which are fees charged bythe lender. Each point charged means that the borrower must pay 1 percent of the loanamount as a fee. For example, if the loan is for $100,000, and two points are charged, theloan repayment schedule is calculated on a $100,000 loan, but the net amount the borrowerreceives is only $98,000. What is the effective annual interest rate charged on such a loanassuming loan repayment occurs over 360 months? Assume the interest rate is 1 percent permonth.
36. Amortizing Loan. You take out a 30-year $100,000 mortgage loan with an APR of 8 per-cent and monthly payments. In 12 years you decide to sell your house and pay off the mort-gage. What is the principal balance on the loan?
37. Amortizing Loan. Consider a 4-year amortizing loan. You borrow $1,000 initially, andrepay it in four equal annual year-end payments.
a. If the interest rate is 10 percent, show that the annual payment is $315.47.b. Fill in the following table, which shows how much of each payment is comprised of in-
terest versus principal repayment (that is, amortization), and the outstanding balance onthe loan at each date.
Loan Year-End Interest Year-End AmortizationTime Balance Due on Balance Payment of Loan
0 $1,000 $100 $315.47 $215.471 ——— ——— 315.47 ———2 ——— ——— 315.47 ———3 ——— ——— 315.47 ———4 0 0 — —
c. Show that the loan balance after 1 year is equal to the year-end payment of $315.47 timesthe 3-year annuity factor.
38. Annuity Value. You’ve borrowed $4,248.68 and agreed to pay back the loan with monthlypayments of $200. If the interest rate is 12 percent stated as an APR, how long will it takeyou to pay back the loan? What is the effective annual rate on the loan?
39. Annuity Value. The $40 million lottery payment that you just won actually pays $2 millionper year for 20 years. If the discount rate is 10 percent, and the first payment comes in 1 year,what is the present value of the winnings? What if the first payment comes immediately?
40. Real Annuities. A retiree wants level consumption in real terms over a 30-year retirement.If the inflation rate equals the interest rate she earns on her $450,000 of savings, how muchcan she spend in real terms each year over the rest of her life?
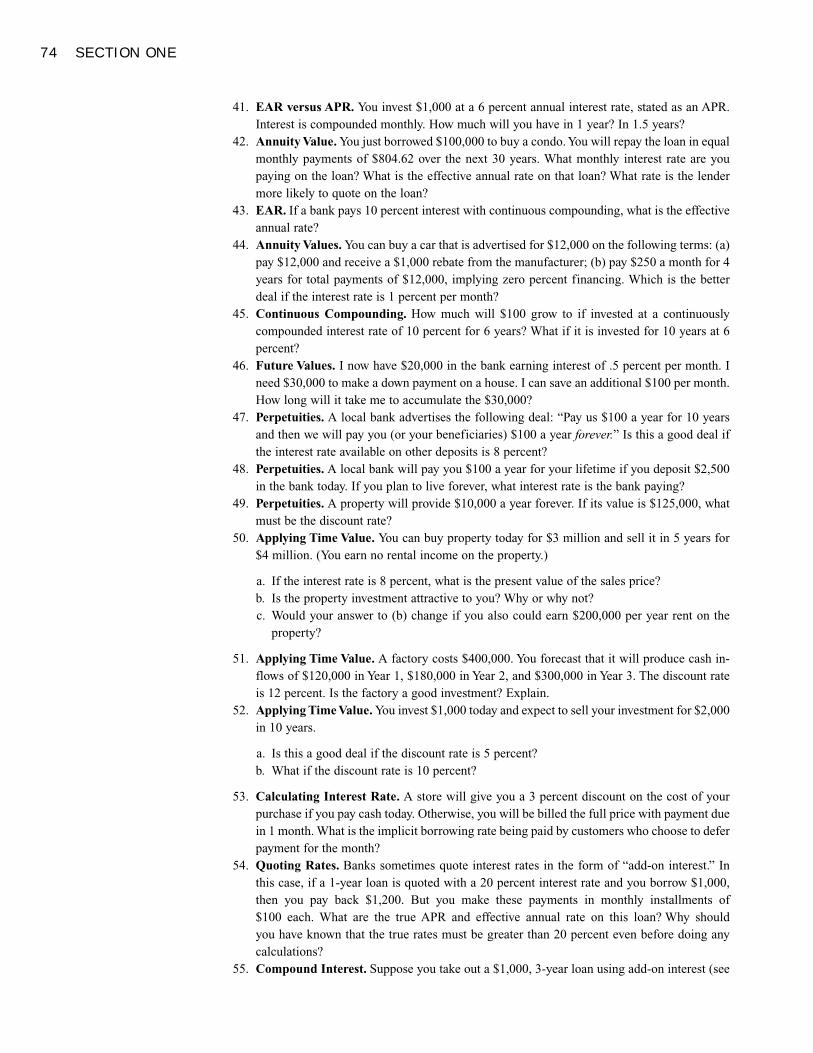
74 SECTION ONE
41. EAR versus APR. You invest $1,000 at a 6 percent annual interest rate, stated as an APR.Interest is compounded monthly. How much will you have in 1 year? In 1.5 years?
42. Annuity Value. You just borrowed $100,000 to buy a condo. You will repay the loan in equalmonthly payments of $804.62 over the next 30 years. What monthly interest rate are youpaying on the loan? What is the effective annual rate on that loan? What rate is the lendermore likely to quote on the loan?
43. EAR. If a bank pays 10 percent interest with continuous compounding, what is the effectiveannual rate?
44. Annuity Values. You can buy a car that is advertised for $12,000 on the following terms: (a)pay $12,000 and receive a $1,000 rebate from the manufacturer; (b) pay $250 a month for 4years for total payments of $12,000, implying zero percent financing. Which is the betterdeal if the interest rate is 1 percent per month?
45. Continuous Compounding. How much will $100 grow to if invested at a continuouslycompounded interest rate of 10 percent for 6 years? What if it is invested for 10 years at 6percent?
46. Future Values. I now have $20,000 in the bank earning interest of .5 percent per month. Ineed $30,000 to make a down payment on a house. I can save an additional $100 per month.How long will it take me to accumulate the $30,000?
47. Perpetuities. A local bank advertises the following deal: “Pay us $100 a year for 10 yearsand then we will pay you (or your beneficiaries) $100 a year forever.” Is this a good deal ifthe interest rate available on other deposits is 8 percent?
48. Perpetuities. A local bank will pay you $100 a year for your lifetime if you deposit $2,500in the bank today. If you plan to live forever, what interest rate is the bank paying?
49. Perpetuities. A property will provide $10,000 a year forever. If its value is $125,000, whatmust be the discount rate?
50. Applying Time Value. You can buy property today for $3 million and sell it in 5 years for$4 million. (You earn no rental income on the property.)
a. If the interest rate is 8 percent, what is the present value of the sales price?b. Is the property investment attractive to you? Why or why not?c. Would your answer to (b) change if you also could earn $200,000 per year rent on the
property?
51. Applying Time Value. A factory costs $400,000. You forecast that it will produce cash in-flows of $120,000 in Year 1, $180,000 in Year 2, and $300,000 in Year 3. The discount rateis 12 percent. Is the factory a good investment? Explain.
52. Applying Time Value. You invest $1,000 today and expect to sell your investment for $2,000in 10 years.
a. Is this a good deal if the discount rate is 5 percent?b. What if the discount rate is 10 percent?
53. Calculating Interest Rate. A store will give you a 3 percent discount on the cost of yourpurchase if you pay cash today. Otherwise, you will be billed the full price with payment duein 1 month. What is the implicit borrowing rate being paid by customers who choose to deferpayment for the month?
54. Quoting Rates. Banks sometimes quote interest rates in the form of “add-on interest.” Inthis case, if a 1-year loan is quoted with a 20 percent interest rate and you borrow $1,000,then you pay back $1,200. But you make these payments in monthly installments of $100 each. What are the true APR and effective annual rate on this loan? Why should you have known that the true rates must be greater than 20 percent even before doing anycalculations?
55. Compound Interest. Suppose you take out a $1,000, 3-year loan using add-on interest (see
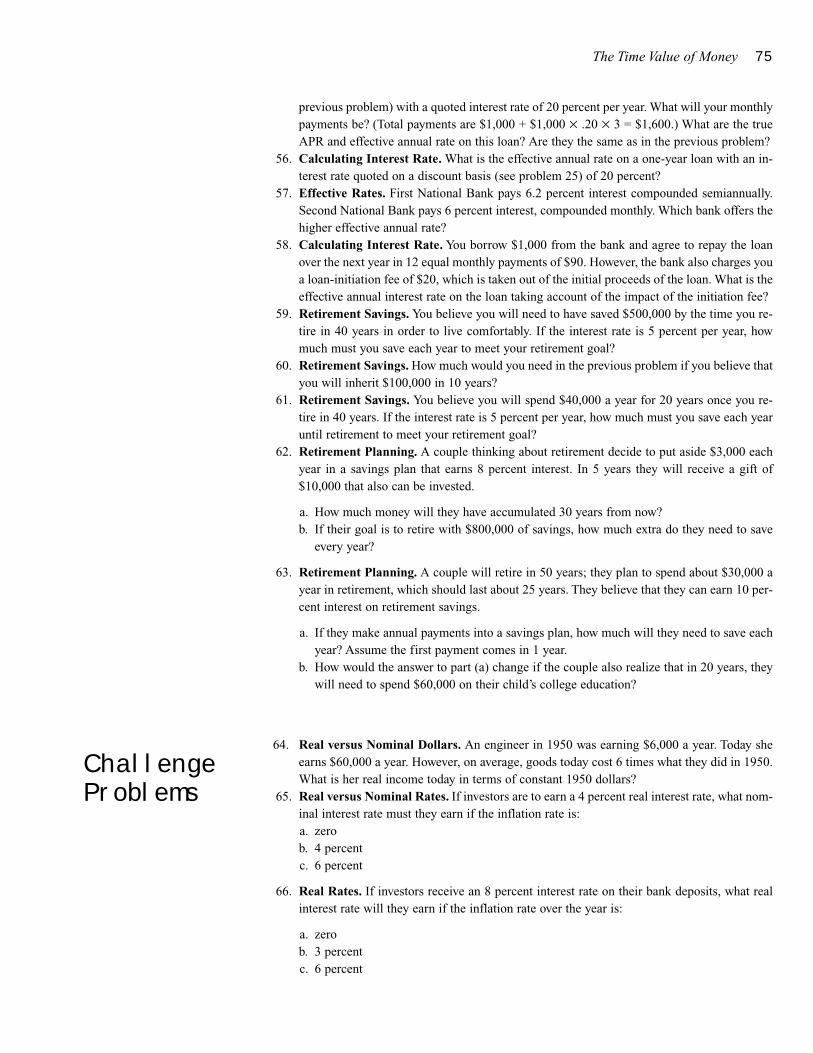
The Time Value of Money 75
previous problem) with a quoted interest rate of 20 percent per year. What will your monthlypayments be? (Total payments are $1,000 + $1,000 × .20 × 3 = $1,600.) What are the trueAPR and effective annual rate on this loan? Are they the same as in the previous problem?
56. Calculating Interest Rate. What is the effective annual rate on a one-year loan with an in-terest rate quoted on a discount basis (see problem 25) of 20 percent?
57. Effective Rates. First National Bank pays 6.2 percent interest compounded semiannually.Second National Bank pays 6 percent interest, compounded monthly. Which bank offers thehigher effective annual rate?
58. Calculating Interest Rate. You borrow $1,000 from the bank and agree to repay the loanover the next year in 12 equal monthly payments of $90. However, the bank also charges youa loan-initiation fee of $20, which is taken out of the initial proceeds of the loan. What is theeffective annual interest rate on the loan taking account of the impact of the initiation fee?
59. Retirement Savings. You believe you will need to have saved $500,000 by the time you re-tire in 40 years in order to live comfortably. If the interest rate is 5 percent per year, howmuch must you save each year to meet your retirement goal?
60. Retirement Savings. How much would you need in the previous problem if you believe thatyou will inherit $100,000 in 10 years?
61. Retirement Savings. You believe you will spend $40,000 a year for 20 years once you re-tire in 40 years. If the interest rate is 5 percent per year, how much must you save each yearuntil retirement to meet your retirement goal?
62. Retirement Planning. A couple thinking about retirement decide to put aside $3,000 eachyear in a savings plan that earns 8 percent interest. In 5 years they will receive a gift of$10,000 that also can be invested.
a. How much money will they have accumulated 30 years from now?b. If their goal is to retire with $800,000 of savings, how much extra do they need to save
every year?
63. Retirement Planning. A couple will retire in 50 years; they plan to spend about $30,000 ayear in retirement, which should last about 25 years. They believe that they can earn 10 per-cent interest on retirement savings.
a. If they make annual payments into a savings plan, how much will they need to save eachyear? Assume the first payment comes in 1 year.
b. How would the answer to part (a) change if the couple also realize that in 20 years, theywill need to spend $60,000 on their child’s college education?
64. Real versus Nominal Dollars. An engineer in 1950 was earning $6,000 a year. Today sheearns $60,000 a year. However, on average, goods today cost 6 times what they did in 1950.What is her real income today in terms of constant 1950 dollars?
65. Real versus Nominal Rates. If investors are to earn a 4 percent real interest rate, what nom-inal interest rate must they earn if the inflation rate is:a. zerob. 4 percentc. 6 percent
66. Real Rates. If investors receive an 8 percent interest rate on their bank deposits, what realinterest rate will they earn if the inflation rate over the year is:
a. zerob. 3 percentc. 6 percent
ChallengeProblems

76 SECTION ONE
67. Real versus Nominal Rates. You will receive $100 from a savings bond in 3 years. Thenominal interest rate is 8 percent.
a. What is the present value of the proceeds from the bond?b. If the inflation rate over the next few years is expected to be 3 percent, what will the real
value of the $100 payoff be in terms of today’s dollars?c. What is the real interest rate?d. Show that the real payoff from the bond (from part b) discounted at the real interest rate
(from part c) gives the same present value for the bond as you found in part a.
68. Real versus Nominal Dollars. Your consulting firm will produce cash flows of $100,000this year, and you expect cash flow to keep pace with any increase in the general level of prices. The interest rate currently is 8 percent, and you anticipate inflation of about 2 percent.
a. What is the present value of your firm’s cash flows for Years 1 through 5?b. How would your answer to (a) change if you anticipated no growth in cash flow?
69. Real versus Nominal Annuities. Good news: you will almost certainly be a millionaire bythe time you retire in 50 years. Bad news: the inflation rate over your lifetime will averageabout 3 percent.
a. What will be the real value of $1 million by the time you retire in terms of today’s dollars?
b. What real annuity (in today’s dollars) will $1 million support if the real interest rate at re-tirement is 2 percent and the annuity must last for 20 years?
70. Rule of 72. Using the Rule of 72, if the interest rate is 8 percent per year, how long will ittake for your money to quadruple in value?
71. Inflation. Inflation in Brazil in 1992 averaged about 23 percent per month. What was theannual inflation rate?
72. Perpetuities. British government 4 percent perpetuities pay £4 interest each year forever.Another bond, 21⁄2 percent perpetuities, pays £2.50 a year forever. What is the value of 4 per-cent perpetuities, if the long-term interest rate is 6 percent? What is the value of 21⁄2 percentperpetuities?
73. Real versus Nominal Annuities.
a. You plan to retire in 30 years and want to accumulate enough by then to provide yourselfwith $30,000 a year for 15 years. If the interest rate is 10 percent, how much must youaccumulate by the time you retire?
b. How much must you save each year until retirement in order to finance your retirementconsumption?
c. Now you remember that the annual inflation rate is 4 percent. If a loaf of bread costs$1.00 today, what will it cost by the time you retire?
d. You really want to consume $30,000 a year in real dollars during retirement and wish tosave an equal real amount each year until then. What is the real amount of savings thatyou need to accumulate by the time you retire?
e. Calculate the required preretirement real annual savings necessary to meet your con-sumption goals. Compare to your answer to (b). Why is there a difference?
f. What is the nominal value of the amount you need to save during the first year? (Assumethe savings are put aside at the end of each year.) The thirtieth year?
74. Retirement and Inflation. Redo part (a) of problem 63, but now assume that the inflationrate over the next 50 years will average 4 percent.

The Time Value of Money 77
a. What is the real annual savings the couple must set aside?b. How much do they need to save in nominal terms in the first year?c. How much do they need to save in nominal terms in the last year?d. What will be their nominal expenditures in the first year of retirement? The last?
75. Annuity Value. What is the value of a perpetuity that pays $100 every 3 months forever?The discount rate quoted on an APR basis is 12 percent.
76. Changing Interest Rates. If the interest rate this year is 8 percent and the interest rate nextyear will be 10 percent, what is the future value of $1 after 2 years? What is the present valueof a payment of $1 to be received in 2 years?
77. Changing Interest Rates. Your wealthy uncle established a $1,000 bank account for youwhen you were born. For the first 8 years of your life, the interest rate earned on the accountwas 8 percent. Since then, rates have been only 6 percent. Now you are 21 years old andready to cash in. How much is in your account?
1 Value after 5 years would have been 24 × (1.05)5 = $30.63; after 50 years, 24 × (1.05)50 =$275.22.
2 Sales double each year. After 4 years, sales will increase by a factor of 2 × 2 × 2 × 2 = 24
= 16 to a value of $.5 × 16 = $8 million.3 Multiply the $1,000 payment by the 10-year discount factor:
PV = $1,000 × 1= $441.06
(1.0853)10
4 If the doubling time is 12 years, then (1 + r)12 = 2, which implies that 1 + r = 21/12 = 1.0595,or r = 5.95 percent. The Rule of 72 would imply that a doubling time of 12 years is con-sistent with an interest rate of 6 percent: 72/6 = 12. Thus the Rule of 72 works quite wellin this case. If the doubling period is only 2 years, then the interest rate is determined by (1+ r)2 = 2, which implies that 1 + r = 21/2 = 1.414, or r = 41.4 percent. The Rule of 72 wouldimply that a doubling time of 2 years is consistent with an interest rate of 36 percent: 72/36= 2. Thus the Rule of 72 is quite inaccurate when the interest rate is high.
5 Gift at Year Present Value
1 10,000/(1.07) = $ 9,345.792 10,000/(1.07)2 = 8,734.393 10,000/(1.07)3 = 8,162.984 10,000/(1.07)4 = 7,628.95
$33,872.11
Gift at Year Future Value at Year 4
1 10,000/(1.07)3 = $12,250.432 10,000/(1.07)2 = 11,4493 10,000/(1.07) = 10,7004 10,000 = 10,000
$44,399.436 The rate is 4/48 = .0833, about 8.3 percent.7 The 4-year discount factor is 1/(1.08)4 = .735. The 4-year annuity factor is [1/.08 – 1/(.08
× 1.084)] = 3.312. This is the difference between the present value of a $1 perpetuity start-ing next year and the present value of a $1 perpetuity starting in Year 5:
Solutions toSelf-TestQuestions
78 SECTION ONE
PV (perpetuity starting next year) =1
= 12.50.08
– PV (perpetuity starting in Year 5) =1
×1
= 12.50 × .735 = 9.188.08 (1.08)4
= PV (4-year annuity) = 12.50 – 9.188 = 3.312
8 Calculate the value of a 19-year annuity, then add the immediate $465,000 payment:
19-year annuity factor =1
–1
r r(1 + r)19
=1
–1
.08 .08(1.08)19
= 9.604
PV = $465,000 × 9.604 = $4,466,000
Total value = $4,466,000 + $465,000
= $4,931,000
Starting the 20-year cash-flow stream immediately, rather than waiting 1 year, increasesvalue by nearly $400,000.
9 Fifteen years means 180 months. Then
Mortgage payment =100,000
180-month annuity factor
=100,000
83.32
= $1,200.17 per month
$1,000 of the payment is interest. The remainder, $200.17, is amortization.10 You will need the present value at 7 percent of a 20-year annuity of $55,000:
Present value = annual spending × annuity factor
The annuity factor is [1/.07 – 1/(.07 × 1.0720)] = 10.594. Thus you need 55,000 × 10.594= $582,670.
11 If the interest rate is 5 percent, the future value of a 50-year, $1 annuity will be
(1.05)50 – 1= 209.348
.05Therefore, we need to choose the cash flow, C, so that C × 209.348 = $500,000. This re-quires that C = $500,000/209.348 = $2,388.37. This required savings level is much higherthan we found in Example 3.12. At a 5 percent interest rate, current savings do not grow asrapidly as when the interest rate was 10 percent; with less of a boost from compound in-terest, we need to set aside greater amounts in order to reach the target of $500,000.
12 The cost in dollars will increase by 5 percent each year, to a value of $5 × (1.05)50 = $57.34.If the inflation rate is 10 percent, the cost will be $5 × (1.10)50 = $586.95.
13 The weekly cost in 1980 is $250 × (370/100) = $925. The real value of a 1980 salary of$30,000, expressed in real 1947 dollars, is $30,000 × (100/370) = $8,108.
14 a. If there’s no inflation, real and nominal rates are equal at 8 percent. With 5 percent in-flation, the real rate is (1.08/1.05) – 1 = .02857, a bit less than 3 percent.
b. If you want a 3 percent real interest rate, you need a 3 percent nominal rate if inflationis zero and an 8.15 percent rate if inflation is 5 percent. Note 1.03 × 1.05 = 1.0815.
MINICASE
The Time Value of Money 79
15 The present value is
PV =$5,000
= $4,629.631.08
The real interest rate is 2.857 percent (see Self-Test 3.14a). The real cash payment is$5,000/(1.05) = $4,761.90. Thus
PV =$4,761.90
= $4,629.631.02857
16 Calculate the real annuity. The real interest rate is 1.10/1.05 – 1 = .0476. We’ll round to 4.8percent. The real annuity is
Annual payment =$3,000,000
30-year annuity factor
= $3,000,0001
–1
.048 .048(1.048)30
=$3,000,000
= $190,72815.73
You can spend this much each year in dollars of constant purchasing power. The purchas-ing power of each dollar will decline at 5 percent per year so you’ll need to spend more innominal dollars: $190,728 × 1.05 = $200,264 in the second year, $190,728 × 1.052 =$210,278 in the third year, and so on.
17 The quarterly rate is 8/4 = 2 percent. The effective annual rate is (1.02)4 – 1 = .0824, or 8.24percent.
Old Alfred Road, who is well-known to drivers on the MaineTurnpike, has reached his seventieth birthday and is ready to re-tire. Mr. Road has no formal training in finance but has saved hismoney and invested carefully.
Mr. Road owns his home—the mortgage is paid off—anddoes not want to move. He is a widower, and he wants to bequeaththe house and any remaining assets to his daughter.
He has accumulated savings of $180,000, conservatively in-vested. The investments are yielding 9 percent interest. Mr. Roadalso has $12,000 in a savings account at 5 percent interest. Hewants to keep the savings account intact for unexpected expensesor emergencies.
Mr. Road’s basic living expenses now average about $1,500per month, and he plans to spend $500 per month on travel andhobbies. To maintain this planned standard of living, he will haveto rely on his investment portfolio. The interest from the portfoliois $16,200 per year (9 percent of $180,000), or $1,350 per month.
Mr. Road will also receive $750 per month in social securitypayments for the rest of his life. These payments are indexed for
inflation. That is, they will be automatically increased in propor-tion to changes in the consumer price index.
Mr. Road’s main concern is with inflation. The inflation ratehas been below 3 percent recently, but a 3 percent rate is unusu-ally low by historical standards. His social security payments willincrease with inflation, but the interest on his investment portfo-lio will not.
What advice do you have for Mr. Road? Can he safely spendall the interest from his investment portfolio? How much could hewithdraw at year-end from that portfolio if he wants to keep itsreal value intact?
Suppose Mr. Road will live for 20 more years and is willingto use up all of his investment portfolio over that period. He alsowants his monthly spending to increase along with inflation overthat period. In other words, he wants his monthly spending to staythe same in real terms. How much can he afford to spend permonth?
Assume that the investment portfolio continues to yield a 9percent rate of return and that the inflation rate is 4 percent.

81
FINANCIAL PLANNING
What Is Financial Planning?Financial Planning Focuses on the Big Picture
Financial Planning Is Not Just Forecasting
Three Requirements for Effective Planning
Financial Planning ModelsComponents of a Financial Planning Model
An Example of a Planning Model
An Improved Model
Planners BewarePitfalls in Model Design
The Assumption in Percentage of Sales Models
The Role of Financial Planning Models
External Financing and Growth
Summary
Financial planning?Financial planners don’t guess the future, they prepare for it.SuperStock
82
What Is Financial Planning?Financial planning is a process consisting of:
1. Analyzing the investment and financing choices open to the firm.2. Projecting the future consequences of current decisions.3. Deciding which alternatives to undertake.4. Measuring subsequent performance against the goals set forth in the financial plan.
Notice that financial planning is not designed to minimize risk. Instead it is a processof deciding which risks to take and which are unnecessary or not worth taking.
Firms must plan for both the short-term and the long-term. Short-term planningrarely looks ahead further than the next 12 months. It is largely the process of makingsure the firm has enough cash to pay its bills and that short-term borrowing and lend-ing are arranged to the best advantage.
t’s been said that a camel looks like a horse designed by committee. If a
firm made all its financial decisions piecemeal, it would end up with a
financial camel. Therefore, smart financial managers consider the overall
effect of future investment and financing decisions. This process is called fi-
nancial planning, and the end result is called a financial plan.
New investments need to be paid for. So investment and financing decisions cannot
be made independently. Financial planning forces managers to think systematically
about their goals for growth, investment, and financing. Planning should reveal any in-
consistencies in these goals.
Planning also helps managers avoid some surprises and think about how they should
react to those surprises that cannot be avoided. We stress that good financial managers
insist on understanding what makes projects work and what could go wrong with them.
The same approach should be taken when investment and financing decisions are con-
sidered as a whole.
Finally, financial planning helps establish goals to motivate managers and provide
standards for measuring performance.
We start by summarizing what financial planning involves and we describe the con-
tents of a typical financial plan. We then discuss the use of financial models in the plan-
ning process. Finally, we examine the relationship between a firm’s growth and its need
for new financing.
After studying this material you should be able to
� Describe the contents and uses of a financial plan.
� Construct a simple financial planning model.
� Estimate the effect of growth on the need for external financing.
I
Financial Planning 83
Here we are more concerned with long-term planning, where a typical planninghorizon is 5 years (although some firms look out 10 years or more). For example, it cantake at least 10 years for an electric utility to design, obtain approval for, build, and testa major generating plant.
FINANCIAL PLANNING FOCUSES ON THE BIG PICTURE
Many of the firm’s capital expenditures are proposed by plant managers. But the finalbudget must also reflect strategic plans made by senior management. Positive-NPV op-portunities occur in those businesses where the firm has a real competitive advantage.Strategic plans need to identify such businesses and look to expand them. The plansalso seek to identify businesses to sell or liquidate as well as businesses that should beallowed to run down.
Strategic planning involves capital budgeting on a grand scale. In this process, fi-nancial planners try to look at the investment by each line of business and avoid gettingbogged down in details. Of course, some individual projects are large enough to havesignificant individual impact. When Walt Disney announced its intention to build a newtheme park in Hong Kong at a cost of $4 billion, you can bet that this project was ex-plicitly analyzed as part of Disney’s long-range financial plan. Normally, however, fi-nancial planners do not work on a project-by-project basis. Smaller projects are aggre-gated into a unit that is treated as a single project.
At the beginning of the planning process the corporate staff might ask each divisionto submit three alternative business plans covering the next 5 years:
1. A best case or aggressive growth plan calling for heavy capital investment and rapidgrowth of existing markets.
2. A normal growth plan in which the division grows with its markets but not signifi-cantly at the expense of its competitors.
3. A plan of retrenchment if the firm’s markets contract. This is planning for lean eco-nomic times.
Of course, the planners might also want to look at the opportunities and costs ofmoving into a wholly new area where the company may be able to exploit some of itsexisting strengths. Often they may recommend entering a market for “strategic” rea-sons—that is, not because the immediate investment has a positive net present value,but because it establishes the firm in a new market and creates options for possiblyvaluable follow-up investments.
As an example, think of the decision by IBM to acquire Lotus Corporation for $3.3billion. Lotus added less than $1 billion of revenues, but Lotus with its Notes softwarehas considerable experience in helping computers talk to each other. This know-howgives IBM an option to produce and market new products in the future.
Because the firm’s future is likely to depend on the options that it acquires today, wewould expect planners to take a particular interest in these options.
In the simplest plans, capital expenditures might be forecast to grow in proportion tosales. In even moderately sophisticated models, however, the need for additional in-vestments will recognize the firm’s ability to use its fixed assets at varying levels of in-tensity by adjusting overtime or by adding additional shifts. Similarly, the plan will alertthe firm to needs for additional investments in working capital. For example, if sales areforecast to increase, the firm should plan to increase inventory levels and should expectan increase in accounts receivable.
PLANNING HORIZONTime horizon for a financialplan.
84 SECTION ONE
Most plans also contain a summary of planned financing. This part of the planshould logically include a discussion of dividend policy, because the more the firm paysout, the more capital it will need to find from sources other than retained earnings.
Some firms need to worry much more than others about raising money. A firm withlimited investment opportunities, ample operating cash flow, and a moderate dividendpayout accumulates considerable “financial slack” in the form of liquid assets and un-used borrowing power. Life is relatively easy for the managers of such firms, and theirfinancing plans are routine. Whether that easy life is in the interests of their stockhold-ers is another matter.
Other firms have to raise capital by selling securities. Naturally, they give careful at-tention to planning the kinds of securities to be sold and the timing of the offerings. Theplan might specify bank borrowing, debt issues, equity issues, or other means to raisecapital.
FINANCIAL PLANNING IS NOT JUST FORECASTING
Forecasting concentrates on the most likely future outcome. But financial planners arenot concerned solely with forecasting. They need to worry about unlikely events as wellas likely ones. If you think ahead about what could go wrong, then you are less likelyto ignore the danger signals and you can react faster to trouble.
Companies have developed a number of ways of asking “what-if ” questions aboutboth their projects and the overall firm. Often planners work through the consequencesof the plan under the most likely set of circumstances and then use sensitivity analysisto vary the assumptions one at a time. For example, they might look at what would hap-pen if a policy of aggressive growth coincided with a recession. Companies using sce-nario analysis might look at the consequences of each business plan under differentplausible scenarios in which several assumptions are varied at once. For example, onescenario might envisage high interest rates contributing to a slowdown in world eco-nomic growth and lower commodity prices. A second scenario might involve a buoyantdomestic economy, high inflation, and a weak currency. The nearby box describes howGeorgia Power Company used scenario analysis to help develop its business plans.
THREE REQUIREMENTS FOR EFFECTIVE PLANNING
Forecasting. The firm will never have perfectly accurate forecasts. If it did, therewould be less need for planning. Still, managers must strive for the best forecasts possible.
Forecasting should not be reduced to a mechanical exercise. Naiveextrapolation or fitting trends to past data is of limited value. Planning isneeded because the future is not likely to resemble the past.
Financial plans help managers ensure that their financing strategies areconsistent with their capital budgets. They highlight the financing decisionsnecessary to support the firm’s production and investment goals.
SEE BOX
FINANCE IN ACTION
Do not forecast in a vacuum. By this we mean that your forecasts should recognizethat your competitors are developing their own plans. For example, your ability to im-plement an aggressive growth plan and increase market share depends on what the com-petition is likely to do. So try putting yourself in the competition’s shoes and think howthey are likely to behave. Of course, if your competitors are also trying to guess yourmovements, you may need the skills of a good poker player to outguess them. For ex-ample, Boeing and Airbus both have schemes to develop new super-jumbo jets. Butsince there isn’t room for two producers, the companies have been engaging in a gameof bluff and counterbluff.
Planners draw on information from many sources. Therefore, inconsistency may bea problem. For example, forecast sales may be the sum of separate forecasts made bymany product managers, each of whom may make different assumptions about infla-tion, growth of the national economy, availability of raw materials, and so on. In suchcases, it makes sense to ask individuals for forecasts based on a common set of macro-economic assumptions.
Choosing the Optimal Financial Plan. In the end, the financial manager has tochoose which plan is best. We would like to tell you exactly how to make this choice.Unfortunately, we can’t. There is no model or procedure that encompasses all the com-plexity and intangibles encountered in financial planning.
85
Contingency Planning at Georgia Power Company
The oil price hikes in 1973–1974 and 1979 caused con-sternation in the planning departments of electric utili-ties. Planners, who had assumed a steady growth in en-ergy usage and prices, found that assumption could nolonger be relied on.
The planning department of the Georgia PowerCompany responded by developing a number of possi-ble scenarios and exploring their implications for Geor-gia Power’s business over the following 10 years. Inplanning for the future, the company was not simply in-terested in the most likely outcome; it also needed todevelop contingency plans to cover any unexpectedoccurrences.
Georgia Power’s planning process involved threesteps: (1) identify the key factors affecting the com-pany’s prospects; (2) determine a range of plausibleoutcomes for each of these factors; and (3) considerwhether a favorable outcome for one factor was likelyto be matched by a favorable outcome for the otherfactors.
This exercise generated three principal scenarios.For example, in the most rosy scenario, the growth ingross national product was expected to exceed 3.2
percent a year. This higher economic growth was likelyto be accompanied by high productivity growth andlower real interest rates as the baby boom generationmatured. However, high growth was also likely to meanthat economic prosperity would be more widely spread,so that the net migration to Georgia and the other sun-belt states was likely to decline. The average price of oilwould probably remain below $18 a barrel as the powerof OPEC weakened, and this would encourage industryto substitute oil for natural gas. The government waslikely to pursue a free-market energy policy, whichwould tend to keep the growth in electricity pricesbelow the rate of inflation.
Georgia Power’s planners explored the implicationsof each scenario for energy demand and the amount ofinvestment the company needed to make. That in turnallowed the financial managers to think about how thecompany could meet the possible demands for cash tofinance the new investment.
Source: Georgia Power Company’s use of scenario analysis is de-scribed in D. L. Goldfarb and W. R. Huss, “Building Scenarios for anElectric Utility,” Long Range Planning 21 (1988), pp. 78–85.
86 SECTION ONE
You sometimes hear managers state corporate goals in terms of accounting numbers.They might say, “We want a 25 percent return on book equity and a profit margin of 10percent.” On the surface such objectives don’t make sense. Shareholders want to bericher, not to have the satisfaction of a 10 percent profit margin. Also, a goal that isstated in terms of accounting ratios is not operational unless it is translated back intowhat that means for business decisions. For example, a higher profit margin can resultfrom higher prices, lower costs, a move into new, high-margin products, or taking overthe firm’s suppliers.1 Setting profit margin as a goal gives no guidance about which ofthese strategies is best.
So why do managers define objectives in this way? In part such goals may be a mu-tual exhortation to work harder, like singing the company song before work. But we sus-pect that managers are often using a code to communicate real concerns. For example,a target profit margin may be a way of saying that in pursuing sales growth the firm hasallowed costs to get out of control.
The danger is that everyone may forget the code and the accounting targets may beseen as goals in themselves.
Watching the Plan Unfold. Financial plans are out of date as soon as they are com-plete. Often they are out of date even earlier. For example, suppose that profits in thefirst year turn out to be 10 percent below forecast. What do you do with your plan?Scrap it and start again? Stick to your guns and hope profits will bounce back? Revisedown your profit forecasts for later years by 10 percent? A good financial plan shouldbe easy to adapt as events unfold and surprises occur.
Long-term plans can also be used as a benchmark to judge subsequent performanceas events unfold. But performance appraisals have little value unless you also take intoaccount the business background against which they were achieved. You are likely to bemuch less concerned if profits decline in a recession than if they decline when theeconomy is buoyant and your competitors’ sales are booming. If you know how a down-turn is likely to throw you off plan, then you have a standard to judge your performanceduring such a downturn and a better idea of what to do about it.
Financial Planning ModelsFinancial planners often use a financial planning model to help them explore the con-sequences of alternative financial strategies. These models range from simple models,such as the one presented later, to models that incorporate hundreds of equations.
Financial planning models support the financial planning process by making it easier and cheaper to construct forecast financial statements. The models automate animportant part of planning that would otherwise be boring, time-consuming, and labor-intensive.
Programming these financial planning models used to consume large amounts ofcomputer time and high-priced talent. These days standard spreadsheet programs suchas Microsoft Excel are regularly used to solve complex financial planning problems.
1 If you take over a supplier, total sales are not affected (to the extent that the supplier is selling to you), butyou capture both the supplier’s and your own profit margin.
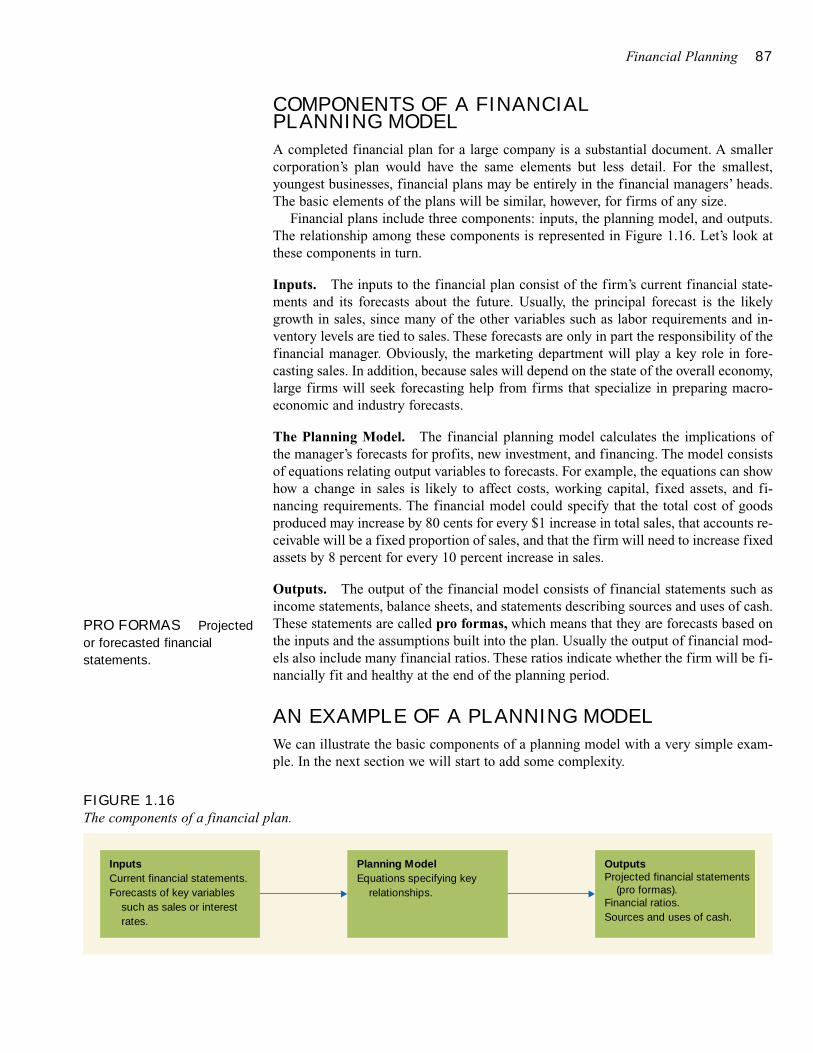
Financial Planning 87
COMPONENTS OF A FINANCIAL PLANNING MODEL
A completed financial plan for a large company is a substantial document. A smallercorporation’s plan would have the same elements but less detail. For the smallest,youngest businesses, financial plans may be entirely in the financial managers’ heads.The basic elements of the plans will be similar, however, for firms of any size.
Financial plans include three components: inputs, the planning model, and outputs.The relationship among these components is represented in Figure 1.16. Let’s look atthese components in turn.
Inputs. The inputs to the financial plan consist of the firm’s current financial state-ments and its forecasts about the future. Usually, the principal forecast is the likelygrowth in sales, since many of the other variables such as labor requirements and in-ventory levels are tied to sales. These forecasts are only in part the responsibility of thefinancial manager. Obviously, the marketing department will play a key role in fore-casting sales. In addition, because sales will depend on the state of the overall economy,large firms will seek forecasting help from firms that specialize in preparing macro-economic and industry forecasts.
The Planning Model. The financial planning model calculates the implications ofthe manager’s forecasts for profits, new investment, and financing. The model consistsof equations relating output variables to forecasts. For example, the equations can showhow a change in sales is likely to affect costs, working capital, fixed assets, and fi-nancing requirements. The financial model could specify that the total cost of goodsproduced may increase by 80 cents for every $1 increase in total sales, that accounts re-ceivable will be a fixed proportion of sales, and that the firm will need to increase fixedassets by 8 percent for every 10 percent increase in sales.
Outputs. The output of the financial model consists of financial statements such asincome statements, balance sheets, and statements describing sources and uses of cash.These statements are called pro formas, which means that they are forecasts based onthe inputs and the assumptions built into the plan. Usually the output of financial mod-els also include many financial ratios. These ratios indicate whether the firm will be fi-nancially fit and healthy at the end of the planning period.
AN EXAMPLE OF A PLANNING MODEL
We can illustrate the basic components of a planning model with a very simple exam-ple. In the next section we will start to add some complexity.
PRO FORMAS Projectedor forecasted financialstatements.
FIGURE 1.16The components of a financial plan.
OutputsProjected financial statements (pro formas).Financial ratios.Sources and uses of cash.
Planning ModelEquations specifying key relationships.
InputsCurrent financial statements.Forecasts of key variables such as sales or interest rates.
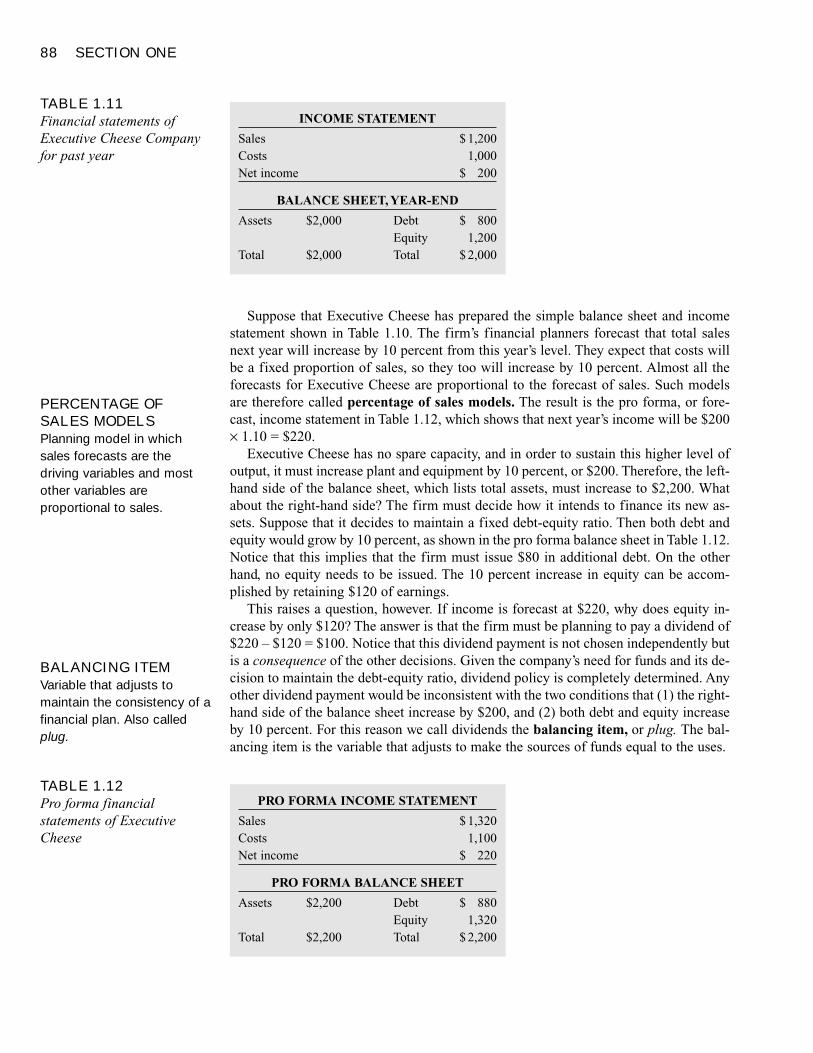
88 SECTION ONE
Suppose that Executive Cheese has prepared the simple balance sheet and incomestatement shown in Table 1.10. The firm’s financial planners forecast that total salesnext year will increase by 10 percent from this year’s level. They expect that costs willbe a fixed proportion of sales, so they too will increase by 10 percent. Almost all theforecasts for Executive Cheese are proportional to the forecast of sales. Such modelsare therefore called percentage of sales models. The result is the pro forma, or fore-cast, income statement in Table 1.12, which shows that next year’s income will be $200× 1.10 = $220.
Executive Cheese has no spare capacity, and in order to sustain this higher level ofoutput, it must increase plant and equipment by 10 percent, or $200. Therefore, the left-hand side of the balance sheet, which lists total assets, must increase to $2,200. Whatabout the right-hand side? The firm must decide how it intends to finance its new as-sets. Suppose that it decides to maintain a fixed debt-equity ratio. Then both debt andequity would grow by 10 percent, as shown in the pro forma balance sheet in Table 1.12.Notice that this implies that the firm must issue $80 in additional debt. On the otherhand, no equity needs to be issued. The 10 percent increase in equity can be accom-plished by retaining $120 of earnings.
This raises a question, however. If income is forecast at $220, why does equity in-crease by only $120? The answer is that the firm must be planning to pay a dividend of$220 – $120 = $100. Notice that this dividend payment is not chosen independently butis a consequence of the other decisions. Given the company’s need for funds and its de-cision to maintain the debt-equity ratio, dividend policy is completely determined. Anyother dividend payment would be inconsistent with the two conditions that (1) the right-hand side of the balance sheet increase by $200, and (2) both debt and equity increaseby 10 percent. For this reason we call dividends the balancing item, or plug. The bal-ancing item is the variable that adjusts to make the sources of funds equal to the uses.
TABLE 1.11Financial statements ofExecutive Cheese Companyfor past year
INCOME STATEMENT
Sales $ 1,200Costs 1,000Net income $ 200
BALANCE SHEET, YEAR-END
Assets $2,000 Debt $ 800Equity 1,200
Total $2,000 Total $ 2,000
TABLE 1.12Pro forma financialstatements of ExecutiveCheese
PRO FORMA INCOME STATEMENT
Sales $ 1,320Costs 1,100Net income $ 220
PRO FORMA BALANCE SHEET
Assets $2,200 Debt $ 880Equity 1,320
Total $2,200 Total $ 2,200
PERCENTAGE OFSALES MODELSPlanning model in whichsales forecasts are thedriving variables and mostother variables areproportional to sales.
BALANCING ITEMVariable that adjusts tomaintain the consistency of afinancial plan. Also calledplug.
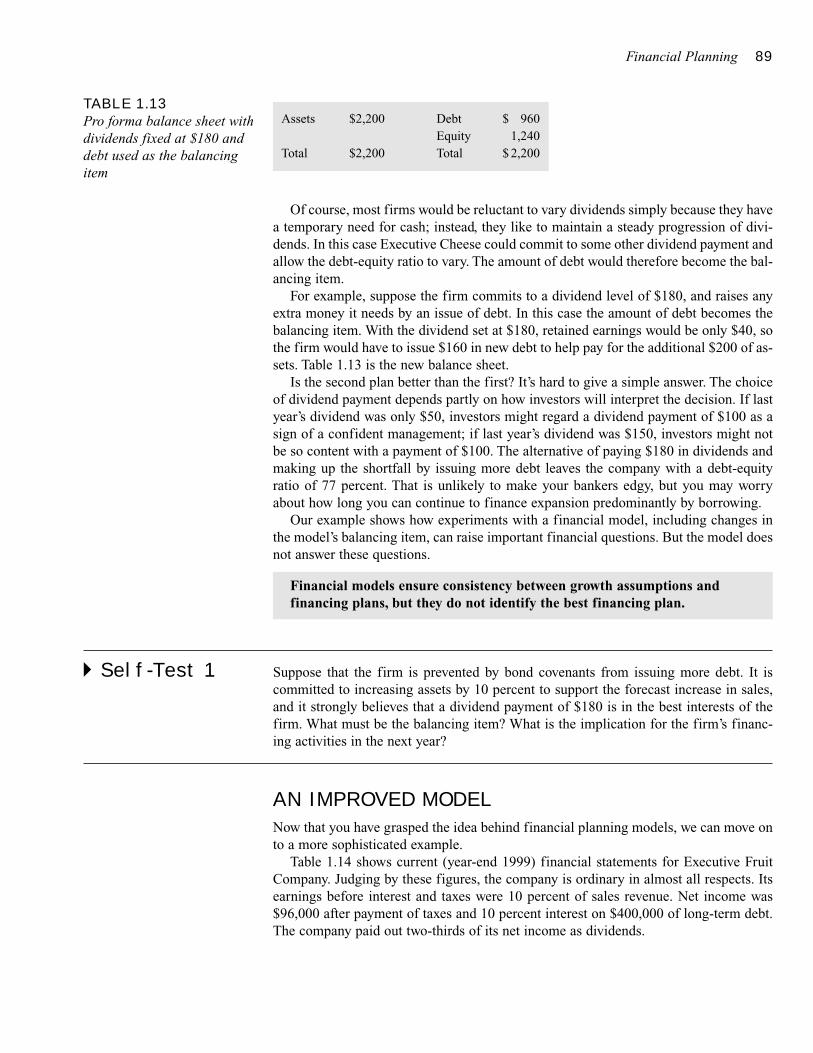
Financial Planning 89
Of course, most firms would be reluctant to vary dividends simply because they havea temporary need for cash; instead, they like to maintain a steady progression of divi-dends. In this case Executive Cheese could commit to some other dividend payment andallow the debt-equity ratio to vary. The amount of debt would therefore become the bal-ancing item.
For example, suppose the firm commits to a dividend level of $180, and raises anyextra money it needs by an issue of debt. In this case the amount of debt becomes thebalancing item. With the dividend set at $180, retained earnings would be only $40, sothe firm would have to issue $160 in new debt to help pay for the additional $200 of as-sets. Table 1.13 is the new balance sheet.
Is the second plan better than the first? It’s hard to give a simple answer. The choiceof dividend payment depends partly on how investors will interpret the decision. If lastyear’s dividend was only $50, investors might regard a dividend payment of $100 as asign of a confident management; if last year’s dividend was $150, investors might notbe so content with a payment of $100. The alternative of paying $180 in dividends andmaking up the shortfall by issuing more debt leaves the company with a debt-equityratio of 77 percent. That is unlikely to make your bankers edgy, but you may worryabout how long you can continue to finance expansion predominantly by borrowing.
Our example shows how experiments with a financial model, including changes inthe model’s balancing item, can raise important financial questions. But the model doesnot answer these questions.
� Self-Test 1 Suppose that the firm is prevented by bond covenants from issuing more debt. It iscommitted to increasing assets by 10 percent to support the forecast increase in sales,and it strongly believes that a dividend payment of $180 is in the best interests of thefirm. What must be the balancing item? What is the implication for the firm’s financ-ing activities in the next year?
AN IMPROVED MODEL
Now that you have grasped the idea behind financial planning models, we can move onto a more sophisticated example.
Table 1.14 shows current (year-end 1999) financial statements for Executive FruitCompany. Judging by these figures, the company is ordinary in almost all respects. Itsearnings before interest and taxes were 10 percent of sales revenue. Net income was$96,000 after payment of taxes and 10 percent interest on $400,000 of long-term debt.The company paid out two-thirds of its net income as dividends.
Financial models ensure consistency between growth assumptions andfinancing plans, but they do not identify the best financing plan.
TABLE 1.13Pro forma balance sheet withdividends fixed at $180 anddebt used as the balancingitem
Assets $2,200 Debt $ 960Equity 1,240
Total $2,200 Total $ 2,200
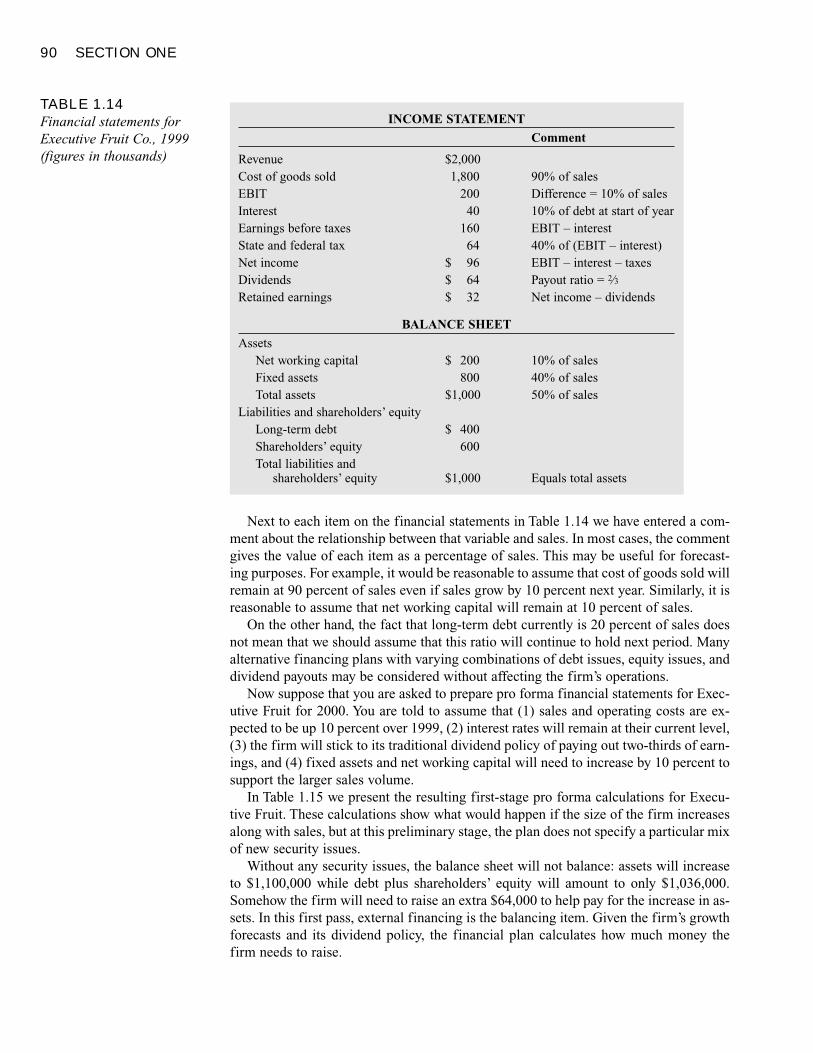
90 SECTION ONE
Next to each item on the financial statements in Table 1.14 we have entered a com-ment about the relationship between that variable and sales. In most cases, the commentgives the value of each item as a percentage of sales. This may be useful for forecast-ing purposes. For example, it would be reasonable to assume that cost of goods sold willremain at 90 percent of sales even if sales grow by 10 percent next year. Similarly, it isreasonable to assume that net working capital will remain at 10 percent of sales.
On the other hand, the fact that long-term debt currently is 20 percent of sales doesnot mean that we should assume that this ratio will continue to hold next period. Manyalternative financing plans with varying combinations of debt issues, equity issues, anddividend payouts may be considered without affecting the firm’s operations.
Now suppose that you are asked to prepare pro forma financial statements for Exec-utive Fruit for 2000. You are told to assume that (1) sales and operating costs are ex-pected to be up 10 percent over 1999, (2) interest rates will remain at their current level,(3) the firm will stick to its traditional dividend policy of paying out two-thirds of earn-ings, and (4) fixed assets and net working capital will need to increase by 10 percent tosupport the larger sales volume.
In Table 1.15 we present the resulting first-stage pro forma calculations for Execu-tive Fruit. These calculations show what would happen if the size of the firm increasesalong with sales, but at this preliminary stage, the plan does not specify a particular mixof new security issues.
Without any security issues, the balance sheet will not balance: assets will increaseto $1,100,000 while debt plus shareholders’ equity will amount to only $1,036,000.Somehow the firm will need to raise an extra $64,000 to help pay for the increase in as-sets. In this first pass, external financing is the balancing item. Given the firm’s growthforecasts and its dividend policy, the financial plan calculates how much money thefirm needs to raise.
TABLE 1.14Financial statements forExecutive Fruit Co., 1999(figures in thousands)
INCOME STATEMENT
Comment
Revenue $2,000Cost of goods sold 1,800 90% of salesEBIT 200 Difference = 10% of salesInterest 40 10% of debt at start of yearEarnings before taxes 160 EBIT – interestState and federal tax 64 40% of (EBIT – interest)Net income $ 96 EBIT – interest – taxesDividends $ 64 Payout ratio = 2⁄3Retained earnings $ 32 Net income – dividends
BALANCE SHEET
AssetsNet working capital $ 200 10% of salesFixed assets 800 40% of salesTotal assets $1,000 50% of sales
Liabilities and shareholders’ equityLong-term debt $ 400Shareholders’ equity 600Total liabilities and
shareholders’ equity $1,000 Equals total assets
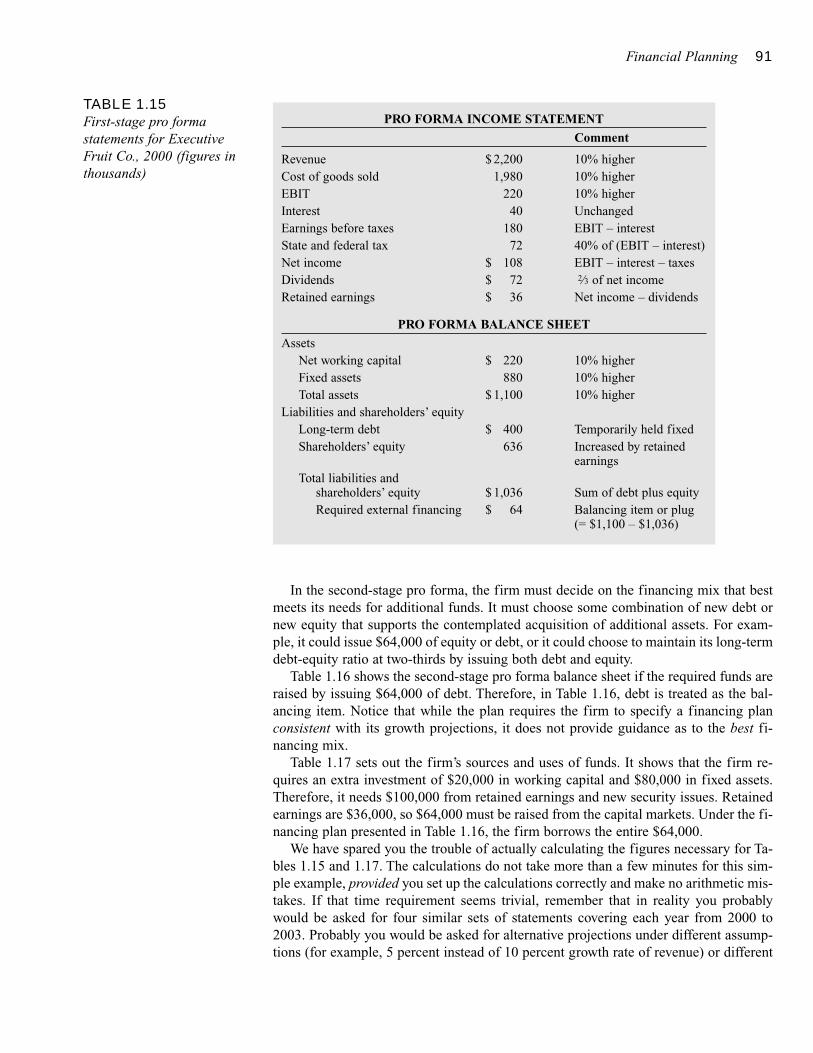
Financial Planning 91
In the second-stage pro forma, the firm must decide on the financing mix that bestmeets its needs for additional funds. It must choose some combination of new debt ornew equity that supports the contemplated acquisition of additional assets. For exam-ple, it could issue $64,000 of equity or debt, or it could choose to maintain its long-termdebt-equity ratio at two-thirds by issuing both debt and equity.
Table 1.16 shows the second-stage pro forma balance sheet if the required funds areraised by issuing $64,000 of debt. Therefore, in Table 1.16, debt is treated as the bal-ancing item. Notice that while the plan requires the firm to specify a financing planconsistent with its growth projections, it does not provide guidance as to the best fi-nancing mix.
Table 1.17 sets out the firm’s sources and uses of funds. It shows that the firm re-quires an extra investment of $20,000 in working capital and $80,000 in fixed assets.Therefore, it needs $100,000 from retained earnings and new security issues. Retainedearnings are $36,000, so $64,000 must be raised from the capital markets. Under the fi-nancing plan presented in Table 1.16, the firm borrows the entire $64,000.
We have spared you the trouble of actually calculating the figures necessary for Ta-bles 1.15 and 1.17. The calculations do not take more than a few minutes for this sim-ple example, provided you set up the calculations correctly and make no arithmetic mis-takes. If that time requirement seems trivial, remember that in reality you probablywould be asked for four similar sets of statements covering each year from 2000 to2003. Probably you would be asked for alternative projections under different assump-tions (for example, 5 percent instead of 10 percent growth rate of revenue) or different
TABLE 1.15First-stage pro formastatements for ExecutiveFruit Co., 2000 (figures inthousands)
PRO FORMA INCOME STATEMENT
Comment
Revenue $ 2,200 10% higherCost of goods sold 1,980 10% higherEBIT 220 10% higherInterest 40 UnchangedEarnings before taxes 180 EBIT – interestState and federal tax 72 40% of (EBIT – interest)Net income $ 108 EBIT – interest – taxesDividends $ 72 2⁄3 of net incomeRetained earnings $ 36 Net income – dividends
PRO FORMA BALANCE SHEET
AssetsNet working capital $ 220 10% higherFixed assets 880 10% higherTotal assets $ 1,100 10% higher
Liabilities and shareholders’ equityLong-term debt $ 400 Temporarily held fixedShareholders’ equity 636 Increased by retained
earningsTotal liabilities and
shareholders’ equity $ 1,036 Sum of debt plus equityRequired external financing $ 64 Balancing item or plug
(= $1,100 – $1,036)
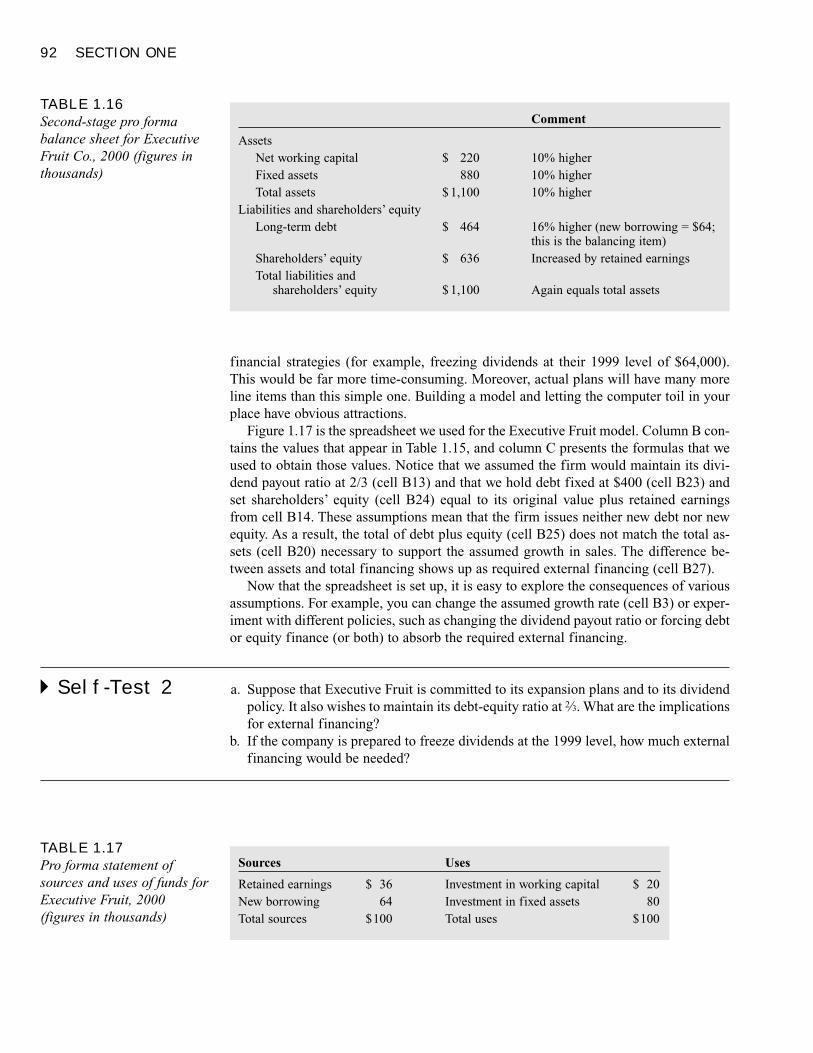
92 SECTION ONE
financial strategies (for example, freezing dividends at their 1999 level of $64,000).This would be far more time-consuming. Moreover, actual plans will have many moreline items than this simple one. Building a model and letting the computer toil in yourplace have obvious attractions.
Figure 1.17 is the spreadsheet we used for the Executive Fruit model. Column B con-tains the values that appear in Table 1.15, and column C presents the formulas that weused to obtain those values. Notice that we assumed the firm would maintain its divi-dend payout ratio at 2/3 (cell B13) and that we hold debt fixed at $400 (cell B23) andset shareholders’ equity (cell B24) equal to its original value plus retained earningsfrom cell B14. These assumptions mean that the firm issues neither new debt nor newequity. As a result, the total of debt plus equity (cell B25) does not match the total as-sets (cell B20) necessary to support the assumed growth in sales. The difference be-tween assets and total financing shows up as required external financing (cell B27).
Now that the spreadsheet is set up, it is easy to explore the consequences of variousassumptions. For example, you can change the assumed growth rate (cell B3) or exper-iment with different policies, such as changing the dividend payout ratio or forcing debtor equity finance (or both) to absorb the required external financing.
� Self-Test 2 a. Suppose that Executive Fruit is committed to its expansion plans and to its dividendpolicy. It also wishes to maintain its debt-equity ratio at 2⁄3. What are the implicationsfor external financing?
b. If the company is prepared to freeze dividends at the 1999 level, how much externalfinancing would be needed?
TABLE 1.17Pro forma statement ofsources and uses of funds forExecutive Fruit, 2000(figures in thousands)
Sources Uses
Retained earnings $ 36 Investment in working capital $ 20New borrowing 64 Investment in fixed assets 80Total sources $100 Total uses $100
TABLE 1.16Second-stage pro formabalance sheet for ExecutiveFruit Co., 2000 (figures inthousands)
Comment
AssetsNet working capital $ 220 10% higherFixed assets 880 10% higherTotal assets $ 1,100 10% higher
Liabilities and shareholders’ equityLong-term debt $ 464 16% higher (new borrowing = $64;
this is the balancing item)Shareholders’ equity $ 636 Increased by retained earningsTotal liabilities and
shareholders’ equity $ 1,100 Again equals total assets
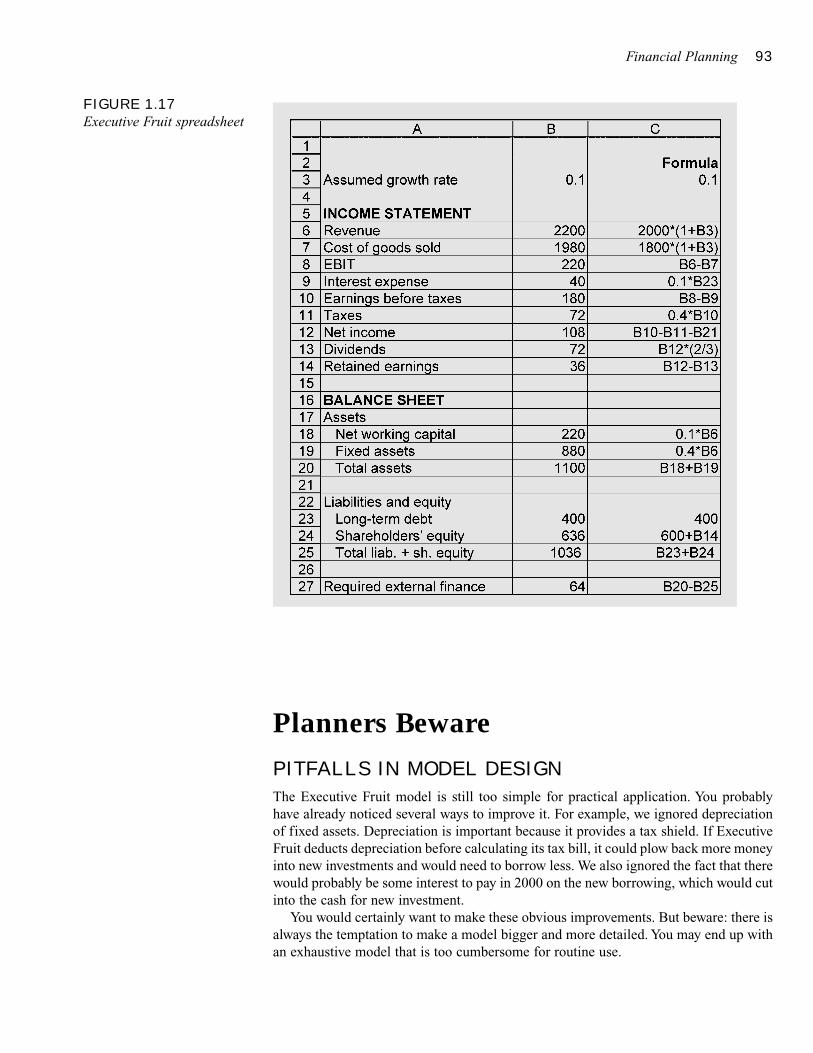
Financial Planning 93
Planners BewarePITFALLS IN MODEL DESIGN
The Executive Fruit model is still too simple for practical application. You probablyhave already noticed several ways to improve it. For example, we ignored depreciationof fixed assets. Depreciation is important because it provides a tax shield. If ExecutiveFruit deducts depreciation before calculating its tax bill, it could plow back more moneyinto new investments and would need to borrow less. We also ignored the fact that therewould probably be some interest to pay in 2000 on the new borrowing, which would cutinto the cash for new investment.
You would certainly want to make these obvious improvements. But beware: there isalways the temptation to make a model bigger and more detailed. You may end up withan exhaustive model that is too cumbersome for routine use.
FIGURE 1.17Executive Fruit spreadsheet
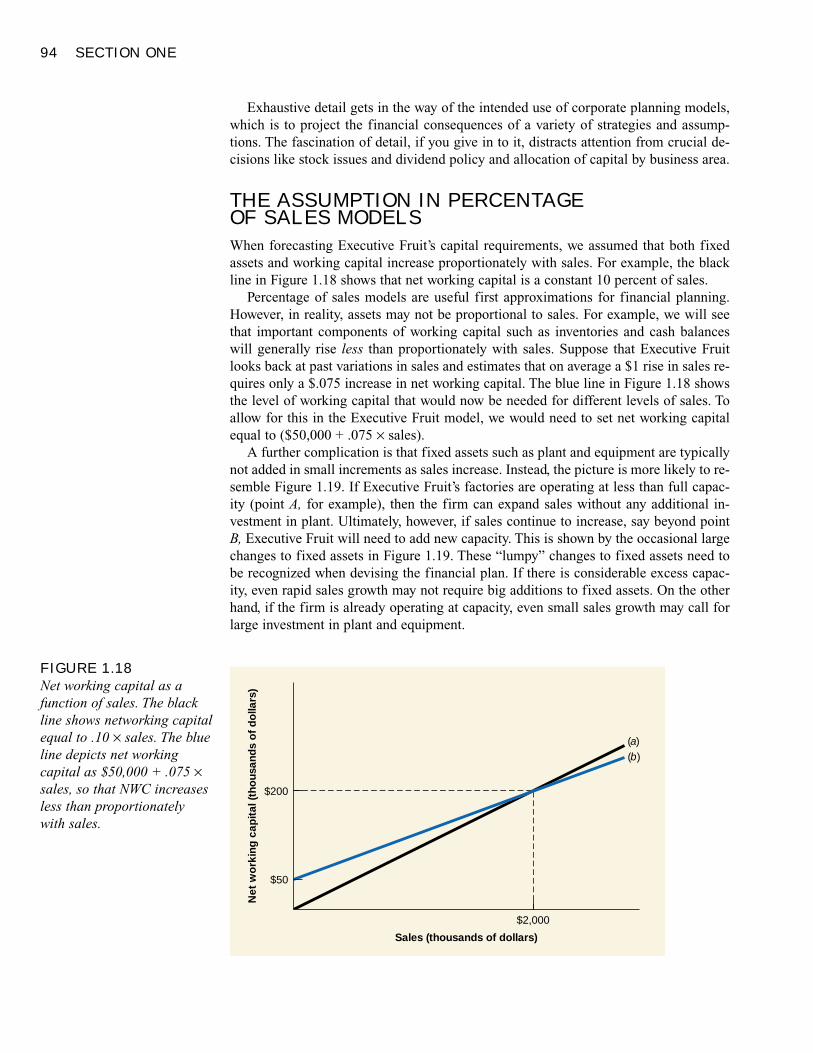
94 SECTION ONE
Exhaustive detail gets in the way of the intended use of corporate planning models,which is to project the financial consequences of a variety of strategies and assump-tions. The fascination of detail, if you give in to it, distracts attention from crucial de-cisions like stock issues and dividend policy and allocation of capital by business area.
THE ASSUMPTION IN PERCENTAGE OF SALES MODELS
When forecasting Executive Fruit’s capital requirements, we assumed that both fixedassets and working capital increase proportionately with sales. For example, the blackline in Figure 1.18 shows that net working capital is a constant 10 percent of sales.
Percentage of sales models are useful first approximations for financial planning.However, in reality, assets may not be proportional to sales. For example, we will seethat important components of working capital such as inventories and cash balanceswill generally rise less than proportionately with sales. Suppose that Executive Fruitlooks back at past variations in sales and estimates that on average a $1 rise in sales re-quires only a $.075 increase in net working capital. The blue line in Figure 1.18 showsthe level of working capital that would now be needed for different levels of sales. Toallow for this in the Executive Fruit model, we would need to set net working capitalequal to ($50,000 + .075 × sales).
A further complication is that fixed assets such as plant and equipment are typicallynot added in small increments as sales increase. Instead, the picture is more likely to re-semble Figure 1.19. If Executive Fruit’s factories are operating at less than full capac-ity (point A, for example), then the firm can expand sales without any additional in-vestment in plant. Ultimately, however, if sales continue to increase, say beyond pointB, Executive Fruit will need to add new capacity. This is shown by the occasional largechanges to fixed assets in Figure 1.19. These “lumpy” changes to fixed assets need tobe recognized when devising the financial plan. If there is considerable excess capac-ity, even rapid sales growth may not require big additions to fixed assets. On the otherhand, if the firm is already operating at capacity, even small sales growth may call forlarge investment in plant and equipment.
FIGURE 1.18Net working capital as afunction of sales. The blackline shows networking capitalequal to .10 × sales. The blueline depicts net workingcapital as $50,000 + .075 ×sales, so that NWC increasesless than proportionatelywith sales.
Sales (thousands of dollars)
Net
wo
rkin
g c
apit
al (t
hous
and
s o
f d
olla
rs)
$200
(b)(a)
$50
$2,000
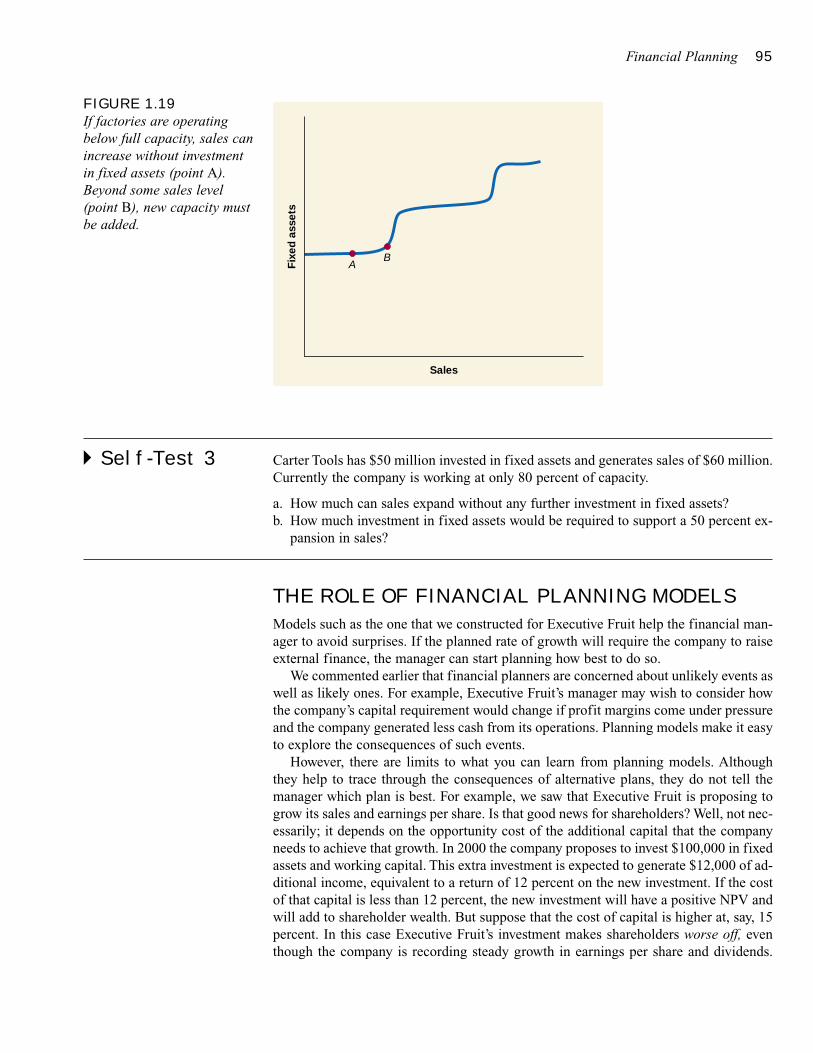
Financial Planning 95
� Self-Test 3 Carter Tools has $50 million invested in fixed assets and generates sales of $60 million.Currently the company is working at only 80 percent of capacity.
a. How much can sales expand without any further investment in fixed assets?b. How much investment in fixed assets would be required to support a 50 percent ex-
pansion in sales?
THE ROLE OF FINANCIAL PLANNING MODELS
Models such as the one that we constructed for Executive Fruit help the financial man-ager to avoid surprises. If the planned rate of growth will require the company to raiseexternal finance, the manager can start planning how best to do so.
We commented earlier that financial planners are concerned about unlikely events aswell as likely ones. For example, Executive Fruit’s manager may wish to consider howthe company’s capital requirement would change if profit margins come under pressureand the company generated less cash from its operations. Planning models make it easyto explore the consequences of such events.
However, there are limits to what you can learn from planning models. Althoughthey help to trace through the consequences of alternative plans, they do not tell themanager which plan is best. For example, we saw that Executive Fruit is proposing togrow its sales and earnings per share. Is that good news for shareholders? Well, not nec-essarily; it depends on the opportunity cost of the additional capital that the companyneeds to achieve that growth. In 2000 the company proposes to invest $100,000 in fixedassets and working capital. This extra investment is expected to generate $12,000 of ad-ditional income, equivalent to a return of 12 percent on the new investment. If the costof that capital is less than 12 percent, the new investment will have a positive NPV andwill add to shareholder wealth. But suppose that the cost of capital is higher at, say, 15percent. In this case Executive Fruit’s investment makes shareholders worse off, eventhough the company is recording steady growth in earnings per share and dividends.
FIGURE 1.19If factories are operatingbelow full capacity, sales canincrease without investmentin fixed assets (point A).Beyond some sales level(point B), new capacity mustbe added.
Sales
AB
Fixe
d a
sset
s
96 SECTION ONE
Executive Fruit’s planning model tells us how much money the firm must raise to fundthe planned growth, but it cannot tell us whether that growth contributes to shareholdervalue. Nor can it tell us whether the company should raise the cash by issuing new debtor equity.
� Self-Test 4 Which of the following questions will a financial plan help to answer?
a. Is the firm’s assumption for asset growth consistent with its plans for debt and eq-uity issues and dividend policy?
b. Will accounts receivable increase in direct proportion to sales?c. Will the contemplated debt-equity mix maximize the value of the firm?
External Financing and GrowthFinancial plans force managers to be consistent in their goals for growth, investments,and financing. The nearby box describes how one company was brought to its kneeswhen it did not plan sufficiently for the cash that would be required to support its am-bitions.
Financial models, such as the one that we have developed for Executive Fruit, canhelp managers trace through the financial consequences of their growth plans and avoidsuch disasters. But there is a danger that the complexities of a full-blown financialmodel can obscure the basic issues. Therefore, managers also use some simple rules ofthumb to draw out the relationship between a firm’s growth objectives and its require-ment for external financing.
Recall that in 1999 Executive Fruit started the year with $1,000,000 of fixed assetsand net working capital, and it had $2,000,000 of sales. In other words, each dollar ofsales required $.50 of net assets. The company forecasts that sales next year will in-crease by $200,000. Therefore, if the ratio of sales to net assets remains constant, assetswill need to rise by .50 × 200,000 = $100,000.2 Part of this increase can be financed byretained earnings, which are forecast to be $36,000. So the amount of external financeneeded is
Required external financing = (sales/net assets) × increase in sales – retained earnings
= (.50 × 200,000) – 36,000 = $64,000
Sometimes it is useful to write this calculation in terms of growth rates. ExecutiveFruit’s forecasted increase in sales is equivalent to a rise of 10 percent. So, if net assetsare a constant proportion of sales, the higher sales volume will also require a 10 per-cent addition to net assets. Thus
New investment = growth rate × initial assets
$100,000 = .10 × $1,000,000
Part of the funds to pay for the new assets is provided by retained earnings. The re-mainder must come from external financing. Therefore,
2 However, remember our earlier warning that the ratio of saIes to net assets may change as the firm grows.
SEE BOX
FINANCE IN ACTION
Required external financing = new investment – retained earnings
= (growth rate � assets) – retained earnings
This simple equation highlights that the amount of external financing depends on thefirm’s projected growth. The faster the firm grows, the more it needs to invest and there-fore the more it needs to raise new capital.
In the case of Executive Fruit,
Required external financing = (.10 × $1,000,000) – $36,000
= $100,000 – $36,000
= $64,000
If Executive Fruit’s assets remain a constant percentage of sales, then the companyneeds to raise $64,000 to produce a 10 percent addition to sales.
The sloping line in Figure 1.20 illustrates how required external financing increaseswith the growth rate. At low growth rates, the firm generates more funds than necessaryfor expansion. In this sense, its requirement for further external funds is negative. It may
97
The Bankruptcy of W.T. Grant: A Failure in Planning
W.T. Grant was the largest and one of the most suc-cessful department store chains in the United Stateswith 1,200 stores, 83,000 employees, and $1.8 billion ofsales. Yet in 1975 the company filed for bankruptcy, inwhat Business Week termed “the most significant bank-ruptcy in U.S. history.”
The seeds of Grant’s difficulties were sown in themid-1960s when the company foresaw a shift in shop-ping habits from inner-city areas to out-of-town cen-ters. The company decided to embark on a rapid ex-pansion policy that involved opening up new stores insuburban areas. In addition to making a substantial in-vestment in new buildings, the company needed to en-sure that the new stores were stocked with merchan-dise and it encouraged customers by extending creditmore freely. As a result, the company’s investment in in-ventories and receivables more than doubled between1967 and 1974.
W.T. Grant’s expansion plan led to impressivegrowth. Sales grew from $900 million in 1967 to $1.8billion in 1974. For a while profits also boomed, grow-ing from $63 million in 1967 to a peak of $90 million in1970. Shareholders were delighted. By 1971 the shareprice had reached a high of $71, up from $20 in 1967.
To achieve the growth in sales, W.T. Grant needed toinvest a total of $650 million in fixed assets, inventories,and receivables. However, it takes time for new storesto reach full profitability, so while profits initially in-creased, the return on capital fell. At the same time, thecompany decided to increase its dividends in line withearnings. This meant that the bulk of the money to fi-nance the new investment had to be raised from thecapital market. W.T. Grant was reluctant to sell moreshares and chose instead to raise the money by issuingmore than $400 million of new debt.
By 1974 Grant’s debt-equity ratio had reached 1.8.This figure was high, but not alarmingly so. The problemwas that rapid expansion combined with recession hadbegun to eat into profits. Almost all the operating cashflows in 1974 were used to service the company’s debt.Yet the company insisted on maintaining the dividendon its common stock. Effectively, it was borrowing topay the dividend. By the next year, W.T. Grant could nolonger service its mountain of debt and had to seekpostponement of payments on a $600 million bankloan.
W.T. Grant’s failure was partly a failure of financialplanning. It did not recognize and plan for the hugecash drain involved in its expansion strategy.
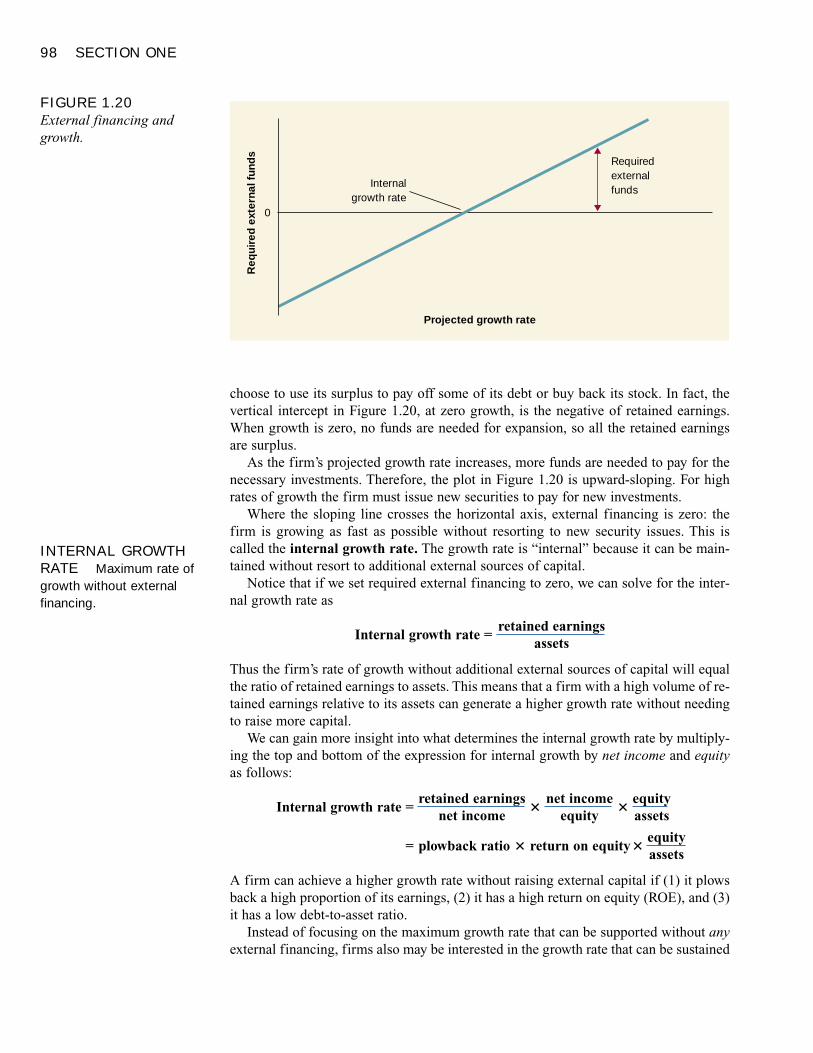
98 SECTION ONE
choose to use its surplus to pay off some of its debt or buy back its stock. In fact, thevertical intercept in Figure 1.20, at zero growth, is the negative of retained earnings.When growth is zero, no funds are needed for expansion, so all the retained earningsare surplus.
As the firm’s projected growth rate increases, more funds are needed to pay for thenecessary investments. Therefore, the plot in Figure 1.20 is upward-sloping. For highrates of growth the firm must issue new securities to pay for new investments.
Where the sloping line crosses the horizontal axis, external financing is zero: thefirm is growing as fast as possible without resorting to new security issues. This iscalled the internal growth rate. The growth rate is “internal” because it can be main-tained without resort to additional external sources of capital.
Notice that if we set required external financing to zero, we can solve for the inter-nal growth rate as
Internal growth rate =retained earnings
assets
Thus the firm’s rate of growth without additional external sources of capital will equalthe ratio of retained earnings to assets. This means that a firm with a high volume of re-tained earnings relative to its assets can generate a higher growth rate without needingto raise more capital.
We can gain more insight into what determines the internal growth rate by multiply-ing the top and bottom of the expression for internal growth by net income and equityas follows:
Internal growth rate =retained earnings
�net income
�equity
net income equity assets
= plowback ratio � return on equity�equityassets
A firm can achieve a higher growth rate without raising external capital if (1) it plowsback a high proportion of its earnings, (2) it has a high return on equity (ROE), and (3)it has a low debt-to-asset ratio.
Instead of focusing on the maximum growth rate that can be supported without anyexternal financing, firms also may be interested in the growth rate that can be sustained
INTERNAL GROWTHRATE Maximum rate ofgrowth without externalfinancing.
FIGURE 1.20External financing andgrowth.
Req
uire
d e
xter
nal f
und
s
Projected growth rate
0
Internalgrowth rate
Requiredexternalfunds
Financial Planning 99
without additional equity issues. Of course, if the firm is able to issue enough debt, vir-tually any growth rate can be financed. It makes more sense to assume that the firm hassettled on an optimal capital structure which it will maintain even as equity is aug-mented by retained earnings. The firm issues only enough debt to keep its debt-equityratio constant. The sustainable growth rate is the highest growth rate the firm canmaintain without increasing its financial leverage. It turns out that the sustainablegrowth rate depends only on the plowback ratio and return on equity:3
sustainable growth rate = plowback ratio � return on equity
� EXAMPLE 1 Internal and Sustainable Growth for Executive Fruit
Executive Fruit has chosen a plowback ratio of 1⁄3. Assume that equity outstanding atthe start of the year is 600, and that outstanding assets at the start of the year are 1,000.Because net income during 1999 is 96, Executive Fruit’s return on equity4 is ROE =96/600 = .16, and its ratio of equity to assets is 600/1,000 = .60. If it is unwilling to raisenew capital, its maximum growth rate is
Internal growth rate = plowback ratio × ROE × equityassets
=1 × .16 × .603
= .032, or 3.2%
This is much less than the 10 percent growth it projects, which explains its need for ex-ternal financing.
SUSTAINABLEGROWTH RATE Steadyrate at which a firm can growwithout changing leverage;plowback ratio × return onequity.
3 Here is a proof.
Required equity issues = growth rate × assets – retained earnings – new debt issues
We find the sustainable growth rate by setting required new equity issues to zero and solving for growth:
Sustainable growth rate =retained earnings + new debt issues
assets
=retained earnings + new debt issues
debt + equity
However, because both debt and equity are growing at the same rate, new debt issues must equal retainedearnings multiplied by the ratio of debt to equity, D/E. Therefore, we can write the sustainable growth rate as
Sustainable growth rate =retained earnings × (1 + D/E)
debt + equity
=retained earnings × (1 + D/E)
=retained earnings
equity × (1 + D/E) equity
=retained earnings × net income
= plowback × ROEnet income equity
4 Note that when we calculate internal or sustainable growth rates, ROE is properly measured by earnings asa proportion of equity at the start of the year rather than as a proportion of either end-of-year equity or theaverage of outstanding equity at the start and end of the year.
100 SECTION ONE
If Executive is prepared to maintain its current ratio of equity to total assets, it canissue an additional 40 cents of debt for every 60 cents of retained earnings. In this case,the maximum growth rate would be
Substainable growth rate = plowback ratio × ROE
=1 × .163
= .0533, or 5.33%
Executive’s planned growth rate of 10 percent requires not only new borrowing butan increase in the debt-equity ratio. In the long run the company will need to either issuenew equity or cut back its rate of growth.5
� Self-Test 5 Suppose Executive Fruit reduces the dividend payout ratio to 25 percent. Calculate itsgrowth rate assuming (a) that no new debt or equity will be issued and (b) that the firmmaintains its equity-to-asset ratio at .60.
SummaryWhat are the contents and uses of a financial plan?
Most firms take financial planning seriously and devote considerable resources to it. Thetangible product of the planning process is a financial plan describing the firm’s financialstrategy and projecting its future consequences by means of pro forma balance sheets,income statements, and statements of sources and uses of funds. The plan establishesfinancial goals and is a benchmark for evaluating subsequent performance. Usually it alsodescribes why that strategy was chosen and how the plan’s financial goals are to beachieved.
Planning, if it is done right, forces the financial manager to think about events that couldupset the firm’s progress and to devise strategies to be held in reserve for counterattackwhen unfortunate surprises occur. Planning is more than forecasting, because forecastingdeals with the most likely outcome. Planners also have to think about events that may occureven though they are unlikely.
In long-range, or strategic, planning, the planning horizon is usually 5 years or more.This kind of planning deals with aggregate decisions; for example, the planner would worryabout whether the broadax division should commit to heavy capital investment and rapidgrowth, but not whether the division should choose machine tool A versus tool B. In fact,planners must be constantly on guard against the fascination of detail, because giving in to itmeans slighting crucial issues like investment strategy, debt policy, and the choice of atarget dividend payout ratio.
5 As the firm issues more debt, its return on equity also changes. But Executive would need to have a veryhigh debt-equity ratio before it could support a growth rate of 10 percent a year and maintain a constant debtratio.
Financial Planning 101
The plan is the end result. The process that produces the plan is valuable in its own right.Planning forces the financial manager to consider the combined effects of all the firm’sinvestment and financing decisions. This is important because these decisions interact andshould not be made independently.
How are financial planning models constructed?
There is no theory or model that leads straight to the optimal financial strategy.Consequently, financial planning proceeds by trial and error. Many different strategies maybe projected under a range of assumptions about the future before one strategy is finallychosen. The dozens of separate projections that may be made during this trial-and-errorprocess generate a heavy load of arithmetic and paperwork. Firms have responded bydeveloping corporate planning models to forecast the financial consequences of specifiedstrategies and assumptions about the future. One very simple starting point may be apercentage of sales model in which many key variables are assumed to be directlyproportional to sales. Planning models are efficient and widely used. But remember thatthere is not much finance in them. Their primary purpose is to produce accountingstatements. The models do not search for the best financial strategy, but only trace out theconsequences of a strategy specified by the model user.
What is the effect of growth on the need for external financing?
Higher growth rates will lead to greater need for investments in fixed assets and workingcapital. The internal growth rate is the maximum rate that the firm can grow if it reliesentirely on reinvested profits to finance its growth, that is, the maximum rate of growthwithout requiring external financing. The sustainable growth rate is the rate at which thefirm can grow without changing its leverage ratio.
www.business.gov/ Tax information for businesses as well as sources for start-ups to get help infinancial planning
www.dtonline.com/finance/bgother.htm Sources of funding for growthwww.dtonline.com/finance/bgdetcap.htm Determining capital needs
planning horizon percentage of sales models internal growth ratepro formas balancing item sustainable growth rate
1. Financial Planning. True or false? Explain.
a. Financial planning should attempt to minimize risk.b. The primary aim of financial planning is to obtain better forecasts of future cash flows
and earnings.c. Financial planning is necessary because financing and investment decisions interact and
should not be made independently.d. Firms’ planning horizons rarely exceed 3 years.e. Individual capital investment projects are not considered in a financial plan unless they
are very large.
Related WebLinks
Key Terms
Quiz
102 SECTION ONE
f. Financial planning requires accurate and consistent forecasting.g. Financial planning models should include as much detail as possible.
2. Financial Models. What are the dangers and disadvantages of using a financial model? Dis-cuss.
3. Using Financial Plans. Corporate financial plans are often used as a basis for judging sub-sequent performance. What can be learned from such comparisons? What problems mightarise and how might you cope with such problems?
4. Growth Rates. Find the sustainable and internal growth rates for a firm with the followingratios: asset turnover = 1.40; profit margin = 5 percent; payout ratio = 25 percent; equity/as-sets = .60.
5. Percentage of Sales Models. Percentage of sales models usually assume that costs, fixed as-sets, and working capital all increase at the same rate as sales. When do you think that theseassumptions do not make sense? Would you feel happier using a percentage of sales modelfor short-term or long-term planning?
6. Relationships among Variables. Comebaq Computers is aiming to increase its market shareby slashing the price of its new range of personal computers. Are costs and assets likely toincrease or decrease as a proportion of sales? Explain.
7. Balancing Items. What are the possible choices of balancing items when using a financialplanning model? Discuss whether some are generally preferable to others.
8. Financial Targets. Managers sometimes state a target growth rate for sales or earnings pershare. Do you think that either makes sense as a corporate goal? If not, why do you thinkthat managers focus on them?
9. Percentage of Sales Models. Here are the abbreviated financial statements for PlannersPeanuts:
INCOME STATEMENT, 2000
Sales $2,000Cost 1,500Net income $ 500
BALANCE SHEET, YEAR-END
1999 2000 1999 2000
Assets $2,500 $3,000 Debt $ 833 $1,000Equity 1,667 2,000
Total $2,500 $3,000 Total $ 2,500 $3,000
If sales increase by 20 percent in 2001, and the company uses a strict percentage of salesplanning model (meaning that all items on the income and balance sheet also increase by 20percent), what must be the balancing item? What will be its value?
10. Required External Financing. If the dividend payout ratio in problem 9 is fixed at 50 per-cent, calculate the required total external financing for growth rates in 2001 of 15 percent,20 percent, and 25 percent.
11. Feasible Growth Rates. What is the maximum possible growth rate for Planners Peanuts(see problem 9) if the payout ratio remains at 50 percent and
a. no external debt or equity is to be issuedb. the firm maintains a fixed debt ratio but issues no equity
PracticeProblems
Financial Planning 103
12. Using Percentage of Sales. Eagle Sports Supply has the following financial statements. As-sume that Eagle’s assets are proportional to its sales.
INCOME STATEMENT, 2000
Sales $950Costs 250EBIT 700Taxes 200Net income $500
BALANCE SHEET, YEAR-END
1999 2000 1999 2000
Assets $2,700 $3,000 Debt $ 900 $1,000Equity 1,800 2,000
Total $2,700 $3,000 Total $ 2,700 $3,000
a. Find Eagle’s required external funds if it maintains a dividend payout ratio of 60 percentand plans a growth rate of 15 percent in 2001.
b. If Eagle chooses not to issue new shares of stock, what variable must be the balancingitem? What will its value be?
c. Now suppose that the firm plans instead to increase long-term debt only to $1,100 anddoes not wish to issue any new shares of stock. Why must the dividend payment now bethe balancing item? What will its value be?
13. Feasible Growth Rates.
a. What is the internal growth rate of Eagle Sports (see problem 12) if the dividend payoutratio is fixed at 60 percent and the equity-to-asset ratio is fixed at 2⁄3?
b. What is the sustainable growth rate?
14. Building Financial Models. How would Executive Fruit’s financial model change if thedividend payout ratio were cut to 1⁄3? Use the revised model to generate a new financial planfor 2000 assuming that debt is the balancing item. Show how the financial statements givenin Table 1.16 would change. What would be required external financing?
15. Required External Financing. Executive Fruit’s financial manager believes that sales in2000 could rise by as much as 20 percent or by as little as 5 percent.
a. Recalculate the first-stage pro forma financial statements (Table 1.15) under these twoassumptions. How does the rate of growth in revenues affect the firm’s need for externalfunds?
b. Assume any required external funds will be raised by issuing long-term debt and that anysurplus funds will be used to retire such debt. Prepare the completed (second-stage) proforma balance sheet.
16. Building Financial Models. The following tables contain financial statements for Dynasta-tics Corporation. Although the company has not been growing, it now plans to expand andwill increase net fixed assets (that is, assets net of depreciation) by $200,000 per year for thenext 5 years and forecasts that the ratio of revenues to total assets will remain at 1.50. An-nual depreciation is 10 percent of net fixed assets at the start of the year. Fixed costs are ex-pected to remain at $56,000 and variable costs at 80 percent of revenue. The company’s pol-icy is to pay out two-thirds of net income as dividends and to maintain a book debt ratio of25 percent of total capital.
104 SECTION ONE
a. Produce a set of financial statements for 2001. Assume that net working capital will equal50 percent of fixed assets.
b. Now assume that the balancing item is debt, and that no equity is to be issued. Prepare acompleted pro forma balance sheet for 2001. What is the projected debt ratio for 2001?
INCOME STATEMENT, 2000(figures in thousands of dollars)
Revenue $1,800Fixed costs 56Variable costs (80% of revenue) 1,440Depreciation 80Interest (8% of beginning-of-year debt) 24Taxable income 200Taxes (at 40%) 80
Net income $ 120Dividends $80Retained earnings $40
BALANCE SHEET, YEAR-END(figures in thousands of dollars)
1999 2000
AssetsNet working capital $ 400 $ 400Fixed assets 800 800
Total assets $1,200 $1,200Liabilities and shareholders’ equity
Debt $ 300 $ 300Equity 900 900
Total liabilities andshareholders’ equity $1,200 $1,200
17. Sustainable Growth. Plank’s Plants had net income of $2,000 on sales of $40,000 last year.The firm paid a dividend of $500. Total assets were $100,000, of which $40,000 was fi-nanced by debt.
a. What is the firm’s sustainable growth rate?b. If the firm grows at its sustainable growth rate, how much debt will be issued next year?c. What would be the maximum possible growth rate if the firm did not issue any debt next
year?
18. Sustainable Growth. A firm has decided that its optimal capital structure is 100 percent eq-uity financed. It perceives its optimal dividend policy to be a 40 percent payout ratio. Assetturnover is sales/assets = .8, the profit margin is 10 percent, and the firm has a target growthrate of 5 percent.
a. Is the firm’s target growth rate consistent with its other goals?b. If not, by how much does it need to increase asset turnover to achieve its goals?c. How much would it need to increase the profit margin instead?
19. Internal Growth. Go Go Industries is growing at 30 percent per year. It is all-equity fi-nanced and has total assets of $1 million. Its return on equity is 20 percent. Its plowbackratio is 40 percent.
Financial Planning 105
a. What is the internal growth rate?b. What is the firm’s need for external financing this year?c. By how much would the firm increase its internal growth rate if it reduced its payout ratio
to zero?d. By how much would such a move reduce the need for external financing? What do you
conclude about the relationship between dividend policy and requirements for external fi-nancing?
20. Sustainable Growth. A firm’s profit margin is 10 percent and its asset turnover ratio is .5.It has no debt, has net income of $10 per share, and pays dividends of $4 per share. What isthe sustainable growth rate?
21. Internal Growth. An all-equity–financed firm plans to grow at an annual rate of at least 10percent. Its return on equity is 15 percent. What is the maximum possible dividend payoutrate the firm can maintain without resorting to additional equity issues?
22. Internal Growth. Suppose the firm in the previous question has a debt-equity ratio of 1⁄3.What is the maximum dividend payout ratio it can maintain without resorting to any exter-nal financing?
23. Internal Growth. A firm has an asset turnover ratio of 2.0. Its plowback ratio is 50 percent,and it is all-equity financed. What must its profit margin be if it wishes to finance 8 percentgrowth using only internally generated funds?
24. Internal Growth. If the profit margin of the firm in the previous problem is 6 percent, whatis the maximum payout ratio that will allow it to grow at 8 percent without resorting to ex-ternal financing?
25. Internal Growth. If the profit margin of the firm in problem 23 is 6 percent, what is themaximum possible growth rate that can be sustained without external financing?
26. Using Percentage of Sales. The 2000 financial statements for Growth Industries are pre-sented below. Sales and costs in 2001 are projected to be 20 percent higher than in 2000.Both current assets and accounts payable are projected to rise in proportion to sales. Thefirm is currently operating at full capacity, so it plans to increase fixed assets in proportionto sales. What external financing will be required by the firm? Interest expense in 2001 willequal 10 percent of long-term debt outstanding at the start of the year. The firm will main-tain a dividend payout ratio of .40.
INCOME STATEMENT, 2000
Sales $ 200,000Costs 150,000EBIT 50,000Interest expense 10,000Taxable income 40,000Taxes (at 35%) 14,000Net income $ 26,000
Dividends 10,400Retained earnings 15,600
106 SECTION ONE
BALANCE SHEET, YEAR-END, 2000
Assets Liabilities
Current assets Current liabilitiesCash $ 3,000 Accounts payable $ 10,000Accounts receivable 8,000 Total current liabilities 10,000Inventories 29,000 Long-term debt 100,000
Total current assets $ 40,000 Stockholders’ equityNet plant and equipment 160,000 Common stock plus
additional paid-in capital 15,000Retained earnings 75,000
Total liabilities plusTotal assets $200,000 stockholders’ equity $200,000
27. Capacity Use and External Financing. Now suppose that the fixed assets of Growth In-dustries (from the previous problem) are operating at only 75 percent of capacity. What isrequired external financing over the next year?
28. Capacity Use and External Financing. If Growth Industries from problem 26 is operatingat only 75 percent of capacity, how much can sales grow before the firm will need to raiseany external funds? Assume that once fixed assets are operating at capacity, they will needto grow thereafter in direct proportion to sales.
29. Internal Growth. For many firms, cash and inventory needs may grow less than propor-tionally with sales. When we recognize this fact, will the firm’s internal growth rate behigher or lower than the level predicted by the formula
Internal growth rate = retained earningsassets
30. Spreadsheet Problem. Use a spreadsheet like that in Figure 1.17 to answer the followingquestions about Executive Fruit:
a. What would be required external financing if the growth rate is 15 percent and the divi-dend payout ratio is 60 percent?
b. Given the assumptions in part (a), what would be the amount of debt and equity issued ifthe firm wants to maintain its debt-equity ratio at a level of 2/3?
c. What formulas would you put in cells C23 and C24 of the spreadsheet in Figure 1.17 tomaintain the debt-equity ratio at 2/3, while forcing the balance sheet to balance (that is,forcing debt + equity = total assets)?
1 The firm cannot issue debt, and its dividend payment is effectively fixed, which limits re-tained earnings to $40. Therefore, the balancing item must be new equity issues. The firmmust raise $200 – $40 = $160 through equity sales in order to finance its plans for $200 inasset acquisitions.
2 a. The total amount of external financing is unchanged, since the dividend payout is un-changed. The $100,000 increase in total assets will now be financed by a mixture of debtand equity. If the debt-equity ratio is to remain at 2⁄3, the firm will need to increase eq-uity by $60,000 and debt by $40,000. Since retained earnings already increase share-holders’ equity by $36,000, the firm needs to issue an additional $24,000 of new equityand $40,000 of debt.
Solutions toSelf-TestQuestions
ChallengeProblems
Financial Planning 107
b. If dividends are frozen at $64,000 instead of increasing to $72,000 as envisioned in Table1.15, then the required external funds fall by $8,000 to $56,000.
3 a. The company currently runs at 80 percent of capacity given the current level of fixed as-sets. Sales can increase until the company is at 100 percent of capacity; therefore, salescan increase to $60 million × (100/80) = $75 million.
b. If sales were to increase by 50 percent to $90 million, new fixed assets would need to beadded. The ratio of assets to sales when the company is operating at 100 percent of ca-pacity (from part a) is $50 million/$75 million = 2/3. Therefore, to support sales of $90million, the company needs at least $90 million × 2/3 = $60 million of fixed assets. Thiscalls for a $10 million investment in additional fixed assets.
4 a. This question is answered by the planning model. Given assumptions for asset growth,the model will show the need for external financing, and this value can be compared tothe firm’s plans for such financing.
b. Such a relationship may be assumed and built into the model. However, the model doesnot help to determine whether it is a reasonable assumption.
c. Financial models do not shed light on the best capital structure. They can tell us onlywhether contemplated financing decisions are consistent with asset growth.
5 a. If the payout ratio were reduced to 25 percent, the maximum growth rate assuming noexternal financing would be .75 × 16 percent × .6 = 7.2 percent.
b. If the firm also can issue enough debt to maintain its equity-to-asset ratio unchanged, thesustainable growth rate will be .75 × 16 percent = 12 percent.

ACCOUNTING AND FINANCE
FINANCIAL STATEMENT ANALYSIS
Appendix A

111
ACCOUNTING ANDFINANCE
A meeting of a corporation’s directors.Most large businesses are organized as corporations. Corporations are owned by stockholders,who vote in a board of directors. The directors appoint the corporation’s top executives andapprove major financial decisions.Comstock, Inc.
The Balance SheetBook Values and Market Values
The Income StatementProfits versus Cash Flow
The Statement of CashFlows
Accounting for Differences
TaxesCorporate Tax
Personal Tax
Summary
large corporation is a team effort. All the players—the shareholders,
lenders, directors, management, and employees—have a stake in the
company’s success and all therefore need to monitor its progress. For this
reason the company prepares regular financial accounts and arranges for an
independent firm of auditors to certify that these accounts present a “true and fair
view.”
Until the mid-nineteenth century most businesses were owner-managed and seldom re-
quired outside capital beyond personal loans to the proprietor. When businesses were
small and there were few outside stakeholders in the firm, accounting could be less for-
mal. But with the industrial revolution and the creation of large railroad and canal com-
panies, the shareholders and bankers demanded information that would help them gauge
a firm’s financial strength. That was when the accounting profession began to come of age.
We don’t want to discuss the details of accounting practice. But because we will be
referring to financial statements throughout this book, it may be useful to review briefly
their main features. In this material we introduce the major financial statements, the
balance sheet, the income statement, and the statement of cash flow. We discuss the im-
portant differences between income and cash flow and between book values and mar-
ket values. We also discuss the federal tax system.
After studying this material you should be able to
� Interpret the information contained in the balance sheet, income statement, and
statement of cash flows.
� Distinguish between market and book value.
� Explain why income differs from cash flow.
� Understand the essential features of the taxation of corporate and personal income.
112
A
The Balance SheetWe will look first at the balance sheet, which presents a snapshot of the firm’s assetsand the source of the money that was used to buy those assets. The assets are listed onthe left-hand side of the balance sheet. Some assets can be turned more easily into cashthan others; these are known as liquid assets. The accountant puts the most liquid assetsat the top of the list and works down to the least liquid.
Look, for example, at the left-hand column of Table A.1, the balance sheet for Pep-siCo, Inc., at the end of 1998. You can see that Pepsi had $311 + $83 = $394 million ofcash and marketable securities. In addition it had sold goods worth $2,453 million buthad not yet received payment. These payments are due soon and therefore the balancesheet shows the unpaid bills or accounts receivable (or simply receivables) as an asset.The next asset consists of inventories. These may be (1) raw materials and ingredientsthat the firm bought from suppliers, (2) work in process, and (3) finished products wait-ing to be shipped from the warehouse. Of course there are always some items that don’t
BALANCE SHEETFinancial statement thatshows the value of the firm’sassets and liabilities at aparticular time.
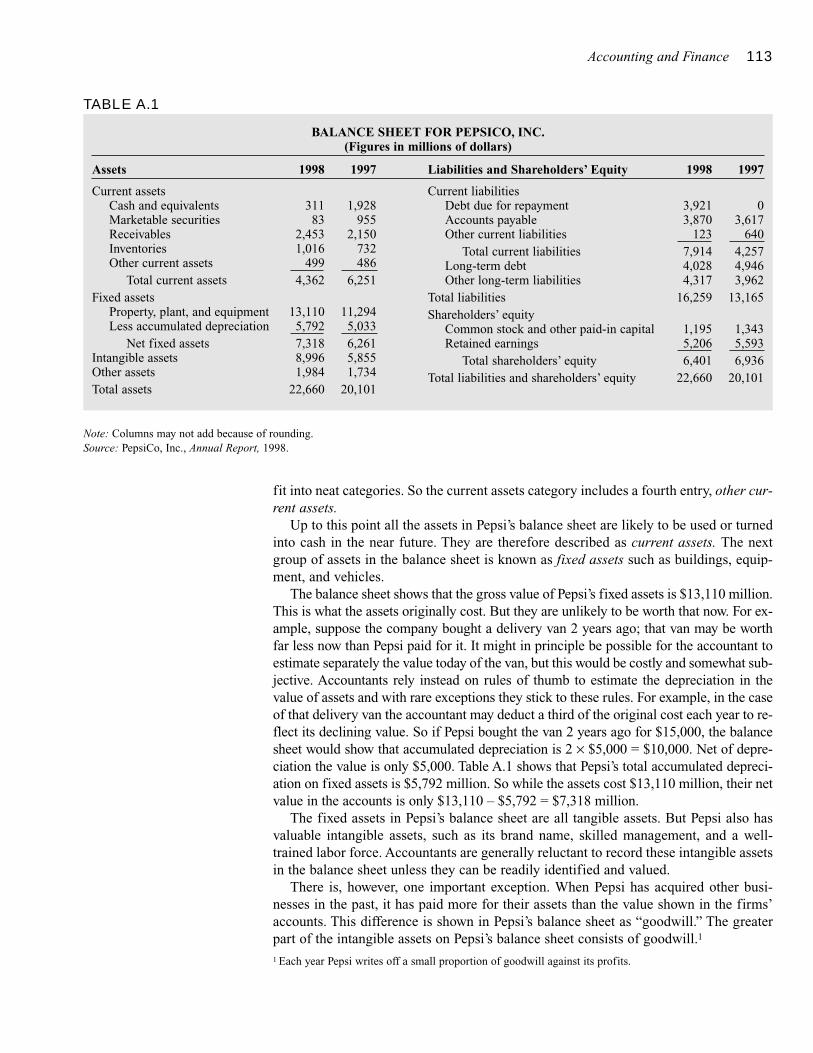
Accounting and Finance 113
fit into neat categories. So the current assets category includes a fourth entry, other cur-rent assets.
Up to this point all the assets in Pepsi’s balance sheet are likely to be used or turnedinto cash in the near future. They are therefore described as current assets. The nextgroup of assets in the balance sheet is known as fixed assets such as buildings, equip-ment, and vehicles.
The balance sheet shows that the gross value of Pepsi’s fixed assets is $13,110 million.This is what the assets originally cost. But they are unlikely to be worth that now. For ex-ample, suppose the company bought a delivery van 2 years ago; that van may be worthfar less now than Pepsi paid for it. It might in principle be possible for the accountant toestimate separately the value today of the van, but this would be costly and somewhat sub-jective. Accountants rely instead on rules of thumb to estimate the depreciation in thevalue of assets and with rare exceptions they stick to these rules. For example, in the caseof that delivery van the accountant may deduct a third of the original cost each year to re-flect its declining value. So if Pepsi bought the van 2 years ago for $15,000, the balancesheet would show that accumulated depreciation is 2 × $5,000 = $10,000. Net of depre-ciation the value is only $5,000. Table A.1 shows that Pepsi’s total accumulated depreci-ation on fixed assets is $5,792 million. So while the assets cost $13,110 million, their netvalue in the accounts is only $13,110 – $5,792 = $7,318 million.
The fixed assets in Pepsi’s balance sheet are all tangible assets. But Pepsi also hasvaluable intangible assets, such as its brand name, skilled management, and a well-trained labor force. Accountants are generally reluctant to record these intangible assetsin the balance sheet unless they can be readily identified and valued.
There is, however, one important exception. When Pepsi has acquired other busi-nesses in the past, it has paid more for their assets than the value shown in the firms’accounts. This difference is shown in Pepsi’s balance sheet as “goodwill.” The greaterpart of the intangible assets on Pepsi’s balance sheet consists of goodwill.1
TABLE A.1
BALANCE SHEET FOR PEPSICO, INC.(Figures in millions of dollars)
Assets 1998 1997
Current assetsCash and equivalents 311 1,928Marketable securities 83 955Receivables 2,453 2,150Inventories 1,016 732Other current assets 499 486
Total current assets 4,362 6,251Fixed assets
Property, plant, and equipment 13,110 11,294Less accumulated depreciation 5,792 5,033
Net fixed assets 7,318 6,261Intangible assets 8,996 5,855Other assets 1,984 1,734Total assets 22,660 20,101
Liabilities and Shareholders’ Equity 1998 1997
Current liabilitiesDebt due for repayment 3,921 0Accounts payable 3,870 3,617Other current liabilities 123 640
Total current liabilities 7,914 4,257Long-term debt 4,028 4,946Other long-term liabilities 4,317 3,962
Total liabilities 16,259 13,165Shareholders’ equity
Common stock and other paid-in capital 1,195 1,343Retained earnings 5,206 5,593
Total shareholders’ equity 6,401 6,936Total liabilities and shareholders’ equity 22,660 20,101
Note: Columns may not add because of rounding.Source: PepsiCo, Inc., Annual Report, 1998.
1 Each year Pepsi writes off a small proportion of goodwill against its profits.
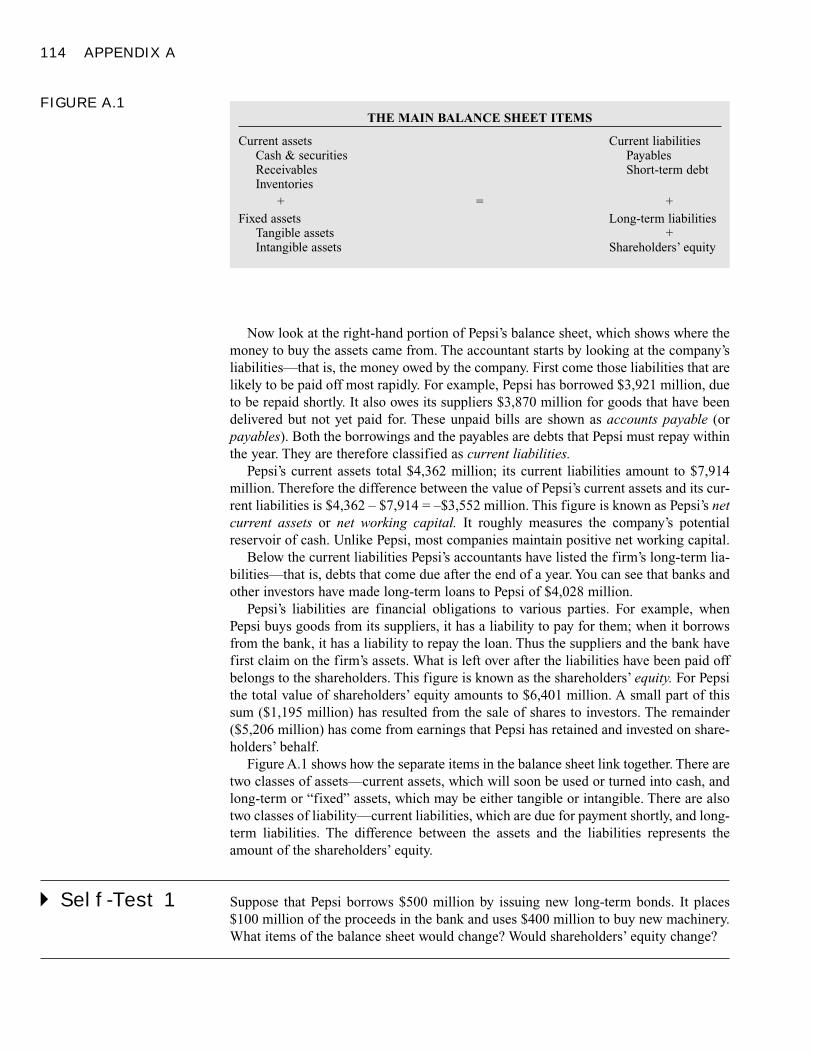
114 APPENDIX A
Now look at the right-hand portion of Pepsi’s balance sheet, which shows where themoney to buy the assets came from. The accountant starts by looking at the company’sliabilities—that is, the money owed by the company. First come those liabilities that arelikely to be paid off most rapidly. For example, Pepsi has borrowed $3,921 million, dueto be repaid shortly. It also owes its suppliers $3,870 million for goods that have beendelivered but not yet paid for. These unpaid bills are shown as accounts payable (orpayables). Both the borrowings and the payables are debts that Pepsi must repay withinthe year. They are therefore classified as current liabilities.
Pepsi’s current assets total $4,362 million; its current liabilities amount to $7,914million. Therefore the difference between the value of Pepsi’s current assets and its cur-rent liabilities is $4,362 – $7,914 = –$3,552 million. This figure is known as Pepsi’s netcurrent assets or net working capital. It roughly measures the company’s potentialreservoir of cash. Unlike Pepsi, most companies maintain positive net working capital.
Below the current liabilities Pepsi’s accountants have listed the firm’s long-term lia-bilities—that is, debts that come due after the end of a year. You can see that banks andother investors have made long-term loans to Pepsi of $4,028 million.
Pepsi’s liabilities are financial obligations to various parties. For example, whenPepsi buys goods from its suppliers, it has a liability to pay for them; when it borrowsfrom the bank, it has a liability to repay the loan. Thus the suppliers and the bank havefirst claim on the firm’s assets. What is left over after the liabilities have been paid offbelongs to the shareholders. This figure is known as the shareholders’ equity. For Pepsithe total value of shareholders’ equity amounts to $6,401 million. A small part of thissum ($1,195 million) has resulted from the sale of shares to investors. The remainder($5,206 million) has come from earnings that Pepsi has retained and invested on share-holders’ behalf.
Figure A.1 shows how the separate items in the balance sheet link together. There aretwo classes of assets—current assets, which will soon be used or turned into cash, andlong-term or “fixed” assets, which may be either tangible or intangible. There are alsotwo classes of liability—current liabilities, which are due for payment shortly, and long-term liabilities. The difference between the assets and the liabilities represents theamount of the shareholders’ equity.
� Self-Test 1 Suppose that Pepsi borrows $500 million by issuing new long-term bonds. It places$100 million of the proceeds in the bank and uses $400 million to buy new machinery.What items of the balance sheet would change? Would shareholders’ equity change?
FIGURE A.1THE MAIN BALANCE SHEET ITEMS
Current assets Current liabilitiesCash & securities PayablesReceivables Short-term debtInventories
+ = +Fixed assets Long-term liabilities
Tangible assets +Intangible assets Shareholders’ equity
Accounting and Finance 115
BOOK VALUES AND MARKET VALUES
Throughout this material we will frequently make a distinction between the book val-ues of the assets shown in the balance sheet and their market values.
Items in the balance sheet are valued according to generally accepted accountingprinciples, commonly called GAAP. These state that assets must be shown in the bal-ance sheet at their historical cost adjusted for depreciation. These book values aretherefore “backward-looking” measures of value. They are based on the past cost of theasset, not its current market price or value to the firm. For example, suppose that aprinting press cost McGraw-Hill $1 million 2 years ago, but that in today’s market suchpresses sell for $1.3 million. The book value of the press would be less than its marketvalue and the balance sheet would understate the value of McGraw-Hill’s assets.
Or consider a specialized plant that Intel develops for producing special-purposecomputer chips at a cost of $100 million. The book value of the plant is $100 millionless depreciation. But suppose that shortly after the plant is constructed, a new chipmakes the existing one obsolete. The market value of Intel’s new plant could fall by 50percent. In this case market value would be less than book value.
The difference between book value and market value is greater for some assets thanfor others. It is zero in the case of cash but potentially very large for fixed assets wherethe accountant starts with the initial cost of the fixed assets and then depreciates thatfigure according to a prespecified schedule. The purpose of depreciation is to allocatethe original cost of the asset over its life, and the rules governing the depreciation ofasset values do not reflect actual loss of market value. As a result, the book value offixed assets often is much higher than the market value, but often it is less.
The same goes for the right-hand side of the balance sheet. In the case of liabilitiesthe accountant simply records the amount of money that you have promised to pay. Forshort-term liabilities this figure is generally close to the market value of that promise.For example, if you owe the bank $1 million tomorrow, the accounts show a book lia-bility of $1 million. As long as you are not bankrupt, that $1 million is also roughly thevalue to the bank of your promise. But now suppose that $1 million is not due to be re-paid for several years. The accounts still show a liability of $1 million, but how muchyour debt is worth depends on what happens to interest rates. If interest rates rise afteryou have issued the debt, lenders may not be prepared to pay as much as $1 million foryour debt; if interest rates fall, they may be prepared to pay more than $1 million.2 Thusthe market value of a long-term liability may be higher or lower than the book value.
The difference between book value and market value is likely to be greatest forshareholders’ equity. The book value of equity measures the cash that shareholders havecontributed in the past plus the cash that the company has retained and reinvested in thebusiness on their behalf. But this often bears little resemblance to the total market valuethat investors place on the shares.
If the market price of the firm’s shares falls through the floor, don’t try telling theshareholders that the book value is satisfactory—they won’t want to hear. Shareholders
To summarize, the market values of neither assets nor liabilities will generally equal their book values. Book values are based on historical ororiginal values. Market values measure current values of assets and liabilities.
GENERALLYACCEPTEDACCOUNTINGPRINCIPLES (GAAP)Procedures for preparingfinancial statements.
BOOK VALUE Net worthof the firm according to thebalance sheet.
2 We will show you how changing interest rates affect the market value of debt.
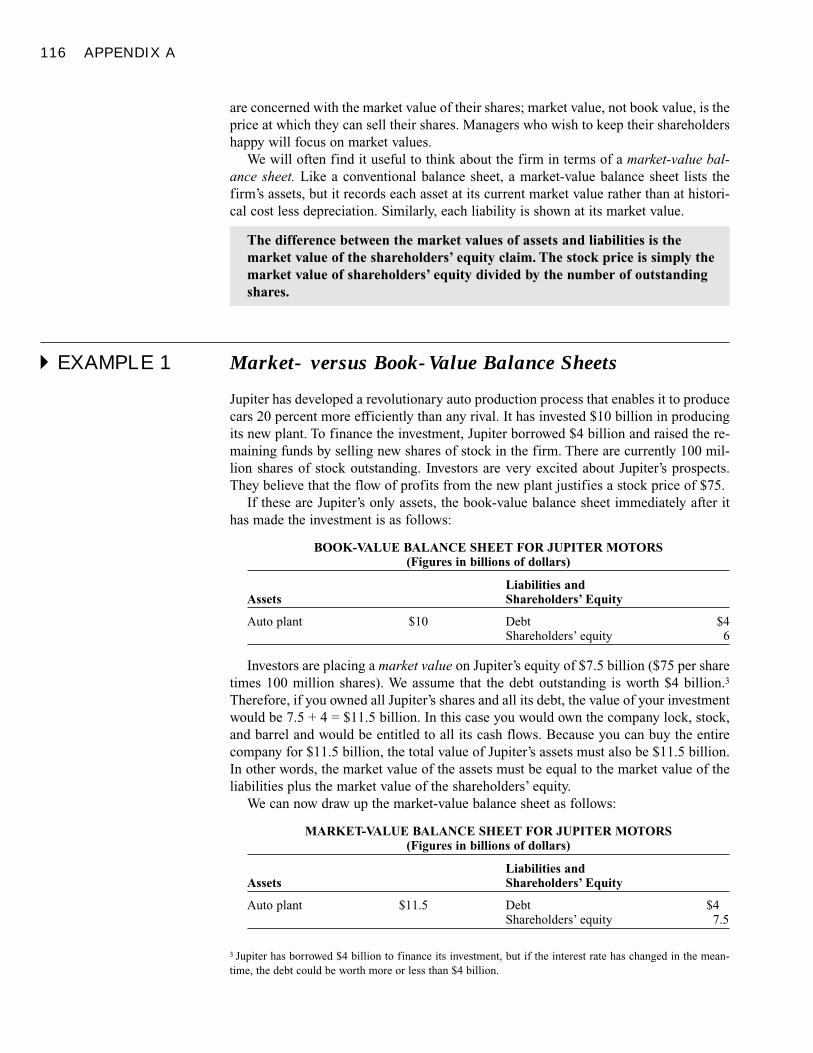
116 APPENDIX A
are concerned with the market value of their shares; market value, not book value, is theprice at which they can sell their shares. Managers who wish to keep their shareholdershappy will focus on market values.
We will often find it useful to think about the firm in terms of a market-value bal-ance sheet. Like a conventional balance sheet, a market-value balance sheet lists thefirm’s assets, but it records each asset at its current market value rather than at histori-cal cost less depreciation. Similarly, each liability is shown at its market value.
� EXAMPLE 1 Market- versus Book-Value Balance Sheets
Jupiter has developed a revolutionary auto production process that enables it to producecars 20 percent more efficiently than any rival. It has invested $10 billion in producingits new plant. To finance the investment, Jupiter borrowed $4 billion and raised the re-maining funds by selling new shares of stock in the firm. There are currently 100 mil-lion shares of stock outstanding. Investors are very excited about Jupiter’s prospects.They believe that the flow of profits from the new plant justifies a stock price of $75.
If these are Jupiter’s only assets, the book-value balance sheet immediately after ithas made the investment is as follows:
BOOK-VALUE BALANCE SHEET FOR JUPITER MOTORS(Figures in billions of dollars)
Liabilities andAssets Shareholders’ Equity
Auto plant $10 Debt $4Shareholders’ equity 6
Investors are placing a market value on Jupiter’s equity of $7.5 billion ($75 per sharetimes 100 million shares). We assume that the debt outstanding is worth $4 billion.3
Therefore, if you owned all Jupiter’s shares and all its debt, the value of your investmentwould be 7.5 + 4 = $11.5 billion. In this case you would own the company lock, stock,and barrel and would be entitled to all its cash flows. Because you can buy the entirecompany for $11.5 billion, the total value of Jupiter’s assets must also be $11.5 billion.In other words, the market value of the assets must be equal to the market value of theliabilities plus the market value of the shareholders’ equity.
We can now draw up the market-value balance sheet as follows:
MARKET-VALUE BALANCE SHEET FOR JUPITER MOTORS(Figures in billions of dollars)
Liabilities andAssets Shareholders’ Equity
Auto plant $11.5 Debt $4Shareholders’ equity 7.5
The difference between the market values of assets and liabilities is the market value of the shareholders’ equity claim. The stock price is simply themarket value of shareholders’ equity divided by the number of outstandingshares.
3 Jupiter has borrowed $4 billion to finance its investment, but if the interest rate has changed in the mean-time, the debt could be worth more or less than $4 billion.
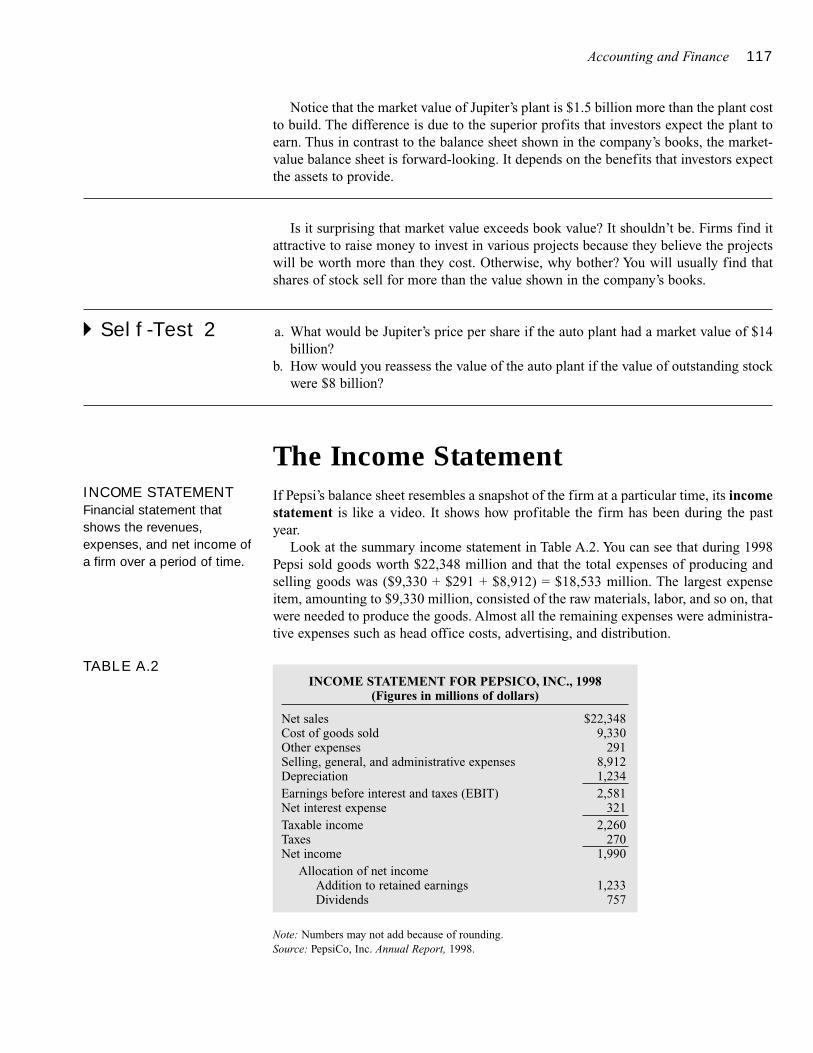
Accounting and Finance 117
Notice that the market value of Jupiter’s plant is $1.5 billion more than the plant costto build. The difference is due to the superior profits that investors expect the plant toearn. Thus in contrast to the balance sheet shown in the company’s books, the market-value balance sheet is forward-looking. It depends on the benefits that investors expectthe assets to provide.
Is it surprising that market value exceeds book value? It shouldn’t be. Firms find itattractive to raise money to invest in various projects because they believe the projectswill be worth more than they cost. Otherwise, why bother? You will usually find thatshares of stock sell for more than the value shown in the company’s books.
� Self-Test 2 a. What would be Jupiter’s price per share if the auto plant had a market value of $14billion?
b. How would you reassess the value of the auto plant if the value of outstanding stockwere $8 billion?
The Income StatementIf Pepsi’s balance sheet resembles a snapshot of the firm at a particular time, its incomestatement is like a video. It shows how profitable the firm has been during the pastyear.
Look at the summary income statement in Table A.2. You can see that during 1998Pepsi sold goods worth $22,348 million and that the total expenses of producing andselling goods was ($9,330 + $291 + $8,912) = $18,533 million. The largest expenseitem, amounting to $9,330 million, consisted of the raw materials, labor, and so on, thatwere needed to produce the goods. Almost all the remaining expenses were administra-tive expenses such as head office costs, advertising, and distribution.
TABLE A.2INCOME STATEMENT FOR PEPSICO, INC., 1998
(Figures in millions of dollars)
Net sales $22,348Cost of goods sold 9,330Other expenses 291Selling, general, and administrative expenses 8,912Depreciation 1,234Earnings before interest and taxes (EBIT) 2,581Net interest expense 321Taxable income 2,260Taxes 270Net income 1,990
Allocation of net incomeAddition to retained earnings 1,233Dividends 757
Note: Numbers may not add because of rounding.Source: PepsiCo, Inc. Annual Report, 1998.
INCOME STATEMENTFinancial statement thatshows the revenues,expenses, and net income ofa firm over a period of time.
118 APPENDIX A
In addition to these out-of-pocket expenses, Pepsi also made a deduction for thevalue of the plant and equipment used up in producing the goods. In 1998 this chargefor depreciation was $1,234 million. Thus Pepsi’s total earnings before interest andtaxes (EBIT) were
EBIT = total revenues – costs – depreciation
= 22,348 – 18,533 – 1,234
= $2,581 million
The remainder of the income statement shows where these earnings went. As we sawearlier, Pepsi has partly financed its investment in plant and equipment by borrowing.In 1998 it paid $321 million of interest on this borrowing. A further slice of the profitwent to the government in the form of taxes. This amounted in 1998 to $270 million.The $1,990 million that was left over after paying interest and taxes belonged to theshareholders. Of this sum Pepsi paid out $757 million in dividends and reinvested theremaining $1,233 million in the business. Presumably, these reinvested funds made thecompany more valuable.
PROFITS VERSUS CASH FLOW
It is important to distinguish between Pepsi’s profits and the cash that the company gen-erates. Here are three reasons why profits and cash are not the same:
1. When Pepsi’s accountants prepare the income statement, they do not simply countthe cash coming in and the cash going out. Instead the accountant starts with thecash payments but then divides these payments into two groups—current expendi-tures (such as wages) and capital expenditures (such as the purchase of new ma-chinery). Current expenditures are deducted from current profits. However, ratherthan deducting the cost of machinery in the year it is purchased, the accountantmakes an annual charge for depreciation. Thus the cost of machinery is spread overits forecast life.
When calculating profits, the accountant does not deduct the expenditure on newequipment that year, even though cash is paid out. However, the accountant doesdeduct depreciation on assets previously purchased, even though no cash is currentlypaid out.
2. Consider the following stages in a manufacturing business. In period 1 the firm pro-duces the goods; it sells them in period 2 for $100; and it gets paid for them in pe-riod 3. Although the cash does not arrive until period 3, the sale shows up in the in-come statement for period 2. The figure for accounts receivable in the balance sheetfor period 2 shows that the company’s customers owe an extra $100 in unpaid bills.Next period, after the customers have paid their bills, the receivables decline by$100.
The cash that the company receives is equal to the sales shown in theincome statement less the increase in unpaid bills:
To calculate the cash produced by the business it is necessary to add backthe depreciation charge (which is not a cash payment) and to subtract theexpenditure on new capital equipment (which is a cash payment).
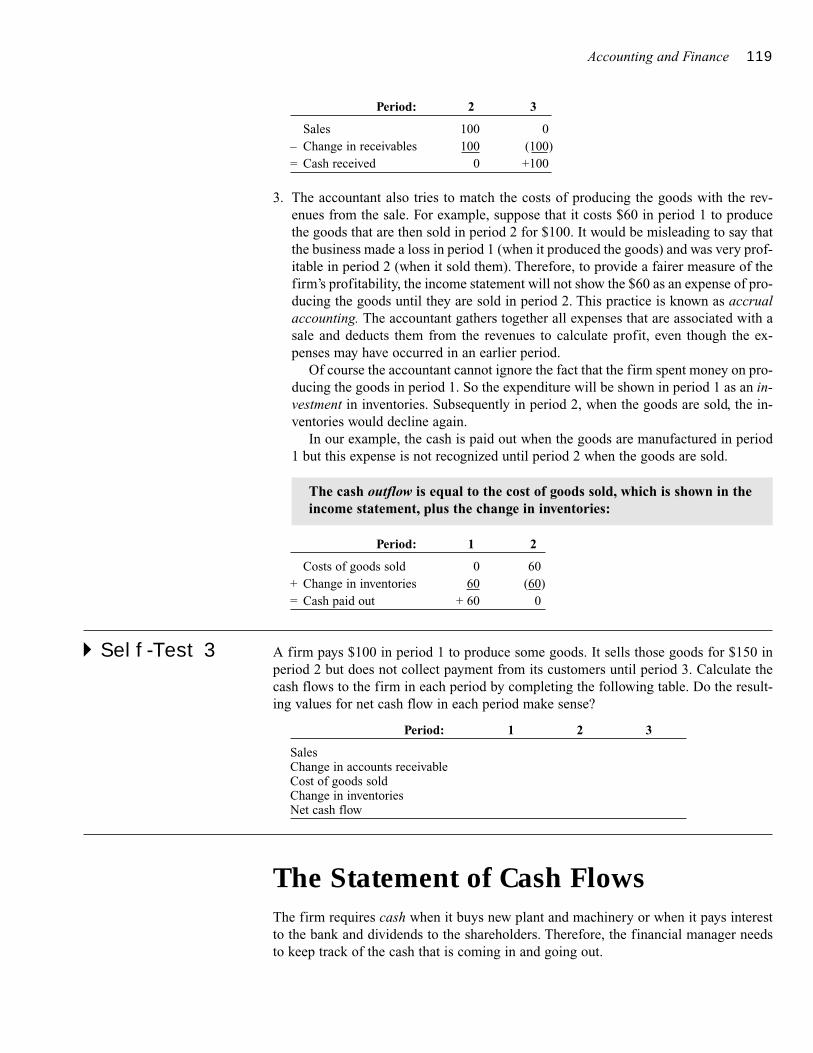
Accounting and Finance 119
Period: 2 3
Sales 100 0– Change in receivables 100 (100)= Cash received 0 +100
3. The accountant also tries to match the costs of producing the goods with the rev-enues from the sale. For example, suppose that it costs $60 in period 1 to producethe goods that are then sold in period 2 for $100. It would be misleading to say thatthe business made a loss in period 1 (when it produced the goods) and was very prof-itable in period 2 (when it sold them). Therefore, to provide a fairer measure of thefirm’s profitability, the income statement will not show the $60 as an expense of pro-ducing the goods until they are sold in period 2. This practice is known as accrualaccounting. The accountant gathers together all expenses that are associated with asale and deducts them from the revenues to calculate profit, even though the ex-penses may have occurred in an earlier period.
Of course the accountant cannot ignore the fact that the firm spent money on pro-ducing the goods in period 1. So the expenditure will be shown in period 1 as an in-vestment in inventories. Subsequently in period 2, when the goods are sold, the in-ventories would decline again.
In our example, the cash is paid out when the goods are manufactured in period1 but this expense is not recognized until period 2 when the goods are sold.
Period: 1 2
Costs of goods sold 0 60+ Change in inventories 60 (60)= Cash paid out + 60 0
� Self-Test 3 A firm pays $100 in period 1 to produce some goods. It sells those goods for $150 inperiod 2 but does not collect payment from its customers until period 3. Calculate thecash flows to the firm in each period by completing the following table. Do the result-ing values for net cash flow in each period make sense?
Period: 1 2 3
SalesChange in accounts receivableCost of goods soldChange in inventoriesNet cash flow
The Statement of Cash FlowsThe firm requires cash when it buys new plant and machinery or when it pays interestto the bank and dividends to the shareholders. Therefore, the financial manager needsto keep track of the cash that is coming in and going out.
The cash outflow is equal to the cost of goods sold, which is shown in theincome statement, plus the change in inventories:
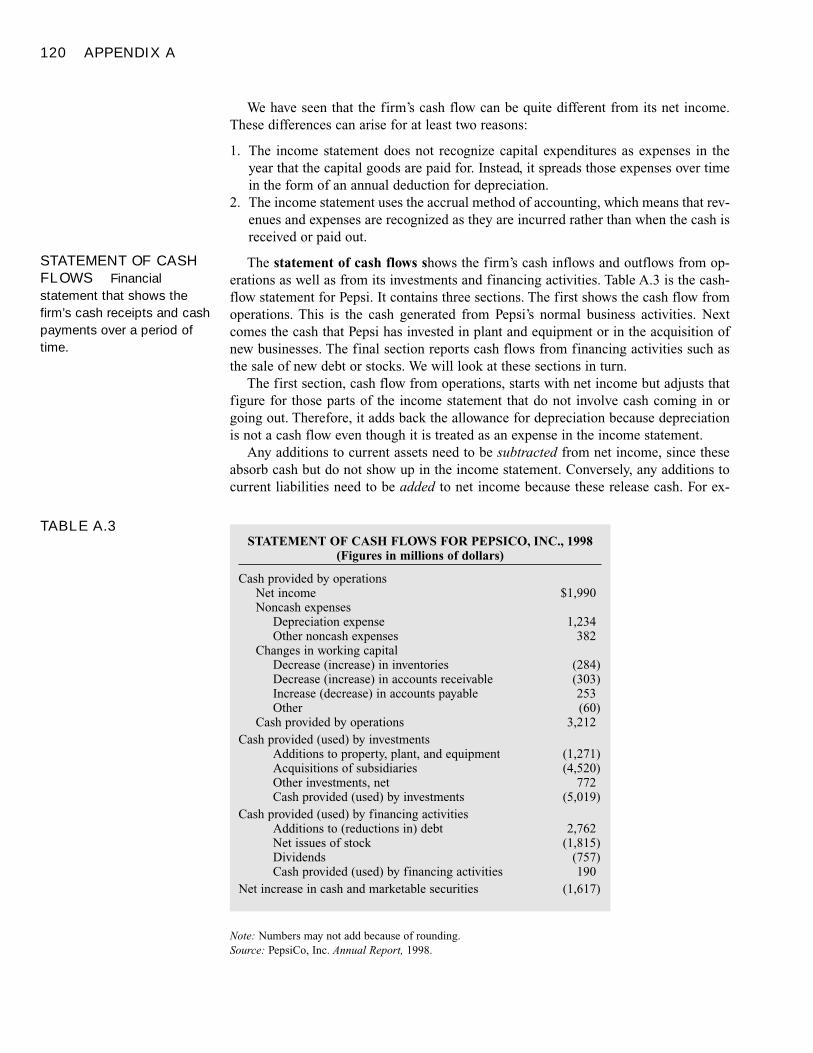
120 APPENDIX A
We have seen that the firm’s cash flow can be quite different from its net income.These differences can arise for at least two reasons:
1. The income statement does not recognize capital expenditures as expenses in theyear that the capital goods are paid for. Instead, it spreads those expenses over timein the form of an annual deduction for depreciation.
2. The income statement uses the accrual method of accounting, which means that rev-enues and expenses are recognized as they are incurred rather than when the cash isreceived or paid out.
The statement of cash flows shows the firm’s cash inflows and outflows from op-erations as well as from its investments and financing activities. Table A.3 is the cash-flow statement for Pepsi. It contains three sections. The first shows the cash flow fromoperations. This is the cash generated from Pepsi’s normal business activities. Nextcomes the cash that Pepsi has invested in plant and equipment or in the acquisition ofnew businesses. The final section reports cash flows from financing activities such asthe sale of new debt or stocks. We will look at these sections in turn.
The first section, cash flow from operations, starts with net income but adjusts thatfigure for those parts of the income statement that do not involve cash coming in orgoing out. Therefore, it adds back the allowance for depreciation because depreciationis not a cash flow even though it is treated as an expense in the income statement.
Any additions to current assets need to be subtracted from net income, since theseabsorb cash but do not show up in the income statement. Conversely, any additions tocurrent liabilities need to be added to net income because these release cash. For ex-
TABLE A.3STATEMENT OF CASH FLOWS FOR PEPSICO, INC., 1998
(Figures in millions of dollars)
Cash provided by operationsNet income $1,990Noncash expenses
Depreciation expense 1,234Other noncash expenses 382
Changes in working capitalDecrease (increase) in inventories (284)Decrease (increase) in accounts receivable (303)Increase (decrease) in accounts payable 253Other (60)
Cash provided by operations 3,212Cash provided (used) by investments
Additions to property, plant, and equipment (1,271)Acquisitions of subsidiaries (4,520)Other investments, net 772Cash provided (used) by investments (5,019)
Cash provided (used) by financing activitiesAdditions to (reductions in) debt 2,762Net issues of stock (1,815)Dividends (757)Cash provided (used) by financing activities 190
Net increase in cash and marketable securities (1,617)
Note: Numbers may not add because of rounding.Source: PepsiCo, Inc. Annual Report, 1998.
STATEMENT OF CASHFLOWS Financialstatement that shows thefirm’s cash receipts and cashpayments over a period oftime.
Accounting and Finance 121
ample, you can see that the increase of $303 million in accounts receivable is subtractedfrom income, because this represents sales that Pepsi includes in its income statementeven though it has not yet received payment from its customers. On the other hand,Pepsi increased accounts payable by $253 million. The accountant deducted this figureas part of the cost of the goods sold by Pepsi in 1998, even though Pepsi had not yetpaid for these goods. Thus the $253 million increase in accounts payable must be addedback to calculate the cash flow from operations.
We have pointed out that depreciation is not a cash payment; it is simply the ac-countant’s allocation to the current year of the original cost of the capital equipment.However, cash does flow out the door when the firm actually buys and pays for newcapital equipment. Therefore, these capital expenditures are set out in the second sec-tion of the cash-flow statement. You can see that Pepsi spent $1,271 on new capitalequipment and $4,520 to purchase new businesses. It also raised $772 million on othernoncurrent assets. Total cash used by investments was $5,019 million.
Finally, the third section of the cash-flow statement shows the cash from financingactivities. Pepsi raised $2,762 million by issuing debt, but it used $1,815 million to buyback its stock and $757 million to pay dividends to its stockholders.4
To summarize, the cash-flow statement tells us that Pepsi generated $3,212 millionfrom operations, it spent $5,019 million on new investments, and it raised a net amountof $190 million in new finance. Pepsi spent more cash than it earned and raised. There-fore, its cash balance fell by $1,617 million. To calculate this change in cash balance,we subtract the uses of cash from the sources:
In millions
Cash flow from operations $3,212– Cash flow for new investment – 5,019+ Cash raised by new financing + 190= Change in cash balance – 1,617
� Self-Test 4 Would the following activities increase or decrease the firm’s cash balance?
a. Inventories are increasedb. The firm reduces its accounts payablec. The firm issues additional common stockd. The firm buys new equipment
Accounting for DifferencesWhile generally accepted accounting principles go a long way to standardize account-ing practice in the United States, accountants still have some leeway in reporting earn-ings and book values. Financial analysts have even more leeway in how to use those re-ports; for example, some analysts will include profits or losses from extraordinary ornonrecurring events when they report net income, but others will not. Similarly, ac-
4 You might think that interest payments also ought to be listed in this section. However, it is usual to includeinterest in the first section with cash flow from operations. This is because, unlike dividends, interest pay-ments are not discretionary. The firm must pay interest when a payment comes due, so these payments aretreated as a business expense rather than as a financing decision.
122 APPENDIX A
countants have discretion concerning the treatment of intangible assets such as patents,trademarks, or franchises. Some believe that including these intangibles on the balancesheet provides the best measure of the company’s value as an ongoing concern. Otherstake a more conservative approach, and they exclude intangible assets. This approach isbetter suited for measuring the liquidation value of the firm.
Another source of imprecision arises from the fact that firms are not required to in-clude all their liabilities on the balance sheet. For example, firms are not always re-quired to include as liabilities on the balance sheet the value of their lease obligations.5
They likewise are not required to include the value of several potential obligations suchas warrants6 sold to investors or issued to employees.
Even bigger differences can arise in international comparisons. Accounting practicescan vary greatly from one country to another. For example, in the United States firmsgenerally maintain one set of accounts that is sent to investors and a different set of ac-counts that is used to calculate their tax bill.7 That would not be allowed in most coun-tries. On the other hand, United States standards are more stringent in most other re-gards. For example, German firms have far greater leeway than United States firms totuck money away in hidden reserve accounts.
When Daimler-Benz AG, producer of the Mercedes-Benz automobile, decided to listits shares on the New York Stock Exchange in 1993, it was required to revise its ac-counting practices to conform to United States standards. While it reported a modestprofit in the first half of 1993 using German accounting rules, it reported a loss of $592million under the much more revealing United States rules, primarily because of dif-ferences in the treatment of reserves.
Such differences in international accounting standards pose a problem for financialanalysts who attempt to compare firms using data from their financial statements. Thisis why foreign firms must restate their financial results using the generally accepted ac-counting principles (GAAP) of the United States before their shares can be listed on aU.S. stock exchange. Many firms have been reluctant to do this and have chosen to listtheir shares elsewhere.
Other countries allow foreign firms to be listed on stock exchanges if their financialstatements are prepared according to International Accounting Standards (IAS) rules,which impose considerable uniformity in accounting practices and are nearly as reveal-ing as U.S. standards. The nearby box reports on current negotiations for internationalaccounting standards.
The lesson here is clear. While accounting values are often the starting point for thefinancial analyst, it is usually necessary to probe more deeply. The financial managerneeds to know how the values on the statements were computed and whether there areimportant assets or liabilities missing altogether.
The trend today is toward greater recognition of the market values of various assetsand liabilities. Firms are now required to acknowledge on the balance sheet the value of
SEE BOX
5 Some airlines at times actually have not had any aircraft on their balance sheets because their aircraft were all leased. In contrast, General Electric owns the world’s largest private airfleet because of its leasingbusiness.6 A warrant is the right to purchase a share of stock from the corporation for a specified price, called the ex-ercise price.7 For example, in their published financial statements most firms in the United States use straight-line depre-ciation. In other words, they make the same deduction for depreciation in each year of the asset’s life. How-ever, when they calculate taxable income, the same companies usually use accelerated depreciation—that is,they make larger deductions for depreciation in the early years of the asset’s life and smaller deductions in thelater years.
Accounting and Finance 123
unfunded pension liabilities and other postemployment benefits, such as medical bene-fits.8 In addition, a growing (although still controversial) trend toward “market-valueaccounting” would have them record many assets at market value rather than at histor-ical book value.
TaxesTaxes often have a major effect on financial decisions. Therefore, we should explainhow corporations and investors are taxed.
CORPORATE TAX
Companies pay tax on their income. Table A.4 shows that there are special low rates ofcorporate tax for small companies, but for large companies (those with income over$18.33 million) the corporate tax rate is 35 percent. Thus for every $100 that the firmearns it pays $35 in corporate tax.
When firms calculate taxable income they are allowed to deduct expenses. These ex-penses include an allowance for depreciation. However, the Internal Revenue Service(IRS) specifies the rates of depreciation that the company can use for different types ofequipment.9 The rates of depreciation that are used to calculate taxes may differ fromthe rates that are used when the firm reports its profits to shareholders.
The company is also allowed to deduct interest paid to debtholders when calculatingits taxable income, but dividends paid to shareholders are not deductible. These divi-dends are therefore paid out of after-tax income. Table A.5 provides an example of howinterest payments reduce corporate taxes.
8 When General Motors recognized the value of its postemployment obligations to GM employees, it resultedin the largest quarterly loss in United States history.9 We will tell you more about these allowances later.
TABLE A.4Corporate tax rates, 1999 Taxable Income, Dollars Tax Rate, %
0–50,000 1550,001–75,000 2575,001–100,000 34
100,001–18,333,333 Varies between 39 and 34 percentOver 18,333,333 35
TABLE A.5Firms A and B both haveearnings before interest andtaxes (EBIT) of $100 million,but A pays out part of itsprofits as debt interest. Thisreduces the corporate taxpaid by A.
Firm A Firm B
EBIT 100 100Interest 40 0Pretax income 60 100Tax (35% of pretax income) 21 35Net income 39 65
Note: Figures in millions of dollars.
FINANCE IN ACTION
The bad news about taxes is that each extra dollar of revenues increases taxable in-come by $1 and results in 35 cents of extra taxes. The good news is that each extra dol-lar of expense reduces taxable income by $1 and therefore reduces taxes by 35 cents.For example, if the firm borrows money, every dollar of interest it pays on the loan re-duces taxes by 35 cents. Therefore, after-tax income is reduced by only 65 cents.
� Self-Test 5 Recalculate the figures in Table A.5 assuming that Firm A now has to make interestpayments of $60 million. What happens to taxes paid? Does net income fall by the ad-ditional $20 million interest payment compared with the case considered in Table A.5,where interest expense was only $40 million?
When firms make profits, they pay 35 percent of the profits to the Internal RevenueService. But the process doesn’t work in reverse; if the firm takes a loss, the IRS does
124
A Hill of BeansThe world cannot have a truly global financial systemwithout the help of its accountants. They are letting in-vestors down.
The biggest impediment to a global capital market is notvolatile exchange rates, nor timid investors. It is thatfirms from one country are not allowed to sell theirshares in many others, including, crucially, in the UnitedStates. And the reason for that is the inability of differentcountries to settle on an international standard for re-porting.
In order to change this, the International AccountingStandards Committee has been trying for years to per-suade as many companies as possible to adopt itsstandards, and to convince securities regulators suchas America’s Securities and Exchange Commission tolet such firms list on their stock exchanges. But theIASC has so far failed to produce standards that theSEC is willing to endorse. It should produce them now.
The purpose of accounting standards is simple: tohelp investors keep track of what managers are doingwith their money. Countries such as America andBritain, in which managers are accountable to lots ofdispersed investors, have had to develop standardsthat are more transparent and rigorous than those ofother countries. And since the purpose of internationalstandards is to encourage such markets on a globalscale, it makes sense to use these countries’ standardsas a guide.
British and American accounting standards havetheir respective flaws, debated ad nauseam by accoun-
tancy’s aficionados. But they are both superior to theIASC’s existing standards in two main ways. First, theypromote transparency by making firms attach to theiraggregate financial tables (such as the profit-and-lossstatement) a set of detailed notes disclosing exactlyhow the main items (such as inventories and pension li-abilities) are calculated. Second, they lay down rules onhow to record certain transactions. In many cases,there is no intellectually “ right” way to do this. The pointis simply that there is a standard method, so that man-agers cannot mislead investors by choosing the methodfor themselves.
Let the Markets Do the Talking
If the merits of Anglo-American accounting are so obvi-ous, why has the IASC not adopted its standards? Evenin their present state, the international standards aremore rigorous than many domestic ones, and thereforeunpopular with local firms. But by introducing a rigor-ous set of international standards, acceptable to theSEC, the committee could unleash some interestingcompetition. Companies which adopted the new stan-dards would enjoy the huge advantage of being able tosell their shares anywhere; those opting for less disclo-sure would be punished by investors. It is amazing howpersuasive the financial markets can be.
Source: © 1999 The Economist Newspaper Group. Reprinted withpermission. Further reproduction prohibited. www.economist.com.
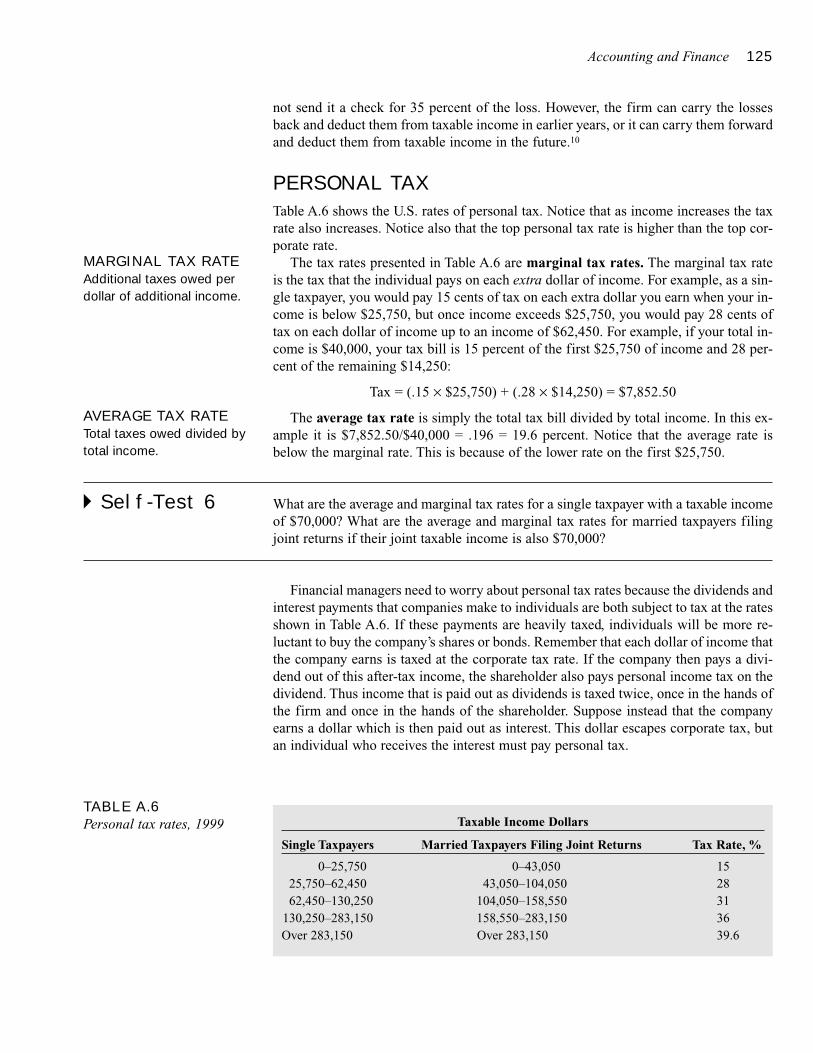
Accounting and Finance 125
not send it a check for 35 percent of the loss. However, the firm can carry the lossesback and deduct them from taxable income in earlier years, or it can carry them forwardand deduct them from taxable income in the future.10
PERSONAL TAX
Table A.6 shows the U.S. rates of personal tax. Notice that as income increases the taxrate also increases. Notice also that the top personal tax rate is higher than the top cor-porate rate.
The tax rates presented in Table A.6 are marginal tax rates. The marginal tax rateis the tax that the individual pays on each extra dollar of income. For example, as a sin-gle taxpayer, you would pay 15 cents of tax on each extra dollar you earn when your in-come is below $25,750, but once income exceeds $25,750, you would pay 28 cents oftax on each dollar of income up to an income of $62,450. For example, if your total in-come is $40,000, your tax bill is 15 percent of the first $25,750 of income and 28 per-cent of the remaining $14,250:
Tax = (.15 × $25,750) + (.28 × $14,250) = $7,852.50
The average tax rate is simply the total tax bill divided by total income. In this ex-ample it is $7,852.50/$40,000 = .196 = 19.6 percent. Notice that the average rate isbelow the marginal rate. This is because of the lower rate on the first $25,750.
� Self-Test 6 What are the average and marginal tax rates for a single taxpayer with a taxable incomeof $70,000? What are the average and marginal tax rates for married taxpayers filingjoint returns if their joint taxable income is also $70,000?
Financial managers need to worry about personal tax rates because the dividends andinterest payments that companies make to individuals are both subject to tax at the ratesshown in Table A.6. If these payments are heavily taxed, individuals will be more re-luctant to buy the company’s shares or bonds. Remember that each dollar of income thatthe company earns is taxed at the corporate tax rate. If the company then pays a divi-dend out of this after-tax income, the shareholder also pays personal income tax on thedividend. Thus income that is paid out as dividends is taxed twice, once in the hands ofthe firm and once in the hands of the shareholder. Suppose instead that the companyearns a dollar which is then paid out as interest. This dollar escapes corporate tax, butan individual who receives the interest must pay personal tax.
TABLE A.6Personal tax rates, 1999 Taxable Income Dollars
Single Taxpayers Married Taxpayers Filing Joint Returns Tax Rate, %
0–25,750 0–43,050 1525,750–62,450 43,050–104,050 2862,450–130,250 104,050–158,550 31
130,250–283,150 158,550–283,150 36Over 283,150 Over 283,150 39.6
MARGINAL TAX RATEAdditional taxes owed perdollar of additional income.
AVERAGE TAX RATETotal taxes owed divided bytotal income.
126 APPENDIX A
Capital gains are also taxed, but only when the capital gains are realized. For exam-ple, suppose that you bought Bio-technics stock when it was selling for 10 cents a share.Its market price is now $1 a share. As long as you hold onto your stock, there is no taxto pay on your gain. But if you sell, the 90 cents of capital gain is taxed. The marginaltax rate on capital gains for most shareholders is 20 percent.
The tax rates in Table A.6 apply to individuals. But financial institutions are majorinvestors in shares and bonds. These institutions often have special rates of tax. For ex-ample, pension funds, which hold huge numbers of shares, are not taxed on either div-idend income or capital gains.
SummaryWhat information is contained in the balance sheet, income statement, and state-ment of cash flows?
Investors and other stakeholders in the firm need regular financial information to help themmonitor the firm’s progress. Accountants summarize this information in a balance sheet,income statement, and statement of cash flows.
The balance sheet provides a snapshot of the firm’s assets and liabilities. The assetsconsist of current assets that can be rapidly turned into cash and fixed assets such as plantand machinery. The liabilities consist of current liabilities that are due for payment shortlyand long-term debts. The difference between the assets and the liabilities represents theamount of the shareholders’ equity.
The income statement measures the profitability of the company during the year. Itshows the difference between revenues and expenses.
The statement of cash flows measures the sources and uses of cash during the year. Thechange in the company’s cash balance is the difference between sources and uses.
What is the difference between market and book value?
It is important to distinguish between the book values that are shown in the companyaccounts and the market values of the assets and liabilities. Book values are historicalmeasures based on the original cost of an asset. For example, the assets in the balance sheetare shown at their historical cost less an allowance for depreciation. Similarly, the figure forshareholders’ equity measures the cash that shareholders have contributed in the past or thatthe company has contributed on their behalf.
Why does accounting income differ from cash flow?
Income is not the same as cash flow. There are two reasons for this: (1) investment in fixedassets is not deducted immediately from income but is instead spread over the expected lifeof the equipment, and (2) the accountant records revenues when the sale is made rather thanwhen the customer actually pays the bill, and at the same time deducts the production costseven though those costs may have been incurred earlier.
What are the essential features of the taxation of corporate and personal income?
For large companies the marginal rate of tax on income is 35 percent. In calculatingtaxable income the company deducts an allowance for depreciation and interest payments. Itcannot deduct dividend payments to the shareholders.

Accounting and Finance 127
Individuals are also taxed on their income, which includes dividends and interest on theirinvestments. Capital gains are taxed, but only when the investment is sold and the gainrealized.
www.ibm.com/investor/FinancialGuide Guide to understanding financial data in an annual re-port from IBM
www.fool.com/Features/1996/sp0708a.htm#4 A look at the balance sheet and how its compo-nents are related
balance sheet book value marginal tax rategenerally accepted income statement average tax rate
accounting principles (GAAP) statement of cash flows
1. Balance Sheet. Construct a balance sheet for Sophie’s Sofas given the following data. Whatis shareholders’ equity?
Cash balances = $10,000Inventory of sofas = $200,000Store and property = $100,000Accounts receivable = $22,000Accounts payable = $17,000Long-term debt = $170,000
2. Financial Statements. Earlier, we characterized the balance sheet as providing a snapshotof the firm at one point in time and the income statement as providing a video. What did wemean by this? Is the statement of cash flow more like a snapshot or a video?
3. Income versus Cash Flow. Explain why accounting revenue generally will differ from afirm’s cash inflows.
4. Working Capital. QuickGrow is in an expanding market, and its sales are increasing by 25percent per year. Would you expect its net working capital to be increasing or decreasing?
5. Tax Rates. Using Table 2.6, calculate the marginal and average tax rates for a single tax-payer with the following incomes:
a. $20,000b. $50,000c. $300,000d. $3,000,000
6. Tax Rates. What would be the marginal and average tax rates for a corporation with an in-come level of $100,000?
7. Taxes. A married couple earned $95,000 in 1999. How much did they pay in taxes? Whatwere their marginal and average tax brackets?
8. Cash Flows. What impact will the following actions have on the firm’s cash balance?
a. The firm sells some goods from inventory.b. The firm sells some machinery to a bank and leases it back for a period of 20 years.c. The firm buys back 1 million shares of stock from existing shareholders.
Related WebLinks
Key Terms
Quiz
128 APPENDIX A
9. Balance Sheet/Income Statement. The year-end 1999 balance sheet of Brandex Inc. listscommon stock and other paid-in capital at $1,100,000 and retained earnings at $3,400,000.The next year, retained earnings were listed at $3,700,000. The firm’s net income in 2000was $900,000. There were no stock repurchases during the year. What were dividends paidby the firm in 2000?
10. Taxes. You have set up your tax preparation firm as an incorporated business. You took$70,000 from the firm as your salary. The firm’s taxable income for the year (net of yoursalary) was $30,000. How much taxes must be paid to the federal government, includingboth your personal taxes and the firm’s taxes? Assume you pay personal taxes as an unmar-ried taxpayer. By how much will you reduce the total tax bill by reducing your salary to$50,000, thereby leaving the firm with taxable income of $50,000? Use the tax rates pre-sented in Tables 2.4 and 2.6.
11. Market versus Book Values. The founder of Alchemy Products, Inc., discovered a way toturn lead into gold and patented this new technology. He then formed a corporation and in-vested $200,000 in setting up a production plant. He believes that he could sell his patent for$50 million.
a. What are the book value and market value of the firm?b. If there are 2 million shares of stock in the new corporation, what would be the price per
share and the book value per share?
12. Income Statement. Sheryl’s Shingles had sales of $10,000 in 2000. The cost of goods soldwas $6,500, general and administrative expenses were $1,000, interest expenses were $500,and depreciation was $1,000. The firm’s tax rate is 35 percent.
a. What is earnings before interest and taxes?b. What is net income?c. What is cash flow from operations?
13. Cash Flow. Can cash flow from operations be positive if net income is negative? Can oper-ating cash flow be negative if net income is positive? Give examples.
14. Cash Flows. Ponzi Products produced 100 chain letter kits this quarter, resulting in a totalcash outlay of $10 per unit. It will sell 50 of the kits next quarter at a price of $11, and theother 50 kits in two quarters at a price of $12. It takes a full quarter for it to collect its billsfrom its customers. (Ignore possible sales in earlier or later quarters.)
a. Prepare an income statement for Ponzi for today and for each of the next three quarters.Ignore taxes.
b. What are the cash flows for the company today and in each of the next three quarters?c. What is Ponzi’s net working capital in each quarter?
15. Profits versus Cash Flow. During the last year of operations, accounts receivable increasedby $10,000, accounts payable increased by $5,000, and inventories decreased by $2,000.What is the total impact of these changes on the difference between profits and cash flow?
16. Income Statement. A firm’s income statement included the following data. The firm’s av-erage tax rate was 20 percent.
Cost of goods sold $8,000Income taxes paid 2,000Administrative expenses 3,000Interest expense 1,000Depreciation 1,000
PracticeProblems
Accounting and Finance 129
a. What was the firm’s net income?b. What must have been the firm’s revenues?c. What was EBIT?
17. Profits versus Cash Flow. Butterfly Tractors had $14 million in sales last year. Cost ofgoods sold was $8 million, depreciation expense was $2 million, interest payment on out-standing debt was $1 million, and the firm’s tax rate was 35 percent.
a. What was the firm’s net income and net cash flow?b. What would happen to net income and cash flow if depreciation were increased by $1
million? How do you explain the differing impact of depreciation on income versus cashflow?
c. Would you expect the change in income and cash flow to have a positive or negative im-pact on the firm’s stock price?
d. Now consider the impact on net income and cash flow if the firm’s interest expense were$1 million higher. Why is this case different from part (b)?
18. Cash Flow. Candy Canes, Inc., spends $100,000 to buy sugar and peppermint in April. Itproduces its candy and sells it to distributors in May for $150,000, but it does not receivepayment until June. For each month, find the firm’s sales, net income, and net cash flow.
19. Financial Statements. Here are the 1999 and 2000 (incomplete) balance sheets for NobelOil Corp.
NOBEL OIL CORP. BALANCE SHEET, AS OF END OF YEAR
Liabilities andAssets 1999 2000 Owners’ Equity 1999 2000
Current assets $ 310 $ 420 Current liabilities $210 $240Net fixed assets 1,200 1,420 Long-term debt 830 920
a. What was owners’ equity at the end of 1999 and 2000?b. If Nobel paid dividends of $100 in 2000, what must have been net income during the
year?c. If Nobel purchased $300 in fixed assets during the year, what must have been the depre-
ciation charge on the income statement?d. What was the change in net working capital between 1999 and 2000?e. If Nobel issued $200 of new long-term debt, how much debt must have been paid off dur-
ing the year?
20. Financial Statements. South Sea Baubles has the following (incomplete) balance sheet andincome statement.
BALANCE SHEET, AS OF END OF YEAR(Figures in millions of dollars)
Liabilities andAssets 1999 2000 Shareholders’ Equity 1999 2000
Current assets $ 90 $140 Current liabilities $ 50 $ 60Net fixed assets 800 900 Long-term debt 600 750
INCOME STATEMENT, 2000(Figures in millions of dollars)
Revenue $1,950Cost of goods sold 1,030Depreciation 350Interest expense 240
130 APPENDIX A
a. What is shareholders’ equity in 1999 and 2000?b. What is net working capital in 1999 and 2000?c. What is taxable income and taxes paid in 2000? Assume the firm pays taxes equal to 35
percent of taxable income.d. What is cash provided by operations during 2000? Pay attention to changes in net work-
ing capital, using Table 2.3 as a guide.e. Net fixed assets increased from $800 million to $900 million during 2000. What must
have been South Sea’s gross investment in fixed assets during 2000?f. If South Sea reduced its outstanding accounts payable by $35 million during the year,
what must have happened to its other current liabilities?
Here are some data on Fincorp, Inc., that you should use for problems 21–28. The balancesheet items correspond to values at year-end of 1999 and 2000, while the income statementitems correspond to revenues or expenses during the year ending in either 1999 or 2000. Allvalues are in thousands of dollars.
1999 2000
Revenue $4,000 $4,100Cost of goods sold 1,600 1,700Depreciation 500 520Inventories 300 350Administrative expenses 500 550Interest expense 150 150Federal and state taxesa 400 420Accounts payable 300 350Accounts receivable 400 450Net fixed assetsb 5,000 5,800Long-term debt 2,000 2,400Notes payable 1,000 600Dividends paid 410 410Cash and marketable securities 800 300
a Taxes are paid in their entirety in the year that the taxobligation is incurred.b Net fixed assets are fixed assets net of accumulateddepreciation since the asset was installed.
21. Balance Sheet. Construct a balance sheet for Fincorp for 1999 and 2000. What is share-holders’ equity?
22. Working Capital. What happened to net working capital during the year?23. Income Statement. Construct an income statement for Fincorp for 1999 and 2000. What
were retained earnings for 2000? How does that compare with the increase in shareholders’equity between the two years?
24. Earnings per Share. Suppose that Fincorp has 500,000 shares outstanding. What wereearnings per share?
25. Taxes. What was the firm’s average tax bracket for each year? Do you have enough infor-mation to determine the marginal tax bracket?
26. Balance Sheet. Examine the values for depreciation in 2000 and net fixed assets in 1999and 2000. What was Fincorp’s gross investment in plant and equipment during 2000?
27. Cash Flows. Construct a statement of cash flows for Fincorp for 2000.28. Book versus Market Value. Now suppose that the market value (in thousands of dollars) of
Fincorp’s fixed assets in 2000 is $6,000, and that the value of its long-term debt is only
Accounting and Finance 131
$2,400. In addition, the consensus among investors is that Fincorp’s past investments in de-veloping the skills of its employees are worth $2,900. This investment of course does notshow up on the balance sheet. What will be the price per share of Fincorp stock?
29. Taxes. Reconsider the data in problem 10 which imply that you have $100,000 of total pre-tax income to allocate between your salary and your firm’s profits. What allocation will min-imize the total tax bill? Hint: Think about marginal tax rates and the ability to shift incomefrom a higher marginal bracket to a lower one.
1 Cash and equivalents would increase by $100 million. Property, plant, and equipment wouldincrease by $400 million. Long-term debt would increase by $500 million. Shareholders’ eq-uity would not increase: assets and liabilities have increased equally, leaving shareholders’equity unchanged.
2 a. If the auto plant were worth $14 billion, the equity in the firm would be worth $14 – $4= $10 billion. With 100 million shares outstanding, each share would be worth $100.
b. If the outstanding stock were worth $8 billion, we would infer that the market values theauto plant at $8 + $4 = $12 billion.
3 Period: 1 2 3
Sales 0 150 0– Change in accounts receivable 0 150 (150)– Cost of goods sold 0 100 0– Change in inventories 100 (100) 0
Net cash flow –100 0 +150
The net cash flow pattern does make sense. The firm expends $100 in period 1 to producethe product, but it is not paid its $150 sales price until period 3. In period 2 no cash is exchanged.
4 a. An increase in inventories uses cash, reducing the firm’s net cash balance.b. A reduction in accounts payable uses cash, reducing the firm’s net cash balance.c. An issue of common stock is a source of cash.d. The purchase of new equipment is a use of cash, and it reduces the firm’s net cash
balance.
5 Firm A Firm B
EBIT 100 100Interest 60 0Pretax income 40 100Tax (35% of pretax income) 14 35Net income 26 65
Note: Figures in millions of dollars.
Taxes owed by Firm A fall from $21 million to $14 million. The reduction in taxes is 35 per-cent of the extra $20 million of interest income. Net income does not fall by the full $20 mil-lion of extra interest expense. It instead falls by interest expense less the reduction in taxes,or $20 million – $7 million = $13 million.
6 For a single taxpayer with taxable income of $70,000, total taxes paid are
ChallengeProblem
Solutions toSelf-TestQuestions
132 APPENDIX A
(.15 × $25,750) + [.28 × (62,450 – 25,750)] + [.31 × (70,000 – 62,450)] = $16,479
The marginal tax rate is 31 percent, but the average tax rate is only 16,479/70,000 = .235, or23.5 percent.
For the married taxpayers filing jointly with taxable income of $70,000, total taxes paid are
(.15 × $43,050) + [.28 × (70,000 – 43,050)] = $14,003.50
The marginal tax rate is 28 percent, and the average tax rate is 14,003.50/70,000 = .200, or20.0 percent.
133
FINANCIAL STATEMENTANALYSIS
Financial RatiosLeverage Ratios
Liquidity Ratios
Efficiency Ratios
Profitability Ratios
The Du Pont SystemOther Financial Ratios
Using Financial RatiosChoosing a Benchmark
Measuring Company Performance
The Role of Financial Ratios
Summary
ivide and conquer” is the only practical strategy for presenting a complex
topic like financial management. That is why we have broken down the
financial manager’s job into separate areas: capital budgeting, dividend
policy, equity financing, and debt policy. Ultimately the financial manager
has to consider the combined effects of decisions in each of these areas on the firm as
a whole. Therefore, we devote all of Part Six to financial planning. We begin by look-
ing at the analysis of financial statements.
Why do companies provide accounting information? Public companies have a vari-
ety of stakeholders: shareholders, bondholders, bankers, suppliers, employees, and
management, for example. These stakeholders all need to monitor how well their inter-
ests are being served. They rely on the company’s periodic financial statements to pro-
vide basic information on the profitability of the firm.
In this material we look at how you can use financial statements to analyze a firm’s
overall performance and assess its current financial standing. You may wish to under-
stand the policies of a competitor or the financial health of a customer. Or you may need
to check your own firm’s financial performance in meeting standard criteria and deter-
mine where there is room for improvement.
We will look at how analysts summarize the large volume of accounting information
by calculating some key financial ratios. We will then describe these ratios and look at
some interesting relationships among them. Next we will show how the ratios are used
and note the limitations of the accounting data on which most ratios are based. Finally,
we will look at some measures of firm performance. Some of these are expressed in
ratio form; some measure how much value the firm’s decisions have added.
After studying this material you should be able to
� Calculate and interpret measures of a firm’s leverage, liquidity, efficiency, and prof-
itability.
� Use the Du Pont formula to understand the determinants of the firm’s return on its
assets and equity.
� Evaluate the potential pitfalls of ratios based on accounting data.
� Understand some key measures of firm performance such as market value added and
economic value added.
134
D
Financial RatiosWe have all heard stories of whizzes who can take a company’s accounts apart in min-utes, calculate a few financial ratios, and discover the company’s innermost secrets. Thetruth, however, is that financial ratios are no substitute for a crystal ball. They are justa convenient way to summarize large quantities of financial data and to compare firms’performance. Ratios help you to ask the right questions: they seldom answer them.
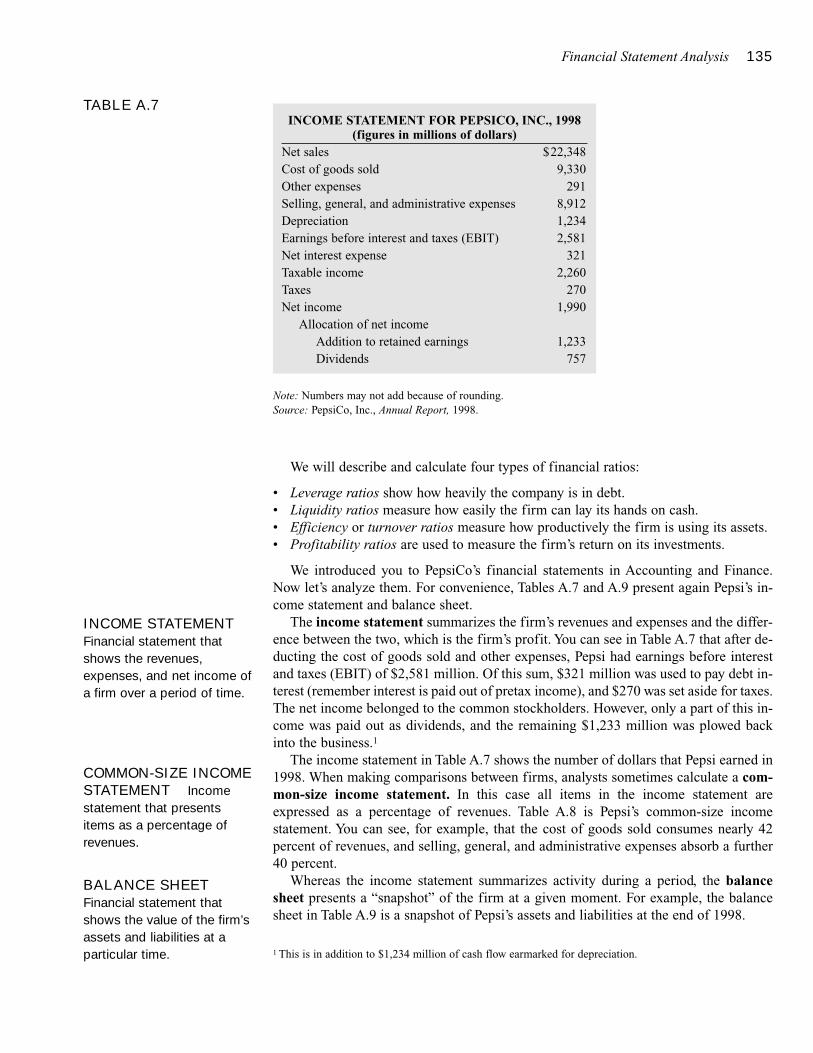
Financial Statement Analysis 135
We will describe and calculate four types of financial ratios:
• Leverage ratios show how heavily the company is in debt.• Liquidity ratios measure how easily the firm can lay its hands on cash.• Efficiency or turnover ratios measure how productively the firm is using its assets.• Profitability ratios are used to measure the firm’s return on its investments.
We introduced you to PepsiCo’s financial statements in Accounting and Finance.Now let’s analyze them. For convenience, Tables A.7 and A.9 present again Pepsi’s in-come statement and balance sheet.
The income statement summarizes the firm’s revenues and expenses and the differ-ence between the two, which is the firm’s profit. You can see in Table A.7 that after de-ducting the cost of goods sold and other expenses, Pepsi had earnings before interestand taxes (EBIT) of $2,581 million. Of this sum, $321 million was used to pay debt in-terest (remember interest is paid out of pretax income), and $270 was set aside for taxes.The net income belonged to the common stockholders. However, only a part of this in-come was paid out as dividends, and the remaining $1,233 million was plowed backinto the business.1
The income statement in Table A.7 shows the number of dollars that Pepsi earned in1998. When making comparisons between firms, analysts sometimes calculate a com-mon-size income statement. In this case all items in the income statement are expressed as a percentage of revenues. Table A.8 is Pepsi’s common-size income statement. You can see, for example, that the cost of goods sold consumes nearly 42 percent of revenues, and selling, general, and administrative expenses absorb a further40 percent.
Whereas the income statement summarizes activity during a period, the balancesheet presents a “snapshot” of the firm at a given moment. For example, the balancesheet in Table A.9 is a snapshot of Pepsi’s assets and liabilities at the end of 1998.
TABLE A.7INCOME STATEMENT FOR PEPSICO, INC., 1998
(figures in millions of dollars)Net sales $22,348Cost of goods sold 9,330Other expenses 291Selling, general, and administrative expenses 8,912Depreciation 1,234Earnings before interest and taxes (EBIT) 2,581Net interest expense 321Taxable income 2,260Taxes 270Net income 1,990
Allocation of net incomeAddition to retained earnings 1,233Dividends 757
Note: Numbers may not add because of rounding.Source: PepsiCo, Inc., Annual Report, 1998.
INCOME STATEMENTFinancial statement thatshows the revenues,expenses, and net income ofa firm over a period of time.
COMMON-SIZE INCOMESTATEMENT Incomestatement that presentsitems as a percentage ofrevenues.
BALANCE SHEETFinancial statement thatshows the value of the firm’sassets and liabilities at aparticular time. 1 This is in addition to $1,234 million of cash flow earmarked for depreciation.
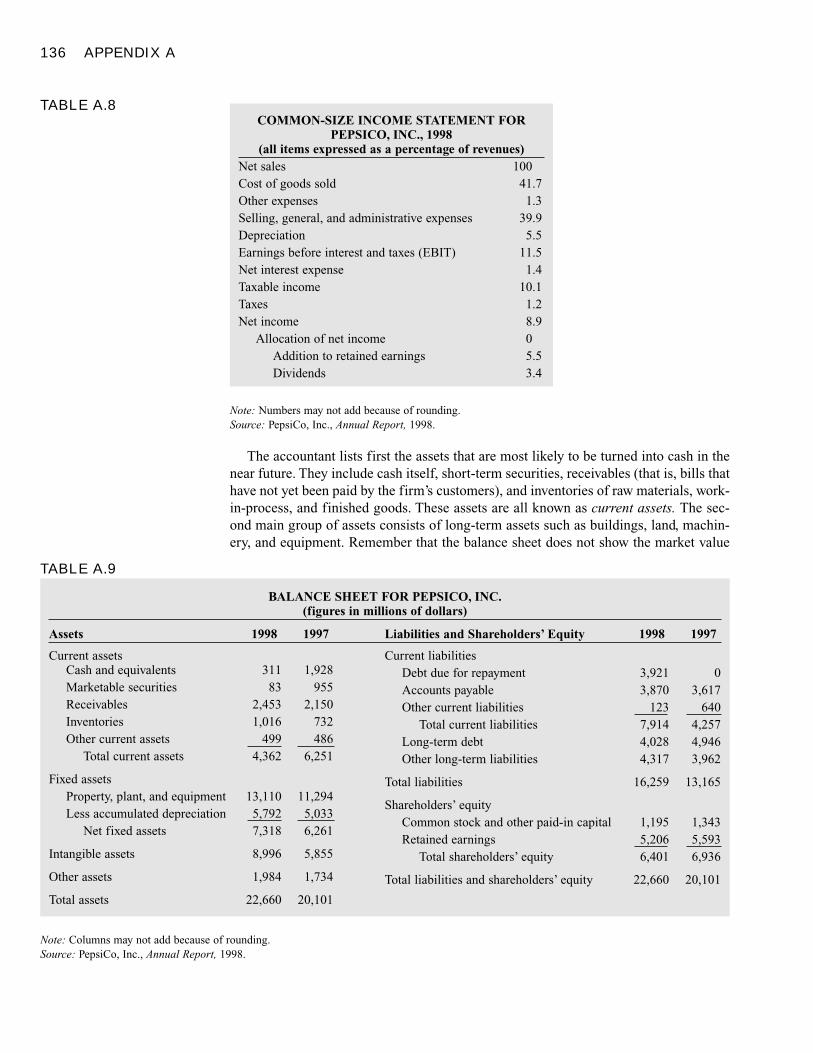
136 APPENDIX A
The accountant lists first the assets that are most likely to be turned into cash in thenear future. They include cash itself, short-term securities, receivables (that is, bills thathave not yet been paid by the firm’s customers), and inventories of raw materials, work-in-process, and finished goods. These assets are all known as current assets. The sec-ond main group of assets consists of long-term assets such as buildings, land, machin-ery, and equipment. Remember that the balance sheet does not show the market value
TABLE A.9
BALANCE SHEET FOR PEPSICO, INC.(figures in millions of dollars)
Assets 1998 1997
Current assetsCash and equivalents 311 1,928Marketable securities 83 955Receivables 2,453 2,150Inventories 1,016 732Other current assets 499 486
Total current assets 4,362 6,251
Fixed assetsProperty, plant, and equipment 13,110 11,294Less accumulated depreciation 5,792 5,033
Net fixed assets 7,318 6,261
Intangible assets 8,996 5,855
Other assets 1,984 1,734
Total assets 22,660 20,101
Liabilities and Shareholders’ Equity 1998 1997
Current liabilitiesDebt due for repayment 3,921 0Accounts payable 3,870 3,617Other current liabilities 123 640
Total current liabilities 7,914 4,257Long-term debt 4,028 4,946Other long-term liabilities 4,317 3,962
Total liabilities 16,259 13,165
Shareholders’ equityCommon stock and other paid-in capital 1,195 1,343Retained earnings 5,206 5,593
Total shareholders’ equity 6,401 6,936
Total liabilities and shareholders’ equity 22,660 20,101
Note: Columns may not add because of rounding.Source: PepsiCo, Inc., Annual Report, 1998.
TABLE A.8COMMON-SIZE INCOME STATEMENT FOR
PEPSICO, INC., 1998(all items expressed as a percentage of revenues)
Net sales 100Cost of goods sold 41.7Other expenses 1.3Selling, general, and administrative expenses 39.9Depreciation 5.5Earnings before interest and taxes (EBIT) 11.5Net interest expense 1.4Taxable income 10.1Taxes 1.2Net income 8.9
Allocation of net income 0Addition to retained earnings 5.5Dividends 3.4
Note: Numbers may not add because of rounding.Source: PepsiCo, Inc., Annual Report, 1998.
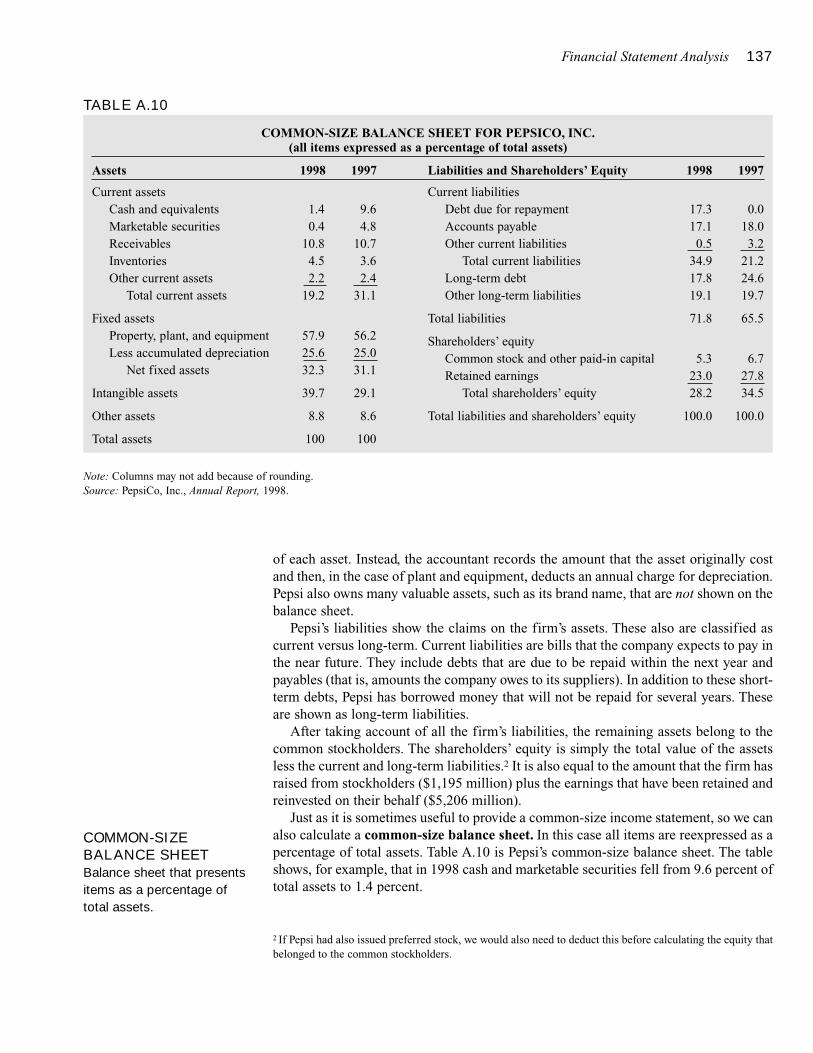
Financial Statement Analysis 137
of each asset. Instead, the accountant records the amount that the asset originally costand then, in the case of plant and equipment, deducts an annual charge for depreciation.Pepsi also owns many valuable assets, such as its brand name, that are not shown on thebalance sheet.
Pepsi’s liabilities show the claims on the firm’s assets. These also are classified ascurrent versus long-term. Current liabilities are bills that the company expects to pay inthe near future. They include debts that are due to be repaid within the next year andpayables (that is, amounts the company owes to its suppliers). In addition to these short-term debts, Pepsi has borrowed money that will not be repaid for several years. Theseare shown as long-term liabilities.
After taking account of all the firm’s liabilities, the remaining assets belong to thecommon stockholders. The shareholders’ equity is simply the total value of the assetsless the current and long-term liabilities.2 It is also equal to the amount that the firm hasraised from stockholders ($1,195 million) plus the earnings that have been retained andreinvested on their behalf ($5,206 million).
Just as it is sometimes useful to provide a common-size income statement, so we canalso calculate a common-size balance sheet. In this case all items are reexpressed as apercentage of total assets. Table A.10 is Pepsi’s common-size balance sheet. The tableshows, for example, that in 1998 cash and marketable securities fell from 9.6 percent oftotal assets to 1.4 percent.
TABLE A.10
COMMON-SIZE BALANCE SHEET FOR PEPSICO, INC.(all items expressed as a percentage of total assets)
Assets 1998 1997
Current assetsCash and equivalents 1.4 9.6Marketable securities 0.4 4.8Receivables 10.8 10.7Inventories 4.5 3.6Other current assets 2.2 2.4
Total current assets 19.2 31.1
Fixed assetsProperty, plant, and equipment 57.9 56.2Less accumulated depreciation 25.6 25.0
Net fixed assets 32.3 31.1
Intangible assets 39.7 29.1
Other assets 8.8 8.6
Total assets 100 100
Liabilities and Shareholders’ Equity 1998 1997
Current liabilitiesDebt due for repayment 17.3 0.0Accounts payable 17.1 18.0Other current liabilities 0.5 3.2
Total current liabilities 34.9 21.2Long-term debt 17.8 24.6Other long-term liabilities 19.1 19.7
Total liabilities 71.8 65.5
Shareholders’ equityCommon stock and other paid-in capital 5.3 6.7Retained earnings 23.0 27.8
Total shareholders’ equity 28.2 34.5
Total liabilities and shareholders’ equity 100.0 100.0
Note: Columns may not add because of rounding.Source: PepsiCo, Inc., Annual Report, 1998.
2 If Pepsi had also issued preferred stock, we would also need to deduct this before calculating the equity thatbelonged to the common stockholders.
COMMON-SIZEBALANCE SHEETBalance sheet that presentsitems as a percentage oftotal assets.
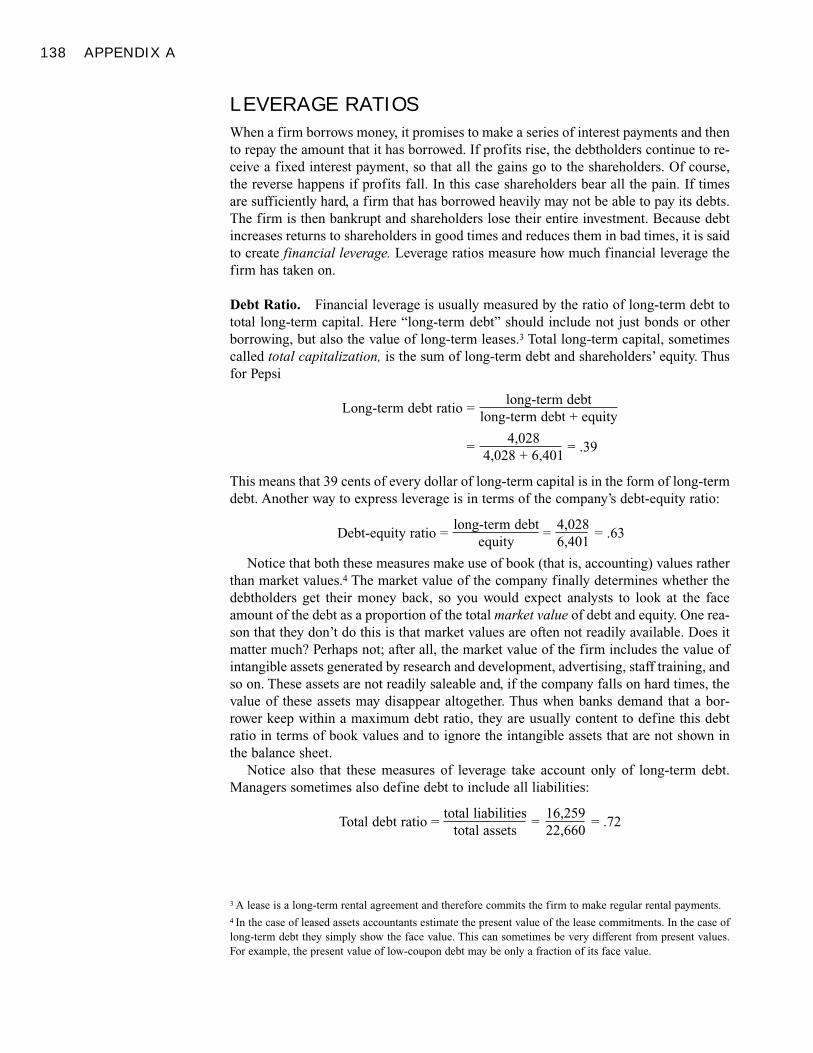
138 APPENDIX A
LEVERAGE RATIOS
When a firm borrows money, it promises to make a series of interest payments and thento repay the amount that it has borrowed. If profits rise, the debtholders continue to re-ceive a fixed interest payment, so that all the gains go to the shareholders. Of course,the reverse happens if profits fall. In this case shareholders bear all the pain. If timesare sufficiently hard, a firm that has borrowed heavily may not be able to pay its debts.The firm is then bankrupt and shareholders lose their entire investment. Because debtincreases returns to shareholders in good times and reduces them in bad times, it is saidto create financial leverage. Leverage ratios measure how much financial leverage thefirm has taken on.
Debt Ratio. Financial leverage is usually measured by the ratio of long-term debt tototal long-term capital. Here “long-term debt” should include not just bonds or otherborrowing, but also the value of long-term leases.3 Total long-term capital, sometimescalled total capitalization, is the sum of long-term debt and shareholders’ equity. Thusfor Pepsi
Long-term debt ratio =long-term debt
long-term debt + equity
=4,028
= .394,028 + 6,401
This means that 39 cents of every dollar of long-term capital is in the form of long-termdebt. Another way to express leverage is in terms of the company’s debt-equity ratio:
Debt-equity ratio =long-term debt
=4,028
= .63equity 6,401
Notice that both these measures make use of book (that is, accounting) values ratherthan market values.4 The market value of the company finally determines whether thedebtholders get their money back, so you would expect analysts to look at the faceamount of the debt as a proportion of the total market value of debt and equity. One rea-son that they don’t do this is that market values are often not readily available. Does itmatter much? Perhaps not; after all, the market value of the firm includes the value ofintangible assets generated by research and development, advertising, staff training, andso on. These assets are not readily saleable and, if the company falls on hard times, thevalue of these assets may disappear altogether. Thus when banks demand that a bor-rower keep within a maximum debt ratio, they are usually content to define this debtratio in terms of book values and to ignore the intangible assets that are not shown inthe balance sheet.
Notice also that these measures of leverage take account only of long-term debt.Managers sometimes also define debt to include all liabilities:
Total debt ratio =total liabilities
=16,259
= .72total assets 22,660
3 A lease is a long-term rental agreement and therefore commits the firm to make regular rental payments. 4 In the case of leased assets accountants estimate the present value of the lease commitments. In the case oflong-term debt they simply show the face value. This can sometimes be very different from present values.For example, the present value of low-coupon debt may be only a fraction of its face value.
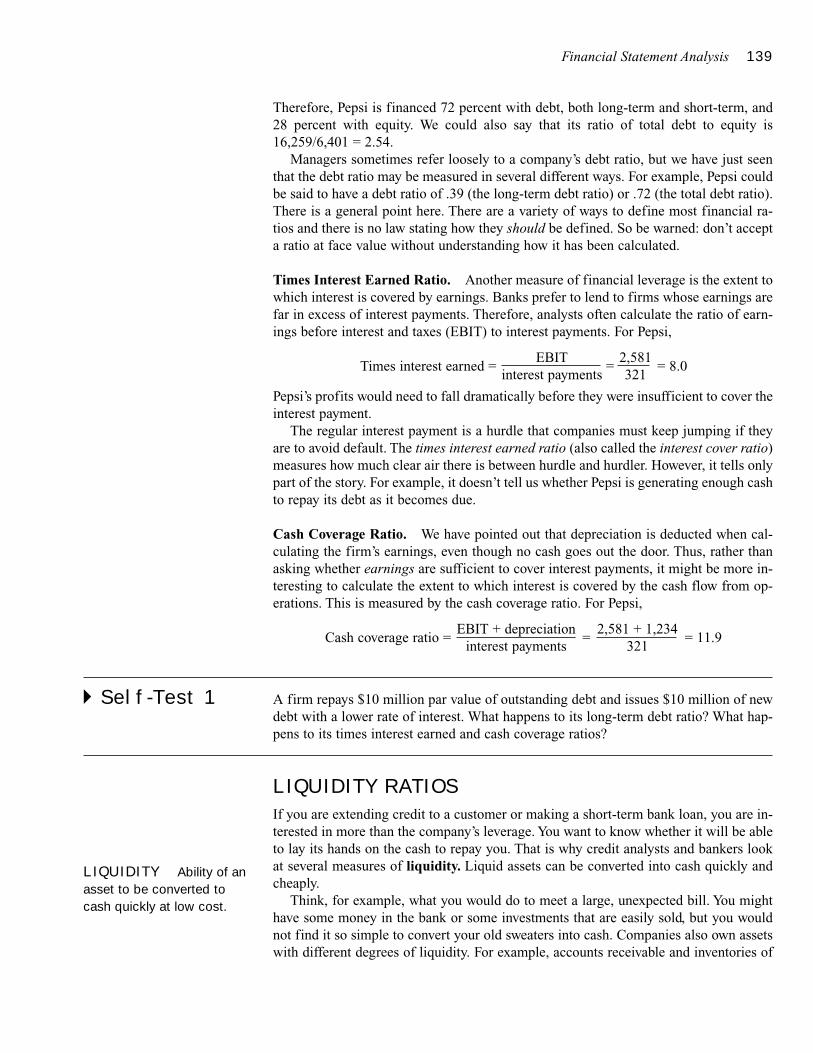
Financial Statement Analysis 139
Therefore, Pepsi is financed 72 percent with debt, both long-term and short-term, and28 percent with equity. We could also say that its ratio of total debt to equity is16,259/6,401 = 2.54.
Managers sometimes refer loosely to a company’s debt ratio, but we have just seenthat the debt ratio may be measured in several different ways. For example, Pepsi couldbe said to have a debt ratio of .39 (the long-term debt ratio) or .72 (the total debt ratio).There is a general point here. There are a variety of ways to define most financial ra-tios and there is no law stating how they should be defined. So be warned: don’t accepta ratio at face value without understanding how it has been calculated.
Times Interest Earned Ratio. Another measure of financial leverage is the extent towhich interest is covered by earnings. Banks prefer to lend to firms whose earnings arefar in excess of interest payments. Therefore, analysts often calculate the ratio of earn-ings before interest and taxes (EBIT) to interest payments. For Pepsi,
Times interest earned =EBIT
=2,581
= 8.0interest payments 321
Pepsi’s profits would need to fall dramatically before they were insufficient to cover theinterest payment.
The regular interest payment is a hurdle that companies must keep jumping if theyare to avoid default. The times interest earned ratio (also called the interest cover ratio)measures how much clear air there is between hurdle and hurdler. However, it tells onlypart of the story. For example, it doesn’t tell us whether Pepsi is generating enough cashto repay its debt as it becomes due.
Cash Coverage Ratio. We have pointed out that depreciation is deducted when cal-culating the firm’s earnings, even though no cash goes out the door. Thus, rather thanasking whether earnings are sufficient to cover interest payments, it might be more in-teresting to calculate the extent to which interest is covered by the cash flow from op-erations. This is measured by the cash coverage ratio. For Pepsi,
Cash coverage ratio =EBIT + depreciation
=2,581 + 1,234
= 11.9interest payments 321
� Self-Test 1 A firm repays $10 million par value of outstanding debt and issues $10 million of newdebt with a lower rate of interest. What happens to its long-term debt ratio? What hap-pens to its times interest earned and cash coverage ratios?
LIQUIDITY RATIOS
If you are extending credit to a customer or making a short-term bank loan, you are in-terested in more than the company’s leverage. You want to know whether it will be ableto lay its hands on the cash to repay you. That is why credit analysts and bankers lookat several measures of liquidity. Liquid assets can be converted into cash quickly andcheaply.
Think, for example, what you would do to meet a large, unexpected bill. You mighthave some money in the bank or some investments that are easily sold, but you wouldnot find it so simple to convert your old sweaters into cash. Companies also own assetswith different degrees of liquidity. For example, accounts receivable and inventories of
LIQUIDITY Ability of anasset to be converted tocash quickly at low cost.
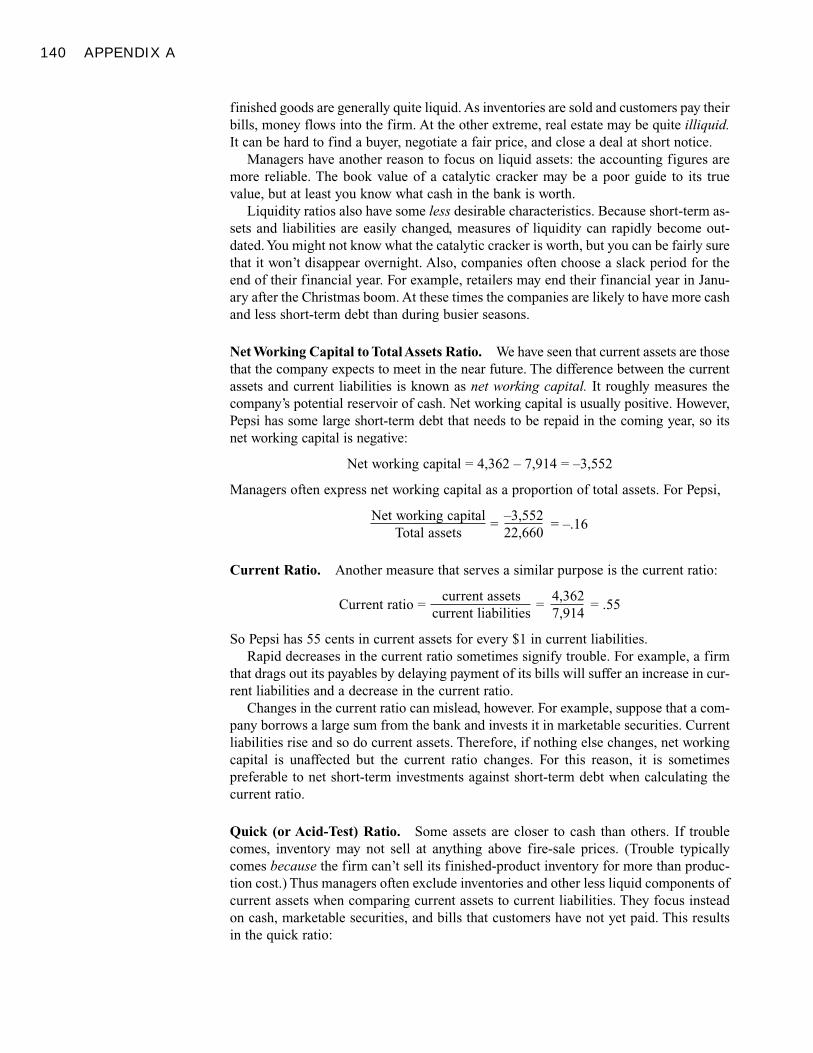
140 APPENDIX A
finished goods are generally quite liquid. As inventories are sold and customers pay theirbills, money flows into the firm. At the other extreme, real estate may be quite illiquid.It can be hard to find a buyer, negotiate a fair price, and close a deal at short notice.
Managers have another reason to focus on liquid assets: the accounting figures aremore reliable. The book value of a catalytic cracker may be a poor guide to its truevalue, but at least you know what cash in the bank is worth.
Liquidity ratios also have some less desirable characteristics. Because short-term as-sets and liabilities are easily changed, measures of liquidity can rapidly become out-dated. You might not know what the catalytic cracker is worth, but you can be fairly surethat it won’t disappear overnight. Also, companies often choose a slack period for theend of their financial year. For example, retailers may end their financial year in Janu-ary after the Christmas boom. At these times the companies are likely to have more cashand less short-term debt than during busier seasons.
Net Working Capital to Total Assets Ratio. We have seen that current assets are thosethat the company expects to meet in the near future. The difference between the currentassets and current liabilities is known as net working capital. It roughly measures thecompany’s potential reservoir of cash. Net working capital is usually positive. However,Pepsi has some large short-term debt that needs to be repaid in the coming year, so itsnet working capital is negative:
Net working capital = 4,362 – 7,914 = –3,552
Managers often express net working capital as a proportion of total assets. For Pepsi,
Net working capital=
–3,552= –.16
Total assets 22,660
Current Ratio. Another measure that serves a similar purpose is the current ratio:
Current ratio =current assets
=4,362
= .55current liabilities 7,914
So Pepsi has 55 cents in current assets for every $1 in current liabilities.Rapid decreases in the current ratio sometimes signify trouble. For example, a firm
that drags out its payables by delaying payment of its bills will suffer an increase in cur-rent liabilities and a decrease in the current ratio.
Changes in the current ratio can mislead, however. For example, suppose that a com-pany borrows a large sum from the bank and invests it in marketable securities. Currentliabilities rise and so do current assets. Therefore, if nothing else changes, net workingcapital is unaffected but the current ratio changes. For this reason, it is sometimespreferable to net short-term investments against short-term debt when calculating thecurrent ratio.
Quick (or Acid-Test) Ratio. Some assets are closer to cash than others. If troublecomes, inventory may not sell at anything above fire-sale prices. (Trouble typicallycomes because the firm can’t sell its finished-product inventory for more than produc-tion cost.) Thus managers often exclude inventories and other less liquid components ofcurrent assets when comparing current assets to current liabilities. They focus insteadon cash, marketable securities, and bills that customers have not yet paid. This resultsin the quick ratio:
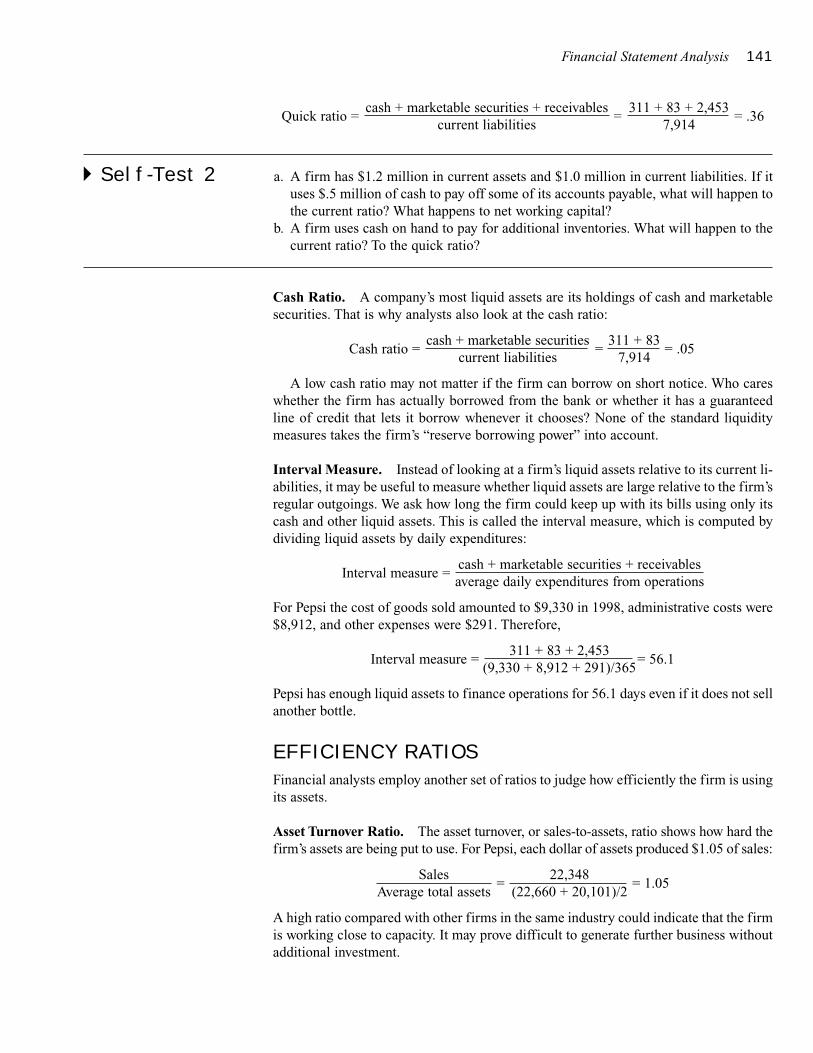
Financial Statement Analysis 141
Quick ratio =cash + marketable securities + receivables
=311 + 83 + 2,453
= .36current liabilities 7,914
� Self-Test 2 a. A firm has $1.2 million in current assets and $1.0 million in current liabilities. If ituses $.5 million of cash to pay off some of its accounts payable, what will happen tothe current ratio? What happens to net working capital?
b. A firm uses cash on hand to pay for additional inventories. What will happen to thecurrent ratio? To the quick ratio?
Cash Ratio. A company’s most liquid assets are its holdings of cash and marketablesecurities. That is why analysts also look at the cash ratio:
Cash ratio =cash + marketable securities
=311 + 83
= .05current liabilities 7,914
A low cash ratio may not matter if the firm can borrow on short notice. Who careswhether the firm has actually borrowed from the bank or whether it has a guaranteedline of credit that lets it borrow whenever it chooses? None of the standard liquiditymeasures takes the firm’s “reserve borrowing power” into account.
Interval Measure. Instead of looking at a firm’s liquid assets relative to its current li-abilities, it may be useful to measure whether liquid assets are large relative to the firm’sregular outgoings. We ask how long the firm could keep up with its bills using only itscash and other liquid assets. This is called the interval measure, which is computed bydividing liquid assets by daily expenditures:
Interval measure =cash + marketable securities + receivablesaverage daily expenditures from operations
For Pepsi the cost of goods sold amounted to $9,330 in 1998, administrative costs were$8,912, and other expenses were $291. Therefore,
Interval measure =311 + 83 + 2,453
= 56.1(9,330 + 8,912 + 291)/365
Pepsi has enough liquid assets to finance operations for 56.1 days even if it does not sellanother bottle.
EFFICIENCY RATIOS
Financial analysts employ another set of ratios to judge how efficiently the firm is usingits assets.
Asset Turnover Ratio. The asset turnover, or sales-to-assets, ratio shows how hard thefirm’s assets are being put to use. For Pepsi, each dollar of assets produced $1.05 of sales:
Sales=
22,348= 1.05
Average total assets (22,660 + 20,101)/2
A high ratio compared with other firms in the same industry could indicate that the firmis working close to capacity. It may prove difficult to generate further business withoutadditional investment.
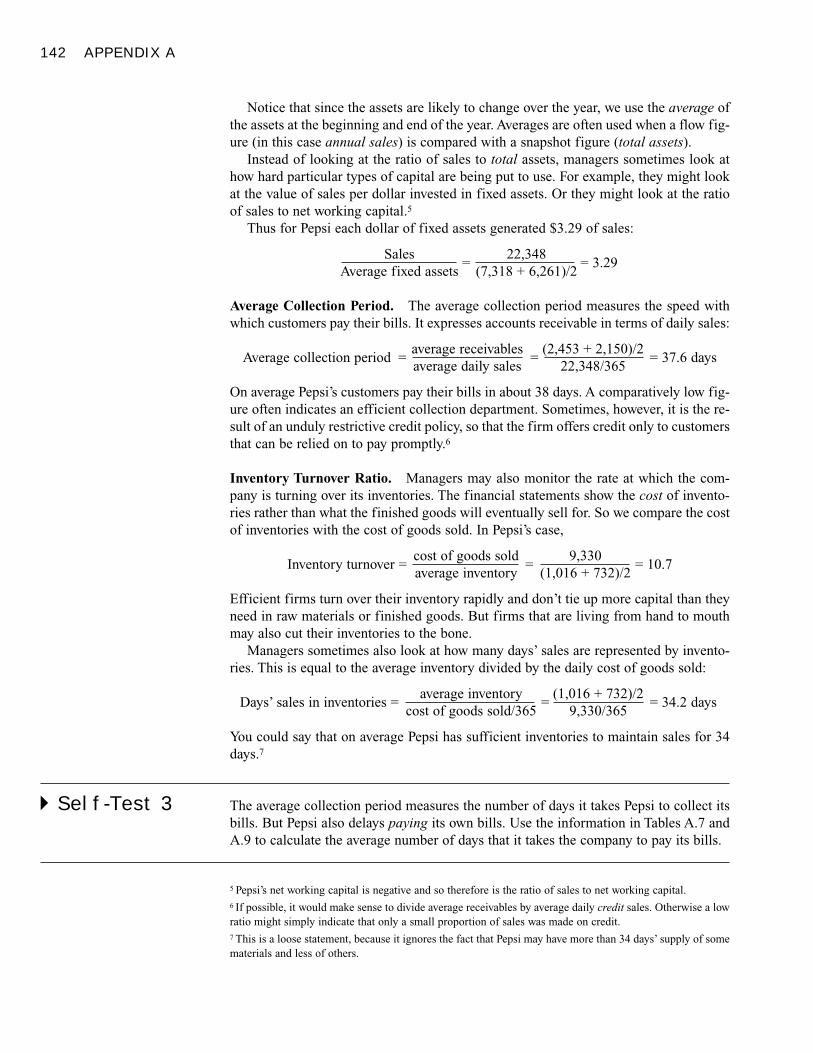
142 APPENDIX A
Notice that since the assets are likely to change over the year, we use the average ofthe assets at the beginning and end of the year. Averages are often used when a flow fig-ure (in this case annual sales) is compared with a snapshot figure (total assets).
Instead of looking at the ratio of sales to total assets, managers sometimes look athow hard particular types of capital are being put to use. For example, they might lookat the value of sales per dollar invested in fixed assets. Or they might look at the ratioof sales to net working capital.5
Thus for Pepsi each dollar of fixed assets generated $3.29 of sales:
Sales=
22,348= 3.29
Average fixed assets (7,318 + 6,261)/2
Average Collection Period. The average collection period measures the speed withwhich customers pay their bills. It expresses accounts receivable in terms of daily sales:
Average collection period =average receivables
=(2,453 + 2,150)/2
= 37.6 daysaverage daily sales 22,348/365
On average Pepsi’s customers pay their bills in about 38 days. A comparatively low fig-ure often indicates an efficient collection department. Sometimes, however, it is the re-sult of an unduly restrictive credit policy, so that the firm offers credit only to customersthat can be relied on to pay promptly.6
Inventory Turnover Ratio. Managers may also monitor the rate at which the com-pany is turning over its inventories. The financial statements show the cost of invento-ries rather than what the finished goods will eventually sell for. So we compare the costof inventories with the cost of goods sold. In Pepsi’s case,
Inventory turnover =cost of goods sold
=9,330
= 10.7average inventory (1,016 + 732)/2
Efficient firms turn over their inventory rapidly and don’t tie up more capital than theyneed in raw materials or finished goods. But firms that are living from hand to mouthmay also cut their inventories to the bone.
Managers sometimes also look at how many days’ sales are represented by invento-ries. This is equal to the average inventory divided by the daily cost of goods sold:
Days’ sales in inventories =average inventory
=(1,016 + 732)/2
= 34.2 dayscost of goods sold/365 9,330/365
You could say that on average Pepsi has sufficient inventories to maintain sales for 34days.7
� Self-Test 3 The average collection period measures the number of days it takes Pepsi to collect itsbills. But Pepsi also delays paying its own bills. Use the information in Tables A.7 andA.9 to calculate the average number of days that it takes the company to pay its bills.
5 Pepsi’s net working capital is negative and so therefore is the ratio of sales to net working capital.6 If possible, it would make sense to divide average receivables by average daily credit sales. Otherwise a lowratio might simply indicate that only a small proportion of sales was made on credit.7 This is a loose statement, because it ignores the fact that Pepsi may have more than 34 days’ supply of somematerials and less of others.
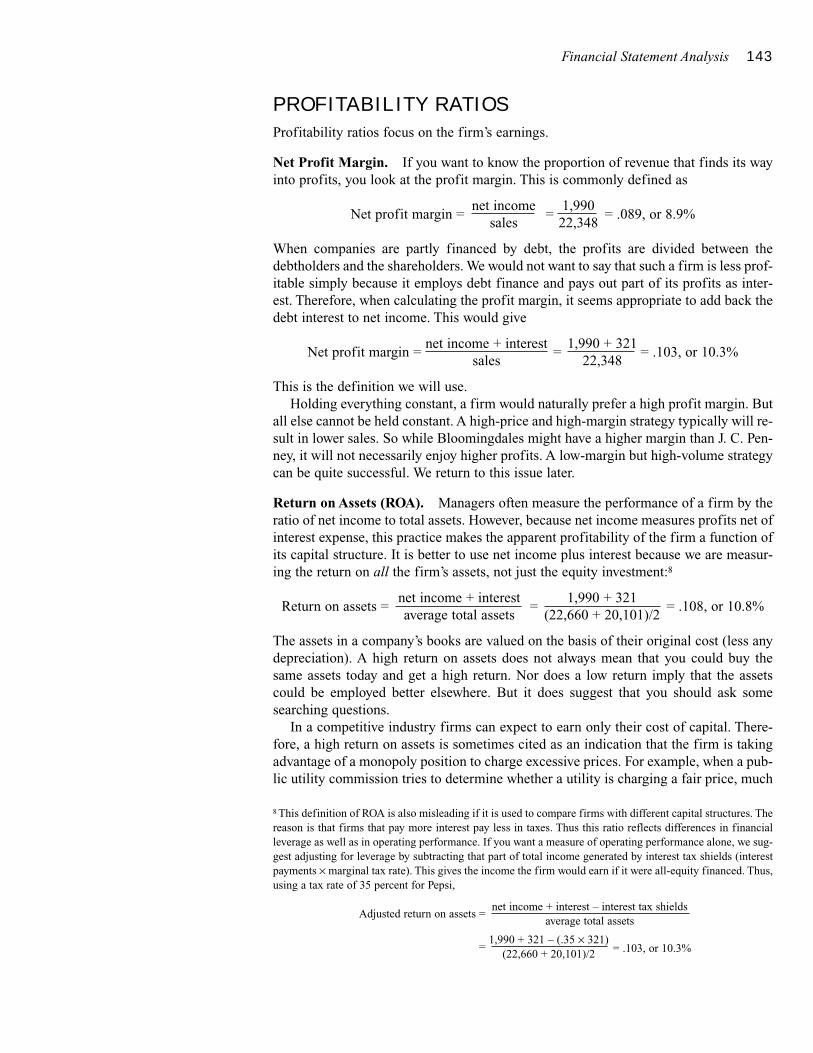
Financial Statement Analysis 143
PROFITABILITY RATIOS
Profitability ratios focus on the firm’s earnings.
Net Profit Margin. If you want to know the proportion of revenue that finds its wayinto profits, you look at the profit margin. This is commonly defined as
Net profit margin =net income
=1,990
= .089, or 8.9%sales 22,348
When companies are partly financed by debt, the profits are divided between thedebtholders and the shareholders. We would not want to say that such a firm is less prof-itable simply because it employs debt finance and pays out part of its profits as inter-est. Therefore, when calculating the profit margin, it seems appropriate to add back thedebt interest to net income. This would give
Net profit margin =net income + interest
=1,990 + 321
= .103, or 10.3%sales 22,348
This is the definition we will use.Holding everything constant, a firm would naturally prefer a high profit margin. But
all else cannot be held constant. A high-price and high-margin strategy typically will re-sult in lower sales. So while Bloomingdales might have a higher margin than J. C. Pen-ney, it will not necessarily enjoy higher profits. A low-margin but high-volume strategycan be quite successful. We return to this issue later.
Return on Assets (ROA). Managers often measure the performance of a firm by theratio of net income to total assets. However, because net income measures profits net ofinterest expense, this practice makes the apparent profitability of the firm a function ofits capital structure. It is better to use net income plus interest because we are measur-ing the return on all the firm’s assets, not just the equity investment:8
Return on assets =net income + interest
=1,990 + 321
= .108, or 10.8%average total assets (22,660 + 20,101)/2
The assets in a company’s books are valued on the basis of their original cost (less anydepreciation). A high return on assets does not always mean that you could buy thesame assets today and get a high return. Nor does a low return imply that the assetscould be employed better elsewhere. But it does suggest that you should ask somesearching questions.
In a competitive industry firms can expect to earn only their cost of capital. There-fore, a high return on assets is sometimes cited as an indication that the firm is takingadvantage of a monopoly position to charge excessive prices. For example, when a pub-lic utility commission tries to determine whether a utility is charging a fair price, much
8 This definition of ROA is also misleading if it is used to compare firms with different capital structures. Thereason is that firms that pay more interest pay less in taxes. Thus this ratio reflects differences in financialleverage as well as in operating performance. If you want a measure of operating performance alone, we sug-gest adjusting for leverage by subtracting that part of total income generated by interest tax shields (interestpayments × marginal tax rate). This gives the income the firm would earn if it were all-equity financed. Thus,using a tax rate of 35 percent for Pepsi,
Adjusted return on assets =net income + interest – interest tax shields
average total assets
=1,990 + 321 – (.35 × 321)
= .103, or 10.3%(22,660 + 20,101)/2
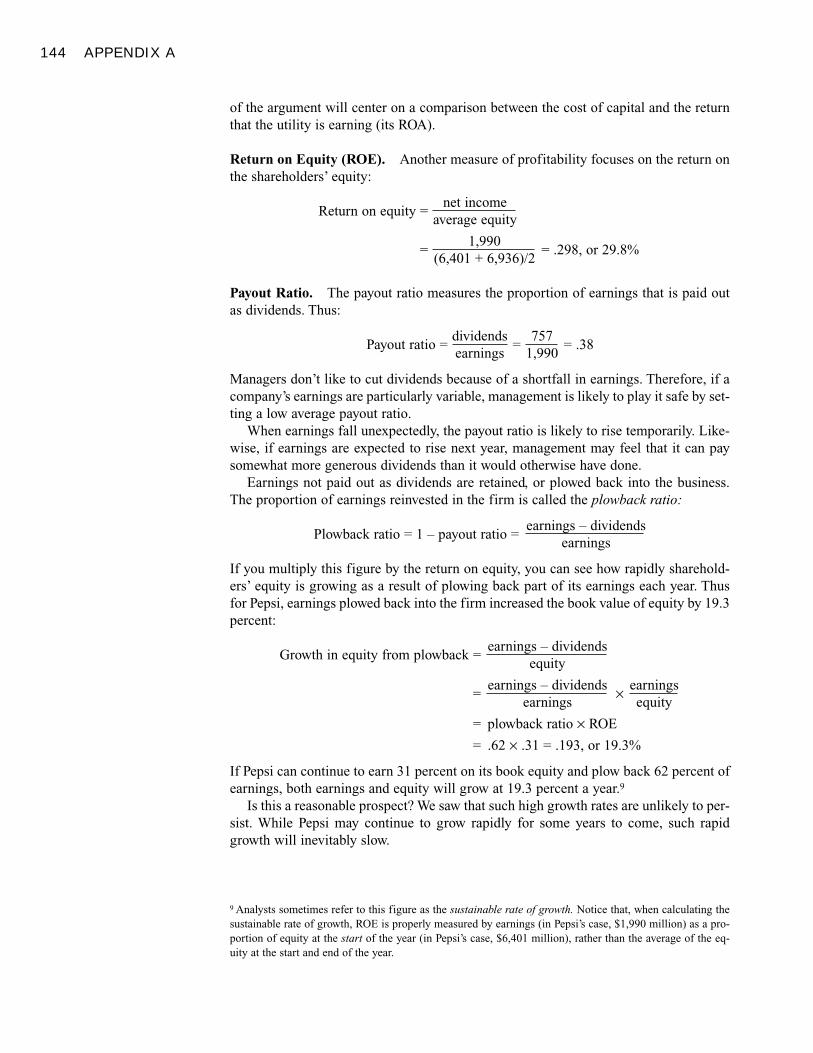
144 APPENDIX A
of the argument will center on a comparison between the cost of capital and the returnthat the utility is earning (its ROA).
Return on Equity (ROE). Another measure of profitability focuses on the return onthe shareholders’ equity:
Return on equity =net income
average equity
=1,990
= .298, or 29.8%(6,401 + 6,936)/2
Payout Ratio. The payout ratio measures the proportion of earnings that is paid outas dividends. Thus:
Payout ratio =dividends
=757
= .38earnings 1,990
Managers don’t like to cut dividends because of a shortfall in earnings. Therefore, if acompany’s earnings are particularly variable, management is likely to play it safe by set-ting a low average payout ratio.
When earnings fall unexpectedly, the payout ratio is likely to rise temporarily. Like-wise, if earnings are expected to rise next year, management may feel that it can paysomewhat more generous dividends than it would otherwise have done.
Earnings not paid out as dividends are retained, or plowed back into the business.The proportion of earnings reinvested in the firm is called the plowback ratio:
Plowback ratio = 1 – payout ratio =earnings – dividends
earnings
If you multiply this figure by the return on equity, you can see how rapidly sharehold-ers’ equity is growing as a result of plowing back part of its earnings each year. Thusfor Pepsi, earnings plowed back into the firm increased the book value of equity by 19.3percent:
Growth in equity from plowback =earnings – dividends
equity
=earnings – dividends × earnings
earnings equity
= plowback ratio × ROE
= .62 × .31 = .193, or 19.3%
If Pepsi can continue to earn 31 percent on its book equity and plow back 62 percent ofearnings, both earnings and equity will grow at 19.3 percent a year.9
Is this a reasonable prospect? We saw that such high growth rates are unlikely to per-sist. While Pepsi may continue to grow rapidly for some years to come, such rapidgrowth will inevitably slow.
9 Analysts sometimes refer to this figure as the sustainable rate of growth. Notice that, when calculating thesustainable rate of growth, ROE is properly measured by earnings (in Pepsi’s case, $1,990 million) as a pro-portion of equity at the start of the year (in Pepsi’s case, $6,401 million), rather than the average of the eq-uity at the start and end of the year.
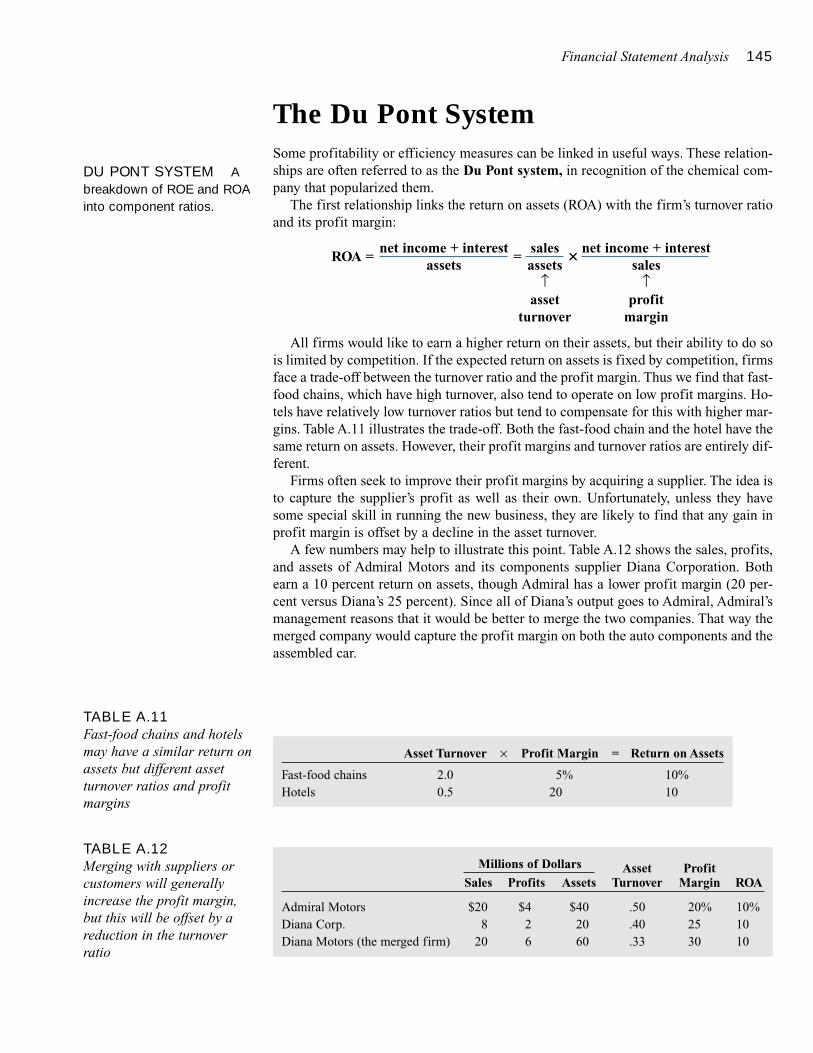
Financial Statement Analysis 145
The Du Pont SystemSome profitability or efficiency measures can be linked in useful ways. These relation-ships are often referred to as the Du Pont system, in recognition of the chemical com-pany that popularized them.
The first relationship links the return on assets (ROA) with the firm’s turnover ratioand its profit margin:
ROA =net income + interest
=sales
�net income + interest
assets assets sales↑ ↑
asset profitturnover margin
All firms would like to earn a higher return on their assets, but their ability to do sois limited by competition. If the expected return on assets is fixed by competition, firmsface a trade-off between the turnover ratio and the profit margin. Thus we find that fast-food chains, which have high turnover, also tend to operate on low profit margins. Ho-tels have relatively low turnover ratios but tend to compensate for this with higher mar-gins. Table A.11 illustrates the trade-off. Both the fast-food chain and the hotel have thesame return on assets. However, their profit margins and turnover ratios are entirely dif-ferent.
Firms often seek to improve their profit margins by acquiring a supplier. The idea isto capture the supplier’s profit as well as their own. Unfortunately, unless they havesome special skill in running the new business, they are likely to find that any gain inprofit margin is offset by a decline in the asset turnover.
A few numbers may help to illustrate this point. Table A.12 shows the sales, profits,and assets of Admiral Motors and its components supplier Diana Corporation. Bothearn a 10 percent return on assets, though Admiral has a lower profit margin (20 per-cent versus Diana’s 25 percent). Since all of Diana’s output goes to Admiral, Admiral’smanagement reasons that it would be better to merge the two companies. That way themerged company would capture the profit margin on both the auto components and theassembled car.
DU PONT SYSTEM Abreakdown of ROE and ROAinto component ratios.
TABLE A.11 Fast-food chains and hotelsmay have a similar return onassets but different assetturnover ratios and profitmargins
Asset Turnover × Profit Margin = Return on Assets
Fast-food chains 2.0 5% 10%Hotels 0.5 20 10
TABLE A.12Merging with suppliers orcustomers will generallyincrease the profit margin,but this will be offset by areduction in the turnoverratio
Millions of Dollars Asset ProfitSales Profits Assets Turnover Margin ROA
Admiral Motors $20 $4 $40 .50 20% 10%Diana Corp. 8 2 20 .40 25 10Diana Motors (the merged firm) 20 6 60 .33 30 10
146 APPENDIX A
The bottom line of Table A.12 shows the effect of the merger. The merged firm doesindeed earn the combined profits. Total sales remain at $20 million, however, because allthe components produced by Diana are used within the company. With higher profits andunchanged sales, the profit margin increases. Unfortunately, the asset turnover ratio isreduced by the merger since the merged firm operates with higher assets. This exactlyoffsets the benefit of the higher profit margin. The return on assets is unchanged.
We can also break down financial ratios to show how the return on equity (ROE) de-pends on the return on assets and leverage:
ROE =earnings available for common stock
=net income
equity equity
Therefore,
ROE =assets
�sales
�net income + interest
�net income
equity assets sales net income + interest↑ ↑ ↑ ↑
leverage asset profit “debtratio turnover margin burden”
Notice that the product of the two middle terms is the return on assets. This dependson the firm’s production and marketing skills and is unaffected by the firm’s financingmix.10 However, the first and fourth terms do depend on the debt-equity mix. The firstterm, assets/equity, which we call the leverage ratio, can be expressed as (equity + lia-bilities)/equity, which equals 1 + total-debt-to-equity ratio. The last term, which we callthe “debt burden,” measures the proportion by which interest expense reduces profits.
Suppose that the firm is financed entirely by equity. In this case both the first andthe fourth terms are equal to 1.0 and the return on equity is identical to the return onassets. If the firm is leveraged, the first term is greater than 1.0 (assets are greater thanequity) and the fourth term is less than 1.0 (part of the profits are absorbed by interest).Thus leverage can either increase or reduce return on equity. Leverage increases ROEwhen the firm’s return on assets is higher than the interest rate on debt.
� Self-Test 4 a. Sappy Syrup has a profit margin below the industry average, but its ROA equals theindustry average. How is this possible?
b. Sappy Syrup’s ROA equals the industry average, but its ROE exceeds the industryaverage. How is this possible?
OTHER FINANCIAL RATIOS
Each of the financial ratios that we have described involves accounting data only. Butmanagers also compare accounting numbers with the values that are established in themarketplace. For example, they may compare the total market value of the firm’s shareswith the book value (the amount that the company has raised from shareholders or reinvested on their behalf). If managers have been successful in adding value for stock-holders, the market-to-book ratio should be greater than 1.0.
10 There is a complication here because the amount of taxes paid depends on the financing mix. It would bebetter to add back any interest tax shields when calculating the firm’s profit margin.
Financial Statement Analysis 147
You can probably think of a number of other ratios that could provide useful insightsinto a company’s health. For example, a retail chain might compare its sales per squarefoot with those of its competitors, a steel producer might look at the cost per ton of steelproduced, and an airline might look at revenues per passenger mile flown. A littlethought and common sense should suggest which measures are likely to provide in-sights into your company’s efficiency.
Using Financial RatiosMany years ago a British bank chairman observed that not only did the bank’s accountsshow its true position but the actual situation was a little better still.11 Since that timeaccounting standards have been much more carefully defined, but companies still haveconsiderable discretion in calculating profits and deciding what to show in the balancesheet. Thus when you calculate financial ratios, you need to look below the surface andunderstand some of the pitfalls of accounting data. The nearby box discusses some waysin which companies can manipulate reported earnings.
For example, the assets shown in Pepsi’s 1998 balance sheet include a figure of$8,996 for “intangibles.” The major intangible consists of “goodwill,” which is the dif-ference between the amount that Pepsi paid when it acquired several companies and thebook value of their assets. Pepsi writes off a proportion of this goodwill from eachyear’s profits. We don’t want to debate whether goodwill is really an asset, but weshould warn you about the dangers of comparing ratios of firms whose balance sheetsinclude a substantial goodwill element with those that do not.
Another pitfall arises because many of the company’s liabilities are not shown in thebalance sheet at all. For example, the liabilities include leases that meet certain tests—for example, leases lasting more than 75 percent of the leased asset’s life. But a leaselasting only 74 percent of asset life escapes the net and is shown only in the footnotesto the financial statements. Read the footnotes carefully; if you take the balance sheetuncritically, you may miss important obligations of the company.
CHOOSING A BENCHMARK
We have shown you how to calculate the principal financial ratios for Pepsi. In practiceyou may not need to calculate all of them, because many measure essentially the samething. For example, if you know that Pepsi’s EBIT is 8.0 times interest payments andthat the company is financed 39 percent with long-term debt, the other leverage ratiosare of relatively little interest.
Once you have selected and calculated the important ratios, you still need some wayof judging whether they are high or low. A good starting point is to compare them withthe equivalent figures for the same company in earlier years. For example, you can seefrom the first two columns of Table A.13 that while Pepsi was somewhat more prof-itable in 1998 than in the previous year, it was also substantially less liquid. It had neg-ative working capital and a much lower cash ratio than in 1997.
It is also helpful to compare Pepsi’s financial position with that of other firms. How-ever, you would not expect companies in different industries to have similar ratios. For
11 Speech by the chairman of the London and County Bank at the Annual Meeting, February 1901. Reportedin The Economist, 1901, p. 204, and cited in C. A. E. Goodhart, The Business of Banking 1891–1914 (Lon-don: Weidenfield and Nicholson, 1972), p. 15.
SEE BOX
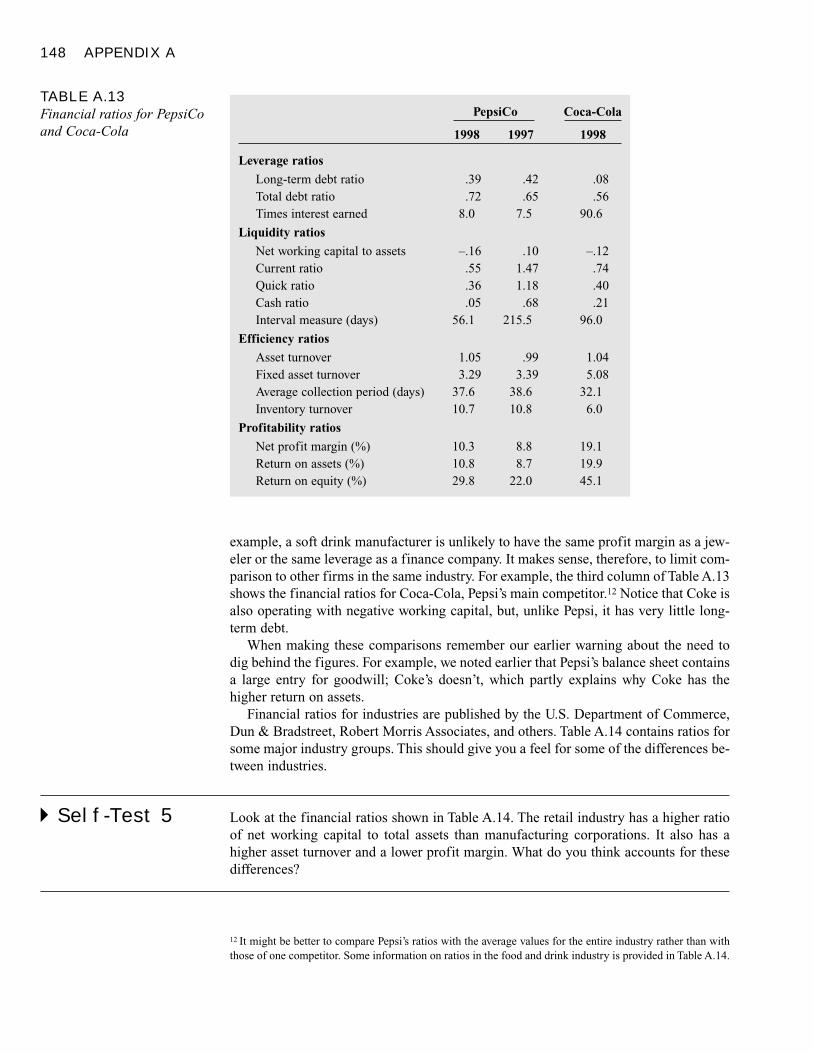
148 APPENDIX A
example, a soft drink manufacturer is unlikely to have the same profit margin as a jew-eler or the same leverage as a finance company. It makes sense, therefore, to limit com-parison to other firms in the same industry. For example, the third column of Table A.13shows the financial ratios for Coca-Cola, Pepsi’s main competitor.12 Notice that Coke isalso operating with negative working capital, but, unlike Pepsi, it has very little long-term debt.
When making these comparisons remember our earlier warning about the need todig behind the figures. For example, we noted earlier that Pepsi’s balance sheet containsa large entry for goodwill; Coke’s doesn’t, which partly explains why Coke has thehigher return on assets.
Financial ratios for industries are published by the U.S. Department of Commerce,Dun & Bradstreet, Robert Morris Associates, and others. Table A.14 contains ratios forsome major industry groups. This should give you a feel for some of the differences be-tween industries.
� Self-Test 5 Look at the financial ratios shown in Table A.14. The retail industry has a higher ratioof net working capital to total assets than manufacturing corporations. It also has ahigher asset turnover and a lower profit margin. What do you think accounts for thesedifferences?
TABLE A.13Financial ratios for PepsiCoand Coca-Cola
PepsiCo Coca-Cola
1998 1997 1998
Leverage ratios
Long-term debt ratio .39 .42 .08Total debt ratio .72 .65 .56Times interest earned 8.0 7.5 90.6
Liquidity ratios
Net working capital to assets –.16 .10 –.12Current ratio .55 1.47 .74Quick ratio .36 1.18 .40Cash ratio .05 .68 .21Interval measure (days) 56.1 215.5 96.0
Efficiency ratios
Asset turnover 1.05 .99 1.04Fixed asset turnover 3.29 3.39 5.08Average collection period (days) 37.6 38.6 32.1Inventory turnover 10.7 10.8 6.0
Profitability ratios
Net profit margin (%) 10.3 8.8 19.1Return on assets (%) 10.8 8.7 19.9Return on equity (%) 29.8 22.0 45.1
12 It might be better to compare Pepsi’s ratios with the average values for the entire industry rather than withthose of one competitor. Some information on ratios in the food and drink industry is provided in Table A.14.
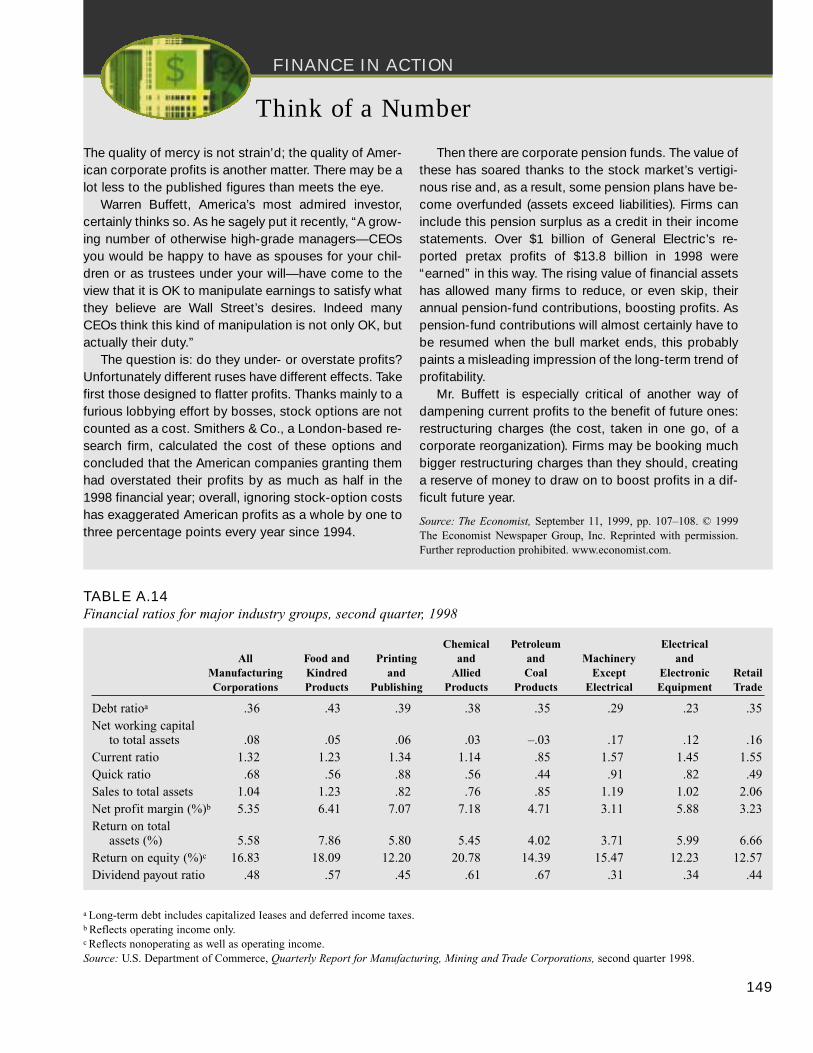
FINANCE IN ACTION
149
TABLE A.14Financial ratios for major industry groups, second quarter, 1998
a Long-term debt includes capitalized Ieases and deferred income taxes.b Reflects operating income only.c Reflects nonoperating as well as operating income.Source: U.S. Department of Commerce, Quarterly Report for Manufacturing, Mining and Trade Corporations, second quarter 1998.
Chemical Petroleum ElectricalAll Food and Printing and and Machinery and
Manufacturing Kindred and Allied Coal Except Electronic RetailCorporations Products Publishing Products Products Electrical Equipment Trade
Debt ratioa .36 .43 .39 .38 .35 .29 .23 .35Net working capital
to total assets .08 .05 .06 .03 –.03 .17 .12 .16Current ratio 1.32 1.23 1.34 1.14 .85 1.57 1.45 1.55Quick ratio .68 .56 .88 .56 .44 .91 .82 .49Sales to total assets 1.04 1.23 .82 .76 .85 1.19 1.02 2.06Net profit margin (%)b 5.35 6.41 7.07 7.18 4.71 3.11 5.88 3.23Return on total
assets (%) 5.58 7.86 5.80 5.45 4.02 3.71 5.99 6.66Return on equity (%)c 16.83 18.09 12.20 20.78 14.39 15.47 12.23 12.57Dividend payout ratio .48 .57 .45 .61 .67 .31 .34 .44
Think of a Number
The quality of mercy is not strain’d; the quality of Amer-ican corporate profits is another matter. There may be alot less to the published figures than meets the eye.
Warren Buffett, America’s most admired investor,certainly thinks so. As he sagely put it recently, “ A grow-ing number of otherwise high-grade managers— CEOsyou would be happy to have as spouses for your chil-dren or as trustees under your will— have come to theview that it is OK to manipulate earnings to satisfy whatthey believe are Wall Street’s desires. Indeed manyCEOs think this kind of manipulation is not only OK, butactually their duty.”
The question is: do they under- or overstate profits?Unfortunately different ruses have different effects. Takefirst those designed to flatter profits. Thanks mainly to afurious lobbying effort by bosses, stock options are notcounted as a cost. Smithers & Co., a London-based re-search firm, calculated the cost of these options andconcluded that the American companies granting themhad overstated their profits by as much as half in the1998 financial year; overall, ignoring stock-option costshas exaggerated American profits as a whole by one tothree percentage points every year since 1994.
Then there are corporate pension funds. The value ofthese has soared thanks to the stock market’s vertigi-nous rise and, as a result, some pension plans have be-come overfunded (assets exceed liabilities). Firms caninclude this pension surplus as a credit in their incomestatements. Over $1 billion of General Electric’s re-ported pretax profits of $13.8 billion in 1998 were“ earned” in this way. The rising value of financial assetshas allowed many firms to reduce, or even skip, theirannual pension-fund contributions, boosting profits. Aspension-fund contributions will almost certainly have tobe resumed when the bull market ends, this probablypaints a misleading impression of the long-term trend ofprofitability.
Mr. Buffett is especially critical of another way ofdampening current profits to the benefit of future ones:restructuring charges (the cost, taken in one go, of acorporate reorganization). Firms may be booking muchbigger restructuring charges than they should, creatinga reserve of money to draw on to boost profits in a dif-ficult future year.
Source: The Economist, September 11, 1999, pp. 107–108. © 1999The Economist Newspaper Group, Inc. Reprinted with permission.Further reproduction prohibited. www.economist.com.
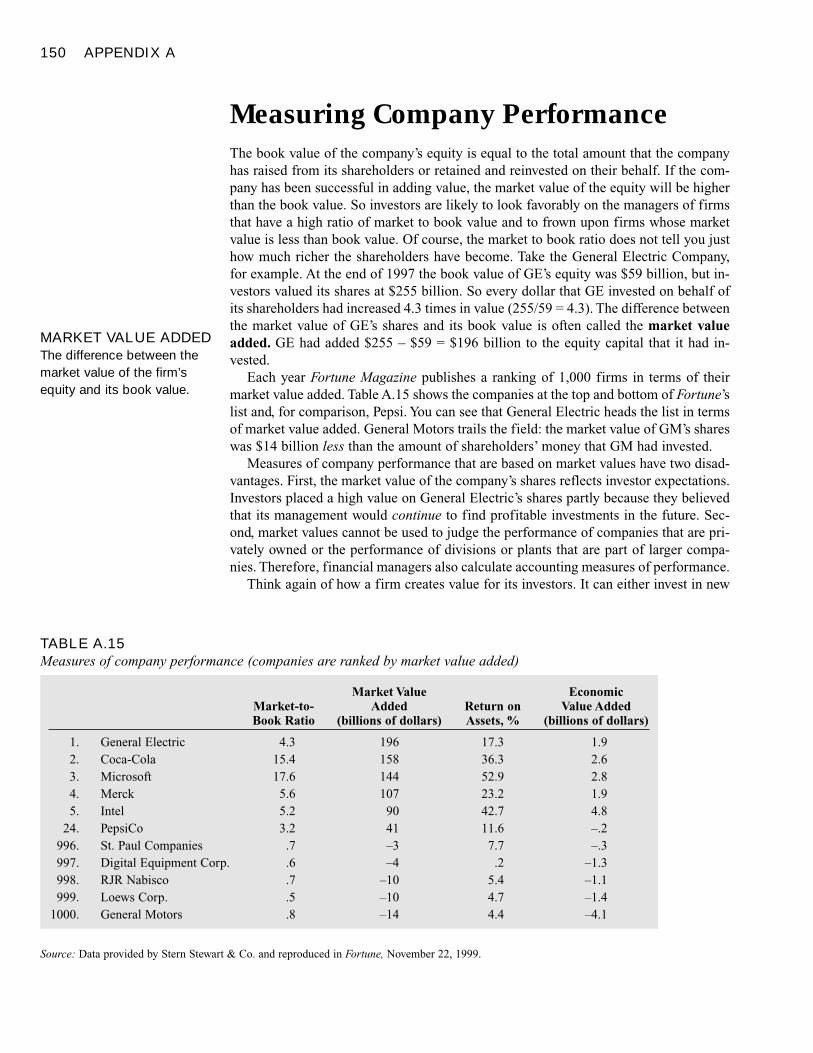
150 APPENDIX A
Measuring Company PerformanceThe book value of the company’s equity is equal to the total amount that the companyhas raised from its shareholders or retained and reinvested on their behalf. If the com-pany has been successful in adding value, the market value of the equity will be higherthan the book value. So investors are likely to look favorably on the managers of firmsthat have a high ratio of market to book value and to frown upon firms whose marketvalue is less than book value. Of course, the market to book ratio does not tell you justhow much richer the shareholders have become. Take the General Electric Company,for example. At the end of 1997 the book value of GE’s equity was $59 billion, but in-vestors valued its shares at $255 billion. So every dollar that GE invested on behalf ofits shareholders had increased 4.3 times in value (255/59 = 4.3). The difference betweenthe market value of GE’s shares and its book value is often called the market valueadded. GE had added $255 – $59 = $196 billion to the equity capital that it had in-vested.
Each year Fortune Magazine publishes a ranking of 1,000 firms in terms of theirmarket value added. Table A.15 shows the companies at the top and bottom of Fortune’slist and, for comparison, Pepsi. You can see that General Electric heads the list in termsof market value added. General Motors trails the field: the market value of GM’s shareswas $14 billion less than the amount of shareholders’ money that GM had invested.
Measures of company performance that are based on market values have two disad-vantages. First, the market value of the company’s shares reflects investor expectations.Investors placed a high value on General Electric’s shares partly because they believedthat its management would continue to find profitable investments in the future. Sec-ond, market values cannot be used to judge the performance of companies that are pri-vately owned or the performance of divisions or plants that are part of larger compa-nies. Therefore, financial managers also calculate accounting measures of performance.
Think again of how a firm creates value for its investors. It can either invest in new
TABLE A.15Measures of company performance (companies are ranked by market value added)
Market Value EconomicMarket-to- Added Return on Value AddedBook Ratio (billions of dollars) Assets, % (billions of dollars)
1. General Electric 4.3 196 17.3 1.92. Coca-Cola 15.4 158 36.3 2.63. Microsoft 17.6 144 52.9 2.84. Merck 5.6 107 23.2 1.95. Intel 5.2 90 42.7 4.8
24. PepsiCo 3.2 41 11.6 –.2996. St. Paul Companies .7 –3 7.7 –.3997. Digital Equipment Corp. .6 –4 .2 –1.3998. RJR Nabisco .7 –10 5.4 –1.1999. Loews Corp. .5 –10 4.7 –1.4
1000. General Motors .8 –14 4.4 –4.1
Source: Data provided by Stern Stewart & Co. and reproduced in Fortune, November 22, 1999.
MARKET VALUE ADDEDThe difference between themarket value of the firm’sequity and its book value.
Financial Statement Analysis 151
plant and equipment or it can return the cash to investors, who can then invest themoney for themselves by buying stocks and bonds in the capital market. The return thatinvestors could expect to earn if they invested in the capital market is called the cost ofcapital. A firm that earns more than the cost of capital makes its investors better off: itis earning them a higher return than they could obtain for themselves. A firm that earnsless than the cost of capital makes investors worse off: they could earn a higher returnsimply by investing their cash in the capital market. Naturally, therefore, financial man-agers are concerned whether the firm’s return on its assets exceeds or falls short of thecost of capital. Look, for example, at the third column of Table A.15, which shows thereturn on assets for our sample of companies. Microsoft had the highest return on as-sets at nearly 53 percent. Since the cost of capital for Microsoft was probably around14 percent, each dollar invested by Microsoft was earning almost four times the returnthat investors could have expected by investing in the capital market.
Let us work out how much this amounted to. Microsoft’s total capital in 1997 was$7.2 billion. With a return of 53 percent, it earned profits on this figure of .53 × 7.2 =$3.8 billion. The total cost of the capital employed by Microsoft was about .14 × 7.2 =$1.0 billion. So after deducting the cost of capital, Microsoft earned 3.8 – 1.0 = $2.8billion. This is called Microsoft’s residual income. It is also known as economic valueadded, or EVA, a term coined by the consultancy firm Stern Stewart, which has donemuch to develop and promote the concept.
The final column of Table A.15 shows the economic value added for our sample oflarge companies. You can see, for example, that while GE has a far lower return on as-sets than Microsoft, the two companies are close in terms of EVA. This is partly becauseGE was less risky and investors did not require such a high return, but also because GEhad far more dollars invested than Microsoft. General Motors is the laggard in the EVAstakes. Its positive return on assets indicates that the company earned a profit after de-ducting out-of-pocket costs. But this profit is calculated before deducting the cost ofcapital. GM’s residual income (or EVA) was negative at –$4.1 billion.
Residual income or EVA is a better measure of a company’s performance than accounting profits. Profits are calculated after deducting all costs except the cost of capital. EVA recognizes that companies need to cover their cost of capital before theyadd value. If a plant or division is not earning a positive EVA, its management is likelyto face some pointed questions about whether the assets could be better employed elsewhere or by fresh management. Therefore, a growing number of firms now calcu-late EVA and tie managers’ compensation to it.
The Role of Financial RatiosIn this material we have encountered a number of measures of a firm’s financial posi-tion. Many of these were in the form of ratios; some, such as market value added andeconomic value added, were measured in dollars.
Before we leave the topic it might be helpful to emphasize the role of such account-ing measures. Whenever two managers get together to discuss the state of the business,there is a good bet that they will refer to financial ratios. Let’s drop in on two conver-sations.
Conversation 1. The CEO was musing out loud: “How are we going to finance thisexpansion? Would the banks be happy to lend us the $30 million that we need?”
RESIDUAL INCOME(ALSO CALLEDECONOMIC VALUEADDED OR EVA) Thenet profit of a firm or divisionafter deducting the cost ofthe capital employed.
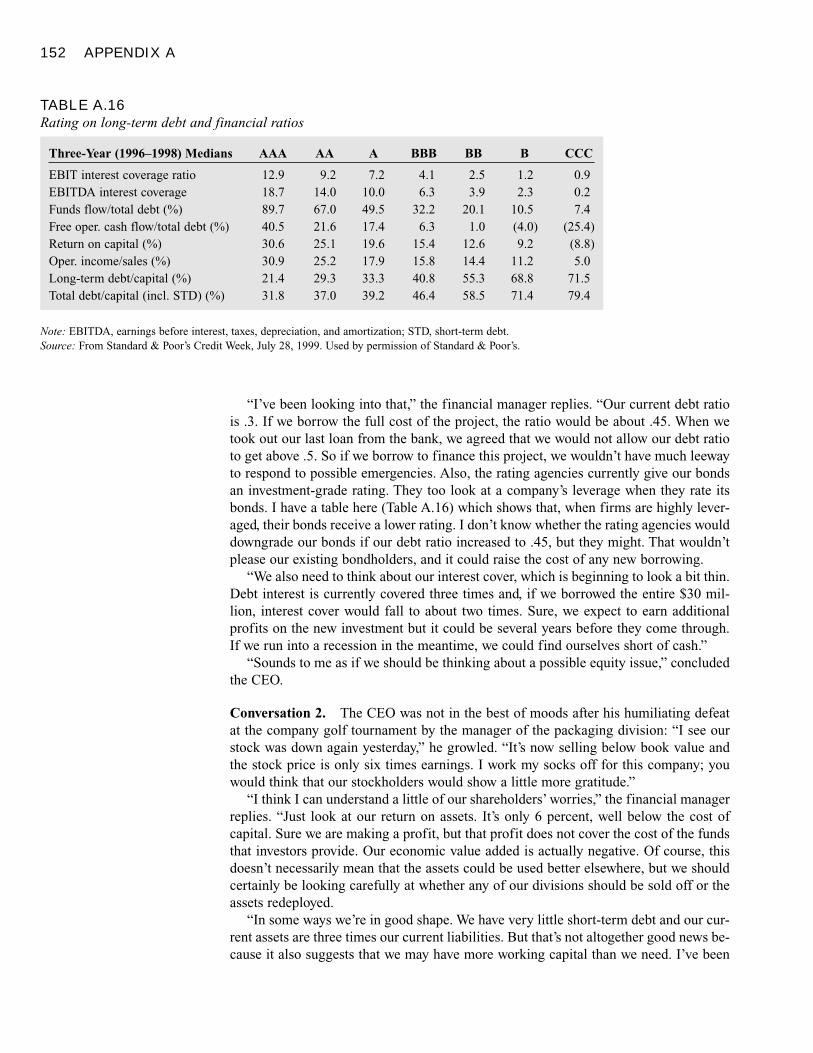
152 APPENDIX A
“I’ve been looking into that,” the financial manager replies. “Our current debt ratiois .3. If we borrow the full cost of the project, the ratio would be about .45. When wetook out our last loan from the bank, we agreed that we would not allow our debt ratioto get above .5. So if we borrow to finance this project, we wouldn’t have much leewayto respond to possible emergencies. Also, the rating agencies currently give our bondsan investment-grade rating. They too look at a company’s leverage when they rate itsbonds. I have a table here (Table A.16) which shows that, when firms are highly lever-aged, their bonds receive a lower rating. I don’t know whether the rating agencies woulddowngrade our bonds if our debt ratio increased to .45, but they might. That wouldn’tplease our existing bondholders, and it could raise the cost of any new borrowing.
“We also need to think about our interest cover, which is beginning to look a bit thin.Debt interest is currently covered three times and, if we borrowed the entire $30 mil-lion, interest cover would fall to about two times. Sure, we expect to earn additionalprofits on the new investment but it could be several years before they come through.If we run into a recession in the meantime, we could find ourselves short of cash.”
“Sounds to me as if we should be thinking about a possible equity issue,” concludedthe CEO.
Conversation 2. The CEO was not in the best of moods after his humiliating defeatat the company golf tournament by the manager of the packaging division: “I see ourstock was down again yesterday,” he growled. “It’s now selling below book value andthe stock price is only six times earnings. I work my socks off for this company; youwould think that our stockholders would show a little more gratitude.”
“I think I can understand a little of our shareholders’ worries,” the financial managerreplies. “Just look at our return on assets. It’s only 6 percent, well below the cost of capital. Sure we are making a profit, but that profit does not cover the cost of the fundsthat investors provide. Our economic value added is actually negative. Of course, thisdoesn’t necessarily mean that the assets could be used better elsewhere, but we shouldcertainly be looking carefully at whether any of our divisions should be sold off or theassets redeployed.
“In some ways we’re in good shape. We have very little short-term debt and our cur-rent assets are three times our current liabilities. But that’s not altogether good news be-cause it also suggests that we may have more working capital than we need. I’ve been
TABLE A.16Rating on long-term debt and financial ratios
Note: EBITDA, earnings before interest, taxes, depreciation, and amortization; STD, short-term debt.Source: From Standard & Poor’s Credit Week, July 28, 1999. Used by permission of Standard & Poor’s.
Three-Year (1996–1998) Medians AAA AA A BBB BB B CCC
EBIT interest coverage ratio 12.9 9.2 7.2 4.1 2.5 1.2 0.9EBITDA interest coverage 18.7 14.0 10.0 6.3 3.9 2.3 0.2Funds flow/total debt (%) 89.7 67.0 49.5 32.2 20.1 10.5 7.4Free oper. cash flow/total debt (%) 40.5 21.6 17.4 6.3 1.0 (4.0) (25.4)Return on capital (%) 30.6 25.1 19.6 15.4 12.6 9.2 (8.8)Oper. income/sales (%) 30.9 25.2 17.9 15.8 14.4 11.2 5.0Long-term debt/capital (%) 21.4 29.3 33.3 40.8 55.3 68.8 71.5Total debt/capital (incl. STD) (%) 31.8 37.0 39.2 46.4 58.5 71.4 79.4
Financial Statement Analysis 153
looking at our main competitors. They turn over their inventory 12 times a year com-pared with our figure of just 8 times. Also, their customers take an average of 45 daysto pay their bills. Ours take 67. If we could just match their performance on these twomeasures, we would release $300 million that could be paid out to shareholders.”
“Perhaps we could talk more about this tomorrow,” said the CEO. “In the meantimeI intend to have a word with the production manager about our inventory levels and withthe credit manager about our collections policy. You’ve also got me thinking aboutwhether we should sell off our packaging division. I’ve always worried about the divi-sional manager there. Spends too much time practicing his backswing and not enoughworrying about his return on assets.”
SummaryWhat are the standard measures of a firm’s leverage, liquidity, profitability, assetmanagement, and market valuation? What is the significance of these measures?
If you are analyzing a company’s financial statements, there is a danger of beingoverwhelmed by the sheer volume of data contained in the income statement, balancesheet, and statement of cash flow. Managers use a few salient ratios to summarize thefirm’s leverage, liquidity, efficiency, and profitability. They may also combine accountingdata with other data to measure the esteem in which investors hold the company or theefficiency with which the firm uses its resources.
Table A.17 summarizes the four categories of financial ratios that we have discussed inthis material. Remember though that financial analysts define the same ratio in differentways or use different terms to describe the same ratio.
Leverage ratios measure the indebtedness of the firm. Liquidity ratios measure howeasily the firm can obtain cash. Efficiency ratios measure how intensively the firm is usingits assets. Profitability ratios measure the firm’s return on its investments. Be selective inyour choice of these ratios. Different ratios often tell you similar things.
Financial ratios crop up repeatedly in financial discussions and arrangements. Forexample, banks and bondholders commonly place limits on the borrower’s leverage ratios.Ratings agencies also look at leverage ratios when they decide how highly to rate the firm’sbonds.
How does the Du Pont formula help identify the determinants of the firm’s returnon its assets and equity?
The Du Pont system provides a useful way to link ratios to explain the firm’s return onassets and equity. The formula states that the return on equity is the product of the firm’sleverage ratio, asset turnover, profit margin, and debt burden. Return on assets is theproduct of the firm’s asset turnover and profit margin.
What are some potential pitfalls of ratio analysis based on accounting data?
Financial ratio analysis will rarely be useful if practiced mechanically. lt requires a largedose of good judgment. Financial ratios seldom provide answers but they do help you askthe right questions. Moreover, accounting data do not necessarily reflect market valuesproperly, and so must be used with caution. You need a benchmark for assessing acompany’s financial position. Therefore, we typically compare financial ratios with thecompany’s ratios in earlier years and with the ratios of other firms in the same business.
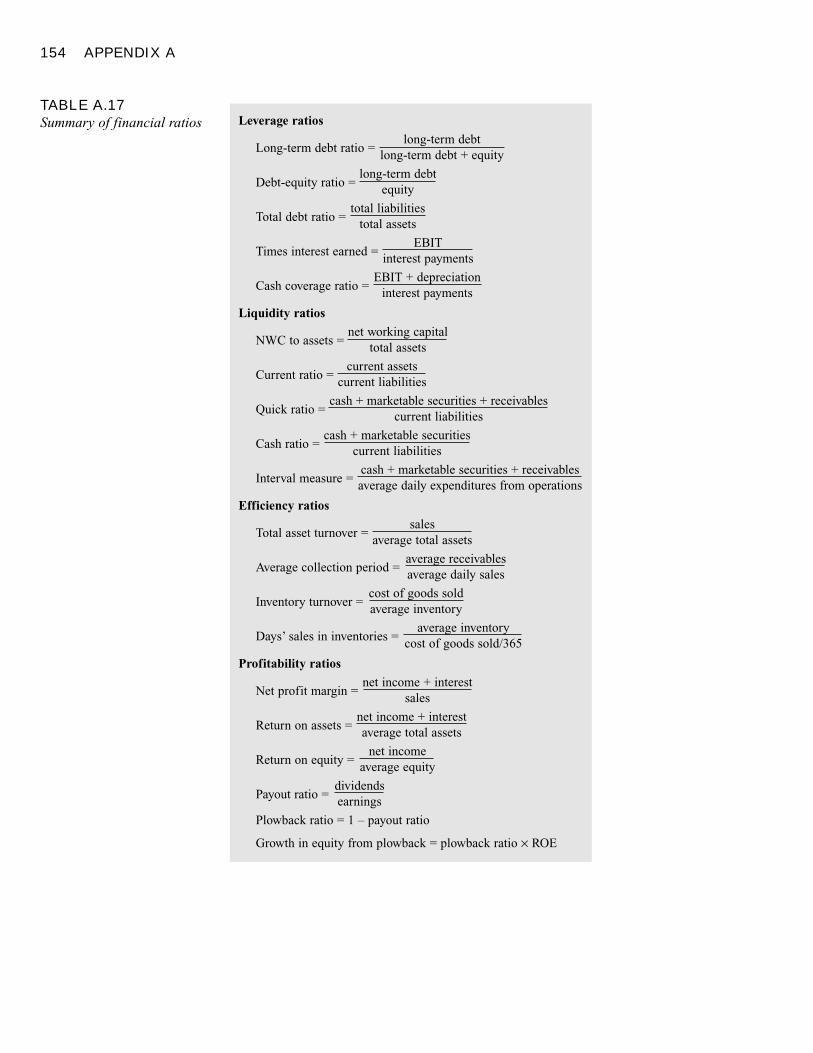
154 APPENDIX A
TABLE A.17Summary of financial ratios Leverage ratios
Long-term debt ratio =long-term debt
long-term debt + equity
Debt-equity ratio =long-term debt
equity
Total debt ratio =total liabilities
total assets
Times interest earned =EBIT
interest payments
Cash coverage ratio =EBIT + depreciation
interest payments
Liquidity ratios
NWC to assets =net working capital
total assets
Current ratio =current assets
current liabilities
Quick ratio =cash + marketable securities + receivables
current liabilities
Cash ratio =cash + marketable securities
current liabilities
Interval measure =cash + marketable securities + receivablesaverage daily expenditures from operations
Efficiency ratios
Total asset turnover =sales
average total assets
Average collection period =average receivablesaverage daily sales
Inventory turnover =cost of goods soldaverage inventory
Days’ sales in inventories =average inventory
cost of goods sold/365
Profitability ratios
Net profit margin =net income + interest
sales
Return on assets =net income + interestaverage total assets
Return on equity =net income
average equity
Payout ratio =dividendsearnings
Plowback ratio = 1 – payout ratio
Growth in equity from plowback = plowback ratio × ROE
Financial Statement Analysis 155
How do measures such as market value added and economic value added help toassess the firm’s performance?
The ratio of the market value of the firm’s equity to its book value indicates how far thevalue of the shareholders’ investment exceeds the money that they have contributed. Thedifference between the market and book values is known as market value added andmeasures the number of dollars of value that the company has added.
Managers often compare the company’s return on assets with the cost of capital, to seewhether the firm is earning the return that investors require. It is also useful to deduct thecost of the capital employed from the company’s profits to see how much profit thecompany has earned after all costs. This measure is known as residual income, economicvalue added, or EVA. Managers of divisions or plants are often judged and rewarded bytheir business’s economic value added.
www.cfonet.com/html/Articles/CFO/1998/98JAtist.html A look at the Du Pont modelwww.stockscreener.com/ How investors use financial analysis to value or screen firmswww.onlinewbc.org/docs/finance/index.html Basics of financial analysis, with tutorials and
toolshttp://profiles.wisi.com/ Detailed information on 18,000 companieswww.hoovers.com/ Hoover’s company directory reports on thousands of companies, IPOs, and
industriesbiz.yahoo.com Useful financial profiles on thousands of firmswww.reportgallery.com Annual reports on thousands of companieswww.prars.com Public Register’s Annual Report Service is the largest annual report service in
the United States, providing annual reports, prospectuses, and 10-K reportswww.sternstewart.com Contains a good discussion of economic value added
income statementcommon-size income statementbalance sheetcommon-size balance sheetliquidity
Du Pont systemmarket value addedresidual incomeeconomic value added (EVA)
1. Calculating Ratios. Here are simplified financial statements of Phone Corporation from arecent year:
INCOME STATEMENT(figures in millions of dollars)
Net sales 13,194Cost of goods sold 4,060Other expenses 4,049Depreciation 2,518Earnings before interest and taxes (EBIT) 2,566Interest expenses 685Income before tax 1,881Taxes 570Net income 1,311Dividends 856
Key Terms
Related WebLinks
Quiz
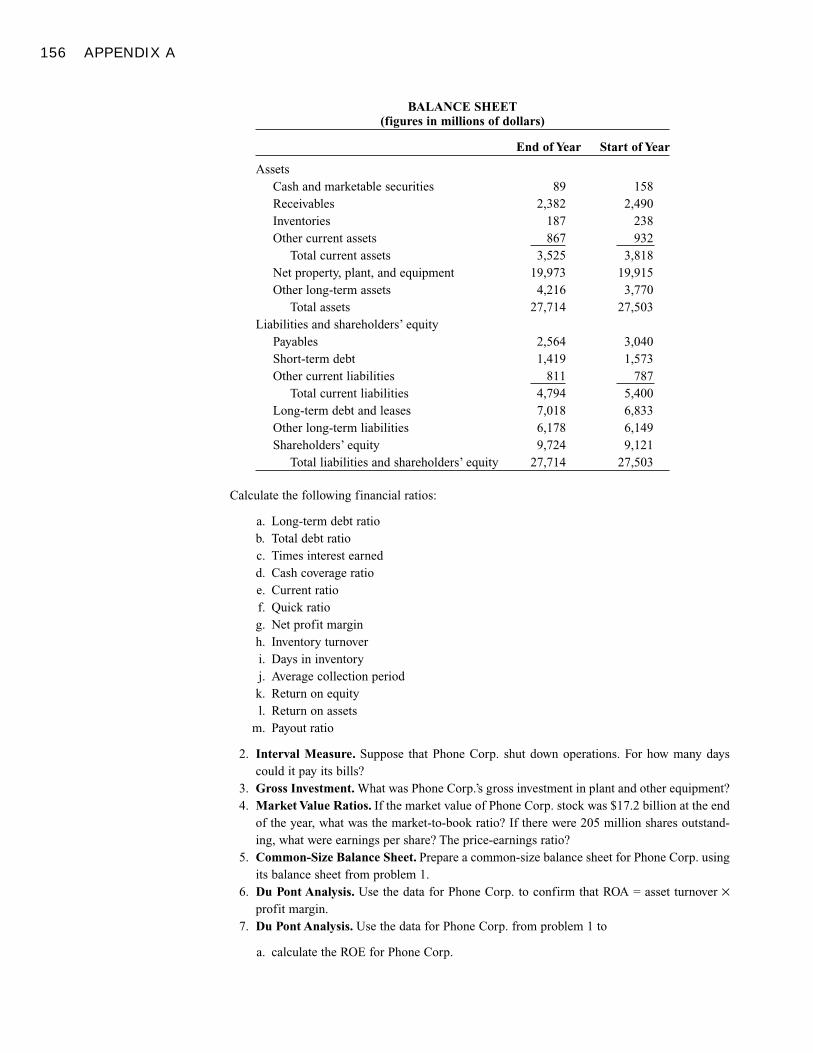
156 APPENDIX A
BALANCE SHEET(figures in millions of dollars)
End of Year Start of Year
AssetsCash and marketable securities 89 158Receivables 2,382 2,490Inventories 187 238Other current assets 867 932
Total current assets 3,525 3,818Net property, plant, and equipment 19,973 19,915Other long-term assets 4,216 3,770
Total assets 27,714 27,503Liabilities and shareholders’ equity
Payables 2,564 3,040Short-term debt 1,419 1,573Other current liabilities 811 787
Total current liabilities 4,794 5,400Long-term debt and leases 7,018 6,833Other long-term liabilities 6,178 6,149Shareholders’ equity 9,724 9,121
Total liabilities and shareholders’ equity 27,714 27,503
Calculate the following financial ratios:
a. Long-term debt ratiob. Total debt ratioc. Times interest earnedd. Cash coverage ratioe. Current ratiof. Quick ratiog. Net profit marginh. Inventory turnoveri. Days in inventoryj. Average collection periodk. Return on equityl. Return on assets
m. Payout ratio
2. Interval Measure. Suppose that Phone Corp. shut down operations. For how many dayscould it pay its bills?
3. Gross Investment. What was Phone Corp.’s gross investment in plant and other equipment?4. Market Value Ratios. If the market value of Phone Corp. stock was $17.2 billion at the end
of the year, what was the market-to-book ratio? If there were 205 million shares outstand-ing, what were earnings per share? The price-earnings ratio?
5. Common-Size Balance Sheet. Prepare a common-size balance sheet for Phone Corp. usingits balance sheet from problem 1.
6. Du Pont Analysis. Use the data for Phone Corp. to confirm that ROA = asset turnover ×profit margin.
7. Du Pont Analysis. Use the data for Phone Corp. from problem 1 to
a. calculate the ROE for Phone Corp.
Financial Statement Analysis 157
b. demonstrate that ROE = leverage ratio × asset turnover ratio × profit margin × debtburden.
8. Asset Turnover. In each case, choose the firm that you expect to have a higher asset turnoverratio.
a. Economics Consulting Group or Pepsib. Catalog Shopping Network or Neiman Marcusc. Electric Utility Co. or Standard Supermarkets
9. Defining Ratios. There are no universally accepted definitions of financial ratios, but someof the following ratios make no sense at all. Substitute the correct definitions.
a. Debt-equity ratio =long-term debt
long-term debt + equity
b. Return on equity =EBIT – tax
average equity
c. Profit margin =net income + interest
sales
d. Inventory turnover =total assets
average inventory
e. Current ratio =current liabilities
current assets
f. Interval measure =current assets – inventories
average daily expenditure from operations
g. Average collection period =sales
average receivables/365
h. Quick ratio =cash + marketable securities + receivables
current liabilities
10. Current Liabilities. Suppose that at year-end Pepsi had unused lines of credit which wouldhave allowed it to borrow a further $300 million. Suppose also that it used this line of creditto borrow $300 million and invested the proceeds in marketable securities. Would the com-pany have appeared to be (a) more or less liquid, (b) more or less highly leveraged? Calcu-late the appropriate ratios.
11. Current Ratio. How would the following actions affect a firm’s current ratio?
a. Inventory is sold at cost.b. The firm takes out a bank loan to pay its accounts due.c. A customer pays its accounts receivable.d. The firm uses cash to purchase additional inventories.
12. Liquidity Ratios. A firm uses $1 million in cash to purchase inventories. What will happento its current ratio? Its quick ratio?
13. Receivables. Chik’s Chickens has average accounts receivable of $6,333. Sales for the yearwere $9,800. What is its average collection period?
14. Inventory. Salad Daze maintains an inventory of produce worth $400. Its total bill for pro-duce over the course of the year was $73,000. How old on average is the lettuce it serves itscustomers?
15. Inventory Turnover. If a firm’s inventory level of $10,000 represents 30 days’ sales, whatis the annual cost of goods sold? What is the inventory turnover ratio?
PracticeProblems
158 APPENDIX A
16. Leverage Ratios. Lever Age pays an 8 percent coupon on outstanding debt with face value$10 million. The firm’s EBIT was $1 million.
a. What is times interest earned?b. If depreciation is $200,000, what is cash coverage?c. If the firm must retire $300,000 of debt for the sinking fund each year, what is its “fixed-
payment cash-coverage ratio” (the ratio of cash flow to interest plus other fixed debt pay-ments)?
17. Du Pont Analysis. Keller Cosmetics maintains a profit margin of 5 percent and assetturnover ratio of 3.
a. What is its ROA?b. If its debt-equity ratio is 1.0, its interest payments and taxes are each $8,000, and EBIT
is $20,000, what is its ROE?
18. Du Pont Analysis. Torrid Romance Publishers has total receivables of $3,000, which repre-sents 20 days’ sales. Average total assets are $75,000. The firm’s profit margin is 5 percent.Find the firm’s ROA and asset turnover ratio.
19. Leverage. A firm has a long-term debt-equity ratio of .4. Shareholders’ equity is $1 million.Current assets are $200,000 and the current ratio is 2.0. The only current liabilities are notespayable. What is the total debt ratio?
20. Leverage Ratios. A firm has a debt-to-equity ratio of .5 and a market-to-book ratio of 2.0.What is the ratio of the book value of debt to the market value of equity?
21. Times Interest Earned. In the past year, TVG had revenues of $3 million, cost of goods soldof $2.5 million, and depreciation expense of $200,000. The firm has a single issue of debtoutstanding with face value of $1 million, market value of $.92 million, and a coupon rateof 8 percent. What is the firm’s times interest earned ratio?
22. Du Pont Analysis. CFA Corp. has a debt-equity ratio that is lower than the industry average,but its cash coverage ratio is also lower than the industry average. What might explain thisseeming contradiction?
23. Leverage. Suppose that a firm has both floating rate and fixed rate debt outstanding. Whateffect will a decline in market interest rates have on the firm’s times interest earned ratio?On the market value debt-to-equity ratio? Based on these answers, would you say that lever-age has increased or decreased?
24. Interpreting Ratios. In each of the following cases, explain briefly which of the two com-panies is likely to be characterized by the higher ratio:
a. Debt-equity ratio: a shipping company or a computer software companyb. Payout ratio: United Foods Inc. or Computer Graphics Inc.c. Ratio of sales to assets: an integrated pulp and paper manufacturer or a paper milld. Average collection period: Regional Electric Power Company or Z-Mart Discount Out-
letse. Price-earnings multiple: Basic Sludge Company or Fledgling Electronics
25. Using Financial Ratios. For each category of financial ratios discussed in this material, givesome examples of who would be likely to examine these ratios and why.
26. Financial Statements. As you can see, someone has spilled ink over some of the entries inthe balance sheet and income statement of Transylvania Railroad. Can you use the follow-ing information to work out the missing entries:
ChallengeProblem
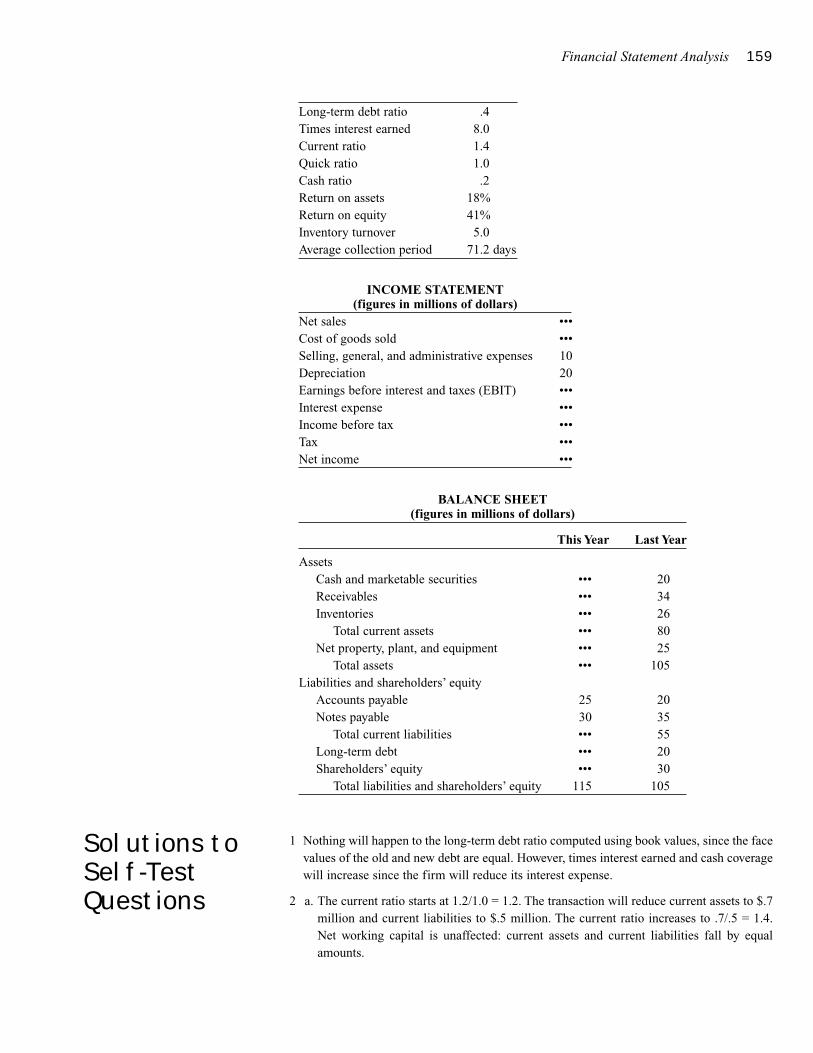
Financial Statement Analysis 159
Long-term debt ratio .4Times interest earned 8.0Current ratio 1.4Quick ratio 1.0Cash ratio .2Return on assets 18%Return on equity 41%Inventory turnover 5.0Average collection period 71.2 days
INCOME STATEMENT(figures in millions of dollars)
Net sales •••Cost of goods sold •••Selling, general, and administrative expenses 10Depreciation 20Earnings before interest and taxes (EBIT) •••Interest expense •••Income before tax •••Tax •••Net income •••
BALANCE SHEET(figures in millions of dollars)
This Year Last Year
AssetsCash and marketable securities ••• 20Receivables ••• 34Inventories ••• 26
Total current assets ••• 80Net property, plant, and equipment ••• 25
Total assets ••• 105Liabilities and shareholders’ equity
Accounts payable 25 20Notes payable 30 35
Total current liabilities ••• 55Long-term debt ••• 20Shareholders’ equity ••• 30
Total liabilities and shareholders’ equity 115 105
1 Nothing will happen to the long-term debt ratio computed using book values, since the facevalues of the old and new debt are equal. However, times interest earned and cash coveragewill increase since the firm will reduce its interest expense.
2 a. The current ratio starts at 1.2/1.0 = 1.2. The transaction will reduce current assets to $.7million and current liabilities to $.5 million. The current ratio increases to .7/.5 = 1.4.Net working capital is unaffected: current assets and current liabilities fall by equalamounts.
Solutions toSelf-TestQuestions
160 APPENDIX A
b. The current ratio is unaffected, since the firm merely exchanges one current asset (cash)for another (inventories). However, the quick ratio will fall since inventories are not in-cluded among the most liquid assets.
3 Average daily expenses are (9,330 + 8,912 + 291)/365 = $50.8 million. Average accountspayable are (3,870 + 3,617)/2 = 3,743.5 million. The average payment delay is therefore3,743.5/50.8 = 73.7 days.
4 a. The firm must compensate for its below-average profit margin with an above-averageturnover ratio. Remember that ROA is the product of margin × turnover.
b. If ROA equals the industry average but ROE exceeds the industry average, the firm musthave above-average leverage. As long as ROA exceeds the borrowing rate, leverage willincrease ROE.
5 Retailers maintain large inventories of goods, specifically the products they stock in theirstores. This shows up in the high net working capital ratio. Their profit margin on sales isrelatively low, but they make up for that low margin by turning over goods rapidly. The highasset turnover allows retailers to earn an adequate return on assets even with a low profitmargin, and competition prevents them from increasing prices and margins to a level thatwould provide a better ROA. In contrast, manufacturing firms have low turnover, and there-fore need higher profit margins to remain viable.
MINICASEBurchetts Green had enjoyed the bank training course, but it wasgood to be starting his first real job in the corporate lendinggroup. Earlier that morning the boss had handed him a set of financial statements for The Hobby Horse Company, Inc. (HH).“Hobby Horse,” she said, “has got a $45 million loan from us dueat the end of September and it is likely to ask us to roll it over.The company seems to have run into some rough weather re-cently and I have asked Furze Platt to go down there this after-noon and see what is happening. It might do you good to go alongwith her. Before you go, take a look at these financial statementsand see what you think the problems are. Here’s a chance for you
to use some of that stuff they taught you in the training course.”Burchetts was familiar with the HH story. Founded in 1990, it
had rapidly built up a chain of discount stores selling materialsfor crafts and hobbies. However, last year a number of new storeopenings coinciding with a poor Christmas season had pushedthe company into loss. Management had halted all new construc-tion and put 15 of its existing stores up for sale.
Burchetts decided to start with the 6-year summary of HH’sbalance sheet and income statement (Table A.18). Then he turnedto examine in more detail the latest position (Tables A.19 andA.20).
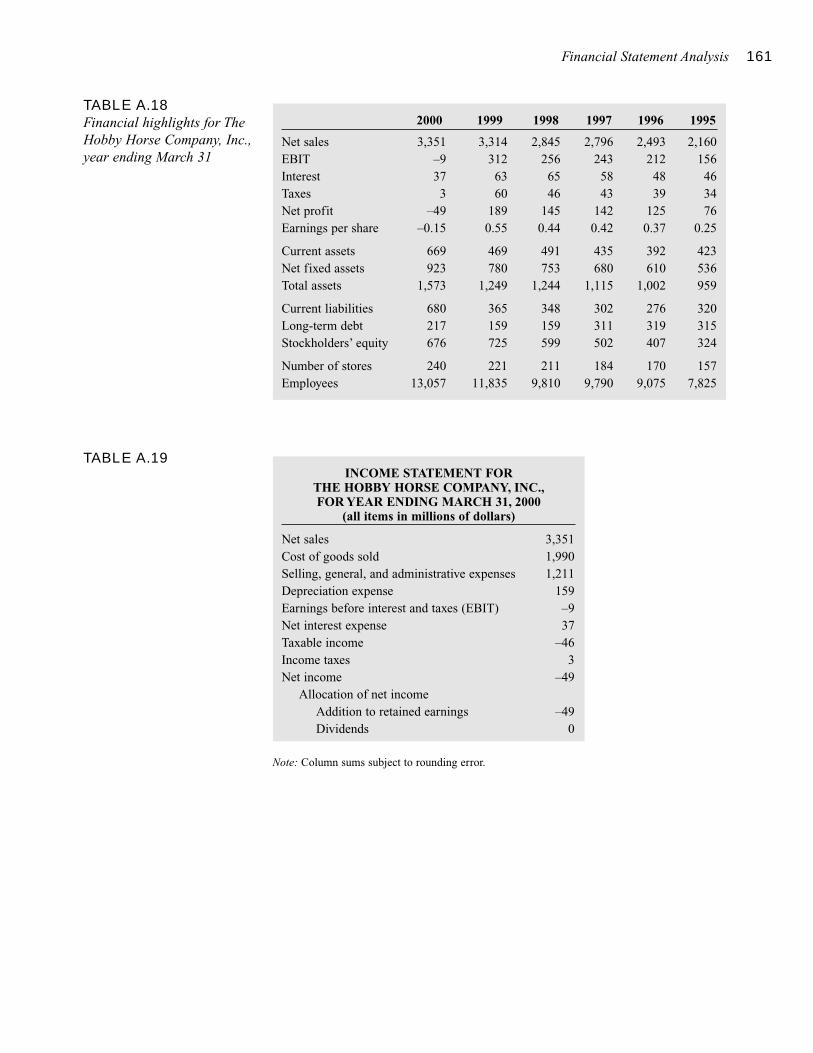
Financial Statement Analysis 161
TABLE A.18Financial highlights for TheHobby Horse Company, Inc.,year ending March 31
2000 1999 1998 1997 1996 1995
Net sales 3,351 3,314 2,845 2,796 2,493 2,160EBIT –9 312 256 243 212 156Interest 37 63 65 58 48 46Taxes 3 60 46 43 39 34Net profit –49 189 145 142 125 76Earnings per share –0.15 0.55 0.44 0.42 0.37 0.25
Current assets 669 469 491 435 392 423Net fixed assets 923 780 753 680 610 536Total assets 1,573 1,249 1,244 1,115 1,002 959
Current liabilities 680 365 348 302 276 320Long-term debt 217 159 159 311 319 315Stockholders’ equity 676 725 599 502 407 324
Number of stores 240 221 211 184 170 157Employees 13,057 11,835 9,810 9,790 9,075 7,825
TABLE A.19INCOME STATEMENT FOR
THE HOBBY HORSE COMPANY, INC.,FOR YEAR ENDING MARCH 31, 2000
(all items in millions of dollars)
Net sales 3,351Cost of goods sold 1,990Selling, general, and administrative expenses 1,211Depreciation expense 159Earnings before interest and taxes (EBIT) –9Net interest expense 37Taxable income –46Income taxes 3Net income –49
Allocation of net incomeAddition to retained earnings –49Dividends 0
Note: Column sums subject to rounding error.
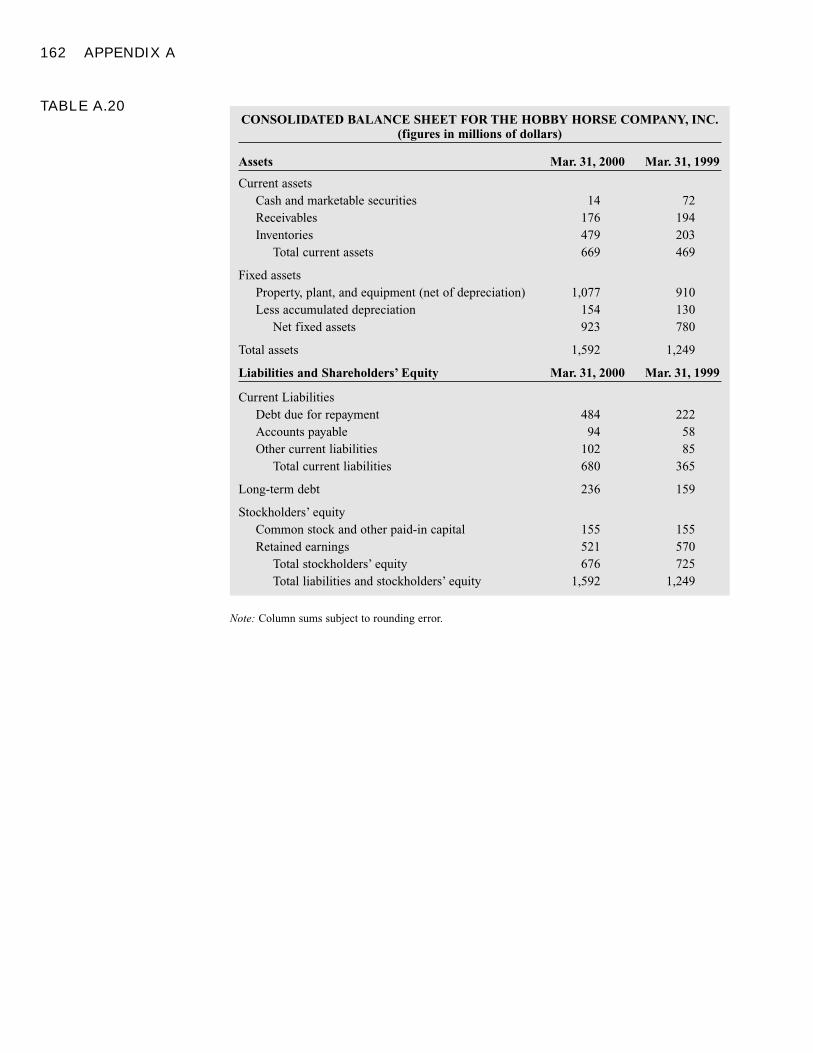
162 APPENDIX A
CONSOLIDATED BALANCE SHEET FOR THE HOBBY HORSE COMPANY, INC.(figures in millions of dollars)
Assets Mar. 31, 2000 Mar. 31, 1999
Current assetsCash and marketable securities 14 72Receivables 176 194Inventories 479 203
Total current assets 669 469
Fixed assetsProperty, plant, and equipment (net of depreciation) 1,077 910Less accumulated depreciation 154 130
Net fixed assets 923 780
Total assets 1,592 1,249
Liabilities and Shareholders’ Equity Mar. 31, 2000 Mar. 31, 1999
Current LiabilitiesDebt due for repayment 484 222Accounts payable 94 58Other current liabilities 102 85
Total current liabilities 680 365
Long-term debt 236 159
Stockholders’ equityCommon stock and other paid-in capital 155 155Retained earnings 521 570
Total stockholders’ equity 676 725Total liabilities and stockholders’ equity 1,592 1,249
Note: Column sums subject to rounding error.
TABLE A.20
Working Capital Management andShort-Term Planning
Cash and Inventory Management
Credit management and Collection
Section 2
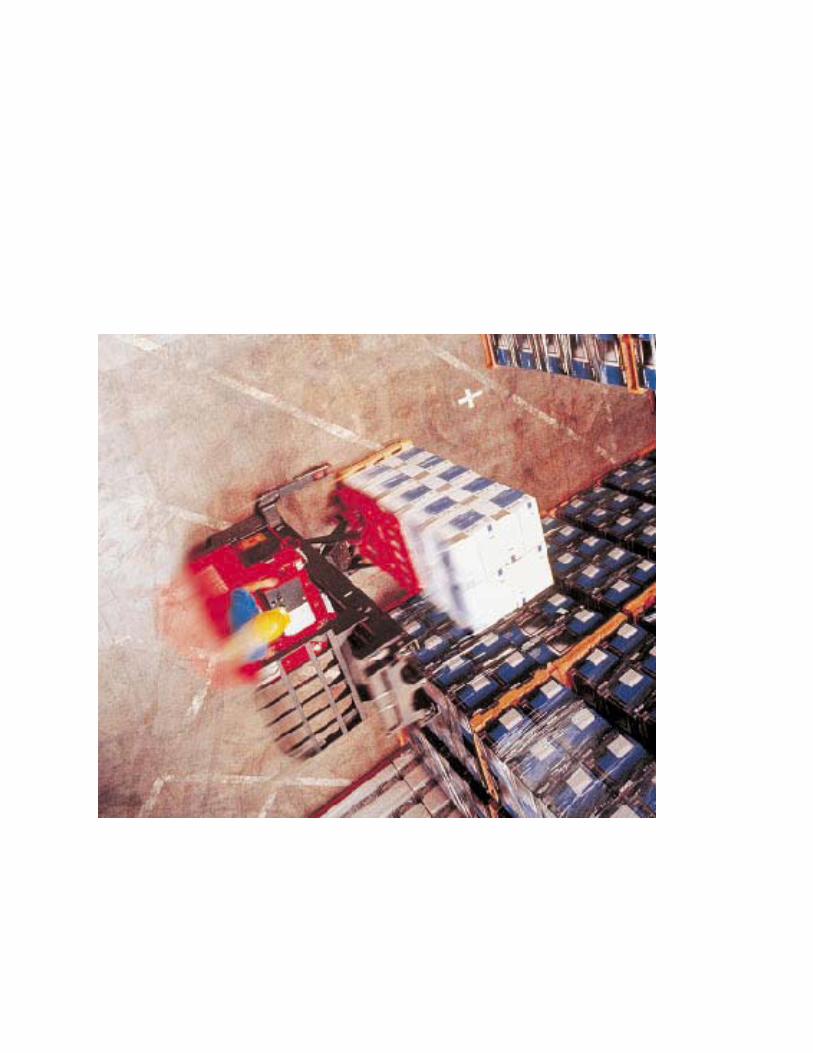
165
WORKING CAPITALMANAGEMENT ANDSHORT-TERM PLANNING
A warehouse of finished-goods inventory.Inventory is a major part of working capital. Investment in working capital has to be planned and managed.John Lund/Tony Stone Images
Working CapitalThe Components of Working Capital
Working Capital and the CashConversion Cycle
The Working Capital Trade-off
Links between Long-Term and Short-Term Financing
Tracing Changes in Cashand Working Capital
Cash BudgetingForecast Sources of Cash
Forecast Uses of Cash
The Cash Balance
A Short-Term Financing PlanOptions for Short-Term Financing
Evaluating the Plan
Sources of Short-TermFinancingBank Loans
Commercial Paper
Secured Loans
The Cost of Bank LoansSimple Interest
Discount Interest
Interest with Compensating Balances
Summary
uch of this material is devoted to long-term financial decisions such as
capital budgeting and the choice of capital structure. These decisions
are called long-term for two reasons. First, they usually involve long-
lived assets or liabilities. Second, they are not easily reversed and thus may
commit the firm to a particular course of action for several years.
Short-term financial decisions generally involve short-lived assets and liabilities,
and usually they are easily reversed. Compare, for example, a 60-day bank loan for $50
million with a $50 million issue of 20-year bonds. The bank loan is clearly a short-term
decision. The firm can repay it 2 months later and be right back where it started. A firm
might conceivably issue a 20-year bond in January and retire it in March, but it would
be extremely inconvenient and expensive to do so. In practice, such a bond issue is a
long-term decision, not only because of the bond’s 20-year maturity, but because the de-
cision to issue it cannot be reversed on short notice.
A financial manager responsible for short-term financial decisions does not have to
look far into the future. The decision to take the 60-day bank loan could properly be
based on cash-flow forecasts for the next few months only. The bond issue decision will
normally reflect forecast cash requirements 5, 10, or more years into the future.
Short-term financial decisions do not involve many of the difficult conceptual issues
encountered elsewhere in this book. In a sense, short-term decisions are easier than
long-term decisions—but they are not less important. A firm can identify extremely
valuable capital investment opportunities, find the precise optimal debt ratio, follow the
perfect dividend policy, and yet founder because no one bothers to raise the cash to pay
this year’s bills. Hence the need for short-term planning.
We will review the major classes of short-term assets and liabilities, show how long-
term financing decisions affect the firm’s short-term financial planning problem, and
describe how financial managers trace changes in cash and working
capital. We will also describe how managers forecast month-by-month cash re-
quirements or surpluses and how they develop short-term investment and financing
strategies.
After studying this material you should be able to
� Understand why the firm needs to invest in net working capital.
� Show how long-term financing policy affects short-term financing requirements.
� Trace a firm’s sources and uses of cash and evaluate its need for short-term
borrowing.
� Develop a short-term financing plan that meets the firm’s need for cash.
166
M
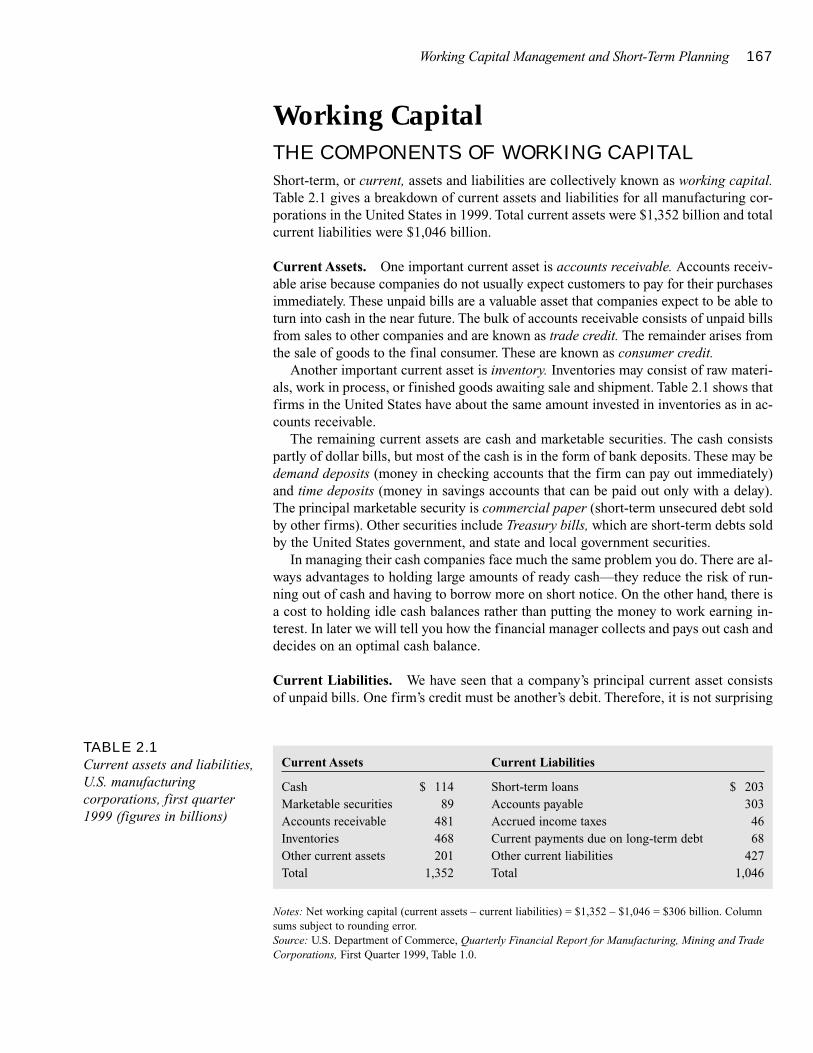
Working Capital Management and Short-Term Planning 167
Working CapitalTHE COMPONENTS OF WORKING CAPITAL
Short-term, or current, assets and liabilities are collectively known as working capital.Table 2.1 gives a breakdown of current assets and liabilities for all manufacturing cor-porations in the United States in 1999. Total current assets were $1,352 billion and totalcurrent liabilities were $1,046 billion.
Current Assets. One important current asset is accounts receivable. Accounts receiv-able arise because companies do not usually expect customers to pay for their purchasesimmediately. These unpaid bills are a valuable asset that companies expect to be able toturn into cash in the near future. The bulk of accounts receivable consists of unpaid billsfrom sales to other companies and are known as trade credit. The remainder arises fromthe sale of goods to the final consumer. These are known as consumer credit.
Another important current asset is inventory. Inventories may consist of raw materi-als, work in process, or finished goods awaiting sale and shipment. Table 2.1 shows thatfirms in the United States have about the same amount invested in inventories as in ac-counts receivable.
The remaining current assets are cash and marketable securities. The cash consistspartly of dollar bills, but most of the cash is in the form of bank deposits. These may bedemand deposits (money in checking accounts that the firm can pay out immediately)and time deposits (money in savings accounts that can be paid out only with a delay).The principal marketable security is commercial paper (short-term unsecured debt soldby other firms). Other securities include Treasury bills, which are short-term debts soldby the United States government, and state and local government securities.
In managing their cash companies face much the same problem you do. There are al-ways advantages to holding large amounts of ready cash—they reduce the risk of run-ning out of cash and having to borrow more on short notice. On the other hand, there isa cost to holding idle cash balances rather than putting the money to work earning in-terest. In later we will tell you how the financial manager collects and pays out cash anddecides on an optimal cash balance.
Current Liabilities. We have seen that a company’s principal current asset consistsof unpaid bills. One firm’s credit must be another’s debit. Therefore, it is not surprising
TABLE 2.1Current assets and liabilities,U.S. manufacturingcorporations, first quarter1999 (figures in billions)
Current Assets Current Liabilities
Cash $ 114 Short-term loans $ 203Marketable securities 89 Accounts payable 303Accounts receivable 481 Accrued income taxes 46Inventories 468 Current payments due on long-term debt 68Other current assets 201 Other current liabilities 427Total 1,352 Total 1,046
Notes: Net working capital (current assets – current liabilities) = $1,352 – $1,046 = $306 billion. Columnsums subject to rounding error.Source: U.S. Department of Commerce, Quarterly Financial Report for Manufacturing, Mining and TradeCorporations, First Quarter 1999, Table 1.0.
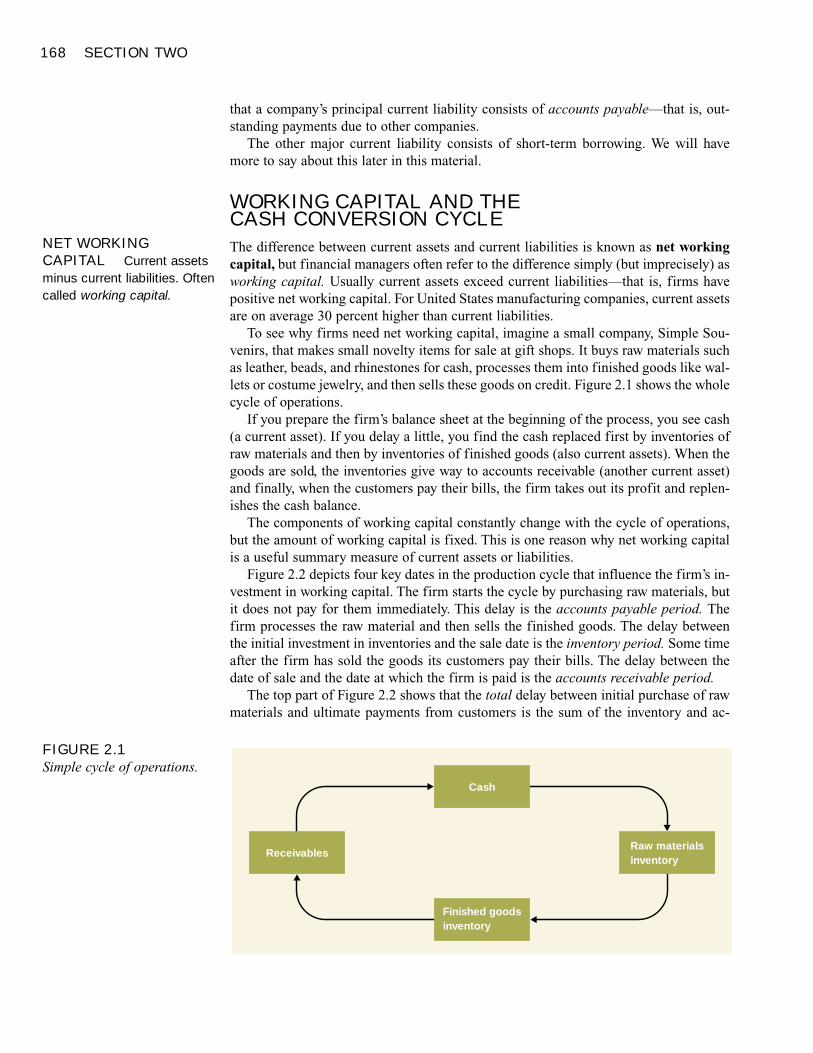
168 SECTION TWO
that a company’s principal current liability consists of accounts payable—that is, out-standing payments due to other companies.
The other major current liability consists of short-term borrowing. We will havemore to say about this later in this material.
WORKING CAPITAL AND THE CASH CONVERSION CYCLE
The difference between current assets and current liabilities is known as net workingcapital, but financial managers often refer to the difference simply (but imprecisely) asworking capital. Usually current assets exceed current liabilities—that is, firms havepositive net working capital. For United States manufacturing companies, current assetsare on average 30 percent higher than current liabilities.
To see why firms need net working capital, imagine a small company, Simple Sou-venirs, that makes small novelty items for sale at gift shops. It buys raw materials suchas leather, beads, and rhinestones for cash, processes them into finished goods like wal-lets or costume jewelry, and then sells these goods on credit. Figure 2.1 shows the wholecycle of operations.
If you prepare the firm’s balance sheet at the beginning of the process, you see cash(a current asset). If you delay a little, you find the cash replaced first by inventories ofraw materials and then by inventories of finished goods (also current assets). When thegoods are sold, the inventories give way to accounts receivable (another current asset)and finally, when the customers pay their bills, the firm takes out its profit and replen-ishes the cash balance.
The components of working capital constantly change with the cycle of operations,but the amount of working capital is fixed. This is one reason why net working capitalis a useful summary measure of current assets or liabilities.
Figure 2.2 depicts four key dates in the production cycle that influence the firm’s in-vestment in working capital. The firm starts the cycle by purchasing raw materials, butit does not pay for them immediately. This delay is the accounts payable period. Thefirm processes the raw material and then sells the finished goods. The delay betweenthe initial investment in inventories and the sale date is the inventory period. Some timeafter the firm has sold the goods its customers pay their bills. The delay between thedate of sale and the date at which the firm is paid is the accounts receivable period.
The top part of Figure 2.2 shows that the total delay between initial purchase of rawmaterials and ultimate payments from customers is the sum of the inventory and ac-
NET WORKINGCAPITAL Current assetsminus current liabilities. Oftencalled working capital.
FIGURE 2.1Simple cycle of operations.
Finished goodsinventory
ReceivablesRaw materialsinventory
Cash
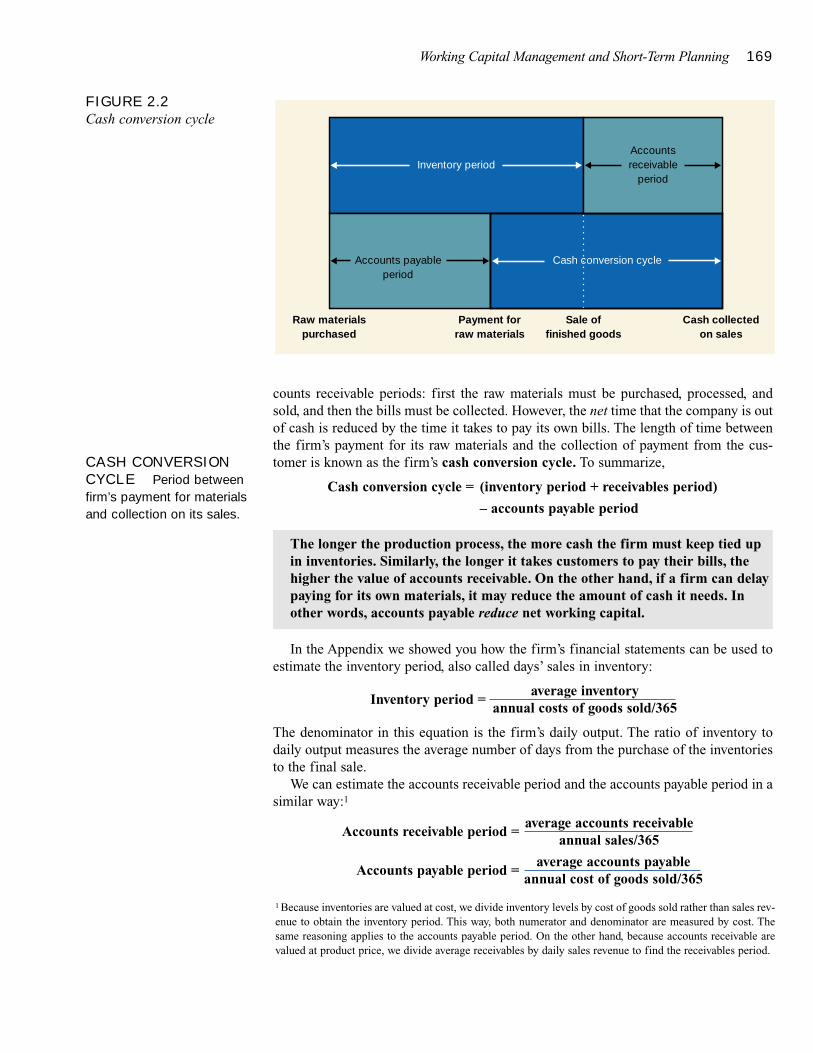
Working Capital Management and Short-Term Planning 169
counts receivable periods: first the raw materials must be purchased, processed, andsold, and then the bills must be collected. However, the net time that the company is outof cash is reduced by the time it takes to pay its own bills. The length of time betweenthe firm’s payment for its raw materials and the collection of payment from the cus-tomer is known as the firm’s cash conversion cycle. To summarize,
Cash conversion cycle = (inventory period + receivables period)
– accounts payable period
In the Appendix we showed you how the firm’s financial statements can be used toestimate the inventory period, also called days’ sales in inventory:
Inventory period =average inventory
annual costs of goods sold/365
The denominator in this equation is the firm’s daily output. The ratio of inventory todaily output measures the average number of days from the purchase of the inventoriesto the final sale.
We can estimate the accounts receivable period and the accounts payable period in asimilar way:1
Accounts receivable period =average accounts receivable
annual sales/365
Accounts payable period =average accounts payable
annual cost of goods sold/365
The longer the production process, the more cash the firm must keep tied upin inventories. Similarly, the longer it takes customers to pay their bills, thehigher the value of accounts receivable. On the other hand, if a firm can delaypaying for its own materials, it may reduce the amount of cash it needs. Inother words, accounts payable reduce net working capital.
FIGURE 2.2Cash conversion cycle
Accounts payableperiod
Raw materials purchased
Payment forraw materials
Sale offinished goods
Cash collectedon sales
Cash conversion cycle
Accountsreceivable
periodInventory period
CASH CONVERSIONCYCLE Period betweenfirm’s payment for materialsand collection on its sales.
1 Because inventories are valued at cost, we divide inventory levels by cost of goods sold rather than sales rev-enue to obtain the inventory period. This way, both numerator and denominator are measured by cost. Thesame reasoning applies to the accounts payable period. On the other hand, because accounts receivable arevalued at product price, we divide average receivables by daily sales revenue to find the receivables period.
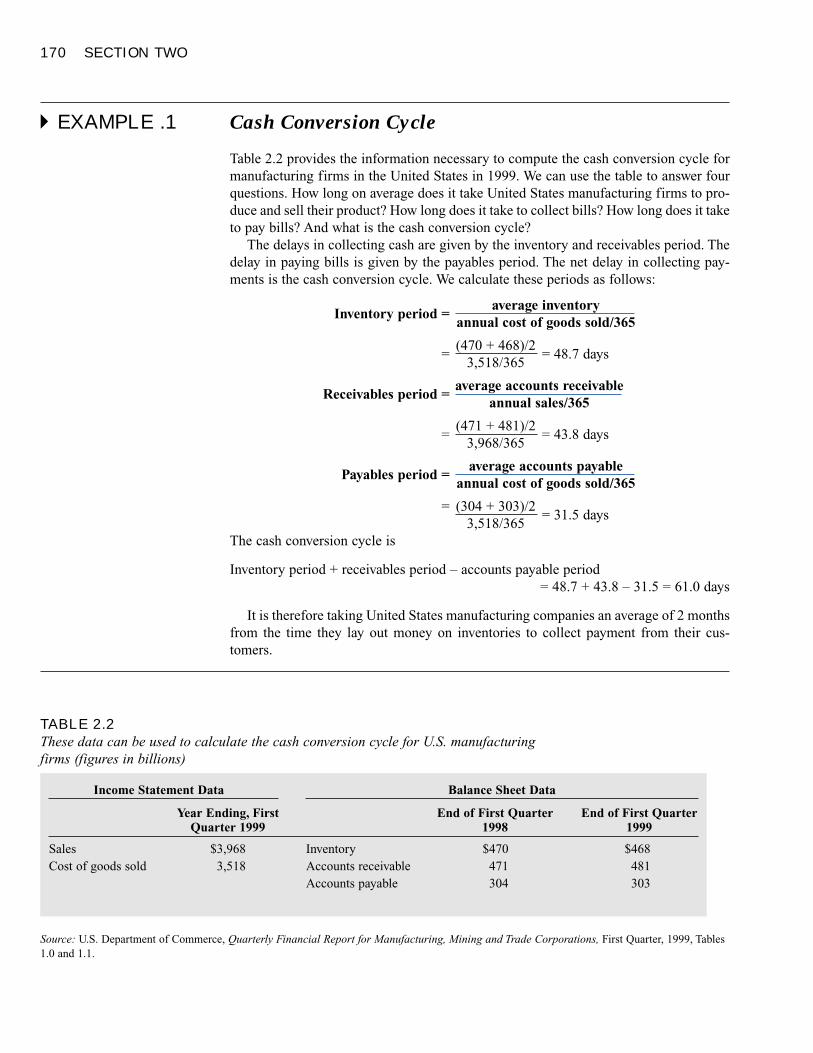
170 SECTION TWO
� EXAMPLE .1 Cash Conversion Cycle
Table 2.2 provides the information necessary to compute the cash conversion cycle formanufacturing firms in the United States in 1999. We can use the table to answer fourquestions. How long on average does it take United States manufacturing firms to pro-duce and sell their product? How long does it take to collect bills? How long does it taketo pay bills? And what is the cash conversion cycle?
The delays in collecting cash are given by the inventory and receivables period. Thedelay in paying bills is given by the payables period. The net delay in collecting pay-ments is the cash conversion cycle. We calculate these periods as follows:
Inventory period =average inventory
annual cost of goods sold/365
=(470 + 468)/2
= 48.7 days3,518/365
Receivables period =average accounts receivable
annual sales/365
=(471 + 481)/2
= 43.8 days3,968/365
Payables period =average accounts payable
annual cost of goods sold/365
= (304 + 303)/2= 31.5 days
3,518/365The cash conversion cycle is
Inventory period + receivables period – accounts payable period= 48.7 + 43.8 – 31.5 = 61.0 days
It is therefore taking United States manufacturing companies an average of 2 monthsfrom the time they lay out money on inventories to collect payment from their cus-tomers.
TABLE 2.2These data can be used to calculate the cash conversion cycle for U.S. manufacturingfirms (figures in billions)
Income Statement Data Balance Sheet Data
Year Ending, First End of First Quarter End of First QuarterQuarter 1999 1998 1999
Sales $3,968 Inventory $470 $468Cost of goods sold 3,518 Accounts receivable 471 481
Accounts payable 304 303
Source: U.S. Department of Commerce, Quarterly Financial Report for Manufacturing, Mining and Trade Corporations, First Quarter, 1999, Tables1.0 and 1.1.
Working Capital Management and Short-Term Planning 171
� Self-Test 1 a. Suppose United States manufacturers are able to reduce inventory levels to a year-average value of $250 billion and average accounts receivable to $300 billion. Byhow many days will this reduce the cash conversion cycle?
b. Suppose that with the same level of inventories, accounts receivable, and accountspayable, United States manufacturers can increase production and sales by 10 per-cent. What will be the effect on the cash conversion cycle?
THE WORKING CAPITAL TRADE-OFF
Of course the cash conversion cycle is not cast in stone. To a large extent it is withinmanagement’s control. Working capital can be managed. For example, accounts receiv-able are affected by the terms of credit the firm offers to its customers. You can cut theamount of money tied up in receivables by getting tough with customers who are slowin paying their bills. (You may find, however, that in the future they take their businesselsewhere.) Similarly, the firm can reduce its investment in inventories of raw materi-als. (Here the risk is that it may one day run out of inventories and production will grindto a halt.)
These considerations show that investment in working capital has both costs andbenefits. For example, the cost of the firm’s investment in receivables is the interest thatcould have been earned if customers had paid their bills earlier. The firm also forgoesinterest income when it holds idle cash balances rather than putting the money to workin marketable securities. The cost of holding inventory includes not only the opportu-nity cost of capital but also storage and insurance costs and the risk of spoilage or obsolescence. All of these carrying costs encourage firms to hold current assets to aminimum.
While carrying costs discourage large investments in current assets, too low a levelof current assets makes it more likely that the firm will face shortage costs. For exam-ple, if the firm runs out of inventory of raw materials, it may have to shut down pro-duction. Similarly, a producer holding a small finished goods inventory is more likelyto be caught short, unable to fill orders promptly. There are also disadvantages to hold-ing small “inventories” of cash. If the firm runs out of cash, it may have to sell securi-ties and incur unnecessary trading costs. The firm may also maintain too low a level ofaccounts receivable. If the firm tries to minimize accounts receivable by restrictingcredit sales, it may lose customers.
In the Appendix we pointed out that in recent years many managers have tried tomake their staff more aware of the cost of the capital that is used in the business. So,when they review the performance of each part of their business, they deduct the costof the capital employed from its profits. This measure is known as residual income oreconomic value added (EVA), which is the term coined by the consulting firm SternStewart. Firms that employ EVA to measure performance have often discovered thatthey can make large savings on working capital. Herman Miller Corporation, the furni-ture manufacturer, found that after it introduced EVA, employees became much moreconscious of the cash tied up in inventories. One sewing machine operator commented:
An important job of the financial manager is to strike a balance between thecosts and benefits of current assets, that is, to find the level of current assetsthat minimizes the sum of carrying costs and shortage costs.
CARRYING COSTSCosts of maintaining currentassets, including opportunitycost of capital.
SHORTAGE COSTSCosts incurred fromshortages in current assets.
172 SECTION TWO
We used to have these stacks of fabric sitting here on the tables until we needed them . . . Wewere going to use the fabric anyway, so who cares that we’re buying it and stacking it upthere? Now no one has excess fabric. They only have stuff we’re working on today. And it’schanged the way we connect with suppliers, and we’re having [them] deliver fabric moreoften.2
The company also started to look at how rapidly customers paid their bills. It foundthat, any time an item was missing from an order, the customer would delay paymentuntil all the pieces had been delivered. When the company cleared up the problem ofmissing items, it made its customers happier and it collected the cash faster.3
We will look more carefully at the costs and benefits of working capital later in thismaterial.
� Self-Test 2 How will the following affect the size of the firm’s optimal investment in current assets?
a. The interest rate rises from 6 percent to 8 percent.b. A just-in-time inventory system is introduced that reduces the risk of inventory
shortages.c. Customers pressure the firm for a more lenient credit sales policy.
Links between Long-Term and Short-Term FinancingBusinesses require capital—that is, money invested in plant, machinery, inventories, accounts receivable, and all the other assets it takes to run a company efficiently. Typically, these assets are not purchased all at once but are obtained gradually over timeas the firm grows. The total cost of these assets is called the firm’s total capital requirement.
When we discussed long-term planning, we showed how the firm needs to developa sensible strategy that allows it to finance its long-term goals and weather possible set-backs. But the firm’s total capital requirement does not grow smoothly and the companymust be able to meet temporary demands for cash. This is the focus of short-term fi-nancial planning.
Figure 2.3 illustrates the growth in the firm’s total capital requirements. The upward-sloping line shows that as the business grows, it is likely to need additionalfixed assets and current assets. You can think of this trendline as showing the base levelof capital that is required. In addition to this base capital requirement, there may be sea-sonal fluctuations in the business that require an additional investment in current assets.Thus the wavy line in the illustration shows that the total capital requirement peaks latein each year. In practice, there would also be week-to-week and month-to-month fluc-tuations in the capital requirement, but these are not shown in Figure 2.3.
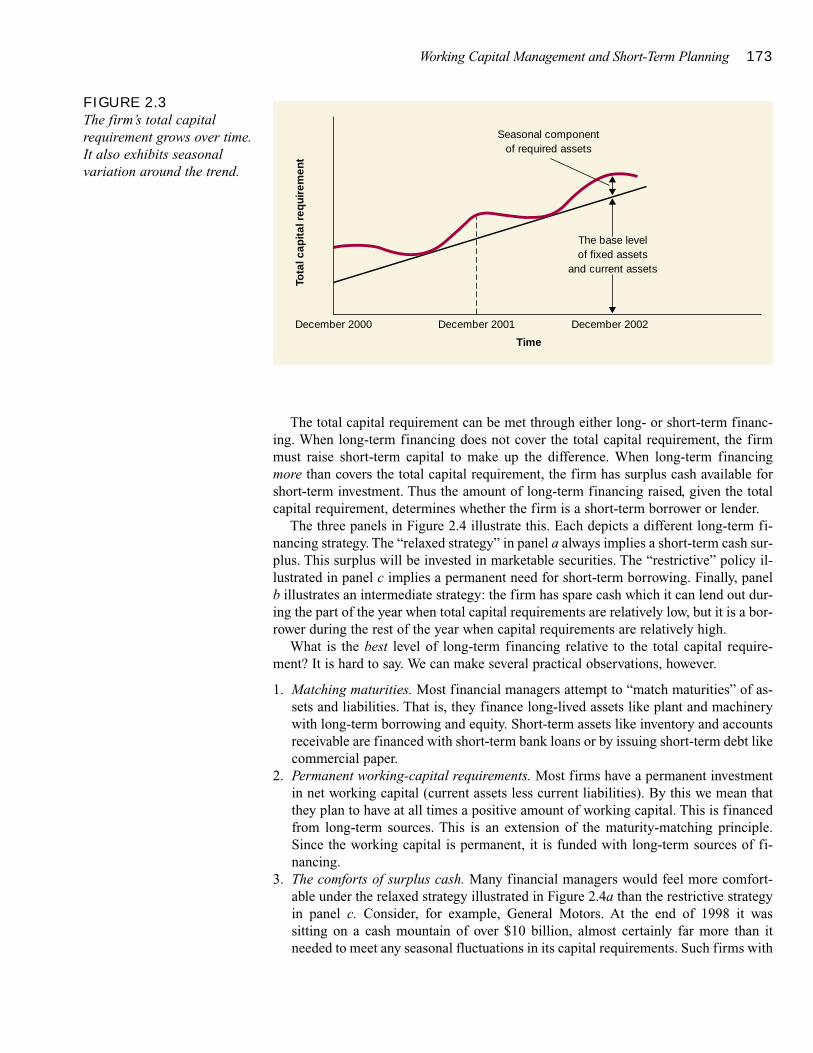
Working Capital Management and Short-Term Planning 173
The total capital requirement can be met through either long- or short-term financ-ing. When long-term financing does not cover the total capital requirement, the firmmust raise short-term capital to make up the difference. When long-term financingmore than covers the total capital requirement, the firm has surplus cash available forshort-term investment. Thus the amount of long-term financing raised, given the totalcapital requirement, determines whether the firm is a short-term borrower or lender.
The three panels in Figure 2.4 illustrate this. Each depicts a different long-term fi-nancing strategy. The “relaxed strategy” in panel a always implies a short-term cash sur-plus. This surplus will be invested in marketable securities. The “restrictive” policy il-lustrated in panel c implies a permanent need for short-term borrowing. Finally, panelb illustrates an intermediate strategy: the firm has spare cash which it can lend out dur-ing the part of the year when total capital requirements are relatively low, but it is a bor-rower during the rest of the year when capital requirements are relatively high.
What is the best level of long-term financing relative to the total capital require-ment? It is hard to say. We can make several practical observations, however.
1. Matching maturities. Most financial managers attempt to “match maturities” of as-sets and liabilities. That is, they finance long-lived assets like plant and machinerywith long-term borrowing and equity. Short-term assets like inventory and accountsreceivable are financed with short-term bank loans or by issuing short-term debt likecommercial paper.
2. Permanent working-capital requirements. Most firms have a permanent investmentin net working capital (current assets less current liabilities). By this we mean thatthey plan to have at all times a positive amount of working capital. This is financedfrom long-term sources. This is an extension of the maturity-matching principle.Since the working capital is permanent, it is funded with long-term sources of fi-nancing.
3. The comforts of surplus cash. Many financial managers would feel more comfort-able under the relaxed strategy illustrated in Figure 2.4a than the restrictive strategyin panel c. Consider, for example, General Motors. At the end of 1998 it was sitting on a cash mountain of over $10 billion, almost certainly far more than itneeded to meet any seasonal fluctuations in its capital requirements. Such firms with
FIGURE 2.3The firm’s total capitalrequirement grows over time.It also exhibits seasonalvariation around the trend.
Seasonal componentof required assets
December 2000 December 2001
Tota
l cap
ital
req
uire
men
t
Time
The base levelof fixed assets
and current assets
December 2002
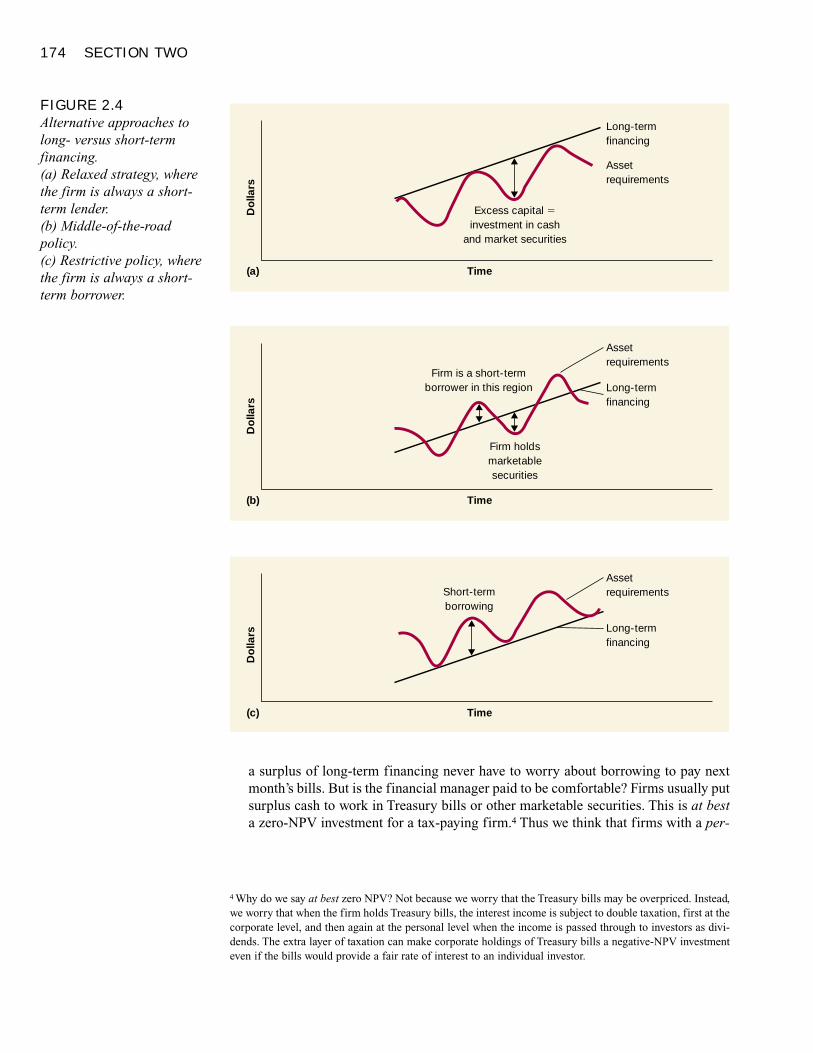
174 SECTION TWO
a surplus of long-term financing never have to worry about borrowing to pay nextmonth’s bills. But is the financial manager paid to be comfortable? Firms usually putsurplus cash to work in Treasury bills or other marketable securities. This is at besta zero-NPV investment for a tax-paying firm.4 Thus we think that firms with a per-
FIGURE 2.4Alternative approaches tolong- versus short-termfinancing.(a) Relaxed strategy, wherethe firm is always a short-term lender.(b) Middle-of-the-roadpolicy.(c) Restrictive policy, wherethe firm is always a short-term borrower.
Excess capital �investment in cash
and market securities
Long-termfinancing
Assetrequirements
Do
llars
Time(a)
Firm holdsmarketablesecurities
Firm is a short-termborrower in this region
Do
llars
Time(b)
Short-termborrowing
Do
llars
Time(c)
Long-termfinancing
Assetrequirements
Long-termfinancing
Assetrequirements
4 Why do we say at best zero NPV? Not because we worry that the Treasury bills may be overpriced. Instead,we worry that when the firm holds Treasury bills, the interest income is subject to double taxation, first at thecorporate level, and then again at the personal level when the income is passed through to investors as divi-dends. The extra layer of taxation can make corporate holdings of Treasury bills a negative-NPV investmenteven if the bills would provide a fair rate of interest to an individual investor.
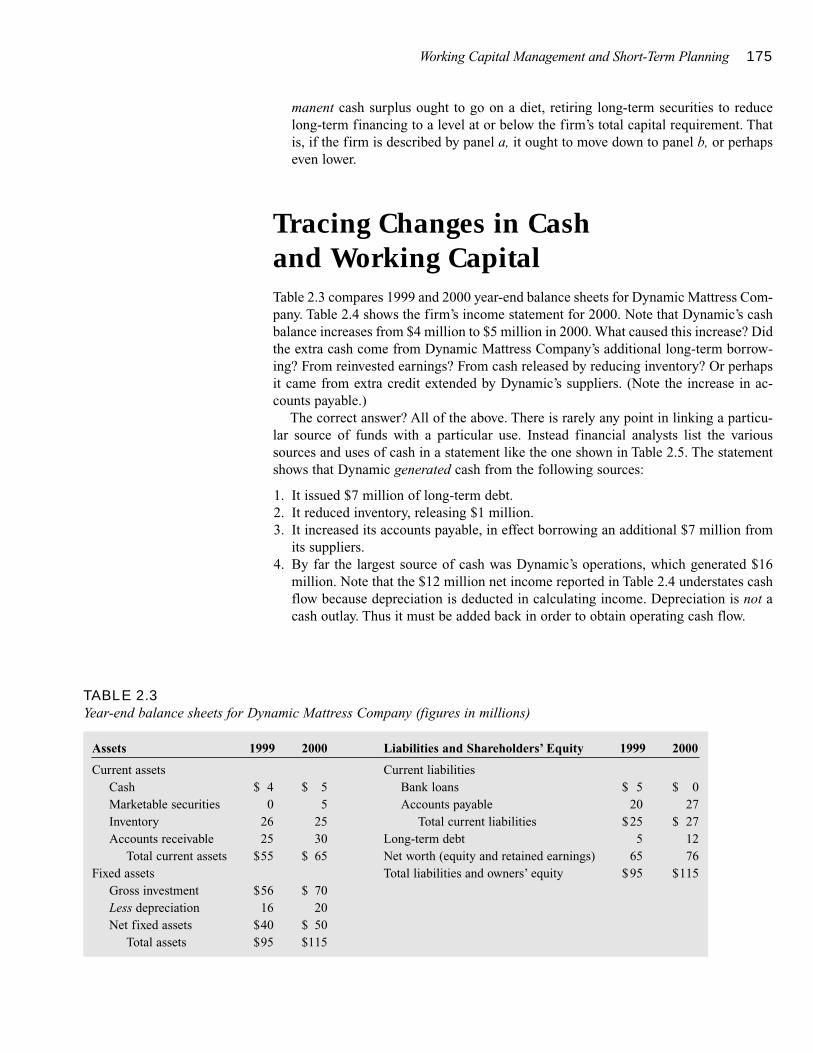
Working Capital Management and Short-Term Planning 175
manent cash surplus ought to go on a diet, retiring long-term securities to reducelong-term financing to a level at or below the firm’s total capital requirement. Thatis, if the firm is described by panel a, it ought to move down to panel b, or perhapseven lower.
Tracing Changes in Cash and Working CapitalTable 2.3 compares 1999 and 2000 year-end balance sheets for Dynamic Mattress Com-pany. Table 2.4 shows the firm’s income statement for 2000. Note that Dynamic’s cashbalance increases from $4 million to $5 million in 2000. What caused this increase? Didthe extra cash come from Dynamic Mattress Company’s additional long-term borrow-ing? From reinvested earnings? From cash released by reducing inventory? Or perhapsit came from extra credit extended by Dynamic’s suppliers. (Note the increase in ac-counts payable.)
The correct answer? All of the above. There is rarely any point in linking a particu-lar source of funds with a particular use. Instead financial analysts list the varioussources and uses of cash in a statement like the one shown in Table 2.5. The statementshows that Dynamic generated cash from the following sources:
1. It issued $7 million of long-term debt.2. It reduced inventory, releasing $1 million.3. It increased its accounts payable, in effect borrowing an additional $7 million from
its suppliers.4. By far the largest source of cash was Dynamic’s operations, which generated $16
million. Note that the $12 million net income reported in Table 2.4 understates cashflow because depreciation is deducted in calculating income. Depreciation is not acash outlay. Thus it must be added back in order to obtain operating cash flow.
TABLE 2.3Year-end balance sheets for Dynamic Mattress Company (figures in millions)
Assets 1999 2000 Liabilities and Shareholders’ Equity 1999 2000
Current assets Current liabilitiesCash $ 4 $ 5 Bank loans $ 5 $ 0Marketable securities 0 5 Accounts payable 20 27Inventory 26 25 Total current liabilities $25 $ 27Accounts receivable 25 30 Long-term debt 5 12
Total current assets $55 $ 65 Net worth (equity and retained earnings) 65 76Fixed assets Total liabilities and owners’ equity $95 $115
Gross investment $56 $ 70Less depreciation 16 20Net fixed assets $40 $ 50
Total assets $95 $115
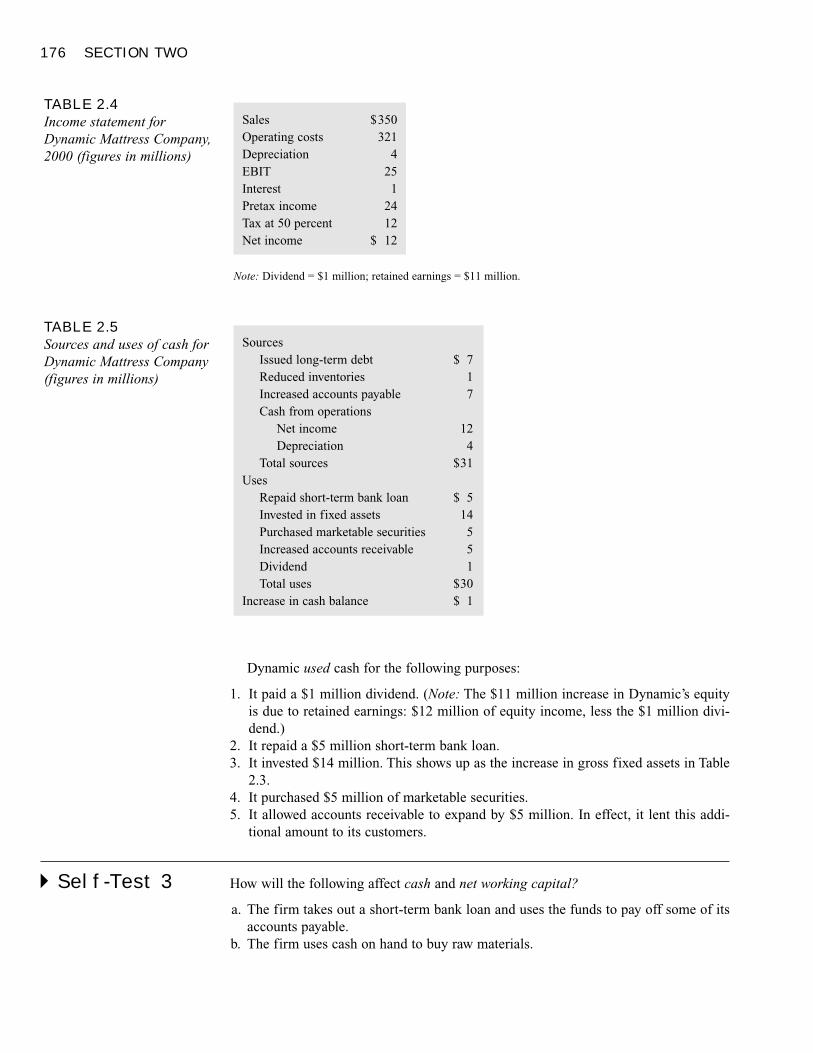
176 SECTION TWO
Dynamic used cash for the following purposes:
1. It paid a $1 million dividend. (Note: The $11 million increase in Dynamic’s equityis due to retained earnings: $12 million of equity income, less the $1 million divi-dend.)
2. It repaid a $5 million short-term bank loan.3. It invested $14 million. This shows up as the increase in gross fixed assets in Table
2.3.4. It purchased $5 million of marketable securities.5. It allowed accounts receivable to expand by $5 million. In effect, it lent this addi-
tional amount to its customers.
� Self-Test 3 How will the following affect cash and net working capital?
a. The firm takes out a short-term bank loan and uses the funds to pay off some of itsaccounts payable.
b. The firm uses cash on hand to buy raw materials.
TABLE 2.4Income statement forDynamic Mattress Company,2000 (figures in millions)
Sales $350Operating costs 321Depreciation 4EBIT 25Interest 1Pretax income 24Tax at 50 percent 12Net income $ 12
Note: Dividend = $1 million; retained earnings = $11 million.
TABLE 2.5Sources and uses of cash forDynamic Mattress Company(figures in millions)
SourcesIssued long-term debt $ 7Reduced inventories 1Increased accounts payable 7Cash from operations
Net income 12Depreciation 4
Total sources $31Uses
Repaid short-term bank loan $ 5Invested in fixed assets 14Purchased marketable securities 5Increased accounts receivable 5Dividend 1Total uses $30
Increase in cash balance $ 1
Working Capital Management and Short-Term Planning 177
c. The firm repurchases outstanding shares of stock.d. The firm sells long-term bonds and puts the proceeds in its bank account.
Cash BudgetingThe financial manager’s task is to forecast future sources and uses of cash. These fore-casts serve two purposes. First, they alert the financial manager to future cash needs.Second, the cash-flow forecasts provide a standard, or budget, against which subsequentperformance can be judged.
There are several ways to produce a quarterly cash budget. Many large firms havedeveloped elaborate “corporate models”; others use a spreadsheet program to plan theircash needs. The procedures of smaller firms may be less formal. But no matter whatmethod is chosen, there are three common steps to preparing a cash budget:
Step 1. Forecast the sources of cash. The largest inflow of cash comes from paymentsby the firm’s customers.
Step 2. Forecast uses of cash.Step 3. Calculate whether the firm is facing a cash shortage or surplus.
The financial plan sets out a strategy for investing cash surpluses or financing anydeficit.
We will illustrate these issues by continuing the example of Dynamic Mattress.
FORECAST SOURCES OF CASH
Most of Dynamic’s cash inflow comes from the sale of mattresses. We therefore startwith a sales forecast by quarter for 2001:5
Quarter: First Second Third Fourth
Sales, millions of dollars 87.5 78.5 116 131
But unless customers pay cash on delivery, sales become accounts receivable beforethey become cash. Cash flow comes from collections on accounts receivable.
Most firms keep track of the average time it takes customers to pay their bills. Fromthis they can forecast what proportion of a quarter’s sales is likely to be converted intocash in that quarter and what proportion is likely to be carried over to the next quarteras accounts receivable. This proportion depends on the lags with which customers paytheir bills. For example, if customers wait 1 month to pay their bills, then on averageone-third of each quarter’s bills will not be paid until the following quarter. If the pay-ment delay is 2 months, then two-thirds of quarterly sales will be collected in the fol-lowing quarter.
Suppose that 80 percent of sales are collected in the immediate quarter and the remaining 20 percent in the next. Table 2.6 shows forecast collections under this as-sumption.
In the first quarter, for example, collections from current sales are 80 percent of$87.5 million, or $70 million. But the firm also collects 20 percent of the previous
5 For simplicity, we present a quarterly forecast. However, most firms would forecast by month instead of byquarter. Sometimes weekly or even daily forecasts are made.
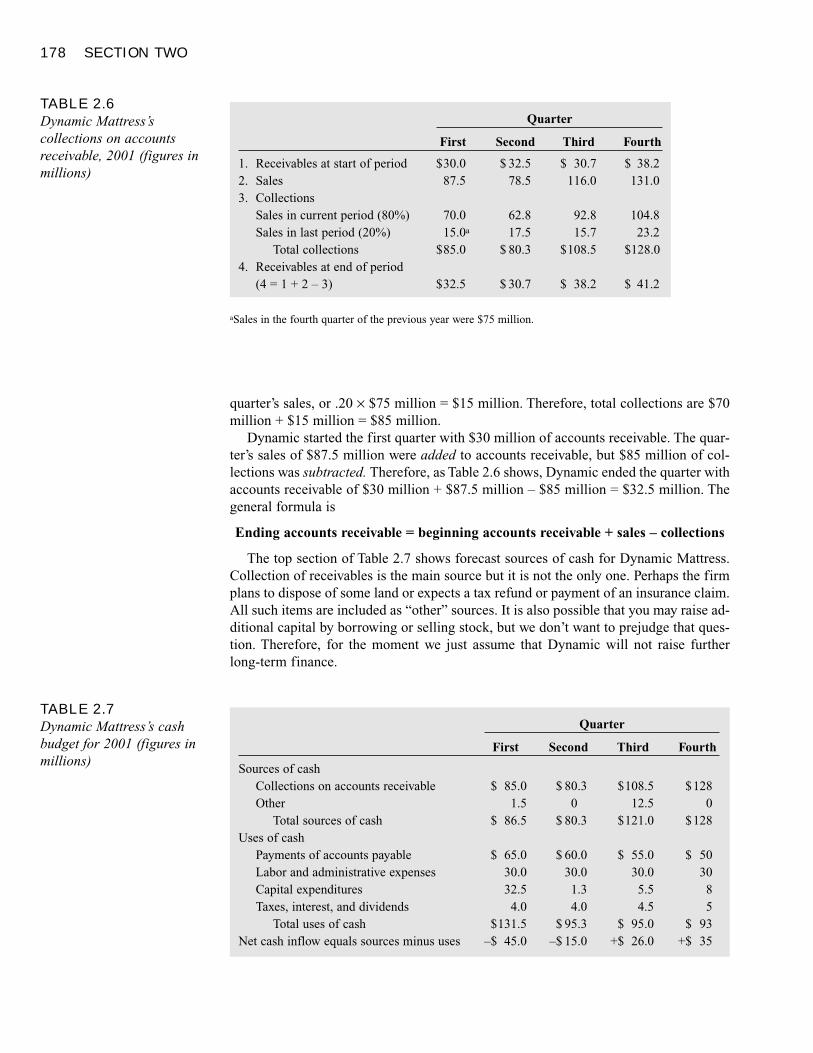
178 SECTION TWO
quarter’s sales, or .20 × $75 million = $15 million. Therefore, total collections are $70million + $15 million = $85 million.
Dynamic started the first quarter with $30 million of accounts receivable. The quar-ter’s sales of $87.5 million were added to accounts receivable, but $85 million of col-lections was subtracted. Therefore, as Table 2.6 shows, Dynamic ended the quarter withaccounts receivable of $30 million + $87.5 million – $85 million = $32.5 million. Thegeneral formula is
Ending accounts receivable = beginning accounts receivable + sales – collections
The top section of Table 2.7 shows forecast sources of cash for Dynamic Mattress.Collection of receivables is the main source but it is not the only one. Perhaps the firmplans to dispose of some land or expects a tax refund or payment of an insurance claim.All such items are included as “other” sources. It is also possible that you may raise ad-ditional capital by borrowing or selling stock, but we don’t want to prejudge that ques-tion. Therefore, for the moment we just assume that Dynamic will not raise furtherlong-term finance.
TABLE 2.7Dynamic Mattress’s cashbudget for 2001 (figures inmillions)
Quarter
First Second Third Fourth
Sources of cashCollections on accounts receivable $ 85.0 $ 80.3 $108.5 $128Other 1.5 0 12.5 0
Total sources of cash $ 86.5 $ 80.3 $121.0 $128Uses of cash
Payments of accounts payable $ 65.0 $ 60.0 $ 55.0 $ 50Labor and administrative expenses 30.0 30.0 30.0 30Capital expenditures 32.5 1.3 5.5 8Taxes, interest, and dividends 4.0 4.0 4.5 5
Total uses of cash $131.5 $ 95.3 $ 95.0 $ 93Net cash inflow equals sources minus uses –$ 45.0 –$ 15.0 +$ 26.0 +$ 35
TABLE 2.6Dynamic Mattress’scollections on accountsreceivable, 2001 (figures inmillions)
Quarter
First Second Third Fourth
1. Receivables at start of period $30.0 $ 32.5 $ 30.7 $ 38.22. Sales 87.5 78.5 116.0 131.03. Collections
Sales in current period (80%) 70.0 62.8 92.8 104.8Sales in last period (20%) 15.0a 17.5 15.7 23.2
Total collections $85.0 $ 80.3 $108.5 $128.04. Receivables at end of period
(4 = 1 + 2 – 3) $32.5 $ 30.7 $ 38.2 $ 41.2
aSales in the fourth quarter of the previous year were $75 million.
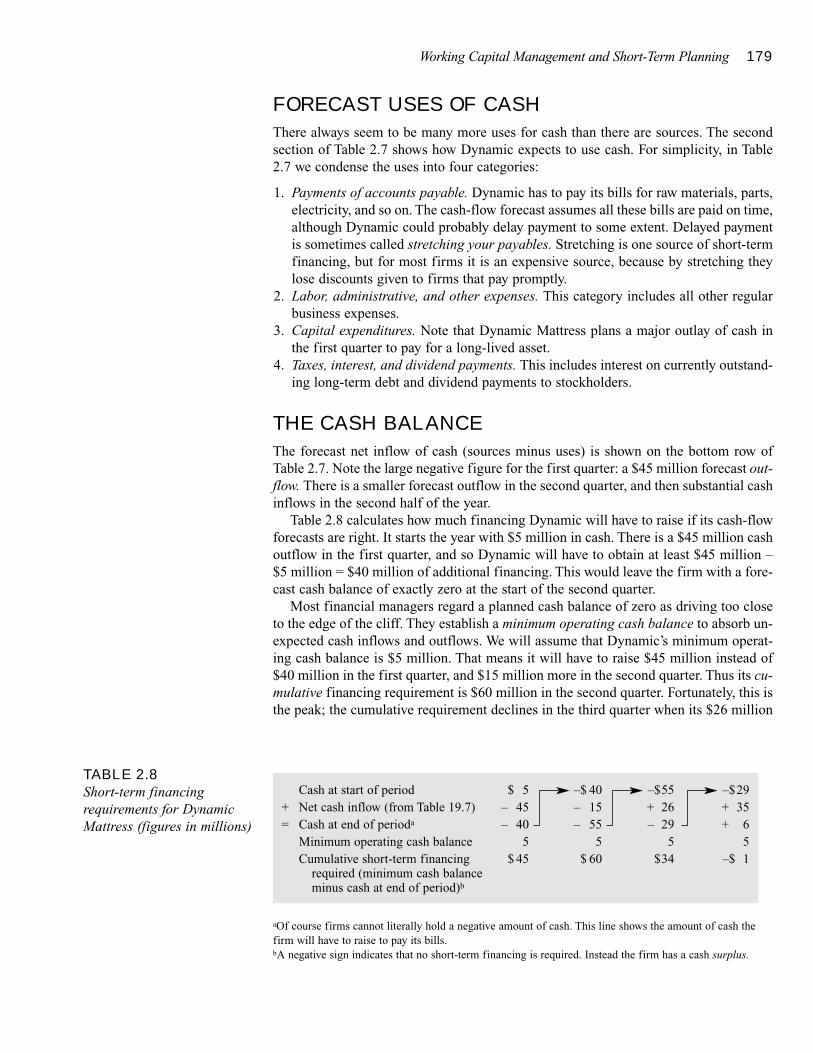
Working Capital Management and Short-Term Planning 179
FORECAST USES OF CASH
There always seem to be many more uses for cash than there are sources. The secondsection of Table 2.7 shows how Dynamic expects to use cash. For simplicity, in Table2.7 we condense the uses into four categories:
1. Payments of accounts payable. Dynamic has to pay its bills for raw materials, parts,electricity, and so on. The cash-flow forecast assumes all these bills are paid on time,although Dynamic could probably delay payment to some extent. Delayed paymentis sometimes called stretching your payables. Stretching is one source of short-termfinancing, but for most firms it is an expensive source, because by stretching theylose discounts given to firms that pay promptly.
2. Labor, administrative, and other expenses. This category includes all other regularbusiness expenses.
3. Capital expenditures. Note that Dynamic Mattress plans a major outlay of cash inthe first quarter to pay for a long-lived asset.
4. Taxes, interest, and dividend payments. This includes interest on currently outstand-ing long-term debt and dividend payments to stockholders.
THE CASH BALANCE
The forecast net inflow of cash (sources minus uses) is shown on the bottom row ofTable 2.7. Note the large negative figure for the first quarter: a $45 million forecast out-flow. There is a smaller forecast outflow in the second quarter, and then substantial cashinflows in the second half of the year.
Table 2.8 calculates how much financing Dynamic will have to raise if its cash-flowforecasts are right. It starts the year with $5 million in cash. There is a $45 million cashoutflow in the first quarter, and so Dynamic will have to obtain at least $45 million –$5 million = $40 million of additional financing. This would leave the firm with a fore-cast cash balance of exactly zero at the start of the second quarter.
Most financial managers regard a planned cash balance of zero as driving too closeto the edge of the cliff. They establish a minimum operating cash balance to absorb un-expected cash inflows and outflows. We will assume that Dynamic’s minimum operat-ing cash balance is $5 million. That means it will have to raise $45 million instead of$40 million in the first quarter, and $15 million more in the second quarter. Thus its cu-mulative financing requirement is $60 million in the second quarter. Fortunately, this isthe peak; the cumulative requirement declines in the third quarter when its $26 million
TABLE 2.8Short-term financingrequirements for DynamicMattress (figures in millions)
Cash at start of period $ 5 –$ 40 –$55 –$29+ Net cash inflow (from Table 19.7) – 45 – 15 + 26 + 35= Cash at end of perioda – 40 – 55 – 29 + 6
Minimum operating cash balance 5 5 5 5Cumulative short-term financing $ 45 $ 60 $34 –$ 1
required (minimum cash balanceminus cash at end of period)b
aOf course firms cannot literally hold a negative amount of cash. This line shows the amount of cash thefirm will have to raise to pay its bills.bA negative sign indicates that no short-term financing is required. Instead the firm has a cash surplus.
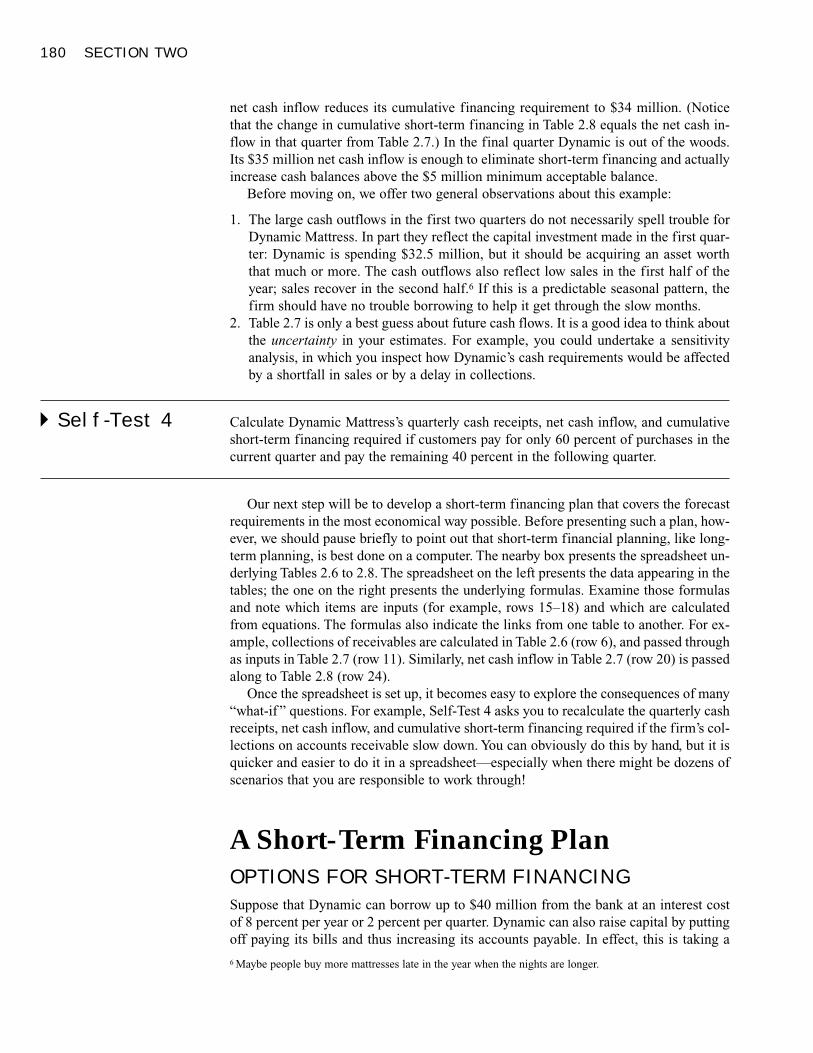
180 SECTION TWO
net cash inflow reduces its cumulative financing requirement to $34 million. (Noticethat the change in cumulative short-term financing in Table 2.8 equals the net cash in-flow in that quarter from Table 2.7.) In the final quarter Dynamic is out of the woods.Its $35 million net cash inflow is enough to eliminate short-term financing and actuallyincrease cash balances above the $5 million minimum acceptable balance.
Before moving on, we offer two general observations about this example:
1. The large cash outflows in the first two quarters do not necessarily spell trouble forDynamic Mattress. In part they reflect the capital investment made in the first quar-ter: Dynamic is spending $32.5 million, but it should be acquiring an asset worththat much or more. The cash outflows also reflect low sales in the first half of theyear; sales recover in the second half.6 If this is a predictable seasonal pattern, thefirm should have no trouble borrowing to help it get through the slow months.
2. Table 2.7 is only a best guess about future cash flows. It is a good idea to think aboutthe uncertainty in your estimates. For example, you could undertake a sensitivityanalysis, in which you inspect how Dynamic’s cash requirements would be affectedby a shortfall in sales or by a delay in collections.
� Self-Test 4 Calculate Dynamic Mattress’s quarterly cash receipts, net cash inflow, and cumulativeshort-term financing required if customers pay for only 60 percent of purchases in thecurrent quarter and pay the remaining 40 percent in the following quarter.
Our next step will be to develop a short-term financing plan that covers the forecastrequirements in the most economical way possible. Before presenting such a plan, how-ever, we should pause briefly to point out that short-term financial planning, like long-term planning, is best done on a computer. The nearby box presents the spreadsheet un-derlying Tables 2.6 to 2.8. The spreadsheet on the left presents the data appearing in thetables; the one on the right presents the underlying formulas. Examine those formulasand note which items are inputs (for example, rows 15–18) and which are calculatedfrom equations. The formulas also indicate the links from one table to another. For ex-ample, collections of receivables are calculated in Table 2.6 (row 6), and passed throughas inputs in Table 2.7 (row 11). Similarly, net cash inflow in Table 2.7 (row 20) is passedalong to Table 2.8 (row 24).
Once the spreadsheet is set up, it becomes easy to explore the consequences of many“what-if ” questions. For example, Self-Test 4 asks you to recalculate the quarterly cashreceipts, net cash inflow, and cumulative short-term financing required if the firm’s col-lections on accounts receivable slow down. You can obviously do this by hand, but it isquicker and easier to do it in a spreadsheet—especially when there might be dozens ofscenarios that you are responsible to work through!
A Short-Term Financing PlanOPTIONS FOR SHORT-TERM FINANCING
Suppose that Dynamic can borrow up to $40 million from the bank at an interest costof 8 percent per year or 2 percent per quarter. Dynamic can also raise capital by puttingoff paying its bills and thus increasing its accounts payable. In effect, this is taking a
6 Maybe people buy more mattresses late in the year when the nights are longer.
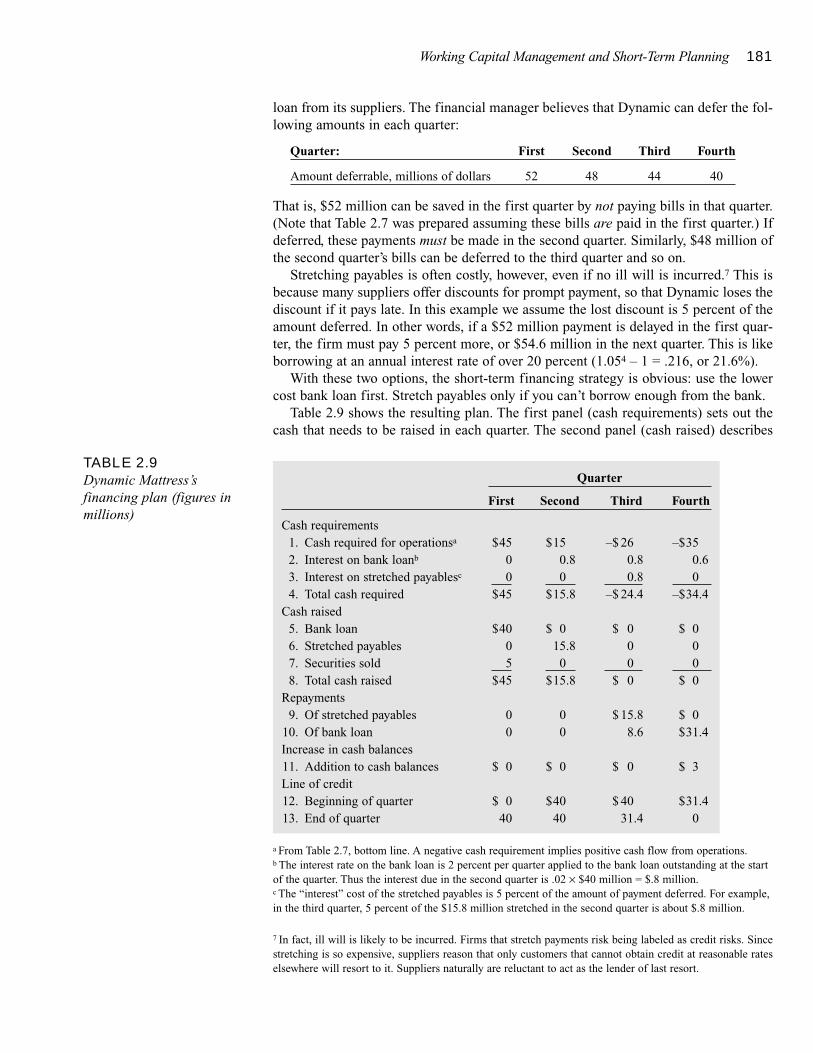
Working Capital Management and Short-Term Planning 181
loan from its suppliers. The financial manager believes that Dynamic can defer the fol-lowing amounts in each quarter:
Quarter: First Second Third Fourth
Amount deferrable, millions of dollars 52 48 44 40
That is, $52 million can be saved in the first quarter by not paying bills in that quarter.(Note that Table 2.7 was prepared assuming these bills are paid in the first quarter.) Ifdeferred, these payments must be made in the second quarter. Similarly, $48 million ofthe second quarter’s bills can be deferred to the third quarter and so on.
Stretching payables is often costly, however, even if no ill will is incurred.7 This isbecause many suppliers offer discounts for prompt payment, so that Dynamic loses thediscount if it pays late. In this example we assume the lost discount is 5 percent of theamount deferred. In other words, if a $52 million payment is delayed in the first quar-ter, the firm must pay 5 percent more, or $54.6 million in the next quarter. This is likeborrowing at an annual interest rate of over 20 percent (1.054 – 1 = .216, or 21.6%).
With these two options, the short-term financing strategy is obvious: use the lowercost bank loan first. Stretch payables only if you can’t borrow enough from the bank.
Table 2.9 shows the resulting plan. The first panel (cash requirements) sets out thecash that needs to be raised in each quarter. The second panel (cash raised) describes
7 In fact, ill will is likely to be incurred. Firms that stretch payments risk being labeled as credit risks. Sincestretching is so expensive, suppliers reason that only customers that cannot obtain credit at reasonable rateselsewhere will resort to it. Suppliers naturally are reluctant to act as the lender of last resort.
TABLE 2.9Dynamic Mattress’sfinancing plan (figures inmillions)
Quarter
First Second Third Fourth
Cash requirements1. Cash required for operationsa $45 $15 –$ 26 –$352. Interest on bank loanb 0 0.8 0.8 0.63. Interest on stretched payablesc 0 0 0.8 04. Total cash required $45 $15.8 –$ 24.4 –$34.4
Cash raised5. Bank loan $40 $ 0 $ 0 $ 06. Stretched payables 0 15.8 0 07. Securities sold 5 0 0 08. Total cash raised $45 $15.8 $ 0 $ 0
Repayments9. Of stretched payables 0 0 $ 15.8 $ 0
10. Of bank loan 0 0 8.6 $31.4Increase in cash balances11. Addition to cash balances $ 0 $ 0 $ 0 $ 3Line of credit12. Beginning of quarter $ 0 $40 $ 40 $31.413. End of quarter 40 40 31.4 0
a From Table 2.7, bottom line. A negative cash requirement implies positive cash flow from operations.b The interest rate on the bank loan is 2 percent per quarter applied to the bank loan outstanding at the startof the quarter. Thus the interest due in the second quarter is .02 × $40 million = $.8 million.c The “interest” cost of the stretched payables is 5 percent of the amount of payment deferred. For example,in the third quarter, 5 percent of the $15.8 million stretched in the second quarter is about $.8 million.
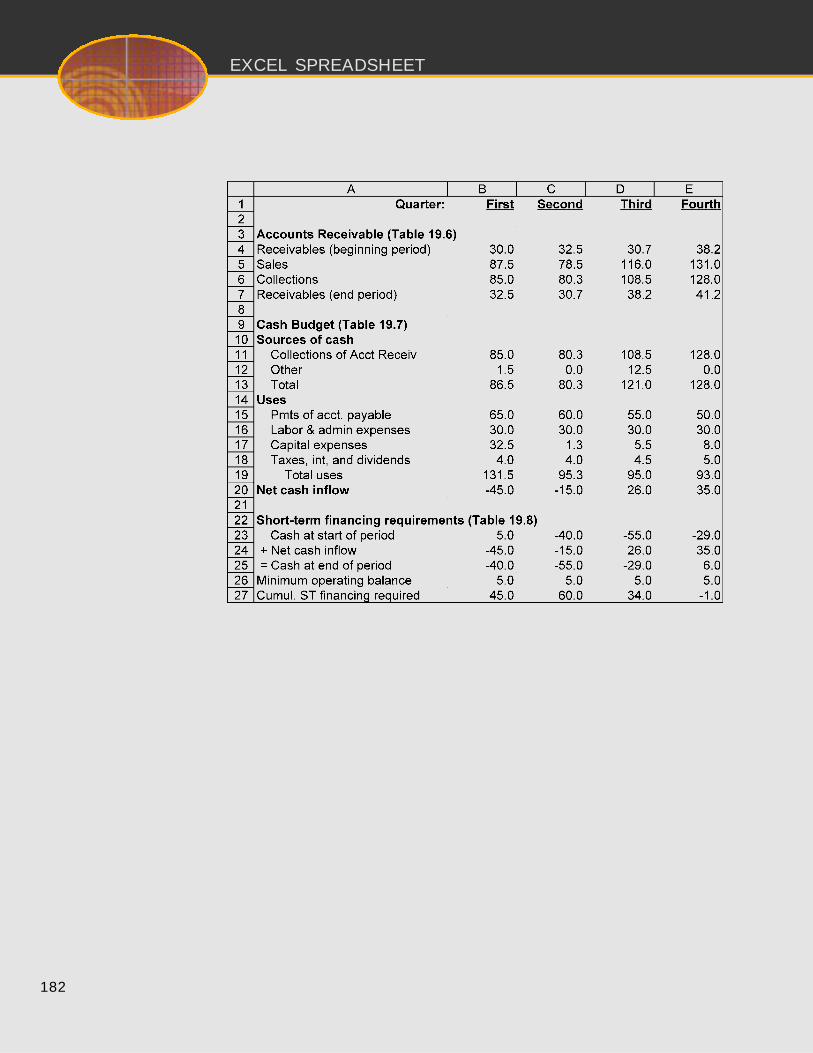
182
EXCEL SPREADSHEET
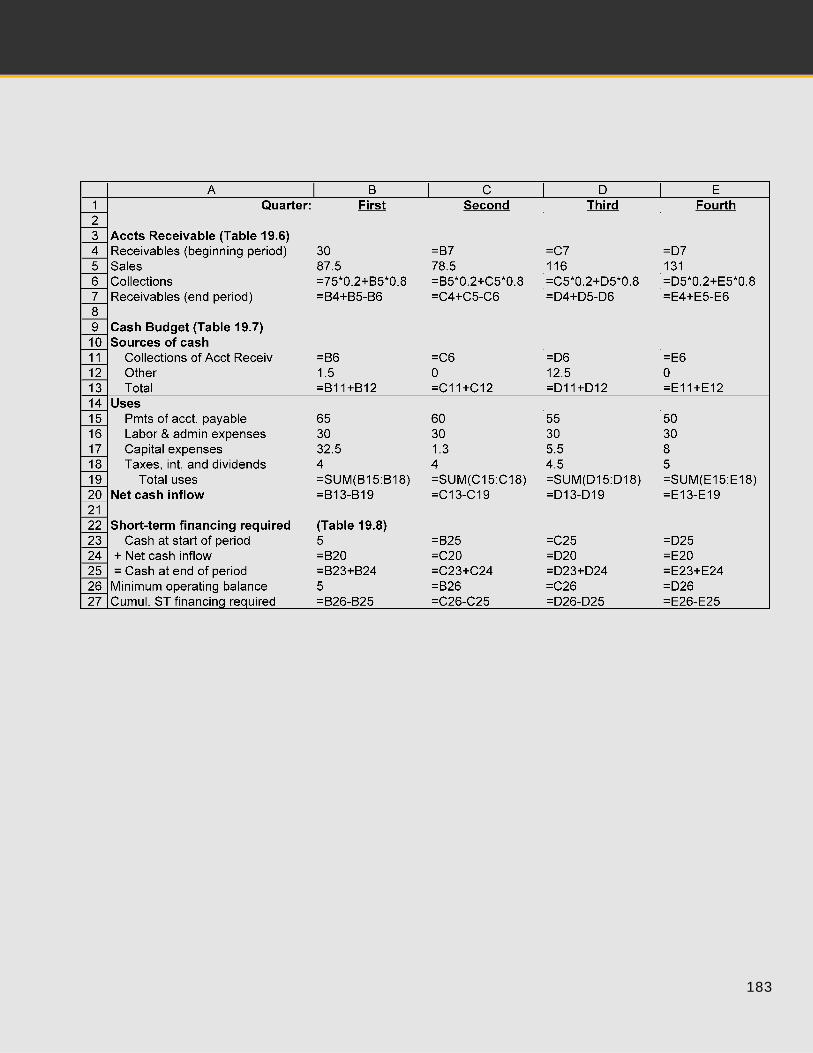
183
184 SECTION TWO
the various sources of financing the firm plans to use. The third and fourth panels de-scribe how the firm will use net cash inflows when they turn positive.
In the first quarter the plan calls for borrowing the full amount available from thebank ($40 million). In addition, the firm sells the $5 million of marketable securities itheld at the end of 2000. Thus under this plan it raises the necessary $45 million in thefirst quarter.
In the second quarter, an additional $15 million must be raised to cover the net cashoutflow predicted in Table 2.7. In addition, $.8 million must be raised to pay interest onthe bank loan. Therefore, the plan calls for Dynamic to maintain its bank borrowing andto stretch $15.8 million in payables. Notice that in the first two quarters, when net cashflow from operations is negative, the firm maintains its cash balance at the minimumacceptable level. Additions to cash balances are zero. Similarly, repayments of out-standing debt are zero. In fact outstanding debt rises in each of these quarters.
In the third and fourth quarters, the firm generates a cash-flow surplus, so the plancalls for Dynamic to pay off its debt. First it pays off stretched payables, as it is requiredto do, and then it uses any remaining cash-flow surplus to pay down its bank loan. Inthe third quarter, all of the net cash inflow is used to reduce outstanding short-term bor-rowing. In the fourth quarter, the firm pays off its remaining short-term borrowing anduses the extra $3 million to increase its cash balances.
� Self-Test 5 Revise Dynamic Mattress’s short-term financial plan assuming it can borrow up to $45million through its line of credit. Assume that the firm will still sell its $5 million ofshort-term securities in the first quarter.
EVALUATING THE PLAN
Does the plan shown in Table 2.9 solve Dynamic’s short-term financing problem? No—the plan is feasible, but Dynamic can probably do better. The most glaring weakness ofthis plan is its reliance on stretching payables, an extremely expensive financing device.Remember that it costs Dynamic 5 percent per quarter to delay paying bills—20 per-cent per year at simple interest. This first plan should merely stimulate the financialmanager to search for cheaper sources of short-term borrowing.
The financial manager would ask several other questions as well. For example:
1. Does Dynamic need a larger reserve of cash or marketable securities to guardagainst, say, its customers stretching their payables (thus slowing down collectionson accounts receivable)?
2. Does the plan yield satisfactory current and quick ratios?8 Its bankers may be wor-ried if these ratios deteriorate.
3. Are there hidden costs to stretching payables? Will suppliers begin to doubt Dy-namic’s creditworthiness?
4. Does the plan for 2001 leave Dynamic in good financial shape for 2002? (Here theanswer is yes, since Dynamic will have paid off all short-term borrowing by the endof the year.)
5. Should Dynamic try to arrange long-term financing for the major capital expendi-ture in the first quarter? This seems sensible, following the rule of thumb that long-term assets deserve long-term financing. It would also dramatically reduce the needfor short-term borrowing. A counterargument is that Dynamic is financing the cap-
Working Capital Management and Short-Term Planning 185
ital investment only temporarily by short-term borrowing. By year-end, the invest-ment is paid for by cash from operations. Thus Dynamic’s initial decision not to seekimmediate long-term financing may reflect a preference for ultimately financing theinvestment with retained earnings.
6. Perhaps the firm’s operating and investment plans can be adjusted to make the short-term financing problem easier. Is there any easy way of deferring the first quarter’slarge cash outflow? For example, suppose that the large capital investment in thefirst quarter is for new mattress-stuffing machines to be delivered and installed inthe first half of the year. The new machines are not scheduled to be ready for full-scale use until August. Perhaps the machine manufacturer could be persuaded to ac-cept 60 percent of the purchase price on delivery and 40 percent when the machinesare installed and operating satisfactorily.
Sources of Short-Term FinancingWe suggested that Dynamic’s manager might want to investigate alternative sources ofshort-term borrowing. Here are some of the possibilities.
BANK LOANS
The simplest and most common source of short-term finance is an unsecured loan froma bank. For example, Dynamic might have a standing arrangement with its bank allow-ing it to borrow up to $40 million. The firm can borrow and repay whenever it wants solong as it does not exceed the credit limit. This kind of arrangement is called a line ofcredit.
Lines of credit are typically reviewed annually, and it is possible that the bank mayseek to cancel it if the firm’s creditworthiness deteriorates. If the firm wants to be surethat it will be able to borrow, it can enter into a revolving credit agreement with thebank. Revolving credit arrangements usually last for a few years and formally committhe bank to lending up to the agreed limit. In return the bank will require the firm topay a commitment fee of around .25 percent on any unused amount.
Most bank loans have durations of only a few months. For example, Dynamic may need a loan to cover a seasonal increase in inventories, and the loan is then repaidas the goods are sold. However, banks also make term loans, which last for severalyears. These term loans sometimes involve huge sums of money, and in this case theymay be parceled out among a syndicate of banks. For example, when Eurotunnel neededto arrange more than $10 billion of borrowing to construct the tunnel between Britainand France, a syndicate of more than 200 international banks combined to provide thecash.
Short-term financing plans must be developed by trial and error. You lay outone plan, think about it, then try again with different assumptions onfinancing and investment alternatives. You continue until you can think of nofurther improvements.
186 SECTION TWO
COMMERCIAL PAPER
When banks lend money, they provide two services. They match up would-be borrow-ers and lenders and they check that the borrower is likely to repay the loan. Banks re-cover the costs of providing these services by charging borrowers on average a higherinterest rate than they pay to lenders. These services are less necessary for large, well-known companies that regularly need to raise large amounts of cash. These companieshave increasingly found it profitable to bypass the bank and to sell short-term debt,known as commercial paper, directly to large investors. Banks have been forced to re-spond by reducing the interest rates on their loans to blue-chip customers.
In the United States commercial paper has a maximum maturity of 9 months, thoughmost paper matures in 60 days or less. Commercial paper is not secured, but companiesgenerally back their issue of paper by arranging a special backup line of credit with abank. This guarantees that they can find the money to repay the paper, and the risk ofdefault is therefore small.
Some companies regularly sell commercial paper in huge amounts. For example, GECapital Corporation has about $70 billion of commercial paper in issue.
SECURED LOANS
Many short-term loans are unsecured, but sometimes the company may offer assets assecurity. Since the bank is lending on a short-term basis, the security generally consistsof liquid assets such as receivables, inventories, or securities. For example, a firm maydecide to borrow short-term money secured by its accounts receivable. When its cus-tomers pay their bills, it can use the cash collected to repay the loan. Banks will not usu-ally lend the full value of the assets that are used as security. For example, a firm thatputs up $100,000 of receivables as security may find that the bank is prepared to lendonly $75,000. The safety margin (or haircut, as it is called) is likely to be even larger inthe case of loans that are secured by inventory.
Accounts Receivable Financing. When a loan is secured by receivables, the firm as-signs the receivables to the bank. If the firm fails to repay the loan, the bank can col-lect the receivables from the firm’s customers and use the cash to pay off the debt. How-ever, the firm is still responsible for the loan even if the receivables ultimately cannotbe collected. The risk of default on the receivables is therefore borne by the firm.
An alternative procedure is to sell the receivables at a discount to a financial institu-tion known as a factor and let it collect the money. In other words, some companiessolve their financing problem by borrowing on the strength of their current assets; oth-ers solve it by selling their current assets. Once the firm has sold its receivables, the fac-tor bears all the responsibility for collecting on the accounts. Therefore, the factor playsthree roles: it administers collection of receivables, takes responsibility for bad debts,and provides finance.
� EXAMPLE 2 Factoring
To illustrate factoring, suppose that the firm sells its accounts receivables to a factor ata 2 percent discount. This means that the factor pays 98 cents for each dollar of accountsreceivable. If the average collection period is 1 month, then in a month the factor shouldbe able to collect $1 for every 98 cents it paid today. Therefore, the implicit interest rate
Working Capital Management and Short-Term Planning 187
is 2/98 = 2.04 percent per month, which corresponds to an effective annual interest rateof (1.0204)12 – 1 = .274, or 27.4 percent.
While factoring would appear from this example to be an expensive source of fi-nancing for the firm, part of the apparently steep interest rate represents payment forthe assumption of default risk as well as for the cost of running the credit operation.
Inventory Financing. Banks also lend on the security of inventory, but they arechoosy about the inventory they will accept. They want to make sure that they can iden-tify and sell it if you default. Automobiles and other standardized nonperishable com-modities are good security for a loan; work in progress and ripe strawberries are poorcollateral.
Banks need to monitor companies to be sure they don’t sell their assets and run offwith the money. Consider, for example, the story of the great salad oil swindle. Fifty-one banks and companies made loans for nearly $200 million to the Allied Crude Veg-etable Oil Refining Corporation in the belief that these loans were secured on valuablesalad oil. Unfortunately, they did not notice that Allied’s tanks contained false com-partments which were mainly filled with seawater. When the fraud was discovered, thepresident of Allied went to jail and the 51 lenders stayed out in the cold looking for their$200 million. The nearby box presents a similar story that illustrates the potential pit-falls of secured lending. Here, too, the loans were not as “secured” as they appeared:the supposed collateral did not exist.
To protect themselves against this sort of risk, lenders often insist on field ware-housing. An independent warehouse company hired by the bank supervises the inven-tory pledged as collateral for the loan. As the firm sells its product and uses the revenueto pay back the loan, the bank directs the warehouse company to release the inventoryback to the firm. If the firm defaults on the loan, the bank keeps the inventory and sellsit to recover the debt.
The Cost of Bank LoansBank loans often extend for several years. Interest payments on these loans are some-times fixed for the term of the loan but more commonly they are adjusted up or downas the general level of interest rates changes.
The interest rate on bank loans of less than a year is almost invariably fixed for theterm of the loan. However, you need to be careful when comparing rates on theseshorter term bank loans, for the rates may be calculated in different ways.
SIMPLE INTEREST
The interest rate on bank loans frequently is quoted as simple interest. For example, ifthe bank quotes an annual rate of 12 percent on a simple interest loan of $100,000 for1 month, then at the end of the month you would need to repay $100,000 plus 1 month’sinterest. This interest is calculated as
Amount of loan × annual interest rate= $100,000 × .12
= $1,000number of periods in the year 12
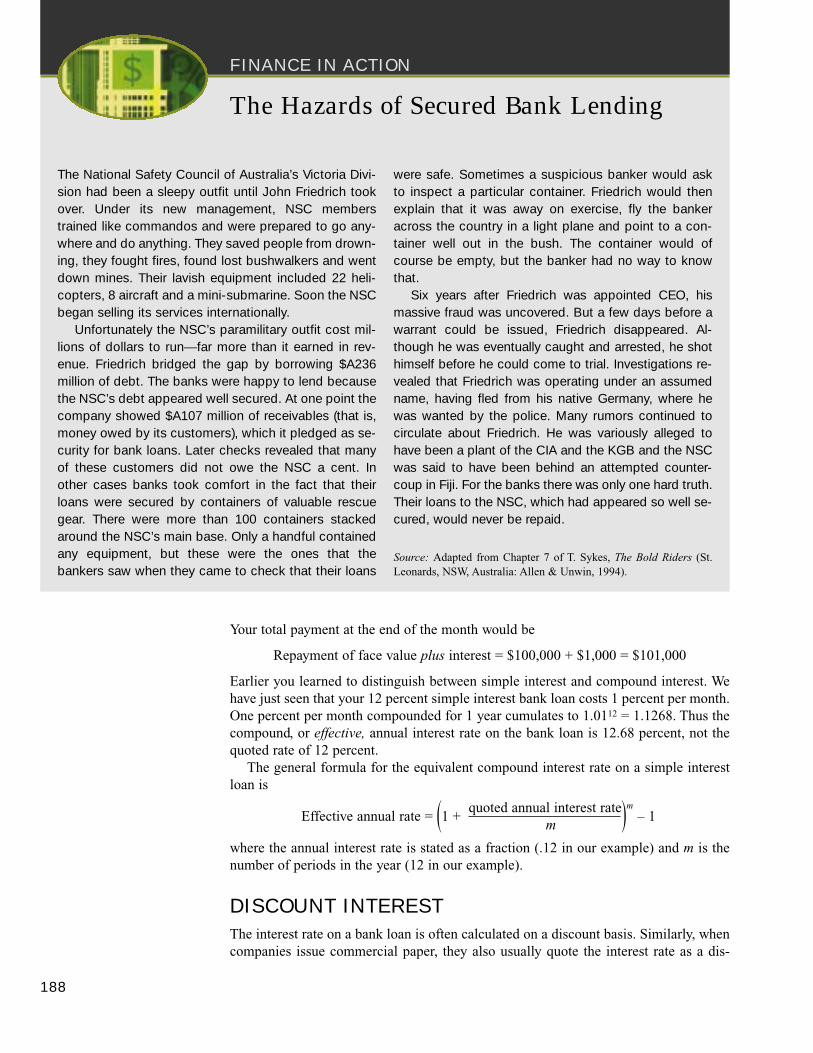
FINANCE IN ACTION
Your total payment at the end of the month would be
Repayment of face value plus interest = $100,000 + $1,000 = $101,000
Earlier you learned to distinguish between simple interest and compound interest. Wehave just seen that your 12 percent simple interest bank loan costs 1 percent per month.One percent per month compounded for 1 year cumulates to 1.0112 = 1.1268. Thus thecompound, or effective, annual interest rate on the bank loan is 12.68 percent, not thequoted rate of 12 percent.
The general formula for the equivalent compound interest rate on a simple interestloan is
Effective annual rate = (1 +quoted annual interest rate)m
– 1m
where the annual interest rate is stated as a fraction (.12 in our example) and m is thenumber of periods in the year (12 in our example).
DISCOUNT INTEREST
The interest rate on a bank loan is often calculated on a discount basis. Similarly, whencompanies issue commercial paper, they also usually quote the interest rate as a dis-
188
The Hazards of Secured Bank Lending
The National Safety Council of Australia’s Victoria Divi-sion had been a sleepy outfit until John Friedrich tookover. Under its new management, NSC memberstrained like commandos and were prepared to go any-where and do anything. They saved people from drown-ing, they fought fires, found lost bushwalkers and wentdown mines. Their lavish equipment included 22 heli-copters, 8 aircraft and a mini-submarine. Soon the NSCbegan selling its services internationally.
Unfortunately the NSC’s paramilitary outfit cost mil-lions of dollars to run— far more than it earned in rev-enue. Friedrich bridged the gap by borrowing $A236million of debt. The banks were happy to lend becausethe NSC’s debt appeared well secured. At one point thecompany showed $A107 million of receivables (that is,money owed by its customers), which it pledged as se-curity for bank loans. Later checks revealed that manyof these customers did not owe the NSC a cent. Inother cases banks took comfort in the fact that theirloans were secured by containers of valuable rescuegear. There were more than 100 containers stackedaround the NSC’s main base. Only a handful containedany equipment, but these were the ones that thebankers saw when they came to check that their loans
were safe. Sometimes a suspicious banker would askto inspect a particular container. Friedrich would thenexplain that it was away on exercise, fly the bankeracross the country in a light plane and point to a con-tainer well out in the bush. The container would ofcourse be empty, but the banker had no way to knowthat.
Six years after Friedrich was appointed CEO, hismassive fraud was uncovered. But a few days before awarrant could be issued, Friedrich disappeared. Al-though he was eventually caught and arrested, he shothimself before he could come to trial. Investigations re-vealed that Friedrich was operating under an assumedname, having fled from his native Germany, where hewas wanted by the police. Many rumors continued tocirculate about Friedrich. He was variously alleged tohave been a plant of the CIA and the KGB and the NSCwas said to have been behind an attempted counter-coup in Fiji. For the banks there was only one hard truth.Their loans to the NSC, which had appeared so well se-cured, would never be repaid.
Source: Adapted from Chapter 7 of T. Sykes, The Bold Riders (St.Leonards, NSW, Australia: Allen & Unwin, 1994).
Working Capital Management and Short-Term Planning 189
count. With a discount interest loan, the bank deducts the interest up front. For exam-ple, suppose that you borrow $100,000 on a discount basis for 1 year at 12 percent. Inthis case the bank hands you $100,000 less 12 percent, or $88,000. Then at the end ofthe year you repay the bank the $100,000 face value of the loan. This is equivalent topaying interest of $12,000 on a loan of $88,000. The effective interest rate on such aloan is therefore $12,000/$88,000 = .1364, or 13.64 percent.
Now suppose that you borrow $100,000 on a discount basis for 1 month at 12 per-cent. In this case the bank deducts 1 percent up-front interest and hands you
Face value of loan × (1 –quoted annual interest rate )number of periods in the year
= $100,000 × (1 –.12) = $99,00012
At the end of the month you repay the bank the $100,000 face value of the loan, so youare effectively paying interest of $1,000 on a loan of $99,000. The monthly interest rateon such a loan is $1,000/$99,000 = 1.01 percent and the compound, or effective, annualinterest rate on this loan is 1.010112 – 1 = .1282, or 12.82 percent. The effective inter-est rate is higher than on the simple interest rate loan because the interest is paid at thebeginning of the month rather than the end.
The general formula for the equivalent compound interest rate on a discount interestloan is
� 1 �m
– 1Effective annual rate on a discount loan =1 –
quoted annual interest ratem
where the quoted annual interest rate is stated as a fraction (.12 in our example) and mis the number of periods in the year (12 in our example).
INTEREST WITH COMPENSATING BALANCES
Bank loans often require the firm to maintain some amount of money on balance at thebank. This is called a compensating balance. For example, a firm might have to main-tain a balance of 20 percent of the amount of the loan. In other words, if the firm bor-rows $100,000, it gets to use only $80,000, because $20,000 (20 percent of $100,000)must be left on deposit in the bank.
If the compensating balance does not pay interest (or pays a below-market rate of in-terest), the actual interest rate on the loan is higher than the stated rate. The reason isthat the borrower must pay interest on the full amount borrowed but has access to onlypart of the funds. For example, we calculated above that a firm borrowing $100,000 for1 month at 12 percent simple interest must pay interest at the end of the month of$1,000. If the firm gets the use of only $80,000, the effective monthly interest rate is$1,000/$80,000 = .0125, or 1.25 percent. This is equivalent to a compound annual in-terest rate of 1.012512 – 1 = .1608, or 16.08 percent.
In general, the compound annual interest rate on a loan with compensating bal-ances is
Effective annual rate on a= ( 1 +
actual interest paid ) m– 1
loan with compensating balances borrowed funds available
where m is the number of periods in the year (again 12 in our example).
190 SECTION TWO
� Self-Test 6 Suppose that Dynamic Mattress needs to raise $20 million for 6 months. Bank A quotesa simple interest rate of 7 percent but requires the firm to maintain an interest-free com-pensating balance of 20 percent. Bank B quotes a simple interest rate of 8 percent butdoes not require any compensating balances. Bank C quotes a discount interest rate of7.5 percent and also does not require compensating balances. What is the effective (orcompound) annual interest rate on each of these loans?
SummaryWhy do firms need to invest in net working capital?
Short-term financial planning is concerned with the management of the firm’s short-term,or current, assets and liabilities. The most important current assets are cash, marketablesecurities, inventory, and accounts receivable. The most important current liabilities arebank loans and accounts payable. The difference between current assets and currentliabilities is called net working capital.
Net working capital arises from lags between the time the firm obtains the raw materialsfor its product and the time it finally collects its bills from customers. The cash conversioncycle is the length of time between the firm’s payment for materials and the date that it getspaid by its customers. The cash conversion cycle is partly within management’s control. Forexample, it can choose to have a higher or lower level of inventories. Management needs totrade off the benefits and costs of investing in current assets. Higher investments in currentassets entail higher carrying costs but lower expected shortage costs.
How does long-term financing policy affect short-term financing requirements?
The nature of the firm’s short-term financial planning problem is determined by the amountof long-term capital it raises. A firm that issues large amounts of long-term debt or commonstock, or which retains a large part of its earnings, may find that it has permanent excesscash. Other firms raise relatively little long-term capital and end up as permanent short-termdebtors. Most firms attempt to find a golden mean by financing all fixed assets and part ofcurrent assets with equity and long-term debt. Such firms may invest cash surpluses duringpart of the year and borrow during the rest of the year.
How does the firm’s sources and uses of cash relate to its need for short-term bor-rowing?
The starting point for short-term financial planning is an understanding of sources and usesof cash. Firms forecast their net cash requirement by forecasting collections on accountsreceivable, adding other cash inflows, and subtracting all forecast cash outlays. If theforecast cash balance is insufficient to cover day-to-day operations and to provide a bufferagainst contingencies, you will need to find additional finance. For example, you mayborrow from a bank on an unsecured line of credit, you may borrow by offering receivablesor inventory as security, or you may issue your own short-term notes known as commercialpaper.
How do firms develop a short-term financing plan that meets their need for cash?
The search for the best short-term financial plan inevitably proceeds by trial and error. Thefinancial manager must explore the consequences of different assumptions about cash
Working Capital Management and Short-Term Planning 191
requirements, interest rates, limits on financing from particular sources, and so on. Firmsare increasingly using computerized financial models to help in this process. Remember thekey differences between the various sources of short-term financing—for example, thedifferences between bank lines of credit and commercial paper. Remember too that firmsoften raise money on the strength of their current assets, especially accounts receivable andinventories.
www.businessfinancemag.com/ Business Finance Magazine has resources and software reviewsfor financial planning
www.toolkit.cch.com/ Financial planning resources of all kindshttp://edge.lowe.org/quick/finance/ Short-term financial management toolswww.ibcdata.com/index.html Short-term investment and money fund rates
net working capital carrying costs line of creditcash conversion cycle shortage costs commercial paper
1. Working Capital Management. Indicate how each of the following six different transac-tions that Dynamic Mattress might make would affect (i) cash and (ii) net working capital:
a. Paying out a $2 million cash dividend.b. A customer paying a $2,500 bill resulting from a previous sale.c. Paying $5,000 previously owed to one of its suppliers.d. Borrowing $1 million long-term and investing the proceeds in inventory.e. Borrowing $1 million short-term and investing the proceeds in inventory.f. Selling $5 million of marketable securities for cash.
2. Short-Term Financial Plans. Fill in the blanks in the following statements:
a. A firm has a cash surplus when its ________ exceeds its ________. The surplus is nor-mally invested in ________.
b. In developing the short-term financial plan, the financial manager starts with a(n)________ budget for the next year. This budget shows the ________ generated or ab-sorbed by the firm’s operations and also the minimum ________ needed to support theseoperations. The financial manager may also wish to invest in ________ as a reserve forunexpected cash requirements.
3. Sources and Uses of Cash. State how each of the following events would affect the firm’sbalance sheet. State whether each change is a source or use of cash.
a. An automobile manufacturer increases production in response to a forecast increase indemand. Unfortunately, the demand does not increase.
b. Competition forces the firm to give customers more time to pay for their purchases.c. The firm sells a parcel of land for $100,000. The land was purchased 5 years earlier for
$200,000.d. The firm repurchases its own common stock.e. The firm pays its quarterly dividend.f. The firm issues $1 million of long-term debt and uses the proceeds to repay a short-term
bank loan.
Related WebLinks
Key Terms
Quiz
192 SECTION TWO
4. Cash Conversion Cycle. What effect will the following events have on the cash conversioncycle?
a. Higher financing rates induce the firm to reduce its level of inventory.b. The firm obtains a new line of credit that enables it to avoid stretching payables to its sup-
pliers.c. The firm factors its accounts receivable.d. A recession occurs, and the firm’s customers increasingly stretch their payables.
5. Managing Working Capital. A new computer system allows your firm to more accuratelymonitor inventory and anticipate future inventory shortfalls. As a result, the firm feels moreable to pare down its inventory levels. What effect will the new system have on working cap-ital and on the cash conversion cycle?
6. Cash Conversion Cycle. Calculate the accounts receivable period, accounts payable period,inventory period, and cash conversion cycle for the following firm:
Income statement data:Sales 5,000Cost of goods sold 4,200
Balance sheet data:
Beginning of Year End of Year
Inventory 500 600Accounts receivable 100 120Accounts payable 250 290
7. Cash Conversion Cycle. What effect will the following have on the cash conversion cycle?
a. Customers are given a larger discount for cash transactions.b. The inventory turnover ratio falls from 8 to 6.c. New technology streamlines the production process.d. The firm adopts a policy of reducing outstanding accounts payable.e. The firm starts producing more goods in response to customers’ advance orders instead
of producing for inventory.f. A temporary glut in the commodity market induces the firm to stock up on raw materi-
als while prices are low.
8. Compensating Balances. Suppose that Dynamic Sofa (a subsidiary of Dynamic Mattress)has a line of credit with a stated interest rate of 10 percent and a compensating balance of25 percent. The compensating balance earns no interest.
a. If the firm needs $10,000, how much will it need to borrow?b. Suppose that Dynamic’s bank offers to forget about the compensating balance require-
ment if the firm pays interest at a rate of 12 percent. Should the firm accept this offer?Why or why not?
c. Redo part (b) if the compensating balance pays interest of 4 percent. Warning: You can-not use the formula in the material for the effective interest rate when the compensatingbalance pays interest. Think about how to measure the effective interest rate on this loan.
PracticeProblems
Working Capital Management and Short-Term Planning 193
9. Compensating Balances. The stated bank loan rate is 8 percent, but the loan requires acompensating balance of 10 percent on which no interest is earned. What is the effective in-terest rate on the loan? What happens to the effective rate if the compensating balance isdoubled to 20 percent?
10. Factoring. A firm sells its accounts receivables to a factor at a 1.5 percent discount. The av-erage collection period is 1 month. What is the implicit effective annual interest rate on thefactoring arrangement? Suppose the average collection period is 1.5 months. How does thisaffect the implicit effective annual interest rate?
11. Discount Loan. A discount bank loan has a quoted annual rate of 6 percent.
a. What is the effective rate of interest if the loan is for 1 year and is paid off in one pay-ment at the end of the year?
b. What is the effective rate of interest if the loan is for 1 month?
12. Compensating Balances. A bank loan has a quoted annual rate of 6 percent. However, theborrower must maintain a balance of 25 percent of the amount of the loan, and the balancedoes not earn any interest.
a. What is the effective rate of interest if the loan is for 1 year and is paid off in one pay-ment at the end of the year?
b. What is the effective rate of interest if the loan is for 1 month?
13. Forecasting Collections. Here is a forecast of sales by National Bromide for the first 4months of 2001 (figures in thousands of dollars):
Month: 1 2 3 4
Cash sales 15 24 18 14Sales on credit 100 120 90 70
On average, 50 percent of credit sales are paid for in the current month, 30 percent in thenext month, and the remainder in the month after that. What are expected cash collectionsin months 3 and 4?
14. Forecasting Payments. If a firm pays its bills with a 30-day delay, what fraction of its pur-chases will be paid for in the current quarter? In the following quarter? What if its paymentdelay is 60 days?
15. Short-Term Planning. Paymore Products places orders for goods equal to 75 percent of itssales forecast in the next quarter. What will be orders in each quarter of the year if the salesforecasts for the next five quarters are:
Quarter in Coming Year Following Year
First Second Third Fourth First quarter
Sales forecast $372 $360 $336 $384 $384
16. Forecasting Payments. Calculate Paymore’s cash payments to its suppliers under the as-sumption that the firm pays for its goods with a 1-month delay. Therefore, on average, two-thirds of purchases are paid for in the quarter that they are purchased and one-third are paidin the following quarter.
17. Forecasting Collections. Now suppose that Paymore’s customers pay their bills with a 2-month delay. What is the forecast for Paymore’s cash receipts in each quarter of the comingyear? Assume that sales in the last quarter of the previous year were $336.
18. Forecasting Net Cash Flow. Assuming that Paymore’s labor and administrative expensesare $65 per quarter and that interest on long-term debt is $40 per quarter, work out the netcash inflow for Paymore for the coming year using a table like Table 2.7.
194 SECTION TWO
19. Short-Term Financing Requirements. Suppose that Paymore’s cash balance at the start ofthe first quarter is $40 and its minimum acceptable cash balance is $30. Work out the short-term financing requirements for the firm in the coming year using a table like Table 2.8. Thefirm pays no dividends.
20. Short-Term Financing Plan. Now assume that Paymore can borrow up to $100 from a lineof credit at an interest rate of 2 percent per quarter. Prepare a short-term financing plan. UseTable 2.9 to guide your answer.
21. Short-Term Plan. Recalculate Dynamic Mattress’s financing plan (Table 2.9) assuming thatthe firm wishes to maintain a minimum cash balance of $10 million instead of $5 million.Assume the firm can convince the bank to extend its line of credit to $45 million.
22. Sources and Uses of Cash. The accompanying tables show Dynamic Mattress’s year-end1998 balance sheet and its income statement for 1999. Use these tables (and Table 2.3) towork out a statement of sources and uses of cash for 1999.
YEAR-END BALANCE SHEET FOR 1998(figures in millions of dollars)
Assets Liabilities
Current assets Current liabilitiesCash 4 Bank loans 4Marketable securities 2 Accounts payable 15Inventory 20 Total current liabilities 19Accounts receivable 22 Long-term debt 5
Total current assets 48 Net worth (equity and retained earnings) 60Fixed assets
Gross investment 50Less depreciation 14 Total liabilities and net worth 84Net fixed assets 36
Total assets 84
INCOME STATEMENT FOR 1999(figures in millions of dollars)
Sales 300Operating costs –285
15Depreciation –2EBIT 13Interest –1Pretax income 12Tax at 50 percent –6Net income 6
Note: Dividend = $1 million and retained earnings = $5 million.
23. Cash Budget. The following data are from the budget of Ritewell Publishers. Half the com-pany’s sales are transacted on a cash basis. The other half are paid for with a 1-month delay.The company pays all of its credit purchases with a 1-month delay. Credit purchases in Jan-uary were $30 and total sales in January were $180.
ChallengeProblem

Working Capital Management and Short-Term Planning 195
February March April
Total sales 200 220 180Cash purchases 70 80 60Credit purchases 40 30 40Labor and administrative expenses 30 30 30Taxes, interest, and dividends 10 10 10Capital expenditures 100 0 0
Complete the following cash budget:
February March April
Sources of cashCollections on current salesCollections on accounts receivable
Total sources of cashUses of cash
Payments of accounts payableCash purchasesLabor and administrative expensesCapital expendituresTaxes, interest, and dividends
Total uses of cashNet cash inflow
Cash at start of period 100+ Net cash inflow= Cash at end of period+ Minimum operating cash balance 100 100 100= Cumulative short-term financing required
1 a. The new values for the accounts receivable period and inventory period are
Days in inventory = 250 = 25.9 days3,518/365
This is a reduction of 22.8 days from the original value of 48.7 days.
Days in receivables =300
= 27.6 days3,968/365
This is a reduction of 16.2 days from the original value of 43.8 daysThe cash conversion cycle falls by a total of 22.8 + 16.2 = 39.0 days.
b. The inventory period, accounts receivable period, and accounts payable period will allfall by a factor of 1.10. (The numerators are unchanged, but the denominators are higherby 10 percent.) Therefore, the conversion cycle will fall from 61 days to 61/1.10 = 55.5days.
2 a. An increase in the interest rate will increase the cost of carrying current assets. The ef-fect is to reduce the optimal level of such assets.
b. The just-in-time system lowers the expected level of shortage costs and reduces theamount of goods the firm ought to be willing to keep in inventory.
Solutions toSelf-TestQuestions
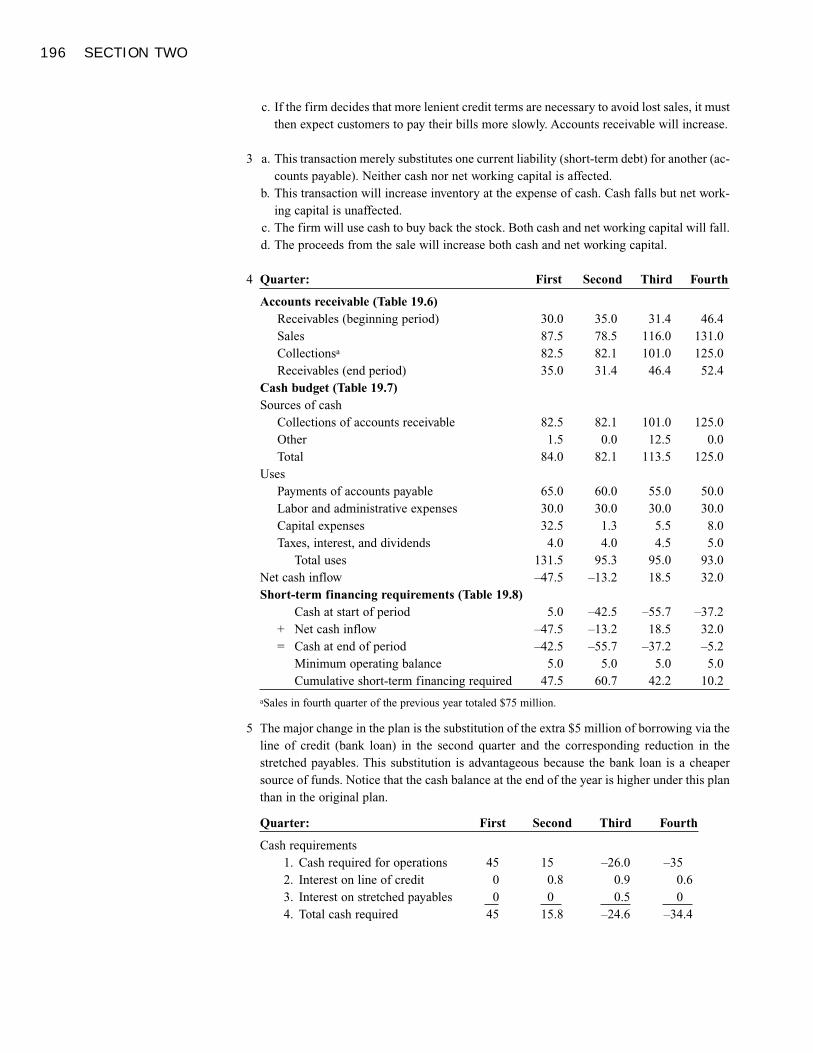
196 SECTION TWO
c. If the firm decides that more lenient credit terms are necessary to avoid lost sales, it mustthen expect customers to pay their bills more slowly. Accounts receivable will increase.
3 a. This transaction merely substitutes one current liability (short-term debt) for another (ac-counts payable). Neither cash nor net working capital is affected.
b. This transaction will increase inventory at the expense of cash. Cash falls but net work-ing capital is unaffected.
c. The firm will use cash to buy back the stock. Both cash and net working capital will fall.d. The proceeds from the sale will increase both cash and net working capital.
4 Quarter: First Second Third Fourth
Accounts receivable (Table 19.6)Receivables (beginning period) 30.0 35.0 31.4 46.4Sales 87.5 78.5 116.0 131.0Collectionsa 82.5 82.1 101.0 125.0Receivables (end period) 35.0 31.4 46.4 52.4
Cash budget (Table 19.7)Sources of cash
Collections of accounts receivable 82.5 82.1 101.0 125.0Other 1.5 0.0 12.5 0.0Total 84.0 82.1 113.5 125.0
UsesPayments of accounts payable 65.0 60.0 55.0 50.0Labor and administrative expenses 30.0 30.0 30.0 30.0Capital expenses 32.5 1.3 5.5 8.0Taxes, interest, and dividends 4.0 4.0 4.5 5.0
Total uses 131.5 95.3 95.0 93.0Net cash inflow –47.5 –13.2 18.5 32.0Short-term financing requirements (Table 19.8)
Cash at start of period 5.0 –42.5 –55.7 –37.2+ Net cash inflow –47.5 –13.2 18.5 32.0= Cash at end of period –42.5 –55.7 –37.2 –5.2
Minimum operating balance 5.0 5.0 5.0 5.0Cumulative short-term financing required 47.5 60.7 42.2 10.2
aSales in fourth quarter of the previous year totaled $75 million.
5 The major change in the plan is the substitution of the extra $5 million of borrowing via theline of credit (bank loan) in the second quarter and the corresponding reduction in thestretched payables. This substitution is advantageous because the bank loan is a cheapersource of funds. Notice that the cash balance at the end of the year is higher under this planthan in the original plan.
Quarter: First Second Third Fourth
Cash requirements1. Cash required for operations 45 15 –26.0 –352. Interest on line of credit 0 0.8 0.9 0.63. Interest on stretched payables 0 0 0.5 04. Total cash required 45 15.8 –24.6 –34.4
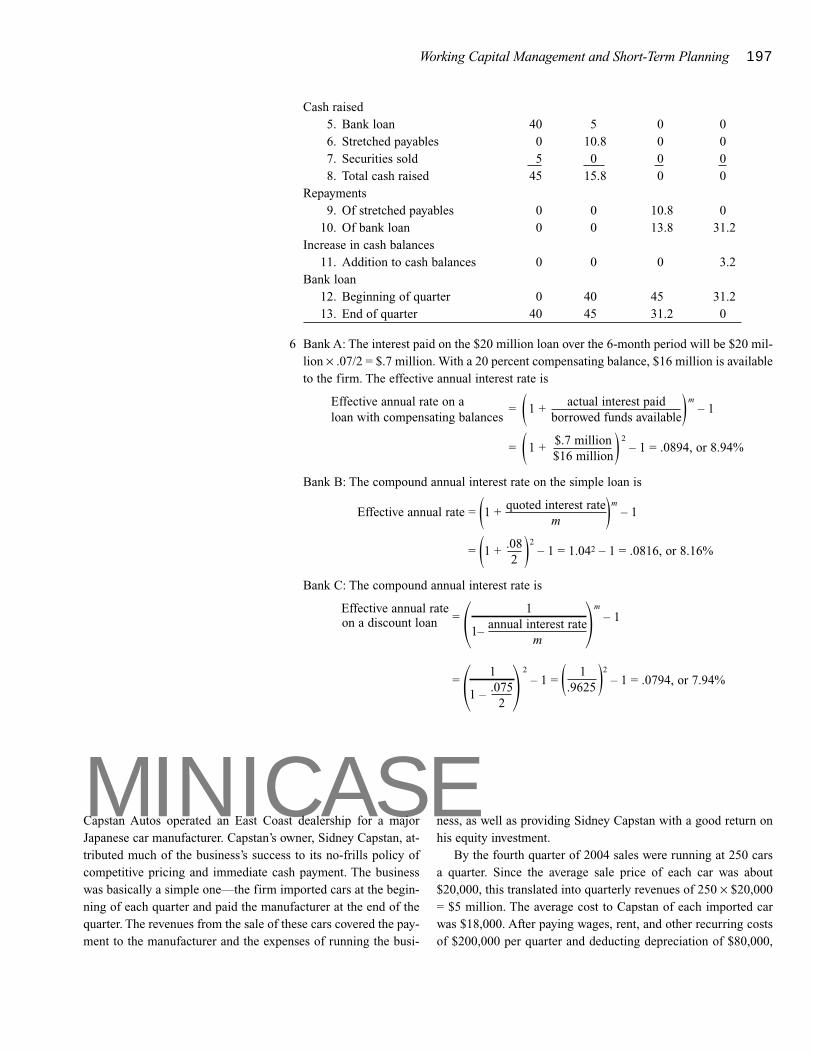
Working Capital Management and Short-Term Planning 197
Cash raised5. Bank loan 40 5 0 06. Stretched payables 0 10.8 0 07. Securities sold 5 0 0 08. Total cash raised 45 15.8 0 0
Repayments9. Of stretched payables 0 0 10.8 0
10. Of bank loan 0 0 13.8 31.2Increase in cash balances
11. Addition to cash balances 0 0 0 3.2Bank loan
12. Beginning of quarter 0 40 45 31.213. End of quarter 40 45 31.2 0
6 Bank A: The interest paid on the $20 million loan over the 6-month period will be $20 mil-lion × .07/2 = $.7 million. With a 20 percent compensating balance, $16 million is availableto the firm. The effective annual interest rate is
Effective annual rate on a = ( 1 + actual interest paid ) m– 1
loan with compensating balances borrowed funds available
= ( 1 + $.7 million ) 2– 1 = .0894, or 8.94%
$16 million
Bank B: The compound annual interest rate on the simple loan is
Effective annual rate = (1 + quoted interest rate)m– 1
m
= (1 + .08 )2– 1 = 1.042 – 1 = .0816, or 8.16%
2
Bank C: The compound annual interest rate is
Effective annual rate= � 1 �m
– 1on a discount loan1– annual interest rate
m
=� 1 � 2
– 1 = ( 1 )2
– 1 = .0794, or 7.94%1 – .075 .9625
2
MINICASECapstan Autos operated an East Coast dealership for a majorJapanese car manufacturer. Capstan’s owner, Sidney Capstan, at-tributed much of the business’s success to its no-frills policy ofcompetitive pricing and immediate cash payment. The businesswas basically a simple one—the firm imported cars at the begin-ning of each quarter and paid the manufacturer at the end of thequarter. The revenues from the sale of these cars covered the pay-ment to the manufacturer and the expenses of running the busi-
ness, as well as providing Sidney Capstan with a good return onhis equity investment.
By the fourth quarter of 2004 sales were running at 250 carsa quarter. Since the average sale price of each car was about$20,000, this translated into quarterly revenues of 250 × $20,000= $5 million. The average cost to Capstan of each imported carwas $18,000. After paying wages, rent, and other recurring costsof $200,000 per quarter and deducting depreciation of $80,000,
198 SECTION TWO
the company was left with earnings before interest and taxes(EBIT) of $220,000 a quarter and net profits of $140,000.
The year 2005 was not a happy year for car importers in theUnited States. Recession led to a general decline in auto sales,while the fall in the value of the dollar shaved profit margins formany dealers in imported cars. Capstan more than most firmsforesaw the difficulties ahead and reacted at once by offering 6months’ free credit while holding the sale price of its cars con-stant. Wages and other costs were pared by 25 percent to$150,000 a quarter and the company effectively eliminated allcapital expenditures. The policy appeared successful. Unit salesfell by 20 percent to 200 units a quarter, but the company contin-ued to operate at a satisfactory profit (see table).
The slump in sales lasted for 6 months, but as consumer con-fidence began to return, auto sales began to recover. The com-pany’s new policy of 6 months’ free credit was proving suffi-ciently popular that Sidney Capstan decided to maintain thepolicy. In the third quarter of 2005 sales had recovered to 225units; by the fourth quarter they were 250 units; and by the firstquarter of the next year they had reached 275 units. It looked asif by the second quarter of 2006 that the company could expect tosell 300 cars. Earnings before interest and tax were already in ex-cess of their previous high and Sidney Capstan was able to con-gratulate himself on weathering what looked to be a tricky period.Over the 18-month period the firm had earned net profits of overhalf a million dollars, and the equity had grown from just under$1 million to about $2 million.
Sidney Capstan was first and foremost a superb salesman andalways left the financial aspects of the business to his financialmanager. However, there was one feature of the financial state-ments that disturbed Sidney Capstan—the mounting level ofdebt, which by the end of the first quarter of 2006 had reached$9.7 million. This unease turned to alarm when the financialmanager phoned to say that the bank was reluctant to extend fur-ther credit and was even questioning its current level of exposureto the company.
Capstan found it impossible to understand how such a suc-cessful year could have landed the company in financial difficul-ties. The company had always had good relationships with itsbank, and the interest rate on its bank loans was a reasonable 8percent a year (or about 2 percent a quarter). Surely, Capstan rea-soned, when the bank saw the projected sales growth for the restof 2006, it would realize that there were plenty of profits to en-able the company to start repaying its loans.
Questions
1. Is Capstan Auto in trouble?2. Is the bank correct to withhold further credit?3. Why is Capstan’s indebtedness increasing if its profits are
higher than ever?
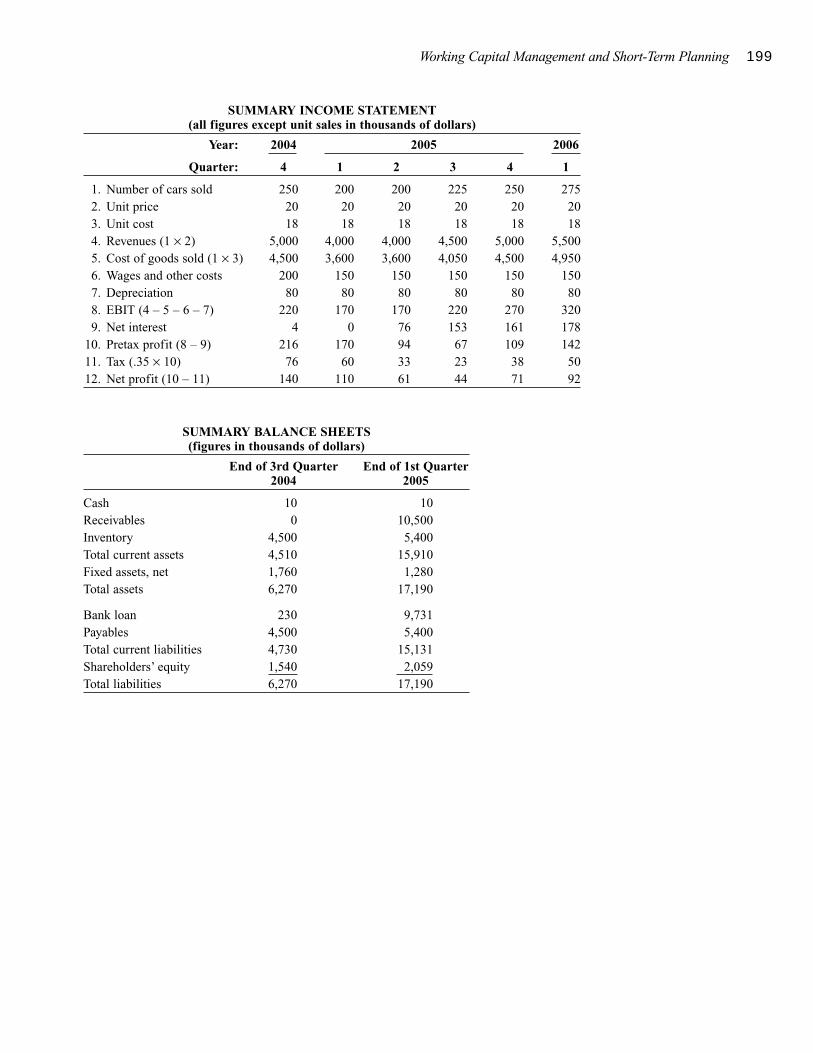
Working Capital Management and Short-Term Planning 199
SUMMARY INCOME STATEMENT(all figures except unit sales in thousands of dollars)
Year: 2004 2005 2006
Quarter: 4 1 2 3 4 1
1. Number of cars sold 250 200 200 225 250 2752. Unit price 20 20 20 20 20 203. Unit cost 18 18 18 18 18 184. Revenues (1 × 2) 5,000 4,000 4,000 4,500 5,000 5,5005. Cost of goods sold (1 × 3) 4,500 3,600 3,600 4,050 4,500 4,9506. Wages and other costs 200 150 150 150 150 1507. Depreciation 80 80 80 80 80 808. EBIT (4 – 5 – 6 – 7) 220 170 170 220 270 3209. Net interest 4 0 76 153 161 178
10. Pretax profit (8 – 9) 216 170 94 67 109 14211. Tax (.35 × 10) 76 60 33 23 38 5012. Net profit (10 – 11) 140 110 61 44 71 92
SUMMARY BALANCE SHEETS(figures in thousands of dollars)
End of 3rd Quarter End of 1st Quarter2004 2005
Cash 10 10Receivables 0 10,500Inventory 4,500 5,400Total current assets 4,510 15,910Fixed assets, net 1,760 1,280Total assets 6,270 17,190
Bank loan 230 9,731Payables 4,500 5,400Total current liabilities 4,730 15,131Shareholders’ equity 1,540 2,059Total liabilities 6,270 17,190
201
CASH AND INVENTORYMANAGEMENT
Cash Collection, Disbursement, and FloatFloat
Valuing Float
Managing FloatSpeeding Up Collections
Controlling Disbursements
Electronic Funds Transfer
Inventories and Cash BalancesManaging Inventories
Managing Inventories of Cash
Uncertain Cash Flows
Cash Management in the Largest Corporations
Investing Idle Cash: The Money Market
Summary
Not the right way to manage cash.Why hoard cash when you could invest it and earn interest? Still, you need some cash to paybills. What’s the right cash inventory? We will see that managing an inventory of cash is similarto managing an inventory of raw materials or finished goods.Telegraph Colour Library/FPG International
n late 1999 citizens and corporations in the United States held nearly
$1,100 billion in cash. This included about $500 billion of currency with
the balance held in demand deposits (checking accounts) with commer-
cial banks. Cash pays no interest. Why, then, do sensible people hold it? Why,
for example, don’t you take all your cash and invest it in interest-bearing securities? The
answer is that cash gives you more liquidity than securities. By this we mean that you
can use it to buy things. It is hard enough getting New York cab drivers to give you
change for a $20 bill, but try asking them to split a Treasury bill.
Of course, rational investors will not hold an asset like cash unless it provides the
same benefit on the margin as other assets such as Treasury bills. The benefit from
holding Treasury bills is the interest that you receive; the benefit from holding cash is
that it gives you a convenient store of liquidity. When you have only a small proportion
of your assets in cash, a little extra liquidity can be extremely useful; when you have a
substantial holding, any additional liquidity is not worth much. Therefore, as a finan-
cial manager you want to hold cash balances up to the point where the value of any ad-
ditional liquidity is equal to the value of the interest forgone.
Cash is simply a raw material that companies need to carry on production. As we will
explain later, the financial manager’s decision to stock up on cash is in many ways sim-
ilar to the production manager’s decision to stock up on inventories of raw materials.
We will therefore look at the general problem of managing inventories and then show
how this helps us to understand how much cash you should hold.
But first you need to learn about the mechanics of cash collection and disbursement.
This may seem a rather humdrum topic but you will find that it involves some interest-
ing and important decisions.
After studying this material you should be able to
� Measure float and explain why it arises and how it can be controlled.
� Calculate the value of changes in float.
� Understand the costs and benefits of holding inventories.
� Cite the costs and benefits of holding cash.
� Explain why an understanding of inventory management can be useful for cash man-
agement.
202
I
Cash Collection, Disbursement, and FloatCompanies don’t keep their cash in a little tin box; they keep it in a bank deposit. To un-derstand how they can make best use of that deposit, you need to understand what hap-pens when companies withdraw money from their account or pay money into it.
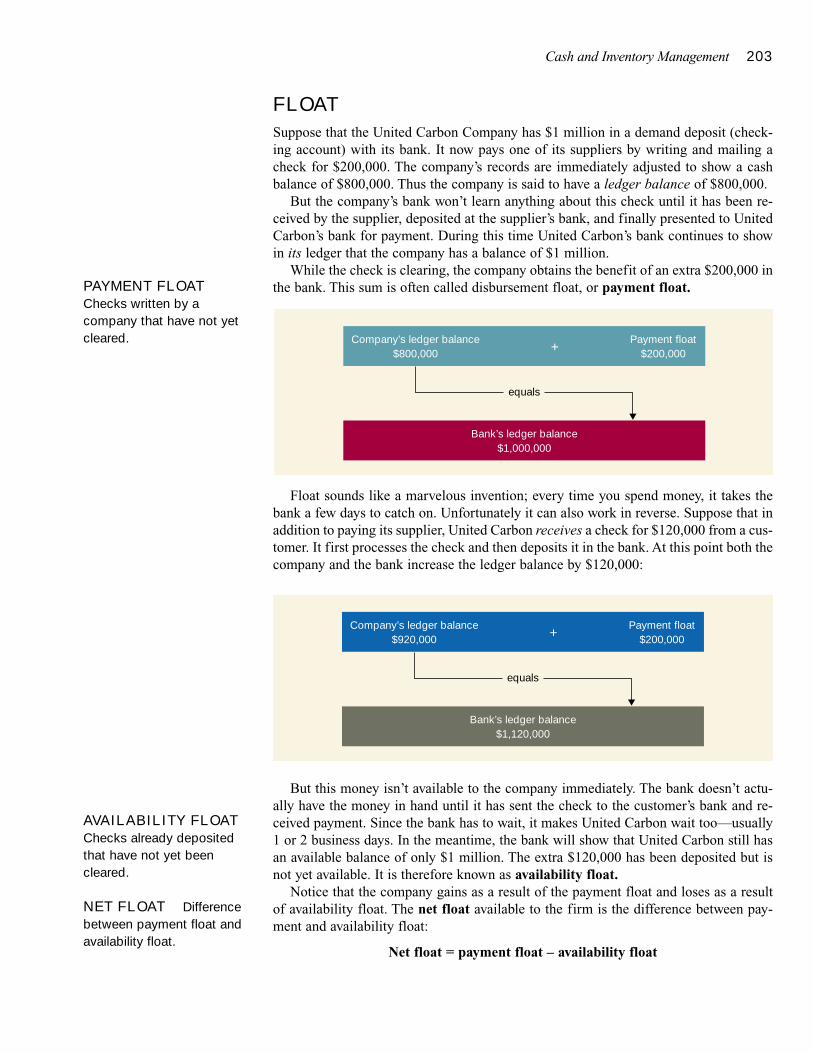
Cash and Inventory Management 203
FLOAT
Suppose that the United Carbon Company has $1 million in a demand deposit (check-ing account) with its bank. It now pays one of its suppliers by writing and mailing acheck for $200,000. The company’s records are immediately adjusted to show a cashbalance of $800,000. Thus the company is said to have a ledger balance of $800,000.
But the company’s bank won’t learn anything about this check until it has been re-ceived by the supplier, deposited at the supplier’s bank, and finally presented to UnitedCarbon’s bank for payment. During this time United Carbon’s bank continues to showin its ledger that the company has a balance of $1 million.
While the check is clearing, the company obtains the benefit of an extra $200,000 inthe bank. This sum is often called disbursement float, or payment float.
Float sounds like a marvelous invention; every time you spend money, it takes thebank a few days to catch on. Unfortunately it can also work in reverse. Suppose that inaddition to paying its supplier, United Carbon receives a check for $120,000 from a cus-tomer. It first processes the check and then deposits it in the bank. At this point both thecompany and the bank increase the ledger balance by $120,000:
But this money isn’t available to the company immediately. The bank doesn’t actu-ally have the money in hand until it has sent the check to the customer’s bank and re-ceived payment. Since the bank has to wait, it makes United Carbon wait too—usually1 or 2 business days. In the meantime, the bank will show that United Carbon still hasan available balance of only $1 million. The extra $120,000 has been deposited but isnot yet available. It is therefore known as availability float.
Notice that the company gains as a result of the payment float and loses as a resultof availability float. The net float available to the firm is the difference between pay-ment and availability float:
Net float = payment float – availability float
PAYMENT FLOATChecks written by acompany that have not yetcleared.
AVAILABILITY FLOATChecks already depositedthat have not yet beencleared.
Company’s ledger balance$800,000
�Payment float
$200,000
Bank’s ledger balance$1,000,000
equals
Company’s ledger balance$920,000
�Payment float
$200,000
Bank’s ledger balance$1,120,000
equals
NET FLOAT Differencebetween payment float andavailability float.
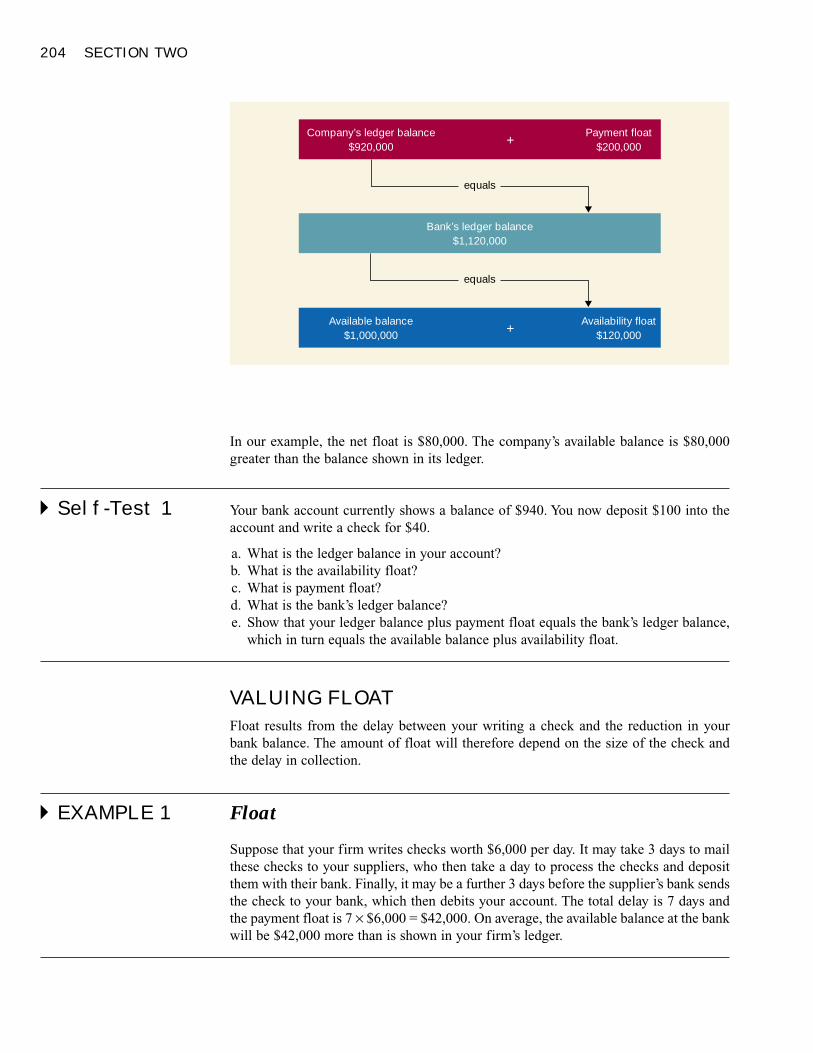
204 SECTION TWO
In our example, the net float is $80,000. The company’s available balance is $80,000greater than the balance shown in its ledger.
� Self-Test 1 Your bank account currently shows a balance of $940. You now deposit $100 into theaccount and write a check for $40.
a. What is the ledger balance in your account?b. What is the availability float?c. What is payment float?d. What is the bank’s ledger balance?e. Show that your ledger balance plus payment float equals the bank’s ledger balance,
which in turn equals the available balance plus availability float.
VALUING FLOAT
Float results from the delay between your writing a check and the reduction in yourbank balance. The amount of float will therefore depend on the size of the check andthe delay in collection.
� EXAMPLE 1 Float
Suppose that your firm writes checks worth $6,000 per day. It may take 3 days to mailthese checks to your suppliers, who then take a day to process the checks and depositthem with their bank. Finally, it may be a further 3 days before the supplier’s bank sendsthe check to your bank, which then debits your account. The total delay is 7 days andthe payment float is 7 × $6,000 = $42,000. On average, the available balance at the bankwill be $42,000 more than is shown in your firm’s ledger.
Available balance$1,000,000
�Availability float
$120,000
Bank’s ledger balance$1,120,000
equals
Company’s ledger balance$920,000
�Payment float
$200,000
equals
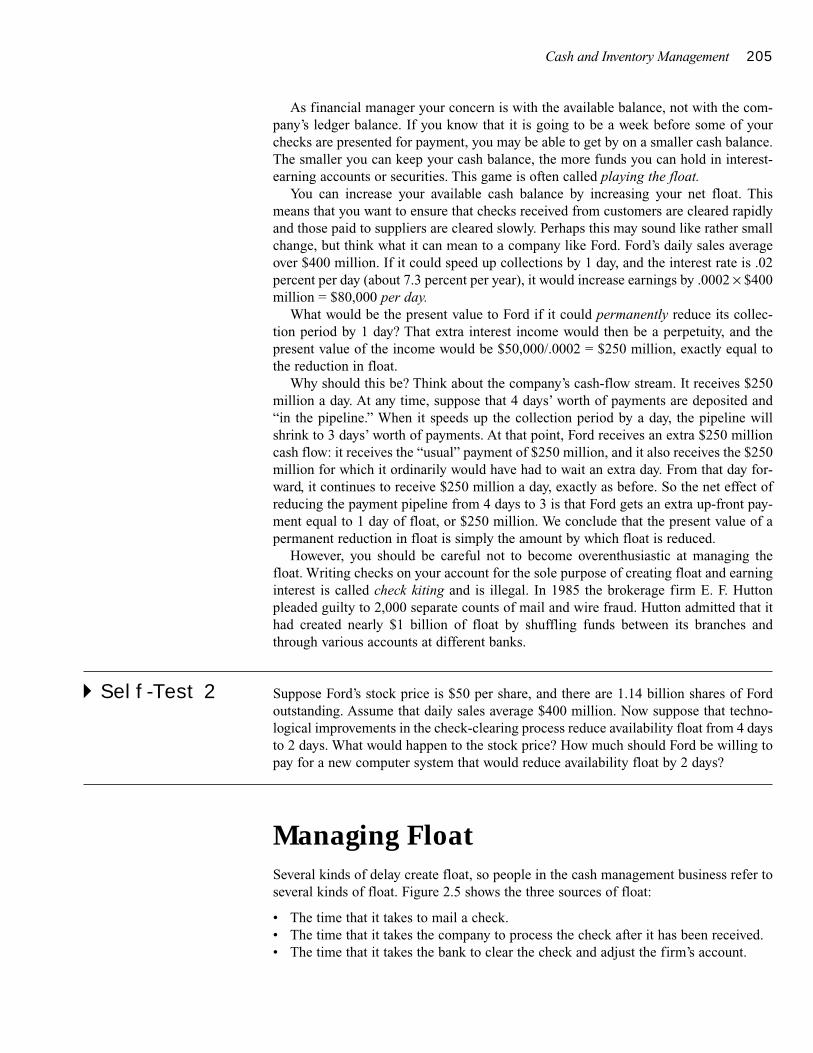
Cash and Inventory Management 205
As financial manager your concern is with the available balance, not with the com-pany’s ledger balance. If you know that it is going to be a week before some of yourchecks are presented for payment, you may be able to get by on a smaller cash balance.The smaller you can keep your cash balance, the more funds you can hold in interest-earning accounts or securities. This game is often called playing the float.
You can increase your available cash balance by increasing your net float. Thismeans that you want to ensure that checks received from customers are cleared rapidlyand those paid to suppliers are cleared slowly. Perhaps this may sound like rather smallchange, but think what it can mean to a company like Ford. Ford’s daily sales averageover $400 million. If it could speed up collections by 1 day, and the interest rate is .02percent per day (about 7.3 percent per year), it would increase earnings by .0002 × $400million = $80,000 per day.
What would be the present value to Ford if it could permanently reduce its collec-tion period by 1 day? That extra interest income would then be a perpetuity, and thepresent value of the income would be $50,000/.0002 = $250 million, exactly equal tothe reduction in float.
Why should this be? Think about the company’s cash-flow stream. It receives $250million a day. At any time, suppose that 4 days’ worth of payments are deposited and“in the pipeline.” When it speeds up the collection period by a day, the pipeline willshrink to 3 days’ worth of payments. At that point, Ford receives an extra $250 millioncash flow: it receives the “usual” payment of $250 million, and it also receives the $250million for which it ordinarily would have had to wait an extra day. From that day for-ward, it continues to receive $250 million a day, exactly as before. So the net effect ofreducing the payment pipeline from 4 days to 3 is that Ford gets an extra up-front pay-ment equal to 1 day of float, or $250 million. We conclude that the present value of apermanent reduction in float is simply the amount by which float is reduced.
However, you should be careful not to become overenthusiastic at managing thefloat. Writing checks on your account for the sole purpose of creating float and earninginterest is called check kiting and is illegal. In 1985 the brokerage firm E. F. Huttonpleaded guilty to 2,000 separate counts of mail and wire fraud. Hutton admitted that ithad created nearly $1 billion of float by shuffling funds between its branches andthrough various accounts at different banks.
� Self-Test 2 Suppose Ford’s stock price is $50 per share, and there are 1.14 billion shares of Fordoutstanding. Assume that daily sales average $400 million. Now suppose that techno-logical improvements in the check-clearing process reduce availability float from 4 daysto 2 days. What would happen to the stock price? How much should Ford be willing topay for a new computer system that would reduce availability float by 2 days?
Managing FloatSeveral kinds of delay create float, so people in the cash management business refer toseveral kinds of float. Figure 2.5 shows the three sources of float:
• The time that it takes to mail a check.• The time that it takes the company to process the check after it has been received.• The time that it takes the bank to clear the check and adjust the firm’s account.
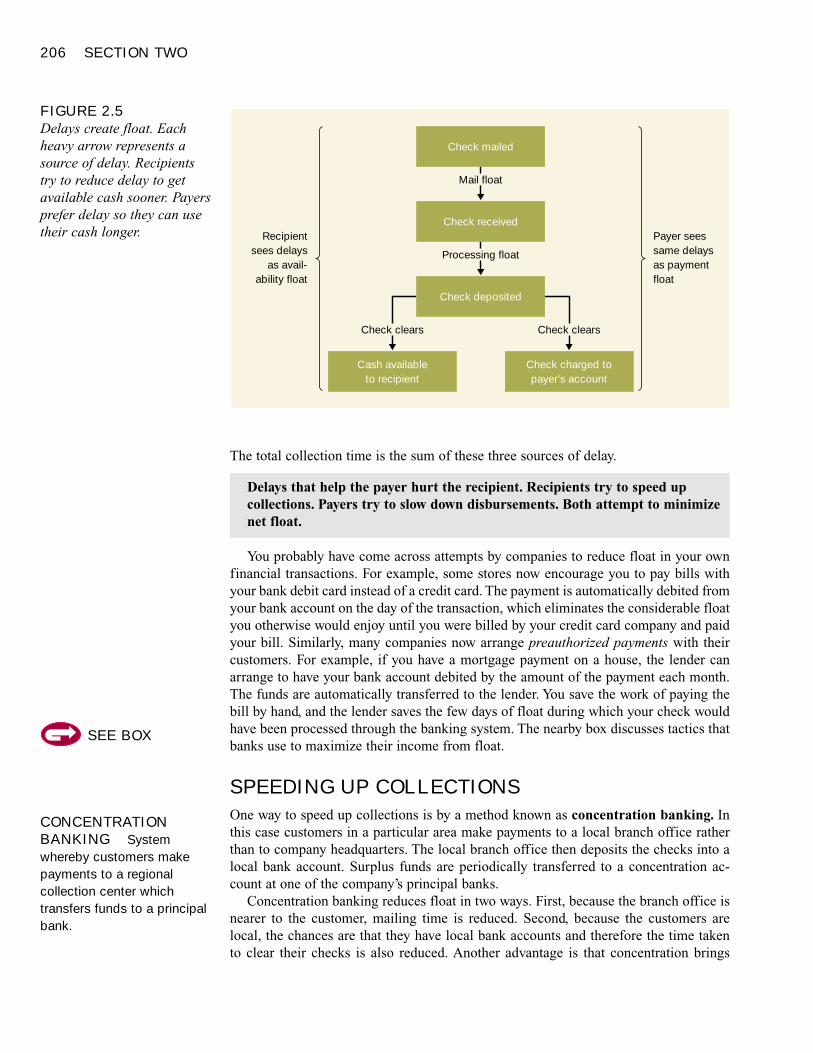
206 SECTION TWO
The total collection time is the sum of these three sources of delay.
You probably have come across attempts by companies to reduce float in your ownfinancial transactions. For example, some stores now encourage you to pay bills withyour bank debit card instead of a credit card. The payment is automatically debited fromyour bank account on the day of the transaction, which eliminates the considerable floatyou otherwise would enjoy until you were billed by your credit card company and paidyour bill. Similarly, many companies now arrange preauthorized payments with theircustomers. For example, if you have a mortgage payment on a house, the lender canarrange to have your bank account debited by the amount of the payment each month.The funds are automatically transferred to the lender. You save the work of paying thebill by hand, and the lender saves the few days of float during which your check wouldhave been processed through the banking system. The nearby box discusses tactics thatbanks use to maximize their income from float.
SPEEDING UP COLLECTIONS
One way to speed up collections is by a method known as concentration banking. Inthis case customers in a particular area make payments to a local branch office ratherthan to company headquarters. The local branch office then deposits the checks into alocal bank account. Surplus funds are periodically transferred to a concentration ac-count at one of the company’s principal banks.
Concentration banking reduces float in two ways. First, because the branch office isnearer to the customer, mailing time is reduced. Second, because the customers arelocal, the chances are that they have local bank accounts and therefore the time taken to clear their checks is also reduced. Another advantage is that concentration brings
Delays that help the payer hurt the recipient. Recipients try to speed upcollections. Payers try to slow down disbursements. Both attempt to minimizenet float.
FIGURE 2.5Delays create float. Eachheavy arrow represents asource of delay. Recipientstry to reduce delay to getavailable cash sooner. Payersprefer delay so they can usetheir cash longer. Recipient
sees delaysas avail-
ability float
Payer seessame delaysas paymentfloat
Mail float
Processing float
Check clears
Cash availableto recipient
Check clears
Check charged topayer’s account
Check mailed
Check received
Check deposited
CONCENTRATIONBANKING Systemwhereby customers makepayments to a regionalcollection center whichtransfers funds to a principalbank.
SEE BOX
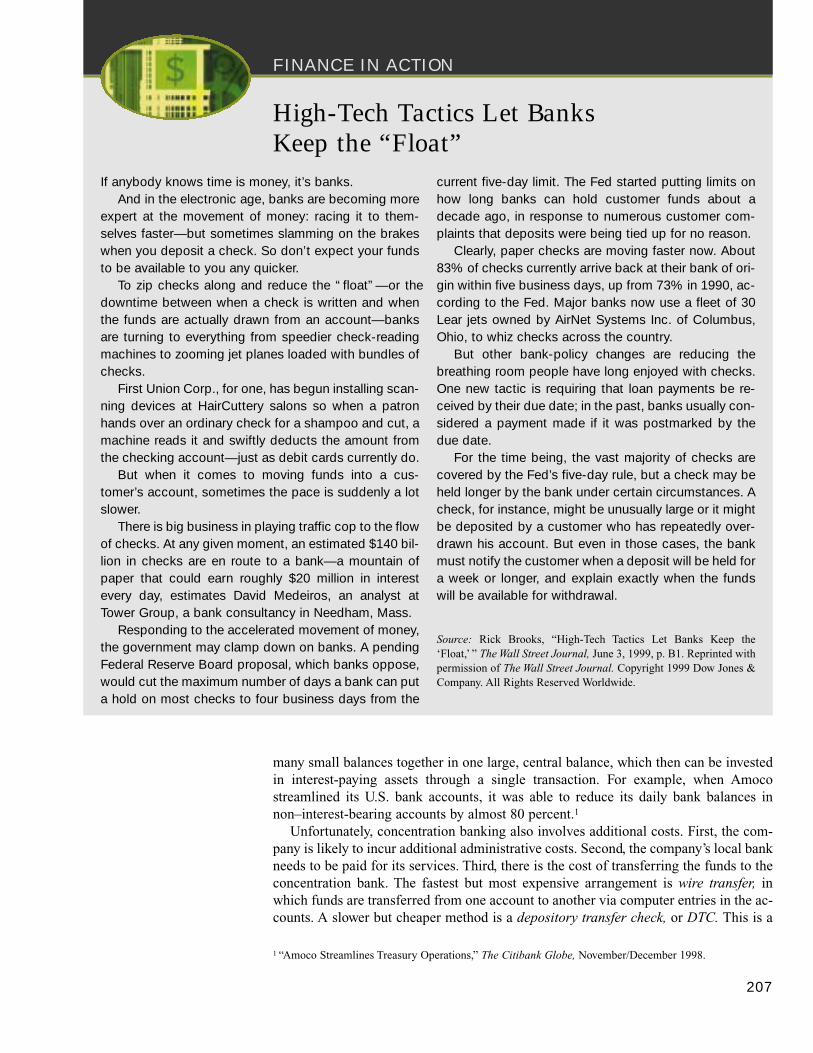
FINANCE IN ACTION
many small balances together in one large, central balance, which then can be investedin interest-paying assets through a single transaction. For example, when Amocostreamlined its U.S. bank accounts, it was able to reduce its daily bank balances innon–interest-bearing accounts by almost 80 percent.1
Unfortunately, concentration banking also involves additional costs. First, the com-pany is likely to incur additional administrative costs. Second, the company’s local bankneeds to be paid for its services. Third, there is the cost of transferring the funds to theconcentration bank. The fastest but most expensive arrangement is wire transfer, inwhich funds are transferred from one account to another via computer entries in the ac-counts. A slower but cheaper method is a depository transfer check, or DTC. This is a
207
High-Tech Tactics Let Banks Keep the “Float”
If anybody knows time is money, it’s banks.And in the electronic age, banks are becoming more
expert at the movement of money: racing it to them-selves faster— but sometimes slamming on the brakeswhen you deposit a check. So don’t expect your fundsto be available to you any quicker.
To zip checks along and reduce the “ float” — or thedowntime between when a check is written and whenthe funds are actually drawn from an account— banksare turning to everything from speedier check-readingmachines to zooming jet planes loaded with bundles ofchecks.
First Union Corp., for one, has begun installing scan-ning devices at HairCuttery salons so when a patronhands over an ordinary check for a shampoo and cut, amachine reads it and swiftly deducts the amount fromthe checking account— just as debit cards currently do.
But when it comes to moving funds into a cus-tomer’s account, sometimes the pace is suddenly a lotslower.
There is big business in playing traffic cop to the flowof checks. At any given moment, an estimated $140 bil-lion in checks are en route to a bank— a mountain ofpaper that could earn roughly $20 million in interestevery day, estimates David Medeiros, an analyst atTower Group, a bank consultancy in Needham, Mass.
Responding to the accelerated movement of money,the government may clamp down on banks. A pendingFederal Reserve Board proposal, which banks oppose,would cut the maximum number of days a bank can puta hold on most checks to four business days from the
current five-day limit. The Fed started putting limits onhow long banks can hold customer funds about adecade ago, in response to numerous customer com-plaints that deposits were being tied up for no reason.
Clearly, paper checks are moving faster now. About83% of checks currently arrive back at their bank of ori-gin within five business days, up from 73% in 1990, ac-cording to the Fed. Major banks now use a fleet of 30Lear jets owned by AirNet Systems Inc. of Columbus,Ohio, to whiz checks across the country.
But other bank-policy changes are reducing thebreathing room people have long enjoyed with checks.One new tactic is requiring that loan payments be re-ceived by their due date; in the past, banks usually con-sidered a payment made if it was postmarked by thedue date.
For the time being, the vast majority of checks arecovered by the Fed’s five-day rule, but a check may beheld longer by the bank under certain circumstances. Acheck, for instance, might be unusually large or it mightbe deposited by a customer who has repeatedly over-drawn his account. But even in those cases, the bankmust notify the customer when a deposit will be held fora week or longer, and explain exactly when the fundswill be available for withdrawal.
Source: Rick Brooks, “High-Tech Tactics Let Banks Keep the‘Float,’ ” The Wall Street Journal, June 3, 1999, p. B1. Reprinted withpermission of The Wall Street Journal. Copyright 1999 Dow Jones &Company. All Rights Reserved Worldwide.
1 “Amoco Streamlines Treasury Operations,” The Citibank Globe, November/December 1998.
208 SECTION TWO
preprinted check used to transfer funds between specified accounts. The funds becomeavailable within 2 days.
Wire transfer makes more sense when large funds are being transferred. For exam-ple, at a daily interest rate of .02 percent, the daily interest on a $10 million paymentwould be $2,000. Suppose a wire transfer costs $10. It clearly would pay to spend $10to save 2 days’ float. On the other hand, it would not be worth using wire transfer forjust $5,000. The extra 2 days’ interest that you pick up amounts to only $2, not nearlyenough to justify the extra expense of the wire transfer.
� EXAMPLE 2 Break-Even Wire Transfer Amount
Suppose the daily interest rate is .02 percent and that a wire transfer saves 2 days of floatbut costs $10 more than a depository transfer check. How large a transfer is necessaryto justify the additional cost of a wire transfer?
The interest savings are .02 percent per day × 2 days × funds to be transferred. Sothe break-even level of funds to be transferred is found by solving
.0004 × size of transfer = $10
Size of transfer =$10
= $25,000.0004
The cost of the wire transfer can be justified for any transfer above this amount.
Often concentration banking is combined with a lock-box system. In a lock-box sys-tem, you pay the local bank to take on the administrative chores. It works as follows.The company rents a locked post office box in each principal region. All customerswithin a region are instructed to send their payments to the post office box. The localbank empties the box at regular intervals (as often as several times per day) and depositsthe checks in your company’s local account. Surplus funds are transferred periodicallyto one of the company’s principal banks.
How many collection points do you need if you use a lock-box system or concen-tration banking? The answer depends on where your customers are and on the speed ofthe United States mail.
� EXAMPLE 3 Lock-Box Systems
Suppose that you are thinking of opening a lock box. The local bank shows you a mapof mail delivery times. From that and knowledge of your customers’ locations, youcome up with the following data:
Average number of daily payments to lock box = 150Average size of payment = $1,200Rate of interest per day = .02 percentSaving in mailing time = 1.2 daysSaving in processing time = .8 day
On this basis, the lock box would reduce collection float by
150 items per day × $1,200 per item × (1.2 + .8) days saved = $360,000
LOCK-BOX SYSTEMSystem whereby customerssend payments to a postoffice box and a local bankcollects and processeschecks.
Cash and Inventory Management 209
Invested at .02 percent per day, that gives a daily return of
.0002 × $360,000 = $72
The bank’s charge for operating the lock-box system depends on the number ofchecks processed. Suppose that the bank charges $.26 per check. That works out to 150× $.26 = $39.00 per day. You are ahead by $72.00 – $39.00 = $33.00 per day, plus what-ever your firm saves from not having to process the checks itself.
Our example assumes that the company has only two choices. It can do nothing or itcan operate the lock box. But maybe there is some other lock-box location, or somemixture of locations, that would be still more effective. Of course, you can always findthis out by working through all possible combinations, but many banks have computerprograms that find the best locations for lock boxes.2
� Self-Test 3 How will the following conditions affect the price that a firm should be willing to payfor a lock-box service?
a. The average size of its payments increases.b. The number of payments per day increases (with no change in average size of pay-
ments).c. The interest rate increases.d. The average mail time saved by the lock-box system increases.e. The processing time saved by the lock-box system increases.
CONTROLLING DISBURSEMENTS
Speeding up collections is not the only way to increase the net float. You can also dothis by slowing down disbursements. One tempting strategy is to increase mail time. Forexample, United Carbon could pay its New York suppliers with checks mailed fromNome, Alaska, and its Los Angeles suppliers with checks mailed from Vienna, Maine.
But on second thought you will realize that these kinds of post office tricks are un-likely to help you. Suppose you have promised to pay a New York supplier on March29. Does it matter whether you mail the check from Alaska on the 26th or from NewYork on the 28th? Such mailing games would buy you time only if your creditor caresmore about the date you mailed the check than the day it arrives. This is unlikely: withthe notable exception of tax returns sent to the IRS, mailing dates are irrelevant. Ofcourse you could use a remote mailing address as an excuse to pay late, but that’s a trickeasily seen through. If you have to pay late, you may as well mail late.
Remote Disbursement. There are effective ways of increasing payment float, how-ever. For example, suppose that United Carbon pays its suppliers with checks writtenon a New York City bank. From the time that the check is deposited by the supplier,there will be an average lapse of little more than a day before it is presented to United Carbon’s bank for payment. The alternative is for United Carbon to pay its sup-pliers with checks mailed to arrive on time, but written on a bank in Helena, Montana;
2 These usually involve linear programming. Linear programming is an efficient method of hunting throughthe possible solutions to find the optimal one.
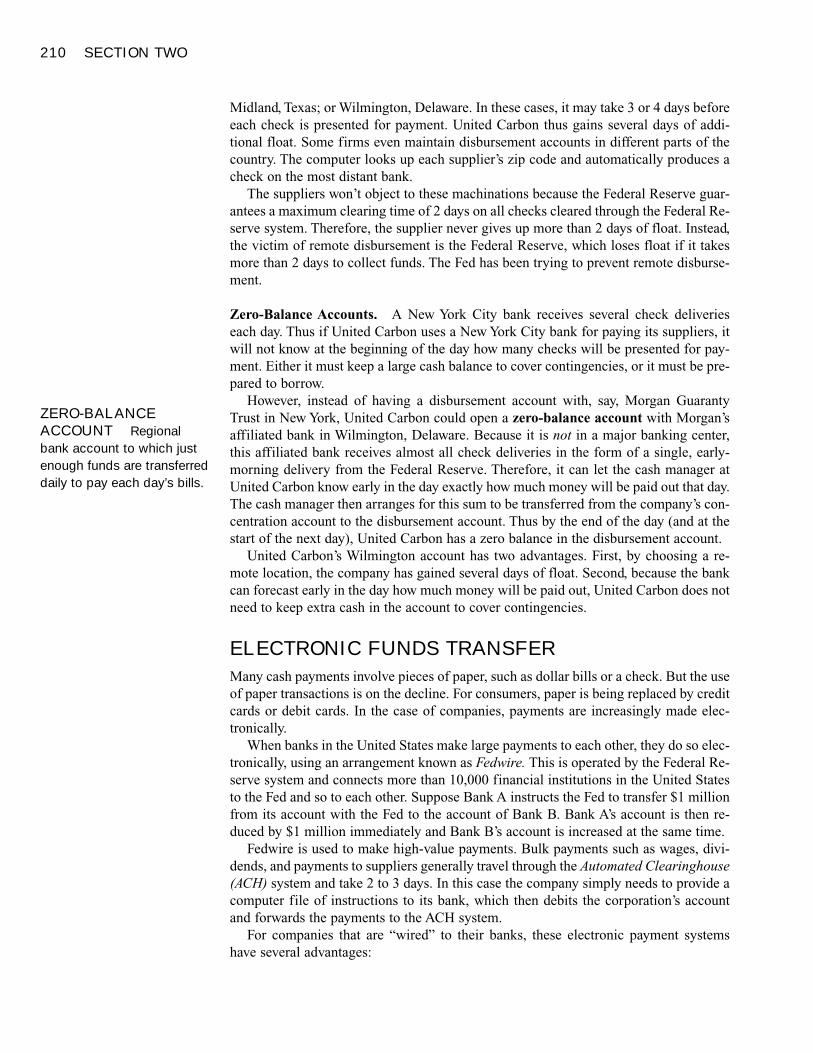
210 SECTION TWO
Midland, Texas; or Wilmington, Delaware. In these cases, it may take 3 or 4 days beforeeach check is presented for payment. United Carbon thus gains several days of addi-tional float. Some firms even maintain disbursement accounts in different parts of thecountry. The computer looks up each supplier’s zip code and automatically produces acheck on the most distant bank.
The suppliers won’t object to these machinations because the Federal Reserve guar-antees a maximum clearing time of 2 days on all checks cleared through the Federal Re-serve system. Therefore, the supplier never gives up more than 2 days of float. Instead,the victim of remote disbursement is the Federal Reserve, which loses float if it takesmore than 2 days to collect funds. The Fed has been trying to prevent remote disburse-ment.
Zero-Balance Accounts. A New York City bank receives several check deliverieseach day. Thus if United Carbon uses a New York City bank for paying its suppliers, itwill not know at the beginning of the day how many checks will be presented for pay-ment. Either it must keep a large cash balance to cover contingencies, or it must be pre-pared to borrow.
However, instead of having a disbursement account with, say, Morgan GuarantyTrust in New York, United Carbon could open a zero-balance account with Morgan’saffiliated bank in Wilmington, Delaware. Because it is not in a major banking center,this affiliated bank receives almost all check deliveries in the form of a single, early-morning delivery from the Federal Reserve. Therefore, it can let the cash manager atUnited Carbon know early in the day exactly how much money will be paid out that day.The cash manager then arranges for this sum to be transferred from the company’s con-centration account to the disbursement account. Thus by the end of the day (and at thestart of the next day), United Carbon has a zero balance in the disbursement account.
United Carbon’s Wilmington account has two advantages. First, by choosing a re-mote location, the company has gained several days of float. Second, because the bankcan forecast early in the day how much money will be paid out, United Carbon does notneed to keep extra cash in the account to cover contingencies.
ELECTRONIC FUNDS TRANSFER
Many cash payments involve pieces of paper, such as dollar bills or a check. But the useof paper transactions is on the decline. For consumers, paper is being replaced by creditcards or debit cards. In the case of companies, payments are increasingly made elec-tronically.
When banks in the United States make large payments to each other, they do so elec-tronically, using an arrangement known as Fedwire. This is operated by the Federal Re-serve system and connects more than 10,000 financial institutions in the United Statesto the Fed and so to each other. Suppose Bank A instructs the Fed to transfer $1 millionfrom its account with the Fed to the account of Bank B. Bank A’s account is then re-duced by $1 million immediately and Bank B’s account is increased at the same time.
Fedwire is used to make high-value payments. Bulk payments such as wages, divi-dends, and payments to suppliers generally travel through the Automated Clearinghouse(ACH) system and take 2 to 3 days. In this case the company simply needs to provide acomputer file of instructions to its bank, which then debits the corporation’s accountand forwards the payments to the ACH system.
For companies that are “wired” to their banks, these electronic payment systemshave several advantages:
ZERO-BALANCEACCOUNT Regionalbank account to which justenough funds are transferreddaily to pay each day’s bills.
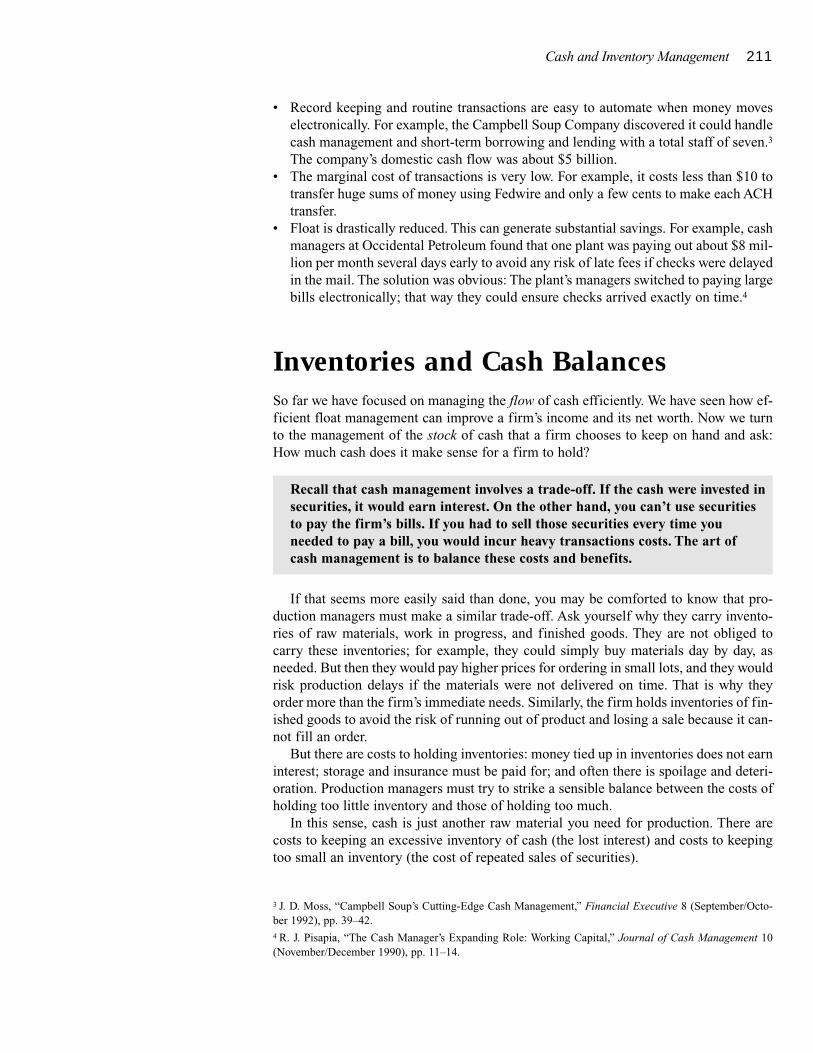
Cash and Inventory Management 211
• Record keeping and routine transactions are easy to automate when money moveselectronically. For example, the Campbell Soup Company discovered it could handlecash management and short-term borrowing and lending with a total staff of seven.3
The company’s domestic cash flow was about $5 billion.• The marginal cost of transactions is very low. For example, it costs less than $10 to
transfer huge sums of money using Fedwire and only a few cents to make each ACHtransfer.
• Float is drastically reduced. This can generate substantial savings. For example, cashmanagers at Occidental Petroleum found that one plant was paying out about $8 mil-lion per month several days early to avoid any risk of late fees if checks were delayedin the mail. The solution was obvious: The plant’s managers switched to paying largebills electronically; that way they could ensure checks arrived exactly on time.4
Inventories and Cash BalancesSo far we have focused on managing the flow of cash efficiently. We have seen how ef-ficient float management can improve a firm’s income and its net worth. Now we turnto the management of the stock of cash that a firm chooses to keep on hand and ask:How much cash does it make sense for a firm to hold?
If that seems more easily said than done, you may be comforted to know that pro-duction managers must make a similar trade-off. Ask yourself why they carry invento-ries of raw materials, work in progress, and finished goods. They are not obliged tocarry these inventories; for example, they could simply buy materials day by day, asneeded. But then they would pay higher prices for ordering in small lots, and they wouldrisk production delays if the materials were not delivered on time. That is why theyorder more than the firm’s immediate needs. Similarly, the firm holds inventories of fin-ished goods to avoid the risk of running out of product and losing a sale because it can-not fill an order.
But there are costs to holding inventories: money tied up in inventories does not earninterest; storage and insurance must be paid for; and often there is spoilage and deteri-oration. Production managers must try to strike a sensible balance between the costs ofholding too little inventory and those of holding too much.
In this sense, cash is just another raw material you need for production. There arecosts to keeping an excessive inventory of cash (the lost interest) and costs to keepingtoo small an inventory (the cost of repeated sales of securities).
Recall that cash management involves a trade-off. If the cash were invested insecurities, it would earn interest. On the other hand, you can’t use securities to pay the firm’s bills. If you had to sell those securities every time you needed to pay a bill, you would incur heavy transactions costs. The art of cash management is to balance these costs and benefits.
3 J. D. Moss, “Campbell Soup’s Cutting-Edge Cash Management,” Financial Executive 8 (September/Octo-ber 1992), pp. 39–42.4 R. J. Pisapia, “The Cash Manager’s Expanding Role: Working Capital,” Journal of Cash Management 10(November/December 1990), pp. 11–14.
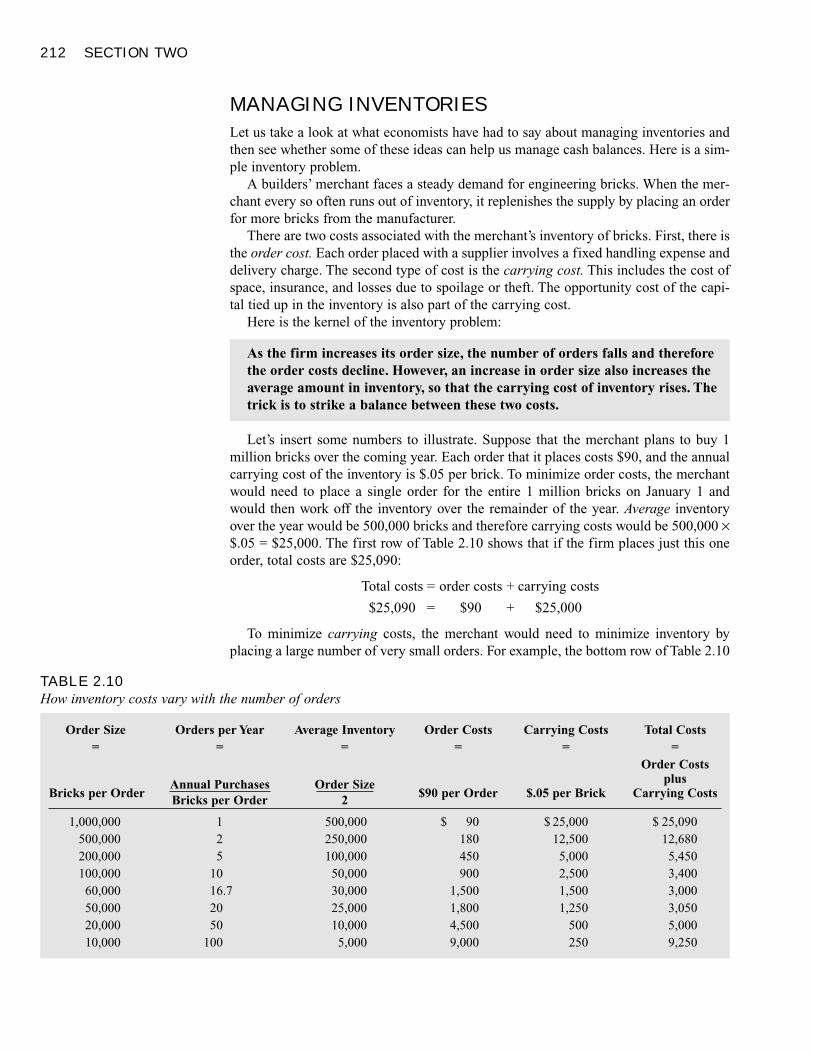
212 SECTION TWO
MANAGING INVENTORIES
Let us take a look at what economists have had to say about managing inventories andthen see whether some of these ideas can help us manage cash balances. Here is a sim-ple inventory problem.
A builders’ merchant faces a steady demand for engineering bricks. When the mer-chant every so often runs out of inventory, it replenishes the supply by placing an orderfor more bricks from the manufacturer.
There are two costs associated with the merchant’s inventory of bricks. First, there isthe order cost. Each order placed with a supplier involves a fixed handling expense anddelivery charge. The second type of cost is the carrying cost. This includes the cost ofspace, insurance, and losses due to spoilage or theft. The opportunity cost of the capi-tal tied up in the inventory is also part of the carrying cost.
Here is the kernel of the inventory problem:
Let’s insert some numbers to illustrate. Suppose that the merchant plans to buy 1million bricks over the coming year. Each order that it places costs $90, and the annualcarrying cost of the inventory is $.05 per brick. To minimize order costs, the merchantwould need to place a single order for the entire 1 million bricks on January 1 andwould then work off the inventory over the remainder of the year. Average inventoryover the year would be 500,000 bricks and therefore carrying costs would be 500,000 ×$.05 = $25,000. The first row of Table 2.10 shows that if the firm places just this oneorder, total costs are $25,090:
Total costs = order costs + carrying costs
$25,090 = $90 + $25,000
To minimize carrying costs, the merchant would need to minimize inventory byplacing a large number of very small orders. For example, the bottom row of Table 2.10
As the firm increases its order size, the number of orders falls and thereforethe order costs decline. However, an increase in order size also increases theaverage amount in inventory, so that the carrying cost of inventory rises. Thetrick is to strike a balance between these two costs.
TABLE 2.10How inventory costs vary with the number of orders
Order Size Orders per Year Average Inventory Order Costs Carrying Costs Total Costs= = = = = =
Order Costsplus
Bricks per OrderAnnual Purchases Order Size
$90 per Order $.05 per Brick Carrying CostsBricks per Order 2
1,000,000 1 500,000 $ 90 $ 25,000 $ 25,090500,000 2 250,000 180 12,500 12,680200,000 5 100,000 450 5,000 5,450100,000 10 50,000 900 2,500 3,400
60,000 16.7 30,000 1,500 1,500 3,00050,000 20 25,000 1,800 1,250 3,05020,000 50 10,000 4,500 500 5,00010,000 100 5,000 9,000 250 9,250
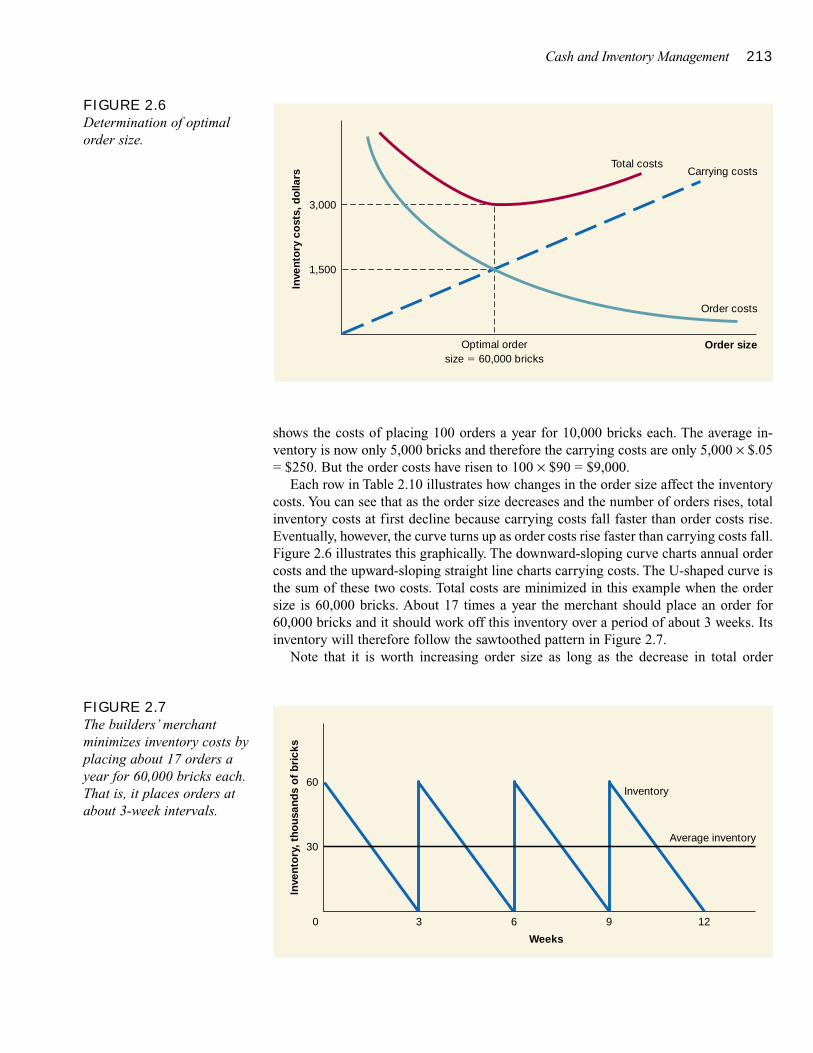
Cash and Inventory Management 213
shows the costs of placing 100 orders a year for 10,000 bricks each. The average in-ventory is now only 5,000 bricks and therefore the carrying costs are only 5,000 × $.05= $250. But the order costs have risen to 100 × $90 = $9,000.
Each row in Table 2.10 illustrates how changes in the order size affect the inventorycosts. You can see that as the order size decreases and the number of orders rises, totalinventory costs at first decline because carrying costs fall faster than order costs rise.Eventually, however, the curve turns up as order costs rise faster than carrying costs fall.Figure 2.6 illustrates this graphically. The downward-sloping curve charts annual ordercosts and the upward-sloping straight line charts carrying costs. The U-shaped curve isthe sum of these two costs. Total costs are minimized in this example when the ordersize is 60,000 bricks. About 17 times a year the merchant should place an order for60,000 bricks and it should work off this inventory over a period of about 3 weeks. Itsinventory will therefore follow the sawtoothed pattern in Figure 2.7.
Note that it is worth increasing order size as long as the decrease in total order
FIGURE 2.6Determination of optimalorder size.
Optimal ordersize � 60,000 bricks
Order costs
Carrying costsTotal costs
Order size
Inve
nto
ry c
ost
s, d
olla
rs
3,000
1,500
FIGURE 2.7The builders’ merchantminimizes inventory costs byplacing about 17 orders ayear for 60,000 bricks each.That is, it places orders atabout 3-week intervals.
Weeks
Inve
nto
ry, t
hous
and
s o
f b
rick
s
0 3 6 9 12
Inventory
Average inventory
60
30
214 SECTION TWO
costs outweighs the increase in carrying costs. The optimal order size is the point atwhich these two effects offset each other. This order size is called the economic orderquantity. There is a neat formula for calculating the economic order quantity. The for-mula is
Economic order quantity =� 2 � annual sales � cost per ordercarrying cost
In the present example,
Economic order quantity =� 2 × 1,000,000 × 90= 60,000 bricks
.05
You have probably already noticed several unrealistic features in our simple exam-ple. First, rather than allowing inventories of bricks to decline to zero, the firm wouldwant to allow for the time it takes to fill an order. If it takes 5 days before the bricks canbe delivered and the builders’ merchant waits until it runs out of stock before placingan order, it will be out of stock for 5 days. In this case the firm should reorder when itsstock of bricks falls to a 5-day supply.
The firm also might want to recognize that the rate at which it sells its goods is sub-ject to uncertainty. Sometimes business may be slack; on other occasions the firm mayland a large order. In this case it should maintain a minimum safety stock below whichit would not want inventories to drop.
The number of bricks the merchant plans to buy in the course of the year, in this case1 million, is also a forecast that is subject to uncertainty. The optimal order size is pro-portional to the square root of the forecast of annual sales.
In recent years a number of firms have used a technique known as just-in-time in-ventory management to make dramatic reductions in inventory levels. Firms that use thejust-in-time system receive a nearly continuous flow of deliveries, with no more than 2or 3 hours’ worth of parts inventory on hand at any time. For these firms the extra costof restocking is completely outweighed by the saving in carrying cost. Just-in-time in-ventory management requires much greater coordination with suppliers to avoid thecosts of stock-outs, however.
Just-in-time inventory management also can reduce costs by allowing suppliers toproduce and transport goods on a steadier schedule. However, just-in-time systems relyheavily on predictability of the production process. A firm with shaky labor relations,for example, would adopt a just-in-time system at its peril, for with essentially no in-ventory on hand, it would be particularly vulnerable to a strike.
� Self-Test 4 The builders’ merchant has experienced an increase in demand for engineering bricks.It now expects to sell 1.25 million bricks a year. Unfortunately, interest rates have risenand the annual carrying cost of the inventory has increased to $.09 per brick. Ordercosts have remained steady at $90 per order.
These are refinements: the important message of our simple example is thatthe firm needs to balance carrying costs and order costs. Carrying costsinclude both the cost of storing the goods and the cost of the capital tied up ininventory. So when storage costs or interest rates are high, inventory levelsshould be kept low. When the costs of restocking are high, inventories shouldalso be high.
ECONOMIC ORDERQUANTITY Order sizethat minimizes total inventorycosts.
Cash and Inventory Management 215
a. Rework Table 20.1 for each of the eight order sizes shown in the table.b. Has the optimal inventory level risen or fallen? Explain why.
MANAGING INVENTORIES OF CASH
William Baumol was the first to notice that this simple inventory model can tell ussomething about the management of cash balances.5 Suppose that you keep a reservoirof cash that is steadily drawn down to pay bills. When it runs out, you replenish the cashbalance by selling short-term securities. In these circumstances your inventory of cashalso follows a sawtoothed pattern like the pattern for inventories we saw in Figure 2.7.
In other words, your cash management problem is just like the problem of findingthe optimal order size faced by the builders’ merchant. You simply need to redefine thevariables. Instead of bricks per order, the order size is defined as the value of short-termsecurities that are sold whenever the cash balance is replenished. Total cash outflowtakes the place of the total number of bricks sold. Cost per order becomes the cost persale of securities, and the carrying cost is just the interest rate. Our formula for theamount of securities to be sold or, equivalently, the initial cash balance is therefore
Initial cash balance =� 2� annual cash outflows�cost per sale of securitiesinterest rate
� EXAMPLE 4 The Optimal Cash Balance
Suppose that you can invest spare cash in U.S. Treasury bills at an interest rate of 8 per-cent, but every sale of bills costs you $20. Your firm pays out cash at a rate of $105,000per month, or $1,260,000 per year. Our formula for the initial cash balance tells us thatthe optimal amount of Treasury bills that you should sell at one time is
� 2 × 1,260,000 × 20= $25,100
.08
Thus your firm would sell approximately $25,000 of Treasury bills four times amonth—about once a week. Its average cash balance will be $25,000/2, or $12,500.
In Baumol’s model a higher interest rate implies smaller sales of bills. In otherwords, when interest rates are high, you should hold more of your funds in interest-bearing securities and make small sales of these securities when you need the cash. Onthe other hand, if you use up cash at a high rate or there are high costs to selling secu-rities, you want to hold large average cash balances. Think about that for a moment. You
The optimal amount of short-term securities sold to raise cash will be higherwhen annual cash outflows are higher and when the cost per sale of securities is higher. Conversely, the initial cash balance falls when the interestrate is higher.
5 See W. J. Baumol, “The Transactions Demand for Cash: An Inventory Theoretic Approach,” Quarterly Jour-nal of Economics 66 (November 1952), pp. 545–556.
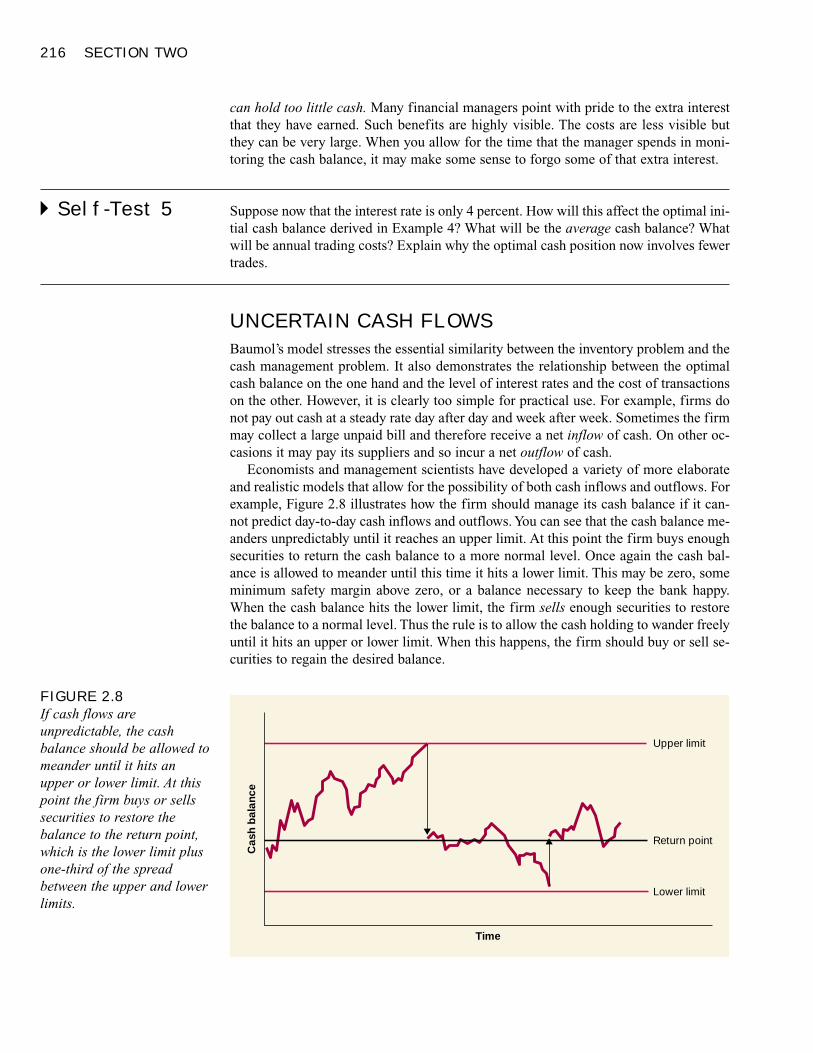
216 SECTION TWO
can hold too little cash. Many financial managers point with pride to the extra interestthat they have earned. Such benefits are highly visible. The costs are less visible butthey can be very large. When you allow for the time that the manager spends in moni-toring the cash balance, it may make some sense to forgo some of that extra interest.
� Self-Test 5 Suppose now that the interest rate is only 4 percent. How will this affect the optimal ini-tial cash balance derived in Example 4? What will be the average cash balance? Whatwill be annual trading costs? Explain why the optimal cash position now involves fewertrades.
UNCERTAIN CASH FLOWS
Baumol’s model stresses the essential similarity between the inventory problem and thecash management problem. It also demonstrates the relationship between the optimalcash balance on the one hand and the level of interest rates and the cost of transactionson the other. However, it is clearly too simple for practical use. For example, firms donot pay out cash at a steady rate day after day and week after week. Sometimes the firmmay collect a large unpaid bill and therefore receive a net inflow of cash. On other oc-casions it may pay its suppliers and so incur a net outflow of cash.
Economists and management scientists have developed a variety of more elaborateand realistic models that allow for the possibility of both cash inflows and outflows. Forexample, Figure 2.8 illustrates how the firm should manage its cash balance if it can-not predict day-to-day cash inflows and outflows. You can see that the cash balance me-anders unpredictably until it reaches an upper limit. At this point the firm buys enoughsecurities to return the cash balance to a more normal level. Once again the cash bal-ance is allowed to meander until this time it hits a lower limit. This may be zero, someminimum safety margin above zero, or a balance necessary to keep the bank happy.When the cash balance hits the lower limit, the firm sells enough securities to restorethe balance to a normal level. Thus the rule is to allow the cash holding to wander freelyuntil it hits an upper or lower limit. When this happens, the firm should buy or sell se-curities to regain the desired balance.
FIGURE 2.8If cash flows areunpredictable, the cashbalance should be allowed tomeander until it hits anupper or lower limit. At thispoint the firm buys or sellssecurities to restore thebalance to the return point,which is the lower limit plusone-third of the spreadbetween the upper and lowerlimits.
Lower limit
Upper limit
Return point
Time
Cas
h b
alan
ce
Cash and Inventory Management 217
How far should the firm allow its cash balance to wander? The answer depends onthree factors. If the day-to-day variability in cash flows is large or if the cost of buyingand selling securities is high, then the firm should set the upper and lower limits farapart. The firm allows wider limits when cash-flow volatility is high to keep down thefrequency of costly security sales and purchases. Similarly, the firm tolerates wider lim-its if the cost of security transactions is high. Conversely, if the rate of interest is highand the incentives to manage cash are correspondingly more important, the firm willset the limits close together.6
Have you noticed one odd feature about Figure 2.8? The cash balance does not re-turn to a point halfway between the lower and upper limits. It always comes back to apoint one-third of the distance from the lower to the upper limit. Always starting at thisreturn point means the firm hits the lower limit more often than the upper limit. Thisdoes not minimize the number of transactions—that would require always starting ex-actly at the middle of the spread. However, always starting at the middle would mean alarger average cash balance and larger interest costs. The lower return point minimizesthe sum of transaction costs and interest costs.
Recognizing uncertainty in cash flows adds some extra realism, but few managerswould concede that cash inflows and outflows are entirely unpredictable. The managerof Toys ‘R’ Us knows that there will be substantial cash inflows around Christmas. Fi-nancial managers know when dividends will be paid and when taxes will be due. Ear-lier we described how firms forecast cash inflows and outflows and how they arrangeshort-term investment and financing decisions to supply cash when needed and put cashto work earning interest when it is not needed.
This kind of short-term financial plan is usually designed to produce a cash balancethat is stable at some lower limit. But there are always fluctuations that financial man-agers cannot plan for, certainly not on a day-to-day basis. You can think of the decisionrule depicted in Figure 2.8 as a way to cope with the cash inflows and outflows whichcannot be predicted, or which are not worth predicting. Trying to predict all cash flowswould chew up enormous amounts of management time.
You should therefore think of these cash management rules as helping us understandthe problem of cash management. But they are not generally used for day-to-day man-agement and would probably not yield substantial savings compared with policies basedon a manager’s judgment, providing of course that the manager understands the trade-offs we have discussed.
� Self-Test 6 How would you expect the firm’s cash balance to respond to the following changes?
a. Interest rates increase.b. The volatility of daily cash flow decreases.c. The transaction cost of buying or selling marketable securities goes up.
CASH MANAGEMENT IN THE LARGEST CORPORATIONS
For very large firms, the transaction costs of buying and selling securities become triv-ial compared with the opportunity cost of holding idle cash balances. Suppose that the
6 See M. H. Miller and D. Orr, “A Model of the Demand for Money by Firms,” Quarterly Journal of Eco-nomics 80 (August 1966), pp. 413–435.
218 SECTION TWO
interest rate is 4 percent per year, or roughly 4/365 = .011 percent per day. Then thedaily interest earned on $1 million is .00011 × $1,000,000 = $110. Even at a cost of $50per transaction, which is generous, it pays to buy Treasury bills today and sell them to-morrow rather than to leave $1 million idle overnight.
A corporation with $1 billion of annual sales has an average daily cash flow of$1,000,000,000/365, about $2.7 million. Firms of this size end up buying or selling se-curities once a day, every day, unless by chance they have only a small positive cash bal-ance at the end of the day.
Why do such firms hold any significant amounts of cash? For two reasons. First,cash may be left in non–interest-bearing accounts to compensate banks for the servicesthey provide. Second, large corporations may have literally hundreds of accounts withdozens of different banks. It is often less expensive to leave idle cash in some of theseaccounts than to monitor each account daily and make daily transfers between them.
One major reason for the proliferation of bank accounts is decentralized manage-ment. You cannot give a subsidiary operating freedom to manage its own affairs with-out giving it the right to spend and receive cash.
Good cash management nevertheless implies some degree of centralization. Youcannot maintain your desired inventory of cash if all the subsidiaries in the group areresponsible for their own private pools of cash. And you certainly want to avoid situa-tions in which one subsidiary is investing its spare cash at 8 percent while another isborrowing at 10 percent. It is not surprising, therefore, that even in highly decentralizedcompanies there is generally central control over cash balances and bank relations.
INVESTING IDLE CASH: THE MONEY MARKET
We have seen that when firms have excess funds, they can invest the surplus in interest-bearing securities. Treasury bills are only one of many securities that might be appro-priate for such short-term investments. More generally, firms may invest in a variety ofsecurities in the money market, the market for short-term financial assets.
Only fixed-income securities with maturities less than 1 year are considered to bepart of the money market. In fact, however, most instruments in the money market haveconsiderably shorter maturity. Limiting maturity has two advantages for the cash man-ager. First, short-term securities entail little interest-rate risk. Recall that price risk dueto interest-rate fluctuations increases with maturity. Very-short-term securities, there-fore, have almost no interest-rate risk. Second, it is far easier to gauge financial stabil-ity over very short horizons. One need not worry as much about deterioration in finan-cial strength over a 90-day horizon as over the 30-year life of a bond. Theseconsiderations imply that high-quality money-market securities are a safe “parkingspot” to keep idle balances until they are converted back to cash.
Most money-market securities are also highly marketable or liquid, meaning that itis easy and cheap to sell the asset for cash. This property, too, is an attractive feature ofsecurities used as temporary investments until cash is needed. Treasury bills are themost liquid asset. Treasury bills are issued by the United States government with orig-inal maturities ranging from 90 days to 1 year.
Some of the other important instruments of the money market are
Commercial paper. This is the short-term, usually unsecured, debt of large and well-known companies. While maturities can range up to 270 days, commercial paper usu-ally is issued with maturities of less than 2 months. Because there is no active tradingin commercial paper, it has low marketability. Therefore, it would not be an appro-
MONEY MARKETMarket for short-termfinancial assets.
Cash and Inventory Management 219
priate investment for a firm that could not hold it until maturity. Both Moody’s andStandard & Poor’s rate commercial paper in terms of the default risk of the issuer.
Certificates of deposit. CDs are time deposits at banks, usually in denominationsgreater than $100,000. Unlike demand deposits (checking accounts), time depositscannot be withdrawn from the bank on demand: the bank pays interest and principalonly at the maturity of the deposit. However, short-term CDs (with maturities lessthan 3 months) are actively traded, so a firm can easily sell the security if it needscash.
Repurchase agreements. Also known as repos, repurchase agreements are in effect col-lateralized loans. A government bond dealer sells Treasury bills to an investor, withan agreement to repurchase them at a later date at a higher price. The increase inprice serves as implicit interest, so the investor in effect is lending money to thedealer, first giving money to the dealer and later getting it back with interest. Thebills serve as collateral for the loan: if the dealer fails, and cannot buy back the bill,the investor can keep it. Repurchase agreements are usually very short term, withmaturities of only a few days.
SummaryWhat is float and why can it be valuable?
The cash shown in the company ledger is not the same as the available balance in its bankaccount. When you write a check, it takes time before your bank balance is adjusteddownward. This is payment float. During this time the available balance will be larger thanthe ledger balance. When you deposit a check, there is a delay before it gets credited to yourbank account. In this case the available balance will be smaller than the ledger balance. Thisis availability float. The difference between payment float and availability float is the netfloat. If you can predict how long it will take checks to clear, you may be able to “play thefloat” and get by on a smaller cash balance. The interest you can thereby earn on the netfloat is a source of value.
What are some tactics to increase net float?
You can manage the float by speeding up collections and slowing down payments. One wayto speed collections is by concentration banking. Customers make payments to a regionaloffice, which then pays the checks into a local bank account. Surplus funds are transferredfrom the local account to a concentration bank. A related technique is lock-box banking. Inthis case customers send their payments to a local post office box. A local bank empties thebox at regular intervals and clears the checks. Concentration banking and lock-box bankingreduce mailing time and the time required to clear checks. Finally, a zero-balance accountis a regional bank account to which just enough funds are transferred each day to pay thatday’s bills.
What are the costs and benefits of holding inventories?
The benefit of higher inventory levels is the reduction in order costs associated withrestocking and the reduced chances of running out of material. The costs are the carryingcosts, which include the cost of space, insurance, spoilage, and the opportunity cost of thecapital tied up in inventory. The economic order quantity is the order size that minimizesthe sum of order costs plus carrying costs.
220 SECTION TWO
What are the costs and benefits of holding cash?
Cash provides liquidity, but it doesn’t pay interest. Securities pay interest, but you can’t usethem to buy things. As financial manager you want to hold cash up to the point where theincremental or marginal benefit of liquidity is equal to the cost of holding cash, that is, theinterest that you could earn on securities.
Why is an understanding of inventory management useful for cash management?
Cash is simply a raw material—like inventories of other goods—that you need to dobusiness. Capital that is tied up in large inventories of any raw material rather than earning interest is expensive. So why do you hold inventories at all? Why not ordermaterials as and when you need them? The answer is that placing many small orders is alsoexpensive. The principles of optimal inventory management and optimal cash managementare similar.
Try to strike a balance between holding too large an inventory of cash (and losinginterest on the money) and making too many small adjustments to your inventory (andincurring additional transaction or administrative costs). If interest rates are high, you wantto hold relatively small inventories of cash. If your cash needs are variable and yourtransaction or administrative costs are high, you want to hold relatively large inventories.
Where do firms invest excess funds until they are needed to pay bills?
Firms can invest idle cash in the money market, the market for short-term financial assets.These assets tend to be short-term, low risk, and highly liquid, making them idealinstruments in which to invest funds for short periods of time before cash is needed.
www.sb.gov.bc.ca/smallbus/workshop/cashflow.html Guide to preparing a cash-flow forecastwww.fpsc.com/firstunion/ First Union’s quarterly magazine with a focus on cash managementwww.ioma.com/mgmtlib/ An on-line “management library” with some articles on cash man-
agementwww.nacha.org/ Automated collection systems for cash management
payment float concentration banking economic order quantityavailability float lock-box system money marketnet float zero-balance account
1. Float. On January 25, Coot Company has $250,000 deposited with a local bank. On Janu-ary 27, the company writes and mails checks of $20,000 and $60,000 to suppliers. At theend of the month, Coot’s financial manager deposits a $45,000 check received from a cus-tomer in the morning mail and picks up the end-of-month account summary from the bank.The manager notes that only the $20,000 payment of the 27th has cleared the bank. Whatare the company’s ledger balance and payment float? What is the company’s net float?
2. Float. A company has the following cash balances:
Company’s ledger balance = $600,000Bank’s ledger balance = $625,000Available balance = $550,000
Key Terms
Quiz
Related WebLinks
Cash and Inventory Management 221
a. Calculate the payment float and availability float.b. Why does the company gain from the payment float?c. Suppose the company adopts a policy of writing checks on a remote bank. How is this
likely to affect the three measures of cash balance?
3. Float. General Products writes checks that average $20,000 daily. These checks take an av-erage of 6 days to clear. It receives payments that average $22,000 daily. It takes 3 days be-fore these checks are available to the firm.
a. Calculate payment float, availability float, and net float.b. What would be General Products’s annual savings if it could reduce availability float to
2 days? The interest rate is 6 percent per year. What would be the present value of thesesavings?
4. Lock Boxes. Anne Teak, the financial manager of a furniture manufacturer, is consideringoperating a lock-box system. She forecasts that 300 payments a day will be made to lockboxes with an average payment size of $1,500. The bank’s charge for operating the lockboxes is $.40 a check. The interest rate is .015 percent per day.
a. If the lock box saves 2 days in collection float, is it worthwhile to adopt the system?b. What minimum reduction in the time to collect and process each check is needed to jus-
tify use of the lock-box system?
5. Cash Management. Complete the following passage by choosing the appropriate term fromthe following list: lock-box banking, wire transfer, payment float, concentration banking,availability float, net float, depository transfer check.The firm’s available balance is equal to its ledger balance plus the ________ and minus the________. The difference between the available balance and the ledger balance is oftencalled the ________. Firms can increase their cash resources by speeding up collections.One way to do this is to arrange for payments to be made to regional offices which pay thechecks into local banks. This is known as ________. Surplus funds are then transferred fromthe local bank to one of the company’s main banks. Transfer may be by the quick but ex-pensive ________ or by the slightly slower but cheaper ________. Another technique is toarrange for a local bank to collect the checks directly from a post office box. This is knownas ________.
6. Lock Boxes. Sherman’s Sherbet currently takes about 6 days to collect and deposit checksfrom customers. A lock-box system could reduce this time to 4 days. Collections average$10,000 daily. The interest rate is .02 percent per day.
a. By how much will the lock-box system reduce collection float?b. What is the daily interest savings of the system?c. Suppose the lock-box service is offered for a fixed monthly fee instead of payment per
check. What is the maximum monthly fee that Sherman’s should be willing to pay for thisservice? (Assume a 30-day month.)
7. Lock Boxes. The financial manager of JAC Cosmetics is considering opening a lock box inPittsburgh. Checks cleared through the lock box will amount to $300,000 per month. Thelock box will make cash available to the company 3 days earlier.
a. Suppose that the bank offers to run the lock box for a $20,000 compensating balance. Isthe lock box worthwhile?
PracticeProblems
222 SECTION TWO
b. Suppose that the bank offers to run the lock box for a fee of $.10 per check cleared in-stead of a compensating balance. What must the average check size be for the fee alter-native to be less costly? Assume an interest rate of 6 percent per year.
c. Why did you need to know the interest rate to answer (b) but not to answer (a)?
8. Collection Policy. Major Manufacturing currently has one bank account located in NewYork to handle all of its collections. The firm keeps a compensating balance of $300,000 topay for these services (see Section 19.7). It is considering opening a bank account with WestCoast National Bank to speed up collections from its many California-based customers.Major estimates that the West Coast account would reduce collection time by 1 day on the$1 million a day of business that it does with its California-based customers. If it opens theaccount, it can reduce the compensating balance with its New York bank to $200,000 sinceit will do less business in New York. However, West Coast also will require a compensatingbalance of $200,000. Should Major open the new account?
9. Economic Order Quantity. Assume that Everyman’s Bookstore uses up cash at a steadyrate of $200,000 a year. The interest rate is 2 percent and each sale of securities costs $20.
a. How many times a year should the store sell securities?b. What is its average cash balance?
10. Economic Order Quantity. Genuine Gems orders a full month’s worth of precious stonesat the beginning of every month. Over the course of the month, it sells off its stock, at whichpoint it restocks inventory for the following month. It sells 200 gems per month, and themonthly carrying cost is $1 per gem. The fixed order cost is $20 per order. Should the firmadjust its inventory policy? If so, should it order smaller stocks more frequently or largerstocks less frequently?
11. Economic Order Quantity. Patty’s Pancakes orders pancake mix once a week. The mix isused up by the end of the week, at which point more is reordered. Each time Patty orderspancake mix, she spends about a half hour of her time, which she estimates is worth $20.Patty sells 200 pounds of pancakes each week. The carrying cost of each pound of the mix is 5 cents per week. Should Patty restock more or less frequently? What is the cost-minimizing order size? How many times per month should Patty restock?
12. Economic Order Quantity. A large consulting firm orders photocopying paper by the car-ton. The firm pays a $30 delivery charge on each order. The total cost of storing the paper,including forgone interest, storage space, and deterioration, comes to about $1.50 per cartonper month. The firm uses about 1,000 cartons of paper per month.
a. Fill in the following table:
Order Size
100 200 250 500
Orders per month ________ ________ ________ ________Total order cost ________ ________ ________ ________Average inventory ________ ________ ________ ________Total carrying costs ________ ________ ________ ________Total inventory costs ________ ________ ________ ________
b. Calculate the economic order quantity. Is your answer consistent with your findings inpart (a)?
Cash and Inventory Management 223
13. Economic Order Quantity. Micro-Encapsulator Corp. (MEC) expects to sell 7,200 minia-ture home encapsulators this year. The cost of placing an order from its supplier is $250.Each unit costs $50 and carrying costs are 20 percent of the purchase price.
a. What is the economic order quantity?b. What are total costs—order costs plus carrying costs—of inventory over the course of the
year?
14. Inventory Management. Suppose now that the supplier in the previous problem offers a 1percent discount on orders of 1,800 units or more. Should MEC accept the supplier’s offer?
15. Inventory Management. A just-in-time inventory system reduces the cost of ordering ad-ditional inventory by a factor of 100. What is the change in the optimal order size predictedby the economic order quantity model?
16. Cash Management. A firm maintains a separate account for cash disbursements. Total dis-bursements are $100,000 per month spread evenly over the month. Administrative and trans-action costs of transferring cash to the disbursement account are $10 per transfer. Mar-ketable securities yield 1 percent per month. Determine the size and number of transfers thatwill minimize the cost of maintaining the special account.
17. Float Management. The Automated Clearinghouse (ACH) system uses electronic commu-nication to provide next-day delivery of payments. The processing cost of making a paymentthrough the ACH system is roughly half the cost of making the same payment by check. Whythen do firms often rationally choose to make payments by check?
18. Float Management. A parent company settles the collection account balances of its sub-sidiaries once a week. (That is, each week it transfers any balances in the accounts to a cen-tral account.) The cost of a wire transfer is $10. A depository transfer check costs $.80. Cashtransferred by wire is available the same day, but the parent must wait 3 days for depositorytransfer checks to clear. Cash can be invested at 12 percent per year. How much money mustbe in a collection account before it pays to use a wire transfer?
19. Float Management. Knob, Inc., is a nationwide distributor of furniture hardware. The com-pany now uses a central billing system for credit sales of $182.5 million annually. First Na-tional, Knob’s principal bank, offers to establish a new concentration banking system for aflat fee of $100,000 per year. The bank estimates that mailing and collection time can be re-duced by 3 days.
a. By how much will Knob’s availability float be reduced under the new system?b. How much extra interest income will the new system generate if the extra funds are used
to reduce borrowing under Knob’s line of credit with First National? Assume the interestrate is 12 percent.
c. Finally, should Knob accept First National’s offer if collection costs under the old systemare $40,000 per year?
20. Cash Management. If cash flows change unpredictably, the firm should allow the cash bal-ance to move within limits.
a. What three factors determine how far apart these limits are?b. How far should the firm adjust its cash balance when it reaches the upper or lower limit?c. Why does it not restore the cash balance to the halfway point?
21. Optimal Cash Balances. Suppose that your weekly cash expenses are $80. Every time youwithdraw money from the automated teller at your bank, you are charged 15 cents. Your bankaccount pays interest of 3 percent annually.

224 SECTION TWO
a. How often should you withdraw funds from the bank?b. What is the optimal-sized withdrawal?c. What is your average amount of cash on hand?
22. Cash Management. Suppose that the rate of interest increases from 4 to 8 percent per year.Would firms’ cash balances go up or down relative to sales? Explain.
23. Cash and Inventory Management. According to the economic order quantity inventorymodel and the Baumol model of cash management, what will happen to cash balances andinventory levels if the firm’s production and sales both double? What is the implication ofyour answer for percentage of sales financial planning models (see Section 18.2)?
24. Float Management. Some years ago, Merrill Lynch increased its float by mailing checksdrawn on West Coast banks to customers in the East and checks drawn on East Coast banksto customers in the West. A subsequent class action suit against Merrill Lynch revealed thatin 28 months from September 1976 Merrill Lynch disbursed $1.25 billion in 365,000 checksto New York State customers alone. The plaintiff ’s lawyer calculated that by using a remotebank Merrill Lynch had increased its average float by 11⁄2 days.7
a. How much did Merrill Lynch disburse per day to New York State customers?b. What was the total gain to Merrill Lynch over the 28 months, assuming an interest rate
of 8 percent?c. What was the present value of the increase in float if the benefits were expected to be per-
manent?d. Suppose that the use of remote banks had involved Merrill Lynch in extra expenses. What
was the maximum extra cost per check that Merrill Lynch would have been prepared topay?
1 a. The ledger balance is $940 + $100 – $40 = $1,000.b. Availability float is $100, since you do not yet have access to the funds you have de-
posited.c. Payment float is $40, since the check that you wrote has not yet cleared.d. The bank’s ledger balance is $940 + $100 = $1,040. The bank is aware of the check you
deposited but is not aware of the check you wrote.e. Ledger balance plus payment float = $1,000 + $40 = $1,040, which equals the bank’s
ledger balance. Available balance + availability float = $940 + $100 = $1,040, also equalto the bank’s ledger balance.
2 The current market value of Ford is $57 billion. The 2-day reduction in float is worth $800million. This increases the value of Ford to $57.8 billion. The new stock price will be57.8/1.14 = $50.70 per share. Ford should be willing to pay up to $800 million for the sys-tem, since the present value of the savings is $800 million.
3 The benefit of the lock-box system, and the price the firm should be willing to pay for thesystem, is higher when:
a. Payment size is higher (since interest is earned on more funds).b. Payments per day are higher (since interest is earned on more funds).c. The interest rate is higher (since the cost of float is higher).
ChallengeProblem
Solutions toSelf-TestQuestions
7 See I. Ross, “The Race Is to the Slow Payer,” Fortune, April 1983, pp. 75–80.
Cash and Inventory Management 225
d. Mail time saved is higher (since more float is saved).e. Processing time saved is higher (since more float is saved).
4 a.
Orders per Average Order Carrying TotalOrder Size Year Inventory Costs Costs Costs
Bricks per 1,250,000 Order Size $90 per $.09 per Order Costs plusOrder Bricks per Order 2 Order Brick Carrying Costs
1,000,000 1.25 500,000 $ 113 $45,000 $45,113500,000 2.50 250,000 225 22,500 22,725200,000 6.25 100,000 563 9,000 9,563100,000 12.50 50,000 1,125 4,500 5,625
60,000 20.83 30,000 1,875 2,700 4,57550,000 25.00 25,000 2,250 2,250 4,50020,000 62.50 10,000 5,625 900 6,52510,000 125.00 5,000 11,250 450 11,700
b. The optimal order size decreases to 50,000 bricks:
Economic order quantity =� 2 × annual sales × costs per ordercarrying cost
=� 2 × 1,250,000 × 90 = 50,000.09
Therefore, the average inventory level will fall to 25,000 bricks. The effect of the highercarrying costs more than offsets the effect of the higher sales.
5 At an interest rate of 4 percent, the optimal initial cash balance is
� 2 × 1,260,000 × 20 = $35,496.04
The average cash balance will be one-half this amount, or $17,748. The firm will need tosell securities 1,260,000/35,496 = 35.5 times per year. Therefore, annual trading costs willbe 35.5 × $20 = $710 per year. Because the interest rate is lower, the firm is willing to holdlarger cash balances.
6 a. Higher interest rates will lead to lower cash balances.b. Higher volatility will lead to higher cash balances.c. Higher transaction costs will lead to higher cash balances.
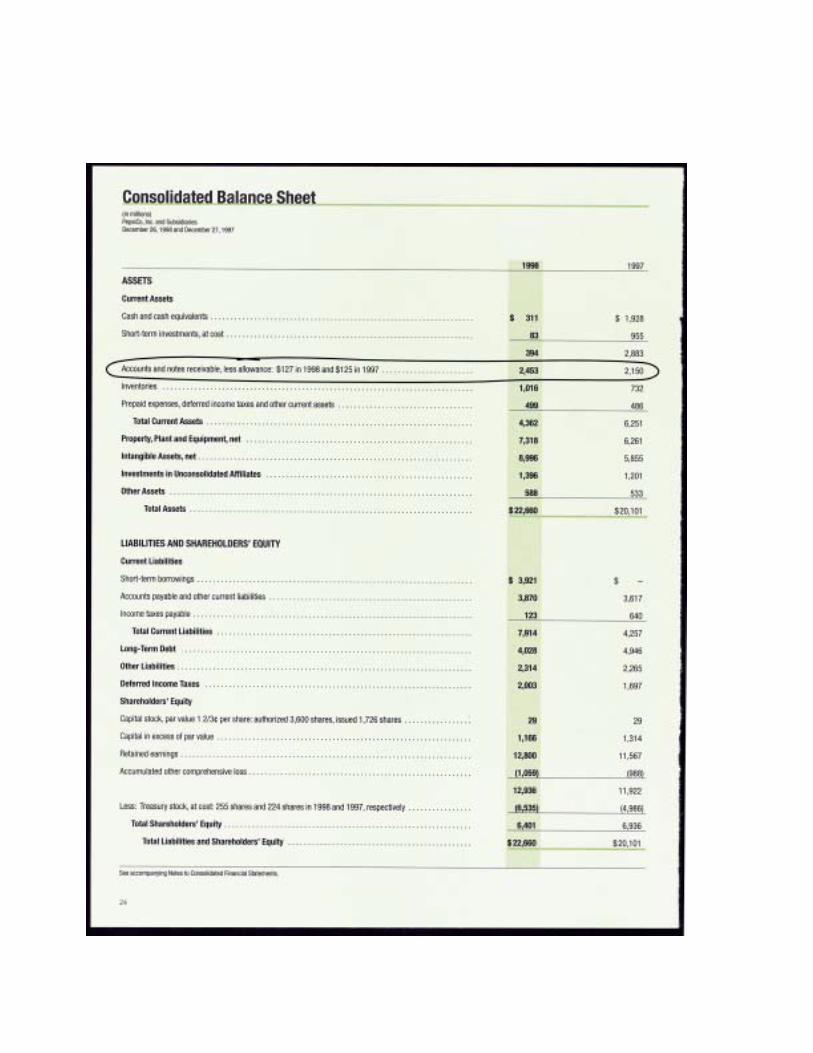
227
CREDIT MANAGEMENTAND COLLECTION
Terms of Sale
Credit Agreements
Credit AnalysisFinancial Ratio Analysis
Numerical Credit Scoring
When to Stop Looking for Clues
The Credit DecisionCredit Decisions with Repeat Orders
Some General Principles
Collection Policy
BankruptcyBankruptcy Procedures
The Choice between Liquidation and Reorganization
Summary
PepsiCo’s accounts show that it is owed $2,453 million by its customers.How do companies decide on the amount of credit that they give their customers?Courtesy of PepsiCo. Inc. © 1998

hen companies sell their products, they sometimes demand cash on de-
livery, but in most cases they allow a delay in payment. The customers’
promises to pay for their purchases constitute a valuable asset; therefore,
the accountant enters these promises in the balance sheet as accounts re-
ceivable. If you turn back to the balance sheet in Table 2.1, you can see that accounts
receivable constitute on the average more than one-third of a firm’s current assets.
These receivables include both trade credit to other firms and consumer credit to retail
customers. The former is by far the larger and will therefore be the main focus of
this material.
Customers may be attracted by the opportunity to buy goods on credit, but there is a
cost to the seller who provides the credit. Take PepsiCo, for example. We saw that in
1998 PepsiCo had sales of $22,300 million, or about $61 million a day. Receivables dur-
ing the year averaged $2,300 million.1 Thus PepsiCo’s customers were taking an aver-
age of 2,300/61 = 37.7 days to pay their bills. Suppose that PepsiCo could collect this
cash 1 day earlier without affecting sales. In that case receivables would decline by $61
million, and PepsiCo would have an extra $61 million of cash in the bank, which it
could either hand back to shareholders or invest to earn interest.
Credit management involves the following steps, which we will discuss in turn.
First, you must establish the terms of sale on which you propose to sell your goods.
How long are you going to give customers to pay their bills? Are you prepared to offer
a cash discount for prompt payment?
Second, you must decide what evidence you need that the customer owes you money.
Do you just ask the buyer to sign a receipt, or do you insist on a more formal IOU?
Third, you must consider which customers are likely to pay their bills. This is called
credit analysis. Do you judge this from the customer’s past payment record or past fi-
nancial statements? Do you also rely on bank references?
Fourth, you must decide on credit policy. How much credit are you prepared to ex-
tend to each customer? Do you play safe by turning down any doubtful prospects? Or
do you accept the risk of a few bad debts as part of the cost of building up a large reg-
ular clientele?
Fifth, after you have granted credit, you have the problem of collecting the money
when it becomes due. This is called collection policy. How do you keep track of pay-
ments and pursue slow payers? If all goes well, this is the end of the matter. But some-
times you will find that the customer is bankrupt and cannot pay. In this case you need
to understand how bankruptcy works.
After studying this material you should be able to
� Measure the implicit interest rate on credit.
� Understand when it makes sense to ask the customer for a formal IOU.
228
W
1 This is an average of receivables at the start of the year and those at the end of the year.
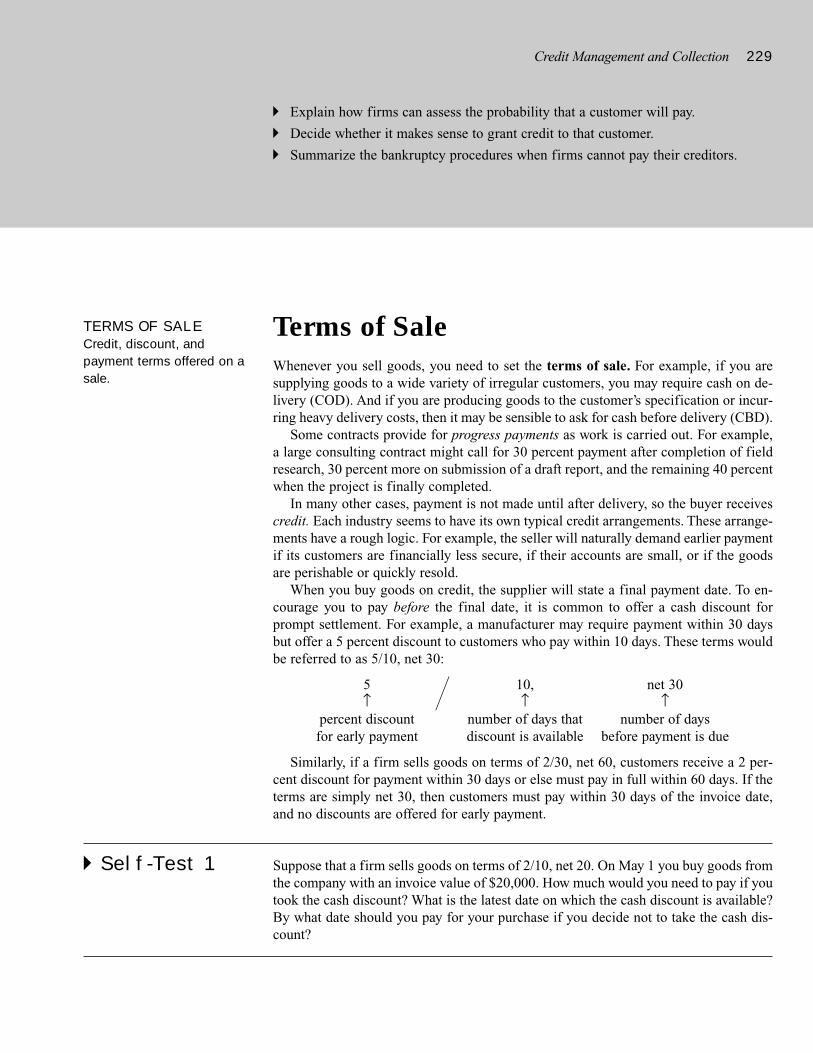
Credit Management and Collection 229
� Explain how firms can assess the probability that a customer will pay.
� Decide whether it makes sense to grant credit to that customer.
� Summarize the bankruptcy procedures when firms cannot pay their creditors.
Terms of SaleWhenever you sell goods, you need to set the terms of sale. For example, if you aresupplying goods to a wide variety of irregular customers, you may require cash on de-livery (COD). And if you are producing goods to the customer’s specification or incur-ring heavy delivery costs, then it may be sensible to ask for cash before delivery (CBD).
Some contracts provide for progress payments as work is carried out. For example,a large consulting contract might call for 30 percent payment after completion of fieldresearch, 30 percent more on submission of a draft report, and the remaining 40 percentwhen the project is finally completed.
In many other cases, payment is not made until after delivery, so the buyer receivescredit. Each industry seems to have its own typical credit arrangements. These arrange-ments have a rough logic. For example, the seller will naturally demand earlier paymentif its customers are financially less secure, if their accounts are small, or if the goodsare perishable or quickly resold.
When you buy goods on credit, the supplier will state a final payment date. To en-courage you to pay before the final date, it is common to offer a cash discount forprompt settlement. For example, a manufacturer may require payment within 30 daysbut offer a 5 percent discount to customers who pay within 10 days. These terms wouldbe referred to as 5/10, net 30:
5 10, net 30↑ � ↑ ↑
percent discount number of days that number of daysfor early payment discount is available before payment is due
Similarly, if a firm sells goods on terms of 2/30, net 60, customers receive a 2 per-cent discount for payment within 30 days or else must pay in full within 60 days. If theterms are simply net 30, then customers must pay within 30 days of the invoice date,and no discounts are offered for early payment.
� Self-Test 1 Suppose that a firm sells goods on terms of 2/10, net 20. On May 1 you buy goods fromthe company with an invoice value of $20,000. How much would you need to pay if youtook the cash discount? What is the latest date on which the cash discount is available?By what date should you pay for your purchase if you decide not to take the cash dis-count?
TERMS OF SALECredit, discount, andpayment terms offered on asale.
230 SECTION TWO
For many items that are bought regularly, it is inconvenient to require separate pay-ment for each delivery. A common solution is to pretend that all sales during the monthin fact occur at the end of the month (EOM). Thus goods may be sold on terms of 8/10,EOM, net 60. This allows the customer a cash discount of 8 percent if the bill is paidwithin 10 days of the end of the month; otherwise the full payment is due within 60 daysof the invoice date.
When purchases are subject to seasonal fluctuations, manufacturers often encouragecustomers to take early delivery by allowing them to delay payment until the usual orderseason. This practice is known as season dating. For example, summer products mighthave terms of 2/10, net 30, but the invoice might be dated May 1 even if the sale takesplace in February. The discount is then available until May 10, and the bill is not dueuntil May 30.
Of course, a free loan is always worth having. But if you pass up a cash discount,then the loan may prove to be very expensive. For example, a customer who buys onterms of 3/10, net 30 may decide to forgo the cash discount and pay on the thirtieth day.The customer obtains an extra 20 days’ credit by deferring payment from 10 to 30 daysafter the sale but pays about 3 percent more for the goods. This is equivalent to bor-rowing money at a rate of 74.3 percent a year. To see why, consider an order of $100. Ifthe firm pays within 10 days, it gets a 3 percent discount and pays only $97. If it waitsthe full 30 days, it pays $100. The extra 20 days of credit increase the payment by thefraction 3/97 = .0309, or 3.09 percent. Therefore, the implicit interest charged to extendthe trade credit is 3.09 percent per 20 days. There are 365/20 = 18.25 twenty-day peri-ods in a year, so the effective annual rate of interest on the loan is (1.0309)18.25 – 1 =.743, or 74.3 percent.
The general formula for calculating the implicit annual interest rate for customerswho do not take the cash discount is
Effective annual rate = (1 +discount )365/extra days credit
– 1discounted price
The discount divided by the discounted price is the percentage increase in price paid bya customer who forgoes the discount. In our example, with terms of 3/10, net 30, thepercentage increase in price is 3/97 = .0309, or 3.09 percent. This is the per-period im-plicit rate of interest. The period of the loan is the number of extra days of credit thatyou can obtain by forgoing the discount. In our example, this is 20 days. To annualizethis rate, we compound the per-period rate by the number of periods in a year.
Of course any firm that delays payment beyond day 30 gains a cheaper loan but dam-ages its reputation for creditworthiness.
� EXAMPLE 1 Trade Credit Rates
What is the implied interest rate on the trade credit if the discount for early payment is5/10, net 60?
The cash discount in this case is 5 percent and customers who choose not to take thediscount receive an extra 60 – 10 = 50 days credit. So the effective annual interest is
A firm that buys on credit is in effect borrowing from its supplier. It savescash today but will have to pay later. This, of course, is an implicit loan fromthe supplier.
Credit Management and Collection 231
Effective annual rate = (1 +discount )365/extra days credit
– 1discounted price
= (1 +5 ) 365/50
– 1 = .454, or 45.4%95
In this case the customer who does not take the discount is effectively borrowing moneyat an annual interest rate of 45.4 percent.
You might wonder why the effective interest rate on trade credit is typically so high.Part of the rate should be viewed as compensation for the costs the firm anticipates incollecting from slow payers. After all, at such steep effective rates, most purchasers willchoose to pay early and receive the discount. Therefore, you might interpret the choiceto stretch payables as a sign of financial difficulties. It follows that the interest rate youcharge to these firms should be high.
� Self-Test 2 What would be the effective annual interest rate in Example 1 if the terms of sale were5/10, net 50? Why is the rate higher?
Credit AgreementsThe terms of sale define the amount of any credit but not the nature of the contract.Repetitive sales are almost always made on open account and involve only an implicitcontract. There is simply a record in the seller’s books and a receipt signed by the buyer.
Sometimes you might want a more formal agreement that the customer owes youmoney. Where the order is very large and there is no complicating cash discount, thecustomer may be asked to sign a promissory note. This is just a straightforward IOU,worded along the following lines:
New YorkApril 1, 2001
Sixty days after date, ABC, Inc., promises to pay to the order of the XYZ Company tenthousand dollars ($10,000) for value received.
Signature
Such an arrangement is not common but it does eliminate the possibility of any sub-sequent disputes about the amount and existence of the debt; the customer knows thathe or she may be sued immediately for failure to pay on the due date.
If you want a clear commitment from the buyer, it is more useful to have it beforeyou deliver the goods. In this case the common procedure is to arrange a commercialdraft. This is simply jargon for an order to pay.2 It works as follows. The seller preparesa draft ordering payment by the customer and sends this draft to the customer’s bank. If
OPEN ACCOUNTAgreement whereby sales aremade with no formal debtcontract.
2 For example, a check is an example of a draft. Whenever you write a check, you are ordering the bank tomake a payment.
232 SECTION TWO
immediate payment is required, the draft is termed a sight draft; otherwise it is knownas a time draft. Depending on whether it is a sight or a time draft, the customer eithertells the bank to pay up or acknowledges the debt by adding the word accepted and asignature. Once accepted, a time draft is like a postdated check and is called a trade ac-ceptance. This trade acceptance is then forwarded to the seller, who holds it until thepayment becomes due.
If the customer’s credit is for any reason suspect, the seller may ask the customer toarrange for his or her bank to accept the time draft. In this case, the bank guarantees thecustomer’s debt and the draft is called a banker’s acceptance. Banker’s acceptances areoften used in overseas trade. They are actively bought and sold in the money market, themarket for short-term high-quality debt.
If you sell goods to a customer who proves unable to pay, you cannot get your goodsback. You simply become a general creditor of the company, in common with other un-fortunates. You can avoid this situation by making a conditional sale, so that ownershipof the goods remains with the seller until full payment is made. The conditional sale iscommon in Europe. In the United States it is used only for goods that are bought on in-stallment. In this case, if the customer fails to make the agreed number of payments,then the equipment can be immediately repossessed by the seller.
Credit AnalysisThere are a number of ways to find out whether customers are likely to pay their debts,that is, to carry out credit analysis. The most obvious indication is whether they havepaid promptly in the past. Prompt payment is usually a good omen, but beware of thecustomer who establishes a high credit limit on the basis of small payments and thendisappears, leaving you with a large unpaid bill.
If you are dealing with a new customer, you will probably check with a credit agency.Dun & Bradstreet, which is by far the largest of these agencies, provides credit ratingson several million domestic and foreign firms. In addition to its rating service, Dun &Bradstreet provides on request a full credit report on a potential customer.
Credit agencies usually report the experience that other firms have had with yourcustomer, but you can also get this information by contacting those firms directly orthrough a credit bureau.
Your bank can also make a credit check. It will contact the customer’s bank and askfor information on the customer’s average bank balance, access to bank credit, and gen-eral reputation.
In addition to checking with your customer’s bank, it might make sense to checkwhat everybody else in the financial community thinks about your customer’s creditstanding. Does that sound expensive? Not if your customer is a public company. Youjust look at the Moody’s or Standard & Poor’s rating for the customer’s bonds.3 You canalso compare prices of these bonds to the prices of other firms’ bonds. (Of course thecomparisons should be between bonds of similar maturity, coupon, and so on.) Finally,you can look at how the customer’s stock price has been behaving recently. A sharp fallin price doesn’t mean that the company is in trouble, but it does suggest that prospectsare less bright than formerly.
CREDIT ANALYSISProcedure to determine thelikelihood a customer will payits bills.
3 We described bond ratings in later.
Credit Management and Collection 233
FINANCIAL RATIO ANALYSIS
We have suggested a number of ways to check whether your customer is a good risk.You can ask your collection manager, a specialized credit agency, a credit bureau, abanker, or the financial community at large. But if you don’t like relying on the judg-ment of others, you can do your own homework. Ideally this would involve a detailedanalysis of the company’s business prospects and financing, but this is usually too ex-pensive. Therefore, credit analysts concentrate on the company’s financial statements,using rough rules of thumb to judge whether the firm is a good credit risk. The rules ofthumb are based on financial ratios. Earlier we described how these ratios are calcu-lated and interpreted.
NUMERICAL CREDIT SCORING
Analyzing credit risk is like detective work. You have a lot of clues—some important,some fitting into a neat pattern, others contradictory. You must weigh these clues tocome up with an overall judgment.
When the firm has a small, regular clientele, the credit manager can easily handlethe process informally and make a judgment about what are often termed the five Cs ofcredit:
1. The customer’s character2. The customer’s capacity to pay3. The customer’s capital4. The collateral provided by the customer4
5. The condition of the customer’s business
When the company is dealing directly with consumers or with a large number ofsmall trade accounts, some streamlining is essential. In these cases it may make senseto use a scoring system to prescreen credit applications.
For example, if you apply for a credit card or a bank loan, you will be asked aboutyour job, home, and financial position. The information that you provide is used to cal-culate an overall credit score. Applicants who do not make the grade on the score arelikely to be refused credit or subjected to more detailed analysis.
Banks and the credit departments of industrial firms also use mechanical credit scor-ing systems to cut the costs of assessing commercial credit applications. One bankclaimed that by introducing a credit scoring system, it cut the cost of reviewing loan applications by two-thirds. It cited the case of an application for a $5,000 credit linefrom a small business. A clerk entered information from the loan application into acomputer and checked the firm’s deposit balances with the bank, as well as the owner’spersonal and business credit files. Immediately the loan officer could see the applicant’sscore: 240 on a scale of 100 to 300, well above the bank’s cut-off figure. All that re-mained for the bank was to check that there was nothing obviously suspicious about theapplication. “We don’t want to lend to set up an alligator farm in the desert,” said onebank official.5
Firms use several statistical techniques to separate the creditworthy sheep from theimpecunious goats. One common method employs multiple discriminant analysis to
4 For example, the customer can offer bonds as collateral. These bonds can then be seized by the seller if thecustomer fails to pay.5 Quoted in S. Hansell, “Need a Loan? Ask the Computer; ‘Credit Scoring’ Changes Small-Business Lend-ing,” The New York Times, April 18, 1995, sec. D, p. 1.
234 SECTION TWO
produce a measure of solvency called a Z score. For example, a study by Edward Alt-man suggested the following relationship between a firm’s financial ratios and its cred-itworthiness (Z):6
Z = 3.3EBIT
+ 1.0sales
+ .6market value of equity
total assets total assets total book debt
+ 1.4retained earnings
+ 1.2working capital
total assets total assets
This equation did a good job at distinguishing the bankrupt and nonbankrupt firms.Of the former, 94 percent had Z scores less than 2.7 before they went bankrupt. In con-trast, 97 percent of the nonbankrupt firms had Z scores above this level.7
� EXAMPLE 2 Credit Scoring
Consider a firm with the following financial ratios:
EBIT= .12
sales= 1.4
market equity= .9
total assets total assets book debt
retained earnings= .4
working capital= .12
total assets total assets
The firm’s Z score is thus
(3.3 × .12) + (1.0 × 1.4) + (.6 × .9) + (1.4 × .4) + (1.2 × .12) = 3.04
This score is above the cutoff level for predicting bankruptcy, and thus would be con-sidered favorably in terms of evaluating the firm’s creditworthiness.
The nearby box describes how statistical scoring systems similar to the Z score canprovide timely first-cut estimates of creditworthiness. These assessments can streamlinethe credit decision and free up labor for other, less mechanical tasks. The box notes thatthese scoring systems can be used in conjunction with large databases on firms, such asthat of Dun & Bradstreet, to provide quick credit scores for thousands of firms.
WHEN TO STOP LOOKING FOR CLUES
We told you earlier where to start looking for clues about a customer’s creditworthiness,but we never said anything about when to stop. A detailed credit analysis costs money,so you need to keep the following basic principle in mind:
Credit analysis is worthwhile only if the expected savings exceed the cost.
6 EBIT is earnings before interest and taxes. E. I. Altman, “Financial Ratios, Discriminant Analysis and thePrediction of Corporate Bankruptcy,” Journal of Finance 23 (September 1968), pp. 589–609.7 This equation was fitted with hindsight. The equation did slightly less well when used to predict bankrupt-cies after 1965.
SEE BOX
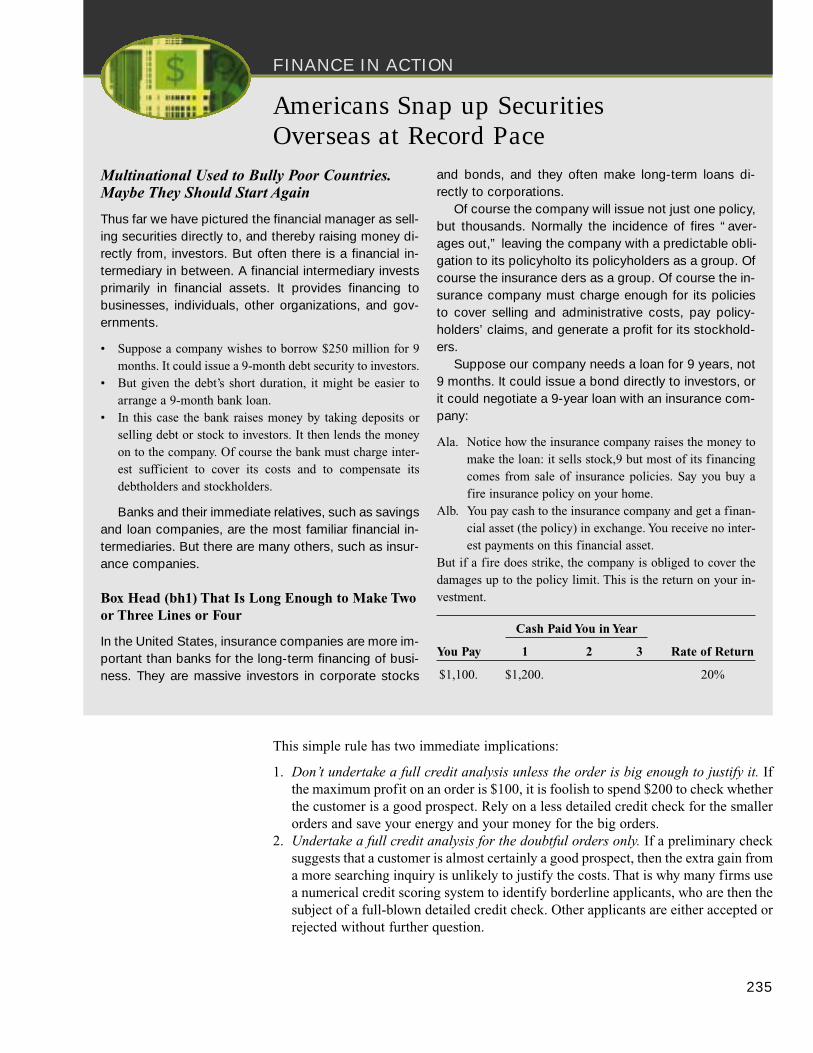
FINANCE IN ACTION
Americans Snap up Securities Overseas at Record Pace
Multinational Used to Bully Poor Countries.Maybe They Should Start Again
Thus far we have pictured the financial manager as sell-ing securities directly to, and thereby raising money di-rectly from, investors. But often there is a financial in-termediary in between. A financial intermediary investsprimarily in financial assets. It provides financing tobusinesses, individuals, other organizations, and gov-ernments.
• Suppose a company wishes to borrow $250 million for 9months. It could issue a 9-month debt security to investors.
• But given the debt’s short duration, it might be easier toarrange a 9-month bank loan.
• In this case the bank raises money by taking deposits orselling debt or stock to investors. It then lends the moneyon to the company. Of course the bank must charge inter-est sufficient to cover its costs and to compensate itsdebtholders and stockholders.
Banks and their immediate relatives, such as savingsand loan companies, are the most familiar financial in-termediaries. But there are many others, such as insur-ance companies.
Box Head (bh1) That Is Long Enough to Make Twoor Three Lines or Four
In the United States, insurance companies are more im-portant than banks for the long-term financing of busi-ness. They are massive investors in corporate stocks
and bonds, and they often make long-term loans di-rectly to corporations.
Of course the company will issue not just one policy,but thousands. Normally the incidence of fires “ aver-ages out,” leaving the company with a predictable obli-gation to its policyholto its policyholders as a group. Ofcourse the insurance ders as a group. Of course the in-surance company must charge enough for its policiesto cover selling and administrative costs, pay policy-holders’ claims, and generate a profit for its stockhold-ers.
Suppose our company needs a loan for 9 years, not9 months. It could issue a bond directly to investors, orit could negotiate a 9-year loan with an insurance com-pany:
Ala. Notice how the insurance company raises the money tomake the loan: it sells stock,9 but most of its financingcomes from sale of insurance policies. Say you buy afire insurance policy on your home.
Alb. You pay cash to the insurance company and get a finan-cial asset (the policy) in exchange. You receive no inter-est payments on this financial asset.
But if a fire does strike, the company is obliged to cover thedamages up to the policy limit. This is the return on your in-vestment.
Cash Paid You in Year
You Pay 1 2 3 Rate of Return
$1,100. $1,200. 20%
This simple rule has two immediate implications:
1. Don’t undertake a full credit analysis unless the order is big enough to justify it. Ifthe maximum profit on an order is $100, it is foolish to spend $200 to check whetherthe customer is a good prospect. Rely on a less detailed credit check for the smallerorders and save your energy and your money for the big orders.
2. Undertake a full credit analysis for the doubtful orders only. If a preliminary checksuggests that a customer is almost certainly a good prospect, then the extra gain froma more searching inquiry is unlikely to justify the costs. That is why many firms usea numerical credit scoring system to identify borderline applicants, who are then thesubject of a full-blown detailed credit check. Other applicants are either accepted orrejected without further question.
235
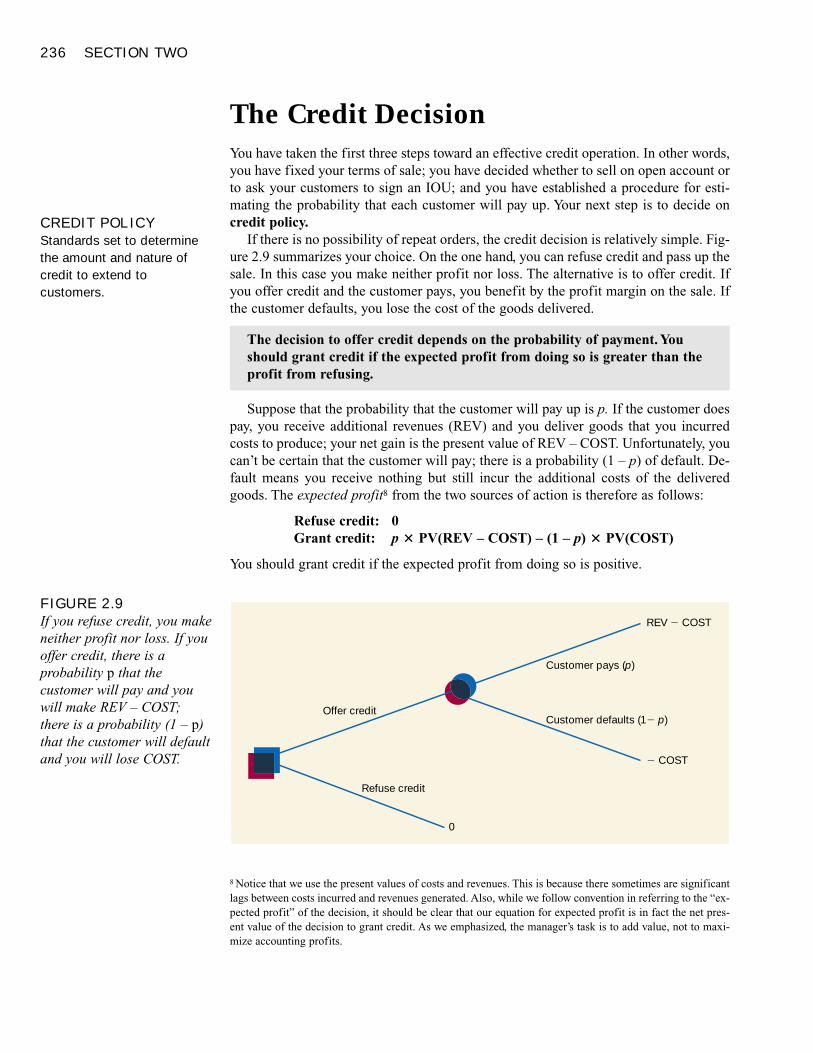
236 SECTION TWO
The Credit DecisionYou have taken the first three steps toward an effective credit operation. In other words,you have fixed your terms of sale; you have decided whether to sell on open account orto ask your customers to sign an IOU; and you have established a procedure for esti-mating the probability that each customer will pay up. Your next step is to decide oncredit policy.
If there is no possibility of repeat orders, the credit decision is relatively simple. Fig-ure 2.9 summarizes your choice. On the one hand, you can refuse credit and pass up thesale. In this case you make neither profit nor loss. The alternative is to offer credit. Ifyou offer credit and the customer pays, you benefit by the profit margin on the sale. Ifthe customer defaults, you lose the cost of the goods delivered.
Suppose that the probability that the customer will pay up is p. If the customer doespay, you receive additional revenues (REV) and you deliver goods that you incurredcosts to produce; your net gain is the present value of REV – COST. Unfortunately, youcan’t be certain that the customer will pay; there is a probability (1 – p) of default. De-fault means you receive nothing but still incur the additional costs of the deliveredgoods. The expected profit8 from the two sources of action is therefore as follows:
Refuse credit: 0Grant credit: p � PV(REV – COST) – (1 – p) � PV(COST)
You should grant credit if the expected profit from doing so is positive.
The decision to offer credit depends on the probability of payment. You should grant credit if the expected profit from doing so is greater than theprofit from refusing.
CREDIT POLICYStandards set to determinethe amount and nature ofcredit to extend tocustomers.
FIGURE 2.9If you refuse credit, you makeneither profit nor loss. If youoffer credit, there is aprobability p that thecustomer will pay and youwill make REV – COST;there is a probability (1 – p)that the customer will defaultand you will lose COST.
REV � COST
� COST
Offer credit
Refuse credit
0
Customer defaults (1� p)
Customer pays (p)
8 Notice that we use the present values of costs and revenues. This is because there sometimes are significantlags between costs incurred and revenues generated. Also, while we follow convention in referring to the “ex-pected profit” of the decision, it should be clear that our equation for expected profit is in fact the net pres-ent value of the decision to grant credit. As we emphasized, the manager’s task is to add value, not to maxi-mize accounting profits.
Credit Management and Collection 237
� EXAMPLE 3 The Credit Decision
Consider the case of the Cast Iron Company. On each nondelinquent sale Cast Iron re-ceives revenues with a present value of $1,200 and incurs costs with a present value of$1,000. Therefore, the company’s expected profit if it offers credit is
p × PV(REV – COST) – (1 – p) × PV(COST) = p × 200 – (1 – p) × 1,000
If the probability of collection is 5/6, Cast Iron can expect to break even:
Expected profit = 5/6 × 200 – (1 – 5/6) × 1,000 = 0
Thus Cast Iron’s policy should be to grant credit whenever the chances of collection arebetter than 5 out of 6.
In this last example, the net present value of granting credit is positive if the proba-bility of collection exceeds 5/6. In general, this break-even probability can be found bysetting the net present value of granting credit equal to zero and solving for p. It turnsout that the formula for the break-even probability is simply the ratio of the presentvalue of costs to revenues:
p × PV(REV – COST) – (1 – p) × PV(COST) = 0
Break-even probability of collection, then, is
p =PV(COST)PV(REV)
� Self-Test 3 What is the break-even probability of collection if the present value of the revenuesfrom the sale is $1,100 rather than $1,200? Why does the break-even probability in-crease? Use your answer to decide whether firms that sell high-profit-margin or low-margin goods should be more willing to issue credit.
CREDIT DECISIONS WITH REPEAT ORDERS
What effect does the possibility of repeat orders have on your credit decision? One ofthe reasons for offering credit today is that you may get yourself a good, regular cus-tomer.
Cast Iron has been asked to extend credit to a new customer. You can find little in-formation on the firm and you believe that the probability of payment is no better than.8. If you grant credit, the expected profit on this order is
Expected profit on initial order = p × PV(REV – COST) – (1 – p) × PV(COST)
= (.8 × 200) – (.2 × 1,000) = –$40
You decide to refuse credit.This is the correct decision if there is no chance of a repeat order. But now consider
future periods. If the customer does pay up, there will be a reorder next year. Havingpaid once, the customer will seem less of a risk. For this reason, any repeat order is veryprofitable.
238 SECTION TWO
Think back to earlier material, and you will recognize that the credit decision bearsmany similarities to our earlier discussion of real options. By granting credit now, thefirm retains the option to grant credit on an entire sequence of potentially profitable re-peat sales. This option can be very valuable and can tilt the decision toward grantingcredit. Even a dubious prospect may warrant some initial credit if there is a chance thatit will develop into a profitable steady customer.
� EXAMPLE 4 Credit Decisions with Repeat Orders
To illustrate, let’s look at an extreme case. Suppose that if a customer pays up on thefirst sale, you can be sure you will have a regular and completely reliable customer. Inthis case, the value of such a customer is not the profit on one order but an entire streamof profits from repeat purchases. For example, suppose that the customer will make onepurchase each year from Cast Iron. If the discount rate is 10 percent and the profit oneach order is $200 a year, then the present value of an indefinite stream of businessfrom a good customer is not $200 but $200/.10 = $2,000. There is a probability p thatCast Iron will secure a good customer with a value of $2,000. There is a probability of(1 – p) that the customer will default, resulting in a loss of $1,000. So, once we recog-nize the benefits of securing a good and permanent customer, the expected profit fromgranting credit is
Expected profit = (p × 2,000) – (1 – p) × 1,000
This is positive for any probability of collection above .33. Thus the break-even prob-ability falls from 5/6 to 1/3.
� Self-Test 4 How will the break-even probability vary with the discount rate? Try a rate of 20 per-cent in Example 4. What is the intuition behind your answer?
SOME GENERAL PRINCIPLES
Real-life situations are generally far more complex than our simple examples. Cus-tomers are not all good or all bad. Many pay late consistently; you get your money, butit costs more to collect and you lose a few months’ interest. And estimating the proba-bility that a customer will pay up is far from an exact science.
Like almost all financial decisions, credit allocation involves a strong dose of judg-ment. Our examples are intended as reminders of the issues involved rather than ascookbook formulas. Here are the basic things to remember.
1. Maximize profit. As credit manager your job is not to minimize the number of badaccounts; it is to maximize profits. You are faced with a trade-off. The best that canhappen is that the customer pays promptly; the worst is default. In the one case thefirm receives the full additional revenues from the sale less the additional costs; in
If one sale may lead to profitable repeat sales, the firm should be inclined togrant credit on the initial purchase.
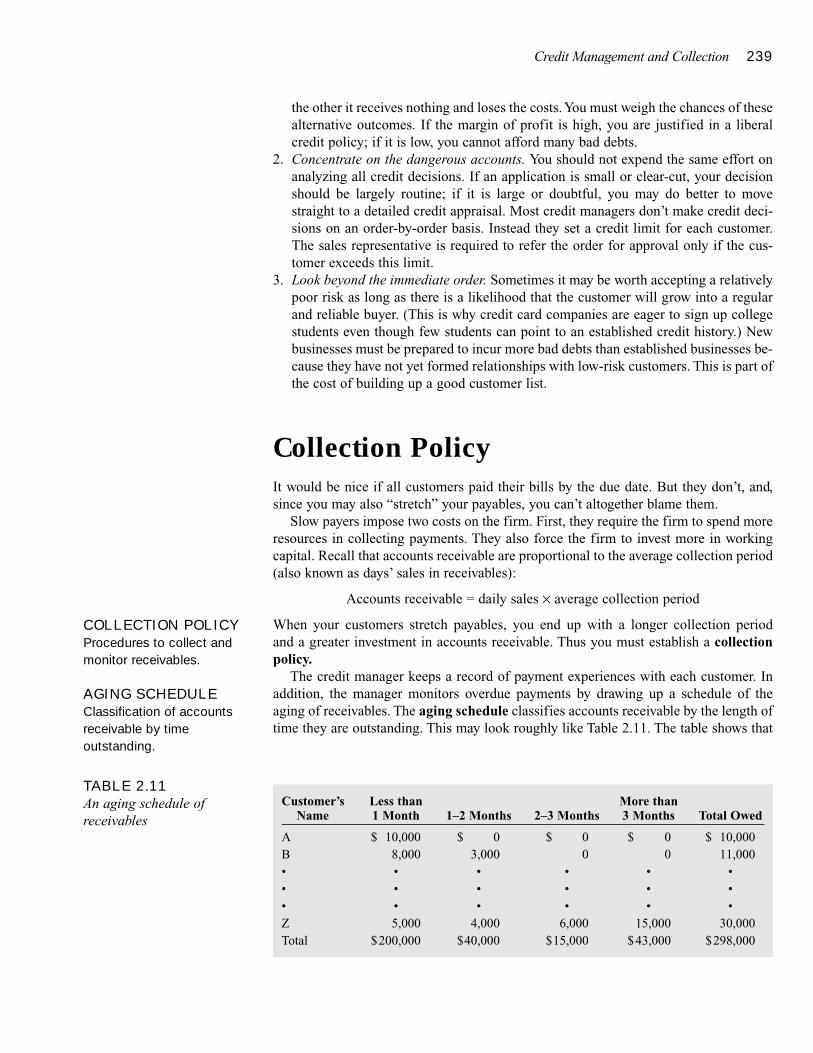
Credit Management and Collection 239
the other it receives nothing and loses the costs. You must weigh the chances of thesealternative outcomes. If the margin of profit is high, you are justified in a liberalcredit policy; if it is low, you cannot afford many bad debts.
2. Concentrate on the dangerous accounts. You should not expend the same effort onanalyzing all credit decisions. If an application is small or clear-cut, your decisionshould be largely routine; if it is large or doubtful, you may do better to movestraight to a detailed credit appraisal. Most credit managers don’t make credit deci-sions on an order-by-order basis. Instead they set a credit limit for each customer.The sales representative is required to refer the order for approval only if the cus-tomer exceeds this limit.
3. Look beyond the immediate order. Sometimes it may be worth accepting a relativelypoor risk as long as there is a likelihood that the customer will grow into a regularand reliable buyer. (This is why credit card companies are eager to sign up collegestudents even though few students can point to an established credit history.) Newbusinesses must be prepared to incur more bad debts than established businesses be-cause they have not yet formed relationships with low-risk customers. This is part ofthe cost of building up a good customer list.
Collection PolicyIt would be nice if all customers paid their bills by the due date. But they don’t, and,since you may also “stretch” your payables, you can’t altogether blame them.
Slow payers impose two costs on the firm. First, they require the firm to spend moreresources in collecting payments. They also force the firm to invest more in workingcapital. Recall that accounts receivable are proportional to the average collection period(also known as days’ sales in receivables):
Accounts receivable = daily sales × average collection period
When your customers stretch payables, you end up with a longer collection period and a greater investment in accounts receivable. Thus you must establish a collectionpolicy.
The credit manager keeps a record of payment experiences with each customer. Inaddition, the manager monitors overdue payments by drawing up a schedule of theaging of receivables. The aging schedule classifies accounts receivable by the length oftime they are outstanding. This may look roughly like Table 2.11. The table shows that
TABLE 2.11An aging schedule ofreceivables
Customer’s Less than More thanName 1 Month 1–2 Months 2–3 Months 3 Months Total Owed
A $ 10,000 $ 0 $ 0 $ 0 $ 10,000B 8,000 3,000 0 0 11,000• • • • • •• • • • • •• • • • • •Z 5,000 4,000 6,000 15,000 30,000Total $200,000 $40,000 $15,000 $43,000 $298,000
COLLECTION POLICYProcedures to collect andmonitor receivables.
AGING SCHEDULEClassification of accountsreceivable by timeoutstanding.
240 SECTION TWO
customer A, for example, is fully current: there are no bills outstanding for more than amonth. Customer Z, however, might present problems, as there are $15,000 in bills thathave been outstanding for more than 3 months.
When a customer is in arrears, the usual procedure is to send a statement of accountand to follow this at intervals with increasingly insistent letters, telephone calls, or faxmessages. If none of these has any effect, most companies turn the debt over to a col-lection agency or an attorney.
� Self-Test 5 Suppose a customer who buys goods on terms 1/10, net 45 always forgoes the cash dis-count and pays on the 45th day after sale. If the firm typically buys $10,000 of goods amonth, spread evenly over the month, what will the aging schedule look like?
There is always a potential conflict of interest between the collection department andthe sales department. Sales representatives commonly complain that they no sooner winnew customers than the collection department frightens them off with threatening let-ters. The collection manager, on the other hand, bemoans the fact that the sales force isconcerned only with winning orders and does not care whether the goods are subse-quently paid for. This conflict is another example of the agency problem introduced ear-lier.
There are instances of cooperation between sales managers and the financial man-agers who worry about collections. For example, the specialty chemicals division of amajor pharmaceutical company actually made a business loan to an important customerthat had been suddenly cut off by its bank. The pharmaceutical company bet that it knewits customer better than the customer’s bank did—and the pharmaceutical company wasright. The customer arranged alternative bank financing, paid back the pharmaceuticalcompany, and became an even more loyal customer. It was a nice example of financialmanagement supporting sales.
BankruptcyWe have reviewed some of the techniques that firms use to evaluate the creditworthi-ness of their customers and to decide whether to issue credit. It would be helpful if thesetechniques were refined to perfectly distinguish among customers that will pay theirbills and those that will go belly up, but this is not a realistic goal. In any event, we haveseen that granting credit to a financially shaky customer may pay off if there is a chancethat the offer will lead to a profitable future relationship. Therefore, it is not uncommonfor firms to have to deal with an insolvent customer.
Our focus here is on business bankruptcy. Such bankruptcies account for only about15 percent of the total number of bankruptcies, but because they are larger than indi-vidual bankruptcies, they involve about half of all claims by value. There are also morecomplications when a business declares bankruptcy than when an individual does so.
Good collection policy balances conflicting goals. The company wants cordialrelations with its customers. It also wants them to pay their bills on time.
BANKRUPTCY Thereorganization or liquidationof a firm that cannot pay itsdebts.
Credit Management and Collection 241
BANKRUPTCY PROCEDURES
A corporation that cannot pay its debts will often try to come to an informal agreementwith its creditors. This is known as a workout. A workout may take several forms. Forexample, the firm may negotiate an extension, that is, an agreement with its creditors todelay payments. Or the firm may negotiate a composition, in which the firm makes par-tial payments to its creditors in exchange for relief of its debts.
The advantage of a negotiated agreement is that the costs and delays of formal bankruptcy are avoided. However, the larger the firm, and the more complicated its capital structure, the less likely it is that a negotiated settlement can be reached. (For example, Wickes Corp. tried—and failed—to reach a negotiated settlement with its250,000 creditors.)
If the firm cannot get an agreement, then it may have no alternative but to file forbankruptcy.9 Under the federal bankruptcy system the firm has a choice of procedures.In about two-thirds of the cases a firm will file for, or be forced into, bankruptcy underChapter 7 of the 1978 Bankruptcy Reform Act. Then the firm’s assets are liquidated—that is, sold—and the proceeds are used to pay creditors.
There is a pecking order of unsecured creditors.10 First come claims for expensesthat arise after bankruptcy is filed, such as attorneys’ fees or employee compensationearned after the filing. If such postfiling claims did not receive priority, no firm inbankruptcy proceedings could continue to operate. Next come claims for wages andemployee benefits earned in the period immediately prior to the filing. Taxes are nextin line, together with debts to some government agencies such as the Small BusinessAdministration or the Pension Benefit Guarantee Corporation. Finally come generalunsecured claims such as bonds or unsecured trade debt.
The alternative to a liquidation is to seek a reorganization, which keeps the firm asa going concern and usually compensates creditors with new securities in the reorgan-ized firm. Such reorganizations are generally in the shareholders’ interests—they havelittle to lose if things deteriorate further and everything to gain if the firm recovers.
Firms attempting reorganization seek refuge under Chapter 11 of the BankruptcyReform Act. Chapter 11 is designed to keep the firm alive and operating and to protectthe value of its assets while a plan of reorganization is worked out. During this period,other proceedings against the firm are halted and the company is operated by existingmanagement or by a court-appointed trustee.
The responsibility for developing a plan of reorganization may fall on the debtorfirm. If no trustee is appointed, the firm has 120 days to present a plan to creditors. Ifthese deadlines are not met, or if a trustee is appointed, anyone can submit a plan—thetrustee, for example, or a committee of creditors.
The reorganization plan is basically a statement of who gets what; each class of cred-itors gives up its claim in exchange for new securities. (Sometimes creditors receivecash as well.) The problem is to design a new capital structure for the firm that will (1) satisfy the creditors and (2) allow the firm to solve the business problems that gotthe firm into trouble in the first place. Sometimes only a plan of baroque complexitycan satisfy these two requirements. When the Penn Central Corporation was finally
WORKOUT Agreementbetween a company and itscreditors establishing thesteps the company musttake to avoid bankruptcy.
LIQUIDATION Sale ofbankrupt firm’s assets.
REORGANIZATIONRestructuring of financialclaims on failing firm to allowit to keep operating.
9 Occasionally creditors will allow the firm to petition for bankruptcy after it has reached an agreement withthe creditors. This is known as a prepackaged bankruptcy. The court simply approves the agreed workoutplan.10 Secured creditors have the first priority to the collateral pledged for their loans.
242 SECTION TWO
reorganized in 1978 (7 years after it became the largest railroad bankruptcy ever), more than a dozen new securities were created and parceled out among 15 classes ofcreditors.
The reorganization plan goes into effect if it is accepted by creditors and confirmedby the court. Acceptance requires approval by a majority of each class of creditor. Once a plan is accepted, the court normally approves it, provided that each class of cred-itors has approved it and that the creditors will be better off under the plan than if thefirm’s assets were liquidated and distributed. The court may, under certain conditions,confirm a plan even if one or more classes of creditors vote against it. This is known asa cram-down.
The terms of a cram-down are open to negotiation among all parties. For example,unsecured creditors may threaten to slow the process as a way of extracting concessionsfrom secured creditors. The secured creditors may take less than 100 cents on the dol-lar and give something to unsecured creditors in order to expedite the process and reachan agreement.
Chapter 11 proceedings are often successful, and the patient emerges fit and healthy.But in other cases cure proves impossible and the assets are liquidated. Sometimes the firm may emerge from Chapter 11 for a brief period before it is once again sub-merged by disaster and back in bankruptcy. For example, TWA came out of bankruptcyat the end of 1993 and was back again less than 2 years later, prompting jokes about“Chapter 22.”
THE CHOICE BETWEEN LIQUIDATION AND REORGANIZATION
Here is an idealized view of the bankruptcy decision. Whenever a payment is due tocreditors, management checks the value of the firm. If the firm is worth more than thepromised payment, the firm pays up (if necessary, raising the cash by an issue ofshares). If not, the equity is worthless, and the firm defaults on its debt and petitions forbankruptcy. If in the court’s judgment the assets of the bankrupt firm can be put to bet-ter use elsewhere, the firm is liquidated and the proceeds are used to pay off the credi-tors. Otherwise, the creditors simply become the new owners and the firm continues tooperate.
In practice, matters are rarely so simple. For example, we observe that firms oftenpetition for bankruptcy even when the equity has a positive value. And firms are oftenreorganized even when the assets could be used more efficiently elsewhere. The nearbybox provides a striking example. There are several reasons.
First, although the reorganized firm is legally a new entity, it is entitled to any tax-loss carry-forwards belonging to the old firm. If the firm is liquidated rather than reor-ganized, any tax-loss carry-forwards disappear. Thus there is an incentive to continue inoperation even if assets are better used by another firm.
Second, if the firm’s assets are sold off, it is easy to determine what is available topay the creditors. However, when the company is reorganized, it needs to conserve cashas far as possible. Therefore, claimants are generally paid in a mixture of cash and se-curities. This makes it less easy to judge whether they have received their entitlement.For example, each bondholder may be offered $300 in cash and $700 in a new bondwhich pays no interest for the first 2 years and a low rate of interest thereafter. A bondof this kind in a company that is struggling to survive may not be worth much, but thebankruptcy court usually looks at the face value of the new bonds and may therefore re-gard the bondholders as paid in full.
SEE BOX
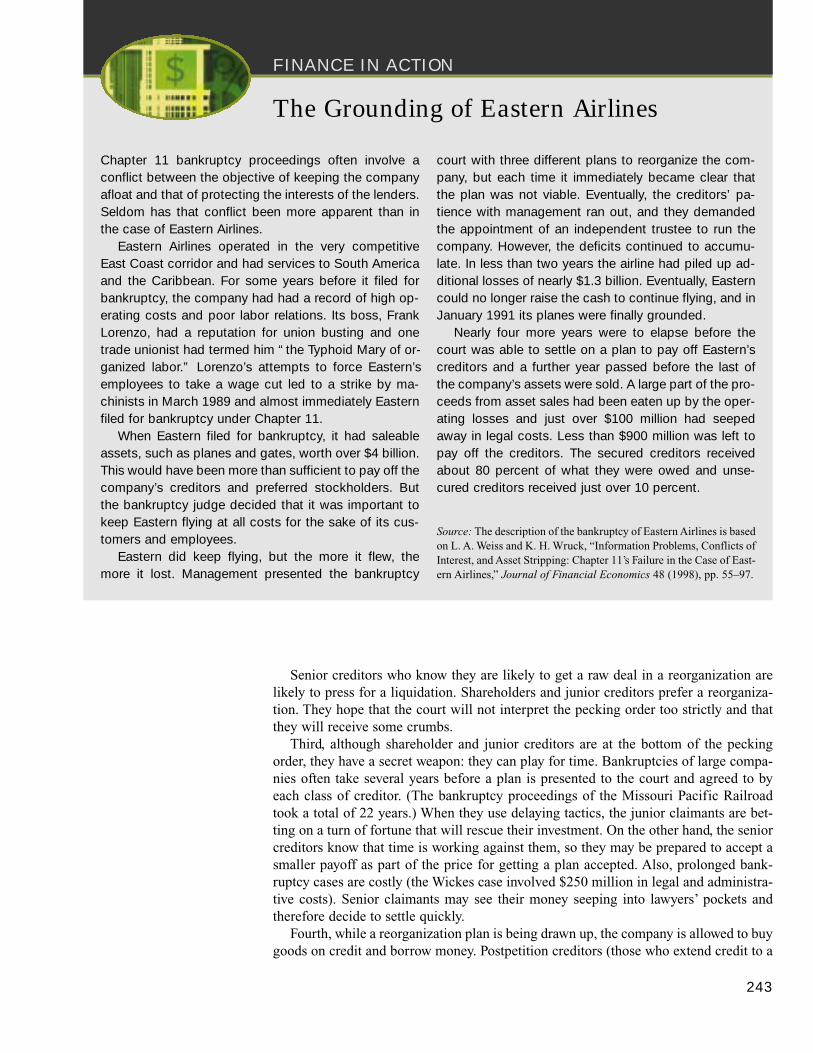
FINANCE IN ACTION
Senior creditors who know they are likely to get a raw deal in a reorganization arelikely to press for a liquidation. Shareholders and junior creditors prefer a reorganiza-tion. They hope that the court will not interpret the pecking order too strictly and thatthey will receive some crumbs.
Third, although shareholder and junior creditors are at the bottom of the peckingorder, they have a secret weapon: they can play for time. Bankruptcies of large compa-nies often take several years before a plan is presented to the court and agreed to byeach class of creditor. (The bankruptcy proceedings of the Missouri Pacific Railroadtook a total of 22 years.) When they use delaying tactics, the junior claimants are bet-ting on a turn of fortune that will rescue their investment. On the other hand, the seniorcreditors know that time is working against them, so they may be prepared to accept asmaller payoff as part of the price for getting a plan accepted. Also, prolonged bank-ruptcy cases are costly (the Wickes case involved $250 million in legal and administra-tive costs). Senior claimants may see their money seeping into lawyers’ pockets andtherefore decide to settle quickly.
Fourth, while a reorganization plan is being drawn up, the company is allowed to buygoods on credit and borrow money. Postpetition creditors (those who extend credit to a
243
The Grounding of Eastern Airlines
Chapter 11 bankruptcy proceedings often involve aconflict between the objective of keeping the companyafloat and that of protecting the interests of the lenders.Seldom has that conflict been more apparent than inthe case of Eastern Airlines.
Eastern Airlines operated in the very competitiveEast Coast corridor and had services to South Americaand the Caribbean. For some years before it filed forbankruptcy, the company had had a record of high op-erating costs and poor labor relations. Its boss, FrankLorenzo, had a reputation for union busting and onetrade unionist had termed him “ the Typhoid Mary of or-ganized labor.” Lorenzo’s attempts to force Eastern’semployees to take a wage cut led to a strike by ma-chinists in March 1989 and almost immediately Easternfiled for bankruptcy under Chapter 11.
When Eastern filed for bankruptcy, it had saleableassets, such as planes and gates, worth over $4 billion.This would have been more than sufficient to pay off thecompany’s creditors and preferred stockholders. Butthe bankruptcy judge decided that it was important tokeep Eastern flying at all costs for the sake of its cus-tomers and employees.
Eastern did keep flying, but the more it flew, themore it lost. Management presented the bankruptcy
court with three different plans to reorganize the com-pany, but each time it immediately became clear thatthe plan was not viable. Eventually, the creditors’ pa-tience with management ran out, and they demandedthe appointment of an independent trustee to run thecompany. However, the deficits continued to accumu-late. In less than two years the airline had piled up ad-ditional losses of nearly $1.3 billion. Eventually, Easterncould no longer raise the cash to continue flying, and inJanuary 1991 its planes were finally grounded.
Nearly four more years were to elapse before thecourt was able to settle on a plan to pay off Eastern’screditors and a further year passed before the last ofthe company’s assets were sold. A large part of the pro-ceeds from asset sales had been eaten up by the oper-ating losses and just over $100 million had seepedaway in legal costs. Less than $900 million was left topay off the creditors. The secured creditors receivedabout 80 percent of what they were owed and unse-cured creditors received just over 10 percent.
Source: The description of the bankruptcy of Eastern Airlines is basedon L. A. Weiss and K. H. Wruck, “Information Problems, Conflicts ofInterest, and Asset Stripping: Chapter 11’s Failure in the Case of East-ern Airlines,” Journal of Financial Economics 48 (1998), pp. 55–97.
244 SECTION TWO
firm already in bankruptcy proceedings) have priority over the old creditors and theirdebt may even be secured by assets that are already mortgaged to existing debtholders.This also gives the prepetition creditors an incentive to settle quickly, before their claimon assets is diluted by the new debt.
Finally, profitable companies may file for Chapter 11 bankruptcy to protect them-selves against “burdensome” suits. For example, in 1982 Manville Corporation wasthreatened by 16,000 damage suits alleging injury from asbestos. Manville filed forbankruptcy under Chapter 11, and the bankruptcy judge agreed to put the damage suitson hold until the company was reorganized. This took 6 years. Of course legislatorsworry that these actions are contrary to the original intent of the bankruptcy acts.
SummaryWhat are the usual steps in credit management?
The first step in credit management is to set normal terms of sale. This means that youmust decide the length of the payment period and the size of any cash discounts. In mostindustries these conditions are standardized.
Your second step is to decide the form of the contract with your customer. Mostdomestic sales are made on open account. In this case the only evidence that the customer owes you money is the entry in your ledger and a receipt signed by the customer. Sometimes, you may require a more formal commitment before you deliver thegoods. For example, the supplier may arrange for the customer to provide a tradeacceptance.
The third task is to assess each customer’s creditworthiness. When you have made anassessment of the customer’s credit standing, the fourth step is to establish sensible creditpolicy. Finally, once the credit policy is set, you need to establish a collection policy toidentify and pursue slow payers.
How do we measure the implicit interest rate on credit?
The effective interest rate for customers who buy goods on credit rather than taking thediscount for quicker payment is
(1 + discount ) 365/extra days credit– 1
discounted price
When does it make sense to ask the customer for a formal IOU?
When a customer places a large order, and you want to eliminate the possibility of anysubsequent disputes about the existence, amount, and scheduled payment date of the debt, aformal IOU or promissory note may be appropriate.
How do firms assess the probability that a customer will pay?
Credit analysis is the process of deciding which customers are likely to pay their bills.There are various sources of information: your own experience with the customer, theexperience of other creditors, the assessment of a credit agency, a check with the customer’sbank, the market value of the customer’s securities, and an analysis of the customer’sfinancial statements. Firms that handle a large volume of credit information often use aformal system for combining the various sources into an overall credit score.
Credit Management and Collection 245
How do firms decide whether it makes sense to grant credit to a customer?
Credit policy refers to the decision to extend credit to a customer. The job of the creditmanager is not to minimize the number of bad debts; it is to maximize profits. This meansthat you need to weigh the odds that the customer will pay, providing you with a profit,against the odds that the customer will default, resulting in a loss. Remember not to be tooshortsighted when reckoning the expected profit. It is often worth accepting the marginalapplicant if there is a chance that the applicant may become a regular and reliable customer.
If credit is granted, the next problem is to set a collection policy. This requires tact andjudgment. You want to be firm with the truly delinquent customer, but you don’t want tooffend the good one by writing demanding letters just because a check has been delayed inthe mail. You will find it easier to spot troublesome accounts if you keep a careful agingschedule of outstanding accounts.
What happens when firms cannot pay their creditors?
A firm that cannot meet obligations may try to arrange a workout with its creditors toenable it to settle its debts. If this is unsuccessful, the firm may file for bankruptcy, inwhich case the business may be liquidated or reorganized. Liquidation means that thefirm’s assets are sold and the proceeds used to pay creditors. Reorganization means that thefirm is maintained as an ongoing concern, and creditors are compensated with securities inthe reorganized firm. Ideally, reorganization should be chosen over liquidation when thefirm as a going concern is worth more than its liquidation value. However, the conflictinginterests of the different parties can result in violations of this principle.
www.nacm.org/ National Association of Credit Managementwww.dnb.com/ Dun & Bradstreet’s site; the premier guide to corporate credit decisionswww.ny.frb.org/pihome/addpub/credit.html The Federal Reserve Bank of New York’s guide to
credit managementwww.creditworthy.com/ Useful tips and online resources for credit managementwww.ftc.gov/bcp/conline/pubs/credit/scoring.htm A discussion of the credit scoring processhttp://bankrupt.com/ Resources for firms that have made some bad decisions
terms of sale collection policy workoutopen account aging schedule liquidationcredit analysis bankruptcy reorganizationcredit policy
1. Trade Credit Rates. Company X sells on a 1/20, net 60, basis. Customer Y buys goods withan invoice of $1,000.
a. How much can Company Y deduct from the bill if it pays on Day 20?b. How many extra days of credit can Company Y receive if it passes up the cash discount?c. What is the effective annual rate of interest if Y pays on the due date rather than Day 20?
2. Terms of Sale. Complete the following passage by selecting the appropriate terms from thefollowing list (some terms may be used more than once): acceptance, open, commercial,trade, the United States, his or her own, note, draft, account, promissory, bank, banker’s, thecustomer’s.
Key Terms
Quiz
Related WebLinks
246 SECTION TWO
Most goods are sold on ________ ________. In this case the only evidence of the debt is arecord in the seller’s books and a signed receipt. When the order is very large, the customermay be asked to sign a(n) ________ ________, which is just a simple IOU. An alternativeis for the seller to arrange a(n) ________ ________ ordering payment by the customer. Inorder to obtain the goods, the customer must acknowledge this order and sign the document.This signed acknowledgment is known as a(n) ________ ________. Sometimes the sellermay also ask ________ ________ bank to sign the document. In this case it is known as a(n)________ ________.
3. Terms of Sale. Indicate which firm of each pair you would expect to grant shorter or longercredit periods:
a. One firm sells hardware; the other sells bread.b. One firm’s customers have an inventory turnover ratio of 10; the other’s customers have
turnover of 15.c. One firm sells mainly to electric utilities; the other to fashion boutiques.
4. Payment Lag. The lag between purchase date and the date at which payment is due is knownas the terms lag. The lag between the due date and the date on which the buyer actually paysis termed the due lag, and the lag between the purchase and actual payment dates is the paylag. Thus
Pay lag = terms lag + due lag
State how you would expect the following events to affect each type of lag:
a. The company imposes a service charge on late payers.b. A recession causes customers to be short of cash.c. The company changes its terms from net 10 to net 20.
5. Bankruptcy. True or false?
a. It makes sense to evaluate the credit manager’s performance by looking at the proportionof bad debts.
b. When a company becomes bankrupt, it is usually in the interests of the equityholders toseek a liquidation rather than a reorganization.
c. A reorganization plan must be presented for approval by each class of creditor.d. The Internal Revenue Service has first claim on the company’s assets in the event of
bankruptcy.e. In a reorganization, creditors may be paid off with a mixture of cash and securities.f. When a company is liquidated, one of the most valuable assets to be sold is often the tax-
loss carry-forward.
6. Trade Credit Rates. A firm currently offers terms of sale of 3/20, net 40. What effect willthe following actions have on the implicit interest rate charged to customers that pass up thecash discount? State whether the implicit interest rate will increase or decrease.
a. The terms are changed to 4/20, net 40.b. The terms are changed to 3/30, net 40.c. The terms are changed to 3/20, net 30.
7. Trade Credit and Receivables. A firm offers terms of 2/15, net 30. Currently, two-thirdsof all customers take advantage of the trade discount; the remainder pay bills at the due date.
a. What will be the firm’s typical value for its accounts receivable period?
PracticeProblems
Credit Management and Collection 247
b. What is the average investment in accounts receivable if annual sales are $20 million?c. What would likely happen to the firm’s accounts receivable period if it changed its terms
to 3/15, net 30?
8. Terms of Sale. Microbiotics currently sells all of its frozen dinners cash on delivery but be-lieves it can increase sales by offering supermarkets 1 month of free credit. The price percarton is $50 and the cost per carton is $40.
a. If unit sales will increase from 1,000 cartons to 1,060 per month, should the firm offerthe credit? The interest rate is 1 percent per month, and all customers will pay their bills.
b. What if the interest rate is 1.5 percent per month?c. What if the interest rate is 1.5 percent per month, but the firm can offer the credit only
as a special deal to new customers, while old customers will continue to pay cash on de-livery?
9. Credit Decision/Repeat Sales. Locust Software sells computer training packages to itsbusiness customers at a price of $101. The cost of production (in present value terms) is $95.Locust sells its packages on terms of net 30 and estimates that about 7 percent of all orderswill be uncollectible. An order comes in for 20 units. The interest rate is 1 percent per month.
a. Should the firm extend credit if this is a one-time order? The sale will not be made un-less credit is extended.
b. What is the break-even probability of collection?c. Now suppose that if a customer pays this month’s bill, it will place an identical order in
each month indefinitely and can be safely assumed to pose no risk of default. Shouldcredit be extended?
d. What is the break-even probability of collection in the repeat-sales case?
10. Bankruptcy. Explain why equity can sometimes have a positive value even when compa-nies petition for bankruptcy.
11. Credit Decision. Look back at Example 3. Cast Iron’s costs have increased from $1,000 to$1,050. Assuming there is no possibility of repeat orders, and that the probability of suc-cessful collection from the customer is p = .9, answer the following:
a. Should Cast Iron grant or refuse credit?b. What is the break-even probability of collection?
12. Credit Analysis. Financial ratios were described earlier. If you were the credit manager, towhich financial ratios would you pay most attention?
13. Credit Decision. The Branding Iron Company sells its irons for $50 apiece wholesale. Pro-duction cost is $40 per iron. There is a 25 percent chance that a prospective customer willgo bankrupt within the next half year. The customer orders 1,000 irons and asks for 6months’ credit. Should you accept the order? Assume a 10 percent per year discount rate, nochance of a repeat order, and that the customer will pay either in full or not at all.
14. Credit Policy. As treasurer of the Universal Bed Corporation, Aristotle Procrustes is wor-ried about his bad debt ratio, which is currently running at 6 percent. He believes that im-posing a more stringent credit policy might reduce sales by 5 percent and reduce the baddebt ratio to 4 percent. If the cost of goods sold is 80 percent of the selling price, should Mr.Procrustes adopt the more stringent policy?
15. Credit Decision/Repeat Sales. Surf City sells its network browsing software for $15 percopy to computer software distributors and allows its customers 1 month to pay their bills.The cost of the software is $10 per copy. The industry is very new and unsettled, however,and the probability that a new customer granted credit will go bankrupt within the next
248 SECTION TWO
month is 25 percent. The firm is considering switching to a cash-on-delivery credit policyto reduce its exposure to defaults on trade credit. The discount rate is 1 percent per month.
a. Should the firm switch to a cash-on-delivery policy? If it does so, its sales will fall by 40percent.
b. How would your answer change if a customer which is granted credit and pays its billscan be expected to generate repeat orders with negligible likelihood of default for eachof the next 6 months? Similarly, customers which pay cash also will generate on average6 months of repeat sales.
16. Credit Policy. A firm currently makes only cash sales. It estimates that allowing trade crediton terms of net 30 would increase monthly sales from 200 to 220 units per month. The priceper unit is $101 and the cost (in present value terms) is $80. The interest rate is 1 percent permonth.
a. Should the firm change its credit policy?b. Would your answer to (a) change if 5 percent of all customers will fail to pay their bills
under the new credit policy?c. What if 5 percent of only the new customers fail to pay their bills? The current customers
take advantage of the 30 days of free credit but remain safe credit risks.
17. Credit Analysis. Use the data in Example 3. Now suppose, however, that 10 percent of CastIron’s customers are slow payers, and that slow payers have a probability of 30 percent ofdefaulting on their bills. If it costs $5 to determine whether a customer has been a promptor slow payer in the past, should Cast Iron undertake such a check? Hint: What is the ex-pected savings from the credit check? It will depend on both the probability of uncoveringa slow payer and the savings from denying these payers credit.
18. Credit Analysis. Look back at the previous problem, but now suppose that if a customer de-faults on a payment, you can eventually collect about half the amount owed to you. Will yoube more or less tempted to pay for a credit check once you account for the possibility of par-tial recovery of debts?
19. Credit Policy. Jim Khana, the credit manager of Velcro Saddles, is reappraising the com-pany’s credit policy. Velcro sells on terms of net 30. Cost of goods sold is 85 percent of sales.Velcro classifies customers on a scale of 1 to 4. During the past 5 years, the collection ex-perience was as follows:
Defaults as Average CollectionPercentage Period in Days for
Classification of Sales Nondefaulting Accounts
1 0 452 2 423 10 504 20 80
The average interest rate was 15 percent. What conclusions (if any) can you draw about Vel-cro’s credit policy? Should the firm deny credit to any of its customers? What other factorsshould be taken into account before changing this policy?
20. Credit Analysis. Galenic, Inc., is a wholesaler for a range of pharmaceutical products. Be-fore deducting any losses from bad debts, Galenic operates on a profit margin of 5 percent.For a long time the firm has employed a numerical credit scoring system based on a smallnumber of key ratios. This has resulted in a bad debt ratio of 1 percent.
ChallengeProblems
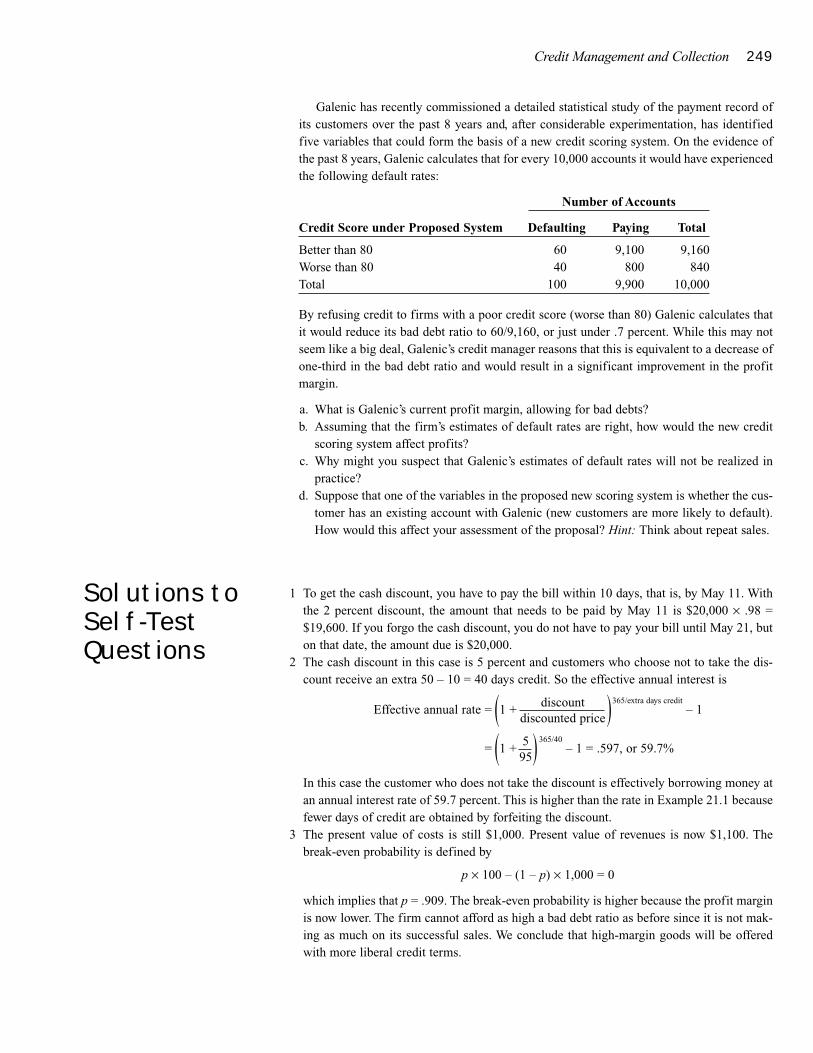
Credit Management and Collection 249
Galenic has recently commissioned a detailed statistical study of the payment record ofits customers over the past 8 years and, after considerable experimentation, has identifiedfive variables that could form the basis of a new credit scoring system. On the evidence ofthe past 8 years, Galenic calculates that for every 10,000 accounts it would have experiencedthe following default rates:
Number of Accounts
Credit Score under Proposed System Defaulting Paying Total
Better than 80 60 9,100 9,160Worse than 80 40 800 840Total 100 9,900 10,000
By refusing credit to firms with a poor credit score (worse than 80) Galenic calculates thatit would reduce its bad debt ratio to 60/9,160, or just under .7 percent. While this may notseem like a big deal, Galenic’s credit manager reasons that this is equivalent to a decrease ofone-third in the bad debt ratio and would result in a significant improvement in the profitmargin.
a. What is Galenic’s current profit margin, allowing for bad debts?b. Assuming that the firm’s estimates of default rates are right, how would the new credit
scoring system affect profits?c. Why might you suspect that Galenic’s estimates of default rates will not be realized in
practice?d. Suppose that one of the variables in the proposed new scoring system is whether the cus-
tomer has an existing account with Galenic (new customers are more likely to default).How would this affect your assessment of the proposal? Hint: Think about repeat sales.
1 To get the cash discount, you have to pay the bill within 10 days, that is, by May 11. Withthe 2 percent discount, the amount that needs to be paid by May 11 is $20,000 × .98 =$19,600. If you forgo the cash discount, you do not have to pay your bill until May 21, buton that date, the amount due is $20,000.
2 The cash discount in this case is 5 percent and customers who choose not to take the dis-count receive an extra 50 – 10 = 40 days credit. So the effective annual interest is
Effective annual rate = (1 + discount )365/extra days credit– 1
discounted price
= (1 + 5 ) 365/40– 1 = .597, or 59.7%
95
In this case the customer who does not take the discount is effectively borrowing money atan annual interest rate of 59.7 percent. This is higher than the rate in Example 21.1 becausefewer days of credit are obtained by forfeiting the discount.
3 The present value of costs is still $1,000. Present value of revenues is now $1,100. Thebreak-even probability is defined by
p × 100 – (1 – p) × 1,000 = 0
which implies that p = .909. The break-even probability is higher because the profit marginis now lower. The firm cannot afford as high a bad debt ratio as before since it is not mak-ing as much on its successful sales. We conclude that high-margin goods will be offeredwith more liberal credit terms.
Solutions toSelf-TestQuestions
250 SECTION TWO
4 The higher the discount rate the less important are future sales. Because the value of repeatsales is lower, the break-even probability on the initial sale is higher. For instance, we sawthat the break-even probability was 1/3 when the discount rate was 10 percent. When thediscount rate is 20 percent, the value of a perpetual flow of repeat sales falls to $200/.20 =$1,000, and the break-even probability increases to 1/2:
1/2 × $1,000 – 1/2 × $1,000 = 0
5 The customer pays bills 45 days after the invoice date. Because goods are purchased daily,at any time there will be bills outstanding with “ages” ranging from 1 to 45 days. At anytime, the customer will have 30 days’ worth of purchases, or $10,000, outstanding for a pe-riod of up to 1 month, and 15 days’ worth of purchases, or $5,000, outstanding for between1 month and 45 days. The aging schedule will appear as follows:
Age of Account Amount
< 1 month $10,0001–2 months $ 5,000
MINICASEGeorge Stamper, a credit analyst with Micro-Encapsulators Corp.(MEC), needed to respond to an urgent e-mail request from theSouth-East sales office. The local sales manager reported that shehad an opportunity to clinch an order from Miami Spice (MS) for50 encapsulators at $10,000 each. She added that she was partic-ularly keen to secure this order since MS was likely to have a con-tinuing need for 50 encapsulators a year and could thereforeprove a very valuable customer. However, orders of this size to anew customer generally required head office agreement, and itwas therefore George’s responsibility to make a rapid assessmentof MS’s creditworthiness and to approve or disapprove the sale.
George knew that MS was a medium-sized company, with apatchy earnings record. After growing rapidly in the 1980s, MShad encountered strong competition in its principal markets andearnings had fallen sharply. George Stamper was not sure exactlyto what extent this was a bad omen. New management had beenbrought in to cut costs and there were some indications that theworst was over for the company. Investors appeared to agree withthis assessment, for the stock price had risen to $5.80 from its lowof $4.25 the previous year. George had in front of him MS’s lat-est financial statements, which are summarized in Table 2.12. Herapidly calculated a few key financial ratios and the company’s Zscore.
George also made a number of other checks on MS. The com-pany had a small issue of bonds outstanding, which were rated Bby Moody’s. Inquiries through MEC’s bank indicated that MS
had unused lines of credit totaling $5 million but had enteredinto discussions with its bank for a renewal of a $15 millionbank loan that was due to be repaid at the end of the year. Tele-phone calls to MS’s other suppliers suggested that the companyhad recently been 30 days late in paying its bills.
George also needed to take into account the profit that thecompany could make on MS’s order. Encapsulators were soldon standard terms of 2/30, net 60. So if MS paid promptly, MECwould receive additional revenues of 50 × $9,800 = $490,000.However, given MS’s cash position, it was more than likely thatit would forgo the cash discount and would not pay until some-time after the 60 days. Since interest rates were about 8 percent,any such delays in payment would reduce the present value toMEC of the revenues. George also recognized that there wereproduction and transportation costs in filling MS’s order. Theseworked out at $475,000, or $9,500 a unit. Corporate profitswere taxed at 35 percent.
Questions
1. What can you say about Miami Spice’s creditworthiness?2. What is the break-even probability of default? How is it af-
fected by the delay before MS pays its bills?3. How should George Stamper’s decision be affected by the
possibility of repeat orders?
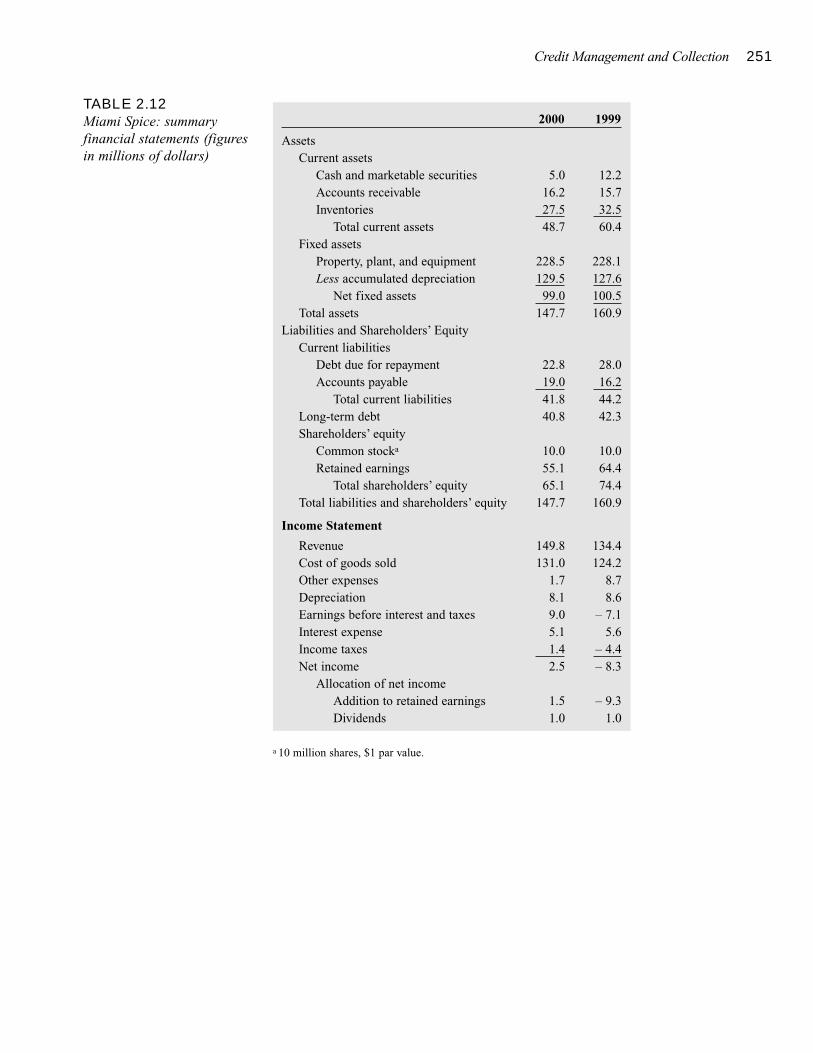
Credit Management and Collection 251
TABLE 2.12Miami Spice: summaryfinancial statements (figuresin millions of dollars)
2000 1999
AssetsCurrent assets
Cash and marketable securities 5.0 12.2Accounts receivable 16.2 15.7Inventories 27.5 32.5
Total current assets 48.7 60.4Fixed assets
Property, plant, and equipment 228.5 228.1Less accumulated depreciation 129.5 127.6
Net fixed assets 99.0 100.5Total assets 147.7 160.9
Liabilities and Shareholders’ EquityCurrent liabilities
Debt due for repayment 22.8 28.0Accounts payable 19.0 16.2
Total current liabilities 41.8 44.2Long-term debt 40.8 42.3Shareholders’ equity
Common stocka 10.0 10.0Retained earnings 55.1 64.4
Total shareholders’ equity 65.1 74.4Total liabilities and shareholders’ equity 147.7 160.9
Income Statement
Revenue 149.8 134.4Cost of goods sold 131.0 124.2Other expenses 1.7 8.7Depreciation 8.1 8.6Earnings before interest and taxes 9.0 – 7.1Interest expense 5.1 5.6Income taxes 1.4 – 4.4Net income 2.5 – 8.3
Allocation of net incomeAddition to retained earnings 1.5 – 9.3Dividends 1.0 1.0
a 10 million shares, $1 par value.

Valuing Bonds
Valuing Stocks
Introduction to Risk, Return, and theOpportunity Cost of Capital
Section 3
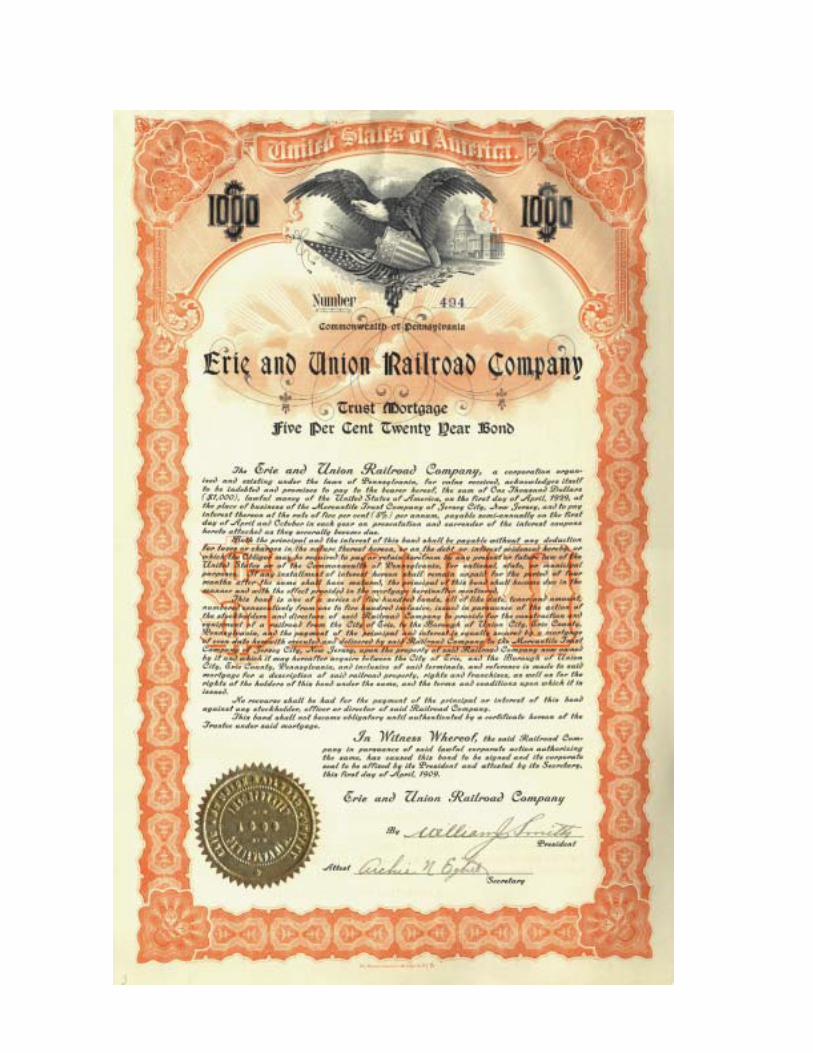
255
VALUING BONDS
Bond CharacteristicsReading the Financial Pages
Bond Prices and YieldsHow Bond Prices Vary with InterestRates
Yield to Maturity versus Current Yield
Rate of Return
Interest Rate Risk
The Yield Curve
Nominal and Real Rates of Interest
Default Risk
Variations in Corporate Bonds
Summary
Bondholders once received a beautifully engraved certificate like this 1909 one for an Erieand Union Railroad bond.Nowadays their ownership is simply recorded on an electronic database.Courtesy of Terry Cox
nvestment in new plant and equipment requires money—often a lot of
money. Sometimes firms may be able to save enough out of previous
earnings to cover the cost of investments, but often they need to raise
cash from investors. In broad terms, we can think of two ways to raise new
money from investors: borrow the cash or sell additional shares of common stock.
If companies need the money only for a short while, they may borrow it from a bank;
if they need it to make long-term investments, they generally issue bonds, which are
simply long-term loans. When companies issue bonds, they promise to make a series of
fixed interest payments and then to repay the debt. As long as the company generates
sufficient cash, the payments on a bond are certain. In this case bond valuation involves
straightforward time-value-of-money computations. But there is some chance that even
the most blue-chip company will fall on hard times and will not be able to repay its
debts. Investors take this default risk into account when they price the bonds and de-
mand a higher interest rate to compensate.
In the first part of this material we sidestep the issue of default risk and we focus on
U.S. Treasury bonds. We show how bond prices are determined by market interest rates
and how those prices respond to changes in rates. We also consider the yield to matu-
rity and discuss why a bond’s yield may vary with its time to maturity.
Later in the material we look at corporate bonds where there is also a possibility of
default. We will see how bond ratings provide a guide to the default risk and how low-
grade bonds offer higher promised yields.
Later we will look in more detail at the securities that companies issue and we will
see that there are many variations on bond design. But for now, we keep our focus on
garden-variety bonds and general principles of bond valuation.
After studying this material you should be able to
� Distinguish among the bond’s coupon rate, current yield, and yield to maturity.
� Find the market price of a bond given its yield to maturity, find a bond’s yield given
its price, and demonstrate why prices and yields vary inversely.
� Show why bonds exhibit interest rate risk.
� Understand why investors pay attention to bond ratings and demand a higher inter-
est rate for bonds with low ratings.
256
I
Bond CharacteristicsGovernments and corporations borrow money by selling bonds to investors. The moneythey collect when the bond is issued, or sold to the public, is the amount of the loan. Inreturn, they agree to make specified payments to the bondholders, who are the lenders.When you own a bond, you generally receive a fixed interest payment each year until
BOND Security thatobligates the issuer to makespecified payments to thebondholder.
Valuing Bonds 257
the bond matures. This payment is known as the coupon because most bonds used tohave coupons that the investors clipped off and mailed to the bond issuer to claim theinterest payment. At maturity, the debt is repaid: the borrower pays the bondholder thebond’s face value (equivalently, its par value).
How do bonds work? Consider a U.S. Treasury bond as an example. Several yearsago, the U.S. Treasury raised money by selling 6 percent coupon, 2002 maturity, Trea-sury bonds. Each bond has a face value of $1,000. Because the coupon rate is 6 per-cent, the government makes coupon payments of 6 percent of $1,000, or $60 each year.1
When the bond matures in July 2002, the government must pay the face value of thebond, $1,000, in addition to the final coupon payment.
Suppose that in 1999 you decided to buy the “6s of 2002,” that is, the 6 percentcoupon bonds maturing in 2002. If you planned to hold the bond until maturity, youwould then have looked forward to the cash flows depicted in Figure 3.1. The initialcash flow is negative and equal to the price you have to pay for the bond. Thereafter, thecash flows equal the annual coupon payment, until the maturity date in 2002, when youreceive the face value of the bond, $1,000, in addition to the final coupon payment.
READING THE FINANCIAL PAGES
The prices at which you can buy and sell bonds are shown each day in the financialpress. Figure 3.2 is an excerpt from the bond quotation page of The Wall Street Journaland shows the prices of bonds and notes that have been issued by the United States Trea-sury. (A note is just a bond with a maturity of less than 10 years at the time it is issued.)The entry for the 6 percent bond maturing in July 2002 that we just looked at is high-lighted. The letter n indicates that it is a note.
Prices are generally quoted in 32nds rather than decimals. Thus for the 6 percentbond the asked price—the price investors pay to buy the bond from a bond dealer—isshown as 101:02. This means that the price is 101 and 2/32, or 101.0625 percent of facevalue, which is $1,010.625.
The bid price is the price investors receive if they sell the bond to a dealer. Just asthe used-car dealer earns his living by reselling cars at higher prices than he paid forthem, so the bond dealer needs to charge a spread between the bid and asked price. No-
COUPON The interestpayments paid to thebondholder.
FACE VALUE Paymentat the maturity of the bond.Also called par value ormaturity value.
COUPON RATE Annualinterest payment as apercentage of face value.
1 In the United States, these coupon payments typically would come in two semiannual installments of $30each. To keep things simple for now, we will assume one coupon payment per year.
$1,060
Year: 1999 2000 2001 2002
$60
$1,000
$60$60
�Price
FIGURE 3.1Cash flows to an investor inthe 6% coupon bondmaturing in the year 2002.
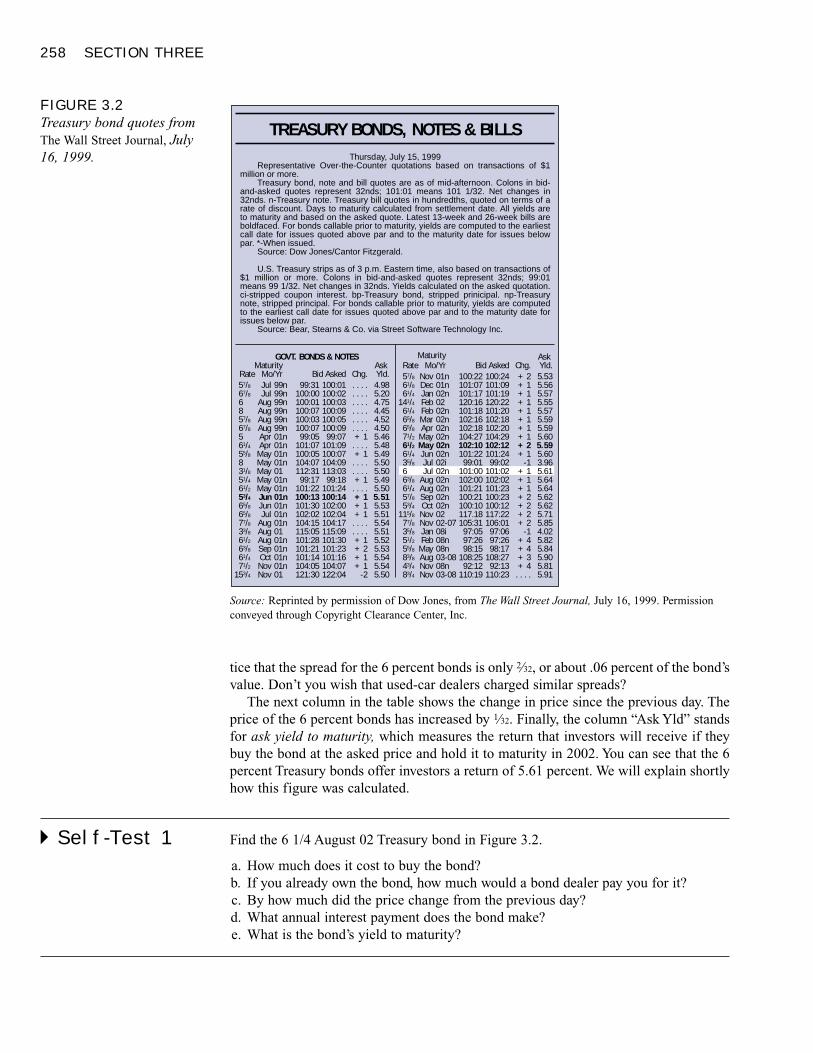
258 SECTION THREE
tice that the spread for the 6 percent bonds is only 2⁄32, or about .06 percent of the bond’svalue. Don’t you wish that used-car dealers charged similar spreads?
The next column in the table shows the change in price since the previous day. Theprice of the 6 percent bonds has increased by 1⁄32. Finally, the column “Ask Yld” standsfor ask yield to maturity, which measures the return that investors will receive if theybuy the bond at the asked price and hold it to maturity in 2002. You can see that the 6percent Treasury bonds offer investors a return of 5.61 percent. We will explain shortlyhow this figure was calculated.
� Self-Test 1 Find the 6 1/4 August 02 Treasury bond in Figure 3.2.
a. How much does it cost to buy the bond?b. If you already own the bond, how much would a bond dealer pay you for it?c. By how much did the price change from the previous day?d. What annual interest payment does the bond make?e. What is the bond’s yield to maturity?
Representative Over-the-Counter quotations based on transactions of $1 million or more.
Treasury bond, note and bill quotes are as of mid-afternoon. Colons in bid-and-asked quotes represent 32nds; 101:01 means 101 1/32. Net changes in 32nds. n-Treasury note. Treasury bill quotes in hundredths, quoted on terms of a rate of discount. Days to maturity calculated from settlement date. All yields are to maturity and based on the asked quote. Latest 13-week and 26-week bills are boldfaced. For bonds callable prior to maturity, yields are computed to the earliest call date for issues quoted above par and to the maturity date for issues below par. *-When issued.
Source: Dow Jones/Cantor Fitzgerald.
U.S. Treasury strips as of 3 p.m. Eastern time, also based on transactions of $1 million or more. Colons in bid-and-asked quotes represent 32nds; 99:01 means 99 1/32. Net changes in 32nds. Yields calculated on the asked quotation. ci-stripped coupon interest. bp-Treasury bond, stripped prinicipal. np-Treasury note, stripped principal. For bonds callable prior to maturity, yields are computed to the earliest call date for issues quoted above par and to the maturity date for issues below par.
Source: Bear, Stearns & Co. via Street Software Technology Inc.
Thursday, July 15, 1999
GOVT. BONDS & NOTES
TREASURY BONDS, NOTES & BILLS
JulJul
AugAugAugAugAprApr
MayMayMayMayMayJunJunJul
AugAugAugSepOctNovNov
99n99n99n99n99n99n01n01n01n01n0101n01n01n01n01n01n0101n01n01n01n01
99:31100:00100:01100:07100:03100:07
99:05101:07100:05104:07112:31
99:17101:22100:13101:30102:02104:15115:05101:28101:21101:14104:05121:30
100:01100:02100:03100:09100:05100:09
99:07101:09100:07104:09113:03
99:18101:24100:14102:00102:04104:17115:09101:30101:23101:16104:07122:04
. . . .
. . . .
. . . .
. . . .
. . . .
. . . .+ 1. . . .+ 1. . . .. . . .+ 1. . . .+ 1+ 1+ 1. . . .. . . .+ 1+ 2+ 1+ 1
-2
4.985.204.754.454.524.505.465.485.495.505.505.495.505.515.535.515.545.515.525.535.545.545.50
57/8
67/8
6857/8
67/8
561/4
55/8
831/8
51/4
61/2
53/4
65/8
65/8
77/8
33/8
61/2
63/8
61/4
71/2
153/4
Mo/YrMaturity
Bid Asked Chg.AskYld.Rate 01n
01n02n0202n02n02n02n02n02n02i02n02n02n02n02n0202-0708i08n08n03-0808n03-08
NovDecJanFebFebMarApr
MayMayJunJulJul
AugAugSepOctNovNovJanFeb
MayAugNovNov
100:22101:07101:17120:16101:18102:16102:18104:27102:10101:2299:01
101:00102:00101:21100:21100:10117.18105:3197:0597:2698:15
108:2592:12
110:19
100:24101:09101:19120:22101:20102:18102:20104:29102:12101:2499:02
101:02102:02101:23100:23100:12117:22106:0197:0697:2698:17
108:2792:13
110:23
+ 2+ 1+ 1+ 1+ 1+ 1+ 1+ 1+ 2+ 1
-1+ 1+ 1+ 1+ 2+ 2+ 2+ 2
-1+ 4+ 4+ 3+ 4. . . .
5.535.565.575.555.575.595.595.605.595.603.965.615.645.645.625.625.715.854.025.825.845.905.815.91
57/8
61/8
61/4
141/4
61/4
65/8
65/8
71/2
61/2
61/4
35/8
663/8
61/4
57/8
53/4
115/8
77/8
35/8
51/2
55/8
83/8
43/4
83/4
Mo/YrMaturity
Bid Asked Chg.AskYld.Rate
FIGURE 3.2Treasury bond quotes fromThe Wall Street Journal, July16, 1999.
Source: Reprinted by permission of Dow Jones, from The Wall Street Journal, July 16, 1999. Permissionconveyed through Copyright Clearance Center, Inc.
Valuing Bonds 259
Bond Prices and YieldsIn Figure 3.1, we examined the cash flows that an investor in 6 percent Treasury bondswould receive. How much would you be willing to pay for this stream of cash flows?To find out, you need to look at the interest rate that investors could earn on similar se-curities. In 1999, Treasury bonds with 3-year maturities offered a return of about 5.6percent. Therefore, to value the 6s of 2002, we need to discount the prospective streamof cash flows at 5.6 percent:
PV =$60
+$60
+$1,060
(1 + r) (1 + r)2 (1 + r)3
=$60
+$60
+$1,060
= $1,010.77(1.056) (1.056)2 (1.056)3
Bond prices are usually expressed as a percentage of their face value. Thus we cansay that our 6 percent Treasury bond is worth 101.077 percent of face value, and itsprice would usually be quoted as 101.077, or about 101 2⁄32.
Did you notice that the coupon payments on the bond are an annuity? In other words,the holder of our 6 percent Treasury bond receives a level stream of coupon paymentsof $60 a year for each of 3 years. At maturity the bondholder gets an additional paymentof $1,000. Therefore, you can use the annuity formula to value the coupon paymentsand then add on the present value of the final payment of face value:
PV = PV (coupons) + PV (face value)= (coupon � annuity factor) + (face value � discount factor)
= $60 × [ 1–
1 ] + 1,000 × 1.056 .056(1.056)3 1.0563
= $161.57 + $849.20 = $1,010.77
If you need to value a bond with many years to run before maturity, it is usually easiestto value the coupon payments as an annuity and then add on the present value of thefinal payment.
� Self-Test 2 Calculate the present value of a 6-year bond with a 9 percent coupon. The interest rateis 12 percent.
� EXAMPLE 1 Bond Prices and Semiannual Coupon Payments
Thus far we’ve assumed that interest payments occur annually. This is the case forbonds in many European countries, but in the United States most bonds make couponpayments semiannually. So when you hear that a bond in the United States has a couponrate of 6 percent, you can generally assume that the bond makes a payment of $60/2 =$30 every 6 months. Similarly, when investors in the United States refer to the bond’sinterest rate, they usually mean the semiannually compounded interest rate. Thus an interest rate quoted at 5.6 percent really means that the 6-month rate is 5.6/2 = 2.8
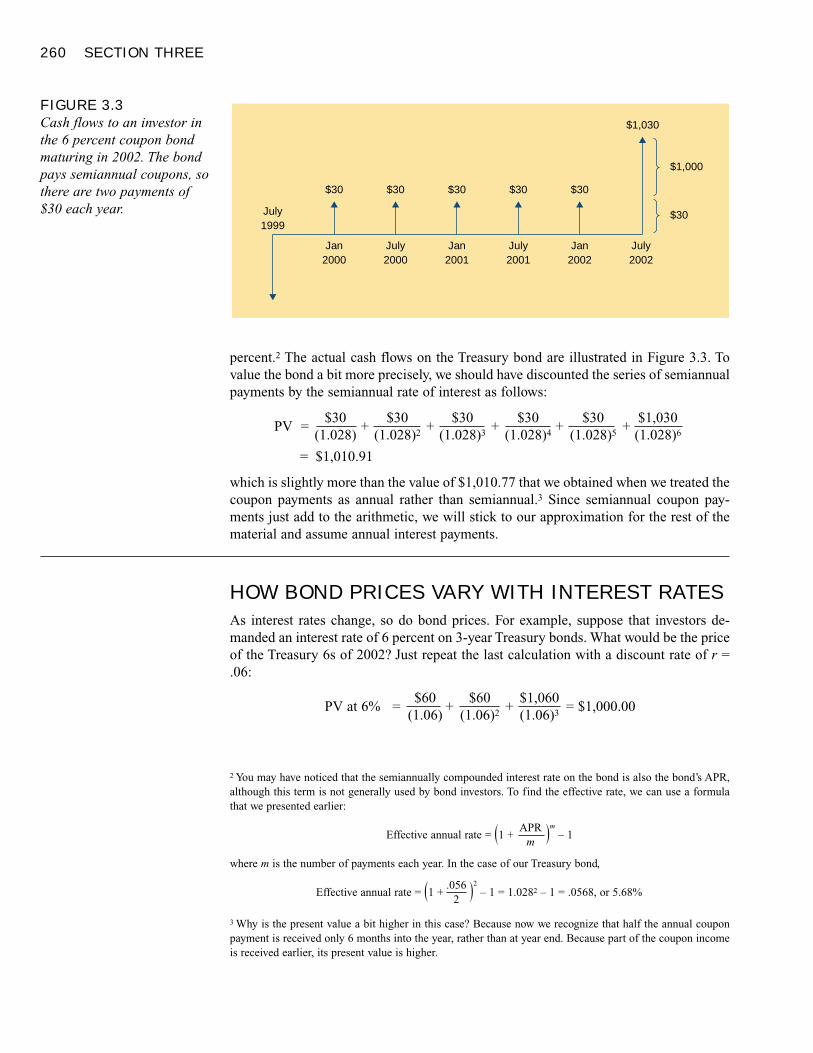
260 SECTION THREE
percent.2 The actual cash flows on the Treasury bond are illustrated in Figure 3.3. Tovalue the bond a bit more precisely, we should have discounted the series of semiannualpayments by the semiannual rate of interest as follows:
PV =$30
+$30
+$30
+$30
+$30
+$1,030
(1.028) (1.028)2 (1.028)3 (1.028)4 (1.028)5 (1.028)6
= $1,010.91
which is slightly more than the value of $1,010.77 that we obtained when we treated thecoupon payments as annual rather than semiannual.3 Since semiannual coupon pay-ments just add to the arithmetic, we will stick to our approximation for the rest of thematerial and assume annual interest payments.
HOW BOND PRICES VARY WITH INTEREST RATES
As interest rates change, so do bond prices. For example, suppose that investors de-manded an interest rate of 6 percent on 3-year Treasury bonds. What would be the priceof the Treasury 6s of 2002? Just repeat the last calculation with a discount rate of r =.06:
PV at 6% =$60
+$60
+$1,060
= $1,000.00(1.06) (1.06)2 (1.06)3
2 You may have noticed that the semiannually compounded interest rate on the bond is also the bond’s APR,although this term is not generally used by bond investors. To find the effective rate, we can use a formulathat we presented earlier:
Effective annual rate = (1 +APR )m
– 1m
where m is the number of payments each year. In the case of our Treasury bond,
Effective annual rate = (1 +.056 )2
– 1 = 1.0282 – 1 = .0568, or 5.68%2
3 Why is the present value a bit higher in this case? Because now we recognize that half the annual couponpayment is received only 6 months into the year, rather than at year end. Because part of the coupon incomeis received earlier, its present value is higher.
$1,030
July2001
Jan2002
July2002
July1999
$30
$1,000
$30
Jan2001
$30 $30
July2000
Jan2000
$30 $30
FIGURE 3.3Cash flows to an investor inthe 6 percent coupon bondmaturing in 2002. The bondpays semiannual coupons, sothere are two payments of$30 each year.
Valuing Bonds 261
Thus when the interest rate is the same as the coupon rate (6 percent in our example),the bond sells for its face value.
We first valued the Treasury bond with an interest rate of 5.6 percent, which is lowerthan the coupon rate. In that case the price of the bond was higher than its face value.We then valued it using an interest rate that is equal to the coupon and found that bondprice equaled face value. You have probably already guessed that when the cash flowsare discounted at a rate that is higher than the bond’s coupon rate, the bond is worth lessthan its face value. The following example confirms that this is the case.
� EXAMPLE 2 Bond Prices and Interest Rates
Investors will pay $1,000 for a 6 percent, 3-year Treasury bond, when the interest rateis 6 percent. Suppose that the interest rate is higher than the coupon rate at (say) 15 per-cent. Now what is the value of the bond? Simple! We just repeat our initial calculationbut with r = .15:
PV at 15% =$60
+$60
+$1,060
= $794.51(1.15) (1.15)2 (1.15)3
The bond sells for 79.45 percent of face value.
YIELD TO MATURITY VERSUS CURRENT YIELD
Suppose you are considering the purchase of a 3-year bond with a coupon rate of 10percent. Your investment adviser quotes a price for the bond. How do you calculate therate of return the bond offers?
For bonds priced at face value the answer is easy. The rate of return is the couponrate. We can check this by setting out the cash flows on your investment:
Cash Paid to You in Year
You Pay 1 2 3 Rate of Return
$1,000 $100 $100 $1,100 10%
Notice that in each year you earn 10 percent on your money ($100/$1,000). In the finalyear you also get back your original investment of $1,000. Therefore, your total returnis 10 percent, the same as the coupon rate.
Now suppose that the market price of the 3-year bond is $1,136.16. Your cash flowsare as follows:
Cash Paid to You in Year
You Pay 1 2 3 Rate of Return
$1,136.16 $100 $100 $1,100 ?
What’s the rate of return now? Notice that you are paying out $1,136.16 and receivingan annual income of $100. So your income as a proportion of the initial outlay is
We conclude that when the market interest rate exceeds the coupon rate,bonds sell for less than face value. When the market interest rate is below thecoupon rate, bonds sell for more than face value.
262 SECTION THREE
$100/$1,136.16 = .088, or 8.8 percent. This is sometimes called the bond’s currentyield.
However, total return depends on both interest income and any capital gains orlosses. A current yield of 8.8 percent may sound attractive only until you realize that thebond’s price must fall. The price today is $1,136.16, but when the bond matures 3 yearsfrom now, the bond will sell for its face value, or $1,000. A price decline (i.e., a capi-tal loss) of $136.16 is guaranteed, so the overall return over the next 3 years must beless than the 8.8 percent current yield.
Let us generalize. A bond that is priced above its face value is said to sell at a pre-mium. Investors who buy a bond at a premium face a capital loss over the life of thebond, so the return on these bonds is always less than the bond’s current yield. A bondpriced below face value sells at a discount. Investors in discount bonds face a capitalgain over the life of the bond; the return on these bonds is greater than the current yield:
We need a measure of return that takes account of both current yield and the changein a bond’s value over its life. The standard measure is called yield to maturity. Theyield to maturity is the answer to the following question: At what interest rate would thebond be correctly priced?
If you can buy the 3-year bond at face value, the yield to maturity is the coupon rate,10 percent. We can confirm this by noting that when we discount the cash flows at 10percent, the present value of the bond is equal to its $1,000 face value:
PV at 10% =$100
+$100
+$1,100
= $1,000.00(1.10) (1.10)2 (1.10)3
But if you have to buy the 3-year bond for $1,136.16, the yield to maturity is only 5percent. At that discount rate, the bond’s present value equals its actual market price,$1,136.16:
PV at 5% =$100
+$100
+$1,100
= $1,136.16(1.05) (1.05)2 (1.05)3
� EXAMPLE 3 Calculating Yield to Maturity for the Treasury Bond
We found the value of the 6 percent coupon Treasury bond by discounting at a 5.6 per-cent interest rate. We could have phrased the question the other way around: If the priceof the bond is $1,010.77, what return do investors expect? We need to find the yield tomaturity, in other words, the discount rate r, that solves the following equation:
Price =$60
+$60
+$1,060
= $1,010.77(1 + r) (1 + r)2 (1 + r)3
The yield to maturity is defined as the discount rate that makes the presentvalue of the bond’s payments equal to its price.
Because it focuses only on current income and ignores prospective priceincreases or decreases, the current yield mismeasures the bond’s total rate ofreturn. It overstates the return of premium bonds and understates that ofdiscount bonds.
CURRENT YIELDAnnual coupon paymentsdivided by bond price.
YIELD TO MATURITYInterest rate for which thepresent value of the bond’spayments equals the price.
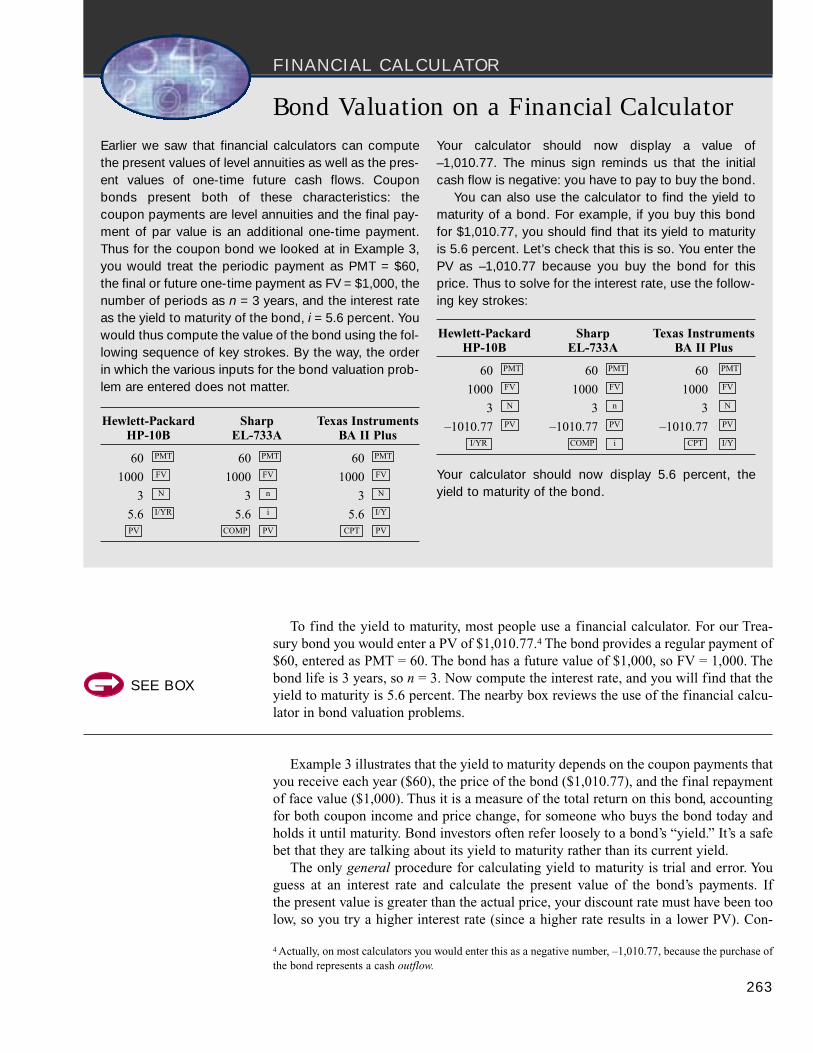
To find the yield to maturity, most people use a financial calculator. For our Trea-sury bond you would enter a PV of $1,010.77.4 The bond provides a regular payment of$60, entered as PMT = 60. The bond has a future value of $1,000, so FV = 1,000. Thebond life is 3 years, so n = 3. Now compute the interest rate, and you will find that theyield to maturity is 5.6 percent. The nearby box reviews the use of the financial calcu-lator in bond valuation problems.
Example 3 illustrates that the yield to maturity depends on the coupon payments thatyou receive each year ($60), the price of the bond ($1,010.77), and the final repaymentof face value ($1,000). Thus it is a measure of the total return on this bond, accountingfor both coupon income and price change, for someone who buys the bond today andholds it until maturity. Bond investors often refer loosely to a bond’s “yield.” It’s a safebet that they are talking about its yield to maturity rather than its current yield.
The only general procedure for calculating yield to maturity is trial and error. Youguess at an interest rate and calculate the present value of the bond’s payments. If the present value is greater than the actual price, your discount rate must have been toolow, so you try a higher interest rate (since a higher rate results in a lower PV). Con-
263
FINANCIAL CALCULATOR
Bond Valuation on a Financial CalculatorEarlier we saw that financial calculators can computethe present values of level annuities as well as the pres-ent values of one-time future cash flows. Couponbonds present both of these characteristics: thecoupon payments are level annuities and the final pay-ment of par value is an additional one-time payment.Thus for the coupon bond we looked at in Example 3,you would treat the periodic payment as PMT = $60,the final or future one-time payment as FV = $1,000, thenumber of periods as n = 3 years, and the interest rateas the yield to maturity of the bond, i = 5.6 percent. Youwould thus compute the value of the bond using the fol-lowing sequence of key strokes. By the way, the orderin which the various inputs for the bond valuation prob-lem are entered does not matter.
Your calculator should now display a value of–1,010.77. The minus sign reminds us that the initialcash flow is negative: you have to pay to buy the bond.
You can also use the calculator to find the yield tomaturity of a bond. For example, if you buy this bondfor $1,010.77, you should find that its yield to maturityis 5.6 percent. Let’s check that this is so. You enter thePV as –1,010.77 because you buy the bond for thisprice. Thus to solve for the interest rate, use the follow-ing key strokes:
Hewlett-Packard Sharp Texas InstrumentsHP-10B EL-733A BA II Plus
60 60 60
1000 1000 1000
3 3 3
–1010.77 –1010.77 –1010.77I/YCPTiCOMPI/YR
PVPVPV
NnN
FVFVFV
PMTPMTPMT
Hewlett-Packard Sharp Texas InstrumentsHP-10B EL-733A BA II Plus
60 60 60
1000 1000 1000
3 3 3
5.6 5.6 5.6PVCPTPVCOMPPV
I/YiI/YR
NnN
FVFVFV
PMTPMTPMT
4 Actually, on most calculators you would enter this as a negative number, –1,010.77, because the purchase ofthe bond represents a cash outflow.
Your calculator should now display 5.6 percent, theyield to maturity of the bond.
SEE BOX
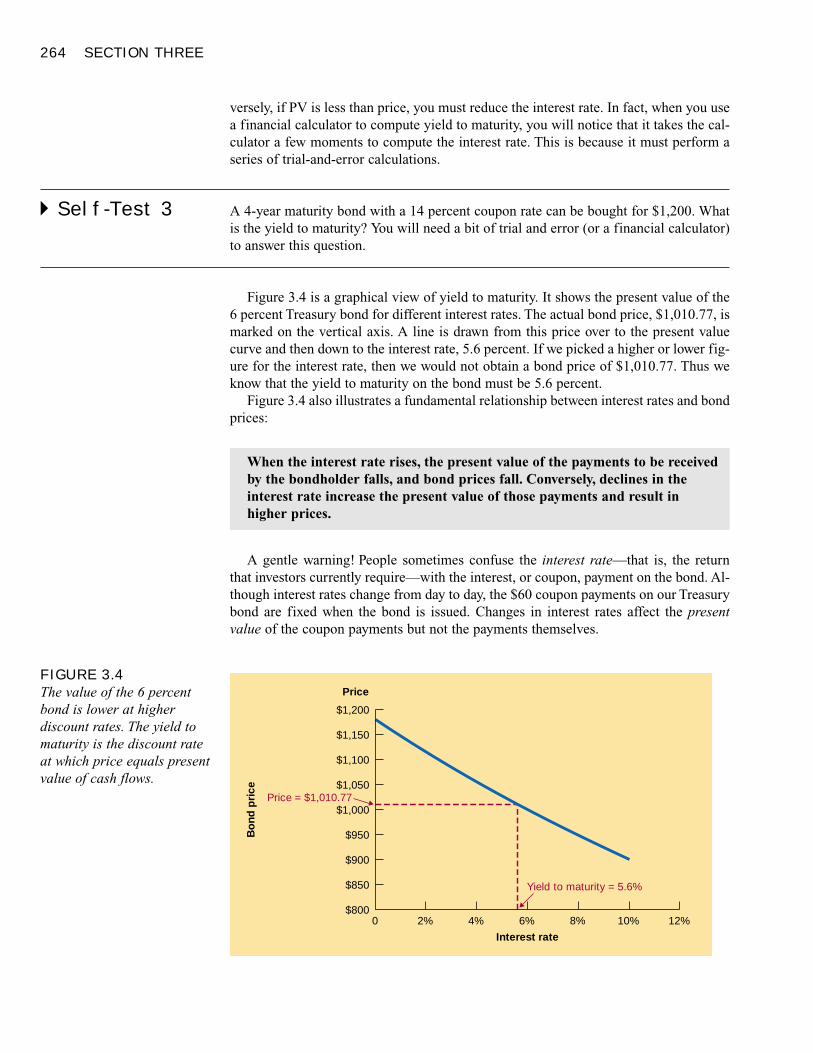
264 SECTION THREE
versely, if PV is less than price, you must reduce the interest rate. In fact, when you usea financial calculator to compute yield to maturity, you will notice that it takes the cal-culator a few moments to compute the interest rate. This is because it must perform aseries of trial-and-error calculations.
� Self-Test 3 A 4-year maturity bond with a 14 percent coupon rate can be bought for $1,200. Whatis the yield to maturity? You will need a bit of trial and error (or a financial calculator)to answer this question.
Figure 3.4 is a graphical view of yield to maturity. It shows the present value of the6 percent Treasury bond for different interest rates. The actual bond price, $1,010.77, ismarked on the vertical axis. A line is drawn from this price over to the present valuecurve and then down to the interest rate, 5.6 percent. If we picked a higher or lower fig-ure for the interest rate, then we would not obtain a bond price of $1,010.77. Thus weknow that the yield to maturity on the bond must be 5.6 percent.
Figure 3.4 also illustrates a fundamental relationship between interest rates and bondprices:
A gentle warning! People sometimes confuse the interest rate—that is, the returnthat investors currently require—with the interest, or coupon, payment on the bond. Al-though interest rates change from day to day, the $60 coupon payments on our Treasurybond are fixed when the bond is issued. Changes in interest rates affect the presentvalue of the coupon payments but not the payments themselves.
When the interest rate rises, the present value of the payments to be receivedby the bondholder falls, and bond prices fall. Conversely, declines in theinterest rate increase the present value of those payments and result in higher prices.
Yield to maturity = 5.6%
Price = $1,010.77
Interest rate
Bo
nd p
rice
$1,200
$1,000
$1,050
$1,100
$1,150
$950
$900
$850
$8000 2% 4% 6% 8% 10% 12%
PriceFIGURE 3.4The value of the 6 percentbond is lower at higherdiscount rates. The yield tomaturity is the discount rateat which price equals presentvalue of cash flows.
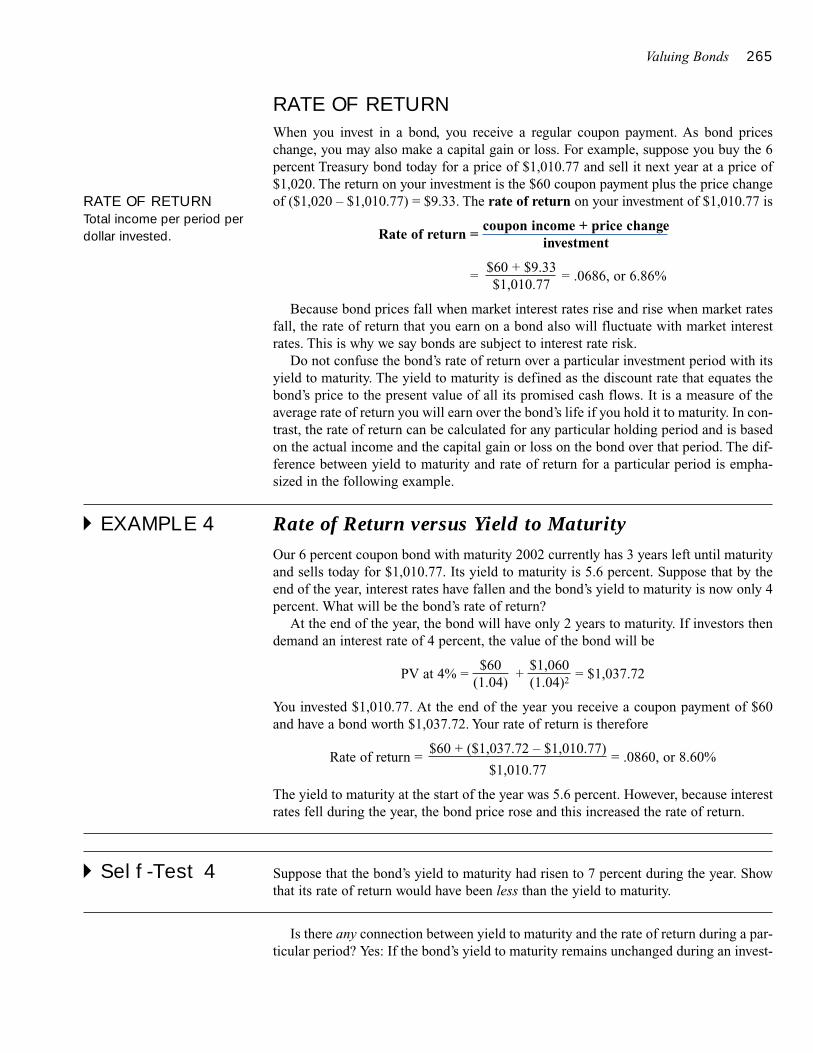
Valuing Bonds 265
RATE OF RETURN
When you invest in a bond, you receive a regular coupon payment. As bond priceschange, you may also make a capital gain or loss. For example, suppose you buy the 6percent Treasury bond today for a price of $1,010.77 and sell it next year at a price of$1,020. The return on your investment is the $60 coupon payment plus the price changeof ($1,020 – $1,010.77) = $9.33. The rate of return on your investment of $1,010.77 is
Rate of return =coupon income + price change
investment
=$60 + $9.33
= .0686, or 6.86%$1,010.77
Because bond prices fall when market interest rates rise and rise when market ratesfall, the rate of return that you earn on a bond also will fluctuate with market interestrates. This is why we say bonds are subject to interest rate risk.
Do not confuse the bond’s rate of return over a particular investment period with itsyield to maturity. The yield to maturity is defined as the discount rate that equates thebond’s price to the present value of all its promised cash flows. It is a measure of theaverage rate of return you will earn over the bond’s life if you hold it to maturity. In con-trast, the rate of return can be calculated for any particular holding period and is basedon the actual income and the capital gain or loss on the bond over that period. The dif-ference between yield to maturity and rate of return for a particular period is empha-sized in the following example.
� EXAMPLE 4 Rate of Return versus Yield to MaturityOur 6 percent coupon bond with maturity 2002 currently has 3 years left until maturityand sells today for $1,010.77. Its yield to maturity is 5.6 percent. Suppose that by theend of the year, interest rates have fallen and the bond’s yield to maturity is now only 4percent. What will be the bond’s rate of return?
At the end of the year, the bond will have only 2 years to maturity. If investors thendemand an interest rate of 4 percent, the value of the bond will be
PV at 4% =$60
+$1,060
= $1,037.72(1.04) (1.04)2
You invested $1,010.77. At the end of the year you receive a coupon payment of $60and have a bond worth $1,037.72. Your rate of return is therefore
Rate of return =$60 + ($1,037.72 – $1,010.77)
= .0860, or 8.60%$1,010.77
The yield to maturity at the start of the year was 5.6 percent. However, because interestrates fell during the year, the bond price rose and this increased the rate of return.
� Self-Test 4 Suppose that the bond’s yield to maturity had risen to 7 percent during the year. Showthat its rate of return would have been less than the yield to maturity.
Is there any connection between yield to maturity and the rate of return during a par-ticular period? Yes: If the bond’s yield to maturity remains unchanged during an invest-
RATE OF RETURNTotal income per period perdollar invested.
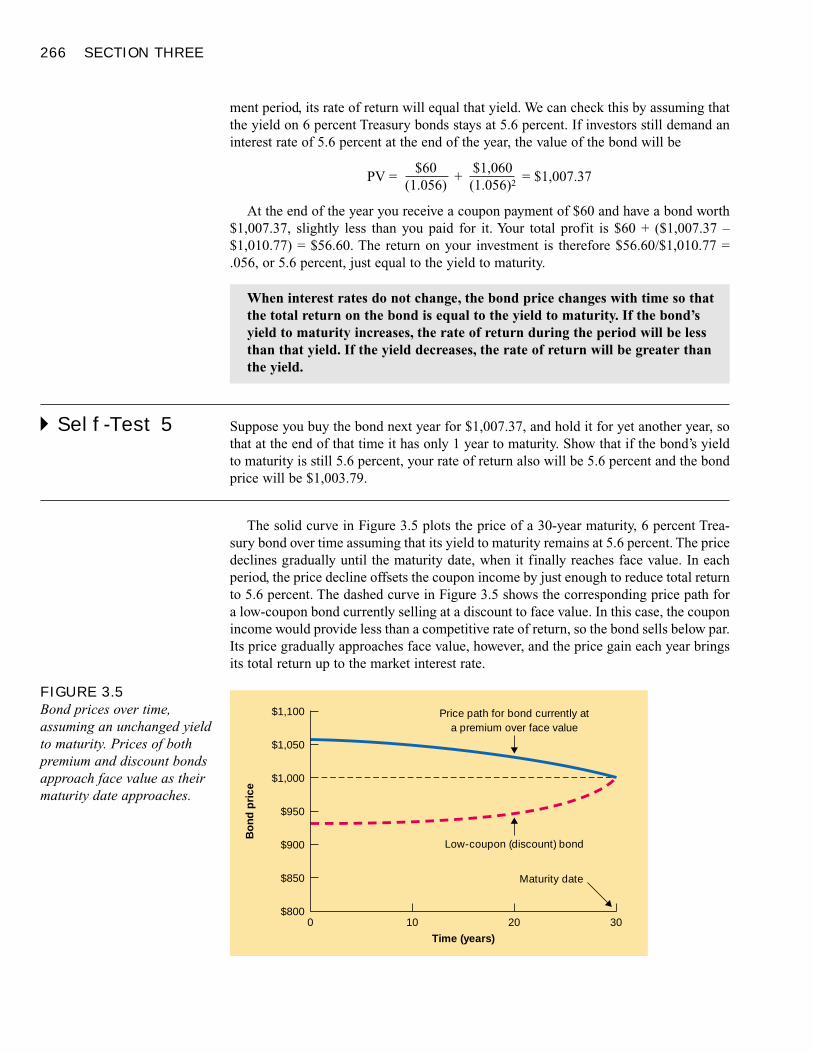
266 SECTION THREE
ment period, its rate of return will equal that yield. We can check this by assuming thatthe yield on 6 percent Treasury bonds stays at 5.6 percent. If investors still demand aninterest rate of 5.6 percent at the end of the year, the value of the bond will be
PV =$60
+$1,060
= $1,007.37(1.056) (1.056)2
At the end of the year you receive a coupon payment of $60 and have a bond worth$1,007.37, slightly less than you paid for it. Your total profit is $60 + ($1,007.37 –$1,010.77) = $56.60. The return on your investment is therefore $56.60/$1,010.77 =.056, or 5.6 percent, just equal to the yield to maturity.
� Self-Test 5 Suppose you buy the bond next year for $1,007.37, and hold it for yet another year, sothat at the end of that time it has only 1 year to maturity. Show that if the bond’s yieldto maturity is still 5.6 percent, your rate of return also will be 5.6 percent and the bondprice will be $1,003.79.
The solid curve in Figure 3.5 plots the price of a 30-year maturity, 6 percent Trea-sury bond over time assuming that its yield to maturity remains at 5.6 percent. The pricedeclines gradually until the maturity date, when it finally reaches face value. In eachperiod, the price decline offsets the coupon income by just enough to reduce total returnto 5.6 percent. The dashed curve in Figure 3.5 shows the corresponding price path fora low-coupon bond currently selling at a discount to face value. In this case, the couponincome would provide less than a competitive rate of return, so the bond sells below par.Its price gradually approaches face value, however, and the price gain each year bringsits total return up to the market interest rate.
When interest rates do not change, the bond price changes with time so thatthe total return on the bond is equal to the yield to maturity. If the bond’syield to maturity increases, the rate of return during the period will be lessthan that yield. If the yield decreases, the rate of return will be greater thanthe yield.
Low-coupon (discount) bond
Maturity date
Price path for bond currently ata premium over face value
Time (years)
Bo
nd p
rice
$1,100
$1,000
$1,050
$950
$900
$850
$8000 10 20 30
FIGURE 3.5Bond prices over time,assuming an unchanged yieldto maturity. Prices of bothpremium and discount bondsapproach face value as theirmaturity date approaches.
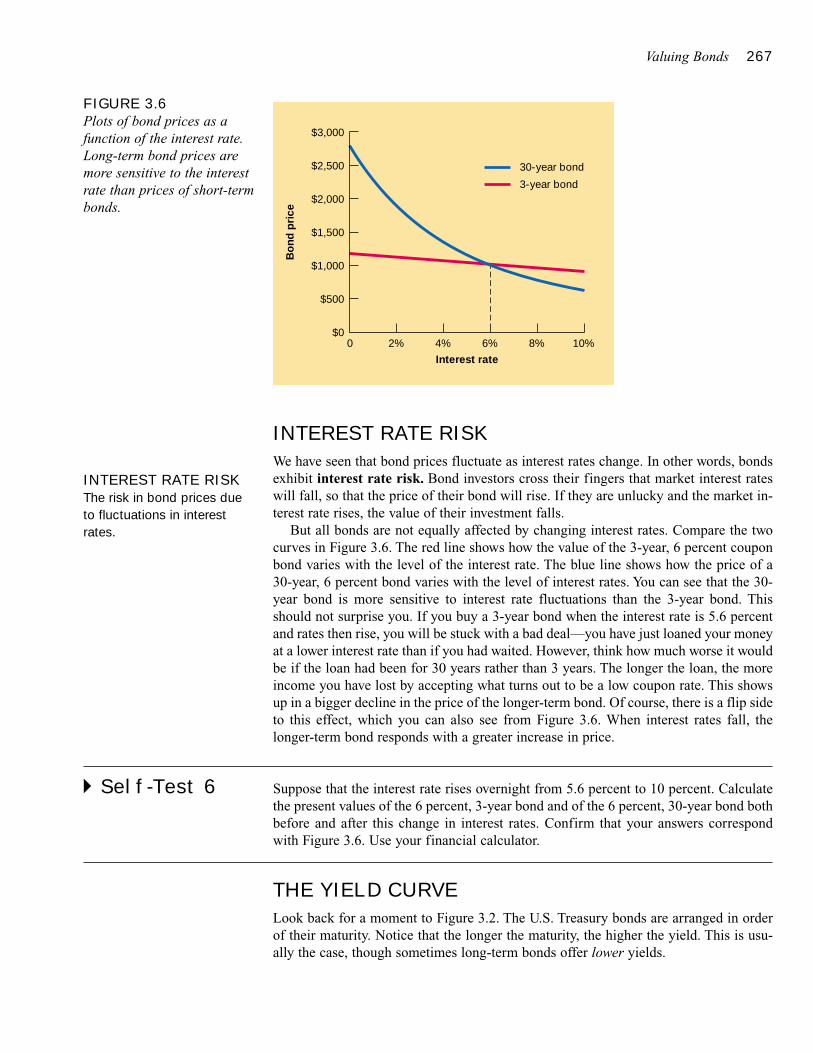
Valuing Bonds 267
INTEREST RATE RISK
We have seen that bond prices fluctuate as interest rates change. In other words, bondsexhibit interest rate risk. Bond investors cross their fingers that market interest rateswill fall, so that the price of their bond will rise. If they are unlucky and the market in-terest rate rises, the value of their investment falls.
But all bonds are not equally affected by changing interest rates. Compare the twocurves in Figure 3.6. The red line shows how the value of the 3-year, 6 percent couponbond varies with the level of the interest rate. The blue line shows how the price of a30-year, 6 percent bond varies with the level of interest rates. You can see that the 30-year bond is more sensitive to interest rate fluctuations than the 3-year bond. Thisshould not surprise you. If you buy a 3-year bond when the interest rate is 5.6 percentand rates then rise, you will be stuck with a bad deal—you have just loaned your moneyat a lower interest rate than if you had waited. However, think how much worse it wouldbe if the loan had been for 30 years rather than 3 years. The longer the loan, the moreincome you have lost by accepting what turns out to be a low coupon rate. This showsup in a bigger decline in the price of the longer-term bond. Of course, there is a flip sideto this effect, which you can also see from Figure 3.6. When interest rates fall, thelonger-term bond responds with a greater increase in price.
� Self-Test 6 Suppose that the interest rate rises overnight from 5.6 percent to 10 percent. Calculatethe present values of the 6 percent, 3-year bond and of the 6 percent, 30-year bond bothbefore and after this change in interest rates. Confirm that your answers correspondwith Figure 3.6. Use your financial calculator.
THE YIELD CURVE
Look back for a moment to Figure 3.2. The U.S. Treasury bonds are arranged in orderof their maturity. Notice that the longer the maturity, the higher the yield. This is usu-ally the case, though sometimes long-term bonds offer lower yields.
$3,000
$2,000
$2,500
$1,500
$1,000
$500
$00 4% 8%2% 6% 10%
30-year bond
3-year bond
Interest rate
Bo
nd p
rice
FIGURE 3.6Plots of bond prices as afunction of the interest rate.Long-term bond prices aremore sensitive to the interestrate than prices of short-termbonds.
INTEREST RATE RISKThe risk in bond prices dueto fluctuations in interestrates.
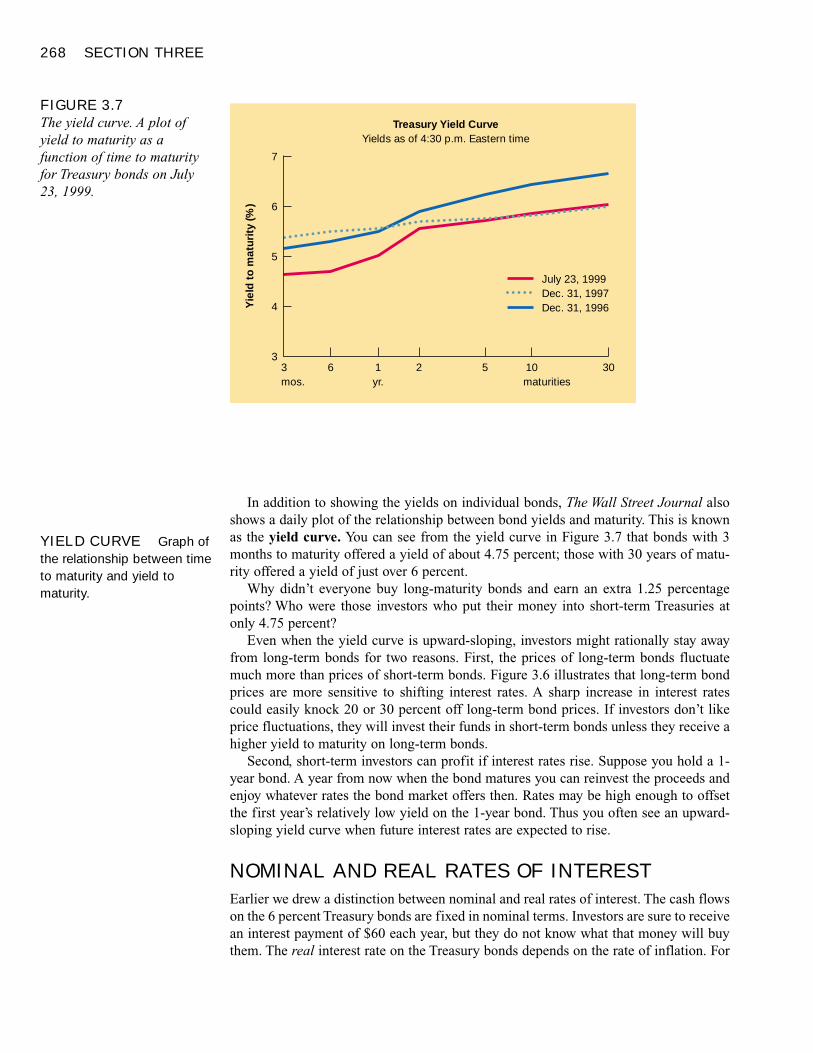
268 SECTION THREE
In addition to showing the yields on individual bonds, The Wall Street Journal alsoshows a daily plot of the relationship between bond yields and maturity. This is knownas the yield curve. You can see from the yield curve in Figure 3.7 that bonds with 3months to maturity offered a yield of about 4.75 percent; those with 30 years of matu-rity offered a yield of just over 6 percent.
Why didn’t everyone buy long-maturity bonds and earn an extra 1.25 percentagepoints? Who were those investors who put their money into short-term Treasuries atonly 4.75 percent?
Even when the yield curve is upward-sloping, investors might rationally stay awayfrom long-term bonds for two reasons. First, the prices of long-term bonds fluctuatemuch more than prices of short-term bonds. Figure 3.6 illustrates that long-term bondprices are more sensitive to shifting interest rates. A sharp increase in interest ratescould easily knock 20 or 30 percent off long-term bond prices. If investors don’t likeprice fluctuations, they will invest their funds in short-term bonds unless they receive ahigher yield to maturity on long-term bonds.
Second, short-term investors can profit if interest rates rise. Suppose you hold a 1-year bond. A year from now when the bond matures you can reinvest the proceeds andenjoy whatever rates the bond market offers then. Rates may be high enough to offsetthe first year’s relatively low yield on the 1-year bond. Thus you often see an upward-sloping yield curve when future interest rates are expected to rise.
NOMINAL AND REAL RATES OF INTEREST
Earlier we drew a distinction between nominal and real rates of interest. The cash flowson the 6 percent Treasury bonds are fixed in nominal terms. Investors are sure to receivean interest payment of $60 each year, but they do not know what that money will buythem. The real interest rate on the Treasury bonds depends on the rate of inflation. For
YIELD CURVE Graph ofthe relationship between timeto maturity and yield tomaturity.
Dec. 31, 1996
7
Treasury Yield CurveYields as of 4:30 p.m. Eastern time
5
6
4
33mos.
2 10maturities
1yr.
6 5 30
Dec. 31, 1997July 23, 1999
Yie
ld t
o m
atur
ity
(%)
FIGURE 3.7The yield curve. A plot ofyield to maturity as afunction of time to maturityfor Treasury bonds on July23, 1999.
Valuing Bonds 269
example, if the nominal rate of interest is 5.6 percent and the inflation rate is 3 percent,then the real interest rate is calculated as follows:
(1 + real interest rate) =1 + nominal interest rate
=1.056
= 1.02521 + inflation rate 1.03
Real interest rate = .0252, or 2.52%
Since the inflation rate is uncertain, so is the real rate of interest on the Treasury bonds.You can nail down a real rate of interest by buying an indexed bond, whose payments
are linked to inflation. Indexed bonds have been available in some countries for manyyears, but they were almost unknown in the United States until 1997 when the U.S.Treasury began to issue inflation-indexed bonds known as Treasury Inflation-ProtectedSecurities, or TIPS. The cash flows on TIPS are fixed, but the nominal cash flows (in-terest and principal) are increased as the consumer price index increases. For example,suppose the U.S. Treasury issues 3 percent, 2-year TIPS. The real cash flows on the 2-year TIPS are therefore
Year 1 Year 2
Real cash flows $30 $1,030
The nominal cash flows on TIPS depend on the inflation rate. For example, suppose in-flation turns out to be 5 percent in Year 1 and a further 4 percent in Year 2. Then thenominal cash flows would be
Year 1 Year 2
Nominal cash flows $30 × 1.05 = $31.50 $1,030 × 1.05 × 1.04 = $1,124.76
These cash payments are just sufficient to provide the holder with a 3 percent real rateof interest.
As we write this in mid-1999, three-year TIPS offer a yield of 3.9 percent. This yieldis a real interest rate. It measures the amount of extra goods your investment will allowyou to buy. The 3.9 percent real yield on TIPS is 1.7 percent less than the 5.6 percentyield on nominal Treasury bonds.5 If the annual inflation rate proves to be higher than1.7 percent, you will earn a higher return by holding TIPS; if the inflation rate is lowerthan 1.7 percent, the reverse will be true. The nearby box discusses the case for invest-ments in TIPS.
Real interest rates depend on the supply of savings and the demand for new invest-ment. As this supply–demand balance changes, real interest rates change. But they doso gradually. We can see this by looking at the United Kingdom, where the governmenthas issued indexed bonds since 1982. The red line in Figure 3.8 shows that the (real) in-terest rate on these bonds has fluctuated within a relatively narrow range.
Suppose that investors revise upward their forecast of inflation by 1 percent. Howwill this affect interest rates? If investors are concerned about the purchasing power oftheir money, the changed forecast should not affect the real rate of interest. The nomi-nal interest rate must therefore rise by 1 percent to compensate investors for the higherinflation prospects.
The blue line in Figure 3.8 shows the nominal rate of interest in the United Kingdomsince 1982. You can see that the nominal rate is much more variable than the real rate.When inflation concern was near its peak in the early 1980s, the nominal interest rate
SEE BOX
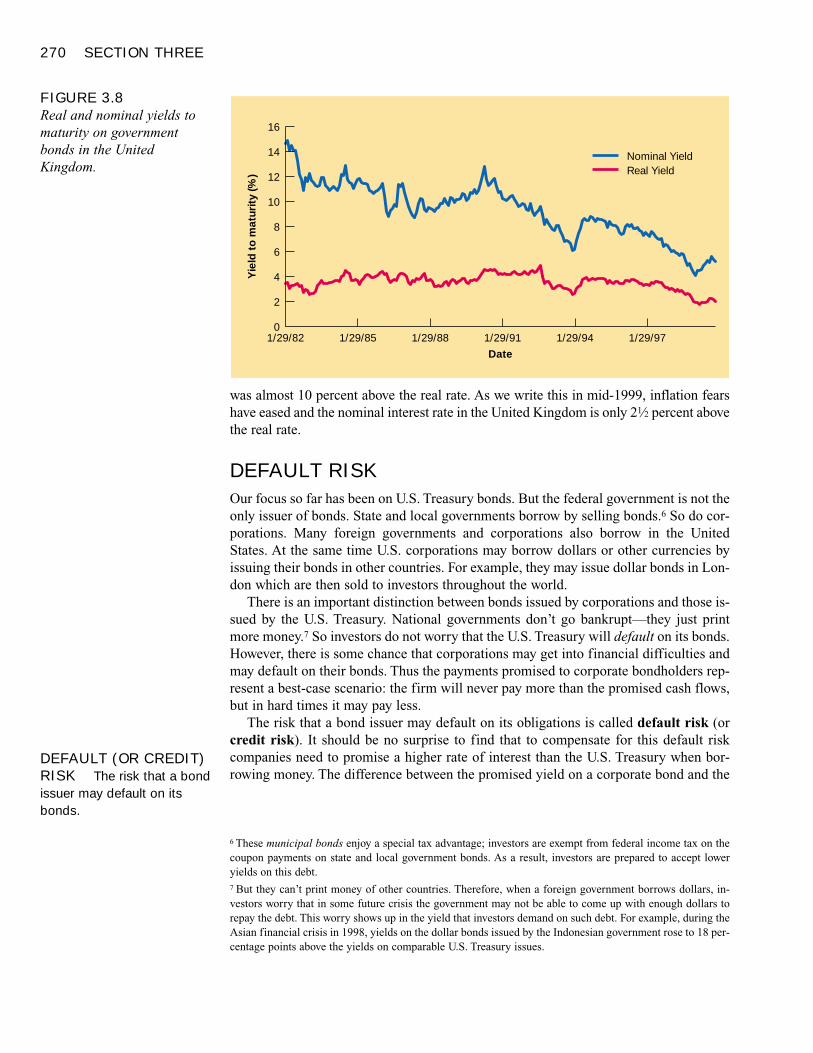
270 SECTION THREE
was almost 10 percent above the real rate. As we write this in mid-1999, inflation fearshave eased and the nominal interest rate in the United Kingdom is only 21⁄2 percent abovethe real rate.
DEFAULT RISK
Our focus so far has been on U.S. Treasury bonds. But the federal government is not theonly issuer of bonds. State and local governments borrow by selling bonds.6 So do cor-porations. Many foreign governments and corporations also borrow in the UnitedStates. At the same time U.S. corporations may borrow dollars or other currencies byissuing their bonds in other countries. For example, they may issue dollar bonds in Lon-don which are then sold to investors throughout the world.
There is an important distinction between bonds issued by corporations and those is-sued by the U.S. Treasury. National governments don’t go bankrupt—they just printmore money.7 So investors do not worry that the U.S. Treasury will default on its bonds.However, there is some chance that corporations may get into financial difficulties andmay default on their bonds. Thus the payments promised to corporate bondholders rep-resent a best-case scenario: the firm will never pay more than the promised cash flows,but in hard times it may pay less.
The risk that a bond issuer may default on its obligations is called default risk (orcredit risk). It should be no surprise to find that to compensate for this default riskcompanies need to promise a higher rate of interest than the U.S. Treasury when bor-rowing money. The difference between the promised yield on a corporate bond and the
6 These municipal bonds enjoy a special tax advantage; investors are exempt from federal income tax on thecoupon payments on state and local government bonds. As a result, investors are prepared to accept loweryields on this debt.7 But they can’t print money of other countries. Therefore, when a foreign government borrows dollars, in-vestors worry that in some future crisis the government may not be able to come up with enough dollars torepay the debt. This worry shows up in the yield that investors demand on such debt. For example, during theAsian financial crisis in 1998, yields on the dollar bonds issued by the Indonesian government rose to 18 per-centage points above the yields on comparable U.S. Treasury issues.
16
10
14
6
12
8
4
2
01/29/82 1/29/88 1/29/941/29/85 1/29/91 1/29/97
Real YieldNominal Yield
Date
Yie
ld t
o m
atur
ity
(%)
FIGURE 3.8Real and nominal yields tomaturity on governmentbonds in the UnitedKingdom.
DEFAULT (OR CREDIT)RISK The risk that a bondissuer may default on itsbonds.
FINANCE IN ACTION
yield on a U.S. Treasury bond with the same coupon and maturity is called the defaultpremium. The greater the chance that the company will get into trouble, the higher thedefault premium demanded by investors.
The safety of most corporate bonds can be judged from bond ratings provided byMoody’s, Standard & Poor’s, or other bond-rating firms. Table 3.1 lists the possiblebond ratings in declining order of quality. For example, the bonds that receive the high-est Moody’s rating are known as Aaa (or “triple A”) bonds. Then come Aa (“double A”),A, Baa bonds, and so on. Bonds rated Baa and above are called investment grade,while those with a rating of Ba or below are referred to as speculative grade, high-yield,or junk bonds.
It is rare for highly rated bonds to default. For example, since 1971 fewer than onein a thousand triple-A bonds have defaulted within 10 years of issue. On the other hand,almost half of the bonds that were rated CCC by Standard & Poor’s at issue have de-faulted within 10 years. Of course, bonds rarely fall suddenly from grace. As timepasses and the company becomes progressively more shaky, the agencies revise thebond’s rating downward to reflect the increasing probability of default.
As you would expect, the yield on corporate bonds varies with the bond rating. Fig-ure 3.9 presents the yields on default-free long-term U.S. Treasury bonds, Aaa-rated
271
A New Leader in the Bond Derby?
With Wall Street pundits fixated on deflation, the idea ofbuying Treasury bonds that protect you against inflationseems as crazy as preparing for a communist takeover.But guess what? Treasury Inflation-Indexed Securitiesare actually a great deal right now. Even if the consumerprice index rises only 1.7% annually over the next threedecades—a mere tenth of a percentage point above thecurrent rate—buy-and-hold investors will be better offwith 30-year inflation-protected securities, commonlyknown as TIPS, than with conventional Treasuries.
TIPS have yet to catch on with individual investors,who have bought only a fraction of the $75 billion is-sued so far, says Dan Bernstein, research director atBridgewater Associates, a Westport (Conn.) moneymanager. Individuals have shied away from TIPS be-cause they’re hard to understand and less liquid thanordinary Treasuries.
Slowing inflation has also given people a reason tostay. If you buy a conventional $1,000, 30-year bond attoday’s 5.5% rate, you are guaranteed $55 in interestpayments each year, no matter what the inflation rate is,until you get your principal back in 2029. Let’s say youbuy TIPS, now yielding 3.9% plus an adjustment for theconsumer price index, and inflation falls to 0.5% fromthe current 1.6%. Because of the lower inflation rate,you’ll get only $44 annually. Nevertheless, even if the
economy falls into deflation, you’ll get the face value ofthe bonds back at maturity.
Less Volatile
But if inflation spikes up, TIPS would outshine conven-tional bonds. For example, a $1,000, 30-year TIPS witha 4% coupon would yield $40 in its first year. If inflationrises by three points, your principal would be worth$1,030. The $30 gain plus the interest would translateinto a 7% total return.
TIPS are attractive for another reason: They’re one-quarter to one-third as volatile as conventional Trea-suries because of their built-in inflation protection. Soinvestors who use them are less exposed to risk, saysChristopher Kinney, a manager at Brown Brothers Har-riman. As a result, a portfolio containing TIPS can havea higher percentage of its assets invested in stocks, po-tentially boosting returns without taking on more risk.
Even so, the price of TIPS can change. If the FederalReserve hikes interest rates, they’ll fall. If it lowers rates,they’ll rise. That won’t be a concern if you hold the TIPSuntil maturity, of course.
Source: Reprinted from April 5, 1999 issue of Business Week by spe-cial permission, copyright © 1999 by the McGraw-Hill Companies.
INVESTMENT GRADEBonds rated Baa or above byMoody’s or BBB or above byStandard & Poor’s.
JUNK BOND Bond witha rating below Baa or BBB.
DEFAULT PREMIUMThe additional yield on abond investors require forbearing credit risk.
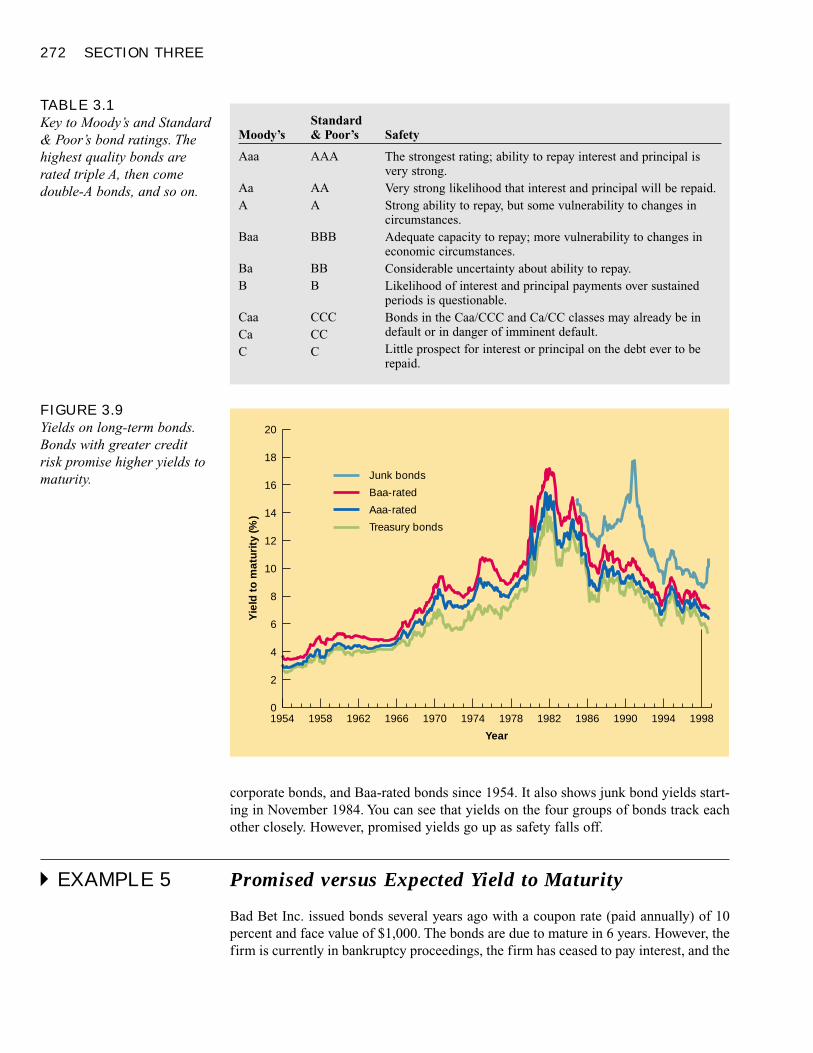
272 SECTION THREE
corporate bonds, and Baa-rated bonds since 1954. It also shows junk bond yields start-ing in November 1984. You can see that yields on the four groups of bonds track eachother closely. However, promised yields go up as safety falls off.
� EXAMPLE 5 Promised versus Expected Yield to Maturity
Bad Bet Inc. issued bonds several years ago with a coupon rate (paid annually) of 10percent and face value of $1,000. The bonds are due to mature in 6 years. However, thefirm is currently in bankruptcy proceedings, the firm has ceased to pay interest, and the
TABLE 3.1Key to Moody’s and Standard& Poor’s bond ratings. Thehighest quality bonds arerated triple A, then comedouble-A bonds, and so on.
StandardMoody’s & Poor’s Safety
Aaa AAA
Aa AAA A
Baa BBB
Ba BBB B
Caa CCCCa CCC C
The strongest rating; ability to repay interest and principal isvery strong.Very strong likelihood that interest and principal will be repaid.Strong ability to repay, but some vulnerability to changes incircumstances.Adequate capacity to repay; more vulnerability to changes ineconomic circumstances.Considerable uncertainty about ability to repay.Likelihood of interest and principal payments over sustainedperiods is questionable.Bonds in the Caa/CCC and Ca/CC classes may already be indefault or in danger of imminent default.Little prospect for interest or principal on the debt ever to berepaid.
20
14
18
12
10
4
16
8
6
2
01954 1958 1962 1966 1970 1974 1978 1982 199419901986 1998
Year
Yie
ld t
o m
atur
ity
(%)
Junk bonds
Baa-rated
Aaa-rated
Treasury bonds
FIGURE 3.9Yields on long-term bonds.Bonds with greater creditrisk promise higher yields tomaturity.
Valuing Bonds 273
bonds sell for only $200. Based on promised cash flow, the yield to maturity on thebond is 63.9 percent. (On your calculator, set PV = –200, FV = 1,000, PMT = 100, n =6, and compute i.) But this calculation is based on the very unlikely possibility that thefirm will resume paying interest and come out of bankruptcy. Suppose that the mostlikely outcome is that after 3 years of litigation, during which no interest will be paid,debtholders will receive 27 cents on the dollar—that is, they will receive $270 for eachbond with $1,000 face value. In this case the expected return on the bond is 10.5 per-cent. (On your calculator, set PV = –200, FV = 270, PMT = 0, n = 3, and compute i.)When default is a real possibility, the promised yield can depart considerably from theexpected return. In this example, the default premium is greater than 50 percent.
VARIATIONS IN CORPORATE BONDS
Most corporate bonds are similar to the 6 percent Treasury bonds that we examined ear-lier in the material. In other words, they promise to make a fixed nominal coupon pay-ment for each year until maturity, at which point they also promise to repay the facevalue. However, you will find that there is greater variety in the design of corporatebonds. We will return to this issue, but here are a few types of corporate bonds that youmay encounter.
Zero-Coupon Bonds. Corporations sometimes issue zero-coupon bonds. In this case,investors receive $1,000 face value at the maturity date but do not receive a regularcoupon payment. In other words, the bond has a coupon rate of zero. You learned howto value such bonds earlier. These bonds are issued at prices considerably below facevalue, and the investor’s return comes from the difference between the purchase priceand the payment of face value at maturity.
Floating-Rate Bonds. Sometimes the coupon rate can change over time. For exam-ple, floating-rate bonds make coupon payments that are tied to some measure of currentmarket rates. The rate might be reset once a year to the current Treasury bill rate plus 2percent. So if the Treasury bill rate at the start of the year is 6 percent, the bond’s couponrate over the next year would set at 8 percent. This arrangement means that the bond’scoupon rate always approximates current market interest rates.
Convertible Bonds. If you buy a convertible bond, you can choose later to exchangeit for a specified number of shares of common stock. For example, a convertible bondthat is issued at par value of $1,000 may be convertible into 50 shares of the firm’sstock. Because convertible bonds offer the opportunity to participate in any price ap-preciation of the company’s stock, investors will accept lower interest rates on convert-ible bonds.
SummaryWhat are the differences between the bond’s coupon rate, current yield, and yieldto maturity?
A bond is a long-term debt of a government or corporation. When you own a bond, youreceive a fixed interest payment each year until the bond matures. This payment is known as
274 SECTION THREE
the coupon. The coupon rate is the annual coupon payment expressed as a fraction of thebond’s face value. At maturity the bond’s face value is repaid. In the United States mostbonds have a face value of $1,000. The current yield is the annual coupon paymentexpressed as a fraction of the bond’s price. The yield to maturity measures the average rateof return to an investor who purchases the bond and holds it until maturity, accounting forcoupon income as well as the difference between purchase price and face value.
How can one find the market price of a bond given its yield to maturity and finda bond’s yield given its price? Why do prices and yields vary inversely?
Bonds are valued by discounting the coupon payments and the final repayment by the yieldto maturity on comparable bonds. The bond payments discounted at the bond’s yield tomaturity equal the bond price. You may also start with the bond price and ask what interestrate the bond offers. This interest rate that equates the present value of bond payments to thebond price is the yield to maturity. Because present values are lower when discount rates arehigher, price and yield to maturity vary inversely.
Why do bonds exhibit interest rate risk?
Bond prices are subject to interest rate risk, rising when market interest rates fall and fallingwhen market rates rise. Long-term bonds exhibit greater interest rate risk than short-termbonds.
Why do investors pay attention to bond ratings and demand a higher interest ratefor bonds with low ratings?
Investors demand higher promised yields if there is a high probability that the borrower willrun into trouble and default. Credit risk implies that the promised yield to maturity on thebond is higher than the expected yield. The additional yield investors require for bearingcredit risk is called the default premium. Bond ratings measure the bond’s credit risk.
www.finpipe.com/ The Financial Pipeline is an Internet site dedicated to financial education; seethe page on Bonds
www.investinginbonds.com/ All about bond pricingwww.bloomberg.com/markets/C13.html A look at the yield curve, updated dailywww.bondmarkets.com/publications/IGCORP/what.htm A guide to corporate bondswww.moodys.com The Web site of the bond rating agencywww.standardandpoors.com/ratings/ Standard & Poor’s Corporation provides information on
how it rates securities
bond yield to maturity junk bondcoupon rate of return credit riskface value, par value, maturity value yield curve default riskcoupon rate default premium interest rate riskcurrent yield investment grade
1. Bond Yields. A 30-year Treasury bond is issued with par value of $1,000, paying interest of$80 per year. If market yields increase shortly after the T-bond is issued, what happens to thebond’s:
a. coupon rateb. price
Related WebLinks
Key Terms
Quiz

Valuing Bonds 275
c. yield to maturityd. current yield
2. Bond Yields. If a bond with par value of $1,000 and a coupon rate of 8 percent is selling ata price of $970, is the bond’s yield to maturity more or less than 8 percent? What about thecurrent yield?
3. Bond Yields. A bond with par value $1,000 has a current yield of 7.5 percent and a couponrate of 8 percent. What is the bond’s price?
4. Bond Pricing. A 6-year Circular File bond pays interest of $80 annually and sells for $950.What is its coupon rate, current yield, and yield to maturity?
5. Bond Pricing. If Circular File (see question 4) wants to issue a new 6-year bond at facevalue, what coupon rate must the bond offer?
6. Bond Yields. An AT&T bond has 10 years until maturity, a coupon rate of 8 percent, andsells for $1,050.
a. What is the current yield on the bond?b. What is the yield to maturity?
7. Coupon Rate. General Matter’s outstanding bond issue has a coupon rate of 10 percent anda current yield of 9.6 percent, and it sells at a yield to maturity of 9.25 percent. The firmwishes to issue additional bonds to the public at par value. What coupon rate must the newbonds offer in order to sell at par?
8. Financial Pages. Refer to Figure 3.2. What is the current yield of the 61⁄4 percent, August2002 maturity bond? What was the closing ask price of the bond on the previous day?
9. Bond Prices and Returns. One bond has a coupon rate of 8 percent, another a coupon rateof 12 percent. Both bonds have 10-year maturities and sell at a yield to maturity of 10 per-cent. If their yields to maturity next year are still 10 percent, what is the rate of return oneach bond? Does the higher coupon bond give a higher rate of return?
10. Bond Returns.
a. If the AT&T bond in problem 6 has a yield to maturity of 8 percent 1 year from now, whatwill its price be?
b. What will be the rate of return on the bond?c. If the inflation rate during the year is 3 percent, what is the real rate of return on the bond?
11. Bond Pricing. A General Motors bond carries a coupon rate of 8 percent, has 9 years untilmaturity, and sells at a yield to maturity of 9 percent.
a. What interest payments do bondholders receive each year?b. At what price does the bond sell? (Assume annual interest payments.)c. What will happen to the bond price if the yield to maturity falls to 7 percent?
12. Bond Pricing. A 30-year maturity bond with face value $1,000 makes annual coupon pay-ments and has a coupon rate of 8 percent. What is the bond’s yield to maturity if the bond isselling for
a. $900b. $1,000c. $1,100
13. Bond Pricing. Repeat the previous problem if the bond makes semiannual coupon pay-ments.
PracticeProblems
276 SECTION THREE
14. Bond Pricing. Fill in the table below for the following zero-coupon bonds. The face valueof each bond is $1,000.
Price Maturity (Years) Yield to Maturity
$300 30 __$300 __ 8%__ 10 10%
15. Consol Bonds. Perpetual Life Corp. has issued consol bonds with coupon payments of $80.(Consols pay interest forever, and never mature. They are perpetuities.) If the required rateof return on these bonds at the time they were issued was 8 percent, at what price were theysold to the public? If the required return today is 12 percent, at what price do the consolssell?
16. Bond Pricing. Sure Tea Co. has issued 9 percent annual coupon bonds which are now sell-ing at a yield to maturity of 10 percent and current yield of 9.8375 percent. What is the re-maining maturity of these bonds?
17. Bond Pricing. Large Industries bonds sell for $1,065.15. The bond life is 9 years, and theyield to maturity is 7 percent. What must be the coupon rate on the bonds?
18. Bond Prices and Yields.
a. Several years ago, Castles in the Sand, Inc., issued bonds at face value at a yield to ma-turity of 8 percent. Now, with 8 years left until the maturity of the bonds, the companyhas run into hard times and the yield to maturity on the bonds has increased to 14 per-cent. What has happened to the price of the bond?
b. Suppose that investors believe that Castles can make good on the promised coupon pay-ments, but that the company will go bankrupt when the bond matures and the principalcomes due. The expectation is that investors will receive only 80 percent of face value atmaturity. If they buy the bond today, what yield to maturity do they expect to receive?
19. Bond Returns. You buy an 8 percent coupon, 10-year maturity bond for $980. A year later,the bond price is $1,050.
a. What is the new yield to maturity on the bond?b. What is your rate of return over the year?
20. Bond Returns. You buy an 8 percent coupon, 10-year maturity bond when its yield to ma-turity is 9 percent. A year later, the yield to maturity is 10 percent. What is your rate of re-turn over the year?
21. Interest Rate Risk. Consider three bonds with 8 percent coupon rates, all selling at facevalue. The short-term bond has a maturity of 4 years, the intermediate-term bond has matu-rity 8 years, and the long-term bond has maturity 30 years.
a. What will happen to the price of each bond if their yields increase to 9 percent?b. What will happen to the price of each bond if their yields decrease to 7 percent?c. What do you conclude about the relationship between time to maturity and the sensitiv-
ity of bond prices to interest rates?
22. Rate of Return. A 2-year maturity bond with face value $1,000 makes annual coupon pay-ments of $80 and is selling at face value. What will be the rate of return on the bond if itsyield to maturity at the end of the year is
a. 6 percentb. 8 percentc. 10 percent

Valuing Bonds 277
23. Rate of Return. A bond that pays coupons annually is issued with a coupon rate of 4 per-cent, maturity of 30 years, and a yield to maturity of 8 percent. What rate of return will beearned by an investor who purchases the bond and holds it for 1 year if the bond’s yield tomaturity at the end of the year is 9 percent?
24. Bond Risk. A bond’s credit rating provides a guide to its risk. Long-term bonds rated Aacurrently offer yields to maturity of 8.5 percent. A-rated bonds sell at yields of 8.8 percent.If a 10-year bond with a coupon rate of 8 percent is downgraded by Moody’s from Aa to Arating, what is the likely effect on the bond price?
25. Real Returns. Suppose that you buy a 1-year maturity bond for $1,000 that will pay youback $1,000 plus a coupon payment of $60 at the end of the year. What real rate of returnwill you earn if the inflation rate is
a. 2 percentb. 4 percentc. 6 percentd. 8 percent
26. Real Returns. Now suppose that the bond in the previous problem is a TIPS (inflation-in-dexed) bond with a coupon rate of 4 percent. What will the cash flow provided by the bondbe for each of the four inflation rates? What will be the real and nominal rates of return onthe bond in each scenario?
27. Real Returns. Now suppose the TIPS bond in the previous problem is a 2-year maturity bond.What will be the bondholder’s cash flows in each year in each of the inflation scenarios?
28. Interest Rate Risk. Suppose interest rates increase from 8 percent to 9 percent. Which bondwill suffer the greater percentage decline in price: a 30-year bond paying annual coupons of8 percent, or a 30-year zero coupon bond? Can you explain intuitively why the zero exhibitsgreater interest rate risk even though it has the same maturity as the coupon bond?
1 a. The ask price is 101 23/32 = 101.71875 percent of face value, or $1,017.1875.b. The bid price is 101 21/32 = 101.65625 percent of face value, or $1,016.5625.c. The price increased by 1/32 = .03125 percent of face value, or $.3125.d. The annual coupon is 6 1/4 percent of face value, or $62.50, paid in two semiannual in-
stallments.e. The yield to maturity, based on the ask price, is given as 5.64 percent.
2 The coupon is 9 percent of $1,000, or $90 a year. First value the 6-year annuity of coupons:
PV = $90 × (6-year annuity factor)
= $90 × [ 1 – 1 ].12 .12(1.12)6
= $90 × 4.11 = $370.03
Then value the final payment and add up:
PV =$1,000
= $506.63(1.12)6
PV of bond = $370.03 + $506.63 = $876.66
3 The yield to maturity is about 8 percent, because the present value of the bond’s cash returnsis $1,199 when discounted at 8 percent:
ChallengeProblem
Solutions toSelf-TestQuestions
278 SECTION THREE
PV = PV (coupons) + PV (final payment)
= (coupon × annuity factor) + (face value × discount factor)
= $140 × [ 1 – 1 ] + $1,000 × 1.08 .08(1.08)4 1.084
= $463.70 + $735.03 = $1,1994 The 6 percent coupon bond with maturity 2002 starts with 3 years left until maturity and
sells for $1,010.77. At the end of the year, the bond has only 2 years to maturity and in-vestors demand an interest rate of 7 percent. Therefore, the value of the bond becomes
PV at 7% = $60 + $1,060 = $981.92(1.07) (1.07)2
You invested $1,010.77. At the end of the year you receive a coupon payment of $60 andhave a bond worth $981.92. Your rate of return is therefore
Rate of return = $60 + ($981.92 – $1,010.77) = .0308, or 3.08%$1,010.77
The yield to maturity at the start of the year was 5.6 percent. However, because interest ratesrose during the year, the bond price fell and the rate of return was below the yield to matu-rity.
5 By the end of this year, the bond will have only 1 year left until maturity. It will make onlyone more payment of coupon plus face value, so its price will be $1,060/1.056 = $1,003.79.The rate of return is therefore
$60 + ($1,003.79 – $1,007.37) = .056, or 5.6%$1,007.37
6 At an interest rate of 5.6 percent, the 3-year bond sells for $1,010.77. If the interest ratejumps to 10 percent, the bond price falls to $900.53, a decline of 10.9 percent. The 30-yearbond sells for $1,057.50 when the interest rate is 5.6 percent, but its price falls to $622.92at an interest rate of 10 percent, a much larger percentage decline of 41.1 percent.
279
VALUING STOCKS
Stocks and the Stock MarketReading the Stock Market Listings
Book Values, Liquidation Values, and Market Values
Valuing Common StocksToday’s Price and Tomorrow’s Price
The Dividend Discount Model
Simplifying the Dividend Discount ModelThe Dividend Discount Model with No Growth
The Constant-Growth Dividend Discount Model
Estimating Expected Rates of Return
Nonconstant Growth
Growth Stocks and Income StocksThe Price-Earnings Ratio
What Do Earnings Mean?
Valuing Entire Businesses
Summary
nstead of borrowing cash to pay for its investments, a firm can sell new
shares of common stock to investors. Whereas bond issues commit the
firm to make a series of specified interest payments to the lenders, stock
issues are more like taking on new partners. The stockholders all share in the
fortunes of the firm according to the number of shares they hold. We will take a first
look at stocks, the stock market, and principles of stock valuation.
We start by looking at how stocks are bought and sold. Then we look at what deter-
mines stock prices and how stock valuation formulas can be used to infer the rate of re-
turn that investors are expecting. We will see how the firm’s investment opportunities
are reflected in the stock price and why stock market analysts focus so much attention
on the price-earnings, or P/E ratio of the company.
Why should you care how stocks are valued? After all, if you want to know the value
of a firm’s stock, you can look up the stock price in The Wall Street Journal. But you
need to know what determines prices for at least two reasons. First, you may wish to
check that any shares that you own are fairly priced and to gauge your beliefs against
the rest of the market. Second, corporations need to have some understanding of how
the market values firms in order to make good capital budgeting decisions. A project is
attractive if it increases shareholder wealth. But you can’t judge that unless you know
how shares are valued.
After studying this material you should be able to
� Understand the stock trading reports in the financial pages of the newspaper.
� Calculate the present value of a stock given forecasts of future dividends and future
stock price.
� Use stock valuation formulas to infer the expected rate of return on a common stock.
� Interpret price-earnings ratios.
280
I
Stocks and the Stock MarketA shareholder is a part-owner of the firm. For example, there were 1,471 million sharesof PepsiCo outstanding at the beginning of 1999, so if you held 1,000 shares of Pepsi,you would have owned 1,000/1,471,000,000 = .00007 percent of the firm. You wouldhave received .00007 percent of any dividends paid by the company and you would be entitled to .00007 percent of the votes that could be cast at the company’s annualmeeting.
Firms issue shares of common stock to the public when they need to raise money.1COMMON STOCKOwnership shares in apublicly held corporation.
1 We use the terms “shares,” “stock,” and “common stock” interchangeably, as we do “shareholders” and“stockholders.”
Valuing Stocks 281
They typically engage investment banking firms such as Merrill Lynch or GoldmanSachs to help them market these shares. Sales of new stock by the firm are said to occurin the primary market. There are two types of primary market issues. In an initialpublic offering, or IPO, a company that has been privately owned sells stock to thepublic for the first time. Some IPOs have proved very popular with investors. For ex-ample, the star performer in 1999 was VA Linux Systems. Its shares were sold to in-vestors at $30 each and by the end of the first day they had reached $239, a gain ofnearly 700 percent.
Established firms that already have issued stock to the public also may decide toraise money from time to time by issuing additional shares. Sales of new shares by suchfirms are also primary market issues and are called seasoned offerings. When a firm is-sues new shares to the public, the previous owners share their ownership of the com-pany with additional shareholders. In this sense, issuing new shares is like having newpartners buy into the firm.
Shares of stock can be risky investments. For example, the shares of Iridium were firstissued to the public in June 1997 at $20 a share. In May 1998 Iridium’s shares touched$70; a little more than a year later, the company filed for bankruptcy and the shares wereno longer traded. You can understand why investors would be unhappy if forced to tie theknot with a particular company forever. So large companies usually arrange for theirstocks to be listed on a stock exchange, which allows investors to trade existing stocksamong themselves. Exchanges are really markets for secondhand stocks, but they preferto describe themselves as secondary markets, which sounds more important.
The two major exchanges in the United States are the New York Stock Exchange(NYSE) and the Nasdaq market. At the NYSE trades in each stock are handled by a spe-cialist, who acts as an auctioneer. The specialist ensures that stocks are sold to those in-vestors who are prepared to pay the most and that they are bought from investors whoare willing to accept the lowest price.
The NYSE is an example of an auction market. By contrast, Nasdaq operates adealer market, in which each dealer uses computer links to quote prices at which he orshe is willing to buy or sell shares. A broker must survey the prices quoted by differentdealers to get a sense of where the best price can be had.
An important development in recent years has been the advent of electronic commu-nication networks, or ECNs, which have captured ever-larger shares of trading volume.These are electronic auction houses that match up investors’ orders to buy and sell shares.
Of course, there are stock exchanges in many other countries. As you can see fromFigure 3.10, the major exchanges in cities such as London, Tokyo, and Frankfurt tradevast numbers of shares. But there are also literally hundreds of smaller exchangesthroughout the world. For example, the Tanzanian stock exchange opens for just half anhour each week and trades shares in two companies.
READING THE STOCK MARKET LISTINGS
When you read the stock market pages in the newspaper, you are looking at the sec-ondary market. Figure 3.11 is an excerpt from The Wall Street Journal of NYSE trad-ing on February 25, 2000. The highlighted bar in the figure highlights the listing for PepsiCo.2 The two numbers to the left of PepsiCo are the highest and lowest prices at
PRIMARY MARKETMarket for newly-issuedsecurities, sold by thecompany to raise cash.
INITIAL PUBLICOFFERING (IPO)First offering of stock to thegeneral public.
SECONDARY MARKETMarket in which already-issued securities are tradedamong investors.
2 The table shows not only the company’s name, usually abbreviated, but also the symbol, or ticker, which isused to identify the company on the NYSE price screens. The symbol for PepsiCo is “PEP”; other compa-nies’ symbols are not at first glance so obvious.
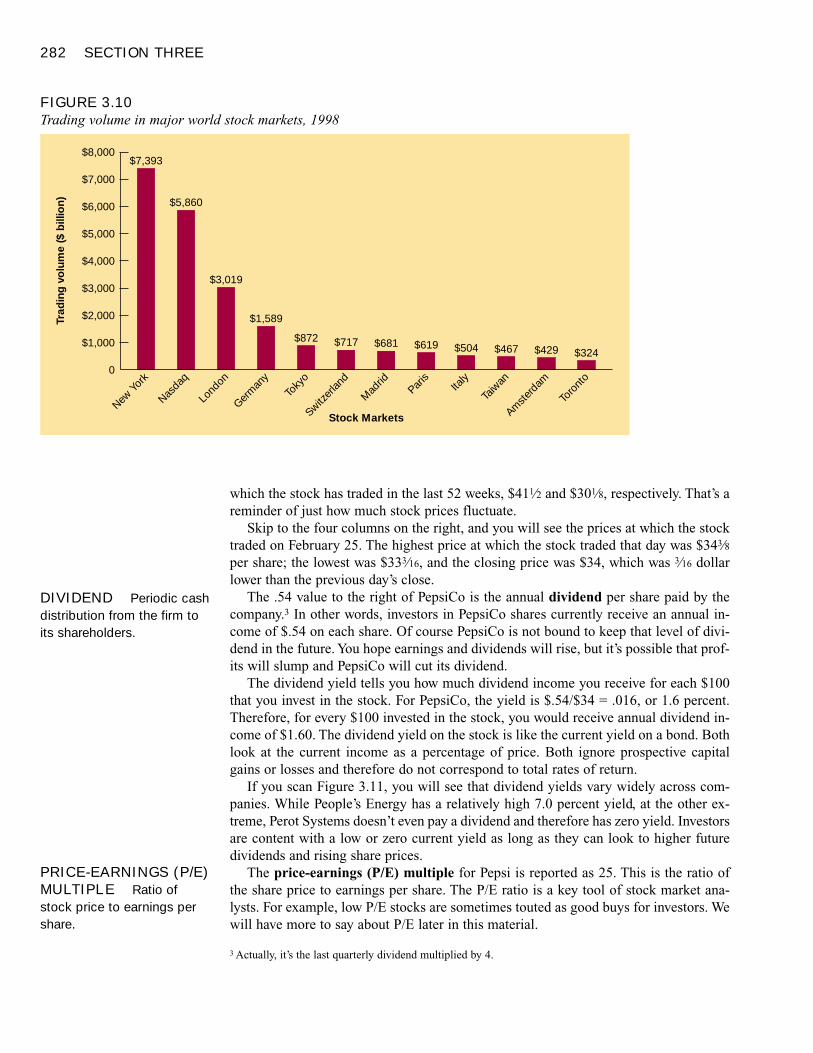
282 SECTION THREE
which the stock has traded in the last 52 weeks, $411⁄2 and $301⁄8, respectively. That’s areminder of just how much stock prices fluctuate.
Skip to the four columns on the right, and you will see the prices at which the stocktraded on February 25. The highest price at which the stock traded that day was $343⁄8per share; the lowest was $333⁄16, and the closing price was $34, which was 3⁄16 dollarlower than the previous day’s close.
The .54 value to the right of PepsiCo is the annual dividend per share paid by thecompany.3 In other words, investors in PepsiCo shares currently receive an annual in-come of $.54 on each share. Of course PepsiCo is not bound to keep that level of divi-dend in the future. You hope earnings and dividends will rise, but it’s possible that prof-its will slump and PepsiCo will cut its dividend.
The dividend yield tells you how much dividend income you receive for each $100that you invest in the stock. For PepsiCo, the yield is $.54/$34 = .016, or 1.6 percent.Therefore, for every $100 invested in the stock, you would receive annual dividend in-come of $1.60. The dividend yield on the stock is like the current yield on a bond. Bothlook at the current income as a percentage of price. Both ignore prospective capitalgains or losses and therefore do not correspond to total rates of return.
If you scan Figure 3.11, you will see that dividend yields vary widely across com-panies. While People’s Energy has a relatively high 7.0 percent yield, at the other ex-treme, Perot Systems doesn’t even pay a dividend and therefore has zero yield. Investorsare content with a low or zero current yield as long as they can look to higher futuredividends and rising share prices.
The price-earnings (P/E) multiple for Pepsi is reported as 25. This is the ratio ofthe share price to earnings per share. The P/E ratio is a key tool of stock market ana-lysts. For example, low P/E stocks are sometimes touted as good buys for investors. Wewill have more to say about P/E later in this material.
DIVIDEND Periodic cashdistribution from the firm toits shareholders.
FIGURE 3.10Trading volume in major world stock markets, 1998
Trad
ing
vo
lum
e ($
bill
ion)
New Yo
rk
Nasdaq
Lond
on
Germ
any
Toky
o
Switzer
land
Mad
ridPar
is
$8,000
$6,000
$4,000
Stock Markets
$2,000
0
$7,000
$5,000
$3,000
$1,000
Italy
Taiw
an
Toro
nto
Amste
rdam
$7,393
$5,860
$3,019
$1,589
$872 $717 $681 $619 $504 $467 $324$429
3 Actually, it’s the last quarterly dividend multiplied by 4.
PRICE-EARNINGS (P/E)MULTIPLE Ratio ofstock price to earnings pershare.
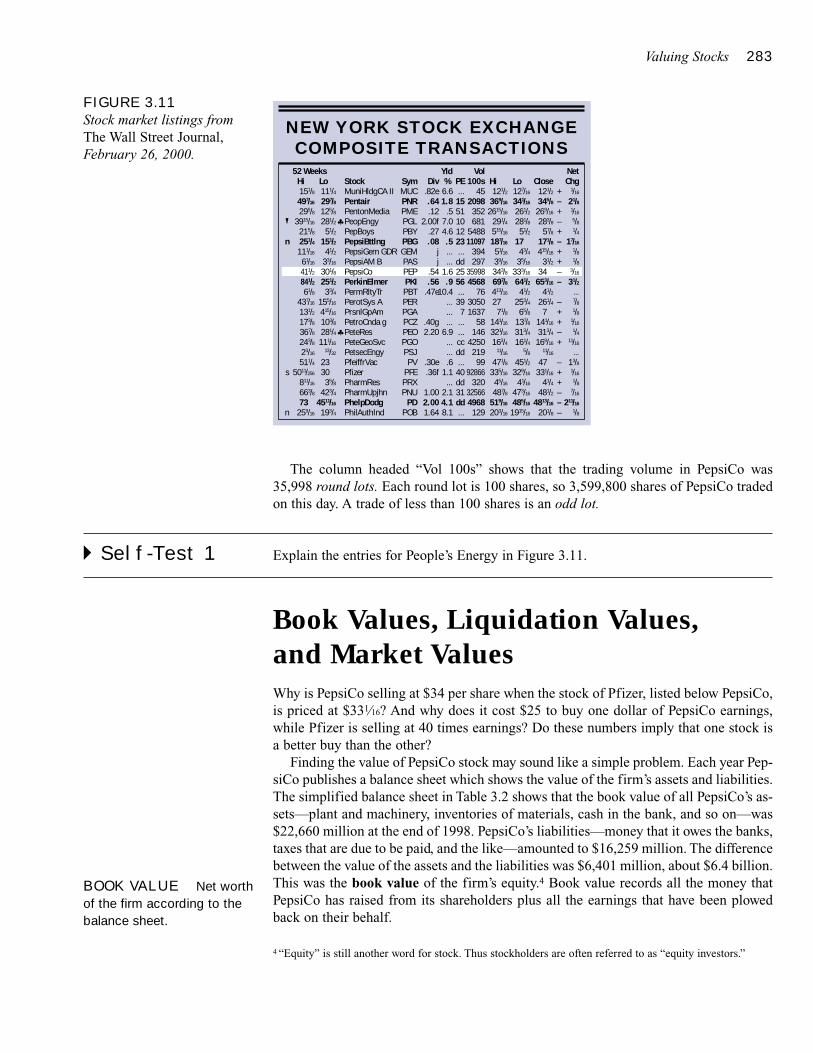
Valuing Stocks 283
The column headed “Vol 100s” shows that the trading volume in PepsiCo was35,998 round lots. Each round lot is 100 shares, so 3,599,800 shares of PepsiCo tradedon this day. A trade of less than 100 shares is an odd lot.
� Self-Test 1 Explain the entries for People’s Energy in Figure 3.11.
Book Values, Liquidation Values, and Market ValuesWhy is PepsiCo selling at $34 per share when the stock of Pfizer, listed below PepsiCo,is priced at $331⁄16? And why does it cost $25 to buy one dollar of PepsiCo earnings,while Pfizer is selling at 40 times earnings? Do these numbers imply that one stock isa better buy than the other?
Finding the value of PepsiCo stock may sound like a simple problem. Each year Pep-siCo publishes a balance sheet which shows the value of the firm’s assets and liabilities.The simplified balance sheet in Table 3.2 shows that the book value of all PepsiCo’s as-sets—plant and machinery, inventories of materials, cash in the bank, and so on—was$22,660 million at the end of 1998. PepsiCo’s liabilities—money that it owes the banks,taxes that are due to be paid, and the like—amounted to $16,259 million. The differencebetween the value of the assets and the liabilities was $6,401 million, about $6.4 billion.This was the book value of the firm’s equity.4 Book value records all the money thatPepsiCo has raised from its shareholders plus all the earnings that have been plowedback on their behalf.
FIGURE 3.11Stock market listings fromThe Wall Street Journal,February 26, 2000.
NEW YORK STOCK EXCHANGECOMPOSITE TRANSACTIONS
MuniHldgCA IIPentairPentonMediaPeopEngyPepBoysPepsiBttlngPepsiGem GDRPepsiAM BPepsiCoPerkinElmerPermRltyTrPerotSys APrsnlGpAmPetroCnda gPeteResPeteGeoSvcPetsecEngyPfeiffrVacPfizerPharmResPharmUpjhnPhelpDodgPhilAuthInd
MUCPNRPMEPGLPBYPBGGEMPASPEPPKIPBTPERPGAPCZPEOPGOPSJPV
PFEPRXPNU
PDPOB
.82e.64.12
2.00f.27.08
jj
.54
.56.47e
.40g2.20
.30e.36f
1.002.001.64
6.61.8
.57.04.6.5......
1.6.9
10.4.........
6.9.......6
1.1...
2.14.18.1
...1551101223...dd2556...397......ccdd...40dd31dd...
452098352681
548811097
394297
359984568
7630501637
58146
425021999
92866320
325664968129
121/2369/16
2615/16
291/4515/16
187/16
51/16
39/16
343/8697/8413/16
2771/8
141/16
321/16
163/411/16
471/8335/16
45/16
487/8519/16
203/16
127/16
341/16
261/2281/851/2
1743/4
35/16
333/16
641/241/2
253/465/8
137/8313/4161/4
5/8451/2
329/16
41/16
473/16
485/16
1915/16
151/8497/16
295/83915/16
215/8251/4111/16
61/16
411/2841/261/8
437/16
131/2173/8367/8243/823/16
511/45011/256
811/16
663/873
259/16
n
s
n
�
�
111/4297/8125/8281/251/2
151/241/2
33/16
301/8251/233/4
155/16
415/16
103/8281/4111/16
13/32
233035/8
423/44511/16
193/4
Hi52 Weeks
Lo Hi LoStock Sym Div % PE CloseVol
100sNetChg
121/2345/8
269/16
283/857/8
171/8415/16
31/234
653/16
41/2261/47
141/16
313/4169/16
11/16
47331/16
41/4481/2
4813/16
201/8
1/16
21/81/165/81/4
17/161/81/8
3/16
31/2...7/81/8
1/161/4
11/16
...13/81/161/8
7/16
211/161/8
+–+–+–++––
–++–+
–++–––
Yld
BOOK VALUE Net worthof the firm according to thebalance sheet.
4 “Equity” is still another word for stock. Thus stockholders are often referred to as “equity investors.”
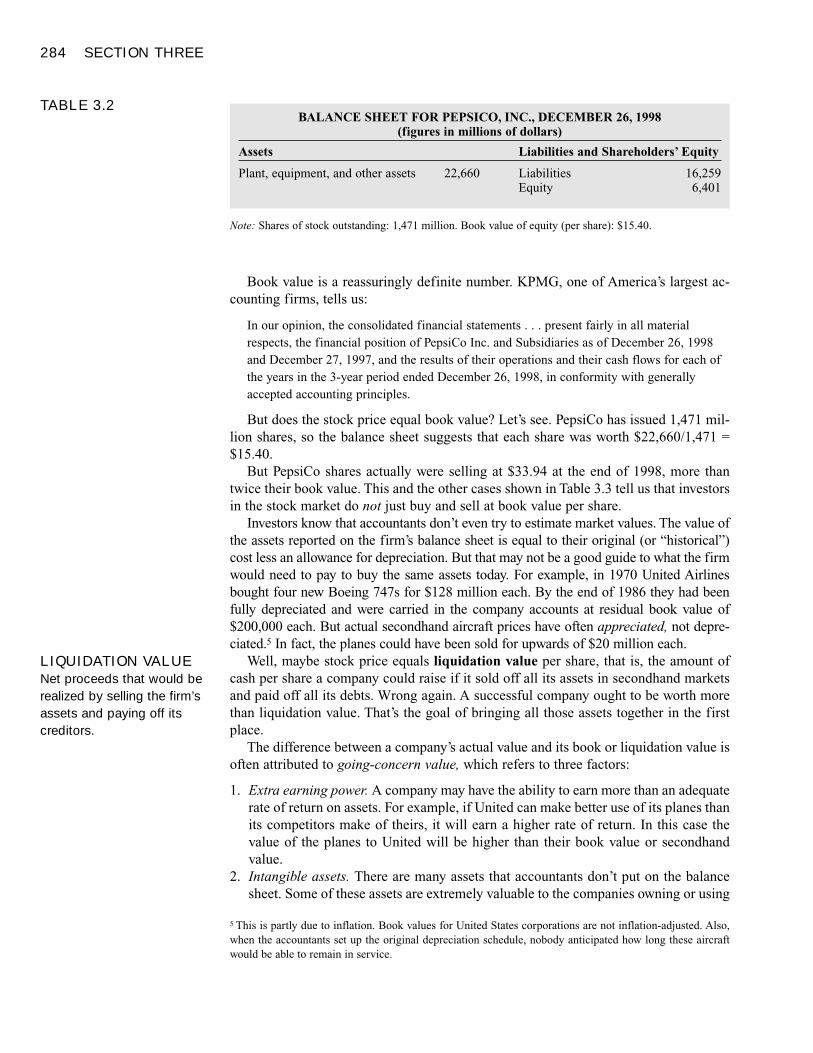
284 SECTION THREE
Book value is a reassuringly definite number. KPMG, one of America’s largest ac-counting firms, tells us:
In our opinion, the consolidated financial statements . . . present fairly in all materialrespects, the financial position of PepsiCo Inc. and Subsidiaries as of December 26, 1998and December 27, 1997, and the results of their operations and their cash flows for each ofthe years in the 3-year period ended December 26, 1998, in conformity with generallyaccepted accounting principles.
But does the stock price equal book value? Let’s see. PepsiCo has issued 1,471 mil-lion shares, so the balance sheet suggests that each share was worth $22,660/1,471 =$15.40.
But PepsiCo shares actually were selling at $33.94 at the end of 1998, more thantwice their book value. This and the other cases shown in Table 3.3 tell us that investorsin the stock market do not just buy and sell at book value per share.
Investors know that accountants don’t even try to estimate market values. The value ofthe assets reported on the firm’s balance sheet is equal to their original (or “historical”)cost less an allowance for depreciation. But that may not be a good guide to what the firmwould need to pay to buy the same assets today. For example, in 1970 United Airlinesbought four new Boeing 747s for $128 million each. By the end of 1986 they had beenfully depreciated and were carried in the company accounts at residual book value of$200,000 each. But actual secondhand aircraft prices have often appreciated, not depre-ciated.5 In fact, the planes could have been sold for upwards of $20 million each.
Well, maybe stock price equals liquidation value per share, that is, the amount ofcash per share a company could raise if it sold off all its assets in secondhand marketsand paid off all its debts. Wrong again. A successful company ought to be worth morethan liquidation value. That’s the goal of bringing all those assets together in the firstplace.
The difference between a company’s actual value and its book or liquidation value isoften attributed to going-concern value, which refers to three factors:
1. Extra earning power. A company may have the ability to earn more than an adequaterate of return on assets. For example, if United can make better use of its planes thanits competitors make of theirs, it will earn a higher rate of return. In this case thevalue of the planes to United will be higher than their book value or secondhandvalue.
2. Intangible assets. There are many assets that accountants don’t put on the balancesheet. Some of these assets are extremely valuable to the companies owning or using
Note: Shares of stock outstanding: 1,471 million. Book value of equity (per share): $15.40.
TABLE 3.2BALANCE SHEET FOR PEPSICO, INC., DECEMBER 26, 1998
(figures in millions of dollars)
Assets Liabilities and Shareholders’ Equity
Plant, equipment, and other assets 22,660 Liabilities 16,259Equity 6,401
5 This is partly due to inflation. Book values for United States corporations are not inflation-adjusted. Also,when the accountants set up the original depreciation schedule, nobody anticipated how long these aircraftwould be able to remain in service.
LIQUIDATION VALUENet proceeds that would berealized by selling the firm’sassets and paying off itscreditors.
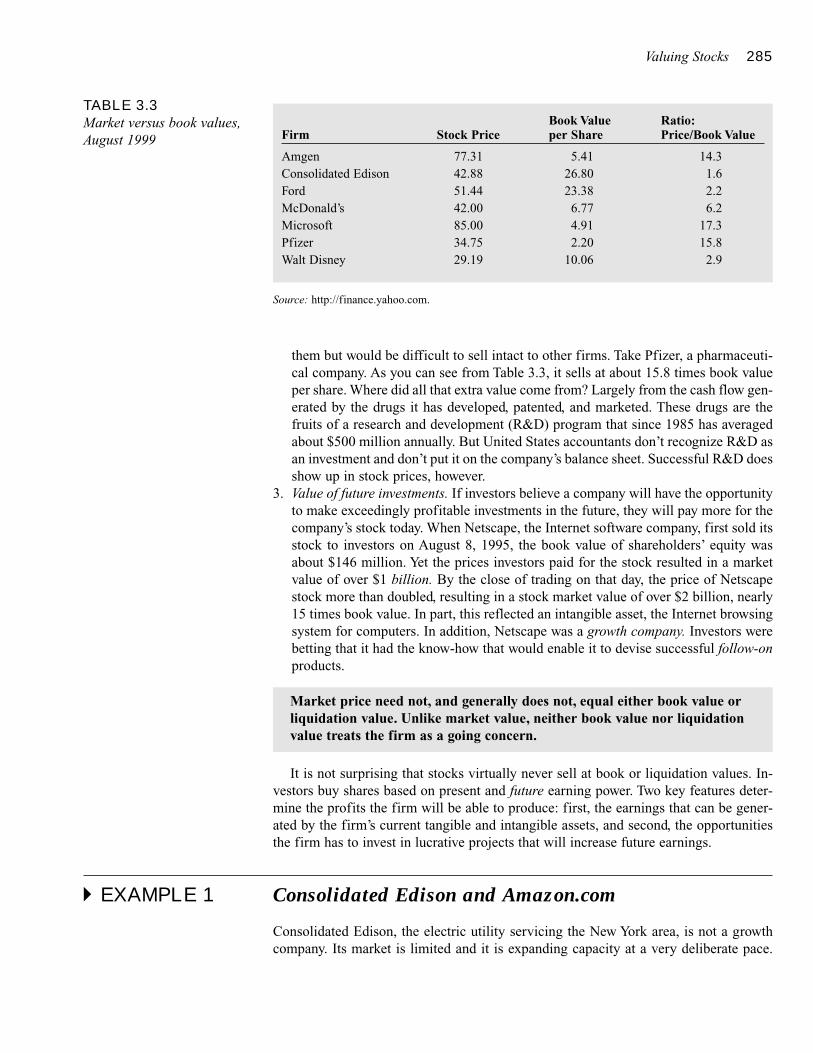
Valuing Stocks 285
them but would be difficult to sell intact to other firms. Take Pfizer, a pharmaceuti-cal company. As you can see from Table 3.3, it sells at about 15.8 times book valueper share. Where did all that extra value come from? Largely from the cash flow gen-erated by the drugs it has developed, patented, and marketed. These drugs are thefruits of a research and development (R&D) program that since 1985 has averagedabout $500 million annually. But United States accountants don’t recognize R&D asan investment and don’t put it on the company’s balance sheet. Successful R&D doesshow up in stock prices, however.
3. Value of future investments. If investors believe a company will have the opportunityto make exceedingly profitable investments in the future, they will pay more for thecompany’s stock today. When Netscape, the Internet software company, first sold itsstock to investors on August 8, 1995, the book value of shareholders’ equity wasabout $146 million. Yet the prices investors paid for the stock resulted in a marketvalue of over $1 billion. By the close of trading on that day, the price of Netscapestock more than doubled, resulting in a stock market value of over $2 billion, nearly15 times book value. In part, this reflected an intangible asset, the Internet browsingsystem for computers. In addition, Netscape was a growth company. Investors werebetting that it had the know-how that would enable it to devise successful follow-onproducts.
It is not surprising that stocks virtually never sell at book or liquidation values. In-vestors buy shares based on present and future earning power. Two key features deter-mine the profits the firm will be able to produce: first, the earnings that can be gener-ated by the firm’s current tangible and intangible assets, and second, the opportunitiesthe firm has to invest in lucrative projects that will increase future earnings.
� EXAMPLE 1 Consolidated Edison and Amazon.com
Consolidated Edison, the electric utility servicing the New York area, is not a growthcompany. Its market is limited and it is expanding capacity at a very deliberate pace.
Market price need not, and generally does not, equal either book value orliquidation value. Unlike market value, neither book value nor liquidationvalue treats the firm as a going concern.
TABLE 3.3Market versus book values,August 1999
Book Value Ratio:Firm Stock Price per Share Price/Book Value
Amgen 77.31 5.41 14.3Consolidated Edison 42.88 26.80 1.6Ford 51.44 23.38 2.2McDonald’s 42.00 6.77 6.2Microsoft 85.00 4.91 17.3Pfizer 34.75 2.20 15.8Walt Disney 29.19 10.06 2.9
Source: http://finance.yahoo.com.
286 SECTION THREE
More important, it is a regulated utility, so its profits on present and future investmentsare limited. Its earnings have been growing slowly, but steadily.
In contrast, Amazon.com has little to show in the way of current earnings. In fact, bySeptember 1999, it had recorded accumulated losses of over $500 million. Neverthe-less, the total market value of Amazon stock in March 2000 was $22 billion. The valuecame from Amazon’s market position, its highly regarded distribution system, and thepromise of new related products which presumably would lead to future earnings. Ama-zon was a pure growth firm, since its market value depended wholly on intangible as-sets and the profitability of future investments. It is not surprising then that while ConEd shares sold for less than their book value in March 2000, Amazon sold for 53 timesbook value.
Financial executives are not bound by generally accepted accounting principles, andthey sometimes construct a firm’s market-value balance sheet. Such a balance sheethelps them to think about and evaluate the sources of firm value. Take a look at Table3.4. A market-value balance sheet contains two classes of assets: (1) assets already inplace, (a) tangible and (b) intangible; and (2) opportunities to invest in attractive futureventures. Consolidated Edison’s stock market value is dominated by tangible assets inplace; Amazon’s by the value of future investment opportunities.
Other firms, like Microsoft, have it all. Microsoft earns plenty from its current prod-ucts. These earnings are part of what makes the stock attractive to investors. In addition,investors are willing to pay for the company’s ability to invest profitably in new ven-tures that will increase future earnings.
Let’s summarize. Just remember:
• Book value records what a company has paid for its assets, with a simple, and oftenunrealistic, deduction for depreciation and no adjustment for inflation. It does notcapture the true value of a business.
• Liquidation value is what the company could net by selling its assets and repayingits debts. It does not capture the value of a successful going concern.
• Market value is the amount that investors are willing to pay for the shares of the firm.This depends on the earning power of today’s assets and the expected profitability offuture investments.
The next question is: What determines market value?
� Self-Test 2 In the 1970s, the computer industry was dominated by IBM and was growing rapidly.In the 1980s, many new competitors entered the market, and computer prices fell. Com-puter makers in the 1990s, including IBM, struggled with thinning profit margins andintense competition. How has IBM’s market-value balance sheet changed over time?Have assets in place become proportionately more or less important? Do you think thisprogression is unique to the computer industry?
TABLE 3.4A MARKET-VALUE BALANCE SHEET
Assets Liabilities and Shareholders’ Equity
Assets in place Market value of debt and other obligationsInvestment opportunities Market value of shareholders’ equity
MARKET-VALUEBALANCE SHEETFinancial statement that usesthe market value of all assetsand liabilities.
Valuing Stocks 287
Valuing Common StocksTODAY’S PRICE AND TOMORROW’S PRICE
The cash payoff to owners of common stocks comes in two forms: (1) cash dividendsand (2) capital gains or losses. Usually investors expect to get some of each. Supposethat the current price of a share is P0, that the expected price a year from now is P1, andthat the expected dividend per share is DIV1. The subscript on P0 denotes time zero,which is today; the subscript on P1 denotes time 1, which is 1 year hence. We simplifyby assuming that dividends are paid only once a year and that the next dividend willcome in 1 year. The rate of return that investors expect from this share over the next yearis the expected dividend per share DIV1 plus the expected increase in price P1 – P0, alldivided by the price at the start of the year P0:
Expected return � r �DIV1 + P1 – P0
P0
Let us now look at how our formula works. Suppose Blue Skies stock is selling for$75 a share (P0 = $75). Investors expect a $3 cash dividend over the next year (DIV1 =$3). They also expect the stock to sell for $81 a year hence (P1 = $81). Then the ex-pected return to stockholders is 12 percent:
r =$3 + $81 – $75
= .12, or 12%$75
Notice that this expected return comes in two parts, the dividend and capital gain:
Expected rate of return = expected dividend yield + expected capital gain
=DIV1 +
P1 – P0
P0 P0
=$3
+$81 – $75
$75 $75
= .04 + .08 = .12, or 12%
Of course, the actual return for Blue Skies may turn out to be more or less than investors expect. For example, in 1998, one of the best performing stocks was Amazon.com. Its price at the end of the year was $321.25, up from $30.125 at the be-ginning of the year. Since the stock did not pay a dividend during the year, investorsearned an actual return of ($0 + $321.25 – $30.125)/$321.25 = 9.66, or 966 percent.
This figure was almost certainly well in excess of investor expectations. At the otherextreme, the modem maker Hayes, which declared bankruptcy during the year, providedan actual return of –98.5 percent, well below expectations. Never confuse the actualoutcome with the expected outcome.
We saw how to work out the expected return on Blue Skies stock given today’s stockprice and forecasts of next year’s stock price and dividends. You can also explain themarket value of the stock in terms of investors’ forecasts of dividends and price and theexpected return offered by other equally risky stocks. This is just the present value ofthe cash flows the stock will provide to its owner:
Price today = P0 =DIV1 + P1
1 + r
For Blue Skies DIV1 = $3 and P1 = $81. If stocks of similar risk offer an expected re-turn of r = 12 percent, then today’s price for Blue Skies should be $75:
288 SECTION THREE
P0 =$3 + $81
= $751.12
How do we know that $75 is the right price? Because no other price could survive incompetitive markets. What if P0 were above $75? Then the expected rate of return onBlue Skies stock would be lower than on other securities of equivalent risk. (Checkthis!) Investors would bail out of Blue Skies stock and substitute the other securities. Inthe process they would force down the price of Blue Skies stock. If P0 were less than$75, Blue Skies stock would offer a higher expected rate of return than equivalent-risksecurities. (Check this too.) Everyone would rush to buy, forcing the price up to $75.When the stock is priced correctly (that is, price equals present value), the expected rateof return on Blue Skies stock is also the rate of return that investors require to hold thestock.
� Self-Test 3 Androscoggin Copper is increasing next year’s dividend to $5.00 per share. The fore-cast stock price next year is $105. Equally risky stocks of other companies offer ex-pected rates of return of 10 percent. What should Androscoggin common stock sell for?
THE DIVIDEND DISCOUNT MODEL
We have managed to explain today’s stock price P0 in terms of the dividend DIV1 andthe expected stock price next year P1. But future stock prices are not easy to forecastdirectly, though you may encounter individuals who claim to be able to do so. A for-mula that requires tomorrow’s stock price to explain today’s stock price is not generallyhelpful.
As it turns out, we can express a stock’s value as the present value of all the forecastfuture dividends paid by the company to its shareholders without referring to the futurestock price. This is the dividend discount model:
P0 = present value of (DIV1, DIV2, DIV3, . . ., DIVt, . . .)
=DIV1 +
DIV2 +DIV3 + . . . +
DIVt + . . .1 + r (1 + r)2 (1 + r)3 (1 + r)t
How far out in the future could we look? In principle, 40, 60, or 100 years or more—corporations are potentially immortal. However, far-distant dividends will not have sig-nificant present values. For example, the present value of $1 received in 30 years usinga 10 percent discount rate is only $.057. Most of the value of established companiescomes from dividends to be paid within a person’s working lifetime.
How do we get from the one-period formula P0 = (DIV1 + P1)/(1 + r) to the dividenddiscount model? We look at increasingly long investment horizons.
Let’s consider investors with different investment horizons. Each investor will valuethe share of stock as the present value of the dividends that she expects to receive plusthe present value of the price at which the stock is eventually sold. Unlike bonds, how-ever, the final horizon date for stocks is not specified—stocks do not “mature.” More-
At each point in time all securities of the same risk are priced to offer thesame expected rate of return. This is a fundamental characteristic of prices inwell-functioning markets. It is also common sense.
DIVIDEND DISCOUNTMODEL Discounted cash-flow model of today’s stockprice which states that sharevalue equals the presentvalue of all expected futuredividends.
Valuing Stocks 289
over, both dividends and final sales price can only be estimated. But the general valua-tion approach is the same. For a one-period investor, the valuation formula looks likethis:
P0 =DIV1 + P1
1 + r
A 2-year investor would value the stock as
P0 =DIV1 +
DIV2 + P2
1 + r (1 + r)2
and a 3-year investor would use the formula
P0 =DIV1 +
DIV2 +DIV3 + P3
1 + r (1 + r)2 (1 + r)3
In fact we can look as far out into the future as we like. Suppose we call our horizondate H. Then the stock valuation formula would be
P0 =DIV1 +
DIV2 + . . . +DIVH + PH
1 + r (1 + r)2 (1 + r)H
Does this mean that investors of different horizons will all come to different conclu-sions about the value of the stock? No! Regardless of the investment horizon, the stockvalue will be the same. This is because the stock price at the horizon date is determinedby expectations of dividends from that date forward. Therefore, as long as the investorsare consistent in their assessment of the prospects of the firm, they will arrive at thesame present value. Let’s confirm this with an example.
� EXAMPLE 2 Valuing Blue Skies Stock
Take Blue Skies. The firm is growing steadily and investors expect both the stock priceand the dividend to increase at 8 percent per year. Now consider three investors, Erste,Zweiter, and Dritter. Erste plans to hold Blue Skies for 1 year, Zweiter for 2, and Drit-ter for 3. Compare their payoffs:
Year 1 Year 2 Year 3
Erste DIV1 = 3P1 = 81
Zweiter DIV1 = 3 DIV2 = 3.24P2 = 87.48
Dritter DIV1 = 3 DIV2 = 3.24 DIV3 = 3.50P3 = 94.48
Remember, we assumed that dividends and stock prices for Blue Skies are expected togrow at a steady 8 percent. Thus DIV2 = $3 × 1.08 = $3.24, DIV3 = $3.24 × 1.08 =$3.50, and so on.
In words, the value of a stock is the present value of the dividends it will payover the investor’s horizon plus the present value of the expected stock price at the end of that horizon.
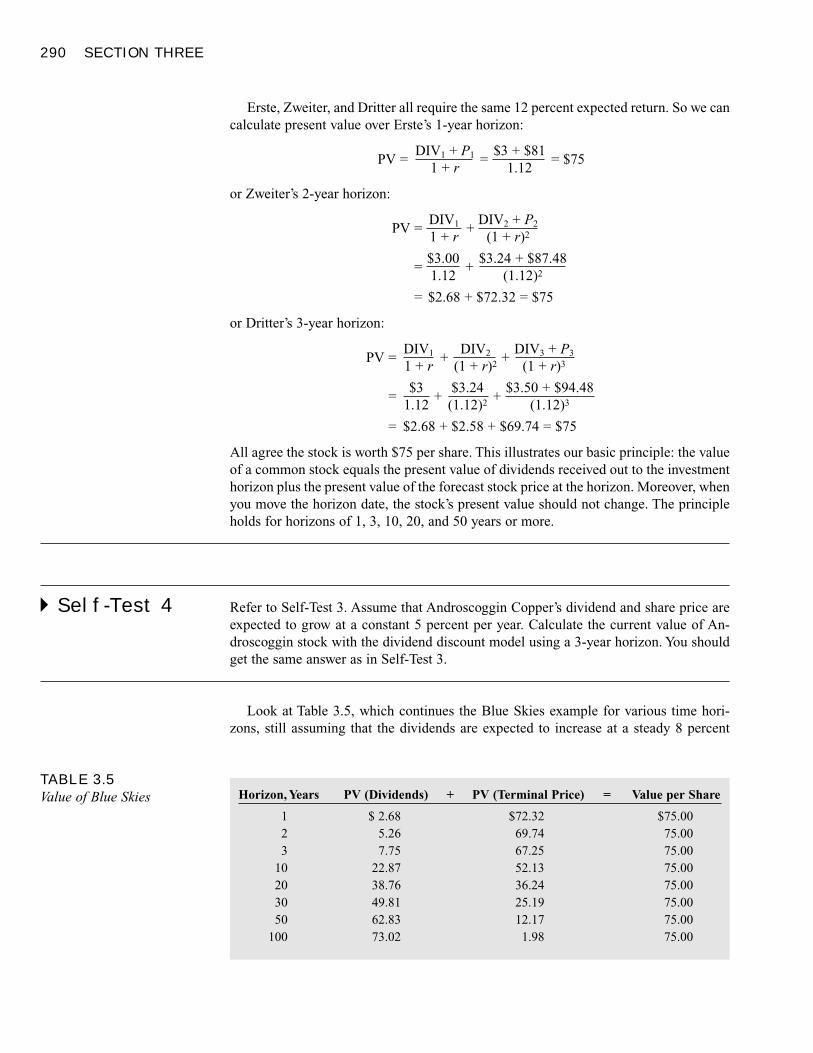
290 SECTION THREE
Erste, Zweiter, and Dritter all require the same 12 percent expected return. So we cancalculate present value over Erste’s 1-year horizon:
PV =DIV1 + P1 =
$3 + $81= $75
1 + r 1.12
or Zweiter’s 2-year horizon:
PV =DIV1 +
DIV2 + P2
1 + r (1 + r)2
=$3.00
+$3.24 + $87.48
1.12 (1.12)2
= $2.68 + $72.32 = $75
or Dritter’s 3-year horizon:
PV =DIV1 +
DIV2 +DIV3 + P3
1 + r (1 + r)2 (1 + r)3
=$3
+$3.24
+$3.50 + $94.48
1.12 (1.12)2 (1.12)3
= $2.68 + $2.58 + $69.74 = $75
All agree the stock is worth $75 per share. This illustrates our basic principle: the valueof a common stock equals the present value of dividends received out to the investmenthorizon plus the present value of the forecast stock price at the horizon. Moreover, whenyou move the horizon date, the stock’s present value should not change. The principleholds for horizons of 1, 3, 10, 20, and 50 years or more.
� Self-Test 4 Refer to Self-Test 3. Assume that Androscoggin Copper’s dividend and share price areexpected to grow at a constant 5 percent per year. Calculate the current value of An-droscoggin stock with the dividend discount model using a 3-year horizon. You shouldget the same answer as in Self-Test 3.
Look at Table 3.5, which continues the Blue Skies example for various time hori-zons, still assuming that the dividends are expected to increase at a steady 8 percent
TABLE 3.5Value of Blue Skies Horizon, Years PV (Dividends) + PV (Terminal Price) = Value per Share
1 $ 2.68 $72.32 $75.002 5.26 69.74 75.003 7.75 67.25 75.00
10 22.87 52.13 75.0020 38.76 36.24 75.0030 49.81 25.19 75.0050 62.83 12.17 75.00
100 73.02 1.98 75.00
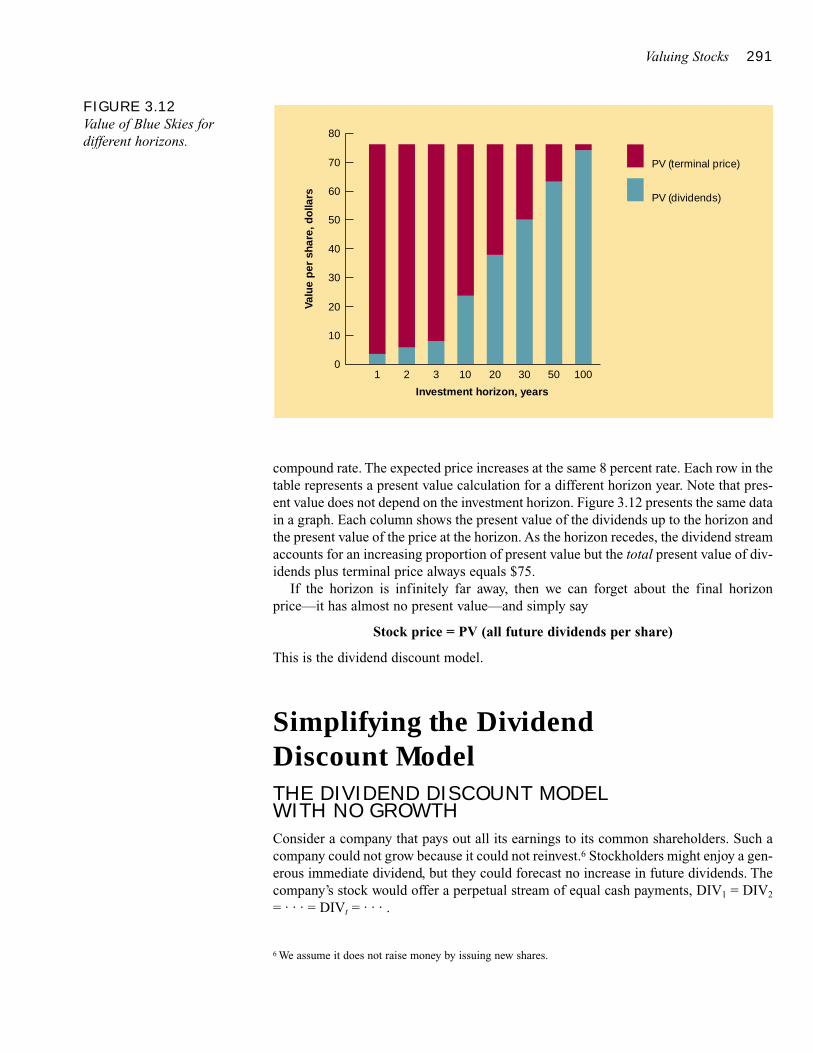
Valuing Stocks 291
compound rate. The expected price increases at the same 8 percent rate. Each row in thetable represents a present value calculation for a different horizon year. Note that pres-ent value does not depend on the investment horizon. Figure 3.12 presents the same datain a graph. Each column shows the present value of the dividends up to the horizon andthe present value of the price at the horizon. As the horizon recedes, the dividend streamaccounts for an increasing proportion of present value but the total present value of div-idends plus terminal price always equals $75.
If the horizon is infinitely far away, then we can forget about the final horizonprice—it has almost no present value—and simply say
Stock price = PV (all future dividends per share)
This is the dividend discount model.
Simplifying the Dividend Discount ModelTHE DIVIDEND DISCOUNT MODEL WITH NO GROWTH
Consider a company that pays out all its earnings to its common shareholders. Such acompany could not grow because it could not reinvest.6 Stockholders might enjoy a gen-erous immediate dividend, but they could forecast no increase in future dividends. Thecompany’s stock would offer a perpetual stream of equal cash payments, DIV1 = DIV2
= . . . = DIVt = . . . .
6 We assume it does not raise money by issuing new shares.
FIGURE 3.12Value of Blue Skies fordifferent horizons.
Valu
e p
er s
hare
, do
llars
1 2 3 10 20 30 50 100
Investment horizon, years
70
80
50
60
40
30
20
10
0
PV (terminal price)
PV (dividends)
292 SECTION THREE
The dividend discount model says that these no-growth shares should sell for thepresent value of a constant, perpetual stream of dividends. We learned how to do thatcalculation when we valued perpetuities earlier. Just divide the annual cash payment bythe discount rate. The discount rate is the rate of return demanded by investors in otherstocks of the same risk:
P0 =DIV1
r
Since our company pays out all its earnings as dividends, dividends and earnings arethe same, and we could just as well calculate stock value by
Value of a no-growth stock = P0 =EPS1
r
where EPS1 represents next year’s earnings per share of stock. Thus some peopleloosely say, “Stock price is the present value of future earnings” and calculate value bythis formula. Be careful—this is a special case. We’ll return to the formula later in thismaterial.
� Self-Test 5 Moonshine Industries has produced a barrel per week for the past 20 years but cannotgrow because of certain legal hazards. It earns $25 per share per year and pays it all outto stockholders. The stockholders have alternative, equivalent-risk ventures yielding 20percent per year on average. How much is one share of Moonshine worth? Assume thecompany can keep going indefinitely.
THE CONSTANT-GROWTH DIVIDEND DISCOUNT MODEL
The dividend discount model requires a forecast of dividends for every year into the fu-ture, which poses a bit of a problem for stocks with potentially infinite lives. Unless wewant to spend a lifetime forecasting dividends, we must use simplifying assumptions toreduce the number of estimates. The simplest simplification assumes a no-growth per-petuity which works for no-growth common shares.
Here’s another simplification that finds a good deal of practical use. Suppose fore-cast dividends grow at a constant rate into the indefinite future. If dividends grow at asteady rate, then instead of forecasting an infinite number of dividends, we need to fore-cast only the next dividend and the dividend growth rate.
Recall Blue Skies Inc. It will pay a $3 dividend in 1 year. If the dividend grows at aconstant rate of g = .08 (8 percent) thereafter, then dividends in future years will be
DIV1 = $3 = $3.00
DIV2 = $3 × (1 + g) = $3 × 1.08 = $3.24
DIV3 = $3 × (1 + g)2 = $3 × 1.082 = $3.50
Plug these forecasts of future dividends into the dividend discount model:
P0 =D1 +
D1(1 + g)+
D1(1 + g)2+
D1(1 + g)3+ . . .
1 + r (1 + r)2 (1 + r)3 (1 + r)4
=$3
+$3.24
+$3.50
+$3.78
+ . . .1.12 1.122 1.123 1.124
= $2.68 + $2.58 + $2.49 + $2.40 + . . .
Valuing Stocks 293
Although there is an infinite number of terms, each term is proportionately smallerthan the preceding one as long as the dividend growth rate g is less than the discountrate r. Because the present value of far-distant dividends will be ever-closer to zero, thesum of all of these terms is finite despite the fact that an infinite number of dividendswill be paid. The sum can be shown to equal
P0 =DIV1
r – g
This equation is called the constant-growth dividend discount model, or the Gor-don growth model after Myron Gordon, who did much to popularize it.7
� EXAMPLE 3 Blue Skies Valued by the Constant-Growth Model
Let’s apply the constant-growth model to Blue Skies. Assume a dividend has justbeen paid. The next dividend, to be paid in a year, is forecast at DIV1 = $3, the growthrate of dividends is g = 8 percent, and the discount rate is r = 12 percent. Therefore, wesolve for the stock value as
P0 =DIV1 =
$3= $75r – g .12 – .08
The constant-growth formula is close to the formula for the present value of a per-petuity. Suppose you forecast no growth in dividends (g = 0). Then the dividend streamis a simple perpetuity, and the valuation formula is P0 = DIV1/r. This is precisely theformula you used in Self-Test 5 to value Moonshine, a no-growth common stock.
The constant-growth model generalizes the perpetuity formula to allow for constantgrowth in dividends. Notice that as g increases, the stock price also rises. However, theconstant-growth formula is valid only when g is less than r. If someone forecasts per-petual dividend growth at a rate greater than investors’ required return r, then two thingshappen:
1. The formula explodes. It gives nutty answers. (Try a numerical example.)2. You know the forecast is wrong, because far-distant dividends would have incredi-
bly high present values. (Again, try a numerical example. Calculate the present valueof a dividend paid after 100 years, assuming DIV1 = $3, r = .12, but g = .20.)
ESTIMATING EXPECTED RATES OF RETURN
We argued earlier that in competitive markets, common stocks with the same risk arepriced to offer the same expected rate of return. But how do you figure out what thatexpected rate of return is?
It’s not easy. Consensus estimates of future dividends, stock prices, or overall ratesof return are not published in The Wall Street Journal or reported by TV newscasters.
CONSTANT-GROWTHDIVIDEND DISCOUNTMODEL Version of thedividend discount model inwhich dividends grow at aconstant rate.
7 Notice that the first dividend is assumed to come at the end of the first period and is discounted for a fullperiod. If the stock has just paid its dividend, then next year’s dividend will be (1 + g) times the dividend justpaid. So another way to write the valuation formula is
P0 =DIV1 =
DIV0 × (1 + g)r – g r – g
294 SECTION THREE
Economists argue about which statistical models give the best estimates. There are nev-ertheless some useful rules of thumb that can give sensible numbers.
One rule of thumb is based on the constant-growth dividend discount model. Re-member that it forecasts a constant growth rate g in both future dividends and stockprices. That means forecast capital gains equal g per year.
We can calculate the expected rate of return by rearranging the constant-growth for-mula as
r =DIV1 + g
P0
= dividend yield + growth rate
For Blue Skies, the expected first-year dividend is $3 and the growth rate 8 percent.With an initial stock price of $75, the expected rate of return is
r =DIV1 + g
P0
=$3
+ .08 = .04 + .08 = .12, or 12%$75
Suppose we found another stock with the same risk as Blue Skies. It ought to offerthe same expected rate of return even if its immediate dividend or expected growth rateis very different. The required rate of return is not the unique property of Blue Skies orany other company; it is set in the worldwide market for common stocks. Blue Skiescannot change its value of r by paying higher or lower dividends or by growing fasteror slower, unless these changes also affect the risk of the stock. When we use the ruleof thumb formula, r = DIV1/P0 + g, we are not saying that r, the expected rate of return,is determined by DIV1 or g. It is determined by the rate of return offered by otherequally risky stocks. That return determines how much investors are willing to pay forBlue Skies’s forecast future dividends:
DIV1 + g = r =expected rate of return offered
P0 by other, equally risky stocks
Given DIV1 and so that Blue Skies offers ang, investors set adequate expected rate ofthe stock price return r
� EXAMPLE 4 Blue Skies Gets a Windfall
Blue Skies has won a lawsuit against its archrival, Nasty Manufacturing, which forcesNasty Manufacturing to withdraw as a competitor in a key market. As a result BlueSkies is able to generate 9 percent per year future growth without sacrificing immedi-ate dividends. Will that increase r, the expected rate of return?
This is very good news for Blue Skies stockholders. The stock price will jump to
P0 =DIV1 =
$3= $100
r – g .12 – .09
But at the new price Blue Skies will offer the same 12 percent expected return:
Valuing Stocks 295
r =DIV1 + g
P0
=$3
+ .09 = .12, or 12%$100
Blue Skies’s good news is reflected in a higher stock price today, not in a higher ex-pected rate of return in the future. The unchanged expected rate of return correspondsto Blue Skies’s unchanged risk.
� Self-Test 6 Androscoggin Copper can grow at 5 percent per year for the indefinite future. It’s sell-ing at $100 and next year’s dividend is $5.00. What is the expected rate of return frominvesting in Carrabasset Mining common stock? Carrabasset and Androscoggin sharesare equally risky.
Few real companies are expected to grow in such a regular and convenient way asBlue Skies or Androscoggin Copper. Nevertheless, in some mature industries, growthis reasonably stable and the constant-growth model approximately valid. In such casesthe model can be turned around to infer the rate of return expected by investors.
NONCONSTANT GROWTH
Many companies grow at rapid or irregular rates for several years before finally settlingdown. Obviously we can’t use the constant-growth dividend discount model in suchcases. However, we have already looked at an alternative approach. Set the investmenthorizon (Year H) at the future year by which you expect the company’s growth to settledown. Calculate the present value of dividends from now to the horizon year. Forecastthe stock price in that year and discount it also to present value. Then add up to get thetotal present value of dividends plus the ending stock price. The formula is
P0 =DIV1 +
DIV2 + . . . +DIVH +
PH
1 + r (1 + r)2 (1 + r)H (1 + r)H
PV of dividends from PV of stock priceYear 1 to horizon at horizon
The stock price in the horizon year is often called terminal value.
� EXAMPLE 5 Estimating the Value of United Bird Seed’s Stock
Ms. Dawn Chorus, founder and president of United Bird Seed, is wondering whetherthe company should make its first public sale of common stock and if so at what price.
The company’s financial plan envisages rapid growth over the next 3 years but onlymoderate growth afterwards. Forecast earnings and dividends are as follows:
Year: 1 2 3 4 5 6 7 8
Earningsper share $2.45 3.11 3.78 5% growth thereafterDividendsper share $1.00 1.20 1.44 5% growth thereafter
296 SECTION THREE
Thus you have a forecast of the dividend stream for the next 3 years. The tricky partis to estimate the price in the horizon Year 3. Ms. Chorus could look at stock prices formature pet food companies whose scale, risk, and growth prospects today roughlymatch those projected for United Bird Seed in Year 3. Suppose further that these com-panies tend to sell at price-earnings ratios of about 8. Then you could reasonably guessthat the P/E ratio of United will likewise be 8. That implies
P3 = 8 × $3.78 = $30.24
You are now in a position to determine the value of shares in United. If investors de-mand a return of r = 10 percent, then price today should be
P0 = PV (dividends from Years 1 to 3) + PV (forecast stock price in Year 3)
PV (dividends) =$1.00
+$1.20
+$1.44
= $2.981.10 1.102 1.103
PV(PH) =$30.24
= $22.72(1.10)3
P0 = $2.98 + $22.72 = $25.70
Thus price today should be about $25.70 per share.United Bird Seed is looking forward to several years of very rapid growth, so you
could not use the constant-growth formula to value United’s stock today. But the for-mula may help you check your estimate of the terminal price in Year 3 when the com-pany has settled down to a steady rate of growth. From then on dividends are forecastto grow at a constant rate of g = .05 (5 percent). Thus the expected dividend in Year 4is
DIV4 = 1.05 × DIV3 = 1.05 × $1.44 = $1.512
and the expected terminal price in Year 3 is
P3 =DIV4 =
$1.512= $30.24
r – g .10 – .05
the same value we found when we used the P/E ratio to predict P3. In this case our twoapproaches give the same estimate of P3, though you shouldn’t bet on that always beingthe case in practice.
� Self-Test 7 Suppose that another stock market analyst predicts that United Bird Seed will not set-tle down to a constant 5 percent growth rate in dividends until after Year 4, and that div-idends in Year 4 will be $1.73 per share. What is the fair price for the stock accordingto this analyst?
Growth Stocks and Income StocksWe often hear investors speak of growth stocks and income stocks. They seem to buygrowth stocks primarily in the expectation of capital gains, and they are interested in thefuture growth of earnings rather than in next year’s dividends. On the other hand, they
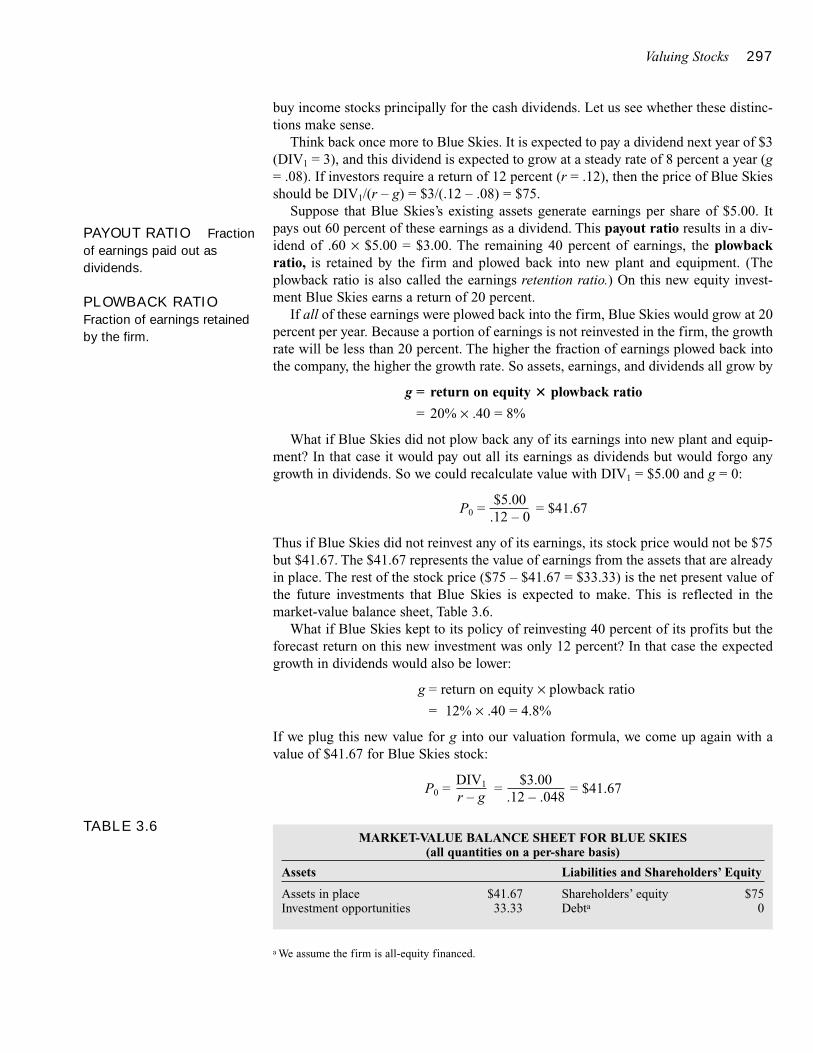
Valuing Stocks 297
buy income stocks principally for the cash dividends. Let us see whether these distinc-tions make sense.
Think back once more to Blue Skies. It is expected to pay a dividend next year of $3(DIV1 = 3), and this dividend is expected to grow at a steady rate of 8 percent a year (g= .08). If investors require a return of 12 percent (r = .12), then the price of Blue Skiesshould be DIV1/(r – g) = $3/(.12 – .08) = $75.
Suppose that Blue Skies’s existing assets generate earnings per share of $5.00. Itpays out 60 percent of these earnings as a dividend. This payout ratio results in a div-idend of .60 × $5.00 = $3.00. The remaining 40 percent of earnings, the plowbackratio, is retained by the firm and plowed back into new plant and equipment. (Theplowback ratio is also called the earnings retention ratio.) On this new equity invest-ment Blue Skies earns a return of 20 percent.
If all of these earnings were plowed back into the firm, Blue Skies would grow at 20percent per year. Because a portion of earnings is not reinvested in the firm, the growthrate will be less than 20 percent. The higher the fraction of earnings plowed back intothe company, the higher the growth rate. So assets, earnings, and dividends all grow by
g = return on equity � plowback ratio
= 20% × .40 = 8%
What if Blue Skies did not plow back any of its earnings into new plant and equip-ment? In that case it would pay out all its earnings as dividends but would forgo anygrowth in dividends. So we could recalculate value with DIV1 = $5.00 and g = 0:
P0 =$5.00
= $41.67.12 – 0
Thus if Blue Skies did not reinvest any of its earnings, its stock price would not be $75but $41.67. The $41.67 represents the value of earnings from the assets that are alreadyin place. The rest of the stock price ($75 – $41.67 = $33.33) is the net present value ofthe future investments that Blue Skies is expected to make. This is reflected in the market-value balance sheet, Table 3.6.
What if Blue Skies kept to its policy of reinvesting 40 percent of its profits but theforecast return on this new investment was only 12 percent? In that case the expectedgrowth in dividends would also be lower:
g = return on equity × plowback ratio
= 12% × .40 = 4.8%
If we plug this new value for g into our valuation formula, we come up again with avalue of $41.67 for Blue Skies stock:
P0 =DIV1 =
$3.00= $41.67
r – g .12 – .048
PAYOUT RATIO Fractionof earnings paid out asdividends.
PLOWBACK RATIOFraction of earnings retainedby the firm.
a We assume the firm is all-equity financed.
TABLE 3.6MARKET-VALUE BALANCE SHEET FOR BLUE SKIES
(all quantities on a per-share basis)
Assets Liabilities and Shareholders’ Equity
Assets in place $41.67 Shareholders’ equity $75Investment opportunities 33.33 Debta 0
298 SECTION THREE
To repeat, if Blue Skies did not plow back earnings or if it earned only the return thatinvestors required on the new investment, its stock price would be $41.67. The totalvalue of Blue Skies stock is $75. Of this figure, $41.67 is the value of the assets alreadyin place, and the remaining $33.33 is the present value of the superior returns on assetsto be acquired in the future. The latter is called the present value of growth opportu-nities, or PVGO. (Remember that investors expected Blue Skies to earn 20 percent onits new investments, well above the 12 percent expected return necessary to attract in-vestors.)
By the way, growth rates calculated as
g = return on equity × plowback ratio
are often referred to as sustainable growth rates.
� Self-Test 8 Suppose that instead of plowing money back into lucrative ventures, Blue Skies’s man-agement is investing at an expected return on equity of 10 percent, which is below thereturn of 12 percent that investors could expect to get from comparable securities.
a. Find the sustainable growth rate of dividends and earnings in these circumstances.Assume a 60 percent payout ratio.
b. Find the new value of its investment opportunities. Explain why this value is nega-tive despite the positive growth rate of earnings and dividends.
c. If you were a corporate raider, would Blue Skies be a good candidate for an at-tempted takeover?
THE PRICE-EARNINGS RATIO
The superior prospects of Blue Skies are reflected in its price-earnings ratio. With astock price of $75.00 and earnings of $5.00, the P/E ratio is $75/$5 = 15. If Blue Skieshad no growth opportunities, its stock price would be only $41.67 and its P/E would be$41.67/$5 = 8.33. The P/E ratio, therefore, is an indicator of the prospects of the firm.To justify a high P/E, one must believe the firm is endowed with ample growth oppor-tunities.
WHAT DO EARNINGS MEAN?
Be careful when you look at price-earnings ratios. In our discussion, “expected futureearnings” refers to expected cash flow less the true depreciation in the value of the as-sets. What is “true” depreciation? It is the amount that the firm must reinvest simply tooffset any deterioration in its assets. In practice, however, when accountants calculatethe earnings that are reported in the company’s income statement, they do not attemptto measure true depreciation. Instead reported earnings are based on generally acceptedaccounting principles, which use rough-and-ready rules of thumb to calculate the de-
Plowing earnings back into new investments may result in growth in earningsand dividends but it does not add to the current stock price if that money isexpected to earn only the return that investors require. Plowing earnings back does add to value if investors believe that the reinvested earnings willearn a higher rate of return.
PRESENT VALUE OF GROWTHOPPORTUNITIES(PVGO) Net presentvalue of a firm’s futureinvestments.
SUSTAINABLEGROWTH RATE Steadyrate at which firm can grow;return on equity × plowbackratio.
FINANCE IN ACTION
preciation of the firm’s assets. A switch in the depreciation method can dramaticallychange reported earnings without affecting the true profitability of the firm.
Other accounting choices that can affect reported earnings are the method for valu-ing inventories, the decision to treat research and development as a current expenserather than as an investment, and the way that tax liabilities are reported.
299
“New Paradigm” View for Stocks Is Bolstered
Maybe all the new-economy hype isn’t just hype afterall.
Almost everyone agrees the revolution in informationtechnology has probably played some part in the ex-traordinary valuations that stocks have reached thisdecade.
But figuring out how big a part has proved elusive.Skeptics look on “new paradigm” arguments as the sortof fuzzy-minded thinking that usually accompaniesspeculative bubbles in the stock market.
Now, some researchers have found compelling evi-dence that conventional accounting understates theearning power of today’s companies—earning powerthat the stock market correctly recognizes.
The research, if correct, goes a long way toward ex-plaining how stocks, in particular of technology compa-nies, could sensibly trade at such unprecedented mul-tiples of earnings.
Friday, those trends were well in force. The DowJones Industrial Average eased 50.97 points to11028.43. But the Nasdaq Composite Index, loadedwith technology stocks, climbed 35.04 to a record2887.06, passing its previous high of 2864.48 set onJuly 16. The Standard & Poor’s 500-stock index, whichadded 4 to 1351.66, now stands at a near-record 33times trailing earnings.
But does such a high price-to-earnings ratio meanstocks are overvalued? Earnings would be higher andP/E ratios lower if companies weren’t spending soheavily on “intangible assets” such as research and de-velopment, software, marketing and computer training.Intangible assets fuel future profits just as surely aswould a “tangible asset” such as a piece of equipmentor a factory. But intangibles are expensed against cur-rent earnings, while “tangible” assets are added to thebalance sheet and gradually depreciated.
This “helps explain the rising value of U.S. equities.That explanation, in turn, suggests that continuedstrong economic growth and strong profit growth in the
future are not so implausible,” Leonard Nakamura, eco-nomic adviser at the Federal Reserve Bank of Philadel-phia says.
Mr. Nakamura estimates that after treating R&D asregular investment and removing inflation’s distortingimpact on inventories and depreciation, the market’sP/E ratio is only a little higher than in 1972, whereas un-adjusted, it is 41% higher.
Federal Reserve Chairman Alan Greenspan ac-knowledged two weeks ago that the economy’s shift to“idea-based value added,” where investment is ex-pensed immediately rather than depreciated over time,has understated earnings, although that is offset by theincreased use of stock options in place of wages. Buthe added, “It does not seem likely . . . that such [ac-counting] adjustments can be the central explanation ofthe extraordinary increase in stock prices.”
Mr. Nakamura says, “It could be that some propor-tion of what’s going on now is a bubble . . . It’s impor-tant not to be complacent about the stock market andthink it will do this forever. On the other hand, it’s im-portant to recognize we’re in fact saving and investinga lot more than it appears on the surface.”
The economic establishment is beginning to acceptsome of these arguments—but only some. The Bureauof Economic Analysis is about to change how it calcu-lates economic output by reclassifying software pur-chases as investments rather than current spending,which it estimates would have boosted the level of out-put in 1996 by 1.5% (although the boost to outputgrowth would be far smaller). But for now it isn’t reclas-sifying databases, or literary or artistic works as invest-ments, as international guidelines suggest.
Source: Republished with permission of Dow Jones, from “ ‘New
Paradigm’ View for Stocks Is Bolstered,” by Greg Ip, The Wall Street
Journal, September 13, 1999: Permission conveyed through Copy-
right Clearance Center, Inc.
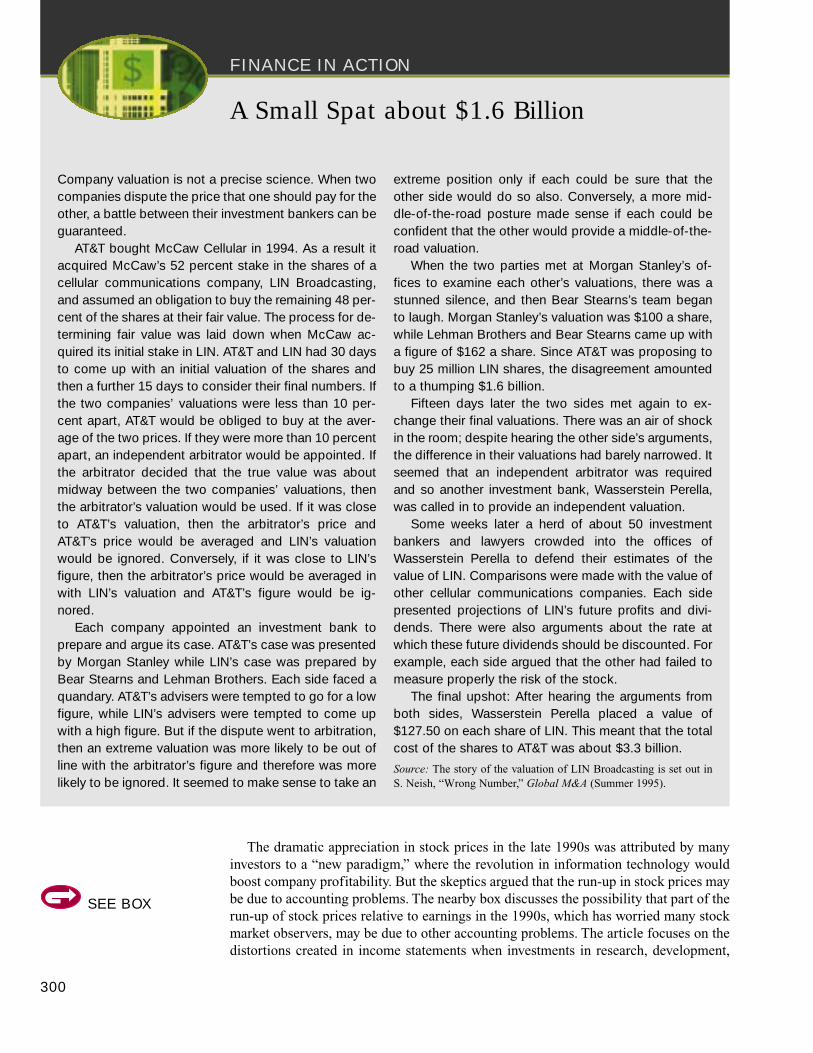
FINANCE IN ACTION
The dramatic appreciation in stock prices in the late 1990s was attributed by manyinvestors to a “new paradigm,” where the revolution in information technology wouldboost company profitability. But the skeptics argued that the run-up in stock prices maybe due to accounting problems. The nearby box discusses the possibility that part of therun-up of stock prices relative to earnings in the 1990s, which has worried many stockmarket observers, may be due to other accounting problems. The article focuses on thedistortions created in income statements when investments in research, development,
300
A Small Spat about $1.6 Billion
Company valuation is not a precise science. When twocompanies dispute the price that one should pay for theother, a battle between their investment bankers can beguaranteed.
AT&T bought McCaw Cellular in 1994. As a result itacquired McCaw’s 52 percent stake in the shares of acellular communications company, LIN Broadcasting,and assumed an obligation to buy the remaining 48 per-cent of the shares at their fair value. The process for de-termining fair value was laid down when McCaw ac-quired its initial stake in LIN. AT&T and LIN had 30 daysto come up with an initial valuation of the shares andthen a further 15 days to consider their final numbers. Ifthe two companies’ valuations were less than 10 per-cent apart, AT&T would be obliged to buy at the aver-age of the two prices. If they were more than 10 percentapart, an independent arbitrator would be appointed. Ifthe arbitrator decided that the true value was aboutmidway between the two companies’ valuations, thenthe arbitrator’s valuation would be used. If it was closeto AT&T’s valuation, then the arbitrator’s price andAT&T’s price would be averaged and LIN’s valuationwould be ignored. Conversely, if it was close to LIN’sfigure, then the arbitrator’s price would be averaged inwith LIN’s valuation and AT&T’s figure would be ig-nored.
Each company appointed an investment bank toprepare and argue its case. AT&T’s case was presentedby Morgan Stanley while LIN’s case was prepared byBear Stearns and Lehman Brothers. Each side faced aquandary. AT&T’s advisers were tempted to go for a lowfigure, while LIN’s advisers were tempted to come upwith a high figure. But if the dispute went to arbitration,then an extreme valuation was more likely to be out ofline with the arbitrator’s figure and therefore was morelikely to be ignored. It seemed to make sense to take an
extreme position only if each could be sure that theother side would do so also. Conversely, a more mid-dle-of-the-road posture made sense if each could beconfident that the other would provide a middle-of-the-road valuation.
When the two parties met at Morgan Stanley’s of-fices to examine each other’s valuations, there was astunned silence, and then Bear Stearns’s team beganto laugh. Morgan Stanley’s valuation was $100 a share,while Lehman Brothers and Bear Stearns came up witha figure of $162 a share. Since AT&T was proposing tobuy 25 million LIN shares, the disagreement amountedto a thumping $1.6 billion.
Fifteen days later the two sides met again to ex-change their final valuations. There was an air of shockin the room; despite hearing the other side’s arguments,the difference in their valuations had barely narrowed. Itseemed that an independent arbitrator was requiredand so another investment bank, Wasserstein Perella,was called in to provide an independent valuation.
Some weeks later a herd of about 50 investmentbankers and lawyers crowded into the offices ofWasserstein Perella to defend their estimates of thevalue of LIN. Comparisons were made with the value ofother cellular communications companies. Each sidepresented projections of LIN’s future profits and divi-dends. There were also arguments about the rate atwhich these future dividends should be discounted. Forexample, each side argued that the other had failed tomeasure properly the risk of the stock.
The final upshot: After hearing the arguments fromboth sides, Wasserstein Perella placed a value of$127.50 on each share of LIN. This meant that the totalcost of the shares to AT&T was about $3.3 billion.
Source: The story of the valuation of LIN Broadcasting is set out inS. Neish, “Wrong Number,” Global M&A (Summer 1995).
SEE BOX
Valuing Stocks 301
software, and training are treated as expenses which reduce reported earnings, ratherthan as investments in intangible assets, which would then be gradually depreciatedover time.
VALUING ENTIRE BUSINESSES
Investors routinely buy and sell shares of common stock. Companies frequently buyand sell entire businesses. So it is natural to ask whether the formulas that we have pre-sented in this material can also be used to value these businesses.
Sure! Take the case of Blue Skies. Suppose that it has 2 million shares outstanding.It plans to pay a dividend of DIV1 = $3 a share. So the total dividend payment is 2 mil-lion × $3 = $6 million. Investors expect a steady dividend growth of 8 percent a yearand require a return of 12 percent. So the total value of Blue Skies is
PV =$6 million
= $150 million.12 – .08
Alternatively, we could say that the total value of the company is the number of sharestimes the value per share:
PV = 2 million × $75 = $150 million
Of course things are always harder in practice than in principle. Forecasting cashflows and settling on an appropriate discount rate require skill and judgment. As thenearby box shows, there can be plenty of room for disagreement.
SummaryWhat information about company stocks is regularly reported in the financialpages of the newspaper?
Firms that wish to raise new capital may either borrow money or bring new “partners” intothe business by selling shares of common stock. Large companies usually arrange for theirstocks to be traded on a stock exchange. The stock listings report the stock’s dividend yield,price, and trading volume.
How can one calculate the present value of a stock given forecasts of future divi-dends and future stock price?
Stockholders generally expect to receive (1) cash dividends and (2) capital gains or losses.The rate of return that they expect over the next year is defined as the expected dividend pershare DIV1 plus the expected increase in price P1 – P0, all divided by the price at the start ofthe year P0.
Unlike the fixed interest payments that the firm promises to bondholders, the dividendsthat are paid to stockholders depend on the fortunes of the firm. That’s why a company’scommon stock is riskier than its debt. The return that investors expect on any one stock isalso the return that they demand on all stocks subject to the same degree of risk. The presentvalue of a stock equals the present value of the forecast future dividends and future stockprice, using that expected return as the discount rate.
How can stock valuation formulas be used to infer the expected rate of return ona common stock?
SEE BOX

302 SECTION THREE
The present value of a share is equal to the stream of expected dividends per share up tosome horizon date plus the expected price at this date, all discounted at the return thatinvestors require. If the horizon date is far away, we simply say that stock price equals thepresent value of all future dividends per share. This is the dividend discount model.
If dividends are expected to grow forever at a constant rate g, then the expected return onthe stock is equal to the dividend yield (DIV1/P0) plus the expected rate of dividend growth.The value of the stock according to this constant-growth dividend discount model is P0 =DIV1/(r – g).
How should investors interpret price-earnings ratios?
You can think of a share’s value as the sum of two parts—the value of the assets in placeand the present value of growth opportunities, that is, of future opportunities for the firmto invest in high-return projects. The price-earnings (P/E) ratio reflects the market’sassessment of the firm’s growth opportunities.
www.ganesha.org/invest/index.html Links to information useful for valuing securitieswww.nasdaq.com/ Information about Nasdaq and Amex-traded stockswww.nyse.com/ Information about stocks and trading on the New York Stock Exchangewww.fool.com/School/HowtoValueStocks.htm How investors value firmswww.zacks.com Information and analyses from Zacks Investment Researchwww.Investools.com Investing tools, links to research reports on public companies and invest-
ment newsletterswww.morningstar.net Morningstar is a premier source of information on mutual fundswww.brill.com More information on mutual funds, as well as articles and other educational re-
sources
1. Dividend Discount Model. Amazon.com has never paid a dividend, but its share price is$66 and the market value of its stock is $22 billion. Does this invalidate the dividend dis-count model?
2. Dividend Yield. Favored stock will pay a dividend this year of $2.40 per share. Its dividendyield is 8 percent. At what price is the stock selling?
3. Preferred Stock. Preferred Products has issued preferred stock with a $7 annual dividendthat will be paid in perpetuity.
a. If the discount rate is 12 percent, at what price should the preferred sell?b. At what price should the stock sell 1 year from now?c. What is the dividend yield, the capital gains yield, and the expected rate of return of the
stock?
Related WebLinks
Key Terms
Quiz
common stockinitial public offering (IPO)secondary marketdividendprice-earnings (P/E) multiplebook value
liquidation valuemarket-value balance sheetdividend discount modelconstant-growth dividend
discount modelpayout ratio
plowback ratiopresent value of growth
opportunities (PVGO)sustainable growth rate
Valuing Stocks 303
4. Constant-Growth Model. Waterworks has a dividend yield of 8 percent. If its dividend isexpected to grow at a constant rate of 5 percent, what must be the expected rate of return onthe company’s stock?
5. Dividend Discount Model. How can we say that price equals the present value of all futuredividends when many actual investors may be seeking capital gains and planning to holdtheir shares for only a year or two? Explain.
6. Rate of Return. Steady As She Goes, Inc., will pay a year-end dividend of $2.50 per share.Investors expect the dividend to grow at a rate of 4 percent indefinitely.
a. If the stock currently sells for $25 per share, what is the expected rate of return on thestock?
b. If the expected rate of return on the stock is 16.5 percent, what is the stock price?
7. Dividend Yield. BMM Industries pays a dividend of $2 per quarter. The dividend yield onits stock is reported at 4.8 percent. What price is the stock selling at?
8. Stock Values. Integrated Potato Chips paid a $1 per share dividend yesterday. You expectthe dividend to grow steadily at a rate of 4 percent per year.
a. What is the expected dividend in each of the next 3 years?b. If the discount rate for the stock is 12 percent, at what price will the stock sell?c. What is the expected stock price 3 years from now?d. If you buy the stock and plan to hold it for 3 years, what payments will you receive? What
is the present value of those payments? Compare your answer to (b).
9. Constant-Growth Model. A stock sells for $40. The next dividend will be $4 per share. Ifthe rate of return earned on reinvested funds is 15 percent and the company reinvests 40 per-cent of earnings in the firm, what must be the discount rate?
10. Constant-Growth Model. Gentleman Gym just paid its annual dividend of $2 per share,and it is widely expected that the dividend will increase by 5 percent per year indefinitely.
a. What price should the stock sell at? The discount rate is 15 percent.b. How would your answer change if the discount rate were only 12 percent? Why does the
answer change?
11. Constant-Growth Model. Arts and Crafts, Inc., will pay a dividend of $5 per share in 1year. It sells at $50 a share, and firms in the same industry provide an expected rate of re-turn of 14 percent. What must be the expected growth rate of the company’s dividends?
12. Constant-Growth Model. Eastern Electric currently pays a dividend of about $1.64 pershare and sells for $27 a share.
a. If investors believe the growth rate of dividends is 3 percent per year, what rate of returndo they expect to earn on the stock?
b. If investors’ required rate of return is 10 percent, what must be the growth rate they ex-pect of the firm?
c. If the sustainable growth rate is 5 percent, and the plowback ratio is .4, what must be therate of return earned by the firm on its new investments?
13. Constant-Growth Model. You believe that the Non-stick Gum Factory will pay a dividendof $2 on its common stock next year. Thereafter, you expect dividends to grow at a rate of 6percent a year in perpetuity. If you require a return of 12 percent on your investment, howmuch should you be prepared to pay for the stock?
PracticeProblems
304 SECTION THREE
14. Negative Growth. Horse and Buggy Inc. is in a declining industry. Sales, earnings, and div-idends are all shrinking at a rate of 10 percent per year.
a. If r = 15 percent and DIV1 = $3, what is the value of a share?b. What price do you forecast for the stock next year?c. What is the expected rate of return on the stock?d. Can you distinguish between “bad stocks” and “bad companies”? Does the fact that the
industry is declining mean that the stock is a bad buy?
15. Constant-Growth Model. Metatrend’s stock will generate earnings of $5 per share thisyear. The discount rate for the stock is 15 percent and the rate of return on reinvested earn-ings also is 15 percent.
a. Find both the growth rate of dividends and the price of the stock if the company reinveststhe following fraction of its earnings in the firm: (i) 0 percent; (ii) 40 percent; (iii) 60 per-cent.
b. Redo part (a) now assuming that the rate of return on reinvested earnings is 20 percent.What is the present value of growth opportunities for each reinvestment rate?
c. Considering your answers to parts (a) and (b), can you briefly state the difference betweencompanies experiencing growth versus companies with growth opportunities?
16. Nonconstant Growth. You expect a share of stock to pay dividends of $1.00, $1.25, and$1.50 in each of the next 3 years. You believe the stock will sell for $20 at the end of thethird year.
a. What is the stock price if the discount rate for the stock is 10 percent?b. What is the dividend yield?
17. Constant-Growth Model. Here are data on two stocks, both of which have discount ratesof 15 percent:
Stock A Stock B
Return on equity 15% 10%Earnings per share $2.00 $1.50Dividends per share $1.00 $1.00
a. What are the dividend payout ratios for each firm?b. What are the expected dividend growth rates for each firm?c. What is the proper stock price for each firm?
18. P/E Ratios. Web Cites Research projects a rate of return of 20 percent on new projects.Management plans to plow back 30 percent of all earnings into the firm. Earnings this yearwill be $2 per share, and investors expect a 12 percent rate of return on the stock.
a. What is the sustainable growth rate?b. What is the stock price?c. What is the present value of growth opportunities?d. What is the P/E ratio?e. What would the price and P/E ratio be if the firm paid out all earnings as dividends?f. What do you conclude about the relationship between growth opportunities and P/E
ratios?
19. Constant-Growth Model. Fincorp will pay a year-end dividend of $4.80 per share, whichis expected to grow at a 4 percent rate for the indefinite future. The discount rate is 12 percent.
Valuing Stocks 305
a. What is the stock selling for?b. If earnings are $6.20 a share, what is the implied value of the firm’s growth opportuni-
ties?
20. P/E Ratios. No-Growth Industries pays out all of its earnings as dividends. It will pay itsnext $4 per share dividend in a year. The discount rate is 12 percent.
a. What is the price-earnings ratio of the company?b. What would the P/E ratio be if the discount rate were 10 percent?
21. Growth Opportunities. Stormy Weather has no attractive investment opportunities. Its re-turn on equity equals the discount rate, which is 10 percent. Its expected earnings this yearare $3 per share. Find the stock price, P/E ratio, and growth rate of dividends for plowbackratios of
a. zerob. .40c. .80
22. Growth Opportunities. Trend-line Inc. has been growing at a rate of 6 percent per year andis expected to continue to do so indefinitely. The next dividend is expected to be $5 pershare.
a. If the market expects a 10 percent rate of return on Trend-line, at what price must it beselling?
b. If Trend-line’s earnings per share will be $8, what part of Trend-line’s value is due to as-sets in place, and what part to growth opportunities?
23. P/E Ratios. Castles in the Sand generates a rate of return of 20 percent on its investmentsand maintains a plowback ratio of .30. Its earnings this year will be $2 per share. Investorsexpect a 12 percent rate of return on the stock.
a. Find the price and P/E ratio of the firm.b. What happens to the P/E ratio if the plowback ratio is reduced to .20? Why?c. Show that if plowback equals zero, the earnings-price ratio E/P falls to the expected rate
of return on the stock.
24. Dividend Growth. Grandiose Growth has a dividend growth rate of 20 percent. The dis-count rate is 10 percent. The end-of-year dividend will be $2 per share.
a. What is the present value of the dividend to be paid in Year 1? Year 2? Year 3?b. Could anyone rationally expect this growth rate to continue indefinitely?
25. Stock Valuation. Start-up Industries is a new firm which has raised $100 million by sellingshares of stock. Management plans to earn a 24 percent rate of return on equity, which ismore than the 15 percent rate of return available on comparable-risk investments. Half of allearnings will be reinvested in the firm.
a. What will be Start-up’s ratio of market value to book value?b. How would that ratio change if the firm can earn only a 10 percent rate of return on its
investments?
26. Nonconstant Growth. Planned Obsolescence has a product that will be in vogue for 3 years,at which point the firm will close up shop and liquidate the assets. As a result, forecasteddividends are DIV1 = $2, DIV2 = $2.50, and DIV3 = $18. What is the stock price if the dis-count rate is 12 percent?
306 SECTION THREE
27. Nonconstant Growth. Tattletale News Corp. has been growing at a rate of 20 percent peryear, and you expect this growth rate in earnings and dividends to continue for another 3years.
a. If the last dividend paid was $2, what will the next dividend be?b. If the discount rate is 15 percent and the steady growth rate after 3 years is 4 percent, what
should the stock price be today?
28. Nonconstant Growth. Reconsider Tattletale News from the previous problem.
a. What is your prediction for the stock price in 1 year?b. Show that the expected rate of return equals the discount rate.
29. Sustainable Growth. Computer Corp. reinvests 60 percent of its earnings in the firm. Thestock sells for $50, and the next dividend will be $2.50 per share. The discount rate is 15percent. What is the rate of return on the company’s reinvested funds?
30. Nonconstant Growth. A company will pay a $1 per share dividend in 1 year. The dividendin 2 years will be $2 per share, and it is expected that dividends will grow at 5 percent peryear thereafter. The expected rate of return on the stock is 12 percent.
a. What is the current price of the stock?b. What is the expected price of the stock in a year?c. Show that the expected return, 12 percent, equals dividend yield plus capital apprecia-
tion.
31. Nonconstant Growth. Phoenix Industries has pulled off a miraculous recovery. Four yearsago it was near bankruptcy. Today, it announced a $1 per share dividend to be paid a yearfrom now, the first dividend since the crisis. Analysts expect dividends to increase by $1 ayear for another 2 years. After the third year (in which dividends are $3 per share) dividendgrowth is expected to settle down to a more moderate long-term growth rate of 6 percent. Ifthe firm’s investors expect to earn a return of 14 percent on this stock, what must be itsprice?
32. Nonconstant Growth. Compost Science, Inc. (CSI), is in the business of convertingBoston’s sewage sludge into fertilizer. The business is not in itself very profitable. However,to induce CSI to remain in business, the Metropolitan District Commission (MDC) hasagreed to pay whatever amount is necessary to yield CSI a 10 percent return on investment.At the end of the year, CSI is expected to pay a $4 dividend. It has been reinvesting 40 per-cent of earnings and growing at 4 percent a year.
a. Suppose CSI continues on this growth trend. What is the expected rate of return frompurchasing the stock at $100?
b. What part of the $100 price is attributable to the present value of growth opportunities?c. Now the MDC announces a plan for CSI to treat Cambridge sewage. CSI’s plant will
therefore be expanded gradually over 5 years. This means that CSI will have to reinvest80 percent of its earnings for 5 years. Starting in Year 6, however, it will again be able topay out 60 percent of earnings. What will be CSI’s stock price once this announcementis made and its consequences for CSI are known?
33. Nonconstant Growth. Better Mousetraps has come out with an improved product, and theworld is beating a path to its door. As a result, the firm projects growth of 20 percent peryear for 4 years. By then, other firms will have copycat technology, competition will drive
ChallengeProblems

Valuing Stocks 307
down profit margins, and the sustainable growth rate will fall to 5 percent. The most recentannual dividend was DIV0 = $1.00 per share.
a. What are the expected values of DIV1, DIV2, DIV3, and DIV4?b. What is the expected stock price 4 years from now? The discount rate is 10 percent.c. What is the stock price today?d. Find the dividend yield, DIV1/P0.e. What will next year’s stock price, P1, be?f. What is the expected rate of return to an investor who buys the stock now and sells it in
1 year?
1 People’s Energy’s high and low prices over the past 52 weeks have been 3915⁄16 and 281⁄2 pershare. Its annual dividend was $2.00 per share and its dividend yield (annual dividend as apercentage of stock price) 7.0 percent. The ratio of stock price to earnings per share, the P/Eratio, is 10. Trading volume was 68,100 shares. The highest price at which the shares tradedduring the day was $291⁄4, the lowest price was $281⁄8, and the closing price was $283⁄8,which was $5/8 lower than the previous day’s closing price.
2 IBM’s forecast future profitability has fallen. Thus the value of future investment opportu-nities has fallen relative to the value of assets in place. This happens in all growth industriessooner or later, as competition increases and profitable new investment opportunities shrink.
3 P0 =DIV1 + P1 =
$5 + $105= $100
1 + r 1.10
4 Since dividends and share price grow at 5 percent,
DIV2 = $5 × 1.05 = $5.25, DIV3 = $5 × 1.052 = $5.51
P3 = $100 × 1.053 = $115.76
P0 =DIV1 +
DIV2 +DIV3 + P3
1 + r (1 + r)2 (1 + r)3
=$5.00
+$5.25
+$5.51 + $115.76
= $1001.10 1.102 1.103
5 P0 = DIV=
$25= $125r .20
6 The two firms have equal risk, so we can use the data for Androscoggin to find the expectedreturn on either stock:
r =DIV1 + g =
$5+ .05 = .10, or 10%P0 $100
7 We’ve already calculated the present value of dividends through Year 3 as $2.98. We can alsoforecast stock price in Year 4 as
P4 =$1.73 × 1.05
= $36.33.10 – .05
P0 = PV (dividends through Year 3) + PV(DIV4) + PV(P4)
= $2.98 +$1.73
+$36.33
1.104 1.104
= $2.98 + $1.18 + $24.81 = $28.97
Solutions toSelf-TestQuestions
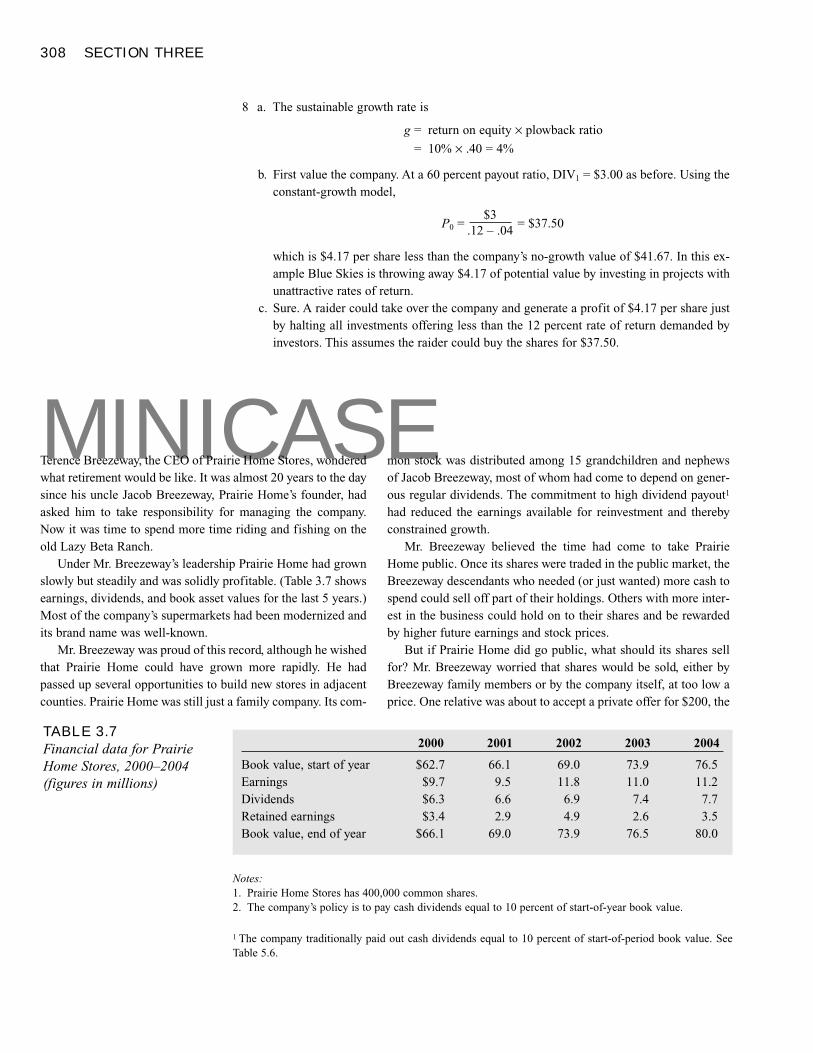
308 SECTION THREE
8 a. The sustainable growth rate is
g = return on equity × plowback ratio
= 10% × .40 = 4%
b. First value the company. At a 60 percent payout ratio, DIV1 = $3.00 as before. Using theconstant-growth model,
P0 =$3
= $37.50.12 – .04
which is $4.17 per share less than the company’s no-growth value of $41.67. In this ex-ample Blue Skies is throwing away $4.17 of potential value by investing in projects withunattractive rates of return.
c. Sure. A raider could take over the company and generate a profit of $4.17 per share justby halting all investments offering less than the 12 percent rate of return demanded byinvestors. This assumes the raider could buy the shares for $37.50.
MINICASETerence Breezeway, the CEO of Prairie Home Stores, wonderedwhat retirement would be like. It was almost 20 years to the daysince his uncle Jacob Breezeway, Prairie Home’s founder, hadasked him to take responsibility for managing the company.Now it was time to spend more time riding and fishing on theold Lazy Beta Ranch.
Under Mr. Breezeway’s leadership Prairie Home had grownslowly but steadily and was solidly profitable. (Table 3.7 showsearnings, dividends, and book asset values for the last 5 years.)Most of the company’s supermarkets had been modernized andits brand name was well-known.
Mr. Breezeway was proud of this record, although he wishedthat Prairie Home could have grown more rapidly. He hadpassed up several opportunities to build new stores in adjacentcounties. Prairie Home was still just a family company. Its com-
mon stock was distributed among 15 grandchildren and nephewsof Jacob Breezeway, most of whom had come to depend on gener-ous regular dividends. The commitment to high dividend payout1
had reduced the earnings available for reinvestment and therebyconstrained growth.
Mr. Breezeway believed the time had come to take PrairieHome public. Once its shares were traded in the public market, theBreezeway descendants who needed (or just wanted) more cash tospend could sell off part of their holdings. Others with more inter-est in the business could hold on to their shares and be rewardedby higher future earnings and stock prices.
But if Prairie Home did go public, what should its shares sellfor? Mr. Breezeway worried that shares would be sold, either byBreezeway family members or by the company itself, at too low aprice. One relative was about to accept a private offer for $200, the
Notes:1. Prairie Home Stores has 400,000 common shares.2. The company’s policy is to pay cash dividends equal to 10 percent of start-of-year book value.
TABLE 3.7Financial data for PrairieHome Stores, 2000–2004(figures in millions)
2000 2001 2002 2003 2004
Book value, start of year $62.7 66.1 69.0 73.9 76.5Earnings $9.7 9.5 11.8 11.0 11.2Dividends $6.3 6.6 6.9 7.4 7.7Retained earnings $3.4 2.9 4.9 2.6 3.5Book value, end of year $66.1 69.0 73.9 76.5 80.0
1 The company traditionally paid out cash dividends equal to 10 percent of start-of-period book value. SeeTable 5.6.
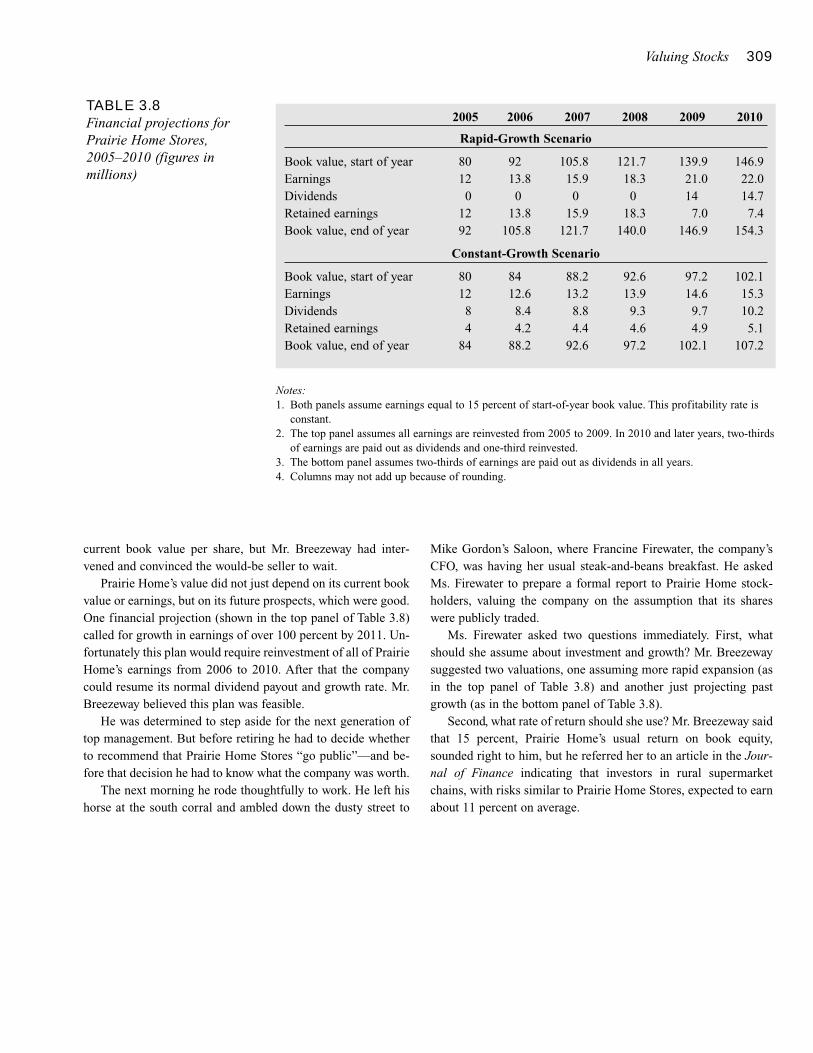
Valuing Stocks 309
current book value per share, but Mr. Breezeway had inter-vened and convinced the would-be seller to wait.
Prairie Home’s value did not just depend on its current bookvalue or earnings, but on its future prospects, which were good.One financial projection (shown in the top panel of Table 3.8)called for growth in earnings of over 100 percent by 2011. Un-fortunately this plan would require reinvestment of all of PrairieHome’s earnings from 2006 to 2010. After that the companycould resume its normal dividend payout and growth rate. Mr.Breezeway believed this plan was feasible.
He was determined to step aside for the next generation oftop management. But before retiring he had to decide whetherto recommend that Prairie Home Stores “go public”—and be-fore that decision he had to know what the company was worth.
The next morning he rode thoughtfully to work. He left hishorse at the south corral and ambled down the dusty street to
Mike Gordon’s Saloon, where Francine Firewater, the company’sCFO, was having her usual steak-and-beans breakfast. He askedMs. Firewater to prepare a formal report to Prairie Home stock-holders, valuing the company on the assumption that its shareswere publicly traded.
Ms. Firewater asked two questions immediately. First, whatshould she assume about investment and growth? Mr. Breezewaysuggested two valuations, one assuming more rapid expansion (asin the top panel of Table 3.8) and another just projecting pastgrowth (as in the bottom panel of Table 3.8).
Second, what rate of return should she use? Mr. Breezeway saidthat 15 percent, Prairie Home’s usual return on book equity,sounded right to him, but he referred her to an article in the Jour-nal of Finance indicating that investors in rural supermarketchains, with risks similar to Prairie Home Stores, expected to earnabout 11 percent on average.
Notes:1. Both panels assume earnings equal to 15 percent of start-of-year book value. This profitability rate is
constant.2. The top panel assumes all earnings are reinvested from 2005 to 2009. In 2010 and later years, two-thirds
of earnings are paid out as dividends and one-third reinvested.3. The bottom panel assumes two-thirds of earnings are paid out as dividends in all years.4. Columns may not add up because of rounding.
TABLE 3.8Financial projections forPrairie Home Stores,2005–2010 (figures inmillions)
2005 2006 2007 2008 2009 2010
Rapid-Growth Scenario
Book value, start of year 80 92 105.8 121.7 139.9 146.9Earnings 12 13.8 15.9 18.3 21.0 22.0Dividends 0 0 0 0 14 14.7Retained earnings 12 13.8 15.9 18.3 7.0 7.4Book value, end of year 92 105.8 121.7 140.0 146.9 154.3
Constant-Growth Scenario
Book value, start of year 80 84 88.2 92.6 97.2 102.1Earnings 12 12.6 13.2 13.9 14.6 15.3Dividends 8 8.4 8.8 9.3 9.7 10.2Retained earnings 4 4.2 4.4 4.6 4.9 5.1Book value, end of year 84 88.2 92.6 97.2 102.1 107.2
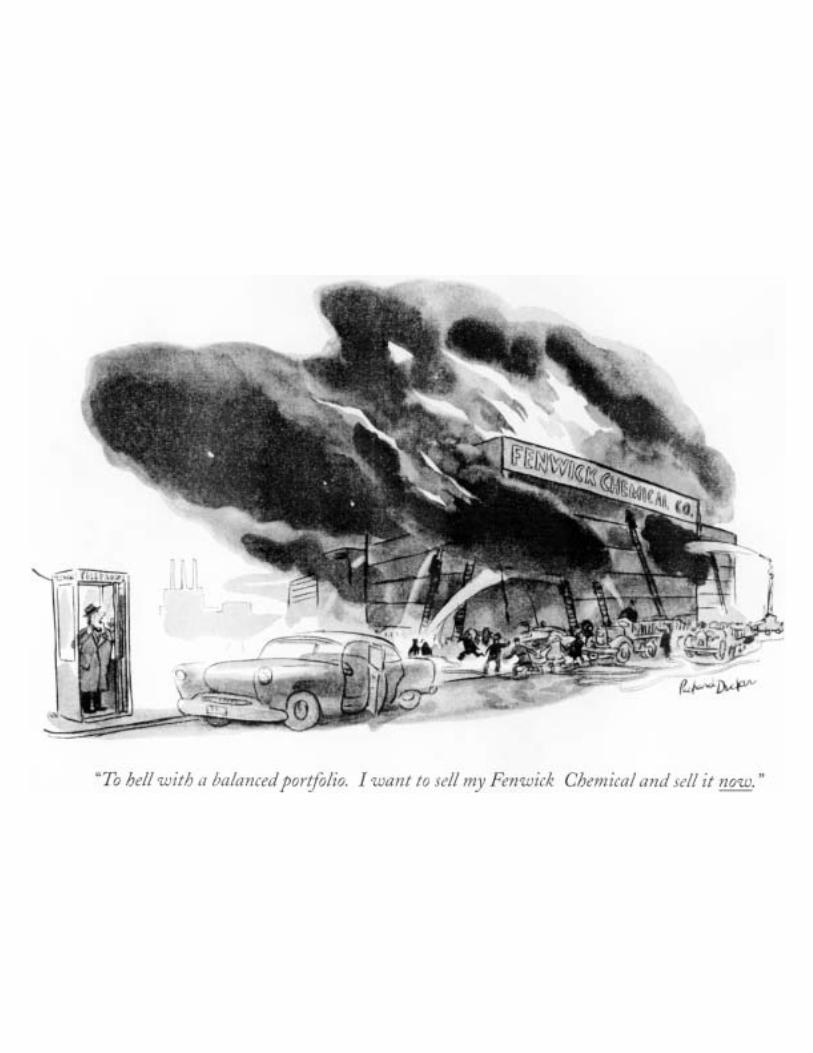
311
INTRODUCTION TO RISK,RETURN, AND THEOPPORTUNITY COST OFCAPITAL
Rates of Return: A Review
Seventy-Three Years ofCapital Market HistoryMarket Indexes
The Historical Record
Using Historical Evidence to EstimateToday’s Cost of Capital
Measuring RiskVariance and Standard Deviation
A Note on Calculating Variance
Measuring the Variation in StockReturns
Risk and DiversificationDiversification
Asset versus Portfolio Risk
Market Risk versus Unique Risk
Thinking about RiskMessage 1: Some Risks Look Big andDangerous but Really Are Diversifiable
Message 2: Market Risks Are Macro Risks
Message 3: Risk Can Be Measured
Summary
More generally, though, investors will want to spread their investments across many securities.© The New Yorker Collection 1957 Richard Decker from cartoonbank.com. All Rights Reserved.
e have thus far skirted the issue of project risk; now it is time to confront
it head-on. We can no longer be satisfied with vague statements like
“The opportunity cost of capital depends on the risk of the project.” We
need to know how to measure risk and we need to understand the relationship
between risk and the cost of capital.
Think for a moment what the cost of capital for a project means. It is the rate of re-
turn that shareholders could expect to earn if they invested in equally risky securities.
So one way to estimate the cost of capital is to find securities that have the same risk as
the project and then estimate the expected rate of return on these securities.
We start our analysis by looking at the rates of return earned in the past from differ-
ent investments, concentrating on the extra return that investors have received for in-
vesting in risky rather than safe securities. We then show how to measure the risk of a
portfolio by calculating its standard deviation and we look again at past history to find
out how risky it is to invest in the stock market.
Finally, we explore the concept of diversification. Most investors do not put all their
eggs into one basket—they diversify. Thus investors are not concerned with the risk of
each security in isolation; instead they are concerned with how much it contributes to
the risk of a diversified portfolio. We therefore need to distinguish between the risk that
can be eliminated by diversification and the risk that cannot be eliminated.
After studying this material you should be able to
� Estimate the opportunity cost of capital for an “average-risk” project.
� Calculate the standard deviation of returns for individual common stocks or for a
stock portfolio.
� Understand why diversification reduces risk.
� Distinguish between unique risk, which can be diversified away, and market risk,
which cannot.
312
W
Rates of Return: A ReviewWhen investors buy a stock or a bond, their return comes in two forms: (1) a dividendor interest payment, and (2) a capital gain or a capital loss. For example, suppose youwere lucky enough to buy the stock of General Electric at the beginning of 1999 whenits price was about $102 a share. By the end of the year the value of that investment hadappreciated to $155, giving a capital gain of $155 – $102 = $53. In addition, in 1999General Electric paid a dividend of $1.46 a share.
The percentage return on your investment was therefore
Percentage return =capital gain + dividend
initial share price
=$53 + $1.46
= 0.534, or 53.4%$102
Introduction to Risk, Return, and the Opportunity Cost of Capital 313
The percentage return can also be expressed as the sum of the dividend yield and per-centage capital gain. The dividend yield is the dividend expressed as a percentage ofthe stock price at the beginning of the year:
Dividend yield =dividend
initial share price
=$1.46
= .014, or 1.4%$102
Similarly, the percentage capital gain is
Percentage capital gain =capital gain
initial share price
=$53
= 0.520, or 52.0%$102
Thus the total return is the sum of 1.4% + 52.0% = 53.4%.Remember we made a distinction between the nominal rate of return and the real rate
of return. The nominal return measures how much more money you will have at the endof the year if you invest today. The return that we just calculated for General Electricstock is therefore a nominal return. The real rate of return tells you how much more youwill be able to buy with your money at the end of the year. To convert from a nominalto a real rate of return, we use the following relationship:
1 + real rate of return =1 + nominal rate of return
1 + inflation rate
In 1999 inflation was only 2.7 percent. So we calculate the real rate of return on Gen-eral Electric stock as follows:
1 + real rate of return =1.534
= 1.4941.027
Therefore, the real rate of return equals .494, or 49.4 percent. Fortunately inflation in1999 was low; the real return was only slightly less than the nominal return.
� Self-Test 1 Suppose you buy a bond for $1,020 with a 15-year maturity paying an annual couponof $80. A year later interest rates have dropped and the bond’s price has increased to$1,050. What are your nominal and real rates of return? Assume the inflation rate is 4percent.
Seventy-Three Years of Capital Market HistoryWhen you invest in a stock, you can’t be sure that your return is going to be as high asthat of General Electric in 1999. But by looking at the history of security returns, youcan get some idea of the return that investors might reasonably expect from investmentsin different types of securities and of the risks that they face. Let us look, therefore, atthe risks and returns that investors have experienced in the past.
314 SECTION THREE
MARKET INDEXES
Investors can choose from an enormous number of different securities. Currently, about3,100 common stocks trade on the New York Stock Exchange, about 1,000 are tradedon the American Stock Exchange and regional exchanges, and more than 5,000 aretraded by a network of dealers linked by computer terminals and telephones.1
Financial analysts can’t track every stock, so they rely on market indexes to sum-marize the return on different classes of securities. The best-known stock market indexin the United States is the Dow Jones Industrial Average, generally known as the Dow.The Dow tracks the performance of a portfolio that holds one share in each of 30 largefirms. For example, suppose that the Dow starts the day at a value of 9,000 and thenrises by 90 points to a new value of 9,090. Investors who own one share in each of the30 companies make a capital gain of 90/9,000 = .01, or 1 percent.2
The Dow Jones Industrial Average was first computed in 1896. Most people are usedto it and expect to hear it on the 6 o’clock news. However, it is far from the best meas-ure of the performance of the stock market. First, with only 30 large industrial stocks,it is not representative of the performance of stocks generally. Second, investors don’tusually hold an equal number of shares in each company. For example, in 1999 therewere 3.3 billion shares in General Electric and only 1.1 billion in Du Pont. So on aver-age investors did not hold the same number of shares in the two firms. Instead, they heldthree times as many shares in General Electric as in Du Pont. It doesn’t make sense,therefore, to look at an index that measures the performance of a portfolio with an equalnumber of shares in the two firms.
The Standard & Poor’s Composite Index, better known as the S&P 500, includesthe stocks of 500 major companies and is therefore a more comprehensive index thanthe Dow. Also, it measures the performance of a portfolio that holds shares in each firmin proportion to the number of shares that have been issued to investors. For example,the S&P portfolio would hold three times as many shares in General Electric as DuPont. Thus the S&P 500 shows the average performance of investors in the 500 firms.
Only a small proportion of the 9,000 or so publicly traded companies are representedin the S&P 500. However, these firms are among the largest in the country and they ac-count for roughly 70 percent of the stocks traded. Therefore, success for professionalinvestors usually means “beating the S&P.”
Some stock market indexes, such as the Wilshire 5000, include an even larger num-ber of stocks, while others focus on special groups of stocks such as the stocks of smallcompanies. There are also stock market indexes for other countries, such as the NikkeiIndex for Tokyo and the Financial Times (FT) Index for London. Morgan Stanley Cap-ital International (MSCI) even computes a world stock market index. The FinancialTimes Company and Standard & Poor’s have combined to produce their own worldindex.
THE HISTORICAL RECORD
The historical returns of stock or bond market indexes can give us an idea of the typi-cal performance of different investments. One popular source of such information is an
1 This network of traders comprises the over-the-counter market. The computer network and price quotationsystem is called the NASDAQ system. NASDAQ stands for the National Association of Security Dealers Au-tomated Quotation system.2 Stock market indexes record the market value of the portfolio. To calculate the total return on the portfoliowe would also need to add in any dividends that are paid.
STANDARD & POOR’SCOMPOSITE INDEXIndex of the investmentperformance of a portfolio of500 large stocks. Also calledthe S&P 500.
MARKET INDEXMeasure of the investmentperformance of the overallmarket.
DOW JONESINDUSTRIAL AVERAGEIndex of the investmentperformance of a portfolio of30 “blue-chip” stocks.
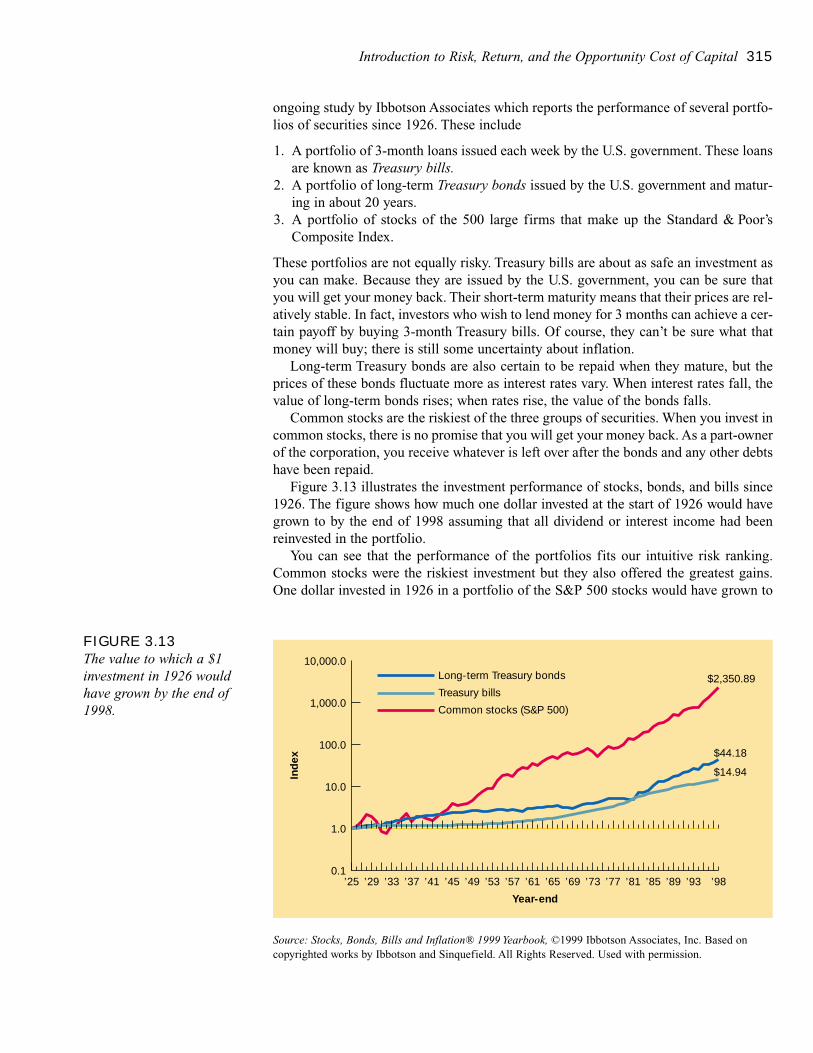
Introduction to Risk, Return, and the Opportunity Cost of Capital 315
ongoing study by Ibbotson Associates which reports the performance of several portfo-lios of securities since 1926. These include
1. A portfolio of 3-month loans issued each week by the U.S. government. These loansare known as Treasury bills.
2. A portfolio of long-term Treasury bonds issued by the U.S. government and matur-ing in about 20 years.
3. A portfolio of stocks of the 500 large firms that make up the Standard & Poor’sComposite Index.
These portfolios are not equally risky. Treasury bills are about as safe an investment asyou can make. Because they are issued by the U.S. government, you can be sure thatyou will get your money back. Their short-term maturity means that their prices are rel-atively stable. In fact, investors who wish to lend money for 3 months can achieve a cer-tain payoff by buying 3-month Treasury bills. Of course, they can’t be sure what thatmoney will buy; there is still some uncertainty about inflation.
Long-term Treasury bonds are also certain to be repaid when they mature, but theprices of these bonds fluctuate more as interest rates vary. When interest rates fall, thevalue of long-term bonds rises; when rates rise, the value of the bonds falls.
Common stocks are the riskiest of the three groups of securities. When you invest incommon stocks, there is no promise that you will get your money back. As a part-ownerof the corporation, you receive whatever is left over after the bonds and any other debtshave been repaid.
Figure 3.13 illustrates the investment performance of stocks, bonds, and bills since1926. The figure shows how much one dollar invested at the start of 1926 would havegrown to by the end of 1998 assuming that all dividend or interest income had beenreinvested in the portfolio.
You can see that the performance of the portfolios fits our intuitive risk ranking.Common stocks were the riskiest investment but they also offered the greatest gains.One dollar invested in 1926 in a portfolio of the S&P 500 stocks would have grown to
FIGURE 3.13The value to which a $1investment in 1926 wouldhave grown by the end of1998.
Ind
ex
’25 ’29 ’33 ’37 ’41 ’45 ’49 ’53 ’57
Year-end
’61 ’65 ’69 ’73 ’77 ’81 ’85
$2,350.89
$44.18
$14.94
’89 ’93 ’98
Long-term Treasury bonds
Treasury bills
Common stocks (S&P 500)
10,000.0
1,000.0
100.0
10.0
1.0
0.1
Source: Stocks, Bonds, Bills and Inflation® 1999 Yearbook, ©1999 Ibbotson Associates, Inc. Based oncopyrighted works by Ibbotson and Sinquefield. All Rights Reserved. Used with permission.
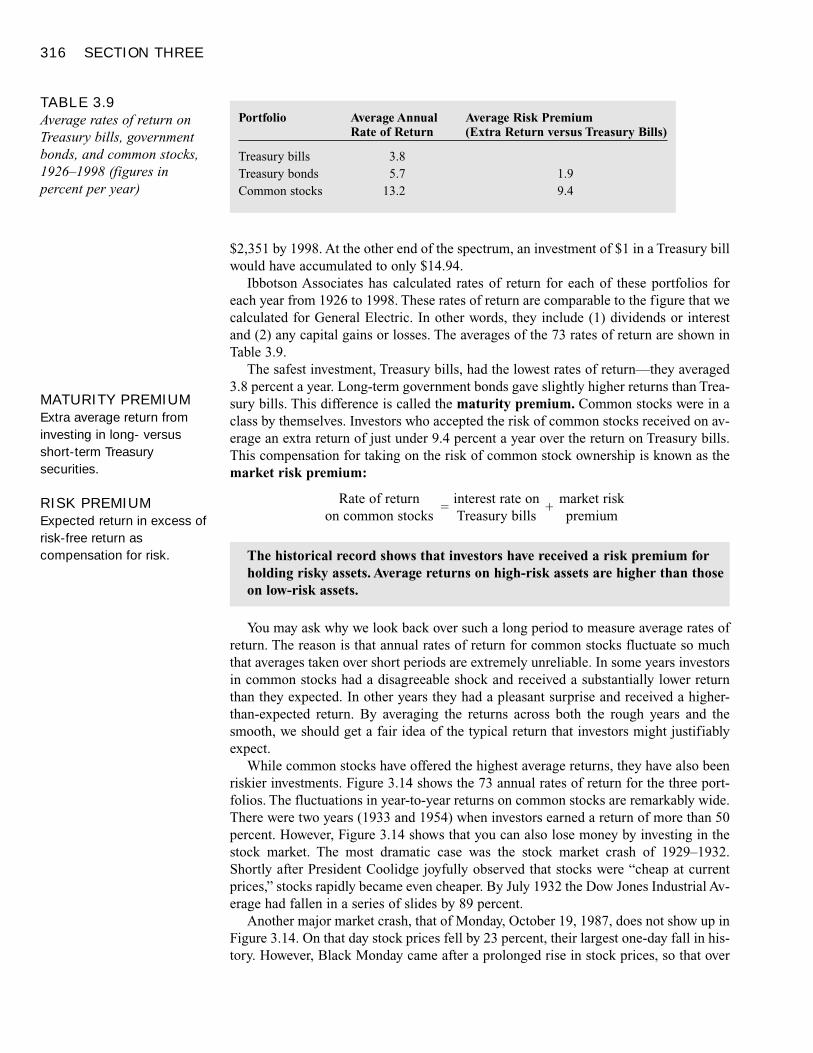
316 SECTION THREE
$2,351 by 1998. At the other end of the spectrum, an investment of $1 in a Treasury billwould have accumulated to only $14.94.
Ibbotson Associates has calculated rates of return for each of these portfolios foreach year from 1926 to 1998. These rates of return are comparable to the figure that wecalculated for General Electric. In other words, they include (1) dividends or interestand (2) any capital gains or losses. The averages of the 73 rates of return are shown inTable 3.9.
The safest investment, Treasury bills, had the lowest rates of return—they averaged3.8 percent a year. Long-term government bonds gave slightly higher returns than Trea-sury bills. This difference is called the maturity premium. Common stocks were in aclass by themselves. Investors who accepted the risk of common stocks received on av-erage an extra return of just under 9.4 percent a year over the return on Treasury bills.This compensation for taking on the risk of common stock ownership is known as themarket risk premium:
Rate of return=
interest rate on+
market riskon common stocks Treasury bills premium
You may ask why we look back over such a long period to measure average rates ofreturn. The reason is that annual rates of return for common stocks fluctuate so muchthat averages taken over short periods are extremely unreliable. In some years investorsin common stocks had a disagreeable shock and received a substantially lower returnthan they expected. In other years they had a pleasant surprise and received a higher-than-expected return. By averaging the returns across both the rough years and thesmooth, we should get a fair idea of the typical return that investors might justifiablyexpect.
While common stocks have offered the highest average returns, they have also beenriskier investments. Figure 3.14 shows the 73 annual rates of return for the three port-folios. The fluctuations in year-to-year returns on common stocks are remarkably wide.There were two years (1933 and 1954) when investors earned a return of more than 50percent. However, Figure 3.14 shows that you can also lose money by investing in thestock market. The most dramatic case was the stock market crash of 1929–1932.Shortly after President Coolidge joyfully observed that stocks were “cheap at currentprices,” stocks rapidly became even cheaper. By July 1932 the Dow Jones Industrial Av-erage had fallen in a series of slides by 89 percent.
Another major market crash, that of Monday, October 19, 1987, does not show up inFigure 3.14. On that day stock prices fell by 23 percent, their largest one-day fall in his-tory. However, Black Monday came after a prolonged rise in stock prices, so that over
The historical record shows that investors have received a risk premium forholding risky assets. Average returns on high-risk assets are higher than thoseon low-risk assets.
TABLE 3.9Average rates of return onTreasury bills, governmentbonds, and common stocks,1926–1998 (figures inpercent per year)
Portfolio Average Annual Average Risk Premium Rate of Return (Extra Return versus Treasury Bills)
Treasury bills 3.8Treasury bonds 5.7 1.9Common stocks 13.2 9.4
MATURITY PREMIUMExtra average return frominvesting in long- versusshort-term Treasurysecurities.
RISK PREMIUMExpected return in excess ofrisk-free return ascompensation for risk.
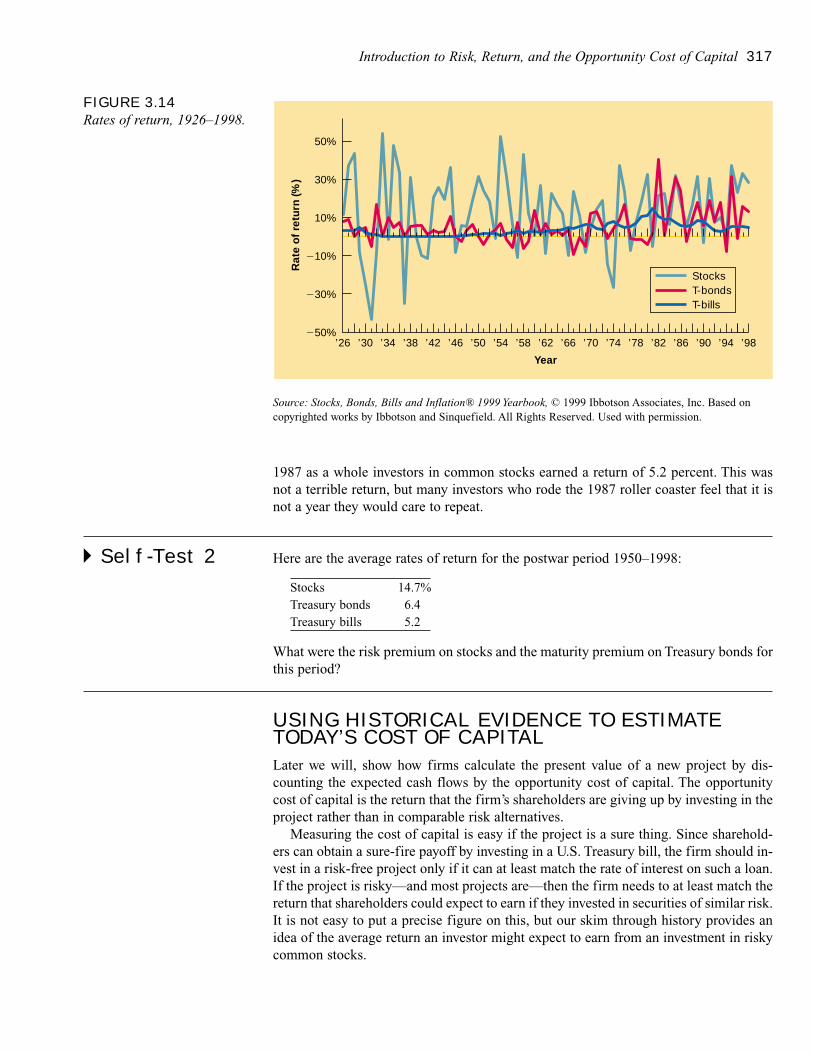
Introduction to Risk, Return, and the Opportunity Cost of Capital 317
1987 as a whole investors in common stocks earned a return of 5.2 percent. This wasnot a terrible return, but many investors who rode the 1987 roller coaster feel that it isnot a year they would care to repeat.
� Self-Test 2 Here are the average rates of return for the postwar period 1950–1998:
Stocks 14.7%Treasury bonds 6.4Treasury bills 5.2
What were the risk premium on stocks and the maturity premium on Treasury bonds forthis period?
USING HISTORICAL EVIDENCE TO ESTIMATETODAY’S COST OF CAPITAL
Later we will, show how firms calculate the present value of a new project by dis-counting the expected cash flows by the opportunity cost of capital. The opportunitycost of capital is the return that the firm’s shareholders are giving up by investing in theproject rather than in comparable risk alternatives.
Measuring the cost of capital is easy if the project is a sure thing. Since sharehold-ers can obtain a sure-fire payoff by investing in a U.S. Treasury bill, the firm should in-vest in a risk-free project only if it can at least match the rate of interest on such a loan.If the project is risky—and most projects are—then the firm needs to at least match thereturn that shareholders could expect to earn if they invested in securities of similar risk.It is not easy to put a precise figure on this, but our skim through history provides anidea of the average return an investor might expect to earn from an investment in riskycommon stocks.
FIGURE 3.14Rates of return, 1926–1998.
Rat
e o
f re
turn
(%)
StocksT-bondsT-bills
50%
30%
10%
�10%
�30%
�50%’26 ’30 ’34 ’38 ’42 ’46 ’50 ’54 ’58
Year
’62 ’66 ’70 ’74 ’78 ’82 ’86 ’90 ’94 ’98
Source: Stocks, Bonds, Bills and Inflation® 1999 Yearbook, © 1999 Ibbotson Associates, Inc. Based oncopyrighted works by Ibbotson and Sinquefield. All Rights Reserved. Used with permission.
318 SECTION THREE
Suppose there is an investment project which you know—don’t ask how—has thesame risk as an investment in the portfolio of stocks in Standard & Poor’s CompositeIndex. We will say that it has the same degree of risk as the market portfolio of com-mon stocks.3
Instead of investing in the project, your shareholders could invest directly in thismarket portfolio of common stocks. Therefore, the opportunity cost of capital for yourproject is the return that the shareholders could expect to earn on the market portfolio.This is what they are giving up by investing money in your project.
The problem of estimating the project cost of capital boils down to estimating thecurrently expected rate of return on the market portfolio. One way to estimate the ex-pected market return is to assume that the future will be like the past and that today’sinvestors expect to receive the average rates of return shown in Table 3.9. In this case,you would judge that the expected market return today is 13.2 percent, the average ofpast market returns.
Unfortunately, this is not the way to do it. Investors are not likely to demand the samereturn each year on an investment in common stocks. For example, we know that the in-terest rate on safe Treasury bills varies over time. At their peak in 1981, Treasury billsoffered a return of 14 percent, more than 10 percentage points above the 3.8 percent av-erage return on bills shown in Table 3.9.
What if you were called upon to estimate the expected return on common stocks in1981? Would you have said 13.2 percent? That doesn’t make sense. Who would investin the risky stock market for an expected return of 13.2 percent when you could get asafe 14 percent from Treasury bills?
A better procedure is to take the current interest rate on Treasury bills plus 9.4 per-cent, the average risk premium shown in Table 3.9. In 1981, when the rate on Treasurybills was 14 percent, that would have given
Expected market=
interest rate on+
normal riskreturn (1981) Treasury bills (1981) premium
= 14% + 9.4% = 23.4%
The first term on the right-hand side tells us the time value of money in 1981; the sec-ond term measures the compensation for risk.
What about today? As we write this in mid-1999, Treasury bills offer a return of only4.8 percent. This suggests that investors in common stocks are looking for a return ofjust over 14 percent:4
Expected market return (1999)
= interest rate on Treasury bills (1999) + normal risk premium
= 4.8 + 9.4 = 14.2%
The expected return on an investment provides compensation to investors both for waiting (the time value of money) and for worrying (the risk of theparticular asset).
3 This is speaking a bit loosely, because the S&P 500 does not include all stocks traded in the United States,much less in world markets.4 In practice, things might be a bit more complicated. We’ve mentioned the yield curve, the relationship be-tween bond maturity and yield. When firms consider investments in long-lived projects, they usually thinkabout risk premiums relative to long-term bonds. In this case, the risk-free rate would be taken as the currentlong-term bond yield less the average maturity premium on such bonds.
Introduction to Risk, Return, and the Opportunity Cost of Capital 319
These calculations assume that there is a normal, stable risk premium on the marketportfolio, so that the expected future risk premium can be measured by the average pastrisk premium. But even with 73 years of data, we cannot estimate the market risk pre-mium exactly; moreover, we cannot be sure that investors today are demanding the samereward for risk that they were in the 1940s or 1960s. All this leaves plenty of room forargument about what the risk premium really is. Many financial managers and econo-mists believe that long-run historical returns are the best measure available and there-fore settle on a risk premium of about 9 percent. Others have a gut instinct that investorsdon’t need such a large risk premium to persuade them to hold common stocks and soshade downward their estimate of the expected future risk premium.
Measuring RiskYou now have some benchmarks. You know that the opportunity cost of capital for safeprojects must be the rate of return offered by safe Treasury bills and you know that theopportunity cost of capital for “average-risk” projects must be the expected return onthe market portfolio. But you don’t know how to estimate the cost of capital for proj-ects that do not fit these two simple cases. Before you can do this you need to under-stand more about investment risk.
The average fuse time for army hand grenades is 7.0 seconds, but that average hidesa lot of potentially relevant information. If you are in the business of throwing grenades,you need some measure of the variation around the average fuse time.5 Similarly, if youare in the business of investing in securities, you need some measure of how far the re-turns may differ from the average.
Figure 3.14 showed the year-by-year returns for several investments from 1926 to1998. Another way of presenting these data is by histograms such as Figure 3.15. Eachbar shows the number of years that the market return fell within a specific range. Forexample, you can see that in 8 of the 73 years the return on common stocks was be-tween +15 percent and +20 percent. The risk shows up in the wide spread of outcomes.In 2 years the return was between +50 percent and +55 percent but there was also 1 yearin which it was between –40 percent and –45 percent.
VARIANCE AND STANDARD DEVIATION
The third histogram in Figure 3.15 shows the variation in common stock returns. Thereturns on common stock have been more variable than returns on bonds and Treasurybills. Common stocks have been risky investments. They will almost certainly continueto be risky investments.
Investment risk depends on the dispersion or spread of possible outcomes. Some-times a picture like Figure 3.15 tells you all you need to know about (past) dispersion.But in general, pictures do not suffice. The financial manager needs a numerical meas-ure of dispersion. The standard measures are variance and standard deviation. Morevariable returns imply greater investment risk. This suggests that some measure of dis-persion will provide a reasonable measure of risk, and dispersion is precisely what ismeasured by variance and standard deviation.
Here is a very simple example showing how variance and standard deviation are
5 We can reassure you; the variation around the standard fuse time is very small.
VARIANCE Averagevalue of squared deviationsfrom mean. A measure ofvolatility.
STANDARD DEVIATIONSquare root of variance.Another measure of volatility.
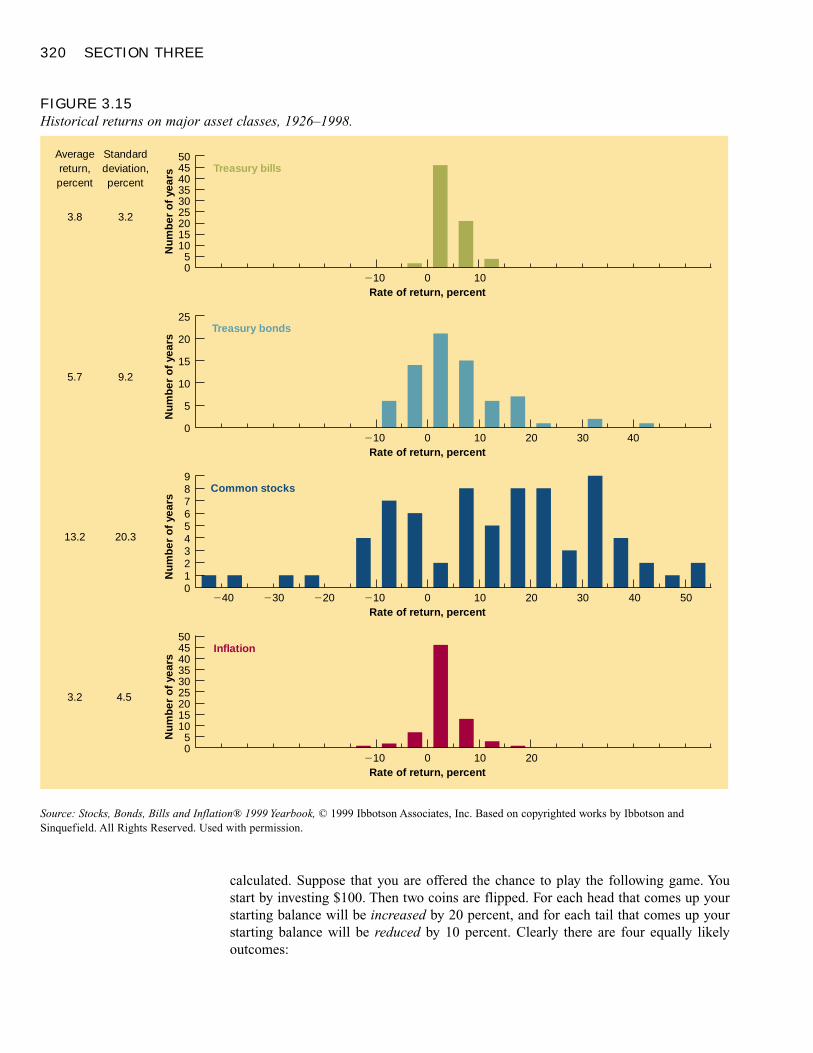
320 SECTION THREE
calculated. Suppose that you are offered the chance to play the following game. Youstart by investing $100. Then two coins are flipped. For each head that comes up your starting balance will be increased by 20 percent, and for each tail that comes up yourstarting balance will be reduced by 10 percent. Clearly there are four equally likely outcomes:
FIGURE 3.15Historical returns on major asset classes, 1926–1998.
Rate of return, percent
Num
ber
of
year
s
0�10 10
Averagereturn,percent
Standarddeviation,percent
3.8 3.2
Treasury bills
Rate of return, percent
Num
ber
of
year
s
0�10�20�30�40 10 20 30 40 50
13.2 20.3
Common stocks
Rate of return, percent
Num
ber
of
year
s
0�10 10 20
3.2 4.5
Inflation
Rate of return, percent
Num
ber
of
year
s
0�10 10 20 30 40
5.7 9.2
Treasury bonds
0123
50454035302520151050
4567
98
05
3025201510
3540
5045
0
5
10
15
20
25
Source: Stocks, Bonds, Bills and Inflation® 1999 Yearbook, © 1999 Ibbotson Associates, Inc. Based on copyrighted works by Ibbotson andSinquefield. All Rights Reserved. Used with permission.
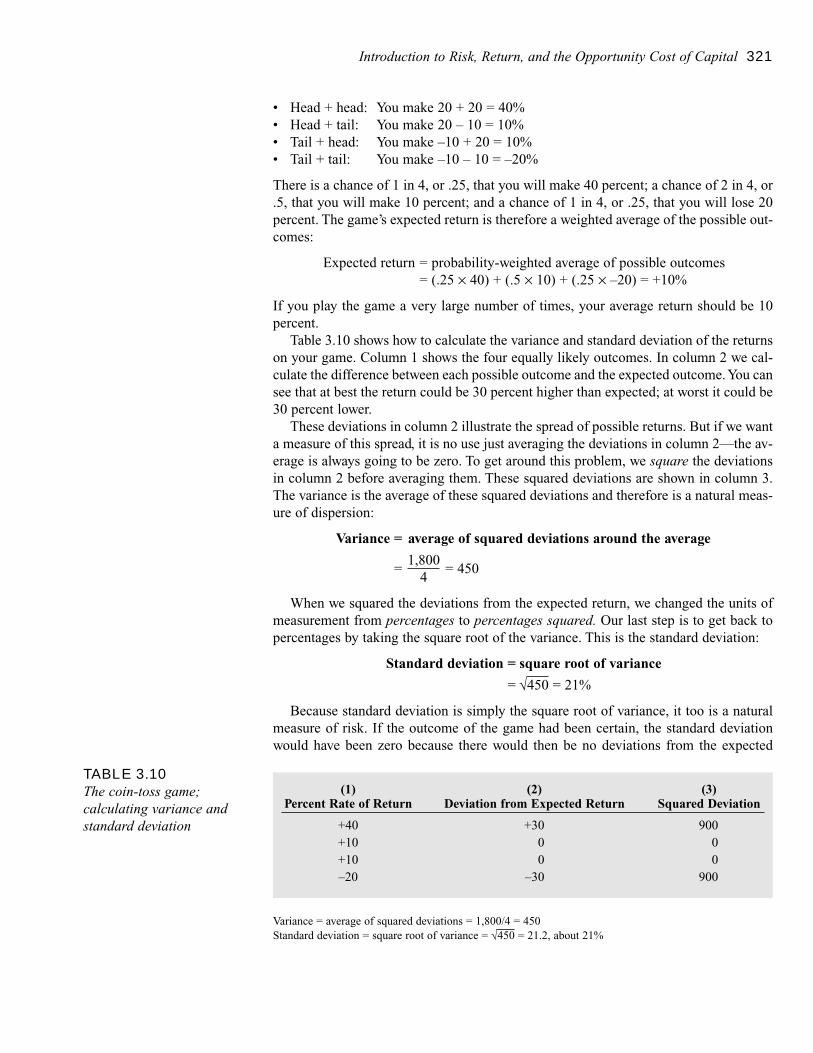
Introduction to Risk, Return, and the Opportunity Cost of Capital 321
• Head + head: You make 20 + 20 = 40%• Head + tail: You make 20 – 10 = 10%• Tail + head: You make –10 + 20 = 10%• Tail + tail: You make –10 – 10 = –20%
There is a chance of 1 in 4, or .25, that you will make 40 percent; a chance of 2 in 4, or.5, that you will make 10 percent; and a chance of 1 in 4, or .25, that you will lose 20percent. The game’s expected return is therefore a weighted average of the possible out-comes:
Expected return = probability-weighted average of possible outcomes = (.25 × 40) + (.5 × 10) + (.25 × –20) = +10%
If you play the game a very large number of times, your average return should be 10percent.
Table 3.10 shows how to calculate the variance and standard deviation of the returnson your game. Column 1 shows the four equally likely outcomes. In column 2 we cal-culate the difference between each possible outcome and the expected outcome. You cansee that at best the return could be 30 percent higher than expected; at worst it could be30 percent lower.
These deviations in column 2 illustrate the spread of possible returns. But if we wanta measure of this spread, it is no use just averaging the deviations in column 2—the av-erage is always going to be zero. To get around this problem, we square the deviationsin column 2 before averaging them. These squared deviations are shown in column 3.The variance is the average of these squared deviations and therefore is a natural meas-ure of dispersion:
Variance = average of squared deviations around the average
=1,800
= 4504
When we squared the deviations from the expected return, we changed the units ofmeasurement from percentages to percentages squared. Our last step is to get back topercentages by taking the square root of the variance. This is the standard deviation:
Standard deviation = square root of variance
= √450 = 21%
Because standard deviation is simply the square root of variance, it too is a naturalmeasure of risk. If the outcome of the game had been certain, the standard deviationwould have been zero because there would then be no deviations from the expected
TABLE 3.10The coin-toss game;calculating variance andstandard deviation
(1) (2) (3)Percent Rate of Return Deviation from Expected Return Squared Deviation
+40 +30 900+10 0 0+10 0 0–20 –30 900
Variance = average of squared deviations = 1,800/4 = 450Standard deviation = square root of variance = √450 = 21.2, about 21%
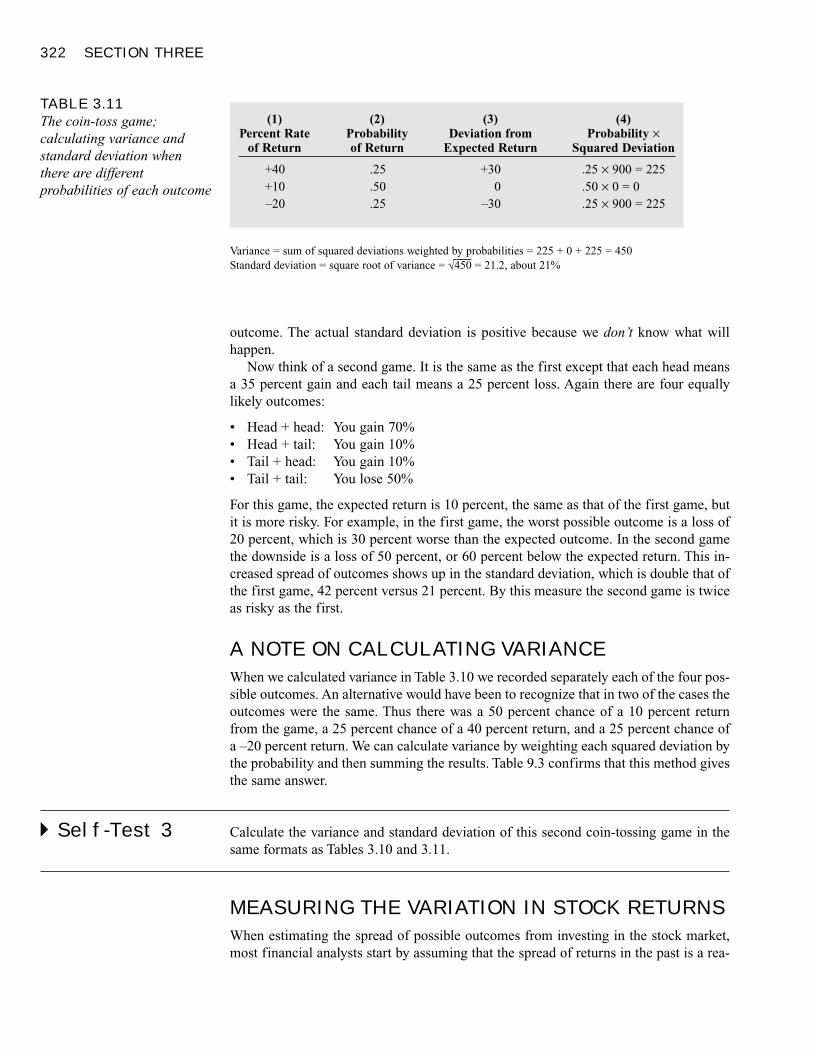
322 SECTION THREE
outcome. The actual standard deviation is positive because we don’t know what willhappen.
Now think of a second game. It is the same as the first except that each head meansa 35 percent gain and each tail means a 25 percent loss. Again there are four equallylikely outcomes:
• Head + head: You gain 70%• Head + tail: You gain 10%• Tail + head: You gain 10%• Tail + tail: You lose 50%
For this game, the expected return is 10 percent, the same as that of the first game, butit is more risky. For example, in the first game, the worst possible outcome is a loss of20 percent, which is 30 percent worse than the expected outcome. In the second gamethe downside is a loss of 50 percent, or 60 percent below the expected return. This in-creased spread of outcomes shows up in the standard deviation, which is double that ofthe first game, 42 percent versus 21 percent. By this measure the second game is twiceas risky as the first.
A NOTE ON CALCULATING VARIANCE
When we calculated variance in Table 3.10 we recorded separately each of the four pos-sible outcomes. An alternative would have been to recognize that in two of the cases theoutcomes were the same. Thus there was a 50 percent chance of a 10 percent returnfrom the game, a 25 percent chance of a 40 percent return, and a 25 percent chance ofa –20 percent return. We can calculate variance by weighting each squared deviation bythe probability and then summing the results. Table 9.3 confirms that this method givesthe same answer.
� Self-Test 3 Calculate the variance and standard deviation of this second coin-tossing game in thesame formats as Tables 3.10 and 3.11.
MEASURING THE VARIATION IN STOCK RETURNS
When estimating the spread of possible outcomes from investing in the stock market,most financial analysts start by assuming that the spread of returns in the past is a rea-
TABLE 3.11The coin-toss game;calculating variance andstandard deviation whenthere are differentprobabilities of each outcome
(1) (2) (3) (4)Percent Rate Probability Deviation from Probability ×
of Return of Return Expected Return Squared Deviation
+40 .25 +30 .25 × 900 = 225+10 .50 0 .50 × 0 = 0–20 .25 –30 .25 × 900 = 225
Variance = sum of squared deviations weighted by probabilities = 225 + 0 + 225 = 450Standard deviation = square root of variance = √450 = 21.2, about 21%
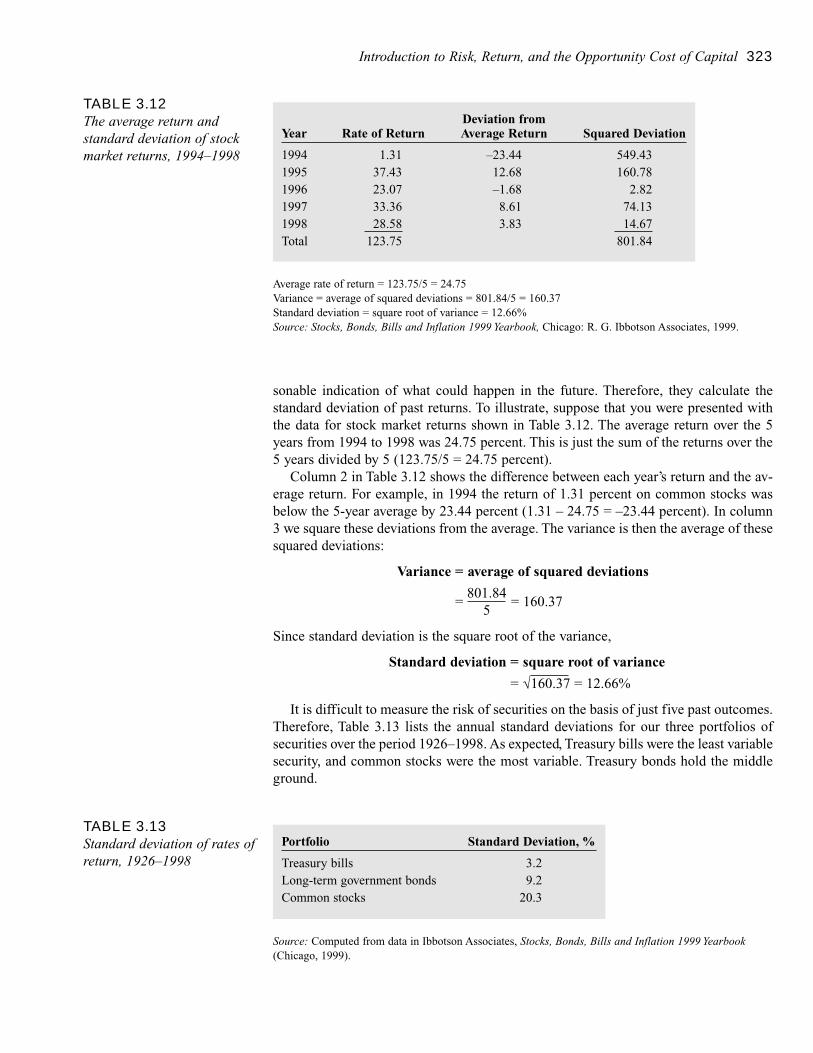
Introduction to Risk, Return, and the Opportunity Cost of Capital 323
sonable indication of what could happen in the future. Therefore, they calculate thestandard deviation of past returns. To illustrate, suppose that you were presented withthe data for stock market returns shown in Table 3.12. The average return over the 5years from 1994 to 1998 was 24.75 percent. This is just the sum of the returns over the5 years divided by 5 (123.75/5 = 24.75 percent).
Column 2 in Table 3.12 shows the difference between each year’s return and the av-erage return. For example, in 1994 the return of 1.31 percent on common stocks wasbelow the 5-year average by 23.44 percent (1.31 – 24.75 = –23.44 percent). In column3 we square these deviations from the average. The variance is then the average of thesesquared deviations:
Variance = average of squared deviations
=801.84
= 160.375
Since standard deviation is the square root of the variance,
Standard deviation = square root of variance
= √160.37 = 12.66%
It is difficult to measure the risk of securities on the basis of just five past outcomes.Therefore, Table 3.13 lists the annual standard deviations for our three portfolios of securities over the period 1926–1998. As expected, Treasury bills were the least variablesecurity, and common stocks were the most variable. Treasury bonds hold the middleground.
TABLE 3.12The average return andstandard deviation of stockmarket returns, 1994–1998
Deviation fromYear Rate of Return Average Return Squared Deviation
1994 1.31 –23.44 549.431995 37.43 12.68 160.781996 23.07 –1.68 2.821997 33.36 8.61 74.131998 28.58 3.83 14.67Total 123.75 801.84
Average rate of return = 123.75/5 = 24.75Variance = average of squared deviations = 801.84/5 = 160.37Standard deviation = square root of variance = 12.66%Source: Stocks, Bonds, Bills and Inflation 1999 Yearbook, Chicago: R. G. Ibbotson Associates, 1999.
TABLE 3.13Standard deviation of rates ofreturn, 1926–1998
Portfolio Standard Deviation, %
Treasury bills 3.2Long-term government bonds 9.2Common stocks 20.3
Source: Computed from data in Ibbotson Associates, Stocks, Bonds, Bills and Inflation 1999 Yearbook(Chicago, 1999).
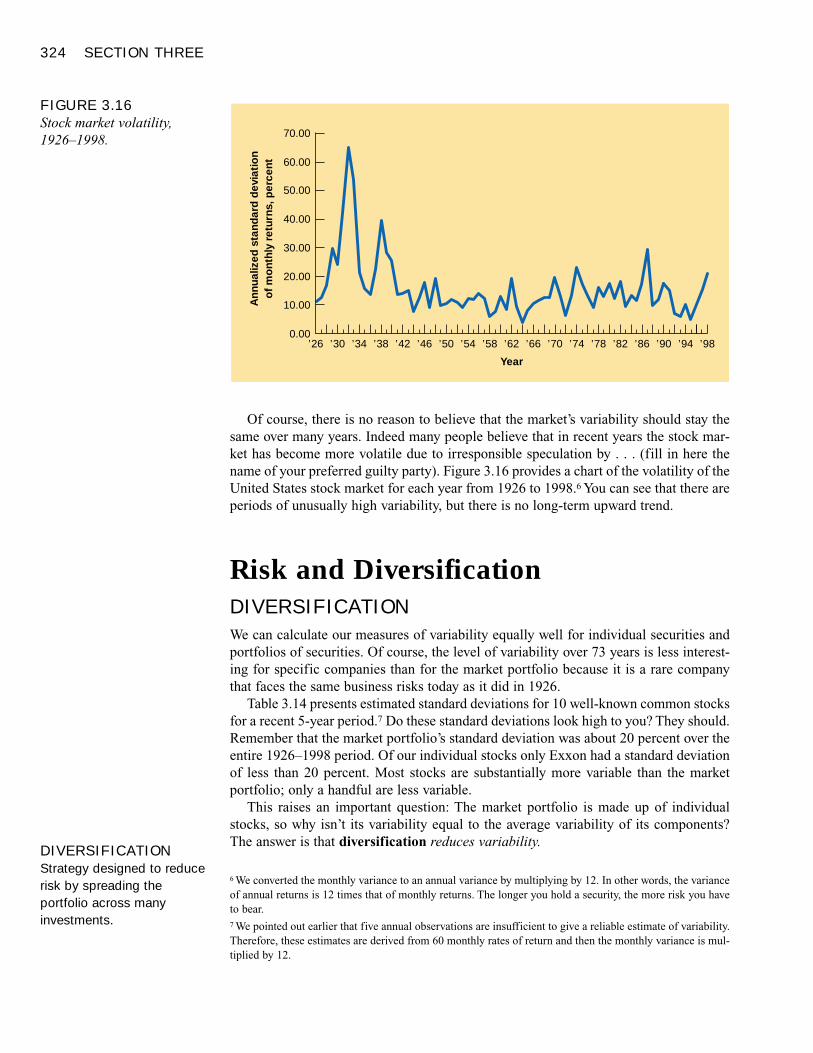
324 SECTION THREE
Of course, there is no reason to believe that the market’s variability should stay thesame over many years. Indeed many people believe that in recent years the stock mar-ket has become more volatile due to irresponsible speculation by . . . (fill in here thename of your preferred guilty party). Figure 3.16 provides a chart of the volatility of theUnited States stock market for each year from 1926 to 1998.6 You can see that there areperiods of unusually high variability, but there is no long-term upward trend.
Risk and DiversificationDIVERSIFICATION
We can calculate our measures of variability equally well for individual securities andportfolios of securities. Of course, the level of variability over 73 years is less interest-ing for specific companies than for the market portfolio because it is a rare companythat faces the same business risks today as it did in 1926.
Table 3.14 presents estimated standard deviations for 10 well-known common stocksfor a recent 5-year period.7 Do these standard deviations look high to you? They should.Remember that the market portfolio’s standard deviation was about 20 percent over theentire 1926–1998 period. Of our individual stocks only Exxon had a standard deviationof less than 20 percent. Most stocks are substantially more variable than the marketportfolio; only a handful are less variable.
This raises an important question: The market portfolio is made up of individualstocks, so why isn’t its variability equal to the average variability of its components?The answer is that diversification reduces variability.
6 We converted the monthly variance to an annual variance by multiplying by 12. In other words, the varianceof annual returns is 12 times that of monthly returns. The longer you hold a security, the more risk you haveto bear.7 We pointed out earlier that five annual observations are insufficient to give a reliable estimate of variability.Therefore, these estimates are derived from 60 monthly rates of return and then the monthly variance is mul-tiplied by 12.
FIGURE 3.16Stock market volatility,1926–1998.
Ann
ualiz
ed s
tand
ard
dev
iati
on
of
mo
nthl
y re
turn
s, p
erce
nt
’26 ’30 ’340.00
10.00
20.00
30.00
40.00
50.00
60.00
70.00
’38 ’42 ’46 ’50 ’54 ’58
Year
’62 ’66 ’70 ’74 ’78 ’82 ’86 ’90 ’94 ’98
DIVERSIFICATIONStrategy designed to reducerisk by spreading theportfolio across manyinvestments.
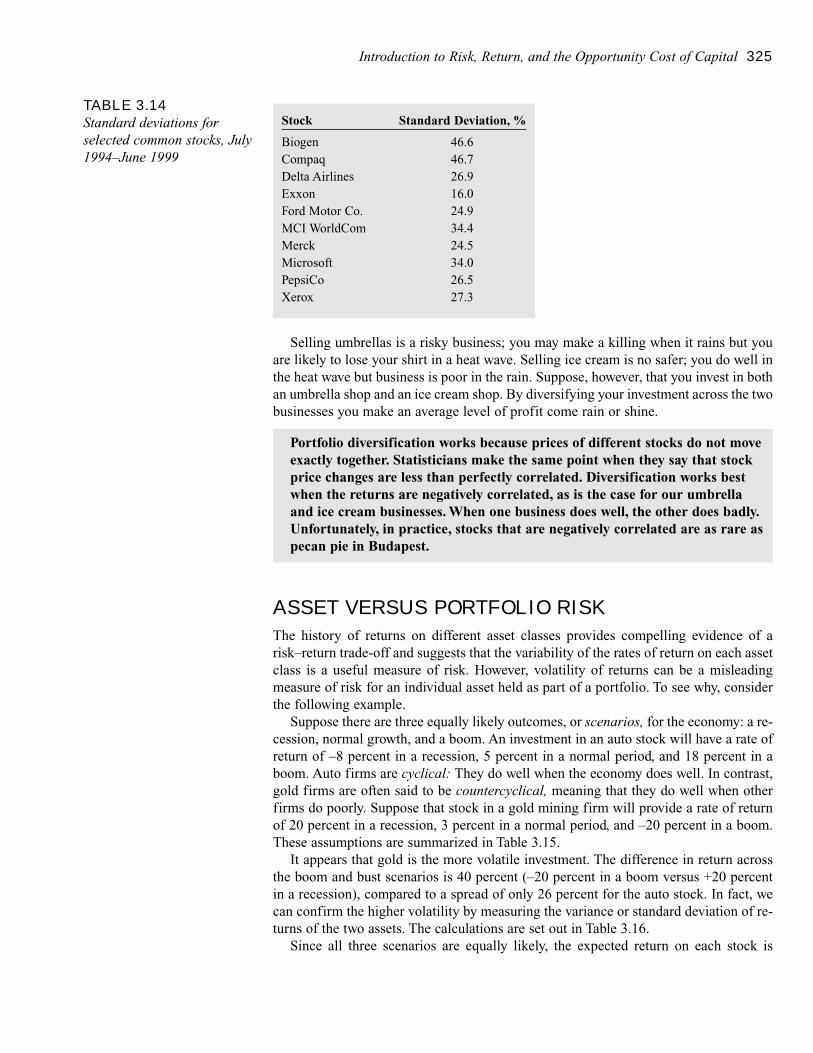
Introduction to Risk, Return, and the Opportunity Cost of Capital 325
Selling umbrellas is a risky business; you may make a killing when it rains but youare likely to lose your shirt in a heat wave. Selling ice cream is no safer; you do well inthe heat wave but business is poor in the rain. Suppose, however, that you invest in bothan umbrella shop and an ice cream shop. By diversifying your investment across the twobusinesses you make an average level of profit come rain or shine.
ASSET VERSUS PORTFOLIO RISK
The history of returns on different asset classes provides compelling evidence of arisk–return trade-off and suggests that the variability of the rates of return on each assetclass is a useful measure of risk. However, volatility of returns can be a misleadingmeasure of risk for an individual asset held as part of a portfolio. To see why, considerthe following example.
Suppose there are three equally likely outcomes, or scenarios, for the economy: a re-cession, normal growth, and a boom. An investment in an auto stock will have a rate ofreturn of –8 percent in a recession, 5 percent in a normal period, and 18 percent in aboom. Auto firms are cyclical: They do well when the economy does well. In contrast,gold firms are often said to be countercyclical, meaning that they do well when otherfirms do poorly. Suppose that stock in a gold mining firm will provide a rate of returnof 20 percent in a recession, 3 percent in a normal period, and –20 percent in a boom.These assumptions are summarized in Table 3.15.
It appears that gold is the more volatile investment. The difference in return acrossthe boom and bust scenarios is 40 percent (–20 percent in a boom versus +20 percentin a recession), compared to a spread of only 26 percent for the auto stock. In fact, wecan confirm the higher volatility by measuring the variance or standard deviation of re-turns of the two assets. The calculations are set out in Table 3.16.
Since all three scenarios are equally likely, the expected return on each stock is
Portfolio diversification works because prices of different stocks do not moveexactly together. Statisticians make the same point when they say that stockprice changes are less than perfectly correlated. Diversification works bestwhen the returns are negatively correlated, as is the case for our umbrella and ice cream businesses. When one business does well, the other does badly.Unfortunately, in practice, stocks that are negatively correlated are as rare aspecan pie in Budapest.
TABLE 3.14Standard deviations forselected common stocks, July1994–June 1999
Stock Standard Deviation, %
Biogen 46.6Compaq 46.7Delta Airlines 26.9Exxon 16.0Ford Motor Co. 24.9MCI WorldCom 34.4Merck 24.5Microsoft 34.0PepsiCo 26.5Xerox 27.3
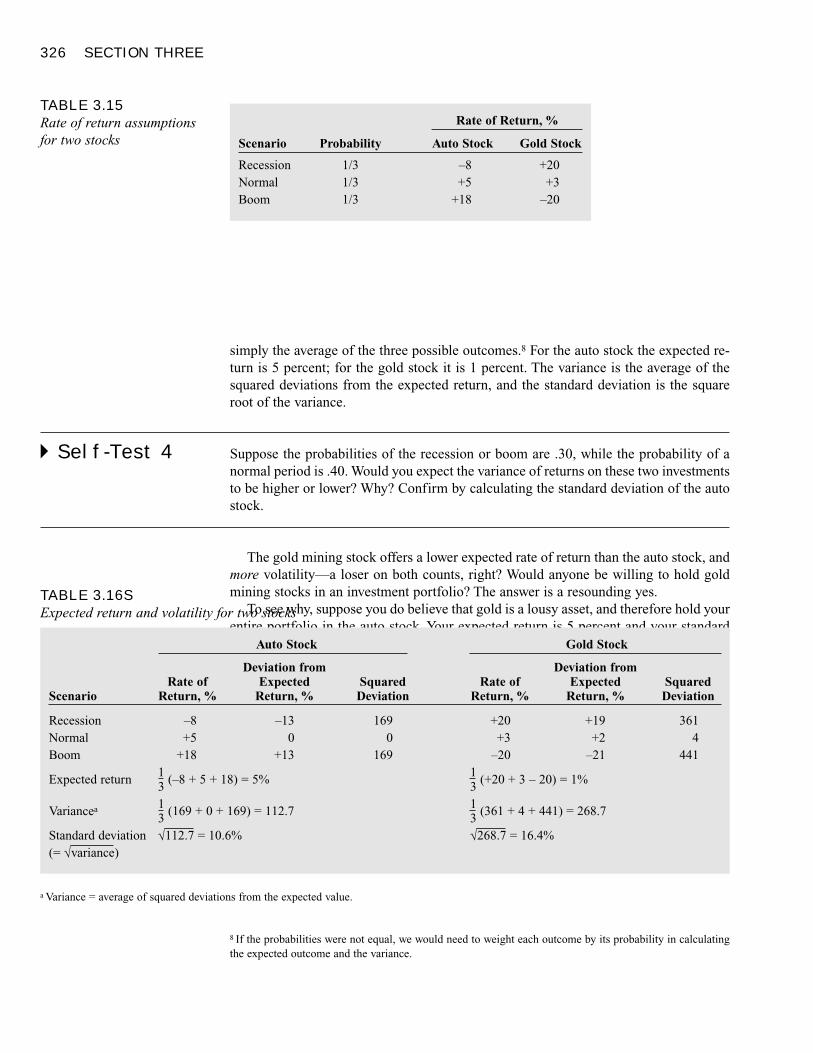
326 SECTION THREE
simply the average of the three possible outcomes.8 For the auto stock the expected re-turn is 5 percent; for the gold stock it is 1 percent. The variance is the average of thesquared deviations from the expected return, and the standard deviation is the squareroot of the variance.
� Self-Test 4 Suppose the probabilities of the recession or boom are .30, while the probability of anormal period is .40. Would you expect the variance of returns on these two investmentsto be higher or lower? Why? Confirm by calculating the standard deviation of the autostock.
The gold mining stock offers a lower expected rate of return than the auto stock, andmore volatility—a loser on both counts, right? Would anyone be willing to hold goldmining stocks in an investment portfolio? The answer is a resounding yes.
To see why, suppose you do believe that gold is a lousy asset, and therefore hold yourentire portfolio in the auto stock. Your expected return is 5 percent and your standard
TABLE 3.16SExpected return and volatility for two stocks
Auto Stock Gold Stock
Deviation from Deviation fromRate of Expected Squared Rate of Expected Squared
Scenario Return, % Return, % Deviation Return, % Return, % Deviation
Recession –8 –13 169 +20 +19 361Normal +5 0 0 +3 +2 4Boom +18 +13 169 –20 –21 441
Expected return 1 (–8 + 5 + 18) = 5% 1 (+20 + 3 – 20) = 1%3 3
Variancea 1 (169 + 0 + 169) = 112.7 1 (361 + 4 + 441) = 268.73 3Standard deviation √112.7 = 10.6% √268.7 = 16.4%(= √variance)
a Variance = average of squared deviations from the expected value.
TABLE 3.15Rate of return assumptionsfor two stocks
Rate of Return, %
Scenario Probability Auto Stock Gold Stock
Recession 1/3 –8 +20Normal 1/3 +5 +3Boom 1/3 +18 –20
8 If the probabilities were not equal, we would need to weight each outcome by its probability in calculatingthe expected outcome and the variance.
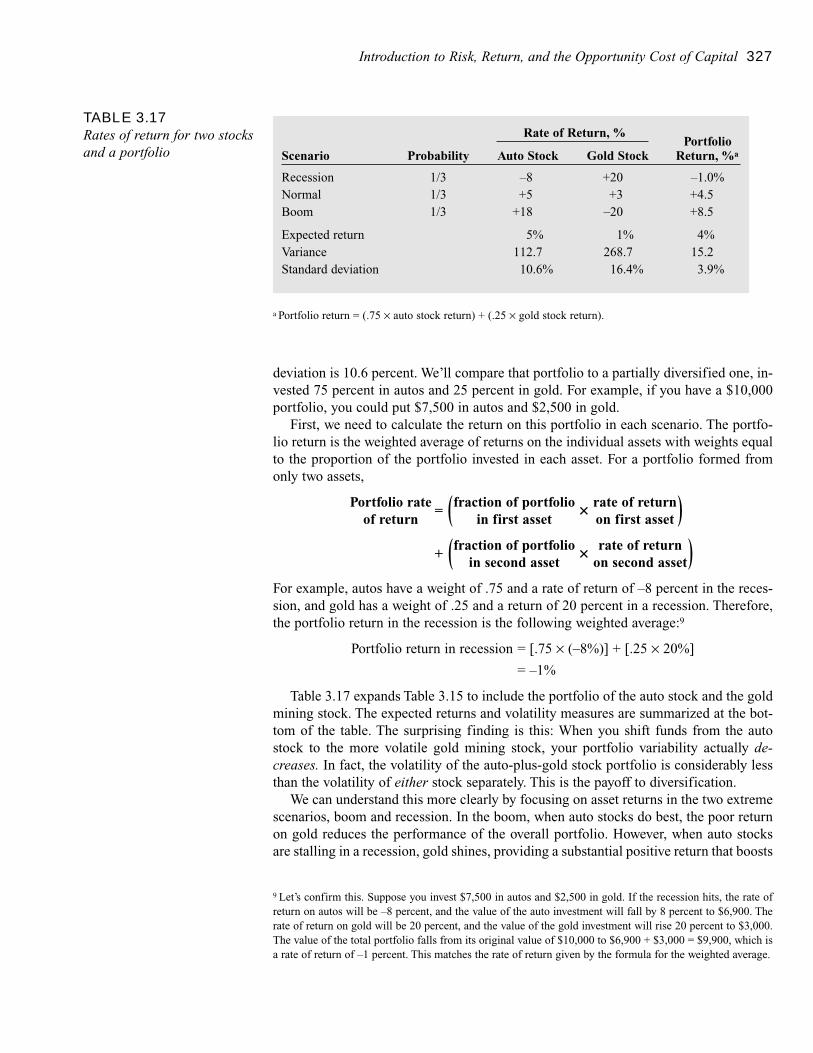
Introduction to Risk, Return, and the Opportunity Cost of Capital 327
deviation is 10.6 percent. We’ll compare that portfolio to a partially diversified one, in-vested 75 percent in autos and 25 percent in gold. For example, if you have a $10,000portfolio, you could put $7,500 in autos and $2,500 in gold.
First, we need to calculate the return on this portfolio in each scenario. The portfo-lio return is the weighted average of returns on the individual assets with weights equalto the proportion of the portfolio invested in each asset. For a portfolio formed fromonly two assets,
Portfolio rate= (fraction of portfolio
�rate of return)of return in first asset on first asset
+ (fraction of portfolio�
rate of return )in second asset on second asset
For example, autos have a weight of .75 and a rate of return of –8 percent in the reces-sion, and gold has a weight of .25 and a return of 20 percent in a recession. Therefore,the portfolio return in the recession is the following weighted average:9
Portfolio return in recession = [.75 × (–8%)] + [.25 × 20%]
= –1%
Table 3.17 expands Table 3.15 to include the portfolio of the auto stock and the goldmining stock. The expected returns and volatility measures are summarized at the bot-tom of the table. The surprising finding is this: When you shift funds from the autostock to the more volatile gold mining stock, your portfolio variability actually de-creases. In fact, the volatility of the auto-plus-gold stock portfolio is considerably lessthan the volatility of either stock separately. This is the payoff to diversification.
We can understand this more clearly by focusing on asset returns in the two extremescenarios, boom and recession. In the boom, when auto stocks do best, the poor returnon gold reduces the performance of the overall portfolio. However, when auto stocksare stalling in a recession, gold shines, providing a substantial positive return that boosts
TABLE 3.17Rates of return for two stocksand a portfolio
Rate of Return, %Portfolio
Scenario Probability Auto Stock Gold Stock Return, %a
Recession 1/3 –8 +20 –1.0%Normal 1/3 +5 +3 +4.5Boom 1/3 +18 –20 +8.5
Expected return 5% 1% 4%Variance 112.7 268.7 15.2Standard deviation 10.6% 16.4% 3.9%
a Portfolio return = (.75 × auto stock return) + (.25 × gold stock return).
9 Let’s confirm this. Suppose you invest $7,500 in autos and $2,500 in gold. If the recession hits, the rate ofreturn on autos will be –8 percent, and the value of the auto investment will fall by 8 percent to $6,900. Therate of return on gold will be 20 percent, and the value of the gold investment will rise 20 percent to $3,000.The value of the total portfolio falls from its original value of $10,000 to $6,900 + $3,000 = $9,900, which isa rate of return of –1 percent. This matches the rate of return given by the formula for the weighted average.
328 SECTION THREE
portfolio performance. The gold stock offsets the swings in the performance of the autostock, reducing the best-case return but improving the worst-case return. The inverse relationship between the returns on the two stocks means that the addition of the goldmining stock to an all-auto portfolio stabilizes returns.
A gold stock is really a negative-risk asset to an investor starting with an all-autoportfolio. Adding it to the portfolio reduces the volatility of returns. The incrementalrisk of the gold stock (that is, the change in overall risk when gold is added to the port-folio) is negative despite the fact that gold returns are highly volatile.
In general, the incremental risk of a stock depends on whether its returns tend to varywith or against the returns of the other assets in the portfolio. Incremental risk does notjust depend on a stock’s volatility. If returns do not move closely with those of the restof the portfolio, the stock will reduce the volatility of portfolio returns.
We can summarize as follows:
� EXAMPLE 1 Merck and Ford Motor
Let’s look at a more realistic example of the effect of diversification. Figure 3.17ashows the monthly returns of Merck stock from 1994 to 1999. The average monthly re-turn was 3.1 percent but you can see that there was considerable variation around thataverage. The standard deviation of monthly returns was 7.1 percent. As a rule of thumb,in roughly one-third of the months the return is likely to be more than one standard de-viation above or below the average return.10 The figure shows that the return did indeeddiffer by more than 7.1 percent from the average on about a third of the occasions.
Figure 3.17b shows the monthly returns of Ford Motor. The average monthly returnon Ford was 2.3 percent and the standard deviation was 7.2 percent, about the same asthat of Merck. Again you can see that in about a third of the cases the return differedfrom the average by more than one standard deviation.
An investment in either Merck or Ford would have been very variable. But the for-tunes of the two stocks were not perfectly related.11 There were many occasions when a
1. Investors care about the expected return and risk of their portfolio ofassets. The risk of the overall portfolio can be measured by the volatility of returns, that is, the variance or standard deviation.
2. The standard deviation of the returns of an individual security measureshow risky that security would be if held in isolation. But an investor whoholds a portfolio of securities is interested only in how each security affects the risk of the entire portfolio. The contribution of a security to the risk of the portfolio depends on how the security’s returns vary withthe investor’s other holdings. Thus a security that is risky if held inisolation may nevertheless serve to reduce the variability of the portfolio,as long as its returns vary inversely with those of the rest of the portfolio.
10 For any normal distribution, approximately one-third of the observations lie more than one standard devi-ation above or below the average. Over short intervals stock returns are roughly normally distributed.11 Statisticians calculate a correlation coefficient as a measure of how closely two series move together. IfFord’s and Merck’s stock moved in perfect lockstep, the correlation coefficient between the returns would be1.0. If their returns were completely unrelated, the correlation would be zero. The actual correlation betweenthe returns on Ford and Merck was .03. In other words, the returns were almost completely unrelated.
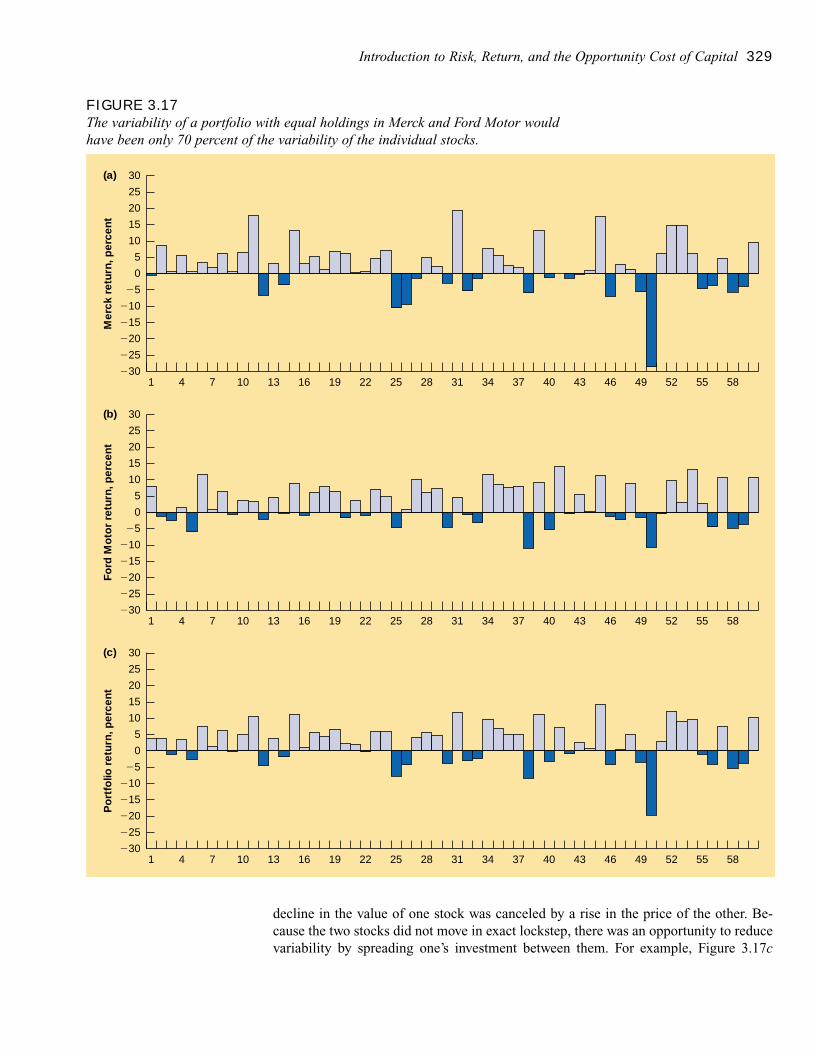
Introduction to Risk, Return, and the Opportunity Cost of Capital 329
decline in the value of one stock was canceled by a rise in the price of the other. Be-cause the two stocks did not move in exact lockstep, there was an opportunity to reducevariability by spreading one’s investment between them. For example, Figure 3.17c
FIGURE 3.17The variability of a portfolio with equal holdings in Merck and Ford Motor wouldhave been only 70 percent of the variability of the individual stocks.
�20
�15
�10
�5
0
5
10
15
20
25
30
Mer
ck r
etur
n, p
erce
nt
�25
�301 4 7 10 13 16 19 22 25 28 31 34 37 40 43 46 49 52 55 58
�20
�15
�10
�5
0
5
10
15
20
25
30
�25
�301 4 7 10 13 16 19 22 25 28 31 34 37 40 43 46 49 52 55 58
�20
�15
�10
�5
0
5
10
15
20
25
30
�25
�301 4 7 10 13 16 19 22 25 28 31 34 37 40 43 46 49 52 55 58
Ford
Mo
tor
retu
rn, p
erce
ntP
ort
folio
ret
urn,
per
cent
(a)
(b)
(c)
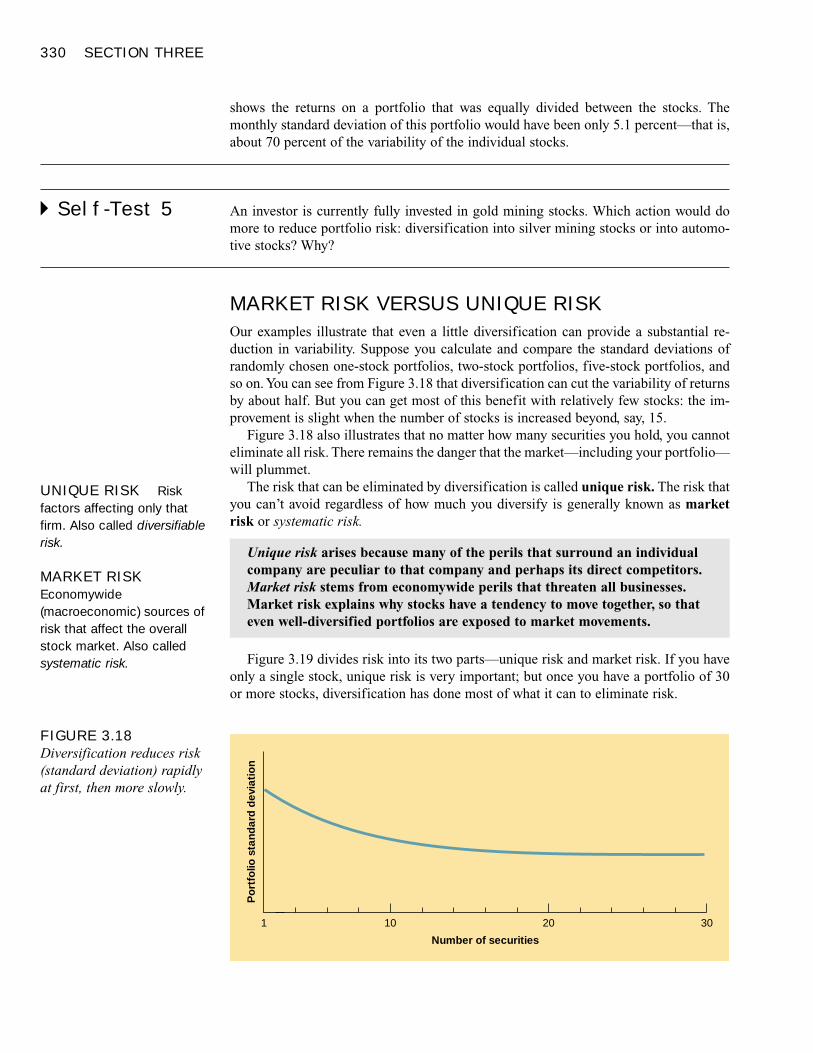
330 SECTION THREE
shows the returns on a portfolio that was equally divided between the stocks. Themonthly standard deviation of this portfolio would have been only 5.1 percent—that is,about 70 percent of the variability of the individual stocks.
� Self-Test 5 An investor is currently fully invested in gold mining stocks. Which action would domore to reduce portfolio risk: diversification into silver mining stocks or into automo-tive stocks? Why?
MARKET RISK VERSUS UNIQUE RISK
Our examples illustrate that even a little diversification can provide a substantial re-duction in variability. Suppose you calculate and compare the standard deviations ofrandomly chosen one-stock portfolios, two-stock portfolios, five-stock portfolios, andso on. You can see from Figure 3.18 that diversification can cut the variability of returnsby about half. But you can get most of this benefit with relatively few stocks: the im-provement is slight when the number of stocks is increased beyond, say, 15.
Figure 3.18 also illustrates that no matter how many securities you hold, you cannoteliminate all risk. There remains the danger that the market—including your portfolio—will plummet.
The risk that can be eliminated by diversification is called unique risk. The risk thatyou can’t avoid regardless of how much you diversify is generally known as marketrisk or systematic risk.
Figure 3.19 divides risk into its two parts—unique risk and market risk. If you haveonly a single stock, unique risk is very important; but once you have a portfolio of 30or more stocks, diversification has done most of what it can to eliminate risk.
Unique risk arises because many of the perils that surround an individualcompany are peculiar to that company and perhaps its direct competitors.Market risk stems from economywide perils that threaten all businesses.Market risk explains why stocks have a tendency to move together, so thateven well-diversified portfolios are exposed to market movements.
FIGURE 3.18Diversification reduces risk(standard deviation) rapidlyat first, then more slowly.
Number of securities
Po
rtfo
lio s
tand
ard
dev
iati
on
1 10 20 30
UNIQUE RISK Riskfactors affecting only thatfirm. Also called diversifiablerisk.
MARKET RISKEconomywide(macroeconomic) sources ofrisk that affect the overallstock market. Also calledsystematic risk.
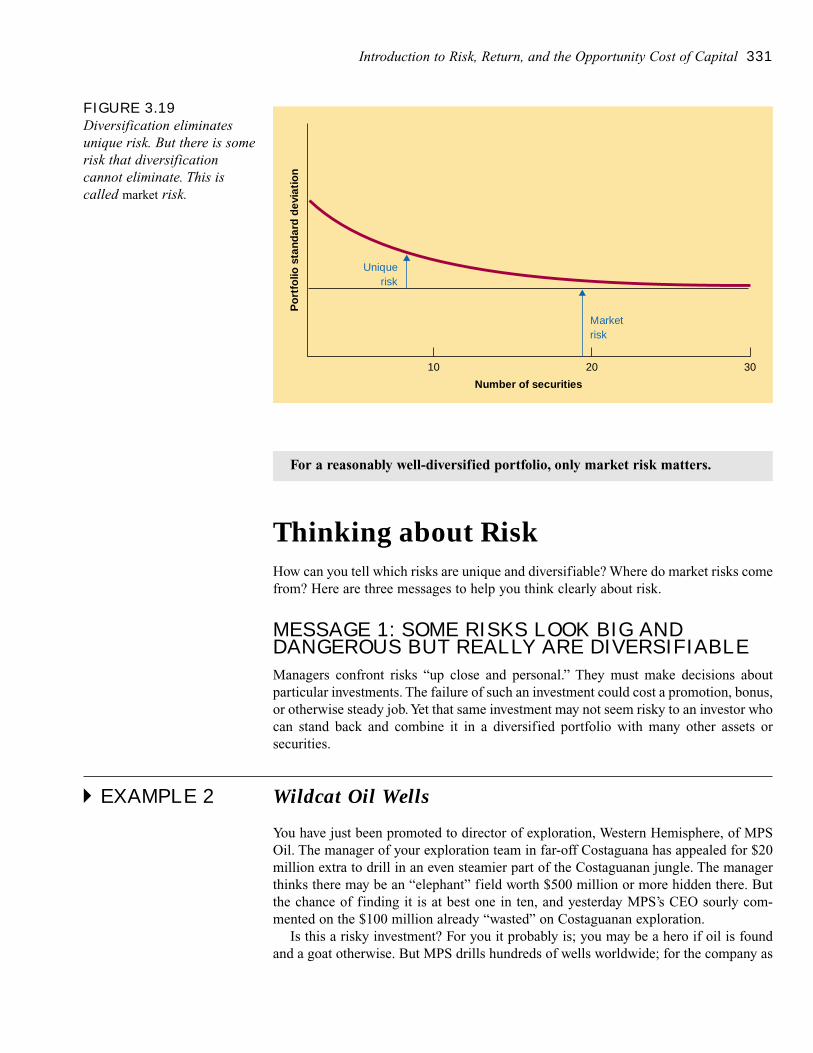
Introduction to Risk, Return, and the Opportunity Cost of Capital 331
Thinking about RiskHow can you tell which risks are unique and diversifiable? Where do market risks comefrom? Here are three messages to help you think clearly about risk.
MESSAGE 1: SOME RISKS LOOK BIG ANDDANGEROUS BUT REALLY ARE DIVERSIFIABLE
Managers confront risks “up close and personal.” They must make decisions about particular investments. The failure of such an investment could cost a promotion, bonus,or otherwise steady job. Yet that same investment may not seem risky to an investor whocan stand back and combine it in a diversified portfolio with many other assets or securities.
� EXAMPLE 2 Wildcat Oil Wells
You have just been promoted to director of exploration, Western Hemisphere, of MPSOil. The manager of your exploration team in far-off Costaguana has appealed for $20million extra to drill in an even steamier part of the Costaguanan jungle. The managerthinks there may be an “elephant” field worth $500 million or more hidden there. Butthe chance of finding it is at best one in ten, and yesterday MPS’s CEO sourly com-mented on the $100 million already “wasted” on Costaguanan exploration.
Is this a risky investment? For you it probably is; you may be a hero if oil is foundand a goat otherwise. But MPS drills hundreds of wells worldwide; for the company as
For a reasonably well-diversified portfolio, only market risk matters.
FIGURE 3.19Diversification eliminatesunique risk. But there is somerisk that diversificationcannot eliminate. This iscalled market risk.
Number of securities
Po
rtfo
lio s
tand
ard
dev
iati
on
10
Uniquerisk
Marketrisk
20 30
332 SECTION THREE
a whole, it’s the average success rate that matters. Geologic risks (is there oil or not?)should average out. The risk of a worldwide drilling program is much less than the ap-parent risk of any single wildcat well.
Back up one step, and think of the investors who buy MPS stock. The investors mayhold other oil companies too, as well as companies producing steel, computers, cloth-ing, cement, and breakfast cereal. They naturally—and realistically—assume that yoursuccesses and failures in drilling oil wells will average out with the thousands of inde-pendent bets made by the companies in their portfolio.
Therefore, the risks you face in Costaguana do not affect the rate of return they de-mand for investing in MPS Oil. Diversified investors in MPS stock will be happy if youfind that elephant field, but they probably will not notice if you fail and lose your job.In any case, they will not demand a higher average rate of return for worrying about ge-ologic risks in Costaguana.
� EXAMPLE 3 Fire Insurance
Would you be willing to write a $100,000 fire insurance policy on your neighbor’shouse? The neighbor is willing to pay you $100 for a year’s protection, and experienceshows that the chance of fire damage in a given year is substantially less than one in athousand. But if your neighbor’s house is damaged by fire, you would have to pay up.
Few of us have deep enough pockets to insure our neighbors, even if the odds of firedamage are very low. Insurance seems a risky business if you think policy by policy.But a large insurance company, which may issue a million policies, is concerned onlywith average losses, which can be predicted with excellent accuracy.
� Self-Test 6 Imagine a laboratory at IBM, late at night. One scientist speaks to another.“You’re right, Watson, I admit this experiment will consume all the rest of this year’s
budget. I don’t know what we’ll do if it fails. But if this yttrium–magnoosium alloy su-perconducts, the patents will be worth millions.”
Would this be a good or bad investment for IBM? Can’t say. But from the ultimateinvestors’ viewpoint this is not a risky investment. Explain why.
MESSAGE 2: MARKET RISKS ARE MACRO RISKS
We have seen that diversified portfolios are not exposed to the unique risks of individ-ual stocks but are exposed to the uncertain events that affect the entire securities mar-ket and the entire economy. These are macroeconomic, or “macro,” factors such aschanges in interest rates, industrial production, inflation, foreign exchange rates, andenergy costs. These factors affect most firms’ earnings and stock prices. When the rel-evant macro risks turn generally favorable, stock prices rise and investors do well; whenthe same variables go the other way, investors suffer.
You can often assess relative market risks just by thinking through exposures to thebusiness cycle and other macro variables. The following businesses have substantialmacro and market risks:
Introduction to Risk, Return, and the Opportunity Cost of Capital 333
• Airlines. Because business travel falls during a recession, and individuals postponevacations and other discretionary travel, the airline industry is subject to the swingsof the business cycle. On the positive side, airline profits really take off when busi-ness is booming and personal incomes are rising.
• Machine tool manufacturers. These businesses are especially exposed to the busi-ness cycle. Manufacturing companies that have excess capacity rarely buy new ma-chine tools to expand. During recessions, excess capacity can be quite high.
Here, on the other hand, are two industries with less than average macro exposures:
• Food companies. Companies selling staples, such as breakfast cereal, flour, and dogfood, find that demand for their products is relatively stable in good times and bad.
• Electric utilities. Business demand for electric power varies somewhat across thebusiness cycle, but by much less than demand for air travel or machine tools. Also,many electric utilities’ profits are regulated. Regulation cuts off upside profit poten-tial but also gives the utilities the opportunity to increase prices when demand isslack.
� Self-Test 7 Which company of each of the following pairs would you expect to be more exposed tomacro risks?
a. A luxury Manhattan restaurant or an established Burger Queen franchise?b. A paint company that sells through small paint and hardware stores to do-it-your-
selfers, or a paint company that sells in large volumes to Ford, GM, and Chrysler?
MESSAGE 3: RISK CAN BE MEASURED
United Airlines clearly has more exposure to macro risks than food companies such asKellogg or General Mills. These are easy cases. But is IBM stock a riskier investmentthan Exxon? That’s not an easy question to reason through. We can, however, measurethe risk of IBM and Exxon by looking at how their stock prices fluctuate.
We’ve already hinted at how to do this. Remember that diversified investors are con-cerned with market risks. The movements of the stock market sum up the net effects ofall relevant macroeconomic uncertainties. If the market portfolio of all traded stocks isup in a particular month, we conclude that the net effect of macroeconomic news is pos-itive. Remember, the performance of the market is barely affected by a firm-specificevent. These cancel out across thousands of stocks in the market.
How do we measure the risk of a single stock, like IBM or Exxon? We do not lookat the stocks in isolation, because the risks that loom when you’re up close to a singlecompany are often diversifiable. Instead we measure the individual stock’s sensitivity tothe fluctuations of the overall stock market.
Remember, investors holding diversified portfolios are mostly concerned withmacroeconomic risks. They do not worry about microeconomic risks peculiarto a particular company or investment project. Micro risks wash out indiversified portfolios. Company managers may worry about both macro andmicro risks, but only the former affect the cost of capital.
334 SECTION THREE
SummaryHow can one estimate the opportunity cost of capital for an “average-risk” project?
Over the past 73 years the return on the Standard & Poor’s Composite Index of commonstocks has averaged almost 9.4 percent a year higher than the return on safe Treasury bills.This is the risk premium that investors have received for taking on the risk of investing instocks. Long-term bonds have offered a higher return than Treasury bills but less than stocks.
If the risk premium in the past is a guide to the future, we can estimate the expectedreturn on the market today by adding that 9.4 percent expected risk premium to today’sinterest rate on Treasury bills. This would be the opportunity cost of capital for an average-risk project, that is, one with the same risk as a typical share of common stock.
How is the standard deviation of returns for individual common stocks or for astock portfolio calculated?
The spread of outcomes on different investments is commonly measured by the variance orstandard deviation of the possible outcomes. The variance is the average of the squareddeviations around the average outcome, and the standard deviation is the square root of thevariance. The standard deviation of the returns on a market portfolio of common stocks hasaveraged about 20 percent a year.
Why does diversification reduce risk?
The standard deviation of returns is generally higher on individual stocks than it is on themarket. Because individual stocks do not move in exact lockstep, much of their risk can bediversified away. By spreading your portfolio across many investments you smooth out therisk of your overall position. The risk that can be eliminated through diversification isknown as unique risk.
What is the difference between unique risk, which can be diversified away, andmarket risk, which cannot?
Even if you hold a well-diversified portfolio, you will not eliminate all risk. You will still beexposed to macroeconomic changes that affect most stocks and the overall stock market.These macro risks combine to create market risk—that is, the risk that the market as awhole will slump.
Stocks are not all equally risky. But what do we mean by a “high-risk stock”? We don’tmean a stock that is risky if held in isolation; we mean a stock that makes an above-averagecontribution to the risk of a diversified portfolio. In other words, investors don’t need toworry much about the risk that they can diversify away; they do need to worry about risk thatcan’t be diversified. This depends on the stock’s sensitivity to macroeconomic conditions.
www.financialengines.com Some good introductory material on risk, return, and inflationwww.stern.nyu.edu/~adamodar/ This New York University site contains some historical data on
market risk and return
market indexDow Jones Industrial AverageStandard & Poor’s Composite Indexmaturity premium
risk premiumvariancestandard deviation
diversificationunique riskmarket risk
Related WebLinks
Key Terms
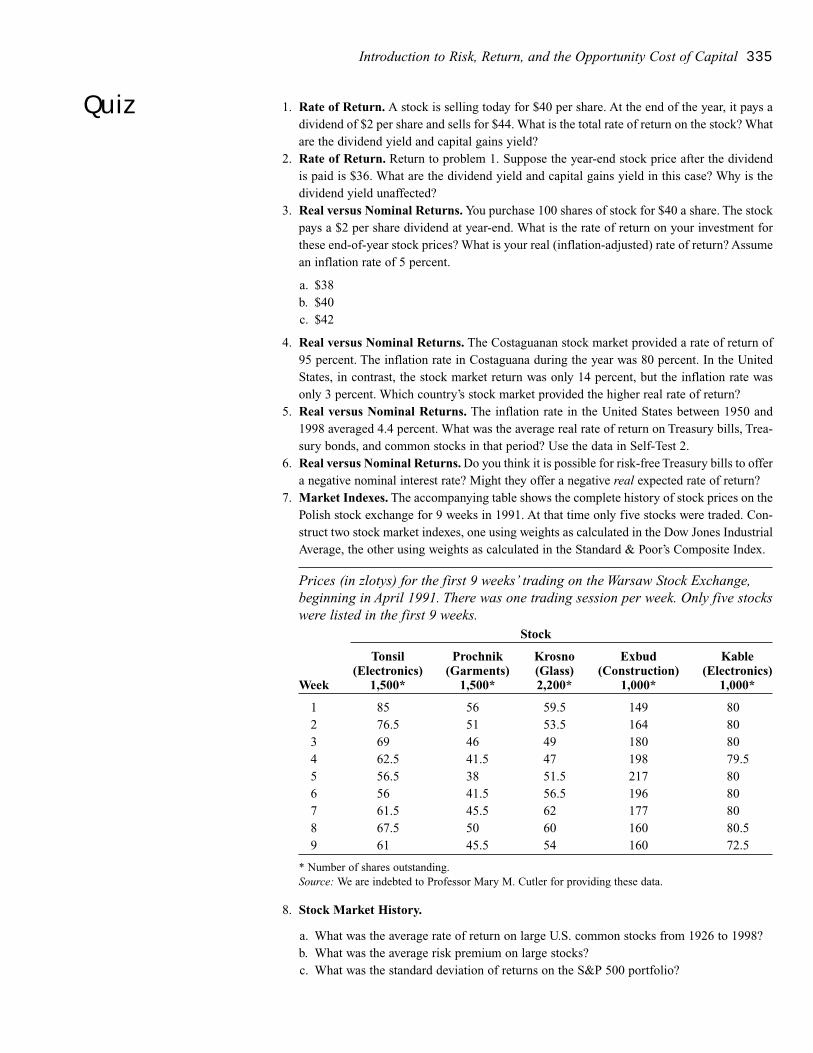
Introduction to Risk, Return, and the Opportunity Cost of Capital 335
1. Rate of Return. A stock is selling today for $40 per share. At the end of the year, it pays adividend of $2 per share and sells for $44. What is the total rate of return on the stock? Whatare the dividend yield and capital gains yield?
2. Rate of Return. Return to problem 1. Suppose the year-end stock price after the dividendis paid is $36. What are the dividend yield and capital gains yield in this case? Why is thedividend yield unaffected?
3. Real versus Nominal Returns. You purchase 100 shares of stock for $40 a share. The stockpays a $2 per share dividend at year-end. What is the rate of return on your investment forthese end-of-year stock prices? What is your real (inflation-adjusted) rate of return? Assumean inflation rate of 5 percent.
a. $38b. $40c. $42
4. Real versus Nominal Returns. The Costaguanan stock market provided a rate of return of95 percent. The inflation rate in Costaguana during the year was 80 percent. In the UnitedStates, in contrast, the stock market return was only 14 percent, but the inflation rate wasonly 3 percent. Which country’s stock market provided the higher real rate of return?
5. Real versus Nominal Returns. The inflation rate in the United States between 1950 and1998 averaged 4.4 percent. What was the average real rate of return on Treasury bills, Trea-sury bonds, and common stocks in that period? Use the data in Self-Test 2.
6. Real versus Nominal Returns. Do you think it is possible for risk-free Treasury bills to offera negative nominal interest rate? Might they offer a negative real expected rate of return?
7. Market Indexes. The accompanying table shows the complete history of stock prices on thePolish stock exchange for 9 weeks in 1991. At that time only five stocks were traded. Con-struct two stock market indexes, one using weights as calculated in the Dow Jones IndustrialAverage, the other using weights as calculated in the Standard & Poor’s Composite Index.
Prices (in zlotys) for the first 9 weeks’ trading on the Warsaw Stock Exchange,beginning in April 1991. There was one trading session per week. Only five stockswere listed in the first 9 weeks.
Stock
Tonsil Prochnik Krosno Exbud Kable(Electronics) (Garments) (Glass) (Construction) (Electronics)
Week 1,500* 1,500* 2,200* 1,000* 1,000*
1 85 56 59.5 149 802 76.5 51 53.5 164 803 69 46 49 180 804 62.5 41.5 47 198 79.55 56.5 38 51.5 217 806 56 41.5 56.5 196 807 61.5 45.5 62 177 808 67.5 50 60 160 80.59 61 45.5 54 160 72.5
* Number of shares outstanding.Source: We are indebted to Professor Mary M. Cutler for providing these data.
8. Stock Market History.
a. What was the average rate of return on large U.S. common stocks from 1926 to 1998?b. What was the average risk premium on large stocks?c. What was the standard deviation of returns on the S&P 500 portfolio?
Quiz
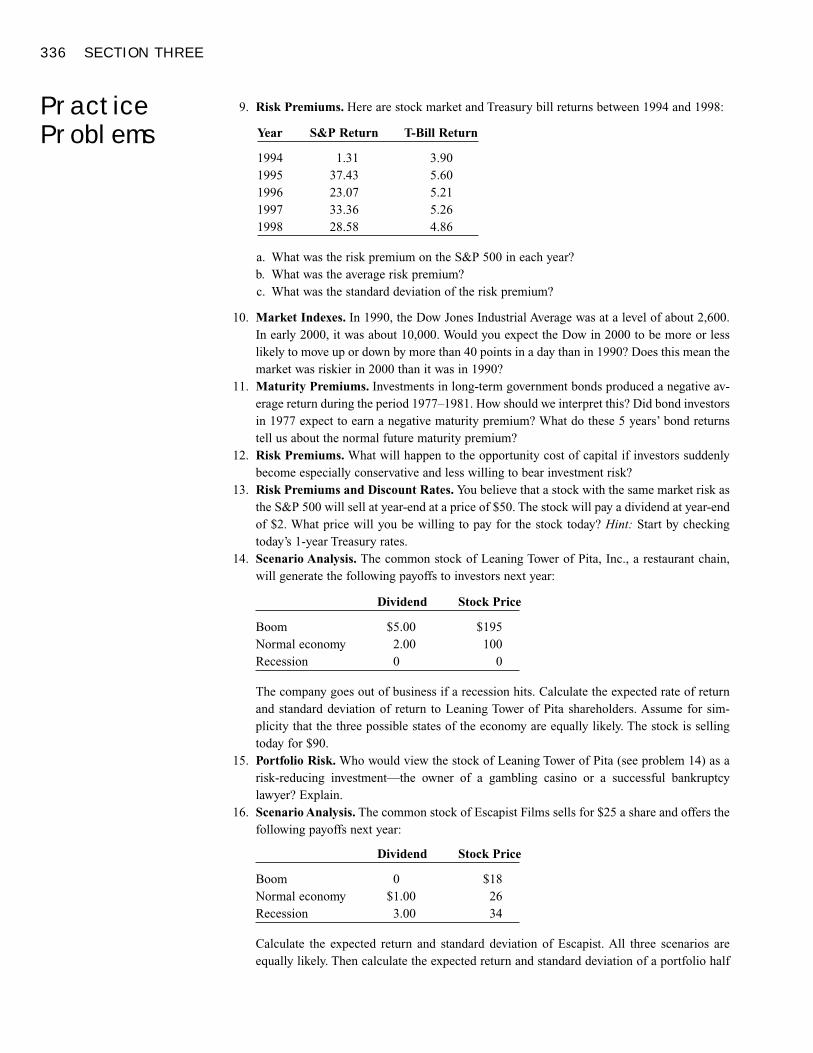
336 SECTION THREE
9. Risk Premiums. Here are stock market and Treasury bill returns between 1994 and 1998:
Year S&P Return T-Bill Return
1994 1.31 3.901995 37.43 5.601996 23.07 5.211997 33.36 5.261998 28.58 4.86
a. What was the risk premium on the S&P 500 in each year?b. What was the average risk premium?c. What was the standard deviation of the risk premium?
10. Market Indexes. In 1990, the Dow Jones Industrial Average was at a level of about 2,600.In early 2000, it was about 10,000. Would you expect the Dow in 2000 to be more or lesslikely to move up or down by more than 40 points in a day than in 1990? Does this mean themarket was riskier in 2000 than it was in 1990?
11. Maturity Premiums. Investments in long-term government bonds produced a negative av-erage return during the period 1977–1981. How should we interpret this? Did bond investorsin 1977 expect to earn a negative maturity premium? What do these 5 years’ bond returnstell us about the normal future maturity premium?
12. Risk Premiums. What will happen to the opportunity cost of capital if investors suddenlybecome especially conservative and less willing to bear investment risk?
13. Risk Premiums and Discount Rates. You believe that a stock with the same market risk asthe S&P 500 will sell at year-end at a price of $50. The stock will pay a dividend at year-endof $2. What price will you be willing to pay for the stock today? Hint: Start by checkingtoday’s 1-year Treasury rates.
14. Scenario Analysis. The common stock of Leaning Tower of Pita, Inc., a restaurant chain,will generate the following payoffs to investors next year:
Dividend Stock Price
Boom $5.00 $195Normal economy 2.00 100Recession 0 0
The company goes out of business if a recession hits. Calculate the expected rate of returnand standard deviation of return to Leaning Tower of Pita shareholders. Assume for sim-plicity that the three possible states of the economy are equally likely. The stock is sellingtoday for $90.
15. Portfolio Risk. Who would view the stock of Leaning Tower of Pita (see problem 14) as arisk-reducing investment—the owner of a gambling casino or a successful bankruptcylawyer? Explain.
16. Scenario Analysis. The common stock of Escapist Films sells for $25 a share and offers thefollowing payoffs next year:
Dividend Stock Price
Boom 0 $18Normal economy $1.00 26Recession 3.00 34
Calculate the expected return and standard deviation of Escapist. All three scenarios areequally likely. Then calculate the expected return and standard deviation of a portfolio half
PracticeProblems
Introduction to Risk, Return, and the Opportunity Cost of Capital 337
invested in Escapist and half in Leaning Tower of Pita (from problem 14). Show that theportfolio standard deviation is lower than either stock’s. Explain why this happens.
17. Scenario Analysis. Consider the following scenario analysis:
Rate of Return
Scenario Probability Stocks Bonds
Recession .20 –5% +14%Normal economy .60 +15 +8Boom .20 +25 +4
a. Is it reasonable to assume that Treasury bonds will provide higher returns in recessionsthan in booms?
b. Calculate the expected rate of return and standard deviation for each investment.c. Which investment would you prefer?
18. Portfolio Analysis. Use the data in the previous problem and consider a portfolio withweights of .60 in stocks and .40 in bonds.
a. What is the rate of return on the portfolio in each scenario?b. What is the expected rate of return and standard deviation of the portfolio?c. Would you prefer to invest in the portfolio, in stocks only, or in bonds only?
19. Risk Premium. If the stock market return in 2004 turns out to be –20 percent, what willhappen to our estimate of the “normal” risk premium? Does this make sense?
20. Diversification. In which of the following situations would you get the largest reduction inrisk by spreading your portfolio across two stocks?
a. The stock returns vary with each other.b. The stock returns are independent.c. The stock returns vary against each other.
21. Market Risk. Which firms of each pair would you expect to have greater market risk:
a. General Steel or General Food Supplies.b. Club Med or General Cinemas.
22. Risk and Return. A stock will provide a rate of return of either –20 percent or +30 percent.
a. If both possibilities are equally likely, calculate the expected return and standard deviation.b. If Treasury bills yield 5 percent, and investors believe that the stock offers a satisfactory
expected return, what must the market risk of the stock be?
23. Unique versus Market Risk. Sassafras Oil is staking all its remaining capital on wildcat ex-ploration off the Côte d’Huile. There is a 10 percent chance of discovering a field with re-serves of 50 million barrels. If it finds oil, it will immediately sell the reserves to Big Oil,at a price depending on the state of the economy. Thus the possible payoffs are as follows:
Value of Reserves, Value of Reserves, Value of per Barrel 50 Million Barrels Dryholes
Boom $4.00 $200,000,000 0Normal economy $5.00 $250,000,000 0Recession $6.00 $300,000,000 0
Is Sassafras Oil a risky investment for a diversified investor in the stock market—compared,say, to the stock of Leaning Tower of Pita, described in problem 14? Explain.
338 SECTION THREE
1 The bond price at the end of the year is $1,050. Therefore, the capital gain on each bond is$1,050 – 1,020 = $30. Your dollar return is the sum of the income from the bond, $80, plusthe capital gain, $30, or $110. The rate of return is
Income plus capital gain = 80 + 30 = .108, or 10.8%Original price 1,020
Real rate of return is
1 + nominal return – 1 = 1.108 – 1 = .065, or 6.5%1 + inflation rate 1.04
2 The risk premium on stocks is the average return in excess of Treasury bills. This was 14.7– 5.2 = 9.5%. The maturity premium is the average return on Treasury bonds minus the re-turn on Treasury bills. It was 6.4 – 5.2 = 1.2%.
3 Rate of Return Deviation Squared Deviation
+70% +60% 3,600+10 0 0+10 0 0–50 –60 3,600
Variance = average of squared deviations = 7,200/4 = 1,800Standard deviation = square root of variance = √1,800 = 42.4, or about 42%
4 The standard deviation should decrease because there is now a lower probability of the moreextreme outcomes. The expected rate of return on the auto stock is now
[.3 × (–8%)] + [.4 × 5%] + [.3 × 18%] = 5%
The variance is
[.3 × (–8 – 5)2] + [.4 × (5 – 5)2] + [.3 × (18 – 5)2] = 101.4
The standard deviation is √101.4 = 10.07 percent, which is lower than the value assumingequal probabilities of each scenario.
5 The gold mining stock’s returns are more highly correlated with the silver mining companythan with a car company. As a result, the automotive firm will offer a greater diversificationbenefit. The power of diversification is lowest when rates of return are highly correlated,performing well or poorly in tandem. Shifting the portfolio from one such firm to anotherhas little impact on overall risk.
6 The success of this project depends on the experiment. Success does not depend on the per-formance of the overall economy. The experiment creates a diversifiable risk. A portfolio ofmany stocks will embody “bets” on many such unique risks. Some bets will work out andsome will fail. Because the outcomes of these risks do not depend on common factors, suchas the overall state of the economy, the risks will tend to cancel out in a well-diversifiedportfolio.
7 a. The luxury restaurant will be more sensitive to the state of the economy because expenseaccount meals will be curtailed in a recession. Burger Queen meals should be relativelyrecession-proof.
b. The paint company that sells to the auto producers will be more sensitive to the state ofthe economy. In a downturn, auto sales fall dramatically as consumers stretch the lives oftheir cars. In contrast, in a recession, more people “do it themselves,” which makes paintsales through small stores more stable and less sensitive to the economy.
Solutions toSelf-TestQuestions
Net Present Value and OtherInvestment Criteria
Using Discounted Cash-FlowAnalysis to Make InvestmentDecisions
Risk, Return, and Capital Budgeting
The Cost of Capital
Section 4
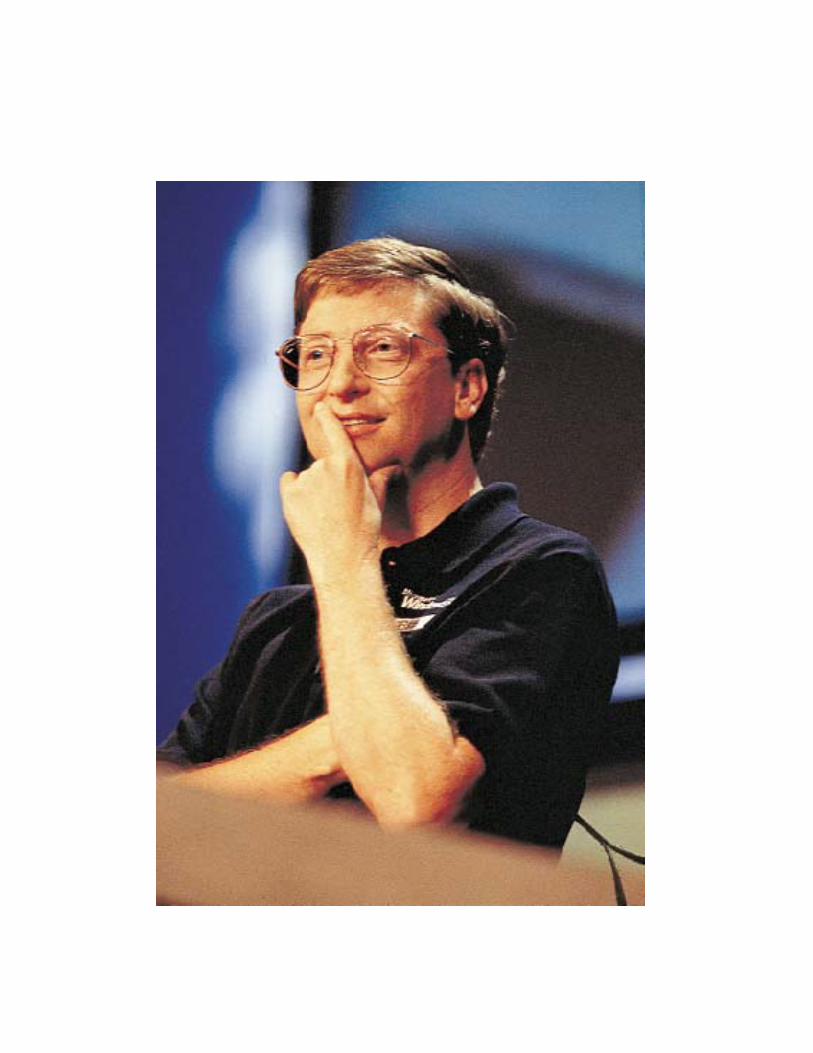
341
NET PRESENT VALUE AND OTHER INVESTMENTCRITERIA
Net Present ValueA Comment on Risk and Present Value
Valuing Long-Lived Projects
Other Investment CriteriaInternal Rate of Return
A Closer Look at the Rate of ReturnRule
Calculating the Rate of Return forLong-Lived Projects
A Word of Caution
Payback
Book Rate of Return
Investment Criteria WhenProjects InteractMutually Exclusive Projects
Investment Timing
Long- versus Short-Lived Equipment
Replacing an Old Machine
Mutually Exclusive Projects and the IRRRule
Other Pitfalls of the IRR Rule
Capital RationingSoft Rationing
Hard Rationing
Pitfalls of the Profitability Index
Summary
A positive NPV always inspires confidence.This man is not worrying about the payback period or the book rate of return.© Jim Levitt/Impact Visuals
he investment decision, also known as capital budgeting, is central to the
success of the company. We have already seen that capital investments
sometimes absorb substantial amounts of cash; they also have very long-
term consequences. The assets you buy today may determine the business
you are in many years hence.
For some investment projects “substantial” is an understatement. Consider the fol-
lowing examples:
� Construction of the Channel Tunnel linking England and France cost about $15 bil-
lion from 1986 to 1994.
� The cost of bringing one new prescription drug to market was estimated to be at least
$300 million.
� The development cost of Ford’s “world car,” the Mondeo, was about $6 billion.
� Production and merchandising costs for three new Star Wars movies will amount to
about $3 billion.
� The future development cost of a super-jumbo jet airliner, seating 600 to 800 pas-
sengers, has been estimated at over $10 billion.
� TAPS, The Alaska Pipeline System, which brings crude oil from Prudhoe Bay to
Valdez on the southern coast of Alaska, cost $9 billion.
Notice from these examples of big capital projects that many projects require heavy
investment in intangible assets. The costs of drug development are almost all research
and testing, for example, and much of the development of Ford’s Mondeo went into de-
sign and testing. Any expenditure made in the hope of generating more cash later can
be called a capital investment project, regardless of whether the cash outlay goes to tan-
gible or intangible assets.
A company’s shareholders prefer to be rich rather than poor. Therefore, they want the
firm to invest in every project that is worth more than it costs. The difference between
a project’s value and its cost is termed the net present value. Companies can best help
their shareholders by investing in projects with a positive net present value.
We start this material by showing how to calculate the net present value of a simple
investment project. We also examine other criteria that companies sometimes consider
when evaluating investments, such as the project’s payback period or book rate of re-
turn. We will see that these are little better than rules of thumb. Although there is a place
for rules of thumb in this world, an engineer needs something more accurate when de-
signing a 100-story building, and a financial manager needs more than a rule of thumb
when making a substantial capital investment decision.
Instead of calculating a project’s net present value, companies sometimes compare
the expected rate of return from investing in a project with the return that shareholders
could earn on equivalent-risk investments in the capital market. Companies accept only
those projects that provide a higher return than shareholders could earn for themselves.
342
T
Net Present Value and Other Investment Criteria 343
This rate of return rule generally gives the same answers as the net present value rule
but, as we shall see, it has some pitfalls.
We then turn to more complex issues such as project interactions. These occur when
a company is obliged to choose between two or more competing proposals; if it accepts
one proposal, it cannot take the other. For example, a company may need to choose be-
tween buying an expensive, durable machine or a cheap and short-lived one. We will
show how the net present value criterion can be used to make such choices.
Sometimes the firm may be forced to make choices because it does not have enough
money to take on every project that it would like. We will explain how to maximize
shareholder wealth when capital is rationed. It turns out that the solution is to pick the
projects that have the highest net present value per dollar invested. This measure is
known as the profitability index.
After studying this material you should be able to
� Calculate the net present value of an investment.
� Calculate the internal rate of return of a project and know what to look out for when
using the internal rate of return rule.
� Explain why the payback rule and book rate of return rule don’t always make share-
holders better off.
� Use the net present value rule to analyze three common problems that involve com-
peting projects: (a) when to postpone an investment expenditure, (b) how to choose
between projects with equal lives, and (c) when to replace equipment.
� Calculate the profitability index and use it to choose between projects when funds
are limited.
Net Present ValueEarlier you learned how to discount future cash payments to find their present value.We now apply these ideas to evaluate a simple investment proposal.
Suppose that you are in the real estate business. You are considering construction ofan office block. The land would cost $50,000 and construction would cost a further$300,000. You foresee a shortage of office space and predict that a year from now youwill be able to sell the building for $400,000. Thus you would be investing $350,000now in the expectation of realizing $400,000 at the end of the year. You should go aheadif the present value of the $400,000 payoff is greater than the investment of $350,000.
Assume for the moment that the $400,000 payoff is a sure thing. The office buildingis not the only way to obtain $400,000 a year from now. You could invest in a 1-yearU.S. Treasury bill. Suppose the T-bill offers interest of 7 percent. How much would youhave to invest in it in order to receive $400,000 at the end of the year? That’s easy: youwould have to invest
344 SECTION FOUR
$400,000 × 1= $400,000 × .935 = $373,832
1.07
Therefore, at an interest rate of 7 percent, the present value of the $400,000 payoff fromthe office building is $373,832.
Let’s assume that as soon as you have purchased the land and laid out the money forconstruction, you decide to cash in on your project. How much could you sell it for?Since the property will be worth $400,000 in a year, investors would be willing to payat most $373,832 for it now. That’s all it would cost them to get the same $400,000 pay-off by investing in a government security. Of course you could always sell your prop-erty for less, but why sell for less than the market will bear?
The $373,832 present value is the only price that satisfies both buyer and seller. Ingeneral, the present value is the only feasible price, and the present value of the prop-erty is also its market price or market value.
To calculate present value, we discounted the expected future payoff by the rate ofreturn offered by comparable investment alternatives. The discount rate—7 percent inour example—is often known as the opportunity cost of capital. It is called the op-portunity cost because it is the return that is being given up by investing in the project.
The building is worth $373,832, but this does not mean that you are $373,832 betteroff. You committed $350,000, and therefore your net present value (NPV) is $23,832.Net present value is found by subtracting the required initial investment from the pres-ent value of the project cash flows:
NPV = PV – required investment
= $373,832 – $350,000 = $23,832
In other words, your office development is worth more than it costs—it makes a netcontribution to value.
A COMMENT ON RISK AND PRESENT VALUE
In our discussion of the office development we assumed we knew the value of the com-pleted project. Of course, you will never be certain about the future values of officebuildings. The $400,000 represents the best forecast, but it is not a sure thing.
Therefore, our initial conclusion about how much investors would pay for the build-ing is wrong. Since they could achieve $400,000 risklessly by investing in $373,832worth of U.S. Treasury bills, they would not buy your building for that amount. Youwould have to cut your asking price to attract investors’ interest.
Here we can invoke a basic financial principle:
Most investors avoid risk when they can do so without sacrificing return. However, theconcepts of present value and the opportunity cost of capital still apply to risky invest-ments. It is still proper to discount the payoff by the rate of return offered by a compa-rable investment. But we have to think of expected payoffs and the expected rates of re-
A risky dollar is worth less than a safe one.
The net present value rule states that managers increase shareholders’ wealthby accepting all projects that are worth more than they cost. Therefore, theyshould accept all projects with a positive net present value.
OPPORTUNITY COSTOF CAPITAL Expectedrate of return given up byinvesting in a project.
NET PRESENT VALUE(NPV) Present value ofcash flows minus initialinvestment.
Net Present Value and Other Investment Criteria 345
turn on other investments.Not all investments are equally risky. The office development is riskier than a Trea-
sury bill, but is probably less risky than investing in a start-up biotech company. Sup-pose you believe the office development is as risky as an investment in the stock mar-ket and that you forecast a 12 percent rate of return for stock market investments. Then12 percent would be the appropriate opportunity cost of capital. That is what you aregiving up by not investing in comparable securities. You can now recompute NPV:
PV = $400,000 × 1= $400,000 × .893 = $357,143
1.12
NPV = PV – $350,000 = $7,143
If other investors agree with your forecast of a $400,000 payoff and with your assess-ment of a 12 percent opportunity cost of capital, then the property ought to be worth$357,143 once construction is under way. If you tried to sell for more than that, therewould be no takers, because the property would then offer a lower expected rate of re-turn than the 12 percent available in the stock market. The office building still makes anet contribution to value, but it is much smaller than our earlier calculations indicated.
� Self-Test 1 What is the office development’s NPV if construction costs increase to $355,000? As-sume the opportunity cost of capital is 12 percent. Is the development still a worthwhileinvestment? How high can development costs be before the project is no longer attrac-tive? Now suppose that the opportunity cost of capital is 20 percent with constructioncosts of $355,000. Why is the office development no longer an attractive investment?
VALUING LONG-LIVED PROJECTS
The net present value rule works for projects of any length. For example, suppose thatyou have identified a possible tenant who would be prepared to rent your office blockfor 3 years at a fixed annual rent of $16,000. You forecast that after you have collectedthe third year’s rent the building could be sold for $450,000. Thus the cash flow in thefirst year is C1 = $16,000, in the second year it is C2 = $16,000, and in the third year itis C3 = $466,000. For simplicity, we will again assume that these cash flows are certainand that the opportunity cost of capital is r = 7 percent.
Figure 4.1 shows a time line of these cash flows and their present values. To find thepresent values, we discount the future cash flows at the 7 percent opportunity cost ofcapital:
PV =C1 +
C2 +C3
1 + r (1 + r)2 (1 + r)3
=$16,000
+$16,000
+$466,000
= $409,3231.07 (1.07)2 (1.07)3
The net present value of the revised project is NPV = $409,323 – $350,000 = $59,323.Constructing the office block and renting it for 3 years makes a greater addition to yourwealth than selling the office block at the end of the first year.
Of course, rather than subtracting the initial investment from the project’s presentvalue, you could calculate NPV directly, as in the following equation, where C0 denotesthe initial cash outflow required to build the office block. (Notice that C0 is negative,reflecting the fact that it is a cash outflow.)
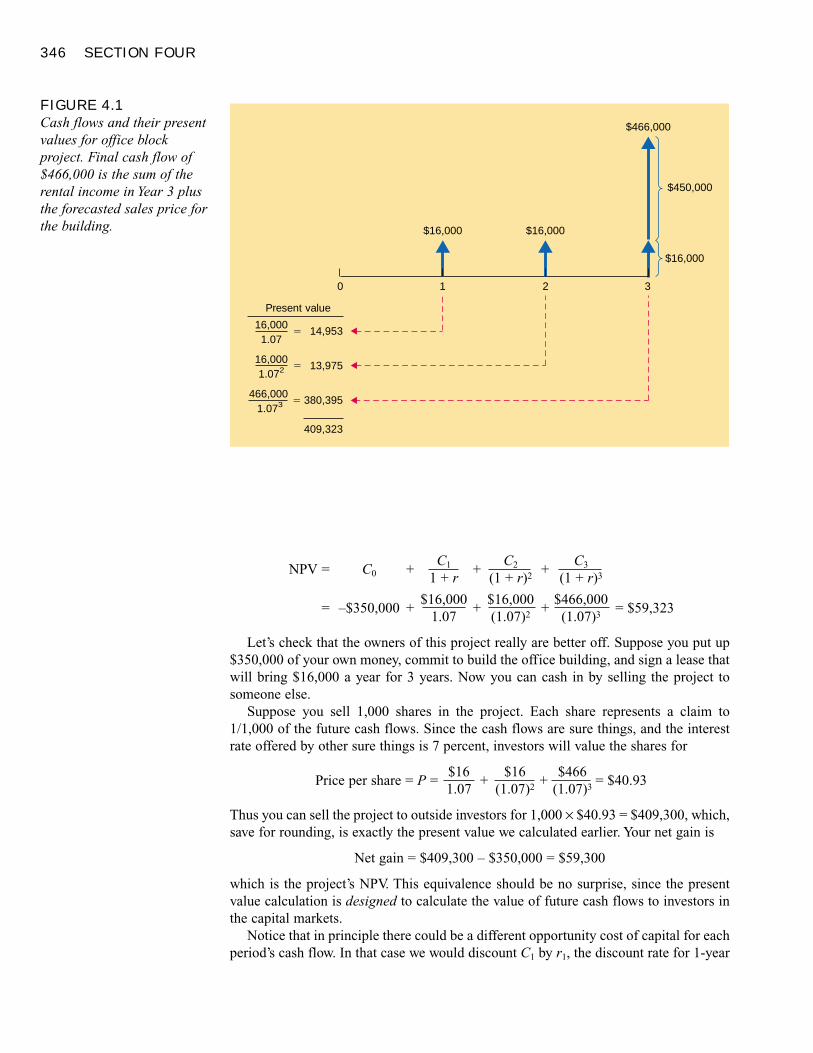
346 SECTION FOUR
NPV = C0 +C1 +
C2 +C3
1 + r (1 + r)2 (1 + r)3
= –$350,000 +$16,000
+$16,000
+$466,000
= $59,3231.07 (1.07)2 (1.07)3
Let’s check that the owners of this project really are better off. Suppose you put up$350,000 of your own money, commit to build the office building, and sign a lease thatwill bring $16,000 a year for 3 years. Now you can cash in by selling the project tosomeone else.
Suppose you sell 1,000 shares in the project. Each share represents a claim to1/1,000 of the future cash flows. Since the cash flows are sure things, and the interestrate offered by other sure things is 7 percent, investors will value the shares for
Price per share = P =$16
+$16
+$466
= $40.931.07 (1.07)2 (1.07)3
Thus you can sell the project to outside investors for 1,000 × $40.93 = $409,300, which,save for rounding, is exactly the present value we calculated earlier. Your net gain is
Net gain = $409,300 – $350,000 = $59,300
which is the project’s NPV. This equivalence should be no surprise, since the presentvalue calculation is designed to calculate the value of future cash flows to investors inthe capital markets.
Notice that in principle there could be a different opportunity cost of capital for eachperiod’s cash flow. In that case we would discount C1 by r1, the discount rate for 1-year
FIGURE 4.1Cash flows and their presentvalues for office blockproject. Final cash flow of$466,000 is the sum of therental income in Year 3 plusthe forecasted sales price forthe building.
0
� 13,975
Present value
409,323
1.07216,000
� 14,9531.07
16,000
� 380,3951.073
466,000
2 31
$450,000
$16,000
$16,000 $16,000
$466,000
Net Present Value and Other Investment Criteria 347
cash flows; C2 would be discounted by r2; and so on. Here we assume that the cost ofcapital is the same regardless of the date of the cash flow. We do this for one reasononly—simplicity. But we are in good company: with only rare exceptions firms decideon an appropriate discount rate and then use it to discount all project cash flows.
� EXAMPLE 1 Valuing a New Computer System
Obsolete Technologies is considering the purchase of a new computer system to helphandle its warehouse inventories. The system costs $50,000, is expected to last 4 years,and should reduce the cost of managing inventories by $22,000 a year. The opportunitycost of capital is 10 percent. Should Obsolete go ahead?
Don’t be put off by the fact that the computer system does not generate any sales. Ifthe expected cost savings are realized, the company’s cash flows will be $22,000 a yearhigher as a result of buying the computer. Thus we can say that the computer increasescash flows by $22,000 a year for each of 4 years. To calculate present value, you candiscount each of these cash flows by 10 percent. However, it is smarter to recognize thatthe cash flows are level and therefore you can use the annuity formula to calculate thepresent value:
PV = cash flow × annuity factor = $22,000 × [ 1–
1 ].10 .10(1.10)4
= $22,000 × 3.170 = $69,740
The net present value is
NPV = –$50,000 + $69,740 = $19,740
The project has a positive NPV of $19,740. Undertaking it would increase the value ofthe firm by that amount.
The first two steps in calculating NPVs—forecasting the cash flows and estimatingthe opportunity cost of capital—are tricky, and we will have a lot more to say aboutthem in later material. But once you have assembled the data, the calculation of presentvalue and net present value should be routine. Here is another example.
� EXAMPLE 2 Calculating Eurotunnel’s NPV
One of the world’s largest commercial investment projects was construction of theChannel Tunnel by the Anglo-French company Eurotunnel. Here is a chance to putyourself in the shoes of Eurotunnel’s financial manager and find out whether the proj-ect looked like a good deal for shareholders. The figures in the column headed cashflow in Table 4.1 are based on the forecasts of construction costs and revenues that thecompany provided to investors in 1986.
The Channel Tunnel project was not a safe investment. Indeed the prospectus to theChannel Tunnel share issue cautioned investors that the project “involves significantrisk and should be regarded at this stage as speculative. If for any reason the Project isabandoned or Eurotunnel is unable to raise the necessary finance, it is likely that equityinvestors will lose some or all of their money.”
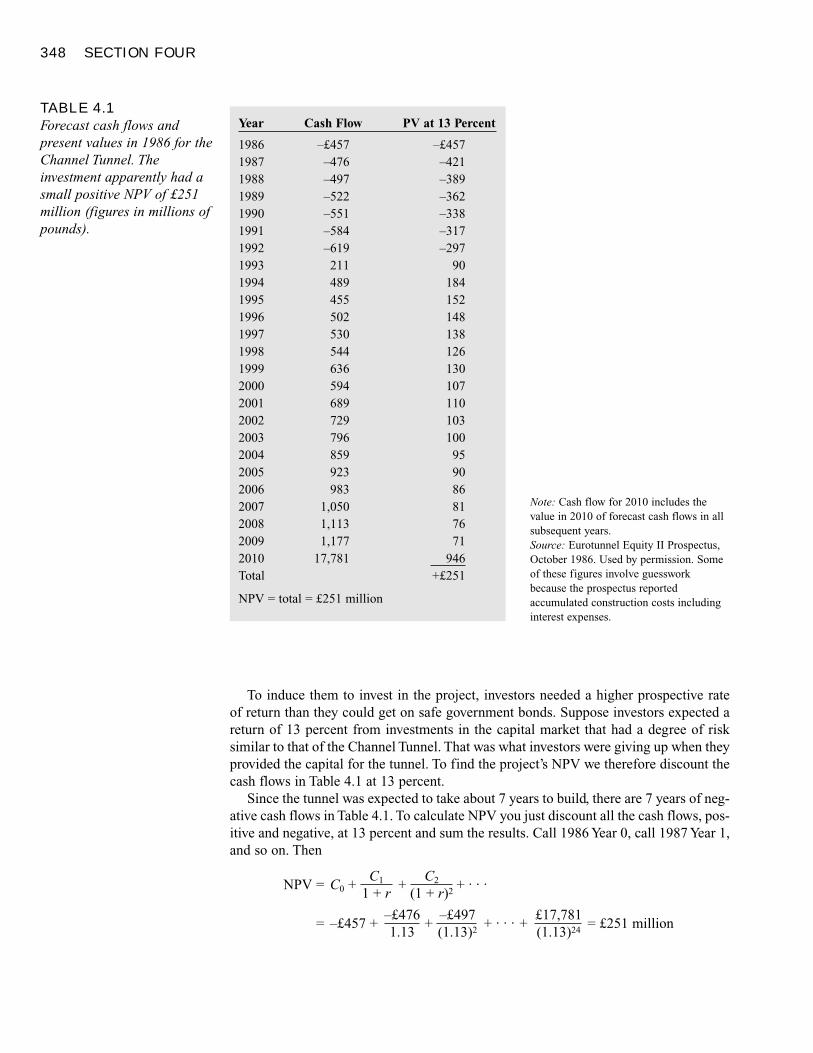
348 SECTION FOUR
To induce them to invest in the project, investors needed a higher prospective rate of return than they could get on safe government bonds. Suppose investors expected areturn of 13 percent from investments in the capital market that had a degree of risksimilar to that of the Channel Tunnel. That was what investors were giving up when theyprovided the capital for the tunnel. To find the project’s NPV we therefore discount thecash flows in Table 4.1 at 13 percent.
Since the tunnel was expected to take about 7 years to build, there are 7 years of neg-ative cash flows in Table 4.1. To calculate NPV you just discount all the cash flows, pos-itive and negative, at 13 percent and sum the results. Call 1986 Year 0, call 1987 Year 1,and so on. Then
NPV = C0 +C1 +
C2 + . . .1 + r (1 + r)2
= –£457 +–£476
+–£497
+ . . . +£17,781
= £251 million1.13 (1.13)2 (1.13)24
TABLE 4.1Forecast cash flows andpresent values in 1986 for theChannel Tunnel. Theinvestment apparently had asmall positive NPV of £251million (figures in millions ofpounds).
Year Cash Flow PV at 13 Percent
1986 –£457 –£4571987 –476 –4211988 –497 –3891989 –522 –3621990 –551 –3381991 –584 –3171992 –619 –2971993 211 901994 489 1841995 455 1521996 502 1481997 530 1381998 544 1261999 636 1302000 594 1072001 689 1102002 729 1032003 796 1002004 859 952005 923 902006 983 862007 1,050 812008 1,113 762009 1,177 712010 17,781 946Total +£251
NPV = total = £251 million
Note: Cash flow for 2010 includes thevalue in 2010 of forecast cash flows in allsubsequent years.Source: Eurotunnel Equity II Prospectus,October 1986. Used by permission. Someof these figures involve guessworkbecause the prospectus reportedaccumulated construction costs includinginterest expenses.
Net Present Value and Other Investment Criteria 349
Net present value of the forecast cash flows is £251 million, making the tunnel a worth-while project, though not by a wide margin, considering the planned investment ofnearly £4 billion.
Of course, NPV calculations are only as good as the underlying cash-flow forecasts.The well-known Pentagon Law of Large Projects states that anything big takes longerand costs more than you’re originally led to believe. As the law predicted, the tunnelproved much more expensive to build than anticipated in 1986, and the opening was de-layed by more than a year. Revenues also have been below forecast, and Eurotunnel hasnot even generated enough profits to pay the interest on its debt. Thus with hindsight,the tunnel was a negative-NPV venture.
Other Investment CriteriaUse of the net present value rule as a criterion for accepting or rejecting investmentprojects will maximize the value of the firm’s shares. However, other criteria are some-times also considered by firms when evaluating investment opportunities. Some ofthese rules are liable to give wrong answers; others simply need to be used with care.In this section, we introduce three of these alternative investment criteria: internal rateof return, payback period, and book rate of return.
INTERNAL RATE OF RETURN
Instead of calculating a project’s net present value, companies often prefer to askwhether the project’s return is higher or lower than the opportunity cost of capital. Forexample, think back to the original proposal to build the office block. You planned to invest $350,000 to get back a cash flow of C1 = $400,000 in 1 year. Therefore, youforecasted a profit on the venture of $400,000 – $350,000 = $50,000, and a rate of return of
Rate of return =profit
=C1 – investment
=$400,000 – $350,000
investment investment $350,000
= .1429, or about 14.3%
The alternative of investing in a U.S. Treasury bill would provide a return of only 7 percent. Thus the return on your office building is higher than the opportunity cost ofcapital.1
This suggests two rules for deciding whether to go ahead with an investment proj-ect:
1. The NPV rule. Invest in any project that has a positive NPV when its cash flows arediscounted at the opportunity cost of capital.
2. The rate of return rule. Invest in any project offering a rate of return that is higherthan the opportunity cost of capital.
1 Recall that we are assuming the profit on the office building is risk-free. Therefore, the opportunity cost ofcapital is the rate of return on other risk-free investments.
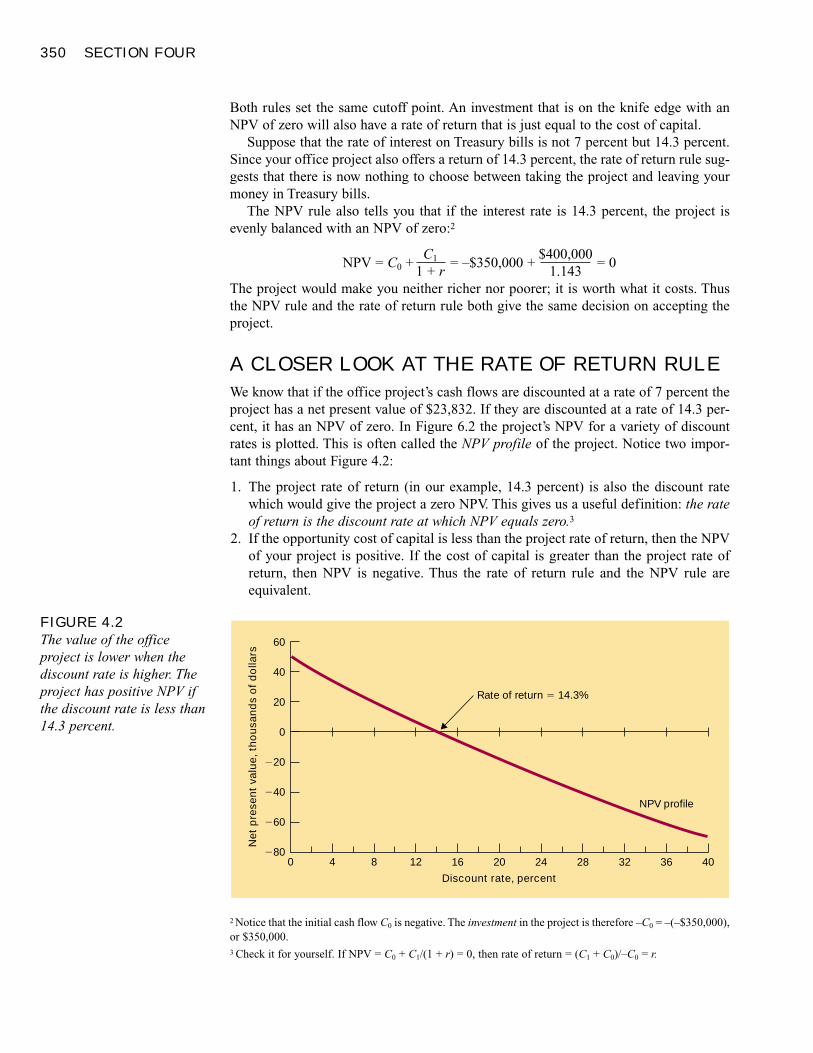
350 SECTION FOUR
Both rules set the same cutoff point. An investment that is on the knife edge with anNPV of zero will also have a rate of return that is just equal to the cost of capital.
Suppose that the rate of interest on Treasury bills is not 7 percent but 14.3 percent.Since your office project also offers a return of 14.3 percent, the rate of return rule sug-gests that there is now nothing to choose between taking the project and leaving yourmoney in Treasury bills.
The NPV rule also tells you that if the interest rate is 14.3 percent, the project isevenly balanced with an NPV of zero:2
NPV = C0 +C1 = –$350,000 +
$400,000= 0
1 + r 1.143The project would make you neither richer nor poorer; it is worth what it costs. Thusthe NPV rule and the rate of return rule both give the same decision on accepting theproject.
A CLOSER LOOK AT THE RATE OF RETURN RULE
We know that if the office project’s cash flows are discounted at a rate of 7 percent theproject has a net present value of $23,832. If they are discounted at a rate of 14.3 per-cent, it has an NPV of zero. In Figure 6.2 the project’s NPV for a variety of discountrates is plotted. This is often called the NPV profile of the project. Notice two impor-tant things about Figure 4.2:
1. The project rate of return (in our example, 14.3 percent) is also the discount ratewhich would give the project a zero NPV. This gives us a useful definition: the rateof return is the discount rate at which NPV equals zero.3
2. If the opportunity cost of capital is less than the project rate of return, then the NPVof your project is positive. If the cost of capital is greater than the project rate of return, then NPV is negative. Thus the rate of return rule and the NPV rule are equivalent.
2 Notice that the initial cash flow C0 is negative. The investment in the project is therefore –C0 = –(–$350,000),or $350,000.3 Check it for yourself. If NPV = C0 + C1/(1 + r) = 0, then rate of return = (C1 + C0)/–C0 = r.
FIGURE 4.2The value of the officeproject is lower when thediscount rate is higher. Theproject has positive NPV ifthe discount rate is less than14.3 percent.
Net
pre
sent
val
ue, t
hous
ands
of d
olla
rs
Discount rate, percent
�80
�60
�40
�20
0
20
40
60
120 4 8 2016
Rate of return � 14.3%
NPV profile
24 32 3628 40
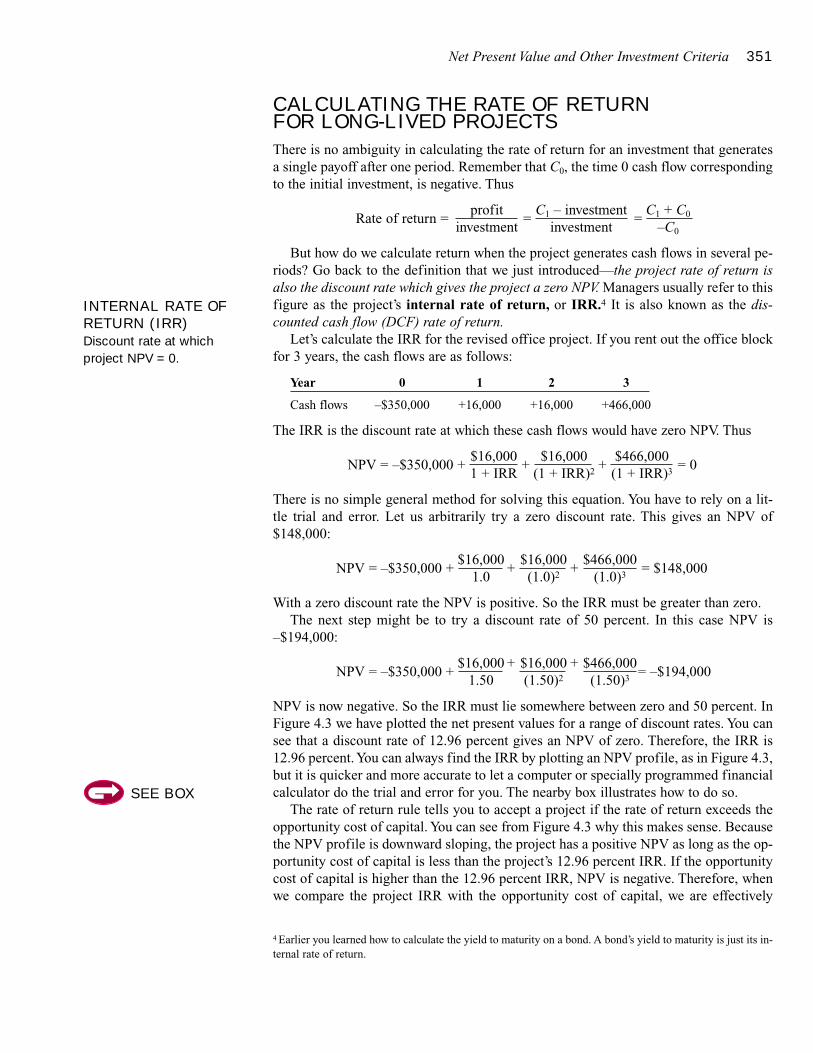
Net Present Value and Other Investment Criteria 351
CALCULATING THE RATE OF RETURN FOR LONG-LIVED PROJECTS
There is no ambiguity in calculating the rate of return for an investment that generatesa single payoff after one period. Remember that C0, the time 0 cash flow correspondingto the initial investment, is negative. Thus
Rate of return =profit
=C1 – investment
=C1 + C0
investment investment –C0
But how do we calculate return when the project generates cash flows in several pe-riods? Go back to the definition that we just introduced—the project rate of return isalso the discount rate which gives the project a zero NPV. Managers usually refer to thisfigure as the project’s internal rate of return, or IRR.4 It is also known as the dis-counted cash flow (DCF) rate of return.
Let’s calculate the IRR for the revised office project. If you rent out the office blockfor 3 years, the cash flows are as follows:
Year 0 1 2 3
Cash flows –$350,000 +16,000 +16,000 +466,000
The IRR is the discount rate at which these cash flows would have zero NPV. Thus
NPV = –$350,000 +$16,000
+$16,000
+$466,000
= 01 + IRR (1 + IRR)2 (1 + IRR)3
There is no simple general method for solving this equation. You have to rely on a lit-tle trial and error. Let us arbitrarily try a zero discount rate. This gives an NPV of$148,000:
NPV = –$350,000 +$16,000
+$16,000
+$466,000
= $148,0001.0 (1.0)2 (1.0)3
With a zero discount rate the NPV is positive. So the IRR must be greater than zero.The next step might be to try a discount rate of 50 percent. In this case NPV is
–$194,000:
NPV = –$350,000 +$16,000 + $16,000 + $466,000
= –$194,0001.50 (1.50)2 (1.50)3
NPV is now negative. So the IRR must lie somewhere between zero and 50 percent. InFigure 4.3 we have plotted the net present values for a range of discount rates. You cansee that a discount rate of 12.96 percent gives an NPV of zero. Therefore, the IRR is12.96 percent. You can always find the IRR by plotting an NPV profile, as in Figure 4.3,but it is quicker and more accurate to let a computer or specially programmed financialcalculator do the trial and error for you. The nearby box illustrates how to do so.
The rate of return rule tells you to accept a project if the rate of return exceeds theopportunity cost of capital. You can see from Figure 4.3 why this makes sense. Becausethe NPV profile is downward sloping, the project has a positive NPV as long as the op-portunity cost of capital is less than the project’s 12.96 percent IRR. If the opportunitycost of capital is higher than the 12.96 percent IRR, NPV is negative. Therefore, whenwe compare the project IRR with the opportunity cost of capital, we are effectively
4 Earlier you learned how to calculate the yield to maturity on a bond. A bond’s yield to maturity is just its in-ternal rate of return.
SEE BOX
INTERNAL RATE OFRETURN (IRR)Discount rate at whichproject NPV = 0.
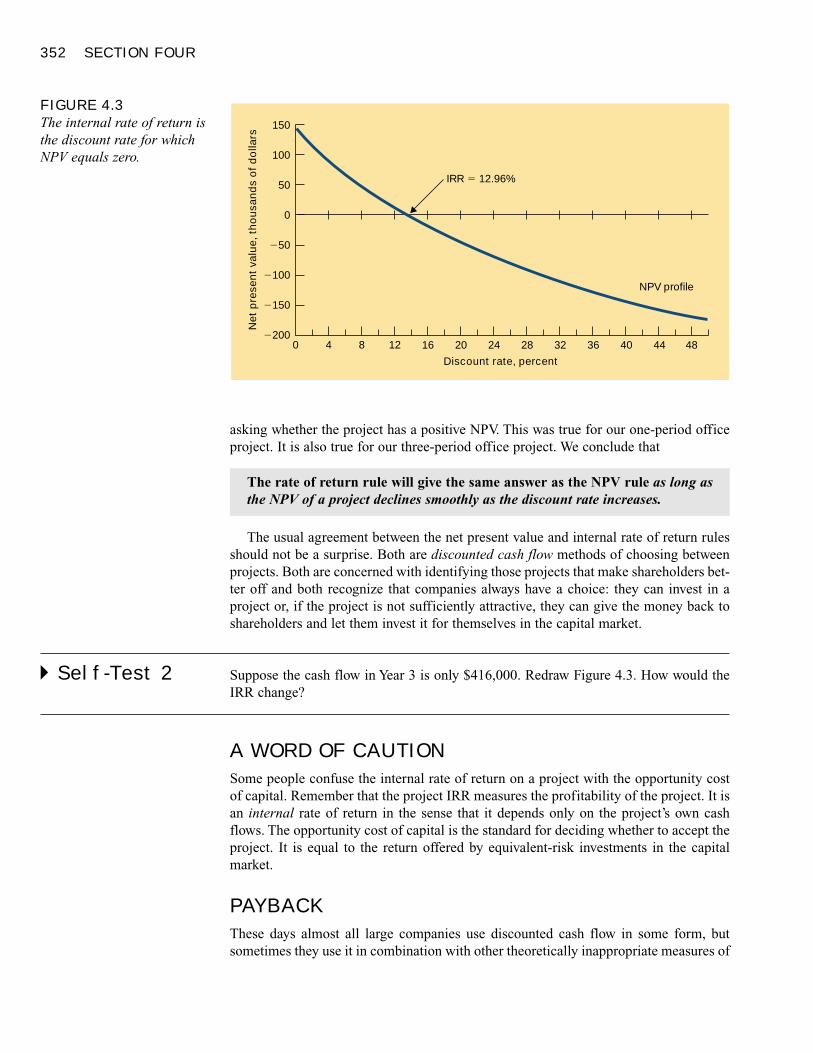
352 SECTION FOUR
asking whether the project has a positive NPV. This was true for our one-period officeproject. It is also true for our three-period office project. We conclude that
The usual agreement between the net present value and internal rate of return rulesshould not be a surprise. Both are discounted cash flow methods of choosing betweenprojects. Both are concerned with identifying those projects that make shareholders bet-ter off and both recognize that companies always have a choice: they can invest in aproject or, if the project is not sufficiently attractive, they can give the money back toshareholders and let them invest it for themselves in the capital market.
� Self-Test 2 Suppose the cash flow in Year 3 is only $416,000. Redraw Figure 4.3. How would theIRR change?
A WORD OF CAUTION
Some people confuse the internal rate of return on a project with the opportunity costof capital. Remember that the project IRR measures the profitability of the project. It isan internal rate of return in the sense that it depends only on the project’s own cashflows. The opportunity cost of capital is the standard for deciding whether to accept theproject. It is equal to the return offered by equivalent-risk investments in the capitalmarket.
PAYBACK
These days almost all large companies use discounted cash flow in some form, butsometimes they use it in combination with other theoretically inappropriate measures of
The rate of return rule will give the same answer as the NPV rule as long asthe NPV of a project declines smoothly as the discount rate increases.
FIGURE 4.3The internal rate of return isthe discount rate for whichNPV equals zero.
Net
pre
sent
val
ue, t
hous
ands
of d
olla
rs
Discount rate, percent
�200
�150
�100
�50
0
50
100
150
120 4 8 2016 24 32 36 40 4428 48
IRR � 12.96%
NPV profile
performance. We next examine two of these measures, the payback period and the bookrate of return.
We suspect that you have often heard conversations that go something like this: “Awashing machine costs about $400. But we are currently spending $3 a week, or around$150 a year, at the laundromat. So the washing machine should pay for itself in less than3 years.” You have just encountered the payback rule.
A project’s payback period is the length of time before you recover your initial in-vestment. For the washing machine the payback period was just under 3 years. The pay-back rule states that a project should be accepted if its payback period is less than aspecified cutoff period. For example, if the cutoff period is 4 years, the washing ma-chine makes the grade; if the cutoff is 2 years, it doesn’t.
As a rough rule of thumb the payback rule may be adequate, but it is easy to see thatit can lead to nonsensical decisions. For example, compare projects A and B. Project A
353
FINANCIAL CALCULATOR
Using Financial Calculators to Find NPV and IRR
Earlierwe saw that the formulas for the present and fu-ture values of level annuities and one-time cash flowsare built into financial calculators. However, as the ex-ample of the office block illustrates, most investmentprojects entail multiple cash flows that cannot be ex-pected to remain level over time. Fortunately, many cal-culators are equipped to handle problems involving asequence of uneven cash flows. In general, the proce-dure is quite simple. You enter the cash flows one byone into the calculator, and then you press the IRR keyto find the project’s internal rate of return. The first cashflow you enter is interpreted as coming immediately, thenext cash flow is interpreted as coming at the end ofone period, and so on. We can illustrate using the officeblock as an example. To find the project IRR, you woulduse the following sequence of keystrokes:
To calculate project NPV, the procedure is similar.You need to enter the discount rate in addition to theproject cash flows, and then simply press the NPV key.Here is the specific sequence of keystrokes, assumingthat the opportunity cost of capital is 7 percent:
Hewlett-Packard Sharpe Texas InstrumentsHP-10B EL-733A BA II Plus
–350,000 –350,00016,000 16,00016,000 16,000 –350,000
466,000 466,000 16,0007 7 16,000
466,000
7CPT↓
ENTER
NPVNPV{NPV}
↓ENTER
↓ENTERiI/YR
↓ENTERCFiCFj
↓ENTERCFiCFj
{CLR Work}2ndCFiCFj
CFCFiCFj
Hewlett-Packard Sharpe Texas InstrumentsHP-10B EL-733A BA II Plus
–350,000 –350,00016,000 16,00016,000 16,000 –350,000
466,000 466,000 16,00016,000
466,000
CPT
IRRIRR{IRR/YR}
↓ENTER
↓ENTER
↓ENTERCFiCFj
↓ENTERCFiCFj
{CLR Work}2ndCFiCFj
CFCFiCFj
The calculator should display the value 12.96, theproject’s internal rate of return.
The calculator should display the value 59,323, theproject’s NPV when the discount rate is 7 percent.
By the way, you can check the accuracy of our ear-lier calculations using your calculator. Enter 50 percentfor the discount rate (press 50, then press i ) and thenpress the NPV key to find that NPV = – 194,148. Enter12.96 (the project’s IRR) as the discount rate and youwill find that NPV is just about zero (it is not exactlyzero, because we are rounding off the IRR to only twodecimal places).
PAYBACK PERIODTime until cash flows recoverthe initial investment of theproject.
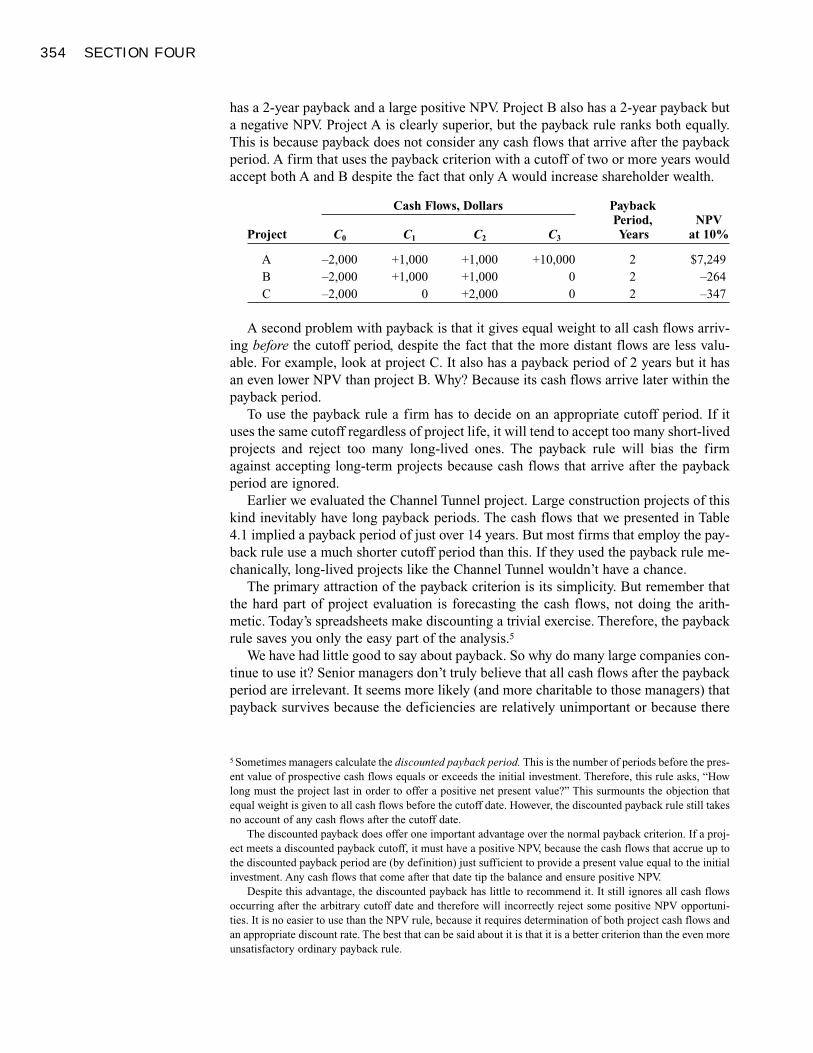
354 SECTION FOUR
has a 2-year payback and a large positive NPV. Project B also has a 2-year payback buta negative NPV. Project A is clearly superior, but the payback rule ranks both equally.This is because payback does not consider any cash flows that arrive after the paybackperiod. A firm that uses the payback criterion with a cutoff of two or more years wouldaccept both A and B despite the fact that only A would increase shareholder wealth.
Cash Flows, Dollars PaybackPeriod, NPV
Project C0 C1 C2 C3 Years at 10%
A –2,000 +1,000 +1,000 +10,000 2 $7,249B –2,000 +1,000 +1,000 0 2 –264C –2,000 0 +2,000 0 2 –347
A second problem with payback is that it gives equal weight to all cash flows arriv-ing before the cutoff period, despite the fact that the more distant flows are less valu-able. For example, look at project C. It also has a payback period of 2 years but it hasan even lower NPV than project B. Why? Because its cash flows arrive later within thepayback period.
To use the payback rule a firm has to decide on an appropriate cutoff period. If ituses the same cutoff regardless of project life, it will tend to accept too many short-livedprojects and reject too many long-lived ones. The payback rule will bias the firmagainst accepting long-term projects because cash flows that arrive after the paybackperiod are ignored.
Earlier we evaluated the Channel Tunnel project. Large construction projects of thiskind inevitably have long payback periods. The cash flows that we presented in Table4.1 implied a payback period of just over 14 years. But most firms that employ the pay-back rule use a much shorter cutoff period than this. If they used the payback rule me-chanically, long-lived projects like the Channel Tunnel wouldn’t have a chance.
The primary attraction of the payback criterion is its simplicity. But remember thatthe hard part of project evaluation is forecasting the cash flows, not doing the arith-metic. Today’s spreadsheets make discounting a trivial exercise. Therefore, the paybackrule saves you only the easy part of the analysis.5
We have had little good to say about payback. So why do many large companies con-tinue to use it? Senior managers don’t truly believe that all cash flows after the paybackperiod are irrelevant. It seems more likely (and more charitable to those managers) thatpayback survives because the deficiencies are relatively unimportant or because there
5 Sometimes managers calculate the discounted payback period. This is the number of periods before the pres-ent value of prospective cash flows equals or exceeds the initial investment. Therefore, this rule asks, “Howlong must the project last in order to offer a positive net present value?” This surmounts the objection thatequal weight is given to all cash flows before the cutoff date. However, the discounted payback rule still takesno account of any cash flows after the cutoff date.
The discounted payback does offer one important advantage over the normal payback criterion. If a proj-ect meets a discounted payback cutoff, it must have a positive NPV, because the cash flows that accrue up tothe discounted payback period are (by definition) just sufficient to provide a present value equal to the initialinvestment. Any cash flows that come after that date tip the balance and ensure positive NPV.
Despite this advantage, the discounted payback has little to recommend it. It still ignores all cash flowsoccurring after the arbitrary cutoff date and therefore will incorrectly reject some positive NPV opportuni-ties. It is no easier to use than the NPV rule, because it requires determination of both project cash flows andan appropriate discount rate. The best that can be said about it is that it is a better criterion than the even moreunsatisfactory ordinary payback rule.
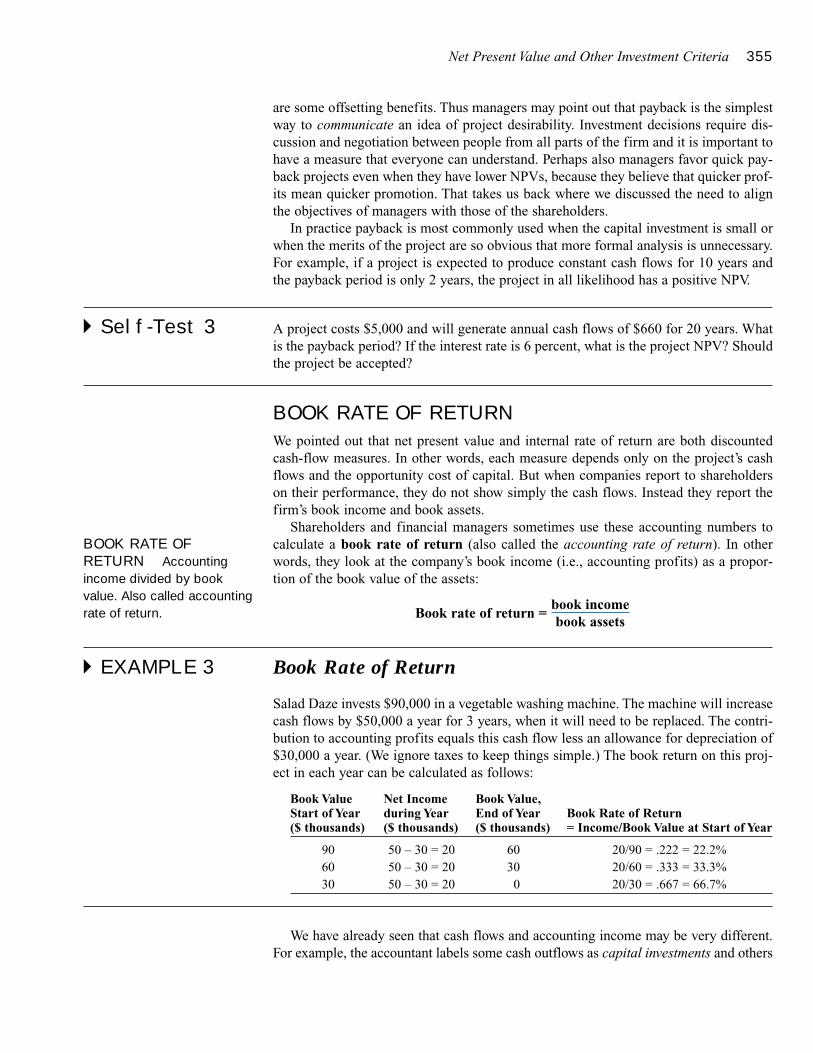
Net Present Value and Other Investment Criteria 355
are some offsetting benefits. Thus managers may point out that payback is the simplestway to communicate an idea of project desirability. Investment decisions require dis-cussion and negotiation between people from all parts of the firm and it is important tohave a measure that everyone can understand. Perhaps also managers favor quick pay-back projects even when they have lower NPVs, because they believe that quicker prof-its mean quicker promotion. That takes us back where we discussed the need to alignthe objectives of managers with those of the shareholders.
In practice payback is most commonly used when the capital investment is small orwhen the merits of the project are so obvious that more formal analysis is unnecessary.For example, if a project is expected to produce constant cash flows for 10 years andthe payback period is only 2 years, the project in all likelihood has a positive NPV.
� Self-Test 3 A project costs $5,000 and will generate annual cash flows of $660 for 20 years. Whatis the payback period? If the interest rate is 6 percent, what is the project NPV? Shouldthe project be accepted?
BOOK RATE OF RETURN
We pointed out that net present value and internal rate of return are both discountedcash-flow measures. In other words, each measure depends only on the project’s cashflows and the opportunity cost of capital. But when companies report to shareholderson their performance, they do not show simply the cash flows. Instead they report thefirm’s book income and book assets.
Shareholders and financial managers sometimes use these accounting numbers tocalculate a book rate of return (also called the accounting rate of return). In otherwords, they look at the company’s book income (i.e., accounting profits) as a propor-tion of the book value of the assets:
Book rate of return =book incomebook assets
� EXAMPLE 3 Book Rate of Return
Salad Daze invests $90,000 in a vegetable washing machine. The machine will increasecash flows by $50,000 a year for 3 years, when it will need to be replaced. The contri-bution to accounting profits equals this cash flow less an allowance for depreciation of$30,000 a year. (We ignore taxes to keep things simple.) The book return on this proj-ect in each year can be calculated as follows:
Book Value Net Income Book Value,Start of Year during Year End of Year Book Rate of Return($ thousands) ($ thousands) ($ thousands) = Income/Book Value at Start of Year
90 50 – 30 = 20 60 20/90 = .222 = 22.2%60 50 – 30 = 20 30 20/60 = .333 = 33.3%30 50 – 30 = 20 0 20/30 = .667 = 66.7%
We have already seen that cash flows and accounting income may be very different.For example, the accountant labels some cash outflows as capital investments and others
BOOK RATE OFRETURN Accountingincome divided by bookvalue. Also called accountingrate of return.
356 SECTION FOUR
as operating expenses. The operating expenses are deducted immediately from eachyear’s income, while the capital investment is depreciated over a number of years. Thusthe book rate of return depends on which items the accountant chooses to treat as capi-tal investments and how rapidly they are depreciated. Book rate of return is not gener-ally the same as the internal rate of return and, as you can see in Self-Test 6.4, the dif-ference between the two can be considerable. Book rate of return therefore can easilygive a misleading impression of the attractiveness of a project.
Managers seldom make investment decisions nowadays on the basis of accountingnumbers. But they know that the company’s shareholders pay considerable attention tobook measures of profitability and naturally, therefore, they look at how major projectswould affect the company’s book rate of return.
� Self-Test 4 Suppose that a company invests $60,000 in a project. The project generates a cash in-flow of $30,000 a year for each of 3 years and nothing thereafter. Book income in eachyear is equal to this cash flow less an allowance for depreciation of $20,000 a year. Forsimplicity, we assume there are no taxes.
a. Calculate the project’s internal rate of return. (If you do not have a financial calcu-lator or spreadsheet program, this will require a little trial and error.)
b. Now calculate the book rate of return in each year by dividing the book income forthat year by the book value of the assets at the start of the year.
Investment Criteria When Projects InteractLet’s pause for a moment to review. We have seen that the NPV rule is the most reliablecriterion for project evaluation. NPV is reliable because it measures the difference be-tween the cost of a project and the value of the project. That difference—the net pres-ent value—is the amount by which the project would increase the value of the firm.Other rules such as payback period or book return may be viewed at best as rough prox-ies for the attractiveness of a proposed project; because they are not based on value,they can easily lead to incorrect investment decisions. Of the alternatives to the NPVrule, IRR is clearly the best choice in that it usually results in the same accept-or-rejectdecision as the NPV rule, but like the alternatives, it does not quantify the contributionto firm value. We will see shortly this can cause problems when managers have tochoose among competing projects.
We are now ready to extend our discussion of investment criteria to encompass someof the issues encountered when managers must choose among projects that interact—that is, when acceptance of one project affects another one. The NPV rule can beadapted to these new problems with only a bit of extra effort. But unless you are care-ful, the IRR rule may lead you astray.
MUTUALLY EXCLUSIVE PROJECTS
Most of the projects we have considered so far involve take-it-or-leave-it decisions. Butalmost all real-world decisions about capital expenditures involve either–or choices.
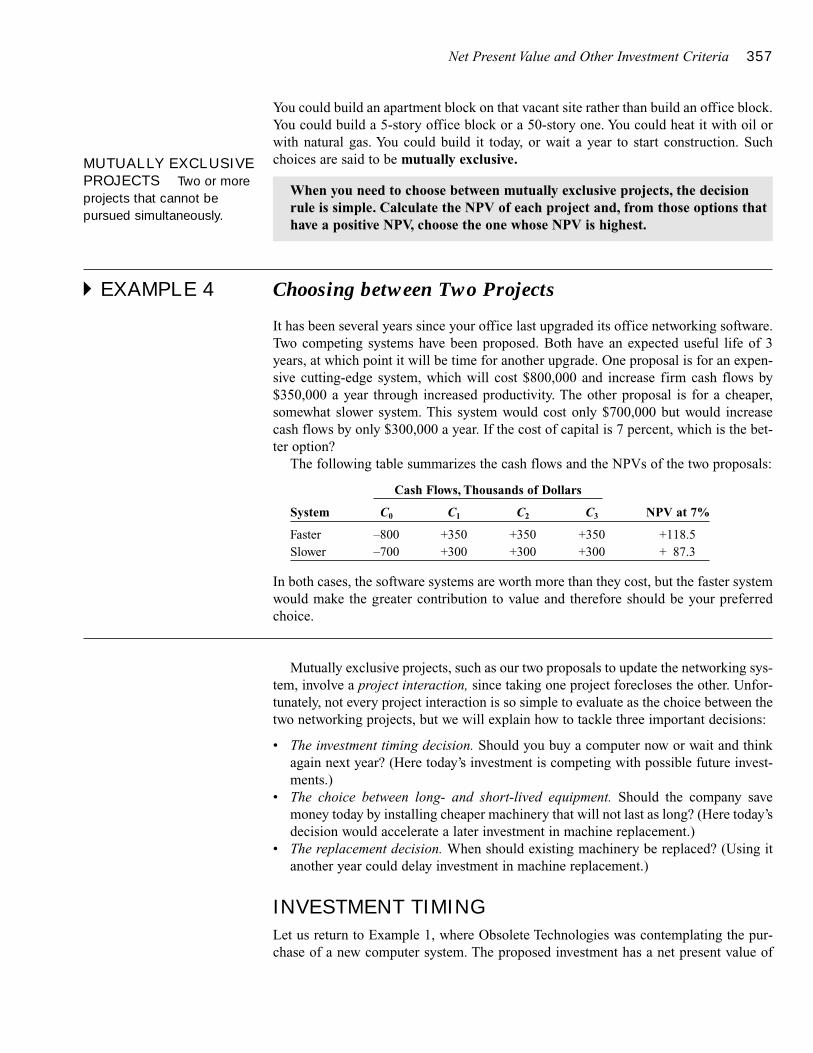
Net Present Value and Other Investment Criteria 357
You could build an apartment block on that vacant site rather than build an office block.You could build a 5-story office block or a 50-story one. You could heat it with oil orwith natural gas. You could build it today, or wait a year to start construction. Suchchoices are said to be mutually exclusive.
� EXAMPLE 4 Choosing between Two Projects
It has been several years since your office last upgraded its office networking software.Two competing systems have been proposed. Both have an expected useful life of 3years, at which point it will be time for another upgrade. One proposal is for an expen-sive cutting-edge system, which will cost $800,000 and increase firm cash flows by$350,000 a year through increased productivity. The other proposal is for a cheaper,somewhat slower system. This system would cost only $700,000 but would increasecash flows by only $300,000 a year. If the cost of capital is 7 percent, which is the bet-ter option?
The following table summarizes the cash flows and the NPVs of the two proposals:
Cash Flows, Thousands of Dollars
System C0 C1 C2 C3 NPV at 7%
Faster –800 +350 +350 +350 +118.5Slower –700 +300 +300 +300 + 87.3
In both cases, the software systems are worth more than they cost, but the faster systemwould make the greater contribution to value and therefore should be your preferredchoice.
Mutually exclusive projects, such as our two proposals to update the networking sys-tem, involve a project interaction, since taking one project forecloses the other. Unfor-tunately, not every project interaction is so simple to evaluate as the choice between thetwo networking projects, but we will explain how to tackle three important decisions:
• The investment timing decision. Should you buy a computer now or wait and thinkagain next year? (Here today’s investment is competing with possible future invest-ments.)
• The choice between long- and short-lived equipment. Should the company savemoney today by installing cheaper machinery that will not last as long? (Here today’sdecision would accelerate a later investment in machine replacement.)
• The replacement decision. When should existing machinery be replaced? (Using itanother year could delay investment in machine replacement.)
INVESTMENT TIMING
Let us return to Example 1, where Obsolete Technologies was contemplating the pur-chase of a new computer system. The proposed investment has a net present value of
When you need to choose between mutually exclusive projects, the decisionrule is simple. Calculate the NPV of each project and, from those options thathave a positive NPV, choose the one whose NPV is highest.
MUTUALLY EXCLUSIVEPROJECTS Two or moreprojects that cannot bepursued simultaneously.
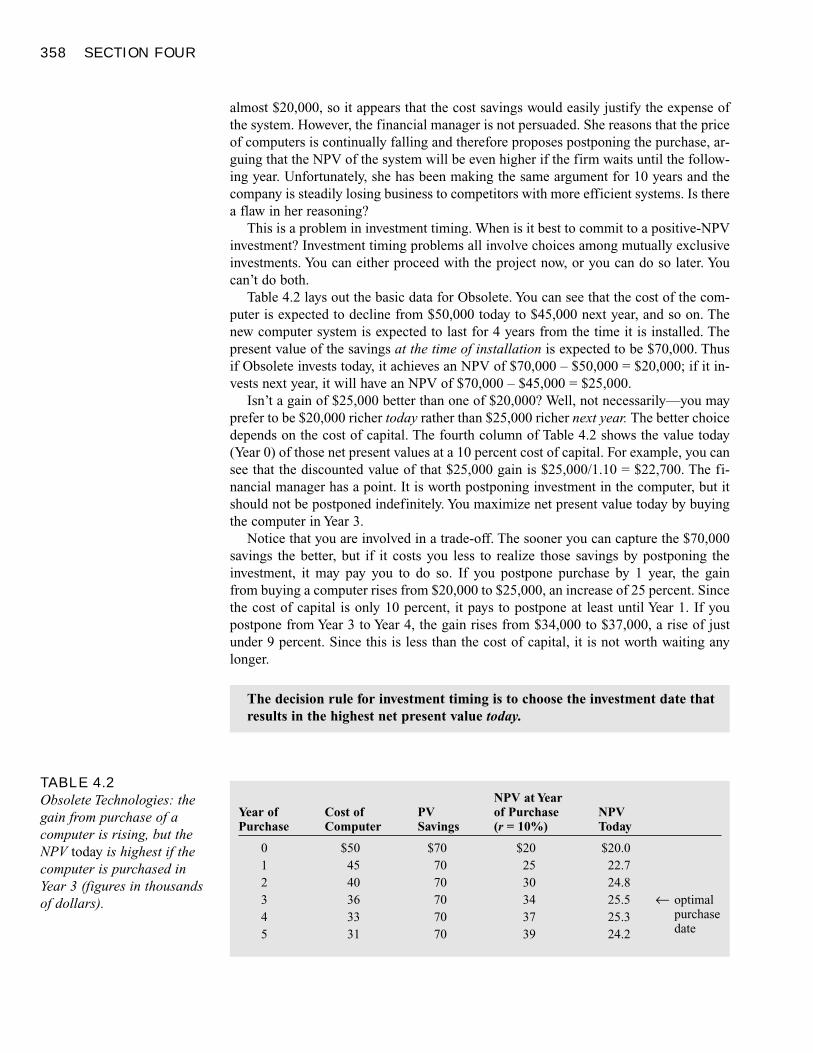
358 SECTION FOUR
almost $20,000, so it appears that the cost savings would easily justify the expense ofthe system. However, the financial manager is not persuaded. She reasons that the priceof computers is continually falling and therefore proposes postponing the purchase, ar-guing that the NPV of the system will be even higher if the firm waits until the follow-ing year. Unfortunately, she has been making the same argument for 10 years and thecompany is steadily losing business to competitors with more efficient systems. Is therea flaw in her reasoning?
This is a problem in investment timing. When is it best to commit to a positive-NPVinvestment? Investment timing problems all involve choices among mutually exclusiveinvestments. You can either proceed with the project now, or you can do so later. Youcan’t do both.
Table 4.2 lays out the basic data for Obsolete. You can see that the cost of the com-puter is expected to decline from $50,000 today to $45,000 next year, and so on. Thenew computer system is expected to last for 4 years from the time it is installed. Thepresent value of the savings at the time of installation is expected to be $70,000. Thusif Obsolete invests today, it achieves an NPV of $70,000 – $50,000 = $20,000; if it in-vests next year, it will have an NPV of $70,000 – $45,000 = $25,000.
Isn’t a gain of $25,000 better than one of $20,000? Well, not necessarily—you mayprefer to be $20,000 richer today rather than $25,000 richer next year. The better choicedepends on the cost of capital. The fourth column of Table 4.2 shows the value today(Year 0) of those net present values at a 10 percent cost of capital. For example, you cansee that the discounted value of that $25,000 gain is $25,000/1.10 = $22,700. The fi-nancial manager has a point. It is worth postponing investment in the computer, but itshould not be postponed indefinitely. You maximize net present value today by buyingthe computer in Year 3.
Notice that you are involved in a trade-off. The sooner you can capture the $70,000savings the better, but if it costs you less to realize those savings by postponing the investment, it may pay you to do so. If you postpone purchase by 1 year, the gain from buying a computer rises from $20,000 to $25,000, an increase of 25 percent. Sincethe cost of capital is only 10 percent, it pays to postpone at least until Year 1. If you postpone from Year 3 to Year 4, the gain rises from $34,000 to $37,000, a rise of justunder 9 percent. Since this is less than the cost of capital, it is not worth waiting anylonger.
The decision rule for investment timing is to choose the investment date thatresults in the highest net present value today.
TABLE 4.2Obsolete Technologies: thegain from purchase of acomputer is rising, but theNPV today is highest if thecomputer is purchased inYear 3 (figures in thousandsof dollars).
NPV at YearYear of Cost of PV of Purchase NPVPurchase Computer Savings (r = 10%) Today
0 $50 $70 $20 $20.01 45 70 25 22.72 40 70 30 24.83 36 70 34 25.5 ← optimal4 33 70 37 25.3 purchase
5 31 70 39 24.2 date
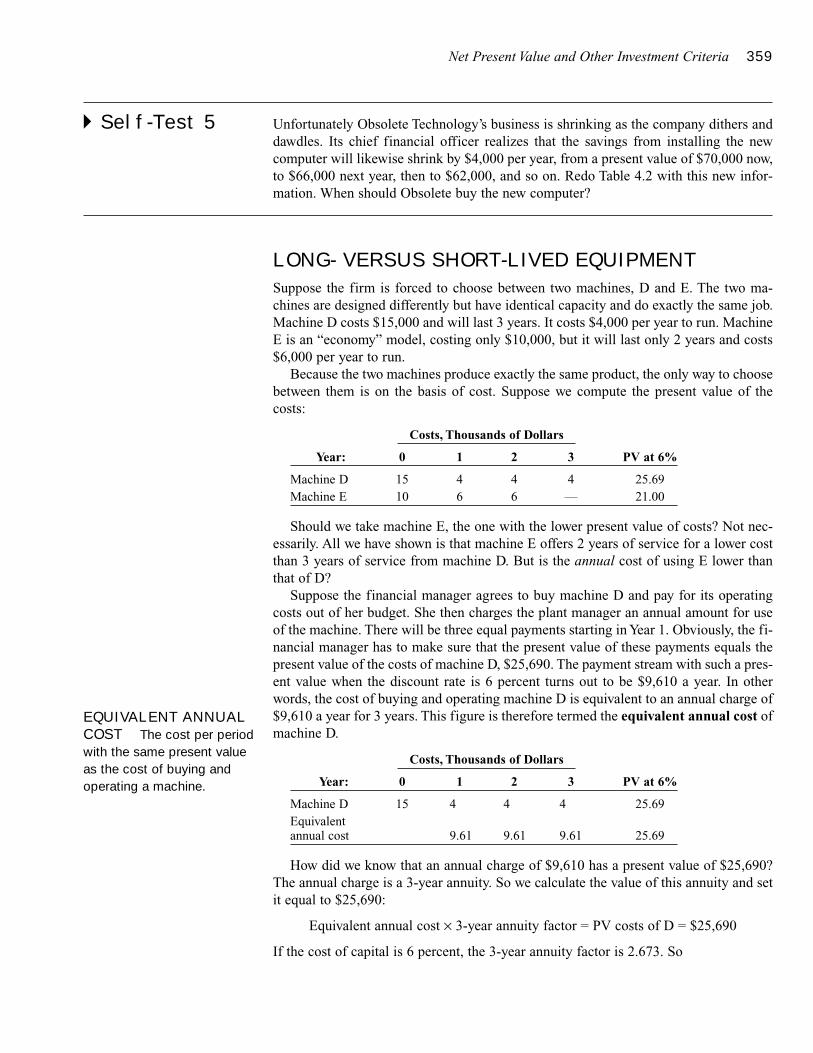
Net Present Value and Other Investment Criteria 359
� Self-Test 5 Unfortunately Obsolete Technology’s business is shrinking as the company dithers anddawdles. Its chief financial officer realizes that the savings from installing the newcomputer will likewise shrink by $4,000 per year, from a present value of $70,000 now,to $66,000 next year, then to $62,000, and so on. Redo Table 4.2 with this new infor-mation. When should Obsolete buy the new computer?
LONG- VERSUS SHORT-LIVED EQUIPMENT
Suppose the firm is forced to choose between two machines, D and E. The two ma-chines are designed differently but have identical capacity and do exactly the same job.Machine D costs $15,000 and will last 3 years. It costs $4,000 per year to run. MachineE is an “economy” model, costing only $10,000, but it will last only 2 years and costs$6,000 per year to run.
Because the two machines produce exactly the same product, the only way to choosebetween them is on the basis of cost. Suppose we compute the present value of thecosts:
Costs, Thousands of Dollars
Year: 0 1 2 3 PV at 6%
Machine D 15 4 4 4 25.69Machine E 10 6 6 — 21.00
Should we take machine E, the one with the lower present value of costs? Not nec-essarily. All we have shown is that machine E offers 2 years of service for a lower costthan 3 years of service from machine D. But is the annual cost of using E lower thanthat of D?
Suppose the financial manager agrees to buy machine D and pay for its operatingcosts out of her budget. She then charges the plant manager an annual amount for useof the machine. There will be three equal payments starting in Year 1. Obviously, the fi-nancial manager has to make sure that the present value of these payments equals thepresent value of the costs of machine D, $25,690. The payment stream with such a pres-ent value when the discount rate is 6 percent turns out to be $9,610 a year. In otherwords, the cost of buying and operating machine D is equivalent to an annual charge of$9,610 a year for 3 years. This figure is therefore termed the equivalent annual cost ofmachine D.
Costs, Thousands of Dollars
Year: 0 1 2 3 PV at 6%
Machine D 15 4 4 4 25.69Equivalentannual cost 9.61 9.61 9.61 25.69
How did we know that an annual charge of $9,610 has a present value of $25,690?The annual charge is a 3-year annuity. So we calculate the value of this annuity and setit equal to $25,690:
Equivalent annual cost × 3-year annuity factor = PV costs of D = $25,690
If the cost of capital is 6 percent, the 3-year annuity factor is 2.673. So
EQUIVALENT ANNUALCOST The cost per periodwith the same present valueas the cost of buying andoperating a machine.
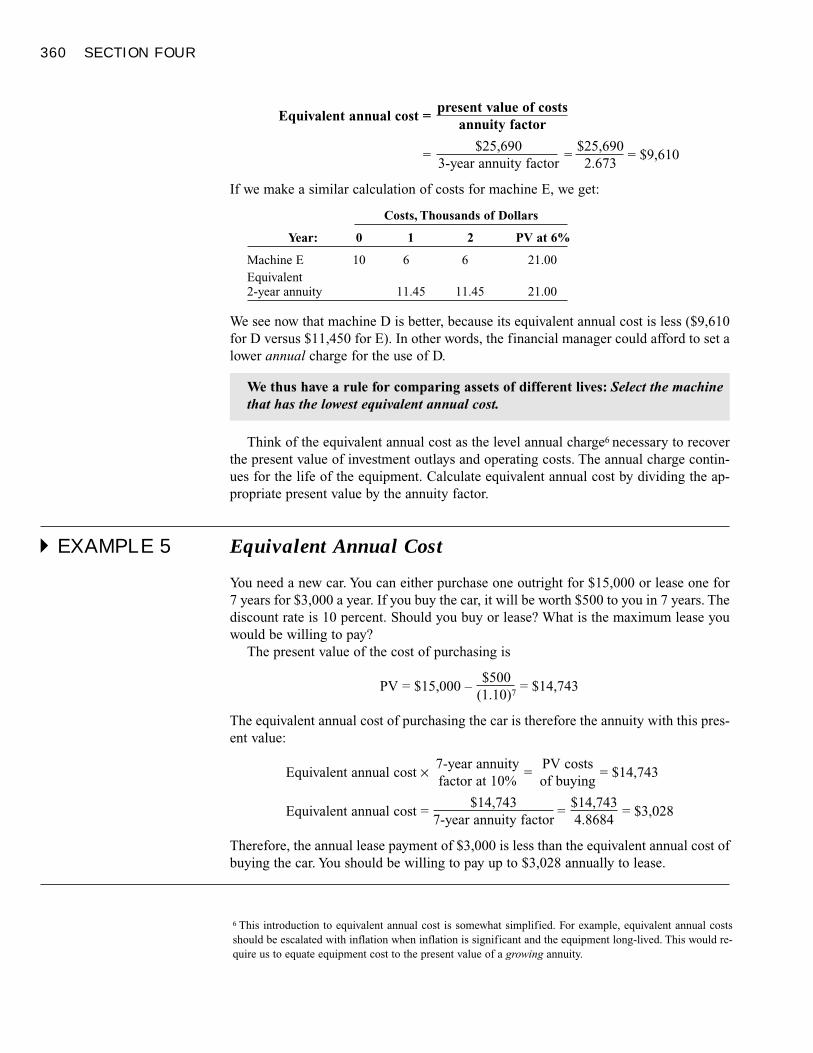
360 SECTION FOUR
Equivalent annual cost =present value of costs
annuity factor
=$25,690
=$25,690
= $9,6103-year annuity factor 2.673
If we make a similar calculation of costs for machine E, we get:
Costs, Thousands of Dollars
Year: 0 1 2 PV at 6%
Machine E 10 6 6 21.00Equivalent2-year annuity 11.45 11.45 21.00
We see now that machine D is better, because its equivalent annual cost is less ($9,610for D versus $11,450 for E). In other words, the financial manager could afford to set alower annual charge for the use of D.
Think of the equivalent annual cost as the level annual charge6 necessary to recoverthe present value of investment outlays and operating costs. The annual charge contin-ues for the life of the equipment. Calculate equivalent annual cost by dividing the ap-propriate present value by the annuity factor.
� EXAMPLE 5 Equivalent Annual Cost
You need a new car. You can either purchase one outright for $15,000 or lease one for7 years for $3,000 a year. If you buy the car, it will be worth $500 to you in 7 years. Thediscount rate is 10 percent. Should you buy or lease? What is the maximum lease youwould be willing to pay?
The present value of the cost of purchasing is
PV = $15,000 –$500
= $14,743(1.10)7
The equivalent annual cost of purchasing the car is therefore the annuity with this pres-ent value:
Equivalent annual cost × 7-year annuity=
PV costs= $14,743
factor at 10% of buying
Equivalent annual cost = $14,743
=$14,743
= $3,0287-year annuity factor 4.8684
Therefore, the annual lease payment of $3,000 is less than the equivalent annual cost ofbuying the car. You should be willing to pay up to $3,028 annually to lease.
We thus have a rule for comparing assets of different lives: Select the machinethat has the lowest equivalent annual cost.
6 This introduction to equivalent annual cost is somewhat simplified. For example, equivalent annual costsshould be escalated with inflation when inflation is significant and the equipment long-lived. This would re-quire us to equate equipment cost to the present value of a growing annuity.
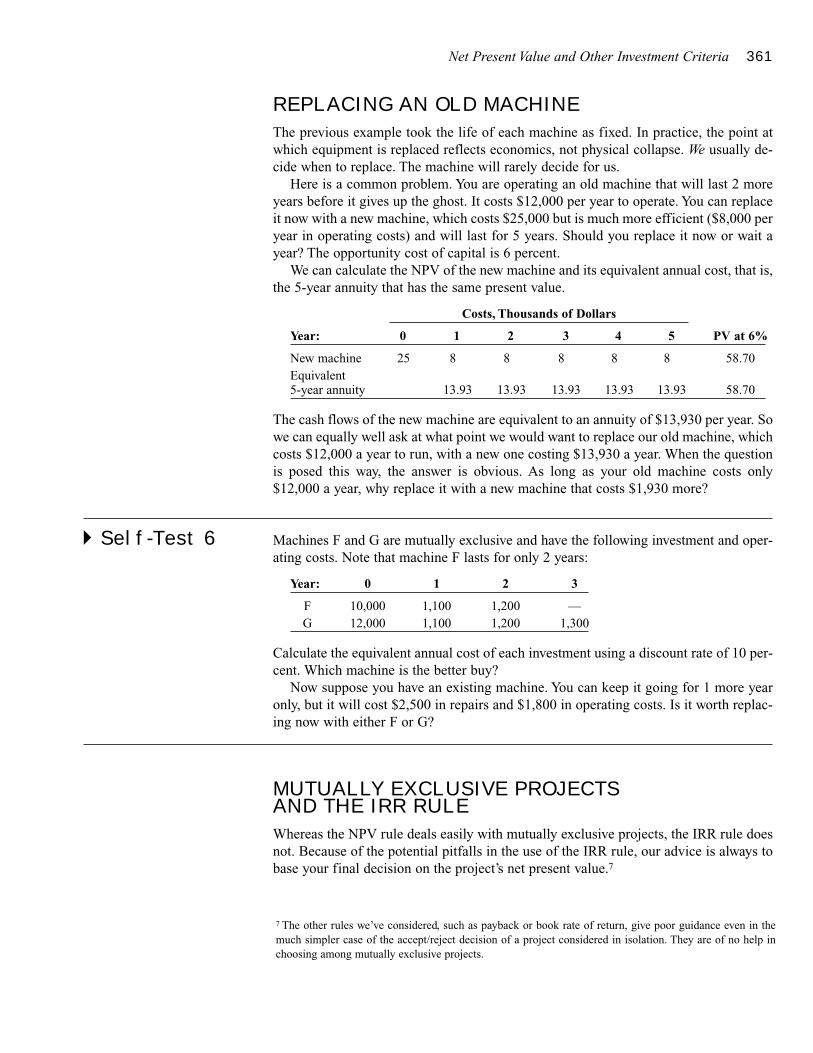
Net Present Value and Other Investment Criteria 361
REPLACING AN OLD MACHINE
The previous example took the life of each machine as fixed. In practice, the point atwhich equipment is replaced reflects economics, not physical collapse. We usually de-cide when to replace. The machine will rarely decide for us.
Here is a common problem. You are operating an old machine that will last 2 moreyears before it gives up the ghost. It costs $12,000 per year to operate. You can replaceit now with a new machine, which costs $25,000 but is much more efficient ($8,000 peryear in operating costs) and will last for 5 years. Should you replace it now or wait ayear? The opportunity cost of capital is 6 percent.
We can calculate the NPV of the new machine and its equivalent annual cost, that is,the 5-year annuity that has the same present value.
Costs, Thousands of Dollars
Year: 0 1 2 3 4 5 PV at 6%
New machine 25 8 8 8 8 8 58.70Equivalent5-year annuity 13.93 13.93 13.93 13.93 13.93 58.70
The cash flows of the new machine are equivalent to an annuity of $13,930 per year. Sowe can equally well ask at what point we would want to replace our old machine, whichcosts $12,000 a year to run, with a new one costing $13,930 a year. When the questionis posed this way, the answer is obvious. As long as your old machine costs only$12,000 a year, why replace it with a new machine that costs $1,930 more?
� Self-Test 6 Machines F and G are mutually exclusive and have the following investment and oper-ating costs. Note that machine F lasts for only 2 years:
Year: 0 1 2 3
F 10,000 1,100 1,200 —G 12,000 1,100 1,200 1,300
Calculate the equivalent annual cost of each investment using a discount rate of 10 per-cent. Which machine is the better buy?
Now suppose you have an existing machine. You can keep it going for 1 more yearonly, but it will cost $2,500 in repairs and $1,800 in operating costs. Is it worth replac-ing now with either F or G?
MUTUALLY EXCLUSIVE PROJECTS AND THE IRR RULE
Whereas the NPV rule deals easily with mutually exclusive projects, the IRR rule doesnot. Because of the potential pitfalls in the use of the IRR rule, our advice is always tobase your final decision on the project’s net present value.7
7 The other rules we’ve considered, such as payback or book rate of return, give poor guidance even in themuch simpler case of the accept/reject decision of a project considered in isolation. They are of no help inchoosing among mutually exclusive projects.
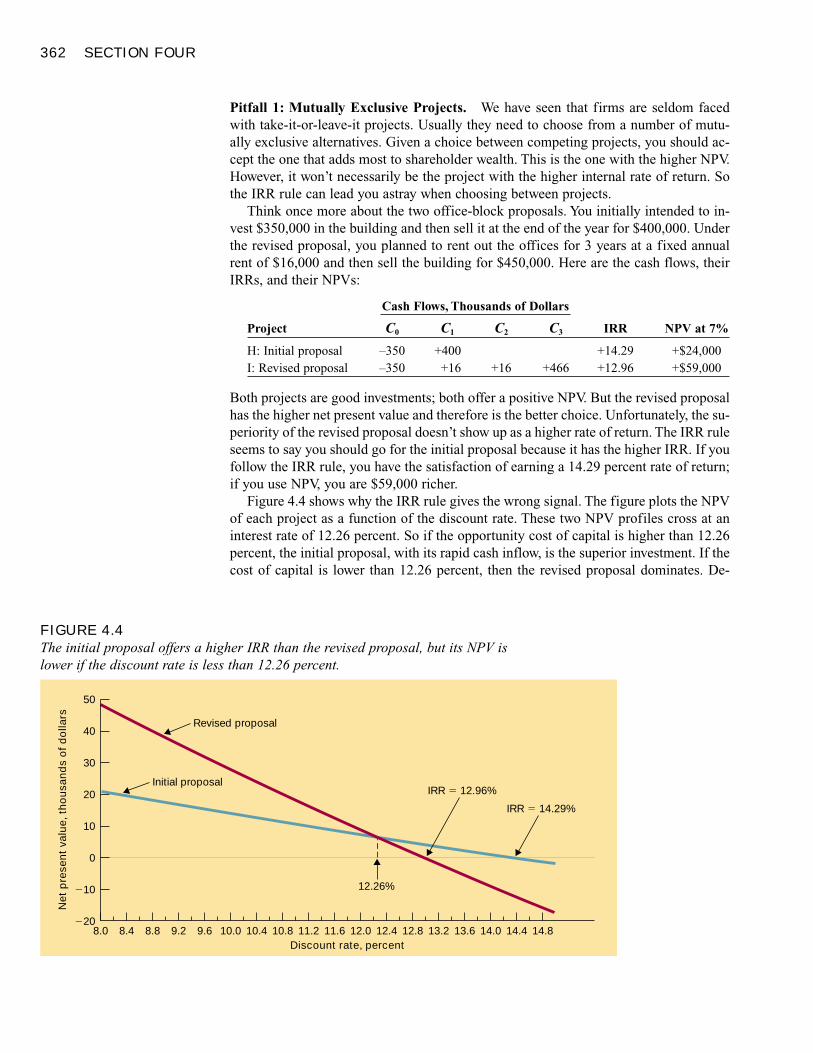
362 SECTION FOUR
Pitfall 1: Mutually Exclusive Projects. We have seen that firms are seldom facedwith take-it-or-leave-it projects. Usually they need to choose from a number of mutu-ally exclusive alternatives. Given a choice between competing projects, you should ac-cept the one that adds most to shareholder wealth. This is the one with the higher NPV.However, it won’t necessarily be the project with the higher internal rate of return. Sothe IRR rule can lead you astray when choosing between projects.
Think once more about the two office-block proposals. You initially intended to in-vest $350,000 in the building and then sell it at the end of the year for $400,000. Underthe revised proposal, you planned to rent out the offices for 3 years at a fixed annualrent of $16,000 and then sell the building for $450,000. Here are the cash flows, theirIRRs, and their NPVs:
Cash Flows, Thousands of Dollars
Project C0 C1 C2 C3 IRR NPV at 7%
H: Initial proposal –350 +400 +14.29 +$24,000I: Revised proposal –350 +16 +16 +466 +12.96 +$59,000
Both projects are good investments; both offer a positive NPV. But the revised proposalhas the higher net present value and therefore is the better choice. Unfortunately, the su-periority of the revised proposal doesn’t show up as a higher rate of return. The IRR ruleseems to say you should go for the initial proposal because it has the higher IRR. If youfollow the IRR rule, you have the satisfaction of earning a 14.29 percent rate of return;if you use NPV, you are $59,000 richer.
Figure 4.4 shows why the IRR rule gives the wrong signal. The figure plots the NPVof each project as a function of the discount rate. These two NPV profiles cross at aninterest rate of 12.26 percent. So if the opportunity cost of capital is higher than 12.26percent, the initial proposal, with its rapid cash inflow, is the superior investment. If thecost of capital is lower than 12.26 percent, then the revised proposal dominates. De-
FIGURE 4.4The initial proposal offers a higher IRR than the revised proposal, but its NPV islower if the discount rate is less than 12.26 percent.
Net
pre
sent
val
ue, t
hous
ands
of d
olla
rs
8.0 8.4 8.8 9.2 9.6 10.0 10.4 10.8 11.2 11.6 12.0 12.4
12.26%
12.8 13.2 13.6 14.0 14.4
Initial proposal
Discount rate, percent
50
40
30
20
10
0
�10
�20
Revised proposal
IRR � 12.96%
14.8
IRR � 14.29%
Net Present Value and Other Investment Criteria 363
pending on the discount rate, either proposal may be superior. For the 7 percent cost ofcapital that we have assumed, the revised proposal is the better choice.
Now consider the IRR of each proposal. The IRR is simply the discount rate at whichNPV equals zero, that is, the discount rate at which the NPV profile crosses the hori-zontal axis in Figure 4.4. As noted, these rates are 14.29 percent for the initial proposaland 12.96 percent for the revised proposal. However, as you can see from Figure 4.4,the higher IRR for the initial proposal does not mean that it has a higher NPV.
In our example both projects involved the same outlay, but the revised proposal hadthe longer life. The IRR rule mistakenly favored the quick payback project with the highpercentage return but the lower NPV.
� Self-Test 7 A rich, friendly, and probably slightly unbalanced benefactor offers you the opportunityto invest $1 million in two mutually exclusive ways. The payoffs are:
a. $2 million after 1 year, a 100 percent return.b. $300,000 a year forever.
Neither investment is risky, and safe securities are yielding 7.5 percent. Which invest-ment will you take? You can’t take both, so the choices are mutually exclusive. Do youwant to earn a high percentage return or do you want to be rich? By the way, if you re-ally had this investment opportunity, you’d have no trouble borrowing the money to un-dertake it.
Pitfall 1a: Mutually Exclusive Projects Involving Different Outlays. A similarmisranking also may occur when comparing projects with the same lives but differentoutlays. In this case the IRR may mistakenly favor small projects with high rates of re-turn but low NPVs.
� Self-Test 8 Your wacky benefactor now offers you the choice of two opportunities:
a. Invest $1,000 today and quadruple your money—a 300 percent return—in 1 yearwith no risk.
b. Invest $1 million for 1 year at a guaranteed 50 percent return.
Which will you take? Do you want to earn a wonderful rate of return (300 percent) ordo you want to be rich?
OTHER PITFALLS OF THE IRR RULE
The IRR rule is subject to problems beyond those associated with mutually exclusiveinvestments. Here are a few more pitfalls to avoid.
Remember, a high IRR is not an end in itself. You want projects that increasethe value of the firm. Projects that earn a good rate of return for a long timeoften have higher NPVs than those that offer high percentage rates of returnbut die young.
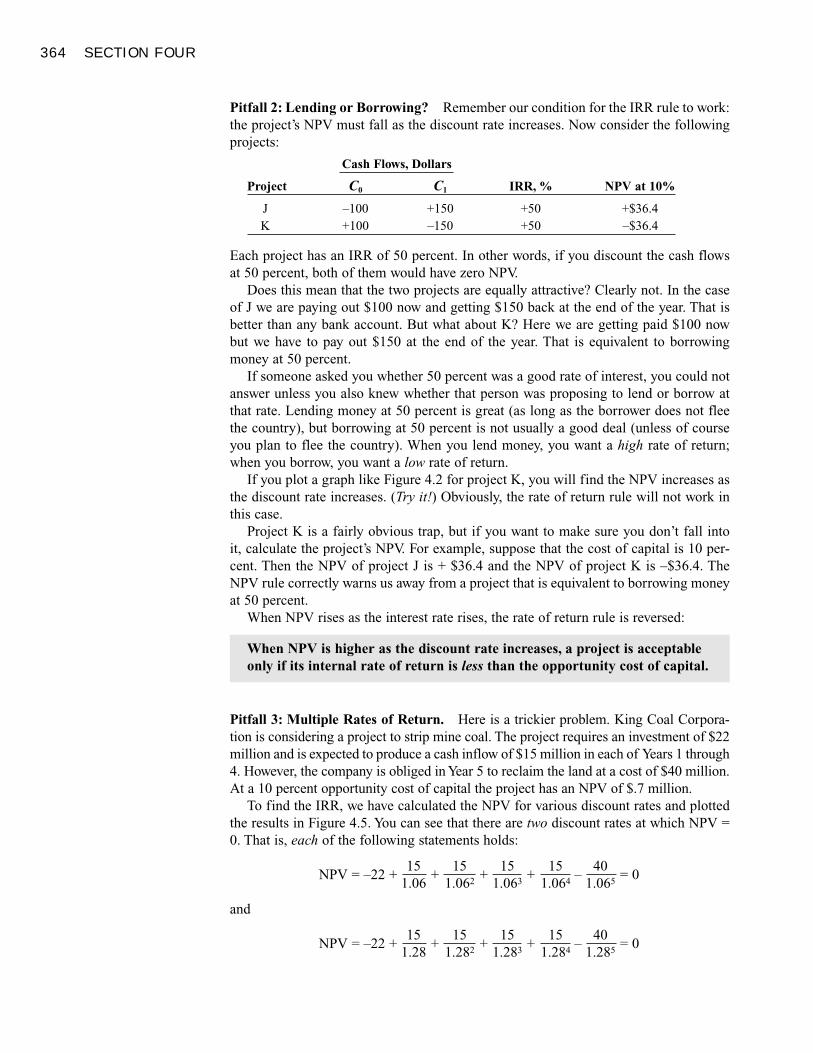
364 SECTION FOUR
Pitfall 2: Lending or Borrowing? Remember our condition for the IRR rule to work:the project’s NPV must fall as the discount rate increases. Now consider the followingprojects:
Cash Flows, Dollars
Project C0 C1 IRR, % NPV at 10%
J –100 +150 +50 +$36.4K +100 –150 +50 –$36.4
Each project has an IRR of 50 percent. In other words, if you discount the cash flowsat 50 percent, both of them would have zero NPV.
Does this mean that the two projects are equally attractive? Clearly not. In the caseof J we are paying out $100 now and getting $150 back at the end of the year. That isbetter than any bank account. But what about K? Here we are getting paid $100 nowbut we have to pay out $150 at the end of the year. That is equivalent to borrowingmoney at 50 percent.
If someone asked you whether 50 percent was a good rate of interest, you could notanswer unless you also knew whether that person was proposing to lend or borrow atthat rate. Lending money at 50 percent is great (as long as the borrower does not fleethe country), but borrowing at 50 percent is not usually a good deal (unless of courseyou plan to flee the country). When you lend money, you want a high rate of return;when you borrow, you want a low rate of return.
If you plot a graph like Figure 4.2 for project K, you will find the NPV increases asthe discount rate increases. (Try it!) Obviously, the rate of return rule will not work inthis case.
Project K is a fairly obvious trap, but if you want to make sure you don’t fall into it, calculate the project’s NPV. For example, suppose that the cost of capital is 10 per-cent. Then the NPV of project J is + $36.4 and the NPV of project K is –$36.4. TheNPV rule correctly warns us away from a project that is equivalent to borrowing moneyat 50 percent.
When NPV rises as the interest rate rises, the rate of return rule is reversed:
Pitfall 3: Multiple Rates of Return. Here is a trickier problem. King Coal Corpora-tion is considering a project to strip mine coal. The project requires an investment of $22million and is expected to produce a cash inflow of $15 million in each of Years 1 through4. However, the company is obliged in Year 5 to reclaim the land at a cost of $40 million.At a 10 percent opportunity cost of capital the project has an NPV of $.7 million.
To find the IRR, we have calculated the NPV for various discount rates and plottedthe results in Figure 4.5. You can see that there are two discount rates at which NPV =0. That is, each of the following statements holds:
NPV = –22 +15
+15
+15
+15
–40
= 01.06 1.062 1.063 1.064 1.065
and
NPV = –22 +15
+15
+15
+15
–40
= 01.28 1.282 1.283 1.284 1.285
When NPV is higher as the discount rate increases, a project is acceptableonly if its internal rate of return is less than the opportunity cost of capital.
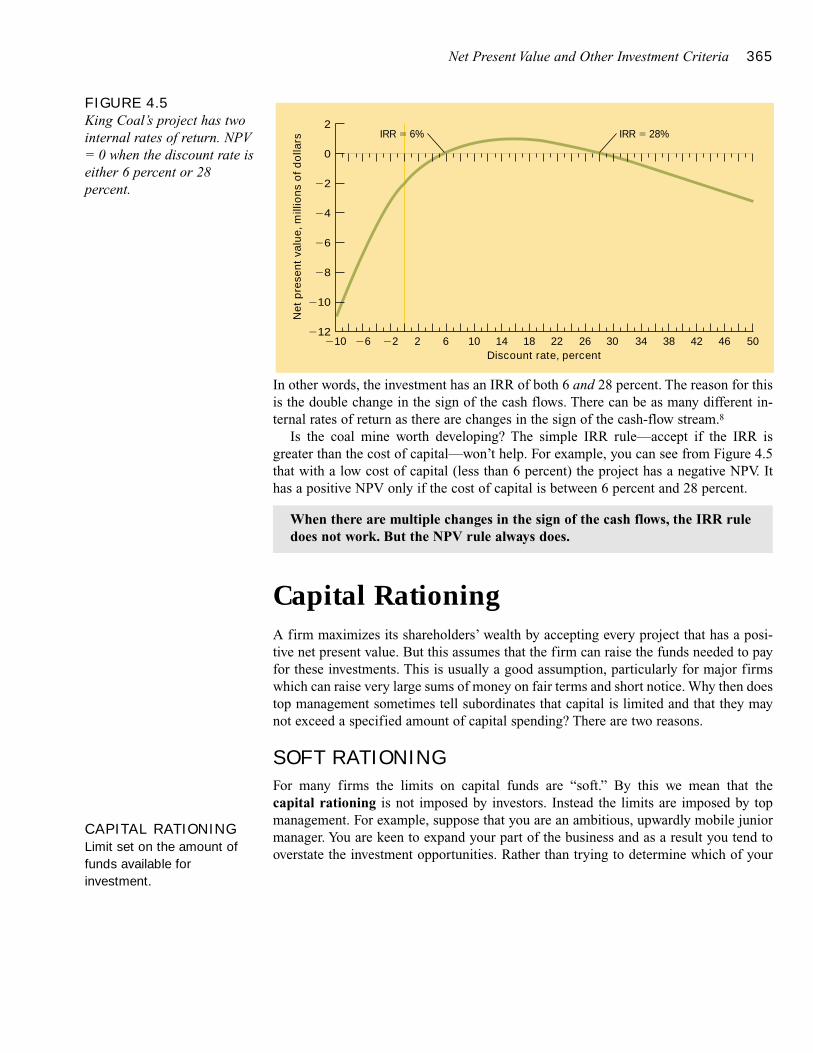
Net Present Value and Other Investment Criteria 365
In other words, the investment has an IRR of both 6 and 28 percent. The reason for thisis the double change in the sign of the cash flows. There can be as many different in-ternal rates of return as there are changes in the sign of the cash-flow stream.8
Is the coal mine worth developing? The simple IRR rule—accept if the IRR isgreater than the cost of capital—won’t help. For example, you can see from Figure 4.5that with a low cost of capital (less than 6 percent) the project has a negative NPV. Ithas a positive NPV only if the cost of capital is between 6 percent and 28 percent.
Capital RationingA firm maximizes its shareholders’ wealth by accepting every project that has a posi-tive net present value. But this assumes that the firm can raise the funds needed to payfor these investments. This is usually a good assumption, particularly for major firmswhich can raise very large sums of money on fair terms and short notice. Why then doestop management sometimes tell subordinates that capital is limited and that they maynot exceed a specified amount of capital spending? There are two reasons.
SOFT RATIONING
For many firms the limits on capital funds are “soft.” By this we mean that the capital rationing is not imposed by investors. Instead the limits are imposed by topmanagement. For example, suppose that you are an ambitious, upwardly mobile juniormanager. You are keen to expand your part of the business and as a result you tend tooverstate the investment opportunities. Rather than trying to determine which of your
When there are multiple changes in the sign of the cash flows, the IRR ruledoes not work. But the NPV rule always does.
FIGURE 4.5King Coal’s project has twointernal rates of return. NPV= 0 when the discount rate iseither 6 percent or 28percent.
Net
pre
sent
val
ue, m
illio
ns o
f dol
lars
Discount rate, percent50�10 �6
2
0
�2
�4
�6
�8
�10
�12�2 2 6 10 14 18 22 26 30 34 38 42 46
IRR � 28%IRR � 6%
CAPITAL RATIONINGLimit set on the amount offunds available forinvestment.
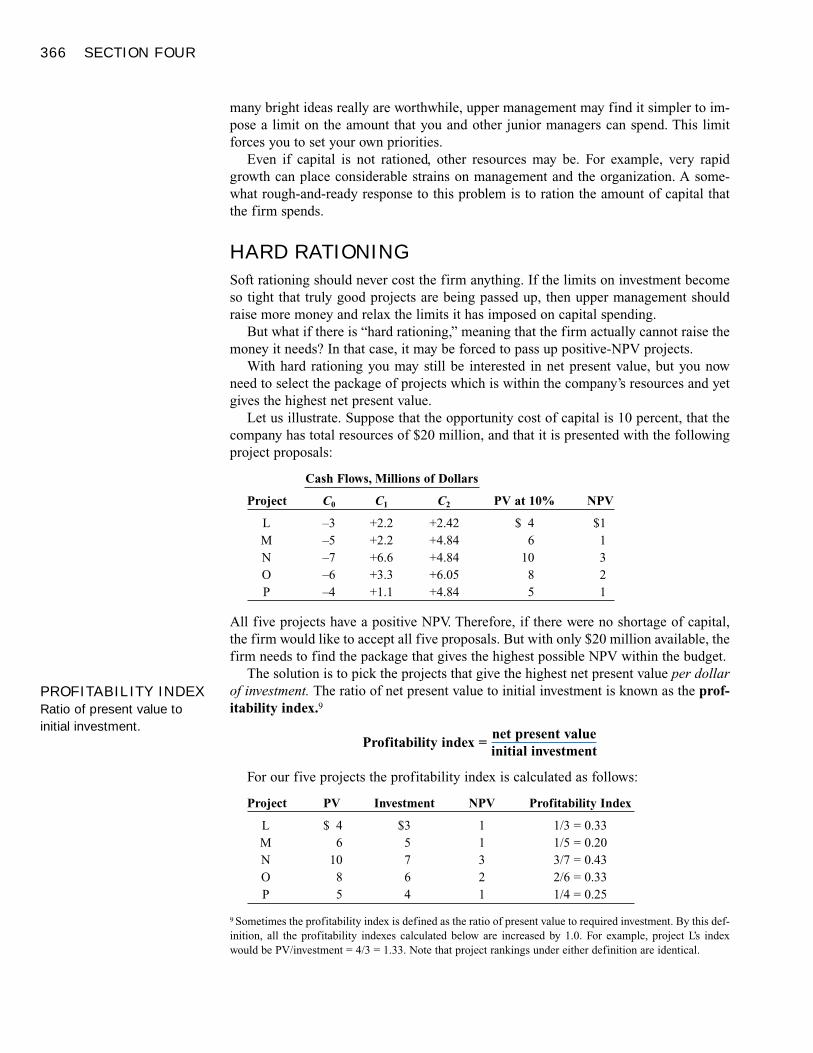
366 SECTION FOUR
many bright ideas really are worthwhile, upper management may find it simpler to im-pose a limit on the amount that you and other junior managers can spend. This limitforces you to set your own priorities.
Even if capital is not rationed, other resources may be. For example, very rapidgrowth can place considerable strains on management and the organization. A some-what rough-and-ready response to this problem is to ration the amount of capital thatthe firm spends.
HARD RATIONING
Soft rationing should never cost the firm anything. If the limits on investment becomeso tight that truly good projects are being passed up, then upper management shouldraise more money and relax the limits it has imposed on capital spending.
But what if there is “hard rationing,” meaning that the firm actually cannot raise themoney it needs? In that case, it may be forced to pass up positive-NPV projects.
With hard rationing you may still be interested in net present value, but you nowneed to select the package of projects which is within the company’s resources and yetgives the highest net present value.
Let us illustrate. Suppose that the opportunity cost of capital is 10 percent, that thecompany has total resources of $20 million, and that it is presented with the followingproject proposals:
Cash Flows, Millions of Dollars
Project C0 C1 C2 PV at 10% NPV
L –3 +2.2 +2.42 $ 4 $1M –5 +2.2 +4.84 6 1N –7 +6.6 +4.84 10 3O –6 +3.3 +6.05 8 2P –4 +1.1 +4.84 5 1
All five projects have a positive NPV. Therefore, if there were no shortage of capital,the firm would like to accept all five proposals. But with only $20 million available, thefirm needs to find the package that gives the highest possible NPV within the budget.
The solution is to pick the projects that give the highest net present value per dollarof investment. The ratio of net present value to initial investment is known as the prof-itability index.9
Profitability index =net present valueinitial investment
For our five projects the profitability index is calculated as follows:
Project PV Investment NPV Profitability Index
L $ 4 $3 1 1/3 = 0.33M 6 5 1 1/5 = 0.20N 10 7 3 3/7 = 0.43O 8 6 2 2/6 = 0.33P 5 4 1 1/4 = 0.25
9 Sometimes the profitability index is defined as the ratio of present value to required investment. By this def-inition, all the profitability indexes calculated below are increased by 1.0. For example, project L’s indexwould be PV/investment = 4/3 = 1.33. Note that project rankings under either definition are identical.
PROFITABILITY INDEXRatio of present value toinitial investment.
Net Present Value and Other Investment Criteria 367
Project N offers the highest ratio of net present value to investment (0.43) and there-fore N is picked first. Next come projects L and O, which tie with a ratio of 0.33, andafter them comes P. These four projects exactly use up the $20 million budget. Betweenthem they offer shareholders the highest attainable gain in wealth.10
� Self-Test 9 Which projects should the firm accept if its capital budget is only $10 million?
PITFALLS OF THE PROFITABILITY INDEX
The profitability index is sometimes used to rank projects even when there is no soft orhard capital rationing. In this case the unwary user may be led to favor small projectsover larger projects with higher NPVs. The profitability index was designed to selectthe projects with the most bang per buck—the greatest NPV per dollar spent. That’s theright objective when bucks are limited. When they are not, a bigger bang is always bet-ter than a smaller one, even when more bucks are spent. Self-Test 10 is a numericalexample.
� Self-Test 10 Calculate the profitability indexes of the two pairs of mutually exclusive investments inSelf-Tests 7 and 8. Use a 7.5 percent discount rate. Does the profitability index give theright ranking in each case?
SummaryWhat is the net present value of an investment, and how do you calculate it?
The net present value of a project measures the difference between its value and cost. NPVis therefore the amount that the project will add to shareholder wealth. A companymaximizes shareholder wealth by accepting all projects that have a positive NPV.
How is the internal rate of return of a project calculated and what must one lookout for when using the internal rate of return rule?
Instead of asking whether a project has a positive NPV, many businesses prefer to askwhether it offers a higher return than shareholders could expect to get by investing in thecapital market. Return is usually defined as the discount rate that would result in a zeroNPV. This is known as the internal rate of return, or IRR. The project is attractive if theIRR exceeds the opportunity cost of capital.
There are some pitfalls in using the internal rate of return rule. Be careful about usingthe IRR when (1) the early cash flows are positive, (2) there is more than one change in thesign of the cash flows, or (3) you need to choose between two mutually exclusive projects.
Why don’t the payback rule and book rate of return rule always make sharehold-ers better off?
10 Unfortunately, when capital is rationed in more than one period, or when personnel, production capacity, orother resources are rationed in addition to capital, it isn’t always possible to get the NPV-maximizing pack-age just by ranking projects on their profitability index. Tedious trial and error may be called for, or linearprogramming methods may be used.
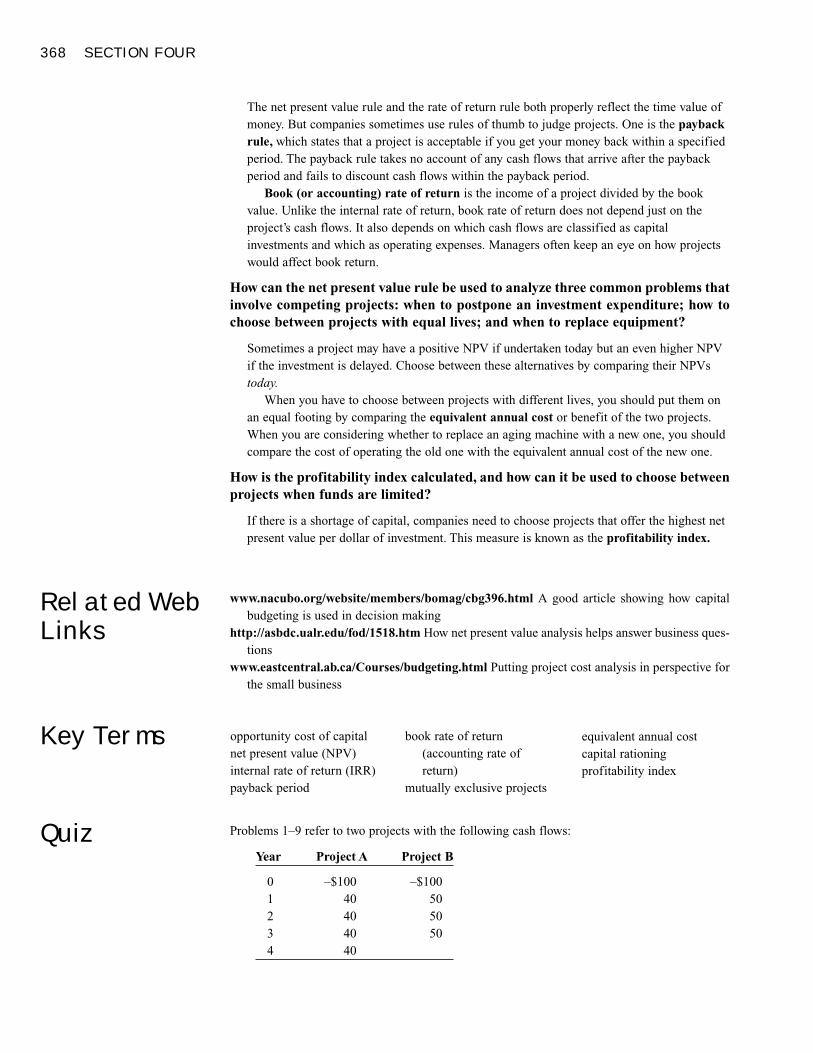
368 SECTION FOUR
The net present value rule and the rate of return rule both properly reflect the time value ofmoney. But companies sometimes use rules of thumb to judge projects. One is the paybackrule, which states that a project is acceptable if you get your money back within a specifiedperiod. The payback rule takes no account of any cash flows that arrive after the paybackperiod and fails to discount cash flows within the payback period.
Book (or accounting) rate of return is the income of a project divided by the bookvalue. Unlike the internal rate of return, book rate of return does not depend just on theproject’s cash flows. It also depends on which cash flows are classified as capitalinvestments and which as operating expenses. Managers often keep an eye on how projectswould affect book return.
How can the net present value rule be used to analyze three common problems thatinvolve competing projects: when to postpone an investment expenditure; how tochoose between projects with equal lives; and when to replace equipment?
Sometimes a project may have a positive NPV if undertaken today but an even higher NPVif the investment is delayed. Choose between these alternatives by comparing their NPVstoday.
When you have to choose between projects with different lives, you should put them onan equal footing by comparing the equivalent annual cost or benefit of the two projects.When you are considering whether to replace an aging machine with a new one, you shouldcompare the cost of operating the old one with the equivalent annual cost of the new one.
How is the profitability index calculated, and how can it be used to choose betweenprojects when funds are limited?
If there is a shortage of capital, companies need to choose projects that offer the highest netpresent value per dollar of investment. This measure is known as the profitability index.
www.nacubo.org/website/members/bomag/cbg396.html A good article showing how capitalbudgeting is used in decision making
http://asbdc.ualr.edu/fod/1518.htm How net present value analysis helps answer business ques-tions
www.eastcentral.ab.ca/Courses/budgeting.html Putting project cost analysis in perspective forthe small business
opportunity cost of capitalnet present value (NPV)internal rate of return (IRR)payback period
book rate of return(accounting rate ofreturn)
mutually exclusive projects
equivalent annual costcapital rationingprofitability index
Problems 1–9 refer to two projects with the following cash flows:
Year Project A Project B
0 –$100 –$1001 40 502 40 503 40 504 40
Related WebLinks
Key Terms
Quiz
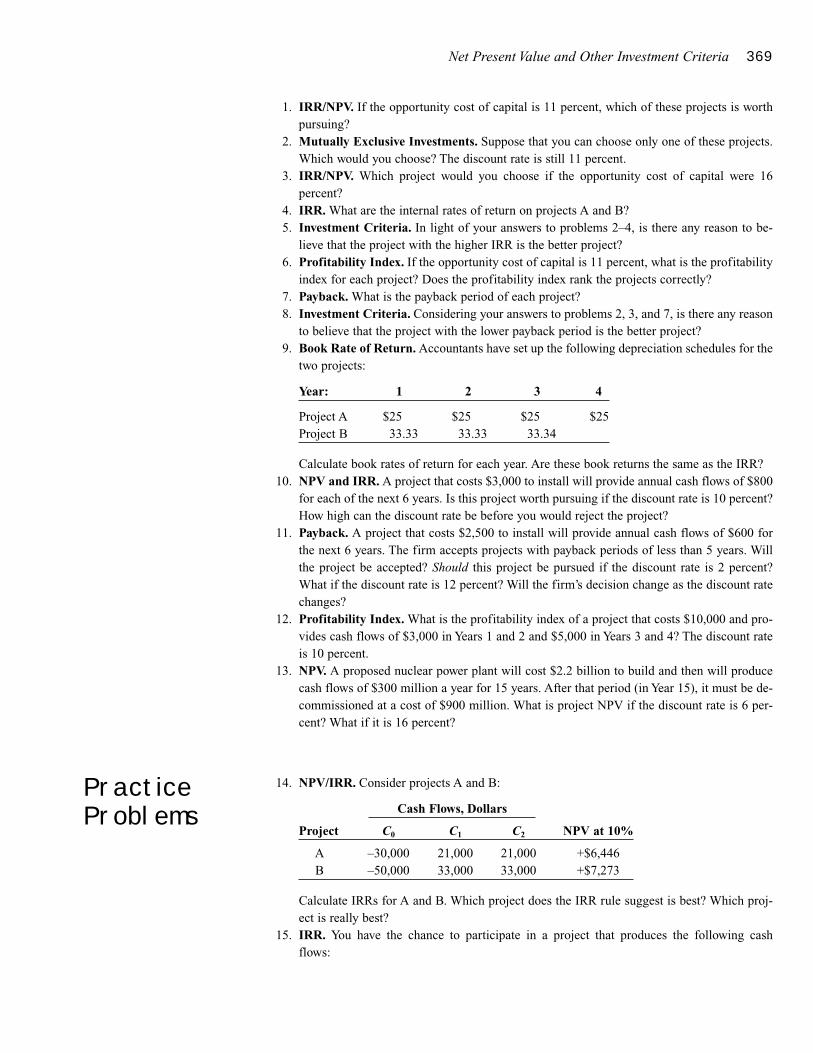
Net Present Value and Other Investment Criteria 369
1. IRR/NPV. If the opportunity cost of capital is 11 percent, which of these projects is worthpursuing?
2. Mutually Exclusive Investments. Suppose that you can choose only one of these projects.Which would you choose? The discount rate is still 11 percent.
3. IRR/NPV. Which project would you choose if the opportunity cost of capital were 16 percent?
4. IRR. What are the internal rates of return on projects A and B?5. Investment Criteria. In light of your answers to problems 2–4, is there any reason to be-
lieve that the project with the higher IRR is the better project?6. Profitability Index. If the opportunity cost of capital is 11 percent, what is the profitability
index for each project? Does the profitability index rank the projects correctly?7. Payback. What is the payback period of each project?8. Investment Criteria. Considering your answers to problems 2, 3, and 7, is there any reason
to believe that the project with the lower payback period is the better project?9. Book Rate of Return. Accountants have set up the following depreciation schedules for the
two projects:
Year: 1 2 3 4
Project A $25 $25 $25 $25Project B 33.33 33.33 33.34
Calculate book rates of return for each year. Are these book returns the same as the IRR?10. NPV and IRR. A project that costs $3,000 to install will provide annual cash flows of $800
for each of the next 6 years. Is this project worth pursuing if the discount rate is 10 percent?How high can the discount rate be before you would reject the project?
11. Payback. A project that costs $2,500 to install will provide annual cash flows of $600 forthe next 6 years. The firm accepts projects with payback periods of less than 5 years. Willthe project be accepted? Should this project be pursued if the discount rate is 2 percent?What if the discount rate is 12 percent? Will the firm’s decision change as the discount ratechanges?
12. Profitability Index. What is the profitability index of a project that costs $10,000 and pro-vides cash flows of $3,000 in Years 1 and 2 and $5,000 in Years 3 and 4? The discount rateis 10 percent.
13. NPV. A proposed nuclear power plant will cost $2.2 billion to build and then will producecash flows of $300 million a year for 15 years. After that period (in Year 15), it must be de-commissioned at a cost of $900 million. What is project NPV if the discount rate is 6 per-cent? What if it is 16 percent?
14. NPV/IRR. Consider projects A and B:
Cash Flows, Dollars
Project C0 C1 C2 NPV at 10%
A –30,000 21,000 21,000 +$6,446B –50,000 33,000 33,000 +$7,273
Calculate IRRs for A and B. Which project does the IRR rule suggest is best? Which proj-ect is really best?
15. IRR. You have the chance to participate in a project that produces the following cash flows:
PracticeProblems
370 SECTION FOUR
C0 C1 C2
+$5,000 +$4,000 –$11,000
The internal rate of return is 13.6 percent. If the opportunity cost of capital is 12 percent,would you accept the offer?
16. NPV/IRR.
a. Calculate the net present value of the following project for discount rates of 0, 50, and100 percent:
C0 C1 C2
–$6,750 +$4,500 +$18,000
b. What is the IRR of the project?
17. IRR. Marielle Machinery Works forecasts the following cash flows on a project under con-sideration. It uses the internal rate of return rule to accept or reject projects. Should this proj-ect be accepted if the required return is 12 percent?
C0 C1 C2 C3
–$10,000 0 +$7,500 +$8,500
18. NPV/IRR. A new computer system will require an initial outlay of $20,000 but it will in-crease the firm’s cash flows by $4,000 a year for each of the next 8 years. Is the system worthinstalling if the required rate of return is 9 percent? What if it is 14 percent? How high canthe discount rate be before you would reject the project?
19. Investment Criteria. If you insulate your office for $1,000, you will save $100 a year inheating expenses. These savings will last forever.
a. What is the NPV of the investment when the cost of capital is 8 percent? 10 percent?b. What is the IRR of the investment?c. What is the payback period on this investment?
20. NPV versus IRR. Here are the cash flows for two mutually exclusive projects:
Project C0 C1 C2 C3
A –$20,000 +$8,000 +$8,000 +$8,000B –$20,000 0 0 +$25,000
a. At what interest rates would you prefer project A to B? Hint: Try drawing the NPV pro-file of each project.
b. What is the IRR of each project?
21. Payback and NPV. A project has a life of 10 years and a payback period of 10 years. Whatmust be true of project NPV?
22. IRR/NPV. Consider this project with an internal rate of return of 13.1 percent. Should youaccept or reject the project if the discount rate is 12 percent?
Year Cash Flow
0 +$1001 –602 –60
23. Payback and NPV.
a. What is the payback period on each of the following projects?
Net Present Value and Other Investment Criteria 371
Cash Flows, Dollars
Project Time: 0 1 2 3 4
A –5,000 +1,000 +1,000 +3,000 0B –1,000 0 +1,000 +2,000 +3,000C –5,000 +1,000 +1,000 +3,000 +5,000
b. Given that you wish to use the payback rule with a cutoff period of 2 years, which proj-ects would you accept?
c. If you use a cutoff period of 3 years, which projects would you accept?d. If the opportunity cost of capital is 10 percent, which projects have positive NPVs?e. “Payback gives too much weight to cash flows that occur after the cutoff date.” True or
false?
24. Book Rate of Return. Consider these data on a proposed project:Original investment = $200Straight-line depreciation of $50 a year for 4 yearsProject life = 4 years
Year: 0 1 2 3 4
Book value $200 — — — —Sales 100 110 120 130Costs 30 35 40 45Depreciation — — — —Net income — — — —
a. Fill in the blanks in the table.b. Find the book rate of return of this project in each year.c. Find project NPV if the discount rate is 20 percent.
25. Book Rate of Return. A machine costs $8,000 and is expected to produce profit before de-preciation of $2,500 in each of Years 1 and 2 and $3,500 in each of Years 3 and 4. Assum-ing that the machine is depreciated at a constant rate of $2,000 a year and that there are notaxes, what is the average return on book?
26. Book Rate of Return. A project requires an initial investment of $10,000, and over its 5-year life it will generate annual cash revenues of $5,000 and cash expenses of $2,000. Thefirm will use straight-line depreciation, but it does not pay taxes.a. Find the book rates of return on the project for each year.b. Is the project worth pursuing if the opportunity cost of capital is 8 percent?c. What would happen to the book rates of return if half the initial $10,000 outlay were
treated as an expense instead of a capital investment? Hint: Instead of depreciating all ofthe $10,000, treat $5,000 as an expense in the first year.
d. Does NPV change as a result of the different accounting treatment proposed in (c)?
27. Profitability Index. Consider the following projects:
Project C0 C1 C2
A –$2,100 +$2,000 +$1,200B – 2,100 + 1,440 + 1,728
a. Calculate the profitability index for A and B assuming a 20 percent opportunity cost ofcapital.
b. Use the profitability index rule to determine which project(s) you should accept (i) if youcould undertake both and (ii) if you could undertake only one.
372 SECTION FOUR
28. Capital Rationing. You are a manager with an investment budget of $8 million. You mayinvest in the following projects. Investment and cash-flow figures are in millions of dollars.
Discount Annual Project Life,Project Rate, % Investment Cash Flow Years
A 10 3 1 5B 12 4 1 8C 8 5 2 4D 8 3 1.5 3E 12 3 1 6
a. Why might these projects have different discount rates?b. Which projects should the manager choose?c. Which projects will be chosen if there is no capital rationing?
29. Profitability Index versus NPV. Consider these two projects:
Project C0 C1 C2 C3
A –$18 +$10 +$10 +$10B –$50 +$25 +$25 +$25
a. Which project has the higher NPV if the discount rate is 10 percent?b. Which has the higher profitability index?c. Which project is most attractive to a firm that can raise an unlimited amount of funds to
pay for its investment projects? Which project is most attractive to a firm that is limitedin the funds it can raise?
30. Mutually Exclusive Investments. Here are the cash flow forecasts for two mutually exclu-sive projects:
Cash Flows, Dollars
Year Project A Project B
0 –$100 –$1001 30 492 50 493 70 49
a. Which project would you choose if the opportunity cost of capital is 2 percent?b. Which would you choose if the opportunity cost of capital is 12 percent?c. Why does your answer change?
31. Equivalent Annual Cost. A precision lathe costs $10,000 and will cost $20,000 a year tooperate and maintain. If the discount rate is 12 percent and the lathe will last for five years,what is the equivalent annual cost of the tool?
32. Equivalent Annual Cost. A firm can lease a truck for 4 years at a cost of $30,000 annually.It can instead buy a truck at a cost of $80,000, with annual maintenance expenses of$10,000. The truck will be sold at the end of 4 years for $20,000. Which is the better optionif the discount rate is 12 percent?
33. Multiple IRR. Consider the following cash flows:
C0 C1 C2 C3 C4
–22 +20 +20 +20 –40
a. Confirm that one internal rate of return on this project is (a shade above) 7 percent, andthat the other is (a shade below) 34 percent.

Net Present Value and Other Investment Criteria 373
b. Is the project attractive if the discount rate is 5 percent?c. What if it is 20 percent? 40 percent?d. Why is the project attractive at midrange discount rates but not at very high or very low
rates?
34. Equivalent Annual Cost. Econo-cool air conditioners cost $300 to purchase, result in elec-tricity bills of $150 per year, and last for 5 years. Luxury Air models cost $500, result inelectricity bills of $100 per year, and last for 8 years. The discount rate is 21 percent.
a. What are the equivalent annual costs of the Econo-cool and Luxury Air models?b. Which model is more cost effective?c. Now you remember that the inflation rate is expected to be 10 percent per year for the
foreseeable future. Redo parts (a) and (b).
35. Investment Timing. You can purchase an optical scanner today for $400. The scanner pro-vides benefits worth $60 a year. The expected life of the scanner is 10 years. Scanners areexpected to decrease in price by 20 percent per year. Suppose the discount rate is 10 percent.Should you purchase the scanner today or wait to purchase? When is the best purchase time?
36. Replacement Decision. You are operating an old machine that is expected to produce a cashinflow of $5,000 in each of the next 3 years before it fails. You can replace it now with a newmachine that costs $20,000 but is much more efficient and will provide a cash flow of$10,000 a year for 4 years. Should you replace your equipment now? The discount rate is 15percent.
37. Replacement Decision. A forklift will last for only 2 more years. It costs $5,000 a year tomaintain. For $20,000 you can buy a new lift which can last for 10 years and should requiremaintenance costs of only $2,000 a year.
a. If the discount rate is 5 percent per year, should you replace the forklift?b. What if the discount rate is 10 percent per year? Why does your answer change?
38. NPV/IRR. Growth Enterprises believes its latest project, which will cost $80,000 to install,will generate a perpetual growing stream of cash flows. Cash flow at the end of this year willbe $5,000, and cash flows in future years are expected to grow indefinitely at an annual rateof 5 percent.
a. If the discount rate for this project is 10 percent, what is the project NPV?b. What is the project IRR?
39. Investment Timing. A classic problem in management of forests is determining when it ismost economically advantageous to cut a tree for lumber. When the tree is young, it growsvery rapidly. As it ages, its growth slows down. Why is the NPV-maximizing rule to cut thetree when its growth rate equals the discount rate?
40. Multiple IRRs. Strip Mining Inc. can develop a new mine at an initial cost of $5 million.The mine will provide a cash flow of $30 million in 1 year. The land then must be reclaimedat a cost of $28 million in the second year.
a. What are the IRRs of this project?b. Should the firm develop the mine if the discount rate is 10 percent? 20 percent? 350 per-
cent? 400 percent?
1 Even if construction costs are $355,000, NPV is still positive:
NPV = PV – $355,000 = $357,143 – $355,000 = $2,143
Therefore, the project is still worth pursuing. The project is viable as long as constructioncosts are less than the PV of the future cash flow, that is, as long as construction costs are
ChallengeProblems
Solutions toSelf-testQuestions
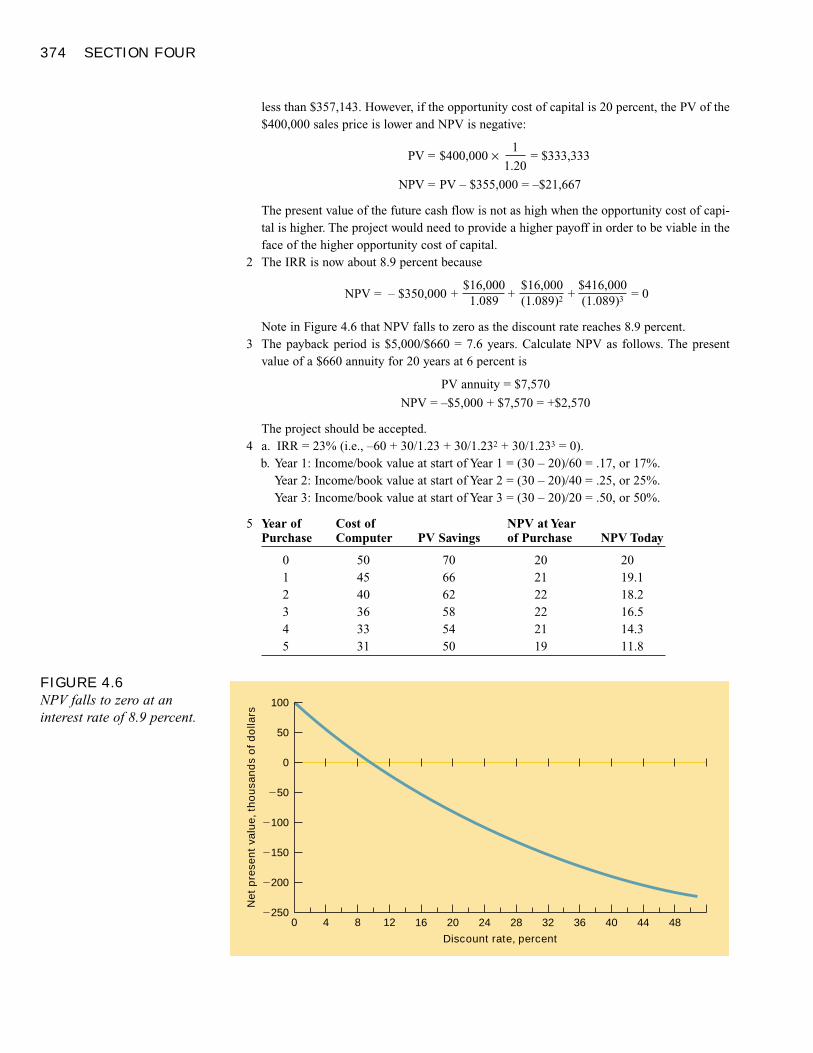
374 SECTION FOUR
less than $357,143. However, if the opportunity cost of capital is 20 percent, the PV of the$400,000 sales price is lower and NPV is negative:
PV = $400,000 ×1
= $333,3331.20
NPV = PV – $355,000 = –$21,667
The present value of the future cash flow is not as high when the opportunity cost of capi-tal is higher. The project would need to provide a higher payoff in order to be viable in theface of the higher opportunity cost of capital.
2 The IRR is now about 8.9 percent because
NPV = – $350,000 +$16,000
+$16,000
+$416,000
= 01.089 (1.089)2 (1.089)3
Note in Figure 4.6 that NPV falls to zero as the discount rate reaches 8.9 percent.3 The payback period is $5,000/$660 = 7.6 years. Calculate NPV as follows. The present
value of a $660 annuity for 20 years at 6 percent is
PV annuity = $7,570
NPV = –$5,000 + $7,570 = +$2,570
The project should be accepted.4 a. IRR = 23% (i.e., –60 + 30/1.23 + 30/1.232 + 30/1.233 = 0).
b. Year 1: Income/book value at start of Year 1 = (30 – 20)/60 = .17, or 17%.Year 2: Income/book value at start of Year 2 = (30 – 20)/40 = .25, or 25%.Year 3: Income/book value at start of Year 3 = (30 – 20)/20 = .50, or 50%.
5 Year of Cost of NPV at YearPurchase Computer PV Savings of Purchase NPV Today
0 50 70 20 201 45 66 21 19.12 40 62 22 18.23 36 58 22 16.54 33 54 21 14.35 31 50 19 11.8
FIGURE 4.6NPV falls to zero at aninterest rate of 8.9 percent.
Net
pre
sent
val
ue, t
hous
ands
of d
olla
rs
Discount rate, percent
�250
�200
�150
�100
�50
0
50
100
120 4 8 2016 24 32 36 40 4428 48
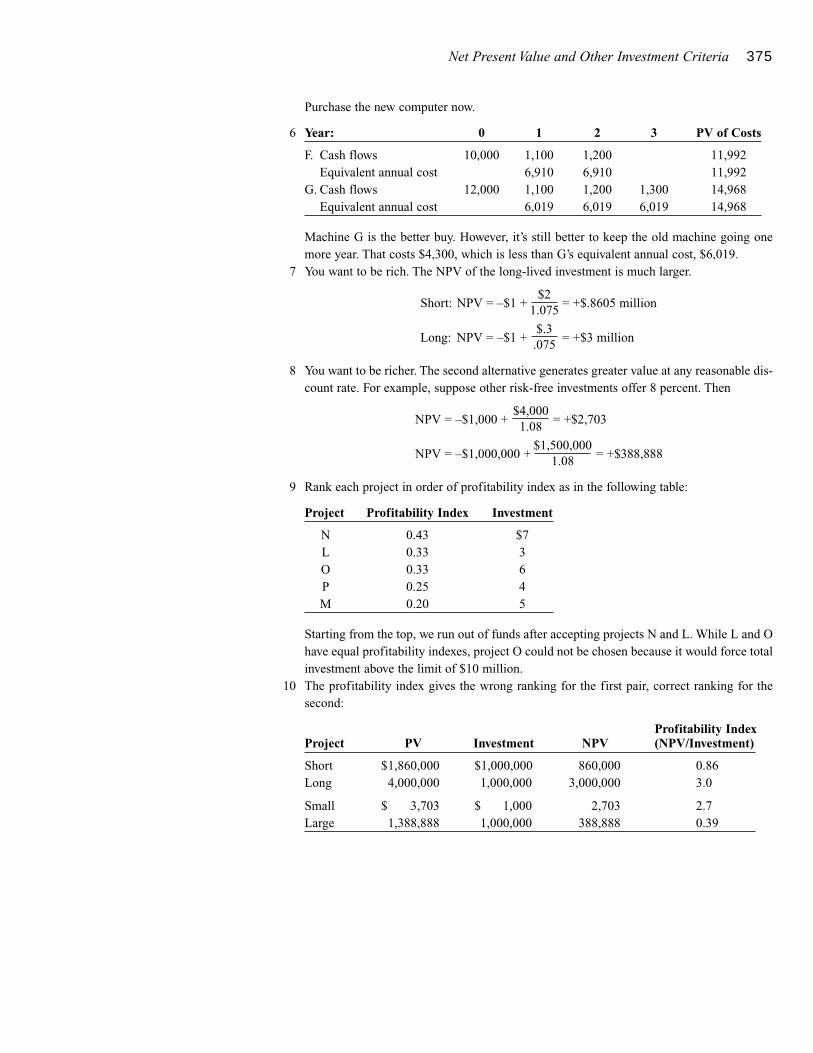
Net Present Value and Other Investment Criteria 375
Purchase the new computer now.
6 Year: 0 1 2 3 PV of Costs
F. Cash flows 10,000 1,100 1,200 11,992Equivalent annual cost 6,910 6,910 11,992
G. Cash flows 12,000 1,100 1,200 1,300 14,968Equivalent annual cost 6,019 6,019 6,019 14,968
Machine G is the better buy. However, it’s still better to keep the old machine going onemore year. That costs $4,300, which is less than G’s equivalent annual cost, $6,019.
7 You want to be rich. The NPV of the long-lived investment is much larger.
Short: NPV = –$1 +$2
= +$.8605 million1.075
Long: NPV = –$1 +$.3
= +$3 million.075
8 You want to be richer. The second alternative generates greater value at any reasonable dis-count rate. For example, suppose other risk-free investments offer 8 percent. Then
NPV = –$1,000 +$4,000
= +$2,7031.08
NPV = –$1,000,000 +$1,500,000
= +$388,8881.08
9 Rank each project in order of profitability index as in the following table:
Project Profitability Index Investment
N 0.43 $7L 0.33 3O 0.33 6P 0.25 4M 0.20 5
Starting from the top, we run out of funds after accepting projects N and L. While L and Ohave equal profitability indexes, project O could not be chosen because it would force totalinvestment above the limit of $10 million.
10 The profitability index gives the wrong ranking for the first pair, correct ranking for thesecond:
Profitability IndexProject PV Investment NPV (NPV/Investment)
Short $1,860,000 $1,000,000 860,000 0.86Long 4,000,000 1,000,000 3,000,000 3.0
Small $ 3,703 $ 1,000 2,703 2.7Large 1,388,888 1,000,000 388,888 0.39

377
USING DISCOUNTEDCASH-FLOW ANALYSIS TO MAKE INVESTMENTDECISIONS
Discount Cash Flows, NotProfits
Discount Incremental CashFlowsInclude All Indirect Effects
Forget Sunk Costs
Include Opportunity Costs
Recognize the Investment in WorkingCapital
Beware of Allocated Overhead Costs
Discount Nominal Cash Flowsby the Nominal Cost of Capital
Separate Investment andFinancing Decisions
Calculating Cash FlowCapital Investment
Investment in Working Capital
Cash Flow from Operations
Example: Blooper IndustriesCalculating Blooper’s Project CashFlows
Calculating the NPV of Blooper’sProject
Further Notes and Wrinkles Arisingfrom Blooper’s Project
Summary
Calculating NPV can be hard work.But you’ve got to sweat the details and learn to do it right.Charles Nes/Liaison Agency
378
hink of the problems that General Motors faces when considering
whether to introduce a new model. How much will we need to invest in
new plant and equipment? What will it cost to market and promote the new
car? How soon can we get the car into production? What is the projected production
cost? What do we need in the way of inventories of raw materials and finished cars?
How many cars can we expect to sell each year and at what price? What credit arrange-
ments will we need to give our dealers? How long will the model stay in production?
What happens at the end of that time? Can we use the plant and equipment elsewhere
in the company? All of these issues affect the level and timing of project cash flows. In
this material we continue our analysis of the capital budgeting decision by turning our
focus to how the financial manager should prepare cash-flow estimates for use in net
present value analysis.
Earlier we used the net present value rule to make a simple capital budgeting deci-
sion. You tackled the problem in four steps:
Step 1: Forecast the project cash flows.Step 2: Estimate the opportunity cost of capital—that is, the rate of return that your
shareholders could expect to earn if they invested their money in the capital market.Step 3: Use the opportunity cost of capital to discount the future cash flows. The proj-
ect’s present value (PV) is equal to the sum of the discounted future cash flows.Step 4: Net present value (NPV) measures whether the project is worth more than it
costs. To calculate NPV you need to subtract the required investment from the pres-ent value of the future payoffs:
NPV = PV – required investment
You should go ahead with the project if it has a positive NPV.
We now need to consider how to apply the net present value rule to practical invest-
ment problems. The first step is to decide what to discount. We know the answer in prin-
ciple: discount cash flows. This is why capital budgeting is often referred to as dis-
counted cash flow, or DCF, analysis. But useful forecasts of cash flows do not arrive on
a silver platter. Often the financial manager has to make do with raw data supplied by
specialists in product design, production, marketing, and so on, and must adjust such
data before they are useful. In addition, most financial forecasts are prepared in ac-
cordance with accounting principles that do not necessarily recognize cash flows when
they occur. These data must also be adjusted.
We start with a discussion of the principles governing the cash flows that are rele-
vant for discounting. We then present an example designed to show how standard ac-
counting information can be used to compute those cash flows and why cash flows and
accounting income usually differ. The example will lead us to various further points, in-
cluding the links between depreciation and taxes and the importance of tracking invest-
ments in working capital.
T
Using Discounted Cash-Flow Analysis to Make Investment Decisions 379
After studying this material you should be able to
� Identify the cash flows properly attributable to a proposed new project.
� Calculate the cash flows of a project from standard financial statements.
� Understand how the company’s tax bill is affected by depreciation and how this af-
fects project value.
� Understand how changes in working capital affect project cash flows.
Discount Cash Flows, Not ProfitsUp to this point we have been concerned mainly with the mechanics of discounting andwith the various methods of project appraisal. We have had almost nothing to say aboutthe problem of what you should discount. The first and most important point is this: tocalculate net present value you need to discount cash flows, not accounting profits.
We stressed the difference between cash flows and profits earlier. Here we stress itagain. Income statements are intended to show how well the firm has performed. Theydo not track cash flows.
If the firm lays out a large amount of money on a big capital project, you would notconclude that the firm performed poorly that year, even though a lot of cash is goingout the door. Therefore, the accountant does not deduct capital expenditure when cal-culating the year’s income but instead depreciates it over several years.
That is fine for computing year-by-year profits, but it could get you into troublewhen working out net present value. For example, suppose that you are analyzing an in-vestment proposal. It costs $2,000 and is expected to bring in a cash flow of $1,500 inthe first year and $500 in the second. You think that the opportunity cost of capital is 10percent and so calculate the present value of the cash flows as follows:
PV =$1,500
+$500
= $1,776.861.10 (1.10)2
The project is worth less than it costs; it has a negative NPV:
NPV = $1,776.86 – $2,000 = –$223.14
The project costs $2,000 today, but accountants would not treat that outlay as an im-mediate expense. They would depreciate that $2,000 over 2 years and deduct the de-preciation from the cash flow to obtain accounting income:
Year 1 Year 2
Cash inflow + $1,500 +$ 500Less depreciation – 1,000 –1,000Accounting income + 500 – 500
Thus an accountant would forecast income of $500 in Year 1 and an accounting loss of$500 in Year 2.
Suppose you were given this forecast income and loss and naively discounted them.Now NPV looks positive:
380 SECTION FOUR
Apparent NPV =$500
+–$500
= $41.321.10 (1.10)2
Of course we know that this is nonsense. The project is obviously a loser; we arespending money today ($2,000 cash outflow) and we are simply getting our money back($1,500 in Year 1 and $500 in Year 2). We are earning a zero return when we could geta 10 percent return by investing our money in the capital market.
The message of the example is this:
Here is another example of the distinction between cash flow and accounting prof-its. Accountants try to show profit as it is earned, rather than when the company and thecustomer get around to paying their bills. For example, an income statement will rec-ognize revenue when the sale is made, even if the bill is not paid for months. This prac-tice also results in a difference between accounting profits and cash flow. The sale gen-erates immediate profits, but the cash flow comes later.
� EXAMPLE 1 Sales before Cash
Reggie Hotspur, ace computer salesman, closed a $500,000 sale on December 15, justin time to count it toward his annual bonus. How did he do it? Well, for one thing hegave the customer 180 days to pay. The income statement will recognize Hotspur’s salein December, even though cash will not arrive until June. But a financial analyst track-ing cash flows would concentrate on the latter event.
The accountant takes care of the timing difference by adding $500,000 to accountsreceivable in December, then reducing accounts receivable when the money arrives inJune. (The total of accounts receivable is just the sum of all cash due from customers.)
You can think of the increase in accounts receivable as an investment—it’s effec-tively a 180-day loan to the customer—and therefore a cash outflow. That investment isrecovered when the customer pays. Thus financial analysts often find it convenient tocalculate cash flow as follows:
December June
Sales $500,000 Sales 0Less investment in Plus recovery ofaccounts receivable – 500,000 accounts receivable +$500,000Cash flow 0 Cash flow $500,000
Note that this procedure gives the correct cash flow of $500,000 in June.
It is not always easy to translate accounting data back into actual dollars. If you arein doubt about what is a cash flow, simply count the dollars coming in and take awaythe dollars going out.
When calculating NPV, recognize investment expenditures when they occur,not later when they show up as depreciation. Projects are financially attractive because of the cash they generate, either for distribution toshareholders or for reinvestment in the firm. Therefore, the focus of capitalbudgeting must be on cash flow, not profits.
Using Discounted Cash-Flow Analysis to Make Investment Decisions 381
� Self-Test 1 A regional supermarket chain is deciding whether to install a tewgit machine in each ofits stores. Each machine costs $250,000. Projected income per machine is as follows:
Year: 1 2 3 4 5
Sales $250,000 $300,000 $300,000 $250,000 $250,000Operating expenses 200,000 200,000 200,000 200,000 200,000Depreciation 50,000 50,000 50,000 50,000 50,000Accounting income 0 50,000 50,000 0 0
Why would the stores continue to operate a machine in Years 4 and 5 if it produces noprofits? What are the cash flows from investing in a machine? Assume each tewgit ma-chine is completely depreciated and has no salvage value at the end of its 5-year life.
Discount Incremental Cash FlowsA project’s present value depends on the extra cash flows that it produces. Forecast firstthe firm’s cash flows if you go ahead with the project. Then forecast the cash flows ifyou don’t accept the project. Take the difference and you have the extra (or incremen-tal) cash flows produced by the project:
Incremental=
cash flow–
cash flowcash flow with project without project
� EXAMPLE 2 Launching a New Product
Consider the decision by Intel to launch its Pentium III microprocessor. A successfullaunch could mean sales of 50 million processors a year and several billion dollars inprofits.
But are these profits all incremental cash flows? Certainly not. Our with-versus-without principle reminds us that we need also to think about what the cash flows wouldbe without the new processor. Intel recognized that if it went ahead with the PentiumIII, demand for its older Pentium II processors would be reduced. The incremental cashflows therefore are
Cash flow with Pentium III cash flow without Pentium III(including lower cash flow – (with higher cash flow
from Pentium II processors) from Pentium II processors)
The trick in capital budgeting is to trace all the incremental flows from a proposedproject. Here are some things to look out for.
INCLUDE ALL INDIRECT EFFECTS
Intel’s new processor illustrates a common indirect effect. New products often damagesales of an existing product. Of course, companies frequently introduce new productsanyway, usually because they believe that their existing product line is under threat from
382 SECTION FOUR
competition. Even if you don’t go ahead with a new product, there is no guarantee thatsales of the existing product line will continue at their present level. Sooner or later theywill decline.
Sometimes a new project will help the firm’s existing business. Suppose that you arethe financial manager of an airline that is considering opening a new short-haul routefrom Peoria, Illinois, to Chicago’s O’Hare Airport. When considered in isolation, thenew route may have a negative NPV. But once you allow for the additional business thatthe new route brings to your other traffic out of O’Hare, it may be a very worthwhileinvestment.
Some capital investments have very long lives once all indirect effects are recog-nized. Consider the introduction of a new jet engine. Engine manufacturers often offerattractive pricing to achieve early sales, because once an engine is installed, 15 years’sales of replacement parts are almost assured. Also, since airlines prefer to reduce thenumber of different engines in their fleet, selling jet engines today improves sales to-morrow as well. Later sales will generate further demands for replacement parts. Thusthe string of incremental effects from the first sales of a new model engine can run out20 years or more.
FORGET SUNK COSTS
Sunk costs are like spilled milk: they are past and irreversible outflows.
Unfortunately, managers often are influenced by sunk costs. For example, in 1971Lockheed sought a federal guarantee for a bank loan to continue development of theTristar airplane. Lockheed and its supporters argued that it would be foolish to abandona project on which nearly $1 billion had already been spent. This was a poor argument,however, because the $1 billion was sunk. The relevant questions were how much more needed to be invested and whether the finished product warranted the incremen-tal investment.
Lockheed’s supporters were not the only ones to appeal to sunk costs. Some of itscritics claimed that it would be foolish to continue with a project that offered noprospect of a satisfactory return on that $1 billion. This argument too was faulty. The$1 billion was gone, and the decision to continue with the project should have dependedonly on the return on the incremental investment.
INCLUDE OPPORTUNITY COSTS
Resources are almost never free, even when no cash changes hands. For example, sup-pose a new manufacturing operation uses land that could otherwise be sold for$100,000. This resource is costly; by using the land you pass up the opportunity to sellit. There is no out-of-pocket cost but there is an opportunity cost, that is, the value ofthe forgone alternative use of the land.
This example prompts us to warn you against judging projects “before versus after”
Sunk costs remain the same whether or not you accept the project. Therefore,they do not affect project NPV.
To forecast incremental cash flow, you must trace out all indirect effects ofaccepting the project.
OPPORTUNITY COSTBenefit or cash flow forgoneas a result of an action.
Using Discounted Cash-Flow Analysis to Make Investment Decisions 383
rather than “with versus without.” A manager comparing before versus after might notassign any value to the land because the firm owns it both before and after:
Cash Flow,Before Take Project After Before versus After
Firm owns land —————� Firm still owns land 0
The proper comparison, with versus without, is as follows:
Cash Flow,Before Take Project After with Project
Firm owns land —————� Firm still owns land 0
Do Not Cash Flow,Before Take Project After without Project
Firm owns land —————� Firm sells land for $100,000$100,000
Comparing the cash flows with and without the project, we see that $100,000 is givenup by undertaking the project. The original cost of purchasing the land is irrelevant—that cost is sunk.
When the resource can be freely traded, its opportunity cost is simply the marketprice.1 However, sometimes opportunity costs are difficult to estimate. Suppose thatyou go ahead with a project to develop Computer Nouveau, pulling your software teamoff their work on a new operating system that some existing customers are not-so-patiently awaiting. The exact cost of infuriating those customers may be impossible tocalculate, but you’ll think twice about the opportunity cost of moving the software teamto Computer Nouveau.
RECOGNIZE THE INVESTMENT IN WORKING CAPITAL
Net working capital (often referred to simply as working capital) is the difference be-tween a company’s short-term assets and liabilities. The principal short-term assets arecash, accounts receivable (customers’ unpaid bills), and inventories of raw materialsand finished goods. The principal short-term liabilities are accounts payable (bills thatyou have not paid), notes payable, and accruals (liabilities for items such as wages ortaxes that have recently been incurred but have not yet been paid).
Most projects entail an additional investment in working capital. For example, be-fore you can start production, you need to invest in inventories of raw materials. Then,when you deliver the finished product, customers may be slow to pay and accounts re-ceivable will increase. (Remember Reggie Hotspur’s computer sale, described inExample 1. It required a $500,000, six-month investment in accounts receivable.) Next
The opportunity cost equals the cash that could be realized from selling theland now, and therefore is a relevant cash flow for project evaluation.
1 If the value of the land to the firm were less than the market price, the firm would sell it. On the other hand,the opportunity cost of using land in a particular project cannot exceed the cost of buying an equivalent par-cel to replace it.
NET WORKINGCAPITAL Current assetsminus current liabilities.
384 SECTION FOUR
year, as business builds up, you may need a larger stock of raw materials and you mayhave even more unpaid bills.
We find that working capital is one of the most common sources of confusion inforecasting project cash flows.2 Here are the most common mistakes:
1. Forgetting about working capital entirely. We hope that you never fall into that trap.2. Forgetting that working capital may change during the life of the project. Imagine
that you sell $100,000 of goods per year and customers pay on average 6 monthslate. You will therefore have $50,000 of unpaid bills. Now you increase prices by 10percent, so that revenues increase to $110,000. If customers continue to pay 6months late, unpaid bills increase to $55,000, and therefore you need to make an ad-ditional investment in working capital of $5,000.
3. Forgetting that working capital is recovered at the end of the project. When the project comes to an end, inventories are run down, any unpaid bills are (you hope)paid off, and you can recover your investment in working capital. This generates acash inflow.
BEWARE OF ALLOCATED OVERHEAD COSTS
We have already mentioned that the accountant’s objective in gathering data is not al-ways the same as the investment analyst’s. A case in point is the allocation of overheadcosts such as rent, heat, or electricity. These overhead costs may not be related to a par-ticular project, but they must be paid for nevertheless. Therefore, when the accountantassigns costs to the firm’s projects, a charge for overhead is usually made. But our prin-ciple of incremental cash flows says that in investment appraisal we should include onlythe extra expenses that would result from the project.
� Self-Test 2 A firm is considering an investment in a new manufacturing plant. The site already isowned by the company, but existing buildings would need to be demolished. Which ofthe following should be treated as incremental cash flows?
a. The market value of the site.b. The market value of the existing buildings.c. Demolition costs and site clearance.d. The cost of a new access road put in last year.e. Lost cash flows on other projects due to executive time spent on the new facility.f. Future depreciation of the new plant.
A project may generate extra overhead costs, but then again, it may not. Weshould be cautious about assuming that the accountant’s allocation ofoverhead costs represents the incremental cash flow that would be incurred by accepting the project.
Investments in working capital, just like investments in plant and equipment,result in cash outflows.
2 If you are not clear why working capital affects cash flow, where we gave a primer on working capital and acouple of simple examples.
Using Discounted Cash-Flow Analysis to Make Investment Decisions 385
Discount Nominal Cash Flows by theNominal Cost of CapitalThe distinction between nominal and real cash flows and interest rates is crucial in cap-ital budgeting. Interest rates are usually quoted in nominal terms. If you invest $100 ina bank deposit offering 6 percent interest, then the bank promises to pay you $106 atthe end of the year. It makes no promises about what that $106 will buy. The real rateof interest on the bank deposit depends on inflation. If inflation is 2 percent, that $106will buy you only 4 percent more goods at the end of the year than your $100 could buytoday. The real rate of interest is therefore about 4 percent.3
If the discount rate is nominal, consistency requires that cash flows be estimated innominal terms as well, taking account of trends in selling price, labor and materialscosts, and so on. This calls for more than simply applying a single assumed inflationrate to all components of cash flow. Some costs or prices increase faster than inflation,some slower. For example, perhaps you have entered into a 5-year fixed-price contractwith a supplier. No matter what happens to inflation over this period, this part of yourcosts is fixed in nominal terms.
Of course, there is nothing wrong with discounting real cash flows at the real inter-est rate, although this is not commonly done. We saw earlier that real cash flows dis-counted at the real discount rate give exactly the same present values as nominal cashflows discounted at the nominal rate.
While the need to maintain consistency may seem like an obvious point, analystssometimes forget to account for the effects of inflation when forecasting future cashflows. As a result, they end up discounting real cash flows at a nominal interest rate.This can grossly understate project values.
� EXAMPLE 3 Cash Flows and Inflation
City Consulting Services is considering moving into a new office building. The cost of a 1-year lease is $8,000, but this cost will increase in future years at the annual
It should go without saying that you cannot mix and match real and nominalquantities. Real cash flows must be discounted at a real discount rate,nominal cash flows at a nominal rate. Discounting real cash flows at a nominal rate is a big mistake.
3 Remember,
Real rate of interest � nominal rate of interest – inflation rate
The exact formula is
1 + real rate of interest =1 + nominal rate of interest
1 + inflation rate
=1.06
= 1.03921.02
Therefore, the real interest rate is .0392, or 3.92 percent.
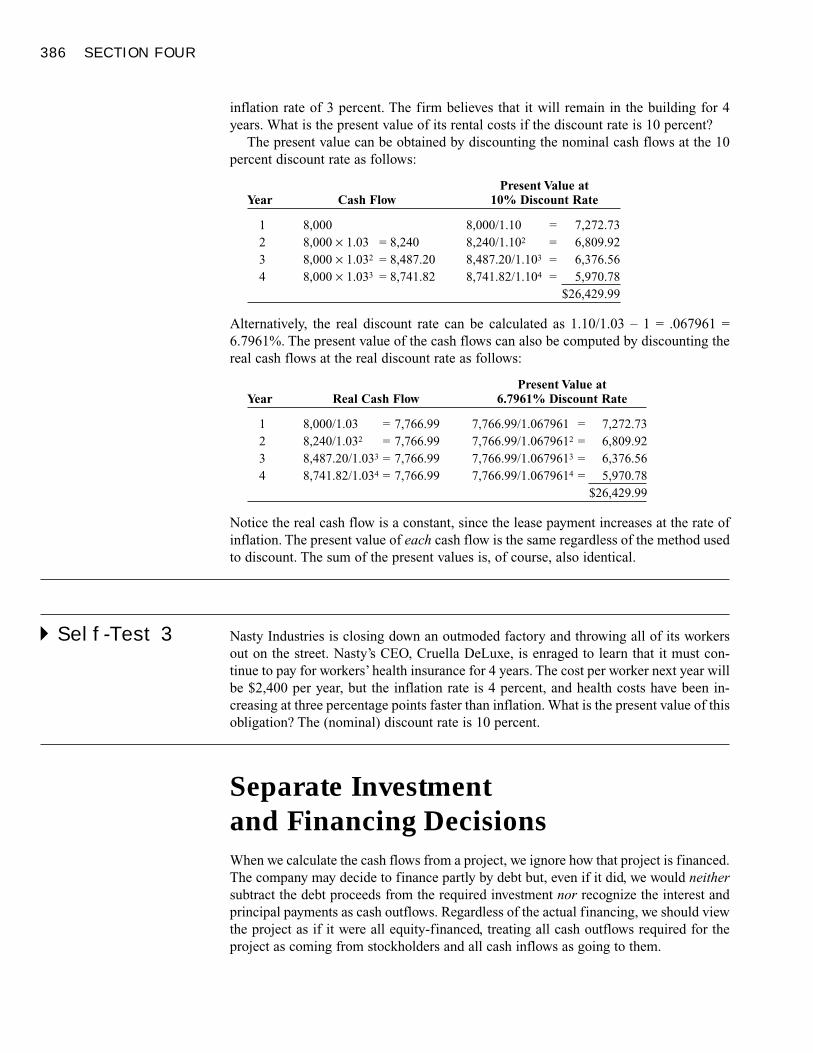
386 SECTION FOUR
inflation rate of 3 percent. The firm believes that it will remain in the building for 4years. What is the present value of its rental costs if the discount rate is 10 percent?
The present value can be obtained by discounting the nominal cash flows at the 10percent discount rate as follows:
Present Value at Year Cash Flow 10% Discount Rate
1 8,000 8,000/1.10 = 7,272.732 8,000 × 1.03 = 8,240 8,240/1.102 = 6,809.923 8,000 × 1.032 = 8,487.20 8,487.20/1.103 = 6,376.564 8,000 × 1.033 = 8,741.82 8,741.82/1.104 = 5,970.78
$26,429.99
Alternatively, the real discount rate can be calculated as 1.10/1.03 – 1 = .067961 =6.7961%. The present value of the cash flows can also be computed by discounting thereal cash flows at the real discount rate as follows:
Present Value at Year Real Cash Flow 6.7961% Discount Rate
1 8,000/1.03 = 7,766.99 7,766.99/1.067961 = 7,272.732 8,240/1.032 = 7,766.99 7,766.99/1.0679612 = 6,809.923 8,487.20/1.033 = 7,766.99 7,766.99/1.0679613 = 6,376.564 8,741.82/1.034 = 7,766.99 7,766.99/1.0679614 = 5,970.78
$26,429.99
Notice the real cash flow is a constant, since the lease payment increases at the rate ofinflation. The present value of each cash flow is the same regardless of the method usedto discount. The sum of the present values is, of course, also identical.
� Self-Test 3 Nasty Industries is closing down an outmoded factory and throwing all of its workersout on the street. Nasty’s CEO, Cruella DeLuxe, is enraged to learn that it must con-tinue to pay for workers’ health insurance for 4 years. The cost per worker next year willbe $2,400 per year, but the inflation rate is 4 percent, and health costs have been in-creasing at three percentage points faster than inflation. What is the present value of thisobligation? The (nominal) discount rate is 10 percent.
Separate Investment and Financing DecisionsWhen we calculate the cash flows from a project, we ignore how that project is financed.The company may decide to finance partly by debt but, even if it did, we would neithersubtract the debt proceeds from the required investment nor recognize the interest andprincipal payments as cash outflows. Regardless of the actual financing, we should viewthe project as if it were all equity-financed, treating all cash outflows required for theproject as coming from stockholders and all cash inflows as going to them.
Using Discounted Cash-Flow Analysis to Make Investment Decisions 387
We do this to separate the analysis of the investment decision from the financing de-cision. We first measure whether the project has a positive net present value, assumingall-equity financing. Then we can undertake a separate analysis of the financing deci-sion. We discuss financing decisions later.
Calculating Cash FlowA project cash flow is the sum of three components: investment in fixed assets such asplant and equipment, investment in working capital, and cash flow from operations:
Total cash flow = cash flow from investment in plant and equipment+ cash flow from investments in working capital+ cash flow from operations
Let’s examine each of these in turn.
CAPITAL INVESTMENT
To get a project off the ground, a company will typically need to make considerable up-front investments in plant, equipment, research, marketing, and so on. For example,Gillette spent about $750 million to develop and build the production line for its Mach3razor cartridge and an additional $300 million in its initial marketing campaign, largelybefore a single razor was sold. These expenditures are negative cash flows—negativebecause they represent a cash outflow from the firm.
Conversely, if a piece of machinery can be sold when the project winds down, thesales price (net of any taxes on the sale) represents a positive cash flow to the firm.
� EXAMPLE 4 Cash Flow from Investments
Gillette’s competitor, Slick, invests $800 million to develop the Mock4 razor blade. Thespecialized blade factory will run for 7 years, until it is replaced by a more advancedtechnology. At that point, the machinery will be sold for scrap metal, for a price of $50million. Taxes of $10 million will be assessed on the sale.
Therefore, the initial cash flow from investment is –$800 million, and the cash flowin 7 years from the disinvestment in the production line will be $50 million – $10 mil-lion = $40 million.
INVESTMENT IN WORKING CAPITAL
We pointed out earlier that when a company builds up inventories of raw materials orfinished product, the company’s cash is reduced; the reduction in cash reflects the firm’sinvestment in inventories. Similarly, cash is reduced when customers are slow to paytheir bills—in this case, the firm makes an investment in accounts receivable. Invest-ment in working capital, just like investment in plant and equipment, represents a neg-ative cash flow. On the other hand, later in the life of a project, when inventories are sold
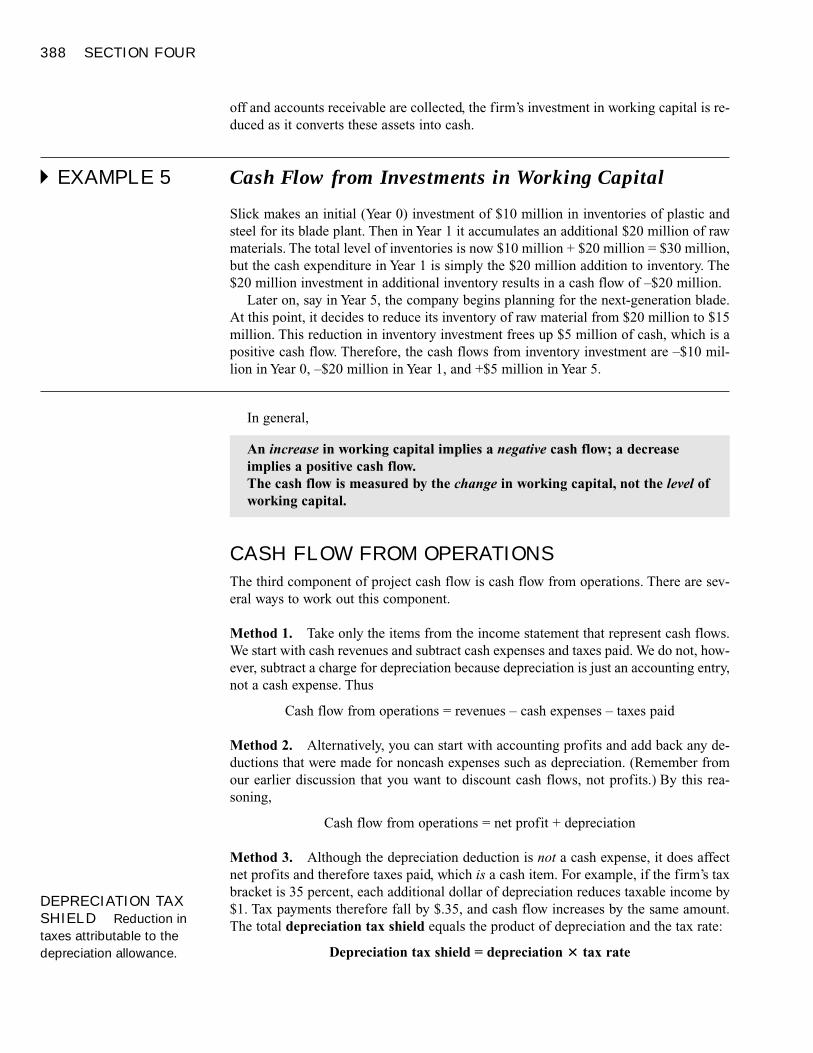
388 SECTION FOUR
off and accounts receivable are collected, the firm’s investment in working capital is re-duced as it converts these assets into cash.
� EXAMPLE 5 Cash Flow from Investments in Working Capital
Slick makes an initial (Year 0) investment of $10 million in inventories of plastic andsteel for its blade plant. Then in Year 1 it accumulates an additional $20 million of rawmaterials. The total level of inventories is now $10 million + $20 million = $30 million,but the cash expenditure in Year 1 is simply the $20 million addition to inventory. The$20 million investment in additional inventory results in a cash flow of –$20 million.
Later on, say in Year 5, the company begins planning for the next-generation blade.At this point, it decides to reduce its inventory of raw material from $20 million to $15million. This reduction in inventory investment frees up $5 million of cash, which is apositive cash flow. Therefore, the cash flows from inventory investment are –$10 mil-lion in Year 0, –$20 million in Year 1, and +$5 million in Year 5.
In general,
CASH FLOW FROM OPERATIONS
The third component of project cash flow is cash flow from operations. There are sev-eral ways to work out this component.
Method 1. Take only the items from the income statement that represent cash flows.We start with cash revenues and subtract cash expenses and taxes paid. We do not, how-ever, subtract a charge for depreciation because depreciation is just an accounting entry,not a cash expense. Thus
Cash flow from operations = revenues – cash expenses – taxes paid
Method 2. Alternatively, you can start with accounting profits and add back any de-ductions that were made for noncash expenses such as depreciation. (Remember fromour earlier discussion that you want to discount cash flows, not profits.) By this rea-soning,
Cash flow from operations = net profit + depreciation
Method 3. Although the depreciation deduction is not a cash expense, it does affectnet profits and therefore taxes paid, which is a cash item. For example, if the firm’s taxbracket is 35 percent, each additional dollar of depreciation reduces taxable income by$1. Tax payments therefore fall by $.35, and cash flow increases by the same amount.The total depreciation tax shield equals the product of depreciation and the tax rate:
Depreciation tax shield = depreciation � tax rate
An increase in working capital implies a negative cash flow; a decrease implies a positive cash flow.The cash flow is measured by the change in working capital, not the level ofworking capital.
DEPRECIATION TAXSHIELD Reduction intaxes attributable to thedepreciation allowance.
Using Discounted Cash-Flow Analysis to Make Investment Decisions 389
This suggests a third way to calculate cash flow from operations. First calculate netprofit assuming zero depreciation. This item would be (revenues – cash expenses) × (1– tax rate). Now add back the tax shield created by depreciation. We then calculate op-erating cash flow as follows:
Cash flow from operations = (revenues – cash expenses) × (1 – tax rate) + (depreciation × tax rate)
The following example confirms that the three methods for estimating cash flow fromoperations all give the same answer.
� EXAMPLE 6 Cash Flow from Operations
A project generates revenues of $1,000, cash expenses of $600, and depreciationcharges of $200 in a particular year. The firm’s tax bracket is 35 percent. Net income iscalculated as follows:
Revenues 1,000– Cash expenses 600– Depreciation expense 200
= Profit before tax 200– Tax at 35% 70
= Net income 130
Methods 1, 2, and 3 all show that cash flow from operations is $330:
Method 1: Cash flow from operations = revenues – cash expenses – taxes= 1,000 – 600 – 70 = 330
Method 2: Cash flow from operations = net profit + depreciation= 130 + 200 = 330
Method 3: Cash flow from operations = (revenues – cash expenses) × (1 – tax rate) + (depreciation × tax rate)
= (1,000 – 600) × (1 – .35) + (200 × .35) = 330
� Self-Test 4 A project generates revenues of $600, expenses of $300, and depreciation charges of$200 in a particular year. The firm’s tax bracket is 35 percent. Find the operating cashflow of the project using all three approaches.
In many cases, a project will seek to improve efficiency or cut costs. A new com-puter system may provide labor savings. A new heating system may be more energy-efficient than the one it replaces. These projects also contribute to the operating cashflow of the firm—not by increasing revenue, but by reducing costs. As the next exam-ple illustrates, we calculate the addition to operating cash flow on cost-cutting projectsjust as we would for projects that increase revenues.
� EXAMPLE 7 Operating Cash Flow on Cost-Cutting Projects
Suppose the new heating system costs $100,000 but reduces heating expenditures by$30,000 a year. The system will be depreciated straight-line over a 5-year period, so the
390 SECTION FOUR
annual depreciation charge will be $20,000. The firm’s tax rate is 35 percent. We cal-culate the incremental effects on revenues, expenses, and depreciation charges as fol-lows. Notice that the reduction in expenses increases revenues minus cash expenses.
Increase in (revenues minus expenses) 30,000– Additional depreciation expense – 20,000
= Incremental profit before tax = 10,000– Incremental tax at 35% – 3,500
= Change in net income = 6,500
Therefore, the increment to operating cash flow can be calculated by method 1 as
Increase in (revenues – cash expenses) – additional taxes =$30,000 – $3,500 = $26,500
or by method 2:
Increase in net profit + additional depreciation = $6,500 + $20,000 = $26,500
or by method 3:
Increase in (revenues – cash expenses) × (1 – tax rate) + (additional depreciation × tax rate) = $30,000 × (1 – .35) + ($20,000 × .35) = $26,500
Example: Blooper IndustriesNow that we have examined many of the pieces of a cash-flow analysis, let’s try to putthem together into a coherent whole. As the newly appointed financial manager ofBlooper Industries, you are about to analyze a proposal for mining and selling a smalldeposit of high-grade magnoosium ore.4 You are given the forecasts shown in Table 4.3.We will walk through the lines in the table.
TABLE 4.3Profit projections forBlooper’s magnoosium mine(figures in thousands ofdollars)
Year: 0 1 2 3 4 5 6
1. Capital investment 10,0002. Working capital 1,500 4,075 4,279 4,493 4,717 3,039 03. Change in
working capital 1,500 2,575 204 214 225 –1,678 –3,0394. Revenues 15,000 15,750 16,538 17,364 18,2335. Expenses 10,000 10,500 11,025 11,576 12,1556. Depreciation of
mining equipment 2,000 2,000 2,000 2,000 2,0007. Pretax profit 3,000 3,250 3,513 3,788 4,0788. Tax (35 percent) 1,050 1,138 1,229 1,326 1,4279. Profit after tax 1,950 2,113 2,283 2,462 2,651
4 Readers have inquired whether magnoosium is a real substance. Here, now, are the facts. Magnoosium wascreated in the early days of TV, when a splendid-sounding announcer closed a variety show by saying, “Thisprogram has been brought to you by Blooper Industries, proud producer of aleemium, magnoosium, andstool.” We forget the company, but the blooper really happened.
Note: Some entries subject to rounding error.
Using Discounted Cash-Flow Analysis to Make Investment Decisions 391
Capital Investment (line 1). The project requires an investment of $10 million inmining machinery. At the end of 5 years the machinery has no further value.
Working Capital (lines 2 and 3). Line 2 shows the level of working capital. As theproject gears up in the early years, working capital increases, but later in the project’slife, the investment in working capital is recovered.
Line 3 shows the change in working capital from year to year. Notice that in Years1–4 the change is positive; in these years the project requires a continuing investmentin working capital. Starting in Year 5 the change is negative; there is a disinvestment asworking capital is recovered.
Revenues (line 4). The company expects to be able to sell 750,000 pounds of mag-noosium a year at a price of $20 a pound in Year 1. That points to initial revenues of750,000 × 20 = $15,000,000. But be careful; inflation is running at about 5 percent ayear. If magnoosium prices keep pace with inflation, you should up your forecast of thesecond-year revenues by 5 percent. Third-year revenues should increase by a further 5percent, and so on. Line 4 in Table 4.3 shows revenues rising in line with inflation.
The sales forecasts in Table 4.3 are cut off after 5 years. That makes sense if the oredeposit will run out at that time. But if Blooper could make sales for Year 6, you shouldinclude them in your forecasts. We have sometimes encountered financial managerswho assume a project life of (say) 5 years, even when they confidently expect revenuesfor 10 years or more. When asked the reason, they explain that forecasting beyond 5years is too hazardous. We sympathize, but you just have to do your best. Do not arbi-trarily truncate a project’s life.
Expenses (line 5). We assume that the expenses of mining and refining also increasein line with inflation at 5 percent a year.
Depreciation (line 6). The company applies straight-line depreciation to the min-ing equipment over 5 years. This means that it deducts one-fifth of the initial $10 mil-lion investment from profits. Thus line 6 shows that the annual depreciation deductionis $2 million.
Pretax Profit (line 7). Pretax profit equals (revenues – expenses – depreciation).
Tax (line 8). Company taxes are 35 percent of pretax profits. For example, in Year 1,
Tax = .35 × 3,000 = 1,050, or $1,050,000
Profit after Tax (line 9). Profit after tax equals pretax profit less taxes.
CALCULATING BLOOPER’S PROJECT CASH FLOWS
Table 4.3 provides all the information you need to figure out the cash flows on the mag-noosium project. In Table 4.4 we use this information to set out the project cash flows.
Capital Investment. Investment in plant and equipment is taken from line 1 of Table4.3. Blooper’s initial investment is a negative cash flow of –$10 million.
STRAIGHT-LINEDEPRECIATIONConstant depreciation foreach year of the asset’saccounting life.
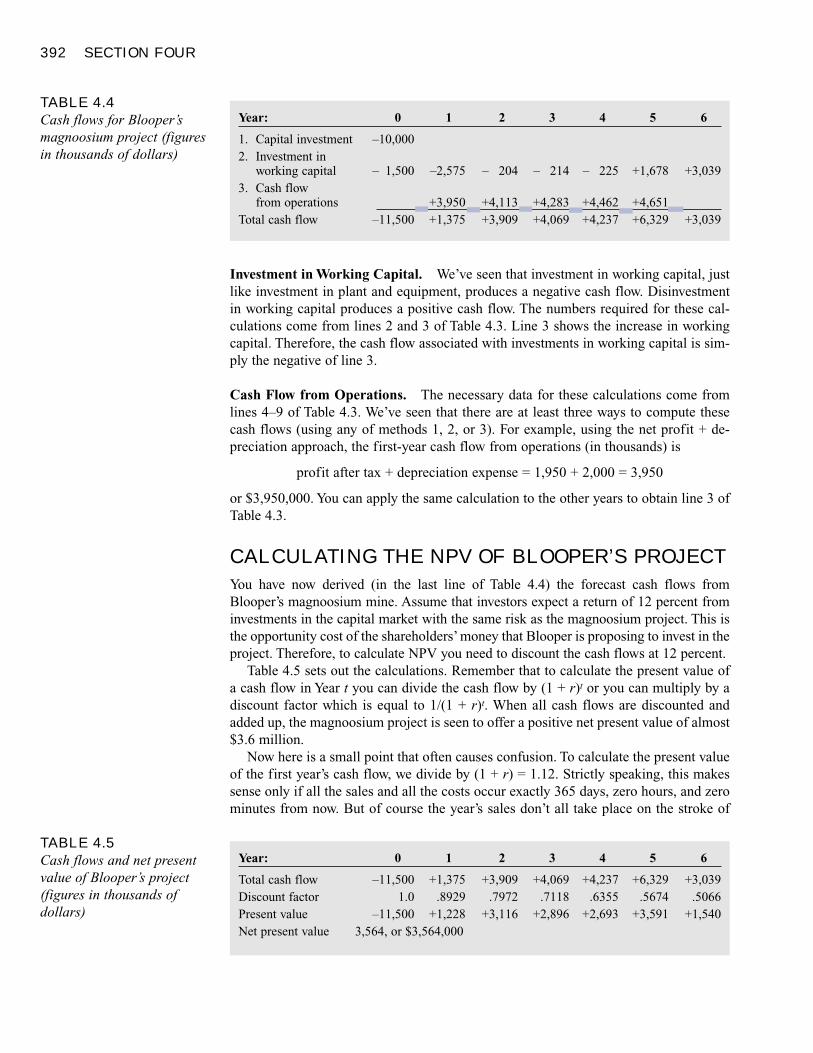
392 SECTION FOUR
Investment in Working Capital. We’ve seen that investment in working capital, justlike investment in plant and equipment, produces a negative cash flow. Disinvestmentin working capital produces a positive cash flow. The numbers required for these cal-culations come from lines 2 and 3 of Table 4.3. Line 3 shows the increase in workingcapital. Therefore, the cash flow associated with investments in working capital is sim-ply the negative of line 3.
Cash Flow from Operations. The necessary data for these calculations come fromlines 4–9 of Table 4.3. We’ve seen that there are at least three ways to compute thesecash flows (using any of methods 1, 2, or 3). For example, using the net profit + de-preciation approach, the first-year cash flow from operations (in thousands) is
profit after tax + depreciation expense = 1,950 + 2,000 = 3,950
or $3,950,000. You can apply the same calculation to the other years to obtain line 3 ofTable 4.3.
CALCULATING THE NPV OF BLOOPER’S PROJECT
You have now derived (in the last line of Table 4.4) the forecast cash flows fromBlooper’s magnoosium mine. Assume that investors expect a return of 12 percent frominvestments in the capital market with the same risk as the magnoosium project. This isthe opportunity cost of the shareholders’ money that Blooper is proposing to invest in theproject. Therefore, to calculate NPV you need to discount the cash flows at 12 percent.
Table 4.5 sets out the calculations. Remember that to calculate the present value ofa cash flow in Year t you can divide the cash flow by (1 + r)t or you can multiply by adiscount factor which is equal to 1/(1 + r)t. When all cash flows are discounted andadded up, the magnoosium project is seen to offer a positive net present value of almost$3.6 million.
Now here is a small point that often causes confusion. To calculate the present valueof the first year’s cash flow, we divide by (1 + r) = 1.12. Strictly speaking, this makessense only if all the sales and all the costs occur exactly 365 days, zero hours, and zerominutes from now. But of course the year’s sales don’t all take place on the stroke of
TABLE 4.4Cash flows for Blooper’smagnoosium project (figuresin thousands of dollars)
Year: 0 1 2 3 4 5 6
1. Capital investment –10,0002. Investment in
working capital – 1,500 –2,575 – 204 – 214 – 225 +1,678 +3,0393. Cash flow
from operations +3,950 +4,113 +4,283 +4,462 +4,651Total cash flow –11,500 +1,375 +3,909 +4,069 +4,237 +6,329 +3,039
TABLE 4.5Cash flows and net presentvalue of Blooper’s project(figures in thousands ofdollars)
Year: 0 1 2 3 4 5 6
Total cash flow –11,500 +1,375 +3,909 +4,069 +4,237 +6,329 +3,039Discount factor 1.0 .8929 .7972 .7118 .6355 .5674 .5066Present value –11,500 +1,228 +3,116 +2,896 +2,693 +3,591 +1,540Net present value 3,564, or $3,564,000
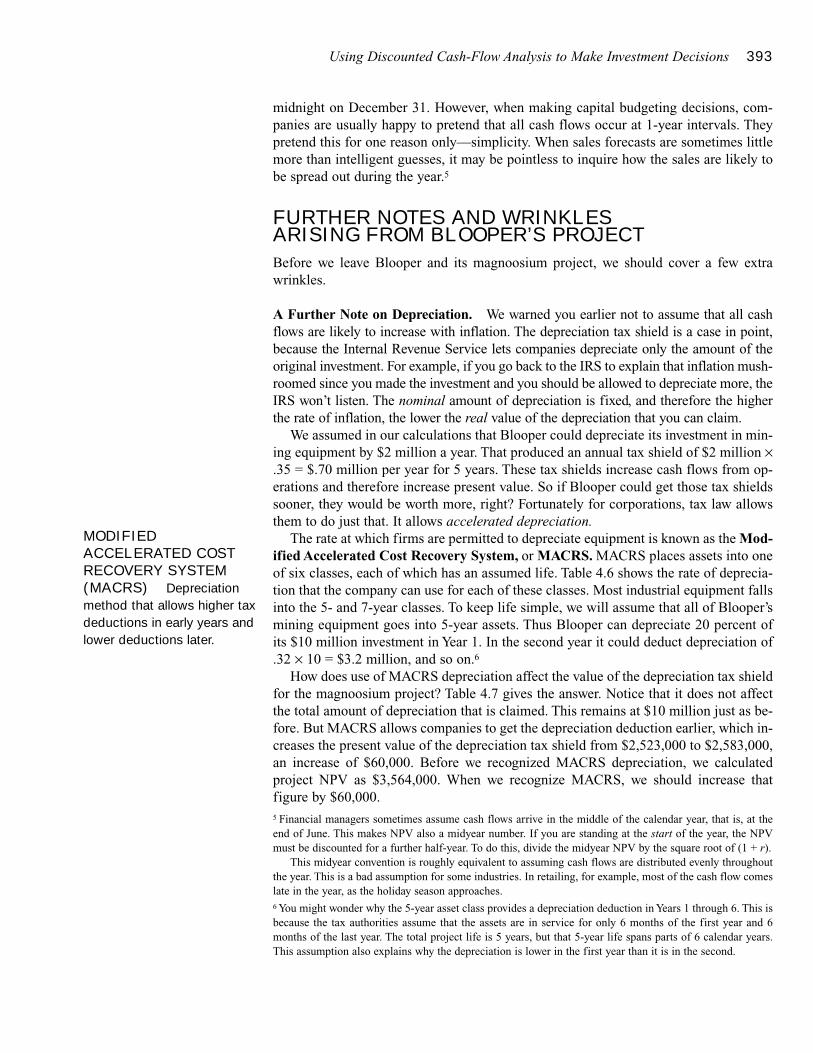
Using Discounted Cash-Flow Analysis to Make Investment Decisions 393
midnight on December 31. However, when making capital budgeting decisions, com-panies are usually happy to pretend that all cash flows occur at 1-year intervals. Theypretend this for one reason only—simplicity. When sales forecasts are sometimes littlemore than intelligent guesses, it may be pointless to inquire how the sales are likely tobe spread out during the year.5
FURTHER NOTES AND WRINKLES ARISING FROM BLOOPER’S PROJECT
Before we leave Blooper and its magnoosium project, we should cover a few extra wrinkles.
A Further Note on Depreciation. We warned you earlier not to assume that all cashflows are likely to increase with inflation. The depreciation tax shield is a case in point,because the Internal Revenue Service lets companies depreciate only the amount of theoriginal investment. For example, if you go back to the IRS to explain that inflation mush-roomed since you made the investment and you should be allowed to depreciate more, theIRS won’t listen. The nominal amount of depreciation is fixed, and therefore the higherthe rate of inflation, the lower the real value of the depreciation that you can claim.
We assumed in our calculations that Blooper could depreciate its investment in min-ing equipment by $2 million a year. That produced an annual tax shield of $2 million ×.35 = $.70 million per year for 5 years. These tax shields increase cash flows from op-erations and therefore increase present value. So if Blooper could get those tax shieldssooner, they would be worth more, right? Fortunately for corporations, tax law allowsthem to do just that. It allows accelerated depreciation.
The rate at which firms are permitted to depreciate equipment is known as the Mod-ified Accelerated Cost Recovery System, or MACRS. MACRS places assets into oneof six classes, each of which has an assumed life. Table 4.6 shows the rate of deprecia-tion that the company can use for each of these classes. Most industrial equipment fallsinto the 5- and 7-year classes. To keep life simple, we will assume that all of Blooper’smining equipment goes into 5-year assets. Thus Blooper can depreciate 20 percent ofits $10 million investment in Year 1. In the second year it could deduct depreciation of.32 × 10 = $3.2 million, and so on.6
How does use of MACRS depreciation affect the value of the depreciation tax shieldfor the magnoosium project? Table 4.7 gives the answer. Notice that it does not affectthe total amount of depreciation that is claimed. This remains at $10 million just as be-fore. But MACRS allows companies to get the depreciation deduction earlier, which in-creases the present value of the depreciation tax shield from $2,523,000 to $2,583,000,an increase of $60,000. Before we recognized MACRS depreciation, we calculatedproject NPV as $3,564,000. When we recognize MACRS, we should increase that figure by $60,000.5 Financial managers sometimes assume cash flows arrive in the middle of the calendar year, that is, at theend of June. This makes NPV also a midyear number. If you are standing at the start of the year, the NPVmust be discounted for a further half-year. To do this, divide the midyear NPV by the square root of (1 + r).
This midyear convention is roughly equivalent to assuming cash flows are distributed evenly throughoutthe year. This is a bad assumption for some industries. In retailing, for example, most of the cash flow comeslate in the year, as the holiday season approaches.6 You might wonder why the 5-year asset class provides a depreciation deduction in Years 1 through 6. This isbecause the tax authorities assume that the assets are in service for only 6 months of the first year and 6months of the last year. The total project life is 5 years, but that 5-year life spans parts of 6 calendar years.This assumption also explains why the depreciation is lower in the first year than it is in the second.
MODIFIEDACCELERATED COSTRECOVERY SYSTEM(MACRS) Depreciationmethod that allows higher taxdeductions in early years andlower deductions later.
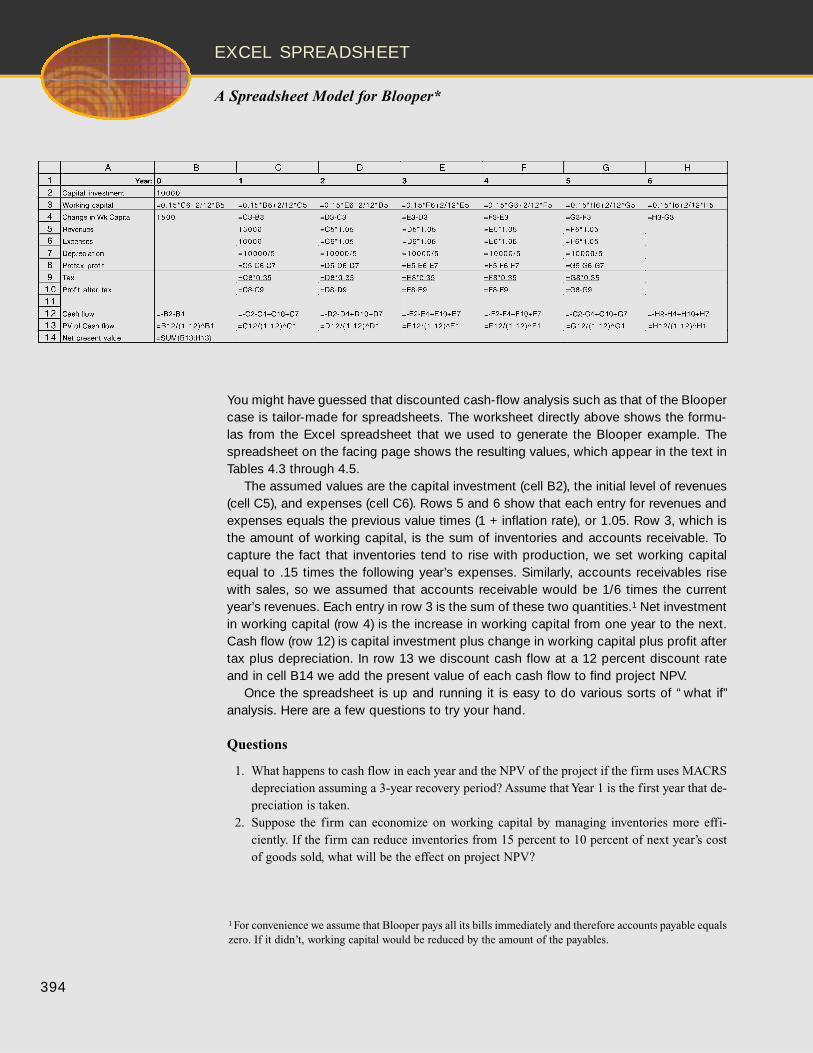
394
EXCEL SPREADSHEET
A Spreadsheet Model for Blooper*
You might have guessed that discounted cash-flow analysis such as that of the Bloopercase is tailor-made for spreadsheets. The worksheet directly above shows the formu-las from the Excel spreadsheet that we used to generate the Blooper example. Thespreadsheet on the facing page shows the resulting values, which appear in the text inTables 4.3 through 4.5.
The assumed values are the capital investment (cell B2), the initial level of revenues(cell C5), and expenses (cell C6). Rows 5 and 6 show that each entry for revenues andexpenses equals the previous value times (1 + inflation rate), or 1.05. Row 3, which isthe amount of working capital, is the sum of inventories and accounts receivable. Tocapture the fact that inventories tend to rise with production, we set working capitalequal to .15 times the following year’s expenses. Similarly, accounts receivables risewith sales, so we assumed that accounts receivable would be 1/6 times the currentyear’s revenues. Each entry in row 3 is the sum of these two quantities.1 Net investmentin working capital (row 4) is the increase in working capital from one year to the next.Cash flow (row 12) is capital investment plus change in working capital plus profit aftertax plus depreciation. In row 13 we discount cash flow at a 12 percent discount rateand in cell B14 we add the present value of each cash flow to find project NPV.
Once the spreadsheet is up and running it is easy to do various sorts of “ what if”analysis. Here are a few questions to try your hand.
Questions
1. What happens to cash flow in each year and the NPV of the project if the firm uses MACRSdepreciation assuming a 3-year recovery period? Assume that Year 1 is the first year that de-preciation is taken.
2. Suppose the firm can economize on working capital by managing inventories more effi-ciently. If the firm can reduce inventories from 15 percent to 10 percent of next year’s costof goods sold, what will be the effect on project NPV?
1 For convenience we assume that Blooper pays all its bills immediately and therefore accounts payable equalszero. If it didn’t, working capital would be reduced by the amount of the payables.
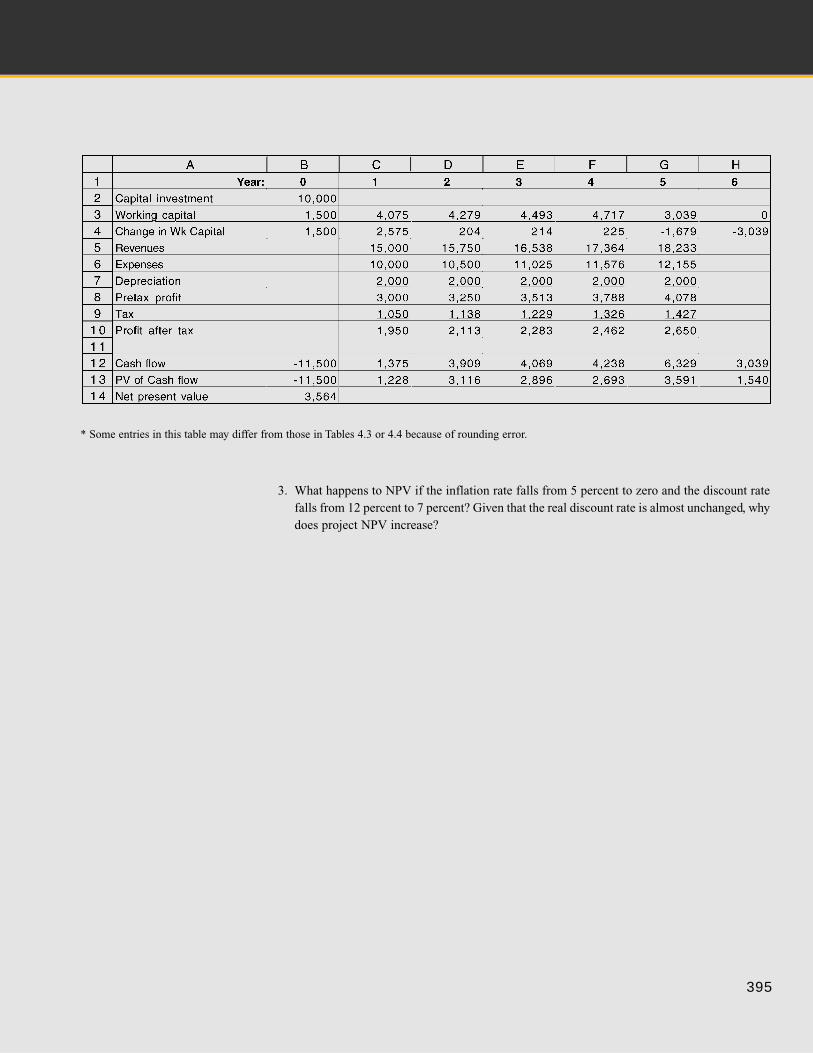
395
3. What happens to NPV if the inflation rate falls from 5 percent to zero and the discount ratefalls from 12 percent to 7 percent? Given that the real discount rate is almost unchanged, whydoes project NPV increase?
* Some entries in this table may differ from those in Tables 4.3 or 4.4 because of rounding error.
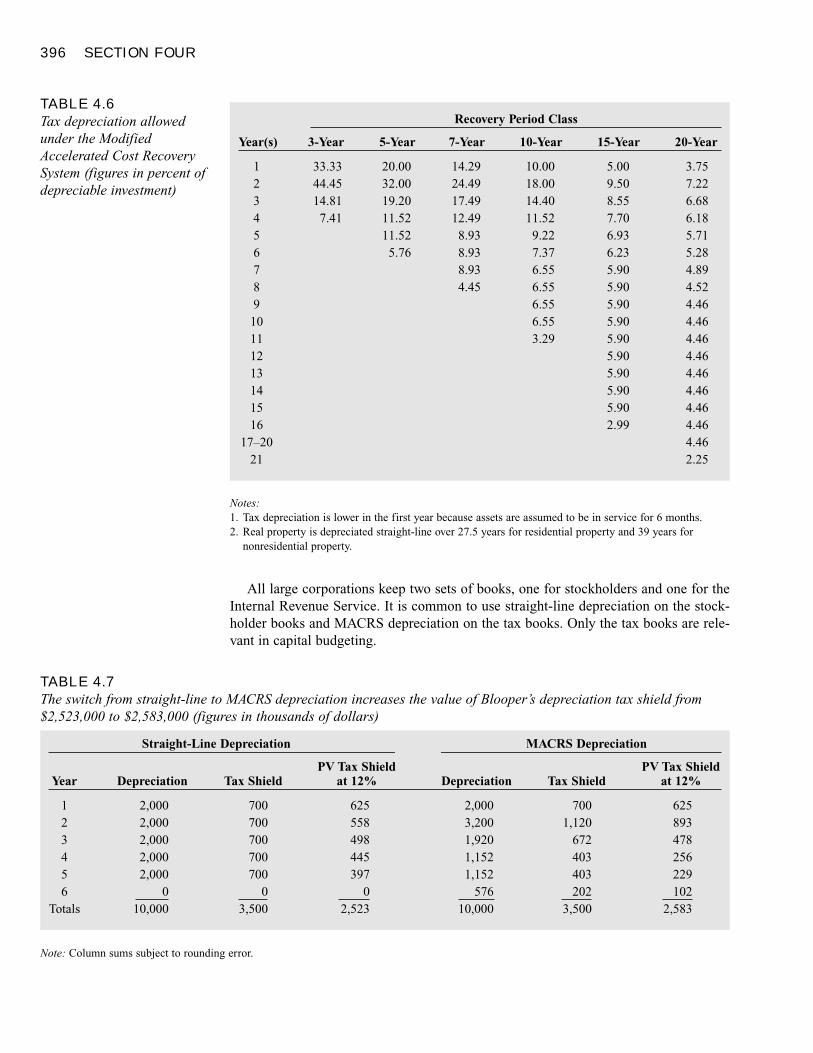
396 SECTION FOUR
All large corporations keep two sets of books, one for stockholders and one for theInternal Revenue Service. It is common to use straight-line depreciation on the stock-holder books and MACRS depreciation on the tax books. Only the tax books are rele-vant in capital budgeting.
TABLE 4.6Tax depreciation allowedunder the ModifiedAccelerated Cost RecoverySystem (figures in percent ofdepreciable investment)
Recovery Period Class
Year(s) 3-Year 5-Year 7-Year 10-Year 15-Year 20-Year
1 33.33 20.00 14.29 10.00 5.00 3.752 44.45 32.00 24.49 18.00 9.50 7.223 14.81 19.20 17.49 14.40 8.55 6.684 7.41 11.52 12.49 11.52 7.70 6.185 11.52 8.93 9.22 6.93 5.716 5.76 8.93 7.37 6.23 5.287 8.93 6.55 5.90 4.898 4.45 6.55 5.90 4.529 6.55 5.90 4.4610 6.55 5.90 4.4611 3.29 5.90 4.4612 5.90 4.4613 5.90 4.4614 5.90 4.4615 5.90 4.4616 2.99 4.46
17–20 4.4621 2.25
Notes:1. Tax depreciation is lower in the first year because assets are assumed to be in service for 6 months.2. Real property is depreciated straight-line over 27.5 years for residential property and 39 years for
nonresidential property.
TABLE 4.7The switch from straight-line to MACRS depreciation increases the value of Blooper’s depreciation tax shield from$2,523,000 to $2,583,000 (figures in thousands of dollars)
Straight-Line Depreciation MACRS Depreciation
PV Tax Shield PV Tax ShieldYear Depreciation Tax Shield at 12% Depreciation Tax Shield at 12%
1 2,000 700 625 2,000 700 6252 2,000 700 558 3,200 1,120 8933 2,000 700 498 1,920 672 4784 2,000 700 445 1,152 403 2565 2,000 700 397 1,152 403 2296 0 0 0 576 202 102
Totals 10,000 3,500 2,523 10,000 3,500 2,583
Note: Column sums subject to rounding error.
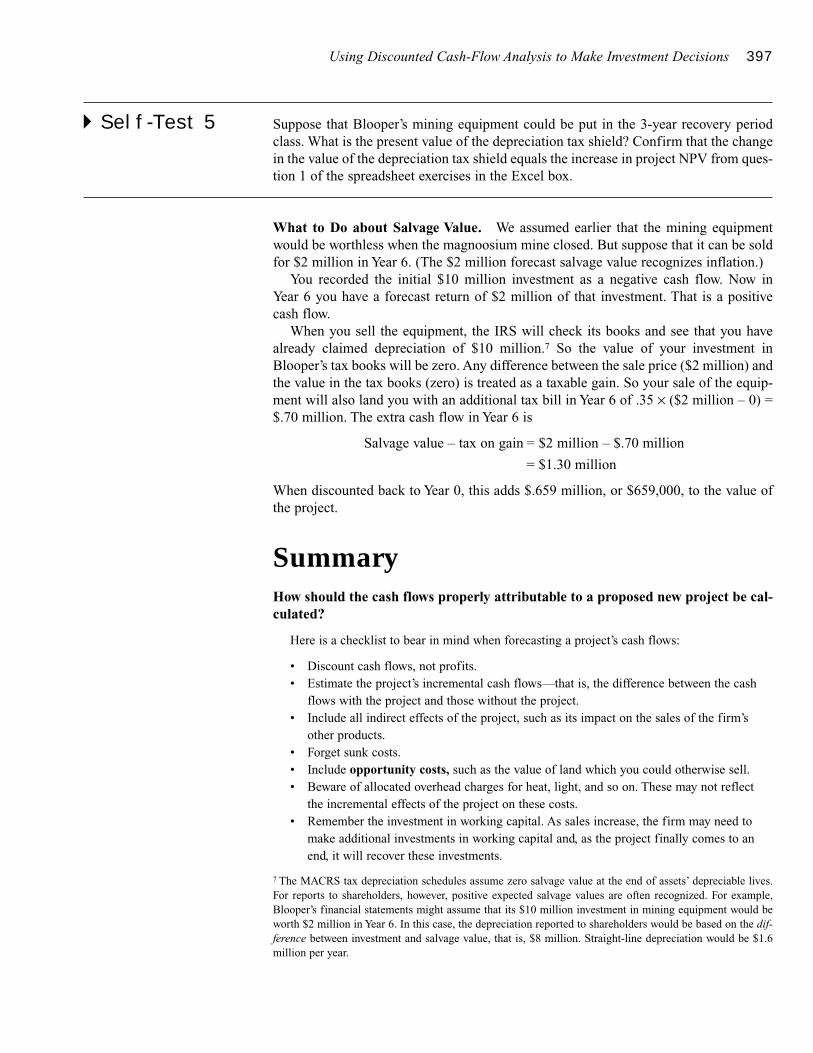
Using Discounted Cash-Flow Analysis to Make Investment Decisions 397
� Self-Test 5 Suppose that Blooper’s mining equipment could be put in the 3-year recovery periodclass. What is the present value of the depreciation tax shield? Confirm that the changein the value of the depreciation tax shield equals the increase in project NPV from ques-tion 1 of the spreadsheet exercises in the Excel box.
What to Do about Salvage Value. We assumed earlier that the mining equipmentwould be worthless when the magnoosium mine closed. But suppose that it can be soldfor $2 million in Year 6. (The $2 million forecast salvage value recognizes inflation.)
You recorded the initial $10 million investment as a negative cash flow. Now in Year 6 you have a forecast return of $2 million of that investment. That is a positive cash flow.
When you sell the equipment, the IRS will check its books and see that you have already claimed depreciation of $10 million.7 So the value of your investment inBlooper’s tax books will be zero. Any difference between the sale price ($2 million) andthe value in the tax books (zero) is treated as a taxable gain. So your sale of the equip-ment will also land you with an additional tax bill in Year 6 of .35 × ($2 million – 0) =$.70 million. The extra cash flow in Year 6 is
Salvage value – tax on gain = $2 million – $.70 million
= $1.30 million
When discounted back to Year 0, this adds $.659 million, or $659,000, to the value ofthe project.
SummaryHow should the cash flows properly attributable to a proposed new project be cal-culated?
Here is a checklist to bear in mind when forecasting a project’s cash flows:
• Discount cash flows, not profits.• Estimate the project’s incremental cash flows—that is, the difference between the cash
flows with the project and those without the project.• Include all indirect effects of the project, such as its impact on the sales of the firm’s
other products.• Forget sunk costs.• Include opportunity costs, such as the value of land which you could otherwise sell.• Beware of allocated overhead charges for heat, light, and so on. These may not reflect
the incremental effects of the project on these costs.• Remember the investment in working capital. As sales increase, the firm may need to
make additional investments in working capital and, as the project finally comes to anend, it will recover these investments.
7 The MACRS tax depreciation schedules assume zero salvage value at the end of assets’ depreciable lives.For reports to shareholders, however, positive expected salvage values are often recognized. For example,Blooper’s financial statements might assume that its $10 million investment in mining equipment would beworth $2 million in Year 6. In this case, the depreciation reported to shareholders would be based on the dif-ference between investment and salvage value, that is, $8 million. Straight-line depreciation would be $1.6million per year.
398 SECTION FOUR
• Do not include debt interest or the cost of repaying a loan. When calculating NPV,assume that the project is financed entirely by the shareholders and that they receive allthe cash flows. This isolates the investment decision from the financing decision.
How can the cash flows of a project be computed from standard financial state-ments?
Project cash flow does not equal profit. You must allow for changes in working capital aswell as noncash expenses such as depreciation. Also, if you use a nominal cost of capital,consistency requires that you forecast nominal cash flows—that is, cash flows that recognizethe effect of inflation.
How is the company’s tax bill affected by depreciation and how does this affectproject value?
Depreciation is not a cash flow. However, because depreciation reduces taxable income, itreduces taxes. This tax reduction is called the depreciation tax shield. ModifiedAccelerated Cost Recovery System (MACRS) depreciation schedules allow more of thedepreciation allowance to be taken in early years than under straight-line depreciation.This increases the present value of the tax shield.
How do changes in working capital affect project cash flows?
Increases in net working capital such as accounts receivable or inventory are investments,and therefore use cash—that is, they reduce the net cash flow provided by the project in thatperiod. When working capital is run down, cash is freed up, so cash flow increases.
www-ec.njit.edu/~mathis/interactive/FCCalcBase4.html A net present value calculator fromProfessor Roswell Mathis
www.4pm.com/articles/palette.html Try the on-line demonstration here to see how good busi-ness judgment is used to formulate cash-flow projections
www.irs.ustreas.gov/prod/bus_info/index.html Tax rules affecting project cash flows can befound here
opportunity costnet working capitaldepreciation tax shield
Modified AcceleratedCost Recovery System(MACRS)
straight-line depreciation
1. Cash Flows. A new project will generate sales of $74 million, costs of $42 million, and de-preciation expense of $10 million in the coming year. The firm’s tax rate is 35 percent. Cal-culate cash flow for the year using all three methods discussed and confirm that they areequal.
2. Cash Flows. Canyon Tours showed the following components of working capital last year:
Beginning End of Year
Accounts receivable $24,000 $22,500Inventory 12,000 13,000Accounts payable 14,500 16,500
Related WebLinks
Key Terms
Quiz
Using Discounted Cash-Flow Analysis to Make Investment Decisions 399
a. What was the change in net working capital during the year?b. If sales were $36,000 and costs were $24,000, what was cash flow for the year? Ignore
taxes.
3. Cash Flows. Tubby Toys estimates that its new line of rubber ducks will generate sales of$7 million, operating costs of $4 million, and a depreciation expense of $1 million. If the taxrate is 40 percent, what is the firm’s operating cash flow? Show that you get the same an-swer using all three methods to calculate operating cash flow.
4. Cash Flows. We’ve emphasized that the firm should pay attention only to cash flows whenassessing the net present value of proposed projects. Depreciation is a noncash expense.Why then does it matter whether we assume straight-line or MACRS depreciation when weassess project NPV?
5. Proper Cash Flows. Quick Computing currently sells 10 million computer chips each year at a price of $20 per chip. It is about to introduce a new chip, and it forecasts annualsales of 12 million of these improved chips at a price of $25 each. However, demand for the old chip will decrease, and sales of the old chip are expected to fall to 3 million per year. The old chip costs $6 each to manufacture, and the new ones will cost $8 each. Whatis the proper cash flow to use to evaluate the present value of the introduction of the newchip?
6. Calculating Net Income. The owner of a bicycle repair shop forecasts revenues of $160,000a year. Variable costs will be $45,000, and rental costs for the shop are $35,000 a year. De-preciation on the repair tools will be $10,000. Prepare an income statement for the shopbased on these estimates. The tax rate is 35 percent.
7. Cash Flows. Calculate the operating cash flow for the repair shop in the previous problemusing all three methods suggested in the material: (a) net income plus depreciation; (b) cashinflow/cash outflow analysis; and (c) the depreciation tax shield approach. Confirm that allthree approaches result in the same value for cash flow.
8. Cash Flows and Working Capital. A house painting business had revenues of $16,000 andexpenses of $9,000. There were no depreciation expenses. However, the business reportedthe following changes in various components of working capital:
Beginning End
Accounts receivable $1,200 $4,500Accounts payable 600 200
Calculate net cash flow for the business for this period.9. Incremental Cash Flows. A corporation donates a valuable painting from its private col-
lection to an art museum. Which of the following are incremental cash flows associated withthe donation?
a. The price the firm paid for the painting.b. The current market value of the painting.c. The deduction from income that it declares for its charitable gift.d. The reduction in taxes due to its declared tax deduction.
10. Operating Cash Flows. Laurel’s Lawn Care, Ltd., has a new mower line that can generaterevenues of $120,000 per year. Direct production costs are $40,000 and the fixed costs of maintaining the lawn mower factory are $15,000 a year. The factory originally cost $1 million and is being depreciated for tax purposes over 25 years using straight-line de-preciation. Calculate the operating cash flows of the project if the firm’s tax bracket is 35percent.
400 SECTION FOUR
11. Operating Cash Flows. Talia’s Tutus bought a new sewing machine for $40,000 that will bedepreciated using the MACRS depreciation schedule for a 5-year recovery period.
a. Find the depreciation charge each year.b. If the sewing machine is sold after 3 years for $20,000, what will be the after-tax pro-
ceeds on the sale if the firm’s tax bracket is 35 percent?
12. Proper Cash Flows. Conference Services Inc. has leased a large office building for $4 mil-lion per year. The building is larger than the company needs: two of the building’s eight sto-ries are almost empty. A manager wants to expand one of her projects, but this will requireusing one of the empty floors. In calculating the net present value of the proposed expan-sion, upper management allocates one-eighth of $4 million of building rental costs (i.e., $.5million) to the project expansion, reasoning that the project will use one-eighth of the build-ing’s capacity.
a. Is this a reasonable procedure for purposes of calculating NPV?b. Can you suggest a better way to assess a cost of the office space used by the project?
13. Cash Flows and Working Capital. A firm had net income last year of $1.2 million. Its de-preciation expenses were $.5 million, and its total cash flow was $1.2 million. What hap-pened to net working capital during the year?
14. Cash Flows and Working Capital. The only capital investment required for a small projectis investment in inventory. Profits this year were $10,000, and inventory increased from$4,000 to $5,000. What was the cash flow from the project?
15. Cash Flows and Working Capital. A firm’s balance sheets for year-end 2000 and 2001contain the following data. What happened to investment in net working capital during2001? All items are in millions of dollars.
Dec. 31, 2000 Dec. 31, 2001
Accounts receivable 32 35Inventories 25 30Accounts payable 12 25
16. Salvage Value. Quick Computing (from problem 5) installed its previous generation of com-puter chip manufacturing equipment 3 years ago. Some of that older equipment will becomeunnecessary when the company goes into production of its new product. The obsolete equip-ment, which originally cost $40 million, has been depreciated straight line over an assumedtax life of 5 years, but it can be sold now for $18 million. The firm’s tax rate is 35 percent.What is the after-tax cash flow from the sale of the equipment?
17. Salvage Value. Your firm purchased machinery with a 7-year MACRS life for $10 million.The project, however, will end after 5 years. If the equipment can be sold for $4 million atthe completion of the project, and your firm’s tax rate is 35 percent, what is the after-tax cashflow from the sale of the machinery?
18. Depreciation and Project Value. Bottoms Up Diaper Service is considering the purchaseof a new industrial washer. It can purchase the washer for $6,000 and sell its old washer for$2,000. The new washer will last for 6 years and save $1,500 a year in expenses. The op-portunity cost of capital is 15 percent, and the firm’s tax rate is 40 percent.
a. If the firm uses straight-line depreciation to an assumed salvage value of zero over a 6-year life, what are the cash flows of the project in Years 0–6? The new washer will in facthave zero salvage value after 6 years, and the old washer is fully depreciated.
b. What is project NPV?c. What will NPV be if the firm uses MACRS depreciation with a 5-year tax life?
PracticeProblems
Using Discounted Cash-Flow Analysis to Make Investment Decisions 401
19. Equivalent Annual Cost. What is the equivalent annual cost of the washer in the previousproblem if the firm uses straight-line depreciation?
20. Cash Flows and NPV. Johnny’s Lunches is considering purchasing a new, energy-efficientgrill. The grill will cost $20,000 and will be depreciated according to the 3-year MACRSschedule. It will be sold for scrap metal after 3 years for $5,000. The grill will have no effecton revenues but will save Johnny’s $10,000 in energy expenses. The tax rate is 35 percent.
a. What are the operating cash flows in Years 1–3?b. What are total cash flows in Years 1–3?c. If the discount rate is 12 percent, should the grill be purchased?
21. Project Evaluation. Revenues generated by a new fad product are forecast as follows:
Year Revenues
1 $40,0002 30,0003 20,0004 10,000
Thereafter 0
Expenses are expected to be 40 percent of revenues, and working capital required in eachyear is expected to be 20 percent of revenues in the following year. The product requires animmediate investment of $50,000 in plant and equipment.
a. What is the initial investment in the product? Remember working capital.b. If the plant and equipment are depreciated over 4 years to a salvage value of zero using
straight-line depreciation, and the firm’s tax rate is 40 percent, what are the project cashflows in each year?
c. If the opportunity cost of capital is 10 percent, what is project NPV?d. What is project IRR?
22. Buy versus Lease. You can buy a car for $25,000 and sell it in 5 years for $5,000. Or youcan lease the car for 5 years for $5,000 a year. The discount rate is 10 percent per year.
a. Which option do you prefer?b. What is the maximum amount you should be willing to pay to lease rather than buy the
car?
23. Project Evaluation. Kinky Copies may buy a high-volume copier. The machine costs$100,000 and will be depreciated straight-line over 5 years to a salvage value of $20,000.Kinky anticipates that the machine actually can be sold in 5 years for $30,000. The machinewill save $20,000 a year in labor costs but will require an increase in working capital, mainlypaper supplies, of $10,000. The firm’s marginal tax rate is 35 percent. Should Kinky buy themachine?
24. Project Evaluation. Blooper Industries must replace its magnoosium purification system.Quick & Dirty Systems sells a relatively cheap purification system for $10 million. The sys-tem will last 5 years. Do-It-Right sells a sturdier but more expensive system for $12 million;it will last for 8 years. Both systems entail $1 million in operating costs; both will be de-preciated straight line to a final value of zero over their useful lives; neither will have anysalvage value at the end of its life. The firm’s tax rate is 35 percent, and the discount rate is12 percent. Which system should Blooper install?
25. Project Evaluation. The following table presents sales forecasts for Golden Gelt Giftware.The unit price is $40. The unit cost of the giftware is $25.
402 SECTION FOUR
Year Unit Sales
1 22,0002 30,0003 14,0004 5,000
Thereafter 0
It is expected that net working capital will amount to 25 percent of sales in the followingyear. For example, the store will need an initial (Year 0) investment in working capital of .25× 22,000 × $40 = $220,000. Plant and equipment necessary to establish the Giftware busi-ness will require an additional investment of $200,000. This investment will be depreciatedusing MACRS and a 3-year life. After 4 years, the equipment will have an economic andbook value of zero. The firm’s tax rate is 35 percent. What is the net present value of theproject? The discount rate is 20 percent.
26. Project Evaluation. Ilana Industries, Inc., needs a new lathe. It can buy a new high-speedlathe for $1 million. The lathe will cost $35,000 to run, will save the firm $125,000 in laborcosts, and will be useful for 10 years. Suppose that for tax purposes, the lathe will be de-preciated on a straight-line basis over its 10-year life to a salvage value of $100,000. The ac-tual market value of the lathe at that time also will be $100,000. The discount rate is 10 per-cent and the corporate tax rate is 35 percent. What is the NPV of buying the new lathe?
27. Project Evaluation. The efficiency gains resulting from a just-in-time inventory manage-ment system will allow a firm to reduce its level of inventories permanently by $250,000.What is the most the firm should be willing to pay for installing the system?
28. Project Evaluation. Better Mousetraps has developed a new trap. It can go into productionfor an initial investment in equipment of $6 million. The equipment will be depreciatedstraight line over 5 years to a value of zero, but in fact it can be sold after 5 years for$500,000. The firm believes that working capital at each date must be maintained at a levelof 10 percent of next year’s forecast sales. The firm estimates production costs equal to$1.50 per trap and believes that the traps can be sold for $4 each. Sales forecasts are givenin the following table. The project will come to an end in 5 years, when the trap becomestechnologically obsolete. The firm’s tax bracket is 35 percent, and the required rate of returnon the project is 12 percent. What is project NPV?
Year: 0 1 2 3 4 5 Thereafter
Sales (millions of traps) 0 .5 .6 1.0 1.0 .6 0
29. Working Capital Management. Return to the previous problem. Suppose the firm can cutits requirements for working capital in half by using better inventory control systems. Byhow much will this increase project NPV?
30. Project Evaluation. PC Shopping Network may upgrade its modem pool. It last upgraded2 years ago, when it spent $115 million on equipment with an assumed life of 5 years andan assumed salvage value of $15 million for tax purposes. The firm uses straight-line de-preciation. The old equipment can be sold today for $80 million. A new modem pool can beinstalled today for $150 million. This will have a 3-year life, and will be depreciated to zerousing straight-line depreciation. The new equipment will enable the firm to increase sales by$25 million per year and decrease operating costs by $10 million per year. At the end of 3years, the new equipment will be worthless. Assume the firm’s tax rate is 35 percent and thediscount rate for projects of this sort is 12 percent.
ChallengeProblems
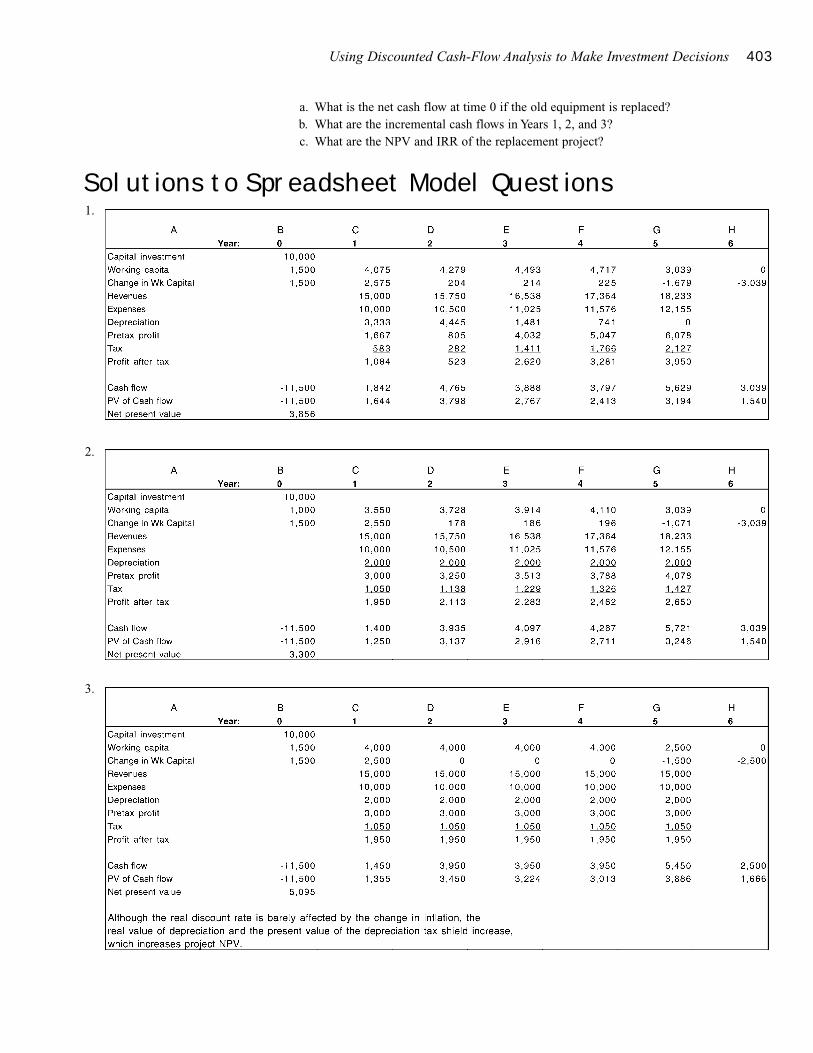
Using Discounted Cash-Flow Analysis to Make Investment Decisions 403
a. What is the net cash flow at time 0 if the old equipment is replaced?b. What are the incremental cash flows in Years 1, 2, and 3?c. What are the NPV and IRR of the replacement project?
1.
2.
3.
Solutions to Spreadsheet Model Questions
404 SECTION FOUR
1 Remember, discount cash flows, not profits. Each tewgit machine costs $250,000 right away.Recognize that outlay, but forget accounting depreciation. Cash flows per machine are:
Year: 0 1 2 3 4 5
Investment(outflow) –250,000Sales 250,000 300,000 300,000 250,000 250,000Operatingexpenses –200,000 –200,000 –200,000 –200,000 –200,000Cash flow –250,000 + 50,000 +100,000 +100,000 + 50,000 + 50,000
Each machine is forecast to generate $50,000 of cash flow in Years 4 and 5. Thus it makessense to keep operating for 5 years.
2 a,b. The site and buildings could have been sold or put to another use. Their values are op-portunity costs, which should be treated as incremental cash outflows.
c. Demolition costs are incremental cash outflows.d. The cost of the access road is sunk and not incremental.e. Lost cash flows from other projects are incremental cash outflows.f. Depreciation is not a cash expense and should not be included, except as it affects taxes.
(Taxes are discussed later in this material.)3 Actual health costs will be increasing at about 7 percent a year.
Year 1 2 3 4
Cost per worker $2,400 $2,568 $2,748 $2,940
The present value at 10 percent is $9,214 if the first payment is made immediately. If it isdelayed a year, present value falls to $8,377.
4 The tax rate is T = 35 percent. Taxes paid will be
T × (revenue – expenses – depreciation) = .35 × (600 – 300 – 200) = $35
Operating cash flow can be calculated as follows.
a. Revenue – expenses – taxes = 600 – 300 – 35 = $265b. Net profit + depreciation = (600 – 300 – 200 – 35) + 200
= 65 + 200 = 265c. (Revenues – cash expenses) × (1 – tax rate) + (depreciation × tax rate)
= (600 – 300) × (1 – .35) + (200 × .35) = 265
5 MACRS 3-Year PV Tax ShieldYear Depreciation Tax Shield at 12%
1 3,333 1,167 1,0422 4,445 1,556 1,2403 1,481 518 3694 741 259 165
Totals 10,000 3,500 2,816
The present value increases to 2,816, or $2,816,000.
Using Discounted Cash-Flow Analysis to Make Investment Decisions 405
MINICASEJack Tar, CFO of Sheetbend & Halyard, Inc., opened the company-confidential envelope. It contained a draft of a com-petitive bid for a contract to supply duffel canvas to the U.S.Navy. The cover memo from Sheetbend’s CEO asked Mr. Tar toreview the bid before it was submitted.
The bid and its supporting documents had been prepared bySheetbend’s sales staff. It called for Sheetbend to supply 100,000yards of duffel canvas per year for 5 years. The proposed sellingprice was fixed at $30 per yard.
Mr. Tar was not usually involved in sales, but this bid was un-usual in at least two respects. First, if accepted by the navy, itwould commit Sheetbend to a fixed price, long-term contract.Second, producing the duffel canvas would require an investmentof $1.5 million to purchase machinery and to refurbish Sheet-bend’s plant in Pleasantboro, Maine.
Mr. Tar set to work and by the end of the week had collectedthe following facts and assumptions:
• The plant in Pleasantboro had been built in the early 1900sand is now idle. The plant was fully depreciated on Sheet-bend’s books, except for the purchase cost of the land (in1947) of $10,000.
• Now that the land was valuable shorefront property, Mr. Tarthought the land and the idle plant could be sold, immediatelyor in the future, for $600,000.
• Refurbishing the plant would cost $500,000. This investmentwould be depreciated for tax purposes on the 10-year MACRSschedule.
• The new machinery would cost $1 million. This investmentcould be depreciated on the 5-year MACRS schedule.
• The refurbished plant and new machinery would last for manyyears. However, the remaining market for duffel canvas wassmall, and it was not clear that additional orders could be ob-tained once the navy contract was finished. The machinerywas custom built and could be used only for duffel canvas. Itssecond-hand value at the end of 5 years was probably zero.
• Table 4.8 shows the sales staff’s forecasts of income from thenavy contract. Mr. Tar reviewed this forecast and decided thatits assumptions were reasonable, except that the forecast usedbook, not tax, depreciation.
• But the forecast income statement contained no mention ofworking capital. Mr. Tar thought that working capital wouldaverage about 10 percent of sales.
Armed with this information, Mr. Tar constructed a spreadsheetto calculate the NPV of the duffel canvas project, assuming thatSheetbend’s bid would be accepted by the navy.
He had just finished debugging the spreadsheet when anotherconfidential envelope arrived from Sheetbend’s CEO. It con-tained a firm offer from a Maine real estate developer to purchaseSheetbend’s Pleasantboro land and plant for $1.5 million in cash.
Should Mr. Tar recommend submitting the bid to the navy atthe proposed price of $30 per yard? The discount rate for thisproject is 12 percent.
TABLE 4.8Forecasted income statementfor the navy duffel canvasproject (dollar figures inthousands, except price peryard)
Year 1 2 3 4 5
1. Yards sold 100.00 100.00 100.00 100.00 100.002. Price per yard 30.00 30.00 30.00 30.00 30.003. Revenue (1 × 2) 3,000.00 3,000.00 3,000.00 3,000.00 3,000.004. Cost of goods sold 2,100.00 2,184.00 2,271.36 2,362.21 2,456.705. Operating cash flow (3 – 4) 900.00 816.00 728.64 637.79 543.306. Depreciation 250.00 250.00 250.00 250.00 250.007. Income (5 – 6) 650.00 566.00 478.64 387.79 293.308. Tax at 35% 227.50 198.10 167.52 135.72 102.659. Net income (7 – 8) $422.50 $367.90 $311.12 $252.06 $190.64
Notes:1. Yards sold and price per yard would be fixed by contract.2. Cost of goods includes fixed cost of $300,000 per year plus variable costs of $18 per yard. Costs are
expected to increase at the inflation rate of 4 percent per year.3. Depreciation: A $1 million investment in machinery is depreciated straight-line over 5 years ($200,000
per year). The $500,000 cost of refurbishing the Pleasantboro plant is depreciated straight-line over 10years ($50,000 per year).
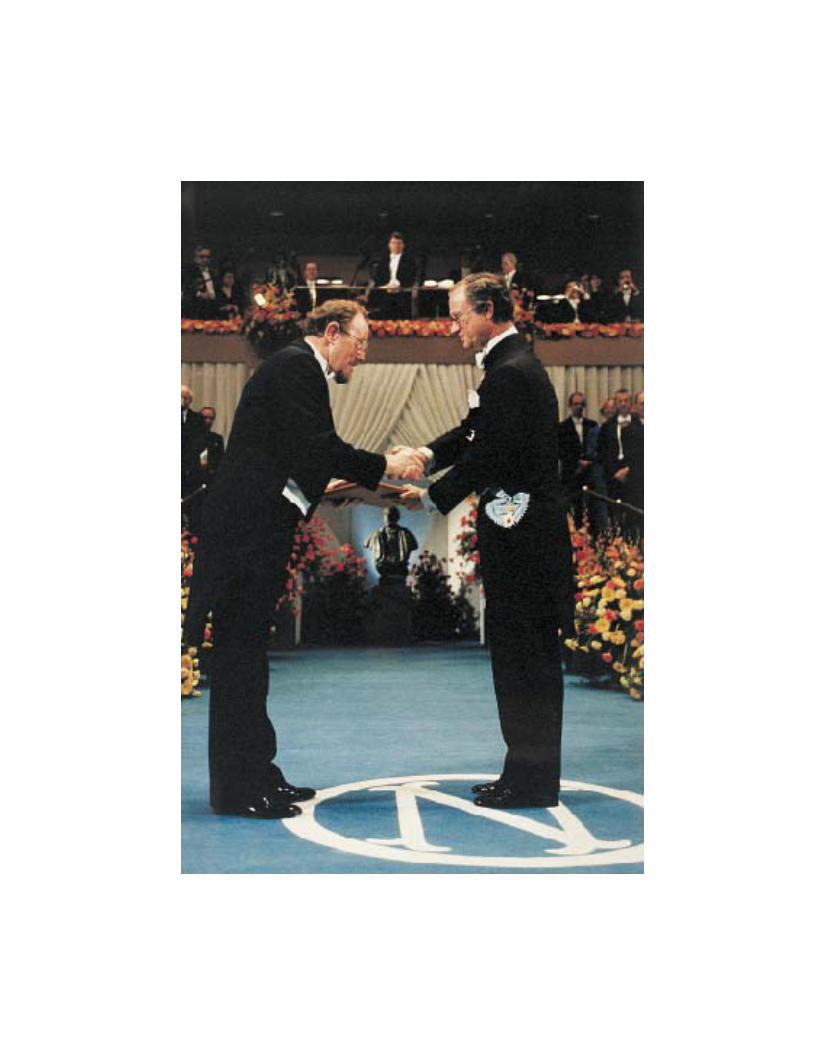
407
RISK, RETURN, ANDCAPITAL BUDGETING
Measuring Market RiskMeasuring Beta
Betas for MCI WorldCom and Exxon
Portfolio Betas
Risk and ReturnWhy the CAPM Works
The Security Market Line
How Well Does the CAPM Work?
Using the CAPM to Estimate Expected Returns
Capital Budgeting and Project RiskCompany versus Project Risk
Determinants of Project Risk
Don’t Add Fudge Factors to Discount Rates
Summary
Professor William F. Sharpe receiving the Nobel Prize in Economics.The prize was for Sharpe’s development of the capital asset pricing model. This model showshow risk should be measured and provides a formula relating risk to the opportunity cost ofcapital.Leif Jansson/Pica Pressfoto
arlier we began to come to grips with the topic of risk. We made the dis-
tinction between unique risk and macro, or market, risk. Unique risk
arises from events that affect only the individual firm or its immediate
competitors; it can be eliminated by diversification. But regardless of how
much you diversify, you cannot avoid the macroeconomic events that create market risk.
This is why investors do not require a higher rate of return to compensate for unique
risk but do need a higher return to persuade them to take on market risk.
How can you measure the market risk of a security or a project? We will see that
market risk is usually measured by the sensitivity of the investment’s returns to fluctu-
ations in the market. We will also see that the risk premium investors demand should be
proportional to this sensitivity. This relationship between risk and return is a useful way
to estimate the return that investors expect from investing in common stocks.
Finally, we will distinguish between the risk of the company’s securities and the risk
of an individual project. We will also consider what managers should do when the risk
of the project is different from that of the company’s existing business.
After studying this material you should be able to
� Measure and interpret the market risk, or beta, of a security.
� Relate the market risk of a security to the rate of return that investors demand.
� Calculate the opportunity cost of capital for a project.
408
E
Measuring Market RiskChanges in interest rates, government spending, monetary policy, oil prices, foreign ex-change rates, and other macroeconomic events affect almost all companies and the re-turns on almost all stocks. We can therefore assess the impact of “macro” news bytracking the rate of return on a market portfolio of all securities. If the market is up ona particular day, then the net impact of macroeconomic changes must be positive. Weknow the performance of the market reflects only macro events, because firm-specificevents—that is, unique risks—average out when we look at the combined performanceof thousands of companies and securities.
In principle the market portfolio should contain all assets in the world economy—not just stocks, but bonds, foreign securities, real estate, and so on. In practice, however,financial analysts make do with indexes of the stock market, usually the Standard &Poor’s Composite Index (the S&P 500).1
Our task here is to define and measure the risk of individual common stocks. Youcan probably see where we are headed. Risk depends on exposure to macroeconomicevents and can be measured as the sensitivity of a stock’s returns to fluctuations in re-turns on the market portfolio. This sensitivity is called the stock’s beta. Beta is oftenwritten as the Greek letter β.
1 We discussed the most popular stock market indexes in Section 9.2.
MARKET PORTFOLIOPortfolio of all assets in theeconomy. In practice a broadstock market index, such asthe Standard & Poor’sComposite, is used torepresent the market.
BETA Sensitivity of astock’s return to the returnon the market portfolio.
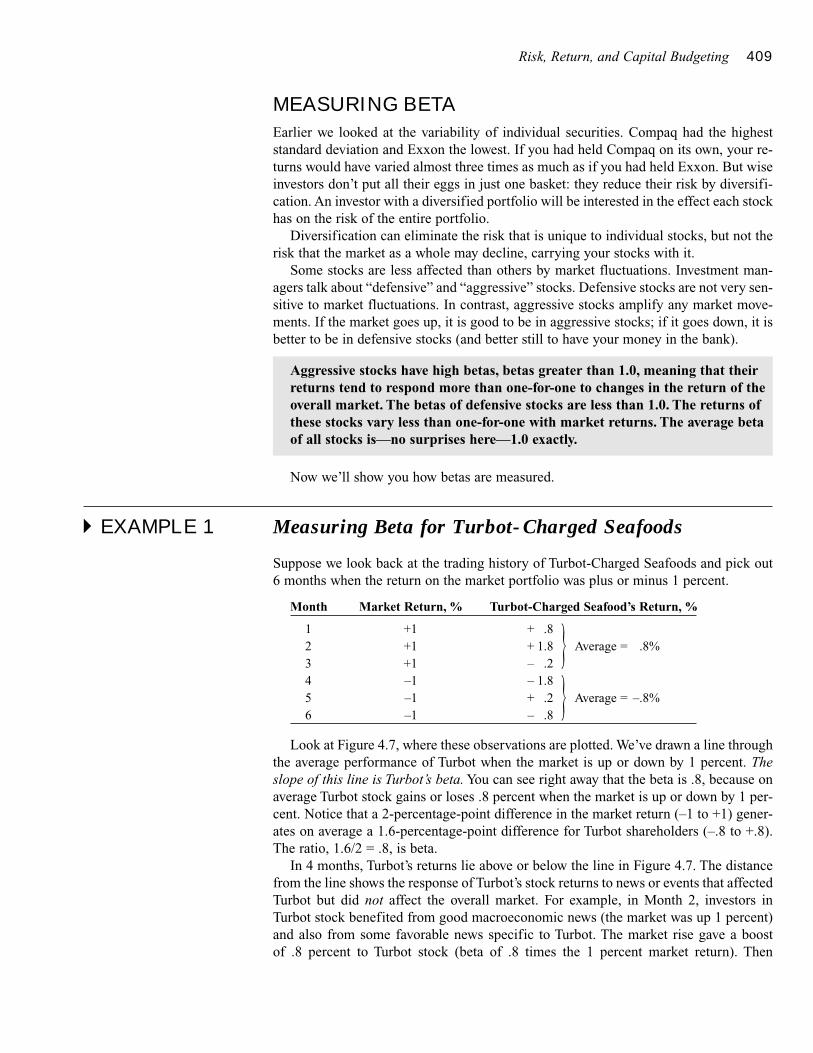
Risk, Return, and Capital Budgeting 409
MEASURING BETA
Earlier we looked at the variability of individual securities. Compaq had the higheststandard deviation and Exxon the lowest. If you had held Compaq on its own, your re-turns would have varied almost three times as much as if you had held Exxon. But wiseinvestors don’t put all their eggs in just one basket: they reduce their risk by diversifi-cation. An investor with a diversified portfolio will be interested in the effect each stockhas on the risk of the entire portfolio.
Diversification can eliminate the risk that is unique to individual stocks, but not therisk that the market as a whole may decline, carrying your stocks with it.
Some stocks are less affected than others by market fluctuations. Investment man-agers talk about “defensive” and “aggressive” stocks. Defensive stocks are not very sen-sitive to market fluctuations. In contrast, aggressive stocks amplify any market move-ments. If the market goes up, it is good to be in aggressive stocks; if it goes down, it isbetter to be in defensive stocks (and better still to have your money in the bank).
Now we’ll show you how betas are measured.
� EXAMPLE 1 Measuring Beta for Turbot-Charged Seafoods
Suppose we look back at the trading history of Turbot-Charged Seafoods and pick out6 months when the return on the market portfolio was plus or minus 1 percent.
Month Market Return, % Turbot-Charged Seafood’s Return, %
1 +1 + .82 +1 + 1.8 } Average = .8%3 +1 – .24 –1 – 1.85 –1 + .2 } Average = –.8%6 –1 – .8
Look at Figure 4.7, where these observations are plotted. We’ve drawn a line throughthe average performance of Turbot when the market is up or down by 1 percent. Theslope of this line is Turbot’s beta. You can see right away that the beta is .8, because onaverage Turbot stock gains or loses .8 percent when the market is up or down by 1 per-cent. Notice that a 2-percentage-point difference in the market return (–1 to +1) gener-ates on average a 1.6-percentage-point difference for Turbot shareholders (–.8 to +.8).The ratio, 1.6/2 = .8, is beta.
In 4 months, Turbot’s returns lie above or below the line in Figure 4.7. The distancefrom the line shows the response of Turbot’s stock returns to news or events that affectedTurbot but did not affect the overall market. For example, in Month 2, investors in Turbot stock benefited from good macroeconomic news (the market was up 1 percent)and also from some favorable news specific to Turbot. The market rise gave a boost of .8 percent to Turbot stock (beta of .8 times the 1 percent market return). Then
Aggressive stocks have high betas, betas greater than 1.0, meaning that theirreturns tend to respond more than one-for-one to changes in the return of theoverall market. The betas of defensive stocks are less than 1.0. The returns ofthese stocks vary less than one-for-one with market returns. The average betaof all stocks is—no surprises here—1.0 exactly.
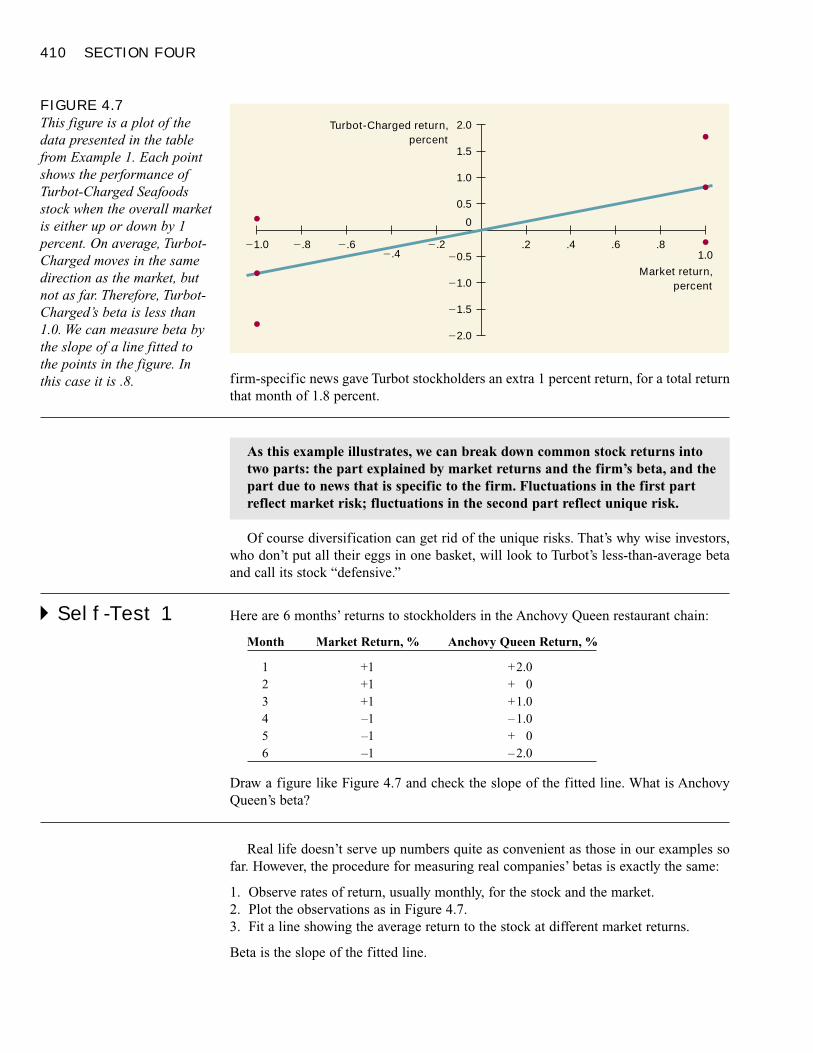
410 SECTION FOUR
firm-specific news gave Turbot stockholders an extra 1 percent return, for a total returnthat month of 1.8 percent.
Of course diversification can get rid of the unique risks. That’s why wise investors,who don’t put all their eggs in one basket, will look to Turbot’s less-than-average betaand call its stock “defensive.”
� Self-Test 1 Here are 6 months’ returns to stockholders in the Anchovy Queen restaurant chain:
Month Market Return, % Anchovy Queen Return, %
1 +1 +2.02 +1 + 03 +1 +1.04 –1 – 1.05 –1 + 06 –1 – 2.0
Draw a figure like Figure 4.7 and check the slope of the fitted line. What is AnchovyQueen’s beta?
Real life doesn’t serve up numbers quite as convenient as those in our examples sofar. However, the procedure for measuring real companies’ betas is exactly the same:
1. Observe rates of return, usually monthly, for the stock and the market.2. Plot the observations as in Figure 4.7.3. Fit a line showing the average return to the stock at different market returns.
Beta is the slope of the fitted line.
As this example illustrates, we can break down common stock returns into two parts: the part explained by market returns and the firm’s beta, and thepart due to news that is specific to the firm. Fluctuations in the first partreflect market risk; fluctuations in the second part reflect unique risk.
FIGURE 4.7This figure is a plot of thedata presented in the tablefrom Example 1. Each pointshows the performance ofTurbot-Charged Seafoodsstock when the overall marketis either up or down by 1percent. On average, Turbot-Charged moves in the samedirection as the market, butnot as far. Therefore, Turbot-Charged’s beta is less than1.0. We can measure beta bythe slope of a line fitted tothe points in the figure. Inthis case it is .8.
Turbot-Charged return,percent
1.0�1.0 �.8 �.6
�.4�.2
�2.0
2.0
1.5
1.0
0.5
0
�0.5
�1.0
�1.5
.8.6.4.2
Market return,percent
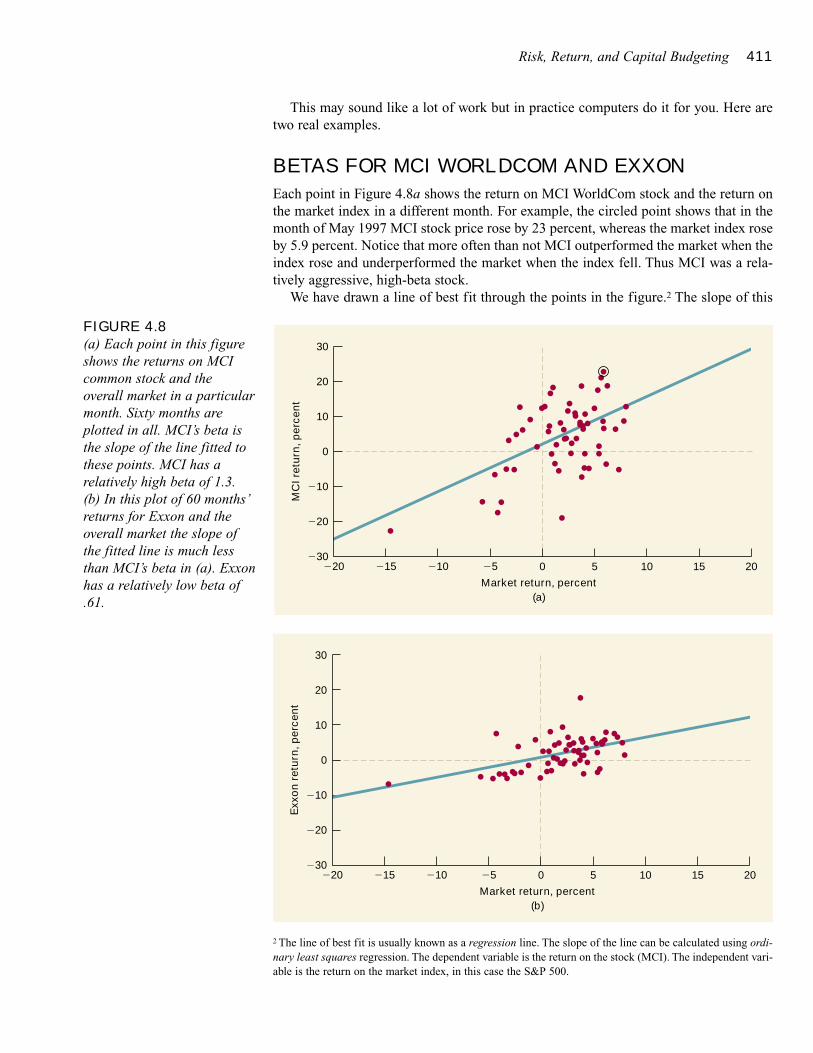
Risk, Return, and Capital Budgeting 411
This may sound like a lot of work but in practice computers do it for you. Here aretwo real examples.
BETAS FOR MCI WORLDCOM AND EXXON
Each point in Figure 4.8a shows the return on MCI WorldCom stock and the return onthe market index in a different month. For example, the circled point shows that in themonth of May 1997 MCI stock price rose by 23 percent, whereas the market index roseby 5.9 percent. Notice that more often than not MCI outperformed the market when theindex rose and underperformed the market when the index fell. Thus MCI was a rela-tively aggressive, high-beta stock.
We have drawn a line of best fit through the points in the figure.2 The slope of this
FIGURE 4.8(a) Each point in this figureshows the returns on MCIcommon stock and theoverall market in a particularmonth. Sixty months areplotted in all. MCI’s beta isthe slope of the line fitted tothese points. MCI has arelatively high beta of 1.3.(b) In this plot of 60 months’returns for Exxon and theoverall market the slope ofthe fitted line is much lessthan MCI’s beta in (a). Exxonhas a relatively low beta of.61.
MC
I ret
urn,
per
cent
Market return, percent(a)
�30
�20
�10
0
10
20
30
�5�20 �15 �10 50 10 15 20
2 The line of best fit is usually known as a regression line. The slope of the line can be calculated using ordi-nary least squares regression. The dependent variable is the return on the stock (MCI). The independent vari-able is the return on the market index, in this case the S&P 500.
Exxo
n re
turn
, per
cent
Market return, percent(b)
�30
�20
�10
0
10
20
30
�5�20 �15 �10 50 10 15 20
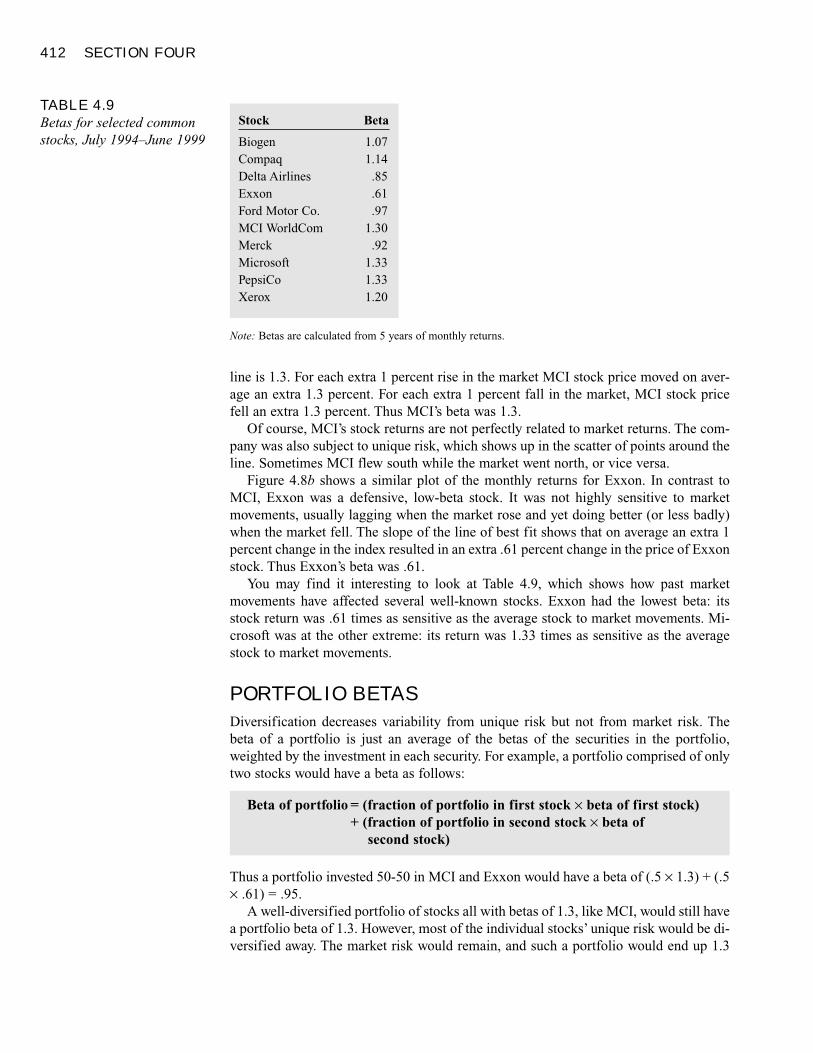
412 SECTION FOUR
line is 1.3. For each extra 1 percent rise in the market MCI stock price moved on aver-age an extra 1.3 percent. For each extra 1 percent fall in the market, MCI stock pricefell an extra 1.3 percent. Thus MCI’s beta was 1.3.
Of course, MCI’s stock returns are not perfectly related to market returns. The com-pany was also subject to unique risk, which shows up in the scatter of points around theline. Sometimes MCI flew south while the market went north, or vice versa.
Figure 4.8b shows a similar plot of the monthly returns for Exxon. In contrast toMCI, Exxon was a defensive, low-beta stock. It was not highly sensitive to marketmovements, usually lagging when the market rose and yet doing better (or less badly)when the market fell. The slope of the line of best fit shows that on average an extra 1percent change in the index resulted in an extra .61 percent change in the price of Exxonstock. Thus Exxon’s beta was .61.
You may find it interesting to look at Table 4.9, which shows how past marketmovements have affected several well-known stocks. Exxon had the lowest beta: itsstock return was .61 times as sensitive as the average stock to market movements. Mi-crosoft was at the other extreme: its return was 1.33 times as sensitive as the averagestock to market movements.
PORTFOLIO BETAS
Diversification decreases variability from unique risk but not from market risk. Thebeta of a portfolio is just an average of the betas of the securities in the portfolio,weighted by the investment in each security. For example, a portfolio comprised of onlytwo stocks would have a beta as follows:
Thus a portfolio invested 50-50 in MCI and Exxon would have a beta of (.5 × 1.3) + (.5× .61) = .95.
A well-diversified portfolio of stocks all with betas of 1.3, like MCI, would still havea portfolio beta of 1.3. However, most of the individual stocks’ unique risk would be di-versified away. The market risk would remain, and such a portfolio would end up 1.3
Beta of portfolio = (fraction of portfolio in first stock × beta of first stock) + (fraction of portfolio in second stock × beta of
second stock)
TABLE 4.9Betas for selected commonstocks, July 1994–June 1999
Stock Beta
Biogen 1.07Compaq 1.14Delta Airlines .85Exxon .61Ford Motor Co. .97MCI WorldCom 1.30Merck .92Microsoft 1.33PepsiCo 1.33Xerox 1.20
Note: Betas are calculated from 5 years of monthly returns.
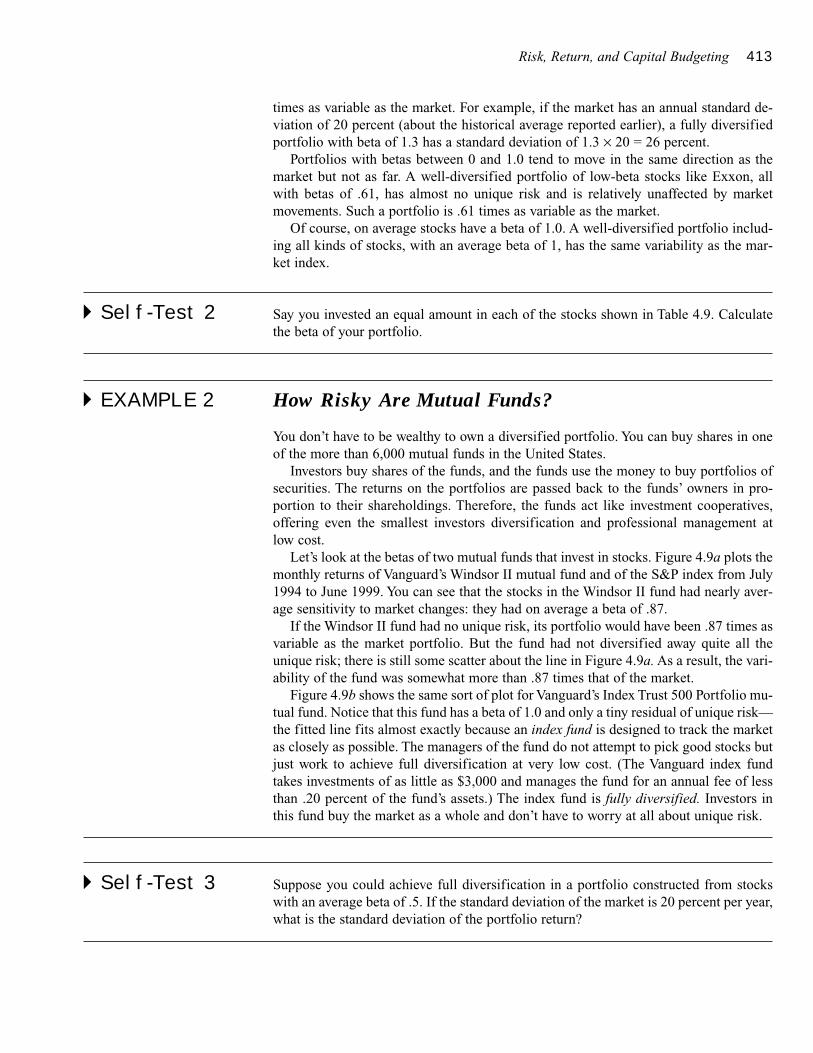
Risk, Return, and Capital Budgeting 413
times as variable as the market. For example, if the market has an annual standard de-viation of 20 percent (about the historical average reported earlier), a fully diversifiedportfolio with beta of 1.3 has a standard deviation of 1.3 × 20 = 26 percent.
Portfolios with betas between 0 and 1.0 tend to move in the same direction as themarket but not as far. A well-diversified portfolio of low-beta stocks like Exxon, allwith betas of .61, has almost no unique risk and is relatively unaffected by marketmovements. Such a portfolio is .61 times as variable as the market.
Of course, on average stocks have a beta of 1.0. A well-diversified portfolio includ-ing all kinds of stocks, with an average beta of 1, has the same variability as the mar-ket index.
� Self-Test 2 Say you invested an equal amount in each of the stocks shown in Table 4.9. Calculatethe beta of your portfolio.
� EXAMPLE 2 How Risky Are Mutual Funds?
You don’t have to be wealthy to own a diversified portfolio. You can buy shares in oneof the more than 6,000 mutual funds in the United States.
Investors buy shares of the funds, and the funds use the money to buy portfolios ofsecurities. The returns on the portfolios are passed back to the funds’ owners in pro-portion to their shareholdings. Therefore, the funds act like investment cooperatives, offering even the smallest investors diversification and professional management at low cost.
Let’s look at the betas of two mutual funds that invest in stocks. Figure 4.9a plots themonthly returns of Vanguard’s Windsor II mutual fund and of the S&P index from July1994 to June 1999. You can see that the stocks in the Windsor II fund had nearly aver-age sensitivity to market changes: they had on average a beta of .87.
If the Windsor II fund had no unique risk, its portfolio would have been .87 times asvariable as the market portfolio. But the fund had not diversified away quite all theunique risk; there is still some scatter about the line in Figure 4.9a. As a result, the vari-ability of the fund was somewhat more than .87 times that of the market.
Figure 4.9b shows the same sort of plot for Vanguard’s Index Trust 500 Portfolio mu-tual fund. Notice that this fund has a beta of 1.0 and only a tiny residual of unique risk—the fitted line fits almost exactly because an index fund is designed to track the marketas closely as possible. The managers of the fund do not attempt to pick good stocks butjust work to achieve full diversification at very low cost. (The Vanguard index fundtakes investments of as little as $3,000 and manages the fund for an annual fee of lessthan .20 percent of the fund’s assets.) The index fund is fully diversified. Investors inthis fund buy the market as a whole and don’t have to worry at all about unique risk.
� Self-Test 3 Suppose you could achieve full diversification in a portfolio constructed from stockswith an average beta of .5. If the standard deviation of the market is 20 percent per year,what is the standard deviation of the portfolio return?
414 SECTION FOUR
Risk and ReturnEarlier we looked at past returns on selected investments. The least risky investmentwas U.S. Treasury bills. Since the return on Treasury bills is fixed, it is unaffected bywhat happens to the market. Thus the beta of Treasury bills is zero. The most risky in-vestment that we considered was the market portfolio of common stocks. This has av-erage market risk: its beta is 1.0.
Wise investors don’t run risks just for fun. They are playing with real money andtherefore require a higher return from the market portfolio than from Treasury bills. Thedifference between the return on the market and the interest rate on bills is termed themarket risk premium. Over the past 73 years the average market risk premium hasbeen just over 9 percent a year. Of course, there is plenty of scope for argument as towhether the past 73 years constitute a typical period, but we will just assume here that9 percent is the normal risk premium, that is, the additional return that an investor couldreasonably expect from investing in the stock market rather than Treasury bills.
FIGURE 4.9(a) The slope of the fitted lineshows that investors in theWindsor II mutual fund boremarket risk slightly belowthat of the S&P 500portfolio. Windsor II’s betawas .87. This was the averagebeta of the individualcommon stocks held by thefund. They also bore someunique risk, however; notethe scatter of Windsor II’sreturns above and below thefitted line.(b) The Vanguard 500Portfolio is a fully diversifiedindex fund designed to trackthe performance of themarket. Note the fund’s beta(1.0) and the absence ofunique risk. The fund’sreturns lie almost preciselyon the fitted line relating itsreturns to those of the S&P500 portfolio.
�20
�10
0
10
20Windsor II return,percent
Market return,percent
�5�20 �15 �10 5 10 15 20
(a)
�20
�10
0
10
20Index 500 return,percent
Market return,percent
�5�20 �15 �10 5 10 15 20
(b)
MARKET RISKPREMIUM Risk premiumof market portfolio.Difference between marketreturn and return on risk-freeTreasury bills.
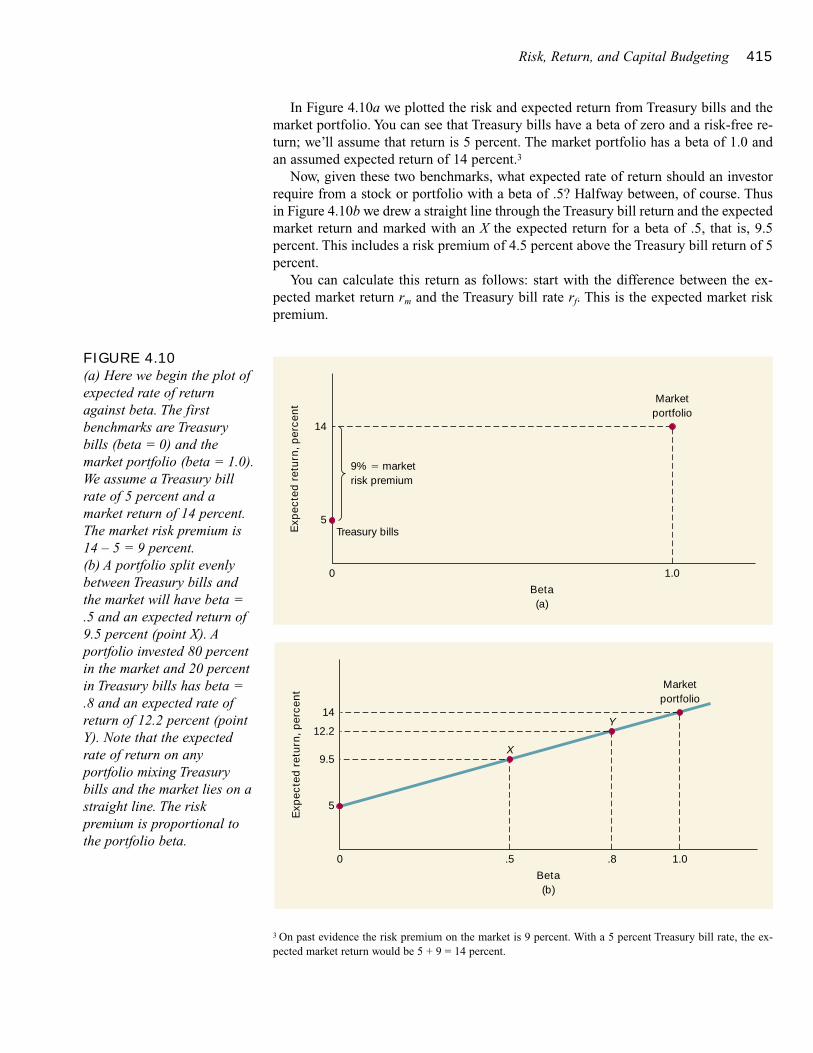
Risk, Return, and Capital Budgeting 415
In Figure 4.10a we plotted the risk and expected return from Treasury bills and themarket portfolio. You can see that Treasury bills have a beta of zero and a risk-free re-turn; we’ll assume that return is 5 percent. The market portfolio has a beta of 1.0 andan assumed expected return of 14 percent.3
Now, given these two benchmarks, what expected rate of return should an investorrequire from a stock or portfolio with a beta of .5? Halfway between, of course. Thus in Figure 4.10b we drew a straight line through the Treasury bill return and the expectedmarket return and marked with an X the expected return for a beta of .5, that is, 9.5 percent. This includes a risk premium of 4.5 percent above the Treasury bill return of 5percent.
You can calculate this return as follows: start with the difference between the ex-pected market return rm and the Treasury bill rate rf. This is the expected market riskpremium.
FIGURE 4.10(a) Here we begin the plot ofexpected rate of returnagainst beta. The firstbenchmarks are Treasurybills (beta = 0) and themarket portfolio (beta = 1.0).We assume a Treasury billrate of 5 percent and amarket return of 14 percent.The market risk premium is14 – 5 = 9 percent.(b) A portfolio split evenlybetween Treasury bills andthe market will have beta =.5 and an expected return of9.5 percent (point X). Aportfolio invested 80 percentin the market and 20 percentin Treasury bills has beta =.8 and an expected rate ofreturn of 12.2 percent (pointY). Note that the expectedrate of return on anyportfolio mixing Treasurybills and the market lies on astraight line. The riskpremium is proportional tothe portfolio beta.
Expe
cted
retu
rn, p
erce
nt
5
Marketportfolio
0
9% � marketrisk premium
Treasury bills
Beta(a)
14
1.0
Expe
cted
retu
rn, p
erce
nt
9.5
5
X
Y
Marketportfolio
0
Beta(b)
14
12.2
.5 .8 1.0
3 On past evidence the risk premium on the market is 9 percent. With a 5 percent Treasury bill rate, the ex-pected market return would be 5 + 9 = 14 percent.
416 SECTION FOUR
Market risk premium = rm – rf = 14% – 5% = 9%
Beta measures risk relative to the market. Therefore, the expected risk premium onany asset equals beta times the market risk premium:
Risk premium on any asset = r – rf = β(rm – rf)
With a beta of .5 and a market risk premium of 9 percent,
Risk premium = β(rm – rf) = .5 × 9 = 4.5%
The total expected rate of return is the sum of the risk-free rate and the risk premium:
Expected return = risk-free rate + risk premium
r = rf + β(rm – rf)
= 5% + 4.5% = 9.5%
You could have calculated the expected rate of return in one step from this formula:
Expected return = r = rf + β(rm – rf)
= 5% + (.5 × 9%) = 9.5%
This formula states the basic risk–return relationship called the capital asset pricingmodel, or CAPM. The CAPM has a simple interpretation:
Note that the expected rate of return on an asset with β = 1 is just the market return.With a risk-free rate of 5 percent and market risk premium of 9 percent,
r = rf + β(rm – rf)
= 5% + (1 × 9%) = 14%
� Self-Test 4 What are the risk premium and expected rate of return on a stock with β = 1.5? Assumea Treasury bill rate of 6 percent and a market risk premium of 9 percent.
WHY THE CAPM WORKS
The CAPM assumes that the stock market is dominated by well-diversified investorswho are concerned only with market risk. That makes sense in a stock market wheretrading is dominated by large institutions and even small fry can diversify at very lowcost.
� EXAMPLE 3 How Would You Invest $1 Million?
Have you ever daydreamed about receiving a $1 million check, no strings attached, froman unknown benefactor? Let’s daydream about how you would invest it.
We have two good candidates: Treasury bills, which offer an absolutely safe return,and the market portfolio (possibly via the Vanguard index fund discussed earlier in this
The expected rates of return demanded by investors depend on two things:(1) compensation for the time value of money (the risk-free rate rf), and (2) arisk premium, which depends on beta and the market risk premium.
CAPITAL ASSETPRICING MODEL(CAPM) Theory of therelationship between risk andreturn which states that theexpected risk premium onany security equals its betatimes the market riskpremium.
Risk, Return, and Capital Budgeting 417
material). The market has generated superior returns on average, but those returns havefluctuated a lot. (Look back to Figure 3.15.) So your investment policy is going to de-pend on your tolerance for risk.
If you’re a cautious soul, you may invest only part of your money in the market port-folio and lend the remainder to the government by buying Treasury bills. Suppose thatyou invest 80 percent of your money in the market portfolio and lend out the other 20percent to the government by buying U.S. Treasury bills. Then the beta of your portfo-lio will be a mixture of the beta of the market (βmarket = 1.0) and the beta of the T-bills(βT-bills = 0):
Beta of portfolio = (proportion × beta of ) + (proportion × beta of )in market market in T-bills T-bills
β = (.8 × βmarket) + (.2 × βT-bills)
= (.8 × 1.0) + (.2 × 0) = .80
The fraction of funds that you invest in the market also affects your return. If you in-vest your entire million in the market portfolio, you earn the full market risk premium.But if you invest only 80 percent of your money in the market, you earn only 80 per-cent of the risk premium.
Expectedrisk premium = (proportion in × risk premium ) + ( proportion in × market risk)on portfolio
T-bills on T-bills market premium
= (.2 × 0) + (.8 × expected market risk premium)
= .8 × expected market risk premium
= .8 × 9 = 7.2%
The expected return on your portfolio is equal to the risk-free interest rate plus theexpected risk premium:
Expected portfolio return = rportfolio = 5 + 7.2 = 12.2%
In Figure 4.10b we show the beta and expected return on this portfolio by the letter Y.
THE SECURITY MARKET LINE
Example 3 illustrates a general point: by investing some proportion of your money inthe market portfolio and lending (or borrowing)4 the balance, you can obtain any com-bination of risk and expected return along the sloping line in Figure 4.11. This line isgenerally known as the security market line.
4 Notice that the security market line extends above the market return at β = 1. How would you generate aportfolio with, say, β = 2? It’s easy, but it’s risky. Suppose you borrow $1 million and invest the loan plus $1million in the market portfolio. That gives you $2 million invested and a $1 million liability. Your portfolionow has a beta of 2.0:
Beta of portfolio = (proportion in market × beta of market) + (proportion in loan × beta of loan)β = (2 × βmarket) + (–1 × βloan)
= (2 × 1.0) + (–1 × 0) = 2
Notice that the proportion in the loan is negative because you are borrowing, not lending money.By the way, borrowing from a bank or stockbroker would not be difficult or unduly expensive as long as
you put up your $2 million stock portfolio as security for the loan.Can you calculate the risk premium and the expected rate of return on this borrow-and-invest strategy?
SECURITY MARKETLINE Relationshipbetween expected return andbeta.
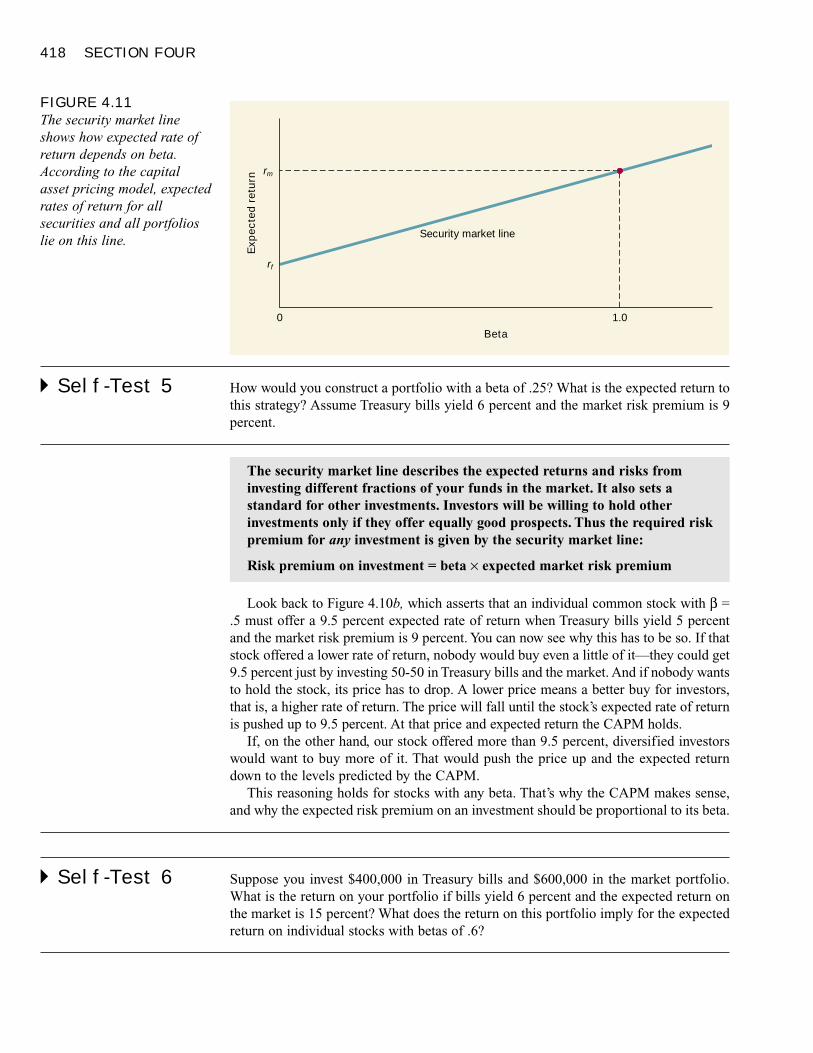
418 SECTION FOUR
� Self-Test 5 How would you construct a portfolio with a beta of .25? What is the expected return tothis strategy? Assume Treasury bills yield 6 percent and the market risk premium is 9percent.
Look back to Figure 4.10b, which asserts that an individual common stock with β =.5 must offer a 9.5 percent expected rate of return when Treasury bills yield 5 percentand the market risk premium is 9 percent. You can now see why this has to be so. If thatstock offered a lower rate of return, nobody would buy even a little of it—they could get9.5 percent just by investing 50-50 in Treasury bills and the market. And if nobody wantsto hold the stock, its price has to drop. A lower price means a better buy for investors,that is, a higher rate of return. The price will fall until the stock’s expected rate of returnis pushed up to 9.5 percent. At that price and expected return the CAPM holds.
If, on the other hand, our stock offered more than 9.5 percent, diversified investorswould want to buy more of it. That would push the price up and the expected returndown to the levels predicted by the CAPM.
This reasoning holds for stocks with any beta. That’s why the CAPM makes sense,and why the expected risk premium on an investment should be proportional to its beta.
� Self-Test 6 Suppose you invest $400,000 in Treasury bills and $600,000 in the market portfolio.What is the return on your portfolio if bills yield 6 percent and the expected return onthe market is 15 percent? What does the return on this portfolio imply for the expectedreturn on individual stocks with betas of .6?
The security market line describes the expected returns and risks frominvesting different fractions of your funds in the market. It also sets astandard for other investments. Investors will be willing to hold otherinvestments only if they offer equally good prospects. Thus the required riskpremium for any investment is given by the security market line:
Risk premium on investment = beta × expected market risk premium
FIGURE 4.11The security market lineshows how expected rate ofreturn depends on beta.According to the capitalasset pricing model, expectedrates of return for allsecurities and all portfolioslie on this line.
Expe
cted
retu
rnrf
0
Security market line
Beta
rm
1.0
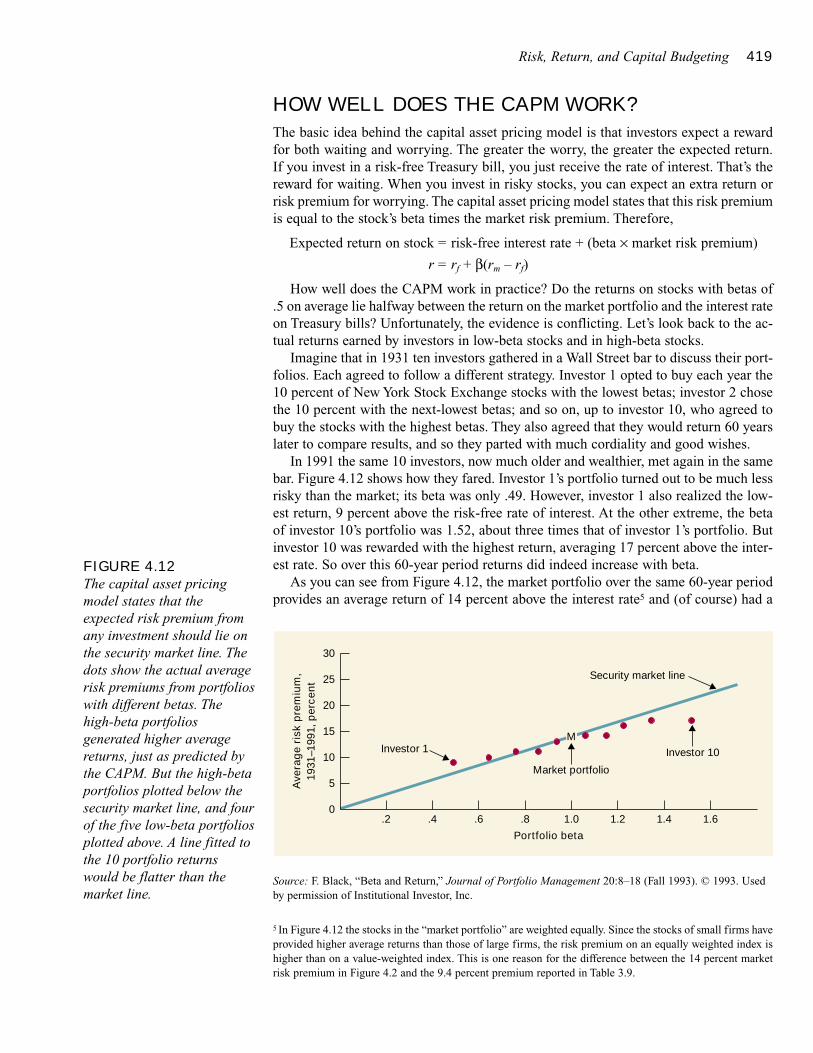
Risk, Return, and Capital Budgeting 419
HOW WELL DOES THE CAPM WORK?
The basic idea behind the capital asset pricing model is that investors expect a rewardfor both waiting and worrying. The greater the worry, the greater the expected return.If you invest in a risk-free Treasury bill, you just receive the rate of interest. That’s thereward for waiting. When you invest in risky stocks, you can expect an extra return orrisk premium for worrying. The capital asset pricing model states that this risk premiumis equal to the stock’s beta times the market risk premium. Therefore,
Expected return on stock = risk-free interest rate + (beta × market risk premium)
r = rf + β(rm – rf)
How well does the CAPM work in practice? Do the returns on stocks with betas of.5 on average lie halfway between the return on the market portfolio and the interest rateon Treasury bills? Unfortunately, the evidence is conflicting. Let’s look back to the ac-tual returns earned by investors in low-beta stocks and in high-beta stocks.
Imagine that in 1931 ten investors gathered in a Wall Street bar to discuss their port-folios. Each agreed to follow a different strategy. Investor 1 opted to buy each year the10 percent of New York Stock Exchange stocks with the lowest betas; investor 2 chosethe 10 percent with the next-lowest betas; and so on, up to investor 10, who agreed tobuy the stocks with the highest betas. They also agreed that they would return 60 yearslater to compare results, and so they parted with much cordiality and good wishes.
In 1991 the same 10 investors, now much older and wealthier, met again in the samebar. Figure 4.12 shows how they fared. Investor 1’s portfolio turned out to be much lessrisky than the market; its beta was only .49. However, investor 1 also realized the low-est return, 9 percent above the risk-free rate of interest. At the other extreme, the betaof investor 10’s portfolio was 1.52, about three times that of investor 1’s portfolio. Butinvestor 10 was rewarded with the highest return, averaging 17 percent above the inter-est rate. So over this 60-year period returns did indeed increase with beta.
As you can see from Figure 4.12, the market portfolio over the same 60-year periodprovides an average return of 14 percent above the interest rate5 and (of course) had a
FIGURE 4.12The capital asset pricingmodel states that theexpected risk premium fromany investment should lie onthe security market line. Thedots show the actual averagerisk premiums from portfolioswith different betas. Thehigh-beta portfoliosgenerated higher averagereturns, just as predicted bythe CAPM. But the high-betaportfolios plotted below thesecurity market line, and fourof the five low-beta portfoliosplotted above. A line fitted tothe 10 portfolio returnswould be flatter than themarket line.
30
25
20
15
10
5
0.2
Portfolio beta
Aver
age
risk
prem
ium
,19
31–1
991,
per
cent
.4
Investor 10
Security market line
.6 .8 1.0 1.2 1.4 1.6
Investor 1
Market portfolio
M
Source: F. Black, “Beta and Return,” Journal of Portfolio Management 20:8–18 (Fall 1993). © 1993. Usedby permission of Institutional Investor, Inc.
5 In Figure 4.12 the stocks in the “market portfolio” are weighted equally. Since the stocks of small firms haveprovided higher average returns than those of large firms, the risk premium on an equally weighted index ishigher than on a value-weighted index. This is one reason for the difference between the 14 percent marketrisk premium in Figure 4.2 and the 9.4 percent premium reported in Table 3.9.
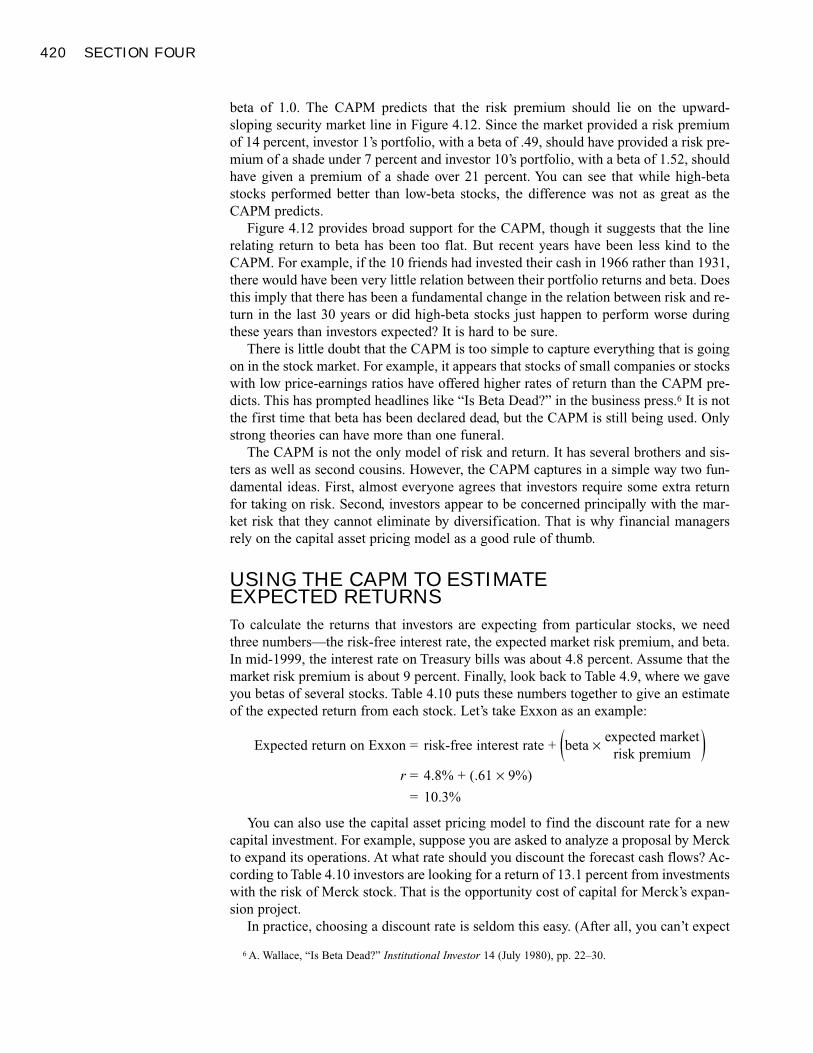
420 SECTION FOUR
beta of 1.0. The CAPM predicts that the risk premium should lie on the upward-sloping security market line in Figure 4.12. Since the market provided a risk premiumof 14 percent, investor 1’s portfolio, with a beta of .49, should have provided a risk pre-mium of a shade under 7 percent and investor 10’s portfolio, with a beta of 1.52, shouldhave given a premium of a shade over 21 percent. You can see that while high-betastocks performed better than low-beta stocks, the difference was not as great as theCAPM predicts.
Figure 4.12 provides broad support for the CAPM, though it suggests that the linerelating return to beta has been too flat. But recent years have been less kind to theCAPM. For example, if the 10 friends had invested their cash in 1966 rather than 1931,there would have been very little relation between their portfolio returns and beta. Doesthis imply that there has been a fundamental change in the relation between risk and re-turn in the last 30 years or did high-beta stocks just happen to perform worse duringthese years than investors expected? It is hard to be sure.
There is little doubt that the CAPM is too simple to capture everything that is goingon in the stock market. For example, it appears that stocks of small companies or stockswith low price-earnings ratios have offered higher rates of return than the CAPM pre-dicts. This has prompted headlines like “Is Beta Dead?” in the business press.6 It is notthe first time that beta has been declared dead, but the CAPM is still being used. Onlystrong theories can have more than one funeral.
The CAPM is not the only model of risk and return. It has several brothers and sis-ters as well as second cousins. However, the CAPM captures in a simple way two fun-damental ideas. First, almost everyone agrees that investors require some extra returnfor taking on risk. Second, investors appear to be concerned principally with the mar-ket risk that they cannot eliminate by diversification. That is why financial managersrely on the capital asset pricing model as a good rule of thumb.
USING THE CAPM TO ESTIMATE EXPECTED RETURNS
To calculate the returns that investors are expecting from particular stocks, we needthree numbers—the risk-free interest rate, the expected market risk premium, and beta.In mid-1999, the interest rate on Treasury bills was about 4.8 percent. Assume that themarket risk premium is about 9 percent. Finally, look back to Table 4.9, where we gaveyou betas of several stocks. Table 4.10 puts these numbers together to give an estimateof the expected return from each stock. Let’s take Exxon as an example:
Expected return on Exxon = risk-free interest rate + (beta × expected market )risk premium
r = 4.8% + (.61 × 9%)
= 10.3%
You can also use the capital asset pricing model to find the discount rate for a newcapital investment. For example, suppose you are asked to analyze a proposal by Merckto expand its operations. At what rate should you discount the forecast cash flows? Ac-cording to Table 4.10 investors are looking for a return of 13.1 percent from investmentswith the risk of Merck stock. That is the opportunity cost of capital for Merck’s expan-sion project.
In practice, choosing a discount rate is seldom this easy. (After all, you can’t expect
6 A. Wallace, “Is Beta Dead?” Institutional Investor 14 (July 1980), pp. 22–30.
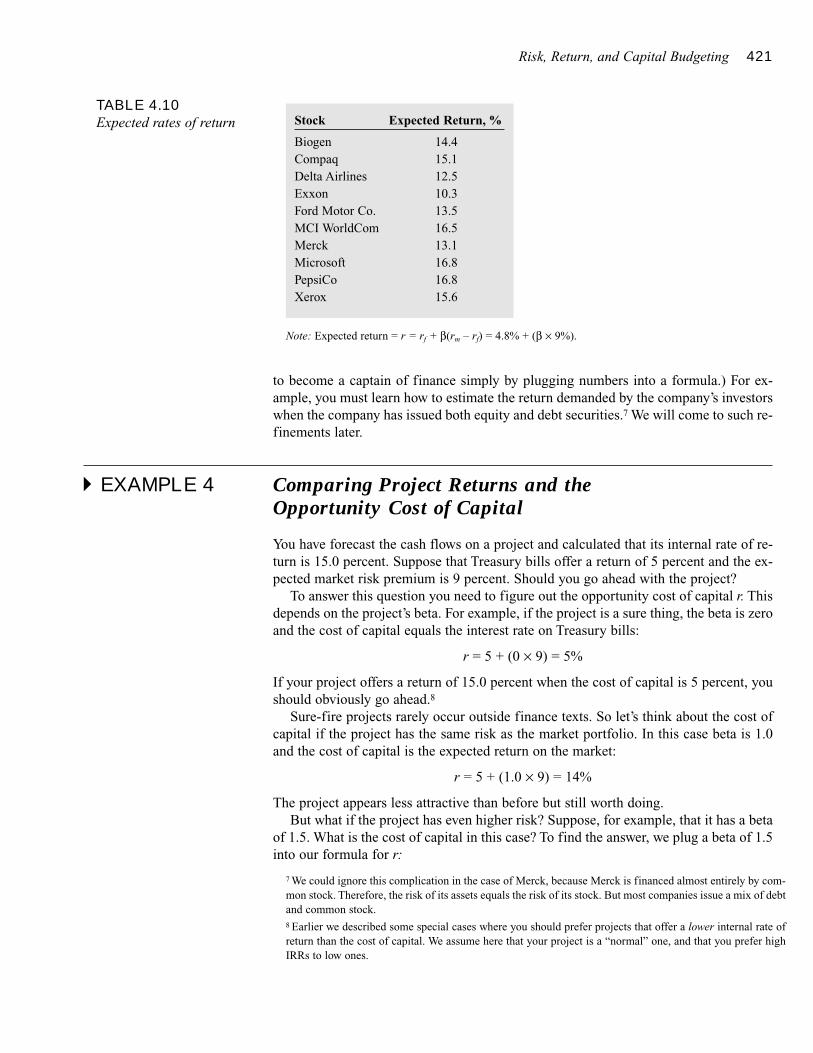
Risk, Return, and Capital Budgeting 421
to become a captain of finance simply by plugging numbers into a formula.) For ex-ample, you must learn how to estimate the return demanded by the company’s investorswhen the company has issued both equity and debt securities.7 We will come to such re-finements later.
� EXAMPLE 4 Comparing Project Returns and the Opportunity Cost of Capital
You have forecast the cash flows on a project and calculated that its internal rate of re-turn is 15.0 percent. Suppose that Treasury bills offer a return of 5 percent and the ex-pected market risk premium is 9 percent. Should you go ahead with the project?
To answer this question you need to figure out the opportunity cost of capital r. Thisdepends on the project’s beta. For example, if the project is a sure thing, the beta is zeroand the cost of capital equals the interest rate on Treasury bills:
r = 5 + (0 × 9) = 5%
If your project offers a return of 15.0 percent when the cost of capital is 5 percent, youshould obviously go ahead.8
Sure-fire projects rarely occur outside finance texts. So let’s think about the cost ofcapital if the project has the same risk as the market portfolio. In this case beta is 1.0and the cost of capital is the expected return on the market:
r = 5 + (1.0 × 9) = 14%
The project appears less attractive than before but still worth doing.But what if the project has even higher risk? Suppose, for example, that it has a beta
of 1.5. What is the cost of capital in this case? To find the answer, we plug a beta of 1.5into our formula for r:
7 We could ignore this complication in the case of Merck, because Merck is financed almost entirely by com-mon stock. Therefore, the risk of its assets equals the risk of its stock. But most companies issue a mix of debtand common stock.8 Earlier we described some special cases where you should prefer projects that offer a lower internal rate ofreturn than the cost of capital. We assume here that your project is a “normal” one, and that you prefer highIRRs to low ones.
TABLE 4.10Expected rates of return Stock Expected Return, %
Biogen 14.4Compaq 15.1Delta Airlines 12.5Exxon 10.3Ford Motor Co. 13.5MCI WorldCom 16.5Merck 13.1Microsoft 16.8PepsiCo 16.8Xerox 15.6
Note: Expected return = r = rf + β(rm – rf) = 4.8% + (β × 9%).
422 SECTION FOUR
r = 5 + (1.5 × 9) = 18.5%
A project this risky would need a return of at least 18.5 percent to justify going ahead.The 15 percent project should be rejected.
This rejection occurs because, as Figure 4.13 shows, the project’s expected rate of re-turn plots below the security market line. The project offers a lower return than investorscan get elsewhere, so it is a negative-NPV investment.
� Self-Test 7 Suppose that Merck’s expansion project is forecast to produce cash flows of $50 mil-lion a year for each of 10 years. What is its present value? Use data from Table 4.10.What would the present value be if the beta of the investment were .7?
Capital Budgeting and Project RiskCOMPANY VERSUS PROJECT RISK
Long before the development of modern theories linking risk and return, smart finan-cial managers adjusted for risk in capital budgeting. They realized intuitively that, otherthings equal, risky projects are less desirable than safe ones and must provide higherrates of return.
Many companies estimate the rate of return required by investors in their securitiesand use this company cost of capital to discount the cash flows on all new projects.
The security market line provides a standard for project acceptance. If theproject’s return lies above the security market line, then the return is higherthan investors could expect to get by investing their funds in the capitalmarket and therefore is an attractive investment opportunity.
FIGURE 4.13The expected return of thisproject is less than theexpected return one couldearn on stock marketinvestments with the samemarket risk (beta). Therefore,the project’s expectedreturn–risk combination liesbelow the security marketline, and the project shouldbe rejected.
Exp
ecte
d r
etur
n, p
erce
nt
18.5
5
Project
0
Beta
14
Security market line
15
1.0 1.5
COMPANY COST OFCAPITAL Expected rateof return demanded byinvestors in a company,determined by the averagerisk of the company’s assetsand operations.
Risk, Return, and Capital Budgeting 423
Since investors require a higher rate of return from a risky company, risky firms willhave a higher company cost of capital and will set a higher discount rate for their newinvestment opportunities. For example, we showed in Table 4.9 that on past evidenceMerck has a beta of .92 and the corresponding expected rate of return (see Table 4.10)is about 13 percent. According to the company cost of capital rule, Merck should use a13 percent cost of capital to calculate project NPVs.
This is a step in the right direction, but we must take care when the firm has issuedsecurities other than equity. Moreover, this approach can get a firm in trouble if its newprojects do not have the same risk as its existing business. Merck’s beta reflects in-vestors’ estimate of the risk of the pharmaceutical business and its company cost of cap-ital is the return that investors require for taking on this risk. If Merck is considering anexpansion of its regular business, it makes sense to discount the forecast cash flows bythe company cost of capital. But suppose that Merck is wondering whether to branchout into production of computer hardware. Its beta tells us nothing about the projectcost of capital. That depends on the risk of the hardware business and the return thatshareholders require from investing in such a business.
The nearby box discusses how companies decide on the discount rate. It notes, forexample, that Siemens, a German industrial giant, uses 16 different discount rates, de-pending on the riskiness of each line of its business.
� Self-Test 8 The company cost of capital for Merck is about 13 percent (see Table 4.10); for Com-paq Computer it is about 15 percent. What would be the more reasonable discount ratefor Merck to use for its proposed computer hardware division? Why?
DETERMINANTS OF PROJECT RISK
We have seen that the company cost of capital is the correct discount rate for projectsthat have the same risk as the company’s existing business, but not for those projectsthat are safer or riskier than the company’s average. How do we know whether a proj-ect is unusually risky? Estimating project risk is never going to be an exact science, buthere are two things to bear in mind.
First, we saw earlier that operating leverage increases the risk of a project. When alarge fraction of your costs is fixed, any change in revenues can have a dramatic effecton earnings. Therefore, projects that involve high fixed costs tend to have higher betas.
Second, many people intuitively associate risk with the variability of earnings. Butmuch of this variability reflects diversifiable risk. Lone prospectors in search of goldlook forward to extremely uncertain future earnings, but whether they strike it rich isnot likely to depend on the performance of the rest of the economy. These investmentshave a high standard deviation but a low beta.
The project cost of capital depends on the use to which that capital is put.Therefore, it depends on the risk of the project and not on the risk of thecompany. If a company invests in a low-risk project, it should discount thecash flows at a correspondingly low cost of capital. If it invests in a high-riskproject, those cash flows should be discounted at a high cost of capital.
PROJECT COST OFCAPITAL Minimumacceptable expected rate ofreturn on a project given itsrisk.
SEE BOX
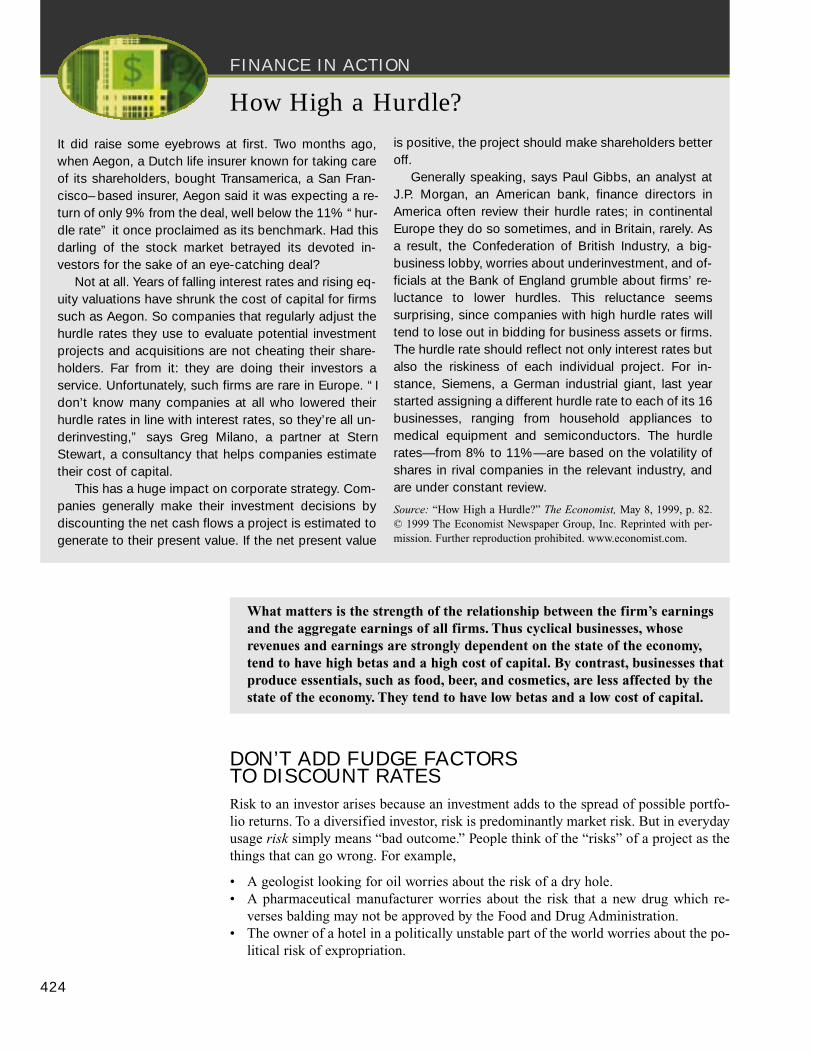
FINANCE IN ACTION
DON’T ADD FUDGE FACTORS TO DISCOUNT RATES
Risk to an investor arises because an investment adds to the spread of possible portfo-lio returns. To a diversified investor, risk is predominantly market risk. But in everydayusage risk simply means “bad outcome.” People think of the “risks” of a project as thethings that can go wrong. For example,
• A geologist looking for oil worries about the risk of a dry hole.• A pharmaceutical manufacturer worries about the risk that a new drug which re-
verses balding may not be approved by the Food and Drug Administration.• The owner of a hotel in a politically unstable part of the world worries about the po-
litical risk of expropriation.
What matters is the strength of the relationship between the firm’s earningsand the aggregate earnings of all firms. Thus cyclical businesses, whoserevenues and earnings are strongly dependent on the state of the economy,tend to have high betas and a high cost of capital. By contrast, businesses thatproduce essentials, such as food, beer, and cosmetics, are less affected by thestate of the economy. They tend to have low betas and a low cost of capital.
424
How High a Hurdle?It did raise some eyebrows at first. Two months ago,when Aegon, a Dutch life insurer known for taking careof its shareholders, bought Transamerica, a San Fran-cisco– based insurer, Aegon said it was expecting a re-turn of only 9% from the deal, well below the 11% “ hur-dle rate” it once proclaimed as its benchmark. Had thisdarling of the stock market betrayed its devoted in-vestors for the sake of an eye-catching deal?
Not at all. Years of falling interest rates and rising eq-uity valuations have shrunk the cost of capital for firmssuch as Aegon. So companies that regularly adjust thehurdle rates they use to evaluate potential investmentprojects and acquisitions are not cheating their share-holders. Far from it: they are doing their investors aservice. Unfortunately, such firms are rare in Europe. “ Idon’t know many companies at all who lowered theirhurdle rates in line with interest rates, so they’re all un-derinvesting,” says Greg Milano, a partner at SternStewart, a consultancy that helps companies estimatetheir cost of capital.
This has a huge impact on corporate strategy. Com-panies generally make their investment decisions bydiscounting the net cash flows a project is estimated togenerate to their present value. If the net present value
is positive, the project should make shareholders betteroff.
Generally speaking, says Paul Gibbs, an analyst atJ.P. Morgan, an American bank, finance directors inAmerica often review their hurdle rates; in continentalEurope they do so sometimes, and in Britain, rarely. Asa result, the Confederation of British Industry, a big-business lobby, worries about underinvestment, and of-ficials at the Bank of England grumble about firms’ re-luctance to lower hurdles. This reluctance seemssurprising, since companies with high hurdle rates willtend to lose out in bidding for business assets or firms.The hurdle rate should reflect not only interest rates butalso the riskiness of each individual project. For in-stance, Siemens, a German industrial giant, last yearstarted assigning a different hurdle rate to each of its 16businesses, ranging from household appliances tomedical equipment and semiconductors. The hurdlerates— from 8% to 11%— are based on the volatility ofshares in rival companies in the relevant industry, andare under constant review.
Source: “How High a Hurdle?” The Economist, May 8, 1999, p. 82.© 1999 The Economist Newspaper Group, Inc. Reprinted with per-mission. Further reproduction prohibited. www.economist.com.
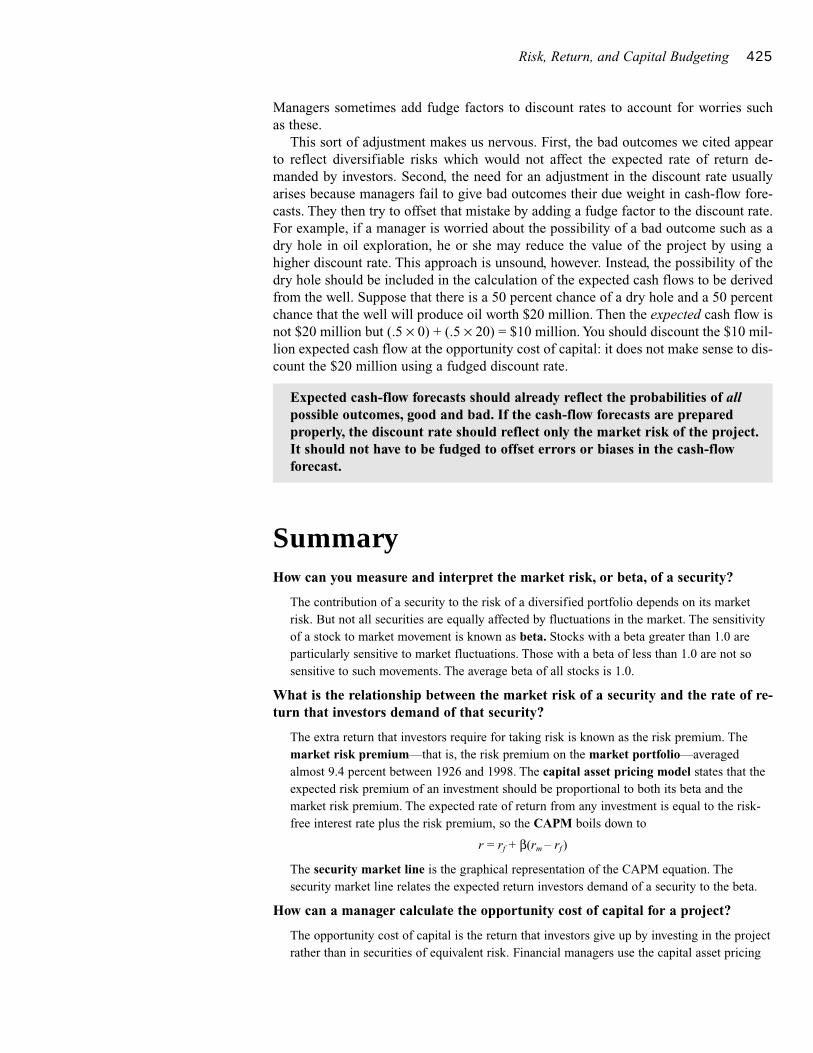
Risk, Return, and Capital Budgeting 425
Managers sometimes add fudge factors to discount rates to account for worries such as these.
This sort of adjustment makes us nervous. First, the bad outcomes we cited appearto reflect diversifiable risks which would not affect the expected rate of return de-manded by investors. Second, the need for an adjustment in the discount rate usuallyarises because managers fail to give bad outcomes their due weight in cash-flow fore-casts. They then try to offset that mistake by adding a fudge factor to the discount rate.For example, if a manager is worried about the possibility of a bad outcome such as adry hole in oil exploration, he or she may reduce the value of the project by using ahigher discount rate. This approach is unsound, however. Instead, the possibility of thedry hole should be included in the calculation of the expected cash flows to be derivedfrom the well. Suppose that there is a 50 percent chance of a dry hole and a 50 percentchance that the well will produce oil worth $20 million. Then the expected cash flow isnot $20 million but (.5 × 0) + (.5 × 20) = $10 million. You should discount the $10 mil-lion expected cash flow at the opportunity cost of capital: it does not make sense to dis-count the $20 million using a fudged discount rate.
SummaryHow can you measure and interpret the market risk, or beta, of a security?
The contribution of a security to the risk of a diversified portfolio depends on its marketrisk. But not all securities are equally affected by fluctuations in the market. The sensitivityof a stock to market movement is known as beta. Stocks with a beta greater than 1.0 areparticularly sensitive to market fluctuations. Those with a beta of less than 1.0 are not sosensitive to such movements. The average beta of all stocks is 1.0.
What is the relationship between the market risk of a security and the rate of re-turn that investors demand of that security?
The extra return that investors require for taking risk is known as the risk premium. Themarket risk premium—that is, the risk premium on the market portfolio—averagedalmost 9.4 percent between 1926 and 1998. The capital asset pricing model states that theexpected risk premium of an investment should be proportional to both its beta and themarket risk premium. The expected rate of return from any investment is equal to the risk-free interest rate plus the risk premium, so the CAPM boils down to
r = rf + β(rm – rf)
The security market line is the graphical representation of the CAPM equation. Thesecurity market line relates the expected return investors demand of a security to the beta.
How can a manager calculate the opportunity cost of capital for a project?
The opportunity cost of capital is the return that investors give up by investing in the projectrather than in securities of equivalent risk. Financial managers use the capital asset pricing
Expected cash-flow forecasts should already reflect the probabilities of allpossible outcomes, good and bad. If the cash-flow forecasts are preparedproperly, the discount rate should reflect only the market risk of the project.It should not have to be fudged to offset errors or biases in the cash-flowforecast.
426 SECTION FOUR
model to estimate the opportunity cost of capital. The company cost of capital is theexpected rate of return demanded by investors in a company, determined by the average riskof the company’s assets and operations.
The opportunity cost of capital depends on the use to which the capital is put. Therefore,required rates of return are determined by the risk of the project, not by the risk of thefirm’s existing business. The project cost of capital is the minimum acceptable expectedrate of return on a project given its risk.
Your cash-flow forecasts should already factor in the chances of pleasant and unpleasantsurprises. Potential bad outcomes should be reflected in the discount rate only to the extentthat they affect beta.
www.stanford.edu/~wfsharpe/ws/wksheets.htm William Sharpe’s site contains “portfolio opti-mizers,” spreadsheets that can be used to construct efficiently diversified portfolios
www.riskmetrics.com RiskMetrics® Group maintains this site, which uses modern portfoliotheory to help manage risk; some of the content at this site, including educational and demon-stration materials, is free.
www.riskview.com A nice site with historical risk and return data as well as software to manageand measure portfolio risk
www.finance.yahoo.com You can find stock betas as well as other risk measures and companyprofiles here
1. Risk and Return. True or false? Explain or qualify as necessary.
a. Investors demand higher expected rates of return on stocks with more variable rates ofreturn.
b. The capital asset pricing model predicts that a security with a beta of zero will providean expected return of zero.
c. An investor who puts $10,000 in Treasury bills and $20,000 in the market portfolio willhave a portfolio beta of 2.0.
d. Investors demand higher expected rates of return from stocks with returns that are highlyexposed to macroeconomic changes.
e. Investors demand higher expected rates of return from stocks with returns that are verysensitive to fluctuations in the stock market.
2. Diversifiable Risk. In light of what you’ve learned about market versus diversifiable(unique) risks, explain why an insurance company has no problem in selling life insuranceto individuals but is reluctant to issue policies insuring against flood damage to residents ofcoastal areas. Why don’t the insurance companies simply charge coastal residents a premiumthat reflects the actuarial probability of damage from hurricanes and other storms?
3. Unique vs. Market Risk. Figure 4.14 plots monthly rates of return from 1993 to 1999 forthe Snake Oil mutual fund. Was this fund well-diversified? Explain.
4. Risk and Return. Suppose that the risk premium on stocks and other securities did in fact
market portfoliobetamarket risk premiumcapital asset pricing model (CAPM)
security market linecompany cost of capitalproject cost of capital
Related WebLinks
Key Terms
Quiz
Risk, Return, and Capital Budgeting 427
rise with total risk (that is, the variability of returns) rather than just market risk. Explainhow investors could exploit the situation to create portfolios with high expected rates of re-turn but low levels of risk.
5. CAPM and Hurdle Rates. A project under consideration has an internal rate of return of14 percent and a beta of .6. The risk-free rate is 5 percent and the expected rate of return onthe market portfolio is 14 percent.
a. Should the project be accepted?b. Should the project be accepted if its beta is 1.6?c. Why does your answer change?
6. CAPM and Valuation. You are considering acquiring a firm that you believe can generateexpected cash flows of $10,000 a year forever. However, you recognize that those cash flowsare uncertain.
a. Suppose you believe that the beta of the firm is .4. How much is the firm worth if therisk-free rate is 5 percent and the expected rate of return on the market portfolio is 15 per-cent?
b. By how much will you overvalue the firm if its beta is actually .6?
7. CAPM and Expected Return. If the risk-free rate is 6 percent and the expected rate of re-turn on the market portfolio is 14 percent, is a security with a beta of 1.25 and an expectedrate of return of 16 percent overpriced or underpriced?
8. Using Beta. Investors expect the market rate of return this year to be 14 percent. A stockwith a beta of .8 has an expected rate of return of 12 percent. If the market return this yearturns out to be 10 percent, what is your best guess as to the rate of return on the stock?
9. Unique vs. Market Risk. Figure 4.15 shows plots of monthly rates of return on three stocksversus the stock market index. The beta and standard deviation of each stock is given besideits plot.
a. Which stock is riskiest to a diversified investor?b. Which stock is riskiest to an undiversified investor who puts all her funds in one of these
stocks?
PracticeProblems
FIGURE 4.14Monthly rates of return forthe Snake Oil mutual fundand the Standard & Poor’sComposite Index. Seeproblem 3.
Snake Oil return,percent
3�3 �2 �1
�5
5
4
3
2
1
0�1
�2
�4
�3
21
Market return,percent
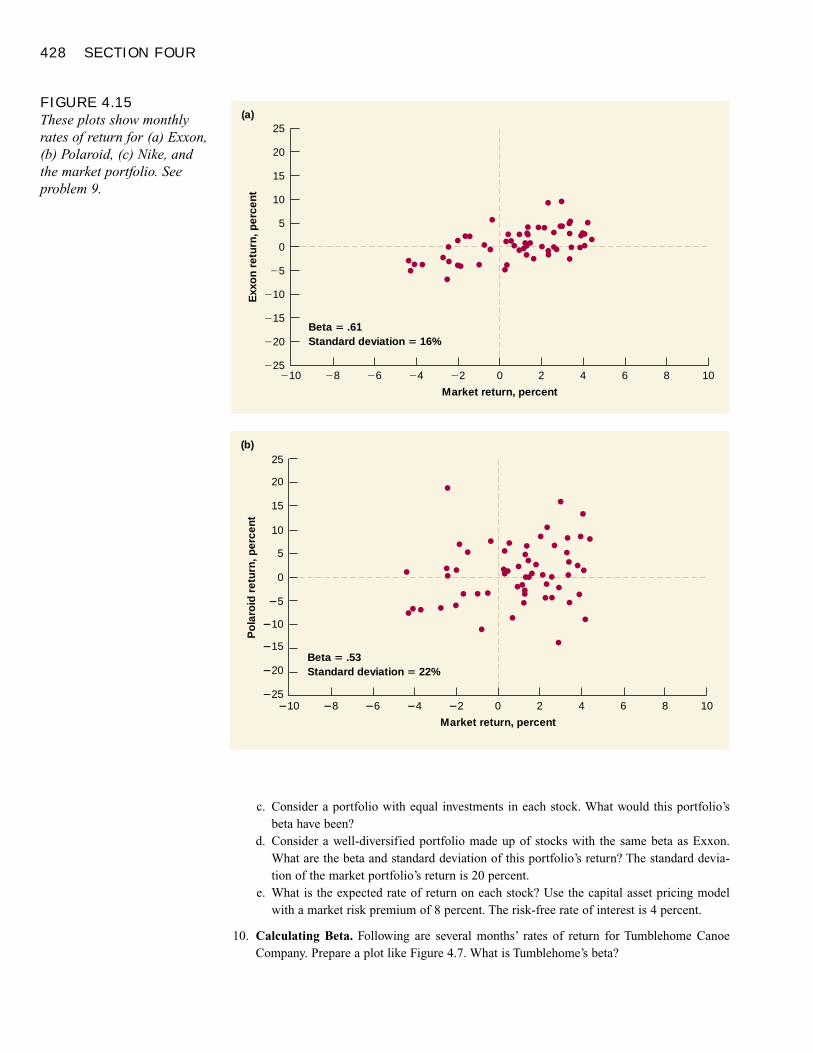
428 SECTION FOUR
c. Consider a portfolio with equal investments in each stock. What would this portfolio’sbeta have been?
d. Consider a well-diversified portfolio made up of stocks with the same beta as Exxon.What are the beta and standard deviation of this portfolio’s return? The standard devia-tion of the market portfolio’s return is 20 percent.
e. What is the expected rate of return on each stock? Use the capital asset pricing modelwith a market risk premium of 8 percent. The risk-free rate of interest is 4 percent.
10. Calculating Beta. Following are several months’ rates of return for Tumblehome CanoeCompany. Prepare a plot like Figure 4.7. What is Tumblehome’s beta?
FIGURE 4.15These plots show monthlyrates of return for (a) Exxon,(b) Polaroid, (c) Nike, andthe market portfolio. Seeproblem 9.
Market return, percent
Exx
on
retu
rn, p
erce
nt
�2 62 40 8 10�6�8�10 �4�25
�20
�15
�10
�5
0
5
10
15
20
Beta � .61Standard deviation � 16%
25(a)
Market return, percent
Po
laro
id r
etur
n, p
erce
nt
�2 62 40 8 10�6�8�10 �4�25
�20
�15
�10
�5
0
5
10
15
20
25
Beta � .53Standard deviation � 22%
(b)
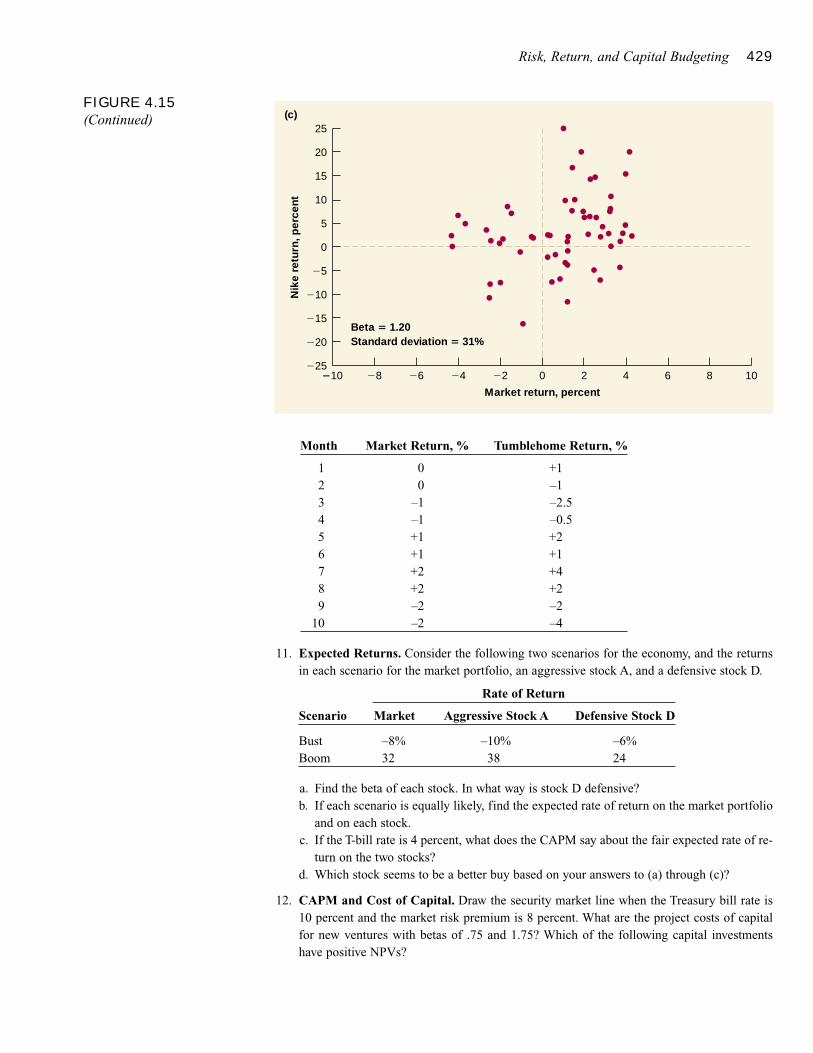
Risk, Return, and Capital Budgeting 429
Month Market Return, % Tumblehome Return, %
1 0 +12 0 –13 –1 –2.54 –1 –0.55 +1 +26 +1 +17 +2 +48 +2 +29 –2 –2
10 –2 –4
11. Expected Returns. Consider the following two scenarios for the economy, and the returnsin each scenario for the market portfolio, an aggressive stock A, and a defensive stock D.
Rate of Return
Scenario Market Aggressive Stock A Defensive Stock D
Bust –8% –10% –6%Boom 32 38 24
a. Find the beta of each stock. In what way is stock D defensive?b. If each scenario is equally likely, find the expected rate of return on the market portfolio
and on each stock.c. If the T-bill rate is 4 percent, what does the CAPM say about the fair expected rate of re-
turn on the two stocks?d. Which stock seems to be a better buy based on your answers to (a) through (c)?
12. CAPM and Cost of Capital. Draw the security market line when the Treasury bill rate is10 percent and the market risk premium is 8 percent. What are the project costs of capitalfor new ventures with betas of .75 and 1.75? Which of the following capital investmentshave positive NPVs?
FIGURE 4.15(Continued)
Market return, percent
Nik
e re
turn
, per
cent
�2 62 40 8 10�6�8�10 �4�25
�20
�15
�10
�5
0
5
10
15
20
25
Beta � 1.20Standard deviation � 31%
(c)
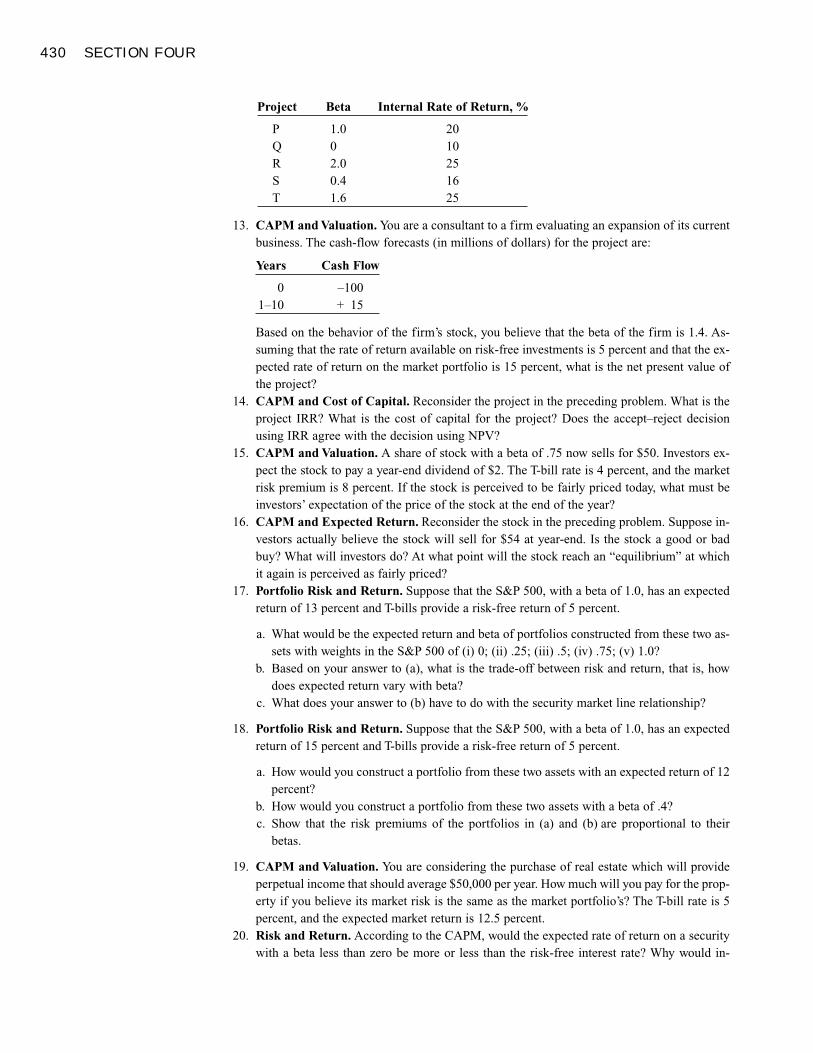
430 SECTION FOUR
Project Beta Internal Rate of Return, %
P 1.0 20Q 0 10R 2.0 25S 0.4 16T 1.6 25
13. CAPM and Valuation. You are a consultant to a firm evaluating an expansion of its currentbusiness. The cash-flow forecasts (in millions of dollars) for the project are:
Years Cash Flow
0 –1001–10 + 15
Based on the behavior of the firm’s stock, you believe that the beta of the firm is 1.4. As-suming that the rate of return available on risk-free investments is 5 percent and that the ex-pected rate of return on the market portfolio is 15 percent, what is the net present value ofthe project?
14. CAPM and Cost of Capital. Reconsider the project in the preceding problem. What is theproject IRR? What is the cost of capital for the project? Does the accept–reject decisionusing IRR agree with the decision using NPV?
15. CAPM and Valuation. A share of stock with a beta of .75 now sells for $50. Investors ex-pect the stock to pay a year-end dividend of $2. The T-bill rate is 4 percent, and the marketrisk premium is 8 percent. If the stock is perceived to be fairly priced today, what must beinvestors’ expectation of the price of the stock at the end of the year?
16. CAPM and Expected Return. Reconsider the stock in the preceding problem. Suppose in-vestors actually believe the stock will sell for $54 at year-end. Is the stock a good or badbuy? What will investors do? At what point will the stock reach an “equilibrium” at whichit again is perceived as fairly priced?
17. Portfolio Risk and Return. Suppose that the S&P 500, with a beta of 1.0, has an expectedreturn of 13 percent and T-bills provide a risk-free return of 5 percent.
a. What would be the expected return and beta of portfolios constructed from these two as-sets with weights in the S&P 500 of (i) 0; (ii) .25; (iii) .5; (iv) .75; (v) 1.0?
b. Based on your answer to (a), what is the trade-off between risk and return, that is, howdoes expected return vary with beta?
c. What does your answer to (b) have to do with the security market line relationship?
18. Portfolio Risk and Return. Suppose that the S&P 500, with a beta of 1.0, has an expectedreturn of 15 percent and T-bills provide a risk-free return of 5 percent.
a. How would you construct a portfolio from these two assets with an expected return of 12percent?
b. How would you construct a portfolio from these two assets with a beta of .4?c. Show that the risk premiums of the portfolios in (a) and (b) are proportional to their
betas.
19. CAPM and Valuation. You are considering the purchase of real estate which will provideperpetual income that should average $50,000 per year. How much will you pay for the prop-erty if you believe its market risk is the same as the market portfolio’s? The T-bill rate is 5percent, and the expected market return is 12.5 percent.
20. Risk and Return. According to the CAPM, would the expected rate of return on a securitywith a beta less than zero be more or less than the risk-free interest rate? Why would in-
Risk, Return, and Capital Budgeting 431
vestors be willing to invest in such a security? Hint: Look back to the auto and gold exam-ple.
21. CAPM and Expected Return. The following table shows betas for several companies. Cal-culate each stock’s expected rate of return using the CAPM. Assume the risk-free rate of in-terest is 5 percent. Use a 9 percent risk premium for the market portfolio.
Company Beta
Bristol-Myers Squibb 1.13General Mills 0.70McGraw-Hill 0.92Amazon.com 2.48
22. CAPM and Expected Return. Stock A has a beta of .5 and investors expect it to return 5percent. Stock B has a beta of 1.5 and investors expect it to return 13 percent. Use the CAPMto find the market risk premium and the expected rate of return on the market.
23. CAPM and Expected Return. If the expected rate of return on the market portfolio is 14percent and T-bills yield 6 percent, what must be the beta of a stock that investors expect toreturn 10 percent?
24. Project Cost of Capital. Suppose General Mills is considering a new investment in thecommon stock of a publishing company. Which of the betas shown in the table in problem21 is most relevant in determining the required rate of return for this venture? Explain whythe expected return to General Mills stock is not the appropriate required return.
25. Risk and Return. True or false? Explain or qualify as necessary.
a. The expected rate of return on an investment with a beta of 2 is twice as high as the ex-pected rate of return of the market portfolio.
b. The contribution of a stock to the risk of a diversified portfolio depends on the marketrisk of the stock.
c. If a stock’s expected rate of return plots below the security market line, it is underpriced.d. A diversified portfolio with a beta of 2 is twice as volatile as the market portfolio.e. An undiversified portfolio with a beta of 2 is twice as volatile as the market portfolio.
26. CAPM and Expected Return. A mutual fund manager expects her portfolio to earn a rateof return of 12 percent this year. The beta of her portfolio is .8. If the rate of return availableon risk-free assets is 5 percent and you expect the rate of return on the market portfolio tobe 15 percent, should you invest in this mutual fund?
27. Required Rate of Return. Reconsider the mutual fund manager in the previous problem.Explain how you would use a stock index mutual fund and a risk-free position in Treasurybills (or a money market mutual fund) to create a portfolio with the same risk as the manager’s but with a higher expected rate of return. What is the rate of return on that port-folio?
28. Required Rate of Return. In view of your answer to the preceding problem, explain why amutual fund must be able to provide an expected rate of return in excess of that predicted by the security market line for investors to consider the fund an attractive investment op-portunity.
29. CAPM. We Do Bankruptcies is a law firm that specializes in providing advice to firms infinancial distress. It prospers in recessions when other firms are struggling. Consequently,its beta is negative, –.2.
a. If the interest rate on Treasury bills is 5 percent and the expected return on the marketportfolio is 15 percent, what is the expected return on the shares of the law firm accord-ing to the CAPM?
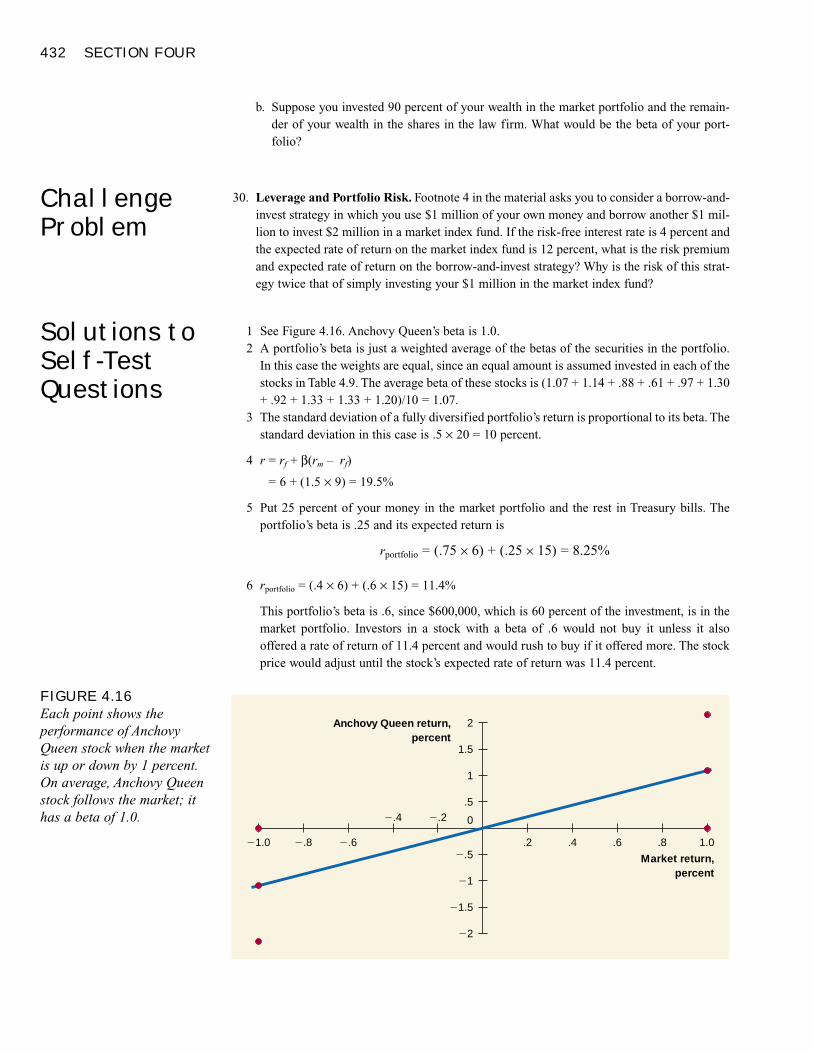
432 SECTION FOUR
b. Suppose you invested 90 percent of your wealth in the market portfolio and the remain-der of your wealth in the shares in the law firm. What would be the beta of your port-folio?
30. Leverage and Portfolio Risk. Footnote 4 in the material asks you to consider a borrow-and-invest strategy in which you use $1 million of your own money and borrow another $1 mil-lion to invest $2 million in a market index fund. If the risk-free interest rate is 4 percent andthe expected rate of return on the market index fund is 12 percent, what is the risk premiumand expected rate of return on the borrow-and-invest strategy? Why is the risk of this strat-egy twice that of simply investing your $1 million in the market index fund?
1 See Figure 4.16. Anchovy Queen’s beta is 1.0.2 A portfolio’s beta is just a weighted average of the betas of the securities in the portfolio.
In this case the weights are equal, since an equal amount is assumed invested in each of thestocks in Table 4.9. The average beta of these stocks is (1.07 + 1.14 + .88 + .61 + .97 + 1.30+ .92 + 1.33 + 1.33 + 1.20)/10 = 1.07.
3 The standard deviation of a fully diversified portfolio’s return is proportional to its beta. Thestandard deviation in this case is .5 × 20 = 10 percent.
4 r = rf + β(rm – rf)
= 6 + (1.5 × 9) = 19.5%
5 Put 25 percent of your money in the market portfolio and the rest in Treasury bills. Theportfolio’s beta is .25 and its expected return is
rportfolio = (.75 × 6) + (.25 × 15) = 8.25%
6 rportfolio = (.4 × 6) + (.6 × 15) = 11.4%
This portfolio’s beta is .6, since $600,000, which is 60 percent of the investment, is in themarket portfolio. Investors in a stock with a beta of .6 would not buy it unless it also offered a rate of return of 11.4 percent and would rush to buy if it offered more. The stockprice would adjust until the stock’s expected rate of return was 11.4 percent.
ChallengeProblem
Solutions toSelf-TestQuestions
FIGURE 4.16Each point shows theperformance of AnchovyQueen stock when the marketis up or down by 1 percent.On average, Anchovy Queenstock follows the market; ithas a beta of 1.0.
Anchovy Queen return,percent
1.0�1.0 �.8 �.6
�.4 �.2
�2
2
1.5
1
.5
0
�.5
�1
�1.5
.8.6.4.2
Market return,percent
Risk, Return, and Capital Budgeting 433
7 Present value = $50 million × 10-year annuity factor at 13.1%
= $270.23 millionIf β = .7, then the cost of capital falls to
r = 4.8% + (.7 × 9%) = 11.1%
and the value of the 10-year annuity increases to $293.23 million.8 Merck should use Compaq’s cost of capital. Merck’s company cost of capital tells us what
expected rate of return investors demand from the pharmaceutical business. This is not theappropriate project cost of capital for Merck’s venture into computer hardware.
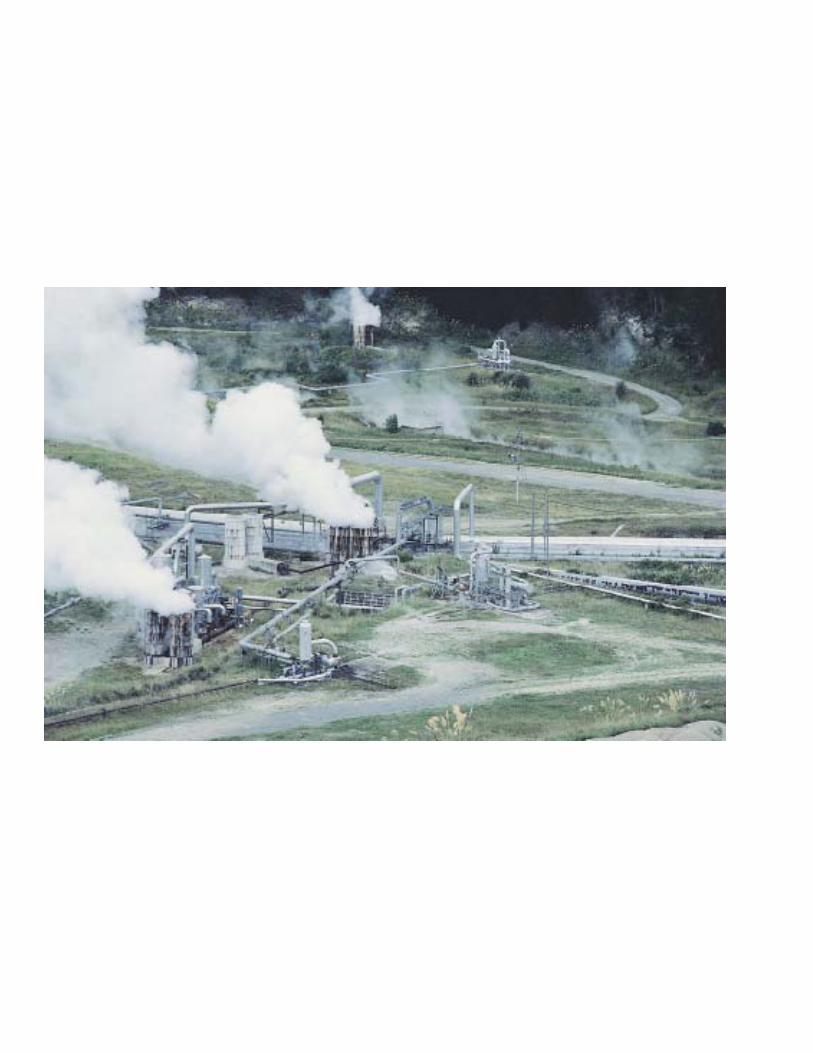
435
THE COST OF CAPITAL
Geothermal’s Cost of Capital
Calculating the Weighted-Average Cost of CapitalCalculating Company Cost of Capital as a Weighted Average
Market versus Book Weights
Taxes and the Weighted-Average Cost of Capital
What If There Are Three (or More) Sources of Financing?
Wrapping Up Geothermal
Checking Our Logic
Measuring Capital Structure
Calculating Required Rates of ReturnThe Expected Return on Bonds
The Expected Return on Common Stock
The Expected Return on Preferred Stock
Big Oil’s Weighted-Average Cost of CapitalReal Oil Company WACCs
Interpreting the Weighted-Average Cost of CapitalWhen You Can and Can’t Use WACC
Some Common Mistakes
How Changing Capital Structure Affects Expected Returns
What Happens When the Corporate Tax Rate Is Not Zero
Flotation Costs and the Cost of Capital
Summary
Jo Ann Cox needs to calculate the required rate of return on this geothermal plant.How should she do it?© Cameramann International, Ltd.
ou learned how to use the capital asset pricing model to estimate the ex-
pected return on a company’s common stock. If the firm is financed
wholly by common stock, then the stockholders own all the firm’s assets
and are entitled to all the cash flows. In this case, the expected return required
by investors in the common stock equals the company cost of capital.1
Most companies, however, are financed by a mixture of securities, including com-
mon stock, bonds, and often preferred stock or other securities. Each of these securities
has different risks and therefore investors in them look for different rates of return. In
these circumstances, the company cost of capital is no longer the same as the expected
return on the common stock. It depends on the expected return from all the securities
that the company has issued. It also depends on taxes, because interest payments made
by a corporation are tax-deductible expenses.
Therefore, the company cost of capital is usually calculated as a weighted average of
the after-tax interest cost of debt financing and the “cost of equity,” that is, the expected
rate of return on the firm’s common stock. The weights are the fractions of debt and eq-
uity in the firm’s capital structure. Managers refer to the firm’s weighted-average cost
of capital, or WACC (rhymes with “quack”).
Managers use the weighted-average cost of capital to evaluate average-risk capital
investment projects. “Average risk” means that the project’s risk matches the risk of the
firm’s existing assets and operations. This material explains how the weighted-average
cost of capital is calculated in practice.
After studying this material you should be able to
� Calculate a firm’s capital structure.
� Estimate the required rates of return on the securities issued by the firm.
� Calculate the weighted-average cost of capital.
� Understand when the weighted-average cost of capital is—or isn’t—the appropriate
discount rate for a new project.
Managers calculating WACC can get bogged down in formulas. We want you to un-
derstand why WACC works, not just how to calculate it. Let’s start with “Why?” We’ll
listen in as a young financial manager struggles to recall the rationale for project dis-
count rates.
436
Y
1 Investors will invest in the firm’s securities only if they offer the same expected return as that of otherequally risky securities. When securities are properly priced, the return that investors can expect from theirinvestments is therefore also the return that they require.
Geothermal’s Cost of CapitalJo Ann Cox, a recent graduate of a prestigious eastern business school, poured a thirdcup of black coffee and tried again to remember what she once knew about project hur-
The Cost of Capital 437
dle rates. Why hadn’t she paid more attention in Finance 101? Why had she sold her fi-nance text the day after passing the finance final?
Costas Thermopolis, her boss and CEO of Geothermal Corporation, had told her toprepare a financial evaluation of a proposed expansion of Geothermal’s production. Shewas to report at 9:00 Monday morning. Thermopolis, whose background was geo-physics, not finance, not only expected a numerical analysis; he expected her to explainit to him.
Thermopolis had founded Geothermal in 1993 to produce electricity from geother-mal energy trapped deep under Nevada. The company had pioneered this business andhad been able to obtain perpetual production rights for a large tract on favorable termsfrom the United States government. When the 1999 oil shock drove up energy pricesworldwide, Geothermal became an exceptionally profitable company. It was currentlyreporting a rate of return on book assets of 25 percent per year.
Now, in 2001, production rights were no longer cheap. The proposed expansionwould cost $30 million and should generate a perpetual after-tax cash flow of $4.5 mil-lion annually. The projected rate of return was 4.5/30 = .15, or 15 percent, much lessthan the profitability of Geothermal’s existing assets. However, once the new projectwas up and running, it would be no riskier than Geothermal’s existing business.
Jo Ann realized that 15 percent was not necessarily a bad return—though of course25 percent would have been better. Fifteen percent might still exceed Geothermal’s costof capital, that is, exceed the expected rate of return that outside investors would de-mand to invest money in the project. If the cost of capital was less than the 15 percentexpected return, expansion would be a good deal and would generate net value for Ge-othermal and its stockholders.
Jo Ann remembered how to calculate the cost of capital for companies which usedonly common stock financing. Briefly she sketched the argument.
“I need the expected rate of return investors would require from Geothermal’s realassets—the wells, pumps, generators, etc. That rate of return depends on the assets’ risk.However, the assets aren’t traded in the stock market, so I can’t observe how risky theyhave been. I can only observe the risk of Geothermal’s common stock.
“But if Geothermal issues only stock—no debt—then owning the stock means own-ing the assets, and the expected return demanded by investors in the stock must also bethe cost of capital for the assets.” She jotted down the following identities:
Value of business = value of stock
Risk of business = risk of stock
Rate of return on business = rate of return on stock
Investors’ required return from business = investors’ required return from stock
Unfortunately, Geothermal had borrowed a substantial amount of money; its stock-holders did not have unencumbered ownership of Geothermal’s assets. The expansionproject would also justify some extra debt finance. Jo Ann realized that she would haveto look at Geothermal’s capital structure—its mix of debt and equity financing—andconsider the required rates of return of debt as well as equity investors.
Geothermal had issued 22.65 million shares, now trading at $20 each. Thus share-holders valued Geothermal’s equity at $20 × 22.65 million = $453 million. In addition,the company had issued bonds with a market value of $194 million. The market valueof the company’s debt and equity was therefore $194 + 453 = $647 million. Debt was194/647 = .3, or 30 percent of the total.
“Geothermal’s worth more to investors than either its debt or its equity,” Jo Ann
438 SECTION FOUR
mused. “But I ought to be able to find the overall value of Geothermal’s business byadding up the debt and equity.” She sketched a rough balance sheet:
Assets Liabilities and Shareholders’ Equity
Market value of assets = value Market value of debt $194 (30%)of Geothermal’s existing business $647 Market value of equity $453 (70%)
Total value $647 Total value $647 (100%)
“Holy Toledo, I’ve got it!” Jo Ann exclaimed. “If I bought all the securities issued byGeothermal, debt as well as equity, I’d own the entire business. That means. . . .” Shejotted again:
Value of business =value of portfolio of all the firm’sdebt and equity securities
Risk of business = risk of portfolio
Rate of return on business = rate of return on portfolio
Investors’ required return on business=
investors’ required return on(company cost of capital) portfolio
“All I have to do is calculate the expected rate of return on a portfolio of all the firm’ssecurities. That’s easy. The debt’s yielding 8 percent, and Fred, that nerdy banker, saysthat equity investors want 14 percent. Suppose he’s right. The portfolio would contain30 percent debt and 70 percent equity, so. . . .”
Portfolio return = (.3 × 8%) + (.7 × 14%) = 12.2%
It was all coming back to her now. The company cost of capital is just a weighted av-erage of returns on debt and equity, with weights depending on relative market valuesof the two securities.
“But there’s one more thing. Interest is tax-deductible. If Geothermal pays $1 of in-terest, taxable income is reduced by $1, and the firm’s tax bill drops by 35 cents (as-suming a 35 percent tax rate). The net cost is only 65 cents. So the cost of debt is not 8percent, but .65 × 8 = 5.2 percent.
“Now I can finally calculate the weighted-average cost of capital:
WACC = (.3 × 5.2%) + (.7 × 14%) = 11.4%
“Looks like the expansion’s a good deal. Fifteen’s better than 11.4. But I sure need abreak.”
Calculating the Weighted-Average Cost of CapitalJo Ann’s conclusions were important. It should be obvious by now that the choice of thediscount rate can be crucial, especially when the project involves large capital expendi-tures or is long-lived. The nearby box describes how a major investment in a power sta-tion—an investment with both a large capital expenditure and very long life—turned onthe choice of the discount rate.
Think again what the company cost of capital is, and what it is used for. We define
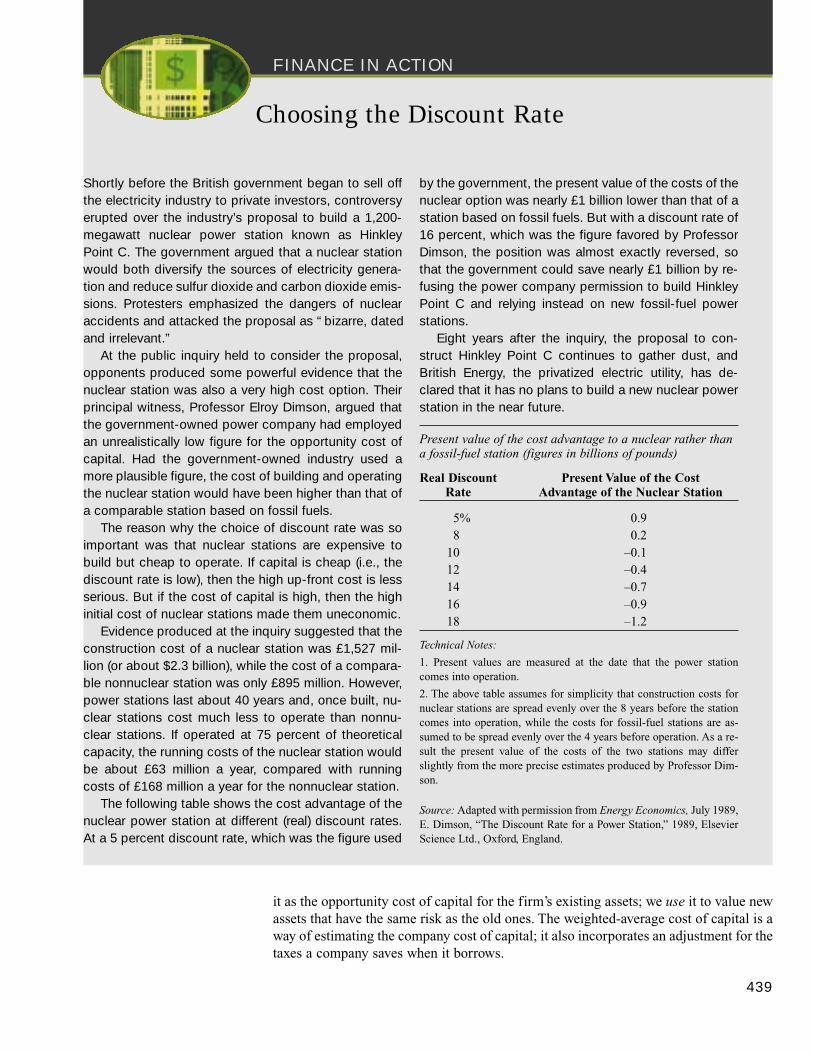
FINANCE IN ACTION
it as the opportunity cost of capital for the firm’s existing assets; we use it to value newassets that have the same risk as the old ones. The weighted-average cost of capital is away of estimating the company cost of capital; it also incorporates an adjustment for thetaxes a company saves when it borrows.
439
Choosing the Discount Rate
Shortly before the British government began to sell offthe electricity industry to private investors, controversyerupted over the industry’s proposal to build a 1,200-megawatt nuclear power station known as HinkleyPoint C. The government argued that a nuclear stationwould both diversify the sources of electricity genera-tion and reduce sulfur dioxide and carbon dioxide emis-sions. Protesters emphasized the dangers of nuclearaccidents and attacked the proposal as “ bizarre, datedand irrelevant.”
At the public inquiry held to consider the proposal,opponents produced some powerful evidence that thenuclear station was also a very high cost option. Theirprincipal witness, Professor Elroy Dimson, argued thatthe government-owned power company had employedan unrealistically low figure for the opportunity cost ofcapital. Had the government-owned industry used amore plausible figure, the cost of building and operatingthe nuclear station would have been higher than that ofa comparable station based on fossil fuels.
The reason why the choice of discount rate was soimportant was that nuclear stations are expensive tobuild but cheap to operate. If capital is cheap (i.e., thediscount rate is low), then the high up-front cost is lessserious. But if the cost of capital is high, then the highinitial cost of nuclear stations made them uneconomic.
Evidence produced at the inquiry suggested that theconstruction cost of a nuclear station was £1,527 mil-lion (or about $2.3 billion), while the cost of a compara-ble nonnuclear station was only £895 million. However,power stations last about 40 years and, once built, nu-clear stations cost much less to operate than nonnu-clear stations. If operated at 75 percent of theoreticalcapacity, the running costs of the nuclear station wouldbe about £63 million a year, compared with runningcosts of £168 million a year for the nonnuclear station.
The following table shows the cost advantage of thenuclear power station at different (real) discount rates.At a 5 percent discount rate, which was the figure used
by the government, the present value of the costs of thenuclear option was nearly £1 billion lower than that of astation based on fossil fuels. But with a discount rate of16 percent, which was the figure favored by ProfessorDimson, the position was almost exactly reversed, sothat the government could save nearly £1 billion by re-fusing the power company permission to build HinkleyPoint C and relying instead on new fossil-fuel powerstations.
Eight years after the inquiry, the proposal to con-struct Hinkley Point C continues to gather dust, andBritish Energy, the privatized electric utility, has de-clared that it has no plans to build a new nuclear powerstation in the near future.
Present value of the cost advantage to a nuclear rather thana fossil-fuel station (figures in billions of pounds)
Real Discount Present Value of the CostRate Advantage of the Nuclear Station
5% 0.98 0.2
10 –0.112 –0.414 –0.716 –0.918 –1.2
Technical Notes:
1. Present values are measured at the date that the power stationcomes into operation.
2. The above table assumes for simplicity that construction costs fornuclear stations are spread evenly over the 8 years before the stationcomes into operation, while the costs for fossil-fuel stations are as-sumed to be spread evenly over the 4 years before operation. As a re-sult the present value of the costs of the two stations may differslightly from the more precise estimates produced by Professor Dim-son.
Source: Adapted with permission from Energy Economics, July 1989,E. Dimson, “The Discount Rate for a Power Station,” 1989, ElsevierScience Ltd., Oxford, England.
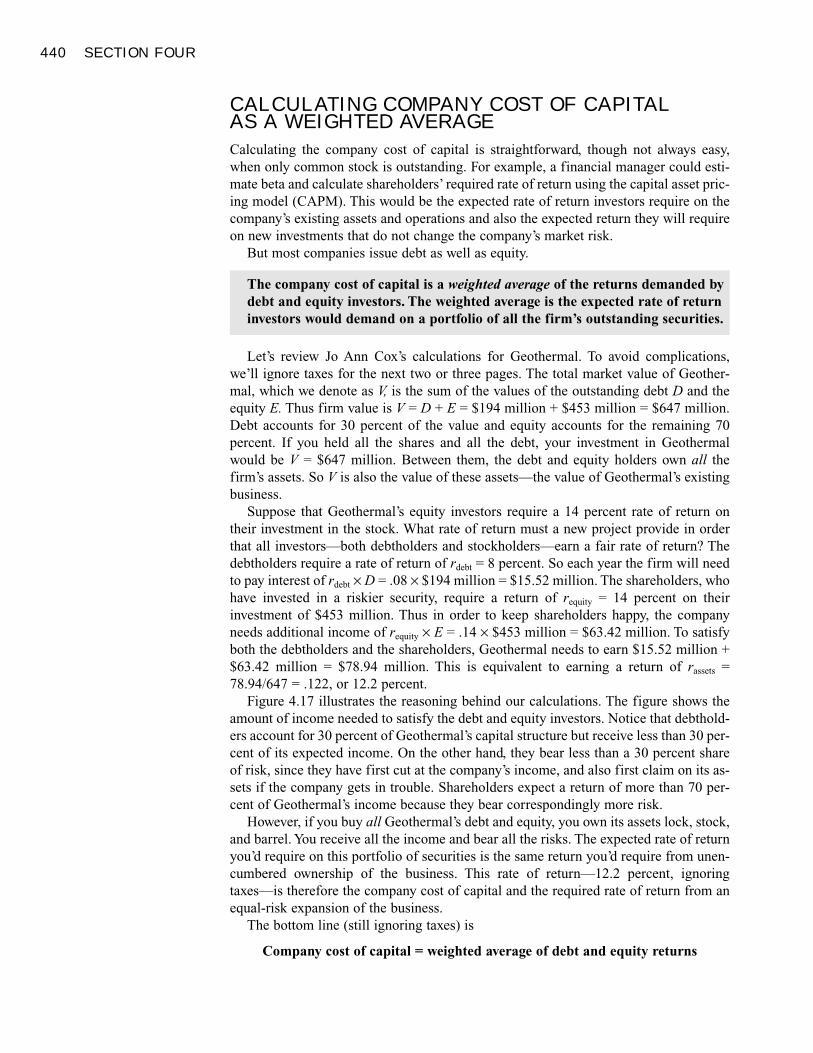
440 SECTION FOUR
CALCULATING COMPANY COST OF CAPITAL AS A WEIGHTED AVERAGE
Calculating the company cost of capital is straightforward, though not always easy,when only common stock is outstanding. For example, a financial manager could esti-mate beta and calculate shareholders’ required rate of return using the capital asset pric-ing model (CAPM). This would be the expected rate of return investors require on thecompany’s existing assets and operations and also the expected return they will requireon new investments that do not change the company’s market risk.
But most companies issue debt as well as equity.
Let’s review Jo Ann Cox’s calculations for Geothermal. To avoid complications,we’ll ignore taxes for the next two or three pages. The total market value of Geother-mal, which we denote as V, is the sum of the values of the outstanding debt D and theequity E. Thus firm value is V = D + E = $194 million + $453 million = $647 million.Debt accounts for 30 percent of the value and equity accounts for the remaining 70 percent. If you held all the shares and all the debt, your investment in Geothermal would be V = $647 million. Between them, the debt and equity holders own all thefirm’s assets. So V is also the value of these assets—the value of Geothermal’s existingbusiness.
Suppose that Geothermal’s equity investors require a 14 percent rate of return ontheir investment in the stock. What rate of return must a new project provide in orderthat all investors—both debtholders and stockholders—earn a fair rate of return? Thedebtholders require a rate of return of rdebt = 8 percent. So each year the firm will needto pay interest of rdebt × D = .08 × $194 million = $15.52 million. The shareholders, whohave invested in a riskier security, require a return of requity = 14 percent on their investment of $453 million. Thus in order to keep shareholders happy, the companyneeds additional income of requity × E = .14 × $453 million = $63.42 million. To satisfyboth the debtholders and the shareholders, Geothermal needs to earn $15.52 million +$63.42 million = $78.94 million. This is equivalent to earning a return of rassets =78.94/647 = .122, or 12.2 percent.
Figure 4.17 illustrates the reasoning behind our calculations. The figure shows theamount of income needed to satisfy the debt and equity investors. Notice that debthold-ers account for 30 percent of Geothermal’s capital structure but receive less than 30 per-cent of its expected income. On the other hand, they bear less than a 30 percent shareof risk, since they have first cut at the company’s income, and also first claim on its as-sets if the company gets in trouble. Shareholders expect a return of more than 70 per-cent of Geothermal’s income because they bear correspondingly more risk.
However, if you buy all Geothermal’s debt and equity, you own its assets lock, stock,and barrel. You receive all the income and bear all the risks. The expected rate of returnyou’d require on this portfolio of securities is the same return you’d require from unen-cumbered ownership of the business. This rate of return—12.2 percent, ignoringtaxes—is therefore the company cost of capital and the required rate of return from anequal-risk expansion of the business.
The bottom line (still ignoring taxes) is
Company cost of capital = weighted average of debt and equity returns
The company cost of capital is a weighted average of the returns demanded bydebt and equity investors. The weighted average is the expected rate of returninvestors would demand on a portfolio of all the firm’s outstanding securities.
The Cost of Capital 441
The underlying algebra is simple. Debtholders need income of (rdebt × D) and the equityinvestors need income of (requity × E). The total income that is needed is (rdebt × D) + (requity × E). The amount of their combined existing investment in the company is V. Soto calculate the return that is needed on the assets, we simply divide the income by theinvestment:
rassets =total income
value of investment
=(D � rdebt) + (E � requity)= ( D
� rdebt) + ( E� requity)V V V
For Geothermal,
rassets = (.30 × 8%) + (.70 × 14%) = 12.2%
This figure is the expected return demanded by investors in the firm’s assets.
� Self-Test 1 Hot Rocks Corp., one of Geothermal’s competitors, has issued long-term bonds with amarket value of $50 million and an expected return of 9.0 percent. It has 4 millionshares outstanding trading for $10 each. At this price the shares offer an expected re-turn of 17 percent. What is the weighted-average cost of capital for Hot Rocks’s assetsand operations? Assume Hot Rocks pays no taxes.
MARKET VERSUS BOOK WEIGHTS
The company cost of capital is the expected rate of return that investors demand fromthe company’s assets and operations.
The cost of capital must be based on what investors are actually willing to pay for the company’s outstanding securities—that is, based on the securities’market values.
FIGURE 4.17Geothermal’s debtholdersaccount for 30 percent of thecompany’s capital structure,but they get a smaller shareof income because theirreturn is guaranteed by thecompany. Geothermal’sstockholders bear more riskand receive, on average,greater return. Of course ifyou buy all the debt and allthe equity, you get all theincome.
Share of capital structure Share of income
Total � $647 (100%) Total � $78.9 (100%)
Debt$194 (30%)
Debt$15.5
(19.7%)
Equity$453 (70%)
Equity$63.4 (80.3%)
442 SECTION FOUR
Market values usually differ from the values recorded by accountants in the com-pany’s books. The book value of Geothermal’s equity reflects money raised in the pastfrom shareholders or reinvested by the firm on their behalf. If investors recognize Ge-othermal’s excellent prospects, the market value of equity may be much higher thanbook, and the debt ratio will be lower when measured in terms of market values ratherthan book values.
Financial managers use book debt-to-value ratios for various other purposes, andsometimes they unthinkingly look to the book ratios when calculating weights for thecompany cost of capital. That’s a mistake, because the company cost of capital meas-ures what investors want from the company, and it depends on how they value the com-pany’s securities. That value depends on future profits and cash flows, not on account-ing history. Book values, while useful for many other purposes, only measure netcumulative historical outlays; they don’t generally measure market values accurately.
� Self-Test 2 Here is a book balance sheet for Duane S. Burg Associates. Figures are in millions.
Assets Liabilities and Shareholders’ Equity
Assets (book value) $75 Debt $25Equity 50
$75 $75
Unfortunately, the company has fallen on hard times. The 6 million shares are tradingfor only $4 apiece, and the market value of its debt securities is 20 percent below theface (book) value. Because of the company’s large cumulative losses, it will pay notaxes on future income.
Suppose shareholders now demand a 20 percent expected rate of return. The bondsare now yielding 14 percent. What is the weighted-average cost of capital?
TAXES AND THE WEIGHTED-AVERAGE COST OF CAPITAL
Thus far in this section our examples have ignored taxes. Taxes are important becauseinterest payments are deducted from income before tax is calculated. Therefore, the costto the company of an interest payment is reduced by the amount of this tax saving.
The interest rate on Geothermal’s debt is rdebt = 8 percent. However, with a corporatetax rate of Tc = .35, the government bears 35 percent of the cost of the interest payments.The government doesn’t send the firm a check for this amount, but the income tax thatthe firm pays is reduced by 35 percent of its interest expense.
Therefore, Geothermal’s after-tax cost of debt is only 100 – 35 = 65 percent of the 8percent pretax cost:
After-tax cost of debt = pretax cost � (1 – tax rate)
= rdebt � (1 – Tc)
= 8% × (1 – .35) = 5.2%
We can now adjust our calculation of Geothermal’s cost of capital to recognize thetax saving associated with interest payments:
Company cost of capital, after-tax = (.3 × 5.2%) + (.7 × 14%) = 11.4%
The Cost of Capital 443
� Self-Test 3 Criss-cross Industries has earnings before interest and taxes (EBIT) of $10 million. In-terest payments are $2 million and the corporate tax rate is 35 percent. Construct a sim-ple income statement to show that the debt interest reduces the taxes the firm owes tothe government. How much more tax would Criss-cross pay if it were financed solelyby equity?
Now we’re back to the weighted-average cost of capital, or WACC. The generalformula is
WACC = [ D� (1 – Tc)rdebt]+ ( E
� requity)V V
� Self-Test 4 Calculate WACC for Hot Rocks (Self-Test 1) and Burg Associates (Self-Test 2) assum-ing the companies face a 35 percent corporate income tax rate.
WHAT IF THERE ARE THREE (OR MORE)SOURCES OF FINANCING?
We have simplified our discussion of the cost of capital by assuming the firm has onlytwo classes of securities: debt and equity. Even if the firm has issued other classes ofsecurities, our general approach to calculating WACC remains unchanged. You simplycalculate the weighted-average after-tax return of each security type.
For example, suppose the firm also has outstanding preferred stock. Preferred stockhas some of the characteristics of both common stock and fixed-income securities. Likebonds, preferred stock promises to pay a given, usually level, stream of dividends. Un-like bonds, however, there is no maturity date for the preferred stock. The promised div-idends constitute a perpetuity as long as the firm stays in business. Moreover, a failureto come up with the cash to pay the dividends does not push the firm into bankruptcy.Instead, dividends owed simply cumulate; the common stockholders do not receive div-idends until the accumulated preferred dividends have been paid. Finally, unlike inter-est payments, preferred stock dividends are not considered tax-deductible expenses.
How would we calculate WACC for a firm with preferred stock as well as commonstock and bonds outstanding? Using P to denote preferred stock, we simply generalizethe formula for WACC as follows:
WACC = [ D� (1 – Tc)rdebt]+ (P
� rpreferred) + (E� requity)V V V
Let’s try an example to make this concrete.
� EXAMPLE 1 Weighted-Average Cost of Capital for Executive Fruit
Unlike Geothermal, Executive Fruit has issued three types of securities—debt, pre-ferred stock, and common stock. The debtholders require a return of 6 percent, the pre-ferred stockholders require an expected return of 12 percent, and the common stock-holders require 18 percent. The debt is valued at $4 million (D = 4), the preferred stock
WEIGHTED-AVERAGECOST OF CAPITAL(WACC) Expected rate ofreturn on a portfolio of all thefirm’s securities, adjusted fortax savings due to interestpayments.
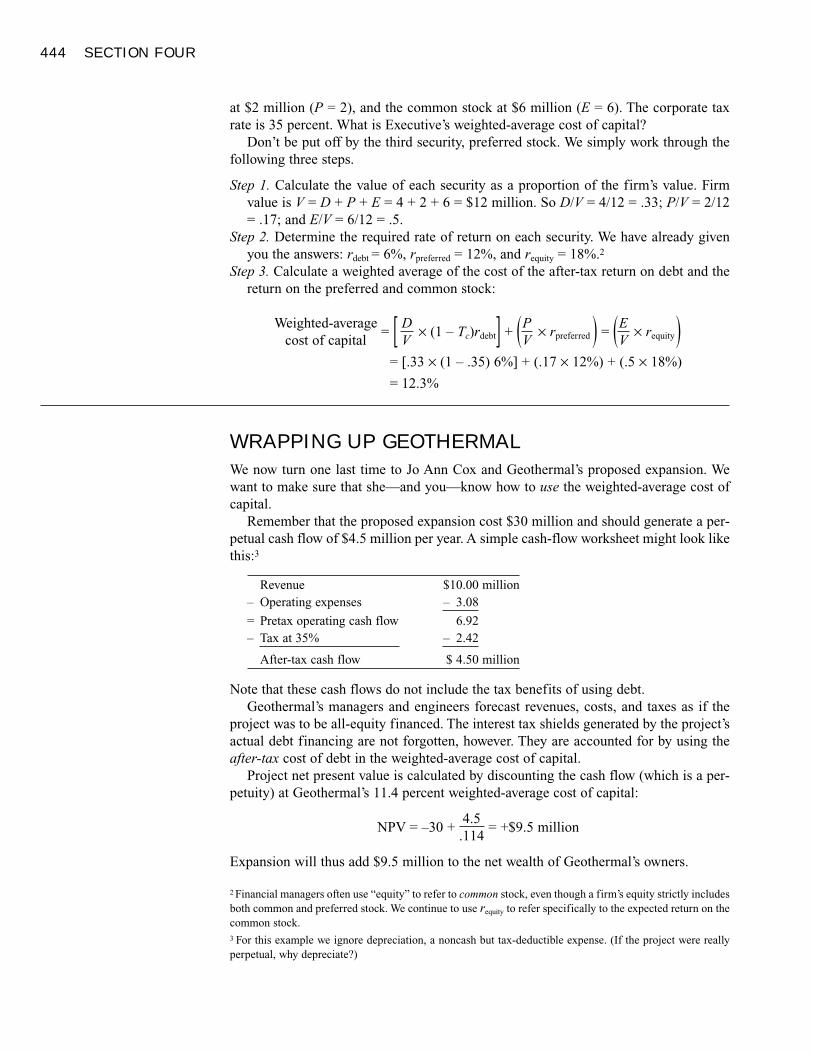
444 SECTION FOUR
at $2 million (P = 2), and the common stock at $6 million (E = 6). The corporate taxrate is 35 percent. What is Executive’s weighted-average cost of capital?
Don’t be put off by the third security, preferred stock. We simply work through thefollowing three steps.
Step 1. Calculate the value of each security as a proportion of the firm’s value. Firmvalue is V = D + P + E = 4 + 2 + 6 = $12 million. So D/V = 4/12 = .33; P/V = 2/12= .17; and E/V = 6/12 = .5.
Step 2. Determine the required rate of return on each security. We have already givenyou the answers: rdebt = 6%, rpreferred = 12%, and requity = 18%.2
Step 3. Calculate a weighted average of the cost of the after-tax return on debt and thereturn on the preferred and common stock:
Weighted-average= [ D × (1 – Tc)rdebt] + (P × rpreferred ) = (E × requity )cost of capital V V V
= [.33 × (1 – .35) 6%] + (.17 × 12%) + (.5 × 18%)
= 12.3%
WRAPPING UP GEOTHERMAL
We now turn one last time to Jo Ann Cox and Geothermal’s proposed expansion. Wewant to make sure that she—and you—know how to use the weighted-average cost ofcapital.
Remember that the proposed expansion cost $30 million and should generate a per-petual cash flow of $4.5 million per year. A simple cash-flow worksheet might look likethis:3
Revenue $10.00 million– Operating expenses – 3.08
= Pretax operating cash flow 6.92– Tax at 35% – 2.42
After-tax cash flow $ 4.50 million
Note that these cash flows do not include the tax benefits of using debt.Geothermal’s managers and engineers forecast revenues, costs, and taxes as if the
project was to be all-equity financed. The interest tax shields generated by the project’sactual debt financing are not forgotten, however. They are accounted for by using theafter-tax cost of debt in the weighted-average cost of capital.
Project net present value is calculated by discounting the cash flow (which is a per-petuity) at Geothermal’s 11.4 percent weighted-average cost of capital:
NPV = –30 +4.5
= +$9.5 million.114
Expansion will thus add $9.5 million to the net wealth of Geothermal’s owners.
2 Financial managers often use “equity” to refer to common stock, even though a firm’s equity strictly includesboth common and preferred stock. We continue to use requity to refer specifically to the expected return on thecommon stock.3 For this example we ignore depreciation, a noncash but tax-deductible expense. (If the project were reallyperpetual, why depreciate?)
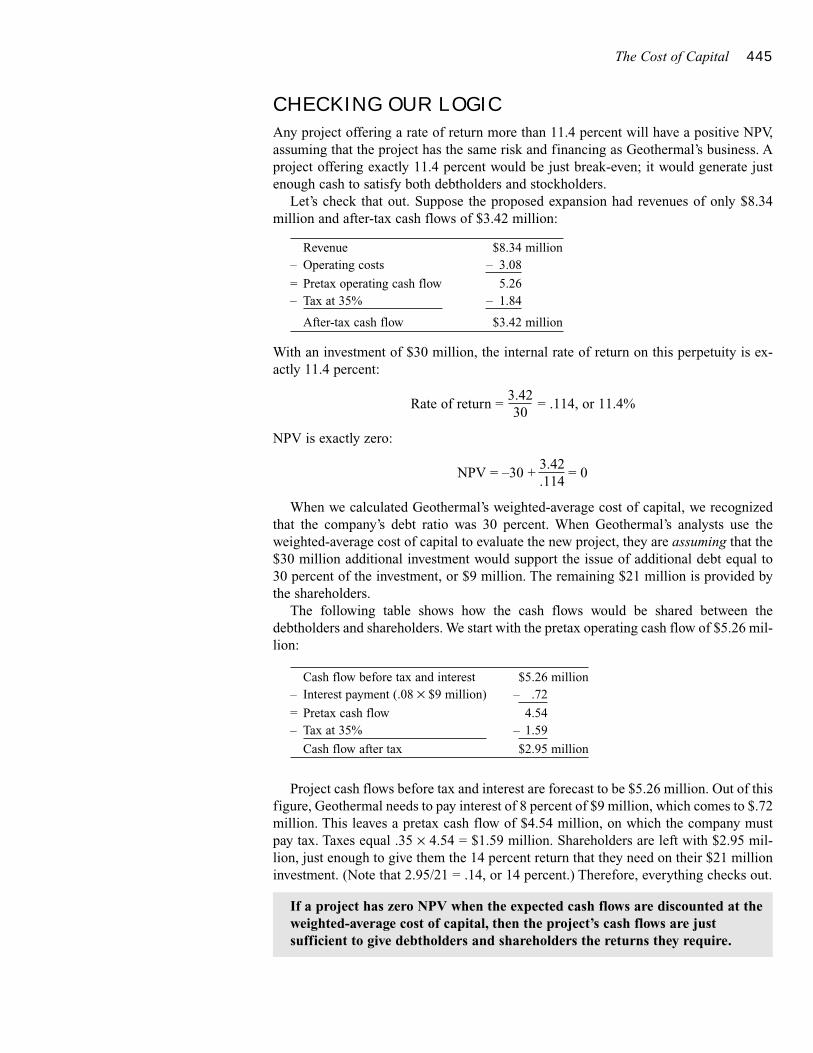
The Cost of Capital 445
CHECKING OUR LOGIC
Any project offering a rate of return more than 11.4 percent will have a positive NPV,assuming that the project has the same risk and financing as Geothermal’s business. Aproject offering exactly 11.4 percent would be just break-even; it would generate justenough cash to satisfy both debtholders and stockholders.
Let’s check that out. Suppose the proposed expansion had revenues of only $8.34million and after-tax cash flows of $3.42 million:
Revenue $8.34 million– Operating costs – 3.08
= Pretax operating cash flow 5.26– Tax at 35% – 1.84
After-tax cash flow $3.42 million
With an investment of $30 million, the internal rate of return on this perpetuity is ex-actly 11.4 percent:
Rate of return =3.42
= .114, or 11.4%30
NPV is exactly zero:
NPV = –30 +3.42
= 0.114
When we calculated Geothermal’s weighted-average cost of capital, we recognizedthat the company’s debt ratio was 30 percent. When Geothermal’s analysts use theweighted-average cost of capital to evaluate the new project, they are assuming that the$30 million additional investment would support the issue of additional debt equal to30 percent of the investment, or $9 million. The remaining $21 million is provided bythe shareholders.
The following table shows how the cash flows would be shared between thedebtholders and shareholders. We start with the pretax operating cash flow of $5.26 mil-lion:
Cash flow before tax and interest $5.26 million– Interest payment (.08 × $9 million) – .72
= Pretax cash flow 4.54– Tax at 35% – 1.59
Cash flow after tax $2.95 million
Project cash flows before tax and interest are forecast to be $5.26 million. Out of thisfigure, Geothermal needs to pay interest of 8 percent of $9 million, which comes to $.72million. This leaves a pretax cash flow of $4.54 million, on which the company mustpay tax. Taxes equal .35 × 4.54 = $1.59 million. Shareholders are left with $2.95 mil-lion, just enough to give them the 14 percent return that they need on their $21 millioninvestment. (Note that 2.95/21 = .14, or 14 percent.) Therefore, everything checks out.
If a project has zero NPV when the expected cash flows are discounted at theweighted-average cost of capital, then the project’s cash flows are justsufficient to give debtholders and shareholders the returns they require.
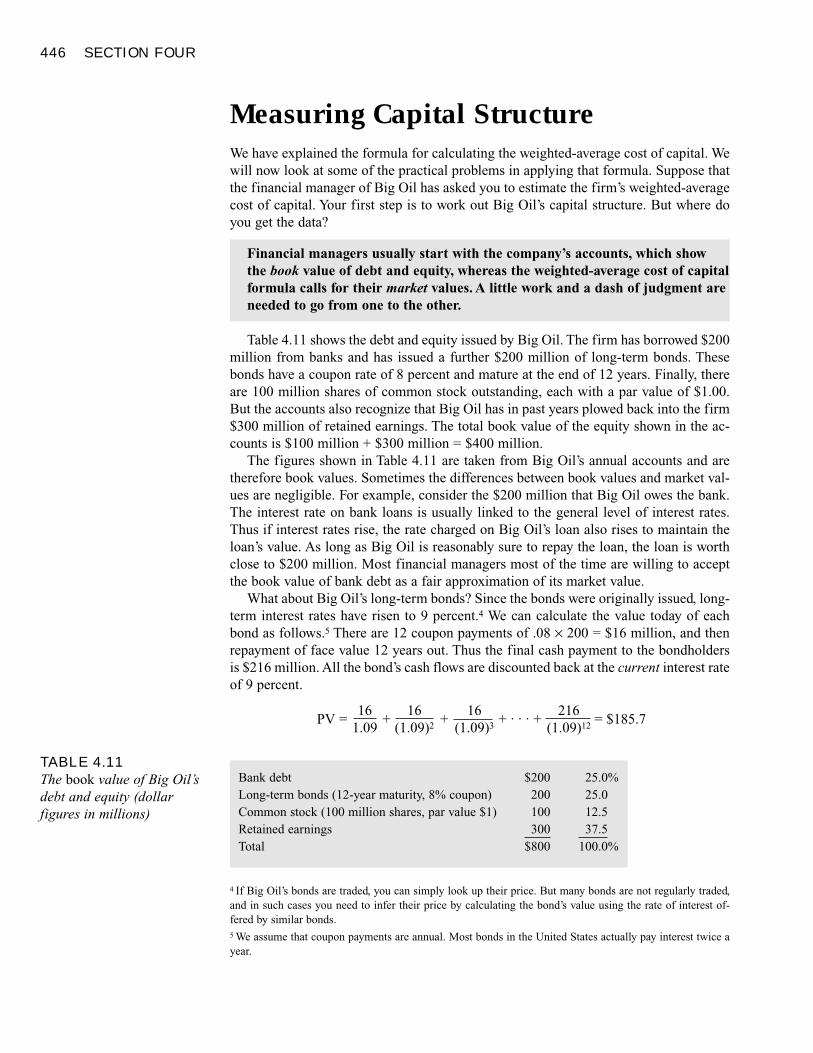
446 SECTION FOUR
Measuring Capital StructureWe have explained the formula for calculating the weighted-average cost of capital. Wewill now look at some of the practical problems in applying that formula. Suppose thatthe financial manager of Big Oil has asked you to estimate the firm’s weighted-averagecost of capital. Your first step is to work out Big Oil’s capital structure. But where doyou get the data?
Table 4.11 shows the debt and equity issued by Big Oil. The firm has borrowed $200million from banks and has issued a further $200 million of long-term bonds. Thesebonds have a coupon rate of 8 percent and mature at the end of 12 years. Finally, thereare 100 million shares of common stock outstanding, each with a par value of $1.00.But the accounts also recognize that Big Oil has in past years plowed back into the firm$300 million of retained earnings. The total book value of the equity shown in the ac-counts is $100 million + $300 million = $400 million.
The figures shown in Table 4.11 are taken from Big Oil’s annual accounts and aretherefore book values. Sometimes the differences between book values and market val-ues are negligible. For example, consider the $200 million that Big Oil owes the bank.The interest rate on bank loans is usually linked to the general level of interest rates.Thus if interest rates rise, the rate charged on Big Oil’s loan also rises to maintain theloan’s value. As long as Big Oil is reasonably sure to repay the loan, the loan is worthclose to $200 million. Most financial managers most of the time are willing to acceptthe book value of bank debt as a fair approximation of its market value.
What about Big Oil’s long-term bonds? Since the bonds were originally issued, long-term interest rates have risen to 9 percent.4 We can calculate the value today of eachbond as follows.5 There are 12 coupon payments of .08 × 200 = $16 million, and thenrepayment of face value 12 years out. Thus the final cash payment to the bondholdersis $216 million. All the bond’s cash flows are discounted back at the current interest rateof 9 percent.
PV =16
+16
+16
+ . . . +216
= $185.71.09 (1.09)2 (1.09)3 (1.09)12
Financial managers usually start with the company’s accounts, which show the book value of debt and equity, whereas the weighted-average cost of capitalformula calls for their market values. A little work and a dash of judgment areneeded to go from one to the other.
TABLE 4.11The book value of Big Oil’sdebt and equity (dollarfigures in millions)
Bank debt $200 25.0%Long-term bonds (12-year maturity, 8% coupon) 200 25.0Common stock (100 million shares, par value $1) 100 12.5Retained earnings 300 37.5Total $800 100.0%
4 If Big Oil’s bonds are traded, you can simply look up their price. But many bonds are not regularly traded,and in such cases you need to infer their price by calculating the bond’s value using the rate of interest of-fered by similar bonds.5 We assume that coupon payments are annual. Most bonds in the United States actually pay interest twice ayear.
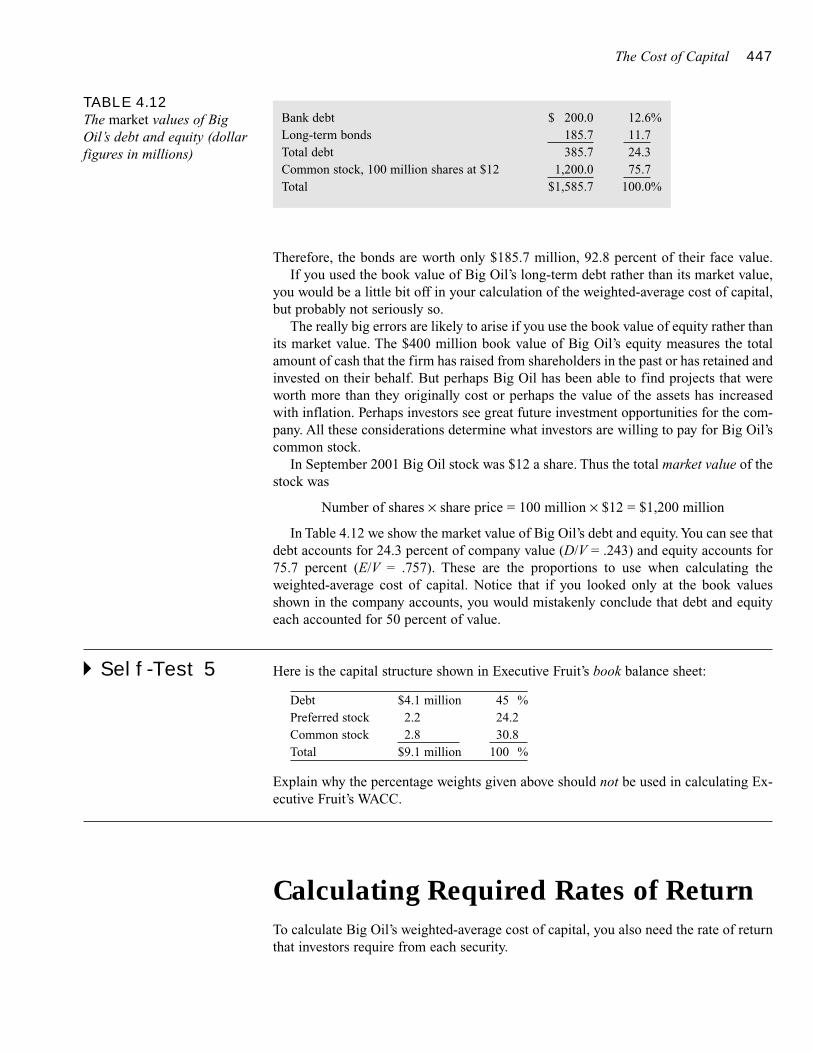
The Cost of Capital 447
Therefore, the bonds are worth only $185.7 million, 92.8 percent of their face value.If you used the book value of Big Oil’s long-term debt rather than its market value,
you would be a little bit off in your calculation of the weighted-average cost of capital,but probably not seriously so.
The really big errors are likely to arise if you use the book value of equity rather thanits market value. The $400 million book value of Big Oil’s equity measures the totalamount of cash that the firm has raised from shareholders in the past or has retained andinvested on their behalf. But perhaps Big Oil has been able to find projects that wereworth more than they originally cost or perhaps the value of the assets has increasedwith inflation. Perhaps investors see great future investment opportunities for the com-pany. All these considerations determine what investors are willing to pay for Big Oil’scommon stock.
In September 2001 Big Oil stock was $12 a share. Thus the total market value of thestock was
Number of shares × share price = 100 million × $12 = $1,200 million
In Table 4.12 we show the market value of Big Oil’s debt and equity. You can see thatdebt accounts for 24.3 percent of company value (D/V = .243) and equity accounts for75.7 percent (E/V = .757). These are the proportions to use when calculating theweighted-average cost of capital. Notice that if you looked only at the book valuesshown in the company accounts, you would mistakenly conclude that debt and equityeach accounted for 50 percent of value.
� Self-Test 5 Here is the capital structure shown in Executive Fruit’s book balance sheet:
Debt $4.1 million 45 %Preferred stock 2.2 24.2Common stock 2.8 30.8Total $9.1 million 100 %
Explain why the percentage weights given above should not be used in calculating Ex-ecutive Fruit’s WACC.
Calculating Required Rates of ReturnTo calculate Big Oil’s weighted-average cost of capital, you also need the rate of returnthat investors require from each security.
TABLE 4.12The market values of BigOil’s debt and equity (dollarfigures in millions)
Bank debt $ 200.0 12.6%Long-term bonds 185.7 11.7Total debt 385.7 24.3Common stock, 100 million shares at $12 1,200.0 75.7Total $1,585.7 100.0%
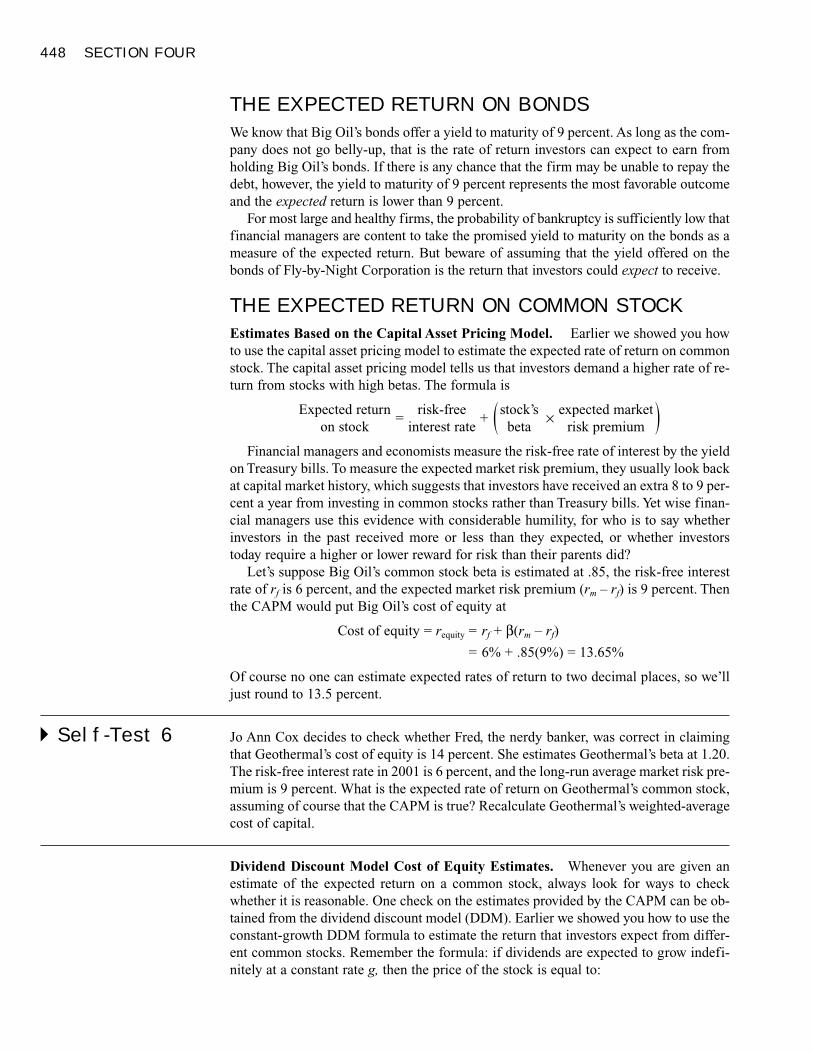
448 SECTION FOUR
THE EXPECTED RETURN ON BONDS
We know that Big Oil’s bonds offer a yield to maturity of 9 percent. As long as the com-pany does not go belly-up, that is the rate of return investors can expect to earn fromholding Big Oil’s bonds. If there is any chance that the firm may be unable to repay thedebt, however, the yield to maturity of 9 percent represents the most favorable outcomeand the expected return is lower than 9 percent.
For most large and healthy firms, the probability of bankruptcy is sufficiently low thatfinancial managers are content to take the promised yield to maturity on the bonds as ameasure of the expected return. But beware of assuming that the yield offered on thebonds of Fly-by-Night Corporation is the return that investors could expect to receive.
THE EXPECTED RETURN ON COMMON STOCK
Estimates Based on the Capital Asset Pricing Model. Earlier we showed you howto use the capital asset pricing model to estimate the expected rate of return on commonstock. The capital asset pricing model tells us that investors demand a higher rate of re-turn from stocks with high betas. The formula is
Expected return=
risk-free+ ( stock’s × expected market )on stock interest rate beta risk premium
Financial managers and economists measure the risk-free rate of interest by the yieldon Treasury bills. To measure the expected market risk premium, they usually look backat capital market history, which suggests that investors have received an extra 8 to 9 per-cent a year from investing in common stocks rather than Treasury bills. Yet wise finan-cial managers use this evidence with considerable humility, for who is to say whetherinvestors in the past received more or less than they expected, or whether investorstoday require a higher or lower reward for risk than their parents did?
Let’s suppose Big Oil’s common stock beta is estimated at .85, the risk-free interestrate of rf is 6 percent, and the expected market risk premium (rm – rf) is 9 percent. Thenthe CAPM would put Big Oil’s cost of equity at
Cost of equity = requity = rf + β(rm – rf)
= 6% + .85(9%) = 13.65%
Of course no one can estimate expected rates of return to two decimal places, so we’lljust round to 13.5 percent.
� Self-Test 6 Jo Ann Cox decides to check whether Fred, the nerdy banker, was correct in claimingthat Geothermal’s cost of equity is 14 percent. She estimates Geothermal’s beta at 1.20.The risk-free interest rate in 2001 is 6 percent, and the long-run average market risk pre-mium is 9 percent. What is the expected rate of return on Geothermal’s common stock,assuming of course that the CAPM is true? Recalculate Geothermal’s weighted-averagecost of capital.
Dividend Discount Model Cost of Equity Estimates. Whenever you are given anestimate of the expected return on a common stock, always look for ways to checkwhether it is reasonable. One check on the estimates provided by the CAPM can be ob-tained from the dividend discount model (DDM). Earlier we showed you how to use theconstant-growth DDM formula to estimate the return that investors expect from differ-ent common stocks. Remember the formula: if dividends are expected to grow indefi-nitely at a constant rate g, then the price of the stock is equal to:
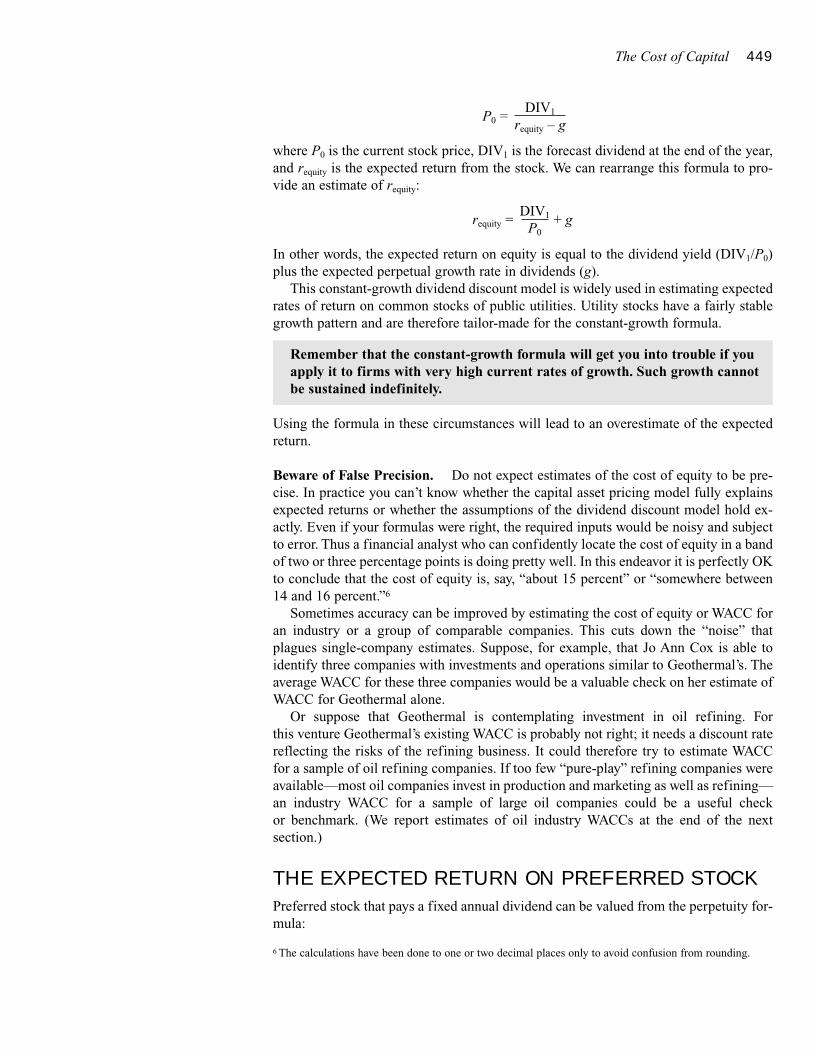
The Cost of Capital 449
P0 =DIV1
requity – g
where P0 is the current stock price, DIV1 is the forecast dividend at the end of the year,and requity is the expected return from the stock. We can rearrange this formula to pro-vide an estimate of requity:
requity =DIV1 + g
P0
In other words, the expected return on equity is equal to the dividend yield (DIV1/P0)plus the expected perpetual growth rate in dividends (g).
This constant-growth dividend discount model is widely used in estimating expectedrates of return on common stocks of public utilities. Utility stocks have a fairly stablegrowth pattern and are therefore tailor-made for the constant-growth formula.
Using the formula in these circumstances will lead to an overestimate of the expectedreturn.
Beware of False Precision. Do not expect estimates of the cost of equity to be pre-cise. In practice you can’t know whether the capital asset pricing model fully explainsexpected returns or whether the assumptions of the dividend discount model hold ex-actly. Even if your formulas were right, the required inputs would be noisy and subjectto error. Thus a financial analyst who can confidently locate the cost of equity in a bandof two or three percentage points is doing pretty well. In this endeavor it is perfectly OKto conclude that the cost of equity is, say, “about 15 percent” or “somewhere between14 and 16 percent.”6
Sometimes accuracy can be improved by estimating the cost of equity or WACC foran industry or a group of comparable companies. This cuts down the “noise” thatplagues single-company estimates. Suppose, for example, that Jo Ann Cox is able toidentify three companies with investments and operations similar to Geothermal’s. Theaverage WACC for these three companies would be a valuable check on her estimate ofWACC for Geothermal alone.
Or suppose that Geothermal is contemplating investment in oil refining. For this venture Geothermal’s existing WACC is probably not right; it needs a discount ratereflecting the risks of the refining business. It could therefore try to estimate WACC for a sample of oil refining companies. If too few “pure-play” refining companies wereavailable—most oil companies invest in production and marketing as well as refining—an industry WACC for a sample of large oil companies could be a useful check or benchmark. (We report estimates of oil industry WACCs at the end of the next section.)
THE EXPECTED RETURN ON PREFERRED STOCK
Preferred stock that pays a fixed annual dividend can be valued from the perpetuity for-mula:
Remember that the constant-growth formula will get you into trouble if youapply it to firms with very high current rates of growth. Such growth cannotbe sustained indefinitely.
6 The calculations have been done to one or two decimal places only to avoid confusion from rounding.
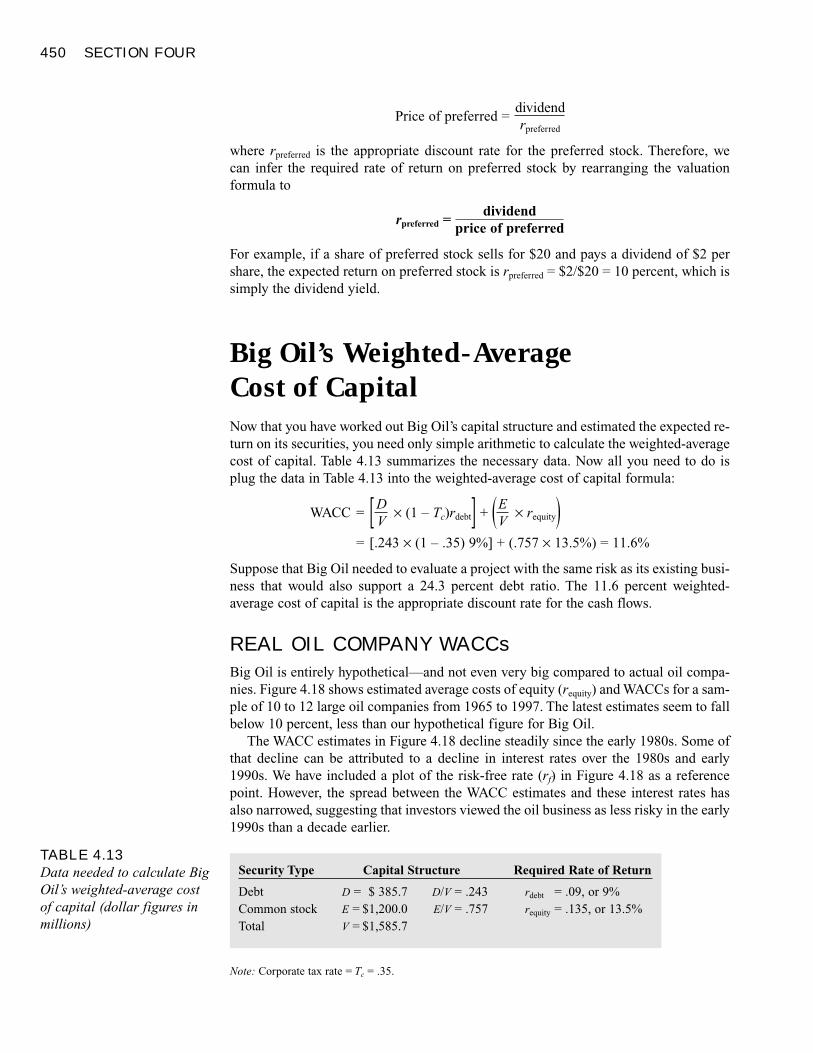
450 SECTION FOUR
Price of preferred =dividendrpreferred
where rpreferred is the appropriate discount rate for the preferred stock. Therefore, we can infer the required rate of return on preferred stock by rearranging the valuation formula to
rpreferred =dividend
price of preferred
For example, if a share of preferred stock sells for $20 and pays a dividend of $2 pershare, the expected return on preferred stock is rpreferred = $2/$20 = 10 percent, which issimply the dividend yield.
Big Oil’s Weighted-Average Cost of CapitalNow that you have worked out Big Oil’s capital structure and estimated the expected re-turn on its securities, you need only simple arithmetic to calculate the weighted-averagecost of capital. Table 4.13 summarizes the necessary data. Now all you need to do isplug the data in Table 4.13 into the weighted-average cost of capital formula:
WACC = [ D × (1 – Tc)rdebt] + (E × requity)V V
= [.243 × (1 – .35) 9%] + (.757 × 13.5%) = 11.6%
Suppose that Big Oil needed to evaluate a project with the same risk as its existing busi-ness that would also support a 24.3 percent debt ratio. The 11.6 percent weighted-average cost of capital is the appropriate discount rate for the cash flows.
REAL OIL COMPANY WACCs
Big Oil is entirely hypothetical—and not even very big compared to actual oil compa-nies. Figure 4.18 shows estimated average costs of equity (requity) and WACCs for a sam-ple of 10 to 12 large oil companies from 1965 to 1997. The latest estimates seem to fallbelow 10 percent, less than our hypothetical figure for Big Oil.
The WACC estimates in Figure 4.18 decline steadily since the early 1980s. Some ofthat decline can be attributed to a decline in interest rates over the 1980s and early1990s. We have included a plot of the risk-free rate (rf) in Figure 4.18 as a referencepoint. However, the spread between the WACC estimates and these interest rates hasalso narrowed, suggesting that investors viewed the oil business as less risky in the early1990s than a decade earlier.
TABLE 4.13Data needed to calculate BigOil’s weighted-average costof capital (dollar figures inmillions)
Security Type Capital Structure Required Rate of Return
Debt D = $ 385.7 D/V = .243 rdebt = .09, or 9%Common stock E = $1,200.0 E/V = .757 requity = .135, or 13.5%Total V = $1,585.7
Note: Corporate tax rate = Tc = .35.
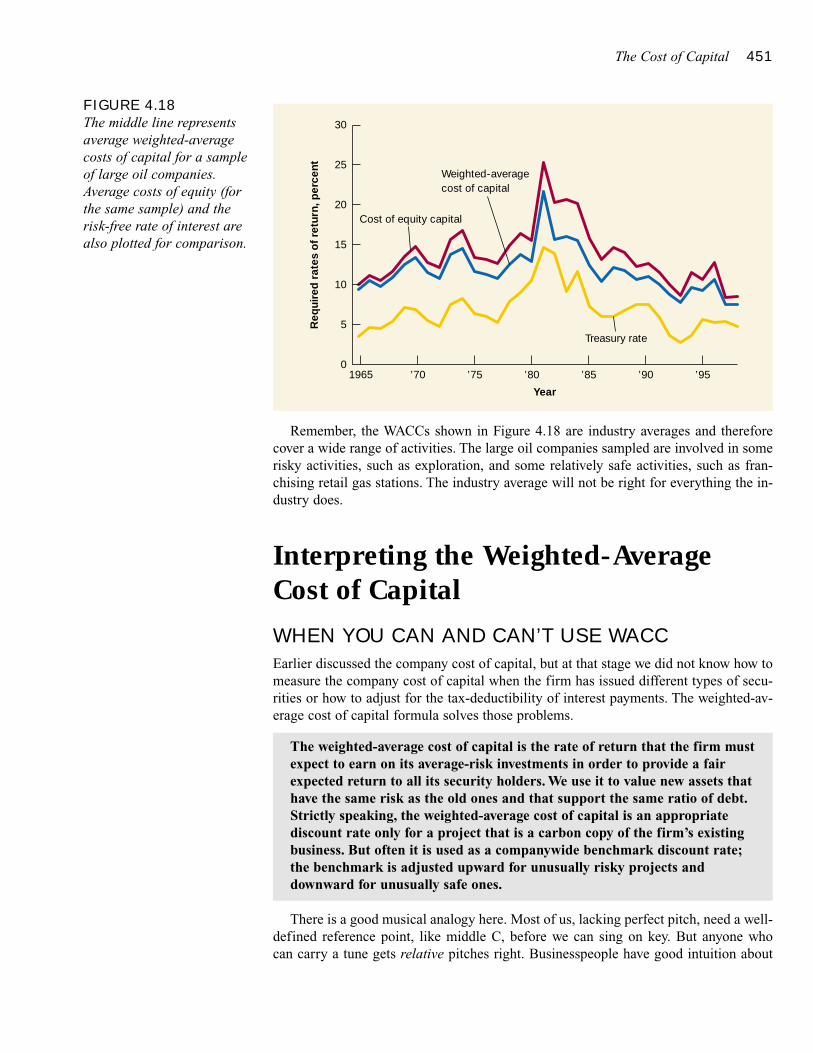
The Cost of Capital 451
Remember, the WACCs shown in Figure 4.18 are industry averages and thereforecover a wide range of activities. The large oil companies sampled are involved in somerisky activities, such as exploration, and some relatively safe activities, such as fran-chising retail gas stations. The industry average will not be right for everything the in-dustry does.
Interpreting the Weighted-AverageCost of CapitalWHEN YOU CAN AND CAN’T USE WACC
Earlier discussed the company cost of capital, but at that stage we did not know how tomeasure the company cost of capital when the firm has issued different types of secu-rities or how to adjust for the tax-deductibility of interest payments. The weighted-av-erage cost of capital formula solves those problems.
There is a good musical analogy here. Most of us, lacking perfect pitch, need a well-defined reference point, like middle C, before we can sing on key. But anyone who can carry a tune gets relative pitches right. Businesspeople have good intuition about
The weighted-average cost of capital is the rate of return that the firm mustexpect to earn on its average-risk investments in order to provide a fairexpected return to all its security holders. We use it to value new assets thathave the same risk as the old ones and that support the same ratio of debt.Strictly speaking, the weighted-average cost of capital is an appropriatediscount rate only for a project that is a carbon copy of the firm’s existingbusiness. But often it is used as a companywide benchmark discount rate; the benchmark is adjusted upward for unusually risky projects anddownward for unusually safe ones.
FIGURE 4.18The middle line representsaverage weighted-averagecosts of capital for a sampleof large oil companies.Average costs of equity (forthe same sample) and therisk-free rate of interest arealso plotted for comparison.
’701965 ’75 ’80 ’85 ’90 ’95
Year
Cost of equity capital
Weighted-averagecost of capital
Treasury rate
Req
uire
d r
ates
of
retu
rn, p
erce
nt 25
30
20
15
10
5
0
452 SECTION FOUR
relative risks, at least in industries they are used to, but not about absolute risk or re-quired rates of return. Therefore, they set a company- or industrywide cost of capital asa benchmark. This is not the right hurdle rate for everything the company does, butjudgmental adjustments can be made for more risky or less risky ventures.
SOME COMMON MISTAKES
One danger with the weighted-average formula is that it tempts people to make logicalerrors. Think back to your estimate of the cost of capital for Big Oil:
WACC = [ D × (1 – Tc)rdebt] + ( E × requity)V V
= [.243 × (1 – .35) 9%] + (.757 × 13.5%) = 11.6%
Now you might be tempted to say to yourself, “Aha! Big Oil has a good credit rating. Itcould easily push up its debt ratio to 50 percent. If the interest rate is 9 percent and therequired return on equity is 13.5 percent, the weighted-average cost of capital would be
WACC = [.50 × (1 – .35) 9%] + (.50 × 13.5%) = 9.7%
At a discount rate of 9.7 percent, we can justify a lot more investment.”That reasoning will get you into trouble. First, if Big Oil increased its borrowing, the
lenders would almost certainly demand a higher rate of interest on the debt. Second, asthe borrowing increased, the risk of the common stock would also increase and there-fore the stockholders would demand a higher return.
When you jumped to the conclusion that Big Oil could lower its weighted-average costof capital to 9.7 percent by borrowing more, you were recognizing only the explicit costof debt and not the implicit cost.
� Self-Test 7 Jo Ann Cox’s boss has pointed out that Geothermal proposes to finance its expansionentirely by borrowing at an interest rate of 8 percent. He argues that this is therefore theappropriate discount rate for the project’s cash flows. Is he right?
HOW CHANGING CAPITAL STRUCTURE AFFECTS EXPECTED RETURNS
We will illustrate how changes in capital structure affect expected returns by focusingon the simplest possible case, where the corporate tax rate Tc is zero.
Think back to our earlier example of Geothermal. Geothermal, you may remember,has the following market-value balance sheet:
Assets Liabilities and Shareholders’ Equity
Assets = value of Geothermal’s $647 Debt $194 (30%)existing business
Equity $453 (70%)
Total value $647 Value $647 (100%)
There are actually two costs of debt finance. The explicit cost of debt is therate of interest that bondholders demand. But there is also an implicit cost,because borrowing increases the required return to equity.
The Cost of Capital 453
Geothermal’s debtholders require a return of 8 percent and the shareholders require areturn of 14 percent. Since we assume here that Geothermal pays no corporate tax, itsweighted-average cost of capital is simply the expected return on the firm’s assets:
WACC = rassets = (.3 × 8%) + (.7 × 14%) = 12.2%
This is the return you would expect if you held all Geothermal’s securities and thereforeowned all its assets.
Now think what will happen if Geothermal borrows an additional $97 million anduses the cash to buy back and retire $97 million of its common stock. The revised mar-ket-value balance sheet is
Assets Liabilities and Shareholders’ Equity
Assets = value of Geothermal’s $647 Debt $291 (45%)existing business
Equity 356 (55%)
Total value $647 Value $647 (100%)
If there are no corporate taxes, the change in capital structure does not affect the totalcash that Geothermal pays out to its security holders and it does not affect the risk ofthose cash flows. Therefore, if investors require a return of 12.2 percent on the totalpackage of debt and equity before the financing, they must require the same 12.2 percent return on the package afterward. The weighted-average cost of capital is there-fore unaffected by the change in the capital structure.
Although the required return on the package of the debt and equity is unaffected, thechange in capital structure does affect the required return on the individual securities.Since the company has more debt than before, the debt is riskier and debtholders arelikely to demand a higher return. Increasing the amount of debt also makes the equityriskier and increases the return that shareholders require.
WHAT HAPPENS WHEN THE CORPORATE TAX RATE IS NOT ZERO
We have shown that when there are no corporate taxes the weighted-average cost of cap-ital is unaffected by a change in capital structure. Unfortunately, taxes can complicatethe picture.7 For the moment, just remember
• The weighted-average cost of capital is the right discount rate for average-risk capital investment projects.
• The weighted-average cost of capital is the return the company needs toearn after tax in order to satisfy all its security holders.
• If the firm increases its debt ratio, both the debt and the equity will become more risky. The debtholders and equity holders require a higherreturn to compensate for the increased risk.
7 There’s nothing wrong with our formulas and examples, provided that the tax deductibility of interest pay-ments doesn’t change the aggregate risk of the debt and equity investors. However, if the tax savings from deducting interest are treated as safe cash flows, the formulas get more complicated. If you really want to diveinto the tax-adjusted formulas showing how WACC changes with capital structure, we suggest later in R. A. Brealey and S. C. Myers, Principles of Corporate Finance, 6th ed. (New York: Irwin/McGraw-Hill,2000).
454 SECTION FOUR
Flotation Costs and the Cost of CapitalTo raise the necessary cash for a new project, the firm may need to issue stocks, bonds,or other securities. The costs of issuing these securities to the public can easily amountto 5 percent of funds raised. For example, a firm issuing $100 million in new equitymay net only $95 million after incurring the costs of the issue.
Flotation costs involve real money. A new project is less attractive if the firm mustspend large sums on issuing new securities. To illustrate, consider a project that willcost $900,000 to install and is expected to generate a level perpetual cash-flow streamof $90,000 a year. At a required rate of return of 10 percent, the project is just barelyviable, with an NPV of zero: –$900,000 + $90,000/.10 = 0.
Now suppose that the firm needs to raise equity to pay for the project, and that flotation costs are 10 percent of funds raised. To raise $900,000, the firm actually must sell $1 million of equity. Since the installed project will be worth only $90,000/.10= $900,000, NPV including flotation costs is actually –$1 million + $900,000 =–$100,000.
In our example, we recognized flotation costs as one of the incremental costs of un-dertaking the project. But instead of recognizing these costs explicitly, some companiesattempt to cope with flotation costs by increasing the cost of capital used to discountproject cash flows. By using a higher discount rate, project present value is reduced.
This procedure is flawed on practical as well as theoretical grounds. First, on apurely practical level, it is far easier to account for flotation costs as a negative cashflow than to search for an adjustment to the discount rate that will give the right NPV.Finding the necessary adjustment is easy only when cash flows are level or will growindefinitely at a constant trend rate. This is almost never the case in practice, however.Of course, there always exists some discount rate that will give the right measure of theproject’s NPV, but this rate could no longer be interpreted as the rate of return availablein the capital market for investments with the same risk as the project.
SummaryWhy do firms compute weighted-average costs of capital?
They need a standard discount rate for average-risk projects. An “average-risk” project isone that has the same risk as the firm’s existing assets and operations.
What about projects that are not average?
The weighted-average cost of capital can still be used as a benchmark. The benchmark isadjusted up for unusually risky projects and down for unusually safe ones.
How do firms compute weighted-average costs of capital?
Here’s the WACC formula one more time:
The cost of capital depends only on interest rates, taxes, and the risk of theproject. Flotation costs should be treated as incremental (negative) cash flows;they do not increase the required rate of return.
The Cost of Capital 455
WACC = rdebt × (1 – Tc) × D/V + requity × E/V
The WACC is the expected rate of return on the portfolio of debt and equity securitiesissued by the firm. The required rate of return on each security is weighted by its proportionof the firm’s total market value (not book value). Since interest payments reduce the firm’sincome tax bill, the required rate of return on debt is measured after tax, as rdebt × (1 – Tc).
This WACC formula is usually written assuming the firm’s capital structure includes justtwo classes of securities, debt and equity. If there is another class, say preferred stock, theformula expands to include it. In other words, we would estimate rpreferred, the rate of returndemanded by preferred stockholders, determine P/V, the fraction of market value accountedfor by preferred, and add rpreferred × P/V to the equation. Of course the weights in the WACCformula always add up to 1.0. In this case D/V + P/V + E/V = 1.0.
How are the costs of debt and equity calculated?
The cost of debt (rdebt) is the market interest rate demanded by bondholders. In other words,it is the rate that the company would pay on new debt issued to finance its investmentprojects. The cost of preferred (rpreferred) is just the preferred dividend divided by the marketprice of a preferred share.
The tricky part is estimating the cost of equity (requity), the expected rate of return on thefirm’s shares. Financial managers use the capital asset pricing model to estimate expectedreturn. But for mature, steady-growth companies, it can also make sense to use the constant-growth dividend discount model. Remember, estimates of expected return are less reliablefor a single firm’s stock than for a sample of comparable-risk firms. Therefore, somemanagers also consider WACCs calculated for industries.
What happens when capital structure changes?
The rates of return on debt and equity will change. For example, increasing the debt ratiowill increase the risk borne by both debt and equity investors and cause them to demandhigher returns. However, this does not necessarily mean that the overall WACC willincrease, because more weight is put on the cost of debt, which is less than the cost ofequity. In fact, if we ignore taxes, the overall cost of capital will stay constant as thefractions of debt and equity change.
Should WACC be adjusted for the costs of issuing securities to finance a project?
No. If acceptance of a project would require the firm to issue securities, the flotation costsof the issue should be added to the investment required for the project. This reduces projectNPV dollar for dollar. There is no need to adjust WACC.
www.geocities.com/WallStreet/Market/1839/irates.html Incorporating risk premiums into thecost of capital
www.financeadvisor.com/coc.htm Another approach to calculating cost of capital
capital structure weighted-average cost of capital (WACC)
1. Cost of Debt. Micro Spinoffs, Inc., issued 20-year debt a year ago at par value with a couponrate of 9 percent, paid annually. Today, the debt is selling at $1,050. If the firm’s tax bracketis 35 percent, what is its after-tax cost of debt?
Related WebLinks
Key Terms
Quiz
456 SECTION FOUR
2. Cost of Preferred Stock. Micro Spinoffs also has preferred stock outstanding. The stockpays a dividend of $4 per share, and the stock sells for $40. What is the cost of preferredstock?
3. Calculating WACC. Suppose Micro Spinoffs’s cost of equity is 12.5 percent. What is itsWACC if equity is 50 percent, preferred stock is 20 percent, and debt is 30 percent of totalcapital?
4. Cost of Equity. Reliable Electric is a regulated public utility, and it is expected to providesteady growth of dividends of 5 percent per year for the indefinite future. Its last dividendwas $5 per share; the stock sold for $60 per share just after the dividend was paid. What isthe company’s cost of equity?
5. Calculating WACC. Reactive Industries has the following capital structure. Its corporate taxrate is 35 percent. What is its WACC?
Security Market Value Required Rate of Return
Debt $20 million 8%Preferred stock $10 million 10%Common stock $50 million 15%
6. Company versus Project Discount Rates. Geothermal’s WACC is 11.4 percent. ExecutiveFruit’s WACC is 12.3 percent. Now Executive Fruit is considering an investment in geother-mal power production. Should it discount project cash flows at 12.3 percent? Why or whynot?
7. Flotation Costs. A project costs $10 million and has NPV of $+2.5 million. The NPV iscomputed by discounting at a WACC of 15 percent. Unfortunately, the $10 million invest-ment will have to be raised by a stock issue. The issue would incur flotation costs of $1.2million. Should the project be undertaken?
8. WACC. The common stock of Buildwell Conservation & Construction, Inc., has a beta of.80. The Treasury bill rate is 4 percent and the market risk premium is estimated at 8 per-cent. BCCI’s capital structure is 30 percent debt paying a 5 percent interest rate, and 70 per-cent equity. What is BCCI’s cost of equity capital? Its WACC? Buildwell pays no taxes.
9. WACC and NPV. BCCI (see the previous problem) is evaluating a project with an internalrate of return of 12 percent. Should it accept the project? If the project will generate a cashflow of $100,000 a year for 7 years, what is the most BCCI should be willing to pay to ini-tiate the project?
10. Calculating WACC. Find the WACC of William Tell Computers. The total book value of thefirm’s equity is $10 million; book value per share is $20. The stock sells for a price of $30per share, and the cost of equity is 15 percent. The firm’s bonds have a par value of $5 mil-lion and sell at a price of 110 percent of par. The yield to maturity on the bonds is 9 percent,and the firm’s tax rate is 40 percent.
11. WACC. Nodebt, Inc., is a firm with all-equity financing. Its equity beta is .80. The Treasurybill rate is 5 percent and the market risk premium is expected to be 10 percent. What isNodebt’s asset beta? What is Nodebt’s weighted-average cost of capital? The firm is exemptfrom paying taxes.
12. Cost of Capital. A financial analyst at Dawn Chemical notes that the firm’s total interestpayments this year were $10 million while total debt outstanding was $80 million, and heconcludes that the cost of debt was 12.5 percent. What is wrong with this conclusion?
13. Cost of Equity. Bunkhouse Electronics is a recently incorporated firm that makes electronicentertainment systems. Its earnings and dividends have been growing at a rate of 30 percent,
PracticeProblems
The Cost of Capital 457
and the current dividend yield is 2 percent. Its beta is 1.2, the market risk premium is 8 per-cent, and the risk-free rate is 4 percent.
a. Calculate two estimates of the firm’s cost of equity.b. Which estimate seems more reasonable to you? Why?
14. Cost of Debt. Olympic Sports has two issues of debt outstanding. One is a 9 percent couponbond with a face value of $20 million, a maturity of 10 years, and a yield to maturity of 10percent. The coupons are paid annually. The other bond issue has a maturity of 15 years, withcoupons also paid annually, and a coupon rate of 10 percent. The face value of the issue is $25 million, and the issue sells for 92.8 percent of par value. The firm’s tax rate is 35 percent.
a. What is the before-tax cost of debt for Olympic?b. What is Olympic’s after-tax cost of debt?
15. Capital Structure. Examine the following book-value balance sheet for University Prod-ucts, Inc. What is the capital structure of the firm based on market values? The preferredstock currently sells for $15 per share and the common stock for $20 per share. There areone million common shares outstanding.
BOOK VALUE BALANCE SHEET(all values in millions)
Assets Liabilities and Net Worth
Cash and short-term securities $ 1 Bonds, coupon = 8%, paid $10.0annually (maturity = 10 years, current yield to maturity = 9%)
Accounts receivable 3 Preferred stock (par value $20 2.0per share)
Inventories 7 Common stock (par value $.10) .1Plant and equipment 21 Additional paid in stockholders’ 9.9
capitalRetained earnings 10.0
Total $32 Total $32.0
16. Calculating WACC. Turn back to University Products’s balance sheet from the previousproblem. If the preferred stock pays a dividend of $2 per share, the beta of the stock is .8,the market risk premium is 10 percent, the risk-free rate is 6 percent, and the firm’s tax rateis 40 percent, what is University’s weighted-average cost of capital?
17. Project Discount Rate. University Products is evaluating a new venture into home com-puter systems (see problems 15 and 16). The internal rate of return on the new venture is estimated at 13.4 percent. WACCs of firms in the personal computer industry tend to average around 14 percent. Should the new project be pursued? Will University Productsmake the correct decision if it discounts cash flows on the proposed venture at the firm’sWACC?
18. Cost of Capital. The total market value of Okefenokee Real Estate Company is $6 million,and the total value of its debt is $4 million. The treasurer estimates that the beta of the stockcurrently is 1.5 and that the expected risk premium on the market is 10 percent. The Trea-sury bill rate is 4 percent.
a. What is the required rate of return on Okefenokee stock?b. What is the beta of the company’s existing portfolio of assets? The debt is perceived to
be virtually risk-free.
458 SECTION FOUR
c. Estimate the weighted-average cost of capital assuming a tax rate of 40 percent.d. Estimate the discount rate for an expansion of the company’s present business.e. Suppose the company wants to diversify into the manufacture of rose-colored glasses.
The beta of optical manufacturers with no debt outstanding is 1.2. What is the requiredrate of return on Okefenokee’s new venture?
19. Changes in Capital Structure. Look again at our calculation of Big Oil’s WACC. SupposeBig Oil is excused from paying taxes. How would its WACC change? Now suppose Big Oilmakes a large stock issue and uses the proceeds to pay off all its debt. How would the costof equity change?
20. Changes in Capital Structure. Refer again to problem 19. Suppose Big Oil starts from thefinancing mix in Table 4.13, and then borrows an additional $200 million from the bank. Itthen pays out a special $200 million dividend, leaving its assets and operations unchanged.What happens to Big Oil’s WACC, still assuming it pays no taxes? What happens to the costof equity?
21. WACC and Taxes. “The after-tax cost of debt is lower when the firm’s tax rate is higher;therefore, the WACC falls when the tax rate rises. Thus, with a lower discount rate, the firmmust be worth more if its tax rate is higher.” Explain why this argument is wrong.
22. Cost of Capital. An analyst at Dawn Chemical notes that its cost of debt is far below thatof equity. He concludes that it is important for the firm to maintain the ability to increase itsborrowing because if it cannot borrow, it will be forced to use more expensive equity to fi-nance some projects. This might lead it to reject some projects that would have seemed at-tractive if evaluated at the lower cost of debt. Comment on this reasoning.
1 Hot Rocks’s 4 million common shares are worth $40 million. Its market value balance sheetis:
Assets Liabilities and Shareholders’ Equity
Assets $90 Debt $50 (56%)Equity 40 (44%)
Value $90 Value $90
WACC = (.56 × 9%) + (.44 × 17%) = 12.5%
We use Hot Rocks’s pretax return on debt because the company pays no taxes.2 Burg’s 6 million shares are now worth only 6 million × $4 = $24 million. The debt is sell-
ing for 80 percent of book, or $20 million. The market value balance sheet is:
Assets Liabilities and Shareholders’ Equity
Assets $44 Debt $20 (45%)Equity 24 (55%)
Value $44 Value $44
WACC = (.45 × 14%) + (.55 × 20%) = 17.3%
Note that this question ignores taxes.
ChallengeProblems
Solutions toSelf-TestQuestions
The Cost of Capital 459
3 Compare the two income statements, one for Criss-cross Industries and the other for a firmwith identical EBIT but no debt in its capital structure. (All figures in millions.)
Criss-cross Firm with No Debt
EBIT $10.0 $10.0Interest expense 2.0 0.0Taxable income 8.0 10.0Taxes owed 2.8 3.5Net income 5.2 6.5Total income accruing to debt & equity holders 7.2 6.5
Notice that Criss-cross pays $.7 million less in taxes than its debt-free counterpart. Ac-cordingly, the total income available to debt plus equity holders is $.7 million higher.
4 For Hot Rocks,
WACC = [.56 × 9 × (1 – .35)] + (.44 × 17) = 10.76%
For Burg Associates,
WACC = [.45 × 14 × (1 – .35)] + (.55 × 20) = 15.1%
5 WACC measures the expected rate of return demanded by debt and equity investors in thefirm (plus a tax adjustment capturing the tax-deductibility of interest payments). Thus thecalculation must be based on what investors are actually paying for the firm’s debt and eq-uity securities. In other words, it must be based on market values.
6 From the CAPM:
requity = rf + βequity (rm – rf)
= 6% + 1.20(9%) = 16.8%
WACC = .3(1 – .35) 8% + .7(16.8%) = 13.3%
7 Jo Ann’s boss is wrong. The ability to borrow at 8 percent does not mean that the cost ofcapital is 8 percent. This analysis ignores the side effects of the borrowing, for example, thatat the higher indebtedness of the firm the equity will be riskier, and therefore the equity-holders will demand a higher rate of return on their investment.
MINICASEBernice Mountaindog was glad to be back at Sea Shore Salt. Employees were treated well. When she had asked a year ago fora leave of absence to complete her degree in finance, top man-agement promptly agreed. When she returned with an honors de-gree, she was promoted from administrative assistant (she hadbeen secretary to Joe-Bob Brinepool, the president) to treasuryanalyst.
Bernice thought the company’s prospects were good. Sure,table salt was a mature business, but Sea Shore Salt had grownsteadily at the expense of its less well-known competitors. Thecompany’s brand name was an important advantage, despite thedifficulty most customers had in pronouncing it rapidly.
Bernice started work on January 2, 2000. The first two weeks
went smoothly. Then Mr. Brinepool’s cost of capital memo as-signed her to explain Sea Shore Salt’s weighted-average cost ofcapital to other managers. The memo came as a surprise to Ber-nice, so she stayed late to prepare for the questions that wouldsurely come the next day.
Bernice first examined Sea Shore Salt’s most recent balancesheet, summarized in Table 4.14. Then she jotted down the fol-lowing additional points:
• The company’s bank charged interest at current market rates,and the long-term debt had just been issued. Book and marketvalues could not differ by much.
• But the preferred stock had been issued 35 years ago, when
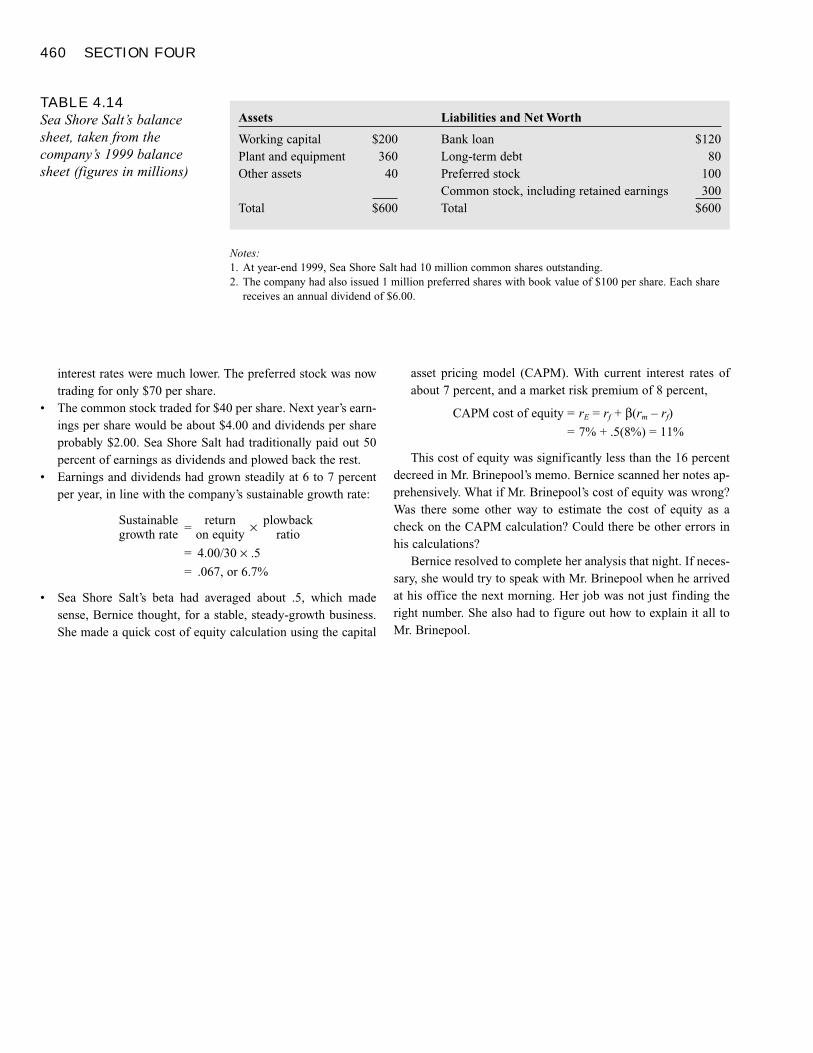
460 SECTION FOUR
interest rates were much lower. The preferred stock was nowtrading for only $70 per share.
• The common stock traded for $40 per share. Next year’s earn-ings per share would be about $4.00 and dividends per shareprobably $2.00. Sea Shore Salt had traditionally paid out 50percent of earnings as dividends and plowed back the rest.
• Earnings and dividends had grown steadily at 6 to 7 percentper year, in line with the company’s sustainable growth rate:
Sustainable=
return × plowbackgrowth rate on equity ratio
= 4.00/30 × .5
= .067, or 6.7%
• Sea Shore Salt’s beta had averaged about .5, which madesense, Bernice thought, for a stable, steady-growth business.She made a quick cost of equity calculation using the capital
asset pricing model (CAPM). With current interest rates ofabout 7 percent, and a market risk premium of 8 percent,
CAPM cost of equity = rE = rf + β(rm – rf)
= 7% + .5(8%) = 11%
This cost of equity was significantly less than the 16 percentdecreed in Mr. Brinepool’s memo. Bernice scanned her notes ap-prehensively. What if Mr. Brinepool’s cost of equity was wrong?Was there some other way to estimate the cost of equity as acheck on the CAPM calculation? Could there be other errors inhis calculations?
Bernice resolved to complete her analysis that night. If neces-sary, she would try to speak with Mr. Brinepool when he arrivedat his office the next morning. Her job was not just finding theright number. She also had to figure out how to explain it all toMr. Brinepool.
TABLE 4.14Sea Shore Salt’s balancesheet, taken from thecompany’s 1999 balancesheet (figures in millions)
Assets Liabilities and Net Worth
Working capital $200 Bank loan $120Plant and equipment 360 Long-term debt 80Other assets 40 Preferred stock 100
Common stock, including retained earnings 300Total $600 Total $600
Notes:1. At year-end 1999, Sea Shore Salt had 10 million common shares outstanding.2. The company had also issued 1 million preferred shares with book value of $100 per share. Each share
receives an annual dividend of $6.00.
The Cost of Capital 461
Sea Shore Salt CompanySpring Vacation Beach, Florida
CONFIDENTIAL MEMORANDUM
DATE: January 15, 2000TO: S.S.S. ManagementFROM: Joe-Bob Brinepool, PresidentSUBJECT: Cost of Capital
This memo states and clarifies our company’s long-standing policy regarding hurdle ratesfor capital investment decisions. There have been many recent questions, and some evidentconfusion, on this matter.
Sea Shore Salt evaluates replacement and expansion investments by discounted cash flow.The discount or hurdle rate is the company’s after-tax weighted-average cost of capital.
The weighted-average cost of capital is simply a blend of the rates of return expected byinvestors in our company. These investors include banks, bond holders, and preferredstock investors in addition to common stockholders. Of course many of you are, or soonwill be, stockholders of our company.
The following table summarizes the composition of Sea Shore Salt’s financing.
Amount (in millions) Percent of Total Rate of Return
Bank loan $120 20% 8%Bond issue 80 13.3 7.75Preferred stock 100 16.7 6Common stock 300 50 16
$600 100%
The rates of return on the bank loan and bond issue are of course just the interest rateswe pay. However, interest is tax-deductible, so the after-tax interest rates are lowerthan shown above. For example, the after-tax cost of our bank financing, given our 35%tax rate, is 8(1 – .35) = 5.2%.
The rate of return on preferred stock is 6%. Sea Shore Salt pays a $6 dividend on each$100 preferred share.
Our target rate of return on equity has been 16% for many years. I know that somenewcomers think this target is too high for the safe and mature salt business. But wemust all aspire to superior profitability.
Once this background is absorbed, the calculation of Sea Shore Salt’s weighted-averagecost of capital (WACC) is elementary:
WACC = 8(1 – .35)(.2) + 7.75(1 – .35)(.133) + 6(.167) + 16(.50) = 10.7%
The official corporate hurdle rate is therefore 10.7%.
If you have further questions about these calculations, please direct them to our newTreasury Analyst, Ms. Bernice Mountaindog. It is a pleasure to have Bernice back at SeaShore Salt after a year’s leave of absence to complete her degree in finance.

Project Analysis
An Overview of Corporate Financing
How Corporations Issue Securities
Section 5
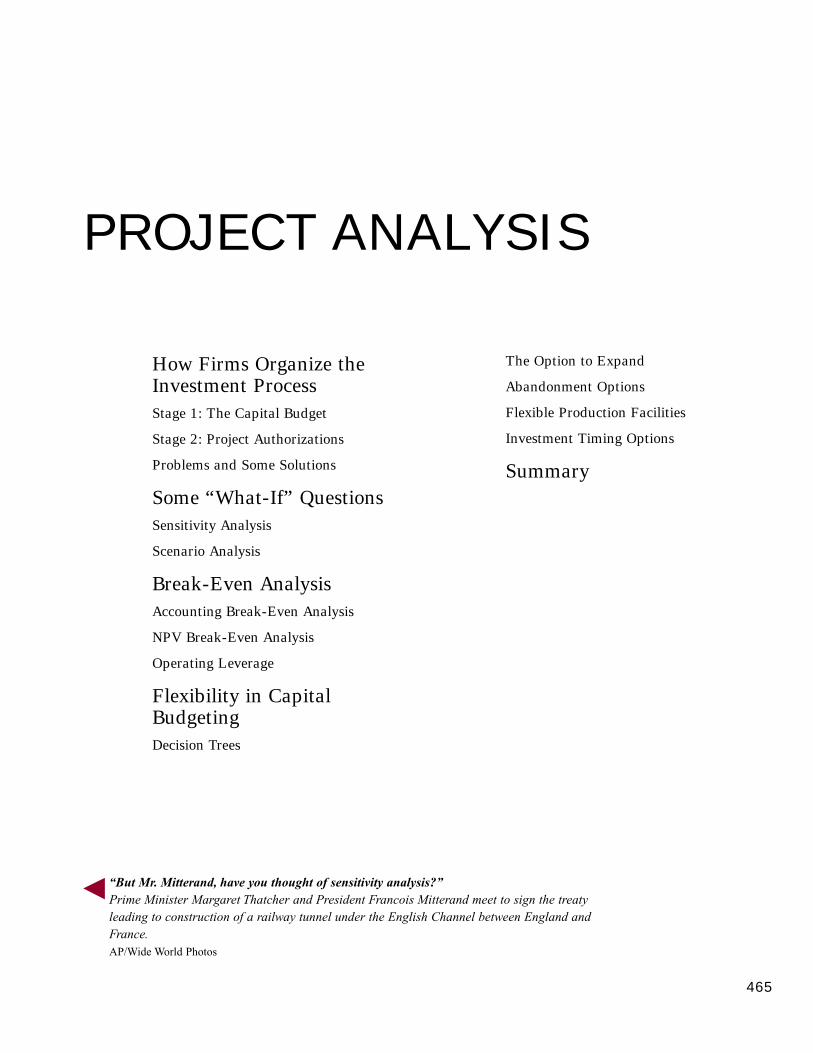
465
PROJECT ANALYSIS
How Firms Organize theInvestment ProcessStage 1: The Capital Budget
Stage 2: Project Authorizations
Problems and Some Solutions
Some “What-If” QuestionsSensitivity Analysis
Scenario Analysis
Break-Even Analysis Accounting Break-Even Analysis
NPV Break-Even Analysis
Operating Leverage
Flexibility in CapitalBudgetingDecision Trees
The Option to Expand
Abandonment Options
Flexible Production Facilities
Investment Timing Options
Summary
“But Mr. Mitterand, have you thought of sensitivity analysis?”Prime Minister Margaret Thatcher and President Francois Mitterand meet to sign the treatyleading to construction of a railway tunnel under the English Channel between England andFrance.AP/Wide World Photos
t helps to use discounted cash-flow techniques to value new projects but
good investment decisions also require good data. Therefore, we start
this material by thinking about how firms organize the capital budgeting
operation to get the kind of information they need. In addition, we look at
how they try to ensure that everyone involved works together toward a common goal.
Project evaluation should never be a mechanical exercise in which the financial man-
ager takes a set of cash-flow forecasts and cranks out a net present value. Cash-flow es-
timates are just that—estimates. Financial managers need to look behind the forecasts
to try to understand what makes the project tick and what could go wrong with it. A
number of techniques have been developed to help managers identify the key assump-
tions in their analysis. These techniques involve asking a number of “what-if ” ques-
tions. What if your market share turns out to be higher or lower than you forecast? What
if interest rates rise during the life of the project? In the second part of this material we
show how managers use the techniques of sensitivity analysis, scenario analysis, and
break-even analysis to help answer these what-if questions.
Books about capital budgeting sometimes create the impression that once the man-
ager has made an investment decision, there is nothing to do but sit back and watch the
cash flows develop. But since cash flows rarely proceed as anticipated, companies con-
stantly need to modify their operations. If cash flows are better than anticipated, the
project may be expanded; if they are worse, it may be scaled back or abandoned alto-
gether. In the third section of this material we describe how good managers take account
of these options when they analyze a project and why they are willing to pay money
today to build in future flexibility.
After studying this material you should be able to
� Appreciate the practical problems of capital budgeting in large corporations.
� Use sensitivity, scenario, and break-even analysis to see how project profitability
would be affected by an error in your forecasts and understand why an overestimate
of sales is more serious for projects with high operating leverage.
� Recognize the importance of managerial flexibility in capital budgeting.
466
I
How Firms Organize the Investment ProcessFor most sizable firms, investments are evaluated in two separate stages.
Project Analysis 467
STAGE 1: THE CAPITAL BUDGET
Once a year, the head office generally asks each of its divisions and plants to provide alist of the investments that they would like to make.1 These are gathered together into aproposed capital budget.
This budget is then reviewed and pruned by senior management and staff specializ-ing in planning and financial analysis. Usually there are negotiations between the firm’ssenior management and its divisional management, and there may also be special analy-ses of major outlays or ventures into new areas. Once the budget has been approved, itgenerally remains the basis for planning over the ensuing year.
Many investment proposals bubble up from the bottom of the organization. Butsometimes the ideas are likely to come from higher up. For example, the managers ofplants A and B cannot be expected to see the potential benefits of closing their plantsand consolidating production at a new plant C. We expect divisional management topropose plant C. Similarly, divisions 1 and 2 may not be eager to give up their own dataprocessing operations to a large central computer. That proposal would come from sen-ior management.
Senior management’s concern is to see that the capital budget matches the firm’sstrategic plans. It needs to ensure that the firm is concentrating its efforts in areas whereit has a real competitive advantage. As part of this effort, management must also iden-tify declining businesses that should be sold or allowed to run down.
The firm’s capital investment choices should reflect both “bottom-up” and “top-down” processes—capital budgeting and strategic planning, respectively. The twoprocesses should complement each other. Plant and division managers, who do most ofthe work in bottom-up capital budgeting, may not see the forest for the trees. Strategicplanners may have a mistaken view of the forest because they do not look at the trees.
STAGE 2: PROJECT AUTHORIZATIONS
The annual budget is important because it allows everybody to exchange ideas beforeattitudes have hardened and personal commitments have been made. However, the factthat your pet project has been included in the annual budget doesn’t mean you have per-mission to go ahead with it. At a later stage you will need to draw up a detailed proposaldescribing particulars of the project, engineering analyses, cash-flow forecasts, andpresent value calculations. If your project is large, this proposal may have to pass anumber of hurdles before it is finally approved.
The type of backup information that you need to provide depends on the project cat-egory. For example, some firms use a fourfold breakdown:
1. Outlays required by law or company policy, for example, for pollution control equip-ment. These outlays do not need to be justified on financial grounds. The main issueis whether requirements are satisfied at the lowest possible cost. The decision istherefore likely to hinge on engineering analyses of alternative technologies.
2. Maintenance or cost reduction, such as machine replacement. Engineering analysisis also important in machine replacement, but new machines have to pay their ownway.
3. Capacity expansion in existing businesses. Projects in this category are less straight-
ACAPITAL BUDGETList of planned investmentprojects.
1 Large firms may be divided into several divisions. For example, International Paper has divisions that spe-cialize in printing paper, packaging, specialty products, and forest products. Each of these divisions may beresponsible for a number of plants.
468 SECTION FIVE
forward; these decisions may hinge on forecasts of demand, possible shifts in tech-nology, and the reactions of competitors.
4. Investment for new products. Projects in this category are most likely to depend onstrategic decisions. The first projects in a new area may not have positive NPVs ifconsidered in isolation, but they may give the firm a valuable option to undertakefollow-up projects. More about this later.
PROBLEMS AND SOME SOLUTIONS
Valuing capital investment opportunities is hard enough when you can do the entire jobyourself. In most firms, however, capital budgeting is a cooperative effort, and thisbrings with it some challenges.
Ensuring that Forecasts Are Consistent. Inconsistent assumptions often creep intoinvestment proposals. For example, suppose that the manager of the furniture divisionis bullish (optimistic) on housing starts but the manager of the appliance division isbearish (pessimistic). This inconsistency makes the projects proposed by the furnituredivision look more attractive than those of the appliance division.
To ensure consistency, many firms begin the capital budgeting process by establish-ing forecasts of economic indicators, such as inflation and the growth in national in-come, as well as forecasts of particular items that are important to the firm’s business,such as housing starts or the price of raw materials. These forecasts can then be used asthe basis for all project analyses.
Eliminating Conflicts of Interest. Earlier we pointed out that while managers wantto do a good job, they are also concerned about their own futures. If the interests ofmanagers conflict with those of stockholders, the result is likely to be poor investmentdecisions. For example, new plant managers naturally want to demonstrate good per-formance right away. To this end, they might propose quick-payback projects even ifNPV is sacrificed. Unfortunately, many firms measure performance and reward man-agers in ways that encourage such behavior. If the firm always demands quick results,it is unlikely that plant managers will concentrate only on NPV.
Reducing Forecast Bias. Someone who is keen to get a project proposal accepted isalso likely to look on the bright side when forecasting the project’s cash flows. Suchoveroptimism is a common feature in financial forecasts. For example, think of largepublic expenditure proposals. How often have you heard of a new missile, dam, or high-way that actually cost less than was originally forecast? Think back to the Eurotunnelproject. The final cost of the project was about 50 percent higher than initial forecasts.It is probably impossible to ever eliminate bias completely, but if senior management isaware of why bias occurs, it is at least partway to solving the problem.
Project sponsors are likely to overstate their case deliberately only if the head officeencourages them to do so. For example, if middle managers believe that success de-pends on having the largest division rather than the most profitable one, they will pro-pose large expansion projects that they do not believe have the largest possible net pres-ent value. Or if divisions must compete for limited resources, they will try to outbideach other for those resources. The fault in such cases is top management’s—if lowerlevel managers are not rewarded based on net present value and contribution to firmvalue, it should not be surprising that they focus their efforts elsewhere.
Other problems stem from sponsors’ eagerness to obtain approval for their favorite
Project Analysis 469
projects. As the proposal travels up the organization, alliances are formed. Thus once adivision has screened its own plants’ proposals, the plants in that division unite in com-peting against outsiders. The result is that the head office may receive several thousandinvestment proposals each year, all essentially sales documents presented by unitedfronts and designed to persuade. The forecasts have been doctored to ensure that NPVappears positive.
Since it is difficult for senior management to evaluate each specific assumption inan investment proposal, capital investment decisions are effectively decentralized what-ever the rules say. Some firms accept this; others rely on head office staff to check cap-ital investment proposals.
Sorting the Wheat from the Chaff. Senior managers are continually bombardedwith requests for funds for capital expenditures. All these requests are supported withdetailed analyses showing that the projects have positive NPVs. How then can managersensure that only worthwhile projects make the grade? One response of senior managersto this problem of poor information is to impose rigid expenditure limits on individualplants or divisions. These limits force the subunits to choose among projects. The firmends up using capital rationing not because capital is unobtainable but as a way of de-centralizing decisions.2
Senior managers might also ask some searching questions about why the project hasa positive NPV. After all, if the project is so attractive, why hasn’t someone already un-dertaken it? Will others copy your idea if it is so profitable? Positive NPVs are plausi-ble only if your company has some competitive advantage.
Such an advantage can arise in several ways. You may be smart or lucky enough tobe the first to the market with a new or improved product for which customers will paypremium prices. Your competitors eventually will enter the market and squeeze out ex-cess profits, but it may take them several years to do so. Or you may have a proprietarytechnology or production cost advantage that competitors cannot easily match. You mayhave a contractual advantage such as the distributorship for a particular region. Or youradvantage may be as simple as a good reputation and an established customer list.
Analyzing competitive advantage can also help ferret out projects that incorrectlyappear to have a negative NPV. If you are the lowest cost producer of a profitable prod-uct in a growing market, then you should invest to expand along with the market. If yourcalculations show a negative NPV for such an expansion, then you probably have madea mistake.
Some “What-If” QuestionsSENSITIVITY ANALYSIS
Uncertainty means that more things can happen than will happen. Therefore, whenevermanagers are given a cash-flow forecast, they try to determine what else might happenand the implications of those possible events. This is called sensitivity analysis.
Put yourself in the well-heeled shoes of the financial manager of the Finefodder su-permarket chain. Finefodder is considering opening a new superstore in Gravenstein
2 We discussed capital rationing earlier.
SENSITIVITYANALYSIS Analysis ofthe effects on projectprofitability of changes insales, costs, and so on.
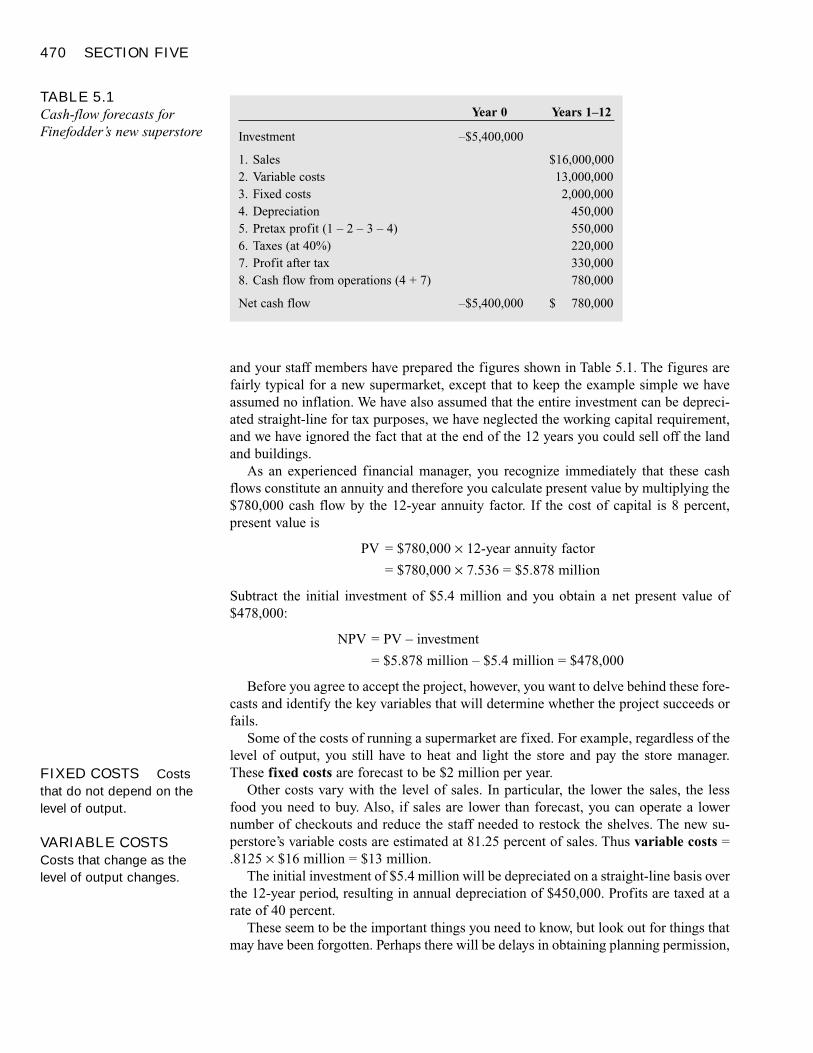
470 SECTION FIVE
and your staff members have prepared the figures shown in Table 5.1. The figures arefairly typical for a new supermarket, except that to keep the example simple we haveassumed no inflation. We have also assumed that the entire investment can be depreci-ated straight-line for tax purposes, we have neglected the working capital requirement,and we have ignored the fact that at the end of the 12 years you could sell off the landand buildings.
As an experienced financial manager, you recognize immediately that these cashflows constitute an annuity and therefore you calculate present value by multiplying the$780,000 cash flow by the 12-year annuity factor. If the cost of capital is 8 percent,present value is
PV = $780,000 × 12-year annuity factor
= $780,000 × 7.536 = $5.878 million
Subtract the initial investment of $5.4 million and you obtain a net present value of$478,000:
NPV = PV – investment
= $5.878 million – $5.4 million = $478,000
Before you agree to accept the project, however, you want to delve behind these fore-casts and identify the key variables that will determine whether the project succeeds orfails.
Some of the costs of running a supermarket are fixed. For example, regardless of thelevel of output, you still have to heat and light the store and pay the store manager.These fixed costs are forecast to be $2 million per year.
Other costs vary with the level of sales. In particular, the lower the sales, the lessfood you need to buy. Also, if sales are lower than forecast, you can operate a lowernumber of checkouts and reduce the staff needed to restock the shelves. The new su-perstore’s variable costs are estimated at 81.25 percent of sales. Thus variable costs =.8125 × $16 million = $13 million.
The initial investment of $5.4 million will be depreciated on a straight-line basis overthe 12-year period, resulting in annual depreciation of $450,000. Profits are taxed at arate of 40 percent.
These seem to be the important things you need to know, but look out for things thatmay have been forgotten. Perhaps there will be delays in obtaining planning permission,
TABLE 5.1Cash-flow forecasts forFinefodder’s new superstore
Year 0 Years 1–12
Investment –$5,400,000
1. Sales $16,000,0002. Variable costs 13,000,0003. Fixed costs 2,000,0004. Depreciation 450,0005. Pretax profit (1 – 2 – 3 – 4) 550,0006. Taxes (at 40%) 220,0007. Profit after tax 330,0008. Cash flow from operations (4 + 7) 780,000
Net cash flow –$5,400,000 $ 780,000
FIXED COSTS Coststhat do not depend on thelevel of output.
VARIABLE COSTSCosts that change as thelevel of output changes.
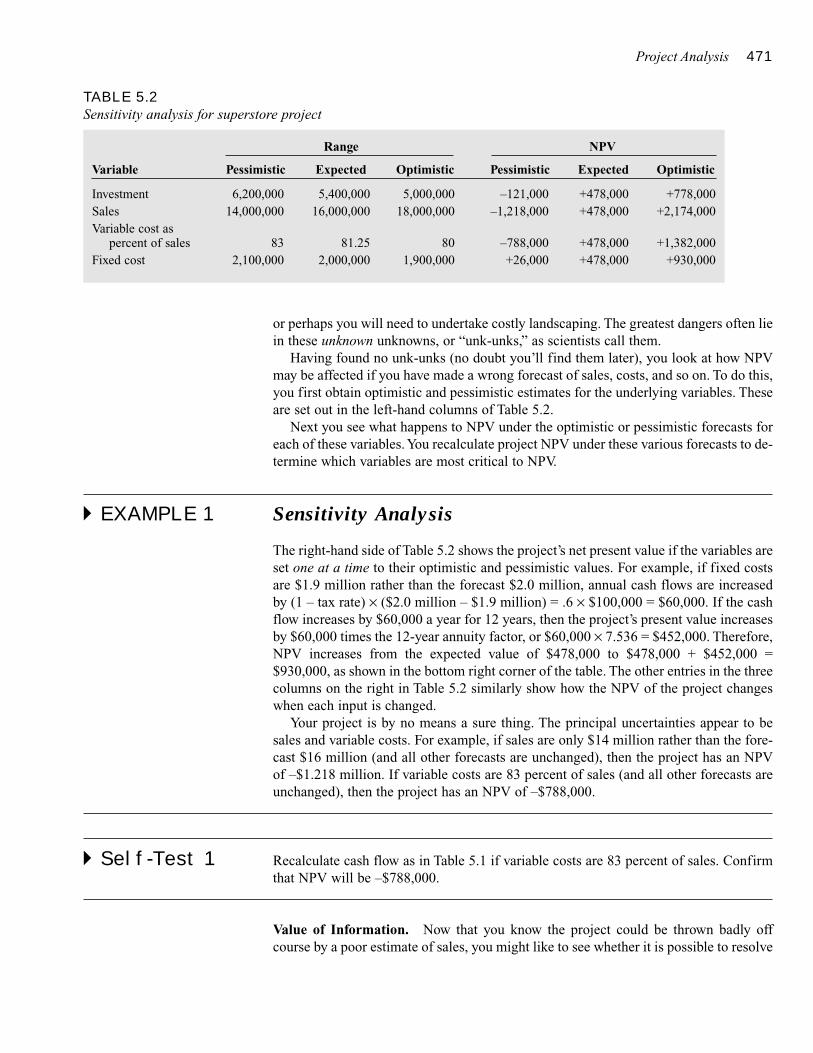
Project Analysis 471
or perhaps you will need to undertake costly landscaping. The greatest dangers often liein these unknown unknowns, or “unk-unks,” as scientists call them.
Having found no unk-unks (no doubt you’ll find them later), you look at how NPVmay be affected if you have made a wrong forecast of sales, costs, and so on. To do this,you first obtain optimistic and pessimistic estimates for the underlying variables. Theseare set out in the left-hand columns of Table 5.2.
Next you see what happens to NPV under the optimistic or pessimistic forecasts foreach of these variables. You recalculate project NPV under these various forecasts to de-termine which variables are most critical to NPV.
� EXAMPLE 1 Sensitivity Analysis
The right-hand side of Table 5.2 shows the project’s net present value if the variables areset one at a time to their optimistic and pessimistic values. For example, if fixed costsare $1.9 million rather than the forecast $2.0 million, annual cash flows are increasedby (1 – tax rate) × ($2.0 million – $1.9 million) = .6 × $100,000 = $60,000. If the cashflow increases by $60,000 a year for 12 years, then the project’s present value increasesby $60,000 times the 12-year annuity factor, or $60,000 × 7.536 = $452,000. Therefore,NPV increases from the expected value of $478,000 to $478,000 + $452,000 =$930,000, as shown in the bottom right corner of the table. The other entries in the threecolumns on the right in Table 5.2 similarly show how the NPV of the project changeswhen each input is changed.
Your project is by no means a sure thing. The principal uncertainties appear to besales and variable costs. For example, if sales are only $14 million rather than the fore-cast $16 million (and all other forecasts are unchanged), then the project has an NPVof –$1.218 million. If variable costs are 83 percent of sales (and all other forecasts areunchanged), then the project has an NPV of –$788,000.
� Self-Test 1 Recalculate cash flow as in Table 5.1 if variable costs are 83 percent of sales. Confirmthat NPV will be –$788,000.
Value of Information. Now that you know the project could be thrown badly offcourse by a poor estimate of sales, you might like to see whether it is possible to resolve
TABLE 5.2Sensitivity analysis for superstore project
Range NPV
Variable Pessimistic Expected Optimistic Pessimistic Expected Optimistic
Investment 6,200,000 5,400,000 5,000,000 –121,000 +478,000 +778,000Sales 14,000,000 16,000,000 18,000,000 –1,218,000 +478,000 +2,174,000Variable cost as
percent of sales 83 81.25 80 –788,000 +478,000 +1,382,000Fixed cost 2,100,000 2,000,000 1,900,000 +26,000 +478,000 +930,000
472 SECTION FIVE
some of this uncertainty. Perhaps your worry is that the store will fail to attract suffi-cient shoppers from neighboring towns. In that case, additional survey data and morecareful analysis of travel times may be worthwhile.
On the other hand, there is less value to gathering additional information about fixed costs. Because the project is marginally profitable even under pessimistic assump-tions about fixed costs, you are unlikely to be in trouble if you have misestimated thatvariable.
Limits to Sensitivity Analysis. Your analysis of the forecasts for Finefodder’s newsuperstore is known as a sensitivity analysis. Sensitivity analysis expresses cash flowsin terms of unknown variables and then calculates the consequences of misestimatingthose variables. It forces the manager to identify the underlying factors, indicates whereadditional information would be most useful, and helps to expose confused or inappro-priate forecasts.
Of course, there is no law stating which variables you should consider in your sen-sitivity analysis. For example, you may wish to look separately at labor costs and thecosts of the goods sold. Or, if you are concerned about a possible change in the corpo-rate tax rate, you may wish to look at the effect of such a change on the project’s NPV.
One drawback to sensitivity analysis is that it gives somewhat ambiguous results. Forexample, what exactly does optimistic or pessimistic mean? One department may be in-terpreting the terms in a different way from another. Ten years from now, after hundredsof projects, hindsight may show that one department’s pessimistic limit was exceededtwice as often as the other’s; but hindsight won’t help you now while you’re making theinvestment decision.
Another problem with sensitivity analysis is that the underlying variables are likelyto be interrelated. For example, if sales exceed expectations, demand will likely bestronger than you anticipated and your profit margins will be wider. Or, if wages arehigher than your forecast, both variable costs and fixed costs are likely to be at the upperend of your range.
Because of these connections, you cannot push one-at-a-time sensitivity analysis toofar. It is impossible to obtain expected, optimistic, and pessimistic values for total proj-ect cash flows from the information in Table 5.2. Still, it does give a sense of which vari-ables should be most closely monitored.
SCENARIO ANALYSIS
When variables are interrelated, managers often find it helpful to look at how their proj-ect would fare under different scenarios. Scenario analysis allows them to look at dif-ferent but consistent combinations of variables. Forecasters generally prefer to give anestimate of revenues or costs under a particular scenario rather than giving some ab-solute optimistic or pessimistic value.
� EXAMPLE 2 Scenario Analysis
You are worried that Stop and Scoff may decide to build a new store in nearby Salome.That would reduce sales in your Gravenstein store by 15 percent and you might beforced into a price war to keep the remaining business. Prices might be reduced to thepoint that variable costs equal 82 percent of revenue. Table 5.3 shows that under this
SCENARIO ANALYSISProject analysis given aparticular combination ofassumptions.
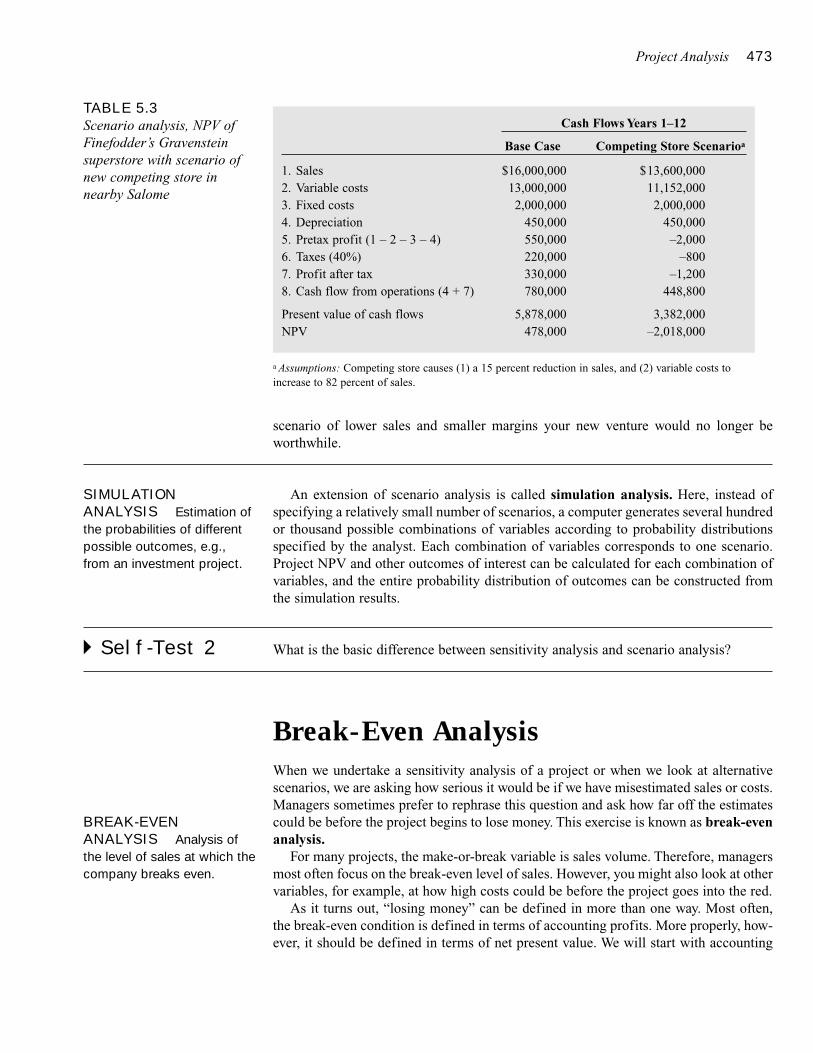
Project Analysis 473
scenario of lower sales and smaller margins your new venture would no longer beworthwhile.
An extension of scenario analysis is called simulation analysis. Here, instead ofspecifying a relatively small number of scenarios, a computer generates several hundredor thousand possible combinations of variables according to probability distributionsspecified by the analyst. Each combination of variables corresponds to one scenario.Project NPV and other outcomes of interest can be calculated for each combination ofvariables, and the entire probability distribution of outcomes can be constructed fromthe simulation results.
� Self-Test 2 What is the basic difference between sensitivity analysis and scenario analysis?
Break-Even AnalysisWhen we undertake a sensitivity analysis of a project or when we look at alternativescenarios, we are asking how serious it would be if we have misestimated sales or costs.Managers sometimes prefer to rephrase this question and ask how far off the estimatescould be before the project begins to lose money. This exercise is known as break-evenanalysis.
For many projects, the make-or-break variable is sales volume. Therefore, managersmost often focus on the break-even level of sales. However, you might also look at othervariables, for example, at how high costs could be before the project goes into the red.
As it turns out, “losing money” can be defined in more than one way. Most often,the break-even condition is defined in terms of accounting profits. More properly, how-ever, it should be defined in terms of net present value. We will start with accounting
TABLE 5.3Scenario analysis, NPV ofFinefodder’s Gravensteinsuperstore with scenario ofnew competing store innearby Salome
Cash Flows Years 1–12
Base Case Competing Store Scenarioa
1. Sales $16,000,000 $13,600,0002. Variable costs 13,000,000 11,152,0003. Fixed costs 2,000,000 2,000,0004. Depreciation 450,000 450,0005. Pretax profit (1 – 2 – 3 – 4) 550,000 –2,0006. Taxes (40%) 220,000 –8007. Profit after tax 330,000 –1,2008. Cash flow from operations (4 + 7) 780,000 448,800
Present value of cash flows 5,878,000 3,382,000NPV 478,000 –2,018,000
a Assumptions: Competing store causes (1) a 15 percent reduction in sales, and (2) variable costs toincrease to 82 percent of sales.
SIMULATIONANALYSIS Estimation ofthe probabilities of differentpossible outcomes, e.g.,from an investment project.
BREAK-EVENANALYSIS Analysis ofthe level of sales at which thecompany breaks even.
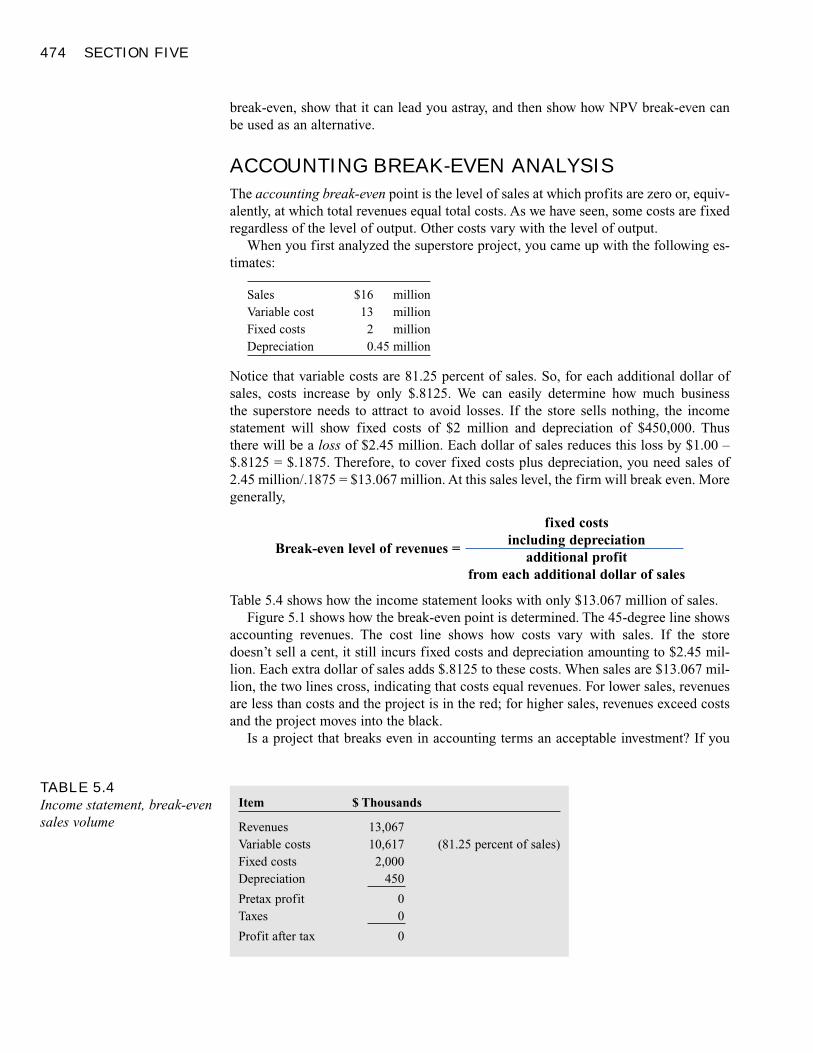
474 SECTION FIVE
break-even, show that it can lead you astray, and then show how NPV break-even canbe used as an alternative.
ACCOUNTING BREAK-EVEN ANALYSIS
The accounting break-even point is the level of sales at which profits are zero or, equiv-alently, at which total revenues equal total costs. As we have seen, some costs are fixedregardless of the level of output. Other costs vary with the level of output.
When you first analyzed the superstore project, you came up with the following es-timates:
Sales $16 millionVariable cost 13 millionFixed costs 2 millionDepreciation 0.45 million
Notice that variable costs are 81.25 percent of sales. So, for each additional dollar ofsales, costs increase by only $.8125. We can easily determine how much business the superstore needs to attract to avoid losses. If the store sells nothing, the incomestatement will show fixed costs of $2 million and depreciation of $450,000. Thus there will be a loss of $2.45 million. Each dollar of sales reduces this loss by $1.00 –$.8125 = $.1875. Therefore, to cover fixed costs plus depreciation, you need sales of2.45 million/.1875 = $13.067 million. At this sales level, the firm will break even. Moregenerally,
fixed costs
Break-even level of revenues =including depreciation
additional profitfrom each additional dollar of sales
Table 5.4 shows how the income statement looks with only $13.067 million of sales.Figure 5.1 shows how the break-even point is determined. The 45-degree line shows
accounting revenues. The cost line shows how costs vary with sales. If the store doesn’t sell a cent, it still incurs fixed costs and depreciation amounting to $2.45 mil-lion. Each extra dollar of sales adds $.8125 to these costs. When sales are $13.067 mil-lion, the two lines cross, indicating that costs equal revenues. For lower sales, revenuesare less than costs and the project is in the red; for higher sales, revenues exceed costsand the project moves into the black.
Is a project that breaks even in accounting terms an acceptable investment? If you
TABLE 5.4Income statement, break-evensales volume
Item $ Thousands
Revenues 13,067Variable costs 10,617 (81.25 percent of sales)Fixed costs 2,000Depreciation 450
Pretax profit 0Taxes 0
Profit after tax 0
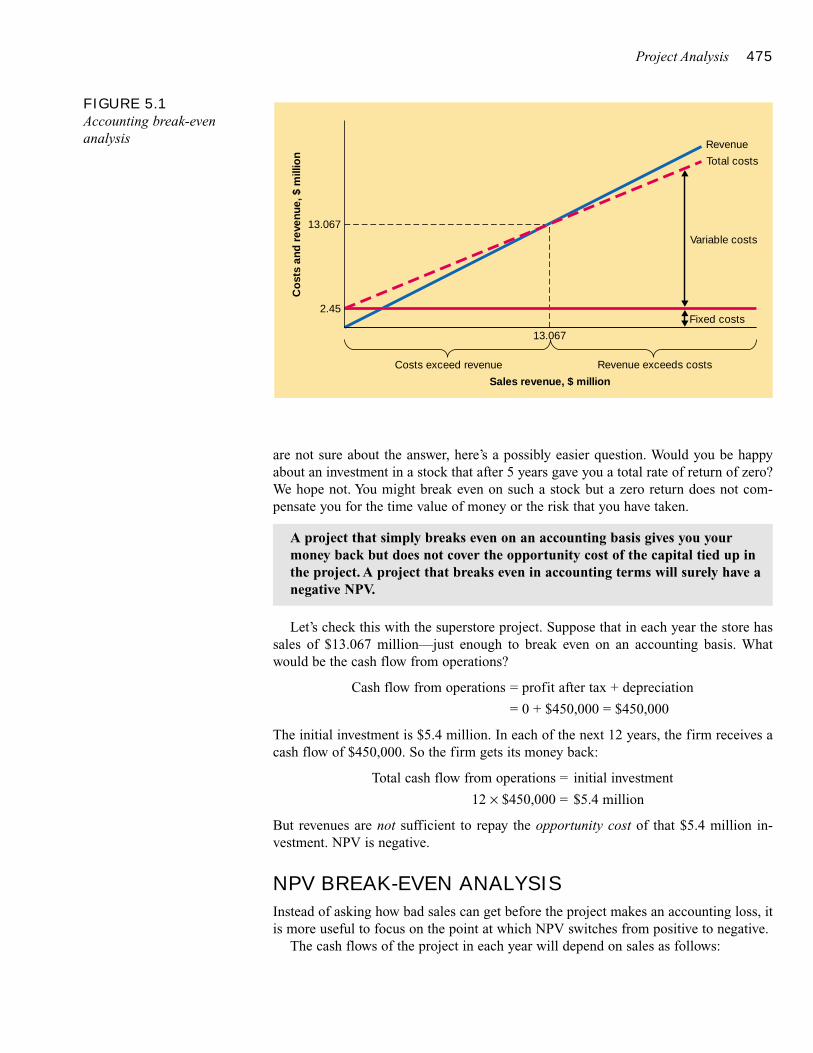
Project Analysis 475
are not sure about the answer, here’s a possibly easier question. Would you be happyabout an investment in a stock that after 5 years gave you a total rate of return of zero?We hope not. You might break even on such a stock but a zero return does not com-pensate you for the time value of money or the risk that you have taken.
Let’s check this with the superstore project. Suppose that in each year the store hassales of $13.067 million—just enough to break even on an accounting basis. Whatwould be the cash flow from operations?
Cash flow from operations = profit after tax + depreciation
= 0 + $450,000 = $450,000
The initial investment is $5.4 million. In each of the next 12 years, the firm receives acash flow of $450,000. So the firm gets its money back:
Total cash flow from operations = initial investment
12 × $450,000 = $5.4 million
But revenues are not sufficient to repay the opportunity cost of that $5.4 million in-vestment. NPV is negative.
NPV BREAK-EVEN ANALYSIS
Instead of asking how bad sales can get before the project makes an accounting loss, itis more useful to focus on the point at which NPV switches from positive to negative.
The cash flows of the project in each year will depend on sales as follows:
A project that simply breaks even on an accounting basis gives you yourmoney back but does not cover the opportunity cost of the capital tied up inthe project. A project that breaks even in accounting terms will surely have anegative NPV.
FIGURE 5.1Accounting break-evenanalysis
Costs exceed revenueSales revenue, $ million
Revenue exceeds costs
13.067Fixed costs
Variable costs
RevenueTotal costs
Co
sts
and
rev
enue
, $ m
illio
n
13.067
2.45
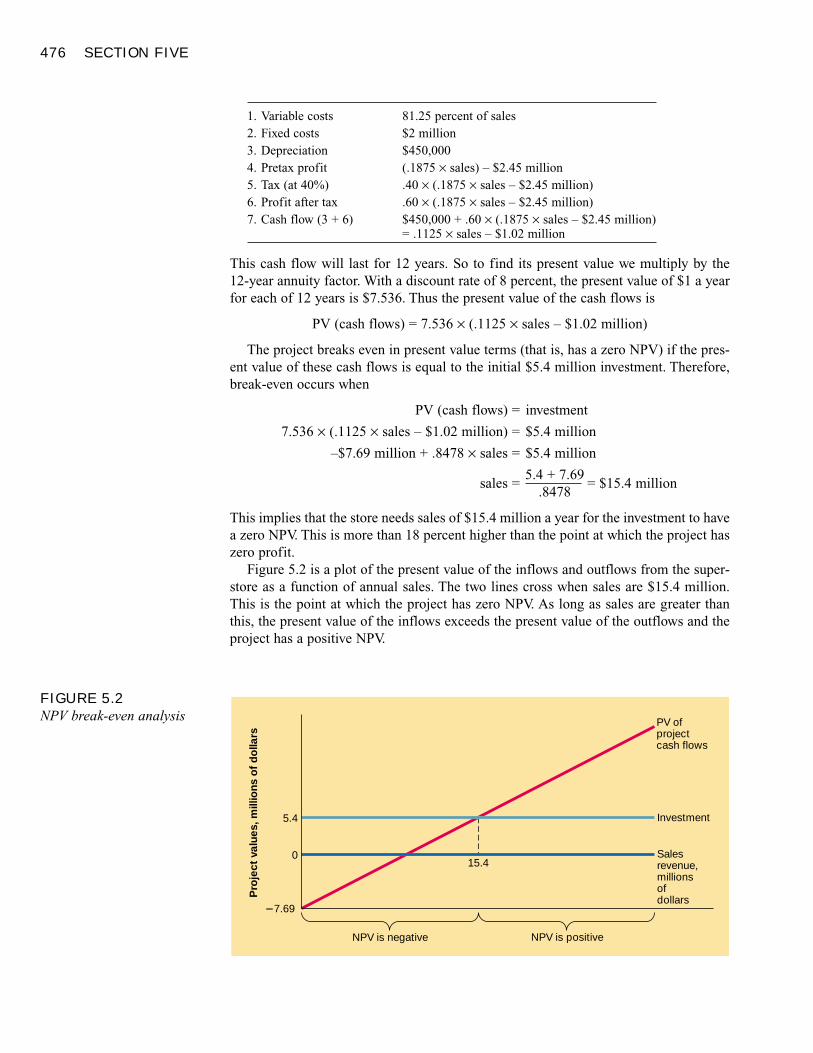
476 SECTION FIVE
1. Variable costs 81.25 percent of sales2. Fixed costs $2 million3. Depreciation $450,0004. Pretax profit (.1875 × sales) – $2.45 million5. Tax (at 40%) .40 × (.1875 × sales – $2.45 million)6. Profit after tax .60 × (.1875 × sales – $2.45 million)7. Cash flow (3 + 6) $450,000 + .60 × (.1875 × sales – $2.45 million)
= .1125 × sales – $1.02 million
This cash flow will last for 12 years. So to find its present value we multiply by the 12-year annuity factor. With a discount rate of 8 percent, the present value of $1 a yearfor each of 12 years is $7.536. Thus the present value of the cash flows is
PV (cash flows) = 7.536 × (.1125 × sales – $1.02 million)
The project breaks even in present value terms (that is, has a zero NPV) if the pres-ent value of these cash flows is equal to the initial $5.4 million investment. Therefore,break-even occurs when
PV (cash flows) = investment
7.536 × (.1125 × sales – $1.02 million) = $5.4 million
–$7.69 million + .8478 × sales = $5.4 million
sales =5.4 + 7.69
= $15.4 million.8478
This implies that the store needs sales of $15.4 million a year for the investment to havea zero NPV. This is more than 18 percent higher than the point at which the project haszero profit.
Figure 5.2 is a plot of the present value of the inflows and outflows from the super-store as a function of annual sales. The two lines cross when sales are $15.4 million.This is the point at which the project has zero NPV. As long as sales are greater thanthis, the present value of the inflows exceeds the present value of the outflows and theproject has a positive NPV.
FIGURE 5.2NPV break-even analysis
NPV is negative NPV is positive
15.4
PV ofprojectcash flows
Investment
Salesrevenue,millionsofdollarsP
roje
ct v
alue
s, m
illio
ns o
f d
olla
rs
5.4
0
�7.69
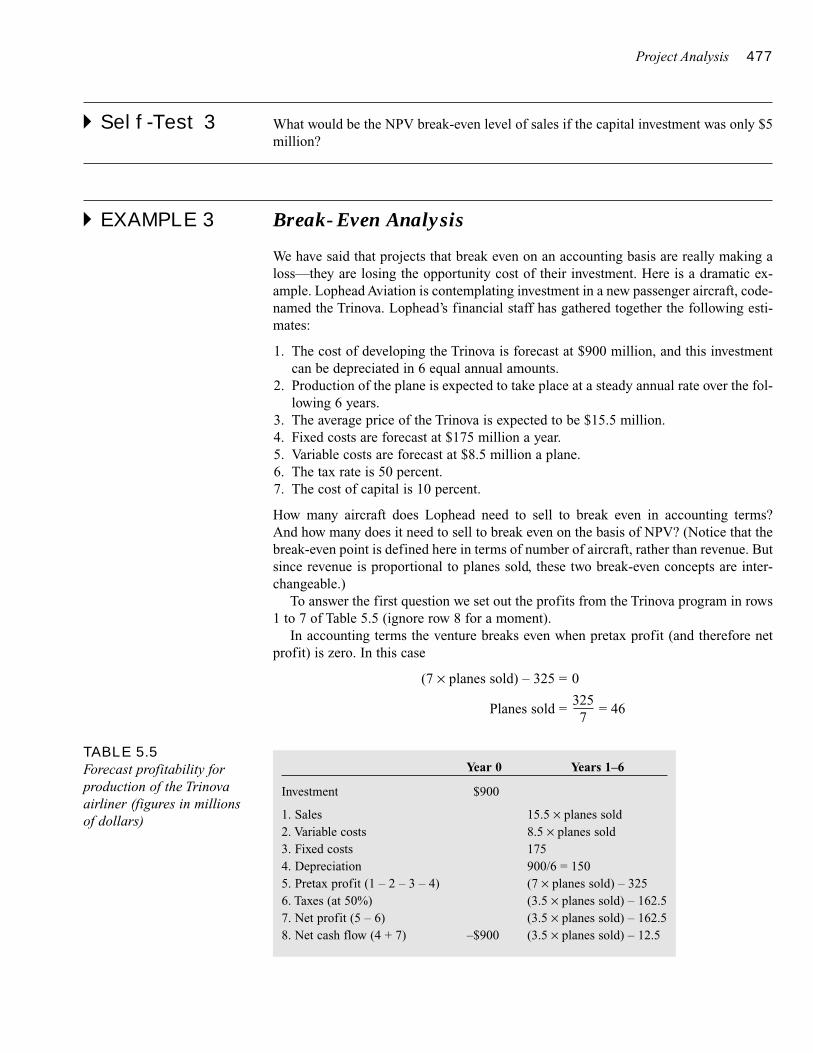
Project Analysis 477
� Self-Test 3 What would be the NPV break-even level of sales if the capital investment was only $5million?
� EXAMPLE 3 Break-Even Analysis
We have said that projects that break even on an accounting basis are really making aloss—they are losing the opportunity cost of their investment. Here is a dramatic ex-ample. Lophead Aviation is contemplating investment in a new passenger aircraft, code-named the Trinova. Lophead’s financial staff has gathered together the following esti-mates:
1. The cost of developing the Trinova is forecast at $900 million, and this investmentcan be depreciated in 6 equal annual amounts.
2. Production of the plane is expected to take place at a steady annual rate over the fol-lowing 6 years.
3. The average price of the Trinova is expected to be $15.5 million.4. Fixed costs are forecast at $175 million a year.5. Variable costs are forecast at $8.5 million a plane.6. The tax rate is 50 percent.7. The cost of capital is 10 percent.
How many aircraft does Lophead need to sell to break even in accounting terms? And how many does it need to sell to break even on the basis of NPV? (Notice that thebreak-even point is defined here in terms of number of aircraft, rather than revenue. Butsince revenue is proportional to planes sold, these two break-even concepts are inter-changeable.)
To answer the first question we set out the profits from the Trinova program in rows1 to 7 of Table 5.5 (ignore row 8 for a moment).
In accounting terms the venture breaks even when pretax profit (and therefore netprofit) is zero. In this case
(7 × planes sold) – 325 = 0
Planes sold =325
= 467
TABLE 5.5Forecast profitability forproduction of the Trinovaairliner (figures in millionsof dollars)
Year 0 Years 1–6
Investment $900
1. Sales 15.5 × planes sold2. Variable costs 8.5 × planes sold3. Fixed costs 1754. Depreciation 900/6 = 1505. Pretax profit (1 – 2 – 3 – 4) (7 × planes sold) – 3256. Taxes (at 50%) (3.5 × planes sold) – 162.57. Net profit (5 – 6) (3.5 × planes sold) – 162.58. Net cash flow (4 + 7) –$900 (3.5 × planes sold) – 12.5
478 SECTION FIVE
Thus Lophead needs to sell about 46 planes a year, or a total of about 280 planes overthe 6 years to show a profit.
Notice that we obtain the same result if we attack the problem in terms of the break-even level of revenue. The variable cost of each plane is $8.5 million, which is 54.8 per-cent of the $15.5 million price. Therefore, each dollar of sales increases pretax profitsby $1 – $.548 = $.452. So
Break-even revenue =fixed costs including depreciation
additional profit from each additional dollar of sales
=$325 million
= $719 million.452
Since each plane cost $15.5 million, this revenue level implies sales of 719/15.5 = 46planes per year.
Now let us look at what sales are needed before the project has a zero NPV. Devel-opment of the Trinova costs $900 million. For each of the next 6 years the company ex-pects a cash flow of $3.5 million × planes sold – $12.5 million (see row 8 of Table 5.5).If the cost of capital is 10 percent, the 6-year annuity factor is 4.355. So
NPV = –900 + 4.355(3.5 × planes sold – 12.5)
= 15.24 × planes sold – 954.44
If the project has a zero NPV,
0 = 15.24 planes sold – 954.44
planes sold = 63
Thus Lophead can recover its initial investment with sales of 46 planes a year (about280 in total), but it needs to sell 63 a year (or about 375 in total) to earn a return on thisinvestment equal to the opportunity cost of capital.
Our example may seem fanciful but it is based loosely on reality. In 1971 Lockheedwas in the middle of a major program to bring out the L-1011 TriStar airliner. This pro-gram was to bring Lockheed to the brink of failure and it tipped Rolls-Royce (supplierof the TriStar engine) over the brink. In giving evidence to Congress, Lockheed arguedthat the TriStar program was commercially attractive and that sales would eventually ex-ceed the break-even point of about 200 aircraft. But in calculating this break-even pointLockheed appears to have ignored the opportunity cost of the huge capital investmentin the project. Lockheed probably needed to sell about 500 aircraft to reach a zero netpresent value.3
� Self-Test 4 What is the basic difference between sensitivity analysis and break-even analysis?
OPERATING LEVERAGE
A project’s break-even point depends on both its fixed costs, which do not vary withsales, and the profit on each extra sale. Managers often face a trade-off between these
3 The true break-even point for the TriStar program is estimated in U. E. Reinhardt, “Break-Even Analysis forLockheed’s TriStar: An Application of Financial Theory,” Journal of Finance 28 (September 1973), pp.821–838.
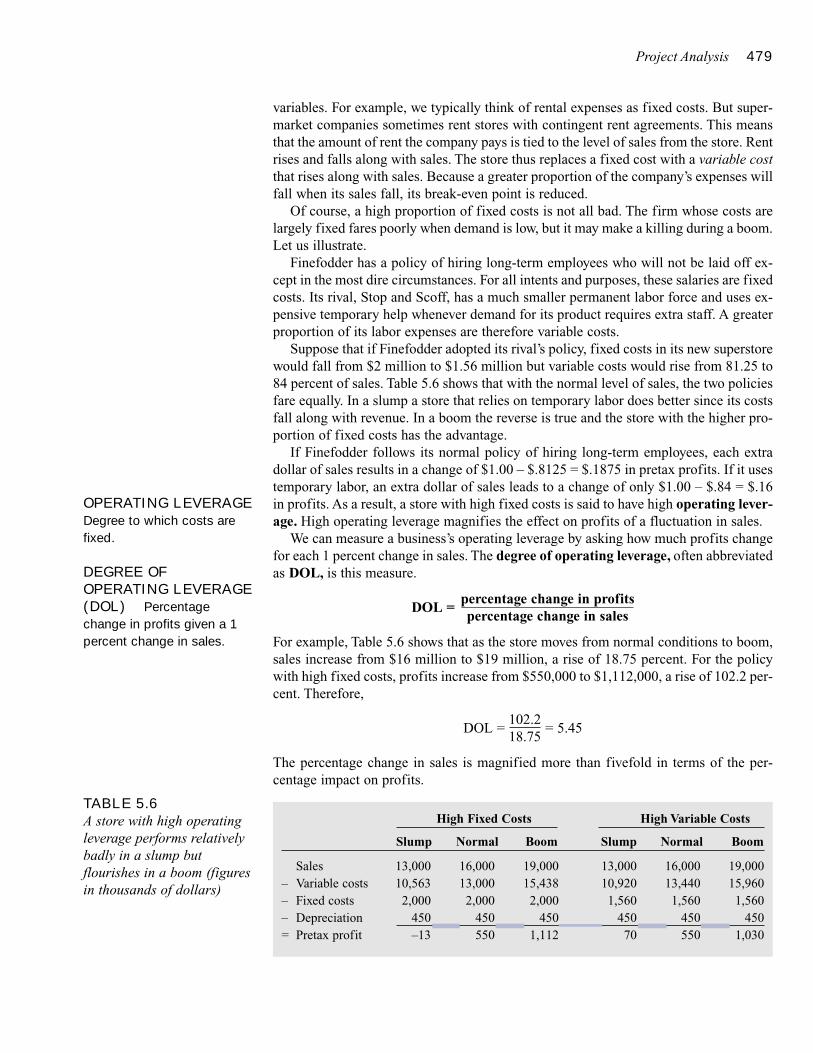
Project Analysis 479
variables. For example, we typically think of rental expenses as fixed costs. But super-market companies sometimes rent stores with contingent rent agreements. This meansthat the amount of rent the company pays is tied to the level of sales from the store. Rentrises and falls along with sales. The store thus replaces a fixed cost with a variable costthat rises along with sales. Because a greater proportion of the company’s expenses willfall when its sales fall, its break-even point is reduced.
Of course, a high proportion of fixed costs is not all bad. The firm whose costs arelargely fixed fares poorly when demand is low, but it may make a killing during a boom.Let us illustrate.
Finefodder has a policy of hiring long-term employees who will not be laid off ex-cept in the most dire circumstances. For all intents and purposes, these salaries are fixedcosts. Its rival, Stop and Scoff, has a much smaller permanent labor force and uses ex-pensive temporary help whenever demand for its product requires extra staff. A greaterproportion of its labor expenses are therefore variable costs.
Suppose that if Finefodder adopted its rival’s policy, fixed costs in its new superstorewould fall from $2 million to $1.56 million but variable costs would rise from 81.25 to84 percent of sales. Table 5.6 shows that with the normal level of sales, the two policiesfare equally. In a slump a store that relies on temporary labor does better since its costsfall along with revenue. In a boom the reverse is true and the store with the higher pro-portion of fixed costs has the advantage.
If Finefodder follows its normal policy of hiring long-term employees, each extradollar of sales results in a change of $1.00 – $.8125 = $.1875 in pretax profits. If it usestemporary labor, an extra dollar of sales leads to a change of only $1.00 – $.84 = $.16in profits. As a result, a store with high fixed costs is said to have high operating lever-age. High operating leverage magnifies the effect on profits of a fluctuation in sales.
We can measure a business’s operating leverage by asking how much profits changefor each 1 percent change in sales. The degree of operating leverage, often abbreviatedas DOL, is this measure.
DOL =percentage change in profitspercentage change in sales
For example, Table 5.6 shows that as the store moves from normal conditions to boom,sales increase from $16 million to $19 million, a rise of 18.75 percent. For the policywith high fixed costs, profits increase from $550,000 to $1,112,000, a rise of 102.2 per-cent. Therefore,
DOL =102.2
= 5.4518.75
The percentage change in sales is magnified more than fivefold in terms of the per-centage impact on profits.
OPERATING LEVERAGEDegree to which costs arefixed.
DEGREE OFOPERATING LEVERAGE(DOL) Percentagechange in profits given a 1percent change in sales.
TABLE 5.6A store with high operatingleverage performs relativelybadly in a slump butflourishes in a boom (figuresin thousands of dollars)
High Fixed Costs High Variable Costs
Slump Normal Boom Slump Normal Boom
Sales 13,000 16,000 19,000 13,000 16,000 19,000– Variable costs 10,563 13,000 15,438 10,920 13,440 15,960– Fixed costs 2,000 2,000 2,000 1,560 1,560 1,560– Depreciation 450 450 450 450 450 450= Pretax profit –13 550 1,112 70 550 1,030
480 SECTION FIVE
Now look at the operating leverage of the store if it uses the policy with low fixedcosts but high variable costs. As the store moves from normal times to boom, profits in-crease from $550,000 to $1,030,000, a rise of 87.3 percent. Therefore,
DOL =87.3
= 4.6518.75
Because some costs remain fixed, a change in sales continues to have a magnified ef-fect on profits but the degree of operating leverage is lower.
In fact, one can show that degree of operating leverage depends on fixed charges (in-cluding depreciation) in the following manner:4
DOL = 1 +fixed costs
profits
This relationship makes it clear that operating leverage increases with fixed costs.
� EXAMPLE 4 Operating Leverage
Suppose the firm adopts the high-fixed-cost policy. Then fixed costs including depre-ciation will be 2.00 + .45 = $2.45 million. Since the store produces profits of $.55 mil-lion at a normal level of sales, DOL should be
DOL = 1 +fixed costs
= 1 +2.00 + .45
= 5.45profits .55
This value matches the one we obtained by comparing the actual percentage changes insales and profits.
We will have more to say about risk later.
� Self-Test 5 Suppose that sales increase by 10 percent from the values in the normal scenario. Com-pute the percentage change in pretax profits from the normal level for both policies inTable 5.6. Compare your answers to the values predicted by the DOL formula.
You can see from this example that the risk of a project is affected by thedegree of operating leverage. If a large proportion of costs is fixed, a shortfallin sales has a magnified effect on profits.
4 This formula for DOL can be derived as follows. If sales increase by 1 percent, then variable costs alsoshould increase by 1 percent, and profits will increase by .01 × (sales – variable costs) = .01 × (profits + fixedcosts). Now recall the definition of DOL:
DOL =percentage change in profits
=change in profits/level of profits
percentage change in sales .01
= 100 × change in profits= 100 × .01 × (profits + fixed costs)
level of profits level of profits
= 1 +fixed costs
profits
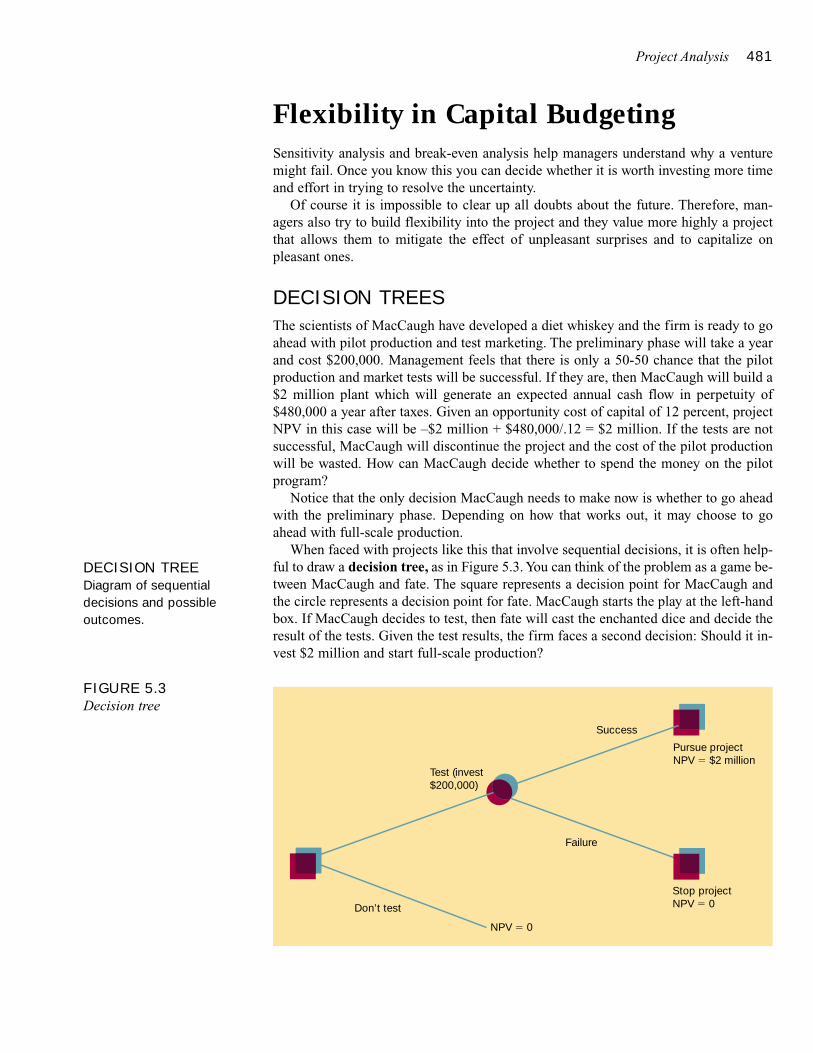
Project Analysis 481
Flexibility in Capital BudgetingSensitivity analysis and break-even analysis help managers understand why a venturemight fail. Once you know this you can decide whether it is worth investing more timeand effort in trying to resolve the uncertainty.
Of course it is impossible to clear up all doubts about the future. Therefore, man-agers also try to build flexibility into the project and they value more highly a projectthat allows them to mitigate the effect of unpleasant surprises and to capitalize onpleasant ones.
DECISION TREES
The scientists of MacCaugh have developed a diet whiskey and the firm is ready to goahead with pilot production and test marketing. The preliminary phase will take a yearand cost $200,000. Management feels that there is only a 50-50 chance that the pilotproduction and market tests will be successful. If they are, then MacCaugh will build a$2 million plant which will generate an expected annual cash flow in perpetuity of$480,000 a year after taxes. Given an opportunity cost of capital of 12 percent, projectNPV in this case will be –$2 million + $480,000/.12 = $2 million. If the tests are notsuccessful, MacCaugh will discontinue the project and the cost of the pilot productionwill be wasted. How can MacCaugh decide whether to spend the money on the pilotprogram?
Notice that the only decision MacCaugh needs to make now is whether to go aheadwith the preliminary phase. Depending on how that works out, it may choose to goahead with full-scale production.
When faced with projects like this that involve sequential decisions, it is often help-ful to draw a decision tree, as in Figure 5.3. You can think of the problem as a game be-tween MacCaugh and fate. The square represents a decision point for MacCaugh andthe circle represents a decision point for fate. MacCaugh starts the play at the left-handbox. If MacCaugh decides to test, then fate will cast the enchanted dice and decide theresult of the tests. Given the test results, the firm faces a second decision: Should it in-vest $2 million and start full-scale production?
DECISION TREEDiagram of sequentialdecisions and possibleoutcomes.
FIGURE 5.3Decision tree
Pursue projectNPV � $2 million
Stop projectNPV � 0
Test (invest$200,000)
Don’t test
NPV � 0
Success
Failure
482 SECTION FIVE
The second-stage decision is obvious: Invest if the tests indicate that NPV is posi-tive, and stop if they indicate that NPV would be negative. Now the firm can easily de-cide between paying for the test program or stopping immediately. The net present valueof stopping is zero, so the first-stage decision boils down to a simple problem: ShouldMacCaugh invest $200,000 now to obtain a 50 percent chance of a project with an NPVof $2 million a year later? If payoffs of zero and $2 million are equally likely, the ex-pected payoff is (.5 × 0) + (.5 × 2 million) = $1 million. Thus the pilot project offers anexpected payoff of $1 million on an investment of $200,000. At any reasonable cost ofcapital this is a good deal.
THE OPTION TO EXPAND
Notice that MacCaugh’s expenditure on the pilot program buys a valuable managerialoption. The firm has the option to produce the new product depending on the outcomeof the tests. If the pilot program turns up disappointing results, the firm can walk awayfrom the project without incurring additional costs.
MacCaugh was not obliged to have a pilot program. Instead, it could have gone di-rectly into full-scale whiskey production. After all, if diet whiskey is a success, thesooner MacCaugh can clean up the market the better. But it is possible that the productwill not take off; in that case the expenditure on the pilot operation may help the firmavoid a costly mistake. When it proposed a pilot project, MacCaugh’s management wassimply following the fundamental rule of swimmers: If you know the water temperature(and depth), dive in; if you don’t, try putting a toe in first.
Here is another example of an apparently unprofitable investment that has value be-cause of the flexibility it gives to make further follow-on investments. Some of theworld’s largest oil reserves are found in the tar sands of Athabasca, Canada. Unfortu-nately, the cost of extracting oil from the sands is substantially higher than the currentmarket price and almost certainly higher than most people’s estimate of the likely pricein the future. Yet oil companies have been prepared to pay considerable sums for thesetracts of barren land. Why?
The answer is that ownership of these tracts gives the companies an option. They arenot obliged to extract the oil. If oil prices remain below the cost of extraction, theAthabasca sands will remain undeveloped. But if prices do rise above the cost of ex-traction, those land purchases could prove very profitable.
Notice that the option to develop the tar sands is valuable because the future price ofoil is uncertain. If we knew that oil prices would remain at their current level, nobodywould pay a cent for the tar sands. It is the possibility that oil prices may fluctuatesharply above or below their present level that gives the option value.5
As a general rule, flexibility is most valuable when the future is mostuncertain. The ability to change course as events develop and new information becomes available is most valuable when it is hard to predict with confidence what the best action ultimately will turn out to be.
The option to walk away once the results are revealed introduces a valuableasymmetry. Good outcomes can be exploited, while bad outcomes can belimited by canceling the project.
5 Oil prices sometimes move very sharply. They roughly halved between the beginning of 1997 and the endof 1998. By early 2000, they had almost trebled.
Project Analysis 483
You can probably think of many other investments that take on added value becauseof the further opportunities that they may open up. For example, when designing a fac-tory, it may make sense to provide for the possibility in the future of an additional pro-duction line; when building a four-lane highway, it may pay to build six-lane bridges sothat the road can be converted later to six lanes if traffic volume turns out to be higherthan expected.
ABANDONMENT OPTIONS
If the option to expand has value, what about the option to bail out? Projects don’t justgo on until the equipment disintegrates. The decision to terminate a project is usuallytaken by management, not by nature. Once the project is no longer profitable, the com-pany will cut its losses and exercise its option to abandon the project.
Some assets are easier to bail out of than others. Tangible assets are usually easier tosell than intangible ones. It helps to have active secondhand markets, which really existonly for standardized, widely used items. Real estate, airplanes, trucks, and certain ma-chine tools are likely to be relatively easy to sell. On the other hand, the knowledge ac-cumulated by a drug company’s research and development program is a specialized in-tangible asset and probably would not have significant abandonment value. Someassets, such as old mattresses, even have negative abandonment value; you have to payto get rid of them. It is very costly to decommission nuclear power plants or to reclaimland that has been strip-mined. Managers recognize the option to abandon when theymake the initial investment.
� EXAMPLE 5 Abandonment Option
Suppose that the Wigeon Company must choose between two technologies for the man-ufacture of a new product, a Wankel engine outboard motor:
1. Technology A uses custom-designed machinery to produce the complex shapes re-quired for Wankel engines at low cost. But if the Wankel engine doesn’t sell, thisequipment will be worthless.
2. Technology B uses standard machine tools. Labor costs are much higher, but thetools can easily be sold if the motor doesn’t sell.
Technology A looks better in an NPV analysis of the new product, because it was de-signed to have the lowest possible cost at the planned production volume. Yet you cansense the advantage of technology B’s flexibility if you are unsure whether the new out-board will sink or swim in the marketplace.
� Self-Test 6 Consider a firm operating a copper mine that incurs both variable and fixed costs ofproduction. Suppose the mine can be shut down temporarily if copper prices fall below
When you are unsure about the success of a venture, you may wish to choose a flexible technology with a good resale market to preserve the option toabandon the project at low cost.
484 SECTION FIVE
the variable cost of mining copper. Why is this a valuable operating option? How doesit increase the NPV of the mine to the operator?
FLEXIBLE PRODUCTION FACILITIES
Companies try to avoid becoming dependent on a single source of raw materials, build-ing flexibility into their production facilities whenever possible. For example, at currentprices gas-fired industrial boilers are cheaper to operate than oil-fired ones. Yet mostcompanies prefer to buy boilers that can use either oil or natural gas, even though thesedual-fired boilers cost more than a gas-fired boiler.6 The reason is obvious. If gas pricesrise relative to oil prices, the dual-fired boiler gives the company a valuable option toswitch to low-cost oil. In effect the company has the option to exchange one asset (anoil-fired boiler) for another (a gas-fired boiler).
If the firm is uncertain about the future demand for its products, it may also build inthe option to vary the output mix. For example, in recent years automobile manufac-turers have made major investments in flexible production facilities that allow them tochange their output rapidly in response to consumer demand.
INVESTMENT TIMING OPTIONS
Suppose that you have a project that might be a big winner or a big loser. The project’supside potential outweighs its downside potential, and it has a positive NPV if under-taken today. However, the project is not “now-or-never.” Should you invest right awayor wait? It’s hard to say. If the project truly is a winner, waiting means loss or deferralof its early cash flows. But if it turns out to be a loser, it may pay to wait and get a bet-ter fix on the likely demand.
You can think of any project proposal as giving you the option to invest today. Youdon’t have to exercise that option immediately. Instead you need to weigh the value ofthe cash flows lost by delaying against the possibility that you will pick up some valu-able information.
Think again of those tar sands in Athabasca. Suppose that the price of oil rises to 10cents a barrel above your cost of production. You can extract the oil profitably at thisprice, and the required investment has a small positive NPV if the price stays where itis. But it still might be worth delaying production. After all, if the price plummets, youwill by waiting avoid a costly mistake. If it rises further, however, you can invest andmake a killing.
We repeat, it is because the future is so uncertain that managers value flexibility. Ide-ally, a project will give the firm an option to expand if things go well and to bail out orswitch production if they don’t. In addition, it may pay the firm to postpone the project.
Some managers treat capital investment decisions as black boxes; they are handedcash-flow forecasts and they churn out present values without looking inside the blackbox. But successful firms ask not only what could be wrong with the forecasts butwhether there are opportunities to respond to surprises. In other words, they recognizethe value of flexibility.
� Self-Test 7 Investments in new products or production capacity often include an option to expand.What are the other major types of options encountered in capital investment decisions?
6 See N. Kulatilaka, “The Value of Flexibility: The Case of a Dual-Fuel Industrial Steam Boiler,” FinancialManagement 22 (Autumn 1993), pp. 271–280.
Project Analysis 485
SummaryWhat are some of the practical problems of capital budgeting in large corporations?
For most large corporations there are two stages in the investment process: the preparationof the capital budget, which is a list of planned investments, and the authorization processfor individual projects. This process is usually a cooperative effort.
Investment projects should never be selected through a purely mechanical process.Managers need to ask why a project should have a positive NPV. A positive NPV isplausible only if the company has some competitive advantage that prevents its rivals fromstealing most of the gains.
How are sensitivity, scenario, and break-even analysis used to see the effect of anerror in forecasts on project profitability? Why is an overestimate of sales more se-rious for projects with high operating leverage?
Good managers realize that the forecasts behind NPV calculations are imperfect. Therefore,they explore the consequences of a poor forecast and check whether it is worth doing somemore homework. They use the following principal tools to answer these what-if questions:
• Sensitivity analysis, where one variable at a time is changed.• Scenario analysis, where the manager looks at the project under alternative scenarios.• Simulation analysis, an extension of scenario analysis in which a computer generates
hundreds or thousands of possible combinations of variables.• Break-even analysis, where the focus is on how far sales could fall before the project
begins to lose money. Often the phrase “lose money” is defined in terms of accountinglosses, but it makes more sense to define it as “failing to cover the opportunity cost ofcapital”—in other words, as a negative NPV.
• Operating leverage, the degree to which costs are fixed. A project’s break-even pointwill be affected by the extent to which costs can be reduced as sales decline. If theproject has mostly fixed costs, it is said to have high operating leverage. High operatingleverage implies that profits are more sensitive to changes in sales.
Why is managerial flexibility important in capital budgeting?
Some projects may take on added value because they give the firm the option to bail out ifthings go wrong or to capitalize on success by expanding. We showed how decision treesmay be used to analyze such flexibility.
www.windpower.dk/tour/econ/econ.htm Evaluation of a sample energy-saving projectwww.palisade.com Software for Monte Carlo analysis
capital budgetsensitivity analysisfixed costsvariable costs
scenario analysissimulation analysisbreak-even analysisoperating leverage
degree of operatingleverage (DOL)
decision tree
1. Fixed and Variable Costs. In a slow year, Wimpy’s Burgers will produce 1 million ham-burgers at a total cost of $1.75 million. In a good year, it can produce 2 million hamburgersat a total cost of $2.25 million. What are the fixed and variable costs of hamburger produc-tion?
Related WebLinks
Key Terms
Quiz
486 SECTION FIVE
2. Average Cost. Reconsider Wimpy’s Burgers from problem 1.
a. What is the average cost per burger when the firm produces 1 million hamburgers?b. What is average cost when the firm produces 2 million hamburgers?c. Why is average cost lower when more burgers are produced?
3. Sensitivity Analysis. A project currently generates sales of $10 million, variable costs equalto 50 percent of sales, and fixed costs of $2 million. The firm’s tax rate is 35 percent. Whatare the effects of the following changes on after-tax profits and cash flow?
a. Sales increase from $10 million to $11 million.b. Variable costs increase to 60 percent of sales.
4. Sensitivity Analysis. The project in the preceding problem will last for 10 years. The dis-count rate is 12 percent.
a. What is the effect on project NPV of each of the changes considered in the problem?b. If project NPV under the base-case scenario is $2 million, how much can fixed costs in-
crease before NPV turns negative?c. How much can fixed costs increase before accounting profits turn negative?
5. Sensitivity Analysis. Emperor’s Clothes Fashions can invest $5 million in a new plant forproducing invisible makeup. The plant has an expected life of 5 years, and expected sales are6 million jars of makeup a year. Fixed costs are $2 million a year, and variable costs are $1per jar. The product will be priced at $2 per jar. The plant will be depreciated straight-lineover 5 years to a salvage value of zero. The opportunity cost of capital is 12 percent, and thetax rate is 40 percent.
a. What is project NPV under these base-case assumptions?b. What is NPV if variable costs turn out to be $1.20 per jar?c. What is NPV if fixed costs turn out to be $1.5 million per year?d. At what price per jar would project NPV equal zero?
6. Scenario Analysis. The most likely outcomes for a particular project are estimated as follows:
Unit price: $50Variable cost: $30Fixed cost: $300,000Expected sales: 30,000 units per year
However, you recognize that some of these estimates are subject to error. Suppose that eachvariable may turn out to be either 10 percent higher or 10 percent lower than the initial esti-mate. The project will last for 10 years and requires an initial investment of $1 million,which will be depreciated straight-line over the project life to a final value of zero. Thefirm’s tax rate is 35 percent and the required rate of return is 14 percent. What is projectNPV in the “best-case scenario,” that is, assuming all variables take on the best possiblevalue? What about the worst-case scenario?
7. Scenario Analysis. Reconsider the best- and worst-case scenarios in the previous problem.Do the best- and worst-case outcomes when each variable is treated independently seem tobe reasonable scenarios in terms of the combinations of variables? For example, if price ishigher than predicted, is it more or less likely that cost is higher than predicted? What otherrelationships may exist among the variables?
PracticeProblems
Project Analysis 487
8. Break-Even. The following estimates have been prepared for a project under consideration:
Fixed costs: $20,000Depreciation: $10,000Price: $2Accounting break-even: 60,000 units
What must be the variable cost per unit?9. Break-Even. Dime a Dozen Diamonds makes synthetic diamonds by treating carbon. Each
diamond can be sold for $100. The materials cost for a standard diamond is $30. The fixedcosts incurred each year for factory upkeep and administrative expenses are $200,000. Themachinery costs $1 million and is depreciated straight-line over 10 years to a salvage valueof zero.
a. What is the accounting break-even level of sales in terms of number of diamonds sold?b. What is the NPV break-even level of sales assuming a tax rate of 35 percent, a 10-year
project life, and a discount rate of 12 percent?
10. Break-Even. Turn back to problem 9.
a. Would the accounting break-even point in the first year of operation increase or decreaseif the machinery were depreciated over a 5-year period?
b. Would the NPV break-even point increase or decrease if the machinery were depreciatedover a 5-year period?
11. Break-Even. You are evaluating a project that will require an investment of $10 million thatwill be depreciated over a period of 7 years. You are concerned that the corporate tax ratewill increase during the life of the project. Would such an increase affect the accountingbreak-even point? Would it affect the NPV break-even point?
12. Break-Even. Define the cash-flow break-even point as the sales volume (in dollars) at whichcash flow equals zero. Is the cash-flow break-even level of sales higher or lower than thezero-profit break-even point?
13. Break-Even and NPV. If a project operates at cash-flow break-even (see problem 12) for itsentire life, what must be true of the project’s NPV?
14. Break-Even. Modern Artifacts can produce keepsakes that will be sold for $80 each. Non-depreciation fixed costs are $1,000 per year and variable costs are $60 per unit.
a. If the project requires an initial investment of $3,000 and is expected to last for 5 yearsand the firm pays no taxes, what are the accounting and NPV break-even levels of sales?The initial investment will be depreciated straight-line over 5 years to a final value ofzero, and the discount rate is 10 percent.
b. How do your answers change if the firm’s tax rate is 40 percent?
15. Break-Even. A financial analyst has computed both accounting and NPV break-even saleslevels for a project under consideration using straight-line depreciation over a 6-year period.The project manager wants to know what will happen to these estimates if the firm usesMACRS depreciation instead. The capital investment will be in a 5-year recovery periodclass under MACRS rules (see Table 7.4). The firm is in a 35 percent tax bracket.
a. What (qualitatively) will happen to the accounting break-even level of sales in the firstyears of the project?
b. What (qualitatively) will happen to NPV break-even level of sales?c. If you were advising the analyst, would the answer to (a) or (b) be important to you?
Specifically, would you say that the switch to MACRS makes the project more or less at-tractive?
488 SECTION FIVE
16. Break-Even. Reconsider Finefodder’s new superstore. Suppose that by investing an addi-tional $600,000 initially in more efficient checkout equipment, Finefodder could reducevariable costs to 80 percent of sales.
a. Using the base-case assumptions (Table 5.1), find the NPV of this alternative scheme.Hint: Remember to focus on the incremental cash flows from the project.
b. At what level of sales will accounting profits be unchanged if the firm invests in the newequipment? Assume the equipment receives the same 12-year straight-line depreciationtreatment as in the original example. Hint: Focus on the project’s incremental effects onfixed and variable costs.
c. What is the NPV break-even point?
17. Break-Even and NPV. If the superstore project (see the previous problem) operates at ac-counting break-even, will net present value be positive or negative?
18. Operating Leverage. You estimate that your cattle farm will generate $1 million of profitson sales of $4 million under normal economic conditions, and that the degree of operatingleverage is 7.5. What will profits be if sales turn out to be $3.5 million? What if they are$4.5 million?
19. Operating Leverage.
a. What is the degree of operating leverage of Modern Artifacts (in problem 14) when salesare $8,000?
b. What is the degree of operating leverage when sales are $10,000?c. Why is operating leverage different at these two levels of sales?
20. Operating Leverage. What is the lowest possible value for the degree of operating leveragefor a profitable firm? Show with a numerical example that if Modern Artifacts (see problem14a) has zero fixed costs, then DOL = 1 and in fact sales and profits are directly propor-tional so that a 1 percent change in sales results in a 1 percent change in profits.
21. Operating Leverage. A project has fixed costs of $1,000 per year, depreciation charges of$500 a year, revenue of $6,000 a year, and variable costs equal to two-thirds of revenues.
a. If sales increase by 5 percent, what will be the increase in pretax profits?b. What is the degree of operating leverage of this project?c. Confirm that the percentage change in profits equals DOL times the percentage change
in sales.
22. Project Options. Your midrange guess as to the amount of oil in a prospective field is 10million barrels, but in fact there is a 50 percent chance that the amount of oil is 15 millionbarrels, and a 50 percent chance of 5 million barrels. If the actual amount of oil is 15 mil-lion barrels, the present value of the cash flows from drilling will be $8 million. If theamount is only 5 million barrels, the present value will be only $2 million. It costs $3 million to drill the well. Suppose that a seismic test that costs $100,000 can verify theamount of oil under the ground. Is it worth paying for the test? Use a decision tree to justifyyour answer.
23. Project Options. A silver mine can yield 10,000 ounces of copper at a variable cost of $8per ounce. The fixed costs of operating the mine are $10,000 per year. In half the years, sil-ver can be sold for $12 per ounce; in the other years, silver can be sold for only $6 per ounce.Ignore taxes.
a. What is the average cash flow you will receive from the mine if it is always kept in op-eration and the silver always is sold in the year it is mined?
b. Now suppose you can shut down the mine in years of low silver prices. What happens tothe average cash flow from the mine?
Project Analysis 489
24. Project Options. An auto plant that costs $100 million to build can produce a new line ofcars that will produce cash flows with a present value of $140 million if the line is success-ful, but only $50 million if it is unsuccessful. You believe that the probability of success isonly about 50 percent.
a. Would you build the plant?b. Suppose that the plant can be sold for $90 million to another automaker if the auto line
is not successful. Now would you build the plant?c. Illustrate the option to abandon in (b) using a decision tree.
25. Production Options. Explain why options to expand or contract production are most valu-able when forecasts about future business conditions are most uncertain.
26. Abandonment Option. Hit or Miss Sports is introducing a new product this year. If its see-at-night soccer balls are a hit, the firm expects to be able to sell 50,000 units a year at a priceof $60 each. If the new product is a bust, only 30,000 units can be sold at a price of $55. Thevariable cost of each ball is $30, and fixed costs are zero. The cost of the manufacturingequipment is $6 million, and the project life is estimated at 10 years. The firm will usestraight-line depreciation over the 10-year life of the project. The firm’s tax rate is 35 per-cent and the discount rate is 12 percent.
a. If each outcome is equally likely, what is expected NPV? Will the firm accept the proj-ect?
b. Suppose now that the firm can abandon the project and sell off the manufacturing equip-ment for $5.4 million if demand for the balls turns out to be weak. The firm will makethe decision to continue or abandon after the first year of sales. Does the option to aban-don change the firm’s decision to accept the project?
27. Expansion Option. Now suppose that Hit or Miss Sports from the previous problem can ex-pand production if the project is successful. By paying its workers overtime, it can increaseproduction by 20,000 units; the variable cost of each ball will be higher, however, equal to$35 per unit. By how much does this option to expand production increase the NPV of theproject?
1 Cash flow forecasts for Finefodder’s new superstore:
Year 0 Years 1–12
Investment –5,400,000
1. Sales 16,000,0002. Variable costs 13,280,0003. Fixed costs 2,000,0004. Depreciation 450,0005. Pretax profit (1 – 2 – 3 – 4) 270,0006. Taxes (at 40%) 108,0007. Profit after tax 162,0008. Cash flow from operations (4 + 7) 612,000
Net cash flow –5,400,000 612,000
NPV = –$5.4 million + (7.536 × $612,000) = –$788,000
2 Both calculate how NPV depends on input assumptions. Sensitivity analysis changes inputsone at a time, whereas scenario analysis changes several variables at once. The changesshould add up to a consistent scenario for the project as a whole.
ChallengeProblems
Solutions toSelf-TestQuestions
490 SECTION FIVE
3 With the lower initial investment, depreciation is also lower; it now equals $417,000 peryear. Cash flow is now as follows:
1. Variable costs 81.25 percent of sales2. Fixed costs $2 million3. Depreciation $417,0004. Pretax profit (.1875 × sales) – $2.417 million5. Tax (at 40%) .4 × (.1875 × sales – $2.417 million)6. Profit after tax .6 × (.1875 × sales – $2.417 million)7. Cash flow (3 + 6) .6 × (.1875 × sales – $2.417 million) + $417,000
= .1125 × sales – $1.033 million
Break-even occurs when
PV (cash inflows) = investment
7.536 × (.1125 × sales – $1.033 million) = $5.0 million
and sales = $15.08 million.4 Break-even analysis finds the level of sales or revenue at which NPV = 0. Sensitivity analy-
sis changes these and other input variables to optimistic and pessimistic values and recalcu-lates NPV.
5 Reworking Table 8.6 for the normal level of sales and 10 percent higher sales gives the fol-lowing:
High Fixed Costs High Variable Costs
Normal 10% Higher Sales Normal 10% Higher Sales
Sales 16,000 17,600 16,000 17,600– Variable costs 13,000 14,300 13,440 14,784– Fixed costs 2,000 2,000 1,560 1,560– Depreciation 450 450 450 450= Pretax profit 550 850 550 806
For the high-fixed-cost policy, profits increase by 54.5 percent, from $550,000 to $850,000.For the low-fixed-cost policy, profits increase by 46.5 percent. In both cases the percentageincrease in profits equals DOL times the percentage increase in sales. This illustrates thatDOL measures the sensitivity of profits to changes in sales.
6 The option to shut down is valuable because the mine operator can avoid incurring losseswhen copper prices are low. If the shut-down option were not available, cash flow in the low-price periods would be negative. With the option, the worst cash flow is zero. By allowingmanagers to respond to market conditions, the option makes the worst-case cash flow bet-ter than it would be otherwise. The average cash flow (that is, averaging over all possiblescenarios) therefore must improve, which increases project NPV.
7 Abandonment options, options due to flexible production facilities, investment timing op-tions.
Project Analysis 491
MINICASEMaxine Peru, the CEO of Peru Resources, hardly noticed theplate of savory quenelles de brochet and the glass of CortonCharlemagne ’94 on the table before her. She was absorbed bythe engineering report handed to her just as she entered the exec-utive dining room.
The report described a proposed new mine on the North Ridgeof Mt. Zircon. A vein of transcendental zirconium ore had beendiscovered there on land owned by Ms. Peru’s company. Test bor-ings indicated sufficient reserves to produce 340 tons per year oftranscendental zirconium over a 7-year period.
The vein probably also contained hydrated zircon gemstones.The amount and quality of these zircons were hard to predict,since they tended to occur in “pockets.” The new mine mightcome across one, two, or dozens of pockets. The mining engineerguessed that 150 pounds per year might be found. The currentprice for high-quality hydrated zircon gemstones was $3,300 perpound.
Peru Resources was a family-owned business with total assetsof $45 million, including cash reserves of $4 million. The outlayrequired for the new mine would be a major commitment. Fortu-nately, Peru Resources was conservatively financed, and Ms. Perubelieved that the company could borrow up to $9 million at an in-terest rate of about 8 percent.
The mine’s operating costs were projected at $900,000 peryear, including $400,000 of fixed costs and $500,000 of variablecosts. Ms. Peru thought these forecasts were accurate. The bigquestion marks seemed to be the initial cost of the mine and theselling price of transcendental zirconium.
Opening the mine, and providing the necessary machineryand ore-crunching facilities, was supposed to cost $10 million,
but cost overruns of 10 percent or 15 percent were common in themining business. In addition, new environmental regulations, ifenacted, could increase the cost of the mine by $1.5 million.
There was a cheaper design for the mine, which would reduceits cost by $1.7 million and eliminate much of the uncertaintyabout cost overruns. Unfortunately, this design would requiremuch higher fixed operating costs. Fixed costs would increase to$850,000 per year at planned production levels.
The current price of transcendental zirconium was $10,000per ton, but there was no consensus about future prices.1 Someexperts were projecting rapid price increases to as much as$14,000 per ton. On the other hand, there were pessimists sayingthat prices could be as low as $7,500 per ton. Ms. Peru did nothave strong views either way: her best guess was that price wouldjust increase with inflation at about 3.5 percent per year. (Mineoperating costs would also increase with inflation.)
Ms. Peru had wide experience in the mining business, and sheknew that investors in similar projects usually wanted a fore-casted nominal rate of return of at least 14 percent.
You have been asked to assist Ms. Peru in evaluating this proj-ect. Lay out the base-case NPV analysis and undertake sensitiv-ity, scenario, or break-even analyses as appropriate. Assume thatPeru Resources pays tax at a 35 percent rate. For simplicity, alsoassume that the investment in the mine could be depreciated fortax purposes straight-line over 7 years.
What forecasts or scenarios should worry Ms. Peru the most?Where would additional information be most helpful? Is there acase for delaying construction of the new mine?1 There were no traded forward or futures contracts on transcendental zir-conium.

493
AN OVERVIEW OFCORPORATE FINANCING
Common StockBook Value versus Market Value
Dividends
Stockholders’ Rights
Voting Procedures
Classes of Stock
Corporate Governance in the United States and Elsewhere
Preferred Stock
Corporate DebtDebt Comes in Many Forms
Innovation in the Debt Market
Convertible Securities
Patterns of Corporate FinancingDo Firms Rely Too Heavily on Internal Funds?
External Sources of Capital
Summary
There are more than 57 different kinds of security that a company can issue.Scott Goodwin Photography
his material begins our analysis of long-term financing decisions. In later
material this will involve a careful look at some classic finance prob-
lems, such as how much firms should borrow and what dividends they
should pay their shareholders. But before getting down to specifics, we will
provide a brief overview of types of long-term finance.
It is customary to classify sources of finance as debt or equity. When the firm bor-
rows, it promises to repay the debt with interest. If it doesn’t keep its promise, the
debtholders may force the firm into bankruptcy. However, no such commitments are
made to the equityholders. They are entitled to whatever is left over after the debthold-
ers have been paid off. For this reason, equity is called a residual claim on the firm.
However, a simple division of sources of finance into debt and equity would miss the
enormous variety of financing instruments that companies use today. For example,
Table 5.7 shows the many long-term securities issued by H. J. Heinz. Yet H. J. Heinz has
not come close to exhausting the menu of possible securities.
This material introduces you to the principal families of securities and explains how
they are used by corporations. We also draw attention to some of the interesting aspects
of firms issuing these securities.
After studying this material you should be able to
� Describe the major classes of securities issued by firms to raise capital.
� Summarize recent trends in the use made by firms of different sources of finance.
494
T
TREASURY STOCKStock that has beenrepurchased by the companyand held in its treasury.
ISSUED SHARESShares that have been issuedby the company.
OUTSTANDINGSHARES Shares thathave been issued by thecompany and are held byinvestors.
Common StockMost major corporations are far too large to be owned by one investor. For example,you would need to lay your hands on over $17 billion if you wanted to own the wholeH. J. Heinz Company.
Heinz is owned by about 61,000 different investors, each of whom holds a numberof shares of common stock. These investors are therefore known as shareholders orstockholders. Altogether Heinz has outstanding 358 million shares of common stock.Thus if you were to buy one Heinz share, you would own 1/358,000,000, or about.00000028 percent of the company. Of course, a large pension fund might hold manythousands of Heinz shares.
The 358 million shares held by investors are not the only shares that have been is-sued by Heinz. The company has also issued a further 72 million shares, which it laterbought back from investors. These shares are held in the company’s treasury and areknown as treasury stock. The shares held by investors are said to be issued and out-standing shares. By contrast, the 72 million treasury shares are said to be issued butnot outstanding.
If Heinz wishes to raise more money, it can sell more shares. However, there is alimit to the number that it can issue without getting the approval of the current share-
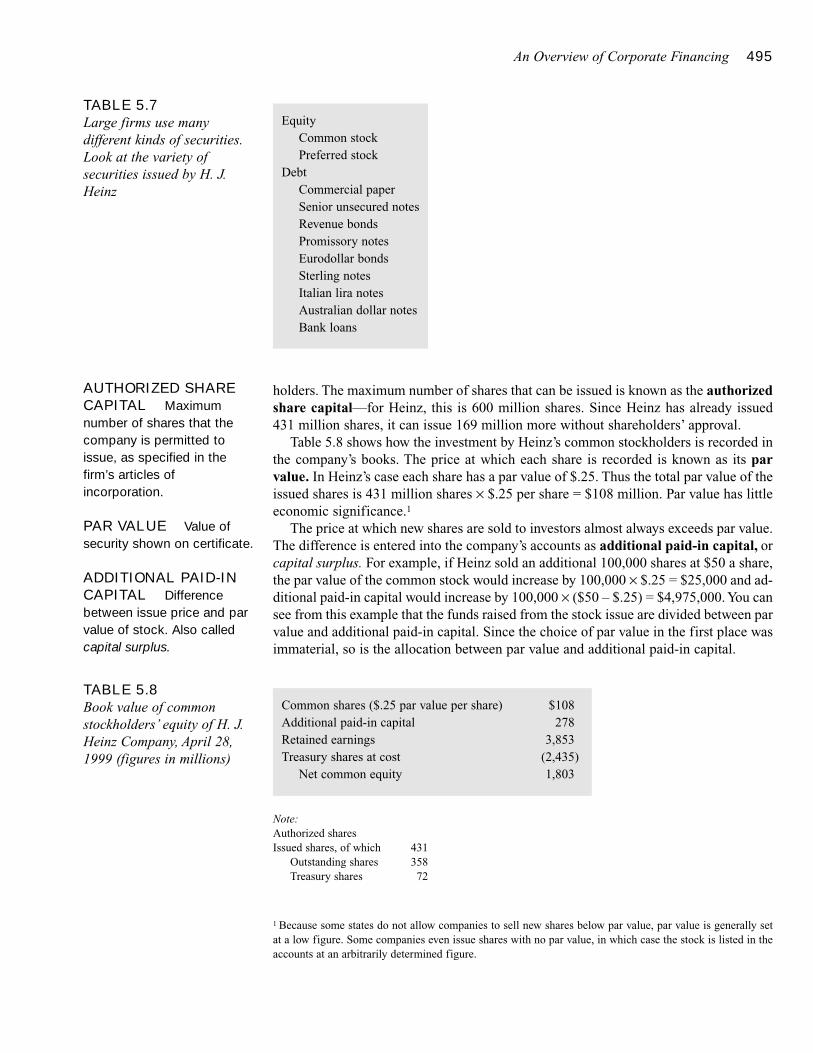
An Overview of Corporate Financing 495
holders. The maximum number of shares that can be issued is known as the authorizedshare capital—for Heinz, this is 600 million shares. Since Heinz has already issued431 million shares, it can issue 169 million more without shareholders’ approval.
Table 5.8 shows how the investment by Heinz’s common stockholders is recorded inthe company’s books. The price at which each share is recorded is known as its parvalue. In Heinz’s case each share has a par value of $.25. Thus the total par value of theissued shares is 431 million shares × $.25 per share = $108 million. Par value has littleeconomic significance.1
The price at which new shares are sold to investors almost always exceeds par value.The difference is entered into the company’s accounts as additional paid-in capital, orcapital surplus. For example, if Heinz sold an additional 100,000 shares at $50 a share,the par value of the common stock would increase by 100,000 × $.25 = $25,000 and ad-ditional paid-in capital would increase by 100,000 × ($50 – $.25) = $4,975,000. You cansee from this example that the funds raised from the stock issue are divided between parvalue and additional paid-in capital. Since the choice of par value in the first place wasimmaterial, so is the allocation between par value and additional paid-in capital.
AUTHORIZED SHARECAPITAL Maximumnumber of shares that thecompany is permitted toissue, as specified in thefirm’s articles ofincorporation.
PAR VALUE Value ofsecurity shown on certificate.
ADDITIONAL PAID-INCAPITAL Differencebetween issue price and parvalue of stock. Also calledcapital surplus.
TABLE 5.7Large firms use manydifferent kinds of securities.Look at the variety ofsecurities issued by H. J.Heinz
EquityCommon stockPreferred stock
DebtCommercial paperSenior unsecured notesRevenue bondsPromissory notesEurodollar bondsSterling notesItalian lira notesAustralian dollar notesBank loans
TABLE 5.8Book value of commonstockholders’ equity of H. J.Heinz Company, April 28,1999 (figures in millions)
Common shares ($.25 par value per share) $108Additional paid-in capital 278Retained earnings 3,853Treasury shares at cost (2,435)
Net common equity 1,803
Note:Authorized sharesIssued shares, of which 431
Outstanding shares 358Treasury shares 72
1 Because some states do not allow companies to sell new shares below par value, par value is generally setat a low figure. Some companies even issue shares with no par value, in which case the stock is listed in theaccounts at an arbitrarily determined figure.
496 SECTION FIVE
Besides buying new stock, shareholders also indirectly contribute new capital to thefirm whenever profits that could be paid out as dividends are instead plowed back intothe company. Table 5.8 shows that the cumulative amount of such retained earnings is$3,853.
Heinz’s books also show the amount that the company has spent in the past on re-purchasing its own stock. The repurchase of the 72 million shares cost Heinz $2,435million. This is money that has in effect been returned to shareholders.
The sum of the par value, additional paid-in capital, and retained earnings, less re-purchased stock, is known as the net common equity of the firm. It equals the totalamount contributed directly by shareholders when the firm issued new stock and indi-rectly when it plowed back part of its earnings.
� Self-Test 1 Generic Products has had one stock issue in which it sold 100,000 shares to the publicat $15 per share. Can you fill in the following table?
Common shares ($1.00 par value per share) ________Additional paid-in capital ________Retained earnings ________Net common equity $4,500,000
BOOK VALUE VERSUS MARKET VALUE
We discussed the distinction between book and market value earlier, but it bearsrepeating.
Heinz’s common equity has a book value of $1,803 million. With 358 million sharesoutstanding, this translates to a book value of $1,803/358 = $5.04 per share. But in April1999 Heinz shares were priced at about $49 each. So the total market value of the com-mon stock was 358 million shares × $49 per share = $17.5 billion, nearly 10 times thebook value.
Market value is usually greater than book value. This is partly because inflation hasdriven the value of many assets above what they originally cost. Also, firms raise capi-tal to invest in projects with present values that exceed initial cost. These positive-NPVprojects made the shareholders better off. So we would expect the market value of thefirm to be higher than the amount of money put up by the shareholders.
However, sometimes projects do go awry and companies fall on hard times. In thiscase, market value can fall below book value.
Book value is a backward-looking measure. It tells us how much capital thefirm has raised from shareholders in the past. It does not measure the valuethat investors place on those shares today. The market value of the firm isforward-looking; it depends on the future dividends that shareholders expectto receive.
RETAINED EARNINGSEarnings not paid out asdividends.
An Overview of Corporate Financing 497
� Self-Test 2 No-name News can be established by investing $10 million in a printing press. Thenewspaper is expected to generate a cash flow of $2 million a year for 20 years. If thecost of capital is 10 percent, is the firm’s market or book value greater? What if the costof capital is 20 percent?
DIVIDENDS
Shareholders hope to receive a series of dividends on their investment. However, thecompany is not obliged to pay any dividend and the decision is up to the board of di-rectors.
Because dividends are discretionary, they are not considered to be a business ex-pense. Therefore, companies are not allowed to deduct dividend payments when theycalculate their taxable income.
STOCKHOLDERS’ RIGHTS
Stockholders have the ultimate control of the company’s affairs. Occasionally compa-nies need shareholder approval before they can take certain actions. For example, theyneed approval to increase the authorized capital or to merge with another company.
The board usually consists of the company’s top management as well as outside di-rectors, who are not employed by the firm. In principle, the board is elected as an agentof the shareholders. It appoints and oversees the management of the firm and meets tovote on such matters as new share issues. Most of the time the board will go along withthe management, but in crisis situations it can be very independent. For example, whenthe management of RJR Nabisco announced that it wanted to take over the company,the outside directors stepped in to make sure that the company was sold to the highestbidder.
VOTING PROCEDURES
In most companies stockholders elect directors by a system of majority voting. In thiscase each director is voted on separately and stockholders can cast one vote for eachshare they own. In some companies directors are elected by cumulative voting. The di-rectors are then voted on jointly and the stockholders can, if they choose, cast all theirvotes for just one candidate. For example, suppose there are five directors to be electedand you own 100 shares. You therefore have a total of 5 × 100 = 500 votes. Under ma-jority voting you can cast a maximum of 100 votes for any one candidate. With a cu-mulative voting system you can cast all 500 votes for your favorite candidate. Cumula-tive voting makes it easier for a minority group of the stockholders to elect a director torepresent their interests. That is why minority groups devote so much effort to cam-paigning for cumulative voting.
On many issues a simple majority of the votes cast is enough to carry the day, butthere are some decisions that require a “supermajority” of, say, 75 percent of those
On most other matters, shareholder control boils down to the right to vote onappointments to the board of directors.
MAJORITY VOTINGVoting system in which eachdirector is voted onseparately.
CUMULATIVE VOTINGVoting system in which all thevotes one shareholder isallowed to cast can be castfor one candidate for theboard of directors.
498 SECTION FIVE
eligible to vote. For example, a supermajority vote is sometimes needed to approve amerger. This requirement makes it difficult for the firm to be taken over and thereforehelps to protect the incumbent management.
Shareholders can either vote in person or appoint a proxy to vote. The issues onwhich they are asked to vote are rarely contested, particularly in the case of large, pub-licly traded firms. Occasionally, however, there are proxy contests in which outsiderscompete with the firm’s existing management and directors for control of the corpora-tion. But the odds are stacked against the outsiders, for the insiders can get the firm topay all the costs of presenting their case and obtaining votes.
CLASSES OF STOCK
Most companies issue just one class of common stock. Sometimes, however, a firm mayhave two or more classes outstanding, which differ in their right to vote or receive div-idends. Suppose that a firm needs fresh capital but its present stockholders do not wantto give up control of the firm. The existing shares could be labeled class A, and thenclass B shares could be issued to outside investors. The class B shares could have lim-ited voting rights, although they would probably sell for less as a result.
CORPORATE GOVERNANCE IN THE UNITED STATES AND ELSEWHERE
Heinz’s shareholders own the company but they don’t manage it. Management is dele-gated to a team of professional managers. Each shareholder owns only a small fractionof Heinz’s shares and can exert little influence on the way the company is run. If share-holders do not like the policies the management team pursues, they can try to vote inanother board of directors who will bring about a change in policy. But such attemptsare rarely successful, and the shareholders’ simplest solution is to sell the shares.
The separation between ownership and management in major United States corpo-rations creates a potential conflict between shareholders (the principals who own thecompany) and managers (their agents who make the decisions). We noted earlier sev-eral mechanisms that have evolved to mitigate this conflict:
• Shareholders elect a board of directors, which then appoints the managers, overseesthem, and on occasion fires them.
• Managers’ remuneration is tied to their performance.• Poorly performing companies are taken over and the management is replaced by a
new team.
These principles of corporate governance do not apply worldwide. The UnitedStates, Canada, Britain, Australia, and other English-speaking countries all havebroadly similar systems, but other countries do not. In Japan industrial and financialcompanies are often linked together in a group, called a keiretsu. For example, the Mit-subishi keiretsu contains 29 core companies, including two banks, two insurance com-panies, an automobile manufacturer, a steel producer, and a cement company. Membersof the keiretsu are tied together in several ways. First, managers may sit on the boardsof directors of other group companies, and a “president’s council” of chief executivesmeets regularly. Second, each company in the group holds shares in many of the othercompanies. And third, companies generally borrow from the keiretsu’s bank or fromelsewhere within the group. These links may have several advantages. Companies canobtain funds from other members of the group without the need to reveal confidential
PROXY CONTESTTakeover attempt in whichoutsiders compete withmanagement forshareholders’ votes.
An Overview of Corporate Financing 499
information to the public, and if a member of the group runs into financial heavyweather, its problems can be worked out with other members of the group rather thanin the bankruptcy court.
The more stable and concentrated shareholder base of large Japanese corporationsmay make it easier for them to resist pressures for short-term performance and allowthem to focus on securing long-term advantage. But the Japanese system of corporategovernance also has its disadvantages, for the lack of market discipline may promote atoo-cozy life and allow lagging or inefficient Japanese corporations to put off painfulsurgery.
Keiretsus are found only in Japan. But large companies in continental Europe arelinked in some similar ways. For example, banks and other companies often own or con-trol large blocks of shares and can push hard for changes in the management or strat-egy of poorly performing firms. (Banks in the United States are prohibited from largeor permanent holdings of the stock of nonfinancial corporations.) Thus oversight andcontrol are entrusted largely to banks and other corporations. Hostile takeovers ofpoorly performing companies are rare in Germany and virtually impossible in Japan.
Preferred StockUsually when investors talk about equity or stock, they are referring to common stock.But Heinz has also issued $200,000 of preferred stock, and this too is part of the com-pany’s equity. The sum of Heinz’s common equity and preferred stock is known as itsnet worth.
For most companies preferred stock is much less important than common stock.However, it can be a useful method of financing in mergers and certain other special sit-uations.
Like debt, preferred stock promises a series of fixed payments to the investor andwith relatively rare exceptions preferred dividends are paid in full and on time. Never-theless, preferred stock is legally an equity security. This is because payment of a pre-ferred dividend is almost invariably within the discretion of the directors. The only ob-ligation is that no dividends can be paid on the common stock until the preferreddividend has been paid.2 If the company goes out of business, the preferred stockhold-ers get in the queue after the debtholders but before the common stockholders.
Preferred stock rarely confers full voting privileges. This is an advantage to firmsthat want to raise new money without sharing control of the firm with the new share-holders. However, if there is any matter that affects their place in the queue, preferredstockholders usually get to vote on it. Most issues also provide the holder with somevoting power if the preferred dividend is skipped.
Companies cannot deduct preferred dividends when they calculate taxable income.
For large corporations, separation of ownership and control is seen the worldover. In the United States, control of large public companies is exercisedthrough the board of directors and pressure from the stock market. In othercountries the stock market is less important, and control shifts to majorstockholders, typically banks and other companies.
PREFERRED STOCKStock that takes priority overcommon stock in regard todividends.
NET WORTH Book valueof common stockholders’equity plus preferred stock.
2 These days this obligation is usually cumulative. In other words, before the common stockholders get a cent,the firm must pay any preferred dividends that have been missed in the past.
500 SECTION FIVE
Like common stock dividends, preferred dividends are paid from after-tax income. Formost industrial firms this is a serious deterrent to issuing preferred. However, regulatedpublic utilities can take tax payments into account when they negotiate with regulatorsthe rates they charge customers. So they can effectively pass the tax disadvantage ofpreferred on to the consumer. A large fraction of the dollar value of new offerings of or-dinary preferred stock consists of issues by utilities.
Preferred stock does have one tax advantage. If one corporation buys another’sstock, only 30 percent of the dividends it receives is taxed. This rule applies to dividendson both common and preferred stock, but it is most important for preferred, for whichreturns are dominated by dividends rather than capital gains.
Suppose that your firm has surplus cash to invest. If it buys a bond, the interest willbe taxed at the company’s tax rate of 35 percent. If it buys a preferred share, it owns anasset like a bond (the preferred dividends can be viewed as “interest”), but the effectivetax rate is only 30 percent of 35 percent, .30 × .35 = .105, or 10.5 percent. It is no sur-prise that most preferred shares are held by corporations.
If you invest your firm’s spare cash in a preferred stock, you will want to make surethat when it is time to sell the stock, it won’t have plummeted in value. One problemwith garden-variety preferred stock that pays a fixed dividend is that the preferreds’market prices go up and down as interest rates change (because present values fall whenrates rise). So one ingenious banker thought up a wrinkle: Why not link the dividend onthe preferred stock to interest rates so that it goes up when interest rates rise and viceversa? The result is known as floating-rate preferred. If you own floating-rate pre-ferred, you know that any change in interest rates will be counterbalanced by a changein the dividend payment, so the value of your investment is protected.
� Self-Test 3 A company in a 35 percent tax bracket can buy a bond yielding 10 percent or a pre-ferred stock of the same firm that is priced to yield 8 percent. Which will provide thehigher after-tax yield? What if the purchaser is a private individual in a 35 percent taxbracket?
Corporate DebtWhen they borrow money, companies promise to make regular interest payments andto repay the principal (that is, the original amount borrowed).
Clearly it will choose bankruptcy only if the value of the assets is less than the amountof the debt. In practice, when companies go bankrupt, this handover of assets is far fromstraightforward. For example, when the furniture company Wickes went into bank-ruptcy, there were 250,000 creditors all jostling for a better place in the queue. Sortingout these problems is left to the bankruptcy court.
Because lenders are not regarded as owners of the firm, they don’t normally have any
However, corporations have limited liability. By this we mean that the promiseto repay the debt is not always kept. If the company gets into deep water, thecompany has the right to default on the debt and to hand over the company’sassets to the lenders.
FLOATING-RATEPREFERRED Preferredstock paying dividends thatvary with short-term interestrates.
An Overview of Corporate Financing 501
voting power. Also, the company’s payments of interest are regarded as a cost and aretherefore deducted from taxable income. Thus interest is paid out of before-tax income,whereas dividends on common and preferred stock are paid out of after-tax income.This means that the government provides a tax subsidy on the use of debt, which it doesnot provide on stock.
DEBT COMES IN MANY FORMS
Some orderly scheme of classification is essential to cope with the almost endless va-riety of debt issues. We will walk you through the major distinguishing characteristics.
Interest Rate. The interest payment, or coupon, on most long-term loans is fixed atthe time of issue. If a $1,000 bond is issued with a coupon of 10 percent, the firm con-tinues to pay $100 a year regardless of how interest rates change. As we pointed out-earlier, you sometimes encounter zero-coupon bonds. In this case the firm does notmake a regular interest payment. It just makes a single payment at maturity. Obviously,investors pay less for zero-coupon bonds.
Most loans from a bank and some long-term loans carry a floating interest rate. Forexample, your firm may be offered a loan at “1 percent over prime.” The prime rate isthe benchmark interest rate charged by banks to large customers with good to excellentcredit. (But the largest and most creditworthy corporations can, and do, borrow at lessthan prime.) The prime rate is adjusted up and down with the general level of interestrates. When the prime rate changes, the interest on your floating-rate loan also changes.
Floating-rate loans are not always tied to the prime rate. Often they are tied to therate at which international banks lend to one another. This is known as the London In-terbank Offered Rate, or LIBOR.
� Self-Test 4 Would you expect the price of a 10-year floating-rate bond to be more or less sensitiveto changes in interest rates than the price of a 10-year maturity fixed-rate bond?
Maturity. Funded debt is any debt repayable more than 1 year from the date of issue.Debt due in less than a year is termed unfunded and is carried on the balance sheet asa current liability. Unfunded debt is often described as short-term debt and funded debtis described as long-term, although it is clearly artificial to call a 364-day debt short-term and a 366-day debt long-term (except in leap years).
There are corporate bonds of nearly every conceivable maturity. For example, WaltDisney Co. has issued bonds with a 100-year maturity. Some British banks have issuedperpetuities—that is, bonds which may survive forever. At the other extreme we findfirms borrowing literally overnight.
Repayment Provisions. Long-term loans are commonly repaid in a steady regularway, perhaps after an initial grace period. For bonds that are publicly traded, this is doneby means of a sinking fund. Each year the firm puts aside a sum of cash into a sinkingfund that is then used to buy back the bonds. When there is a sinking fund, investors areprepared to lend at a lower rate of interest. They know that they are more likely to berepaid if the company sets aside some cash each year than if the entire loan has to berepaid on one specified day.
Firms issuing debt to the public sometimes reserve the right to call the debt—that is,
PRIME RATEBenchmark interest ratecharged by banks.
FUNDED DEBT Debtwith more than 1 yearremaining to maturity.
SINKING FUND Fundestablished to retire debtbefore maturity.
502 SECTION FIVE
issuers of callable bonds may buy back the bonds before the final maturity date. Theprice at which the firm can call the bonds is set at the time that the bonds are issued.
This option to call the bond is attractive to the issuer. If interest rates decline andbond prices rise, the issuer may repay the bonds at the specified call price and borrowthe money back at a lower rate of interest.3
The call provision comes at the expense of bondholders, for it limits investors’ cap-ital gain potential. If interest rates fall and bond prices rise, holders of callable bondsmay find their bonds bought back by the firm for the call price.
� Self-Test 5 Suppose Heinz is considering two issues of 20-year maturity coupon bonds; one issuewill be callable, the other not. For a given coupon rate, will the callable or noncallablebond sell at the higher price? If the bonds are both to be sold to the public at par value,which bond must have the higher coupon rate?
Seniority. Some debts are subordinated. In the event of default the subordinatedlender gets in line behind the firm’s general creditors. The subordinated lender holds ajunior claim and is paid only after all senior creditors are satisfied.
When you lend money to a firm, you can assume that you hold a senior claim unlessthe debt agreement says otherwise. However, this does not always put you at the frontof the line, for the firm may have set aside some of its assets specifically for the pro-tection of other lenders. That brings us to our next classification.
Security. When you borrow to buy your home, the savings and loan company willtake out a mortgage on the house. The mortgage acts as security for the loan. If you de-fault on the loan payments, the S&L can seize your home.
When companies borrow, they also may set aside certain assets as security for theloan. These assets are termed collateral and the debt is said to be secured. In the eventof default, the secured lender has first claim on the collateral; unsecured lenders have ageneral claim on the rest of the firm’s assets but only a junior claim on the collateral.
Default Risk. Seniority and security do not guarantee payment. A debt can be seniorand secured but still as risky as a dizzy tightrope walker—it depends on the value andthe risk of the firm’s assets. Earlier, we showed how the safety of most corporate bondscan be judged from bond ratings provided by Moody’s and Standard & Poor’s. Bondsthat are rated “triple-A” seldom default. At the other extreme, many speculative-grade(or “junk”) bonds may be teetering on the brink.
As you would expect, investors demand a high return from low-rated bonds. We sawevidence of this in Section 3, where Figure 3.9 showed yields on default-free U.S. Trea-sury bonds as well as on corporate bonds in various rating classes. The lower-ratedbonds did in fact offer higher promised yields to maturity.
Country and Currency. These days capital markets know few national boundariesand many large firms in the United States borrow abroad. For example, an Americancompany may choose to finance a new plant in Switzerland by borrowing Swiss francsfrom a Swiss bank, or it may expand its Dutch operation by issuing a bond in Holland.
CALLABLE BONDBond that may berepurchased by firm beforematurity at specified callprice.
SUBORDINATED DEBTDebt that may be repaid inbankruptcy only after seniordebt is paid.
SECURED DEBT Debtthat has first claim onspecified collateral in theevent of default.
3 Sometimes callable bonds specify a period during which the firm is not allowed to call the bond if the pur-pose is simply to issue another bond at a lower interest rate.
An Overview of Corporate Financing 503
Also many foreign companies come to the United States to borrow dollars, which arethen used to finance their operations throughout the world.
In addition to these national capital markets, there is also an international capitalmarket centered mainly in London. There are some 500 banks in London from over 70different countries; they include such giants as Citicorp, Union Bank of Switzerland,Deutsche Bank, Bank of Tokyo–Mitsubishi, Banque Nationale de Paris, and BarclaysBank. One reason they are there is to collect deposits in the major currencies. For ex-ample, suppose an Arab sheikh has just received payment in dollars for a large sale ofoil to the United States. Rather than depositing the check in the United States, he maychoose to open a dollar account with a bank in London. Dollars held in a bank outsidethe United States came to be known as eurodollars. Similarly, yen held outside Japanwere termed euroyen, and so on). When the new European currency was named theeuro, the term eurodollars became confusing. Doubtless in time bankers will dream upa new name for dollars held outside the United States; until they do, we’ll just call theminternational dollars.
The London bank branch that is holding the sheikh’s dollar deposit may temporarilylend those dollars to a company, in the same way that a bank in the United States mayrelend dollars that have been deposited with it. Thus a company can either borrow dol-lars from a bank in the United States or borrow dollars from a bank in London.4
If a firm wants to make an issue of long-term bonds, it can choose to do so in theUnited States. Alternatively, it can sell the bonds to investors in several countries. Thesebonds have traditionally been known as eurobonds, but international bonds may be aless misleading term. The payments on these bonds may be fixed in dollars, euros, orany other major currency. Companies usually sell these bonds to the London branchesof the major international banks, which then resell them to investors throughout theworld.
Public versus Private Placements. Publicly issued bonds are sold to anyone whowishes to buy and, once they have been issued, they can be freely traded in the securi-ties markets. In a private placement, the issue is sold directly to a small number ofbanks, insurance companies, or other investment institutions. Privately placed bondscannot be resold to individuals in the United States but only to other qualified institu-tional investors. However, there is increasingly active trading among these investors.
We will have more to say about the difference between public issues and privateplacements later.
Protective Covenants. When investors lend to a company, they know that they mightnot get their money back. But they expect that the company will use their money welland not take unreasonable risks. To help ensure this, lenders usually impose a numberof conditions, or protective covenants, on companies that borrow from them. An hon-est firm is willing to accept these conditions because it knows that they enable the firmto borrow at a reasonable rate of interest.
Companies that borrow in moderation are less likely to get into difficulties thanthose that are up to the gunwales in debt. So lenders usually restrict the amount of extradebt that the firm can issue. Lenders are also eager to prevent others from pushingahead of them in the queue if trouble occurs. So they will not allow the company to cre-ate new debt that is senior to them or to put aside assets for other lenders.
EURODOLLARS Dollarsheld on deposit in a bankoutside the United States.
EUROBOND Bond that ismarketed internationally.
PRIVATE PLACEMENTSale of securities to a limitednumber of investors withouta public offering.
PROTECTIVECOVENANT Restrictionon a firm to protectbondholders.
4 Because the Federal Reserve requires banks in the United States to keep interest-free reserves, there is in ef-fect a tax on dollar deposits in the United States. Overseas dollar deposits are free of this tax and thereforebanks can afford to charge the borrower slightly lower interest rates.
504 SECTION FIVE
Another possible hazard for lenders is that the company will pay a bumper dividendto the shareholders, leaving no cash for the debtholders. Therefore, lenders sometimeslimit the size of the dividends that can be paid.
The story of Marriott in the nearby box shows what can happen when bondholdersare not sufficiently careful about the conditions they impose. In the wake of the largelosses suffered by Marriott bondholders, several observers predicted that investorswould demand more restrictive bond covenants in future transactions.
� Self-Test 6 In 1988 RJR Nabisco, the food and tobacco giant, had $5 billion of A-rated debt out-standing. In that year the company was taken over, and $19 billion of debt was issuedand used to buy back equity. The debt ratio skyrocketed, and the debt was downgradedto a BB rating. The holders of the previously issued debt were furious, and one filed alawsuit claiming that RJR had violated an implicit obligation not to undertake major fi-nancing changes at the expense of existing bondholders. Why did these bondholders be-lieve they had been harmed by the massive issue of new debt? What type of explicit re-striction would you have wanted if you had been one of the original bondholders?
A Debt by Any Other Name. The word debt sounds straightforward, but companiesenter into a number of financial arrangements that look suspiciously like debt yet aretreated differently in the accounts. Some of these obligations are easily identifiable. Forexample, accounts payable are simply obligations to pay for goods that have alreadybeen delivered and are therefore like a short-term debt.
Other arrangements are not so easy to spot. For example, instead of borrowingmoney to buy equipment, many companies lease or rent it on a long-term basis. In thiscase the firm promises to make a series of payments to the lessor (the owner of theequipment). This is just like the obligation to make payments on an outstanding loan.What if the firm can’t make the payments? The lessor can then take back the equipment,which is precisely what would happen if the firm had borrowed money from the lessor,using the equipment as collateral for the loan.
� EXAMPLE 1 The Terms of Heinz’s Bond Issue
Now that you are familiar with some of the jargon, you might like to look at an exam-ple of a bond issue. Table 5.9 is a summary of the terms of a bond issue by Heinz takenfrom Moody’s Industrial Manual. We have added some explanatory notes.
INNOVATION IN THE DEBT MARKET
We have discussed domestic bonds and eurobonds, fixed-rate and floating-rate loans,secured and unsecured loans, senior and junior loans, and much more. You might thinkthat this gives you all the choice you need. Yet almost every day companies and theiradvisers dream up a new type of debt. Here are some examples of unusual bonds.
Indexed Bonds. We saw in earlier how the United States government has issuedbonds whose payments rise in line with inflation. Occasionally borrowers have linkedthe payments on their bonds to the price of a particular commodity. For example, Mex-
LEASE Long-term rentalagreement.
SEE BOX
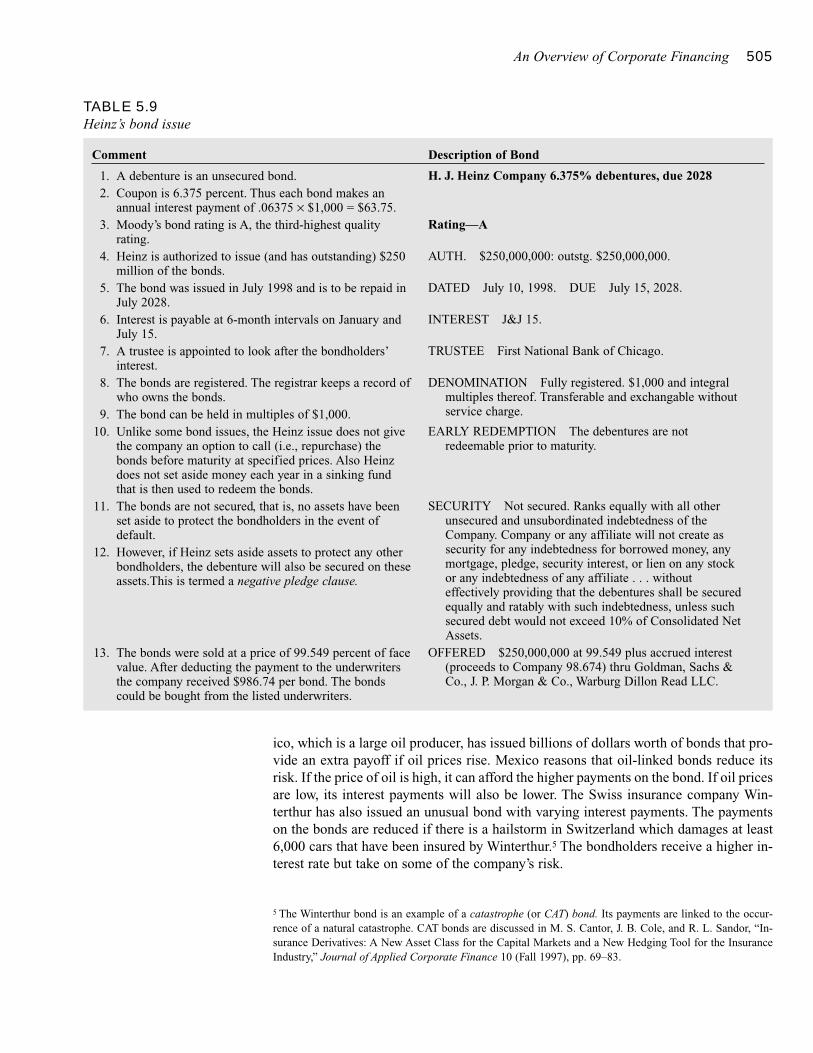
An Overview of Corporate Financing 505
ico, which is a large oil producer, has issued billions of dollars worth of bonds that pro-vide an extra payoff if oil prices rise. Mexico reasons that oil-linked bonds reduce itsrisk. If the price of oil is high, it can afford the higher payments on the bond. If oil pricesare low, its interest payments will also be lower. The Swiss insurance company Win-terthur has also issued an unusual bond with varying interest payments. The paymentson the bonds are reduced if there is a hailstorm in Switzerland which damages at least6,000 cars that have been insured by Winterthur.5 The bondholders receive a higher in-terest rate but take on some of the company’s risk.
TABLE 5.9Heinz’s bond issue
Comment Description of Bond
1. A debenture is an unsecured bond.2. Coupon is 6.375 percent. Thus each bond makes an
annual interest payment of .06375 × $1,000 = $63.75.3. Moody’s bond rating is A, the third-highest quality
rating.4. Heinz is authorized to issue (and has outstanding) $250
million of the bonds.5. The bond was issued in July 1998 and is to be repaid in
July 2028.6. Interest is payable at 6-month intervals on January and
July 15.7. A trustee is appointed to look after the bondholders’
interest.8. The bonds are registered. The registrar keeps a record of
who owns the bonds.9. The bond can be held in multiples of $1,000.
10. Unlike some bond issues, the Heinz issue does not givethe company an option to call (i.e., repurchase) thebonds before maturity at specified prices. Also Heinzdoes not set aside money each year in a sinking fundthat is then used to redeem the bonds.
11. The bonds are not secured, that is, no assets have beenset aside to protect the bondholders in the event ofdefault.
12. However, if Heinz sets aside assets to protect any otherbondholders, the debenture will also be secured on theseassets.This is termed a negative pledge clause.
13. The bonds were sold at a price of 99.549 percent of facevalue. After deducting the payment to the underwritersthe company received $986.74 per bond. The bondscould be bought from the listed underwriters.
H. J. Heinz Company 6.375% debentures, due 2028
Rating—A
AUTH. $250,000,000: outstg. $250,000,000.
DATED July 10, 1998. DUE July 15, 2028.
INTEREST J&J 15.
TRUSTEE First National Bank of Chicago.
DENOMINATION Fully registered. $1,000 and integralmultiples thereof. Transferable and exchangable withoutservice charge.
EARLY REDEMPTION The debentures are notredeemable prior to maturity.
SECURITY Not secured. Ranks equally with all otherunsecured and unsubordinated indebtedness of theCompany. Company or any affiliate will not create assecurity for any indebtedness for borrowed money, anymortgage, pledge, security interest, or lien on any stockor any indebtedness of any affiliate . . . withouteffectively providing that the debentures shall be securedequally and ratably with such indebtedness, unless suchsecured debt would not exceed 10% of Consolidated NetAssets.
OFFERED $250,000,000 at 99.549 plus accrued interest(proceeds to Company 98.674) thru Goldman, Sachs &Co., J. P. Morgan & Co., Warburg Dillon Read LLC.
5 The Winterthur bond is an example of a catastrophe (or CAT) bond. Its payments are linked to the occur-rence of a natural catastrophe. CAT bonds are discussed in M. S. Cantor, J. B. Cole, and R. L. Sandor, “In-surance Derivatives: A New Asset Class for the Capital Markets and a New Hedging Tool for the InsuranceIndustry,” Journal of Applied Corporate Finance 10 (Fall 1997), pp. 69–83.
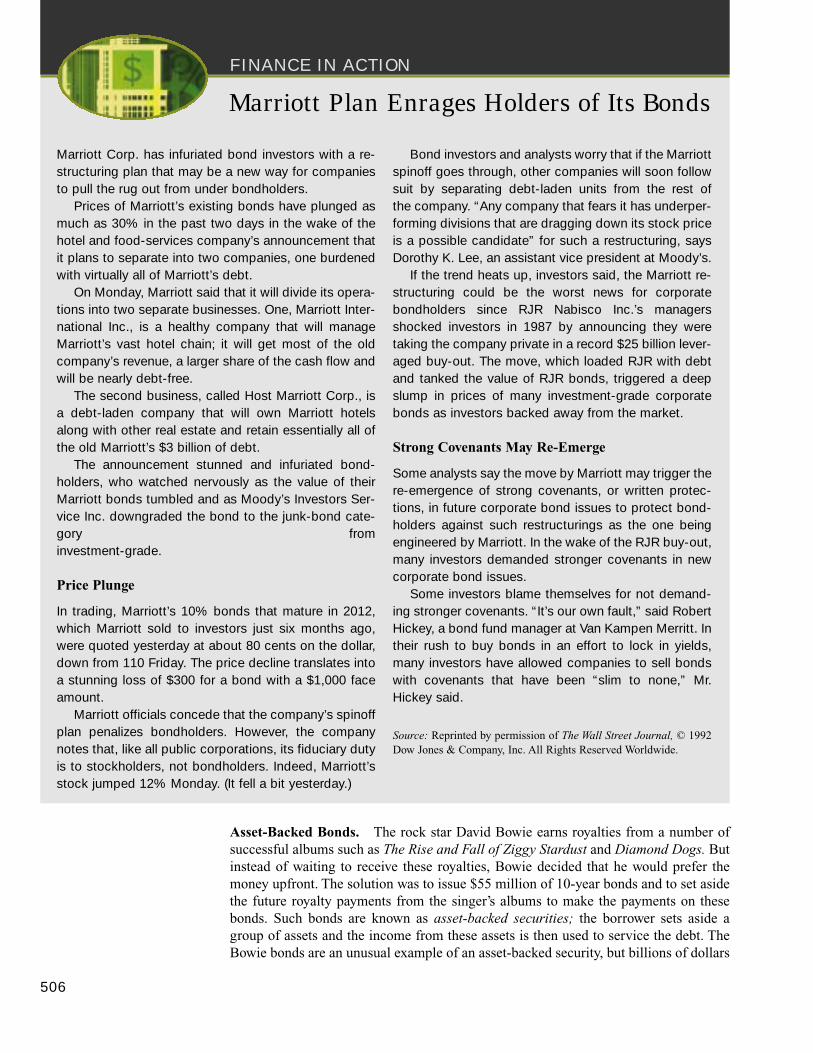
FINANCE IN ACTION
Asset-Backed Bonds. The rock star David Bowie earns royalties from a number ofsuccessful albums such as The Rise and Fall of Ziggy Stardust and Diamond Dogs. Butinstead of waiting to receive these royalties, Bowie decided that he would prefer themoney upfront. The solution was to issue $55 million of 10-year bonds and to set asidethe future royalty payments from the singer’s albums to make the payments on thesebonds. Such bonds are known as asset-backed securities; the borrower sets aside agroup of assets and the income from these assets is then used to service the debt. TheBowie bonds are an unusual example of an asset-backed security, but billions of dollars
506
Marriott Plan Enrages Holders of Its Bonds
Marriott Corp. has infuriated bond investors with a re-structuring plan that may be a new way for companiesto pull the rug out from under bondholders.
Prices of Marriott’s existing bonds have plunged asmuch as 30% in the past two days in the wake of thehotel and food-services company’s announcement thatit plans to separate into two companies, one burdenedwith virtually all of Marriott’s debt.
On Monday, Marriott said that it will divide its opera-tions into two separate businesses. One, Marriott Inter-national Inc., is a healthy company that will manageMarriott’s vast hotel chain; it will get most of the oldcompany’s revenue, a larger share of the cash flow andwill be nearly debt-free.
The second business, called Host Marriott Corp., isa debt-laden company that will own Marriott hotelsalong with other real estate and retain essentially all ofthe old Marriott’s $3 billion of debt.
The announcement stunned and infuriated bond-holders, who watched nervously as the value of theirMarriott bonds tumbled and as Moody’s Investors Ser-vice Inc. downgraded the bond to the junk-bond cate-gory from investment-grade.
Price Plunge
In trading, Marriott’s 10% bonds that mature in 2012,which Marriott sold to investors just six months ago,were quoted yesterday at about 80 cents on the dollar,down from 110 Friday. The price decline translates intoa stunning loss of $300 for a bond with a $1,000 faceamount.
Marriott officials concede that the company’s spinoffplan penalizes bondholders. However, the companynotes that, like all public corporations, its fiduciary dutyis to stockholders, not bondholders. Indeed, Marriott’sstock jumped 12% Monday. (It fell a bit yesterday.)
Bond investors and analysts worry that if the Marriottspinoff goes through, other companies will soon followsuit by separating debt-laden units from the rest of the company. “ Any company that fears it has underper-forming divisions that are dragging down its stock priceis a possible candidate” for such a restructuring, saysDorothy K. Lee, an assistant vice president at Moody’s.
If the trend heats up, investors said, the Marriott re-structuring could be the worst news for corporatebondholders since RJR Nabisco Inc.’s managersshocked investors in 1987 by announcing they weretaking the company private in a record $25 billion lever-aged buy-out. The move, which loaded RJR with debtand tanked the value of RJR bonds, triggered a deepslump in prices of many investment-grade corporatebonds as investors backed away from the market.
Strong Covenants May Re-Emerge
Some analysts say the move by Marriott may trigger there-emergence of strong covenants, or written protec-tions, in future corporate bond issues to protect bond-holders against such restructurings as the one beingengineered by Marriott. In the wake of the RJR buy-out,many investors demanded stronger covenants in newcorporate bond issues.
Some investors blame themselves for not demand-ing stronger covenants. “ It’s our own fault,” said RobertHickey, a bond fund manager at Van Kampen Merritt. Intheir rush to buy bonds in an effort to lock in yields,many investors have allowed companies to sell bondswith covenants that have been “ slim to none,” Mr.Hickey said.
Source: Reprinted by permission of The Wall Street Journal, © 1992Dow Jones & Company, Inc. All Rights Reserved Worldwide.
An Overview of Corporate Financing 507
of house mortgages and credit card loans are packaged each year and resold as asset-backed bonds.
Reverse floaters. Floating-rate bonds that pay a higher rate of interest when other in-terest rates fall and a lower rate when other rates rise are called reverse floaters. Theyare riskier than normal bonds. When interest rates rise, the prices of all bonds fall, butthe prices of reverse floaters suffer a double whammy because the coupon payments onthe bonds fall as the discount rate rises. In 1994 Orange County, California, learned thisthe hard way, when it invested heavily in reverse floaters. Robert Citron, the treasurer,was betting that interest rates would fall. He was wrong; interest rates rose sharply andpartly as a result of its investment in reverse floaters, the county lost $1.7 billion.
These three examples illustrate the great variety of potential security designs. Aslong as you can convince investors of its attractions, you can issue a callable, subordi-nated, floating-rate bond denominated in euros. Rather than combining features of ex-isting securities, you may be able to create an entirely new one. We can imagine a cop-per mining company issuing preferred shares on which the dividend fluctuates with theworld copper price. We know of no such security, but it is perfectly legal to issue itand—who knows?—it might generate considerable interest among investors.
Variety is intrinsically good. People have different tastes, levels of wealth, rates oftax, and so on. Why not offer them a choice? Of course the problem is the expense ofdesigning and marketing new securities. But if you can think of a new security that willappeal to investors, you may be able to issue it on especially favorable terms and thusincrease the value of your company.
Convertible SecuritiesWe have seen that companies sometimes have the option to repay an issue of bonds be-fore maturity. There are also cases in which investors have an option. The most dramaticcase is provided by a warrant, which is nothing but an option. Companies often issuewarrants and bonds in a package.
� EXAMPLE 2 Warrants
Macaw Bill wishes to make a bond issue, which could include some warrants as a“sweetener.” Each warrant might allow you to purchase one share of Macaw stock at aprice of $50 any time during the next 5 years. If Macaw’s stock performs well, that op-tion could turn out to be very valuable. For instance, if the stock price at the end of the5 years is $80, then you pay the company $50 and receive in exchange a share worth$80. Of course, an investment in warrants also has its perils. If the price of Macaw stockfails to rise above $50, then the warrants expire worthless.
A convertible bond gives its owner the option to exchange the bond for a predeter-mined number of common shares. The convertible bondholder hopes that the company’sshare price will zoom up so that the bond can be converted at a big profit. But if theshares zoom down, there is no obligation to convert; the bondholder remains just that.Not surprisingly, investors value this option to keep the bond or exchange it for shares,
WARRANT Right to buyshares from a company at astipulated price before a setdate.
CONVERTIBLE BONDBond that the holder mayexchange for a specifiedamount of another security.
508 SECTION FIVE
and therefore a convertible bond sells at a higher price than a comparable bond that isnot convertible.
The convertible is rather like a package of a bond and a warrant. But there is an im-portant difference: when the owners of a convertible wish to exercise their options tobuy shares, they do not pay cash—they just exchange the bond for shares of the stock.
Companies may also issue convertible preferred stock. In this case the investor re-ceives preferred stock with fixed dividend payments but has the option to exchange thispreferred stock for the company’s common stock. The preferred stock issued by Heinzis convertible into common stock.
These examples do not exhaust the options encountered by the financial manager.
Patterns of Corporate FinancingWe have now completed our tour of corporate securities. You may feel like the touristwho has just gone through 12 cathedrals in 5 days. But there will be plenty of time inlater material for reflection and analysis. For now, let’s look at how firms use thesesources of finance.
Figure 5.4 summarizes the sources of capital for United States corporations. Themost striking aspect of this figure is the dominance of internally generated funds, de-fined as depreciation plus earnings that are not paid out as dividends.6 During the 1980sinternally generated cash covered approximately three-quarters of firms’ capital re-quirements.
DO FIRMS RELY TOO HEAVILY ON INTERNAL FUNDS?
Gordon Donaldson, in a survey of corporate debt policies, encountered several firmswhich acknowledged “that it was their long-term object to hold to a rate of growthwhich was consistent with their capacity to generate funds internally.” A number ofother firms appeared to think less hard about expenditure proposals that could be fi-nanced internally.7
At first glance, this behavior doesn’t make sense. As we have already noted, retainedprofits are additional capital invested by shareholders and represent, in effect, a com-pulsory issue of shares. A firm that retains $1 million could have paid out the cash asdividends and then sold new common shares to raise the same amount of additionalcapital. The opportunity cost of capital ought not to depend on whether the project is fi-nanced by retained profits or a new stock issue.
Firms have two broad sources of cash. They can raise money from externalsources by an issue of debt or equity. Or they can plow back part of theirprofits. When the firm retains cash rather than paying the money out asdividends, it is increasing shareholders’ investment in the firm.
INTERNALLYGENERATED FUNDSCash reinvested in the firm:depreciation plus earningsnot paid out as dividends.
6 Remember that depreciation is a noncash expense.7 See G. Donaldson, Corporate Debt Capacity, Division of Research, Graduate School of Business Adminis-tration, Harvard University, Boston, 1961, Chapter 3, especially pp. 51–56.
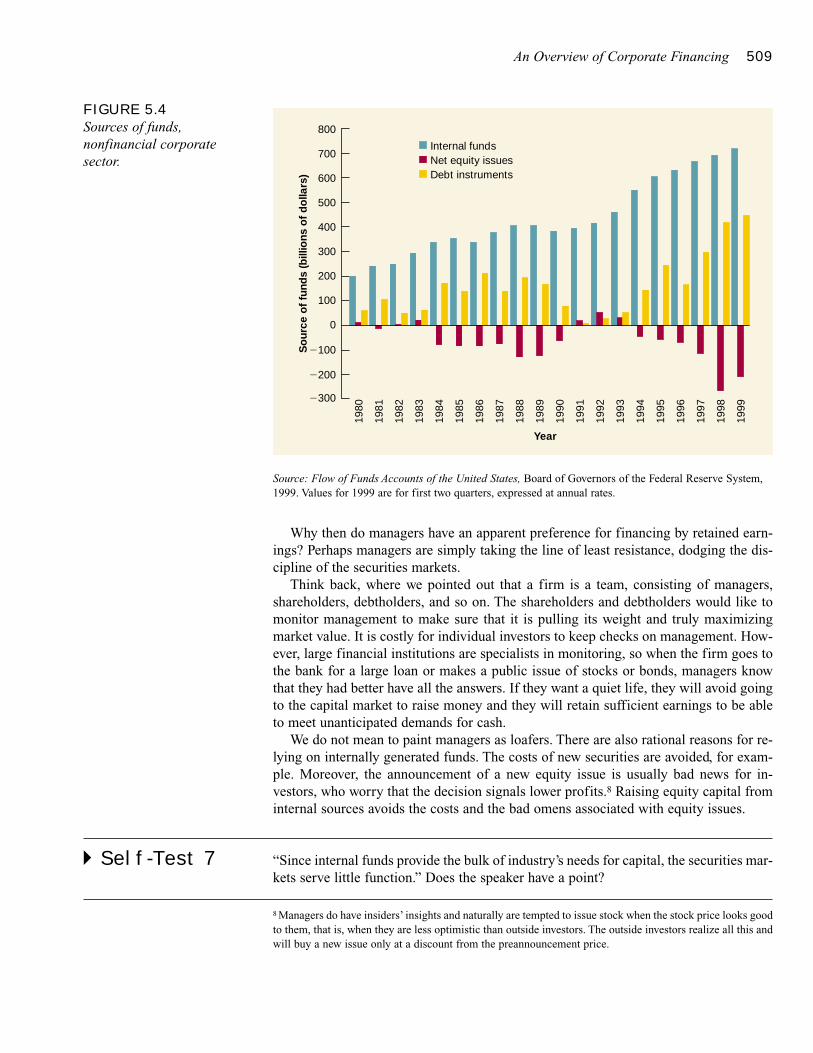
An Overview of Corporate Financing 509
Why then do managers have an apparent preference for financing by retained earn-ings? Perhaps managers are simply taking the line of least resistance, dodging the dis-cipline of the securities markets.
Think back, where we pointed out that a firm is a team, consisting of managers,shareholders, debtholders, and so on. The shareholders and debtholders would like tomonitor management to make sure that it is pulling its weight and truly maximizingmarket value. It is costly for individual investors to keep checks on management. How-ever, large financial institutions are specialists in monitoring, so when the firm goes tothe bank for a large loan or makes a public issue of stocks or bonds, managers knowthat they had better have all the answers. If they want a quiet life, they will avoid goingto the capital market to raise money and they will retain sufficient earnings to be ableto meet unanticipated demands for cash.
We do not mean to paint managers as loafers. There are also rational reasons for re-lying on internally generated funds. The costs of new securities are avoided, for exam-ple. Moreover, the announcement of a new equity issue is usually bad news for in-vestors, who worry that the decision signals lower profits.8 Raising equity capital frominternal sources avoids the costs and the bad omens associated with equity issues.
� Self-Test 7 “Since internal funds provide the bulk of industry’s needs for capital, the securities mar-kets serve little function.” Does the speaker have a point?
FIGURE 5.4Sources of funds,nonfinancial corporatesector.
So
urce
of
fund
s (b
illio
ns o
f d
olla
rs)
Year
800
500
Internal fundsNet equity issuesDebt instruments
400
300
200
100
0
�100
�300
600
700
�200
1980
1982
1984
1986
1988
1990
1994
1996
1998
1992
1981
1983
1985
1987
1989
1993
1995
1997
1999
1991
Source: Flow of Funds Accounts of the United States, Board of Governors of the Federal Reserve System,1999. Values for 1999 are for first two quarters, expressed at annual rates.
8 Managers do have insiders’ insights and naturally are tempted to issue stock when the stock price looks goodto them, that is, when they are less optimistic than outside investors. The outside investors realize all this andwill buy a new issue only at a discount from the preannouncement price.
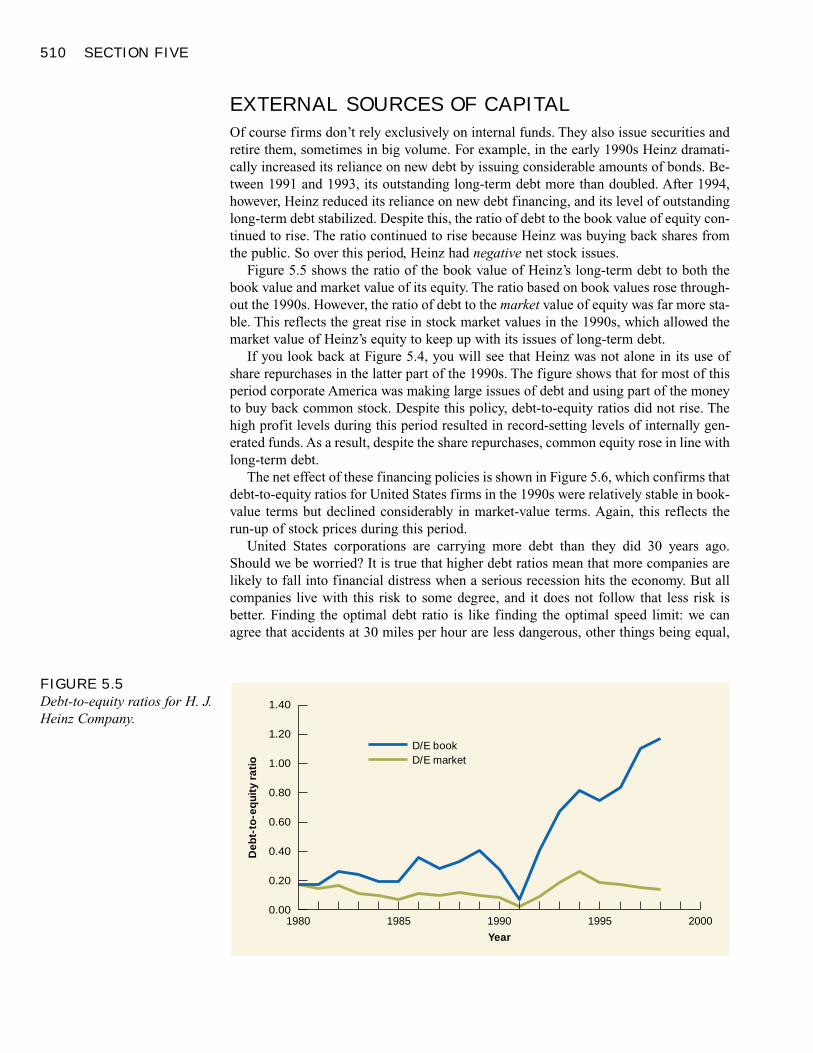
510 SECTION FIVE
EXTERNAL SOURCES OF CAPITAL
Of course firms don’t rely exclusively on internal funds. They also issue securities andretire them, sometimes in big volume. For example, in the early 1990s Heinz dramati-cally increased its reliance on new debt by issuing considerable amounts of bonds. Be-tween 1991 and 1993, its outstanding long-term debt more than doubled. After 1994,however, Heinz reduced its reliance on new debt financing, and its level of outstandinglong-term debt stabilized. Despite this, the ratio of debt to the book value of equity con-tinued to rise. The ratio continued to rise because Heinz was buying back shares fromthe public. So over this period, Heinz had negative net stock issues.
Figure 5.5 shows the ratio of the book value of Heinz’s long-term debt to both thebook value and market value of its equity. The ratio based on book values rose through-out the 1990s. However, the ratio of debt to the market value of equity was far more sta-ble. This reflects the great rise in stock market values in the 1990s, which allowed themarket value of Heinz’s equity to keep up with its issues of long-term debt.
If you look back at Figure 5.4, you will see that Heinz was not alone in its use ofshare repurchases in the latter part of the 1990s. The figure shows that for most of thisperiod corporate America was making large issues of debt and using part of the moneyto buy back common stock. Despite this policy, debt-to-equity ratios did not rise. Thehigh profit levels during this period resulted in record-setting levels of internally gen-erated funds. As a result, despite the share repurchases, common equity rose in line withlong-term debt.
The net effect of these financing policies is shown in Figure 5.6, which confirms thatdebt-to-equity ratios for United States firms in the 1990s were relatively stable in book-value terms but declined considerably in market-value terms. Again, this reflects therun-up of stock prices during this period.
United States corporations are carrying more debt than they did 30 years ago.Should we be worried? It is true that higher debt ratios mean that more companies arelikely to fall into financial distress when a serious recession hits the economy. But allcompanies live with this risk to some degree, and it does not follow that less risk is better. Finding the optimal debt ratio is like finding the optimal speed limit: we canagree that accidents at 30 miles per hour are less dangerous, other things being equal,
FIGURE 5.5Debt-to-equity ratios for H. J.Heinz Company.
Deb
t-to
-eq
uity
rat
io
Year
1.40
1.20
1.00
0.60
0.40
0.20
0.00
0.80
1980 1985 1990 1995 2000
D/E bookD/E market
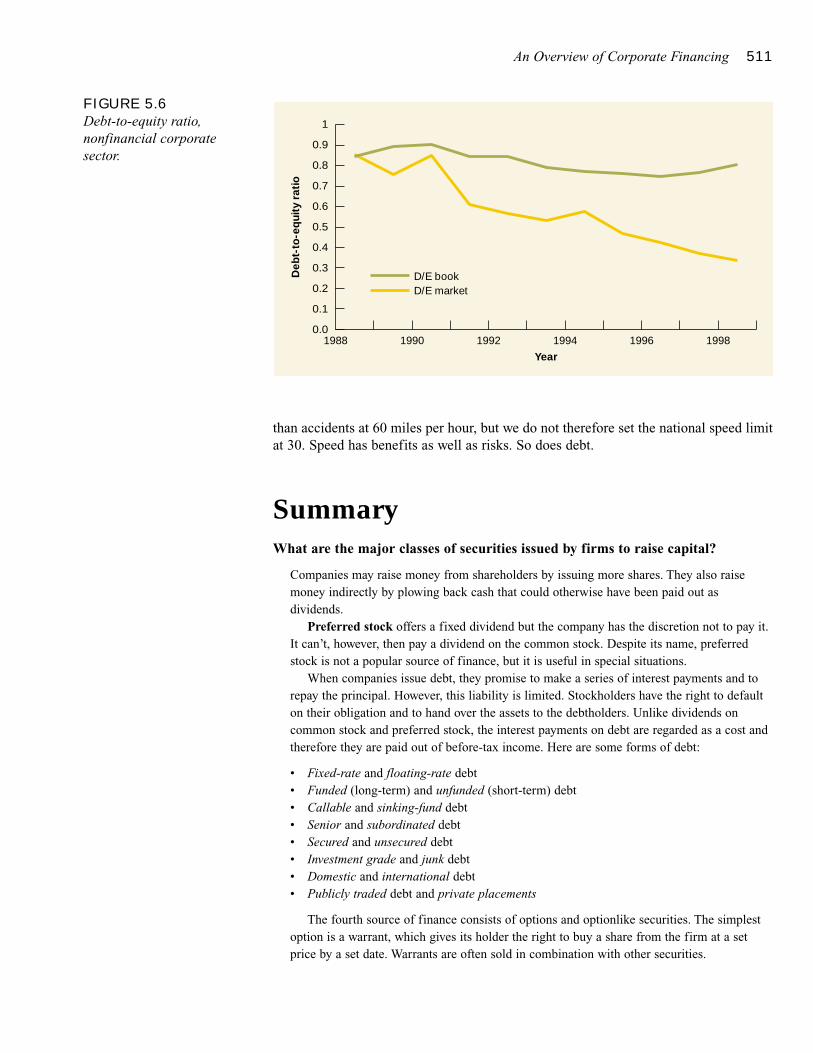
An Overview of Corporate Financing 511
than accidents at 60 miles per hour, but we do not therefore set the national speed limitat 30. Speed has benefits as well as risks. So does debt.
SummaryWhat are the major classes of securities issued by firms to raise capital?
Companies may raise money from shareholders by issuing more shares. They also raisemoney indirectly by plowing back cash that could otherwise have been paid out asdividends.
Preferred stock offers a fixed dividend but the company has the discretion not to pay it.It can’t, however, then pay a dividend on the common stock. Despite its name, preferredstock is not a popular source of finance, but it is useful in special situations.
When companies issue debt, they promise to make a series of interest payments and torepay the principal. However, this liability is limited. Stockholders have the right to defaulton their obligation and to hand over the assets to the debtholders. Unlike dividends oncommon stock and preferred stock, the interest payments on debt are regarded as a cost andtherefore they are paid out of before-tax income. Here are some forms of debt:
• Fixed-rate and floating-rate debt• Funded (long-term) and unfunded (short-term) debt• Callable and sinking-fund debt• Senior and subordinated debt• Secured and unsecured debt• Investment grade and junk debt• Domestic and international debt• Publicly traded debt and private placements
The fourth source of finance consists of options and optionlike securities. The simplestoption is a warrant, which gives its holder the right to buy a share from the firm at a setprice by a set date. Warrants are often sold in combination with other securities.
FIGURE 5.6Debt-to-equity ratio,nonfinancial corporatesector.
Deb
t-to
-eq
uity
rat
io
Year
1
0.9
0.8
0.6
0.5
0.4
0.3
0.2
0.1
0.0
0.7
1988 1990 1992 1994 1996 1998
D/E bookD/E market
512 SECTION FIVE
Convertible bonds give their holder the right to convert the bond to shares. They thereforeresemble a package of straight debt and a warrant.
What are recent trends in firms’ use of different sources of finance?
Internally generated cash is the principal source of company funds. Some people worryabout that; they think that if management does not go to the trouble of raising money, it maybe profligate in spending it.
In the late 1990s, net equity issues were negative; that is, companies repurchased moreequity than they issued. At the same time companies issued large quantities of debt.However, large levels of internally generated funds in this period allowed book equity toincrease despite the share repurchases, with the result that the ratio of long-term debt tobook value of equity was fairly stable. Moreover, the stock market boom of the 1990s meantthat the ratio of debt to the market value of equity actually fell considerably during thisperiod.
www.AshtonAnalytics.com/ Information about the debt marketswww.finpipe.com/ See “Types of Debt” for descriptions of many debt instrumentswww.fcnbd.com/corporate/capital/mezzanine/index.html A menu of choices for corporations
issuing different kinds of debtwww.corpfinet.com/ The corporate finance networkwww.hoovers.com/ Information about corporations and corporate financing
treasury stockissued sharesoutstanding sharesauthorized share capitalpar valueadditional paid-in capitalretained earningsmajority votingcumulative voting
proxy contestpreferred stocknet worthfloating-rate preferredprime ratefunded debtsinking fundcallable bondsubordinated debt
secured debteurodollarseurobondprivate placementprotective covenantleasewarrantconvertible bondinternally generated funds
1. Equity Accounts. The authorized share capital of the Alfred Cake Company is 100,000shares. The equity is currently shown in the company’s books as follows:
Common stock ($1.00 par value) $ 60,000Additional paid-in capital 10,000Retained earnings 30,000Common equity 100,000Treasury stock (2,000 shares) 5,000Net common equity 95,000
a. How many shares are issued?b. How many are outstanding?c. How many more shares can be issued without the approval of shareholders?
Related WebLinks
Key Terms
Quiz
An Overview of Corporate Financing 513
2. Equity Accounts.
a. Look back at problem 1. Suppose that the company issues 10,000 shares at $5 a share.Which of the above figures would change?
b. What would happen to the company’s books if instead it bought back 1,000 shares at $5per share?
3. Financing Terms. Fill in the blanks by choosing the appropriate term from the followinglist: lease, funded, floating-rate, eurobond, convertible, subordinated, call, sinking fund,prime rate, private placement, public issue, senior, unfunded, eurodollar rate, warrant,debentures, term loan.
a. Debt maturing in more than 1 year is often called _________ debt.b. An issue of bonds that is sold simultaneously in several countries is traditionally called
a(n) _________.c. If a lender ranks behind the firm’s general creditors in the event of default, the loan is
said to be _________.d. In many cases a firm is obliged to make regular contributions to a(n) _________, which
is then used to repurchase bonds.e. Most bonds give the firm the right to repurchase or _________ the bonds at specified
prices.f. The benchmark interest rate that banks charge to their customers with good to excellent
credit is generally termed the _________.g. The interest rate on bank loans is often tied to short-term interest rates. These loans are
usually called _________ loans.h. Where there is a(n) _________, securities are sold directly to a small group of institu-
tional investors. These securities cannot be resold to individual investors. In the case ofa(n) _________, debt can be freely bought and sold by individual investors.
i. A long-term rental agreement is called a(n) _________.j. A(n) _________ bond can be exchanged for shares of the issuing corporation.k. A(n) _________ gives its owner the right to buy shares in the issuing company at a pre-
determined price.
4. Financing Trends. True or false? Explain.
a. In several recent years, nonfinancial corporations in the United States have repurchasedmore stock than they have issued.
b. A corporation pays tax on only 30 percent of the common or preferred dividends it re-ceives from other corporations.
c. Because of the tax advantage, a large fraction of preferred shares is held by corporations.
5. Preferred Stock. In what ways is preferred stock like long-term debt? In what ways is it likecommon stock?
6. Voting for Directors. If there are 10 directors to be elected and a shareholder owns 90shares, indicate the maximum number of votes that he or she can cast for a favorite candi-date under
a. majority votingb. cumulative voting
PracticeProblems
514 SECTION FIVE
7. Voting for Directors. The shareholders of the Pickwick Paper Company need to elect fivedirectors. There are 400,000 shares outstanding. How many shares do you need to own toensure that you can elect at least one director if the company has
a. majority votingb. cumulative voting
Hint: How many votes in total will be cast? How many votes are required to ensure that atleast one-fifth of votes are cast for your choice?
8. Equity Accounts. Look back at Table 5.8.
a. Suppose that Heinz issues 10 million shares at $55 a share. Rework Table 5.8 to show thecompany’s equity after the issue.
b. Suppose that Heinz subsequently repurchased 500,000 shares at $60 a share. Rework part(a) to show the effect of the further change.
9. Equity Accounts. Common Products has just made its first issue of stock. It raised $2 mil-lion by selling 200,000 shares of stock to the public. These are the only shares outstanding.The par value of each share was $1.50. Fill in the following table:
Common shares (par value) ________Additional paid-in capital ________Retained earnings ________Net common equity $2,500,000
10. Protective Covenants. Why might a bond agreement limit the amount of assets that the firmcan lease?
11. Bond Yields. Other things equal, will the following provisions increase or decrease the yieldto maturity at which a firm can issue a bond?
a. A call provisionb. A restriction on further borrowingc. A provision of specific collateral for the bondd. An option to convert the bonds into shares
12. Income Bonds. Income bonds are unusual. Interest payments on such bonds may be skippedor deferred if the firm’s income is insufficient to make the payment. In what way are thesebonds like preferred stock? Why might a firm choose to issue an income bond instead ofpreferred stock?
13. Preferred Stock. Preferred stock of financially strong firms sometimes sells at lower yieldsthan the bonds of those firms. For weaker firms, the preferred stock has a higher yield. Whatmight explain this pattern?
1 Par value of common shares must be $1 × 100,000 shares = $100,000. Additional paid-incapital is ($15 – $1) × 100,000 = $1,400,000. Since book value is $4,500,000, retainedearnings must be $3,000,000. Therefore, the accounts look like this:
Common shares ($1.00 par value per share) 100,000Additional paid-in capital 1,400,000Retained earnings 3,000,000Net common equity $4,500,000
Solutions toSelf-TestQuestions
An Overview of Corporate Financing 515
2 Book value is $10 million. At a discount rate of 10 percent, the market value of the firmought to be $2 million × 20-year annuity factor at 10% = $17 million, which exceeds bookvalue. At a discount rate of 20 percent, market value falls to $9.7 million, which is belowbook value.
3 The corporation’s after-tax yield on the bonds is 10% – (.35 × 10%) = 6.5%. The after-taxyield on the preferred is 8% – [.35 × (.30 × 8%)] = 7.16%. The preferred stock provides thehigher after-tax rate despite its lower before-tax rate. For the individual, the tax rate on boththe preferred and the bond is equal to 35 percent, so the investment with the higher before-tax rate also provides the higher after-tax rate.
4 Because the coupon on floating-rate debt adjusts periodically to current market conditions,the bondholder is less vulnerable to changes in market yields. The coupon rate paid by thebond is not locked in for as long a period of time. Therefore, prices of floaters should beless sensitive to changes in market interest rates.
5 The callable bond will sell at a lower price. Investors will not pay as much for the callablebond since they know that the firm may call it away from them if interest rates fall. Thusthey know that their capital gains potential is limited, which makes the bond less valuable.If both bonds are to sell at par value, the callable bond must pay a higher coupon rate ascompensation to the investor for the firm’s right to call the bond.
6 The extra debt makes it more likely that the firm will not be able to make good on its prom-ised payments to its creditors. If the new debt is not junior to the already-issued debt, thenthe original bondholders suffer a loss when their bonds become more susceptible to defaultrisk. A protective covenant limiting the amount of new debt that the firm can issue wouldhave prevented this problem. Investors, having witnessed the problems of the RJR bond-holders, generally demanded the covenant on future debt issues.
7 Capital markets provide liquidity for investors. Because individual stockholders can alwayslay their hands on cash by selling shares, they are prepared to invest in companies that re-tain earnings rather than pay them out as dividends. Well-functioning capital markets allowthe firm to serve all its stockholders simply by maximizing value. Capital markets also pro-vide managers with information. Without this information, it would be very difficult to de-termine opportunity costs of capital or to assess financial performance.
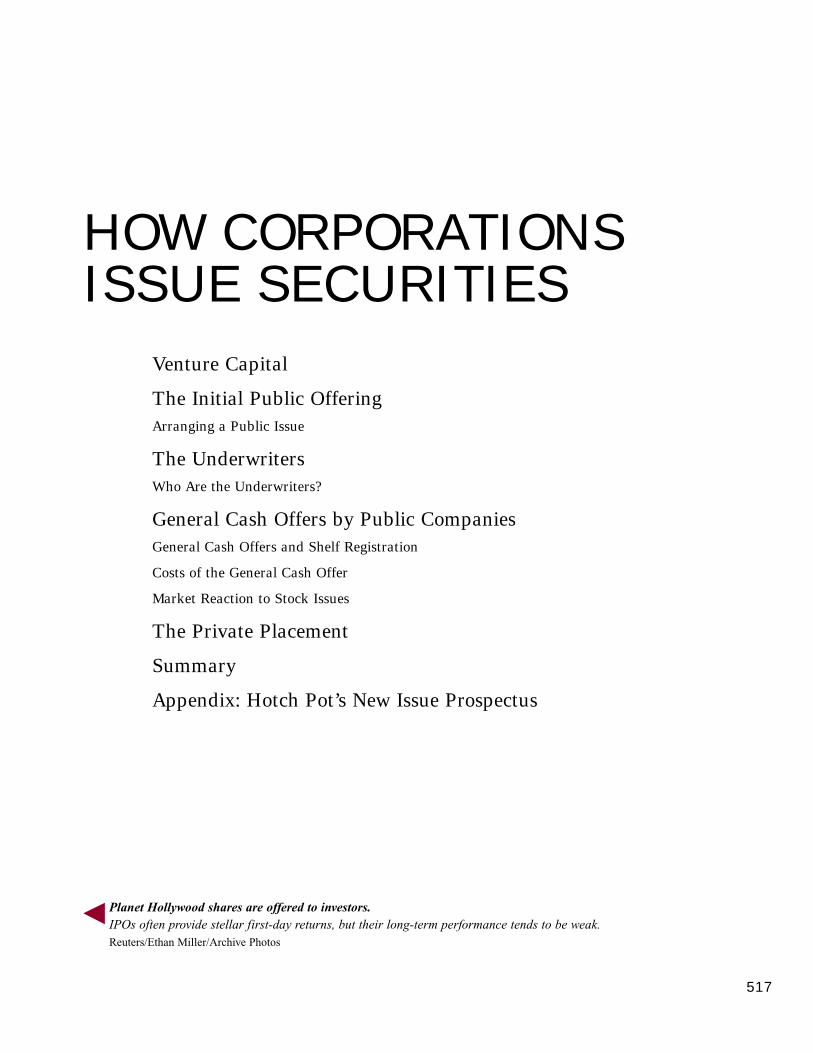
517
HOW CORPORATIONSISSUE SECURITIES
Venture Capital
The Initial Public OfferingArranging a Public Issue
The UnderwritersWho Are the Underwriters?
General Cash Offers by Public CompaniesGeneral Cash Offers and Shelf Registration
Costs of the General Cash Offer
Market Reaction to Stock Issues
The Private Placement
Summary
Appendix: Hotch Pot’s New Issue Prospectus
Planet Hollywood shares are offered to investors.IPOs often provide stellar first-day returns, but their long-term performance tends to be weak.Reuters/Ethan Miller/Archive Photos
518
ill Gates and Paul Allen founded Microsoft in 1975, when both
were around 20 years old. Eleven years later Microsoft shares were sold
to the public for $21 a share and immediately zoomed to $35. The largest
shareholder was Bill Gates, whose shares in Microsoft then were worth
$350 million.
In 1976 two college dropouts, Steve Jobs and Steve Wozniak, sold their most valu-
able possessions, a van and a couple of calculators, and used the cash to start manufac-
turing computers in a garage. In 1980, when Apple Computer went public, the shares
were offered to investors at $22 and jumped to $36. At that point, the shares owned by
the company’s two founders were worth $414 million.
In 1994 Marc Andreesen, a 24-year-old from the University of Illinois, joined with
an investor, James Clark, to found Netscape Communications. Just over a year later
Netscape stock was offered to the public at $28 a share and immediately leapt to $71.
At this price James Clark’s shares were worth $566 million, while Marc Andreesen’s
shares were worth $245 million.
Such stories illustrate that the most important asset of a new firm may be a good
idea. But that is not all you need. To take an idea from the drawing board to a prototype
and through to large-scale production requires ever greater amounts of capital.
To get a new company off the ground, entrepreneurs may rely on their own savings
and personal bank loans. But this is unlikely to be sufficient to build a successful en-
terprise. Venture capital firms specialize in providing new equity capital to help firms
over the awkward adolescent period before they are large enough to “go public.” In the
first part of this material we will explain how venture capital firms do this.
If the firm continues to be successful, there is likely to come a time when it needs to
tap a wider source of capital. At this point it will make its first public issue of common
stock. This is known as an initial public offering, or IPO. In the second section of the
material we will describe what is involved in an IPO.
A company’s initial public offering is seldom its last. Earlier we saw that internally
generated cash is not usually sufficient to satisfy the firm’s needs. Established compa-
nies make up the deficit by issuing more equity or debt. The remainder of this material
looks at this process.
After studying this material you should be able to
� Understand how venture capital firms design successful deals.
� Understand how firms make initial public offerings and the costs of such offerings.
� Know what is involved when established firms make a general cash offer or a pri-
vate placement of securities.
� Explain the role of the underwriter in an issue of securities.
B
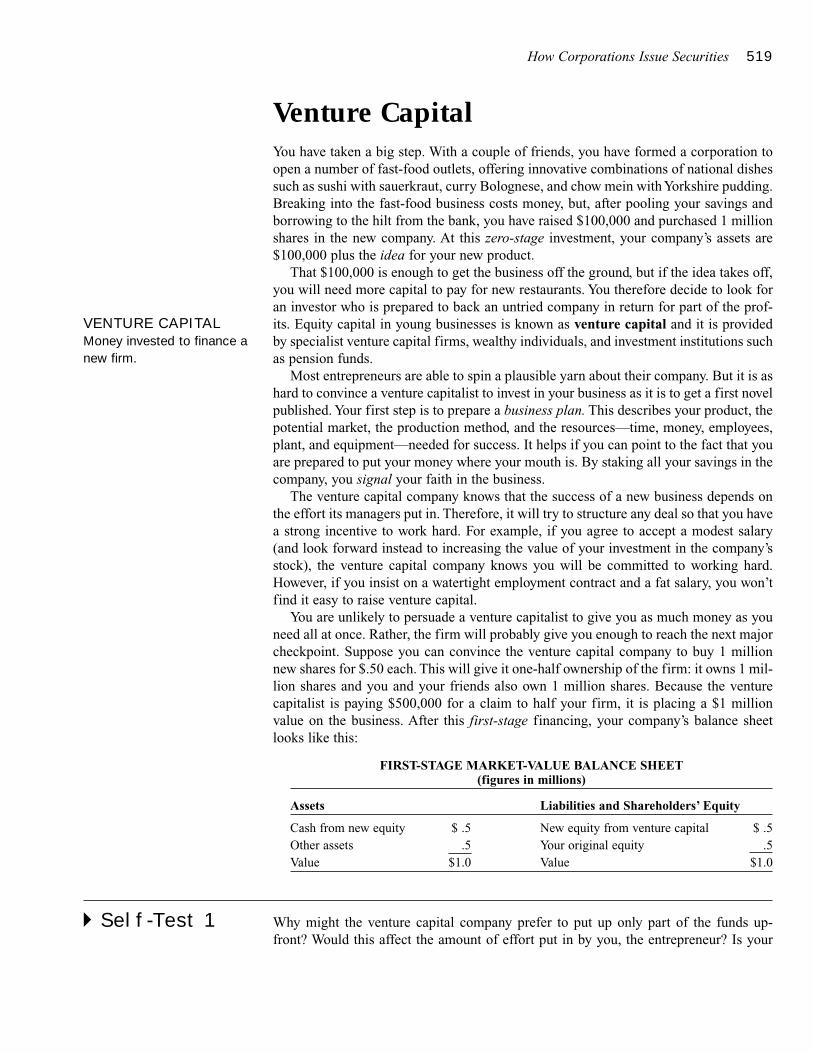
How Corporations Issue Securities 519
Venture CapitalYou have taken a big step. With a couple of friends, you have formed a corporation toopen a number of fast-food outlets, offering innovative combinations of national dishessuch as sushi with sauerkraut, curry Bolognese, and chow mein with Yorkshire pudding.Breaking into the fast-food business costs money, but, after pooling your savings andborrowing to the hilt from the bank, you have raised $100,000 and purchased 1 millionshares in the new company. At this zero-stage investment, your company’s assets are$100,000 plus the idea for your new product.
That $100,000 is enough to get the business off the ground, but if the idea takes off,you will need more capital to pay for new restaurants. You therefore decide to look foran investor who is prepared to back an untried company in return for part of the prof-its. Equity capital in young businesses is known as venture capital and it is providedby specialist venture capital firms, wealthy individuals, and investment institutions suchas pension funds.
Most entrepreneurs are able to spin a plausible yarn about their company. But it is ashard to convince a venture capitalist to invest in your business as it is to get a first novelpublished. Your first step is to prepare a business plan. This describes your product, thepotential market, the production method, and the resources—time, money, employees,plant, and equipment—needed for success. It helps if you can point to the fact that youare prepared to put your money where your mouth is. By staking all your savings in thecompany, you signal your faith in the business.
The venture capital company knows that the success of a new business depends onthe effort its managers put in. Therefore, it will try to structure any deal so that you havea strong incentive to work hard. For example, if you agree to accept a modest salary(and look forward instead to increasing the value of your investment in the company’sstock), the venture capital company knows you will be committed to working hard.However, if you insist on a watertight employment contract and a fat salary, you won’tfind it easy to raise venture capital.
You are unlikely to persuade a venture capitalist to give you as much money as youneed all at once. Rather, the firm will probably give you enough to reach the next majorcheckpoint. Suppose you can convince the venture capital company to buy 1 millionnew shares for $.50 each. This will give it one-half ownership of the firm: it owns 1 mil-lion shares and you and your friends also own 1 million shares. Because the venturecapitalist is paying $500,000 for a claim to half your firm, it is placing a $1 millionvalue on the business. After this first-stage financing, your company’s balance sheetlooks like this:
FIRST-STAGE MARKET-VALUE BALANCE SHEET(figures in millions)
Assets Liabilities and Shareholders’ Equity
Cash from new equity $ .5 New equity from venture capital $ .5Other assets .5 Your original equity .5Value $1.0 Value $1.0
� Self-Test 1 Why might the venture capital company prefer to put up only part of the funds up-front? Would this affect the amount of effort put in by you, the entrepreneur? Is your
VENTURE CAPITALMoney invested to finance anew firm.
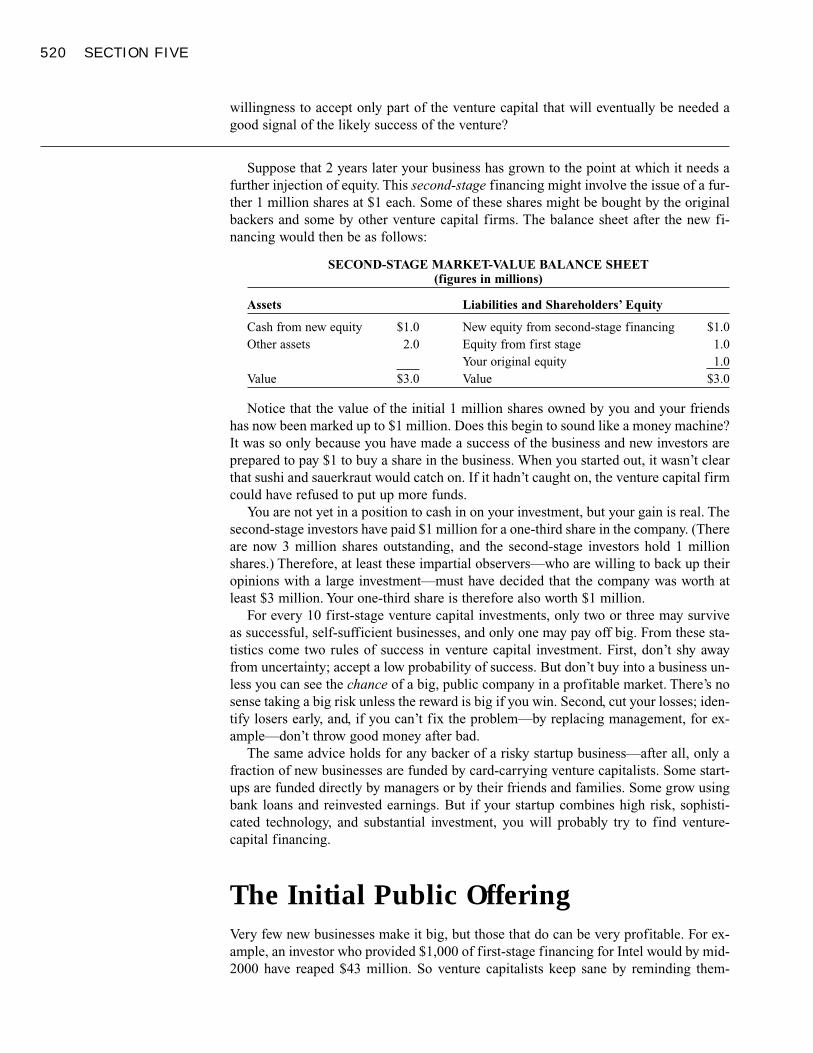
520 SECTION FIVE
willingness to accept only part of the venture capital that will eventually be needed agood signal of the likely success of the venture?
Suppose that 2 years later your business has grown to the point at which it needs afurther injection of equity. This second-stage financing might involve the issue of a fur-ther 1 million shares at $1 each. Some of these shares might be bought by the originalbackers and some by other venture capital firms. The balance sheet after the new fi-nancing would then be as follows:
SECOND-STAGE MARKET-VALUE BALANCE SHEET(figures in millions)
Assets Liabilities and Shareholders’ Equity
Cash from new equity $1.0 New equity from second-stage financing $1.0Other assets 2.0 Equity from first stage 1.0
Your original equity 1.0Value $3.0 Value $3.0
Notice that the value of the initial 1 million shares owned by you and your friendshas now been marked up to $1 million. Does this begin to sound like a money machine?It was so only because you have made a success of the business and new investors areprepared to pay $1 to buy a share in the business. When you started out, it wasn’t clearthat sushi and sauerkraut would catch on. If it hadn’t caught on, the venture capital firmcould have refused to put up more funds.
You are not yet in a position to cash in on your investment, but your gain is real. Thesecond-stage investors have paid $1 million for a one-third share in the company. (Thereare now 3 million shares outstanding, and the second-stage investors hold 1 millionshares.) Therefore, at least these impartial observers—who are willing to back up theiropinions with a large investment—must have decided that the company was worth atleast $3 million. Your one-third share is therefore also worth $1 million.
For every 10 first-stage venture capital investments, only two or three may surviveas successful, self-sufficient businesses, and only one may pay off big. From these sta-tistics come two rules of success in venture capital investment. First, don’t shy awayfrom uncertainty; accept a low probability of success. But don’t buy into a business un-less you can see the chance of a big, public company in a profitable market. There’s nosense taking a big risk unless the reward is big if you win. Second, cut your losses; iden-tify losers early, and, if you can’t fix the problem—by replacing management, for ex-ample—don’t throw good money after bad.
The same advice holds for any backer of a risky startup business—after all, only afraction of new businesses are funded by card-carrying venture capitalists. Some start-ups are funded directly by managers or by their friends and families. Some grow usingbank loans and reinvested earnings. But if your startup combines high risk, sophisti-cated technology, and substantial investment, you will probably try to find venture-capital financing.
The Initial Public OfferingVery few new businesses make it big, but those that do can be very profitable. For ex-ample, an investor who provided $1,000 of first-stage financing for Intel would by mid-2000 have reaped $43 million. So venture capitalists keep sane by reminding them-
How Corporations Issue Securities 521
selves of the success stories1—those who got in on the ground floor of firms like Inteland Federal Express and Lotus Development Corporation.2 If a startup is successful, thefirm may need to raise a considerable amount of capital to gear up its production ca-pacity. At this point, it needs more capital than can comfortably be provided by a smallnumber of individuals or venture capitalists. The firm decides to sell shares to the pub-lic to raise the necessary funds.
An IPO is called a primary offering when new shares are sold to raise additional cashfor the company. It is a secondary offering when the company’s founders and the ven-ture capitalist cash in on some of their gains by selling shares. A secondary offer there-fore is no more than a sale of shares from the early investors in the firm to new in-vestors, and the cash raised in a secondary offer does not flow to the company. Ofcourse, IPOs can be and commonly are both primary and secondary: the firm raises newcash at the same time that some of the already-existing shares in the firm are sold to thepublic. Some of the biggest secondary offerings have involved governments selling offstock in nationalized enterprises. For example, the Japanese government raised $12.6billion by selling its stock in Nippon Telegraph and Telephone and the British govern-ment took in $9 billion from its sale of British Gas. The world’s largest IPO took placein 1999 when the Italian government raised $19.3 billion from the sale of shares in thestate-owned electricity company, Enel.
ARRANGING A PUBLIC ISSUE
Once a firm decides to go public, the first task is to select the underwriters.
A small IPO may have only one underwriter, but larger issues usually require a syn-dicate of underwriters who buy the issue and resell it. For example, the initial public of-fering by Microsoft involved a total of 114 underwriters.
In the typical underwriting arrangement, called a firm commitment, the underwritersbuy the securities from the firm and then resell them to the public. The underwriters re-ceive payment in the form of a spread—that is, they are allowed to sell the shares at aslightly higher price than they paid for them. But the underwriters also accept the riskthat they won’t be able to sell the stock at the agreed offering price. If that happens, theywill be stuck with unsold shares and must get the best price they can for them. In themore risky cases, the underwriter may not be willing to enter into a firm commitmentand handles the issue on a best efforts basis. In this case the underwriter agrees to sellas much of the issue as possible but does not guarantee the sale of the entire issue.
Underwriters are investment banking firms that act as financial midwives to anew issue. Usually they play a triple role—first providing the company withprocedural and financial advice, then buying the stock, and finally reselling itto the public.
A firm is said to go public when it sells its first issue of shares in a generaloffering to investors. This first sale of stock is called an initial public offering,or IPO.
INITIAL PUBLICOFFERING (IPO) Firstoffering of stock to thegeneral public.
UNDERWRITER Firmthat buys an issue ofsecurities from a companyand resells it to the public.
SPREAD Differencebetween public offer priceand price paid byunderwriter.
522 SECTION FIVE
Before any stock can be sold to the public, the company must register the stock withthe Securities and Exchange Commission (SEC). This involves preparation of a detailedand sometimes cumbersome registration statement, which contains information aboutthe proposed financing and the firm’s history, existing business, and plans for the fu-ture. The SEC does not evaluate the wisdom of an investment in the firm but it doescheck the registration statement for accuracy and completeness. The firm must alsocomply with the “blue-sky” laws of each state, so named because they seek to protectthe public against firms that fraudulently promise the blue sky to investors.3
The first part of the registration statement is distributed to the public in the form ofa preliminary prospectus. One function of the prospectus is to warn investors about therisks involved in any investment in the firm. Some investors have joked that if they readprospectuses carefully, they would never dare buy any new issue. The appendix to thismaterial is a possible prospectus for your fast-food business.
The company and its underwriters also need to set the issue price. To gauge howmuch the stock is worth, they may undertake discounted cash-flow calculations likethose described earlier. They also look at the price-earnings ratios of the shares of thefirm’s principal competitors.
Before settling on the issue price, the underwriters may arrange a “roadshow,” whichgives the underwriters and the company’s management an opportunity to talk to poten-tial investors. These investors may then offer their reaction to the issue, suggest whatthey think is a fair price, and indicate how much stock they would be prepared to buy.This allows the underwriters to build up a book of likely orders. Although investors arenot bound by their indications, they know that if they want to remain in the underwrit-ers’ good books, they must be careful not to renege on their expressions of interest.
The managers of the firm are eager to secure the highest possible price for theirstock, but the underwriters are likely to be cautious because they will be left with anyunsold stock if they overestimate investor demand. As a result, underwriters typicallytry to underprice the initial public offering. Underpricing, they argue, is needed totempt investors to buy stock and to reduce the cost of marketing the issue to customers.
It is common to see the stock price increase substantially from the issue price in thedays following an issue. Such immediate price jumps indicate the amount by which theshares were underpriced compared to what investors were willing to pay for them. Astudy by Ibbotson, Sindelar, and Ritter of approximately 9,000 new issues from 1960 to1987 found average underpricing of 16 percent.4 Sometimes new issues are dramati-cally underpriced. In November 1998, for example, 3.1 million shares in theglobe.com
Underpricing represents a cost to the existing owners since the new investorsare allowed to buy shares in the firm at a favorable price. The cost ofunderpricing may be very large.
3 Sometimes states go beyond blue-sky laws in their efforts to protect their residents. In 1980 when AppleComputer Inc. made its first public issue, the Massachusetts state government decided the offering was toorisky for its residents and therefore banned the sale of the shares to investors in the state. The state relentedlater, after the issue was out and the price had risen. Massachusetts investors obviously did not appreciate this“protection.”4 R. G. Ibbotson, J. L. Sindelar, and J. R. Ritter, “Initial Public Offerings,” Journal of Applied Corporate Fi-nance 1 (Summer 1988), pp. 37–45. Note, however, that initial underpricing does not mean that IPOs are su-perior long-run investments. In fact, IPO returns over the first 3 years of trading have been less than a con-trol sample of matching firms. See J. R. Ritter, “The Long-Run Performance of Initial Public Offerings,”Journal of Finance 46 (March 1991), pp. 3–27.
PROSPECTUS Formalsummary that providesinformation on an issue ofsecurities.
UNDERPRICINGIssuing securities at anoffering price set below thetrue value of the security.
Project Analysis 523
were sold in an IPO at a price of $9 a share. In the first day of trading 15.6 millionshares changed hands and the price at one point touched $97. Unfortunately, the bo-nanza did not last. Within a year the stock price had fallen by over two-thirds from itsfirst-day peak. The nearby box reports on the phenomenal performance of Internet IPOsin the late 1990s.
� EXAMPLE 1 Underpricing of IPOs
Suppose an IPO is a secondary issue, and the firm’s founders sell part of their holdingto investors. Clearly, if the shares are sold for less than their true worth, the founderswill suffer an opportunity loss.
But what if the IPO is a primary issue that raises new cash for the company? Do thefounders care whether the shares are sold for less than their market value? The follow-ing example illustrates that they do care.
Suppose Cosmos.com has 2 million shares outstanding and now offers a further 1million shares to investors at $50. On the first day of trading the share price jumps to$80, so that the shares that the company sold for $50 million are now worth $80 mil-lion. The total market capitalization of the company is 3 million × $80 = $240 million.
The value of the founders’ shares is equal to the total value of the company less thevalue of the shares that have been sold to the public—in other words, $240 – $80 = $160million. The founders might justifiably rejoice at their good fortune. However, if thecompany had issued shares at a higher price, it would have needed to sell fewer sharesto raise the $50 million that it needs, and the founders would have retained a largershare of the company. For example, suppose that the outside investors, who put up $50million, received shares that were worth only $50 million. In that case the value of thefounders’ shares would be $240 –$50 = $190 million.
The effect of selling shares below their true value is to transfer $30 million of valuefrom the founders to the investors who buy the new shares.
Unfortunately, underpricing does not mean that anyone can become wealthy by buy-ing stock in IPOs. If an issue is underpriced, everybody will want to buy it and the un-derwriters will not have enough stock to go around. You are therefore likely to get onlya small share of these hot issues. If it is overpriced, other investors are unlikely to wantit and the underwriter will be only too delighted to sell it to you. This phenomenon isknown as the winner’s curse.5 It implies that, unless you can spot which issues are un-derpriced, you are likely to receive a small proportion of the cheap issues and a largeproportion of the expensive ones. Since the dice are loaded against uninformed in-vestors, they will play the game only if there is substantial underpricing on average.
� EXAMPLE 2 Underpricing of IPOs and Investor Returns
Suppose that an investor will earn an immediate 10 percent return on underpriced IPOsand lose 5 percent on overpriced IPOs. But because of high demand, you may get only
5 The highest bidder in an auction is the participant who places the highest value on the auctioned object.Therefore, it is likely that the winning bidder has an overly optimistic assessment of true value. Winning theauction suggests that you have overpaid for the object—this is the winner’s curse. In the case of IPOs, yourability to “win” an allotment of shares may signal that the stock is overpriced.
SEE BOX
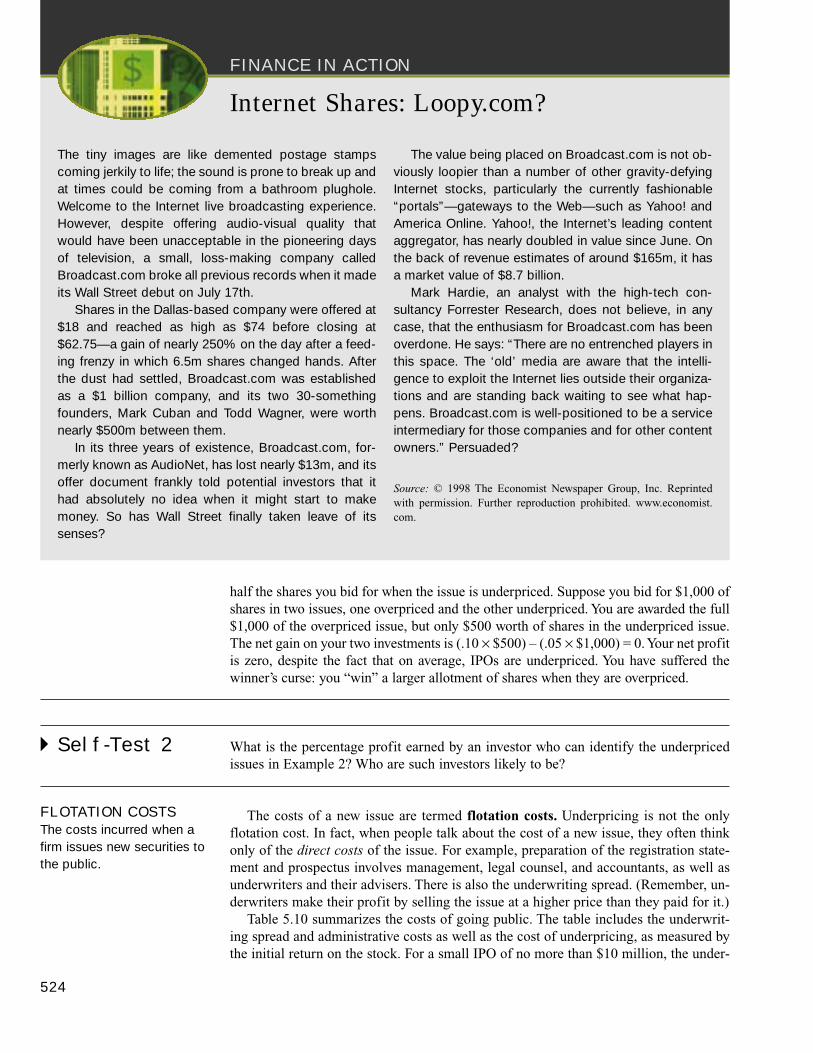
FINANCE IN ACTION
half the shares you bid for when the issue is underpriced. Suppose you bid for $1,000 ofshares in two issues, one overpriced and the other underpriced. You are awarded the full$1,000 of the overpriced issue, but only $500 worth of shares in the underpriced issue.The net gain on your two investments is (.10 × $500) – (.05 × $1,000) = 0. Your net profitis zero, despite the fact that on average, IPOs are underpriced. You have suffered thewinner’s curse: you “win” a larger allotment of shares when they are overpriced.
� Self-Test 2 What is the percentage profit earned by an investor who can identify the underpricedissues in Example 2? Who are such investors likely to be?
The costs of a new issue are termed flotation costs. Underpricing is not the onlyflotation cost. In fact, when people talk about the cost of a new issue, they often thinkonly of the direct costs of the issue. For example, preparation of the registration state-ment and prospectus involves management, legal counsel, and accountants, as well asunderwriters and their advisers. There is also the underwriting spread. (Remember, un-derwriters make their profit by selling the issue at a higher price than they paid for it.)
Table 5.10 summarizes the costs of going public. The table includes the underwrit-ing spread and administrative costs as well as the cost of underpricing, as measured bythe initial return on the stock. For a small IPO of no more than $10 million, the under-
524
Internet Shares: Loopy.com?
The tiny images are like demented postage stampscoming jerkily to life; the sound is prone to break up and at times could be coming from a bathroom plughole.Welcome to the Internet live broadcasting experience.However, despite offering audio-visual quality that would have been unacceptable in the pioneering daysof television, a small, loss-making company calledBroadcast.com broke all previous records when it madeits Wall Street debut on July 17th.
Shares in the Dallas-based company were offered at$18 and reached as high as $74 before closing at$62.75— a gain of nearly 250% on the day after a feed-ing frenzy in which 6.5m shares changed hands. Afterthe dust had settled, Broadcast.com was establishedas a $1 billion company, and its two 30-somethingfounders, Mark Cuban and Todd Wagner, were worthnearly $500m between them.
In its three years of existence, Broadcast.com, for-merly known as AudioNet, has lost nearly $13m, and itsoffer document frankly told potential investors that ithad absolutely no idea when it might start to makemoney. So has Wall Street finally taken leave of itssenses?
The value being placed on Broadcast.com is not ob-viously loopier than a number of other gravity-defyingInternet stocks, particularly the currently fashionable“ portals” — gateways to the Web— such as Yahoo! andAmerica Online. Yahoo!, the Internet’s leading contentaggregator, has nearly doubled in value since June. Onthe back of revenue estimates of around $165m, it hasa market value of $8.7 billion.
Mark Hardie, an analyst with the high-tech con-sultancy Forrester Research, does not believe, in anycase, that the enthusiasm for Broadcast.com has beenoverdone. He says: “ There are no entrenched players inthis space. The ‘old’ media are aware that the intelli-gence to exploit the Internet lies outside their organiza-tions and are standing back waiting to see what hap-pens. Broadcast.com is well-positioned to be a serviceintermediary for those companies and for other contentowners.” Persuaded?
Source: © 1998 The Economist Newspaper Group, Inc. Reprintedwith permission. Further reproduction prohibited. www.economist.com.
FLOTATION COSTSThe costs incurred when afirm issues new securities tothe public.
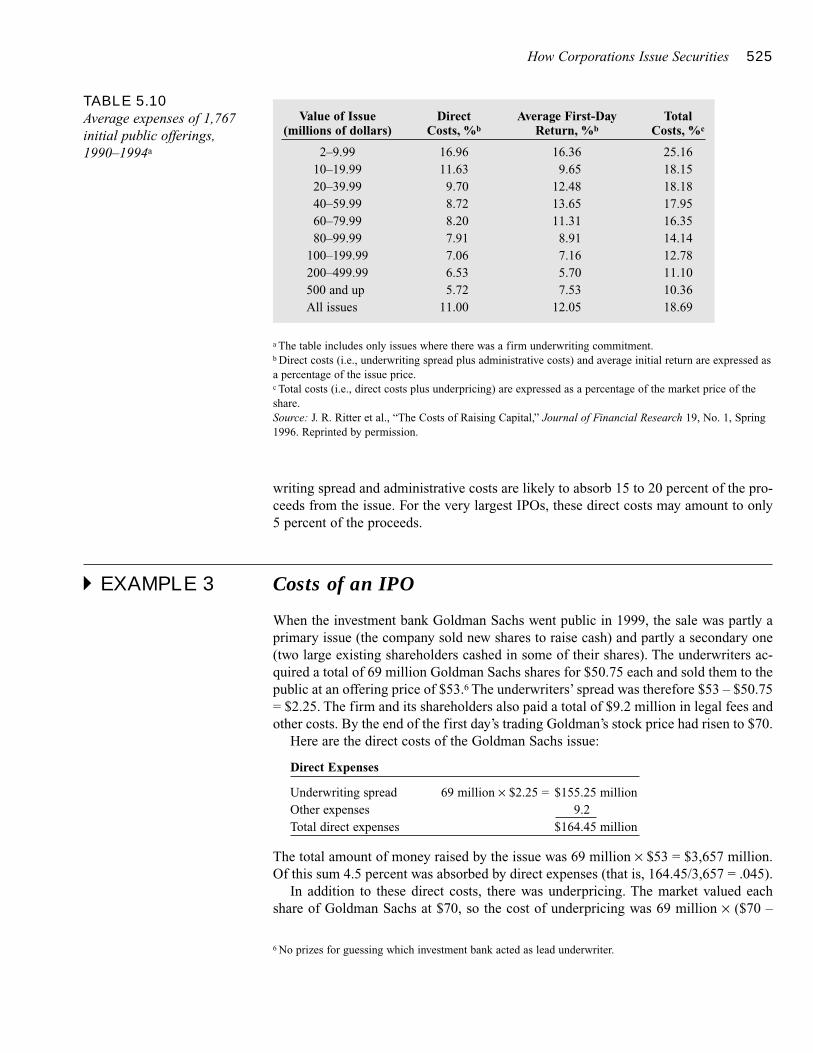
How Corporations Issue Securities 525
writing spread and administrative costs are likely to absorb 15 to 20 percent of the pro-ceeds from the issue. For the very largest IPOs, these direct costs may amount to only5 percent of the proceeds.
� EXAMPLE 3 Costs of an IPO
When the investment bank Goldman Sachs went public in 1999, the sale was partly aprimary issue (the company sold new shares to raise cash) and partly a secondary one(two large existing shareholders cashed in some of their shares). The underwriters ac-quired a total of 69 million Goldman Sachs shares for $50.75 each and sold them to thepublic at an offering price of $53.6 The underwriters’ spread was therefore $53 – $50.75= $2.25. The firm and its shareholders also paid a total of $9.2 million in legal fees andother costs. By the end of the first day’s trading Goldman’s stock price had risen to $70.
Here are the direct costs of the Goldman Sachs issue:
Direct Expenses
Underwriting spread 69 million × $2.25 = $155.25 millionOther expenses 9.2Total direct expenses $164.45 million
The total amount of money raised by the issue was 69 million × $53 = $3,657 million.Of this sum 4.5 percent was absorbed by direct expenses (that is, 164.45/3,657 = .045).
In addition to these direct costs, there was underpricing. The market valued eachshare of Goldman Sachs at $70, so the cost of underpricing was 69 million × ($70 –
TABLE 5.10Average expenses of 1,767initial public offerings,1990–1994a
Value of Issue Direct Average First-Day Total(millions of dollars) Costs, %b Return, %b Costs, %c
2–9.99 16.96 16.36 25.1610–19.99 11.63 9.65 18.1520–39.99 9.70 12.48 18.1840–59.99 8.72 13.65 17.9560–79.99 8.20 11.31 16.3580–99.99 7.91 8.91 14.14
100–199.99 7.06 7.16 12.78200–499.99 6.53 5.70 11.10500 and up 5.72 7.53 10.36All issues 11.00 12.05 18.69
a The table includes only issues where there was a firm underwriting commitment.b Direct costs (i.e., underwriting spread plus administrative costs) and average initial return are expressed asa percentage of the issue price.c Total costs (i.e., direct costs plus underpricing) are expressed as a percentage of the market price of theshare.Source: J. R. Ritter et al., “The Costs of Raising Capital,” Journal of Financial Research 19, No. 1, Spring1996. Reprinted by permission.
6 No prizes for guessing which investment bank acted as lead underwriter.
526 SECTION FIVE
$53) = $1,173 million, resulting in total costs of $164.45 + $1,173 = $1,337.45 million.Therefore, while the total market value of the issued shares was 69 million × $70 =$4,830 million, direct costs and the costs of underpricing absorbed nearly 28 percent ofthe market value of the shares.
� Self-Test 3 Suppose that the underwriters acquired Goldman Sachs shares for $60 and sold them tothe public at an offering price of $64. If all other features of the offer were unchanged(and investors still valued the stock at $70 a share), what would have been the directcosts of the issue and the costs of underpricing? What would have been the total costsas a proportion of the market value of the shares?
The UnderwritersWe have described underwriters as playing a triple role—providing advice, buying anew issue from the company, and reselling it to investors. Underwriters don’t just helpthe company to make its initial public offering; they are called in whenever a companywishes to raise cash by selling securities to the public.
Underwriting is not always fun. On October 15, 1987, the British government final-ized arrangements to sell its holding of British Petroleum (BP) shares at £3.30 a share.This huge issue involving more than $12 billion was underwritten by an internationalgroup of underwriters and simultaneously marketed in a number of countries. Four daysafter the underwriting arrangement was finalized, the October stock market crash oc-curred and stock prices nose-dived. The underwriters appealed to the British govern-ment to cancel the issue but the government hardened its heart and pointed out that theunderwriters knew the risks when they agreed to handle the sale.7 By the closing dateof the offer, the price of BP stock had fallen to £2.96 and the underwriters had lost morethan $1 billion.
WHO ARE THE UNDERWRITERS?
Since underwriters play such a crucial role in new issues, we should look at who theyare. Several thousand investment banks, security dealers, and brokers are at least spo-
Most companies raise capital only occasionally, but underwriters are in thebusiness all the time. Established underwriters are careful of their reputationand will not handle a new issue unless they believe the facts have beenpresented fairly to investors. Thus, in addition to handling the sale of an issue, the underwriters in effect give it their seal of approval. This impliedendorsement may be worth quite a bit to a company that is coming to themarket for the first time.
7 The government’s only concession was to put a floor on the underwriters’ losses by giving them the optionto resell their stock to the government at £2.80 a share. The BP offering is described and analyzed in C. Mus-carella and M. Vetsuypens, “The British Petroleum Stock Offering: An Application of Option Pricing,” Jour-nal of Applied Corporate Finance 1 (1989), pp. 74–80.
How Corporations Issue Securities 527
radically involved in underwriting. However, the market for the larger issues is domi-nated by the major investment banking firms, which specialize in underwriting new is-sues, dealing in securities, and arranging mergers. These firms enjoy great prestige, ex-perience, and financial muscle. Table 5.11 lists some of the largest firms, ranked bytotal volume of issues in 1998. Merrill Lynch, the winner, raised a total of $304 billion.Of course, only a small proportion of these issues was for companies that were comingto the market for the first time.
Earlier we pointed out that instead of issuing bonds in the United States, many cor-porations issue international bonds in London, which are then sold to investors outsidethe United States. In addition, new equity issues by large multinational companies areincreasingly marketed to investors throughout the world. Since these securities are soldin a number of countries, many of the major international banks are involved in under-writing the issues. For example, look at Table 5.12 which shows the names of the prin-cipal underwriters of international issues in 1998.
TABLE 5.12Top underwriters ofinternational issues ofsecurities, 1998 (figures inbillions)
Underwriter Value of Issues
Warburg Dillon Read $ 63.6Merrill Lynch 52.3Morgan Stanley Dean Witter 43.6Goldman Sachs 42.5ABN AMRO 41.5Deutsche Bank 39.0Paribas 38.7J. P. Morgan 36.0Barclays Capital 31.1Credit Suisse First Boston 25.7All underwriters $665.5
Source: Securities Data Co.
TABLE 5.11Top underwriters of U.S. debtand equity, 1998 (figures inbillions)
Underwriter Value of Issues
Merrill Lynch $ 304Salomon Smith Barney 225Morgan Stanley Dean Witter 203Goldman Sachs 192Lehman Brothers 147Credit Suisse First Boston 127J. P. Morgan 89Bear Stearns 83Chase Manhattan 71Donaldson Lufkin & Jenrette 61All underwriters $1,820
Source: Securities Data Co.
528 SECTION FIVE
General Cash Offers by Public CompaniesAfter the initial public offering a successful firm will continue to grow and from timeto time it will need to raise more money by issuing stock or bonds. An issue of addi-tional stock by a company whose stock already is publicly traded is called a seasonedoffering. Any issue of securities needs to be formally approved by the firm’s board ofdirectors. If a stock issue requires an increase in the company’s authorized capital, italso needs the consent of the stockholders.
Public companies can issue securities either by making a general cash offer to in-vestors at large or by making a rights issue, which is limited to existing shareholders.In the latter case, the company offers the shareholders the opportunity, or right, to buymore shares at an “attractive” price. For example, if the current stock price is $100, thecompany might offer investors an additional share at $50 for each share they hold. Sup-pose that before the issue an investor has one share worth $100 and $50 in the bank. Ifthe investor takes up the offer of a new share, that $50 of cash is transferred from theinvestor’s bank account to the company’s. The investor now has two shares that are aclaim on the original assets worth $100 and on the $50 cash that the company hasraised. So the two shares are worth a total of $150, or $75 each.
� EXAMPLE 4 Rights Issues
Easy Writer Word Processing Company has 1 million shares outstanding, selling at $20a share. To finance the development of a new software package, it plans a rights issue,allowing one new share to be purchased for each 10 shares currently held. The purchaseprice will be $10 a share. How many shares will be issued? How much money will beraised? What will be the stock price after the rights issue?
The firm will issue one new share for every 10 old ones, or 100,000 shares. Soshares outstanding will rise to 1.1 million. The firm will raise $10 × 100,000 = $1 mil-lion. Therefore, the total value of the firm will increase from $20 million to $21 mil-lion, and the stock price will fall to $21 million/1.1 million shares = $19.09 per share.
In some countries the rights issue is the most common or only method for issuingstock, but in the United States rights issues are now very rare. We therefore will con-centrate on the mechanics of the general cash offer.
GENERAL CASH OFFERS AND SHELFREGISTRATION
When a public company makes a general cash offer of debt or equity, it essentially fol-lows the same procedure used when it first went public. This means that it must firstregister the issue with the SEC and draw up a prospectus.8 Before settling on the issueprice, the underwriters will usually contact potential investors and build up a book of
SEASONED OFFERINGSale of securities by a firmthat is already publiclytraded.
RIGHTS ISSUE Issue ofsecurities offered only tocurrent stockholders.
GENERAL CASH OFFERSale of securities open to allinvestors by an already-public company.
8 The procedure is similar when a company makes an international issue of bonds or equity, but as long asthese issues are not sold publicly in the United States, they do not need to be registered with the SEC.
How Corporations Issue Securities 529
likely orders. The company will then sell the issue to the underwriters, and they in turnwill offer the securities to the public.
Companies do not need to prepare a separate registration statement every time theyissue new securities. Instead, they are allowed to file a single registration statement cov-ering financing plans for up to 2 years into the future. The actual issues can then be soldto the public with scant additional paperwork, whenever the firm needs cash or thinksit can issue securities at an attractive price. This is called shelf registration—the regis-tration is put “on the shelf,” to be taken down, dusted off, and used as needed.
Think of how you might use shelf registration when you are a financial manager.Suppose that your company is likely to need up to $200 million of new long-term debtover the next year or so. It can file a registration statement for that amount. It now hasapproval to issue up to $200 million of debt, but it isn’t obliged to issue any. Nor is itrequired to work through any particular underwriters—the registration statement mayname the underwriters the firm thinks it may work with, but others can be substitutedlater.
Now you can sit back and issue debt as needed, in bits and pieces if you like. Sup-pose Merrill Lynch comes across an insurance company with $10 million ready to in-vest in corporate bonds, priced to yield, say, 7.3 percent. If you think that’s a good deal,you say “OK” and the deal is done, subject to only a little additional paperwork. Mer-rill Lynch then resells the bonds to the insurance company, hoping for a higher pricethan it paid for them.
Here is another possible deal. Suppose you think you see a window of opportunityin which interest rates are “temporarily low.” You invite bids for $100 million of bonds.Some bids may come from large investment bankers acting alone, others from ad hocsyndicates. But that’s not your problem; if the price is right, you just take the best dealoffered.
Thus shelf registration gives firms several different things that they did not have pre-viously:
1. Securities can be issued in dribs and drabs without incurring excessive costs.2. Securities can be issued on short notice.3. Security issues can be timed to take advantage of “market conditions” (although any
financial manager who can reliably identify favorable market conditions could makea lot more money by quitting and becoming a bond or stock trader instead).
4. The issuing firm can make sure that underwriters compete for its business.
Not all companies eligible for shelf registration actually use it for all their public is-sues. Sometimes they believe they can get a better deal by making one large issuethrough traditional channels, especially when the security to be issued has some unusualfeature or when the firm believes it needs the investment banker’s counsel or stamp ofapproval on the issue. Thus shelf registration is less often used for issues of commonstock than for garden-variety corporate bonds.
COSTS OF THE GENERAL CASH OFFER
Whenever a firm makes a cash offer, it incurs substantial administrative costs. Also, thefirm needs to compensate the underwriters by selling them securities below the pricethat they expect to receive from investors. Figure 5.7 shows the average underwritingspread and administrative costs for several types of security issues in the United States.9
SHELF REGISTRATIONA procedure that allows firmsto file one registrationstatement for several issuesof the same security.
9 These figures do not capture all administrative costs. For example, they do not include management timespent on the issue.
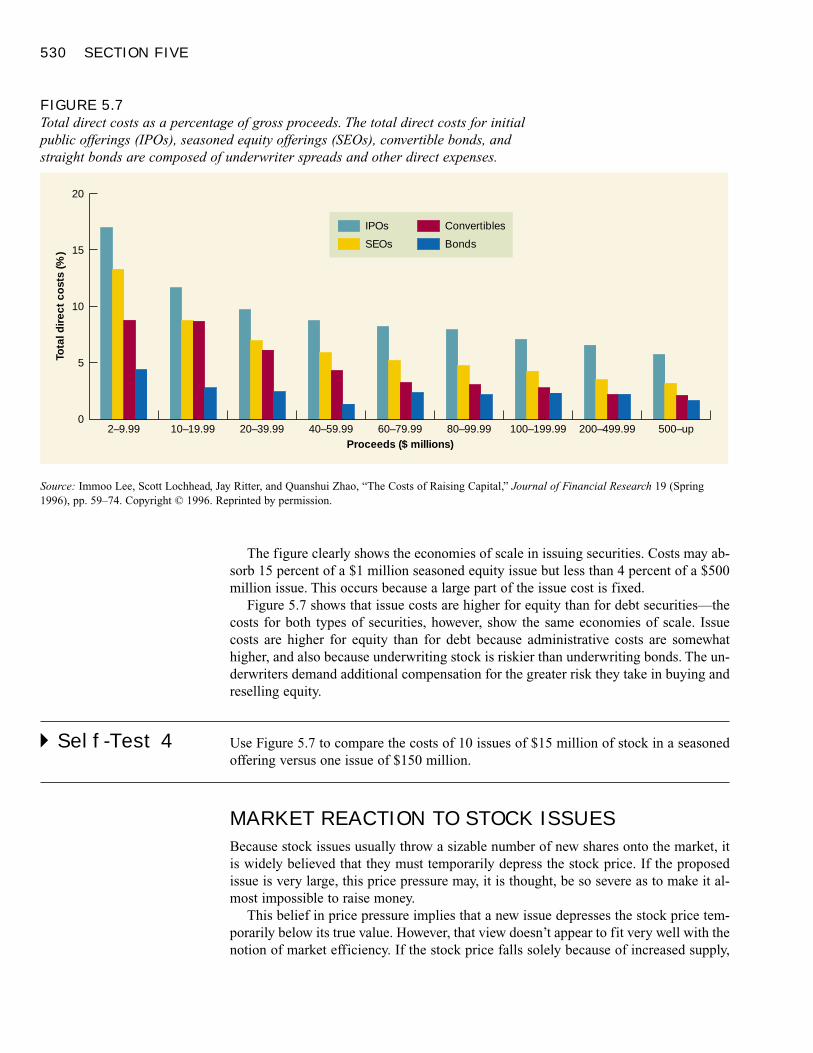
530 SECTION FIVE
The figure clearly shows the economies of scale in issuing securities. Costs may ab-sorb 15 percent of a $1 million seasoned equity issue but less than 4 percent of a $500million issue. This occurs because a large part of the issue cost is fixed.
Figure 5.7 shows that issue costs are higher for equity than for debt securities—thecosts for both types of securities, however, show the same economies of scale. Issuecosts are higher for equity than for debt because administrative costs are somewhathigher, and also because underwriting stock is riskier than underwriting bonds. The un-derwriters demand additional compensation for the greater risk they take in buying andreselling equity.
� Self-Test 4 Use Figure 5.7 to compare the costs of 10 issues of $15 million of stock in a seasonedoffering versus one issue of $150 million.
MARKET REACTION TO STOCK ISSUES
Because stock issues usually throw a sizable number of new shares onto the market, itis widely believed that they must temporarily depress the stock price. If the proposedissue is very large, this price pressure may, it is thought, be so severe as to make it al-most impossible to raise money.
This belief in price pressure implies that a new issue depresses the stock price tem-porarily below its true value. However, that view doesn’t appear to fit very well with thenotion of market efficiency. If the stock price falls solely because of increased supply,
FIGURE 5.7Total direct costs as a percentage of gross proceeds. The total direct costs for initialpublic offerings (IPOs), seasoned equity offerings (SEOs), convertible bonds, andstraight bonds are composed of underwriter spreads and other direct expenses.
Proceeds ($ millions)
Tota
l dir
ect
cost
s (%
)
20
15
10
5
02– 9.99 10– 19.99 20– 39.99 40– 59.99 60– 79.99
IPOs
80– 99.99 100– 199.99 200– 499.99 500– up
SEOs
Convertibles
Bonds
Source: Immoo Lee, Scott Lochhead, Jay Ritter, and Quanshui Zhao, “The Costs of Raising Capital,” Journal of Financial Research 19 (Spring1996), pp. 59–74. Copyright © 1996. Reprinted by permission.
How Corporations Issue Securities 531
then that stock would offer a higher return than comparable stocks and investors wouldbe attracted to it as ants to a picnic.
Economists who have studied new issues of common stock have generally found thatthe announcement of the issue does result in a decline in the stock price. For industrialissues in the United States this decline amounts to about 3 percent.10 While this may notsound overwhelming, such a price drop can be a large fraction of the money raised. Sup-pose that a company with a market value of equity of $5 billion announces its intentionto issue $500 million of additional equity and thereby causes the stock price to drop by3 percent. The loss in value is .03 × $5 billion, or $150 million. That’s 30 percent of theamount of money raised (.30 × $500 million = $150 million).
What’s going on here? Is the price of the stock simply depressed by the prospect ofthe additional supply? Possibly, but here is an alternative explanation.
Suppose managers (who have better information about the firm than outside in-vestors) know that their stock is undervalued. If the company sells new stock at this lowprice, it will give the new shareholders a good deal at the expense of the old share-holders. In these circumstances managers might be prepared to forgo the new invest-ment rather than sell shares at too low a price.
If managers know that the stock is overvalued, the position is reversed. If the com-pany sells new shares at the high price, it will help its existing shareholders at the ex-pense of the new ones. Managers might be prepared to issue stock even if the new cashwere just put in the bank.
Of course investors are not stupid. They can predict that managers are more likely toissue stock when they think it is overvalued and therefore they mark the price of thestock down accordingly.
The Private PlacementWhenever a company makes a public offering, it must register the issue with the SEC. It could avoid this costly process by selling the issue privately. There are no hard-and-fast definitions of a private placement, but the SEC has insisted that the securityshould be sold to no more than a dozen or so knowledgeable investors.
The tendency for stock prices to decline at the time of an issue may havenothing to do with increased supply. Instead, the stock issue may simply be asignal that well-informed managers believe the market has overpriced thestock.11
10 See, for example, P. Asquith and D. W. Mullins, “Equity Issues and Offering Dilution,” Journal of Finan-cial Economics 15 (January–February 1986), pp. 61–90; R. W. Masulis and A. N. Korwar, “Seasoned EquityOfferings: An Empirical Investigation,” Journal of Financial Economics 15 (January–February 1986), pp.91–118; W. H. Mikkelson and M. M. Partch, “Valuation Effects of Security Offerings and the IssuanceProcess,” Journal of Financial Economics 15 (January–February 1986), pp. 31–60. There appears to be asmaller price decline for utility issues. Also Marsh observed a smaller decline for rights issues in the UnitedKingdom; see P. R. Marsh, “Equity Rights Issues and the Efficiency of the UK Stock Market,” Journal of Fi-nance 34 (September 1979), pp. 839–862.11 This explanation was developed in S. C. Myers and N. S. Majluf, “Corporate Financing and Investment De-cisions When Firms Have Information that Investors Do Not Have,” Journal of Financial Economics 13(1984), pp. 187–222.
PRIVATE PLACEMENTSale of securities to a limitednumber of investors withouta public offering.
532 SECTION FIVE
One disadvantage of a private placement is that the investor cannot easily resell thesecurity. This is less important to institutions such as life insurance companies, whichinvest huge sums of money in corporate debt for the long haul. However, in 1990 theSEC relaxed its restrictions on who could buy unregistered issues. Under the new rule,Rule 144a, large financial institutions can trade unregistered securities among them-selves.
As you would expect, it costs less to arrange a private placement than to make a pub-lic issue. That might not be so important for the very large issues where costs are lesssignificant, but it is a particular advantage for companies making smaller issues.
Another advantage of the private placement is that the debt contract can be custom-tailored for firms with special problems or opportunities. Also, if the firm wishes laterto change the terms of the debt, it is much simpler to do this with a private placementwhere only a few investors are involved.
Therefore, it is not surprising that private placements occupy a particular niche in thecorporate debt market, namely, loans to small and medium-sized firms. These are thefirms that face the highest costs in public issues, that require the most detailed investi-gation, and that may require specialized, flexible loan arrangements.
We do not mean that large, safe, and conventional firms should rule out privateplacements. Enormous amounts of capital are sometimes raised by this method. For ex-ample, AT&T once borrowed $500 million in a single private placement. Nevertheless,the advantages of private placement—avoiding registration costs and establishing a di-rect relationship with the lender—are generally more important to smaller firms.
Of course these advantages are not free. Lenders in private placements have to becompensated for the risks they face and for the costs of research and negotiation. Theyalso have to be compensated for holding an asset that is not easily resold. All these fac-tors are rolled into the interest rate paid by the firm. It is difficult to generalize aboutthe differences in interest rates between private placements and public issues, but a typ-ical yield differential is on the order of half a percentage point.
SummaryHow do venture capital firms design successful deals?
Infant companies raise venture capital to carry them through to the point at which they canmake their first public issue of stock. More established publicly traded companies can issueadditional securities in a general cash offer.
Financing choices should be designed to avoid conflicts of interest. This is especiallyimportant in the case of a young company that is raising venture capital. If both managersand investors have an important equity stake in the company, they are likely to pull in thesame direction. The willingness to take that stake also signals management’s confidence inthe new company’s future. Therefore, most deals require that the entrepreneur maintain largestakes in the firm. In addition, most venture financing is done in stages that keep the firmon a short leash, and force it to prove at several crucial points that it is worthy of additionalinvestment.
How do firms make initial public offerings and what are the costs of such offerings?
The initial public offering is the first sale of shares in a general offering to investors. Thesale of the securities is usually managed by an underwriting firm which buys the sharesfrom the company and resells them to the public. The underwriter helps to prepare aprospectus, which describes the company and its prospects. The costs of an IPO include
How Corporations Issue Securities 533
direct costs such as legal and administrative fees, as well as the underwriting spread—thedifference between the price the underwriter pays to acquire the shares from the firm andthe price the public pays the underwriter for those shares. Another major implicit cost is theunderpricing of the issue—that is, shares are typically sold to the public somewhat belowthe true value of the security. This discount is reflected in abnormally high average returnsto new issues on the first day of trading.
What are some of the significant issues that arise when established firms make ageneral cash offer or a private placement of securities?
There are always economies of scale in issuing securities. It is cheaper to go to the marketonce for $100 million than to make two trips for $50 million each. Consequently, firms“bunch” security issues. This may mean relying on short-term financing until a large issueis justified. Or it may mean issuing more than is needed at the moment to avoid anotherissue later.
A seasoned offering may depress the stock price. The extent of this price decline varies,but for issues of common stocks by industrial firms the fall in the value of the existing stockmay amount to a significant proportion of the money raised. The likely explanation for thispressure is the information the market reads into the company’s decision to issue stock.
Shelf registration often makes sense for debt issues by blue-chip firms. Shelfregistration reduces the time taken to arrange a new issue, it increases flexibility, and it maycut underwriting costs. It seems best suited for debt issues by large firms that are happy toswitch between investment banks. It seems least suited for issues of unusually riskysecurities or for issues by small companies that most need a close relationship with aninvestment bank.
Private placements are well-suited for small, risky, or unusual firms. The specialadvantages of private placement stem from avoiding registration expenses and a more directrelationship with the lender. These are not worth as much to blue-chip borrowers.
What is the role of the underwriter in an issue of securities?
The underwriter manages the sale of the securities for the issuing company. Theunderwriting firms have expertise in such sales because they are in the business all the time,whereas the company raises capital only occasionally. Moreover, the underwriters may givean implicit seal of approval to the offering. Because the underwriters will not want tosquander their reputation by misrepresenting facts to the public, the implied endorsementmay be quite important to a firm coming to the market for the first time.
www.FreeEDGAR.com/default.htm Information on registration of new securities offeringshttp://cbs.marketwatch.com/news/current/ipo_rep.htx?source=htx/http2_mw List of new
IPOswww.cob.ohio-state.edu/~fin/resources_education/credit.htm The changing mix of corporate
financingwww.investorama.com/features/proxystatements.html The role of the proxy statement in in-
vestor relationswww.vnpartners.com/primer.htm Venture capital as a source of project financing
venture capital prospectus rights issueinitial public offering (IPO) underpricing general cash offerunderwriter flotation costs shelf registrationspread seasoned offering private placement
Related WebLinks
Key Terms
534 SECTION FIVE
1. Underwriting.
a. Is a rights issue more likely to be used for an initial public offering or for subsequent is-sues of stock?
b. Is a private placement more likely to be used for issues of seasoned stock or seasonedbonds by an industrial company?
c. Is shelf registration more likely to be used for issues of unseasoned stocks or bonds by alarge industrial company?
2. Underwriting. Each of the following terms is associated with one of the events beneath.Can you match them up?
a. Shelf registrationb. Firm commitmentc. Rights issue
A. The underwriter agrees to buy the issue from the company at a fixed price.B. The company offers to sell stock to existing stockholders.C. Several issues of the same security may be sold under the same registration.
3. Underwriting Costs. State for each of the following pairs of issues which you would expectto involve the lower proportionate underwriting and administrative costs, other things equal:
a. A large issue/a small issueb. A bond issue/a common stock issuec. A small private placement of bonds/a small general cash offer of bonds
4. IPO Costs. Why are the issue costs for debt issues generally less than those for equity is-sues?
5. Venture Capital. Why do venture capital companies prefer to advance money in stages?6. IPOs. Your broker calls and says that you can get 500 shares of an imminent IPO at the of-
fering price. Should you buy? Are you worried about the fact that your broker called you?
7. IPO Underpricing. Having heard about IPO underpricing, I put in an order to my brokerfor 1,000 shares of every IPO he can get for me. After 3 months, my investment record is asfollows:
Shares Allocated Price per InitialIPO to Me Share Return
A 500 $10 7%B 200 20 12C 1,000 8 –2D 0 12 23
a. What is the average underpricing of this sample of IPOs?b. What is the average initial return on my “portfolio” of shares purchased from the four
IPOs I bid on? Calculate the average initial return, weighting by the amount of money in-vested in each issue.
c. Why have I performed so poorly relative to the average initial return on the full sampleof IPOs? What lessons do you draw from my experience?
8. IPO Costs. Moonscape has just completed an initial public offering. The firm sold 3 mil-lion shares at an offer price of $8 per share. The underwriting spread was $.50 a share. The
Quiz
PracticeProblems
How Corporations Issue Securities 535
price of the stock closed at $11 per share at the end of the first day of trading. The firm in-curred $100,000 in legal, administrative, and other costs. What were flotation costs as a frac-tion of funds raised? Were flotation costs for Moonscape higher or lower than is typical forIPOs of this size (see Table 5.10)?
9. IPO Costs. Look at the illustrative new issue prospectus in the appendix.
a. Is this issue a primary offering, a secondary offering, or both?b. What are the direct costs of the issue as a percentage of the total proceeds? Are these
more than the average for an issue of this size?c. Suppose that on the first day of trading the price of Hotch Pot stock is $15 a share. What
are the total costs of the issue as a percentage of the market price?d. After paying her share of the expenses, how much will the firm’s president, Emma Lu-
cullus, receive from the sale? What will be the value of the shares that she retains in thecompany?
10. Flotation Costs. “For small issues of common stock, the costs of flotation amount to about15 percent of the proceeds. This means that the opportunity cost of external equity capital isabout 15 percentage points higher than that of retained earnings.” Does this follow?
11. Flotation Costs. When Microsoft went public, the company sold 2 million new shares (theprimary issue). In addition, existing shareholders sold .8 million shares (the secondary issue)and kept 21.1 million shares. The new shares were offered to the public at $21 and the un-derwriters received a spread of $1.31 a share. At the end of the first day’s trading the mar-ket price was $35 a share.
a. How much money did the company receive before paying its portion of the direct costs?b. How much did the existing shareholders receive from the sale before paying their portion
of the direct costs?c. If the issue had been sold to the underwriters for $30 a share, how many shares would the
company have needed to sell to raise the same amount of cash?d. How much better off would the existing shareholders have been?
12. Flotation Costs. The market value of the marketing research firm Fax Facts is $600 million.The firm issues an additional $100 million of stock, but as a result the stock price falls by 2percent. What is the cost of the price drop to existing shareholders as a fraction of the fundsraised?
13. Flotation Costs. Young Corporation stock currently sells for $30 per share. There are 1 mil-lion shares currently outstanding. The company announces plans to raise $3 million by of-fering shares to the public at a price of $30 per share.
a. If the underwriting spread is 8 percent, how many shares will the company need to issuein order to be left with net proceeds of $3 million?
b. If other administrative costs are $60,000 what is the dollar value of the total direct costsof the issue?
c. If the share price falls by 3 percent at the announcement of the plans to proceed with aseasoned offering, what is the dollar cost of the announcement effect?
14. Private Placements. You need to choose between the following types of issues:
A public issue of $10 million face value of 10-year debt. The interest rate on the debt wouldbe 8.5 percent and the debt would be issued at face value. The underwriting spread wouldbe 1.5 percent and other expenses would be $80,000.
A private placement of $10 million face value of 10-year debt. The interest rate on the private placement would be 9 percent but the total issuing expenses would be only$30,000.

536 SECTION FIVE
a. What is the difference in the proceeds to the company net of expenses?b. Other things equal, which is the better deal?c. What other factors beyond the interest rate and issue costs would you wish to consider
before deciding between the two offers?
15. Rights. In 2001 Pandora, Inc., makes a rights issue at a subscription price of $5 a share. Onenew share can be purchased for every four shares held. Before the issue there were 10 mil-lion shares outstanding and the share price was $6.
a. What is the total amount of new money raised?b. What is the expected stock price after the rights are issued?
16. Rights. Problem 15 contains details of a rights offering by Pandora. Suppose that the com-pany had decided to issue the new stock at $4 instead of $5 a share. How many new shareswould it have needed to raise the same sum of money? Recalculate the answers to problem15. Show that Pandora’s shareholders are just as well off if it issues the shares at $4 a sharerather than the $5 assumed in problem 15.
17. Rights. Consolidated Jewels needs to raise $2 million to pay for its Diamonds in the Roughcampaign. It will raise the funds by offering 200,000 rights, each of which entitles the owner tobuy one new share. The company currently has outstanding 1 million shares priced at $20 each.
a. What must be the subscription price on the rights the company plans to offer?b. What will be the share price after the rights issue?c. What is the value of a right to buy one share?d. How many rights would be issued to an investor who currently owns 1,000 shares?e. Show that the investor who currently holds 1,000 shares is unaffected by the rights issue.
Specifically, show that the value of the rights plus the value of the 1,000 shares after therights issue equals the value of the 1,000 shares before the rights issue.
18. Rights. Associated Breweries is planning to market unleaded beer. To finance the venture itproposes to make a rights issue with a subscription price of $10. One new share can be pur-chased for each two shares held. The company currently has outstanding 100,000 sharespriced at $40 a share. Assuming that the new money is invested to earn a fair return, givevalues for the
a. number of new sharesb. amount of new investmentc. total value of company after issued. total number of shares after issuee. share price after the issue
19. Venture Capital. Here is a difficult question. Pickwick Electronics is a new high-tech com-pany financed entirely by 1 million ordinary shares, all of which are owned by George Pick-wick. The firm needs to raise $1 million now for stage 1 and, assuming all goes well, a fur-ther $1 million at the end of 5 years for stage 2.
First Cookham Venture Partners is considering two possible financing schemes:
Buying 2 million shares now at their current valuation of $1.Buying 1 million shares at the current valuation and investing a further $1 million at
the end of 5 years at whatever the shares are worth.
The outlook for Pickwick is uncertain, but as long as the company can secure the additionalfinance for stage 2, it will be worth either $2 million or $12 million after completing stage
ChallengeProblem
How Corporations Issue Securities 537
2. (The company will be valueless if it cannot raise the funds for stage 2.) Show the possi-ble payoffs for Mr. Pickwick and First Cookham and explain why one scheme might be pre-ferred. Assume an interest rate of zero.
1 Unless the firm can secure second-stage financing, it is unlikely to succeed. If the entre-preneur is going to reap any reward on his own investment, he needs to put in enough ef-fort to get further financing. By accepting only part of the necessary venture capital, man-agement increases its own risk and reduces that of the venture capitalist. This decisionwould be costly and foolish if management lacked confidence that the project would besuccessful enough to get past the first stage. A credible signal by management is one thatonly managers who are truly confident can afford to provide. However, words are cheap andthere is little to be lost by saying that you are confident (although if you are proved wrong,you may find it difficult to raise money a second time).
2 If an investor can distinguish between overpriced and underpriced issues, she will bid onlyon the underpriced ones. In this case she will purchase only issues that provide a 10 percentgain. However, the ability to distinguish these issues requires considerable insight and re-search. The return to the informed IPO participant may be viewed as a return on the re-sources expended to become informed.
3 Direct expenses:
Underwriting spread = 69 million × $4 $ 276.0 millionOther expenses 9.2Total direct expenses $ 285.2 millionUnderpricing = 69 million × ($70 – $64) $ 414.0 millionTotal expenses $ 699.2 millionMarket value of issue = 69 million × $70 $4,830.0 million
Expenses as proportion of market value = 699.2/4,830 = .145 = 14.5%.4 Ten issues of $15 million each will cost about 9 percent of proceeds, or .09 × $150 million
= $13.5 million. One issue of $150 million will cost only 4 percent of $150 million, or $6million.
MINICASEPet.Com was founded in 1997 by two graduates of the Universityof Wisconsin with help from Georgina Sloberg, who had built upan enviable reputation for backing new start-up businesses.Pet.Com’s user-friendly system was designed to find buyers forunwanted pets. Within 3 years the company was generating rev-enues of $3.4 million a year, and, despite racking up sizable losses,was regarded by investors as one of the hottest new e-commercebusinesses. The news that the company was preparing to go pub-lic therefore generated considerable excitement.
The company’s entire equity capital of 1.5 million shares wasowned by the two founders and Ms. Sloberg. The initial public of-fering involved the sale of 500,000 shares by the three existingshareholders, together with the sale of a further 750,000 shares bythe company in order to provide funds for expansion.
The company estimated that the issue would involve legalfees, auditing, printing, and other expenses of $1.3 million, whichwould be shared proportionately between the selling shareholdersand the company. In addition, the company agreed to pay the un-derwriters a spread of $1.25 per share.
The roadshow had confirmed the high level of interest in theissue, and indications from investors suggested that the entireissue could be sold at a price of $24 a share. The underwriters,however, cautioned about being too greedy on price. Theypointed out that indications from investors were not the same asfirm orders. Also, they argued, it was much more important tohave a successful issue than to have a group of disgruntled share-holders. They therefore suggested an issue price of $18 a share.
That evening Pet.Com’s financial manager decided to run
Solutions toSelf-TestQuestions
538 SECTION FIVE
through some calculations. First she worked out the net receiptsto the company and the existing shareholders assuming that thestock was sold for $18 a share. Next she looked at the variouscosts of the IPO and tried to judge how they stacked up againstthe typical costs for similar IPOs. That brought her up against thequestion of underpricing. When she had raised the matter withthe underwriters that morning, they had dismissed the notion thatthe initial day’s return on an IPO should be considered part of theissue costs. One of the members of the underwriting team had
asked: “The underwriters want to see a high return and a highstock price. Would Pet.Com prefer a low stock price? Would thatmake the issue less costly?” Pet.Com’s financial manager was notconvinced but felt that she should have a good answer. She won-dered whether underpricing was only a problem because the ex-isting shareholders were selling part of their holdings. Perhapsthe issue price would not matter if they had not planned to sell.
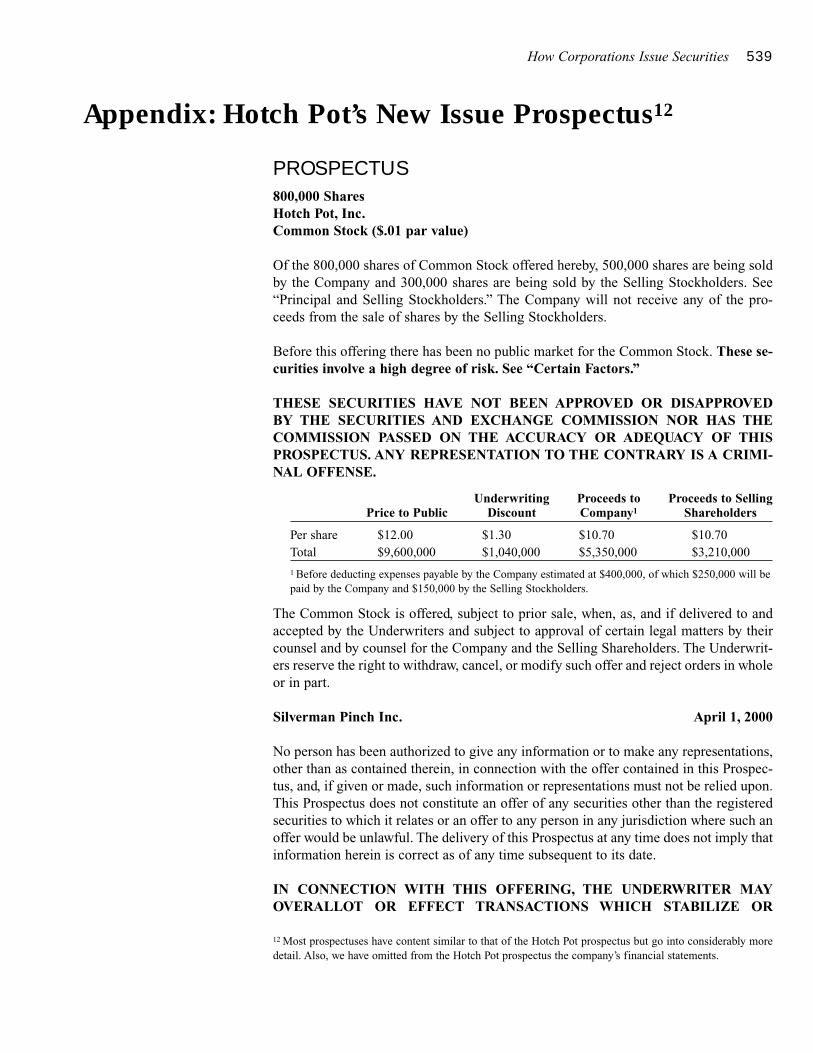
How Corporations Issue Securities 539
Appendix: Hotch Pot’s New Issue Prospectus12
PROSPECTUS
800,000 SharesHotch Pot, Inc.Common Stock ($.01 par value)
Of the 800,000 shares of Common Stock offered hereby, 500,000 shares are being soldby the Company and 300,000 shares are being sold by the Selling Stockholders. See“Principal and Selling Stockholders.” The Company will not receive any of the pro-ceeds from the sale of shares by the Selling Stockholders.
Before this offering there has been no public market for the Common Stock. These se-curities involve a high degree of risk. See “Certain Factors.”
THESE SECURITIES HAVE NOT BEEN APPROVED OR DISAPPROVED BY THE SECURITIES AND EXCHANGE COMMISSION NOR HAS THECOMMISSION PASSED ON THE ACCURACY OR ADEQUACY OF THISPROSPECTUS. ANY REPRESENTATION TO THE CONTRARY IS A CRIMI-NAL OFFENSE.
Underwriting Proceeds to Proceeds to SellingPrice to Public Discount Company1 Shareholders
Per share $12.00 $1.30 $10.70 $10.70Total $9,600,000 $1,040,000 $5,350,000 $3,210,000
1 Before deducting expenses payable by the Company estimated at $400,000, of which $250,000 will bepaid by the Company and $150,000 by the Selling Stockholders.
The Common Stock is offered, subject to prior sale, when, as, and if delivered to andaccepted by the Underwriters and subject to approval of certain legal matters by theircounsel and by counsel for the Company and the Selling Shareholders. The Underwrit-ers reserve the right to withdraw, cancel, or modify such offer and reject orders in wholeor in part.
Silverman Pinch Inc. April 1, 2000
No person has been authorized to give any information or to make any representations,other than as contained therein, in connection with the offer contained in this Prospec-tus, and, if given or made, such information or representations must not be relied upon.This Prospectus does not constitute an offer of any securities other than the registeredsecurities to which it relates or an offer to any person in any jurisdiction where such anoffer would be unlawful. The delivery of this Prospectus at any time does not imply thatinformation herein is correct as of any time subsequent to its date.
IN CONNECTION WITH THIS OFFERING, THE UNDERWRITER MAYOVERALLOT OR EFFECT TRANSACTIONS WHICH STABILIZE OR
12 Most prospectuses have content similar to that of the Hotch Pot prospectus but go into considerably moredetail. Also, we have omitted from the Hotch Pot prospectus the company’s financial statements.
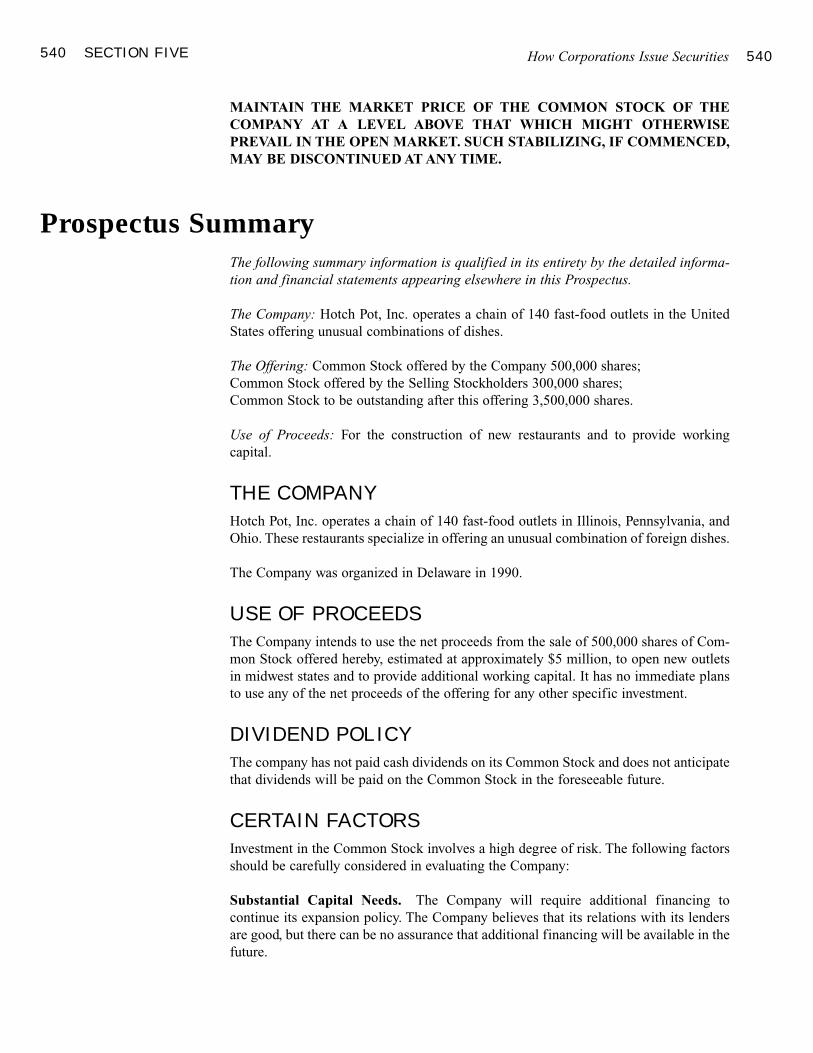
540 SECTION FIVE
MAINTAIN THE MARKET PRICE OF THE COMMON STOCK OF THECOMPANY AT A LEVEL ABOVE THAT WHICH MIGHT OTHERWISE PREVAIL IN THE OPEN MARKET. SUCH STABILIZING, IF COMMENCED,MAY BE DISCONTINUED AT ANY TIME.
Prospectus SummaryThe following summary information is qualified in its entirety by the detailed informa-tion and financial statements appearing elsewhere in this Prospectus.
The Company: Hotch Pot, Inc. operates a chain of 140 fast-food outlets in the UnitedStates offering unusual combinations of dishes.
The Offering: Common Stock offered by the Company 500,000 shares;Common Stock offered by the Selling Stockholders 300,000 shares;Common Stock to be outstanding after this offering 3,500,000 shares.
Use of Proceeds: For the construction of new restaurants and to provide working capital.
THE COMPANY
Hotch Pot, Inc. operates a chain of 140 fast-food outlets in Illinois, Pennsylvania, andOhio. These restaurants specialize in offering an unusual combination of foreign dishes.
The Company was organized in Delaware in 1990.
USE OF PROCEEDS
The Company intends to use the net proceeds from the sale of 500,000 shares of Com-mon Stock offered hereby, estimated at approximately $5 million, to open new outletsin midwest states and to provide additional working capital. It has no immediate plansto use any of the net proceeds of the offering for any other specific investment.
DIVIDEND POLICY
The company has not paid cash dividends on its Common Stock and does not anticipatethat dividends will be paid on the Common Stock in the foreseeable future.
CERTAIN FACTORS
Investment in the Common Stock involves a high degree of risk. The following factorsshould be carefully considered in evaluating the Company:
Substantial Capital Needs. The Company will require additional financing to continue its expansion policy. The Company believes that its relations with its lendersare good, but there can be no assurance that additional financing will be available in thefuture.
How Corporations Issue Securities 540
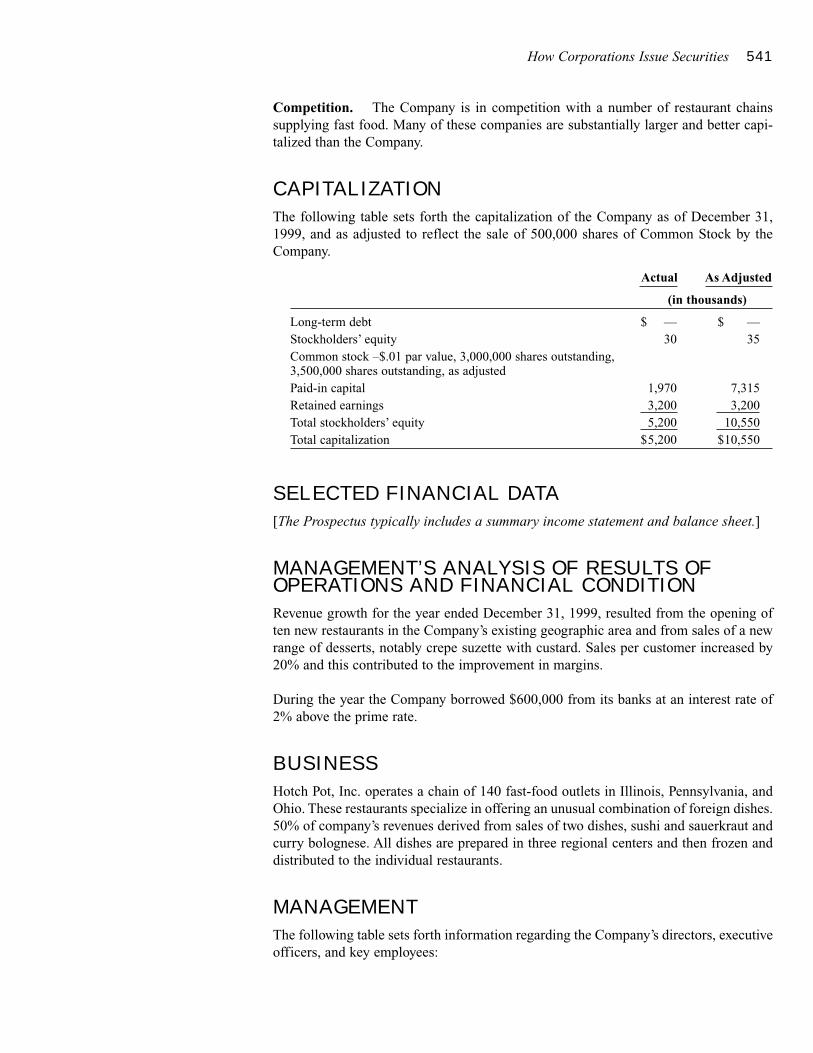
How Corporations Issue Securities 541
Competition. The Company is in competition with a number of restaurant chainssupplying fast food. Many of these companies are substantially larger and better capi-talized than the Company.
CAPITALIZATION
The following table sets forth the capitalization of the Company as of December 31,1999, and as adjusted to reflect the sale of 500,000 shares of Common Stock by theCompany.
Actual As Adjusted
(in thousands)
Long-term debt $ — $ —Stockholders’ equity 30 35Common stock –$.01 par value, 3,000,000 shares outstanding, 3,500,000 shares outstanding, as adjustedPaid-in capital 1,970 7,315Retained earnings 3,200 3,200Total stockholders’ equity 5,200 10,550Total capitalization $5,200 $10,550
SELECTED FINANCIAL DATA
[The Prospectus typically includes a summary income statement and balance sheet.]
MANAGEMENT’S ANALYSIS OF RESULTS OFOPERATIONS AND FINANCIAL CONDITION
Revenue growth for the year ended December 31, 1999, resulted from the opening often new restaurants in the Company’s existing geographic area and from sales of a newrange of desserts, notably crepe suzette with custard. Sales per customer increased by20% and this contributed to the improvement in margins.
During the year the Company borrowed $600,000 from its banks at an interest rate of2% above the prime rate.
BUSINESS
Hotch Pot, Inc. operates a chain of 140 fast-food outlets in Illinois, Pennsylvania, andOhio. These restaurants specialize in offering an unusual combination of foreign dishes.50% of company’s revenues derived from sales of two dishes, sushi and sauerkraut andcurry bolognese. All dishes are prepared in three regional centers and then frozen anddistributed to the individual restaurants.
MANAGEMENT
The following table sets forth information regarding the Company’s directors, executiveofficers, and key employees:
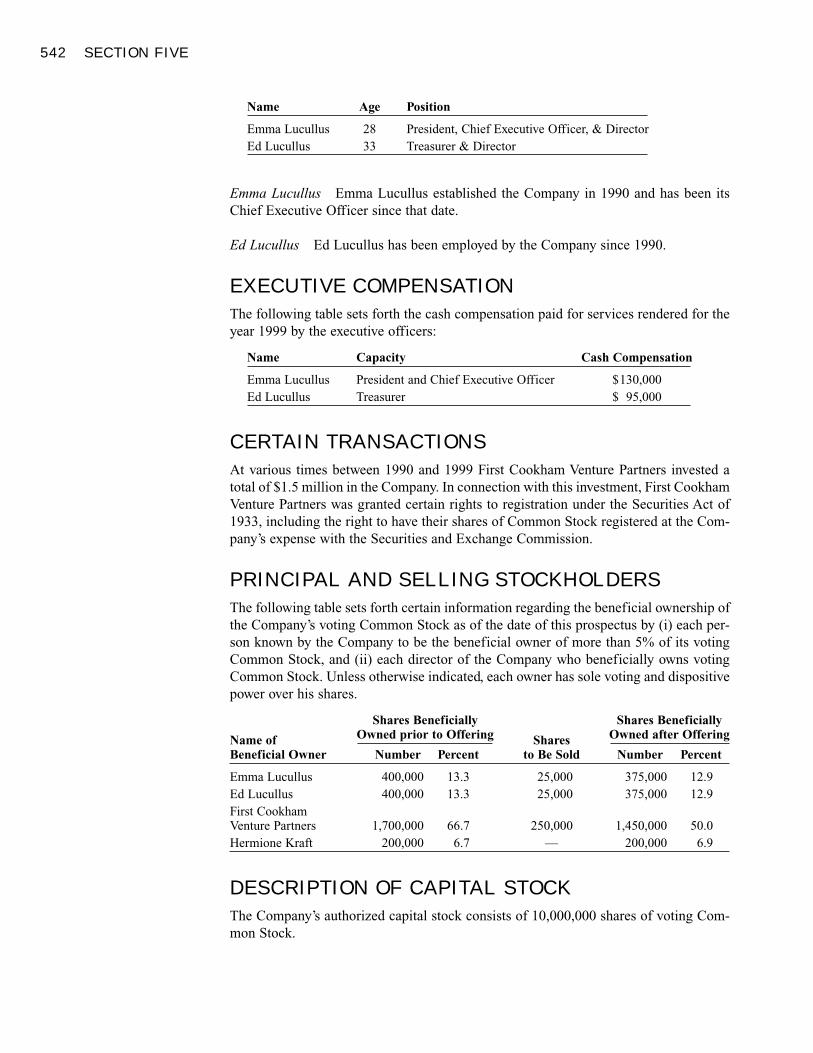
542 SECTION FIVE
Name Age Position
Emma Lucullus 28 President, Chief Executive Officer, & DirectorEd Lucullus 33 Treasurer & Director
Emma Lucullus Emma Lucullus established the Company in 1990 and has been itsChief Executive Officer since that date.
Ed Lucullus Ed Lucullus has been employed by the Company since 1990.
EXECUTIVE COMPENSATION
The following table sets forth the cash compensation paid for services rendered for theyear 1999 by the executive officers:
Name Capacity Cash Compensation
Emma Lucullus President and Chief Executive Officer $130,000Ed Lucullus Treasurer $ 95,000
CERTAIN TRANSACTIONS
At various times between 1990 and 1999 First Cookham Venture Partners invested atotal of $1.5 million in the Company. In connection with this investment, First CookhamVenture Partners was granted certain rights to registration under the Securities Act of1933, including the right to have their shares of Common Stock registered at the Com-pany’s expense with the Securities and Exchange Commission.
PRINCIPAL AND SELLING STOCKHOLDERS
The following table sets forth certain information regarding the beneficial ownership ofthe Company’s voting Common Stock as of the date of this prospectus by (i) each per-son known by the Company to be the beneficial owner of more than 5% of its votingCommon Stock, and (ii) each director of the Company who beneficially owns votingCommon Stock. Unless otherwise indicated, each owner has sole voting and dispositivepower over his shares.
Shares Beneficially Shares BeneficiallyOwned prior to Offering Owned after OfferingName of Shares
Beneficial Owner Number Percent to Be Sold Number Percent
Emma Lucullus 400,000 13.3 25,000 375,000 12.9Ed Lucullus 400,000 13.3 25,000 375,000 12.9First CookhamVenture Partners 1,700,000 66.7 250,000 1,450,000 50.0Hermione Kraft 200,000 6.7 — 200,000 6.9
DESCRIPTION OF CAPITAL STOCK
The Company’s authorized capital stock consists of 10,000,000 shares of voting Com-mon Stock.
How Corporations Issue Securities 543
As of the date of this Prospectus, there are 4 holders of record of the Common Stock.
Under the terms of one of the Company’s loan agreements, the Company may not paycash dividends on Common Stock except from net profits without the written consentof the lender.
UNDERWRITING
Subject to the terms and conditions set forth in the Underwriting Agreement, the Un-derwriter, Silverman Pinch Inc., has agreed to purchase from the Company and the Sell-ing Stockholders 800,000 shares of Common Stock.
There is no public market for the Common Stock. The price to the public for the Com-mon Stock was determined by negotiation between the Company and the Underwriterand was based on, among other things, the Company’s financial and operating historyand condition, its prospects, and the prospects for its industry in general, the manage-ment of the Company, and the market prices of securities for companies in businessessimilar to that of the Company.
LEGAL MATTERS
The validity of the shares of Common Stock offered by the Prospectus is being passedon for the Company by Blair, Kohl, and Chirac and for the Underwriter by ChretienHoward.
LEGAL PROCEEDINGS
Hotch Pot was served in January 2000 with a summons and complaint in an actioncommenced by a customer who alleges that consumption of the Company’s productscaused severe nausea and loss of feeling in both feet. The Company believes that thecomplaint is without foundation.
EXPERTS
The consolidated financial statements of the Company have been so included in re-liance on the reports of Hooper Firebrand, independent accountants, given on the au-thority of that firm as experts in auditing and accounting.
FINANCIAL STATEMENTS
[Text and tables omitted.]

Leasing
Leverage and Capital Structure
Appendix B


547
LEASING
548 APPENDIX B
1 In addition to arranging financing for asset users, captive finance companies (or subsidiaries) may purchasetheir parent company’s accounts receivable. General Motors Acceptance Corporation (GMAC) and GeneralElectric (GE) Capital are examples of captive finance companies.
LEASING VERSUS BUYING
As far as the lessee is concerned, it is the use of the asset that is important, not neces-sarily who has title to it. One way to obtain the use of an asset is to lease it. Anotherway is to obtain outside financing and buy it. Thus, the decision to lease or buy amountsto a comparison of alternative financing arrangements for the use of an asset.
Figure B.1 compares leasing and buying. The lessee, Sass Company, might be a hos-pital, a law firm, or any other firm that uses computers. The lessor is an independentleasing company that purchased the computer from a manufacturer such as Hewlett-Packard (HP). Leases of this type, in which the leasing company purchases the assetfrom the manufacturer, are called direct leases. Of course, HP might choose to lease itsown computers, and many companies, including HP and some of the other companiesmentioned previously, have set up wholly owned subsidiaries called captive financecompanies to lease out their products.1
As shown in Figure B.1, whether it leases or buys, Sass Company ends up using theasset. The key difference is that in one case (buy), Sass arranges the financing,
purchases the asset, and holds title to the asset. In the other case (lease), the leasingcompany arranges the financing, purchases the asset, and holds title to the asset.
OPERATING LEASES
Years ago, a lease in which the lessee received an equipment operator along with theequipment was called an operating lease. Today, an operating lease (or service lease)is difficult to define precisely, but this form of leasing has several important character-istics.
First of all, with an operating lease, the payments received by the lessor are usuallynot enough to allow the lessor to fully recover the cost of the asset. A primary reason isthat operating leases are often relatively short-term. Therefore, the life of the lease maybe much shorter than the economic life of the asset. For example, if you lease a car fortwo years, the car will have a substantial residual value at the end of the lease, and thelease payments you make will pay off only a fraction of the original cost of the car. Thelessor in an operating lease expects to either lease the asset again or sell it when thelease terminates.
A second characteristic of an operating lease is that it frequently requires that the les-sor maintain the asset. The lessor may also be responsible for any taxes or insurance. Ofcourse, these costs will be passed on, at least in part, to the lessee in the form of higherlease payments.
The third, and perhaps most interesting, feature of an operating lease is the cancela-tion option. This option can give the lessee the right to cancel the lease before the ex-piration date. If the option to cancel is exercised, the lessee returns the equipment to thelessor and ceases to make payments. The value of a cancelation clause depends onwhether technological and/or economic conditions are likely to make the value of theasset to the lessee less than the present value of the future lease payments under thelease.
To leasing practitioners, these three characteristics define an operating lease. How-ever, as we will see shortly, accountants use the term in a somewhat different way.
OPERATING LEASEUsually a shorter-term leaseunder which the lessor isresponsible for insurance,taxes, and upkeep. May becancelable by the lessee onshort notice.
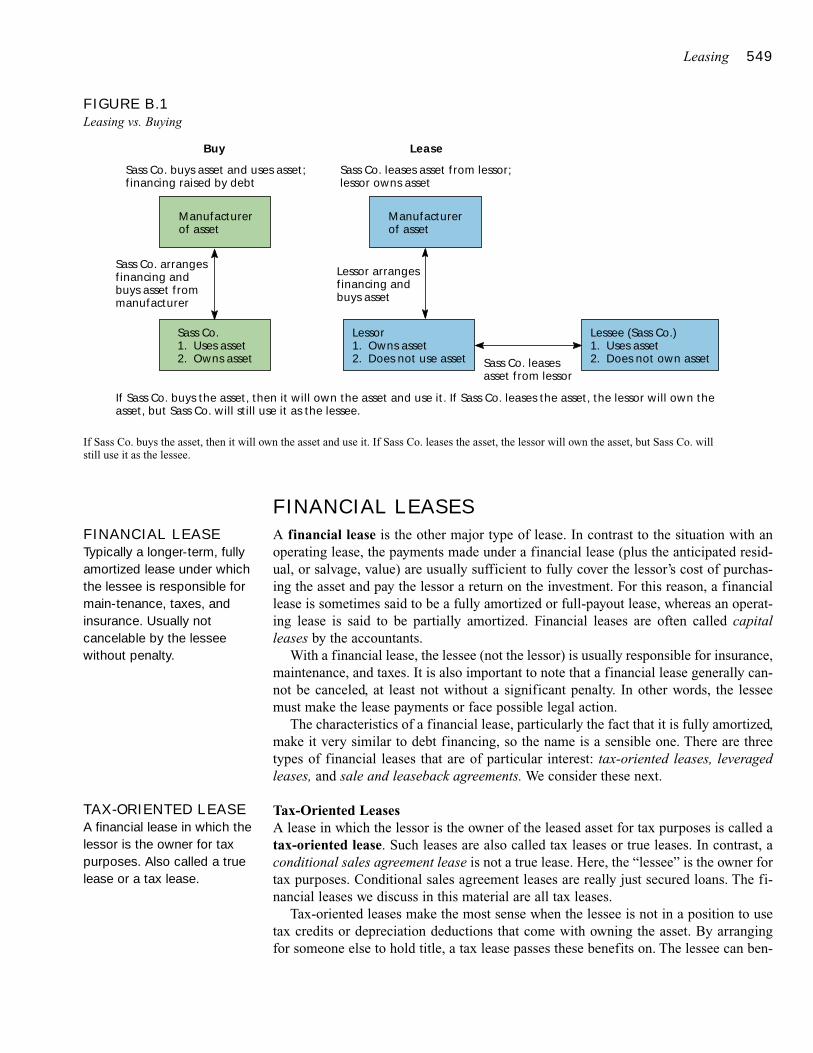
Leasing 549
FINANCIAL LEASES
A financial lease is the other major type of lease. In contrast to the situation with anoperating lease, the payments made under a financial lease (plus the anticipated resid-ual, or salvage, value) are usually sufficient to fully cover the lessor’s cost of purchas-ing the asset and pay the lessor a return on the investment. For this reason, a financiallease is sometimes said to be a fully amortized or full-payout lease, whereas an operat-ing lease is said to be partially amortized. Financial leases are often called capitalleases by the accountants.
With a financial lease, the lessee (not the lessor) is usually responsible for insurance,maintenance, and taxes. It is also important to note that a financial lease generally can-not be canceled, at least not without a significant penalty. In other words, the lesseemust make the lease payments or face possible legal action.
The characteristics of a financial lease, particularly the fact that it is fully amortized,make it very similar to debt financing, so the name is a sensible one. There are threetypes of financial leases that are of particular interest: tax-oriented leases, leveragedleases, and sale and leaseback agreements. We consider these next.
Tax-Oriented LeasesA lease in which the lessor is the owner of the leased asset for tax purposes is called atax-oriented lease. Such leases are also called tax leases or true leases. In contrast, aconditional sales agreement lease is not a true lease. Here, the “lessee” is the owner fortax purposes. Conditional sales agreement leases are really just secured loans. The fi-nancial leases we discuss in this material are all tax leases.
Tax-oriented leases make the most sense when the lessee is not in a position to usetax credits or depreciation deductions that come with owning the asset. By arrangingfor someone else to hold title, a tax lease passes these benefits on. The lessee can ben-
FIGURE B.1Leasing vs. Buying
Sass Co. buys asset and uses asset;financing raised by debt
Buy
Sass Co. leases asset from lessor;lessor owns asset
Lease
Manufacturerof asset
Manufacturerof asset
Sass Co. arranges financing andbuys asset from manufacturer
Lessor arranges financing andbuys asset
Sass Co.1. Uses asset2. Owns asset
Lessor1. Owns asset2. Does not use asset
Lessee (Sass Co.)1. Uses asset2. Does not own assetSass Co. leases
asset from lessor
If Sass Co. buys the asset, then it will own the asset and use it. If Sass Co. leases the asset, the lessor will own the asset, but Sass Co. will still use it as the lessee.
If Sass Co. buys the asset, then it will own the asset and use it. If Sass Co. leases the asset, the lessor will own the asset, but Sass Co. willstill use it as the lessee.
FINANCIAL LEASETypically a longer-term, fullyamortized lease under whichthe lessee is responsible formain-tenance, taxes, andinsurance. Usually notcancelable by the lesseewithout penalty.
TAX-ORIENTED LEASEA financial lease in which thelessor is the owner for taxpurposes. Also called a truelease or a tax lease.
550 APPENDIX B
efit because the lessor may return a portion of the tax benefits to the lessee in the formof lower lease costs.
Leveraged LeasesA leveraged lease is a tax-oriented lease in which the lessor borrows a substantial por-tion of the purchase price of the leased asset on a nonrecourse basis, meaning that if thelessee stops making the lease payments, the lessor does not have to keep making theloan payments. Instead, the lender must proceed against the lessee to recover its invest-ment. In contrast, with a single-investor lease, if the lessor borrows to purchase theasset, the lessor remains responsible for the loan payments regardless of whether or notthe lessee makes the lease payments.
Sale and Leaseback AgreementsA sale and leaseback occurs when a company sells an asset it owns to another partyand immediately leases it back. In a sale and leaseback, two things happen:
1. The lessee receives cash from the sale of the asset.2. The lessee continues to use the asset.
Often, with a sale and leaseback, the lessee may have the option to repurchase theleased asset at the end of the lease.
An example of a sale and leaseback occurred in July 1985 when the city of Oakland,California, used the proceeds from the sale of its city hall and 23 other buildings to helpmeet the liabilities of its $150 million Police and Retirement System, which was un-derfunded by about $60 million. As part of the same transaction, Oakland leased backthe buildings to provide for their continued use.
A little more recently, in March 1998, cash-strapped Korean Airlines announcedplans to sell 14 of its aircraft and then lease them back from the purchaser. Althoughthe purchaser was not revealed, it was widely understood that KAL was working withGeneral Electric Capital Aviation Services, one of the largest lessors specializing in air-craft. Under terms of the deal, KAL would raise about $386 million in badly neededcash without giving up control of its planes.
CONCEPT QUESTIONS
• What are the differences between an operating lease and a financial lease?
• What is a tax-oriented lease?
• What is a sale and leaseback agreement?
Accounting and LeasingBefore November 1976, leasing was frequently called off–balance sheet financing. Asthe name implies, a firm could arrange to use an asset through a lease and not neces-sarily disclose the existence of the lease contract on the balance sheet. Lessees had toreport information on leasing activity only in the footnotes to their financial statements.
In November 1976, the Financial Accounting Standards Board (FASB) issued itsStatement of Financial Accounting Standards No. 13 (FASB 13), “Accounting forLeases.” The basic idea of FASB 13 is that certain financial leases must be “capital-
LEVERAGED LEASE Afinancial lease in which thelessor borrows a substantialfraction of the cost of theleased asset on anonrecourse basis.
SALE AND LEASEBACKA financial lease in which thelessee sells an asset to thelessor and then leases itback.
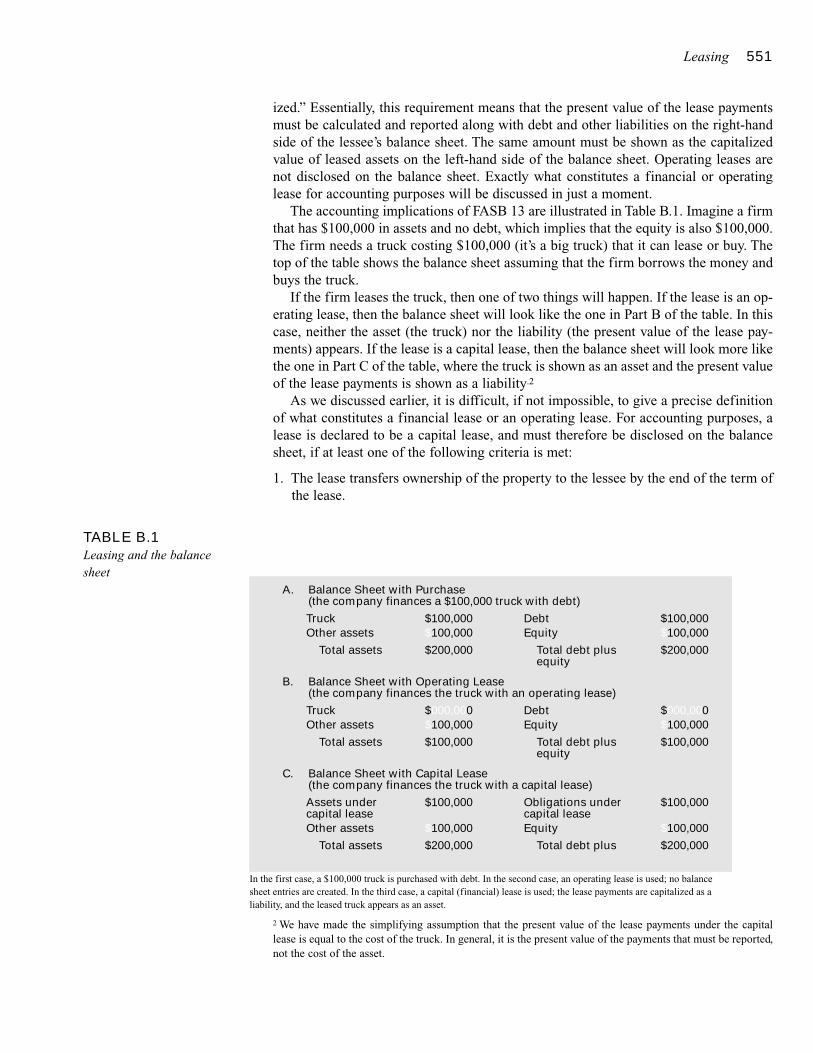
Leasing 551
ized.” Essentially, this requirement means that the present value of the lease paymentsmust be calculated and reported along with debt and other liabilities on the right-handside of the lessee’s balance sheet. The same amount must be shown as the capitalizedvalue of leased assets on the left-hand side of the balance sheet. Operating leases arenot disclosed on the balance sheet. Exactly what constitutes a financial or operatinglease for accounting purposes will be discussed in just a moment.
The accounting implications of FASB 13 are illustrated in Table B.1. Imagine a firmthat has $100,000 in assets and no debt, which implies that the equity is also $100,000.The firm needs a truck costing $100,000 (it’s a big truck) that it can lease or buy. Thetop of the table shows the balance sheet assuming that the firm borrows the money andbuys the truck.
If the firm leases the truck, then one of two things will happen. If the lease is an op-erating lease, then the balance sheet will look like the one in Part B of the table. In thiscase, neither the asset (the truck) nor the liability (the present value of the lease pay-ments) appears. If the lease is a capital lease, then the balance sheet will look more likethe one in Part C of the table, where the truck is shown as an asset and the present valueof the lease payments is shown as a liability.2
As we discussed earlier, it is difficult, if not impossible, to give a precise definitionof what constitutes a financial lease or an operating lease. For accounting purposes, alease is declared to be a capital lease, and must therefore be disclosed on the balancesheet, if at least one of the following criteria is met:
1. The lease transfers ownership of the property to the lessee by the end of the term ofthe lease.
2 We have made the simplifying assumption that the present value of the lease payments under the capitallease is equal to the cost of the truck. In general, it is the present value of the payments that must be reported,not the cost of the asset.
A. Balance Sheet with Purchase(the company finances a $100,000 truck with debt)
Truck $100,000 Debt $100,000Other assets $100,000 Equity $100,000
Total assets $200,000 Total debt plus $200,000equity
B. Balance Sheet with Operating Lease(the company finances the truck with an operating lease)
Truck $000,000 Debt $000,000Other assets $100,000 Equity $100,000
Total assets $100,000 Total debt plus $100,000equity
C. Balance Sheet with Capital Lease(the company finances the truck with a capital lease)
Assets under $100,000 Obligations under $100,000capital lease capital leaseOther assets $100,000 Equity $100,000
Total assets $200,000 Total debt plus $200,000
TABLE B.1Leasing and the balancesheet
In the first case, a $100,000 truck is purchased with debt. In the second case, an operating lease is used; no balancesheet entries are created. In the third case, a capital (financial) lease is used; the lease payments are capitalized as aliability, and the leased truck appears as an asset.
552 APPENDIX B
2. The lessee can purchase the asset at a price below fair market value (bargain pur-chase price option) when the lease expires.
3. The lease term is 75 percent or more of the estimated economic life of the asset.4. The present value of the lease payments is at least 90 percent of the fair market value
of the asset at the start of the lease.
If one or more of the four criteria are met, the lease is a capital lease; otherwise, itis an operating lease for accounting purposes.
A firm might be tempted to try and “cook the books” by taking advantage of thesomewhat arbitrary distinction between operating leases and capital leases. Suppose atrucking firm wants to lease a $100,000 truck. The truck is expected to last for 15 years.A (perhaps unethical) financial manager could try to negotiate a lease contract for 10years with lease payments having a present value of $89,000. These terms would getaround Criteria 3 and 4. If Criteria 1 and 2 were similarly circumvented, the arrange-ment would be an operating lease and would not show up on the balance sheet.
There are several alleged benefits from “hiding” financial leases. One of the advan-tages of keeping leases off the balance sheet has to do with fooling financial analysts,creditors, and investors. The idea is that if leases are not on the balance sheet, they willnot be noticed.
Financial managers who devote substantial effort to keeping leases off the balancesheet are probably wasting time. Of course, if leases are not on the balance sheet, tra-ditional measures of financial leverage, such as the ratio of total debt to total assets, willunderstate the true degree of financial leverage. As a consequence, the balance sheetwill appear “stronger” than it really is. But it seems unlikely that this type of manipu-lation would mislead many people.
CONCEPT QUESTIONS
• For accounting purposes, what constitutes a capital lease?
• How are capital leases reported?
Taxes, the IRS and LeasesThe lessee can deduct lease payments for income tax purposes if the lease is deemed tobe a true lease by the Internal Revenue Service. The tax shields associated with leasepayments are critical to the economic viability of a lease, so IRS guidelines are an im-portant consideration.
Essentially, the IRS requires that a lease be primarily for business purposes and notmerely for purposes of tax avoidance.
In broad terms, a lease that is valid from the IRS’s perspective will meet the follow-ing standards:
1. The term of the lease must be less than 80 percent of the economic life of the asset.If the term is greater than this, the transaction will be regarded as a conditional sale.
2. The lease should not include an option to acquire the asset at the end of the leaseterm at a price below the asset’s then–fair market value. This type of bargain optionwould give the lessee the asset’s residual scrap value, implying an equity interest.
3. The lease should not have a schedule of payments that are very high at the start of
Leasing 553
the lease term and thereafter very low. If the lease requires early “balloon” pay-ments, this will be considered evidence that the lease is being used to avoid taxesand not for a legitimate business purpose. The IRS may require an adjustment in thepayments for tax purposes in such cases.
4. The lease payments must provide the lessor with a fair market rate of return. Theprofit potential of the lease to the lessor should be apart from the deal’s tax benefits.
5. Renewal options must be reasonable and reflect the fair market value of the asset atthe time of renewal. This requirement can be met by, for example, granting the les-see the first option to meet a competing outside offer.
The IRS is concerned about lease contracts because leases sometimes appear to beset up solely to defer taxes. To see how this could happen, suppose that a firm plans topurchase a $1 million bus that has a five-year life for depreciation purposes. Assumethat straight-line depreciation to a zero salvage value is used. The depreciation expensewould be $200,000 per year. Now suppose the firm can lease the bus for $500,000 peryear for two years and buy the bus for $1 at the end of the two-year term. The presentvalue of the tax benefits is clearly less if the bus is bought than if the bus is leased. Thespeedup of lease payments greatly benefits the firm and basically gives it a form of ac-celerated depreciation. In this case, the IRS might decide that the primary purpose ofthe lease was to defer taxes.
CONCEPT QUESTIONS
• Why is the IRS concerned about leasing?
• What are some of the standards the IRS uses in evaluating a lease?
The Cash Flows from LeasingTo begin our analysis of the leasing decision, we need to identify the relevant cashflows. The first part of this section illustrates how this is done. A key point, and one towatch for, is that taxes are a very important consideration in a lease analysis.
THE INCREMENTAL CASH FLOWS
Consider the decision confronting the Tasha Corporation, which manufactures pipe.Business has been expanding, and Tasha currently has a five-year backlog of pipe or-ders for the Trans-Missouri Pipeline.
The International Boring Machine Corporation (IBMC) makes a pipe-boring ma-chine that can be purchased for $10,000. Tasha has determined that it needs a new ma-chine, and the IBMC model will save Tasha $6,000 per year in reduced electricity billsfor the next five years.
Tasha has a corporate tax rate of 34 percent. For simplicity, we assume that five-yearstraight-line depreciation will be used for the pipe-boring machine, and, after five years,the machine will be worthless. Johnson Leasing Corporation has offered to lease thesame pipe-boring machine to Tasha for lease payments of $2,500 paid at the end of eachof the next five years. With the lease, Tasha would remain responsible for maintenance,insurance, and operating expenses.3
3 We have assumed that all lease payments are made in arrears, that is, at the end of the year. Actually, manyleases require payments to be made at the beginning of the year.
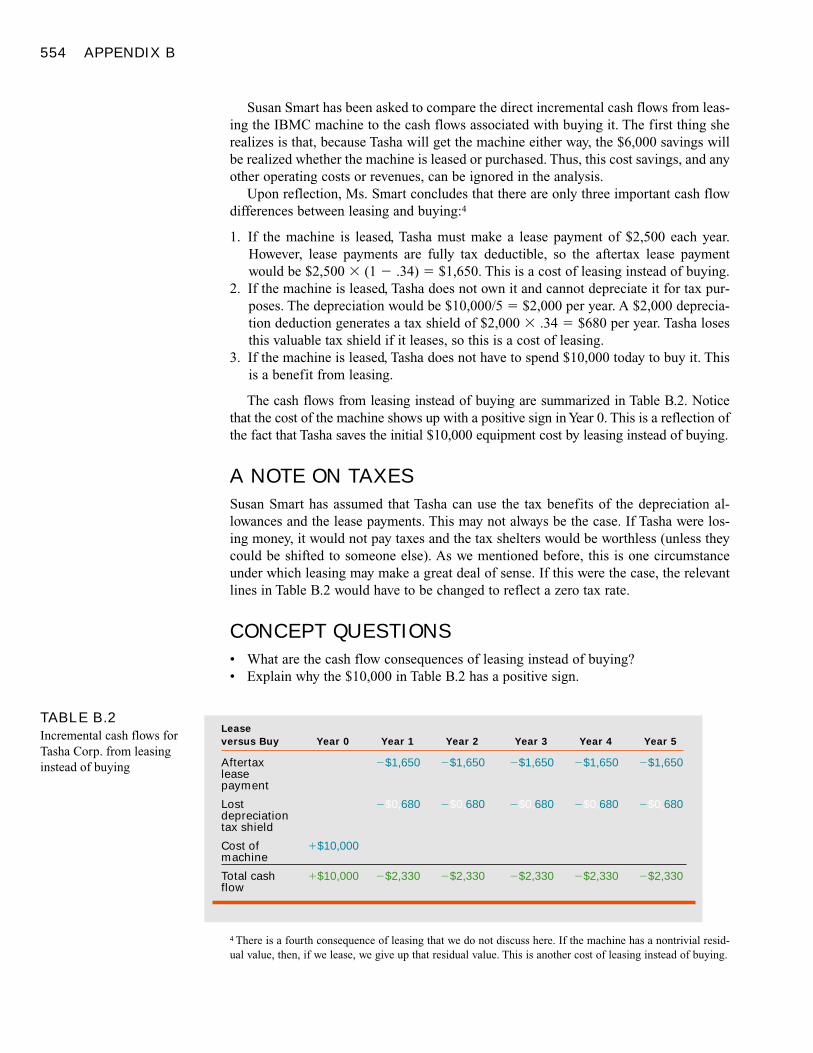
554 APPENDIX B
Susan Smart has been asked to compare the direct incremental cash flows from leas-ing the IBMC machine to the cash flows associated with buying it. The first thing sherealizes is that, because Tasha will get the machine either way, the $6,000 savings willbe realized whether the machine is leased or purchased. Thus, this cost savings, and anyother operating costs or revenues, can be ignored in the analysis.
Upon reflection, Ms. Smart concludes that there are only three important cash flowdifferences between leasing and buying:4
1. If the machine is leased, Tasha must make a lease payment of $2,500 each year.However, lease payments are fully tax deductible, so the aftertax lease paymentwould be $2,500 � (1 � .34) � $1,650. This is a cost of leasing instead of buying.
2. If the machine is leased, Tasha does not own it and cannot depreciate it for tax pur-poses. The depreciation would be $10,000/5 � $2,000 per year. A $2,000 deprecia-tion deduction generates a tax shield of $2,000 � .34 � $680 per year. Tasha losesthis valuable tax shield if it leases, so this is a cost of leasing.
3. If the machine is leased, Tasha does not have to spend $10,000 today to buy it. Thisis a benefit from leasing.
The cash flows from leasing instead of buying are summarized in Table B.2. Noticethat the cost of the machine shows up with a positive sign in Year 0. This is a reflection ofthe fact that Tasha saves the initial $10,000 equipment cost by leasing instead of buying.
A NOTE ON TAXES
Susan Smart has assumed that Tasha can use the tax benefits of the depreciation al-lowances and the lease payments. This may not always be the case. If Tasha were los-ing money, it would not pay taxes and the tax shelters would be worthless (unless theycould be shifted to someone else). As we mentioned before, this is one circumstanceunder which leasing may make a great deal of sense. If this were the case, the relevantlines in Table B.2 would have to be changed to reflect a zero tax rate.
CONCEPT QUESTIONS
• What are the cash flow consequences of leasing instead of buying?• Explain why the $10,000 in Table B.2 has a positive sign.
4 There is a fourth consequence of leasing that we do not discuss here. If the machine has a nontrivial resid-ual value, then, if we lease, we give up that residual value. This is another cost of leasing instead of buying.
Leaseversus Buy Year 0 Year 1 Year 2 Year 3 Year 4 Year 5
Aftertax �$1,650 �$1,650 �$1,650 �$1,650 �$1,650leasepayment
Lost �$0,680 �$0,680 �$0,680 �$0,680 �$0,680depreciationtax shield
Cost of �$10,000machine
Total cash �$10,000 �$2,330 �$2,330 �$2,330 �$2,330 �$2,330flow
TABLE B.2Incremental cash flows forTasha Corp. from leasinginstead of buying
Leasing 555
Lease or Buy?Based on our discussion thus far, Ms. Smart’s analysis comes down to this: if TashaCorp. leases instead of buying, it saves $10,000 today because it avoids having to payfor the machine, but it must give up $2,330 per year for the next five years in exchange.We now must decide whether getting $10,000 today and then paying back $2,330 peryear is a good idea.
A PRELIMINARY ANALYSIS
Suppose Tasha were to borrow $10,000 today and promise to make aftertax paymentsof $2,330 per year for the next five years. This is essentially what Tasha will be doingif it leases instead of buying. What interest rate would Tasha be paying on this “loan”?Note that we need to find the unknown rate for a five-year annuity with payments of$2,330 per year and a present value of $10,000. It is easy to verify that the rate is 5.317percent.
Suppose Tasha were to borrow $10,000 today and promise to make aftertax pay-ments of $2,330 per year for the next five years. This is essentially what Tasha will bedoing if it leases instead of buying. What interest rate would Tasha be paying on this“loan”? Note that we need to find the unknown rate for a five-year annuity with pay-ments of $2,330 per year and a present value of $10,000. It is easy to verify that the rateis 5.317 percent.
The cash flows for our hypothetical loan are identical to the cash flows from leasinginstead of buying, and what we have illustrated is that when Tasha leases the machine,it effectively arranges financing at an aftertax rate of 5.317 percent. Whether this is agood deal or not depends on what rate Tasha would pay if it simply borrowed the money.For example, suppose Tasha can arrange a five-year loan with its bank at a rate of7.57575 percent. Should Tasha sign the lease or should it go with the bank?
Because Tasha is in a 34 percent tax bracket, the aftertax interest rate would be7.57575 � (1 � .34) = 5 percent. This is less than the 5.317 percent implicit aftertaxrate on the lease. In this particular case, Tasha would be better off borrowing the moneybecause it would get a better rate.
We have seen that Tasha should buy rather than lease. The steps in our analysis canbe summarized as follows:
1. Calculate the incremental aftertax cash flows from leasing instead of buying.2. Use these cash flows to calculate the implicit aftertax interest rate on the lease.3. Compare this rate to the company’s aftertax borrowing cost and choose the cheaper
source of financing.
The most important thing to note from our discussion thus far is that in evaluating alease, the relevant rate for the comparison is the company’s aftertax borrowing rate. Thefundamental reason is that the alternative to leasing is long-term borrowing, so the af-tertax interest rate on such borrowing is the relevant benchmark.
THREE POTENTIAL PITFALLS
There are three potential problems with the implicit rate that we calculated on the lease.First of all, we can interpret this rate as the internal rate of return, or IRR, on the deci-sion to lease rather than buy, but doing so can be confusing. To see why, notice that the
556 APPENDIX B
IRR from leasing is 5.317 percent, which is greater than Tasha’s aftertax borrowing costof 5 percent. Normally, the higher the IRR, the better, but we decided that leasing wasa bad idea here. The reason is that the cash flows are not conventional; the first cashflow is positive and the rest are negative, which is just the opposite of the conventionalcase. With this cash flow pattern, the IRR represents the rate we pay, not the rate we get,so the lower the IRR, the better.
A second, and related, potential pitfall has to do with the fact that we calculated theadvantage of leasing instead of buying. We could have done just the opposite and comeup with the advantage of buying instead of leasing. If we did this, the cash flows wouldbe the same, but the signs would be reversed. The IRR would be the same. Now, how-ever, the cash flows would be conventional, so we could interpret the 5.317 percent IRRas saying that borrowing and buying is better.
The third potential problem is that our implicit rate is based on the net cash flows ofleasing instead of buying. There is another rate that is sometimes calculated, which isbased solely on the lease payments. If we wanted to, we could note that the lease pro-vides $10,000 in financing and requires five payments of $2,500 each. It would betempting to then determine an implicit rate based on these numbers, but the resultingrate would not be meaningful for making lease versus buy decisions, and it should notbe confused with the implicit return on leasing instead of borrowing and buying.
Perhaps because of these potential sources of confusion, the IRR approach we haveoutlined thus far is not as widely used as the NPV-based approach that we describe next.
NPV ANALYSIS
Now that we know that the relevant rate for evaluating a lease versus buy decision is thefirm’s aftertax borrowing cost, an NPV analysis is straightforward. We simply discountthe cash flows back to the present at Tasha’s aftertax borrowing rate of 5 percent as fol-lows:
NPV � $10,000 � 2,330 � (1 � 1/1.055)/.05
� �$87.68
The NPV from leasing instead of buying is 2$87.68, verifying our earlier conclusionthat leasing is a bad idea. Once again, notice the signs of the cash flows; the first is pos-itive, the rest are negative. The NPV we have computed here is often called the net ad-vantage to leasing (NAL). Surveys indicate that the NAL approach is the most popu-lar means of lease analysis in the real world.
A MISCONCEPTION
In our lease versus buy analysis, it looks as though we ignored the fact that if Tasha bor-rows the $10,000 to buy the machine, it will have to repay the money with interest. Infact, we reasoned that if Tasha leased the machine, it would be better off by $10,000today because it wouldn’t have to pay for the machine. It is tempting to argue that ifTasha borrowed the money, it wouldn’t have to come up with the $10,000. Instead,Tasha would make a series of principal and interest payments over the next five years.This observation is true, but not particularly relevant. The reason is that if Tasha bor-rows $10,000 at an aftertax cost of 5 percent, the present value of the aftertax loan pay-ments is simply $10,000, no matter what the repayment schedule is (assuming that the
NET ADVANTAGE TOLEASING (NAL) TheNPV that is calculated whendeciding whether to lease anasset or to buy it.
Leasing 557
loan is fully amortized). Thus, we could write down the aftertax loan repayments andwork with these, but it would just be extra work for no gain.
LEASE EVALUATION
In our Tasha Corp. example, suppose Tasha is able to negotiate a lease payment of$2,000 per year. What would be the NPV of the lease in this case?
With this new lease payment, the aftertax lease payment would be $2,000 � (1 �.34) � $1,320, which is $1,650 � 1,320 � $330 less than before. Referring back toTable B.2, note that the aftertax cash flows would be �$2,000 instead of �$2,330. At5 percent, the NPV would be:
NPV � $10,000 � 2,000 � (1 � 1/1.055)/.05� �$1341.05
Thus, the lease is very attractive.
CONCEPT QUESTIONS
• What is the relevant discount rate for evaluating whether or not to lease an asset? Why?
• Explain how to go about a lease versus buy analysis.

559
LEVERAGE AND CAPITALSTRUCTURE
560 APPENDIX B
The Capital Structure QuestionHow should a firm go about choosing its debt-equity ratio? Here, as always, we assumethat the guiding principle is to choose the course of action that maximizes the value ofa share of stock. However, when it comes to capital structure decisions, this is essen-tially the same thing as maximizing the value of the whole firm, and, for convenience,we will tend to frame our discussion in terms of firm value.
The WACC (Weighted Average Cost of Capital) tells us that the firm’s overall costof capital is a weighted average of the costs of the various components of the firm’s cap-ital structure. When we described the WACC, we took the firm’s capital structure asgiven. Thus, one important issue that we will want to explore is what happens to the costof capital when we vary the amount of debt financing, or the debt-equity ratio.
A primary reason for studying the WACC is that the value of the firm is maximizedwhen the WACC is minimized. The WACC is the discount rate appropriate for the firm’soverall cash flows. Since values and discount rates move in opposite directions, mini-mizing the WACC will maximize the value of the firm’s cash flows.
Thus, we will want to choose the firm’s capital structure so that the WACC is mini-mized. For this reason, we will say that one capital structure is better than another if itresults in a lower weighted average cost of capital. Further, we say that a particular debt-equity ratio represents the optimal capital structure if it results in the lowest possibleWACC. This optimal capital structure is sometimes called the firm’s target capitalstructure as well.
CONCEPT QUESTIONS
• What is the relationship between the WACC and the value of the firm?
• What is an optimal capital structure?
The Effect of Financial LeverageIn this section, we examine the impact of financial leverage on the payoffs to stock-holders. As you may recall, financial leverage refers to the extent to which a firm relieson debt. The more debt financing a firm uses in its capital structure, the more financialleverage it employs.
As we describe, financial leverage can dramatically alter the payoffs to shareholdersin the firm. Remarkably, however, financial leverage may not affect the overall cost ofcapital. If this is true, then a firm’s capital structure is irrelevant because changes in cap-ital structure won’t affect the value of the firm.
THE IMPACT OF FINANCIAL LEVERAGE
We start by illustrating how financial leverage works. For now, we ignore the impact oftaxes. Also, for ease of presentation, we describe the impact of leverage in terms of itseffects on earnings per share, EPS, and return on equity, ROE. These are, of course, ac-counting numbers and, as such, are not our primary concern. Using cash flows insteadof these accounting numbers would lead to precisely the same conclusions, but a littlemore work would be needed.
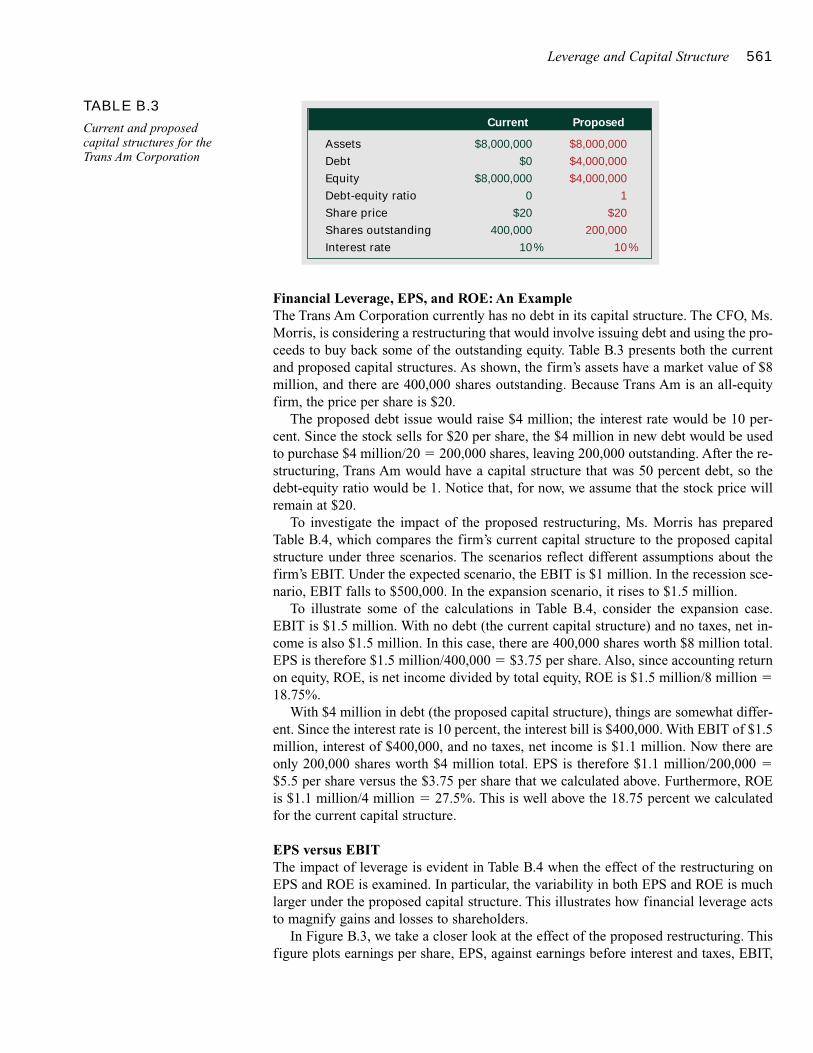
Leverage and Capital Structure 561
Financial Leverage, EPS, and ROE: An ExampleThe Trans Am Corporation currently has no debt in its capital structure. The CFO, Ms.Morris, is considering a restructuring that would involve issuing debt and using the pro-ceeds to buy back some of the outstanding equity. Table B.3 presents both the currentand proposed capital structures. As shown, the firm’s assets have a market value of $8million, and there are 400,000 shares outstanding. Because Trans Am is an all-equityfirm, the price per share is $20.
The proposed debt issue would raise $4 million; the interest rate would be 10 per-cent. Since the stock sells for $20 per share, the $4 million in new debt would be usedto purchase $4 million/20 � 200,000 shares, leaving 200,000 outstanding. After the re-structuring, Trans Am would have a capital structure that was 50 percent debt, so thedebt-equity ratio would be 1. Notice that, for now, we assume that the stock price willremain at $20.
To investigate the impact of the proposed restructuring, Ms. Morris has preparedTable B.4, which compares the firm’s current capital structure to the proposed capitalstructure under three scenarios. The scenarios reflect different assumptions about thefirm’s EBIT. Under the expected scenario, the EBIT is $1 million. In the recession sce-nario, EBIT falls to $500,000. In the expansion scenario, it rises to $1.5 million.
To illustrate some of the calculations in Table B.4, consider the expansion case.EBIT is $1.5 million. With no debt (the current capital structure) and no taxes, net in-come is also $1.5 million. In this case, there are 400,000 shares worth $8 million total.EPS is therefore $1.5 million/400,000 � $3.75 per share. Also, since accounting returnon equity, ROE, is net income divided by total equity, ROE is $1.5 million/8 million �18.75%.
With $4 million in debt (the proposed capital structure), things are somewhat differ-ent. Since the interest rate is 10 percent, the interest bill is $400,000. With EBIT of $1.5million, interest of $400,000, and no taxes, net income is $1.1 million. Now there areonly 200,000 shares worth $4 million total. EPS is therefore $1.1 million/200,000 �$5.5 per share versus the $3.75 per share that we calculated above. Furthermore, ROEis $1.1 million/4 million � 27.5%. This is well above the 18.75 percent we calculatedfor the current capital structure.
EPS versus EBITThe impact of leverage is evident in Table B.4 when the effect of the restructuring onEPS and ROE is examined. In particular, the variability in both EPS and ROE is muchlarger under the proposed capital structure. This illustrates how financial leverage actsto magnify gains and losses to shareholders.
In Figure B.3, we take a closer look at the effect of the proposed restructuring. Thisfigure plots earnings per share, EPS, against earnings before interest and taxes, EBIT,
Current Proposed
Assets $8,000,000 $8,000,000
Debt $0 $4,000,000
Equity $8,000,000 $4,000,000
Debt-equity ratio 0 1
Share price $20 $20
Shares outstanding 400,000 200,000
Interest rate 10% 10%
TABLE B.3
Current and proposedcapital structures for theTrans Am Corporation
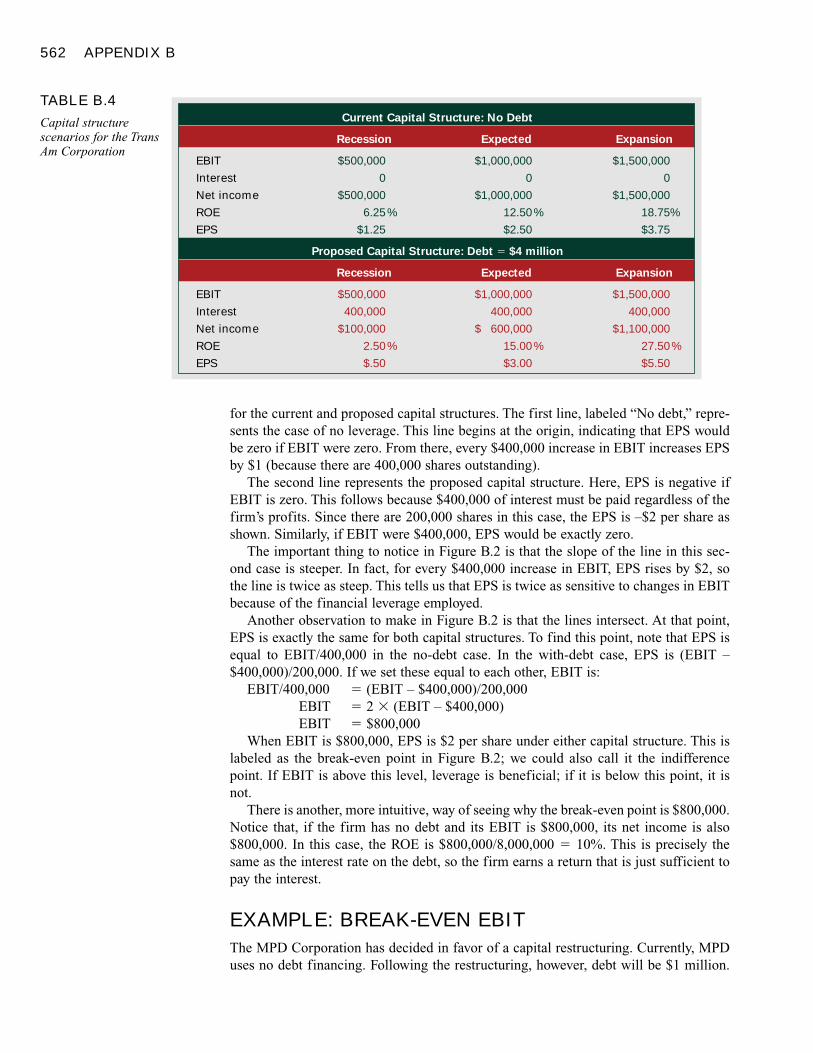
562 APPENDIX B
for the current and proposed capital structures. The first line, labeled “No debt,” repre-sents the case of no leverage. This line begins at the origin, indicating that EPS wouldbe zero if EBIT were zero. From there, every $400,000 increase in EBIT increases EPSby $1 (because there are 400,000 shares outstanding).
The second line represents the proposed capital structure. Here, EPS is negative ifEBIT is zero. This follows because $400,000 of interest must be paid regardless of thefirm’s profits. Since there are 200,000 shares in this case, the EPS is –$2 per share asshown. Similarly, if EBIT were $400,000, EPS would be exactly zero.
The important thing to notice in Figure B.2 is that the slope of the line in this sec-ond case is steeper. In fact, for every $400,000 increase in EBIT, EPS rises by $2, sothe line is twice as steep. This tells us that EPS is twice as sensitive to changes in EBITbecause of the financial leverage employed.
Another observation to make in Figure B.2 is that the lines intersect. At that point,EPS is exactly the same for both capital structures. To find this point, note that EPS isequal to EBIT/400,000 in the no-debt case. In the with-debt case, EPS is (EBIT –$400,000)/200,000. If we set these equal to each other, EBIT is:
EBIT/400,000 � (EBIT – $400,000)/200,000EBIT � 2 � (EBIT – $400,000)EBIT � $800,000
When EBIT is $800,000, EPS is $2 per share under either capital structure. This islabeled as the break-even point in Figure B.2; we could also call it the indifferencepoint. If EBIT is above this level, leverage is beneficial; if it is below this point, it isnot.
There is another, more intuitive, way of seeing why the break-even point is $800,000.Notice that, if the firm has no debt and its EBIT is $800,000, its net income is also$800,000. In this case, the ROE is $800,000/8,000,000 � 10%. This is precisely thesame as the interest rate on the debt, so the firm earns a return that is just sufficient topay the interest.
EXAMPLE: BREAK-EVEN EBIT
The MPD Corporation has decided in favor of a capital restructuring. Currently, MPDuses no debt financing. Following the restructuring, however, debt will be $1 million.
Current Capital Structure: No Debt
Recession Expected Expansion
EBIT $500,000 $1,000,000 $1,500,000
Interest 0 0 0
Net income $500,000 $1,000,000 $1,500,000
ROE 6.25% 12.50% 18.75%
EPS $1.25 $2.50 $3.75
Proposed Capital Structure: Debt � $4 million
Recession Expected Expansion
EBIT $500,000 $1,000,000 $1,500,000
Interest 400,000 400,000 400,000
Net income $100,000 $ 600,000 $1,100,000
ROE 2.50% 15.00% 27.50%
EPS $.50 $3.00 $5.50
TABLE B.4
Capital structure scenarios for the TransAm Corporation
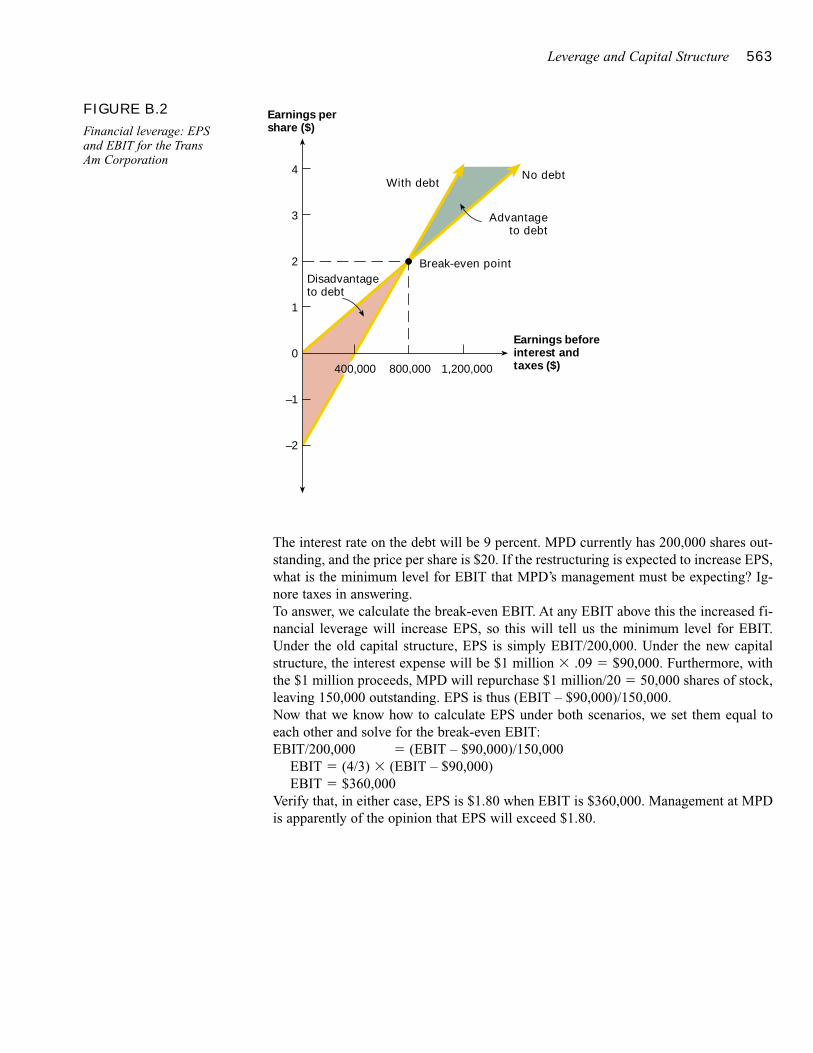
Leverage and Capital Structure 563
The interest rate on the debt will be 9 percent. MPD currently has 200,000 shares out-standing, and the price per share is $20. If the restructuring is expected to increase EPS,what is the minimum level for EBIT that MPD’s management must be expecting? Ig-nore taxes in answering.To answer, we calculate the break-even EBIT. At any EBIT above this the increased fi-nancial leverage will increase EPS, so this will tell us the minimum level for EBIT.Under the old capital structure, EPS is simply EBIT/200,000. Under the new capitalstructure, the interest expense will be $1 million � .09 � $90,000. Furthermore, withthe $1 million proceeds, MPD will repurchase $1 million/20 � 50,000 shares of stock,leaving 150,000 outstanding. EPS is thus (EBIT – $90,000)/150,000.Now that we know how to calculate EPS under both scenarios, we set them equal toeach other and solve for the break-even EBIT:EBIT/200,000 � (EBIT – $90,000)/150,000
EBIT � (4/3) � (EBIT – $90,000)EBIT � $360,000
Verify that, in either case, EPS is $1.80 when EBIT is $360,000. Management at MPDis apparently of the opinion that EPS will exceed $1.80.
Earnings beforeinterest andtaxes ($)
Earnings pershare ($)
4
3
2
1
0
–1
–2
400,000 800,000 1,200,000
Disadvantageto debt
With debtNo debt
Advantageto debt
Break-even point
FIGURE B.2
Financial leverage: EPSand EBIT for the TransAm Corporation


Mergers, Acquisitions, and CorporateControl
International Financial Management
Section 6
567
MERGERS, ACQUISITIONS,AND CORPORATECONTROL
The Market for CorporateControlMethod 1: Proxy Contests
Method 2: Mergers and Acquisitions
Method 3: Leveraged Buyouts
Method 4: Divestitures and Spin-offs
Sensible Motives for MergersEconomies of Scale
Economies of Vertical Integration
Combining Complementary Resources
Mergers as a Use for Surplus Funds
Dubious Reasons for MergersDiversification
The Bootstrap Game
Evaluating MergersMergers Financed by Cash
Mergers Financed by Stock
A Warning
Another Warning
Merger TacticsWho Gets the Gains?
Leveraged BuyoutsBarbarians at the Gate?
Mergers and the EconomyMerger Waves
Do Mergers Generate Net Benefits?
Summary
A merger is consummated.These two managers are clearly delighted, but why do companies decide to merge?Reuters/Peter Morgan/Archive Photos
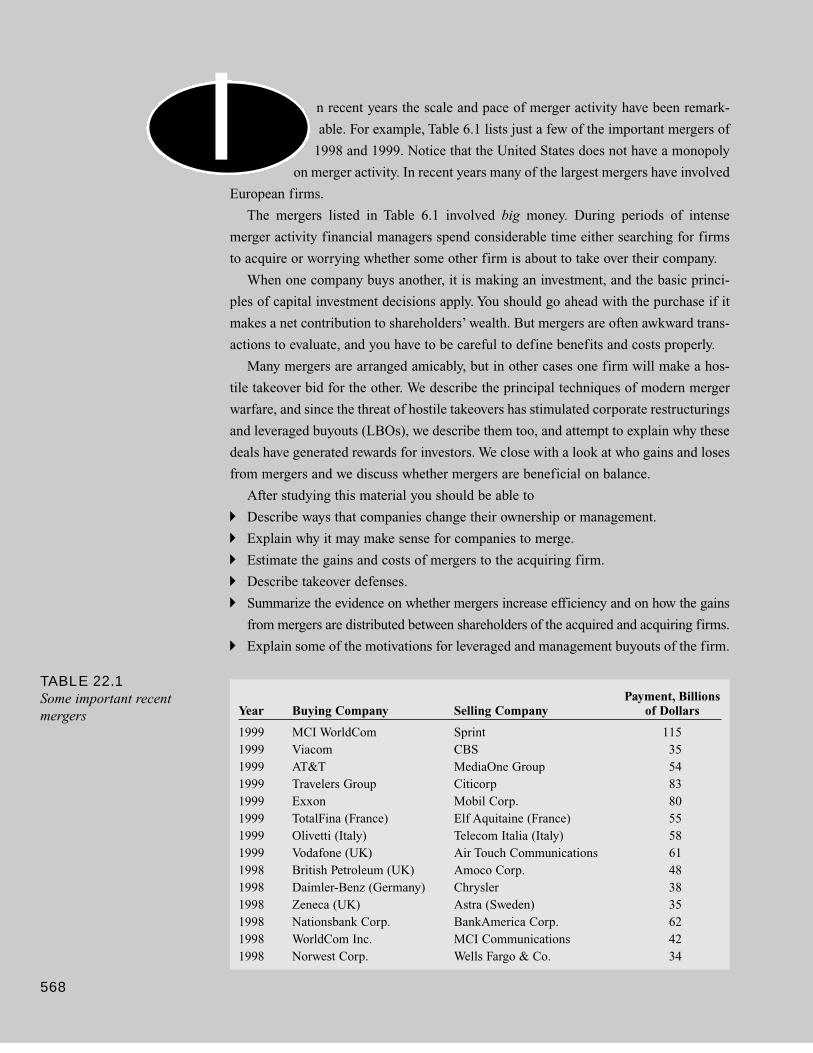
n recent years the scale and pace of merger activity have been remark-
able. For example, Table 6.1 lists just a few of the important mergers of
1998 and 1999. Notice that the United States does not have a monopoly
on merger activity. In recent years many of the largest mergers have involved
European firms.
The mergers listed in Table 6.1 involved big money. During periods of intense
merger activity financial managers spend considerable time either searching for firms
to acquire or worrying whether some other firm is about to take over their company.
When one company buys another, it is making an investment, and the basic princi-
ples of capital investment decisions apply. You should go ahead with the purchase if it
makes a net contribution to shareholders’ wealth. But mergers are often awkward trans-
actions to evaluate, and you have to be careful to define benefits and costs properly.
Many mergers are arranged amicably, but in other cases one firm will make a hos-
tile takeover bid for the other. We describe the principal techniques of modern merger
warfare, and since the threat of hostile takeovers has stimulated corporate restructurings
and leveraged buyouts (LBOs), we describe them too, and attempt to explain why these
deals have generated rewards for investors. We close with a look at who gains and loses
from mergers and we discuss whether mergers are beneficial on balance.
After studying this material you should be able to
� Describe ways that companies change their ownership or management.
� Explain why it may make sense for companies to merge.
� Estimate the gains and costs of mergers to the acquiring firm.
� Describe takeover defenses.
� Summarize the evidence on whether mergers increase efficiency and on how the gains
from mergers are distributed between shareholders of the acquired and acquiring firms.
� Explain some of the motivations for leveraged and management buyouts of the firm.
568
I
TABLE 22.1Some important recentmergers
Payment, BillionsYear Buying Company Selling Company of Dollars
1999 MCI WorldCom Sprint 1151999 Viacom CBS 351999 AT&T MediaOne Group 541999 Travelers Group Citicorp 831999 Exxon Mobil Corp. 801999 TotalFina (France) Elf Aquitaine (France) 551999 Olivetti (Italy) Telecom Italia (Italy) 581999 Vodafone (UK) Air Touch Communications 611998 British Petroleum (UK) Amoco Corp. 481998 Daimler-Benz (Germany) Chrysler 381998 Zeneca (UK) Astra (Sweden) 351998 Nationsbank Corp. BankAmerica Corp. 621998 WorldCom Inc. MCI Communications 421998 Norwest Corp. Wells Fargo & Co. 34
Mergers, Acquisitions, and Corporate Control 569
The Market for Corporate ControlThe shareholders are the owners of the firm. But most shareholders do not feel like theboss, and with good reason. Try buying a share of General Motors stock and marchinginto the boardroom for a chat with your employee, the chief executive officer.
The ownership and management of large corporations are almost always separated.Shareholders do not directly appoint or supervise the firm’s managers. They elect theboard of directors, who act as their agents in choosing and monitoring the managers ofthe firm. Shareholders have a direct say in very few matters. Control of the firm is inthe hands of the managers, subject to the general oversight of the board of directors.
The separation of ownership and management or control creates potential agencycosts. Agency costs occur when managers or directors take actions adverse to share-holders’ interests.
The temptation to take such actions may be ever-present, but there are many forcesand constraints working to keep managers’ and shareholders’ interests in line. As wepointed out earlier, managers’ paychecks in large corporations are almost always tied tothe profitability of the firm and the performance of its shares. Boards of directors taketheir responsibilities seriously—they may face lawsuits if they don’t—and therefore arereluctant to rubber-stamp obviously bad financial decisions.
But what ensures that the board has engaged the most talented managers? What hap-pens if managers are inadequate? What if the board of directors is derelict in monitor-ing the performance of managers? Or what if the firm’s managers are fine, but re-sources of the firm could be used more efficiently by merging with another firm? Canwe count on managers to pursue arrangements that would put them out of jobs?
These are all questions about the market for corporate control, the mechanisms bywhich firms are matched up with management teams and owners who can make themost of the firm’s resources. You should not take a firm’s current ownership and man-agement for granted. If it is possible for the value of the firm to be enhanced by chang-ing management or by reorganizing under new owners, there will be incentives forsomeone to make a change.
We will review briefly each of these methods.
METHOD 1: PROXY CONTESTS
Shareholders elect the board of directors to keep watch on management and replace un-satisfactory managers. If the board is lax, shareholders are free to elect a differentboard. In theory this ensures that the corporation is run in the best interests of share-holders.
In practice things are not so clear-cut. Ownership in large corporations is widely dis-persed. Usually even the largest single shareholder holds only a small fraction of the
There are four ways to change the management of a firm. These are (1) asuccessful proxy contest in which a group of stockholders votes in a new group of directors, who then pick a new management team; (2) the purchaseof one firm by another in a merger or acquisition; (3) a leveraged buyout ofthe firm by a private group of investors; and (4) a divestiture, in which a firmeither sells part of its operations to another company or spins it off as anindependent firm.
570 SECTION SIX
shares. Most shareholders have little notion who is on the board or what the membersstand for. Management, on the other hand, deals directly with the board and has a per-sonal relationship with its members. In many corporations, management sits on thecommittee that nominates candidates for the board. It is not surprising that some boardsseem less than aggressive in forcing managers to run a lean, efficient operation and toact primarily in the interests of shareholders.
When a group of investors believes that the board and its management team shouldbe replaced, they can launch a proxy contest. A proxy is the right to vote another share-holder’s shares. In a proxy contest, the dissident shareholders attempt to obtain enoughproxies to elect their own slate to the board of directors. Once the new board is in con-trol, management can be replaced. A proxy fight is therefore a direct contest for controlof the corporation.
But most proxy contests fail. Dissidents who engage in such fights must use theirown money, while management can use the corporation’s funds and lines of communi-cation with shareholders to defend itself. Such fights can cost millions of dollars.1
Institutional shareholders such as large pension funds have become more aggressivein pressing for managerial accountability. These funds have been able to gain conces-sions from firms without initiating proxy contests. For example, firms have agreed tosplit the jobs of chief executive officer and chairman of the board of directors. This en-sures that an outsider is responsible for keeping watch over the company. Also, morefirms now bar corporate insiders from serving on the committee that nominates candi-dates to the board. Perhaps as a result of shareholder pressure, boards also seem to begetting more aggressive. For example, outside directors were widely credited for has-tening the recent replacement of top management at Coke and British Airwaves.
METHOD 2: MERGERS AND ACQUISITIONS
Proxy contests are rare, and successful ones are rarer still. Poorly performing managersface a greater risk from acquisition. If the management of one firm observes anotherfirm underperforming, it can try to acquire the business and replace the poor managerswith its own team. In practice, corporate takeovers are the arenas where contests for cor-porate control are usually fought.
There are three ways for one firm to acquire another. One possibility is to merge thetwo companies into one, in which case the acquiring company assumes all the assetsand all the liabilities of the other. Such a merger must have the approval of at least 50percent of the stockholders of each firm.2 The acquired firm ceases to exist, and its for-mer shareholders receive cash and/or securities in the acquiring firm. In many mergersthere is a clear acquiring company, whose management then runs the enlarged firm.However, a merger is often a combination of two equals with both managements hav-ing a major say in the running of the new company. For example, the $330 billion pro-posed merger between Time Warner and AOL is a merger of equals.
A second alternative is for the acquiring firm to buy the target firm’s stock in ex-change for cash, shares, or other securities. The acquired firm may continue to exist asa separate entity, but it is now owned by the acquirer. The approval and cooperation ofthe target firm’s managers are generally sought, but even if they resist, the acquirer can
PROXY CONTESTTakeover attempt in whichoutsiders compete withmanagement forshareholders’ votes. Alsocalled proxy fight.
MERGER Combination oftwo firms into one, with theacquirer assuming assetsand liabilities of the targetfirm.
1 J. H. Mulherin and A. B. Poulsen provide an analysis of proxy fights in “Proxy Contests and CorporateChange: Implications for Shareholder Wealth,” Journal of Financial Economics 47 (1998), pp. 279–313.2 Corporate charters and state laws sometimes specify a higher percentage.
Mergers, Acquisitions, and Corporate Control 571
attempt to purchase a majority of the outstanding shares. By offering to buy shares directly from shareholders, the acquiring firm can bypass the target firm’s managementaltogether. The offer to purchase stock is called a tender offer. If the tender offer is successful, the buyer obtains control and can, if it chooses, toss out incumbent man-agement.
The third approach is to buy the target firm’s assets. In this case ownership of the assets needs to be transferred, and payment is made to the selling firm rather than di-rectly to its stockholders. Usually, the target firm sells only some of its assets, but oc-casionally it sells all of them. In this case, the selling firm continues to exist as an in-dependent entity, but it becomes an empty shell—a corporation engaged in no businessactivity.
The terminology of mergers and acquisitions (M&A) can be confusing. Thesephrases are used loosely to refer to any kind of corporate combination or takeover. Butstrictly speaking, merger means the combination of all the assets and liabilities of twofirms. The purchase of the stock or assets of another firm is an acquisition.
METHOD 3: LEVERAGED BUYOUTS
Sometimes a group of investors takes over a firm by means of a leveraged buyout, orLBO. The LBO group takes the firm private and its shares no longer trade in the secu-rities markets. Usually a considerable proportion of LBO financing is borrowed, hencethe term leveraged buyout.
If the investor group is led by the management of the firm, the takeover is called amanagement buyout, or MBO. In this case, the firm’s managers actually buy the firmfrom the shareholders and continue to run it. They become owner-managers. We willdiscuss LBOs and MBOs later.
METHOD 4: DIVESTITURES AND SPIN-OFFS
Firms not only acquire businesses; they also sell them. Divestitures are part of the mar-ket for corporate control. In recent years the number of divestitures has been about halfthe number of mergers.
Instead of selling a business to another firm, companies may spin off the business byseparating it from the parent firm and distributing stock in the newly independent com-pany to the shareholders of the parent company. For example, in 1996, AT&T was splitinto four separate firms: AT&T continued to operate telecommunication services, Lu-cent took responsibility for telecommunication equipment manufacturing, NCR took onthe computer business, and AT&T Capital, which handled leasing, was spun off andsold to another firm. Instead of holding shares in one megafirm, AT&T’s shareholderswere given shares in Lucent and NCR as well as AT&T. Investors clearly welcomed thismove: when the announcement of the split was made in 1995, AT&T’s shares jumped11 percent.
Probably the most frequent motive for spin-offs is improved efficiency. Companiessometimes refer to a business as being a “poor fit.” By spinning off a poor fit, the man-agement of the parent company can concentrate on its main activity. If each businessmust stand on its own feet, there is no risk that funds will be siphoned off from one inorder to support unprofitable investments in the other. Moreover, if the two parts of thebusiness are independent, it is easy to see the value of each and to reward managers ac-cordingly.
TENDER OFFERTakeover attempt in whichoutsiders directly offer to buythe stock of the firm’sshareholders.
ACQUISITION Takeoverof a firm by purchase of thatfirm’s common stock orassets.
LEVERAGED BUYOUT(LBO) Acquisition of thefirm by a private group usingsubstantial borrowed funds.
MANAGEMENT BUYOUT(MBO) Acquisition of thefirm by its own managementin a leveraged buyout.
572 SECTION SIX
Sensible Motives for MergersWe now look more closely at mergers and acquisitions and consider when they do anddo not make sense. Mergers are often categorized as horizontal, vertical, or conglom-erate. A horizontal merger is one that takes place between two firms in the same line ofbusiness; the merged firms are former competitors. Most of the mergers around the turnof the twentieth century were of this type. Recent examples of horizontal mergers haveoccurred in banking, such as the merger between Deutsche Bank and Bankers Trust,and in oil, such as the merger between Exxon and Mobil.
A horizontal merger can be blocked if it would be anticompetitive or create too muchmarket power. The Mobil and Exxon merger was challenged, but it was finally con-summated after the two companies agreed to sell a number of service stations to otherretailers.
During the 1920s, vertical mergers were predominant. A vertical merger is one inwhich the buyer expands backward toward the source of raw material or forward in thedirection of the ultimate consumer. Thus a soft drink manufacturer might buy a sugarproducer (expanding backward) or a fast-food chain as an outlet for its product (ex-panding forward). Pepsi owns BurgerKing, for example.
A conglomerate merger involves companies in unrelated lines of business. For ex-ample, before it went belly up in 1999, the Korean conglomerate, Daewoo, had nearly400 different subsidiaries and 150,000 employees. It built ships in Korea, manufacturedmicrowaves in France, TVs in Mexico, cars in Poland, fertilizers in Vietnam, and man-aged hotels in China and a bank in Hungary. No U.S. company is as diversified as Dae-woo, but in the 1960s and 1970s it was common in the United States for unrelated busi-nesses to merge. However, the number of conglomerate mergers declined in the 1980s.In fact much of the action in the 1980s came from breaking up the conglomerates thathad been formed 10 to 20 years earlier.
� Self-Test 1 Are the following hypothetical mergers horizontal, vertical, or conglomerate?
a. IBM acquires Apple Computer.b. Apple Computer acquires Stop & Shop (a supermarket chain).c. Stop & Shop acquires Campbell Soup.d. Campbell Soup acquires IBM.
We have already seen that one motive for a merger is to replace the existing man-agement team. If this motive is important, one would expect that poorly performingfirms would tend to be targets for acquisition; this seems to be the case.3 However,firms also acquire other firms for reasons that have nothing to do with inadequate man-agement. Many mergers and acquisitions are motivated by possible gains in efficiencyfrom combining operations. These mergers create synergies. By this we mean that thetwo firms are worth more together than apart.
3 For example, Palepu found that investors in firms that were subsequently acquired earned relatively low ratesof return for several years before the merger. See K. Palepu, “Predicting Takeover Targets: A Methodologicaland Empirical Analysis,” Journal of Accounting and Economics 8 (March 1986), pp. 3–36.
Mergers, Acquisitions, and Corporate Control 573
It would be convenient if we could say that certain types of mergers are usually suc-cessful and other types fail. Unfortunately, there are no such simple generalizations.Many mergers that appear to make sense nevertheless fail because managers cannothandle the complex task of integrating two firms with different production processes,accounting methods, and corporate cultures. Moreover, the value of most businesses de-pends on human assets—managers, skilled workers, scientists, and engineers. If thesepeople are not happy in their new roles in the acquiring firm, the best of them will leave.Beware of paying too much for assets that go down in the elevator and out to the park-ing lot at the close of each business day.
With this caveat in mind, we will now consider possible sources of synergy.
ECONOMIES OF SCALE
Just as most of us believe that we would be happier if only we were a little richer, somanagers always seem to believe their firm would be more competitive if only it werejust a little bigger. They hope for economies of scale, that is, the opportunity to spreadfixed costs across a larger volume of output. The banking industry provides many ex-amples. By the 1970s, it was clear that the United States had too many small, localbanks. Some (now very large) banks grew by systematically buying up smaller banksand streamlining their operations. Most of the cost savings came from consolidating“backoffice” operations, such as computer systems for processing checks and credit-card transactions and payments.
These economies of scale are the natural goal of horizontal mergers. But they havebeen claimed in conglomerate mergers, too. The architects of these mergers havepointed to the economies that come from sharing central services such as accounting,financial control, and top-level management.
ECONOMIES OF VERTICAL INTEGRATION
Large industrial companies commonly like to gain as much control and coordination aspossible over the production process by expanding back toward the output of the rawmaterial and forward to the ultimate consumer. One way to achieve this is to merge witha supplier or a customer. Consider Du Pont’s purchase of an oil company, Conoco. Thiswas vertical integration because petroleum is the ultimate raw material for much of DuPont’s chemical production.
Do not assume that more vertical integration is necessarily better than less. Carriedto extremes, it is absurdly inefficient. For example, before the Polish economy was re-structured, LOT, the Polish state airline, found itself raising pigs to make sure that itsemployees had fresh meat on their tables. (Of course, in a centrally managed economyit may prove necessary to grow your own meat, since you can’t be sure you’ll be able tobuy it.)
Vertical integration is less popular recently. Many companies are finding it more ef-ficient to outsource the provision of many activities. For example, Du Pont seems tohave become less convinced of the benefits of vertical integration, for in 1999 it soldoff Conoco.
A merger adds value only if synergies, better management, or other changesmake the two firms worth more together than apart.
574 SECTION SIX
COMBINING COMPLEMENTARY RESOURCES
Many small firms are acquired by large firms that can provide the missing ingredientsnecessary for the firm’s success. The small firm may have a unique product but lack theengineering and sales organization necessary to produce and market it on a large scale.The firm could develop engineering and sales talent from scratch, but it may be quickerand cheaper to merge with a firm that already has ample talent. The two firms havecomplementary resources—each has what the other needs—so it may make sense forthem to merge. Also the merger may open up opportunities that neither firm would pur-sue otherwise. Federal Express’s purchase of Caliber System, a trucking company, is anexample. Federal Express specializes in shipping packages by air, mostly for overnightdelivery. Caliber’s RMS subsidiary moves nonexpress packages by truck. RMS greatlyincreases Federal Express’s capability to move packages on the ground. At the sametime, RMS-originated business can move easily on the Federal Express system whenrapid or distant delivery is essential.
� EXAMPLE 1 Complementary Resources
Of course two large firms may also merge because they have complementary resources.Consider the 1989 merger between two electric utilities, Utah Power & Light and PacifiCorp, which serves customers in California. Utah Power’s peak demand comes inthe summer, for air conditioning. PacifiCorp’s peak comes in the winter, for heating.The savings from combining the two firms’ generating systems were estimated at $45million annually.
MERGERS AS A USE FOR SURPLUS FUNDS
Suppose that your firm is in a mature industry. It is generating a substantial amount ofcash, but it has few profitable investment opportunities. Ideally such a firm should dis-tribute the surplus cash to shareholders by increasing its dividend payment or by repur-chasing its shares. Unfortunately, energetic managers are often reluctant to shrink theirfirm in this way.
If the firm is not willing to purchase its own shares, it can instead purchase some-one else’s. Thus firms with a surplus of cash and a shortage of good investment oppor-tunities often turn to mergers financed by cash as a way of deploying their capital.
Firms that have excess cash and do not pay it out or redeploy it by acquisition oftenfind themselves targets for takeover by other firms that propose to redeploy the cash forthem. During the oil price slump of the early 1980s, many cash-rich oil companiesfound themselves threatened by takeover. This was not because their cash was a uniqueasset. The acquirers wanted to capture the companies’ cash flow to make sure it was notfrittered away on negative-NPV oil exploration projects. We return to this free-cash-flow motive for takeovers later.
We have discussed how mergers may make economic sense, but things can still gowrong when managers don’t do their homework. That was the case for Converse Inc.,which produces athletic shoes. In May 1995 Converse announced that it was acquiringApex One, a leading maker of sportswear. Apex brought with it a number of valuablelicenses for professional and college teams. As one enthusiast observed, “By lettingthem outfit athletes from head to toe, the Apex deal potentially puts them on an even
Mergers, Acquisitions, and Corporate Control 575
keel with Nike and Reebok.” However, 85 days later Converse closed down Apex Oneafter incurring a $46 million loss on its investment.
What went wrong? The problem appears to have begun when Apex was severalmonths late in introducing its fall product lines. Converse’s management complainedthat, in light of these delays, Apex’s $100 million revenue projection at the time of thepurchase had been unrealistic and over the next 3 months projections were progres-sively scaled back to $40 million. Inevitably, the closure of Apex was followed by a vol-ley of legal suits.4
Dubious Reasons for MergersThe benefits that we have described so far all make economic sense. Other argumentssometimes given for mergers are more dubious. Here are two.
DIVERSIFICATION
We have suggested that the managers of a cash-rich company may prefer to see that cash used for acquisitions. That is why we often see cash-rich firms in stagnant indus-tries merging their way into fresh woods and pastures new. What about diversificationas an end in itself? It is obvious that diversification reduces risk. Isn’t that a gain frommerging?
The trouble with this argument is that diversification is easier and cheaper for thestockholder than for the corporation. Why should firm A buy firm B to diversify whenthe shareholders of firm A can buy shares in firm B to diversify their own portfolios?It is far easier and cheaper for individual investors to diversify than it is for firms tocombine operations.
THE BOOTSTRAP GAME
During the 1960s some conglomerate companies made acquisitions which offered noevident economic gains. Nevertheless, the conglomerates’ aggressive strategy producedseveral years of rising earnings per share. To see how this can happen, let us look at theacquisition of Muck and Slurry by the well-known conglomerate World Enterprises.
� EXAMPLE 2 The Bootstrap Game
The position before the merger is set out in the first two columns of Table 6.2. Noticethat because Muck and Slurry has relatively poor growth prospects, its stock sells at alower price-earnings ratio than World Enterprises (line 3). The merger, we assume, pro-duces no economic benefits, so the firms should be worth exactly the same together asapart. The value of World Enterprises after the merger is therefore equal to the sum ofthe separate values of the two firms (line 6).
Since World Enterprises stock is selling for double the price of Muck and Slurry stock
4 This description of the Apex One purchase draws on M. Maremount, “How Converse Got Its Laces All Tan-gled,” Business Week, September 4, 1995, p. 37, and A. Bernstein, “Converse, Apex Sellers Point Fingers inCourt Battle,” Sporting Goods Business, May 1996, p. 8.
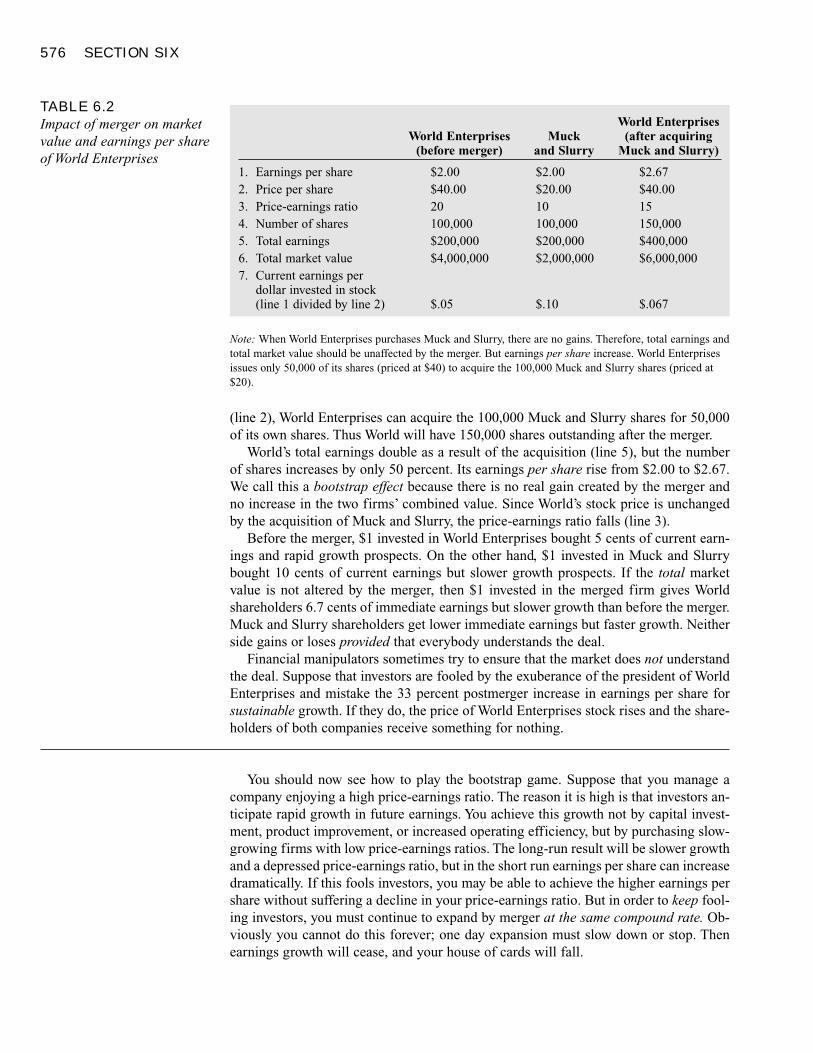
576 SECTION SIX
(line 2), World Enterprises can acquire the 100,000 Muck and Slurry shares for 50,000of its own shares. Thus World will have 150,000 shares outstanding after the merger.
World’s total earnings double as a result of the acquisition (line 5), but the numberof shares increases by only 50 percent. Its earnings per share rise from $2.00 to $2.67.We call this a bootstrap effect because there is no real gain created by the merger andno increase in the two firms’ combined value. Since World’s stock price is unchangedby the acquisition of Muck and Slurry, the price-earnings ratio falls (line 3).
Before the merger, $1 invested in World Enterprises bought 5 cents of current earn-ings and rapid growth prospects. On the other hand, $1 invested in Muck and Slurrybought 10 cents of current earnings but slower growth prospects. If the total marketvalue is not altered by the merger, then $1 invested in the merged firm gives Worldshareholders 6.7 cents of immediate earnings but slower growth than before the merger.Muck and Slurry shareholders get lower immediate earnings but faster growth. Neitherside gains or loses provided that everybody understands the deal.
Financial manipulators sometimes try to ensure that the market does not understandthe deal. Suppose that investors are fooled by the exuberance of the president of WorldEnterprises and mistake the 33 percent postmerger increase in earnings per share forsustainable growth. If they do, the price of World Enterprises stock rises and the share-holders of both companies receive something for nothing.
You should now see how to play the bootstrap game. Suppose that you manage acompany enjoying a high price-earnings ratio. The reason it is high is that investors an-ticipate rapid growth in future earnings. You achieve this growth not by capital invest-ment, product improvement, or increased operating efficiency, but by purchasing slow-growing firms with low price-earnings ratios. The long-run result will be slower growthand a depressed price-earnings ratio, but in the short run earnings per share can increasedramatically. If this fools investors, you may be able to achieve the higher earnings pershare without suffering a decline in your price-earnings ratio. But in order to keep fool-ing investors, you must continue to expand by merger at the same compound rate. Ob-viously you cannot do this forever; one day expansion must slow down or stop. Thenearnings growth will cease, and your house of cards will fall.
TABLE 6.2Impact of merger on marketvalue and earnings per shareof World Enterprises
World EnterprisesWorld Enterprises Muck (after acquiring
(before merger) and Slurry Muck and Slurry)
1. Earnings per share $2.00 $2.00 $2.672. Price per share $40.00 $20.00 $40.003. Price-earnings ratio 20 10 154. Number of shares 100,000 100,000 150,0005. Total earnings $200,000 $200,000 $400,0006. Total market value $4,000,000 $2,000,000 $6,000,0007. Current earnings per
dollar invested in stock (line 1 divided by line 2) $.05 $.10 $.067
Note: When World Enterprises purchases Muck and Slurry, there are no gains. Therefore, total earnings andtotal market value should be unaffected by the merger. But earnings per share increase. World Enterprisesissues only 50,000 of its shares (priced at $40) to acquire the 100,000 Muck and Slurry shares (priced at$20).
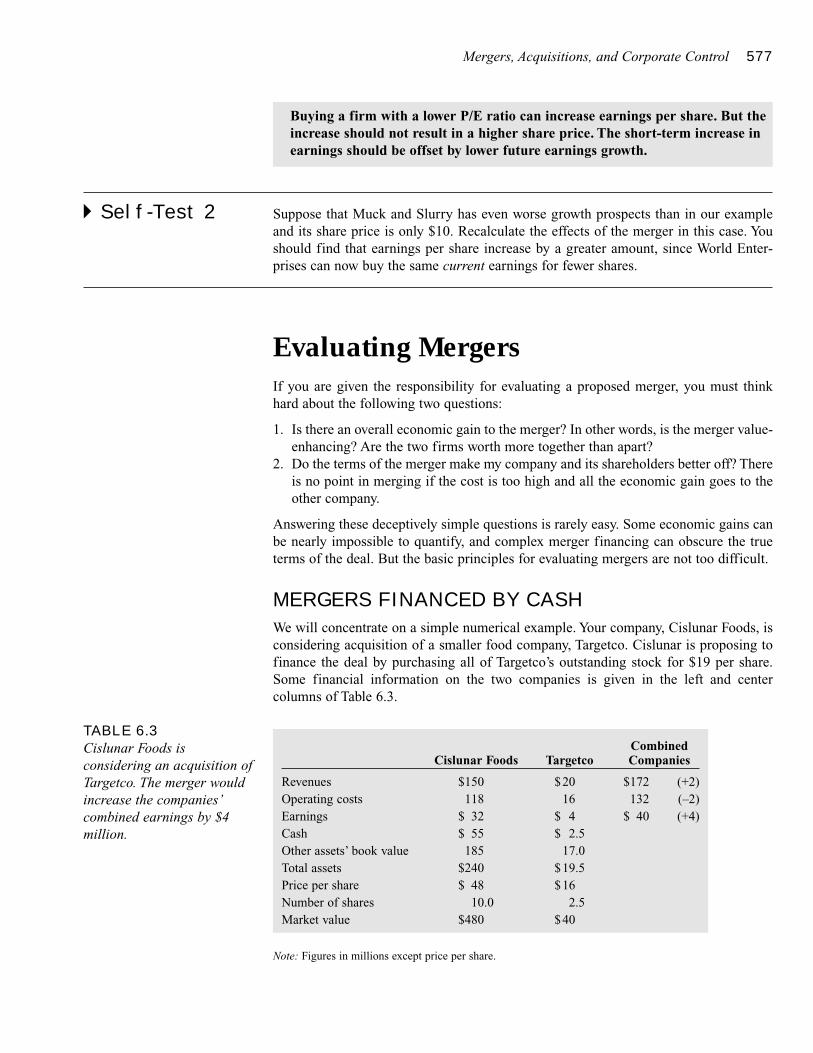
Mergers, Acquisitions, and Corporate Control 577
� Self-Test 2 Suppose that Muck and Slurry has even worse growth prospects than in our exampleand its share price is only $10. Recalculate the effects of the merger in this case. Youshould find that earnings per share increase by a greater amount, since World Enter-prises can now buy the same current earnings for fewer shares.
Evaluating MergersIf you are given the responsibility for evaluating a proposed merger, you must thinkhard about the following two questions:
1. Is there an overall economic gain to the merger? In other words, is the merger value-enhancing? Are the two firms worth more together than apart?
2. Do the terms of the merger make my company and its shareholders better off? Thereis no point in merging if the cost is too high and all the economic gain goes to theother company.
Answering these deceptively simple questions is rarely easy. Some economic gains canbe nearly impossible to quantify, and complex merger financing can obscure the trueterms of the deal. But the basic principles for evaluating mergers are not too difficult.
MERGERS FINANCED BY CASH
We will concentrate on a simple numerical example. Your company, Cislunar Foods, isconsidering acquisition of a smaller food company, Targetco. Cislunar is proposing tofinance the deal by purchasing all of Targetco’s outstanding stock for $19 per share.Some financial information on the two companies is given in the left and centercolumns of Table 6.3.
Buying a firm with a lower P/E ratio can increase earnings per share. But theincrease should not result in a higher share price. The short-term increase inearnings should be offset by lower future earnings growth.
TABLE 6.3Cislunar Foods isconsidering an acquisition ofTargetco. The merger wouldincrease the companies’combined earnings by $4million.
CombinedCislunar Foods Targetco Companies
Revenues $150 $20 $172 (+2)Operating costs 118 16 132 (–2)Earnings $ 32 $ 4 $ 40 (+4)Cash $ 55 $ 2.5Other assets’ book value 185 17.0Total assets $240 $19.5Price per share $ 48 $16Number of shares 10.0 2.5Market value $480 $40
Note: Figures in millions except price per share.
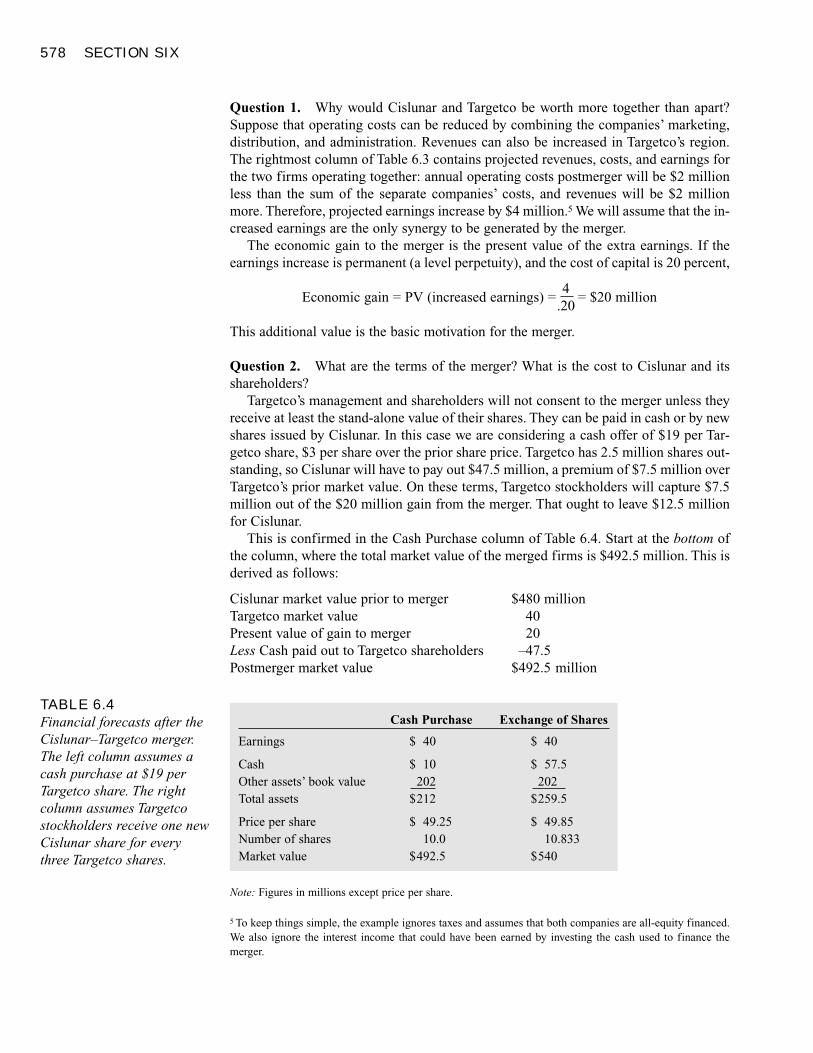
578 SECTION SIX
Question 1. Why would Cislunar and Targetco be worth more together than apart?Suppose that operating costs can be reduced by combining the companies’ marketing,distribution, and administration. Revenues can also be increased in Targetco’s region.The rightmost column of Table 6.3 contains projected revenues, costs, and earnings forthe two firms operating together: annual operating costs postmerger will be $2 millionless than the sum of the separate companies’ costs, and revenues will be $2 millionmore. Therefore, projected earnings increase by $4 million.5 We will assume that the in-creased earnings are the only synergy to be generated by the merger.
The economic gain to the merger is the present value of the extra earnings. If theearnings increase is permanent (a level perpetuity), and the cost of capital is 20 percent,
Economic gain = PV (increased earnings) =4
= $20 million.20
This additional value is the basic motivation for the merger.
Question 2. What are the terms of the merger? What is the cost to Cislunar and itsshareholders?
Targetco’s management and shareholders will not consent to the merger unless theyreceive at least the stand-alone value of their shares. They can be paid in cash or by newshares issued by Cislunar. In this case we are considering a cash offer of $19 per Tar-getco share, $3 per share over the prior share price. Targetco has 2.5 million shares out-standing, so Cislunar will have to pay out $47.5 million, a premium of $7.5 million overTargetco’s prior market value. On these terms, Targetco stockholders will capture $7.5million out of the $20 million gain from the merger. That ought to leave $12.5 millionfor Cislunar.
This is confirmed in the Cash Purchase column of Table 6.4. Start at the bottom ofthe column, where the total market value of the merged firms is $492.5 million. This isderived as follows:
Cislunar market value prior to merger $480 millionTargetco market value 40Present value of gain to merger 20Less Cash paid out to Targetco shareholders –47.5Postmerger market value $492.5 million
TABLE 6.4Financial forecasts after theCislunar–Targetco merger.The left column assumes acash purchase at $19 perTargetco share. The rightcolumn assumes Targetcostockholders receive one newCislunar share for everythree Targetco shares.
Cash Purchase Exchange of Shares
Earnings $ 40 $ 40
Cash $ 10 $ 57.5Other assets’ book value 202 202Total assets $212 $259.5
Price per share $ 49.25 $ 49.85Number of shares 10.0 10.833Market value $492.5 $540
Note: Figures in millions except price per share.
5 To keep things simple, the example ignores taxes and assumes that both companies are all-equity financed.We also ignore the interest income that could have been earned by investing the cash used to finance themerger.
Mergers, Acquisitions, and Corporate Control 579
The postmerger share price for Cislunar will be $49.25, an increase of $1.25 per share.There are 10 million shares now outstanding, so the total increase in the value of Cis-lunar shares is $12.5 million.
Now let’s summarize. The merger makes sense for Cislunar for two reasons. First, themerger adds $20 million of overall value. Second, the terms of the merger give only $7.5million of the $20 million overall gain to Targetco’s stockholders, leaving $12.5 millionfor Cislunar. You could say that the cost of acquiring Targetco is $7.5 million, the differ-ence between the cash payment and the value of Targetco as a separate company.
Cost = cash paid out – Targetco value = $47.5 – 40 = $7.5 million
Of course the Targetco stockholders are ahead by $7.5 million. Their gain is your cost.As we’ve already seen, Cislunar stockholders come out $12.5 million ahead. This is themerger’s NPV for Cislunar:
NPV = economic gain – cost = $20 – 7.5 = $12.5 million
Writing down the economic gain and cost of a merger in this way separates the mo-tive for the merger (the economic gain, or value added) from the terms of the merger(the division of the gain between the two merging companies).
� Self-Test 3 Killer Shark Inc. makes a surprise cash offer of $22 a share for Goldfish Industries. Be-fore the offer, Goldfish was selling for $18 a share. Goldfish has 1 million shares out-standing. What must Killer Shark believe about the present value of the improvement itcan bring to Goldfish’s operations?
MERGERS FINANCED BY STOCK
What if Cislunar wants to conserve its cash for other investments, and therefore decidesto pay for the Targetco acquisition with new Cislunar shares? The deal calls for Targetcoshareholders to receive one Cislunar share in exchange for every three Targetco shares.
It’s the same merger, but the financing is different. The right column of Table 6.4works out the consequences. Again, start at the bottom of the column. Note that the mar-ket value of Cislunar’s shares after the merger is $540 million, $47.5 million higher thanin the cash deal, because that cash is kept rather than paid out to Targetco shareholders.On the other hand, there are more shares outstanding, since 833,333 new shares have tobe issued in exchange for the 2.5 million Targetco shares (a 1 to 3 ratio). Therefore, theprice per share is 540/10.833 = $49.85, which is 60 cents higher than in the cash offer.
Why do Cislunar stockholders do better from the share exchange? The economicgain from the merger is the same, but the Targetco stockholders capture less of it. Theyget 833,333 shares at $49.85, or $41.5 million, a premium of only $1.5 million overTargetco’s prior market value.
Cost = value of shares issued – Targetco value
= $41.5 – 40 = $1.5 million
The merger’s NPV to Cislunar’s original shareholders is
NPV = economic gain – cost = 20 – 1.5 = $18.5 million
Note that Cislunar stock rises by $1.85 from its prior value. The total increase in valuefor Cislunar’s original shareholders, who retain 10 million shares, is $18.5 million.
580 SECTION SIX
Evaluating the terms of a merger can be tricky when there is an exchange of shares.The target company’s shareholders will retain a stake in the merged firms, so you haveto figure out what the firm’s shares will be worth after the merger is announced and itsbenefits appreciated by investors. Notice that we started with the total market value ofCislunar and Targetco postmerger, took account of the merger terms (833,333 newshares issued), and worked back to the postmerger share price. Only then could we workout the division of the merger gains between the two companies.
There is a key distinction between cash and stock for financing mergers. If cash isoffered, the cost of the merger is not affected by the size of the merger gains. If stock isoffered, the cost depends on the gains because the gains show up in the post-mergershare price, and these shares are used to pay for the acquired firm. The nearby box il-lustrates how complex a stock offer can be. When Gillette offered to buy Duracell, giv-ing Duracell shareholders about a 20 percent stake in the merged firm, the attractive-ness of the deal depended on the stock market’s valuation of both firms.
Stock financing also mitigates the effects of over- or undervaluation of either firm.Suppose, for example, that A overestimates B’s value as a separate entity, perhaps be-cause it has overlooked some hidden liability. Thus A makes too generous an offer.Other things equal, A’s stockholders are better off if it is a stock rather than a cash offer.With a stock offer, the inevitable bad news about B’s value will fall partly on B’s for-mer stockholders.
� Self-Test 4 Suppose Targetco shareholders demand one Cislunar share for every 2.5 Targetcoshares. Otherwise they will not accept the merger. Under these revised terms, is themerger still a good deal for Cislunar?
A WARNING
The cost of a merger is the premium the acquirer pays for the target firm over its valueas a separate company. If the target is a public company, you can measure its separatevalue by multiplying its stock price by the number of outstanding shares. Watch out,though: if investors expect the target to be acquired, its stock price may overstate thecompany’s separate value. The target company’s stock price may already have risen inanticipation of a premium to be paid by an acquiring firm.
ANOTHER WARNING
Some companies begin their merger analyses with a forecast of the target firm’s futurecash flows. Any revenue increases or cost reductions attributable to the merger are in-cluded in the forecasts, which are then discounted back to the present and comparedwith the purchase price:
Estimated net gain = DCF valuation of target including merger benefits
– cash required for acquisition
This is a dangerous procedure. Even the brightest and best-trained analyst can makelarge errors in valuing a business. The estimated net gain may come up positive not be-cause the merger makes sense, but simply because the analyst’s cash-flow forecasts aretoo optimistic. On the other hand, a good merger may not be pursued if the analyst failsto recognize the target’s potential as a stand-alone business.
SEE BOX
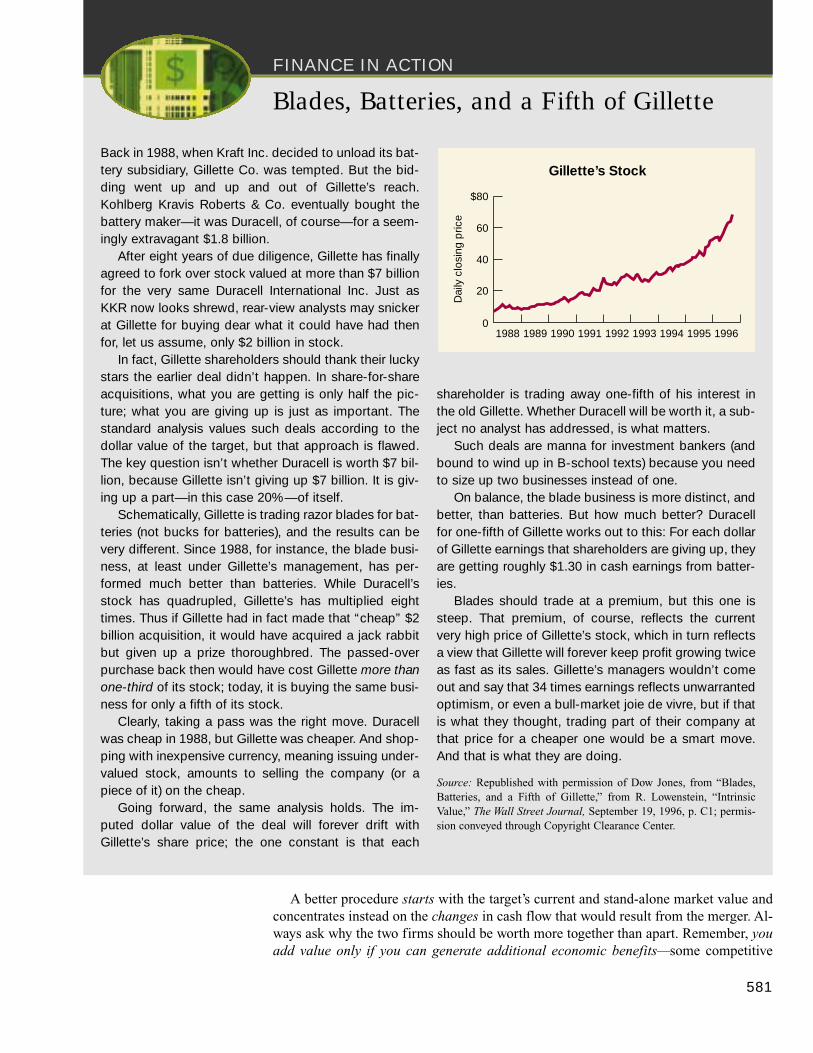
FINANCE IN ACTION
A better procedure starts with the target’s current and stand-alone market value andconcentrates instead on the changes in cash flow that would result from the merger. Al-ways ask why the two firms should be worth more together than apart. Remember, youadd value only if you can generate additional economic benefits—some competitive
581
Blades, Batteries, and a Fifth of Gillette
Back in 1988, when Kraft Inc. decided to unload its bat-tery subsidiary, Gillette Co. was tempted. But the bid-ding went up and up and out of Gillette’s reach.Kohlberg Kravis Roberts & Co. eventually bought thebattery maker— it was Duracell, of course— for a seem-ingly extravagant $1.8 billion.
After eight years of due diligence, Gillette has finallyagreed to fork over stock valued at more than $7 billionfor the very same Duracell International Inc. Just asKKR now looks shrewd, rear-view analysts may snickerat Gillette for buying dear what it could have had thenfor, let us assume, only $2 billion in stock.
In fact, Gillette shareholders should thank their luckystars the earlier deal didn’t happen. In share-for-shareacquisitions, what you are getting is only half the pic-ture; what you are giving up is just as important. Thestandard analysis values such deals according to thedollar value of the target, but that approach is flawed.The key question isn’t whether Duracell is worth $7 bil-lion, because Gillette isn’t giving up $7 billion. It is giv-ing up a part— in this case 20%— of itself.
Schematically, Gillette is trading razor blades for bat-teries (not bucks for batteries), and the results can bevery different. Since 1988, for instance, the blade busi-ness, at least under Gillette’s management, has per-formed much better than batteries. While Duracell’sstock has quadrupled, Gillette’s has multiplied eighttimes. Thus if Gillette had in fact made that “ cheap” $2billion acquisition, it would have acquired a jack rabbitbut given up a prize thoroughbred. The passed-overpurchase back then would have cost Gillette more thanone-third of its stock; today, it is buying the same busi-ness for only a fifth of its stock.
Clearly, taking a pass was the right move. Duracellwas cheap in 1988, but Gillette was cheaper. And shop-ping with inexpensive currency, meaning issuing under-valued stock, amounts to selling the company (or apiece of it) on the cheap.
Going forward, the same analysis holds. The im-puted dollar value of the deal will forever drift withGillette’s share price; the one constant is that each
shareholder is trading away one-fifth of his interest inthe old Gillette. Whether Duracell will be worth it, a sub-ject no analyst has addressed, is what matters.
Such deals are manna for investment bankers (andbound to wind up in B-school texts) because you needto size up two businesses instead of one.
On balance, the blade business is more distinct, andbetter, than batteries. But how much better? Duracellfor one-fifth of Gillette works out to this: For each dollarof Gillette earnings that shareholders are giving up, theyare getting roughly $1.30 in cash earnings from batter-ies.
Blades should trade at a premium, but this one issteep. That premium, of course, reflects the currentvery high price of Gillette’s stock, which in turn reflectsa view that Gillette will forever keep profit growing twiceas fast as its sales. Gillette’s managers wouldn’t comeout and say that 34 times earnings reflects unwarrantedoptimism, or even a bull-market joie de vivre, but if thatis what they thought, trading part of their company atthat price for a cheaper one would be a smart move.And that is what they are doing.
Source: Republished with permission of Dow Jones, from “Blades,Batteries, and a Fifth of Gillette,” from R. Lowenstein, “IntrinsicValue,” The Wall Street Journal, September 19, 1996, p. C1; permis-sion conveyed through Copyright Clearance Center.
$80
Dai
ly c
losi
ng p
rice
60
40
20
0199619951994199319921991199019891988
Gillette’s Stock
582 SECTION SIX
edge that other firms can’t match and that the target firm’s managers can’t achieve ontheir own.
It makes sense to keep an eye on the value that investors place on the gains from merg-ing. If A’s stock price falls when the deal is announced, investors are sending a messagethat the merger benefits are doubtful or that A is paying too much for these benefits.
Merger TacticsIn recent years, most mergers have been agreed upon by both parties, but occasionally,an acquirer goes over the heads of the target firm’s management and makes a tenderoffer directly to its stockholders. The management of the target firm may advise share-holders to accept the tender, or it may attempt to fight the bid in the hope that the ac-quirer will either raise its offer or throw in the towel.
The rules of merger warfare are largely set by federal and state laws6 and the courtsact as referee to see that contests are conducted fairly. We will look at one recent con-test that illustrates the tactics and weapons employed. Outside the English-speakingcountries hostile takeovers once were rare. But the world is changing, and the nearbybox describes a recent takeover battle between Italian companies.
� EXAMPLE 3 AlliedSignal Takes Over AMP
AMP was the world’s largest producer of cables for computers and other electronicequipment. Its performance had disappointed investors, and the company was widelyviewed as ripe for change in operations and management.
AlliedSignal believed that it could make these changes faster and better than AMP’sincumbent management. So in summer 1998, when AMP announced that its quarterlyprofits were down 50 percent, AlliedSignal declared that it would bid $44.50 per sharefor AMP’s stock. AMP’s stock price immediately bounded by nearly 50 percent to about$43 per share.
AMP at first seemed impregnable. It was chartered in Pennsylvania, which hadpassed tough antitakeover laws. Pennsylvania corporations could “just say no” totakeovers that might adversely affect employees and local communities. AMP had alsoprotected itself against takeover by establishing a poison pill. This gave its sharehold-ers the right to buy more shares at a bargain price if there was a bid.
AlliedSignal held out an olive branch, hinting that price was flexible if AMP wasready to talk turkey. When its proposal was rebuffed, Allied decided to go ahead withits offer and 72 percent of AMP shareholders accepted. However, there was still theproblem of the poison pill, and AlliedSignal’s offer stated that it was not obliged to buyany shares until the poison pill was removed. This was not something that AMP’s man-agement was likely to do voluntarily.
AMP fought back vigorously. It announced a plan to borrow $3 billion to repurchaseits shares at $55 per share—its management’s view of the true value of AMP stock. Atthe same time it asked the Pennsylvania legislature to pass a law that would effectivelybar the merger. The governor gave his support and in October the bill was approved inthe Pennsylvania House of Representatives and sent to the Senate for consideration.
6 The principal federal act regulating takeovers is the Williams Act of 1968.
SEE BOX
POISON PILL Measuretaken by a target firm toavoid acquisition; forexample, the right forexisting shareholders to buyadditional shares at anattractive price if a bidderacquires a large holding.
FINANCE IN ACTION
Meanwhile AlliedSignal was discovering that it too had powerful allies. About 80percent of AMP’s shares were owned by mutual funds, pension funds, and other largeinvestors. Many of these institutions publicly disagreed with AMP’s stubbornness. TheCollege Retirement Equities Fund (CREF), one of the largest U.S. pension funds, thentook an extraordinary step: it filed a legal brief supporting AlliedSignal’s case in the
583
An Italian Takeover Battle
Hostile takeovers were almost unheard of in Italy— thatis, until 1999 when Olivetti made a takeover bid for Tele-com Italia. What made this bid even more remarkablewas the fact that Telecom was seven times the size ofOlivetti.
The recently privatized Telecom was Italy’s principalfixed-line telecommunications firm. Its performance,however, had been lackluster and Olivetti saw plenty ofroom for improved efficiency. Therefore, in November1998 Olivetti set about appointing advisers for a possi-ble bid. These consisted of the Italian investment bankMediobanca and three American firms, Chase Manhat-tan, Lehman Brothers, and Donaldson, Lufkin & Jen-rette (DLJ).
Everybody agreed that Olivetti would have to offermainly cash to Telecom shareholders rather thanOlivetti’s shares. The company would need to borrowthis cash, and to pay it back it would have no choicebut to run a tight ship and keep costs under control.Chase, therefore, set about signing up a syndicate of 25major banks that would be prepared to lend 22.5 billioneuros, equivalent to nearly $24 billion.
Olivetti made its takeover bid for Telecom in Febru-ary 1999. The bid was worth over 50 billion euros andthe cash would come from a mixture of the syndicatedbank loan, an issue of bonds, and an issue of shares.Investors’ initial response to the offer was lukewarm.Some doubted whether a minnow like Olivetti couldsuccessfully swallow a whale like Telecom. Althoughthe offer price was more than a third higher than Tele-com’s market price before the bid, many investors re-garded it as too low.
Telecom began to prepare its defenses. It too ap-pointed three advisers— Banca IMI, J. P. Morgan, andCredit Suisse First Boston (CSFB). They ran through anumber of possible measures that the company couldtake. One possibility was for Telecom to turn the tablesby making a bid for Olivetti. Another idea was that Tele-com should buy the remaining shares of TIM, a com-pany in which it already had a holding. This would makeTelecom a still larger bite for Olivetti to swallow. A third
possibility was for Telecom to borrow a large amount ofcash and use it to buy back some of its shares. In-vestors would then know that Telecom had every incen-tive to cut costs and generate the extra cash to pay offthis debt. Another potential defense was for Telecom tolook for a “ white knight” that would make a more con-genial partner.
In the business plan that it sent to shareholders,Telecom stated that it was proposing to acquire the re-mainder of TIM shares and also to buy back some of itsshares. Soon afterwards it announced that it had founda white knight in the form of a German company,Deutsche Telekom, and would shortly submit the pro-posal to shareholders. Investors were not convincedthat a takeover with Deutsche Telekom would makesense, and The Wall Street Journal likened the prospectto two elephants mating. There was a further potentialproblem with such a merger. The German governmentretained a large holding in Deutsche Telekom and wouldtherefore be the dominant shareholder in a merged firm.The Italian government retained the right to veto anymerger involving Telecom Italia. It was unlikely to objectto Olivetti as a merger partner, but it might be unhappyto see the country’s principal telecommunications com-pany largely controlled by another government. So al-though Deutsche Telekom’s offer was more generousthan Olivetti’s, investors were far from certain that itwould be allowed to proceed.
In March Olivetti upped its bid for Telecom by 15percent. The new bid was worth 58 billion euros and of-fered Telecom investors a profit of over 50 percent onthe January stock price. In May 1999 Telecom Italia’sshareholders began to respond to Olivetti’s bid. At firstthere was only a trickle of acceptances, but by the timethe offer closed 3 weeks later, the trickle had become aflood and it was clear that Olivetti had won.
Source: The bid for Telecom Italia is described in M. Walker, “TheSack of Telecom Italia,” Euromoney, July 1999, pp. 30–46. A recordof the offer, together with copies of press releases and other informa-tion, is provided on www.olivetti.com/press/.
584 SECTION SIX
federal court. Then the Hixon family, descendants of AMP’s co-founder, made public aletter to AMP’s management expressing “dismay” and asking, “Who do managementand the board work for? The central issue is that AMP’s management will not permitshareholders to voice their will.”7
As the weeks passed, AMP’s defenses, while still intact, did not look quite so strong.By mid-October, it became clear that AMP would not receive timely help from thePennsylvania legislature. In November, the federal court gave AlliedSignal the go-aheadto ask shareholders to vote to remove the poison pill. Remember, 72 percent of its stock-holders had already accepted AlliedSignal’s tender offer.
Then, suddenly, AMP gave up: management had found a white knight when TycoInternational came to its rescue. Tyco was prepared to offer stock worth $55 for eachAMP share. AlliedSignal dropped out of the bidding; it didn’t think AMP was worththat much.
What are the lessons? First, the example illustrates some of the stratagems of mergerwarfare. Firms like AMP that are worried about being taken over usually prepare theirdefenses in advance. Often they will persuade shareholders to agree to shark-repellentchanges to the corporate charter. For example, the charter may be amended to requirethat any merger must be approved by a supermajority of 80 percent of the shares ratherthan the normal 50 percent.
Firms frequently deter potential bidders by devising poison pills, which make thecompany unappetizing. For example, the poison pill may give existing shareholders theright to buy the company’s shares at half price as soon as a bidder acquires more than15 percent of the shares. The bidder is not entitled to the discount. Thus the bidder re-sembles Tantalus—as soon as it has acquired 15 percent of the shares, control is liftedaway from its reach.
The battle for AMP demonstrates the strength of poison pills and other takeover de-fenses. AlliedSignal’s offensive still gained ground, but with great expense and effortand at a very slow pace.
The second lesson of the AMP story is the potential power of institutional investors.The main reason that AMP caved in was not failure of its legal defenses but economicpressure from its major shareholders.
Did AMP’s management and board act in the shareholders’ interests? In the end, yes.They said that AMP was worth more than AlliedSignal’s offer, and they found anotherbuyer to prove them right. However, they would not have searched for a white knightabsent AlliedSignal’s bid.
WHO GETS THE GAINS?
Is it better to own shares in the acquiring firm or the target? In general, shareholders ofthe target firm do best. Franks, Harris, and Titman studied 399 acquisitions by largeU.S. firms between 1975 and 1984. They found that shareholders who sold followingthe announcement of the bid received a healthy gain averaging 28 percent.8 On the otherhand, it appears that investors expected acquiring companies to just about break even.
WHITE KNIGHTFriendly potential acquirersought by a target companythreatened by an unwelcomesuitor.
SHARK REPELLENTAmendments to a companycharter made to forestalltakeover attempts.
7 S. Lipin and G. Fairclothy, “AMP’s Antitakeover Tactics Rile Holder,” The Wall Street Journal, October 5,1998, p. A18.8 J. R. Franks, R. S. Harris, and S. Titman, “The Postmerger Share-Price Performance of Acquiring Firms,”Journal of Financial Economics 29 (March 1991), pp. 81–96.
Mergers, Acquisitions, and Corporate Control 585
The prices of their shares fell by 1 percent.9 The value of the total package—buyer plusseller—increased by 4 percent. Of course, these are averages; selling shareholderssometimes obtain much higher returns. When IBM took over Lotus, it paid a premiumof 100 percent, or about $1.7 billion, for Lotus stock.
Why do sellers earn higher returns? The most important reason is the competitionamong potential bidders. Once the first bidder puts the target company “in play,” one ormore additional suitors often jump in, sometimes as white knights at the invitation ofthe target firm’s management. Every time one suitor tops another’s bid, more of themerger gain slides toward the target. At the same time the target firm’s managementmay mount various legal and financial counterattacks, ensuring that capitulation, if andwhen it comes, is at the highest attainable price.
Of course, bidders and targets are not the only possible winners. Unsuccessful bid-ders often win, too, by selling off their holdings in target companies at substantial prof-its. Such shares may be sold on the open market or sold back to the target company.10
Sometimes they are sold to the successful suitor.Other winners include investment bankers, lawyers, accountants, and in some cases
arbitrageurs, or “arbs,” who speculate on the likely success of takeover bids.“Speculate” has a negative ring, but it can be a useful social service. A tender offer
may present shareholders with a difficult decision. Should they accept, should they wait to see if someone else produces a better offer, or should they sell their stock in the market? This quandary presents an opportunity for the arbitrageurs. In other words,they buy from the target’s shareholders and take on the risk that the deal will not gothrough.11
Leveraged BuyoutsLeveraged buyouts, or LBOs, differ from ordinary acquisitions in two ways. First, alarge fraction of the purchase price is debt-financed. Some, perhaps all, of this debt isjunk, that is, below investment grade. Second, the shares of the LBO no longer trade onthe open market. The remaining equity in the LBO is privately held by a small group of(usually institutional) investors. When this group is led by the company’s management,the acquisition is called a management buyout (MBO). Many LBOs are in fact MBOs.
In the 1970s and 1980s many management buyouts were arranged for unwanted di-visions of large, diversified companies. Smaller divisions outside the companies’ mainlines of business often lacked top management’s interest and commitment, and divi-sional management chafed under corporate bureaucracy. Many such divisions floweredwhen spun off as MBOs. Their managers, pushed by the need to generate cash for debtservice and encouraged by a substantial personal stake in the business, found ways tocut costs and compete more effectively.
During the 1980s MBO/LBO activity shifted to buyouts of entire businesses, including large, mature public corporations. The largest, most dramatic, and best-
9 The small loss to the shareholders of acquiring firms is not statistically significant. Other studies using dif-ferent samples have observed a small positive return.10 When a potential acquirer sells the shares back to the target, the transaction is known as greenmail.11 Strictly speaking, an arbitrageur is an investor who makes a riskless profit. Arbitrageurs in merger battlesoften take very large risks indeed. Their activities are sometimes known as “risk arbitrage.”
586 SECTION SIX
documented LBO of them all was the $25 billion takeover of RJR Nabisco in 1988 byKohlberg Kravis Roberts (KKR). The players, tactics, and controversies of LBOs arewrit large in this case.
� EXAMPLE 4 RJR Nabisco12
On October 28, 1988, the board of directors of RJR Nabisco revealed that Ross John-son, the company’s chief executive officer, had formed a group of investors prepared tobuy all the firm’s stock for $75 per share in cash and take the company private. John-son’s group was backed up and advised by Shearson Lehman Hutton, the investmentbank subsidiary of American Express.
RJR’s share price immediately moved to about $75, handing shareholders a 36 per-cent gain over the previous day’s price of $56. At the same time RJR’s bonds fell, sinceit was clear that existing bondholders would soon have a lot more company.
Johnson’s offer lifted RJR onto the auction block. Once the company was in play, itsboard of directors was obliged to consider other offers, which were not long coming.Four days later, a group of investors led by LBO specialists Kohlberg Kravis Robertsbid $90 per share, $79 in cash plus preferred stock valued at $11.
The bidding finally closed on November 30, some 32 days after the initial offer wasrevealed. In the end it was Johnson’s group against KKR. KKR offered $109 per share,after adding $1 per share (roughly $230 million) at the last hour. The KKR bid was $81in cash, convertible subordinated debentures valued at about $10, and preferred sharesvalued at about $18. Johnson’s group bid $112 in cash and securities.
But the RJR board chose KKR. True, Johnson’s group had offered $3 per share more,but its security valuations were viewed as “softer” and perhaps overstated. Also, KKR’splanned asset sales were less drastic; perhaps their plans for managing the business in-spired more confidence. Finally, the Johnson group’s proposal contained a managementcompensation package that seemed extremely generous and had generated an avalancheof bad press.
But where did the merger benefits come from? What could justify offering $109 pershare, about $25 billion in all, for a company that only 33 days previously had been sell-ing for $56 per share?
KKR and other bidders were betting on two things. First, they expected to generatebillions of additional dollars from interest tax shields, reduced capital expenditures, andsales of assets not strictly necessary to RJR’s core businesses. Asset sales alone wereprojected to generate $5 billion. Second, they expected to make those core businessessignificantly more profitable, mainly by cutting back on expenses and bureaucracy. Ap-parently there was plenty to cut, including the RJR “Air Force,” which at one point op-erated 10 corporate jets.
In the year after KKR took over, new management was installed. This group sold as-sets and cut back operating expenses and capital spending. There were also layoffs. Asexpected, high interest charges meant a net loss of $976 million for 1989, but pretax op-erating income actually increased, despite extensive asset sales, including the sale ofRJR’s European food operations.
While management was cutting costs and selling assets, prices in the junk bond mar-
12 The story of the RJR Nabisco buyout is reconstructed by B. Burrough and J. Helyar in Barbarians at theGate: The Fall of RJR Nabisco (New York: Harper & Row, 1990) and is the subject of a movie with the sametitle.
Mergers, Acquisitions, and Corporate Control 587
ket were rapidly declining, implying much higher future interest charges for RJR andstricter terms on any refinancing. In mid-1990 KKR made an additional equity invest-ment, and later that year the company announced an offer of cash and new shares in ex-change for $753 million of junk bonds. By 1993 the burden of debt had been reducedfrom $26 billion to $14 billion. For RJR, the world’s largest LBO, it seemed that highdebt was a temporary, not permanent, virtue.
BARBARIANS AT THE GATE?
The buyout of RJR crystallized views on LBOs, the junk bond market, and the takeoverbusiness. For many it exemplified all that was wrong with finance in the 1980s, espe-cially the willingness of “raiders” to carve up established companies, leaving them withenormous debt burdens, basically in order to get rich quick.
There was plenty of confusion, stupidity, and greed in the LBO business. Not all thepeople involved were nice. On the other hand, LBOs generated enormous increases inmarket value, and most of the gains went to selling stockholders, not raiders. For ex-ample, the biggest winners in the RJR Nabisco LBO were the company’s stockholders.
We should therefore consider briefly where these gains may have come from beforewe try to pass judgment on LBOs. There are several possibilities.
The Junk Bond Markets. LBOs and debt-financed takeovers may have been drivenby artificially cheap funding from the junk bond markets. With hindsight it seems thatinvestors in junk bonds underestimated the risks of default. Default rates climbedpainfully between 1989 and 1991. At the same time the junk bond market became muchless liquid after the demise of Drexel Burnham Lambert, the chief market maker. Yieldsrose dramatically, and new issues dried up. Suddenly junk-financed LBOs seemed todisappear from the scene.13
Leverage and Taxes. As we explained earlier, borrowing money saves taxes. Buttaxes were not the main driving force behind LBOs. The value of interest tax shieldswas just not big enough to explain the observed gains in market value.
Of course, if interest tax shields were the main motive for LBOs’ high debt, thenLBO managers would not be so concerned to pay off debt. We saw that this was one ofthe first tasks facing RJR Nabisco’s new management.
Other Stakeholders. It is possible that the gain to the selling stockholders is justsomeone else’s loss and that no value is generated overall. Therefore, we should look atthe total gain to all investors in an LBO, not just the selling stockholders.
Bondholders are the obvious losers. The debt they thought was well-secured mayturn into junk when the borrower goes through an LBO. We noted how market prices ofRJR Nabisco debt fell sharply when Ross Johnson’s first LBO offer was announced.But again, the value losses suffered by bondholders in LBOs are not nearly largeenough to explain stockholder gains.
Leverage and Incentives. Managers and employees of LBOs work harder and oftensmarter. They have to generate cash to service the extra debt. Moreover, managers’
13 There was a sharp revival of junk bond sales in 1992 and 1993 and 1996 was a banner year. But many ofthese issues simply replaced existing bonds. It remains to be seen whether junk bonds will make a lasting re-covery.
588 SECTION SIX
personal fortunes are riding on the LBO’s success. They become owners rather than or-ganization men or women.
It is hard to measure the payoff from better incentives, but there is some evidence ofimproved operating efficiency in LBOs. Kaplan, who studied 48 management buyoutsbetween 1980 and 1986, found average increases in operating income of 24 percent overthe following 3 years. Ratios of operating income and net cash flow to assets and salesincreased dramatically. He observed cutbacks in capital expenditures but not in em-ployment. Kaplan suggests that these operating changes “are due to improved incen-tives rather than layoffs or managerial exploitation of shareholders through inside in-formation.”14
Free Cash Flow. The free-cash-flow theory of takeovers is basically that mature firmswith a surplus of cash will tend to waste it. This contrasts with standard finance theory,which says that firms with more cash than positive-NPV investment opportunitiesshould give the cash back to investors through higher dividends or share repurchases.But we see firms like RJR Nabisco spending on corporate luxuries and questionablecapital investments. One benefit of LBOs is to put such companies on a diet and forcethem to pay out cash to service debt.
The free-cash-flow theory predicts that mature, “cash cow” companies will be themost likely targets of LBOs. We can find many examples that fit the theory, includingRJR Nabisco. The theory says that the gains in market value generated by LBOs are justthe present values of the future cash flows that would otherwise have been fritteredaway.15
We do not endorse the free-cash-flow theory as the sole explanation for LBOs. Wehave mentioned several other plausible rationales, and we suspect that most LBOs aredriven by a mixture of motives. Nor do we say that all LBOs are beneficial. On the con-trary, there are many mistakes and even soundly motivated LBOs can be dangerous, asthe bankruptcies of Campeau, Revco, National Gypsum, and many other highly lever-aged companies prove. However, we do take issue with those who portray LBOs simplyas Wall Street barbarians breaking up the traditional strengths of corporate America. Inmany cases LBOs have generated true gains.
In the next section we sum up the long-run impact of mergers and acquisitions, in-cluding LBOs, in the United States economy. We warn you, however, that there are noneat answers. Our assessment has to be mixed and tentative.
Mergers and the EconomyMERGER WAVES
Mergers come in waves. The first episode of intense merger activity occurred at the turnof the twentieth century and the second in the 1920s. There was a further boom from1967 to 1969 and then again in the 1980s and 1990s. Each episode coincided with a pe-
14 S. Kaplan, “The Effects of Management Buyouts on Operating Performance and Value,” Journal of Finan-cial Economics 24 (October 1989), pp. 217–254.15 The free-cash-flow theory’s chief proponent is Michael Jensen. See M. C. Jensen, “The Eclipse of the Pub-lic Corporation,” Harvard Business Review 67 (September–October 1989), pp. 61–74, and “The AgencyCosts of Free Cash Flow, Corporate Finance and Takeovers,” American Economic Review 76 (May 1986), pp.323–329.
Mergers, Acquisitions, and Corporate Control 589
riod of buoyant stock prices, though in each case there were substantial differences inthe types of companies that merged and how they went about it.
We don’t really understand why merger activity is so volatile. If mergers areprompted by economic motives, at least one of these motives must be “here today, gonetomorrow,” and it must somehow be associated with high stock prices. But none of theeconomic motives that we review in this material has anything to do with the generallevel of the stock market. None of the motives burst on the scene in 1967, departed in1970, reappeared for most of the 1980s, and reappeared again in the mid-1990s.
Some mergers may result from mistakes in valuation on the part of the stock market.In other words, the buyer may believe that investors have underestimated the value ofthe seller or may hope that they will overestimate the value of the combined firm. Whydon’t we see just as many firms hunting for bargain acquisitions when the stock marketis low? It is possible that “suckers are born every minute,” but it’s difficult to believethat they can be harvested only in bull markets.
During the 1980s merger boom, only the very largest companies were immune fromattack from a rival management team. For example, in 1985 Pantry Pride, a small su-permarket chain recently emerged from bankruptcy, made a bid for the cosmetics com-pany Revlon. Revlon’s assets were more than five times those of Pantry Pride. Whatmade the bid possible (and eventually successful) was the ability of Pantry Pride to fi-nance the takeover by borrowing $2.1 billion. The growth of leveraged buyouts duringthe 1980s depended on the development of a junk bond market that allowed bidders toplace low-grade bonds rapidly and in high volume.
By the end of the decade the merger environment had changed. Many of the obvioustargets had disappeared, and the battle for RJR Nabisco highlighted the increasing costof victory. Institutions were reluctant to increase their holdings of junk bonds. More-over, the market for these bonds had depended to a remarkable extent on one individ-ual, Michael Milken, of the investment bank Drexel Burnham Lambert. By the late1980s Milken and his employer were in trouble. Milken was indicted by a grand jury on98 counts and was subsequently sentenced to jail and ordered to pay $600 million.Drexel filed for bankruptcy, but by that time the junk bond market was moribund andthe finance for highly leveraged buyouts had largely dried up.16 Finally, in reaction tothe perceived excess of the merger boom, the state legislatures and the courts began tolean against takeovers.
The decline in merger activity proved temporary; by the mid-1990s stock marketsand mergers were booming again. However, LBOs remained out of fashion, and rela-tively few mergers were intended simply to replace management. Instead, companiesbegan to look once more at the possible benefits from combining two businesses.
DO MERGERS GENERATE NET BENEFITS?
There are undoubtedly good acquisitions and bad acquisitions, but economists find ithard to agree on whether acquisitions are beneficial on balance. We do know that merg-ers generate substantial gains to stockholders of acquired firms.
Since buyers seem roughly to break even and sellers make substantial gains, it seemsthat there are positive gains to mergers. But not everybody is convinced. Some believethat investors analyzing mergers pay too much attention to short-term earnings gainsand don’t notice that these gains are at the expense of long-term prospects.
16 For a history of the role of Milken in the development of the junk bond market, see C. Bruck, The Preda-tor’s Ball: The Junk Bond Raiders and the Man Who Staked Them (New York: Simon and Schuster, 1988).
590 SECTION SIX
Since we can’t observe how companies would have fared in the absence of a merger,it is difficult to measure the effects on profitability. Studies of recent merger activitysuggest that mergers do seem to improve real productivity. For example, Healy, Palepu,and Ruback examined 50 large mergers between 1979 and 1983 and found an averageincrease in the companies’ pretax returns of 2.4 percentage points.17 They argue that thisgain came from generating a higher level of sales from the same assets. There was noevidence that the companies were mortgaging their long-term futures by cutting backon long-term investments; expenditures on capital equipment and research and devel-opment tracked the industry average.
If you are concerned with public policy toward mergers, you do not want to look onlyat their impact on the shareholders of the companies concerned. For instance, we havealready seen that in the case of RJR Nabisco some part of the shareholders’ gain was atthe expense of the bondholders and the Internal Revenue Service (through the enlargedinterest tax shield). The acquirer’s shareholders may also gain at the expense of the tar-get firm’s employees, who in some cases are laid off or are forced to take pay cuts aftertakeovers.
Many people believe that the merger wave of the 1980s led to excessive debt levelsand left many companies ill-equipped to survive a recession. Also, many savings andloan companies and some large insurance firms invested heavily in junk bonds. De-faults on these bonds threatened, and in some cases extinguished, their solvency.
Perhaps the most important effect of acquisition is felt by the managers of compa-nies that are not taken over. For example, one effect of LBOs was that the managers ofeven the largest corporations could not feel safe from challenge. Perhaps the threat oftakeover spurs the whole of corporate America to try harder. Unfortunately, we don’tknow whether on balance the threat of merger makes for more active days or sleeplessnights.
We do know that merger activity is very costly. For example, in the RJR Nabiscobuyout, the total fees paid to the investment banks, lawyers, and accountants amountedto over $1 billion.
Even if the gains to the community exceed these costs, one wonders whether thesame benefits could not be achieved more cheaply another way. For example, are lever-aged buyouts necessary to make managers work harder? Perhaps the problem lies in theway that many corporations reward and penalize their managers. Perhaps many of thegains from takeover could be captured by linking management compensation moreclosely to performance.
SummaryIn what ways do companies change the composition of their ownership or man-agement?
If the board of directors fails to replace an inefficient management, there are four ways toeffect a change: (1) shareholders may engage in a proxy contest to replace the board; (2)the firm may be acquired by another; (3) the firm may be purchased by a private group ofinvestors in a leveraged buyout, or (4) it may sell off part of its operations to another
Mergers, Acquisitions, and Corporate Control 591
company. There are three ways for one firm to acquire another: (1) it can merge all theassets and liabilities of the target firm into those of its own company; (2) it can buy thestock of the target; or (3) it can buy the individual assets of the target. The offer to buy thestock of the target firm is called a tender offer. The purchase of the stock or assets ofanother firm is called an acquisition.
Why may it make sense for companies to merge?
A merger may be undertaken in order to replace an inefficient management. But sometimestwo business may be more valuable together than apart. Gains may stem from economies ofscale, economies of vertical integration, the combination of complementary resources, orredeployment of surplus funds. We don’t know how frequently these benefits occur, but theydo make economic sense. Sometimes mergers are undertaken to diversify risks or artificiallyincrease growth of earnings per share. These motives are dubious.
How should the gains and costs of mergers to the acquiring firm be measured?
A merger generates an economic gain if the two firms are worth more together than apart.The gain is the difference between the value of the merged firm and the value of the twofirms run independently. The cost is the premium that the buyer pays for the selling firmover its value as a separate entity. When payment is in the form of shares, the value of thispayment naturally depends on what those shares are worth after the merger is complete. Youshould go ahead with the merger if the gain exceeds the cost.
What are some takeover defenses?
Mergers are often amicably negotiated between the management and directors of the twocompanies; but if the seller is reluctant, the would-be buyer can decide to make a tenderoffer for the stock. We sketched some of the offensive and defensive tactics used in takeoverbattles. These defenses include shark repellents (changes in the company charter meant tomake a takeover more difficult to achieve), poison pills (measures that make takeover of thefirm more costly), and the search for white knights (the attempt to find a friendly acquirerbefore the unfriendly one takes over the firm).
Do mergers increase efficiency and how are the gains from mergers distributed be-tween shareholders of the acquired and acquiring firms?
We observed that when the target firm is acquired, its shareholders typically win: targetfirms’ shareholders earn abnormally large returns. The bidding firm’s shareholders roughlybreak even. This suggests that the typical merger appears to generate positive net benefits,but competition among bidders and active defense by management of the target firm pushesmost of the gains toward selling shareholders.
Mergers seem to generate economic gains, but they are also costly. Investment bankers,lawyers, and arbitrageurs thrived during the 1980s merger and LBO boom. Many companieswere left with heavy debt burdens and had to sell assets or improve performance to staysolvent. By the end of 1990, the new-issue junk bond market had dried up, and thecorporate jousting field was strangely quiet. But not for long. As we write this material earlyin 2000, stock markets and mergers are again booming.
What are some of the motivations for leveraged and management buyouts of thefirm?
In a leveraged buyout (LBO) or management buyout (MBO), all public shares arerepurchased and the company “goes private.” LBOs tend to involve mature businesses withample cash flow and modest growth opportunities. LBOs and other debt-financed takeovers
592 SECTION SIX
are driven by a mixture of motives, including (1) the value of interest tax shields; (2)transfers of value from bondholders, who may see the value of their bonds fall as the firmpiles up more debt; and (3) the opportunity to create better incentives for managers andemployees, who have a personal stake in the company. In addition, many LBOs have beendesigned to force firms with surplus cash to distribute it to shareholders rather than plowingit back. Investors feared such companies would otherwise channel free cash flow intonegative-NPV investments.
www.secdata.com/ Good source of merger datawww.mergernetwork.com/ Information about mergers and acquisitionshttp://viking.som.yale.edu/will/finman540/acquira3.htm A sample case looking at an acquisi-
tionwww.lens-inc.com/ Active corporate governance strategieswww.corpgov.net/ The Corporate Governance Network
proxy contest acquisition poison pillmerger leveraged buyout (LBO) white knighttender offer management buyout (MBO) shark repellent
1. Merger Motives. Which of the following motives for mergers make economic sense?
a. Merging to achieve economies of scale.b. Merging to reduce risk by diversification.c. Merging to redeploy cash generated by a firm with ample profits but limited growth op-
portunities.d. Merging to increase earnings per share.
2. Merger Motives. Explain why it might make good sense for Northeast Heating and North-east Air Conditioning to merge into one company.
3. Empirical Facts. True or false?
a. Sellers almost always gain in mergers.b. Buyers almost always gain in mergers.c. Firms that do unusually well tend to be acquisition targets.d. Merger activity in the United States varies dramatically from year to year.e. On the average, mergers produce substantial economic gains.f. Tender offers require the approval of the selling firm’s management.g. The cost of a merger is always independent of the economic gain produced by the merger.
4. Merger Tactics. Connect each term to its correct definition or description:
A. LBO 1. Attempt to gain control of a firm by winning the votes of itsB. Poison pill stockholders.C. Tender offer 2. Changes in corporate charter designed to deter unwelcome D. Shark repellent takeover.E. Proxy contest 3. Friendly potential acquirer sought by a threatened target firm.
Related WebLinks
Key Terms
Quiz
Mergers, Acquisitions, and Corporate Control 593
F. White knight 4. Shareholders are issued rights to buy shares if bidder acquireslarge stake in the firm.
5. Offer to buy shares directly from stockholders.6. Company or business bought out by private investors, largely
debt-financed.
5. Empirical Facts. True or false?
a. One of the first tasks of an LBO’s financial manager is to pay down debt.b. Shareholders of bidding companies earn higher abnormal returns when the merger is fi-
nanced with stock than in cash-financed deals.c. Targets for LBOs in the 1980s tended to be profitable companies in mature industries
with limited investment opportunities.
6. Merger Gains. Acquiring Corp. is considering a takeover of Takeover Target Inc. Acquiringhas 10 million shares outstanding, which sell for $40 each. Takeover Target has 5 millionshares outstanding, which sell for $20 each. If the merger gains are estimated at $20 million,what is the highest price per share that Acquiring should be willing to pay to Takeover Tar-get shareholders?
7. Mergers and P/E Ratios. If Acquiring Corp. from problem 6 has a price-earnings ratio of12, and Takeover Target has a P/E ratio of 8, what should be the P/E ratio of the mergedfirm? Assume in this case that the merger is financed by an issue of new Acquiring Corp.shares. Takeover Target will get one Acquiring share for every two Takeover Target sharesheld.
8. Merger Gains and Costs. Velcro Saddles is contemplating the acquisition of Pogo SkiSticks, Inc. The values of the two companies as separate entities are $20 million and $10 mil-lion, respectively. Velcro Saddles estimates that by combining the two companies, it will re-duce marketing and administrative costs by $500,000 per year in perpetuity. Velcro Saddlesis willing to pay $14 million cash for Pogo. The opportunity cost of capital is 10 percent.
a. What is the gain from merger?b. What is the cost of the cash offer?c. What is the NPV of the acquisition under the cash offer?
9. Stock versus Cash Offers. Suppose that instead of making a cash offer as in problem 8, Vel-cro Saddles considers offering Pogo shareholders a 50 percent holding in Velcro Saddles.
a. What is the value of the stock in the merged company held by the original Pogo share-holders?
b. What is the cost of the stock alternative?c. What is its NPV under the stock offer?
10. Merger Gains. Immense Appetite, Inc., believes that it can acquire Sleepy Industries andimprove efficiency to the extent that the market value of Sleepy will increase by $5 million.Sleepy currently sells for $20 a share, and there are 1 million shares outstanding.
a. Sleepy’s management is willing to accept a cash offer of $25 a share. Can the merger beaccomplished on a friendly basis?
b. What will happen if Sleepy’s management holds out for an offer of $28 a share?
11. Mergers and P/E Ratios. Castles in the Sand currently sells at a price-earnings multiple of10. The firm has 2 million shares outstanding, and sells at a price per share of $40. Firm
PracticeProblems
594 SECTION SIX
Foundation has a P/E multiple of 8, has 1 million shares outstanding, and sells at a price pershare of $20.
a. If Castles acquires the other firm by exchanging one of its shares for every two of FirmFoundation’s, what will be the earnings per share of the merged firm?
b. What should be the P/E of the new firm if the merger has no economic gains? What willhappen to Castles’s price per share? Show that shareholders of neither Castles nor FirmFoundation realize any change in wealth.
c. What will happen to Castles’s price per share if the market does not realize that the P/Eratio of the merged firm ought to differ from Castles’s premerger ratio?
d. How are the gains from the merger split between shareholders of the two firms if the mar-ket is fooled as in part (c)?
12. Stock versus Cash Offers. Sweet Cola Corp. (SCC) is bidding to take over Salty Dog Pret-zels (SDP). SCC has 3,000 shares outstanding, selling at $50 per share. SDP has 2,000shares outstanding, selling at $17.50 a share. SCC estimates the economic gain from themerger to be $10,000.
a. If SDP can be acquired for $20 a share, what is the NPV of the merger to SCC?b. What will SCC sell for when the market learns that it plans to acquire SDP for $20 a
share? What will SDP sell for? What are the percentage gains to the shareholders of eachfirm?
c. Now suppose that the merger takes place through an exchange of stock. Based on thepremerger prices of the firms, SCC sells for $50, so instead of paying $20 cash, SCC is-sues .40 of its shares for every SDP share acquired. What will be the price of the mergedfirm?
d. What is the NPV of the merger to SCC when it uses an exchange of stock? Why doesyour answer differ from part (a)?
13. Bootstrap Game. The Muck and Slurry merger has fallen through (see Section 6.3). ButWorld Enterprises is determined to report earnings per share of $2.67. It therefore acquiresthe Wheelrim and Axle Company. You are given the following facts:
World Wheelrim MergedEnterprises and Axle Firm
Earnings per share $2.00 $2.50 $2.67Price per share $40.00 $25.00 _____Price-earnings ratio 20 10 _____Number of shares 100,000 200,000 _____Total earnings $200,000 $500,000 _____Total market value $4,000,000 $5,000,000 _____
Once again there are no gains from merging. In exchange for Wheelrim and Axle shares,World Enterprises issues just enough of its own shares to ensure its $2.67 earnings per shareobjective.
a. Complete the above table for the merged firm.b. How many shares of World Enterprises are exchanged for each share of Wheelrim and
Axle?c. What is the cost of the merger to World Enterprises?d. What is the change in the total market value of those World Enterprises shares that were
outstanding before the merger?
ChallengeProblems

Mergers, Acquisitions, and Corporate Control 595
14. Merger Gains and Costs. As treasurer of Leisure Products, Inc., you are investigating thepossible acquisition of Plastitoys. You have the following basic data:
Leisure Products Plastitoys
Forecast earnings per share $5.00 $1.50Forecast dividend per share $3.00 $.80Number of shares 1,000,000 600,000Stock price $90.00 $20.00
You estimate that investors currently expect a steady growth of about 6 percent in Plastitoys’searnings and dividends. You believe that Leisure Products could increase Plastitoys’s growthrate to 8 percent per year, without any additional capital investment required.
a. What is the gain from the acquisition?b. What is the cost of the acquisition if Leisure Products pays $25 in cash for each share of
Plastitoys?c. What is the cost of the acquisition if Leisure Products offers one share of Leisure Prod-
ucts for every three shares of Plastitoys?d. How would the cost of the cash offer and the share offer alter if the expected growth rate
of Plastitoys were not increased by the merger?
1 a. Horizontal merger. IBM is in the same industry as Apple Computer.b. Conglomerate merger. Apple Computer and Stop & Shop are in different industries.c. Vertical merger. Stop & Shop is expanding backward to acquire one of its suppliers,
Campbell Soup.d. Conglomerate merger. Campbell Soup and IBM are in different industries.
2 Given current earnings of $2.00 a share, and a share price of $10, Muck and Slurry wouldhave a market value of $1,000,000 and a price-earnings ratio of only 5. It can be acquiredfor only half as many shares of World Enterprises, 25,000 shares. Therefore, the mergedfirm will have 125,000 shares outstanding and earnings of $400,000, resulting in earningsper share of $3.20, higher than the $2.67 value in the third column of Table 6..2.
3 The cost of the merger is $4 million: the $4 per share premium offered to Goldfish share-holders times 1 million shares. If the merger has positive NPV to Killer Shark, the gainmust be greater than $4 million.
4 Yes. Look again at Table 6.4. Total market value is still $540, but Cislunar will have to issue1 million shares to complete the merger. Total shares in the merged firm will be 11 million.The postmerger share price is $49.09, so Cislunar and its shareholders still come out ahead.
MINICASEMcPhee Food Halls operated a chain of supermarkets in the westof Scotland. The company had had a lackluster record and, sincethe death of its founder in late 1998, it had been regarded as aprime target for a takeover bid. In anticipation of a bid, McPhee’sshare price moved up from £4.90 in March to a 12-month highof £5.80 on June 10, despite the fact that the London stock mar-ket index as a whole was largely unchanged.
Almost nobody anticipated a bid coming from Fenton, a di-versified retail business with a chain of clothing and departmentstores. Though Fenton operated food halls in several of its de-partment stores, it had relatively little experience in food retail-ing. Fenton’s management had, however, been contemplating amerger with McPhee for some time. They not only felt that theycould make use of McPhee’s food retailing skills within their
Solutions toSelf-TestQuestions
596 SECTION SIX
department stores, but they believed that better management andinventory control in McPhee’s business could result in cost sav-ings worth £10 million.
Fenton’s offer of 8 Fenton shares for every 10 McPhee shareswas announced after the market close on June 10. Since McPheehad 5 million shares outstanding, the acquisition would add anadditional 5 × (8/10) = 4 million shares to the 10 million Fentonshares that were already outstanding. While Fenton’s manage-ment believed that it would be difficult for McPhee to mount asuccessful takeover defense, the company and its investmentbankers privately agreed that the company could afford to raisethe offer if it proved necessary.
Investors were not persuaded of the benefits of combining asupermarket with a department store company, and on June 11
Fenton’s shares opened lower and drifted down £.10 to close theday at £7.90. McPhee’s shares, however, jumped to £6.32 a share.
Fenton’s financial manager was due to attend a meeting withthe company’s investment bankers that evening, but before doingso, he decided to run the numbers once again. First he reesti-mated the gain and cost of the merger. Then he analyzed thatday’s fall in Fenton’s stock price to see whether investors be-lieved there were any gains to be had from merging. Finally, hedecided to revisit the issue of whether Fenton could afford toraise its bid at a later stage. If the effect was simply a further fallin the price of Fenton stock, the move could be self-defeating.
597
INTERNATIONALFINANCIAL MANAGEMENT
Foreign Exchange Markets
Some Basic RelationshipsExchange Rates and Inflation
Inflation and Interest Rates
Interest Rates and Exchange Rates
The Forward Rate and the Expected Spot Rate
Some Implications
Hedging Exchange Rate Risk
International Capital BudgetingNet Present Value Analysis
The Cost of Capital for Foreign Investment
Avoiding Fudge Factors
Summary
hus far we have talked principally about doing business at home. But
many companies have substantial overseas interests. Of course the ob-
jectives of international financial management are still the same. You
want to buy assets that are worth more than they cost, and you want to pay for
them by issuing liabilities that are worth less than the money raised. But when you
try to apply these criteria to an international business, you come up against some new
wrinkles.
You must, for example, know how to deal with more than one currency. Therefore
we open this material with a look at foreign exchange markets.
The financial manager must also remember that interest rates differ from country to
country. For example, in late 1999 the short-term rate of interest was about .1 percent
in Japan, 6 percent in the United States, and 3 percent in the euro countries. We will dis-
cuss the reasons for these differences in interest rates, along with some of the implica-
tions for financing overseas operations.
Exchange rate fluctuations can knock companies off course and transform black ink
into red. We will therefore discuss how firms can protect themselves against exchange
risks.
We will also discuss how international companies decide on capital investments.
How do they choose the discount rate? You’ll find that the basic principles of capital
budgeting are the same as for domestic projects, but there are a few pitfalls to watch for.
After studying this material you should be able to
� Understand the difference between spot and forward exchange rates.
� Understand the basic relationships between spot exchange rates, forward exchange
rates, interest rates, and inflation rates.
� Formulate simple strategies to protect the firm against exchange rate risk.
� Perform an NPV analysis for projects with cash flows in foreign currencies.
598
T
Foreign Exchange MarketsAn American company that imports goods from Switzerland may need to exchange its dollars for Swiss francs in order to pay for its purchases. An American company exporting to Switzerland may receive Swiss francs, which it sells in exchange for dollars. Both firms must make use of the foreign exchange market, where currenciesare traded.
The foreign exchange market has no central marketplace. All business is conductedby computer and telephone. The principal dealers are the large commercial banks, and
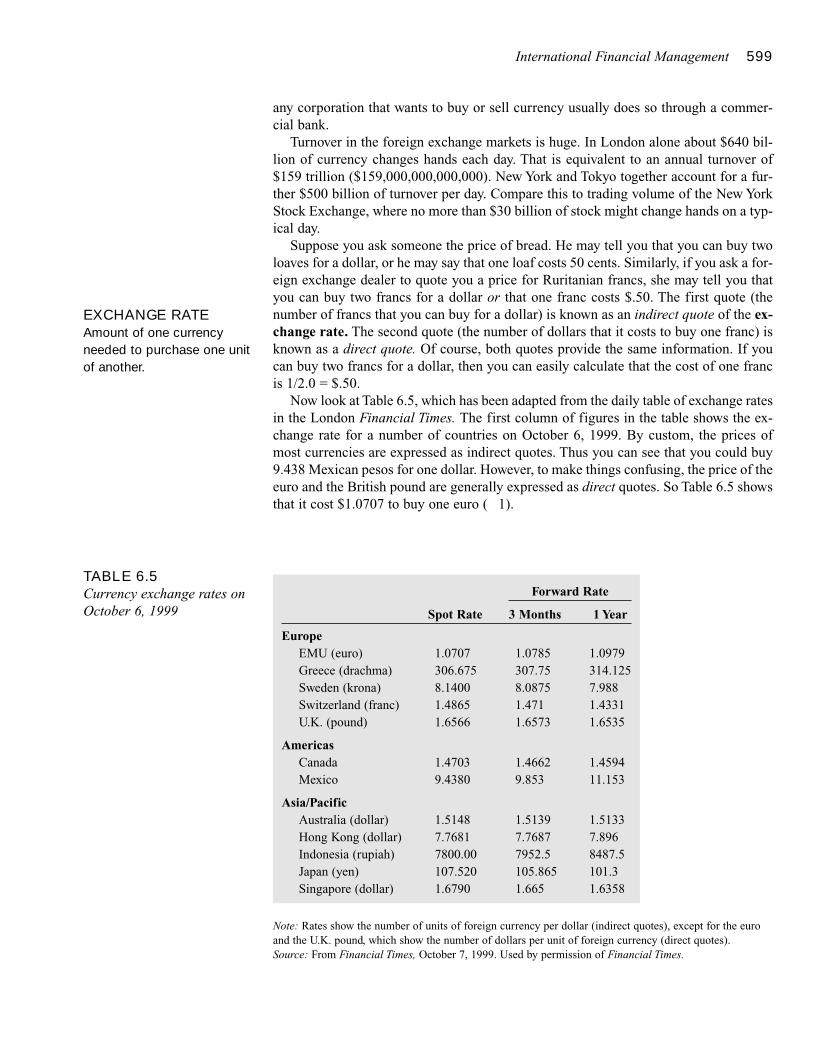
International Financial Management 599
any corporation that wants to buy or sell currency usually does so through a commer-cial bank.
Turnover in the foreign exchange markets is huge. In London alone about $640 bil-lion of currency changes hands each day. That is equivalent to an annual turnover of$159 trillion ($159,000,000,000,000). New York and Tokyo together account for a fur-ther $500 billion of turnover per day. Compare this to trading volume of the New YorkStock Exchange, where no more than $30 billion of stock might change hands on a typ-ical day.
Suppose you ask someone the price of bread. He may tell you that you can buy twoloaves for a dollar, or he may say that one loaf costs 50 cents. Similarly, if you ask a for-eign exchange dealer to quote you a price for Ruritanian francs, she may tell you thatyou can buy two francs for a dollar or that one franc costs $.50. The first quote (thenumber of francs that you can buy for a dollar) is known as an indirect quote of the ex-change rate. The second quote (the number of dollars that it costs to buy one franc) isknown as a direct quote. Of course, both quotes provide the same information. If youcan buy two francs for a dollar, then you can easily calculate that the cost of one francis 1/2.0 = $.50.
Now look at Table 6.5, which has been adapted from the daily table of exchange ratesin the London Financial Times. The first column of figures in the table shows the ex-change rate for a number of countries on October 6, 1999. By custom, the prices ofmost currencies are expressed as indirect quotes. Thus you can see that you could buy9.438 Mexican pesos for one dollar. However, to make things confusing, the price of theeuro and the British pound are generally expressed as direct quotes. So Table 6.5 showsthat it cost $1.0707 to buy one euro ( 1).
TABLE 6.5Currency exchange rates onOctober 6, 1999
Forward Rate
Spot Rate 3 Months 1 Year
EuropeEMU (euro) 1.0707 1.0785 1.0979Greece (drachma) 306.675 307.75 314.125Sweden (krona) 8.1400 8.0875 7.988Switzerland (franc) 1.4865 1.471 1.4331U.K. (pound) 1.6566 1.6573 1.6535
AmericasCanada 1.4703 1.4662 1.4594Mexico 9.4380 9.853 11.153
Asia/PacificAustralia (dollar) 1.5148 1.5139 1.5133Hong Kong (dollar) 7.7681 7.7687 7.896Indonesia (rupiah) 7800.00 7952.5 8487.5Japan (yen) 107.520 105.865 101.3Singapore (dollar) 1.6790 1.665 1.6358
Note: Rates show the number of units of foreign currency per dollar (indirect quotes), except for the euroand the U.K. pound, which show the number of dollars per unit of foreign currency (direct quotes).Source: From Financial Times, October 7, 1999. Used by permission of Financial Times.
EXCHANGE RATEAmount of one currencyneeded to purchase one unitof another.

600 SECTION SIX
� EXAMPLE 5 A Yen for Trade
How many yen will it cost a Japanese importer to purchase $1,000 worth of orangesfrom a California farmer? How many dollars will it take for that farmer to buy a Japa-nese VCR priced in Japan at 30,000 yen (¥)?
The exchange rate is ¥107.52 per dollar. The $1,000 of oranges will require theJapanese importer to come up with 1,000 × 107.52 = ¥107,520. The VCR will requirethe American importer to come up with 30,000/107.52 = $279.
� Self-Test 1 Use the exchange rates in Table 6.5. How many euros can you buy for one dollar (an in-direct quote)? How many dollars can you buy for one yen (a direct quote)?
The exchange rates in the first column of figures in Table 6.5 are the prices of cur-rency for immediate delivery. These are known as spot rates of exchange. For exam-ple, the spot rate of exchange for Mexican pesos is pesos9.4380/$. In other words, itcost 9.438 Mexican pesos to buy one dollar.
Many countries allow their currencies to float, so that the exchange rate fluctuatesfrom day to day, and from minute to minute. When the currency increases in value,meaning that you need less of the foreign currency to buy one dollar, the currency issaid to appreciate. When you need more of the currency to buy one dollar, the currencyis said to depreciate.
� Self-Test 2 Table 6.5 shows the exchange rate for the Swiss franc on October 6, 1999. The next daythe spot rate of exchange for the Swiss franc was SFr1.4852/$. Thus you could buyfewer Swiss francs for your dollar than one day earlier. Had the Swiss franc appreciatedor depreciated?
Some countries try to avoid fluctuations in the value of their currency and seek in-stead to maintain a fixed exchange rate. But fixed rates seldom last forever. If every-body tries to sell the currency, eventually the country will be forced to allow the cur-rency to depreciate. When this happens, exchange rates can change dramatically. Forexample, when Indonesia gave up trying to fix its exchange rate in fall 1997, the valueof the Indonesian rupiah fell by 80 percent in a few months.
These fluctuations in exchange rates can get companies into hot water. For example,suppose you have agreed to buy a shipment of Japanese VCRs for ¥100 million and tomake the payment when you take delivery of the VCRs at the end of 12 months. Youcould wait until the 12 months have passed and then buy 100 million yen at the spot ex-change rate. If the spot rate is unchanged at ¥107.52/$, then the VCRs will cost you 100million/107.52 = $930,060. But you are taking a risk by waiting, for the yen may be-come more expensive. For example, if the yen appreciates to ¥100/$, then you will haveto pay out 100 million/100 = $1 million.
You can avoid exchange rate risk and fix the dollar cost of VCRs by “buying the yenforward,” that is, by arranging now to buy yen in the future. A foreign exchange forwardcontract is an agreement to exchange at a future date a given amount of currency at an
SPOT RATE OFEXCHANGE Exchangerate for an immediatetransaction.
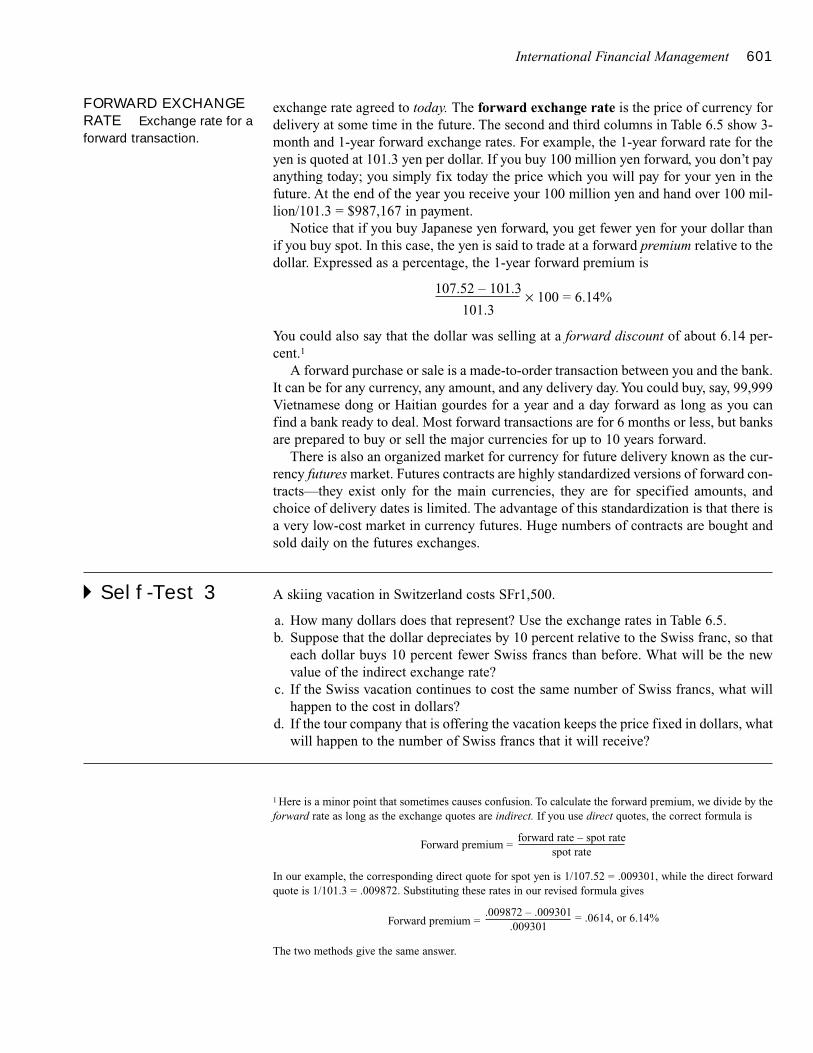
International Financial Management 601
exchange rate agreed to today. The forward exchange rate is the price of currency fordelivery at some time in the future. The second and third columns in Table 6.5 show 3-month and 1-year forward exchange rates. For example, the 1-year forward rate for theyen is quoted at 101.3 yen per dollar. If you buy 100 million yen forward, you don’t payanything today; you simply fix today the price which you will pay for your yen in thefuture. At the end of the year you receive your 100 million yen and hand over 100 mil-lion/101.3 = $987,167 in payment.
Notice that if you buy Japanese yen forward, you get fewer yen for your dollar thanif you buy spot. In this case, the yen is said to trade at a forward premium relative to thedollar. Expressed as a percentage, the 1-year forward premium is
107.52 – 101.3 × 100 = 6.14%101.3
You could also say that the dollar was selling at a forward discount of about 6.14 per-cent.1
A forward purchase or sale is a made-to-order transaction between you and the bank.It can be for any currency, any amount, and any delivery day. You could buy, say, 99,999Vietnamese dong or Haitian gourdes for a year and a day forward as long as you canfind a bank ready to deal. Most forward transactions are for 6 months or less, but banksare prepared to buy or sell the major currencies for up to 10 years forward.
There is also an organized market for currency for future delivery known as the cur-rency futures market. Futures contracts are highly standardized versions of forward con-tracts—they exist only for the main currencies, they are for specified amounts, andchoice of delivery dates is limited. The advantage of this standardization is that there isa very low-cost market in currency futures. Huge numbers of contracts are bought andsold daily on the futures exchanges.
� Self-Test 3 A skiing vacation in Switzerland costs SFr1,500.
a. How many dollars does that represent? Use the exchange rates in Table 6.5.b. Suppose that the dollar depreciates by 10 percent relative to the Swiss franc, so that
each dollar buys 10 percent fewer Swiss francs than before. What will be the newvalue of the indirect exchange rate?
c. If the Swiss vacation continues to cost the same number of Swiss francs, what willhappen to the cost in dollars?
d. If the tour company that is offering the vacation keeps the price fixed in dollars, whatwill happen to the number of Swiss francs that it will receive?
FORWARD EXCHANGERATE Exchange rate for aforward transaction.
1 Here is a minor point that sometimes causes confusion. To calculate the forward premium, we divide by theforward rate as long as the exchange quotes are indirect. If you use direct quotes, the correct formula is
Forward premium =forward rate – spot rate
spot rate
In our example, the corresponding direct quote for spot yen is 1/107.52 = .009301, while the direct forwardquote is 1/101.3 = .009872. Substituting these rates in our revised formula gives
Forward premium =.009872 – .009301
.009301= .0614, or 6.14%
The two methods give the same answer.
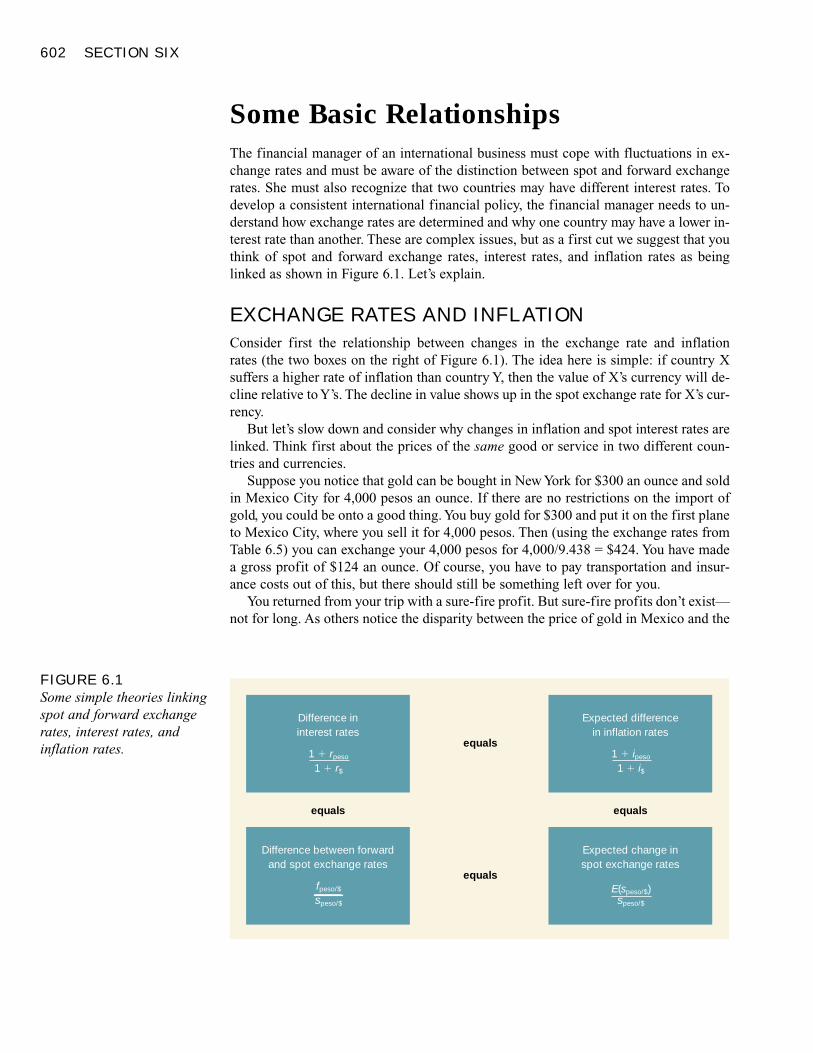
602 SECTION SIX
Some Basic RelationshipsThe financial manager of an international business must cope with fluctuations in ex-change rates and must be aware of the distinction between spot and forward exchangerates. She must also recognize that two countries may have different interest rates. Todevelop a consistent international financial policy, the financial manager needs to un-derstand how exchange rates are determined and why one country may have a lower in-terest rate than another. These are complex issues, but as a first cut we suggest that youthink of spot and forward exchange rates, interest rates, and inflation rates as beinglinked as shown in Figure 6.1. Let’s explain.
EXCHANGE RATES AND INFLATION
Consider first the relationship between changes in the exchange rate and inflation rates (the two boxes on the right of Figure 6.1). The idea here is simple: if country Xsuffers a higher rate of inflation than country Y, then the value of X’s currency will de-cline relative to Y’s. The decline in value shows up in the spot exchange rate for X’s cur-rency.
But let’s slow down and consider why changes in inflation and spot interest rates arelinked. Think first about the prices of the same good or service in two different coun-tries and currencies.
Suppose you notice that gold can be bought in New York for $300 an ounce and soldin Mexico City for 4,000 pesos an ounce. If there are no restrictions on the import ofgold, you could be onto a good thing. You buy gold for $300 and put it on the first planeto Mexico City, where you sell it for 4,000 pesos. Then (using the exchange rates fromTable 6.5) you can exchange your 4,000 pesos for 4,000/9.438 = $424. You have madea gross profit of $124 an ounce. Of course, you have to pay transportation and insur-ance costs out of this, but there should still be something left over for you.
You returned from your trip with a sure-fire profit. But sure-fire profits don’t exist—not for long. As others notice the disparity between the price of gold in Mexico and the
FIGURE 6.1Some simple theories linkingspot and forward exchangerates, interest rates, andinflation rates.
Difference ininterest rates
equals
equals
equals
1 � rpeso
1 � r$
Difference between forwardand spot exchange rates
fpeso/$
speso/$
Expected differencein inflation rates
equals
1 � ipeso
1 � i$
Expected change inspot exchange rates
E(speso/$)speso/$
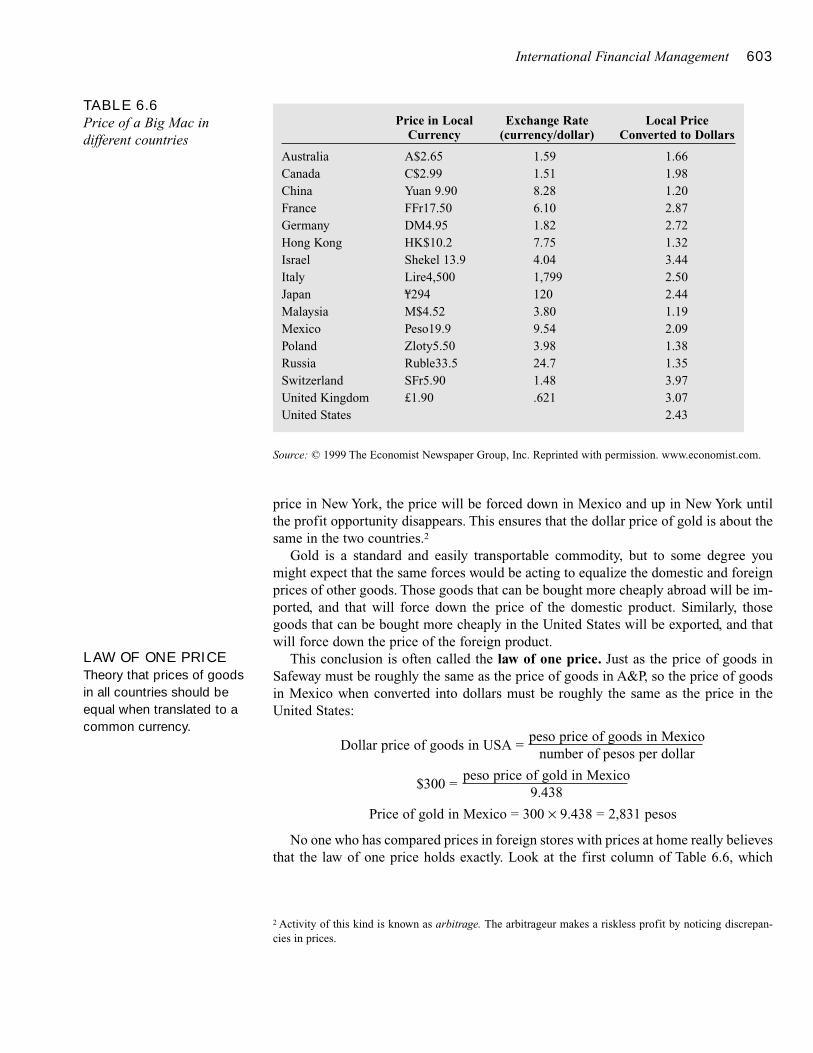
International Financial Management 603
price in New York, the price will be forced down in Mexico and up in New York untilthe profit opportunity disappears. This ensures that the dollar price of gold is about thesame in the two countries.2
Gold is a standard and easily transportable commodity, but to some degree youmight expect that the same forces would be acting to equalize the domestic and foreignprices of other goods. Those goods that can be bought more cheaply abroad will be im-ported, and that will force down the price of the domestic product. Similarly, thosegoods that can be bought more cheaply in the United States will be exported, and thatwill force down the price of the foreign product.
This conclusion is often called the law of one price. Just as the price of goods inSafeway must be roughly the same as the price of goods in A&P, so the price of goodsin Mexico when converted into dollars must be roughly the same as the price in theUnited States:
Dollar price of goods in USA =peso price of goods in Mexico
number of pesos per dollar
$300 =peso price of gold in Mexico
9.438
Price of gold in Mexico = 300 × 9.438 = 2,831 pesos
No one who has compared prices in foreign stores with prices at home really believesthat the law of one price holds exactly. Look at the first column of Table 6.6, which
TABLE 6.6Price of a Big Mac indifferent countries
Price in Local Exchange Rate Local PriceCurrency (currency/dollar) Converted to Dollars
Australia A$2.65 1.59 1.66Canada C$2.99 1.51 1.98China Yuan 9.90 8.28 1.20France FFr17.50 6.10 2.87Germany DM4.95 1.82 2.72Hong Kong HK$10.2 7.75 1.32Israel Shekel 13.9 4.04 3.44Italy Lire4,500 1,799 2.50Japan ¥294 120 2.44Malaysia M$4.52 3.80 1.19Mexico Peso19.9 9.54 2.09Poland Zloty5.50 3.98 1.38Russia Ruble33.5 24.7 1.35Switzerland SFr5.90 1.48 3.97United Kingdom £1.90 .621 3.07United States 2.43
Source: © 1999 The Economist Newspaper Group, Inc. Reprinted with permission. www.economist.com.
2 Activity of this kind is known as arbitrage. The arbitrageur makes a riskless profit by noticing discrepan-cies in prices.
LAW OF ONE PRICETheory that prices of goodsin all countries should beequal when translated to acommon currency.
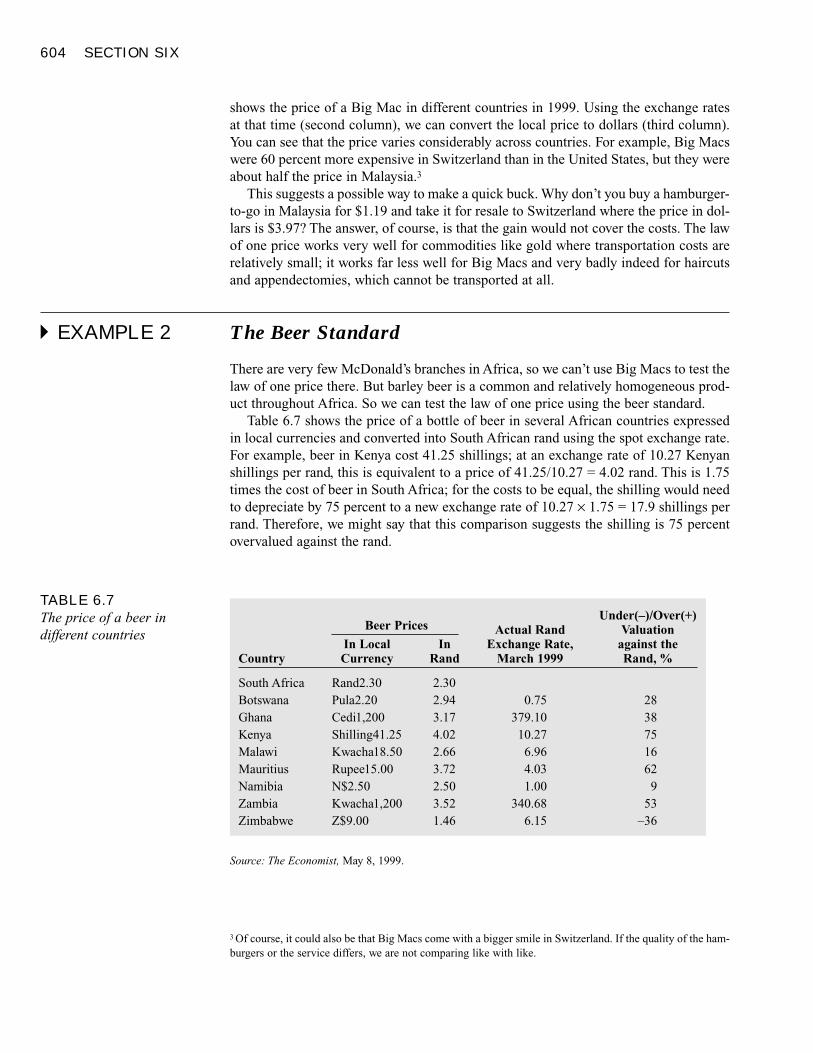
604 SECTION SIX
shows the price of a Big Mac in different countries in 1999. Using the exchange ratesat that time (second column), we can convert the local price to dollars (third column).You can see that the price varies considerably across countries. For example, Big Macswere 60 percent more expensive in Switzerland than in the United States, but they wereabout half the price in Malaysia.3
This suggests a possible way to make a quick buck. Why don’t you buy a hamburger-to-go in Malaysia for $1.19 and take it for resale to Switzerland where the price in dol-lars is $3.97? The answer, of course, is that the gain would not cover the costs. The lawof one price works very well for commodities like gold where transportation costs arerelatively small; it works far less well for Big Macs and very badly indeed for haircutsand appendectomies, which cannot be transported at all.
� EXAMPLE 2 The Beer Standard
There are very few McDonald’s branches in Africa, so we can’t use Big Macs to test thelaw of one price there. But barley beer is a common and relatively homogeneous prod-uct throughout Africa. So we can test the law of one price using the beer standard.
Table 6.7 shows the price of a bottle of beer in several African countries expressedin local currencies and converted into South African rand using the spot exchange rate.For example, beer in Kenya cost 41.25 shillings; at an exchange rate of 10.27 Kenyanshillings per rand, this is equivalent to a price of 41.25/10.27 = 4.02 rand. This is 1.75times the cost of beer in South Africa; for the costs to be equal, the shilling would needto depreciate by 75 percent to a new exchange rate of 10.27 × 1.75 = 17.9 shillings perrand. Therefore, we might say that this comparison suggests the shilling is 75 percentovervalued against the rand.
TABLE 6.7The price of a beer indifferent countries
Under(–)/Over(+)Beer Prices Actual Rand Valuation
In Local In Exchange Rate, against theCountry Currency Rand March 1999 Rand, %
South Africa Rand2.30 2.30Botswana Pula2.20 2.94 0.75 28Ghana Cedi1,200 3.17 379.10 38Kenya Shilling41.25 4.02 10.27 75Malawi Kwacha18.50 2.66 6.96 16Mauritius Rupee15.00 3.72 4.03 62Namibia N$2.50 2.50 1.00 9Zambia Kwacha1,200 3.52 340.68 53Zimbabwe Z$9.00 1.46 6.15 –36
Source: The Economist, May 8, 1999.
3 Of course, it could also be that Big Macs come with a bigger smile in Switzerland. If the quality of the ham-burgers or the service differs, we are not comparing like with like.
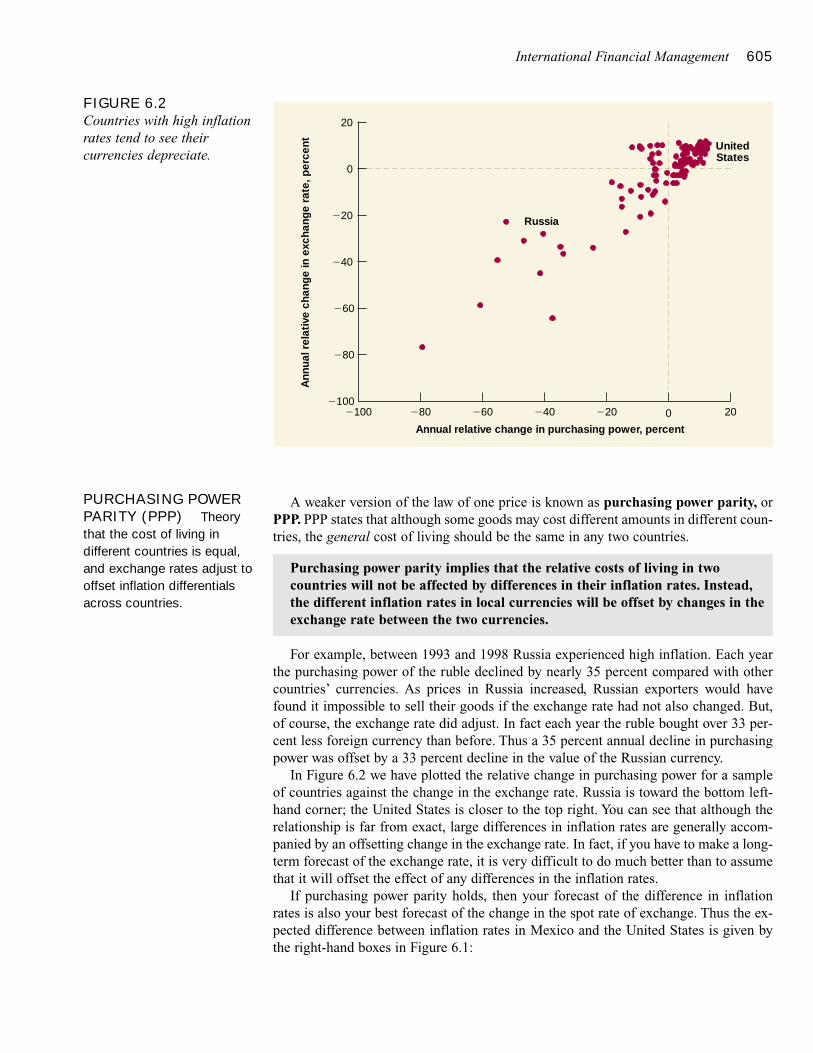
International Financial Management 605
A weaker version of the law of one price is known as purchasing power parity, orPPP. PPP states that although some goods may cost different amounts in different coun-tries, the general cost of living should be the same in any two countries.
For example, between 1993 and 1998 Russia experienced high inflation. Each yearthe purchasing power of the ruble declined by nearly 35 percent compared with othercountries’ currencies. As prices in Russia increased, Russian exporters would havefound it impossible to sell their goods if the exchange rate had not also changed. But,of course, the exchange rate did adjust. In fact each year the ruble bought over 33 per-cent less foreign currency than before. Thus a 35 percent annual decline in purchasingpower was offset by a 33 percent decline in the value of the Russian currency.
In Figure 6.2 we have plotted the relative change in purchasing power for a sampleof countries against the change in the exchange rate. Russia is toward the bottom left-hand corner; the United States is closer to the top right. You can see that although therelationship is far from exact, large differences in inflation rates are generally accom-panied by an offsetting change in the exchange rate. In fact, if you have to make a long-term forecast of the exchange rate, it is very difficult to do much better than to assumethat it will offset the effect of any differences in the inflation rates.
If purchasing power parity holds, then your forecast of the difference in inflationrates is also your best forecast of the change in the spot rate of exchange. Thus the ex-pected difference between inflation rates in Mexico and the United States is given bythe right-hand boxes in Figure 6.1:
Purchasing power parity implies that the relative costs of living in twocountries will not be affected by differences in their inflation rates. Instead,the different inflation rates in local currencies will be offset by changes in theexchange rate between the two currencies.
PURCHASING POWERPARITY (PPP) Theorythat the cost of living indifferent countries is equal,and exchange rates adjust tooffset inflation differentialsacross countries.
FIGURE 6.2Countries with high inflationrates tend to see theircurrencies depreciate.
Ann
ual r
elat
ive
chan
ge
in e
xcha
nge
rate
, per
cent
Annual relative change in purchasing power, percent
20
0
�20
�40
�60
�80
�100�100 �80 �60 �40 �20 0 20
Russia
UnitedStates
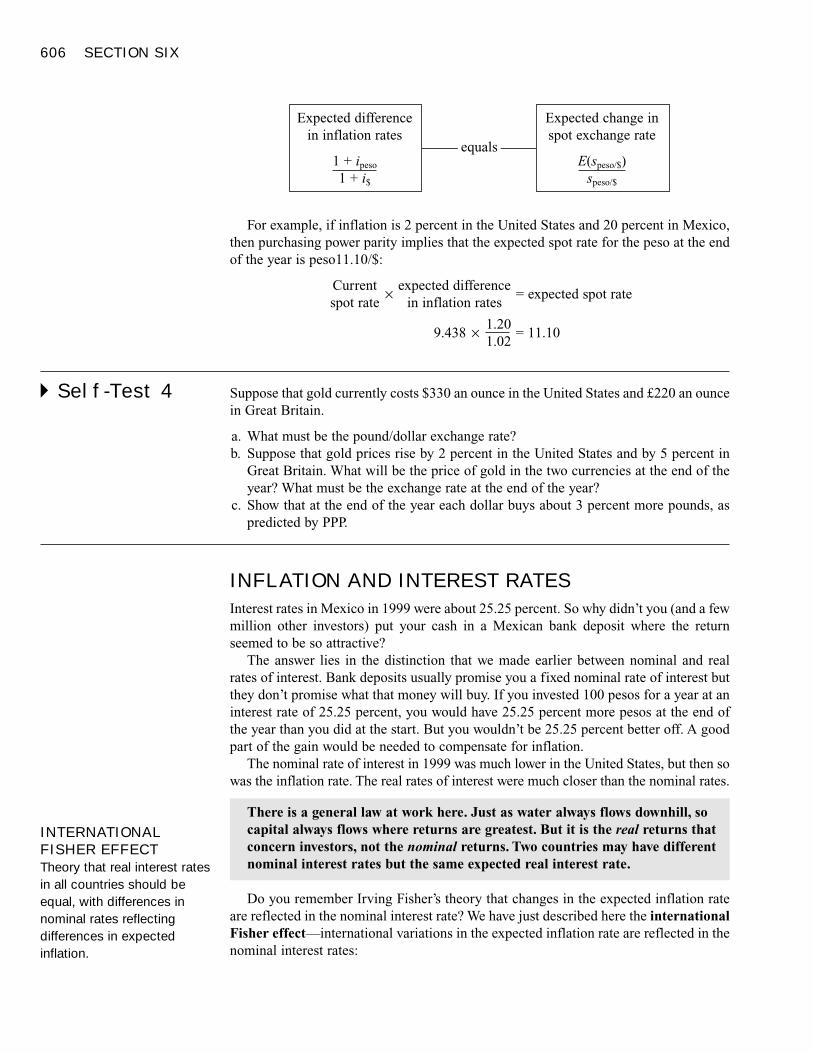
606 SECTION SIX
For example, if inflation is 2 percent in the United States and 20 percent in Mexico,then purchasing power parity implies that the expected spot rate for the peso at the endof the year is peso11.10/$:
Current × expected difference= expected spot rate
spot rate in inflation rates
9.438 × 1.20= 11.10
1.02
� Self-Test 4 Suppose that gold currently costs $330 an ounce in the United States and £220 an ouncein Great Britain.
a. What must be the pound/dollar exchange rate?b. Suppose that gold prices rise by 2 percent in the United States and by 5 percent in
Great Britain. What will be the price of gold in the two currencies at the end of theyear? What must be the exchange rate at the end of the year?
c. Show that at the end of the year each dollar buys about 3 percent more pounds, aspredicted by PPP.
INFLATION AND INTEREST RATES
Interest rates in Mexico in 1999 were about 25.25 percent. So why didn’t you (and a fewmillion other investors) put your cash in a Mexican bank deposit where the returnseemed to be so attractive?
The answer lies in the distinction that we made earlier between nominal and realrates of interest. Bank deposits usually promise you a fixed nominal rate of interest butthey don’t promise what that money will buy. If you invested 100 pesos for a year at aninterest rate of 25.25 percent, you would have 25.25 percent more pesos at the end ofthe year than you did at the start. But you wouldn’t be 25.25 percent better off. A goodpart of the gain would be needed to compensate for inflation.
The nominal rate of interest in 1999 was much lower in the United States, but then sowas the inflation rate. The real rates of interest were much closer than the nominal rates.
Do you remember Irving Fisher’s theory that changes in the expected inflation rateare reflected in the nominal interest rate? We have just described here the internationalFisher effect—international variations in the expected inflation rate are reflected in thenominal interest rates:
There is a general law at work here. Just as water always flows downhill, socapital always flows where returns are greatest. But it is the real returns thatconcern investors, not the nominal returns. Two countries may have differentnominal interest rates but the same expected real interest rate.
Expected differencein inflation rates
1 + ipeso
1 + i$
Expected change inspot exchange rate
E(speso/$)speso/$
equals
INTERNATIONALFISHER EFFECTTheory that real interest ratesin all countries should beequal, with differences innominal rates reflectingdifferences in expectedinflation.
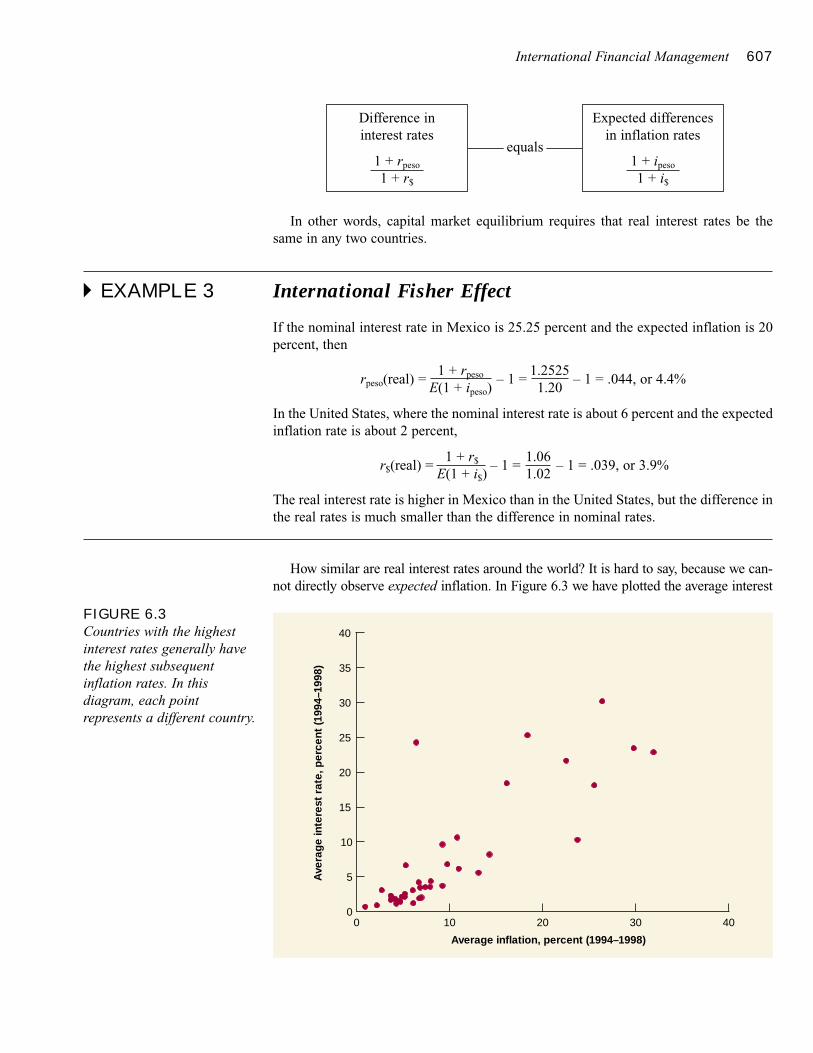
International Financial Management 607
In other words, capital market equilibrium requires that real interest rates be thesame in any two countries.
� EXAMPLE 3 International Fisher Effect
If the nominal interest rate in Mexico is 25.25 percent and the expected inflation is 20percent, then
rpeso(real) =1 + rpeso – 1 =
1.2525– 1 = .044, or 4.4%
E(1 + ipeso) 1.20
In the United States, where the nominal interest rate is about 6 percent and the expectedinflation rate is about 2 percent,
r$(real) =1 + r$ – 1 =
1.06– 1 = .039, or 3.9%
E(1 + i$) 1.02
The real interest rate is higher in Mexico than in the United States, but the difference inthe real rates is much smaller than the difference in nominal rates.
How similar are real interest rates around the world? It is hard to say, because we can-not directly observe expected inflation. In Figure 6.3 we have plotted the average interest
Difference in interest rates
1 + rpeso
1 + r$
Expected differencesin inflation rates
1 + ipeso
1 + i$
equals
FIGURE 6.3Countries with the highestinterest rates generally havethe highest subsequentinflation rates. In thisdiagram, each pointrepresents a different country.
Ave
rag
e in
tere
st r
ate,
per
cent
(199
4–19
98)
Average inflation, percent (1994–1998)
40
30
20
15
10
5
0
25
35
0 10 20 30 40
608 SECTION SIX
rate in each of 40 countries against the inflation that in fact occurred. You can see that thecountries with the highest interest rates generally had the highest inflation rates.
� Self-Test 5 American investors can invest $1,000 at an interest rate of 6.0 percent. Alternatively,they can convert those funds to 306,675 drachma at the current exchange rate and in-vest at 8.5 percent in Greece. If the expected inflation rate in the United States is 2 per-cent, what must be investors’ forecast of the inflation rate in Greece?
INTEREST RATES AND EXCHANGE RATES
You are an investor with $1 million to invest for 1 year. The interest rate in Mexico is25.25 percent and in the United States it is 6 percent. Is it better to make a peso loan ora dollar loan?
The answer seems obvious: Isn’t it better to earn an interest rate of 25.25 percentthan 6 percent? But appearances may be deceptive. If you lend in Mexico, you first needto convert your $1 million into pesos. When the loan is repaid at the end of the year,you need to convert your pesos back into dollars. Of course you don’t know what theexchange rate will be at the end of the year but you can fix the future value of yourpesos by selling them forward. If the forward rate of exchange is sufficiently low, youmay do just as well keeping your money in the United States.
Let’s use the data from Table 6.5 to check which loan is the better deal:
• Dollar loan: The rate of interest on a dollar loan is 6 percent. Therefore, at the endof the year you get 1,000,000 × 1.06 = $1,060,000.
• Peso loan: The current rate of exchange (from Table 6.5) is peso9.438/$. Therefore,for $1 million, you can buy 1,000,000 × 9.438 = peso9,438,000. The rate of intereston a 1-year peso loan is 25.25 percent. So at the end of the year, you getpeso9,438,000 × 1.2525 = peso11,821,000. Of course, you don’t know what the ex-change rate will be at the end of the year. But that doesn’t matter. You can nail downthe price at which you sell your pesos. The 1-year forward rate is peso11.153/$.Therefore, by selling the peso11,821,000 forward, you make sure that you will get11,821,000/11.153 = $1,059,900.
Thus the two investments offer almost exactly the same rate of return. They have to—they are both risk-free. If the domestic interest rate were different from the “covered”foreign rate, you would have a money machine: you could borrow in the market withthe lower rate and lend in the market with the higher rate.
When you make a peso loan, you gain because you get a higher interest rate. But youlose because you sell the pesos forward at a lower price than you have to pay for themtoday. The interest rate differential is
1 + rpeso =1.2525
= 1.18161 + r$ 1.06
A difference in interest rates must be offset by a difference between spot andforward exchange rates. If the risk-free interest rate in country X is higherthan in country Y, then country X’s currency will buy less of Y’s in a forwardtransaction than in a spot transaction.
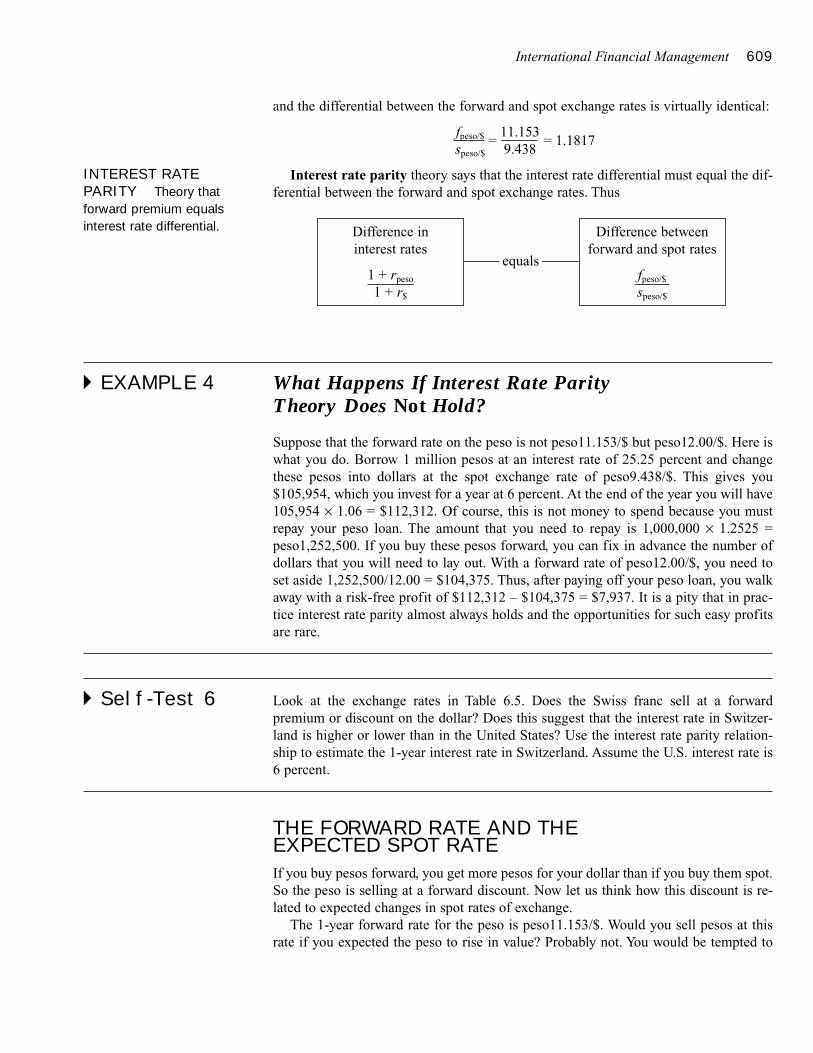
International Financial Management 609
and the differential between the forward and spot exchange rates is virtually identical:
fpeso/$ =11.153
= 1.1817speso/$ 9.438
Interest rate parity theory says that the interest rate differential must equal the dif-ferential between the forward and spot exchange rates. Thus
� EXAMPLE 4 What Happens If Interest Rate Parity Theory Does Not Hold?
Suppose that the forward rate on the peso is not peso11.153/$ but peso12.00/$. Here iswhat you do. Borrow 1 million pesos at an interest rate of 25.25 percent and changethese pesos into dollars at the spot exchange rate of peso9.438/$. This gives you$105,954, which you invest for a year at 6 percent. At the end of the year you will have105,954 × 1.06 = $112,312. Of course, this is not money to spend because you mustrepay your peso loan. The amount that you need to repay is 1,000,000 × 1.2525 =peso1,252,500. If you buy these pesos forward, you can fix in advance the number ofdollars that you will need to lay out. With a forward rate of peso12.00/$, you need toset aside 1,252,500/12.00 = $104,375. Thus, after paying off your peso loan, you walkaway with a risk-free profit of $112,312 – $104,375 = $7,937. It is a pity that in prac-tice interest rate parity almost always holds and the opportunities for such easy profitsare rare.
� Self-Test 6 Look at the exchange rates in Table 6.5. Does the Swiss franc sell at a forward premium or discount on the dollar? Does this suggest that the interest rate in Switzer-land is higher or lower than in the United States? Use the interest rate parity relation-ship to estimate the 1-year interest rate in Switzerland. Assume the U.S. interest rate is6 percent.
THE FORWARD RATE AND THE EXPECTED SPOT RATE
If you buy pesos forward, you get more pesos for your dollar than if you buy them spot.So the peso is selling at a forward discount. Now let us think how this discount is re-lated to expected changes in spot rates of exchange.
The 1-year forward rate for the peso is peso11.153/$. Would you sell pesos at thisrate if you expected the peso to rise in value? Probably not. You would be tempted to
Difference in interest rates
1 + rpeso
1 + r$
Difference betweenforward and spot rates
fpeso/$
speso/$
equals
INTEREST RATEPARITY Theory thatforward premium equalsinterest rate differential.
610 SECTION SIX
wait until the end of the year and get a better price for your pesos in the spot market. Ifother traders felt the same way, nobody would sell pesos forward and everybody wouldwant to buy. The result would be that the number of pesos that you could get for yourdollar in the forward market would fall. Similarly, if traders expected the peso to fallsharply in value, they might be reluctant to buy forward and, in order to attract buyers,the number of pesos that you could buy for a dollar in the forward market would needto rise.4
This is the reasoning behind the expectations theory of exchange rates, which pre-dicts that the forward rate equals the expected future spot exchange rate: fpeso/$ =E(speso/$). Equivalently, we can say that the percentage difference between the forwardrate and today’s spot rate is equal to the expected percentage change in the spot rate:
This is the final leg of our quadrilateral in Figure 6.1.
The theory passes this simple test reasonably well. This is important news for the fi-nancial manager; it means that a company which always covers its foreign exchangecommitments by buying or selling currency in the forward market does not have to paya premium to avoid exchange rate risk: on average, the forward price at which it agreesto exchange currency will equal the eventual spot exchange rate, no better but no worse.
We should, however, warn you that the forward rate does not tell you very muchabout the future spot rate. For example, when the forward rate appears to suggest thatthe spot rate is likely to appreciate, you will find that the spot rate is about equally likelyto head off in the opposite direction.
SOME IMPLICATIONS
Our four simple relationships ignore many of the complexities of interest rates and ex-change rates. But they capture the more important features and emphasize that interna-tional capital markets and currency markets function well and offer no free lunches.When managers forget this, it can be costly. For example, in the late 1980s, several Aus-tralian banks observed that interest rates in Switzerland were about 8 percentage pointslower than those in Australia and advised their clients to borrow Swiss francs. Was thisadvice correct? According to the international Fisher effect, the lower Swiss interest
The expectations theory of forward rates does not imply that managers areperfect forecasters. Sometimes the actual future spot rate will turn out to beabove the previous forward rate. Sometimes it will fall below. But if the theoryis correct, we should find that on the average the forward rate is equal to thefuture spot rate.
Difference betweenforward and spot rates
fpeso/$
speso/$
Expected change inspot exchange rate
E(speso/$)speso/$
equals
4 This reasoning ignores risk. If a forward purchase reduces your risk sufficiently, you might be prepared tobuy forward even if you expected to pay more as a result. Similarly, if a forward sale reduces risk, you mightbe prepared to sell forward even if you expected to receive less as a result.
EXPECTATIONSTHEORY OF EXCHANGERATES Theory thatexpected spot exchange rateequals the forward rate.
International Financial Management 611
rate indicated that investors were expecting a lower inflation rate in Switzerland than inAustralia and this in turn would result in an appreciation of the Swiss franc relative tothe Australian dollar. Thus it was likely that the advantage of the low Swiss interest ratewould be offset by the fact that it would cost the borrowers more Australian dollars torepay the loan. As it turned out, the Swiss franc appreciated very rapidly, the Australianbanks found that they had a number of very irate clients and agreed to compensate themfor the losses they had incurred. Moral: Don’t assume automatically that it is cheaperto borrow in a currency with a low nominal rate of interest.
� Self-Test 7 In October 1998 Stellar Corporation borrowed 100 million Japanese yen at an attractiveinterest rate of 2 percent, when the exchange rate between the yen and U.S. dollar was¥123.97/$. One year later when Stellar came to repay its loan, the exchange rate was¥107.52/$. Calculate in U.S. dollars the amount that Stellar borrowed and the amountsthat it paid in interest and principal (assume annual interest payments). What was theeffective U.S. dollar interest rate on the loan?
Here is another case where our simple relationships can stop you from falling into atrap. Managers sometimes talk as if you make money simply by buying currencies thatgo up in value and selling those that go down. But if investors anticipate the change inthe exchange rate, then it will be reflected in the interest rate differential; therefore, whatyou gain on the currency you will lose in terms of interest income. You make moneyfrom currency speculation only if you can predict whether the exchange rate will changeby more or less than the interest rate differential. In other words, you must be able to pre-dict whether the exchange rate will change by more or less than the forward premium.
� EXAMPLE 5 Measuring Currency Gains
The financial manager of Universal Waffle is proud of his acumen. Instead of keepinghis cash in U.S. dollars, he for many years invested it in German deutschemark deposits.He calculates that between the end of 1980 and 1998, the deutschemark increased invalue by nearly 47 percent, or about 2.1 percent a year. But did the manager really gainfrom investing in foreign currency? Let’s check.
The compound rate of interest on dollar deposits during the period was 9.0 percent,while the compound rate of interest on deutschemark deposits was only 6.9 percent. Sothe 2.1 percent a year appreciation in the value of the deutschemark was almost exactlyoffset by the lower rate of interest on deutschemark deposits.
The interest rate differential (which by interest rate parity is equal to the forward pre-mium) is a measure of the market’s expectation of the change in the value of the cur-rency. The difference between the German and United States interest rates during thisperiod suggests that the market was expecting the deutschemark to appreciate by justover 2 percent a year,5 and that is almost exactly what happened.
5 If the interest rate is 9.0 percent on dollar deposits and 6.9 percent on deutschemark deposits, our simple re-lationship implies that the expected change in the value of the deutschemark was (1 + r$)/(1 + rDM) – 1 =1.090/1.069 – 1 = .020, or 2.0 percent per year.
612 SECTION SIX
Hedging Exchange Rate RiskFirms with international operations are subject to exchange rate risk. As exchange ratesfluctuate, the dollar value of the firm’s revenues or expenses also fluctuates. It helps todistinguish two types of exchange rate risk: contractual and noncontractual. By con-tractual risk, we mean that the firm is committed either to pay or to receive a knownamount of foreign currency. For example, our VCR importer was committed to pay¥100 million at the end of 12 months. If the value of the yen appreciates rapidly overthis period, those VCRs will cost more dollars than the firm expected.
Noncontractual risk arises because exchange rate fluctuations can affect the competi-tive position of the firm. For example, during 1991 and 1992 the value of the deutsche-mark appreciated relative to that of other major currencies. As a result, Porsche and otherGerman luxury car manufacturers found it increasingly difficult to compete in the UnitedStates. American dealers that had a franchise to sell German luxury cars also took a bath.Thus the German car producers and their dealers in the United States were exposed to ex-change rate changes even if they had no fixed obligations to pay or receive dollars.
Exchange rate changes can get companies into big trouble and therefore most com-panies aim to limit at least their contractual exposure to currency fluctuations. Let uslook at an example of how this can be done.
In 1989 a British company, Enterprise Oil, bought some oil properties from TexasEastern for $440 million.6 Since the payment was delayed a couple of months, Enter-prise’s plans for financing the purchase could have been thrown out of kilter if the dol-lar had strengthened during this period.
Enterprise therefore decided to avoid, or hedge, this risk. It did so by borrowingpounds, which it converted into dollars at the current spot rate and invested for 2months. In that way Enterprise guaranteed it would have just enough dollars availableto pay for the purchase. Of course it was possible that the dollar would depreciate overthe 2 months, in which case Enterprise would have regretted that it did not wait and buythe dollars spot. Unfortunately, you cannot have your cake and eat it too. By fixing itsdollar cost, Enterprise forfeited the chance of pleasant as well as unpleasant surprises.
Was there any other way that Enterprise could hedge against exchange loss? Ofcourse. It could buy $440 million 2 months forward. No cash would change hands im-mediately but Enterprise would fix the price at which it buys its dollars at the end of 2months. It would therefore eliminate all exchange risk on the deal. Interest rate paritytheory tells us that the difference between buying spot and buying forward is equal tothe difference between the rate of interest that you pay at home and the interest that youearn overseas. In other words, the two methods of eliminating risk should be equivalent.
Let us check this. In March 1989 the 2-month interest rate in the United States wasabout 9.7 percent and the interest rate in the United Kingdom was 13.0 percent. Thespot exchange rate was $1.743 to the pound and the 2-month forward rate was $1.730/£.Table 6.8 shows that the cash flows from the two methods of hedging the dollar pay-ment for Texas Eastern were almost identical.7
What is the cost of such a hedge? You sometimes hear managers say that it is equalto the difference between the forward rate and today’s spot rate. This is wrong. If En-terprise did not hedge, it would pay the spot rate for dollars at the time that the payment
6 See “Enterprise Oil’s Mega Forex Option,” Corporate Finance 53 (April 1989), p. 13.7 We are not sure of Enterprise’s borrowing rate but the company is rumored to have hedged at an effectiveforward rate of $1.73/£.
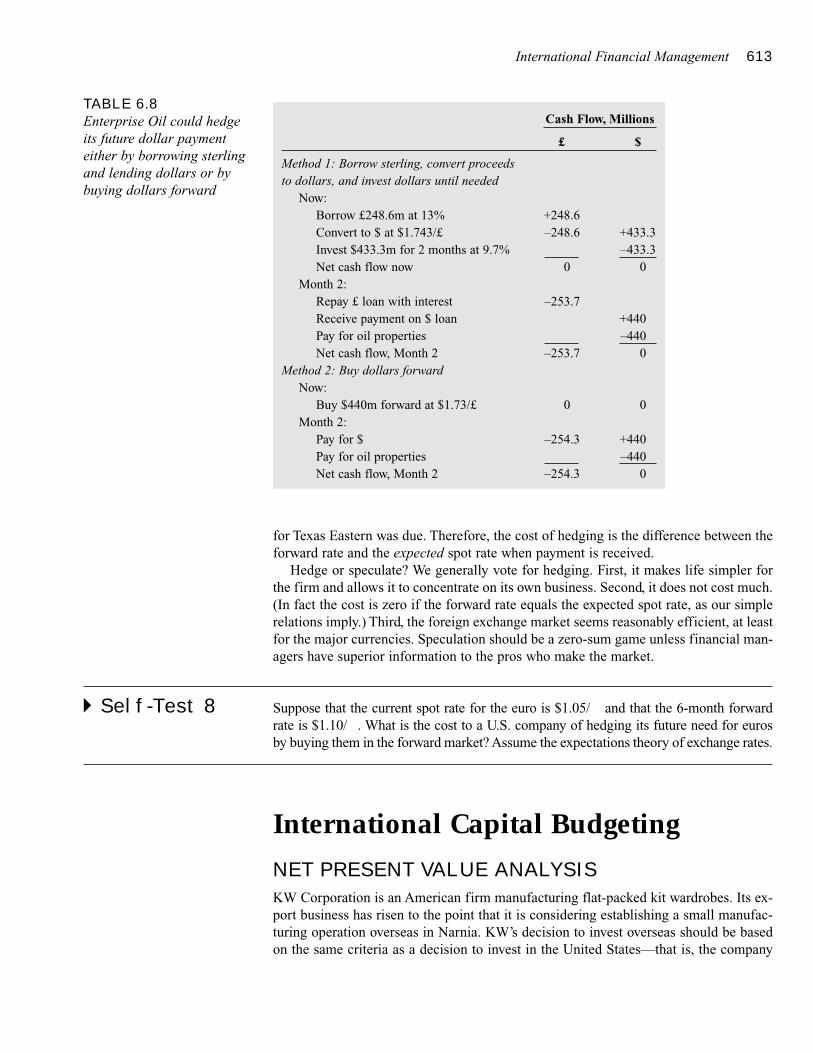
International Financial Management 613
for Texas Eastern was due. Therefore, the cost of hedging is the difference between theforward rate and the expected spot rate when payment is received.
Hedge or speculate? We generally vote for hedging. First, it makes life simpler forthe firm and allows it to concentrate on its own business. Second, it does not cost much.(In fact the cost is zero if the forward rate equals the expected spot rate, as our simplerelations imply.) Third, the foreign exchange market seems reasonably efficient, at leastfor the major currencies. Speculation should be a zero-sum game unless financial man-agers have superior information to the pros who make the market.
� Self-Test 8 Suppose that the current spot rate for the euro is $1.05/ and that the 6-month forwardrate is $1.10/ . What is the cost to a U.S. company of hedging its future need for eurosby buying them in the forward market? Assume the expectations theory of exchange rates.
International Capital BudgetingNET PRESENT VALUE ANALYSIS
KW Corporation is an American firm manufacturing flat-packed kit wardrobes. Its ex-port business has risen to the point that it is considering establishing a small manufac-turing operation overseas in Narnia. KW’s decision to invest overseas should be basedon the same criteria as a decision to invest in the United States—that is, the company
TABLE 6.8Enterprise Oil could hedgeits future dollar paymenteither by borrowing sterlingand lending dollars or bybuying dollars forward
Cash Flow, Millions
£ $
Method 1: Borrow sterling, convert proceedsto dollars, and invest dollars until needed
Now:Borrow £248.6m at 13% +248.6Convert to $ at $1.743/£ –248.6 +433.3Invest $433.3m for 2 months at 9.7% –433.3Net cash flow now 0 0
Month 2:Repay £ loan with interest –253.7Receive payment on $ loan +440Pay for oil properties –440Net cash flow, Month 2 –253.7 0
Method 2: Buy dollars forwardNow:
Buy $440m forward at $1.73/£ 0 0Month 2:
Pay for $ –254.3 +440Pay for oil properties –440Net cash flow, Month 2 –254.3 0
614 SECTION SIX
needs to forecast the incremental cash flows from the project, discount the cash flowsat the opportunity cost of capital, and accept those projects with a positive NPV.
Suppose KW’s Narnian facility is expected to generate the following cash flows inNarnian leos:
Year 0 1 2 3 4 5
Cash flow (millions of leos) –7.6 2.0 2.5 3.0 3.5 4.0
The interest rate in the United States is 5 percent. KW’s financial manager estimatesthat the company requires an additional expected return of 10 percent to compensate forthe risk of the project, so the opportunity cost of capital for the project is 5 + 10 = 15percent.
Notice that KW’s opportunity cost of capital is stated in terms of the return on a dollar-denominated investment, but the cash flows are given in leos. A project that of-fers a 15 percent expected return in leos could fall far short of offering the required re-turn in dollars if the value of the leo is expected to decline. Conversely, a project thatoffers an expected return of less than 15 percent in leos may be worthwhile if the leo islikely to appreciate.
To translate the leo cash flows into dollars, KW needs a forecast of the leo/dollar ex-change rate. Where does this come from? We suggest using the simple parity relation-ships in Figure 6.1. These tell us that the expected annual change in the spot rate (thesoutheast box in Figure 6.1) is equal to the difference between the interest rates in thetwo countries (the northwest box). For example, suppose that the financial managerlooks in the newspaper and finds that the current exchange rate is 2 leos to the dollar(sL/$ = 2.0), while the interest rate is 5 percent in the United States (r$ = .05) and 10 per-cent in Narnia (rL = .10). Thus the manager sees right away that the leo is likely to de-preciate by about 5 percent a year.8 For example, at the end of 1 year
Expected spot=
spot rate × expected changerate in Year 1 in Year 0 in spot rate
= 2.00 × 1.10= L2.095/$
1.05
The forecast exchange rates for each year of the project are calculated in a similarway as follows:
Year Forecast Exchange Rate
0 Spot exchange rate = L2.00/$1 2.00 × (1.10/1.05) = L2.095/$2 2.00 × (1.10/1.05)2 = L2.195/$3 2.00 × (1.10/1.05)3 = L2.300/$4 2.00 × (1.10/1.05)4 = L2.409/$5 2.00 × (1.10/1.05)5 = L2.524/$
You cannot compare the project’s return measured in one currency with thereturn that you require from investing in another currency. If the opportunitycost of capital is measured as a dollar-denominated return, consistencydemands that the forecast cash flows should also be stated in dollars.
8 The financial manager could equally well use the forward exchange rate (fL/$) to estimate the expected spotrate. In practice it is usually easier to find interest rates in the financial press than yearly forward rates.
International Financial Management 615
The financial manager can use these projected exchange rates to convert the leo cashflows into dollars:9
Year 0 1 2 3 4 5
Cash flow – 7.6 2.0 2.5 3.0 3.5 4.0($ millions) 2.00 2.095 2.195 2.300 2.409 2.524
= –$3.8 = $.95 = $1.14 = $1.30 = $1.45 = $1.58
Now the manager discounts these dollar cash flows at the 15 percent dollar cost of cap-ital:
NPV = – 3.8 +.95
+1.14
+1.30
+1.45
+1.58
1.15 1.152 1.153 1.154 1.155
= $.36 million, or $360,000
Notice that the manager discounted cash flows at 15 percent, not the United Statesrisk-free interest rate of 5 percent. The cash flows are risky, so a risk-adjusted interestrate is appropriate. The positive NPV tells the manager that the project is worth under-taking; it increases shareholder wealth by $360,000.
� Self-Test 9 Suppose that the nominal interest rate in Narnia is 3 percent rather than 10 percent. Thespot exchange rate is still L2.00/$ and the forecast leo cash flows on KW’s project arealso the same as before.
a. What do you deduce about the likely difference in the inflation rates in Narnia andthe United States?
b. Would you now forecast that the leo will appreciate against the dollar or depreciate?c. Do you think that the NPV of KW’s project will now be higher or lower than the fig-
ure we calculated above? Check your answer by calculating NPV under this new as-sumption.
THE COST OF CAPITAL FOR FOREIGN INVESTMENT
We did not say how KW arrived at a 15 percent dollar discount rate for its Narnian proj-ect. That depends on the risk of overseas investment and the reward that investors re-quire for taking this risk. These are issues on which few economists can agree, but wewill tell you where we stand.10
Remember that the risk of an investment cannot be considered in isolation; it de-pends on the securities that the investor holds in his or her portfolio. For example, sup-pose KW’s shareholders invest mainly in companies that do business in the United
9 Suppose KW’s managers do not go along with what market prices are telling them. For example, perhapsthey believe that the leo is likely to appreciate relative to the dollar. Should they plug their own currency fore-casts into their present value calculations? We think not. It would be stupid to undertake what might be an un-profitable investment just because management is optimistic about the currency. Given its exchange rate fore-cast, KW would do better to pass up the investment in wardrobe manufacturing and buy leos instead.10 Why don’t economists agree? One fundamental reason is that economists have never been able to agree onwhat makes one country different from another. Is it just that they have different currencies? Or is it that theircitizens have different tastes? Or is it that they are subject to different regulations and taxes? The answer af-fects the relationship between security prices in different countries.
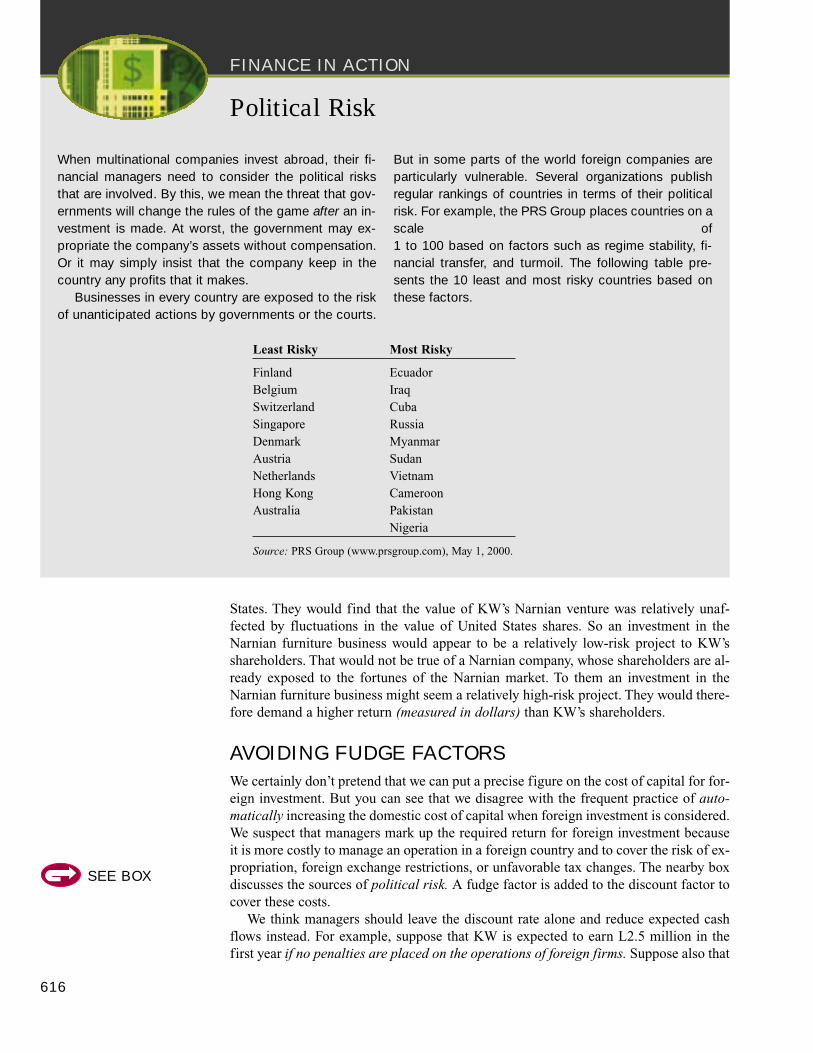
FINANCE IN ACTION
States. They would find that the value of KW’s Narnian venture was relatively unaf-fected by fluctuations in the value of United States shares. So an investment in theNarnian furniture business would appear to be a relatively low-risk project to KW’sshareholders. That would not be true of a Narnian company, whose shareholders are al-ready exposed to the fortunes of the Narnian market. To them an investment in theNarnian furniture business might seem a relatively high-risk project. They would there-fore demand a higher return (measured in dollars) than KW’s shareholders.
AVOIDING FUDGE FACTORS
We certainly don’t pretend that we can put a precise figure on the cost of capital for for-eign investment. But you can see that we disagree with the frequent practice of auto-matically increasing the domestic cost of capital when foreign investment is considered.We suspect that managers mark up the required return for foreign investment becauseit is more costly to manage an operation in a foreign country and to cover the risk of ex-propriation, foreign exchange restrictions, or unfavorable tax changes. The nearby boxdiscusses the sources of political risk. A fudge factor is added to the discount factor tocover these costs.
We think managers should leave the discount rate alone and reduce expected cashflows instead. For example, suppose that KW is expected to earn L2.5 million in thefirst year if no penalties are placed on the operations of foreign firms. Suppose also that
616
Political Risk
When multinational companies invest abroad, their fi-nancial managers need to consider the political risksthat are involved. By this, we mean the threat that gov-ernments will change the rules of the game after an in-vestment is made. At worst, the government may ex-propriate the company’s assets without compensation.Or it may simply insist that the company keep in thecountry any profits that it makes.
Businesses in every country are exposed to the riskof unanticipated actions by governments or the courts.
But in some parts of the world foreign companies areparticularly vulnerable. Several organizations publishregular rankings of countries in terms of their politicalrisk. For example, the PRS Group places countries on ascale of 1 to 100 based on factors such as regime stability, fi-nancial transfer, and turmoil. The following table pre-sents the 10 least and most risky countries based onthese factors.
Least Risky Most Risky
Finland EcuadorBelgium IraqSwitzerland CubaSingapore RussiaDenmark MyanmarAustria SudanNetherlands VietnamHong Kong CameroonAustralia Pakistan
Nigeria
Source: PRS Group (www.prsgroup.com), May 1, 2000.
SEE BOX
International Financial Management 617
there is a 20 percent chance that KW’s cash flow may be expropriated without com-pensation. The expected cash flow is not L2.5 million but .8 × 2.5 million = L2.0 mil-lion.
The end result may be the same if you pretend that the expected cash flow is L2.5million but add a fudge factor to the discount rate. Nevertheless, adjusting cash flowsbrings management’s assumptions about “political risks” out in the open for scrutinyand sensitivity analysis.
SummaryWhat is the difference between spot and forward exchange rates?
The exchange rate is the amount of one currency needed to purchase one unit of anothercurrency. The spot rate of exchange is the exchange rate for an immediate transaction. Theforward rate is the exchange rate for a forward transaction, that is, a transaction at aspecified future date.
What are the basic relationships between spot exchange rates, forward exchangerates, interest rates, and inflation rates?
To produce order out of chaos, the international financial manager needs some model of therelationships between exchange rates, interest rates, and inflation rates. Four very simpletheories prove useful:
• In its strict form, purchasing power parity states that $1 must have the same purchasingpower in every country. You only need to take a vacation abroad to know that this doesn’tsquare well with the facts. Nevertheless, on average, changes in exchange rates matchdifferences in inflation rates and, if you need a long-term forecast of the exchange rate, itis difficult to do much better than to assume that the exchange rate will offset the effectof any differences in the inflation rates.
• In an open world capital market real rates of interest would have to be the same. Thusdifferences in nominal interest rates result from differences in expected inflation rates.This international Fisher effect suggests that firms should not simply borrow whereinterest rates are lowest. Those countries are also likely to have the lowest inflation ratesand the strongest currencies.
• Interest rate parity theory states that the interest differential between two countriesmust be equal to the difference between the forward and spot exchange rates. In theinternational markets, arbitrage ensures that parity almost always holds.
• The expectations theory of exchange rates tells us that the forward rate equals theexpected spot rate (though it is very far from being a perfect forecaster of the spot rate).
What are some simple strategies to protect the firm against exchange rate risk?
Our simple theories about forward rates have two practical implications for the problem ofhedging overseas operations. First, the expectations theory suggests that hedging exchangerisk is on average costless. Second, there are two ways to hedge against exchange risk—oneis to buy or sell currency forward, the other is to lend or borrow abroad. Interest rate paritytells us that the cost of the two methods should be the same.
How do we perform an NPV analysis for projects with cash flows in foreign cur-rencies?
618 SECTION SIX
Overseas investment decisions are no different in principle from domestic decisions. Youneed to forecast the project’s cash flows and then discount them at the opportunity cost ofcapital. But it is important to remember that if the opportunity cost of capital is stated indollars, the cash flows must also be converted to dollars. This requires a forecast of foreignexchange rates. We suggest that you rely on the simple parity relationships and use theinterest rate differential to produce these forecasts. In international capital budgeting thereturn that shareholders require from foreign investments must be estimated. Adding apremium for the “extra risks” of overseas investment is not a good solution.
www.cme.com/eurofx/ The Chicago Mercantile Exchange’s information center on managing Eu-ropean foreign exchange risk with Euro contracts
www.bloomberg.com/markets Data on current exchange rates as well as securitieswww.ms.com/msci.html Information for global investing from Morgan Stanley Capital Interna-
tionalwww.global-investor.com Global Investor Directory with information about major international
marketswww.emgmkts.com/index.htm Analysis of economic, political, and financial events in emerg-
ing marketswww.jpmorgan.com/research Information about emerging marketswww.florin.com/v4/valore4.html Issues in currency risk management
exchange rate law of one price international Fisher effectspot rate of exchange purchasing power parity interest rate parityforward exchange rate (PPP) expectations theory of exchange rates
1. Exchange Rates. Use Table 6.5 to answer these questions:
a. How many euros can you buy for $100? How many dollars can you buy for 100 euros?b. How many Swiss francs can you buy for $100? How many dollars can you buy for 100
Swiss francs?c. If the euro depreciates with respect to the dollar, will the direct exchange rate quoted in
Table 6.5 increase or decrease? What about the indirect exchange rate?d. Is a United States or an Australian dollar worth more?
2. Exchange Rate Relationships. Look at Table 6.5.
a. How many Japanese yen do you get for your dollar?b. What is the 1-year forward rate for the yen?c. Is the yen at a forward discount or premium on the dollar?d. Calculate the annual percentage discount or premium on the yen.e. If the interest rate on dollars is 6.5 percent, what do you think is the interest rate on yen?f. According to the expectations theory, what is the expected spot rate for the yen in 1 year’s
time?g. According to purchasing power parity, what is the expected difference in the rate of price
inflation in the United States and Japan?
3. Exchange Rate Relationships. Define each of the following theories in a sentence or sim-ple equation:
Related WebLinks
Key Terms
Quiz
International Financial Management 619
a. Interest rate parity theory.b. Expectations theory of forward rates.c. Law of one price.d. International Fisher effect (relationship between interest rates in different countries).
4. International Capital Budgeting. Which of the following items do you need if you do allyour capital budgeting calculations in your own currency?
Forecasts of future exchange ratesForecasts of the foreign inflation rateForecasts of the domestic inflation rateForeign interest ratesDomestic interest rates
5. Foreign Currency Management. Ms. Rosetta Stone, the treasurer of International Reprints,Inc., has noticed that the interest rate in Switzerland is below the rates in most other coun-tries. She is therefore suggesting that the company should make an issue of Swiss francbonds. What considerations ought she first take into account?
6. Hedging Exchange Rate Risk. An importer in the United States is due to take delivery ofsilk scarves from Europe in 6 months. The price is fixed in euros. Which of the followingtransactions could eliminate the importer’s exchange risk?
a. Buy euros forward.b. Sell euros forward.c. Borrow euros, buy dollars at the spot exchange rate.d. Sell euros at the spot exchange rate, lend dollars.
7. Currency Risk. Sanyo produces audio and video consumer goods and exports a large frac-tion of its output to the United States under its own name and the Fisher brand name. Itprices its products in yen, meaning that it seeks to maintain a fixed price in terms of yen.Suppose the yen moves from ¥108.02/$ to ¥100/$. What currency risk does Sanyo face?How can it reduce its exposure?
8. Managing Exchange Rate Risk. A firm in the United States is due to receive payment of1 million Australian dollars in 8 years’ time. It would like to protect itself against a declinein the value of the Australian dollar but finds it difficult to arrange a forward sale for sucha long period. Is there any other way that it can protect itself?
9. Interest Rate Parity. The following table shows interest rates and exchange rates for theU.S. dollar and Mexican peso. The spot exchange rate is 9.5 pesos per dollar. Complete themissing entries:
1 Month 1 Year
Dollar interest rate (annually compounded) 5.5 7.0Peso interest rate (annually compounded) 20% ___Forward pesos per dollar ____ 11.2
Hint: When calculating the 1-month forward rate, remember to translate the annual interestrate into a monthly interest rate.
10. Exchange Rate Risk. An American investor buys 100 shares of London Enterprises at aprice of £50 when the exchange rate is $1.60/£. A year later the shares are selling at £52. Nodividends have been paid.
PracticeProblems
620 SECTION SIX
a. What is the rate of return to an American investor if the exchange rate is still $1.60/£?b. What if the exchange rate is $1.70/£?c. What if the exchange rate is $1.50/£?
11. Interest Rate Parity. Look at Table 6.5. If the 3-month interest rate on dollars is 6.0 percent(annualized), what do you think is the 3-month sterling (U.K.) interest rate? Explain whatwould happen if the rate were substantially above your figure. Hint: In your calculations re-member to convert the annually compounded interest rate into a rate for 3 months.
12. Expectations Theory. Table 6.5 shows the 1-year forward rate on the Canadian dollar.
a. Is the Canadian dollar at a forward discount or a premium on the U.S. dollar?b. What is the annualized percentage discount or premium?c. If you have no other information about the two currencies, what is your best guess about
the spot rate in 1 year?d. Suppose that you expect to receive 100,000 Canadian dollars in 1 year. How many U.S.
dollars is this likely to be worth?
13. Interest Rate Parity. Suppose the interest rate on 1-year loans in the United States is 5 per-cent while in the United Kingdom the interest rate is 6 percent. The spot exchange rate is$1.55/£ and the forward rate is $1.54/£. In what country would you choose to borrow? Tolend? Can you profit from this situation?
14. Purchasing Power Parity. Suppose that the inflation rate in the United States is 4 percentand in Canada it is 5 percent. What would you expect is happening to the exchange rate be-tween the United States and Canadian dollars?
15. Cross Rates. Look at Table 6.5. How many Swiss francs can you buy for $1? How many yencan you buy? What rate do you think a Japanese bank would quote for buying or sellingSwiss francs? Explain what would happen if it quoted a rate that was substantially less thanyour figure.
16. International Capital Budgeting. Suppose that you do use your own views about exchangerates when valuing an overseas investment proposal. Specifically, suppose that you believethat the leo will depreciate by 2 percent per year. Recalculate the NPV of KW’s project.
17. Currency Risk. You have bid for a possible export order that would provide a cash inflowof ∼1 million in 6 months. The spot exchange rate is ∼1.06/$ and the 1-year forward rate is∼1.07/$. There are two sources of uncertainty: (1) the euro could appreciate or depreciate,and (2) you may or may not receive the export order. Illustrate in each case the profits orlosses that you would make if you sell ∼1 million forward by filling in the following table.Assume that the exchange rate in 1 year will be either ∼1.02/$ or ∼1.12/$.
Profit/Loss
Spot Rate Receive Order Lose Order
∼1.12/$ __________ __________∼1.02/$ __________ __________
18. Managing Currency Risk. General Gadget Corp. (GGC) is a United States–based multi-national firm that makes electrical coconut scrapers. These gadgets are made only in theUnited States using local inputs. The scrapers are sold mainly to Asian and West Indiancountries where coconuts are grown.
a. If GGC sells scrapers in Trinidad, what is the currency risk faced by the firm?b. In what currency should GGC borrow funds to pay for its investment in order to mitigate
its foreign exchange exposure?

International Financial Management 621
c. Suppose that GGC begins manufacturing its products in Trinidad using local (Trini-dadian) inputs and labor. How does this affect its exchange rate risk?
19. Currency Risk. If investors recognize the impacts of inflation and exchange rate changeson a firm’s cash flows, changes in exchange rates should be reflected in stock prices. Howwould the stock price of each of the following Swiss companies be affected by an unantici-pated appreciation in the Swiss franc of 10 percent, only 2 percent of which could be justi-fied by comparing Swiss inflation to that in the rest of the world?
a. Swiss Air: More than two-thirds of its employees are Swiss. Most revenues come from in-ternational fares set in U.S. dollars.
b. Nestlé: Fewer than 5 percent of its employees are Swiss. Most revenues are derived fromsales of consumer goods in a wide range of countries with competition from local pro-ducers.
c. Union Bank of Switzerland: Most employees are Swiss. All non–Swiss franc monetarypositions are fully hedged.
20. International Capital Budgeting. An American firm is evaluating an investment in In-donesia. The project costs 500 billion Indonesian rupiah and it is expected to produce an in-come of 250 billion Indonesian rupiah a year in real terms for each of the next 3 years. Theexpected inflation rate in Indonesia is 12 percent a year and the firm estimates that an ap-propriate discount rate for the project would be about 8 percent above the risk-free rate ofinterest. Calculate the net present value of the project in U.S. dollars. Exchange rates aregiven in Table 6.5. The interest rate is about 15.3 percent in Indonesia and 6 percent in theUnited States.
1 Direct quote: $1.0707/Indirect quote: 1/1.0707 = .934/$.Indirect quote: ¥107.520/$Direct quote: $.0093/¥
2 The dollar buys fewer Swiss francs, so the franc has appreciated with respect to the dollar.
3 a. 1,500/1.4865 = $1,009b. Indirect exchange rate: $1 = .9 × 1.4865 = 1.3379 francs.c. 1,500/1.3379 = $1,121. The dollar price increases.d. 1,009 × 1.3379 = 1,350 francs.
4 a. £220 = $330. Therefore £1 = 330/220 = $1.50.b. In the United States, price = $330 × 1.02 = $336.60. In Great Britain, price = £220 × 1.05
= £231. The new exchange rate = $336.60/£231 = $1.457/£.c. Initially $1 buys 1/1.50 = £.667. At the end of the year, $1 buys 1/1.457 = £.686, which
is about 3 percent higher than the original value of £.667.
5 The real interest rate in the United States is 1.06/1.02 – 1 = .039, or 3.9%. If the real rateis the same in Greece, then expected inflation must be (1 + nominal rate)/(1 + real rate) –1 = 1.085/1.039 – 1 = .044, or 4.4%.
6 The Swiss franc is at a forward premium (that is, you get fewer francs for $1 in the forwardmarket). This implies that interest rates in Switzerland are lower than in the United States.The interest rate in the United States is 6 percent. Interest rate parity states
ChallengeProblem
Solutions toSelf-TestQuestions
622 SECTION SIX
1 + rfranc =ffranc/$
1 + r$ sfranc/$
Therefore rfranc = 1.06 × 1.4331 – 1 = .022, or 2.2%1.4865
7 Stellar borrows ¥100 million in 1998. It pays ¥2 million in interest at the end of 1999, whenit also repays the loan. Cash flows in dollars are:
1998: + 100 million = +$806,647123.97
1999: Interest = 2 million = $ 18,601107.52
Principal = 100 million = 930,059107.52
Total $948,661
To find the dollar interest rate, solve
806,647 × (1 + r$) = 948,661
r$ = 948,661 – 1 = .176 = 17.6%806,647
8 According to the expectations theory of exchange rates, the forward rate equals the ex-pected future spot exchange rate. Therefore, the expected cost of the hedge—the differencebetween the forward rate and expected spot rate—is zero!
9 a. The lower interest rate in Narnia than in the United States suggests that forecast inflationis lower in Narnia. If real interest rates are the same in the two countries, then the dif-ference in inflation rates is about 5 – 3 = 2 percent.
b. The lower interest rate (and lower expected inflation rate) in Narnia suggests that in-vestors are expecting the leo to appreciate against the dollar.
c. Since KW can now expect to change its leo cash flows into more dollars than before, theproject’s NPV is increased. Forecast exchange rates will be as follows:
Year Forecast Exchange Rate
0 Spot exchange rate = L2.00/$1 2.00 × (1.03/1.05) = L1.962/$2 2.00 × (1.03/1.05)2 = L1.925/$3 2.00 × (1.03/1.05)3 = L1.888/$4 2.00 × (1.03/1.05)4 = L1.852/$5 2.00 × (1.03/1.05)5 = L1.817/$
The expected dollar cash flows from the project are
Year 0 1 2 3 4 5
Cash flow –7.6 2.0 2.5 3.0 3.5 4.0(millions 2.00 1.962 1.925 1.888 1.852 1.817of dollars) = –$3.8 = $1.02 = $1.30 = $1.59 = $1.89 = $2.20
Discounting these dollar cash flows at the 15 percent dollar cost of capital gives
NPV = – 3.8 + 1.02 + 1.30 + 1.59 + 1.89 + 2.201.15 1.152 1.153 1.154 1.155
= $1.29 million, or $1,290,000
International Financial Management 623
The project is worth more because the reduced interest rate in Narnia suggests that investorsexpect the leo to appreciate in value. Thus the dollar cash flows from the project are higherthan in Section 6.4.
MINICASE“Jumping jackasses! Not another one!” groaned George Luger.This was the third memo that he had received that morning fromthe CEO of VCR Importers. It read as follows:
From: CEO’s OfficeTo: Company Treasurer
George,
I have been looking at some of our foreign exchange deals and they don’t seem to make sense.First, we have been buying yen forward to cover the cost of our imports. You have explained that this insures us against the
risk that the dollar may depreciate over the next year, but it is incredibly expensive insurance. Each dollar buys only 101.3 yen whenwe buy forward, compared with the current spot rate of 107.52 yen to the dollar. We could save a fortune by buying yen as andwhen we need them rather than buying them forward.
Another possibility has occurred to me. If we are worried that the dollar may depreciate (or do I mean “appreciate”?), whydon’t we buy yen at the low spot rate of ¥107.52 to the dollar and then put them on deposit until we have to pay for the VCRs? Thatway we can make sure that we get a good rate for our yen.
I am also worried that we are missing out on some cheap financing. We are paying about 8 percent to borrow dollars for oneyear, but Ben Hur was telling me at lunch that we could get a one-year yen loan for about 1.75 percent. I find that a bit surprising,but if that’s the case, why don’t we repay our dollar loans and borrow yen instead?
Perhaps we could discuss these ideas at next Wednesday’s meeting. I would be interested in your views on the matter.
Jill Edison


PRESENT VALUE TABLES
Appendix C
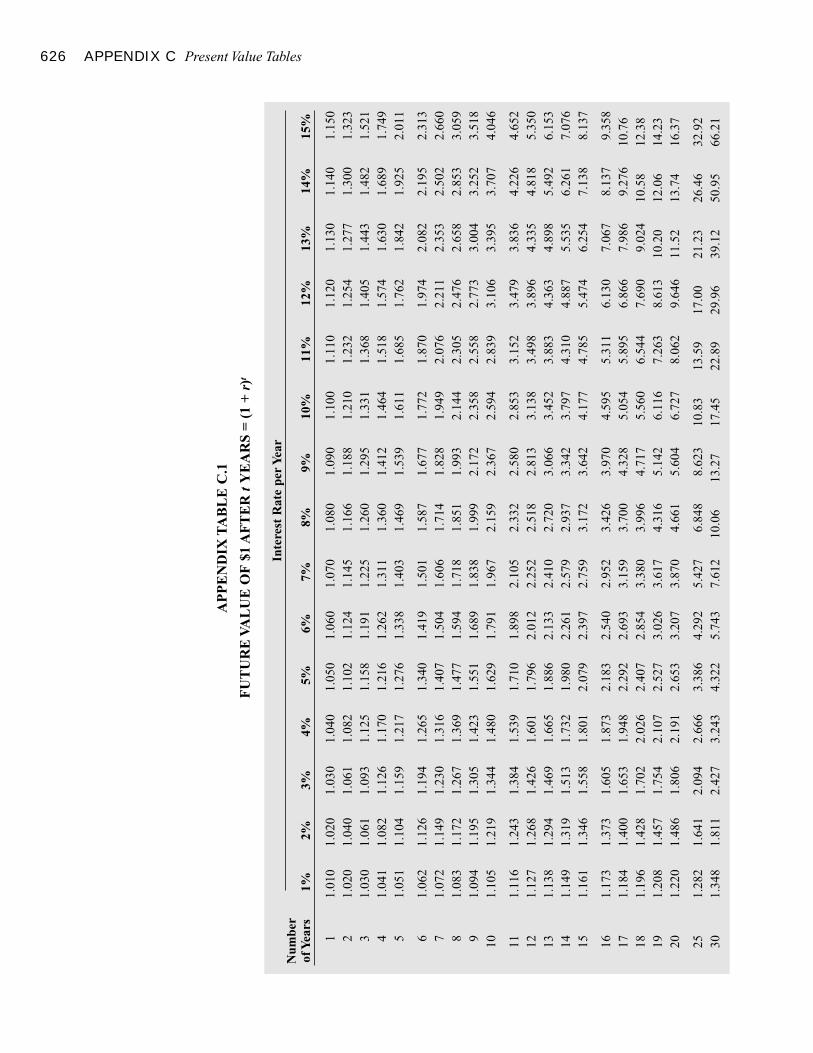
626 APPENDIX C Present Value Tables
AP
PE
ND
IX T
AB
LE
C.1
FU
TU
RE
VA
LU
E O
F $
1 A
FT
ER
tY
EA
RS
= (
1 +
r)t
Inte
rest
Rat
e pe
r Y
ear
Num
ber
of Y
ears
1%2%
3%4%
5%6%
7%8%
9%10
%11
%12
%13
%14
%15
%
11.
010
1.02
01.
030
1.04
01.
050
1.06
01.
070
1.08
01.
090
1.10
01.
110
1.12
01.
130
1.14
01.
150
21.
020
1.04
01.
061
1.08
21.
102
1.12
41.
145
1.16
61.
188
1.21
01.
232
1.25
41.
277
1.30
01.
323
31.
030
1.06
11.
093
1.12
51.
158
1.19
11.
225
1.26
01.
295
1.33
11.
368
1.40
51.
443
1.48
21.
521
41.
041
1.08
21.
126
1.17
01.
216
1.26
21.
311
1.36
01.
412
1.46
41.
518
1.57
41.
630
1.68
91.
749
51.
051
1.10
41.
159
1.21
71.
276
1.33
81.
403
1.46
91.
539
1.61
11.
685
1.76
21.
842
1.92
52.
011
61.
062
1.12
61.
194
1.26
51.
340
1.41
91.
501
1.58
71.
677
1.77
21.
870
1.97
42.
082
2.19
52.
313
71.
072
1.14
91.
230
1.31
61.
407
1.50
41.
606
1.71
41.
828
1.94
92.
076
2.21
12.
353
2.50
22.
660
81.
083
1.17
21.
267
1.36
91.
477
1.59
41.
718
1.85
11.
993
2.14
42.
305
2.47
62.
658
2.85
33.
059
91.
094
1.19
51.
305
1.42
31.
551
1.68
91.
838
1.99
92.
172
2.35
82.
558
2.77
33.
004
3.25
23.
518
101.
105
1.21
91.
344
1.48
01.
629
1.79
11.
967
2.15
92.
367
2.59
42.
839
3.10
63.
395
3.70
74.
046
111.
116
1.24
31.
384
1.53
91.
710
1.89
82.
105
2.33
22.
580
2.85
33.
152
3.47
93.
836
4.22
64.
652
121.
127
1.26
81.
426
1.60
11.
796
2.01
22.
252
2.51
82.
813
3.13
83.
498
3.89
64.
335
4.81
85.
350
131.
138
1.29
41.
469
1.66
51.
886
2.13
32.
410
2.72
03.
066
3.45
23.
883
4.36
34.
898
5.49
26.
153
141.
149
1.31
91.
513
1.73
21.
980
2.26
12.
579
2.93
73.
342
3.79
74.
310
4.88
75.
535
6.26
17.
076
151.
161
1.34
61.
558
1.80
12.
079
2.39
72.
759
3.17
23.
642
4.17
74.
785
5.47
46.
254
7.13
88.
137
161.
173
1.37
31.
605
1.87
32.
183
2.54
02.
952
3.42
63.
970
4.59
55.
311
6.13
07.
067
8.13
79.
358
171.
184
1.40
01.
653
1.94
82.
292
2.69
33.
159
3.70
04.
328
5.05
45.
895
6.86
67.
986
9.27
610
.76
181.
196
1.42
81.
702
2.02
62.
407
2.85
43.
380
3.99
64.
717
5.56
06.
544
7.69
09.
024
10.5
812
.38
191.
208
1.45
71.
754
2.10
72.
527
3.02
63.
617
4.31
65.
142
6.11
67.
263
8.61
310
.20
12.0
614
.23
201.
220
1.48
61.
806
2.19
12.
653
3.20
73.
870
4.66
15.
604
6.72
78.
062
9.64
611
.52
13.7
416
.37
251.
282
1.64
12.
094
2.66
63.
386
4.29
25.
427
6.84
88.
623
10.8
313
.59
17.0
021
.23
26.4
632
.92
301.
348
1.81
12.
427
3.24
34.
322
5.74
37.
612
10.0
613
.27
17.4
522
.89
29.9
639
.12
50.9
566
.21
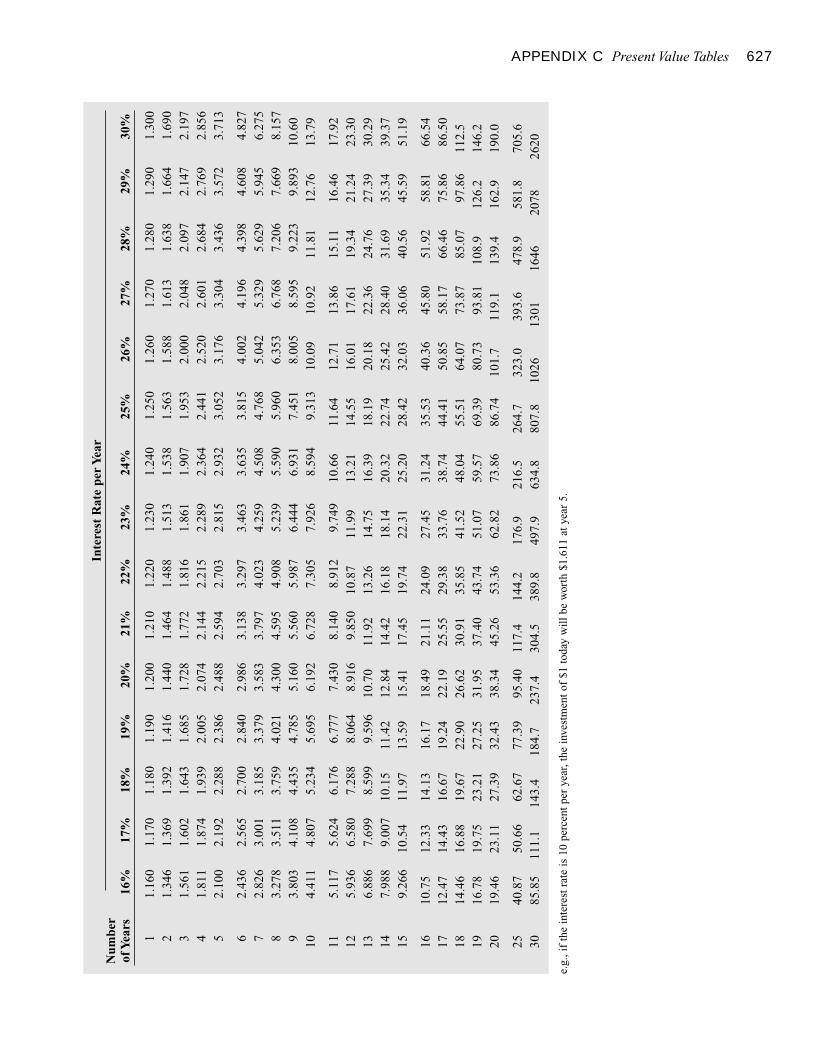
APPENDIX C Present Value Tables 627
e.g.
, if
the
inte
rest
rat
e is
10
perc
ent p
er y
ear,
the
inve
stm
ent o
f $1
toda
y w
ill b
e w
orth
$1.
611
at y
ear
5.
Inte
rest
Rat
e pe
r Y
ear
Num
ber
of Y
ears
16%
17%
18%
19%
20%
21%
22%
23%
24%
25%
26%
27%
28%
29%
30%
11.
160
1.17
01.
180
1.19
01.
200
1.21
01.
220
1.23
01.
240
1.25
01.
260
1.27
01.
280
1.29
01.
300
21.
346
1.36
91.
392
1.41
61.
440
1.46
41.
488
1.51
31.
538
1.56
31.
588
1.61
31.
638
1.66
41.
690
31.
561
1.60
21.
643
1.68
51.
728
1.77
21.
816
1.86
11.
907
1.95
32.
000
2.04
82.
097
2.14
72.
197
41.
811
1.87
41.
939
2.00
52.
074
2.14
42.
215
2.28
92.
364
2.44
12.
520
2.60
12.
684
2.76
92.
856
52.
100
2.19
22.
288
2.38
62.
488
2.59
42.
703
2.81
52.
932
3.05
23.
176
3.30
43.
436
3.57
23.
713
62.
436
2.56
52.
700
2.84
02.
986
3.13
83.
297
3.46
33.
635
3.81
54.
002
4.19
64.
398
4.60
84.
827
72.
826
3.00
13.
185
3.37
93.
583
3.79
74.
023
4.25
94.
508
4.76
85.
042
5.32
95.
629
5.94
56.
275
83.
278
3.51
13.
759
4.02
14.
300
4.59
54.
908
5.23
95.
590
5.96
06.
353
6.76
87.
206
7.66
98.
157
93.
803
4.10
84.
435
4.78
55.
160
5.56
05.
987
6.44
46.
931
7.45
18.
005
8.59
59.
223
9.89
310
.60
104.
411
4.80
75.
234
5.69
56.
192
6.72
87.
305
7.92
68.
594
9.31
310
.09
10.9
211
.81
12.7
613
.79
115.
117
5.62
46.
176
6.77
77.
430
8.14
08.
912
9.74
910
.66
11.6
412
.71
13.8
615
.11
16.4
617
.92
125.
936
6.58
07.
288
8.06
48.
916
9.85
010
.87
11.9
913
.21
14.5
516
.01
17.6
119
.34
21.2
423
.30
136.
886
7.69
98.
599
9.59
610
.70
11.9
213
.26
14.7
516
.39
18.1
920
.18
22.3
624
.76
27.3
930
.29
147.
988
9.00
710
.15
11.4
212
.84
14.4
216
.18
18.1
420
.32
22.7
425
.42
28.4
031
.69
35.3
439
.37
159.
266
10.5
411
.97
13.5
915
.41
17.4
519
.74
22.3
125
.20
28.4
232
.03
36.0
640
.56
45.5
951
.19
1610
.75
12.3
314
.13
16.1
718
.49
21.1
124
.09
27.4
531
.24
35.5
340
.36
45.8
051
.92
58.8
166
.54
1712
.47
14.4
316
.67
19.2
422
.19
25.5
529
.38
33.7
638
.74
44.4
150
.85
58.1
766
.46
75.8
686
.50
1814
.46
16.8
819
.67
22.9
026
.62
30.9
135
.85
41.5
248
.04
55.5
164
.07
73.8
785
.07
97.8
611
2.5
1916
.78
19.7
523
.21
27.2
531
.95
37.4
043
.74
51.0
759
.57
69.3
980
.73
93.8
110
8.9
126.
214
6.2
2019
.46
23.1
127
.39
32.4
338
.34
45.2
653
.36
62.8
273
.86
86.7
410
1.7
119.
113
9.4
162.
919
0.0
2540
.87
50.6
662
.67
77.3
995
.40
117.
414
4.2
176.
921
6.5
264.
732
3.0
393.
647
8.9
581.
870
5.6
3085
.85
111.
114
3.4
184.
723
7.4
304.
538
9.8
497.
963
4.8
807.
810
2613
0116
4620
7826
20

628 APPENDIX C Present Value Tables
AP
PE
ND
IX T
AB
LE
C.2
DIS
CO
UN
T F
AC
TO
RS:
PR
ESE
NT
VA
LU
E O
F $
1 T
O B
E R
EC
EIV
ED
AF
TE
R t
YE
AR
S =
1/(
1 +
r)t
Inte
rest
Rat
e pe
r Y
ear
Num
ber
of Y
ears
1%2%
3%4%
5%6%
7%8%
9%10
%11
%12
%13
%14
%15
%
1.9
90.9
80.9
71.9
62.9
52.9
43.9
35.9
26.9
17.9
09.9
01.8
93.8
85.8
77.8
702
.980
.961
.943
.925
.907
.890
.873
.857
.842
.826
.812
.797
.783
.769
.756
3.9
71.9
42.9
15.8
89.8
64.8
40.8
16.7
94.7
72.7
51.7
31.7
12.6
93.6
75.6
584
.961
.924
.888
.855
.823
.792
.763
.735
.708
.683
.659
.636
.613
.592
.572
5.9
51.9
06.8
63.8
22.7
84.7
47.7
13.6
81.6
50.6
21.5
93.5
67.5
43.5
19.4
97
6.9
42.8
88.8
37.7
90.7
46.7
05.6
66.6
30.5
96.5
64.5
35.5
07.4
80.4
56.4
327
.933
.871
.813
.760
.711
.665
.623
.583
.547
.513
.482
.452
.425
.400
.376
8.9
23.8
53.7
89.7
31.6
77.6
27.5
82.5
40.5
02.4
67.4
34.4
04.3
76.3
51.3
279
.914
.837
.766
.703
.645
.592
.544
.500
.460
.424
.391
.361
.333
.308
.284
10.9
05.8
20.7
44.6
76.6
14.5
58.5
08.4
63.4
22.3
86.3
52.3
22.2
95.2
70.2
47
11.8
96.8
04.7
22.6
50.5
85.5
27.4
75.4
29.3
88.3
50.3
17.2
87.2
61.2
37.2
1512
.887
.788
.701
.625
.557
.497
.444
.397
.356
.319
.286
.257
.231
.208
.187
13.8
79.7
73.6
81.6
01.5
30.4
69.4
15.3
68.3
26.2
90.2
58.2
29.2
04.1
82.1
6314
.870
.758
.661
.577
.505
.442
.388
.340
.299
.263
.232
.205
.181
.160
.141
15.8
61.7
43.6
42.5
55.4
81.4
17.3
62.3
15.2
75.2
39.2
09.1
83.1
60.1
40.1
23
16.8
53.7
28.6
23.5
34.4
58.3
94.3
39.2
92.2
52.2
18.1
88.1
63.1
41.1
23.1
0717
.844
.714
.605
.513
.436
.371
.317
.270
.231
.198
.170
.146
.125
.108
.093
18.8
36.7
00.5
87.4
94.4
16.3
50.2
96.2
50.2
12.1
80.1
53.1
30.1
11.0
95.0
8119
.828
.686
.570
.475
.396
.331
.277
.232
.194
.164
.138
.116
.098
.083
.070
20.8
20.6
73.5
54.4
56.3
77.3
12.2
58.2
15.1
78.1
49.1
24.1
04.0
87.0
73.0
61
25.7
80.6
10.4
78.3
75.2
95.2
33.1
84.1
46.1
16.0
92.0
74.0
59.0
47.0
38.0
3030
.742
.552
.412
.308
.231
.174
.131
.099
.075
.057
.044
.033
.026
.020
.015
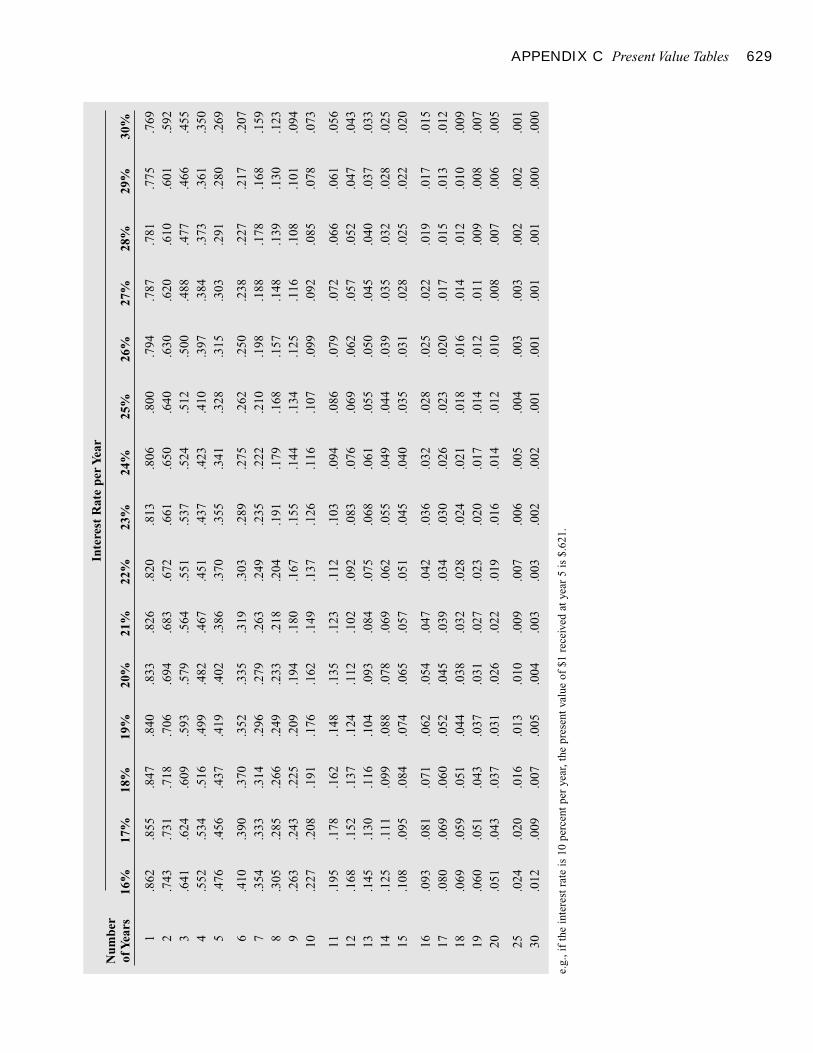
APPENDIX C Present Value Tables 629
Inte
rest
Rat
e pe
r Y
ear
Num
ber
of Y
ears
16%
17%
18%
19%
20%
21%
22%
23%
24%
25%
26%
27%
28%
29%
30%
1.8
62.8
55.8
47.8
40.8
33.8
26.8
20.8
13.8
06.8
00.7
94.7
87.7
81.7
75.7
692
.743
.731
.718
.706
.694
.683
.672
.661
.650
.640
.630
.620
.610
.601
.592
3.6
41.6
24.6
09.5
93.5
79.5
64.5
51.5
37.5
24.5
12.5
00.4
88.4
77.4
66.4
554
.552
.534
.516
.499
.482
.467
.451
.437
.423
.410
.397
.384
.373
.361
.350
5.4
76.4
56.4
37.4
19.4
02.3
86.3
70.3
55.3
41.3
28.3
15.3
03.2
91.2
80.2
69
6.4
10.3
90.3
70.3
52.3
35.3
19.3
03.2
89.2
75.2
62.2
50.2
38.2
27.2
17.2
077
.354
.333
.314
.296
.279
.263
.249
.235
.222
.210
.198
.188
.178
.168
.159
8.3
05.2
85.2
66.2
49.2
33.2
18.2
04.1
91.1
79.1
68.1
57.1
48.1
39.1
30.1
239
.263
.243
.225
.209
.194
.180
.167
.155
.144
.134
.125
.116
.108
.101
.094
10.2
27.2
08.1
91.1
76.1
62.1
49.1
37.1
26.1
16.1
07.0
99.0
92.0
85.0
78.0
73
11.1
95.1
78.1
62.1
48.1
35.1
23.1
12.1
03.0
94.0
86.0
79.0
72.0
66.0
61.0
5612
.168
.152
.137
.124
.112
.102
.092
.083
.076
.069
.062
.057
.052
.047
.043
13.1
45.1
30.1
16.1
04.0
93.0
84.0
75.0
68.0
61.0
55.0
50.0
45.0
40.0
37.0
3314
.125
.111
.099
.088
.078
.069
.062
.055
.049
.044
.039
.035
.032
.028
.025
15.1
08.0
95.0
84.0
74.0
65.0
57.0
51.0
45.0
40.0
35.0
31.0
28.0
25.0
22.0
20
16.0
93.0
81.0
71.0
62.0
54.0
47.0
42.0
36.0
32.0
28.0
25.0
22.0
19.0
17.0
1517
.080
.069
.060
.052
.045
.039
.034
.030
.026
.023
.020
.017
.015
.013
.012
18.0
69.0
59.0
51.0
44.0
38.0
32.0
28.0
24.0
21.0
18.0
16.0
14.0
12.0
10.0
0919
.060
.051
.043
.037
.031
.027
.023
.020
.017
.014
.012
.011
.009
.008
.007
20.0
51.0
43.0
37.0
31.0
26.0
22.0
19.0
16.0
14.0
12.0
10.0
08.0
07.0
06.0
05
25.0
24.0
20.0
16.0
13.0
10.0
09.0
07.0
06.0
05.0
04.0
03.0
03.0
02.0
02.0
0130
.012
.009
.007
.005
.004
.003
.003
.002
.002
.001
.001
.001
.001
.000
.000
e.g.
, if
the
inte
rest
rat
e is
10
perc
ent p
er y
ear,
the
pres
ent v
alue
of
$1 r
ecei
ved
at y
ear
5 is
$.6
21.
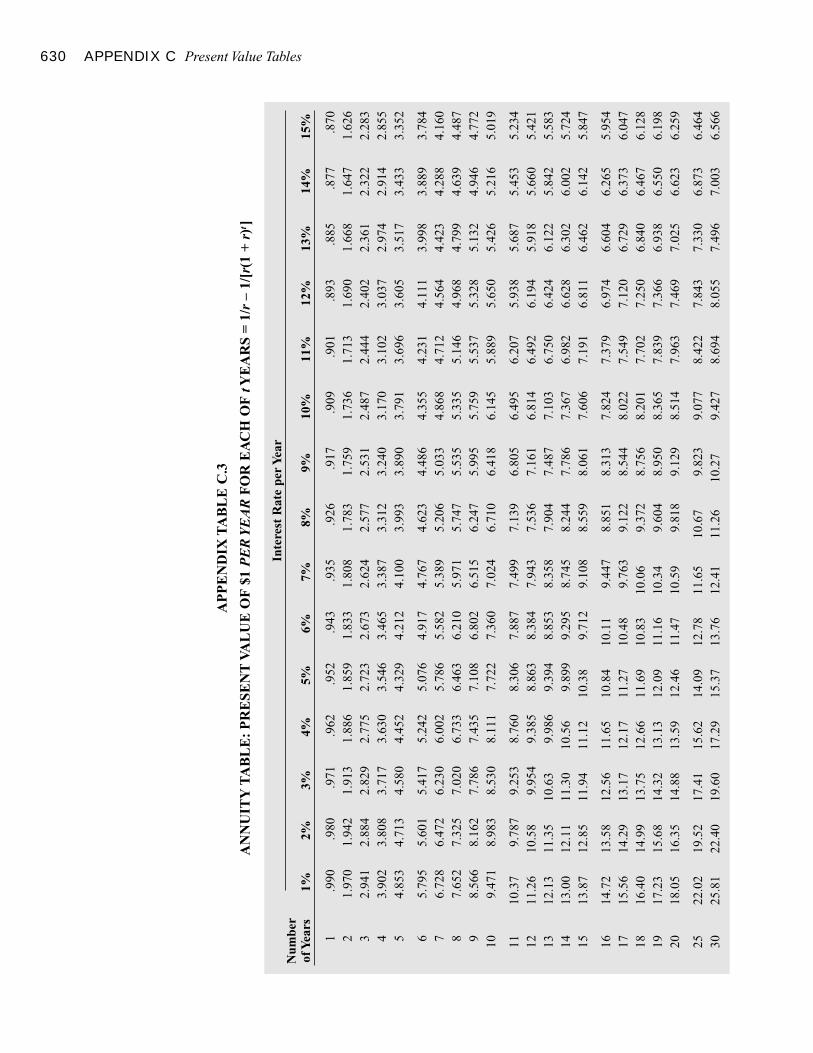
630 APPENDIX C Present Value Tables
AP
PE
ND
IX T
AB
LE
C.3
AN
NU
ITY
TA
BL
E:
PR
ESE
NT
VA
LU
E O
F $
1 P
ER
YE
AR
FO
R E
AC
H O
F t
YE
AR
S =
1/r
– 1/
[r(1
+ r
)t]
Inte
rest
Rat
e pe
r Y
ear
Num
ber
of Y
ears
1%2%
3%4%
5%6%
7%8%
9%10
%11
%12
%13
%14
%15
%
1.9
90.9
80.9
71.9
62.9
52.9
43.9
35.9
26.9
17.9
09.9
01.8
93.8
85.8
77.8
702
1.97
01.
942
1.91
31.
886
1.85
91.
833
1.80
81.
783
1.75
91.
736
1.71
31.
690
1.66
81.
647
1.62
63
2.94
12.
884
2.82
92.
775
2.72
32.
673
2.62
42.
577
2.53
12.
487
2.44
42.
402
2.36
12.
322
2.28
34
3.90
23.
808
3.71
73.
630
3.54
63.
465
3.38
73.
312
3.24
03.
170
3.10
23.
037
2.97
42.
914
2.85
55
4.85
34.
713
4.58
04.
452
4.32
94.
212
4.10
03.
993
3.89
03.
791
3.69
63.
605
3.51
73.
433
3.35
2
65.
795
5.60
15.
417
5.24
25.
076
4.91
74.
767
4.62
34.
486
4.35
54.
231
4.11
13.
998
3.88
93.
784
76.
728
6.47
26.
230
6.00
25.
786
5.58
25.
389
5.20
65.
033
4.86
84.
712
4.56
44.
423
4.28
84.
160
87.
652
7.32
57.
020
6.73
36.
463
6.21
05.
971
5.74
75.
535
5.33
55.
146
4.96
84.
799
4.63
94.
487
98.
566
8.16
27.
786
7.43
57.
108
6.80
26.
515
6.24
75.
995
5.75
95.
537
5.32
85.
132
4.94
64.
772
109.
471
8.98
38.
530
8.11
17.
722
7.36
07.
024
6.71
06.
418
6.14
55.
889
5.65
05.
426
5.21
65.
019
1110
.37
9.78
79.
253
8.76
08.
306
7.88
77.
499
7.13
96.
805
6.49
56.
207
5.93
85.
687
5.45
35.
234
1211
.26
10.5
89.
954
9.38
58.
863
8.38
47.
943
7.53
67.
161
6.81
46.
492
6.19
45.
918
5.66
05.
421
1312
.13
11.3
510
.63
9.98
69.
394
8.85
38.
358
7.90
47.
487
7.10
36.
750
6.42
46.
122
5.84
25.
583
1413
.00
12.1
111
.30
10.5
69.
899
9.29
58.
745
8.24
47.
786
7.36
76.
982
6.62
86.
302
6.00
25.
724
1513
.87
12.8
511
.94
11.1
210
.38
9.71
29.
108
8.55
98.
061
7.60
67.
191
6.81
16.
462
6.14
25.
847
1614
.72
13.5
812
.56
11.6
510
.84
10.1
19.
447
8.85
18.
313
7.82
47.
379
6.97
46.
604
6.26
55.
954
1715
.56
14.2
913
.17
12.1
711
.27
10.4
89.
763
9.12
28.
544
8.02
27.
549
7.12
06.
729
6.37
36.
047
1816
.40
14.9
913
.75
12.6
611
.69
10.8
310
.06
9.37
28.
756
8.20
17.
702
7.25
06.
840
6.46
76.
128
1917
.23
15.6
814
.32
13.1
312
.09
11.1
610
.34
9.60
48.
950
8.36
57.
839
7.36
66.
938
6.55
06.
198
2018
.05
16.3
514
.88
13.5
912
.46
11.4
710
.59
9.81
89.
129
8.51
47.
963
7.46
97.
025
6.62
36.
259
2522
.02
19.5
217
.41
15.6
214
.09
12.7
811
.65
10.6
79.
823
9.07
78.
422
7.84
37.
330
6.87
36.
464
3025
.81
22.4
019
.60
17.2
915
.37
13.7
612
.41
11.2
610
.27
9.42
78.
694
8.05
57.
496
7.00
36.
566

APPENDIX C Present Value Tables 631
Inte
rest
Rat
e pe
r Y
ear
Num
ber
of Y
ears
16%
17%
18%
19%
20%
21%
22%
23%
24%
25%
26%
27%
28%
29%
30%
1.8
62.8
55.8
47.8
40.8
33.8
26.8
20.8
13.8
06.8
00.7
94.7
87.7
81.7
75.7
692
1.60
51.
585
1.56
61.
547
1.52
81.
509
1.49
21.
474
1.45
71.
440
1.42
41.
407
1.39
21.
376
1.36
13
2.24
62.
210
2.17
42.
140
2.10
62.
074
2.04
22.
011
1.98
11.
952
1.92
31.
896
1.86
81.
842
1.81
64
2.79
82.
743
2.69
02.
639
2.58
92.
540
2.49
42.
448
2.40
42.
362
2.32
02.
280
2.24
12.
203
2.16
65
3.27
43.
199
3.12
73.
058
2.99
12.
926
2.86
42.
803
2.74
52.
689
2.63
52.
583
2.53
22.
483
2.43
6
63.
685
3.58
93.
498
3.41
03.
326
3.24
53.
167
3.09
23.
020
2.95
12.
885
2.82
12.
759
2.70
02.
643
74.
039
3.92
23.
812
3.70
63.
605
3.50
83.
416
3.32
73.
242
3.16
13.
083
3.00
92.
937
2.86
82.
802
84.
344
4.20
74.
078
3.95
43.
837
3.72
63.
619
3.51
83.
421
3.32
93.
241
3.15
63.
076
2.99
92.
925
94.
607
4.45
14.
303
4.16
34.
031
3.90
53.
786
3.67
33.
566
3.46
33.
366
3.27
33.
184
3.10
03.
019
104.
833
4.65
94.
494
4.33
94.
192
4.05
43.
923
3.79
93.
682
3.57
13.
465
3.36
43.
269
3.17
83.
092
115.
029
4.83
64.
656
4.48
64.
327
4.17
74.
035
3.90
23.
776
3.65
63.
543
3.43
73.
335
3.23
93.
147
125.
197
4.98
84.
793
4.61
14.
439
4.27
84.
127
3.98
53.
851
3.72
53.
606
3.49
33.
387
3.28
63.
190
135.
342
5.11
84.
910
4.71
54.
533
4.36
24.
203
4.05
33.
912
3.78
03.
656
3.53
83.
427
3.32
23.
223
145.
468
5.22
95.
008
4.80
24.
611
4.43
24.
265
4.10
83.
962
3.82
43.
695
3.57
33.
459
3.35
13.
249
155.
575
5.32
45.
092
4.87
64.
675
4.48
94.
315
4.15
34.
001
3.85
93.
726
3.60
13.
483
3.37
33.
268
165.
668
5.40
55.
162
4.93
84.
730
4.53
64.
357
4.18
94.
033
3.88
73.
751
3.62
33.
503
3.39
03.
283
175.
749
5.47
55.
222
4.99
04.
775
4.57
64.
391
4.21
94.
059
3.91
03.
771
3.64
03.
518
3.40
33.
295
185.
818
5.53
45.
273
5.03
34.
812
4.60
84.
419
4.24
34.
080
3.92
83.
786
3.65
43.
529
3.41
33.
304
195.
877
5.58
45.
316
5.07
04.
843
4.63
54.
442
4.26
34.
097
3.94
23.
799
3.66
43.
539
3.42
13.
311
205.
929
5.62
85.
353
5.10
14.
870
4.65
74.
460
4.27
94.
110
3.95
43.
808
3.67
33.
546
3.42
73.
316
256.
097
5.76
65.
467
5.19
54.
948
4.72
14.
514
4.32
34.
147
3.98
53.
834
3.69
43.
564
3.44
23.
329
306.
177
5.82
95.
517
5.23
54.
979
4.74
64.
534
4.33
94.
160
3.99
53.
842
3.70
13.
569
3.44
73.
332
e.g.
, if
the
inte
rest
rat
e is
10
perc
ent p
er y
ear,
the
pres
ent v
alue
of
$1 r
ecei
ved
in e
ach
of th
e ne
xt 5
yea
rs is
$3.
791.
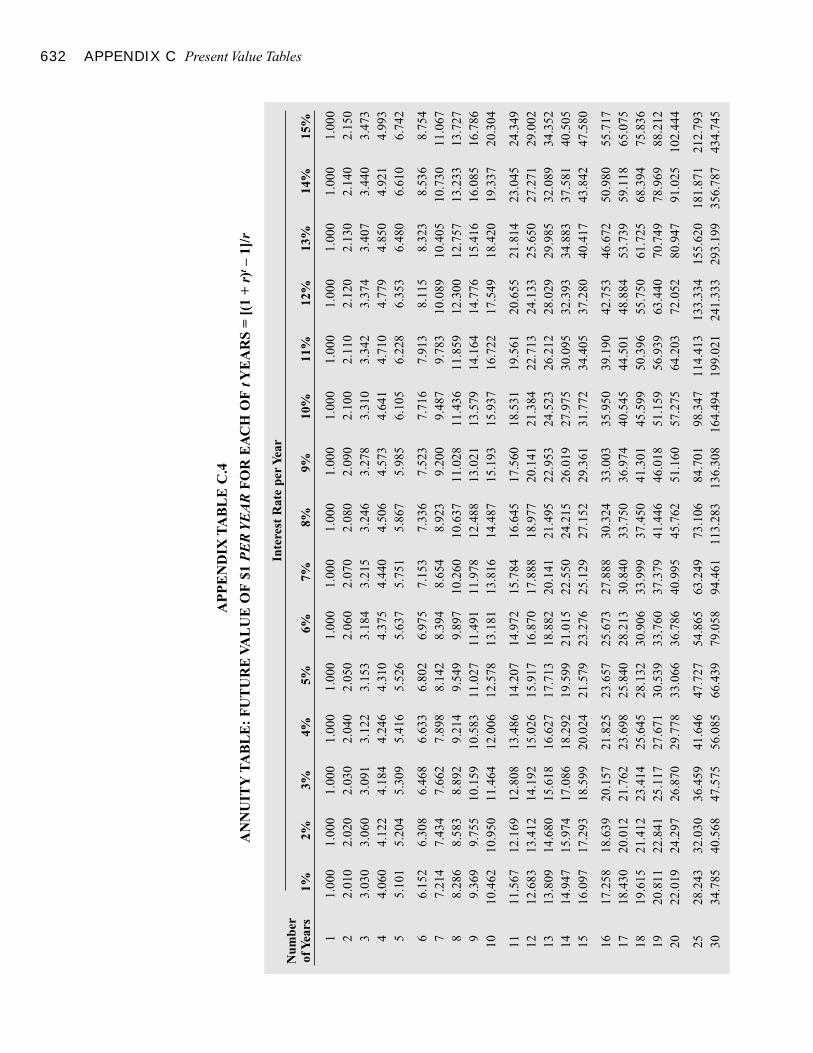
632 APPENDIX C Present Value Tables
AP
PE
ND
IX T
AB
LE
C.4
AN
NU
ITY
TA
BL
E:
FU
TU
RE
VA
LU
E O
F $
1 P
ER
YE
AR
FO
R E
AC
H O
F t
YE
AR
S =
[(1
+ r
)t–
1]/r
Inte
rest
Rat
e pe
r Y
ear
Num
ber
of Y
ears
1%2%
3%4%
5%6%
7%8%
9%10
%11
%12
%13
%14
%15
%
11.
000
1.00
01.
000
1.00
01.
000
1.00
01.
000
1.00
01.
000
1.00
01.
000
1.00
01.
000
1.00
01.
000
22.
010
2.02
02.
030
2.04
02.
050
2.06
02.
070
2.08
02.
090
2.10
02.
110
2.12
02.
130
2.14
02.
150
33.
030
3.06
03.
091
3.12
23.
153
3.18
43.
215
3.24
63.
278
3.31
03.
342
3.37
43.
407
3.44
03.
473
44.
060
4.12
24.
184
4.24
64.
310
4.37
54.
440
4.50
64.
573
4.64
14.
710
4.77
94.
850
4.92
14.
993
55.
101
5.20
45.
309
5.41
65.
526
5.63
75.
751
5.86
75.
985
6.10
56.
228
6.35
36.
480
6.61
06.
742
66.
152
6.30
86.
468
6.63
36.
802
6.97
57.
153
7.33
67.
523
7.71
67.
913
8.11
58.
323
8.53
68.
754
77.
214
7.43
47.
662
7.89
88.
142
8.39
48.
654
8.92
39.
200
9.48
79.
783
10.0
8910
.405
10.7
3011
.067
88.
286
8.58
38.
892
9.21
49.
549
9.89
710
.260
10.6
3711
.028
11.4
3611
.859
12.3
0012
.757
13.2
3313
.727
99.
369
9.75
510
.159
10.5
8311
.027
11.4
9111
.978
12.4
8813
.021
13.5
7914
.164
14.7
7615
.416
16.0
8516
.786
1010
.462
10.9
5011
.464
12.0
0612
.578
13.1
8113
.816
14.4
8715
.193
15.9
3716
.722
17.5
4918
.420
19.3
3720
.304
1111
.567
12.1
6912
.808
13.4
8614
.207
14.9
7215
.784
16.6
4517
.560
18.5
3119
.561
20.6
5521
.814
23.0
4524
.349
1212
.683
13.4
1214
.192
15.0
2615
.917
16.8
7017
.888
18.9
7720
.141
21.3
8422
.713
24.1
3325
.650
27.2
7129
.002
1313
.809
14.6
8015
.618
16.6
2717
.713
18.8
8220
.141
21.4
9522
.953
24.5
2326
.212
28.0
2929
.985
32.0
8934
.352
1414
.947
15.9
7417
.086
18.2
9219
.599
21.0
1522
.550
24.2
1526
.019
27.9
7530
.095
32.3
9334
.883
37.5
8140
.505
1516
.097
17.2
9318
.599
20.0
2421
.579
23.2
7625
.129
27.1
5229
.361
31.7
7234
.405
37.2
8040
.417
43.8
4247
.580
1617
.258
18.6
3920
.157
21.8
2523
.657
25.6
7327
.888
30.3
2433
.003
35.9
5039
.190
42.7
5346
.672
50.9
8055
.717
1718
.430
20.0
1221
.762
23.6
9825
.840
28.2
1330
.840
33.7
5036
.974
40.5
4544
.501
48.8
8453
.739
59.1
1865
.075
1819
.615
21.4
1223
.414
25.6
4528
.132
30.9
0633
.999
37.4
5041
.301
45.5
9950
.396
55.7
5061
.725
68.3
9475
.836
1920
.811
22.8
4125
.117
27.6
7130
.539
33.7
6037
.379
41.4
4646
.018
51.1
5956
.939
63.4
4070
.749
78.9
6988
.212
2022
.019
24.2
9726
.870
29.7
7833
.066
36.7
8640
.995
45.7
6251
.160
57.2
7564
.203
72.0
5280
.947
91.0
2510
2.44
4
2528
.243
32.0
3036
.459
41.6
4647
.727
54.8
6563
.249
73.1
0684
.701
98.3
4711
4.41
313
3.33
415
5.62
018
1.87
121
2.79
330
34.7
8540
.568
47.5
7556
.085
66.4
3979
.058
94.4
6111
3.28
313
6.30
816
4.49
419
9.02
124
1.33
329
3.19
935
6.78
743
4.74
5
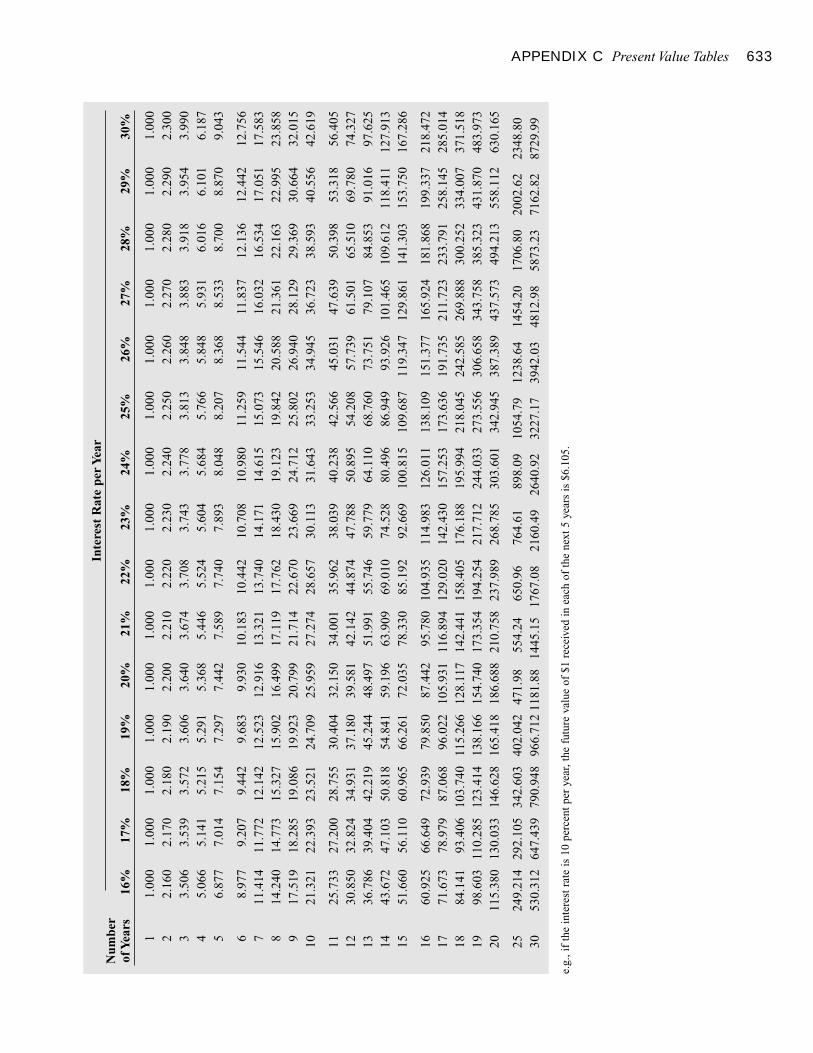
APPENDIX C Present Value Tables 633
Inte
rest
Rat
e pe
r Y
ear
Num
ber
of Y
ears
16%
17%
18%
19%
20%
21%
22%
23%
24%
25%
26%
27%
28%
29%
30%
11.
000
1.00
01.
000
1.00
01.
000
1.00
01.
000
1.00
01.
000
1.00
01.
000
1.00
01.
000
1.00
01.
000
22.
160
2.17
02.
180
2.19
02.
200
2.21
02.
220
2.23
02.
240
2.25
02.
260
2.27
02.
280
2.29
02.
300
33.
506
3.53
93.
572
3.60
63.
640
3.67
43.
708
3.74
33.
778
3.81
33.
848
3.88
33.
918
3.95
43.
990
45.
066
5.14
15.
215
5.29
15.
368
5.44
65.
524
5.60
45.
684
5.76
65.
848
5.93
16.
016
6.10
16.
187
56.
877
7.01
47.
154
7.29
77.
442
7.58
97.
740
7.89
38.
048
8.20
78.
368
8.53
38.
700
8.87
09.
043
68.
977
9.20
79.
442
9.68
39.
930
10.1
8310
.442
10.7
0810
.980
11.2
5911
.544
11.8
3712
.136
12.4
4212
.756
711
.414
11.7
7212
.142
12.5
2312
.916
13.3
2113
.740
14.1
7114
.615
15.0
7315
.546
16.0
3216
.534
17.0
5117
.583
814
.240
14.7
7315
.327
15.9
0216
.499
17.1
1917
.762
18.4
3019
.123
19.8
4220
.588
21.3
6122
.163
22.9
9523
.858
917
.519
18.2
8519
.086
19.9
2320
.799
21.7
1422
.670
23.6
6924
.712
25.8
0226
.940
28.1
2929
.369
30.6
6432
.015
1021
.321
22.3
9323
.521
24.7
0925
.959
27.2
7428
.657
30.1
1331
.643
33.2
5334
.945
36.7
2338
.593
40.5
5642
.619
1125
.733
27.2
0028
.755
30.4
0432
.150
34.0
0135
.962
38.0
3940
.238
42.5
6645
.031
47.6
3950
.398
53.3
1856
.405
1230
.850
32.8
2434
.931
37.1
8039
.581
42.1
4244
.874
47.7
8850
.895
54.2
0857
.739
61.5
0165
.510
69.7
8074
.327
1336
.786
39.4
0442
.219
45.2
4448
.497
51.9
9155
.746
59.7
7964
.110
68.7
6073
.751
79.1
0784
.853
91.0
1697
.625
1443
.672
47.1
0350
.818
54.8
4159
.196
63.9
0969
.010
74.5
2880
.496
86.9
4993
.926
101.
465
109.
612
118.
411
127.
913
1551
.660
56.1
1060
.965
66.2
6172
.035
78.3
3085
.192
92.6
6910
0.81
510
9.68
711
9.34
712
9.86
114
1.30
315
3.75
016
7.28
6
1660
.925
66.6
4972
.939
79.8
5087
.442
95.7
8010
4.93
511
4.98
312
6.01
113
8.10
915
1.37
716
5.92
418
1.86
819
9.33
721
8.47
217
71.6
7378
.979
87.0
6896
.022
105.
931
116.
894
129.
020
142.
430
157.
253
173.
636
191.
735
211.
723
233.
791
258.
145
285.
014
1884
.141
93.4
0610
3.74
011
5.26
612
8.11
714
2.44
115
8.40
517
6.18
819
5.99
421
8.04
524
2.58
526
9.88
830
0.25
233
4.00
737
1.51
819
98.6
0311
0.28
512
3.41
413
8.16
615
4.74
017
3.35
419
4.25
421
7.71
224
4.03
327
3.55
630
6.65
834
3.75
838
5.32
343
1.87
048
3.97
320
115.
380
130.
033
146.
628
165.
418
186.
688
210.
758
237.
989
268.
785
303.
601
342.
945
387.
389
437.
573
494.
213
558.
112
630.
165
2524
9.21
429
2.10
534
2.60
340
2.04
247
1.98
554.
2465
0.96
764.
6189
8.09
1054
.79
1238
.64
1454
.20
1706
.80
2002
.62
2348
.80
3053
0.31
264
7.43
979
0.94
896
6.71
211
81.8
814
45.1
517
67.0
821
60.4
926
40.9
232
27.1
739
42.0
348
12.9
858
73.2
371
62.8
287
29.9
9
e.g.
, if
the
inte
rest
rat
e is
10
perc
ent p
er y
ear,
the
futu
re v
alue
of
$1 r
ecei
ved
in e
ach
of th
e ne
xt 5
yea
rs is
$6.
105.

Glossary
acquisition: Takeover of a firm by purchase of that firm’s com-mon stock or assets.
additional paid-in capital: Difference between issue price andpar value of stock. Also called capital surplus.
agency problems: Conflicts of interest between the firm’s own-ers and managers.
aging schedule: Classification of accounts receivable by timeoutstanding.
annual percentage rate (APR): Interest rate that is annualizedusing simple interest.
annuity: Equally spaced level stream of cash flows.annuity due: Level stream of cash flows starting immediately.annuity factor: Present value of an annuity of $1 per period.authorized share capital: Maximum number of shares that the
company is permitted to issue, as specified in the firm’s arti-cles of incorporation.
availability float: Checks already deposited that have not yetbeen cleared.
average tax rate: Total taxes owed divided by total income.balance sheet: Financial statement that shows the value of the
firm’s assets and liabilities at a particular time.balancing item: Variable that adjusts to maintain the consistency
of a financial plan. Also called plug.bankruptcy: The reorganization or liquidation of a firm that can-
not pay its debts.bear market: A market in which stock or bond prices are gener-
ally falling.beta: Sensitivity of a stock’s return to the return on the market
portfolio.bond: Security that obligates the issuer to make specified pay-
ments to the bondholder.book rate of return: Accounting income divided by book value.
Also called accounting rate of return.book value: Net worth of the firm’s assets or liabilities accord-
ing to the balance sheet.break-even analysis: Analysis of the level of sales at which the
company breaks even.bull market: A market in which stock or bond prices are gener-
ally rising.call option: Right to buy an asset at a specified exercise price on
or before the exercise date.callable bond: Bond that may be repurchased by the issuer be-
fore maturity at specified call price.capital asset pricing model (CAPM): Theory of the relationship
between risk and return which states that the expected riskpremium on any security equals its beta times the market riskpremium.
capital budget: List of planned investment projects.capital budgeting decision: Decision as to which real assets the
firm should acquire.capital markets: Markets for long-term financing.capital rationing: Limit set on the amount of funds available for
investment.capital structure: Firm’s mix of long-term financing.CAPM: See capital asset pricing model.carrying costs: Costs of maintaining current assets, including
opportunity cost of capital.cash conversion cycle: Period between firm’s payment for mate-
rials and collection on its sales.cash cow: Business that produces a lot of cash but few growth
prospects.cash dividend: Payment of cash by the firm to its shareholders.CEO: Acronym for chief executive officer.CFO: See chief financial officer.chief financial officer (CFO): Officer who oversees the treas-
urer and controller and sets overall financial strategy.collection policy: Procedures to collect and monitor receivables.commercial paper: Short-term unsecured notes issued by firms.common-size balance sheet: Balance sheet that presents items
as a percentage of total assets.common-size income statement: Income statement that presents
items as a percentage of revenues.common stock: Ownership shares in a publicly held corporation.company cost of capital: Expected rate of return demanded by
investors in a company, determined by the average risk of thecompany’s assets and operations.
compound interest: Interest earned on interest.concentration banking: System whereby customers make pay-
ments to a regional collection center which transfers funds toa principal bank.
constant-growth dividend discount model: Version of the divi-dend discount model in which dividends grow at a constant rate.
controller: Officer responsible for budgeting, accounting, andauditing.
convertible bond: Bond that the holder may exchange for a spec-ified number of shares.
corporation: Business owned by stockholders who are not per-sonally liable for the business’s liabilities.
635
636 GLOSSARY
costs of financial distress: Costs arising from bankruptcy or dis-torted business decisions before bankruptcy.
coupon: The interest payments paid to the bondholder.coupon rate: Annual interest payment as a percentage of face
value.credit analysis: Procedure to determine the likelihood a cus-
tomer will pay its bills.credit policy: Standards set to determine the amount and nature
of credit to extend to customers.cumulative voting: Voting system in which all the votes one
shareholder is allowed to cast can be cast for one candidate forthe board of directors.
current yield: Annual coupon payments divided by bond price.decision tree: Diagram of sequential decisions and possible out-
comes.default premium: Difference in promised yields between a
default-free bond and a riskier bond.degree of operating leverage (DOL): Percentage change in prof-
its given a 1 percent change in sales.depreciation tax shield: Reduction in taxes attributable to the
depreciation allowance.discount factor: Present value of a $1 future payment.discount rate: Interest rate used to compute present values of fu-
ture cash flows.diversification: Strategy designed to reduce risk by spreading
the portfolio across many investments.dividend: Periodic cash distribution from the firm to its share-
holders.dividend discount model: Computation of today’s stock price
which states that share value equals the present value of allexpected future dividends.
dividend payout ratio: Percentage of earnings paid out as divi-dends.
Dow Jones Industrial Average: Index of the investment per-formance of a portfolio of 30 “blue-chip” stocks.
Du Pont system: A breakdown of ROE and ROA into compo-nent ratios.
economic order quantity: Order size that minimizes total inven-tory costs.
economic value added (EVA): Term used by the consulting firmStern Stewart for profit remaining after deduction of the costof the capital employed.
effective annual interest rate: Interest rate that is annualizedusing compound interest.
efficient capital markets: Financial markets in which securityprices rapidly reflect all relevant information about asset val-ues.
equivalent annual cost: The cost per period with the same pres-ent value as the cost of buying and operating a machine.
eurobond: Bond that is marketed internationally.eurodollars: Dollars held on deposit in a bank outside the
United States.EVA: See economic value added.
exchange rate: Amount of one currency needed to purchase oneunit of another.
ex-dividend date: Date that determines whether a stockholder isentitled to a dividend payment; anyone holding stock beforethis date is entitled to a dividend.
expectations theory of exchange rates: Theory that expectedspot exchange rate equals the forward rate.
face value: Payment at the maturity of the bond. Also called parvalue or maturity value.
Fed: See Federal Reserve.Federal Reserve (the Fed): The central bank in the United
States, responsible for setting interest rates.financial assets: Claims to the income generated by real assets.
Also called securities.financial intermediary: Firm that raises money from many
small investors and provides financing to businesses or otherorganizations by investing in their securities.
financial leverage: Debt financing amplifies the effects ofchanges in operating income on the returns to stockholders.
financial markets: Markets in which financial assets are traded.financial risk: Risk to shareholders resulting from the use of
debt.financial slack: Ready access to cash or debt financing.financing decision: Decision as to how to raise the money to
pay for investments in real assets.fixed costs: Costs that do not depend on the level of output.floating-rate security: Security paying dividends or interest that
vary with short-term interest rates.forex: Abbreviation for foreign exchange; also abbreviated fx.forward contract: Agreement to buy or sell an asset in the future
at an agreed price.forward rate of exchange: Exchange rate for a forward transac-
tion.fundamental analysts: Analysts who attempt to find under- or
overvalued securities by analyzing fundamental information,such as earnings, asset values, and business prospects.
funded debt: Debt with more than 1 year remaining to maturity.future value: Amount to which an investment will grow after
earning interest.futures contract: Exchange-traded promise to buy or sell an
asset in the future at a prespecified price.fx: Abbreviation for foreign exchange; also abbreviated forex.GAAP: See generally accepted accounting principles.general cash offer: Sale of securities open to all investors by an
already-public company.generally accepted accounting principles (GAAP): Procedures
for preparing financial statements.income statement: Financial statement that shows the revenues,
expenses, and net income of a firm over a period of time.inflation: Rate at which prices as a whole are increasing.information content of dividends: Dividend increases send good
news about cash flow and earnings. Dividend cuts send badnews.

GLOSSARY 637
initial public offering (IPO): First offering of stock to the gen-eral public.
interest rate parity: Theory that forward premium equals inter-est rate differential.
interest tax shield: Tax savings resulting from deductibility ofinterest payments.
internal growth rate: Maximum rate of growth without externalfinancing.
internal rate of return (IRR): Discount rate at which projectNPV = 0.
internally generated funds: Cash reinvested in the firm; depre-ciation plus earnings not paid out as dividends.
international Fisher effect: Theory that real interest rates in allcountries should be equal, with differences in nominal ratesreflecting differences in expected inflation.
in the black: Making a profit.in the red: Making a loss.investment grade: Bonds rated Baa or above by Moody’s or
BBB or above by Standard & Poor’s.issued shares: Shares that have been issued by the company.IPO: See initial public offering.IRR: See internal rate of return.junk bond: Bond with a rating below Baa or BBB.law of one price: Theory that prices of goods in all countries
should be equal when translated to a common currency.lease: Long-term rental agreement.leveraged buyout (LBO): Acquisition of the firm by a private
group using substantial borrowed funds.limited liability: The owners of the corporation are not person-
ally responsible for its obligations.line of credit: Agreement by a bank that a company may borrow
at any time up to an established limit.liquidation: Sale of bankrupt firm’s assets.liquidation value: Net proceeds that would be realized by selling
the firm’s assets and paying off its creditors.liquidity: Ability of an asset to be converted to cash quickly at
low cost.lock-box system: System whereby customers send payments to a
post office box and a local bank collects and processeschecks.
long position: Purchase of an investment.majority voting: Voting system in which each director is voted
on separately.management buyout (MBO): Acquisition of the firm by its own
management in a leveraged buyout.M&A: Abbreviation for mergers and acquisitions.marginal tax rate: Additional taxes owed per dollar of addi-
tional income.market index: Measure of the investment performance of the
overall market.market portfolio: Portfolio of all assets in the economy. In prac-
tice a broad stock market index, such as the Standard & Poor’sComposite, is used to represent the market.
market risk: Economywide (macroeconomic) sources of risk thataffect the overall stock market. Also called systematic risk.
market risk premium: Risk premium of market portfolio. Dif-ference between market return and return on risk-free Trea-sury bills.
market value added: Market value of equity minus book value.market-value balance sheet: Financial statement that uses the
market value of all assets and liabilities.maturity premium: Extra average return from investing in long-
versus short-term Treasury securities.merger: Combination of two firms into one, with the acquirer
assuming assets and liabilities of the target firm.MM dividend-irrelevance proposition: Theory that under ideal
conditions, the value of the firm is unaffected by dividendpolicy.
MM’s proposition I (debt irrelevance proposition): The value ofa firm is unaffected by its capital structure.
MM’s proposition II: The required rate of return on equity in-creases as the firm’s debt-equity ratio increases.
Modified Accelerated Cost Recovery System (MACRS): Depre-ciation method that allows higher tax deductions in early yearsand lower deductions later.
money market: Market for short-term financial assets.mutually exclusive projects: Two or more projects that cannot be
pursued simultaneously.net float: Difference between payment float and availability
float.net present value (NPV): Present value of cash flows minus ini-
tial investment.net working capital: Current assets minus current liabilities.net worth: Book value of common stockholders’ equity plus pre-
ferred stock.nominal interest rate: Rate at which money invested grows.NPV: See net present value.NYSE: New York Stock Exchange.open account: Agreement whereby sales are made with no for-
mal debt contract.operating leverage: Degree to which costs are fixed.operating risk (business risk): Risk in firm’s operating income.opportunity cost of capital: Expected rate of return given up by
investing in a project.opportunity cost: Benefit or cash flow forgone as a result of an
action.OTC: See over-the-counter.outstanding shares: Shares that have been issued by the com-
pany and are held by investors.over-the-counter (OTC): Shares traded off an organized ex-
change. Also used to refer to the Nasdaq market.par value: Value of security shown on certificate.partnership: Business owned by two or more persons who are
personally responsible for all its liabilities.payback period: Time until cash flows recover the initial invest-
ment of the project.
638 GLOSSARY
payment float: Checks written by a company that have not yetcleared.
payout ratio: Fraction of earnings paid out as dividends.P/E: See price-earnings multiple.pecking order theory: Firms prefer to issue debt rather than eq-
uity if internal finance is insufficient.percentage of sales models: Planning model in which sales fore-
casts are the driving variables and most other variables areproportional to sales.
perpetuity: Stream of level cash payments that never ends.planning horizon: Time horizon for a financial plan.plowback ratio: Fraction of earnings retained by the firm.poison pill: Measure taken by a target firm to avoid acquisition;
for example, the right for existing shareholders to buy addi-tional shares at an attractive price if a bidder acquires a largeholding.
preferred stock: Stock that takes priority over common stock inregard to dividends.
present value (PV): Value today of a future cash flow.present value of growth opportunities (PVGO): Net present
value of a firm’s future investments.price-earnings (P/E) multiple: Ratio of stock price to earnings
per share.primary market: Market for the sale of new securities by corpo-
rations.prime rate: Benchmark interest rate charged by banks.private placement: Sale of securities to a limited number of in-
vestors without a public offering.pro formas: Projected or forecasted financial statements.profitability index: Ratio of net present value to initial invest-
ment.project cost of capital: Minimum acceptable expected rate of re-
turn on a project given its risk.prospectus: Formal summary that provides information on an
issue of securities.protective covenant: Restriction on a firm to protect bond-
holders.proxy contest: Takeover attempt in which outsiders compete
with management for shareholders’ votes. Also called proxyfight.
purchasing power parity (PPP): Theory that the cost of living indifferent countries is equal, and exchange rates adjust to off-set inflation differentials across countries.
put option: Right to sell an asset at a specified exercise price onor before the exercise date.
PV: See present value.random walk theory: Security prices change randomly, with no
predictable trends or patterns.rate of return: Total income per period per dollar invested.real assets: Assets used to produce goods and services.real interest rate: Rate at which the purchasing power of an in-
vestment increases.real options: Options embedded in real assets.real value of $1: Purchasing power–adjusted value of a dollar.
reorganization: Restructuring of financial claims on failingfirm to allow it to keep operating.
residual income: Also called economic value added. Profitminus cost of capital employed.
restructuring: Process of changing the firm’s capital structurewithout changing its assets.
retained earnings: Earnings not paid out as dividends.rights issue: Issue of securities offered only to current stock-
holders.risk premium: Expected return in excess of risk-free return as
compensation for risk.S&P: Abbreviation for Standard & Poor’s stockmarket index.scenario analysis: Project analysis given a particular combina-
tion of assumptions.seasoned offering: Sale of securities by a firm that is already
publicly traded.SEC: See Securities and Exchange Commission.secondary market: Market in which already issued securities are
traded among investors.secured debt: Debt that has first claim on specified collateral in
the event of default.Securities and Exchange Commission (SEC): Federal agency
responsible for regulation of securities markets in the UnitedStates.
security market line: Relationship between expected return andbeta.
semi-strong-form efficiency: Market prices reflect all publiclyavailable information.
sensitivity analysis: Analysis of the effects of changes in sales,costs, and so on, on project profitability.
shark repellent: Amendments to a company charter made toforestall takeover attempts.
shelf registration: A procedure that allows firms to file one reg-istration statement for several issues of the same security.
shortage costs: Costs incurred from shortages in current assets.short position: The sale of an investment, particularly by some-
one who does not yet own it.simple interest: Interest earned only on the original investment;
no interest is earned on interest.simulation analysis: Estimation of the probabilities of different
possible outcomes, e.g., from an investment project.sinking fund: Fund established to retire debt before maturity.sole proprietor: Sole owner of a business which has no partners
and no shareholders. The proprietor is personally liable for allthe firm’s obligations.
spot rate of exchange: Exchange rate for an immediate transac-tion.
spread: Difference between public offer price and price paid byunderwriter.
stakeholder: Anyone with a financial interest in the firm.Standard & Poor’s Composite Index: Index of the investment
performance of a portfolio of 500 large stocks. Also called theS&P 500.
GLOSSARY 639
standard deviation: Square root of variance. Another measure ofvolatility.
statement of cash flows: Financial statement that shows thefirm’s cash receipts and cash payments over a period of time.
stock dividend: Distribution of additional shares to a firm’sstockholders.
stock repurchase: Firm buys back stock from its shareholders.stock split: Issue of additional shares to firm’s stockholders.straight-line depreciation: Constant depreciation for each year
of the asset’s accounting life.strong-form efficiency: Market prices rapidly reflect all infor-
mation that could in principle be used to determine true value.subordinated debt: Debt that may be repaid in bankruptcy only
after senior debt is paid.sunk costs: Costs that have been incurred and cannot be recov-
ered.sustainable growth rate: Steady rate at which a firm can grow
without changing leverage; plowback ratio × return on equity.swap: Arrangement by two counterparties to exchange one
stream of cash flows for another.technical analysts: Investors who attempt to identify over- or
undervalued stocks by searching for patterns in past prices.tender offer: Takeover attempt in which outsiders directly offer
to buy the stock of the firm’s shareholders.terms of sale: Credit, discount, and payment terms offered on a
sale.trade-off theory: Debt levels are chosen to balance interest tax
shields against the costs of financial distress.treasurer: Manager responsible for financing, cash manage-
ment, and relationships with financial markets and institu-tions.
treasury stock: Stock that has been repurchased by the companyand held in its treasury.
underpricing: Issuing securities at an offering price set belowthe true value of the security.
underwriter: Firm that buys an issue of securities from a com-pany and resells it to the public.
unique risk: Risk factors affecting only that firm. Also called di-versifiable risk.
variable costs: Costs that change as the level of output changes.variance: Average value of squared deviations from mean. A
measure of volatility.venture capital: Money invested to finance a new firm.WACC: See weighted-average cost of capital.warrant: Right to buy shares from a company at a stipulated
price before a set date.weak-form efficiency: Market prices rapidly reflect all informa-
tion contained in the history of past prices.weighted-average cost of capital (WACC): Expected rate of re-
turn on a portfolio of all the firm’s securities, adjusted for taxsavings due to interest payments.
white knight: Friendly potential acquirer sought by a target com-pany threatened by an unwelcome suitor.
workout: Agreement between a company and its creditors estab-lishing the steps the company must take to avoid bankruptcy.
yield curve: Graph of the relationship between time to maturityand yield to maturity.
yield to maturity: Interest rate for which the present value of thebond’s payments equals the price.
zero-balance account: Regional bank account to which justenough funds are transferred daily to pay each day’s bills.

Related Documents


