Noninvasive Diagnostic Tests for Breast Abnormalities: Update of a 2006 Review Comparative Effectiveness Review Number 47

Welcome message from author
This document is posted to help you gain knowledge. Please leave a comment to let me know what you think about it! Share it to your friends and learn new things together.
Transcript

Noninvasive DiagnosticTests for BreastAbnormalities: Update of a 2006 Review
Comparative Effectiveness ReviewNumber 47
Comparative Effectiveness Review Number 47
Noninvasive Diagnostic Tests for Breast Abnormalities: Update of a 2006 Review Prepared for: Agency for Healthcare Research and Quality U.S. Department of Health and Human Services 540 Gaither Road Rockville, MD 20850 www.ahrq.gov Contract No. 290-02-0019 Prepared by: ECRI Institute Evidence-based Practice Center Plymouth Meeting, PA Investigators: Wendy Bruening, Ph.D. Stacey Uhl, M.S.S. Joann Fontanarosa, Ph.D. James Reston, Ph.D., M.P.H. Jonathan Treadwell, Ph.D. Karen Schoelles, M.D., S.M., FACP AHRQ Publication No. 12-EHC014-EF February 2012

ii
This report is based on research conducted by the ECRI Institute Evidence-based Practice Center (EPC) under contract to the Agency for Healthcare Research and Quality (AHRQ), Rockville, MD (Contract No. 290-02-0019). The findings and conclusions in this document are those of the author(s), who are responsible for its contents; the findings and conclusions do not necessarily represent the views of AHRQ. Therefore, no statement in this report should be construed as an official position of AHRQ or of the U.S. Department of Health and Human Services. The information in this report is intended to help healthcare decisionmakers—patients and clinicians, health system leaders, and policymakers, among others—make well-informed decisions and thereby improve the quality of health care services. This report is not intended to be a substitute for the application of clinical judgment. Anyone who makes decisions concerning the provision of clinical care should consider this report in the same way as any medical reference and in conjunction with all other pertinent information, i.e., in the context of available resources and circumstances presented by individual patients. This report may be used, in whole or in part, as the basis for the development of clinical practice guidelines and other quality enhancement tools, or as a basis for reimbursement and coverage policies. AHRQ or U.S. Department of Health and Human Services endorsement of such derivative products may not be stated or implied. This document is in the public domain and may be used and reprinted without permission except those copyrighted materials that are clearly noted in the document. Further reproduction of those copyrighted materials is prohibited without the specific permission of copyright holders. Persons using assistive technology may not be able to fully access information in this report. For assistance contact [email protected]. None of the investigators has any affiliations or financial involvement that conflicts with the material presented in this report. Suggested Citation: Bruening W, Uhl S, Fontanarosa J, Reston J, Treadwell J, Schoelles K. Noninvasive Diagnostic Tests for Breast Abnormalities: Update of a 2006 Review. Comparative Effectiveness Review No. 47. (Prepared by the ECRI Institute Evidence-based Practice Center under Contract No. 290-02-0019.) AHRQ Publication No. 12-EHC014-EF. Rockville, MD: Agency for Healthcare Research and Quality; February 2012. www.effectivehealthcare.ahrq.gov/reports/final.cfm.
iii
Preface The Agency for Healthcare Research and Quality (AHRQ) conducts the Effective Health
Care Program as part of its mission to organize knowledge and make it available to inform decisions about health care. As part of the Medicare Prescription Drug, Improvement, and Modernization Act of 2003, Congress directed AHRQ to conduct and support research on the comparative outcomes, clinical effectiveness, and appropriateness of pharmaceuticals, devices, and health care services to meet the needs of Medicare, Medicaid, and the Children’s Health Insurance Program (CHIP).
AHRQ has an established network of Evidence-based Practice Centers (EPCs) that produce Evidence Reports/Technology Assessments to assist public- and private-sector organizations in their efforts to improve the quality of health care. The EPCs now lend their expertise to the Effective Health Care Program by conducting Comparative Effectiveness Reviews (CERs) of medications, devices, and other relevant interventions, including strategies for how these items and services can best be organized, managed, and delivered.
Systematic reviews are the building blocks underlying evidence-based practice; they focus attention on the strength and limits of evidence from research studies about the effectiveness and safety of a clinical intervention. In the context of developing recommendations for practice, systematic reviews are useful because they define the strengths and limits of the evidence, clarifying whether assertions about the value of the intervention are based on strong evidence from clinical studies. For more information about systematic reviews, see http://effectivehealthcare.ahrq.gov/reference/purpose.cfm
AHRQ expects that CERs will be helpful to health plans, providers, purchasers, government programs, and the health care system as a whole. In addition, AHRQ is committed to presenting information in different formats so that consumers who make decisions about their own and their family’s health can benefit from the evidence.
Transparency and stakeholder input are essential to the Effective Health Care Program. Please visit the Web site (www.effectivehealthcare.ahrq.gov) to see draft research questions and reports or to join an email list to learn about new program products and opportunities for input. Comparative Effectiveness Reviews will be updated regularly.
We welcome comments on this CER. They may be sent by mail to the Task Order Officer named below at: Agency for Healthcare Research and Quality, 540 Gaither Road, Rockville, MD 20850, or by email to [email protected]. Carolyn M. Clancy, M.D. Jean Slutsky, P.A., M.S.P.H. Director Director, Center for Outcomes and Evidence Agency for Healthcare Research and Quality Agency for Healthcare Research and Quality Stephanie Chang, M.D., M.P.H. William Lawrence, M.D., M.S. Director, EPC Program Task Order Officer Agency for Healthcare Research and Quality Center for Outcomes and Evidence
Agency for Healthcare Research and Quality

iv
Acknowledgments The Evidence-based Practice Center would like to thank Eileen Erinoff, M.S.L.I.S., and
Helen Dunn for providing literature retrieval and documentation management support; and Lydia Dharia for her assistance with the final preparations of the report.
Technical Expert Panel Joann Elmore, M.D., M.P.H. Harborview Medical Center Seattle, WA Constantine Gatsonis, Ph.D. Brown University Providence, RI Deborah Laxague, R.N. National Breast Cancer Coalition Grenada, CA
Carol Lee, M.D. Memorial Sloan Kettering Cancer Center New York, NY Mark Robson, M.D. Memorial Sloan Kettering Cancer Center New York, NY Robert Rosenberg, M.D. University of New Mexico Albuquerque, NM
Peer Reviewers Wendie Berg, M.D., Ph.D. American Radiology Services/Johns Hopkins Lutherville, MD Christopher Comstock, M.D. Memorial Sloan Kettering Cancer Center New York, NY Deborah Laxague, R.N. National Breast Cancer Coalition Grenada, CA
Carol Lee, M.D. Memorial Sloan Kettering Cancer Center New York, NY Constance Lehman, M.D., Ph.D. University of Washington Seattle, WA
iii
Noninvasive Diagnostic Tests for Breast Abnormalities: Update of a 2006 Review
Structured Abstract Objectives. To systematically review the literature on the diagnostic accuracy of noninvasive imaging technologies proposed to be useful as part of the workup after recall of women with suspicious breast abnormalities identified on routine screening. This report is an update of a Comparative Effectiveness Review originally published in 2006. Data Sources. We searched the medical literature, including PubMed and Embase, from December 1994 through September 2010. We included diagnostic cohort studies that enrolled the patient population of interest and used current generation scanners and protocols of the noninvasive imaging technologies of interest. We excluded case-control studies, meeting presentations, and very small (<10 patients) studies. Review Methods: We abstracted data from the included studies and used a bivariate mixed-effects binomial regression model for meta-analysis. We used the summary likelihood ratios and Bayes’ theorem to calculate the post-test probability of having a benign or malignant lesion. We explored heterogeneity in the data with meta-regressions using standard methodology. We graded the strength of evidence supporting each major conclusion as high, moderate, low, or insufficient. The grade was developed by considering four important domains: the risk of bias in the evidence base (internal validity, or quality of the studies), the consistency of the findings, the precision of the results, and the directness of the evidence. Results. We identified 41 studies of magnetic resonance imaging (MRI). The summary sensitivity of MRI was 91.7 percent (95% CI: 88.5 to 94.1%) and the summary specificity was 77.5 percent (95% CI: 71.0 to 82.9%). The estimate of accuracy was judged to be supported by a moderate to low strength of evidence (low for the estimate of specificity due to the lack of precision as reflected in the wide confidence interval). Bayes’ theorem and the summary estimates of accuracy suggest that only women with a pre-MRI suspicion of malignancy of 12 percent or less will have their post-MRI suspicion of malignancy change sufficiently to suggest that a change in patient management may be appropriate. We identified seven studies of positron emission tomography (PET). The summary sensitivity of PET was 83.0 percent (95% CI: 73.0 to 89.0%) and the summary specificity was 74.0 percent (95% CI: 58.0 to 86.0%). The estimate of accuracy was judged to be supported by a Low strength of evidence. Bayes’ theorem and the summary estimates of accuracy suggest that only women with a pre-PET suspicion of malignancy of 5 percent or less will have their post-PET suspicion of malignancy change sufficiently to suggest that a change in patient management may be appropriate. We identified 10 studies of scintimammography. The summary sensitivity of scintimammography was 84.7 percent (95% CI: 78.0 to 89.7%) and the summary specificity was 77.0 percent (95% CI: 64.7 to 85.9%). The estimate of accuracy was judged to be supported by a Low strength of evidence. Bayes’ theorem and the summary estimates of accuracy suggest that

iv
only women with a pre-scintimammography suspicion of malignancy of 5 percent or less will have their post-scintimammography suspicion of malignancy change sufficiently to suggest that a change in patient management may be appropriate. We identified 21 studies of B-mode grayscale ultrasound, six studies of color Doppler ultrasound, and seven studies of power Doppler ultrasound. For B-mode grayscale, summary sensitivity was 92.4 percent (95% CI: 84.6 to 96.4%) and the summary specificity was 75.8 percent (95% CI: 60.8 to 86.3%); for color Doppler, summary sensitivity was 88.5 percent (95% CI: 74.4 to 95.4%) and summary specificity was 76.4 percent (95% CI: 61.7 to 86.7%); for power Doppler, summary sensitivity was 70.8 percent (95% CI: 47 to 86.6%) and summary specificity was 72.6 percent (95% CI: 59.9 to 82.5%). These estimates of accuracy were all judged to be supported by a Low strength of evidence. Bayes’ theorem and the summary estimates of accuracy suggest that only women with a pre-ultrasound suspicion of malignancy of 10 percent or less will have their post-ultrasound suspicion of malignancy change sufficiently to suggest that a change in patient management may be appropriate. Conclusions. The use of noninvasive imaging, in addition to standard workup of women recalled for evaluation of an abnormality detected on breast cancer screening, may be clinically useful for diagnostic purposes only for women with a low (less than 12%) pretest suspicion of malignancy. When choosing which noninvasive imaging technology to use for this purpose, the evidence appears to suggest that diagnostic B-mode grayscale ultrasound and MRI are more accurate than PET, scintimammography, or Doppler ultrasound. The utility of these findings, however, depend on whether clinicians can identify women with a pretest suspicion of malignancy in the ranges necessary for the tests to affect management. Several of the expert reviewers of this report did not think this is currently possible.

v
Contents Executive Summary .................................................................................................................ES-1 Introduction ....................................................................................................................................1
Background ................................................................................................................................1 Breast Cancer .......................................................................................................................1 Breast Cancer Diagnosis ......................................................................................................1 Noninvasive Imaging ...........................................................................................................3 Conceptual Framework ........................................................................................................4 Diagnostic Test Characteristics ............................................................................................6
Scope and Key Questions ..........................................................................................................7 Methods ...........................................................................................................................................9
Topic Development ....................................................................................................................9 Patients .................................................................................................................................9 Interventions ........................................................................................................................9 Comparators .......................................................................................................................10 Outcomes ...........................................................................................................................10 Timing ................................................................................................................................10 Setting ................................................................................................................................10
Search Strategy ........................................................................................................................10 Study Selection ........................................................................................................................11 Data Abstraction ......................................................................................................................14 Study Quality Evaluation .........................................................................................................14 Strength of Evidence Assessment ............................................................................................14
Overall Rating of Strength of Evidence .............................................................................16 Applicability ............................................................................................................................16 Data Analysis and Synthesis ....................................................................................................16 Peer Review and Public Commentary .....................................................................................17
Results ...........................................................................................................................................18 Magnetic Resonance Imaging ..................................................................................................18
Background ........................................................................................................................18 Findings From 2006 Review ..............................................................................................21 Evidence Base ....................................................................................................................21 Key Question 1. What is the accuracy of MRI for diagnosis of breast cancer
in women referred for further evaluation after identification of a possible breast abnormality on routine screening (mammography and/or clinical or self-detection of a palpable lesion)? ........................................................................21
Key Question 2. Are there demographic (e.g., age) and clinical risk factors (e.g., morphologic characteristics of the lesion) that affect the accuracy of the tests considered in Key Question 1? ..................................................................22
Key Question 3. Are there other factors and considerations that may affect the accuracy or acceptability of MRI? .........................................................................22
Previously Published Systematic Reviews ........................................................................22 Conclusion .........................................................................................................................24
Positron Emission Tomography ...............................................................................................27 Background ........................................................................................................................27 Findings From 2006 Review ..............................................................................................29

vi
Evidence Base ....................................................................................................................29 Key Question 1. What is the accuracy of PET for diagnosis of breast cancer
in women referred for further evaluation after identification of a possible breast abnormality on routine screening (mammography and/or clinical or self-detection of a palpable lesion)? ........................................................................30
Key Question 2. Are there demographic (e.g., age) and clinical risk factors (e.g., morphologic characteristics of the lesion) that affect the accuracy of the tests considered in Key Question 1? ..................................................................30
Key Question 3. Are there other factors and considerations that may affect the accuracy or acceptability of the tests considered in Key Questions 1 and 2? ........31
Previously Published Systematic Reviews ........................................................................31 Conclusion .........................................................................................................................31
Scintimammography ................................................................................................................34 Background ........................................................................................................................34 Findings From 2006 Review ..............................................................................................35 Evidence Base ....................................................................................................................35 Key Question 1. What is the accuracy of scintimammography for diagnosis
of breast cancer in women referred for further evaluation after identification of a possible breast abnormality on routine screening (mammography and/or clinical or self-detection of a palpable lesion)? ................................................36
Key Question 2. Are there demographic (e.g., age) and clinical risk factors (e.g., morphologic characteristics of the lesion) that affect the accuracy of the tests considered in Question 1? ..........................................................................36
Key Question 3. Are there other factors and considerations that may affect the accuracy or acceptability of the tests considered in Key Questions 1 and 2? ........36
Previously Published Systematic Reviews ........................................................................36 Conclusion .........................................................................................................................38
Ultrasound ................................................................................................................................41 Background ........................................................................................................................41 Findings From 2006 Review ..............................................................................................43 Evidence Base ....................................................................................................................43 Key Question 1. What is the accuracy of ultrasound for diagnosis of breast
cancer in women referred for further evaluation after identification of a possible breast abnormality on routine screening (mammography and/or clinical or self-detection of a palpable lesion)? ...........................................................43
Key Question 2. Are there demographic (e.g., age) and clinical risk factors (e.g., morphologic characteristics of the lesion) that affect the accuracy of the tests considered in Key Question 1? ..................................................................45
Key Question 3. Are there other factors and considerations that may affect the accuracy or acceptability of the tests considered in Key Questions 1 and 2? ........45
Previously Published Systematic Reviews ........................................................................45 Conclusion .........................................................................................................................46
Comparative Accuracy and Safety ...........................................................................................50 Summary and Discussion ............................................................................................................52
Changes Since 2006 .................................................................................................................53 Limitations of the Evidence Base ............................................................................................54

vii
Applicability ............................................................................................................................54 Possible Impact of Key Assumptions on the Conclusions ......................................................55 Future Research .......................................................................................................................55
References .....................................................................................................................................57 Acronyms and Abbreviations .....................................................................................................72 Glossary ........................................................................................................................................73 Tables Table A. Summary of Key Findings ..........................................................................................ES-8 Table 1. Example of a 2x2 Table .....................................................................................................6 Table 2. Noninvasive Current Technologies To Be Evaluated ......................................................12 Table 3. Other Published Technology Assessments of MRI .........................................................23 Table 4. Included Studies: Magnetic Resonance Imaging (MRI) ..................................................24 Table 5. Magnetic Resonance Imaging (MRI) Accuracy ..............................................................26 Table 6. Clinical Interpretations of Magnetic Resonance Accuracy: Benign Finding
on MRI .....................................................................................................................................26 Table 7. Clinical Interpretations of MRI Accuracy: Malignant Finding on MRI ..........................27 Table 8. Included Studies: PET and PET/CT ................................................................................32 Table 9. PET Accuracy ..................................................................................................................32 Table 10. Clinical Interpretations of PET Accuracy: Benign Finding on PET .............................33 Table 11. Clinical Interpretations of PET Accuracy: Malignant Finding on PET .........................33 Table 12. Other Published Technology Assessments of Scintimammography .............................37 Table 13. Included Studies: Scintimammography .........................................................................39 Table 14. Scintimammography Accuracy ......................................................................................39 Table 15. Clinical Interpretations of Scintimammography Accuracy: Benign Finding
on Scintimammography ...........................................................................................................40 Table 16. Clinical Interpretations of Scintimammography Accuracy: Malignant Finding
on Scintimammography ...........................................................................................................40 Table 17. Included Studies: Ultrasound .........................................................................................47 Table 18. Ultrasound Accuracy: Accuracy of Different Types of Ultrasound ..............................48 Table 19. Clinical Interpretations of Ultrasound Accuracy: Benign Finding
on Ultrasound ...........................................................................................................................49 Table 20. Clinical Interpretations of Ultrasound Accuracy: Malignant Finding
on Ultrasound ...........................................................................................................................49 Table 21. Summary Accuracy Results ...........................................................................................51 Table 22. Comparative Safety Concerns........................................................................................51 Figures Figure 1. Analytical Framework ......................................................................................................5 Figure 2. Study Selection Process ..................................................................................................18 Figure 3. Possible Clinical Scenarios for Magnetic Resonance Imaging (MRI):
Theoretical Changes in Management .......................................................................................27 Figure 4. Possible Clinical Scenarios for Positron Emission Tomography (PET):
Theoretical Changes in Management .......................................................................................34

viii
Figure 5. Possible Clinical Scenarios for Scintimammography (SC): Theoretical Changes in Management .........................................................................................................................41
Figure 6. Possible Clinical Scenarios for B-Mode Grayscale Ultrasound (US): Theoretical Changes in Management .......................................................................................50
Appendixes Appendix A. Search Strategy and Exact Search Strings Appendix B. Sample Data Abstraction Forms Appendix C. Evidence Tables Appendix D. List of Excluded Studies

ES-1
Executive Summary
Background Breast cancer is one of the most common malignancies of women, with approximately
200,000 new cases diagnosed every year in the United States.1 Some breast cancers are identified by physical examination (either self-examination or an examination performed by a physician). Population-wide screening programs that use x-ray mammography to examine asymptomatic women for early signs of breast cancer are also in common use.2-4 If a suspicious area is seen on x-ray mammography, women are usually recalled for further examination. The results of these examinations are used to make decisions about further management: return to normal screening/return for short-interval followup/refer for biopsy. In current standard practice the examinations conducted after recall usually consist of diagnostic mammography and possibly ultrasound. More and more often women are being sent for additional imaging during recall workup. Extensive diagnostic ultrasound examinations and MRI are currently the most commonly chosen additional imaging added to the workup, but other imaging technologies are offered by some practitioners.
It is important to triage recalled women into the correct management pathway. Women with readily treatable early-stage cancers who get mistakenly triaged into “return to normal screening” may experience a significant delay in diagnosis and treatment of the cancer. However, the majority of women who are recalled for further assessment after a screening mammography do not have cancer, and significant numbers of healthy women are referred for biopsy or short-interval followup after recall and diagnostic mammography.5,6
A number of noninvasive imaging technologies have been developed and proposed to be useful as part of the workup after recall. This evidence review focuses on additional noninvasive imaging studies that can be conducted (in addition to standard workup) after discovery of a possible abnormality on screening mammography or physical examination. These studies are intended to guide patient management decisions. In other words, these imaging studies are not intended to provide a final diagnosis as to the nature of the breast lesion; rather, they are intended to provide additional information about the nature of the lesions such that women can be more appropriately triaged into the correct management pathway. It is important to evaluate the evidence to see if women do or do not benefit from the addition of these imaging modalities to the standard workup after recall on breast cancer screening.
Because there are no available studies that directly evaluate whether women benefit from additional imaging in this context, we addressed this important question indirectly. First we evaluated the accuracy of the imaging tests in distinguishing between “benign” and “malignant” breast lesions. Inaccurate tests will lead to suboptimal management decisions and less than desirable patient outcomes. The accuracy of the noninvasive imaging tests was primarily measured in terms of sensitivity and specificity. Sensitivity is a measure of how accurately the test can identify women with cancer; specificity is a measure of how accurately the test can identify women who do not have cancer. A test with high sensitivity will rarely misclassify women with cancer as not having cancer, and a test with high specificity will rarely misclassify women without cancer as having cancer.
The accuracy of a test can also be expressed in a more clinically useful measure, namely, likelihood ratios. When making medical decisions, a clinician can use likelihood ratios and test results to estimate the probability of an individual woman having breast cancer. Clinicians use

ES-2
individual patient characteristics (such as age and family history) and features seen on the diagnostic mammogram (such as microcalcifications or distortions) to estimate a woman’s risk of malignancy. This estimate is known as a “pre-test” or “prior” probability. The clinician can then use the likelihood ratios (that express the accuracy of the test) to decide if an additional imaging test will be helpful in guiding management decisions. For example, if a clinician estimates a woman’s risk of malignancy as greater than 50 percent, most likely the use of any additional imaging test, even a very accurate imaging test, will not change the clinician’s management recommendation of a biopsy, and therefore additional imaging will not be beneficial to the woman. However, if a clinician estimates a woman’s risk of malignancy as being uncertain or close to a clinical threshold (2%), the likelihood ratios can be used to estimate whether the results of an additional test are likely to change management decisions and possibly affect patient outcomes.
After establishing the accuracy of the various imaging tests, we used the summary likelihood ratios to prepare simple models of various clinical scenarios. In doing so, we attempted to indirectly address the implicit question of whether women benefit from the addition of noninvasive imaging tests to standard workup after recall for evaluation of a possible breast abnormality detected by screening mammography or physical examination.
This report is an update of a Comparative Effectiveness Review (CER) of the same title originally published in 2006.7 In addition to an update of the literature, the Key Questions have been revised and additional noninvasive imaging tests have been added.
Methods
Topic Development and Scope The topic was selected for update by the Effective Health Care program. The Key Questions
were posted for public comment. A Technical Expert Panel was assembled to provide expert input, and a protocol for updating the review was developed by the EPC authors and approved by the Agency for Healthcare Research and Quality.
Patient Population The patient population of interest is the general population of women participating in routine
breast cancer screening programs (including mammography, clinical examination, and self-examination) who have been recalled after discovery of a possible abnormality and who have already undergone standard workup (which usually includes diagnostic mammography and/or ultrasound) . In other words, the patient population of interest consists of women who have or might receive a Breast Imaging-Reporting and Data System (BI-RADS®) rating of 0, or 3 to 5, after standard workup. Some of the women evaluated may have had an ultrasound examination before being examined using the technology under study, including the women being evaluated by diagnostic ultrasound. Although not explicitly stated in the studies, in most cases this prior ultrasound seemed to be used primarily to identify women with simple benign cysts, who were then not included in the study. Populations that were not evaluated in this review include: women thought to be at very high risk of breast cancer due to family history or breast cancer (BRCA) gene mutations; women with a personal history of breast cancer; women presenting with overt symptoms (such as pain or nipple discharge); and men.

ES-3
Interventions The noninvasive diagnostic tests evaluated were ultrasound (conventional B-mode grayscale,
harmonic, tomography, color Doppler, and power Doppler); magnetic resonance imaging (MRI, with gadolinium-based contrast agents) with or without computer-aided diagnosis (CADx); positron emission tomography (PET, with 18-fluorodeoxyglucose [FDG]), with or without concurrent computed tomography (CT) scans (including positron emission mammography [PEM]); scintimammography (with technetium-99m sestamibi [MIBI]), including Breast Specific Gamma Imaging (BSGI).
Comparators The accuracy of the noninvasive diagnostic tests were evaluated by a direct comparison with
histopathology (surgical or biopsy specimens) or with clinical followup, or a combination of these methods. In addition, the relative accuracy of the different tests under evaluation were directly and indirectly compared as the evidence permitted.
Outcomes Outcomes of interest are diagnostic test characteristics; namely, sensitivity, specificity, and
likelihood ratios. Because predictive values vary as the prevalence of disease changes, we did not calculate predictive values. Adverse events related to the procedures, such as radiation exposure, discomfort, and reactions to contrast agents, were also be discussed as the evidence permitted. Our literature searches did not identify any relevant studies that directly reported the impact of the diagnostic tests on patient-oriented outcomes. Therefore, we used the estimates of accuracy and various clinical scenarios to address the implicit, very important question of whether women benefit from the use of these noninvasive imaging tests.
Timing Any duration of followup, from same day interventions to many years of clinical followup,
were evaluated.
Setting Any care setting was evaluated, including general hospitals, physician’s offices, and
specialized breast imaging centers.
Study Selection We searched the medical literature, including PubMed and Embase, from December 1994
through September 2010. We included diagnostic cohort studies that enrolled the patient population of interest and used current generation scanners and protocols of the noninvasive imaging technologies of interest. We excluded case-control studies, meeting presentations, and very small (<10 patients) studies. Data were abstracted from the included studies.
Strength of Evidence We graded the strength of evidence supporting each major conclusion as high, moderate,
low, or insufficient. The grade was developed by considering four important domains: the risk of bias in the evidence base (internal validity, or the quality of the studies), the consistency of the findings, the precision of the results, and the directness of the evidence.

ES-4
Data Analysis We used a bivariate mixed-effects binomial regression model for meta-analysis of data.8,9 We
used summary likelihood ratios and Bayes’ theorem to calculate the post-test probability of having a benign or malignant lesion. In cases where a bivariate binomial model could not be fit, we meta-analyzed the data using two random-effects models, one for sensitivity and one for specificity.10 We explored heterogeneity in the data with meta-regressions using standard methodology.9
Peer Review and Public Commentary The draft received comments from peer reviewers, and from members of the public through
an open public comment period.
Results
Magnetic Resonance Imaging We identified 41studies of MRI that included a total of 3,882 patients with 4,202 suspicious
breast lesions.11-51 We combined the data reported by all 41 studies into a bivariate binomial mixed-effects model. The summary sensitivity was 91.7 percent (95% CI: 88.5 to 94.1%) and the summary specificity was 77.5 percent (95% CI: 71.0 to 82.9%). The estimate of accuracy was judged to be supported by a moderate to low strength of evidence (low for the estimate of specificity due to the wide confidence interval). The dataset was very heterogeneous (I2 = 98.4%). We explored the heterogeneity with meta-regression and found that the prevalence of disease in the study population and whether or not the image readers were blinded was statistically significantly correlated with the results. Subgroup analyses found that MRI was less sensitive for evaluation of microcalcifications (84.0% vs. 91.7% summary sensitivity).
The probability that a woman actually has cancer (invasive or in situ) even after a finding of “benign” on MRI depends on her probability of having cancer before undergoing the test. Bayes’ theorem and the summary likelihood ratios indicate that if a woman with an estimated 5 to 10 percent chance of having cancer undergoes MRI and has a finding of “benign” she will then have an estimated 1 percent chance of having cancer; a woman with an estimated 20 percent chance of having cancer who has a finding of “benign” on MRI will then have an estimated 3 percent chance of having cancer; and a woman with an estimated 50 percent chance of having cancer who has a finding of “benign” on MRI will then have an estimated 10 percent chance of having cancer.
Positron Emission Tomography We identified seven studies of PET34,35,41,52-55 and one study of PET/CT16 that met our
inclusion criteria. The studies of stand-alone PET included 308 women with 403 suspicious breast lesions. We combined the data reported by the seven studies of PET into a bivariate binomial mixed-effects model. The summary sensitivity was 83.0 percent (95% CI: 73.0 to 89.0%) and the summary specificity was 74.0 percent (95% CI: 58.0 to 86.0%). The estimate of accuracy was judged to be supported by a Low strength of evidence. The dataset contained moderate heterogeneity (I2 = 64.0%). We explored the heterogeneity with meta-regression and

ES-5
did not identify any possible causes. Subgroup analyses found that PET was more sensitive for evaluation of palpable lesions.
The probability that a woman actually does have cancer (invasive or in situ) even after a finding of “benign” on PET depends on her probability of having cancer before undergoing the test. Bayes’ theorem and the summary likelihood ratios indicate that if a woman with an estimated 5 percent chance of having cancer undergoes PET and has a finding of “benign” she will then have an estimated 1 percent chance of having cancer; a woman with an estimated 20 percent chance of having cancer who has a finding of “benign” on PET will then have an estimated 6 percent chance of having cancer; and a woman with an estimated 50 percent chance of having cancer who has a finding of “benign” on PET will then have an estimated 19 percent chance of having cancer.
Scintimammography We identified 10 studies of scintimammography14,56-64 and one study of BSGI19 that met our
inclusion criteria. The studies included a total of 1,064 suspicious lesions. We combined the data reported by all 11 studies into a bivariate binomial mixed-effects model. The summary sensitivity was 84.7 percent (95% CI: 78.0 to 89.7%) and the summary specificity was 77.0 percent (95% CI: 64.7 to 85.9%). The estimate of accuracy was judged to be supported by a low strength of evidence. The dataset was very heterogeneous (I2 = 93.0%). We explored the heterogeneity with meta-regression and did not identify any possible causes.
The probability that a woman actually does have cancer (invasive or in situ) even after a finding of “benign” on scintimammography depends on her probability of having cancer before undergoing the test. Bayes’ theorem and the summary likelihood ratios indicate that if a woman with an estimated 5 percent chance of having cancer undergoes scintimammography and has a finding of “benign” she will then have an estimated 1 percent chance of having cancer; a woman with an estimated 20 percent chance of having cancer who has a finding of “benign” on scintimammography will then have an estimated 5 percent chance of having cancer; and a woman with an estimated 50 percent chance of having cancer who has a finding of “benign” on scintimammography will then have an estimated 17 percent chance of having cancer.
Ultrasound We identified a total of 31 diagnostic cohort studies of ultrasound. Of these, there were 21
studies of B-mode grayscale ultrasound,18,26,65-83 six studies of color Doppler ultrasound,78,80,84-87 and nine studies of power Doppler ultrasound.65,72,75,77,86,88-91 We combined the data reported by these studies into bivariate binomial mixed-effects models. For B-mode grayscale, summary sensitivity was 92.4 percent (95% CI: 84.6 to 96.4%) and the summary specificity was 75.8 percent (95% CI: 60.8 to 86.3%); for color Doppler, summary sensitivity was 88.5 percent (95% CI: 74.4 to 95.4%) and summary specificity was 76.4 percent (95% CI: 61.7 to 86.7%); for power Doppler, summary sensitivity was 70.8 percent (95% CI: 47 to 86.6%) and summary specificity was 72.6 percent (95% CI: 59.9 to 82.5%). These estimates of accuracy were all judged to be supported by a low strength of evidence. The datasets were heterogeneous. We explored the heterogeneity of the largest dataset (21 studies of B-mode) with meta-regression and found that whether the studies blinded the image readers and accounted for inter-reader differences were statistically significantly associated with the results.
The probability that a woman actually does have cancer (invasive or in situ) even after a finding of “benign” on ultrasound depends on her probability of having cancer before

ES-6
undergoing the test. Bayes’ theorem and the summary likelihood ratios indicate that if a woman with an estimated 5 to 10 percent chance of having cancer undergoes B-mode grayscale ultrasound and has a finding of “benign” she will then have an estimated 1 percent chance of having cancer; a woman with an estimated 20 percent chance of having cancer who has a finding of “benign” on B-mode grayscale ultrasound will then have an estimated 2 percent chance of having cancer; and a woman with an estimated 50 percent chance of having cancer who has a finding of “benign” on B-mode grayscale ultrasound will then have an estimated 9 percent chance of having cancer.
Discussion According to the American College of Radiology, the threshold of suspicion of malignancy
at which management of women changes is 2 percent.92 After recall and workup, women with a suspicion of malignancy greater than 2 percent are generally recommended to undergo tissue sampling of some kind (biopsy), and women with a lower suspicion of malignancy are triaged into imaging management pathways (short-interval followup or return to regular screening). We used the 2 percent threshold to explore the clinical usefulness of the various noninvasive imaging technologies as add-ons to the current standard of care; namely, if a woman was recalled for evaluation after a screening mammography, and received standard-of-care workup versus standard-of-care workup plus the noninvasive imaging technology, would use of the noninvasive imaging technology be likely to alter the recommendations for care after the workup?
For all of the technologies evaluated in this assessment, only women with a low suspicion of malignancy after standard-of-care workup might be expected to experience a change in management decisions as a result of additional noninvasive imaging. A woman with a ≤12 percent suspicion of malignancy who has benign findings on MRI could have her suspicion of malignancy drop below the 2 percent threshold, and therefore she might be assigned to short-interval imaging followup management rather than tissue sampling management; a woman with a 1 percent suspicion of malignancy who has benign findings on MRI could have her suspicion of malignancy drop to near 0 percent and therefore she might be assigned to return to normal screening rather than short-interval followup imaging; a woman with a 1 percent suspicion of malignancy who has malignant findings on MRI could have her suspicion of malignancy increase to 4 percent and therefore she might be assigned to tissue sampling management rather than short-interval followup. The equivalent thresholds of pre-test suspicion of malignancy at which additional imaging may change management are: for B-mode grayscale ultrasound, 1 to 10 percent; for scintimammography, 1 to 5 percent; and for PET, 1 to 5 percent.
Therefore, if the 2 percent threshold is chosen, the use of noninvasive imaging in addition to standard workup may be clinically useful for diagnostic purposes only for women with a low suspicion of malignancy. When choosing which noninvasive imaging technology to use for this purpose, diagnostic B-mode grayscale ultrasound and MRI appear to be more accurate than PET, scintimammography, or the other types of ultrasound (e.g., Doppler) that were evaluated in this comparative effectiveness review.
Women thought to be at moderate to high risk of malignancy after standard workup will not have their estimate of risk of malignancy change sufficiently after further noninvasive imaging to affect management decisions. For many patients the suspicion of malignancy will not be able to be estimated with sufficient precision for clinicians to feel comfortable recommending return to normal screening (rather than a biopsy or short-interval followup) solely on the basis of additional noninvasive imaging. Estimates of risk of malignancy are based on features of the

ES-7
mammographic images, patient characteristics, patient history, and patient family history. Several of our expert reviewers did not think such precise estimation of risk is feasible using currently available methods. Potential harms of noninvasive imaging, such as radiation exposure, also need to be considered when deciding whether to perform these tests.
Changes Since 2006 This CER is an update of a CER finalized in 2006.7 The updated results are, in general,
very similar to the findings of the 2006 report. For MRI, in 2006 we found that the sensitivity was 92.5 percent and the specificity was 75.5 percent; the updated evidence base supported estimates of 91.7 percent sensitivity and 77.5 percent specificity. In both reports, MRI was found to be less sensitive (approximately 85%) for evaluation of microcalcifications than for evaluation of lesions in general. For PET, in 2006 we found that the sensitivity was 82.2 percent and the specificity was 78.3 percent; the updated evidence base supported estimates of 83.0 percent sensitivity and 74.0 percent specificity. In the updated report we attempted to evaluate the accuracy of PET/CT, but only one study that met the inclusion criteria was identified.
For scintimammography, the updated evidence base identified a sensitivity of 84.7 percent, much higher than the sensitivity estimate from 2006 of 68.7 percent. Specificity was estimated at 84.8 percent in 2006, and at 77.0 percent in the update; however, the confidence intervals around the updated estimate of specificity are wide. It is possible that improvements in the technology in the last few years improved the sensitivity of the technique.
For ultrasound, in 2006 we evaluated a relatively small set of studies of B-mode grayscale ultrasound, and estimated a sensitivity of 86.1 percent and a specificity of 66.4 percent. The update included a significantly expanded evidence base on B-mode grayscale ultrasound, and identified a sensitivity of 92.4 percent and specificity of 75.8 percent. In the update we included numerous other types of ultrasound, including power and color Doppler ultrasound, that were not studied in the 2006 report.
Remaining Issues The conclusions of quantitative accuracy were for the most part rated as being supported by
low strength of evidence, due primarily to the imprecision of the estimates (wide confidence intervals around the estimates of accuracy); the publication of additional diagnostic accuracy studies are likely to increase the precision of the estimates of accuracy, which may upgrade the strength of evidence rating. There was also considerable heterogeneity (inconsistency) in the majority of the evidence bases, which contributed to the low strength of evidence rating. Most likely the heterogeneity was due to slight differences in imaging methodology or patient populations across studies; future research intended to tease out factors affecting the accuracy of imaging may be helpful to the clinician when deciding whether a test may be a useful addition to standard workup for management of a particular patient.
However, the publication of additional diagnostic accuracy studies is unlikely to affect the implications of the conclusions. The conclusions of diagnostic accuracy lead indirectly to a conclusion that only women with a low (1 to 12%) suspicion of malignancy will experience a “change in management” (which may or may not be beneficial) from the use of these noninvasive diagnostic tests. Improving the precision of the estimates of accuracy or upgrading the strength of evidence rating in response to the publication of more diagnostic accuracy studies will not affect the indirect conclusion. Studies that address the issue of how to establish more

ES-8
accurate estimates of malignancy from diagnostic mammography for an individual patient may be more clinically relevant than additional diagnostic accuracy studies.
A limitation of the current evidence base that should be addressed in future research is the patient population being evaluated. Many of the currently available studies were conducted only on women who had been scheduled for biopsy after standard workup, and therefore the patient population studied is not truly representative of the entire patient population of interest. Additional studies that enroll women referred for short-interval followup after standard workup are needed to confirm that the findings of this assessment do apply to the patient population of interest.
In addition, the majority of studies did not report data separately for different categories of breast lesions or patient characteristics. Future research should focus on the accuracy of noninvasive imaging technologies for discrete categories of lesions, such as nonpalpable lesions classified as BI-RADS 3, or for discrete categories of women, such as women older than age 75. Information from more granular groupings of women will allow estimates of test accuracy to be more immediately clinically useful.
Future research efforts should also focus on studies that report the impact of the use of noninvasive imaging on patient-oriented outcomes such as quality of life, and on evaluation of newer noninvasive imaging technologies.
Conclusions Our key findings are summarized in Table A. In conclusion, the use of noninvasive imaging
in addition to standard workup after recall for evaluation of a breast lesion detected on screening mammography or physical examination may be clinically useful for diagnostic purposes only for women with a low (1 to 12%) suspicion of malignancy. When choosing which noninvasive imaging technology to use for this purpose, diagnostic B-mode grayscale ultrasound and MRI appear to more accurate than PET, scintimammography, or Doppler ultrasound. However, whether these findings are clinically relevant hinges on whether clinicians can identify those women who, after standard workup after recall, have a risk of malignancy in this range. Several expert reviewers of this report expressed doubt about the feasibility of such precise estimation.
Table A. Summary of key findings
Technology Summary Sensitivity
Summary Specificity
Pretest Probability of Malignancy Thresholda
Strength of Evidence
B-mode grayscale 2D ultrasound
92.4% (84.6 to 96.4%)
75.8% (60.8 to 86.3%)
1 to 10% Low
MRI 91.7%
(88.5 to 94.1%) 77.5%
(71.0 to 82.9%) 1 to 12%
Moderate (sensitivity) to Low (specificity)
Scintimammography 84.7%
(78.0 to 89.7%) 77.0%
(64.7 to 85.9%) 1 to 5% Low
PET 83.0%
(73.0 to 89.0%) 74.0%
(58.0 to 86%) 1 to 5% Low
a The threshold at which use of the noninvasive imaging test may change the post-test probability of malignancy sufficiently to trigger a change in patient management.

ES-9
References 1. American Cancer Society (ACS).
Cancer facts & figures 2010. Atlanta (GA): American Cancer Society (ACS); 2010. 68 p. www.cancer.org/acs/groups/content/ @epidemiologysurveilance/documents/document/acspc-026238.pdf.
2. U.S. Preventive Services Task Force (USPSTF). Screening for breast cancer: recommendations and rationale. AHRQ Publication No. APPIP02-507A. Rockville, MD: Agency for Healthcare Research and Quality; February 2002.
3. Humphrey LL, Helfand M, Chan BK, et al. Breast cancer screening: a summary of the evidence for the U.S. Preventive Services Task Force. Ann Intern Med. 2002 Sep 3;137(5 Part 1):347-67. PMID: 12204020
4. U.S. Preventive Services Task Force. Screening for breast cancer: U.S. Preventive Services Task Force recommendation statement. Ann Intern Med 2009 Nov 17;151(10):716-26, W-236. PMID: 19920272
5. Elmore JG, Barton MB, Moceri VM, et al. Ten-year risk of false positive screening mammograms and clinical breast examinations. N Engl J Med. 1998 Apr 16;338(16):1089-96. PMID: 9545356
6. Rosenberg RD, Yankaskas BC, Abraham LA, et al. Performance benchmarks for screening mammography. Radiology. 2006 Oct;241(1):55-66. PMID: 16990671
7. Bruening W, Launders J, Pinkney N, et al. Effectiveness of noninvasive diagnostic tests for breast abnormalities. Comparative Effectiveness Review No. 2 (Prepared by ECRI Evidence-based Practice center under Contract No. 290-02-0019). AHRQ Publication No. 06-EHC005-EF. Rockville, MD: Agency for Healthcare Research and Quality; 2006. http://effectivehealthcare.ahrq.gov/repFiles/BrCADx%20Final%20Report.pdf.
8. Harbord RM, Deeks JJ, Egger M, et al. A unification of models for meta-analysis of diagnostic accuracy studies. Biostatistics. 2007 Apr;8(2):239-51. PMID: 16698768
9. STATA statistics/data analysis. MP parallel edition. College Station (TX): StataCorp; 1984-2007. Single user Stata for Windows. hwww.stata.com.
10. Zamora J, Abraira V, Muriel A, et al. Meta-DiSc: a software for meta-analysis of test accuracy data. BMC Med Res Methodol. 2006;6:31. PMID: 16836745
11. Akita A, Tanimoto A, Jinno H, et al. The clinical value of bilateral breast MR imaging: is it worth performing on patients showing suspicious microcalcifications on mammography? Eur Radiol. 2009 Sep;19(9):2089-96. PMID: 19350244
12. Baltzer PA, Freiberg C, Beger S, et al. Clinical MR-mammography: are computer-assisted methods superior to visual or manual measurements for curve type analysis? A systematic approach. Acad Radiol. 2009 Sep;16(9):1070-6. PMID: 19523854
13. Hara M, Watanabe T, Okumura A, et al. Angle between 1 and 4 min gives the most significant difference in time-intensity curves between benign disease and breast cancer: analysis of dynamic magnetic resonance imaging in 103 patients with breast lesions. Clin Imaging. 2009 Sep-Oct;33(5):335-42. PMID: 19712811
14. Kim IJ, Kim YK, Kim SJ. Detection and prediction of breast cancer using couble phase Tc-99m MIBI scintimammography in comparison with MRI. Onkologie. 2009 Oct;32(10):556-60. PMID: 19816071
15. Lo GG, Ai V, Chan JK, et al. Diffusion-weighted magnetic resonance imaging of breast lesions: first experiences at 3 T. J Comput Assist Tomogr. 2009 Jan-Feb;33(1):63-9. PMID: 19188787
16. Imbriaco M, Caprio MG, Limite G, et al. Dual-time-point 18F-FDG PET/CT versus dynamic breast MRI of suspicious breast lesions. AJR Am J Roentgenol. 2008 Nov;191(5):1323-30. PMID: 18941064
17. Pediconi F, Catalano C, Padula S, et al. Contrast-enhanced MR mammography: improved lesion detection and differentiation with gadobenate dimeglumine. AJR Am J Roentgenol. 2008 Nov;191(5):1339-46. PMID: 18941066

ES-10
18. Vassiou K, Kanavou T, Vlychou M, et al. Characterization of breast lesions with CE-MR multimodal morphological and kinetic analysis: comparison with conventional mammography and high-resolution ultrasound. Eur J Radiol. 2009 Apr;70(1):69-76. PMID: 18295425
19. Brem RF, Petrovitch I, et al. Breast-specific gamma imaging with 99mTc-Sestamibi and magnetic resonance imaging in the diagnosis of breast cancer--a comparative study. Breast J. 2007 Sep-Oct;13(5):465-9. PMID: 17760667
20. Cilotti A, Iacconi C, Marini C, et al. Contrast-enhanced MR imaging in patients with BI-RADS 3-5 microcalcifications. Radiol Med. 2007 Mar;112(2):272-86. PMID: 17361370
21. Pediconi F, Catalano C, Padula S, et al. Contrast-enhanced magnetic resonance mammography: does it affect surgical decision-making in patients with breast cancer? Breast Cancer Res Treat. 2007 Nov;106(1):65-74. PMID: 17203383
22. Zhu J, Kurihara Y, Kanemaki Y, et al. Diagnostic accuracy of high-resolution MRI using a microscopy coil for patients with presumed DCIS following mammography screening. J Magn Reson Imaging. 2007 Jan;25(1):96-103. PMID: 17154376
23. Bazzocchi M, Zuiani C, Panizza P, et al. Contrast-enhanced breast MRI in patients with suspicious microcalcifications on mammography: results of a multicenter trial. AJR Am J Roentgenol. 2006 Jun;186(6):1723-32. PMID: 16714666
24. Gokalp G, Topal U. MR imaging in probably benign lesions (BI-RADS category 3) of the breast. Eur J Radiol. 2006 Mar;57(3):436-44. PMID: 16316732
25. Kneeshaw PJ, Lowry M, Manton D, et al. Differentiation of benign from malignant breast disease associated with screening detected microcalcifications using dynamic contrast enhanced magnetic resonance imaging. Breast. 2006 Feb;15(1):29-38. PMID: 16002292
26. Ricci P, Cantisani V, Ballesio L, et al. Benign and malignant breast lesions: efficacy of real time contrast-enhanced ultrasound vs. magnetic resonance imaging. Ultraschall Med. 2007 Feb;28(1):57-62. PMID: 17304413
27. Pediconi F, Catalano C, Venditti F, et al. Color-coded automated signal intensity curves for detection and characterization of breast lesions: preliminary evaluation of a new software package for integrated magnetic resonance-based breast imaging. Invest Radiol. 2005 Jul;40(7):448-57. PMID: 15973137
28. Pediconi F, Catalano C, Occhiato R, et al. Breast lesion detection and characterization at contrast-enhanced MR mammography: gadobenate dimeglumine versus gadopentetate dimeglumine. Radiology. 2005 Oct;237(1):45-56. PMID: 16126926
29. Wiener JI, Schilling KJ, Adami C, et al. Assessment of suspected breast cancer by MRI: a prospective clinical trial using a combined kinetic and morphologic analysis. AJR Am J Roentgenol. 2005 Mar;184(3):878-86. PMID: 15728612
30. Bluemke DA, Gatsonis CA, Chen MH, et al. Magnetic resonance imaging of the breast prior to biopsy. JAMA. 2004 Dec 8;292(22):2735-42. PMID: 15585733
31. Huang W, Fisher PR, Dulaimy K, et al. Detection of breast malignancy: diagnostic MR protocol for improved specificity. Radiology. 2004 Aug;232(2):585-91. PMID: 15205478
32. Bone B, Wiberg MK, Szabo BK, et al. Comparison of 99mTc-sestamibi scintimammography and dynamic MR imaging as adjuncts to mammography in the diagnosis of breast cancer. Acta Radiol. 2003 Jan;44(1):28-34. PMID: 12630995
33. Daldrup-Link HE, Kaiser A, Helbich T, et al. Macromolecular contrast medium (feruglose) versus small molecular contrast medium (gadopentetate) enhanced magnetic resonance imaging: differentiation of benign and malignant breast lesions. Acad Radiol. 2003 Nov;10(11):1237-46. PMID: 14626298

ES-11
34. Heinisch M, Gallowitsch HJ, Mikosch P, et al. Comparison of FDG-PET and dynamic contrast-enhanced MRI in the evaluation of suggestive breast lesions. Breast. 2003 Feb;12(1):17-22. PMID: 14659351
35. Walter C, Scheidhauer K, Scharl A, et al. Clinical and diagnostic value of preoperative MR mammography and FDG-PET in suspicious breast lesions. Eur Radiol. 2003 Jul;13(7):1651-6. PMID: 12835981
36. Guo Y, Cai YQ, Cai ZL, et al. Differentiation of clinically benign and malignant breast lesions using diffusion-weighted imaging. J Magn Reson Imaging. 2002 Aug;16(2):172-8. PMID: 12203765
37. Kelcz F, Furman-Haran E, Grobgeld D, et al. Clinical testing of high-spatial-resolution parametric contrast-enhanced MR imaging of the breast. AJR Am J Roentgenol. 2002 Dec;179(6):1485-92. PMID: 12438042
38. Schedel H, Oellinger H, Kohlschein P, et al. Magnetic Resonance Female Breast Imaging (MRFBI) - evaluation of the changes in signal intensity over time pre- and post-administration of 0.2 mmol/kg Gd-DTPA. Zentralbl Gynakol. 2002 Feb;124(2):104-10. PMID: 11935495
39. Trecate G, Tess JD, Vergnaghi D, et al. Breast microcalcifications studied with 3D contrast-enhanced high-field magnetic resonance imaging: more accuracy in the diagnosis of breast cancer. Tumori. 2002 May-Jun;88(3):224-33. PMID: 12195761
40. Kristoffersen Wiberg M, Aspelin P, Perbeck L, et al. Value of MR imaging in clinical evaluation of breast lesions. Acta Radiol. 2002 May;43(3):275-81. PMID: 12100324
41. Brix G, Henze M, et al. Comparison of pharmacokinetic MRI and [18F] fluorodeoxyglucose PET in the diagnosis of breast cancer: initial experience. Eur Radiol. 2001;11(10):2058-70. PMID: 11702142
42. Cecil KM, Schnall MD, Siegelman ES, et al. The evaluation of human breast lesions with magnetic resonance imaging and proton magnetic resonance spectroscopy. Breast Cancer Res Treat. 2001 Jul;68(1):45-54. PMID: 11678308
43. Furman-Haran E, Grobgeld D, Kelcz F, et al. Critical role of spatial resolution in dynamic contrast-enhanced breast MRI. J Magn Reson Imaging. 2001 Jun;13(6):862-7. PMID: 11382945
44. Imbriaco M, Del Vecchio S, Riccardi A, et al. Scintimammography with 99mTc-MIBI versus dynamic MRI for non-invasive characterization of breast masses. Eur J Nucl Med. 2001 Jan;28(1):56-63. PMID: 11202453
45. Malich A, Boehm T, Facius M, et al. Differentiation of mammographically suspicious lesions: evaluation of breast ultrasound, MRI mammography and electrical impedance scanning as adjunctive technologies in breast cancer detection. Clin Radiol. 2001 Apr;56(4):278-83. PMID: 11286578
46. Nakahara H, Namba K, Fukami A, et al. Three-dimensional MR imaging of mammographically detected suspicious microcalcifications. Breast Cancer. 2001;8(2):116-24. PMID: 11342984
47. Torheim G, Godtliebsen F, Axelson D, et al. Feature extraction and classification of dynamic contrast-enhanced T2*-weighted breast image data. IEEE Trans Med Imaging. 2001 Dec;20(12):1293-301. PMID: 11811829
48. Wedegartner U, Bick U, Wortler K, et al. Differentiation between benign and malignant findings on MR-mammography: usefulness of morphological criteria. Eur Radiol. 2001;11(9):1645-50. PMID: 11511885
49. Yeung DK, Cheung HS, Tse GM. Human breast lesions: characterization with contrast-enhanced in vivo proton MR spectroscopy--initial results. Radiology. 2001 Jul;220(1):40-6. PMID: 11425970
50. Kvistad KA, Rydland J, Vainio J, et al. Breast lesions: evaluation with dynamic contrast-enhanced T1-weighted MR imaging and with T2*-weighted first-pass perfusion MR imaging. Radiology. 2000 Aug;216(2):545-53. PMID: 10924584
51. Van Goethem M, Biltjes IG, De Schepper AM. Indications for MR mammography. A Belgian study. JBR-BTR. 2000 Jun;83(3):126-9. PMID: 11025925

ES-12
52. Kaida H, Ishibashi M, Fuji T, et al. Improved breast cancer detection of prone breast fluorodeoxyglucose-PET in 118 patients. Nucl Med Commun. 2008 Oct;29(10):885-93. PMID: 18769306
53. Buchmann I, Riedmuller K, Hoffner S, et al. Comparison of 99mtechnetium-pertechnetate and 123iodide SPECT with FDG-PET in patients suspicious for breast cancer. Cancer Biother Radiopharm. 2007 Dec;22(6):779-89. PMID: 18158769
54. Schirrmeister H, Kuhn T, Guhlmann A, et al. Fluorine-18 2-deoxy-2-fluoro-D-glucose PET in the preoperative staging of breast cancer: comparison with the standard staging procedures. Eur J Nucl Med. 2001 Mar;28(3):351-8. PMID: 11315604
55. Yutani K, Shiba E, Kusuoka H, et al. Comparison of FDG-PET with MIBI-SPECT in the detection of breast cancer and axillary lymph node metastasis. J Comput Assist Tomogr. 2000 Mar-Apr;24(2):274-80. PMID: 10752892
56. Mathieu I, Mazy S, Willemart B, et al. Inconclusive triple diagnosis in breast cancer imaging: is there a place for scintimammography? J Nucl Med. 2005 Oct;46(10):1574-81. PMID: 16204705
57. Habib S, Maseeh-uz-Zaman, Hameed A, et al. Diagnostic accuracy of Tc-99m-MIBI for breast carcinoma in correlation with mammography and sonography. J Coll Physicians Surg Pak. 2009 Oct;19(10):622-6. PMID: 19811712
58. Kim IJ, Kim SJ, Kim YK. Comparison of double phase Tc-99m MIBI and Tc-99m tetrofosmin scintimammography for characterization of breast lesions: Visual and quantitative analyses. Neoplasma. 2008;55(6):526-31. PMID: 18999882
59. Kim SJ, Bae YT, Lee JS, et al. Diagnostic performances of double-phase tc-99m MIBI scintimammography in patients with indeterminate ultrasound findings: visual and quantitative analyses. Ann Nucl Med. 2007 Jun;21(3):145-50. PMID: 17561585
60. Pinero A, Galindo PJ, Illana J, et al. Diagnostic efficiency of sestamibi gammagraphy and Doppler sonography in the preoperative assessment of breast lesions. Clin Transl Oncol. 2006 Feb;8(2):103-7. PMID: 16632424
61. Grosso M, Chiacchio S, Bianchi F, et al. Comparison between 99mTc-sestamibi scintimammography and X-ray mammography in the characterization of clusters of microcalcifications: a prospective long-term study. Anticancer Res. 2009 Oct;29(10):4251-7. PMID: 19846982
62. Wang F, Wang Z, Wu J, et al. The role of technetium-99m-labeled octreotide acetate scintigraphy in suspected breast cancer and correlates with expression of SSTR. Nucl Med Biol. 2008 Aug;35(6):665-71. PMID: 18678351
63. Gommans GM, van der Zant FM, van Dongen A, et al. (99M)Technetium-sestamibi scintimammography in non-palpable breast lesions found on screening X-ray mammography. Eur J Surg Oncol. 2007 Feb;33(1):23-7. PMID: 17126524
64. Schillaci O, Danieli R, Filippi L, et al. Scintimammography with a hybrid SPECT/CT imaging system. Anticancer Res. 2007 Jan;27(1 B):557-62. PMID: 17348441
65. Gokalp G, Topal U, Kizilkaya E. Power Doppler sonography: anything to add to BI-RADS US in solid breast masses? Eur J Radiol. 2009 Apr;70(1):77-85. PMID: 18243623
66. Liu H, Jiang YX, Liu JB, et al. Evaluation of breast lesions with contrast-enhanced ultrasound using the microvascular imaging technique: initial observations. Breast. 2008 Oct;17(5):532-9. PMID: 18534851
67. Vade A, Lafita VS, Ward KA, et al. Role of breast sonography in imaging of adolescents with palpable solid breast masses. AJR Am J Roentgenol. 2008 Sep;191(3):659-63. PMID: 18716091
68. Cha JH, Moon WK, Cho N, et al. Characterization of benign and malignant solid breast masses: comparison of conventional US and tissue harmonic imaging. Radiology. 2007 Jan;242(1):63-9. PMID: 17090709
69. Chala L, Endo E, Kim S, et al. Gray-scale sonography of solid breast masses: diagnosis of probably benign masses and reduction of the number of biopsies. J Clin Ultrasound. 2007 Jan;35(1):9-19. PMID: 17149763

ES-13
70. Zhi H, Ou B, Luo BM, et al. Comparison of ultrasound elastography, mammography, and sonography in the diagnosis of solid breast lesions. J Ultrasound Med. 2007 Jun;26(6):807-15. PMID: 17526612
71. Cho N, Moon WK, Cha JH, et al. Differentiating benign from malignant solid breast masses: comparison of two-dimensional and three-dimensional US. Radiology. 2006 Jul;240(1):26-32. PMID: 16684920
72. Forsberg F, Goldberg BB, Merritt CR, et al. Diagnosing breast lesions with contrast-enhanced 3-dimensional power Doppler imaging. J Ultrasound Med. 2004 Feb;23(2):173-82. PMID: 14992354
73. Meyberg-Solomayer GC, Kraemer B, Bergmann A, et al. Does 3-D sonography bring any advantage to noninvasive breast diagnostics? Ultrasound Med Biol. 2004 May;30(5):583-9. PMID: 15183222
74. Chen DR, Jeng LB, Kao A, et al. Comparing thallium-201 spect mammoscintigraphy and ultrasonography to detect breast cancer in mammographical dense breasts. Neoplasma. 2003;50(3):222-6. PMID: 12937857
75. Kook SH, Kwag HJ. Value of contrast-enhanced power Doppler sonography using a microbubble echo-enhancing agent in evaluation of small breast lesions. J Clin Ultrasound. 2003 Jun;31(5):227-38. PMID: 12767017
76. Marini C, Traino C, Cilotti A, et al. Differentiation of benign and malignant breast microcalcifications: mammography versus mammography-sonography combination. Radiol Med. 2003 Jan-Feb;105(1-2):17-26. PMID: 12700541
77. Reinikainen H, Rissanen T, Paivansalo M, et al. B-mode, power Doppler and contrast-enhanced power Doppler ultrasonography in the diagnosis of breast tumors. Acta Radiol. 2001 Jan;42(1):106-13. PMID: 11167342
78. Blohmer JU, Oellinger H, Schmidt C, et al. Comparison of various imaging methods with particular evaluation of color Doppler sonography for planning surgery for breast tumors. Arch Gynecol Obstet. 1999;262(3-4):159-71. PMID: 10326635
79. Chao TC, Lo YF, Chen SC, et al. Prospective sonographic study of 3093 breast tumors. J Ultrasound Med. 1999 May;18(5):363-70. PMID: 10327015
80. Wilkens TH, Burke BJ, Cancelada DA, et al. Evaluation of palpable breast masses with color Doppler sonography and gray scale imaging. J Ultrasound Med. 1998 Feb;17(2):109-15. PMID: 9527570
81. Stavros AT, Thickman D, Rapp CL, et al. Solid breast nodules: use of sonography to distinguish between benign and malignant lesions. Radiology. 1995 Jul;196(1):123-34. PMID: 7784555
82. Ciatto S, Rosselli del Turco M, Catarzi S, et al. The contribution of ultrasonography to the differential diagnosis of breast cancer. Neoplasma. 1994;41(6):341-5. PMID: 7870218
83. Perre CI, Koot VC, de Hooge P, et al. The value of ultrasound in the evaluation of palpable breast tumours: a prospective study of 400 cases. Eur J Surg Oncol. 1994 Dec;20(6):637-40. PMID: 7995413
84. Caruso G, Ienzi R, Cirino A, et al. Breast lesion characterization with contrast-enhanced US. Work in progress. Radiol Med. 2002 Nov-Dec;104(5-6):443-50. PMID: 12589266
85. Koukouraki S, Koukourakis MI, Vagios E, et al. The role of 99mTc-sestamibi scintimammography and colour Doppler ultrasonography in the evaluation of breast lesions. Nucl Med Commun. 2001 Nov;22(11):1243-8. PMID: 11606891
86. Schroeder RJ, Maeurer J, Vogl TJ, et al. D-galactose-based signal-enhanced color Doppler sonography of breast tumors and tumorlike lesions. Invest Radiol. 1999 Feb;34(2):109-15. PMID: 9951790
87. Buadu LD, Murakami J, Murayama S, et al. Colour Doppler sonography of breast masses: a multiparameter analysis. Clin Radiol. 1997;52:917-23. PMID: 9413965

ES-14
88. Zdemir A, Kilic K, Ozdemir H, et al. Contrast-enhanced power Doppler sonography in breast lesions: effect on differential diagnosis after mammography and gray scale sonography. J Ultrasound Med. 2004 Feb;23(2):183-95; quiz 196-7. PMID: 14992355
89. Milz P, Lienemann A, Kessler M, et al. Evaluation of breast lesions by power Doppler sonography. Eur Radiol. 2001;11(4):547-54. PMID: 11354745
90. Moon WK, Im JG, Noh DY, et al. Nonpalpable breast lesions: evaluation with power Doppler US and a microbubble contrast agent-initial experience. Radiology. 2000 Oct;217(1):240-6. PMID: 11012451
91. Albrecht T, Patel N, Cosgrove DO, et al. Enhancement of power Doppler signals from breast lesions with the ultrasound contrast agent EchoGen emulsion: subjective and quantitative assessment. Acad Radiol. 1998 Apr;5 Suppl 1:S195-8; discussion S199. PMID: 9561080
92. Guidance chapter. In: Breast Imaging Reporting and Data System Atlas (BI-RADS Atlas). BI-RADS - Mammography. 4th ed. Reston (VA): American College of Radiology (ACR); 2003. p. 253-60. www.acr.org/SecondaryMainMenuCategories/quality_safety/BIRADSAtlas/BIRADSAtlasexcerptedtext/BIRADSMammographyFourthEdition/FollowUpandOutcomeMonitoringDoc4.aspx.
1
Introduction
Background
Breast Cancer Breast cancer is the second most common malignancy of women.1 The American Cancer
Society estimates that in the United States in 2010, 54,010 women were diagnosed with new cases of in situ cancer, 207,090 women were newly diagnosed as having invasive breast cancer, and there were 39,840 deaths due to this disease.1 In the general population, the cumulative risk of being diagnosed with breast cancer by age 70 is estimated to be 6 percent (lifetime risk of 13%).93,94
The most common type of breast cancer, accounting for over 85 percent of cases diagnosed, is ductal carcinoma.95 Ductal carcinoma arises within the ducts of the breast from the cells lining the ducts. Early-stage breast cancer confined to the inside of the duct is referred to as ductal carcinoma in situ (DCIS). Later stages of ductal carcinoma that have invaded or broken through the walls of the ducts into nearby tissues may be referred to as invasive or infiltrating ductal carcinoma. Cases of invasive ductal carcinoma that are found to be well-differentiated specific subtypes (such as mucinous, medullary, tubular, or papillary) are much rarer than the common “otherwise not specified” type of invasive ductal carcinoma.
Another type of invasive carcinoma is lobular carcinoma. Lobular carcinoma is similar to ductal carcinoma, first arising in the terminal ducts of the lobules and then invading through the walls of the ducts and invading nearby tissues. Other rare types of potentially life-threatening breast tumors include papillary carcinoma, inflammatory breast cancer, and sarcomas, among others.95
A number of different breast lesions have been described that, while not malignant, are believed to predispose to the development of invasive breast carcinomas. These lesions include atypical ductal hyperplasia (ADH), papillary lesions, radial scars, atypical lobular hyperplasia (ALH), and lobular carcinoma in situ (LCIS).96 However, the most commonly reported breast abnormalities diagnosed after screening are benign: benign fibrocystic changes, cysts, and benign fibroadenomas.
Breast Cancer Diagnosis Breast cancer is usually first detected by feeling a lump on physical examination (either self-
examination or an exam conducted by a health practitioner) or by observing an abnormality during x-ray screening mammography. Survival rates depend on the stage of disease at diagnosis. At stage 0 (carcinoma in situ) the 5-year survival rate is close to 100 percent. The five-year survival rate for women with stage IV (cancer that has spread beyond the breast) is only 23 percent.1 Because early breast cancer is asymptomatic, the only way to detect it is through screening of asymptomatic women. Mammography is a widely accepted and used method for breast cancer screening.2-4 Meta-analyses of large clinical trials have demonstrated that mammography screening reduces breast cancer mortality.97,98
Mammography uses x-rays to examine the breast for clusters of microcalcifications, circumscribed and dense masses, masses with indistinct margins, architectural distortion compared with the contralateral breast, or other abnormal structures. The United States Preventive Services Task Force (USPSTF) has recently recommended routine screening

2
mammography every two years for women aged 50 to 74, with decisions to screen women under the age of 50 made on an individual basis.4 After identification of a possible abnormality on screening mammography or physical examination, women typically undergo additional imaging studies (diagnostic mammography and/or ultrasound) and a physical examination. If these studies suggest the abnormality may be malignant, a biopsy of the suspicious area may be recommended.
The American College of Radiology has created a standardized system for reporting the results of mammography, the Breast Imaging-Reporting and Data System (BI-RADS®).99-101 There are seven categories of assessment, each with an accompanying clinical management recommendation:
0 Need additional imaging evaluation and/or prior mammograms for comparison 1 Negative 2 Benign finding 3 Probably benign finding. Initial short interval followup suggested. 4 Suspicious abnormality. Biopsy should be considered. 5 Highly suggestive of malignancy. Appropriate action should be taken. 6 Known biopsy-proven malignancy. Appropriate action should be taken. Noninvasive breast imaging tests have multiple uses, including image-guidance of biopsy
procedures, searching for multifocal lesions in a woman diagnosed with or at high risk of breast cancer, and screening women at high risk of breast cancer. This evidence review specifically focuses only on the use of noninvasive imaging studies that can be conducted after the discovery of a possible abnormality on screening mammography or physical examination- studies intended to guide patient management decisions. In other words, these studies are not intended to provide a final diagnosis as to the nature of the breast lesion; rather, they are intended to provide additional information about the nature of the lesion such that women can be appropriately triaged into “biopsy/watchful waiting/return to normal screening intervals” care pathways.
It is important to accurately triage women into the correct care pathway. Women with readily treatable breast cancers who get incorrectly triaged into “return to normal screening care pathways” may experience a significant delay in diagnosis and treatment of the cancer. However, the majority of women who are recalled for further assessment after a screening mammogram do not have cancer. Elmore et al. estimated that the cumulative risk for a woman having a false-positive finding on screening mammography is close to 50 percent after 10 years of yearly screenings.5 In addition, diagnostic mammography performed after a mammographic screening recall often leads to identification of a “probably benign” (BI-RADS 3) lesion. Women with “probably benign” lesions are usually referred for short-interval repeat mammography examinations, meaning that they wait for three to six months before being re-tested. Many women experience considerable emotional distress and anxiety during this waiting period.102 If an available noninvasive diagnostic test could assist clinicians in evaluating women recalled for further investigation after mammographic screening, namely, in assisting in accurately distinguishing between “benign,” “probably benign,” and “probably not benign” lesions, then some women could avoid having to spend several months wondering if they have cancer or not.
The majority of women who traditionally have been referred for biopsy also do not have cancer. Studies in the U.S. generally find that only 20 to 30 percent of women who undergo biopsy are diagnosed with breast cancer.6,103 Exposing large numbers of women who do not have cancer to invasive procedures may be considered an undesirable medical practice. In conclusion, current workup after recall results in a large number of false-positives. If additional tests could

3
reduce the false-positive rate without increasing the false-negative rate then it is possible that women could benefit from adding these tests to standard workup.
Because there are no available studies that directly evaluate whether women benefit from additional noninvasive imaging, we addressed this important question indirectly. First we evaluated the accuracy of the imaging tests in distinguishing between “benign” and “malignant” breast lesions. Inaccurate tests will lead to sub-optimal management decisions and less than desirable patient outcomes. The accuracy of the noninvasive imaging tests was primarily measured in terms of sensitivity and specificity. Sensitivity is a measure of how accurately the test can identify women with cancer; specificity is a measure of how accurately the test can identify women who do not have cancer. A test with high sensitivity will rarely misclassify women with cancer as not having cancer, and a test with high specificity will rarely misclassify women without cancer as having cancer.
The accuracy of a test can also be expressed in a more clinically useful measure, namely, likelihood ratios. When making medical decisions a clinician can use likelihood ratios and test results to estimate the probability of an individual woman having breast cancer. Clinicians use individual patient characteristics (such as age and family history) and features seen on the diagnostic mammogram (such as microcalcifications or distortions) to estimate a woman’s risk of malignancy. This estimate is known as a “pre-test” or “prior” probability. The clinician can then use the likelihood ratios (that express the accuracy of the test) and Bayes’ theorem to decide if an additional imaging test will be helpful in guiding management decisions.
After establishing the accuracy of the various imaging tests we used the summary likelihood ratios to prepare simple models of various clinical scenarios to attempt to indirectly address the implicit question of whether women benefit from the addition of noninvasive imaging tests to standard work-up after recall for evaluation of a possible breast abnormality detected by screening mammography or physical examination. This information may be useful to clinicians in deciding when, or if, it is clinically appropriate to use various types of noninvasive technologies to evaluate breast abnormalities.
Because women with a previous history of breast cancer and women known to be at high risk of breast cancer (due to carrying BRCA1 and BRCA2 mutations or having a very strong family history of breast cancer) have a very different risk profile than the rest of the population, we did not evaluate the use of noninvasive technologies for such women in this review. Instead, we focused on the use of noninvasive imaging technology for women from the general population who present with an abnormal finding by screening mammography or physical examination. We also (as the evidence permitted) examined the influence of age; the size and morphological characteristics of the lesion; and other key clinical risk factors on the accuracy of the noninvasive imaging methods.
Noninvasive Imaging Noninvasive imaging technologies generally fall into two primary groups: technologies that
examine the anatomy, or physical structure, of the breast; and technologies that detect abnormal metabolic patterns. Some noninvasive imaging technologies are slightly invasive in that they require the infusion or injection of a tracer or contrast agent; and some technologies expose patients to radiation. Each of the noninvasive technologies considered in this review is briefly introduced in the Results section of this report.

4
Conceptual Framework The analytical framework (Figure 1) demonstrates the links between patients, tests,
interventions, and outcomes. The numbers on the diagram refer to the Key Questions (see next section) and their placement in Figure 1 illustrates the many links separating the Key Questions from the patient-oriented outcomes. Fryback and Thornbury have proposed a six-level model of assessing diagnostic efficacy.104 Level 1 is analytic validity; Level 2 is diagnostic accuracy; Level 3 is diagnostic thinking; Level 4 is impact on choice of treatment; Level 5 is patient-oriented outcomes; and Level 6 is societal impact. Demonstration of efficacy at each lower level is logically necessary, but not sufficient, to assure efficacy at higher levels. Patients and health-care providers are generally most interested in studies that evaluate the impact of diagnostic tests on Level 5, patient-oriented outcomes, and on Level 4, impact on choice of treatment. However, studies that directly link diagnostic tests to patient-oriented outcomes are expensive, require very long followup, and are difficult to conduct. In the absence of direct evidence, the effect of diagnostic tests on patient-oriented outcomes can sometimes be estimated by creating indirect chains of evidence by evaluating other levels. Our literature searches did not identify any relevant studies that directly reported the impact of the diagnostic tests on patient-oriented outcomes.
Therefore, we chose to approach this project by conducting a systematic review of the diagnostic accuracy of various noninvasive methods of evaluating breast abnormalities (Level 2). After establishing the accuracy of the tests, we constructed an indirect chain of evidence in an attempt to address Level 4 (impact on choice of treatment or use of additional diagnostic tests), and where possible Level 5 (impact on patient-oriented outcomes). We used the estimates of accuracy and the usual clinical scenario to address the implicit, very important question of whether women benefit from the additional use of these noninvasive imaging tests.

5
Figure 1. Analytical framework
CT = computed tomography; MRI = magnetic resonance imaging; PET = positron emission tomography; SC = scintimammography Note: Figure 1 depicts the Key Questions within the context of the patient population, diagnostic tests, subsequent interventions, and outcomes. In general, the figure illustrates how the use of additional noninvasive imaging tests may affect decisions about patient management, and how such decisions may impact patient outcomes. The Key Questions are depicted within the figure as numbers inside circles. Outcomes illustrated but not directly examined in this report are indicated by dashed lines.

6
Diagnostic Test Characteristics No diagnostic test is perfect. Studies of test performance compare test results on a group of
individuals, some of whom have the disease and some of whom do not. Each individual undergoes the experimental test as well as a second reference test to determine “true” disease status. The relationship between the diagnostic test results and disease status is described using diagnostic test characteristics. It is important that the reference test is very accurate in measuring “true” disease status, or else the performance of the experimental diagnostic test will be poorly estimated.
Sensitivity and Specificity The results of the experimental and reference standard test and their relationship are
commonly presented as two-by-two (2x2) tables (see Table 1). From the 2x2 table, sensitivity and specificity are readily calculated:
Sensitivity = TP/(TP+FN) Specificity = TN/(FP+TN)
Table 1. Example of a 2x2 table Disease
Present Absent
Test Results Positive True positives (TP) False positives (FP)
Negative False negatives (FN) True negatives (TN)
Sensitivity and specificity are test properties that are useful when deciding whether to use the
test. Sensitivity is the proportion of people with the disease who have a positive test for the disease. A test with high sensitivity will rarely misclassify people with the disease as not having the disease (the test rarely has false-negative errors). Specificity is the proportion of people without the disease who have a negative test. A test with high specificity will rarely misclassify people without the disease as diseased (the test rarely has false-positive errors).
Predictive Values and Likelihood Ratios To make sense of a diagnostic investigation, a clinician needs to be able to make an inference
regarding the probability that a patient has the disease in question according to the result obtained from the test. Sensitivity and specificity do not directly provide this information. The predictive values and likelihood ratios can also be directly calculated from a 2x2 table:
Positive predictive value = TP/(TP+FP) Negative predictive value = TN/(FN+TN) Positive likelihood ratio = (TP/(TP+FN))/(FP/(FP+TN)) Negative likelihood ratio = (FN/(TP+FN))/(TN/(FP+TN)) The positive predictive value of a test is the probability of a patient having the disease
following a positive test result. The negative predictive value is the probability of a patient not having the disease following a negative test result. Predictive values describe the probabilities that positive or negative results are correct for an individual patient. However, predictive values depend on the prevalence of disease in the population. A study that enrolled a patient population with a disease prevalence of 70 percent may report a positive predictive value of 80 percent. If a clinician tests a patient from a population with a disease prevalence of 70 percent, and the test

7
comes back positive, the clinician knows the patient has an 80 percent chance of having the disease in question. However, if the patient comes from a population with a disease prevalence of 20 percent, the clinician cannot apply the results of the study directly to this patient.
Because sensitivity and specificity are difficult to directly apply to clinical situations, and predictive values vary markedly as a function of disease prevalence (i.e., may be different for each patient subpopulation) a combined measure of diagnostic performance, the likelihood ratio, is a more clinically useful diagnostic test performance measure. Negative likelihood ratios measure the ability of the test to accurately “rule out” disease, and positive likelihood ratios measure the ability of the test to accurately detect disease.
Likelihood ratios are independent of prevalence and therefore can be directly applied in the clinic to update an individual’s estimated chances of disease according to their test result. Likelihood ratios can be used in Bayes’ theorem to calculate post-test odds of having a disease from the pre-test suspicion of the patient’s odds of having that disease. Clinicians may be familiar with simple nomograms that allow a direct visualization of post-test chances of disease given a positive or negative test result, without the need to go through the tedious calculations of Bayes’ theorem; see, for example, the interactive form of the nomogram provided by the Center for Evidence-based Medicine at http://www.cebm.net.
When making medical decisions a clinician can use likelihood ratios and the test results to estimate the probability of an individual woman having breast cancer. Clinicians use individual patient characteristics such as age, family history, and personal history; and features seen on the diagnostic mammogram, such as microcalcifications or distortions, to estimate a woman’s risk of malignancy. This estimate is known as a “pre-test” or “prior” probability. The clinician can then use the likelihood ratios (that express the accuracy of the test) to help decide if an additional imaging test will be helpful in guiding management decisions. For example, if a clinician estimates a woman’s risk of malignancy as “very high >50 percent” or “very low <1 percent” most likely the use of any additional imaging test will not change the clinician’s management recommendations, and therefore additional imaging will not be beneficial to the woman. However, if a clinician estimates a woman’s risk of malignancy as being uncertain or in an intermediate area, the likelihood ratios can be used to estimate whether an additional test is likely to change management decisions.
Scope and Key Questions This systematic review was commissioned by the Agency for Healthcare Research and
Quality (AHRQ) to address the following Key Questions: Key Question 1. What is the accuracy (expressed as sensitivity, specificity, predictive values,
and likelihood ratios) of noninvasive tests for diagnosis of breast cancer in women referred for further evaluation after identification of a possible breast abnormality on routine screening (mammography and/or clinical or self-detection of a palpable lesion)? The noninvasive tests to be evaluated are:
Ultrasound (conventional B-mode, color Doppler, power Doppler, tissue harmonics, and tomography)
Magnetic resonance imaging (MRI) with breast-specific coils and gadolinium-based contrast agents, with or without computer-aided diagnosis (CADx)
Positron emission tomography (PET) with 18-fluorodeoxyglucose (FDG) as the tracer, with or without concurrent computed tomography (CT) scans

8
Scintimammography (SMM) with technetium-99m sestamibi (MIBI) as the tracer, including Breast Specific Gamma Imaging (BSGI)
Key Question 2. Are there demographic (e.g., age) and clinical risk factors (e.g., morphologic characteristics of the lesion) that affect the accuracy of the tests considered in Key Question 1?
Key Question 3. Are there other factors and considerations (e.g., safety, care setting, patient preferences, ease of access to care) that may affect the accuracy or acceptability of the tests considered in Key Questions 1 and 2?
This report is an update of a Comparative Effectiveness Review (CER) of the same title originally published in 2006. The Key Questions have been revised and additional diagnostic tests have been added to the list of tests to be evaluated. The 2006 version of the CER only evaluated B-mode ultrasound, MRI (without CADx), PET (without CT), and full-body scintimammography.
9
Methods
Topic Development AHRQ requested an update of the evidence report Effectiveness of Noninvasive Diagnostic
Tests for Breast Abnormalities.7 The original report was finalized in February 2006. Due to technological advances and continuing innovation in the fields of noninvasive imaging, the conclusions of the original report are possibly no longer relevant to current clinical practice. Consequently, the topic was selected for update. The EPC recruited a technical expert panel (TEP) to give input on key steps including the selection and refinement of the questions to be examined. The expert panel membership is provided in the front matter of this report.
Upon AHRQ approval, the draft Key Questions were posted for public comment. After receipt and consideration of the public commentary, ECRI Institute finalized the Key Questions and submitted them to AHRQ for approval. These Key Questions are presented in the Scope and Key Questions section of the Introduction.
ECRI Institute created a work plan for developing the evidence report. The process consisted of working with AHRQ and the TEP to outline the report’s objectives, performing a comprehensive literature search, abstracting data, constructing evidence tables, synthesizing the data, and submitting the report for peer review.
In designing the study questions and methodology at the outset of this report, the EPC consulted several technical and content experts. Broad expertise and perspectives were sought. Divergent and conflicted opinions are common and perceived as healthy scientific discourse that results in a thoughtful, relevant systematic review. Therefore, in the end, study questions, design and/or methodologic approaches do not necessarily represent the views of individual technical and content experts.
The topic development procedure employed the “PICOTS” approach; namely, carefully and clearly defining the Patients, the Intervention(s), the Comparator(s), the Outcomes, the Timing of followup, and the Setting of care.105
Patients The patient population of interest is the general population of women participating in routine
breast cancer screening programs (including mammography, clinical examination, and self-examination). who have been recalled after discovery of a possible abnormality and who have already undergone standard work-up, which may include diagnostic mammography and/or ultrasound (BI-RADS 0, and 3 to 5). Populations that will not be evaluated in this review include: women thought to be at very high risk of breast cancer due to family history or BRCA mutations; women with a personal history of breast cancer; women with overt symptoms such as nipple discharge or pain; and men.
Interventions The noninvasive diagnostic tests to be evaluated are: Ultrasound (conventional B-mode, harmonic, tomography, color Doppler, and
power Doppler) Magnetic resonance imaging (MRI) with breast-specific coils and gadolinium-based
contrast agents, with or without computer-aided diagnosis (CADx)

10
Positron emission tomography (PET) with 18-fluorodeoxyglucose (FDG) as the tracer, with or without concurrent computed tomography (CT) scans, and positron emission mammography.
Scintimammography with technetium-99m sestamibi (MIBI) as the tracer, including Breast Specific Gamma Imaging (BSGI).
Technologies that were proposed for evaluation but, after discussion by the TEP, were not included, are: elastography; molecular breast imaging; scintimammography using tracers other than MIBI; PET using tracers other than FDG; digital tomosynthesis mammography; computer-aided diagnostic x-ray mammography; breast thermography; electrical impedance tomography; and optical breast imaging. The primary reasons that the TEP decided to not include these technologies in the current CER was a) insufficient robust evidence available about the technology at this time; b) no devices that employ the technology are currently available or approved in the United States; and/or c) the technology is primarily intended to be used in the screening setting.
Comparators The accuracy of the noninvasive imaging tests was evaluated by a direct comparison to
histopathology (biopsy or surgical specimens) or to clinical followup, or a combination of these methods. In addition, the relative accuracy of the different tests under evaluation was evaluated by directly and indirectly comparing the tests (as the reported evidence permitted).
Outcomes Outcomes of interest are diagnostic test characteristics, namely, sensitivity, specificity, and
likelihood ratios. Adverse events related to the procedures, such as radiation, discomfort, and reactions to contrast agents, were also discussed.
Timing Any duration of followup, from same-day interventions to many years of clinical followup,
was evaluated.
Setting Any care setting was acceptable, including general hospitals, physician’s offices, and
specialized breast imaging centers.
Search Strategy The medical literature was searched from December 1994 through September 2010. The full
strategy is provided in Appendix A. In brief, we searched 10 external and internal databases, including PubMed and EMBASE, for clinical trials addressing the Key Questions. To supplement the electronic searches, we also examined the bibliographies/reference lists of included studies, recent narrative reviews, and scanned the content of new issues of selected journals and selected relevant gray literature sources.

11
Study Selection We selected the studies that we consider in this report using a priori inclusion criteria. Some
of the criteria we employed are geared towards ensuring that we used only the most reliable evidence. Other criteria were developed to ensure that the evidence is not derived from atypical patients or interventions, and/or outmoded technologies.
Studies of diagnostic test performance compare results of the experimental test to a reference test. The reference test is intended to measure the “true” disease status of each patient. It is important that the results of the reference test be very close to the truth, or the performance of the experimental test will be poorly estimated. For the diagnosis of breast cancer, the “gold standard” reference test is open surgical biopsy. However, an issue with the use of open surgical biopsy as the reference standard in large cohort studies of screening-detected breast abnormalities is the difficulty of subjecting women with probably benign lesions to open surgical biopsy. Furthermore, restricting the evidence base to studies that used open surgery as the reference standard for all enrolled subjects would eliminate the majority of the evidence. Therefore, we have chosen to use a combination of clinical and radiologic followup as well as core-needle biopsy and open surgical biopsy as the reference standard for our analysis, although we acknowledge that this decision may cause our analysis to over-estimate the accuracy of the noninvasive tests.106
We used the following formal criteria to determine which studies would be included in our analysis. Many of our inclusion criteria were intended to reduce the potential for spectrum bias. Spectrum bias refers to the fact that diagnostic test performance is not constant across populations with different spectrums of disease. For example, patients presenting with severe symptoms of disease may be easier to diagnose than asymptomatic patients in a screening population; and a diagnostic test that performs well in the former population may perform poorly in the latter population. The results of our analysis are intended to apply to a general population of women participating in routine breast cancer screening programs (mammography, clinical examination, and self-examination programs) and therefore many of our inclusion criteria are intended to eliminate studies that enrolled populations of women at very high risk of breast cancer due to family history, or populations of women at risk of recurrence of a previously diagnosed breast cancer.
1. The study must have directly compared the test of interest to core-needle biopsy, open surgery, or clinical followup of the same patient.
Although it is possible to estimate diagnostic accuracy from a two-group trial, the results of such indirect comparisons must be viewed with great caution. Diagnostic cohort studies, wherein each patient acts as her own control, are the preferred study design for evaluating the accuracy of a diagnostic test.107 Studies may have performed biopsy procedures on all patients, or may have performed biopsy on some patients and followed the other patients with clinical examination and mammograms. Fine-needle aspiration of solid lesions is not an acceptable reference standard for the purposes of this assessment.108-111
Retrospective cohort studies that enrolled all or consecutive patients were considered acceptable for inclusion. However, retrospective case-control studies and case reports were excluded. Retrospective case-control studies have been shown to overestimate the accuracy of diagnostic tests, and case reports often report unusual situations or individuals that are unlikely to yield results that are applicable to general practice.106,107 Retrospective case studies (studies that selected cases for study on the basis of the type of

12
lesion diagnosed) were also excluded because the data such studies report cannot be used to accurately calculate the overall diagnostic accuracy of the test.106
2. The studies must have used current generation scanners and protocols of the selected technologies only. Other noninvasive breast imaging technologies are out of the scope of this assessment.
Studies of outdated technology and experimental technology are not relevant to current clinical practice. Definitions of “outdated technology” and “current technology” were developed through discussions with experts in relevant fields. Definitions of “current technology to be included” are defined in Table 2.
Table 2. Noninvasive current technologies to be evaluated
Technology Cutoff Publication Date (to present) To Exclude Outdated Technology
Other Inclusion Criteria
Ultrasound 1994
Magnetic resonance imaging (MRI) 2000 Must have used specific breast coils, and used gadolinium-based contrast agents
Computer Aided Detection (CAD) MRI 2005
Must have used specific breast coils, and used gadolinium-based contrast agents. CAD systems must be FDA approved for diagnostic breast cancer use, and are defined as stand-alone third-party packages that may be added to standard MRI systems to assist interpretation of the images.
Positron emission tomography (PET) 2000 FDG (fluorodeoxyglucose) as the PET tracer; includes positron emission mammography systems (PEM).
Combined PET/computed tomography (CT) systems
2000 FDG as the PET tracer
Scintimammography (SMM) 2005
Includes breast specific gamma imaging (BSGI) and also single photon emission tomography (SPECT); only studies that used sestamibi, also called MIBI, also called Technetium-99m sestamibi, as the tracer.
3. The study enrolled female human subjects. Animal studies or studies of “imaging phantoms” are outside the scope of the report.
Studies of breast cancer in men are outside the scope of the report. However, studies of predominantly female patients that enrolled one or two men were considered acceptable.
4. The study must have enrolled patients referred for the purpose of primary diagnosis of a breast abnormality detected by routine screening (mammography and/or physical examination).
Studies that enrolled women who were referred for evaluation after discovery of a possible breast abnormality by screening mammography or routine physical examination were included. Studies that enrolled subjects that were undergoing evaluation for any of the following purposes were excluded as being out of scope of the report: screening of asymptomatic women; breast cancer staging; evaluation for a possible recurrence of breast cancer; monitoring response to treatment; evaluation of the axillary lymph nodes; evaluation of metastatic or suspected metastatic disease; or diagnosis of types of cancer

13
other than primary breast cancer. Studies that enrolled patients from high-risk populations such as BRCA1/2 mutation carriers, or patients with a strong family history of breast cancer, are also out of scope. If a study enrolled a mixed patient population and did not report data separately, it was excluded if more than 15 percent of the subjects did not fall into the “primary diagnosis of women at average risk presenting with an abnormality detected on routine screening” category.
5. Study must have reported test sensitivity and specificity, or sufficient data to calculate these measures of diagnostic test performance; or (for Key Question 3) reported factors that affected the accuracy of the noninvasive test being evaluated.
Other outcomes are beyond the scope of this report. 6. Fifty percent or more of the subjects must have completed the study.
Studies with extremely high rates of attrition are prone to bias and were excluded. 7. Study must be published in English.
Moher et al. have demonstrated that exclusion of non-English language studies from meta-analyses has little impact on the conclusions drawn. Juni et al found that non-English studies typically were of lower methodological quality and that excluding them had little effect on effect size estimates in the majority of meta-analyses they examined. Although we recognize that in some situations exclusion of non-English studies could lead to bias, we believe that the few instances in which this may occur do not justify the time and cost typically necessary for translation of studies to identify those of acceptable quality for inclusion in our reviews.112,113
8. Study must be published as a peer-reviewed full article. Meeting abstracts were not included.
Published meeting abstracts have not been peer-reviewed and often do not include sufficient details about experimental methods to permit one to verify that the study was well designed.114,115 In addition, it is not uncommon for abstracts that are published as part of conference proceedings to have inconsistencies when compared to the final publication of the study, or to describe studies that are never published as full articles.116-
120 9. The study must have enrolled 10 or more individuals per arm.
The results of very small studies are unlikely to be applicable to general clinical practice. Small studies are unable to detect sufficient numbers of events for meaningful analyses to be performed, and are at risk of enrolling unique individuals.
10. When several sequential reports from the same patients/study are available, only outcome data from the most recent report were included. However, we used relevant data from earlier and smaller reports if the report presented pertinent data not presented in the more recent report.
The abstracts of articles identified by the literature searches were screened for possible relevance in duplicate by four analysts. All exclusions at the abstract level were approved by the lead research analyst. The full-length articles of studies that appeared relevant at the abstract level were then obtained and three research assistants examined the articles to see if they met the inclusion criteria. All exclusions were approved by the lead research analyst. The excluded articles and primary reason for exclusion are shown in the Appendixes.

14
Data Abstraction Standardized data abstraction forms were created and data were entered by each reviewer
into the SRS© 4.0 database (see Appendixes). Three research assistants abstracted the data. The first fifty articles were abstracted in duplicate. All conflicts were resolved by the lead research analyst.
Study Quality Evaluation We used an internal validity rating scale for diagnostic studies to grade the quality (internal
validity) of the evidence base (see Appendixes). This instrument is based on a modification of the QUADAS instrument with reference to empirical studies of design-related bias in diagnostic test studies.106,121 Each question in the instrument addresses an aspect of study design or conduct that can help to protect against bias. Each question can be answered “yes,” “no,” or “not reported,” and each is phrased such that an answer of “yes” indicates that the study reported a protection against bias on that aspect.
Responses to the questions in the quality assessment instrument for each study are presented in the Evidence Tables in Appendix C.
Strength of Evidence Assessment We applied a formal grading system that conforms with the CER Methods Guide
recommendations on grading the strength of evidence.122,123 The overall strength of evidence supporting each major conclusion was graded as High,
Moderate, Low, or Insufficient. The grade was developed by considering four important domains: the risk of bias in the evidence base, the consistency of the findings, the precision of the results, and the directness of the evidence.
The risk of bias (internal validity) of each individual study was rated as being Low, Medium, or High; and the risk of bias of the aggregate evidence base supporting each major conclusion was similarly rated as being Low, Medium, or High. We used our inclusion/exclusion criteria to eliminate studies with designs known to be prone to bias from the evidence base. Namely, case reports, case-control studies, and retrospective studies that did not enroll all or consecutive patients were not included for analysis. Because we eliminated all studies with a High risk of bias from the evidence base, we consider the remaining evidence base to have either a Low or Medium risk of bias.
We initially used an internal validity rating instrument for diagnostic studies to grade the internal validity of the individual studies (see section above Study Quality Evaluation). However, after we had conducted meta-regressions investigating the correlation between key individual items on the quality rating instrument and the results reported by the studies (see Appendix D for details), we consistently found that the majority of the items on the instrument had no statistically significant correlation with the reported results (with one exception, discussed below). We therefore concluded that the quality instrument was not adequately capturing the potential for bias of the studies in our sample (after eliminating study designs known to be prone to bias, such as retrospective case-control studies and case reports during the inclusion/exclusion process). Unlike studies of interventions, diagnostic cohort studies are quite simple in design, with one group of patients acting as their own controls. As long as all enrolled patients receive both the diagnostic test and the reference standard test, opportunities for bias (due to study design or conduct) to affect the results are limited. As mentioned above, we eliminated all

15
studies with a High risk of bias due to their study design from the evidence base. We did not identify any obvious design flaws in the remaining studies that suggested they were at Medium risk of bias; therefore, we rated all of the included studies, and the aggregate evidence bases, as being at Low risk of bias.
Meta-regressions did identify a statistically significant correlation between blinding of image readers to patient clinical information and the reported results of studies of MRI and ultrasound. Studies that blinded image readers to patient clinical information generally reported the blinded image readers had less accurate findings. It may, therefore, be that lack of blinding is a design flaw that is biasing the results. However, an alternative interpretation, which we favor, is that blinding image readers to patient clinical information is an artificial construct that will rarely if ever occur in clinical practice; therefore, non-blinded studies are generating an estimate of accuracy that is closer to the “real” accuracy that can be obtained in clinical practice. The majority of the studies are either non-blinded or did not specifically state whether they were blinded, leading us to believe that our aggregate pooled summary estimate of accuracy is close to the “real” accuracy of the technologies as used in routine clinical practice.
We rated the consistency of conclusions supported by meta-analyses with the statistic I2.124,125 Datasets that were found to have an I2 of less than 50 percent were rated as being “Consistent”; those with I2 of 50 percent or greater were rated as being “Inconsistent”; and datasets for which I2 could not be calculated (e.g., a single study) were rated as “Consistency Unknown.”
For qualitative direct comparisons between different diagnostic tests, we rated conclusions as consistent if the effect sizes were all in the same direction. For example, when comparing the accuracy of ultrasound without a contrast agent to the accuracy of ultrasound with a contrast agent, if the estimates of sensitivity of the individual studies are consistently higher for studies that used a contrast agent, then the evidence base would be rated as “consistent.”
We defined a “precise” estimate of sensitivity or specificity as one for which the upper AND lower bound of the 95 percent confidence interval was no more than 5 points away from the summary estimate; for example, sensitivity 98 percent (95% CI: 97 to 100%) would be a precise estimate of sensitivity, whereas sensitivity 95 percent (95% CI: 88 to 100%) would be an imprecise estimate of sensitivity. Precision could be rated separately for summary estimates of sensitivity and specificity for each major conclusion.
For qualitative direct comparisons between different diagnostic tests, the conclusion is “Precise” if the confidence intervals around the summary estimates being compared do not overlap. We did not derive any formal conclusions (or formally rate the strength of evidence for any speculative statements) about indirect comparisons between different diagnostic tests.
According to the Methods Guide,122 The rating of directness relates to whether the evidence links the interventions directly to
health outcomes. For studies of diagnostic test accuracy, the evidence should always be rated as “Indirect”
because the outcome of test accuracy is indirectly related to health outcomes. However, the Key Questions in this particular comparative effectiveness review do not ask about the impact of test accuracy on health outcomes. We therefore did not incorporate the “Indirectness” of the evidence into the overall rating of strength of evidence for these Key Questions because they did not ask about health outcomes.

16
Overall Rating of Strength of Evidence The initial rating is based on the risk of bias. If the evidence base has a Low risk of bias, the
initial strength of evidence rating is High; if the evidence base has a Moderate risk of bias, the initial strength of evidence rating is Moderate; if the evidence base has a High risk of bias, the initial strength of evidence rating is Low. For this particular comparative effectiveness review, as explained above, the rating of risk of bias was Low for all evidence bases, and therefore the initial strength of evidence rating is High. The remaining two domains are used to up- or down- grade the initial rating as per the following flow charts:
Consistent, Precise: High Inconsistent, Precise: Moderate Consistent, Imprecise: Moderate Inconsistent, Imprecise: Low “Consistency Unknown,” Precise: Low “Consistency Unknown,” Imprecise: Insufficient Evidence bases judged to be too small to support an evidence-based conclusion (e.g., one or
two small studies) were simply rated “Insufficient” without formally considering the various domains. Further details about grading the strength of evidence may be found in the Evidence Tables section of the Appendixes.
Applicability The issue of applicability was chiefly addressed by excluding studies that enrolled patient
populations that were not a general population of asymptomatic women participating in routine breast cancer screening programs. We defined the population of interest as women at average risk of breast cancer participating in routine breast cancer screening programs (including mammography, clinical examination, and self-examination) who had been recalled after discovery of an abnormality and who had already undergone a standard work-up (diagnostic mammography and/or ultrasound and/or physical examination). We excluded studies that enrolled women thought to be at very high risk of breast cancer due to personal history, family history, or known carriers of BRCA mutations, and also excluded studies that enrolled patients presenting with overt symptoms such as nipple discharge or pain.
Data Analysis and Synthesis The majority of studies reported data on a per-lesion rather than a per-patient basis, and
therefore we analyzed the data on a per-lesion basis assuming that statistical assumptions about data independence were not being violated. Because the number of lesions was usually very similar to the number of patients (i.e., the vast majority of patients only had one lesion) we do not believe that this assumption will have a significant impact on the results.
We performed a standard diagnostic accuracy analysis. For the diagnostic accuracy analysis: True negatives were defined as lesions diagnosed as benign on imaging that were found
to be benign by the reference standard; False negatives were defined as lesions diagnosed as benign on imaging that were found
to be malignant (invasive or in situ) by the reference standard; True positives were defined as lesions diagnosed as malignant (invasive or in situ) on
imaging that were found to be malignant (invasive or in situ) on the reference standard

17
False positives were defined as lesions diagnosed as malignant that were found to be benign on the reference standard.
We meta-analyzed the data reported by the studies using a bivariate mixed-effects binomial regression model as described by Harbord et al.8 All such analyses were computed by the STATA 10.0 statistical software package using the “midas” command.9 The summary likelihood ratios and Bayes’ theorem were used to calculate the post-test probability of having a benign or malignant lesion. In cases where a bivariate binomial regression model could not be fit, we meta-analyzed the data using a random-effects model and the software package Meta-Disc.10 Meta-regressions were also performed with the STATA software and the “midas” command. We did not assess the possibility of publication bias because statistical methods developed to assess the possibility of publication bias in treatment studies have not been validated for use with studies of diagnostic accuracy.126,127
Diagnostic tests all have a trade-off between minimizing false-negative and minimizing false-positive errors. False-positive errors that occur during breast screening diagnostic workups are not considered to be as clinically relevant as false-negative errors. Women who experience a false-positive error will be sent for unnecessary procedures, and may suffer from anxiety and a temporarily reduced quality of life, as well as morbidities related to the procedures. However, women who experience a false-negative error may suffer morbidities, reduced quality of life, and possibly even a shortened lifespan from a delayed cancer diagnosis.
Likelihood ratios can be used along with Bayes’ theorem to directly compute an individual woman’s risk of actually having a malignancy following a diagnosis on imaging. However, each individual woman’s post-test risk varies by her pre-test risk of malignancy. Simple nomograms are available for in-office use that allow clinicians to directly read individual patients’ post-test risk off a graph without having to go through the tedium of calculations. Predictive value is another commonly used measure of errors; however, negative and positive predictive values are specific to specific populations of women. Predictive values vary by the prevalence of disease in each specific population and should not be applied to other populations with different prevalences of disease. For this reason, we have avoided the use of predictive values in this systematic review.
Peer Review and Public Commentary A draft of the completed report was sent to the peer reviewers and representatives of AHRQ.
The draft report was posted to the Effective Health Care Web site for public comment. In response to the comments of the peer reviewers and the public, revisions were made to the evidence report, and a summary of the comments and their disposition has been submitted to AHRQ, and will be made publicly available within 3 months of publication of this final report. Synthesis of the scientific literature presented here does not necessarily represent the views of individual reviewers.

18
Results Our literature searches identified a total of 4,511 possible articles. After review of the
abstracts, we selected 384 for further review as full-length articles to determine whether they met the inclusion criteria. The study selection process is summarized in Figure 2. Full details of excluded articles and reasons for exclusion are shown in the Appendixes. The included articles are described throughout this Results section. We have organized the Results section by type of noninvasive test rather than by Key Question.
Figure 2. Study selection process
Magnetic Resonance Imaging
Background
Technology Magnetic resonance imaging (MRI) systems use strong magnetic fields and radiofrequency
energy to translate hydrogen nuclei distribution in tissues into computer-generated images of the

19
structure of the interior of the breast. MRI does not expose patients to radiation. However, the procedure is not completely noninvasive because often contrast agents are infused to improve the resolution of the images.
MRI systems are usually described primarily in terms of strength of the magnet, in the unit Tesla (T). Systems in commercial use for breast imaging usually vary from 0.5T to 3.0T. In general, increasing the strength of the magnet increases the spatial resolution of the images. MRI systems that use field strengths below 1.0T are usually open gantries and are primarily used for patients who cannot be accommodated inside the bore of a higher field strength magnet due to claustrophobia. An additional reason for the use of open gantry systems is that MRI-guided invasive procedures, such as biopsies, are much easier to perform than in closed systems.128
Surface coils are routinely used in MRI to increase the efficiency of signal detection and, by extension, the image quality. Dedicated breast coils have been available for some time and are considered a prerequisite for breast imaging.129 The dedicated breast coils allow the patient to lie prone with her breasts in close proximity to the coils. Some coils are designed to immobilize the breasts with compression. The compression reduces the volume to be imaged (and therefore reduces image acquisition time) and moves the coils closer to the tissue and helps prevent patient movement (so image quality is improved).130,131 Coils are described by the number of channels they contain. In general, increasing the number of channels improves the signal to noise ratio.130,132,133 Eight-channel breast coils are considered standard equipment for breast MRI examinations.
While all suppliers of MRI equipment provide suggested protocols for different examination types, it is common for users to customize these. The degree of protocol customization largely depends on the clinical users, both radiologists and technologists. Even in tightly controlled studies with a limited number of institutions all using equipment supplied by the same manufacturer, differences in technique have been observed.134
MR images are susceptible to a number of artifacts that could cause image distortion and false interpretations. In particular, breast MR images are prone to artifacts caused by sternal wires and prosthetic cardiac valves.135 Also, respiratory motion can be a problem, although when the patient is prone the effect is reduced.135 Interpretation of the images is a subjective procedure that requires specialized training.136,137 Computer-based tools to partially automate the interpretation procedure are available and may reduce subjectivity and decrease time required for image interpretation.138
The use of contrast agents for MRI breast examinations is considered standard procedure. Gadolinium-based paramagnetic contrast agents accumulate in the vascular system and can aid in visualizing tumors by highlighting areas containing a dense blood vessel network. There are currently five slightly different gadolinium-based contrast agents in common clinical use: gadobenate dimeglumine, gadopentetate dimeglumine, gadodiamide, gadoteridol, and gadoversetamide.139 These agents differ slightly in molecular structure; all, however, consist of the heavy metal gadolinium bound to a chelating molecule.140 Different agents may have different imaging properties.141,142 When using conventional gadolinium contrast agents, the exact dose used does not appear to be particularly relevant to image quality when used in the normal range (0.1 to 0.2 mmol/kg). When contrast is taken up by a lesion, one of three characteristic enhancement and wash-out curves are usually observed: continuous enhancement, rapid enhancement followed by a plateau, or rapid enhancement followed by rapid wash-out. Rapid wash-out is considered indicative of malignancy.136 In premenopausal women, the normal parenchyma can demonstrate enhancement that can decrease the specificity of breast MRI

20
studies.143,144 The amount of enhancement depends on the stage in the menstrual cycle. Therefore, in order to ensure accurate results, an MRI study should if possible be performed during the second week of the menstrual cycle when proliferative changes are at their lowest level.
For the purposes of this assessment, only MRI conducted on a 0.5 to 3T system using dedicated breast coils and gadolinium-based contrast agents has been considered. These requirements were selected because they describe the systems and methods currently considered to be “standard practice” for breast imaging; other systems and methods would be unlikely to produce results that would be applicable to current clinical practice.145
Patient Safety and Comfort A number of well-known safety hazards exist when a patient is undergoing an MRI exam.
Examples include: patient heating, pacemaker malfunction, dislodgment of metallic implants, peripheral nerve stimulation, acoustic noise, and radio frequency induced burns.146-151 Precautions are taken at MRI facilities to routinely screen patients for possible contraindications. Patients are routinely asked to wear earplugs and are given an emergency call button. No adverse effects have been conclusively identified in association with the magnetic fields to which patients are exposed during routine MRI scanning.152-155 Therefore, so long as routine precautions are followed, breast MRI can be considered a safe exam for most patients.
A search for reports of patient discomfort did not find any reports of severe discomfort. In fact, in order to decrease patient motion, it is important that the patient be as comfortable as possible.135 Breast compression does increase the level of discomfort, but the amount is not significant, particularly when compared to the compression that is exerted during x-ray mammography exams.
Gadolinium-based contrast agents are generally considered to be very safe for most patients; some patients may experience allergic reactions which are generally mild.156,157 However, in 2007, FDA requested that manufacturers include a new warning on the labeling of all gadolinium-based contrast agents which are used to enhance MRI.139 The new labeling warns that the use of these agents increases the risk of development of nephrogenic systemic fibrosis (NSF) in patients with pre-existing acute or chronic severe renal insufficiency or renal dysfunction due to recent liver transplantation or hepatorenal syndrome.158-160 NSF is a progressive, disabling, and potentially fatal disorder that leads to deposition of excessive connective tissue in the skin and internal organs. The condition was previously unknown; the typical patient is a middle-aged individual with severe renal disease who first exhibits skin changes 2 to 4 weeks after undergoing an MRI examination that used gadolinium-based contrast agents.160
Accreditation Factors General-purpose MRI systems are cleared for marketing by United States Food and Drug
Administration (FDA) under the 510(k) process. Accessories such as breast coils are cleared separately, also under the 510(k) process. Imaging devices are usually not cleared for specific indications; they are cleared for marketing for all indications in the entire body or in specified parts of the body.
There is no nationwide compulsory accreditation for MRI facilities. The American College of Radiology does administer a voluntary accreditation program.161

21
Findings From 2006 Review Our CER from 2006 included 19 prospective diagnostic cohort studies of MRI (published
between 1991 and 2004) that studied a total of 2181 suspicious breast lesions.30-32,34,35,40-42,44-
46,141,162-168 We found that for suspicious lesions in general, at a fixed 95 percent sensitivity, the
specificity of MRI was 62.8 percent. At the mean threshold of the studies, the sensitivity was 92.5 percent and the specificity was 72.4 percent. For lesions with microcalcifications, our analysis found that the sensitivity of MRI was 85.9 percent and the specificity was 75.5 percent.
Evidence Base Our literature searches identified 41 diagnostic cohort studies of MRI (published 2000
through 2009) that studied a total of 3882 patients with 4,202 suspicious breast lesions.11-51 The majority of the studies used 1.5T magnets (33 studies) and gadopentetic acid enhancement (26 studies). The studies and patients are described in detail in the Appendixes, and listed at the end of this subsection on MRI in Table 4.
Key Question 1. What is the accuracy of MRI for diagnosis of breast cancer in women referred for further evaluation after identification of a possible breast abnormality on routine screening (mammography and/or clinical or self-detection of a palpable lesion)?
We combined the data reported by all 41 studies into a bivariate binomial mixed model. The data were extremely heterogeneous (I2 = 98.4%). The summary sensitivity of MRI for all lesions was 91.7 percent (95% CI: 88.5 to 94.1%) and the summary specificity was 77.5 percent (95% CI: 71.0 to 82.9%). These summary estimates are fairly similar to our 2006 estimates of the accuracy of MRI (at the mean threshold the sensitivity was 92.5%, and the specificity was 72.4%).
We investigated the heterogeneity with meta-regression. The variables investigated were: the strength of the magnet, the type of contrast agent used, whether the study enrolled all/consecutive patients or not, whether the study was prospective in design or not, whether all diagnoses were verified by histopathology or not, whether any financial conflicts of interest from the funding source existed or not, whether the study was multi- or single-centered, whether readers were blinded to clinical information or not, whether the study accounted for inter-reader differences or not, the geographical setting of the study, whether the study was clearly affected by spectrum bias or not, and the prevalence of disease. The prevalence of disease in the study population and whether or not readers were blinded to clinical information were both found to be statistically significantly correlated with the accuracy data reported by the studies (p = 0.02 and 0.03, respectively). However, in subgroup analyses there was a statistical correlation between blinding of readers and prevalence of disease. Graphical analysis of prevalence of disease by accuracy failed to reveal any consistent pattern; therefore it is possible that the correlation between prevalence of disease and accuracy is an artifact caused by the correlation between blinding and enrollment of a population with a higher prevalence of disease. Studies that reported they had blinded readers to clinical information had a lower sensitivity than non-blinded studies (86.8% vs. 93.9%) but approximately the same specificity (74.7% vs. 78.0%).

22
Key Question 2. Are there demographic (e.g., age) and clinical risk factors (e.g., morphologic characteristics of the lesion) that affect the accuracy of the tests considered in Key Question 1?
Two studies reported the accuracy of MRI by patient age.30,44 One of these two studies (Bluemke et al.30) investigated the relative accuracy by premenopausal status vs. post-menopausal status of the patients, and reported virtually no difference in either sensitivity or specificity between groups. The other study (Imbriaco et al.44) reported the accuracy of MRI for women 50 years of age and older vs. younger women, and found that MRI was more sensitive (100% vs. 92.9%) in younger women, but had virtually the same specificity (75.0%) in both age groups.
Eight of the studies enrolled patients who had been referred for further investigation after identification of microcalcifications on mammography.20,22,23,25,30,39,46,51 When combined in a bivariate mixed-effects model the data from these eight studies had very low heterogeneity (I2 = 3.86%). The summary sensitivity of MRI for microcalcifications was 84.0 percent (79.5 to 88.3%) and the summary specificity was 79.4 percent (71.5 to 85.6%). The summary sensitivity of MRI for evaluation of microcalcifications is considerably lower than the sensitivity of MRI for evaluation of any/all lesions (84.0% vs. 91.7%). The specificity for microcalcifications is approximately the same (79.4% vs. 77.5%). Two studies also directly compared the sensitivity of MRI for evaluation of microcalcifications vs. other types or all types of lesions (Bluemke et al.30 and Van Goethem et al.51) and reported similar results: the sensitivity of MRI for evaluation of microcalcifications is approximately 85 percent, which is considerably lower than the sensitivity of MRI for evaluation of all/other types of lesions; whereas the specificity of MRI for evaluation of microcalcifications is approximately 77 percent, which may be slightly higher than the specificity of MRI for evaluation of all/other types of lesions.
Two studies evaluated the accuracy of MRI for dense breasts vs. all or non-dense breasts (Bluemke et al.30 and Wiberg et al.40), and reported virtually no difference in the accuracy of MRI for evaluation of these different categories of breast tissue.
One study enrolled only patients with lesions classified as BIRADS 3 before investigation by MRI (Gokalp and Topal24); however, only one enrolled patient (out of 43 total) was found to have a malignancy and therefore the patient population is too small to draw conclusions about the accuracy of MRI for probably benign lesions.
One study each investigated the accuracy of MRI for lesions broken down by palpable vs. non-palpable (Bluemke et al.30) and large lesion vs. small lesion (Imbracio et al.44).
Key Question 3. Are there other factors and considerations that may affect the accuracy or acceptability of MRI?
One study reported the accuracy of MRI images interpreted with and without a Computer Aided Diagnosis (CAD) software system.12 The study reported virtually no difference in either sensitivity (77.4% vs. 78.9%) or specificity (73.2% vs. 73.2%) with or without CAD assistance.
Previously Published Systematic Reviews We identified three systematic reviews of the use of MRI to evaluate women with prior
clinical findings that suggest the possibility of breast cancer; two were published prior to the release of the 2006 version of this report. The methods and conclusions of these reviews are summarized in Table 3. The authors of two of the systematic reviews concluded that the negative

23
predictive value of MRI is too low for this indication, and therefore patients did not benefit from being examined by MRI after mammography; the authors of the third review (Peters et al.) did not speculate on the clinical utility of MRI.169
Table 3. Other published technology assessments of MRI Study Methods Conclusions
Peters et al. 2008169
Systematic review of the literature on the diagnostic performance of contrast-enhanced MRI for breast lesions. The review included studies published 1985 through 2005, and identified 44 studies of 3101 women who had both MRI and breast biopsies. Summary ROC was fitted, and bivariate analyses were performed.
The summary sensitivity of MRI was 90% (95% CI: 88 to 92%), and the specificity was 72% (95% CI: 67% to 77%). Meta-regressions found that the prevalence of cancer in the population being studied affected the accuracy, as did the criteria used to identify lesions as malignant.
The Blue Cross/Blue Shield Technology Evaluation Program, published in 2002170 and then updated in 2004171
Systematic review of the literature on the use of MRI to evaluate suspicious breast lesions in order to avoid biopsies. The review included 25 prospective studies and 14 retrospective studies. Reported data were described and a small, informal cost-benefit analysis was performed.
Reported sensitivity for MRI ranged from 91% to 99%; specificity ranged from 31% to 91%; and negative predictive value ranged from 56% to 99%. The authors of the review pointed out that in many of the populations studied, small breast lesions had been specifically excluded, and therefore the diagnostic performance of MRI in the clinic, where smaller lesions are often encountered, may be less accurate than predicted from these studies. The authors of the review performed a small, informal cost-benefit analysis and concluded that the negative predictive value of MRI was too low, even under the best possible conditions, to recommend the use of MRI for this indication. The potential benefit of sparing patients from unnecessary biopsy was not found to outweigh the potential harm of missed or delayed diagnosis of breast cancer.
Hrung et al. 1999172
A systematic review focused on women presenting with either a lesion that was palpably abnormal, or a BIRADS category 4 lesion detected by mammography. The review included 16 studies published between 1994 and 1997. Quality of the studies was rated on a 10-point scale (1 = highest quality, 10 = poorest quality). The data from the included studies were combined meta-analytically using the method of Littenburg and Moses.173 The authors then conducted a cost-effectiveness analysis.
The mean quality score of the included studies was 3.0, indicating low quality. The optimal operating point of MRI, chosen to have a sensitivity of 95%, was found to have a specificity of 67%. Breast MRI is cost-effective relative to needle core biopsy only if MRI performance achieves a sensitivity and specificity of 93%, and needle core biopsy performance is less than the best available estimates. Therefore, the authors concluded that choosing needle core biopsy instead of MRI both increased patients QALYs and lowered the average cost per patient.

24
Conclusion We found that the summary sensitivity of MRI for all lesions is 91.7 percent (95% CI: 88.5
to 94.1%) and the summary specificity is 77.5 percent (95% CI: 71.0 to 82.9%) (Table 5). The data are inconsistent (namely, demonstrated significant heterogeneity in our statistical model), but the estimate of sensitivity is precise, therefore the strength of evidence supporting the estimate of the sensitivity of MRI is moderate. The estimate of specificity is imprecise, and therefore the strength of evidence supporting the estimate of specificity of MRI is low.
The only patient or lesion “factor” that was found to affect the accuracy of MRI and that had sufficient evidence to support a conclusion was the consistent finding that the sensitivity of MRI for evaluation of microcalcifications is considerably lower than the sensitivity of MRI for evaluation of any/all lesions. The strength of evidence supporting this conclusion was rated as high.
To aid in interpretation of these findings, we used Bayes’ theorem and the summary likelihood ratios for MRI used to evaluate lesions in general and to evaluate lesions with microcalcifications (see Table 6 and Table 7). These calculations suggest that MRI examinations of women thought to have a higher than 12 percent pre-MRI probability of cancer will not be very clinically useful for diagnostic purposes because the input provided by the MRI examinations would probably not affect the suspicion of malignancy sufficiently to alter clinical decisions about management of the patient (e.g., recommendations for biopsy vs. followup). For many women an MRI examination will probably not result in a change in management or affect patient outcomes. In Figure 3, we illustrate models of theoretical changes in management that could be made after the use of MRI. Figure 3 demonstrates that the majority of women referred for biopsy after standard work-up (the left-most pathway) would probably experience no change in management after the addition of MRI to the work-up. The middle and right-most pathways in Figure 3 indicate that women with low (12% and 1%) suspicion of malignancy after standard work-up might have their risk of malignancy shift across the “change in management” thresholds after the addition of an MRI. Note that a “change in management” does not necessarily mean that the patient will benefit from the change. For example, a woman thought to have a 1 percent suspicion of malignancy may be referred for a biopsy instead of short-interval followup after an MRI; but in most cases this biopsy will return a “benign” finding, suggesting the primary clinical impact of the addition of an MRI exam to the work-up of this particular patient population may be to increase the rate of unnecessary biopsies.
A critical question for the application of this finding is whether it is feasible for clinicians to precisely estimate pretest probability in this range. Many of our expert reviewers did not think it is possible using currently available risk assessment methods.
Table 4. Included studies: magnetic resonance imaging (MRI) Study MRI Methods Studied Design* N Patients
Akita et al. 200911 1.5T gadodiamide Diagnostic cohort study 50
Baltzer et al. 200912 1.5T gadopentetic acid CAD assistance vs. not
Prospective diagnostic cohort 329
Hara et al. 200913 1.5T gadodiamide Diagnostic cohort study 103
Kim et al. 200914 1.5T gadopentetic acid Diagnostic cohort study 249
Lo et al. 200915 3T gadopentetic acid Prospective diagnostic cohort 31
Imbracio et al. 200816 1.5T gadopentetic acid Prospective diagnostic cohort 44

25
Table 4. Included studies: magnetic resonance imaging (MRI) (continued)
Study MRI Methods Studied Design* N Patients
Pediconi et al. 200817 1.5T gadopentetic acid vs. gadobenic acid
Prospective diagnostic cohort 47
Vassiou et al. 200918 1.5T gadopentetic acid Prospective diagnostic cohort 69
Brem et al. 200719 1.5T gadopentetic acid Diagnostic cohort study 23
Cilotti et al. 200720 1.5T gadoteridol Retrospective 55
Pediconi et al. 200721 1.5T gadobenic acid Prospective diagnostic cohort 164
Zhu et al. 200722 1.5T gadodiamide Retrospective 52
Bazzocchi et al. 200623 1.0 or 1.5 T gadoteridol Prospective diagnostic cohort 174
Gokalp and Topal 200624 1.5T gadopentetic acid Prospective diagnostic cohort 43
Kneeshaw et al. 200625 1.5T gadopentetic acid Prospective diagnostic cohort 88
Ricci et al. 200626 1.5T gadobenic acid Prospective diagnostic cohort 48
Pediconi et al. 200527 1.5T gadobenic acid Prospective diagnostic cohort 36
Pediconi et al. 200528 1.5T gadopentetic acid vs. gadobenic acid
Prospective diagnostic cohort 26
Wiener et al. 200529 1.5 T gadopentetic acid Prospective diagnostic cohort 65
Bluemke et al. 200430 1.5T gadopentetic acid Prospective diagnostic cohort 821
Huang et al. 200431 1.5T gadodiamide Prospective diagnostic cohort 50
Bone et al. 200332 1.5T gadopentetic acid Prospective diagnostic cohort 97
Daldrup-Link et al. 200333 1.5T gadopentetic acid Prospective diagnostic cohort 14
Heinisch et al. 200334 1.0T gadopentetic acid Prospective diagnostic cohort 36
Walter et al. 200335 1.0T gadopentetic acid Prospective diagnostic cohort 40
Guo et al. 200236 1.5T gadopentetic acid Retrospective diagnostic cohort 52
Kelcz et al. 200237 1.5T gadodiamide Prospective diagnostic cohort 62
Schedel et al. 200238 1.5T gadopentetic acid Diagnostic cohort study 65
Trecate et al. 200239 1.5T gadopentetic acid Prospective diagnostic cohort 28
Wiberg et al. 200240 1.5T gadopentetic acid Prospective diagnostic cohort 93
Brix et al. 200141 1.5T gadopentetic acid Prospective diagnostic cohort 14
Cecil et al. 200142 1.5T gadopentetic acid Diagnostic cohort study 37
Furman-Haran et al. 200143
1.5T gadodiamide Prospective diagnostic cohort 40
Imbriaco et al. 200144 0.5T gadopentetic acid Prospective diagnostic cohort 49
Malich et al. 200145 1.5T gadopentetic acid Diagnostic cohort study 94
Nakahara et al. 200146 0.5T gadopentetic acid Retrospective review of patients with microcalcifications on mammogram
40
Torheim et al. 200147 1.5T gadodiamide Prospective diagnostic cohort 127
Wedegartner et al. 200148 1.0T gadopentetic acid Prospective diagnostic cohort 53
Yeung et al. 200149 1.5T gadopentetic acid Diagnostic cohort study 30
Kvistad et al. 200050 1.5T gadodiamide Prospective diagnostic cohort 130
Van Goethem et al. 200051
NR T gadopentetic acid
Retrospective review of patients with microcalcifications or a problem after clinical examination/mammogram/US
75
* At times it was difficult to determine if a study was prospective or retrospective, and in those cases we defaulted to simply calling it a “diagnostic cohort study.”

26
Table 5. Magnetic resonance imaging (MRI) accuracy
N Studies
N Lesions Summary Sensitivity (95% CI)
Summary Specificity (95% CI)
Strength of Evidence
MRI, overall 41 3,882 91.7%
(88.5 to 94.1%) 77.5%
(71.0 to 82.9%)
Moderate (sensitivity)/ Low (specificity)
MRI, lesions with microcalcifications
8 692 84.3%
(79.5 to 88.3%) 79.4%
(71.5 to 85.6%)
High (sensitivity), Moderate (specificity)
MRI, dense breasts vs. others
2 935 Results were inconsistent
Results were inconsistent
Insufficient
MRI, lesions classified as BIRADS 3 before MRI imaging
1 56 100.0%
(20.8 to 99.2%) 96.4%
(87.5 to 98.9%) Insufficient
MRI, palpable lesions vs. non-nonpalpable lesions
1 821 MRI is more sensitive for palpable lesions
MRI is more specific for non-palpable lesions
Insufficient
MRI, small lesions vs. larger lesions
1 53 MRI is more sensitive for larger lesions
MRI is more specific for larger lesions
Insufficient
MRI, readers blinded vs. not
41 3,882
Sensitivity is lower if readers are blinded to patient clinical information
Specificity is not affected
Moderate
MRI, CAD assistance vs. not
1 451 Sensitivity is not affected
Specificity is not affected
Insufficient
MRI, patient age 2 874 Results were inconsistent
Specificity is not affected
Insufficient
Table 6. Clinical interpretations of magnetic resonance accuracy: benign finding on MRI
Pretest Probability of the Lesion Being Malignant
Post-test Probability of the Lesion Being Malignant Despite a Finding of “Benign” on the MRI Exam
Lesions in Generala Lesions with Microcalcifications
1% 0% (0 to 0%) 0% (0 to 0%)
5% 1% (0 to 1%) 1% (0% to 1%)
10% 1% (1 to 2%) 2% (2 to 3%)
12% 1% (1 to 2%) Not calculated
20% 3% (2 to 4%) 5% (4 to 6%)
30% 5% (3 to 6%) 8% (6 to 10%)
40% 7% (5 to 9%) 12% (9 to 15%)
50% 10% (7 to 13%) 16% (13 to 21%)
60% 14% (11 to 18%) 23% (18 to 28%)
70% 20% (16 to 26%) 31% (26 to 38%)
80% 31% (24 to 38%) 44% (37 to 51%)
90% 50% (42 to 57%) 64% (57 to 70%) a The summary negative likelihood ratio is 0.11 (95% CI: 0.079 to 0.15).

27
Table 7. Clinical interpretations of MRI accuracy: malignant finding on MRI
Pretest Probability of the Lesion Being Malignant
Post-test Probability of the Lesion Being Malignant After a Finding of “Malignant” on the MRI Exam
Lesions in Generala Lesions with Microcalcifications
1% 4% (3 to 5%) 4% (3 to 5%)
5% 18% (14 to 22%) 18% (13 to 23%)
10% 31% (26 to 37%) 31% (25 to 39%)
20% 50% (44 to 57%) 51% (42 to 59%)
30% 64% (57 to 69%) 64% (56 to 71%)
40% 73% (67 to 78%) 73% (66 to 79%)
50% 80% (76 to 84%) 80% (75 to 85%)
60% 86% (82 to 89%) 86% (81 to 90%)
70% 90% (88 to 93%) 91% (87 to 93%)
80% 94% (93 to 95%) 94% (92 to 96%)
90% 97% (97 to 98%) 97% (96 to 98%) a The summary positive likelihood ratio is 4.1 (95% CI: 3.1 to 5.3).
Figure 3. Possible clinical scenarios for MRI: theoretical changes in management
Positron Emission Tomography
Background
Technology Positron emission tomography (PET) is a nuclear imaging modality that uses radioactive
tracers to provide images of metabolic processes. Several different radiopharmaceuticals can be used in PET imaging. The tracer most commonly used is 18F-fluorodeoxyglucose (FDG). Fluorine-18 (18F) is a positron-emitting radionuclide, and this assessment will focus exclusively on PET scans that used FDG as a tracer. Fluorodeoxyglucose is a glucose analog that accumulates in tissue in proportion to the tissue’s metabolic activity. Rapidly dividing tumor cells metabolize large amounts of glucose. The uptake of the radioactive tracer FDG can be monitored by PET and provide images of regional glucose metabolism. Areas of elevated metabolism, which may be tumor cells, can be visualized on the PET images.

28
When performing a PET scan, a small amount of FDG is injected into the bloodstream, and a gamma camera, dedicated breast scanner, or whole-body scanner is used to generate images that highlight areas of high tracer uptake. Whole-body scanners have a ring of detectors that surround the patient and image the entire body. Gamma cameras have only two detectors, one at each side of the patient, and image only a restricted portion of the body. Dedicated breast scanners have two detectors designed to image only the breasts. The performance of the different cameras may vary. However, it is not clear how clinically relevant these differences are with respect to the accuracy of breast imaging.174
Other factors may also affect the quality of the breast image acquired through a PET scan. In general, longer image acquisition times will improve the image quality of any PET scan.174 However, other factors such as patient movement, comfort, and workflow suggest that acquisition times be kept to minimum. The optimum time depends on the characteristics of the detector, with dedicated breast cameras requiring the least amount of time (four to five minutes) and whole body scanners requiring the most time (45 to 60 minutes) to acquire the full image.174
In whole-body PET studies, it is standard practice to acquire a second set of images so that the reconstructed images can be corrected to account for differences in the attenuation of the gamma photons in different areas of the body (“attenuation correction”). In breast imaging some operators believe that attenuation correction is essential for tumor localization and quantification of uptake.175
The standardized uptake value (SUV), which is the mean tracer activity detected normalized for the injected dose of tracer and body weight, is dependent on the image reconstruction algorithm.174 The reconstruction algorithm is manufacturer dependent. Therefore, diagnostic performance of breast PET imaging may vary across manufacturers. Diagnostic performance may also vary depending on study-specific factors such as FDG uptake time, patient motion, size of the lesion, histology of lesion, patient weight, blood glucose level, patient position, spatial resolution, and interpretation of the breast image.175-177
According to Rosen et al., stand-alone whole-body PET scanners for oncology indications are rapidly becoming obsolete.178 Combined computed tomography (CT)/PET systems are increasingly available and currently account for almost all of the new whole-body PET installations. These systems allow images of metabolism and anatomy to be obtained at the same time. The combined machine uses x-rays to generate 3D anatomical images (CT scanning) upon which the PET images of metabolism can be overlaid on a computer workstation. In this report, whole-body scanners that combine PET with CT and stand-alone PET scanners will be considered as separate technologies.
Patient Safety and Comfort Using a typical dose for a whole-body scan, the effective radiation dose delivered during a
typical PET study is 19 Sv/MBq (the value depends on how often the patient voids). This translates to 7.6 mSv for a typical 400 MBq whole-body PET exam. The use of a combined CT/PET scanner also exposes the patient to x-rays. A typical abdominal CT scan exposes the body to approximately 10 mSv, for a total of around 18 mSv for a single PET/CT study.179 For comparison, a typical x-ray mammogram exposes women to 0.36 mSV.180 Studies of atomic-bomb survivors and radiation workers have found a significant increase in the risk of cancer after exposure to as little as 20 mSv.179 Therefore, radiation dose from PET/CT scans may be a health concern. Following the exam, the short half-life of 18F means that additional precautions, such as avoiding public transportation, are not necessary.181

29
The intravenous administration of any pharmaceutical could lead to an adverse reaction. In a retrospective analysis of 81,801 administrations of PET radiopharmaceuticals, the number of serious adverse reactions reported was zero.182 Therefore, PET radiopharmaceuticals can be considered safe. All PET studies require the patient to relax for about an hour before image acquisition begins. In a whole-body PET camera, the patient must lie prone for 15 minutes to an hour, depending on the coverage of the study. No significant patient comfort issues have been reported.
Accreditation Factors The Intersocietal Commission for the Accreditation of Nuclear Medicine Laboratories
(ICANL) offers voluntary accreditation to facilities based on a peer review of their staff’s qualifications, education, equipment, quality control, and volume of clinical procedures.183
All medical and technical staff are required to meet specific minimum experience and education requirements in order for their facility to be accredited by ICANL. Options available to a facility’s medical staff range from board certification in nuclear medicine to board certification in a specialty area with a minimum number of years’ practice and volume of studies interpreted.
The accreditation program requires the technical director and all technologists working in the facility to hold the RT(N) credential from the American Registry of Radiologic Technologists (ARRT) or the CNMT credential from the Nuclear Medicine Technology Certification Board (NMTCB). In all situations, the physician is ultimately responsible to see that the appropriate images are obtained.
Findings From 2006 Review In the 2006 version of this CER, we included eight prospective diagnostic cohort studies of
226 breast lesions that were examined by whole-body PET scanning34,35,41,55,184-187 and one study of 50 patients that compared whole-body PET scanning to PET imaging with a gamma camera.188 We found that for suspicious lesions in general, at a fixed sensitivity of 95 percent, the specificity of whole-body PET scanning was only 46.7 percent. At the mean threshold of the included studies, the sensitivity of PET scanning was 82.2 percent and the specificity was 78.3 percent. There were no or insufficient data to come to any conclusions about the use of PET to evaluate any sub-populations of patients. Finally, we found that whole-body PET scanning was more accurate than gamma camera PET imaging for ruling out breast cancer. No studies of dedicated breast PET scanners met the inclusion criteria.
Evidence Base Our literature searches identified seven diagnostic cohort studies of 18-fluorodeoxyglucose
PET that met our inclusion criteria34,35,41,52-55 and one study of the diagnostic value of dual-time point FDG-PET/CT.16 All of the studies used a whole-body PET scanner. We did not identify any studies that used PEM devices and met the inclusion criteria.
The included studies enrolled 398 patients who were all women with suspicious lesions detected by physical exam, mammography, or ultrasound. Overall, a total of 403 lesions were detected. One of the studies excluded patients with lesions smaller than 1.0 cm (Brix et al.41). Patients ranged in age from 21 to 91, and reported mean ages ranged from 48.3 to 58.0, suggesting that the patient populations studied are younger than the typical breast cancer population. In all seven studies, final diagnosis was established through biopsy or surgery. One

30
study also clinically followed patients who were diagnosed as benign at biopsy (Kaida et al. 200852). The included studies are listed in Table 8 at the end of this subsection on PET, and are described in detail in the Appendixes.
The single included study of PET/CT enrolled a total of 44 patients with 55 suspicious breast lesions detected by physical examination, mammography, or ultrasound.16 No studies of dedicated breast PET scanners met the inclusion criteria.
Key Question 1. What is the accuracy of PET for diagnosis of breast cancer in women referred for further evaluation after identification of a possible breast abnormality on routine screening (mammography and/or clinical or self-detection of a palpable lesion)?
Seven studies reported results for 403 lesions in patients referred for further evaluation by whole-body PET scanning for suspicious breast lesions (abnormal mammogram and/or physical examination and/or ultrasound examination), summarized in Table 8. When combined in a mixed-effects bivariate model, the summary sensitivity of PET for all lesions was 83.0 percent (95% CI: 73.0 to 89.0%), and the summary specificity was 74.0 percent (95% CI: 58 to 86%), findings that are virtually identical to our estimates in the 2006 CER (Table 9). However, the data were found to contain significant heterogeneity (I2 = 64.0%), indicating substantial variability across the study results. The observed heterogeneity could not be explained through meta-regression using the following covariates: position (prone versus supine), enrolled mostly patients with palpable lesions (>75% vs. <75% or not reported), and blinded to patient clinical information (versus not blinded or not reported).
Because the PET data are inconsistent and imprecise, we rated the strength of evidence supporting the estimate of accuracy as “low.”
The study of PET/CT was a single-center study that enrolled a total of 44 patients with 55 suspicious breast lesions detected by physical examination, mammography, or ultrasound.16 PET scanning was performed at two time points. The first acquisition (Time 1) occurred immediately after an initial whole-body PET scan, and the second one (Time 2) occurred three hours after the first. At both time points, the images of the breast were acquired in the prone position. The CT data were used for attenuation correction, and images were reconstructed using a standard iterative algorithm.
The authors reported that dual-time point PET/CT (Time 2) demonstrated a sensitivity of 80 percent and specificity of 100 percent compared to a sensitivity of 62 percent and specificity of 100 percent for single time-point PET/CT. The authors concluded that malignant lesions showed a significant increase in FDG over time compared to benign lesions.
Key Question 2. Are there demographic (e.g., age) and clinical risk factors (e.g., morphologic characteristics of the lesion) that affect the accuracy of the tests considered in Key Question 1?
In three of the seven studies that addressed Key Question 1, the majority (>75.0%) of the women presented with palpable breast lesions— Kiada et al.52: 88.0 percent palpable, Schirrmeister et al.54: 76.0 percent, and Yutani et al.55: 93.0 percent palpable. Because there were only three studies, we could not fit the data in a bivariate model. Instead, we pooled the reported sensitivities and specificities in random-effects meta-analyses. However, the data were heterogeneous (I2 = 68.0% and I2 = 54.6% for sensitivity and specificity, respectively), indicating substantial variability among the study results. With only three studies, we did not attempt to

31
explore possible reason(s) for the heterogeneity. The overall sensitivity for primarily palpable lesions is higher than that for all seven studies considered under Key 1 (86.5% vs. 83.0%), but the specificity is lower (64.2% vs. 74.0%).
One study directly compared images acquired when patients were in prone position to images of the same patients in supine position.52 In this study by Kaida et al. 2008, 118 women with 122 lesions suspected of having breast cancer underwent whole-body PET in the supine position immediately followed by prone breast PET imaging. According to the results reported in the study, the sensitivity and specificity of images in the supine position were 83.0 percent and 50.0 percent, respectively. The sensitivity and specificity of images in the prone position were 96.0 percent and 50.0 percent, respectively.
One study, Yutani et al. 2000, reported results separately for patients with BIRADS 5, lesions 1.5 cm or larger, and who were younger than 65.55 The authors reported that PET was more sensitive for larger lesions, but the specificity was unchanged; and for the other factors, the accuracy of PET was virtually the same as for PET for all patients.
Key Question 3. Are there other factors and considerations that may affect the accuracy or acceptability of the tests considered in Key Questions 1 and 2?
None of the seven studies on stand-alone PET scanning or the one study on PET with CT reported information that addressed this question.
Previously Published Systematic Reviews We identified two systematic reviews of PET for differential diagnosis of breast lesions.
The review published by Sampson et al. in 2002 assessed the performance of PET in the differential diagnosis of benign and malignant lesions among patients with abnormal mammograms or a palpable breast mass.189,190 The review included 13 articles published before March 2001. A more recent review was written by Escalona et al. and published in 2010.191 This review included 16 studies of PET for diagnosis of breast lesions published before February 2007.
Sampson et al. performed a meta-analysis using a random-effects model, and selected a point on the summary ROC that reflected test performance, with a sensitivity of 89 percent and a specificity of 80 percent. When the prevalence of malignancy was 50 percent, 40 percent of all patients would benefit by avoiding the harm of a biopsy with negative biopsy results. However, the negative predictive value was found to only be 88 percent. For a patient with a negative PET scan, the authors concluded that a 12 percent chance of a missed or delayed diagnosis of breast cancer is too high to make it worth the 88 percent chance of avoiding biopsy of a benign lesion.189,190
Escalona et al. conducted a narrative discussion of the included studies and their findings. The authors concluded that “FDG-PET does not appear to be sufficiently accurate to be used in isolation for ruling out the presence of a primary tumour.”191
Conclusion We found that the summary sensitivity of PET for all lesions is 83.0 percent (95% CI: 73.0 to
89.0%) and the summary specificity is 74.0 percent (95% CI: 58.0 to 86.0%). The data are,

32
however, inconsistent and imprecise, therefore the strength of evidence supporting the estimate of the accuracy of PET is low.
There was insufficient data reported by the studies to conclude much about the impact of various factors on the accuracy of PET. PET may be equally accurate for evaluation of palpable lesions as for evaluation of lesions in general, but only three studies reported information about palpable lesions only.
To aid in interpretation of these findings, we used Bayes’ theorem and the summary likelihood ratios for PET used to evaluate lesions in general (see Table 10 and Table 11). These calculations suggest that PET examinations of women thought to have a higher than 5 percent chance of malignancy will not be very clinically useful for diagnostic purposes because the input provided by the PET examination would probably not affect the suspicion of malignancy sufficiently to alter clinical decisions about management of the patient (e.g., recommendations for biopsy vs. followup). A critical question for the application of this finding is whether it is feasible for clinicians to precisely estimate pretest probability in this range. Several of our expert reviewers did not think it is possible using currently available risk assessment methods. For many women a PET examination will probably not result in a change in management or affect patient outcomes. This is further illustrated in Figure 4, where models of theoretical changes in management that could be made after the use of PET are shown graphically.
Table 8. Included studies: PET and PET/CT Study PET Methods Studied Study Design* Number of Patients
Imbriaco et al. 200816 PET/CT Diagnostic cohort study 44
Kaida et al. 200852 Whole body PET Prospective cohort study 118
Buchmann et al. 200753 Whole body PET Prospective cohort study 29
Hienisch et al. 200334 Whole body PET Prospective cohort study 36
Walter et al. 200335 Whole body PET Prospective cohort study 44
Brix et al. 200141 Whole body PET Prospective cohort study 14
Schirrmeister et al. 200154 Whole body PET Prospective cohort study 117
Yutani et al. 200055 Whole body PET Prospective cohort study 40 * At times it was difficult to determine if a study was prospective or retrospective, and in those cases we defaulted to simply calling it a “diagnostic cohort study.”
Table 9. PET accuracy
Category N
Studies N
Lesions Summary Sensitivity
(95% CI) Summary Specificity
(95% CI) Strength of Evidence
PET 7 403 83.0%
(73.0 to 89.0%) 74.0%
(58.0 to 86%) Low
PET/CT 1 55 80%
(63 to 89%) 100%
(63 to 100%) Insufficient
PET, palpable lesions
3 275 86.5%
(81.4 to 90.7%) 64.2%
(49.8 to 76.9%) Low
PET, prone vs. supine
1 122 PET performed in the prone position is more sensitive
Patient position did not affect specificity of PET
Insufficient
PET, BIRADS 5 lesions
1 26 93%
(76.5% to 99.1%) 100.0%
(15.7% to 84.3%) Insufficient
PET, large lesions 1 27 79.4%
(62.1% to 91.3%) 100.0%
(2.5% to 100.0%) Insufficient
PET, patients younger than age 65
1 25 78.1%
(60.0% to 90.7%) 100.0%
(15.8% to 100.0%) Insufficient

33
Table 10. Clinical interpretations of PET accuracy: benign finding on PET
Pre-test Probability of the Lesion Being Malignant
Post-test Probability of the Lesion Being Malignant Despite a Finding of “Benign” on the PET Exam
Lesions in Generala
1% 0% (0 to 0%)
5% 1% (1 to 2%)
10% 3% (2 to 4%)
20% 6% (4 to 8%)
30% 9% (6 to 14%)
40% 14% (9 to 20%)
50% 19% (13 to 27%)
60% 26% (18 to 36%)
70% 36% (26 to 46%)
80% 49% (38 to 60%)
90% 68% (57 to 77%) a The summary negative likelihood ratio is 0.24 (95% CI: 0.15 to 0.37).
Table 11. Clinical interpretations of PET accuracy: malignant finding on PET
Pre-test Probability of the Lesion Being Malignant
Post-test Probability of the Lesion Being Malignant After a Finding of “Malignant” on the PET Exam
Lesions in Generala
1% 3% (2 to 5%)
5% 14% (9 to 22%)
10% 26% (17 to 38%)
20% 44% (32 to 57%)
30% 58% (45 to 70%)
40% 68% (56 to 78%)
50% 76% (66 to 84%)
60% 83% (74 to 89%)
70% 88% (82 to 93%)
80% 93% (88 to 96%)
90% 97% (94 to 98%) a The positive likelihood ratio is 3.2 (95% CI: 1.9 to 5.4).

34
Figure 4. Possible clinical scenarios for positron emission tomography (PET): theoretical changes in management
Scintimammography
Background
Technology Scintimammography (SMM) is similar to PET scanning in that it detects tissues that
accumulate higher levels of a radioactive tracer. The tracer most commonly used for breast examination is 99mtechnetium-sestamibi (MIBI), and this assessment will only evaluate studies that used MIBI as the tracer. MIBI has a strong affinity for breast tumors, but may also accumulate in areas of inflammation or infection.192 A method of improving visualization of tumor tissue specifically is “double phase” SMM, in which two sets of images, one acquired immediately after administration of the tracer, and one approximately 30 minutes later, are acquired and compared. Gamma cameras used for scintimammography are designed to perform either planar imaging or single photon emission tomography (SPECT). In planar imaging, each imaged point represents the superimposition of all materials in front and behind it over-laid into a two-dimensional image. This causes objects that are perpendicular to the image to appear shortened.193 SPECT is a technique that uses multiple camera heads and computer processing to create a three-dimensional representation of the administered radiopharmaceutical taken up by tissue.
Scintimammography with MIBI may have limited spatial resolution for demonstrating cancers with diameters smaller than 10 mm.194-196 The sensitivity of scintimammography has also been reported to be affected by type of tumor, size of tumor, and the phase of the menstrual cycle.197 Scintimammography has been reported to be unaffected by the presence of a breast implant or by the density of the breast tissue.197
Breast specific gamma imaging (BSGI) is an offshoot of scintimammography. In 1999, Dilon Technologies received FDA 510(k) clearance for a BSGI camera. Their current product, the Dilon 6800®, is purported to overcome the obstacles of traditional scintimammography by providing a high resolution image with a small field of view. Specifically, the manufacturer claims it can identify very early stage cancers, about 1 mm in size; is not affected by breast

35
density; can differentiate benign from malignant lesions; and is smaller than traditional gamma imaging systems, allowing for easy portability from site to site.198
Patient Safety and Comfort A typical scintimammography study exposes the patient to approximately 9 mSv.199
For comparison, a typical x-ray mammogram exposes the patient to 0.36 mSv.180 Intravenous injection of MIBI has been associated with very few reported adverse
reactions.200 A case of a patient without a past history of allergies, who developed a rash following administration of MIBI, has been reported in the literature.201 Another study reports, in addition to rash development, patients experiencing a strange taste following injection of MIBI.202
Other than removal of all clothing and jewelry above the waist, no special preparation is required of patients undergoing a scintimammography imaging study. Compared to other breast imaging procedures, scintimammography imaging takes longer to perform – forty minutes or more.203 During a typical study, the patient is placed in a prone position with the breast to be imaged hanging down.204 Although taut compression of the breast to be imaged is not required, prevention of cross-talk may require compression of the opposite breast.195,205
Accreditation Factors The Intersocietal Commission for the Accreditation of Nuclear Medicine Laboratories
(ICANL) offers voluntary accreditation to facilities based on a peer review of their staff’s qualifications, education, equipment, quality control, and volume of clinical procedures.183
All medical and technical staff are required to meet specific minimum experience and education requirements in order for their facility to be accredited by ICANL. Options available to a facility’s medical staff range from board certification in nuclear medicine to board certification in a specialty area with a minimum number of years’ practice and volume of studies interpreted.
The accreditation program requires the technical director and all technologists working in the facility to hold the RT(N) credential from the American Registry of Radiologic Technologists (ARRT) or the CNMT credential from the Nuclear Medicine Technology Certification Board (NMTCB). In all situations, the physician is ultimately responsible to see that the appropriate images are obtained.
Findings From 2006 Review Forty-four diagnostic cohort studies published in 45 manuscripts met our inclusion
criteria.32,36,44,55,85,163,166,167,185,206-241 Our analysis found that for non-palpable lesions, at a fixed 95 percent sensitivity, the specificity of scintimammography was only 39.2 percent. At the mean threshold of the included studies, the sensitivity was 68.7 percent and the specificity was 84.8 percent. For palpable lesions and suspicious breast lesions in general, there was unexplained heterogeneity in the data, and therefore summary diagnostic test characteristics were not calculated.
Evidence Base Our literature searches identified a total of 11 studies of 1,064 patients that met the inclusion
criteria for Key Question 1. One study evaluated BSGI;19 another tested planar and SPECT imaging combined;56 five studies assessed double-phase scintimammography;14,57-60 and the

36
remaining four studies assessed planar imaging.61-64 These studies are described in detail in the Appendixes, and are listed at the end of this subsection on scintimammography in Table 13.
Key Question 1. What is the accuracy of scintimammography for diagnosis of breast cancer in women referred for further evaluation after identification of a possible breast abnormality on routine screening (mammography and/or clinical or self-detection of a palpable lesion)?
When all 11 studies were combined in the analysis, regardless of imaging technique(s) used, the summary sensitivity of SMM for all lesions was 84.7 percent (78.0 to 89.7%) and the summary specificity was 77.0 percent (95% CI: 64.7 to 85.9%). We also meta-analyzed the data reported by the nine included studies that used standard SMM (planar and double-phase imaging) by fitting a bivariate mixed-effects model. The summary sensitivity of standard SMM for all lesions was 84 percent (95% CI: 76% to 89%) and the summary specificity was 79 percent (95% CI: 63% to 89%), approximately the same as for the full dataset. In 2006, we found that the sensitivity of scintimammography was 68.7 percent and the specificity was 84.8 percent. Improvements in technology and techniques since then, such as the development of double-phase imaging, may explain the improved accuracy in the more recent studies.
There was a great deal of heterogeneity (I2 = 93%) in the reported data. We were unable to identify with meta-regression any study- related characteristics that explained this heterogeneity, such as consecutive enrollment of patients, blinding of the diagnostic test reader to patient history/other clinical information, and use of the gold standard (biopsy) as the reference standard.
Key Question 2. Are there demographic (e.g., age) and clinical risk factors (e.g., morphologic characteristics of the lesion) that affect the accuracy of the tests considered in Key Question 1?
Two studies evaluated only patients with palpable breast masses,57,62 one study evaluated only patients with non-palpable breast masses,63 and one study evaluated only patients with microcalcifications detected on x-ray mammography.61 With so few studies reporting on each category, evidence-based conclusions are difficult to support.
None of the studies reported outcomes by patient demographics or any other clinical risk factors that may have affected the accuracy of SMM.
Key Question 3. Are there other factors and considerations that may affect the accuracy or acceptability of the tests considered in Key Questions 1 and 2?
None were identified.
Previously Published Systematic Reviews We identified two decision/cost effectiveness analyses and four systematic reviews of the use
of scintimammography to evaluate women after a positive mammography exam. The majority of these analyses were published prior to publication of most of the studies included in the present report. The findings of these reports are briefly summarized in Table 12. The accuracy of scintimammography reported by all four systematic reviews is very similar to our findings—a summary sensitivity of approximately 85 percent. Most of the systematic reviews reported a

37
slightly higher (approximately 85%) specificity than our finding of approximately 80 percent specificity, but the confidence interval around our estimate of 80 percent is wide (imprecise estimate).
Table 12. Other published technology assessments of scintimammography Study Methods Conclusions
Hussain and Buscombe 2006242
A meta-analysis of trials of scintimammography for diagnosis of breast cancer was performed. Studies that included more than 100 patients published since 1997 were identified and included.
The overall sensitivity was 85% and the specificity was 84%.
Liu et al. 2005243
A systematic review and meta-analysis intended to determine the value of scintimammography in diagnosing primary breast cancer. The authors of the review excluded the bulk of the published literature on the basis of “poor quality.”
The overall sensitivity was 86% and specificity was 80% for diagnosis of breast cancer by scintimammography; these numbers dropped to 69% for diagnosis of non-palpable lesions
Medical Advisory Secretariat, Ontario Ministry of Health 2003200
A systematic review of the literature on the effectiveness of scintimammography in breast cancer detection. Studies published between 1992 and 2002 were eligible for inclusion. Seven studies directly comparing ultrasound to scintimammography, and 49 studies assessing the accuracy of scintimammography, were included. The data from the included studies were combined meta-analytically using the method of Littenburg and Moses.173
The authors concluded that scintimammography is an effective imaging technique that can improve the ability to classify patients correctly. Summary receiver operating curves were shown, but no summary test characteristics were derived.
Liberman et al. 2003244
A systematic review of the literature on the accuracy of scintimammography in the diagnosis of breast cancer. The review included 64 papers published between January 1967 and December 1999. The diagnostic test characteristics were individually combined meta-analytically in a fixed-effects model. Quality of the studies was formally assessed and used to weight the studies in the meta-analysis.
The aggregated summary test characteristics for scintimammography were 85.2% sensitivity and 86.6% specificity. For patients with a palpable mass, sensitivity was 87.8% and specificity was 87.5%. For patients without a palpable mass, lesions detected by mammography, sensitivity was 66.8% and specificity was 86.9%. The authors of the review concluded that scintimammography may be used effectively as an adjunct to mammography and physical examination in the diagnosis of breast cancer.

38
Table 12. Other published technology assessments of scintimammography (continued)
Study Methods Conclusions
Allen et al. 2000245
A decision tree sensitivity analysis comparing three patient management strategies: core needle biopsy after indeterminate or positive mammograms; core needle biopsy after positive mammograms, but patients with indeterminate mammograms were examined by scintimammography, and sent for core biopsy only if positive by scintimammography; all patients with indeterminate or positive mammograms were examined by scintimammography, and sent for core biopsy only if positive by scintimammography. Values used in the analysis were derived from the general literature.
The model predicted that the use of scintimammography would save money by reducing the number of biopsies, but at a cost of lost life expectancy. The use of scintimammography after indeterminate mammograms would save $189 million per year (assuming 21 million women undergo mammographic screening per year) at a cost of a loss of 0.000178 years of mean life expectancy. The use of scintimammography after positive and indeterminate mammograms would save $420 million per year, at a cost of a loss of 0.000222 years of life expectancy.
Hillner 1997246
A decision analysis model comparing scintimammography to core biopsy and open surgical biopsy for hypothetical cohorts of women with nonpalpable breast lesions detected by mammography. The performances of scintimammography and biopsy were estimated from the general literature.
The model predicted that per 1,000 women, core biopsy would miss seven invasive and 10 in situ cancers, as compared to open surgery. Scintimammography would miss an additional 16 invasive cancers and 12 in situ cancers, as compared to core biopsy. However, most missed cancers would be detected if all women with negative findings received a 6-month followup mammography, and 65% of women undergoing scintimammography would be able to avoid any type of biopsy. Compared to undergoing immediate surgery, costs would be reduced by 20% with core biopsy, and by 39% with scintimammography. For each cancer diagnosis that was delayed by six months, the authors concluded that scintimammography would save $77,500.
Conclusion The estimates of the accuracy of various types of scintimammography, along with a rating of
the strength of evidence supporting the accuracy estimate, are summarized in Table 14. We found that the summary sensitivity of scintimammography for all lesions was 84.7 percent (95% CI: 78.0 to 89.7%) and the summary specificity was 77.0 percent (64.7 to 85.9%). The data are, however, inconsistent and imprecise, therefore the strength of evidence supporting the estimate of the accuracy of scintimammography is low.
There was insufficient data reported by the studies to conclude much about the impact of patient demographics, clinical risk factors, lesion types, or other various factors on the accuracy of scintimammography.
To aid in interpretation of these findings, we used Bayes’ theorem and the summary likelihood ratios for scintimammography used to evaluate lesions in general (see Table 15 and Table 16). These calculations suggest that SC examinations of women thought to have a higher

39
than 5 percent pre-SC probability of cancer will not be very clinically useful for diagnostic purposes because the input provided by the SC examinations would probably not affect the suspicion of malignancy sufficiently to alter clinical decisions about management of the patient (e.g., recommendations for biopsy vs. followup). Whether it is feasible for clinicians to estimate prior probability in this range is unclear; several of our expert reviewers did not think estimates could be this precise using currently available methods. For many women a SC examination will probably not result in a change in management or affect patient outcomes. In Figure 5 we illustrate models of theoretical changes in management that could be made after the use of scintimammography.
Table 13. Included studies: scintimammography
Study Scintimammography
Methods Studied Design* N Patients
Grosso et al. 200961 Planar scintimammography with patient supine and prone
Prospective diagnostic cohort 283
Habib et al. 200957 Double-phase scintimammography with patients supine and prone
Prospective diagnostic cohort 22
Kim et al. 200914 Double-phase scintimammography Prospective diagnostic cohort 249
Kim et al. 200858 Double-phase scintimammography Prospective diagnostic cohort 75
Wang et al. 200862 Planar scintimammography Prospective diagnostic cohort 55
Brem et al. 200719 BSGI Diagnostic cohort 33
Gommans et al. 200763 Planar scintimammography Prospective diagnostic cohort 101
Kim et al. 200759 Double-phase scintimammography Prospective diagnostic cohort 78
Schillaci et al. 200764 Planar scintimammography Prospective diagnostic cohort 53
Pinero et al. 200660 Double phase scintimammography Prospective diagnostic cohort 88
Mathieu et al. 200556 SPECT Retrospective chart review 37 * At times it was difficult to determine if a study was prospective or retrospective, and in those cases we defaulted to simply calling it a “diagnostic cohort study.”
Table 14. Scintimammography accuracy
Category N Studies N Lesions Summary Sensitivity (95% CI)
Summary Specificity (95% CI)
Strength of Evidence
Scintimammography, any
11 1,064 84.7%
(78.0 to 89.7%) 77.0%
(64.7 to 85.9%) Low
Scintimammography, double-phase planar
5 502 84.6%
(73.2 to 91.7%) 72.8%
(59.2 to 83.1%) Low
Scintimammography, planar
4 492 81.5%
(74.3 to 87.3%) 82.1%
(77.6 to 86.0%) Low
Scintimammography, BSGI
1 33 88.9%
(51.8 to 99.7%) 70.8%
(48.9 to 87.4%) Insufficient
Scintimammography, SPECT
1 37 95.0%
(75.1 to 99.9%) 70.6%
(44.0 to 89.7%) Insufficient
Scintimammography, palpable lesions
2 77 85.0%
(73.4 to 92.9%) 90.5%
(80.4 to 96.4%) Insufficient
Scintimammography, nonpalpable lesions
1 101 82.2%
(67.9 to 92.0%) 92.9%
(82.7 to 98.0%) Insufficient
Scintimammography, microcalcifications
1 283 78.1%
(60.0 to 90.7%) 82.5%
(77.2 to 87.0%) Insufficient

40
Table 15. Clinical interpretations of scintimammography accuracy: benign finding on scintimammography
Pre-test Probability of the Lesion Being Malignant
Post-test Probability of the Lesion Being Malignant Despite a Finding of “Benign” on the SC Exam
Lesions in Generala
1% 0% (0 to 0%)
5% 1% (1 to 2%)
10% 2% (2 to 3%)
20% 5% (3 to 6%)
30% 8% (6 to 11%)
40% 12% (9 to 16%)
50% 17% (13 to 22%)
60% 23% (18 to 29%)
70% 32% (25 to 39%)
80% 44% (36 to 52%)
90% 64% (56 to 71%) a The summary negative likelihood ratio is 0.21 (95% CI: 0.15 to 0.29).
Table 16. Clinical interpretations of scintimammography accuracy: malignant finding on scintimammography
Pre-test Probability of the Lesion Being Malignant
Post-test Probability of the Lesion Being Malignant After a Finding of “Malignant” on the Scintimammography Exam
Lesions in Generala
1% 4% (2 to 5%)
5% 17% (10 to 26%)
10% 29% (21 to 39%)
20% 48% (37 to 59%)
30% 61% (51 to 71%)
40% 71% (61 to 79%)
50% 79% (71 to 85%)
60% 85% (78 to 89%)
70% 90% (85 to 93%)
80% 94% (91 to 96%)
90% 97% (96 to 98%) a The summary positive likelihood ratio is 3.9 (95% CI: 2.2 to 6.8).

41
Figure 5. Possible clinical scenarios for scintimammography (SC): theoretical changes in management
SC = scintimammography
Ultrasound
Background
Technology Ultrasound waves are high-frequency sound waves that reflect at boundaries between tissues
with different acoustic properties. Ultrasound is commonly used to distinguish between solid breast lesions and cysts, and to guide biopsy needles.247
The most commonly used type of ultrasound (conventional, or regular, ultrasound) may be referred to as B-mode gray-scale ultrasound.248 The contrast resolution of conventional ultrasound depends on the transducer’s frequency. All modern breast imaging applications employ high frequency transducers (7 MHz or higher). Ultrasound images obtained by B-mode gray-scale imaging use differences in the brightness of the image (caused by different ways the ultrasound waves reflect and absorb off tissue interfaces) to examine the internal anatomy of the breast.248 The echoes of the sound waves are combined to form two-dimensional images of the structure of the interior of the breast. Malignant breast lesions generally appear darker on the images than the surrounding normal tissues, and often have ill-defined borders.249-251
One of the known problems with B-mode ultrasound is that interpretation of the images is primarily done by visually inspecting the image. Differences in human perception and utilization of different features for use in diagnosis cause variability in diagnosis and reader-dependent variations in the accuracy of diagnosis.249 Computer-aided diagnosis (CAD) systems are under development to address this problem. CAD systems are designed to detect patterns in images that are suggestive of malignancy, and to draw the readers’ attention to the areas of suspicion.
Compound imaging is a variant on B-mode imaging that is intended to reduce the “noise” in the image and thus improve the image quality.249 Compound imaging takes multiple ultrasound views from different angles and combines the many views into a single two-dimensional image.

42
Another variant on B-mode ultrasound is harmonic imaging. B-mode ultrasound waves develop harmonics (multiples of the transmission frequency) as they pass through breast tissue. Digital encoding can be used by computers to construct images from the harmonic frequencies.248 Harmonic images generally have improved resolution and fewer artifacts than regular B-mode ultrasound.249
Doppler ultrasound uses ultrasound to evaluate blood flow through vessels. The speed of blood flow can be evaluated by observing changes in the pitch of the reflected sound waves (the Doppler effect). Malignant masses often exhibit increased rates and amounts of blood flow (increased vascularity) in comparison to benign tissues.249 Doppler imaging can also be performed with microbubble contrast agents that enhance imaging of blood vessels.249 Two primary types of Doppler imaging exist, color and power. Color Doppler imaging encodes the mean Doppler frequency shifts at particular locations in various colors, whereas power Doppler imaging encodes the power of the signal (extent of the Doppler effect) at particular locations in various colors.252 Color Doppler therefore detects the velocity of the blood cells while power Doppler detects the amount of blood present.252
Ultrasound tomography uses ultrasound to acquire multiple images of the breast from different angles, and uses a computer to develop a 3D image of the structure of the interior of the breast. We intended to include ultrasound tomography in this systematic review, but did not identify any studies that met the inclusion criteria.
Patient Safety and Comfort Ultrasound is generally considered to be extremely safe. Ultrasound examinations that use
microbubble contrast agents have the potential for patients to react to the agents, but most reactions appear to be transient and mild, and consist of alteration of taste, facial flushing, and pain at the injection site.253
During a typical ultrasound breast imaging study, the patient is placed in a supine oblique position, with a pillow under the shoulder and the arm extended behind the head.254 Because taut compression is not required, ultrasound is generally painless. As long as routine practices are followed, ultrasound breast imaging can be considered a safe exam for most patients.
Accreditation Factors The American College of Radiology (ACR) has instituted a voluntary breast ultrasound
accreditation program that offers facilities the opportunity for peer review of their staff’s qualifications, equipment, and quality control and quality assurance programs.255
A physician supervising and interpreting breast ultrasound examinations is required to meet specific minimum experience and education requirements in order for their facility to be accredited by the ACR.
The accreditation program requires sonographers/mammographers to be certified by the American Registry of Diagnostic Medical Sonography (ARDMS), or post-primary certification (“advanced registry”) in breast sonography by the American Registry of Radiologic Technologists (ARRT), or certification by the ARRT or unrestricted state license and qualified to do mammography under Mammography Quality Standards Act (MQSA). The physician is not required to be present during breast ultrasound examinations performed by ARDMS sonographers or ARRT technologists with certification in breast sonography. However, the physician must be in the department during breast ultrasound examinations performed by ARRT

43
technologists without an advanced registry in breast sonography. In all situations, the physician is ultimately responsible to see that the appropriate images are obtained.
Findings From 2006 Review In the 2006 version of this CER, we included eight prospective diagnostic cohort studies of
5,348 breast lesions that were examined by B-mode gray-scale ultrasound.45,73,79,83,162,256-258 We found that for suspicious lesions in general, the sensitivity of ultrasound examination was 86.1 percent, the specificity was 66.4 percent, and the negative predictive value was 93.3 percent (for a population with a prevalence of disease of 25.7%). The stability of these estimates was judged to be moderate, indicating a small chance that publication of new evidence could substantially change these estimates.
Evidence Base Our literature searches identified 31 diagnostic cohort studies of various types of ultrasound
published between 1994 and 2009.18,26,45,60,65-91 These studies included a total of 8,642 patients with 9,044 breast lesions. The included studies are listed in Table 17 at the end of this subsection on ultrasound, and are described in detail in the Appendixes. A complexity in interpreting the evidence base is that some of the women enrolled in the included studies may have undergone a prior B-mode grayscale ultrasound examination before being enrolled in the study. In many cases, the studies reported that only women with “solid” lesions were included in the study, suggesting that women found to have simple cysts by ultrasound were not part of the study population. Other studies reported that women found to “clearly benign” (probably fibroadenomas and simple cysts) lesions on ultrasound were not included in the study. We believe the use of these study inclusion criteria improves the applicability of the evidence base. In standard clinical practice a woman recalled for further evaluation would, under most circumstances, undergo an ultrasound examination to rule out cysts and obviously benign lesions before being examined more thoroughly for signs of malignancy (although in standard practice the diagnostic portion of the US exam and identification of simple cysts with US would probably be conducted during the same ultrasound session).
Key Question 1. What is the accuracy of ultrasound for diagnosis of breast cancer in women referred for further evaluation after identification of a possible breast abnormality on routine screening (mammography and/or clinical or self-detection of a palpable lesion)?
B-mode 2D Grayscale Twenty-one studies of 8,199 lesions addressed the accuracy of B-mode 2D grayscale.18,26,65-83
We combined the reported data in a bivariate binomial model. The summary sensitivity of B-mode 2D grayscale ultrasound for all lesions was 92.4 percent (95% CI: 84.6 to 96.4%) and the summary specificity was 75.8 percent (60.8 to 86.3%); there was, however, considerable heterogeneity in the data (I2 = 99.6%). In our 2006 assessment, we found that for suspicious lesions in general, the sensitivity of B-mode ultrasound examination was 86.1 percent, considerably lower than the findings of the current update; and we also found in 2006 that the specificity was 66.4 percent, lower than the 75.8 percent specificity of the current update. The

44
2006 version of the report included only a small subset of the evidence base included in the current update.
We conducted meta-regressions to explore the heterogeneity in the data. The variables we investigated were: whether the studies accounted for inter-reader differences; whether the studies blinded image readers to clinical information or not; whether all diagnoses were verified by histopathology or not; whether a prospective design was used; whether the study was funded by a source without a financial interest in the results or not; whether the study enrolled consecutive/ all patients; the geographical location of the study; what type(s) of breast lesions were enrolled in the study; and the prevalence of disease in the study. Two of these variables, whether the studies accounted for inter-reader differences, and whether the studies blinded image readers to clinical information or not, were statistically significantly associated with the results (p = 0.01 and 0.03, respectively). Subgroup analyses found that studies that had blinded image readers to clinical information had a higher sensitivity (96.6% vs. 87.0%) but a much lower specificity (59.5% vs. 85.1%) than unblinded studies. Studies that had accounted for inter-reader differences had a similar sensitivity (93.4% vs. 93.0%) but a much lower specificity (52.7% vs. 90.1%) than studies that did not account for inter-reader differences.
B-mode 2D Grayscale, Contrast Enhanced Only two studies of a total of 154 breast lesions reported on the accuracy of B-mode 2D
grayscale contrast-enhanced ultrasound compared to non-contrast enhanced.26,66 Contrast enhancement was reported to increase the sensitivity (97.5% vs. 82.7%) but to not dramatically affect the specificity (76.7% vs. 74.0%).
B-mode 3D Grayscale Only one study of 150 breast lesions, Cho et al., reported on the accuracy of B-mode 3D
grayscale ultrasound.71
Color Doppler Ultrasound Six studies of a total of 718 lesions reported on the accuracy of color Doppler
ultrasound.78,80,84-87 We combined the data reported by these studies in a bivariate binomial model. The summary sensitivity of color Doppler ultrasound for all lesions was 88.5 percent (95% CI: 74.4 to 95.4%) and the summary specificity was 76.4 percent (95% CI: 61.7 to 86.7%). There was considerable heterogeneity in the data (I2 = 95.2%). Exclusion of data from two studies that enrolled only patients with palpable lesions80,85 from the bivariate model did not affect the results. There were too few studies of color Doppler to perform full meta-regressions.
Color Doppler Ultrasound, Contrast Enhanced Two studies of 146 lesions compared the accuracy of contrast-enhanced color Doppler to
non-enhanced color Doppler.84,86 Contrast-enhancement was found to slightly increase the sensitivity (97.8% vs. 95.7%) and to dramatically increase the specificity (90.7% vs. 55.6%).
Color Doppler Ultrasound Directly Compared With B-mode Grayscale Ultrasound
Two studies directly compared the accuracy of color Doppler ultrasound to B-mode grayscale ultrasound.78,80 Color Doppler was found to have a higher sensitivity (74.0% vs. 53.1%) but a lower specificity than B-mode ultrasound (84.0% vs. 96.3%).

45
Power Doppler Ultrasound Nine studies of a total of 614 lesions reported on the accuracy of power Doppler
ultrasound.65,72,75,77,86,88-91 We combined the data in a bivariate binomial model. The summary sensitivity of power Doppler ultrasound for all lesions was 70.8 percent (95% CI: 47.5 to 86.6%) and the summary specificity was 72.6 percent (95% CI: 59.9 to 82.5%). There was considerable heterogeneity in the data (I2 = 97.4%).
Power Doppler Ultrasound, Contrast Enhanced Seven studies of 403 lesions reported on the accuracy of contrast-enhanced power Doppler
ultrasound.72,75,77,86,88,90,91 When we combined the data in a bivariate binomial model, the summary sensitivity for all lesions was 89.3 percent (95% CI: 52.4 to 98.4%) and the summary specificity was 70.4 percent (95% CI: 55.4 to 82.0%). There was considerable heterogeneity in the data (I2 = 87.5%).
Power Doppler Ultrasound Directly Compared With B-mode Grayscale Ultrasound
Four studies of 248 lesions directly compared the accuracy of power Doppler ultrasound to B-mode grayscale ultrasound.65,72,75,77 Power Doppler was found to have a lower sensitivity (54.7% vs. 87.7%) but a higher specificity (79.4% vs. 50.7%) than B-mode grayscale ultrasound in these four direct comparisons.
Power Doppler Ultrasound Directly Compared With Color Doppler Ultrasound
One study directly compared the accuracy of power Doppler, with and without contrast-enhancement, to color Doppler, with and without contrast-enhancement.86 This study reported that all four methods had a 100 percent sensitivity, but specificity for contrast-enhanced methods was much higher than for non-contrast-enhanced methods.
Tissue Harmonics Only one study of 91 lesions reported on the accuracy of tissue harmonic ultrasound
methods.68
Key Question 2. Are there demographic (e.g., age) and clinical risk factors (e.g., morphologic characteristics of the lesion) that affect the accuracy of the tests considered in Key Question 1?
None were identified.
Key Question 3. Are there other factors and considerations that may affect the accuracy or acceptability of the tests considered in Key Questions 1 and 2?
None were identified.
Previously Published Systematic Reviews Flobbe et al. published a decision analysis model comparing different strategies for managing
patients presenting with palpable breast masses in 2004.259 Their decision model was based

46
entirely on data from a single clinical study they previously authored (Flobbe et al.260). This particular clinical study by Flobbe et al. was excluded from the current report because it was confounded. Findings from the ultrasound exams influenced the way each patient was managed, including whether the patient was evaluated by biopsy. Therefore the data from Flobbe et al. cannot be used to accurately estimate the diagnostic characteristics of ultrasound because the study is strongly affected by verification bias. Because the decision model developed by Flobbe et al. was based entirely upon this confounded study, the results of the decision model are also suspect and will not be discussed here.
Conclusion The estimates of the accuracy of the various types of ultrasound, along with a rating of the
strength of evidence supporting the accuracy estimate, are summarized in Table 18. We intended to evaluate ultrasound tomography, but did not identify any relevant studies that met the inclusion criteria.
Qualitative indirect and direct comparisons between different types of ultrasound imaging were also performed. B-mode grayscale ultrasound was found to be more sensitive than either power or color Doppler imaging (conclusion supported by a Low strength of evidence). Color Doppler imaging was more accurate (both more sensitive and more specific) than power Doppler imaging (conclusion supported by a Low strength of evidence). In general, contrast-enhancement was found to improve the accuracy of all types of ultrasound imaging (conclusion supported by a Low strength of evidence). However, in actual clinical practice, it is unlikely that Doppler imaging would be used in isolation; most likely Doppler imaging and B-mode imaging would be performed by the same operator during the same procedure, and the image reader would incorporate information from all of the types of imaging into the diagnosis. There is insufficient data available to reach conclusions about the accuracy of combined ultrasound modalities.
We were unable to identify any patient demographics, clinical risk factors, or other factors that affected the accuracy of the various types of ultrasound imaging. Most of the studies did not enroll women found to have obvious cysts, and therefore our findings do not apply to women who clearly have cystic lesions on ultrasound imaging.
To aid in interpretation of these findings, we used Bayes’ theorem and the summary likelihood ratios for the three primary types of ultrasound imaging (see Table 19 and Table 20). These calculations suggest that diagnostic ultrasound examinations of women thought to have a higher than 10 percent pre-ultrasound probability of cancer will not be very clinically useful for diagnostic purposes because the input provided by the ultrasound examinations would probably not affect the suspicion of malignancy sufficiently to alter clinical decisions about management of the patient (e.g., recommendations for biopsy vs. followup). These calculations suggest that ultrasound examinations may be clinically useful for diagnostic purposes for only a small subgroup of women, but clinicians would need to be able to identify women with a >0 percent but <10 percent suspicion of malignancy following standard workup. Several of our expert reviewers did not think this was currently feasible. For many women an ultrasound examination will probably not result in a change in management or affect patient outcomes. This is further illustrated in Figure 6, where models of theoretical changes in management that could be made afterthe use of diagnostic grayscale B-mode ultrasound are shown graphically.
Because most of the included studies did not enroll women found to have simple cysts or obviously benign lesions, our results did not measure the accuracy of ultrasound for identification of cysts or obviously benign lesions, and should not be applied to the use of

47
ultrasound for these purposes. Ultrasound is generally accepted to have been well-established for accurately identifying simple cysts and certain types of “obviously benign” lesions.
Table 17. Included studies: ultrasound Study US Methods Studied Design* N Patients
Gokalp et al. 200965
B-mode 2D grayscale, power Doppler, and combination of both methods
Prospective diagnostic cohort 49
Vassiou et al. 200918
B-mode 2D grayscale Prospective diagnostic cohort 69
Liu et al. 200866
B-mode 2D grayscale, with and without contrast (with Sono Vue [Bracco, Italy]), and combination of both methods
Diagnostic cohort study 108
Vade et al. 200867
B-mode 2D grayscale Retrospective chart review 20
Cha et al. 200768
B-mode 2D grayscale and tissue harmonic imaging
Prospective diagnostic cohort 88
Chala et al. 200769
B-mode 2D grayscale Retrospective chart review 203
Zhi et al. 200770
B-mode 2D grayscale Diagnostic cohort study 232
Cho et al. 200671
B-mode 2D and 3D grayscale Prospective diagnostic cohort 141
Pinero et al. 200660
Combination power Doppler and color Doppler using a contrast agent (Levovist [Schering AG, Berlin, Germany])
Prospective diagnostic cohort 88
Ricci et al. 200626
B-mode grayscale with and without contrast (with Sono Vue [Bracco, Italy]); also compared US to MRI
Prospective diagnostic cohort 48
Forsberg et al. 200472
B-mode 2D grayscale and power Doppler, with and without contrast (Levovist or Optison)
Diagnostic cohort study 55
Meyberg-Solomayer et al. 200473
B-mode 2D gray-scale Prospective diagnostic cohort 65
Ozdemir et al. 200488
Power Doppler, with or without contrast (Levovist)
Prospective diagnostic cohort 80
Chen et al. 200374
B-mode 2D gray scale Prospective diagnostic cohort 32
Kook and Kwag 200375
B-mode US and power Doppler, with and without contrast (Levovist)
Prospective diagnostic cohort 36
Marini et al. 200376
B-mode 2D grayscale Diagnostic cohort study 238
Caruso et al. 200284
Color Doppler with and without contrast (Levovist)
Prospective diagnostic cohort 36
Koukouraki et al. 200185
Color Doppler Prospective diagnostic cohort 116
Malich et al. 200145
Combination of B-mode, power Doppler, and color Doppler; also compared US to MRI
Diagnostic cohort study 94
Milz et al. 200189
Power Doppler Prospective diagnostic cohort 102
Reinikainen et al. 200177
B-mode US and power Doppler, with and without contrast (Levovist)
Prospective diagnostic cohort 63

48
Table 17. Included studies: ultrasound (continued)
Study US Methods Studied Design* N Patients
Moon et al. 200090
Power Doppler, with and without contrast (Levovist)
Prospective diagnostic cohort 69
Blohmer et al. 199978
B-mode 2D gray-scale and color Doppler Prospective diagnostic cohort 200
Chao et al. 199979
B-mode 2D gray-scale Prospective diagnostic cohort 3,050
Schroeder et al. 199986
Power and color Doppler, with and without contrast (Levovist)
Prospective diagnostic cohort 92
Albrecht et al. 199891
Power Doppler, with or without contrast (EchoGen)
Prospective diagnostic cohort 20
Wilkens et al. 199880
B-mode 2D gray-scale and color Doppler Diagnostic cohort study 53
Buadu et al. 199787
Color Doppler Diagnostic cohort study 114
Stavros et al. 199581
B-mode 2D gray-scale Prospective diagnostic cohort 622
Ciatto et al. 199482
B-mode 2D gray scale Prospective diagnostic cohort 2,079
Perre et al. 199483
B-mode 2D gray-scale Prospective diagnostic cohort 380
* At times it was difficult to determine if a study was prospective or retrospective, and in those cases we defaulted to simply calling it a “diagnostic cohort study.”
Table 18. Ultrasound accuracy: accuracy of different types of ultrasound
Type of Ultrasound N
Studies N
Lesions
Summary Sensitivity (95% CI)
Summary Specificity (95% CI)
Strength of Evidence
B-mode grayscale 2D 21 8,199 92.4%
(84.6 to 96.4%) 75.8%
(60.8 to 86.3%) Low
B-mode grayscale 2D contrast enhanced
2 154 97.5%
(91.4 to 99.7%) 76.7%
(65.4 to 85.8%) Low
B-mode grayscale 3D 1 150 98.3%
(91.1 to 100.0%) 70.0%
(59.4 to 79.2%) Insufficient
Color Doppler 6 718 88.5%
(74.4 to 95.4%) 76.4%
(61.7 to 86.7%) Low
Color Doppler contrast enhanced
2 146 97.8%
(92.4 to 99.7%) 90.7%
(79.7 to 96.9%) Low
Power Doppler 9 614 70.8%
(47.5 to 86.6%) 72.6%
(59.9 to 82.5%) Low
Power Doppler contrast enhanced
7 403 89.3%
(52.4 to 98.4%) 70.4%
(55.4 to 82.0%) Low
Tissue harmonics 1 91 96.7%
(82.8 to 99.9%) 62.3%
(49.0 to 74.4%) Insufficient

49
Table 19. Clinical interpretations of ultrasound accuracy: benign finding on ultrasound
Pre-test Probability of the Lesion Being Malignant
Post-test Probability of the Lesion Being Malignant Despite a Finding of “Benign” on the Ultrasound Exam
B-mode Grayscale 2D Ultrasounda
Power Doppler Ultrasound
Color Doppler Ultrasound
1% 0% (0 to 0%) 0% (0 to 1%) 0% (0 to 0%)
5% 1% (0 to 1%) 2% (1 to 4%) 1% (0 to 2%)
10% 1% (1 to 2%) 4% (2 to 8%) 2% (1 to 3%)
20% 2% (1 to 5%) 9% (5 to 16%) 4% (2 to 7%)
30% 4% (2 to 8%) 15% (9 to 24%) 6% (3 to 12%)
40% 6% (3 to 12%) 21% (13 to 33%) 9% (5 to 17%)
50% 9% (5 to 17%) 29% (18 to 43%) 13% (7 to 24%)
60% 13% (7 to 23%) 38% (25 to 53%) 18% (10 to 32%)
70% 19% (10 to 32%) 48% (34 to 63%) 26% (14 to 42%)
80% 29% (16 to 45%) 62% (47 to 75%) 38% (22 to 56%)
90% 47% (31 to 65%) 78% (66 to 87%) 57% (39 to 74%) a The summary negative likelihood ratio is 0.10 (95% CI: 0.049 to 0.20).
Table 20. Clinical interpretations of ultrasound accuracy: malignant finding on ultrasound
Pre-test Probability of the Lesion Being Malignant
Post-test Probability of the Lesion Being Malignant After a Finding of “Malignant” on the Ultrasound Exam
B-mode Grayscale 2D Ultrasounda
Power Doppler Ultrasound
Color Doppler Ultrasound
1% 4% (2 to 7%) 3% (2 to 4%) 4% (2 to 6%)
5% 17% (5 to 11%) 12% (9 to 16%) 17% (11 to 24%)
10% 30% (20 to 42%) 22% (17 to 29%) 29% (21 to 40%)
20% 49% (36 to 62%) 39% (32 to 47%) 48% (38 to 62%)
30% 62% (49 to 73%) 53% (45 to 61%) 62% (51 to 72%)
40% 72% (60 to 81%) 63% (56 to 71%) 71% (62 to 80%)
50% 79% (69 to 86%) 72% (66 to 78%) 79% (71 to 86%)
60% 85% (77 to 91%) 80% (74 to 84%) 85% (78 to 90%)
70% 90% (84 to 94%) 86% (82 to 89%) 90% (85 to 93%)
80% 94% (90 to 96%) 91% (88 to 94%) 94% (91 to 96%)
90% 97% (95 to 98%) 96% (94 to 97%) 97% (96 to 98%) a The summary positive likelihood ratio is 3.8 (95% CI: 2.3 to 0.96).

50
Figure 6. Possible clinical scenarios for B-mode grayscale ultrasound (US): theoretical changes in management
Comparative Accuracy and Safety We identified three studies that directly compared PET and MRI34,35,41 and one study that
directly compared PET/CT and MRI.16 There was no consistent pattern of relative accuracy across the three studies that directly compared PET and MRI. Imbracio et al. directly compared the diagnostic accuracy of PET/CT and MRI in the same set of patients.16 MRI was more sensitive but less specific than PET/CT in diagnosing breast lesions in this study.16 A qualitative indirect comparison of the summary accuracy estimates from the other sections of this report suggests that MRI is more sensitive than PET, but the two imaging methods have approximately the same specificity. Indirect comparisons may be inaccurate and should be used with extreme caution.
We identified two studies that directly compared B-mode grayscale ultrasound to MRI,18,26 and one study that compared a combination of several Doppler ultrasound methods to MRI.45 All three studies found that MRI was more sensitive than ultrasound for diagnosing breast lesions (results for specificity were inconsistent across studies). A qualitative indirect comparison of the summary accuracy estimates from the other sections of this report suggest that the two imaging methods are of approximately equal accuracy. As mentioned above, indirect comparisons should only be used with extreme skepticism about their accuracy.
We identified one study that directly compared scintimammography to a combination of several Doppler ultrasound methods60 that found the two methods were approximately equally accurate, with a slightly higher sensitivity for scintimammography. Qualitative indirect comparisons of the summary accuracy estimates from the other sections of this report suggest that ultrasound may be slightly more sensitive than scintimammography, but this finding should not be considered to be supported by solid evidence (see comments above about indirect comparisons).
We identified one study14 that directly compared scintimammography and MRI, and found MRI to be more sensitive but less specific than scintimammography. A qualitative indirect comparison of the summary accuracy estimates from the other sections of this report concurs with the direct comparison conclusion. We also identified one study19 that directly compared

51
MRI to a variant of scintimammography (BSGI) with similar findings (MRI more sensitive but less specific than BSGI).
The summary estimates of accuracy of each modality are shown in Table 21, and comparative safety concerns are shown in Table 22. The data suggest, but do not prove, that ultrasound and MRI are more accurate than PET or scintimammography for evaluation of suspicious breast lesions. Because the evidence supporting these comparisons is, for the most part, indirect in nature, and not reported in sufficient detail to support statistical testing, we have refrained from drawing any solid evidence-based conclusions about comparisons across technologies.
Table 21. Summary accuracy results
Technology N
Studies N
Lesions
Summary Sensitivity (95% CI)
Summary Specificity (95% CI)
Post-test Probability of “Malignancy”a
Strength of
Evidence
B-mode grayscale 2D
21 8,199 92.4%
(84.6 to 96.4%)
75.8% (60.8 to 86.3%)
2% (1 to 5%)
Low
MRI 41 3,882 91.7%
(88.5 to 94.1%)
77.5% (71.0 to 82.9%)
3% (2 to 4%)
Moderate (sensitivity)/ Low (specificity)
Scintimammography 11 1,064 84.7%
(78.0 to 89.7%)
77.0% (64.7 to 85.9%)
5% (3 to 6%)
Low
PET 7 403 83.0%
(73.0 to 89.0%)
74.0% (58.0 to 86%)
6% (4 to 8%)
Low
a Post-test probability of a lesion being “malignant” after a benign finding on the test for a typical woman with an estimated 20% chance of having a malignant lesion.
Table 22. Comparative safety concerns
Technology Radiation Exposure
Possible Contrast Agent Reactions Other Concerns
B-mode grayscale 2D None None None
MRI None Rare cases of nephrotoxicity and rare cases of severe allergic reactions
Accidental injury from the magnetic field
Scintimammography 9.0 mSv Rare cases of severe allergic reactions
None
PET 7.6 mSv Rare cases of severe allergic reactions
None
X-ray mammographya 0.36 mSv None None a Provided for comparison purposes.

52
Summary and Discussion After identification of a possible abnormality on screening mammography or physical
examination, women typically undergo additional imaging studies (diagnostic mammography) and a physical examination. If these studies suggest the abnormality may be malignant, a biopsy of the suspicious area may be recommended. This evidence review focuses on the noninvasive imaging studies conducted after the discovery of a possible abnormality on screening mammography or physical examination - studies intended to guide patient management decisions. In other words, these studies are not intended to provide a final diagnosis as to the nature of the breast lesion; rather, they are intended to provide additional information about the nature of the lesion such that women can be appropriately triaged into “biopsy,” “watchful waiting,” or “return to normal screening intervals” care pathways.
According to the American College of Radiology, the threshold of suspicion at which management of women changes is 2 percent.92 After recall and workup, women with a suspicion of malignancy greater than 2 percent are generally advised to undergo tissue sampling of some kind (i.e., biopsy), and women with a lower suspicion of malignancy are triaged into imaging pathways. We used the 2 percent threshold to explore the clinical usefulness of the various noninvasive imaging technologies as add-ons to the current standard of care, namely, if a woman was recalled for evaluation after a screening mammography, and received standard of care workup vs. standard of care workup plus the noninvasive imaging technology, would the use of the noninvasive imaging technology be likely to alter the recommendations for care after the workup?
For all of the technologies evaluated in this assessment, only women with a low suspicion of malignancy after standard of care workup might be expected to experience a change in management decisions as a result of additional noninvasive imaging. A woman with a ≤12 percent suspicion of malignancy who has benign findings on MRI could have her suspicion of malignancy drop below the 2 percent threshold, and therefore she might be assigned to short-interval imaging followup management rather than tissue sampling management; a woman with a 1 percent suspicion of malignancy who has benign findings on MRI could have her suspicion of malignancy drop to near 0 percent and therefore she might be assigned to return to normal screening rather than short-interval followup imaging; a woman with a 1 percent suspicion of malignancy who has malignant findings on MRI could have her suspicion of malignancy increase to 4 percent and therefore she might be assigned to tissue sampling management rather than short-interval followup. The equivalent thresholds of pretest suspicion of malignancy at which additional imaging may change management are: for B-mode grayscale ultrasound, 1 to 10 percent; for scintimammography, 1 to 5 percent; and for PET, 1 to 5 percent.
Only women with a low suspicion of malignancy on standard of care workup might be expected to experience a change in management decisions as a result of additional noninvasive imaging. Clinicians can estimate the risk of malignancy by using patient age, family and personal history details, details of the mammographic images, and results of physical examination.261,262 Current standard practice already requires clinicians to estimate patient risk of malignancy. BI-RADS scores, for example, are estimates of patient risk of malignancy. Information is available that can be used to generate more precise estimates. For example, Wiratkapun et al. recently reported that a large cohort of women classified as BI-RADS 4 after diagnostic mammography were subsequently found to have a 20 percent prevalence of breast cancer, indicating that the methods used by this center to assign women as BI-RADS 4 were estimating that these women
53
had a 20 percent probability of malignancy. Wiratkapun et al. performed a retrospective analysis of clinical risk factors and details of the mammographic images and found that these women could be classified into sub-categories that had cancer prevalences that ranged from as low as 9 percent to as high as 57 percent.261
Therefore, if the 2 percent threshold is chosen, the use of noninvasive imaging in addition to standard workup may be clinically useful for diagnostic purposes only for women with a low (generally, less than 12%) suspicion of malignancy. When choosing which noninvasive imaging technology to use for this purpose, diagnostic B-mode grayscale ultrasound and MRI appear to more accurate than PET, scintimammography, or the other types of ultrasound (Doppler) that were evaluated in this comparative effectiveness review.
Noninvasive imaging appears to be an acceptable option for many women. Liang et al. invited a series of women referred for breast biopsy to undergo an additional mammographic exam, MRI, and scintimammography before the biopsy.263 The women reported that MRI and scintimammography were much more comfortable than mammography, and that they would rather have additional noninvasive tests, even if they had to pay extra money out of pocket, instead of proceeding to immediate biopsy (assuming the results of the noninvasive tests were very accurate).
Several of our expert peer reviewers did not think that it is currently feasible for clinicians to estimate pre-test probability with sufficient precision to identify women with >0 but <5, 10 or 12 percent suspicion of malignancy after standard work-up. If it is not possible, then it is unlikely that these findings can be applied in practice. Furthermore, there are possible harms from noninvasive imaging, such as radiation exposure, that also need to be considered during decision-making.
Changes Since 2006 This CER is an update of a CER finalized in 2006. The updated results are, in general,
very similar to the findings of the 2006 report. For MRI, in 2006 we found that the sensitivity was 92.5 percent and the specificity was 75.5 percent; the updated evidence base supported estimates of 91.7 percent sensitivity and 77.5 percent specificity. In both reports, MRI was found to be less sensitive (approximately 85%) for evaluation of microcalcifications than for evaluation of lesions in general. For PET, in 2006 we found that the sensitivity was 82.2 percent and the specificity was 78.3 percent; the updated evidence base supported estimates of 83.0 percent sensitivity and 74.0 percent specificity. In the updated report we attempted to evaluate the accuracy of PET/CT, but only one study that met the inclusion criteria was identified.
For scintimammography, the updated evidence base identified a sensitivity of 84.7 percent, much higher than the sensitivity estimate from 2006 of 68.7 percent. Specificity was estimated at 84.8 percent in 2006, and at 77.0 percent in the update; however, the confidence intervals around the updated estimate of specificity are wide. It is possible that improvements in the technology in the last few years improved the sensitivity of the technique.
For ultrasound, in 2006 we only evaluated a relatively small subset of studies of B-mode grayscale ultrasound, and estimated a sensitivity of 86.1 percent and a specificity of 66.4 percent. The update included a significantly expanded evidence base on B-mode grayscale ultrasound, and identified a sensitivity of 92.4 percent and specificity of 75.8 percent. In the update we included numerous other types of ultrasound, including power and color Doppler ultrasound, that were not studied in the 2006 report.

54
Limitations of the Evidence Base The majority of conclusions about accuracy were rated as supported by “Low” strength of
evidence. The evidence bases were rated as Low rather than Moderate or High due primarily to the heterogeneity of the results (inconsistency). All of the evidence bases were found to contain significant heterogeneity, and exploratory meta-regressions did not identify satisfactory explanations for the heterogeneity.
Another limitation of the evidence base is that most of the studies included only patients who had been referred for biopsy or surgery. Therefore the patient population under study does not contain a good representation of patients thought to be at sufficiently low risk of malignancy that additional imaging would be considered rather than immediate biopsy. The studies also did not distinguish between patients diagnosed with DCIS vs. invasive cancer; this point is important in addressing the consequences of delayed diagnoses of cancer, because a delay in diagnosis of DCIS may not be as harmful as a delay in diagnosis of invasive cancer. In addition, little information was reported about different patient subgroups, making it difficult to address Key Questions 2 and 3.
Applicability We used inclusion criteria intended to restrict the evidence base to only those studies that
included the population of interest: women of average baseline risk after discovery of a suspicious lesion on routine screening who had already undergone standard recall and workup (diagnostic x-ray mammography). “Women of average baseline risk” refers to women who do not have a strong family history of breast cancer, do not carry a known genetic susceptibility mutation, do not have a prior personal history of breast cancer, and are not presenting for examination because of an overt symptom such as nipple discharge. However, the patient populations studied had much higher prevalences of cancers than would be expected if the populations were actually representative of the patient population of interest. The prevalence of cancers in the general population sent for breast biopsy (in the U.S.) has been reported to be approximately 20 to 30 percent percent.103 The population of interest includes not only those women who will be referred for biopsy, but should also include women who will be referred for short interval followup, and therefore the expected prevalence of cancers in the population of interest should be lower than 20 percent. However, the prevalence of cancers in the included studies was 25.8 percent for ultrasound, 54.5 percent for MRI, 56 percent for scintimammography, and 75.9 percent for PET. One reason for the elevated prevalence is that the studies generally attempted to use the “gold standard” reference to verify diagnoses (histopathology), and therefore many of the studies only enrolled patients who subsequently underwent biopsy or surgery. An additional possible reason for the elevated prevalence of disease is the fact that many of the studies were conducted in non-U.S. locations, where the prevalence of cancers in populations sent for biopsy has been reported to be 60 to 70 percent.264
The patient populations studied are therefore not truly representative of the patient population of interest. It is possible that the accuracy estimates we derived from these studies do not apply to women thought to be at sufficiently low risk of malignancy that additional imaging would be considered rather than immediate biopsy.

55
Possible Impact of Key Assumptions on the Conclusions The key assumption made was that the “reference standard,” a combination of biopsy,
open surgery, and patient followup, was 100 percent accurate. Open surgery has been reported to have a false-negative rate of approximately 1 to 2 percent.265 Biopsy and patient followup have error rates higher than open surgery. Therefore some of the reference standard diagnoses were almost certainly incorrect. However, the errors should consist of a low rate of both false-negatives and false-positives, which should not systematically bias the results in any one direction. It seems unlikely that our estimates of diagnostic accuracy are significantly different from the “true” accuracy solely due to errors made by the reference standard diagnoses.
In addition, we have assumed the ACR’s suggested threshold of “change of management” of 2 percent is applicable and valid. It is possible that some patients or physicians may wish to use a different threshold. For example, a patient who has a strong desire to avoid biopsy may prefer the use of a higher threshold, whereas a patient who has a strong desire to avoid any uncertainty about breast cancer at all may prefer the use of a lower threshold. However, our results can be directly applied to such situations. Our post-test probability calculations can simply have a different threshold of “change in management” applied in order to derive theoretical models of the impact of the use of the different threshold on management decisions.
Future Research The strength of the evidence supporting the conclusions about accuracy in this assessment
was in general rated as “low” primarily due to imprecise estimates of accuracy (wide confidence intervals) and/or inconsistencies across studies (heterogeneity). While further studies on the diagnostic accuracy of the noninvasive technologies evaluated are unlikely to substantially change the conclusions, the publication of additional diagnostic accuracy studies may increase the precision of the estimates of accuracy, and provide enough additional information to allow productive exploration into the causes of the heterogeneity. An additional limitation of the evidence base that could be explored in future research is inclusion of women thought to be at low risk of malignancy - the majority of the published studies only included women thought to be at moderate to high risk of malignancy.
One primary shortcoming in the current evidence base is the lack of evidence for specific subgroups of lesion types. For example, while we were able to determine the accuracy of MRI for patients presenting with microcalcifications, we were unable to determine the accuracy of PET, ultrasound, or scintimammography for patients presenting with microcalcifications due to lack of evidence. We had also hoped to be able to study the impact of variations in MRI methodology on the accuracy, but the many variations of imaging methods in use and the inconsistency in reporting across studies precluded any such analysis. Also, due to lack of evidence we were unable to determine the impact of patient characteristics such as age on the accuracy of the various imaging methods. Future diagnostic accuracy studies that report data for specific subgroups of patients or directly compare different imaging methods would be helpful in addressing these unanswered questions.
Studies of new technologies, and improvements in current technologies, are of course essential. For example, the use of computer-aided diagnosis software (CADx) to help interpret MRI images is a technology that appears to be rapidly diffusing, yet there is little clinical evidence available at this time on the impact of CADx on MRI accuracy.

56
A number of expert reviewers of this report commented that, based on the current state of knowledge, it is impossible to predict the pre-test probability of malignancy with sufficient accuracy to allow the findings of this technology report to be directly used in clinical practice. Therefore, continued research to improve clinicians’ ability to accurately estimate a woman’s probability of malignancy prior to diagnostic tests could also help to avoid missing cancers and to avoid unnecessary biopsies.
Future research efforts should also be turned to studies that report the impact of the use of noninvasive imaging on management decisions and patient-oriented outcomes. The ideal design for such a study would be a randomized controlled trial in which one group undergoes noninvasive imaging and one does not; the noninvasive imaging results are then used in management decisions; and the patients are followed up for long periods of time to determine the downstream impact of the use of noninvasive imaging on survival and quality of life. Admittedly such studies may be logistically difficult to conduct. When randomized trials are difficult to perform for logistical reasons, modeling studies are often considered acceptable methods of providing information about links between diagnostic testing strategies and patient outcomes.
The diagnostic thresholds that trigger invasive diagnostic testing should also be studied in the context of the addition of noninvasive imaging to standard protocols. Current standard of care results in large numbers of healthy women undergoing invasive diagnostic procedures, and many women may be undergoing treatment for small early-stage breast cancers that will never become clinically relevant even if not diagnosed and treated.5,103,266,267 The diagnostic thresholds in current use are intended to reduce the rate of missed cancers, which by necessity causes a loss of specificity. The low thresholds are also intended to partially compensate for diagnostic inaccuracy of tests in current use. The hope is that the addition of new kinds of noninvasive imaging to standard protocols may be able to reduce the number of false-positives without increasing the number of false-negatives. The thresholds used in clinical practice to trigger implementation of invasive diagnostic testing and treatment should be based on solid evidence about patient benefit-to-harm ratios derived from controlled trials and modeling studies.

57
References 1. American Cancer Society (ACS).
Cancer facts & figures 2010. Atlanta (GA): American Cancer Society (ACS); 2010. 68 p. www.cancer.org/acs/groups/content/ @epidemiologysurveilance/documents/document/acspc-026238.pdf.
2. U.S. Preventive Services Task Force (USPSTF). Screening for breast cancer: recommendations and rationale. Washington (DC): Agency for Healthcare Research and Quality (AHRQ); 2002 Feb. 10 p. (AHRQ Pub.; no. 02-507A). www.ahrq.gov/clinic/3rduspstf/breastcancer.
3. Humphrey LL, Helfand M, Chan BK, et al. Breast cancer screening: a summary of the evidence for the U.S. Preventive Services Task Force. Ann Intern Med 2002 Sep 3;137(5 Part 1):347-67. PMID: 12204020
4. U.S. Preventive Services Task Force. Screening for breast cancer: U.S. Preventive Services Task Force recommendation statement. Ann Intern Med 2009 Nov 17;151(10):716-26, W-236. PMID: 19920272
5. Elmore JG, Barton MB, Moceri VM, et al. Ten-year risk of false positive screening mammograms and clinical breast examinations. N Engl J Med 1998 Apr 16;338(16):1089-96. PMID: 9545356
6. Rosenberg RD, Yankaskas BC, Abraham LA, et al. Performance benchmarks for screening mammography. Radiology 2006 Oct;241(1):55-66. PMID: 16990671
7. Bruening W, Launders J, Pinkney N, et al. Effectiveness of noninvasive diagnostic tests for breast abnormalities (Prepared by ECRI Evidence-based Practice center under Contract No. 290-02-0019). Rockville (MD): Agency for Healthcare Research and Quality (AHRQ); 2006. 130 p. (Comparative effectiveness review; no. 2). http://effectivehealthcare.ahrq.gov/repFiles/BrCADx%20Final%20Report.pdf.
8. Harbord RM, Deeks JJ, Egger M, et al. A unification of models for meta-analysis of diagnostic accuracy studies. Biostatistics 2007 Apr;8(2):239-51. PMID: 16698768
9. STATA statistics/data analysis. MP parallel edition. College Station (TX): StataCorp; 1984-2007. Single user Stata for Windows. www.stata.com.
10. Zamora J, Abraira V, Muriel A, et al. Meta-DiSc: a software for meta-analysis of test accuracy data. BMC Med Res Methodol 2006;6:31. PMID: 16836745
11. Akita A, Tanimoto A, Jinno H, et al. The clinical value of bilateral breast MR imaging: is it worth performing on patients showing suspicious microcalcifications on mammography? Eur Radiol 2009 Sep;19(9):2089-96. PMID: 19350244
12. Baltzer PA, Freiberg C, Beger S, et al. Clinical MR-mammography: are computer-assisted methods superior to visual or manual measurements for curve type analysis? A systematic approach. Acad Radiol 2009 Sep;16(9):1070-6. PMID: 19523854
13. Hara M, Watanabe T, Okumura A, et al. Angle between 1 and 4 min gives the most significant difference in time-intensity curves between benign disease and breast cancer: analysis of dynamic magnetic resonance imaging in 103 patients with breast lesions. Clin Imaging 2009 Sep-Oct;33(5):335-42. PMID: 19712811
14. Kim IJ, Kim YK, Kim SJ. Detection and prediction of breast cancer using couble phase Tc-99m MIBI scintimammography in comparison with MRI. Onkologie 2009 Oct;32(10):556-60. PMID: 19816071
15. Lo GG, Ai V, Chan JK, et al. Diffusion-weighted magnetic resonance imaging of breast lesions: first experiences at 3 T. J Comput Assist Tomogr 2009 Jan-Feb;33(1):63-9. PMID: 19188787
16. Imbriaco M, Caprio MG, Limite G, et al. Dual-time-point 18F-FDG PET/CT versus dynamic breast MRI of suspicious breast lesions. AJR Am J Roentgenol 2008 Nov;191(5):1323-30. PMID: 18941064

58
17. Pediconi F, Catalano C, Padula S, et al. Contrast-enhanced MR mammography: improved lesion detection and differentiation with gadobenate dimeglumine. AJR Am J Roentgenol 2008 Nov;191(5):1339-46. PMID: 18941066
18. Vassiou K, Kanavou T, Vlychou M, et al. Characterization of breast lesions with CE-MR multimodal morphological and kinetic analysis: comparison with conventional mammography and high-resolution ultrasound. Eur J Radiol 2009 Apr;70(1):69-76. PMID: 18295425
19. Brem RF, Petrovitch I, et al. Breast-specific gamma imaging with 99mTc-Sestamibi and magnetic resonance imaging in the diagnosis of breast cancer--a comparative study. Breast J 2007 Sep-Oct;13(5):465-9. PMID: 17760667
20. Cilotti A, Iacconi C, Marini C, et al. Contrast-enhanced MR imaging in patients with BI-RADS 3-5 microcalcifications. Radiol Med 2007 Mar;112(2):272-86. PMID: 17361370
21. Pediconi F, Catalano C, Padula S, et al. Contrast-enhanced magnetic resonance mammography: does it affect surgical decision-making in patients with breast cancer? Breast Cancer Res Treat 2007 Nov;106(1):65-74. PMID: 17203383
22. Zhu J, Kurihara Y, Kanemaki Y, et al. Diagnostic accuracy of high-resolution MRI using a microscopy coil for patients with presumed DCIS following mammography screening. J Magn Reson Imaging 2007 Jan;25(1):96-103. PMID: 17154376
23. Bazzocchi M, Zuiani C, Panizza P, et al. Contrast-enhanced breast MRI in patients with suspicious microcalcifications on mammography: results of a multicenter trial. AJR Am J Roentgenol 2006 Jun;186(6):1723-32. PMID: 16714666
24. Gokalp G, Topal U. MR imaging in probably benign lesions (BI-RADS category 3) of the breast. Eur J Radiol 2006 Mar;57(3):436-44. PMID: 16316732
25. Kneeshaw PJ, Lowry M, Manton D, et al. Differentiation of benign from malignant breast disease associated with screening detected microcalcifications using dynamic contrast enhanced magnetic resonance imaging. Breast 2006 Feb;15(1):29-38. PMID: 16002292
26. Ricci P, Cantisani V, Ballesio L, et al. Benign and malignant breast lesions: efficacy of real time contrast-enhanced ultrasound vs. magnetic resonance imaging. Ultraschall Med 2007 Feb;28(1):57-62. PMID: 17304413
27. Pediconi F, Catalano C, Venditti F, et al. Color-coded automated signal intensity curves for detection and characterization of breast lesions: preliminary evaluation of a new software package for integrated magnetic resonance-based breast imaging. Invest Radiol 2005 Jul;40(7):448-57. PMID: 15973137
28. Pediconi F, Catalano C, Occhiato R, et al. Breast lesion detection and characterization at contrast-enhanced MR mammography: gadobenate dimeglumine versus gadopentetate dimeglumine. Radiology 2005 Oct;237(1):45-56. PMID: 16126926
29. Wiener JI, Schilling KJ, Adami C, et al. Assessment of suspected breast cancer by MRI: a prospective clinical trial using a combined kinetic and morphologic analysis. AJR Am J Roentgenol 2005 Mar;184(3):878-86. PMID: 15728612
30. Bluemke DA, Gatsonis CA, Chen MH, et al. Magnetic resonance imaging of the breast prior to biopsy. JAMA 2004 Dec 8;292(22):2735-42. PMID: 15585733
31. Huang W, Fisher PR, Dulaimy K, et al. Detection of breast malignancy: diagnostic MR protocol for improved specificity. Radiology 2004 Aug;232(2):585-91. PMID: 15205478
32. Bone B, Wiberg MK, Szabo BK, et al. Comparison of 99mTc-sestamibi scintimammography and dynamic MR imaging as adjuncts to mammography in the diagnosis of breast cancer. Acta Radiol 2003 Jan;44(1):28-34. PMID: 12630995

59
33. Daldrup-Link HE, Kaiser A, Helbich T, et al. Macromolecular contrast medium (feruglose) versus small molecular contrast medium (gadopentetate) enhanced magnetic resonance imaging: differentiation of benign and malignant breast lesions. Acad Radiol 2003 Nov;10(11):1237-46. PMID: 14626298
34. Heinisch M, Gallowitsch HJ, Mikosch P, et al. Comparison of FDG-PET and dynamic contrast-enhanced MRI in the evaluation of suggestive breast lesions. Breast 2003 Feb;12(1):17-22. PMID: 14659351
35. Walter C, Scheidhauer K, Scharl A, et al. Clinical and diagnostic value of preoperative MR mammography and FDG-PET in suspicious breast lesions. Eur Radiol 2003 Jul;13(7):1651-6. PMID: 12835981
36. Guo Y, Cai YQ, Cai ZL, et al. Differentiation of clinically benign and malignant breast lesions using diffusion-weighted imaging. J Magn Reson Imaging 2002 Aug;16(2):172-8. PMID: 12203765
37. Kelcz F, Furman-Haran E, Grobgeld D, et al. Clinical testing of high-spatial-resolution parametric contrast-enhanced MR imaging of the breast. AJR Am J Roentgenol 2002 Dec;179(6):1485-92. PMID: 12438042
38. Schedel H, Oellinger H, Kohlschein P, et al. Magnetic Resonance Female Breast Imaging (MRFBI) - evaluation of the changes in signal intensity over time pre- and post-administration of 0.2 mmol/kg Gd-DTPA. Zentralbl Gynakol 2002 Feb;124(2):104-10. PMID: 11935495
39. Trecate G, Tess JD, Vergnaghi D, et al. Breast microcalcifications studied with 3D contrast-enhanced high-field magnetic resonance imaging: more accuracy in the diagnosis of breast cancer. Tumori 2002 May-Jun;88(3):224-33. PMID: 12195761
40. Kristoffersen Wiberg M, Aspelin P, Perbeck L, et al. Value of MR imaging in clinical evaluation of breast lesions. Acta Radiol 2002 May;43(3):275-81. PMID: 12100324
41. Brix G, Henze M, et al. Comparison of pharmacokinetic MRI and [18F] fluorodeoxyglucose PET in the diagnosis of breast cancer: initial experience. Eur Radiol 2001;11(10):2058-70. PMID: 11702142
42. Cecil KM, Schnall MD, Siegelman ES, et al. The evaluation of human breast lesions with magnetic resonance imaging and proton magnetic resonance spectroscopy. Breast Cancer Res Treat 2001 Jul;68(1):45-54. PMID: 11678308
43. Furman-Haran E, Grobgeld D, Kelcz F, et al. Critical role of spatial resolution in dynamic contrast-enhanced breast MRI. J Magn Reson Imaging 2001 Jun;13(6):862-7. PMID: 11382945
44. Imbriaco M, Del Vecchio S, Riccardi A, et al. Scintimammography with 99mTc-MIBI versus dynamic MRI for non-invasive characterization of breast masses. Eur J Nucl Med 2001 Jan;28(1):56-63. PMID: 11202453
45. Malich A, Boehm T, Facius M, et al. Differentiation of mammographically suspicious lesions: evaluation of breast ultrasound, MRI mammography and electrical impedance scanning as adjunctive technologies in breast cancer detection. Clin Radiol 2001 Apr;56(4):278-83. PMID: 11286578
46. Nakahara H, Namba K, Fukami A, et al. Three-dimensional MR imaging of mammographically detected suspicious microcalcifications. Breast Cancer 2001;8(2):116-24. PMID: 11342984
47. Torheim G, Godtliebsen F, Axelson D, et al. Feature extraction and classification of dynamic contrast-enhanced T2*-weighted breast image data. IEEE Trans Med Imaging 2001 Dec;20(12):1293-301. PMID: 11811829
48. Wedegartner U, Bick U, Wortler K, et al. Differentiation between benign and malignant findings on MR-mammography: usefulness of morphological criteria. Eur Radiol 2001;11(9):1645-50. PMID: 11511885
49. Yeung DK, Cheung HS, Tse GM. Human breast lesions: characterization with contrast-enhanced in vivo proton MR spectroscopy--initial results. Radiology 2001 Jul;220(1):40-6. PMID: 11425970

60
50. Kvistad KA, Rydland J, Vainio J, et al. Breast lesions: evaluation with dynamic contrast-enhanced T1-weighted MR imaging and with T2*-weighted first-pass perfusion MR imaging. Radiology 2000 Aug;216(2):545-53. PMID: 10924584
51. Van Goethem M, Biltjes IG, De Schepper AM. Indications for MR mammography. A Belgian study. JBR-BTR 2000 Jun;83(3):126-9. PMID: 11025925
52. Kaida H, Ishibashi M, Fuji T, et al. Improved breast cancer detection of prone breast fluorodeoxyglucose-PET in 118 patients. Nucl Med Commun 2008 Oct;29(10):885-93. PMID: 18769306
53. Buchmann I, Riedmuller K, Hoffner S, et al. Comparison of 99mtechnetium-pertechnetate and 123iodide SPECT with FDG-PET in patients suspicious for breast cancer. Cancer Biother Radiopharm 2007 Dec;22(6):779-89. PMID: 18158769
54. Schirrmeister H, Kuhn T, Guhlmann A, et al. Fluorine-18 2-deoxy-2-fluoro-D-glucose PET in the preoperative staging of breast cancer: comparison with the standard staging procedures. Eur J Nucl Med 2001 Mar;28(3):351-8. PMID: 11315604
55. Yutani K, Shiba E, Kusuoka H, et al. Comparison of FDG-PET with MIBI-SPECT in the detection of breast cancer and axillary lymph node metastasis. J Comput Assist Tomogr 2000 Mar-Apr;24(2):274-80. PMID: 10752892
56. Mathieu I, Mazy S, Willemart B, et al. Inconclusive triple diagnosis in breast cancer imaging: is there a place for scintimammography? J Nucl Med 2005 Oct;46(10):1574-81. PMID: 16204705
57. Habib S, Maseeh-uz-Zaman, Hameed A, et al. Diagnostic accuracy of Tc-99m-MIBI for breast carcinoma in correlation with mammography and sonography. J Coll Physicians Surg Pak 2009 Oct;19(10):622-6. PMID: 19811712
58. Kim IJ, Kim SJ, Kim YK. Comparison of double phase Tc-99m MIBI and Tc-99m tetrofosmin scintimammography for characterization of breast lesions: Visual and quantitative analyses. Neoplasma 2008;55(6):526-31. PMID: 18999882
59. Kim SJ, Bae YT, Lee JS, et al. Diagnostic performances of double-phase tc-99m MIBI scintimammography in patients with indeterminate ultrasound findings: visual and quantitative analyses. Ann Nucl Med 2007 Jun;21(3):145-50. PMID: 17561585
60. Pinero A, Galindo PJ, Illana J, et al. Diagnostic efficiency of sestamibi gammagraphy and Doppler sonography in the preoperative assessment of breast lesions. Clin Transl Oncol 2006 Feb;8(2):103-7. PMID: 16632424
61. Grosso M, Chiacchio S, Bianchi F, et al. Comparison between 99mTc-sestamibi scintimammography and X-ray mammography in the characterization of clusters of microcalcifications: a prospective long-term study. Anticancer Res 2009 Oct;29(10):4251-7. PMID: 19846982
62. Wang F, Wang Z, Wu J, et al. The role of technetium-99m-labeled octreotide acetate scintigraphy in suspected breast cancer and correlates with expression of SSTR. Nucl Med Biol 2008 Aug;35(6):665-71. PMID: 18678351
63. Gommans GM, van der Zant FM, van Dongen A, et al. (99M)Technetium-sestamibi scintimammography in non-palpable breast lesions found on screening X-ray mammography. Eur J Surg Oncol 2007 Feb;33(1):23-7. PMID: 17126524
64. Schillaci O, Danieli R, Filippi L, et al. Scintimammography with a hybrid SPECT/CT imaging system. Anticancer Res 2007 Jan;27(1 B):557-62. PMID: 17348441
65. Gokalp G, Topal U, Kizilkaya E. Power Doppler sonography: anything to add to BI-RADS US in solid breast masses? Eur J Radiol 2009 Apr;70(1):77-85. PMID: 18243623
66. Liu H, Jiang YX, Liu JB, et al. Evaluation of breast lesions with contrast-enhanced ultrasound using the microvascular imaging technique: initial observations. Breast 2008 Oct;17(5):532-9. PMID: 18534851
67. Vade A, Lafita VS, Ward KA, et al. Role of breast sonography in imaging of adolescents with palpable solid breast masses. AJR Am J Roentgenol 2008 Sep;191(3):659-63. PMID: 18716091

61
68. Cha JH, Moon WK, Cho N, et al. Characterization of benign and malignant solid breast masses: comparison of conventional US and tissue harmonic imaging. Radiology 2007 Jan;242(1):63-9. PMID: 17090709
69. Chala L, Endo E, Kim S, et al. Gray-scale sonography of solid breast masses: diagnosis of probably benign masses and reduction of the number of biopsies. J Clin Ultrasound 2007 Jan;35(1):9-19. PMID: 17149763
70. Zhi H, Ou B, Luo BM, et al. Comparison of ultrasound elastography, mammography, and sonography in the diagnosis of solid breast lesions. J Ultrasound Med 2007 Jun;26(6):807-15. PMID: 17526612
71. Cho N, Moon WK, Cha JH, et al. Differentiating benign from malignant solid breast masses: comparison of two-dimensional and three-dimensional US. Radiology 2006 Jul;240(1):26-32. PMID: 16684920
72. Forsberg F, Goldberg BB, Merritt CR, et al. Diagnosing breast lesions with contrast-enhanced 3-dimensional power Doppler imaging. J Ultrasound Med 2004 Feb;23(2):173-82. PMID: 14992354
73. Meyberg-Solomayer GC, Kraemer B, Bergmann A, et al. Does 3-D sonography bring any advantage to noninvasive breast diagnostics? Ultrasound Med Biol 2004 May;30(5):583-9. PMID: 15183222
74. Chen DR, Jeng LB, Kao A, et al. Comparing thallium-201 spect mammoscintigraphy and ultrasonography to detect breast cancer in mammographical dense breasts. Neoplasma 2003;50(3):222-6. PMID: 12937857
75. Kook SH, Kwag HJ. Value of contrast-enhanced power Doppler sonography using a microbubble echo-enhancing agent in evaluation of small breast lesions. J Clin Ultrasound 2003 Jun;31(5):227-38. PMID: 12767017
76. Marini C, Traino C, Cilotti A, et al. Differentiation of benign and malignant breast microcalcifications: mammography versus mammography-sonography combination. Radiol Med 2003 Jan-Feb;105(1-2):17-26. PMID: 12700541
77. Reinikainen H, Rissanen T, Paivansalo M, et al. B-mode, power Doppler and contrast-enhanced power Doppler ultrasonography in the diagnosis of breast tumors. Acta Radiol 2001 Jan;42(1):106-13. PMID: 11167342
78. Blohmer JU, Oellinger H, Schmidt C, et al. Comparison of various imaging methods with particular evaluation of color Doppler sonography for planning surgery for breast tumors. Arch Gynecol Obstet 1999;262(3-4):159-71. PMID: 10326635
79. Chao TC, Lo YF, Chen SC, et al. Prospective sonographic study of 3093 breast tumors. J Ultrasound Med 1999 May;18(5):363-70. PMID: 10327015
80. Wilkens TH, Burke BJ, Cancelada DA, et al. Evaluation of palpable breast masses with color Doppler sonography and gray scale imaging. J Ultrasound Med 1998 Feb;17(2):109-15. PMID: 9527570
81. Stavros AT, Thickman D, Rapp CL, et al. Solid breast nodules: use of sonography to distinguish between benign and malignant lesions. Radiology 1995 Jul;196(1):123-34. PMID: 7784555
82. Ciatto S, Rosselli del Turco M, Catarzi S, et al. The contribution of ultrasonography to the differential diagnosis of breast cancer. Neoplasma 1994;41(6):341-5. PMID: 7870218
83. Perre CI, Koot VC, de Hooge P, et al. The value of ultrasound in the evaluation of palpable breast tumours: a prospective study of 400 cases. Eur J Surg Oncol 1994 Dec;20(6):637-40. PMID: 7995413
84. Caruso G, Ienzi R, Cirino A, et al. Breast lesion characterization with contrast-enhanced US. Work in progress. Radiol Med 2002 Nov-Dec;104(5-6):443-50. PMID: 12589266
85. Koukouraki S, Koukourakis MI, Vagios E, et al. The role of 99mTc-sestamibi scintimammography and colour Doppler ultrasonography in the evaluation of breast lesions. Nucl Med Commun 2001 Nov;22(11):1243-8. PMID: 11606891
86. Schroeder RJ, Maeurer J, Vogl TJ, et al. D-galactose-based signal-enhanced color Doppler sonography of breast tumors and tumorlike lesions. Invest Radiol 1999 Feb;34(2):109-15. PMID: 9951790

62
87. Buadu LD, Murakami J, Murayama S, et al. Colour Doppler sonography of breast masses: a multiparameter analysis. Clin Radiol 1997;52:917-23. PMID: 9413965
88. Zdemir A, Kilic K, Ozdemir H, et al. Contrast-enhanced power Doppler sonography in breast lesions: effect on differential diagnosis after mammography and gray scale sonography. J Ultrasound Med 2004 Feb;23(2):183-95; quiz 196-7. PMID: 14992355
89. Milz P, Lienemann A, Kessler M, et al. Evaluation of breast lesions by power Doppler sonography. Eur Radiol 2001;11(4):547-54. PMID: 11354745
90. Moon WK, Im JG, Noh DY, et al. Nonpalpable breast lesions: evaluation with power Doppler US and a microbubble contrast agent-initial experience. Radiology 2000 Oct;217(1):240-6. PMID: 11012451
91. Albrecht T, Patel N, Cosgrove DO, et al. Enhancement of power Doppler signals from breast lesions with the ultrasound contrast agent EchoGen emulsion: subjective and quantitative assessment. Acad Radiol 1998 Apr;5 Suppl 1:S195-8; discussion S199. PMID: 9561080
92. Guidance chapter. In: Breast Imaging Reporting and Data System Atlas (BI-RADS Atlas). BI-RADS - Mammography. 4th ed. Reston (VA): American College of Radiology (ACR); 2003. p. 253-60. www.acr.org/SecondaryMainMenuCategories/quality_safety/BIRADSAtlas/BIRADSAtlasexcerptedtext/BIRADSMammographyFourthEdition/FollowUpandOutcomeMonitoringDoc4.aspx.
93. Surveillance Epidemiology and End Results. SEER stat fact sheets - cancer of the breast. [internet]. Bethesda (MD): National Cancer Institute (NCI); [accessed 2007 Feb 5]. [3 p]. Available: http://seer.cancer.gov/statfacts/html/breast_print.html.
94. Feuer EJ, Wun LM. DEVCAN: probability of developing or dying of cancer software, version 4.1. [internet]. Bethesda (MD): National Cancer Institute (NCI); 1999 [accessed 2002 May 28]. [1 p]. Available: http://canques.seer.cancer.gov/cgi-bin/cq_submit?dir-devcan1999&db=1&rpt=TAB&sel=.
95. Harvey JA. Unusual breast cancers: useful clues to expanding the differential diagnosis. Radiology 2007 Mar;242(3):683-94. PMID: 17325062
96. Levine P, Simsir A, Cangiarella J. Management issues in breast lesions diagnosed by fine-needle aspiration and percutaneous core breast biopsy. Am J Clin Pathol 2006 Jun;125 Suppl:S124-34. PMID: 16830962
97. Nelson HD, Tyne K, Naik A, et al. Screening for Breast Cancer: Systematic Evidence Review Update for the US Preventive Services Task Force. Ann Intern Med 2009 Nov. PMID: 20722173
98. Gotzsche PC, Nielsen M. Screening for breast cancer with mammography. In: Cochrane Database of Systematic Reviews [internet]. Issue 4. Hoboken (NJ): John Wiley & Sons, Ltd.; 2009 [accessed 2010 Oct 8]. [Art. No.: CD001877]. Available: DOI: 10.1002/14651858.CD001877.pub3. PMID: 19821284
99. Liberman L, Menell JH. Breast imaging reporting and data system (BI-RADS). Radiol Clin North Am 2002 May;40(3):409-30. PMID: 12117184
100. Diagnostic and Interventional Radiology Department. Mammography. Omaha (NE): Creighton University School of Medicine; 22 p. http://radiology.creighton.edu/mammo.html.
101. Obenauer S, Hermann KP, Grabbe E. Applications and literature review of the BI-RADS classification. Eur Radiol 2005 May;15(5):1027-36. PMID: 15856253
102. Ng EY, Sree SV, Ng KH, et al. The use of tissue electrical characteristics for breast cancer detection: a perspective review. Technol Cancer Res Treat 2008 Aug;7(4):295-308. PMID: 18642968

63
103. Lacquement MA, Mitchell D, Hollingsworth AB. Positive predictive value of the Breast Imaging Reporting and Data System. J Am Coll Surg 1999 Jul;189(1):34-40. PMID: 10401738
104. Fryback DG, Thornbury JR. The efficacy of diagnostic imaging. Med Decis Making 1991 Apr-Jun;11(2):88-94. PMID: 1907710
105. Counsell C. Formulating questions and locating primary studies for inclusion in systematic reviews. Ann Intern Med 1997 Sep 1;127(5):380-7. PMID: 9273830
106. Lijmer JG, Mol BW, Heisterkamp S, et al. Empirical evidence of design-related bias in studies of diagnostic tests. JAMA 1999 Sep 15;282(11):1061-6. PMID: 10493205
107. Deeks JJ. Systematic reviews of evaluations of diagnostic and screening tests. In: Egger M, Smith GD, Altman DG, editors. Systematic reviews in health care: meta-analysis in context. 2nd ed. London, England: BMJ Books; 2001. p. 248-82.
108. Bojia F, Demisse M, Dejane A, et al. Comparison of fine-needle aspiration cytology and excisional biopsy of breast lesions. East Afr Med J 2001 May;78(5):226-8. PMID: 12002079
109. Vetrani A, Fulciniti F, Di Benedetto G, et al. Fine-needle aspiration biopsies of breast masses. An additional experience with 1153 cases (1985 to 1988) and a meta-analysis. Cancer 1992 Feb 1;69(3):736-40. PMID: 1530911
110. Abu-Salem OT. Fine needle aspiration biopsy (FNAB) of breast lumps: comparison study between pre- and post-operative histological diagnosis. Arch Inst Pasteur Tunis 2002;79(1-4):59-63. PMID: 15072246
111. Ljung BM, Drejet A, Chiampi N, et al. Diagnostic accuracy of fine-needle aspiration biopsy is determined by physician training in sampling technique. Cancer 2001 Aug 25;93(4):263-8. PMID: 11507700
112. Moher D, Pham B, Klassen TP, et al. What contributions do languages other than English make on the results of meta-analyses? J Clin Epidemiol 2000 Sep;53(9):964-72. PMID: 11004423
113. Juni P, Holenstein F, Sterne J, et al. Direction and impact of language bias in meta-analyses of controlled trials: empirical study. Int J Epidemiol 2002 Feb;31(1):115-23. PMID: 11914306
114. Chalmers I, Adams M, Dickersin K, et al. A cohort study of summary reports of controlled trials. JAMA 1990 Mar 9;263(10):1401-5. PMID: 2304219
115. Neinstein LS. A review of Society for Adolescent Medicine abstracts and Journal of Adolescent Health Care articles. J Adolesc Health Care 1987 Mar;8(2):198-203. PMID: 3818406
116. Dundar Y, Dodd S, Williamson P, et al. Case study of the comparison of data from conference abstracts and full-text articles in health technology assessment of rapidly evolving technologies: does it make a difference? Int J Technol Assess Health Care 2006 Jul;22(3):288-94.
117. De Bellefeuille C, Morrison CA, Tannock IF. The fate of abstracts submitted to a cancer meeting: factors which influence presentation and subsequent publication. Ann Oncol 1992 Mar;3(3):187-91. PMID: 1586615
118. Scherer RW, Langenberg P. Full publication of results initially presented in abstracts. In: Cochrane Library [Cochrane methodology review]. Issue 2. Oxford: Update Software; 2001 [accessed 2001 Apr 23]. [35 p]. Available: www.cochrane.org/index.htm.
119. Marx WF, Cloft HJ, Do HM, et al. The fate of neuroradiologic abstracts presented at national meetings in 1993: rate of subsequent publication in peer-reviewed, indexed journals. AJNR Am J Neuroradiol 1999 Jun-Jul;20(6):1173-7. PMID: 10445467
120. Yentis SM, Campbell FA, Lerman J. Publication of abstracts presented at anaesthesia meetings. Can J Anaesth 1993 Jul;40(7):632-4. PMID: 8403137

64
121. Whiting P, Rutjes AW, Reitsma JB, et al. The development of QUADAS: a tool for the quality assessment of studies of diagnostic accuracy included in systematic reviews. BMC Med Res Methodol 2003 Nov 10;3(1):25. www.biomedcentral.com/ content/pdf/1471-2288-3-25.pdf. PMID: 14606960
122. Owens DK, Lohr KN, Atkins D, et al. Grading the strength of a body of evidence when comparing medical interventions-Agency for Healthcare Research and Quality and the Effective Health Care Program. J Clin Epidemiol 2010 May;63(5):513-23. PMID: 19595577
123. Owens D, Lohr K, Atkins D, et al. Grading the strength of a body of evidence when comparing medical interventions. In: Methods guide for comparative effectiveness reviews. Rockville (MD): Agency for Healthcare Research and Quality (AHRQ); 2009 Jul. p. 19. http://effectivehealthcare.ahrq.gov/ehc/products/122/328/2009_0805_grading.pdf.
124. Higgins JP, Thompson SG. Quantifying heterogeneity in a meta-analysis. Stat Med 2002 Jun 15;21(11):1539-58. PMID: 12111919
125. Higgins JP, Thompson SG, Deeks JJ, et al. Measuring inconsistency in meta-analyses. BMJ 2003 Sep 6;327(7414):557-60. PMID: 12958120
126. Deeks J, Macaskill P, Irwig L. Detecting publication bias in systematic reviews of diagnostic test accuracy [abstract O-009]. In: Cochrane Collaboration [database online]. Oxford (UK): Cochrane Collaboration; 2004 [accessed 2005 May 25]. [1 p]. Available: www.cochrane.org/colloquia/abstracts/ottawa/O-009.htm.
127. Deeks J, Macaskill P, Irwig L. By how much does publication bias affect the results of systematic reviews of diagnostic test accuracy? (abstract O-010). In: Cochrane Collaboration [database online]. Oxford (UK): Cochrane Collaboration; 2004 [accessed 2005 May 25]. [2 p]. Available: www.cochrane.org/colloquia/abstracts/ottawa/O-010.htm.
128. Paakko E, Reinikainen H, Lindholm EL, et al. Low-field versus high-field MRI in diagnosing breast disorders. Eur Radiol 2005 Jul;15(7):1361-8. PMID: 15711841
129. American College of Radiology (ACR). ACR Breast Imaging and Reporting Data System, Breast Imaging Atlas. Reston (VA): American College of Radiology (ACR); 2003. ACR BI-RADS - Magnetic Resonance Imaging.
130. Orel SG, Schnall MD. MR imaging of the breast for the detection, diagnosis, and staging of breast cancer. Radiology 2001 Jul;220(1):13-30. PMID: 11425968
131. Helbich TH. Contrast-enhanced magnetic resonance imaging of the breast. Eur J Radiol 2000 Jun;34(3):208-19. PMID: 10927162
132. Artemov D, Revelon G, Atalar E, et al. Switchable multicoil array for MR micro-imaging of breast lesions. Magn Reson Med 1999 Mar;41(3):569-74. PMID: 10204882
133. Shen GX, Wu J, Boada FE. Multiple channel phased arrays for echo planar imaging. MAGMA 2000 Dec;11(3):138-43. PMID: 11154955
134. Heywang-Kobrunner SH, Bick U, Bradley WG Jr, et al. International investigation of breast MRI: results of a multicentre study (11 sites) concerning diagnostic parameters for contrast-enhanced MRI based on 519 histopathologically correlated lesions. Eur Radiol 2001;11(4):531-46. PMID: 11354744
135. Coulthard A, Potterton AJ. Pitfalls of breast MRI. Br J Radiol 2000 Jun;73(870):665-71. PMID: 10911793
136. Kuhl CK, Schild HH. Dynamic image interpretation of MRI of the breast. J Magn Reson Imaging 2000 Dec;12(6):965-74. PMID: 11105038
137. Lee CH. Problem solving MR imaging of the breast. Radiol Clin North Am 2004 Sep;42(5):919-34. PMID: 15337425
138. Partridge SC, Heumann EJ, Hylton NM. Semi-automated analysis for MRI of breast tumors. Stud Health Technol Inform 1999;62:259-60. PMID: 10538368

65
139. MedWatch. Information on Gadolinium-Containing Contrast Agents. [internet]. Rockville (MD): U.S. Food and Drug Administration; 2009 Aug 13 [accessed 2010 Mar 17]. Available: www.fda.gov/Drugs/DrugSafety/PostmarketDrugSafetyInformationforPatientsandProviders/ucm142882.htm.
140. Sardanelli F, Iozzelli A, Fausto A. Contrast agents and temporal resolution in breast MR imaging. J Exp Clin Cancer Res 2002 Sep;21(3 Suppl):69-75. PMID: 12585658
141. Knopp MV, Bourne MW, Sardanelli F, et al. Gadobenate dimeglumine-enhanced MRI of the breast: analysis of dose response and comparison with gadopentetate dimeglumine. AJR Am J Roentgenol 2003 Sep;181(3):663-76. PMID: 12933457
142. National Cancer Data Base (NCDB) [database online]. Chicago (IL): American College of Surgeons (ACS); 1996-1998. [accessed 1999 Mar 5]. Relative survival of breast cancer patients by AJCC stage of disease at diagnosis, 1985-1990 cases [table]. [3 p]. Available: www.facs.org/about_college/acsdept/cancer_dept/programs/ncdb/breastcancer4.html.
143. Morris EA. Review of breast MRI: indications and limitations. Semin Roentgenol 2001 Jul;36(3):226-37. PMID: 11475069
144. Rieber A, Nussle K, Merkle E, et al. MR mammography: influence of menstrual cycle on the dynamic contrast enhancement of fibrocystic disease. Eur Radiol 1999;9(6):1107-12. PMID: 10415244
145. Morris EA, Bassett LW, Berg WA, et al. ACR practice guideline for the performance of contrast-enhanced magnetic resonance imaging (MRI) of the breast. [online publication]. Reston (VA): American College of Radiology (ACR); 2008. 7 p. www.acr.org/SecondaryMainMenuCategories/quality_safety/guidelines/breast/mri_breast.aspx.
146. Medical magnetic resonance (MR) procedures: protection of patients. Health Phys 2004 Aug;87(2):197-216. PMID: 15257220
147. Shellock FG. Radiofrequency energy-induced heating during MR procedures: a review. J Magn Reson Imaging 2000 Jul;12(1):30-6. PMID: 10931562
148. Fiek M, Remp T, Reithmann C, et al. Complete loss of ICD programmability after magnetic resonance imaging. Pacing Clin Electrophysiol 2004 Jul;27(7):1002-4. PMID: 15271024
149. Shellock FG. Magnetic resonance safety update 2002: implants and devices. J Magn Reson Imaging 2002 Nov;16(5):485-96. PMID: 12412025
150. Foster JR, Hall DA, Summerfield AQ, et al. Sound-level measurements and calculations of safe noise dosage during EPI at 3 T. J Magn Reson Imaging 2000 Jul;12(1):157-63. PMID: 10931575
151. Dempsey MF, Condon B, Hadley DM. Investigation of the factors responsible for burns during MRI. J Magn Reson Imaging 2001 Apr;13(4):627-31. PMID: 11276109
152. Feychting M. Health effects of static magnetic fields--a review of the epidemiological evidence. Prog Biophys Mol Biol 2005 Feb-Apr;87(2-3):241-6. PMID: 15556662
153. Hong CZ, Shellock FG. Short-term exposure to a 1.5 tesla static magnetic field does not affect somato-sensory-evoked potentials in man. Magn Reson Imaging 1990;8(1):65-9. PMID: 2325519
154. Shellock FG, Schaefer DJ, Gordon CJ. Effect of a 1.5 T static magnetic field on body temperature of man. Magn Reson Med 1986 Aug;3(4):644-7. PMID: 3747826
155. Budinger TF. Nuclear magnetic resonance (NMR) in vivo studies: known thresholds for health effects. J Comput Assist Tomogr 1981 Dec;5(6):800-11. PMID: 7033311
156. Runge VM. Safety of approved MR contrast media for intravenous injection. J Magn Reson Imaging 2000 Aug 1;12(2):205-13.
157. Sardanelli F, Lozzelli A, Fausto A. MR imaging of the breast: indications, established technique, and new directions. Eur Radiol 2003 Nov;13 Suppl 3:N28-36. PMID: 15015878

66
158. Centers for Disease Control and Prevention (CDC). Nephrogenic fibrosing dermopathy associated with exposure to gadolinium-containing contrast agents--St. Louis, Missouri, 2002-2006. MMWR Morb Mortal Wkly Rep 2007 Feb 23;56(7):137-41. PMID: 17318112
159. Marckmann P, Skov L, Rossen K, et al. Nephrogenic systemic fibrosis: suspected causative role of gadodiamide used for contrast-enhanced magnetic resonance imaging. J Am Soc Nephrol 2006 Sep;17(9):2359-62. PMID: 16885403
160. Grobner T. Gadolinium--a specific trigger for the development of nephrogenic fibrosing dermopathy and nephrogenic systemic fibrosis. Nephrol Dial Transplant 2006 Apr;21(4):1104-8. PMID: 16431890
161. Brice J. Experts put MRI accreditation program to the test. Diagn Imaging 2001 Jul;23(7):44-7, 49.
162. Hachiya J, Seki T, Okada M, et al. MR imaging of the breast with Gd-DTPA enhancement: comparison with mammography and ultrasonography. Radiat Med 1991 Nov-Dec;9(6):232-40. PMID: 1668410
163. Palmedo H, Grunwald F, Bender H, et al. Scintimammography with technetium-99m methoxyisobutylisonitrile: comparison with mammography and magnetic resonance imaging. Eur J Nucl Med 1996 Aug;23(8):940-6. PMID: 8753683
164. Obdeijn IM, Kuijpers TJ, van Dijk P, et al. MR lesion detection in a breast cancer population. J Magn Reson Imaging 1996 Nov-Dec;6(6):849-54. PMID: 8956127
165. Heiberg EV, Perman WH, Herrmann VM, et al. Dynamic sequential 3D gadolinium-enhanced MRI of the whole breast. Magn Reson Imaging 1996;14(4):337-48. PMID: 8782170
166. Tiling R, Sommer H, Pechmann M, et al. Comparison of technetium-99m-sestamibi scintimammography with contrast- enhanced MRI for diagnosis of breast lesions. J Nucl Med 1997 Jan;38(1):58-62. PMID: 8998151
167. Tiling R, Khalkhali I, Sommer H, et al. Role of technetium-99m sestamibi scintimammography and contrast- enhanced magnetic resonance imaging for the evaluation of indeterminate mammograms. Eur J Nucl Med 1997 Oct;24(10):1221-9. PMID: 9323262
168. Del Maschio A, Bazzocchi M, Giuseppetti GM, et al. Breast MRI: report on a multicentric national trial by the Study Section of Magnetic Resonance and Breast Imaging. Radiol Med 2002 Oct;104(4):262-72. PMID: 12569307
169. Peters NH, Borel Rinkes IH, Zuithoff NP, et al. Meta-analysis of MR imaging in the diagnosis of breast lesions. Radiology 2008 Jan;246(1):116-24. PMID: 18024435
170. Blue Cross Blue Shield Association (BCBS). Magnetic resonance imaging of the breast: differential diagnosis of a breast lesion to avoid biopsy. Technol Eval Cent Asses Program 2002 Feb;16(15):1-29.
171. Breast MRI for detection or diagnosis of primary or recurrent breast cancer. Technol Eval Cent Asses Program Exec Summ 2004 Apr;19(1):1-9. PMID: 15314823
172. Hrung JM, Sonnad SS, Schwartz JS, et al. Accuracy of MR imaging in the work-up of suspicious breast lesions: a diagnostic meta-analysis. Acad Radiol 1999 Jul;6(7):387-97. PMID: 10410164
173. Littenberg B, Moses LE. Estimating diagnostic accuracy from multiple conflicting reports: a new meta-analytic method. Med Decis Making 1993 Oct-Dec;13(4):313-21. PMID: 8246704
174. Bergmann H, Dobrozemsky G, et al. An inter-laboratory comparison study of image quality of PET scanners using the NEMA NU 2-2001 procedure for assessment of image quality. Phys Med Biol 2005 May 21;50(10):2193-207. PMID: 15876661
175. Avril N, Schelling M, Dose J, et al. Utility of PET in breast cancer. Clin Positron Imaging 1999 Oct;2(5):261-71. PMID: 14516650
176. McDonough MD, DePeri ER, Mincey BA. The role of positron emission tomographic imaging in breast cancer. Curr Oncol Rep 2004 Jan;6(1):62-8. PMID: 14664763

67
177. Yutani K, Tatsumi M, Uehara T, et al. Effect of patients' being prone during FDG PET for the diagnosis of breast cancer. AJR Am J Roentgenol 1999 Nov;173(5):1337-9. PMID: 10541114
178. Rosen EL, Eubank WB, Mankoff DA. FDG PET, PET/CT, and breast cancer imaging. Radiographics 2007 Oct;27 Suppl 1:S215-29. PMID: 18180228
179. Brenner DJ, Hall EJ. Computed tomography--an increasing source of radiation exposure. N Engl J Med 2007 Nov 29;357(22):2277-84. PMID: 18046031
180. Radiation exposure from medical exams and procedures: fact sheet. McLean (VA): Health Physics Society (HPS); 2010 Jan. 4 p. http://hps.org/documents/ Medical_Exposures_Fact_Sheet.pdf.
181. Cronin B, Marsden PK, O'Doherty MJ. Are restrictions to behaviour of patients required following fluorine-18 fluorodeoxyglucose positron emission tomographic studies? Eur J Nucl Med 1999 Feb;26(2):121-8. PMID: 9933345
182. Silberstein EB. Prevalence of adverse reactions to positron emitting radiopharmaceuticals in nuclear medicine. Pharmacopeia Committee of the Society of Nuclear Medicine. J Nucl Med 1998 Dec;39(12):2190-2. PMID: 9867168
183. Katanick SL. Fundamentals of ICANL accreditation. J Nucl Med Technol 2005 Mar;33(1):19-23. PMID: 15731016
184. Yutani K, Tatsumi M, Shiba E, et al. Comparison of dual-head coincidence gamma camera FDG imaging with FDG PET in detection of breast cancer and axillary lymph node metastasis. J Nucl Med 1999 Jun;40(6):1003-8. PMID: 10452318
185. Palmedo H, Bender H, Grunwald F, et al. Comparison of fluorine-18 fluorodeoxyglucose positron emission tomography and technetium-99m methoxyisobutylisonitrile scintimammography in the detection of breast tumours. Eur J Nucl Med 1997 Sep;24(9):1138-45. PMID: 9283107
186. Crowe JP Jr, Adler LP, Shenk RR, et al. Positron emission tomography and breast masses: comparison with clinical, mammographic, and pathological findings. Ann Surg Oncol 1994 Mar;1(2):132-40. PMID: 7834438
187. Tse NY, Hoh CK, Hawkins RA, et al. The application of positron emission tomographic imaging with fluorodeoxyglucose to the evaluation of breast disease. Ann Surg 1992 Jul;216(1):27-34. PMID: 1632699
188. Holle LH, Trampert L, Lung-Kurt S, et al. Investigations of breast tumors with fluorine-18-fluorodeoxyglucose and SPECT. J Nucl Med 1996 Apr;37(4):615-22. PMID: 8691251
189. Samson DJ, Flamm CR, Pisano ED, et al. Should FDG PET be used to decide whether a patient with an abnormal mammogram or breast finding at physical examination should undergo biopsy. Acad Radiol 2002 Jul;9(7):773-83. PMID: 12139091
190. Agency for Healthcare Research and Quality (AHRQ). FDG positron emission tomography for evaluating breast cancer - systematic review. Rockville (MD): Agency for Healthcare Research and Quality (AHRQ); 2001. www.mrw.interscience.wiley.com/cochrane/clhta/articles/HTA-20020419/frame.html.
191. Escalona S, Blasco JA, Reza MM, et al. A systematic review of FDG-PET in breast cancer. Med Oncol 2010 Mar;27(1):114-29.
192. Monticciolo DL. How useful are new radiographic tools for detecting breast cancer? Postgrad Med 2004 Mar;115(3):76-7. PMID: 15038257
193. Prendergast A, Adams J, Delgado M, et al. SPECT vs. Planar Imaging [power point]. [slide set]. Waltham (MA): Daum Communications Corp.; [accessed 2010 Mar 2]. [6 slides]. Available: http://74.125.93.132/search?q=cache:xzGe13cT8CUJ:keiserstudents.tripod.com/sitebuildercontent/sitebuilderfiles/spectvs.ppt+what+is+planar+imaging+AND+prendergast&cd=1&hl=en&ct=clnk&gl=us.
194. Edell SL, Eisen MD. Current imaging modalities for the diagnosis of breast cancer. Del Med J 1999 Sep;71(9):377-82. PMID: 10584437
68
195. Khalkhali I, Caravaglia G, Abdel-Nabi HH, et al. Society of Nuclear Medicine procedure guideline for breast scintigraphy. version 2.0. Reston (VA): Society of Nuclear Medicine; 2004 Jun 2. 4 p. http://interactive.snm.org/docs/Breast_v2.0.pdf.
196. Zegel H, Heller L, Edell S, et al. Tc-99m sestamibi scintimammography in the mammographically dense breast. Clin Nucl Med 1999 Dec;24(12):968-74. PMID: 10595479
197. Schillaci O, Buscombe JR. Breast scintigraphy today: indications and limitations. Eur J Nucl Med Mol Imaging 2004 Jun;31 Suppl 1:S35-45. PMID: 15103505
198. BSGI/Molecular breast imaging. [Web site]. Newport News (VA): Dilon Technologies; [accessed 2010 Feb 16]. [Various p]. Available: www.dilon.com/pages/ bsgi__molecular_breast_imaging/34.php.
199. Hendrick RE. Radiation doses and cancer risks from breast imaging studies. Radiology 2010 Oct;257(1):246-53. PMID: 20736332
200. Medical Advisory Secretariat, Ontario Ministry of Health and Long-Term Care. Scintimammography. Toronto: Ontario Ministry of Health and Long-Term Care; 2003. www.mrw.interscience.wiley.com/ cochrane/clhta/articles/HTA-20040735/ frame.html.
201. Thomson LE, Allman KC. Erythema multiforme reaction to sestamibi. J Nucl Med 2001 Mar;42(3):534. PMID: 11337537
202. Hesslewood SR, Keeling DH. Frequency of adverse reactions to radiopharmaceuticals in Europe. Eur J Nucl Med 1997 Sep;24(9):1179-82. PMID: 9283115
203. Klaus AJ, Klingensmith WC 3rd, Parker SH, et al. Comparative value of 99mTc-sestamibi scintimammography and sonography in the diagnostic workup of breast masses. AJR Am J Roentgenol 2000 Jun;174(6):1779-83. PMID: 10845522
204. Bombardieri E, Crippa F, Baio SM, et al. Nuclear medicine advances in breast cancer imaging. Tumori 2001 Sep-Oct;87(5):277-87. PMID: 11765174
205. Khalkhali I, Vargas HI. The role of nuclear medicine in breast cancer detection: functional breast imaging. Radiol Clin North Am 2001 Sep;39(5):1053-68. PMID: 11587058
206. Bekis R, Derebek E, Balci P, et al. 99mTc sestamibi scintimammography. Screening mammographic non-palpable suspicious breast lesions: preliminary results. Nucl Med (Stuttg) 2004 Feb;43(1):16-20. PMID: 14978536
207. Fondrinier E, Muratet JP, Anglade E, et al. Clinical experience with 99mTc-MIBI scintimammography in patients with breast microcalcifications. Breast 2004 Aug;13(4):316-20. PMID: 15325666
208. Krishnaiah G, Sher-Ahmed A, Ugwu-Dike M, et al. Technetium-99m sestamibi scintimammography complements mammography in the detection of breast cancer. Breast J 2003 Jul-Aug;9(4):288-94. PMID: 12846862
209. Maunda KY, Chande H, Mselle TF, et al. 99mTc sestamibi scintimammography in the diagnosis of palpable breast masses. Nucl Med Commun 2003 Feb;24(2):141-4. PMID: 12548038
210. Sampalis FS, Denis R, Picard D, et al. International prospective evaluation of scintimammography with (99m)technetium sestamibi. Am J Surg 2003 Jun;185(6):544-9. PMID: 12781883
211. Sanidas EE, Koukouraki S, Velidaki A, et al. Contribution of 99mTc-anti-carcinoembryonic antigen antibody and 99mTc-sestamibi scintimammography in the evaluation of high risk palpable breast lesions. Nucl Med Commun 2003 Mar;24(3):291-6. PMID: 12612470
212. Wilczek B, Aspelin P, Bone B, et al. Complementary use of scintimammography with 99m-Tc-MIBI to triple diagnostic procedure in palpable and non-palpable breast lesions. Acta Radiol 2003 May;44(3):288-93. PMID: 12752000
213. Khalkhali I, Baum JK, Villanueva-Meyer J, et al. (99m)Tc sestamibi breast imaging for the examination of patients with dense and fatty breasts: multicenter study. Radiology 2002 Jan;222(1):149-55. PMID: 11799940

69
214. Leidenius MH, Leppanen EA, Tykka HT, et al. The role of Tc99m-sestamibi scintimammography in combination with the triple assessment of primary breast cancer. Eur J Surg Oncol 2002 Mar;28(2):108-12. PMID: 11884044
215. Aguilar J, Andres B, Nicolas F, et al. Value of 99mTc-MIBI scintimammography in women with impalpable breast lesions seen on mammography. Eur J Surg 2001 May;167(5):344-6. PMID: 11419548
216. Alonso O, Massardo T, Delgado LB, et al. Is (99m)Tc-sestamibi scintimammography complementary to conventional mammography for detecting breast cancer in patients with palpable masses? J Nucl Med 2001 Nov;42(11):1614-21. PMID: 11696629
217. Gutfilen B, Fonseca LM. Comparison of Tc-99m THY and Tc-99m MIBI scans for diagnosis of breast lesions. J Exp Clin Cancer Res 2001 Sep;20(3):385-91. PMID: 11718219
218. Lumachi F, Ferretti G, Povolato M, et al. Sestamibi scintimammography in pT1 breast cancer: alternative or complementary to X-ray mammography. Anticancer Res 2001 May-Jun;21(3C):2201-5. PMID: 11501847
219. Lumachi F, Ferretti G, Povolato M, et al. Usefulness of 99m-Tc-sestamibi scintimammography in suspected breast cancer and in axillary lymph node metastases detection. Eur J Surg Oncol 2001 Apr;27(3):256-9. PMID: 11373101
220. Papantoniou V, Christodoulidou J, Papadaki E, et al. 99mTc-(V)DMSA scintimammography in the assessment of breast lesions: comparative study with 99mTc-MIBI. Eur J Nucl Med 2001 Jul;28(7):923-8. PMID: 11504092
221. Chen S, Liu W, Mao Y, et al. 99 mTc-MIBI and 99 mTc-MDP scintimammography for detecting breast carcinoma. Chin Med J 2000;113(5):400-3.
222. Danielsson R, Bone B, Gad A, et al. Sensitivity and specificity of planar scintimammography with 99mTc-sestamibi. Acta Radiol 1999 Jul;40(4):394-9. PMID: 10394867
223. Danielsson R, Bone B, Agren B, et al. Comparison of planar and SPECT scintimammography with 99mTc-sestamibi in the diagnosis of breast carcinoma. Acta Radiol 1999 Mar;40(2):176-80. PMID: 10080730
224. Obwegeser R, Berghammer P, Rodrigues M, et al. A head-to-head comparison between technetium-99m-tetrofosmin and technetium-99m-MIBI scintigraphy to evaluate suspicious breast lesions. Eur J Nucl Med 1999 Dec;26(12):1553-9. PMID: 10638406
225. Tofani A, Sciuto R, Semprebene A, et al. 99Tcm-MIBI scintimammography in 300 consecutive patients: factors that may affect accuracy. Nucl Med Commun 1999 Dec;20(12):1113-21. PMID: 10664992
226. De Vincentis G, Gianni W, Pani R, et al. Role of 99 mTc-Sestamibi scintimammography by SPEM camera in the management of breast cancer in the elderly. Breast Cancer Res Treat 1998;48(2):159-63.
227. Mekhmandarov S, Sandbank J, Cohen M, et al. Technetium-99m-MIBI scintimammography in palpable and nonpalpable breast lesions. J Nucl Med 1998 Jan;39(1):86-91. PMID: 9443742
228. Uriarte I, Carril JM, Quirce R, et al. Optimization of X-ray mammography and technetium-99m methoxyisobutylisonitrile scintimammography in the diagnosis of non- palpable breast lesions. Eur J Nucl Med 1998 May;25(5):491-6. PMID: 9575244
229. Alonso JC, Soriano A, Zarca MA, et al. Breast cancer detection with sestamibi-Tc-99m and Tl-201 radionuclides in patients with non conclusive mammography. Anticancer Res 1997 May-Jun;17(3B):1661-5. PMID: 9179214
230. Ambrus E, Rajtar M, Ormandi K, et al. Value of 99m-Tc MIBI and 99m-Tc(V) DMSA scintigraphy in evaluation of breast mass lesions. Anticancer Res 1997 May-Jun;17(3B):1599-605. PMID: 9179201
231. Carril JM, Gomez-Barquin R, Quirce R, et al. Contribution of 99mTc-MIBI scintimammography to the diagnosis of non- palpable breast lesions in relation to mammographic probability of malignancy. Anticancer Res 1997 May-Jun;17(3B):1677-81. PMID: 9179217

70
232. Chen SL, Yin YQ, Chen JX, et al. The usefulness of technetium-99m-MIBI scintimammography in diagnosis of breast cancer: using surgical histopathologic diagnosis as the gold standard. Anticancer Res 1997 May-Jun;17(3B):1695-8. PMID: 9179221
233. Schillaci O, Scopinaro F, Danieli R, et al. 99Tcm-sestamibi scintimammography in patients with suspicious breast lesions: comparison of SPET and planar images in the detection of primary tumours and axillary lymph node involvement. Nucl Med Commun 1997 Sep;18(9):839-45. PMID: 9352550
234. Scopinaro F, Schillaci O, Ussof W, et al. A three center study on the diagnostic accuracy of 99mTc-MIBI scintimammography. Anticancer Res 1997 May-Jun;17(3B):1631-4. PMID: 9179208
235. Scopinaro F, Ierardi M, Porfiri LM, et al. 99mTc-MIBI prone scintimammography in patients with high and intermediate risk mammography. Anticancer Res 1997 May-Jun;17(3B):1635-8. PMID: 9179209
236. Maffioli L, Agresti R, Chiti A, et al. Prone scintimammography in patients with non-palpable breast lesions. Anticancer Res 1996 May-Jun;16(3A):1269-73. PMID: 8702249
237. Palmedo H, Schomburg A, Grunwald F, et al. Scintimammography with Tc-99m MIBI in patients with suspicion of primary breast cancer. Nucl Med Biol 1996 Aug;23(6):681-4. PMID: 8940710
238. Palmedo H, Schomburg A, Grunwald F, et al. Technetium-99m-MIBI scintimammography for suspicious breast lesions. J Nucl Med 1996 Apr;37(4):626-30. PMID: 8691253
239. Villanueva-Meyer J, Leonard MH Jr, Briscoe E, et al. Mammoscintigraphy with technetium-99m-sestamibi in suspected breast cancer. J Nucl Med 1996 Jun;37(6):926-30. PMID: 8683313
240. Yuen-Green M, Wasnich R, Caindec-Ranchez S, et al. New method for breast cancer detection using TC-99m sestamibi scintimammography. Hawaii Med J 1996 Feb;55(2):26-8. PMID: 8820628
241. Burak Z, Argon M, Memis A, et al. Evaluation of palpable breast masses with 99Tcm-MIBI: a comparative study with mammography and ultrasonography. Nucl Med Commun 1994 Aug;15(8):604-12. PMID: 7970442
242. Hussain R, Buscombe JR. A meta-analysis of scintimammography: an evidence-based approach to its clinical utility. Nucl Med Commun 2006 Jul;27(7):589-94. PMID: 16794520
243. Liu M, Guo YM, Guo XJ, et al. Evaluation of 99mTc-MIBI scintimammorgraphy in the diagnosis of primary breast cancer: A meta-analysis. Chi J Evid Based Med 2005 Jul;5(7):536-42.
244. Liberman M, Sampalis F, Mulder DS, et al. Breast cancer diagnosis by scintimammography: a meta-analysis and review of the literature (Provisional record). Breast Cancer Res Treat 2003;80(1):115-26.
245. Allen MW, Hendi P, Schwimmer J, et al. Decision analysis for the cost effectiveness of sestamibi scintimammography in minimizing unnecessary biopsies. Q J Nucl Med 2000 Jun;44(2):168-85. PMID: 10967626
246. Hillner BE. Decision analysis: MIBI imaging of nonpalpable breast abnormalities. J Nucl Med 1997 Nov;38(11):1772-8. PMID: 9374352
247. Skaane P. Ultrasonography as adjunct to mammography in the evaluation of breast tumors. Acta Radiol Suppl 1999;420:7-47. PMID: 10693544
248. Athanasiou A, Tardivon A, Ollivier L, et al. How to optimize breast ultrasound. Eur J Radiol 2009 Jan;69(1):6-13. PMID: 18818037
249. Sehgal CM, Weinstein SP, Arger PH, et al. A review of breast ultrasound. J Mammary Gland Biol Neoplasia 2006 Apr;11(2):113-23. PMID: 17082996
250. Gokhale S. Ultrasound characterization of breast masses. Indian J Radiol Imaging 2009 Aug 1;19(3):242-7. PMID: 19881096
251. American College of Radiology (ACR). ACR Breast Imaging and Reporting Data System, Breast Imaging Atlas. Reston (VA): American College of Radiology (ACR); 2003. ACR BI-RADS - Ultrasound.

71
252. Martinoli C, Pretolesi F, Crespi G, et al. Power Doppler sonography: clinical applications. Eur J Radiol 1998 May;27 Suppl 2:S133-40. PMID: 9652513
253. Wink MH, Wijkstra H, De La Rosette JJ, et al. Ultrasound imaging and contrast agents: A safe alternative to MRI? Minim Invasive Ther Allied Technol 2006 Apr;15(2):93-100. PMID: 16754192
254. Boonjunwetwat D, Prathombutr A. Imaging of benign papillary neoplasm of the breast: mammographic, galactographic and sonographic findings. J Med Assoc Thai 2000 Aug;83(8):832-8. PMID: 10998834
255. American College of Radiology. Breast ultrasound accreditation program requirements. Reston (VA): American College of Radiology; 2005. 9 p. www.acr.org/s_acr/bin.asp?CID=591&DID=12137&DOC=FILE.PDF.
256. Chen SC, Cheung YC, Su CH, et al. Analysis of sonographic features for the differentiation of benign and malignant breast tumors of different sizes. Ultrasound Obstet Gynecol 2004 Feb;23(2):188-93. PMID: 14770402
257. McNicholas MM, Mercer PM, Miller JC, et al. Color Doppler sonography in the evaluation of palpable breast masses. AJR Am J Roentgenol 1993 Oct;161(4):765-71. PMID: 8372754
258. van Oord JC, van der Vliet AM, Thyn CJ, et al. The value of ultrasound mammography in palpable breast masses. Rofo 1991 Jul;155(1):63-6. PMID: 1854938
259. Flobbe K, Kessels AG, Severens JL, et al. Costs and effects of ultrasonography in the evaluation of palpable breast masses. Int J Technol Assess Health Care 2004 Fall;20(4):440-8. PMID: 15609793
260. Flobbe K, Bosch AM, Kessels AG, et al. The additional diagnostic value of ultrasonography in the diagnosis of breast cancer. Arch Intern Med 2003 May 26;163(10):1194-9. PMID: 12767956
261. Wiratkapun C, Bunyapaiboonsri W, Wibulpolprasert B, et al. Biopsy rate and positive predictive value for breast cancer in BI-RADS category 4 breast lesions. J Med Assoc Thai 2010 Jul;93(7):830-7. PMID: 20649064
262. Venkatesan A, Chu P, Kerlikowske K, et al. Positive predictive value of specific mammographic findings according to reader and patient variables. Radiology 2009 Mar;250(3):648-57. PMID: 19164116
263. Liang W, Lawrence WF, Burnett CB, et al. Acceptability of diagnostic tests for breast cancer. Breast Cancer Res Treat 2003 May;79(2):199-206. PMID: 12825854
264. Verkooijen HM, Peeters PH, Buskens E, et al. Diagnostic accuracy of large-core needle biopsy for nonpalpable breast disease: a meta-analysis. Br J Cancer 2000 Mar;82(5):1017-21. PMID: 10737383
265. Antley CM, Mooney EE, Layfield LJ. A comparison of accuracy rates between open biopsy, cutting-needle biopsy, and fine-needle aspiration biopsy of the breast: a 3-year experience. Breast J 1998;4(1):3-8.
266. Page DL, Dupont WD, Rogers LW, et al. Intraductal carcinoma of the breast: follow-up after biopsy only. Cancer 1982 Feb 15;49(4):751-8. PMID: 6275978
267. Yen MF, Tabar L, Vitak B, et al. Quantifying the potential problem of overdiagnosis of ductal carcinoma in situ in breast cancer screening. Eur J Cancer 2003 Aug;39(12):1746-54. PMID: 12888370

72
Acronyms and Abbreviations
ADH Atypical ductal hyperplasia AHRQ Agency for Healthcare Research and Quality ALH Atypical lobular hyperplasia BI-RADS® Breast Imaging Reporting and Data System BSGI Breast specific gamma imaging CER Comparative Effectiveness Review CI Confidence interval CT Computed tomography 2D Two dimensional 3D Three dimensional DCIS Ductal carcinoma in situ FDG fluorodeoxyglucose FN False negative FP False positive LCIS Lobular carcinoma in situ MIBI Sestamibi MRI Magnetic resonance imaging NA Not applicable NR Not reported PET Positron emission tomography SMM Scintimammography SPECT Single photon emission computed tomography TEP Technical expert panel TN True negative TP True positive UK United Kingdom US Ultrasound USA United States of America

73
Glossary
Atypical ductal hyperplasia (ADH). A condition in which the cells that line the milk ducts of the breast experience abnormal growth. The lesion itself is not malignant but may sometimes contain foci of malignant cells and women with ADH have an elevated risk of developing a malignant lesion. Doppler ultrasound. A method of using ultrasound to evaluate blood flow through vessels. The speed of blood flow is evaluated by observing changes in the pitch of the reflected sound waves. Ductal carcinoma in situ (DCIS). A type of early stage breast cancer that is confined to the breast duct in which it arose. Harmonic ultrasound. Ultrasound waves develop harmonics as they pass through breast tissue. Digital encoding can be used by computers to construct images from the harmonic frequencies. High-risk lesion. Any of a number of different types of non-cancerous lesions of the breast that have been observed to sometimes contain foci of malignant cells, and women diagnosed with these types of lesions have an elevated risk of developing a malignant lesion. Some common types of high-risk lesions include atypical ductal hyperplasia (ADH), radial scars, papillary lesions, atypical lobular hyperplasia (ALH), and lobular carcinoma in situ (LCIS).Magnetic resonance imaging: A method of imaging internal anatomy by using strong magnetic fields and radiofrequency energy. Microcalcification. A tiny deposit of calcium visible as a bright spot on a mammogram. Tight clusters of microcalcifications may be a sign of a malignant lesion. Negative likelihood ratio. The ability of the diagnostic test to accurately “rule out” the presence of breast cancer. Negative predictive value. The probability of a woman actually not having breast cancer after testing negative for breast cancer. Negative predictive value = (true negatives)/(false negatives + true negatives). Palpable lesion. A breast lesion that can be felt by manual manipulation. Positive likelihood ratio. The ability of the diagnostic test to accurately predict the presence of breast cancer. Positive predictive value. The probability of a woman actually having breast cancer after testing positive for breast cancer. Positive predictive value = (true positives)/(true positives + false positives). Positron emission tomography. A method of imaging tissues by tracking the metabolism of a positron-emitting radioactive tracer.

74
Scintimammography. A method of imaging tissues by tracking the metabolism of a radioactive tracer. Sensitivity. The proportion of women with breast cancer who test positive for breast cancer. Sensitivity = (true positives)/(true positives + false negatives). Specificity. The proportion of women with benign lesions who test negative for breast cancer. Specificity = (true negatives)/(false positives + true negatives). Tomography ultrasound. Multiple ultrasound images from different angles are acquired and a computer used the information to develop a three-dimensional image of the interior anatomy of the breast. Ultrasound. A method of imaging anatomy by observing the reflections of high-frequency sound waves off of tissues with different acoustic properties. Conventional ultrasound is often referred to as B-mode ultrasound.

A-1
Appendix A. Search Strategy and Exact Search Strings
Table A1. Electronic database searches
Name Date Limits Platform/Provider
The Cochrane Central Register of Controlled Trials (CENTRAL)
Through September 9, 2010 www.thecochranelibrary.com
The Cochrane Database of Methodology Reviews (Methodology Reviews)
Through September 9, 2010 www.thecochranelibrary.com
The Cochrane Database of Systematic Reviews (Cochrane Reviews)
Through September 9, 2010 www.thecochranelibrary.com
Database of Abstracts of Reviews of Effects (DARE)
Through September 9, 2010 www.thecochranelibrary.com
EMBASE (Excerpta Medica) Through September 9, 2010 OVID
Health Technology Assessment Database (HTA)
Through September 9, 2010 www.thecochranelibrary.com
Healthcare Standards Through September 9, 2010 www.ecri.org
MEDLINE Through September 9, 2010 OVID
U.K. National Health Service Economic Evaluation Database (NHS EED)
Through 2009, Issue 4 www.thecochranelibrary.com
U.S. National Guideline Clearinghouse™ (NGC)
Searched December 1, 2009 www.ngc.gov

A-2
Search Strategies The search strategies employed combinations of freetext keywords as well as controlled
vocabulary terms including (but not limited to) the following concepts. The strategy below is presented in OVID syntax; the search was simultaneously conducted across Embase, MEDLINE, and PsycINFO. A parallel strategy was used to search the databases comprising the Cochrane Library. Medical Subject Headings (MeSH), EMTREE, PsycINFO and Keywords
Conventions:
OVID
$ = truncation character (wildcard)
exp = “explodes” controlled vocabulary term (e.g., expands search to all more specific related terms in the vocabulary’s hierarchy)
.de. = limit controlled vocabulary heading
.fs. = floating subheading
.hw. = limit to heading word
.md. = type of methodology (PsycINFO)
.mp. = combined search fields (default if no fields are specified)
.pt. = publication type
.ti. = limit to title
.tw. = limit to title and abstract fields
PubMed
[mh] = MeSH heading
[majr] = MeSH heading designated as major topic
[pt] = publication type
[sb] = subset of PubMed database (PreMEDLINE, Systematic, OldMEDLINE)
[sh] = MeSH subheading (qualifiers used in conjunction with MeSH headings)
[tiab] = keyword in title or abstract
[tw] = text word

ECRI Institute Evidence-based Practice Center Effectiveness of Non-invasive Diagnostic Tests for Breast Abnormalities
A-3
Table A2. Topic specific search terms
Concept Controlled Vocabulary Keywords
Breast diseases breast cancer
breast carcinoma breast diseases
breast neoplasms
breast cancer
breast carcinoma
breast lesions breast lumps
breast neoplasms
breast tumors
breast tumours
Diagnosis diagnosis diagnostic accuracy
diagnostic imaging
diagnostic procedure
diagnostic value
early diagnosis
sensitivity and specificity
tumor diagnosis
accuracy
diagnosis
false negative
false positive
gold standard
likelihood
precision predictive value
receiver operating characteristic
ROC
sensitivity
specificity
true negative
true positive
Non-invasive technique noninvasive
non-invasive Ultrasonography echomammography
ultrasonography
ultrasonography, mammary
ultrasound
echography
echomammography
sonography
sonomammography
ultrasonic ultrasonography
ultrasound
Magnetic resonance imaging
magnetic resonance imaging
nuclear magnetic resonance imaging
magnet strength
magnetic resonance MR
MRI
NMR
nuclear magnetic resonance
pulse sequence

Table A2. Topic specific search terms (continued)
A-4
Concept Controlled Vocabulary Keywords
Positron emission tomography
fluorodeoxyglucose F 18 positron emission tomography
tomography,emission-computed
computed tomography
F18
F-18 FDG
f-fluorodeoxyglucose
PET
positron emission tomography
Scintimammography gamma cameras gamma spectrometry
methoxy isobutyl isonitrile technetium tc-99
nuclear medicine
organotechnetium compounds [diagnostic use]
radionuclide imaging
radiopharmaceuticals
scintillation camera
scintimammography
spectrometry, gamma
technetium Tc 99m Sestamibi [diagnostic use]
BSGI gamma camera
gammagraphy
gammagraphy
MIBI
miraluma
nuclear medicine
pem tetrofosomin
radionuclide
radiotracers
scintimammography
sestamibi
technetium
tetrofosmin
SPECT single photon emission computer tomography
spectrometry, x-ray emission
SPECT
SPET
Tomosynthesis three dimensional imaging 3D
3-D
three dimensional tomosynthesis
Computer-aided detection computer assisted diagnosis
diagnosis, computer-assisted
digital mammography
image analysis image interpretation, computer-
assisted
image processing, computer-assisted
radiographic image interpretation, computer-assisted
CAD computer aided detection
computer aided diagnosis
computer assisted detection
computer assisted diagnosis
digital mammography
Doppler ultrasound doppler echography ultrasonography, Doppler
ultrasonography, doppler, color
ultrasonography, doppler, duplex
doppler echography
doppler ultrasonography

Table A2. Topic specific search terms (continued)
A-5
Concept Controlled Vocabulary Keywords
Combined PET/CT computer assisted tomography positron-emission tomography
tomography, emission-computed
tomography, x-ray computed
PET/CT
positron emission tomography and computed tomography

ECRI Institute Evidence-based Practice Center Effectiveness of Non-invasive Diagnostic Tests for Breast Abnormalities
A‐6
Table A3. CINAHL/EMBASE/MEDLINE
Set N Concept Search Statement
1 Breast diseases exp Breast neoplasms/ or exp breast diseases/ or exp breast cancer/ or breast carcinoma/ or ((breast or mammary) and (cancer$ or neoplasm$ or carcinoma$ or tumor$ or tumour$ or lump$ or lesion$)).mp.
2 Diagnosis “sensitivity and specificity”/ or early diagnosis/ or diagnostic imaging/ or diagnostic value/ or diagnostic accuracy/ or diagnostic procedure/ or tumor diagnosis/ or diagnos$.mp. or di.xs. or “gold standard”.mp. or ROC.mp. or “receiver operating characteristic”.mp. or likelihood.mp. or ((false or true) adj (positive or negative)).tw. or “predictive value”.mp. or accuracy.mp. or precision.mp. or sensitivity.mp. or specificity.mp.
3 Combine sets 1 and 2
4 Non-invasive technique (2005-2009)
3 and (noninvasive or non-invasive).mp.
5 Ultrasonography (2005-2009)
3 and (ultrasonography.fs. or ultrasonography, mammary/ or echogra$.mp. or echomammog$.mp. or sonogra$.mp. or sonomammogr$.mp. or ultrasound.mp. or ultrason$.mp. or echomammography/ or ultrasound/)
6 Magnetic resonance imaging (2000-2009)
3 and (exp magnetic resonance imaging/ or “magnet strength”.mp. or pulse sequence.mp. or MR.mp. or MRI.mp. or nuclear magnetic resonance.mp. or NMR.mp. or nuclear magnetic resonance imaging/ or magnetic resonance.mp.)
7 Positron emission tomography (2000-2009)
3 and ((FDG$ or f-fluorodeoxyglucose or f18 or f-18).mp. or fluorodeoxyglucose F 18/ or PET.ti. or positron emission tomography.mp. or exp tomography,emission-computed/ or (comput$ ADJ tomograph$).tw. or positron emission tomography/)
8 Scintimammography (2005-2009)
3 and ((gamma camera$ or gammagraph$ or nuclear medicine or radionuclide$).mp. or radionuclide imaging.fs. or radiotracer$.mp. or radiopharmaceuticals/ or sestamibi.mp. or technetium Tc 99m Sestamibi/du or gammagraph$.mp. or pem tetrofosomin.mp. or technetium.mp. or miraluma.mp. or tetrofosmin.mp. or scintimammogr$.mp. or spectrometry, gamma/ or methoxy isobutyl isonitrile technetium tc-99/ or nuclear medicine/ or scintillation camera/ or scintimammography/ or gamma spectrometry/ or exp organotechnetium compounds/du or MIBI.mp. or BSGI.mp. or gamma cameras/)
9 SPECT (2005-2009)
3 and (exp spectrometry, x-ray emission/ or SPET.mp. or SPECT.mp. or single photon emission computer tomography/)
10 Tomosynthesis 2007-2009)
3 and (tomosynthesis.mp. or three dimensional imaging/ or 3-D.mp. or 3D.mp. or imaging, three dimensional/ or ((three or 3) ADJ dimension$)).tw.

Table A3. CINAHL/EMBASE/MEDLINE (continued)
A-7
Set N Concept Search Statement
11 Computer-aided detection (2001-2009)
3 and (diagnosis, computer-assisted/ or image interpretation, computer-assisted/ or radiographic image interpretation, computer-assisted/ or computer assisted diagnosis/ or digital mammography/ or (comput$ ADJ (aided or assisted) ADJ (detection or diagnos$)).tw. or digital mammogra$.mp. or CAD.mp. or exp image processing, computer-assisted/ or image analysis/)
12 Doppler ultrasound (1997-2009)
3 and (ultrasonography, doppler/ or ultrasonography, doppler, duplex/ or ultrasonography, doppler, color/ or doppler echography/ or (doppler ADJ2 (ultraso$ or echograph$)).tw.)
13 Combined PET/CT (2000-2009)
3 and (((positron-emission tomography/ or tomography, emission-computed/) and (tomography, x-ray computed/ or computer assisted tomography.mp.)) or (pet ADJ ct).tw. or pet/ct or (positron emission tomograph$ and comput$ tomograph$).mp.)
14 Combine sets or/4-13
15 Limit by publication type
15 not ((letter or editorial or news or comment or case reports or note or conference paper).de. or (letter or editorial or news or comment or case reports).pt.)

B-1
Appendix B. Sample Data Abstraction Forms
Abstract Screening Form
1. Is the topic of the article “diagnosis of breast cancer”?
2. Is the article a full-length published journal article?
3. Is the article written in English?
4. Is the article describing a clinical study?
5. Does the study use one of the technologies being considered in the report?
6. Does the study appear to address at least one of the Key Questions?
7. Is the study about diagnosis and not about screening asymptomatic individuals?
8. Did the study enroll at least 10 female humans?
Inclusion/Exclusion Screening Form 2. Did the study directly compare the test of interest to an acceptable reference standard-
core-needle biopsy, open surgery, or patient followup- in the same group of patients?
3. Were at least 85% of the originally enrolled patients evaluated by both the non-invasive imaging technology and an acceptable reference standard?
4. If the study is retrospective in design, did it enroll all patients, consecutive patients, or a randomized sample of patients? Retrospective case-control and case studies are excluded.
5. The studies must have used current generation scanners and protocols of the selected technologies only, as defined in the following list of technologies and cut-off publication dates (to present):
Ultrasound (B-mode grayscale, tissue harmonics, power Doppler, color Doppler, tomography): 1994+
Magnetic resonance imaging (MRI), without computer aided-detection (CADx), using breast-specific coils and gadolinium-based contrast agents: 2000+
Magnetic resonance imaging (MRI), with computer aided-detection (CADx) (breast-specific coils and gadolinium-based contrast agents, CAD package FDA approved): 2000+
Positron emission imaging (PET), with or without computed tomography (PET/CT), using 18-flurodeoxyglucose (FDG) as the tracer: 2000+
Scintimammography, including breast specific gamma imaging (BSG1) and single photon emission computed tomography (SPECT), using technetium-99m sestamibi (sestamibi or MIBI) as the tracer: 2005+

B-2
6. Did the study enrolled female human subjects? If male subjects were enrolled, the majority (90%+) of the patients must have been female.
7. Did the study enroll patients referred for the purpose of primary diagnosis of a breast abnormality detected by routine screening (mammography and/or physical examination)? Studies that enrolled subjects that were undergoing evaluation for any of the following purposes were excluded as being out of scope of the report: screening of asymptomatic women; breast cancer staging; evaluation for a possible recurrence of breast cancer; monitoring response to treatment; evaluation of the axillary lymph nodes; evaluation of metastatic or suspected metastatic disease; or diagnosis of types of cancer other than primary breast cancer. Studies that enrolled patients from high-risk populations such as BRCA1/2 mutation carriers, or patients with a strong family history of breast cancer, are also out of scope. If a study enrolled a mixed patient population and did not report data separately, it was excluded if more than 15% of the subjects did not fall into the “primary diagnosis of women at average risk presenting with an abnormality detected on routine screening” category.
8. Did the study report test sensitivity, specificity, or sufficient data to calculate these measures of diagnostic test performance; or (for Key Question 3) reported factors that affected the accuracy of the non-invasive test being evaluated.
9. Was a complete set of data reported for at least 50% or more of the originally enrolled patients? Studies with extremely high rates of attrition are prone to bias and were excluded.
10. Was the study published in English?
11. Study must be published as a peer-reviewed full article. Meeting abstracts were not included.
12. Did the study enroll 10 or more individuals per arm?
13. Does the study include data that was also published in a different manuscript?
Quality Assessment (Risk of Bias) Form
1. Was patient recruitment either consecutive or random?
2. Was the study prospective in design?
3. Were more than 85% of the patients approached for recruitment enrolled in the study?
4. Were the patient inclusion/ exclusion criteria consistently applied to all patients?
5. Was the study free from obvious spectrum bias? Obvious spectrum bias was defined as more than 40% or less than 10% of the breast lesions were diagnosed as malignant; and/or the mean or median age of the enrolled population was less than 50 or greater than 70.
6. Did the study account for inter-reader/scorer differences?
7. Were the reader(s) of the biopsies blinded to the results of the reference standard?
8. Were readers of the reference standard blinded to the results of the biopsy?

B-3
9. Were the readers of the biopsy blinded to all other clinical information?
10. Were readers of the reference standard blinded to all other clinical information?
11. Were patients assessed by a reference standard regardless of the biopsy results?
12. Were the patients assessed by the gold standard (open surgical procedure) regardless of the initial biopsy results?
13. Was a diagnostic threshold chosen a priori by the study?
14. Were there no intervening treatments or interventions conducted between the time the diagnostic test was performed and the reference standard was performed?
15. Was a complete set of data reported for at least 85% of enrolled lesions?
16. Was funding for this study provided by a source that doesn’t have an obvious financial interest in the findings of the study?
17. Was the report of the study free from unresolvable discrepancies?
Study Design and Patients Data Abstraction Form Study design: Multi-center: Country set in: Source of funding: Patient recruitment methods: Patient enrollment criteria: N patients enrolled: N lesions enrolled: N lesions completing study: Patient age, mean or median, range: Describe imaging methods: Describe imaging operators/readers: Care setting: Reference standard: % lesions malignant: % lesions palpable: Tumor size: Other lesion descriptors:
Data Abstraction Form Category/type/descriptors:
Number TP Number FP
Number FN Number TN

C-1
Appendix C. Evidence Tables
Magnetic Resonance Imaging (MRI) Total of 41 studies
Total of 3,882 patients; 4,202 lesions
1 study of 3.0T; 2 studies of 0.5T; 3 studies of 1.0T; 33 studies of 1.5T; 1 study of mixed 1.0T and 1.5T; and 1 study NR
1 study comparing CAD assistance to not
26 studies of gadopentetic acid; 8 studies of gadodiamide; 3 studies of gadobenic acid; 2 studies of gadoteridol; 2 studies mixed or not reported; 2 studies compared gadopentetic acid to gadobenic acid.
Table C1. Included studies of MRI
Study MRI Methods Studied Design N Patients
N Lesions
Geographical Location
Funded by
Akita et al. 20091
1.5T gadodiamide Diagnostic cohort study 50 50 Japan NR
Baltzer et al. 20092
1.5T gadopentetic acid
CAD assistance vs. not
Prospective diagnostic cohort study
329 469 Germany NR
Hara et al. 20093
1.5T gadodiamide Diagnostic cohort study 103 93 Japan NR
Kim et al. 20094
1.5T gadopentetic acid Diagnostic cohort study 249 249 South Korea Pusan National University Research Grant
Lo et al. 20095
3T gadopentetic acid Prospective diagnostic cohort study
31 31 Hong Kong NR
Imbracio et al. 20086
1.5T gadopentetic acid Prospective diagnostic cohort study
44 55 Italy NR
Pediconi et al. 20087
1.5T gadopentetic acid vs. gadobenic acid
Prospective diagnostic cohort study
47 78 Italy NR
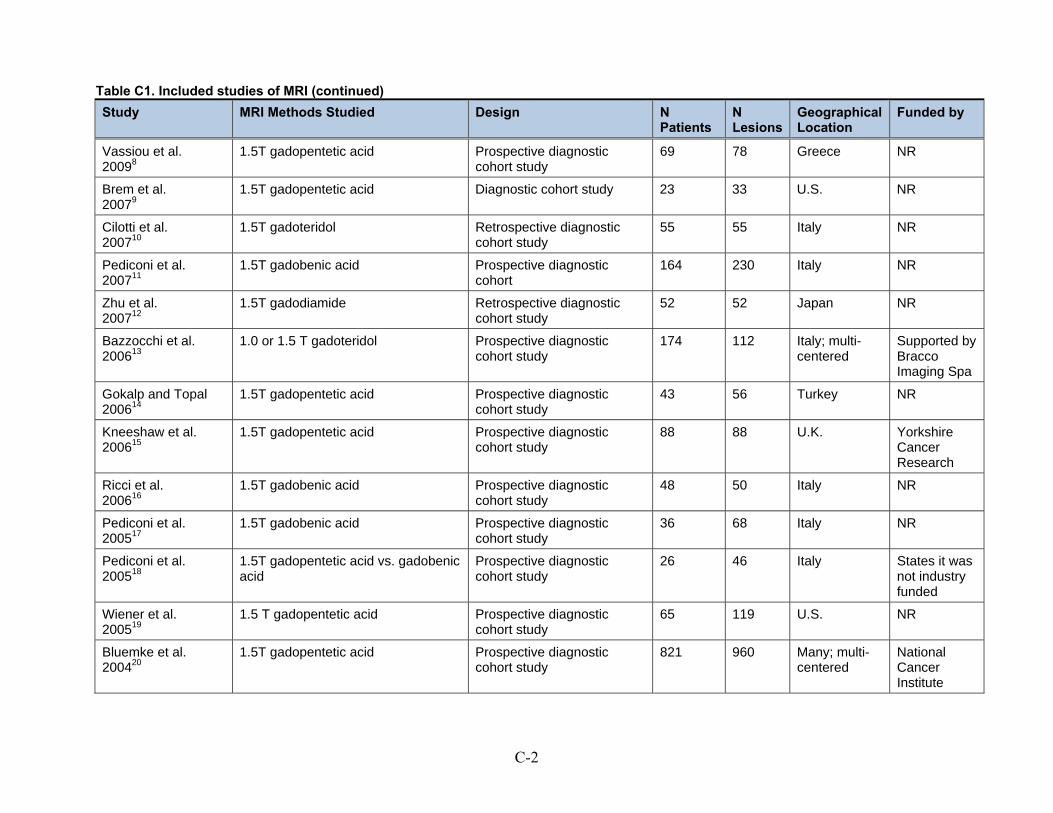
Table C1. Included studies of MRI (continued)
C-2
Study MRI Methods Studied Design N Patients
N Lesions
Geographical Location
Funded by
Vassiou et al. 20098
1.5T gadopentetic acid Prospective diagnostic cohort study
69 78 Greece NR
Brem et al. 20079
1.5T gadopentetic acid Diagnostic cohort study 23 33 U.S. NR
Cilotti et al. 200710
1.5T gadoteridol Retrospective diagnostic cohort study
55 55 Italy NR
Pediconi et al. 200711
1.5T gadobenic acid Prospective diagnostic cohort
164 230 Italy NR
Zhu et al. 200712
1.5T gadodiamide Retrospective diagnostic cohort study
52 52 Japan NR
Bazzocchi et al. 200613
1.0 or 1.5 T gadoteridol Prospective diagnostic cohort study
174 112 Italy; multi-centered
Supported by Bracco Imaging Spa
Gokalp and Topal 200614
1.5T gadopentetic acid Prospective diagnostic cohort study
43 56 Turkey NR
Kneeshaw et al. 200615
1.5T gadopentetic acid Prospective diagnostic cohort study
88 88 U.K. Yorkshire Cancer Research
Ricci et al. 200616
1.5T gadobenic acid Prospective diagnostic cohort study
48 50 Italy NR
Pediconi et al. 200517
1.5T gadobenic acid Prospective diagnostic cohort study
36 68 Italy NR
Pediconi et al. 200518
1.5T gadopentetic acid vs. gadobenic acid
Prospective diagnostic cohort study
26 46 Italy States it was not industry funded
Wiener et al. 200519
1.5 T gadopentetic acid Prospective diagnostic cohort study
65 119 U.S. NR
Bluemke et al. 200420
1.5T gadopentetic acid Prospective diagnostic cohort study
821 960 Many; multi-centered
National Cancer Institute

Table C1. Included studies of MRI (continued)
C-3
Study MRI Methods Studied Design N Patients
N Lesions
Geographical Location
Funded by
Huang et al. 200421
1.5T gadodiamide Prospective diagnostic cohort study
50 50 U.S. Susan G. Komen Breast Cancer Foundation
Bone et al. 200322
1.5T gadopentetic acid Prospective diagnostic cohort study
97 111 Hungary NR
Daldrup-Link et al. 200323
1.5T gadopentetic acid Prospective diagnostic cohort study
14 19 Germany NR
Heinisch et al. 200324
1.0T gadopentetic acid Prospective diagnostic cohort study
36 40 Austria NR
Walter et al. 200325
1.0T gadopentetic acid Prospective diagnostic cohort study
40 42 Germany NR
Guo et al. 200226
1.5T gadopentetic acid Retrospective diagnostic cohort study
52 47 China NR
Kelcz et al. 200227
1.5T gadodiamide Prospective diagnostic cohort study
62 68 U.S. Weizman Institute of Science, Rehovot, Israel and the Israel Binational Science Foundation in the United States
Schedel et al. 200228
1.5T gadopentetic acid Diagnostic cohort study 65 34 Germany NR
Trecate et al. 200229
1.5T gadopentetic acid Prospective diagnostic cohort study
28 28 Italy NR
Wiberg et al. 200230
1.5T gadopentetic acid Prospective diagnostic cohort study
93 114 Sweden NR

Table C1. Included studies of MRI (continued)
C-4
Study MRI Methods Studied Design N Patients
N Lesions
Geographical Location
Funded by
Brix et al. 200131
1.5T gadopentetic acid Prospective diagnostic cohort study
14 14 Germany Wilhelm Sanders-Stifttung grant
Cecil et al. 200132
1.5T gadopentetic acid Diagnostic cohort study 37 23 U.S. Grant funding through the National Institute of Health and U.S. Army
Furman-Haran et al. 200133
1.5T gadodiamide Prospective diagnostic cohort study
40 48 U.S. U.S.-Israel Binational Foundation
Imbriaco et al. 200134
0.5T gadopentetic acid Prospective diagnostic cohort study
49 49 Italy Associazione Italiana Ricerca Cancro
Malich et al. 200135
1.5T gadopentetic acid Diagnostic cohort study 94 100 Germany NR
Nakahara et al. 200136
0.5T gadopentetic acid Retrospectivediagnostic cohort study
40 40 Japan NR
Torheim et al. 200137
1.5T gadodiamide Prospective diagnostic cohort study
127 127 Norway Norwegian Research Council
Wedegartner et al. 200138
1.0T gadopentetic acid Prospective diagnostic cohort study
53 62 Germany NR
Yeung et al. 200139
1.5T gadopentetic acid Diagnostic cohort study 30 23 China NR
Kvistad et al. 200040
1.5T gadodiamide Prospective diagnostic cohort study
130 130 Norway Norwegian Cancer Society

Table C1. Included studies of MRI (continued)
C-5
Study MRI Methods Studied Design N Patients
N Lesions
Geographical Location
Funded by
Van Goethem et al. 200041
NR T gadopentetic acid Retrospective diagnostic cohort study
75 75 Belgium; multi-centered
NR
NR Not reported T Tesla U.K. United Kingdom U.S. United States

ECRI Institute Evidence-based Practice Center Effectiveness of Non-invasive Diagnostic Tests for Breast Abnormalities
C-6
Table C2. MRI studies: patient and lesion details
Study Inclusion/Exclusion Criteria
N Patients
N Lesions
N Completed Study
Median or Mean Age (Years)
Age Range (Years)
% Lesions (n/N) Malignant
% Lesions Palpable
Akita et al. 20091
Patients with mammographically detected microcalcifications classified as BI-RADS 3 or higher
50 50 50 Mean: 50.6 28 to 80 26.0% (13/50)
NR
Baltzer et al. 20092
Consecutive female patients with unclear or suspect findings on mammography who underwent surgery; patients who underwent preoperative chemotherapy were excluded.
329 469 469 55.3 15 to 83 59.5% (279/469)
NR
Hara et al. 20093
Patients with suspected malignancy in routine examination.
103 93 93 49.1 21 to 75 23.6% (22/93)
NR
Kim et al. 20094
Consecutive patients with palpable breast masses on physical examination and/or suspicious mammographic findings
249 249 249 47 37 to 57 85.3% (205/249)
59%
Lo et al. 20095
Patients with suspicious lesions on mammography/US
31 31 31 46 34 to 69 64.5% (20/31)
NR
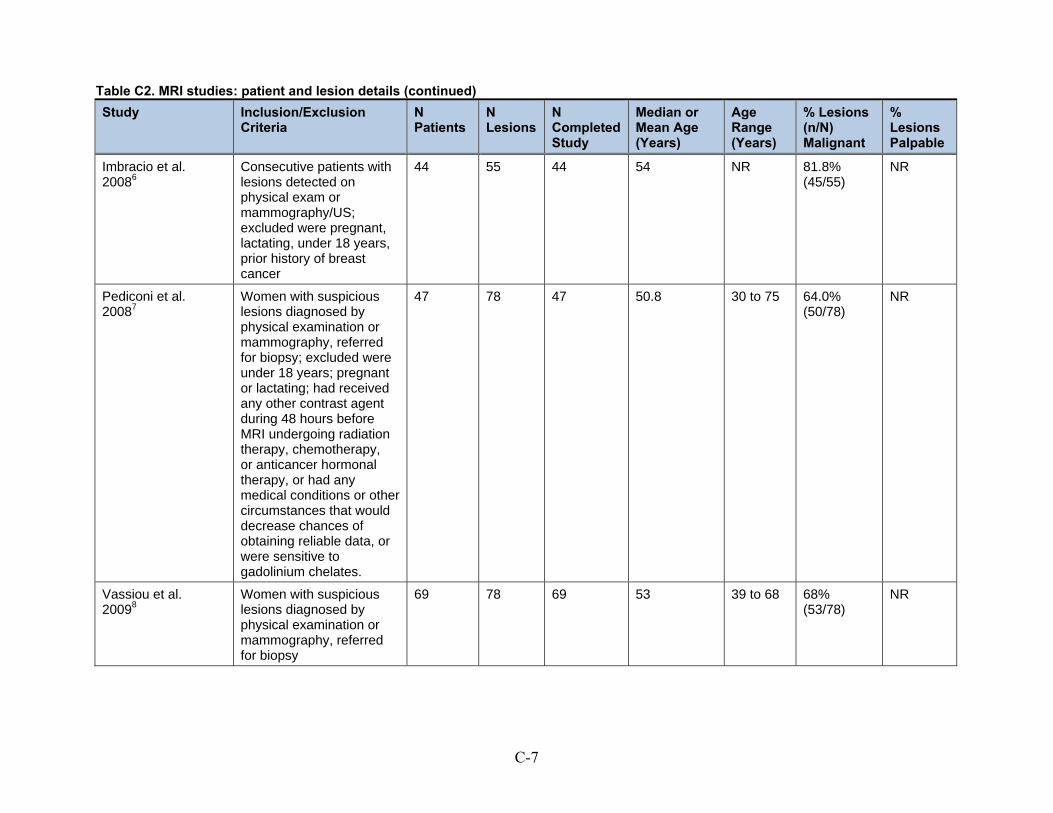
Table C2. MRI studies: patient and lesion details (continued)
C-7
Study Inclusion/Exclusion Criteria
N Patients
N Lesions
N Completed Study
Median or Mean Age (Years)
Age Range (Years)
% Lesions (n/N) Malignant
% Lesions Palpable
Imbracio et al. 20086
Consecutive patients with lesions detected on physical exam or mammography/US; excluded were pregnant, lactating, under 18 years, prior history of breast cancer
44 55 44 54 NR 81.8% (45/55)
NR
Pediconi et al. 20087
Women with suspicious lesions diagnosed by physical examination or mammography, referred for biopsy; excluded were under 18 years; pregnant or lactating; had received any other contrast agent during 48 hours before MRI undergoing radiation therapy, chemotherapy, or anticancer hormonal therapy, or had any medical conditions or other circumstances that would decrease chances of obtaining reliable data, or were sensitive to gadolinium chelates.
47 78 47 50.8 30 to 75 64.0% (50/78)
NR
Vassiou et al. 20098
Women with suspicious lesions diagnosed by physical examination or mammography, referred for biopsy
69 78 69 53 39 to 68 68% (53/78)
NR

Table C2. MRI studies: patient and lesion details (continued)
C-8
Study Inclusion/Exclusion Criteria
N Patients
N Lesions
N Completed Study
Median or Mean Age (Years)
Age Range (Years)
% Lesions (n/N) Malignant
% Lesions Palpable
Brem et al. 20079
Indeterminate breast findings that required a biopsy
23 33 33 53 33 to 70 27.3% (9/33)
NR
Cilotti et al. 200710
Patients with BIRADS 3-5 microcalcifications from mammography that were not opaque or distorted
55 55 55 56 37 to 76 47.3% (26/55)
0%
Pediconi et al. 200711
Consecutive patients with suspicious clinical exam, mammogram and or US; excluded were patients contraindicated for MRI or with mammogram BIRADS 2 or 3
164 230 164 NR NR 93.3% (211/226)
NR
Zhu et al. 200712
consecutive patients with microcalcifications suspicious of DCIS; patients with palpable lesions
52 52 52 NR 30 to 74 50% (26/52)
0%
Bazzocchi et al. 200613
Patients with mammographically detected microcalcifications (BIRADS 4-5); any race; associated or not with an opacity; excluded were younger than 18 years, contraindications to MRI, pregnant/breastfeeding, severe renal failure, sensitivity to gadolinium.
174 112 112 NR NR 67.0% (75/112)
0%

Table C2. MRI studies: patient and lesion details (continued)
C-9
Study Inclusion/Exclusion Criteria
N Patients
N Lesions
N Completed Study
Median or Mean Age (Years)
Age Range (Years)
% Lesions (n/N) Malignant
% Lesions Palpable
Gokalp and Topal 200614
Nonpalpable lesions defined as BIRADS category 3 on screening mammography
43 56 43 49.7 37 to 68 1.8% (1/56)
0.00%
Kneeshaw et al. 200615
Patients with microcalcifications on mammography
88 88 88 58 50 to75 22.7% (20/88)
0%
Ricci et al. 200616
Consecutive patients with lesions detected on mammography
48 50 50 58 40 to 81 76% (38/50)
NR
Pediconi et al. 200517
Consecutive patients with suspected breast cancer based on mammogram/US; Excluded under 18 years of age; pregnant/lactating; undergoing cancer treatment; or had another contrast agent in the last 48 hours
36 68 36 NR 31 to 78 79.4% (54/68)
NR
Pediconi et al. 200518
Consecutive patients with suspected breast cancer based on mammogram/US; Excluded under 18 years of age; pregnant/lactating; undergoing cancer treatment; or had another contrast agent in the last 48 hours
26 46 25 47.8 32 to 67 82.6% (38/46)
NR

Table C2. MRI studies: patient and lesion details (continued)
C-10
Study Inclusion/Exclusion Criteria
N Patients
N Lesions
N Completed Study
Median or Mean Age (Years)
Age Range (Years)
% Lesions (n/N) Malignant
% Lesions Palpable
Wiener et al. 200519
Women 18 to 80 years of age with suspicious lesions diagnosed by physical examination or mammography, referred for biopsy; Excluded if: a prior invasive breast procedure had been performed within 6 months of the surgery; contraindication to MRI (pacemaker, metallic implant, etc.); history of prior breast cancer in the affected breast; pregnancy
960 960 821 53.2 42 to 65 49.2% (404/821)
39%
Bluemke et al. 200420
Patients with a BIRADS 4 or 5 at mammography scheduled for CNB/surgery
50 50 50 50.2 34 to 71 36.0% (18/50)
NR
Huang et al. 200421
Patients with indeterminate lesions on mammogram, US, or both; MRI done during the first 2 weeks of menstrual cycle, who were candidates for surgery; excluded were lesions larger than 5 cm, thought to have multicentric disease, not a candidate for radiation, small breast to lesion ratio
65 119 65 NR NR 58.0% (69/119)
72.3% (47/65)

Table C2. MRI studies: patient and lesion details (continued)
C-11
Study Inclusion/Exclusion Criteria
N Patients
N Lesions
N Completed Study
Median or Mean Age (Years)
Age Range (Years)
% Lesions (n/N) Malignant
% Lesions Palpable
Bone et al. 200322
Consecutive patients scheduled for surgery after detection of lesions by palpation or mammography
97 111 90 54 33 to 81 71.2% (79/111)
NR
Daldrup-Link et al. 200323
Women with suspicious lesions diagnosed by physical examination, mammography, or ultrasound, scheduled for surgery; Excluded were: women less than 18 years of age, with implanted metal devices, claustrophobia, pregnant, lactating, or had been administered iron oxides with 7 days before the study, participation in antoher study, serious liver dysfunction, or a history of serious allergies or reactions to any drugs particularly contrast agents.
14 19 19 55 35 to 77 47% (9/19)
NR
Heinisch et al. 200324
Women with suspicious breast lesions detected by physical exam, mammography, and/or ultrasound, scheduled for biopsy, referred when there happened to be time on the scanners
36 40 40 48.3 25 to 77 62.5% (25/40)
NR

Table C2. MRI studies: patient and lesion details (continued)
C-12
Study Inclusion/Exclusion Criteria
N Patients
N Lesions
N Completed Study
Median or Mean Age (Years)
Age Range (Years)
% Lesions (n/N) Malignant
% Lesions Palpable
Walter et al. 200325
A subset of patients were randomly selected from a consecutive series who were referred for biopsy due to findings on mammography, ultrasound, or physical examination
40 42 42 52 21 to 77 45.2% (19/42)
NR
Guo et al. 200226
No specific criteria reported
52 47 47 58 25 to 75 56.4% (31/55)
NR
Kelcz et al. 200227
Women with palpable masses, or who had mammographic or sonographic abnormalities thought to require biopsy. Women with prebiopsy studies indicating a high likelihood of a cyst were excluded
62 68 57 50 31 to 80 46.0% (31/68)
NR

Table C2. MRI studies: patient and lesion details (continued)
C-13
Study Inclusion/Exclusion Criteria
N Patients
N Lesions
N Completed Study
Median or Mean Age (Years)
Age Range (Years)
% Lesions (n/N) Malignant
% Lesions Palpable
Schedel et al. 200228
Women with suspicious lesions diagnosed by physical examination or mammography, referred for biopsy; Excluded were women who had undergone tumor therapy or had diagnostic puncture of the breast to be evaluated within 3 months of the study, women who had undergone any kind of breast surgery within 6 months, or women who had irradiation treatment of the breast within 18 months.
65 34 57 52 21 to 78 59.6% (34/57)
NR
Trecate et al. 200229
Patients with mammographically suspicious clustered or diffuse microcalcifications
28 28 28 NR 33 to 65 53.6% (15/28)
NR
Wiberg et al. 200230
Consecutive patients scheduled for surgery between January 1996 to June 1997 after detection of lesions by palpation or mammography and after undergoing diagnostic triple assessment (diagnostic mammography, physical exam, and fine needle aspiration) who had no contraindications to MRI
93 114 114 54 33 to 81 72% (82/114)
54%

Table C2. MRI studies: patient and lesion details (continued)
C-14
Study Inclusion/Exclusion Criteria
N Patients
N Lesions
N Completed Study
Median or Mean Age (Years)
Age Range (Years)
% Lesions (n/N) Malignant
% Lesions Palpable
Brix et al. 200131
Patients with suspicious lesions detected on mammography or physical examination who were scheduled for a biopsy.
14 14 14 49 35 to 66 64.2% (9/14)
NR
Cecil et al. 200132
Women with a palpable or suspicious mass detected by mammography that was at least 1 cm in diameter but did not appear to be a focal mass.
37 23 37 47 18 to 85 60.5% (23/38)
NR
Furman-Haran et al. 200133
Patients had lesions at mammography/US and biopsy was recommended
40 48 40 NR NR 52.1% (25/48)
71%
Imbriaco et al. 200134
Consecutive patients with a suspicious breast lesion detected either by physical examination or mammography and US; Patients were excluded if they were pregnant, lactating, under 18 years of age, had a personal history of breast cancer or had undergone fine-needle aspiration before the MRI could be performed
49 49 49 49 30 to 60 51% (25/49)
37%
Malich et al. 200135
Consecutive patients with equivocal mammographic abnormalities referred for biopsy
94 100 90 NR NR 67% (60/90)
NR

Table C2. MRI studies: patient and lesion details (continued)
C-15
Study Inclusion/Exclusion Criteria
N Patients
N Lesions
N Completed Study
Median or Mean Age (Years)
Age Range (Years)
% Lesions (n/N) Malignant
% Lesions Palpable
Nakahara et al. 200136
Only patients who proceeded to biopsy were included
40 40 40 49.5 27 to 76 50.0% (20/40)
0%
Torheim et al. 200137
Patients with solid breast tumors
127 127 126 53 NR 55.1% (70/127)
NR
Wedegartner et al. 200138
Patients with palpable or mamographically suspicious lesions scheduled for excisional biopsy
53 62 53 49 18 to 82 71.0% (44/62)
NR
Yeung et al. 200139
Women that showed non-specific lesions larger than 1.5 cm on mammography or ultrasound.
30 23 30 50 20 to 80 77.0% (23/30)
NR
Kvistad et al. 200040
Patients with recently discovered solid breast tumors (palpable masses or mammographic screening) scheduled to undergo biopsy were invited; patients with cysts and microcalcifications but no solid mass were excluded, as were patients unable to undergo MRI due to old age, poor physical condition, claustrophobia, or lack of available time on the MRI schedule.
130 130 130 59 37 to 82 55.4% (72/130)
74%

Table C2. MRI studies: patient and lesion details (continued)
C-16
Study Inclusion/Exclusion Criteria
N Patients
N Lesions
N Completed Study
Median or Mean Age (Years)
Age Range (Years)
% Lesions (n/N) Malignant
% Lesions Palpable
Van Goethem et al. 200041
Consecutive patients from 9 hospitals having MRI for any indication.
75 75 74 NR NR 36.5% (27/74)
NR
MRI Magnetic resonance imaging NR Not reported US Ultrasound

C-17
Table C3. Details of MRI methodology
Study Tesla Machine Used
Precontrast Sequence
Contrast Agent Post-contrast Sequence
Other/Final Sequence
Readers Reference Standard
Akita et al. 20091
1.5T Signa HD (General Electric, Milwaukee, WI)
T2 weighted FSE with fat suppression, and T1 weighted SPGR
Gadodiamide hydrate (Omniscan) 0.1 mmol/kg
Dynamic 3D fat-suppressed
Fat-suppressed delayed-phase sagittal
Consensus of two radiologists
All patients underwent stereotactic vacuum-assisted breast biopsy
Baltzer et al. 20092
1.5T Magnetom Symphony or Sonata (Siemens, Erlangen, Germany)
T1 weighted SPGR
Gd-DTPA 0.1 mmol/kg
Dynamic FLASH
T2 weighted TSE
Consensus of two blinded reviewers vs. CAD
Open surgery
Hara et al. 20093
1.5T Magnetom Symphony (Siemens, Erlangen, Germany)
T2 and T1 weighted fat suppressed
Gadodiamide hydrate (Omniscan) 0.15 mmol/kg
Dynamic None reported
One blinded radiologist
Fine needle biopsy and follw-up every 3 or 6 months (median follow-up 309 days)
Kim et al. 20094
1.5T Somatom Vision (Siemens, Erlangen, Germany)
T1 weighted FLASH
Gd-DTPA 0.16 mmol/kg
Dynamic T1 weighted 3D FLASH
None reported
Consensus of two radiologists
Open surgical biopsy (n = 215) or core needle biopsy (n = 24)
Lo et al. 20095
3T Magnetom Tim Trio (Siemens, Erlangen, Germany)
Diffusion-weighted single-shot followed by T1 and T2-weighted fat saturated
Gd-DTPA 0.1 mmol/kg
Dynamic 3D T1 weighted fat-saturated
Consensus of two radiologists
Needle or excisional biopsy

Table C3. Details of MRI methodology (continued)
C-18
Study Tesla Machine Used
Precontrast Sequence
Contrast Agent Post-contrast Sequence
Other/Final Sequence
Readers Reference Standard
Imbracio et al. 20086
1.5T Gyroscan Intera (Philips Healthcare)
FFE Gd-DTPA 0.1 mmol/kg
Dynamic T1-weighted 3D FFE
None reported
One radiologist
Excisional or core needle biopsy
Pediconi et al. 20087
1.5T Visions Plus (Siemens)
T1 weighted gradient echo
Gd-DTPA or gadobenate dimeglumine, 0.1 mmol/kg
Dynamic T1-weighted 3D gradient echo
None reported
Consensus of two blinded radiologists
Surgery, excisional biopsy, or core biopsy in all patients 24 hours to 1 month after MRI
Vassiou et al. 20098
1.5T Magnetom Vision (Siemens, Erlangen, Germany)
T2 weighted TSE
Gd-DTPA 0.2 mmol/kg
Dynamic T1 weighted SPGR
None reported
Not reported
Surgery, excisional biopsy, or core biopsy in all patients within 2 months after MRI
Brem et al. 20079
1.5T General Electric Healthcare, Milwaukee, WI
T1 and T2 weighted fat saturated
Gd-DTPA 0.1 mmol/kg
Dynamic T1 weighted
T1 fat saturated
Two experienced non-blinded breast imagers
MRI-guided biopsy and follow-up if needed
Cilotti et al. 200710
1.5T Symphony (Seimens)
T1 weighted, then T2 weighted fat saturated, then T1 3D FLASH
Gadoteridol (Prohance, Bracco) 0.1 mmol/kg
Dynamic None reported
Not reported
Vaccumm assisted steotactic core needle biopsy or surgery

Table C3. Details of MRI methodology (continued)
C-19
Study Tesla Machine Used
Precontrast Sequence
Contrast Agent Post-contrast Sequence
Other/Final Sequence
Readers Reference Standard
Pediconi et al. 200711
1.5T Seimens Vision Plus (Seimens, Erlangen, Germany)
T1 weighted gradient echo
Gadobenate dimeglumine (MultiHance; Bracco Imaging, Milan, Italy) 0.1 mmol/kg
Dynamic 3D T1 weighted gradient echo
None reported
Two radiologists in consensus
Open surgery or core needle biopsy or followup
Zhu et al. 200712
1.5T Intera Master (Phillips Medical Systems, Cleveland, OH)
T2 weighted TSE and T1 weighted FFE fat saturated
Gadodiamide hydrate (Omniscan; Daiichi Pharma-ceuticals) 0.1 mmol/kg
Dynamic T1 weighted
None reported
One radiologist
Vacuum assisted core needle biopsy or surgery
Bazzocchi et al. 200613
1.0 or 1.5 T
Various 3D gradient echo
Gadoteridol (ProHance, Bracco Imaging) 0.1 mmol/kg
Dynamic None reported
Consensus of two blinded radiologists
Surgical biopsy after preoperative localization with a hook wire technique
Gokalp and Topal 200614
1.5T Magnetom Vision (Siemens, Erlangen, Germany)
T2 weighted TSE fat suppressed then T1 weighted 3D FLASH
Gd-DTPA 0.1 mmol/kg
Dynamic T1 weighted 3D FLASH
None reported
One radiologist
Follow up or biopsy
Kneeshaw et al. 200615
1.5T Signa Echospeed (General Electric, Milwaukee, WI)
T1 weighted 3D
Gd-DTPA 0.1 mmol/kg
Dynamic T1 weighted SPGR
T1 weighted 3D fat suppressed
One radiologist
Open surgery or follow-up

Table C3. Details of MRI methodology (continued)
C-20
Study Tesla Machine Used
Precontrast Sequence
Contrast Agent Post-contrast Sequence
Other/Final Sequence
Readers Reference Standard
Ricci et al. 200616
1.5T Magnetom Vision Plus (Seimens, Elrangen, Germany)
T2 weighted and T1 weighted 3D FLASH
Gadobenate dimeglumine 0.1 mmol/kg
Dynamic T1 weighted 3D SPGR
None reported
Not reported
Open surgical biopsy
Pediconi et al. 200517
1.5T Vision Plus (Siemens, Erhlangen, Germany)
T1 weighted Gadobenate dimeglumine 0.1 mmol/kg
Dynamic 3D T1 weighted
None reported
Two blinded radiologists in consensus
Surgery, biopsy, or follow-up
Pediconi et al. 200518
1.5T Vision Plus (Siemens, Erhlangen, Germany)
T1 weighted Gd-DTPA or gadobenate dimeglumine, 0.1 mmol/kg
Dynamic 3D T1 weighted
None reported
Two blinded radiologists in consensus
Surgery, biopsy, or follow-up
Wiener et al. 200519
1.5 T Symphony (Seimens)
T1 and T2 weighted
Gd-DTPA 0.1 mmol/kg
Dynamic 3D FLASH T1 weighted SPGR
None reported
One radiologist
Open surgery or core-needle biopsy; all core-needle biopsies were followed by either surgical excision or at least 1 year of clinical and mammo-graphic followup

Table C3. Details of MRI methodology (continued)
C-21
Study Tesla Machine Used
Precontrast Sequence
Contrast Agent Post-contrast Sequence
Other/Final Sequence
Readers Reference Standard
Bluemke et al. 200420
1.5T Various T2 weighted, then 3D T1-weighted
Gd-DTPA 0.1 mmol/kg
3D T1 weighted fat suppressed; women with enhancing lesions also underwent 2D dynamic T1 weighted
None reported
One reader per center
Excisional or core needle biopsy
Huang et al. 200421
1.5T Edge (Marconi Medical Systems, Cleveland, OH)
None reported Gadodiamide hydrate (Omniscan; Daiichi Pharma-ceuticals) 0.1 mmol/kg
Dynamic 3D T1 weighted SPGR
T2 weighted FLASH perfusion imaging
Not reported
Excisional biopsy or image guided core needle biopsy
Bone et al. 200322
1.5T Magentom SP63 (Seimens)
3D T1 weighted FLASH
Gd-DTPA 0.2 mmol/kg
Dynamic 3D T1 weighted FLASH
None reported
One radiologist
Surgical biopsy
Daldrup-Link et al. 200323
1.5T Philips ACS NT (BEST, the Nether-lands)
2D T2 weighted TSE
Gd-DTPA 0.2 mmol/kg
Dynamic 3D T1 weighted FLASH
None reported
Two radiologists
Open surgery
Heinisch et al. 200324
1.0T Not reported
T2 weighted TSE
Gd-DTPA 0.2 mmol/kg
Conventional dynamic
High-resolution 3D FFE with fat suppression including an additional contrast media injection
One radiologist
Open surgery
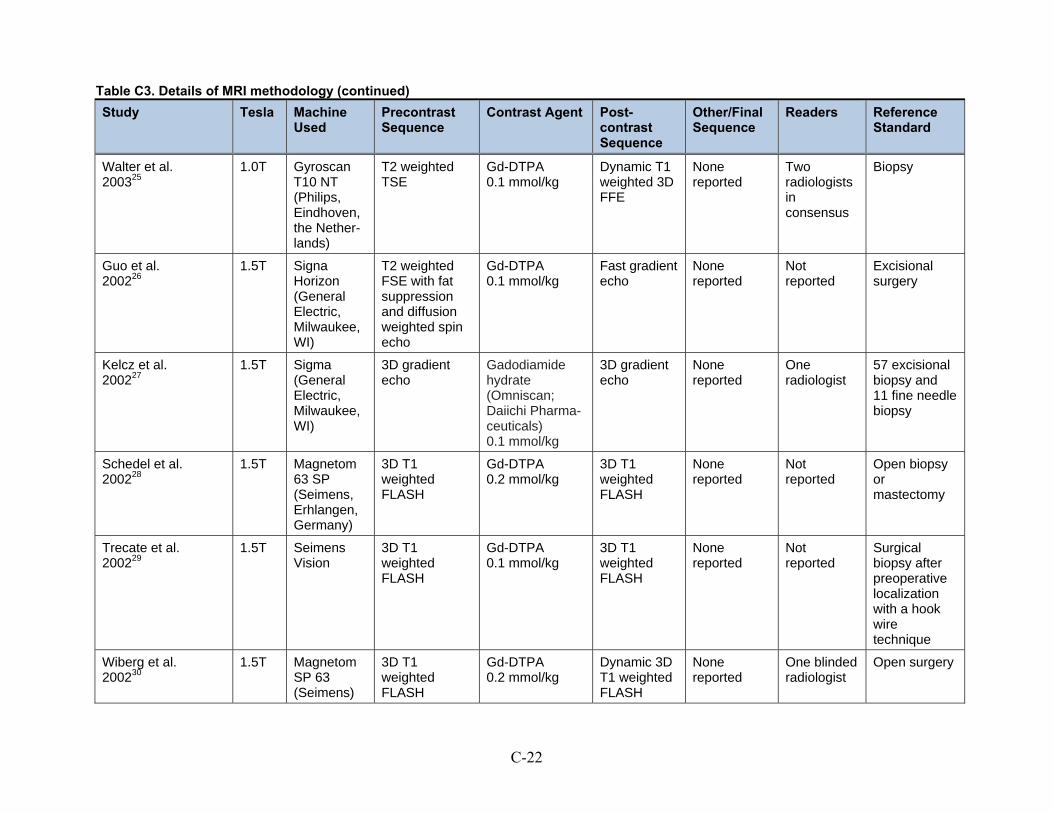
Table C3. Details of MRI methodology (continued)
C-22
Study Tesla Machine Used
Precontrast Sequence
Contrast Agent Post-contrast Sequence
Other/Final Sequence
Readers Reference Standard
Walter et al. 200325
1.0T Gyroscan T10 NT (Philips, Eindhoven, the Nether-lands)
T2 weighted TSE
Gd-DTPA 0.1 mmol/kg
Dynamic T1 weighted 3D FFE
None reported
Two radiologists in consensus
Biopsy
Guo et al. 200226
1.5T Signa Horizon (General Electric, Milwaukee, WI)
T2 weighted FSE with fat suppression and diffusion weighted spin echo
Gd-DTPA 0.1 mmol/kg
Fast gradient echo
None reported
Not reported
Excisional surgery
Kelcz et al. 200227
1.5T Sigma (General Electric, Milwaukee, WI)
3D gradient echo
Gadodiamide hydrate (Omniscan; Daiichi Pharma-ceuticals) 0.1 mmol/kg
3D gradient echo
None reported
One radiologist
57 excisional biopsy and 11 fine needle biopsy
Schedel et al. 200228
1.5T Magnetom 63 SP (Seimens, Erhlangen, Germany)
3D T1 weighted FLASH
Gd-DTPA 0.2 mmol/kg
3D T1 weighted FLASH
None reported
Not reported
Open biopsy or mastectomy
Trecate et al. 200229
1.5T Seimens Vision
3D T1 weighted FLASH
Gd-DTPA 0.1 mmol/kg
3D T1 weighted FLASH
None reported
Not reported
Surgical biopsy after preoperative localization with a hook wire technique
Wiberg et al. 200230
1.5T Magnetom SP 63 (Seimens)
3D T1 weighted FLASH
Gd-DTPA 0.2 mmol/kg
Dynamic 3D T1 weighted FLASH
None reported
One blinded radiologist
Open surgery
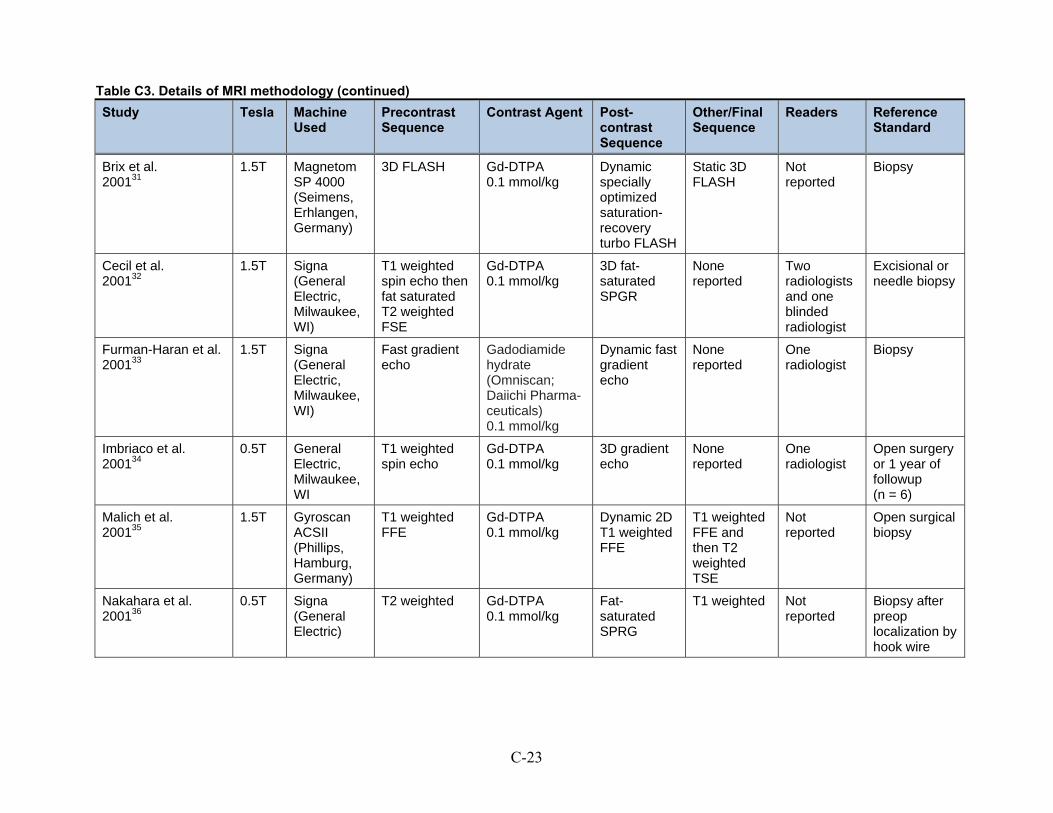
Table C3. Details of MRI methodology (continued)
C-23
Study Tesla Machine Used
Precontrast Sequence
Contrast Agent Post-contrast Sequence
Other/Final Sequence
Readers Reference Standard
Brix et al. 200131
1.5T Magnetom SP 4000 (Seimens, Erhlangen, Germany)
3D FLASH Gd-DTPA 0.1 mmol/kg
Dynamic specially optimized saturation-recovery turbo FLASH
Static 3D FLASH
Not reported
Biopsy
Cecil et al. 200132
1.5T Signa (General Electric, Milwaukee, WI)
T1 weighted spin echo then fat saturated T2 weighted FSE
Gd-DTPA 0.1 mmol/kg
3D fat-saturated SPGR
None reported
Two radiologists and one blinded radiologist
Excisional or needle biopsy
Furman-Haran et al. 200133
1.5T Signa (General Electric, Milwaukee, WI)
Fast gradient echo
Gadodiamide hydrate (Omniscan; Daiichi Pharma-ceuticals) 0.1 mmol/kg
Dynamic fast gradient echo
None reported
One radiologist
Biopsy
Imbriaco et al. 200134
0.5T General Electric, Milwaukee, WI
T1 weighted spin echo
Gd-DTPA 0.1 mmol/kg
3D gradient echo
None reported
One radiologist
Open surgery or 1 year of followup (n = 6)
Malich et al. 200135
1.5T Gyroscan ACSII (Phillips, Hamburg, Germany)
T1 weighted FFE
Gd-DTPA 0.1 mmol/kg
Dynamic 2D T1 weighted FFE
T1 weighted FFE and then T2 weighted TSE
Not reported
Open surgical biopsy
Nakahara et al. 200136
0.5T Signa (General Electric)
T2 weighted Gd-DTPA 0.1 mmol/kg
Fat-saturated SPRG
T1 weighted Not reported
Biopsy after preop localization by hook wire

Table C3. Details of MRI methodology (continued)
C-24
Study Tesla Machine Used
Precontrast Sequence
Contrast Agent Post-contrast Sequence
Other/Final Sequence
Readers Reference Standard
Torheim et al. 200137
1.5T Picker Edge II (Picker, Cleveland, OH)
None reported Gadodiamide hydrate (Omniscan; Daiichi Pharma-ceuticals) 0.1 mmol/kg
Dynamic 3D SPRG
T2 weighted perfusion imaging
Not reported
Excisional biopsy or FNA plus imaging follow up
Wedegartner et al. 200138
1.0T Magentom 63 SP or Magnetom Impact (Seimens)
None reported Gd-DTPA 0.2 mmol/kg
Dynamic 3D or 2D FLASH
None reported
Panel of five blinded radiologists
Excisional biopsy, image guided biopsy
Yeung et al. 200139
1.5T Gyroscan ACS NT (Philips, Best, the Netherlands)
T1 weighted spin echo fat saturation
Gd-DTPA 0.2 mmol/kg
T1 weighted spin echo fat saturation and T2 weighted TSE
None reported
Not reported
15 mastectomy; 1 hook-wire guided excision; 16 core biopsy; and 5 fine-needle aspiration
Kvistad et al. 200040
1.5T Picker Edge II (Picker, Cleveland, OH)
3D T1 weighted SPGR
Gadodiamide hydrate (Omniscan; Daiichi Pharma-ceuticals) 0.1 mmol/kg
Dynamic 3D T1 weighted SPGR
T2 weighted perfusion imaging
Not reported
Open surgery (n = 100) or a mean of 18 months followup (n = 30)
Van Goethem et al. 200041
NR Various None reported Gd-DTPA 0.1 mmol/kg
3D FLASH None reported
Not reported
Biopsy and follow-up
3D Three dimensional FFE Fast field echo FLASH Fast low-angle shot FSE Fast spin echo Gd-DTPA Magnevist, also called gadolinium diethylenetriamine penta-acetic acid dimeglumine, also called gadopentetic acid NR Not reported

Table C3. Details of MRI methodology (continued)
C-25
SPGR Spoiled gradient echo T Tesla TSE Turbo spin echo

C-26
Table C4. MRI studies: Information for meta-regressions
Study Mag
net
Tra
cera
Co
nse
cuti
ve o
r A
ll E
nro
llmen
t (1
= Y
es)
Pro
spec
tive
Des
ign
(1
= Y
es)
Pro
bab
ly A
ffec
ted
by
Sp
ectr
um
Bia
sb (
1 =
Yes
)
Acc
ou
nte
d f
or
Inte
r-re
ader
D
iffe
ren
ces
(1 =
Yes
)
Rea
der
s B
lind
ed t
o C
linic
al
Info
rmat
ion
(1
= Y
es)
All
Dia
gn
ose
s C
on
firm
ed
by
His
top
ath
olo
gy
(1 =
Yes
)
Mu
lti-
cen
tere
d (
1 =
Yes
)
Fu
nd
ed b
y (1
= D
ecla
red
N
o F
inan
cial
Co
nfl
icts
of
Inte
rest
)
Geo
gra
ph
ic R
egio
nc
Pro
po
rtio
n M
alig
nan
t
Akita et al. 20091
1.5 2 1 0 1 0 0 1 0 0 1 0.26
Baltzer et al. 20092
1.5 1 1 1 0 1 1 1 0 0 3 0.60
Hara et al. 20093
1.5 2 1 0 1 0 0 0 0 0 1 0.24
Kim et al. 20094
1.5 1 1 0 0 0 0 0 0 1 1 0.85
Lo et al. 20095
3.0 1 0 1 0 0 1 0 0 0 0 0.65
Imbracio et al. 20086
1.5 1 1 1 0 0 0 0 0 0 2 0.82
Pediconi et al. 20087
1.5 1 0 1 0 0 1 1 0 0 2 0.64
Vassiou et al. 20098
1.5 1 0 1 0 0 0 1 0 0 2 0.68
Brem et al. 20079
1.5 1 0 0 1 0 0 0 0 0 4 0.27
Cilotti et al. 200710
1.5 4 0 0 0 0 0 0 0 0 2 0.47

Table C4. MRI studies: Information for meta-regressions (continued)
C-27
Study Mag
net
Tra
cera
Co
nse
cuti
ve o
r A
ll E
nro
llmen
t (1
= Y
es)
Pro
spec
tive
Des
ign
(1
= Y
es)
Pro
bab
ly A
ffec
ted
by
Sp
ectr
um
Bia
sb (
1 =
Yes
)
Acc
ou
nte
d f
or
Inte
r-re
ader
D
iffe
ren
ces
(1 =
Yes
)
Rea
der
s B
lind
ed t
o C
linic
al
Info
rmat
ion
(1
= Y
es)
All
Dia
gn
ose
s C
on
firm
ed
by
His
top
ath
olo
gy
(1 =
Yes
)
Mu
lti-
cen
tere
d (
1 =
Yes
)
Fu
nd
ed b
y (1
= D
ecla
red
N
o F
inan
cial
Co
nfl
icts
of
Inte
rest
)
Geo
gra
ph
ic R
egio
nc
Pro
po
rtio
n M
alig
nan
t
Pediconi et al. 200711
1.5 3 1 1 0 1 0 0 0 0 2 0.93
Zhu et al. 200712
1.5 2 1 0 0 0 0 0 0 0 1 0.50
Bazzocchi et al. 200613
1.2 4 0 1 0 1 1 1 1 1 2 0.67
Gokalp and Topal 200614
1.5 1 1 1 0 0 0 0 0 0 2 0.02
Kneeshaw et al. 200615
1.5 1 0 1 1 0 0 0 0 1 3 0.23
Ricci et al. 200616
1.5 3 1 1 0 0 0 1 0 0 2 0.67
Pediconi et al. 200517
1.5 3 1 1 0 1 1 0 0 0 2 0.79
Pediconi et al. 200518
1.5 1 1 1 0 1 1 0 0 1 2 0.83
Wiener et al. 200519
1.5 1 0 1 0 0 0 0 0 0 4 0.49
Bluemke et al. 200420
1.5 1 0 1 0 0 0 0 1 1 6 0.36
Huang et al. 200421
1.5 2 0 1 1 0 0 0 0 1 4 0.58

Table C4. MRI studies: Information for meta-regressions (continued)
C-28
Study Mag
net
Tra
cera
Co
nse
cuti
ve o
r A
ll E
nro
llmen
t (1
= Y
es)
Pro
spec
tive
Des
ign
(1
= Y
es)
Pro
bab
ly A
ffec
ted
by
Sp
ectr
um
Bia
sb (
1 =
Yes
)
Acc
ou
nte
d f
or
Inte
r-re
ader
D
iffe
ren
ces
(1 =
Yes
)
Rea
der
s B
lind
ed t
o C
linic
al
Info
rmat
ion
(1
= Y
es)
All
Dia
gn
ose
s C
on
firm
ed
by
His
top
ath
olo
gy
(1 =
Yes
)
Mu
lti-
cen
tere
d (
1 =
Yes
)
Fu
nd
ed b
y (1
= D
ecla
red
N
o F
inan
cial
Co
nfl
icts
of
Inte
rest
)
Geo
gra
ph
ic R
egio
nc
Pro
po
rtio
n M
alig
nan
t
Bone et al. 200322
1.5 1 1 1 0 0 1 1 0 0 3 0.71
Daldrup-Link et al. 200323
1.5 1 0 1 0 0 0 1 0 0 3 0.47
Heinisch et al. 200324
1.0 1 0 1 0 0 0 1 0 0 3 0.63
Walter et al. 200325
1.0 1 1 1 0 0 0 1 0 0 3 0.45
Guo et al. 200226
1.5 1 0 0 0 0 0 1 0 0 0 0.56
Kelcz et al. 200227
1.5 2 1 1 0 0 0 0 0 1 4 0.46
Schedel et al. 200228
1.5 1 0 0 0 0 0 1 0 0 3 0.60
Trecate et al. 200229
1.5 1 0 1 0 0 0 1 0 0 2 0.54
Wiberg et al. 200230
1.5 1 1 1 0 0 1 1 0 0 3 0.72
Brix et al. 200131
1.5 1 1 1 0 0 1 1 0 1 3 0.70
Cecil et al. 200132
1.5 1 1 0 0 0 0 0 0 1 4 0.60

Table C4. MRI studies: Information for meta-regressions (continued)
C-29
Study Mag
net
Tra
cera
Co
nse
cuti
ve o
r A
ll E
nro
llmen
t (1
= Y
es)
Pro
spec
tive
Des
ign
(1
= Y
es)
Pro
bab
ly A
ffec
ted
by
Sp
ectr
um
Bia
sb (
1 =
Yes
)
Acc
ou
nte
d f
or
Inte
r-re
ader
D
iffe
ren
ces
(1 =
Yes
)
Rea
der
s B
lind
ed t
o C
linic
al
Info
rmat
ion
(1
= Y
es)
All
Dia
gn
ose
s C
on
firm
ed
by
His
top
ath
olo
gy
(1 =
Yes
)
Mu
lti-
cen
tere
d (
1 =
Yes
)
Fu
nd
ed b
y (1
= D
ecla
red
N
o F
inan
cial
Co
nfl
icts
of
Inte
rest
)
Geo
gra
ph
ic R
egio
nc
Pro
po
rtio
n M
alig
nan
t
Furman-Haran et al. 200133
1.5 2 0 1 0 0 1 1 0 1 4 0.52
Imbriaco et al. 200134
0.5 1 1 1 0 0 1 0 0 1 2 0.51
Malich et al. 200135
1.5 1 1 0 0 0 0 1 0 0 3 0.67
Nakahara et al. 200136
0.5 1 0 0 0 0 0 1 0 0 1 0.50
Torheim et al. 200137
1.5 2 0 1 0 0 0 0 0 1 3 0.55
Wedegartner et al. 200138
1.0 1 0 1 0 0 1 1 0 0 3 0.71
Yeung et al. 200139
1.5 1 1 0 0 0 0 0 0 0 0 0.77
Kvistad et al. 200040
1.5 2 0 1 0 1 1 0 0 1 3 0.55
Van Goethem et al. 200041
1.2 1 1 0 1 0 0 0 1 0 3 0.37
a For Tracer, 1 = gadopentetic acid; 2 = gadodiamide; 3 = gadobenic acid; 4 = gadoteridol; 0 = mixed or not reported. For the studies directly comparing tracers, data for gadopentetic acid was used in the primary meta-regression.
b Spectrum bias defined as median/mean age greater than 50 and/or % lesions malignant less than 10% or greater than 40% c China = 0; Asia = 1; Turkey, Greece, Italy = 2; Europe and United Kingdom = 3; North America = 4; South America = 5; multiple = 6

C-30
Positron Emission Tomography (PET) Total of 8 studies
Total of 438 patients, 459 lesions
7 studies of PET; 1 study of PET/CT
Table C5. Included studies of PET
Study PET Methods Studied
Design N Patients
N Lesions
Geographical Location
Funded by
Imbriaco et al. 20086
PET/CT Diagnostic cohort study 44 55 Italy Not reported
Kaida et al. 200842
PET Prospective diagnostic cohort 118 122 Japan Not reported
Buchmann et al. 200743
PET Prospective diagnostic cohort 29 29 Germany Not reported
Hienisch et al. 200324
PET Prospective diagnostic cohort 36 40 Austria Not reported
Walter et al. 200325
PET Prospective diagnostic cohort 40 42 Germany Not reported
Brix et al. 200131
PET Prospective diagnostic cohort 14 14 Germany Wilhelm Sanders-Stiftung
Schirrmeister et al. 200144
PET Prospective diagnostic cohort 117 117 Germany Not reported
Yutani et al. 200045
PET Prospective diagnostic cohort 40 40 Japan Not reported
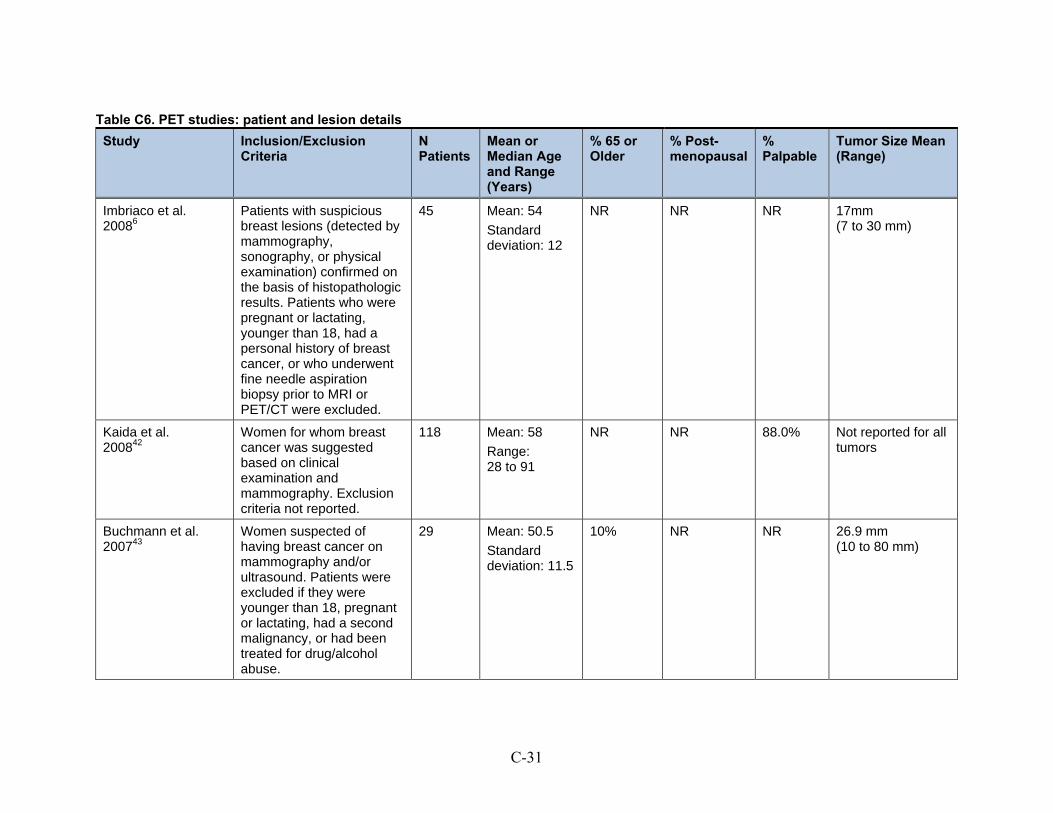
C-31
Table C6. PET studies: patient and lesion details
Study Inclusion/Exclusion Criteria
N Patients
Mean or Median Age and Range (Years)
% 65 or Older
% Post-menopausal
% Palpable
Tumor Size Mean (Range)
Imbriaco et al. 20086
Patients with suspicious breast lesions (detected by mammography, sonography, or physical examination) confirmed on the basis of histopathologic results. Patients who were pregnant or lactating, younger than 18, had a personal history of breast cancer, or who underwent fine needle aspiration biopsy prior to MRI or PET/CT were excluded.
45 Mean: 54
Standard deviation: 12
NR NR NR 17mm (7 to 30 mm)
Kaida et al. 200842
Women for whom breast cancer was suggested based on clinical examination and mammography. Exclusion criteria not reported.
118 Mean: 58
Range: 28 to 91
NR NR 88.0% Not reported for all tumors
Buchmann et al. 200743
Women suspected of having breast cancer on mammography and/or ultrasound. Patients were excluded if they were younger than 18, pregnant or lactating, had a second malignancy, or had been treated for drug/alcohol abuse.
29 Mean: 50.5
Standard deviation: 11.5
10% NR NR 26.9 mm (10 to 80 mm)

Table C6. PET studies: patient and lesion details (continued)
C-32
Study Inclusion/Exclusion Criteria
N Patients
Mean or Median Age and Range (Years)
% 65 or Older
% Post-menopausal
% Palpable
Tumor Size Mean (Range)
Hienisch et al. 200324
Women with suspicious breast lesions detected by physical exam, mammography, and/or ultrasound, scheduled for biopsy, referred when there was time on the scanners. Pregnant women were excluded.
36 Mean: 48.3
Range: 25 to 77
NR NR NR 16.7 mm (5 to 45 mm)
Walter et al. 200325
Patients referred to the clinic for biopsy of suspicious lesions on the basis of mammography, ultrasound, or physical examination. Referred patients were chosen randomly from 550 possible patients to fill restricted scanner time.
44 Mean: 52
Range: 21 to 77
NR NR NR Mean NR (0.5 to 6.0 cm)
Brix et al. 200131
Women with suspicious breast lesions detected by physical exam, mammography, and/or ultrasound, scheduled for biopsy, referred when there was time on the scanners. Women with lesions smaller than 10 mm, elevated blood glucose, younger than age 18, pregnant, or had metal implants were excluded.
14 Mean: 49
Range: 35 to 66
NR NR NR Excluded lesions <10 mm
Mean and range NR

Table C6. PET studies: patient and lesion details (continued)
C-33
Study Inclusion/Exclusion Criteria
N Patients
Mean or Median Age and Range (Years)
% 65 or Older
% Post-menopausal
% Palpable
Tumor Size Mean (Range)
Schirrmeister et al. 200144
Women with palpable breast tumors or suspicious lesions on mammography and/or ultrasound. Pregnant women and women younger than 18 were excluded from the study.
117 Mean: 56.8
Range: 28 to 86
NR 51.3% 76% Not reported for all tumors
Yutani et al. 200045
Patients with suspicious lesions (detected by mammography, ultrasound, or physical exam) scheduled for excisional biopsy.
40 Mean: 51
Range: 25 to 86
15% NR 93% 21 mm (4 to 45 mm)
CT Computer tomography FDG 18-fluorodeoxyglucose NR Not reported PET Positron emission tomography

C-34
Table C7. Details of PET methodology
Study Type of Scanner
PET Parameters Tracer FDG Parameters Reference Standard
Imbriaco et al. 20086
Whole body PET/CT
Prone position, 60 minutes after injection (Time 1) and 3 hours after injection (Time 2) CT images were reconstructed using standard iterative algorithm
5.2 MBq/kg of body weight, fast of 6 to 8 hours
Biopsy or surgery
Kaida et al. 200842
Whole body Supine position, 60 minutes after tracer followed by prone imaging 85 minutes after tracer
263 MBq, fast of at least 4 hours Biopsy or surgery Benign patients followed for up to 2 years
Buchmann et al. 200743
Whole body Supine position, 60 minutes after tracer followed by prone imaging 135 minutes after tracer.
263 (±15) MBq, injected in fasting state (total fast time not reported)
All surgery
Hienisch et al. 200324
Whole body Prone position, 70 minutes after tracer
120 to 180 MBq, fast of 12 hours or longer
All surgery
Walter et al. 200325
Whole body Prone position, 40 to 60 minutes after tracer
300 to 370 MBq, fast of 12 hours or longer
All surgery
Brix et al. 200131
Whole body Prone position, 60 minutes after tracer
138 to 248 MBq, fast of 6 hours or longer
Biopsy or surgery
Schirrmeister et al. 200144
Whole body Prone position, 45 to 60 minutes after tracer
370 MBq, fast of 8 hours Biopsy or surgery
Yutani et al. 200045
Whole body Supine position, 60 minutes after tracer
370 MBq, fast of 4 hours or longer
All surgery
CT Computed tomography FDG 18-fluorodeoxyglucose MBq Mega becquerel NR Not reported PET Positron emission tomography
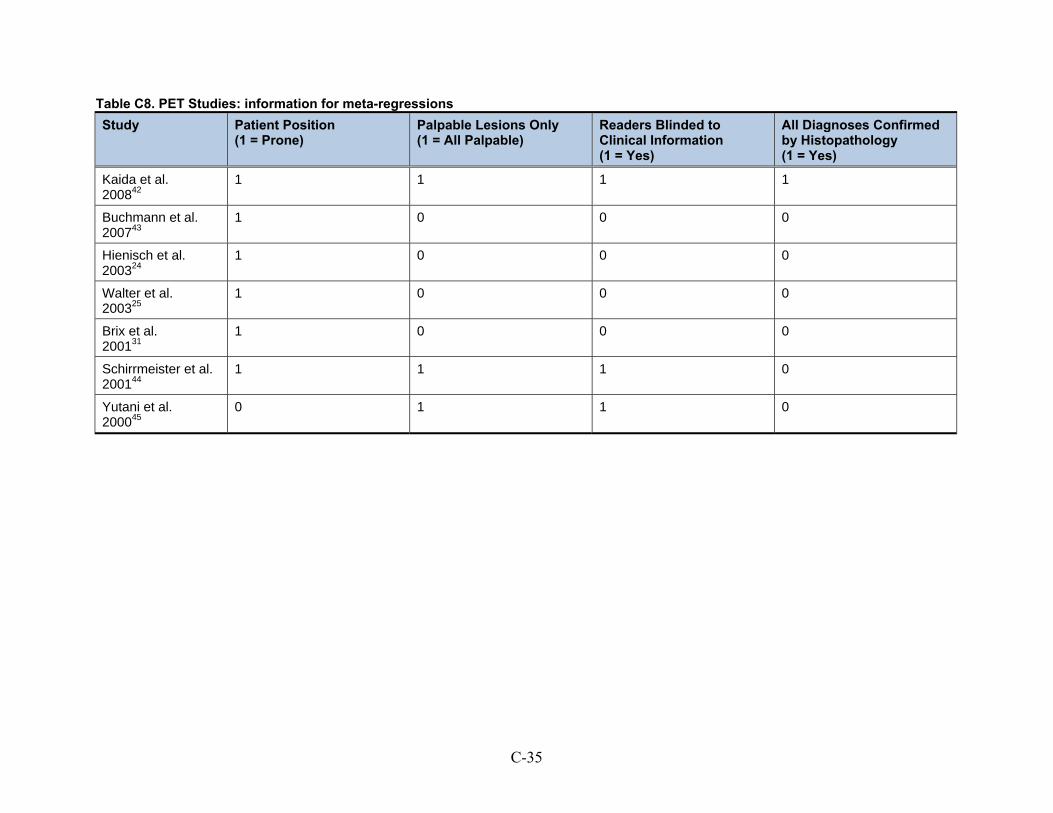
C-35
Table C8. PET Studies: information for meta-regressions
Study Patient Position (1 = Prone)
Palpable Lesions Only (1 = All Palpable)
Readers Blinded to Clinical Information (1 = Yes)
All Diagnoses Confirmed by Histopathology (1 = Yes)
Kaida et al. 200842
1 1 1 1
Buchmann et al. 200743
1 0 0 0
Hienisch et al. 200324
1 0 0 0
Walter et al. 200325
1 0 0 0
Brix et al. 200131
1 0 0 0
Schirrmeister et al. 200144
1 1 1 0
Yutani et al. 200045
0 1 1 0

ECRI Institute Evidence-based Practice Center Effectiveness of Non-invasive Diagnostic Tests for Breast Abnormalities
C-36
Scintimammography (SMM) Total of 11 studies
Total of 1,074 patients, 1,074 lesions
10 studies of conventional SMM, 1 study of BSG1
Table C9. Included studies of scintimammography
Study SMM Methods Studied Design N Patients
N Lesions
Geographical Location
Funding Source
Grosso et al. 200946
SMM at 5 minutes after administration of 99m Tc sestamibi, planar images with patient supine and prone.
Prospective diagnostic cohort
283 283 Italy NR
Habib et al. 200947
Double-phase SMM images were acquired 5-10 minutes and one hour after administration of with 99m Tc sestamibi, planar images patients prone and supine
Prospective diagnostic cohort
22 22 Karachi NR
Kim et al. 20094
Double-phase SMM at 10 minutes and 3 hours after 99m Tc sestamibi administration, planar images in prone and lateral positions.
Prospective diagnostic cohort
249 249 Republic of Korea Pusan National University Research Grant
Kim et al. 200848
Double-phase SMM images after 10 minutes and three hours after IV administration of 99m Tc sestamibi; planar images with patient in the lateral and prone positions and planar anterior chest image with patient in supine position
Prospective diagnostic cohort
75 75 Republic of Korea NR
Wang et al. 200849
SMM with 99mTc-MIBI; planar images with patient supine (anterior and oblique views) and prone (lateral views)
Prospective diagnostic cohort
55 55 China Jiangsu Government Science Grant and Nanjing Health Bureau Grant, China

Table C9. Included studies of scintimammography (continued)
C-37
Study SMM Methods Studied Design N Patients
N Lesions
Geographical Location
Funding Source
Brem et al. 20079
BSGI 10 minutes after 99mTc-sestamibi injection, images were obtained in the cranial caudal and medial lateral oblique projections
NR 33 33 U.S. NR
Gommans et al. 200750
SMM mages were taken 5 minutes after injection of 99m Tc sestamibi; anterior, left and right lateral images (10 minute acquisition, 256x256), patient supine and prone
Prospective diagnostic cohort
101 101 Netherlands NR
Kim et al. 200751
Double-phase SMM performed 10 minutes and 3 hrs after IV 99m Tc sestamibi; Planar images, patient prone and lateral and anterior chest images in the supine position.
Prospective diagnostic cohort
78 78 South Korea Pusan National University Research Grant
Schillaci et al. 200752
99m Tc sestamibi; planar images were acquired (left and right lateral images with patient prone and an anterior chest image, with patient supine)
Prospective diagnostic cohort
53 53 Italy NR
Pinero et al. 200653
Double-phase Sestamibi gammagraphy; planar images 5 minutes and one hour after injection of 99m Tc sestamibi, patient prone and supine
Prospective diagnostic cohort
88 88 Spain NR
Mathieu et al. 200554
Patient supine 10 minutes after 99mTc-MIBI, and prone position, 256x256 matrix, SPECT and planar images
Retrospective chart review
37 37 Belgium NR
U.S. United States

C-38
Table C10. Scintimammography studies: patient and lesion details
Study Inclusion/Exclusion Criteria
N P
atie
nts
N L
esio
ns
N C
om
ple
ted
S
tud
y
Med
ian
or
Mea
n A
ge
(Yea
rs)
Ag
e R
ang
e (Y
ears
)
% L
esio
ns
(n/N
) M
alig
nan
t
% L
esio
ns
Pal
pab
le
Lesion Size
Grosso et al. 200946
Patients with non-palpable breast lesions (microcalcifications) detected on screening mammography. Other inclusion criteria: SMM within 2 weeks after conventional mammography, breast lesion operated upon within 1 month after SMM; a minimum follow-up of 5 years after SMM; mental capacity and age above 18 years.
Exclusion criteria: a palpable lesion suspicious of malignancy; palpable nodes in the axillary region; a history of prior carcinoma; prior FNA or CNB within one week prior to SMM, pregnancy and lactation.
283 283 283 53 ±8.2 32-79 11.3% 0% NR

Table C10. Scintimammography studies: patient and lesion details (continued)
C-39
Study Inclusion/Exclusion Criteria
N P
atie
nts
N L
esio
ns
N C
om
ple
ted
S
tud
y
Med
ian
or
Mea
n A
ge
(Yea
rs)
Ag
e R
ang
e (Y
ears
)
% L
esio
ns
(n/N
) M
alig
nan
t
% L
esio
ns
Pal
pab
le
Lesion Size
Habib et al. 200947
Women with a palpable mass or lump or with positive or indeterminate findings on mammography. Exclusion criteria: medically unstable patients; lactating or pregnant women; patients with a history of surgery within the past week.
22 22 22 Mean: 36.5
Median: 40.0
17 to 80 68.2% 90.9% NR
Kim et al. 20094
Patients with palpable masses on physical examination and/or suspicious mammographic findings. No exclusion criteria presented.
249 239 239 47 ±9.7 NR 85.3% 85.3% Malignant: 0.3 to 3.5 cm, Mean: 1.61 ±0.69 cm
Benign: 0.7 to 3.5, Mean: 1.87 ±0.67 cm
Kim et al. 200848
Patients with palpable breast masses on physical examination and/or suspicious mammograms. No exclusion criteria presented.
75 75 75 46.9 ±9.5 NR 65.3% 54.7% NR
Wang et al. 200849
Patients with palpable breast lesions. No exclusion criteria presented.
55 55 55 48 ±14.7 7 to 77 67.3% 100% NR
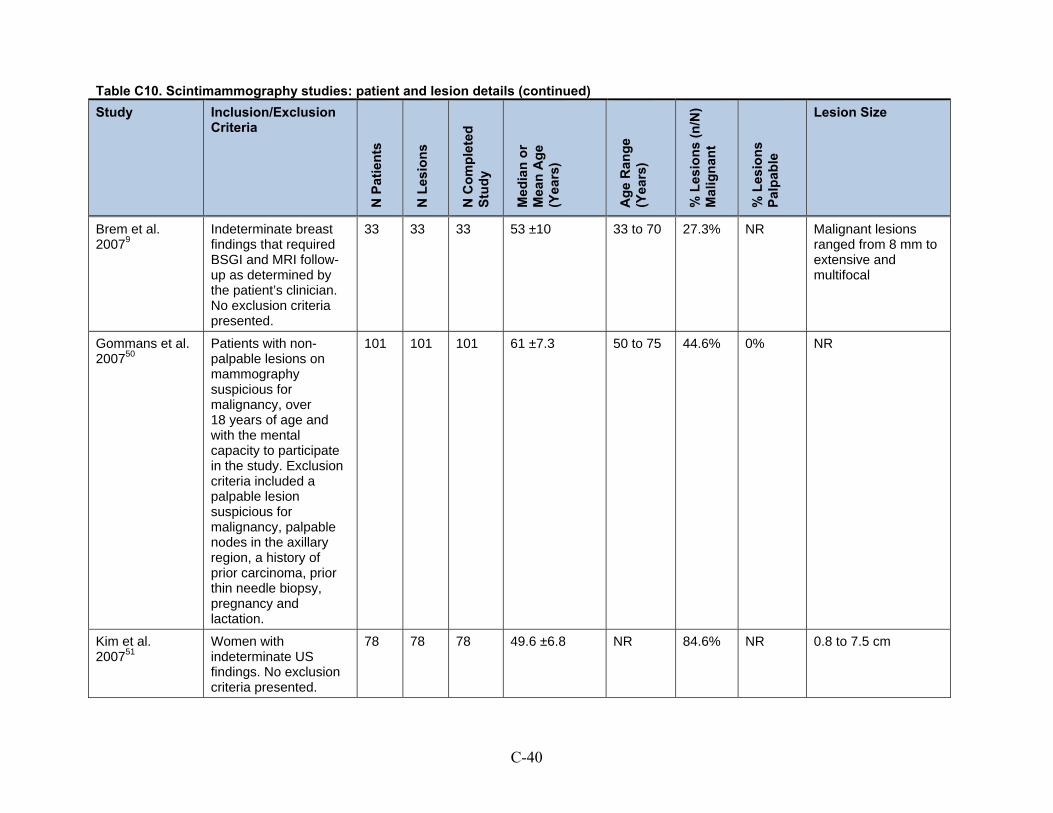
Table C10. Scintimammography studies: patient and lesion details (continued)
C-40
Study Inclusion/Exclusion Criteria
N P
atie
nts
N L
esio
ns
N C
om
ple
ted
S
tud
y
Med
ian
or
Mea
n A
ge
(Yea
rs)
Ag
e R
ang
e (Y
ears
)
% L
esio
ns
(n/N
) M
alig
nan
t
% L
esio
ns
Pal
pab
le
Lesion Size
Brem et al. 20079
Indeterminate breast findings that required BSGI and MRI follow-up as determined by the patient’s clinician. No exclusion criteria presented.
33 33 33 53 ±10 33 to 70 27.3% NR Malignant lesions ranged from 8 mm to extensive and multifocal
Gommans et al. 200750
Patients with non-palpable lesions on mammography suspicious for malignancy, over 18 years of age and with the mental capacity to participate in the study. Exclusion criteria included a palpable lesion suspicious for malignancy, palpable nodes in the axillary region, a history of prior carcinoma, prior thin needle biopsy, pregnancy and lactation.
101 101 101 61 ±7.3 50 to 75 44.6% 0% NR
Kim et al. 200751
Women with indeterminate US findings. No exclusion criteria presented.
78 78 78 49.6 ±6.8 NR 84.6% NR 0.8 to 7.5 cm

Table C10. Scintimammography studies: patient and lesion details (continued)
C-41
Study Inclusion/Exclusion Criteria
N P
atie
nts
N L
esio
ns
N C
om
ple
ted
S
tud
y
Med
ian
or
Mea
n A
ge
(Yea
rs)
Ag
e R
ang
e (Y
ears
)
% L
esio
ns
(n/N
) M
alig
nan
t
% L
esio
ns
Pal
pab
le
Lesion Size
Schillaci et al. 200752
Patients with suspicious lesions on mammography. No exclusion criteria presented.
53 53 53 NR 27 to 78 69.8% 60.4% NR
Pinero et al. 200653
Palpable or non-palpable lesions with a BIRADS score of either 4 or 5 on mammography. Excluded were men and pregnant women.
88 88 88 57.65 33 to 87 77.3% 64.8% NR
Mathieu et al. 200554
Patients with inconclusive/ contradictory triple screen (mammography, US, FNA) result. Retrospective chart review. No exclusion criteria presented.
37 37 37 NR NR 54.1% NR NR
FNA Fine-needle aspiration NR Not reported US Ultrasound

C-42
Table C11. Details of scintimammography methods
Study Tracer Imager Specifications Brand Type of Imaging
Matrix Method
Grosso et al. 200946
740 MBq 99mTc-sestamibi A dual head large fied of view gamma camera equipped with low energy, high resolution collaminators
GE Medical Systems Millennium MG, Milwaukee, WI, USA
Planar images with patient supine and prone.
256 x 256 pixels
Not specified
Habib et al. 200947
740 MBq (20 mCi) Tc-99m sestamibi
Single headed gamma camera equipped with a low energy all purpose collimator
NR Planar images with patients prone and supine
NR Double-phase SMM at 10 mins and 60-90 mins
Kim et al. 20094
925 MBq Tc-99m MIBI Dual headed gamma camera equipped with low energy high resolution collimators
Vertex™, ADAC, Milpitas, CA, USA)
Planar images in prone and lateral positions.
128 x 128 pixels
Double-phase SMM at 10 minutes and 3 hours
Kim et al. 200848
925 MBq Tc-99m MIBI Dual headed gamma camera equipped with low energy high resolution collimators
Vertex™, ADAC, Milpitas, CA, USA)
Planar images with patient in the lateral and prone positions and planar anterior chest image with patient in supine position
128 x 128 pixels
Double-phase SMM images after 10 minutes and three hours
Wang et al. 200849
740 MBq (20mCi) 99m Tc-MIBI
Dual headed gamma camera equipped with a high resolution parallel hole collimator
Millennium VG, Hawkeye; General Electric Medical Systems
Planar images with patient supine (anterior and oblique views) and prone (lateral views)
256 x 256
Not specified

Table C11. Details of scintimammography methods (continued)
C-43
Study Tracer Imager Specifications Brand Type of Imaging
Matrix Method
Brem et al. 20079
25.0-30.0 mCi 99mTc-sestamibi (925-1110 MBq)
High resolution breast specific gamma camera
Dilon 6800, Dilon Technologies, Inc., Newport News, VA
Images were obtained in the cranial caudal and medial lateral oblique projections
Not reported
BSGI
Gommans et al. 200750
700 MBq 99mTc-sestamibi One head used; Low energy high resolution collimator
GE-Millenium VG To label 99mTc sestamibi, 99mTc pertechnetate in saline was added to Cardiolite; SMM mages were taken 5 minutes after injection; anterior, left and right lateral images (10 minute acquisition, 256x256), patient supine and prone
256 x 256
Not spcified
Kim et al. 200751
925 MBq of Tc-99m MIBI Dual headed gamma camera equipped with low energy high resolution collimators
Vertex, ADAC, Milpitas, CA, USA
Planar images, patient prone and lateral and anterior chest images in the supine position.
128 x 128
Double-phase SMM performed 10 minutes and 3 hrs

Table C11. Details of scintimammography methods (continued)
C-44
Study Tracer Imager Specifications Brand Type of Imaging
Matrix Method
Schillaci et al. 200752
740 MBq Tc-99m sestamibi Combined SPECT/CT system composed of a dual head variable angle gamma camera. This system allowed for sequential interchangeable acquisition of nuclear medicine and CT images
Millenium VG and Hawkeye;General Electric Medical Systems, Milwaukee, WI, USA
99m Tc sestamibi; planar images were acquired (left and right lateral images with patient prone and an anterior chest image, with patient supine)
256 x 256
SMM
Pinero et al. 200653
740 MBq (20 mCi) Cardiolite
gamma camera equipped with a high resolution collimator
Elscint SP6 Planar images twith patient prone and supine
NR Double-phase Sestamibi gamma-graphy
Mathieu et al. 200554
740 MBq (20 mCi)
99mTc-MIBI Triple head system using a high resolution lowenergy collimator
Multispect; Siemens Patients in the supine and prone position
256 x 256
SPECT and planar images
NR Not reported

C-45
Table C12. Scintimammography studies: information for meta-regression
Study Consecutive or All Enrollment (1 = Yes)
Readers Blinded to Clinical Information (1 = Yes)
All Diagnoses Confirmed by Histopathology (1 = Yes)
Percent Malignant
Grosso et al. 200946
1 1 0 11.3%
Habib et al. 200947
0 1 0 68.2%
Kim et al. 20094
1 0 0 85.3%
Kim et al. 200848
0 1 0 65.3%
Wang et al. 200849
1 1 1 67.3%
Gommans et al. 200750
1 1 0 44.6%
Kim et al. 200751
1 1 0 84.6%
Schillaci et al. 200752
0 0 1 69.8%
Pinero et al. 200653
1 0 1 77.3%

C-46
Ultrasound
Included Studies of Ultrasound
Total of 31 studies
Total of 8,642 patients; 9,044 lesions
Types of Ultrasound Studied: (many articles studied more than one type of ultrasound)
B-mode 2D grayscale: 21 studies
B-mode 2D grayscale contrast enhanced: 2 studies
B-mode 3D grayscale: 1 study
Color Doppler: 6 studies
Color Doppler, contrast enhanced: 2 studies
Combination of methods: 4 studies
Power Doppler: 9 studies
Power Doppler, contrast enhanced: 7 studies
Tissue harmonics: 1 study
Table C13. Included studies of ultrasound
Study US Methods Studied Design N Patients N Lesions Geographical Location
Funding Source
Gokalp et al. 200955
B-mode 2D grayscale, power Doppler, and combination of both methods
Prospective diagnostic cohort
49 94 Turkey NR
Vassiou et al. 20098
B-mode 2D grayscale Prospective diagnostic cohort
69 78 Greece NR

Table C13. Included studies of ultrasound (continued)
C-47
Study US Methods Studied Design N Patients N Lesions Geographical Location
Funding Source
Liu et al. 200856
B-mode 2D grayscale, with and without contrast (with Sono Vue [Bracco, Italy]), and combination of both methods
Diagnostic cohort study
108 108 China Authors report no financial conflicts of interest
Vade et al. 200857
B-mode 2D grayscale Retrospective chart review
20 21 USA NR
Cha et al. 200758
B-mode 2D grayscale and tissue harmonic imaging
Prospective diagnostic cohort
88 91 Korea NR
Chala et al. 200759
B-mode 2D grayscale Retrospective chart review
203 229 Brazil NR
Zhi et al. 200760
B-mode 2D grayscale Diagnostic cohort study
232 296 China NR
Cho et al. 200661
B-mode 2D and 3D grayscale Prospective diagnostic cohort
141 150 Korea NR
Pinero et al. 200653
Combination power Doppler and color Doppler using a contrast agent (Levovist [Schering AG, Berlin, Germany])
Prospective diagnostic cohort
88 88 Spain NR
Ricci et al. 200616
B-mode grayscale with and without contrast (with Sono Vue [Bracco, Italy]); also compared US to MRI
Prospective diagnostic cohort
48 50 Italy NR
Forsberg et al. 200462
B-mode 2D grayscale and power Doppler, with and without contrast (Levovist or Optison)
Diagnostic cohort study
55 55 USA U.S. Army Medical Research and Material Command and National Institutes of Health
Meyberg-Solomayer et al. 200463
B-mode 2D gray-scale Prospective diagnostic cohort
65 65 Germany NR

Table C13. Included studies of ultrasound (continued)
C-48
Study US Methods Studied Design N Patients N Lesions Geographical Location
Funding Source
Ozdemir et al. 200464
Power Doppler, with or without contrast (Levovist)
Prospective diagnostic cohort
80 81 Turkey NR
Chen et al. 200365
B-mode 2D gray scale Prospective diagnostic cohort
32 32 China NR
Kook and Kwag 200366
B-mode US and power Doppler, with and without contrast (Levovist)
Prospective diagnostic cohort
36 36 South Korea NR
Marini et al. 200367
B-mode 2D grayscale Diagnostic cohort study
238 238 Italy NR
Caruso et al. 200268
Color Doppler with and without contrast (Levovist)
Prospective diagnostic cohort
36 36 Italy NR
Koukouraki et al. 200169
Color Doppler Prospective diagnostic cohort
116 116 Greece NR
Malich et al. 200135
Combination of B-mode, power Doppler, and color Doppler; also compared US to MRI
Diagnostic cohort study
94 100 Sweden NR
Milz et al. 200170
Power Doppler Prospective diagnostic cohort
102 118 Germany NR
Reinikainen et al. 200171
B-mode US and power Doppler, with and without contrast (Levovist)
Prospective diagnostic cohort
63 69 Finland Finnish Breast Cancer Group and Cancer Society of Northern Finland
Moon et al. 200072
Power Doppler, with and without contrast (Levovist)
Prospective diagnostic cohort
69 69 South Korea Seoul National University Hospital Research Fund

Table C13. Included studies of ultrasound (continued)
C-49
Study US Methods Studied Design N Patients N Lesions Geographical Location
Funding Source
Blohmer et al. 199973
B-mode 2D gray-scale and color Doppler
Prospective diagnostic cohort
200 200 Germany NR
Chao et al. 199974
B-mode 2D gray-scale Prospective diagnostic cohort
3050 3093 Taiwan NR
Schroeder et al. 199975
Power and color Doppler, with and without contrast (Levovist)
Prospective diagnostic cohort
92 110 Germany NR
Albrecht et al. 199876
Power Doppler, with or without contrast (EchoGen)
Prospective diagnostic cohort
20 20 United Kingdom NR
Wilkens et al. 199877
B-mode 2D gray-scale and color Doppler
Diagnostic cohort study
53 55 USA NR
Buadu et al. 199778
Color Doppler Diagnostic cohort study
114 117 Japan NR
Stavros et al. 199579
B-mode 2D gray-scale Prospective diagnostic cohort
622 750 USA NR
Ciatto et al. 199480
B-mode 2D gray scale Prospective diagnostic cohort
2079 2079 Italy NR
Perre et al. 199481
B-mode 2D gray-scale Prospective diagnostic cohort
380 400 Netherlands NR
NR Not reported US Ultrasound USA United States of America

C-50
Table C14. Ultrasound studies: patient and lesion details
Study Inclusion/Exclusion Criteria
N Patients
N Lesions
N Completed Study
Median or Mean Age (Years)
Age Range (Years)
% Lesions (n/N) Malignant
% Lesions Palpable
Lesion Size Mean (Range)
Gokalp et al. 200955
Patients with solid breast lesions referred for US-guided core needle biopsy
49 94 49 53.6 27 to 89 41.5% (39/94)
NR 16.35 mm (5 to 35 mm)
Vassiou et al. 20098
Women with suspicious lesions diagnosed by physical examination or mammography, referred for biopsy
69 78 69 53 39 to 68 68% (53/78) NR NR
Liu et al. 200856
Consecutive patients with US-visible breast lesions who were referred for open surgical biopsy
108 108 104 44 19 to 86 41.3% (43/104)
NR 2.4 cm (0.5 to 7.6 cm)
Vade et al. 200857
Consecutive patients under the age of 20 with palpable breast masses
20 21 21 14.8 13 to 19 0% 100% NR
Cha et al. 200758
Consecutive patients with solid breast lesions that were visible on US who were scheduled to undergo biopsy due to findings on mammography and/or physical exam
88 91 91 45 25 to 67 33% (30/91) 32% 13 mm (4 to 28 mm)

Table C14. Ultrasound studies: patient and lesion details (continued)
C-51
Study Inclusion/Exclusion Criteria
N Patients
N Lesions
N Completed Study
Median or Mean Age (Years)
Age Range (Years)
% Lesions (n/N) Malignant
% Lesions Palpable
Lesion Size Mean (Range)
Chala et al. 200759
Consecutive female patients with solid breast lesions who were referred for biopsy due to findings on mammography and/or physical exam
203 229 229 56 30 to 77 22.7% (52/229)
56.3% (129/229)
19 mm (5 to 62 mm)
Zhi et al. 200760
Consecutive patients with solid breast lesions
232 296 296 42 17 to 87 29.4% (87/296)
NR 15.5 mm (3.1 to 100.6 mm)
Cho et al. 200661
Consecutive patients with solid breast lesions that were visible on US who were scheduled to undergo biopsy due to findings on mammography and/or physical exam
141 150 150 46 25 to 71 40% (60/150)
38.70% 4 to 36 mm (range NR)
Pinero et al. 200653
Consecutive patients who were scheduled to undergo biopsy due to findings on mammography and/or physical exam, who were not pregnant
88 88 88 57.7 33 to 87 77% (68/88) 65% NR
Ricci et al. 200616
Consecutive patients with breast lesions detected on mammography
48 50 50 58 40 to 81 76% (38/50) NR NR

Table C14. Ultrasound studies: patient and lesion details (continued)
C-52
Study Inclusion/Exclusion Criteria
N Patients
N Lesions
N Completed Study
Median or Mean Age (Years)
Age Range (Years)
% Lesions (n/N) Malignant
% Lesions Palpable
Lesion Size Mean (Range)
Forsberg et al. 200462
Patients with solid breast lesions detected on mammography and/or physical exam, who were mentally stable, not pregnant, and not breast-feeding
55 55 50 52 26 to 72 29% (16/55) NR NR
Meyberg-Solomayer et al. 200463
Female patients with breast lesions
65 65 65 54 16 to 96 64.6% (42/65)
NR 21.5 mm (2 to 70 mm)
Ozdemir et al. 200464
Patients with breast lesions that were not clearly cystic or benign, that were visible on US, who were likely to have followup data due to living near the study center, who were scheduled to undergo biopsy due to findings on mammography and/or physical exam
80 81 69 47.3 19 to 75 40.5% (28/69)
32% 16.1 mm (6 to 44 mm)
Chen et al. 200365
Patients with palpable lesions that had indeterminate mammographic results due to dense breasts
32 32 32 44.6 34 to 55 75% (24/32) 100% NR

Table C14. Ultrasound studies: patient and lesion details (continued)
C-53
Study Inclusion/Exclusion Criteria
N Patients
N Lesions
N Completed Study
Median or Mean Age (Years)
Age Range (Years)
% Lesions (n/N) Malignant
% Lesions Palpable
Lesion Size Mean (Range)
Kook and Kwag 200366
Patients referred for diagnostic US after discovery of a palpable mass or mammographic abnormality that was 2 cm or smaller in diameter
36 36 36 43.5 18 to 69 47% (17/36) NR 2 cm or less
Mean and range NR
Marini et al. 200367
Consecutive patients with microcalcifications detected on mammography who were older than 27 years of age, and who had an US exam followed by either a biopsy or at least three years of clinical followup
238 238 238 55 31 to 98 39% (94/238)
NR NR
Caruso et al. 200268
Patients with a single breast lesion 1 to 2 cm in diameter with no microcalcifications that was detected on mammography
36 36 36 55 42 to 63 56% (20/36) NR 1 to 2 cm
Mean and range NR

Table C14. Ultrasound studies: patient and lesion details (continued)
C-54
Study Inclusion/Exclusion Criteria
N Patients
N Lesions
N Completed Study
Median or Mean Age (Years)
Age Range (Years)
% Lesions (n/N) Malignant
% Lesions Palpable
Lesion Size Mean (Range)
Koukouraki et al. 200169
Women with abnormal findings on screening mammography who were scheduled for an open surgical biopsy
116 116 116 NR 25 to 78 74% (86/116)
32.70% NR
Malich et al. 200135
Consecutive patients with equivocal mammographic abnormalities
94 100 100 NR NR 62% (62/100)
NR NR
Milz et al. 200170
Patients with indeterminate findings after mammography and examination who were referred for diagnostic US
102 118 118 51 15 to 77 47% (55/118)
NR NR
Reinikainen et al. 200171
Patients with an US-visible breast lesion detected by palpation or mammography that was suggestive of malignancy or not conclusively benign
63 69 65 51 20 to 81 52.3% (34/65)
81.50% NR

Table C14. Ultrasound studies: patient and lesion details (continued)
C-55
Study Inclusion/Exclusion Criteria
N Patients
N Lesions
N Completed Study
Median or Mean Age (Years)
Age Range (Years)
% Lesions (n/N) Malignant
% Lesions Palpable
Lesion Size Mean (Range)
Moon et al. 200072
Consecutive patients with suspicious non-palpable lesions detected on mammography who were scheduled to undergo surgical biopsy
69 69 50 52 30 to 67 44% (22/50) 0% NR
Blohmer et al. 199973
Patients referred for biopsy because of a suspicious breast lesion
200 200 168 (regular US), 150 (Doppler US)
NR NR 49.5% (99/200)
NR NR
Chao et al. 199974
Patients with solid breast masses
3,050 3,093 3,093 38.7 14 to 86 24% (733/3093)
NR 2.1 cm (0.5 to 24 cm)
Schroeder et al. 199975
Patients with clinically suspected breast tumors after mammography and examination
92 110 110 46.1 17 to 79 65.5% (72/110)
NR NR
Albrecht et al. 199876
Patients with breast lesions
20 20 20 47 22 to 74 55% (11/20) NR NR
Wilkens et al. 199877
Patients with palpable masses; those with obvious simple cysts were excluded
53 55 55 NR 13 to 81 40% (22/55) 100% NR
Buadu et al. 199778
Consecutive patients referred for surgery due to breast masses or suspicious mammograms
114 117 116 49 15 to 78 72.4% (84/116)
NR NR

Table C14. Ultrasound studies: patient and lesion details (continued)
C-56
Study Inclusion/Exclusion Criteria
N Patients
N Lesions
N Completed Study
Median or Mean Age (Years)
Age Range (Years)
% Lesions (n/N) Malignant
% Lesions Palpable
Lesion Size Mean (Range)
Stavros et al. 199579
Patients with indeterminate mammographic findings of solid lesions; obviously malignant lesions were excluded
622 750 750 47 18 to 88 16.7% (125/750)
NR most were 1.5 cm or smaller
Mean and range NR
Ciatto et al. 199480
Consecutive women with clinical or mammographic abnormalities who were referred for diagnostic US
2,079 2,079 2,079 48 14 to 93 12.5% (259/2079)
NR NR
Perre et al. 199481
Female patients with palpable breast lesions
380 400 400 49.3 13.7 to 98.9
43.5% (174/400)
100% NR
NR Not reported US Ultrasound

C-57
Table C15. Ultrasound studies: details of methods
Study US Method US Device US MHz US Operators Reference Standard
Gokalp et al. 200955
B-mode 2D grayscale, power Doppler, and combination of both methods
ATL HDI 5000 (Philips-ATL Medical Systems, Bothell, WA)
5 to 12 MHZ One radiologist Core needle biopsy followed by surgery or 2 years followup
Vassiou et al. 20098
B-mode 2D grayscale Technos, Esaote 7 to 12 MHz One radiologist Core needle biopsy or surgery
Liu et al. 200856
B-mode 2D grayscale, with and without contrast (with Sono Vue [Bracco, Italy]), and combination of both methods
HDI 5000 or iU22 (Phillips Medical Systems, Bothell, WA)
4 to 7 or 8 MHZ
Two radiologists in consensus
Open surgical biopsy
Vade et al. 200857
B-mode 2D gray-scale Sequoia (Siemens Medical Solutions)
7 to 15 MHz NR 14 had open biopsy, 3 had FNA, and 4 had 3 to 6 months of followup
Cha et al. 200758
B-mode 2D gray-scale and tissue harmonic imaging
LIGIQ 700 (GE Medical Systems, Milwaukee, WI)
5 to 13 MHz One operator obtained all of the image, and then four other radiologists evaluated all images
Open sugery (n = 30) or core-needle biopsy and followup (n = 61)
Chala et al. 200759
B-mode 2D gray-scale HDI 3000 or 5000 (Phillips Ultrasound, Bothell, WA) or Logiq 700 (GE medical Systems, Milwaukee, WI)
5 to 12 MHZ One of three operators
Core-needle biopsy except 20 cases had FNA followed by 28 to 30 months of followup
Zhi et al. 200760
B-mode 2D gray-scale EUB-8500 (Hitachi Medical Corp., Tokyo, Japan)
7.5 to 13.0 MHZ
2 operators in consensus
Open surgical biopsy

Table C15. Ultrasound studies: details of methods (continued)
C-58
Study US Method US Device US MHz US Operators Reference Standard
Cho et al. 200661
B-mode 2D and 3D gray-scale Voluson 530D (GE Kretz, Zipf, Austria)
5 to 10 MHz One operator obtained all of the image, and then three other radiologists evaluated all images
Open surgery (n = 78) or core-needle biopsy and followup (n = 72)
Pinero et al. 200653
Combination power Doppler and color Doppler using a contrast agent (Levovist [Schering AG, Berlin, Germany])
SSA-370 A Power Vision 6000 (Toshiba Corp.)
6 to 11 MHz One radiologist Open surgery
Ricci et al. 200616
B-mode grayscale with and without contrast (with Sono Vue [Bracco, Italy]); also compared US to MRI
Esatune (Esaote, Genova, Italy)
5 to 10 MHz Two radiologists in consensus
Open surgical biopsy
Forsberg et al. 200462
B-mode 2D grayscale and power Doppler, with and without contrast (Levovist or Optison)
HDI 3000 (Philips Medical Systems, Bothell, WA), for 3D a LIS 6000A (Life Imaging Systems Inc., London, Ontario, Canada)
5 to 10 MHz One of two radiologists
Open surgical biopsy
Meyberg-Solomayer et al. 200463
B-mode 2D gray-scale HDI 3000 (ATL, Zipf, Austria) or Voluson 730 (General Electric, Bothell, WA)
5 to 12 or 5 to 10 MHz
One operator, entire study
Core biopsy or lumpectomy
Ozdemir et al. 200464
Power Doppler, with or without contrast (Levovist)
HDI 5000 (Phillips Medical Systems, Bothwell, WA)
5 to 12 MHZ One radiologist Open surgical biopsy, core needle biopsy, or patient followup for at least 2 years
Chen et al. 200365
B-mode 2D gray scale Aloka 650 (Aloka, Tokyo, Japan)
7.5 MHz Two radiologists in consensus
Open surgical biopsy or excision
Kook and Kwag 200366
B-mode US and power Doppler, with and without contrast (Levovist)
Logiq 700 (GE Medical Systems, Milwaukee, WI)
9 to 12 MHz Two radiologists in consensus
Open surgical or core needle biopsy

Table C15. Ultrasound studies: details of methods (continued)
C-59
Study US Method US Device US MHz US Operators Reference Standard
Marini et al. 200367
B-mode 2D grayscale AU530 (Esaote, Genoa, Italy)
10 to 13 MHz Two radiologists in consensus
Core biopsy or at least three years followup
Caruso et al. 200268
Color Doppler with and without contrast (Levovist)
ATL HDI 5000 (Philips-ATL Medical Systems, Bothell, WA)
5 to 10 MHz NR Open surgical biopsy
Koukouraki et al. 200169
color Doppler Accuson 128XP/10 7.5 MHz NR Open surgery
Malich et al. 200135
Combination of B-mode, power Doppler, and color Doppler; also compared US to MRI
HDI 5000 (ATL, Bothwell, WA) or SONOLINE Versa Pro (Siemens, Solna, Sweden)
7.5 to 10 MHz
One of several operators
Histological examination
Milz et al. 200170
Power Doppler AU 4 Esaote (Biomedica, Milan, Italy)
4.7 MHz One of two radiologists
Open surgical biopsy or fine needle (n = 2) aspiration
Reinikainen et al. 200171
B-mode US and power Doppler, with and without contrast (Levovist)
Power Vision (Toshiba) 10 MHz Two radiologists independently, then in consensus about disagreements
Open surgical biopsy
Moon et al. 200072
Power Doppler, with and without contrast (Levovist)
HDI 3000 (Advanced Technology Laboratories, Bothell, WA)
5 to 10 MHz Two radiologists in consensus
Open surgical biopsy
Blohmer et al. 199973
B-mode 2D gray-scale and color Doppler
NR NR NR Open surgical biopsy
Chao et al. 199974
B-mode 2D gray-scale Aloka SSD-2000 (Aloka, Tokyo, Japan)
7.5 MHz One of three operators
Histological examination
Schroeder et al. 199975
Power and color Doppler, with and without contrast (Levovist)
Elegra (Siemens AG, Berlin, Germany)
9.0 MHz Two radiologists independently
Open surgery (n = 75), or 9 to 12 months of followup
Albrecht et al. 199876
Power Doppler, with or without contrast (EchoGen)
Acuson 128 XP10 (Mountain View, CA)
7.0 MHz Two radiologists independently
Histological examination, FNA (n = 3), or followup six months (n = 1)

Table C15. Ultrasound studies: details of methods (continued)
C-60
Study US Method US Device US MHz US Operators Reference Standard
Wilkens et al. 199877
B-mode 2D gray-scale and color Doppler
Advanced Technologies Laboratory (Bothell, WA)
10 MHz One radiologist Open surgical biopsy
Buadu et al. 199778
Color Doppler Toshiba SSA-260-A (Toshiba Ltd, Japan)
7.5 MHz NR Open surgical biopsy
Stavros et al. 199579
B-mode 2D gray-scale Diasonics Spectra (Milpitas, CA), Advanced Technology Laboratories (High Definition Imaging, Bothell, WA) or Acoustic Imaging Modell 5200 (Phoeniz, AZ)
7.5 to 10.0 MHz
One of five radiologists
Open surgery (44%) or core-needle biopsy (55%)
Ciatto et al. 199480
B-mode 2D gray scale Esaote (Esaote Ansaldo, Milano, Italy)
10 MHz One radiologist Open surgical biopsy (n = 320) or 1 to 2 years of followup (n = 1,759)
Perre et al. 199481
B-mode 2D gray-scale Toshiba SSA-270-A (Toshiba Ltd, Japan)
7.5 MHz One operator, entire study
Open surgical biopsy except cysts
2D Two dimensional FNA Fine needle aspiration MHz mega Hertz

C-61
Table C16. Ultrasound studies: information for meta-regressions
Study Co
nse
cuti
ve o
r A
ll E
nro
llmen
t (1
= Y
es)
Pro
spec
tive
Des
ign
(1
= Y
es)
Pro
bab
ly A
ffec
ted
by
Sp
ectr
um
Bia
sa (1
= Y
es)
Acc
ou
nte
d f
or
Inte
rrea
der
Dif
fere
nce
s (1
= Y
es)
Rea
der
s B
lind
ed t
o
Clin
ical
Info
rmat
ion
(1
= Y
es)
All
Dia
gn
ose
s C
on
firm
ed b
y H
isto
pat
ho
log
y (1
= Y
es)
Fu
nd
ed b
y (1
= D
ecla
red
N
o F
inan
cial
Co
nfl
icts
o
f In
tere
st)
Geo
gra
ph
ic R
egio
nb
Pro
po
rtio
n M
alig
nan
t
Gokalp et al. 200955
0 1 0 0 0 0 0 2 0.415
Vassiou et al. 20098
0 1 0 0 0 1 0 2 0.68
Liu et al. 200856
1 0 0 1 1 1 1 0 0.413
Vade et al. 200857
1 0 0 0 0 0 0 4 0%
Cha et al. 200758
1 1 0 1 1 0 0 1 0.33
Chala et al. 200759
1 0 1 0 1 0 0 5 0.227
Zhi et al. 200760
1 0 0 1 0 1 0 0 0.294
Cho et al. 200661
1 1 0 1 1 0 0 1 0.4
Pinero et al. 200653
1 1 0 0 0 1 0 3 0.77
Ricci et al. 200616
1 1 0 1 0 1 0 3 0.76
Forsberg et al. 200462
0 0 1 0 0 1 0 4 0.29

Table C16. Ultrasound studies: information for meta-regressions (continued)
C-62
Study Co
nse
cuti
ve o
r A
ll E
nro
llmen
t (1
= Y
es)
Pro
spec
tive
Des
ign
(1
= Y
es)
Pro
bab
ly A
ffec
ted
by
Sp
ectr
um
Bia
sa (1
= Y
es)
Acc
ou
nte
d f
or
Inte
rrea
der
Dif
fere
nce
s (1
= Y
es)
Rea
der
s B
lind
ed t
o
Clin
ical
Info
rmat
ion
(1
= Y
es)
All
Dia
gn
ose
s C
on
firm
ed b
y H
isto
pat
ho
log
y (1
= Y
es)
Fu
nd
ed b
y (1
= D
ecla
red
N
o F
inan
cial
Co
nfl
icts
o
f In
tere
st)
Geo
gra
ph
ic R
egio
nb
Pro
po
rtio
n M
alig
nan
t
Meyberg-Solomayer et al. 200463
0 1 0 0 0 0 0 3 0.645
Ozdemir et al. 200464
0 1 0 0 0 0 0 2 0.405
Chen et al. 200365
0 1 0 1 0 1 0 0 0.75
Kook and Kwag 200366
0 1 0 1 1 0 0 1 0.47
Marini et al. 200367
1 0 1 1 1 0 0 2 0.39
Caruso et al. 200268
0 1 0 0 0 1 0 2 0.56
Koukouraki et al. 200169
0 1 0 0 1 1 0 2 0.74
Malich et al. 200135
1 0 0 0 0 0 0 3 0.62
Milz et al. 200170
0 1 0 0 0 1 0 3 0.47
Reinikainen et al. 200171
0 1 0 1 1 1 1 3 0.523
Moon et al. 200072
1 1 0 1 0 1 1 1 0.44

Table C16. Ultrasound studies: information for meta-regressions (continued)
C-63
Study Co
nse
cuti
ve o
r A
ll E
nro
llmen
t (1
= Y
es)
Pro
spec
tive
Des
ign
(1
= Y
es)
Pro
bab
ly A
ffec
ted
by
Sp
ectr
um
Bia
sa (1
= Y
es)
Acc
ou
nte
d f
or
Inte
rrea
der
Dif
fere
nce
s (1
= Y
es)
Rea
der
s B
lind
ed t
o
Clin
ical
Info
rmat
ion
(1
= Y
es)
All
Dia
gn
ose
s C
on
firm
ed b
y H
isto
pat
ho
log
y (1
= Y
es)
Fu
nd
ed b
y (1
= D
ecla
red
N
o F
inan
cial
Co
nfl
icts
o
f In
tere
st)
Geo
gra
ph
ic R
egio
nb
Pro
po
rtio
n M
alig
nan
t
Blohmer et al. 199973
0 1 0 0 0 1 0 3 0.495
Chao et al. 199974
0 1 0 0 0 0 0 1 0.24
Schroeder et al. 199975
1 1 0 1 1 0 0 3 0.655
Albrecht et al. 199876
0 1 0 1 1 0 0 3 0.55
Wilkens et al. 199877
0 0 0 0 0 1 0 4 0.4
Buadu et al. 199778
1 0 0 0 0 1 0 1 0.724
Stavros et al. 199579
0 1 0 0 0 0 0 4 0.164
Ciatto et al. 199480
1 1 1 0 0 0 0 2 0.125
Perre et al. 199481
0 1 0 0 1 0 0 3 0.435
a Spectrum bias defined as median/mean age greater than 50 and/or % lesions malignant less than 10% or greater than 40% b China = 0; Asia = 1; Turkey, Greece, Italy = 2; Europe and United Kingdom = 3; North America = 4; South America = 5

C-64
Data Analysis MRI
Table C17. MRI accuracy data
Study Category TP FP FN TN Sensitivity (95% CI)
Specificity (95% CI)
Akita et al. 20091
All 11 0 2 37 84.6% (57.6% to 95.4%)
100.0% (90.3% to 99.9%)
Baltzer et al. 20092
Readers 202 51 59 139 77.4% (71.9% to 82.0%)
73.2% (66.4% to 78.9%)
CAD 220 51 59 139 78.9% (73.7% to 83.2%)
73.2% (66.4% to 78.9%)
Hara et al. 20093
All 26 6 3 58 89.7% (73.4% to 96.3%)
90.6% (80.9% to 95.5%)
Kim et al. 20094
All 48 82 2 117 96.0% (86.4% to 98.8%)
58.8% (51.8% to 65.4%)
Lo et al. 20095
All 19 1 1 10 95.0% (76.1% to 98.9%)
90.9% (61.9% to 98.1%)
Imbracio et al. 20086
All 44 2 1 8 97.8% (88.3% to 99.5%)
80.0% (48.9% to 94.0%)
Pediconi et al. 20087
Gadopentetic acid 24 8 8 10 75.0% (57.8% to 86.6%)
55.6% (33.8% to 75.3%)
Gadobenic acid 31 5 1 13 96.9% (84.0% to 99.3%)
72.2% (49.1% to 87.3%)
Vassiou et al. 20098
All 52 14 1 11 98.1% (89.9% to 99.6%)
44.0% (26.7% to 62.9%)
Brem et al. 20079
All 9 18 0 6 100.0% (69.5% to 99.7%)
25.0% (12.2% to 45.0%)
Cilotti et al. 200710
Microcalcifications 19 7 7 22 73.1% (53.8% to 86.2%)
75.9% (57.8% to 87.6%)
Pediconi et al. 200711
All 211 15 0 4 100.0% (98.2% to 100.0%)
21.1% (8.7% to 43.5%)
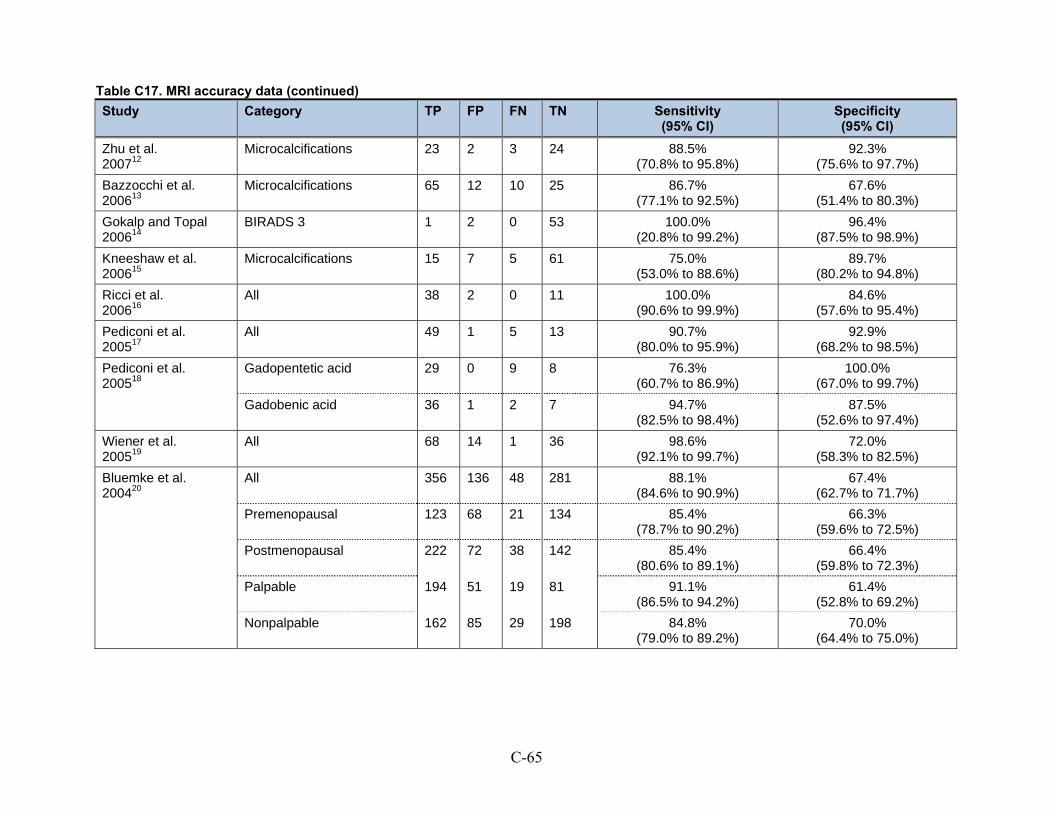
Table C17. MRI accuracy data (continued)
C-65
Study Category TP FP FN TN Sensitivity (95% CI)
Specificity (95% CI)
Zhu et al. 200712
Microcalcifications 23 2 3 24 88.5% (70.8% to 95.8%)
92.3% (75.6% to 97.7%)
Bazzocchi et al. 200613
Microcalcifications 65 12 10 25 86.7% (77.1% to 92.5%)
67.6% (51.4% to 80.3%)
Gokalp and Topal 200614
BIRADS 3 1 2 0 53 100.0% (20.8% to 99.2%)
96.4% (87.5% to 98.9%)
Kneeshaw et al. 200615
Microcalcifications 15 7 5 61 75.0% (53.0% to 88.6%)
89.7% (80.2% to 94.8%)
Ricci et al. 200616
All 38 2 0 11 100.0% (90.6% to 99.9%)
84.6% (57.6% to 95.4%)
Pediconi et al. 200517
All 49 1 5 13 90.7% (80.0% to 95.9%)
92.9% (68.2% to 98.5%)
Pediconi et al. 200518
Gadopentetic acid 29 0 9 8 76.3% (60.7% to 86.9%)
100.0% (67.0% to 99.7%)
Gadobenic acid 36 1 2 7 94.7% (82.5% to 98.4%)
87.5% (52.6% to 97.4%)
Wiener et al. 200519
All 68 14 1 36 98.6% (92.1% to 99.7%)
72.0% (58.3% to 82.5%)
Bluemke et al. 200420
All 356 136 48 281 88.1% (84.6% to 90.9%)
67.4% (62.7% to 71.7%)
Premenopausal 123 68 21 134 85.4% (78.7% to 90.2%)
66.3% (59.6% to 72.5%)
Postmenopausal 222 72 38 142 85.4% (80.6% to 89.1%)
66.4% (59.8% to 72.3%)
Palpable 194 51 19 81 91.1% (86.5% to 94.2%)
61.4% (52.8% to 69.2%)
Nonpalpable 162 85 29 198 84.8% (79.0% to 89.2%)
70.0% (64.4% to 75.0%)
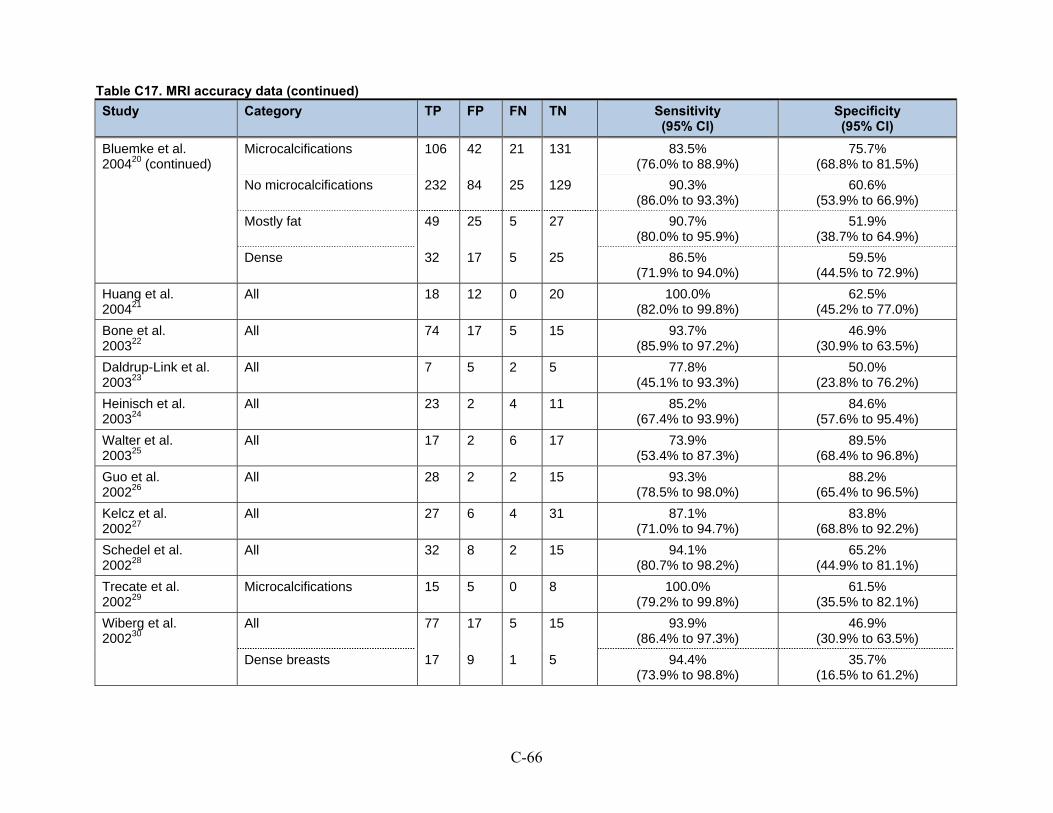
Table C17. MRI accuracy data (continued)
C-66
Study Category TP FP FN TN Sensitivity (95% CI)
Specificity (95% CI)
Bluemke et al. 200420 (continued)
Microcalcifications 106 42 21 131 83.5% (76.0% to 88.9%)
75.7% (68.8% to 81.5%)
No microcalcifications 232 84 25 129 90.3% (86.0% to 93.3%)
60.6% (53.9% to 66.9%)
Mostly fat 49 25 5 27 90.7% (80.0% to 95.9%)
51.9% (38.7% to 64.9%)
Dense 32 17 5 25 86.5% (71.9% to 94.0%)
59.5% (44.5% to 72.9%)
Huang et al. 200421
All 18 12 0 20 100.0% (82.0% to 99.8%)
62.5% (45.2% to 77.0%)
Bone et al. 200322
All 74 17 5 15 93.7% (85.9% to 97.2%)
46.9% (30.9% to 63.5%)
Daldrup-Link et al. 200323
All 7 5 2 5 77.8% (45.1% to 93.3%)
50.0% (23.8% to 76.2%)
Heinisch et al. 200324
All 23 2 4 11 85.2% (67.4% to 93.9%)
84.6% (57.6% to 95.4%)
Walter et al. 200325
All 17 2 6 17 73.9% (53.4% to 87.3%)
89.5% (68.4% to 96.8%)
Guo et al. 200226
All 28 2 2 15 93.3% (78.5% to 98.0%)
88.2% (65.4% to 96.5%)
Kelcz et al. 200227
All 27 6 4 31 87.1% (71.0% to 94.7%)
83.8% (68.8% to 92.2%)
Schedel et al. 200228
All 32 8 2 15 94.1% (80.7% to 98.2%)
65.2% (44.9% to 81.1%)
Trecate et al. 200229
Microcalcifications 15 5 0 8 100.0% (79.2% to 99.8%)
61.5% (35.5% to 82.1%)
Wiberg et al. 200230
All 77 17 5 15 93.9% (86.4% to 97.3%)
46.9% (30.9% to 63.5%)
Dense breasts 17 9 1 5 94.4% (73.9% to 98.8%)
35.7% (16.5% to 61.2%)

Table C17. MRI accuracy data (continued)
C-67
Study Category TP FP FN TN Sensitivity (95% CI)
Specificity (95% CI)
Brix et al. 200131
All 8 1 2 2 80.0% (48.9% to 94.0%)
66.7% (21.0% to 93.3%)
Cecil et al. 200132
All 22 2 1 13 95.7% (78.7% to 99.0%)
86.7% (61.9% to 96.0%)
Furman-Haran et al. 200133
All 21 2 4 21 84.0% (65.2% to 93.4%)
91.3% (73.0% to 97.4%)
Imbriaco et al. 200134
All 24 6 1 22 96.0% (80.2% to 99.1%)
78.6% (60.4% to 89.6%)
Younger than 50 yrs 11 3 0 9 100.0% (73.6% to 99.7%)
75.0% (46.7% to 90.8%)
50 and older yrs 13 3 1 9 92.9% (68.2% to 98.5%)
75.0% (46.7% to 90.8%)
Lesion 10 mm or larger 19 3 1 13 95.0% (76.1% to 98.9%)
81.3% (56.8% to 93.2%)
Lesion smaller than 10 mm 5 3 0 5 100.0% (56.0% to 99.6%)
62.5% (30.6% to 86.0%)
Malich et al. 200135
All 53 7 1 29 98.1% (90.1% to 99.6%)
80.6% (64.9% to 90.1%)
Nakahara et al. 200136
Microcalcifications 19 3 1 17 95.0% (76.1% to 98.9%)
85.0% (63.8% to 94.6%)
Torheim et al. 200137
All 57 7 13 50 81.4% (70.7% to 88.7%)
87.7% (76.7% to 93.8%)
Wedegartner et al. 200138
All 37 4 7 14 84.1% (70.5% to 92.0%)
77.8% (54.7% to 90.8%)
Yeung et al. 200139
All 22 1 2 5 91.7% (73.9% to 97.5%)
83.3% (43.5% to 96.5%)
Kvistad et al. 200040
All 63 12 9 46 87.5% (77.8% to 93.2%)
79.3% (67.2% to 87.7%)
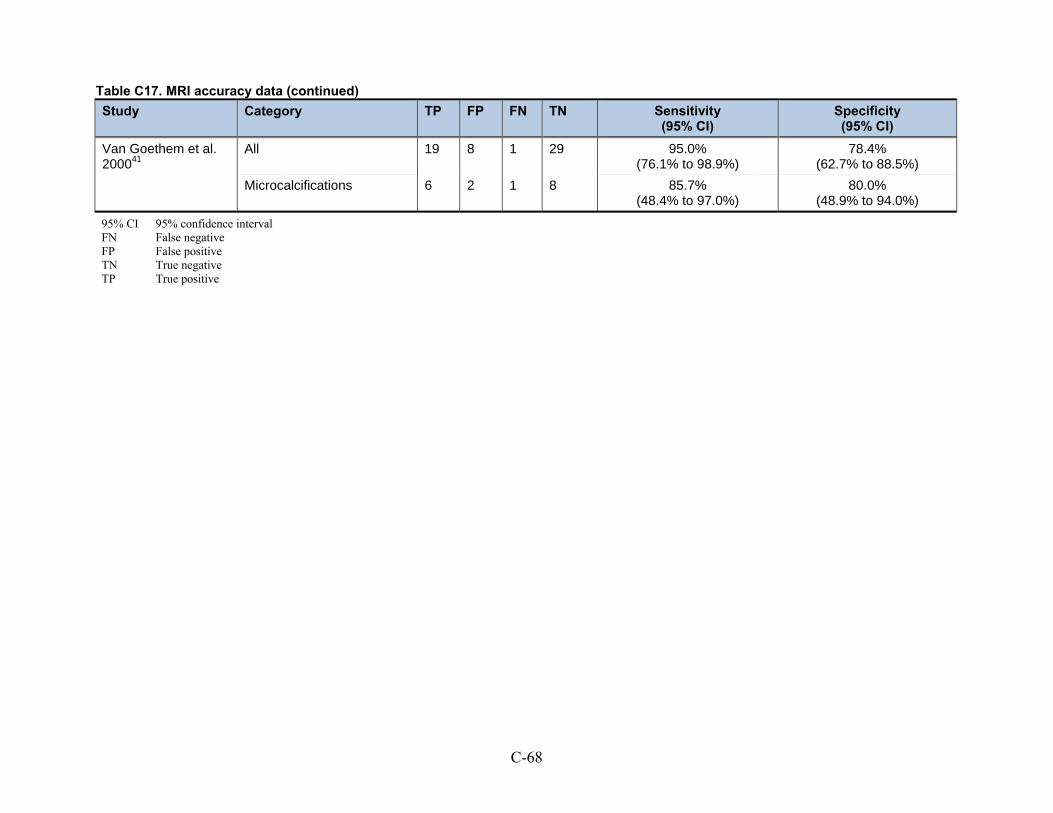
Table C17. MRI accuracy data (continued)
C-68
Study Category TP FP FN TN Sensitivity (95% CI)
Specificity (95% CI)
Van Goethem et al. 200041
All 19 8 1 29 95.0% (76.1% to 98.9%)
78.4% (62.7% to 88.5%)
Microcalcifications 6 2 1 8 85.7% (48.4% to 97.0%)
80.0% (48.9% to 94.0%)
95% CI 95% confidence interval FN False negative FP False positive TN True negative TP True positive

C-69
META-ANALYTIC INTEGRATION OF DIAGNOSTIC TEST ACCURACY STUDIES
Accuracy of MRI in General
SUMMARY DATA AND PERFORMANCE ESTIMATES
Bivariate Binomial Mixed Model
Number of studies = 41
Reference-positive Subjects = 2,209
Reference-negative Subjects = 1,843
Pretest Prob of Disease = 0.545
Between-study variance (varlogitSEN) = 0.831 (95% CI: 0.402 to 1.718)
Between-study variance (varlogitSPE) = 0.901 (95% CI: 0.493 to 1.649)
Correlation (Mixed Model) = -0.607
ROC Area, AUROC = 0.93 (95% CI: 0.90 to 0.95)
Heterogeneity (Chi-square): LRT_Q = 128.856, df = 2.00, LRT_p = 0.000
Inconsistency (I-square): LRT_I2 = 98.4% (95% CI: 97.6 to 99.3%)
Summary Parameter Estimates (95% CI)
Sensitivity: 91.7% (88.5 to 94.1%)
Specificity: 77.5% (71.0 to 82.9%)
Positive Likelihood Ratio: 4.08 (3.10 to 5.30)
Negative Likelihood Ratio: 0.11 (0.079 to 0.15)
Diagnostic Score: 3.638 (3.253 to 4.023)
Diagnostic Odds Ratio: 38.008 (25.864 to 55.856)
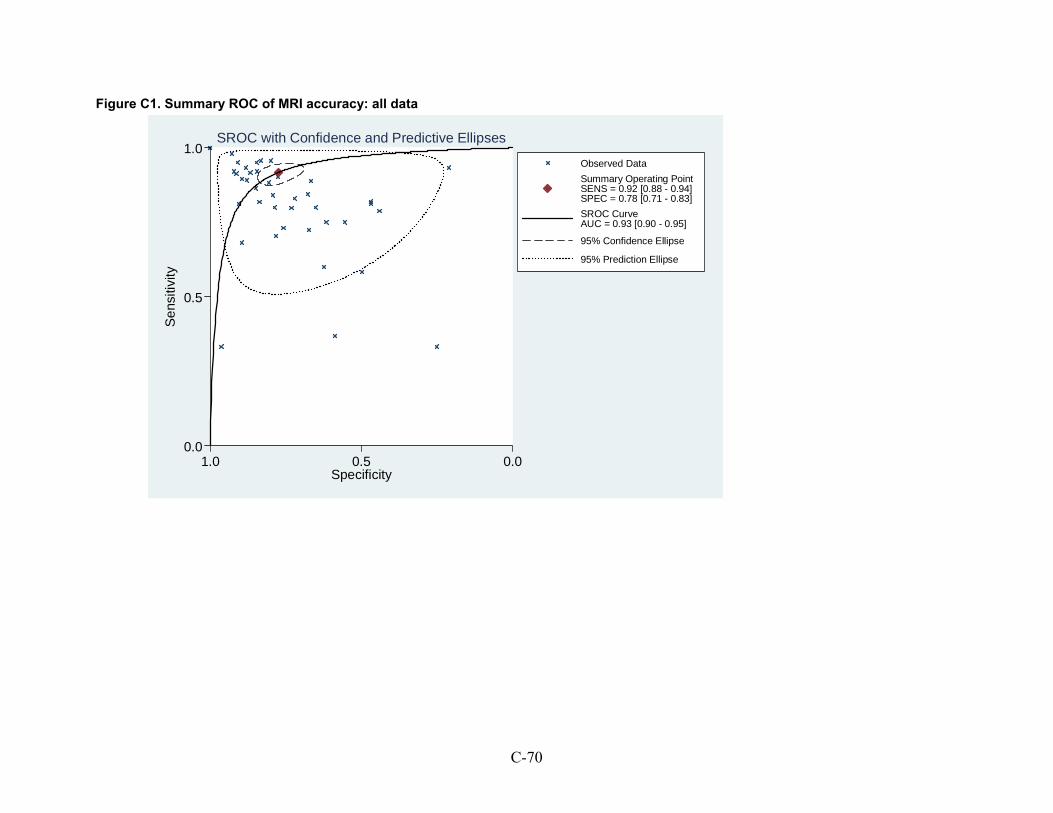
C-70
Figure C1. Summary ROC of MRI accuracy: all data
0.0
0.5
1.0
Se
nsiti
vity
0.00.51.0Specificity
Observed Data
Summary Operating PointSENS = 0.92 [0.88 - 0.94]SPEC = 0.78 [0.71 - 0.83]
SROC CurveAUC = 0.93 [0.90 - 0.95]
95% Confidence Ellipse
95% Prediction Ellipse
SROC with Confidence and Predictive Ellipses

C-71
Exploration of Heterogeneity: Accuracy of MRI
Meta-regressions of All Data
Bivariate Model
Variable p-Value
Prevalence of disease 0.02
Readers blinded to clinical information 0.03
Geographical location 0.08
Enrolled consecutive or all patients 0.13
Prospective design 0.18
All diagnoses verified by histopathology 0.28
Funding source 0.36
Multi-centered 0.52
Accounted for inter-reader differences 0.56
Spectrum bias 0.64
Magnet strength 0.87
Contrast agent 0.97
Statistically Significant Models
Parameter Prevalence of Disease Readers Blinded to Clinical Information
I2 (95% CI) 74.4% (43.5 to 100.0%) 70.2% (33.7 to 100.0%) Heterogeneity (LRTChi) 7.80 6.72 Sensitivity: 96% 87%
95% CI 91 to 98% 80 to 92% Coefficient 3.23 1.93 z 2.69 -2.04 p of z 0.01 0.04
Specificity: 56% 75% 95% CI 36 to 73% 63 to 85% Coefficient 0.23 1.12 z -3.55 -0.39 p of z 0.00 0.70
Subgroup Analyses of Statistically Significant Models
Accuracy of Studies with Readers Blinded to Clinical Information vs. Not

C-72
META-ANALYTIC INTEGRATION OF DIAGNOSTIC TEST ACCURACY STUDIES
SUMMARY DATA AND PERFORMANCE ESTIMATES
Bivariate Binomial Mixed Model
Parameter Blinded Not Blinded (or Not Reported)
Number of studies 13 28
Number of patients 1,289 2,763
Prevalence of disease 63.4% 50.4%
I2 89.9% 98.1%
Sensitivity (95% CI) 86.8% (82.1 to 90.4%) 93.9% (90.0 to 96.4%)
Specificity (95% CI) 74.7% (64.4 to 82.9%) 78.0% (70.0 to 84.5%)
AUROC (95% CI) 0.89 (0.86 to 0.92) 0.94 (0.91 to 0.96)

C-73
Figure C2. Graph of MRI sensitivity and specificity relative to prevalence of disease
0.5
0.55
0.6
0.65
0.7
0.75
0.8
0.85
0.9
0.95
1
0 0.1 0.2 0.3 0.4 0.5 0.6 0.7 0.8 0.9 1
Prevalence of disease
Sensitivity
Specificity

C-74
Figure C3. Accuracy of MRI: blinded study design vs. not
Blinded
Not blinded
0.0%
10.0%
20.0%
30.0%
40.0%
50.0%
60.0%
70.0%
80.0%
90.0%
100.0%
0.0%10.0%20.0%30.0%40.0%50.0%60.0%70.0%80.0%90.0%100.0%
Sensitivity
Specificity

C-75
Accuracy of Studies with Disease Prevalence Greater or Less than 60%
META-ANALYTIC INTEGRATION OF DIAGNOSTIC TEST ACCURACY STUDIES
SUMMARY DATA AND PERFORMANCE ESTIMATES
Bivariate Binomial Mixed Model
Parameter Prevalence >60% Prevalence 60% or lessa
Number of studies 17 24 Number of patients 1,430 2,622 Prevalence of disease 65.5% 44.5% I2 96.0% 64.1 sensitivity; 82.3 specificity Sensitivity (95% CI) 93.8% (89.1% to 96.6%) 86.3% (84.3% to 88.2%) Specificity (95% CI) 70.3% (58.1% to 80.1%) 76.1% (73.7% to 78.3%) AUROC (95% CI) 0.91 (0.88 to 0.93) 0.91 a Could not fit a bivariate model; individual parameters estimated using Meta-Disc

C-76
Subgroup Analyses of MRI Data
Methods Factors
CAD assistance in interpreting images
Table C18. Accuracy of MRI: CAD
Study Category TP FP FN TN Sensitivity (95% CI)
Specificity (95% CI)
Baltzer et al. 20092
Readers alone 202 51 59 139 77.4% (71.9% to 82.0%)
73.2% (66.4% to 78.9%)
CAD assistance 220 51 59 139 78.9% (73.7% to 83.2%)
73.2% (66.4% to 78.9%)
FN False negative FP False positive TN True negative TP True positive
Contrast agent
Table C19. MRI accuracy: studies directly comparing different contrast agents
Study Category TP FP FN TN Sensitivity (95% CI)
Specificity (95% CI)
Pediconi et al. 20087
Gadopentetic acid 24 8 8 10 75.0% (57.8% to 86.6%)
55.6% (33.8% to 75.3%)
Gadobenic acid 31 5 1 13 96.9% (84.0% to 99.3%)
72.2% (49.1% to 87.3%)
Pediconi et al. 200518
Gadopentetic acid 29 0 9 8 76.3% (60.7% to 86.9%)
100.0% (67.0% to 99.7%)
Gadobenic acid 36 1 2 7 94.7% (82.5% to 98.4%)
87.5% (52.6% to 97.4%)
FN False negative FP False positive TN True negative TP True positive

C-77
Accuracy of Studies: Subgroup analysis comparison of Contrast Agents
META-ANALYTIC INTEGRATION OF DIAGNOSTIC TEST ACCURACY STUDIES
SUMMARY DATA AND PERFORMANCE ESTIMATES
Bivariate Binomial Mixed Model
Parameter Gadopentetic Acid Gadodiamide Gadobenic Acid Gadoteridola
Number of studies 28 8 5 2
Number of patients 2,918 618 445 167
Prevalence of disease 52.1% 46.0% 83.8% 60.5%
I2 96.7% 76.2% 92.8% 57.6% (sensitivity) 0.0% (specificity)
Sensitivity (95% CI) 91.8% (88.0 to 94.4%) 86.5% (81.4 to 90.4%) 98.3% (90.9 to 99.7%) 83.2% (74.4 to 89.9%)
Specificity (95% CI) 74.4% (66.0 to 80.9%) 87.8% (79.2 to 93.1%) 75.5% (44.9 to 92.1%) 71.2% (58.7 to 81.7%)
AUROC (95% CI) 0.92 (0.89 to 0.94) 0.91 (0.89 to 0.94) 0.97 (0.95 to 0.98) NA with only 2 studies a Could not fit a bivariate model; individual parameters estimated using Meta-Disc

C-78
Patient Factors
Table C20. Accuracy of MRI: miscellaneous patient factors
Study Category TP FP FN TN Sensitivity (95% CI)
Specificity (95% CI)
Bluemke et al. 200420
All 356 136 48 281 88.1% (84.6% to 90.9%)
67.4% (62.7% to 71.7%)
Premenopausal 123 68 21 134 85.4% (78.7% to 90.2%)
66.3% (59.6% to 72.5%)
Postmenopausal 222 72 38 142 85.4% (80.6% to 89.1%)
66.4% (59.8% to 72.3%)
Imbriaco et al. 200134
All 24 6 1 22 96.0% (80.2% to 99.1%)
78.6% (60.4% to 89.6%)
Younger than 50 years 11 3 0 9 100.0% (73.6% to 99.7%)
75.0% (46.7% to 90.8%)
50 and older years 13 3 1 9 92.9% (68.2% to 98.5%)
75.0% (46.7% to 90.8%)
FN False negative FP False positive TN True negative TP True positive

C-79
Lesion Factors
Microcalcifications on mammography
Accuracy of Studies: Subgroup analysis comparison of studies that enrolled patients with microcalcifications to all studies
META-ANALYTIC INTEGRATION OF DIAGNOSTIC TEST ACCURACY STUDIES
SUMMARY DATA AND PERFORMANCE ESTIMATES
Bivariate Binomial Mixed Model
Parameter All Microcalcifications
Number of studies 41 8
Number of patients 4,052 692
Prevalence of disease 54.5% 45.7%
I2 98.4% 3.86%
Sensitivity (95% CI) 91.7% (88.5% to 94.1%) 84.0% (79.5% to 88.3%)
Specificity (95% CI) 77.5% (71.0% to 82.9%) 79.4% (71.5% to 85.6%)
AUROC (95% CI) 0.93 (0.90 to 0.95) 0.88 (0.85 to 0.91)

C-80
Figure C4. Summary ROC MRI: patients with microcalcifications on mammography
0.0
0.5
1.0
Se
nsiti
vity
0.00.51.0Specificity
Observed Data
Summary Operating PointSENS = 0.84 [0.80 - 0.88]SPEC = 0.79 [0.72 - 0.86]
SROC CurveAUC = 0.88 [0.85 - 0.91]
95% Confidence Ellipse
95% Prediction Ellipse
SROC with Confidence and Predictive Ellipses

C-81
Table C21. Accuracy of MRI for microcalcifications: studies that directly compared microcalcifications to other
Study Category TP FP FN TN Sensitivity (95% CI)
Specificity (95% CI)
Bluemke et al. 200420
No microcalcifications 232 84 25 129 90.3% (86.0% to 93.3%)
60.6% (53.9% to 66.9%)
Microcalcifications 106 42 21 131 83.5% (76.0% to 88.9%)
75.7% (68.8% to 81.5%)
Van Goethem et al. 200041
All 19 8 1 29 95.0% (76.1% to 98.9%)
78.4% (62.7% to 88.5%)
Microcalcifications 6 2 1 8 85.7% (48.4% to 97.0%)
80.0% (48.9% to 94.0%)
FN False negative FP False positive TN True negative TP True positive
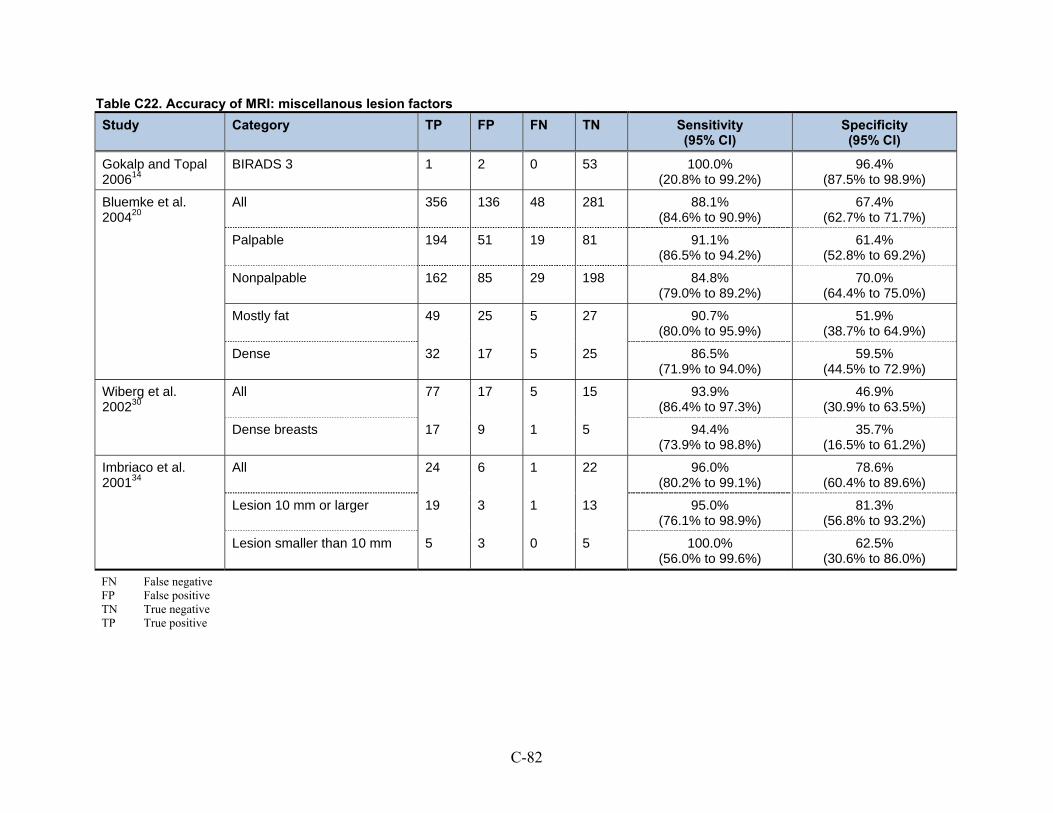
C-82
Table C22. Accuracy of MRI: miscellanous lesion factors
Study Category TP FP FN TN Sensitivity (95% CI)
Specificity (95% CI)
Gokalp and Topal 200614
BIRADS 3 1 2 0 53 100.0% (20.8% to 99.2%)
96.4% (87.5% to 98.9%)
Bluemke et al. 200420
All 356 136 48 281 88.1% (84.6% to 90.9%)
67.4% (62.7% to 71.7%)
Palpable 194 51 19 81 91.1% (86.5% to 94.2%)
61.4% (52.8% to 69.2%)
Nonpalpable 162 85 29 198 84.8% (79.0% to 89.2%)
70.0% (64.4% to 75.0%)
Mostly fat 49 25 5 27 90.7% (80.0% to 95.9%)
51.9% (38.7% to 64.9%)
Dense 32 17 5 25 86.5% (71.9% to 94.0%)
59.5% (44.5% to 72.9%)
Wiberg et al. 200230
All 77 17 5 15 93.9% (86.4% to 97.3%)
46.9% (30.9% to 63.5%)
Dense breasts 17 9 1 5 94.4% (73.9% to 98.8%)
35.7% (16.5% to 61.2%)
Imbriaco et al. 200134
All 24 6 1 22 96.0% (80.2% to 99.1%)
78.6% (60.4% to 89.6%)
Lesion 10 mm or larger 19 3 1 13 95.0% (76.1% to 98.9%)
81.3% (56.8% to 93.2%)
Lesion smaller than 10 mm 5 3 0 5 100.0% (56.0% to 99.6%)
62.5% (30.6% to 86.0%)
FN False negative FP False positive TN True negative TP True positive

C-83
PET
Table C23. PET accuracy data
Study Position Patient Subgroup TP FP FN TN Sensitivity (95% CI)
Specificity (95% CI)
Kaida et al. 200842
Supine All 81 12 17 12 82.7% (73.7% to 89.6%)
50.0% (29.1% to 70.9%)
Prone All 109 4 5 4 95.6% (90% to 98.6%)
50.0% (15.7% to 84.3%)
Buchmann et al. 200743
Prone All 25 0 3 1 89.3% (71.8% to 97.7%)
100.0% (02.5% to 100.0%)
Hienisch et al. 200324
Prone All 17 4 8 11 68.0% (46.5% to 85.1%)
73.3% (44.9% to 92.2%)
Walter et al. 200325
Prone All 12 2 7 21 63.2% (38.4% to 83.7%)
91.3% (72.0% to 98.9%)
Brix et al. 200131
Prone All 8 2 1 2 88.9% (51.8% to 99.7%)
50.0% (06.8% to 93.2%)
Schirrmeister et al. 200144
Prone All 83 7 6 21 93.3% (85.9% to 97.5%)
75.0% (55.1% to 89.3%)
Yutani et al. 200045
Supine All 30 0 8 2 78.9 (62.7% to 90.4%)
100.0% (15.8% to 100.0%)
BIRADS 5 26 0 2 2 93% (76.5% to 99.1%)
100.0% (15.7% to 84.3%)
Lesion 1.5 cm or larger 27 0 1 1 79.4% (62.1% to 91.3%)
100.0% (02.5% to 100.0%)
Palpable lesion 29 0 7 1 80.6% (64.0% to 91.8%)
100.0% (02.5% to 100.0%)
Younger than 65 25 0 7 2 78.1% (60.0% to 90.7%)
100.0% (15.8% to 100.0%)
FN False negative FP False positive TN True negative TP True positive

C-84
Table C24. PET/CT accuracy data
Study Time of Scan
Patient Subgroup True Positive
False Positive
False Negative
True Negative
Sensitivity (95% CI)
Specificity (95% CI)
Imbriaco et al. 20076
Early All 22 0 14 8 61.1% (43.5% to 76.9%)
100% (63.1% to 100%)
Late All 29 0 7 8 80.6% (64.0% to 91.8%)
100% (63.1% to 100%)
Early Lesions >10 mm NR NR NR NR 74.1% (53.7% to 88.9%)
Reported by authors
100.0% (63.1% to 100.0%)
Reported by authors
Late Lesions >10 mm NR NR NR NR 87.1% (70.2% to 96.4%)
Reported by authors
100.0% (39.8% to 100.0%)
Reported by authors
Early Lesions <10 mm NR NR NR NR 27.3% (06.0% to 61.0%)
Reported by authors
100.0% (66.4% to 100.0%)
Reported by authors
Late Lesions <10 mm NR NR NR NR 60.0% (32.3% to 83.7%)
Reported by authors
100.0% (47.8% to 100.0%)
Reported by authors
FN False negative FP False positive TN True negative TP True positive

C-85
META-ANALYTIC INTEGRATION OF DIAGNOSTIC TEST ACCURACY STUDIES
Accuracy of PET
SUMMARY DATA AND PERFORMANCE ESTIMATES
Bivariate Binomial Mixed Model
Number of studies = 7
Reference-positive Subjects = 306
Reference-negative Subjects = 97
Pretest Prob of Disease = 0.759
Between-study variance (varlogitSEN) = 0.308 (95% CI: 0.051-1.868)
Between-study variance (varlogitSPE) = 0.393 (95% CI: 0.043-3.623)
Correlation (Mixed Model) = -0.456
ROC Area, AUROC = 0.86 (95% CI: 0.82 to 0.89)
Heterogeneity (Chi-square): LRT_Q = 5.623, df = 2.00, LRT_p = 0.030
Inconsistency (I-square): LRT_I2 = 64.4% (95% CI: 19.99 to 100.00%)
Summary Parameter Estimates (95% CI)
Sensitivity: 82.6% (73.5 to 89.1%)
Specificity: 73.9% (57.5 to 85.5%)
Positive Likelihood Ratio: 3.16 (1.86 to 5.38)
Negative Likelihood Ratio: 0.235 (0.15 to 0.37)
Diagnostic Score: 2.599 (1.794 to 3.404)
Diagnostic Odds Ratio: 13.449 (6.011 to 30.090)

C-86
Figure C5. Summary ROC of PET
Table C25. PET studies: results of meta-regression
Variable p-Value
Patient postion 0.52
Palpable lesions only 0.25
Readers blinded to clinical information 0.05
All diagnoses verified by histopathology 0.08
0.0
0.5
1.0
Se
nsiti
vity
0.00.51.0Specificity
Observed Data
Summary Operating PointSENS = 0.83 [0.73 - 0.89]SPEC = 0.74 [0.58 - 0.86]
SROC CurveAUC = 0.86 [0.82 - 0.89]
95% Confidence Ellipse
95% Prediction Ellipse
SROC with Confidence and Predictive Ellipses

C-87
Scintimammography
Table C26. Accuracy of scintimammography
Study Patient Subgroup True Positive
False Negative
False Positive
True Negative
Sensitivity (95% CI)
Specificity (95% CI)
Brem et al. 20079
All patients 8 1 7 17 88.9% (51.8 to 99.7)
70.8% (48.9 to 87.4)
Grosso et al. 200946
Nonpalpable lesions 25 7 44 207 78.1% (60.0 to 90.7)
82.5% (77.2 to 87.0)
Habib et al. 200947
Palpable lesions 14 1 2 5 93.3% (68.1 to 99.8)
71.4% (29.0 to 96.3)
Kim et al. 20094
All patients 169 34 10 26 83.3% (77.4 to 88.1)
72.2% (54.8 to 85.8)
Wang et al. 200849
Palpable lesions 34 3 12 6 91.9% (78.1 to 98.3)
33.3% (13.3 to 59.0)
Kim et al. 200848
All patients 30 19 5 21 61.2% (46.2 to 74.8)
80.8% (60.6 to 93.4)
Gommans et al. 200750
Non-palpable lesions 37 8 4 52 82.2% (67.9 to 92.0)
92.9% (82.7 to 98.0)
Kim et al. 200751
All patients 57 9 0 12 86.4% (75.7 to 93.6)
100% (75.3 to 100.0)
Schillaci et al. 200752
All patients 27 10 1 15 73.0% (55.9 to 86.2)
93.8% (69.8 to 99.8)
Pinero et al. 200653
All patients 63 5 10 10 92.6% (83.7 to 97.6)
50.0% (27.2 to 72.8)
Mathieu et al. 200554
All patients 19 1 5 12 95.0% (75.1 to 99.9)
70.6% (44.0 to 89.7)
FN False negative FP False positive TN True negative TP True positive

C-88
META-ANALYTIC INTEGRATION OF DIAGNOSTIC TEST ACCURACY STUDIES
Planar Scintimammography
SUMMARY DATA AND PERFORMANCE ESTIMATES
Bivariate Binomial Mixed Model
Number of studies = 9
Reference-positive Units = 552
Reference-negative Units = 442
Pretest Prob of Disease = 0.56
Between-study variance in sensitivity (ICC_SEN) = 0.09 (95% CI: 0.00-0.21)
Between-study variance in sensitivity (MED_SEN) = 0.63 (95% CI: 0.56-0.75)
Between-study variance in specificity (ICC_SPE) = 0.23 (95% CI: 0.00-0.46)
Between-study variance in specificity (MED_SPE) = 0.72 (95% CI: 0.62-0.86)
Correlation (Mixed Model) = -0.76
ROC Area, AUROC = 0.88 (95% CI: 0.85 to 0.91)
Heterogeneity (Chi-square): LRT_Q = 27.288, df = 2.00, LRT_p = 0.000
Inconsistency (I-square): 93.0 % (95% CI: 86.0% to 99.0%)
Summary Parameter Estimates (95% CI)
Sensitivity: 84.0% (76.0% to 89.0%)
Specificity: 79.0% (63.0% to 89.0%)
Positive Likelihood Ratio: 3.9 (2.2 to 6.8)
Negative Likelihood Ratio: 0.21 (0.15 to 0.29)
Diagnostic Odds Ratio: 19 (10 to 35)

C-89
Figure C6. Summary ROC of scintimammography
Table C27. Scintimammography studies: results of meta-regression
Variable p-Value
Consecutive or all enrollment 0.11
All diagnoses verified by histopathology 0.24
Readers blinded to clinical information 0.93

C-90
Ultrasound
Ultrasound B-mode 2D grayscale
21 studies, 8,199 lesions
Table C28. Ultrasound accuracy data: B-mode 2D grayscale
Study Category TP FP FN TN Sensitivity (95% CI)
Specificity (95% CI)
Gokalp et al. 200955
All 39 23 0 32 100.0% (91.0% to 100.0%)
58.2% (44.1% to 71.3%)
Vassiou et al. 20098
All 44 6 9 19 83.0% (70.7% to 90.7%)
76.0% (56.5% to 94.3%)
Liu et al. 200856
All 41 15 2 46 95.3% (84.2% to 99.4%)
75.4% (62.7% to 85.5%)
Vade et al. 200857
Palpable lesions 0 6 0 15 Not calculated Not calculated
Cha et al. 200758
All 29 23 1 38 96.7% (82.8% to 99.9%
62.3% (49.0% to 74.4%)
Chala et al. 200759
All 51 96 1 81 98.1% (89.7% to 100.0%)
45.8% (38.3% to 53.4%)
Zhi et al. 200760
All 62 56 25 153 71.3% (60.6% to 80.5%)
73.2% (66.7% to 79.1%)
Cho et al. 200661
All 58 32 2 59 96.7% (88.5% to 99.6%)
64.8% (54.1% to 74.6%)
Ricci et al. 200616
All 26 4 12 8 68.4% (51.3% to 82.5%)
66.7% (34.9% to 90.1%)
Forsberg et al. 200462
All 10 5 14 24 41.7% (22.1% to 63.4%)
82.8% (64.2% to 94.2%)
Meyberg-Solomayer et al. 200463
All 42 0 0 23 100.0% (91.6% to 100.0%)
100.0% (85.2% to 100.0%)
Chen et al. 200365
Palpable lesions 22 5 2 3 91.7% (73.0% to 99.0%)
37.5% (8.5% to 75.5%)

Table C28. Ultrasound accuracy data: B-mode 2D grayscale (continued)
C-91
Study Category TP FP FN TN Sensitivity (95% CI)
Specificity (95% CI)
Kook and Kwag 200366
2 cm or less 17 10 0 9 100.0% (80.5% to 100.0%)
47.4% (24.4% to 71.1%)
Marini et al. 200367
Microcalcifications 81 96 13 48 86.2% (77.5% to 92.4%)
33.3% (25.7% to 41.7%)
Reinikainen et al. 200171
All 34 28 0 3 100.0% (89.7% to 100.0%)
9.7% (2.0% to 25.8%)
Blohmer et al. 199973
All 76 4 81 70 48.45 (40.4% to 56.5%)
94.6% (86.7% to 98.5%)
Chao et al. 199974
All 639 797 103 1,554 86.1% (83.4% to 88.5%)
66.1% (64.1% to 68.0%)
Wilkens et al. 199877
Palpable lesions 19 0 3 33 86.4% (65.1% to 97.1%)
100.0% (89.4% to 100.0%)
Stavros et al. 199579
All 123 202 2 424 98.4% (94.3% to 99.8%)
67.7% (63.9% to 71.4%)
Ciatto et al. 199480
All 176 42 84 1,777 76.7% (61.6% to 73.3%)
97.7% (96.%9 to 98.3%)
Perre et al. 199481
Palpable lesions 168 4 4 211 97.7% (94.2% to 99.4%)
98.1% (95.3% to 99.5%)
FN False negative FP False positive TN True negative TP True positive

C-92
META-ANALYTIC INTEGRATION OF DIAGNOSTIC TEST ACCURACY STUDIES
Ultrasound B-mode Grayscale 2D
SUMMARY DATA AND PERFORMANCE ESTIMATES
Bivariate Binomial Mixed Model
Number of studies = 21
Reference-positive Subjects = 2,115
Reference-negative Subjects = 6,084
Pretest Prob of Disease = 0.258
Between-study variance (varlogitSEN) = 2.662 (95% CI: 1.162 to 6.096)
Between-study variance (varlogitSPE) = 2.455 (95% CI: 1.200 to 5.022)
Correlation (Mixed Model) = -0.331
ROC Area, AUROC = 0.92 (95% CI: 0.90 to 0.94)
Heterogeneity (Chi-square): LRT_Q = 612.405, df = 2.00, LRT_p = 0.000
Inconsistency (I-square): 99.7 % (95% CI: 99.6% to 99.78%)
Summary Parameter Estimates (95% CI)
Sensitivity: 92.4% (84.6% to 96.4%)
Specificity: 75.8% (60.8% to 86.3%)
Positive Likelihood Ratio: 3.814 (2.272 to 0.964)
Negative Likelihood Ratio: 0.100 (0.049 to 0.203)
Diagnostic Score: 3.64 (2.738 to 6.403)
Diagnostic Odds Ratio: 38.083 (15.458 to 93.824)

C-93
Figure C7. Bivariate binomial mixed-effects model of ultrasound B-mode grayscale 2D: summary ROC
0.0
0.5
1.0
Se
nsiti
vity
0.00.51.0Specificity
Observed Data
Summary Operating PointSENS = 0.92 [0.85 - 0.96]SPEC = 0.76 [0.61 - 0.86]
SROC CurveAUC = 0.92 [0.90 - 0.94]
95% Confidence Ellipse
95% Prediction Ellipse

C-94
Exploration of Heterogeneity Bivariate Model
Variable p-Value
Accounted for inter-reader differences 0.01
Readers blinded to clinical information 0.03
All diagnoses verified by histopathology 0.06
Prospective design 0.18
Funding source 0.20
Enrolled consecutive or all patients 0.40
Geographical location 0.53
Type of lesion enrolled 0.85
Prevalence of disease 0.86
Statistically Significant Models
Parameter Accounted for Inter-reader Differences Readers Blinded to Clinical Information
I2 (95% CI) 76.8% (49.44 to 100.0%) 72.1% (38.05% to 100.0%)
Heterogeneity (LRTChi) 8.63 7.16
Sensitivity: 94% 98%
95% CI 82% to 98% 92% to 99%
Coefficient 2.80 3.70
z 0.33 2.46
p of z 0.74 0.01
Specificity: 52% 59%
95% CI 30% to 73% 33% to 81%
Coefficient 0.08 0.38
z -3.10 -1.84
p of z 0.00 0.07

C-95
Subgroup Analyses of Statistically Significant Models
Accuracy of Studies with Readers Blinded to Clinical Information vs. Not
META-ANALYTIC INTEGRATION OF DIAGNOSTIC TEST ACCURACY STUDIES
SUMMARY DATA AND PERFORMANCE ESTIMATES
Bivariate Binomial Mixed Model
Parameter Blinded Not Blinded (or Not Reported)
Number of studies 8 12
Number of patients 1,301 6,820
Prevalence of disease 38.6% 22.9%
I2 90.7% 99.6%
Sensitivity (95% CI) 96.6% (92.3% to 98.5%) 87.0% (69.7% to 95.1%)
Specificity (95% CI) 59.5% (32.2% to 82.0%) 85.1% (69.0% to 93.6%)
AUROC (95% CI) 0.96 (0.94 to 0.97) 0.93 (0.90 to 0.95)
Accuracy of Studies with Interreader Differences Accounted for vs. Not
META-ANALYTIC INTEGRATION OF DIAGNOSTIC TEST ACCURACY STUDIES
SUMMARY DATA AND PERFORMANCE ESTIMATES
Bivariate Binomial Mixed Model
Parameter Accounted for Not
Number of studies 9 11
Number of patients 1,063 7,037
Prevalence of disease 40.2% 23.2%
I2 96.7% 99.6%
Sensitivity (95% CI) 93.4% (83.1% to 97.6%) 93.0% (77.3% to 98.1%)
Specificity (95% CI) 52.7% (36.6% to 68.3%) 90.1% (74.3% to 96.6%)
AUROC (95% CI) 0.83 (0.79 to 0.86) 0.97 (0.95 to 0.98)
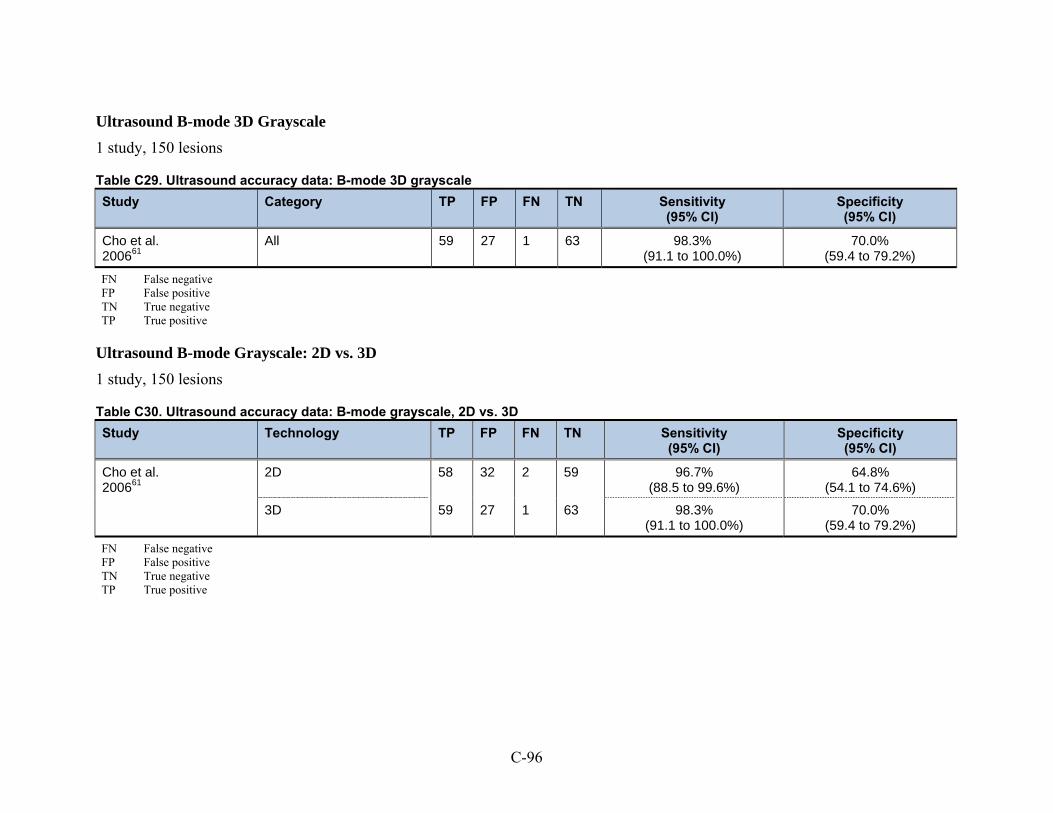
C-96
Ultrasound B-mode 3D Grayscale
1 study, 150 lesions
Table C29. Ultrasound accuracy data: B-mode 3D grayscale
Study Category TP FP FN TN Sensitivity (95% CI)
Specificity (95% CI)
Cho et al. 200661
All 59 27 1 63 98.3% (91.1 to 100.0%)
70.0% (59.4 to 79.2%)
FN False negative FP False positive TN True negative TP True positive
Ultrasound B-mode Grayscale: 2D vs. 3D
1 study, 150 lesions
Table C30. Ultrasound accuracy data: B-mode grayscale, 2D vs. 3D
Study Technology TP FP FN TN Sensitivity (95% CI)
Specificity (95% CI)
Cho et al. 200661
2D 58 32 2 59 96.7% (88.5 to 99.6%)
64.8% (54.1 to 74.6%)
3D 59 27 1 63 98.3% (91.1 to 100.0%)
70.0% (59.4 to 79.2%)
FN False negative FP False positive TN True negative TP True positive

C-97
Ultrasound B-mode 2D Contrast Enhanced
2 studies, 154 lesions
Table C31. Ultrasound accuracy data: B-mode 2D grayscale contrast enhanced
Study Category TP FP FN TN Sensitivity (95% CI)
Specificity (95% CI)
Liu et al. 200856
All 41 7 2 54 95.3% (84.2% to 99.4%)
88.5% (77.8% to 95.3%)
Ricci et al. 200616
All 38 10 0 2 100.0% (90.7% to 100.0%)
Not calculated
Summary (random-effects) 97.5% (91.4% to 99.7%)
I2 = 61.2%
76.7% (65.4% to 85.8%)
I2 = 96.0%
FN False negative FP False positive TN True negative TP True positive

C-98
Ultrasound B-mode 2D Contrast Enhanced vs. Not Enhanced
2 studies, 154 lesions
Table C32. Ultrasound accuracy data: B-mode 2D grayscale contrast enhanced vs. not enhanced
Study Category TP FP FN TN Sensitivity (95% CI)
Specificity (95% CI)
Liu et al. 200856
Contrast Enhanced 41 7 2 54 95.3% (84.2% to 99.4%)
88.5% (77.8% to 95.3%)
Not Enhanced 41 15 2 46 95.3% (84.2% to 99.4%)
75.4% (62.7% to 85.5%)
Ricci et al. 200616
Contrast Enhanced 38 10 0 2 100.0% (90.7% to 100.0%)
Not calculated
Not Enhanced 26 4 12 8 68.4% (72.7% to 90.2%)
66.7% (34.9% to 90.1%)
Summary (random-effects) Contrast Enhanced 97.5% (91.4% to 99.7%)
I2 = 61.2%
76.7% (65.4% to 85.8%)
I2 = 96.0%
Summary (random effects) Not Enhanced 82.7% (72.7% to 90.2%)
I2 = 90.9%
74.0% (62.4% to 83.5%)
I2 = 0.0%
FN False negative FP False positive TN True negative TP True positive

C-99
Ultrasound Color Doppler
6 studies, 718 lesions
Table C33. Ultrasound accuracy data: color doppler
Study Category TP FP FN TN Sensitivity (95% CI)
Specificity (95% CI)
Caruso et al. 200268
All 16 1 4 15 80.0% (56.3% to 94.3%)
93.8% (69.8% to 99.8%)
Koukouraki et al. 200169
All 76 4 9 26 89.4% (80.8% to 95.0%)
86.7% (69.3% to 96.2%)
Palpable lesions 61 2 6 9 91.0% (81.5% to 96.6%)
81.8% (48.2% to 97.7%)
Non-palpable lesions 14 2 5 17 73.7% (48.8% to 90.9%)
89.5% (66.9% to 98.7%)
Blohmer et al. 199973
All 58 13 20 79 74.4% (63.2% to 83.6%)
85.9% (77.0% to 92.3%)
Schroeder et al. 199975
All 72 23 0 15 100.0% (95.0% to 100.0%)
39.5% (24.0% to 56.6%)
Wilkens et al. 199877
Palpable lesions 16 7 6 26 72.7% (49.8% to 89.3%)
78.8% (61.1% to 91.0%)
Buadu et al. 199778
All 73 11 9 23 89.0% (80.2% to 94.9%)
67.6% (49.5% to 82.6%)
FN False negative FP False positive TN True negative TP True positive

C-100
META-ANALYTIC INTEGRATION OF DIAGNOSTIC TEST ACCURACY STUDIES
Ultrasound Color Doppler
Using All Lesions data from Koukouraki et al. 200169 and including Wilkens et al. 199877 (reported data from palpable lesions only)
SUMMARY DATA AND PERFORMANCE ESTIMATES
Bivariate Binomial Mixed Model
Number of studies = 6
Reference-positive Subjects = 359
Reference-negative Subjects = 243
Pretest Prob of Disease = 0.596
Between-study variance (varlogitSEN) = 1.201 (95% CI: 0.224 to 6.443)
Between-study variance (varlogitSPE) = 0.591 (95% CI: 0.149 to 2.352)
Correlation (Mixed Model) = -1.000
ROC Area, AUROC = 0.89 (95% CI: 0.86 to 0.91)
Heterogeneity (Chi-square): LRT_Q = 41.754, df = 2.00, LRT_p = 0.000
Inconsistency (I-square): 95.2% (95% CI: 91.4 to 99.1)
Summary Parameter Estimates (95% CI)
Sensitivity: 88.5% (74.4% to 95.4%)
Specificity: 76.4% (61.7% to 86.7%)
Positive Likelihood Ratio: 3.760 (2.399 to 5.892)
Negative Likelihood Ratio: 0.150 (0.072 to 0.314)
Diagnostic Score: 3.223 (2.635 to 3.811)
Diagnostic Odds Ratio: 25.096 (13.938 to 45.187)

C-101
Exploration of Heterogeneity:
Ultrasound Color Doppler
Using All data from Koukouraki et al. 200169 and not including Wilkens et al. 199877 (reported data from palpable lesions only)
SUMMARY DATA AND PERFORMANCE ESTIMATES
Bivariate Binomial Mixed Model
Number of studies = 5
Reference-positive Subjects = 337
Reference-negative Subjects = 210
Heterogeneity (Chi-square): LRT_Q = 42.292, df = 2.00, LRT_p = 0.000
Inconsistency (I-square): 95.3% (95% CI: 91.48 to 99.06)
Compare to Inconsistency from full data set including Wilkens et al. 1998;77 I-square: 95.2%, 95% CI (91.4 to 99.1)

C-102
Figure C8. Bivariate binomial mixed-effects model of ultrasound color doppler: summary ROC
Too few studies to perform meta-regression
0.0
0.5
1.0
Se
nsiti
vity
0.00.51.0Specificity
Observed Data
Summary Operating PointSENS = 0.89 [0.74 - 0.95]SPEC = 0.76 [0.62 - 0.87]
SROC CurveAUC = 0.89 [0.86 - 0.91]
95% Confidence Ellipse
95% Prediction Ellipse
SROC with Confidence and Predictive Ellipses

C-103
Ultrasound Color Doppler Contrast Enhanced
2 studies, 146 lesions
Table C34. Ultrasound accuracy data: color doppler contrast enhanced
Study Category TP FP FN TN Sensitivity (95% CI)
Specificity (95% CI)
Caruso et al. 200268
All 18 3 2 13 90.0% (68.3% to 98.8%)
81.3% (54.4% to 96.0%)
Schroeder et al. 199975
All 72 2 0 36 100.0% (95.0% to 100.0%)
94.7% (82.3% to 99.4%)
Summary (random-effects) 97.8% (92.4% to 99.7%)
I2 = 84.0%
90.7% (79.7% to 96.9%)
I2 = 54.6%
FN False negative FP False positive TN True negative TP True positive

C-104
Ultrasound Color Doppler Contrast Enhanced vs. Not Enhanced
2 studies, 146 lesions
Table C35. Ultrasound accuracy data: color doppler contrast enhanced vs. not enhanced
Study Category TP FP FN TN Sensitivity (95% CI)
Specificity (95% CI)
Caruso et al. 200268
Contrast Enhanced 18 3 2 13 90.0% (68.3% to 98.8%)
81.3% (54.4% to 96.0%)
Not Enhanced 16 1 4 15 80.0% (56.3% to 94.3%)
93.8% (69.8% to 99.8%)
Schroeder et al. 199975
Contrast Enhanced 72 2 0 36 100.0% (95.0% to 100.0%)
94.7% (82.3% to 99.4%)
Not Enhanced 72 23 0 15 100.0% (95.0% to 100.0%)
39.5% (24.0% to 56.6%)
Summary (random-effects) Contrast Enhanced 97.8% (92.4% to 99.7%)
I2 = 84.0%
90.7% (79.7% to 96.9%)
I2 = 54.6%
Summary (random-effects) Not Enhanced 95.7% (89.2% to 98.8%)
I2 = 92.2%
55.6% (41.4% to 69.1%)
I2 = 93.6%
FN False negative FP False positive TN True negative TP True positive

C-105
Ultrasound Color Doppler vs. B-mode Grayscale 2D
2 studies, 225 lesions
Table C36. Ultrasound accuracy data: color doppler vs. B-mode grayscale 2D
Study Category TP FP FN TN Sensitivity (95% CI)
Specificity (95% CI)
Blohmer et al. 199973
Color Doppler 58 13 20 79 74.4% (63.2% to 83.6%)
85.9% (77.0% to 92.3%)
B-mode 76 4 81 70 48.4% (40.4% to 56.5%)
94.6% (86.7% to 98.5%)
Wilkens et al. 199877
Color Doppler; palpable lesions only 16 7 6 26 72.7% (49.8% to 89.3%)
78.8% (61.1% to 91.0%)
B-mode; palpable lesions only 19 0 3 33 86.4% (65.1% to 97.1%)
100.0% (89.4% to 100.0%)
Summary (random-effects) Color Doppler 74.0% (64.3% to 82.3%)
I2 = 0.0%
84.0% (76.4% to 89.9%)
I2 = 0.0%
Summary (random-effects) B-mode 53.1% (45.5% to 60.6%)
I2 = 92.0%
96.3% (90.7% to 99.0%)
I2 = 66.9%
FN False negative FP False positive TN True negative TP True positive

C-106
Ultrasound Power Doppler
9 studies, 614 lesions
Table C37. Ultrasound accuracy data: power doppler
Study Category TP FP FN TN Sensitivity (95% CI)
Specificity (95% CI)
Gokalp et al. 200955
All 28 10 11 45 71.8% (55.1% to 85.0%)
81.8% (69.1% to 90.9%)
Forsberg et al. 200462
All 11 4 16 22 40.7% (22.4% to 61.2%)
84.6% (65.1% to 95.6%)
Ozdemir et al. 200464
All 23 26 5 14 82.1% (63.1% to 93.9%)
35.0% (20.6% to 51.7%)
Kook and Kwag 200366
2 cm or less 5 5 12 14 29.4% (10.3% to 56.0%)
73.7% (48.8% to 90.9%)
Milz et al. 200170
All 41 16 14 47 74.5% (61.0% to 85.3%)
74.6% (62.1% to 84.7%)
Reinikainen et al. 200171
All 20 8 14 23 58.8% (40.7% to 75.45)
74.2% (55.4% to 88.1%)
Moon et al. 200072
Non-palpable lesions 8 4 14 24 36.4% (17.2% to 59.3%)
85.7% (67.3% to 96.0%)
Schroeder et al. 199975
All 72 21 0 17 100.0% (95.0% to 100.0%)
44.7% (28.6% to 61.7%)
Albrecht et al. 199876
All 9 1 2 8 81.8% (48.2% to 97.7%)
88.9% (51.8% to 99.7%)
FN False negative FP False positive TN True negative TP True positive

C-107
META-ANALYTIC INTEGRATION OF DIAGNOSTIC TEST ACCURACY STUDIES
Ultrasound Power Doppler
SUMMARY DATA AND PERFORMANCE ESTIMATES
Bivariate Binomial Mixed Model
Number of studies = 9
Reference-positive Subjects = 305
Reference-negative Subjects = 309
Pretest Prob of Disease = 0.497
Between-study variance (varlogitSEN) = 1.995 (95% CI: 0.606-6.566)
Between-study variance (varlogitSPE) = 0.576 (95% CI: 0.178-1.870)
Correlation (Mixed Model) = -0.797
ROC Area, AUROC = 0.77 (95% CI: 0.74 to 0.81)
Heterogeneity (Chi-square): LRT_Q = 76.788, df = 2.00, LRT_p = 0.000
Inconsistency (I-square): 97.4% (95% CI: 95.7%-99.1%)
Summary Parameter Estimates (95% CI)
Sensitivity: 70.8% (47.5% to 86.6%)
Specificity: 72.6% (59.9% to 82.5%)
Positive Likelihood Ratio: 2.586 (1.882 to 3.555)
Negative Likelihood Ratio: 0.402 (0.219 to 0.738)
Diagnostic Score: 1.860 (1.110 to 2.611)
Diagnostic Odds Ratio: 6.426 (3.035 to 13.606)

C-108
Figure C9. Bivariate binomial mixed-effects model of ultrasound power doppler: summary ROC
0.0
0.5
1.0
Se
nsiti
vity
0.00.51.0Specificity
Observed Data
Summary Operating PointSENS = 0.71 [0.47 - 0.87]SPEC = 0.73 [0.60 - 0.83]
SROC CurveAUC = 0.77 [0.74 - 0.81]
95% Confidence Ellipse
95% Prediction Ellipse
SROC with Confidence and Predictive Ellipses

C-109
Ultrasound Power Doppler vs. B-mode 2D grayscale
4 studies, 248 lesions
Table C38. Ultrasound accuracy data: power doppler vs. B-mode 2D grayscale
Study Category TP FP FN TN Sensitivity (95% CI)
Specificity (95% CI)
Gokalp et al. 200955
B-mode 39 23 0 32 100.0% (91.0% to 100.0%)
58.2% (44.1% to 71.3%)
Power Doppler 28 10 11 45 71.8% (55.1% to 85.0%)
81.8% (69.1% to 90.9%)
Forsberg et al. 200462
B-mode 10 5 14 24 41.7% (22.1% to 63.4%)
82.8% (64.2% to 94.2%)
Power Doppler 11 4 16 22 40.7% (22.4% to 61.2%)
84.6% (65.1% to 95.6%)
Kook and Kwag 200366
B-mode, lesions 2 cm or less 17 10 0 9 100.0% (80.5% to 100.0%)
47.4% (24.4% to 71.1%)
Power Doppler, lesions 2 cm or less 5 5 12 14 29.4% (10.3% to 56.0%)
73.7% (48.8% to 90.9%)
Reinikainen et al. 200171
B-mode 34 28 0 3 100.0% (89.7% to 100.0%)
9.7% (2.0% to 25.8%)
Power Doppler 20 8 14 23 58.8% (40.7% to 75.45)
74.2% (55.4% to 88.1%)
Summary (random effects) B-mode 87.7% (80.3% to 93.1%)
I2 = 94.3%
50.7% (42.0% to 59.5%)
I2 = 92.2%
Summary (random effects) Power Doppler 54.7% (45.2% to 63.9%)
I2 = 74.1%
79.4% (71.4% to 86.0%)
I2 = 0.0%
FN False negative FP False positive TN True negative TP True positive

C-110
Ultrasound Power Doppler with Contrast Agent
7 studies, 403 lesions
Table C39. Ultrasound accuracy data: power doppler with contrast agent
Study Category TP FP FN TN Sensitivity (95% CI)
Specificity (95% CI)
Forsberg et al. 200462
All 8 7 23 15 25.8% (11.9% to 44.6%)
68.2% (45.1% to 86.1%)
Ozdemir et al. 200464
All 23 14 5 27 82.1% (63.1% to 93.9%)
65.9% (49.4% to 79.9%)
Kook and Kwag 200366
2 cm or less 12 8 5 11 70.6% (44.0% to 89.7%)
57.9% (33.5% to 79.7%)
Reinikainen et al. 200171
All 19 17 15 14 55.9% (37.9% to 72.8%)
45.2% (27.3% to 64.0%)
Moon et al. 200072
Non-palpable lesions 21 6 1 22 95.5% (77.2% to 99.9%)
78.6% (59.0% to 91.7%)
Schroeder et al. 199975
All 72 2 0 36 100.0% (95.0% to 100.0%)
94.7% (82.3% to 99.4%)
Albrecht et al. 199876
All 11 4 0 5 100.0% (71.5% to 100.0%)
55.6% (21.2% to 86.3%)
FN False negative FP False positive TN True negative TP True positive

C-111
META-ANALYTIC INTEGRATION OF DIAGNOSTIC TEST ACCURACY STUDIES
Ultrasound Power Doppler with Contrast
SUMMARY DATA AND PERFORMANCE ESTIMATES
Bivariate Binomial Mixed Model
Number of studies = 7
Reference-positive Subjects = 215
Reference-negative Subjects = 188
Pretest Prob of Disease = 0.533
Between-study variance (varlogitSEN) = 5.785 (95% CI: 1.218-27.486)
Between-study variance (varlogitSPE) = 0.548 (95% CI: 0.117-2.560)
Correlation (Mixed Model) = 0.947
ROC Area, AUROC = 0.81 (95% CI: 0.77 to 0.84)
Heterogeneity (Chi-square): LRT_Q = 16.015, df = 2.00, LRT_p = 0.000
Inconsistency (I-square): 87.51% (95% CI: 74.55 to 100.00)
Summary Parameter Estimates (95% CI)
Sensitivity: 89.3% (52.4% to 98.4%)
Specificity: 70.4% (55.4% to 82.0%)
Positive Likelihood Ratio: 3.016 (1.603 to 5.675)
Negative Likelihood Ratio: 0.153 (0.022 to 1.072)
Diagnostic Score: 2.984 (0.452 to 5.517)
Diagnostic Odds Ratio: 19.772 (1.571 to 248.893)
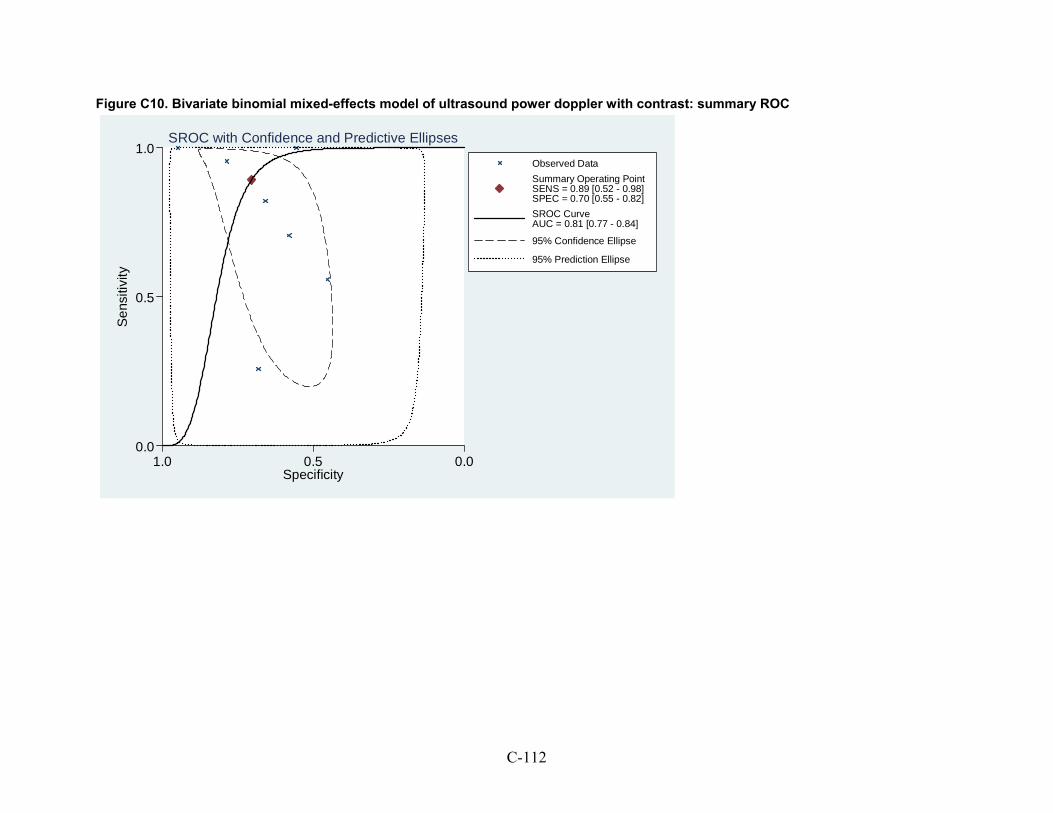
C-112
Figure C10. Bivariate binomial mixed-effects model of ultrasound power doppler with contrast: summary ROC
0.0
0.5
1.0
Se
nsiti
vity
0.00.51.0Specificity
Observed Data
Summary Operating PointSENS = 0.89 [0.52 - 0.98]SPEC = 0.70 [0.55 - 0.82]
SROC CurveAUC = 0.81 [0.77 - 0.84]
95% Confidence Ellipse
95% Prediction Ellipse
SROC with Confidence and Predictive Ellipses
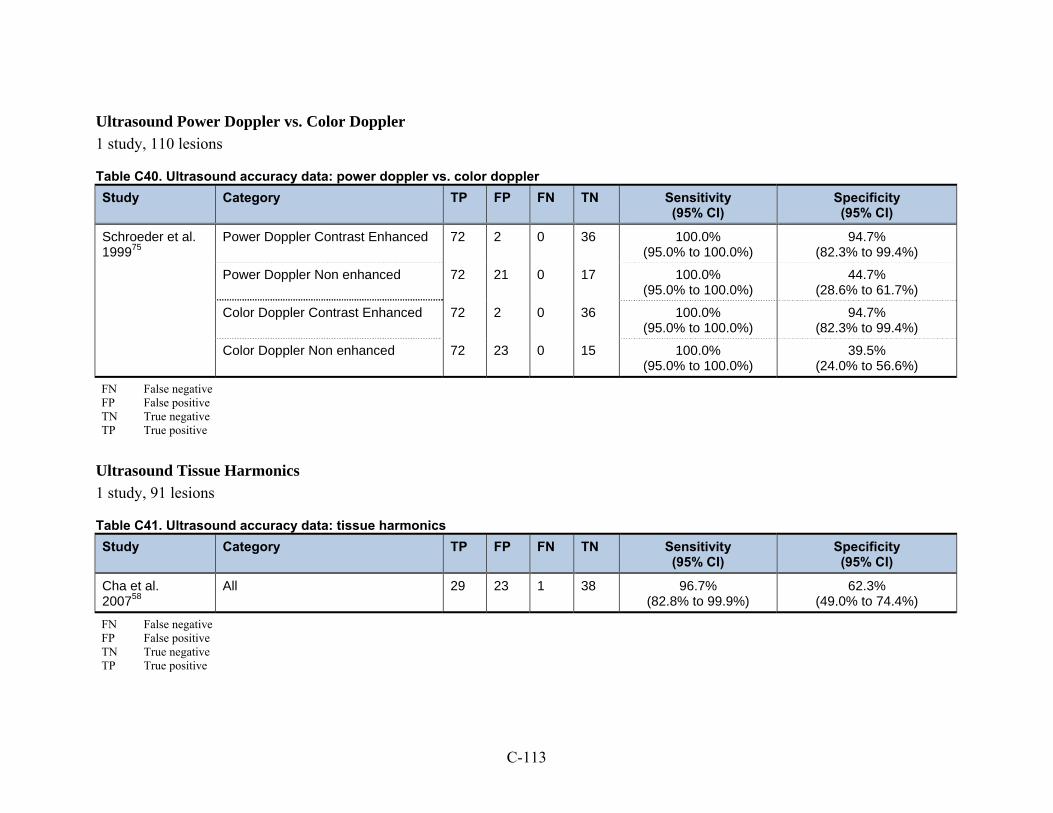
C-113
Ultrasound Power Doppler vs. Color Doppler
1 study, 110 lesions
Table C40. Ultrasound accuracy data: power doppler vs. color doppler
Study Category TP FP FN TN Sensitivity (95% CI)
Specificity (95% CI)
Schroeder et al. 199975
Power Doppler Contrast Enhanced 72 2 0 36 100.0% (95.0% to 100.0%)
94.7% (82.3% to 99.4%)
Power Doppler Non enhanced 72 21 0 17 100.0% (95.0% to 100.0%)
44.7% (28.6% to 61.7%)
Color Doppler Contrast Enhanced 72 2 0 36 100.0% (95.0% to 100.0%)
94.7% (82.3% to 99.4%)
Color Doppler Non enhanced 72 23 0 15 100.0% (95.0% to 100.0%)
39.5% (24.0% to 56.6%)
FN False negative FP False positive TN True negative TP True positive
Ultrasound Tissue Harmonics
1 study, 91 lesions
Table C41. Ultrasound accuracy data: tissue harmonics
Study Category TP FP FN TN Sensitivity (95% CI)
Specificity (95% CI)
Cha et al. 200758
All 29 23 1 38 96.7% (82.8% to 99.9%)
62.3% (49.0% to 74.4%)
FN False negative FP False positive TN True negative TP True positive

C-114
Ultrasound Tissue Harmonics vs. B-mode Grayscale
1 study, 91 lesions
Table C42. Ultrasound accuracy data: tissue harmonics vs. B-mode grayscale
Study Category TP FP FN TN Sensitivity (95% CI)
Specificity (95% CI)
Cha et al. 200758
Tissue harmonics 29 23 1 38 96.7% (82.8% to 99.9%)
62.3% (49.0% to 74.4%)
B-mode grayscale 29 23 1 38 96.7% (82.8% to 99.9%)
62.3% (49.0% to 74.4%)
FN false negative FP false positive TN true negative TP true positive

C-115
Ultrasound Combination Methods
4 studies that used multiple ultrasound methods, in combination, to diagnose breast lesions
Table C43. Ultrasound accuracy data: combination methods
Study Category TP FP FN TN Sensitivity (95% CI)
Specificity (95% CI)
Gokalp et al. 200955
Combination of B-mode 2D grayscale and power Doppler
39 26 0 29 100.0% (91.0% to 100.0%)
52.7% (38.8% to 66.3%)
Liu et al. 200856
Combination of B-mode and contrast-enhanced B-mode 2D grayscale
42 6 1 55 97.7% (87.7% to 99.9%)
90.2% (79.8% to 96.3%)
Pinero et al. 200653
Combination power Doppler and color Doppler, contrast enhanced
All lesions 60 9 8 11 88.2%
(78.1% to 94.8%) 55.0%
(31.5% to 76.9%)
Palpable lesions 42 2 5 8 89.4% (76.9% to 96.5%)
80.0% (44.4% to 97.5%)
Non-palpable lesions 17 6 4 4 81.0% (58.1% to 94.6%)
40.0% (12.2% to 73.8%)
Malich et al. 200135
Combination of B-mode, power Doppler, and color Doppler
48 4 14 34 77.4% (65.0% to 87.1%)
89.5% (75.2% to 97.1%)
FN false negative FP false positive TN true negative TP true positive

C-116
Table C44. Ultrasound accuracy: accuracy of different types of ultrasound
Type of Ultrasound N Studies
N Lesions
Risk of Bias
Consistency Precision Summary Sensitivity (95% CI)
Summary Specificity (95% CI)
Strength of Evidence
B-mode grayscale 2D 21 8,199 Low Inconsistent Imprecise 92.4% (84.6% to 96.4%)
75.8% (60.8% to 86.3%)
Low
B-mode grayscale 2D contrast enhanced
2 154 Low Inconsistent Imprecise 97.5% (91.4% to 99.7%)
76.7% (65.4% to 85.8%)
Low
B-mode grayscale 3D 1 150 Low Unknown Imprecise 98.3% (91.1% to 100.0%)
70.0% (59.4% to 79.2%)
Insufficient
Color Doppler 6 718 Low Inconsistent Imprecise 88.5% (74.4% to 95.4%)
76.4% (61.% to 86.7%)
Low
Color Doppler contrast enhanced
2 146 Low Inconsistent Imprecise 97.8% (92.4% to 99.7%)
90.7% (79.7% to 96.9%)
Low
Power Doppler 9 614 Low Inconsistent Imprecise 70.8% (47.5% to 86.6%)
72.6% (59.9% to 82.5%)
Low
Power Doppler contrast enhanced
7 403 Low Inconsistent Imprecise 89.3% (52.4% to 98.4%)
70.4% (55.4% to 82.0%)
Low
Tissue harmonics 1 91 Low Unknown Imprecise 96.7% (82.8% to 99.9%)
62.3% (49.0% to 74.4%)
Insufficient
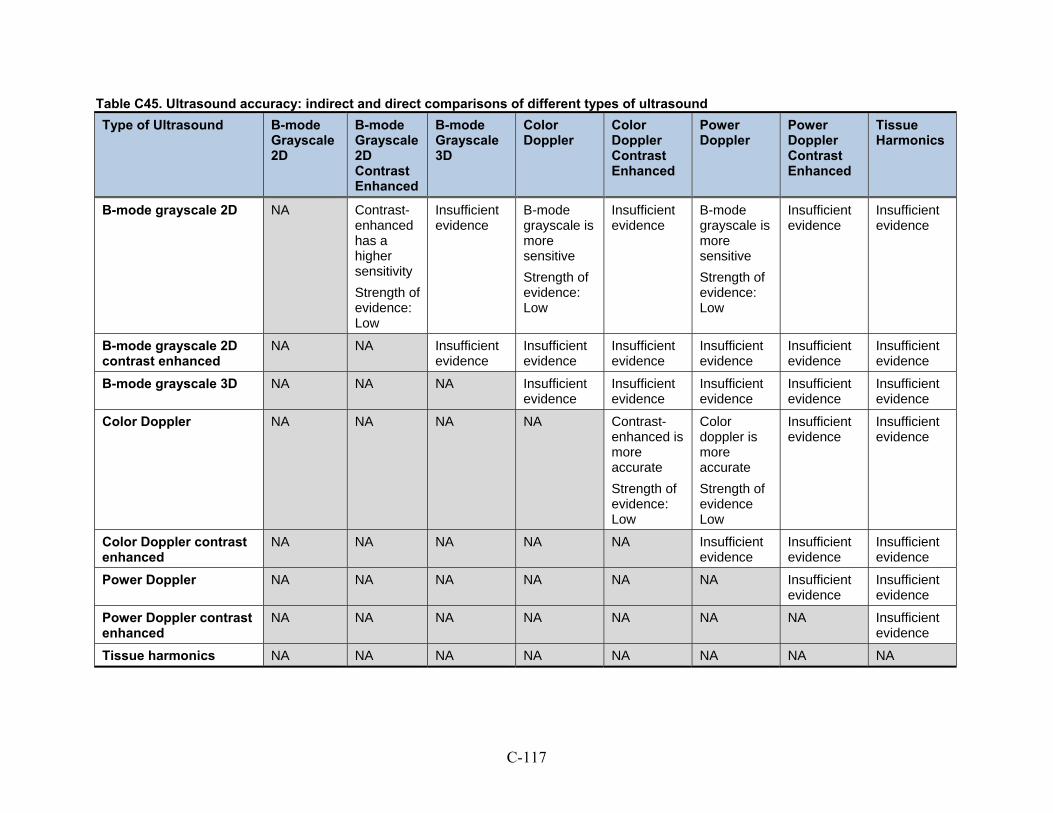
C-117
Table C45. Ultrasound accuracy: indirect and direct comparisons of different types of ultrasound
Type of Ultrasound B-mode Grayscale 2D
B-mode Grayscale 2D Contrast Enhanced
B-mode Grayscale 3D
Color Doppler
Color Doppler Contrast Enhanced
Power Doppler
Power Doppler Contrast Enhanced
Tissue Harmonics
B-mode grayscale 2D NA Contrast-enhanced has a higher sensitivity
Strength of evidence: Low
Insufficient evidence
B-mode grayscale is more sensitive
Strength of evidence: Low
Insufficient evidence
B-mode grayscale is more sensitive
Strength of evidence: Low
Insufficient evidence
Insufficient evidence
B-mode grayscale 2D contrast enhanced
NA NA Insufficient evidence
Insufficient evidence
Insufficient evidence
Insufficient evidence
Insufficient evidence
Insufficient evidence
B-mode grayscale 3D NA NA NA Insufficient evidence
Insufficient evidence
Insufficient evidence
Insufficient evidence
Insufficient evidence
Color Doppler NA NA NA NA Contrast-enhanced is more accurate
Strength of evidence: Low
Color doppler is more accurate
Strength of evidence Low
Insufficient evidence
Insufficient evidence
Color Doppler contrast enhanced
NA NA NA NA NA Insufficient evidence
Insufficient evidence
Insufficient evidence
Power Doppler NA NA NA NA NA NA Insufficient evidence
Insufficient evidence
Power Doppler contrast enhanced
NA NA NA NA NA NA NA Insufficient evidence
Tissue harmonics NA NA NA NA NA NA NA NA

C-118
Direct Comparisons
Table C46. Direct comparison of PET and MRI
Study Category TP FP FN TP Sensitivity (95% CI)
Specificity (95% CI)
Heinisch et al. 200324
PET 17 4 8 11 68.0% (46.5% to 85.1%)
73.3% (44.9% to 92.2%)
MRI 23 2 4 11 85.2% (67.4% to 93.9%)
84.6% (57.6% to 95.4%)
Walter et al. 200325
PET 12 2 7 21 63.2% (38.4% to 83.7%)
91.3% (72.0% to 98.9%)
MRI 17 2 6 17 73.9% (53.4% to 87.3%)
89.5% (68.4% to 96.8%)
Brix et al. 200131
PET 8 2 1 2 88.9% (51.8% to 99.7%)
50.0% (06.8% to 93.2%)
MRI 8 1 2 2 80.0% (48.9% to 94.0%)
66.7% (21.0% to 93.3%)
Imbriaco et al. 20076
PET-CT 29 0 7 8 80.6% (64.0% to 91.8%)
100% (63.1% to 100%)
MRI 44 2 1 8 97.8% (88.3% to 99.5%)
80.0% (48.9% to 94.0%)
FN False negative FP False positive TN True negative TP True positive

C-119
Table C47. Direct comparison of MRI and ultrasound
Study Category TP FP FN TN Sensitivity (95% CI)
Specificity (95% CI)
Vassiou et al. 20098
MRI 52 14 1 11 98.1% (89.9% to 99.6%)
44.0% (26.7% to 62.9%)
US, B-mode 2D grayscale 44 6 9 19 83.0% (70.7 to 90.7%)
76.0% (56.5 to 94.3%)
Ricci et al. 200616
MRI 38 2 0 11 100.0% (90.6% to 99.9%)
84.6% (57.6% to 95.4%)
US, B mode grayscale, contrast enhanced
38 10 0 2 100.0% (90.7 to 100.0%)
Not calculated
US, B mode grayscale, not enhanced
26 4 12 8 68.4% (72.7 to 90.2%)
66.7% (34.9 to 90.1%)
Malich et al. 200135
MRI 53 7 1 29 98.1% (90.1% to 99.6%)
80.6% (64.9% to 90.1%)
Combination of B-mode, power Doppler, and color Doppler
48 4 14 34 77.4% (65.0 to 87.1%)
89.5% (75.2 to 97.1%)
FN False negative FP False positive TN True negative TP True positive US Ultrasound

C-120
Table C48. Direct comparison of scintimammography to doppler ultrasound (combined method)
Study Category Patient Subgroup TP FP FN TN Sensitivity
(95%CI) Specificity
(95%CI)
Pinero et al. 200653
Double phase SMM All, mixed population 63 10 5 10 92.6% (83.7 to 97.6)
50.0% (27.2 to 72.8)
Combination power Doppler and color Doppler, contrast enhanced
60 8 9 11 88.2% (78.1 to 94.8)
55.0% (31.5 to 76.9)
Pinero et al. 200653
Double phase SMM Palpable lesions only 43 3 4 7 91.5% (79.6 to 97.6)
70.0% (34.8 to 93.3)
Combination power Doppler and color Doppler, contrast enhanced
42 2 5 8 89.4% (76.9 to 96.5)
80.0% (44.4 to 97.5)
Pinero et al. 200653
Double phase SMM Non-palpable 20 1 6 4 95.2% (76.2 to 99.9)
40.0% (12.2 to 73.8)
Combination power Doppler and color Doppler, contrast enhanced
17 4 6 4 81.0% (58.1 to 94.6)
40.0% (12.2 to 73.8)
FN False negative FP False positive TN True negative TP True positive

C-121
Table C49. Comparison of scintimammography with MRI
Study Category TP FP FN TN Sensitivity
(95%CI) Specificity
(95%CI)
Kim et al. 20094
Double phase SMM 169 10 34 26 83.3% (77.4 to 88.1)
72.2% (54.8 to 85.8)
Dynamic contrast enhanced MRI 196 14 8 21 96.1% (92.4 to 98.3)
60.0% (42.1 to 76.1)
FN False negative FP False positive TN True negative TP True positive
Table C50. Comparison of BSGI to MRI
Study Type of Scanner TP FP FN TN Sensitivity
(95%CI) Specificity
(95%CI)
Brem et al. 20079
BSGI 8 7 1 17 88.9% (51.8 to 99.7)
70.8% (48.9 to 87.4)
Dynamic contrast enhanced MRI 9 18 0 6 100% (66.4 to 100)
25.0% (10.0 to 46.7)
FN False negative FP False positive TN True negative TP True positive

C-122
Grading the Strength of Evidence
We applied a formal grading system that conforms with the CER Methods Guide Manual recommendations on grading the strength of evidence.82,83
The overall strength of evidence supporting each major conclusion was graded as High, Moderate, Low, or Insufficient. The grade was developed by considering four important domains: the risk of bias in the evidence base, the consistency of the findings, the precision of the results, and the directness of the evidence. The grading system moves stepwise to consider each important domain. These steps are described below.
Risk of Bias According to the Methods Guide:82
Risk of bias is the degree to which the included studies for a given outcome or comparison have a high likelihood of adequate protection against bias (i.e., good internal validity) assessed through two main elements:
Study design of individual studies
Aggregate quality of the studies under consideration.
The risk of bias of each individual study was rated as being Low, Medium, or High; and the risk of bias of the aggregate evidence base supporting each major conclusion was similarly rated as being Low, Medium, or High.
We used our inclusion/exclusion criteria to eliminate studies with designs known to be prone to bias from the evidence base. Namely, case reports, case-control studies, and retrospective studies that did not enroll all or consecutive patients were not included for analysis. Because we eliminated all studies with a High risk of bias from the evidence base, we consider the remaining evidence base to have either a Low or Medium risk of bias.
We initially used an internal validity rating instrument for diagnostic studies to grade the internal validity of the individual studies (Table 54). This instrument is based on a modification of the QUADAS instrument.84 Each question in the instrument addresses an aspect of study design or conduct that can help to protect against bias. Each question can be answered “yes,” “no,” or “not reported,” and each is phrased such that an answer of “yes” indicates that the study reported a protection against bias on that aspect. See Table 55 through Table 58 for application of the instrument to the included studies.

C-123
Table C51. Quality assessment instrument
N Question
1 Was patient recruitment either consecutive or random?
2 Was the study prospective in design?
3 Were more than 85% of the patients approached for recruitment enrolled in the study?
4 Were the patient inclusion/exclusion criteria consistently applied to all patients?
5 Was the study free from obvious spectrum bias? Obvious spectrum bias was defined as more than 40% or less than 10% of the breast lesions were diagnosed as malignant; and/or the mean or median age of the enrolled population was less than 50 or greater than 70.
6 Did the study account for inter-reader/scorer differences?
7 Were the reader(s) of the biopsies blinded to the results of the reference standard?
8 Were readers of the reference standard blinded to the results of the biopsy?
9 Were the readers of the biopsy blinded to all other clinical information?
10 Were readers of the reference standard blinded to all other clinical information?
11 Were patients assessed by a reference standard regardless of the biopsy results?
12 Were the patients assessed by the gold standard (open surgical procedure) regardless of the initial biopsy results?
13 Was a diagnostic threshold chosen a priori by the study?
14 Were there no intervening treatments or interventions conducted between the time the diagnostic test was performed and the reference standard was performed?
15 Was a complete set of data reported for at least 85% of enrolled lesions?
16 Was funding for this study provided by a source that doesn’t have an obvious financial interest in the findings of the study?
17 Was the report of the study free from unresolvable discrepancies?
We conducted meta-regressions investigating the correlation between key individual items on the quality rating instrument and the results reported by the studies (see Appendix C for details). We consistently found that the majority of the items on the instrument had no statistically significant correlation with the reported results. Some (but not most) of the evidence bases were found to have a statistically significant impact of “reader blinded to other clinical information” and “accounted for inter-reader differences” on the study results.
We concluded that the quality instrument was not adequately capturing the potential for bias of the studies. Unlike studies of interventions, diagnostic cohort studies are quite simple in design- one group of patients acting as their own controls. As long as all enrolled patients receive both the diagnostic test and the reference standard test, opportunities for bias to affect the results are limited. As mentioned above, we eliminated all studies with a High risk of bias due to their study design from the evidence base. We did not identify any design flaws in the remaining studies that suggested they were at Medium risk of bias; therefore, we rated all of the included studies, and the aggregate evidence bases, as being at Low risk of bias.
C-124
Consistency According to the Methods Guide:82
The principal definition of consistency is the degree to which the reported effect sizes from included studies appear to have the same direction of effect. This can be assessed through two main elements:
Effect sizes have the same sign (that is, are on the same side of “no effect”)
The range of effect sizes is narrow.
The first definition, effect sizes being on the same side of “no effect,” is not applicable to meta-analyses of the accuracy of a diagnostic test. Therefore, for these cases, we used the second definition, the range of effect sizes being narrow. We measured the “narrowness” of the range of effect sizes with the statistic I2.85,86 Data sets that were found to have an I2 of less than 50% were rated as being “Consistent”; 50% or greater were rated as being “Inconsistent”; and data sets for which I2 could not be calculated (e.g., a single study) were rated as “Consistency Unknown.”
For qualitative comparisons between different diagnostic tests we used the first definition, that of effect sizes being on the same side of an effect. For example, when comparing the accuracy of ultrasound without a contrast agent to the accuracy of ultrasound with a contrast agent, if the estimates of sensitivity of the individual studies are consistently higher for studies that used a contrast agent, then the evidence base would be rated as “consistent.”
Precision According to the Methods Guide:82
Precision is the degree of certainty surrounding an effect estimate…if a meta-analysis was performed, this will be the confidence interval around the summary effect size.
A precise estimate is an estimate that would allow a clinically useful conclusion.
Diagnostic test characteristics (sensitivity, specificity) are reported on a scale from 0.0 to 100.0%. We defined a “precise” estimate of sensitivity or specificity as one for which the upper AND lower bound of the 95% confidence interval was no more than 5 points away from the summary estimate; for example, sensitivity 98% (95% CI: 97 to 100%) would be a precise estimate of sensitivity, whereas sensitivity 95% (95% CI: 88 to 100%) would be an imprecise estimate of sensitivity. Precision could be rated separately for summary estimates of sensitivity and specificity for each major conclusion.
For qualitative comparisons between different diagnostic tests, the conclusion is Precise if the confidence intervals around the summary estimates being compared do not overlap.
Directness According to the Methods Guide:82
The rating of directness relates to whether the evidence links the interventions directly to health outcomes.
For studies of diagnostic test accuracy, the evidence is always rated as “Indirect” because the outcome of test accuracy is indirectly related to health outcomes. However, the Key Questions in this particular comparative effectiveness review do not ask about the impact of test accuracy on

C-125
health outcomes. We therefore did not incorporate the “Indirectness” of the evidence into the overall rating of strength of evidence for Key Questions that did not ask about health outcomes.
Overall Rating of Strength of Evidence The initial rating is based on the risk of bias. If the evidence base has a Low risk of bias, the
initial strength of evidence rating is High; if the evidence base has a Moderate risk of bias, the initial strength of evidence rating is Moderate; if the evidence base has a High risk of bias, the initial strength of evidence rating is Low. For this particular comparative effectiveness review, as explained above, the rating of risk of bias was Low for all evidence bases, and therefore the initial strength of evidence rating is High.
The remaining two domains are used to up- or down- grade the initial rating as per the following flow charts:
Consistent, Precise: High
Inconsistent, Precise: Moderate
Consistent, Imprecise: Moderate
Inconsistent, Imprecise: Low
“Consistency Unknown,” Precise: Low
“Consistency Unknown,” Imprecise: Insufficient


ECRI Institute Evidence-based Practice Center Effectiveness of Non-invasive Diagnostic Tests for Breast Abnormalities
C-127
MRI
Table C52. MRI studies: quality evaluation
Question 1 2 3 4 5 6 7 8 9 10 11 12 13 14 15 16 17
Study Co
nse
cuti
ve
Pro
spec
tive
≥85%
En
rolle
d
Co
nsi
sten
t C
rite
ria
Sp
ectr
um
Bia
s
Inte
rrea
der
D
iffe
ren
ces
Blin
ded
to
R
efer
ence
Res
ult
s
Blin
ded
to
D
iag
no
stic
Res
ult
s
Dx
Rea
der
Blin
ded
to
Clin
ical
Info
Ref
Rea
der
Blin
ded
to
Clin
ical
Info
Ref
eren
ce S
tan
dar
d
Go
ld S
tan
dar
d
A p
riori
Th
resh
old
No
Inte
rven
ing
T
reat
men
t
85%
Acc
ou
nte
d f
or
Fu
nd
ing
Dis
crep
ancy
Akita et al. 20091
Yes NR Yes Yes Yes NR Yes NR No NR Yes Yes Yes NR Yes NR Yes
Baltzer et al. 20092
Yes Yes Yes Yes No Yes Yes NR Yes NR Yes Yes Yes Yes Yes NR Yes
Hara et al. 200987
Yes NR NR Yes Yes NR Yes NR NR NR Yes No Yes NR Yes NR Yes
Kim et al. 20094
Yes NR NR Yes No NR Yes NR No NR Yes No No Yes Yes Yes Yes
Lo et al. 20095
NR Yes NR Yes No NR Yes NR Yes NR Yes No Yes NR Yes NR Yes
Imbriaco et al. 20086
Yes Yes Yes Yes No No Yes NR No NR Yes No Yes Yes Yes NR Yes
Pediconi et al. 20087
NR Yes NR Yes No NR Yes NR Yes NR Yes Yes Yes Yes Yes NR No
Vassiou et al. 20098
NR Yes NR Yes No NR Yes NR NR NR Yes Yes Yes NR Yes NR Yes
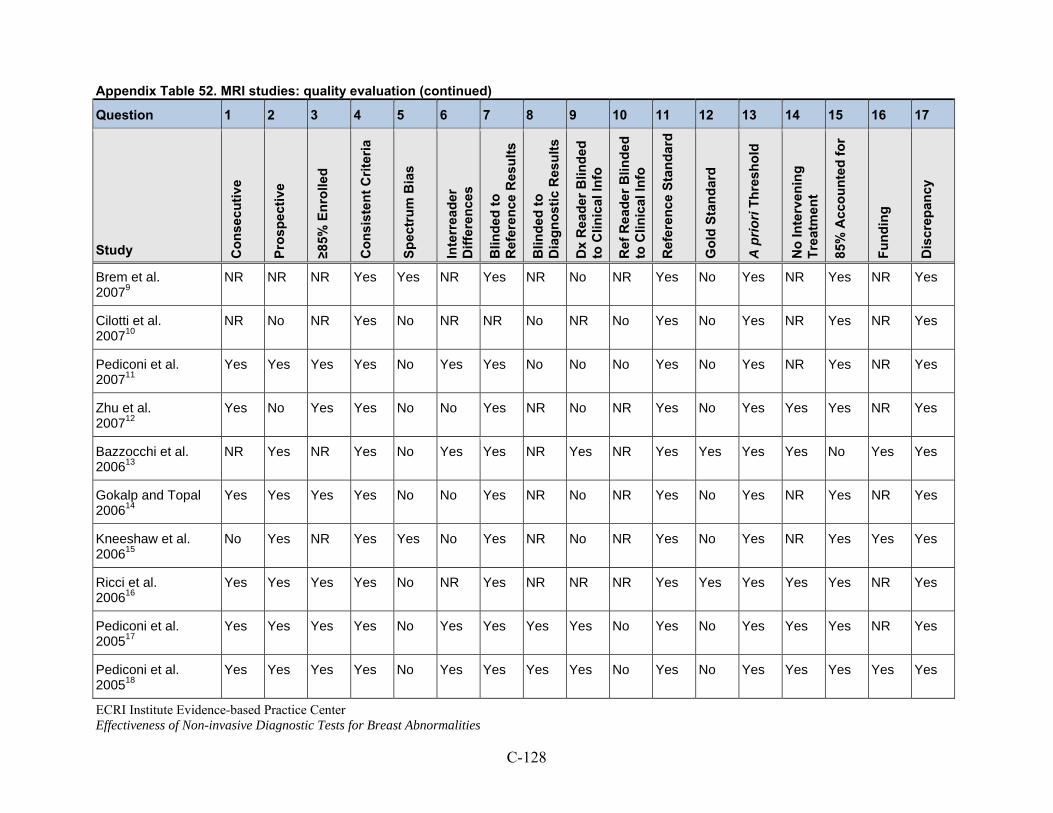
Appendix Table 52. MRI studies: quality evaluation (continued)
ECRI Institute Evidence-based Practice Center Effectiveness of Non-invasive Diagnostic Tests for Breast Abnormalities
C-128
Question 1 2 3 4 5 6 7 8 9 10 11 12 13 14 15 16 17
Study Co
nse
cuti
ve
Pro
spec
tive
≥85%
En
rolle
d
Co
nsi
sten
t C
rite
ria
Sp
ectr
um
Bia
s
Inte
rrea
der
D
iffe
ren
ces
Blin
ded
to
R
efer
ence
Res
ult
s
Blin
ded
to
D
iag
no
stic
Res
ult
s
Dx
Rea
der
Blin
ded
to
Clin
ical
Info
Ref
Rea
der
Blin
ded
to
Clin
ical
Info
Ref
eren
ce S
tan
dar
d
Go
ld S
tan
dar
d
A p
riori
Th
resh
old
No
Inte
rven
ing
T
reat
men
t
85%
Acc
ou
nte
d f
or
Fu
nd
ing
Dis
crep
ancy
Brem et al. 20079
NR NR NR Yes Yes NR Yes NR No NR Yes No Yes NR Yes NR Yes
Cilotti et al. 200710
NR No NR Yes No NR NR No NR No Yes No Yes NR Yes NR Yes
Pediconi et al. 200711
Yes Yes Yes Yes No Yes Yes No No No Yes No Yes NR Yes NR Yes
Zhu et al. 200712
Yes No Yes Yes No No Yes NR No NR Yes No Yes Yes Yes NR Yes
Bazzocchi et al. 200613
NR Yes NR Yes No Yes Yes NR Yes NR Yes Yes Yes Yes No Yes Yes
Gokalp and Topal 200614
Yes Yes Yes Yes No No Yes NR No NR Yes No Yes NR Yes NR Yes
Kneeshaw et al. 200615
No Yes NR Yes Yes No Yes NR No NR Yes No Yes NR Yes Yes Yes
Ricci et al. 200616
Yes Yes Yes Yes No NR Yes NR NR NR Yes Yes Yes Yes Yes NR Yes
Pediconi et al. 200517
Yes Yes Yes Yes No Yes Yes Yes Yes No Yes No Yes Yes Yes NR Yes
Pediconi et al. 200518
Yes Yes Yes Yes No Yes Yes Yes Yes No Yes No Yes Yes Yes Yes Yes

Appendix Table 52. MRI studies: quality evaluation (continued)
ECRI Institute Evidence-based Practice Center Effectiveness of Non-invasive Diagnostic Tests for Breast Abnormalities
C-129
Question 1 2 3 4 5 6 7 8 9 10 11 12 13 14 15 16 17
Study Co
nse
cuti
ve
Pro
spec
tive
≥85%
En
rolle
d
Co
nsi
sten
t C
rite
ria
Sp
ectr
um
Bia
s
Inte
rrea
der
D
iffe
ren
ces
Blin
ded
to
R
efer
ence
Res
ult
s
Blin
ded
to
D
iag
no
stic
Res
ult
s
Dx
Rea
der
Blin
ded
to
Clin
ical
Info
Ref
Rea
der
Blin
ded
to
Clin
ical
Info
Ref
eren
ce S
tan
dar
d
Go
ld S
tan
dar
d
A p
riori
Th
resh
old
No
Inte
rven
ing
T
reat
men
t
85%
Acc
ou
nte
d f
or
Fu
nd
ing
Dis
crep
ancy
Wiener et al. 200519
No Yes No Yes No No Yes NR No NR Yes No Yes NR Yes NR Yes
Bluemke et al. 200420
NR Yes Yes Yes No No Yes NR NR NR Yes No Yes Yes Yes Yes Yes
Huang et al. 200421
NR Yes NR Yes Yes NR Yes NR NR NR Yes No Yes Yes Yes Yes Yes
Bone et al. 200322
Yes Yes Yes Yes No No Yes NR Yes NR Yes Yes Yes Yes Yes NR Yes
Daldrup-Link et al. 200323
No Yes No Yes No NR Yes NR NR NR Yes Yes Yes Yes Yes NR Yes
Heinisch et al. 200324
NR Yes NR Yes No NR Yes NR No NR Yes Yes Yes Yes Yes NR Yes
Walter et al. 200325
Yes Yes Yes Yes No NR Yes NR NR NR Yes Yes Yes Yes Yes NR Yes
Guo et al. 200226
NR No NR NR No NR NR NR NR NR Yes Yes Yes NR Yes NR Yes
Kelcz et al. 200227
Yes Yes NR Yes No NR Yes NR No NR Yes No Yes Yes Yes Yes Yes
Schedel et al. 200228
NR NR NR Yes No NR Yes NR NR NR Yes Yes Yes Yes Yes NR Yes

Appendix Table 52. MRI studies: quality evaluation (continued)
ECRI Institute Evidence-based Practice Center Effectiveness of Non-invasive Diagnostic Tests for Breast Abnormalities
C-130
Question 1 2 3 4 5 6 7 8 9 10 11 12 13 14 15 16 17
Study Co
nse
cuti
ve
Pro
spec
tive
≥85%
En
rolle
d
Co
nsi
sten
t C
rite
ria
Sp
ectr
um
Bia
s
Inte
rrea
der
D
iffe
ren
ces
Blin
ded
to
R
efer
ence
Res
ult
s
Blin
ded
to
D
iag
no
stic
Res
ult
s
Dx
Rea
der
Blin
ded
to
Clin
ical
Info
Ref
Rea
der
Blin
ded
to
Clin
ical
Info
Ref
eren
ce S
tan
dar
d
Go
ld S
tan
dar
d
A p
riori
Th
resh
old
No
Inte
rven
ing
T
reat
men
t
85%
Acc
ou
nte
d f
or
Fu
nd
ing
Dis
crep
ancy
Trecate et al. 200229
NR Yes NR Yes No NR Yes NR NR NR Yes Yes Yes NR Yes NR Yes
Wiberg et al. 200230
Yes Yes Yes Yes No No Yes NR Yes NR Yes Yes Yes Yes Yes NR Yes
Brix et al. 200131
Yes Yes NR Yes No NR Yes NR Yes NR Yes Yes Yes Yes Yes NR Yes
Cecil et al. 200132
Yes NR NR Yes No NR Yes NR No NR Yes No Yes NR Yes Yes Yes
Furman-Haran et al. 200133
NR Yes NR Yes No No Yes Yes Yes No Yes Yes No NR Yes Yes Yes
Imbriaco et al. 200134
Yes Yes NR Yes No NR Yes NR Yes NR Yes No Yes Yes Yes Yes Yes
Malich et al. 200135
Yes NR Yes Yes No No Yes NR NR NR Yes Yes Yes Yes Yes NR Yes
Nakahara et al. 200136
No No No Yes No NR Yes NR NR NR Yes Yes Yes NR Yes NR Yes
Torheim et al. 200137
NR Yes NR Yes No No NR NR NR NR Yes No Yes NR Yes Yes Yes
Wedegartner et al. 200138
NR Yes NR Yes No NR Yes NR Yes NR Yes Yes Yes NR Yes NR Yes

Appendix Table 52. MRI studies: quality evaluation (continued)
ECRI Institute Evidence-based Practice Center Effectiveness of Non-invasive Diagnostic Tests for Breast Abnormalities
C-131
Question 1 2 3 4 5 6 7 8 9 10 11 12 13 14 15 16 17
Study Co
nse
cuti
ve
Pro
spec
tive
≥85%
En
rolle
d
Co
nsi
sten
t C
rite
ria
Sp
ectr
um
Bia
s
Inte
rrea
der
D
iffe
ren
ces
Blin
ded
to
R
efer
ence
Res
ult
s
Blin
ded
to
D
iag
no
stic
Res
ult
s
Dx
Rea
der
Blin
ded
to
Clin
ical
Info
Ref
Rea
der
Blin
ded
to
Clin
ical
Info
Ref
eren
ce S
tan
dar
d
Go
ld S
tan
dar
d
A p
riori
Th
resh
old
No
Inte
rven
ing
T
reat
men
t
85%
Acc
ou
nte
d f
or
Fu
nd
ing
Dis
crep
ancy
Yeung et al. 200139
Yes NR NR Yes No NR Yes Yes NR NR Yes No Yes Yes Yes NR Yes
Kvistad et al. 200040
NR Yes NR Yes No Yes Yes NR Yes NR Yes No Yes Yes Yes Yes Yes
Van Goethem et al. 200041
Yes No Yes Yes Yes NR Yes NR NR NR Yes No NR NR Yes NR Yes
NR Not reported
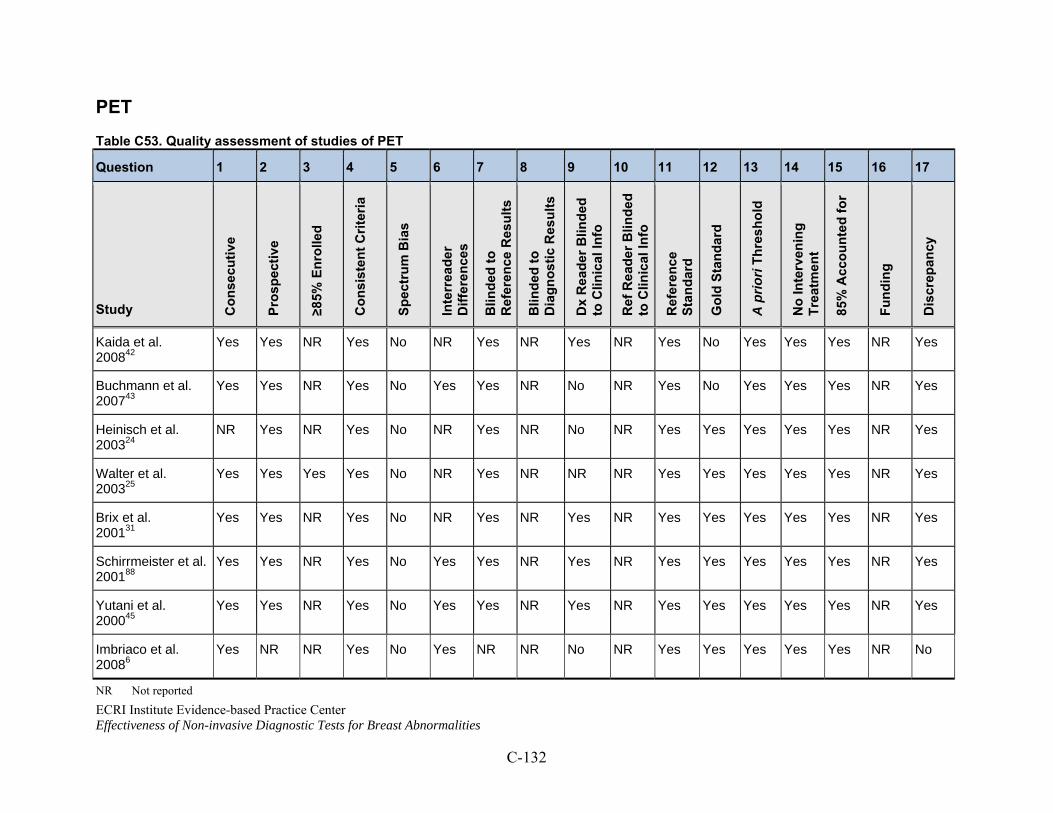
ECRI Institute Evidence-based Practice Center Effectiveness of Non-invasive Diagnostic Tests for Breast Abnormalities
C-132
PET
Table C53. Quality assessment of studies of PET
Question 1 2 3 4 5 6 7 8 9 10 11 12 13 14 15 16 17
Study Co
nse
cuti
ve
Pro
spec
tive
≥85%
En
rolle
d
Co
nsi
sten
t C
rite
ria
Sp
ectr
um
Bia
s
Inte
rrea
der
D
iffe
ren
ces
Blin
ded
to
R
efer
ence
Res
ult
s
Blin
ded
to
D
iag
no
stic
Res
ult
s
Dx
Rea
der
Blin
ded
to
Clin
ical
Info
Ref
Rea
der
Blin
ded
to
Clin
ical
Info
Ref
eren
ce
Sta
nd
ard
Go
ld S
tan
dar
d
A p
riori
Th
resh
old
No
Inte
rven
ing
T
reat
men
t
85%
Acc
ou
nte
d f
or
Fu
nd
ing
Dis
crep
ancy
Kaida et al. 200842
Yes Yes NR Yes No NR Yes NR Yes NR Yes No Yes Yes Yes NR Yes
Buchmann et al. 200743
Yes Yes NR Yes No Yes Yes NR No NR Yes No Yes Yes Yes NR Yes
Heinisch et al. 200324
NR Yes NR Yes No NR Yes NR No NR Yes Yes Yes Yes Yes NR Yes
Walter et al. 200325
Yes Yes Yes Yes No NR Yes NR NR NR Yes Yes Yes Yes Yes NR Yes
Brix et al. 200131
Yes Yes NR Yes No NR Yes NR Yes NR Yes Yes Yes Yes Yes NR Yes
Schirrmeister et al. 200188
Yes Yes NR Yes No Yes Yes NR Yes NR Yes Yes Yes Yes Yes NR Yes
Yutani et al. 200045
Yes Yes NR Yes No Yes Yes NR Yes NR Yes Yes Yes Yes Yes NR Yes
Imbriaco et al. 20086
Yes NR NR Yes No Yes NR NR No NR Yes Yes Yes Yes Yes NR No
NR Not reported

ECRI Institute Evidence-based Practice Center Effectiveness of Non-invasive Diagnostic Tests for Breast Abnormalities
C-133
Scintimammography
Table C54. Quality assessment of studies of scintimammography
Question 1 2 3 4 5 6 7 8 9 10 11 12 13 14 15 16 17
Study Co
nse
cuti
ve
Pro
spec
tive
>85
% E
nro
lled
Co
nsi
sten
t C
rite
ria
Sp
ectr
um
Bia
s
Inte
rrea
der
Dif
fere
nce
s
Blin
ded
to
Ref
eren
ce
Res
ult
s
Blin
ded
to
Dia
gn
ost
ic
Res
ult
s
Dx
Rea
der
Blin
ded
to
C
linic
al In
fo
Ref
eren
ce R
ead
er
Blin
ded
to
Clin
ical
Info
Ref
eren
ce s
tan
dar
d
Go
ld S
tan
dar
d
A P
rio
ri T
hre
sho
ld
No
Inte
rven
ing
T
reat
men
t
85%
Acc
ou
nte
d f
or
Fu
nd
ing
Dis
crep
ancy
Grosso et al. 200946
Yes Yes Yes Yes Yes Yes Yes NR Yes NR Yes No Yes Yes Yes NR Yes
Habib et al. 200947
NR Yes NR Yes No Yes Yes NR Yes NR Yes No Yes NR Yes NR Yes
Kim et al. 20094
Yes Yes Yes Yes No Yes Yes NR NR NR Yes No Yes NR Yes Yes Yes
Kim et al. 200848
NR Yes NR Yes No Yes Yes NR Yes NR Yes No Yes NR Yes NR Yes
Wang et al. 200849
Yes Yes Yes Yes No Yes Yes NR Yes NR Yes Yes Yes NR Yes Yes Yes
Brem et al. 20079
NR NR NR Yes Yes NR Yes NR No NR Yes No Yes NR Yes NR Yes
Gommans et al. 200750
Yes Yes Yes Yes No Yes Yes NR Yes NR Yes No Yes Yes Yes NR Yes

Table C54. Quality assessment of studies of scintimammography (continued)
ECRI Institute Evidence-based Practice Center Effectiveness of Non-invasive Diagnostic Tests for Breast Abnormalities
C-134
Question 1 2 3 4 5 6 7 8 9 10 11 12 13 14 15 16 17
Study Co
nse
cuti
ve
Pro
spec
tive
>85
% E
nro
lled
Co
nsi
sten
t C
rite
ria
Sp
ectr
um
Bia
s
Inte
rrea
der
Dif
fere
nce
s
Blin
ded
to
Ref
eren
ce
Res
ult
s
Blin
ded
to
Dia
gn
ost
ic
Res
ult
s
Dx
Rea
der
Blin
ded
to
C
linic
al In
fo
Ref
eren
ce R
ead
er
Blin
ded
to
Clin
ical
Info
Ref
eren
ce s
tan
dar
d
Go
ld S
tan
dar
d
A P
rio
ri T
hre
sho
ld
No
Inte
rven
ing
T
reat
men
t
85%
Acc
ou
nte
d f
or
Fu
nd
ing
Dis
crep
ancy
Kim et al. 200751
Yes Yes Yes Yes No Yes Yes NR Yes NR Yes No Yes NR Yes Yes Yes
Schillaci et al. 200752
NR Yes NR Yes No Yes Yes NR NR NR Yes Yes Yes NR Yes NR Yes
Pinero et al. 200653
Yes Yes Yes Yes No NR Yes NR NR NR Yes Yes Yes NR Yes NR Yes
Mathieu et al. 200554
NR No NR Yes No Yes NR NR NR NR Yes No No NR Yes NR Yes
NR Not reported

ECRI Institute Evidence-based Practice Center Effectiveness of Non-invasive Diagnostic Tests for Breast Abnormalities
C-135
Ultrasound
Table C55. Ultrasound studies: quality evaluation
Question 1 2 3 4 5 6 7 8 9 10 11 12 13 14 15 16 17
Study Co
nse
cuti
ve
Pro
spec
tive
≥85%
En
rolle
d
Co
nsi
sten
t C
rite
ria
Sp
ectr
um
Bia
s
Inte
rrea
der
D
iffe
ren
ces
Blin
ded
to
R
efer
ence
Res
ult
s
Blin
ded
to
D
iag
no
stic
Res
ult
s
Dx
Rea
der
Blin
ded
to
Clin
ical
Info
Ref
Rea
der
Blin
ded
to
Clin
ical
Info
Ref
eren
ce S
tan
dar
d
Go
ld S
tan
dar
d
A P
riori
Th
resh
old
No
Inte
rven
ing
T
reat
men
t
85%
Acc
ou
nte
d f
or
Fu
nd
ing
Dis
crep
ancy
Gokalp et al. 200955
NR Yes NR Yes No No NR NR NR NR Yes No Yes Yes Yes NR Yes
Liu et al. 200856
Yes NR No Yes No Yes NR NR Yes NR Yes Yes Yes Yes Yes Yes Yes
Vade et al. 200857
Yes No Yes Yes No NR NR NR NR NR Yes No Yes Yes Yes NR Yes
Cha et al. 200758
Yes Yes Yes Yes No Yes NR NR Yes NR Yes No Yes Yes Yes NR Yes
Chala et al. 200759
Yes No Yes Yes Yes No NR NR Yes NR Yes No Yes Yes Yes NR Yes
Zhi et al. 200760
Yes NR Yes Yes No Yes NR NR NR NR Yes Yes Yes Yes Yes NR Yes
Cho et al. 200661
Yes Yes Yes Yes No Yes NR NR Yes NR Yes No Yes Yes Yes NR Yes
Pinero et al. 200653
Yes Yes Yes Yes No No NR NR NR NR Yes Yes Yes Yes Yes NR Yes

Table C55. Ultrasound studies: quality evaluation (continued)
ECRI Institute Evidence-based Practice Center Effectiveness of Non-invasive Diagnostic Tests for Breast Abnormalities
C-136
Question 1 2 3 4 5 6 7 8 9 10 11 12 13 14 15 16 17
Study Co
nse
cuti
ve
Pro
spec
tive
≥85%
En
rolle
d
Co
nsi
sten
t C
rite
ria
Sp
ectr
um
Bia
s
Inte
rrea
der
D
iffe
ren
ces
Blin
ded
to
R
efer
ence
Res
ult
s
Blin
ded
to
D
iag
no
stic
Res
ult
s
Dx
Rea
der
Blin
ded
to
Clin
ical
Info
Ref
Rea
der
Blin
ded
to
Clin
ical
Info
Ref
eren
ce S
tan
dar
d
Go
ld S
tan
dar
d
A P
riori
Th
resh
old
No
Inte
rven
ing
T
reat
men
t
85%
Acc
ou
nte
d f
or
Fu
nd
ing
Dis
crep
ancy
Ricci et al. 200616
Yes Yes Yes Yes No Yes NR NR NR NR Yes Yes Yes Yes Yes NR Yes
Forsberg et al. 200462
NR NR Yes Yes Yes No NR NR NR NR Yes Yes Yes Yes Yes No Yes
Meyberg-Solomayer et al. 200463
NR Yes NR Yes No No NR NR NR NR Yes No Yes Yes Yes NR Yes
Ozdemir et al. 200464
NR Yes NR Yes No No NR NR NR NR Yes No Yes Yes Yes NR Yes
Chen et al. 200365
NR Yes NR Yes No Yes NR NR NR NR Yes Yes Yes Yes Yes NR Yes
Kook and Kwag 200366
NR Yes NR Yes No Yes Yes NR Yes NR Yes No Yes Yes Yes NR Yes
Marini et al. 200367
Yes NR Yes Yes Yes Yes NR NR Yes NR Yes No Yes Yes Yes NR Yes
Caruso et al. 200268
NR Yes Yes Yes No NR NR NR NR NR Yes Yes Yes Yes Yes NR Yes
Koukouraki et al. 200169
NR Yes NR Yes No NR NR NR Yes NR Yes Yes Yes Yes Yes NR Yes

Table C55. Ultrasound studies: quality evaluation (continued)
ECRI Institute Evidence-based Practice Center Effectiveness of Non-invasive Diagnostic Tests for Breast Abnormalities
C-137
Question 1 2 3 4 5 6 7 8 9 10 11 12 13 14 15 16 17
Study Co
nse
cuti
ve
Pro
spec
tive
≥85%
En
rolle
d
Co
nsi
sten
t C
rite
ria
Sp
ectr
um
Bia
s
Inte
rrea
der
D
iffe
ren
ces
Blin
ded
to
R
efer
ence
Res
ult
s
Blin
ded
to
D
iag
no
stic
Res
ult
s
Dx
Rea
der
Blin
ded
to
Clin
ical
Info
Ref
Rea
der
Blin
ded
to
Clin
ical
Info
Ref
eren
ce S
tan
dar
d
Go
ld S
tan
dar
d
A P
riori
Th
resh
old
No
Inte
rven
ing
T
reat
men
t
85%
Acc
ou
nte
d f
or
Fu
nd
ing
Dis
crep
ancy
Malich et al. 200135
Yes NR Yes Yes No No NR NR No NR Yes NR Yes Yes Yes NR Yes
Milz et al. 200170
NR Yes NR Yes No NR NR NR NR NR Yes Yes No Yes Yes NR Yes
Reinikainen et al. 200171
NR Yes Yes Yes No Yes NR NR Yes NR Yes Yes Yes Yes Yes Yes Yes
Moon et al. 200072
Yes Yes No NR No Yes NR NR NR NR Yes Yes No Yes No Yes Yes
Blohmer et al. 199973
NR Yes NR Yes No NR NR NR NR NR Yes Yes Yes Yes No NR Yes
Chao et al. 199974
NR Yes NR Yes No No NR NR NR NR Yes NR Yes Yes Yes NR Yes
Schroeder et al. 199975
Yes Yes Yes Yes No Yes NR NR Yes NR Yes No Yes Yes Yes NR Yes
Albrecht et al. 199876
NR Yes NR Yes No Yes NR NR Yes NR Yes No Yes Yes Yes NR Yes
Wilkens et al. 199877
NR NR NR Yes NR No NR NR NR NR Yes Yes Yes Yes Yes NR Yes

Table C55. Ultrasound studies: quality evaluation (continued)
ECRI Institute Evidence-based Practice Center Effectiveness of Non-invasive Diagnostic Tests for Breast Abnormalities
C-138
Question 1 2 3 4 5 6 7 8 9 10 11 12 13 14 15 16 17
Study Co
nse
cuti
ve
Pro
spec
tive
≥85%
En
rolle
d
Co
nsi
sten
t C
rite
ria
Sp
ectr
um
Bia
s
Inte
rrea
der
D
iffe
ren
ces
Blin
ded
to
R
efer
ence
Res
ult
s
Blin
ded
to
D
iag
no
stic
Res
ult
s
Dx
Rea
der
Blin
ded
to
Clin
ical
Info
Ref
Rea
der
Blin
ded
to
Clin
ical
Info
Ref
eren
ce S
tan
dar
d
Go
ld S
tan
dar
d
A P
riori
Th
resh
old
No
Inte
rven
ing
T
reat
men
t
85%
Acc
ou
nte
d f
or
Fu
nd
ing
Dis
crep
ancy
Buadu et al. 199778
Yes NR Yes Yes No NR NR NR NR NR Yes Yes Yes Yes Yes NR Yes
Stavros et al. 199579
NR Yes NR Yes No NR NR NR NR NR Yes No Yes Yes Yes NR Yes
Ciatto et al. 199480
Yes Yes Yes Yes Yes No NR NR NR NR Yes No Yes Yes Yes NR Yes
Perre et al. 199481
NR Yes NR Yes No No NR NR Yes NR Yes No Yes Yes Yes NR Yes
NR Not reported

ECRI Institute Evidence-based Practice Center Effectiveness of Non-invasive Diagnostic Tests for Breast Abnormalities
D-1
Appendix D. List of Excluded Studies
MRI Exclusions 103 total excluded Reasons for Exclusion
Did not enroll the patient population of interest: 54 studies
Did not use an acceptable reference standard to verify diagnoses of at least 85% of patients: 12 studies
Study of experimental methods not clinically relevant: 14 studies
Did not address any of the Key Questions: 9 studies
Did not report sufficient data to calculate the outcomes of interest: 6 studies
Duplicate reports of the same studies/patients: 4 studies
Retrospective study that did not enroll all or consecutive patients: 3 studies
Reported data from fewer than 50% of the enrolled patients: 1 study
Table D1. Studies of MRI that did not meet the inclusion criteria
Study Reason for Exclusion
Baltzer et al. 201089
Exploratory study of experimental diagnostic methods
Baltzer et al. 201090
Did not enroll the patient population of interest
Baltzer et al. 201091
Exploratory study of experimental diagnostic methods
Belli et al. 201092
Did not use an acceptable reference standard
Benndorf et al. 201093
Did not enroll the patient population of interest
Bhooshan et al. 201094
Exploratory study of experimental diagnostic methods
Carbonaro et al. 201095
Did not enroll the patient population of interest
Dietzel et al. 201096
Exploratory study of experimental diagnostic methods
Dietzel et al. 201097
Exploratory study of experimental diagnostic methods
El Khouli et al. 201098
Exploratory study of experimental diagnostic methods

Table D1. Studies of MRI that did not meet the inclusion criteria (continued)
D-2
Study Reason for Exclusion
Hauth et al. 201099
Did not address any of the Key Questions
Meeuwis et al. 2010100
Did not enroll the patient population of interest
Peters et al. 2010101
Exploratory study of experimental diagnostic methods
Weinstein et al. 2010102
Did not enroll the patient population of interest
Arazi-Kleinman et al. 2009103
Enrolled only patients at very high risk of breast cancer
Baltzer et al. 2009104
Enrolled only patients at very high risk of breast cancer
Baltzer et al. 2009105
Did not enroll the patient population of interest
Baltzer et al. 2009105
Enrolled only patients at very high risk of breast cancer
Bluemke et al. 200920
Duplicate patient population as in Bluemke et al.20
Calabrese et al. 2009106
Enrolled only patients at very high risk of breast cancer
Ciatto et al. 2009107
Exploratory study of experimental diagnostic methods
El Khouli et al. 2009108
Does not address any of the Key Questions
El Khouli et al. 2009109
Retrospective study that did not enroll all or consecutive patients
Gutierrez et al. 2009110
Does not address any of the Key Questions
Kim et al. 2009111
Enrolled only patients diagnosed with invasive breast cancer
Kurz et al. 2009112
Does not address any of the Key Questions
Palle and Reddy et al. 2009113
Did not report how or if the MRI diagnoses were verified
Pediconi et al. 2009114
Fewer than 85% of the lesions had their diagnoses verified with an acceptable reference standard
Pereira et al. 2009115
Exploratory study of experimental diagnostic methods
Perfetto et al. 2009116
Retrospective study that did not enroll all or consecutive patients
Pinker et al. 2009117
Did not report data for patients with diagnosis verified by followup instead of histopathology (45% of enrolled patients)

Table D1. Studies of MRI that did not meet the inclusion criteria (continued)
D-3
Study Reason for Exclusion
Potente et al. 2009118
Enrolled only patients at very high risk of breast cancer
Schuten et al. 2009119
Only enrolled patients diagnosed with breast cancer
Stadlbauer et al. 2009120
Only 60% of diagnoses were verified with an acceptable reference standard
Woodhams et al. 2009121
Does not address any of the Key Questions
Baek et al. 2008122
Enrolled only patients at very high risk of breast cancer
Ballesio et al. 2008123
Did not enroll the patient population of interest
Choudhury et al. 2008124
Did not enroll the patient population of interest
Ertas et al. 2008125
Did not report sufficient data to calculate the outcomes of interest
Hatakenaka et al. 2008126
Did not enroll the patient population of interest
Heusner et al. 2008127
Enrolled only patients diagnosed with breast cancer
Lieberman et al. 2008128
Enrolled only patients diagnosed with breast cancer
Okafuji et al. 2008129
Enrolled only patients at very high risk of breast cancer
Veltman et al. 2008130
Does not address any of the Key Questions
Di Nallo et al. 2007131
Did not report sufficient data to calculate the outcomes of interest
Grunwald 2007132
Reported MRI results for fewer than 50% of the enrolled patients
Iglesias et al. 2007133
Enrolled only patients with benign lesions
Klifa et al. 2007134
Retrospective study that did not enroll all or consecutive patients
Meinel et al. 2007135
The results of the MRI examination were used to decide which patients to enroll
Williams et al. 2007136
Enrolled only patients at very high risk of breast cancer
Bartella et al. 2006137
Enrolled only patients at very high risk of breast cancer
Goto et al. 2006138
The results of the MRI examination were used to decide which patients to enroll
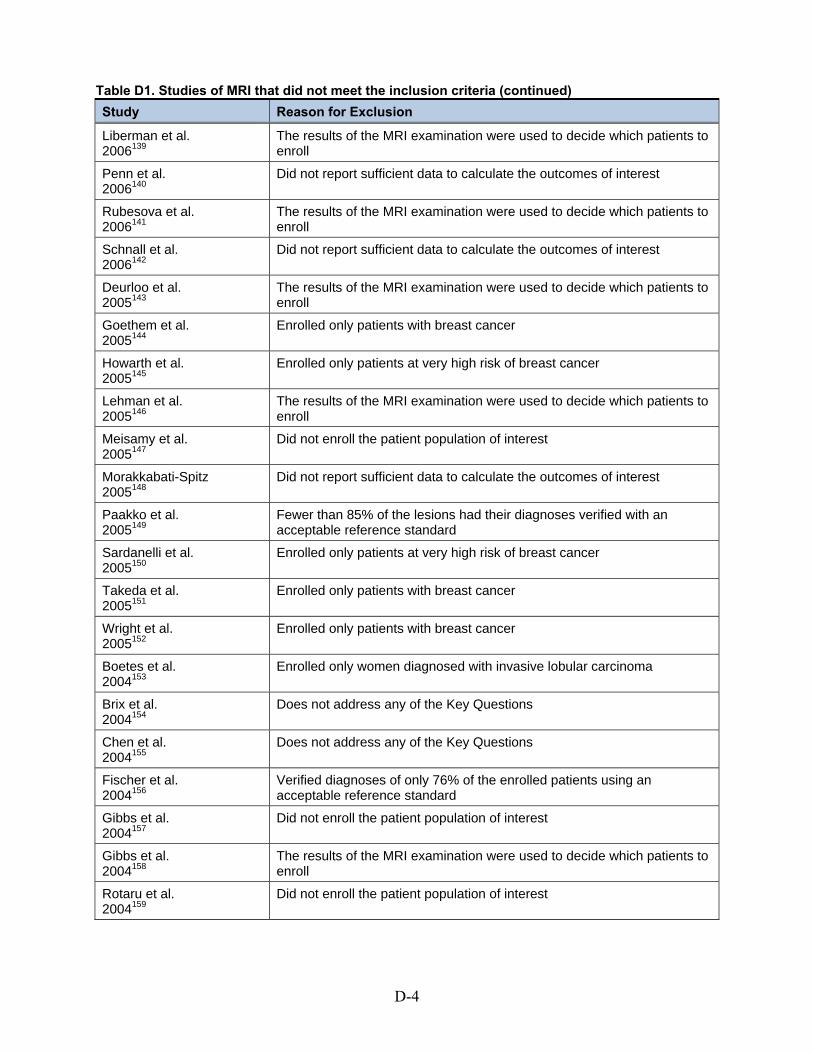
Table D1. Studies of MRI that did not meet the inclusion criteria (continued)
D-4
Study Reason for Exclusion
Liberman et al. 2006139
The results of the MRI examination were used to decide which patients to enroll
Penn et al. 2006140
Did not report sufficient data to calculate the outcomes of interest
Rubesova et al. 2006141
The results of the MRI examination were used to decide which patients to enroll
Schnall et al. 2006142
Did not report sufficient data to calculate the outcomes of interest
Deurloo et al. 2005143
The results of the MRI examination were used to decide which patients to enroll
Goethem et al. 2005144
Enrolled only patients with breast cancer
Howarth et al. 2005145
Enrolled only patients at very high risk of breast cancer
Lehman et al. 2005146
The results of the MRI examination were used to decide which patients to enroll
Meisamy et al. 2005147
Did not enroll the patient population of interest
Morakkabati-Spitz 2005148
Did not report sufficient data to calculate the outcomes of interest
Paakko et al. 2005149
Fewer than 85% of the lesions had their diagnoses verified with an acceptable reference standard
Sardanelli et al. 2005150
Enrolled only patients at very high risk of breast cancer
Takeda et al. 2005151
Enrolled only patients with breast cancer
Wright et al. 2005152
Enrolled only patients with breast cancer
Boetes et al. 2004153
Enrolled only women diagnosed with invasive lobular carcinoma
Brix et al. 2004154
Does not address any of the Key Questions
Chen et al. 2004155
Does not address any of the Key Questions
Fischer et al. 2004156
Verified diagnoses of only 76% of the enrolled patients using an acceptable reference standard
Gibbs et al. 2004157
Did not enroll the patient population of interest
Gibbs et al. 2004158
The results of the MRI examination were used to decide which patients to enroll
Rotaru et al. 2004159
Did not enroll the patient population of interest

Table D1. Studies of MRI that did not meet the inclusion criteria (continued)
D-5
Study Reason for Exclusion
Schelfout et al. 2004160
Did not enroll the patient population of interest
Szabo et al. 2004161
The results of the MRI examination were used to decide which patients to enroll
Van Goethem et al. 2004162
Did not enroll the patient population of interest
Bagni et al. 2003163
Fewer than 85% of the lesions had their diagnoses verified with an acceptable reference standard
Gibbs and Turnbull 2003164
Did not report sufficient data to calculate the outcomes of interest
Knopp et al. 2003165
Fewer than 85% of the lesions had their diagnoses verified with an acceptable reference standard
LaTrenta et al. 2003166
Enrolled only patients at very high risk of breast cancer
Nakahara et al. 2003167
Did not enroll the patient population of interest
Szabo et al. 2003168
Exploratory study of experimental diagnostic methods
Baum et al. 2002169
Enrolled only patients at very high risk of breast cancer
Carriero et al. 2002170
Exploratory study of experimental diagnostic methods
Choi et al. 2002171
Exploratory study of experimental diagnostic methods
Del Maschio et al. 2002172
Discussion of the study Bazzocchi et al.13
Hlawatsch et al. 2002173
Did not enroll the patient population of interest
Liberman et al. 2002174
Enrolled only patients at very high risk of breast cancer
Nakahara et al. 2002175
Enrolled only patients diagnosed with breast cancer
Nunes et al. 2002176
Fewer than 85% of the lesions had their diagnoses verified with an acceptable reference standard
Reinikainen et al. 2002177
Did not enroll the patient population of interest
Teifke et al. 2002178
Only 48% of diagnoses were verified with an acceptable reference standard
Trecate et al. 200229
Duplicate report of the same patients enrolled in Trecate et al.29
Alamo et al. 2001179
Did not enroll the patient population of interest

Table D1. Studies of MRI that did not meet the inclusion criteria (continued)
D-6
Study Reason for Exclusion
Francis et al. 2001180
Enrolled only patients diagnosed with invasive lobular carcinoma
Hewwang-Kobrunner et al. 2001181
Exploratory study of experimental diagnostic methods
Khatri et al. 2001182
Excluded patients without evidence of a lesion at MRI
Lucht et al. 2001183
Exploratory study of experimental diagnostic methods
Malur et al. 2001184
Did not enroll the patient population of interest
Ando et al. 2000185
Only reported data for patients with MRI images suggestive of malignancy
Imbriaco et al. 200034
Duplicate report of the same patients enrolled in Imbracio et al.34
Kinkel et al. 2000186
Retrospective study that did not enroll all or consecutive patients
MRI Magnetic resonance imaging

D-7
PET Exclusions 19 total excluded Reasons for Exclusion
Did not enroll the patient population of interest: 13 studies
Study of experimental methods not clinically relevant: 3 studies
Did not report sufficient information to calculate the outcomes of interest: 1 study
Duplicate report of the same studies/patients: 2 studies
Table D2. Studies of PET that did not meet the inclusion criteria
Study Reason
Caprio et al. 2010187
Duplicate report of data found in Imbracio et al.34
Heusner et al. 2008127
Did not study the population of interest. Enrolled only patients with confirmed breast cancer.
Zytoon et al. 2008188
Did not study the population of interest. Enrolled only patients with confirmed breast cancer.
Berg et al. 2006189
Did not study the population of interest. Forty-three percent (43%) of patients had a confirmed diagnosis of breast cancer and had undergone prior diagnostic biopsies.
Kumar et al. 2006190
Did not study the population of interest. Most of the enrolled patients had a confirmed diagnosis of breast cancer and had undergone prior diagnostic/excision biopsies.
Mavi et al. 2006191
Did not study the population of interest. Enrolled only patients with confirmed breast cancer.
Tatsumi et al. 2006192
Did not study the population of interest. Enrolled only patients with confirmed breast cancer.
Kumar et al. 2005193
Did not study the population of interest. Most enrolled patients had a confirmed diagnosis of breast cancer and had undergone prior diagnostic/excision biopsies
Roman et al. 2005194
Did not study the population of interest. Enrolled only patients with confirmed breast cancer.
Rosen et al. 2005195
Did not study the technology of interest-- experimental methods.
Inoue et al. 2004196
Did not study the population of interest. Enrolled only patients with confirmed breast cancer.
Marshall et al. 2004197
Did not study the population of interest. Enrolled only patients with confirmed breast cancer.
Smyczek-Gargya et al. 2004198
Did not study the population of interest. Enrolled only patients with confirmed breast cancer.
Levine et al. 2003199
Did not study the technology of interest-- experimental methods.

Table D2. Studies of PET that did not meet the inclusion criteria (continued)
D-8
Study Reason
Buck et al. 2002200
Did not report any of the outcomes of interest.
Danforth et al. 2002201
Did not study the population of interest. Enrolled only patients with confirmed breast cancer.
Paul et al. 2002202
Did not study the population of interest. Enrolled only patients with confirmed breast cancer.
Avril et al. 2000203
Update, with additional patients, of Avril et al.,203 which reports that it studied a mixed population of patients (some patients had a history of breast cancer).
Murthy et al. 2000204
Did not study the technology of interest-- experimental methods.

ECRI Institute Evidence-based Practice Center Effectiveness of Non-invasive Diagnostic Tests for Breast Abnormalities
D-9
Scintimammography 18 total excluded Reasons for Exclusion
Did not use the tracer of interest: 5 studies
Did not use an acceptable reference standard to verify diagnoses of at least 85% of the patients: 5 studies
Did not enroll the patient population of interest: 3 studies
Did not address any of the Key Questions: 3 studies
Study of experimental methods not clinically relevant: 2 studies
Table D3. Studies of scintimammography that did not meet the inclusion criteria
Study Reason for Exclusion
Brem et al. 2010205
Did not address any of the Key Questions
Ozulker et al. 2010206
Did not use an acceptable reference standard
Brem et al. 2008207
Did not enroll the patient population of interest
Hruska et al. 2008208
Exploratory study of experimental diagnostic methods
Sharma et al. 2008209
99mTc-methionine tracer
Spanu et al. 2008210
Tc99m tetrofosmin tracer
Spanu et al. 2008211
Tc99m tetrofosmin tracer
Buchmann et al. 200743
99mTechnetium-Perechnetate or Iodide
Spanu et al. 2007212
Tc99m tetrofosmin
Bekis et al. 2005213
Does not address any of the Key Questions
Brem et al. 2005214
Patients were at high-risk for breast cancer with normal mammograms/ clinical examination
Howarth et al. 2005145
26% of subjects had previous breast surgery/29% were positive for a family history of breast cancer
Kim et al. 2005215
Did not use an acceptable reference standard to verify diagnoses of at least 85% of the patients
Myslivecek et al. 2005216
Did not use an acceptable reference standard to verify diagnoses of at least 85% of the patients

Table D3. Studies of scintimammography that did not meet the inclusion criteria (continued)
D-10
Study Reason for Exclusion
Papantoniou et al. 2005217
Does not address any of the Key Questions
Rhodes et al. 2005218
Prototype device
Tiling et al. 2005219
Did not use an acceptable reference standard to verify diagnoses of at least 85% of the patients
Kim et al. 2003220
Did not use an acceptable reference standard to verify diagnoses of at least 85% of the patients
Tc Technetium

ECRI Institute Evidence-based Practice Center Effectiveness of Non-invasive Diagnostic Tests for Breast Abnormalities
D-11
Ultrasound Exclusions 153 total excluded Reasons for Exclusion
Did not enroll the patient population of interest: 63 studies
Did not address any of the Key Questions: 27 studies
Did not use an acceptable reference standard to verify diagnoses of at least 85% of patients: 27 studies
Retrospective study that did not enroll all or consecutive patients: 11 studies
Did not report sufficient information to calculate the outcomes of interest: 8 studies
Study of experimental methods not clinically relevant: 9 studies
Duplicate reports of the same studies/patients: 3 articles
Reported data for fewer than 50% of the enrolled patients: 3 studies
Retrospective case-control design: 1 study
Did not report sufficient details of the US methods to permit analysis: 1 study

D-12
Table D4. Studies of ultrasound that did not meet the inclusion criteria
Study Primary Reason for Exclusion
Caproni et al. 2010221
Did not use an acceptable reference standard
Dave et al. 2010222
Study of experimental technology
Cheng et al. 2010223
Study of experimental technology
Hongjia et al. 2010224
Did not enroll the patient population of interest
Moon et al. 2010225
Retrospective study that did not enroll all or consecutive patients
Moriguchi et al. 2010226
Did not use an acceptable reference standard
Sorelli et al. 2010227
Did not use an acceptable reference standard
Wang et al. 2010228
Study of experimental technology
Baek et al. 2009229
Retrospective study that did not enroll all or consecutive patients
Balleyguier et al. 2009230
Did not verify the diagnoses with an acceptable reference standard
Barr et al. 2009231
Does not address any of the Key Questions
Devolli-Disha et al. 2009232
Did not enroll the patient population of interest
Habib et al. 200947
Did not report any details of the US methods
Kim et al. 2009233
Data was reported for fewer than 50% of the enrolled patients
Kotsianos-Hermle et al. 2009234
Did not enroll the patient population of interest
Masroor et al. 2009235
Did not enroll the patient population of interest
Masroor et al. 2009236
Did not enroll the patient population of interest
McCavert et al. 2009237
Did not verify the diagnoses with an acceptable reference standard
Su et al. 2009238
Retrospective study that did not enroll all or consecutive patients
Barnard et al. 2008239
Did not report sufficient data to calculate the outcomes of interest
Bilali et al. 2008240
Did not report sufficient data to calculate the outcomes of interest

Table D4. Studies of ultrasound that did not meet the inclusion criteria (continued)
D-13
Study Primary Reason for Exclusion
Choudhury et al. 2008124
Did not enroll the patient population of interest
Forsberg et al. 2008241
Exploratory study of experimental diagnostic methods
Kang et al. 2008242
Data was reported for fewer than 50% of the enrolled patients
Kwak et al. 2008243
Data was reported for fewer than 50% of the enrolled patients
LeCarpentier et al. 2008244
Did not report sufficient data to calculate the outcomes of interest
Park et al. 2008245
Did not enroll the patient population of interest
Singh et al. 2008246
Did not verify the diagnoses with an acceptable reference standard
Wenkel et al. 2008247
Only 65% of diagnoses were verified with an acceptable reference standard
Abbattista et al. 2007248
Did not verify the diagnoses with an acceptable reference standard
Ballesio et al. 2007249
Did not enroll the patient population of interest
Ciatto and Houssami 2007250
Only enrolled patients diagnosed with carcinomas
Constantini et al. 2007251
Only 72% of diagnoses were verified with an acceptable reference standard
Graf et al. 2007252
Did not enroll the patient population of interest
Jiang et al. 2007253
Does not address any of the Key Questions
Osako et al. 2007254
Only enrolled patients diagnosed with carcinomas
Prasad and Houserkova 2007255
Only 10% of diagnoses were verified with an acceptable reference standard
Scaperrotta et al. 2007256
Did not report data for patients diagnosed as “clearly benign” on the diagnostic test of interest (US)
Thomas et al. 2007257
Did not enroll the patient population of interest
Constantini et al. 2006258
Duplicate report of data from Constantini et al.251
Del Frate et al. 2006259
Did not enroll the patient population of interest
Grunwald et al. 2006260
Did not enroll the patient population of interest

Table D4. Studies of ultrasound that did not meet the inclusion criteria (continued)
D-14
Study Primary Reason for Exclusion
Malik et al. 2006261
Did not verify the diagnoses with an acceptable reference standard
Regner et al. 2006262
Does not address any of the Key Questions
Thomas et al. 2006263
Did not enroll the patient population of interest
Adepoju et al. 2005264
Did not enroll the patient population of interest
Baez et al. 2005265
Only 37% of diagnoses were verified with an acceptable reference standard
Berg 2005266
Did not enroll the patient population of interest
Cawson et al. 2005267
Enrolled only patients diagnosed with radial scars
Cha et al. 2005268
Did not report sufficient data to calculate the outcomes of interest
Cho et al. 2005269
Did not verify the diagnoses of lesions diagnosed on US as benign
Cho et al. 2005269
Only 40% of diagnoses were verified with an acceptable reference standard
Eljuga and Susac 2005270
Retrospective study that did not enroll all or consecutive patients
Nagashima et al. 2005271
Enrolled only patients diagnosed with ductal carcinoma in situ
Shahid et al. 2005272
Did not enroll the patient population of interest
Szabo et al. 2005273
Only 62.7% of diagnoses were verified with an acceptable reference standard
Tohno and Ueno 2005274
Only enrolled patients diagnosed with carcinomas
Tumyan et al. 2005275
Did not enroll the patient population of interest
Benson et al. 2004276
Mixed patient population; primarily a study of screening asymptomatic patients
Boetes et al. 2004153
Enrolled only women diagnosed with invasive lobular carcinoma
Chen et al. 2004277
Retrospective study that did not enroll all or consecutive patients
Cid et al. 2004278
Did not enroll the patient population of interest
Cura et al. 2004279
Exploratory study of experimental diagnostic methods

Table D4. Studies of ultrasound that did not meet the inclusion criteria (continued)
D-15
Study Primary Reason for Exclusion
Drukker et al. 2004280
Does not address any of the Key Questions
Foxcroft et al. 2004281
Enrolled only women diagnosed with breast cancer
Georgian-Smith 2004282
Enrolled only patients diagnosed with hamartoma
Gibbs et al. 2004157
Did not enroll the patient population of interest
Murad and Bari 2004283
Only 70% of diagnoses were verified with an acceptable reference standard
Rotaru and Luciani 2004159
Only enrolled patients that were difficult to diagnose by US
Santamaria et al. 2004284
Enrolled only patients diagnosed with invasive carcinoma
Schelfout et al. 2004160
Did not enroll the patient population of interest
Sehgal et al. 2004285
Does not address any of the Key Questions
Selinko et al. 2004286
Enrolled only women diagnosed with invasive lobular carcinoma
Strano et al. 2004287
Does not address any of the Key Questions
Van Goethem et al. 2004162
Did not enroll the patient population of interest
Yang and Tse 2004288
Enrolled only women with DCIS
Zonderland et al. 2004289
Does not address any of the Key Questions
Chen et al. 2003290
Does not address any of the Key Questions
Chen et al. 2003291
Enrolled only women diagnosed with carcinoma
Drukker and Giger 2003292
Does not address any of the Key Questions
Flobbe et al. 2003293
Did not report sufficient data to calculate the outcomes of interest
Kazimierz et al. 2003294
Did not verify the diagnoses with an acceptable reference standard
Martinez et al. 2003295
Did not enroll the patient population of interest
Mesaki et al. 2003296
Only 40% of diagnoses were verified with an acceptable reference standard

Table D4. Studies of ultrasound that did not meet the inclusion criteria (continued)
D-16
Study Primary Reason for Exclusion
Nakahara et al. 2003167
Did not enroll the patient population of interest
Park et al. 2003297
Does not address any of the Key Questions
Puglisi et al. 2003298
Enrolled only women with papillary breast lesions
Shetty et al. 2003299
Did not report sufficient data to calculate the outcomes of interest
Chen et al. 2002300
Did not enroll the patient population of interest
Chen et al. 2002301
Does not address any of the Key Questions
Germer et al. 2002302
Does not address any of the Key Questions
Gunhan-Bilgen et al. 2002303
Enrolled only women diagnosed with inflammatory carcinoma
Hlawatsch et al. 2002173
Did not enroll the patient population of interest
Krestan et al. 2002304
Does not address any of the Key Questions
Kuo et al. 2002305
Does not address any of the Key Questions
Kuo et al. 2002306
Does not address any of the Key Questions
Lee et al. 2002307
Retrospective study that did not enroll all or consecutive patients
Muttarak et al. 2002308
Enrolled only patients diagnosed with phyllodes tumors
Reinikainen et al. 2002177
Did not enroll the patient population of interest
Tan et al. 2002309
Enrolled only patients diagnosed with invasive lobular carcinoma
Taylor et al. 2002310
Did not report sufficient data to calculate the outcomes of interest
Teifke et al. 2002178
Only 48% of diagnoses were verified with an acceptable reference standard
Wang et al. 2002311
Duplicate report of data from Chen et al.311
Wang et al. 2002312
Duplicate report of data from Chen et al.311
Yilmaz et al. 2002313
Enrolled only women diagnosed with medullary carcinomas

Table D4. Studies of ultrasound that did not meet the inclusion criteria (continued)
D-17
Study Primary Reason for Exclusion
Alamo et al. 2001179
Did not enroll the patient population of interest
Allen et al. 2001314
Does not address any of the Key Questions
Arger et al. 2001315
Does not address any of the Key Questions
Bhatti et al. 2001316
Did not enroll the patient population of interest
Chou et al. 2001317
Does not address any of the Key Questions
Cwikla et al. 2001318
Enrolled only patients diagnosed with multi-focal carcinomas
Francis et al. 2001180
Enrolled only patients diagnosed with invasive lobular carcinoma
Malur et al. 2001184
Did not enroll the patient population of interest
Ozdemir et al. 2001319
Did not report sufficient data to calculate the outcomes of interest
Rosen and Soo 2001320
Does not address any of the Key Questions
Soo et al. 2001321
Enrolled only patients with negative US findings who were later diagnosed with carcinomas
Whitehouse et al. 2001322
Does not address any of the Key Questions
Chaudhari et al. 2000323
Does not address any of the Key Questions
Choi et al. 2000324
Retrospective study that did not enroll all or consecutive patients
Evans and Lyons 2000325
Enrolled only patients diagnosed with small invasive lobular carcinomas
Klaus et al. 2000326
Only enrolled patients who underwent a biopsy because of findings on the diagnostic test of interest (ultrasound)
Madjar et al. 2000327
Does not address any of the Key Questions
Stuhrmann et al. 2000328
Did not enroll the patient population of interest
Thibault et al. 2000329
Only 31% of diagnoses were verified with an acceptable reference standard
Baker et al. 1999330
Does not address any of the Key Questions
Blohmer et al. 1999331
Exploratory study of experimental diagnostic methods

Table D4. Studies of ultrasound that did not meet the inclusion criteria (continued)
D-18
Study Primary Reason for Exclusion
Chao et al. 1999332
Exploratory study of experimental diagnostic methods
Eltahir et al. 1999333
Retrospective study with only 33.7% of the consecutively enrolled patients examined by ultrasound
Huang et al. 1999334
Did not enroll the patient population of interest
Kook et al. 1999335
Retrospective study that did not enroll all or consecutive patients
Moss et al. 1999336
Only 33% of diagnoses were verified with an acceptable reference standard
Obwegeser et al. 1999337
Did not verify the diagnoses with an acceptable reference standard
Rahbar et al. 1999338
Does not address any of the Key Questions
Rotten et al. 1999339
Did not enroll the patient population of interest
Skaane 1999340
Enrolled only patients diagnosed with malignant tumors
Zonderland et al. 1999341
Did not enroll the patient population of interest
Brnic et al. 1998342
Only 13% of diagnoses were verified with an acceptable reference standard
Carson et al. 1998343
Does not address any of the Key Questions
Delorme et al. 1998344
Exploratory study of experimental diagnostic methods
Giuseppetti et al. 1998345
Only 70% of diagnoses were verified with an acceptable reference standard
Hayashi et al. 1998346
Retrospective study that did not enroll all or consecutive patients
Huber et al. 1998347
Does not address any of the Key Questions
Wright et al. 1998348
Did not report what reference standard, if any, was used to verify the diagnoses
Cabasares et al. 1997349
Did not enroll the patient population of interest
Jain et al. 1997350
Did not verify the diagnoses with an acceptable reference standard
Madjar et al. 1997351
Did not enroll the patient population of interest
Muller-Schimpfle et al. 1997352
Does not address any of the Key Questions

Table D4. Studies of ultrasound that did not meet the inclusion criteria (continued)
D-19
Study Primary Reason for Exclusion
Raza and Baum 1997353
Only enrolled patients that were referred for biopsy on the basis of the US examinations
Schelling et al. 1997354
Exploratory study of experimental diagnostic methods
Skaane et al. 1997355
Retrospective case-control study
Yang et al. 1997356
Only enrolled patients diagnosed with carcinomas
Edde 1994357
Did not enroll the patient population of interest
Saitoh et al. 1994358
Retrospective study that did not enroll all or consecutive patients
US Ultrasound

D-20
ECRI Institute Personnel
All ECRI Institute personnel involved in the preparation of this report may be contacted at:
ECRI Institute 5200 Butler Pike Plymouth Meeting, PA 19462 Telephone: (610) 825-6000 Facsimile: (610) 834-1275
Karen M. Schoelles, M.D., S.M., F.A.C.P. Director, Evidence-based Practice Center Medical Director, Health Technology Assessment Group
Wendy Bruening, Ph.D. Associate Director, Evidence-based Practice Center and Health Technology Assessment Group
Stacey Uhl, M.S.S. Senior Research Analyst, Evidence-based Practice Center and Health Technology Assessment Group
Joann Fontanarosa, Ph.D. Research Analyst, Evidence-based Practice Center and Health Technology Assessment Group
James T. Reston, Ph.D., M.P.H. Associate Director, Evidence-based Practice Center and Health Technology Assessment Group
Jonathan R. Treadwell, Ph.D. Associate Director, Evidence-Based Practice Center and Health Technology Assessment Group

D-21
References to Appendixes
1. Akita A, Tanimoto A, Jinno H, et al. The clinical value of bilateral breast MR imaging: is it worth performing on patients showing suspicious microcalcifications on mammography? Eur Radiol 2009 Sep;19(9):2089-96. PMID: 19350244
2. Baltzer PA, Freiberg C, Beger S, et al. Clinical MR-mammography: are computer-assisted methods superior to visual or manual measurements for curve type analysis? A systematic approach. Acad Radiol 2009 Sep;16(9):1070-6. PMID: 19523854
3. Hara M, Watanabe T, Okumura A, et al. Angle between 1 and 4 min gives the most significant difference in time-intensity curves between benign disease and breast cancer: analysis of dynamic magnetic resonance imaging in 103 patients with breast lesions. Clin Imaging 2009 Sep;33(5):335-42. PMID: 19712811
4. Kim IJ, Kim YK, Kim SJ. Detection and prediction of breast cancer using double phase Tc-99m MIBI scintimammography in comparison with MRI. Onkologie 2009 Oct;32(10):556-60. PMID: 19816071
5. Lo GG, Ai V, Chan JK, et al. Diffusion-weighted magnetic resonance imaging of breast lesions: first experiences at 3 T. J Comput Assist Tomogr 2009 Jan;33(1):63-9. PMID: 19188787
6. Imbriaco M, Caprio MG, Limite G, et al. Dual-time-point 18F-FDG PET/CT versus dynamic breast MRI of suspicious breast lesions. AJR Am J Roentgenol 2008 Nov;191(5):1323-30. PMID: 18941064
7. Pediconi F, Catalano C, Padula S, et al. Contrast-enhanced MR mammography: improved lesion detection and differentiation with gadobenate dimeglumine. AJR Am J Roentgenol 2008 Nov;191(5):1339-46. PMID: 18941066
8. Vassiou K, Kanavou T, Vlychou M, et al. Characterization of breast lesions with CE-MR multimodal morphological and kinetic analysis: comparison with conventional mammography and high-resolution ultrasound. Eur J Radiol 2009 Apr;70(1):69-76. PMID: 18295425
9. Brem RF, Petrovitch I, Rapelyea JA, et al. Breast-specific gamma imaging with 99mTc-Sestamibi and magnetic resonance imaging in the diagnosis of breast cancer--a comparative study. Breast J 2007 Sep;13(5):465-9. PMID: 17760667
10. Cilotti A, Iacconi C, Marini C, et al. Contrast-enhanced MR imaging in patients with BI-RADS 3-5 microcalcifications. Radiol Med 2007 Mar;112(2):272-86. PMID: 17361370
11. Pediconi F, Catalano C, Padula S, et al. Contrast-enhanced magnetic resonance mammography: does it affect surgical decision-making in patients with breast cancer? Breast Cancer Res Treat 2007 Nov;106(1):65-74. PMID: 17203383
12. Zhu J, Kurihara Y, Kanemaki Y, et al. Diagnostic accuracy of high-resolution MRI using a microscopy coil for patients with presumed DCIS following mammography screening. J Magn Reson Imaging 2007 Jan;25(1):96-103. PMID: 17154376
13. Bazzocchi M, Zuiani C, Panizza P, et al. Contrast-enhanced breast MRI in patients with suspicious microcalcifications on mammography: results of a multicenter trial. AJR Am J Roentgenol 2006 Jun;186(6):1723-32. PMID: 16714666
14. Gokalp G, Topal U. MR imaging in probably benign lesions (BI-RADS category 3) of the breast. Eur J Radiol 2006 Mar;57(3):436-44. PMID: 16316732
15. Kneeshaw PJ, Lowry M, Manton D, et al. Differentiation of benign from malignant breast disease associated with screening detected microcalcifications using dynamic contrast enhanced magnetic resonance imaging. Breast 2006 Feb;15(1):29-38. PMID: 16002292

D-22
16. Ricci P, Cantisani V, Ballesio L, et al. Benign and malignant breast lesions: efficacy of real time contrast-enhanced ultrasound vs. magnetic resonance imaging. Ultraschall Med 2007 Feb;28(1):57-62. PMID: 17304413
17. Pediconi F, Catalano C, Venditti F, et al. Color-coded automated signal intensity curves for detection and characterization of breast lesions: preliminary evaluation of a new software package for integrated magnetic resonance-based breast imaging. Invest Radiol 2005 Jul;40(7):448-57. PMID: 15973137
18. Pediconi F, Catalano C, Occhiato R, et al. Breast lesion detection and characterization at contrast-enhanced MR mammography: gadobenate dimeglumine versus gadopentetate dimeglumine. Radiology 2005 Oct;237(1):45-56. PMID: 16126926
19. Wiener JI, Schilling KJ, Adami C, et al. Assessment of suspected breast cancer by MRI: a prospective clinical trial using a combined kinetic and morphologic analysis. AJR Am J Roentgenol 2005 Mar;184(3):878-86. PMID: 15728612
20. Bluemke DA, Gatsonis CA, Chen MH, et al. Magnetic resonance imaging of the breast prior to biopsy. JAMA 2004 Dec 8;292(22):2735-42. PMID: 15585733
21. Huang W, Fisher PR, Dulaimy K, et al. Detection of breast malignancy: diagnostic MR protocol for improved specificity. Radiology 2004 Aug;232(2):585-91. PMID: 15205478
22. Bone B, Wiberg MK, Szabo BK, et al. Comparison of 99mTc-sestamibi scintimammography and dynamic MR imaging as adjuncts to mammography in the diagnosis of breast cancer. Acta Radiol 2003 Jan;44(1):28-34. PMID: 12630995
23. drup-Link HE, Kaiser A, Helbich T, et al. Macromolecular contrast medium (feruglose) versus small molecular contrast medium (gadopentetate) enhanced magnetic resonance imaging: differentiation of benign and malignant breast lesions. Acad Radiol 2003 Nov;10(11):1237-46. PMID: 14626298
24. Heinisch M, Gallowitsch HJ, Mikosch P, et al. Comparison of FDG-PET and dynamic contrast-enhanced MRI in the evaluation of suggestive breast lesions. Breast 2003 Feb;12(1):17-22. PMID: 14659351
25. Walter C, Scheidhauer K, Scharl A, et al. Clinical and diagnostic value of preoperative MR mammography and FDG-PET in suspicious breast lesions. Eur Radiol 2003 Jul;13(7):1651-6. PMID: 12835981
26. Guo Y, Cai YQ, Cai ZL, et al. Differentiation of clinically benign and malignant breast lesions using diffusion-weighted imaging. J Magn Reson Imaging 2002 Aug;16(2):172-8. PMID: 12203765
27. Kelcz F, Furman-Haran E, Grobgeld D, et al. Clinical testing of high-spatial-resolution parametric contrast-enhanced MR imaging of the breast. AJR Am J Roentgenol 2002 Dec;179(6):1485-92. PMID: 12438042
28. Schedel H, Oellinger H, Kohlschein P, et al. Magnetic Resonance Female Breast Imaging (MRFBI) - Evaluation of the Changes in Signal Intensity over Time Pre- and Post-administration of 0.2 mmol/kg Gd-DTPA. Zentralbl Gynakol 2002 Feb;124(2):104-10. PMID: 11935495
29. Trecate G, Tess JD, Vergnaghi D, et al. Breast microcalcifications studied with 3D contrast-enhanced high-field magnetic resonance imaging: more accuracy in the diagnosis of breast cancer. Tumori 2002 May;88(3):224-33. PMID: 12195761
30. Kristoffersen WM, Aspelin P, Perbeck L, et al. Value of MR imaging in clinical evaluation of breast lesions. Acta Radiol 2002 May;43(3):275-81. PMID: 12100324
31. Brix G, Henze M, Knopp MV, et al. Comparison of pharmacokinetic MRI and [18F] fluorodeoxyglucose PET in the diagnosis of breast cancer: initial experience. Eur Radiol 2001;11(10):2058-70. PMID: 11702142
32. Cecil KM, Schnall MD, Siegelman ES, et al. The evaluation of human breast lesions with magnetic resonance imaging and proton magnetic resonance spectroscopy. Breast Cancer Res Treat 2001 Jul;68(1):45-54. PMID: 11678308

D-23
33. Furman-Haran E, Grobgeld D, Kelcz F, et al. Critical role of spatial resolution in dynamic contrast-enhanced breast MRI. J Magn Reson Imaging 2001 Jun;13(6):862-7. PMID: 11382945
34. Imbriaco M, Del VS, Riccardi A, et al. Scintimammography with 99mTc-MIBI versus dynamic MRI for non-invasive characterization of breast masses. Eur J Nucl Med 2001 Jan;28(1):56-63. PMID: 11202453
35. Malich A, Boehm T, Facius M, et al. Differentiation of mammographically suspicious lesions: evaluation of breast ultrasound, MRI mammography and electrical impedance scanning as adjunctive technologies in breast cancer detection. Clin Radiol 2001 Apr;56(4):278-83. PMID: 11286578
36. Nakahara H, Namba K, Fukami A, et al. Three-dimensional MR imaging of mammographically detected suspicious microcalcifications. Breast Cancer 2001;8(2):116-24. PMID: 11342984
37. Torheim G, Godtliebsen F, Axelson D, et al. Feature extraction and classification of dynamic contrast-enhanced T2*-weighted breast image data. IEEE Trans Med Imaging 2001 Dec;20(12):1293-301. PMID: 11811829
38. Wedegartner U, Bick U, Wortler K, et al. Differentiation between benign and malignant findings on MR-mammography: usefulness of morphological criteria. Eur Radiol 2001;11(9):1645-50. PMID: 11511885
39. Yeung DK, Cheung HS, Tse GM. Human breast lesions: characterization with contrast-enhanced in vivo proton MR spectroscopy--initial results. Radiology 2001 Jul;220(1):40-6. PMID: 11425970
40. Kvistad KA, Rydland J, Vainio J, et al. Breast lesions: evaluation with dynamic contrast-enhanced T1-weighted MR imaging and with T2*-weighted first-pass perfusion MR imaging. Radiology 2000 Aug;216(2):545-53. PMID: 10924584
41. Van GM, Biltjes IG, De Schepper AM. Indications for MR mammography. A Belgian study. JBR-BTR 2000 Jun;83(3):126-9. PMID: 11025925
42. Kaida H, Ishibashi M, Fuji T, et al. Improved breast cancer detection of prone breast fluorodeoxyglucose-PET in 118 patients. Nucl Med Commun 2008 Oct;29(10):885-93. PMID: 18769306
43. Buchmann I, Riedmuller K, Hoffner S, et al. Comparison of 99mtechnetium-pertechnetate and 123iodide SPECT with FDG-PET in patients suspicious for breast cancer. Cancer Biother Radiopharm 2007 Dec;22(6):779-89. PMID: 18158769
44. Schirrmeister H, Kuhn T, Guhlmann A, et al. Fluorine-18 2-deoxy-2-fluoro-D-glucose PET in the preoperative staging of breast cancer: comparison with the standard staging procedures. Eur J Nucl Med 2001 Mar;28(3):351-8. PMID: 11315604
45. Yutani K, Shiba E, Kusuoka H, et al. Comparison of FDG-PET with MIBI-SPECT in the detection of breast cancer and axillary lymph node metastasis. J Comput Assist Tomogr 2000 Mar;24(2):274-80. PMID: 10752892
46. Grosso M, Chiacchio S, Bianchi F, et al. Comparison between 99mTc-sestamibi scintimammography and X-ray mammography in the characterization of clusters of microcalcifications: a prospective long-term study. Anticancer Res 2009 Oct;29(10):4251-7. PMID: 19846982
47. Habib S, Maseeh-uz-Zaman, Hameed A, et al. Diagnostic accuracy of Tc-99m-MIBI for breast carcinoma in correlation with mammography and sonography. J Coll Physicians Surg Pak 2009 Oct;19(10):622-6. PMID: 19811712
48. Kim IJ, Kim SJ, Kim YK. Comparison of double phase Tc-99m MIBI and Tc-99m tetrofosmin scintimammography for characterization of breast lesions: Visual and quantitative analyses. Neoplasma 2008;55(6):526-31. PMID: 18999882
49. Wang F, Wang Z, Wu J, et al. The role of technetium-99m-labeled octreotide acetate scintigraphy in suspected breast cancer and correlates with expression of SSTR. Nucl Med Biol 2008 Aug;35(6):665-71. PMID: 18678351

D-24
50. Gommans GM, van der Zant FM, van DA, et al. (99M)Technetium-sestamibi scintimammography in non-palpable breast lesions found on screening X-ray mammography. Eur J Surg Oncol 2007 Feb;33(1):23-7. PMID: 17126524
51. Kim SJ, Bae YT, Lee JS, et al. Diagnostic performances of double-phase tc-99m MIBI scintimammography in patients with indeterminate ultrasound findings: visual and quantitative analyses. Ann Nucl Med 2007 Jun;21(3):145-50. PMID: 17561585
52. Schillaci O, Danieli R, Filippi L, et al. Scintimammography with a hybrid SPECT/CT imaging system. Anticancer Res 2007 Jan;27(1 B):557-62. PMID: 17348441
53. Pinero A, Galindo PJ, Illana J, et al. Diagnostic efficiency of sestamibi gammagraphy and Doppler sonography in the preoperative assessment of breast lesions. Clin Transl Oncol 2006 Feb;8(2):103-7. PMID: 16632424
54. Mathieu I, Mazy S, Willemart B, et al. Inconclusive triple diagnosis in breast cancer imaging: is there a place for scintimammography? J Nucl Med 2005 Oct;46(10):1574-81. PMID: 16204705
55. Gokalp G, Topal U, Kizilkaya E. Power Doppler sonography: anything to add to BI-RADS US in solid breast masses? Eur J Radiol 2009 Apr;70(1):77-85. PMID: 18243623
56. Liu H, Jiang YX, Liu JB, et al. Evaluation of breast lesions with contrast-enhanced ultrasound using the microvascular imaging technique: initial observations. Breast 2008 Oct;17(5):532-9. PMID: 18534851
57. Vade A, Lafita VS, Ward KA, et al. Role of breast sonography in imaging of adolescents with palpable solid breast masses. AJR Am J Roentgenol 2008 Sep;191(3):659-63. PMID: 18716091
58. Cha JH, Moon WK, Cho N, et al. Characterization of benign and malignant solid breast masses: comparison of conventional US and tissue harmonic imaging. Radiology 2007 Jan;242(1):63-9. PMID: 17090709
59. Chala L, Endo E, Kim S, et al. Gray-scale sonography of solid breast masses: diagnosis of probably benign masses and reduction of the number of biopsies. J Clin Ultrasound 2007 Jan;35(1):9-19. PMID: 17149763
60. Zhi H, Ou B, Luo BM, et al. Comparison of ultrasound elastography, mammography, and sonography in the diagnosis of solid breast lesions. J Ultrasound Med 2007 Jun;26(6):807-15. PMID: 17526612
61. Cho N, Moon WK, Cha JH, et al. Differentiating benign from malignant solid breast masses: comparison of two-dimensional and three-dimensional US. Radiology 2006 Jul;240(1):26-32. PMID: 16684920
62. Forsberg F, Goldberg BB, Merritt CR, et al. Diagnosing breast lesions with contrast-enhanced 3-dimensional power Doppler imaging. J Ultrasound Med 2004 Feb;23(2):173-82. PMID: 14992354
63. Meyberg-Solomayer GC, Kraemer B, Bergmann A, et al. Does 3-D sonography bring any advantage to noninvasive breast diagnostics? Ultrasound Med Biol 2004 May;30(5):583-9. PMID: 15183222
64. Zdemir A, Kilic K, Ozdemir H, et al. Contrast-enhanced power Doppler sonography in breast lesions: effect on differential diagnosis after mammography and gray scale sonography. J Ultrasound Med 2004 Feb;23(2):183-95. PMID: 14992355
65. Chen DR, Jeng LB, Kao A, et al. Comparing thallium-201 spect mammoscintigraphy and ultrasonography to detect breast cancer in mammographical dense breasts. Neoplasma 2003;50(3):222-6. PMID: 12937857
66. Kook SH, Kwag HJ. Value of contrast-enhanced power Doppler sonography using a microbubble echo-enhancing agent in evaluation of small breast lesions. J Clin Ultrasound 2003 Jun;31(5):227-38. PMID: 12767017
67. Marini C, Traino C, Cilotti A, et al. Differentiation of benign and malignant breast microcalcifications: mammography versus mammography-sonography combination. Radiol Med 2003 Jan;105(1-2):17-26. PMID: 12700541
D-25
68. Caruso G, Ienzi R, Cirino A, et al. Breast lesion characterization with contrast-enhanced US. Work in progress. Radiol Med 2002 Nov;104(5-6):443-50. PMID: 12589266
69. Koukouraki S, Koukourakis MI, Vagios E, et al. The role of 99mTc-sestamibi scintimammography and colour Doppler ultrasonography in the evaluation of breast lesions. Nucl Med Commun 2001 Nov;22(11):1243-8. PMID: 11606891
70. Milz P, Lienemann A, Kessler M, et al. Evaluation of breast lesions by power Doppler sonography. Eur Radiol 2001;11(4):547-54. PMID: 11354745
71. Reinikainen H, Rissanen T, Paivansalo M, et al. B-mode, power Doppler and contrast-enhanced power Doppler ultrasonography in the diagnosis of breast tumors. Acta Radiol 2001 Jan;42(1):106-13. PMID: 11167342
72. Moon WK, Im JG, Noh DY, et al. Nonpalpable breast lesions: evaluation with power Doppler US and a microbubble contrast agent-initial experience. Radiology 2000 Oct;217(1):240-6. PMID: 11012451
73. Blohmer JU, Oellinger H, Schmidt C, et al. Comparison of various imaging methods with particular evaluation of color Doppler sonography for planning surgery for breast tumors. Arch Gynecol Obstet 1999;262(3-4):159-71. PMID: 10326635
74. Chao TC, Lo YF, Chen SC, et al. Prospective sonographic study of 3093 breast tumors. J Ultrasound Med 1999 May;18(5):363-70. PMID: 10327015
75. Schroeder RJ, Maeurer J, Vogl TJ, et al. D-galactose-based signal-enhanced color Doppler sonography of breast tumors and tumorlike lesions. Invest Radiol 1999 Feb;34(2):109-15. PMID: 9951790
76. Albrecht T, Patel N, Cosgrove DO, et al. Enhancement of power Doppler signals from breast lesions with the ultrasound contrast agent EchoGen emulsion: subjective and quantitative assessment. Acad Radiol 1998 Apr;5 Suppl 1:S195-S198. PMID: 9561080
77. Wilkens TH, Burke BJ, Cancelada DA, et al. Evaluation of palpable breast masses with color Doppler sonography and gray scale imaging. J Ultrasound Med 1998 Feb;17(2):109-15. PMID: 9527570
78. Buadu LD, Murakami J, Murayama S, et al. Colour Doppler sonography of breast masses: a multiparameter analysis. Clin Radiol 1997;52:917-23. PMID: 9413965
79. Stavros AT, Thickman D, Rapp CL, et al. Solid breast nodules: use of sonography to distinguish between benign and malignant lesions. Radiology 1995 Jul;196(1):123-34. PMID: 7784555
80. Ciatto S, Rosselli del TM, Catarzi S, et al. The contribution of ultrasonography to the differential diagnosis of breast cancer. Neoplasma 1994;41(6):341-5. PMID: 7870218
81. Perre CI, Koot VC, de HP, et al. The value of ultrasound in the evaluation of palpable breast tumours: a prospective study of 400 cases. Eur J Surg Oncol 1994 Dec;20(6):637-40. PMID: 7995413
82. Owens DK, Lohr KN, Atkins D, et al. Grading the strength of a body of evidence when comparing medical interventions-Agency for Healthcare Research and Quality and the Effective Health Care Program. J Clin Epidemiol 2010 May;63(5):513-23. PMID: 19595577
83. Owens D, Lohr K, Atkins D, et al. Grading the strength of a body of evidence when comparing medical interventions. 2009 Jul;19.
84. Whiting P, Rutjes AW, Reitsma JB, et al. The development of QUADAS: a tool for the quality assessment of studies of diagnostic accuracy included in systematic reviews. BMC Med Res Methodol 2003 Nov 10;3(1):25. PMID: 14606960
85. Higgins JP, Thompson SG. Quantifying heterogeneity in a meta-analysis. Stat Med 2002 Jun 15;21(11):1539-58. PMID: 12111919
86. Higgins JP, Thompson SG, Deeks JJ, et al. Measuring inconsistency in meta-analyses. BMJ 2003 Sep 6;327(7414):557-60. PMID: 12958120

D-26
87. Zhao H, Steinberg GK, Sapolsky RM. General versus specific actions of mild-moderate hypothermia in attenuating cerebral ischemic damage. J Cereb Blood Flow Metab 2007 Dec;27(12):1879-94. PMID: 17684517
88. Innovative radiation therapy may extend survival for inoperable liver cancer patients. Health Technol Trends 2002 Jul;1-8.
89. Baltzer PA, Benndorf M, Dietzel M, et al. Sensitivity and specificity of unenhanced MR mammography (DWI combined with T2-weighted TSE imaging, ueMRM) for the differentiation of mass lesions. Eur Radiol 2010 May;20(5):1101-10. PMID: 19936758
90. Baltzer PA, Benndorf M, Dietzel M, et al. False-positive findings at contrast-enhanced breast MRI: a BI-RADS descriptor study. AJR Am J Roentgenol 2010 Jun;194(6):1658-63. PMID: 20489110
91. Baltzer PA, Kaiser CG, Dietzel M, et al. Value of ductal obstruction sign in the differentiation of benign and malignant breast lesions at MR imaging. Eur J Radiol 2010 Aug;75(2):e18-e21. PMID: 19954911
92. Belli P, Costantini M, Bufi E, et al. Diffusion-weighted imaging in breast lesion evaluation. Radiol Med 2010 Feb;115(1):51-69. PMID: 19902330
93. Benndorf M, Baltzer PA, Vag T, et al. Breast MRI as an adjunct to mammography: Does it really suffer from low specificity? A retrospective analysis stratified by mammographic BI-RADS classes. Acta Radiol 2010 Sep;51(7):715-21. PMID: 20707656
94. Bhooshan N, Giger ML, Jansen SA, et al. Cancerous breast lesions on dynamic contrast-enhanced MR images: computerized characterization for image-based prognostic markers. Radiology 2010 Mar;254(3):680-90. PMID: 20123903
95. Carbonaro LA, Verardi N, Di LG, et al. Handling a high relaxivity contrast material for dynamic breast MR imaging using higher thresholds for the initial enhancement. Invest Radiol 2010 Mar;45(3):114-20. PMID: 20065856
96. Dietzel M, Baltzer PA, Vag T, et al. The adjacent vessel sign on breast MRI: new data and a subgroup analysis for 1,084 histologically verified cases. Korean J Radiol 2010 Mar;11(2):178-86. PMID: 20191065
97. Dietzel M, Baltzer PA, Vag T, et al. The hook sign for differential diagnosis of malignant from benign lesions in magnetic resonance mammography: experience in a study of 1084 histologically verified cases. Acta Radiol 2010 Mar;51(2):137-43. PMID: 20092368
98. Ei Khouli RH, Jacobs MA, Mezban SD, et al. Diffusion-weighted imaging improves the diagnostic accuracy of conventional 3.0-T breast MR imaging. Radiology 2010 Jul;256(1):64-73. PMID: 20574085
99. Hauth E, Umutlu L, Ku MS, et al. Follow-up of probably benign lesions (BI-RADS 3 category) in breast MR imaging. Breast J 2010 May;16(3):297-304.
100. Meeuwis C, van d, V, Stapper G, et al. Computer-aided detection (CAD) for breast MRI: evaluation of efficacy at 3.0 T. Eur Radiol 2010 Mar;20(3):522-8. PMID: 19727750
101. Peters NH, Vincken KL, van den Bosch MA, et al. Quantitative diffusion weighted imaging for differentiation of benign and malignant breast lesions: the influence of the choice of b-values. J Magn Reson Imaging 2010 May;31(5):1100-5. PMID: 20432344
102. Weinstein SP, Hanna LG, Gatsonis C, et al. Frequency of malignancy seen in probably benign lesions at contrast-enhanced breast MR imaging: findings from ACRIN 6667. Radiology 2010 Jun;255(3):731-7. PMID: 20501712
103. razi-Kleinman T, Causer PA, Jong RA, et al. Can breast MRI computer-aided detection (CAD) improve radiologist accuracy for lesions detected at MRI screening and recommended for biopsy in a high-risk population? Clin Radiol 2009 Dec;64(12):1166-74. PMID: 19913125

D-27
104. Baltzer PA, Renz DM, Herrmann KH, et al. Diffusion-weighted imaging (DWI) in MR mammography (MRM): Clinical comparison of echo planar imaging (EPI) and half-Fourier single-shot turbo spin echo (HASTE) diffusion techniques. Eur Radiol 2009;19(7):1612-20. PMID: 19288109
105. Baltzer PA, Renz DM, Kullnig PE, et al. Application of computer-aided diagnosis (CAD) in MR-mammography (MRM): do we really need whole lesion time curve distribution analysis? Acad Radiol 2009 Apr;16(4):435-42. PMID: 19268855
106. Calabrese M, Brizzi D, Carbonaro L, et al. Contrast-enhanced breast MR imaging of claustrophobic or oversized patients using an open low-field magnet. Radiol Med 2009 Mar;114(2):267-85. PMID: 19194774
107. Ciatto S, Cascio D, Fauci F, et al. Computer-assisted diagnosis (CAD) in mammography: comparison of diagnostic accuracy of a new algorithm (Cyclopus, Medicad) with two commercial systems. Radiol Med 2009 Jun;114(4):626-35. PMID: 19444587
108. El Khouli RH, Macura KJ, Barker PB, et al. Relationship of temporal resolution to diagnostic performance for dynamic contrast enhanced MRI of the breast. J Magn Reson Imaging 2009 Nov;30(5):999-1004. PMID: 19856413
109. El Khouli RH, Macura KJ, Jacobs MA, et al. Dynamic contrast-enhanced MRI of the breast: quantitative method for kinetic curve type assessment. Am J Roentgenol 2009 Oct;193(4):W295-W300. PMID: 19770298
110. Gutierrez RL, Demartini WB, Eby PR, et al. BI-RADS lesion characteristics predict likelihood of malignancy in breast MRI for masses but not for nonmasslike enhancement. Am J Roentgenol 2009 Oct;193(4):994-1000. PMID: 19770321
111. Kim SH, Cha ES, Kim HS, et al. Diffusion-weighted imaging of breast cancer: correlation of the apparent diffusion coefficient value with prognostic factors. J Magn Reson Imaging 2009 Sep;30(3):615-20. PMID: 19711411
112. Kurz KD, Steinhaus D, Klar V, et al. Assessment of three different software systems in the evaluation of dynamic MRI of the breast. Eur J Radiol 2009 Feb;69(2):300-7. PMID: 18060715
113. Palle L, Reddy B. Role of diffusion MRI in characterizing benign and malignant breast lesions. Indian J Radiol Imaging 2009 Nov 1;19(4):287-90. PMID: 19881104
114. Pediconi F, Catalano C, Roselli A, et al. The challenge of imaging dense breast parenchyma: is magnetic resonance mammography the technique of choice? A comparative study with x-ray mammography and whole-breast ultrasound. Invest Radiol 2009 Jul;44(7):412-21. PMID: 19448554
115. Pereira FP, Martins G, Figueiredo E, et al. Assessment of breast lesions with diffusion-weighted MRI: comparing the use of different b values. Am J Roentgenol 2009 Oct;193(4):1030-5. PMID: 19770326
116. Perfetto F, Fiorentino F, Urbano F, et al. Adjunctive diagnostic value of MRI in the breast radial scar. Radiol Med 2009 Aug;114(5):757-70. PMID: 19484584
117. Pinker K, Grabner G, Bogner W, et al. A combined high temporal and high spatial resolution 3 Tesla MR imaging protocol for the assessment of breast lesions: initial results. Invest Radiol 2009 Sep;44(9):553-8. PMID: 19652611
118. Potente G, Messineo D, Maggi C, et al. Practical application of contrast-enhanced magnetic resonance mammography [CE-MRM] by an algorithm combining morphological and enhancement patterns. Comput Med Imaging Graph 2009 Mar;33(2):83-90. PMID: 19095407
119. Schouten van der Velden AP, Boetes C, Bult P, et al. Magnetic resonance imaging in size assessment of invasive breast carcinoma with an extensive intraductal component. BMC Med Imag 2009;9:5. PMID: 19351404
120. Stadlbauer A, Bernt R, Gruber S, et al. Diffusion-weighted MR imaging with background body signal suppression (DWIBS) for the diagnosis of malignant and benign breast lesions. Eur Radiol 2009 Oct;19(10):2349-56. PMID: 19415286
121. Woodhams R, Kakita S, Hata H, et al. Diffusion-weighted imaging of mucinous carcinoma of the breast: evaluation of apparent diffusion coefficient and signal intensity in correlation with histologic findings. AJR Am J Roentgenol 2009 Jul;193(1):260-6. PMID: 19542422

D-28
122. Baek HM, Chen JH, Yu HJ, et al. Detection of choline signal in human breast lesions with chemical-shift imaging. J Magn Reson Imaging 2008 May;27(5):1114-21. PMID: 18425841
123. Ballesio L, Maggi C, Savelli S, et al. Role of breast magnetic resonance imaging (MRI) in patients with unilateral nipple discharge: preliminary study. Radiol Med 2008 Mar;113(2):249-64. PMID: 18386126
124. Choudhury S, Isomoto I, Hyashi K. Magnetic resonance imaging features of breasts in patients with nipple discharge. Bangladesh Med Res Counc Bull 2008 Aug;34(2):44-7. PMID: 19119538
125. Ertas G, Gulcur HO, Tunaci M. An interactive dynamic analysis and decision support software for MR mammography. Comput Med Imaging Graph 2008 Jun;32(4):284-93. PMID: 18343634
126. Hatakenaka M, Soeda H, Yabuuchi H, et al. Apparent diffusion coefficients of breast tumors: clinical application. Magn Reson Med Sci 2008;7(1):23-9. PMID: 18460845
127. Heusner TA, Kuemmel S, Umutlu L, et al. Breast cancer staging in a single session: whole-body PET/CT mammography. J Nucl Med 2008 Aug;49(8):1215-22. PMID: 18632831
128. Lieberman S, Sella T, Maly B, et al. Breast magnetic resonance imaging characteristics in women with occult primary breast carcinoma. Isr Med Assoc J 2008;10(6):448-52. PMID: 18669145
129. Okafuji T, Yabuuchi H, Soeda H, et al. Circumscribed mass lesions on mammography: dynamic contrast-enhanced MR imaging to differentiate malignancy and benignancy. Magn Reson Med Sci 2008;7(4):195-204. PMID: 19110514
130. Veltman J, Stoutjesdijk M, Mann R, et al. Contrast-enhanced magnetic resonance imaging of the breast: the value of pharmacokinetic parameters derived from fast dynamic imaging during initial enhancement in classifying lesions. Eur Radiol 2008 Jun;18(6):1123-33. PMID: 18270714
131. Di Nallo AM, Crecco M, Ortenzia O, et al. The breast dynamic contrast enhanced MRI: preliminary results of a quantitative analysis. J Exp Clin Cancer Res 2007 Jun;26(2):235-9. PMID: 17725104
132. Grunwald S, Heyer H, Paepke S, et al. Diagnostic value of ductoscopy in the diagnosis of nipple discharge and intraductal proliferations in comparison to standard methods. Onkologie 2007 May;30(5):243-8. PMID: 17460418
133. Iglesias A, Arias M, Santiago P, et al. Benign breast lesions that simulate malignancy: magnetic resonance imaging with radiologic-pathologic correlation. Curr Probl Diagn Radiol 2007 Mar;36(2):66-82. PMID: 17331838
134. Klifa CS, Shimakawa A, Siraj Z, et al. Characterization of breast lesions using the 3D FIESTA sequence and contrast-enhanced magnetic resonance imaging. J Magn Reson Imaging 2007 Jan;25(1):82-8. PMID: 17173311
135. Meinel LA, Stolpen AH, Berbaum KS, et al. Breast MRI lesion classification: improved performance of human readers with a backpropagation neural network computer-aided diagnosis (CAD) system. J Magn Reson Imaging 2007 Jan;25(1):89-95. PMID: 17154399
136. Williams TC, Demartini WB, Partridge SC, et al. Breast MR Imaging: computer-aided evaluation program for discriminating benign from malignant lesions. Radiology 2007 Jul;244(1):94-103. PMID: 17507720
137. Bartella L, Morris EA, Dershaw DD, et al. Proton MR spectroscopy with choline peak as malignancy marker improves positive predictive value for breast cancer diagnosis: preliminary study. Radiology 2006 Jun;239(3):686-92. PMID: 16603660
138. Goto M, Ito H, Akazawa K, et al. Diagnosis of breast tumors by contrast-enhanced MR imaging: comparison between the diagnostic performance of dynamic enhancement patterns and morphologic features. J Magn Reson Imaging 2007 Jan;25(1):104-12. PMID: 17152054

D-29
139. Liberman L, Mason G, Morris EA, et al. Does size matter? Positive predictive value of MRI-detected breast lesions as a function of lesion size. AJR Am J Roentgenol 2006 Feb;186(2):426-30. PMID: 16423948
140. Penn A, Thompson S, Brem R, et al. Morphologic blooming in breast MRI as a characterization of margin for discriminating benign from malignant lesions. Acad Radiol 2006 Nov;13(11):1344-54. PMID: 17070452
141. Rubesova E, Grell AS, De Maertelaer V, et al. Quantitative diffusion imaging in breast cancer: a clinical prospective study. J Magn Reson Imaging 2006 Aug;24(2):319-24. PMID: 16786565
142. Schnall MD, Blume J, Bluemke DA, et al. Diagnostic architectural and dynamic features at breast MR imaging: multicenter study. Radiology 2006 Jan;238(1):42-53. PMID: 16373758
143. Deurloo EE, Muller SH, Peterse JL, et al. Clinically and mammographically occult breast lesions on MR images: potential effect of computerized assessment on clinical reading. Radiology 2005 Mar;234(3):693-701. PMID: 15650040
144. Van GM, Schelfout K, Kersschot E, et al. Comparison of MRI features of different grades of DCIS and invasive carcinoma of the breast. JBR-BTR 2005 Sep;88(5):225-32. PMID: 16302331
145. Howarth D, Slater S, Lau P, et al. Complementary role of adjunctive breast magnetic resonance imaging and scintimammography in patients of all ages undergoing breast cancer surgery. Australas Radiol 2005 Aug;49(4):289-97. PMID: 16026435
146. Lehman CD, Peacock S, Demartini WB, et al. A new automated software system to evaluate breast MR examinations: improved specificity without decreased sensitivity. Am J Roentgenol 2006 Jul 1;187(1):51-6. PMID: 16794155
147. Meisamy S, Bolan PJ, Baker EH, et al. Adding in vivo quantitative 1H MR spectroscopy to improve diagnostic accuracy of breast MR imaging: preliminary results of observer performance study at 4.0 T. Radiology 2005 Aug;236(2):465-75. PMID: 16040903
148. Morakkabati-Spitz N, Leutner C, Schild H, et al. Diagnostic usefulness of segmental and linear enhancement in dynamic breast MRI. Eur Radiol 2005 Sep;15(9):2010-7. PMID: 15841382
149. Paakko E, Reinikainen H, Lindholm EL, et al. Low-field versus high-field MRI in diagnosing breast disorders. Eur Radiol 2005 Jul;15(7):1361-8. PMID: 15711841
150. Sardanelli F, Iozzelli A, Fausto A, et al. Gadobenate dimeglumine-enhanced MR imaging breast vascular maps: association between invasive cancer and ipsilateral increased vascularity. Radiology 2005 Jun;235(3):791-7. PMID: 15845796
151. Takeda Y, Yoshikawa K. Contrast-enhanced dynamic MR imaging parameters and histological types of invasive ductal carcinoma of breast. Biomed Pharmacother 2005 Apr;59(3):115-21. PMID: 15795104
152. Wright H, Listinsky J, Rim A, et al. Magnetic resonance imaging as a diagnostic tool for breast cancer in premenopausal women. Am J Surg 2005 Oct;190(4):572-5. PMID: 16164923
153. Boetes C, Veltman J, van DL, et al. The role of MRI in invasive lobular carcinoma. Breast Cancer Res Treat 2004 Jul;86(1):31-7. PMID: 15218359
154. Brix G, Kiessling F, Lucht R, et al. Microcirculation and microvasculature in breast tumors: pharmacokinetic analysis of dynamic MR image series. Magn Reson Med 2004 Aug;52(2):420-9. PMID: 15282828
155. Chen W, Giger ML, Lan L, et al. Computerized interpretation of breast MRI: investigation of enhancement-variance dynamics. Med Phys 2004 May;31(5):1076-82. PMID: 15191295
156. Fischer DR, Baltzer P, Malich A, et al. Is the “blooming sign” a promising additional tool to determine malignancy in MR mammography? Eur Radiol 2004 Mar;14(3):394-401. PMID: 14517688
157. Gibbs P, Liney GP, Lowry M, et al. Differentiation of benign and malignant 1 cm breast lesions using dynamic contrast enhanced MRI. Breast 2004 Apr;13(2):115-21. PMID: 15019691

D-30
158. Gibbs P, Liney GP, Lowry M, et al. Differentiation of benign and malignant sub-1 cm breast lesions using dynamic contrast enhanced MRI. Breast 2004 Apr;13(2):115-21. PMID: 15019691
159. Rotaru N, Luciani A. Magnetic resonance imaging of the breast: potential for lesion characterization. J BUON 2004 Jan;9(1):77-82. PMID: 17385833
160. Schelfout K, Van GM, Kersschot E, et al. Contrast-enhanced MR imaging of breast lesions and effect on treatment. Eur J Surg Oncol 2004 Jun;30(5):501-7. PMID: 15135477
161. Szabo BK, Aspelin P, Wiberg MK. Neural network approach to the segmentation and classification of dynamic magnetic resonance images of the breast: comparison with empiric and quantitative kinetic parameters. Acad Radiol 2004 Dec;11(12):1344-54. PMID: 15596372
162. Van GM, Schelfout K, Dijckmans L, et al. MR mammography in the pre-operative staging of breast cancer in patients with dense breast tissue: comparison with mammography and ultrasound. Eur Radiol 2004 May;14(5):809-16. PMID: 14615904
163. Bagni B, Franceschetto A, Casolo A, et al. Scintimammography with 99mTc-MIBI and magnetic resonance imaging in the evaluation of breast cancer. Eur J Nucl Med Mol Imaging 2003 Oct;30(10):1383-8. PMID: 12910383
164. Gibbs P, Turnbull LW. Textural analysis of contrast-enhanced MR images of the breast. Magn Reson Med 2003 Jul;50(1):92-8. PMID: 12815683
165. Knopp MV, Bourne MW, Sardanelli F, et al. Gadobenate dimeglumine-enhanced MRI of the breast: analysis of dose response and comparison with gadopentetate dimeglumine. AJR Am J Roentgenol 2003 Sep;181(3):663-76. PMID: 12933457
166. LaTrenta LR, Menell JH, Morris EA, et al. Breast lesions detected with MR imaging: utility and histopathologic importance of identification with US. Radiology 2003 Jun;227(3):856-61. PMID: 12773685
167. Nakahara H, Namba K, Watanabe R, et al. A comparison of MR imaging, galactography and ultrasonography in patients with nipple discharge. Breast Cancer 2003;10(4):320-9. PMID: 14634510
168. Szabo BK, Aspelin P, Wiberg MK, et al. Dynamic MR imaging of the breast. Analysis of kinetic and morphologic diagnostic criteria. Acta Radiol 2003 Jul;44(4):379-86. PMID: 12846687
169. Baum F, Fischer U, Vosshenrich R, et al. Classification of hypervascularized lesions in CE MR imaging of the breast. Eur Radiol 2002 May;12(5):1087-92. PMID: 11976850
170. Carriero A, Di CA, Mansour M, et al. Maximum intensity projection analysis in magnetic resonance of the breast. J Exp Clin Cancer Res 2002 Sep;21(3 Suppl):77-81. PMID: 12585659
171. Choi BG, Kim HH, Kim EN, et al. New subtraction algorithms for evaluation of lesions on dynamic contrast-enhanced MR mammography. Eur Radiol 2002 Dec;12(12):3018-22. PMID: 12439585
172. Del MA, Bazzocchi M, Giuseppetti GM, et al. Breast MRI: report on a multicentric national trial by the Study Section of Magnetic Resonance and Breast Imaging. Radiol Med 2002 Oct;104(4):262-72. PMID: 12569307
173. Hlawatsch A, Teifke A, Schmidt M, et al. Preoperative assessment of breast cancer: sonography versus MR imaging. AJR Am J Roentgenol 2002 Dec;179(6):1493-501. PMID: 12438043
174. Liberman L, Morris EA, Lee MJ, et al. Breast lesions detected on MR imaging: features and positive predictive value. AJR Am J Roentgenol 2002 Jul;179(1):171-8. PMID: 12076929
175. Nakahara H, Namba K, Wakamatsu H, et al. Extension of breast cancer: comparison of CT and MRI. Radiat Med 2002 Jan;20(1):17-23. PMID: 12002599
176. Nunes LW, Englander SA, Charafeddine R, et al. Optimal post-contrast timing of breast MR image acquisition for architectural feature analysis. J Magn Reson Imaging 2002 Jul;16(1):42-50. PMID: 12112502

D-31
177. Reinikainen H, Paakko E, Suramo I, et al. Dynamics of contrast enhancement in MR imaging and power Doppler ultrasonography of solid breast lesions. Acta Radiol 2002 Sep;43(5):492-500. PMID: 12423460
178. Teifke A, Hlawatsch A, Beier T, et al. Undetected malignancies of the breast: dynamic contrast-enhanced MR imaging at 1.0 T. Radiology 2002 Sep;224(3):881-8. PMID: 12202728
179. Alamo L, Fischer U. Contrast-enhanced color Doppler ultrasound characteristics in hypervascular breast tumors: comparison with MRI. Eur Radiol 2001;11(6):970-7. PMID: 11419173
180. Francis A, England DW, Rowlands DC, et al. The diagnosis of invasive lobular breast carcinoma. Does MRI have a role? Breast 2001;10(1):38-40. PMID: 14965557
181. Heywang-Kobrunner SH, Bick U, Bradley WG, Jr., et al. International investigation of breast MRI: results of a multicentre study (11 sites) concerning diagnostic parameters for contrast-enhanced MRI based on 519 histopathologically correlated lesions. Eur Radiol 2001;11(4):531-46. PMID: 11354744
182. Khatri VP, Stuppino JJ, Espinosa MH, et al. Improved accuracy in differentiating malignant from benign mammographic abnormalities: a simple, improved magnetic resonance imaging method. Cancer 2001 Aug 1;92(3):471-8. PMID: 11505390
183. Lucht RE, Knopp MV, Brix G. Classification of signal-time curves from dynamic MR mammography by neural networks. Magn Reson Imaging 2001 Jan;19(1):51-7. PMID: 11295347
184. Malur S, Wurdinger S, Moritz A, et al. Comparison of written reports of mammography, sonography and magnetic resonance mammography for preoperative evaluation of breast lesions, with special emphasis on magnetic resonance mammography. Breast Cancer Res 2001;3(1):55-60. PMID: 11250746
185. Ando Y, Fukatsu H, Ishiguchi T, et al. Diagnostic utility of tumor vascularity on magnetic resonance imaging of the breast. Magn Reson Imaging 2000 Sep;18(7):807-13. PMID: 11027873
186. Kinkel K, Helbich TH, Esserman LJ, et al. Dynamic high-spatial-resolution MR imaging of suspicious breast lesions: diagnostic criteria and interobserver variability. AJR Am J Roentgenol 2000 Jul;175(1):35-43. PMID: 10882243
187. Caprio MG, Cangiano A, Imbriaco M, et al. Dual-time-point [18F]-FDG PET/CT in the diagnostic evaluation of suspicious breast lesions. Radiol Med 2010 Mar;115(2):215-24. PMID: 20017002
188. Zytoon AA, Murakami K, El-Kholy MR, et al. Dual time point FDG-PET/CT imaging... Potential tool for diagnosis of breast cancer. Clin Radiol 2008 Nov;63(11):1213-27. PMID: 18929039
189. Berg WA, Weinberg IN, Narayanan D, et al. High-resolution fluorodeoxyglucose positron emission tomography with compression (“positron emission mammography”) is highly accurate in depicting primary breast cancer. Breast J 2006 Jul;12(4):309-23. PMID: 16848840
190. Kumar R, Chauhan A, Zhuang H, et al. Clinicopathologic factors associated with false negative FDG-PET in primary breast cancer. Breast Cancer Res Treat 2006 Aug;98(3):267-74. PMID: 16555126
191. Mavi A, Urhan M, Yu JQ, et al. Dual time point 18F-FDG PET imaging detects breast cancer with high sensitivity and correlates well with histologic subtypes. J Nucl Med 2006 Sep;47(9):1440-6. PMID: 16954551
192. Tatsumi M, Cohade C, Mourtzikos KA, et al. Initial experience with FDG-PET/CT in the evaluation of breast cancer. Eur J Nucl Med Mol Imaging 2006 Mar;33(3):254-62. PMID: 16258765
193. Kumar R, Loving VA, Chauhan A, et al. Potential of dual-time-point imaging to improve breast cancer diagnosis with 18F-FDG PET. J Nucl Med 2005 Nov;46(11):1819-24. PMID: 16269595
194. Roman CD, Martin WH, Delbeke D. Incremental value of fusion imaging with integrated PET-CT in oncology. Clin Nucl Med 2005 Jul;30(7):470-7. PMID: 15965321

D-32
195. Rosen EL, Turkington TG, Soo MS, et al. Detection of primary breast carcinoma with a dedicated, large-field-of-view FDG PET mammography device: initial experience. Radiology 2005 Feb;234(2):527-34. PMID: 15671006
196. Inoue T, Yutani K, Taguchi T, et al. Preoperative evaluation of prognosis in breast cancer patients by [(18)F]2-Deoxy-2-fluoro-D-glucose-positron emission tomography. J Cancer Res Clin Oncol 2004 May;130(5):273-8. PMID: 14986112
197. Marshall C, Mustafa S, Wheatley DC, et al. A comparison of 18F-FDG gamma camera PET, mammography and ultrasonography in demonstrating primary disease in locally advanced breast cancer. Nucl Med Commun 2004 Jul;25(7):721-5. PMID: 15208500
198. Smyczek-Gargya B, Fersis N, Dittmann H, et al. PET with [18F]fluorothymidine for imaging of primary breast cancer: a pilot study. Eur J Nucl Med Mol Imaging 2004 May;31(5):720-4. PMID: 14991243
199. Levine EA, Freimanis RI, Perrier ND, et al. Positron emission mammography: initial clinical results. Ann Surg Oncol 2003 Jan;10(1):86-91. PMID: 12513966
200. Buck A, Schirrmeister H, Kuhn T, et al. FDG uptake in breast cancer: correlation with biological and clinical prognostic parameters. Eur J Nucl Med Mol Imaging 2002 Oct;29(10):1317-23. PMID: 12271413
201. Danforth DN, Jr., Aloj L, Carrasquillo JA, et al. The role of 18F-FDG-PET in the local/regional evaluation of women with breast cancer. Breast Cancer Res Treat 2002 Sep;75(2):135-46. PMID: 12243506
202. Paul AK, Tatsumi M, Yutani K, et al. Effects of iterative reconstruction on image contrast and lesion detection in gamma camera coincidence imaging in lung and breast cancers. Nucl Med Commun 2002 Jan;23(1):103-10. PMID: 11748445
203. Avril N, Rose CA, Schelling M, et al. Breast imaging with positron emission tomography and fluorine-18 fluorodeoxyglucose: use and limitations. J Clin Oncol 2000 Oct 15;18(20):3495-502. PMID: 11032590
204. Murthy K, Aznar M, Thompson CJ, et al. Results of preliminary clinical trials of the positron emission mammography system PEM-I: a dedicated breast imaging system producing glucose metabolic images using FDG. J Nucl Med 2000 Nov;41(11):1851-8. PMID: 11079494
205. Brem RF, Shahan C, Rapleyea JA, et al. Detection of occult foci of breast cancer using breast-specific gamma imaging in women with one mammographic or clinically suspicious breast lesion. Acad Radiol 2010 Jun;17(6):735-43. PMID: 20457416
206. Ozulker T, Ozulker F, Ozpacaci T, et al. The efficacy of (99m)Tc-MIBI scintimammography in the evaluation of breast lesions and axillary involvement: a comparison with X-rays mammography, ultrasonography and magnetic resonance imaging. Hell J Nucl Med 2010 May;13(2):144-9. PMID: 20808988
207. Brem RF, Floerke AC, Rapelyea JA, et al. Breast-specific gamma imaging as an adjunct imaging modality for the diagnosis of breast cancer. Radiology 2008 Jun;247(3):651-7. PMID: 18487533
208. Hruska CB, Phillips SW, Whaley DH, et al. Molecular breast imaging: use of a dual-head dedicated gamma camera to detect small breast tumors. AJR Am J Roentgenol 2008 Dec;191(6):1805-15. PMID: 19020253
209. Sharma R, Tripathi M, Panwar P, et al. 99mTc-methionine scintimammography in the evaluation of breast cancer. Nucl Med Commun 2009 May;30(5):338-42. PMID: 19282793
210. Spanu A, Chessa F, Meloni GB, et al. The role of planar scintimammography with high-resolution dedicated breast camera in the diagnosis of primary breast cancer. Clin Nucl Med 2008 Nov;33(11):739-42. PMID: 18936602
211. Spanu A, Chessa F, Sanna D, et al. Scintimammography with a high resolution dedicated breast camera in comparison with SPECT/CT in primary breast cancer detection. Q J Nucl Med Mol Imaging 2009 Jun;53(3):271-80. PMID: 18596669
D-33
212. Spanu A, Cottu P, Manca A, et al. Scintimammography with dedicated breast camera in unifocal and multifocal/multicentric primary breast cancer detection: a comparative study with SPECT. Int J Oncol 2007 Aug;31(2):369-77. PMID: 17611694
213. Bekis R, Degirmenci B, Aydin A, et al. Correlation between 99mTc-MIBI uptake and angiogenesis in MIBI-positive breast lesions. Nucl Med Biol 2005 Jul;32(5):465-72. PMID: 15982577
214. Brem RF, Rapelyea JA, Zisman G, et al. Occult breast cancer: scintimammography with high-resolution breast-specific gamma camera in women at high risk for breast cancer. Radiology 2005 Oct;237(1):274-80. PMID: 16126919
215. Kim SJ, Kim IJ, Bae YT, et al. Comparison of early and delayed quantified indices of double-phase (99m)Tc MIBI scintimammography in the detection of primary breast cancer. Acta Radiol 2005 Apr;46(2):148-54. PMID: 15902889
216. Myslivecek M, Koranda P, Kaminek M, et al. Technetium-99m-MIBI scintimammography by planar and SPECT imaging in the diagnosis of breast carcinoma and axillary lymph node involvement. World J Nucl Med 2005 Jul 1;4(3):159-64.
217. Papantoniou V, Tsiouris S, Mainta E, et al. Imaging in situ breast carcinoma (with or without an invasive component) with technetium-99m pentavalent dimercaptosuccinic acid and technetium-99m 2-methoxy isobutyl isonitrile scintimammography. Breast Cancer Res 2005;7(1):R33-R45. PMID: 15642168
218. Rhodes DJ, O’Connor MK, Phillips SW, et al. Molecular breast imaging: a new technique using technetium Tc 99m scintimammography to detect small tumors of the breast. Mayo Clin Proc 2005 Jan;80(1):24-30. PMID: 15667025
219. Tiling R, Kessler M, Untch M, et al. Initial evaluation of breast cancer using Tc-99m sestamibi scintimammography. Eur J Radiol 2005;53(2):206-12. PMID: 15664284
220. Kim SJ, Kim IJ, Bae YT, et al. Comparison of quantitative and visual analysis of Tc-99m MIBI scintimammography for detection of primary breast cancer. Eur J Radiol 2005 Feb;53(2):192-8. PMID: 15664282
221. Caproni N, Marchisio F, Pecchi A, et al. Contrast-enhanced ultrasound in the characterisation of breast masses: utility of quantitative analysis in comparison with MRI. Eur Radiol 2010 Jun;20(6):1384-95. PMID: 20033178
222. Dave JK, Forsberg F, Fernandes S, et al. Static and dynamic cumulative maximum intensity display mode for subharmonic breast imaging: a comparative study with mammographic and conventional ultrasound techniques. J Ultrasound Med 2010 Aug;29(8):1177-85. PMID: 20660451
223. Cheng JZ, Chou YH, Huang CS, et al. Computer-aided US diagnosis of breast lesions by using cell-based contour grouping. Radiology 2010 Jun;255(3):746-54. PMID: 20501714
224. Zhao H, Xu R, Ouyang Q, et al. Contrast-enhanced ultrasound is helpful in the differentiation of malignant and benign breast lesions. Eur J Radiol 2010 Feb;73(2):288-93. PMID: 19559551
225. Moon HJ, Kim MJ, Kwak JY, et al. Probably benign breast lesions on ultrasonography: a retrospective review of ultrasonographic features and clinical factors affecting the BI-RADS categorization. Acta Radiol 2010 May;51(4):375-82. PMID: 20350247
226. Moriguchi SM, de Luca LA, Griva BL, et al. Accuracy of 99mTc-sestamibi scintimammography for breast cancer diagnosis. Exp Ther Med 2010 Jan;1(1):205-9.
227. Sorelli PG, Cosgrove DO, Svensson WE, et al. Can contrast-enhanced sonography distinguish benign from malignant breast masses? J Clin Ultrasound 2010 May;38(4):177-81. PMID: 20146214
228. Wang Y, Jiang S, Wang H, et al. CAD algorithms for solid breast masses discrimination: evaluation of the accuracy and interobserver variability. Ultrasound Med Biol 2010 Aug;36(8):1273-81. PMID: 20691917

D-34
229. Baek SE, Kim MJ, Kim EK, et al. Effect of clinical information on diagnostic performance in breast sonography. J Ultrasound Med 2009 Oct;28(10):1349-56. PMID: 19778881
230. Balleyguier C, Opolon P, Mathieu MC, et al. New potential and applications of contrast-enhanced ultrasound of the breast: Own investigations and review of the literature. Eur J Radiol 2009 Jan;69(1):14-23. PMID: 18977102
231. Barr RG, Maldonado RL, Georgian-Smith D. Comparison of conventional, compounding, computer enhancement, and compounding with computer enhancement in ultrasound imaging of the breast. Ultrasound Q 2009 Sep;25(3):129-34. PMID: 19730052
232. volli-Disha E, Manxhuka-Kerliu S, Ymeri H, et al. Comparative accuracy of mammography and ultrasound in women with breast symptoms according to age and breast density. Bosn J Basic Med Sci 2009 May;9(2):131-6. PMID: 19485945
233. Hee YK, Bo KS, Kim HY, et al. Additional breast ultrasound examinations in clustered calcifications: for improving diagnostic performance. J Breast Cancer 2009 Sep;12(3):142-50.
234. Kotsianos-Hermle D, Hiltawsky KM, Wirth S, et al. Analysis of 107 breast lesions with automated 3D ultrasound and comparison with mammography and manual ultrasound. Eur J Radiol 2009 Jul;71(1):109-15. PMID: 18468829
235. Masroor I, Ahmed MN, Pasha S. To evaluate the role of sonography as an adjunct to mammography in women with dense breasts. J Pak Med Assoc 2009 May;59(5):298-301. PMID: 19438134
236. Masroor I, Afzal S, Sakhawat S, et al. Negative predictive value of mammography and sonography in mastalgia with negative physical findings. J Pak Med Assoc 2009 Sep;59(9):598-601. PMID: 19750852
237. McCavert M, O’Donnell ME, Aroori S, et al. Ultrasound is a useful adjunct to mammography in the assessment of breast tumours in all patients. Int J Clin Pract 2009 Nov;63(11):1589-94. PMID: 19686337
238. Su Y, An T, Wang D, et al. Evaluation of ultrasonic scores in differential diagnosis of breast solid lesions. J Diagn Med Sonogr 2009 Nov;25(6):310-5.
239. Barnard S, Leen E, Cooke T, et al. A contrast-enhanced ultrasound study of benign and malignant breast tissue. S Afr Med J 2008 May;98(5):386-91. PMID: 18637311
240. Bilali M, Lagoudianakis EE, Peitsidis P, et al. The role of sonography in the diagnosis of cystic lesions of the breast. Eur J Gynaecol Oncol 2009;30(5):506-8. PMID: 19899402
241. Forsberg F, Kuruvilla B, Pascua MB, et al. Comparing contrast-enhanced color flow imaging and pathological measures of breast lesion vascularity. Ultrasound Med Biol 2008 Sep;34(9):1365-72. PMID: 18436369
242. Kang SS, Ko EY, Han BK, et al. Breast US in patients who had microcalcifications with low concern of malignancy on screening mammography. Eur J Radiol 2008 Aug;67(2):285-91. PMID: 17703906
243. Kwak JY, Kim EK, Kim MJ, et al. Power Doppler sonography: evaluation of solid breast lesions and correlation with lymph node metastasis. Clin Imaging 2008 May;32(3):167-71. PMID: 18502342
244. LeCarpentier GL, Roubidoux MA, Fowlkes JB, et al. Suspicious breast lesions: assessment of 3D Doppler US indexes for classification in a test population and fourfold cross-validation scheme. Radiology 2008 Nov;249(2):463-70. PMID: 18936310
245. Park YM, Kim EK, Lee JH, et al. Palpable breast masses with probably benign morphology at sonography: can biopsy be deferred? Acta Radiol 2008 Dec;49(10):1104-11. PMID: 18855166
246. Singh K, Azad T, Gupta GD. The accuracy of ultrasound in diagnosis of palpable breast lumps. Jk Sci 2008;10(4):186-8.
247. Wenkel E, Heckmann M, Heinrich M, et al. Automated breast ultrasound: lesion detection and BI-RADS classification--a pilot study. ROFO Fortschr Geb Rontgenstr Nuklearmed 2008 Sep;180(9):804-8. PMID: 18704878

D-35
248. Abbattista T, Serri L, Busilacchi P. Three-dimensional sonographic study of breast nodules. J Ultrasound 2007 Jun;10(2):93-8.
249. Ballesio L, Maggi C, Savelli S, et al. Adjunctive diagnostic value of ultrasonography evaluation in patients with suspected ductal breast disease. Radiol Med 2007 Apr;112(3):354-65. PMID: 17440697
250. Mercadante S, Intravaia G, Villari P, et al. Intrathecal treatment in cancer patients unresponsive to multiple trials of systemic opioids. Clin J Pain 2007 Nov;23(9):793-8. PMID: 18075407
251. Costantini M, Belli P, Ierardi C, et al. Solid breast mass characterisation: use of the sonographic BI-RADS classification. Radiol Med 2007 Sep;112(6):877-94. PMID: 17885742
252. Graf O, Helbich TH, Hopf G, et al. Probably benign breast masses at US: is follow-up an acceptable alternative to biopsy? Radiology 2007 Jul;244(1):87-93. PMID: 17581897
253. Jiang YX, Liu H, Liu JB, et al. Breast tumor size assessment: comparison of conventional ultrasound and contrast-enhanced ultrasound. Ultrasound Med Biol 2007 Dec;33(12):1873-81. PMID: 17686569
254. Osako T, Iwase T, Takahashi K, et al. Diagnostic mammography and ultrasonography for palpable and nonpalpable breast cancer in women aged 30 to 39 years. Breast Cancer 2007;14(3):255-9. PMID: 17690501
255. Prasad SN, Houserkova D. A comparison of mammography and ultrasonography in the evaluation of breast masses. Biomed Pap Med Fac Univ Palacky Olomouc Czech Repub 2007 Dec;151(2):315-22. PMID: 18345271
256. Scaperrotta G, Ferranti C, Costa C, et al. Role of sonoelastography in non-palpable breast lesions. Eur Radiol 2008 Nov;18(11):2381-9. PMID: 18523780
257. Thomas A, Warm M, Hoopmann M, et al. Tissue Doppler and strain imaging for evaluating tissue elasticity of breast lesions. Acad Radiol 2007 May;14(5):522-9. PMID: 17434065
258. Costantini M, Belli P, Lombardi R, et al. Characterization of solid breast masses: use of the sonographic breast imaging reporting and data system lexicon. J Ultrasound Med 2006 May;25(5):649-59. PMID: 16632790
259. Del FC, Bestagno A, Cerniato R, et al. Sonographic criteria for differentiation of benign and malignant solid breast lesions: size is of value. Radiol Med 2006 Sep;111(6):783-96. PMID: 16896562
260. Grunwald S, Bojahr B, Schwesinger G, et al. Mammary ductoscopy for the evaluation of nipple discharge and comparison with standard diagnostic techniques. J Minim Invasive Gynecol 2006 Sep;13(5):418-23. PMID: 16962525
261. Malik G, Waqar F, Buledi GQ. Sonomammography for evaluation of solid breast masses in young patients. J Ayub Med Coll Abbottabad 2006 Apr;18(2):34-7. PMID: 16977811
262. Regner DM, Hesley GK, Hangiandreou NJ, et al. Breast lesions: evaluation with US strain imaging--clinical experience of multiple observers. Radiology 2006 Feb;238(2):425-37. PMID: 16436810
263. Thomas A, Kummel S, Fritzsche F, et al. Real-time sonoelastography performed in addition to B-mode ultrasound and mammography: improved differentiation of breast lesions? Acad Radiol 2006 Dec;13(12):1496-504. PMID: 17138118
264. Adepoju LJ, Chun J, El-Tamer M, et al. The value of clinical characteristics and breast-imaging studies in predicting a histopathologic diagnosis of cancer or high-risk lesion in patients with spontaneous nipple discharge. Am J Surg 2005 Oct;190(4):644-6. PMID: 16164940
265. Baez E, Strathmann K, Vetter M, et al. Likelihood of malignancy in breast lesions characterised by ultrasound with a combined diagnostic score. Ultrasound Med Biol 2005 Feb;31(2):179-84. PMID: 15708456
266. Berg WA. Sonographically depicted breast clustered microcysts: is follow-up appropriate? AJR Am J Roentgenol 2005 Oct;185(4):952-9. PMID: 16177414
D-36
267. Cawson JN. Can sonography be used to help differentiate between radial scars and breast cancers? Breast 2005 Oct;14(5):352-9. PMID: 16216736
268. Cha JH, Moon WK, Cho N, et al. Differentiation of benign from malignant solid breast masses: conventional US versus spatial compound imaging. Radiology 2005 Dec;237(3):841-6. PMID: 16304106
269. Cho KR, Seo BK, Lee JY, et al. A comparative study of 2D and 3D ultrasonography for evaluation of solid breast masses. Eur J Radiol 2005 Jun;54(3):365-70. PMID: 15899337
270. Eljuga L, Susac I. The value of diagnostic methods to detect pathologic changes in the breast. Libri Oncologici 2005;33(1-3):7-14.
271. Nagashima T, Hashimoto H, Oshida K, et al. Ultrasound Demonstration of Mammographically Detected Microcalcifications in Patients with Ductal Carcinoma in situ of the Breast. Breast Cancer 2005;12(3):216-20. PMID: 16110292
272. Shahid R, Ghaffar A, Bhatti AM. Role of grey scale ultrasound in benign and malignant breast lesions. J Coll Physicians Surg Pak 2005 Apr;15(4):193-5. PMID: 15857587
273. Szabo BK, Saracco A, Wilczek B, et al. Adjunctive diagnostic value of targeted electrical impedance imaging to conventional methods in the evaluation of breast lesions. Acta Radiol 2005 Dec;46(8):782-90. PMID: 16392602
274. Tohno E, Ueno E. Ultrasound (US) diagnosis of nonpalpable breast cancer. Breast Cancer 2005;12(4):267-71. PMID: 16286906
275. Tumyan L, Hoyt AC, Bassett LW. Negative predictive value of sonography and mammography in patients with focal breast pain. Breast J 2005 Sep;11(5):333-7. PMID: 16174154
276. Benson SR, Blue J, Judd K, et al. Ultrasound is now better than mammography for the detection of invasive breast cancer. Am J Surg 2004 Oct;188(4):381-5. PMID: 15474430
277. Chen SC, Cheung YC, Su CH, et al. Analysis of sonographic features for the differentiation of benign and malignant breast tumors of different sizes. Ultrasound Obstet Gynecol 2004 Feb;23(2):188-93. PMID: 14770402
278. Cid JA, Rampaul RS, Ellis IO, et al. Woman feels breast lump--surgeon cannot: the role of ultrasound in arbitration. Eur J Cancer 2004 Sep;40(14):2053-5. PMID: 15341978
279. del Cura JL, Elizagaray E, Zabala R, et al. The use of unenhanced Doppler sonography in the evaluation of solid breast lesions. AJR Am J Roentgenol 2005 Jun;184(6):1788-94. PMID: 15908531
280. Drukker K, Giger ML, Vyborny CJ, et al. Computerized detection and classification of cancer on breast ultrasound. Acad Radiol 2004 May;11(5):526-35. PMID: 15147617
281. Foxcroft LM, Evans EB, Porter AJ. The diagnosis of breast cancer in women younger than 40. Breast 2004 Aug;13(4):297-306. PMID: 15325664
282. Georgian-Smith D, Kricun B, McKee G, et al. The mammary hamartoma: appreciation of additional imaging characteristics. J Ultrasound Med 2004 Oct;23(10):1267-73. PMID: 15448315
283. Murad M, Bari V. Ultrasound differentiation of benign versus malignant solid breast masses. J Coll Physicians Surg Pak 2004 Mar;14(3):166-9. PMID: 15228851
284. Santamaria G, Velasco M, Farre X, et al. Power Doppler sonography of invasive breast carcinoma: does tumor vascularization contribute to prediction of axillary status? Radiology 2005 Feb;234(2):374-80. PMID: 15601892
285. Sehgal CM, Cary TW, Kangas SA, et al. Computer-based margin analysis of breast sonography for differentiating malignant and benign masses. J Ultrasound Med 2004 Sep;23(9):1201-9. PMID: 15328435
286. Selinko VL, Middleton LP, Dempsey PJ. Role of sonography in diagnosing and staging invasive lobular carcinoma. J Clin Ultrasound 2004 Sep;32(7):323-32. PMID: 15293298

D-37
287. Strano S, Gombos EC, Friedland O, et al. Color Doppler imaging of fibroadenomas of the breast with histopathologic correlation. J Clin Ultrasound 2004 Sep;32(7):317-22. PMID: 15293297
288. Yang WT, Tse GM. Sonographic, mammographic, and histopathologic correlation of symptomatic ductal carcinoma in situ. AJR Am J Roentgenol 2004 Jan;182(1):101-10. PMID: 14684521
289. Zonderland HM, Pope Jr TL, Nieborg AJ. The positive predictive value of the breast imaging reporting and data system (BI-RADS) as a method of quality assessment in breast imaging in a hospital population. Eur Radiol 2004;14(10):1743-50.
290. Chen WM, Chang RF, Moon WK, et al. Breast cancer diagnosis using three-dimensional ultrasound and pixel relation analysis. Ultrasound Med Biol 2003 Jul;29(7):1027-35. PMID: 12878249
291. Chen SC, Cheung YC, Lo YF, et al. Sonographic differentiation of invasive and intraductal carcinomas of the breast. Br J Radiol 2003 Sep;76(909):600-4. PMID: 14500273
292. Drukker K, Giger ML, Mendelson EB. Computerized analysis of shadowing on breast ultrasound for improved lesion detection. Med Phys 2003 Jul;30(7):1833-42. PMID: 12906202
293. Flobbe K, Bosch AM, Kessels AG, et al. The additional diagnostic value of ultrasonography in the diagnosis of breast cancer. Arch Intern Med 2003 May 26;163(10):1194-9. PMID: 12767956
294. Szopinski KT, Pajk AM, Wysocki M, et al. Tissue harmonic imaging: utility in breast sonography. J Ultrasound Med 2003 May;22(5):479-87. PMID: 12751859
295. Martinez AM, Medina CJ, Bustos C, et al. Assessment of breast lesions using Doppler with contrast agents. Eur J Gynaecol Oncol 2003;24(6):527-30. PMID: 14658595
296. Mesaki K, Hisa N, Kubota K, et al. Differentiation of benign and malignant breast tumors using Doppler spectral parameters including acceleration time index. Oncol Rep (Athens) 2003 Jul;10(4):945-50. PMID: 12792750
297. Park JM, Yoon GS, Kim SM, et al. Sonographic detection of multifocality in breast carcinoma. J Clin Ultrasound 2003 Jul;31(6):293-8. PMID: 12811787
298. Puglisi F, Zuiani C, Bazzocchi M, et al. Role of mammography, ultrasound and large core biopsy in the diagnostic evaluation of papillary breast lesions. Oncology 2003;65(4):311-5. PMID: 14707450
299. Shetty MK, Shah YP, Sharman RS. Prospective evaluation of the value of combined mammographic and sonographic assessment in patients with palpable abnormalities of the breast. J Ultrasound Med 2003 Mar;22(3):263-8. PMID: 12636326
300. Chen DR, Chang RF, Lee JH, et al. Three-dimensional breast ultrasound imaging in patients with nipple discharge: a pictorial review of 27 patients. J Med Ultrasound 2002;10(2):69-75.
301. Chen DR, Kuo WJ, Chang RF, et al. Use of the bootstrap technique with small training sets for computer-aided diagnosis in breast ultrasound. Ultrasound Med Biol 2002 Jul;28(7):897-902. PMID: 12208332
302. Germer U, Tetzlaff A, Geipel A, et al. Strong impact of estrogen environment on Doppler variables used for differentiation between benign and malignant breast lesions. Ultrasound Obstet Gynecol 2002 Apr;19(4):380-5. PMID: 11952968
303. Gunhan-Bilgen I, Ustun EE, Memis A. Inflammatory breast carcinoma: mammographic, ultrasonographic, clinical, and pathologic findings in 142 cases. Radiology 2002 Jun;223(3):829-38. PMID: 12034956
304. Krestan CR, Riedl C, Memarsadeghi M, et al. 3D-power Doppler ultrasound of breast lesions with a microbubble contrast agent. Acad Radiol 2002 Aug;9 Suppl 2:S384-S385. PMID: 12188284
305. Kuo WJ, Chang RF, Lee CC, et al. Retrieval technique for the diagnosis of solid breast tumors on sonogram. Ultrasound Med Biol 2002 Jul;28(7):903-9. PMID: 12208333
306. Kuo WJ, Chang RF, Moon WK, et al. Computer-aided diagnosis of breast tumors with different US systems. Acad Radiol 2002 Jul;9(7):793-9. PMID: 12139093

D-38
307. Lee SW, Choi HY, Baek SY, et al. Role of color and power doppler imaging in differentiating between malignant and benign solid breast masses. J Clin Ultrasound 2002 Oct;30(8):459-64. PMID: 12242733
308. Muttarak M, Pojchamarnwiputh S, Chaiwun B. Mammographic and ultrasonographic features of benign and malignant phyllodes tumours. Asian Oceanian J Radiol 2002;7(1):9-15.
309. Tan SM, Behranwala KA, Trott PA, et al. A retrospective study comparing the individual modalities of triple assessment in the pre-operative diagnosis of invasive lobular breast carcinoma. Eur J Surg Oncol 2002;28(3):203-8. PMID: 11944950
310. Taylor KJ, Merritt C, Piccoli C, et al. Ultrasound as a complement to mammography and breast examination to characterize breast masses. Ultrasound Med Biol 2002 Jan;28(1):19-26. PMID: 11879948
311. Wang HC, Chen DR, Kao CH, et al. Detecting breast cancer in mammographically dense breasts: comparing technetium-99m tetrofosmin mammoscintigraphy and ultrasonography. Cancer Invest 2002;20(7-8):932-8. PMID: 12449724
312. Wang HC, Sun SS, Kao A, et al. Comparison of technetium-99m methoxyisobutylisonitrile scintimammography and ultrasonography in the diagnosis of breast cancer in patients with mammographically dense breast. Cancer Invest 2002;20(3):318-23. PMID: 12025226
313. Yilmaz E, Lebe B, Balci P, et al. Comparison of mammographic and sonographic findings in typical and atypical medullary carcinomas of the breast. Clin Radiol 2002 Jul;57(7):640-5. PMID: 12096865
314. Allen SA, Cunliffe WJ, Gray J, et al. Pre-operative estimation of primary breast cancer size: a comparison of clinical assessment, mammography and ultrasound. Breast 2001 Aug;10(4):299-305. PMID: 14965598
315. Arger PH, Sehgal CM, Conant EF, et al. Interreader variability and predictive value of US descriptions of solid breast masses: pilot study. Acad Radiol 2001 Apr;8(4):335-42. PMID: 11293782
316. Bhatti PT, LeCarpentier GL, Roubidoux MA, et al. Discrimination of sonographically detected breast masses using frequency shift color Doppler imaging in combination with age and gray scale criteria. J Ultrasound Med 2001 Apr;20(4):343-50. PMID: 11316312
317. Chou YH, Tiu CM, Hung GS, et al. Stepwise logistic regression analysis of tumor contour features for breast ultrasound diagnosis. Ultrasound Med Biol 2001 Nov;27(11):1493-8. PMID: 11750748
318. Cwikla JB, Buscombe JR, Holloway B, et al. Can scintimammography with (99m)Tc-MIBI identify multifocal and multicentric primary breast cancer? Nucl Med Commun 2001 Dec;22(12):1287-93. PMID: 11711898
319. Ozdemir A, Ozdemir H, Maral I, et al. Differential diagnosis of solid breast lesions: contribution of Doppler studies to mammography and gray scale imaging. J Ultrasound Med 2001 Oct;20(10):1091-101. PMID: 11587016
320. Rosen EL, Soo MS. Tissue harmonic imaging sonography of breast lesions: improved margin analysis, conspicuity, and image quality compared to conventional ultrasound. Clin Imaging 2001 Nov;25(6):379-84. PMID: 11733148
321. Soo MS, Rosen EL, Baker JA, et al. Negative predictive value of sonography with mammography in patients with palpable breast lesions. AJR Am J Roentgenol 2001 Nov;177(5):1167-70. PMID: 11641195
322. Whitehouse PA, Baber Y, Brown G, et al. The use of ultrasound by breast surgeons in outpatients: an accurate extension of clinical diagnosis. Eur J Surg Oncol 2001 Nov;27(7):611-6. PMID: 11669586
323. Chaudhari MH, Forsberg F, Voodarla A, et al. Breast tumor vascularity identified by contrast enhanced ultrasound and pathology: initial results. Ultrasonics 2000 Mar;38(1-8):105-9. PMID: 10829638

D-39
324. Choi HY, Kim HY, Baek SY, et al. Significance of resistive index in color Doppler ultrasonogram: differentiation between benign and malignant breast masses. Clin Imaging 1999 Sep;23(5):284-8. PMID: 10665344
325. Evans N, Lyons K. The use of ultrasound in the diagnosis of invasive lobular carcinoma of the breast less than 10 mm in size. Clin Radiol 2000 Apr;55(4):261-3. PMID: 10767184
326. Klaus AJ, Klingensmith WC, III, Parker SH, et al. Comparative value of 99mTc-sestamibi scintimammography and sonography in the diagnostic workup of breast masses. AJR Am J Roentgenol 2000 Jun;174(6):1779-83. PMID: 10845522
327. Madjar H, Prompeler HJ, Del FC, et al. A new Doppler signal enhancing agent for flow assessment in breast lesions. Eur J Ultrasound 2000 Dec;12(2):123-30. PMID: 11118919
328. Stuhrmann M, Aronius R, Schietzel M. Tumor vascularity of breast lesions: potentials and limits of contrast-enhanced Doppler sonography. AJR Am J Roentgenol 2000 Dec;175(6):1585-9. PMID: 11090380
329. Thibault F, Meunier M, Klijanienko J, et al. Diagnostic accuracy of sonography and combined sonographic assessment and sonographically guided cytology in nonpalpable solid breast lesions. J Clin Ultrasound 2000 Oct;28(8):387-98. PMID: 10993966
330. Baker JA, Kornguth PJ, Soo MS, et al. Sonography of solid breast lesions: observer variability of lesion description and assessment. AJR Am J Roentgenol 1999 Jun;172(6):1621-5. PMID: 10350302
331. Blohmer JU, Oellinger H, Grineisen Y, et al. Changes in spectral Doppler measurement of V(max) after administration of an ultrasound contrast agent - A possible new variable for the differential diagnosis of breast lesions. Tumordiagn Ther 1999 Dec;20(6):164-70.
332. Chao TC, Lo YF, Chen SC, et al. Color Doppler ultrasound in benign and malignant breast tumors. Breast Cancer Res Treat 1999 Sep;57(2):193-9. PMID: 10598046
333. Eltahir A, Jibril JA, Squair J, et al. The accuracy of ‘one-stop’ diagnosis for 1,110 patients presenting to a symptomatic breast clinic. J R Coll Surg Edinb 1999 Aug;44(4):226-30. PMID: 10453144
334. Huang CS, Wu CY, Chu JS, et al. Microcalcifications of non-palpable breast lesions detected by ultrasonography: correlation with mammography and histopathology. Ultrasound Obstet Gynecol 1999 Jun;13(6):431-6. PMID: 10423808
335. Kook SH, Park HW, Lee YR, et al. Evaluation of solid breast lesions with power Doppler sonography. J Clin Ultrasound 1999 Jun;27(5):231-7. PMID: 10355886
336. Moss HA, Britton PD, Flower CDR, et al. How reliable is modern breast imaging in differentiating benign from malignant breast lesions in the symptomatic population? Clin Radiol 1999;54(10):676-82. PMID: 10541394
337. Obwegeser R, Berghammer P, Kubista E. Accuracy of 99mTc-sestamibi scintimammography for breast cancer diagnosis. Lancet 1999 Jun 5;353(9168):1938. PMID: 10371578
338. Rahbar G, Sie AC, Hansen GC, et al. Benign versus malignant solid breast masses: US differentiation. Radiology 1999 Dec;213(3):889-94. PMID: 10580971
339. Rotten D, Levaillant JM, Zerat L. Analysis of normal breast tissue and of solid breast masses using three-dimensional ultrasound mammography. Ultrasound Obstet Gynecol 1999 Aug;14(2):114-24. PMID: 10492871
340. Skaane P. The additional value of US to mammography in the diagnosis of breast cancer. A prospective study. Acta Radiol 1999 Sep;40(5):486-90. PMID: 10485236
341. Zonderland HM, Coerkamp EG, Hermans J, et al. Diagnosis of breast cancer: contribution of US as an adjunct to mammography. Radiology 1999 Nov;213(2):413-22. PMID: 10551221
342. Brnic Z, Drinkovic I, Hebrang A. High-resolution ultrasound and power-Doppler - advances in pre-invasive diagnosis of solid breast lesions: our one-year experience. Radiol Oncol 1998;32(4):353-61.

D-40
343. Carson PL, Fowlkes JB, Roubidoux MA, et al. 3-D color Doppler image quantification of breast masses. Ultrasound Med Biol 1998 Sep;24(7):945-52. PMID: 9809628
344. Delorme S, Zuna I, Huber S, et al. Colour Doppler sonography in breast tumours: an update. Eur Radiol 1998;8(2):189-93. PMID: 9477264
345. Giuseppetti GM, Baldassarre S, Marconi E. Color Doppler sonography. Eur J Radiol 1998 May;27 Suppl 2:S254-S258. PMID: 9652531
346. Hayashi N, Miyamoto Y, Nakata N, et al. Breast masses: color Doppler, power Doppler, and spectral analysis findings. J Clin Ultrasound 1998 Jun;26(5):231-8. PMID: 9608365
347. Huber S, Helbich T, Kettenbach J, et al. Effects of a microbubble contrast agent on breast tumors: computer-assisted quantitative assessment with color Doppler US--early experience. Radiology 1998 Aug;208(2):485-9. PMID: 9680580
348. Wright IA, Pugh ND, Lyons K, et al. Power Doppler in breast tumours: a comparison with conventional colour Doppler imaging. Eur J Ultrasound 1998 Aug;7(3):175-81. PMID: 9700212
349. Cabasares HV. Office-based breast ultrasonography in a small community surgical practice. Am Surg 1997 Aug;63(8):716-9. PMID: 9247440
350. Jain M, Bhargava SK, Narang P. Color doppler ultrasonography study of palpable breast lumps - a pilot study. Indian J Radiol Imaging 1997;7(2):79-82.
351. Madjar H, Sauerbrei W, Prompeler HJ, et al. Color Doppler and duplex flow analysis for classification of breast lesions. Gynecol Oncol 1997 Mar;64(3):392-403. PMID: 9062140
352. Muller-Schimpfle M, Stoll P, Stern W, et al. Do mammography, sonography, and MR mammography have a diagnostic benefit compared with mammography and sonography? AJR Am J Roentgenol 1997 May;168(5):1323-9. PMID: 9129436
353. Raza S, Baum JK. Solid breast lesions: evaluation with power Doppler US. Radiology 1997 Apr;203(1):164-8. PMID: 9122386
354. Schelling M, Gnirs J, Braun M, et al. Optimized differential diagnosis of breast lesions by combined B-mode and color Doppler sonography. Ultrasound Obstet Gynecol 1997 Jul;10(1):48-53. PMID: 9263423
355. Skaane P, Engedal K, Skjennald A. Interobserver variation in the interpretation of breast imaging. Comparison of mammography, ultrasonography, and both combined in the interpretation of palpable noncalcified breast masses. Acta Radiol 1997 Jul;38(4 Pt 1):497-502. PMID: 9240666
356. Yang WT, Suen M, Ahuja A, et al. In vivo demonstration of microcalcification in breast cancer using high resolution ultrasound. Br J Radiol 1997 Jul;70(835):685-90. PMID: 9245879
357. Edde DJ. Whole-breast compression ultrasonography with the patient in the sitting position. Can Assoc Radiol J 1994 Aug;45(4):324-6. PMID: 8062127
358. Saitoh R, Kojima R, Ito K, et al. Real-time high resolution ultrasonography of solid breast masses: use of a 10-MHz mechanical sector transducer with a water bag. Radiat Med 1994 Sep;12(5):201-8. PMID: 7863023
Related Documents