7QC tools for Experiment Design and Problem Solving Surang Judistprasert Bio-innova & Synchron co.,ltd

Welcome message from author
This document is posted to help you gain knowledge. Please leave a comment to let me know what you think about it! Share it to your friends and learn new things together.
Transcript

7QC tools for Experiment Design and
Problem Solving
Surang Judistprasert
Bio-innova & Synchron co.,ltd

QbD - Regulatory insights ICH Q8 (R2)
The product is designed to meet patient
requirements
The process is designed to consistently meet the product’s critical
quality attributes & is continuously monitored and updated to assure
consistent quality over time
The impact of starting materials and process parameters on
product quality is understood
Critical sources of process variability are identified and controlled
Good science leads to better quality product, fewer product rejects/recalls, and enhanced public
health protection

QbD - Regulatory insights ICH Q8
(R2) Pharmaceutical Development
“The level of development will depend on the complexity of
the process and the product and on the opportunities
chosen or wanted by the applicant.”
Proposed by applicant, and approved by regulator, based
on demonstrated product knowledge and process
understanding
Degree of regulatory flexibility is determined by the level and
relevance of the scientific knowledge provided
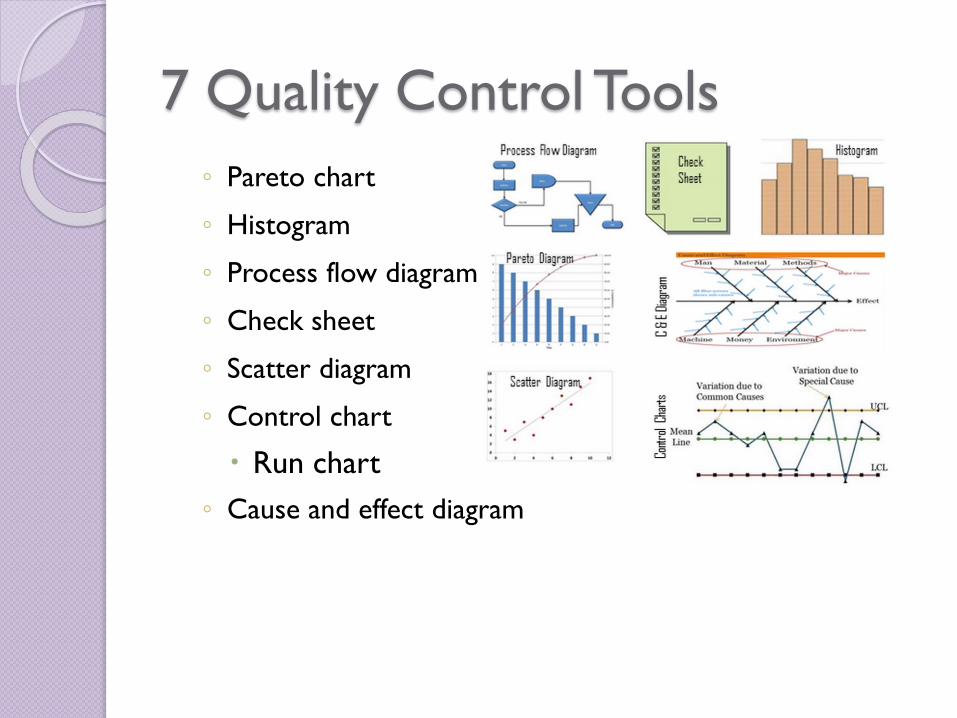
7 Quality Control Tools
◦ Pareto chart
◦ Histogram
◦ Process flow diagram
◦ Check sheet
◦ Scatter diagram
◦ Control chart
Run chart
◦ Cause and effect diagram

How to apply 7QC tools in DOE
Cause and effect diagram
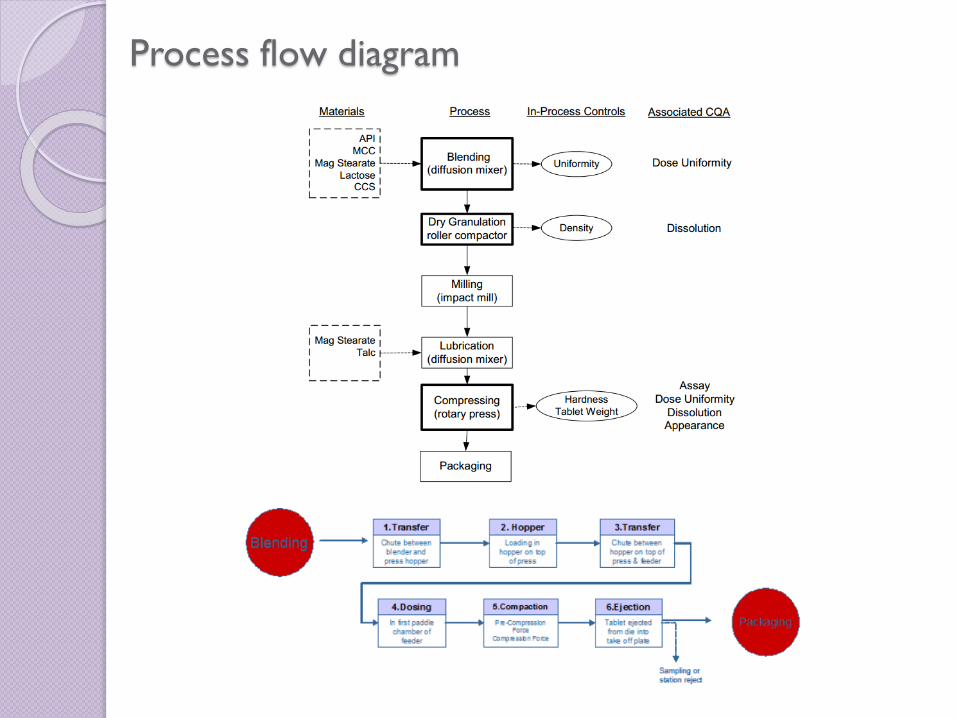
Process flow diagram

Check sheet
A series of multivariate analyses, including DoE, was
undertaken to investigate the relationship between the
input attributes, compression process parameters and
output attributes
DOE1 = screening all parameter for find no impact
parameters
DOE2 = investigate more fully impact parameter to
Quality attributes. Find target range of parameters
DOE3 = investigate impact of the range of input on
target process parameter
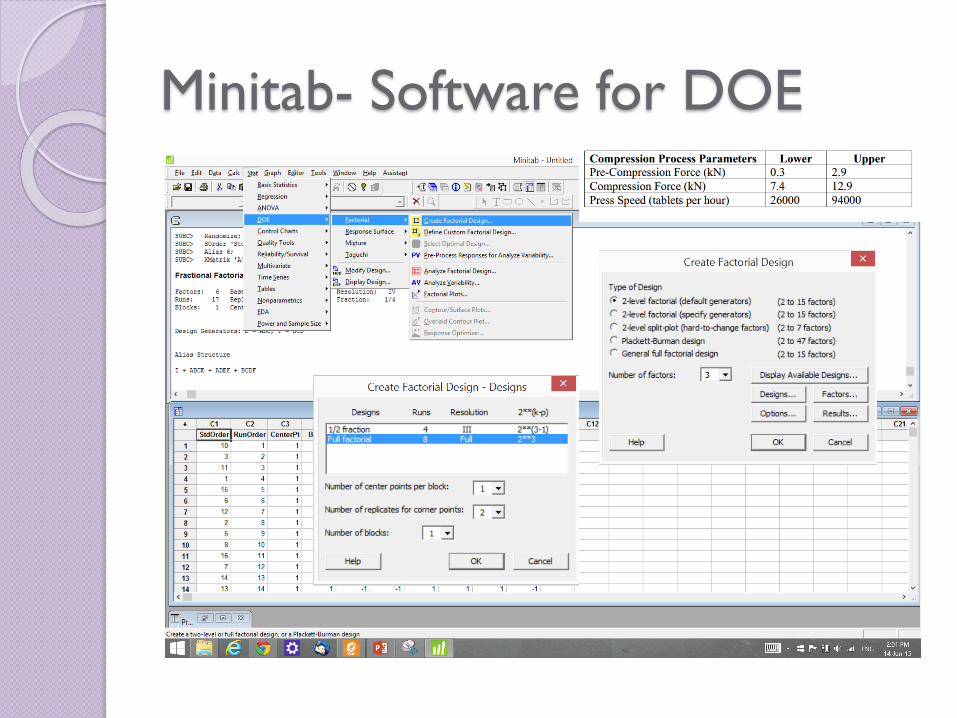
Minitab- Software for DOE
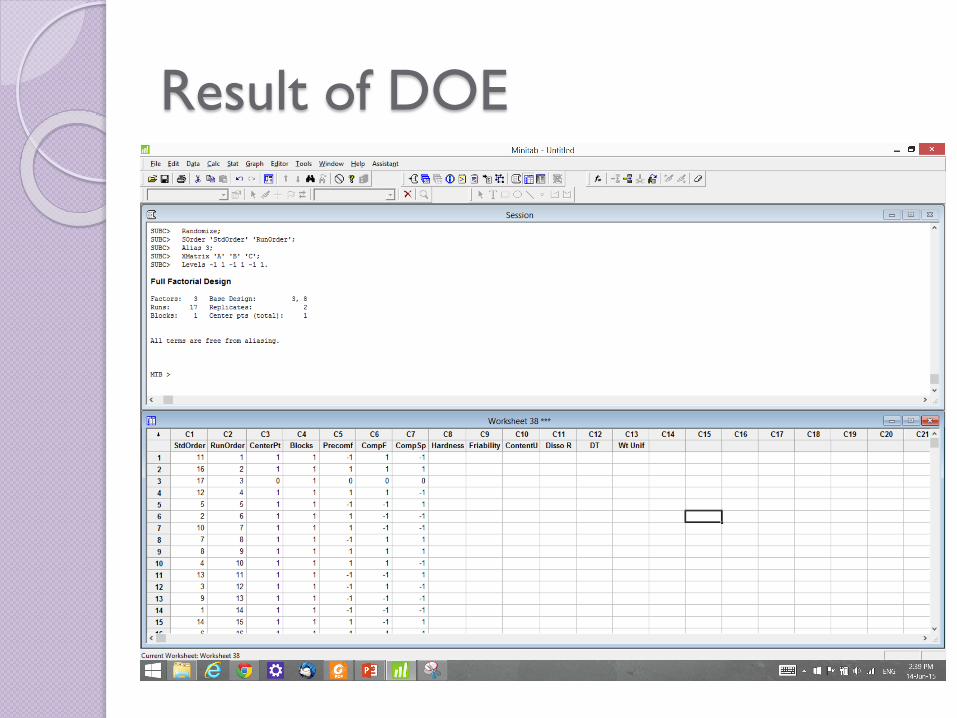
Result of DOE

Scatter diagram
Example for investigate range of
compression parameter
Study of effect parameter X
on Y = scatter diagram e.g.
stability trend

Pareto diagram (80/20)
28
16
12 12
64 3
0
5
10
15
20
25
30
Loose
Threads
Stitching
flaws
Button
problems
Material
flaws
Vilfredo Pareto (1848-1923)
Italian economist
20% of the population has
80% of the wealth
Juran used the term “vital few,
trivial many”. He noted that 20%
of the quality problems caused
80% of the dollar loss.
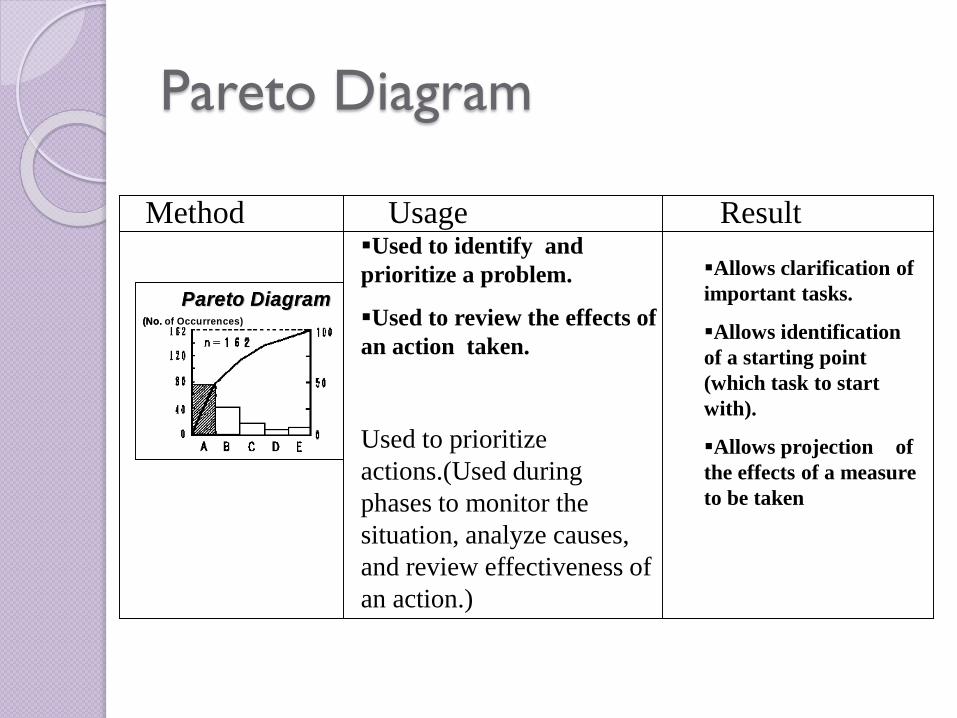
Pareto Diagram
Pareto Diagram Pareto Diagram
( No. of Occurrences)
Pareto Diagram Pareto Diagram
( No. of Occurrences)
Used to prioritize
actions.(Used during
phases to monitor the
situation, analyze causes,
and review effectiveness of
an action.)
Used to identify and
prioritize a problem.
Used to review the effects of
an action taken.
Allows clarification of
important tasks.
Allows identification
of a starting point
(which task to start
with).
Allows projection of
the effects of a measure
to be taken
Method Usage Result

Histogram

Control chart – run chart
Run/trend

Benefit of 7QC tools
Identifies problems Give importance for planning Stress to importance of the process Priorities task Encourage everyone to think
systematically

Example ACE tablets

Q&A
Related Documents