I Circular 282 August 1985 f1t4 Alabama Agricultural Experiment Station Auburn University Gale A. Buchanan, Director Auburn University, Alabama 7',;. ,,, Ir, 4. 4,- Yid'' iA x ti

Welcome message from author
This document is posted to help you gain knowledge. Please leave a comment to let me know what you think about it! Share it to your friends and learn new things together.
Transcript

I
Circular 282August 1985 f1t4
Alabama Agricultural Experiment Station Auburn UniversityGale A. Buchanan, Director Auburn University, Alabama
7',;.
,,,Ir,
4.
4,- Yid'' iA x
ti

CONTENTSPage
INTRODUCTION ................................................... .................... 3MATERIALS AND METHODS ................................. .................... 4RESULTS AND DISCUSSION .................................. ..................... 9CONCLUSION .................................................... .................... 11LITERATURE CITED ........................................ ..................... 27
FIRST PRINTI'ING 3M, JULY 1985
Information contained herein is available to all personswithout regard to race, color, sex, or national origin.
Nutrient Content of Nursery-GrownLoblolly Pine Seedlings
James N. Boyer and David B. South'
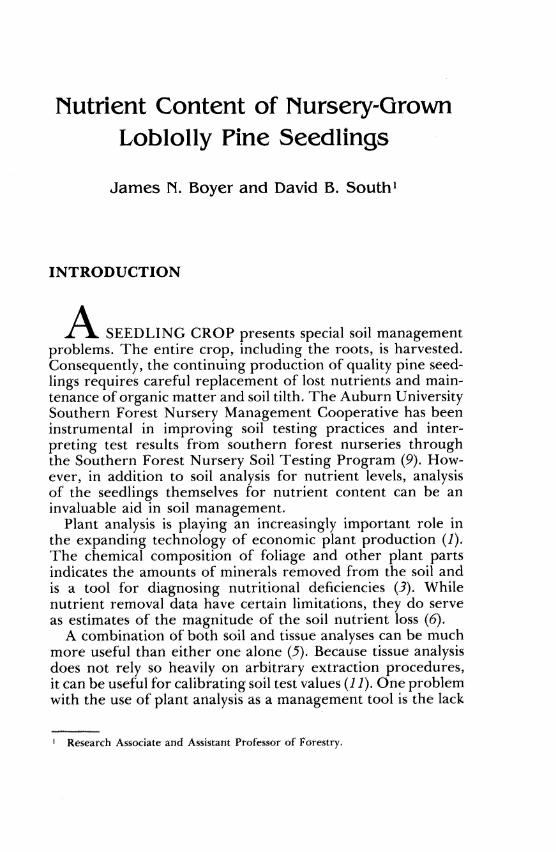
INTRODUCTION
A SEEDLING CROP presents special soil managementproblems. The entire crop, including the roots, is harvested.Consequently, the continuing production of quality pine seed-lings requires careful replacement of lost nutrients and main-tenance of organic matter and soil tilth. The Auburn UniversitySouthern Forest Nursery Management Cooperative has beeninstrumental in improving soil testing practices and inter-preting test results from southern forest nurseries throughthe Southern Forest Nursery Soil Testing Program (9). How-ever, in addition to soil analysis for nutrient levels, analysisof the seedlings themselves for nutrient content can be aninvaluable aid in soil management.
Plant analysis is playing an increasingly important role inthe expanding technology of economic plant production (1).The chemical composition of foliage and other plant partsindicates the amounts of minerals removed from the soil andis a tool for diagnosing nutritional deficiencies (3). Whilenutrient removal data have certain limitations, they do serveas estimates of the magnitude of the soil nutrient loss (6).
A combination of both soil and tissue analyses can be muchmore useful than either one alone (5). Because tissue analysisdoes not rely so heavily on arbitrary extraction procedures,it can be useful for calibrating soil test values (11i). One problemwith the use of plant analysis as a management tool is the lack
1 Research Associate and Assistant Professor of Forestry.

of suitable reference standards (1). The objective of the re-search on which this publication is based was to provide rangesof nutrient levels which seedling producers may use to comparethe nutritional status of their loblolly pine (Pinus taeda L.)seedlings with that of seedlings sampled during 2 years at alarge number of nurseries.
MATERIALS AND METHODS
From late November 1981 to late January 1982, 21 forestnurseries in 10 Southern States were visited to sample loblollypine seedlings in production at that time. In December 1982,20 nurseries in six states were visited, including eight whichhad been sampled the previous season, figure 1. Randomnurseries were visited the first year and samples representingmany seed sources were chosen from an average area in thenursery. The second year, only nurseries which sowed Liv-ingston Parish (Louisiana) seed were visited, and an averagearea within that seed source was sampled.
FIG. 1. Locations of Southeast U. S. nurseries from which seedling samples weretaken for nutrient analysis.
[4]

At each nursery, one linear bed-foot sample (4 square feet)of 1-0 seedlings was hand-lifted. The sample was separatedinto foliage, stems, and roots. The plant components wereoven-dried, weighed, and chemically analyzed, table 1.
TABLE 1. DESCRIPTION OF METHODS EMPLOYED FOR TISSUE NUTRIENT ANALYSIS'
Element2 Method
N ..................... Kjeldahl digestion with H2S0 4 K2S0 2-Hg catalyst, distillation intostandard acid and titration.
P ...................... Dry ashed at 500°C and dissolved in 1:1 HC1. Phosphorus inextract determined colorimetrically.
Ca, Mg, K,Na, Zn, Mn,Fe, Cu, Al ........... Dry ashed at 500 0 C and dissolved in 1:1 HC1. Metals in extract
determined by atomic absorption.S ...................... Sample ashed with Mg (NO0) 2 . Sulfate in ash determined by BaS04
precipitation.B ...................... Dry ashed at 500 0 C and dissolved in 1:1 HCI. Boron in extract
determined by Azomethine-H colorimetric method.
'Analyses performed by A&L Laboratories, Memphis, Tennessee.'Element abbreviations: N = itrogen, P - phosphorus, Ca = calcium, Mg =
magnesium, K = potassium, Na sodium, Zn = zinc, Mn = manganese, Fe -=iron,
Cu = copper, Al = aluminum,S-- sulfur, and B = boron.
Nutrient levels are reported as a percent of dry weight oras parts per million by dry weight (p.p.m.). The median,minimum, and maximum values for these data are listed intable 2 for the different plant components. From these dataand plant dry weights, calculations were made of the poundsper acre (total area, including tractor paths) of each soilnutrient removed from the soil by the seedling crop. Themedian, minimum, and maximum values for soil nutrientremoval are listed in table 3. Table 4 shows nutrient removalvalues as milligrams per seedling. Histograms are used to showthe distributions of seedling dry weights, figure 2, nutrientlevels for each plant component, and the total amount of eachnutrient removed from the soil, figures 3-15. Bar heights inthese figures refer to the percent of the total number ofsamples having that value. Histograms are also used to showthe foliar concentrations of phosphorus, potassium, magne-sium, and calcium relative to nitrogen concentration, figure16. Only foliage samples with more than 1.2 percent and lessthan 2.0 percent nitrogen were included in this figure. Wheremeans for the two sampling seasons are significantly different,the portion of the distribution representing the first year ofsampling is shaded.
[5]

TABLE 2. MACRO- AND MICRONUTRIENT CONCENTRATIONS IN SAMPLE COMPONENTS OF LOBLOLLY PINE SEEDLINGS
ConcentrationTissue
N P K Mg Ca S Na Fe* Al* Mn* B Cu Zn
Pct. Pct. Pct. Pct. Pct. Pct. Pct. ppm. p.p.m. p.p.m. ppm. ppm. pp.FoliageMinimum..........0.92 0.12 0.82 0.03 0.22 0.05 0.01 107 340 85 10 2 30Median ............. 1.64 .21 1.12 .10 .30 .08 .02 412 650 518 17 6 55Maximum.......... 2.24 .30 1.47 .23 .66 .16 .12 2,150 6,380 1,350 65 10 87
StemsMinimum ............ 45 .10 .82 .05 .14 .02 .01 85 130 65 8 2 32Median.............. 95 .20 1.12 .11 .22 .06 .02 274 460 329 16 8 59Maximum.......... 1.79 .37 1.46 .16 .33 .19 .13 880 2,770 1,020 33 24 97
RootsMinimum........... .52 .12 .87 .03 .10 .04 .01 395 780 63 13 3 26Median.............. 85 .20 1.14 .10 .20 .08 .03 1,470 3,460 304 23 9 47Maximum........... 1.66 .39 1.53 .16 .31 .49 .22 3,410 15,270 733 47 26 94
*Contamination from soil makes these results of doubtful value.
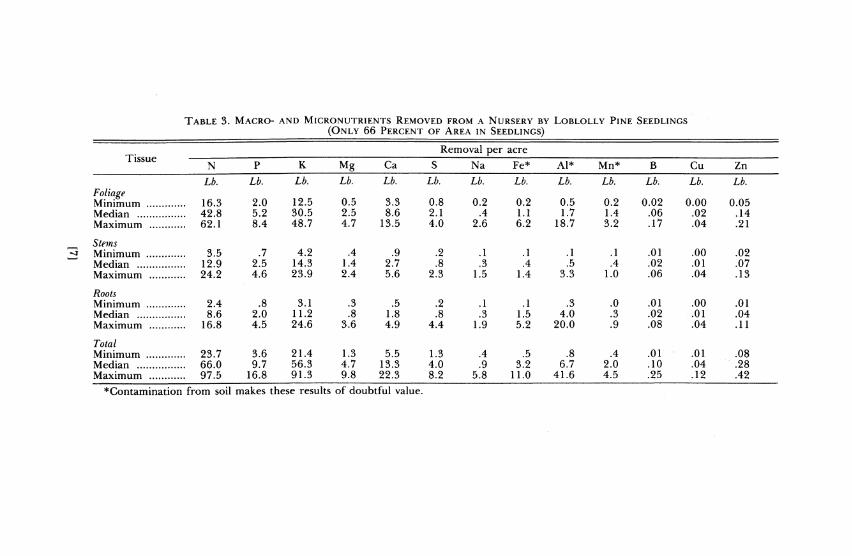
TABLE 3. MACRO- AND MICRONUTRIENTS REMOVED FROM A NURSERY BY LOBLOLLY PINE SEEDLINGS(ONLY 66 PERCENT OF AREA IN SEEDLINGS)
Removal per acreTissue
N P K Mg Ca S Na Fe* Al* Mn* B Cu Zn
Lb. Lb. Lb. Lb. Lb. Lb. Lb. Lb. Lb. Lb. Lb. Lb. Lb.FoliageMinimum .......... 16.3 2.0 12.5 0.5 3.3 0.8 0.2 0.2 0.5 0.2 0.02 0.00 0.05Median ............. 42.8 5.2 30.5 2.5 8.6 2.1 .4 1.1 1.7 1.4 .06 .02 .14Maximum ........... 62.1 8.4 48.7 4.7 13.5 4.0 2.6 6.2 18.7 3.2 .17 .04 .21
StemnsJ Minimum ........... 3.5 .7 4.2 .4 .9 .2 .1 .1 .1 .1 .01 .00 .02
Median .. .......... 12.9 2.5 14.3 1.4 2.7 .8 .3 .4 .5 .4 .02 .01 .07Maximum ........... 24.2 4.6 23.9 2.4 5.6 2.3 1.5 1.4 3.3 1.0 .06 .04 .13
RootsMinimum ............. 2.4 .8 3.1 .3 .5 .2 .1 .1 .3 .0 .01 .00 .01Median ............... 8.6 2.0 11.2 .8 1.8 .8 .3 1.5 4.0 .3 .02 .01 .04Maximum ............ 16.8 4.5 24.6 3.6 4.9 4.4 1.9 5.2 20.0 .9 .08 .04 .11
TotalMinimum ............ 23.7 3.6 21.4 1.3 5.5 1.3 .4 .5 .8 .4 .01 .01 .08Median .............. .. 66.0 9.7 56.3 4.7 13.3 4.0 .9 3.2 6.7 2.0 .10 .04 .28Maximum ........... 97.5 16.8 91.3 9.8 22.3 8.2 5.8 11.0 41.6 4.5 .25 .12 .42
*Contamination from soil makes these results of doubtful value.

TABLE 4. MACRO- AND MICRONU I RIEN CONTIFNT OF LOBLOLLY PINE SEEDLINGS
Amount per seedlingTissue N P K Mg Ca S Na Fe* Al* Mn* B Cu Zn111g tg tmg mg ag tmg tag tmg tag ng tag tag ag
FoliageMinimumii............. 12.0 1.3 6.6 0.3 2.3 0.5 0.1 0.1 0.3 0.1 0.01 0.00 0.03Median............. 21.6 2.7 14.5 1.2 4.3 1.0 .2 .6 .9 .7 .03 .01 .07Maximum.......... 30.7 4.5 26.2 3.1 7.3 2.4 1.5 3.9 11.4 1.5 .08 .02 .14
StemsMinimum ............ 1.7 .5 2.0 .2 .6 .1
00 Median.............. 6.4 1.2 7.3 .6 1.4 .4Maximum .......... 12.5 2.5 12.2 1.4 3.0 1.2
.0
.1.9
.0 .0
.2 .3
.7 2.0
RootsMinimum ............ 1.2 .3 1.5 .1 .3 .1 .0 .1 .1Median ............. 4.5 .9 5.4 .5 1.0 .4 .2 .8 1.7Maximum .......... 7.9 2.4 11.6 1.7 2.6 2.3 1.2 2.8 12.5
.0 .00 .00 .01
.2 .01 .01 .04
.5 .03 .02 .06
.0 .00 .00 .01
.1 .01 .00 .02
.5 .03 .02 .06
TotalMinimum........... 16.2 2.6 10.1 .7 3.7 .7 .2 .2 .4 .2 .02 .00 .06Median .............. 32.5 4.9 27.1 2.3 6.7 1.9 .5 1.7 3.4 1.1 .05 .02 .13Maximum .......... 50.4 9.2 49.2 5.2 12.0 4.4 3.4 6.8 26.0 2.3 .14 .06 .25
*Contamination from soil makes these results of doubtful value.

RESULTS AND DISCUSSION
Nutrient concentrations reported for this survey are gen-erally comparable to values found elsewhere, although somedifferences may occur due to varying methods used for analysis.Most studies of plant nutrient content involve only the foliage.However, in this survey, stems and roots combined containednearly three-fourths as much nutrients as did the foliage.Furthermore, while studies usually report nutrient concentra-tion in the tissue, it is important for the nurseryman to thinkin terms of soil nutrient depletion by plant removal. Thisinformation, together with soil test results and informationon leaching amounts and the relationship between plant nu-trient concentrations and productivity, can help the nursery-man manage for soil fertility more efficiently. Furthermore,absolute levels of nutrients taken by themselves may not beas important as the ratios of one element to another. Thispublication provides distributions of not only the nutrientconcentrations in the various plant parts, but also of the totalamount of nutrients removed from the soil. While these datado not show what concentrations are optimum for seedlingproduction, they do give the nurseryman an indication ofwhere his nursery may stand in relation to other nurserieswith regard to plant nutrient levels and removals.
Most data for nutrient levels in southern pine seedlings havearisen from studies where soil fertility levels were varied.Results from this survey show the distributions of nutrientsin seedlings produced operationally at nurseries throughoutthe South over two growing seasons.
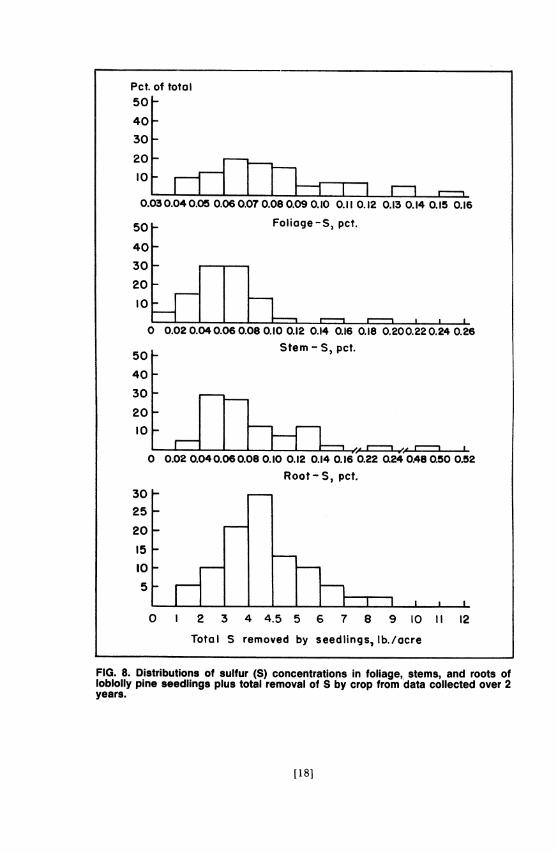
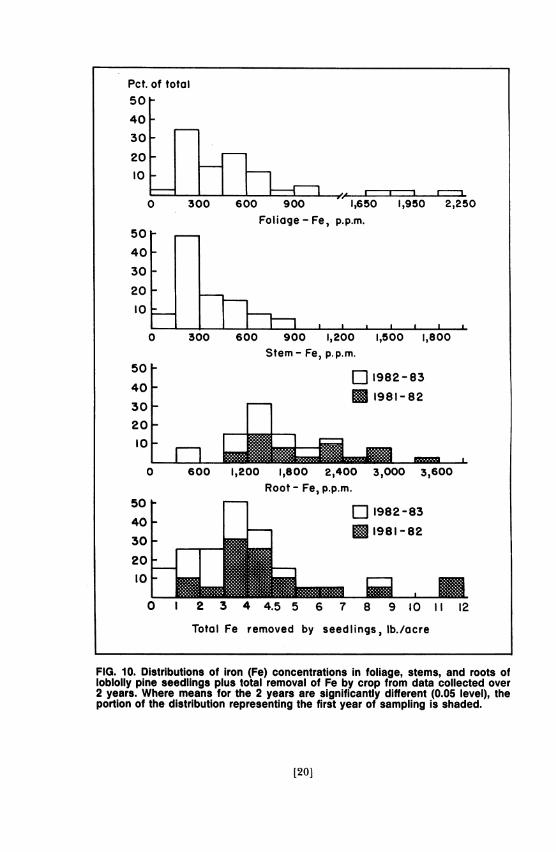
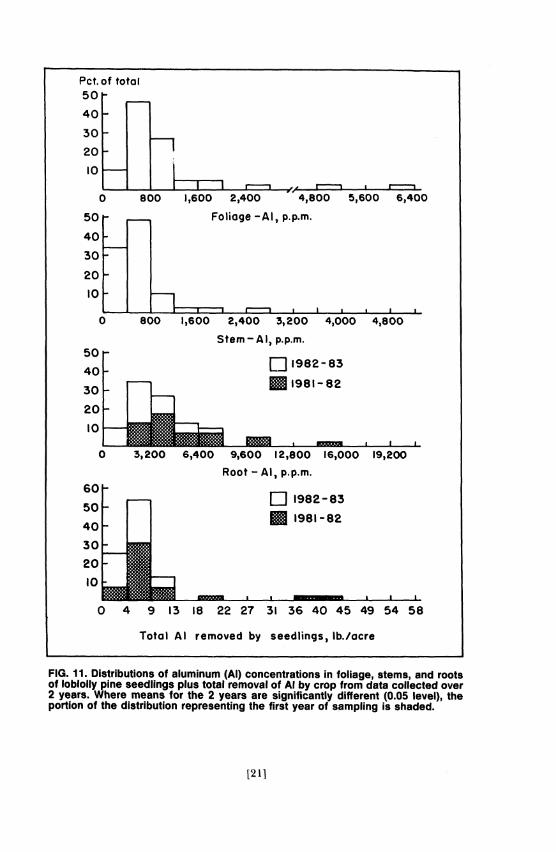
More nitrogen was removed from the soil by loblolly pineseedlings than any other nutrient, although potassium was aclose second, table 3. In foliage, the concentration of nitrogenwas higher than potassium, however, stems and roots containedmore of the latter, table 2. Nitrogen and potassium togethermade up nearly three-fourths (73 percent) of total elementremoval. Calcium was the next most abundant element inplant tissues, followed by phosphorus. Many samples wereabnormally high in iron, aluminum, and manganese, appar-ently due to soil contamination.
Fowells and Krauss (2) reported that less than 1.2 percentnitrogen and less than 0.10 percent phosphorus in loblollypine foliage were deficient levels. Sucoff (10) reported the
[9]

same deficiency levels for these nutrients in Virginia pine(Pinus virginiana Mill.) foliage. According to these standardsand deficiency levels for potassium, calcium, and magnesiumlisted by Sucoff (10), a few samples in this survey were deficientin nitrogen, while none was deficient in phosphorus, potassium,or calcium. However, many nurseries were deficient in mag-nesium. Fowells and Krauss (2) also reported that trees growbest with foliar concentrations of 1.7-2.3 percent nitrogenand 0.14-0.18 percent phosphorus. Higher concentrations rep-resent luxury consumption. Most samples in this survey werebelow this level of nitrogen but above the phosphorus level.Munson and Stone (7) pointed out the need for a clearerdefinition of minimum levels of potassium in nursery seedlings.Moisture stress seems to be the major cause of planting failuresin the South, and potassium concentration is related to droughttolerance (4).
Information on the proper ratio of one element to anotheris scarce. Shear et al. (8) dealt with this subject in some depth,but little if any work has been done on nutrient balance inloblolly pine. Shear et al. (8) stated that maximum growth andyield occur only upon the coincidence of optimum nutrientintensity and balance. Figure 16 shows the ratios of phospho-rus, potassium, magnesium, and calcium to nitrogen. The dataare displayed as percent of nitrogen concentration. For somesamples, the data suggest that certain nutrients may not bein the correct balance.
The time of year sampling for nutrient content is done canhave a major effect on results. The tissue nutrient concen-trations of actively growing plants will be quite different fromthose of dormant plants. Furthermore, nutrient status of lob-lolly pine seedlings may also change over the course of thedormant period or lifting season. Munson and Stone (7) showedthat nitrogen, phosphorus, calcium, and magnesium concen-trations remained relatively constant during the lifting season(November-March), while potassium concentration progres-sively declined. However, due to increasing seedling dry weightduring the latter part of the lifting season (January-March),total seedling nutrient content increased significantly for allelements during this period. Their soil nutrient removal valuesfor the January lifting were slightly to substantially higherthan these findings, table 3. In order to accurately reflectactual soil nutrient removal, sampling for plant analysis shouldcoincide with the most active period of lifting.
[101
CONCLUSION
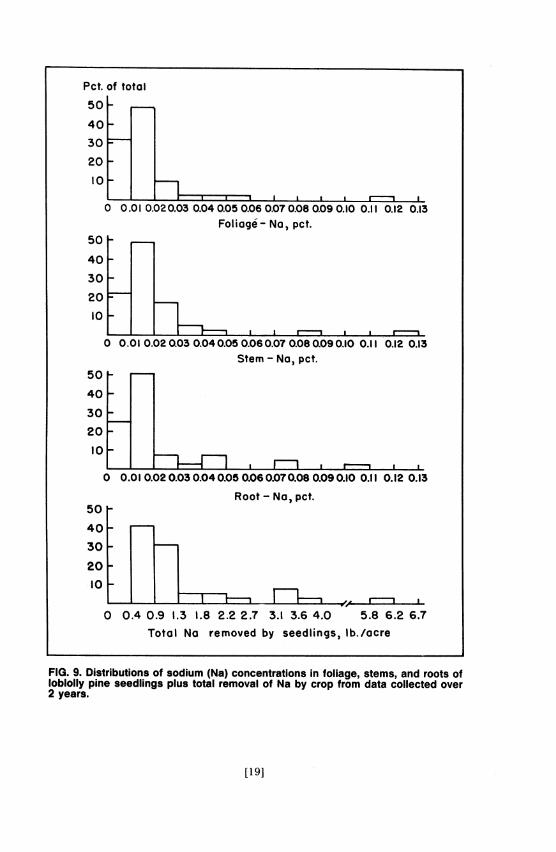
Seedling concentrations of nitrogen, phosphorus, potassium,and calcium reported for this survey are generally comparablewith values previously reported in the literature. However,the range of values for magnesium and sodium are generallylower than values reported elsewhere. This may well be dueto a difference in quantification procedures. Previous data formicronutrient concentrations in pine seedlings are scarce. Inaddition to nutrient concentrations in plant tissues, nurserymanagers should also be concerned with the magnitude of thedrain on soil nutrients by seedling removal.
This survey gives nursery managers the opportunity to com-pare the nutrient status of their seedlings with that from othernurseries in the South. To make such a comparison, a nurserymanager should: (1) sample seedlings at the end of the growingseason, preferably in December; (2) harvest an average areaof seedlings (include tractor paths in area calculation), carefullywash soil from roots, oven-dry and weigh foliage, stems, androots separately, and calculate pounds per acre for the plantparts; (3) send the separate components (from about 30 seed-lings) to a laboratory for analysis (the same laboratory eachtime); (4) multiply the concentration value for each componentby its weight value to get the amount of nutrients removedby that component; and (5) add the three components todetermine the total element removal from an acre of soil.
[11]
Pct. of total
25 El 1982- 8320 1981-82
5,000
weight, lb. /acre
357 714 1,071 1,428 1,786 2,142
357 714 1,071 1,428 1,786 2,142
Root weight, lb. /acre
oi77[I
1,428 2,857 4,285 5,714 7,142
] 1982-83*1981-82
8,571 10,000
rotal seedling weight, lb. /acre
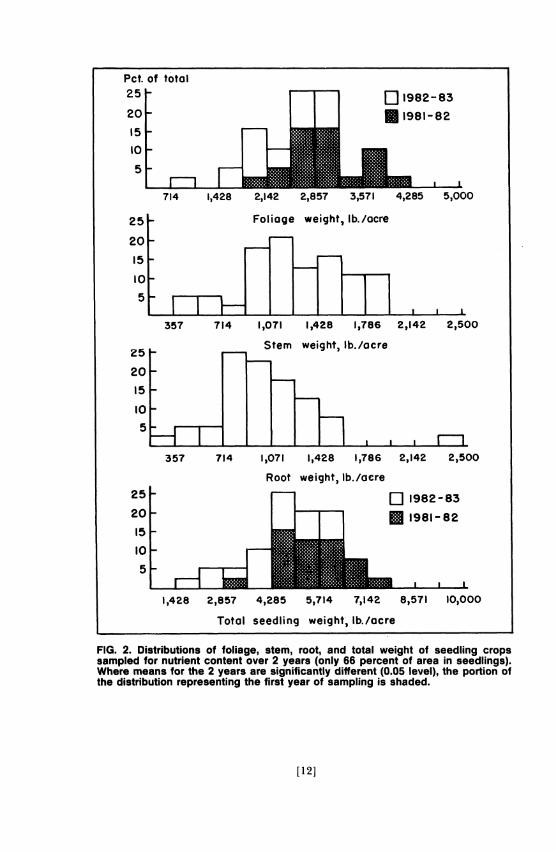
FIG. 2. Distributions of foliage, stem, root, and total weight of seedling cropssampled for nutrient content over 2 years (only 66 percent of area in seedlings).Where means for the 2 years are significantly different (0.05 level), the portion ofthe distribution representing the first year of sampling is shaded.
[12]
25
20
15
10
5
2,500
2,500
25
10
5
Pct. of total
0.6 0.8 1.0 1.2 1.4 1.6 1.8 2.0 2.2 2.4 2.6 2.8 3.0 3.2
50 Foliage - N, pct.
40F302010
0.20.40.6 0.8 1.0 1.2 1.4 1.6 1.8 2.0 2.2 2.4 2.6 2.8
Stem - N, pct.
50
40
30
20
10
0.2 0.4 0.6 0.8 1.0 1.2 1.4 1.6 1.8 2.0 2.2 2.4 2.6 2.8
Root - N, pct.25
15
5
9 18 27 3645 54 6271 80 8998 107 116 125
rotal N removed by seedlings, lb. /ocre
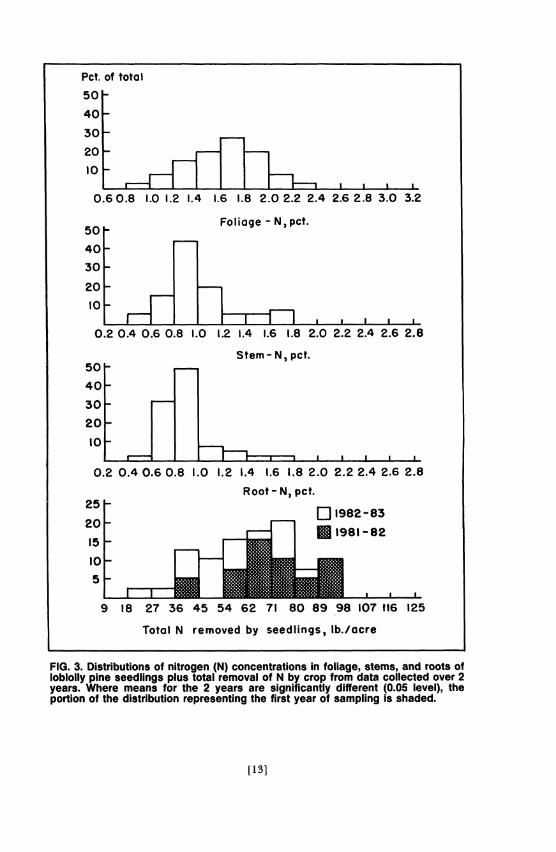
FIG. 3. Distributions of nitrogen (N) concentrations in foliage, stems, and roots ofloblolly pine seedlings plus total removal of N by crop from data collected over 2years. Where means for the 2 years are significantly different (0.05 level), theportion of the distribution representing the first year of sampling is shaded.
[13]
Pct. of total50
4030
2010F
0.08 0.10 0.12
50
40F
30F201
i0OI-r4
50
Foliage- P, pct.
0.24 0.28 0.32 0.36 0.40 0.44 0.48 0.52 0.56Stem - P, pct.
Root - P, pct.
25 1J 1982-83
20
15
10
5
2 4 5 7 9 II 12 14 16 18 20 21 23 25
Total P removed by seedlings, lb./acre
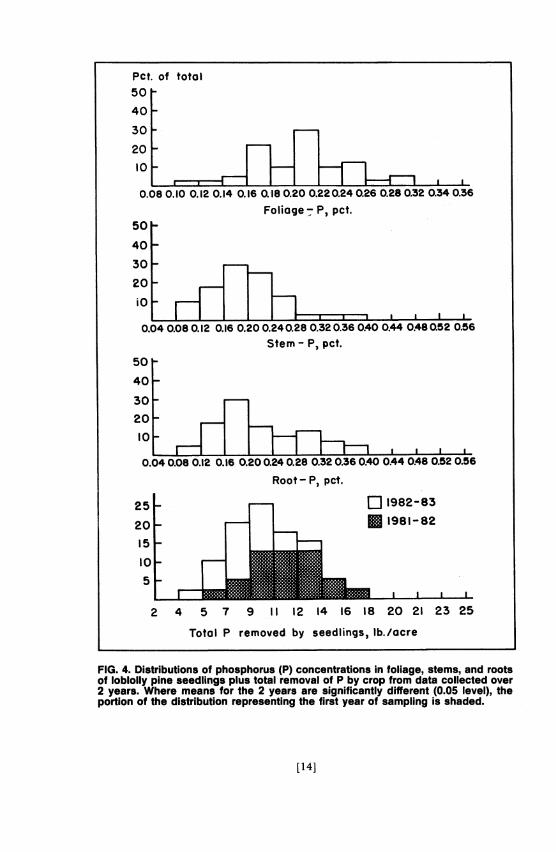
FIG. 4. Distributions of phosphorus (P) concentrations in foliage, stems, and rootsof loblolly pine seedlings plus total removal of P by crop from data collected over2 years. Where means for the 2 years are significantly different (0.05 level), theportion of the distribution representing the first year of sampling is shaded.
[14]
Foliage-K, pct.25
20
15
E 1982-83I1981-82
0.7 0.8 0.9 1.0 1.1 1.2 1.3 1.4 1.5 1.6 1.7 1.8 1.9 2.0Stem - K, pct.
2520
15
10-
5
0.7 0.8 0.9 1.0 1.1 1.2 1.3 1.4 1.5 1.6 1.7 1.8 1.9 2.0Root-K, pct.
25
20
15
10-
5
9 18 27 36 45 54 62 71 80 89 98 107 116 125
rotal K removed by seedlings, lb/acre
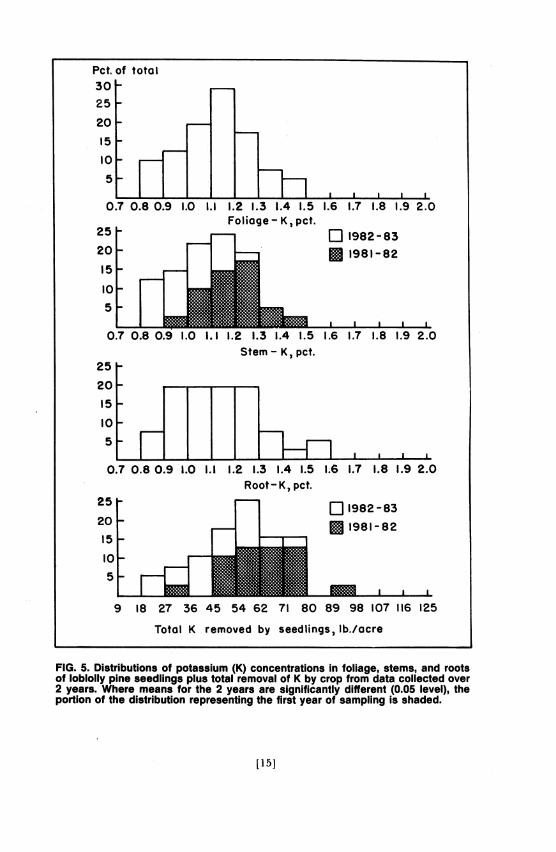
FIG. 5. Distributions of potassium (K) concentrations in foliage, stems, and rootsof loblolly pine seedlings plus total removal of K by crop from data collected over2 years. Where means for the 2 years are significantly different (0.05 level), theportion of the distribution representing the first year of sampling is shaded.
[15]

Pct. of total25
20 F15 FFl0
0 .2 .
30
25
20
15
lO
5
0.
El1982-831981- 82
m-DO 0.10 0.12 0.14 0.16 0.18 0.200.22 0.24 0.26Foliage - Mg,) pct.
[] 1982-83
01981-82
40.06 0.08 0.10 0.12 0.14 0.16 0.18 0.20 0.22 0,24 026Stem - Mg, pct.
201510
5
0 0.02 0.04 0.06 0.08 0.10 0.12 0.14 0.16 0.18 0.20 0.22 0.24 0.26
Root - Mg, pct.
251928
20 18-8
15
10
5
Total Mg removed by seedlings, lb./acre
FIG. 6. Distributions of magnesium (Mg) concentrations in foliage, stems, and rootsof loblolly pine seedlings plus total removal of Mg by crop from data collectedover 2 years. Means for the 2 years are significantly different (0.05 level) and theportion of each distribution representing the first year of sampling is shaded.
[16]
;L, I I I

Pct.50
40~
30
20-
I0-
of total
so m
0.20 0.24 0.28 0.32 0.36 0.40 0.44 0.48 0.52 0.56 0.60 0.64 0.68 0.72
Foliage - Ca, pct.
50
40
30
20
I0
0.08 0.12 0.16 0.20 0.24 0.28 0.32 0.36 0.40 044 048 0.52 0.56 0.60Stem-Ca, pct.
s0
Q 1982-83
L II ® 1981- 82
Root-Ca, pct.
I 1 < <. I
4 5 7 9 1 1 12 1 4 16 18 20 21 23 25 27
Total Ca removed by seedlings, lb./acrej
FIG. 7. Distributions of calcium (Ca) concentrations in foliage, stems, and roots ofloblolly pine seedlings plus total removal of Ca by crop from data collected over2 years. Where means for the 2 years are significantly different (0.05 level), theportion of the distribution representing the first year of sampling is shaded.
[17]
1 1 t t
E-I I
Pct. of total50
40F
'I;o m '--i
0.030.040.05 0.06 0.07 0.08 0.09 0.10 0.11 0.12 0.13 0.14 0.15 0.16
50 F Foliage -S, pct..
40
30
20
10
0 0.02 0.04 0.08 0.08 0.10 0.12 0.14 0.16 0.18 0.20 0.22 0.24 0.26
50
40
30
20
10
30
25
20
15
10
5
Root-S, pct.
0 I 2 3 4 4.5 5 6 7 8 9 10 11
Total S removed by seedlings, lb./acre
12
FIG. 8. Distributions of sulfur (S) concentrations in foliage, stems, and roots ofloblolly pine seedlings plus total removal of S by crop from data collected over 2years.
[18]
5
H n i
Pct. of total
50
40
30
20
1oL I
0 0.0 1 0.02 0.03 0.04 0.05 0.06 0.07 0.08 0.09 0.10 0.11 0.12 0.13Foliage6- Na, pct.
50
40
30
20
1O
0 0.01 0.02 0.03 0.04 0.05 0.06 0.07 0.08 0.09 0.10 0.11 0.12 0.13
Stem - No, pct.
50
40
30
20
10
0 0.010.020.030.040.050.060.070.080.09 0.10 0.11 0.12 0.13
Root - Na, pct.50
40F30F20F
0 0.4 0.9 1.3 1.8 2.2 2.7 3.1 3.6 4.0 5.8 6.2 6.7
rotal No removed by seedlings, lb./acre
FIG. 9. Distributions of sodium (Na) concentrations in foliage, stems, and roots ofloblolly pine seedlings plus total removal of Na by crop from data collected over2 years.
[191
Pct. of total50
40
30
20
to,oLL~i I L== r-I I-- r--m
0 300 600 900 1,650 1,950 2,250Foliage - Fe, p.p.m.
50
40
30
20
10
0 300 600 900 1,200 1,500 1,800Stem - Fe, p. ..
50 50 LI 1982-8340
30
0 600 1,200 1,800 2,400 3,000 3,600Root - Fe, p.p.m.
501928
401918
30-
20
10
Total Fe removed by seedlings, lb./acre
FIG. 10. Distributions of iron (Fe) concentrations in foliage, stems, and roots ofloblolly pine seedlings plus total removal of Fe by crop from data collected over2 years. Where means for the 2 years are significantly different (0.05 level), theportion of the distribution representing the first year of sampling is shaded.
[20]
Pct.of total50
40
30
20
10
0
50-
40-
30-F20-F
10 L0
50-
40-30-F20-F
10 L0
60 I50F40F30L20F10-
100 1,600 2,400 4,800 5,600 6,400
11 Foliage -Al, p.p.m.
800 1,600 2,400 3,200 4,000 4,800
Stem-Al, p.p.m.
0 1982-83
r- 1981-82
0 4 9 13
Root - Al, p.p.m.
j ]1982-831981-82
18 22 27 31 36 40 45 49 54 58
Total Al removed by seedlings, lb./acre
FIG. 11. Distributions of aluminum (Al) concentrations in foliage, stems, and rootsof loblolly pine seedlings plus total removal of Al by crop from data collected over2 years. Where means for the 2 years are significantly different (0.05 level), theportion of the distribution representing the first year of sampling is shaded.
[21}
I I I
.www. a a a
I0
Pct. of total
25 [-1982-83
20 1-1981-8215
O I 2 3 4 5 6 7 8 9 10 II 12 13Foliage -Cu, p.p.m.
25D-1982-83
20
15
10-
5
O 2 4 6 8 10 12 14 16 18 20 22 24 26
Stem - Cu, p.p.m.25
S2 1982-8320
15
10
5
0 2 4 6 8 I0 12 14 16 18 20 22 24 26Root - Cu, p.p.m.
0 0.02 0.04 0.05 0.07 0.09 0.11
Total Cu removed by seedlings, lb./acre
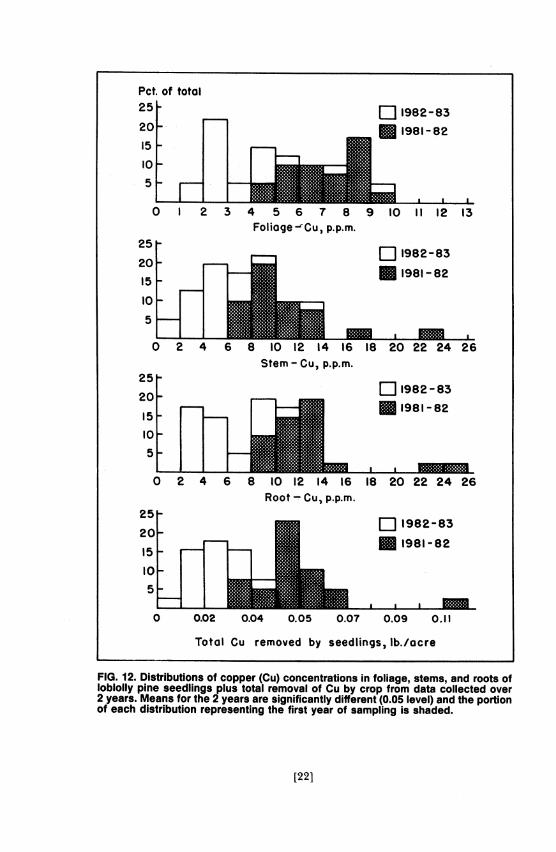
FIG. 12. Distributions of copper (Cu) concentrations in foliage, stems, and roots ofloblolly pine seedlings plus total removal of Cu by crop from data collected over2 years. Means for the 2 years are significantly different (0.05 level) and the portionof each distribution representing the first year of sampling is shaded.
[22]

Pct. of total252015to
10-
F0 10
30
25
20
15
I0
5-
0 10
30
25
20
15
I0
5
0 10
of tOtQ)
3
20 30 40 50 60 70 80 90 100 110 120 130
Foliage - Zn, p.p.m.
LQ 1982 -83
20 30 40 50 60 TO 80 90 100 110 120 130
Stem - Zn, p.p.m.0 1982 -83
1981- 82
20 30 40 50 60 7O 80 90 100 110 120 130
Root - Zn, p.p.m.LI 1982 -83
nFr., IN1981- 82
0 0.09 0.18 0.27 0.36 0.45 0.53
0 Total Zn removed by seedlings,Ilb./Ocrej
FIG. 13. Distributions of zinc (Zn) concentrations in foliage, stems, and roots ofloblolly pine seedlings plus total removal of Zn by crop from data collected over2 years. Where means for the 2 years are significantly different (0.05 level), theportion of the distribution representing the first year of sampling is shaded.
[23]
I I I TI W L
Pct. of total
1,300
Foliage - Mn, p.p.m.
mD 200 400 600 800 1,000 1,200
Stem - Mn, p.p.m.
200 400 600 800 1,000 1,200Root - Mn, p.p.m.
L 1982-8311981-82
0.9 1.3 1.8 2.2 2.7 3.1 3.6 4.0 4.5 4.9 5.4 5.8
Total Mn removed by seedlings, lb/ocre
25
20-F15F1o0F5
0 0.4
t
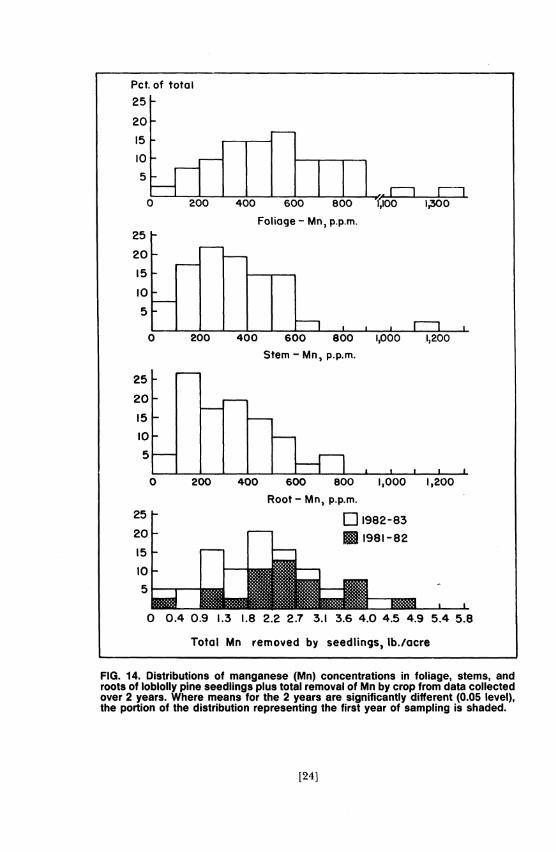
FIG. 14. Distributions of manganese (Mn) concentrations in foliage, stems, androots of loblolly pine seedlings plus total removal of Mn by crop from data collectedover 2 years. Where means for the 2 years are significantly different (0.05 level),the portion of the distribution representing the first year of sampling is shaded.
[24]
25
20
15
10
5
25
20
15
10
5
T ;

Pct. of total25
20
151 19 18
10-
5
8 12 16 2024 28 32 3640 445660 64 68Foliage - B, p.p.m.
25- Q 1982-831981-82
25120F15I0
5
8 12
1 1 1
20 24 28 32 36 40 44 48 52Stem - B, p.p.m.
[] 1982-83
IM1981- 8 2
28 32 36 40 44 48 52 56 60Root - B) p.p.m.
25
201981582
15
10
5
.04 .05 .07 .09 .11 .12 .14 .16 .18 .20 .21 .23 .25 .27
Total B removed by seedlings, lb/acre
FIG. 15. Distributions of boron (B) concentrations in foliage, stems, and roots ofloblolly pine seedlings plus total removal of B by crop from data collected over 2years. Means for the 2 years are significantly different (0.05 level) and the portionof each distribution representing the first year of sampling is shaded.
[25]

Pct. of total
50
40F
30F20F
L0T 8 9 10 1I 12 13 14 15 16 IT 18 19 20
P as apct. of N
20 30 40 50 60
50
40
30
20
10
50
40F30 F20FIOt -
70 80 90 100 110 120 130 140 150
K as a pct. of N
Mg as a pct. of N
10 12, 14 16 18 20 22 24 26 28 30 32 34 36
Co as a pct. of NI
FIG. 16. Distributions of phosphorus (P), potassium (K), magnesium (Mg), andcalcium (Ca) concentrations in foliage as a percent of foliar nitrogen concentration.
[261
50
40
30
20
I0
r- F -i I -
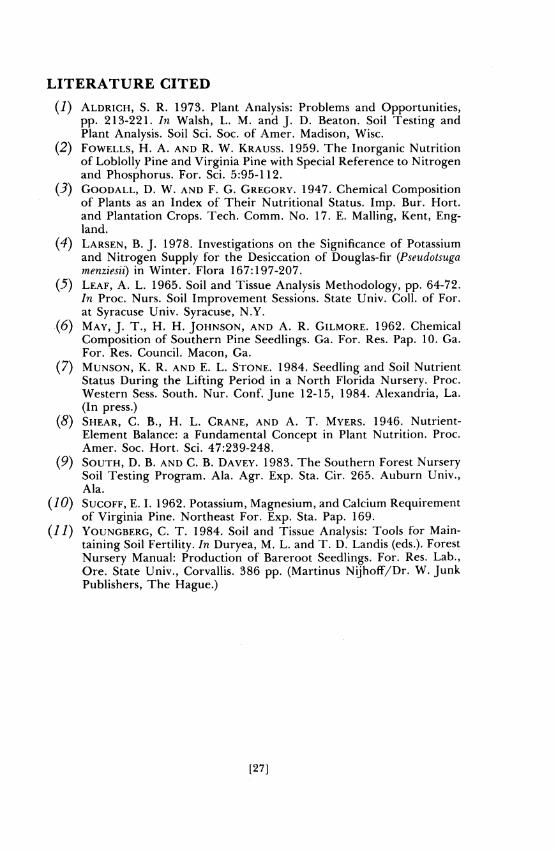
LITERATURE CITED
(1) ALDRICH, S. R. 1973. Plant Analysis: Problems and Opportunities,pp. 213-221. In Walsh, L. M. and J. D. Beaton. Soil Testing andPlant Analysis. Soil Sci. Soc. of Amer. Madison, Wisc.
(2) FOWELLS, H. A. AND R. W. KRAUSS. 1959. The Inorganic Nutritionof Loblolly Pine and Virginia Pine with Special Reference to Nitrogenand Phosphorus. For. Sci. 5:95-112.
(3) GOODALL, D. W. AND F. G. GREGORY. 1947. Chemical Compositionof Plants as an Index of Their Nutritional Status. Imp. Bur. Hort.and Plantation Crops. Tech. Comm. No. 17. E. Malling, Kent, Eng-land.
(4) LARSEN, B. J. 1978. Investigations on the Significance of Potassiumand Nitrogen Supply for the Desiccation of Douglas-fir (Pseudotsugamenziesii) in Winter. Flora 167:197-207.
(5) LEAF, A. L. 1965. Soil and Tissue Analysis Methodology, pp. 64-72.In Proc. Nurs. Soil Improvement Sessions. State Univ. Coll. of For.at Syracuse Univ. Syracuse, N.Y.
(6) MAY, J. T., H. H. JOHNSON, AND A. R. GILMORE. 1962. ChemicalComposition of Southern Pine Seedlings. Ga. For. Res. Pap. 10. Ga.For. Res. Council. Macon, Ga.
(7) MUNSON, K. R. AND E. L. STONE. 1984. Seedling and Soil NutrientStatus During the Lifting Period in a North Florida Nursery. Proc.Western Sess. South. Nur. Conf. June 12-15, 1984. Alexandria, La.(In press.)
(8) SHEAR, C. B., H. L. CRANE, AND A. T. MYERS. 1946. Nutrient-Element Balance: a Fundamental Concept in Plant Nutrition. Proc.Amer. Soc. Hort. Sci. 47:239-248.
(9) SOUTH, D. B. AND C. B. DAVEY. 1983. The Southern Forest NurserySoil Testing Program. Ala. Agr. Exp. Sta. Cir. 265. Auburn Univ.,Ala.
(10) SUCoFF, E. I. 1962. Potassium, Magnesium, and Calcium Requirementof Virginia Pine. Northeast For. Exp. Sta. Pap. 169.
(11) YOUNGBERG, C. T. 1984. Soil and Tissue Analysis: Tools for Main-taining Soil Fertility. In Duryea, M. L. and T. D. Landis (eds.). ForestNursery Manual: Production of Bareroot Seedlings. For. Res. Lab.,Ore. State Univ., Corvallis. 386 pp. (Martinus Nijhoff/Dr. W. JunkPublishers, The Hague.)
[27]
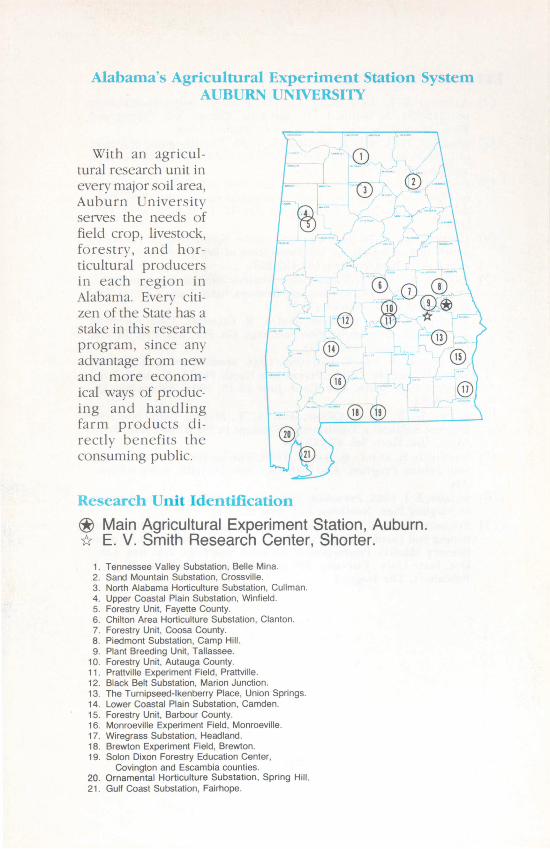
AUBURN UNIVERSITY
With an agricul- Qrural research unit incxvery mtajo r soil area, 0Auburn UnIllxersitserves the nccds offield crop. livestock,torestrx, and hor
ticultural prod)ucersii each region in Alabama. Everx citizen of the State has astake in this research 1
program, since anyx1adv antag~e fromi neand m(ore econon - isical xways of produc-ing anc handlI ing 9 0ifarm prodlucts di-rectlx henefits the 0consuming public 2
'iit i
® Main Agricultural Experiment Station, Auburn.' E. V. Smith Research Center, Shorter.
1. Tennessee Valley Substation, Belle Mina.2 Sand Mountain Substation, Crossville3. North Alabama Horticulture Substation, Cullman4. Upper Coastal Plain Substation, Winfield5. Forestry Unit. Fayette County6. Chilton Area Horticulture Substation, Clanton7 Forestry Unit. Coosa County8. Piedmont Substation, Camp Hill.9 Plant Breeding Unit, Tallassee
10. Forestry Unit, Autauga County.11. Prattville Experiment Field, Prattville12. Black Belt Substation, Marion Junction.13. The Turnipseed-Ikenberry Place, Union Springs14. Lower Coastal Plain Substation, Camden15 Forestry Unit, Barbour County.16. Monroeville Experiment Field, Monroeville.17 Wiregrass Substation. Headland.18. Brewton Experiment Field, Brewton.19 Solon Dixon Forestry Education Center,
Covington and Escambia counties.20 Ornamental Horticulture Substation, Spring Hill.21 Gulf Coast Substation, Fairhope
Related Documents