7-5 Box-and-Whisker Plots Course 2 Warm Up Problem of the Day Lesson Presentation

7-5 Box-and-Whisker Plots Course 2 Warm Up Warm Up Problem of the Day Problem of the Day Lesson Presentation Lesson Presentation.
Dec 15, 2015
Welcome message from author
This document is posted to help you gain knowledge. Please leave a comment to let me know what you think about it! Share it to your friends and learn new things together.
Transcript
7-5 Box-and-Whisker Plots
Course 2
Warm Up
Problem of the Day
Lesson Presentation
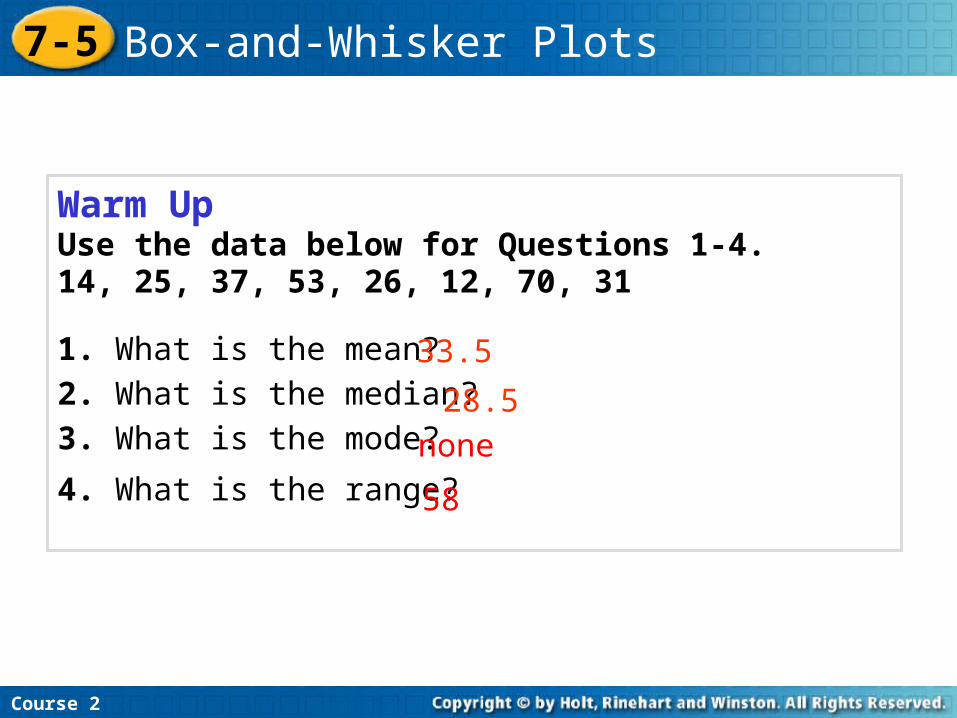
Warm UpUse the data below for Questions 1-4.14, 25, 37, 53, 26, 12, 70, 31
1. What is the mean?2. What is the median?3. What is the mode?
4. What is the range?
33.5
28.5none
58
Course 2
7-5 Box-and-Whisker Plots
Problem of the Day
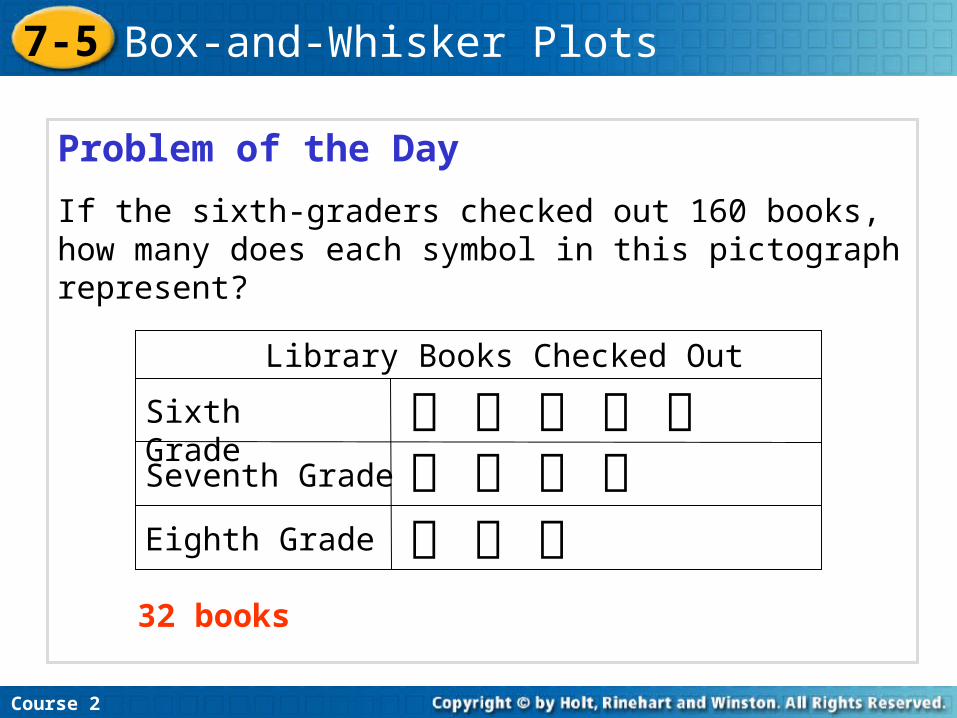
If the sixth-graders checked out 160 books, how many does each symbol in this pictograph represent?
32 books
Library Books Checked Out
Sixth Grade
Seventh Grade
Eighth Grade
Course 2
7-5 Box-and-Whisker Plots
Learn to display and analyze data in
box-and-whisker plots.
Course 2
7-5 Box-and-Whisker Plots
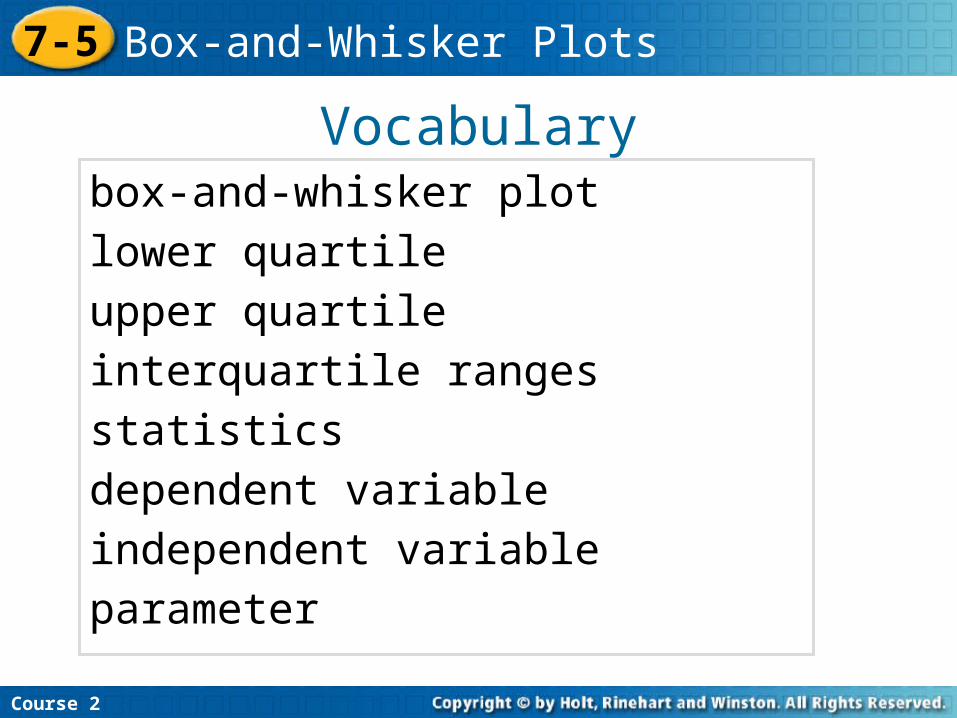
Vocabularybox-and-whisker plotlower quartileupper quartileinterquartile rangesstatisticsdependent variableindependent variableparameter
Course 2
7-5 Box-and-Whisker Plots
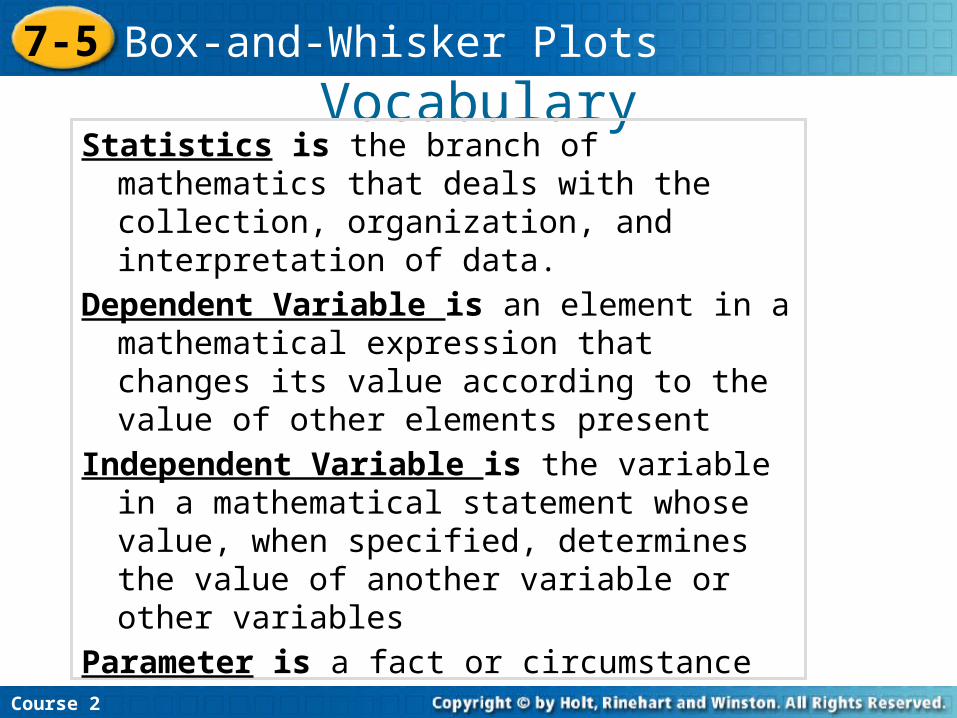
VocabularyStatistics is the branch of mathematics
that deals with the collection, organization, and interpretation of data.
Dependent Variable is an element in a mathematical expression that changes its value according to the value of other elements present
Independent Variable is the variable in a mathematical statement whose value, when specified, determines the value of another variable or other variables
Parameter is a fact or circumstance that restricts how something is done or what can be done
Course 2
7-5 Box-and-Whisker Plots
Course 2
7-5 Box-and-Whisker Plots
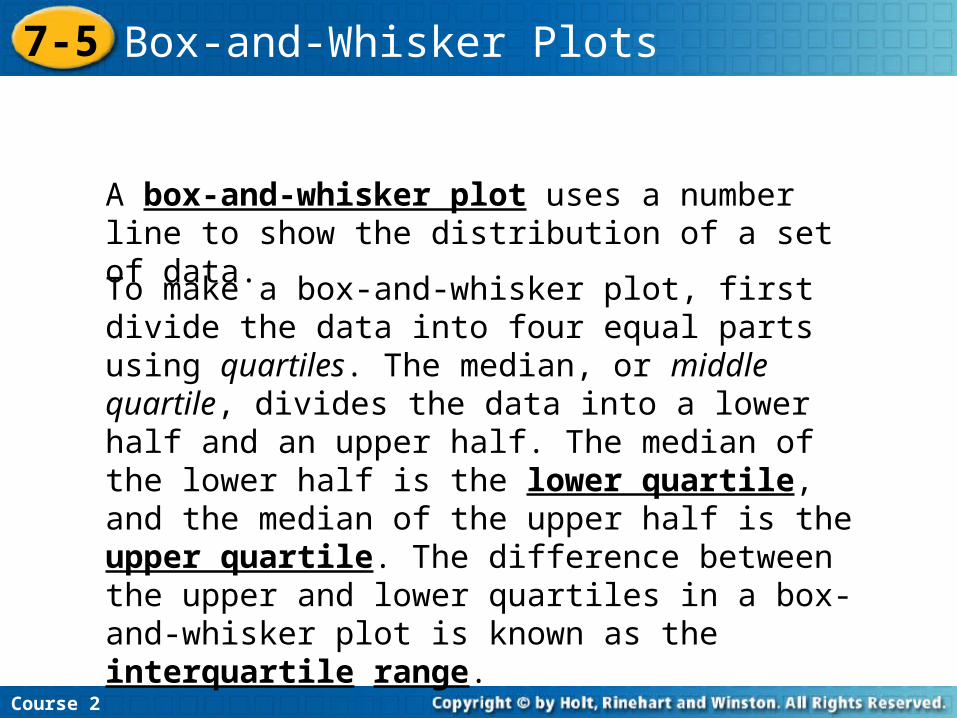
A box-and-whisker plot uses a number line to show the distribution of a set of data.
To make a box-and-whisker plot, first divide the data into four equal parts using quartiles. The median, or middle quartile, divides the data into a lower half and an upper half. The median of the lower half is the lower quartile, and the median of the upper half is the upper quartile. The difference between the upper and lower quartiles in a box-and-whisker plot is known as the interquartile range.
Course 2
7-5 Box-and-Whisker Plots
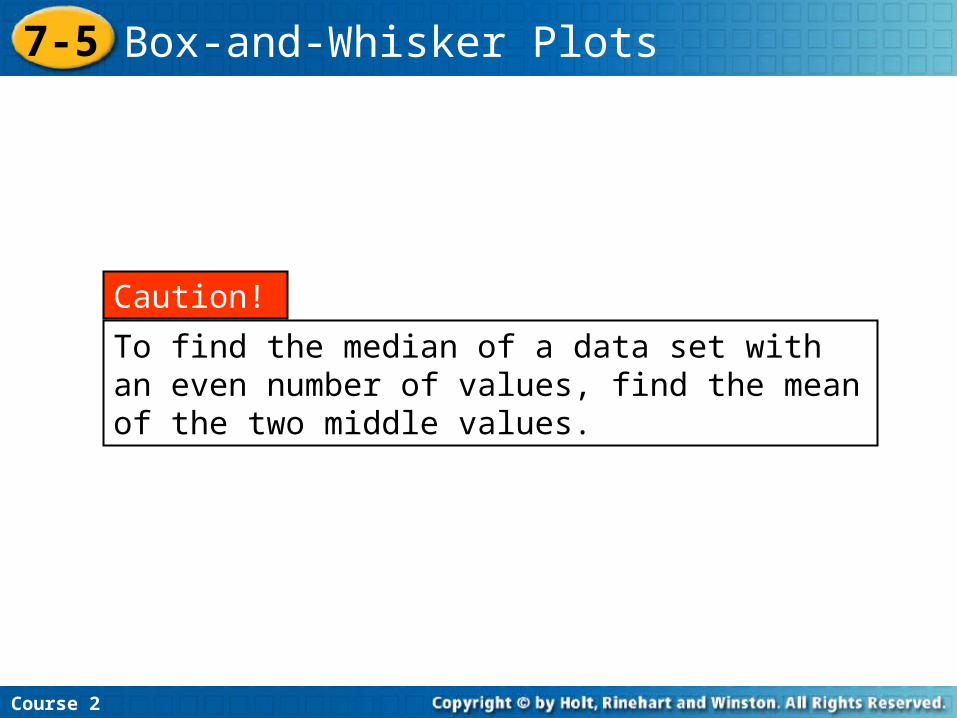
To find the median of a data set with an even number of values, find the mean of the two middle values.
Caution!
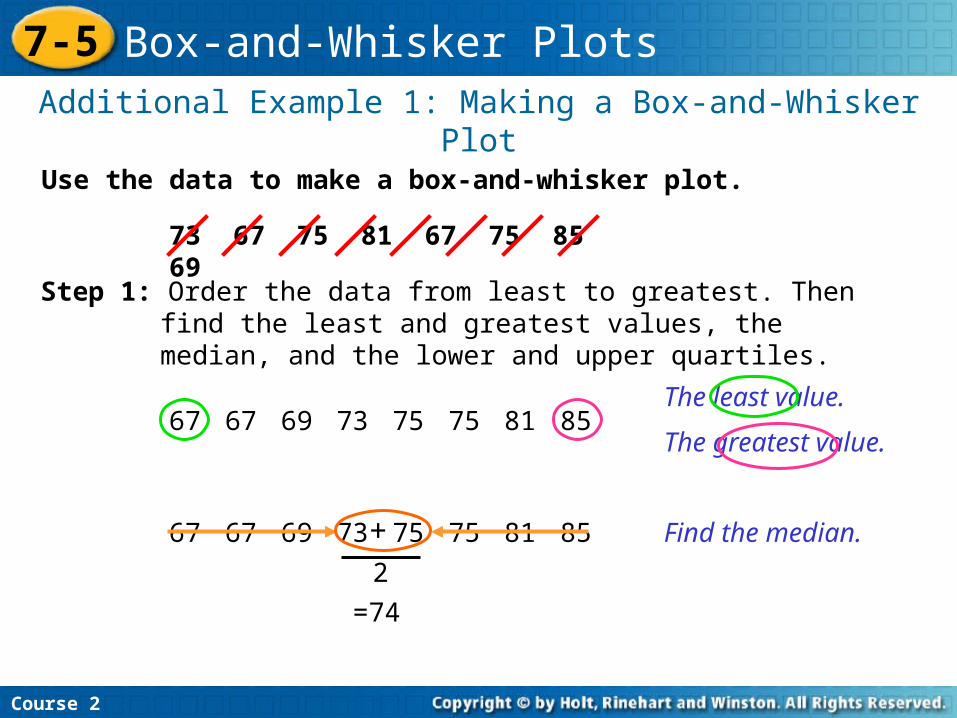
Use the data to make a box-and-whisker plot.
Additional Example 1: Making a Box-and-Whisker Plot
Course 2
7-5 Box-and-Whisker Plots
73 67 75 81 67 75 85 69
Step 1: Order the data from least to greatest. Then find the least and greatest values, the median, and the lower and upper quartiles.
The least value.
The greatest value.67 67 69 73 75 75 81 85
Find the median.67 67 69 73 75 75 81 85
2
+
=74
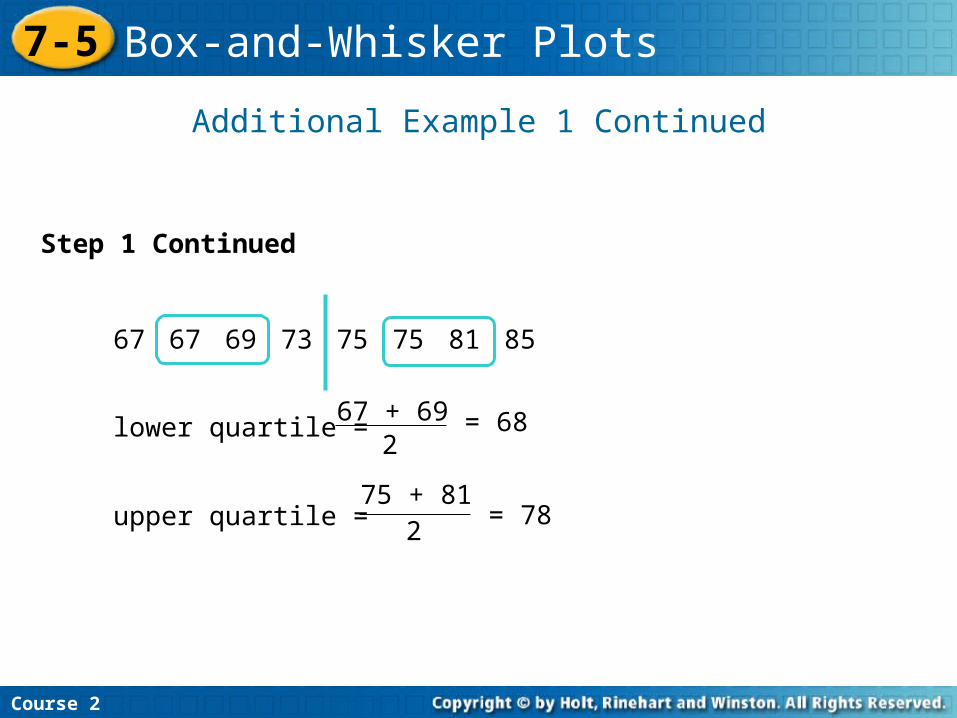
Additional Example 1 Continued
Course 2
7-5 Box-and-Whisker Plots
67 67 69 73 75 75 81 85
lower quartile = 67 + 692
= 68
upper quartile = 75 + 81
2= 78
Step 1 Continued
Additional Example 1 Continued
Course 2
7-5 Box-and-Whisker Plots
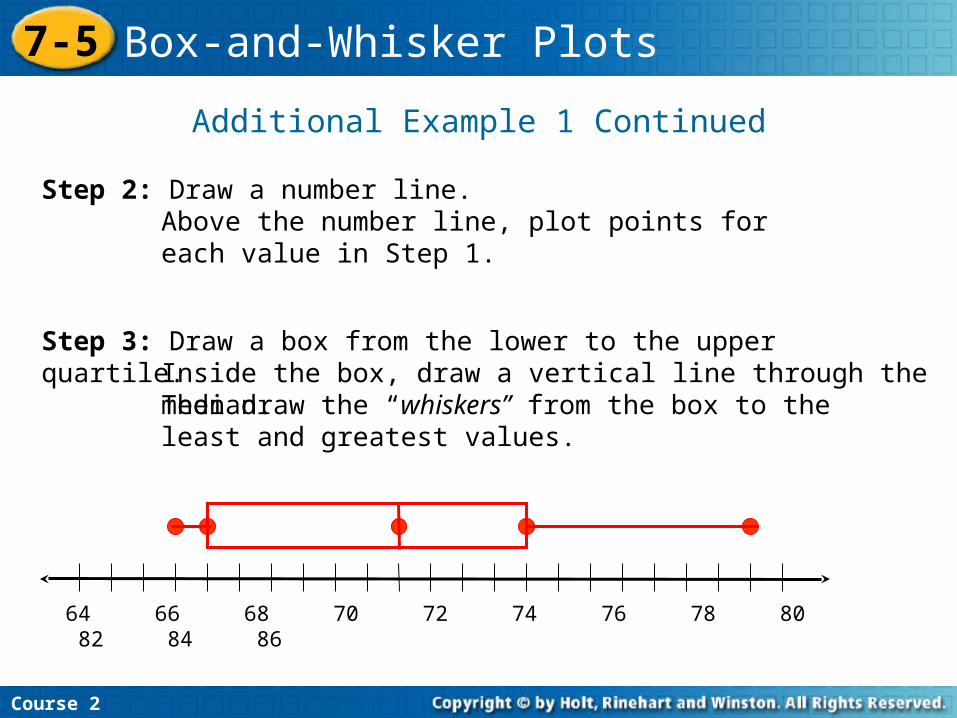
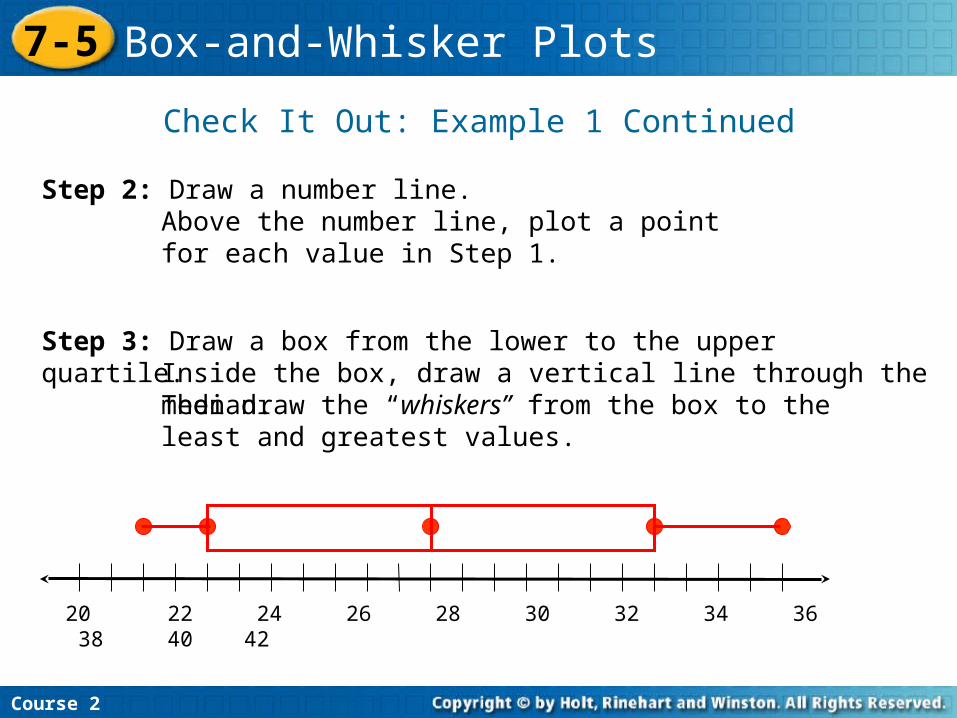
Step 2: Draw a number line.
64 66 68 70 72 74 76 78 80 82 84 86
Above the number line, plot points for each value in Step 1.
Step 3: Draw a box from the lower to the upper quartile. Inside the box, draw a vertical line through the median.Then draw the “whiskers” from the box to the least and greatest values.
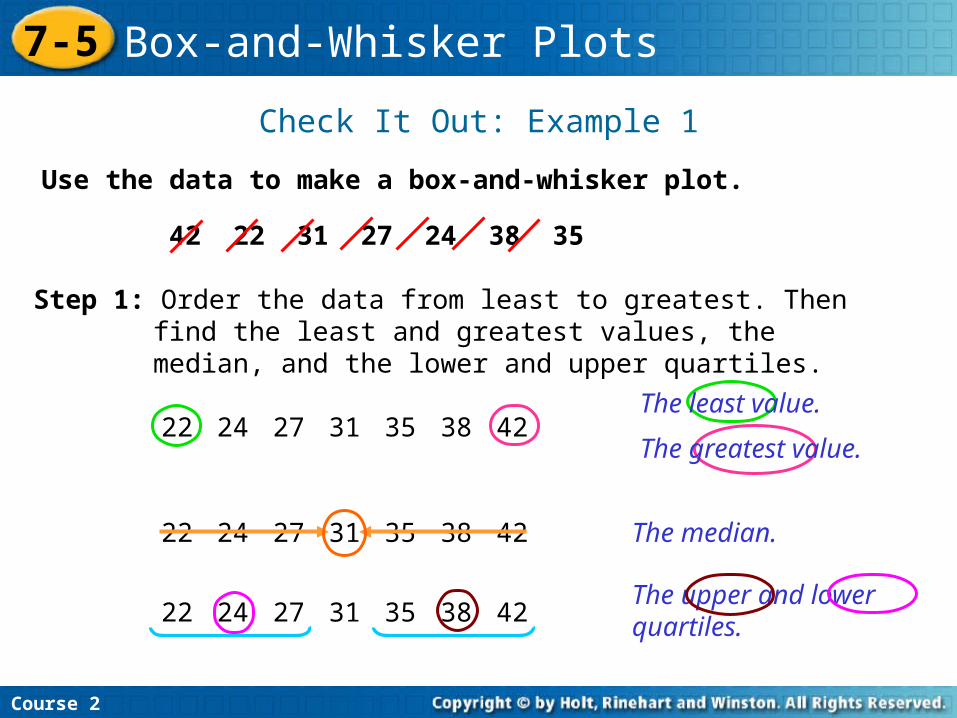
Check It Out: Example 1
Course 2
7-5 Box-and-Whisker Plots
Use the data to make a box-and-whisker plot.
42 22 31 27 24 38 35
22 24 27 31 35 38 42
22 24 27 31 35 38 42
The least value.
The greatest value.
The median.
The upper and lower quartiles.22 24 27 31 35 38 42
Step 1: Order the data from least to greatest. Then find the least and greatest values, the median, and the lower and upper quartiles.
Check It Out: Example 1 Continued
Course 2
7-5 Box-and-Whisker Plots
Step 2: Draw a number line.
20 22 24 26 28 30 32 34 36 38 40 42
Above the number line, plot a point for each value in Step 1.
Step 3: Draw a box from the lower to the upper quartile. Inside the box, draw a vertical line through the median.Then draw the “whiskers” from the box to the least and greatest values.
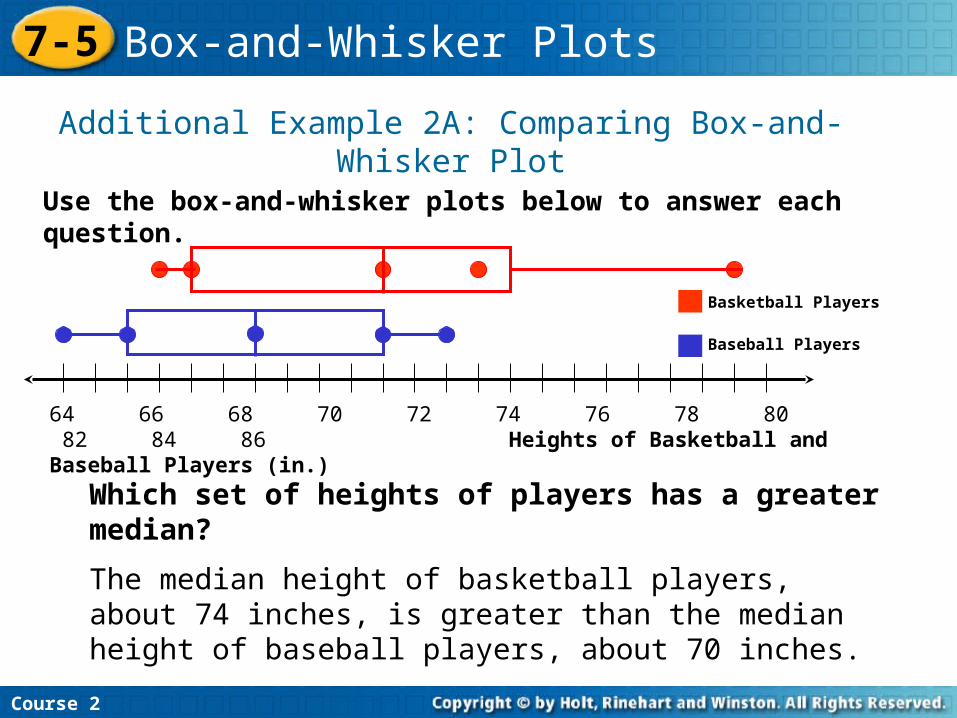
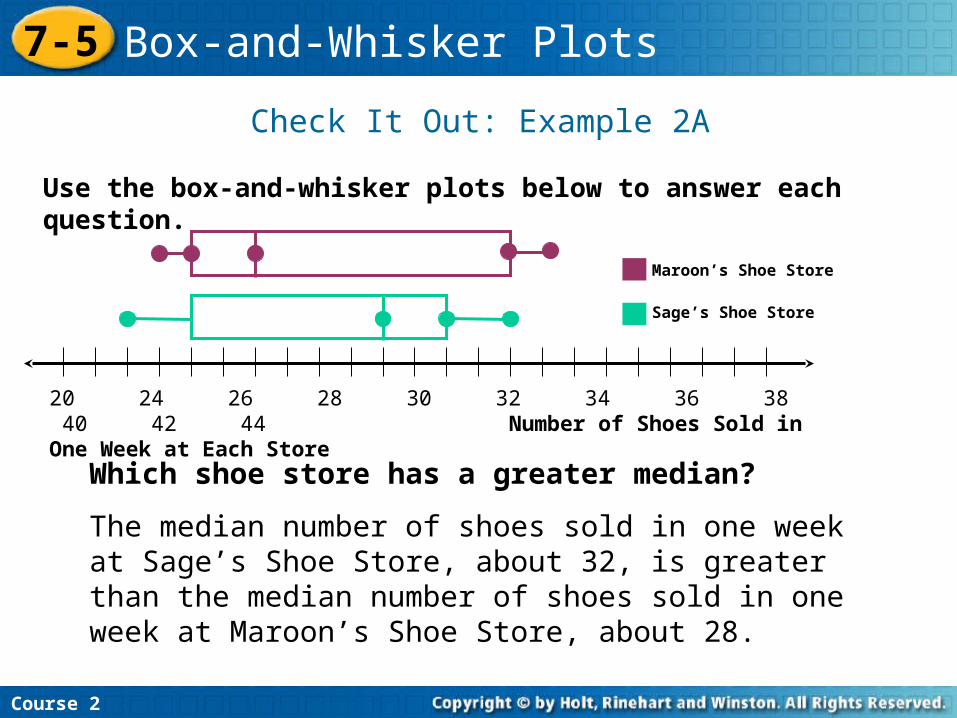
Use the box-and-whisker plots below to answer each question.
Additional Example 2A: Comparing Box-and-Whisker Plot
Course 2
7-5 Box-and-Whisker Plots
Which set of heights of players has a greater median?
The median height of basketball players, about 74 inches, is greater than the median height of baseball players, about 70 inches.
64 66 68 70 72 74 76 78 80 82 84 86 t Heights of Basketball and Baseball Players (in.)
Basketball Players
Baseball Players

Use the box-and-whisker plots below to answer each question.
Additional Example 2B: Comparing Box-and-Whisker Plot
Course 2
7-5 Box-and-Whisker Plots
Which players have a greater interquartile range?
The basketball players have a longer box, so they have a greater interquartile range.
64 66 68 70 72 74 76 78 80 82 84 86 t Heights of Basketball and Baseball Players (in.)
Basketball Players
Baseball Players
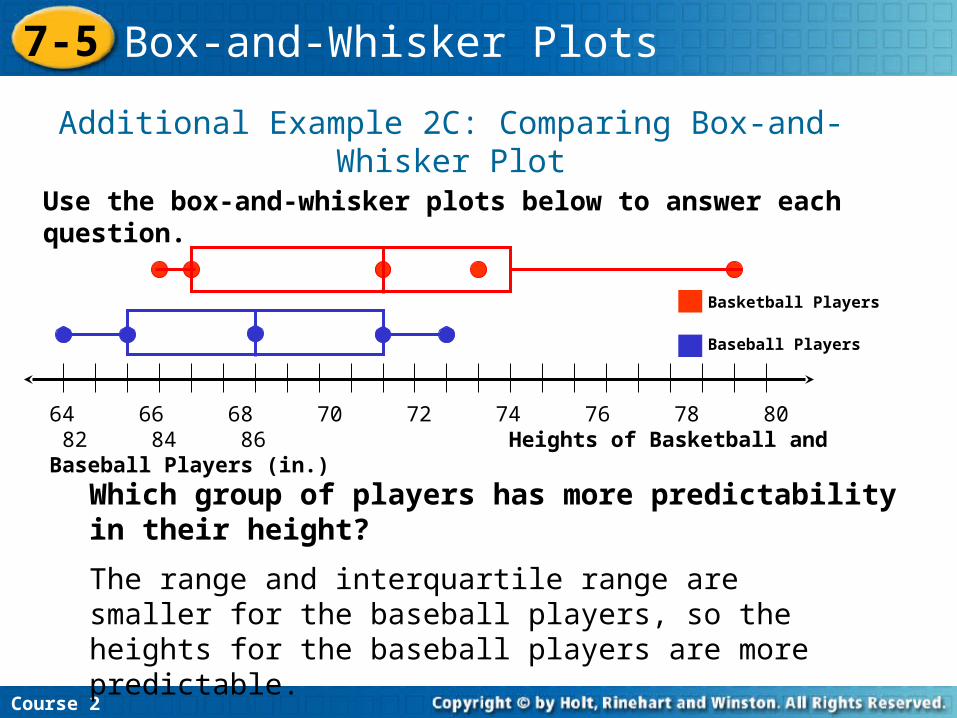
Use the box-and-whisker plots below to answer each question.
Additional Example 2C: Comparing Box-and-Whisker Plot
Course 2
7-5 Box-and-Whisker Plots
Which group of players has more predictability in their height?
The range and interquartile range are smaller for the baseball players, so the heights for the baseball players are more predictable.
64 66 68 70 72 74 76 78 80 82 84 86 t Heights of Basketball and Baseball Players (in.)
Basketball Players
Baseball Players
Use the box-and-whisker plots below to answer each question.
Check It Out: Example 2A
Course 2
7-5 Box-and-Whisker Plots
Which shoe store has a greater median?
The median number of shoes sold in one week at Sage’s Shoe Store, about 32, is greater than the median number of shoes sold in one week at Maroon’s Shoe Store, about 28.
20 24 26 28 30 32 34 36 38 40 42 44 t Number of Shoes Sold in One Week at Each Store
Maroon’s Shoe Store
Sage’s Shoe Store
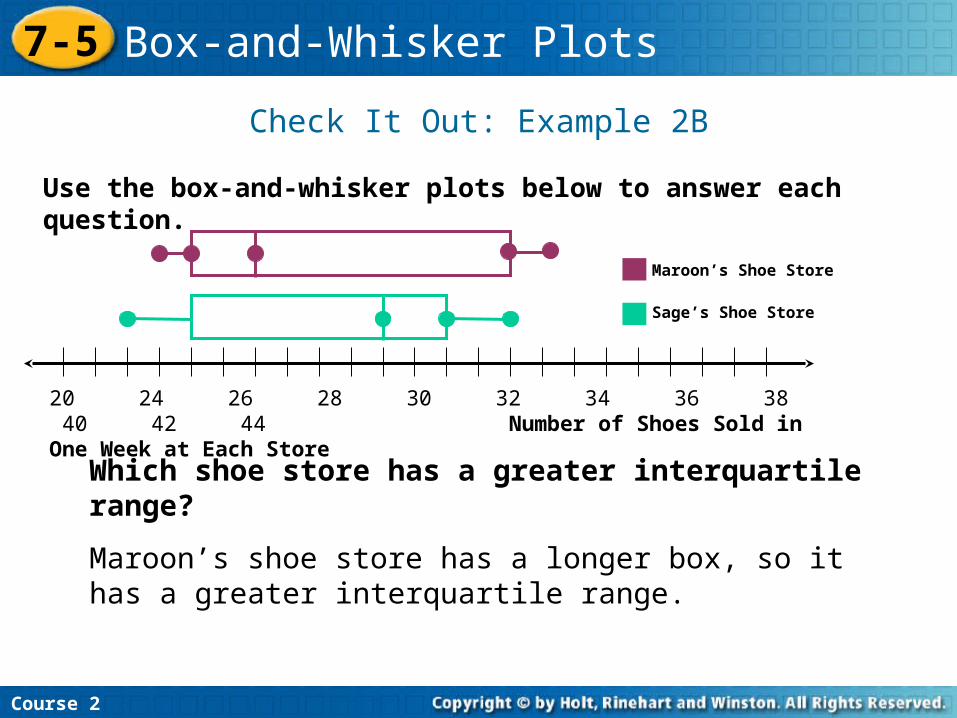
Use the box-and-whisker plots below to answer each question.
Check It Out: Example 2B
Course 2
7-5 Box-and-Whisker Plots
Which shoe store has a greater interquartile range?
Maroon’s shoe store has a longer box, so it has a greater interquartile range.
20 24 26 28 30 32 34 36 38 40 42 44 t Number of Shoes Sold in One Week at Each Store
Maroon’s Shoe Store
Sage’s Shoe Store
Use the box-and-whisker plots below to answer each question.
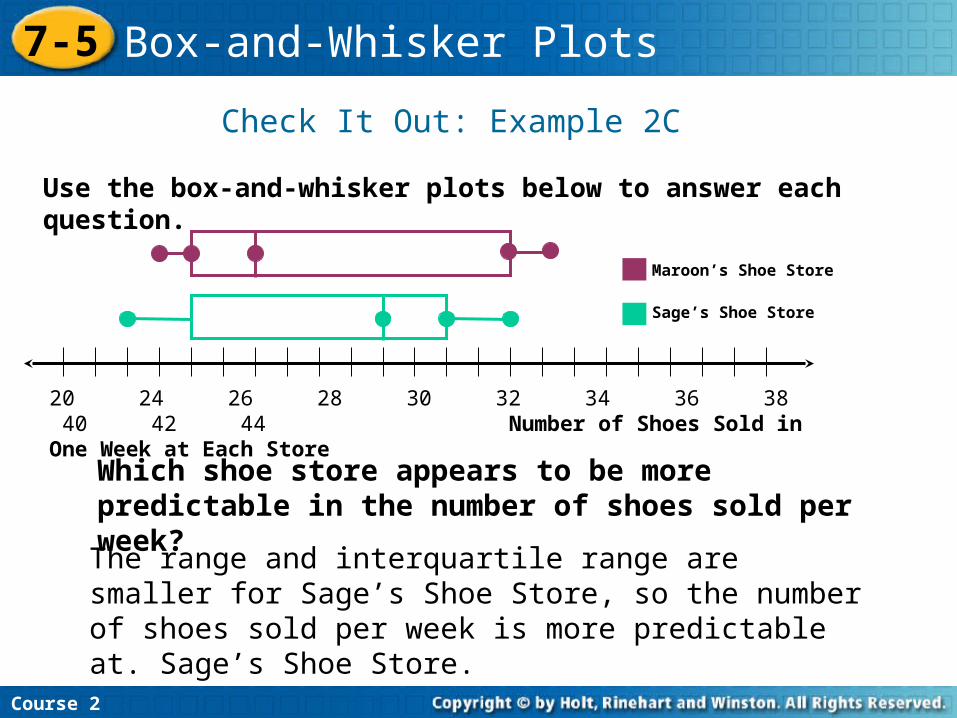
Check It Out: Example 2C
Course 2
7-5 Box-and-Whisker Plots
Which shoe store appears to be more predictable in the number of shoes sold per week?
The range and interquartile range are smaller for Sage’s Shoe Store, so the number of shoes sold per week is more predictable at. Sage’s Shoe Store.
20 24 26 28 30 32 34 36 38 40 42 44 t Number of Shoes Sold in One Week at Each Store
Maroon’s Shoe Store
Sage’s Shoe Store
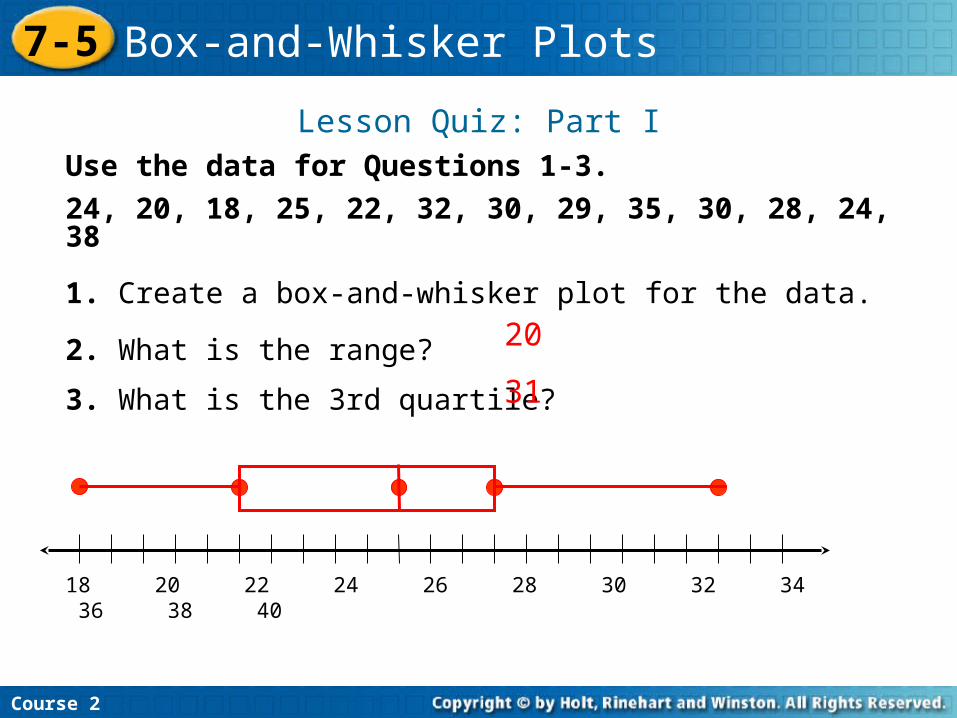
Lesson Quiz: Part I
Use the data for Questions 1-3.
24, 20, 18, 25, 22, 32, 30, 29, 35, 30, 28, 24, 38
1. Create a box-and-whisker plot for the data.
2. What is the range?
3. What is the 3rd quartile?
20
31
Course 2
7-5 Box-and-Whisker Plots
18 20 22 24 26 28 30 32 34 36 38 40
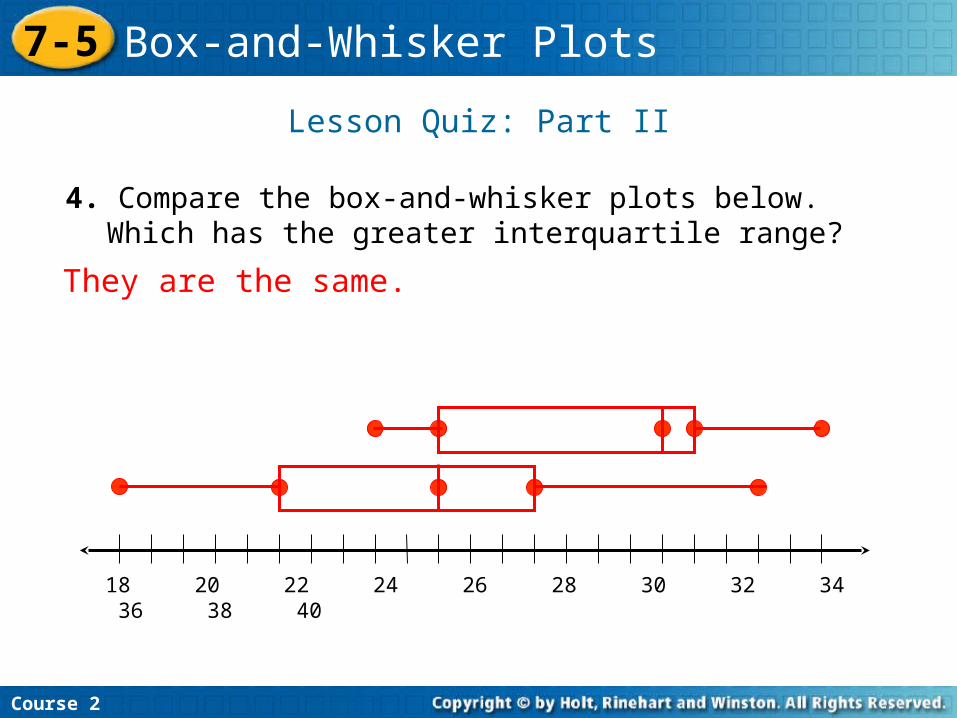
Lesson Quiz: Part II
4. Compare the box-and-whisker plots below. Which has the greater interquartile range?
They are the same.
Course 2
7-5 Box-and-Whisker Plots
18 20 22 24 26 28 30 32 34 36 38 40
Related Documents