Instance Based Machine Learning in a Nutshell Prof. Dr. Andreas Zinnen

6f4dde1e-f4cb-4393-9a7f-b4d2e1256f15
Dec 11, 2015
budapest
Welcome message from author
This document is posted to help you gain knowledge. Please leave a comment to let me know what you think about it! Share it to your friends and learn new things together.
Transcript

Instance Based Machine Learning in a Nutshell Prof. Dr. Andreas Zinnen

2 Dr. Andreas Zinnen Modelling and Simulation using MATLAB®
Unit 0 Administration
Administration (Organization of Exercises)
Submission Deadline Review Deadline Sample Solu3on
Cluster Analysis 0 + 21 0 + 28 0 + 21
KNN Regression (Sample)
CV KNN Regr. (Sample)
KNN ClassificaAon 0 + 21
CV KNN ClassificaAon 0 + 21
Histograms 0 + 21
Parzen Window 0 + 21
CV Parzen Window 0 + 21
NW Regression (Sample)
NW ClassificaAon 0 + 21 0 + 28 0 + 21
Note: You have to participate in the peer review process to get your exercises graded.

3 Dr. Andreas Zinnen Modelling and Simulation using MATLAB®
Unit 1 Introduction
Introduction – What is Machine Learning?
Arthur Samuel: "Field of study that gives computers the ability to learn without being explicitly programmed"
Theoretical Interpretation: Construction of models for a nontrivial dependence between some observations, which we will commonly refer to as x and a desired response, which we refer to as y. By using learning we can infer such a dependency between x and y in a systematic fashion.

4 Dr. Andreas Zinnen Modelling and Simulation using MATLAB®
Unit 1 Introduction
Introduction - Application Areas
Web Page Ranking
Hand Writing Recognition Face and Speech Recognition
dear stress, lets break up
http://www.daserste.de/
Weather Forecast
http
s://w
ww
.goo
gle.
de/
Dear students, have fun during this course!

5 Dr. Andreas Zinnen Modelling and Simulation using MATLAB®
Unit 1 Introduction
Introduction - Four Applications of Machine Learning
“Woo
denB
oard
”
“Sta
rryS
ky”-
Bar
"R
ackW
heel
ie"
”Saw
Toot
h”
6 Dr. Andreas Zinnen Modelling and Simulation using MATLAB®
• A feature is a measurable property of a phenomenon: • Computer vision (images, videos)
• Color / shape / intensity / edges / frequency / … • Audio:
• Frequency / loudness / spectrum / amplitude / … • Scribbles:
• Latitude or longitude (geographic) • Temperature [ ] and consumption of soft drinks [Liters] • Light intensity / regularity of objects • Saw’s Vibration
• Feature selection is key to pattern recognition (discriminant / independent)
Unit 1 Introduction
Introduction - What are Features in Pattern Recognition?
7 Dr. Andreas Zinnen Modelling and Simulation using MATLAB®
Unit 2 Cluster Analysis
Cluster Analysis (Scribble ”Rack-Wheelie“)
• Task of grouping objects in clusters • Ideally objects of a cluster are more similar (in some
sense) to each other than to those in other clusters • Popular notions of clusters include groups with small
distances among the cluster members, dense areas of the data space, intervals or particular statistical distributions
• Application areas • Data mining • Statistical data analysis
• pattern recognition • information retrieval • bioinformatics

8 Dr. Andreas Zinnen Modelling and Simulation using MATLAB®
Given n d-dim. observations , k-means clustering aims to partition the n observations into k sets so as to minimize the within-cluster sum of squares: where is the mean of points in
Unit 2 Cluster Analysis
k-Means Clustering

9 Dr. Andreas Zinnen Modelling and Simulation using MATLAB®
Unit 2 Cluster Analysis
k-Means Clustering
Algorithm (Overview): • Initialization Step • Assignment Step • Update Step Repeat until the assignment does not change

10 Dr. Andreas Zinnen Modelling and Simulation using MATLAB®
• Forgy Method: Choose k means randomly from the data set: • Random Partition: Randomly assign each sample to a cluster, then perform update step
Unit 2 Cluster Analysis
k-Means Clustering (Initialization Step)

11 Dr. Andreas Zinnen Modelling and Simulation using MATLAB®
Assign each observation to the cluster whose mean yields the least within-cluster sum of squares. Since the sum of squares is the squared Euclidian distance, this is intuitively the nearest mean. Where each is assigned to exactly one , even if it could be assigned to two or more of them.
Unit 2 Cluster Analysis
k-Means Clustering (Assignment Step)
12 Dr. Andreas Zinnen Modelling and Simulation using MATLAB®
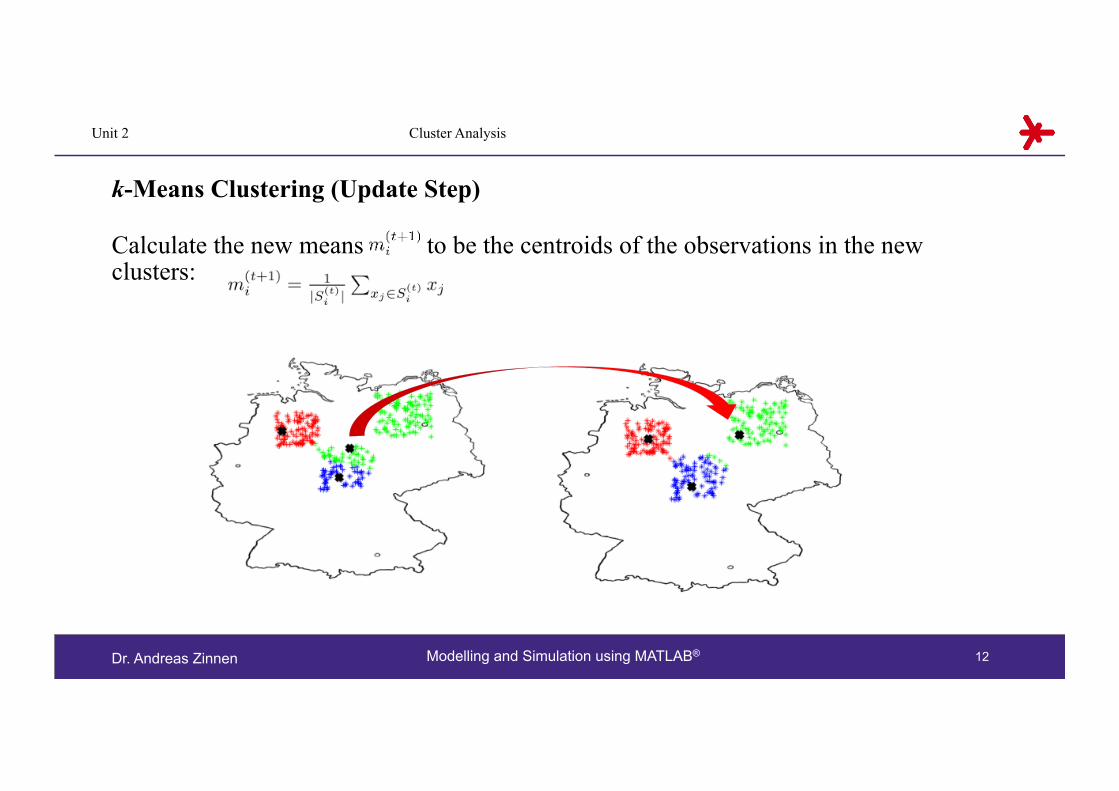
Calculate the new means to be the centroids of the observations in the new clusters:
Unit 2 Cluster Analysis
k-Means Clustering (Update Step)

13 Dr. Andreas Zinnen Modelling and Simulation using MATLAB®
Unit 2 Cluster Analysis
k-Means Clustering (Importance of Initialization) Different initializations will lead to different cluster centers

14 Dr. Andreas Zinnen Modelling and Simulation using MATLAB®
Exercise Clustering (Unit 2) Cluster Analysis
k-Means Clustering (Implementation in )
• Download Clustering.zip and unzip the file to your computer. The folder will contain following files:
• dataClustering.mat (the data set) • Deutschland.jpg (Background image for the plots – a map of Germany) • motivationClustering.m (file illustrating the problem) • solutionClustering.m (main file calling the clustering) • KMeansClustering.m (the exercise file)

15 Dr. Andreas Zinnen Modelling and Simulation using MATLAB®
Cluster Analysis
1. Open and run motivationClustering.m 2. Open solutionClustering.m
(that the code will not run as KMeansClustering.m needs to be implemented first) 3. Open KMeansClustering.m: Implement “Exercise 1” and “Exercise 2” 4. Run solutionClustering.m 5. Upload the generated Figure as a PDF or JPG for peer review:
(the picture will be generated by solutionClustering.m)
Exercise Clustering (Unit 2)
k-Means Clustering (Implementation in )

16 Dr. Andreas Zinnen Modelling and Simulation using MATLAB®
Unit 3 Regression Analysis
Regression Analysis (Scribble “StarrySky”-Bar)
?

17 Dr. Andreas Zinnen Modelling and Simulation using MATLAB®
Unit 3 Regression Analysis
Regression Analysis: Introduction
• Statistical process for estimating the relationship between a dependent variable y and one or more independent variables x
• Widely used for prediction and forecasting • Prediction within the range of values in the dataset used
for model-fitting is known informally as interpolation • Prediction outside this range of the data is
known as extrapolation
• Focus of this lecture on instance based regression for interpolation
?

18 Dr. Andreas Zinnen Modelling and Simulation using MATLAB®
Unit 3 Regression Analysis
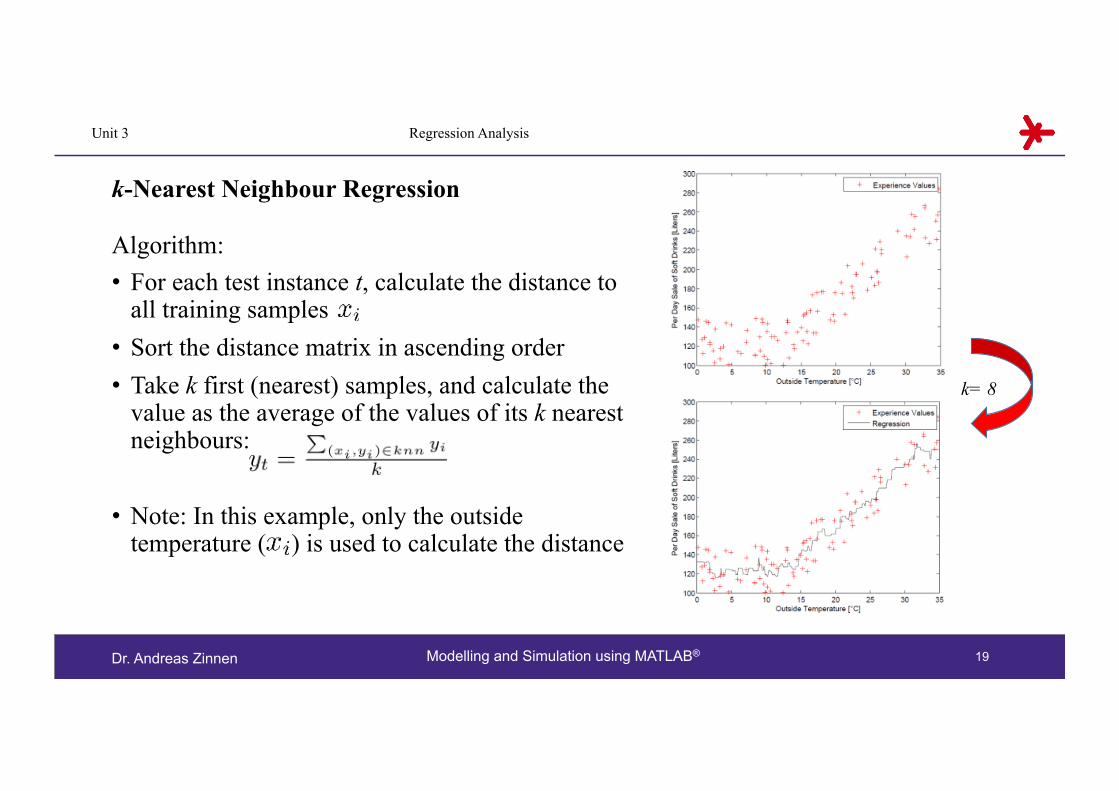
k-Nearest Neighbour Regression
Idea: For each Test Value consider the k nearest neighbours (knn) to calculate . Assignment Step: • The value is the average of its k nearest
neighbours’ values. • Example: results in
19 Dr. Andreas Zinnen Modelling and Simulation using MATLAB®
Unit 3 Regression Analysis
k-Nearest Neighbour Regression
Algorithm: • For each test instance t, calculate the distance to
all training samples • Sort the distance matrix in ascending order • Take k first (nearest) samples, and calculate the
value as the average of the values of its k nearest neighbours:
• Note: In this example, only the outside temperature ( ) is used to calculate the distance
k= 8

20 Dr. Andreas Zinnen Modelling and Simulation using MATLAB®
Exercise KNN Regression (Unit 3) Regression Analysis
k-Nearest Neighbour Regression (Implementation in )
• Download KNNRegression.zip and unzip the file to your computer. The folder will contain following files:
• dataDrinks.mat (the data set) • motivationRegression.m (file illustrating the problem) • solutionRegression.m (main file calling the clustering) • KNNRegression.m (the exercise file)

21 Dr. Andreas Zinnen Modelling and Simulation using MATLAB®
Regression Analysis
1. Open and run motivationRegression.m 2. Open solutionRegression.m (running the code will give an error, as the function
KNNRegression needs to be implemented first) 3. Open KNNRegression.m: Implement Exercise 1 4. Run solutionRegression.m 5. Compare the resulting figure with the figure given by the sample solution
Exercise KNN Regression (Unit 3)
k-Nearest Neighbour Regression (Implementation in )

22 Dr. Andreas Zinnen Modelling and Simulation using MATLAB®
Unit 3 Regression Analysis
k-Nearest Neighbour Regression (What is an adequate k? )
k = 1 (overfitting) k = 13 (good) k = 50 (too general)

23 Dr. Andreas Zinnen Modelling and Simulation using MATLAB®
Unit 3 Regression Analysis
Parameter Optimization: Cross Validation (CV)
• Cross Validation • is a model validation technique • shows how a model will generalize to an independent data set • splits the observations into n equally sized subsets (folds)
• Each of the folds is used as a validation set at a time while the remainder is used to generate a model
…
fold 1 fold 2 fold 5

24 Dr. Andreas Zinnen Modelling and Simulation using MATLAB®
What is an adequate k? • Loop over k (e.g. 1, ..., 25)
• Use Cross Validation to ensure that data points will not be in training and test at the same time
• Predict the value for each data point using KNN regression • Calculate the error ei for each observation as the difference of labeled
and predicted value (see previous slide) • Sum up all errors: • Print the total sum
• Choose best k • Note: CV will ensure that each sample will be in the test set
exactly once
Unit 3 Regression Analysis
k-Nearest Neighbour Regression

25 Dr. Andreas Zinnen Modelling and Simulation using MATLAB®
Unit 3 Regression Analysis
k-Nearest Neighbour Regression
• Evaluation: Calculate the error ei as the difference of labeled and predicted value

26 Dr. Andreas Zinnen Modelling and Simulation using MATLAB®
Unit 3 Regression Analysis
Parameter Optimization: Cross Validation (CV)
…

27 Dr. Andreas Zinnen Modelling and Simulation using MATLAB®
Example CV KNN Regression (Unit 3) Regression Analysis
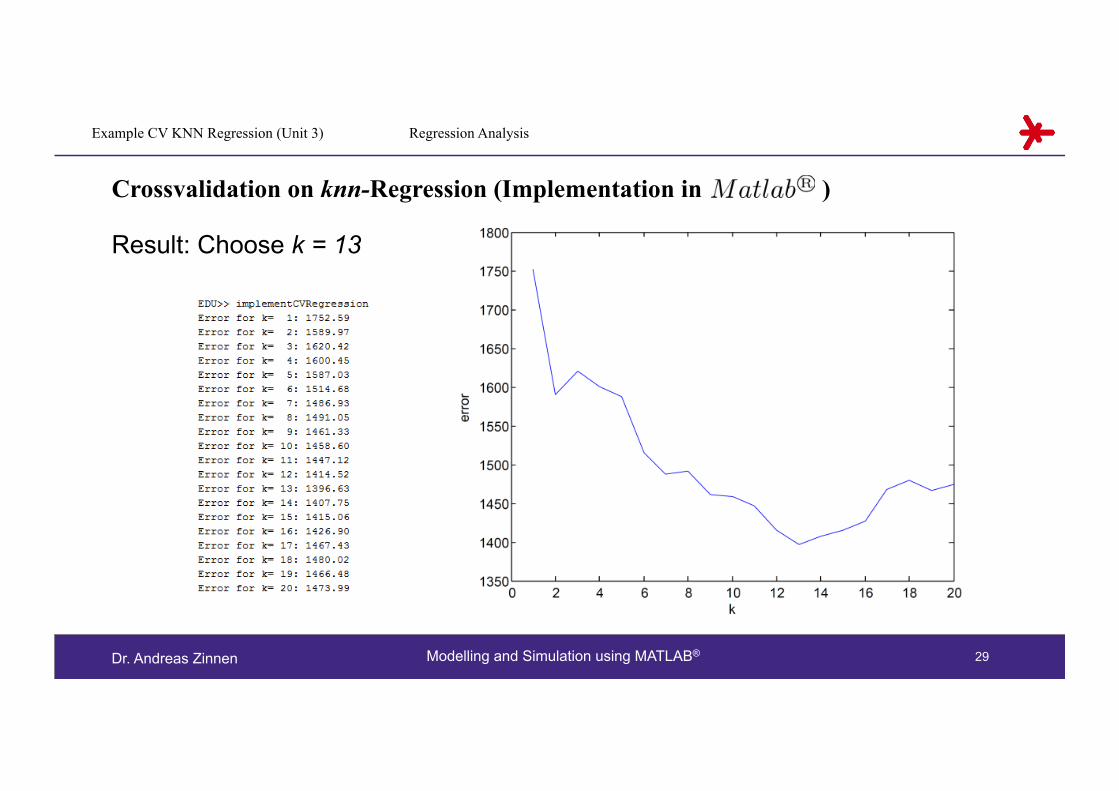
Crossvalidation on knn-Regression (Implementation in )
• Download CVRegression.zip and unzip the file to your computer. The folder will contain following files:
• illustrateCV.m (sample file to show how CV works) • dataDrinks.mat (the data set) • KNNRegression.m (including implementation) • implementCVRegression.m (the sample file)

28 Dr. Andreas Zinnen Modelling and Simulation using MATLAB®
Regression Analysis
1. Open, run and understand illustrateCV.m 2. Implement the exercises 3. Compare your resulting results with the results given by the sample solution 4. Open implementCVRegression.m: Try to understand following steps:
1. Loop over k using Cross Validation (use illustrateCV.m) 2. Calculate the error for each k as the sum of the errors of each sample in current_test
Reset the error for each k 3. Print the error for each k using:
Note: k is the loop variable, error the sum of errors for one loop cycle, e.g. k = 12
Example CV KNN Regression (Unit 3)
Crossvalidation on knn-Regression (Implementation in )
29 Dr. Andreas Zinnen Modelling and Simulation using MATLAB®
Result: Choose k = 13
Regression Analysis Example CV KNN Regression (Unit 3)
Crossvalidation on knn-Regression (Implementation in )

30 Dr. Andreas Zinnen Modelling and Simulation using MATLAB®
Unit 4 Classification
Classification (Scribble “WoodenBoard“)

31 Dr. Andreas Zinnen Modelling and Simulation using MATLAB®
Training Data: Pairs of observations drawn from a distribution such as: (blood status, cancer), (jet’s sound profile, defect), (color, part) Goal: Estimate , given x at a new location.
Unit 4 Classification
Classification: Introduction
k = 1 k = 7 k = 50

32 Dr. Andreas Zinnen Modelling and Simulation using MATLAB®
Unit 4 Classification
k-Nearest-Neighbour Classification
Idea: For each Test Point t consider the k nearest neighbours to assign a class label. Assignment Step: • Consider k (=7) nearest neighbours
• 2 samples belong to class 1 • 5 samples belong to class -1
• Assign label -1

33 Dr. Andreas Zinnen Modelling and Simulation using MATLAB®
Unit 4 Classification
k-Nearest-Neighbour Classification
Algorithm: • For each test instance t, calculate the distance to all training samples • Sort the distance matrix in ascending order • Take k first samples, and assign the label which is most frequent among the k nearest training
samples
k= 7

34 Dr. Andreas Zinnen Modelling and Simulation using MATLAB®
Exercise KNN Classification (Unit 4) Classification
k-Nearest-Neighbour Classification (Implementation in )
• Download KNNClassification.zip and unzip the file to your computer. The folder will contain following files:
• woodData.mat (the data set) • motivationClassifcation.m (file illustrating the problem) • solutionClassification.m (main file calling the classification) • KNNClassification.m (the exercise file)
35 Dr. Andreas Zinnen Modelling and Simulation using MATLAB®
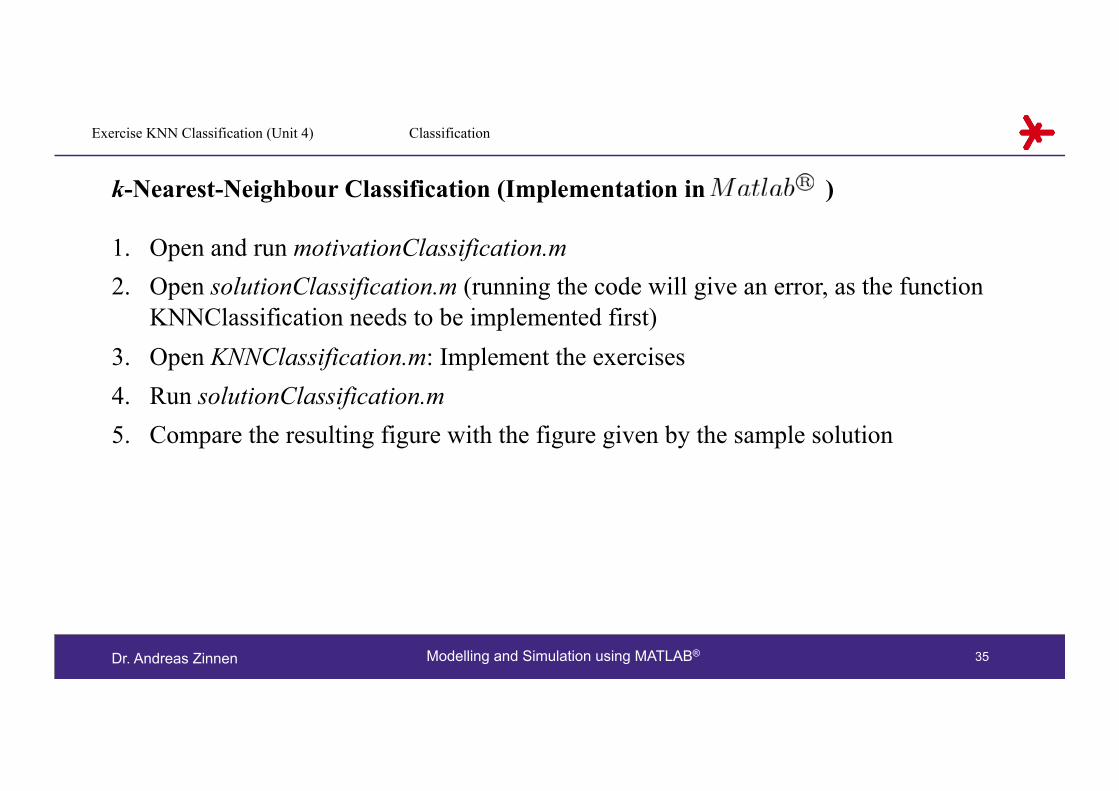
Classification
1. Open and run motivationClassification.m 2. Open solutionClassification.m (running the code will give an error, as the function
KNNClassification needs to be implemented first) 3. Open KNNClassification.m: Implement the exercises 4. Run solutionClassification.m 5. Compare the resulting figure with the figure given by the sample solution
Exercise KNN Classification (Unit 4)
k-Nearest-Neighbour Classification (Implementation in )

36 Dr. Andreas Zinnen Modelling and Simulation using MATLAB®
What is an adequate k? • Loop over k (e.g. 1, …, 20)
• Use Cross Validation to ensure that data points will not be in training and test at the same time
• Predict the label for each data point of the test set using KNN classification
• Calculate the number of correctly and wrongly assigned samples
• Choose best k
Classification
k-Nearest-neighbour Classification
Exercise CV KNN Classification (Unit 4)
37 Dr. Andreas Zinnen Modelling and Simulation using MATLAB®
Exercise CV KNN Classification (Unit 4) Classification
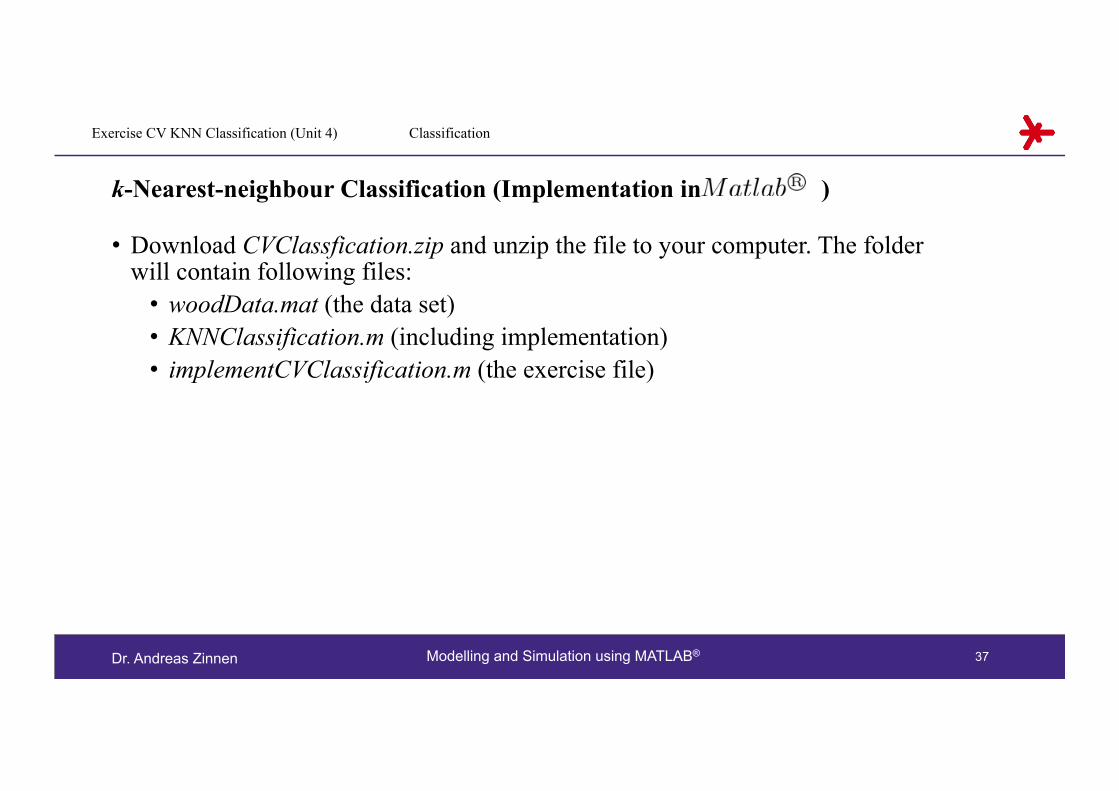
k-Nearest-neighbour Classification (Implementation in )
• Download CVClassfication.zip and unzip the file to your computer. The folder will contain following files:
• woodData.mat (the data set) • KNNClassification.m (including implementation) • implementCVClassification.m (the exercise file)

38 Dr. Andreas Zinnen Modelling and Simulation using MATLAB®
Classification
1. Open implementCVClassification.m (running the code will give an error, as file needs to be extended by cross-validation and a loop) 1. Loop over k using Cross Validation 2. Calculate the number of correctly and wrongly assigned samples for each k and the recognition
rate 3. Print the error for each k using (cf. slide 36):
Note: k is the loop variable, correctClassified and missClassified the number of respective samples, the recognition rate is calculated as illustrated in the fprintf command. Reset the given variables for each k
4. Plot the recognition rate for each k 5. Compare the your results with the results given by the sample solution
Exercise CV KNN Classification (Unit 4)
k-Nearest-neighbour Classification (Implementation in )

39 Dr. Andreas Zinnen Modelling and Simulation using MATLAB®
Unit 5
Novelty Detection
Novelty Detection (Scribble “SawTooth”)
Goal: identify abnormal behavior • Step 1: Model the machine’s normal behavior • Step 2: Use a threshold to find abnormal characteristics

40 Dr. Andreas Zinnen Modelling and Simulation using MATLAB®
Unit 5 Novelty Detection
Density Estimation (Step 1)
• Use observations for the purpose of density estimation • Histogram: Discrete density estimation
•
• Parzen Window: Continuous density estimation

41 Dr. Andreas Zinnen Modelling and Simulation using MATLAB®
Unit 5 Novelty Detection
Density Estimation using Histograms
• Discretize the domain into bins: Let • k be the total number of equally spaced bins • w be the bin width • and be a function counting the number of samples that fall into
each of the bins
• Calculate each bin height (normalized by the overall area):
• Note that the total bin area (blue area) will sum up to 1:

42 Dr. Andreas Zinnen Modelling and Simulation using MATLAB®
Exercise Histograms (Unit 5) Novelty Detection
Density Estimation using Histograms
• Download Histograms.zip and unzip the file to your computer. The folder will contain following files:
• dataRejectionSampling50000.mat (the data set) • exerciseHistograms.m (the exercise file)
• Open and implement exerciseHistograms.m • Run exerciseHistograms.m • Compare the resulting figure with the figure given by the sample solution

43 Dr. Andreas Zinnen Modelling and Simulation using MATLAB®
Unit 5 Novelty Detection
Density Estimation using Histograms
Problem: • There is a tradeoff between the amount of data and the number of bins
• Small number of bins will lead to bad estimation (left figure) • Many bins and little samples will mostly lead to a bad estimation (right figure)
• Often there is the need for a continuous density estimation
#bin
s = 6
, #sa
mpl
es =
500
#bin
s = 1
00, #
sam
ples
= 1
00

44 Dr. Andreas Zinnen Modelling and Simulation using MATLAB®
Unit 5 Novelty Detection
Density Estimation using Parzen Windows
• Start with a density estimate with discrete values as given by histograms:
• Smooth the estimate using a kernel k(x): For a density estimate on this is achieved by:
• Choose k in a way to ensure that it is a probability distribution, i.e.:
• Adjust the kernel width h

45 Dr. Andreas Zinnen Modelling and Simulation using MATLAB®
Unit 5 Novelty Detection
Density Estimation using Parzen Windows
• Example: Use Gauss Kernel in 1-dimensional space:
Weighting Function for x (blue star)

46 Dr. Andreas Zinnen Modelling and Simulation using MATLAB®
Novelty Detection
Density Estimation: Implementation
• Download ParzenGaussian.zip and unzip the file to your computer. The folder will contain following files:
• dataRejectionSampling50000.mat (the data set) • parzenDensity.m (the exercise file)
• Open and implement parzenDensity.m • Implement the Gaussian Kernel
• Run parzenDensity.m • Compare your results with the results of the sample solution
Exercise Parzen Window (Unit 5)

47 Dr. Andreas Zinnen Modelling and Simulation using MATLAB®
Unit 5 Novelty Detection
Density Estimation using Parzen Windows
• Importance of kernel width h:
h = 0.01 h = 2

48 Dr. Andreas Zinnen Modelling and Simulation using MATLAB®
Unit 5 Novelty Detection
Density Estimation using Parzen Windows
• Apply cross-validation to calculate the probability • Ensure that training and test is strictly separated when calculating
• Calculate the overall probability (likelihood) as the product of all • Note: Consider the logarithm for reasons of computationally stability • Evaluation: choose h such that the log-likelihood of the data is maximized
•

49 Dr. Andreas Zinnen Modelling and Simulation using MATLAB®
Novelty Detection
Density Estimation: Implementation
• Download ParzenCrossValidation.zip and unzip the file to your computer. The folder will contain following files:
• dataRejectionSampling10000.mat (the data set) • parzenDensityCV.m (the exercise file)
• Open and implement parzenDensityCV.m • Implement the Gaussian Kernel including CV
• Run parzenDensityCV.m • Compare your results with the results of the sample solution
Exercise Parzen Window (Unit 5)
50 Dr. Andreas Zinnen Modelling and Simulation using MATLAB®
Unit 5 Novelty Detection
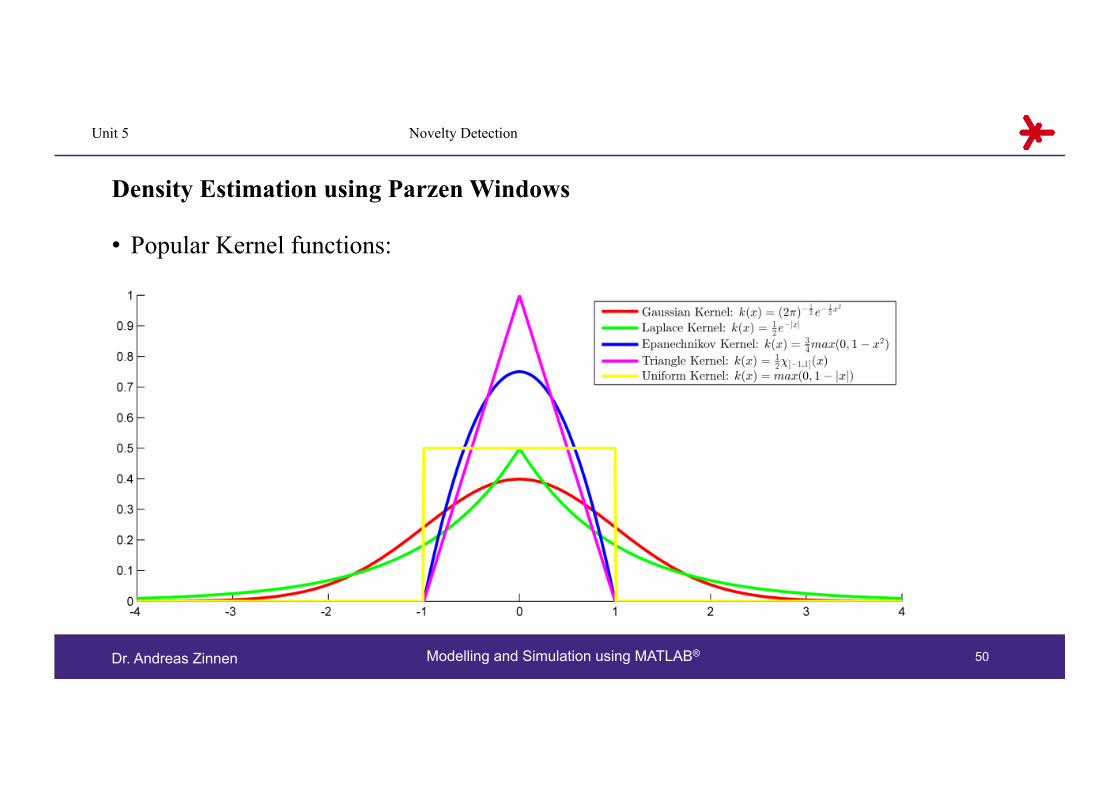
Density Estimation using Parzen Windows
• Popular Kernel functions:

51 Dr. Andreas Zinnen Modelling and Simulation using MATLAB®
Unit 5 Novelty Detection
Density Estimation: Silverman’s Rule
• Observation: • A data set often contains regions with high and low densities at the same time
• Request: • Choose a narrow kernel width for regions with high density • Select a wide kernel width for regions with low density
• Solution: • The k nearest neighbours give a rough estimate about the density
• Challenge: • Find adequate c and k using Cross Validation

52 Dr. Andreas Zinnen Modelling and Simulation using MATLAB®
Unit 5 Novelty Detection
Density Estimation: Silverman’s Rule
Using Silverman’s Rule: c = 0.8, k = 30 Parzen Window with fixed h = 0.96
Please download ParzenSilverman.zip to obtain a sample implementation for Silverman

53 Dr. Andreas Zinnen Modelling and Simulation using MATLAB®
Unit 5 Novelty Detection
Novelty Detection (Step 2)
• Consider a test sample x as normal if the estimated probablity is greater or equal than a threshold t:
• Declare a test sample x as abnormal if the estimated probablity is smaller than a threshold t:
• Example: Algorithm discarding 5% of instances: • Compute all probabilities using CV • Sort the data and fix a threshold t to declare 5% of all
samples as outliers • Check if for an unknown sample x

54 Dr. Andreas Zinnen Modelling and Simulation using MATLAB®
Use kernel to smooth-out k-nearest neighbour regression Define as a combination of the labels , weighted by
Unit 6 Extension Classification & Regression
Nadaraya-Watson Estimator (Regression)

55 Dr. Andreas Zinnen Modelling and Simulation using MATLAB®
Using a Gaussian kernel in 1D leads to following regression results
Unit 6 Extension Classification & Regression
Nadaraya-Watson Estimator (Regression)

56 Dr. Andreas Zinnen Modelling and Simulation using MATLAB®
Exercise Regression (Unit 6) Extension Classification & Regression
Nadaraya-Watson Regression (Implementation in )
• Download NWRegression.zip and unzip the file to your computer. The folder will contain following files:
• dataDrinks.mat (the data set) • NWRegression.m (including implementation) • implementCVRegression.m (the exercise file)
• Run implementCVRegression.m • Compare your solution with the sample solution

57 Dr. Andreas Zinnen Modelling and Simulation using MATLAB®
Unit 6 Extension Classification & Regression
Nadaraya-Watson Estimator (Classification)
Use kernel to smooth-out the k-nearest neighbour classifier Note: x are values in 2-D

58 Dr. Andreas Zinnen Modelling and Simulation using MATLAB®
Using a Gaussian kernel in 2D leads to following classification results
Unit 6 Extension Classification & Regression
Nadaraya-Watson Estimator (Classification)

59 Dr. Andreas Zinnen Modelling and Simulation using MATLAB®
Exercise Classification (Unit 6) Extension Classification & Regression
Nadaraya-Watson Classification (Implementation in )
• Download NWClassfication.zip and unzip the file to your computer. The folder will contain following files:
• woodData.mat (the data set) • NWClassification.m (including implementation) • implementCVClassification.m (the exercise file) • solutionClassification.m
• Run implementCVClassification.m to find the optimal h • Run solutionClassification.m with the optimal h • Upload the generated Figure as PDF or JPG for peer review

60 Dr. Andreas Zinnen Modelling and Simulation using MATLAB®
Literature & References
Literature & References
PATTERN RECOGNITION AND MACHINE LEARNING Christopher Bishop Information Science and Statistics 2007 INTRODUCTION TO MACHINE LEARNING Alex Smola, S.V.N. Vishwanathan http://alex.smola.org/drafts/thebook.pdf
Related Documents