6D ‐ Northwestern Ohio Synod 6D ‐ Northwestern Ohio Synod Your Synod at a Glance 1. Summary of Form A Report – Includes summary of congregational membership statistics, financial statistics and ethnic membership. 2. Summary of Form C Report – Includes summary of congregational programming for the synod, including curriculum used for education, what assistances are offered to those with disabilities, and ways in which congregations practiced advocacy. 3. Select Congregational Statistics – Includes the size, location, and past attendance data for congregations within the synod. 4. Synod Trend Report ‐ Synod Trend Report showing the baptized membership, average attendance and giving for the synod from 2010 to 2016. 5. Size of all ELCA Congregations – Distribution of all ELCA congregations based on average attendance. 6. Congregation Size/Type by Synod – Distribution of congregations by average attendance for each synod. 7. Ethnicity by Synod/Conference – The percentage of people of color within a synod and conference. 8. Congregation Growth/Decline by Synod – Congregations growing, declining, or remaining stable based on changes in average attendance from 2013 to 2016 by region. 9. Largest Attendance Congregations by Synod – Ranking of congregations based on average attendance. 10. Racially Diverse Congregations by Synod – Congregations showing the most racial/ethnic diversity, especially with congregations with no racial/ethnic community in the majority. 11. Congregations with Most Baptisms by Synod – Ranking of congregations based on child and adult baptisms. 12. Synod Demographics – Includes population projections and many characteristics for the synod's territory. 13. Age – Chart comparing the age of clergy in the synod to the age of clergy in the ELCA. 14. Map – Map of Projected Change in Population by ZIP Code and Change in Average Attendance for the synod. 15. Community Context – Community context of congregations in ELCA synods, based on the parochial forms. 16. Scatter grams – Trend charts by Total Giving and Worship Attendance showing the change in percent total giving and percent worshiping attendance from 2008 to 2012 and 2012 to 2016. 17. ELCA Roster – Distribution of Rostered Ministers by Job and Active Status Run date: Thursday, November 9, 2017

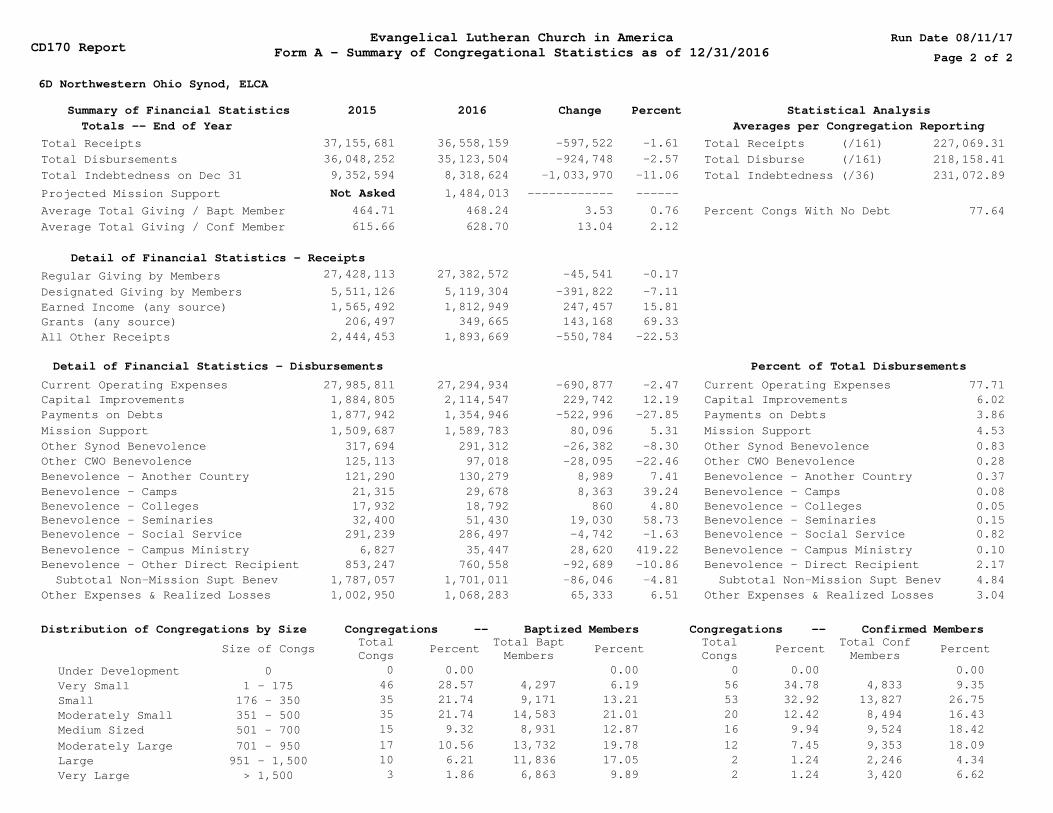
Welcome message from author
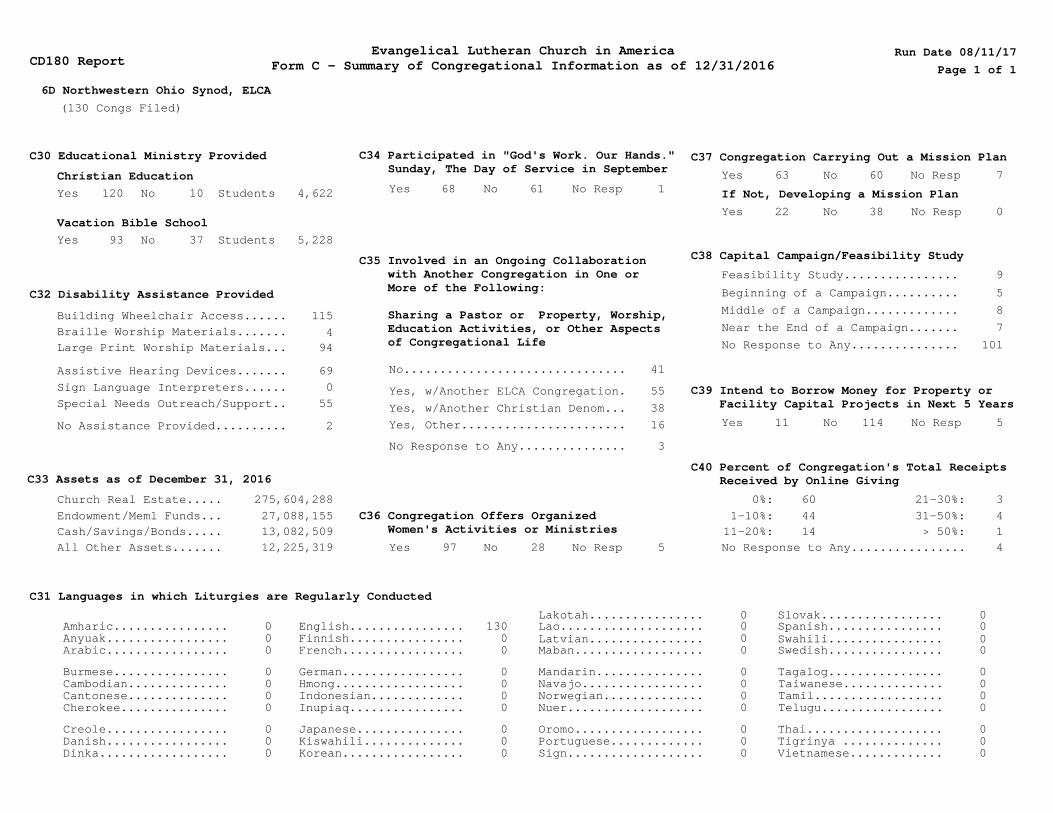
This document is posted to help you gain knowledge. Please leave a comment to let me know what you think about it! Share it to your friends and learn new things together.
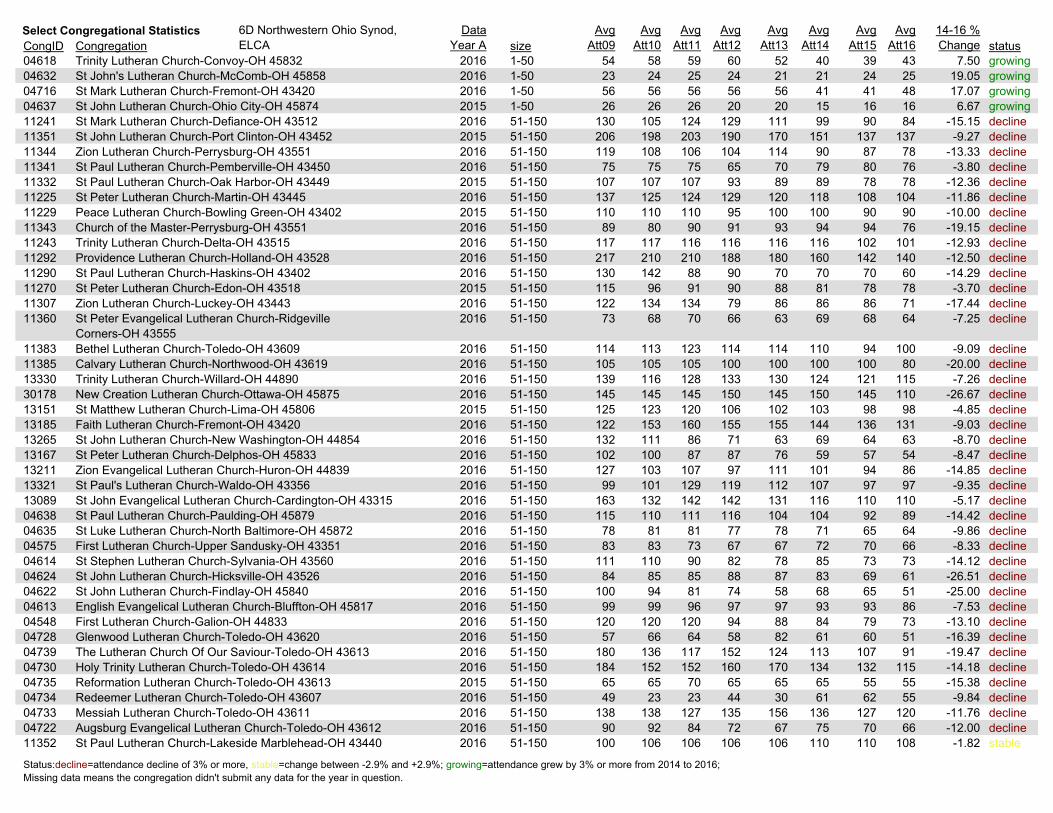
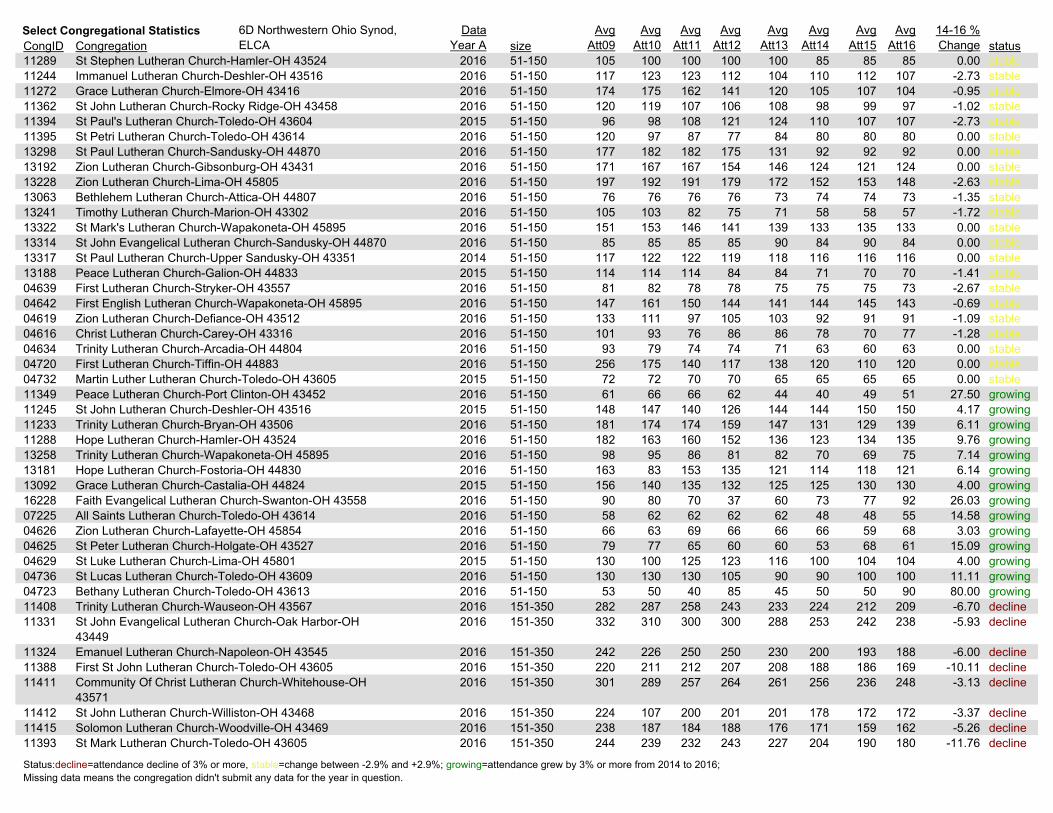
Transcript

6D ‐ Northwestern Ohio Synod
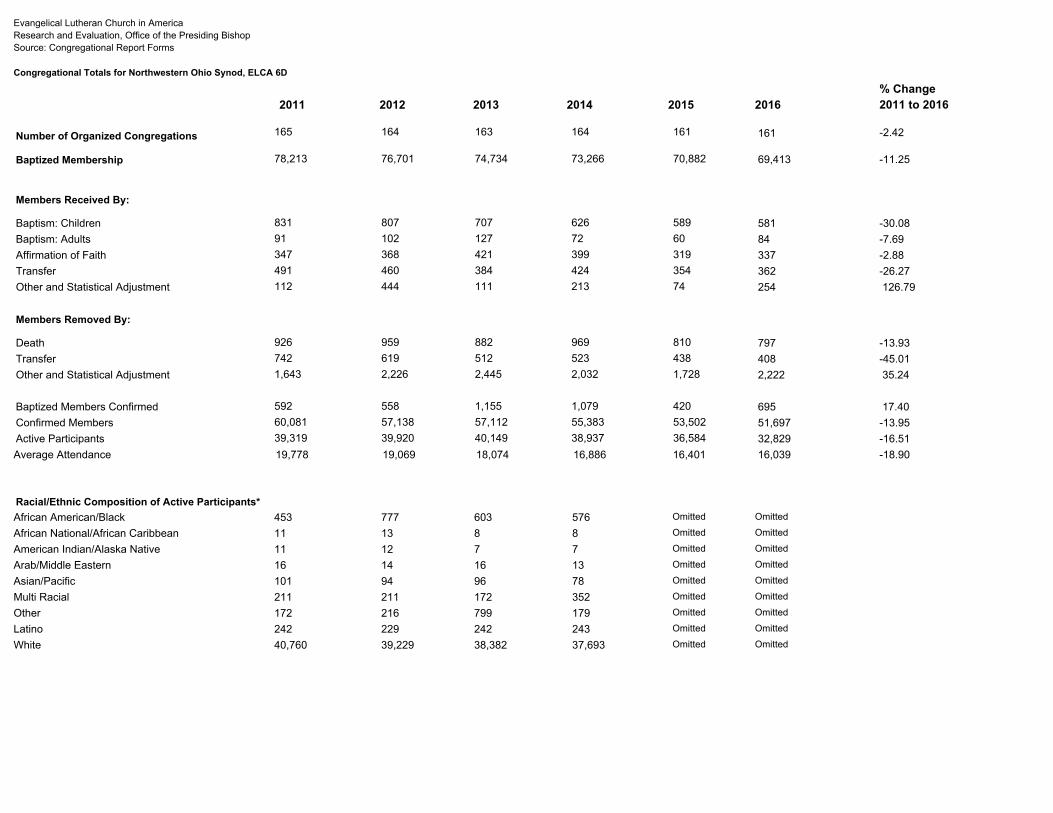
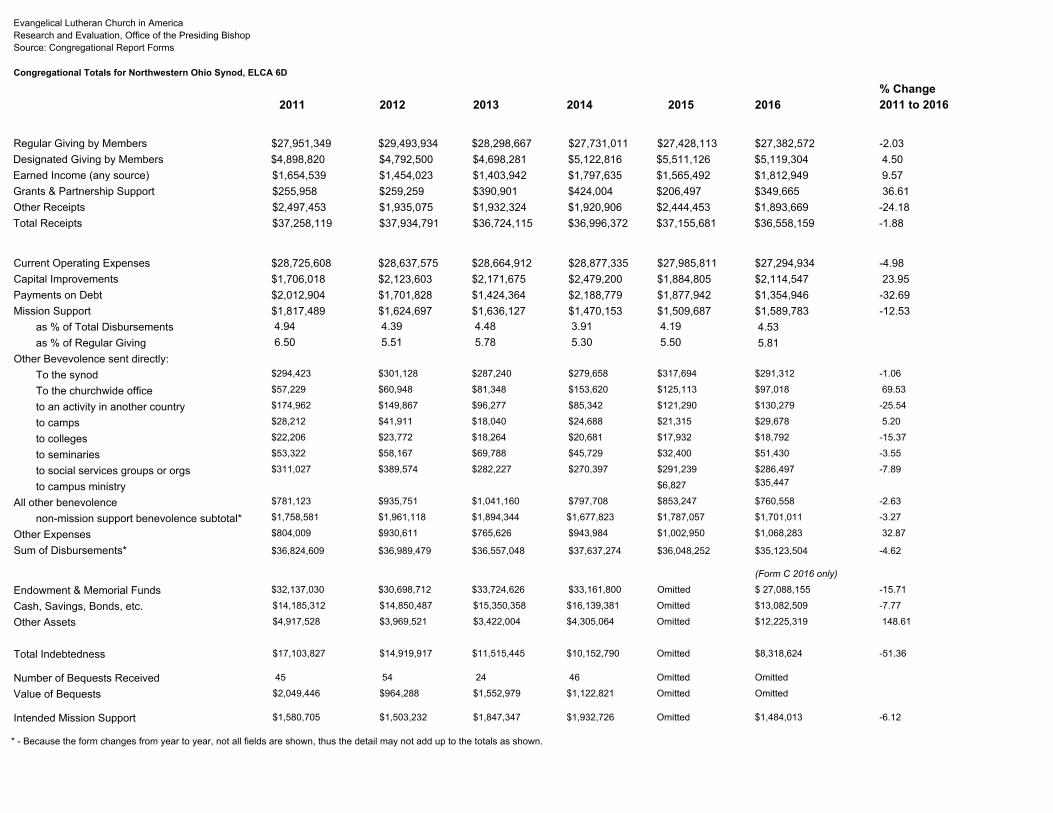
6D ‐ Northwestern Ohio Synod Your Synod at a Glance 1. Summary of Form A Report – Includes summary of congregational membership statistics, financial statistics and ethnic membership. 2. Summary of Form C Report – Includes summary of congregational programming for the synod, including curriculum used for education, what
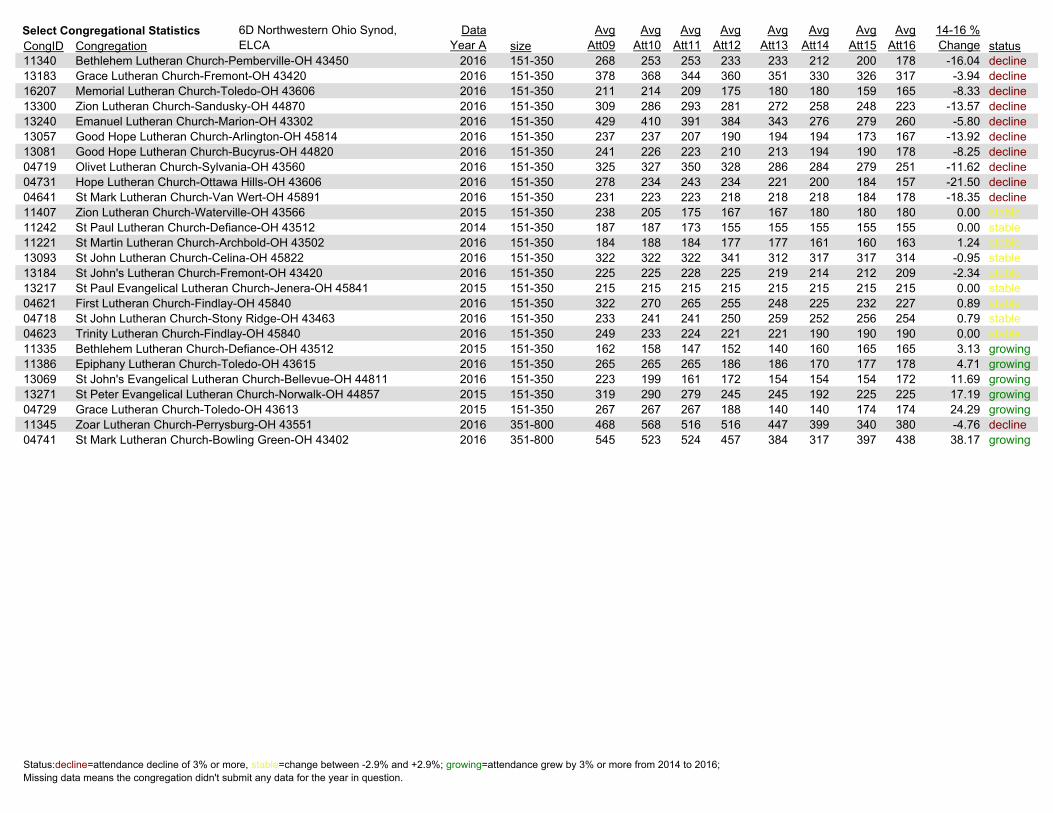
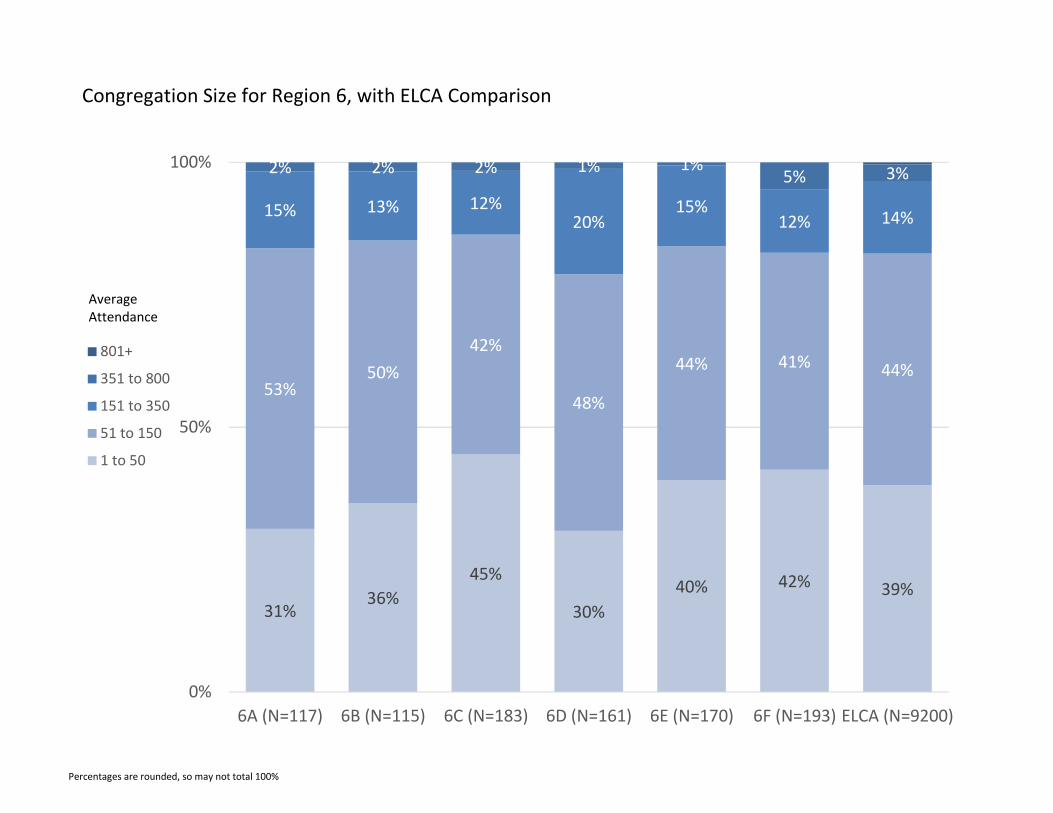
assistances are offered to those with disabilities, and ways in which congregations practiced advocacy. 3. Select Congregational Statistics – Includes the size, location, and past attendance data for congregations within the synod. 4. Synod Trend Report ‐ Synod Trend Report showing the baptized membership, average attendance and giving for the synod from 2010 to 2016. 5. Size of all ELCA Congregations – Distribution of all ELCA congregations based on average attendance. 6. Congregation Size/Type by Synod – Distribution of congregations by average attendance for each synod. 7. Ethnicity by Synod/Conference – The percentage of people of color within a synod and conference. 8. Congregation Growth/Decline by Synod – Congregations growing, declining, or remaining stable based on changes in average attendance from
2013 to 2016 by region. 9. Largest Attendance Congregations by Synod – Ranking of congregations based on average attendance. 10. Racially Diverse Congregations by Synod – Congregations showing the most racial/ethnic diversity, especially with congregations with no
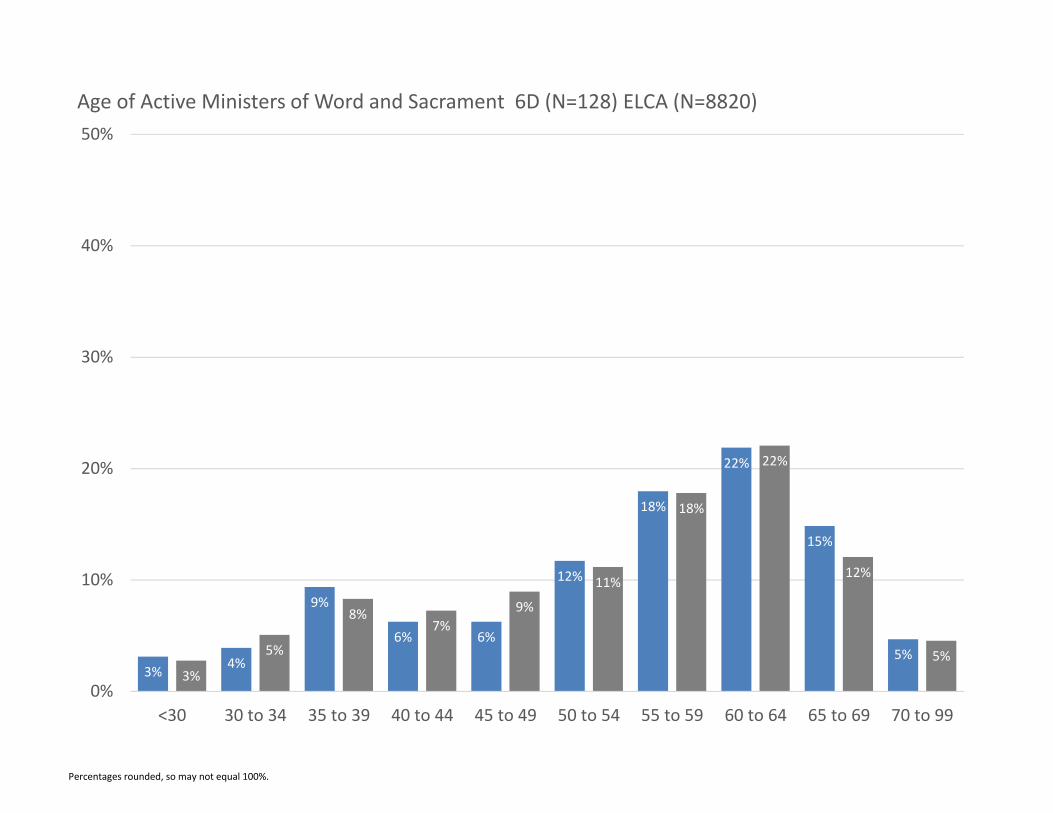
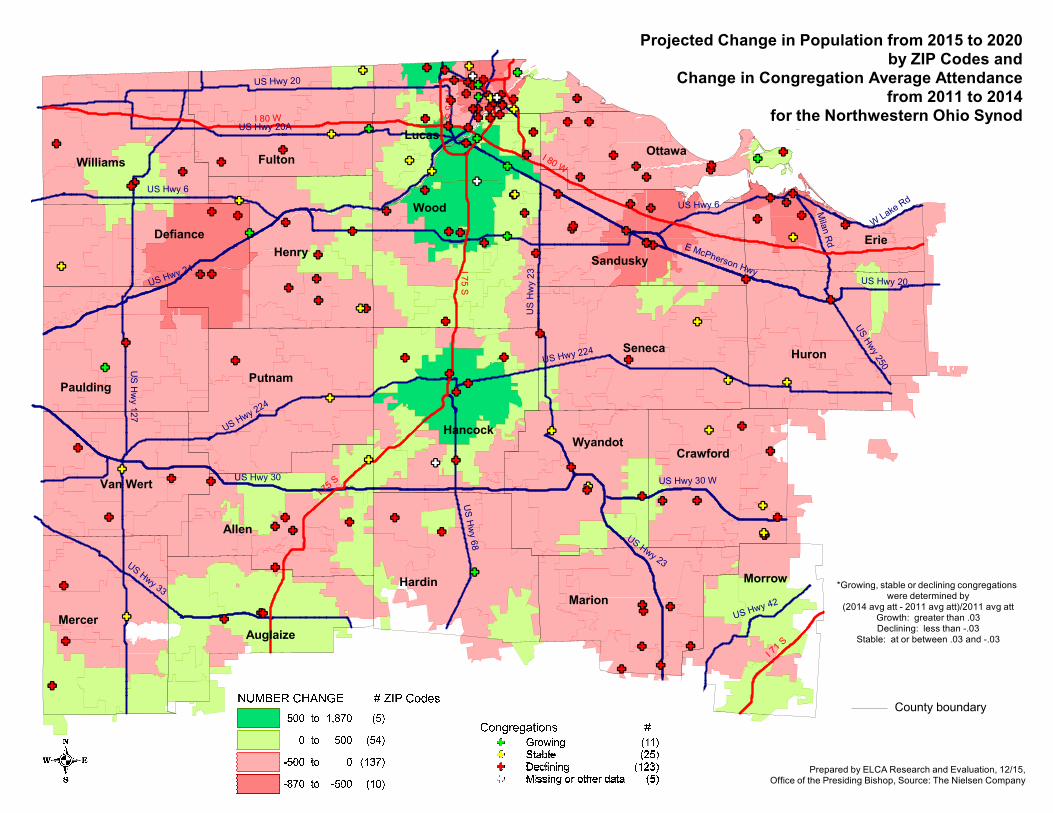
racial/ethnic community in the majority. 11. Congregations with Most Baptisms by Synod – Ranking of congregations based on child and adult baptisms. 12. Synod Demographics – Includes population projections and many characteristics for the synod's territory. 13. Age – Chart comparing the age of clergy in the synod to the age of clergy in the ELCA. 14. Map – Map of Projected Change in Population by ZIP Code and Change in Average Attendance for the synod. 15. Community Context – Community context of congregations in ELCA synods, based on the parochial forms. 16. Scatter grams – Trend charts by Total Giving and Worship Attendance showing the change in percent total giving and percent worshiping
attendance from 2008 to 2012 and 2012 to 2016. 17. ELCA Roster – Distribution of Rostered Ministers by Job and Active Status
Run date: Thursday, November 9, 2017
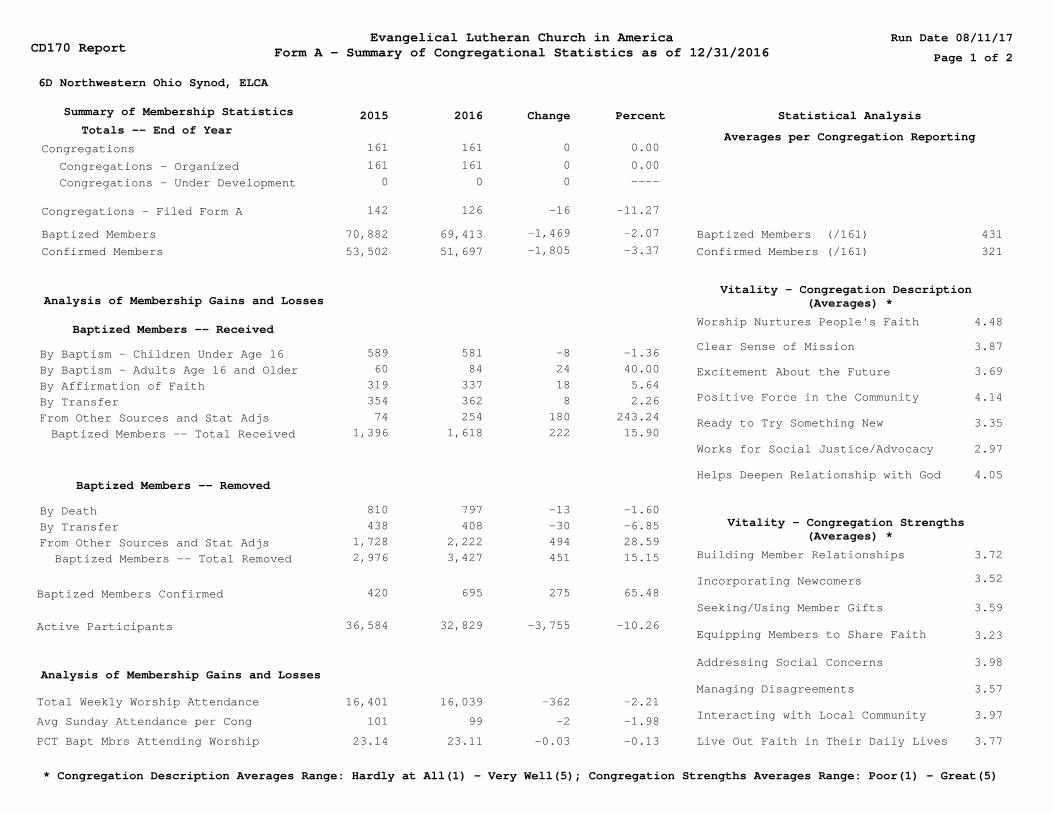
Evangelical Lutheran Church in AmericaForm A - Summary of Congregational Statistics as of 12/31/2016
6D Northwestern Ohio Synod, ELCA
2015 2016 Change PercentSummary of Membership Statistics
Analysis of Membership Gains and Losses
Totals -- End of Year
Confirmed Members
Congregations
Baptized Members
Baptized Members -- Removed
Baptized Members (/161)
By Baptism - Children Under Age 16
By Baptism - Adults Age 16 and Older
By Affirmation of Faith
By Transfer
From Other Sources and Stat Adjs
Baptized Members -- Total Received
Averages per Congregation Reporting
Statistical Analysis
Page 1 of 2
Congregations - Under Development
Congregations - Organized
Congregations - Filed Form A
Vitality - Congregation Description (Averages) *
Interacting with Local Community
Live Out Faith in Their Daily Lives
Addressing Social Concerns
Seeking/Using Member Gifts
Helps Deepen Relationship with God
Works for Social Justice/Advocacy
Ready to Try Something New
Positive Force in the Community
Excitement About the Future
Clear Sense of Mission
Worship Nurtures People's Faith
Managing Disagreements
Baptized Members -- Received
Baptized Members -- Total Removed
By Transfer
By Death
From Other Sources and Stat Adjs
Total Weekly Worship Attendance
Avg Sunday Attendance per Cong
PCT Bapt Mbrs Attending Worship
Analysis of Membership Gains and Losses
Active Participants
Baptized Members Confirmed
161
161
0
126
161
161
0
142
0
0
-16
69,413
51,697
695
70,882
53,502
420
581
84
337
589
60
319
-8
24
18
797
408
2,222
810
438
1,728
-13
-30
494
362
254
354
74
8
180
1,6181,396 222
3,4272,976 451
-1,469
-1,805
275
32,82936,584 -3,755
0.00
0.00
-11.27
-2.07
-3.37
-1.36
40.00
2.26
243.24
15.90
5.64
-1.60
-6.85
15.15
65.48
-10.26
28.59
Confirmed Members (/161)
16,039
99
16,401
101
-362
-2
23.1123.14 -0.03
-2.21
-1.98
-0.13
4.48
3.87
3.69
4.14
3.35
2.97
4.05
3.72
3.52
3.59
3.23
3.98
3.57
3.97
3.77
CD170 ReportRun Date 08/11/17
321
431
0
----
Building Member Relationships
Incorporating Newcomers
Equipping Members to Share Faith
Vitality - Congregation Strengths (Averages) *
* Congregation Description Averages Range: Hardly at All(1) - Very Well(5); Congregation Strengths Averages Range: Poor(1) - Great(5)
Evangelical Lutheran Church in AmericaForm A - Summary of Congregational Statistics as of 12/31/2016
6D Northwestern Ohio Synod, ELCA
2015 2016 Change PercentSummary of Financial StatisticsTotals -- End of Year Averages per Congregation Reporting
Statistical Analysis
Page 2 of 2CD170 Report
Run Date 08/11/17
Percent of Total Disbursements
Detail of Financial Statistics - Receipts
Detail of Financial Statistics - Disbursements
Total Receipts
Total Disbursements
Total Indebtedness on Dec 31
Average Total Giving / Bapt Member
Average Total Giving / Conf Member
Current Operating Expenses
Payments on DebtsCapital Improvements
Other Synod Benevolence
Regular Giving by Members
Designated Giving by MembersEarned Income (any source)Grants (any source)All Other Receipts
Mission Support
Subtotal Non-Mission Supt Benev
Other CWO BenevolenceBenevolence - Another CountryBenevolence - Camps
Other Expenses & Realized Losses
Total Receipts (/161)
Total Disburse (/161)
Total Indebtedness (/36)
227,069.31
218,158.41
231,072.89
Percent Congs With No Debt 77.64
Current Operating Expenses
Payments on DebtsCapital Improvements
Mission Support
Subtotal Non-Mission Supt BenevOther Expenses & Realized Losses
77.71
4.53
4.843.04
6.023.86
36,558,159
8,318,624
35,123,504
468.24
628.70
27,382,572
5,119,3041,812,949
349,6651,893,669
27,294,9342,114,5471,354,946
1,589,783
1,701,0111,068,283
291,31297,018
130,27929,678
37,155,681
9,352,594
36,048,252
464.71
615.66
27,428,113
5,511,1261,565,492
206,4972,444,453
27,985,8111,884,8051,877,942
1,509,687
1,787,0571,002,950
317,694125,113121,29021,315
-597,522
-1,033,970
-924,748
3.53
13.04
-45,541
247,457143,168
-550,784
-391,822
-690,877
-522,996
80,096
-86,046
229,742
65,333
-28,0958,9898,363
-26,382
-1.61
-2.57
-11.06
0.76
2.12
-0.17
-7.1115.8169.33
-22.53
-2.4712.19
-27.85
5.31
-4.816.51
-8.30-22.46
7.4139.24
Benevolence - CollegesBenevolence - SeminariesBenevolence - Social Service
18,79251,430
286,497
17,93232,400
291,239
86019,030-4,742
4.8058.73-1.63
Benevolence - Other Direct Recipient Benevolence - Direct Recipient 2.17760,558853,247 -92,689 -10.86
Benevolence - SeminariesBenevolence - Colleges
Benevolence - Social Service 0.82
0.050.15
Other Synod Benevolence
Benevolence - Another CountryOther CWO Benevolence
0.830.280.37
Benevolence - Camps 0.08
Benevolence - Campus Ministry 35,4476,827 28,620 419.22 Benevolence - Campus Ministry 0.10
Under DevelopmentVery SmallSmallModerately SmallMedium Sized
Moderately LargeLargeVery Large
01 - 175
176 - 350351 - 500501 - 700
701 - 950951 - 1,500
> 1,500
0
353515
17
310
460
532016
12
22
569,171
14,5838,931
13,732
6,86311,836
4,29713,8278,4949,524
9,353
3,4202,246
4,8330.00 0.00
28.57 6.1921.74 13.21
0.0034.7832.92
0.009.35
26.7521.749.32
10.566.211.86
21.0112.87
19.7817.059.89
12.429.94
7.45
16.4318.42
18.094.346.62
1.241.24
Distribution of Congregations by Size Congregations -- Baptized Members Congregations -- Confirmed Members
Size of CongsTotalCongs
TotalCongs
Total BaptMembers
Total ConfMembers
Percent Percent Percent Percent
Projected Mission Support 1,484,013Not Asked ------------ ------
Evangelical Lutheran Church in AmericaForm C - Summary of Congregational Information as of 12/31/2016 Page 1 of 1
(130 Congs Filed)
CD180 Report
6D Northwestern Ohio Synod, ELCA
C30 Educational Ministry Provided
C32 Disability Assistance Provided
C39 Intend to Borrow Money for Property or Facility Capital Projects in Next 5 Years
Christian Education
Building Wheelchair Access......
Yes No
Braille Worship Materials.......
Assistive Hearing Devices.......
Special Needs Outreach/Support..
C35 Involved in an Ongoing Collaboration with Another Congregation in One or More of the Following:
Sharing a Pastor or Property, Worship, Education Activities, or Other Aspects of Congregational Life
Vacation Bible School
Yes No
C33 Assets as of December 31, 2016
Church Real Estate.....
All Other Assets.......
Cash/Savings/Bonds.....Endowment/Meml Funds...
C34 Participated in "God's Work. Our Hands." Sunday, The Day of Service in September
Yes No
C31 Languages in which Liturgies are Regularly Conducted
Amharic................Anyuak.................
German.................
Oromo..................
Arabic.................
Portuguese.............
Hmong..................
Sign...................
Burmese................
Indonesian.............
Spanish................
Inupiaq................
Swahili................
Cambodian..............
Japanese...............Kiswahili..............
Tagalog................
Cantonese..............
Korean.................
Taiwanese..............
Lao....................
Cherokee...............
Latvian................
Telugu.................
Creole.................
Maban..................
Thai...................Danish.................
Mandarin...............
Tigrinya ..............
Swedish................
English................
Navajo.................
Finnish................
Norwegian..............
Vietnamese.............
120 10
93 37
000
0000
00
0
13000
0000
000
000
00
0
000
00
00
0
275,604,288
12,225,319
13,082,50927,088,155
68 61 1
115
94
69
55
French.................
Nuer...................
0
0
0
0
0
Yes, w/Another ELCA Congregation.
Yes, w/Another Christian Denom...
No Response to Any...............
55
38
3
Feasibility Study................
Beginning of a Campaign..........
Middle of a Campaign.............
9
5
8
7
No Assistance Provided.......... 2
Yes No63 60 No Resp 7
Large Print Worship Materials...
Sign Language Interpreters...... 0
No............................... 41
4
No Resp
Tamil..................
Yes, Other....................... 16
Run Date 08/11/17
Students 4,622
Students 5,228
No Response to Any............... 101
C38 Capital Campaign/Feasibility Study
60
44
3
41
If Not, Developing a Mission Plan
Yes No22 38 No Resp 0
14
No Response to Any................ 4
Near the End of a Campaign.......
C37 Congregation Carrying Out a Mission Plan
C36 Congregation Offers Organized Women's Activities or Ministries
Yes No97 28 5No Resp
Yes No11 114 5No Resp
0%:
1-10%:11-20%:
21-30%:
31-50%:> 50%:
C40 Percent of Congregation's Total Receipts Received by Online Giving
Dinka.................. 0
Lakotah................ 0 Slovak................. 0

Avg
Att09
Avg
Att10
Avg
Att11
Avg
Att12
Avg
Att13
Avg
Att14
Avg
Att15
Avg
Att16
14-16 %
ChangeSelect Congregational Statistics
CongID Congregation
Data
Year A
6D Northwestern Ohio Synod,
ELCA statussize 55 57 49 60 47 44 -10.2011313 Faith Lutheran Church-Metamora-OH 43540 50 49 2016 decline1-50
41 35 38 34 35 32 -8.5711308 St John Lutheran Church-Marblehead-OH 43440 34 35 2016 decline1-50
71 62 62 61 49 43 -23.2111240 Bethlehem Lutheran Church-Defiance-OH 43512 57 56 2016 decline1-50
56 56 49 43 38 40 -4.7611228 Hope Lutheran Church-Bowling Green-OH 43402 46 42 2016 decline1-50
66 55 55 49 36 36 -10.0011391 St John Lutheran Church-Toledo-OH 43609 43 40 2015 decline1-50
98 76 63 56 40 32 -28.8911387 Faith Lutheran Church-Toledo-OH 43609 42 45 2016 decline1-50
42 56 72 50 59 47 -20.3411396 Salem Lutheran Church-Toledo-OH 43604 53 59 2016 decline1-50
56 54 55 67 49 50 -9.0911227 Christ Evangelical Lutheran Church-Bowling Green-OH
43402
63 55 2016 decline1-50
113 113 46 46 46 38 -17.3913096 Nazareth Lutheran Church-Chatfield-OH 44825 52 46 2016 decline1-50
56 55 50 44 33 29 -14.7113324 St Paul Lutheran Church-Coldwater-OH 45828 40 34 2016 decline1-50
44 39 38 36 31 28 -22.2213292 St Paul Evangelical Lutheran Church-Rockford-OH 45882 34 36 2016 decline1-50
52 53 41 40 31 27 -20.5913180 Trinity Lutheran Church-Fort Recovery-OH 45846 35 34 2016 decline1-50
51 51 51 51 24 24 -22.5813186 Trinity Lutheran Church-Fremont-OH 43420 51 31 2015 decline1-50
25 25 25 22 19 18 -5.2613191 First English Lutheran Church-Gibsonburg-OH 43431 20 19 2016 decline1-50
41 42 41 40 32 29 -17.1413205 Emmanuel Lutheran Church-Hessville-OH 43442 33 35 2016 decline1-50
62 59 48 52 43 42 -4.5513242 Trinity Lutheran Church-Marion-OH 43302 48 44 2016 decline1-50
60 54 52 49 49 40 -13.0413169 St John Lutheran Church-Dola-OH 45835 45 46 2016 decline1-50
56 61 61 64 35 35 -23.9113082 Martin Luther Lutheran Church-Bucyrus-OH 44820 46 46 2015 decline1-50
33 31 31 44 38 30 -18.9213078 St John Lutheran Church-Paulding-OH 45879 44 37 2016 decline1-50
65 53 49 -7.5530976 Salem Grace United Evangelical Lutheran
Church-Luckey-OH 43443
65 53 2016 decline1-50
20 20 20 20 12 10 -23.0804633 Trinity Lutheran Church-Middle Point-OH 45863 20 13 2016 decline1-50
50 50 50 44 24 24 -45.4504631 Trinity Lutheran Church-Malinta-OH 43535 44 44 2015 decline1-50
65 52 51 52 38 38 -20.8304630 St Paul Lutheran Church-McClure-OH 43534 48 48 2015 decline1-50
98 70 70 73 45 45 -11.7604566 Nevada Lutheran Church-Nevada-OH 44849 61 51 2015 decline1-50
68 62 61 60 54 44 -16.9804715 St Luke Lutheran Church-Curtice-OH 43412 53 53 2016 decline1-50
24 24 22 22 22 20 -9.0904544 St John Lutheran Church-Crestline-OH 44827 22 22 2016 decline1-50
50 40 40 35 30 30 -14.2904563 St Paul Lutheran Church-Marion-OH 43302 35 35 2016 decline1-50
17 18 17 28 11 11 -35.2904721 Ascension Lutheran Church-Toledo-OH 43604 17 17 2015 decline1-50
23 24 25 30 15 16 -11.1104574 Crouse Memorial Lutheran Church-Tiro-OH 44887 19 18 2016 decline1-50
34 31 35 34 25 23 -32.3504727 First St Mark Lutheran Church-Oregon-OH 43616 34 34 2016 decline1-50
55 58 58 58 50 50 -9.0904615 First Lutheran Church-Bryan-OH 43506 53 55 2016 decline1-50
59 55 55 53 50 47 -6.0004546 St Paul Lutheran Church-North Robinson-OH 44827 49 50 2016 decline1-50
91 69 69 45 35 35 0.0011390 St James Lutheran Church-Toledo-OH 43623 45 35 2014 stable1-50
70 65 60 55 48 48 0.0011384 Bethlehem Lutheran Church-Toledo-OH 43605 50 48 2015 stable1-50
15 15 15 15 15 0.0013295 St James Lutheran Church-Portland-IN 47371 15 15 2012 stable1-50
40 41 40 42 40 38 -2.5613189 Trinity Lutheran Church-Galion-OH 44833 39 39 2016 stable1-50
18 20 20 20 20 20 0.0013288 Zion Lutheran Church-Republic-OH 44867 20 20 2015 stable1-50
42 46 46 34 34 0.0030869 Threshold Lutheran Church-Rossford-OH 43460 46 34 2014 stable1-50
44 44 44 35 35 35 0.0004612 St Mark Lutheran Church-Ada-OH 45810 35 35 2012 stable1-50
48 48 48 35 31 36 12.5011230 St James Lutheran Church-Bradner-OH 43406 36 32 2016 growing1-50
52 52 52 42 45 45 18.4216172 Hosanna Lutheran Church-Grand Rapids-OH 43522 39 38 2016 growing1-50
104 89 55 55 50 50 42.8613286 St Paul Lutheran Church-Prospect-OH 43342 53 35 2015 growing1-50
31 33 35 39 42 42 5.0016276 Our Savior Lutheran Church-Kenton-OH 43326 39 40 2015 growing1-50
30 29 29 30 24 22 10.0016022 Christ Lutheran Church-Continental-OH 45831 20 20 2016 growing1-50
Status:decline=attendance decline of 3% or more, stable=change between -2.9% and +2.9%; growing=attendance grew by 3% or more from 2014 to 2016;
Missing data means the congregation didn't submit any data for the year in question.
Avg
Att09
Avg
Att10
Avg
Att11
Avg
Att12
Avg
Att13
Avg
Att14
Avg
Att15
Avg
Att16
14-16 %
ChangeSelect Congregational Statistics
CongID Congregation
Data
Year A
6D Northwestern Ohio Synod,
ELCA statussize 54 58 59 60 39 43 7.5004618 Trinity Lutheran Church-Convoy-OH 45832 52 40 2016 growing1-50
23 24 25 24 24 25 19.0504632 St John's Lutheran Church-McComb-OH 45858 21 21 2016 growing1-50
56 56 56 56 41 48 17.0704716 St Mark Lutheran Church-Fremont-OH 43420 56 41 2016 growing1-50
26 26 26 20 16 16 6.6704637 St John Lutheran Church-Ohio City-OH 45874 20 15 2015 growing1-50
130 105 124 129 90 84 -15.1511241 St Mark Lutheran Church-Defiance-OH 43512 111 99 2016 decline51-150
206 198 203 190 137 137 -9.2711351 St John Lutheran Church-Port Clinton-OH 43452 170 151 2015 decline51-150
119 108 106 104 87 78 -13.3311344 Zion Lutheran Church-Perrysburg-OH 43551 114 90 2016 decline51-150
75 75 75 65 80 76 -3.8011341 St Paul Lutheran Church-Pemberville-OH 43450 70 79 2016 decline51-150
107 107 107 93 78 78 -12.3611332 St Paul Lutheran Church-Oak Harbor-OH 43449 89 89 2015 decline51-150
137 125 124 129 108 104 -11.8611225 St Peter Lutheran Church-Martin-OH 43445 120 118 2016 decline51-150
110 110 110 95 90 90 -10.0011229 Peace Lutheran Church-Bowling Green-OH 43402 100 100 2015 decline51-150
89 80 90 91 94 76 -19.1511343 Church of the Master-Perrysburg-OH 43551 93 94 2016 decline51-150
117 117 116 116 102 101 -12.9311243 Trinity Lutheran Church-Delta-OH 43515 116 116 2016 decline51-150
217 210 210 188 142 140 -12.5011292 Providence Lutheran Church-Holland-OH 43528 180 160 2016 decline51-150
130 142 88 90 70 60 -14.2911290 St Paul Lutheran Church-Haskins-OH 43402 70 70 2016 decline51-150
115 96 91 90 78 78 -3.7011270 St Peter Lutheran Church-Edon-OH 43518 88 81 2015 decline51-150
122 134 134 79 86 71 -17.4411307 Zion Lutheran Church-Luckey-OH 43443 86 86 2016 decline51-150
73 68 70 66 68 64 -7.2511360 St Peter Evangelical Lutheran Church-Ridgeville
Corners-OH 43555
63 69 2016 decline51-150
114 113 123 114 94 100 -9.0911383 Bethel Lutheran Church-Toledo-OH 43609 114 110 2016 decline51-150
105 105 105 100 100 80 -20.0011385 Calvary Lutheran Church-Northwood-OH 43619 100 100 2016 decline51-150
139 116 128 133 121 115 -7.2613330 Trinity Lutheran Church-Willard-OH 44890 130 124 2016 decline51-150
145 145 145 150 145 110 -26.6730178 New Creation Lutheran Church-Ottawa-OH 45875 145 150 2016 decline51-150
125 123 120 106 98 98 -4.8513151 St Matthew Lutheran Church-Lima-OH 45806 102 103 2015 decline51-150
122 153 160 155 136 131 -9.0313185 Faith Lutheran Church-Fremont-OH 43420 155 144 2016 decline51-150
132 111 86 71 64 63 -8.7013265 St John Lutheran Church-New Washington-OH 44854 63 69 2016 decline51-150
102 100 87 87 57 54 -8.4713167 St Peter Lutheran Church-Delphos-OH 45833 76 59 2016 decline51-150
127 103 107 97 94 86 -14.8513211 Zion Evangelical Lutheran Church-Huron-OH 44839 111 101 2016 decline51-150
99 101 129 119 97 97 -9.3513321 St Paul's Lutheran Church-Waldo-OH 43356 112 107 2016 decline51-150
163 132 142 142 110 110 -5.1713089 St John Evangelical Lutheran Church-Cardington-OH 43315 131 116 2016 decline51-150
115 110 111 116 92 89 -14.4204638 St Paul Lutheran Church-Paulding-OH 45879 104 104 2016 decline51-150
78 81 81 77 65 64 -9.8604635 St Luke Lutheran Church-North Baltimore-OH 45872 78 71 2016 decline51-150
83 83 73 67 70 66 -8.3304575 First Lutheran Church-Upper Sandusky-OH 43351 67 72 2016 decline51-150
111 110 90 82 73 73 -14.1204614 St Stephen Lutheran Church-Sylvania-OH 43560 78 85 2016 decline51-150
84 85 85 88 69 61 -26.5104624 St John Lutheran Church-Hicksville-OH 43526 87 83 2016 decline51-150
100 94 81 74 65 51 -25.0004622 St John Lutheran Church-Findlay-OH 45840 58 68 2016 decline51-150
99 99 96 97 93 86 -7.5304613 English Evangelical Lutheran Church-Bluffton-OH 45817 97 93 2016 decline51-150
120 120 120 94 79 73 -13.1004548 First Lutheran Church-Galion-OH 44833 88 84 2016 decline51-150
57 66 64 58 60 51 -16.3904728 Glenwood Lutheran Church-Toledo-OH 43620 82 61 2016 decline51-150
180 136 117 152 107 91 -19.4704739 The Lutheran Church Of Our Saviour-Toledo-OH 43613 124 113 2016 decline51-150
184 152 152 160 132 115 -14.1804730 Holy Trinity Lutheran Church-Toledo-OH 43614 170 134 2016 decline51-150
65 65 70 65 55 55 -15.3804735 Reformation Lutheran Church-Toledo-OH 43613 65 65 2015 decline51-150
49 23 23 44 62 55 -9.8404734 Redeemer Lutheran Church-Toledo-OH 43607 30 61 2016 decline51-150
138 138 127 135 127 120 -11.7604733 Messiah Lutheran Church-Toledo-OH 43611 156 136 2016 decline51-150
90 92 84 72 70 66 -12.0004722 Augsburg Evangelical Lutheran Church-Toledo-OH 43612 67 75 2016 decline51-150
100 106 106 106 110 108 -1.8211352 St Paul Lutheran Church-Lakeside Marblehead-OH 43440 106 110 2016 stable51-150
Status:decline=attendance decline of 3% or more, stable=change between -2.9% and +2.9%; growing=attendance grew by 3% or more from 2014 to 2016;
Missing data means the congregation didn't submit any data for the year in question.
Avg
Att09
Avg
Att10
Avg
Att11
Avg
Att12
Avg
Att13
Avg
Att14
Avg
Att15
Avg
Att16
14-16 %
ChangeSelect Congregational Statistics
CongID Congregation
Data
Year A
6D Northwestern Ohio Synod,
ELCA statussize 105 100 100 100 85 85 0.0011289 St Stephen Lutheran Church-Hamler-OH 43524 100 85 2016 stable51-150
117 123 123 112 112 107 -2.7311244 Immanuel Lutheran Church-Deshler-OH 43516 104 110 2016 stable51-150
174 175 162 141 107 104 -0.9511272 Grace Lutheran Church-Elmore-OH 43416 120 105 2016 stable51-150
120 119 107 106 99 97 -1.0211362 St John Lutheran Church-Rocky Ridge-OH 43458 108 98 2016 stable51-150
96 98 108 121 107 107 -2.7311394 St Paul's Lutheran Church-Toledo-OH 43604 124 110 2015 stable51-150
120 97 87 77 80 80 0.0011395 St Petri Lutheran Church-Toledo-OH 43614 84 80 2016 stable51-150
177 182 182 175 92 92 0.0013298 St Paul Lutheran Church-Sandusky-OH 44870 131 92 2016 stable51-150
171 167 167 154 121 124 0.0013192 Zion Lutheran Church-Gibsonburg-OH 43431 146 124 2016 stable51-150
197 192 191 179 153 148 -2.6313228 Zion Lutheran Church-Lima-OH 45805 172 152 2016 stable51-150
76 76 76 76 74 73 -1.3513063 Bethlehem Lutheran Church-Attica-OH 44807 73 74 2016 stable51-150
105 103 82 75 58 57 -1.7213241 Timothy Lutheran Church-Marion-OH 43302 71 58 2016 stable51-150
151 153 146 141 135 133 0.0013322 St Mark's Lutheran Church-Wapakoneta-OH 45895 139 133 2016 stable51-150
85 85 85 85 90 84 0.0013314 St John Evangelical Lutheran Church-Sandusky-OH 44870 90 84 2016 stable51-150
117 122 122 119 116 116 0.0013317 St Paul Lutheran Church-Upper Sandusky-OH 43351 118 116 2014 stable51-150
114 114 114 84 70 70 -1.4113188 Peace Lutheran Church-Galion-OH 44833 84 71 2015 stable51-150
81 82 78 78 75 73 -2.6704639 First Lutheran Church-Stryker-OH 43557 75 75 2016 stable51-150
147 161 150 144 145 143 -0.6904642 First English Lutheran Church-Wapakoneta-OH 45895 141 144 2016 stable51-150
133 111 97 105 91 91 -1.0904619 Zion Lutheran Church-Defiance-OH 43512 103 92 2016 stable51-150
101 93 76 86 70 77 -1.2804616 Christ Lutheran Church-Carey-OH 43316 86 78 2016 stable51-150
93 79 74 74 60 63 0.0004634 Trinity Lutheran Church-Arcadia-OH 44804 71 63 2016 stable51-150
256 175 140 117 110 120 0.0004720 First Lutheran Church-Tiffin-OH 44883 138 120 2016 stable51-150
72 72 70 70 65 65 0.0004732 Martin Luther Lutheran Church-Toledo-OH 43605 65 65 2015 stable51-150
61 66 66 62 49 51 27.5011349 Peace Lutheran Church-Port Clinton-OH 43452 44 40 2016 growing51-150
148 147 140 126 150 150 4.1711245 St John Lutheran Church-Deshler-OH 43516 144 144 2015 growing51-150
181 174 174 159 129 139 6.1111233 Trinity Lutheran Church-Bryan-OH 43506 147 131 2016 growing51-150
182 163 160 152 134 135 9.7611288 Hope Lutheran Church-Hamler-OH 43524 136 123 2016 growing51-150
98 95 86 81 69 75 7.1413258 Trinity Lutheran Church-Wapakoneta-OH 45895 82 70 2016 growing51-150
163 83 153 135 118 121 6.1413181 Hope Lutheran Church-Fostoria-OH 44830 121 114 2016 growing51-150
156 140 135 132 130 130 4.0013092 Grace Lutheran Church-Castalia-OH 44824 125 125 2015 growing51-150
90 80 70 37 77 92 26.0316228 Faith Evangelical Lutheran Church-Swanton-OH 43558 60 73 2016 growing51-150
58 62 62 62 48 55 14.5807225 All Saints Lutheran Church-Toledo-OH 43614 62 48 2016 growing51-150
66 63 69 66 59 68 3.0304626 Zion Lutheran Church-Lafayette-OH 45854 66 66 2016 growing51-150
79 77 65 60 68 61 15.0904625 St Peter Lutheran Church-Holgate-OH 43527 60 53 2016 growing51-150
130 100 125 123 104 104 4.0004629 St Luke Lutheran Church-Lima-OH 45801 116 100 2015 growing51-150
130 130 130 105 100 100 11.1104736 St Lucas Lutheran Church-Toledo-OH 43609 90 90 2016 growing51-150
53 50 40 85 50 90 80.0004723 Bethany Lutheran Church-Toledo-OH 43613 45 50 2016 growing51-150
282 287 258 243 212 209 -6.7011408 Trinity Lutheran Church-Wauseon-OH 43567 233 224 2016 decline151-350
332 310 300 300 242 238 -5.9311331 St John Evangelical Lutheran Church-Oak Harbor-OH
43449
288 253 2016 decline151-350
242 226 250 250 193 188 -6.0011324 Emanuel Lutheran Church-Napoleon-OH 43545 230 200 2016 decline151-350
220 211 212 207 186 169 -10.1111388 First St John Lutheran Church-Toledo-OH 43605 208 188 2016 decline151-350
301 289 257 264 236 248 -3.1311411 Community Of Christ Lutheran Church-Whitehouse-OH
43571
261 256 2016 decline151-350
224 107 200 201 172 172 -3.3711412 St John Lutheran Church-Williston-OH 43468 201 178 2016 decline151-350
238 187 184 188 159 162 -5.2611415 Solomon Lutheran Church-Woodville-OH 43469 176 171 2016 decline151-350
244 239 232 243 190 180 -11.7611393 St Mark Lutheran Church-Toledo-OH 43605 227 204 2016 decline151-350
Status:decline=attendance decline of 3% or more, stable=change between -2.9% and +2.9%; growing=attendance grew by 3% or more from 2014 to 2016;
Missing data means the congregation didn't submit any data for the year in question.
Avg
Att09
Avg
Att10
Avg
Att11
Avg
Att12
Avg
Att13
Avg
Att14
Avg
Att15
Avg
Att16
14-16 %
ChangeSelect Congregational Statistics
CongID Congregation
Data
Year A
6D Northwestern Ohio Synod,
ELCA statussize 268 253 253 233 200 178 -16.0411340 Bethlehem Lutheran Church-Pemberville-OH 43450 233 212 2016 decline151-350
378 368 344 360 326 317 -3.9413183 Grace Lutheran Church-Fremont-OH 43420 351 330 2016 decline151-350
211 214 209 175 159 165 -8.3316207 Memorial Lutheran Church-Toledo-OH 43606 180 180 2016 decline151-350
309 286 293 281 248 223 -13.5713300 Zion Lutheran Church-Sandusky-OH 44870 272 258 2016 decline151-350
429 410 391 384 279 260 -5.8013240 Emanuel Lutheran Church-Marion-OH 43302 343 276 2016 decline151-350
237 237 207 190 173 167 -13.9213057 Good Hope Lutheran Church-Arlington-OH 45814 194 194 2016 decline151-350
241 226 223 210 190 178 -8.2513081 Good Hope Lutheran Church-Bucyrus-OH 44820 213 194 2016 decline151-350
325 327 350 328 279 251 -11.6204719 Olivet Lutheran Church-Sylvania-OH 43560 286 284 2016 decline151-350
278 234 243 234 184 157 -21.5004731 Hope Lutheran Church-Ottawa Hills-OH 43606 221 200 2016 decline151-350
231 223 223 218 184 178 -18.3504641 St Mark Lutheran Church-Van Wert-OH 45891 218 218 2016 decline151-350
238 205 175 167 180 180 0.0011407 Zion Lutheran Church-Waterville-OH 43566 167 180 2015 stable151-350
187 187 173 155 155 155 0.0011242 St Paul Lutheran Church-Defiance-OH 43512 155 155 2014 stable151-350
184 188 184 177 160 163 1.2411221 St Martin Lutheran Church-Archbold-OH 43502 177 161 2016 stable151-350
322 322 322 341 317 314 -0.9513093 St John Lutheran Church-Celina-OH 45822 312 317 2016 stable151-350
225 225 228 225 212 209 -2.3413184 St John's Lutheran Church-Fremont-OH 43420 219 214 2016 stable151-350
215 215 215 215 215 215 0.0013217 St Paul Evangelical Lutheran Church-Jenera-OH 45841 215 215 2015 stable151-350
322 270 265 255 232 227 0.8904621 First Lutheran Church-Findlay-OH 45840 248 225 2016 stable151-350
233 241 241 250 256 254 0.7904718 St John Lutheran Church-Stony Ridge-OH 43463 259 252 2016 stable151-350
249 233 224 221 190 190 0.0004623 Trinity Lutheran Church-Findlay-OH 45840 221 190 2016 stable151-350
162 158 147 152 165 165 3.1311335 Bethlehem Lutheran Church-Defiance-OH 43512 140 160 2015 growing151-350
265 265 265 186 177 178 4.7111386 Epiphany Lutheran Church-Toledo-OH 43615 186 170 2016 growing151-350
223 199 161 172 154 172 11.6913069 St John's Evangelical Lutheran Church-Bellevue-OH 44811 154 154 2016 growing151-350
319 290 279 245 225 225 17.1913271 St Peter Evangelical Lutheran Church-Norwalk-OH 44857 245 192 2015 growing151-350
267 267 267 188 174 174 24.2904729 Grace Lutheran Church-Toledo-OH 43613 140 140 2015 growing151-350
468 568 516 516 340 380 -4.7611345 Zoar Lutheran Church-Perrysburg-OH 43551 447 399 2016 decline351-800
545 523 524 457 397 438 38.1704741 St Mark Lutheran Church-Bowling Green-OH 43402 384 317 2016 growing351-800
Status:decline=attendance decline of 3% or more, stable=change between -2.9% and +2.9%; growing=attendance grew by 3% or more from 2014 to 2016;
Missing data means the congregation didn't submit any data for the year in question.
Evangelical Lutheran Church in America
Research and Evaluation, Office of the Presiding Bishop
Source: Congregational Report Forms
Congregational Totals for Northwestern Ohio Synod, ELCA 6D
% Change
2011 to 20162014201320122011 2015 2016
164
73,266Baptized Membership
Number of Organized Congregations
Members Received By:
626
72
399
424
213Other and Statistical Adjustment
Transfer
Affirmation of Faith
Baptism: Adults
Baptism: Children
Members Removed By:
969
523
2,032
1,079
55,383
38,937Active Participants
Confirmed Members
Baptized Members Confirmed
Death
Other and Statistical Adjustment
Transfer
163
74,734
707
127
421
384
111
882
512
2,445
1,155
57,112
40,149
164
76,701
807
102
368
460
444
959
619
2,226
558
57,138
39,920
165
78,213
831
91
347
491
112
926
742
1,643
592
60,081
39,319
-2.42
-11.25
-30.08
-7.69
-2.88
-26.27
126.79
-13.93
-45.01
35.24
17.40
-13.95
-16.51
161
70,882
589
60
319
354
74
810
438
1,728
420
53,502
36,584
161
69,413
581
84
337
362
254
797
408
2,222
695
51,697
32,829
Average Attendance 16,039 16,401 16,886 18,074 19,069 19,778 -18.90
Racial/Ethnic Composition of Active Participants*
576
8
7
13
78
352
37,693
243
179Other
Latino
Asian/Pacific
Multi Racial
White
Arab/Middle Eastern
American Indian/Alaska Native
African National/African Caribbean
African American/Black 603
8
7
16
96
172
799
242
38,382
777
13
12
14
94
211
216
229
39,229
453
11
11
16
101
211
172
242
40,760
Omitted
Omitted
Omitted
Omitted
Omitted
Omitted
Omitted
Omitted
Omitted
Omitted
Omitted
Omitted
Omitted
Omitted
Omitted
Omitted
Omitted
Omitted
Evangelical Lutheran Church in America
Research and Evaluation, Office of the Presiding Bishop
Source: Congregational Report Forms
Congregational Totals for Northwestern Ohio Synod, ELCA 6D
% Change
2011 to 20162014201320122011 2015 2016
Regular Giving by Members
Designated Giving by Members
Earned Income (any source)
Grants & Partnership Support
Other Receipts
Total Receipts
Current Operating Expenses
Capital Improvements
Payments on Debt
Mission Support
as % of Total Disbursements
as % of Regular Giving
Other Bevevolence sent directly:
To the synod
To the churchwide office
to an activity in another country
to camps
to colleges
to seminaries
to social services groups or orgs
All other benevolence
non-mission support benevolence subtotal*
Other Expenses
Sum of Disbursements*
Endowment & Memorial Funds
Cash, Savings, Bonds, etc.
Other Assets
Total Indebtedness
Number of Bequests Received
Value of Bequests
Intended Mission Support
$27,731,011
$5,122,816
$1,797,635
$424,004
$1,920,906
$36,996,372
$28,877,335
$2,479,200
$2,188,779
$1,470,153
$279,658
$153,620
$85,342
$24,688
$20,681
$45,729
$270,397
$797,708
$943,984
$37,637,274
$33,161,800
$16,139,381
$4,305,064
$10,152,790
46
$1,122,821
$1,932,726
$28,298,667
$4,698,281
$1,403,942
$390,901
$1,932,324
$36,724,115
$28,664,912
$2,171,675
$1,424,364
$1,636,127
$287,240
$81,348
$96,277
$18,040
$18,264
$69,788
$282,227
$1,041,160
$765,626
$36,557,048
$33,724,626
$15,350,358
$3,422,004
$11,515,445
24
$1,552,979
$1,847,347
$29,493,934
$4,792,500
$1,454,023
$259,259
$1,935,075
$37,934,791
$28,637,575
$2,123,603
$1,701,828
$1,624,697
$301,128
$60,948
$149,867
$41,911
$23,772
$58,167
$389,574
$935,751
$930,611
$36,989,479
$30,698,712
$14,850,487
$3,969,521
$14,919,917
54
$964,288
$1,503,232
$27,951,349
$4,898,820
$1,654,539
$255,958
$2,497,453
$37,258,119
$28,725,608
$1,706,018
$2,012,904
$1,817,489
$294,423
$57,229
$174,962
$28,212
$22,206
$53,322
$311,027
$781,123
$804,009
$36,824,609
$32,137,030
$14,185,312
$4,917,528
$17,103,827
45
$2,049,446
$1,580,705
-2.03
4.50
9.57
36.61
-24.18
-1.88
-4.98
23.95
-32.69
-12.53
4.94 4.39 4.48 3.91
6.50 5.51 5.78 5.30
-1.06
69.53
-25.54
5.20
-15.37
-3.55
-7.89
-2.63
32.87
-4.62
-15.71
-7.77
148.61
-51.36
-6.12
$27,428,113
$5,511,126
$1,565,492
$206,497
$2,444,453
$37,155,681
$27,985,811
$1,884,805
$1,877,942
$1,509,687
$317,694
$125,113
$121,290
$21,315
$17,932
$32,400
$291,239
to campus ministry $6,827
$853,247
$1,002,950
$36,048,252
4.19
5.50
$1,758,581 $1,961,118 $1,894,344 $1,677,823 $1,787,057 -3.27
Omitted
Omitted
Omitted
Omitted
Omitted
Omitted
Omitted
* - Because the form changes from year to year, not all fields are shown, thus the detail may not add up to the totals as shown.
$27,382,572
$5,119,304
$1,812,949
$349,665
$1,893,669
$36,558,159
$27,294,934
$2,114,547
$1,354,946
$1,589,783
$291,312
$97,018
$130,279
$29,678
$18,792
$51,430
$286,497
$35,447
$760,558
$1,068,283
$35,123,504
$1,701,011
$1,484,013
$8,318,624
4.53
5.81
Omitted
Omitted
$ 27,088,155
$13,082,509
$12,225,319
(Form C 2016 only)

Based on 9113 congregations reporting baptized membership and 9200 reporting average attendance. Numbers rounded, so many not equal 100%. Source: ELCA Congregational data, run date: 10/24/2017
1.0
2.4
3.3
6.36.6
13.1
10.5
8.8
12.512.9
10.7
4.9
7.0
8.9
15.9
14.3
17.9
12.1
13.8
6.8
3.73.2
2.1
0.90.3 0.3
0
10
20
1 and 20 21 and 35 36 and 50 51 and 75 76 and100
101 and150
151 and200
201 and250
251 and350
351 and500
501 and750
751 and1000
1001 ormore
Percentage of Congregations by Size, Baptized Membership and Average Worship Attendance
57% of congregations have average worship attendance of 75 or less
50% of congregations have 350 or fewer baptized members
Percentages are rounded, so may not total 100%
31%36%
45%
30%40% 42% 39%
53%50%
42%
48%
44% 41% 44%
15% 13% 12%20%
15%12% 14%
2% 2% 2% 1% 1%5% 3%
0%
0%
50%
100%
6A (N=117) 6B (N=115) 6C (N=183) 6D (N=161) 6E (N=170) 6F (N=193) ELCA (N=9200)
801+
351 to 800
151 to 350
51 to 150
1 to 50
Congregation Size for Region 6, with ELCA Comparison
AverageAttendance
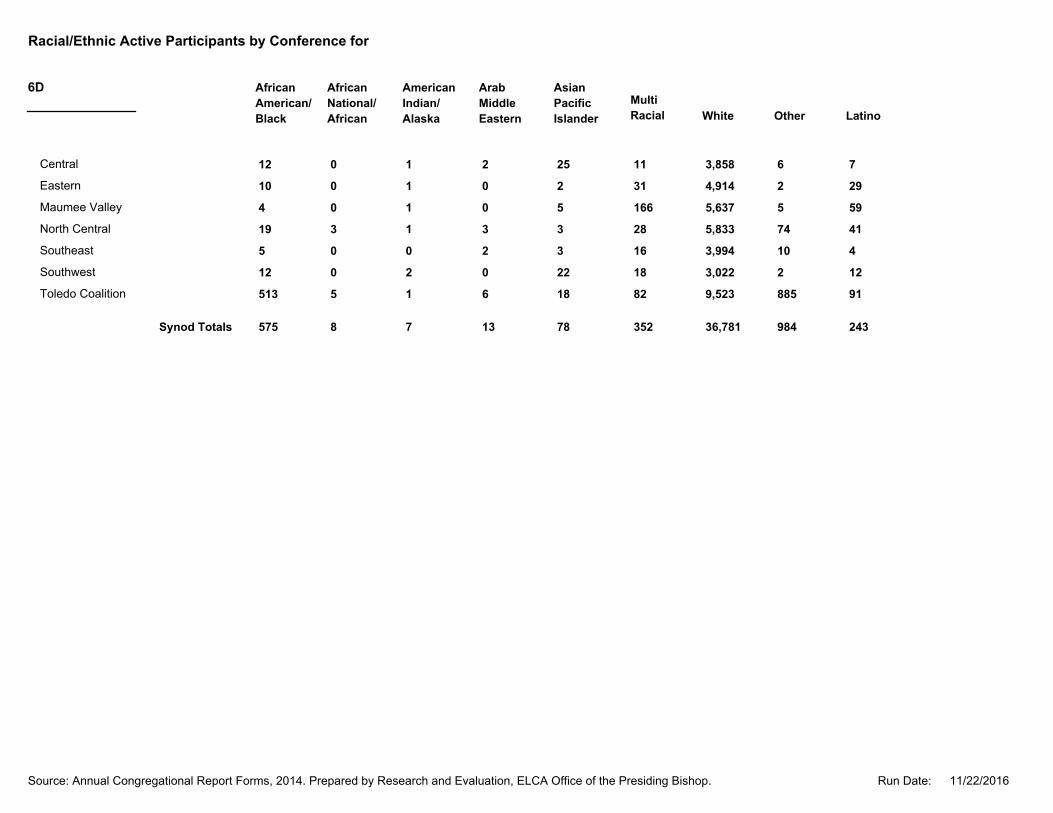
Racial/Ethnic Active Participants by Conference for
6D Arab
Middle
Eastern
Multi
Racial White Other Latino
Asian
Pacific
Islander
American
Indian/
Alaska
African
National/
African
African
American/
Black
Central 0 7 6 3,858 11 25 1 12 2
Eastern 0 29 2 4,914 31 2 1 10 0
Maumee Valley 0 59 5 5,637 166 5 1 4 0
North Central 3 41 74 5,833 28 3 1 19 3
Southeast 0 4 10 3,994 16 3 0 5 2
Southwest 0 12 2 3,022 18 22 2 12 0
Toledo Coalition 5 91 885 9,523 82 18 1 513 6
243 984 36,781 352 78 13 7 8 575Synod Totals
11/22/2016Run Date:Source: Annual Congregational Report Forms, 2014. Prepared by Research and Evaluation, ELCA Office of the Presiding Bishop.

Percentages are rounded, so may not total 100%
69% 72%67%
78%67%
50%55%
16%18% 24%
11%23%
32%28%
15%10% 9% 11% 11%
18% 17%
0%
50%
100%
6A (N=114) 6B (N=117) 6C (N=183) 6D (N=161) 6E (N=171) 6F (N=195) ELCA (N=8692)
Change in Average Attendance between 2014 and 2016, Region 6Decline: lost at least 3%, Stable: ‐3/+3% change, Growth: gained at least 3%
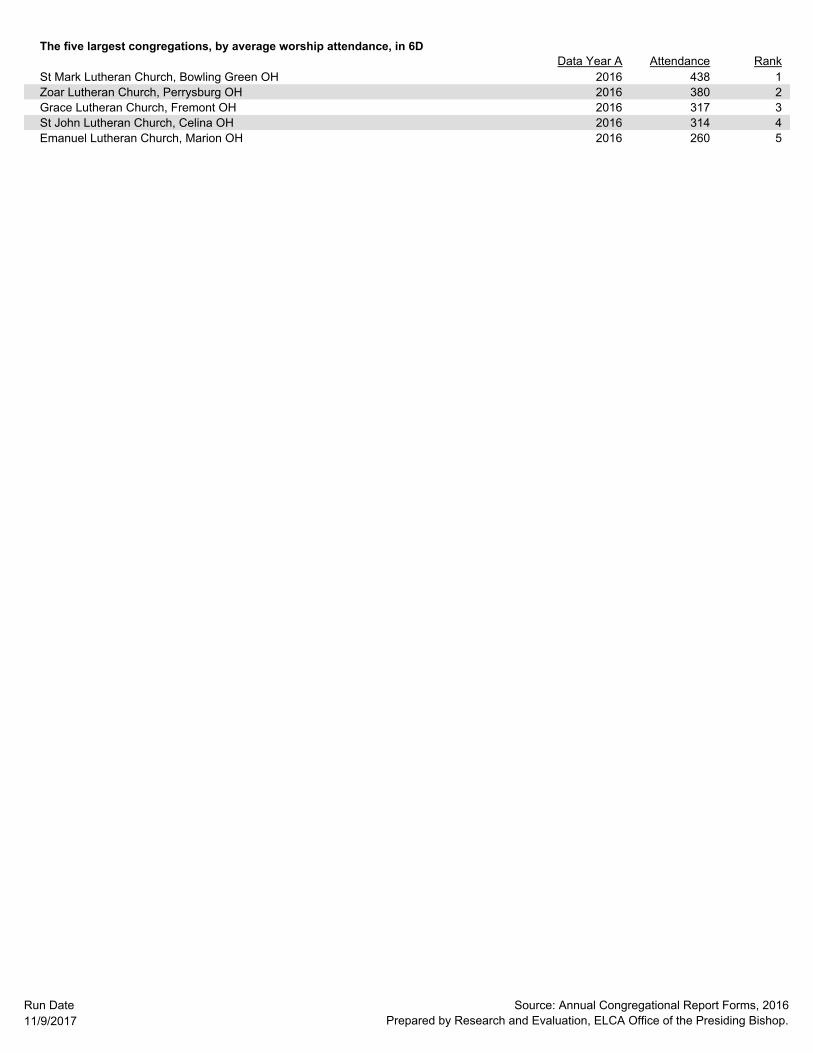
The five largest congregations, by average worship attendance, in 6D
RankAttendanceData Year A
2016 438 1St Mark Lutheran Church, Bowling Green OH
2016 380 2Zoar Lutheran Church, Perrysburg OH
2016 317 3Grace Lutheran Church, Fremont OH
2016 314 4St John Lutheran Church, Celina OH
2016 260 5Emanuel Lutheran Church, Marion OH
11/9/2017
Run Date Source: Annual Congregational Report Forms, 2016
Prepared by Research and Evaluation, ELCA Office of the Presiding Bishop.
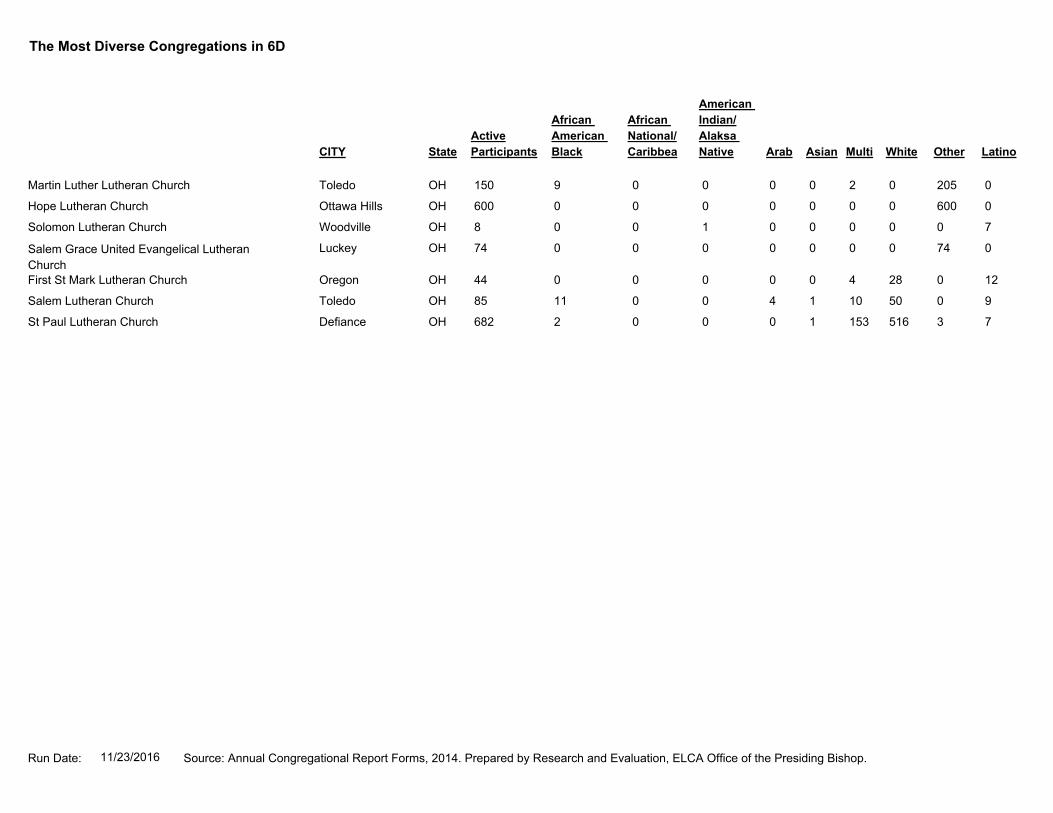
Active
Participants
African
American
Black
African
National/
Caribbea
American
Indian/
Alaksa
Native Arab Asian Multi White Other Latino
The Most Diverse Congregations in 6D
CITY State
Martin Luther Lutheran Church 150 9 0 0 0 2 0 205 0 0OHToledo
Hope Lutheran Church 600 0 0 0 0 0 0 600 0 0OHOttawa Hills
Solomon Lutheran Church 8 0 0 0 0 0 0 0 7 1OHWoodville
Salem Grace United Evangelical Lutheran
Church
74 0 0 0 0 0 0 74 0 0OHLuckey
First St Mark Lutheran Church 44 0 0 0 0 4 28 0 12 0OHOregon
Salem Lutheran Church 85 11 0 4 1 10 50 0 9 0OHToledo
St Paul Lutheran Church 682 2 0 0 1 153 516 3 7 0OHDefiance
11/23/2016Run Date: Source: Annual Congregational Report Forms, 2014. Prepared by Research and Evaluation, ELCA Office of the Presiding Bishop.
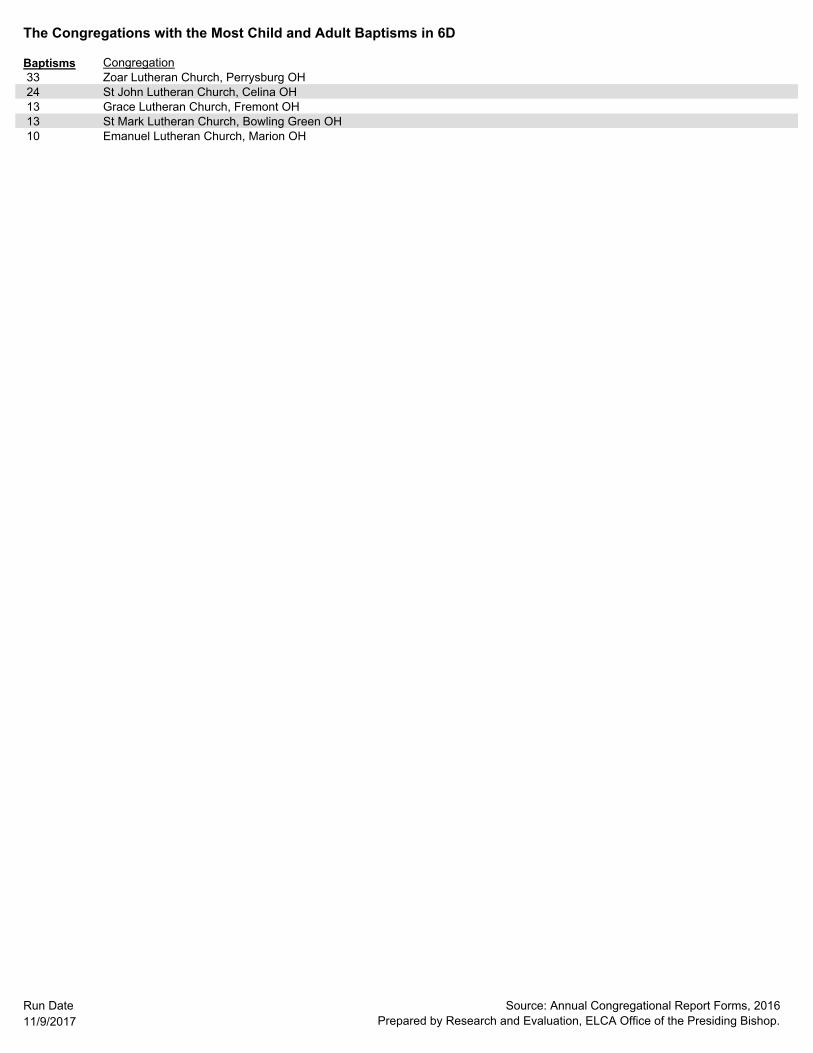
The Congregations with the Most Child and Adult Baptisms in 6D
Baptisms Congregation 33 Zoar Lutheran Church, Perrysburg OH 24 St John Lutheran Church, Celina OH 13 Grace Lutheran Church, Fremont OH 13 St Mark Lutheran Church, Bowling Green OH 10 Emanuel Lutheran Church, Marion OH
11/9/2017
Run Date Source: Annual Congregational Report Forms, 2016
Prepared by Research and Evaluation, ELCA Office of the Presiding Bishop.
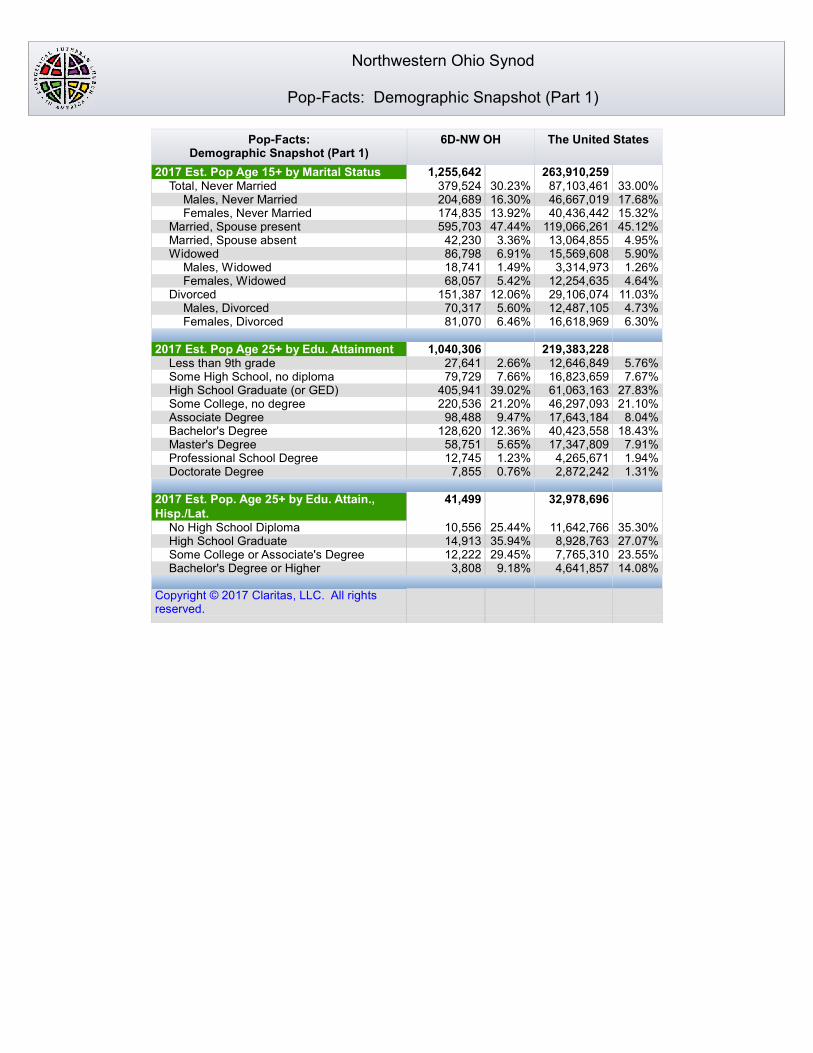
Northwestern Ohio Synod
Pop-Facts: Demographic Snapshot (Part 1)
Pop-Facts:Demographic Snapshot (Part 1)
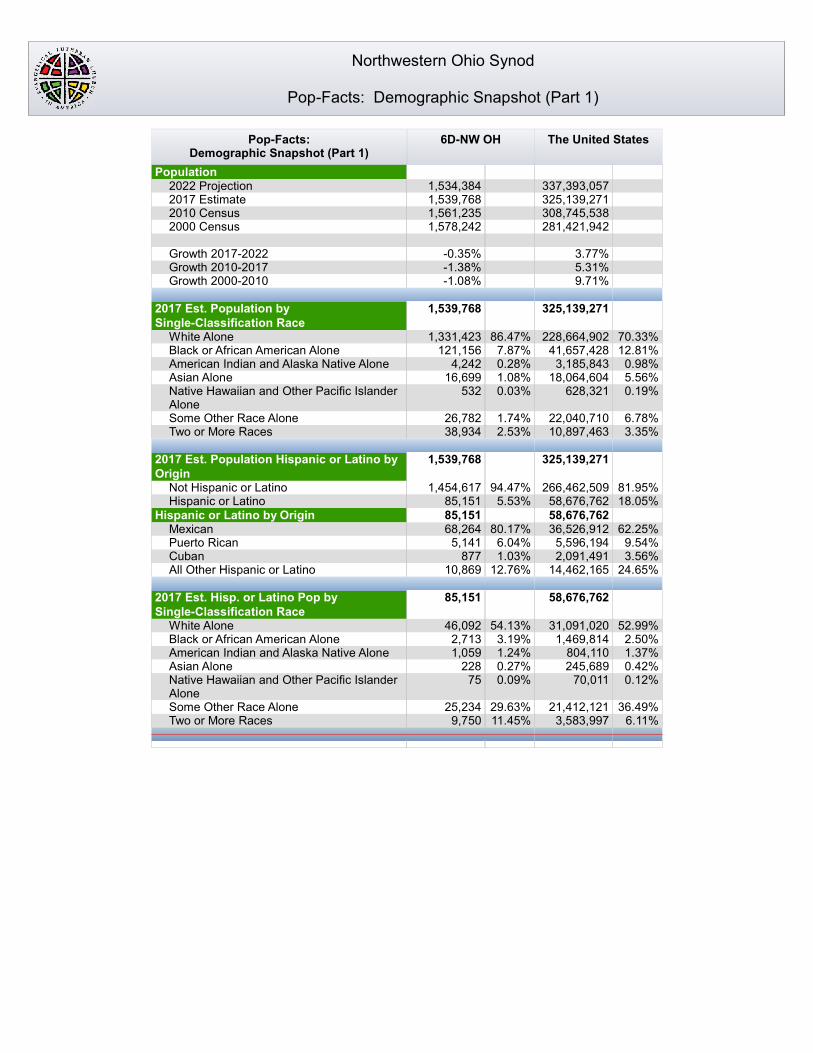
Population2022 Projection2017 Estimate2010 Census2000 Census
Growth 2017-2022Growth 2010-2017Growth 2000-2010
2017 Est. Population by Single-Classification Race
White AloneBlack or African American AloneAmerican Indian and Alaska Native AloneAsian AloneNative Hawaiian and Other Pacific Islander AloneSome Other Race AloneTwo or More Races
2017 Est. Population Hispanic or Latino by Origin
Not Hispanic or LatinoHispanic or Latino
Hispanic or Latino by OriginMexicanPuerto RicanCubanAll Other Hispanic or Latino
2017 Est. Hisp. or Latino Pop by Single-Classification Race
White AloneBlack or African American AloneAmerican Indian and Alaska Native AloneAsian AloneNative Hawaiian and Other Pacific Islander AloneSome Other Race AloneTwo or More Races
6D-NW OH
1,534,3841,539,7681,561,2351,578,242
-0.35%-1.38%-1.08%
1,539,768
86.47%1,331,423 7.87%121,156 0.28%4,242 1.08%16,699 0.03%532
1.74%26,782 2.53%38,934
1,539,768
94.47%1,454,617 5.53%85,151
85,15180.17%68,264 6.04%5,141 1.03%877
12.76%10,869
85,151
54.13%46,092 3.19%2,713 1.24%1,059 0.27%228 0.09%75
29.63%25,23411.45%9,750
The United States
337,393,057325,139,271308,745,538281,421,942
3.77%5.31%9.71%
325,139,271
70.33%228,664,90212.81%41,657,428 0.98%3,185,843 5.56%18,064,604 0.19%628,321
6.78%22,040,710 3.35%10,897,463
325,139,271
81.95%266,462,50918.05%58,676,762
58,676,76262.25%36,526,912 9.54%5,596,194 3.56%2,091,491
24.65%14,462,165
58,676,762
52.99%31,091,020 2.50%1,469,814 1.37%804,110 0.42%245,689 0.12%70,011
36.49%21,412,121 6.11%3,583,997
Northwestern Ohio Synod
Pop-Facts: Demographic Snapshot (Part 1)
Pop-Facts:Demographic Snapshot (Part 1)
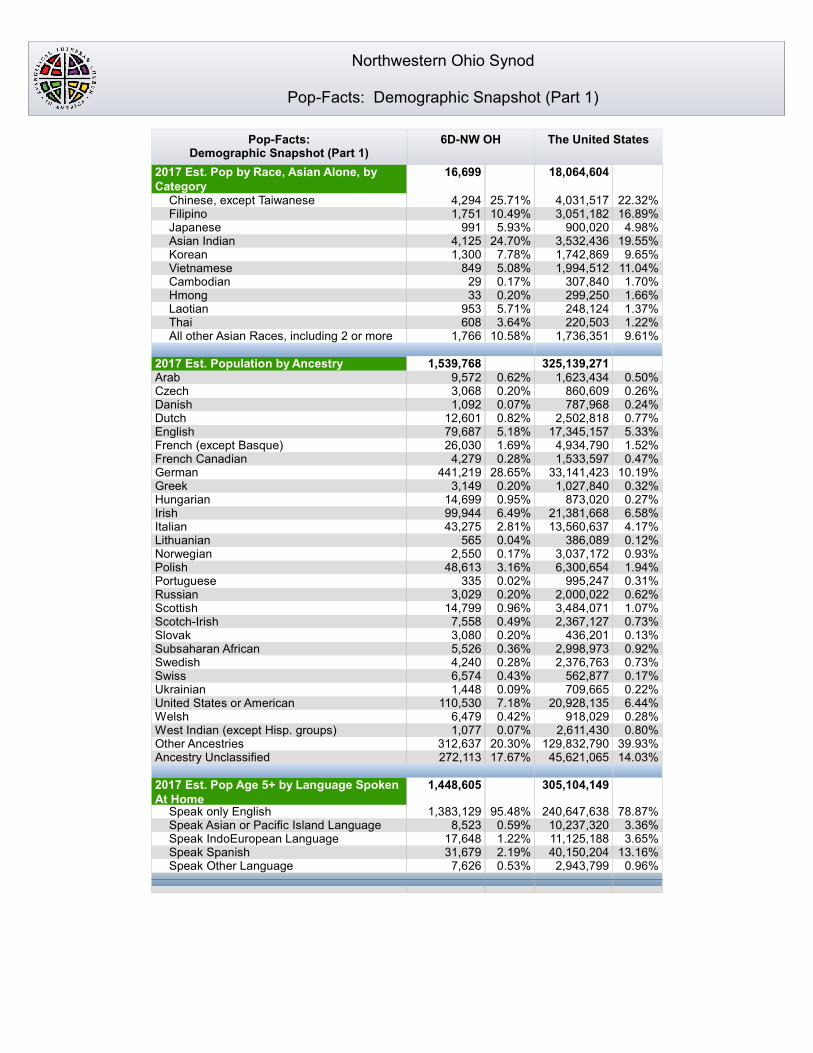
2017 Est. Pop by Race, Asian Alone, by Category
Chinese, except TaiwaneseFilipinoJapaneseAsian IndianKoreanVietnameseCambodianHmongLaotianThaiAll other Asian Races, including 2 or more
2017 Est. Population by AncestryArabCzechDanishDutchEnglishFrench (except Basque)French CanadianGermanGreekHungarianIrishItalianLithuanianNorwegianPolishPortugueseRussianScottishScotch-IrishSlovakSubsaharan AfricanSwedishSwissUkrainianUnited States or AmericanWelshWest Indian (except Hisp. groups)Other AncestriesAncestry Unclassified
2017 Est. Pop Age 5+ by Language Spoken At Home
Speak only EnglishSpeak Asian or Pacific Island LanguageSpeak IndoEuropean LanguageSpeak SpanishSpeak Other Language
6D-NW OH
16,699
25.71%4,29410.49%1,751 5.93%991
24.70%4,125 7.78%1,300 5.08%849 0.17%29 0.20%33 5.71%953 3.64%608
10.58%1,766
1,539,768 0.62%9,572 0.20%3,068 0.07%1,092 0.82%12,601 5.18%79,687 1.69%26,030 0.28%4,279
28.65%441,219 0.20%3,149 0.95%14,699 6.49%99,944 2.81%43,275 0.04%565 0.17%2,550 3.16%48,613 0.02%335 0.20%3,029 0.96%14,799 0.49%7,558 0.20%3,080 0.36%5,526 0.28%4,240 0.43%6,574 0.09%1,448 7.18%110,530 0.42%6,479 0.07%1,077
20.30%312,63717.67%272,113
1,448,605
95.48%1,383,129 0.59%8,523 1.22%17,648 2.19%31,679 0.53%7,626
The United States
18,064,604
22.32%4,031,51716.89%3,051,182 4.98%900,020
19.55%3,532,436 9.65%1,742,86911.04%1,994,512 1.70%307,840 1.66%299,250 1.37%248,124 1.22%220,503 9.61%1,736,351
325,139,271 0.50%1,623,434 0.26%860,609 0.24%787,968 0.77%2,502,818 5.33%17,345,157 1.52%4,934,790 0.47%1,533,597
10.19%33,141,423 0.32%1,027,840 0.27%873,020 6.58%21,381,668 4.17%13,560,637 0.12%386,089 0.93%3,037,172 1.94%6,300,654 0.31%995,247 0.62%2,000,022 1.07%3,484,071 0.73%2,367,127 0.13%436,201 0.92%2,998,973 0.73%2,376,763 0.17%562,877 0.22%709,665 6.44%20,928,135 0.28%918,029 0.80%2,611,430
39.93%129,832,79014.03%45,621,065
305,104,149
78.87%240,647,638 3.36%10,237,320 3.65%11,125,188
13.16%40,150,204 0.96%2,943,799
Northwestern Ohio Synod
Pop-Facts: Demographic Snapshot (Part 1)
Pop-Facts:Demographic Snapshot (Part 1)
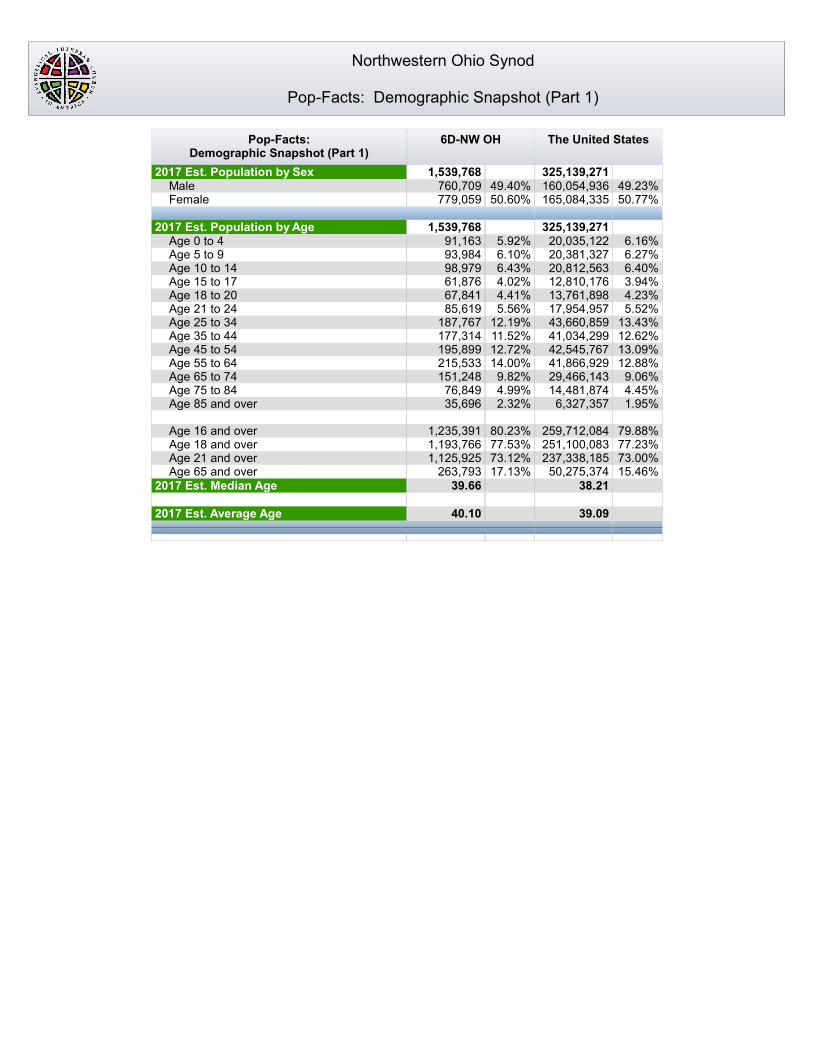
2017 Est. Population by SexMaleFemale
2017 Est. Population by AgeAge 0 to 4Age 5 to 9Age 10 to 14Age 15 to 17Age 18 to 20Age 21 to 24Age 25 to 34Age 35 to 44Age 45 to 54Age 55 to 64Age 65 to 74Age 75 to 84Age 85 and over
Age 16 and overAge 18 and overAge 21 and overAge 65 and over
2017 Est. Median Age
2017 Est. Average Age
6D-NW OH
1,539,76849.40%760,70950.60%779,059
1,539,768 5.92%91,163 6.10%93,984 6.43%98,979 4.02%61,876 4.41%67,841 5.56%85,619
12.19%187,76711.52%177,31412.72%195,89914.00%215,533 9.82%151,248 4.99%76,849 2.32%35,696
80.23%1,235,39177.53%1,193,76673.12%1,125,92517.13%263,793
39.66
40.10
The United States
325,139,27149.23%160,054,93650.77%165,084,335
325,139,271 6.16%20,035,122 6.27%20,381,327 6.40%20,812,563 3.94%12,810,176 4.23%13,761,898 5.52%17,954,957
13.43%43,660,85912.62%41,034,29913.09%42,545,76712.88%41,866,929 9.06%29,466,143 4.45%14,481,874 1.95%6,327,357
79.88%259,712,08477.23%251,100,08373.00%237,338,18515.46%50,275,374
38.21
39.09
Northwestern Ohio Synod
Pop-Facts: Demographic Snapshot (Part 1)
Pop-Facts:Demographic Snapshot (Part 1)
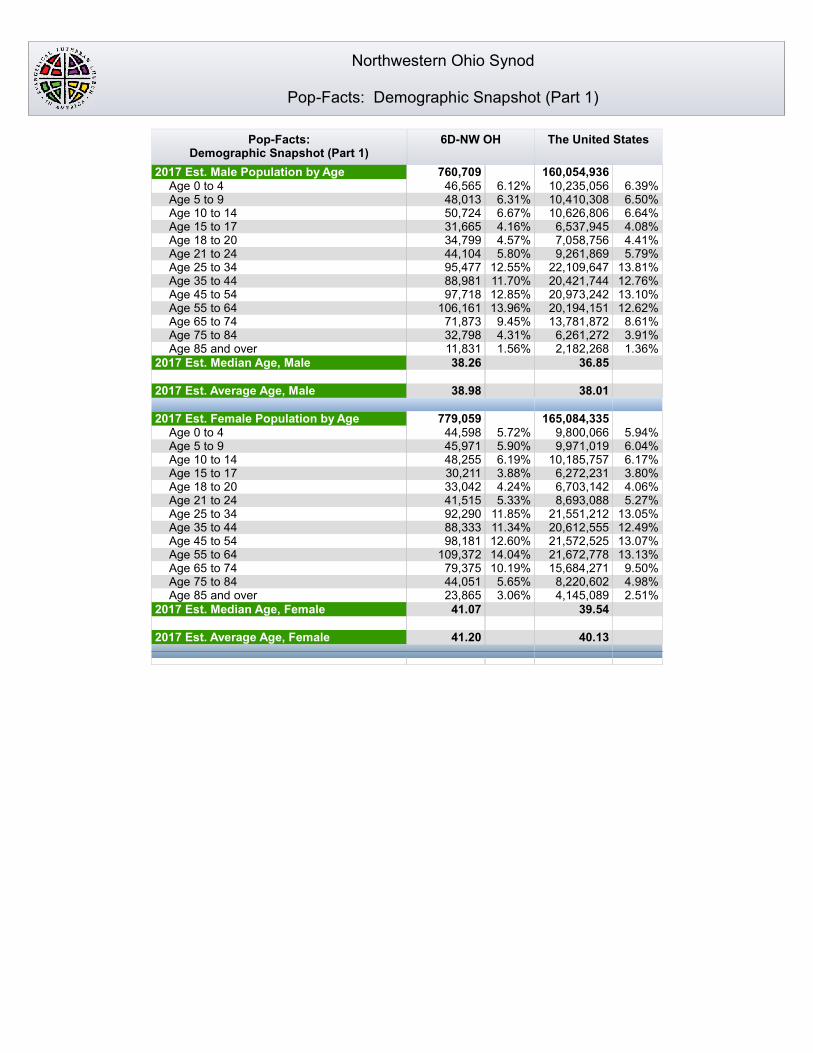
2017 Est. Male Population by AgeAge 0 to 4Age 5 to 9Age 10 to 14Age 15 to 17Age 18 to 20Age 21 to 24Age 25 to 34Age 35 to 44Age 45 to 54Age 55 to 64Age 65 to 74Age 75 to 84Age 85 and over
2017 Est. Median Age, Male
2017 Est. Average Age, Male
2017 Est. Female Population by AgeAge 0 to 4Age 5 to 9Age 10 to 14Age 15 to 17Age 18 to 20Age 21 to 24Age 25 to 34Age 35 to 44Age 45 to 54Age 55 to 64Age 65 to 74Age 75 to 84Age 85 and over
2017 Est. Median Age, Female
2017 Est. Average Age, Female
6D-NW OH
760,709 6.12%46,565 6.31%48,013 6.67%50,724 4.16%31,665 4.57%34,799 5.80%44,104
12.55%95,47711.70%88,98112.85%97,71813.96%106,161 9.45%71,873 4.31%32,798 1.56%11,831
38.26
38.98
779,059 5.72%44,598 5.90%45,971 6.19%48,255 3.88%30,211 4.24%33,042 5.33%41,51511.85%92,29011.34%88,33312.60%98,18114.04%109,37210.19%79,375 5.65%44,051 3.06%23,865
41.07
41.20
The United States
160,054,936 6.39%10,235,056 6.50%10,410,308 6.64%10,626,806 4.08%6,537,945 4.41%7,058,756 5.79%9,261,869
13.81%22,109,64712.76%20,421,74413.10%20,973,24212.62%20,194,151 8.61%13,781,872 3.91%6,261,272 1.36%2,182,268
36.85
38.01
165,084,335 5.94%9,800,066 6.04%9,971,019 6.17%10,185,757 3.80%6,272,231 4.06%6,703,142 5.27%8,693,088
13.05%21,551,21212.49%20,612,55513.07%21,572,52513.13%21,672,778 9.50%15,684,271 4.98%8,220,602 2.51%4,145,089
39.54
40.13
Northwestern Ohio Synod
Pop-Facts: Demographic Snapshot (Part 1)
Pop-Facts:Demographic Snapshot (Part 1)
2017 Est. Pop Age 15+ by Marital StatusTotal, Never Married
Males, Never MarriedFemales, Never Married
Married, Spouse presentMarried, Spouse absentWidowed
Males, WidowedFemales, Widowed
DivorcedMales, DivorcedFemales, Divorced
2017 Est. Pop Age 25+ by Edu. AttainmentLess than 9th gradeSome High School, no diplomaHigh School Graduate (or GED)Some College, no degreeAssociate DegreeBachelor's DegreeMaster's DegreeProfessional School DegreeDoctorate Degree
2017 Est. Pop. Age 25+ by Edu. Attain., Hisp./Lat.
No High School DiplomaHigh School GraduateSome College or Associate's DegreeBachelor's Degree or Higher
Copyright © 2017 Claritas, LLC. All rights reserved.
6D-NW OH
1,255,64230.23%379,52416.30%204,68913.92%174,83547.44%595,703 3.36%42,230 6.91%86,798 1.49%18,741 5.42%68,057
12.06%151,387 5.60%70,317 6.46%81,070
1,040,306 2.66%27,641 7.66%79,729
39.02%405,94121.20%220,536 9.47%98,488
12.36%128,620 5.65%58,751 1.23%12,745 0.76%7,855
41,499
25.44%10,55635.94%14,91329.45%12,222 9.18%3,808
The United States
263,910,25933.00%87,103,46117.68%46,667,01915.32%40,436,44245.12%119,066,261 4.95%13,064,855 5.90%15,569,608 1.26%3,314,973 4.64%12,254,63511.03%29,106,074 4.73%12,487,105 6.30%16,618,969
219,383,228 5.76%12,646,849 7.67%16,823,659
27.83%61,063,16321.10%46,297,093 8.04%17,643,184
18.43%40,423,558 7.91%17,347,809 1.94%4,265,671 1.31%2,872,242
32,978,696
35.30%11,642,76627.07%8,928,76323.55%7,765,31014.08%4,641,857
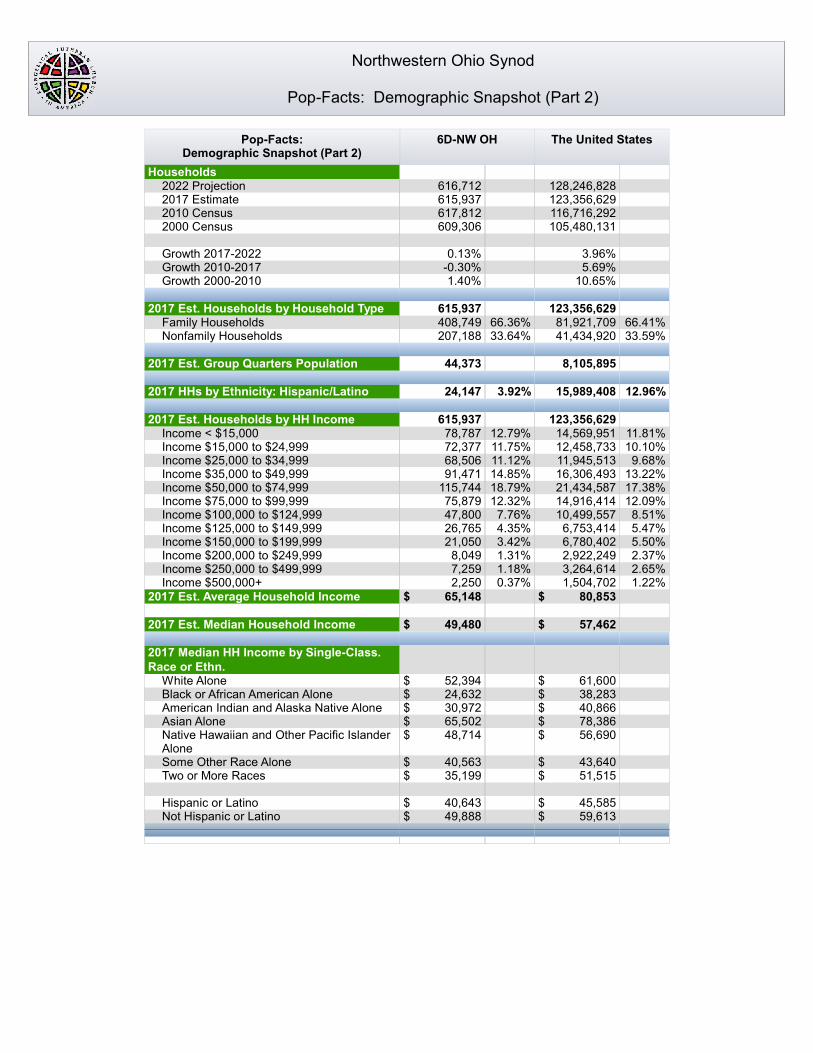
Northwestern Ohio Synod
Pop-Facts: Demographic Snapshot (Part 2)
Pop-Facts:Demographic Snapshot (Part 2)
Households2022 Projection2017 Estimate2010 Census2000 Census
Growth 2017-2022Growth 2010-2017Growth 2000-2010
2017 Est. Households by Household TypeFamily HouseholdsNonfamily Households
2017 Est. Group Quarters Population
2017 HHs by Ethnicity: Hispanic/Latino
2017 Est. Households by HH IncomeIncome < $15,000Income $15,000 to $24,999Income $25,000 to $34,999Income $35,000 to $49,999Income $50,000 to $74,999Income $75,000 to $99,999Income $100,000 to $124,999Income $125,000 to $149,999Income $150,000 to $199,999Income $200,000 to $249,999Income $250,000 to $499,999Income $500,000+
2017 Est. Average Household Income
2017 Est. Median Household Income
2017 Median HH Income by Single-Class. Race or Ethn.
White AloneBlack or African American AloneAmerican Indian and Alaska Native AloneAsian AloneNative Hawaiian and Other Pacific Islander AloneSome Other Race AloneTwo or More Races
Hispanic or LatinoNot Hispanic or Latino
6D-NW OH
616,712615,937617,812609,306
0.13%-0.30%1.40%
615,93766.36%408,74933.64%207,188
44,373
3.92%24,147
615,93712.79%78,78711.75%72,37711.12%68,50614.85%91,47118.79%115,74412.32%75,879 7.76%47,800 4.35%26,765 3.42%21,050 1.31%8,049 1.18%7,259 0.37%2,250
$ 65,148
$ 49,480
$ 52,394$ 24,632$ 30,972$ 65,502$ 48,714
$ 40,563$ 35,199
$ 40,643$ 49,888
The United States
128,246,828123,356,629116,716,292105,480,131
3.96%5.69%
10.65%
123,356,62966.41%81,921,70933.59%41,434,920
8,105,895
12.96%15,989,408
123,356,62911.81%14,569,95110.10%12,458,733 9.68%11,945,513
13.22%16,306,49317.38%21,434,58712.09%14,916,414 8.51%10,499,557 5.47%6,753,414 5.50%6,780,402 2.37%2,922,249 2.65%3,264,614 1.22%1,504,702
$ 80,853
$ 57,462
$ 61,600$ 38,283$ 40,866$ 78,386$ 56,690
$ 43,640$ 51,515
$ 45,585$ 59,613
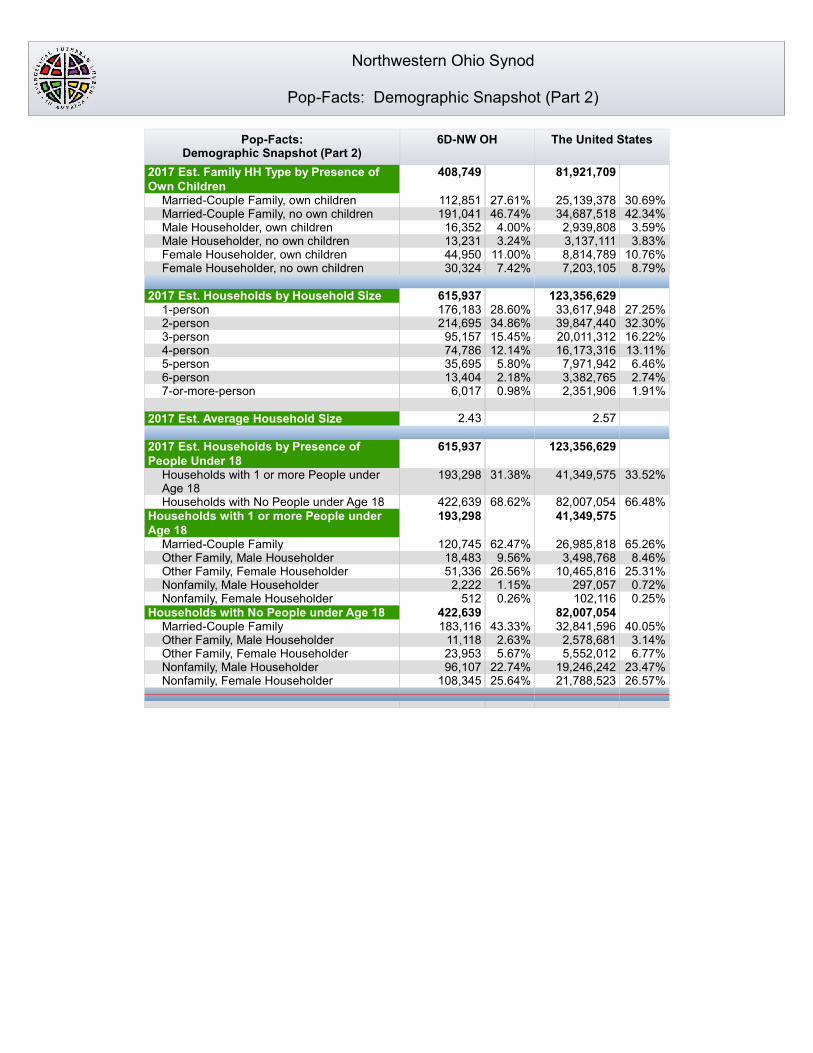
Northwestern Ohio Synod
Pop-Facts: Demographic Snapshot (Part 2)
Pop-Facts:Demographic Snapshot (Part 2)
2017 Est. Family HH Type by Presence of Own Children
Married-Couple Family, own childrenMarried-Couple Family, no own childrenMale Householder, own childrenMale Householder, no own childrenFemale Householder, own childrenFemale Householder, no own children
2017 Est. Households by Household Size1-person2-person3-person4-person5-person6-person7-or-more-person
2017 Est. Average Household Size
2017 Est. Households by Presence of People Under 18
Households with 1 or more People under Age 18Households with No People under Age 18
Households with 1 or more People under Age 18
Married-Couple FamilyOther Family, Male HouseholderOther Family, Female HouseholderNonfamily, Male HouseholderNonfamily, Female Householder
Households with No People under Age 18Married-Couple FamilyOther Family, Male HouseholderOther Family, Female HouseholderNonfamily, Male HouseholderNonfamily, Female Householder
6D-NW OH
408,749
27.61%112,85146.74%191,041 4.00%16,352 3.24%13,23111.00%44,950 7.42%30,324
615,93728.60%176,18334.86%214,69515.45%95,15712.14%74,786 5.80%35,695 2.18%13,404 0.98%6,017
2.43
615,937
31.38%193,298
68.62%422,639193,298
62.47%120,745 9.56%18,483
26.56%51,336 1.15%2,222 0.26%512
422,63943.33%183,116 2.63%11,118 5.67%23,953
22.74%96,10725.64%108,345
The United States
81,921,709
30.69%25,139,37842.34%34,687,518 3.59%2,939,808 3.83%3,137,111
10.76%8,814,789 8.79%7,203,105
123,356,62927.25%33,617,94832.30%39,847,44016.22%20,011,31213.11%16,173,316 6.46%7,971,942 2.74%3,382,765 1.91%2,351,906
2.57
123,356,629
33.52%41,349,575
66.48%82,007,05441,349,575
65.26%26,985,818 8.46%3,498,768
25.31%10,465,816 0.72%297,057 0.25%102,116
82,007,05440.05%32,841,596 3.14%2,578,681 6.77%5,552,012
23.47%19,246,24226.57%21,788,523
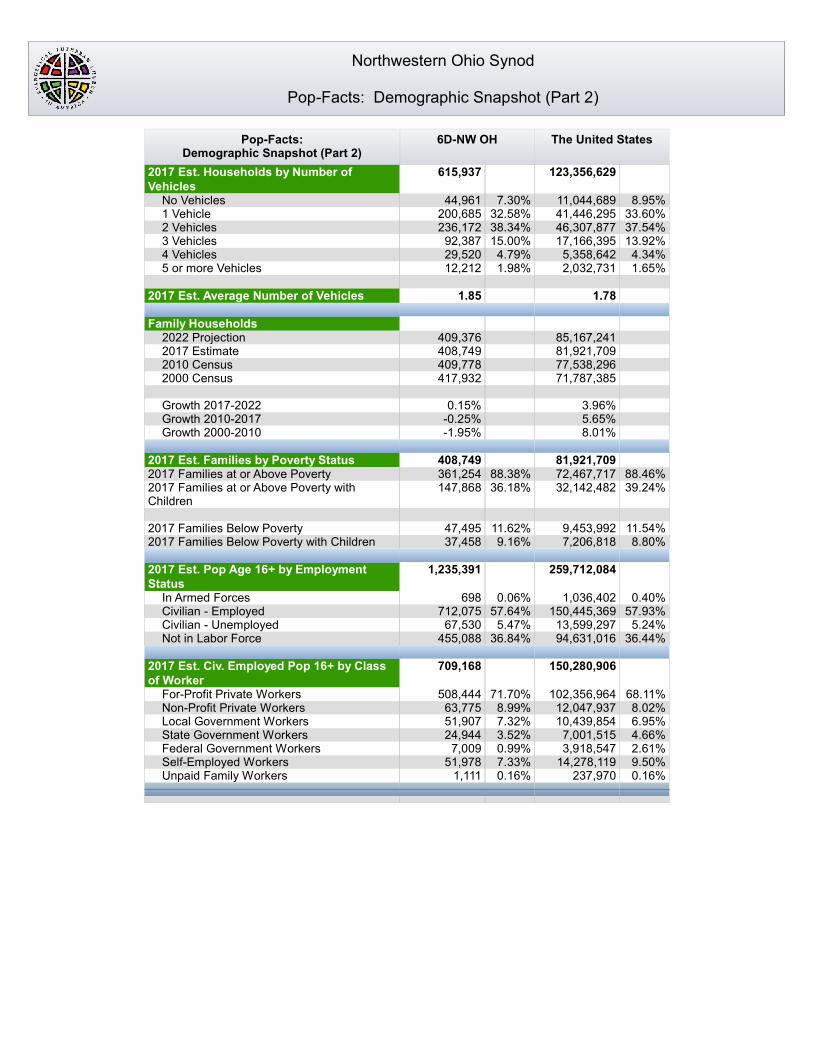
Northwestern Ohio Synod
Pop-Facts: Demographic Snapshot (Part 2)
Pop-Facts:Demographic Snapshot (Part 2)
2017 Est. Households by Number of Vehicles
No Vehicles1 Vehicle2 Vehicles3 Vehicles4 Vehicles5 or more Vehicles
2017 Est. Average Number of Vehicles
Family Households2022 Projection2017 Estimate2010 Census2000 Census
Growth 2017-2022Growth 2010-2017Growth 2000-2010
2017 Est. Families by Poverty Status2017 Families at or Above Poverty2017 Families at or Above Poverty with Children
2017 Families Below Poverty2017 Families Below Poverty with Children
2017 Est. Pop Age 16+ by Employment Status
In Armed ForcesCivilian - EmployedCivilian - UnemployedNot in Labor Force
2017 Est. Civ. Employed Pop 16+ by Class of Worker
For-Profit Private WorkersNon-Profit Private WorkersLocal Government WorkersState Government WorkersFederal Government WorkersSelf-Employed WorkersUnpaid Family Workers
6D-NW OH
615,937
7.30%44,96132.58%200,68538.34%236,17215.00%92,387 4.79%29,520 1.98%12,212
1.85
409,376408,749409,778417,932
0.15%-0.25%-1.95%
408,74988.38%361,25436.18%147,868
11.62%47,495 9.16%37,458
1,235,391
0.06%69857.64%712,075 5.47%67,530
36.84%455,088
709,168
71.70%508,444 8.99%63,775 7.32%51,907 3.52%24,944 0.99%7,009 7.33%51,978 0.16%1,111
The United States
123,356,629
8.95%11,044,68933.60%41,446,29537.54%46,307,87713.92%17,166,395 4.34%5,358,642 1.65%2,032,731
1.78
85,167,24181,921,70977,538,29671,787,385
3.96%5.65%8.01%
81,921,70988.46%72,467,71739.24%32,142,482
11.54%9,453,992 8.80%7,206,818
259,712,084
0.40%1,036,40257.93%150,445,369 5.24%13,599,297
36.44%94,631,016
150,280,906
68.11%102,356,964 8.02%12,047,937 6.95%10,439,854 4.66%7,001,515 2.61%3,918,547 9.50%14,278,119 0.16%237,970

Northwestern Ohio Synod
Pop-Facts: Demographic Snapshot (Part 2)
Pop-Facts:Demographic Snapshot (Part 2)
2017 Est. Civ. Employed Pop 16+ by Occupation
Architect/EngineerArts/Entertainment/SportsBuilding Grounds MaintenanceBusiness/Financial OperationsCommunity/Social ServicesComputer/MathematicalConstruction/ExtractionEducation/Training/LibraryFarming/Fishing/ForestryFood Prep/ServingHealthcare Practitioner/TechnicianHealthcare SupportMaintenance RepairLegalLife/Physical/Social ScienceManagementOffice/Admin. SupportProductionProtective ServiceSales/RelatedPersonal Care/ServiceTransportation/Moving
2017 Est. Pop 16+ by Occupation Classification
Blue CollarWhite CollarService & Farm
2017 Est. Workers Age 16+ by Transp. To Work
Drove AloneCar PooledPublic TransportationWalkedBicycleOther MeansWorked at Home
2017 Est. Workers Age 16+ by Travel Time to Work*
Less than 15 minutes15 to 29 Minutes30 to 44 Minutes45 to 59 Minutes60 or more Minutes
2017 Est. Avg. Travel Time to Work in Minutes*
2017 Est. Occupied Housing Units by Tenure
Owner-OccupiedRenter-Occupied
2017 Occupied Housing Units: Avg. Length of Residence
Owner-OccupiedRenter-Occupied
6D-NW OH
709,168
1.61%11,437 1.16%8,235 3.70%26,262 3.11%22,077 1.63%11,594 1.17%8,287 4.64%32,895 5.40%38,294 0.59%4,204 6.72%47,637 6.32%44,829 2.93%20,780 3.68%26,107 0.59%4,156 0.46%3,292 7.80%55,282
12.49%88,60412.72%90,235 1.78%12,629 9.27%65,769 3.00%21,262 9.21%65,301
709,168
30.25%214,53851.03%361,85618.72%132,774
693,814
85.00%589,735 8.16%56,603 0.70%4,828 2.29%15,923 0.31%2,133 0.90%6,273 2.64%18,319
262,940257,208
95,63831,20628,497
22.49
615,937
70.33%433,21629.67%182,721
197
The United States
150,280,906
1.81%2,723,909 1.93%2,893,951 4.04%6,064,609 4.78%7,180,360 1.67%2,513,810 2.70%4,052,460 5.03%7,555,677 6.05%9,085,385 0.74%1,108,648 5.86%8,799,451 5.72%8,597,421 2.47%3,708,830 3.20%4,810,211 1.14%1,718,275 0.87%1,309,020 9.85%14,807,444
13.25%19,911,637 5.96%8,961,168 2.22%3,333,560
10.81%16,243,384 3.69%5,551,021 6.22%9,350,675
150,280,906
20.41%30,677,73160.58%91,037,05619.01%28,566,119
148,083,513
76.44%113,194,537 9.44%13,981,848 5.09%7,537,731 2.77%4,097,293 0.61%901,175 1.23%1,817,204 4.43%6,553,725
38,318,23351,571,17228,692,49811,049,61311,918,345
28.35
123,356,629
64.94%80,105,48135.06%43,251,148
177
Northwestern Ohio Synod
Pop-Facts: Demographic Snapshot (Part 2)
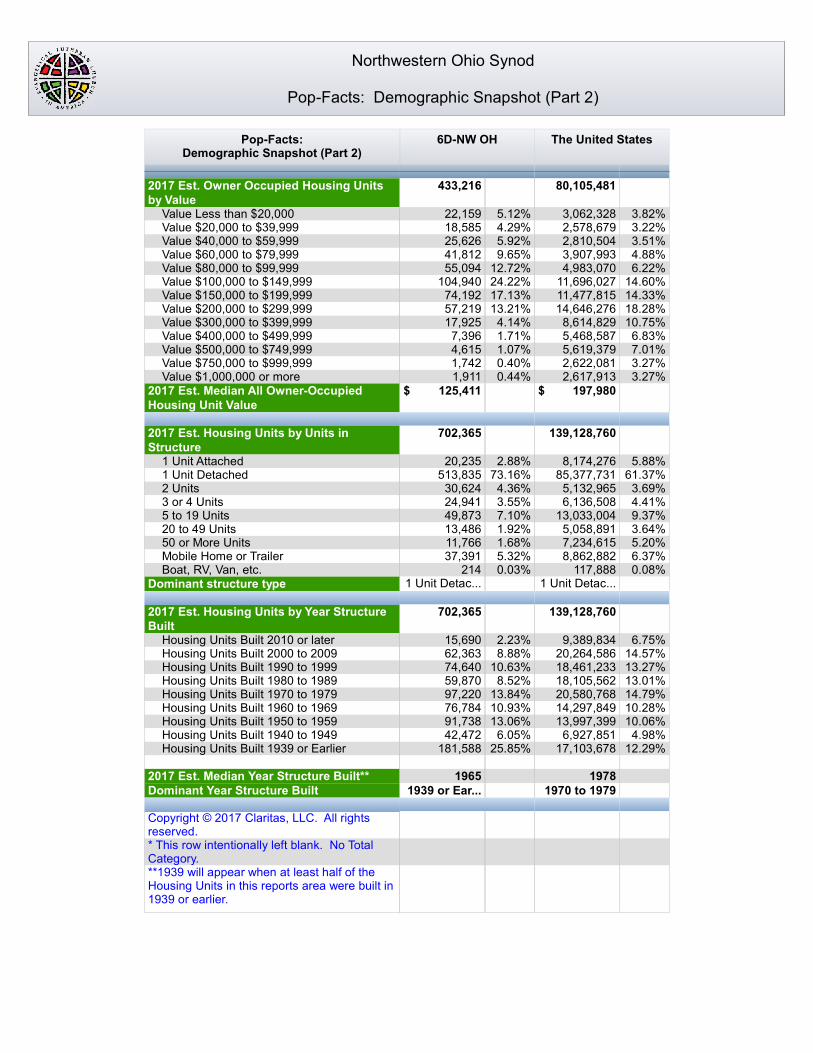
Pop-Facts:Demographic Snapshot (Part 2)
2017 Est. Owner Occupied Housing Units by Value
Value Less than $20,000Value $20,000 to $39,999Value $40,000 to $59,999Value $60,000 to $79,999Value $80,000 to $99,999Value $100,000 to $149,999Value $150,000 to $199,999Value $200,000 to $299,999Value $300,000 to $399,999Value $400,000 to $499,999Value $500,000 to $749,999Value $750,000 to $999,999Value $1,000,000 or more
2017 Est. Median All Owner-Occupied Housing Unit Value
2017 Est. Housing Units by Units in Structure
1 Unit Attached1 Unit Detached2 Units3 or 4 Units5 to 19 Units20 to 49 Units50 or More UnitsMobile Home or TrailerBoat, RV, Van, etc.
Dominant structure type
2017 Est. Housing Units by Year Structure Built
Housing Units Built 2010 or laterHousing Units Built 2000 to 2009Housing Units Built 1990 to 1999Housing Units Built 1980 to 1989Housing Units Built 1970 to 1979Housing Units Built 1960 to 1969Housing Units Built 1950 to 1959Housing Units Built 1940 to 1949Housing Units Built 1939 or Earlier
2017 Est. Median Year Structure Built**Dominant Year Structure Built
Copyright © 2017 Claritas, LLC. All rights reserved.* This row intentionally left blank. No Total Category.**1939 will appear when at least half of the Housing Units in this reports area were built in1939 or earlier.
6D-NW OH
433,216
5.12%22,159 4.29%18,585 5.92%25,626 9.65%41,812
12.72%55,09424.22%104,94017.13%74,19213.21%57,219 4.14%17,925 1.71%7,396 1.07%4,615 0.40%1,742 0.44%1,911
$ 125,411
702,365
2.88%20,23573.16%513,835 4.36%30,624 3.55%24,941 7.10%49,873 1.92%13,486 1.68%11,766 5.32%37,391 0.03%214
1 Unit Detac...
702,365
2.23%15,690 8.88%62,363
10.63%74,640 8.52%59,870
13.84%97,22010.93%76,78413.06%91,738 6.05%42,472
25.85%181,588
19651939 or Ear...
The United States
80,105,481
3.82%3,062,328 3.22%2,578,679 3.51%2,810,504 4.88%3,907,993 6.22%4,983,070
14.60%11,696,02714.33%11,477,81518.28%14,646,27610.75%8,614,829 6.83%5,468,587 7.01%5,619,379 3.27%2,622,081 3.27%2,617,913
$ 197,980
139,128,760
5.88%8,174,27661.37%85,377,731 3.69%5,132,965 4.41%6,136,508 9.37%13,033,004 3.64%5,058,891 5.20%7,234,615 6.37%8,862,882 0.08%117,888
1 Unit Detac...
139,128,760
6.75%9,389,83414.57%20,264,58613.27%18,461,23313.01%18,105,56214.79%20,580,76810.28%14,297,84910.06%13,997,399 4.98%6,927,851
12.29%17,103,678
19781970 to 1979
Northwestern Ohio Synod
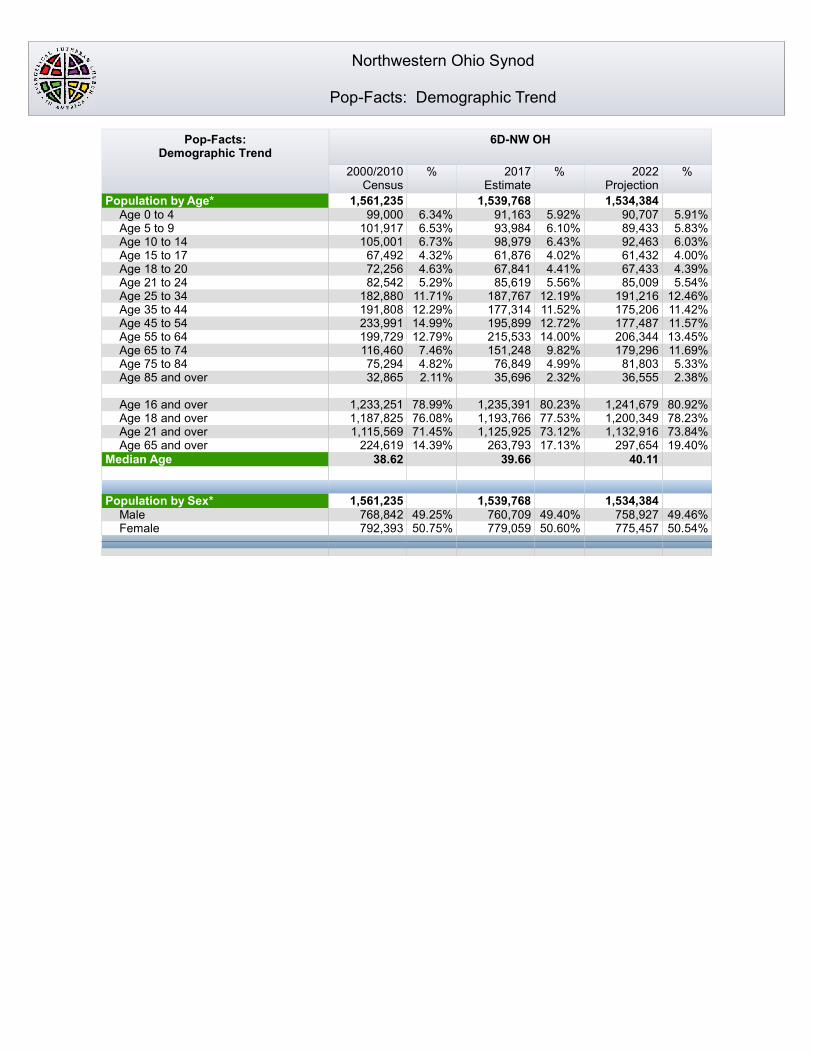
Pop-Facts: Demographic Trend
Pop-Facts:Demographic Trend
Population by Age*Age 0 to 4Age 5 to 9Age 10 to 14Age 15 to 17Age 18 to 20Age 21 to 24Age 25 to 34Age 35 to 44Age 45 to 54Age 55 to 64Age 65 to 74Age 75 to 84Age 85 and over
Age 16 and overAge 18 and overAge 21 and overAge 65 and over
Median Age
Population by Sex*MaleFemale
6D-NW OH
%2000/2010Census
%2017Estimate
%2022Projection
1,561,235 1,539,768 1,534,384 6.34%99,000 5.92%91,163 5.91%90,707 6.53%101,917 6.10%93,984 5.83%89,433 6.73%105,001 6.43%98,979 6.03%92,463 4.32%67,492 4.02%61,876 4.00%61,432 4.63%72,256 4.41%67,841 4.39%67,433 5.29%82,542 5.56%85,619 5.54%85,00911.71%182,880 12.19%187,767 12.46%191,21612.29%191,808 11.52%177,314 11.42%175,20614.99%233,991 12.72%195,899 11.57%177,48712.79%199,729 14.00%215,533 13.45%206,344 7.46%116,460 9.82%151,248 11.69%179,296 4.82%75,294 4.99%76,849 5.33%81,803 2.11%32,865 2.32%35,696 2.38%36,555
78.99%1,233,251 80.23%1,235,391 80.92%1,241,67976.08%1,187,825 77.53%1,193,766 78.23%1,200,34971.45%1,115,569 73.12%1,125,925 73.84%1,132,91614.39%224,619 17.13%263,793 19.40%297,654
38.62 39.66 40.11
1,561,235 1,539,768 1,534,38449.25%768,842 49.40%760,709 49.46%758,92750.75%792,393 50.60%779,059 50.54%775,457
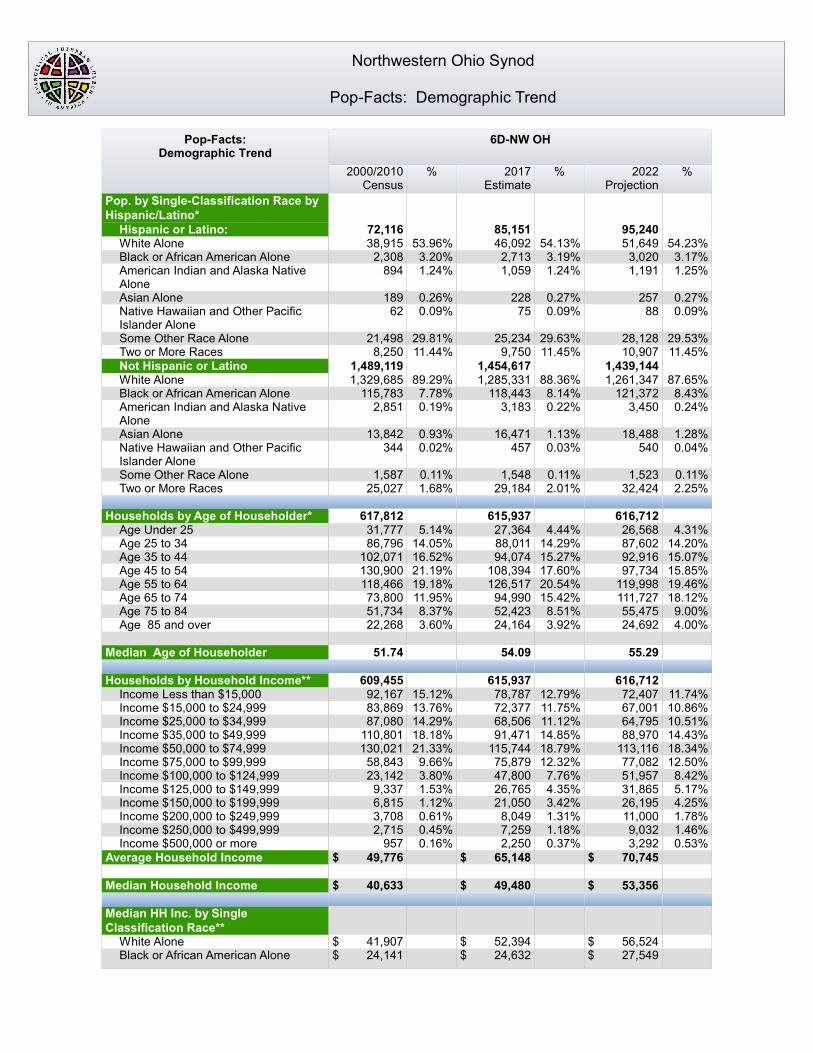
Northwestern Ohio Synod
Pop-Facts: Demographic Trend
Pop-Facts:Demographic Trend
Pop. by Single-Classification Race by Hispanic/Latino*
Hispanic or Latino:White AloneBlack or African American AloneAmerican Indian and Alaska Native AloneAsian AloneNative Hawaiian and Other Pacific Islander AloneSome Other Race AloneTwo or More RacesNot Hispanic or LatinoWhite AloneBlack or African American AloneAmerican Indian and Alaska Native AloneAsian AloneNative Hawaiian and Other Pacific Islander AloneSome Other Race AloneTwo or More Races
Households by Age of Householder*Age Under 25Age 25 to 34Age 35 to 44Age 45 to 54Age 55 to 64Age 65 to 74Age 75 to 84Age 85 and over
Median Age of Householder
Households by Household Income**Income Less than $15,000Income $15,000 to $24,999Income $25,000 to $34,999Income $35,000 to $49,999Income $50,000 to $74,999Income $75,000 to $99,999Income $100,000 to $124,999Income $125,000 to $149,999Income $150,000 to $199,999Income $200,000 to $249,999Income $250,000 to $499,999Income $500,000 or more
Average Household Income
Median Household Income
Median HH Inc. by Single Classification Race**
White AloneBlack or African American Alone
6D-NW OH
%2000/2010Census
%2017Estimate
%2022Projection
72,116 85,151 95,24053.96%38,915 54.13%46,092 54.23%51,649 3.20%2,308 3.19%2,713 3.17%3,020 1.24%894 1.24%1,059 1.25%1,191
0.26%189 0.27%228 0.27%257 0.09%62 0.09%75 0.09%88
29.81%21,498 29.63%25,234 29.53%28,12811.44%8,250 11.45%9,750 11.45%10,907
1,489,119 1,454,617 1,439,14489.29%1,329,685 88.36%1,285,331 87.65%1,261,347 7.78%115,783 8.14%118,443 8.43%121,372 0.19%2,851 0.22%3,183 0.24%3,450
0.93%13,842 1.13%16,471 1.28%18,488 0.02%344 0.03%457 0.04%540
0.11%1,587 0.11%1,548 0.11%1,523 1.68%25,027 2.01%29,184 2.25%32,424
617,812 615,937 616,712 5.14%31,777 4.44%27,364 4.31%26,568
14.05%86,796 14.29%88,011 14.20%87,60216.52%102,071 15.27%94,074 15.07%92,91621.19%130,900 17.60%108,394 15.85%97,73419.18%118,466 20.54%126,517 19.46%119,99811.95%73,800 15.42%94,990 18.12%111,727 8.37%51,734 8.51%52,423 9.00%55,475 3.60%22,268 3.92%24,164 4.00%24,692
51.74 54.09 55.29
609,455 615,937 616,71215.12%92,167 12.79%78,787 11.74%72,40713.76%83,869 11.75%72,377 10.86%67,00114.29%87,080 11.12%68,506 10.51%64,79518.18%110,801 14.85%91,471 14.43%88,97021.33%130,021 18.79%115,744 18.34%113,116 9.66%58,843 12.32%75,879 12.50%77,082 3.80%23,142 7.76%47,800 8.42%51,957 1.53%9,337 4.35%26,765 5.17%31,865 1.12%6,815 3.42%21,050 4.25%26,195 0.61%3,708 1.31%8,049 1.78%11,000 0.45%2,715 1.18%7,259 1.46%9,032 0.16%957 0.37%2,250 0.53%3,292
$ 49,776 $ 65,148 $ 70,745
$ 40,633 $ 49,480 $ 53,356
$ 41,907 $ 52,394 $ 56,524$ 24,141 $ 24,632 $ 27,549
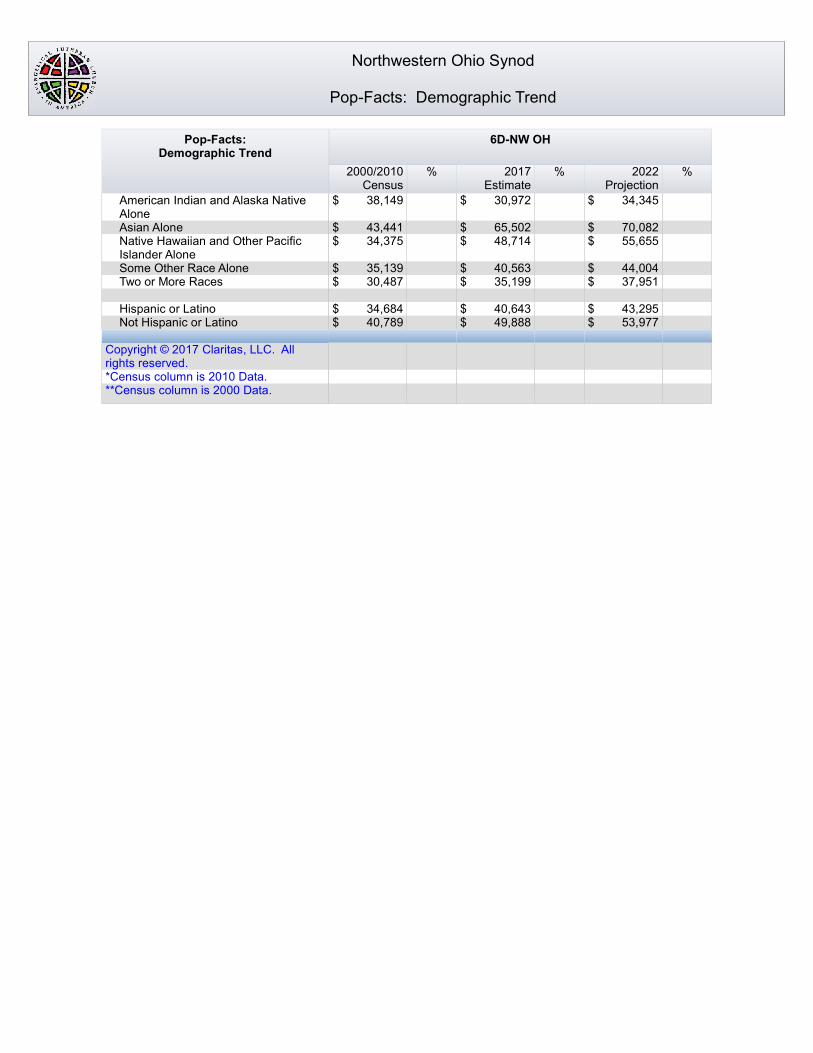
Northwestern Ohio Synod
Pop-Facts: Demographic Trend
Pop-Facts:Demographic Trend
American Indian and Alaska Native AloneAsian AloneNative Hawaiian and Other Pacific Islander AloneSome Other Race AloneTwo or More Races
Hispanic or LatinoNot Hispanic or Latino
Copyright © 2017 Claritas, LLC. All rights reserved.*Census column is 2010 Data.**Census column is 2000 Data.
6D-NW OH
%2000/2010Census
%2017Estimate
%2022Projection
$ 38,149 $ 30,972 $ 34,345
$ 43,441 $ 65,502 $ 70,082$ 34,375 $ 48,714 $ 55,655
$ 35,139 $ 40,563 $ 44,004$ 30,487 $ 35,199 $ 37,951
$ 34,684 $ 40,643 $ 43,295$ 40,789 $ 49,888 $ 53,977
Percentages rounded, so may not equal 100%.
3% 4%
9%
6% 6%
12%
18%
22%
15%
5%3%
5%
8%7%
9%
11%
18%
22%
12%
5%
0%
10%
20%
30%
40%
50%
<30 30 to 34 35 to 39 40 to 44 45 to 49 50 to 54 55 to 59 60 to 64 65 to 69 70 to 99
Age of Active Ministers of Word and Sacrament 6D (N=128) ELCA (N=8820)


W Lake Rd
US Hwy 6
E McPherson Hwy
US Hwy 250
US Hwy 30 W
US Hwy
42
US Hwy 68
US Hwy 33
US Hwy 30
US Hwy 224
US Hwy 127
US Hwy 20A
US Hwy 6
Milan Rd
US Hwy 20
US Hwy 23
US Hwy 23
US Hwy 224
US Hw
y 24
US Hwy 20
I 71 S
I 75 S
I 475 S
I 75 S
I 80 W
I 80 W
Wood
Hancock
Erie
Sandusky
Huron
Crawford
Morrow
Marion
Wyandot
Hardin
Mercer
Allen
PutnamPaulding
Defiance
FultonWilliams
Auglaize
Henry
Lucas
Ottawa
Seneca
Van Wert
*Growing, stable or declining congregationswere determined by
(2014 avg att - 2011 avg att)/2011 avg attGrowth: greater than .03Declining: less than -.03
Stable: at or between .03 and -.03
Prepared by ELCA Research and Evaluation, 12/15,Office of the Presiding Bishop, Source: The Nielsen Company
County boundary
Projected Change in Population from 2015 to 2020
by ZIP Codes and
Change in Congregation Average Attendance
from 2011 to 2014
for the Northwestern Ohio Synod
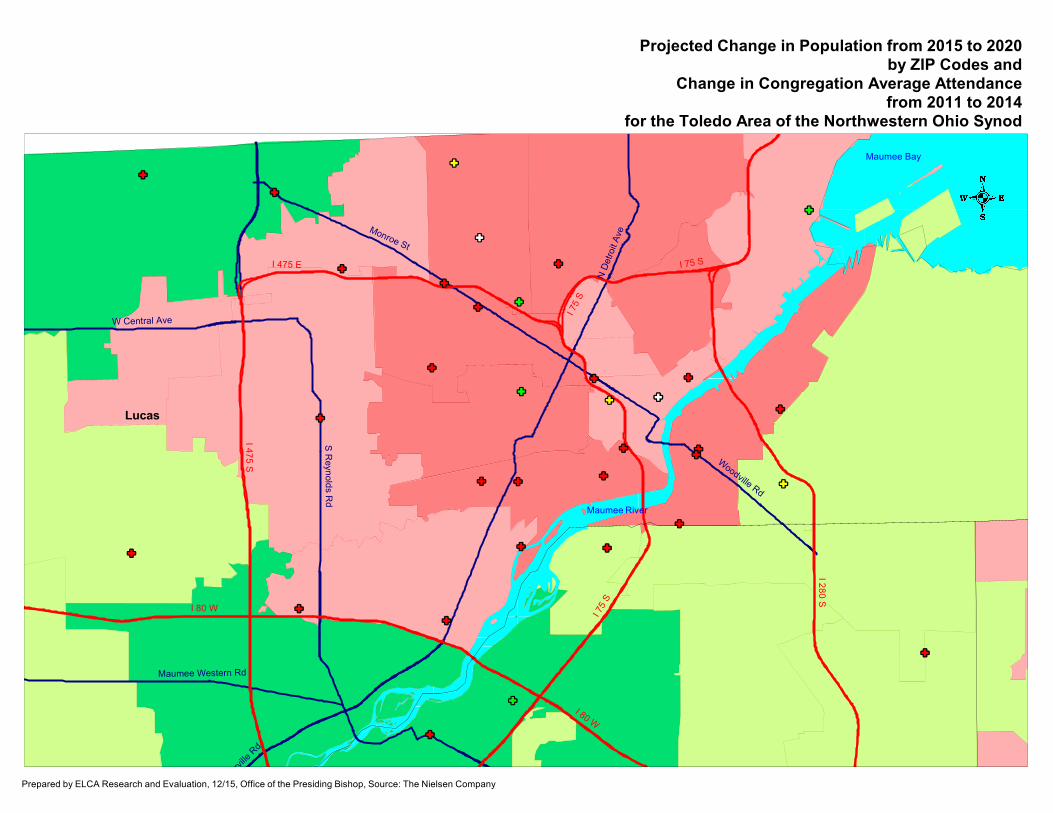
Projected Change in Population from 2015 to 2020
by ZIP Codes and
Change in Congregation Average Attendance
from 2011 to 2014
for the Toledo Area of the Northwestern Ohio Synod
Prepared by ELCA Research and Evaluation, 12/15, Office of the Presiding Bishop, Source: The Nielsen Company
Maumee Bay
Maumee River
N Detroit Ave
Woodville Rd
terville Rd
Maumee Western Rd
S Reynol ds Rd
Monroe St
W Central Ave
I 75 S
I 75 S
I 75 S
I 280 S
I 80 W
I 80 W
I 475 E
I 475 S
Lucas
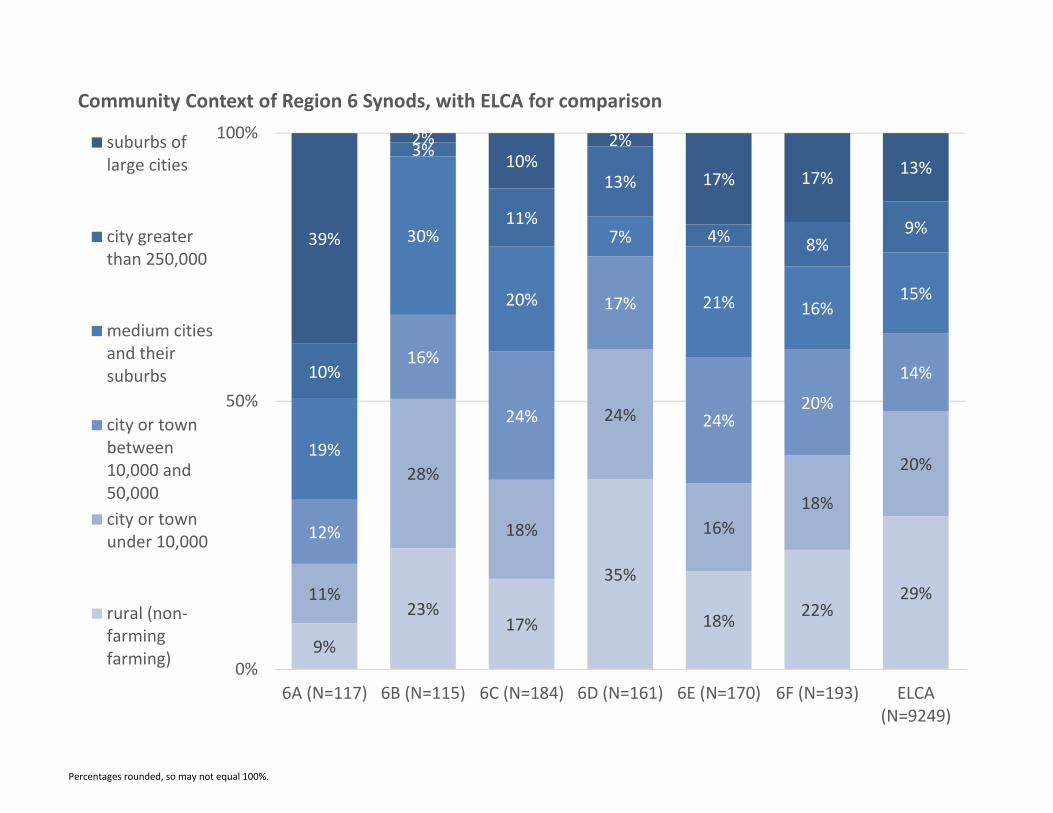
Percentages rounded, so may not equal 100%.
9%
23%17%
35%
18% 22%29%11%
28%
18%
24%
16%18%
20%
12%
16%
24%
17%
24%20%
14%
19%
30%
20%
7%
21% 16%15%
10%
3%
11%
13%
4% 8%9%39%
2%10%
2%
17% 17% 13%
0%
50%
100%
6A (N=117) 6B (N=115) 6C (N=184) 6D (N=161) 6E (N=170) 6F (N=193) ELCA(N=9249)
Community Context of Region 6 Synods, with ELCA for comparison
suburbs oflarge cities
city greaterthan 250,000
medium citiesand theirsuburbs
city or townbetween10,000 and50,000city or townunder 10,000
rural (non‐farmingfarming)
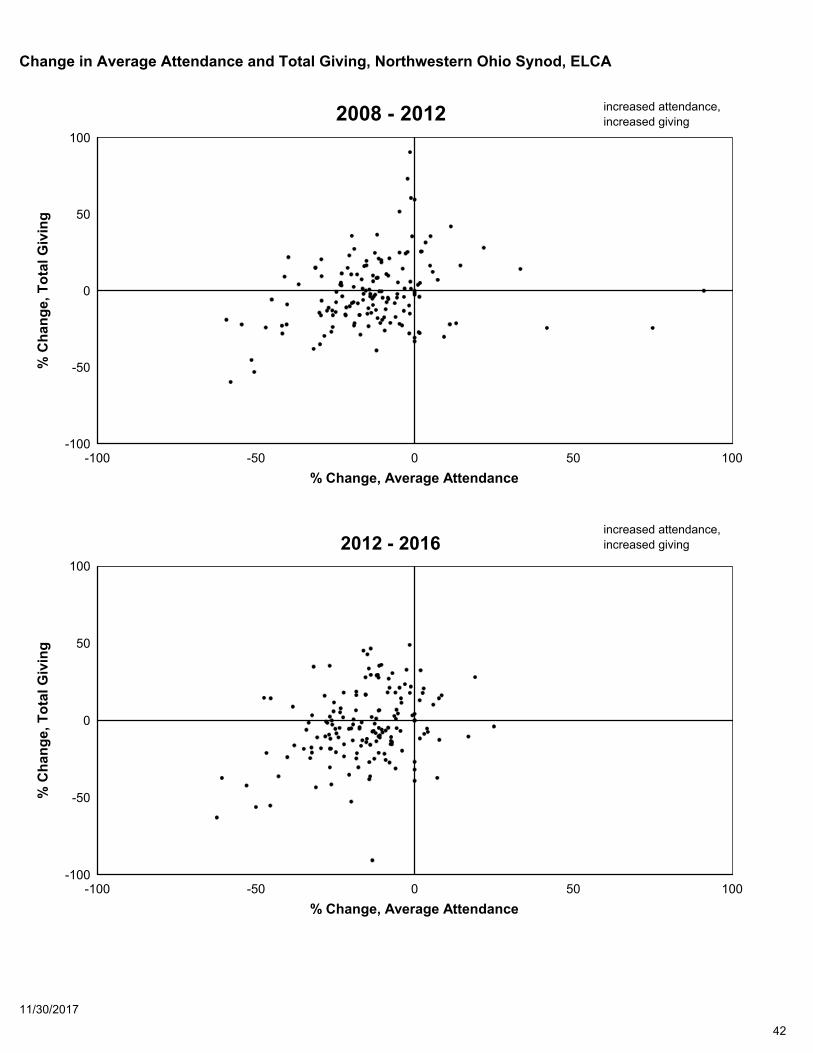
-100 -50 0 50 100-100
-50
0
50
100
% Change, Average Attendance
% C
ha
ng
e,
To
tal
Giv
ing
2008 - 2012 increased attendance,
increased giving
-100 -50 0 50 100-100
-50
0
50
100
% Change, Average Attendance
% C
ha
ng
e,
To
tal
Giv
ing
2012 - 2016increased attendance,
increased giving
Change in Average Attendance and Total Giving, Northwestern Ohio Synod, ELCA
42
11/30/2017
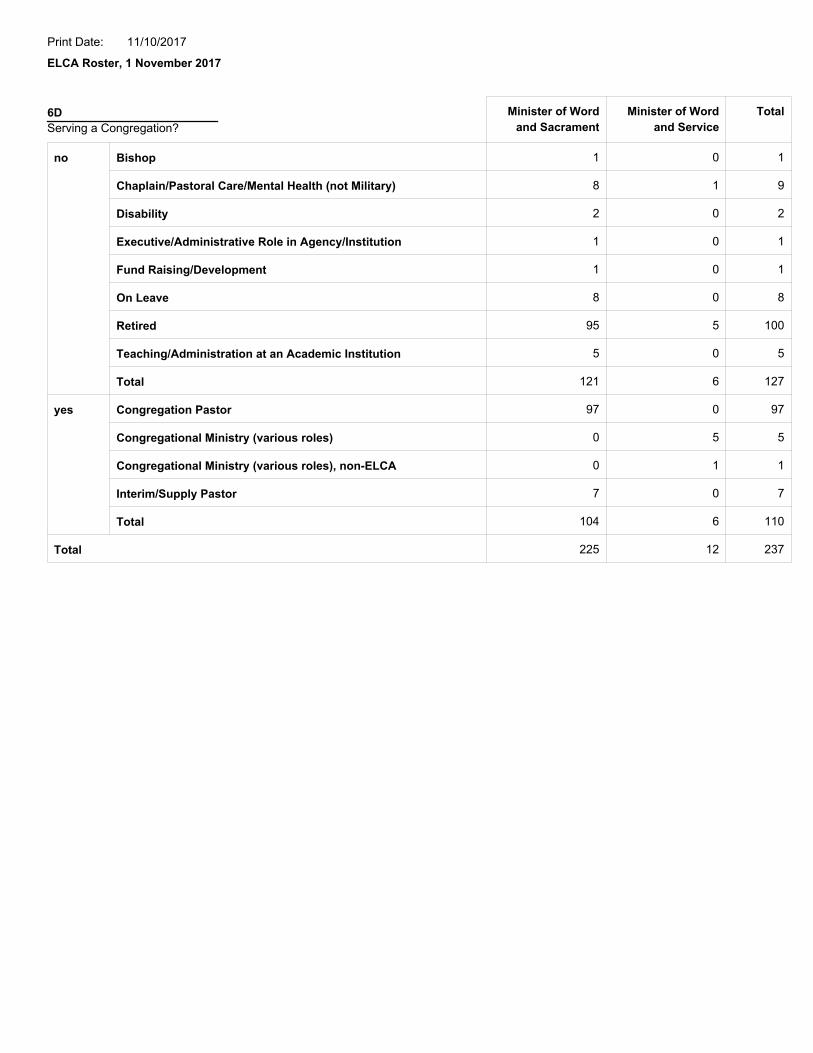
11/10/2017
ELCA Roster, 1 November 2017
Print Date:
Minister of Word
and Sacrament
Minister of Word
and Service
Total
no Bishop 1 0 1
Chaplain/Pastoral Care/Mental Health (not Military) 8 1 9
Disability 2 0 2
Executive/Administrative Role in Agency/Institution 1 0 1
Fund Raising/Development 1 0 1
On Leave 8 0 8
Retired 95 5 100
Teaching/Administration at an Academic Institution 5 0 5
Total 121 6 127
yes Congregation Pastor 97 0 97
Congregational Ministry (various roles) 0 5 5
Congregational Ministry (various roles), non-ELCA 0 1 1
Interim/Supply Pastor 7 0 7
Total 104 6 110
Total 225 12 237
6D
Serving a Congregation?
Related Documents