Australian Institute of Health and Welfare 2018. Australia’s health 2018. Australia’s health series no. 16. AUS 221. Canberra: AIHW. 6 2018 Australia’s health Chapter 6 6.9 Supply of the health workforce for the Indigenous population Appropriate, culturally safe and accessible services are an essential component of health care for Aboriginal and Torres Strait Islander Australians (Department of Health 2013). Previous work by the AIHW has shown, however, that not all Indigenous Australians have equal access to health service locations, and that, on average, areas characterised by poorer access also have poorer health outcomes (AIHW 2015, 2017). The differential supply and accessibility of health services is compounded by the fact that Indigenous Australians are more likely than non-Indigenous Australians to live in Remote and Very remote areas. This population distribution is important because distance and remoteness often pose substantial challenges for workforce recruitment and health service delivery, particularly in areas where populations are widely dispersed or isolated. Identifying areas of relative workforce supply challenges is an important first step for policy discussions on how to: • improve supply in these areas, or • ensure that residents’ needs for primary health care services are met in other ways (such as through outreach services, telehealth and e-health, medical chests with essential supplies for emergency and non-emergency treatment, the S100 Remote Aboriginal Health Services Program for accessing medicines, and online/telephone-based counselling by psychologists). This article focuses on how the supply of three groups of relevant health professionals— general practitioners (GPs), dentists and midwives—is distributed across Australia. It uses a new index developed by the AIHW, the Geographically-adjusted Index of Relative Supply (GIRS), to identify areas with supply challenges, and looks at the numbers and percentages of Indigenous Australians who live in these areas. Summary-level information is also presented on the relative workforce supply for nurses, pharmacists, psychologists and optometrists. It is important to note that the GIRS is a relative supply measure—it is not a measure of the extent to which people are able to access services. What is the GIRS? The GIRS is an index used to compare health workforce supply across small geographic areas. It ranges from 0 to 8 and was calculated for each of the 2,092 Statistical Area Level 2s (SA2s) in Australia, using workforce data from 2014. Areas with lower GIRS scores face relatively more challenges with workforce supply than those with higher GIRS scores. This does not imply, however, that areas with higher GIRS scores do not face such challenges. The GIRS takes the known workforce supply based in an area and adjusts it for three other factors—land size, population dispersion, and the proximity of the population to the relevant service locations. Box 6.9.1 provides an overview of why these factors are important.

Welcome message from author
This document is posted to help you gain knowledge. Please leave a comment to let me know what you think about it! Share it to your friends and learn new things together.
Transcript

Australian Institute of Health and Welfare 2018. Australia’s health 2018. Australia’s health series no. 16. AUS 221. Canberra: AIHW.
6
2018
Australia’s health
Ch
apte
r 6
6.9 Supply of the health workforce for the Indigenous population
Appropriate, culturally safe and accessible services are an essential component of health care for Aboriginal and Torres Strait Islander Australians (Department of Health 2013). Previous work by the AIHW has shown, however, that not all Indigenous Australians have equal access to health service locations, and that, on average, areas characterised by poorer access also have poorer health outcomes (AIHW 2015, 2017).
The differential supply and accessibility of health services is compounded by the fact that Indigenous Australians are more likely than non-Indigenous Australians to live in Remote and Very remote areas. This population distribution is important because distance and remoteness often pose substantial challenges for workforce recruitment and health service delivery, particularly in areas where populations are widely dispersed or isolated.
Identifying areas of relative workforce supply challenges is an important first step for policy discussions on how to:
• improve supply in these areas, or
• ensure that residents’ needs for primary health care services are met in other ways (such as through outreach services, telehealth and e-health, medical chests with essential supplies for emergency and non-emergency treatment, the S100 Remote Aboriginal Health Services Program for accessing medicines, and online/telephone-based counselling by psychologists).
This article focuses on how the supply of three groups of relevant health professionals—general practitioners (GPs), dentists and midwives—is distributed across Australia. It uses a new index developed by the AIHW, the Geographically-adjusted Index of Relative Supply (GIRS), to identify areas with supply challenges, and looks at the numbers and percentages of Indigenous Australians who live in these areas. Summary-level information is also presented on the relative workforce supply for nurses, pharmacists, psychologists and optometrists. It is important to note that the GIRS is a relative supply measure—it is not a measure of the extent to which people are able to access services.
What is the GIRS?The GIRS is an index used to compare health workforce supply across small geographic areas. It ranges from 0 to 8 and was calculated for each of the 2,092 Statistical Area Level 2s (SA2s) in Australia, using workforce data from 2014. Areas with lower GIRS scores face relatively more challenges with workforce supply than those with higher GIRS scores. This does not imply, however, that areas with higher GIRS scores do not face such challenges.
The GIRS takes the known workforce supply based in an area and adjusts it for three other factors—land size, population dispersion, and the proximity of the population to the relevant service locations. Box 6.9.1 provides an overview of why these factors are important.
2
2018
Australia’s health
Australian Institute of Health and Welfare 2018. Australia’s health 2018. Australia’s health series no. 16. AUS 221. Canberra: AIHW.
6
Ch
apte
r 6
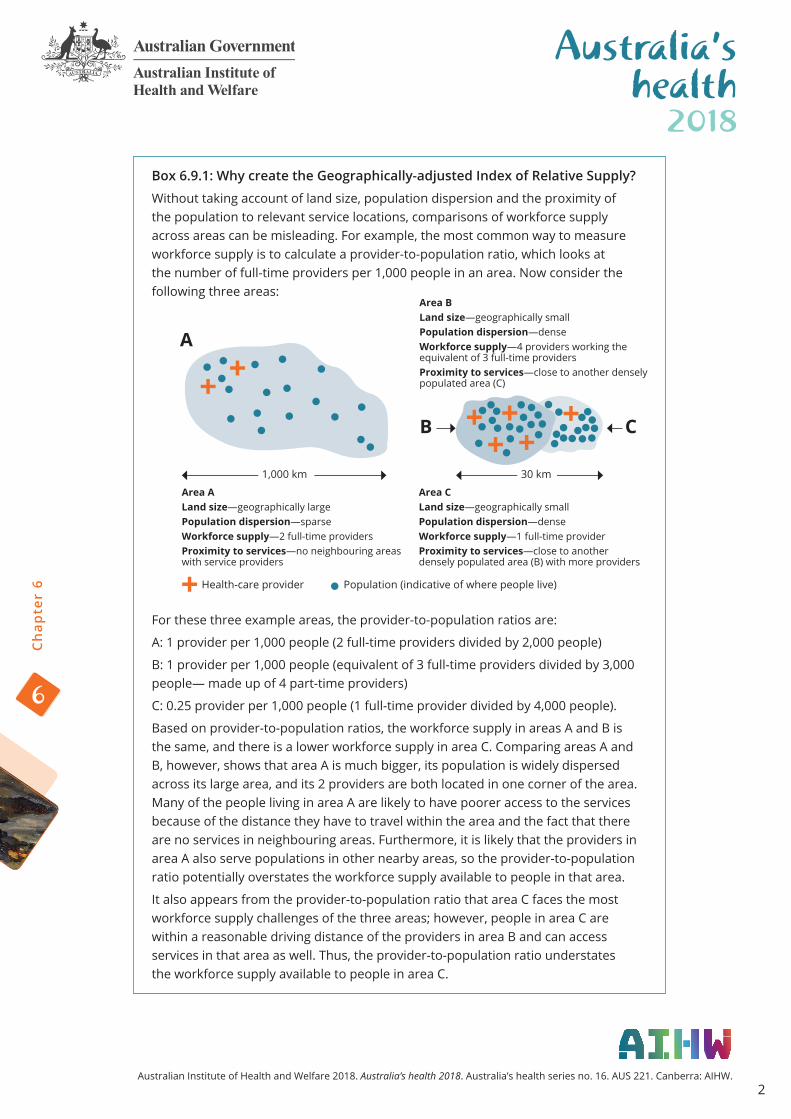
Box 6.9.1: Why create the Geographically-adjusted Index of Relative Supply?
Without taking account of land size, population dispersion and the proximity of the population to relevant service locations, comparisons of workforce supply across areas can be misleading. For example, the most common way to measure workforce supply is to calculate a provider-to-population ratio, which looks at the number of full-time providers per 1,000 people in an area. Now consider the following three areas:
For these three example areas, the provider-to-population ratios are:
A: 1 provider per 1,000 people (2 full-time providers divided by 2,000 people)
B: 1 provider per 1,000 people (equivalent of 3 full-time providers divided by 3,000 people— made up of 4 part-time providers)
C: 0.25 provider per 1,000 people (1 full-time provider divided by 4,000 people).
Based on provider-to-population ratios, the workforce supply in areas A and B is the same, and there is a lower workforce supply in area C. Comparing areas A and B, however, shows that area A is much bigger, its population is widely dispersed across its large area, and its 2 providers are both located in one corner of the area. Many of the people living in area A are likely to have poorer access to the services because of the distance they have to travel within the area and the fact that there are no services in neighbouring areas. Furthermore, it is likely that the providers in area A also serve populations in other nearby areas, so the provider-to-population ratio potentially overstates the workforce supply available to people in that area.
It also appears from the provider-to-population ratio that area C faces the most workforce supply challenges of the three areas; however, people in area C are within a reasonable driving distance of the providers in area B and can access services in that area as well. Thus, the provider-to-population ratio understates the workforce supply available to people in area C.
Area BLand size—geographically small Population dispersion—denseWorkforce supply—4 providers working the equivalent of 3 full-time providersProximity to services—close to another densely populated area (C)
1,000 km 30 km
Area ALand size—geographically large Population dispersion—sparseWorkforce supply—2 full-time providersProximity to services—no neighbouring areas with service providers
Area CLand size—geographically small Population dispersion—denseWorkforce supply—1 full-time providerProximity to services—close to another densely populated area (B) with more providers
Health-care provider Population (indicative of where people live)
A
B C

3
2018
Australia’s health
Australian Institute of Health and Welfare 2018. Australia’s health 2018. Australia’s health series no. 16. AUS 221. Canberra: AIHW.
6
Ch
apte
r 6
Box 6.9.1 (continued): Why create the Geographically-adjusted Index of Relative Supply?
The GIRS takes into account how hard it might be for people to access services based on the dispersion of the population, the size of the area and whether people can access services in neighbouring areas. Therefore, it is a better indicator of the relative workforce supply in an area than provider-to-population ratios on their own.
For more information see supplementary document S6.9 ‘Estimating the supply of the health workforce’ available online at <www.aihw.gov.au/reports/australias-health/australias-health-2018/related-material>.
Relationship between the GIRS and health outcomesThe GIRS aims to capture relative workforce supply across areas. A low GIRS score would be expected to indicate an area where the risk of poor health outcomes is relatively high because of these supply challenges. One indicator that has been shown to relate to poor access to primary health services is potentially preventable hospitalisations (PPHs)—namely, hospitalisations that might have been prevented through the timely and appropriate provision and use of primary care or other non-hospital services (AIHW 2014a; Li et al. 2009).
A correlation analysis of GIRS scores with PPH rates at the SA2 level found that areas with lower relative workforce supply were significantly more likely to have a higher percentage of hospitalisations that were potentially preventable than areas with higher relative workforce supply. The relationship between PPH and relative workforce supply was tested separately for GPs, pharmacists and dentists, and the association was statistically significant for all three professions (AIHW 2016a).
Bringing together relative workforce supply and the distribution of the Indigenous population Information on the number of Indigenous and non-Indigenous Australians living in each SA2 was linked with the GIRS scores to calculate the number of Indigenous people who live in areas with relative workforce supply challenges.
The next section of this article presents the findings for GPs, dentists and midwives.
Guide to GIRS scores
There is an inverse relationship between GIRS scores and the likelihood of relative workforce supply challenges; that is, areas with a GIRS score of 0 or 1 are likely to face higher workforce supply challenges than areas with a GIRS score of 6–8.

4
2018
Australia’s health
Australian Institute of Health and Welfare 2018. Australia’s health 2018. Australia’s health series no. 16. AUS 221. Canberra: AIHW.
6
Ch
apte
r 6
General practitionersGPs are medical practitioners who are registered with the Medical Board of Australia. After completing their university studies, they receive provisional registration and must complete an internship and specialist training before receiving general medical registration.
GPs play a key role in Australia’s primary health care system. Their duties include providing preventive care and screening, managing acute and chronic illnesses and providing a link to specialist and multidisciplinary care. They also perform important legal functions, such as certifying documents and assessing eligibility for programs such as the Disability Support Pension. GPs work in a variety of settings, including in private, solo or group practices; in Indigenous Specific Primary Health Care Services (ISPHCS) and/or community health services; and in hospital-based clinics. They may also provide additional services outside their practice locations, including at outreach clinics and through home visits and visits to locations such as aged care facilities (AIHW 2014a).
Given the higher health needs of the Indigenous population relative to the non-Indigenous population, the supply of the GP workforce is a critical issue for Indigenous people. Identifying areas in which Indigenous people live that have relatively low supplies of GPs provides a starting point for further examination and potential policy follow-up.
Relative workforce supply of GPs and relationship to the distribution of the Indigenous population The geographic distribution of the relative workforce supply of GPs throughout Australia is shown in Figure 6.9.1. There were 39 areas with a high probability of GP workforce supply challenges (GIRS scores of 0–1): 23 were in Very remote areas, 7 in Remote areas, 6 in Outer regional areas and 3 in Inner regional areas (for more information on the distribution of the GIRS by remoteness see Supplementary Table S6.9.1.
For an interactive version of the map in Figure 6.9.1, see the online data visualisation tool at <www.aihw.gov.au/reports/australias-health/australias-health-2018/contents/supply-of-the-health-workforce-for-the-indigenous-population-maps>.

5
2018
Australia’s health
Australian Institute of Health and Welfare 2018. Australia’s health 2018. Australia’s health series no. 16. AUS 221. Canberra: AIHW.
6
Ch
apte
r 6
Figure 6.9.1: GP GIRS scores by SA2, 2014
More than 46,000 Indigenous Australians (6.9% of the Indigenous population) live in the 39 areas with the highest likelihoods of GP workforce supply challenges. This percentage is 14 times as high as that for non-Indigenous Australians (0.5%) (Table 6.9.1).
Table 6.9.1: Distribution of SA2s and population by area-level relative GP workforce supply (GIRS score), 2014
GP GIRS score
Number of SA2s
Population distribution (number) Population distribution (%)
IndigenousNon-
Indigenous Total IndigenousNon-
IndigenousRate ratio
0–1 39 46,199 108,321 154,520 6.9 0.5 13.8
2–3 397 169,980 2,438,260 2,620,529 25.4 11.3 2.2
4–5 834 279,754 9,372,408 9,691,475 41.9 43.4 1.0
6–8 822 172,308 9,680,037 9,853,282 25.8 44.8 0.6
Total 2,092 668,241 21,599,026 22,319,806 100.0 100.0
Note: Lower GIRS scores indicate areas with higher probabilities of workforce supply challenges compared with areas with higher GIRS scores. The Indigenous and non-Indigenous populations do not add up to the total population as the Australian Bureau of Statistics did not provide a breakdown by Indigenous status for 23 SA2s. Only SA2s with at least a population of 100 were included.
GIRS for GPs
6
2018
Australia’s health
Australian Institute of Health and Welfare 2018. Australia’s health 2018. Australia’s health series no. 16. AUS 221. Canberra: AIHW.
6
Ch
apte
r 6
DentistsDentists are independent practitioners who provide assessment, diagnosis, treatment, management and preventive services related to oral health. The education requirement for a graduate dentist to be registered is a minimum 4-year full-time education program approved by the National Board (Dental Board of Australia 2015).
Physical, financial and cultural access to dentists is a critical issue for Indigenous health. Indigenous Australians have overall poorer oral health than non-Indigenous Australians, which includes having more caries (cavities), more tooth loss and higher rates of periodontal disease. Poor dental health has important social as well as physical consequences, and can affect all aspects of daily life.
Dentist services may be delivered by resident or visiting dentists at private practice locations, in clinic/hospital settings, through ISPHCS or through mobile dental services.
Relative workforce supply of dentists and relationship to the distribution of the Indigenous populationThe relative workforce supply of dentists across Australia is shown in Figure 6.9.2. There were 43 areas with the highest probability of dentist workforce supply challenges (GIRS scores of 0–1): 25 in Very remote areas, 7 in Remote areas, 10 in Outer regional areas and 1 in an Inner regional area (for more information on the distribution of the GIRS by remoteness see Supplementary Table S6.9.2.
For an interactive version of the map in Figure 6.9.2, see the online data visualisation tool at <www.aihw.gov.au/reports/australias-health/australias-health-2018/contents/supply-of-the-health-workforce-for-the-indigenous-population-maps>.

7
2018
Australia’s health
Australian Institute of Health and Welfare 2018. Australia’s health 2018. Australia’s health series no. 16. AUS 221. Canberra: AIHW.
6
Ch
apte
r 6
Figure 6.9.2: Dentist GIRS scores by SA2, 2014
Nearly 77,000 Indigenous Australians (12% of the Indigenous population) live in the 43 areas with the highest likelihoods of dentist workforce supply challenges. This percentage is 19 times as high as that for non-Indigenous Australians (Table 6.9.2).
Table 6.9.2: Distribution of SA2s and population by area-level relative dentist workforce supply (GIRS score), 2014
Dentist GIRS score
Number of SA2s
Population distribution (number) Population distribution (%)
IndigenousNon-
Indigenous Total IndigenousNon-
IndigenousRate ratio
0–1 43 76,803 132,602 209,405 11.5 0.6 18.8
2–3 396 137,746 2,388,973 2,539,008 20.6 11.1 1.9
4–5 749 272,780 8,272,467 8,584,560 40.8 38.3 1.1
6–8 905 180,912 10,804,984 10,986,833 27.1 50.0 0.5
Total 2,092 668,241 21,599,026 22,319,806 100.0 100.0
Note: Lower GIRS scores indicate areas with higher probabilities of workforce supply challenges compared with areas with higher GIRS scores. The Indigenous and non-Indigenous populations do not add up to the total population because the Australian Bureau of Statistics did not provide a breakdown by Indigenous status for 23 SA2s.
GIRS for dentists
8
2018
Australia’s health
Australian Institute of Health and Welfare 2018. Australia’s health 2018. Australia’s health series no. 16. AUS 221. Canberra: AIHW.
6
Ch
apte
r 6
Midwives Midwives provide care and advice to women during pregnancy, labour and birth; they also provide postnatal care for women and babies in diverse settings, including the home, community, hospitals, clinics, ISPHCS, and health units (AIHW 2013b). Midwives can be registered as nurses, as midwives, or as both. Only data on midwifery-specific full-time equivalents were included in the midwifery GIRS.
To register and practise as a midwife, a person must have appropriate qualifications in midwifery. There are two paths to obtaining these qualifications. Midwives can first qualify as a registered nurse and then undertake additional education and training in midwifery. However, some universities now offer direct-entry midwifery undergraduate programs. Direct-entry midwives, as with other midwives, must be registered with the Nursing and Midwifery Board of Australia to practise, but are restricted to practising midwifery only, whereas other midwives can also practise general nursing.
Access to midwives is particularly critical for the health of Indigenous mothers and babies. Indigenous mothers are less likely to attend antenatal care in the first trimester of pregnancy, have higher levels of social disadvantage, and are more likely to smoke during pregnancy. These factors contribute to the higher likelihood that babies born to Indigenous mothers are born prematurely and are of low birthweight. Both these factors increase the likelihood of babies dying before their first birthday.
There are a large number of government and non-government initiatives to improve access to high-quality, culturally appropriate care for Indigenous mothers and babies in order to reduce these disparities (AIHW 2014b).
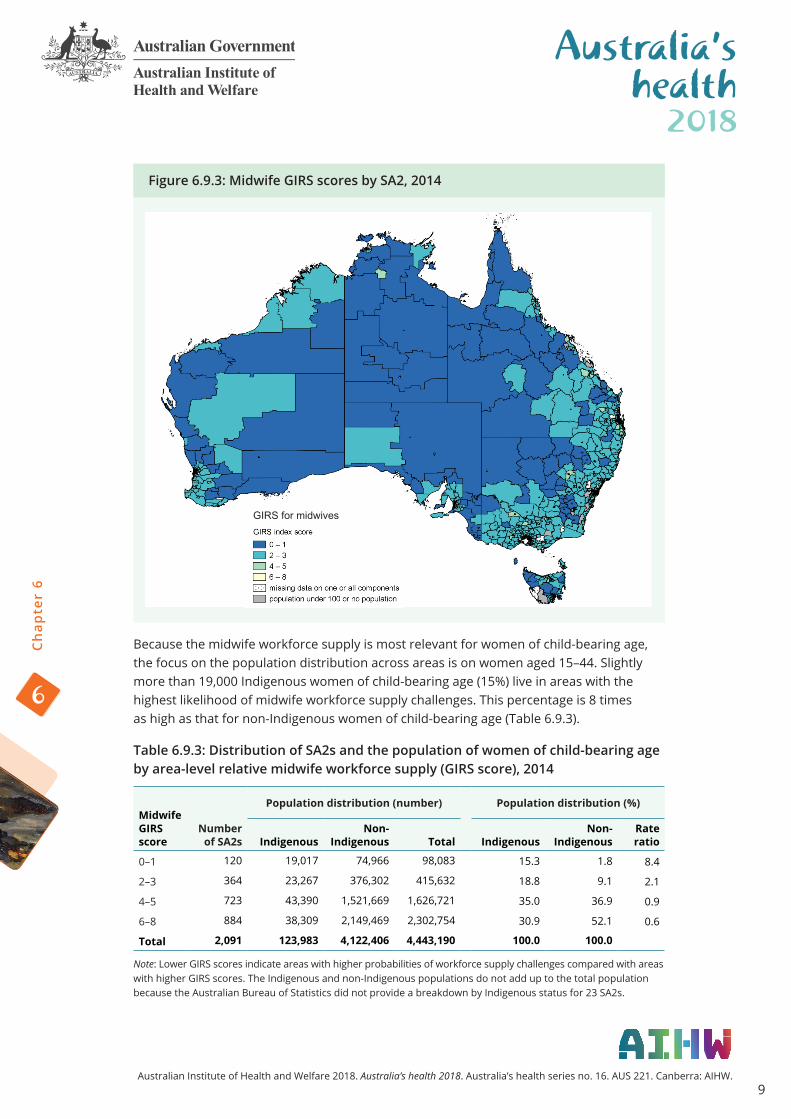
Relative workforce supply of midwives and relationship to the distribution of Indigenous women of child-bearing age The relative workforce supply of midwives across Australia is shown in Figure 6.9.3. There were 120 areas with the highest probability of midwife workforce supply challenges (GIRS scores of 0–1): 34 in Very remote areas, 22 in Remote areas, 51 in Outer regional areas and 13 in Inner regional areas (for more information on the distribution of the GIRS by remoteness see Supplementary Table S6.9.3.
For an interactive version of the map in Figure 6.9.3, see the online data visualisation tool at <www.aihw.gov.au/reports/australias-health/australias-health-2018/contents/supply-of-the-health-workforce-for-the-indigenous-population-maps>.
9
2018
Australia’s health
Australian Institute of Health and Welfare 2018. Australia’s health 2018. Australia’s health series no. 16. AUS 221. Canberra: AIHW.
6
Ch
apte
r 6
Figure 6.9.3: Midwife GIRS scores by SA2, 2014
Because the midwife workforce supply is most relevant for women of child-bearing age, the focus on the population distribution across areas is on women aged 15–44. Slightly more than 19,000 Indigenous women of child-bearing age (15%) live in areas with the highest likelihood of midwife workforce supply challenges. This percentage is 8 times as high as that for non-Indigenous women of child-bearing age (Table 6.9.3).
Table 6.9.3: Distribution of SA2s and the population of women of child-bearing age by area-level relative midwife workforce supply (GIRS score), 2014
Midwife GIRS score
Number of SA2s
Population distribution (number) Population distribution (%)
IndigenousNon-
Indigenous Total IndigenousNon-
IndigenousRate ratio
0–1 120 19,017 74,966 98,083 15.3 1.8 8.4
2–3 364 23,267 376,302 415,632 18.8 9.1 2.1
4–5 723 43,390 1,521,669 1,626,721 35.0 36.9 0.9
6–8 884 38,309 2,149,469 2,302,754 30.9 52.1 0.6
Total 2,091 123,983 4,122,406 4,443,190 100.0 100.0
Note: Lower GIRS scores indicate areas with higher probabilities of workforce supply challenges compared with areas with higher GIRS scores. The Indigenous and non-Indigenous populations do not add up to the total population because the Australian Bureau of Statistics did not provide a breakdown by Indigenous status for 23 SA2s.
GIRS for midwives

10
2018
Australia’s health
Australian Institute of Health and Welfare 2018. Australia’s health 2018. Australia’s health series no. 16. AUS 221. Canberra: AIHW.
6
Ch
apte
r 6
Additional professionsThe focus of this article has been on relative workforce supply challenges for GPs, dentists and midwives, as measured by the GIRS. These findings are drawn from a larger project that also examined the workforce supply of nurses, pharmacists, psychologists and optometrists (AIHW 2016a).
A summary of GIRS scores for all seven professions is presented in Table 6.9.4. It shows that, relative to other professions, a greater proportion of areas faced likely supply challenges (GIRS score of 0 or 1) for midwives (5.7%) and optometrists (2.7%). By comparison, less than 1% of areas faced supply challenges for nurses.
Table 6.9.4: Distribution of SA2s by relative workforce supply and profession
Number of SA2s by GIRS scores and profession
GIRS score GPs Nurses Midwives Pharmacists Dentists Psychologists Optometrists
0–1 39 17 120 45 43 49 56
2–3 397 436 364 391 396 400 365
4–5 834 808 723 750 748 687 776
6–8 822 831 884 906 905 956 895
Total 2,092 2,092 2,091 2,092 2,092 2,092 2,092
% of SA2s by GIRS scores and profession
GIRS score GPs Nurses Midwives Pharmacists Dentists Psychologists Optometrists
0–1 1.9 0.8 5.7 2.2 2.1 2.3 2.7
2–3 19.0 20.8 17.4 18.7 18.9 19.1 17.4
4–5 39.9 38.6 34.6 35.9 35.8 32.8 37.1
6–8 39.3 39.7 42.3 43.3 43.3 45.7 42.8
Total 100 100 100 100 100 100 100
Note: Includes only SA2s with resident populations of at least 100 people and valid data on all four GIRS components. Scores of 0 and 1 indicate a higher probability that an area faces supply challenges compared with areas with higher GIRS scores. There are only 2,091 SA2s with valid midwife GIRS scores.
Consistency in relative workforce supply within areasIndividual GIRS scores are important to identify areas of workforce supply challenge for each profession. Another issue is the consistency in workforce supply across professions. In other words, if an area had likely workforce supply challenges for one profession, did it also have these challenges for other professions? It might be expected, for example, that regions with a lower relative supply of GPs or nurses might also have a lower relative supply of dentists or psychologists.
To measure the consistency of relative workforce supply across the seven professions, the number of times that each SA2 had a GIRS score of 0 or 1 (that is, it was measured as having a low level of relative supply for that profession) was counted across the seven professions. Values for this summary score can range between 0 (no GIRS scores of 0 or 1) to 7 (GIRS scores of 0 or 1 for every profession). Unlike the GIRS scores, where a lower score means a higher potential for workforce supply challenges, higher values on the summary score reflect a higher number of workforce supply challenges.
11
2018
Australia’s health
Australian Institute of Health and Welfare 2018. Australia’s health 2018. Australia’s health series no. 16. AUS 221. Canberra: AIHW.
6
Ch
apte
r 6
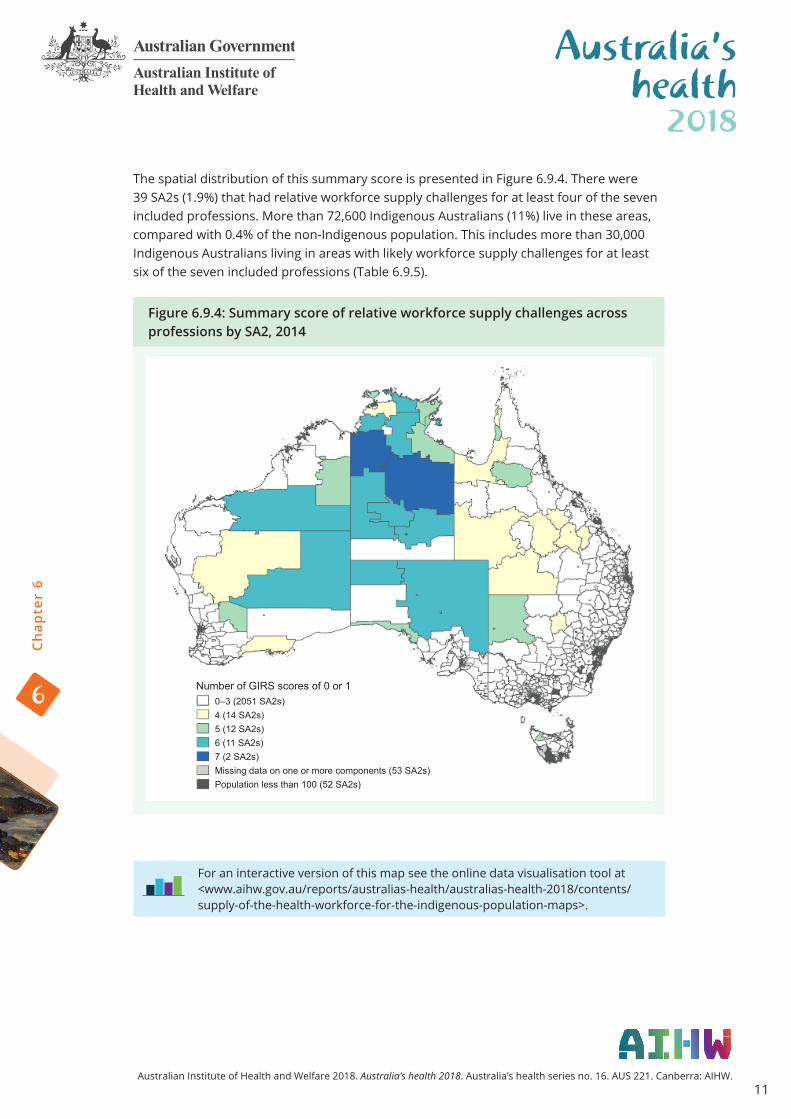
The spatial distribution of this summary score is presented in Figure 6.9.4. There were 39 SA2s (1.9%) that had relative workforce supply challenges for at least four of the seven included professions. More than 72,600 Indigenous Australians (11%) live in these areas, compared with 0.4% of the non-Indigenous population. This includes more than 30,000 Indigenous Australians living in areas with likely workforce supply challenges for at least six of the seven included professions (Table 6.9.5).
Figure 6.9.4: Summary score of relative workforce supply challenges across professions by SA2, 2014
Number of GIRS scores of 0 or 10–3 (2051 SA2s)4 (14 SA2s)5 (12 SA2s)6 (11 SA2s)7 (2 SA2s)Missing data on one or more components (53 SA2s)Population less than 100 (52 SA2s)
For an interactive version of this map see the online data visualisation tool at <www.aihw.gov.au/reports/australias-health/australias-health-2018/contents/supply-of-the-health-workforce-for-the-indigenous-population-maps>.

12
2018
Australia’s health
Australian Institute of Health and Welfare 2018. Australia’s health 2018. Australia’s health series no. 16. AUS 221. Canberra: AIHW.
6
Ch
apte
r 6
Table 6.9.5: Summary score of relative workforce supply across all seven professions
Population distribution Areas Number %
Summary scoreNo. of
SA2s % Indigenous Non-
Indigenous Indigenous Non-
Indigenous0 (no GIRS scores of 0 or 1 for any profession)
1,936 92.5 534,066 20,786,865 80.5 97.0
1 79 3.8 29,100 402,938 4.4 1.9
2 17 0.8 14,888 69,048 2.2 0.3
3 20 1.0 12,539 83,105 1.9 0.4
4 14 0.7 19,030 45,677 2.9 0.2
5 12 0.6 22,589 26,496 3.4 0.1
6 11 0.5 26,357 16,514 4.0 0.1
7 (GIRS scores of 0 or 1 for every profession)
2 0.1 4,695 1,225 0.7 0.0
Total 2,091 100.0 663,264 21,431,868 100.00 100.00
Note: Higher numbers of GIRS scores of 0 or 1 indicate a greater level of relative workforce supply challenges. SA2s included are only those with resident populations greater than 100 and valid data for all seven GIRS scores.
What is the AIHW doing?The AIHW is incorporating relative workforce supply measures in analyses of how area-level characteristics can help to explain geographic variation in health outcomes for Indigenous Australians.
What is missing from the picture?The GIRS was unable to include important factors such as the adequacy of services, the extent to which services are financially or culturally accessible and the extent to which the services in an area meet the needs of the population as data on these factors are unavailable.
Where do I go for more information?For more information on relative workforce supply, see Spatial distribution of the supply of the clinical health workforce 2014: relationship to the distribution of the Indigenous population.
For related reports, see Spatial variation in Aboriginal and Torres Strait Islander women’s access to 4 types of maternal health services, Spatial variation in Aboriginal and Torres Strait Islander people’s access to primary health services and Access to primary health care relative to need for Indigenous Australians.
See also supplementary document S6.9 ‘Estimating the supply of the health workforce’ available online at <www.aihw.gov.au/reports/australias-health/australias-health-2018/related-material>.
13
2018
Australia’s health
Australian Institute of Health and Welfare 2018. Australia’s health 2018. Australia’s health series no. 16. AUS 221. Canberra: AIHW.
6
Ch
apte
r 6
ReferencesDental Board of Australia 2015. Registration standards. Viewed 11 September 2015, <http://www.dentalboard.gov.au/Registration-Standards.aspx>.
Department of Health 2013. National Aboriginal and Torres Strait Islander Health Plan 2013–2023. Canberra: Department of Health.
Li SQ, Gray NJ, Guthridge SL & Pircher SLM 2009. Avoidable hospitalisation in Aboriginal and non-Aboriginal people in the Northern Territory. Medical Journal of Australia 190(10):532–6.
Related Documents